Time series models of symptoms in schizophrenia
11
Psychiatry Research 113 (2002) 127–137 0165-1781/02/$ - see front matter 2002 Elsevier Science Ireland Ltd. All rights reserved. PII: S0165-1781 Ž 02 . 00247-0 Time series models of symptoms in schizophrenia Wolfgang Tschacher*, Zeno Kupper University of Bern, University Hospital of Social and Community Psychiatry, Laupenstrasse 49, CH-3010 Bern, Switzerland Received 21 March 2001; received in revised form 3 October 2001; accepted 28 October 2001 Abstract The symptom courses of 84 schizophrenia patients (mean age: 24.4 years; mean previous admissions: 1.3; 64% males) of a community-based acute ward were examined to identify dynamic patterns of symptoms and to investigate the relation between these patterns and treatment outcome. The symptoms were monitored by systematic daily staff ratings using a scale composed of three factors: psychoticity, excitement, and withdrawal. Patients showed moderate to high symptomatic improvement documented by effect size measures. Each of the 84 symptom trajectories was analyzed by time series methods using vector autoregression (VAR) that models the day-to-day interrelations between symptom factors. Multiple and stepwise regression analyses were then performed on the basis of the VAR models. Two VAR parameters were found to be associated significantly with favorable outcome in this exploratory study: ‘withdrawal preceding a reduction of psychoticity’ as well as ‘excitement preceding an increase of withdrawal’. The findings were interpreted as generating hypotheses about how patients cope with psychotic episodes. 2002 Elsevier Science Ireland Ltd. All rights reserved. Keywords: Coping; Dynamic disease; Dynamic patterns; Negative symptoms; Time series analysis; Schizophrenia 1. Introduction Several studies conducted in recent years have shown that time courses of bipolar disorder (Gott- schalk et al., 1995; Pezard et al., 1996), schizo- phrenia (Marengo et al., 2000; Tschacher et al., 1997), and other disorders (Globus and Arpaia, 1994; Belair et al., 1995; Tschacher, 1996) reveal ´ specific dynamic patterns. The concept of ‘dynam- ic diseases’ is essential in this respect, suggesting that characteristics of a disorder may not only lie in its structure, its (biological) substrate, but in its *Corresponding author. Tel.: q41-31-387-6164; fax: q41- 31-382-9020. E-mail address: [email protected] (W. Tschacher). dynamics as well. In the mathematical language of dynamic systems theory (e.g. Kelso, 1995), invariant and stable dynamic patterns are called attractors. As a consequence, the premise of the dynamic disease concept can be sketched briefly as follows: Pathological phenomena are governed by an attractor emerging in a dynamic system; the type of attractor realized in the course of a disorder is, in addition to biological classifications, a poten- tially essential property of the disorder. Consider- ing the heterogeneity of schizophrenia spectrum disorders, one would expect to find a number of different dynamic patterns. The objective of the present study was to inves- tigate the dynamic invariants presented in schizo- phrenia and schizophrenia-like psychotic processes
Transcript of Time series models of symptoms in schizophrenia

Psychiatry Research 113(2002) 127–137
0165-1781/02/$ - see front matter� 2002 Elsevier Science Ireland Ltd. All rights reserved.PII: S0165-1781Ž02.00247-0
Time series models of symptoms in schizophrenia
Wolfgang Tschacher*, Zeno Kupper
University of Bern, University Hospital of Social and Community Psychiatry, Laupenstrasse 49, CH-3010 Bern, Switzerland
Received 21 March 2001; received in revised form 3 October 2001; accepted 28 October 2001
Abstract
The symptom courses of 84 schizophrenia patients(mean age: 24.4 years; mean previous admissions: 1.3; 64%males) of a community-based acute ward were examined to identify dynamic patterns of symptoms and to investigatethe relation between these patterns and treatment outcome. The symptoms were monitored by systematic daily staffratings using a scale composed of three factors: psychoticity, excitement, and withdrawal. Patients showed moderateto high symptomatic improvement documented by effect size measures. Each of the 84 symptom trajectories wasanalyzed by time series methods using vector autoregression(VAR) that models the day-to-day interrelations betweensymptom factors. Multiple and stepwise regression analyses were then performed on the basis of the VAR models.Two VAR parameters were found to be associated significantly with favorable outcome in this exploratory study:‘withdrawal preceding a reduction of psychoticity’ as well as ‘excitement preceding an increase of withdrawal’. Thefindings were interpreted as generating hypotheses about how patients cope with psychotic episodes.� 2002 Elsevier Science Ireland Ltd. All rights reserved.
Keywords: Coping; Dynamic disease; Dynamic patterns; Negative symptoms; Time series analysis; Schizophrenia
1. Introduction
Several studies conducted in recent years haveshown that time courses of bipolar disorder(Gott-schalk et al., 1995; Pezard et al., 1996), schizo-phrenia (Marengo et al., 2000; Tschacher et al.,1997), and other disorders(Globus and Arpaia,1994; Belair et al., 1995; Tschacher, 1996) reveal´specific dynamic patterns. The concept of ‘dynam-ic diseases’ is essential in this respect, suggestingthat characteristics of a disorder may not only liein its structure, its(biological) substrate, but in its
*Corresponding author. Tel.:q41-31-387-6164; fax:q41-31-382-9020.
E-mail address: [email protected](W. Tschacher).
dynamics as well. In the mathematical languageof dynamic systems theory(e.g. Kelso, 1995),invariant and stable dynamic patterns are calledattractors. As a consequence, the premise of thedynamic disease concept can be sketched brieflyas follows: Pathological phenomena are governedby an attractor emerging in a dynamic system; thetype of attractor realized in the course of a disorderis, in addition to biological classifications, a poten-tially essential property of the disorder. Consider-ing the heterogeneity of schizophrenia spectrumdisorders, one would expect to find a number ofdifferent dynamic patterns.
The objective of the present study was to inves-tigate the dynamic invariants presented in schizo-phrenia and schizophrenia-like psychotic processes

128 W. Tschacher, Z. Kupper / Psychiatry Research 113 (2002) 127–137
soon after the onset of disease. First, descriptionsof the dynamic patterns involved in this disorderhad to be provided on the basis of empirical data.In a second step consequent to this modeling ofthe dynamics of psychosis, we wished to assessthe relevance of these patterns if they existed. Thiscould be achieved by determining their associa-tions with outcome. The first objective of ourstudy—modeling the dynamic invariants of psy-chosis—is in line with demands that futureresearch should focus on ‘the interrelationshipsamong the dimensions of the schizophrenic disor-ders’ (Cuesta and Peralta, 1995). Our study couldelaborate on recent findings concerning the dynam-ic disease concept of schizophrenia(Tschacher etal., 1997; Kupper and Hoffmann, 2000). For thissake we introduced multivariate frequent measure-ments of symptoms, monitored in a sample ofyoung patients, to examine the temporal associa-tions between the various aspects of psychosis.
At present, relatively little is known about(espe-cially, short-term) associations among psychopa-thology variables. In spite of a general trendtowards dynamic systems approaches in biologicalas well as behavioral and cognitive sciences, veryfew empirical investigations have been publishedto date in this field. An exception is the study ofEaton et al.(1995), who used monthly measure-ments in a 10-year period finding that positive andnegative symptoms were autocorrelated but longi-tudinally independent of each other. Their finding,however, stands in contrast with reports of notableinterrelations between the positive and negativesyndromes(e.g. Maurer and Hafner, 1991). Time¨
series modeling of psychosis, especially with realempirical measurements as its foundation, is clear-ly still in its infancy. This state of affairs influencedthe study reported here in two ways: First, wechose daily measurements as our sampling ratebecause day-to-day variations appeared to be anatural time scale for the modeling of singlepsychotic episodes. Second, we evaluated simplelinear dynamic models in an attempt to achieve afirst exploratory approximation to the presumablycomplex dynamics of schizophrenia.
2. Methods
2.1. Subjects
The sample consisted of 84 treatment episodesgenerated by 84 patients of the acute ward ‘Soteria’in Bern, Switzerland(cf. Ciompi et al., 1993).During these treatment episodes the patients wereadmitted as inpatients of the Soteria ward.Throughout the period of hospitalization, the tem-poral evolution of psychotic symptoms of a patientwas observed. Patients had a mean age of 24.4years (S.D. 6.0 years). The mean length of thetreatment episodes was 91 days(S.D. 51.5 days)documented by daily ratings. Patients had a meanof 1.3 (most frequently occurring score, 0) previ-ous admissions as inpatients. Males accounted for64% of patients.
The sample was a subgroup of Soteria patientswhich was selected solely on the grounds of thefollowing two criteria: First, for methodologicalreasons, the minimum observation period was 20days; patients with shorter treatment episodes werenot considered in this study. Second, only thosepatients were included who had received an ICD-10 diagnosis of schizophrenia(F20, ns29) orschizotypal and acute psychotic disorder(F23,ns55). In patients with multiple recorded admissions,the first admission was chosen.
The patients received regular inpatient treatmentin the Soteria clinic. Treatment consisted of milieutherapy in a community-based open ward com-bined with low-dose neuroleptic therapy. Ciompiet al. (1993) reported that the prescription ofneuroleptics(chlorpromazine equivalents) in thisward was approximately 50% of that of a matchedcontrol group undergoing standard psychiatrictreatment. The therapeutic stance was centered onthe individual resources of patients rather thantheir deficits. In general, the treatment philosophyconformed to a holistic and humanistic approachpromoting positive affects. The patients wereviewed as residents undergoing a period of seriouscrisis, thus avoiding psychiatric categories andlabeling. The ward atmosphere may be describedas supportive and tolerant with an emphasis onproviding shelter from stressful events.
129W. Tschacher, Z. Kupper / Psychiatry Research 113 (2002) 127–137
2.2. Time series data
Ratings of a patient’s symptomatology wereperformed daily by the staff of the ward. Theratings were based on observation, not on a stan-dardized interview. The raters were nurses whointeracted closely with the patients during the day.Therefore, their impressions were not merelyderived from observation but also from talkingwith patients about their problems and symptoms,albeit in a non-standardized way. Ratings werealways made at the end of the day after work hadbeen completed. The raters were blind to theprevious ratings of a patient’s symptoms. Eachpatient was assessed by multiple raters becausedifferent nurses were on duty in the course of apatient’s stay.
A rating scale was developed especially forthese frequent multivariate ratings of psychoticsymptoms. This scale was based on the univariatescale described in Aebi et al.(1993) and Tschacheret al. (1997), which had allowed fairly reliableobservations(Kendall’s tau of 0.70). The newrating scale used in the present study was com-posed of nine items addressing hallucinations,delusions, derealization, confusion, anxiety, ambiv-alence, tension, depressiveness, and negativesymptoms(reliability and validity assessments areprovided below). Each item was quantified by anine-point Likert scale. In this way, the symptomcourse for each patient was mapped throughoutthe period of hospitalization.
2.3. Treatment outcome data
Outcome was assessed by comparing the symp-tom levels of the initial days of treatment withthose of the final days of treatment. This assess-ment was based on the daily symptom ratings. Foreach individual course, the outcome measures weredefined as follows:
¯ ¯x yxpre postES sx SDpre
where ES denotes the effect size of variablexx
(for example, ‘hallucinations’), which is definedas the difference of the averages of the initial andfinal 5 days( ), normalized by , the¯ ¯x yx SDpre post pre
sample standard deviation of the initial valuesx . In the process-outcome investigation, thesepre
effect sizes were the outcome variables to bepredicted by the process parameters.
2.4. Time series modeling
As a first preparatory step prior to time seriesanalysis, principal component analysis(PCA) wasconducted to test if the nine variables might bereduced to a smaller set of factors. The reason forfactorizing the raw data was to achieve a con-densed description of the 84 courses which wouldallow the computation of parsimonious time seriesmodels with few parameters. We performed PCAof all concatenated ratings of all patients(n)14 000), the so-called chained-P technique. Thenumber of meaningful factors was determined withthe scree test. A three-factor solution was chosenthat accounted for 73.2% of the total variance.
Subsequent varimax rotation grouped the threefactors as follows: The factor ‘psychoticity’ wascomposed of the ratings of hallucinations, delu-sions, derealization, and confusion(explained var-iance: 28.5%); the factor ‘excitement’ consisted ofanxiety, ambivalence, and tension(explained var-iance: 26.3%); the factor ‘withdrawal’ includeddepressiveness and negative symptoms(explainedvariance: 18.4%). The internal consistency of thethree factors as expressed by Cronbach’s coeffi-cient wasas0.87 for ‘psychoticity’(four items),as0.76 for ‘excitement’(three items) and as0.72 for ‘withdrawal’(two items). Considering thesmall number of items in the factors, these valuescorresponded to a good internal consistency. Thefinal values of the factors were computed as theunweighted means of the highest loading items(e.g. ‘withdrawal’ at dayt was defined by themean of ‘depressiveness’ and ‘negative symptoms’at dayt).
Interrater reliability of the factor scores and ofthe sum of all scales was assessed in an extensivetest under naturalistic conditions in the treatmentsetting. Reliability was calculated using intraclasscorrelations (ICC) (Shrout and Fleiss, 1979).Weighted values of multiple ICC(2,1) scores werecomputed. Interrater reliability was ICCs0.71 forthe sum score, ICCs0.60 for ‘psychoticity’,

130 W. Tschacher, Z. Kupper / Psychiatry Research 113 (2002) 127–137
ICCs0.66 for ‘excitement’ and ICCs0.58 for‘withdrawal’.
The validity of the daily ratings was assessedby comparing averaged daily ratings with PANSSscores in 25 randomly selected patients. Dailyratings were averaged across a period of one, twoand four weeks that preceded the date of therespective PANSS interview. Correlations betweenthese averaged daily ratings and the PANSS scoresin general ranged from moderate to high, support-ing the validity of the daily ratings. The factor‘psychoticity’ correlated with the PANSS positivescore for all three time periods(Pearson’srs0.60for one preceding week,rs0.63 for two weeks,and rs0.76 for four weeks). ‘Psychoticity’ wasbest described by PANSS P1 ‘delusions’(validitiesrs0.64y0.71y0.76). The factor ‘withdrawal’ cor-related with the PANSS negative score(rs0.62y0.61y0.57). This factor captured especially wellthe PANSS items ‘emotional withdrawal’ N2(0.73y0.70y0.67), ‘passive social withdrawal’ N4(0.69y0.67y0.66), and ‘lack of spontaneity’ N6(0.68y0.71y0.67). The factor ‘excitement’ corre-lated moderately with the PANSS ‘general psycho-pathology’ scale(0.50y0.52y0.43). (It should benoted, however, that the correlation between thefactor ‘excitement’ and PANSS P4 ‘excitement’was small. Therefore, these variables have identicallabels but must not be considered congruent.)
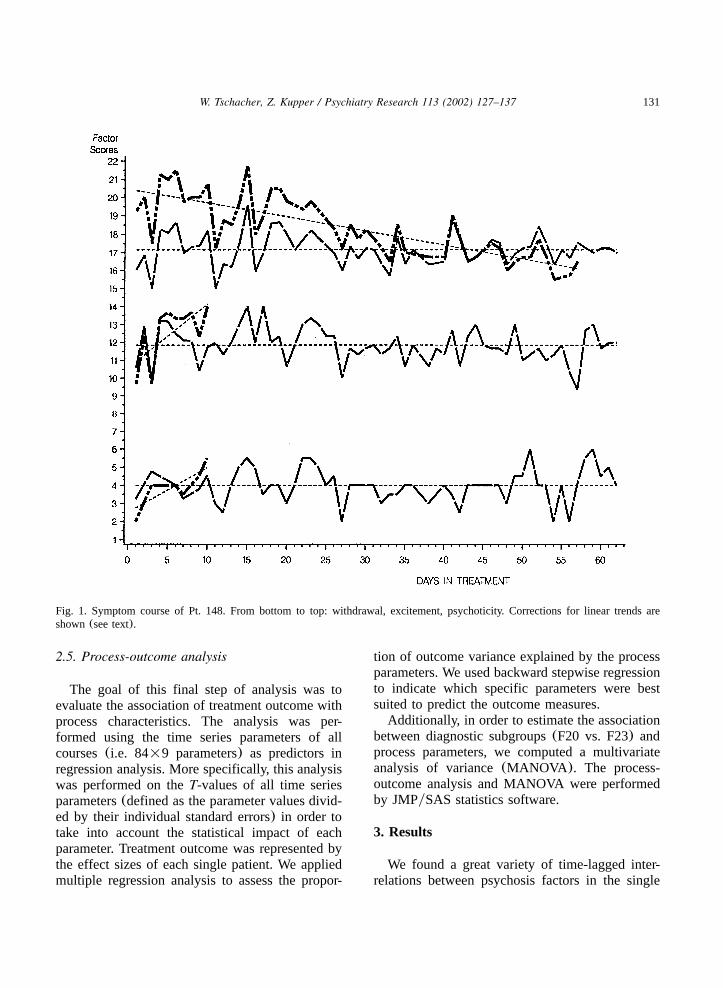
Time series analysis depends crucially on thestationarity of the courses. A further preparatorystep was therefore to ensure stationarity of the databy eliminating statistical trends in the time seriesof the three factors if present. A filter was imple-mented(Kupper and Tschacher, 2002) which cor-rected for the linear, ramp-like trends of the seriesoccurring frequently in the dataset. These trends,of course, reflected the effects of treatment whichwere expressed in the treatment outcome datadescribed above, but had to be removed for ensu-ing time series analysis. The filter consisted of anautomated iterative procedure: In each course oflength N, a time window starting from day 1 today m was defined(with 10FmFN). In all timewindows the ratio of the variance explained by alinear trend to the total variance was estimatedseparately for each of the three factors(using theprocedure AUTOREG in SAS). The time window
m was chosen which yielded the maximum ratio.Then the respective linear trends were removedfrom the series(see Fig. 1 for an example). Analternative method to make the time series station-ary would be to difference the data and computemodels composed of differenced factors. Differ-encing, however, has the disadvantage that allfurther discussion would have to address the dif-ferenced variables(e.g. ‘change in withdrawal’)instead of the observed variables(e.g. ‘withdraw-al’) which would have made interpretation moredifficult.
In a final step, time series analyses were per-formed in each of the 84 courses of symptomfactors (Fig. 1 depicts one such course). Wedecided to compute autoregressive models of firstorder (i.e. lag 1 models) throughout the sample.The reason for modeling all courses in the sameway was to ascertain comparability across allcourses which is a necessary condition for theaggregation of the models. The AIC criterion ofAkaike (1976) is a tool to estimate the optimalmodeling order for a given time series. Accordingto this criterion, in a majority of cases(63%) atime series model of first order was most appro-priate. In 17% of the courses no lagged model wasproposed by the criterion; in 14%(6%) of thecourses modeling with time lag 2(lag 3 or higher)was suggested. In these latter cases, no systematicbias is introduced even if the less optimal modelis enforced. We used the procedure STATESPACEof SASyETS software(1993) to compute the lag1 interrelations between factors. Statespace modelsof lag 1 are equivalent to vector autoregression(VAR) of first order (the method is called vectorautoregression because each time step of eachcourse is given by a vector of three symptomfactors). In other words, we determined the regres-sive association of each of the three factors psy-choticity, excitement and withdrawal at dayt-1with these factors at dayt (one day later). Includ-ing the three autocorrelations, this yielded 3=3s9 parameters which quantified the strength of theseday-to-day interrelations.
At the end of this procedure, 9 parameters foreach of the 84 courses were available for furtheranalyses.
131W. Tschacher, Z. Kupper / Psychiatry Research 113 (2002) 127–137
Fig. 1. Symptom course of Pt. 148. From bottom to top: withdrawal, excitement, psychoticity. Corrections for linear trends areshown(see text).
2.5. Process-outcome analysis
The goal of this final step of analysis was toevaluate the association of treatment outcome withprocess characteristics. The analysis was per-formed using the time series parameters of allcourses(i.e. 84=9 parameters) as predictors inregression analysis. More specifically, this analysiswas performed on theT-values of all time seriesparameters(defined as the parameter values divid-ed by their individual standard errors) in order totake into account the statistical impact of eachparameter. Treatment outcome was represented bythe effect sizes of each single patient. We appliedmultiple regression analysis to assess the propor-
tion of outcome variance explained by the processparameters. We used backward stepwise regressionto indicate which specific parameters were bestsuited to predict the outcome measures.
Additionally, in order to estimate the associationbetween diagnostic subgroups(F20 vs. F23) andprocess parameters, we computed a multivariateanalysis of variance(MANOVA ). The process-outcome analysis and MANOVA were performedby JMPySAS statistics software.
3. Results
We found a great variety of time-lagged inter-relations between psychosis factors in the single
132 W. Tschacher, Z. Kupper / Psychiatry Research 113 (2002) 127–137
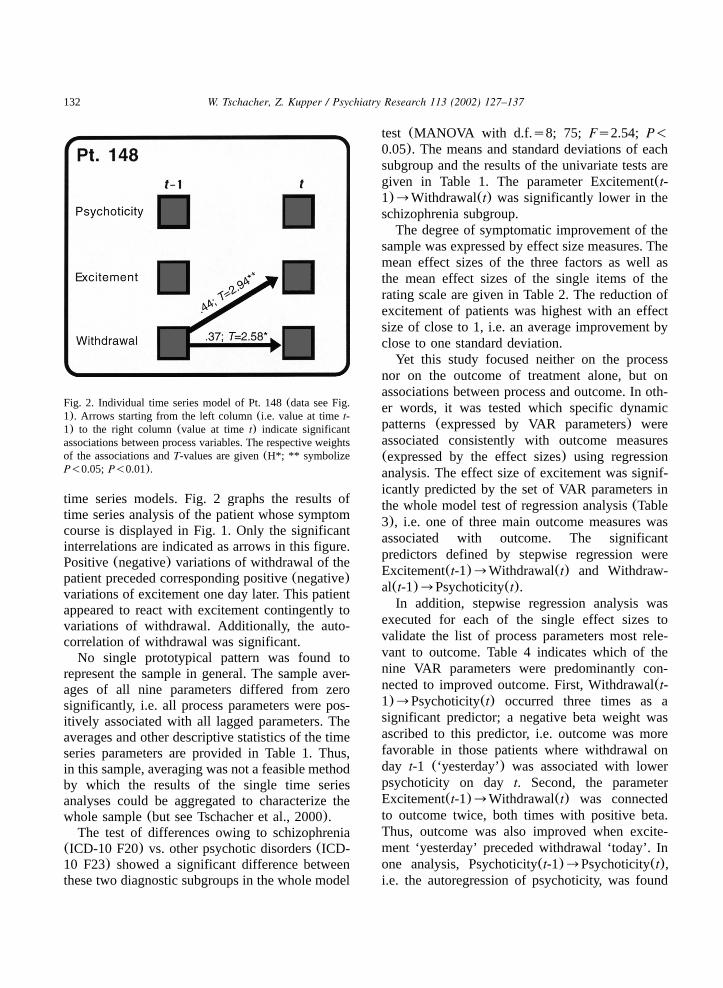
Fig. 2. Individual time series model of Pt. 148(data see Fig.1). Arrows starting from the left column(i.e. value at timet-1) to the right column(value at timet) indicate significantassociations between process variables. The respective weightsof the associations andT-values are given(H*; ** symbolizeP-0.05; P-0.01).
time series models. Fig. 2 graphs the results oftime series analysis of the patient whose symptomcourse is displayed in Fig. 1. Only the significantinterrelations are indicated as arrows in this figure.Positive(negative) variations of withdrawal of thepatient preceded corresponding positive(negative)variations of excitement one day later. This patientappeared to react with excitement contingently tovariations of withdrawal. Additionally, the auto-correlation of withdrawal was significant.
No single prototypical pattern was found torepresent the sample in general. The sample aver-ages of all nine parameters differed from zerosignificantly, i.e. all process parameters were pos-itively associated with all lagged parameters. Theaverages and other descriptive statistics of the timeseries parameters are provided in Table 1. Thus,in this sample, averaging was not a feasible methodby which the results of the single time seriesanalyses could be aggregated to characterize thewhole sample(but see Tschacher et al., 2000).
The test of differences owing to schizophrenia(ICD-10 F20) vs. other psychotic disorders(ICD-10 F23) showed a significant difference betweenthese two diagnostic subgroups in the whole model
test (MANOVA with d.f.s8; 75; Fs2.54; P-0.05). The means and standard deviations of eachsubgroup and the results of the univariate tests aregiven in Table 1. The parameter Excitement(t-1)™Withdrawal(t) was significantly lower in theschizophrenia subgroup.
The degree of symptomatic improvement of thesample was expressed by effect size measures. Themean effect sizes of the three factors as well asthe mean effect sizes of the single items of therating scale are given in Table 2. The reduction ofexcitement of patients was highest with an effectsize of close to 1, i.e. an average improvement byclose to one standard deviation.
Yet this study focused neither on the processnor on the outcome of treatment alone, but onassociations between process and outcome. In oth-er words, it was tested which specific dynamicpatterns (expressed by VAR parameters) wereassociated consistently with outcome measures(expressed by the effect sizes) using regressionanalysis. The effect size of excitement was signif-icantly predicted by the set of VAR parameters inthe whole model test of regression analysis(Table3), i.e. one of three main outcome measures wasassociated with outcome. The significantpredictors defined by stepwise regression wereExcitement(t-1)™Withdrawal(t) and Withdraw-al(t-1)™Psychoticity(t).
In addition, stepwise regression analysis wasexecuted for each of the single effect sizes tovalidate the list of process parameters most rele-vant to outcome. Table 4 indicates which of thenine VAR parameters were predominantly con-nected to improved outcome. First, Withdrawal(t-1)™Psychoticity(t) occurred three times as asignificant predictor; a negative beta weight wasascribed to this predictor, i.e. outcome was morefavorable in those patients where withdrawal onday t-1 (‘yesterday’) was associated with lowerpsychoticity on day t. Second, the parameterExcitement(t-1)™Withdrawal(t) was connectedto outcome twice, both times with positive beta.Thus, outcome was also improved when excite-ment ‘yesterday’ preceded withdrawal ‘today’. Inone analysis, Psychoticity(t-1)™Psychoticity(t),i.e. the autoregression of psychoticity, was found
133W. Tschacher, Z. Kupper / Psychiatry Research 113 (2002) 127–137
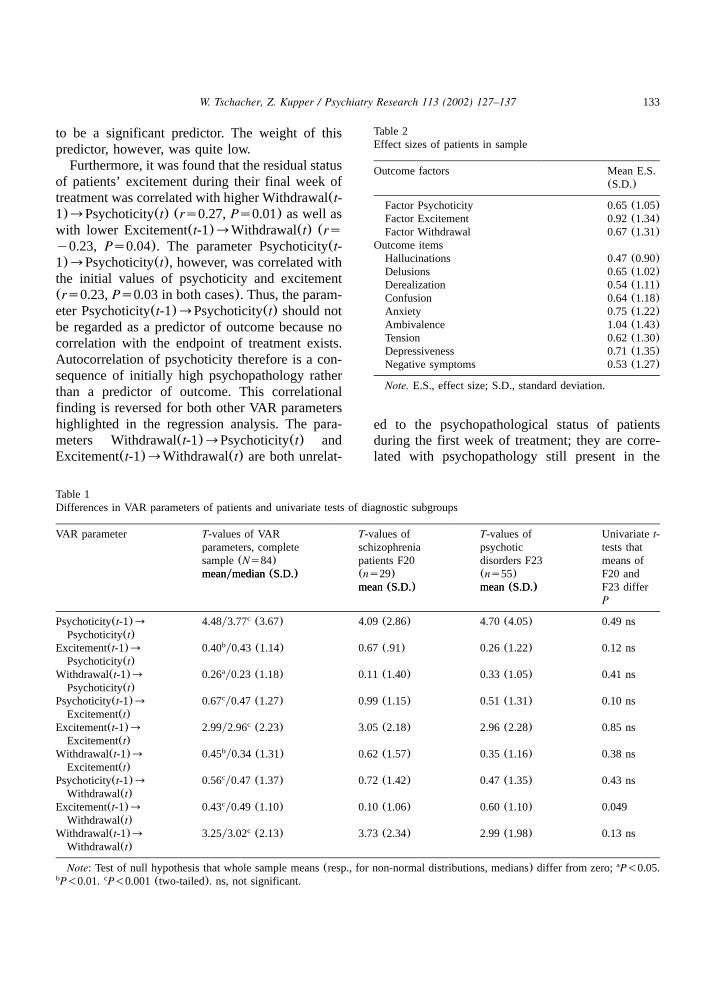
Table 2Effect sizes of patients in sample
Outcome factors Mean E.S.(S.D.)
Factor Psychoticity 0.65(1.05)Factor Excitement 0.92(1.34)Factor Withdrawal 0.67(1.31)
Outcome itemsHallucinations 0.47(0.90)Delusions 0.65(1.02)Derealization 0.54(1.11)Confusion 0.64(1.18)Anxiety 0.75(1.22)Ambivalence 1.04(1.43)Tension 0.62(1.30)Depressiveness 0.71(1.35)Negative symptoms 0.53(1.27)
Note. E.S., effect size; S.D., standard deviation.
Table 1Differences in VAR parameters of patients and univariate tests of diagnostic subgroups
VAR parameter T-values of VAR T-values of T-values of Univariatet-parameters, complete schizophrenia psychotic tests thatsample(Ns84) patients F20 disorders F23 means ofmeanymedian(S.D.) (ns29) (ns55) F20 and
mean(S.D.) mean(S.D.) F23 differmeanymedian(S.D.)
mean(S.D.) mean(S.D.)P
Psychoticity(t-1)™ 4.48y3.77 (3.67)c 4.09 (2.86) 4.70 (4.05) 0.49 nsPsychoticity(t)
Excitement(t-1)™ 0.40 y0.43 (1.14)b 0.67 (.91) 0.26 (1.22) 0.12 nsPsychoticity(t)
Withdrawal(t-1)™ 0.26 y0.23 (1.18)a 0.11 (1.40) 0.33 (1.05) 0.41 nsPsychoticity(t)
Psychoticity(t-1)™ 0.67 y0.47 (1.27)c 0.99 (1.15) 0.51 (1.31) 0.10 nsExcitement(t)
Excitement(t-1)™ 2.99y2.96 (2.23)c 3.05 (2.18) 2.96 (2.28) 0.85 nsExcitement(t)
Withdrawal(t-1)™ 0.45 y0.34 (1.31)b 0.62 (1.57) 0.35 (1.16) 0.38 nsExcitement(t)
Psychoticity(t-1)™ 0.56 y0.47 (1.37)c 0.72 (1.42) 0.47 (1.35) 0.43 nsWithdrawal(t)
Excitement(t-1)™ 0.43 y0.49 (1.10)c 0.10 (1.06) 0.60 (1.10) 0.049Withdrawal(t)
Withdrawal(t-1)™ 3.25y3.02 (2.13)c 3.73 (2.34) 2.99 (1.98) 0.13 nsWithdrawal(t)
Note: Test of null hypothesis that whole sample means(resp., for non-normal distributions, medians) differ from zero; P-0.05.a
P-0.01. P-0.001(two-tailed). ns, not significant.b c
to be a significant predictor. The weight of thispredictor, however, was quite low.
Furthermore, it was found that the residual statusof patients’ excitement during their final week oftreatment was correlated with higher Withdrawal(t-1)™Psychoticity(t) (rs0.27,Ps0.01) as well aswith lower Excitement(t-1)™Withdrawal(t) (rsy0.23, Ps0.04). The parameter Psychoticity(t-1)™Psychoticity(t), however, was correlated withthe initial values of psychoticity and excitement(rs0.23,Ps0.03 in both cases). Thus, the param-eter Psychoticity(t-1)™Psychoticity(t) should notbe regarded as a predictor of outcome because nocorrelation with the endpoint of treatment exists.Autocorrelation of psychoticity therefore is a con-sequence of initially high psychopathology ratherthan a predictor of outcome. This correlationalfinding is reversed for both other VAR parametershighlighted in the regression analysis. The para-meters Withdrawal(t-1)™Psychoticity(t) andExcitement(t-1)™Withdrawal(t) are both unrelat-
ed to the psychopathological status of patientsduring the first week of treatment; they are corre-lated with psychopathology still present in the

134 W. Tschacher, Z. Kupper / Psychiatry Research 113 (2002) 127–137
Table 3Process-outcome analysis: multiple regression and stepwise regression analyses for VAR parameters predicting effect sizes of factors
Outcome domain Multiple Stepwise Significant predictors inregression regression stepwise regression model(whole model) (backward)
R2 F R2 F
ES of psychoticity 0.10 0.89 0.04 3.51 Excitement(t–1)™Withdrawal(t)ES of excitement 0.23 2.39a 0.17 8.22c Withdrawal(t–1)™Psychoticity(t)
Excitement(t–1)™Withdrawal(t)ES of withdrawal 0.10 0.93 – –
Note: Dashes indicate that backward stepwise regression analysis could not be performed because all VAR parameters failed toenter the model.Ns84. P-0.05. P-0.01. P-0.001. ES, effect size. VAR, vector autoregression.a b c
Table 4Process-outcome analysis: significant predictors for outcome in subscales(backward stepwise regression)
Outcome variable Stepwise Significant predictors(P-0.05) Estimate ofregression predictorR2
ES of 0.05 Psychoticity(t–1)™Psychoticity(t) 0.06hallucinations
ES of anxiety 0.13 Withdrawal(t–1)™Psychoticity(t) y0.29Excitement(t–1)™Withdrawal(t) 0.24
ES of ambivalence 0.09 Withdrawal(t–1)™Psychoticity(t) y0.37ES of tension 0.15 Withdrawal(t–1)™Psychoticity(t) y0.23
Excitement(t–1)™Withdrawal(t) 0.36
Note: In 5 of 9 subscales, VAR parameters failed to enter the regression model at significance level.Ns84. ES, effect size. VAR,vector autoregression.
Fig. 3. Graphical display of parameters associated with out-come(predictors) in the sample. Dotted arrow indicates neg-ative association.
final week of treatment right before discharge.Thus these two parameters result from the process-outcome investigation as true predictors of out-come. These predictors are displayed graphicallyin Fig. 3.
4. Discussion
Analyzing data of systematic daily observationsof schizophrenia and acute psychotic courses, weidentified substantial autocorrelations and laggedcross-correlations in the process data. Descriptionsof the dynamical patterns underlying psychoticdisorders could thus be provided for all individualepisodes. This stands as an example for the mod-eling of invariants that is called for by the dynam-ical disease concept. Consistent with theheterogeneity of schizophrenia spectrum disorders,no single prototypical pattern for the whole sampleemerged. There were some differences, however,

135W. Tschacher, Z. Kupper / Psychiatry Research 113 (2002) 127–137
between the schizophrenia diagnostic subgroup andthe schizophrenia-like psychosis subgroup; but thissign of differential dynamic patterns was consid-ered as weak compared to the heterogeneity ofprocess patterns.
This study represents an exploratory approachto the short-term dynamics of psychopathology, afield where few quantitative studies exist to date.Its exploratory nature is reflected by variouspoints: First, the use of ‘soft’ techniques such asstepwise regression analysis does not allow us todecide between rival hypotheses as an experimen-tal design would. This methodology was used toestablish a tentative first step in largely unknownterrain. Second, given the field conditions of theSoteria clinic, potent external variables(‘thirdvariables’) such as medication, life events, familyinterventions, etc., were not controlled for or ran-domized. Field studies, however, entail advantagesas well as disadvantages: While some variablescannot be controlled, the observations obtained bya field study design are recorded with little obtru-siveness and have high ecological validity. Thevalues of interrater reliability were slightly lowerthan those usually reported for psychopathologyscales such as PANSS, SANS and SAPS or BPRS.This should be viewed, however, in the light thatthe conventional scales include a large number ofsubscales—the reliabilities of these subscales areoften in the range of the reliabilities reported here.Especially the validities of the daily ratings areremarkably high for measurements in the field. Incontrast to Eaton et al.(1995), who found nocross-correlations between monthly ratings of pos-itive and negative symptoms, these were large inour modeling of daily data. This may mean thatthe time scale of day-to-day variations is a naturaltime scale that deserves more attention in futureresearch.
Due to the process-outcome results obtained byregression analysis, Withdrawal(t-1)™Psychotici-ty(t) and Excitement(t-1)™Withdrawal(t) werepredictive of outcome. Lacking an experimentalenvironment, these dynamic findings must be inter-preted with caution. Third variables might distorta coefficient in a time series model. Nevertheless,we hold alternative explanations to be unlikelygiven the consistent significant findings in this
rather large sample of 84 independent patients whowere monitored at over 7000 points of measure-ment. Therefore, based on the statistics of the timeseries analyses, one may assume that if somefactor A significantly preceded factor B in a timeseries model, factor A is intrinsically related tofactor B; A may even have caused B.
Thus, we may generate the following hypothesesabout process-outcome relationships: First, in morefavorable courses of disorder, withdrawal was fol-lowed by lessened psychoticity. In other words,withdrawal appeared to have a beneficial, dampingeffect on psychoticity in good outcome patients—withdrawal was antagonistic to subsequent psy-choticity. Second, withdrawal was preceded byexcitement in favorable courses. This ‘antipsy-chotic’ impact of excitement may be regarded asindirect in that it alleviated psychoticity via itspositive, enhancing association with withdrawal.This effect of excitement on withdrawal was espe-cially high in acute psychosis(F23) patients.
One may speculate that coping mechanisms arereflected in this dynamic structure; the daily vari-ation of withdrawal and excitement represented abeneficial function in the dynamic patterns ofsymptomatology. The coping capacity of patientsis at the core of an integrative view of schizophre-nia (Liberman, 1986). Its varying impact on thecourse of schizophrenia disorders has been docu-mented by numerous authors(e.g. Boker and¨Brenner, 1983; Lee et al., 1993; Hoffmann et al.,2000). It may be noted here that coping capacityand self-efficacy are generally regarded as funda-mental therapeutic mechanisms in psychotherapyresearch(Grawe, 1997). Evidence of coping pro-cesses in schizophrenia would be of obvious clin-ical importance because it would suggest atherapeutic use of these processes. In the contextof our data, coping with psychoticity might meanthat specific psychotic symptoms(hallucinations,delusions, etc.) may be successfully dealt with byless specific emotional and behavioral means asare included in the factors excitement and with-drawal of the present study. If it were possible toimplement such mechanisms contingently to pre-vent or alleviate psychosis in the way shown inFig. 3, a positive outcome should be enhanced.The assumption, however, that the dynamic pat-

136 W. Tschacher, Z. Kupper / Psychiatry Research 113 (2002) 127–137
terns indicate coping mechanisms is hypothetical.Experimental designs are needed to support thesehypotheses.
Withdrawal, i.e. behavior that was rated bynurses as depressive and negative-symptomatic,signaled the reduction of psychotic symptoms inour data. This finding is consistent with the con-cept of secondary negative symptoms(Remingtonet al., 1999; Moeller, 1995) and phasic negativesymptoms (Tandon et al., 2000). It is a well-established finding that(primary) negative symp-tomatology generally antedates the outbreak ofmanifest positive symptoms in the biographies ofpersons with schizophrenia(e.g. Maurer and Haf-¨ner, 1991). Our data point to a reversal of thispattern in patients who eventually get better—theirwithdrawal antedates reduced psychoticity. Thus,the present investigation suggests that withdrawalynegative symptoms consist of two components,thereby differentiating the view of the pathognomicnature of the negative-positive sequence by intro-ducing a different time scale—daily fluctuationsin contrast to the usually much longer time scalesof longitudinal studies in schizophrenia research.We propose that temporal sequences in whichwithdrawal antedates an increase of specific symp-toms of schizophrenia may be related to the generalpathological progression of the disorder(Conrad,1958; Ciompi, 1982), and we wish to add thehypothesis that this progression might be reversedby coping mechanisms on a day-to-day time scale.This would be in line with the finding that phasicnegative symptoms are correlated with positivetreatment response(Tandon et al., 2000).
What consequences may be drawn from theobserved day-to-day dynamics? First, the hypoth-esis that there are ways by which schizophreniacan be coped with obviously needs more empirical,preferably experimental support. Therapeuticapplications such as coping-oriented cognitive-behavioral treatment programs(Tarrier et al., 1993;Schaub et al., 1997; Haddock et al., 1998) wouldbenefit greatly from more precise knowledge ofdynamic invariants in psychotic processes. Second,the therapeutic philosophy of the Soteria clinic,where unspecific milieu treatment was provided,may not be as ‘unspecific’ after all. One of itsmajor tenets is that a shielding off from external
stressors has an antipsychotic effect in episodes ofpsychotic disorder(Ciompi, 1982). The presentfinding of the effect of withdrawal is clearly inline with this therapeutic guideline.
Our general conclusion is that both schizophre-nia research and the treatment of schizophreniashould be ‘dynamics-informed’, i.e. attuned toaddressing the underlying dynamics of symptomtrajectories. The dynamic view in schizophreniaresearch may—in the future—help to integrateresearch approaches which have been pursuedquite independently of each other: the longitudinalor epidemiological approach examining time scalesof months or years and the clinically basedapproach that addresses the time scale reflectingone single admission, i.e. days and weeks. Oneintegrating feature of these different research strat-egies is that sequential patterns of behavior aresought which may characterize schizophrenia spec-trum patients as a whole as well as subgroupsamong the schizophrenia population.
Acknowledgments
This study was in part supported by the SwissNational Foundation grant 32-55954. The authorsthank the staff and directors of Soteria Bern,especially Luc Ciompi and Michel Broccard. Weare also grateful for the help provided by YolandaHuber, Nina Jacobshagen, and SimoneWassilevski.
References
Aebi, E., Ackermann, K., Revenstorf, D., 1993. Ein Konzeptder sozialen Unterstutzung fur akut Schizophrene. Zeitschrift¨ ¨fur Klinische Psychologie. Psychopathologie und Psychoth-¨erapie 41, 18–30.
Akaike, H., 1976. Canonical correlations analysis of timeseries and the use of an information criterion. In: Mehra,R., Lainiotis, D.G.(Eds.), Advances and Case Studies inSystem Identification. Academic Press, New York, pp.27–96.
Callaghan, T., 1995. In: Belair, J., Glass, L., an der Heiden,´U., Milton, J.(Eds.), Dynamical Disease. American Instituteof Physics Press, Woodbury, NY.
Boker, W., Brenner, H.D., 1983. Selbstheilungsversuche Schi-¨zophrener. Psychopathologische Befunde und Folgerungenfur Forschung und Therapie. Nervenarzt 54, 578–589.¨
Ciompi, L., 1982. Affektlogik. Stuttgart: Klett-Cotta. publishedin English in 1988: The Psyche and Schizophrenia. TheBond between Affect and Logic. Harvard University Press,Cambridge MA.

137W. Tschacher, Z. Kupper / Psychiatry Research 113 (2002) 127–137
Ciompi, L., Kupper, Z., Aebi, E., Dauwalder, H.P., Hub-schmidt, T., Trutsch, K., Rutishauser, C., 1993. Das Pilot-¨projekt ‘Soteria Bern: zur Behandlung akut Schizophrener.II. Ergebnisse einer vergleichenden prospektiven Verlaufs-studie uber 2 Jahre. Nervenarzt 64, 440–450.¨
Conrad, K., 1958. Die beginnende Schizophrenie. Thieme,Stuttgart.
Cuesta, M.J., Peralta, V., 1995. Psychopathological dimensionsin schizophrenia. Schizophrenia Bulletin 21, 473–482.
Eaton, W.W., Thara, R., Federman, B., Melton, B., Liang,K.Y., 1995. Structure and course of positive and negativesymptoms in schizophrenia. Archives of General Psychiatry52, 127–134.
Globus, G.G., Arpaia, J.P., 1994. Psychiatry and the newdynamics. Biological Psychiatry 35, 352–364.
Gottschalk, A., Bauer, M.S., Whybrow, P.C., 1995. Evidenceof chaotic mood variation in bipolar disorder. Archives ofGeneral Psychiatry 52, 947–959.
Grawe, K., 1997. Research-informed psychotherapy. Psycho-therapy Research 7, 1–19.
Haddock, G., Tarrier, N., Spaulding, W., Yusupoff, L., Kinney,C., McCarthy, E., 1998. Individual cognitive-behavior ther-apy in the treatment of hallucinations and delusions: areview. Clinical Psychology Review 18, 821–838.
Hoffmann, H., Kupper, Z., Kunz, B., 2000. Hopelessness andits Impact on rehabilitation outcome in schizophrenia—anexploratory study. Schizophrenia Research 43, 147–158.
Kelso, J.A.S., 1995. Dynamic Patterns: The Self-Organizationof Brain and Behavior. MIT Press, Cambridge MA.
Kupper, Z., Hoffmann, H., 2000. Course patterns of psycho-social functioning in schizophrenia patients attending avocational rehabilitation program. Schizophrenia Bulletin26, 680–698.
Kupper, Z., Tschacher, W., 2002. Symptom trajectories inpsychotic episodes. Comprehensive Psychiatry 43, 311–318.
Lee, P.W., Lieh-Mak, F., Yu, K.K., Spinks, J.A., 1993. Copingstrategies of schizophrenic patients and their relationship tooutcome. British Journal of Psychiatry 163, 177–182.
Liberman, R.P., 1986. Coping and competence as protectivefactors in the vulnerability-stress model of schizophrenia.In: Goldstein, M.J., Hand, I., Hahlweg, K.(Eds.), Treatmentof Schizophrenia. Springer, Berlin, pp. 201–215.
Marengo, J., Harrow, M., Herbener, E.S., Sands, J., 2000. Aprospective longitudinal 10-year study of schizophrenia’s
three major factors and depression. Psychiatry Research 97,61–77.
Maurer, K., Hafner, H., 1991. Dependence, independence or¨interdependence of positive and negative symptoms. In:Marneros, A., Andreasen, N.C., Tsuang, M.T.(Eds.), Neg-ative vs. Positive Schizophrenia. Springer, Berlin, pp.160–182.
Moeller, H.J., 1995. The psychopathology of schizophrenia:an integrated view on positive symptoms and negativesymptoms. International Clinical Psychopharmacology 10,57–64.
Pezard, L., Nandrino, J.-L., Renault, B., Massioui, F.E., Alli-laire, J.-F., Varela, F.J., Martinerie, J., 1996. Depression asa dynamical disease. Biological Psychiatry 39, 991–999.
Remington, G., Chong, S.A., Kapur, S., 1999. Distinguishingchange in primary and secondary negative symptoms. Amer-ican Journal of Psychiatry 156, 974–975.
Schaub, A., Andres, K., Brenner, H.D., Donzel, G., 1997.Developing a group format coping-oriented treatment pro-gramme for schizophrenic patients. In: Brenner, H.D., Bok-¨er, W., Genner, R.(Eds.), Towards a ComprehensiveTherapy for Schizophrenia. Hogrefe and Huber, Seattle, pp.228–251.
Shrout, P.E., Fleiss, J.L., 1979. Intraclass correlations: uses inassessing rater reliability. Psychological Bulletin 86,420–428.
Tandon, R., DeQuardo, J.R., Taylor, S.F., McGrath, M., Jibson,M., Eiser, A., Goldman, M., 2000. Phasic and enduringnegative symptoms in schizophrenia: biological markers andrelationship to outcome. Schizophrenia Research 45,191–201.
Tarrier, N., Sharpe, L., Beckett, R., Harwood, S., Baker, A.,Yusopoff, L., 1993. A trial of two cognitive behaviouralmethods of treating drug-resistant residual psychotic symp-toms in schizophrenic patients. II. Treatment-specific chang-es in coping and problem-solving skills. Social Psychiatryand Psychiatric Epidemiology 28, 5–10.
Tschacher, W., 1996. The dynamics of psychosocial crises—time courses and causal models. Journal of Nervous andMental Disease 184, 172–179.
Tschacher, W., Baur, N., Grawe, K., 2000. Temporal interactionof process variables in psychotherapy. PsychotherapyResearch 10, 296–309.
Tschacher, W., Scheier, C., Hashimoto, Y., 1997. Dynamicalanalysis of schizophrenia courses. Biological Psychiatry 41,428–437.