Optimisation of pre-treatment conditions for plantain (Musa ...
10
Quality Assurance and Safety of Crops & Foods, 2018; 10 (3): 223-232 Wageningen Academic Publishers ISSN 1757-837X online, DOI 10.3920/QAS2017.1216 223 1. Introduction Plantain (Musa parasidiaca) is one of the important staple food crops consumed in the tropics after rice, wheat and maize and is obtainable in about 120-130 tropical countries in the world (Kawongolo, 2013). It is an essential food crop in sub-Sahara Africa and serves as source of nutrient and household income for many people in Africa, Asia and South America (Kawongolo, 2013). The aggregated world production of plantain was just over 76 million metric tons (Olumba, 2014), out of which over 12 million metric tons are harvested yearly in Africa (Fakayode et al., 2011). Nigeria is the fifth largest producer of plantain in the world with about 3,088,938 tonnes produced in 2016 (FAO, 2017). The majority of plantain is produced in the southern part of the country due to the suitability of the weather conditions (Ayanwale et al., 2016). In spite of the large amount of plantain harvested yearly in Nigeria, Odemero (2013) reported that over 40% of the harvested plantain is lost during distribution. Adeniji et al. (2010) reported that post- harvest losses of plantain are caused by lack of processing options, rough handling and unavailability of appropriate Optimisation of pre-treatment conditions for plantain (Musa parasidiaca) flour using Box-Behnken design G.J. Fadimu 1,2* , L.O. Sanni 1 , A.A. Adebowale 1 , S.O. Kareem 3 , O.P. Sobukola 1 , O.E. Kajihausa 1 , P. Abdulsalam- Saghir 4 , B.O. Siwoku 5 , A.O. Akinsanya 5 and M.K. Adenekan 6 1 Department of Food Science and Technology, Federal University of Agriculture, P.M.B. 2240, Abeokuta, Ogun State, Nigeria; 2 Department of Food Science and Nutrition, King Saud University, Riyadh, Saudi Arabia; 3 Department of Microbiology, Federal University of Agriculture, P.M.B. 2240, Abeokuta, Ogun State, Nigeria; 4 Department of Agricultural Extension and Rural Development, Federal University of Agriculture, P.M.B. 2240, Abeokuta, Ogun State, Nigeria; 5 CAVA II (Nigeria), Department of Food Science and Technology, Federal University of Agriculture, P.M.B. 2240, Abeokuta, Ogun State, Nigeria; 6 Department of Food Technology, Moshood Abiola Polytechnic, Abeokuta, Nigeria; [email protected] Received: 20 November 2017 / Accepted: 20 April 2018 © 2018 Wageningen Academic Publishers RESEARCH ARTICLE Abstract The demand for plantain flour has increased in recent years due to its health benefits and industrial applications. Information on the optimum processing conditions to produce plantain flour of good quality is scarce. This study investigated the effects of pre-treatment on some quality attributes of unripe plantain flour. Response surface methodology (RSM) based on Box-Behnken design was used to optimise the pre-treatment conditions: blanching temperature (50-70 °C), blanching time (5-10 min) and potassium metabisulphite concentration (PMC) (1-2%). The functional and pasting properties of the plantain flour were determined using standard laboratory procedures. Data collected were subjected to analysis of variance, while RSM based on Box-Behnken design was used for response surface and regression analysis. Result of functional and proximate composition showed that pre-treatment significantly (P<0.05) affected the parameters. The bulk density, water absorption capacity, swelling power, solubility index and dispersibility values ranged from 0.65-0.71 g/ml, 124.67-160.25%, 32.56-44.32%, 4.32-5.99% and 58-70%, respectively. The moisture content, crude fibre, values ranged from 8.61-11.70% and 2.23-3.59%, respectively. The optimum pre-treatment conditions for unripe plantain flour with a desirability of 0.870 were a blanching temperature of 50 °C, a blanching time of 6.447 min and 1% PMC. The coefficient of determination (R 2 ) for the quadratic models developed ranged between 0.64 and 0.99 and these high values indicates a good fit between predicted values and the experimental data points. Keywords: processing conditions, plantain, flour, response surface methodology, Box-Behnken design
-
Upload
khangminh22 -
Category
Documents
-
view
3 -
download
0
Transcript of Optimisation of pre-treatment conditions for plantain (Musa ...

Quality Assurance and Safety of Crops & Foods, 2018; 10 (3): 223-232 Wageningen Academic P u b l i s h e r s
ISSN 1757-837X online, DOI 10.3920/QAS2017.1216 223
1. Introduction
Plantain (Musa parasidiaca) is one of the important staple food crops consumed in the tropics after rice, wheat and maize and is obtainable in about 120-130 tropical countries in the world (Kawongolo, 2013). It is an essential food crop in sub-Sahara Africa and serves as source of nutrient and household income for many people in Africa, Asia and South America (Kawongolo, 2013). The aggregated world production of plantain was just over 76 million metric tons (Olumba, 2014), out of which over 12 million metric
tons are harvested yearly in Africa (Fakayode et al., 2011). Nigeria is the fifth largest producer of plantain in the world with about 3,088,938 tonnes produced in 2016 (FAO, 2017). The majority of plantain is produced in the southern part of the country due to the suitability of the weather conditions (Ayanwale et al., 2016). In spite of the large amount of plantain harvested yearly in Nigeria, Odemero (2013) reported that over 40% of the harvested plantain is lost during distribution. Adeniji et al. (2010) reported that post-harvest losses of plantain are caused by lack of processing options, rough handling and unavailability of appropriate
Optimisation of pre-treatment conditions for plantain (Musa parasidiaca) flour using Box-Behnken design
G.J. Fadimu1,2*, L.O. Sanni1, A.A. Adebowale1, S.O. Kareem3, O.P. Sobukola1, O.E. Kajihausa1, P. Abdulsalam-Saghir4, B.O. Siwoku5, A.O. Akinsanya5 and M.K. Adenekan6
1Department of Food Science and Technology, Federal University of Agriculture, P.M.B. 2240, Abeokuta, Ogun State, Nigeria; 2Department of Food Science and Nutrition, King Saud University, Riyadh, Saudi Arabia; 3Department of Microbiology, Federal University of Agriculture, P.M.B. 2240, Abeokuta, Ogun State, Nigeria; 4Department of Agricultural Extension and Rural Development, Federal University of Agriculture, P.M.B. 2240, Abeokuta, Ogun State, Nigeria; 5CAVA II (Nigeria), Department of Food Science and Technology, Federal University of Agriculture, P.M.B. 2240, Abeokuta, Ogun State, Nigeria; 6Department of Food Technology, Moshood Abiola Polytechnic, Abeokuta, Nigeria; [email protected]
Received: 20 November 2017 / Accepted: 20 April 2018 © 2018 Wageningen Academic Publishers
RESEARCH ARTICLEAbstract
The demand for plantain flour has increased in recent years due to its health benefits and industrial applications. Information on the optimum processing conditions to produce plantain flour of good quality is scarce. This study investigated the effects of pre-treatment on some quality attributes of unripe plantain flour. Response surface methodology (RSM) based on Box-Behnken design was used to optimise the pre-treatment conditions: blanching temperature (50-70 °C), blanching time (5-10 min) and potassium metabisulphite concentration (PMC) (1-2%). The functional and pasting properties of the plantain flour were determined using standard laboratory procedures. Data collected were subjected to analysis of variance, while RSM based on Box-Behnken design was used for response surface and regression analysis. Result of functional and proximate composition showed that pre-treatment significantly (P<0.05) affected the parameters. The bulk density, water absorption capacity, swelling power, solubility index and dispersibility values ranged from 0.65-0.71 g/ml, 124.67-160.25%, 32.56-44.32%, 4.32-5.99% and 58-70%, respectively. The moisture content, crude fibre, values ranged from 8.61-11.70% and 2.23-3.59%, respectively. The optimum pre-treatment conditions for unripe plantain flour with a desirability of 0.870 were a blanching temperature of 50 °C, a blanching time of 6.447 min and 1% PMC. The coefficient of determination (R2) for the quadratic models developed ranged between 0.64 and 0.99 and these high values indicates a good fit between predicted values and the experimental data points.
Keywords: processing conditions, plantain, flour, response surface methodology, Box-Behnken design

G.J. Fadimu et al.
224 Quality Assurance and Safety of Crops & Foods 10 (3)
storage facilities. Generally, plantain is harvested at a matured but unripe stage and undergoes rapid respiration after harvest, making it a short-lived agricultural product that requires urgent attention immediately after harvest. It is therefore essential to develop techniques to process plantain into more stable agricultural products after harvest.
Matured unripe plantain could be processed into flour. In Nigeria, plantain flour is usually processed into a gruel called amala that is often recommended for people with diabetics because of its low glycaemic index (Falade, 2009). The use of plantain flour for production of baked goods has been reported by Arisa et al. (2013). However, the end use of plantain flour in food products depends on the attractiveness of its colour. Colour is an important physical parameter in flour quality (Arisa et al., 2013). The colour and other quality parameters of plantain flour can be improved by pre-treating the plantain fruits before drying.
Pre-treatments are unit operations applied to raw materials prior to processing in order to improve the appearance and other properties of the materials. Different pre-treatment methods have been developed and successfully used for pretreating fruit-based agricultural products, such as salt solution, honey dip, lemon juice, ascorbic acid, sulphiting, osmotic pre-treatment, and blanching (Karim, 2005). Sulphiting and blanching are the pre-treatments commonly used for plantain during processing into flour (Arisa et al., 2013). Pre-treatment processes are applied to arrest enzymatic browning, which could affect the colour of plantain fruits during drying. Previous studies on pre-treatment methods to improve the properties of plantain focused on the manipulation of different blanching and sulphiting conditions. There is limited information on the optimum pre-treatment conditions for producing good quality plantain flour.
Optimisation process is a tool used for developing optimum synergy of variables that will produce an efficient and economic process in manufacturing setting. The traditional technique of studying one factor at a time can yield a reasonable outcome in some cases, but it is equally important to study the combined effects of many factors and this is what optimisation tend to achieve. Optimisation as used in food processing is a technique used to combine different processing conditions in order to obtain conditions that can produce products of acceptable quality attributes (Sobukola et al., 2008). Response surface methodology (RSM) is a statistical and mathematical technique used for analysing contour plots to obtain the best processing conditions and multiple quadratic regression equation to fit between the factors and the response function. RSM is a useful technology in developing processes and optimising their performance (Raissi, 2009). Optimisation of different biochemical and biotechnological processes related to food processing have been successfully applied using RSM
(Pompeu et al., 2009). The objective of this present study was to optimise the effect of pre-treatment conditions (blanching temperature, blanching time and potassium metabisulphite (K2S2O5) concentration) for producing good quality plantain flour.
2. Materials and methods
Materials
Matured unripe plantain fruit was obtained from the plantain plantation of the Federal University of Agriculture (FUNAAB), Abeokuta, Nigeria. Plantain of the same variety and maturity level was carefully selected, while the ripeness stage was determined by matching the peel colour of the plantain fruits against a standardised colour chart. K2S2O5 was purchased from Libertas Laboratory (Abeokuta, Nigeria).
Preparation of plantain flour
Matured unripe plantain was processed in the food processing laboratory of Department of Food Science and Technology, FUNAAB, Abeokuta, Nigeria. Plantain fruits were first washed, peeled and sliced using plantain slicer. The plantain slices were pretreated after which they were dried in a cabinet dryer (Serial No 3114; LEEC Limited, Nottingham, UK) for 24 h at 60 °C according to Olaoye et al. (2006). The dried chips were then milled into flour using Philips blender (HR2001; Amsterdam, the Netherlands), sieved using a 250 µm mesh, packed in different zip lock polyethylene bags and stored at room temperature before analysis.
Statistical and experimental design
RSM using the Box-Behnken design was used to develop the experiment and optimisation of pre-treatment conditions for plantain flour. The choice of the three pre-treatment factors was based on earlier studies of plantain flour (Arinola et al., 2016; Oluwalana et al., 2011). These three independent variables were designated as X1 (blanching temperature), X2 (blanching time) and X3 (K2S2O5 concentration) and were used to create 17 pre-treatments conditions. The independent variables and their corresponding levels are given in Table 1.
The second order polynomial equation generated as a function of the predicted responses of water absorption capacity, swelling power, solubility index, dispersibility, crude fibre and moisture content is given below:
Yi = a0 + a1X1 + a2X2 + a3X3 + a11X1 + a22X2 + a33X3 + a12X1X2 + a13X1X2 + a23X2X3 + έ (1)

Pre-treatment conditions for plantain flour using Box-Behnken design
Quality Assurance and Safety of Crops & Foods 10 (3) 225
The predicted responses were designated as Yi associated with each factor level combinations a2 to a2,3 are the regression coefficients: X1, X2, X3 are the factors.
The optimal process parameters for plantain flour were estimated using Design Expert software version 8 (State-Ease, Minneapolis, MN, USA). The coefficients in the second-order polynomial were calculated by multiple regression analysis, based on the experimentally obtained data using Equation (1). The equations were validated using analysis of variance (ANOVA). Response surface plots were drawn to determine the individual and interactive effects of the test variables for water absorption capacity, swelling power, solubility index, dispersibility, crude fibre and moisture content. The optimal values of each factor to optimise the process responses were based on Numerical Optimisation. The order in which the experiments were carried out was randomised to minimise error.
Functional properties of the plantain flour
Determination of bulk density
Bulk density of plantain flour was determined using the method of Mpotokwane et al. (2008). An 100 ml measuring cylinder was filled with the sample to mark 100 ml, the cylinder was tapped 50 times and then reweighed. Bulk density was calculated as the ratio of the bulk density and the volume of the container (g/ml) (Akpapunan and Markakis, 1981).
Determination of water absorption capacity
Water absorption capacity of the plantain flour was determined as described by Sathe and Salunkhe (1981). One gram of the sample was mixed with 10 ml distilled water. The mixture was allowed to stand at room temperature for 30 min and then centrifuged at 1.073×g for 15 min. Water absorption capacity was expressed as percentage increase in weight of sample.
Determination of swelling power and solubility index
Swelling power and solubility index were determined as described by Leach et al. (1959). 1% flour solution was prepared and heated in a water bath (Gallenkamp Water bath Model BKS-350-030; Gallenkamp, London, UK), maintained at 90 °C for 30 min with constant stirring and cooling. The suspension was centrifuged at 3000 rpm for 20 min and the supernatant was decanted into a pre-weighed can and dried at 100 °C to constant weight. The dried can were weighed for calculation of solubility, while the weight of wet sediment in centrifuge tube was used to determine swelling power.
Determination of dispersibility
Dispersibility of the plantain flour was determined using the method described by Kulkami and Ingle (1991). 10 g of flour sample was suspended in an 100 ml measuring cylinder and distilled water was added to reach a volume of 100 ml. The mixture was stirred vigorously and allowed to settle for 3 h. The volume of settled particles was recorded and subtracted from 100 and the difference was reported as percentage dispersibility.
Proximate analysis
Moisture
Moisture content of the plantain flour was determined using air-oven method as described by AOAC (2000). A Gallenkamp hot air oven CHF097 model) was used to dry all samples to constant weight. The percentage moisture content was determined using the formula:
W1 – W2 Percentage moisture content = __________ × 100 (2) W
where:
W1 = weight of sample in dish before drying;
W2= weight of dried sample + dish after drying;
W = weight of sample.
Crude protein content
Total nitrogen in the plantain flour was determined using the micro-Kjedhal method as described by AOAC (2000). A conversion factor of 6.25 was used for the determination of crude protein present in the samples.
Table 1. Independent variables and their levels in the Box-Behnken design.
Independent variables Unit Symbol Coded levels
-1 0 +1Blanching temperature °C X1 50 60 70Blanching time Min X2 5 7.5 10K2S2O5 concentration % X3 1 1.5 2

G.J. Fadimu et al.
226 Quality Assurance and Safety of Crops & Foods 10 (3)
Fat content
Fat content was determined using Soxhlet method as described by AOAC (2000). Petroleum ether was used for the extraction and the percentage of fat present was determined using Equation 3:
x – y Percentage fat content = _______× 100 (3) z
where:
x = weight of fat + flask;
y = weight of flask;
z = weight of sample (in grams).
Crude fibre and ash content
Crude fibre content of the plantain flour was determined using the method described by AOAC (2000). Also, the ash content of the plantain flour was determined using the method described by AOAC (2000)
Total carbohydrate content
The total carbohydrate content of the plantain flour was calculated by difference method using Equation 4:
%Carbohydrate = 100 – (Protein + Moisture + Fat + Fibre + Ash) (4)
3. Results and discussion
Functional properties of pre-treated plantain flour
Bulk density
The bulk density of the plantain flours varied from 0.65 to 0.71 g/ml. The minimum bulk density (0.65 g/ml) was obtained from treatment 13 (60 °C blanching temperature, 10 min blanching time and 2% K2S2O5 concentration), whereas maximum bulk density was observed for treatments 1, 8 and 10 (60 °C, 7.5 min, 1.5%; 50 °C, 7.5 min, 1.0%; 50 °C, 7.5 min, 2.0%) as shown in Table 2. The quadratic effect of blanching time had a significantly negative effect (P<0.05) on the bulk density of the flours (Table 3). As the K2S2O5 concentration increased, the bulk density of the plantain flour increased (Figure 1A), whereas with an increase in blanching temperature the bulk density of the plantain flours decreased (Figure 1B). Similar findings have been reported by Oluwalana et al. (2011) for plantain flour. However, this is contrary to the findings of Fagbemi (1999) who reported that blanching increased the bulk density of plantain flour. The significant decrease in bulk density as blanching temperature increased may be due to the changes in the porosity of the starch present in the plantain and which subsequently decrease the bulk density.
Table 2. Effect of pre-treatment on the functional properties of pre-treated plantain flour.1
Treatment BT (°C) Bt (min) K2S2O5 (%) Y1 (g/ml) Y2 (%) Y3 (%) Y4 (%) Y5 (%)
1 60 7.5 1.5 0.70 134.70 38.54 67.0 4.802 70 7.5 1.0 0.67 129.04 36.85 68.0 4.523 50 5.0 1.5 0.67 153.12 42.81 68.0 5.614 60 5.0 2.0 0.69 138.16 37.48 69.5 4.425 60 7.5 1.5 0.71 134.84 38.78 69.5 4.826 60 7.5 1.5 0.71 133.04 38.62 68.0 4.817 70 10.0 1.5 0.67 127.34 34.80 66.0 4.508 50 7.5 1.0 0.71 158.72 44.18 70.0 5.899 60 7.5 1.5 0.71 135.94 38.03 67.0 5.6610 50 7.5 2.0 0.71 152.56 43.89 68.0 5.6611 70 5.0 1.5 0.67 124.67 32.56 58.0 4.4912 60 10.0 1.0 0.67 138.84 37.99 70.0 4.5913 60 10.0 2.0 0.65 136.16 37.98 68.5 4.6214 50 10.0 1.5 0.68 160.25 44.32 64.5 5.9915 60 7.5 1.5 0.71 135.05 38.52 69.5 4.7616 60 5.0 1.0 0.67 137.38 37.62 69.0 4.7017 70 7.5 2.0 0.69 126.88 33.57 66.0 4.32
1 BT = blanching temperature; Bt = blanching time, K2S2O5 = potassium metabisulphite, Y1 = bulk density, Y2 = water absorption capacity, Y3 = swelling power, Y4 = dispersibility, Y5 = solubility index.

Pre-treatment conditions for plantain flour using Box-Behnken design
Quality Assurance and Safety of Crops & Foods 10 (3) 227
Water absorption capacity
Water absorption, which measures the capacity of flour to absorb water and swell for enhanced consistency, is desirable in food systems as it helps to improve yield and consistency (Adepeju et al., 2011). The water absorption of the plantain flour varied from 126.88 to 160.26%. The minimum water absorption capacity was obtained for treatment 17 (70 °C blanching temperature, blanching time 7.5 min and K2S2O5 concentration of 2.0%), whereas the maximum value (160.25%) was observed for treatment 14 (50 °C, 10 min and 1.5%) (Table 2). From Table 3, the main effect of blanching temperature had negative significant effect (P<0.05) on the water absorption capacity whereas, quadratic effect of blanching temperature had positive significant effect on the water absorption capacity. The
water absorption capacity of the plantain flour decreased as the blanching temperature increased (Figure 2B), whereas the water absorption capacity increased as the blanching time increased. K2S2O5 concentration however had no significant effect on the water absorption capacity (Figure 2A). Similar results have been reported by Oluwalana et al. (2011) for plantain flour.
Dispersibility
Dispersibility is a measure of the reconstitution ability of flour in water. The higher the dispersibility the better the flour reconstitutes in water (Kulkarni and Ingle, 1991). The dispersibility of plantain flour varied between 58 and 70%. The treatments 8 and 12 (50 °C, 7.5 min, 1.0% and 60 °C, 10 min, 1.0%) had the maximum values while treatment 11
0.655 0.670 0.682 0.696 0.709
Bulk
dens
ity
5.00 6.25
7.50 8.75
10.00
1.00 1.25
1.50 1.75
2.00
B: blanching time C: concentration
0.683 0.689 0.696 0.703 0.709
Bulk
dens
ity
50.00 55.00
60.00 65.00
70.00
1.00 1.25
1.50 1.75
2.00
A: blanching temperature C: concentration
A B
Figure 1. Response surface plot for bulk density (g/ml) as a function of potassium metabisulphite concentration and (A) blanching time or (B) blanching temperature.
134.319 135.973 137.627 139.281 140.935
Wate
r abs
orpti
on ca
pacit
y
5.00 6.25
7.50 8.75
10.00
1.00 1.25
1.50 1.75
2.00
B: blanching time C: concentration
A B
125.511 133.8
142.089 150.378 158.668
Wate
r abs
orpti
on ca
pacit
y
50.00 55.00
60.00 65.00
70.00
1.00 1.25
1.50 1.75
2.00
A: blanching temperature C: concentration
Figure 2. Response surface plot for water absorption capacity (%) as a function of potassium metabisulphite concentration and (A) blanching time or (B) blanching temperature.

G.J. Fadimu et al.
228 Quality Assurance and Safety of Crops & Foods 10 (3)
(70 °C, 5.0 mins, 1.5%) had the minimum value (Table 2). The main effect of blanching temperature and quadratic effect of K2S2O5 concentration had positive significant effect on the dispersibility of the plantain flours while the quadratic effect of blanching temperature and interactive effect of blanching temperature and blanching time had negative significant effect on the plantain flour (Table 3). There was significant decrease in dispersibility as the blanching temperature and time increased (Figure 3B) whereas the dispersibility initially decreased with increase in K2S2O5 concentration, but it later increased with increase in concentration (Figure 3A). The decrease in dispersibility as blanching temperature increased may be attributed to
partial gelatinisation of the starch in the plantain which caused a reduction in the hydrophilic ability leading to reduction in hydration capacity of the flour thereby causing a reduction in dispersibility.
Proximate composition of pre-treated plantain flour
Moisture content
Moisture content of plantain flour ranged from 8.61 to 11.70%. The treatment 1 (60 °C blanching temperature, 7.5 min blanching time and 1.5% K2S2O5) recorded maximum moisture content (11.70%), whereas treatment
Figure 3. Response surface plot for dispersibility (%) as a function of blanching time and (A) potassium metabisulphite concentration or (B) blanching temperature.
A B
59.125 61.459 63.793 66.126 68.460
Disp
ersib
ility
50.00 55.00
60.00 65.00
70.00
5.00 6.25
7.50 8.75
10.00
A: blanching temperature B: blanching time
66.224 67.540 68.855 70.171 71.487
Disp
ersib
ility
5.00 6.25
7.50 8.75
10.00
1.00 1.25
1.50 1.75
2.00
B: blanching time C: concentration
Table 3. Regression analysis of responses for functional properties and physicochemical composition.1,2
Coefficient Y1 Y2 Y3 Y4 Y5 Y6 Y7 Y8 Y9 Y10 Y11
R2 0.874 0.985 0.982 0.906 0.879 0.777 0.974 0.974 0.969 0.982 0.860A -0.005 -14.59* -4.68* 1.56* -0.67* 0.76* -0.47* -0.30* -0.52* -0.35* -0.58*B -0.0075 1.16 0.58 -0.56 0.06 -0.12 -0.11* 0.014 -0.11* 0.012 0.25C 0.0025 -1.28 -0.47 0.62 -0.085 1.20 0.00 0.027 -0.040 0.00 0.051A2 -0.009 5.40* 0.99* -2.66* 0.35* -0.64* 0.095 -0.086* 0.24* -0.028 -0.89*B2 -0.034* 1.23 -0.87* -1.41 -0.17 -0.31* -0.11* -0.00012 -0.098 0.036 -0.72*C2 -0.004 1.69 0.13 2.46* -0.22 -0.25* 0.037 -0.0026 -0.022 -0.076* -0.83*AB 0.005 -1.11 0.18 -2.87* -0.093 -0.30 0.0087 -0.048 0.14* 0.0075 -0.45AC 0.005 1.00 -0.75 0.000 0.0075 0.061 -0.15* -0.005 0.014 -0.043 -0.31BC -0.001 -0.87 0.032 -0.50 0.078 0.33 -0.039 0.0037 -0.046 0.041 -0.15F-value 5.42 53.52 43.49 7.50 5.66 17.60 29.70 29.20 24.57 44.21 4.78P-value 0.0182 0.0001 0.0001 0.0073 0.879 0.0005 0.0001 0.0001 0.0002 0.0001 0.0257
1 A = blanching temperature; B = blanching time; C = potassium metabisulphite concentration; Y1 = bulk density; Y2 = water absorption capacity; Y3 = swelling power; Y4 = dispersibility; Y5 = solubility index; Y6 = carbohydrate; Y7 = protein; Y8 = fat; Y9 = crude fibre; Y10 = ash; Y11 = moisture; R2 = coefficient of determination.2 Significant values at 5% level are indicated with an asterisk.
Pre-treatment conditions for plantain flour using Box-Behnken design
Quality Assurance and Safety of Crops & Foods 10 (3) 229
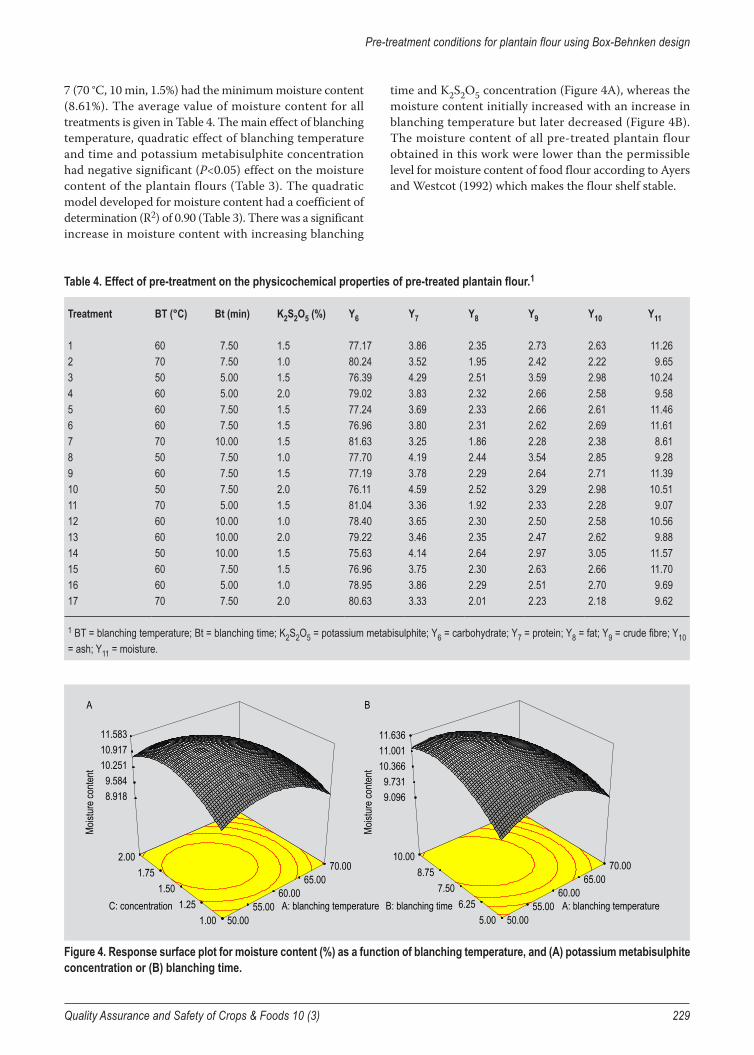
7 (70 °C, 10 min, 1.5%) had the minimum moisture content (8.61%). The average value of moisture content for all treatments is given in Table 4. The main effect of blanching temperature, quadratic effect of blanching temperature and time and potassium metabisulphite concentration had negative significant (P<0.05) effect on the moisture content of the plantain flours (Table 3). The quadratic model developed for moisture content had a coefficient of determination (R2) of 0.90 (Table 3). There was a significant increase in moisture content with increasing blanching
time and K2S2O5 concentration (Figure 4A), whereas the moisture content initially increased with an increase in blanching temperature but later decreased (Figure 4B). The moisture content of all pre-treated plantain flour obtained in this work were lower than the permissible level for moisture content of food flour according to Ayers and Westcot (1992) which makes the flour shelf stable.
Table 4. Effect of pre-treatment on the physicochemical properties of pre-treated plantain flour.1
Treatment BT (°C) Bt (min) K2S2O5 (%) Y6 Y7 Y8 Y9 Y10 Y11
1 60 7.50 1.5 77.17 3.86 2.35 2.73 2.63 11.262 70 7.50 1.0 80.24 3.52 1.95 2.42 2.22 9.653 50 5.00 1.5 76.39 4.29 2.51 3.59 2.98 10.244 60 5.00 2.0 79.02 3.83 2.32 2.66 2.58 9.585 60 7.50 1.5 77.24 3.69 2.33 2.66 2.61 11.466 60 7.50 1.5 76.96 3.80 2.31 2.62 2.69 11.617 70 10.00 1.5 81.63 3.25 1.86 2.28 2.38 8.618 50 7.50 1.0 77.70 4.19 2.44 3.54 2.85 9.289 60 7.50 1.5 77.19 3.78 2.29 2.64 2.71 11.3910 50 7.50 2.0 76.11 4.59 2.52 3.29 2.98 10.5111 70 5.00 1.5 81.04 3.36 1.92 2.33 2.28 9.0712 60 10.00 1.0 78.40 3.65 2.30 2.50 2.58 10.5613 60 10.00 2.0 79.22 3.46 2.35 2.47 2.62 9.8814 50 10.00 1.5 75.63 4.14 2.64 2.97 3.05 11.5715 60 7.50 1.5 76.96 3.75 2.30 2.63 2.66 11.7016 60 5.00 1.0 78.95 3.86 2.29 2.51 2.70 9.6917 70 7.50 2.0 80.63 3.33 2.01 2.23 2.18 9.62
1 BT = blanching temperature; Bt = blanching time; K2S2O5 = potassium metabisulphite; Y6 = carbohydrate; Y7 = protein; Y8 = fat; Y9 = crude fibre; Y10 = ash; Y11 = moisture.
8.9189.584
10.25110.91711.583
A B
Mois
ture c
onten
t
50.00 55.00
60.00 65.00
70.00
1.00 1.25
1.50 1.75
2.00
A: blanching temperature C: concentration
9.0969.731
10.36611.00111.636
Mois
ture c
onten
t
50.00 55.00
60.00 65.00
70.00
5.00 6.25
7.50 8.75
10.00
A: blanching temperature B: blanching time
Figure 4. Response surface plot for moisture content (%) as a function of blanching temperature, and (A) potassium metabisulphite concentration or (B) blanching time.
G.J. Fadimu et al.
230 Quality Assurance and Safety of Crops & Foods 10 (3)
Crude fibre
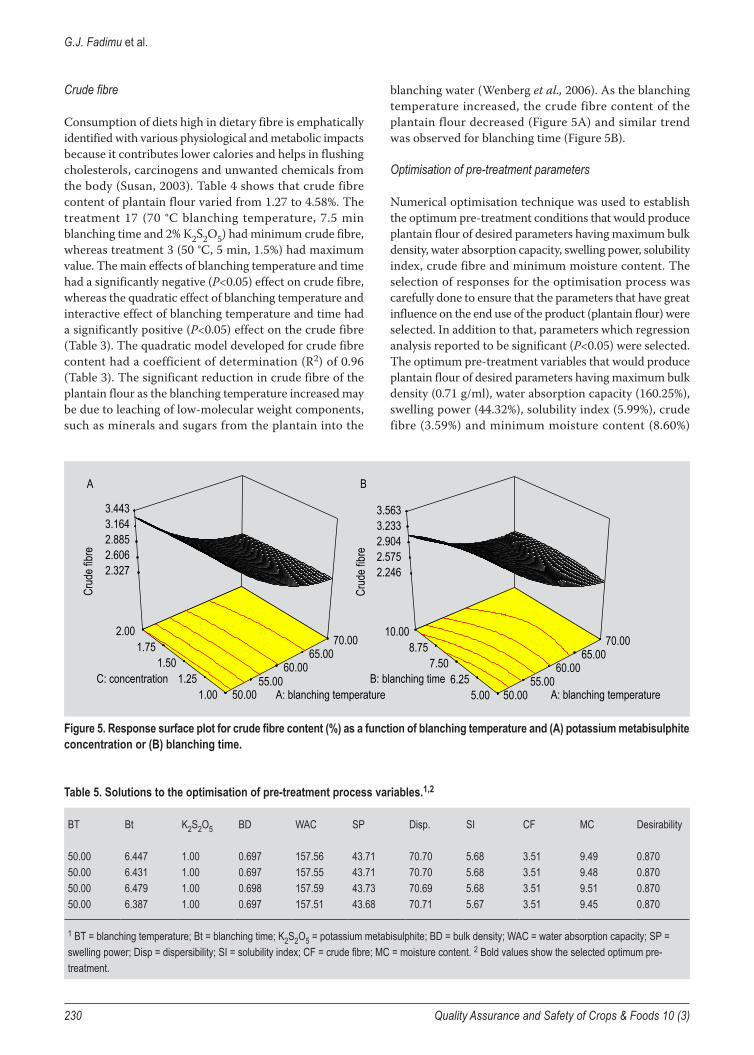
Consumption of diets high in dietary fibre is emphatically identified with various physiological and metabolic impacts because it contributes lower calories and helps in flushing cholesterols, carcinogens and unwanted chemicals from the body (Susan, 2003). Table 4 shows that crude fibre content of plantain flour varied from 1.27 to 4.58%. The treatment 17 (70 °C blanching temperature, 7.5 min blanching time and 2% K2S2O5) had minimum crude fibre, whereas treatment 3 (50 °C, 5 min, 1.5%) had maximum value. The main effects of blanching temperature and time had a significantly negative (P<0.05) effect on crude fibre, whereas the quadratic effect of blanching temperature and interactive effect of blanching temperature and time had a significantly positive (P<0.05) effect on the crude fibre (Table 3). The quadratic model developed for crude fibre content had a coefficient of determination (R2) of 0.96 (Table 3). The significant reduction in crude fibre of the plantain flour as the blanching temperature increased may be due to leaching of low-molecular weight components, such as minerals and sugars from the plantain into the
blanching water (Wenberg et al., 2006). As the blanching temperature increased, the crude fibre content of the plantain flour decreased (Figure 5A) and similar trend was observed for blanching time (Figure 5B).
Optimisation of pre-treatment parameters
Numerical optimisation technique was used to establish the optimum pre-treatment conditions that would produce plantain flour of desired parameters having maximum bulk density, water absorption capacity, swelling power, solubility index, crude fibre and minimum moisture content. The selection of responses for the optimisation process was carefully done to ensure that the parameters that have great influence on the end use of the product (plantain flour) were selected. In addition to that, parameters which regression analysis reported to be significant (P<0.05) were selected. The optimum pre-treatment variables that would produce plantain flour of desired parameters having maximum bulk density (0.71 g/ml), water absorption capacity (160.25%), swelling power (44.32%), solubility index (5.99%), crude fibre (3.59%) and minimum moisture content (8.60%)
Table 5. Solutions to the optimisation of pre-treatment process variables.1,2
BT Bt K2S2O5 BD WAC SP Disp. SI CF MC Desirability
50.00 6.447 1.00 0.697 157.56 43.71 70.70 5.68 3.51 9.49 0.87050.00 6.431 1.00 0.697 157.55 43.71 70.70 5.68 3.51 9.48 0.87050.00 6.479 1.00 0.698 157.59 43.73 70.69 5.68 3.51 9.51 0.87050.00 6.387 1.00 0.697 157.51 43.68 70.71 5.67 3.51 9.45 0.870
1 BT = blanching temperature; Bt = blanching time; K2S2O5 = potassium metabisulphite; BD = bulk density; WAC = water absorption capacity; SP = swelling power; Disp = dispersibility; SI = solubility index; CF = crude fibre; MC = moisture content. 2 Bold values show the selected optimum pre-treatment.
2.3272.6062.8853.1643.443
A B
Cru
de fib
re
50.00 55.00
60.00 65.00
70.00
1.00 1.25
1.50 1.75
2.00
A: blanching temperature C: concentration
2.2462.5752.9043.2333.563
Cru
de fib
re
50.00 55.00
60.00 65.00
70.00
5.00 6.25
7.50 8.75
10.00
A: blanching temperature B: blanching time
Figure 5. Response surface plot for crude fibre content (%) as a function of blanching temperature and (A) potassium metabisulphite concentration or (B) blanching time.

Pre-treatment conditions for plantain flour using Box-Behnken design
Quality Assurance and Safety of Crops & Foods 10 (3) 231
with desirability of 0.0870 was found to be a blanching temperature 50 °C, blanching time of 6.447 min and 1% K2S2O5 solution (Table 5).
4. Conclusions
This study revealed that blanching temperature, blanching time and K2S2O5 concentration could be used to pretreat plantain fruits to produce good quality plantain flour. The optimised pre-treatment conditions was found to be 50°C blanching temperature, blanching time 6.447 minutes and 1% K2S2O5 concentration. The desirability for all the responses was found to be 0.870 and all the derived mathematical models for the various responses were found to be significantly fit to predict the data. This work has shown that the appearance of plantain flour could be improved with the use of appropriate pre-treatment conditions.
Acknowledgements
The authors of this paper acknowledge the financial support provided by World Bank under auspices of CORAF/WECARD for sponsoring this project Upscaling the Nigerian Flash Drying Experience for Sustainable Regional Trade and Income Generation in West Africa (UDESWA).
References
Adeniji, T.A., Hart, A.D., Tenkouano, A., Barimalaa, I.S. and Sanni, L.O., 2010. Comparative study of pasting properties of improved plantain, banana and cassava varieties with emphasis on industrial application. African Journal of Food Agriculture Nutrition and Development 10: 2601-2614.
Adepeju, A.B., Gbadamosi, S.O., Adeniran, A.H. and Omobuwajo, T.O., 2011. Functional and pasting characteristics of breadfruit (Artocarpus altilis) flours. African Journal of Food Science 5: 529-535.
Akpapunan, M.A. and Markakis, P. 1981. Physicochemical and nutritional aspects of cowpea flour. Journal of Food Science 46: 972-973.
Arinola, S.O., Ogunbusola, E.M. and Adebayo, S.F., 2016. Effect of drying methods on the chemical, pasting and functional properties of unripe plantain (Musa paradisiaca) flour. British Journal of Applied Science and Technology 14: 1-7.
Arisa, N.U., Adelekan, A.O., Alamu, A.E. and Ogunfowora, E.J., 2013. The effects of pretreatments of plantain (Musa parasidiaca) flour on the pasting and sensory characteristics of biscuits. International Journal of Food and Nutrition 2: 1.
Association of Official Analytical Chemists (AOAC), 2000. Official Methods of Analysis,17th edition,. Association of Official Analytical Chemists International, Washington, DC, USA.
Ayanwale, A.B., Fatunbi, A.O. and Ojo, M., 2016. Innovation opportunities in plantain production in Nigeria. Guide Book1. Forum for Agricultural Research in Africa (FARA), Accra, Ghana.
Ayers, R.S. and Westcot, D.W., 1992. Water quality for agriculture. Irrigation and Drainage Paper 29 Rev. 1. FAO, Rome, Italy.
Fagbemi, T.N., 1999. Effect of blanching and ripening on the functional properties of plantain (Musa aab) flour. Plant Food for Human Nutrition 54: 261-269.
Fakayode, B.S., Rahji, M.A.Y., Ayinde, O. and Nnom, G.O., 2011. An economic assessment of plantain production in Rivers State, Nigeria International Journal of Agricultural Economics and Rural Development 4: 2.
Falade, K.O. and Olugbuyi, A.O., 2009. Effects of maturity and drying methods on the physico-chemical and reconstitution properties of plantain flour. International Journal of Food Science and Technology 45: 170-178.
Food and Agriculture Organization of the United Nations (FAO), 2017. Production, commodity by country; FAOSTAT Data. FAO, Rome, Italy. Available at: http://www.fao.org/faostat/en/#rankings/countries.
Kawongolo, J.B., 2013. Optimization of processing technology for commercial drying of bananas (Matooke). PhD dissertation submitted to Department of Agricultural Engineering, University of Kassel, Germany.
Kulkarni, D.N. and Ingle U.M., 1991. Sorghum malt based weaning food formulations: preparation, functional properties and nutritive value. Food and Nutrition Bulletin 13: 322-327.
Leach, H.W., McCoven, L.D. and Scoch, T.J., 1957. Structure of the starch granule. swelling and solubility patterns of various starches. Cereal Chemistry 36: 534-544.
Mpotokwane, S.M., Gaditlhatlhelwe, A., Sebaka, A. and Jideani, V.A., 2008. Physical properties of Bambara groundnuts from Botswana. Journal of Food Engineering 89: 93-98.
Odemero, A.F., 2013. Factor analysis on small scale banana production in the rain forest zone of Delta State, Nigeria. Journal of Natural Sciences Research 3: 1-7.
Olaoye, O.A., Onilude, A.A. and Idowu, O. 2006. Quality characteristics of bread produced from composite flours of wheat, plantain and soybeans. African Journal of Biotechnology 5: 1102-1106.
Olumba, C.C., 2014. Productivity of improved plantain technologies in Anambra State, Nigeria. African Journal of Agricultural Research 9: 2196-2204.
Oluwalana, I.B., Oluwamukomi, M.O., Fagbemi, T.N. and Oluwafemi, G.I., 2011. Effects of temperature and period of blanching on the pasting and functional properties of plantain (Musa parasidiaca) flour. Journal of Stored Products and Postharvest Research 2: 164-169.
Pompeu, D.R., Silva, E.M. and Rogez, H., 2009. Optimisation of solvent extraction of phenolic antioxidants from fruits of Euterpe oleracea using response surface methodology. Bioresource Technology 100: 6076-6082.
Raissi, S., 2009. Developing new processes and optimizing performance using response surface methodology world academy of science. Engineering Technology 49: 1039-1042.
Sathe, S.K. and Salunke, D.K., 1981. Functional properties of the great northern bean (Phaseolus vulgaris L.). Journal of Food Science 46: 71-81.

G.J. Fadimu et al.
232 Quality Assurance and Safety of Crops & Foods 10 (3)
Sobukola, O.P., Awonorin, S.O., Sanni, L.O. and Bamiro, F.O., 2008. Deep-fat frying of yam slices: optimization of processing conditions using response surface methodology. Journal of Food Processing and Preservation 32: 343-360.
Susan, M.K., 2003. Fiber fundamentals. Physician and Sport Medicine 26: 3.
Wenberg, M., Ekvall, J., Olsson, K. and Nyman, M., 2006. Change in carbohydrate and glucosinolate composition in white cabbage (Brassica oleracea var. Capitata) during blanching and treatment with acetic acid. Food Chemistry 95: 226-236.