Simulation model of ANN and PID controller for direct current ...

Proceedings of the 8th International Symposium on Mechatronics and its Applications (ISMA12), Sharjah, UAE, April 10-12, 2012
ISMA12-1
Optimal PID-fuzzy Logic Controller for Type 1 Diabetic Patients
Mohamed Al-Fandi, Yousef Sardahi, Mohammad A. K. Jaradat
Jordan University of Science and Technology
Department of Mechanical Engineering
P.O. Box 3030, Irbid, Jordan [email protected]
ABSTRACT
In this paper, an optimal PID-FLC (Proportional Integral
Derivative Fuzzy Logic Controller) is proposed. The design of
this system aims to control blood glucose elevation in Type1
diabetic patients. An automated system integrated with a
miniaturized insulin infusion pump and a continuous biosensor
that measures the glucose level was built to replace beta cells in
the pancreas. The main contribution of the paper is that it
introduces an automated insulin delivery system based on a
parallel PID-FLC structure tuned with genetic algorithms. This
control system was compared to an optimal PI-FLC and PD-
FLC as well as a reference model. The results revealed that the
controllers could maintain the glucose level within a normal
range. In addition, the performance of the PI-FLC and the PID-
FLC was very close to that of beta cells in normal individuals.
So, they can be exploited prosperously as control systems to
manage blood glucose concentrations in Type 1 diabetic
patients. In addition, the PID-FLC saved the amount of the
daily delivered insulin. While, its performance was
approximately the same as that of the PI-FLC.
1. INTRODUCTION
Diabetic Mellitus (DM) is a set of lingering metabolic disorders,
which result in hyperglycemia [1]. This occurs when the
pancreatic beta cells become unable to produce insulin or its
secreted amount is not enough as in Type 1 diabetes. In 2001,
Type 1 diabetic patients were estimated to be more than 120
million people around the world [2]. This number is candidate
to reach 300 million by the year 2025 [2]. As the number of the
sufferers increases, the expenses on the health care system will
mount. In addition, this disease causes some risky
complications, such as kidney failure, blindness, nerve damage,
heart attack, and ineffectively of the immune system. [2]. In
order to alleviate these complications, glycemic control was
adopted by many authors. A classical PID controller integrated
with an intravenous enzymatic glucose sensor and an implanted
insulin pump was introduced in [3]. A linear and nonlinear
model predictive control was discussed in [4]. A robust H∞
controller to automate insulin delivery was proposed in [5].
Another algorithm based on an H2 /H∞ control for type I
diabetic patients under intensive care was presented in [6]. A
comparison study between fuzzy logic controllers and
conventional techniques was addressed in [7, 8]. Therein, the
fuzzy systems had better transient characteristics than those of
the conventional ones.
Most of these developed control systems used the simple
Bergman model as a patient model, which does not accurately
describe the glucose-insulin kinetics [10]. In addition, these
controllers focused on keeping the glucose level at a specific
reference point instead of imitating the oscillatory fashion of
glucose and insulin profiles in non-diabetic individuals [10]. A
PI-FLC to control the glucose level in Type 1 diabetic subjects
was investigated in [10]. The objective of the system was to
mimic the glucose-insulin dynamics in healthy persons. The
parameters of the controller including membership functions
and scaling variables were tuned using the genetic algorithm. In
this paper, the PI-FLC was merged with an optimal PD-FLC to
design an optimal PID-FLC. The advantage of this method is
that it reduces the size of the genetic algorithm’s search space
since the PI-FLC and the PD-FLC are optimized separately.
These controllers were implemented on the same glucose-
insulin model. This mathematical model is a set of nonlinear
and delay differential equations that describe glucose-insulin
kinetics in healthy persons.
2. Mathematical model
The simulation trials were conducted on the mathematical
model developed in [11]. In this model, the time change of
glucose concentration (dG/dt) under an external insulin
infusion (Iin) has the form of Eq. (1) while the change in insulin
concentration over time takes the form of Eq. (2).
)1())(())(())(())(()( 253432 tIftIftGftGftGdt
dGin
)2())(()( tIdtIdt
dIiin
This model was solved by using Matlab as shown in Figure 1. In this figure, G(t) is the plasma glucose concentration and I(t)
stands for the insulin concentration. Gin represents the external
glucose intake. The insulin-independent utilization of glucose
by the brain and nerve cells is denoted by f2(G (t)). On the other
side, the insulin-dependent consumption of glucose is
represented by the pair f3(G (t)) f4 (I (t)). f5(I (t)) denotes the
hepatic production of the glucose relying on the insulin level. As in [11], we assumed that the delay of the dependent
utilization, τ3, and that of the glucose production, τ2, were 5 and
15 minutes, respectively. The insulin degradation rate, di, was
assumed to be proportionally related to the insulin concentration
with value of 0.0076 min-1.

Proceedings of the 8th International Symposium on Mechatronics and its Applications (ISMA12), Sharjah, UAE, April 10-12, 2012
ISMA12-2
Figure 1. glucose-insulin dynamic model.
3. PD-FLC
The block diagram of a control system for Type 1 diabetic
patients is shown in Figure 2. It incorporates a PD-FLC, which
is indicated by the dotted rectangle, and the patient model in
the forward path.
Figure 2. Optimal PD-FLC
This system was designed based on two input-linguistic
variables, the error signal (e) and its rate of change (de/dt). The
error signal is the difference between the glucose level under
the normal model and that under the control system. An
exogenous insulin infusion rate was considered as an output
linguistic variable (Iin,f ). The rapid-acting lispro insulin was
chosen as the injected drug. As in [10], each fuzzy linguistic
variable was divided into seven Gaussian membership
functions and Mamdani type fuzzy logic was chosen as an
inference system.
TABLE 1 FUZZY RULES OF THE PD-FLC
e
ce
CE- NH
CE-NM
CE-NL
CE-Z
CE-PL
CE-PM
CE-PH
E-
NH
NH NH NH NH NM NL Z
E-NM
NH NH NH NM NL Z PL
E-
NL
NH NH NM NL Z PL PM
E-Z NH NM NL Z PL PM PH
E-
PL
NM NL Z PL PM PH PH
E-PM
NL Z PL PM PH PH PH
E-
PH
Z PL PM PH PH PH PH
TABLE 2 LINGUISTIC MEANING
Linguistic variable Meaning
NH Negative High
NM Negative Medium
NL Negative Low
Z Zero
PL Positive Low
PM Positive Medium
PH Positive High
This portioning resulted in 49 fuzzy rules as in Table 1. The
linguistic meaning of each fuzzy term is shown in Table 2.
Under the selected fuzzy inference system, the total output of
the control system (Iin) can be given by [3]:
fininin IGII . (3)
)))*,*((*(,dt
deGCEeGEfuzzdefuzzI fin (4)
Where, defuzz and fuzz are the defuzzification and the
fuzzification operations, respectively. GE, GCE, and GIin are
scaling gains of the error, the change in error, and the fuzzy
system‘s output, respectively.
As shown in Figure 2, the said scaling parameters as
well as those of the membership functions at the input and the
output stage were tuned by the genetic algorithm. In this
research, we ensued the same optimization procedure as in
[11]. The objective function was to minimize the Mean
Absolute Error (MAPE) between the glucose value under the
control system and that under the normal model according to
the following formula:
n
t
elfuzzyel GGGn
MAPE0
modmod /)(1
(5)
Where, n is the simulation time, which goes on for 24 hours.
Gmodel stands for the glucose concentration that is retuned by
the normal model. Gfuzzy denotes the actual glucose level under
the fuzzy controller.
4. PI-FLC
The PI-FLC introduced in [10] was adopted here. The details
about the block diagram of this controller and the optimization
procedure were not repeated here to avoid redundancy.
5. PID-FLC
The success of the fuzzy controllers in controlling nonlinear
plants originates from the nonlinearity existing in their outputs
[12]. In addition, these controllers are simple because they
nearly imitate humans in thinking and their natural language is
easily comprehensible for humans [13]. However, tuning the
parameters of these controllers is not easy since many
parameters need to be selected. When the number of
parameters increases, the search space becomes wide which
lead to non-satisfactory results. To avoid this, the parallel
structure design of the PID controller was adopted as shown in
Figure 3. It is based on uniting the PD-FLC and the PI-FLC.
The output of the controller-the delivered-insulin (mU/min)- is
expressed by the following form:
PIinPDinPIDin III ,,, (6)
Proceedings of the 8th International Symposium on Mechatronics and its Applications (ISMA12), Sharjah, UAE, April 10-12, 2012
ISMA12-3
Where, Iin,PID is the total amount of the insulin delivered by the
PID-FLC. Iin, PD denotes the amount of the insulin delivered by
the PD-FLC. Iin, PI is the amount of insulin released by the PI-
FLC. The parameters λ and β are the perspective participant
rates of the PD and PI, respectively. In order to design an
optimal PID-FLC, λ and β were evaluated by the genetic
algorithm to determine their optimal values in building the
optimal PID FLC.
Figure 3. Optimal PID-FLC
When these two participants were passed to the genetic
algorithm, it returned 0.9875 and 0.0132 for the β and λ factors,
respectively. So, Eq. (6) takes the following form:
PIinPDinPIDin III ,,, 9875.00132.0 (7)
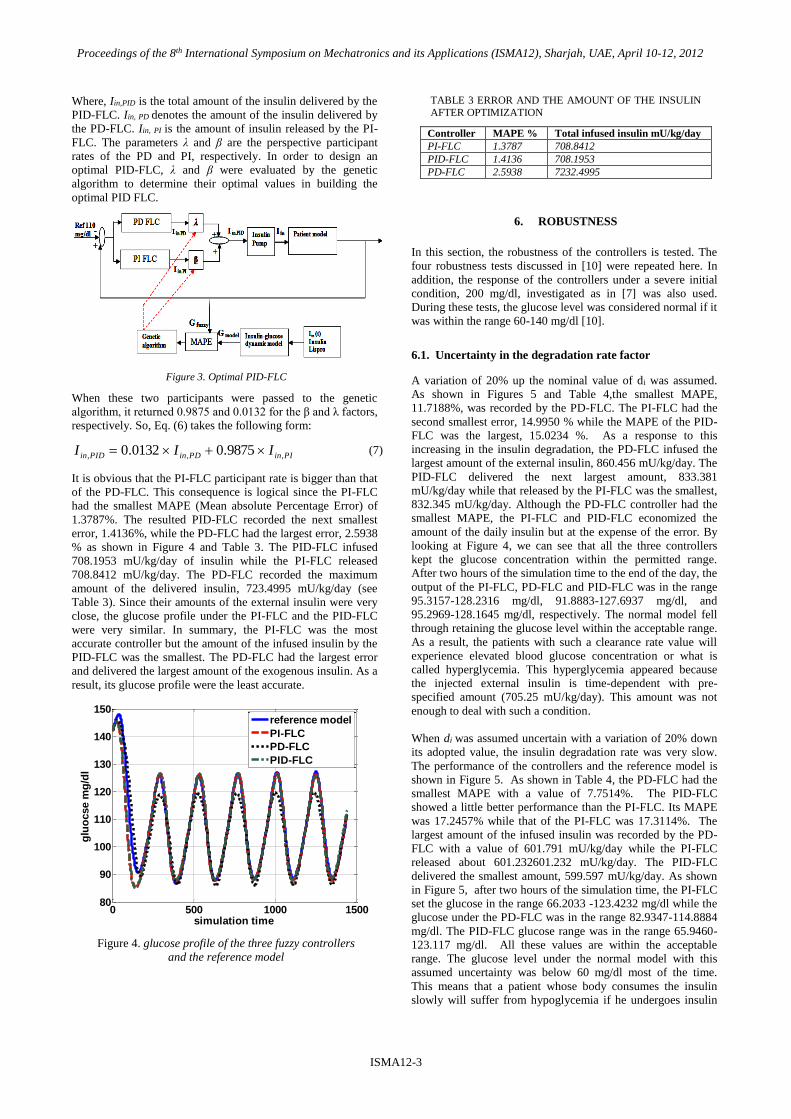
It is obvious that the PI-FLC participant rate is bigger than that
of the PD-FLC. This consequence is logical since the PI-FLC
had the smallest MAPE (Mean absolute Percentage Error) of
1.3787%. The resulted PID-FLC recorded the next smallest
error, 1.4136%, while the PD-FLC had the largest error, 2.5938
% as shown in Figure 4 and Table 3. The PID-FLC infused
708.1953 mU/kg/day of insulin while the PI-FLC released
708.8412 mU/kg/day. The PD-FLC recorded the maximum
amount of the delivered insulin, 723.4995 mU/kg/day (see
Table 3). Since their amounts of the external insulin were very
close, the glucose profile under the PI-FLC and the PID-FLC
were very similar. In summary, the PI-FLC was the most
accurate controller but the amount of the infused insulin by the
PID-FLC was the smallest. The PD-FLC had the largest error
and delivered the largest amount of the exogenous insulin. As a
result, its glucose profile were the least accurate.
Figure 4. glucose profile of the three fuzzy controllers
and the reference model
TABLE 3 ERROR AND THE AMOUNT OF THE INSULIN
AFTER OPTIMIZATION
Controller MAPE % Total infused insulin mU/kg/day
PI-FLC 1.3787 708.8412
PID-FLC 1.4136 708.1953
PD-FLC 2.5938 7232.4995
6. ROBUSTNESS
In this section, the robustness of the controllers is tested. The
four robustness tests discussed in [10] were repeated here. In
addition, the response of the controllers under a severe initial
condition, 200 mg/dl, investigated as in [7] was also used.
During these tests, the glucose level was considered normal if it
was within the range 60-140 mg/dl [10].
6.1. Uncertainty in the degradation rate factor
A variation of 20% up the nominal value of di was assumed.
As shown in Figures 5 and Table 4,the smallest MAPE,
11.7188%, was recorded by the PD-FLC. The PI-FLC had the
second smallest error, 14.9950 % while the MAPE of the PID-
FLC was the largest, 15.0234 %. As a response to this
increasing in the insulin degradation, the PD-FLC infused the
largest amount of the external insulin, 860.456 mU/kg/day. The
PID-FLC delivered the next largest amount, 833.381
mU/kg/day while that released by the PI-FLC was the smallest,
832.345 mU/kg/day. Although the PD-FLC controller had the
smallest MAPE, the PI-FLC and PID-FLC economized the
amount of the daily insulin but at the expense of the error. By
looking at Figure 4, we can see that all the three controllers
kept the glucose concentration within the permitted range.
After two hours of the simulation time to the end of the day, the
output of the PI-FLC, PD-FLC and PID-FLC was in the range
95.3157-128.2316 mg/dl, 91.8883-127.6937 mg/dl, and
95.2969-128.1645 mg/dl, respectively. The normal model fell
through retaining the glucose level within the acceptable range.
As a result, the patients with such a clearance rate value will
experience elevated blood glucose concentration or what is
called hyperglycemia. This hyperglycemia appeared because
the injected external insulin is time-dependent with pre-
specified amount (705.25 mU/kg/day). This amount was not
enough to deal with such a condition.
When di was assumed uncertain with a variation of 20% down
its adopted value, the insulin degradation rate was very slow.
The performance of the controllers and the reference model is
shown in Figure 5. As shown in Table 4, the PD-FLC had the
smallest MAPE with a value of 7.7514%. The PID-FLC
showed a little better performance than the PI-FLC. Its MAPE
was 17.2457% while that of the PI-FLC was 17.3114%. The
largest amount of the infused insulin was recorded by the PD-
FLC with a value of 601.791 mU/kg/day while the PI-FLC
released about 601.232601.232 mU/kg/day. The PID-FLC
delivered the smallest amount, 599.597 mU/kg/day. As shown
in Figure 5, after two hours of the simulation time, the PI-FLC
set the glucose in the range 66.2033 -123.4232 mg/dl while the
glucose under the PD-FLC was in the range 82.9347-114.8884
mg/dl. The PID-FLC glucose range was in the range 65.9460-
123.117 mg/dl. All these values are within the acceptable
range. The glucose level under the normal model with this
assumed uncertainty was below 60 mg/dl most of the time.
This means that a patient whose body consumes the insulin
slowly will suffer from hypoglycemia if he undergoes insulin
0 500 1000 150080
90
100
110
120
130
140
150
simulation time
glu
ocse m
g/d
l
reference model
PI-FLC
PD-FLC
PID-FLC

Proceedings of the 8th International Symposium on Mechatronics and its Applications (ISMA12), Sharjah, UAE, April 10-12, 2012
ISMA12-4
treatment under the normal model with its pre-specified amount
of insulin. This hypoglycemia hurts the brain function which
results in coma [10]. As before, it can be observed that the
performance of the PI-FLC and that of PID-FLC are very close.
To sum up, the PD-FLC controller showed better performance
than the others while the PI-FLC and the PID-FLC delivered
less amount of the exogenous insulin. The three controllers
maintained the glucose normal while the reference model
failed.
Figure 5. glucose profile when di =0.00912
TABLE 4 ERROR AND INSULIN AMOUNT OF THE
CONTROLLERS UNDER (UNCERTAINTY TEST)
Controller MAPE
20%up
MAPE
20% down
Insulin
20%up
Insulin
20%down
PI-FLC 14.995 17.3114 832.345 601.2317
PID-FLC 15.0234 17.2457 833.381 599.5973
PD-FLC 11.7188 7.7514 860.4559 601.7913
Figure 6. glucose profile when di =0.00608
6.2. Error in sensor measurements
The sensor’s performance may be affected by patient
conditions [8]. To simulate this case, a white Gaussian
noise with variance of 0.1 and zero mean was assumed.
The measured glucose, Gmeasured, has the form of Eq. (8).
NGG fuzzymeasured (8) (6)
Where, Gfuzzy is the glucose value under the fuzzy
controllers and N is the white Gaussian noise. As shown
in Table 5, the PI-FLC was the most robust controller in
this test. It had a MAPE value of 4.4765%. As known, the
derivative controller is very sensitive to noise. So, the PD
recorded the largest MAPE with a value of 9.2793%,
while the PID-FLC had the second smallest error of
5.6695%. The total amount of the daily-injected insulin
was 742.7466 mU/kg/day in the case of the PD-FLC. The
PI-FLC secreted the next largest amount, 716.6236
mU/kg/day. The PID-FLC injected the smallest amount,
710.9893 mU/kg/day. The glucose profile is shown in
Figure 7. It can be noticed that the PI-FC still more close
to the normal model than the others. As a conclusion, the
PI-FLC was the most effective controller while the PID-
FLC was more effective in saving the infused insulin than
the other approaches.
Figure 7.glucose profile with white noise added as
disturbance to the system output
TABLE 5 NOISE IN THE SENSOR MEASUREMENTS
Controller MAPE (%) Insulin Amount
PI-FLC 4.4765 716.6236
PID-FLC 5.6695 710.9893
PD-FLC 9.2793 742.7466
6.3. Severe initial condition
Figure 8 shows the performance of the controllers as response
to high glucose concentration, 200 mg/dl. As shown in Table
6, the PI-FLC was the fastest in correcting the high glucose
level. It took about 89.835 minute to bring the glucose back to
its accepted range. The PID-FLC was the second fastest
controller. About 90.04 minute was taken to return the glucose
to its permitted range. The PD-FLC was the slowest, 122.5
minute. It was even slower than the reference model.
Figure 8. glucose profiles of the controllers and the
normal model under severe initial condition.
0 500 1000 150050
100
150
200
250
simulation time
glu
ocse m
g/d
l
uncertain reference model
PI-FLC
PD-FLC
PID-FLC
0 500 1000 15000
50
100
150
200
simulation time
glu
ocse m
g/d
l
uncertain reference model
PI-FLC
PD-FLC
PID-FLC
0 500 1000 150060
80
100
120
140
160
simulation time
glu
ocs
e m
g/d
l
reference model
PI-FLC
PD-FLC
PID-FLC
0 500 1000 150060
80
100
120
140
160
180
200
simulation time
glu
ocse m
g/d
l
reference model
PI-FLC
PD-FLC
PID-FLC
Proceedings of the 8th International Symposium on Mechatronics and its Applications (ISMA12), Sharjah, UAE, April 10-12, 2012
ISMA12-5
TABLE 6 SEVER GLUCOSE TEST
Controller Time
PI-FLC 89.835
PID-FLC 90.04
PD-FLC 122.5
6.4. Changing the glucose intake profile
The glucose intake profile introduced in [10] was
used here to compare the controllers’ performance under
this test. Table 6 shows the MAPE and the amount of the
externally infused insulin under this test. As shown , the
PD-FLC had the largest error and delivered the maximum
amount of the insulin. The error between the glucose
profile under the PID-FLC and that under the undisturbed
normal model was the smallest. Its released insulin
amount was also the smallest. The PI-FLC recorded the
second smallest error and the second lowest amount of
the external insulin. The glucose profile of these
techniques as well as the disturbed reference model is
shown in Figure 9. At the starting of the simulation time,
the glucose concentration reached 145.5494, 144.6585,
and 144.6608 under the PD-FLC, the PI-FLC and the
PID-FLC, respectively. After 2 hours of simulation, the
PD-FLC recorded the highest glucose level of 131.7177
mg/dl. The PI-FLC had the next maximum glucose value
of 127.9845. The PID-FLC output reached 127.8682
mg/dl. The low limits of these controllers during this time
were 90.7963 mg/dl, 86.6861 mg/dl, and 86.4651 mg/dl,
respectively. All these values are within the permitted
range. In addition, it can be observed that the PI-FLC and
the PID-FLC behave in the same fashion. In general, all
the techniques could keep the glucose level normal most
of the time TABLE 7 CHANGE GLUCOSE INTAKE PROFILE.
Controller MAPE (%) Insulin Amount
PI-FLC 12.7602 747.638
PID-FLC 11.9346 746.994
PD-FLC 16.7494 893.1328
Figure 9. glucose profiles of the controllers and the
reference model, change glucose intake profile
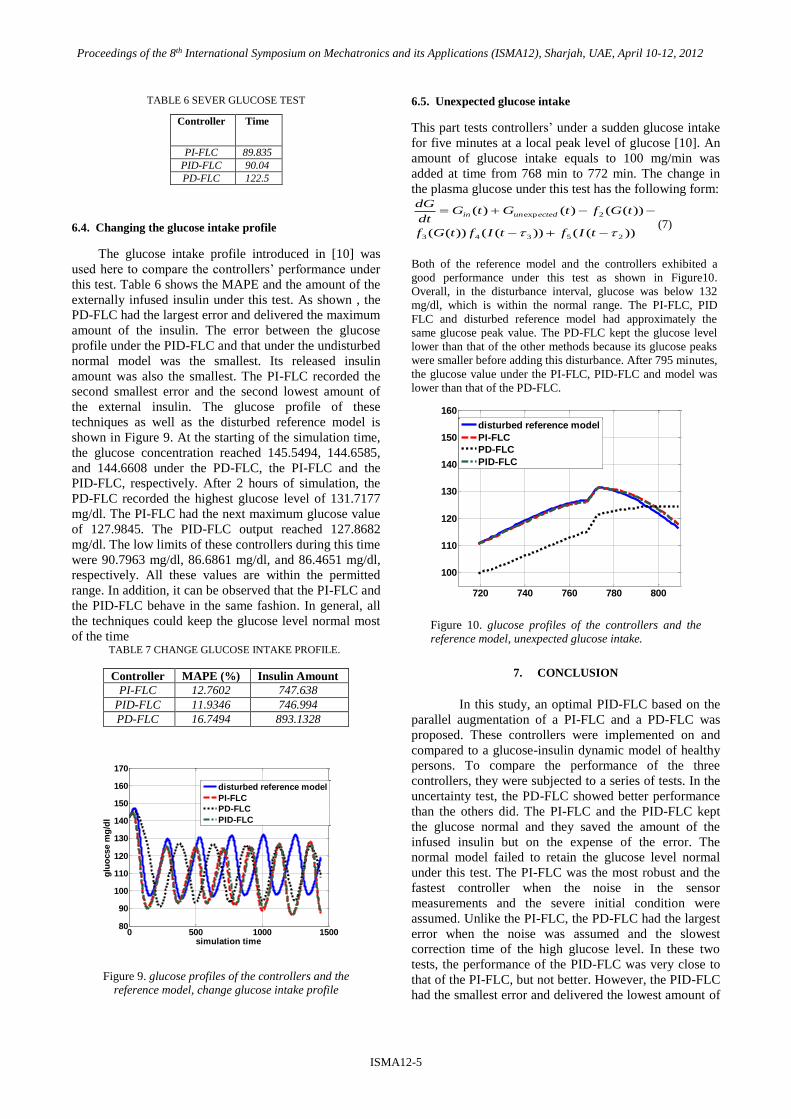
6.5. Unexpected glucose intake
This part tests controllers’ under a sudden glucose intake
for five minutes at a local peak level of glucose [10]. An
amount of glucose intake equals to 100 mg/min was
added at time from 768 min to 772 min. The change in
the plasma glucose under this test has the following form:
))(())(())((
))(()()(
25343
2exp
tIftIftGf
tGftGtGdt
dGectedunin
(7)
Both of the reference model and the controllers exhibited a
good performance under this test as shown in Figure10.
Overall, in the disturbance interval, glucose was below 132
mg/dl, which is within the normal range. The PI-FLC, PID
FLC and disturbed reference model had approximately the
same glucose peak value. The PD-FLC kept the glucose level
lower than that of the other methods because its glucose peaks
were smaller before adding this disturbance. After 795 minutes,
the glucose value under the PI-FLC, PID-FLC and model was
lower than that of the PD-FLC.
Figure 10. glucose profiles of the controllers and the
reference model, unexpected glucose intake.
7. CONCLUSION
In this study, an optimal PID-FLC based on the
parallel augmentation of a PI-FLC and a PD-FLC was
proposed. These controllers were implemented on and
compared to a glucose-insulin dynamic model of healthy
persons. To compare the performance of the three
controllers, they were subjected to a series of tests. In the
uncertainty test, the PD-FLC showed better performance
than the others did. The PI-FLC and the PID-FLC kept
the glucose normal and they saved the amount of the
infused insulin but on the expense of the error. The
normal model failed to retain the glucose level normal
under this test. The PI-FLC was the most robust and the
fastest controller when the noise in the sensor
measurements and the severe initial condition were
assumed. Unlike the PI-FLC, the PD-FLC had the largest
error when the noise was assumed and the slowest
correction time of the high glucose level. In these two
tests, the performance of the PID-FLC was very close to
that of the PI-FLC, but not better. However, the PID-FLC
had the smallest error and delivered the lowest amount of
0 500 1000 150080
90
100
110
120
130
140
150
160
170
simulation time
glu
ocse m
g/d
l
disturbed reference model
PI-FLC
PD-FLC
PID-FLC
720 740 760 780 800
100
110
120
130
140
150
160
disturbed reference model
PI-FLC
PD-FLC
PID-FLC

Proceedings of the 8th International Symposium on Mechatronics and its Applications (ISMA12), Sharjah, UAE, April 10-12, 2012
ISMA12-6
insulin when the input glucose profile was changed. In
this test, the PI-FLC came in the second rank after the
PID-FLC with respect to error and insulin amount. All
approaches showed acceptable performance and when an
unexpected amount of glucose was added. Over all, the
PI-FLC and the PID-FLC seemed to be more robust in
most of the tests. Hence, they are good candidates as
control systems to regulate blood concentrations in Type
1 diabetic subjects.
8. REFERENCES
[1] Chisholm-Burns,M., Schwinghammer, T., Wells,B.,
Malone, P., Kolesar, J., DiPiro, J., Pharmacotherapy
Principles & Practice, 2nd edition. New York: McGraw
Hill Medical; 2008.
[2] Doran , C., Hudson ,N., Moorhead ,K., Chase, J., Shaw,
G., Hann, C., Derivative weighted active insulin control
modelling and clinical trials for ICU patients, Medical
Engineering & Physics , 2004; 26:855-866.
[3] Renard ,E., Costalat, G., Chevassus ,H., Bringer, J., Closed
loop insulin delivery using implanted insulin pumps and
sensors in type 1 diabetic patients, Diabetes Research and
Clinical Practice, 2006; 74: S173–S177.
[4] Magni , L., Raimondo , D., Manb , C. , Nicolao , G. ,
Kovatchev , B., Cobelli , C., Model predictive control of
glucose concentration in type I diabetic patients: An in
silico trial. Biomedical Signal Processing and Control,
2009; 4: 338–346.
[5] Ruiz-Velazqueza, E., Femat, R., Campos-Delgadoc, D.U.,
Blood glucose control for type I diabetes mellitus: A robust
tracking H∞ problem. Control Engineering Practice., 2004;
12: 1179–1195.
[6] Kovàcs , L., Palàncz , B., Glucose-Insulin Control of
Type1 Diabetic Patients in H2/ H∞ Space via Computer
Algebra, Springer-Verlag Berlin Heidelberg , 2007; 95-
109.
[7] Ibbini , M., Masadeh, M. , A fuzzy logic based closed-loop
control system for blood glucose level regulation in
diabetics, Journal of Medical Engineering &Technology,
2005; 29:2, 64 – 69.
[8] Ibbini , M., A PI-fuzzy logic controller for the regulation
of blood glucose level in diabetic patients, Journal of
Medical Engineering &Technology , 2006; 30:2, 83-92.
[9] Takahashi, D., Xiao, Y., Hu, F., A survey of insulin
dependent diabetes, Part II, Control methods, International
Journal of Telemedicine and Applications, 2008;
doi:10.1155/2008/739385.
[10] Al-Fandi, M., Jaradat, M., Sardahi, Y., Optimal PI-Fuzzy
Logic Controller of Glucose Concentration using Genetic
Algorithm , International Journal of Knowledge-Based and
Intelligent Engineering Systems , 2010. p 99-117.
[11] Wang , H., Li, J., kuang Y. , Mathematical modeling and
qualitative analysis of insulin therapies, Mathematical
Biosciences , 2007; 210:17–33.
[12] Ghafari, A., Alasty, A. , Design and real time experimental
implementation of gain scheduling PID fuzzy controller for
hybrid stepper motor in micro-step operation, Proceeding
of the IEEE international conference on mechatronics,
2004; 421-426.
[13] Lee, K., First Course on Fuzzy Theory and Applications,
New York: Springer-Verlag Berlin Heidelberg; 2005.
[14] Marchetti, G., Barolo M., Jovanovic, L ., Zisser ,H.,
Seborg, D., A feedforward-Feedback Glucose control
Strategy for type 1 Diabetes Mellitus., Process Control,
2008; 18(2):149-162.
Copyright © 2022 FDOKUMEN