Optimal integration of visual and proprioceptive movement information for the perception of...
10
RESEARCH ARTICLE Optimal integration of visual and proprioceptive movement information for the perception of trajectory geometry Johanna Reuschel • Knut Drewing • Denise Y. P. Henriques • Frank Ro ¨sler • Katja Fiehler Received: 25 June 2009 / Accepted: 13 November 2009 / Published online: 2 December 2009 Ó Springer-Verlag 2009 Abstract Many studies demonstrated a higher accuracy in perception and action when using more than one sense. The maximum-likelihood estimation (MLE) model offers a recent approach on how perceptual information is inte- grated across different sensory modalities suggesting sta- tistically optimal integration. The purpose of the present study was to investigate how visual and proprioceptive movement information is integrated for the perception of trajectory geometry. To test this, participants sat in front of an apparatus that moved a handle along a horizontal plane. Participants had to decide whether two consecutive tra- jectories formed an acute or an obtuse movement path. Judgments had to be based on information from a single modality alone, i.e., vision or proprioception, or on the combined information of both modalities. We estimated both the bias and variance for each single modality con- dition and predicted these parameters for the bimodal condition using the MLE model. Consistent with previous findings, variability decreased for perceptual judgments about trajectory geometry based on combined visual- proprioceptive information. Furthermore, the observed bimodal data corresponded well to the predicted parameters. Our results suggest that visual and proprioceptive movement information for the perception of trajectory geometry is integrated in a statistically optimal manner. Keywords Multisensory integration Maximum-likelihood estimation (MLE) Space perception Vision Proprioception Angular trajectory Introduction Humans use information from several modalities in everyday life, especially when interacting with objects in their environment. For example, grasping a cup of tea requires a combination of visual, proprioceptive, and tactile information to localize the position of the object and the hand, and to control the arm movement in order to suc- cessfully perform a goal-directed action. Simultaneous input from different senses can increase the detectability of external stimuli, disambiguate their discrimination, and speed up responsiveness (Stein and Meredith 1993). Multisensory integration, referring to the interaction between redundant signals (Ernst and Bu ¨lthoff 2004), rests on neural mechanisms which combine redundant infor- mation from single modalities into a unitary percept. For example, when integrating vision and proprioception, these inputs are more likely to be combined to a unitary percept when they are spatially coincident (Gepshtein et al. 2005; Sambo and Forster 2008). In this case, both modalities contribute to the same percept. Following the ‘ideal observer’ model, information from multiple senses is integrated by weighting the single modalities with respect to their reliability, yielding to the most reliable J. Reuschel (&) F. Ro ¨sler K. Fiehler (&) Department of Experimental and Biological Psychology, Philipps-University Marburg, Gutenbergstr. 18, 35032 Marburg, Germany e-mail: [email protected] K. Fiehler e-mail: fi[email protected] K. Drewing Department of Experimental Psychology, Justus-Liebig-University Giessen, Giessen, Germany D. Y. P. Henriques Center for Vision Research, School of Kinesiology and Health Science, York University, Toronto, Canada 123 Exp Brain Res (2010) 201:853–862 DOI 10.1007/s00221-009-2099-4
Transcript of Optimal integration of visual and proprioceptive movement information for the perception of...

RESEARCH ARTICLE
Optimal integration of visual and proprioceptive movementinformation for the perception of trajectory geometry
Johanna Reuschel • Knut Drewing •
Denise Y. P. Henriques • Frank Rosler •
Katja Fiehler
Received: 25 June 2009 / Accepted: 13 November 2009 / Published online: 2 December 2009
� Springer-Verlag 2009
Abstract Many studies demonstrated a higher accuracy
in perception and action when using more than one sense.
The maximum-likelihood estimation (MLE) model offers a
recent approach on how perceptual information is inte-
grated across different sensory modalities suggesting sta-
tistically optimal integration. The purpose of the present
study was to investigate how visual and proprioceptive
movement information is integrated for the perception of
trajectory geometry. To test this, participants sat in front of
an apparatus that moved a handle along a horizontal plane.
Participants had to decide whether two consecutive tra-
jectories formed an acute or an obtuse movement path.
Judgments had to be based on information from a single
modality alone, i.e., vision or proprioception, or on the
combined information of both modalities. We estimated
both the bias and variance for each single modality con-
dition and predicted these parameters for the bimodal
condition using the MLE model. Consistent with previous
findings, variability decreased for perceptual judgments
about trajectory geometry based on combined visual-
proprioceptive information. Furthermore, the observed
bimodal data corresponded well to the predicted parameters.
Our results suggest that visual and proprioceptive movement
information for the perception of trajectory geometry is
integrated in a statistically optimal manner.
Keywords Multisensory integration �Maximum-likelihood estimation (MLE) �Space perception � Vision � Proprioception �Angular trajectory
Introduction
Humans use information from several modalities in
everyday life, especially when interacting with objects in
their environment. For example, grasping a cup of tea
requires a combination of visual, proprioceptive, and tactile
information to localize the position of the object and the
hand, and to control the arm movement in order to suc-
cessfully perform a goal-directed action. Simultaneous
input from different senses can increase the detectability of
external stimuli, disambiguate their discrimination, and
speed up responsiveness (Stein and Meredith 1993).
Multisensory integration, referring to the interaction
between redundant signals (Ernst and Bulthoff 2004), rests
on neural mechanisms which combine redundant infor-
mation from single modalities into a unitary percept. For
example, when integrating vision and proprioception, these
inputs are more likely to be combined to a unitary percept
when they are spatially coincident (Gepshtein et al. 2005;
Sambo and Forster 2008). In this case, both modalities
contribute to the same percept. Following the ‘ideal
observer’ model, information from multiple senses is
integrated by weighting the single modalities with respect
to their reliability, yielding to the most reliable
J. Reuschel (&) � F. Rosler � K. Fiehler (&)
Department of Experimental and Biological Psychology,
Philipps-University Marburg, Gutenbergstr. 18,
35032 Marburg, Germany
e-mail: [email protected]
K. Fiehler
e-mail: [email protected]
K. Drewing
Department of Experimental Psychology,
Justus-Liebig-University Giessen, Giessen, Germany
D. Y. P. Henriques
Center for Vision Research, School of Kinesiology
and Health Science, York University, Toronto, Canada
123
Exp Brain Res (2010) 201:853–862
DOI 10.1007/s00221-009-2099-4

multisensory estimate (Ernst and Banks 2002; Ernst and
Bulthoff 2004; Landy et al. 1995; Yuille and Bulthoff
1996). Therefore, senses with small variance, and conse-
quently high reliability, contribute more to a multisensory
percept than those with a large variance. An optimal inte-
gration occurs if the percept’s reliability is maximal, i.e., if
its variance is minimal. The maximum-likelihood estima-
tion (MLE) model (Ernst and Banks 2002; Landy et al.
1995) describes optimal integration under the assumptions
that noise in each single modality’s estimate follows a
Gaussian distribution and that these noise distributions are
mutually independent from each other. The MLE model
predicts a linear combination of the unimodal information
which is weighted proportionally to the modality’s relative
reliability. Under this combination rule, integration of
different sensory information is statistically optimal.
Several studies have reported evidence for optimal
integration of different cues within a single modality. In
vision, for example, disparity and texture cues (Hillis et al.
2004; Knill and Saunders 2003) seem to be optimally
integrated in order to perceive surface slant. Regarding the
haptic domain, the integration of force and position cues
for shape perception has been shown to follow predictions
from optimal integration (Drewing and Ernst 2006;
Drewing et al. 2008). The MLE model has been success-
fully applied to the integration of redundant information
across different modalities as well. Optimal integration has
been demonstrated for visual and haptic information of size
(Ernst and Banks 2002; Gepshtein et al. 2005; Helbig and
Ernst 2008) and shape (Helbig and Ernst 2007). Further-
more, there is evidence that position information provided
by vision and audition (Alais and Burr 2004b), or by vision
and proprioception (van Beers et al. 1996, 1999) is also
integrated in an optimal way (for an exception see Rosas
et al. 2005).
So far, little is known about the integration of vision and
proprioception for the perception of path geometry. To this
end, unimodal and bimodal stimuli following a movement
trajectory are required, thus, providing sensory information
which changes along space and time. A few studies have
examined integration of moving auditory and visual stimuli
showing improved motion detection when audition and
vision are presented simultaneously (Alais and Burr 2004a;
Meyer et al. 2005; Wuerger et al. 2003).
The present study investigates how visual and proprio-
ceptive movement information for the perception of tra-
jectory geometry yields a unified percept. More precisely,
we quantitatively tested whether visual and proprioceptive
movement information of angular trajectories is integrated
in a statistically optimal fashion according to the MLE
model. Participants received sensory information about a
moving light dot (vision) and their moving limb (proprio-
ception) through either one modality alone (unimodal
condition) or both modalities (bimodal condition). They
were asked to indicate whether an angle consisting of two
consecutive trajectories felt more like an acute or an obtuse
movement path.
We fitted psychometric functions for all conditions.
Therefore, we determined the angle that each participant
judged as being acute or obtuse with equal frequency, or in
other words, their estimate of a right angle. Previous results
of Lakatos and Marks (1998) indicate that there is a natural
discrepancy between visual and proprioceptive biases for
perceived angularity. They showed that participants per-
ceived angles as being more acute-angled in the proprio-
ceptive than in the visual condition. Since our task is
comparable to the one of Lakatos and Marks (1998), we
suppose a natural discrepancy between the single estimates,
i.e., proprioceptive bias should be shifted more toward
acute-angularity than visual bias. Such natural discrepancy
between both modalities would enable us to test whether
the multisensory percept (measured by the bimodal bias)
can be predicted as a weighted average of the single uni-
modal estimates, with weights that depend on the reliability
of each input (first prediction from MLE model). We
hypothesize that the observed bimodal biases would be
similar to the predicted bimodal biases. According to the
MLE model, these combined (bimodal) estimates should be
more reliable than either of the unimodal estimates (inverse
of the percept’s variance; Landy et al. 1995). To examine
this second prediction, we measured the variance for each
unimodal and bimodal estimate from the response proba-
bility functions. If visual and proprioceptive movement
information is integrated in a statistically optimal fashion,
the reliability of the bimodal percept of a right angle should
be greater than those from the unimodal conditions, i.e., the
bimodal percept should be more precise (less variable) than
either the visual or proprioceptive percept. The amount by
which this variability should decrease when combining
visual and proprioceptive information should be similar to
that predicted by the MLE model.
Our results confirmed both predictions made by the
MLE model, suggesting that integration of visual and
proprioceptive movement information for the perception of
trajectory geometry follows the optimal observer model.
Methods
Participants
We recruited 15 female participants (mean age:
22.07 years, range: 20–26 years) who voluntarily took part
in this experiment. However, we eliminated three partici-
pants that produced outliers greater than two standard
deviations from the mean for each condition and included
854 Exp Brain Res (2010) 201:853–862
123
12 participants in the statistical analyses. They were naıve
to the purpose of the study and were paid for participation.
All participants had normal or corrected-to-normal vision
and were right handed as assessed by a German translation
of the Edinburgh Handedness Inventory (mean ± standard
deviation: 86.37 ± 14.00) (Oldfield 1971). The experiment
lasted approximately 70 min, and was performed in
accordance with the ethical standards laid down in the
Declaration of Helsinki (2000).
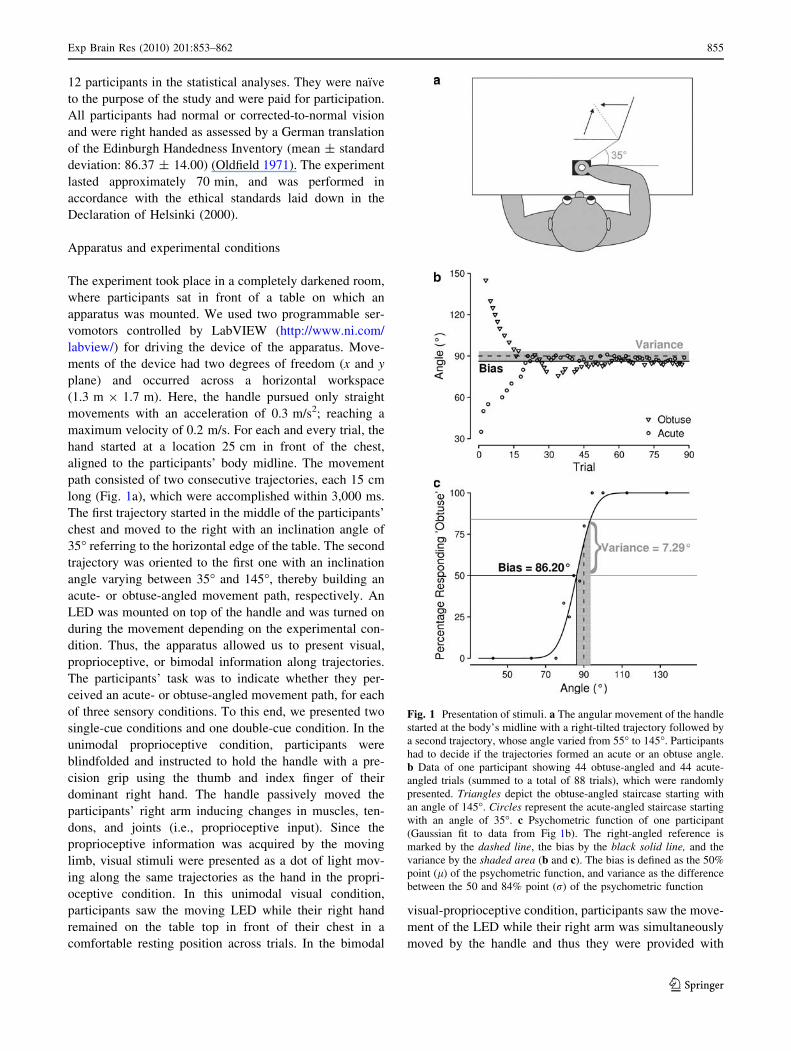
Apparatus and experimental conditions
The experiment took place in a completely darkened room,
where participants sat in front of a table on which an
apparatus was mounted. We used two programmable ser-
vomotors controlled by LabVIEW (http://www.ni.com/
labview/) for driving the device of the apparatus. Move-
ments of the device had two degrees of freedom (x and y
plane) and occurred across a horizontal workspace
(1.3 m 9 1.7 m). Here, the handle pursued only straight
movements with an acceleration of 0.3 m/s2; reaching a
maximum velocity of 0.2 m/s. For each and every trial, the
hand started at a location 25 cm in front of the chest,
aligned to the participants’ body midline. The movement
path consisted of two consecutive trajectories, each 15 cm
long (Fig. 1a), which were accomplished within 3,000 ms.
The first trajectory started in the middle of the participants’
chest and moved to the right with an inclination angle of
35� referring to the horizontal edge of the table. The second
trajectory was oriented to the first one with an inclination
angle varying between 35� and 145�, thereby building an
acute- or obtuse-angled movement path, respectively. An
LED was mounted on top of the handle and was turned on
during the movement depending on the experimental con-
dition. Thus, the apparatus allowed us to present visual,
proprioceptive, or bimodal information along trajectories.
The participants’ task was to indicate whether they per-
ceived an acute- or obtuse-angled movement path, for each
of three sensory conditions. To this end, we presented two
single-cue conditions and one double-cue condition. In the
unimodal proprioceptive condition, participants were
blindfolded and instructed to hold the handle with a pre-
cision grip using the thumb and index finger of their
dominant right hand. The handle passively moved the
participants’ right arm inducing changes in muscles, ten-
dons, and joints (i.e., proprioceptive input). Since the
proprioceptive information was acquired by the moving
limb, visual stimuli were presented as a dot of light mov-
ing along the same trajectories as the hand in the propri-
oceptive condition. In this unimodal visual condition,
participants saw the moving LED while their right hand
remained on the table top in front of their chest in a
comfortable resting position across trials. In the bimodal
visual-proprioceptive condition, participants saw the move-
ment of the LED while their right arm was simultaneously
moved by the handle and thus they were provided with
Fig. 1 Presentation of stimuli. a The angular movement of the handle
started at the body’s midline with a right-tilted trajectory followed by
a second trajectory, whose angle varied from 55� to 145�. Participants
had to decide if the trajectories formed an acute or an obtuse angle.
b Data of one participant showing 44 obtuse-angled and 44 acute-
angled trials (summed to a total of 88 trials), which were randomly
presented. Triangles depict the obtuse-angled staircase starting with
an angle of 145�. Circles represent the acute-angled staircase starting
with an angle of 35�. c Psychometric function of one participant
(Gaussian fit to data from Fig 1b). The right-angled reference is
marked by the dashed line, the bias by the black solid line, and the
variance by the shaded area (b and c). The bias is defined as the 50%
point (l) of the psychometric function, and variance as the difference
between the 50 and 84% point (r) of the psychometric function
Exp Brain Res (2010) 201:853–862 855
123

information from both modalities. Each participant per-
formed the three conditions in randomized order.
Procedure
Prior to the experiment we aligned the starting position of
the handle to the body midline of each participant. Fur-
thermore, we used an immoveable but adjustable chair and
a chin rest to ensure constant body posture throughout the
experiment. The height of the chair, the chin rest, and the
placement of the button box were adjusted for each indi-
vidual for a comfortable seat position.
At the beginning of each experimental condition par-
ticipants positioned their left hand on the response box and
started the experiment by pressing the enter key when they
were ready to start. Each experimental condition consisted
of 88 trials and each trial proceeded in the following way.
A high-pitched tone (duration: 500 ms) was presented
through the headphones indicating the start of the move-
ment (duration: about 3,000 ms). After movement com-
pletion, a low-pitched tone (duration: 500 ms) occurred.
This second tone prompted the participants to judge whe-
ther the path geometry was acute- or obtuse-angled, i.e.,
participants should discriminate between ‘yes, this path
geometry exceeded 90�’ (i.e., obtuse), and ‘no, this path
geometry was less than 90�’ (i.e., acute). We used a single
interval to rule out any memory component. Moreover, we
instructed the participants to focus on the whole movement,
i.e., path geometry. Indeed, evaluation of used strategies
validated that they really proceeded in this way. Partici-
pants indicated their judgments by pressing one of two
response buttons with the index or the middle finger of the
left hand. After the participants’ response, the handle
immediately returned to the start position and the next trial
was initiated.
We generated the trajectories by two randomly inter-
woven adaptive staircase procedures (see Treutwein 1995,
for a review), one beginning with an obvious acute angle
(35�) and the other with an obvious obtuse angle (145�).
Each staircase consisted of 44 steps, resulting in a total of
88 trials (Fig. 1b). In the first two trials we applied the
stochastic approximation by Robbins-Monro (Robbins and
Monro 1951):
Xnþ1 ¼ Xn �c
nZn � /ð Þ ð1Þ
where n is the number of the current trial, X the value of the
stimulus, and c the initial step size (set at 15�). Z defines if
the response was correct (1) or incorrect (0), referring to
the corresponding staircase (e.g., ‘acute’ is correct for the
acute- and incorrect for the obtuse-angled staircase). / is
the probability of responding in a correct or incorrect way
with respect to the corresponding staircase (0.5 in a
yes–no-design). For the following trials we used the
accelerated stochastic approximation by Kesten (1958):
Xnþ1 ¼ Xn �c
2þ mshift
Zn � /ð Þ ð2Þ
which additionally includes mshift for the number of shifts
in the response category, i.e., mshift increased by one when
the response switched from obtuse- to acute-angled along
one staircase. For each staircase, the angular path became
less acute or obtuse (i.e., closer to being a right angle)
when the response was consistent with the previous
response for the same staircase and increasing if it was not.
The adaptive staircase procedure enabled us to reliably
determine the bias and the variance because the stimuli
were mainly presented around these parameters. Averaged
across all participants, about 38% of all trials consisted of
trajectories close to the bias (between the 40 to 60% point
of the psychometric function), and about 44% of trajecto-
ries occurred around the 10–40% and 60–90% range of the
psychometric function. These values were crucial for our
variance estimate computed as the difference between the
50 and 84% point on the best fitting psychometric function.
Before the experiment, we assured that participants were
familiar with the geometrical concepts of acute, obtuse, and
right angles. In addition, participants performed a short
training session prior to each of the three experimental
conditions, where the reference trajectory (right angle) and
the most deviating acute- and obtuse-angled trajectories
were presented alternately. The training sessions were
implemented to ensure that all participants were familiar
with the movements of the device, and that they had a
concrete idea of the internal reference of a right angle and
the first acute- and obtuse-angled stimuli.
Data analysis
We collected angular data on a circular scale which can be
analyzed by circular statistics using specialized models,
e.g., the wrapped normal distribution (Fisher 1993;
Jammalamadaka and SenGupta 2001). However, for our
results for the range of angles tested (discrepancy between
modalities \35�; variances \20�), the wrapped normal
distribution is nearly identical to the Gaussian distribution
which we chose for simplification and comparability to
previous results (e.g., Chen and Levi 1996; Helbig and
Ernst 2007; Lakatos and Marks 1998; Regan et al. 1996;
Voisin et al. 2002).
Applying the adaptive staircase algorithm, we acquired
88 values of the presented angles and the corresponding
responses per participant and experimental condition
(Fig. 1b). In order to obtain estimates for perceptual vari-
ability and bias, we determined individual psychometric
functions for each condition. We then fitted cumulative
856 Exp Brain Res (2010) 201:853–862
123

Gaussian functions to the psychometric functions using the
psignifit toolbox for MATLAB (see http://www.boostrap-
software./org/psignifit/; Wichmann and Hill 2001), which
implements maximum-likelihood estimation methods. The
bias was defined as the point where the angle was judged to
be acute or obtuse with equal frequency. Thus, the bias is
equal to the mean of the Gaussian distribution (50% point
of the psychometric function; Fig. 1c) and corresponded to
the angle which was perceived as right-angled. To measure
the variance of the percept, we calculated the difference
between the bias and the 84% point of the psychometric
function. This difference corresponded to one standard
deviation of the Gaussian distribution (Fig. 1c). Hence, the
variance determined how much an angle had to deviate
from a trajectory perceived as right-angled to reliably
discriminate this angle as obtuse or acute. We calculated
these two variables (bias and variance) for each participant,
for each condition. These values were used to test the MLE
model across all participants.
Results
Predicting bimodal movement discrimination
of angular trajectories
The purpose of this study was to investigate whether visual
and proprioceptive movement information along angular
trajectories is integrated in a statistically optimal fashion. To
this end, we calculated the perceptual bias and variability for
each experimental condition (unimodal visual, unimodal
proprioceptive, and bimodal visual-proprioceptive). The
visual and the proprioceptive biases differed significantly
from each other and from the bimodal bias. As predicted, the
proprioceptive modality showed a clear bias in the acute
direction compared to the visual modality (t(11) = -3.48;
p \ 0.05; one-sided t test; Fig. 2a), i.e., angles which were
perceived as right-angled were more acute in the proprio-
ceptive than in the visual condition. The bimodal bias
lay between the unimodal biases and differed significantly
from both unimodal estimates (from vision: t(11) = 2.02;
p \ 0.05; from proprioception: t(11) = -4.00; p \ 0.05;
one-sided t tests; see Fig. 2a). We used this natural dis-
crepancy to predict the bimodal performance from both
unimodal estimates according to the MLE model of optimal
integration. The MLE predicts the bimodal percept (i.e., the
bias, Svp) by a weighted average of the unimodal estimates
(bias of vision Sv, and proprioception Sp):
Svp ¼ wvSv þ wpSp ð3Þ
The weights are chosen according to the unimodal
reliabilities:
wv ¼rv
rv þ rp
ð4Þ
and correspondingly for wp. That is, the optimal visual (wv)
and proprioceptive weights (wp) are formed by their
reliability (visual reliability rv; proprioceptive reliability rp),
standardized at the total reliability. Thus, less reliable
percepts contribute to a combined bimodal percept with a
lower weight. The reliability (r) is the inverse of the
variance (r2):
r ¼ 1
r2ð5Þ
The variance in the present study corresponded to the
standard deviation r. Consequently, this parameter could
be used to compute the reliability for each modality.
Furthermore, the MLE model predicts (given that noise
distributions are independent and follow a Gaussian dis-
tribution) that the reliability of the bimodal percept is the
sum of the unimodal reliabilities:
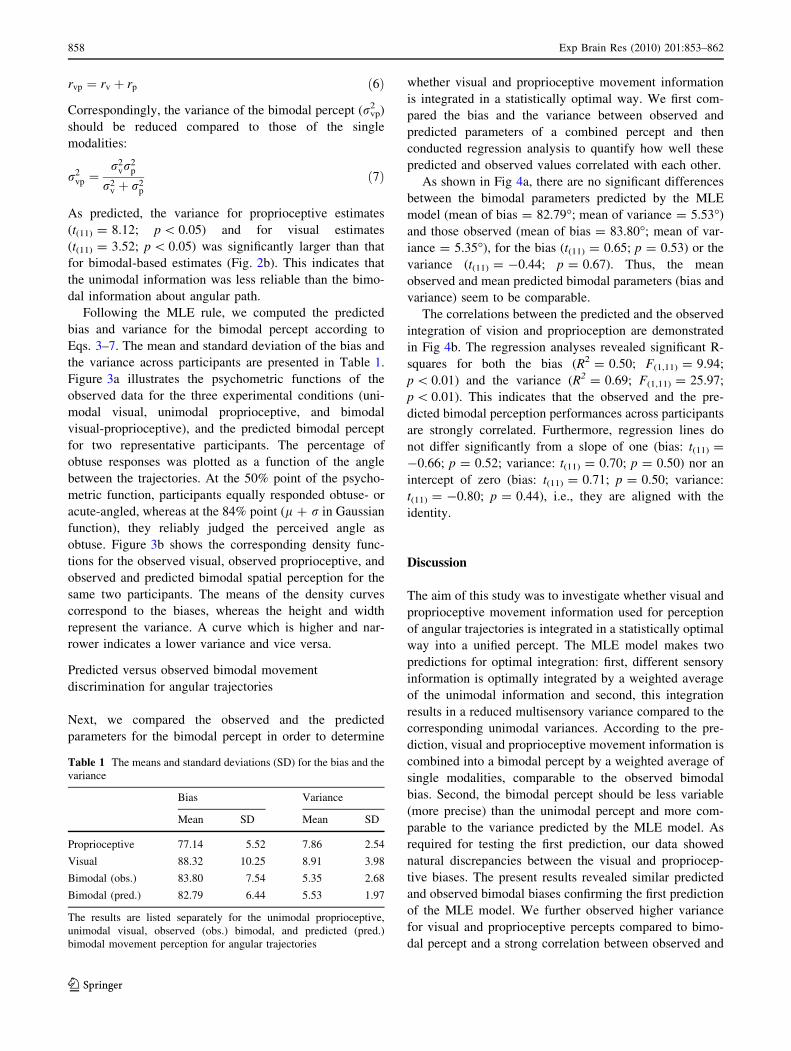
Fig. 2 Results of paired t tests for the biases (a) and variance (b) of
the unimodal and bimodal estimates for all participants (thin bars).
Thick open bars show these estimates averaged across participants for
the bimodal visual-proprioceptive, the unimodal proprioceptive, and
the unimodal visual perception. Significant differences of means are
marked by an asterisk. Error bars are standard errors of the mean
Exp Brain Res (2010) 201:853–862 857
123
rvp ¼ rv þ rp ð6Þ
Correspondingly, the variance of the bimodal percept (rvp2 )
should be reduced compared to those of the single
modalities:
r2vp ¼
r2vr
2p
r2v þ r2
p
ð7Þ
As predicted, the variance for proprioceptive estimates
(t(11) = 8.12; p \ 0.05) and for visual estimates
(t(11) = 3.52; p \ 0.05) was significantly larger than that
for bimodal-based estimates (Fig. 2b). This indicates that
the unimodal information was less reliable than the bimo-
dal information about angular path.
Following the MLE rule, we computed the predicted
bias and variance for the bimodal percept according to
Eqs. 3–7. The mean and standard deviation of the bias and
the variance across participants are presented in Table 1.
Figure 3a illustrates the psychometric functions of the
observed data for the three experimental conditions (uni-
modal visual, unimodal proprioceptive, and bimodal
visual-proprioceptive), and the predicted bimodal percept
for two representative participants. The percentage of
obtuse responses was plotted as a function of the angle
between the trajectories. At the 50% point of the psycho-
metric function, participants equally responded obtuse- or
acute-angled, whereas at the 84% point (l ? r in Gaussian
function), they reliably judged the perceived angle as
obtuse. Figure 3b shows the corresponding density func-
tions for the observed visual, observed proprioceptive, and
observed and predicted bimodal spatial perception for the
same two participants. The means of the density curves
correspond to the biases, whereas the height and width
represent the variance. A curve which is higher and nar-
rower indicates a lower variance and vice versa.
Predicted versus observed bimodal movement
discrimination for angular trajectories
Next, we compared the observed and the predicted
parameters for the bimodal percept in order to determine
whether visual and proprioceptive movement information
is integrated in a statistically optimal way. We first com-
pared the bias and the variance between observed and
predicted parameters of a combined percept and then
conducted regression analysis to quantify how well these
predicted and observed values correlated with each other.
As shown in Fig 4a, there are no significant differences
between the bimodal parameters predicted by the MLE
model (mean of bias = 82.79�; mean of variance = 5.53�)
and those observed (mean of bias = 83.80�; mean of var-
iance = 5.35�), for the bias (t(11) = 0.65; p = 0.53) or the
variance (t(11) = -0.44; p = 0.67). Thus, the mean
observed and mean predicted bimodal parameters (bias and
variance) seem to be comparable.
The correlations between the predicted and the observed
integration of vision and proprioception are demonstrated
in Fig 4b. The regression analyses revealed significant R-
squares for both the bias (R2 = 0.50; F(1,11) = 9.94;
p \ 0.01) and the variance (R2 = 0.69; F(1,11) = 25.97;
p \ 0.01). This indicates that the observed and the pre-
dicted bimodal perception performances across participants
are strongly correlated. Furthermore, regression lines do
not differ significantly from a slope of one (bias: t(11) =
-0.66; p = 0.52; variance: t(11) = 0.70; p = 0.50) nor an
intercept of zero (bias: t(11) = 0.71; p = 0.50; variance:
t(11) = -0.80; p = 0.44), i.e., they are aligned with the
identity.
Discussion
The aim of this study was to investigate whether visual and
proprioceptive movement information used for perception
of angular trajectories is integrated in a statistically optimal
way into a unified percept. The MLE model makes two
predictions for optimal integration: first, different sensory
information is optimally integrated by a weighted average
of the unimodal information and second, this integration
results in a reduced multisensory variance compared to the
corresponding unimodal variances. According to the pre-
diction, visual and proprioceptive movement information is
combined into a bimodal percept by a weighted average of
single modalities, comparable to the observed bimodal
bias. Second, the bimodal percept should be less variable
(more precise) than the unimodal percept and more com-
parable to the variance predicted by the MLE model. As
required for testing the first prediction, our data showed
natural discrepancies between the visual and propriocep-
tive biases. The present results revealed similar predicted
and observed bimodal biases confirming the first prediction
of the MLE model. We further observed higher variance
for visual and proprioceptive percepts compared to bimo-
dal percept and a strong correlation between observed and
Table 1 The means and standard deviations (SD) for the bias and the
variance
Bias Variance
Mean SD Mean SD
Proprioceptive 77.14 5.52 7.86 2.54
Visual 88.32 10.25 8.91 3.98
Bimodal (obs.) 83.80 7.54 5.35 2.68
Bimodal (pred.) 82.79 6.44 5.53 1.97
The results are listed separately for the unimodal proprioceptive,
unimodal visual, observed (obs.) bimodal, and predicted (pred.)
bimodal movement perception for angular trajectories
858 Exp Brain Res (2010) 201:853–862
123

predicted bimodal variances, consistent with the second
prediction by the MLE model. Overall, our results confirm
the predictions from the MLE model suggesting that visual
and proprioceptive movement information of trajectory
geometry is optimally integrated.
The results of the present study fit well with recent
research on integration of multisensory information. It has
been shown that the integration of unimodal information
perceived by the same sensory system (vision: Hillis et al.
2004; Knill and Saunders 2003; haptics: Drewing and Ernst
2006; Drewing et al. 2008), as well as information per-
ceived from different senses (Alais and Burr 2004b; Ernst
and Banks 2002; Helbig and Ernst 2007, 2008; van Beers
et al. 1996, 1999) are optimally integrated. Our results
confirm the predictions of the MLE model and thus extend
previous findings to the integration of visual and pro-
prioceptive movement information for the perception of
trajectory geometry. Van Beers et al. (1996, 1999) first
investigated integration of visual and proprioceptive sen-
sory information for perception of position by having
participants match the position of proprioceptive, visual, or
visual-proprioceptive targets with their index finger.
Examining the visual-proprioceptive integration of position
information they found that visual localization was more
precise in the azimuth than in the radial direction (depth)
and that proprioceptive localization was more precise in the
radial (depth) than in the azimuth direction (van Beers et al.
1999). Furthermore, the authors (van Beers et al. 1999)
convincingly showed that mechanisms integrating visual
and proprioceptive position information efficiently take
into account these direction-dependent reliabilities pre-
dicted by optimal integration. We extended the results of
multisensory integration of spatial position information
(van Beers et al. 1996, 1999) to multisensory integration of
movement information of path geometry. Thus, we quan-
titatively validated the MLE model for moving visual and
proprioceptive spatial information. To this end, we used
purely visual and purely proprioceptive stimuli in the
unimodal conditions and used the same stimulus presen-
tation in the bimodal condition as well.
In the present study, participants underestimated angular
trajectories in the unimodal proprioceptive condition,
Fig. 3 Psychometric functions (a) and density curves (b) of two
participants (SM and AS), showing the bias and the variance for the
proprioceptive (gray dotted line), visual (black dotted line), observed
(obs.) bimodal (black solid line) and predicted (pred.) bimodal
percept (gray solid line). a Psychometric functions. The bias (single
estimate) is defined as the 50% point (l) of the psychometric function,
and the variance as the difference between the 50 and 84% point (r)
of the psychometric function. b Density functions. The bimodal
percept is signed as visual-proprioceptive (vp). The means of the
density curves reflect the bias, and their width and height reflect
the variance (higher and narrower shapes reflect a lower variance).
The variance defines the weights of the single modalities that
correspond to their contribution to a unified bimodal percept. W(p) is
the weight of the proprioceptive perception and W(v) is the weight of
the visual perception; both are used for predicting the bimodal bias
Exp Brain Res (2010) 201:853–862 859
123

overestimated angular trajectories in the unimodal visual
condition, and showed a nearly unbiased perception in the
bimodal (visual proprioceptive) condition. The observed
values for the visual, proprioceptive, and visual-proprio-
ceptive biases are comparable to previous findings of
Lakatos and Marks (1998), who investigated the accuracy
with which angles are perceived. Their results differed
from ours by about 2� for the proprioceptive bias, and 1�for the visual and visual-proprioceptive biases.
We found a higher variance in vision and proprioception
compared to the bimodal percept. The variability of pro-
prioceptive estimates of hand path angles were similar to
those of Voisin et al. (2002) when we applied the same
mode of variance calculation (the difference between the
50 and 75% point of the psychometric function; Voisin
et al. 2002: mean of 7.16� versus present data: mean of
5.33�). In the study by Voisin et al. (2002), participants ran
their index finger along two edges of a triangle constructed
from Plexiglas after the finger had been anaesthetized, i.e.,
judgments were based on proprioceptive information only,
not tactile information. However, other studies have sug-
gested that people are more sensitive to detecting angular
deviation for visual stimuli (in the order of 1�–2�; Chen and
Levi 1996; Kennedy et al. 2006; Regan et al. 1996) than
that which was suggested by our own results. This is likely
because these other studies used whole lines while we used
a sequential presentation of a moving dot. A lower variance
of vision and therefore a higher weight of vision compared
to other sensory information were observed in non-conflict
conditions of several integration studies as well (Alais and
Burr 2004b; Ernst and Banks 2002; Helbig and Ernst
2007). However, in the present study, proprioception and
vision contributed to the bimodal percept nearly to the
same extent, i.e., vision and proprioception were equally
reliable. This may be due to some experimental factors.
First, participants perceived trajectories in two-dimensional
space, including not only azimuth but also depth
information. Previous experiments on space perception
(Gepshtein and Banks 2003; van Beers et al. 2002) have
shown that in depth direction proprioception is more
heavily weighted than vision. Second, visual information
was presented sequentially rather than simultaneously: this
made the angle along which the dot moved much more
difficult to decipher than if the visual stimuli showed the
Fig. 4 Comparison of observed
and predicted parameters.
a Thin bars represents the bias
(top panel) and variance
(bottom panel) for each
participant while the thick barsrepresent the averages across
participants. Error bars are
standard errors of the mean.
b Scatter plots of the bias (toppanel), and variance (bottompanel): observed bimodal values
of each participant are plotted as
a function of predicted bimodal
values. The relationship
between observed and predicted
bimodal values is illustrated by
the regression line (black solidline). The identity with an
intercept of zero and a slope of
one is depicted by the gray solidline
860 Exp Brain Res (2010) 201:853–862
123
complete movement path, i.e., an angle with two visible
lines. This is why we attempted to make the stimuli pre-
sentation similar across the modalities. So, given the
greater difficulty in detecting the angle of a moving dot, it
is not surprising that the reliability of this visual informa-
tion be poorer and therefore more equivalent to that of
proprioceptive information, and thus leads to equal vari-
ance of both proprioception and vision.
The results of the present study together with previous
MLE findings give some indication of putative underlying
brain mechanisms responsible for multisensory integration.
Recent studies propose several brain areas involved in
multisensory integration. The primary sensory cortices
(Martuzzi et al. 2007), subcortical structures, like the
superior colliculus (Calvert et al. 2001), and cortical con-
vergence zones, like the superior temporal sulcus (STS)
(Beauchamp et al. 2004), or the intraparietal sulcus (IPS) in
the posterior parietal cortex (PPC) (Calvert et al. 2001),
have been discussed as neural substrates of multisensory
integration (for a review see Amedi et al. 2005). Consis-
tently, electrophysiological studies in monkeys (Duhamel
et al. 1998; Schlack et al. 2005) and in humans (Gobbele
et al. 2003; Gondan et al. 2005), and functional imaging
studies in humans (Macaluso et al. 2003; Ricciardi et al.
2006; Fiehler et al. 2008), have found activation in the PPC
during spatial processing using different sensory modali-
ties. Polymodal neurons responding to self movements and
motion stimuli in peripersonal space irrespective of the
sensory modality have been identified in monkey IPS, in
particular within the ventral intraparietal area (VIP)
(Duhamel et al. 1998). Accordingly, neuroimaging studies
suggest a putative human homologue of the macaques’
polymodal area VIP which is responsive to visual, tactile,
and auditory motion stimuli (Bremmer et al. 2001; for a
review see Grefkes and Fink 2005). Furthermore, studies in
humans have found that brain regions which are usually
activated during visual motion perception [human middle
temporal/V5 complex (MT/V5)], were also active during
tactile (Blake et al. 2004) or auditory motion perception
(Alink et al. 2008).
However, it remains unclear whether the discussed brain
areas integrate multisensory input in a statistically optimal
fashion. A recent study in monkeys investigated the neural
mechanisms underlying multisensory integration by using
combined electrophysiological and psychophysical meth-
ods (Gu et al. 2008). While monkeys had to integrate visual
and vestibular tilt information, neuronal activity was
recorded in the monkeys’ dorsal medial superior temporal
(MSTd) area—located near area MT and sensitive to
movements in space. The response of MSTd neurons was
highly correlated with behavioral performance, i.e., firing
rates reflected the response pattern predicted by MLE
based on the behavioral data. The approach of combining
different techniques could advance our understanding of
brain functioning, and thus provide direction for future
research.
In conclusion, the present results suggest that movement
information of trajectory geometry perceived by vision and
proprioception is integrated in a statistically optimal fash-
ion, following the MLE.
Acknowledgments This research was supported by grant Fi 1567
from the German Research Foundation (DFG) assigned to Katja
Fiehler and Frank Rosler, by the research unit DFG/FOR 560
‘Perception and Action’ and by the TransCoop-Program from the
Alexander von Humboldt Foundation assigned to Katja Fiehler and
Denise Y.P. Henriques. We thank Stefan Westermann and Oguz
Balandi for programming the experiment and Iseult Beets for helpful
comments on the manuscript.
References
Alais D, Burr D (2004a) No direction-specific bimodal facilitation for
audiovisual motion detection. Brain Res Cogn Brain Res
19:185–194
Alais D, Burr D (2004b) The ventriloquist effect results from near-
optimal bimodal integration. Curr Biol 14:257–262
Alink A, Singer W, Muckli L (2008) Capture of auditory motion by
vision is represented by an activation shift from auditory to
visual motion cortex. J Neurosci 28:2690–2697
Amedi A, von Kriegstein K, van Atteveldt NM, Beauchamp MS,
Naumer MJ (2005) Functional imaging of human crossmodal
identification and object recognition. Exp Brain Res 166:559–
571
Beauchamp MS, Lee KE, Argall BD, Martin A (2004) Integration of
auditory and visual information about objects in superior
temporal sulcus. Neuron 41:809–823
Blake R, Sobel KV, James TW (2004) Neural synergy between
kinetic vision and touch. Psychol Sci 15:397–402
Bremmer F, Schlack A, Shah NJ, Zafiris O, Kubischik M, Hoffmann
K, Zilles K, Fink GR (2001) Polymodal motion processing in
posterior parietal and premotor cortex: a human fMRI study
strongly implies equivalencies between humans and monkeys.
Neuron 29:287–296
Calvert GA, Hansen PC, Iversen SD, Brammer MJ (2001) Detection
of audio–visual integration sites in humans by application of
electrophysiological criteria to the BOLD effect. Neuroimage
14:427–438
Chen S, Levi DM (1996) Angle judgement: is the whole the sum of its
parts? Vision Res 36:1721–1735
Drewing K, Ernst MO (2006) Integration of force and position cues
for shape perception through active touch. Brain Res 1078:92–
100
Drewing K, Wiecki TV, Ernst MO (2008) Material properties
determine how force and position signals combine in haptic
shape perception. Acta Psychol (Amst) 128:264–273
Duhamel JR, Colby CL, Goldberg ME (1998) Ventral intraparietal
area of the macaque: congruent visual and somatic response
properties. J Neurophysiol 79:126–136
Ernst MO, Banks MS (2002) Humans integrate visual and haptic
information in a statistically optimal fashion. Nature 415:429–
433
Ernst MO, Bulthoff HH (2004) Merging the senses into a robust
percept. Trends Cogn Sci 8:162–169
Exp Brain Res (2010) 201:853–862 861
123

Fiehler K, Burke M, Engel A, Bien S, Rosler F (2008) Kinesthetic
working memory and action control within the dorsal stream.
Cereb Cortex 18:243–253
Fisher NI (1993) Statistical Analysis of Circular Data. Cambridge
University Press, Cambridge
Gepshtein S, Banks MS (2003) Viewing geometry determines how
vision and haptics combine in size perception. Curr Biol 13:483–
488
Gepshtein S, Burge J, Ernst MO, Banks MS (2005) The combination
of vision and touch depends on spatial proximity. J Vis 5:1013–
1023
Gobbele R, Schurmann M, Forss N, Juottonen K, Buchner H, Hari R
(2003) Activation of the human posterior parietal and temporo-
parietal cortices during audiotactile interaction. Neuroimage
20:503–511
Gondan M, Niederhaus B, Rosler F, Roder B (2005) Multisensory
processing in the redundant-target effect: a behavioral and event-
related potential study. Percept Psychophys 67:713–726
Grefkes C, Fink GR (2005) The functional organization of the
intraparietal sulcus in humans and monkeys. J Anat 207:3–17
Gu Y, Angelaki DE, DeAngelis GC (2008) Neural correlates of
multisensory cue integration in macaque MSTd. Nat Neurosci
11:1201–1210
Helbig HB, Ernst MO (2007) Optimal integration of shape informa-
tion from vision and touch. Exp Brain Res 179:595–606
Helbig HB, Ernst MO (2008) Visual-haptic cue weighting is
independent of modality-specific attention. J Vis 8:21.1–21.6
Hillis JM, Watt SJ, Landy MS, Banks MS (2004) Slant from texture
and disparity cues: optimal cue combination. J Vis 4:967–992
Jammalamadaka SR, Sengupta A (2001) Topics in circular statistics.
World Scientific Press, Singapore
Kennedy GJ, Orbach HS, Loffler G (2006) Effects of global shape on
angle discrimination. Vision Res 46:1530–1539
Kesten H (1958) Accelerated stochastic approximation. Ann Math
Stat 29:41–59
Knill DC, Saunders JA (2003) Do humans optimally integrate stereo
and texture information for judgments of surface slant? Vision
Res 43:2539–2558
Lakatos S, Marks LE (1998) Haptic underestimation of angular
extent. Perception 27:737–754
Landy MS, Maloney LT, Johnston EB, Young M (1995) Measure-
ment and modeling of depth cue combination: in defense of
weak fusion. Vision Res 35:389–412
Macaluso E, Driver J, Frith CD (2003) Multimodal spatial represen-
tations engaged in human parietal cortex during both saccadic
and manual spatial orienting. Curr Biol 13:990–999
Martuzzi R, Murray MM, Michel CM, Thiran JP, Maeder PP, Clarke
S, Meuli RA (2007) Multisensory interactions within human
primary cortices revealed by BOLD dynamics. Cereb Cortex
17:1672–1679
Meyer GF, Wuerger SM, Rohrbein F, Zetzsche C (2005) Low-level
integration of auditory and visual motion signals requires spatial
co-localisation. Exp Brain Res 166:538–547
Oldfield RC (1971) The assessment and analysis of handedness: the
Edinburgh inventory. Neuropsychologia 9:97–113
Regan D, Gray R, Hamstra SJ (1996) Evidence for a neural
mechanism that encodes angles. Vision Res 36:323–330
Ricciardi E, Bonino D, Gentili C, Sani L, Pietrini P, Vecchi T (2006)
Neural correlates of spatial working memory in humans: a
functional magnetic resonance imaging study comparing visual
and tactile processes. Neuroscience 139:339–349
Robbins H, Monro S (1951) A stochastic approximation method. Ann
Math Stat 22:400–407
Rosas P, Wagemans J, Ernst MO, Wichmann FA (2005) Texture and
haptic cues in slant discrimination: reliability-based cue weight-
ing without statistically optimal cue combination. J Opt Soc Am
A Opt Image Sci Vis 22:801–809
Sambo CF, Forster B (2008) An ERP investigation on visuotactile
interactions in peripersonal and extrapersonal space: evidence
for the spatial rule. J Cogn Neurosci 21:1550–1559
Schlack A, Sterbing-D’Angelo SJ, Hartung K, Hoffmann KP,
Bremmer F (2005) Multisensory space representations in the
macaque ventral intraparietal area. J Neurosci 25:4616–4625
Stein BE, Meredith MA (1993) The merging of the senses. MIT Press,
Cambridge
Treutwein B (1995) Adaptive psychophysical procedures. Vision Res
35:2503–2522
van Beers RJ, Sittig AC, van der Denier Gon JJ (1996) How humans
combine simultaneous proprioceptive and visual position infor-
mation. Exp Brain Res 111:253–261
van Beers RJ, Sittig AC, van der Denier Gon JJ (1999) Integration of
proprioceptive and visual position-information: an experimen-
tally supported model. J Neurophysiol 81:1355–1364
van Beers RJ, Wolpert DM, Haggard P (2002) When feeling is more
important than seeing in sensorimotor adaptation. Curr Biol
12:834–837
Voisin J, Lamarre I, Chapman CE (2002) Haptic discrimination of
object shape in humans: contribution of cutanous and proprio-
ceptive inputs. Exp Brain Res 145:251–260
Wichmann FA, Hill NJ (2001) The psychometric function: I. Fitting,
sampling, and goodness of fit. Percept Psychophys 63:1293–
1313
Wuerger SM, Hofbauer M, Meyer GF (2003) The integration of
auditory and visual motion signals at threshold. Percept
Psychophys 65:1188–1196
Yuille AL, Bulthoff HH (1996) Bayesian theory and psychophysics.
In: Knill D, Richards W (eds) Perception as Bayesian inference.
Cambridge University Press, Cambridge
862 Exp Brain Res (2010) 201:853–862
123