Optimal Bidding Strategy for GENCO with Green Power in Day ...
10
Optimal Bidding Strategy for GENCO with Green Power in Day-ahead Electricity Market Xian Guo, Student Member, IEEE and Dr. Cameron A. MacKenzie 1 January 5, 2016. This paper is currently under review with a journal. Please check back for updates to the paper. Abstract—The electricity market has evolved from a regulated monopoly to a more liberalized competitive market, which allows a generating company (GENCO) to bid to provide energy. The two-period structure of the electricity market (day-ahead and real-time market) introduces a mechanism for determining the GENCO’s optimal bidding strategy. The difference between clearing prices for each period adds uncertainty to GENCO’s determination of its optimal bid. In addition, the fast growth of renewable energy sources (wind and solar power) and their increasing penetration to the power system adds uncertainty over how much energy the GENCO can actually produce in the real- time market. Based on the two-period market structure, we develop an optimization model for a single GENCO with green power to derive an optimal strategy to bid a price and quantity for the day-ahead market with the objective of maximizing its expected profit. Furthermore, we apply the optimization model with risk-aversion attitude to reduce chance of negative profits for GENCO. We fit probability distributions to historical data to reflect the uncertainties, and Monte-Carlo simulation allows us to solve the stochastic optimization problem. The optimization model and corresponding algorithm are verified in Southern California Edison, a GENCO in California ISO. Index Terms—GENCO, bidding strategy, green power, electricity market, risk-aversion, utility function, stochastic optimization NOMENCLATURE Decision variables Bid quantity for day-ahead market (MW) Bid price for day-ahead market ($/MWh) Exogenous random variables Actual generated quantity for real-time market from generation technology (MW), = , , , , 1- wind, 2-solar, 3-coal, 4-gas Total actual generated quantity for real-time market (MW), =∑ = , , Clearing price for day-head (DA) or real-time (RT) market ($/MWh), i.e., DA-price or RT-price Parameters Production costs for generation technology ($/MWh), = , , , , Curtailment costs for variable generation technology ($/MWh), = , The probability of scenario = , , … , The profit made by scenario Xian Guo and Dr. Cameron Mackenzie are with Iowa State University, Ames, IA 50010 USA (e-mail: [email protected]). I. INTRODUCTION Since the 1990s, the electricity market has evolved from a vertically integrated structure to a competitive deregulated market design. The reconstructed market is similar to an imperfect competition or oligopoly market due to the special characteristics, such as a limited number of suppliers, long construction periods of power plants and large capital investment sizes [1]. The current market structure is consisted of two separate financial settlements: day-ahead market and real- time market. The day-ahead market is a forward market, which is settled 24 hours before the operating day and allows market participants to commit selling offer or buying biddings for the next operating day. The real-time market is settled every five minutes in the specific operating day, which balances the difference between day-ahead commitments and the real-time actual production and demand. A typical energy market timeline is shown in Figure 1, which illustrates the well-organized structure of the two-period settlements in ISO-New England (Independent System Operator) [2]. Fig. 1. Electricity market timeline Under such a market setting, the supplier (generation company (GENCO), or virtual bidder) can maximize its profits by strategic bidding, and the buyers (load-serving entities) hope to pay a reasonable amount to satisfy their demand requirements. Thus, the development of optimal bidding strategy for GENCO is crucial. With the fast growth of renewable energy, especially wind and solar power, a GENCO’s optimal bidding strategy becomes more complicated and challenging. In addition to dealing with the possible load deviations, the output uncertainty from solar and wind power should also be considered when a GENCO
-
Upload
khangminh22 -
Category
Documents
-
view
2 -
download
0
Transcript of Optimal Bidding Strategy for GENCO with Green Power in Day ...
Optimal Bidding Strategy for GENCO with Green
Power in Day-ahead Electricity Market
Xian Guo, Student Member, IEEE and Dr. Cameron A. MacKenzie1
January 5, 2016. This paper is currently under review with a journal. Please check back for updates to the paper.
Abstract—The electricity market has evolved from a regulated
monopoly to a more liberalized competitive market, which allows
a generating company (GENCO) to bid to provide energy. The
two-period structure of the electricity market (day-ahead and
real-time market) introduces a mechanism for determining the
GENCO’s optimal bidding strategy. The difference between
clearing prices for each period adds uncertainty to GENCO’s
determination of its optimal bid. In addition, the fast growth of
renewable energy sources (wind and solar power) and their
increasing penetration to the power system adds uncertainty over
how much energy the GENCO can actually produce in the real-
time market. Based on the two-period market structure, we
develop an optimization model for a single GENCO with green
power to derive an optimal strategy to bid a price and quantity for
the day-ahead market with the objective of maximizing its
expected profit. Furthermore, we apply the optimization model
with risk-aversion attitude to reduce chance of negative profits for
GENCO. We fit probability distributions to historical data to
reflect the uncertainties, and Monte-Carlo simulation allows us to
solve the stochastic optimization problem. The optimization model
and corresponding algorithm are verified in Southern California
Edison, a GENCO in California ISO.
Index Terms—GENCO, bidding strategy, green power,
electricity market, risk-aversion, utility function, stochastic
optimization
NOMENCLATURE
Decision variables
𝑮𝑩𝑰𝑫 Bid quantity for day-ahead market (MW)
𝝆𝑩𝑰𝑫 Bid price for day-ahead market ($/MWh)
Exogenous random variables
𝑮𝒊 Actual generated quantity for real-time market from
generation technology 𝒊 (MW), 𝒊 = 𝟏, 𝟐, 𝟑, 𝟒 , 1-
wind, 2-solar, 3-coal, 4-gas
𝑮 Total actual generated quantity for real-time market
(MW), 𝑮 = ∑ 𝑮𝒊𝟒𝒊=𝟏
𝝆𝑫𝑨, 𝝆𝑹𝑻, Clearing price for day-head (DA) or real-time (RT)
market ($/MWh), i.e., DA-price or RT-price
Parameters
𝒄𝒊 Production costs for generation technology
𝒊($/MWh), 𝒊 = 𝟏, 𝟐, 𝟑, 𝟒
𝒄𝑪𝑻,𝒊 Curtailment costs for variable generation technology
𝒊 ($/MWh), 𝒊 = 𝟏, 𝟐
𝑷𝒋 The probability of scenario 𝒋 = 𝟏, 𝟐, … , 𝟕
𝑭𝒋 The profit made by scenario 𝒋
Xian Guo and Dr. Cameron Mackenzie are with Iowa State University, Ames, IA 50010 USA (e-mail: [email protected]).
I. INTRODUCTION
Since the 1990s, the electricity market has evolved from a
vertically integrated structure to a competitive deregulated
market design. The reconstructed market is similar to an
imperfect competition or oligopoly market due to the special
characteristics, such as a limited number of suppliers, long
construction periods of power plants and large capital
investment sizes [1]. The current market structure is consisted of
two separate financial settlements: day-ahead market and real-
time market. The day-ahead market is a forward market, which
is settled 24 hours before the operating day and allows market
participants to commit selling offer or buying biddings for the
next operating day. The real-time market is settled every five
minutes in the specific operating day, which balances the
difference between day-ahead commitments and the real-time
actual production and demand. A typical energy market timeline
is shown in Figure 1, which illustrates the well-organized
structure of the two-period settlements in ISO-New England
(Independent System Operator) [2].
Fig. 1. Electricity market timeline
Under such a market setting, the supplier (generation
company (GENCO), or virtual bidder) can maximize its profits
by strategic bidding, and the buyers (load-serving entities) hope
to pay a reasonable amount to satisfy their demand requirements.
Thus, the development of optimal bidding strategy for GENCO
is crucial.
With the fast growth of renewable energy, especially wind
and solar power, a GENCO’s optimal bidding strategy becomes
more complicated and challenging. In addition to dealing with
the possible load deviations, the output uncertainty from solar
and wind power should also be considered when a GENCO
develops a bidding strategy. In particular, the GENCO should
pay for energy production deviations resulted from the
prediction error [3]. Thus, researching the optimal bidding
strategy for GENCO with green power in day-ahead electricity
market is of interest.
Prior research has modeled the optimal bidding strategy for
GENCOs ([1], [4]). The models fall into four categories: 1) a
single GENCO optimization model [5-7]; 2) game theory with
multiple GENCOs and buyers [8-10]; 3) agent-based models
[11,12] and 4) hybrid models [13,14]. Most of them focus on the
bidding strategy based on the day-ahead market, and only a few
consider the background of the real-time market [15]. Some
literature addresses the bidding strategy when relying on
renewable energy [16-18]. A mixed-integer nonlinear
programming model determines the optimal hydro scheduling
and offering strategies in the Portugal energy market [16]. A
stochastic Cournot model based on generated scenarios from the
Auto Regressive Moving Average is proposed to realize
strategic bidding for wind-dominated GENCOs [17]. Angarita
et al. [18] introduce a combined bidding strategy for wind farm
and hydro generating units, which can reduce the loss brought
by the fact that variable energy has uncertain output.
In summary, much of the foregoing research focuses on a
single market, which does not address the difference between
day-ahead market and real-time market. For most of these cases,
only a single generation technology is considered, which cannot
satisfy the real-world fact that multiple technologies (especially
green power) are available within a single GENCO. The unique
contribution of this paper is the development of an optimization
model based on a two-period market structure to determine the
optimal bidding strategy for a GENCO with green power and
multiple generation technology. The electricity prices for both
periods and the generation output for the green power are
uncertain. This type of model allows the GENCO to produce
more electricity from fossil fuel sources if the renewable energy
sources generate less electricity than anticipated. The GENCO
can determine the best way to meet its requirements based on
which generation technology costs less and produces the highest
profits. We also incorporate risk attitude into the model to
understand how the bidding strategy should change for a risk-
averse GENCO. This is another significant contribution of this
paper.
Based on a typical electricity market structure and
management rules, we develop a stochastic optimization model
in order to recommend the optimal bidding strategy for a
GENCO who wishes to maximize its expected profit or expected
utility under this two-period electricity market.
The remaining of the paper is organized as follows. Section
II introduces the market structure and management rules, which
is the foundation of our analysis. Section III details and
formulates the bidding problem and proposes the stochastic
optimization model. Section IV applies the model to Southern
California Edison (SCE, a GENCO from California ISO,
CAISO). Section V concludes the paper.
II. MARKET STRUCTURE AND MANAGEMENT RULES
A. Market structure
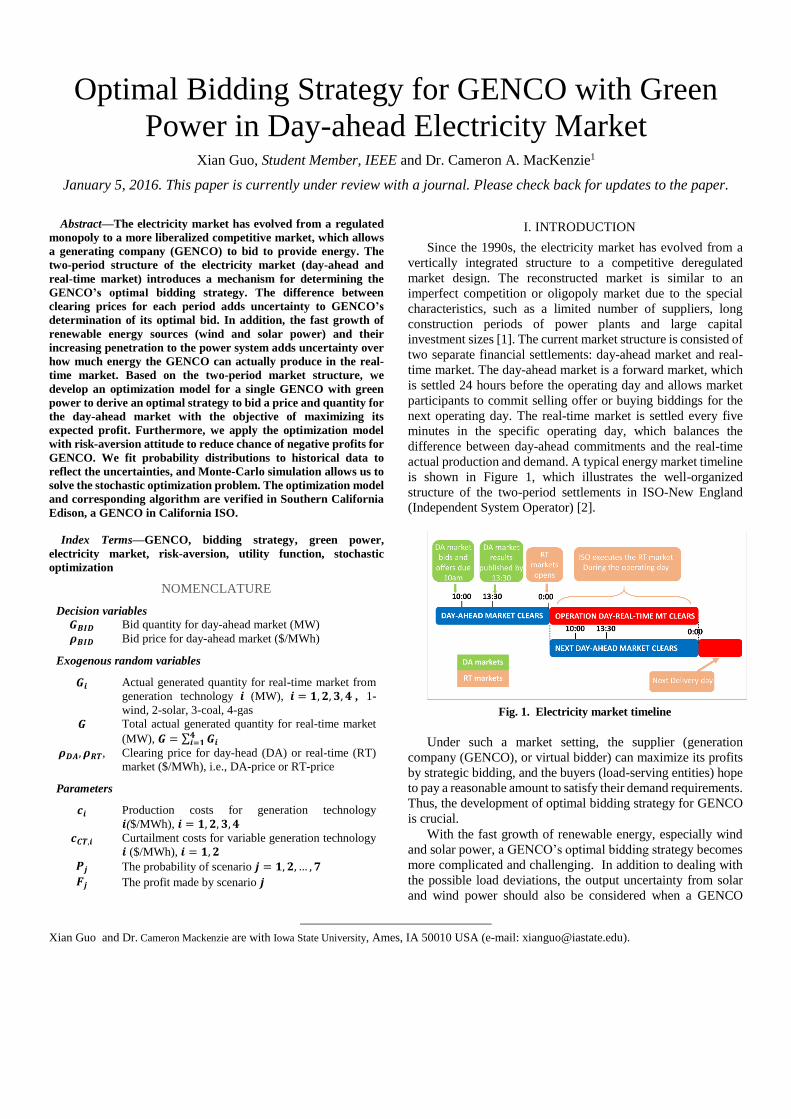
A bidding strategy is based on the market structure and
auction rules. The typical market structure includes a wholesale
market and retail market, and GENCOs participate in the
wholesale market, as shown in Figure 2. The buyers include
large energy users and distribution utilities and retailers. A
GENCO can sell its electricity production directly to power
pools by competing in the electricity energy market, entering
into bilateral contracts, or providing ancillary service in the
corresponding reserve market. This paper focuses exclusively
on the bidding strategy of a GENCO in the power pool. Daily
auctions for electricity power exist in the pool-based electricity
market, which determines the wholesale electricity price.
Fig. 2. General structure of wholesale electricity market
B. Market clearing mechanism
The pool-based market is a type of mediated market, which
serves as an auction center to which all buyers and sellers submit
bids. The bid of a GENCO has two components: a bid price and
a bid quantity. After the period of submitting bids closes, the
generation bids are cleared or scheduled in price ordered from
lower to higher prices in order to eliminate the more expensive
bids. An ISO conducts this procedure [1].
As shown in Figure 3, the intersection point between the
aggregated hourly supply offer curve and the aggregated hourly
demand bid curve is the market clearing price (MCP), which is
also called equilibrium point. The MCP is set as either the last
accepted offer or the first rejected offer. GENCOs whose bid
prices are less than or equal to the MCP are “committed” to sell
their bid quantity in the following day. The GENCOs are paid
by uniform pricing or pay-as-bid [1]. Uniform pricing means
that all cleared GENCOs are paid the same MCP, no matter how
much their original bidding price is. Pay-as-bid indicates that the
committed GENCO will sell its energy at the price that it bid
assuming it is less than the MCP. In order to simplify the
calculation and analysis, this paper assumes a uniform pricing
market, which means the GENCO sells its energy at the MCP.
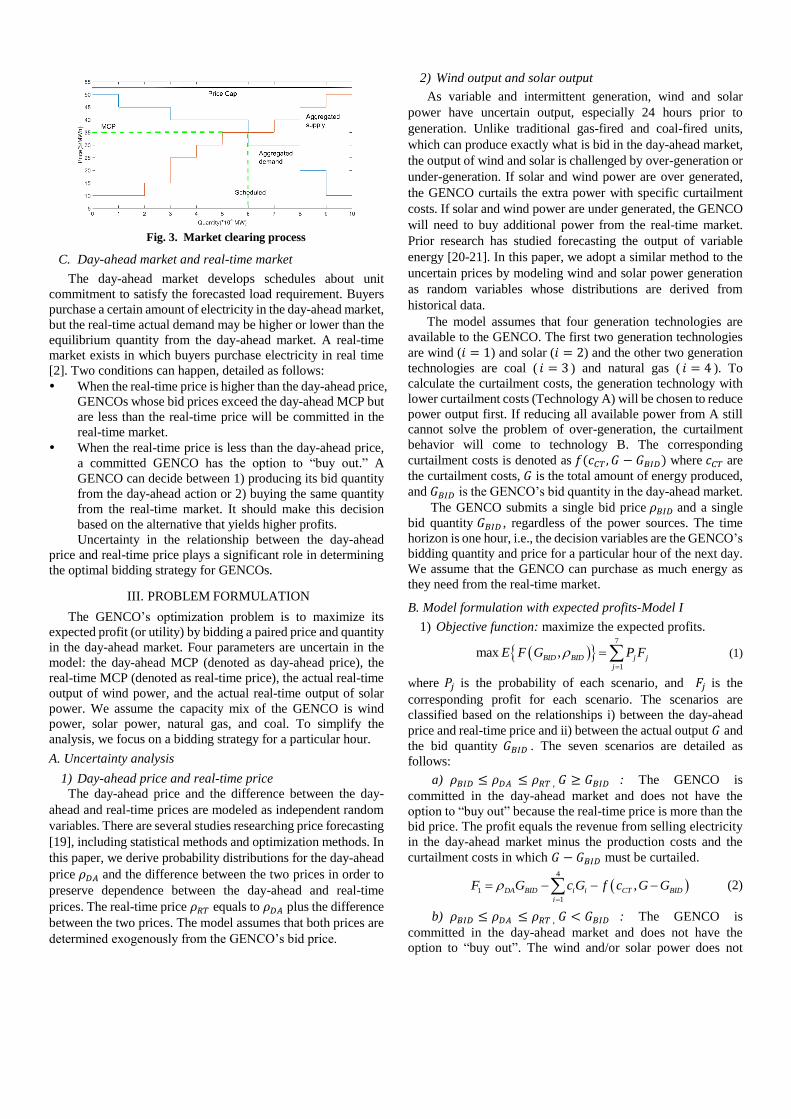
Fig. 3. Market clearing process
C. Day-ahead market and real-time market
The day-ahead market develops schedules about unit
commitment to satisfy the forecasted load requirement. Buyers
purchase a certain amount of electricity in the day-ahead market,
but the real-time actual demand may be higher or lower than the
equilibrium quantity from the day-ahead market. A real-time
market exists in which buyers purchase electricity in real time
[2]. Two conditions can happen, detailed as follows:
When the real-time price is higher than the day-ahead price,
GENCOs whose bid prices exceed the day-ahead MCP but
are less than the real-time price will be committed in the
real-time market.
When the real-time price is less than the day-ahead price,
a committed GENCO has the option to “buy out.” A
GENCO can decide between 1) producing its bid quantity
from the day-ahead action or 2) buying the same quantity
from the real-time market. It should make this decision
based on the alternative that yields higher profits.
Uncertainty in the relationship between the day-ahead
price and real-time price plays a significant role in determining
the optimal bidding strategy for GENCOs.
III. PROBLEM FORMULATION
The GENCO’s optimization problem is to maximize its
expected profit (or utility) by bidding a paired price and quantity
in the day-ahead market. Four parameters are uncertain in the
model: the day-ahead MCP (denoted as day-ahead price), the
real-time MCP (denoted as real-time price), the actual real-time
output of wind power, and the actual real-time output of solar
power. We assume the capacity mix of the GENCO is wind
power, solar power, natural gas, and coal. To simplify the
analysis, we focus on a bidding strategy for a particular hour.
A. Uncertainty analysis
1) Day-ahead price and real-time price
The day-ahead price and the difference between the day-
ahead and real-time prices are modeled as independent random
variables. There are several studies researching price forecasting
[19], including statistical methods and optimization methods. In
this paper, we derive probability distributions for the day-ahead
price 𝜌𝐷𝐴 and the difference between the two prices in order to
preserve dependence between the day-ahead and real-time
prices. The real-time price 𝜌𝑅𝑇 equals to 𝜌𝐷𝐴 plus the difference
between the two prices. The model assumes that both prices are
determined exogenously from the GENCO’s bid price.
2) Wind output and solar output
As variable and intermittent generation, wind and solar
power have uncertain output, especially 24 hours prior to
generation. Unlike traditional gas-fired and coal-fired units,
which can produce exactly what is bid in the day-ahead market,
the output of wind and solar is challenged by over-generation or
under-generation. If solar and wind power are over generated,
the GENCO curtails the extra power with specific curtailment
costs. If solar and wind power are under generated, the GENCO
will need to buy additional power from the real-time market.
Prior research has studied forecasting the output of variable
energy [20-21]. In this paper, we adopt a similar method to the
uncertain prices by modeling wind and solar power generation
as random variables whose distributions are derived from
historical data.
The model assumes that four generation technologies are
available to the GENCO. The first two generation technologies
are wind (𝑖 = 1) and solar (𝑖 = 2) and the other two generation
technologies are coal ( 𝑖 = 3 ) and natural gas ( 𝑖 = 4 ). To
calculate the curtailment costs, the generation technology with
lower curtailment costs (Technology A) will be chosen to reduce
power output first. If reducing all available power from A still
cannot solve the problem of over-generation, the curtailment
behavior will come to technology B. The corresponding
curtailment costs is denoted as 𝑓(𝑐𝐶𝑇 , 𝐺 − 𝐺𝐵𝐼𝐷) where 𝑐𝐶𝑇 are
the curtailment costs, 𝐺 is the total amount of energy produced,
and 𝐺𝐵𝐼𝐷 is the GENCO’s bid quantity in the day-ahead market.
The GENCO submits a single bid price 𝜌𝐵𝐼𝐷 and a single
bid quantity 𝐺𝐵𝐼𝐷 , regardless of the power sources. The time
horizon is one hour, i.e., the decision variables are the GENCO’s
bidding quantity and price for a particular hour of the next day.
We assume that the GENCO can purchase as much energy as
they need from the real-time market.
B. Model formulation with expected profits-Model I
1) Objective function: maximize the expected profits.
7
1
max ,BID BID j j
j
E F G P F
(1)
where 𝑃𝑗 is the probability of each scenario, and 𝐹𝑗 is the
corresponding profit for each scenario. The scenarios are
classified based on the relationships i) between the day-ahead
price and real-time price and ii) between the actual output 𝐺 and
the bid quantity 𝐺𝐵𝐼𝐷 . The seven scenarios are detailed as
follows:
a) 𝜌𝐵𝐼𝐷 ≤ 𝜌𝐷𝐴 ≤ 𝜌𝑅𝑇 , 𝐺 ≥ 𝐺𝐵𝐼𝐷 : The GENCO is
committed in the day-ahead market and does not have the
option to “buy out” because the real-time price is more than the
bid price. The profit equals the revenue from selling electricity
in the day-ahead market minus the production costs and the
curtailment costs in which 𝐺 − 𝐺𝐵𝐼𝐷 must be curtailed.
4
1
1
,DA BID i i CT BID
i
F G c G f c G G
(2)
b) 𝜌𝐵𝐼𝐷 ≤ 𝜌𝐷𝐴 ≤ 𝜌𝑅𝑇 , 𝐺 < 𝐺𝐵𝐼𝐷 : The GENCO is
committed in the day-ahead market and does not have the
option to “buy out”. The wind and/or solar power does not
generate enough, and the GENCO should buy the additional
power from the real-time market. The profit equals the revenue
from the day-ahead market minus the production costs and the
costs for purchasing additional power in the real-time market.
4
2
1
DA BID i i RT BID
i
F G c G G G
(3)
c) 𝜌𝐵𝐼𝐷 ≤ 𝜌𝐷𝐴 , 𝜌𝐷𝐴 > 𝜌𝑅𝑇 , 𝐺 ≥ 𝐺𝐵𝐼𝐷 : The GENCO
makes decisions of “produce or buy” based on the production
costs 𝑐𝑖 and real-time price (plus curtailment costs for wind and
solar power) for each generation technology. As with the first
scenario, the surplus power 𝐺 − 𝐺𝐵𝐼𝐷 must be curtailed.
2
3 ,
1
4
3
min ,
min , ,
DA BID i RT CT i i
i
i RT i CT BID
i
F G c c G
c G f c G G
(4)
d) 𝜌𝐵𝐼𝐷 ≤ 𝜌𝐷𝐴 , 𝜌𝐷𝐴 > 𝜌𝑅𝑇 , 𝐺 < 𝐺𝐵𝐼𝐷 : The GENCO is
committed in the day-ahead market and has the option to “buy
out”, but it also needs to buy additional power from the real-
time market.
2
4 ,
1
4
3
min ,
min ,
DA BID i RT CT i i
i
i RT i RT BID
i
F G c c G
c G G G
(5)
e) 𝜌𝐷𝐴 < 𝜌𝐵𝐼𝐷 < 𝜌𝑅𝑇 , 𝐺 < 𝐺𝐵𝐼𝐷 : The GENCO is not
committed in the day-ahead market, but it will be committed in
real-time market.
4
5
1
RT BID i i RT BID
i
F G c G G G
(6)
f) 𝜌𝐷𝐴 < 𝜌𝐵𝐼𝐷 < 𝜌𝑅𝑇 , 𝐺 ≥ 𝐺𝐵𝐼𝐷 : The GENCO is
committed in the real-time market and needs to curtail extra
power produced by the green energy.
4
6
1
,RT BID i i CT BID
i
F G c G f c G G
(7)
g) All other situations: The GENCO will not be
committed but it will need to pay the curtailment costs for wind
and solar power. 2
7 ,
1
CT i i
i
F c G
(8)
2) Constraints:
The optimization model has a few constraints. One
constraint is:
_ in _ maxBID m BID BID (9)
where 𝜌𝐷𝐴_𝑚𝑖𝑛 is the minimum day-ahead price and 𝜌𝐷𝐴_𝑚𝑎𝑥 is
the maximum day-ahead price. The GENCO should not bid a
price less than the minimum day-ahead price (to avoid extreme
clearing prices) or bid more than the maximum day-ahead price.
The second constraint is that the total bid quantity should not
exceed the maximum available capacity (the capacity factor is
included):
4
_ max
1
BID i
i
G G
(10)
where 𝐺𝑖_𝑚𝑎𝑥 is the maximum amount of electricity that can be
produced by generation technology 𝑖. The model assumes the GENCO can purchase as much
electricity as it needs in the real-time market (e.g., if the wind or
solar power under generates). This is a reasonable assumption
for our case study because the GENCO only produces about 20%
of the region’s electricity. However, if the GENCO is a major
player in the market, a constraint could be added that limits how
much electricity it can purchase in the real-time market.
C. Model formulation with risk attitude-Model II
A GENCO may be risk averse, which means it may be
willing to sacrifice the possibility of higher profits in order to
avoid losing money. In order to integrate a GENCO’s risk
attitude, we propose Model II, which introduces a utility
function to describe the GENCO’s risk attitude over the
uncertain profits.
1) Utility function of GENCO
We assume an exponential utility function to represent the
GENCO’s preferences, as shown as equation (11).
/1 x RU x e (11)
where 𝑥 is the GENCO’s profit and 𝑅 represents its risk
tolerance (where both are in millions of dollars). When 𝑅 > 0,
the GENCO is risk averse, and a smaller value of 𝑅 indicates
more risk-aversion. If 𝑅 < 0, the GENCO is risk seeking and if
𝑅 → ∞, 𝑈(𝑥) becomes risk-neutral [22].
The GENCO’s risk tolerance has a direct relation to the
GENCO’s willingness to accept an uncertain deal between
earning $1 million and losing $1 million. The value of 𝑅 can be
calculated based on the probability 𝑞 for which the GENCO is
indifferent between no gain and no loss ($0) and a 𝑞 probability
of earning $1 million and 1 − 𝑞 probability of losing $1 million.
Figure 4 depicts that indifference relationship, and equation (12)
shows how to calculate 𝑅 given a value for 𝑞.
1
ln1
Rq
q
(12)
Fig.4. Assessing risk tolerance
2) Model formulation
Given a utility function, Model II calculates the utility for
each scenario as depicted in equations (2)-(8) and maximizes the
expected utility as given in equation (13). Since higher expected
profits may mean more risk, a risk-averse GENCO may choose
a bidding strategy that yields lower expected profits than a risk-
neutral GENCO.
7
1
max ,BID BID j j
j
E U F G P U F
(13)
C. Solving procedure
Monte-Carlo simulation provides an efficient alternative to
deal with the four uncertain parameters. The simulation
generates thousands of realizations of price and output
uncertainties, and an optimization algorithm determines the
optimal bidding strategy given these simulated values. The
algorithm works identically whether expected profit or expected
utility is maximized.
The solving process is detailed as follows:
Collect historical data for the day-ahead price, real-time price,
hourly wind output, and hourly solar output, and fit the
corresponding distributions;
Apply the Monte-Carlo simulation to generate price and
variable power output data;
Apply an optimization tool to solve the model and achieve the
optimal bidding strategy for a GENCO.
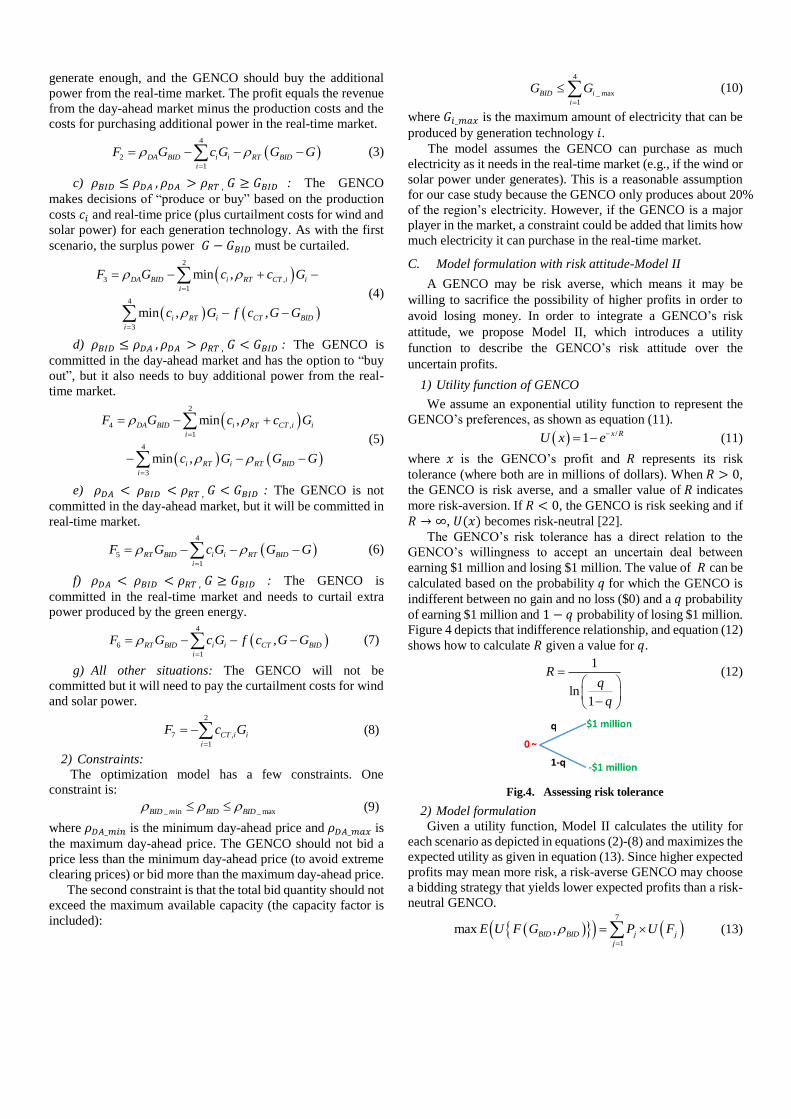
IV. NUMERICAL EXAMPLE
We utilize our model and algorithm for a GENCO in
CAISO---Southern California Edison (SCE). The generation
mix for SCE is shown in Figure 5, where the mix represents the
maximum generation that SCE can produce. The production
costs for green power is $0/MWh, $66.13 for coal-fired units,
and $26.60/MWh for gas-fired units. The curtailment costs for
wind and solar power are $3/MWh and $0 MWh,
correspondingly.
Fig. 5. Modified generation mix of SCE (MW)
A. Fitting distribution
We collect hourly data of day-ahead price, real-time price,
and wind and solar output in 20142. The day-ahead price is
subtracted from the real-time price for each data point. These
values depend on the season and time of day, and we select a
total of 12 conditions: hour 1 (midnight), hour 13 (1 p.m.) and
hour 17 (5 p.m.) each for spring (S), summer (Sm), fall (F), and
winter (W) seasons. We fit each of the four uncertain parameters
to a probability distribution for each of these 12 conditions, as
indicated in Appendix Table A-1.
B. Solving the model
We use Matlab to generate 100,000 cases and use the
optimization toolbox Pattern Search in Matlab to solve the
model. Pattern search is a direct-search optimization method that
does not require calculating the gradient of the objective
2 Wind and solar output source:
http://www.caiso.com/green/renewableswatch.html;
function. The pattern search algorithm finds a sequence of points
that improve the objective function from one sequence to the
next [23]. Pattern search has been identified as a successful
heuristic for solving non-differentiable optimization problems
[24, 25].
We verified each solution for a particular hour with another
data set of 100,000 simulated cases, and the optimal bidding
strategy for SCE shows little change given the new simulated
cases. Thus, 100,000 simulations are reasonable to solve this
optimization model with these distributions.
C. Results analysis
1) Bidding strategy analysis
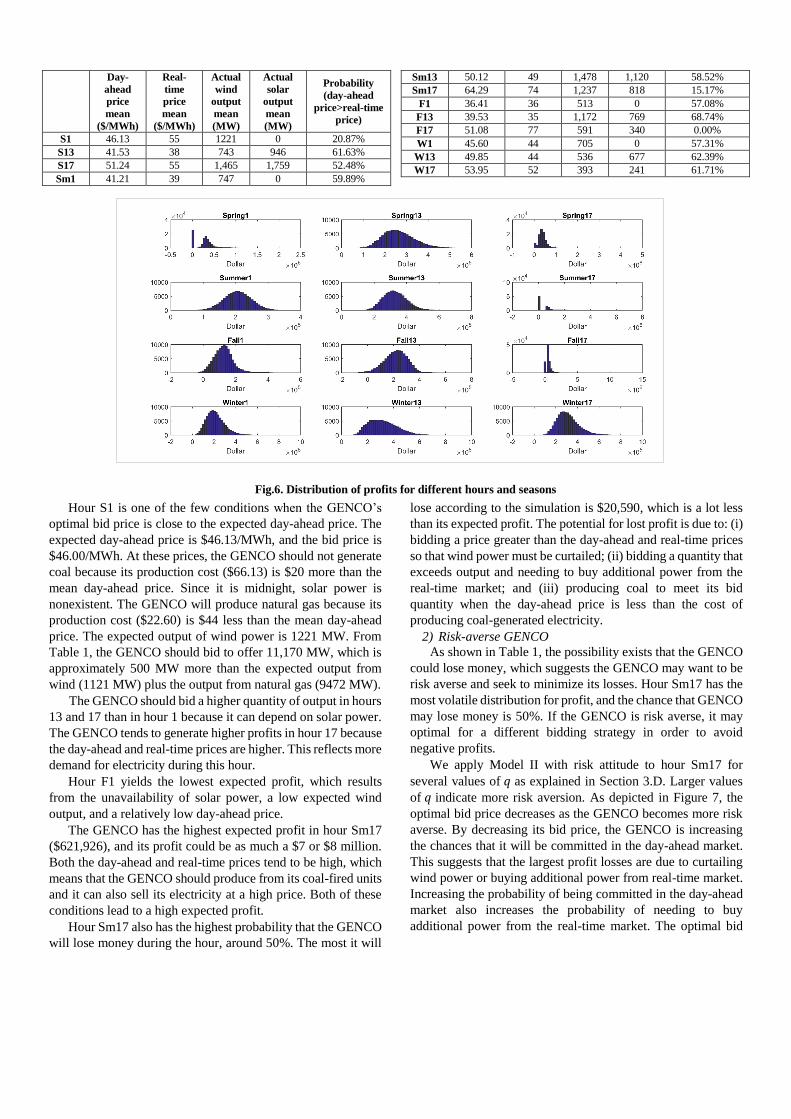
Table 1 indicates the optimal bidding strategy for the
GENCO, including its expected profit, the standard deviation in
profit, and the probability that the GENCO will lose money.
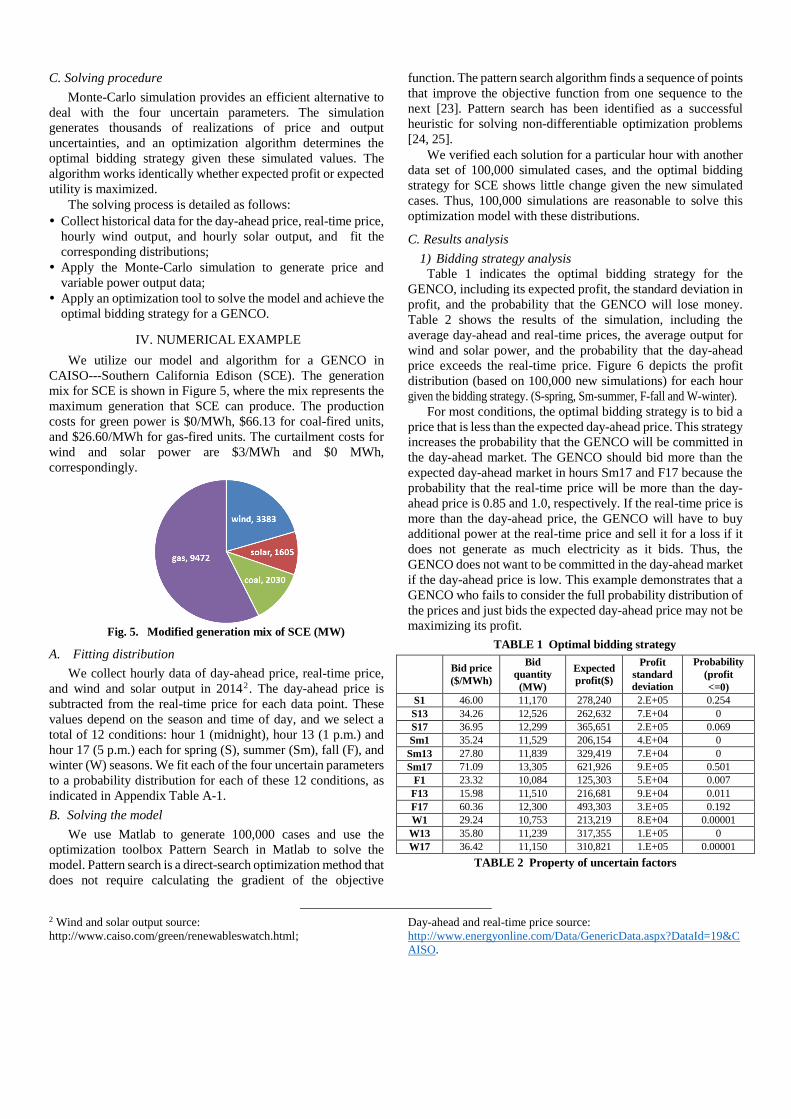
Table 2 shows the results of the simulation, including the
average day-ahead and real-time prices, the average output for
wind and solar power, and the probability that the day-ahead
price exceeds the real-time price. Figure 6 depicts the profit
distribution (based on 100,000 new simulations) for each hour
given the bidding strategy. (S-spring, Sm-summer, F-fall and W-winter).
For most conditions, the optimal bidding strategy is to bid a
price that is less than the expected day-ahead price. This strategy
increases the probability that the GENCO will be committed in
the day-ahead market. The GENCO should bid more than the
expected day-ahead market in hours Sm17 and F17 because the
probability that the real-time price will be more than the day-
ahead price is 0.85 and 1.0, respectively. If the real-time price is
more than the day-ahead price, the GENCO will have to buy
additional power at the real-time price and sell it for a loss if it
does not generate as much electricity as it bids. Thus, the
GENCO does not want to be committed in the day-ahead market
if the day-ahead price is low. This example demonstrates that a
GENCO who fails to consider the full probability distribution of
the prices and just bids the expected day-ahead price may not be
maximizing its profit.
TABLE 1 Optimal bidding strategy
Bid price
($/MWh)
Bid
quantity
(MW)
Expected
profit($)
Profit
standard
deviation
Probability
(profit
<=0)
S1 46.00 11,170 278,240 2.E+05 0.254
S13 34.26 12,526 262,632 7.E+04 0
S17 36.95 12,299 365,651 2.E+05 0.069
Sm1 35.24 11,529 206,154 4.E+04 0
Sm13 27.80 11,839 329,419 7.E+04 0
Sm17 71.09 13,305 621,926 9.E+05 0.501
F1 23.32 10,084 125,303 5.E+04 0.007
F13 15.98 11,510 216,681 9.E+04 0.011
F17 60.36 12,300 493,303 3.E+05 0.192
W1 29.24 10,753 213,219 8.E+04 0.00001
W13 35.80 11,239 317,355 1.E+05 0
W17 36.42 11,150 310,821 1.E+05 0.00001
TABLE 2 Property of uncertain factors
Day-ahead and real-time price source:
http://www.energyonline.com/Data/GenericData.aspx?DataId=19&C
AISO.
Day-
ahead
price
mean
($/MWh)
Real-
time
price
mean
($/MWh)
Actual
wind
output
mean
(MW)
Actual
solar
output
mean
(MW)
Probability
(day-ahead
price>real-time
price)
S1 46.13 55 1221 0 20.87%
S13 41.53 38 743 946 61.63%
S17 51.24 55 1,465 1,759 52.48%
Sm1 41.21 39 747 0 59.89%
Sm13 50.12 49 1,478 1,120 58.52%
Sm17 64.29 74 1,237 818 15.17%
F1 36.41 36 513 0 57.08%
F13 39.53 35 1,172 769 68.74%
F17 51.08 77 591 340 0.00%
W1 45.60 44 705 0 57.31%
W13 49.85 44 536 677 62.39%
W17 53.95 52 393 241 61.71%
Fig.6. Distribution of profits for different hours and seasons
Hour S1 is one of the few conditions when the GENCO’s
optimal bid price is close to the expected day-ahead price. The
expected day-ahead price is $46.13/MWh, and the bid price is
$46.00/MWh. At these prices, the GENCO should not generate
coal because its production cost ($66.13) is $20 more than the
mean day-ahead price. Since it is midnight, solar power is
nonexistent. The GENCO will produce natural gas because its
production cost ($22.60) is $44 less than the mean day-ahead
price. The expected output of wind power is 1221 MW. From
Table 1, the GENCO should bid to offer 11,170 MW, which is
approximately 500 MW more than the expected output from
wind (1121 MW) plus the output from natural gas (9472 MW).
The GENCO should bid a higher quantity of output in hours
13 and 17 than in hour 1 because it can depend on solar power.
The GENCO tends to generate higher profits in hour 17 because
the day-ahead and real-time prices are higher. This reflects more
demand for electricity during this hour.
Hour F1 yields the lowest expected profit, which results
from the unavailability of solar power, a low expected wind
output, and a relatively low day-ahead price.
The GENCO has the highest expected profit in hour Sm17
($621,926), and its profit could be as much a $7 or $8 million.
Both the day-ahead and real-time prices tend to be high, which
means that the GENCO should produce from its coal-fired units
and it can also sell its electricity at a high price. Both of these
conditions lead to a high expected profit.
Hour Sm17 also has the highest probability that the GENCO
will lose money during the hour, around 50%. The most it will
lose according to the simulation is $20,590, which is a lot less
than its expected profit. The potential for lost profit is due to: (i)
bidding a price greater than the day-ahead and real-time prices
so that wind power must be curtailed; (ii) bidding a quantity that
exceeds output and needing to buy additional power from the
real-time market; and (iii) producing coal to meet its bid
quantity when the day-ahead price is less than the cost of
producing coal-generated electricity.
2) Risk-averse GENCO
As shown in Table 1, the possibility exists that the GENCO
could lose money, which suggests the GENCO may want to be
risk averse and seek to minimize its losses. Hour Sm17 has the
most volatile distribution for profit, and the chance that GENCO
may lose money is 50%. If the GENCO is risk averse, it may
optimal for a different bidding strategy in order to avoid
negative profits.
We apply Model II with risk attitude to hour Sm17 for
several values of 𝑞 as explained in Section 3.D. Larger values
of 𝑞 indicate more risk aversion. As depicted in Figure 7, the
optimal bid price decreases as the GENCO becomes more risk
averse. By decreasing its bid price, the GENCO is increasing
the chances that it will be committed in the day-ahead market.
This suggests that the largest profit losses are due to curtailing
wind power or buying additional power from real-time market.
Increasing the probability of being committed in the day-ahead
market also increases the probability of needing to buy
additional power from the real-time market. The optimal bid
price continues to fall until it reaches the minimum day-ahead
price, approximately $40 /MWh.
Fig.7. Optimal bid price as a function of risk aversion
The optimal bid quantity stays relatively constant at 13,305
MW as the GENCO becomes more risk averse (Figure 8). The
optimal bid quantity does increase by approximately 500 MW
as the GENCO becomes more risk averse.
Fig.8. Optimal bid quantity as a function of risk aversion
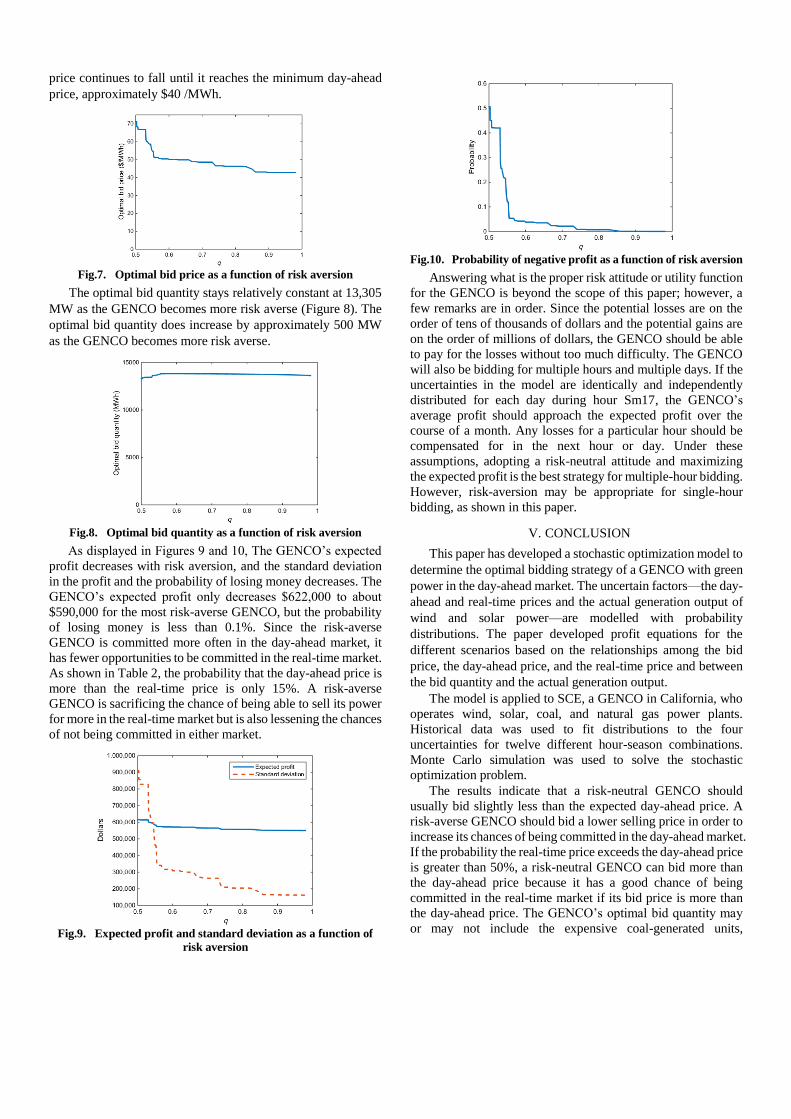
As displayed in Figures 9 and 10, The GENCO’s expected
profit decreases with risk aversion, and the standard deviation
in the profit and the probability of losing money decreases. The
GENCO’s expected profit only decreases $622,000 to about
$590,000 for the most risk-averse GENCO, but the probability
of losing money is less than 0.1%. Since the risk-averse
GENCO is committed more often in the day-ahead market, it
has fewer opportunities to be committed in the real-time market.
As shown in Table 2, the probability that the day-ahead price is
more than the real-time price is only 15%. A risk-averse
GENCO is sacrificing the chance of being able to sell its power
for more in the real-time market but is also lessening the chances
of not being committed in either market.
Fig.9. Expected profit and standard deviation as a function of
risk aversion
Fig.10. Probability of negative profit as a function of risk aversion
Answering what is the proper risk attitude or utility function
for the GENCO is beyond the scope of this paper; however, a
few remarks are in order. Since the potential losses are on the
order of tens of thousands of dollars and the potential gains are
on the order of millions of dollars, the GENCO should be able
to pay for the losses without too much difficulty. The GENCO
will also be bidding for multiple hours and multiple days. If the
uncertainties in the model are identically and independently
distributed for each day during hour Sm17, the GENCO’s
average profit should approach the expected profit over the
course of a month. Any losses for a particular hour should be
compensated for in the next hour or day. Under these
assumptions, adopting a risk-neutral attitude and maximizing
the expected profit is the best strategy for multiple-hour bidding.
However, risk-aversion may be appropriate for single-hour
bidding, as shown in this paper.
V. CONCLUSION
This paper has developed a stochastic optimization model to
determine the optimal bidding strategy of a GENCO with green
power in the day-ahead market. The uncertain factors—the day-
ahead and real-time prices and the actual generation output of
wind and solar power—are modelled with probability
distributions. The paper developed profit equations for the
different scenarios based on the relationships among the bid
price, the day-ahead price, and the real-time price and between
the bid quantity and the actual generation output.
The model is applied to SCE, a GENCO in California, who
operates wind, solar, coal, and natural gas power plants.
Historical data was used to fit distributions to the four
uncertainties for twelve different hour-season combinations.
Monte Carlo simulation was used to solve the stochastic
optimization problem.
The results indicate that a risk-neutral GENCO should
usually bid slightly less than the expected day-ahead price. A
risk-averse GENCO should bid a lower selling price in order to
increase its chances of being committed in the day-ahead market.
If the probability the real-time price exceeds the day-ahead price
is greater than 50%, a risk-neutral GENCO can bid more than
the day-ahead price because it has a good chance of being
committed in the real-time market if its bid price is more than
the day-ahead price. The GENCO’s optimal bid quantity may
or may not include the expensive coal-generated units,

depending on how the distribution on the day-ahead price
compares with the cost of generating electricity from coal.
Future work can refine the model to account for the
possibility that the GENCO may not be able to purchase
additional power on the real-time market if actual generation is
less than the bid quantity. A GENCO’s bid may also influence
the market clearing price, which would require the probability
distributions to be dependent upon the GENCO’s strategy. The
effect of including multiple GENCOs could also be included in
the model.
To our knowledge, this paper represents the first model that
incorporates two periods (day-ahead and real-time markets)
with multiple generating technologies including green power.
Modeling uncertainties with probability distributions based on
historical data allow us to develop realistic results that a
GENCO can use to make better decisions in the electricity
markets.
REFERENCES
[1] Li, G., Shi, J., & Qu, X. (2011). Modeling methods for GENCO
bidding strategy optimization in the liberalized electricity spot
market–A state-of-the-art review. Energy, 36(8), 4686-4700.
[2] Energy market introduction-introduction to wholesale electricity
markets (WEM101). [online]. http://www.iso-ne.com/static-
assets/documents/2015/05/05_wem101_april_2015_energy_
market _intro.pdf.
[3] Cormack J, Hollis A, Zareipour H, Rosehart W. The large-scale
integration of wind generation: impacts on price, reliability and
dispatchable conventional uppliers. Energy Policy
2010;38(7):3837e46.
[4] David, A. K., & Wen, F. (2000). Strategic bidding in competitive
electricity markets: a literature survey. In Power Engineering
Society Summer Meeting, 2000. IEEE (Vol. 4, pp. 2168-2173).
IEEE
[5] Borghetti, A., Frangioni, A., Lacalandra, F., Nucci, C. A., &
Pelacchi, P. (2003, June). Using of a cost-based unit commitment
algorithm to assist bidding strategy decisions. In Power Tech
Conference Proceedings, 2003 IEEE Bologna (Vol. 2, pp. 8-pp).
IEEE.
[6] Valenzuela, J., & Mazumdar, M. (2003). Commitment of electric
power generators under stochastic market prices. Operations
Research, 51(6), 880-893.
[7] Foley, A. M., Gallachóir, B. Ó., Hur, J., Baldick, R., & McKeogh,
E. J. (2010). A strategic review of electricity systems models.
Energy, 35(12), 4522-4530.
[8] Borenstein, S., & Bushnell, J. (1999). An empirical analysis of
the potential for market power in California’s electricity industry.
The Journal of Industrial Economics, 47(3), 285-323.
[9] Federico G, Rahman D. Bidding in an electricity pay-as-bid
auction. Journal of Regulatory Economics 2003;24(2):175-211.
[10] Klemperer, P. D., & Meyer, M. A. (1989). Supply function
equilibria in oligopoly under uncertainty. Econometrica: Journal
of the Econometric Society, 1243-1277.
[11] Rahimiyan, M., & Mashhadi, H. R. (2008). Supplier's optimal
bidding strategy in electricity pay-as-bid auction: Comparison of
the Q-learning and a model-based approach. Electric Power
Systems Research, 78(1), 165-175.
[12] Tesfatsion, L. (2006). Agent-based computational economics: A
constructive approach to economic theory. Handbook of
computational economics, 2, 831-880.
[13] Yamin, H. Y., & Shahidehpour, S. M. (2004). Self-scheduling
and energy bidding in competitive electricity markets. Electric
Power Systems Research, 71(3), 203-209.
[14] Azevedo, E. M., & Correia, P. B. (2006). Bidding strategies in
Brazilian electricity auctions. International Journal of Electrical
Power & Energy Systems, 28(5), 309-314.
[15] Gao, F., Sheble, G. B., Hedman, K. W., & Yu, C. N. (2015).
Optimal bidding strategy for GENCOs based on parametric
linear programming considering incomplete information.
International Journal of Electrical Power & Energy Systems, 66,
272-279.
[16] Catalao, J. P. S., Pousinho, H. M. I., & Contreras, J. (2012).
Optimal hydro scheduling and offering strategies considering
price uncertainty and risk management. Energy, 37(1), 237-244.
[17] Sharma, K. C., Bhakar, R., & Tiwari, H. P. (2014). Strategic
bidding for wind power producers in electricity markets. Energy
Conversion and Management, 86, 259-267.
[18] Angarita, J. L., Usaola, J., & Martínez-Crespo, J. (2009).
Combined hydro-wind generation bids in a pool-based electricity
market. Electric Power Systems Research, 79(7), 1038-1046.
[19] Daneshi, H., & Daneshi, A. (2008, April). Price forecasting in
deregulated electricity markets-a bibliographical survey. In
Electric Utility Deregulation and Restructuring and Power
Technologies, 2008. DRPT 2008. Third International Conference
on (pp. 657-661). IEEE.
[20] Cadogan, J., Milligan, M., Wan, Y., & Kirby, B. (2001). Short-
Term Output Variations in Wind Farms--Implications for
Ancillary Services in the United States: Preprint (No. NREL/CP-
500-29155). National Renewable Energy Lab., Golden, CO (US).
[21] Zhang, J., Hodge, B. M., Florita, A., Lu, S., Hamann, H. F., &
Banunarayanan, V. (2013). Metrics for Evaluating the Accuracy
of Solar Power Forecasting.
[22] Clemen, R. T., & Reilly, T. (2004). Making Hard Decisions with
Decision Tools Suite. Update edition. Mason, OH: Cengage
Learning.
[23]How Pattern Search Works. Mathworks. [online]
http://www.mathworks.com/help/gads/how-pattern-search-
polling-works.html.
[24] Lewis, R. M., & Torczon, V. (1999). Pattern search algorithms
for bound constrained minimization. SIAM Journal on
Optimization, 9(4), 1082-1099.
[25] Lewis, R. M., & Torczon, V. (2000). Pattern search methods for
linearly constrained minimization. SIAM Journal on
Optimization, 10(3), 917-941.

Xian Guo (S’12) received the B.S. degree from
Shanghai University of Electric Power in 2010 and M.S
degree from Shanghai Jiao Tong University in 2013,
China. Currently she is pursuing the PhD. Degree at
Iowa State University, Ames, IA, USA. She was a summer intern in Argonne National Lab
in 2014. Her research interests are power system
optimization, electricity market and risk analysis.
Cameron A. MacKenzie is currently an assistant
professor in the Department of Industrial and Manufacturing Systems Engineering at Iowa State
University, Ames. He received the B.Sc. degree in
mathematics and the B.A. degree in history from Indiana University–Purdue University at Fort Wayne,
Fort Wayne, the M.Sc. degree in management science
and engineering from Stanford University, Stanford, CA, the M.A. degree in international affairs from The
George Washington University, Washington, DC, and the Ph.D. degree in
industrial engineering from the University of Oklahoma, Norman. His research focuses on decision and risk analysis, with a particular emphasis on
modeling the business and economic impacts caused by disruptions and
building resilience within organizations.
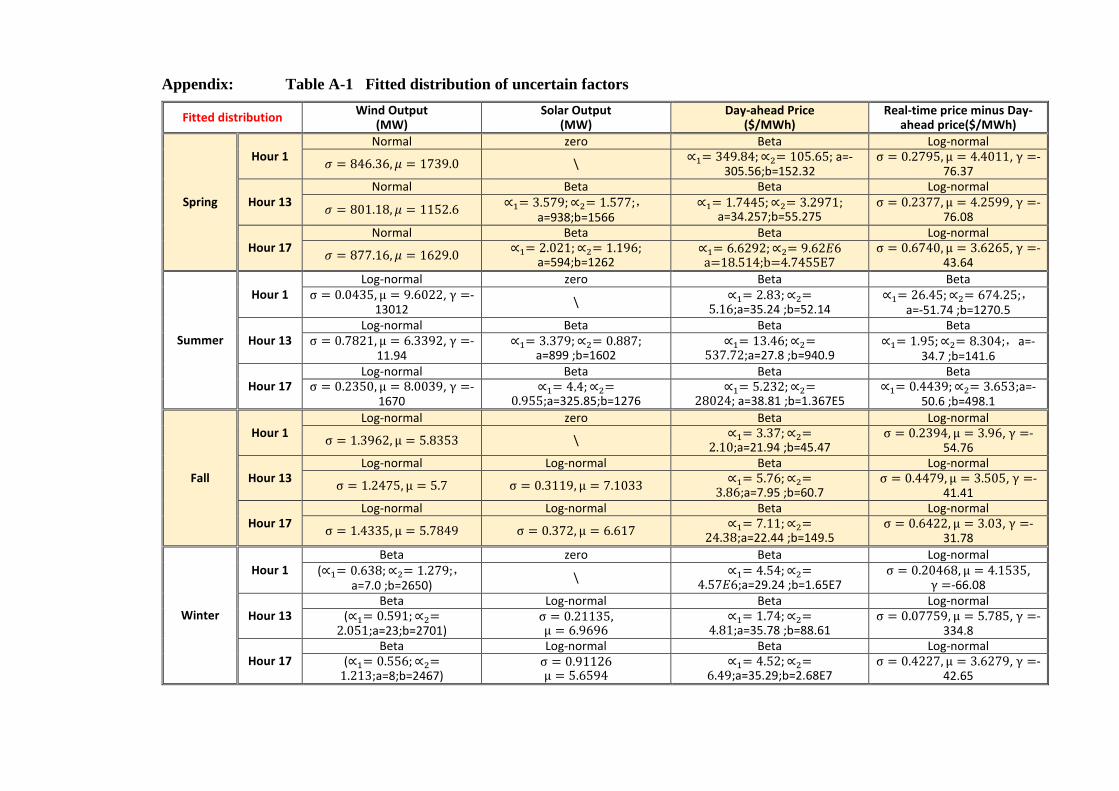
Appendix: Table A-1 Fitted distribution of uncertain factors
Fitted distribution Wind Output
(MW) Solar Output
(MW) Day-ahead Price
($/MWh) Real-time price minus Day-
ahead price($/MWh)
Spring
Hour 1 Normal zero Beta Log-normal
𝜎 = 846.36, 𝜇 = 1739.0 \ ∝1= 349.84; ∝2= 105.65; a=-
305.56;b=152.32 σ = 0.2795, μ = 4.4011, γ =-
76.37
Hour 13 Normal Beta Beta Log-normal
𝜎 = 801.18, 𝜇 = 1152.6 ∝1= 3.579; ∝2= 1.577;,
a=938;b=1566 ∝1= 1.7445; ∝2= 3.2971;
a=34.257;b=55.275 σ = 0.2377, μ = 4.2599, γ =-
76.08
Hour 17 Normal Beta Beta Log-normal
𝜎 = 877.16, 𝜇 = 1629.0 ∝1= 2.021; ∝2= 1.196;
a=594;b=1262 ∝1= 6.6292; ∝2= 9.62𝐸6
a=18.514;b=4.7455E7 σ = 0.6740, μ = 3.6265, γ =-
43.64
Summer
Hour 1 Log-normal zero Beta Beta
σ = 0.0435, μ = 9.6022, γ =-13012
\ ∝1= 2.83; ∝2=
5.16;a=35.24 ;b=52.14 ∝1= 26.45; ∝2= 674.25;,
a=-51.74 ;b=1270.5
Hour 13 Log-normal Beta Beta Beta
σ = 0.7821, μ = 6.3392, γ =-11.94
∝1= 3.379; ∝2= 0.887; a=899 ;b=1602
∝1= 13.46; ∝2=537.72;a=27.8 ;b=940.9
∝1= 1.95; ∝2= 8.304;,a=-34.7 ;b=141.6
Hour 17 Log-normal Beta Beta Beta
σ = 0.2350, μ = 8.0039, γ =-1670
∝1= 4.4; ∝2=0.955;a=325.85;b=1276
∝1= 5.232; ∝2=28024; a=38.81 ;b=1.367E5
∝1= 0.4439; ∝2= 3.653;a=-50.6 ;b=498.1
Fall
Hour 1 Log-normal zero Beta Log-normal
σ = 1.3962, μ = 5.8353 \ ∝1= 3.37; ∝2=
2.10;a=21.94 ;b=45.47 σ = 0.2394, μ = 3.96, γ =-
54.76
Hour 13 Log-normal Log-normal Beta Log-normal
σ = 1.2475, μ = 5.7 σ = 0.3119, μ = 7.1033 ∝1= 5.76; ∝2=
3.86;a=7.95 ;b=60.7 σ = 0.4479, μ = 3.505, γ =-
41.41
Hour 17 Log-normal Log-normal Beta Log-normal
σ = 1.4335, μ = 5.7849 σ = 0.372, μ = 6.617 ∝1= 7.11; ∝2=
24.38;a=22.44 ;b=149.5 σ = 0.6422, μ = 3.03, γ =-
31.78
Winter
Hour 1 Beta zero Beta Log-normal
(∝1= 0.638; ∝2= 1.279;,a=7.0 ;b=2650)
\ ∝1= 4.54; ∝2=
4.57𝐸6;a=29.24 ;b=1.65E7 σ = 0.20468, μ = 4.1535,
γ =-66.08
Hour 13 Beta Log-normal Beta Log-normal
(∝1= 0.591; ∝2=2.051;a=23;b=2701)
σ = 0.21135, μ = 6.9696
∝1= 1.74; ∝2=4.81;a=35.78 ;b=88.61
σ = 0.07759, μ = 5.785, γ =-334.8
Hour 17 Beta Log-normal Beta Log-normal
(∝1= 0.556; ∝2=1.213;a=8;b=2467)
σ = 0.91126 μ = 5.6594
∝1= 4.52; ∝2=6.49;a=35.29;b=2.68E7
σ = 0.4227, μ = 3.6279, γ =-42.65