Optima Nutrition: an allocative efficiency tool to reduce ...
12
RESEARCH ARTICLE Open Access Optima Nutrition: an allocative efficiency tool to reduce childhood stunting by better targeting of nutrition-related interventions Ruth Pearson 1,2,3*† , Madhura Killedar 1,2,3† , Janka Petravic 1,2,3 , Jakub J. Kakietek 4 , Nick Scott 1,2,3 , Kelsey L. Grantham 1,2,3 , Robyn M. Stuart 1,3,5 , David J. Kedziora 1,2,3 , Cliff C. Kerr 1,3,6 , Jolene Skordis-Worrall 3,7 , Meera Shekar 4 and David P. Wilson 1,2,3 Abstract Background: Child stunting due to chronic malnutrition is a major problem in low- and middle-income countries due, in part, to inadequate nutrition-related practices and insufficient access to services. Limited budgets for nutritional interventions mean that available resources must be targeted in the most cost-effective manner to have the greatest impact. Quantitative tools can help guide budget allocation decisions. Methods: The Optima approach is an established framework to conduct resource allocation optimization analyses. We applied this approach to develop a new tool, ‘Optima Nutrition’ , for conducting allocative efficiency analyses that address childhood stunting. At the core of the Optima approach is an epidemiological model for assessing the burden of disease; we use an adapted version of the Lives Saved Tool (LiST). Six nutritional interventions have been included in the first release of the tool: antenatal micronutrient supplementation, balanced energy-protein supplementation, exclusive breastfeeding promotion, promotion of improved infant and young child feeding (IYCF) practices, public provision of complementary foods, and vitamin A supplementation. To demonstrate the use of this tool, we applied it to evaluate the optimal allocation of resources in 7 districts in Bangladesh, using both publicly available data (such as through DHS) and data from a complementary costing study. Results: Optima Nutrition can be used to estimate how to target resources to improve nutrition outcomes. Specifically, for the Bangladesh example, despite only limited nutrition-related funding available (an estimated $0.75 per person in need per year), even without any extra resources, better targeting of investments in nutrition programming could increase the cumulative number of children living without stunting by 1.3 million (an extra 5%) by 2030 compared to the current resource allocation. To minimize stunting, priority interventions should include promotion of improved IYCF practices as well as vitamin A supplementation. Once these programs are adequately funded, the public provision of complementary foods should be funded as the next priority. Programmatic efforts should give greatest emphasis to the regions of Dhaka and Chittagong, which have the greatest number of stunted children. Conclusions: A resource optimization tool can provide important guidance for targeting nutrition investments to achieve greater impact. * Correspondence: [email protected] † Equal contributors 1 Burnet Institute, Melbourne, Australia 2 Department of Epidemiology and Preventive Medicine, Monash University, Melbourne, Australia Full list of author information is available at the end of the article © The Author(s). 2018, corrected publication April 2018. Open Access This article is distributed under the terms of the Creative Commons Attribution 4.0 International License (http://creativecommons.org/licenses/by/4.0/), which permits unrestricted use, distribution, and reproduction in any medium, provided you give appropriate credit to the original author(s) and the source, provide a link to the Creative Commons license, and indicate if changes were made. The Creative Commons Public Domain Dedication waiver (http://creativecommons.org/publicdomain/zero/1.0/) applies to the data made available in this article, unless otherwise stated. Pearson et al. BMC Public Health (2018) 18:384 https://doi.org/10.1186/s12889-018-5294-z Public Disclosure Authorized Public Disclosure Authorized Public Disclosure Authorized Public Disclosure Authorized
-
Upload
khangminh22 -
Category
Documents
-
view
0 -
download
0
Transcript of Optima Nutrition: an allocative efficiency tool to reduce ...
RESEARCH ARTICLE Open Access
Optima Nutrition: an allocative efficiencytool to reduce childhood stunting by bettertargeting of nutrition-related interventionsRuth Pearson1,2,3*† , Madhura Killedar1,2,3†, Janka Petravic1,2,3, Jakub J. Kakietek4, Nick Scott1,2,3,Kelsey L. Grantham1,2,3, Robyn M. Stuart1,3,5, David J. Kedziora1,2,3, Cliff C. Kerr1,3,6, Jolene Skordis-Worrall3,7,Meera Shekar4 and David P. Wilson1,2,3
Abstract
Background: Child stunting due to chronic malnutrition is a major problem in low- and middle-income countriesdue, in part, to inadequate nutrition-related practices and insufficient access to services. Limited budgets fornutritional interventions mean that available resources must be targeted in the most cost-effective manner to havethe greatest impact. Quantitative tools can help guide budget allocation decisions.
Methods: The Optima approach is an established framework to conduct resource allocation optimization analyses.We applied this approach to develop a new tool, ‘Optima Nutrition’, for conducting allocative efficiency analysesthat address childhood stunting. At the core of the Optima approach is an epidemiological model for assessingthe burden of disease; we use an adapted version of the Lives Saved Tool (LiST). Six nutritional interventions havebeen included in the first release of the tool: antenatal micronutrient supplementation, balanced energy-proteinsupplementation, exclusive breastfeeding promotion, promotion of improved infant and young child feeding (IYCF)practices, public provision of complementary foods, and vitamin A supplementation. To demonstrate the use of thistool, we applied it to evaluate the optimal allocation of resources in 7 districts in Bangladesh, using both publiclyavailable data (such as through DHS) and data from a complementary costing study.
Results: Optima Nutrition can be used to estimate how to target resources to improve nutrition outcomes. Specifically,for the Bangladesh example, despite only limited nutrition-related funding available (an estimated $0.75 per person inneed per year), even without any extra resources, better targeting of investments in nutrition programming couldincrease the cumulative number of children living without stunting by 1.3 million (an extra 5%) by 2030 compared tothe current resource allocation. To minimize stunting, priority interventions should include promotion of improved IYCFpractices as well as vitamin A supplementation. Once these programs are adequately funded, the public provision ofcomplementary foods should be funded as the next priority. Programmatic efforts should give greatest emphasis tothe regions of Dhaka and Chittagong, which have the greatest number of stunted children.
Conclusions: A resource optimization tool can provide important guidance for targeting nutrition investments toachieve greater impact.
* Correspondence: [email protected]†Equal contributors1Burnet Institute, Melbourne, Australia2Department of Epidemiology and Preventive Medicine, Monash University,Melbourne, AustraliaFull list of author information is available at the end of the article
© The Author(s). 2018, corrected publication April 2018. Open Access This article is distributed under the terms of theCreative Commons Attribution 4.0 International License (http://creativecommons.org/licenses/by/4.0/), which permitsunrestricted use, distribution, and reproduction in any medium, provided you give appropriate credit to the original author(s)and the source, provide a link to the Creative Commons license, and indicate if changes were made. The Creative CommonsPublic Domain Dedication waiver (http://creativecommons.org/publicdomain/zero/1.0/) applies to the data made available inthis article, unless otherwise stated.
Pearson et al. BMC Public Health (2018) 18:384 https://doi.org/10.1186/s12889-018-5294-z
Pub
lic D
iscl
osur
e A
utho
rized
Pub
lic D
iscl
osur
e A
utho
rized
Pub
lic D
iscl
osur
e A
utho
rized
Pub
lic D
iscl
osur
e A
utho
rized
BackgroundStunting, or reduced linear growth, affects around 200million children younger than 5 years of age – mostly inAsia and Africa [1, 2]. Stunting is a predictor of poorercognitive and physical development, which has beenshown to reduce productive capacity and economic out-put [3–8]. Sustainable Development Goal 2 calls for anend to malnutrition by 2030 and significant reductionsin stunting by 2025. Research suggests that this goal can bepartly met through a set of evidence-based interventions[9] in the period from conception to 5 years of age [10].There are numerous proven ways in which undernutri-
tion and stunting can be reduced. Correct feeding prac-tices, which include exclusive breastfeeding for the first6 months and continued breastfeeding, combined with ap-propriate complementary foods until the age of 24 months,not only provide a key source of nutrients but also protec-tion against gastrointestinal and other infections [11].Sub-optimal breastfeeding is associated with poorer childgrowth outcomes because of replacement with less nutri-tious foods and greater risk of infection [12, 13]. For chil-dren aged 6 months to 5 years, providing high quality andnutritionally diverse complementary foods, and supple-menting diets with micro-nutrients including vitamin Aand zinc, if needed, can also reduce the risk of stunting[14–16]. In addition to nutritional interventions, the riskof stunting can be reduced by addressing household, en-vironmental, socioeconomic and cultural factors [17, 18].The quality and use of health, social protection, and sani-tation service delivery systems are further elements af-fecting nutrition outcomes.Since there are only scarce resources from domestic
sources or from international donors for nutrition-related interventions [19], it is imperative that availablebudgets are used in a manner which can achieve thegreatest possible outcome. There is evidence from di-verse settings that better health resource allocation deci-sions result in substantial improvements in populationhealth [20–22]. Quantitative tools can be useful to inte-grate available knowledge and data into a logical frame-work and provide analytical evidence for improvingresource allocation decisions. This study introduces anew tool, Optima Nutrition, specially designed and de-veloped to inform allocative efficiency decisions relatedto stunting.Existing modeling tools provide an effective base for
enabling policy makers to estimate the epidemiologicalimpact of nutritional interventions on population out-comes. These include the Lives Saved Tool (LiST) [23, 24],PROFILES [25], World Breastfeeding Costing Initiative(WBCi) [26], CMAM Costing Tool [27] and MINIMOD[28]. LiST calculates the expected impact and cost ofscaling up numerous maternal and child health interven-tions including nutritional interventions; PROFILES
demonstrates the effect of nutritional interventions onhealth and economic development; and WBCi estimatesthe cost and impact of scaling up promotion and supportservices for breastfeeding and correct infant and youngchild feeding (IYCF) practices. The CMAM Costing Toolestimates the cost of establishing, maintaining or expand-ing services for community management of acute malnu-trition (CMAM), and is offered as a part of FANTA (Foodand Nutrition Technical Assistance) Project [29] – aUSAID-funded project for strengthening food securityand nutrition policies. MINIMOD finds the mix ofdelivery systems that maximizes effective coverage of amicronutrient supplementation. Some of these tools con-sider the benefits of single interventions, whereas othersincorporate the effects of multiple interventions simultan-eously. Currently, no tool is capable of estimating the allo-cation of a given budget across a range of nutritionalinterventions that gets as close as possible to attaining cer-tain objectives. The Optima Nutrition tool aims to fill thisgap by building on the strengths of the existing nutritionmodeling field and expertise in allocative efficiency toolsfrom other fields.A consortium of academic institutions and develop-
ment partners has produced a suite of modeling toolswith central focus on improving allocative efficiency.Optima tools have been applied in partnership with thegovernments of over 40 low- and middle-income coun-tries to assess how more targeted resource allocationdecisions can lead to improved outcomes for major in-fectious diseases including HIV, TB and malaria (e.g.[30–35])). These studies have influenced health re-source allocation, shifting funding to the most cost-effective mix of programs and assisting with nationalstrategic plan development and operational planning inmany countries.
MethodsThe Optima approach combines: (i) a core epidemio-logical model that relates intervention outcomes to epi-demiological outcomes; (ii) cost functions that relatecoverage and expenditure on interventions to inter-vention outcomes; (iii) an objective function definedby national strategic targets and constraints defined bylogistic, ethical, political and financial considerations;(iv) a formal mathematical optimization algorithmaround other components to estimate the most alloca-tively efficient use of resources. To develop the OptimaNutrition tool, we followed this approach, using a repli-cated version of the LiST model to serve as the core epi-demiological model. Both LiST and the Optima approachhave been described in detail elsewhere [24, 30], but inthis section we provide a short summary of them both,and describe how they were integrated to develop OptimaNutrition. In addition, we provide details on the data that
Pearson et al. BMC Public Health (2018) 18:384 Page 2 of 12
were collated and used in the demonstration example ofOptima Nutrition’s application to Bangladesh.
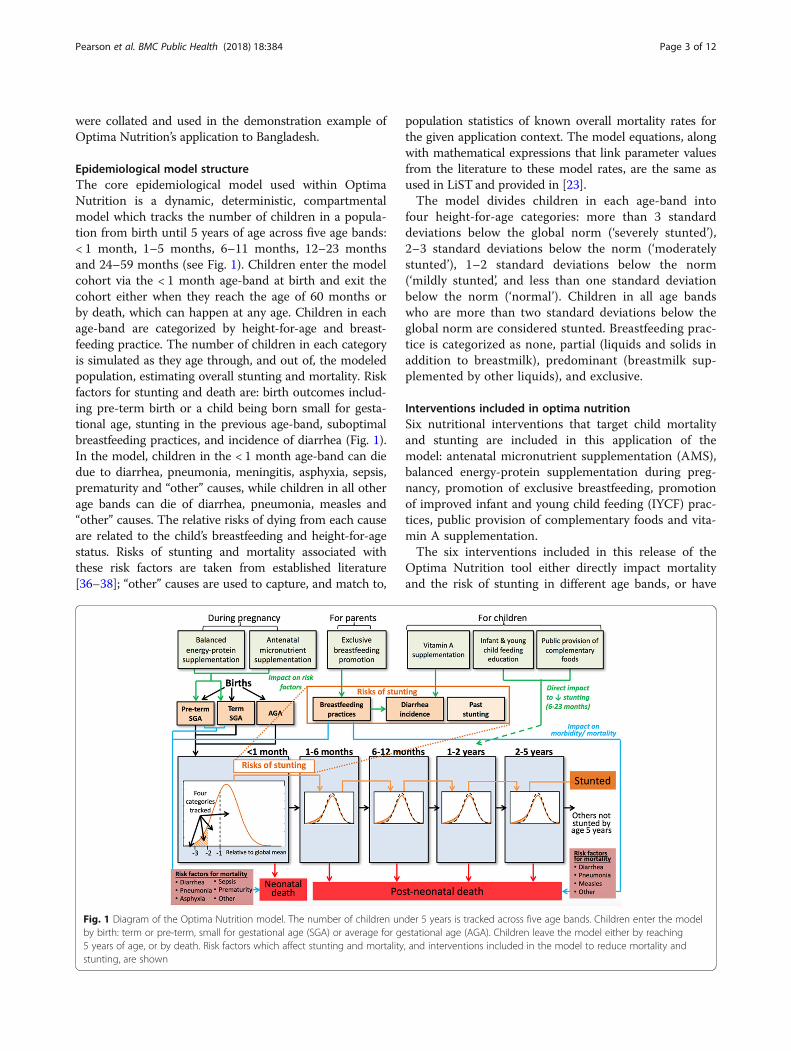
Epidemiological model structureThe core epidemiological model used within OptimaNutrition is a dynamic, deterministic, compartmentalmodel which tracks the number of children in a popula-tion from birth until 5 years of age across five age bands:< 1 month, 1–5 months, 6–11 months, 12–23 monthsand 24–59 months (see Fig. 1). Children enter the modelcohort via the < 1 month age-band at birth and exit thecohort either when they reach the age of 60 months orby death, which can happen at any age. Children in eachage-band are categorized by height-for-age and breast-feeding practice. The number of children in each categoryis simulated as they age through, and out of, the modeledpopulation, estimating overall stunting and mortality. Riskfactors for stunting and death are: birth outcomes includ-ing pre-term birth or a child being born small for gesta-tional age, stunting in the previous age-band, suboptimalbreastfeeding practices, and incidence of diarrhea (Fig. 1).In the model, children in the < 1 month age-band can diedue to diarrhea, pneumonia, meningitis, asphyxia, sepsis,prematurity and “other” causes, while children in all otherage bands can die of diarrhea, pneumonia, measles and“other” causes. The relative risks of dying from each causeare related to the child’s breastfeeding and height-for-agestatus. Risks of stunting and mortality associated withthese risk factors are taken from established literature[36–38]; “other” causes are used to capture, and match to,
population statistics of known overall mortality rates forthe given application context. The model equations, alongwith mathematical expressions that link parameter valuesfrom the literature to these model rates, are the same asused in LiST and provided in [23].The model divides children in each age-band into
four height-for-age categories: more than 3 standarddeviations below the global norm (‘severely stunted’),2–3 standard deviations below the norm (‘moderatelystunted’), 1–2 standard deviations below the norm(‘mildly stunted’, and less than one standard deviationbelow the norm (‘normal’). Children in all age bandswho are more than two standard deviations below theglobal norm are considered stunted. Breastfeeding prac-tice is categorized as none, partial (liquids and solids inaddition to breastmilk), predominant (breastmilk sup-plemented by other liquids), and exclusive.
Interventions included in optima nutritionSix nutritional interventions that target child mortalityand stunting are included in this application of themodel: antenatal micronutrient supplementation (AMS),balanced energy-protein supplementation during preg-nancy, promotion of exclusive breastfeeding, promotionof improved infant and young child feeding (IYCF) prac-tices, public provision of complementary foods and vita-min A supplementation.The six interventions included in this release of the
Optima Nutrition tool either directly impact mortalityand the risk of stunting in different age bands, or have
Fig. 1 Diagram of the Optima Nutrition model. The number of children under 5 years is tracked across five age bands. Children enter the modelby birth: term or pre-term, small for gestational age (SGA) or average for gestational age (AGA). Children leave the model either by reaching5 years of age, or by death. Risk factors which affect stunting and mortality, and interventions included in the model to reduce mortality andstunting, are shown
Pearson et al. BMC Public Health (2018) 18:384 Page 3 of 12
influence by impacting associated risk factors includingincidence of diarrhea, breastfeeding practice or birthoutcomes. The impact of these interventions on differentage bands in the modeled cohort is illustrated in Fig. 1:
� Antenatal micronutrient supplementation – given topregnant women, improves birth outcomes [39]
� Balanced protein-energy supplementation – given topregnant women below poverty line, improves birthoutcomes [40].
� Breastfeeding promotion – behavioral interventionthat targets pregnant women and (mothers of )children < 6 months, increases prevalence ofexclusive breastfeeding of children under 6 monthsof age, which reduces incidence of diarrhea andall-cause mortality in this age group [37, 41].
� Infant and young child feeding program –behavioral intervention targeting (mothers of )children 6–23 months of age, which reducesstunting and all-cause mortality by promotingpartial breastfeeding and correct complementaryfeeding practices. Complementary feeding educationcan only benefit the population with sufficientincome to afford recommended complementaryfoods [42].
� Public provision of complementary foods –complementary food provided to children6–23 months below poverty line in addition tocomplementary feeding education, in order toreduce their risk of stunting. We assume thateducation around complementary feeding doesnot impact the population below the poverty lineunless supplemented with public provision ofcomplementary foods [43].
� Vitamin A supplementation – given to children6 months and older to reduce the incidence ofand mortality from diarrhea [44, 45].
As a form of validation of the epidemiological compo-nent of our model, we compared the effects of scalingup the included interventions on stunting and mortalityto what was estimated by LiST. For the number of childdeaths per year, Optima and LiST are in good agree-ment, with the same percentage of averted deaths. Thereare small differences between the predictions of stuntingaverted in the two models (Optima has a slightly higherestimate), which can be explained by the differences inupdating timesteps (yearly in LiST, monthly in Optima).
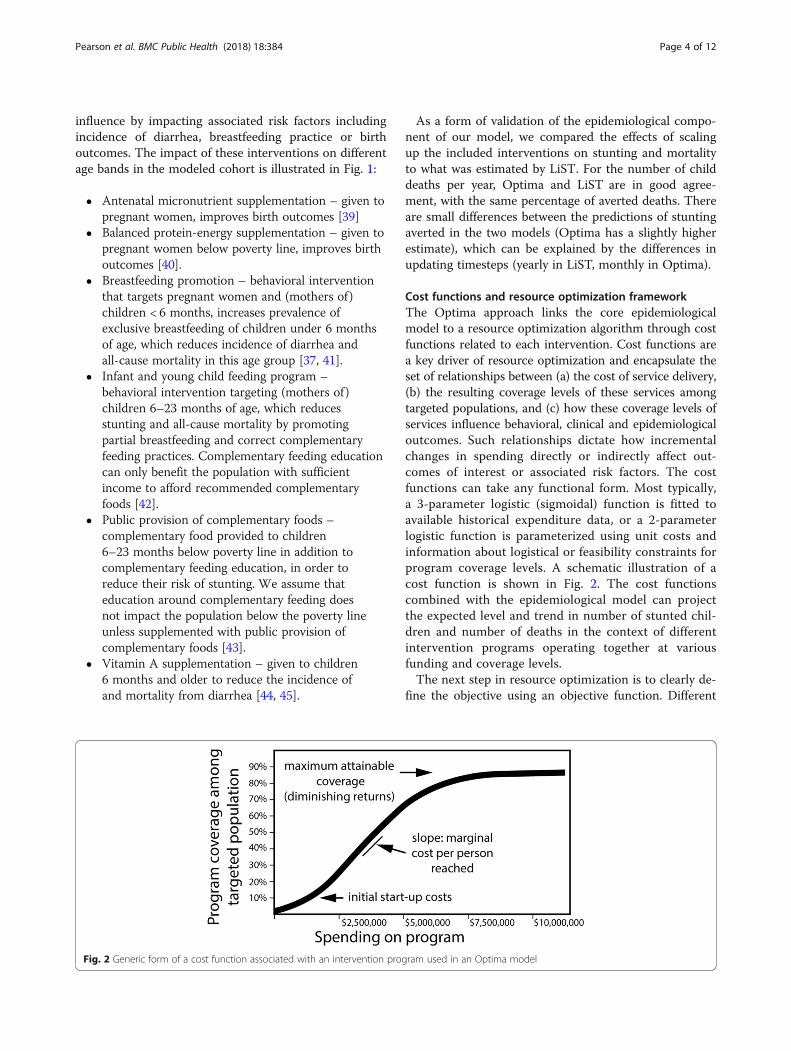
Cost functions and resource optimization frameworkThe Optima approach links the core epidemiologicalmodel to a resource optimization algorithm through costfunctions related to each intervention. Cost functions area key driver of resource optimization and encapsulate theset of relationships between (a) the cost of service delivery,(b) the resulting coverage levels of these services amongtargeted populations, and (c) how these coverage levels ofservices influence behavioral, clinical and epidemiologicaloutcomes. Such relationships dictate how incrementalchanges in spending directly or indirectly affect out-comes of interest or associated risk factors. The costfunctions can take any functional form. Most typically,a 3-parameter logistic (sigmoidal) function is fitted toavailable historical expenditure data, or a 2-parameterlogistic function is parameterized using unit costs andinformation about logistical or feasibility constraints forprogram coverage levels. A schematic illustration of acost function is shown in Fig. 2. The cost functionscombined with the epidemiological model can projectthe expected level and trend in number of stunted chil-dren and number of deaths in the context of differentintervention programs operating together at variousfunding and coverage levels.The next step in resource optimization is to clearly de-
fine the objective using an objective function. Different
Fig. 2 Generic form of a cost function associated with an intervention program used in an Optima model
Pearson et al. BMC Public Health (2018) 18:384 Page 4 of 12

objective functions will lead to different resource allo-cations and consequently different outcomes. For ex-ample, the objective to solely minimize the number ofstunted children at age 5 years and the objective tosolely minimize the number of child deaths would leadto different funding allocations and have conflictingoutcomes. Minimizing cases of stunting would requirepreferential funding of the nutrient-intake interventionsthat have little direct impact on general survival (suchas complementary feeding), which may result in in-creased mortality, particularly in stunted children. Onthe other hand, minimizing child deaths would prefer-entially fund interventions with direct impact on mor-tality (such as breastfeeding promotion), and mayincrease stunting prevalence because of improved sur-vival of stunted children. We explored numerous ob-jective functions (any of which could easily be used inthe model) but have established a default objectivefunction for Optima Nutrition of maximizing the num-ber of children who are alive and not stunted by age5 years (the ‘alive and not stunted’ objective). Althoughany time horizon can be used in analyses, the defaulttime horizon for Optima Nutrition is from the nextyear of programming (e.g. 2018) until 2030, the end ofthe sustainable development goals (SDGs).Many optimization algorithms could be used around
the calibrated epidemiological model informed bysetting-specific data, and the cost functions, to calculatethe resource allocation that will be the best solutionagainst the objective function. Optima Nutrition uses anAdaptive Stochastic Descent (ASD) algorithm [46]. ASDuses simple principles to form probabilistic assumptionsabout (a) which parameters have the greatest effect onthe objective function, and (b) optimal step sizes foreach parameter.
A demonstration of optima nutrition: Bangladesh as anillustrative case studyWe demonstrate the use of Optima Nutrition throughan example application. For illustrative purposes, themodel is populated with available data from Bangladesh.Bangladesh has a population of about 160 million, in-creasing at 2 million (1.25%) annually. While the under-five mortality rate has dropped considerably over the last25 years, it is currently estimated at 46 deaths per 1000live births, of which half are neonatal. Of the approxi-mately 15 million children aged less than 5 years inBangladesh, over 5 million (36%) are stunted [47]. Thishigh stunting prevalence is contributing to relatively veryhigh child mortality as well as reduced cognitive devel-opment and related consequences [48].The epidemiological model within Optima Nutrition
was populated with available data from seven adminis-trative divisions of Bangladesh (Barisal, Chittagong,
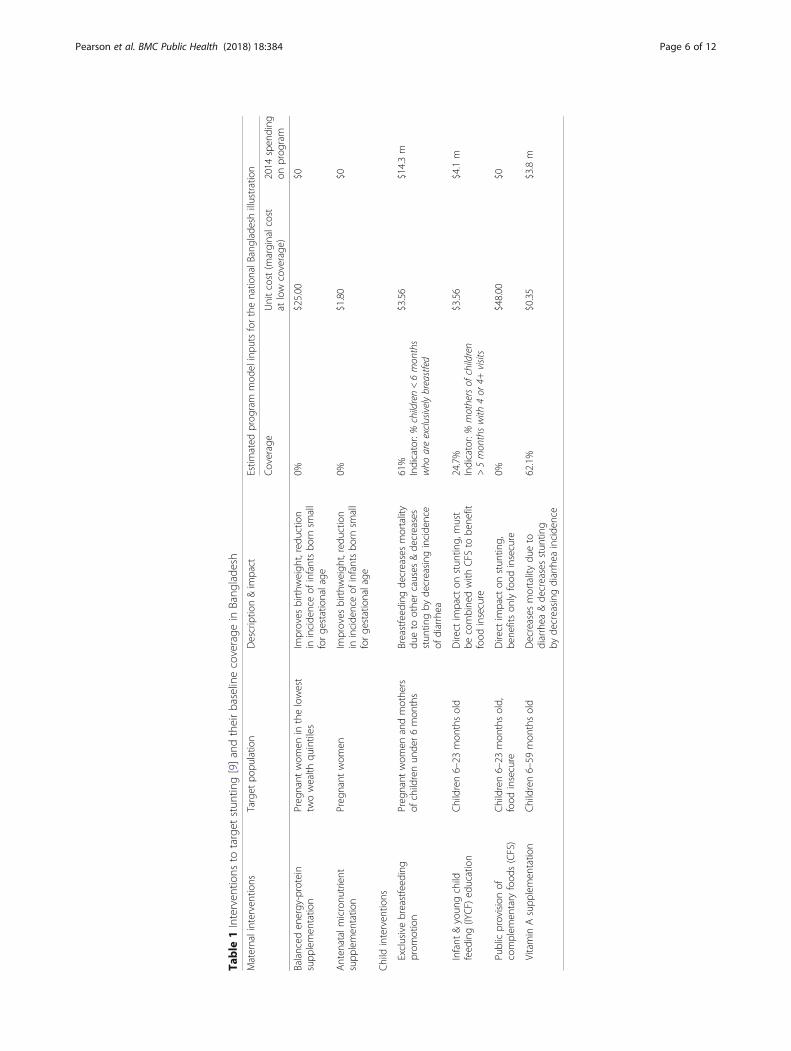
Dhaka, Khulna, Rajshahi, Rangpur and Sylhet). Demo-graphic data (population size in each of the five age-groups) was taken from the Bangladesh Bureau of Statis-tics [49], and the 2016 number and future projections oflive births were taken from the UN Population Divisiondatabase. Child mortality and prevalence of stunting,breastfeeding practices in each age group and povertydata were taken from the Bangladesh Demographic andHealth Surveys [50, 51] Unit cost data to inform costfunctions was taken from a report led by the WorldBank and UNICEF for the Government of Bangladesh[52]. These unit costs were calculated using program ex-perience approach, which captures all aspects of servicedelivery—including the costs of commodities, transpor-tation and storage, personnel, training, supervision,monitoring and evaluation, relevant overhead, wastage,etc. for each intervention. We assume that the relation-ship between investment and the number of peoplereached by each intervention is approximately linear atlow and moderate coverage levels, but that marginalcosts steadily increase at higher coverage levels (see Fig. 2)as the remainder of the target population may be hard toreach [53]. We have not accounted for any start-up costsin this application because of insufficient data and becauserecurrent annual costs are most important in theoptimization of the annual budget. For each of the inter-ventions considered, the estimated national 2014 coveragelevels and unit costs are provided in Table 1. Region-specific Unit costs were the same as national for all inter-ventions except AMS, which was the most expensive inRangpur ($1.82) and the least expensive in Dhaka ($1.78).The unit costs are assumed to be the marginal costs atlow program coverage, which is applicable for currentscale of programs in Bangladesh.For each of the seven administrative divisions, we
estimated the optimal distribution of resources acrossintervention programs under a range of different totalavailable budgets. This provided a relationship betweentotal available budget and number of stunted childrenand/or child deaths for each geographical region, repre-senting the best available outcome attainable for eachbudget. This ‘budget-outcome’ relationship was usedwith interpolations to generate a curve for a predictedprojection of the best available outcome attainable forany budget. By comparing the budget-outcome curvesbetween geographical regions, the optimization algo-rithm was extended to optimize national outcomes byshifting funding between divisions.
ResultsHere we present the results of the case study forBangladesh that was carried out to demonstrate the useof Optima Nutrition. Currently, no published estimatesof expenditure on the nutrition-specific interventions in
Pearson et al. BMC Public Health (2018) 18:384 Page 5 of 12
Table
1Interven
tions
totarget
stun
ting[9]andtheirbaselinecoverage
inBang
lade
sh
Maternalinterventions
Target
popu
latio
nDescriptio
n&im
pact
Estim
ated
prog
ram
mod
elinpu
tsforthenatio
nalB
angladeshillustration
Coverage
Unitcost(m
arginalcost
atlow
coverage
)2014
spen
ding
onprog
ram
Balanced
energy-protein
supp
lemen
tatio
nPreg
nant
wom
enin
thelowest
twowealth
quintiles
Improves
birthw
eigh
t,redu
ction
inincide
nceof
infantsbo
rnsm
all
forge
stationalage
0%$25.00
$0
Anten
atalmicronu
trient
supp
lemen
tatio
nPreg
nant
wom
enIm
proves
birthw
eigh
t,redu
ction
inincide
nceof
infantsbo
rnsm
all
forge
stationalage
0%$1.80
$0
Child
interven
tions
Exclusivebreastfeed
ing
prom
otion
Preg
nant
wom
enandmothe
rsof
childrenun
der6mon
ths
Breastfeed
ingde
creasesmortality
dueto
othe
rcauses
&de
creases
stun
tingby
decreasing
incide
nce
ofdiarrhea
61%
Indicator:%
children<6mon
ths
who
areexclusivelybreastfed
$3.56
$14.3m
Infant
&youn
gchild
feed
ing(IYCF
)ed
ucation
Children6–23
mon
thsold
Direct
impact
onstun
ting,
must
becombine
dwith
CFS
tobe
nefit
food
insecure
24.7%
Indicator:%
mothersof
children
>5mon
thswith
4or
4+visits
$3.56
$4.1m
Publicprovisionof
complem
entary
food
s(CFS)
Children6–23
mon
thsold,
food
insecure
Direct
impact
onstun
ting,
bene
fitson
lyfood
insecure
0%$48.00
$0
Vitamin
Asupp
lemen
tatio
nChildren6–59
mon
thsold
Decreases
mortalitydu
eto
diarrhea
&de
creasesstun
ting
byde
creasing
diarrhea
incide
nce
62.1%
$0.35
$3.8m
Pearson et al. BMC Public Health (2018) 18:384 Page 6 of 12
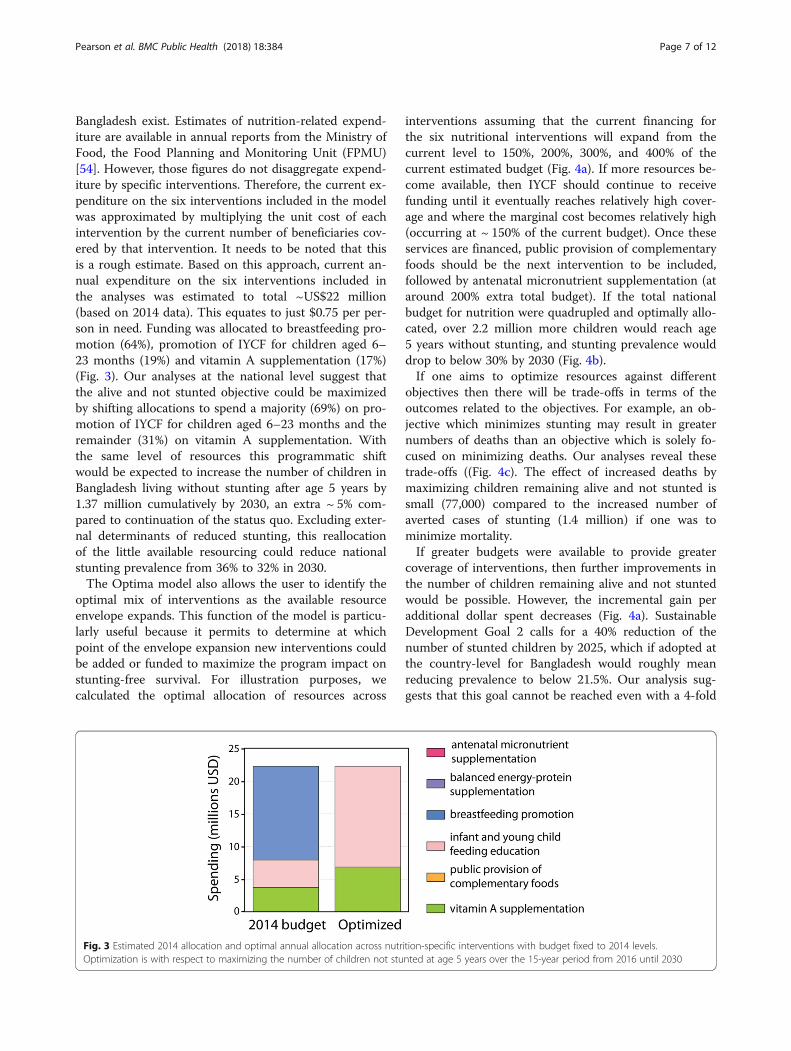
Bangladesh exist. Estimates of nutrition-related expend-iture are available in annual reports from the Ministry ofFood, the Food Planning and Monitoring Unit (FPMU)[54]. However, those figures do not disaggregate expend-iture by specific interventions. Therefore, the current ex-penditure on the six interventions included in the modelwas approximated by multiplying the unit cost of eachintervention by the current number of beneficiaries cov-ered by that intervention. It needs to be noted that thisis a rough estimate. Based on this approach, current an-nual expenditure on the six interventions included inthe analyses was estimated to total ~US$22 million(based on 2014 data). This equates to just $0.75 per per-son in need. Funding was allocated to breastfeeding pro-motion (64%), promotion of IYCF for children aged 6–23 months (19%) and vitamin A supplementation (17%)(Fig. 3). Our analyses at the national level suggest thatthe alive and not stunted objective could be maximizedby shifting allocations to spend a majority (69%) on pro-motion of IYCF for children aged 6–23 months and theremainder (31%) on vitamin A supplementation. Withthe same level of resources this programmatic shiftwould be expected to increase the number of children inBangladesh living without stunting after age 5 years by1.37 million cumulatively by 2030, an extra ~ 5% com-pared to continuation of the status quo. Excluding exter-nal determinants of reduced stunting, this reallocationof the little available resourcing could reduce nationalstunting prevalence from 36% to 32% in 2030.The Optima model also allows the user to identify the
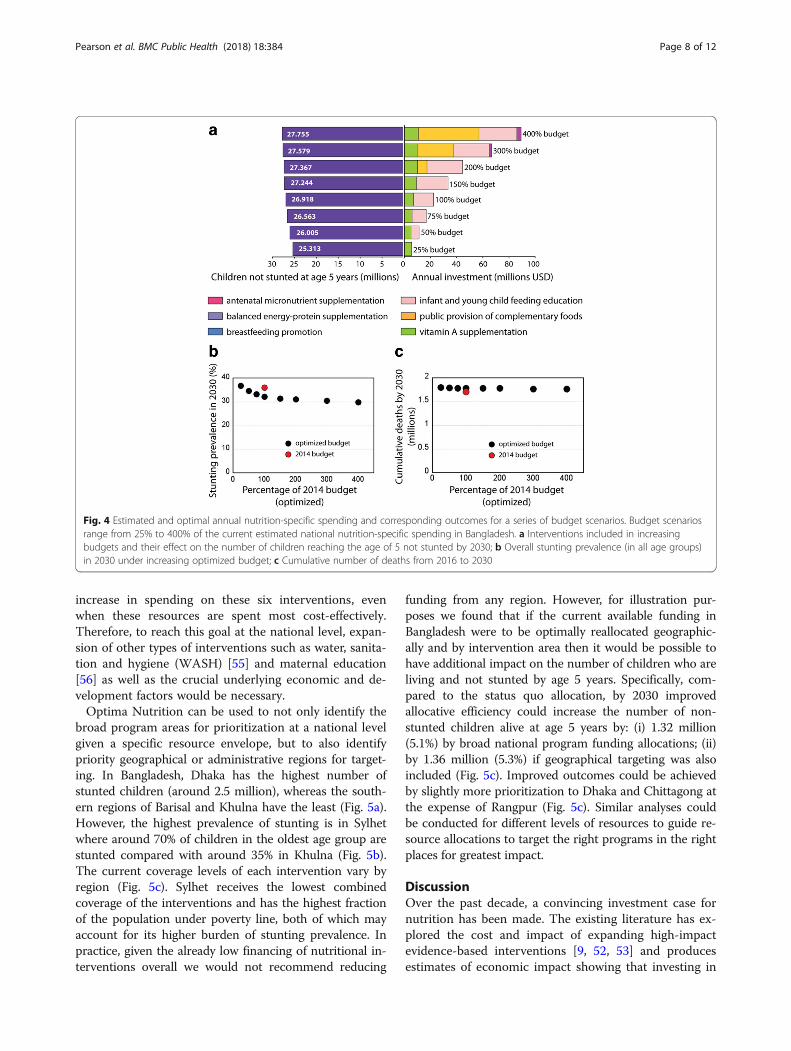
optimal mix of interventions as the available resourceenvelope expands. This function of the model is particu-larly useful because it permits to determine at whichpoint of the envelope expansion new interventions couldbe added or funded to maximize the program impact onstunting-free survival. For illustration purposes, wecalculated the optimal allocation of resources across
interventions assuming that the current financing forthe six nutritional interventions will expand from thecurrent level to 150%, 200%, 300%, and 400% of thecurrent estimated budget (Fig. 4a). If more resources be-come available, then IYCF should continue to receivefunding until it eventually reaches relatively high cover-age and where the marginal cost becomes relatively high(occurring at ~ 150% of the current budget). Once theseservices are financed, public provision of complementaryfoods should be the next intervention to be included,followed by antenatal micronutrient supplementation (ataround 200% extra total budget). If the total nationalbudget for nutrition were quadrupled and optimally allo-cated, over 2.2 million more children would reach age5 years without stunting, and stunting prevalence woulddrop to below 30% by 2030 (Fig. 4b).If one aims to optimize resources against different
objectives then there will be trade-offs in terms of theoutcomes related to the objectives. For example, an ob-jective which minimizes stunting may result in greaternumbers of deaths than an objective which is solely fo-cused on minimizing deaths. Our analyses reveal thesetrade-offs ((Fig. 4c). The effect of increased deaths bymaximizing children remaining alive and not stunted issmall (77,000) compared to the increased number ofaverted cases of stunting (1.4 million) if one was tominimize mortality.If greater budgets were available to provide greater
coverage of interventions, then further improvements inthe number of children remaining alive and not stuntedwould be possible. However, the incremental gain peradditional dollar spent decreases (Fig. 4a). SustainableDevelopment Goal 2 calls for a 40% reduction of thenumber of stunted children by 2025, which if adopted atthe country-level for Bangladesh would roughly meanreducing prevalence to below 21.5%. Our analysis sug-gests that this goal cannot be reached even with a 4-fold
Fig. 3 Estimated 2014 allocation and optimal annual allocation across nutrition-specific interventions with budget fixed to 2014 levels.Optimization is with respect to maximizing the number of children not stunted at age 5 years over the 15-year period from 2016 until 2030
Pearson et al. BMC Public Health (2018) 18:384 Page 7 of 12
increase in spending on these six interventions, evenwhen these resources are spent most cost-effectively.Therefore, to reach this goal at the national level, expan-sion of other types of interventions such as water, sanita-tion and hygiene (WASH) [55] and maternal education[56] as well as the crucial underlying economic and de-velopment factors would be necessary.Optima Nutrition can be used to not only identify the
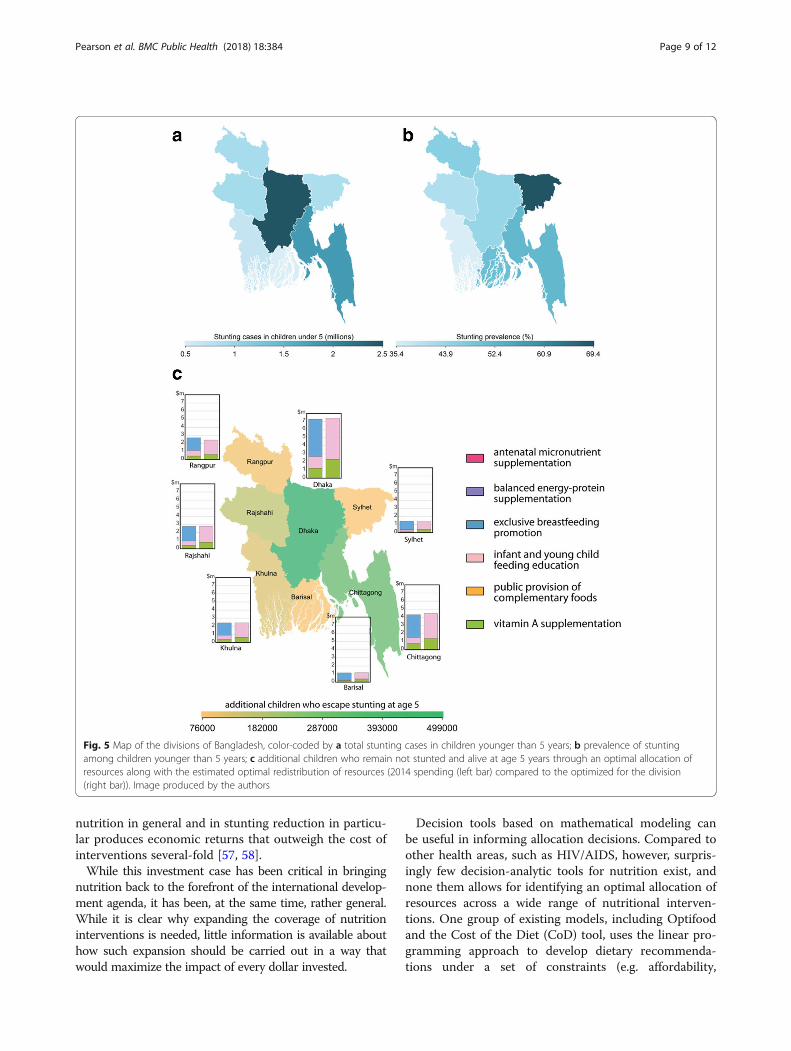
broad program areas for prioritization at a national levelgiven a specific resource envelope, but to also identifypriority geographical or administrative regions for target-ing. In Bangladesh, Dhaka has the highest number ofstunted children (around 2.5 million), whereas the south-ern regions of Barisal and Khulna have the least (Fig. 5a).However, the highest prevalence of stunting is in Sylhetwhere around 70% of children in the oldest age group arestunted compared with around 35% in Khulna (Fig. 5b).The current coverage levels of each intervention vary byregion (Fig. 5c). Sylhet receives the lowest combinedcoverage of the interventions and has the highest fractionof the population under poverty line, both of which mayaccount for its higher burden of stunting prevalence. Inpractice, given the already low financing of nutritional in-terventions overall we would not recommend reducing
funding from any region. However, for illustration pur-poses we found that if the current available funding inBangladesh were to be optimally reallocated geographic-ally and by intervention area then it would be possible tohave additional impact on the number of children who areliving and not stunted by age 5 years. Specifically, com-pared to the status quo allocation, by 2030 improvedallocative efficiency could increase the number of non-stunted children alive at age 5 years by: (i) 1.32 million(5.1%) by broad national program funding allocations; (ii)by 1.36 million (5.3%) if geographical targeting was alsoincluded (Fig. 5c). Improved outcomes could be achievedby slightly more prioritization to Dhaka and Chittagong atthe expense of Rangpur (Fig. 5c). Similar analyses couldbe conducted for different levels of resources to guide re-source allocations to target the right programs in the rightplaces for greatest impact.
DiscussionOver the past decade, a convincing investment case fornutrition has been made. The existing literature has ex-plored the cost and impact of expanding high-impactevidence-based interventions [9, 52, 53] and producesestimates of economic impact showing that investing in
Fig. 4 Estimated and optimal annual nutrition-specific spending and corresponding outcomes for a series of budget scenarios. Budget scenariosrange from 25% to 400% of the current estimated national nutrition-specific spending in Bangladesh. a Interventions included in increasingbudgets and their effect on the number of children reaching the age of 5 not stunted by 2030; b Overall stunting prevalence (in all age groups)in 2030 under increasing optimized budget; c Cumulative number of deaths from 2016 to 2030
Pearson et al. BMC Public Health (2018) 18:384 Page 8 of 12
nutrition in general and in stunting reduction in particu-lar produces economic returns that outweigh the cost ofinterventions several-fold [57, 58].While this investment case has been critical in bringing
nutrition back to the forefront of the international develop-ment agenda, it has been, at the same time, rather general.While it is clear why expanding the coverage of nutritioninterventions is needed, little information is available abouthow such expansion should be carried out in a way thatwould maximize the impact of every dollar invested.
Decision tools based on mathematical modeling canbe useful in informing allocation decisions. Compared toother health areas, such as HIV/AIDS, however, surpris-ingly few decision-analytic tools for nutrition exist, andnone them allows for identifying an optimal allocation ofresources across a wide range of nutritional interven-tions. One group of existing models, including Optifoodand the Cost of the Diet (CoD) tool, uses the linear pro-gramming approach to develop dietary recommenda-tions under a set of constraints (e.g. affordability,
Fig. 5 Map of the divisions of Bangladesh, color-coded by a total stunting cases in children younger than 5 years; b prevalence of stuntingamong children younger than 5 years; c additional children who remain not stunted and alive at age 5 years through an optimal allocation ofresources along with the estimated optimal redistribution of resources (2014 spending (left bar) compared to the optimized for the division(right bar)). Image produced by the authors
Pearson et al. BMC Public Health (2018) 18:384 Page 9 of 12
availability of specific foods in a given country context).Optifood has been recently used to develop recommen-dations for complementary feeding in Indonesia [59],Myanmar [60], and Kenya [61]. Linear programmingtools can also be combined with expenditure and con-sumption data to estimate the proportion of the popula-tion that can and cannot afford optimal diets. The CoDhas been used in that way to advocate of the expansionof public provision of complementary foods in Indonesia(see [62]). While important, dietary recommendationsare not easily translated into specific interventions andthe linear programming approach provides no informationregarding cost-effectiveness or efficiency of interventions.The Lives Saved Tool (LiST) has been used in estimat-
ing comparative cost-effectiveness of nutrition interven-tions (e.g. [63, 64]). However, the tool itself is notdesigned to assess cost-effectiveness directly and thestudies mentioned above combined LiST modelling withadditional Excel-based models to develop comparativecost effectiveness estimates. The traditional approach totechnical assessments of how to achieve the best valuefor money is to calculate a cost-effectiveness ratio for eachintervention in isolation, then rank them in a league table,nominating funding to each intervention in sequence toscale until all resources are depleted. We and others haveshown that the traditional league table approach is not thebest use of resources, because it does not account for theinteractions between interventions and disease burden dy-namics due to other implementations [65].MINIMOD is the only other decision-analytic model
that examines allocative efficiency of nutrition invest-ments and identifies a mix of interventions that maxi-mizes specific nutrition or health outcomes. Oneparticular strength of the model is that is allows forcomparison of different delivery platforms for a singleintervention (e.g. vitamin a supplementation throughcampaigns, facility-based supplementation, fortificationof different food vehicles) [66]. However, currently, themodel is limited to micro-nutrient interventions and re-quires very specific data on consumption, diet compos-ition, and micro-nutrient deficiency levels which need tobe collected through specialized surveys (see [67]).Furthermore, MINMOD does not have a user interfacewhich limits its utility for program managers and deci-sion makers. In contrast, Optima nutrition considers amuch broader range of interventions, including micro-nutrient supplementation, behavioural interventions,and provision of complementary foods. Most of the datathe model requires is easily available through surveyssuch as DHS or MICS, of which several waves exist formost developing countries. Finally, a graphic user inter-face is under development. The final version of the toolwill be cloud-based and available online to researchers,program managers and policy makers.
As with any model being applied to a complex real-world problem, applications of the Optima Nutritiontool will have limitations. Mathematical models are sim-plifications of the processes that they represent. Thecurrent application had limitations in model structure.This includes considering the populations in Bangladeshto be uniformly mixed within each age band. Interven-tions were also considered without flow-on effects; forexample, breastfeeding promotion targeted to mothersof children aged < 6 months may have ongoing benefitsfor age-appropriate breastfeeding up to 23 months, butthese effects are likely to be setting- and program-specific and are largely unknown. In particular, details ofthe content of the programs (e.g. number of visits andhelp provided during each visit for IYCF) are rarelystudied and therefore difficult to quantify. Another typeof limitation is around model parameterization and data.Where studies were available which evaluated the impactof nutrition interventions from the literature, they wereused in this study, assuming the effectiveness levels wereconsistent universally, when in reality they are morelikely to be country-dependent. This leaves inherent un-certainty in the optimization. In addition, uncertainty inthe demographics (e.g. age structure of under-five popu-lation), nutritional (e.g. stunting prevalence, feedingpractices) and costing (e.g. unit costs of interventions,structure of cost functions) data collected in countrysurveys contribute to overall uncertainty in the resultsand conclusions of the study. The results are implica-tions of the data used. We used the best data available,assuming that population surveys (such as DHS) are rea-sonably precise and representative of the target popula-tions. We used a complementary nutritional interventionscosting study in Bangladesh to parameterize the unit costsused in this model. That costing study was performedwith an intention to be used in this analytical study. Des-pite the limitations in the structure and parameterizationof the tool, we believe that the approach taken in thisstudy appropriately sheds new insight into prioritizationof nutrition interventions in Bangladesh. Modelled out-comes should only serve as guidance in the decision-making process, representing the best available evidenceat the time. Other factors, including various social, politi-cal and implementation demands and constraints need tobe considered.Currently, Optima nutrition is limited to a set of six
nutrition- specific interventions affecting stunting. An ex-tension of the model to other aspects of malnutrition(wasting, anaemia), nutrition behaviours (prevalence ofbreastfeeding) and nutrition-specific interventions target-ing those outcomes is ongoing. The expanded version ofOptima Nutrition will also include some nutrition-sensitive interventions such as water and sanitation(WASH) and family planning.
Pearson et al. BMC Public Health (2018) 18:384 Page 10 of 12

ConclusionsReaching the SDG nutrition and food security target willrequire a systematic effort to maximize the efficiencyand impact of nutrition budgets. We hope that OptimaNutrition can be a useful in informing priority setting andallocation of resources across nutritional interventions.
AbbreviationsAMS: Antenatal micronutrient supplementation; ASD: Adaptive StochasticDescent; CMAM: Community management of acute malnutrition; CoD: Costof the Diet; FANTA: Food and Nutrition Technical Assistance; FPMU: FoodPlanning and Monitoring Unit; IYCF: Improved infant and young child feeding;LiST: Lives Saved Tool; SDGs: Sustainable development goals; WASH: Water,sanitation and hygiene; WBCi: World Breastfeeding Costing Initiative
AcknowledgmentsNot applicable.
FundingThis work was funded by the World Bank. D.P.W. was supported by a NationalHealth and Medical Research Council Senior Research Fellowship. The authorsgratefully acknowledge the support provided to the Burnet Institute by theVictorian Government Operational Infrastructure Support Program. The NationalHealth and Medical Research Council and the Victorian Government OperationalInfrastructure Support Program had no role in the design of the study, thecollection, analysis and interpretation of data, or in writing the manuscript.
Availability of data and materialsNo individual patient data were used for this analysis. Publicly available,referenced aggregate summary data were used for the epidemiologicalmodel. The datasets used and analysed during the current study areavailable from the corresponding author on reasonable request.
Authors’ contributionsDW, JK, MS conceptualized Optima Nutrition and guided the initiative. RP, MK,and DW prepared the manuscript. RP, MK and NS built the computationalmodel. JP translated LiST and designed core epidemiological model features.JK and MS collected costing data. KG, RS, CK assisted with transferring coreOptima algorithms and code to Optima Nutrition. DK designed the geospatialoptimization feature. JSW provided nutrition advice and data interpretation. Allauthors contributed to the interpretation of data; literature search; and read,edited, and approved the manuscript.
Ethics approval and consent to participateThe mathematical model used in this study did not use any data collectedfrom human participants that was not publically available in BangladeshDemographics and Health Survey reports.
Consent for publicationNot applicable.
Competing interestsThe authors declare that they have no competing interests.
Publisher’s NoteSpringer Nature remains neutral with regard to jurisdictional claims inpublished maps and institutional affiliations.
Author details1Burnet Institute, Melbourne, Australia. 2Department of Epidemiology andPreventive Medicine, Monash University, Melbourne, Australia. 3OptimaConsortium for Decision Science, Melbourne, Australia. 4The World Bank, ICFInternational, Washington D.C., USA. 5Department of Mathematical Sciences,University of Copenhagen, Copenhagen, Denmark. 6Complex Systems Group,School of Physics, University of Sydney, Sydney, Australia. 7Institute for GlobalHealth, University College London, London, UK.
Received: 8 August 2017 Accepted: 12 March 2018
References1. De Onis M, Blössner M, Borghi E. Global prevalence and trends of
overweight and obesity among preschool children. Am J Clin Nutr. 2010;95(5):1257–64.
2. Black RE, Victora CG, Walker SP, Bhutta ZA, Christian P, De Onis M, Ezzati M,Grantham-McGregor S, Katz J, Martorell R, et al. Maternal and childundernutrition and overweight in low-income and middle-incomecountries. Lancet. 2013;382(9890):427–51.
3. Grantham-McGregor SM, Powell CA, Walker SP, Himes JH. Nutritionalsupplementation, psychosocial stimulation, and mental development ofstunted children: the Jamaican study. Lancet. 1991;338(8758):1–5.
4. Alderman H, Hoddinott J, Kinsey B. Long term consequences of earlychildhood malnutrition. Oxf Econ Pap. 2006;58(3):450–74.
5. Walker SP, Chang SM, Powell CA, Simonoff E, Grantham-McGregor SM. Earlychildhood stunting is associated with poor psychological functioning in lateadolescence and effects are reduced by psychosocial stimulation. J Nutr.2007;137(11):2464–9.
6. Kar BR, Rao SL, Chandramouli B. Cognitive development in children withchronic protein energy malnutrition. Behav Brain Funct. 2008;4(1):1.
7. Victora CG, Adair L, Fall C, Hallal PC, Martorell R, Richter L, Sachdev HS, forthe maternal and child undernutrition study group. Maternal and childundernutrition: consequences for adult health and human capital. Lancet.2008;371(9609):340–57.
8. The consequences of early childhood growth failure over the life course.http://ebrary.ifpri.org/utils/getfile/collection/p15738coll2/id/124899/filename/124900.pdf.
9. Bhutta ZA, Das JK, Rizvi A, Gaffey MF, Walker N, Horton S, Webb P, Lartey A,Black RE, The Lancet Nutrition Interventions Review Group, et al. Evidence-based interventions for improvement of maternal and child nutrition: whatcan be done and at what cost? Lancet. 2013;382(9890):452–77.
10. Victora CG, de Onis M, Hallal PC, Blössner M, Shrimpton R. Worldwidetiming of growth faltering: revisiting implications for interventions.Pediatrics. 2010;125(3):473–80.
11. Kramer MS, Kakuma R. Optimal duration of exclusive breastfeeding.Cochrane Database Syst Rev. 2012;8:CD003517.
12. Espo M, Kulmala T, Maleta K, Cullinan T, Salin ML, Ashorn P. Determinants oflinear growth and predictors of severe stunting during infancy in ruralMalawi. Acta Paediatr. 2002;91(12):1364–70.
13. Saha KK, Frongillo EA, Alam DS, Arifeen SE, Persson LA, Rasmussen KM.Appropriate infant feeding practices result in better growth of infants andyoung children in rural Bangladesh. Am J Clin Nutr. 2008;87(6):1852–9.
14. Arimond M, Ruel MT. Dietary diversity is associated with child nutritional status:evidence from 11 demographic and health surveys. J Nutr. 2004;134:2579–85.
15. Steyn NP, Nel JH, Nantel G, Kennedy G, Labadarios D. Food variety anddietary diversity scores in children: are they good indicators of dietaryadequacy? Public Health Nutr. 2006;9(5):644–50.
16. Onyango AW, Borghi E, de Onis M, Casanovas Mdel C, Garza C.Complementary feeding and attained linear growth among 6-23-month-oldchildren. Public Health Nutr. 2014;17(9):1975–83.
17. Dewey KG, Adu-Afarwuah S. Systematic review of the efficacy andeffectiveness of complementary feeding interventions in developingcountries. Matern Child Nutr. 2008;4(Suppl 1):24–85.
18. Fink G, Gunther I, Hill K. The effect of water and sanitation on child health:evidence from the demographic and health surveys 1986-2007. Int JEpidemiol. 2011;40(5):1196–204.
19. D'Alimonte MR, Rogers H, de Ferranti D. Financing the global nutritiontargets. In: Shekar M, Kakietek J, Dayton Eberwein J, Walters D, editors. Aninvestment framework for nutrition. Washington DC: International Bank forRecnstruction and Development, The World Bank; 2017.
20. de Savigny D, Casale H, Mbuya C, Reid G. Fixing health systems. 2nd ed.Ottawa: International Development Centre; 2008.
21. Knaul FM, González-Pier E, Gómez-Dantés O, García-Junco D, Arreola-Ornelas H, Barraza-Lloréns M, Sandoval R, Caballero F, Hernández-Avila M,Juan M, et al. The quest for universal health coverage: achieving socialprotection for all in Mexico. Lancet. 2012;380:1259–79.
22. Bitran R. Explicit health guarantees for Chileans: the AUGE benefitspackage. In: UNICO Studies Series 21, vol. 2015. Washington DC: TheWorld Bank; 2013.
Pearson et al. BMC Public Health (2018) 18:384 Page 11 of 12
23. Winfrey W, McKinnon R, Stover J. Methods used in the lives saved tool(LiST). BMC Public Health. 2011;11(Suppl 3):1.
24. Walker N, Tam Y, Friberg IK. Overview of the lives saved tool (LiST). BMCPublic Health. 2013;13(Suppl 3):S1.
25. Heymann H. PROFILES: an evidence-based tool for nutrition education andpromotion. J Nutr Educ Behav. 2012;44(4):S25.
26. World Breastfeeding Costing Initiative (WBCi). [http://ibfan.org/world-breastfeeding-costing-initiative]
27. CMAM Costing Tool. [http://www.fantaproject.org/tools/cmam-costing-tool]28. Brown KH, Engle-Stone R, Kagin J, Rettig E, Vosti SA. Use of optimization
modeling for selecting National Micronutrient Intervention Strategies: anexample based on potential programs for control of vitamin a deficiency inCameroon. Food Nutr Bull. 2015;36(Suppl 3):S141–8.
29. FANTA III. Food and Nutrition Technical Assistance. [http://www.fantaproject.org/]30. Kerr CC, Stuart RM, Gray RT, Shattock AJ, Fraser-Hurt N, Benedikt C, Haacker
M, Berdnikov M, Mahmood AM, Jaber SA, et al. Optima: a model for HIVepidemic analysis, program prioritisation, and resource optimisation. JAIDS.2015;69:365–76.
31. The World Bank. Optimizing HIV Investments in Armenia. Washington DC:The World Bank; 2015.
32. Grantham K, Reagan D, Law M, Wilson DP. Optimizing Investments in theNational HIV responses of Indonesia and Thailand: a report for World HealthOrganization South-East Asia regional office. Sydney: World HealthOrganization, UNSW Australia; 2016.
33. Masaki E, Fraser N, Haacker M, Obst M, Wootton R, Sunkutu R, Gorgens M,Gray RT, Shattock A, Kerr CC, et al. Zambia's HIV response: prioritised andstrategic allocation of HIV resources for impact and sustainability.Washington DC: The World Bank; 2015.
34. Kelly S, Shattock A, Kerr CC, Gama T, Nhlabatsi N, Zagatti G, Harimurti P,Wilson DP, Gorgens M. HIV mathematcal modelling to support Swaziland’sdevelopment of its HIV investment case, vol. 2016. Sydney: The World Bank,UNSW Australia; 2014.
35. Scott N, Hussain SA, Martin-Hughes R, Fowkes FJ, Kerr CC, Pearson R,Kedziora DJ, Killedar M, Stuart RM, Wilson DP. Maximizing the impact ofmalaria funding through allocative efficiency: using the right interventionsin the right locations. Malar J. 2017;16(1):368.
36. Black RE, Allen LH, Bhutta ZA, Caulfield LE, de Onis M, Ezzati M, Mathers C,Rivera J, for the maternal and child undernutrition study group. Maternaland child undernutrition: global and regional exposures and healthconsequences. Lancet. 2008;371(9608):243–60.
37. Lamberti LM, Walker CLF, Noiman A, Victora C, Black RE. Breastfeeding andthe risk for diarrhea morbidity and mortality. BMC Public Health. 2011;11(Suppl 3):S15.
38. Wang H, Liddell CA, Coates MM, Mooney MD, Levitz CE, Schumacher AE,Apfel H, Iannarone M, Phillips B, Lofgren KT, et al. Global, regional, andnational levels of neonatal, infant, and under-5 mortality during 1990–2013:a systematic analysis for the Global Burden of Disease Study 2013. Lancet.2014;384(9947):957–79.
39. Haider BA, Bhutta ZA. Multiple-micronutrient supplementation for womenduring pregnancy. Cochrane Database Syst Rev. 2012;11:CD004905.
40. Imdad A, Bhutta ZA. Effect of balanced protein energy supplementationduring pregnancy on birth outcomes. BMC Public Health. 2011;11(Suppl 3):S17.
41. Imdad A, Yakoob MY, Bhutta ZA. Effect of breastfeeding promotioninterventions on breastfeeding rates, with special focus on developingcountries. BMC Public Health. 2011;11(Suppl 3):S24.
42. Imdad A, Yakoob MY, Bhutta ZA. Impact of maternal education aboutcomplementary feeding and provision of complementary foods on childgrowth in developing countries. BMC Public Health. 2011;11(Suppl 3):S25.
43. Lassi ZS, Das JK, Zahid G, Imdad A, Bhutta ZA. Impact of education andprovision of complementary feeding on growth and morbidity in childrenless than 2 years of age in developing countries: a systematic review. BMCPublic Health. 2013;13(3):S13.
44. Imdad A, Herzer K, Mayo-Wilson E, Yakoob MY, Bhutta ZA. Vitamin asupplementation for preventing morbidity and mortality in children from 6months to 5 years of age. Cochrane Database Syst Rev. 2010;12:CD008524.
45. Haider BA, Bhutta ZA. Neonatal vitamin a supplementation for theprevention of mortality and morbidity in term neonates in developingcountries. Cochrane Database Syst Rev. 2011;(10):CD006980. https://doi.org/10.1002/14651858.CD006980.pub2.
46. Kerr CC, Smolinski T, Dura-Bernal S, Wilson D: Optimization by Bayesianadaptive locally linear stochastic descent under review 2017.
47. International Food Policy Research Institute: Global nutrition report 2016:from promise to impact: ending malnutrition by 2030. vol. 2016.Washington DC: International Food Policy Research Institute; 2016.
48. Olofin I, McDonald CM, Ezzati M, Flaxman S, Black RE, Fawzi WW, CaulfieldLE, Danaei G, for the Nutrition Impact Model Study (anthropometry cohortpooling). Associations of suboptimal growth with all-cause and cause-specific mortality in children under five years: a pooled analysis of tenprospective studies. PLoS One. 2013;8(5):e64636.
49. Institute of Statistical Research and Training, Bangladesh Bureau of sStatistics:Population projection of Bangladesh: dynamics and trends 2011–2061. 2015.
50. National Institute of Population Research and Training (NIPORT), Mitra andAssociates, ICF International. Bangladesh demographic and health survey2014. Dhaka, Bangladesh, and Rockville, Maryland, USA: NIPORT, Mitra andAssociates, ICF International; 2016.
51. National Institute of Population Research and Training (NIPORT), Mitra andAssociates, ICF International. Bangladesh demographic and health survey2011. Dhaka, Bangladesh and Calverton, Maryland, USA: NIPORT, Mitra andAssociates, and ICF International; 2013.
52. Shekar M, Kakietek J, Dayton Eberwein J, Walters D. An investmentframework for nutrition: reaching the global targets for stunting, anemia,breastfeeding, and wasting. Washington DC: The World Bank; 2017.
53. Horton S, Shekar M, McDonald C, Mahal A, Brooks JK. Scaling up nutrition:What will it cost? Washington D.C.: The World Bank; 2010.
54. Food Planning and Monitoring Unit. National Food Policy plan of actionand country investment plan monitoring report 2015. Dhaka: Ministry ofFood, Government of the People’s Republic of Bangladesh; 2015.
55. Cumming O, Cairncross S. Can water, sanitation and hygiene help eliminatestunting? Current evidence and policy implications. Matern Child Nutr. 2016;12:91–105.
56. Headey D, Hoddinott J, Ali D, Tesfaye R, Dereje M. The other Asian enigma:explaining the rapid reduction of undernutrition in Bangladesh. World Dev.2015;66:749–61.
57. Hoddinott J, Alderman H, Behrman JR, Haddad L, Horton S. The economicrationale for investing in stunting reduction. Matern Child Nutr. 2013;9(Suppl 2):69–82.
58. Alderman H, Haddad L, Headey DD, Smith L. Association between economicgrowth and early childhood nutrition. Lancet Glob Health. 2014;2(9):e500.
59. Fahmida U, Santika O, Kolopaking R, Ferguson E. Complementary feedingrecommendations based on locally available foods in Indonesia. Food NutrBull. 2014;35(4 Suppl):S174–9.
60. Hlaing LM, Fahmida U, Htet MK, Utomo B, Firmansyah A, Ferguson EL. Localfood-based complementary feeding recommendations developed by the linearprogramming approach to improve the intake of problem nutrients among 12-23-month-old Myanmar children. Br J Nutr. 2016;116(Suppl 1):S16–26.
61. Vossenaar M, Knight FA, Tumilowicz A, Hotz C, Chege P, Ferguson EL.Context-specific complementary feeding recommendations developedusing Optifood could improve the diets of breast-fed infants and youngchildren from diverse livelihood groups in northern Kenya. Public HealthNutr. 2017;20(6):971–83.
62. Baldi G, Martini E, Catharina M, Muslimatun S, Fahmida U, Basuni Jahari A,Hardinsyah, Frega R, Geniez P, Grede N, et al. Cost of the diet (CoD) tool:first results from Indonesia and applications for policy discussion on foodand nutrition security. Food Nutr Bull. 2013;34(2):S35–42.
63. Shekar M, Dayton-Eberwein J, Kakietek J. The cost of stunting in South Asiaand the benefits of public Investments in Nutrition, vol. 12; 2016.
64. Kakietek J, Shekar M, Dayton Eberwein J, Walters D. Financing needs toreach the four global nutrition targets: stunting, anemia, breastfeeding, andwasting. In: Shekar M, Kakietek J, Dayton Eberwein J, Walters D, editors. Aninvestment framework for nutrition: reaching the global targets for stunting,anemia, breastfeeding, and wasting. Washington DC: The World Bank; 2017.
65. Chiu C, Johnson LF, Jamieson L, Larson BA, Meyer-Rath G. Designing anoptimal HIV programme for South Africa: Does the optimal package changewhen diminishing returns are considered? BMC Public Health. 2017;17:143.
66. Vosti SA, Kagin J, Engle-Stone R, Brown KH. An economic optimizationmodel for improving the efficiency of vitamin a interventions: anapplication to young children in Cameroon. Food Nutr Bull. 2015;36(Suppl 3):S193–207.
67. Engle-Stone R, Nankap M, Ndjebayi AO, Vosti SA, Brown KH. Estimating theeffective coverage of programs to control vitamin a deficiency and itsconsequences among women and young children in Cameroon. Food NutrBull. 2015;36(S3):S149–71.
Pearson et al. BMC Public Health (2018) 18:384 Page 12 of 12