pushover analysis of reinforced concrete frames designed as ...
Upload
khangminh22Category
view
0download
0
Energy Dissipating Façade Systems Designed to Reduce Structural Response during
Earthquakes
A thesis submitted in fulfilment
of the requirements for the degree of
Doctor of Philosophy
By
Pouya Abtahi
Centre for Infrastructure Engineering
Western Sydney University
November 2017

gÉ `ç UxÄÉäxw YtÅ|ÄçN
`tÜát? at{|w? ]tätw? c|ÜÉâé

ii
ACKNOWLEDGMENTS
I am very grateful and indebted to my Principal Supervisor Prof Bijan Samali for his
confidence in me and dedication to my education, for his unlimited support and
supervision and encouragement throughout the course of this study. His insight and
excellent suggestions were extremely important in finalizing this thesis. I also want to
thank Dr Ali Saleh as my co supervisor for his contributions to this thesis. I would like
to thank Western Sydney University (Institute for Infrastructure Engineering) and
University of Technology, Sydney (Centre for Built Infrastructure Research) for
providing Postgraduate Research Scholarship to carry out my research project. I would
also like to thank Dr Guido Lori from Permasteelisa Group for his continual support,
and excellent technical support. He has taught me not only the fundamentals that I
sought but also the strategic problem solving that are critical to their application.
I would also like to thank Permasteelisa Group for its financial support and their
managers, Dr Danijel Mocibob and Dr Marc Zobec for the management of this ARC
Linkage research project. I wish to also extend my thanks to fellow postgraduate
students and friends for their support and contributions to this research with whom I
shared the ups and downs of completing this research project. Finally, I wish to
express my gratitude to my wife Marsa, parents Javad and Nahid and my younger
brother Pirouz who so generously supported me, and encouraged me to focus on this
work. And to whom this thesis is dedicated.

iii
LIST OF PUBLICATIONS RELATED TO
THIS THESIS
Journal Articles & Conference Papers
1. Evaluation of the effect of smart façade systems in reducing dynamic response of
structures subjected to seismic loads, B Samali, P Abtahi, “Journal of Earthquakes
and Structures” August 2016.
2. Performance of flexible façade systems in reducing the lateral displacement of
concrete frames subjected to seismic loads, P Abtahi, B Samali, M. Zobec, T. Ngo,
22th ACMSM: “Materials to Structures: Advancement through Innovation”,
Sydney, Australia December 2012.
3. Evaluation of Effect of Sacrificial Bracket Façade Elements in Reduction of
Dynamic Behaviour of Concrete Structural Models during Seismic Activities, B
Samali, P Abtahi, 6th WCSCM: “World Conference on Structural Control and
Monitoring”, Barcelona Spain, July 2014.
4. Evaluation of In-plane and out-of-plane movement of façade panels to reduce
structure response during earthquake excitation, P Abtahi, B Samali, 23th
ACMSM: “Materials to Structures: Advancement through Innovation”, Byron Bay,
Australia December 2014.
5. A Review of the Drawbacks of Current Fixed Connection Façade Systems, Non-
Structural Standards, and Ways of Integrating Movable Façade Technology into
Buildings, P Abtahi, B Samali, ICACE 2015: “International Conference on
Architecture and Civil Engineering” Venice, Italy, April 2015.
iv
TABLE OF CONTENTS
CERTIFICATE OF AUTHORSHIP/ORIGINALITY ....................................................................................... I
ACKNOWLEDGMENTS ............................................................................................................................... II
CHAPTER 1 ..................................................................................................................................................... 1
INTRODUCTION
1.1 BACKGROUND OF THE STUDY .......................................................................................................... 2
1.2 RESEARCH PROBLEM ....................................................................................................................... 5
1.3 RESEARCH OBJECTIVE AND AIMS .................................................................................................... 6
1.3.1 Research Objectives ................................................................................................................... 6
1.3.2 Thesis Aims ............................................................................................................................... 8
1.4 METHODOLOGY OF RESEARCH ........................................................................................................ 8
1.5 SCOPE OF RESEARCH ....................................................................................................................... 9
1.6 DISSERTATION LAYOUT .................................................................................................................. 9
CHAPTER 2 ................................................................................................................................................... 11
GENERAL INFORMATION ABOUT EARTHQUAKE LOADS AND METHODS OF
MITIGATING SEISMIC ACTIVITY
2.1 INTRODUCTION .............................................................................................................................. 12
2.2 EARTHQUAKE-RESISTANT DESIGN FOR STRUCTURAL BUILDINGS ................................................... 13
2.2.1 Force Method ........................................................................................................................... 17
2.2.2 Displacement Method .............................................................................................................. 17
2.2.3 Review of AS1170.4 Australian Standard ............................................................................... 18
2.2.4 Seismic retrofitting of building structure ................................................................................. 18
2.3 DRAWBACKS OF CURRENT NON-STRUCTURAL AUSTRALIAN AND INTERNATIONAL STANDARDS
FOR THE DESIGN AND DAMAGE ASSESSMENT OF PRIMARY STRUCTURE AND FAÇADE PANELS ....................... 19
2.3.1 Introduction .............................................................................................................................. 19
2.4 MODIFICATIONS IN STRUCTURAL SYSTEMS ................................................................................... 29

v
2.4.1 Cladding Isolation .................................................................................................................... 30
2.4.2 Addition of Damping Systems ................................................................................................. 30
2.5 ENERGY DISSIPATION SYSTEMS .................................................................................................... 32
2.5.1 Passive Controllers ................................................................................................................... 33
2.5.1.1 Tuned Mass Damper ....................................................................................................... 34
2.5.1.1.1 Equation of Motion ..................................................................................................... 36
2.5.1.1.2 Determining TMD Parameters .................................................................................... 40
2.5.1.2 Tuned Liquid dampers .................................................................................................... 40
2.5.1.3 Multiple Tuned Mass Dampers ...................................................................................... 42
2.5.1.4 Nonlinear Tuned Mass Dampers (NTMD) ..................................................................... 46
2.5.1.5 Pendulum Tuned Mass Damper (PTMD) ....................................................................... 49
2.5.1.6 Base Isolation ................................................................................................................. 51
2.5.1.7 Viscous Fluid Dampers (VF) .......................................................................................... 52
2.5.1.8 Viscoelastic Dampers (VE) ............................................................................................ 53
2.5.2 Semi-Active Controllers .......................................................................................................... 54
2.5.3 Active Control of Structures .................................................................................................... 55
2.6 ANALYTICAL METHOD FOR ANALYSING NONLINEAR SYSTEMS .................................................... 57
2.6.1 Perturbation Method: Multiple Scales Method ........................................................................ 58
2.6.2 Local Stability Analysis ........................................................................................................... 59
2.7 NUMERICAL METHODS FOR ANALYSING NONLINEAR SYSTEMS .................................................... 60
2.7.1 Time Integration Method ......................................................................................................... 61
2.7.2 Continuation Method ............................................................................................................... 62
2.8 SUMMARY ..................................................................................................................................... 65
CHAPTER 3 ................................................................................................................................................... 67
LITERATURE REVIEW OF FAÇADE SYSTEMS
3.1 INTRODUCTION .............................................................................................................................. 68
3.2 TYPES OF FACADE SYSTEMS .......................................................................................................... 70
3.2.1 Infills ........................................................................................................................................ 70
3.2.2 Light Weight Cladding ............................................................................................................. 71
3.2.2.1 Stick System ................................................................................................................... 71
vi
3.2.2.2 Curtain Wall ................................................................................................................... 72
3.2.2.3 Unitized Curtain Wall ..................................................................................................... 73
3.2.2.4 Panelized Curtain Wall ................................................................................................... 75
3.2.2.5 Spandrel Panel Ribbon Glazing ...................................................................................... 75
3.2.2.6 Bolted Glass Façade ....................................................................................................... 76
3.2.2.7 Double Skin Façade ........................................................................................................ 77
3.2.2.7.1 Definition .................................................................................................................... 77
3.2.2.7.2 History ........................................................................................................................ 80
3.2.2.7.3 Examples ..................................................................................................................... 81
3.2.3 Heavyweight Cladding ............................................................................................................. 82
3.3 TYPICAL FACADE CONNECTIONS AND THEIR INHERENT PROBLEMS .............................................. 83
3.3.1 Bearing Connection .................................................................................................................. 84
3.3.2 Tie-back connection ................................................................................................................. 84
3.3.3 Governing Failure Mechanism in Attachment ......................................................................... 84
3.4 FAÇADE PANELS CAPABILITY AND COMPATIBILITY TO THE PROPOSED NOVEL DESIGNS.............. 87
3.4.1 Infills ........................................................................................................................................ 88
3.4.2 Lightweight Cladding .............................................................................................................. 89
3.4.3 Curtain Walls ........................................................................................................................... 90
3.4.4 Panelised Curtain Wall ............................................................................................................. 91
3.4.5 Double Skin Façade System..................................................................................................... 92
3.4.6 Heavyweight Cladding ............................................................................................................. 92
3.5 CHAPTER SUMMERY AND CONCLUSION ........................................................................................ 94
CHAPTER 4 ................................................................................................................................................... 96
FEASIBILITY STUDY & PRIMARY NUMBERICAL MODELLING
4.1 INTRODUCTION AND METHODOLOGY ............................................................................................ 97
4.2 BEHAVIOUR OF DOUBLE-SKIN-FAÇADE IN SUPPRESSING EARTHQUAKE LOADS ........................... 99
4.2.1 Introduction .............................................................................................................................. 99
4.2.2 System Modelling .................................................................................................................. 100
4.2.3 Dynamic Responses of the System ........................................................................................ 101
vii
4.3 FIRST PROPOSAL (FEASIBILITY STUDY OF FAÇADE SYSTEM AS MULTI TUNED MASS DAMPER WITH
3D NUMERICAL MODELLING IN SAP2000) .................................................................................................... 103
4.3.1 Earthquake Loading Records and Boundary Condition: ........................................................ 104
4.3.2 Material Properties ................................................................................................................. 108
4.3.3 Structural Modelling and its Dynamic Behaviour .................................................................. 109
4.3.4 Results of Computer Modelling ............................................................................................. 112
4.3.5 Conclusion: ............................................................................................................................ 114
4.4 SECOND PROPOSAL - NUMERICAL MODELLING OF FACADES WITH SACRIFICIAL ELEMENTS IN
SAP2000 115
4.4.1 Introduction ............................................................................................................................ 115
4.4.2 Preliminary Numerical Modelling ......................................................................................... 116
4.4.3 Out-of-Plane Concept of Façade Behaviour .......................................................................... 119
4.4.3.1 Results and Discussion ................................................................................................. 121
4.4.3.2 Conclusion .................................................................................................................... 122
4.4.4 In-Plane Concept of Façade Behaviour .................................................................................. 122
4.4.4.1 Results and Discussion ................................................................................................. 125
4.4.4.2 Conclusion .................................................................................................................... 127
4.5 FINITE ELEMENT MODELLING USING ANSYS APDL ................................................................. 128
4.5.1 Introduction of Smart Bracket with Combined Shear and Axial Movement ......................... 128
4.5.2 Development of Smart Passive Façade System-Assigning a Nonlinear Behaviour to Façade
Connection 129
4.5.3 Earthquake Records and Their Features ................................................................................. 131
4.5.4 Structural Models ................................................................................................................... 133
4.5.5 Bracket Element Behaviour ................................................................................................... 133
4.5.6 Criteria for Evaluation of the System ..................................................................................... 135
4.5.6.1 Lateral Displacement Control ....................................................................................... 135
4.5.6.2 Drift Control ................................................................................................................. 138
4.5.6.3 Acceleration of Primary Structure ................................................................................ 141
4.5.6.4 Root Mean Square of Top Displacement ...................................................................... 142
4.5.7 Conclusions ............................................................................................................................ 143

viii
CHAPTER 5 ................................................................................................................................................. 145
MID-RISE 10-STOREY STRUCTRAL MODELS
INTRODUCTION
5.2 MODELLING APPROACH AND ASSUMPTIONS ............................................................................... 146
5.2.1 Finite Element Analysis ......................................................................................................... 147
5.2.1.1 Meshing Size ................................................................................................................ 147
5.2.1.1.1 Column, Beam and Slab ............................................................................................ 148
5.2.1.1.2 Bracket (Spring Beam) .............................................................................................. 148
5.2.1.1.3 Façade Column ......................................................................................................... 148
5.2.1.2 Direction of Applied Loads and Building Boundary Conditions ................................. 148
5.2.2 Element Behaviour and Structural Modelling ........................................................................ 149
5.2.2.1 Material Properties ....................................................................................................... 151
5.2.2.2 Consideration of Seismic Mass .................................................................................... 151
5.2.2.3 Design of Structural Elements ...................................................................................... 152
5.2.2.3.1 Equivalent Sections for Structural Beams and Columns ........................................... 152
5.2.2.4 Assumption of Strong Column and Weak Beam Connection by Semi-Rigid Connections
153
5.2.3 Details of Cladding System (Double Skin) Modelling........................................................... 154
5.2.3.1 Material Properties ....................................................................................................... 155
5.2.3.2 Façade Column Modelling ........................................................................................... 155
5.2.3.3 Details of Bracket Modelling ....................................................................................... 158
5.3 TYPES OF NUMERICAL MODELLINGS ........................................................................................... 161
5.3.1 Modal Analysis ...................................................................................................................... 161
5.3.1.1 Results .......................................................................................................................... 161
5.3.2 Dynamic Time-History Analysis (Holistic Nonlinear Time-History Analysis) ..................... 163
5.3.2.1 Dynamic Interpretation of Energy Content the Selected Earthquakes (Power Spectral
Density) 163
5.3.2.2 Judgment on Engineering Demand Parameters ............................................................ 167
5.3.2.2.1 Top Lateral Displacement ......................................................................................... 168
5.3.2.2.2 Root Mean Square (RMS) of Top Displacement (mm) ............................................ 176

ix
5.3.2.2.3 Relative Displacement of Façade and Main Structure .............................................. 177
5.3.2.2.4 Structural Inter-Storey Drift ...................................................................................... 179
5.3.2.2.4.1 Inter-Storey Drift Calculation and In-Plane Seismic Design ............................. 179
5.3.2.2.4.2 Results ............................................................................................................... 180
5.3.2.2.5 Top Lateral Acceleration........................................................................................... 184
5.3.2.2.6 Root Mean Square (RMS) of Top Acceleration ........................................................ 191
5.3.2.2.7 Base Shear ................................................................................................................. 192
5.4 FINDINGS AND CONCLUSION ....................................................................................................... 193
CHAPTER 6 ................................................................................................................................................. 194
HIGH-RISE 30-STOREY STRUCTRAL MODELS
6.1 INTRODUCTION ............................................................................................................................ 195
6.2 ASSUMPTIONS.............................................................................................................................. 196
6.2.1 Element behaviour and structural modelling ......................................................................... 196
6.2.2 Details of Bracket modelling ................................................................................................. 198
6.3 TYPES OF NUMERICAL MODELLINGS ............................................................................................ 199
6.3.1 Modal Analysis ...................................................................................................................... 199
6.3.1.1 Results .......................................................................................................................... 200
6.3.2 Dynamic Time-History Analysis (Holistic Nonlinear time-history analysis) ........................ 201
6.3.2.1 Judgement on engineering demand parameters ............................................................ 202
6.3.2.1.1 Top lateral displacement ........................................................................................... 202
6.3.2.1.2 Root mean square (RMS) response of top displacement (mm) ................................. 210
6.3.2.1.3 Maximum relative displacement of façade and main structure ................................. 211
6.3.2.1.4 Structural inter-storey drift ........................................................................................ 212
6.3.2.1.5 Top lateral acceleration ............................................................................................. 217
6.3.2.1.6 Root mean square (RMS) of top acceleration response ............................................ 223
6.3.2.1.7 Base shear force ........................................................................................................ 224
6.4 APPLICATION OF ADVANCED CLADDING CONNECTIONS AND DESIGN STEPS .............................. 225
6.5 FINDINGS AND CONCLUSION ........................................................................................................ 226
CHAPTER 7 ................................................................................................................................................. 228

x
FINANCIAL CONSIDERATIONS
7.1 INTRODUCTION ............................................................................................................................ 229
7.2 FINANCIAL ASSESSMENT OF MOVABLE FAÇADE SYSTEM AS A NEW RETROFITTING METHOD ....... 230
7.3 ADDITIONAL COST OF THE MOVABLE FACADE TO BUILDING STRUCTURE ..................................... 230
7.3.1 Introduction ............................................................................................................................ 230
7.3.2 Design or re-design procedure ............................................................................................... 231
7.3.3 Maintenance ........................................................................................................................... 232
7.3.3.1 Preventive maintenance strategies and their cost.......................................................... 232
7.3.3.2 Quarterly and annual inspection of the proposed system ............................................. 234
7.3.4 Importance of thermal performance ....................................................................................... 236
7.3.5 Damage cost to the façade system after an earthquake .......................................................... 236
7.3.6 Interaction with insurance companies for Earthquake Insurance Premium (EIP) .................. 237
7.4 COST BENEFITS TO THE MAIN STRUCTURE ................................................................................... 238
7.4.1 Introduction ............................................................................................................................ 238
7.4.2 Case studies ............................................................................................................................ 244
7.4.2.1 Case study 1 .................................................................................................................. 244
7.4.2.1.1 Construction cost....................................................................................................... 245
7.4.2.1.2 Construction time ...................................................................................................... 246
7.4.2.1.3 Labour cost ................................................................................................................ 249
7.4.2.1.4 Rental income ........................................................................................................... 249
7.4.2.1.5 Overall Saving .......................................................................................................... 250
7.4.2.2 Case study 2 .................................................................................................................. 252
7.4.2.2.1 Construction cost....................................................................................................... 252
7.4.2.2.2 Construction time ...................................................................................................... 254
7.4.2.2.3 Labour cost ................................................................................................................ 254
7.4.2.2.4 Rental income ........................................................................................................... 255
7.4.2.2.5 Overall Profit ............................................................................................................ 256
7.5 STRATEGIES AND APPROACHES .................................................................................................... 258
7.6 SUMMARY AND CONCLUSIONS ..................................................................................................... 258
CHAPTER 8 ................................................................................................................................................. 263
xi
CONCLUSION AND FUTURE WORK
8.1 GENERAL CONCLUSIONS .............................................................................................................. 264
8.1.1 Application and contribution of this research to design ......................................................... 268
8.2 RECOMMENDATIONS FOR FUTURE RESEARCH .............................................................................. 270
8.2.1 Further research that would improve and complement this thesis ......................................... 271
8.2.2 Proposed experimental test program ...................................................................................... 272
8.2.2.1 Test setup, specimen design and terminology .............................................................. 272
APPENDIX A ............................................................................................................................................... 279
SECTIONS OF THE STRUCTURAL MODELS ........................................................................................ 279
APPENDIX B ............................................................................................................................................... 288
THESIS TERMINOLOGY ........................................................................................................................... 288
REFERENCE ................................................................................................................................................ 291

xii
LIST OF FIGURES
Figure 2-1: Seismic hazard versus return period (Paulay 1992) ........................................................................... 12
Figure 2-2: Seismic performance levels of a building .......................................................................................... 25
Figure 2-3: Relationship between excitation and role of passive controllers in structure Loop (Symans 1999) .. 34
Figure 2-4: Schematic View of Displacement of TMD (Soong and Spencer 2002) ............................................. 36
Figure 2-5: Single Degree of Freedom System with the Use of TMD (Soong and Dargush 1997)...................... 37
Figure 2-6: Multi-Degree-of-Freedom System with TMD ................................................................................... 39
Figure 2-7 Illustration of a schematic model of a TLD ........................................................................................ 41
Figure 2-8: TLD used in Rincon Hill (the first U.S. residential tower) (Soong and Spencer 2002) ..................... 42
Figure 2-9 Schematic model of multiple TMD (MTMDs) in parallel .................................................................. 42
Figure 2-10 Schematic model of multiple TMD (MTMDs) in series ................................................................... 43
Figure 2-11 Schematic model of nonlinear TMD (NTMD) ................................................................................. 46
Figure 2-12 Illustration of the PTMD installed in Taipei 101 (Soong and Spencer 2002) ................................... 49
Figure 2-13: Difference between lateral deformation in controlled and uncontrolled systems (Otani 1981) ....... 51
Figure 2-14: Typical viscous fluid dampers used in diagonal bracings (Hemalatha and Jaya 2008) ................... 53
Figure 2-15: Typical VE Damper Configuration (Soong and Spencer 2002) ....................................................... 54
Figure 2-16: Structure with a Semi-Active Control System (Symans 1999) ........................................................ 55
Figure 2-17: Structure with Active Control System (Symans 1999) .................................................................... 56
Figure 2-18: Structure with a Hybrid Control System (Symans 1999) ................................................................. 57
Figure 3-1: Typical components of a façade panel (Olanders Window Replacement 2011) ................................ 68
Figure 3-2: Stick system façade (Permasteelisa 2009) ......................................................................................... 71
Figure 3-3: Typical assembly of stick system façade (Permasteelisa 2009) ......................................................... 72
Figure 3-4: Unitized Curtain Wall (Permasteelisa 2009) ...................................................................................... 74
Figure 3-5: Installation of curtain wall (Permasteelisa 2009) ............................................................................... 74
Figure 3-6: Panelized curtain wall (Permasteelisa 2009) ...................................................................................... 75
Figure 3-7: Example of spandrel panel ribbon glazing (Permasteelisa 2009) ...................................................... 76
Figure 3-8: Independent assembly (Permasteelisa 2009) ..................................................................................... 76
Figure 3-9: Suspended assembly (Permasteelisa 2009) ........................................................................................ 77
Figure 3-10: Typical Double-Skin-Façade System (Poizaris 2004) ..................................................................... 78
xiii
Figure 3-11: Exterior Circulation Double Skin Curtain Wall (Arons 2000) ........................................................ 79
Figure 3-12: Facade detail: Hot expelled at each floor, cool air drawn in (Lee, Selkowitz et al. 2002) ............... 79
Figure 3-13: Steiff factory, Giengen/Brenz, Germany (Streicher, Heimrath et al. 2007). .................................... 81
Figure 3-14: Precast facade panel installations (Traulsen and McClellan 2010) .................................................. 82
Figure 3-15: Different failure mechanisms and push-over behaviour of precast panels attached to a frame system
(Baird, Diaferia et al. 2011) ........................................................................................................................ 85
Figure 4-1: Simplified model of the primary structure and façade system connected by movable brackets ...... 100
Figure 4-2: Detail of façade connection to primary structure and modelling assumption in SAP2000 .............. 101
Figure 4-3: Scaled Northridge earthquake excitation record .............................................................................. 105
Figure 4-4: Scaled El-Centro earthquake excitation record ................................................................................ 105
Figure 4-5: Scaled Kobe earthquake excitation record ....................................................................................... 105
Figure 4-6: Scaled Hachinohe earthquake excitation record .............................................................................. 106
Figure 4-7: Response Spectra of scaled Northridge earthquake record .............................................................. 106
Figure 4-8: Response Spectra of scaled El Centro earthquake record ................................................................ 107
Figure 4-9: Response Spectra of scaled Kobe earthquake record ....................................................................... 107
Figure 4-10: Response Spectra of scaled Hachinohe earthquake record ............................................................ 107
Figure 4-11: Schematic plan of the structural model .......................................................................................... 109
Figure 4-12: Schematic view of primary structural model with details of brackets and connections ................. 111
Figure 4-13: Time history analysis of structural model under Northridge earthquake ....................................... 112
Figure 4-14: Time history analysis of structural model under El-Centro earthquake ......................................... 112
Figure 4-15: Time history analysis of structural model under Kobe earthquake ................................................ 113
Figure 4-16: Time history analysis of structural model under Hachinohe earthquake ....................................... 113
Figure 4-17: Elastic structure in X direction ....................................................................................................... 117
Figure 4-18: plastic structure with auto-defined plastic hinges in elements ....................................................... 118
Figure 4-19: plastic structure incorporated with façade elements with auto-defined plastic hinges in structural
elements and user-defined plastic hinges in bracket elements .................................................................. 118
Figure 4-20: Typical façade panel subjected to wind forces............................................................................... 120
Figure 4-21: Top lateral displacement of structure with plastic brackets in El-Centro earthquake .................... 121
Figure 4-22: Rheinbach glass museum, Rheinbach (Wellershoff and Sedlacek 2003) ...................................... 123
xiv
Figure 4-23: In-plane concept of façade behaviour (façade as a shell element in structure frame and its
connections) .............................................................................................................................................. 124
Figure 4-24: Relative displacement of top level of main structure with different stiffness of bracket under 1940
El Centro Earthquake ................................................................................................................................ 125
Figure 4-25: Relative displacement between shell and structure at top level under 1940 El Centro Earthquake126
Figure 4-26: Proposed Multi-linear behaviour of the façade bracket acting as axial damper system ................. 129
Figure 4-27: Seismic hazard versus return period (Paulay 1992) ....................................................................... 131
Figure 4-28: Displacement Power Spectrum Density for 1994 Northridge earthquake ..................................... 132
Figure 4-29: Displacement Power Spectrum Density for 1963 Hachinohe earthquake ...................................... 132
Figure 4-30: Configuration of the proposed damper system .............................................................................. 134
Figure 4-31: Relative displacement between top and bottom of the primary structure during Northridge record
.................................................................................................................................................................. 136
Figure 4-32: Relative displacement between top and bottom of the primary structure during Hachinohe record
.................................................................................................................................................................. 137
Figure 4-33: Drift for primary structure with different stiffness for shear bracket façade elements during
Northridge earthquake ............................................................................................................................... 140
Figure 4-34: Drift for primary structure with different stiffness for shear bracket façade elements during
Hachinohe earthquake ............................................................................................................................... 141
Figure 4-35: Acceleration in top floor of primary structure with different shear stiffness for bracket facades
during Northridge earthquake ................................................................................................................... 142
Figure 4-36: Acceleration in top floor of primary structure with different shear stiffness for bracket facades
during Hachinohe earthquake ................................................................................................................... 142
Figure 5-1: Direction of applied earthquake in the 3-D model ........................................................................... 149
Figure 5-2: Front view of exterior elevation of the 3D frame model .................................................................. 150
Figure 5-3: Plan view of the 3D frame model (dimensions are in mm).............................................................. 150
Figure 5-4: Reinforced concrete section and assumed equivalent section .......................................................... 153
Figure 5-5: Details of proposed column/beam connection ................................................................................. 154
Figure 5-6: Modelled force-deformation hysteretic curve for modelling plastic hinges in reinforced concrete
beams ........................................................................................................................................................ 154
Figure 5-7: Schematic view of facade column element and their configuration in each floor ........................... 157

xv
Figure 5-8: Elevation view of façade connection ............................................................................................... 158
Figure 5-9: Defined Force-deformation curve of the axial connection ............................................................... 159
Figure 5-10: Defined Force-deformation curve of the shear connection ............................................................ 160
Figure 5-11: Plan view of damper connections to the main structure and their behaviour in applied earthquake
.................................................................................................................................................................. 160
Figure 5-12: Comparison of effective modal mass percentages for the first three modes .................................. 162
Figure 5-13: Seismic and wind hazard versus excitation frequency (or period) (Paulay 1992) ......................... 164
Figure 5-14: Displacement Power Spectral Density for 1994 Northridge earthquake ........................................ 165
Figure 5-15: Displacement Power Spectrum Density for 1940 El-Centro earthquake ....................................... 166
Figure 5-16: Displacement Power Spectrum Density for 1995 Kobe earthquake .............................................. 167
Figure 5-17: Displacement Power Spectrum Density for Hachinohe earthquake............................................... 167
Figure 5-18: Time-history of top floor displacements of primary structure coupled with DSFs with different
bracket connector stiffness during 1994 Northridge earthquake ............................................................... 169
Figure 5-19: Top floor displacements of primary structure coupled with DSFs with different bracket connector
stiffness during 1940 El-Centro Earthquake ............................................................................................. 170
Figure 5-20: Top floor displacements of primary structure coupled with DSFs with different bracket connector
stiffness during 1995 Kobe Earthquake .................................................................................................... 170
Figure 5-21: Top floor displacements of primary structure coupled with DSFs with different bracket connector
stiffness during 1968 Hachinohe Earthquake ............................................................................................ 171
Figure 5-22: Top floor displacements of primary structure coupled with DSFs with different shear connector
during 1994 Northridge Earthquake .......................................................................................................... 172
Figure 5-23: Top floor displacements of primary structure coupled with DSFs with different shear connector
during 1940 El-Centro Earthquake ........................................................................................................... 173
Figure 5-24: Top floor displacements of primary structure coupled with DSFs with different shear connector
during 1995 Kobe Earthquake .................................................................................................................. 174
Figure 5-25: Top floor displacements of primary structure coupled with DSFs with different shear connector
during 1968 Hachinohe Earthquake .......................................................................................................... 175
Figure 5-26: Schematic diagram of a building movement under earthquake ground motion. ............................ 180
Figure 5-27: Drift for primary structure with different stiffness for shear bracket façade elements during 1994
Northridge earthquake ............................................................................................................................... 181
xvi
Figure 5-28: Drift for primary structure with different stiffness for shear bracket façade elements during 1940
El-Centro earthquake ................................................................................................................................ 181
Figure 5-29: Drift for primary structure with different stiffness for shear bracket façade elements during 1995
Kobe earthquake ....................................................................................................................................... 182
Figure 5-30: Drift for primary structure with different stiffness for shear bracket façade elements during 1968
Hachinohe earthquake ............................................................................................................................... 182
Figure 5-31: Time-history of top floor accelerations of primary structure coupled with DSFs with optimal
bracket connector stiffness during 1994 Northridge Earthquake .............................................................. 185
Figure 5-32: Time-history top floor accelerations of primary structure coupled with DSFs with optimal bracket
connector stiffness during 1940 El-Centro Earthquake ............................................................................. 186
Figure 5-33 : Time-history top floor accelerations of primary structure coupled with DSFs with optimal bracket
connector stiffness during 1995 Kobe Earthquake .................................................................................... 186
Figure 5-34: Time-history top floor accelerations of primary structure coupled with DSFs with optimal bracket
connector stiffness during Hachinohe Earthquake .................................................................................... 187
Figure 5-35: Calculation of base shear in a structure.......................................................................................... 192
Figure 6-1: Front view of exterior elevation of the 3D frame model .................................................................. 197
Figure 6-2: Plan view of the 30m by 30m 3D frame model (dimensions are in mm) ........................................ 197
Figure 6-3: Defined Force-deformation curve of the axial connection ............................................................... 198
Figure 6-4: Defined Force-deformation curve of the shear connection .............................................................. 199
Figure 6-5: Comparison of effective modal mass percentages for the first three modes .................................... 201
Figure 6-6: Time-history of top floor displacements of primary structure coupled with DSFs with different
bracket connector stiffness during 1994 Northridge earthquake ............................................................... 203
Figure 6-7: Time-history of top floor displacements of primary structure coupled with DSFs with different
bracket connector stiffness during 1940 El Centro earthquake ................................................................. 204
Figure 6-8: Top floor displacements of primary structure coupled with DSFs with different bracket connector
stiffness during 1995 Kobe Earthquake .................................................................................................... 204
Figure 6-9: Top floor displacements of primary structure coupled with DSFs with different bracket connector
stiffness during 1968 Hachinohe Earthquake ............................................................................................ 205
Figure 6-10: Top floor displacements of primary structure coupled with DSFs with different shear connectors
during 1994 Northridge Earthquake .......................................................................................................... 206

xvii
Figure 6-11: Top floor displacements of primary structure coupled with DSFs with different shear connectors
during 1940 El Centro Earthquake ............................................................................................................ 207
Figure 6-12: Top floor displacements of primary structure coupled with DSFs with different shear connectors
during 1995 Kobe Earthquake .................................................................................................................. 208
Figure 6-13: Top floor displacements of primary structure coupled with DSFs with different shear connectors
during 1968 Hachinohe Earthquake .......................................................................................................... 208
Figure 6-14: Maximum drift for primary structure with different stiffness for shear bracket façade elements
during 1994 Northridge earthquake .......................................................................................................... 213
Figure 6-15: Maximum drift for primary structure with different stiffness for shear bracket façade elements
during 1940 El-Centro earthquake ............................................................................................................ 214
Figure 6-16: Maximum drift for primary structure with different stiffness for shear bracket façade elements
during 1995 Kobe earthquake ................................................................................................................... 214
Figure 6-17: Maximum drift for primary structure with different stiffness for shear bracket façade elements
during 1968 Hachinohe earthquake ........................................................................................................... 215
Figure 6-18: Time-history of top floor accelerations of primary structure coupled with DSFs with optimal
bracket connector stiffness during 1994 Northridge Earthquake .............................................................. 218
Figure 6-19: Time-history top floor accelerations of primary structure coupled with DSFs with optimal bracket
connector stiffness during 1940 El-Centro Earthquake ............................................................................. 218
Figure 6-20: Time-history top floor accelerations of primary structure coupled with DSFs with optimal bracket
connector stiffness during 1995 Kobe Earthquake .................................................................................... 219
Figure 6-21: Time-history top floor accelerations of primary structure coupled with DSFs with optimal bracket
connector stiffness during Hachinohe Earthquake .................................................................................... 219
Figure 7-1: Earthquake Insurance Premium versus seismic zone (Permasteelisa 2009) .................................... 238
Figure 7-2: Location of selected cities ................................................................................................................ 240
Figure 7-3: Construction costs ............................................................................................................................ 242
Figure 7-4: Labour costs ..................................................................................................................................... 242
Figure 7-5: Material costs ................................................................................................................................... 243
Figure 7-6: Rental prices and cap rate ................................................................................................................ 243
Figure 7-7: Comparison between dimensions of beam/column elements in both the conventional and smart
façade systems........................................................................................................................................... 244

xviii
Figure 7-8: Building Construction cost with conventional façade and smart façade systems ............................ 245
Figure 7-9: Construction cost distribution with conventional and smart façade systems ................................... 246
Figure 7-10: Comparison of construction time between conventional and smart façade systems ...................... 248
Figure 7-11: Construction time with constant amount of labour and time in both smart and conventional façade
systems. ..................................................................................................................................................... 248
Figure 7-12: Comparison of labour costs between conventional and smart façade systems .............................. 249
Figure 7-13: Rental income increase due to smart façade system over 20 years ................................................ 250
Figure 7-14: Comparison of building component expenses profit by using smart façade system ...................... 251
Figure 7-15: Comparison of overall saving by using smart façade system ........................................................ 251
Figure 7-16: Comparison between dimensions of beam/column elements in both the conventional and smart
façade systems........................................................................................................................................... 252
Figure 7-17: Building Construction cost with conventional façade and smart façade systems .......................... 253
Figure 7-18: Construction cost distribution of a mid-rise building with conventional and smart façade systems
.................................................................................................................................................................. 253
Figure 7-19: Comparison of construction time between conventional and smart façade systems ...................... 254
Figure 7-20: Comparison of labour cost between conventional and smart façade systems ............................... 255
Figure 7-21: Additional rental income due to using smart façade system .......................................................... 256
Figure 7-22: Comparison of building component expenses/savings by using smart façade system ................... 257
Figure 7-23: Comparison of overall savings when using smart façade system .................................................. 257
Figure 8-1: Details of proposed connection for attachment of façade outer skin to slab of main structure ........ 271
Figure 8-2: South-west sketch of the building structure and elevation of the specimen ..................................... 273
Figure 8-3: Sketch of details of experimental model .......................................................................................... 274
Figure 8-4: Sketch of details of experimental model .......................................................................................... 275
Figure 8-5: Sketch of details of experimental model .......................................................................................... 275
Figure 8-6: Sketch of details of experimental model .......................................................................................... 276
Figure 8-7: Sketch of details of experimental model .......................................................................................... 276
Figure 8-8: Side views of attachment of the proposed damper system to slab of primary structure .................. 277
Figure 8-9: Top view of attachment of damper system to slab of primary structure .......................................... 278
xix
LIST OF TABLES
Table 2-1: Non-structural performance level ........................................................................................................ 25
Table 3-1: Different kinds of façade systems ....................................................................................................... 70
Table 4-1: Earthquake ground motions used in this study .................................................................................. 105
Table 4-2: Material properties of façade system ................................................................................................. 108
Table 4-3: Material properties of primary structure............................................................................................ 108
Table 4-4: Structure model dynamic properties .................................................................................................. 110
Table 4-5: Results of time history analysis ......................................................................................................... 113
Table 4-6: Frequency of first three modes of the structure ................................................................................. 116
Table 4-7: Root mean square of top floor displacement cases with different plastic plateau forces (mm) ........ 122
Table 4-8: Maximum lateral displacement of the structure in different value of shell spring stiffness in El Centro
Earthquake ................................................................................................................................................ 126
Table 4-9: Root Means Square for in-plane-shell ............................................................................................... 126
Table 4-10: Lateral Displacement of top façade panels under 1940 El Centro Earthquake ............................... 127
Table 4-11: Root Mean Square of relative displacement of façade shell element at top level of structure ........ 127
Table 4-12: Maximum top lateral displacement in primary structure incorporating low shear stiffness bracket
facades during Northridge record .............................................................................................................. 137
Table 4-13: Maximum top lateral displacement in primary structure incorporating with low shear stiffness
bracket facades during Hachinohe record ................................................................................................. 138
Table 4-14: In plane drift of primary structure with different bracket stiffness during 1994 Northridge
earthquake (in mm) ................................................................................................................................... 140
Table 4-15: In plane drift of primary structure in case of different bracket stiffness during 1963 Hachinohe
earthquake (in mm) ................................................................................................................................... 141
Table 4-16: Root mean square of top displacement using different value of shear stiffness during 1994
Northridge earthquake ............................................................................................................................... 143
Table 4-17: Root mean square of top displacement using different value of shear stiffness during 1963
Hachinohe earthquake ............................................................................................................................... 143
Table 5-1: Structural sections for beam and column elements ........................................................................... 149
Table 5-2: Selected concrete properties .............................................................................................................. 151

xx
Table 5-3: Mass values for bare frame model .................................................................................................... 151
Table 5-4: Assumed factors for earthquake design ............................................................................................. 152
Table 5-5: Material properties of façade panel components ............................................................................... 155
Table 5-6: Modal vibration periods of models with bare-frame, fixed and flexible facades .............................. 161
Table 5-7: Participating modal mass percentages ............................................................................................... 162
Table 5-8: Characteristics of selected earthquake records .................................................................................. 164
Table 5-9: Comparison between maximum top floor displacements of primary structure coupled with DSFs with
different bracket connector stiffness during the four earthquakes............................................................. 171
Table 5-10: Comparison between maximum top floor displacements of primary structure with various shear
façade bracket stiffness during the four earthquakes ................................................................................ 176
Table 5-11: Root mean square of top displacement using different value of shear stiffness for the 3D models
during the excitations ................................................................................................................................ 177
Table 5-12: Relative Displacement between the primary structure model and outer layer of façade system during
1994 Northridge earthquake ...................................................................................................................... 177
Table 5-13: Relative Displacement between the primary structure model and outer layer of façade system during
1940 El-Centro earthquake ....................................................................................................................... 178
Table 5-14: Relative Displacement between the primary structure model and outer layer of façade system during
1995 Kobe earthquake .............................................................................................................................. 178
Table 5-15: Relative Displacement between the primary structure model and out layer of façade system during
1968 Hachinohe earthquake ...................................................................................................................... 178
Table 5-16: Comparison of storey drift with different bracket stiffness during 1994 Northridge earthquake .... 183
Table 5-17: Comparison of storey drift with different bracket stiffness during 1940 El Centro earthquake ...... 183
Table 5-18: Comparison of storey drift with different bracket stiffness during 1995 Kobe earthquake ............ 183
Table 5-19: Comparison of storey drift with different bracket stiffness during 1968 Hachinohe earthquake .... 184
Table 5-20: Comparison of absolute maximum value of interstorey drifts for each bracket case ...................... 184
Table 5-21: Comparison between top floor accelerations (mm/sec2) of primary structure coupled with DSFs with
optimal bracket connector stiffness during 1994 Northridge Earthquake ................................................. 187
Table 5-22: Comparison between top floor accelerations (mm/sec2) of primary structure coupled with DSFs with
optimal bracket connector stiffness during 1940 El Centro Earthquake ................................................... 188

xxi
Table 5-23: Comparison between top floor accelerations (mm/sec2) of primary structure coupled with DSFs with
optimal bracket connector stiffness during 1995 Kobe Earthquake .......................................................... 188
Table 5-24: Comparison between top floor accelerations (mm/sec2) of primary structure coupled with DSFs with
optimal bracket connector stiffness during 1968 Hachinohe Earthquake ................................................. 189
Table 5-25: Comparison between top floor accelerations (mm/sec2) of primary structure with various shear
façade bracket stiffness during 1994 Northridge earthquake .................................................................... 189
Table 5-26: Comparison between top floor accelerations (mm/sec2) of primary structure with various shear
façade bracket stiffness during 1940 El Centro earthquake ...................................................................... 190
Table 5-27: Comparison between top floor accelerations (mm/sec2) of primary structure with various shear
façade bracket stiffness during 1995 Kobe earthquake ............................................................................. 190
Table 5-28: Comparison between top floor accelerations (mm/sec2) of primary structure with various shear
façade bracket stiffness during 1968 Hachinohe earthquake .................................................................... 190
Table 5-29: Root mean square of top acceleration using optimal values of shear stiffness for the 3D models
during the four excitations ........................................................................................................................ 191
Table 5-30: Comparison between base shear forces (Knaack, Klein et al.) of the 3-D primary structure in various
bracket stiffness......................................................................................................................................... 193
Table 6-1: Structural sections for beam and column elements ........................................................................... 196
Table 6-2: Modal vibration periods of models with bare-frame, fixed and flexible facades .............................. 200
Table 6-3: Participating modal mass percentages ............................................................................................... 201
Table 6-4: Comparison between maximum top floor displacements of primary structure coupled with DSFs with
different bracket connector stiffness during the four earthquakes............................................................. 205
Table 6-5: Comparison between maximum top floor displacements (mm) of primary structure with various shear
façade bracket stiffness during the four earthquakes ................................................................................ 209
Table 6-6: Root mean square response of top displacement using different values of shear stiffness for the 3D
models during different earthquake excitations ........................................................................................ 210
Table 6-7: Maximum relative Displacement between 3D structure model and outer layer of façade system
during 1994 Northridge earthquake .......................................................................................................... 211
Table 6-8: Maximum relative Displacement between 3D structure model and outer layer of façade system
during 1940 El-Centro earthquake ............................................................................................................ 211

xxii
Table 6-9: Maximum relative Displacement between 3D structure model and outer layer of façade system
during 1995 Kobe earthquake ................................................................................................................... 212
Table 6-10: Maximum relative Displacement between 3D structure model and out layer of façade system during
1968 Hachinohe earthquake ...................................................................................................................... 212
Table 6-11: Comparison of maximum inter-storey drift with different bracket stiffness during 1994 Northridge
earthquake ................................................................................................................................................. 215
Table 6-12: Comparison of maximum inter-storey drift with different bracket stiffness during 1940 El-Centro
earthquake ................................................................................................................................................. 216
Table 6-13: Comparison of maximum inter-storey drift with different bracket stiffness during 1995 Kobe
earthquake ................................................................................................................................................. 216
Table 6-14: Comparison of maximum inter storey drift with different bracket stiffness during 1968 Hachinohe
earthquake ................................................................................................................................................. 216
Table 6-15: Comparison of absolute maximum values of inter-storey drifts for each bracket case ................... 217
Table 6-16: Comparison between top floor accelerations (mm/sec2) of primary structure coupled with DSFs with
optimal bracket connector stiffness during 1994 Northridge Earthquake ................................................. 220
Table 6-17: Comparison between top floor accelerations (mm/sec2) of primary structure coupled with DSFs with
optimal bracket connector stiffness during 1940 El Centro Earthquake ................................................... 220
Table 6-18: Comparison between top floor accelerations (mm/sec2) of primary structure coupled with DSFs with
optimal bracket connector stiffness during 1995 Kobe Earthquake .......................................................... 221
Table 6-19: Comparison between top floor accelerations (mm/sec2) of primary structure coupled with DSFs with
optimal bracket connector stiffness during 1968 Hachinohe Earthquake ................................................. 221
Table 6-20: Comparison between top floor accelerations of primary structure with various shear façade bracket
stiffness during 1994 Northridge earthquake ............................................................................................ 222
Table 6-21: Comparison between top floor accelerations of primary structure with various shear façade bracket
stiffness during 1940 El Centro earthquake .............................................................................................. 222
Table 6-22: Comparison between top floor accelerations of primary structure with various shear façade bracket
stiffness during 1995 Kobe earthquake ..................................................................................................... 222
Table 6-23: Comparison between top floor accelerations of primary structure with various shear façade bracket
stiffness during 1968 Hachinohe earthquake ............................................................................................ 223
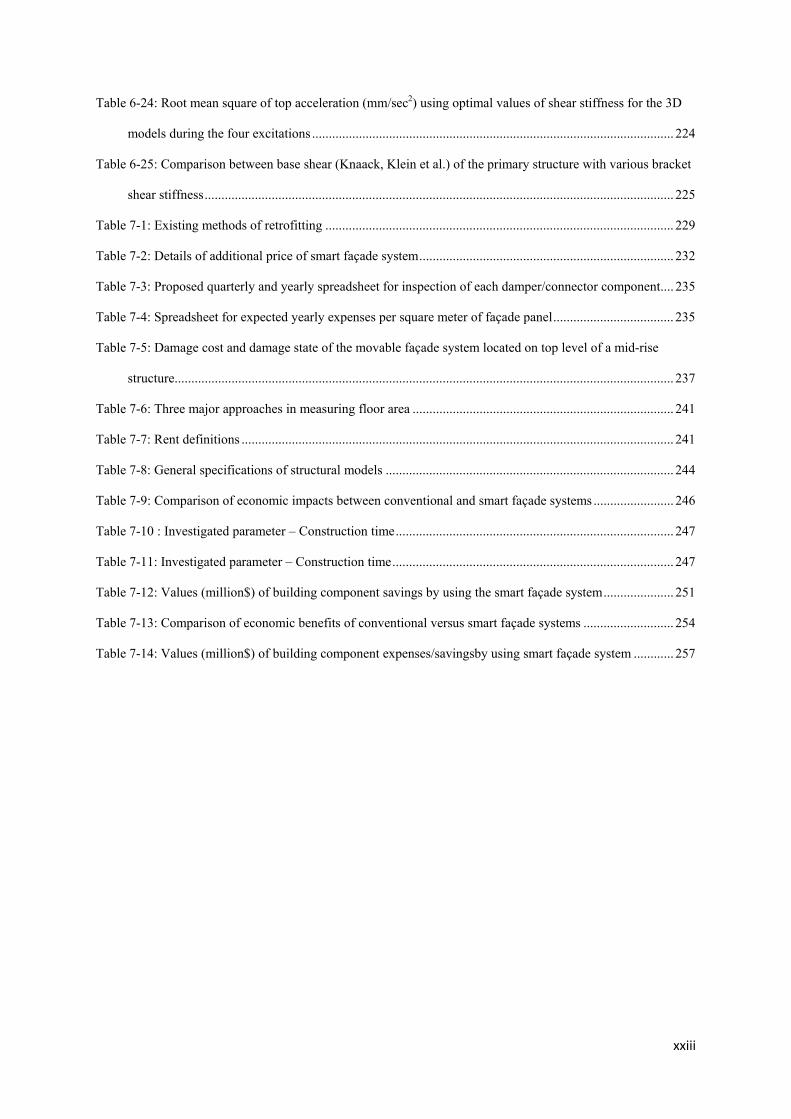
xxiii
Table 6-24: Root mean square of top acceleration (mm/sec2) using optimal values of shear stiffness for the 3D
models during the four excitations ............................................................................................................ 224
Table 6-25: Comparison between base shear (Knaack, Klein et al.) of the primary structure with various bracket
shear stiffness ............................................................................................................................................ 225
Table 7-1: Existing methods of retrofitting ........................................................................................................ 229
Table 7-2: Details of additional price of smart façade system ............................................................................ 232
Table 7-3: Proposed quarterly and yearly spreadsheet for inspection of each damper/connector component .... 235
Table 7-4: Spreadsheet for expected yearly expenses per square meter of façade panel .................................... 235
Table 7-5: Damage cost and damage state of the movable façade system located on top level of a mid-rise
structure ..................................................................................................................................................... 237
Table 7-6: Three major approaches in measuring floor area .............................................................................. 241
Table 7-7: Rent definitions ................................................................................................................................. 241
Table 7-8: General specifications of structural models ...................................................................................... 244
Table 7-9: Comparison of economic impacts between conventional and smart façade systems ........................ 246
Table 7-10 : Investigated parameter – Construction time ................................................................................... 247
Table 7-11: Investigated parameter – Construction time .................................................................................... 247
Table 7-12: Values (million$) of building component savings by using the smart façade system ..................... 251
Table 7-13: Comparison of economic benefits of conventional versus smart façade systems ........................... 254
Table 7-14: Values (million$) of building component expenses/savingsby using smart façade system ............ 257
xxiv
ABSTRACT
Strong earthquakes cause severe shaking, mostly lateral, of the ground over a large area
which imparts strong excitation to building structures. These earthquakes are extreme
actions, from which buildings may not survive unless being properly designed in advance.
In recent years, many new devices such as energy-absorber or isolation systems have been
introduced. But, most of them have some disadvantages such as complexity of design and
requirement of large spaces for installation and significant cost. To date the engineering
community has seen structural facade systems as non-structural elements with a high
aesthetic value and a barrier between the outdoor and indoor environments.
As an integral part of buildings, they are susceptible to potential failure when subjected
to severe environmental forces such as earthquake and high wind in case they are not
designed properly. Seismic loads can potentially impose significant in-plane loading on
the facade system and may lead to damage and breakage in the case of insufficient
connection detailing and big inter-storey drifts. The role of facades in reducing energy use
in a building has also been recognized and the industry is witnessing the emergence of
many energy efficient facade systems. Despite these advancements, the facade has been
rarely considered or designed as a potential earthquake-induced vibration absorber for
structural buildings.
Development and implementation of advanced facade systems for enhancing the
seismic response of building structures have been a topic of debate for structural and
architectural engineers for some time. The main idea here is to design and implement a
seismic control method using a novel façade system, as an energy-absorbing device, to
decrease the level of energy imparted to the main structure during seismic activities and

xxv
hence reliance structural ductility to dissipate seismic energy. Various configurations and
specifications of the proposed system are suggested in this thesis. Multiple design
variations were evaluated as well. To prove the concept and find the optimum value of
façade damper properties, a series of non-linear structural analysis and finite element
modelling was conducted using SAP2000 and ANSYS program respectively. First,
conventional façade brackets were replaced by the so-called sacrificial elements, which
can have back and forth movements during earthquake excitations. Predefined plastic
hinge behaviour is suggested for the façade bracket elements in a double skin façade
system.
Second, façade bracket properties in terms of stiffness and damping of the proposed
system were optimized to obtain the desired response. Third, the potential of utilizing a
movable exterior skin in a double-skin facade was investigated and it was found that with
optimal allowance of façade in-plane movement and appropriate bracket stiffness, a
substantial portion of earthquake-induced vibration energy can be dissipated, which could
lead to avoiding expensive seismic designs. A series of dynamic time history analyses
were carried out to determine the behaviour and response of the proposed system on
typical concrete frame structures under different intensity earthquakes. SAP2000 and
ANSYS programs were used for the numerical analyses in all phases of the feasibility
study.
The initial works demonstrated that the seismic response for low- and mid-rise
structural buildings subjected to moderate to severe earthquakes can substantially be
reduced by the introduction of a smart design of a double skin system. Application of
flexible connections in façade systems can, if properly designed, reduce the inelastic
xxvi
deformation of structural models in comparison with the case without flexible
connections.
KEYWORDS: Façade Systems, Multi-Skin Façade, Multi-Storey Building, Seismic Load,
Wind Load

1
CHAPTER 1
INTRODUCTION

2
1.1 Background of the Study
Advances in building heights are often accompanied by increased flexibility and
inadequate inherent damping in building structures. In addition, it leads to increased
susceptibility of structures to the actions of wind and earthquake. Earthquakes have
been one of the biggest challenges for structural engineers, because they occur without
any warning and cause great damage to structural elements. Fundamental vibration
period and frequency of structures have direct correlation with their overall height.
This frequency is within the approximate range of 0.3 to 3.0 Hz for low- to mid-rise
buildings.
On the other hand, frequencies associated with most of the earthquake records are
between 1 and 5 Hz. Therefore, they affect a wide range of structures from mid- to
high-rise structures due to potential resonance compared with wind gust with lower
natural frequencies. Therefore, resonant conditions, in which the frequency of seismic
forces is similar to that of building structures, can most probably happen during
seismic activities in the case of mid-rise structures. In the case of seismic activities,
low- to mid-rise buildings may be susceptible to excessive inter-story drifts, large
shear forces, and noticeable accelerations.
Building structures designed to withstand seismic shocks have been undergoing a
critical appraisal in recent years, with the emphasis changing from "strength" to
"performance". Performance-based design and analysis are starting to dominate
research, development, and practice of earthquake engineering, particularly after the
1994 Northridge and 1995 Kobe earthquakes. Damage to structural elements, if not
designed properly based on modern codes, is very common and makes them
vulnerable to collapse during strong ground excitations. Under resonant conditions,

3
response of the structure reaches a maximum value and many structural elements may
collapse due to large overall displacements of the structure. Structural and earthquake
engineers have attempted to reduce the earthquake-induced response of main structure
using a combination of stronger materials and allowing for ductility. In addition, the
level of damping in a conventional elastic structure is relatively low; therefore, the
amount of energy dissipation during transient disturbances is also low, which is not
desirable in terms of their dynamic behaviour.
During strong excitations, such as earthquakes, conventional structures usually
deform well beyond their elastic limits and, finally, fail or collapse, because most of
the energy is absorbed by the structure itself through localized damage. Therefore,
various state-of-the-art technologies are used in the design and construction of new
buildings in order to improve their dynamic behaviour. Acceptance of innovative
systems in building structures is based on a combination of performance enhancement
versus construction costs and long-term effects. New innovative devices need to be
integrated into these structures with realistic evaluation of their performance and
influence on structural systems as well as verification of their ability for long-term
operations.
One of these approaches includes adding energy absorbers to a structure. The aim
of involving energy absorbers in a structure is to allow for hysteretic behaviours on
specially designed and detailed regions of the structure and avoid inelastic behaviour
in primary gravity load-resisting structural elements. Correctly implemented, a perfect
damper should be able to simultaneously decrease both stress and deflection in the
structure. So, increasing the overall damping ratio by devices such as damper systems
is a desirable solution in comparison with costly stiffening systems such as belt truss

4
and out riggers, which increase mass and cost of a structure to a large extent. Failure
of non-structural elements, especially façade systems, has been very common during
seismic activities. In recent decades, there has been an increasing desire for fully
glazed building structures and consequently façade panels, hence, non-structural and
other susceptible elements are in danger of damage and brakeage during earthquake
excitations.
Facade elements have been considered as non-structural elements mainly because
of their mass and stiffness in comparison to the main structure and their outer position
(Thambiratnam 2010, Tasligedik, Pampanin et al. 2012). On the other hand, protection
of structures is now shifting from complete reliance on the inelastic deformation of the
structure to dissipating the energy associated with severe dynamic loadings, through
the application of passive, semi-active, and active structural control devices to
mitigate excessive responses from dynamic excitations. Because of the significant
attention of building owners to facade elements as an aesthetically appealing feature
of structures, protection or mitigation of their damage is very crucial in terms of
economic and safety issues.
Interaction between structural and façade engineers have been rather limited in the
design of a building structure and both sides, especially structural engineers, do not
have sufficient information about structural role of façade panels (Hareer 2007),
(Moon 2009). More importantly, as architects develop new and leading edge creative
facade designs, it becomes more critical to focus on their connection details and
interaction with the primary structure. The design performance of facades as non-
structural elements has now been mainly focused on evaluating the damage sustained
by facade frames with fixed, not movable, connections. Incorporating facade systems

5
equipped with energy dissipative devices in order to damp out some of the seismic
energy during earthquake excitation and development of a new generation of façade
bracket elements are new topics which were discussed here (Behr 2006). Emphasis of
this research is on evaluating the interrelation between newly designed façade systems
and building structures in order to reduce the seismic response of main structure for
new buildings as well as retrofit of existing buildings (Goodno B. J. 1996).
1.2 Research Problem
It should be noted that loss of valuable and prime space coupled with initial cost of
installing large sized damper systems has been accepted unwillingly by building
owners and any viable alternative system to dissipate earthquake induced excitations
will be welcomed by the owners. Façade panels with various shapes, weights, and
connections usually act as a barrier between the indoor and outdoor environments.
They also play a major role in enhancing the aesthetics of building structures and are
attached by different types of connections to the primary structure or inner panels in
double skin façade systems. It has been reported that structural and non-structural
elements are likely to be impaired with different levels of damage in the case of a
severe earthquake.
Damage to façade panels is very common when subjected to environmental loads
(Hareer, Environment et al. 2006). The glazing systems, which are attached firmly to
the main structure, are not able to endure large lateral deformations, which can result
in significant dysfunction or failure at the strut connections or frame panels. Because
of the fixed attachment of façade panels, they have to move back and forth with the
primary structure during earthquakes and this movement causes damage and racking
to the façade panels and their surrounding structure (Sivanerupan, Wilson et al.

6
2008). Moreover, even small-scale damage to façade sealants has an impact on
thermal and weather insulation and leads to significant additional cost to building
maintenance. Also, with the crucial role of facades for safety of occupants and the
primary structure, only few studies have been conducted regarding the safety issues of
these systems when they are subjected to dynamic loads. Structures recently built in
seismic regions have been designed according to modern seismic codes and, in most
cases, could withstand the expected earthquakes with only a moderate amount of
damage; but, with more severe excitations, there would be much more damage
(Hareer, Environment et al. 2006).
Thus, the demand for the analysis and design of structural and non-structural
elements that can resist extreme loading has become much more important over the
past decades. The seismic analysis of glazing and facade systems, particularly their
connections, is a comparatively new field of research that needs more consideration.
Damage to façade panel(s) is a clear contributor to the overall damage and
accessibility to buildings after a seismic event. The current trend in building façade
and vulnerability of façade systems to extreme loads has led to increased demands for
safer and more economical structural façade (Saelens, Roels et al. 2003, Hareer,
Environment et al. 2006, Hareer 2007).
1.3 Research Objective and Aims
1.3.1 Research Objectives
The main objective of this research is to conduct a comprehensive analytical study
on the seismic response of movable façade systems equipped with passive damper
system and to highlight and assess the possible scenarios of new bracket connections
that can reduce damage and prevent the progressive collapse of panels' connections,

7
frame panels, and the primary structure. The major objectives of this study are as
follows:
1. In the first stage, to show the preliminary feasibility of the movable concept,
SAP2000 and ANSYS structural analysis packages were used to model two-
and three-dimensional frame structures with and without moving façade
systems. Various combinations of façade systems in terms of mass ratio,
frequency ratio, damper location, and number of dampers were analysed to
prove the feasibility of the proposed system.
2. To determine an optimal façade system, the second phase is devoted to full
scale analysis using ANSYS finite element package. The analysis determined
the sensitivity of parameters such as height of the main structure, intensity of
applied earthquakes as well as supporting stiffness of bracket elements in
achieving an optimal system. The evaluated parameters in this project are as
follows:
i. 4 Structural models (10 and 30-storey buildings in 2-D and 3-D)
ii. 4 Different earthquake records
iii. Different connection properties (selection of optimum dynamic properties
for façade brackets)
iv. Facade types and influence of mass
3. To prove the feasibility and effectiveness of the new smart façade system,
prototype testing is required as part of experimental investigations. As part of
the future works of this program, and based on the results of previous works,
Permasteelisa Group (the project industry partner) will fabricate and deliver at
least one façade unit with designated damper systems (passive or semi-active)
for testing.

8
4. To conduct a financial viability and cost benefit analysis of the proposed
system in terms of initial investment as well as life cycle costs of utilising
facade dampers instead of mechanical dampers.
1.3.2 Thesis Aims
A new facade damper system will concentrate on different types of flexible/energy
absorbing façade systems and their behaviour under earthquake loading is assessed. A
substantial number of numerical, analytical and experimental analyses related to the
applied seismic loads applied to the facade systems will be performed. The façade
system will be an energy absorbing one incorporating specially designed passive
dampers. Design of a new energy absorbing façade system, fully tested against
selected applied earthquake loads, is the ultimate goal of the research.
1.4 Methodology of Research
Main methods used to carry out investigations on the feasibility and performance of
the proposed system are based on analytical observations. The main part of this
research was conducted using computer simulations including time history nonlinear
analysis and finite element analysis for the primary and detailed modelling,
respectively. Material and dynamic properties (stiffness as well as mass and natural
frequencies of vibration) of the main structure, damping property, configuration and
location of dampers, facade mass and selected earthquakes were the influential
parameters. Based on all above parameters, properties of optimum facade connection
were evaluated. Finally, the results of investigation showed that with an innovative
and precise design of bracket façade, stack joint and structural sealants significant
reduction in structural response can be achieved.

9
1.5 Scope of Research
Effect of movable façade system as a passive damper on the dynamic behaviour of
primary structure are investigated in this research. Movable façade systems have the
potential to reduce the lateral displacements and accelerations of buildings as well as
level of damage in structural elements. In areas prone to severe earthquakes, effects
of seismic activities can be mitigated using energy absorption devices or mechanisms.
Hysteretic behaviour of bracket elements, stiffness of brackets, direction of facade
movement, and arrangement of these devices are very crucial in the reduction of
damage in structural buildings. Another major factor considered in the design
procedure is: How much additional cost is involved when dissipative smart façade
systems are used?
1.6 Dissertation Layout
This dissertation was organized in seven chapters. An introduction about the
research proposal and objectives is provided in this chapter. Literature review of the
relevant previous research in this area and general information about earthquake,
structural design, and damper systems are presented in Chapter 2. Different type of
façade systems and previous analytical and experimental studies on the interaction of
façade systems with the main structure during wind and earthquake excitations are
summarized in Chapter 3. However, the previous studies did not take a holistic
approach to movable façade systems, and have not considered façade panels as
structural elements. Thus, preliminary numerical modelling and feasibility study of the
proposed idea were developed in Chapter 4. Nonlinear analytical models of multi-
storey buildings with different cladding types and interaction between different façade
systems with main structure during earthquake excitations are presented in this

10
chapter. To demonstrate the effectiveness of the proposed system, comprehensive 3-D
dynamic time-history analyses of 10- and 30-storey structural models are presented in
Chapters 5 and 6, respectively. Financial assessment and feasibility of the proposed
system with some case studies are then discussed in detail in Chapter 7. Finally, the
main results and conclusions of the dissertation and future research needs are
summarized in Chapter 8.

11
CHAPTER 2
GENERAL INFORMATION
ABOUT EARTHQUAKE
LOADS AND METHODS OF
MITIGATING SEISMIC
ACTIVITY

12
2.1 Introduction
The race toward new building heights has not been without its challenges.
Unfortunately, these advances in height are often accompanied by increased flexibility
and shortage of adequate inherent damping in buildings. In addition, it leads to increased
susceptibility of structures to the actions of wind and earthquakes among other loads.
Average return period of earthquake excitations versus seismic hazard (measured in
terms of peak ground acceleration) is shown in Figure 2-1.
Figure 2-1: Seismic hazard versus return period (Paulay 1992)
Additionally, predicting the frequency content of earthquakes is quite complicated,
since their frequency content is a function of many factors including distance from the
epicentre and foundation soil conditions and containing several dominant frequencies
may amplify higher vibration modes in addition to the fundamental mode of vibration.
The level of damping in a conventional elastic structure is very low; therefore, the
amount of energy dissipated during transient disturbances is also very low. During
strong excitations, such as earthquakes, conventional structures are usually deformed
well beyond their elastic limits and finally fail or collapse. Therefore, most of the
imparted energy is absorbed by the structure itself through localized damage while it
13
is failing. As a response to the inherent inadequacies in the philosophy of conventional
seismic design, a number of innovative approaches have been suggested in recent
times.
2.2 Earthquake-resistant design for structural buildings
In early building design procedures, only gravity loads were considered. Generally,
there is no significant change in these loads during the life time of buildings. These
factors had considerably simplified the design process of buildings and allowed
engineers to design and construct magnificent structures before developing the scientific
basis and design methods of structures. The simplification process allowed the use of
trial and error method in designing, especially if the designer is not bound by economic
and material usage constraints.
In the new construction era, resources are limited; so, designs should be efficient. In
addition, we expect to be protected against environmental forces such as wind,
earthquakes, etc, which are not gravitational, static and single-component. For these
loads, inertia effects are important and lead to dynamic magnification and cyclic
response. Compared with gravitational loads, it is very difficult to predict the magnitude
and nature of dynamic loads. Using current approaches, wind and small earthquake
loadings are idealized in such a manner that the structure behaves in an elastic range,
while some damage is allowed at the time of medium to intensive earthquakes by
yielding of certain components.
Even a modest consideration of lateral forces in design improves the survival of
buildings although considerable improvement can be achieved by considering the actual
dynamic nature of the environmental disturbances. As a result, in dynamic terms, new
concepts of structural protection have been progressed or are at different stages of

14
progress. Many seismic design methods and construction technologies have been
improved over the years to decrease the seismic responses of buildings, bridges, and
potentially vulnerable structures (Paulay 1992) . Structural design standards impose
some regulations and criteria such as maximum top displacement and storey drifts to
evaluate the level of damage in structural elements and safety of occupants. Strong
earthquakes shake the ground severely (mostly laterally) over a large area and applies
strong excitations to building structures, with the result that buildings not designed to
withstand these forces may not survive (Paulay 1992, Elghazouli 2009).
Recently, the structures built in seismic regions are being designed according to
modern seismic codes and, in most cases, can withstand expected earthquakes with
reasonable amount of damage (Baird, Diaferia et al. 2011). However, if a more severe
excitation occurs, it can produce considerably more severe damage (De Matteis 2005).
Building survival in a large earthquake depends on the ability of its lateral resisting
system to dissipate energy hysterically while undergoing large inelastic deformations.
Concept of weak beam strong columns is considered in the design of structural
connections (Calvi et al. 2002). For earthquake-resistant structures, beams should deform
inelastically and dissipate energy with no damage to vital columns and should preferably
stay within the elastic range with minor plastic deformation.
Most of the design codes introduce four methods of analyses which are quasi-static
method, time history analysis, response spectrum analysis, and static pushover analysis
(Wilkinson and Hiley 2006). Time history analysis is the best method for design in order
to understand the response of a structural system during an earthquake. It involves
dynamic computer analysis of the structure under earthquake loading. A dynamic
analysis of a structure by the time history method includes calculating the response of a

15
structure at each increment of time when the structure base is subjected to a specific
ground-motion time history. The advantage of using this method over the linear elastic
response spectrum method is that it can be used to analyse the response of highly non-
linear structures as well. But, the downside of the analysis is that it generally requires
more computing effort and memory and usually most designers are only interested in the
maximum structural response, not necessarily the response at each time increment. The
applied ground-motion time histories should be appropriate for a specific site and have
response spectra which approximate an appropriate design. For the seismic design of
structural buildings, there are some crucial factors as discussed below:
1. Torsion: involving centre of mass and geometric centre of floors. Uneven mass
distribution which places the centre of mass outside the geometric centre and leads to
torsion (stress concentration) and should be avoided if possible or at least minimised.
It should be mentioned that a certain amount of torsion is unavoidable in every
building design. Symmetrical arrangement of masses and stiffening elements will
result in balanced stiffness and mass in orthogonal directions and keep torsion within
a manageable range.
2. Damping: Buildings in general are poor absorbers of dynamic shocks.
3. Ductility: For a given seismic demand, if the structure (or one’s design) does not
remain elastic, it undergoes plasticity/fracture/damage; then, stiffness could drop
dramatically and deformations will increase significantly. Under these increased
deformations, structural designers should ensure that the structure remains stable
without collapsing, should not loose vertical load-carrying capacity, and should be
detailing it in such a way that can undergo large deformations without collapsing.
The ability of a structure to undergo large deformations without collapsing is
called ductility and the detailing of the structure that enables it to have large ductility

16
is called ductile or ductility detailing. Normal reinforced concrete structures are
considered as non-ductile materials and fail abruptly by crumbling. Good ductility
can be achieved by carefully detailed joints. Overall ductility factor of structural
models is evaluated by comparing top lateral displacement of structure in case of
static load (elastic deformation) and earthquake (plastic deformation). For an
appropriately designed structure, this ratio should be around 2 to 4. Local ductility
for each structural element is evaluated by comparing elastic strain and plastic strain
in both columns and beams.
4. Strength and stiffness: Degree of resistance to deflection or drift (stiffness) and
ability to withstand loads safely (Strength). Property of a material to resist and bear
applied forces within a safe limit
5. Building configuration: determines the way seismic forces are distributed within the
structure, their relative magnitude, and load paths.
With well design of connections, plastic hinges should be formed in beam elements;
absorb earthquake energy, which in turn change frequency of the structure. As a result of
this change, frequency of structure would change from frequency at resonance triggered
by earthquake acceleration. Based on the aforementioned approach, order of failure in a
well-designed structure should be as follows: Beams<Connection<Columns. It is highly
recommended in seismic design to make roof floors as light as possible (light weight or
thin roofs) and ensure towel designed connections to hold the whole frame together
(strong moment connections). There are two major philosophies in the design of
structural buildings, as discussed below.

17
2.2.1 Force Method
Structural design philosophy has been, until recently, focused on forced-based (FB)
design methods, in which inertia of the structure generates forces within the structure.
This method uses over-strength and ductility factor (or structural response factor) to
evaluate the performance of structure (Chandler and Mendis 2000).
2.2.2 Displacement Method
In this method, a limit is placed on inter-storey drifts and overall building lateral
deflection according to displacement-based design. In this method, design of building
structures should be according to top displacement limitation and inter-storey drift which
should be less than and 1.5% of storey height, respectively (Chandler and Mendis
2000). This method requires the structure to be represented as a single-degree-of-
freedom structure and the seismic performance is assessed by comparing the
displacement demand with the estimated structural displacement capacity (Fajfar 2000).
The displacement capacity (∆ ) is obtained from a non-linear push-over analysis where
the designer calculates displacement as a function of increasing horizontal force until the
structure is deemed to have failed (Ghobarah 2001). Structural failure is assumed to have
occurred when the overall structure ceases to be able to support gravitational loads and
collapse is followed (Priestley 2000). The resultant force-displacement plot is commonly
known as the "push-over" (or capacity) curve which indicates the capacity of the
structure to deform (Doherty, Griffith et al. 2002). Calculations for developing the
transformed capacity curve are material-dependent, but should include effects such as
elastic and inelastic deflections of the structure together with deflection contributions
from foundation flexibility and P-delta effects (Smith, Coull et al. 1991).

18
2.2.3 Review of AS1170.4 Australian Standard
Australian Standard 1170.4 requires earthquake analysis for all buildings and utilizes
a three-tiered approach, depending on earthquake design category (EDC):
EDC1 – Simple static analysis (10% weight of each floor is applied to each floor of
the structure)
EDC2 – Static earthquake analysis
EDC3 – Dynamic earthquake analysis
Most designers use the force-based principles of EDC1 or EDC2, except in the design
of tall buildings (where higher mode effects are important) in which EDC3 method is
often used. The new standard also allows the designer to undertake a displacement-based
check for earthquake code compliance following a design for gravity and wind loads,
which is often sufficient in low-seismicity areas on rock or firm soil sites. There is an
important distinction between this definition of failure (in terms of ensuring sustained
gravitational load-carrying capacity) with the traditional definition of failure used in high
seismic regions for ensuring that horizontal resistance capacity is at least 80% of the
nominal capacity (AS1170.1 2002, NZS1170.5 2004)
2.2.4 Seismic retrofitting of building structure
Seismic retrofitting refers to modification of the existing structures to make them
more resistant to seismic activity, ground motion, or soil failure due to earthquakes and
hence code compliant. Different retrofitting strategies and technical methods have been
used by structural designers to achieve an overall retrofit performance objective, such as
increasing strength, increasing deformability, and reducing deformation demands (Ma,
Cooper et al. 2012). Design of structures with adequate detailing and reinforcement for
19
seismic protection has additional cost for building owners as well as requiring increased
time of construction. Moreover, retrofitting the existing structures which are old and/or
non-engineered is too expensive and building owners may prefer to demolish the whole
structure and start again in many developing countries (Martinez-Rodrigo and Romero
2003). It is also crucial to keep in mind that there is no such thing as a fully earthquake-
proof structure; however, seismic performance can be significantly enhanced through
proper initial design, subsequent rehabilitation, or modifications using novel as well as
traditional ideas (Asadi, Da Silva et al. 2012). A new way of retrofitting an existing
building structures uses façade panels which have been considered as non-structural
elements thus far and this is the main thrust of this thesis.
2.3 Drawbacks of Current Non-structural Australian and international
Standards for the Design and Damage Assessment of Primary Structure
and Façade Panels
2.3.1 Introduction
The role, played by the so-called "non-structural components", is not incorporated
into either Australian or international standards and is therefore, not considered in the
current design process (Behr et al. 2006). Current Australian Standards 4284, 1288,
2047 and FEMA356, 389 for the damage assessment of non-structural components are
discussed and any necessary revisions needed for new bracket connections are
proposed in this section. It is costly to design and construct a building to withstand the
maximum probable earthquake; therefore, the designer and owner must establish an
acceptable level of damage at an appropriate risk level. This acceptable level of risk
should include the degree in which the glazing unit will can be damaged and the level
at which there will exist the possibility of air and water penetration into the building,
because structural and non-structural performance levels are not necessarily the same
20
(AS1288.4 2006, Behr 2006). Non-structural parts, including their components and
fasteners, should be designed for horizontal and vertical earthquake forces, because it
is mainly anticipated that the level of damage to non-structural components would be
worse than that of the main structure (FEMA356 2000, Behr 2006) . The current
seismic design provisions typically require non-structural components to be secured so
that they do not present a falling hazard; but, they may still undergo so severe damage
that they cannot function any longer (Palermo, Pampanin et al. 2010) .The major
concern regarding glazed facade panels is racking action due to the relative lateral
movement of buildings from earthquake excitation. Some methods for improving
these components, such as adding smooth corners around each glass panel and using
heat strengthened, toughened, and laminated glasses, have already been suggested;
but, at present, the seismic drift performance of glazed facades is not considered at the
design stage by facade engineers (Behr 1998).
Australian Standard AS4284 is more concerned with testing building facades for
determining the performance of a representative building facade under simulated
loading conditions before production commences, rather than using a sample as an
opportunity for the manufacturer to evaluate the fabrication and installation process
(AS/NZS4284 2008). This standard is applied to all types of facades, including low- to
high-rise, commercial, industrial, and residential buildings with fixed facade
connections. According to the standard's recommendation, a seismic loading test is
necessary and applicable for testing prototypes in a test facility and on-site testing.
The parts and components of facades should be designed for earthquake actions using
the established principles of structural dynamics, general method using design
accelerations, or the simplified method. The first method implies an accurate dynamic
analysis, which is time-consuming and tedious; but, the second and third methods are

21
more practical and will be described and discussed below. Based on Section 8 of AS
1170.4, the architectural components and their fixings should be designed for the
acceleration determined by the design methods given in this standard, while the force
generated on the facade components can be calculated from equation (2-1) (AS1170.4
2007)
0.5 (2-1)
Based on a simple method, panels should be designed to resist the force of a
horizontal earthquake as determined in Equation 2.2. The force should be applied to
the centre of the mass in combination with the weight of the element.
0 (2-2)
= Effective acceleration of the floor at the level where the panel is situated,
calculated from the earthquake actions determined for the structure using other
sections of the standard
Component importance factor taken as:
1.5 for the components critical for life safety, parts required to function
immediately following an earthquake, and all the components in a structure which are
at importance level 4
1 for all other components
Component amplification factor
2.5 for flexible spring-type mounting systems for mechanical equipment
=1 for all other mounting systems
Component ductility factor

22
=1 for rigid components with non-ductile or brittle materials or connections
= 2.5 for all other components
Seismic weight of component (Knaack, Klein et al.)
Probability factor
Hazard factor
Height amplification factor at height where the component is attached
0 Bracketed value of the spectral shape factor for the period of zero sec
It should be noted that values for all mentioned factors can be calculated from
AS.1170.4. Based on FEMA 356, the facade frame is designed in accordance with the
capacity design principles, while the system is designed according to the drift limits in
Serviceability Limit State (SLS) and the Ultimate Limit State (Traulsen and
McClellan). The serviceability limit state (SLS) is specified in the form of deflection
limits for earthquakes by design standards.
These deflection limits are related to earthquake actions with annual probability of
exceedance of 0.04 (Behr, Belarbi et al. 1995, FEMA356 2000) ; i.e. corresponding to
a return period of 25 years. The ultimate limit state (ULS requirement is defined such
that the facade should remain supported and not interfere with evacuation for the
design level earthquake; also, facade damage is expected in an ULS event according
to the current design standards, because the SLS limits define deflections beyond
which repairs can be expected. However, the damage should not be life-threatening.
For a safe design, the panels' drift should be between the range of SLS and ULS; but,
even with larger deflections than the SLS limit, a smart and innovative design for the
facade brackets can reduce the risk of extreme damage to the facade panels (Behr,

23
Belarbi et al. 1995, FEMA356 2000). Glazing should satisfy the design requirements
for ultimate and serviceability limit states in accordance with the procedure given in
the standard. The standard for earthquake actions in Australia is AS 1170.4 -2007; it
limits the inter-story drift to 1.5% of storey height in buildings and also proposes that
attachment of cladding and facade panels to aseismic-force-resisting system should
have sufficient deformation and rotational capacity (AS1170.4 2007,
Sivagnanasundram 2011) .
However, with rigid connections and large earthquake forces, it is very difficult and
risky to allow large deformations and apply inertia forces without incurring much
damage in the brackets, facade frame, and main facade frame. This means that
moveable brackets with flexible materials or newly designed attachments are the best
ways for reducing the risk of damage and threats to occupants and passing pedestrians
(Rajgopal and Jayachandran 2012) . Performance-based seismic design is a relatively
new concept that reflects a natural evolution in engineering design practice. It is based
on the investigations of building performance in past earthquakes and laboratory
research and has resulted in improved analytical tools and computational capabilities.
Building performance can be described qualitatively in terms of (FEMA356 2000):
Safety afforded to building occupants during and after an earthquake;
Cost and feasibility of restoring the building to pre-earthquake conditions;
Length of time the building is removed from service to conduct repairs;
Economic, architectural, or historic impacts on the community at large.
The primary function of performance-based seismic design is the ability to achieve,
through analytical tools, a building design that will reliably perform in a prescribed
manner under one or more seismic hazard conditions. The performance, or condition
of the building as a whole, is typically expressed through qualitative terms and

24
intended to be meaningful to the general public. These terms use general terminology
and concepts describing the status of the facility (i.e. Fully Operational, Operational,
Life Safety and Near Collapse), but should be also associated and linked to
appropriate technically-sound engineering terms and parameters. These performance-
based design criteria are applicable to both structural and non-structural elements.
Older infill panels do not contain any in-plane movement allowance apart from the
small gaps around each panel of glass. These gaps are typically only a few millimetres
wide and consequently only allow a minimal amount of in-plane drift before the glass
begins to carry force.
The building performance levels typically are the structural performance level that
describes the limiting damage state of the structural systems, plus a non-structural
performance level that describes the limiting damage state of the non-structural
systems and components. These performance characteristics are directly related to the
extent of damage sustained by the building during a damaging earthquake. The
maximum in-plane drift demand and performance assessment of facade panels have
already been described in some books on design, and also by previous researchers.
The level of damage to each facade is called facade performance levels (or damage
states), suggested by FEMA356, and is determined in terms of the following
performance levels shown in Figure 2-2(FEMA356 2000).
1. Operational performance level 2. Immediate Occupancy performance level 3. Life Safety performance level 4. High Hazard performance level or Collapse Prevention
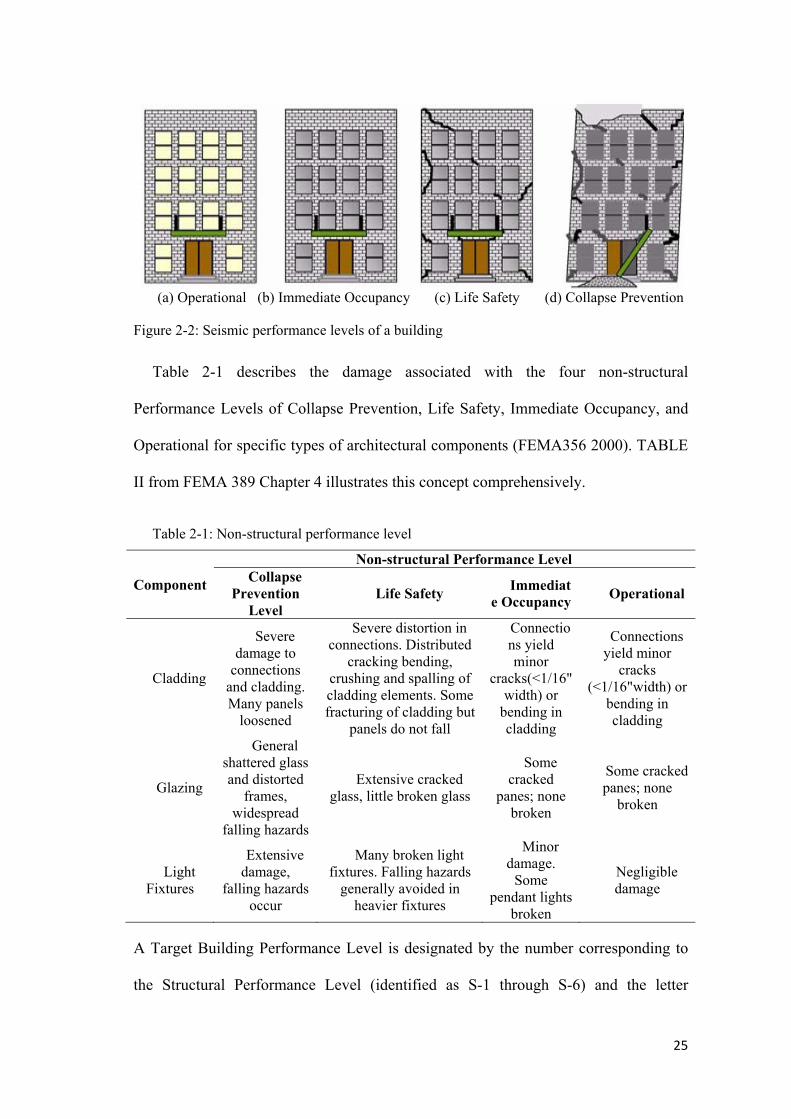
25
(a) Operational (b) Immediate Occupancy (c) Life Safety (d) Collapse Prevention
Figure 2-2: Seismic performance levels of a building
Table 2-1 describes the damage associated with the four non-structural
Performance Levels of Collapse Prevention, Life Safety, Immediate Occupancy, and
Operational for specific types of architectural components (FEMA356 2000). TABLE
II from FEMA 389 Chapter 4 illustrates this concept comprehensively.
Table 2-1: Non-structural performance level
Component
Non-structural Performance Level Collapse
Prevention Level
Life Safety Immediate Occupancy Operational
Cladding
Severe damage to
connections and cladding. Many panels
loosened
Severe distortion in connections. Distributed
cracking bending, crushing and spalling of cladding elements. Some fracturing of cladding but
panels do not fall
Connections yield minor
cracks(<1/16" width) or
bending in cladding
Connections yield minor
cracks (<1/16"width) or
bending in cladding
Glazing
General shattered glass and distorted
frames, widespread
falling hazards
Extensive cracked glass, little broken glass
Some cracked
panes; none broken
Some cracked panes; none
broken
Light Fixtures
Extensive damage,
falling hazards occur
Many broken light fixtures. Falling hazards
generally avoided in heavier fixtures
Minor damage.
Some pendant lights
broken
Negligible damage
A Target Building Performance Level is designated by the number corresponding to
the Structural Performance Level (identified as S-1 through S-6) and the letter

26
corresponding to the Non-structural Performance Level (identified as N-A through N-
E). Note that the four Target Building Performance Levels discussed above are each
designated as follows:
Operational Level (1-A): Immediate Occupancy Structural Performance Level (S-
1) plus Operational Non-structural Performance Level (N-A).
Immediate Occupancy Level (1-B): Immediate Occupancy
Structural Performance Level (S-1) plus Immediate Occupancy Non-structural
Performance Level (N-B).
Life Safety Level (3-C): Life Safety Structural Performance Level (S-3) plus Life
Safety Non-structural Performance Level (N-C).
Collapse Prevention Level (5-E): Collapse Prevention Structural Performance
Level (S-5) plus Not Considered Non-structural Performance Level (N-E).
The seismic rehabilitation of the existing architectural components that is
permanently installed or is an integral part of a building system has been suggested by
FEMA. An assessment process is needed to determine which non-structural
components are to be rehabilitated. These rehabilitation requirements are related to the
zone of seismicity and Hazards Reduced, Life Safety, and Immediate Occupancy
Performance Levels. Based on the FEMA 356 recommendation, non-structural
components should be rehabilitated by completing the following steps:
1. The rehabilitation objectives shall be established by selecting a non-structural
Performance Level and earthquake hazard level in accordance with FEMA
Section11.4. The zone of seismicity shall be determined as well.
2. The components shall be assessed by inspecting them.
3. Analysis and rehabilitation requirements of the component for the selected non-
structural Performance Level and appropriate zone of seismicity shall be determined.

27
4. Interaction between structural and non-structural components.
5. Each type of non-structural component shall be classified.
6. Acceptability of connections between non-structural components and the
structure shall be established.
7. If non-structural components which do not meet the requirements of the selected
non-structural Performance Level they shall be rehabilitated (FEMA-389 2004).
FEMA recommends that a direct visual inspection of each type of non-structural
component in the building shall be carried out. They shall be assessed by checking the
presence and configuration of each type of non-structural component, their attachment
to the structure, their physical condition, and whether or not degradation is present and
whether the non-structural components could potentially influence the overall
performance of the building (FEMA356 2000). If detailed drawings of the facade
system are available, at least one sample of each type of non-structural components
shall be observed , but if there are no deviations from the drawings the sample shall be
considered representative of the installed conditions (FEMA-389 2004).
If there are deviations, then, at least 10% of all occurrences of the component shall
be observed. If detailed drawings are not available, at least three samples of each type
of non-structural component shall be observed, but if there are no deviations between
the three components, the sample shall be considered representative of installed
conditions. If there are deviations, then at least 20% of all occurrences of the
component shall be observed. Current facade standards are focused specifically on
evaluating facade systems with fixed connectors, but, specific test requirements are
necessary if a movable bracket concept is to be introduced into the market. This gap in
the facade standards must be filled as soon as the concept has been proven by
experimental tests. The impact of performance-based strategies on future design codes

28
for novel non-structural elements and their attachments should also be considered.
While current design codes clearly require life safety design for only a single level of
ground motion, the next generation of performance-based seismic design guidelines
shall provide engineers with more comprehensive guidelines to design and construct
buildings that pass a number of performance criteria when subjected to earthquakes
with varying degrees of severity. Performance-based strategies are incorporated by
using three “Seismic Use Groups.” These groups are categorised based on the
occupancy of the structures and the relative consequences of earthquake-induced
damage to the structures as follows:
Group I structure such as low-rise commercial office buildings with basically lower life hazards
Group II structures such as elementary schools with a large number of occupants Group III structures such as medical facilities that are essential for post-earthquake
recovery
The design criteria for each group are intended to produce specific types of
performance in design earthquake events, based on the importance of reducing
structural damage and improving life safety. It is expected that the successful
development of a guideline for both structural and non-structural elements will require
an enormous effort in terms of financial and technical participation (FEMA-389 2004)
Seismic design needs to be considered in order to select appropriate glazing materials which are listed as below:
1. Flexible frames to accommodate rocking without damage or serviceability issues
2. Adequate glass to frame clearances
3. Laminated glass in annealed or heat-strengthened constructions, either monolithic or in an insulating glass unit
4. Bottom and side blocks
5. Silicone glazing

29
The following items should be considered when glazing material and frame
types are going to be selected:
Energy conservation
Sound reduction qualities
Potential threats and vulnerabilities as determined by building owners, security consultants, and project design teams
Primary consideration of environmental threats will minimize budget concerns and
decrease project completion time while modifying safety protection to the highest
level. Protecting building inhabitants is another factor that should be considered. The
number of damaged frames can be reduced through the use of properly designed
movable façade systems (W. Bush, Steinberg et al. 2004).
2.4 Modifications in Structural Systems
An efficient structural system can provide the most effective means of controlling
structural dynamic response. The use of space frame and mega-frame concepts,
outrigger trusses, belt trusses and Band-Aid type stiffening systems can offer
additional resistance to earthquake and wind loads (Kareem 1992). Other alternatives
include modification of the structural mode shapes to increase the mass participating
in the dynamics of building in the fundamental mode. However, in this situation care
must be exercised as the contributing loading in the fundamental loading may also
experience an increase. Other options may include shifting the major stiffness axes
from the principal geometric axes (Kareem 1992). These solutions are however costly
with little possibility of retrofitting a structure through such modifications. Although
other conventional technics like mass damper and tunned damper are likely to be more
feasible.

30
2.4.1 Cladding Isolation
Kareem (1992)) proposed the concept of isolation in the mountings of the cladding
to the structural system. Buildings are isolated from earthquake excitation by
employing isolator bearings between the building and the foundations and a similar
concept is proposed for cladding. The integrated effects of the unsteady aerodynamic
loads acting on cladding are transferred to the frame which results in building motion.
If the cladding is connected to the frame by an isolation mounting, then the
aerodynamic loads transferred to the frame will be reduced and consequently the
building motion will also be reduced. In order for this mounting to be effective, the
ratio of excitation frequency to the natural frequency of the cladding system should be
greater than the square root of two (Kareem 1992).
In this situation the mounting system is more effective without any damping based
on principles of vibration isolation. The proposed system can be materialized by
dividing the claddings on the building envelop into several segments. The preliminary
calculations suggested that such a mounting system would be quite soft and pneumatic
mounts may be an appropriate choice. Such an installation may cause the cost of a
cladding system to rise significantly. This can be overcome by using these systems in
staggered configurations and the remaining portions of the building envelop may
utilize conventional cladding. The staggered arrangement has been proposed to help
reduce the correlation of wind-induced pressure which in turn would result in
lessening of the integrated loads (Kareem 1992)..
2.4.2 Addition of Damping Systems
Damping is becoming a part of the structural engineer’s design vocabulary. It is
well known that the introduction of damping into structural systems is a very efficient

31
method in reducing the effects of dynamic loads on these systems. Over the past
thirty-five years the idea of introducing a separate system to increase the damping in
buildings has gained widespread acceptance (McNamara, Boggs et al. 1997). Wind
engineers have introduced damping systems in large scale structures such as the
World Trade Centre (Mahmoodi, Robertson et al. 1987) and Citicorp Center
(McNamara and J 1977) in New York city. In the design of tall buildings, engineers
must assume a level of natural damping in the structure in order to assess the building
habitability during frequent wind storms. The actual damping in building structures is
a difficult quantity to measure prior to building construction and varies with response
levels, type of structural systems, cladding system and materials used for construction.
Recognizing this uncertainty associated with estimating the natural damping in
structural systems, engineers have introduced energy dissipating systems into the
design of buildings to augment damping.
These systems are designed to provide specific amounts of damping and by
controlling the damping provided the uncertainty associated with assuming the
damping present is eliminated. Structural designers attempting to solve motion
comfort problems in tall buildings have found that direct addition of damping to the
structure is the most reliable way of assuring a well-behaved structure in turbulent
environments (McNamara, Boggs et al. 1997). The use of energy dissipating systems
related to wind effects on buildings is focused on the reduction of the acceleration
response of the upper floors of a tall building. Occupant discomfort due to wind-
induced motion is strongly dependent on the turbulent and buffeting characteristics of
the wind and presently there exists no satisfactory computational procedure to
determine these effects (McNamara, Boggs et al. 1997). The dynamic characteristics
of the structure are calculated (eg vibration period, mass) and an estimate of the

32
natural damping is made based on the type of the lateral load resisting system and the
materials used in construction. Predictions of acceleration response levels for various
assumed damping values can be generated by wind engineers. A level of damping is
then selected which satisfies the appropriate design criteria. The parametric
adjustments in the structural properties; mass, stiffness, and damping can change the
overall structural response. The acceleration response of a building is given by the
dynamic equation of motion
Acceleration (2-3)
From Equation (2-3), when the stiffness is increased to reduce acceleration, the
ratio of stiffness to mass ratio, governing the natural frequency of building, should be
considered in the structural design. Slope of the load spectrum with frequency should
also be considered. Addition of structural damping or energy dissipation devices, such
as passive energy absorbers and active feedback control systems to the basic structural
system of buildings, results in the reduction of acceleration.
2.5 Energy Dissipation Systems
By adding damper devices to the main structure, the majority of energy input that is
applied to the buildings during seismic excitation can be dissipated. Therefore, structural
response can be reduced by 40-60% in comparison to the traditional structures without an
energy dissipation system and therefore the against failure increases (Aiken 1999).
Mechanical dampers can dissipate majority major proportion of vibration energy input
applied to the buildings during earthquakes or winds. They can also be installed on the
bracings, walls, joints, connection parts, non-structural elements, or any other appropriate
space in structures. Energy balance equation during an earthquake in building structures
equipped with the energy dissipation system is as follows (Aiken 1999):

33
EIin = Ep+ Ek+ Ep+ Eb (2-4)
where:
EIin: Energy input to the structure,
Ep: Potential energy during structural vibration,
Ek: Kinetic energy during structural vibration,
Ed: Energy dissipated by viscous damping of structure or equipment,
Eb: Energy dissipated by energy dissipation system,
The goal is to increase Eb so that, for a given EI, the elastic strain energy in the
structure is minimized. It means that the structure would endure smaller deformations for
a given level of input energy than if it did not contain energy dissipation system (Aiken
1999). Alternatively, increasing Eb permits Ep to be reduced for a higher level of EI. The
role of a passive energy dissipation system is to increase the hysteretic damping in the
structure. Tests and research have shown that energy dissipation systems can dissipate
about 90% of the total energy input at the end of an earthquake (Uang and Bertero 1990)
2.5.1 Passive Controllers
A passive control system does not require any external power for operation and
performance; it utilizes the motion of the structure to generate control forces (Spencer
Jr and Nagarajaiah 2003). Systems in this category are generally reliable and have low
maintenance requirements, since they are not influenced by power outages which are
common during earthquakes. Since they do not infuse energy into the system, they are
capable of stabilizing the structural motion. Control forces are generated as a function
of the response of the structure at the location of the passive control system. These
systems increase the energy dissipation capacity of a structure through localized,
discrete energy dissipation devices (Thambiratnam 2010). New civil engineering

34
structures tend to be lighter as well as more slender and have smaller natural damping
capacity than those of their older counterparts. This trend has increased the importance
of damping technology to lessen the impact or intensity of earthquake and wind-
induced vibrations (Shiba, Mase et al. 1998).
Figure 2-3: Relationship between excitation and role of passive controllers in structure
Loop (Symans 1999)
The passive systems increase the energy dissipation capacity of a structure through
localized, discrete energy dissipation devices located either within a seismic isolation
system or over the height of the structure (Kitagawa and Midorikawa 1998).
Depending on their construction, these systems may also increase the stiffness and
strength of the structure to which they are connected. Role of passive controllers in a
structure is shown in Figure 2-3. Generally, they are categorized as the following
systems (Zhou and Xian 2001).
2.5.1.1 Tuned Mass Damper
Tuned mass dampers (TMDs) have been found effective in decreasing the response of
structures subjected to dynamic loads. These devices are sub-classified based on their
mechanism of energy dissipation and system requirement (Aldemir 2003). It is important
to note that a passive TMD can only be tuned to a single structural frequency. While the
first-mode response of an MDOF structure with the implementation of TMDs can be
substantially reduced, the higher mode response may in fact increase as the number of
stories increases (Sadek, Mohraz et al. 1997). Passive TMDs are a very efficient solution
35
for the control of vibrations in the structures subjected to long-duration, narrow-band
excitations (Soong and Spencer 2002). These dampers are usually mounted on the top
floor of buildings and improve structure responses by changing their dynamic behaviour.
Using TMDs, small reduction in cumulative yielding of components is observed, whereas
the reduction in ductility ratio is non-significant (Soong and Dargush 1997, Soong and
Spencer 2002).The natural frequency of the TMD is tuned in resonance to one of the
dominant frequencies of the structure (usually the first natural frequency). The mass of
the TMD is about 2.5 - 4% of the building mass in the fundamental mode and are
mounted in the location in which the structure experiences maximum response, mostly
near the top. Space restrictions will not permit traditional TMD arrangement, leading to
adopting alternative arrangements, including multi-stage pendulums, to be used (Ji, Moon
et al. 2005).
Despite the fact that TMDs are often effective, better performance has been noted
through the use of multiple TMDs composed of several dampers placed in parallel
configuration with natural frequencies around the optimum frequency (Li 2002). TMDs
have advantages including simplicity, reliability, effectiveness, and low-cost in
manufacturing and maintenance. Their main disadvantage is the sensitivity to tuning ratio.
The mistuning or non-optimum damping will significantly reduce the effectiveness of the
TMD (Lukkunaprasit and Wanitkorkul 2001). Effectiveness of a TMD on the response of
a single-degree-of-freedom system could simply be extended to continuous structures
such as tall buildings by a modal approach. A single TMD cannot provide vibration
control for more than one mode; therefore, multi-tuned mass dampers (MTMDs) are used
to evaluate and control the vibration of multiple structural modes (Li 2002) .The
parameter optimization of a TMD is a significant issue. The parameters which directly
affect the response of the main system are mass, damping, and stiffness of a TMD.

36
It is conventional to optimize the damping and tuning frequency ratio for the purpose
of computational convenience in most studies (Sadek, Mohraz et al. 1997). They are
frequently implemented with a frictional or hydraulic component that turns mechanical
kinetic energy into heat, like an automotive shock absorber (Li 2000). Typically, dampers
are huge concrete or steel blocks mounted inside skyscrapers or other structures and
moved in the opposite direction to the structure by means of springs, fluids, or pendulum
action. A typical TMD is depicted in Figure 2-4.
Figure 2-4: Schematic View of Displacement of TMD (Soong and Spencer 2002)
2.5.1.1.1 Equation of Motion
In the first step, the response of a single-degree-of-freedom (SDOF) structure-TMD
system subjected to a vibratory force, P is considered, as shown in Figure 2-5 and then the
TMD - multi-degree-of-freedom (MDOF) system is pursued, as demonstrated in Figure
2-6 (Tsai and Lin 1993). According to Figure 2-5, the system is a SDOF system with a
TMD that acts together as a two-degree-of-freedom system. Index d represents the TMD
parameters. The governing equations are as follows:
mmm (2-5)
The equation of motion of the main system is shown in equation (2-6):
1 m u 2ξ ωu ω u mu (2-6)
Direction of Motion
Support
Floor
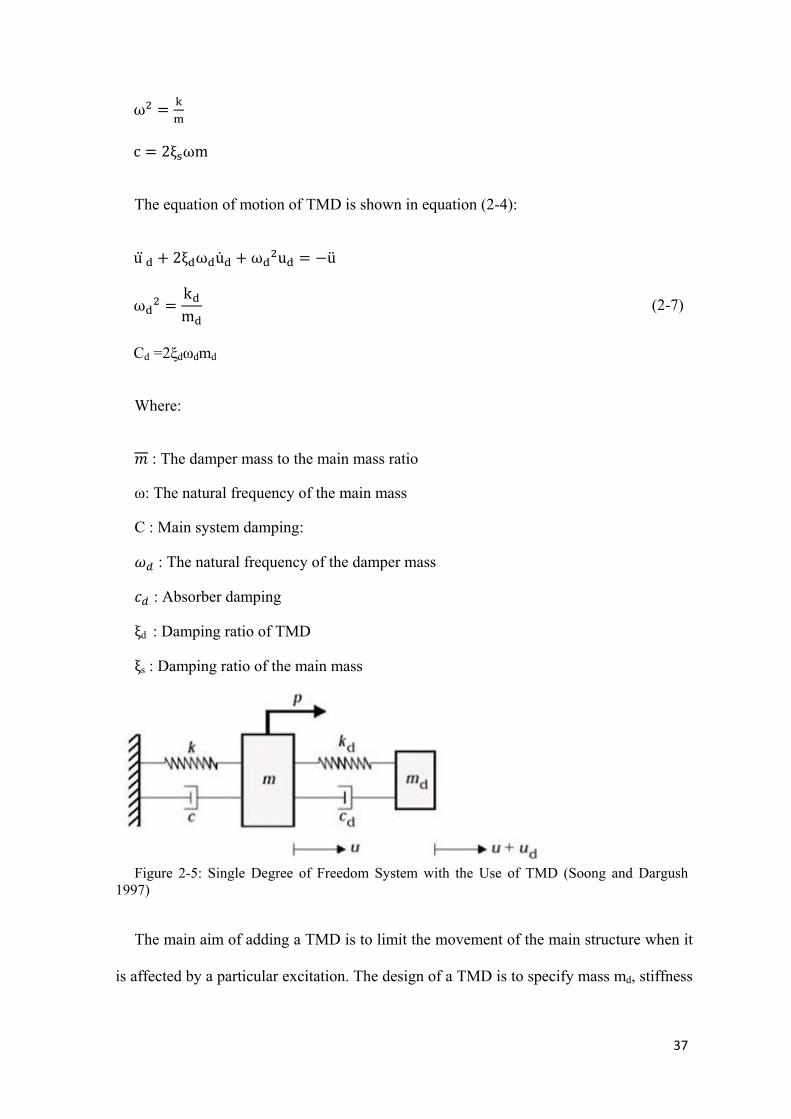
37
ω
c 2ξ ωm
The equation of motion of TMD is shown in equation (2-4):
u 2ξ ω u ω u u
ωkm
Cd =2ξdωdmd
(2-7)
Where:
: The damper mass to the main mass ratio
ω: The natural frequency of the main mass
C : Main system damping:
: The natural frequency of the damper mass
: Absorber damping
ξd : Damping ratio of TMD
ξs : Damping ratio of the main mass
Figure 2-5: Single Degree of Freedom System with the Use of TMD (Soong and Dargush
1997)
The main aim of adding a TMD is to limit the movement of the main structure when it
is affected by a particular excitation. The design of a TMD is to specify mass md, stiffness
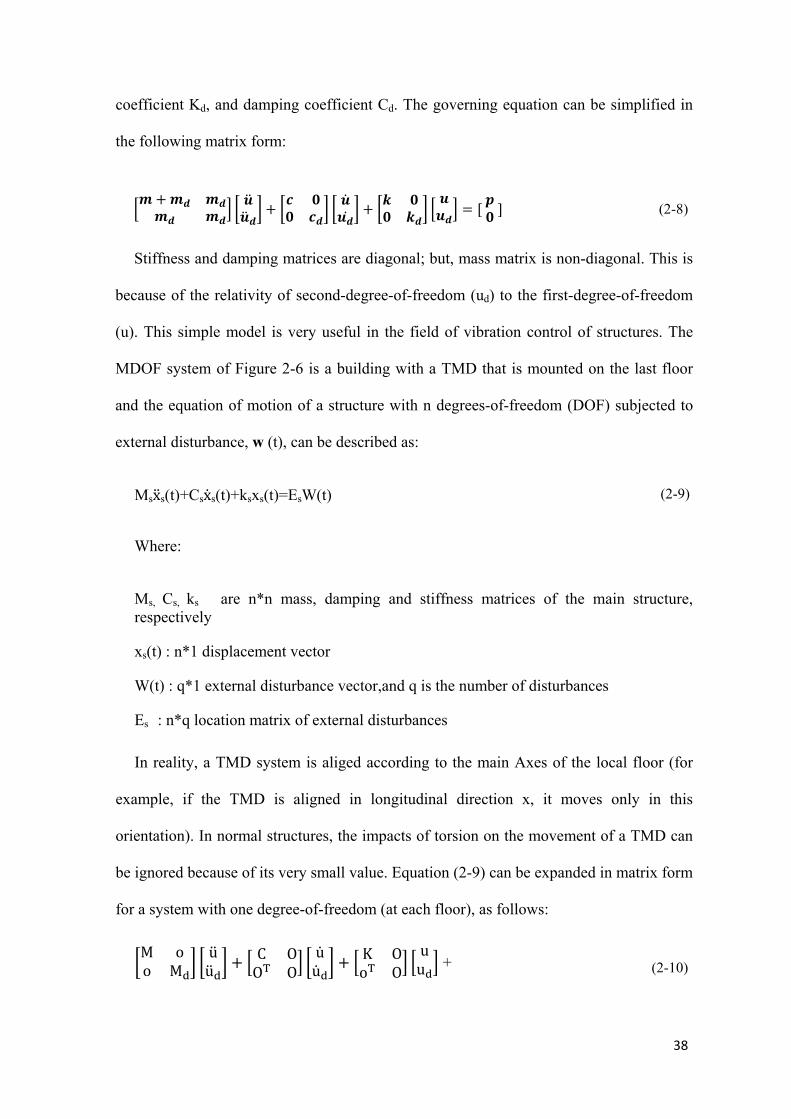
38
coefficient Kd, and damping coefficient Cd. The governing equation can be simplified in
the following matrix form:
(2-8)
Stiffness and damping matrices are diagonal; but, mass matrix is non-diagonal. This is
because of the relativity of second-degree-of-freedom (ud) to the first-degree-of-freedom
(u). This simple model is very useful in the field of vibration control of structures. The
MDOF system of Figure 2-6 is a building with a TMD that is mounted on the last floor
and the equation of motion of a structure with n degrees-of-freedom (DOF) subjected to
external disturbance, w (t), can be described as:
Msxs(t)+Csxs(t)+ksxs(t)=EsW(t) (2-9)
Where:
Ms, Cs, ks are n*n mass, damping and stiffness matrices of the main structure, respectively
xs(t) : n*1 displacement vector
W(t) : q*1 external disturbance vector,and q is the number of disturbances
Es : n*q location matrix of external disturbances
In reality, a TMD system is aliged according to the main Axes of the local floor (for
example, if the TMD is aligned in longitudinal direction x, it moves only in this
orientation). In normal structures, the impacts of torsion on the movement of a TMD can
be ignored because of its very small value. Equation (2-9) can be expanded in matrix form
for a system with one degree-of-freedom (at each floor), as follows:
M oo M
uu
C OO O
uu
K Oo O
uu + (2-10)
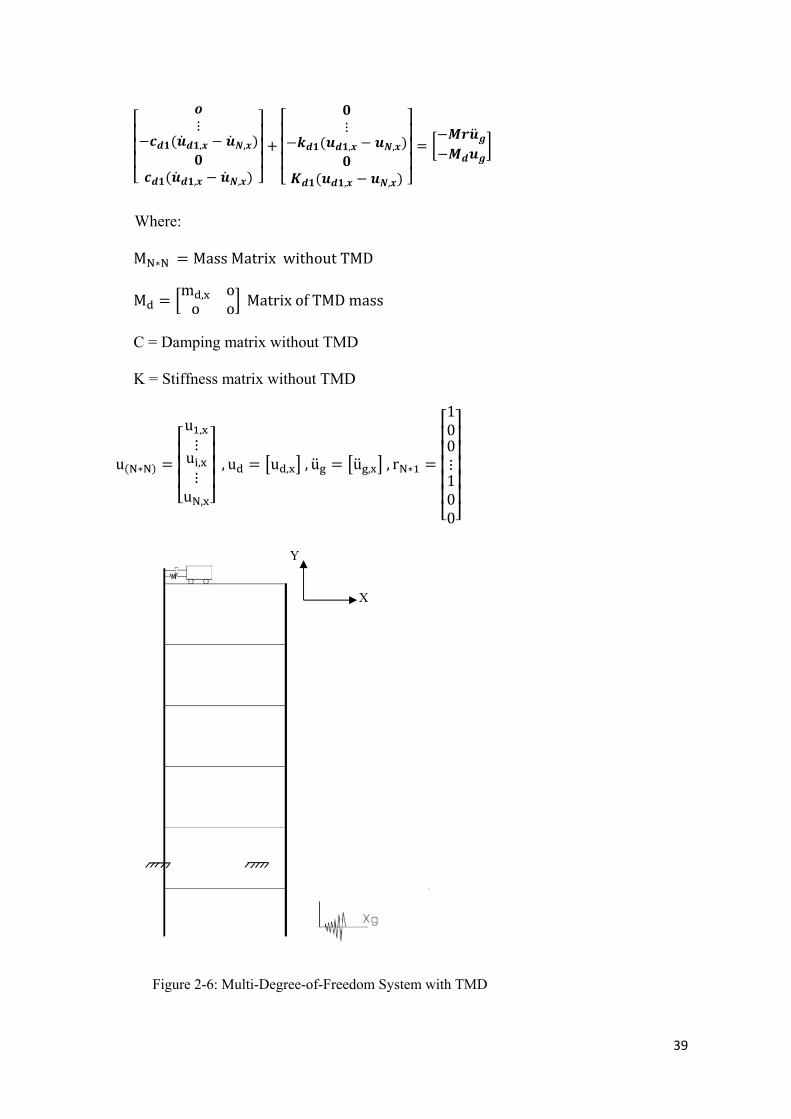
39
⋮, ,
, ,
⋮, ,
, ,
Where:
M ∗ MassMatrixwithoutTMD
Mm , oo o MatrixofTMDmass
C = Damping matrix without TMD K = Stiffness matrix without TMD
u ∗
u ,
⋮u ,
⋮u ,
, u u , , u u , , r ∗
100⋮100
Figure 2-6: Multi-Degree-of-Freedom System with TMD
X
Y
40
2.5.1.1.2 Determining TMD Parameters
In the first step, in designing the TMD mass, frequency and damping coefficient must
be defined. Mass of a TMD is a percent of the first modal mass (or the mode that the
TMD is tuned to control it) and the frequency of motion of a TMD is percentage of the
main frequency of the same mode (Clark 1988). Choice of damping coefficient is
somewhat arbitrary; but, it must be realistic and practical. If T is the first mode period of a
building, a TMD, with a natural period in the range of T- ε to T+ε, is chosen in order to
remain effective. The optimal damping ratio of TMD is adopted from Den Hartog's
recommendations (Rana and Soong 1998):
∗ ∑
∑ ,
MTMD μ ∗
ωTMD=γfω
KTMD=MTMDω TMD
CTMD=2ζTMDMTMDωTMD
(2-11)
CoefficientsM,γ , and ζTMD must be defined beforehand. The last step in designing the
TMD is to check and verify that TMD provides responses which are within the acceptable
responses of the building; otherwise, the design process is repeated.
2.5.1.2 Tuned Liquid dampers
Another idea to reduce the vibration of the primary structure is to use the tuned
liquid dampers (TLDs), as shown in Figure 2-7, Tuned liquid dampers, encompassing
both tuned sloshing dampers (TSDs) and tuned liquid column dampers (TLCDs), have
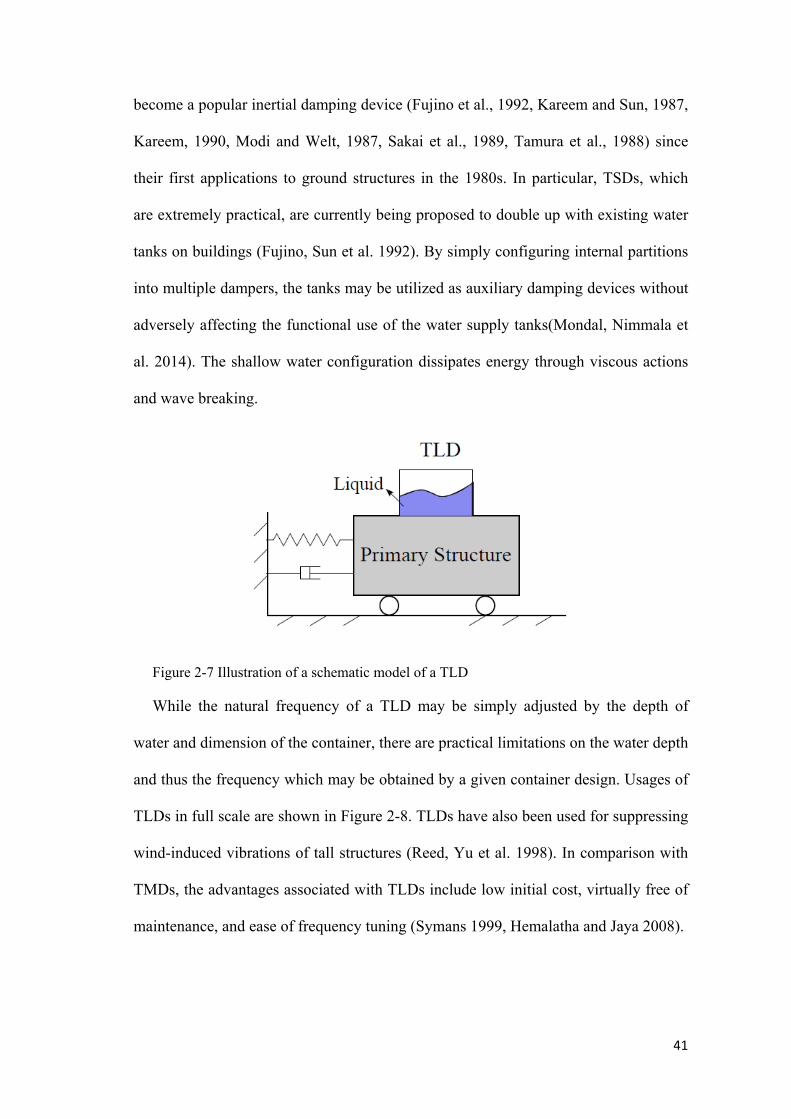
41
become a popular inertial damping device (Fujino et al., 1992, Kareem and Sun, 1987,
Kareem, 1990, Modi and Welt, 1987, Sakai et al., 1989, Tamura et al., 1988) since
their first applications to ground structures in the 1980s. In particular, TSDs, which
are extremely practical, are currently being proposed to double up with existing water
tanks on buildings (Fujino, Sun et al. 1992). By simply configuring internal partitions
into multiple dampers, the tanks may be utilized as auxiliary damping devices without
adversely affecting the functional use of the water supply tanks(Mondal, Nimmala et
al. 2014). The shallow water configuration dissipates energy through viscous actions
and wave breaking.
Figure 2-7 Illustration of a schematic model of a TLD
While the natural frequency of a TLD may be simply adjusted by the depth of
water and dimension of the container, there are practical limitations on the water depth
and thus the frequency which may be obtained by a given container design. Usages of
TLDs in full scale are shown in Figure 2-8. TLDs have also been used for suppressing
wind-induced vibrations of tall structures (Reed, Yu et al. 1998). In comparison with
TMDs, the advantages associated with TLDs include low initial cost, virtually free of
maintenance, and ease of frequency tuning (Symans 1999, Hemalatha and Jaya 2008).

42
Figure 2-8: TLD used in Rincon Hill (the first U.S. residential tower) (Soong and Spencer 2002)
Each TLCD has a broad horizontal chamber at the bottom with a column of water
at each end. The dampers work by allowing the water to move back and forth along
the bottom chamber of the tank and up into the columns (Soong and Dargush 1997,
Soong and Spencer 2002).
2.5.1.3 Multiple Tuned Mass Dampers
In order to overcome the aforementioned limitations in a TMD, multiple Tuned
Mass Dampers (MTMDs) were proposed, analyzed and tested. As its name suggests,
MTMDs consists of a number of TMDs which are attached to the primary structure in
parallel as illustrated in Figure 2-9, or in series as illustrated in Figure 2-10. Hereby,
the MTMDs in parallel are introduced first.
Figure 2-9 Schematic model of multiple TMD (MTMDs) in parallel
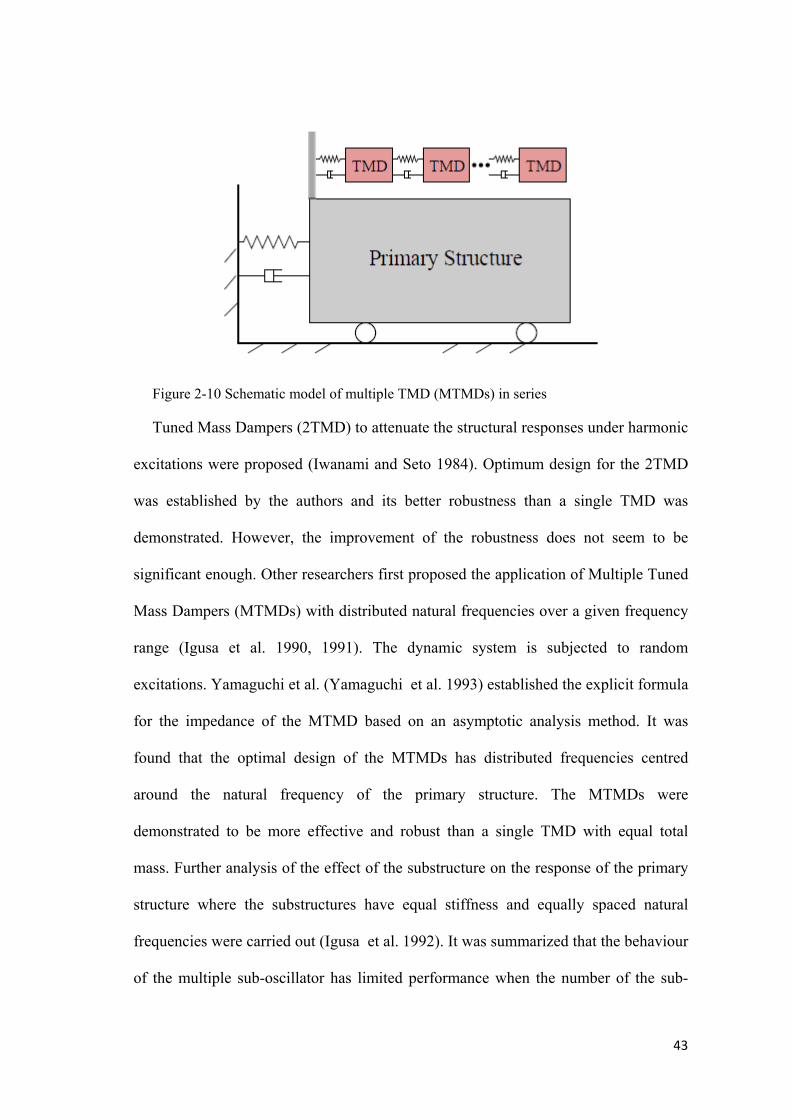
43
Figure 2-10 Schematic model of multiple TMD (MTMDs) in series
Tuned Mass Dampers (2TMD) to attenuate the structural responses under harmonic
excitations were proposed (Iwanami and Seto 1984). Optimum design for the 2TMD
was established by the authors and its better robustness than a single TMD was
demonstrated. However, the improvement of the robustness does not seem to be
significant enough. Other researchers first proposed the application of Multiple Tuned
Mass Dampers (MTMDs) with distributed natural frequencies over a given frequency
range (Igusa et al. 1990, 1991). The dynamic system is subjected to random
excitations. Yamaguchi et al. (Yamaguchi et al. 1993) established the explicit formula
for the impedance of the MTMD based on an asymptotic analysis method. It was
found that the optimal design of the MTMDs has distributed frequencies centred
around the natural frequency of the primary structure. The MTMDs were
demonstrated to be more effective and robust than a single TMD with equal total
mass. Further analysis of the effect of the substructure on the response of the primary
structure where the substructures have equal stiffness and equally spaced natural
frequencies were carried out (Igusa et al. 1992). It was summarized that the behaviour
of the multiple sub-oscillator has limited performance when the number of the sub-

44
oscillators becomes large and the natural frequency becomes closely spaced. The
behaviour of the multiple sub-oscillator can be represented by an equivalent damping
when the natural frequencies span a sufficiently wide range. It was demonstrated that
the effectiveness of the sub-oscillators is more significant than that of an equivalent
single TMD when the damping of the primary structure is limited to low values. The
fundamental characteristics of the MTMDs under harmonic loadings was investigated
(Yamaguchi 1993). Analytical steady-state solutions for the primary structure and
each of the MTMD were obtained. Effectiveness and robustness of the design
parameters (frequency range, damping ratio, number of TMDs) were evaluated
numerically based on the analytical solution. The results confirmed the advantage of a
MTMD over a single TMD in reduction effectiveness and robustness.
Furthermore, the authors revealed that there exists an optimum MTMD for the
given total number of TMDs with the optimum frequency range and the optimum
damping ratio. Abe and Fujino (Abe et al. 1994) studied the modal properties of the
MTMD-structure system and the effectiveness of the MTMD. Closed-form solutions
for the modal properties (modal frequencies, damping and shapes) of the MTMD-
structure system were derived using perturbation technique. Based on the closed-form
solutions, the reduction effectiveness was examined through evaluating the equivalent
damping added to the primary structure from the MTMD, revealing that an optimum
damping ratio exists for the MTMD. The authors also proposed a critical bandwidth of
the natural frequencies for the MTMD to make multiple tuning for the MTMD. Based
on the overall results, a general design procedure regarding the mass ratio, the number
of TMD, the damping ratio is summarized in the paper.
45
Abe and Igusa (Abe et al. 1995) further analyzed the performance of the MTMD
used in structures with multiple vibration modes. Analytical results were obtained
based on perturbation theory. It was illustrated that for structures with widely spaced
natural frequencies, the response can be approximated by the response of the well-
known single-mode structure/TMD system. In comparison, for structures with “p”
closely spaced natural frequencies, at least “p” TMDs are needed to control the “p”
closely spaced modes. In addition, the placement of the TMDs in the case of structures
with “p” closely-spaced modes is demonstrated to be important. When the TMDs are
placed inappropriately, their effectiveness will be limited. It was also found in the
paper that the coupling of the closely spaced modes can be reduced by using certain
TMD parameters and placements. The original system can be approximately
represented by a set of decoupled SDOF structure/TMD systems.
The dynamic characteristics and effectiveness of the MTMDs under random
excitations which were represented by wind and seismic loadings were evaluated
(Kareem et al. 1995). Qualitatively similar findings were obtained as that concluded
under harmonic loadings. Furthermore, it was found that an optimum MTMD exists
when the frequency range, total number of TMDs and damping ratio are selected
optimally. It was also revealed that the MTMD with variable mass dampers or
variable frequency spacing alone, or the combination thereof did not show any distinct
advantage or disadvantage over uniformly distributed mass or frequency MTMD
system. In addition, the frequency range was found to be the most important parameter
in designing a MTMD, then comes the damping ratio and the number of MTMD.
Several research on the effectiveness and robustness of a MTMD under harmonic
ground acceleration were conducted (Li 2000). In the MTMD, the stiffness and the
damping coefficient were fixed while the mass of each of the TMDs were varied to

46
obtain variable frequency and damping ratio. As a comparison, the MTMD with fixed
mass and variable stiffness and damping coefficient is used and referred to as MTMD
(II). It was found that the optimum frequency spacing of the MTMD is the same as
that of the MTMD (II); the average damping ratio of the MTMD is a little larger than
that of the MTMD (II). In addition, it was demonstrated that the optimum MTMD is
more effective than the optimum MTMD (II) and a single optimum TMD.
2.5.1.4 Nonlinear Tuned Mass Dampers (NTMD)
It is well-known that the conventional TMD is sensitive to the structural variation
such as damage, mass variation or other sources. The TMD will lose its effectiveness
in reducing, or will even amplify, the structural responses when the frequency of the
structure shifts. To address the limitations of the TMD, research effort on nonlinear
Tuned Mass Damper (NTMD) with a nonlinear spring as illustrated in Figure 2-11.
Figure 2-11 Schematic model of nonlinear TMD (NTMD)
Roberson (Roberson 1952) first investigated an undamped nonlinear dynamic
vibration absorber consisting of a linear and a hardening cubic spring was investigate.
He defined a ‘suppression bandwidth’ as a frequency band between the response
peaks over which the normalized primary system response amplitude is less than

47
unity. It was demonstrated that the suppression band for the nonlinear TMD was much
wider than that of a TMD. This finding was later confirmed experimentally by Arnold
(Arnold 1955). Roberson’s work (Roberson 1952) was followed by Pipes (Pipes 1953)
using a hyperbolic sine spring without damping. The author concluded that the
nonlinearity in the spring can prevent the occurrence of sharp resonant peaks and to
introduce odd harmonic components of relatively small amplitude in the motion of the
absorber and primary system. In order to further improve the performance of the
NTMD, the Behaviour of a solid-type NTMD in reducing the primary structure
response was studied (Snowdon 1960). It was demonstrated that an NTMD with a
spring whose stiffness is proportional to frequency and a fixed damping factor can
reduce the resonance of the primary structure considerably.
Alternatives for the spring-dashpot NTMD, such as a triple-element NTMD, were
investigated and indicated that if a third element is introduced in series, a 15% to 30%
reduction can be obtained (Snowdon 1974). However, the promising reduction is quite
sensitive to the tuning of frequency. Meanwhile, Masri (Masri 1972) considered the
forced vibration of a family of piecewise linear two degrees of freedom (DOF)
dissipative non-autonomous systems. Exact solutions were obtained and the
asymptotic stability was confirmed. Analytical results showed that the properly
designed NTMD combing features of dynamic neutralizers, Lanchester dampers, and
impact dampers reduced some of the deficiencies inherent in the system, and was
better than the conventional forms of TMDs. Hunt and Nissen (Hunt et al. 1982)
introduced a viscous damper to an NTMD with a Belleville softening spring.
Softening force-displacement curves were illustrated where the softening nonlinearity
is controlled by the geometry of the Belleville washer. It was demonstrated that the
effective bandwidth could be doubled compared to the case of a conventional linear

48
TMD when a softening nonlinear spring is used. Use of such kinds of softening
nonlinear spring will greatly increase the possibilities of the NTMD to reduce the
unwanted vibrations to an acceptable level. Nissen et al. (Nissen et al. 1985), based on
the design procedure proposed in Hunt’s work (Hunt et al. 1982), realized the optimal
design for a softening NTMD with a Belleville spring from a technical perspective,
aiming to maximize the effective bandwidth. Afterwards, Jordanov et al. (Jordanov et
al. 1989) proposed a numerical method for optimal design for linear and a nonlinear
TMD in undamped and damped primary systems. The method of sounding was
utilized to examine the objective functions and to find the optimal solution under
multi-criteria. The effectiveness of the proposed algorithm for searching the optimal
design was demonstrated in the research.
Natsiavas (Natsiavas 1992) investigated the steady-state solutions and the stability
characteristics of a nonlinear system consisting of a nonlinear primary structure and a
weakly nonlinear TMD. An averaging method was used to obtain the approximate
steady-state solution and Eigen analysis was performed to characterize the stability of
the located oscillations. Two types of stability were encountered: one is the
saddlenode type bifurcation and the other is the Hopf bifurcation. Based on the
obtained steady-state solution, a parametric study was implemented for three cases:
linear primary structure plus nonlinear TMD, nonlinear primary structure with linear
TMD, and nonlinear primary structure with nonlinear TMD. In each case, the
representative result was illustrated. It was indicated that the selection of proper
parameters of the nonlinear TMD would result in substantial improvements and avoid
potentially dangerous effects.
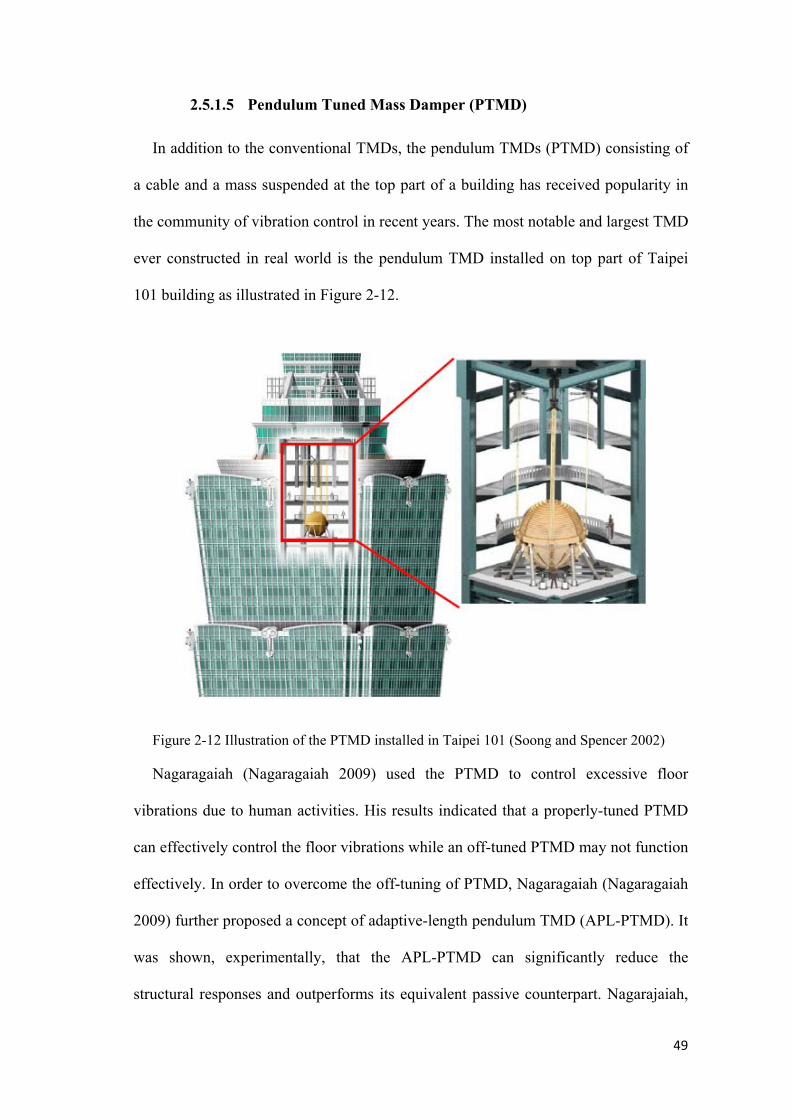
49
2.5.1.5 Pendulum Tuned Mass Damper (PTMD)
In addition to the conventional TMDs, the pendulum TMDs (PTMD) consisting of
a cable and a mass suspended at the top part of a building has received popularity in
the community of vibration control in recent years. The most notable and largest TMD
ever constructed in real world is the pendulum TMD installed on top part of Taipei
101 building as illustrated in Figure 2-12.
Figure 2-12 Illustration of the PTMD installed in Taipei 101 (Soong and Spencer 2002)
Nagaragaiah (Nagaragaiah 2009) used the PTMD to control excessive floor
vibrations due to human activities. His results indicated that a properly-tuned PTMD
can effectively control the floor vibrations while an off-tuned PTMD may not function
effectively. In order to overcome the off-tuning of PTMD, Nagaragaiah (Nagaragaiah
2009) further proposed a concept of adaptive-length pendulum TMD (APL-PTMD). It
was shown, experimentally, that the APL-PTMD can significantly reduce the
structural responses and outperforms its equivalent passive counterpart. Nagarajaiah,
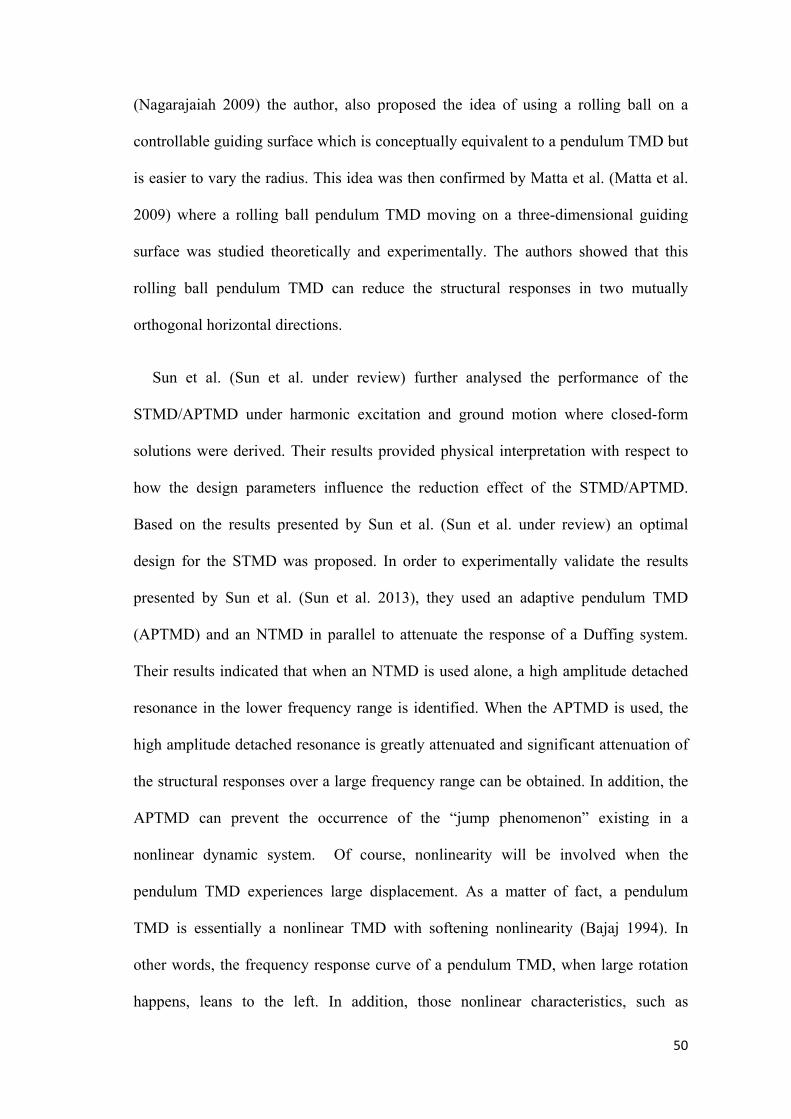
50
(Nagarajaiah 2009) the author, also proposed the idea of using a rolling ball on a
controllable guiding surface which is conceptually equivalent to a pendulum TMD but
is easier to vary the radius. This idea was then confirmed by Matta et al. (Matta et al.
2009) where a rolling ball pendulum TMD moving on a three-dimensional guiding
surface was studied theoretically and experimentally. The authors showed that this
rolling ball pendulum TMD can reduce the structural responses in two mutually
orthogonal horizontal directions.
Sun et al. (Sun et al. under review) further analysed the performance of the
STMD/APTMD under harmonic excitation and ground motion where closed-form
solutions were derived. Their results provided physical interpretation with respect to
how the design parameters influence the reduction effect of the STMD/APTMD.
Based on the results presented by Sun et al. (Sun et al. under review) an optimal
design for the STMD was proposed. In order to experimentally validate the results
presented by Sun et al. (Sun et al. 2013), they used an adaptive pendulum TMD
(APTMD) and an NTMD in parallel to attenuate the response of a Duffing system.
Their results indicated that when an NTMD is used alone, a high amplitude detached
resonance in the lower frequency range is identified. When the APTMD is used, the
high amplitude detached resonance is greatly attenuated and significant attenuation of
the structural responses over a large frequency range can be obtained. In addition, the
APTMD can prevent the occurrence of the “jump phenomenon” existing in a
nonlinear dynamic system. Of course, nonlinearity will be involved when the
pendulum TMD experiences large displacement. As a matter of fact, a pendulum
TMD is essentially a nonlinear TMD with softening nonlinearity (Bajaj 1994). In
other words, the frequency response curve of a pendulum TMD, when large rotation
happens, leans to the left. In addition, those nonlinear characteristics, such as

51
bifurcation and chaos within a nonlinear dynamic system can also result when a
pendulum TMD is used. Research efforts on this aspect can be found in Lee et al. (Lee
et al. 1999) and Song et al. (Song et al. 2003).
2.5.1.6 Base Isolation
Through a proper initial design or subsequent modifications, building or non-building
structures could survive the impact of a potentially devastating seismic impact (Kitagawa
and Midorikawa 1998). In these systems, a flexible isolation system is introduced between
the foundation and superstructure to increase the natural period of the system. Increment
in flexibility typically results in the deflection of a major portion of the earthquake
energy, reducing accelerations in the superstructure, while increasing the displacement
across the isolation level.
Figure 2-13: Difference between lateral deformation in controlled and uncontrolled
systems (Otani 1981)
It can be applied both to a newly-designed building and to seismic upgrading of the
existing structures (Zhou and Xian 2001). Normally, excavations are made around the
building and the building is separated from the foundations (Soong and Spencer

52
2002). Steel or reinforced concrete beams replace the connections to the foundations
by the isolating pads or base isolators. The base isolation tends to restrict transmission
of the ground motion to the building; it also keeps the buildings' position properly
over the foundation (Seki, Vacareanu et al. 2008). By their response to an earthquake
impact, all isolation units may be divided into two basic groups: shear units and
sliding units. This technology can be used both for new structural design and seismic
retrofitting (Jangid and Kelly 2001). The difference between roof displacement of
controlled and uncontrolled systems and the shape of foundation of a structure with
base isolation controller are shown in Figure 2-13 (Otani 1981)
2.5.1.7 Viscous Fluid Dampers (VF)
Viscous Fluid damper operates based on the principle of fluid flow through orifices.
They dissipate energy through the movement of a piston in a highly VF based on the
concept of fluid orificing, i.e. a stainless steel piston moves through the chambers that are
filled with inert, non-flammable, and non-toxic silicone oil that remains stable for over
long periods of time (Taylor and Constantinou 1998). The pressure difference between the
two chambers causes silicone oil to flow through an orifice in the piston head and seismic
energy is transformed into heat, which dissipates into the atmosphere (Taylor and Duflot
2005). These devices are attractive for incorporation in diagonal bracing systems. By
requiring no external power source and little maintenance, they have become very
attractive for structural applications. Viscous fluid dampers used in a steel bridge structure
are shown in Figure 2-14.

53
Figure 2-14: Typical viscous fluid dampers used in diagonal bracings (Hemalatha and Jaya 2008)
Viscous Fluid dampers typically exhibit very high energy dissipation capacity in
comparison to their physical size (Jagadish, Prasad et al. 1979, Kitagawa and Midorikawa
1998). This form of damper dissipates energy by applying a withstanding force over a
finite displacement through the action of a piston forced through a fluid-filled chamber for
a completely viscous, linear behaviour, or in a damping wall which uses a full-storey steel
plate traveling in a wall filled with viscous materials to provide added damping (Carlson
and Jolly 2000).
2.5.1.8 Viscoelastic Dampers (VE)
Viscoelastic materials used in structural applications are usually copolymers or glassy
substances that dissipate energy through shear deformation. Therefore, energy dissipation
takes place when relative movements occur between the centre plate and the outer steel
flanges. In order to incorporate the mechanical effects from VE dampers into the
structural dynamic design, it is important to use a proper force-deformation model to
correctly describe the frequency dependence of the damper (Fu and Kasai 1998). A

54
typical VE damper, which consists of VE layers sandwiched between steel plates is
shown in Figure 2-15. Therefore, energy dissipation takes place when relative
movements occur between the central plate and the outer steel flanges.
Figure 2-15: Typical VE Damper Configuration (Soong and Spencer 2002)
2.5.2 Semi-Active Controllers
A semi-active control system may be defined as a system which typically requires a
small external power source for operation (e.g. Battery) and utilizes motion of the
structure to develop control forces. The magnitude of control force can be adjusted by
the external power source (Aldemir 2003). Control forces are improved based on the
feedback from the sensors that measure the excitation and/or response of the structure.
In general, the performance of the structure with the semi-active control system is
superior to the one with a passive control system, while simultaneously requiring
smaller control forces (Ji, Moon et al. 2005). A semi-active control system is generally
originated from a passive control system which has been subsequently modified to
allow for the adjustment of mechanical properties. Control forces are developed
through an appropriate (based on a pre-determined control algorithm) adjustment of
the mechanical properties of the semi-active control system. Furthermore, control
forces in many semi-active control systems initially act to oppose the motion of the
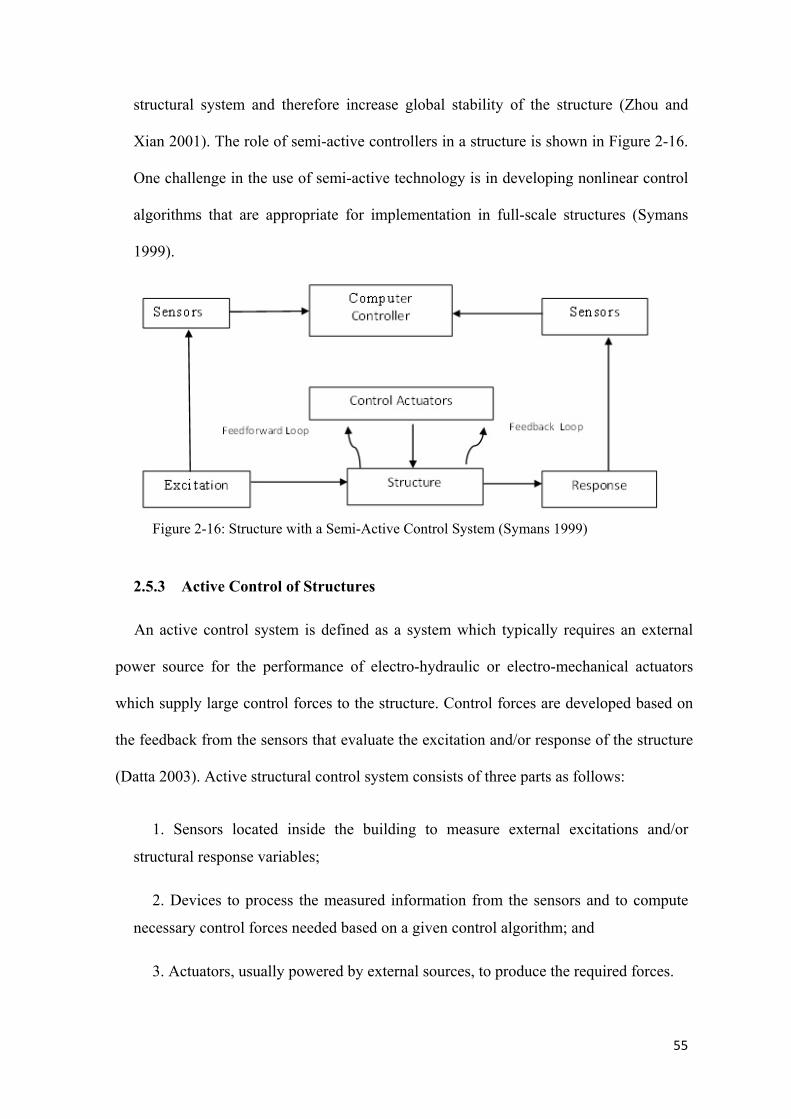
55
structural system and therefore increase global stability of the structure (Zhou and
Xian 2001). The role of semi-active controllers in a structure is shown in Figure 2-16.
One challenge in the use of semi-active technology is in developing nonlinear control
algorithms that are appropriate for implementation in full-scale structures (Symans
1999).
Figure 2-16: Structure with a Semi-Active Control System (Symans 1999)
2.5.3 Active Control of Structures
An active control system is defined as a system which typically requires an external
power source for the performance of electro-hydraulic or electro-mechanical actuators
which supply large control forces to the structure. Control forces are developed based on
the feedback from the sensors that evaluate the excitation and/or response of the structure
(Datta 2003). Active structural control system consists of three parts as follows:
1. Sensors located inside the building to measure external excitations and/or
structural response variables;
2. Devices to process the measured information from the sensors and to compute
necessary control forces needed based on a given control algorithm; and
3. Actuators, usually powered by external sources, to produce the required forces.
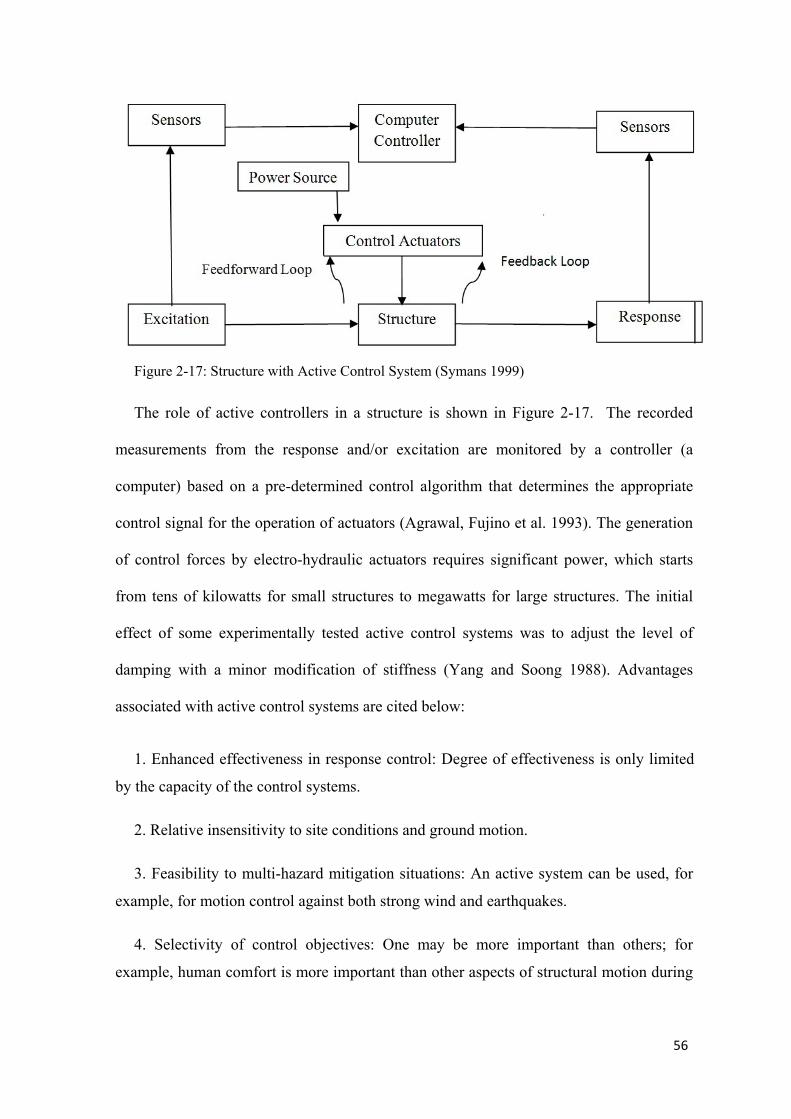
56
Figure 2-17: Structure with Active Control System (Symans 1999)
The role of active controllers in a structure is shown in Figure 2-17. The recorded
measurements from the response and/or excitation are monitored by a controller (a
computer) based on a pre-determined control algorithm that determines the appropriate
control signal for the operation of actuators (Agrawal, Fujino et al. 1993). The generation
of control forces by electro-hydraulic actuators requires significant power, which starts
from tens of kilowatts for small structures to megawatts for large structures. The initial
effect of some experimentally tested active control systems was to adjust the level of
damping with a minor modification of stiffness (Yang and Soong 1988). Advantages
associated with active control systems are cited below:
1. Enhanced effectiveness in response control: Degree of effectiveness is only limited
by the capacity of the control systems.
2. Relative insensitivity to site conditions and ground motion.
3. Feasibility to multi-hazard mitigation situations: An active system can be used, for
example, for motion control against both strong wind and earthquakes.
4. Selectivity of control objectives: One may be more important than others; for
example, human comfort is more important than other aspects of structural motion during

57
noncritical times, whereas increased structural safety may be the objective during severe
dynamic loading (Soong and Spencer 2002).
Three major classes of control systems described above are sometimes combined to
form a new kind of controller called hybrid control systems (Tabuada 2009). Hybrid
control systems consist of combined passive and active devices or combined passive and
semi-active devices. The role of hybrid controllers in a structure is shown in Figure 2-18
(Yang and Agrawal 2002).
Figure 2-18: Structure with a Hybrid Control System (Symans 1999)
2.6 Analytical Method for Analysing Nonlinear Systems
Because a nonlinear dynamic system is very difficult to analyse directly,
researchers resorted to seek the approximate solutions. Perturbation methods, which
are widely used in the field of nonlinear dynamics, are a technique in which an
approximate solution is achieved in an asymptotic fashion. This approach can produce
accurate results for weakly nonlinear structure experiencing relatively small
oscillations. However, its accuracy will be weakened when strong nonlinearity and
large displacement is experienced by the system.
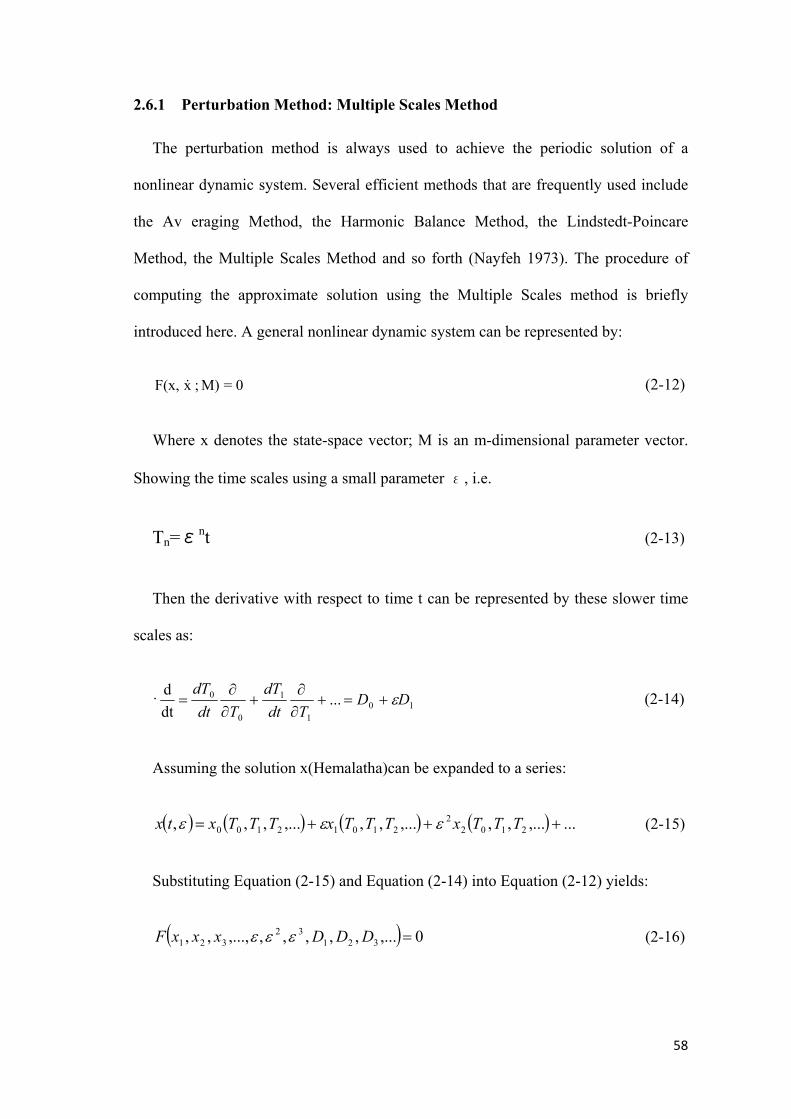
58
2.6.1 Perturbation Method: Multiple Scales Method
The perturbation method is always used to achieve the periodic solution of a
nonlinear dynamic system. Several efficient methods that are frequently used include
the Av eraging Method, the Harmonic Balance Method, the Lindstedt-Poincare
Method, the Multiple Scales Method and so forth (Nayfeh 1973). The procedure of
computing the approximate solution using the Multiple Scales method is briefly
introduced here. A general nonlinear dynamic system can be represented by:
(2-12)
Where x denotes the state-space vector; M is an m-dimensional parameter vector.
Showing the time scales using a small parameter ε, i.e.
Tn=εnt (2-13)
Then the derivative with respect to time t can be represented by these slower time
scales as:
· (2-14)
Assuming the solution x(Hemalatha)can be expanded to a series:
(2-15)
Substituting Equation (2-15) and Equation (2-14) into Equation (2-12) yields:
(2-16)
0 = M); x F(x,
101
1
0
0 ...dt
d DDTdt
dTTdt
dT
...,...,,,...,,,...,,, 21022
21012100 TTTxTTTxTTTxtx
0,...,,,,,,...,,, 32132
321 DDDxxxF
59
Since the small parameter ε is arbitrary, the coefficients of the ε with different
orders should equal zero to make the equation hold, i.e. Then a set of equations are
obtained. Solving these equations from the low order term to high order term yields
the expression for x1, x2, x3….Eventually, the frequency response function, which is a
nonlinear algebraic equation, can be obtained by means of eliminating the scalar
terms. Then the frequency response curve can be calculated through numerically
solving the nonlinear algebraic equation. Because the solution of the frequency
response function is multi-valued for which the stability needs to be determined. This
is discussed in the following subsection.
2.6.2 Local Stability Analysis
Stability of the solution needs to be determined through eigen analysis. The general
Equation (2-12) can be written as:
(2-17)
Let X0(t) be the solution of the system at parameter M0, i.e. X0(t) = G(t;M0). Adding
a small disturbance y(t) to X0(t), i.e.
x(t) = X0(t)+y(t) (2-18)
Substituting Equation (2-18) into Equation (2-17), expanding the result and
retaining the linear terms in disturbance produces:
(2-19)
Equation (2-19) reduces to:
M)xG(t; x
2
000 )();(
)MG(t; M)y(t); (t)G(X (t)y (t)X yOtyxMtG
60
(2-20)
Local stability of the solution X0 can be determined be means of analyzing the eigen
values of the matrix A. If A is a constant matrix, its eigen value and eigen vector can
be calculated directly. Otherwise, Floquet theory is needed to determine the local
stability also by means of analyzing the eigen value of a monodromy matrix (Nayfeh
1995). If the real part of all the eigen values are negative, the disturbance will
eventually vanish and the examined solution is asymptotically stable. On the other
hand, the solution is unstable if the real part of the eigen values are positive. In the
case that the real part of the eigen value is zero, bifurcations will occur, which can be
analyzed by keeping higher order terms when Taylor expanding Equation (2-18). In
addition, if the real eigen value changes sign, a Saddle-node bifurcation might occur
and if a pair of complex conjugate eigenvalues whose real part changes sign, the Hopf
bifurcation resulting in quasi-periodic oscillations might occur. It is noted that the
rules listed here are general description for determining the local stability of the
solution.
2.7 Numerical Methods for Analysing Nonlinear Systems
In comparison with the analytical methods, numerical approaches are suitable for
solving problems involving strong nonlinearity and large displacement. With the rapid
progress of computers and high-performance computing (HPC), numerical
computation is playing a more and more important role in the field of science and
technology. As for computing the solutions for nonlinear systems, two methods are
always used: one is the Time Integration Method and the other is the parameter
Continuation Method. The following subsections will introduce the principles of each
of the two methods.
)yMA(t; (t)y 0
61
2.7.1 Time Integration Method
The most direct numerical method for computing the periodic solutions of a
dynamic system is the so-called brute-force approach (Nayfeh 1995) which is
essentially based on time integration. In this approach, the system is integrated at a
given initial condition for a long enough time until the steady-state solution is reached.
The advantage of this approach is that it is clear and easy to implement. Meanwhile, it
is very general because it can calculate fixed points, periodic solutions, quasi-periodic
solutions and chaotic solutions. Mathematically, a dynamic system can be represented
by a set of ordinary differential equations (ODEs) or partial differential equations
(PDEs) together with the initial values (IV) and the boundary values (BV). Problems
with initial values are referred to as IVP and the latter is BVP.
Approximate numerical solutions for the IVP can be obtained through time
integration. Generally, the numerical methods for IVP can fall into two large
categories: explicit method and implicit method. Explicit method, as the name
suggests, the value of the variables at the right hand side (R.H.S.) of an equation at
each time step are known; hence, no iterations are needed to compute the value for the
next step. In comparison, there are unknown variables at the R.H.S. when computing
the value for the next time step and iterations are performed until the convergence
criterion is satisfied. Generally, the implicit method has higher order accuracy and is
more stable than the explicit method. Forward Euler method, the Runge-kutta method,
and the Gaussian quadrature method belong to explicit methods. Implicit methods
include Back Euler method, the Adams-Moulton method (JohnC 2003), the well-
known Newmark-β method which is widely used in structural engineering and so
forth.

62
2.7.2 Continuation Method
Although the time-integration method is simple and general, it has several
disadvantages:
(1) for lightly damped system, the convergence can be very slow because the
transient response takes a long time to decay, (2) not all the unstable solutions can be
located by reversing the direction of integration and, (3) it is difficult to judge whether
the steady-state solution is achieved. In order to overcome these drawbacks, a more
direct approach is proposed and used here.
In comparison with the time integration method, Continuation method for periodic
solutions computes the solution through generating a continuum of periodic solutions
with respect to a control parameter, say α, rather than direct time integration. The
solution seeking procedure starts from an initial guess, say x0, which is the solution
corresponding to the starting point of the continuation parameter, say α0. The initial
guess can be obtained either analytically or numerically. Then the continuation
parameter α is varied from α0 to α1 and the initial solution x0 is updated to x1 by
means of solving a set of algebraic equations resulting from discretizing the original
dynamic system. The procedure is similar to that for solving boundary value problems
(BVPs). Arc length method, which is widely used in BVPs, is used in some softwares,
like DERPER (Holodniok 1984). Another similar method, Pseudo-Archlength method
(Doedel 1986, 1991) which uses a pseudo-arc length constraint equation (arc length
constraint equation is used in the Arc length continuation method), is used in AUTO
(Doedel 1987) bifurcation and continuation software. The principle behind the Arc
length method and the Pseudo-Arc length method are illustrated here:
63
Arc length Continuation
For a dynamic system defined by Equation (2-12), let x(T(s), )(s), )(s)) with period
T(s) be a periodic solution of the equation, where the arc length s is used as the
continuation parameter and η denotes the state-space variable. Hence, the solution
x(T(s), n(s), n(s)) satisfies the following equation:
G(T(s,f), the following equations,− η(s) = 0 (2-21)
with the initial condition: x(T(0), )(0), )(0)) = η(0). Differentiating Equation (2-
21) with respect to s yields:
(2-22)
where (˙) denotes derivative with respect to s; ∂ den is a n×n matrix, ∂atri is a
n×1 matrix, ∂ maT is a n×1 matrix. Equation (2-22) contains n linear algebraic
equations while the system has (n+ 2) unknowns . Therefore, two additional
equations are needed. One additional equation comes from the Euclidean arc length
normalization:
(2-23)
Another equation is specified in the form of a phase condition, i.e. one variable ηk
in the vector η along the continuation path is fixed.
(2.24)
0,,G
,,G
,,T
G
TTTT
,,T
122 TT
0s
k
dd

64
With the two additional equations, the (n+2) equations can be solved for the
periodic solution x(T, equ).
Pseudo-Arc length Continuation
The principle behind Pseudo-Arc length Continuation method differs from the Arc
length method in that the two additional equations are specified in a similar but
different manner. The first equation is specified using a phase condition in an integral
form. Let s0 and s be the two consecutive points on the branch; x0 = x(T0, 0, 0),
are the two periodic solutions corresponding to the two points s0 and s. If is a
solution, then is also a solution for any σ. Then the phase condition is
obtained when the distance is minimized with respect to the time variation :
(2-25)
Setting dD(σ)/dd = 0 produces.
(2-26)
Assuming the solution of Eq. (3.15) is σ∗, i.e. (3.14) reduces to:
(2.27)
Integrating Equation (2-27) by parts and using Equation (2-12) produces:
(t)x
x
) +(t x
x-x 0
dtDT 2
0
0 (t)x-)(tx
dtd
T 2
0
0 (t)x-)(tx
) +(t x
dtxxdtxxT
xxdtt TTTTT
00
0
0 02
1(t)x-x(t)
65
(2-28)
The second equation is specified by the pseudo-arc length constraint:
(2-29)
where (˙) designates derivative with respect to the arc length s and δs represents
the step size along the continuation path. Equation (2-22) together with Equation (2-
28) and Equation (2-29) constitute the (n+2) equations for the dynamic system with (n
+ 2) unknowns. Then the solution x(T(s),η(s),α(s)) can be achieved by means of
solving the (n + 2) linear algebraic equations.
2.8 Summary
General information about earthquake and seismic activity, earthquake-resistant
design for structural buildings and review of AS1170.4, Australian Standard, have
been reviewed at the beginning of this chapter. Additionally, an overview with respect
to the research effort focusing on several kinds of those widely used TMDs, including
the conventional passive TMDs, the LTMDs, the NTMDs, the MTMDs and the
STMDs, and the related variable damping and stiffness devices are presented in this
chapter. The TMDs, which have been well understood and widely deployed in real
engineering applications, have their limitations due to the narrow effective
suppression bandwidth. In comparison, The MTMDs and the NTMDs can effectively
broaden the suppression bandwidth. However, the application of NTMDs is more
convenient than that of the MTMDs, which needs a lot of effort in the process of
design and installation. At the same time, it is demonstrated that the STMDs can
dtTxFxxdtxtx TT
TTT
0000
0
00
0
;,,
s
T
TTTdtxxtx 00000
0
0)(

66
provide comparable response reduction to that of the active TMDs yet they require an
order of magnitude less power. Therefore, the NTMDs and the STMDs are the focus
of this thesis. In addition, analytical and numerical methods used to solve nonlinear
dynamic equations have been reviewed in this chapter. To sum up, the Continuation
Method can be used to efficiently and accurately trace stable and unstable solution
branches with respect to a predetermined control parameter. This method is especially
useful in the analysis of nonlinear systems due to the complex and often unpredictable
response behaviour. Additionally, the Psuedo-Arc length method provides the unique
ability to trace folding solution branches. Therefore, in the current thesis, the
bifurcation continuation software AUTO (Doedel 1997), which is based on the
Psuedo-Arc length method, is used to compute the responses of the nonlinear dynamic
systems.

67
CHAPTER 3
LITERATURE REVIEW OF
FAÇADE SYSTEMS

68
3.1 Introduction
A façade is generally one exterior side of a building, usually but not always, the front.
The word comes from French, literally meaning "frontage" or "face". The aluminium
frame which consists of mullions and transoms is normally in-filled with glass that
provides an architecturally pleasing skin as well as advantages such as natural day
lighting. From the architectural viewpoint, facade of a building is very important from
the design standpoint, since it sets the character for the rest of the building. Façade also
provides shielding against environmental factors like wind or rain and provides light and
ventilation to the structure (G. James Glass and Aluminium Pty Ltd 2003, Hareer 2007)
Figure 3-1: Typical components of a façade panel (Olanders Window Replacement 2011)
Fast developments during the 19th century era, when industrial revolution happened,
led to major advances in structural technologies. In the field of facade systems, these
advances resulted in the usage of industrialized components in the installation. Also, size
of facade components and their strength and durability have been improved. After
significant changes in the field of structural design, the role of façade system has become
more noteworthy to be considered. Two famous materials which have been used widely
since 1930 are precast concrete and aluminium (Zhang, Provis et al. 2014). After World
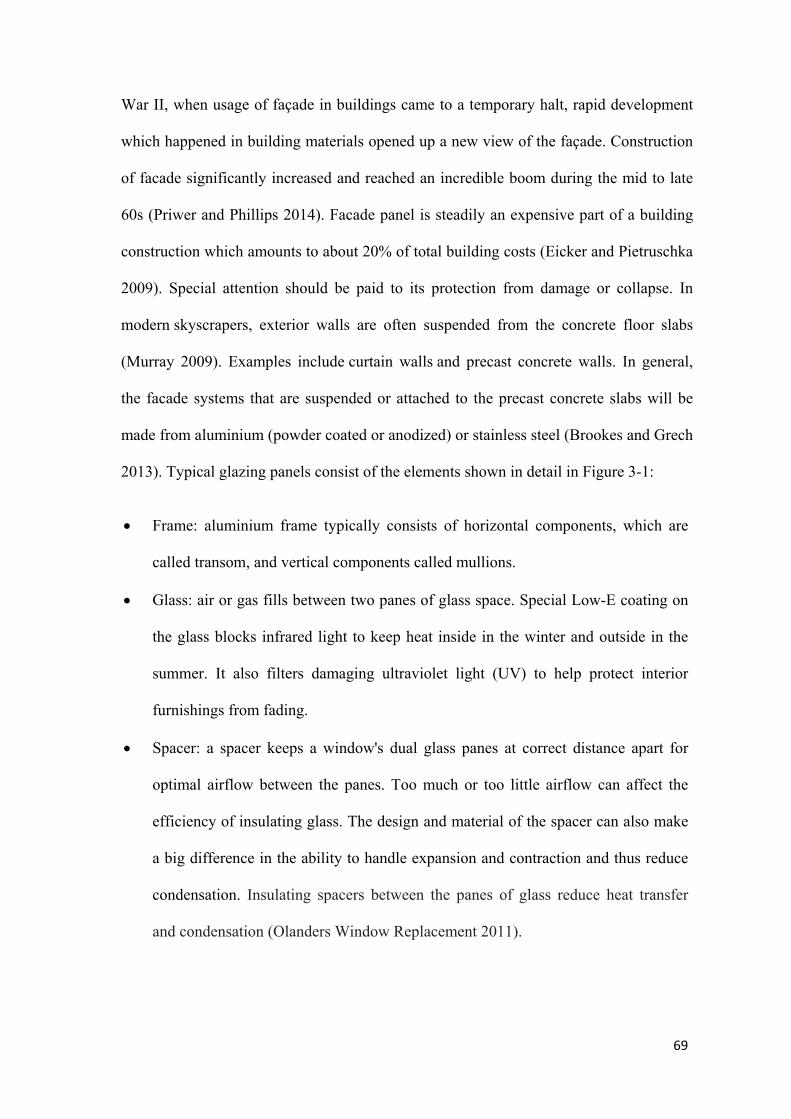
69
War II, when usage of façade in buildings came to a temporary halt, rapid development
which happened in building materials opened up a new view of the façade. Construction
of facade significantly increased and reached an incredible boom during the mid to late
60s (Priwer and Phillips 2014). Facade panel is steadily an expensive part of a building
construction which amounts to about 20% of total building costs (Eicker and Pietruschka
2009). Special attention should be paid to its protection from damage or collapse. In
modern skyscrapers, exterior walls are often suspended from the concrete floor slabs
(Murray 2009). Examples include curtain walls and precast concrete walls. In general,
the facade systems that are suspended or attached to the precast concrete slabs will be
made from aluminium (powder coated or anodized) or stainless steel (Brookes and Grech
2013). Typical glazing panels consist of the elements shown in detail in Figure 3-1:
Frame: aluminium frame typically consists of horizontal components, which are
called transom, and vertical components called mullions.
Glass: air or gas fills between two panes of glass space. Special Low-E coating on
the glass blocks infrared light to keep heat inside in the winter and outside in the
summer. It also filters damaging ultraviolet light (UV) to help protect interior
furnishings from fading.
Spacer: a spacer keeps a window's dual glass panes at correct distance apart for
optimal airflow between the panes. Too much or too little airflow can affect the
efficiency of insulating glass. The design and material of the spacer can also make
a big difference in the ability to handle expansion and contraction and thus reduce
condensation. Insulating spacers between the panes of glass reduce heat transfer
and condensation (Olanders Window Replacement 2011).

70
3.2 Types of Facade Systems
More than 70 different kinds of facade systems have been defined in terms of
shape, weight, and performance by architectural designers. But, generally speaking,
panels are categorized as heavy cladding, light weight cladding, and in-fills, as shown
in Table 3-1. There is also the possibility of a combination of the two called a mixed
system. Cladding is attached externally to the primary structure, whereas in-fills are
constructed within the frame of the structure.
Table 3-1: Different kinds of façade systems
Infills Heavyweight Cladding Lightweight Cladding Glazing Infills Precast concrete panels Curtain wall Masonry Infills Stone panels Stick curtain
- - Spider glazing - - Brick veneer - - Double skin
3.2.1 Infills
Clay bricks or concrete masonry blocks are heavy rigid materials that have been
conventionally used as in-fill units. This type of system is simple to construct and is
particularly prevalent in low- to medium-rise office structures. Masonry in-fill
constructions have been built in medium-risk seismic regions, but not high seismic
regions for several decades because of concerns about their poor seismic performance
and complexity of their interaction with structures (AAMA 501.4 2000). However,
more light weight in-fill panels such as light steel- or timber-framed in-fill walls (dry
walls) are now available (Tasligedik, Pampanin et al. 2012) . In-fill panels are often
combined with a glazing in-fill system consisting of an aluminium frame attached
directly to the in-fill panel or structure (Rice 2006). Some minor in-plane movement
of panels is controlled by rubber gaskets which hold the panes of glass in place (Baird,

71
Palermo et al. 2012). These systems are normally located within the frame of the
structure.
3.2.2 Light Weight Cladding
Lightweight cladding incorporates large sized glazing which in turn includes a
broad range of facade systems where each typology of lightweight cladding can also
include a wide range of systems.
3.2.2.1 Stick System
Stick curtains are very common and versatile and can be used for any kind of
building from glass high-rise to single storey shop fronts (Permasteelisa 2009).
Because of the number of joints in stick curtain walling, it has generally been very
good in accommodating variability and movement in the building frame. It is also
suitable for irregularly-shaped buildings.
Figure 3-2: Stick system façade (Permasteelisa 2009)
Assembly is slower than pre-assembled systems (Walker III, Niemoeller et al.
2011). A typical stick system and its installation are shown in Figure 3-2 and Figure
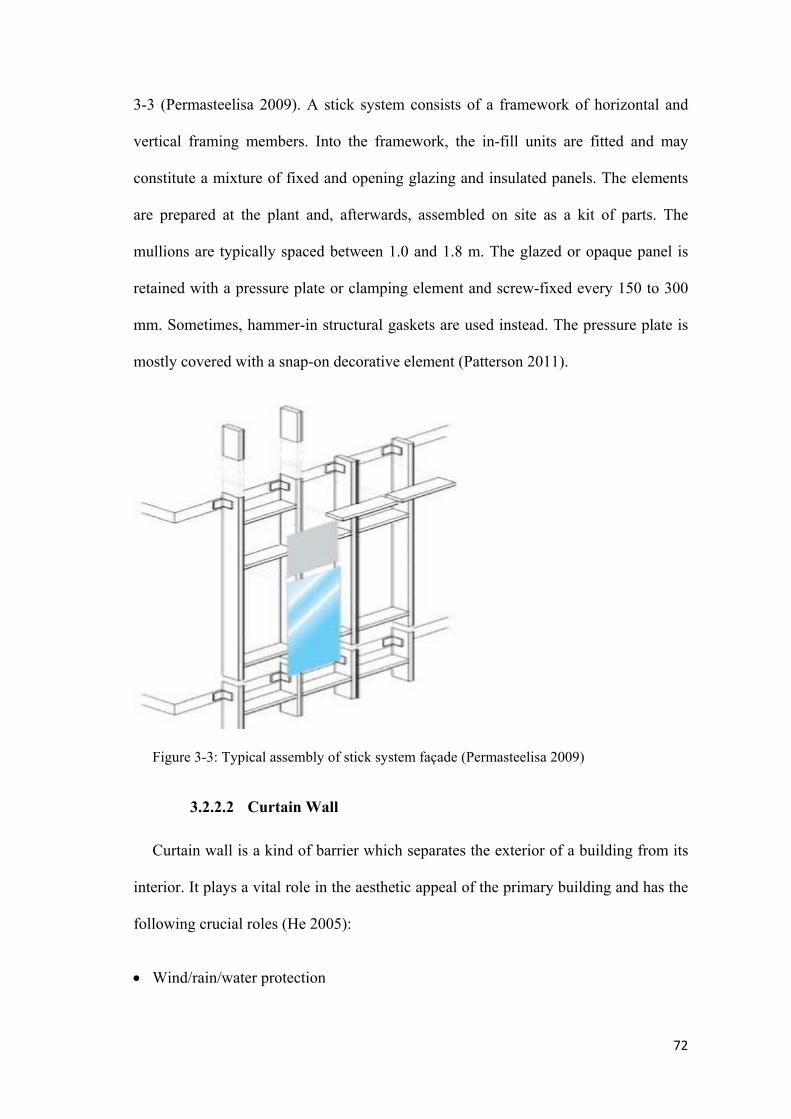
72
3-3 (Permasteelisa 2009). A stick system consists of a framework of horizontal and
vertical framing members. Into the framework, the in-fill units are fitted and may
constitute a mixture of fixed and opening glazing and insulated panels. The elements
are prepared at the plant and, afterwards, assembled on site as a kit of parts. The
mullions are typically spaced between 1.0 and 1.8 m. The glazed or opaque panel is
retained with a pressure plate or clamping element and screw-fixed every 150 to 300
mm. Sometimes, hammer-in structural gaskets are used instead. The pressure plate is
mostly covered with a snap-on decorative element (Patterson 2011).
Figure 3-3: Typical assembly of stick system façade (Permasteelisa 2009)
3.2.2.2 Curtain Wall
Curtain wall is a kind of barrier which separates the exterior of a building from its
interior. It plays a vital role in the aesthetic appeal of the primary building and has the
following crucial roles (He 2005):
Wind/rain/water protection
73
Insulation against hot and cold climates
Protection from noise and pollution
The curtain wall facade does not carry any dead-load from the building other than
its own weight. The wall transfers horizontal wind loads acting upon it to the main
building structure through connections at floors or columns of the building. Curtain
walls are designed to span multiple floors and consider design requirements such as
thermal expansion and contraction, building sway and movement, water diversion and
thermal efficiency for cost-effective heating, and cooling and lighting in the building
(Permasteelisa 2009). Framed-glazed curtain walls are typically designed with
extruded aluminium members although early curtain walls were made of steel. They
are designed to resist air and water infiltration, sway induced by wind and seismic
forces acting on the building, and its own weight. Curtain walls can be divided into
these groups (Kragh and Components 2001):
3.2.2.3 Unitized Curtain Wall
Unitized curtain walls are pre-fabricated; so, mechanical handling is required to
position, align, and fix units onto pre-positioned brackets attached to the concrete
floor slab or structural frame (Speck 2010). They span floor to floor and are anchored
to the building's load-bearing structure. Pre-fabrication of this type of facade allows
for better quality controls, makes installation very quick, does not require the use of
scaffolding, and minimizes work in the worksite with lower installation costs. Typical
unitized curtain walls and their installation are shown in Figure 3-4 and Figure 3-5.
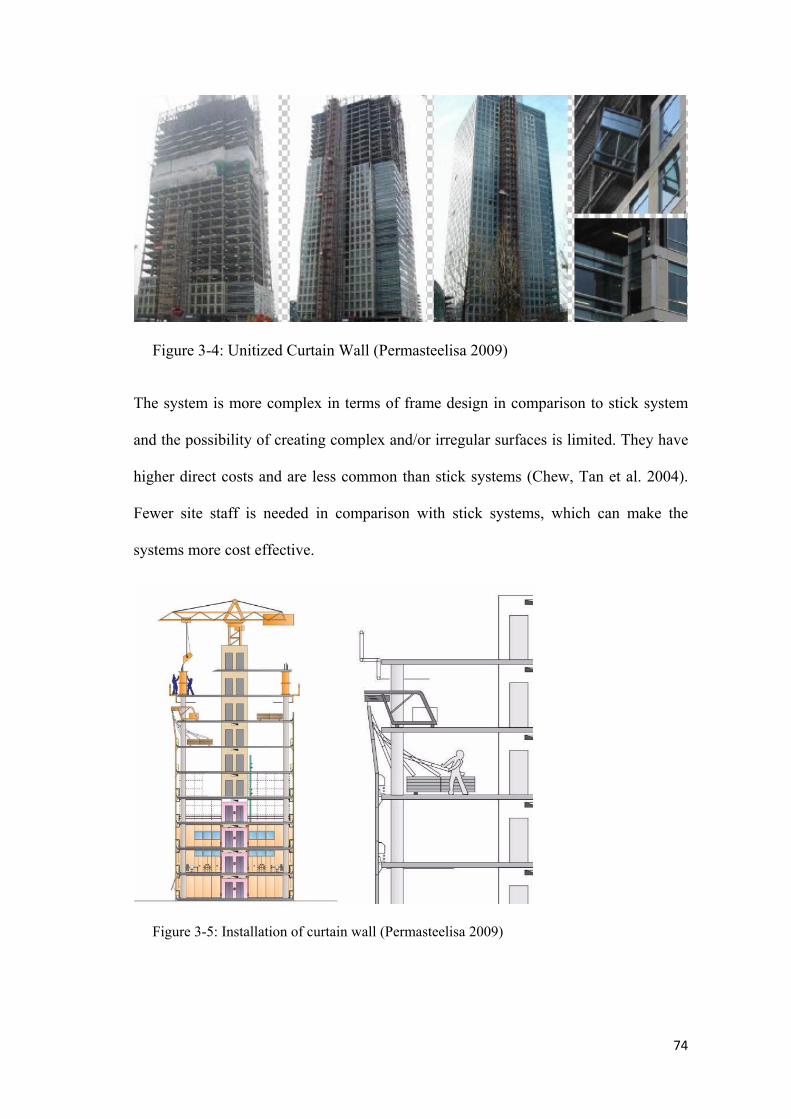
74
Figure 3-4: Unitized Curtain Wall (Permasteelisa 2009)
The system is more complex in terms of frame design in comparison to stick system
and the possibility of creating complex and/or irregular surfaces is limited. They have
higher direct costs and are less common than stick systems (Chew, Tan et al. 2004).
Fewer site staff is needed in comparison with stick systems, which can make the
systems more cost effective.
Figure 3-5: Installation of curtain wall (Permasteelisa 2009)

75
3.2.2.4 Panelized Curtain Wall
Panelised curtain walling is composed of large prefabricated panels of bay width
and storey height, which are connected back to the primary structural columns or to
the floor slabs close to the primary structure (Lindow and Jasinski 2003). Fixing the
panels close to the columns reduces problems due to the slab deflection in the mid
span which affects stick and unitized systems (Webb 1989). Panels may be of precast
concrete or comprise a structural steel framework, which can be used to support most
of the cladding materials (e.g. stone, metal, and masonry). A typical panelized curtain
wall is shown in Figure 3-6.
Figure 3-6: Panelized curtain wall (Permasteelisa 2009)
3.2.2.5 Spandrel Panel Ribbon Glazing
Spandrel panel ribbon glazing is a long or continuous run of vision units fixed
between spandrel panels supported by vertical columns or the floor slabs (Hinman and
Arnold 2010). They can be used in conjunction with spandrel panels, i.e. horizontally
spanning prefabricated or precast concrete units. It may also be used with spandrels
composed of stand walls which are faced with rain screen panels (Mazzoni, Bowser et

76
al. 1976). Typical spandrel panel ribbon glazing system in a multi storey structure is
shown in Figure 3-7.
Figure 3-7: Example of spandrel panel ribbon glazing (Permasteelisa 2009)
3.2.2.6 Bolted Glass Façade
This type of facade is created to fulfil an architectural and functional requirement
for maximum transparency. It eliminates all opaque supporting elements and does not
employ sticks (Vyzantiadou and Avdelas 2004). Glazed panels are suspended using
the lightest possible systems available. There are two different types of glass facades:
the independent assembly and suspended assembly, shown in Figure 3-8 and Figure
3-9 (Carmody, Selkowitz et al. 2004).
Figure 3-8: Independent assembly (Permasteelisa 2009)

77
Figure 3-9: Suspended assembly (Permasteelisa 2009)
3.2.2.7 Double Skin Façade
3.2.2.7.1 Definition
Designing and building energy-efficient residential and commercial buildings is a
priority for building and construction industry. Attention of government
administrators and building owners to environmentally-friendly structures has been
drawn to these state-of-the-art concepts. It is also expected to move to higher star
rating buildings that deliver better energy and thermal efficiency and comfort (Arons
2000). Developments of a new kind of facade systems have been boosted because of
energy performance concerns of previous facade technologies (da Silva and Gomes
2008). Transparency and visual attraction are other crucial factors to be considered in
high glass skyscrapers. Based on those essential elements, double-skin or multi-skin
facade (also known as active envelope) systems are recently presented as a valuable
solution for achieving the aforementioned goals in modern architecture (Poizaris
2004). The double‐skin facade systems are the architectural concept driven by
aesthetics and desire for mostly all‐glass high-rise buildings. They consist of two
panes separated by a cavity through which air can circulate naturally or mechanically.

78
A typical double-skin facade system is shown in Figure 3-10 (Poizaris 2004) . In most
cases, a shading device is provided in the cavity (Hensen, Bartak et al. 2002). Higher
prices due to complexity of design and installation can be justified by their increasing
demands because of wide transparent surfaces and high thermal performance
(Streicher, Heimrath et al. 2007).
Figure 3-10: Typical Double-Skin-Façade System (Poizaris 2004)
For evaluating the installation of double skin facades as a glazing envelope of
buildings, factors of climate, orientation, detailing, and construction cost and energy
price should be considered. They should be evaluated in terms of their relative
advantages in relation to those factors (Poirazis 2008). Double-skin facades can be
described as a traditional single-facade doubled inside or outside by a second and
essentially glazed facade. Apart from the type of the ventilation inside the cavity, the
origin and destination of the air can differ depending mostly on climatic conditions,
usage, location, occupational hours of building, and the HVAC strategy. Each of these
two façade layers is commonly called a skin and these skins are placed in such a way
that air flows in the intermediate cavity (Poirazis 2008). Through the cavity, for
example, hot air can be effectively removed in summer time and also natural

79
ventilation can be introduced even at higher levels of tall buildings, because there are
additional exterior skins which act as wind buffers.
Figure 3-11: Exterior Circulation Double Skin Curtain Wall (Arons 2000)
The glass skins can be single- or double-glazing units and are often for protection
and heat extraction reasons during the cooling period, with solar shading devices
positioned inside the cavity (D. Saelens 2003).
Figure 3-12: Facade detail: Hot expelled at each floor, cool air drawn in (Lee, Selkowitz
et al. 2002)
In Figure 3-11 and Figure 3-12 the way ventilation works in the system is shown
(Arons 2000). The DSF system reduces energy usage in buildings which potentially

80
results in economic benefits in the long run, even though their initial construction cost
is higher than that of conventional single-skin facades (Shameri, Alghoul et al. 2011).
DSFs have the potential to reduce building heating and cooling energy consumption in
several ways; however, not all DSFs built in recent years perform well (Gratia and De
Herde 2007). Furthermore, in most cases, large air-conditioning systems have to make
up for summer overheating problems and energy consumption often exceeds the
intended heating energy savings. Other concerns about DSF performance include fire
safety (fires spreading between floors via the cavity) and their maintenance is costly
(Zhou and Chen 2010).
3.2.2.7.2 History
Jean-Baptiste Jobard, Director of Industrial Museum in Brussels, described an early
version of a mechanically ventilated multiple-skin facade in 1849. He mentioned how
in winter, hot air should be circulated between two glazing, while, in summer, it
should be cold air (Saelens, Roels et al. 2003). The first instance of a double-skin
curtain wall appeared in 1903 in Steiff Factory in Giengen/ Brenz. Priorities were to
maximize day lighting while taking into account the cold weather and strong winds of
the region (Saelens, Blocken et al. 2005). The solution was a three-storey structure
with a ground floor for storage space and two upper floors for work areas. The
structure of the building proved to be successful and two additions were built in 1904
and 1908 with the same double-skin system, but using timber, instead of steel, in the
structure for economic reasons. The building is shown in Figure 3-13 (Streicher,
Heimrath et al. 2007).
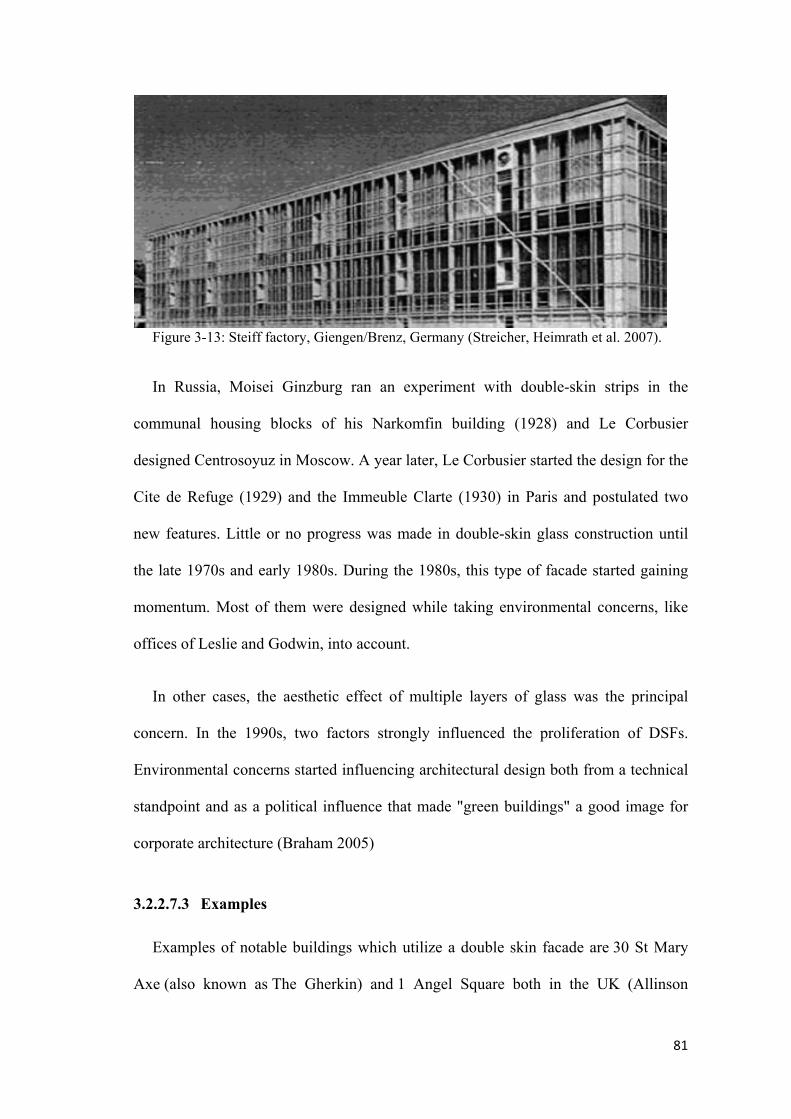
81
Figure 3-13: Steiff factory, Giengen/Brenz, Germany (Streicher, Heimrath et al. 2007).
In Russia, Moisei Ginzburg ran an experiment with double-skin strips in the
communal housing blocks of his Narkomfin building (1928) and Le Corbusier
designed Centrosoyuz in Moscow. A year later, Le Corbusier started the design for the
Cite de Refuge (1929) and the Immeuble Clarte (1930) in Paris and postulated two
new features. Little or no progress was made in double-skin glass construction until
the late 1970s and early 1980s. During the 1980s, this type of facade started gaining
momentum. Most of them were designed while taking environmental concerns, like
offices of Leslie and Godwin, into account.
In other cases, the aesthetic effect of multiple layers of glass was the principal
concern. In the 1990s, two factors strongly influenced the proliferation of DSFs.
Environmental concerns started influencing architectural design both from a technical
standpoint and as a political influence that made "green buildings" a good image for
corporate architecture (Braham 2005)
3.2.2.7.3 Examples
Examples of notable buildings which utilize a double skin facade are 30 St Mary
Axe (also known as The Gherkin) and 1 Angel Square both in the UK (Allinson

82
2007). Both of these buildings achieved great environmental credentials for their size
with the benefits of a double-skin key. The Gherkin features triangular windows on
the outer skin which skelter up the skyscraper. These windows are opened according
to weather and building data and allow more or less air to flow through the building
for ventilation (Roth 2007).
3.2.3 Heavyweight Cladding
Heavy claddings can be defined as having a mass of more than 80 kg/m2 (Baird,
Palermo et al. 2011). Most of the heavy claddings surveyed during previous
earthquakes are precast concrete panel systems; so, the window system inside the
panels could have been classified as a glass in-fill, because the surrounding panels
have such high in-plane stiffness that no allowance for movement is made for these
window systems.
Figure 3-14: Precast facade panel installations (Traulsen and McClellan 2010)

83
Precast concrete panels have been the most popular cladding material used in new
non-residential buildings over the past decade (Palermo, Pampanin et al. 2010). They
can be either storey-height panels that provide multiple architectural functions, or
panels that are purely aesthetic. Typical precast façade panels and their installation are
shown in Figure 3-14 (Traulsen and McClellan 2010).
3.3 Typical Facade Connections and their Inherent Problems
Cladding connections can have numerous configurations; however, they are
typically attached to either the beams or columns of primary structures. Insufficient
connection strength and low damping capability of facade components are reported as
the main cause of failure in most buildings (Palermo, Pampanin et al. 2010). These
elements may be susceptible to excessive inter-storey deformations and noticeable
accelerations. Glass panel’s damage can be a threat to pedestrians and the cause of
additional cost for repair or reinstallation.
Throughout an earthquake excitation, the behaviour of the facade panels is
governed by the cyclic interaction between the panels and the supporting primary
structure and usually three primary effects are applied simultaneously to the facade
and connections. (1) Accelerations of the panel generate inertia forces which are
transmitted from the panel to the main structure via shear loading of the connectors
(Baird, Palermo et al. 2012). (2) Horizontal inter-storey drift resisted by the panels,
which results in horizontal shear forces in the connection, and (3) panel’s gravity load
which is carried by the bearing connections. The success of facade systems is related
to the capability of the facade connections in meeting both strength and ductility
requirements (Hunt 2010).

84
3.3.1 Bearing Connection
For the bearing connections, the connector elements in both horizontal and vertical
directions are assumed to be very stiff and very strong in order to transfer the self-
weight of the panel to the structure. The fixed bearing connections support the gravity
loads of the cladding, whereas light weight claddings are generally fixed to the
structure with connections that do not allow movement; therefore, they must be able to
tolerate relative displacement within the system (Palermo, Pampanin et al. 2010).
3.3.2 Tie-back connection
Tie-back connections have lower stiffness and yield strength; so, they govern the
force that can be carried by the cladding. Tie-back connections are designed to
provide a large level of ductility (Baird, Palermo et al. 2011). Ductile tie-back
connections allow relative movement between cladding and structure; also, they can
deform under in-plane loading while providing out-of-plane support (Metelli and Riva
2007). Tie-back connections must also be capable of withstanding out-of-plane wind
forces on the panel. They are remarkably weaker and less stiff than the bearing
connections and cannot carry sufficient force to ever yield; thus, the panel is assumed
to remain elastic. If a connection fails for any reason, it is preferable to replace the
faulty connection rather than the whole damaged panels (Khoraskani 2015).
3.3.3 Governing Failure Mechanism in Attachment
Cladding system is composed of structural frame members, a connector body, and a
cladding panel linked to each other with strong and stiff attachments. If the in-plane
strength of the cladding panel is greater than that of the connector body, then the
connector body (weakest link of the chain) is expected to govern the overall cladding
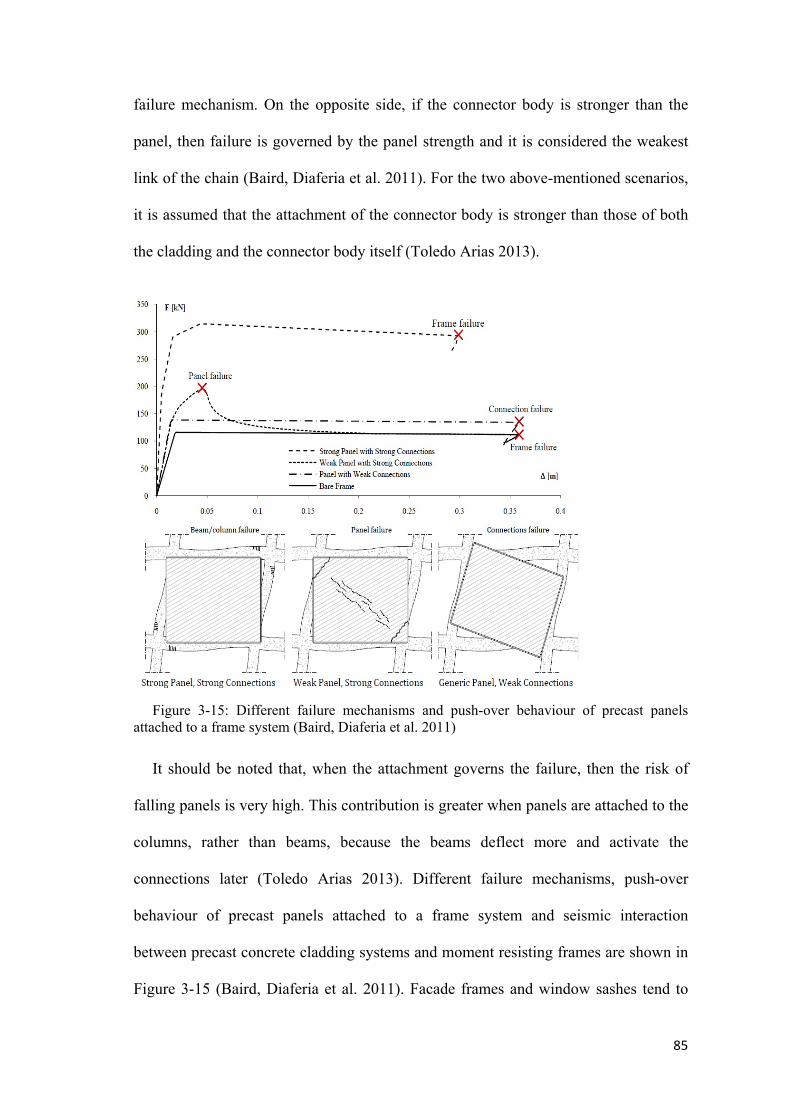
85
failure mechanism. On the opposite side, if the connector body is stronger than the
panel, then failure is governed by the panel strength and it is considered the weakest
link of the chain (Baird, Diaferia et al. 2011). For the two above-mentioned scenarios,
it is assumed that the attachment of the connector body is stronger than those of both
the cladding and the connector body itself (Toledo Arias 2013).
Figure 3-15: Different failure mechanisms and push-over behaviour of precast panels attached to a frame system (Baird, Diaferia et al. 2011)
It should be noted that, when the attachment governs the failure, then the risk of
falling panels is very high. This contribution is greater when panels are attached to the
columns, rather than beams, because the beams deflect more and activate the
connections later (Toledo Arias 2013). Different failure mechanisms, push-over
behaviour of precast panels attached to a frame system and seismic interaction
between precast concrete cladding systems and moment resisting frames are shown in
Figure 3-15 (Baird, Diaferia et al. 2011). Facade frames and window sashes tend to

86
move with local distortion during seismic activities, which result in a change in the
angularity of corners, known as racking, in buildings. Inter-storey drift, which is a
very crucial parameter for deflection and causing damage in structures, can result in
cracking of glass panels during earthquakes. AS 1170.4 (2007), clauses 5.4.4 and
5.5.4, specify that, "the inter-storey drift at the ultimate limit state, calculated from the
forces determined according to strength and stability provisions shall not exceed 1.5%
of the storey height for each level and the attachment of cladding and facade panels to
the seismic-force-resisting system shall have sufficient deformation and rotational
capacity. This requirement is for the ultimate limit state of buildings for seismic
performance and, for a typical 3600 mm heigh floor, it amounts to relative floor to
floor building deflection of 54 mm.
New Zealand Standard "Earthquake actions", NZS 1170.5, (2004) specifies in
clause 7.5 that, a maximum inter-storey drift limit of 2.5% is applicable for the
ultimate limit state for a 500 year Return Period event. In the case of a 2500 year
Return Period near fault event, this limit has to be increased to 3.75%. Drift limits of
2.5 and 3.75% create demands of 90 and 135 mm, respectively, on facade systems
while assuming the storey height of 3600 mm. Council on Tall Buildings, Group SB
(1979), examined the serviceability wind drift criteria from industry sources and
literature and found that drift limits ranging from 0.001 to 0.004 H (H: height of the
building) were used. However, the council stated that buildings designed in the past
have been known to perform satisfactorily when designed for drift limits from 0.002
to 0.005 H. ASCE Task Committee found that most of the designs for institutional,
commercial, and residential building types used drift ratios in the order of 0.002 to
0.0025 H for steel-framed buildings. Unitized curtain wall systems, with the increased

87
usage in glass, are particularly vulnerable during seismic activities and pose the threat
of flying and falling glass.
Numerous and extensive studies have been done after widespread glass damage in
Mexico (1985) and San Francisco (1989) due to devastating earthquakes (Hareer,
Environment et al. 2006). Two main factors should be evaluated when considering
earthquake damage:
How glass systems perform and respond to racking.
How glazing performs after being cracked from frame movement.
Despite extensive studies in the area of seismic loading and response, major
building codes do not address these issues. Areas that are considered in industrial
standards include:
American Architectural Manufacturing Association (AAMA 501.4) has
developed a test method, AAMA 501.4, focusing on serviceability, which does
not address life safety.
National Earthquake Hazards Reduction Program's (NEHRP) guidelines,
published by Federal Emergency Management Agency, cover life safety and
ensure that glass fall-out does not occur due to the movement of building frame.
International Building Code (IBC), 2003 edition, refers to seismic design
provisions contained in ASCE 7-02 (Minimum Design Loads for Buildings and
Other Structures).
ASCE 7-02, in turn, refers to AAMA 501.6-01 (Recommended Dynamic Test
Method for Determining the Seismic Drift Causing Glass Fallout from a Wall
System).
3.4 Façade Panels Capability and Compatibility to the Proposed Novel Designs
The proposed solutions for each facade system will be discussed case by case to
evaluate their potential for incorporation into newly designed connections. In Chapter
11 of FEMA356, Architectural components are categorized as glass blocks,

88
prefabricated panels, and glazed exterior wall systems (FEMA356 2000, FEMA-389
2004). Facade panels, including their possible damage and capacity to incorporation
into a new system, will be presented and discussed case by case.
3.4.1 Infills
Infill facades have usually the worst performance among the facade groups; indeed,
most of them are categorized as Operational or Immediate Occupancy after
earthquakes (AS1170.4 2007). Modern glazing infills generally perform much better
and do not suffer from as much damage as the older infills. Reinforced masonry infill
did not typically show much damage other than small cracks and it has been proven
before that the movable infill has a positive effect on the seismic performance of the
primary structure (Behr, Belarbi et al. 1995, B. Samali 2014, B. Samali 2014). The
infill facade panels that are parallel to earthquake action are like shear walls (shell
elements) inside each frame of the structure and can represent in-plane behaviour
during excitation (Abtahi, Samali et al. 2012).
During computer modelling, each panel was attached to the main structure frame
by two horizontal and vertical springs on each side. The horizontal springs have
specific stiffness and damping; but, the stiffness varies between some reasonable
values in order to evaluate the response of the main structure. The vertical springs are
stiffer, only carry the weight of the facade panels, and transfer gravity loads to the
structural elements. If a facade panel can withstand the internal applied force of an
earthquake and the facade glass does not break, then they can represent the infill walls
and increase the stiffness of the main structure (B. Samali 2014). This is why the
following three parameters must be considered in this proposal: using glass with
appropriate thickness; using high strength Laminated Safety Glass; and using a shock

89
absorber to dampen parts of the applied force; in fact, the thickness of glass for each
panel should be designed according to AS.4667 standard provisions. Laminated glass
is a composite material consisting of two or more sheets of glass that are permanently
bonded to each other by a plastic interlayer material. Since the relatively high surface
compression inherent in laminated glass is a crucial parameter when designing the
toughening process, it should be used to increase the strength of the glass and produce
fracture characteristics; however, this process can increase the risk of spontaneous
fracture.
Moreover, since tempered glass cools down faster while being heat strengthened,
compression on the surfaces and edges is higher. In fact, the surface compression is at
least 69,800 kN/m2 and edge compression is at least 67,700 kN/m2, which means that
tempered glass is 45 times stronger than annealed or untreated glass; therefore, it is a
reliable option for the proposed application. Another method of increasing the
consistency of glass panes is to use organic safety film or other glass coatings (Behr,
Belarbi et al. 1995)
3.4.2 Lightweight Cladding
Normal lightweight cladding weighs less than 80 kg/m2. Furthermore, 82% of
lightweight claddings is deemed to be either at Operational or Immediate Occupancy
levels and exhibit either no damage or very minor damage such as ejected window
seals or cracked glass after earthquake activities (Pinelli, Craig et al. 1995). Damage is
categorized by damage to the frame and glass, respectively. Newer lightweight
claddings are proportionately less likely to exhibit moderate to severe damage.
However, issues still exist with current design and construction techniques, because

90
even lightweight cladding systems of less than 20 years old experience heavy damage
(De Matteis 2005).
In some cases, screws which attach the facade frame to the sub-frame are either
sheared off or torn out of the wood (Palermo, Pampanin et al. 2010) . During an
earthquake, multiple sections of the curtain wall become completely detached from
the building and, in extreme cases, the aluminium frames and glazing fall onto the
footpath (Georgiou 2010). The main reason why glass breaks is because insufficient
allowance is made for the movement of glass panels during an earthquake. Glass
damage is common in most cases where lightweight cladding contains glass; so,
damage is categorized according to FEMA 356 (FEMA356 2000). These systems are
sub-categorized as shown below and their ability to be incorporated into the proposed
system will be discussed case by case
3.4.3 Curtain Walls
Curtain wall facades are designed to span multiple floors; so, they only carry their
own self weight; however, they are designed to resist sway induced by wind
and seismic forces acting on the building (AAMA 501.4 2000). A horizontal wind
load is transferred through the wall and then to the main building structure through the
anchors which attach the mullions to the floors or columns of the building (Behr
1998). In most situations, the curtain wall can naturally withstand seismic and wind
induced building sways because of the space provided between the glazing infill and
the mullion. Curtain wall systems are designed to accommodate 25-35 mm of relative
floor movement (vertical movement) without overall system performance failure. But
sometimes large floor drifts transfer large forces to the façade brackets and may result
in panel damage, glass breakage, or falling of the whole frame. Stick systems that act
91
like curtain walls are a desired lightweight choice in modern multi-storey buildings
(Chew, Tan et al. 2004). They are installed as long pieces (referred to as sticks)
between floors vertically, and between vertical members horizontally. Unitized
Curtain Walls, as newer systems, are hung on the structure of a building as an
enclosure (Behr, Belarbi et al. 1995). They have a similar configuration to a stick
system but they are much faster to install because most of their fabrication is carried
out in a factory (Memari, Behr et al. 2003). These systems cannot be incorporated
with an in-plane concept to use their in-plane stiffness as additional stiffness for the
whole structure because they are not located inside the main frame of the structure,
and they also have a low allowable movement (only 75mm) so incorporating them
with out-of-plane concept using anchorages with very low axial stiffness is not
practical either (Sanders 2006). Indeed, as proven before, façade frames with low axial
stiffness in brackets have excessive back and forth movements, which means
widespread damage and casualties may happen (Pinelli, Craig et al. 1995)
3.4.4 Panelised Curtain Wall
It was shown previously that numerous severe damage is likely in the spider
glazing (Bolted Glass Façade) after an earthquake excitation (Amadio and Bedon
2012), with the damage initiating around the “spider” that holds each panel of glass,
possibly because the spider concentrates the stress in these regions due to the
connection being attached to the structure. The possibility of incorporating bolted
glass facades into the proposed system to reduce the response of primary structures to
earthquakes is very low (Roth 2007, Permasteelisa 2009). Indeed, it has been proven
that, if some design changes are made and viscoelastic spider connectors are used in
the cable supporting facade system, they could mitigate the force of an air blast load
92
applied to the main components of facades, especially glass panels; but, during
earthquake excitation, which has a longer applied force and different range of
frequencies, the scenario is completely different (Walker III, Niemoeller et al. 2011).
3.4.5 Double Skin Façade System
One of the more recent variations to the stick system is a double-skin facade system
that consists of two layers of facade material (typically glass) which creates a sealed
cavity and improves the thermal and acoustic performance of the building (Pinelli,
Craig et al. 1995). Double-skin facade systems are being increasingly used in high-
profiled buildings and, because of their configuration and the gap between the two
layers, they have the capability of being incorporated into the newly proposed system.
Using the in-plane stiffness concept in the inner layer of double-skin facade is a good
option; but, it needs some changes in design and the glass panels need to be stiffer.
Moreover, the outer skin can be attached to the inner frame and/or primary structure
with low shear stiffness brackets that can move freely during an earthquake, and the
gap between each panel must be large enough to avoid any extra damage when the
panels collide. The only barrier for the application of the in-plane concept in double-
skin system is small mass of the outer skin in comparison to overall mass of the main
structure (Arons 2000).
3.4.6 Heavyweight Cladding
Heavy claddings perform better than most facade systems and perform at either
Operational or Immediate Occupancy ranges because they have exhibited little to no
evidence of damage. The performance level of Immediate Occupancy is used for
claddings that show some evidence of cracking or where it was clear that the panels
had residual displacements and/or rotations. The performance level of Life Safety is

93
used for claddings where damage is visible; in some cases, several spandrel panels
shear off their bolted connections and fall onto the footpath below; this type of
damage is classified as high hazard (Baird, Diaferia et al. 2011).
A complete disconnection of panels, which leads to racking and spalling, is also
common, as is minor damage in the form of panels with residual displacements and/or
rotations and ejection of sealing joints between them. After considering the weight of
these panels, using the newly proposed system would be risky and requires great
attention to details and application of higher safety factors (Hunt 2010). It is shown
that facade panels could be considered as structural elements and movable panels.
Also, they have the potential to reduce building lateral displacement, if axial stiffness
of facade brackets is tuned to the first frequency of the main structure during
excitations (Sacks, Eastman et al. 2005).
But, it is proven that, due to low calculated axial stiffness of panels' brackets, they
have excessive lateral movements, which demonstrates a significant barrier for the
practical implementation of the proposed system. In addition, frequency content of
earthquake records is not identical and may detune the calculated stiffness of brackets
(Behr and Belarbi 1996). Several research groups have investigated the interaction
between precast cladding panels and the supporting framing. Analytical and
experimental studies have revealed that cladding may have a significant influence on
the seismic response of the building as a whole (Yee and Eng 2001). Little to no
damage is expected in the precast panels themselves due to their thickness and
rigidity. As such, the panels are modelled to behave as rigid blocks, and the damage to
the cladding system is concentrated on the connectors and window glazing system
(Goodno and Palsson 1986).

94
3.5 Chapter Summery and Conclusion
The effects of earthquake load on mid-rise and high-rise buildings are well known by
the engineering community. In the case of this kind of extreme loading, building
structures may be susceptible to excessive deflections and noticeable accelerations and
such problems are usually reduced by the adoption of external damper systems. The
loss of valuable and prime space coupled with the initial cost of installing large sized
damper systems have been accepted by building owners with reluctance and any
viable alternative system to dissipate seismic excitations would be highly appreciated
by them. Similarly, for medium sized buildings the reliance on damper systems to
alleviate earthquake induced actions has also received much attention in recent years.
To date, very few engineers and architects have exploited the potential of façade
systems as an energy absorbing system to combat seismic loads. Most attempts, so
far, have considered façade as an add-on with no or little structural contribution and
this is evidenced by the exclusion of façade systems in computer modelling of
building structures as an analysis tool. Double-skin façade systems (DFS) are
becoming very popular for improving the sustainability of commercial buildings in
Australia and overseas. In these cases, it is proposed to use a moveable façade skin
attached to passive devices which are, in turn, attached to the main building frame.
The energy imparted by earthquake forces can be dissipated by the absorbing façade
system with major economic benefits. It is important to mention that Double Skin-
Façade (DSF) system is the selected type of façade system to be used in this thesis.
This kind of façade system has an adjustable cavity in which the damper device can be
installed and this gap allows for in-plane and out-of-plane movement of outer skin of
DSF system during earthquake actions.

95
CHAPTER 4
FEASIBILITY STUDY &
PRIMARY NUMBERICAL
MODELLING
96
4.1 Introduction and Methodology
To date, the engineering community has viewed structural facade systems as non-
structural elements with a high aesthetic value and a barrier between the outdoor and
indoor environments. The role of facades in the dissipation of imparted energy due to
external loading in a building has been also recognized and the industry is also
witnessing the emergence of many energy-efficient facade systems (Abtahi, Samali et
al. 2012). It has been also recognized that facade systems add some stiffness and
damping to the overall building despite the new and modern systems; e.g. curtain
walls which add a relatively small amount of stiffness and damping to the overall
building (Mohotti, Lunmantara et al. 2013).
Despite these advancements, facade has rarely been considered or designed as a
potential earthquake-induced vibration absorber for structural buildings (Houston
2011). The potential of utilizing a movable exterior skin in a typical double-skin
facade system is investigated in this chapter and shown that, with optimal choice of
materials for stiffness and damping of brackets connecting the two skins, a substantial
portion of earthquake-induced vibration energy can be dissipated in order to avoid
expensive aseismic designs. The initial work has demonstrated that the seismic
response for mid-rise buildings subjected to moderate earthquakes can be substantially
reduced by introducing a smart design of a double-skin system connections.
During a significant seismic activity, glass openings often break and also
aluminium transoms and mullions are distorted badly. From architectural and
economical viewpoints, damage to these expensive non-structural elements causes
great economic losses to building owners. Architects, engineers, and designers have
made great efforts to minimize frame and glazing concerns based on the established

97
performance criteria and standards during recent decades (Yankelevsky, Schwarz et
al. 2011). But, with stiff connectors, which attach facade panels to floor slabs, this
problem still exists. Glazing panels should be designed in a way to move backward
and forward when subjected to external forces; therefore, they perform better under
these circumstances. This suggestion not only decreases potential losses and mitigates
damage, but also reduces glass brakeage and injuries to occupants from fragments
(Sivagnanasundram 2011).
The primary idea for the design of advanced connections is to reassign a structural
role to the architectural facade in order to introduce the added passive damping into
the structural system. Damage assessment of facade frames and threat of glazing
thrown to the ground will be evaluated as the possible stages of analysis in order to
ensure that acceptable protection is considered and design remains within the available
funds. The outcome of this study would lead to the development of a new generation
of facade bracket elements, which can sacrifice themselves to absorb some parts of the
applied energy of earthquake and reduce seismic response of the main structure for
new as well as the existing buildings to be retrofitted (Li, Hutchinson et al. 2011).
As described earlier, analytical analysis in this research is divided into three
different sections as described below. Generally, there are two design criteria in facade
design in order to attain the desired level of performance; the first is their ability to
withstand environmental forces such as earthquake and severe winds and, second, they
can be designed to break away in order to avoid overloading the structure (Elghazouli
2009).

4.2 Behaviour of Double-Skin-Façade in Suppressing Earthquake Loads
4.2.1 Introduction
In recent decades, buildings with significant usage of glass are becoming more
common. The development of non-load bearing curtain walling technology around the
turn of the 20th century, along with double skin façade (DSF) system, which have
substantial cavity space between the inner and outer façade layers, have increased
interest in these systems with the aim of fully exploiting their potential. Building
façades generally perform as environmental medium between the controlled interior
and harsh exterior as well as building identifiers through their aesthetic design.
Kareem (1992)) proposed the concept of isolation in the mountings of the cladding
to the structural system. Buildings are isolated from earthquake excitation by
employing isolator bearings between the building and the foundation and a similar
concept is proposed for cladding. If the cladding is connected to the frame by an
isolation mounting, then the dynamic loads transferring from the frame will be
reduced and consequently the building motion will be reduced as well. In order for
this mounting to be effective, the ratio of excitation frequency to the natural frequency
of the cladding should be greater than square root of two (Kareem 1992). In this
situation, the mounting system is more effective without any damping.
The proposed system can be materialized by dividing the cladding on the building
envelope into several segments. The preliminary calculations of Kareem (1992)
suggest that such a mounting system will be quite soft and pneumatic mounts may be
an appropriate choice here. Such an installation may cause the cost of a cladding
system to be, however, very high. This can be overcome by using these systems in
staggered configurations and the remaining portions of the building envelope may
98

utilize conventional cladding. Moon (2005)) showed that dynamic motion of tall
buildings can be reduced, for example, by more than 50% when the DSF façade
connectors are designed to have about half of the primary structure frequency.
However, there exists a design challenge which is the excessive and extreme motion
of the DSF outer skins, which would disturb occupants through visible cues, and
would potentially undermine the ventilation system intended by DSF systems through
pumping cavity air around the building.
4.2.2 System Modelling
To evaluate the seismic behaviour of the proposed system, the main structure and
the facade system were simplified and modelled as a two-degree-of-freedom system as
shown in Figure 4-1. The system consisted of a primary mass (m) of the main building
structure along with the secondary mass (md) corresponding to the facade system. The
concept of the simplified system model is in essence similar to the concept of a tuned
mass damper (TMD) modelled in structures. The two masses were attached by a low-
axial-stiffness spring ( ) and a damper system (Moon 2009).
Figure 4-1: Simplified model of the primary structure and façade system connected by movable brackets
Connection properties concerning stiffness and damping were evaluated and varied
to achieve the appropriate response. In order to achieve optimal performance of the
99
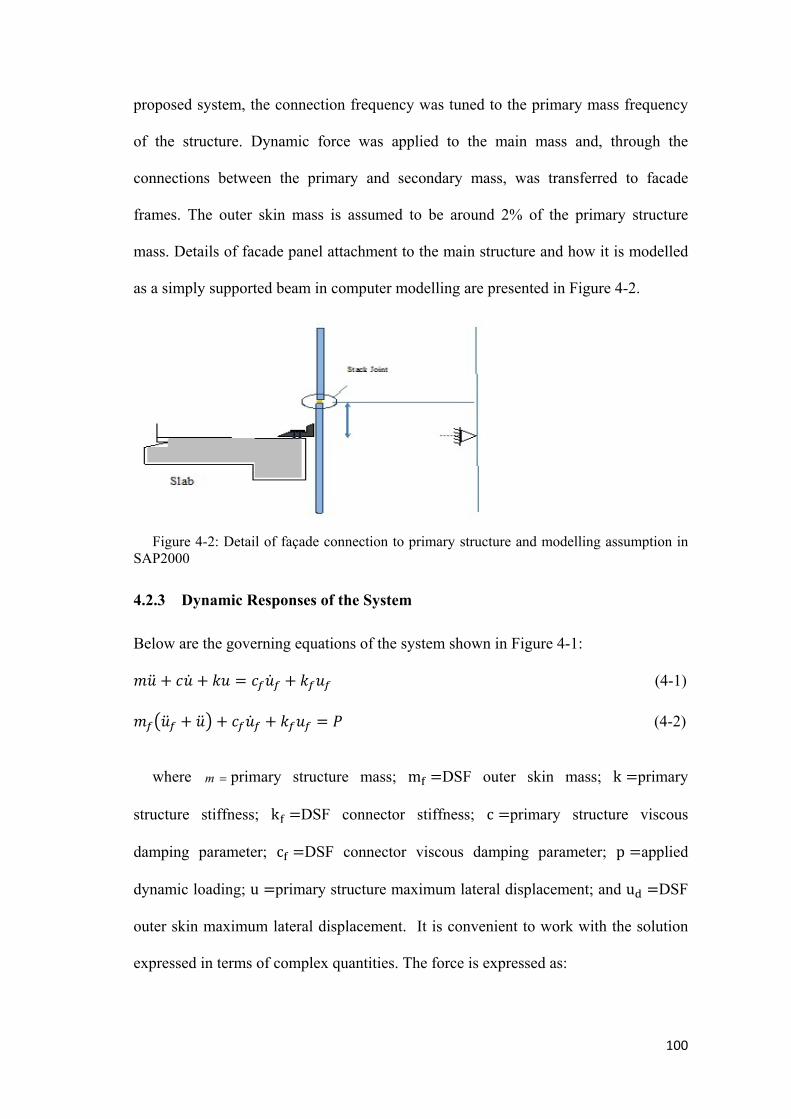
100
proposed system, the connection frequency was tuned to the primary mass frequency
of the structure. Dynamic force was applied to the main mass and, through the
connections between the primary and secondary mass, was transferred to facade
frames. The outer skin mass is assumed to be around 2% of the primary structure
mass. Details of facade panel attachment to the main structure and how it is modelled
as a simply supported beam in computer modelling are presented in Figure 4-2.
Figure 4-2: Detail of façade connection to primary structure and modelling assumption in SAP2000
4.2.3 Dynamic Responses of the System
Below are the governing equations of the system shown in Figure 4-1:
(4-1)
(4-2)
where primary structure mass; m DSF outer skin mass; k primary
structure stiffness; k DSF connector stiffness; c primary structure viscous
damping parameter; c DSF connector viscous damping parameter; p applied
dynamic loading; u primary structure maximum lateral displacement; and u DSF
outer skin maximum lateral displacement. It is convenient to work with the solution
expressed in terms of complex quantities. The force is expressed as:
m

101
(4-3)
Where forcing frequency and is a real quantity representing the loading
amplitude. The response is taken as
(4-4)
(4-5)
Where natural frequency of the primary structure, and
the response amplitudes, and , are considered to be complex quantities. Then the
corresponding solution is given by either the real or imaginary parts of and .
Substituting Equations (4.3)–(4.5) into the set of governing Equations (4-1) and (4-2)
results in:
Ω Ω Ω (4-6)
Ω Ω (4-7)
Considering the following notations:
(4-8)
2 (4-9)
where primary structural damping ratio, and
(4-10)
p
u fu
u fu

102
and natural frequency of the DSF outer skin, Stiffness of the brackets which
is a variable and a function of the input frequency.
2 (4-11)
where façade connector damping ratio. Defining as the DSF outer skin mass
to primary mass ratio
(4-12)
and defining f as the DSF outer skin frequency to primary structure frequency ratio,
(4-13)
and defining as the forcing frequency to primary structure frequency ratio,
ρ (4-14)
Then the corresponding Frequency Response Functions (FRF) can be obtained by
derivation from the equations of motion as follows.
(4-15)
(4-16)
4.3 First Proposal (Feasibility Study of Façade System as Multi Tuned Mass
Damper with 3D Numerical Modelling in SAP2000)
As described before, effectiveness of a TMD for the response reduction of a single
degree of freedom (SDOF) system could be simply extended to continuous MDOF
structures such as tall buildings by a modal approach. A single TMD cannot provide
vibration control to more than one mode; therefore, Multi-Tuned Mass Dampers
(MTMDs) have used to evaluate and control multiple structure modes of vibration (Li
f fk
f m
2)322223232(2)242222422(
22244
ffmfffffffffmf
fffH
2)322223232(2)242222422(
2242)12(
ffmfffffffffmfmfH

103
2002). Initially, a comprehensive literature review was required to evaluate in depth
the feasibility of using movable facade systems as a Multi Tuned Mass Damper along
the height of the structure. Therefore, numerous studies and various computer model
evaluations were conducted based on the design procedure of a TMD system in the
analytical part of this research to evaluate the simulations. The ratio of facade mass to
main structure mass was a main issue in this evaluation for using TMD design
procedure to achieve correctly tuned damper properties and facade mass relative to the
main structure. At the first stage, to show the feasibility of the movable facade
concept, SAP2000 structural analysis package was used to provide advanced nonlinear
time-history analysis on a 3D frame structure with and without moving facade systems
subjected to two near-field and two far-field benchmark earthquakes used for the
assessment. This program was used to generate the geometry, boundary conditions,
and loading conditions of the model as well as analysis.
4.3.1 Earthquake Loading Records and Boundary Condition:
Earthquake loads are normally defined as lateral dynamic loads and can be vertical
loads as well. These loads are very complex, and potentially more destructive than
wind loads. In an earthquake-prone zone, every structure must be designed to
withstand and survive damaging earthquakes. The scaling of earthquake loads are
based on time domain and frequency content of the records are unchanged during the
whole record. The seismic loadings applied to the structural models in this chapter
were from time histories of horizontal ground accelerations of chosen past earthquake
records. The accelerations were applied in the x-direction at the base of the structure.
Four typical earthquake records suggested by International Association for Structural

104
Control and Monitoring including two far-field and two near-field earthquake
excitations were chosen for the primary study.
Table 4-1: Earthquake ground motions used in this study
Earthquake Country Year PGA(g) Mw(R)Northridge USA 1994 0.843 6.7El-Centro USA 1940 0.349 6.9
Kobe Japan 1995 0.833 6.8Hachinohe Japan 1968 0.229 7.5
These records were El-Centro (far field), Hachinohe (far field), Northridge near
field), and Kobe (near field) earthquakes which are shown in Figure 4-3 to Figure 4-6
and Table 4-1.
Figure 4-3: Scaled Northridge earthquake excitation record
Figure 4-4: Scaled El-Centro earthquake excitation record
Figure 4-5: Scaled Kobe earthquake excitation record
-1-0.8-0.6-0.4-0.2
00.20.40.60.8
1
0 5 10 15 20 25 30
Acc
eler
atio
n (g
)
Time (Sec)
-1-0.8-0.6-0.4-0.2
00.20.40.60.8
1
0 5 10 15 20 25 30 35 40 45 50 55
Acc
eler
atio
n (g
)
Time (Sec)
-1-0.8-0.6-0.4-0.2
00.20.40.60.8
1
0 5 10 15 20 25 30 35 40 45 50
Acc
eler
atio
n (g
)
Time (Sec)

105
Figure 4-6: Scaled Hachinohe earthquake excitation record
To confirm the effectiveness of the façade systems in the range of frequencies of
interest, it is critical to establish the frequency range where the maximum seismic
energy is concentrated. Therefore, elastic response spectra of the four earthquake
records are computed by means of the Newmark time integration method (Streicher,
Heimrath et al.) by using PRISM software (Streicher, Heimrath et al.). By using this
program seismic response analysis of SDOF system can be calculated. Response
spectra of the earthquake records are shown in Figure 4-7, Figure 4-8, Figure 4-9 and
Figure 4-10.
Figure 4-7: Response Spectra of scaled Northridge earthquake record
-1-0.8-0.6-0.4-0.2
00.20.40.60.8
1
0 5 10 15 20 25 30 35
Acc
eler
atio
n (g
)
Time (Sec)
0
0.5
1
1.5
2
2.5
3
3.5
4
0 5 10 15 20 25 30 35 40 45 50
Acc
eler
atio
n [
g]
Frequency (Hz)

106
Figure 4-8: Response Spectra of scaled El Centro earthquake record
Figure 4-9: Response Spectra of scaled Kobe earthquake record
Figure 4-10: Response Spectra of scaled Hachinohe earthquake record
From these spectra it is clear that most of the seismic energy is concentrated
between about 2 and 5 Hz and, therefore for the façade system to act as an effective
damper system it should possess a system frequency in the same range. In order to
consistently compare the response of a structural model under different earthquakes,
0
0.5
1
1.5
2
2.5
3
3.5
4
0 5 10 15 20 25 30 35 40 45 50
Acc
eler
atio
n [
g]
Frequency (Hz)
0
0.5
1
1.5
2
2.5
3
3.5
4
0 5 10 15 20 25 30 35 40 45 50
Acc
eler
atio
n [
g]
Frequency (Hz)
0
0.5
1
1.5
2
2.5
3
3.5
4
0 5 10 15 20 25 30 35 40 45 50
Acc
eler
atio
n [
g]
Frequency (Hz)
Hachinohe
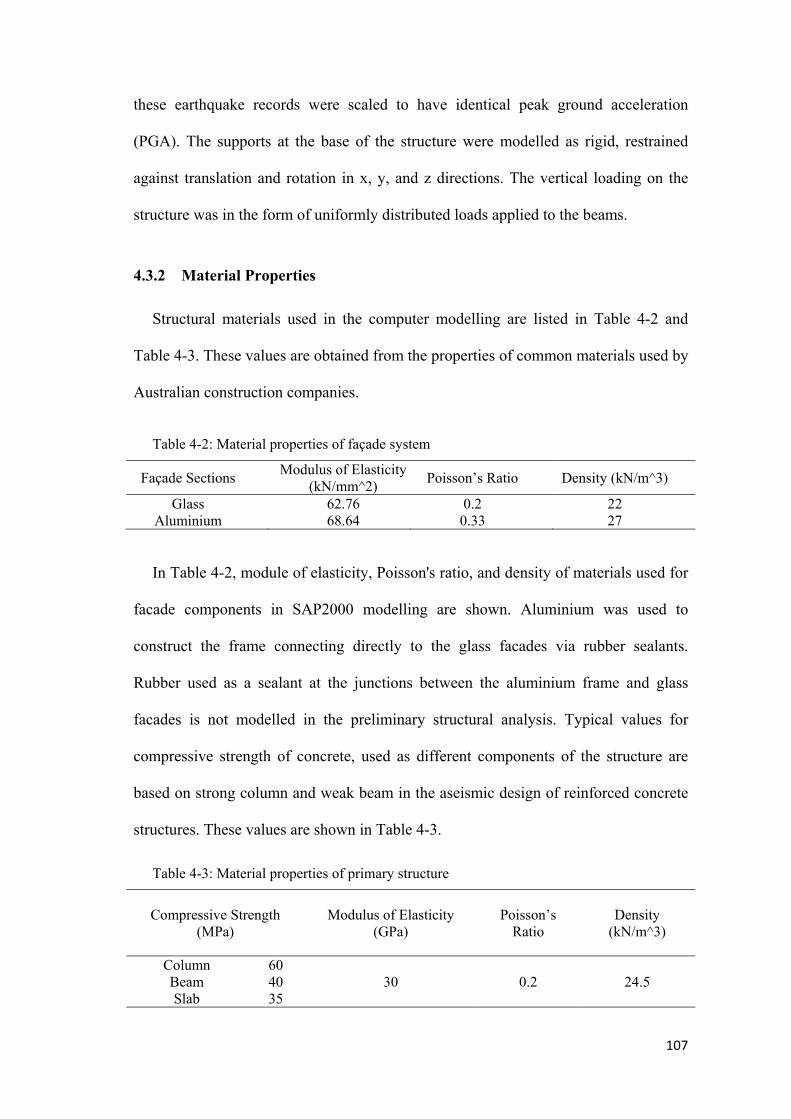
107
these earthquake records were scaled to have identical peak ground acceleration
(PGA). The supports at the base of the structure were modelled as rigid, restrained
against translation and rotation in x, y, and z directions. The vertical loading on the
structure was in the form of uniformly distributed loads applied to the beams.
4.3.2 Material Properties
Structural materials used in the computer modelling are listed in Table 4-2 and
Table 4-3. These values are obtained from the properties of common materials used by
Australian construction companies.
Table 4-2: Material properties of façade system
Façade Sections Modulus of Elasticity
(kN/mm^2) Poisson’s Ratio Density (kN/m^3)
Glass 62.76 0.2 22Aluminium 68.64 0.33 27
In Table 4-2, module of elasticity, Poisson's ratio, and density of materials used for
facade components in SAP2000 modelling are shown. Aluminium was used to
construct the frame connecting directly to the glass facades via rubber sealants.
Rubber used as a sealant at the junctions between the aluminium frame and glass
facades is not modelled in the preliminary structural analysis. Typical values for
compressive strength of concrete, used as different components of the structure are
based on strong column and weak beam in the aseismic design of reinforced concrete
structures. These values are shown in Table 4-3.
Table 4-3: Material properties of primary structure
Compressive Strength (MPa)
Modulus of Elasticity (GPa)
Poisson’s Ratio
Density (kN/m^3)
Column 6030 0.2 24.5Beam 40
Slab 35
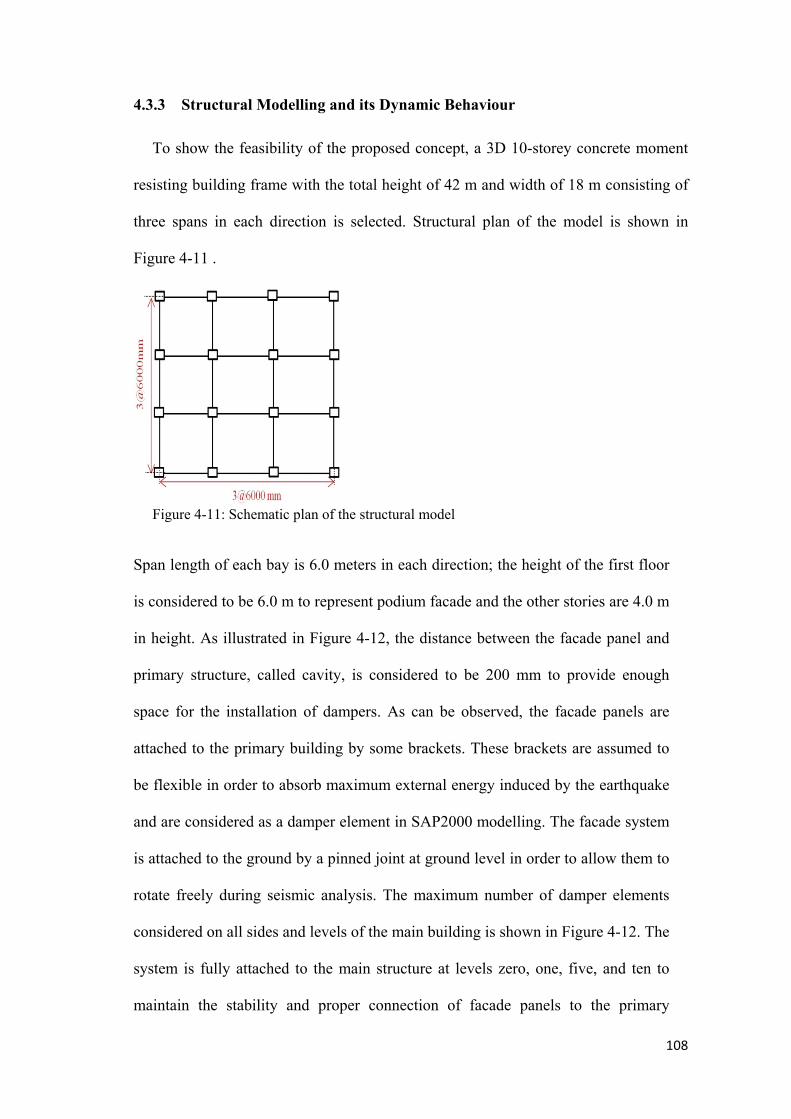
108
4.3.3 Structural Modelling and its Dynamic Behaviour
To show the feasibility of the proposed concept, a 3D 10-storey concrete moment
resisting building frame with the total height of 42 m and width of 18 m consisting of
three spans in each direction is selected. Structural plan of the model is shown in
Figure 4-11 .
Figure 4-11: Schematic plan of the structural model
Span length of each bay is 6.0 meters in each direction; the height of the first floor
is considered to be 6.0 m to represent podium facade and the other stories are 4.0 m
in height. As illustrated in Figure 4-12, the distance between the facade panel and
primary structure, called cavity, is considered to be 200 mm to provide enough
space for the installation of dampers. As can be observed, the facade panels are
attached to the primary building by some brackets. These brackets are assumed to
be flexible in order to absorb maximum external energy induced by the earthquake
and are considered as a damper element in SAP2000 modelling. The facade system
is attached to the ground by a pinned joint at ground level in order to allow them to
rotate freely during seismic analysis. The maximum number of damper elements
considered on all sides and levels of the main building is shown in Figure 4-12. The
system is fully attached to the main structure at levels zero, one, five, and ten to
maintain the stability and proper connection of facade panels to the primary

109
structure. Attachment between facade panels on each floor is assumed as a pinned
joint and they are attached to each other from the above and below by these pinned
joints to move freely during the application of environmental forces. The gap is
called stack joint and is located 900 mm above the floor slab level on each floor.
The stack joint is designed to resist lateral loads, while the two floor anchors resist
both lateral loads and applied gravity load to the concrete slab. Time-history
dynamic analysis is selected to acquire the response of the structure under seismic
loading. primary structure’s damping ratio is assumed to be 5%, which is within the
range of statistically reasonable values based on the measured natural damping
ratios for mid-rise building.
Table 4-4: Structure model dynamic properties
Weight (Knaack, Klein
et al.) Period (Sec) Frequency(HZ)
Bare Frame 2,800 0.78 1.28
Frame with Movable facade
2,870 0.97 1.03
This analysis assembles the mass, stiffness, and damping matrices and solves the
equations of dynamic equilibrium at different time instances. The response of the
structure is obtained for the selected time steps of the input earthquake record. The As
shown in Table 4-4, the vibration period of the bare frame is slightly less than the
building with movable facade system. Dynamic properties of damper system are very
crucial for evaluating the potential of the movable facade system. Damping ratio is
considered to be 5% of critical for each of the damper elements. Stiffness of the
damper elements is set in a way to act as a multi-tuned mass damper along the height
of the structure and their main frequency is tuned to the first or second frequency
mode of the primary structure.
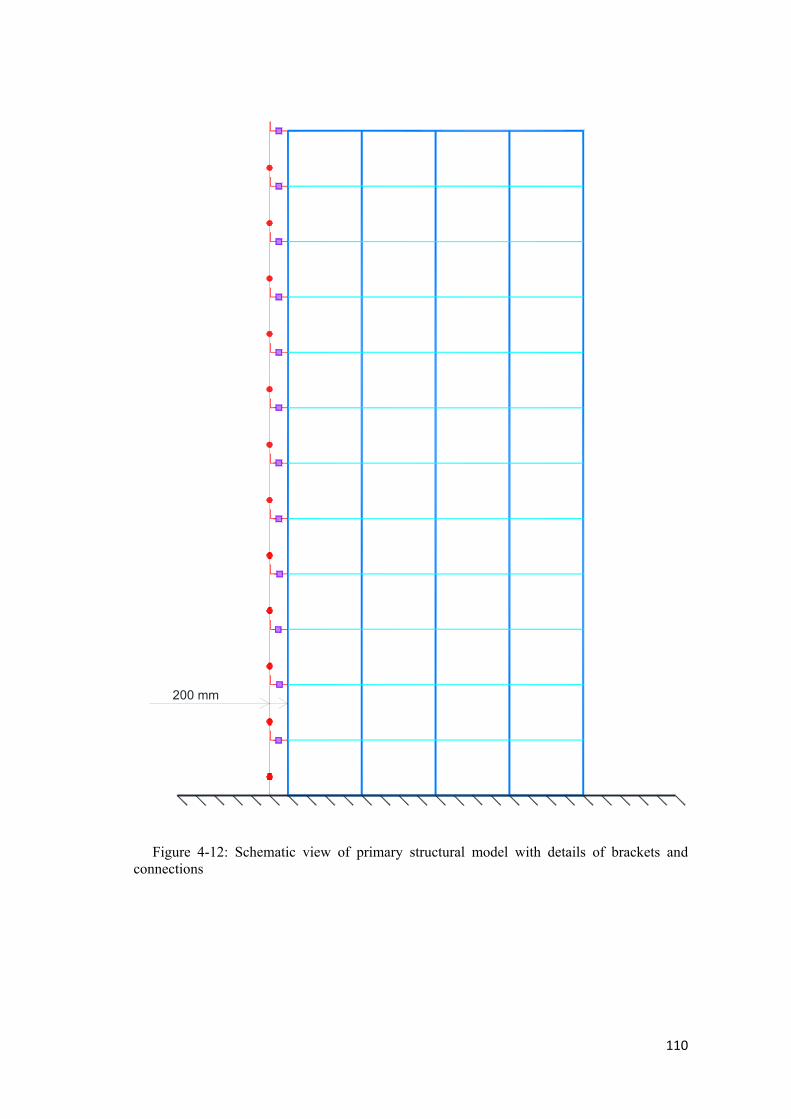
110
Figure 4-12: Schematic view of primary structural model with details of brackets and connections
200 mm

111
4.3.4 Results of Computer Modelling
Effects of implementing the maximum number of damper systems, which can be
installed in a 10-storey structure system, are evaluated. These dampers are installed
between the main structure and glazing system on two faces of the building, along the
same direction as the applied earthquake excitation. Totally, 28 cases are investigated
with the stiffness of the connections in the range (5-10,000 kN/m). The optimal value
of stiffness was found to be around 10 kN/m for all four earthquake records. The total
weight of the structure including cladding panels is 2,870,kN. The results of the above
analyses are then compared with those of the structural system without energy
absorbing connections. Time-history responses of top floor displacement for the
structure without facade frames, structure with ordinary rigid facade connections, and
structure fitted with advanced connectors under the selected earthquake excitations
obtained from analytical models using computer program SAP2000 are illustrated in
Figure 4-13 to Figure 4-16.
Figure 4-13: Time history analysis of structural model under Northridge earthquake
Figure 4-14: Time history analysis of structural model under El-Centro earthquake
-800-600-400-200
0200400600800
0 3 6 9 12 15
Lat
eral
dis
palc
emen
t(m
m)
Time (Sec)
Bare frame Conventional façade Movable façade
-800-600-400-200
0200400600800
0 3 6 9 12 15
Lat
eral
dis
palc
emen
t(m
m)
Time (Sec)
Bare frame Conventional façade Movable façade

Figure 4-15: Time history analysis of structural model under Kobe earthquake
Figure 4-16: Time history analysis of structural model under Hachinohe earthquake
It can be seen from the figures and Table 4-5 that, with suitable damper connection
properties, acceptable reductions in lateral displacement of the building under all
earthquake excitations can be achieved. It is observed from these figures that the
facade system, even a fixed one, can slightly reduce the top displacement of structural
models in certain situations.
Table 4-5: Results of time history analysis
Records Peak Displacement (mm)
% Reduction in Peak Displacement Without
Facade With Fixed
Facade With Movable
Facade Northridge 492 525 356 27 El-Centro 333 298 235 25
Kobe 436 282 196 54 Hachinohe 273 260 206 25
However, the fixed facade system slightly increases the response of the main
structure during most parts of the Northridge earthquake. According to these results, it
is seen that, with the use of movable façade, the overall lateral displacement of the
primary structure, subjected to seismic loads, is somewhat decreased. The seismic
response of the building facade system, under Northridge earthquake, is higher in
-800-600-400-200
0200400600800
0 3 6 9 12 15
Lat
eral
dis
palc
emen
t(m
m)
Time (Sec)
Bare frame Conventional façade Movable façade
-800-600-400-200
0200400600800
0 3 6 9 12 15
Lat
eral
dis
palc
emen
t(m
m)
Time (Sec)
Bare frame Conventional façade Movable façade
112

113
value than the El-Centro results. However, better results with higher response
reduction are also achieved under Northridge earthquake, considering this system in
facade connections. As demonstrated in El-Centro, Hachinohe, and Northridge, the
reduction is almost similar and there is around 26% reduction in lateral displacement.
In Kobe earthquake, this percentage is much higher: i.e. 54 %. As illustrated in Figure
4-16, after the second peak, which is the biggest in the time-history analysis,
effectiveness of the damper is reduced too much or even is amplified in the negative
direction. This phenomenon happened in Kobe excitation because of jerky behaviour
of this earthquake that could lead to detuning of damper system as a result of the
effect of very high dynamic impact load to the primary structure after the second peak.
Comparison of responses for the undamped and damped structures demonstrates that
the advanced bracket connectors are able to decrease the peak values of top floor
displacement of the primary structure.
4.3.5 Conclusion:
After numerous time-history analyses in SAP2000, the concept of the integrated
façade/damper system is proven promising. However, there is some ambiguity about
some parameters and assumptions in the first part of this study, as follows:
By using bracket elements with low axial stiffness, the outer skin starts to move
excessively during earthquake excitation. Excessive movement of panels beyond
the allowable practical limits is not acceptable.
Facade panel mass should be considered based on the reality and practical values
which is generally small in modern buildings.
The damper device with high damping capacity should be selected.
The external skin of double-skin facade as a TMD system does not seem to be
effective, because the overall mass of the facade panels is not enough to be
considered as MTMD system along the height of the structure in order to affect the
primary structure response.
4.4 Second Proposal - Numerical Modelling of Facades with Sacrificial
Elements in SAP2000
4.4.1 Introduction
With well-designed structural connections, plastic hinges will form in beam elements
during a severe earthquake; they absorb earthquake energy and change frequency of the
structure as well. Based on the aforementioned design, the preferred order of failure in a
well-designed structure should be in this order: beams<connection<columns. At the
second stage, a 2-D structural model is evaluated and natural damping of bare frame is
compared to the structure which is equipped with damper elements between facade and
the primary structure. Therefore, there are two primary aims here:
The possibility of bringing the response of main structure to an acceptable limit
with the maximum number of dampers
Study the effect of maximum number of dampers on the overall damping behaviour
of mid-rise structures
In following configurations, out-of-plane and in-plane behaviours of facade panels
are evaluated to show the possible effect of bracket configuration on the primary
structure's lateral displacement. The analysis is conducted to determine the sensitivity
of parameters such as facade panel height, damper locations, number of dampers, and
damping of supporting bracket systems in achieving an optimal system. The selected
loading is again the typical earthquake records suggested by International Association
114
115
for Structural Control and Monitoring. All the numerical simulations were conducted
in SAP2000 program. For the initial studies, El Centro earthquake is applied to
evaluate the response of the whole system in different situations.
4.4.2 Preliminary Numerical Modelling
According to the results of the previous sections, it is concluded that design
procedure for bracket elements should be changed to have meaningful reductions of
primary structure displacements. To achieve this, the idea is to define a bracket
element which has elasto-plastic behaviour. Their initial stiffness is similar to the
practical values which is around 40 . The first innovation is to define plastic hinges
in the brackets with different values of plastic force plateau to evaluate their
effectiveness during dynamic excitations. By creation of these plastic joints the
brackets can vibrate like multiple pendulums and better dissipate the seismic energy
without total collapse. The large available ductility of the joints can absorb a large
portion of seismic energy and reduce lateral displacements. For this purpose, a 3-D
12-storey concrete structure consisting of four bays with the span length of 8 m in X
direction and five bays with the span length of 6 m in Y direction is selected. The
storey height is set at 3.0 meter.
Table 4-6: Frequency of first three modes of the structure
Modes Natural Frequency(Hz) Period of Vibration(T in Sec) 1 0.92 1.092 3.45 0.343 5.26 0.19
Based on Australian and New Zealand standard (AS/NZS 1170.1: 2002) permanent
and imposed loads were calculated and applied to the structures in the form of
uniformly distributed loads. The vertical loading on the structure was 40 kN/m applied
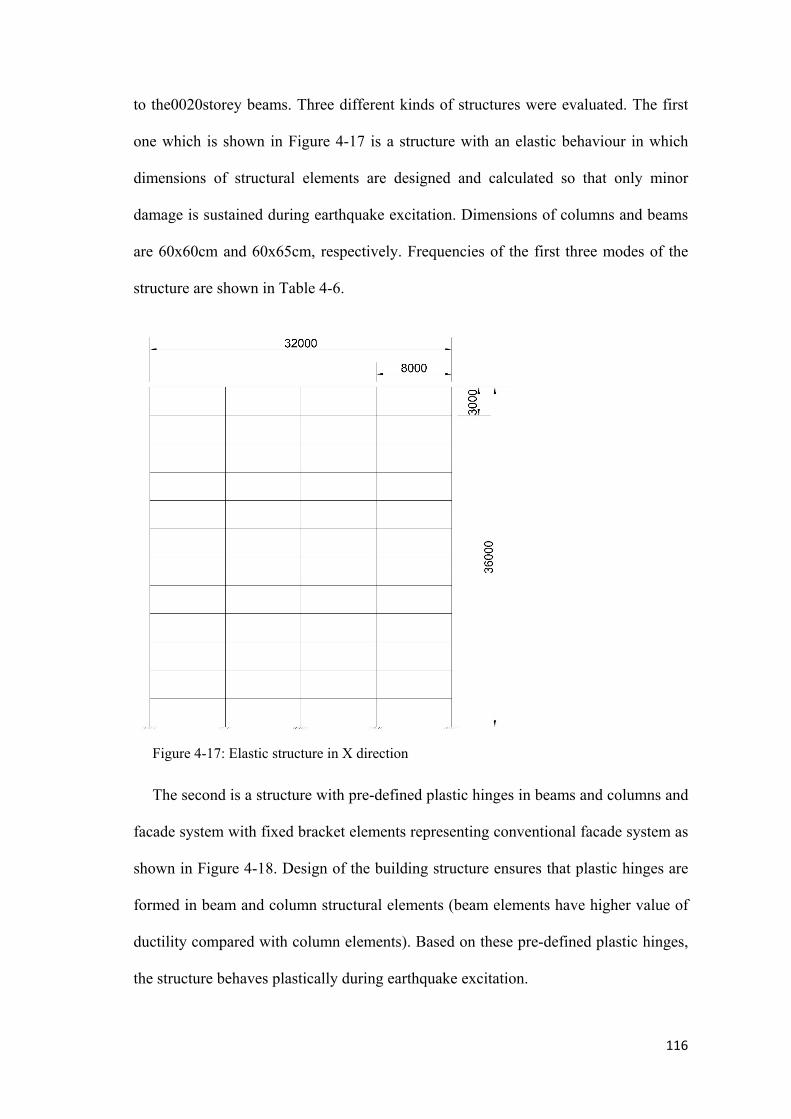
116
to the0020storey beams. Three different kinds of structures were evaluated. The first
one which is shown in Figure 4-17 is a structure with an elastic behaviour in which
dimensions of structural elements are designed and calculated so that only minor
damage is sustained during earthquake excitation. Dimensions of columns and beams
are 60x60cm and 60x65cm, respectively. Frequencies of the first three modes of the
structure are shown in Table 4-6.
Figure 4-17: Elastic structure in X direction
The second is a structure with pre-defined plastic hinges in beams and columns and
facade system with fixed bracket elements representing conventional facade system as
shown in Figure 4-18. Design of the building structure ensures that plastic hinges are
formed in beam and column structural elements (beam elements have higher value of
ductility compared with column elements). Based on these pre-defined plastic hinges,
the structure behaves plastically during earthquake excitation.
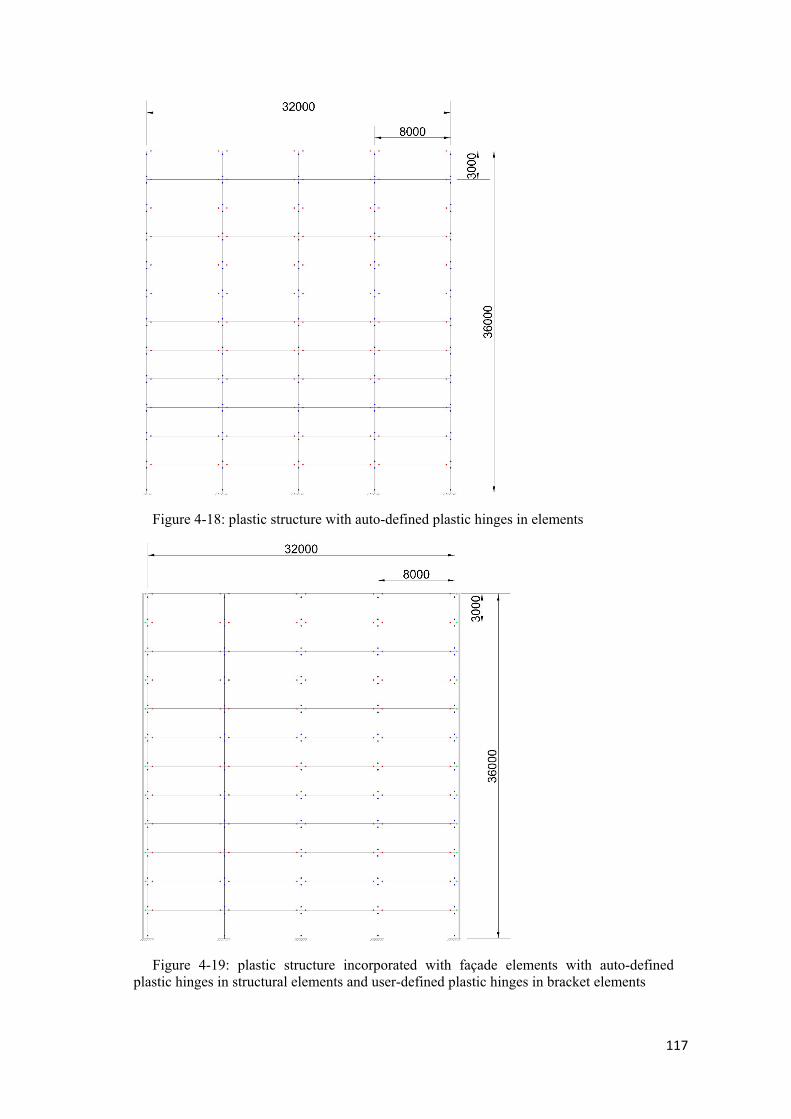
117
Figure 4-18: plastic structure with auto-defined plastic hinges in elements
Figure 4-19: plastic structure incorporated with façade elements with auto-defined plastic hinges in structural elements and user-defined plastic hinges in bracket elements
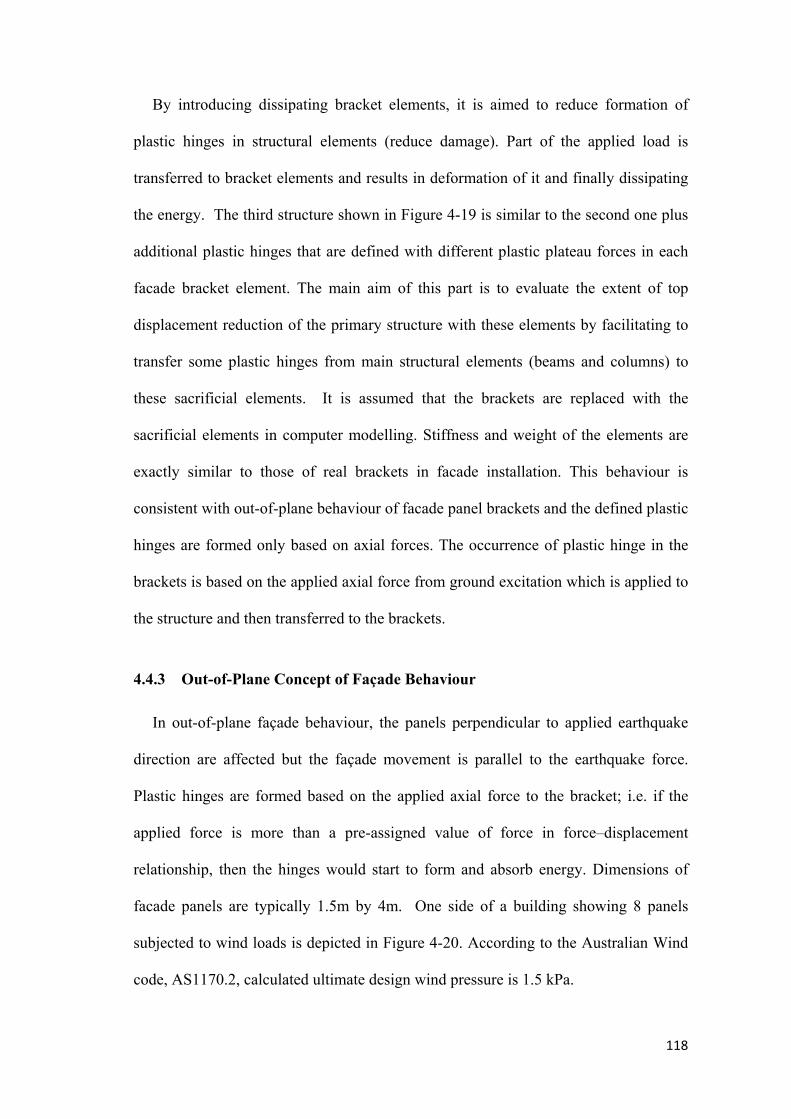
118
By introducing dissipating bracket elements, it is aimed to reduce formation of
plastic hinges in structural elements (reduce damage). Part of the applied load is
transferred to bracket elements and results in deformation of it and finally dissipating
the energy. The third structure shown in Figure 4-19 is similar to the second one plus
additional plastic hinges that are defined with different plastic plateau forces in each
facade bracket element. The main aim of this part is to evaluate the extent of top
displacement reduction of the primary structure with these elements by facilitating to
transfer some plastic hinges from main structural elements (beams and columns) to
these sacrificial elements. It is assumed that the brackets are replaced with the
sacrificial elements in computer modelling. Stiffness and weight of the elements are
exactly similar to those of real brackets in facade installation. This behaviour is
consistent with out-of-plane behaviour of facade panel brackets and the defined plastic
hinges are formed only based on axial forces. The occurrence of plastic hinge in the
brackets is based on the applied axial force from ground excitation which is applied to
the structure and then transferred to the brackets.
4.4.3 Out-of-Plane Concept of Façade Behaviour
In out-of-plane façade behaviour, the panels perpendicular to applied earthquake
direction are affected but the façade movement is parallel to the earthquake force.
Plastic hinges are formed based on the applied axial force to the bracket; i.e. if the
applied force is more than a pre-assigned value of force in force–displacement
relationship, then the hinges would start to form and absorb energy. Dimensions of
facade panels are typically 1.5m by 4m. One side of a building showing 8 panels
subjected to wind loads is depicted in Figure 4-20. According to the Australian Wind
code, AS1170.2, calculated ultimate design wind pressure is 1.5 kPa.
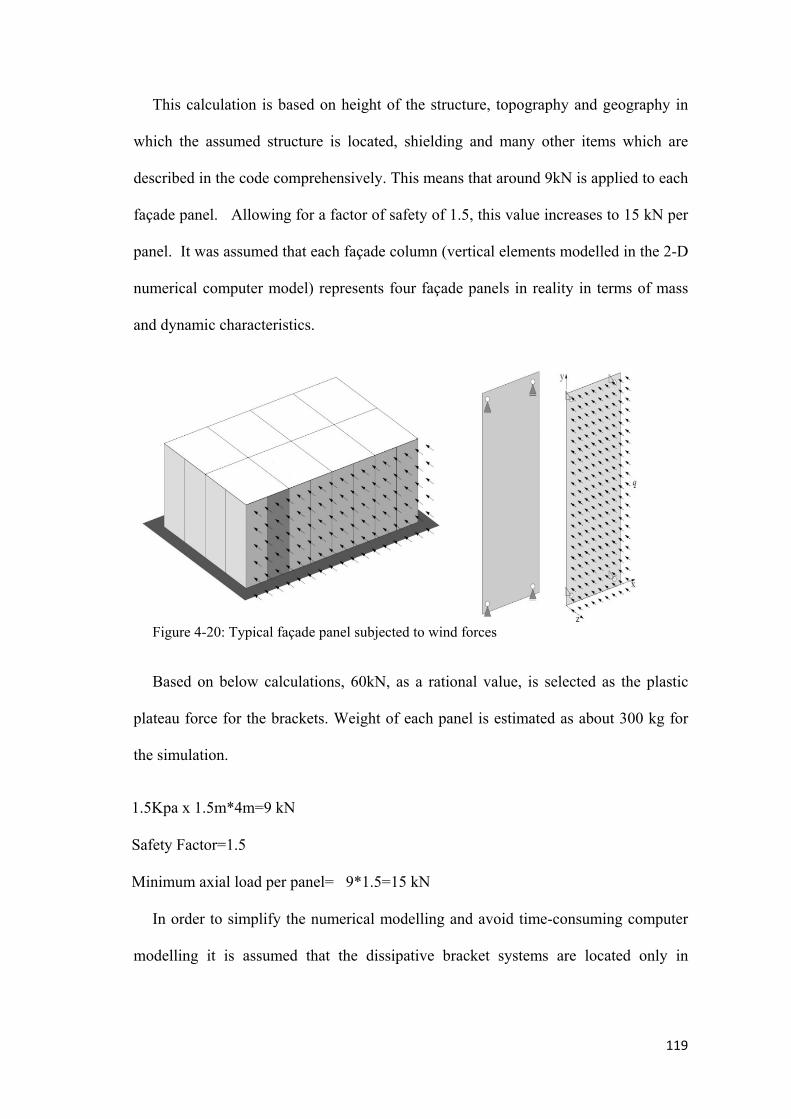
119
This calculation is based on height of the structure, topography and geography in
which the assumed structure is located, shielding and many other items which are
described in the code comprehensively. This means that around 9kN is applied to each
façade panel. Allowing for a factor of safety of 1.5, this value increases to 15 kN per
panel. It was assumed that each façade column (vertical elements modelled in the 2-D
numerical computer model) represents four façade panels in reality in terms of mass
and dynamic characteristics.
Figure 4-20: Typical façade panel subjected to wind forces
Based on below calculations, 60kN, as a rational value, is selected as the plastic
plateau force for the brackets. Weight of each panel is estimated as about 300 kg for
the simulation.
1.5Kpa x 1.5m*4m=9 kN
Safety Factor=1.5
Minimum axial load per panel= 9*1.5=15 kN
In order to simplify the numerical modelling and avoid time-consuming computer
modelling it is assumed that the dissipative bracket systems are located only in
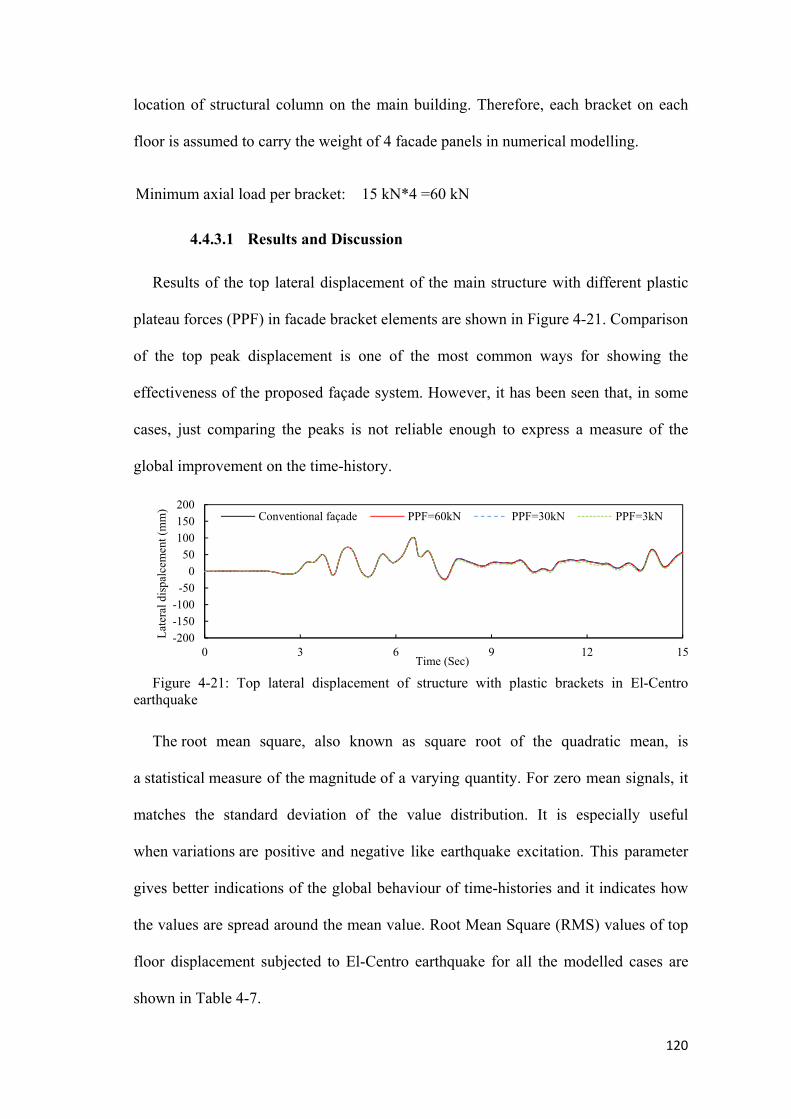
120
location of structural column on the main building. Therefore, each bracket on each
floor is assumed to carry the weight of 4 facade panels in numerical modelling.
Minimum axial load per bracket: 15 kN*4 =60 kN
4.4.3.1 Results and Discussion
Results of the top lateral displacement of the main structure with different plastic
plateau forces (PPF) in facade bracket elements are shown in Figure 4-21. Comparison
of the top peak displacement is one of the most common ways for showing the
effectiveness of the proposed façade system. However, it has been seen that, in some
cases, just comparing the peaks is not reliable enough to express a measure of the
global improvement on the time-history.
Figure 4-21: Top lateral displacement of structure with plastic brackets in El-Centro earthquake
The root mean square, also known as square root of the quadratic mean, is
a statistical measure of the magnitude of a varying quantity. For zero mean signals, it
matches the standard deviation of the value distribution. It is especially useful
when variations are positive and negative like earthquake excitation. This parameter
gives better indications of the global behaviour of time-histories and it indicates how
the values are spread around the mean value. Root Mean Square (RMS) values of top
floor displacement subjected to El-Centro earthquake for all the modelled cases are
shown in Table 4-7.
-200
-150
-100
-50
0
50
100
150
200
0 3 6 9 12 15
Lat
eral
dis
palc
emen
t (m
m)
Time (Sec)
Conventional façade PPF=60kN PPF=30kN PPF=3kN

121
Table 4-7: Root mean square of top floor displacement cases with different plastic plateau forces (mm)
Conventional facade system
PPF 60kN PPF 6kN PPF 3kN PPF 0.5kN
106.61 106.37 106.16 102.35 109.10
4.4.3.2 Conclusion
Facade panels have been considered as non-structural elements in all simulations,
mainly because of their mass ratio in comparison to main structure and their role in
carrying gravity loads. After the preliminary analysis, it is proven that this mass is not
large enough to activate the bracket elements. Also, due to the earthquake excitation,
the structure's maximum axial force in each bracket element is about 6 kN which is far
less than 60 kN, calculated based on practical considerations. A very small value of
plastic plateau force (around 3 kN) should be considered in order to achieve a minor
visible, but not significant, effect on the top lateral displacement of the main structure.
It can be concluded that façade elements undergoing out of plane movements are not
effective.
4.4.4 In-Plane Concept of Façade Behaviour
Ideas of glass structures or load bearing glass walls have been proposed before
(Wellershoff and Sedlacek 2003). An example of this ‘engineered transparency’ in
building envelopes such as the Reinbach Pavilion is shown in Figure 4-22.

Figure 4-22: Rheinbach glass museum, Rheinbach (Wellershoff and Sedlacek 2003)
Facade panels moving in parallel to direction of earthquake motion can be considered
as shell elements inside each frame of structure to represent their in-plane behaviour
during seismic excitation. (Pinelli et al. 1992) undertook parametric studies on a 6-
storey steel frame building fitted with two precast cladding panels per bay. They
studied the incorporation of metallic dampers into the connectors used to attach
architectural cladding to a building. The studied structure was a ¼ scale 6-storey 3-bay
moment resisting steel frame building constructed in the 1980s for laboratory testing
at National Centre for Earthquake Engineering Research in the US. For the cladding
to-frame interaction, the test frame was provided with two precast cladding panels per
bay (Pinelli, Craig et al. 1995). The panels were considered to be rigid and each panel
was attached at its bottom to the steel frame by two rigid bearing connectors and at its
top by two advanced connectors, which was a metallic hysteretic damper. In this
section, similar to the previous research, the in-plane behaviour and movement of
double-skin facade panel is assumed to be integrated into the structural frame and is
modelled as a wall system in which the in-plane stiffness is incorporated into the main
structural frame. Stiffness of each vertical connection is calibrated in order to
represent the behaviour of the panels. The modelled spring element has only axial
122

stiffness with zero shear stiffness. Instead of modelling the glass and aluminium frame
of the facade panels, it is assumed that the shell element is made of a smeared material
with combined properties of both materials.
Figure 4-23: In-plane concept of façade behaviour (façade as a shell element in structure frame and its connections)
Stiffness of the shell element is chosen to be a practical value between glass and
aluminium in computer modelling. The length of structural bay is 8000 mm and it is
assumed that dimensions of each shell element is 7600mm by 3600mm by 200mm as
there is a 200mm gap distance between the structural frame and the shells in each
direction. They are attached to the structural frame on each of the four sides by
vertical bearing connections which are modelled as simple linear spring elements with
a very high stiffness value in the computer program. The configuration and
attachments of in-plane system is shown in Figure 4-23. The shell element has similar
specifications to the five facade panels with normal height and width of 3600 mm and
1500 mm, respectively, per bay. Therefore, the weight of each shell element is equal
to that of five facade panels. Stiffness of each horizontal connection, which represents
an energy absorbing connection, is calibrated in order to incorporate them into the
total lateral stiffness of the whole structure. It should be noted that these shell
123
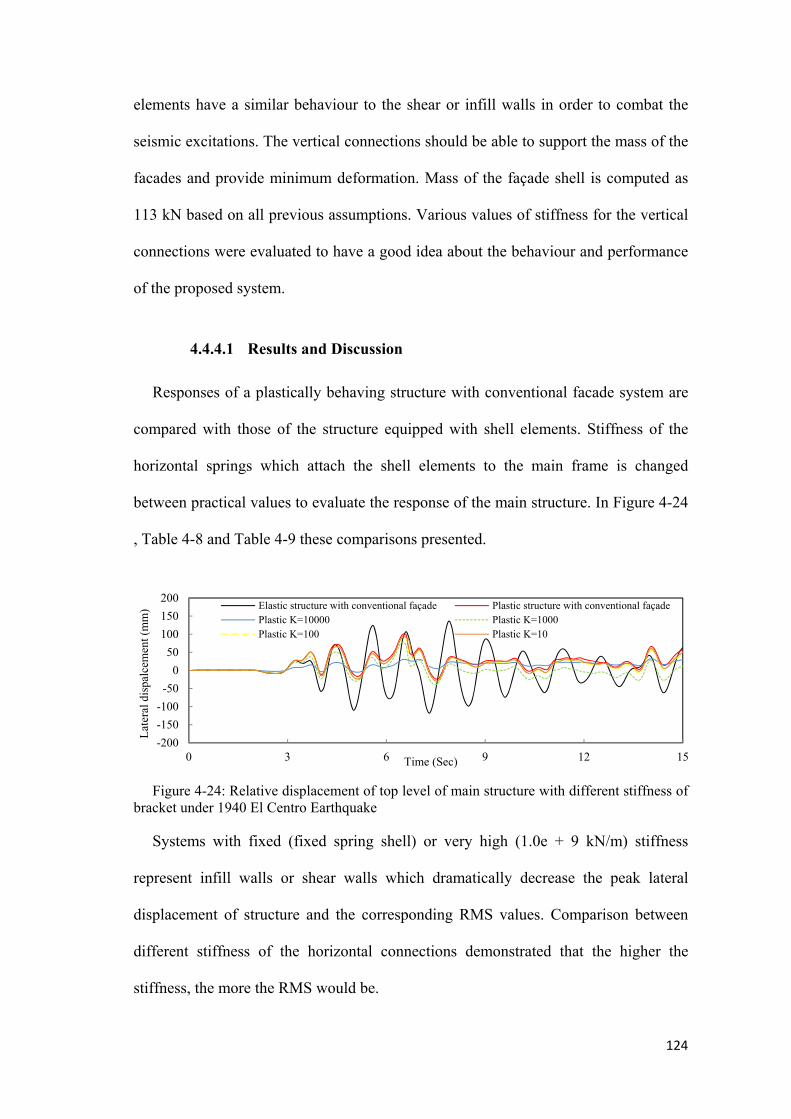
124
elements have a similar behaviour to the shear or infill walls in order to combat the
seismic excitations. The vertical connections should be able to support the mass of the
facades and provide minimum deformation. Mass of the façade shell is computed as
113 kN based on all previous assumptions. Various values of stiffness for the vertical
connections were evaluated to have a good idea about the behaviour and performance
of the proposed system.
4.4.4.1 Results and Discussion
Responses of a plastically behaving structure with conventional facade system are
compared with those of the structure equipped with shell elements. Stiffness of the
horizontal springs which attach the shell elements to the main frame is changed
between practical values to evaluate the response of the main structure. In Figure 4-24
, Table 4-8 and Table 4-9 these comparisons presented.
Figure 4-24: Relative displacement of top level of main structure with different stiffness of bracket under 1940 El Centro Earthquake
Systems with fixed (fixed spring shell) or very high (1.0e + 9 kN/m) stiffness
represent infill walls or shear walls which dramatically decrease the peak lateral
displacement of structure and the corresponding RMS values. Comparison between
different stiffness of the horizontal connections demonstrated that the higher the
stiffness, the more the RMS would be.
-200
-150
-100
-50
0
50
100
150
200
0 3 6 9 12 15
Lat
eral
dis
palc
emen
t (m
m)
Time (Sec)
Elastic structure with conventional façade Plastic structure with conventional façadePlastic K=10000 Plastic K=1000Plastic K=100 Plastic K=10
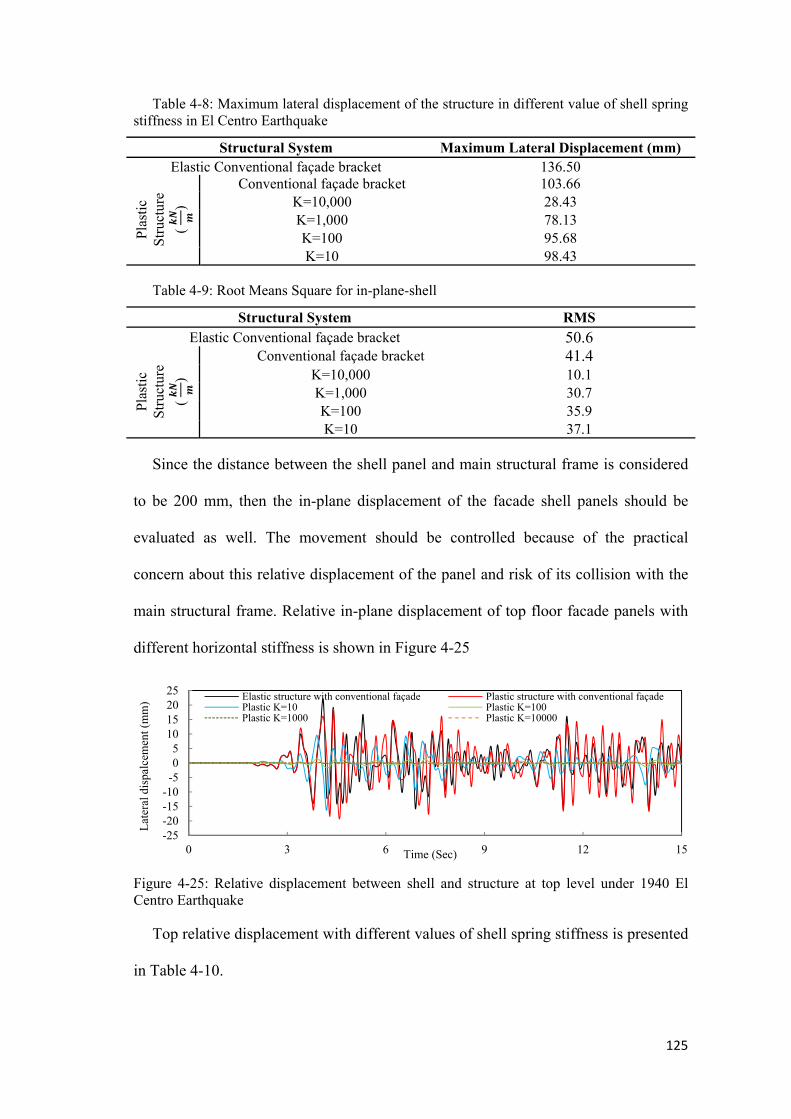
125
Table 4-8: Maximum lateral displacement of the structure in different value of shell spring stiffness in El Centro Earthquake
Structural System Maximum Lateral Displacement (mm) Elastic Conventional façade bracket 136.50
Pla
stic
S
truc
ture
( )
Conventional façade bracket 103.66 K=10,000 28.43K=1,000 78.13K=100 95.68K=10 98.43
Table 4-9: Root Means Square for in-plane-shell
Structural System RMS Elastic Conventional façade bracket 50.6
Pla
stic
S
truc
ture
( )
Conventional façade bracket 41.4 K=10,000 10.1K=1,000 30.7K=100 35.9K=10 37.1
Since the distance between the shell panel and main structural frame is considered
to be 200 mm, then the in-plane displacement of the facade shell panels should be
evaluated as well. The movement should be controlled because of the practical
concern about this relative displacement of the panel and risk of its collision with the
main structural frame. Relative in-plane displacement of top floor facade panels with
different horizontal stiffness is shown in Figure 4-25
Figure 4-25: Relative displacement between shell and structure at top level under 1940 El Centro Earthquake
Top relative displacement with different values of shell spring stiffness is presented
in Table 4-10.
-25-20-15-10-505
10152025
0 3 6 9 12 15
Lat
eral
dis
palc
emen
t (m
m)
Time (Sec)
Elastic structure with conventional façade Plastic structure with conventional façadePlastic K=10 Plastic K=100Plastic K=1000 Plastic K=10000
126
Table 4-10: Lateral Displacement of top façade panels under 1940 El Centro Earthquake
Structural System Maximum Lateral Displacement (mm) Elastic Conventional façade bracket 22
Pla
stic
S
truc
ture
( )
Conventional façade bracket 19 K=10,000 0.03K=1,000 0.28K=100 2K=10 16
Also, for the relative displacement of the spring shell facade with different
stiffness, the values of RMS are shown in Table 4-11.
Table 4-11: Root Mean Square of relative displacement of façade shell element at top level of structure
Structural System RMS Elastic Conventional façade bracket 7.9
Pla
stic
S
truc
ture
( )
Conventional façade bracket 7.0 K=10,000 0.0K=1,000 0.1K=100 0.6K=10 6.1
It is seen that the proposed system is working very effectively in terms of reducing
the response of the primary structure. With the stiffness of around 1,000 , this
reduction reaches its maximum.
4.4.4.2 Conclusion
Based on the results of this section, it is demonstrated that incorporating the in-
plane stiffness of facade panels can be a feasible concept in order to reduce the
response of the primary structure. Determining the tensile strength of glass elements is
a crucial part in developing this idea. A stress-history interaction equation that is
useful for determining the tensile strength of glass with accuracy is the key parameter
for the proposal. As the facade panels are only located on the perimeter of the
structure, then the concept cannot be used for the internal frames of structures.
127
Moreover, the results are very sensitive to the energy content and dominant
frequencies of the applied earthquake; therefore, the possibility of both near- and far-
field earthquake motions should be evaluated in order to assess the capability of the
proposed system.
4.5 Finite Element Modelling Using ANSYS APDL
4.5.1 Introduction of Smart Bracket with Combined Shear and Axial
Movement
Fundamental vibration period and frequency of structures have direct correlation
with their overall height. This frequency is within an approximate range of 0.3 to 3.0
Hz for low- to mid-rise buildings. On the other hand, frequencies associated with most
earthquake records are between 0.2 and 5 Hz depending on many factors including sub
soil conditions (Figure 4-27). Therefore, resonant conditions, in which the frequency of
seismic force is similar to that of building structures, can most probably happen during
seismic activities. In the case of seismic activities, low- to mid-rise buildings may be
susceptible to excessive inter-storey drifts, large shear forces, and noticeable
accelerations.
A comprehensive assessment procedure for ensuring the feasibility of the proposed
system to mitigate seismic hazard is performed in this section of the thesis. In the
previous sections, it was shown that facade panels could be considered as structural
elements and as movable panels; then they have the potential to reduce buildings'
lateral displacement if axial stiffness of facade brackets is such that yielding can occur
during earthquake excitations. In this section, a new concept is introduced in order to
utilize dynamic capability of movable facade panels in order to reduce the response of
primary structure during different earthquake events. Adding more functions to the

128
bracket elements in addition to carrying the self-weight of panels is novel in designing
the new generation of facade panels. Selection of suitable materials to provide the
desired behaviour would be a part of future works related to the proposed idea.
4.5.2 Development of Smart Passive Façade System-Assigning a Nonlinear
Behaviour to Façade Connection
Initial investigations have illustrated that the best results in terms of reducing
ductility demand on main structural components can be achieved using a facade
moving at the TMD frequency (bracket with low stiffness). On the other hand, facade
brackets should be designed to withstand severe winds; it means that they should
display reasonable vertical and horizontal displacement and stiffness. It should be
noted that, based on facade design calculations, each facade panel should have a
plus/minus reasonable displacement during the force application. The main concept is
to replace the conventional bracket elements, which have a rigid behaviour, with new
bracket elements with low shear and axial stiffness to yield and be sacrificed and
hence absorb energy in the case of extreme earthquake excitations
Figure 4-26: Proposed Multi-linear behaviour of the façade bracket acting as axial damper system
For
ce (
n)
Deformation (mm)
129
They should have the ability to deform under tensile stress. The advanced connectors
are modelled as a nonlinear translational spring element, which could incorporate a
bilinear behaviour with strain hardening and inelastic unloading. The proposed
behaviour of bracket elements is shown in Figure 4-26. The excessive movement of
smart facade panels are controlled by the third slope. The last slope which has much
higher stiffness acts as a brake against the panels back and forth movement. The
required stiffness is calculated based on the maximum allowable movement of facade
panels in practice. Third phase of force-deformation behaviour of the panel is
associated with a higher stiffness ratio to ensure façade remains at a safe distance from
the main structure. The initial stiffness of these systems is designed based on the wind
loads for each specific region. The secondary stiffness for each individual facade
panel should be designed to allow yielding of the brackets after a threshold seismic
acceleration is reached.
For example, for a region which is located in an earthquake-prone zone with low
wind forces, the first stiffness is designed with low stiffness to increase the efficiency
of the system. For the region which is an earthquake-prone zone with high wind
forces, the first stiffness should be designed with higher stiffness to withstand
expected wind forces and the second slope of bracket stiffness should be designed to
allow yielding for mitigating the effect of earthquake. The second slope should be
designed specifically based on earthquake forces capable of yielding and forming
plastic hinges in the brackets. If the resulting facade displacements reach a particular
threshold value the stiffness is increased the stop further façade displacements.
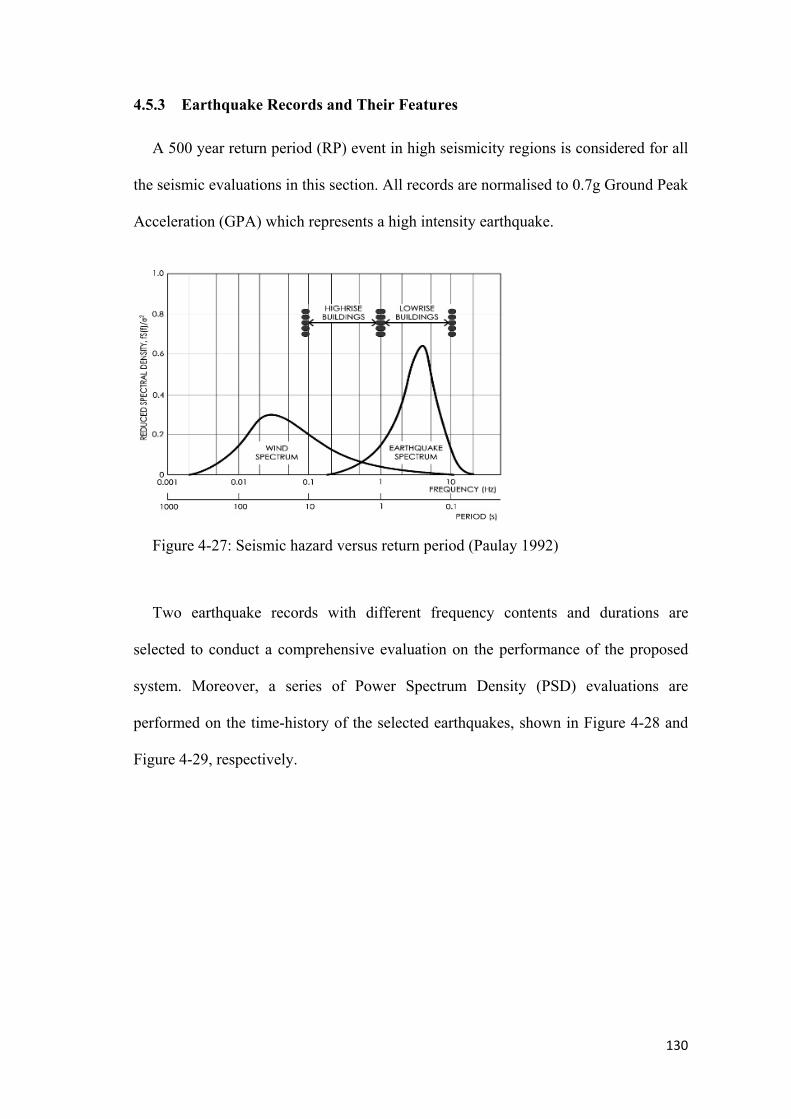
130
4.5.3 Earthquake Records and Their Features
A 500 year return period (RP) event in high seismicity regions is considered for all
the seismic evaluations in this section. All records are normalised to 0.7g Ground Peak
Acceleration (GPA) which represents a high intensity earthquake.
Figure 4-27: Seismic hazard versus return period (Paulay 1992)
Two earthquake records with different frequency contents and durations are
selected to conduct a comprehensive evaluation on the performance of the proposed
system. Moreover, a series of Power Spectrum Density (PSD) evaluations are
performed on the time-history of the selected earthquakes, shown in Figure 4-28 and
Figure 4-29, respectively.

131
(a)Whole record (b) Comparision between first 10seconds with second 10 seconds
Figure 4-28: Displacement Power Spectrum Density for 1994 Northridge earthquake
(a)Whole record (b) Comparision between first 10seconds with second 10 seconds
Figure 4-29: Displacement Power Spectrum Density for 1963 Hachinohe earthquake
Displacement time-history of the records is applied to the structure using ANSYS
APDL program. It is important to note that the comprehensive evaluation of PSD is
necessary for designing and selecting the best stiffness of the brackets. For example,
in Northridge earthquake, the dominant frequency containing significant seismic
energy is evident during the first 10 sec of the record and the second 10 sec of the
0E+0
1E+4
2E+4
3E+4
4E+4
5E+4
6E+4
0 0.2 0.4 0.6 0.8 1
PSD
Dis
plac
emen
t 103
x [m
m^2
/Hz]
Frequency (Hz)
WholeRecord
0E+0
1E+4
2E+4
3E+4
4E+4
5E+4
6E+4
7E+4
0 0.2 0.4 0.6 0.8 1
PSD
Dis
plac
emen
t 103
x [m
m^2
/Hz]
Frequency (Hz)
First 10 seconds
Second 10 seconds
0E+0
5E+3
1E+4
2E+4
2E+4
3E+4
3E+4
0 0.2 0.4 0.6 0.8 1
PSD
Dis
plac
emen
t 103
x [m
m^2
/Hz]
Frequency (Hz)
Whole Record
0E+0
5E+3
1E+4
2E+4
2E+4
3E+4
3E+4
0 0.2 0.4 0.6 0.8 1
PSD
Dis
plac
emen
t 103
x [m
m^2
/Hz]
Frequency (Hz)
First 10 seconds
Second 10 seconds
132
record does not contain high energy in the considered frequency range. For
Hachinohe record, it is seen that frequency content is almost steady during the whole
record.
4.5.4 Structural Models
In a finite element analysis, selection of mesh size and layout is critical. It is
usually desirable to use as many elements as possible in the analysis to improve
accuracy. However, such an analysis will require excessive computer modelling time.
In this analysis, adequate number of elements are chosen for both frames and facades
in order to obtain sufficient accuracy of the results without excessive use of computer
time after carrying out a convergence study. To show the feasibility of the concept,
ANSYS APDL package is used to model the external panel of a 3D 12-storey structure
with rigid and sacrificial brackets. Length of each bay is 8.0 meters and height of every
floor is considered to be 4.0 meters with the overall height of the structure of 48m. All
structural joints are modelled as a semi-rigid connection based on Euro code
(moment-rotation relation) to accurately model the actual behaviour of the structure..
If designed properly, ductility ratio of column and beam elements should be around 1-
1.5 and 6-8, respectively, to reach the overall ductility of 3-4 for the structure.
4.5.5 Bracket Element Behaviour
It has been proven that facade panels with particular weight and dynamic
characteristics can mitigate the response of the main structure. As mentioned earlier,
direction of the applied earthquake force could be horizontal or vertical; therefore,
bracket facade elements can be loaded in axial and/or shear directions. The key
criterion for designing the bracket stiffness is to have comprehensive knowledge about
the nature of earthquake forces. Then, a series of power spectral density (PSD)

133
analyses were conducted to evaluate the content and frequency range of the selected
records. Facade brackets are tuned to the main frequency of structure to maximise
deformation and hence the load on the brackets. Brackets' axial stiffness should be
designed to withstand at least the design wind load with negligible facade movements.
It is assumed that each panel is attached to the slab of main structure with four
brackets, one at each corner. The value of the calculated stiffness is higher than the
value calculated based on considering the facade panels as a multi Tuned Mass
Damper (TMD) along the height of the structure. It should be noted that the axial
force in the conventional brackets due to earthquake excitation would be another
parameter, which should be considered in calculations.
Figure 4-30: Configuration of the proposed damper system
COMBIN14 element is used in ANSYS for modelling a simple linear spring-damper
element, which represents the assumed behaviour of the bracket element. Shear
stiffness of the brackets is changed between some preselected values (100, 80, 50, 20,
15, 12, 10, 8, and 5 N/mm) to gain an understanding of their respective effects and the
results are shown in the following figures. The proposed damper system, which
replaces the conventional bracket system, principally behaves like a Viscoelastic
damper which is shown in Figure 4-30. The conventional bracket system has
dimensions of length of 350mm, width of 280mm and thickness of 20mm. other
technical specification of the conventional bracket is listed as below:

ElasticModulusofeffectivesection:4
28000
Areaofeffectivesection: ∗ 5600
Allowableflexuralstrenght:1.65
4.09 . .
It consists of two plates which are filled with a viscoelastic material with a high
value of axial stiffness in one direction and low value of shear stiffness in the
perpendicular direction. One end of the bracket system is connected to façade element
and the other end to the main structural element (column or slab). The inner plate is a
separator between the two layers of visco-elastic material in order to allow more
relative displacement to the bracket system.
Conventional bracket system which represent rigid bracket element has length of
350mm, width of 280mm and thickness of 20mm. This bracket element
4.5.6 Criteria for Evaluation of the System
To gain an insight into the performance of the system, three criteria are evaluated
and the results are shown below. Top lateral displacement and acceleration of the
primary structure, storey drifts, and root mean square of displacement are the criteria
for interpreting the overall performance of the system.
4.5.6.1 Lateral Displacement Control
In this research, the effects of implementing novel bracket facade elements with low
shear stiffness, which can be installed in a 12-storey structure system, are evaluated.
The conventional bracket elements are replaced with these novel connections, which
are installed between the main structure and glazing system on all four faces of the
building. One outer frame, along the same direction as the earthquake excitation, is
134
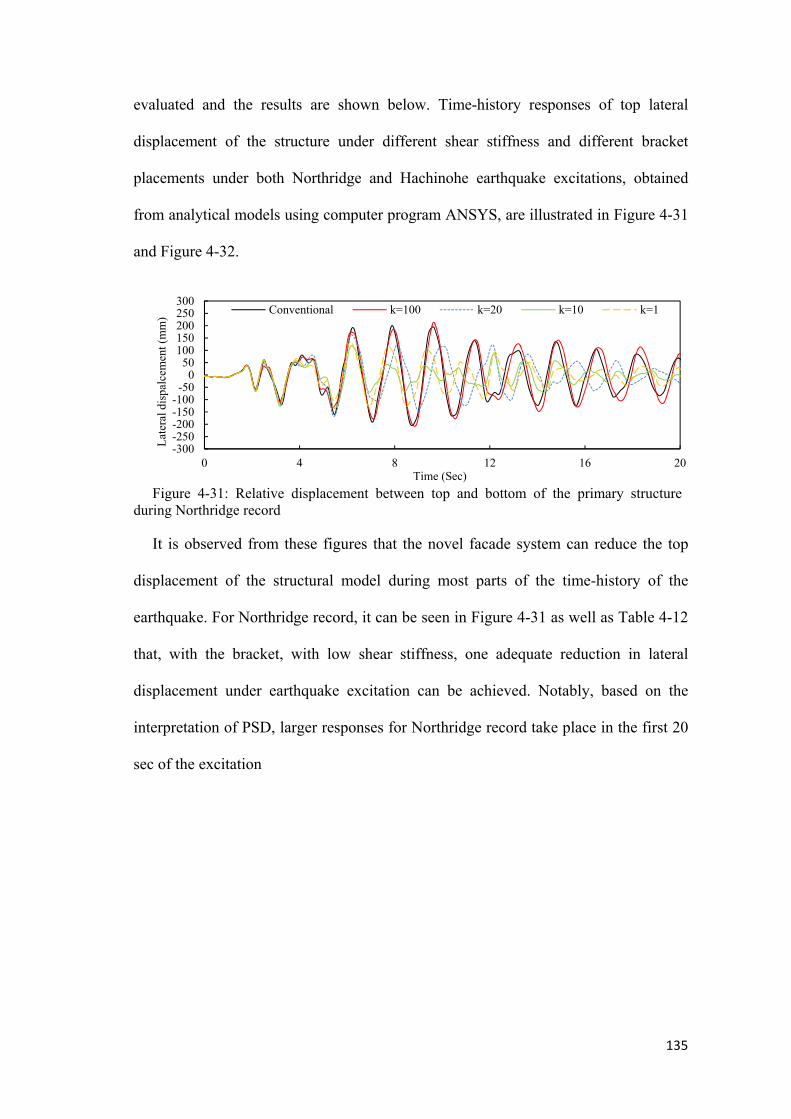
135
evaluated and the results are shown below. Time-history responses of top lateral
displacement of the structure under different shear stiffness and different bracket
placements under both Northridge and Hachinohe earthquake excitations, obtained
from analytical models using computer program ANSYS, are illustrated in Figure 4-31
and Figure 4-32.
Figure 4-31: Relative displacement between top and bottom of the primary structure during Northridge record
It is observed from these figures that the novel facade system can reduce the top
displacement of the structural model during most parts of the time-history of the
earthquake. For Northridge record, it can be seen in Figure 4-31 as well as Table 4-12
that, with the bracket, with low shear stiffness, one adequate reduction in lateral
displacement under earthquake excitation can be achieved. Notably, based on the
interpretation of PSD, larger responses for Northridge record take place in the first 20
sec of the excitation
-300-250-200-150-100-50
050
100150200250300
0 4 8 12 16 20
Lat
eral
dis
palc
emen
t (m
m)
Time (Sec)
Conventional k=100 k=20 k=10 k=1

136
Figure 4-32: Relative displacement between top and bottom of the primary structure during Hachinohe record
Bracket elements with the shear stiffness of 10 N/mm are tuned to the frequency of
primary structure which has a similar frequency to the dominant frequency of
Northridge excitation. The maximum reduction of the top lateral displacement of the
structure subjected to Northridge excitation takes place during the first 20 sec of
excitation. According to these results, it is shown that, with the use of low shear
stiffness brackets, the overall lateral displacement of the primary structure subjected to
seismic load can be decreased.
Table 4-12: Maximum top lateral displacement in primary structure incorporating low shear stiffness bracket facades during Northridge record
Northridge Record Maximum Displacement (mm) % Reduction
Conventional 205 -
She
ar S
tiff
ness
(N
/mm
)
100 214 - 80 211 - 50 214 - 20 168 18 15 161 22 12 148 28 10 136 35 5 124 40 1 139 32
It is also demonstrated that values of 1 and 20 N/mm have less effect on response
reduction compared to the values of 5 and 10 N/mm. To be more precise, it is
concluded that the optimum range is from 5 to 15 N/mm for the Northridge
earthquake record. For Hachinohe record, it can be seen in Figure 4-32 as well as
-300-250-200-150-100-50
050
100150200250300
0 4 8 12 16 20
Lat
eral
dis
palc
emen
t (m
m)
Time (Sec)
Conventional k=100 k=20 k=10 k=1

137
Table 4-13 that with the bracket with low shear stiffness adequate reduction of lateral
displacement under earthquake excitation can be achieved. Bracket elements with the
shear stiffness of 20 N/mm are tuned to the frequency of the primary structure which
has a similar frequency to the dominant frequency of Northridge excitation.
Table 4-13: Maximum top lateral displacement in primary structure incorporating with low shear stiffness bracket facades during Hachinohe record
Northridge Record Maximum
Displacement (mm) % Reduction
Conventional 126 -
She
ar S
tiff
ness
(N
/mm
)
100 108 1480 94 2550 79 3720 66 4715 71 4312 78 3810 83 345 79 371 75 40
According to these results, it is shown that, with the use of low shear stiffness brackets,
the overall lateral displacement of the primary structure subjected to Hachinohe
seismic load is decreased. It is also demonstrated that values of 1 to 20 N/mm have
similar effects on response reduction compared to the value of 20 N/mm which has
maximum reduction. To be more precise, it is concluded that the optimum range is
from 10 to 20 N/mm for the Hachinohe earthquake record.
4.5.6.2 Drift Control
The in-plane seismic assessment of glass facade systems requires an estimation of
the likely in-plane drift demand from the earthquake action. AS 1170.4 (2007), clauses
5.4.4 and 5.5.4, specify that, “the inter-storey drift in the ultimate limit state, calculated
from the forces determined according to strength and stability provisions, shall not
exceed 1.5% of the storey height for each level” and “the attachment of cladding and

138
facade panels to the seismic-force-resisting system shall have sufficient deformation
and rotational capacity”. Therefore, for the typical floor height of 3600 mm, the
maximum allowable relative storey deflection is 54 mm. An earthquake-induced drift
is a controversial issue for the safety assessment of building structures. Seismic drift
demand on buildings can be investigated in many ways using elastic or inelastic
approaches with static or dynamic analyses (Sivanerupan et al. 2008). Drift levels are
set to ensure that the design storey drift does not exceed that level, which is consistent
with the ductility of the available element based on structural detail requirements of
AS1170.4. In-plane and out-of-plane seismic drift demands of facade systems should
be estimated if low shear stiffness is used in the bracket elements. The drift capacity of
a framed glazed system before glass breakage depends on the edge clearance and
aspect ratio. These items should be considered in detail to evaluate in-plane and out-of-
plane deformations of the frame. If the drift between the facade panels is higher than the
limit, then the facade is considered unsafe and it is necessary to carry out further assessments.
The results indicate that framed glazed facade systems with typical minimum edge
clearance in regular buildings are not vulnerable to the selected earthquakes. In
computer modelling, the facade panels are assumed to be conventional curtain wall
systems, which are attached to the slab of the main structure at four points. Point fixed
(frameless) glazing is another type, which needs separate analytical modelling and
rational testing to assess the contribution to response reduction. Commercially
available curtain walls provide serviceability movements in the range of 10-15mm
(30% drift) for inter-storey displacement demand. These systems seem to reach this
ultimate condition at the inter-storey drift of approximately 30-40 mm. Drifts for each
storey for primary structure with different stiffness for shear bracket façade elements

139
during Northridge and Hachinohe earthquakes are shown in Figure 4-33 and Figure
4-34.
Figure 4-33: Drift for primary structure with different stiffness for shear bracket façade elements during Northridge earthquake
As illustrated in Figure 4-33 drift for the floors with the shear stiffness of 10 N/mm
for bracket elements is decreased by the maximum value of 44% which is a promising
result. Values of in-plane drifts of the primary structure for the selected shear stiffness
are shown in Table 4-14 for Northridge earthquake.
Table 4-14: In plane drift of primary structure with different bracket stiffness during 1994 Northridge earthquake (in mm)
0
10
20
30
40
50
0 1 2 3 4 5 6 7 8 9 10 11 12
Dri
ft b
etw
een
stor
eis(
mm
)
Storey
Conventional k=100 k=20 k=10 k=1
Floors Conventional 100 20 10 1
12 11.0 10.1 10.0 9.8 10.111 11.0 10.5 8.6 11.0 9.010 15.6 14.9 11.8 10.9 11.09 19.8 17.9 14.3 11.5 13.08 22.7 19.8 16.2 12.7 14.47 23.8 22.1 18.4 14.3 15.96 23.6 23.9 19.6 14.9 16.75 24.9 24.8 19.8 14.5 16.34 26.5 24.7 21.1 15.6 16.73 28.9 24.7 22.8 17.3 16.92 26.7 22.2 21.1 16.2 15.41 14.2 11.7 11.1 8.6 8.2

140
Figure 4-34: Drift for primary structure with different stiffness for shear bracket façade elements during Hachinohe earthquake
As illustrated in Figure 4-34, drift for the floors with the shear stiffness of 20
N/mm for bracket elements is decreased by the maximum value of 60% which is
another promising result. Values of in-plane drifts of primary structure for the selected
shear stiffness are shown in Table 4-15 for Hachinohe earthquakes.
Table 4-15: In plane drift of primary structure in case of different bracket stiffness during 1963 Hachinohe earthquake (in mm)
4.5.6.3 Acceleration of Primary Structure
Controlling the acceleration of structures is very crucial during earthquake
excitations. Excessive acceleration in a structure can cause severe damage to sensitive
equipment. Top floor acceleration of the primary structure is compared using various
bracket facade stiffness values and results are shown for both earthquake records. As
0
10
20
30
40
50
0 1 2 3 4 5 6 7 8 9 10 11 12
Dri
ft b
etw
een
stor
eis(
mm
)
Storey
Conventional k=100 k=20 k=10 k=1
Floors Conventional 100 20 10 1
12 24.8 21.2 11.3 17.9 16.711 24.7 21.0 12.2 19.4 18.010 21.6 18.4 11.9 18.9 17.69 20.8 17.0 9.5 15.2 14.18 17.4 14.2 8.4 13.4 12.47 20.1 16.2 7.6 12.2 12.06 22.9 19.0 8.9 13.2 12.15 24.0 19.9 9.9 15.0 14.34 23.5 19.5 10.1 14.00 13.03 24.7 20.9 11.1 17.6 16.32 26.2 22.2 15.7 18.10 19.91 28.1 23.0 17.8 20.00 20.2
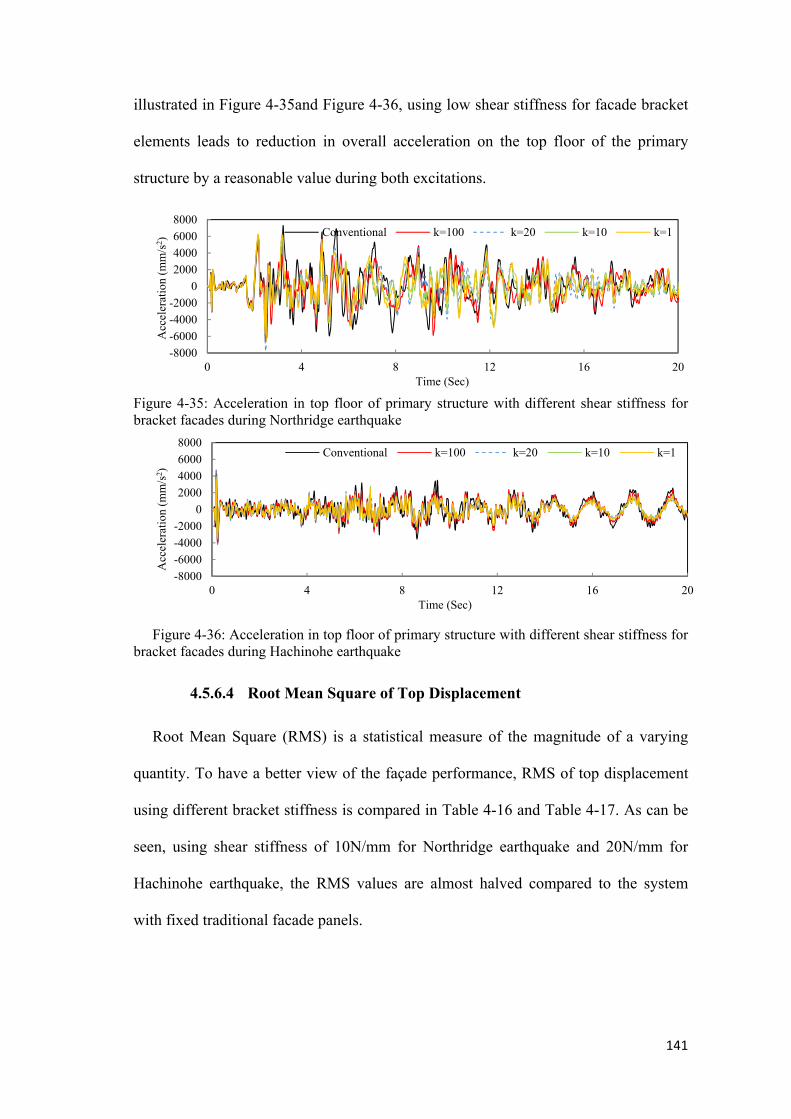
141
illustrated in Figure 4-35and Figure 4-36, using low shear stiffness for facade bracket
elements leads to reduction in overall acceleration on the top floor of the primary
structure by a reasonable value during both excitations.
Figure 4-35: Acceleration in top floor of primary structure with different shear stiffness for bracket facades during Northridge earthquake
Figure 4-36: Acceleration in top floor of primary structure with different shear stiffness for bracket facades during Hachinohe earthquake
4.5.6.4 Root Mean Square of Top Displacement
Root Mean Square (RMS) is a statistical measure of the magnitude of a varying
quantity. To have a better view of the façade performance, RMS of top displacement
using different bracket stiffness is compared in Table 4-16 and Table 4-17. As can be
seen, using shear stiffness of 10N/mm for Northridge earthquake and 20N/mm for
Hachinohe earthquake, the RMS values are almost halved compared to the system
with fixed traditional facade panels.
-8000
-6000
-4000
-2000
0
2000
4000
6000
8000
0 4 8 12 16 20
Acc
eler
atio
n (m
m/s
2 )
Time (Sec)
Conventional k=100 k=20 k=10 k=1
-8000
-6000
-4000
-2000
0
2000
4000
6000
8000
0 4 8 12 16 20
Acc
eler
atio
n (m
m/s
2 )
Time (Sec)
Conventional k=100 k=20 k=10 k=1

142
Table 4-16: Root mean square of top displacement using different value of shear stiffness during 1994 Northridge earthquake
Type of Structure RMS, mm % Reduction Conventional 67.2 -
100 69.2 -80 70.1 -50 73.1 -20 47.2 3010 31.9 531 42.2 37
Table 4-17: Root mean square of top displacement using different value of shear stiffness during 1963 Hachinohe earthquake
Type of Structure RMS, mm % Reduction Conventional 62.5 -
100 55.3 1180 51.3 1850 47.3 2420 24.5 6010 42.1 321 38.3 38
4.5.7 Conclusions
From the numerical results of the current study, it is found that bracket facade
elements with low shear stiffness can mitigate the response of structures. Reaching a
lower value of stiffness would not lead to excessive movement of panels, as was
proved for lower axial stiffness. In this study, the most efficient configuration of shear
brackets is their placement at the top 1/3 height of the building. However, it must be
emphasized that, to reach the maximum performance, using designed brackets on all
floors of the structure is recommended; but, this adds additional cost to construction.
All results are based on using a simple linear element with low shear stiffness and
higher axial stiffness. Selection of bracket material is a crucial aspect in terms of the
practicality of the proposed idea. Viscoelastic material, code ISD-111 VE polymer,
manufactured by 3M Company would be one possible choice for material selection
and bracket experimental testing in future works. At this stage of computer analysis, a

143
new concept is introduced to utilize dynamic capability of movable facade panels to
reduce the response of primary structure during different earthquake events. Adding
more functions to the bracket elements in addition to carrying self-weight of panels is
novel in designing a new generation of facade panels. Selection of suitable materials
for providing the desired behaviour would be a part of the future work on the proposed
idea. Maximum in-plane and out-of-plane drift capacity of the proposed facade panels
are evaluated to demonstrate the overall feasibility of the system.
In-plane drift capacity of glazed facade systems should be considered as a key
factor for designing the bracket stiffness. Designing an advanced facade connection is
a complex process and will be time-consuming if used for commercial purpose. But, it
could be justified by the overall increased efficiency of structural facade functioning
in regard to dynamic response, such as a seismic situation. The advanced facade
connection can provide better uniformly distributed energy dissipation over the height
of the building without involving any structural members. The experimental testing
under the conditions close to the realistic physical structure should be conducted. The
main idea behind the experimental phase is to validate the numerical model as well as
observing the real behaviour of the system subjected to a number of earthquake
records.
144
CHAPTER 5
MID-RISE 10-STOREY
STRUCTRAL MODELS

145
5.1 Introduction
In this chapter, the performance of the proposed movable façade system models,
described in Chapter 4, is investigated, comprehensively, with modal analyses and
nonlinear dynamic time-history analyses. The overall behaviour of the mid-rise
structural models with movable dissipative cladding is compared to the same structure
with conventional façade system, and the dynamic effects and behaviour of the new
cladding system are compared across the models with different axial and shear
stiffness connections. The effects of the movable cladding system on the seismic
response of the bare-frame structures are studied by performing modal and nonlinear
dynamic time-history analyses.
Analytical calculations have shown that the movement of cladding system
significantly influences the seismic response of mid-rise structural buildings with
movable dissipative cladding in moderate to severe earthquakes. Normally, fix-
cladding systems reduce the fundamental period of the structural building by few
percent. Effects of the movable cladding on the fundamental period of the structural
building are discussed in this section as well. Additionally, effects of the cladding on
inter-storey drifts, floors displacement, floors acceleration, plastic hinge rotations in
beam/column connections and base shear are going to be discussed in this chapter.
Time-history analyses of each model are performed with selected recorded ground
motions to determine the structural reliability of the proposed connections.
5.2 Modelling Approach and Assumptions
The modelling approach used for the mid-rise structural building with movable
claddings is discussed in this section. Finite element assumptions, building
dimensions, actual beam-column member sizes, equivalent section member sizes,
146
connection details, and total seismic masses are discussed in details in this chapter. It
should be mentioned that defining the reinforced concrete material with all details and
modelling of structural interaction between the steel bars and the concrete material is
beyond the scope of this computer modelling. Hence, a smeared model is used
combining the properties of concrete and steel in the complex structural model in the
3-D 10-storey structure.
5.2.1 Finite Element Analysis
The program selected for the numerical analysis is ANSYS APDL. This
programme is used for generating the geometry, boundary conditions and loading
conditions of the models for both analyses. To decrease the computational time and to
simplify the structural modelling, one-dimensional frame elements were selected for
beams and columns and two-dimensional plane stress elements were chosen for facade
panels in this program. The beams connecting the two columns of the equivalent bay
are modelled as elastic elements with rotational springs at both ends. Rotational
springs are utilised to model the equivalent strength and stiffness of all beam/column
connections. Each spring represents the cumulative strength of half the number of
simple connections.
5.2.1.1 Meshing Size
In a finite element analysis, selection of mesh size and layout is crucial. Usually, it
is ideal to use as many elements as possible in the analysis to improve accuracy.
However, such an analysis will require excessive computer time. In this analysis,
adequate numbers of mesh elements were selected for both structural frame and
façade components to obtain sufficient accuracy of results without excessive
computational times.
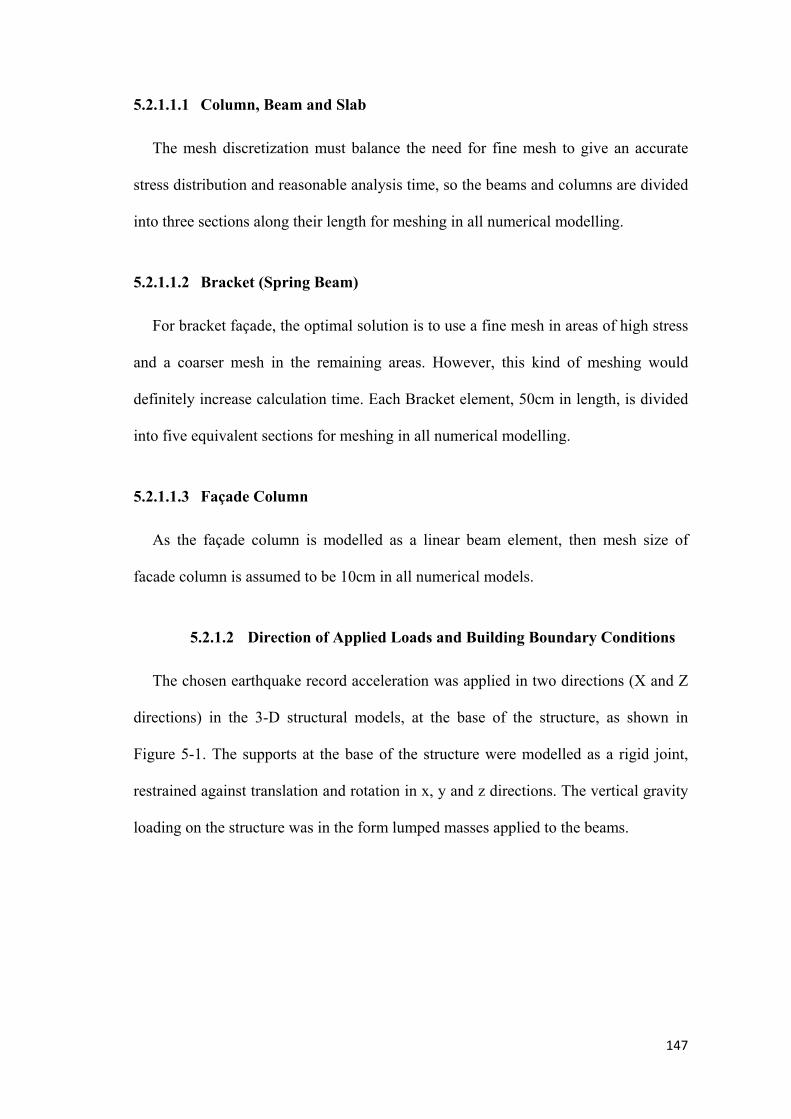
147
5.2.1.1.1 Column, Beam and Slab
The mesh discretization must balance the need for fine mesh to give an accurate
stress distribution and reasonable analysis time, so the beams and columns are divided
into three sections along their length for meshing in all numerical modelling.
5.2.1.1.2 Bracket (Spring Beam)
For bracket façade, the optimal solution is to use a fine mesh in areas of high stress
and a coarser mesh in the remaining areas. However, this kind of meshing would
definitely increase calculation time. Each Bracket element, 50cm in length, is divided
into five equivalent sections for meshing in all numerical modelling.
5.2.1.1.3 Façade Column
As the façade column is modelled as a linear beam element, then mesh size of
facade column is assumed to be 10cm in all numerical models.
5.2.1.2 Direction of Applied Loads and Building Boundary Conditions
The chosen earthquake record acceleration was applied in two directions (X and Z
directions) in the 3-D structural models, at the base of the structure, as shown in
Figure 5-1. The supports at the base of the structure were modelled as a rigid joint,
restrained against translation and rotation in x, y and z directions. The vertical gravity
loading on the structure was in the form lumped masses applied to the beams.
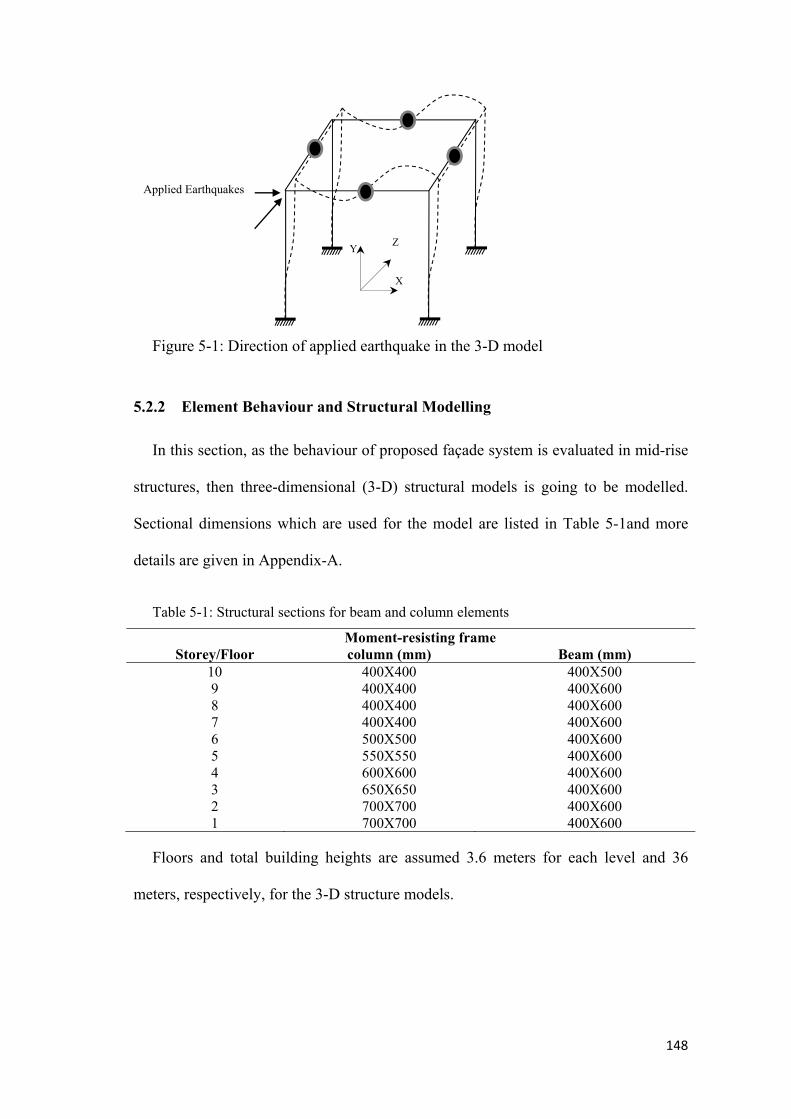
148
Figure 5-1: Direction of applied earthquake in the 3-D model
5.2.2 Element Behaviour and Structural Modelling
In this section, as the behaviour of proposed façade system is evaluated in mid-rise
structures, then three-dimensional (3-D) structural models is going to be modelled.
Sectional dimensions which are used for the model are listed in Table 5-1and more
details are given in Appendix-A.
Table 5-1: Structural sections for beam and column elements
Moment-resisting frame Storey/Floor column (mm) Beam (mm)
10 400X400 400X5009 400X400 400X6008 400X400 400X6007 400X400 400X6006 500X500 400X6005 550X550 400X6004 600X600 400X6003 650X650 400X6002 700X700 400X6001 700X700 400X600
Floors and total building heights are assumed 3.6 meters for each level and 36
meters, respectively, for the 3-D structure models.
Applied Earthquakes
Y
X
Z

149
Figure 5-2: Front view of exterior elevation of the 3D frame model
The view of frame structure used for the 3D models in this section is shown in
Figure 5-2. The model has four and three bays in X and four bays in Z directions,
correspondingly. The length of each bay is considered as 6 meters for both directions.
It is assumed that building mass is distributed equally at each floor along the height of
the structure. Figure 5-3 shows beams and columns layout in building structure plan.
Figure 5-3: Plan view of the 3D frame model (dimensions are in mm)
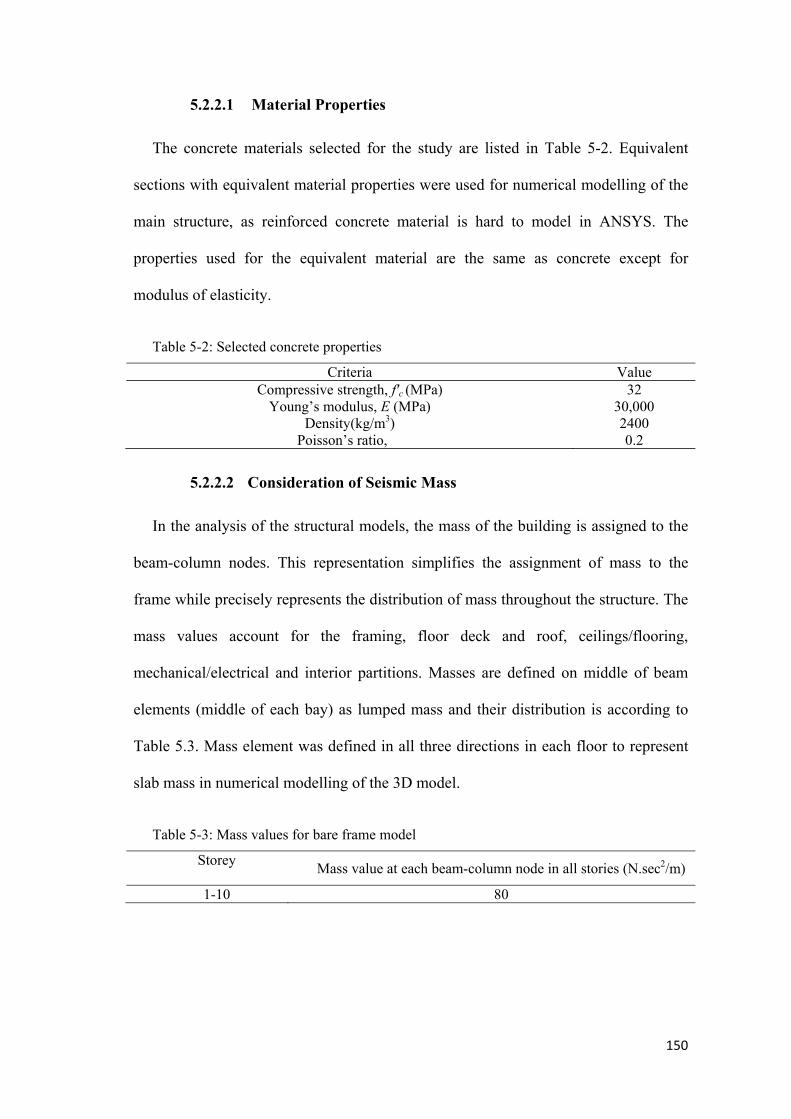
150
5.2.2.1 Material Properties
The concrete materials selected for the study are listed in Table 5-2. Equivalent
sections with equivalent material properties were used for numerical modelling of the
main structure, as reinforced concrete material is hard to model in ANSYS. The
properties used for the equivalent material are the same as concrete except for
modulus of elasticity.
Table 5-2: Selected concrete properties
Criteria ValueCompressive strength, f'c (MPa) 32
Young’s modulus, E (MPa) 30,000Density(kg/m3) 2400
Poisson’s ratio, � 0.2
5.2.2.2 Consideration of Seismic Mass
In the analysis of the structural models, the mass of the building is assigned to the
beam-column nodes. This representation simplifies the assignment of mass to the
frame while precisely represents the distribution of mass throughout the structure. The
mass values account for the framing, floor deck and roof, ceilings/flooring,
mechanical/electrical and interior partitions. Masses are defined on middle of beam
elements (middle of each bay) as lumped mass and their distribution is according to
Table 5.3. Mass element was defined in all three directions in each floor to represent
slab mass in numerical modelling of the 3D model.
Table 5-3: Mass values for bare frame model
Storey Mass value at each beam-column node in all stories (N.sec2/m)
1-10 80
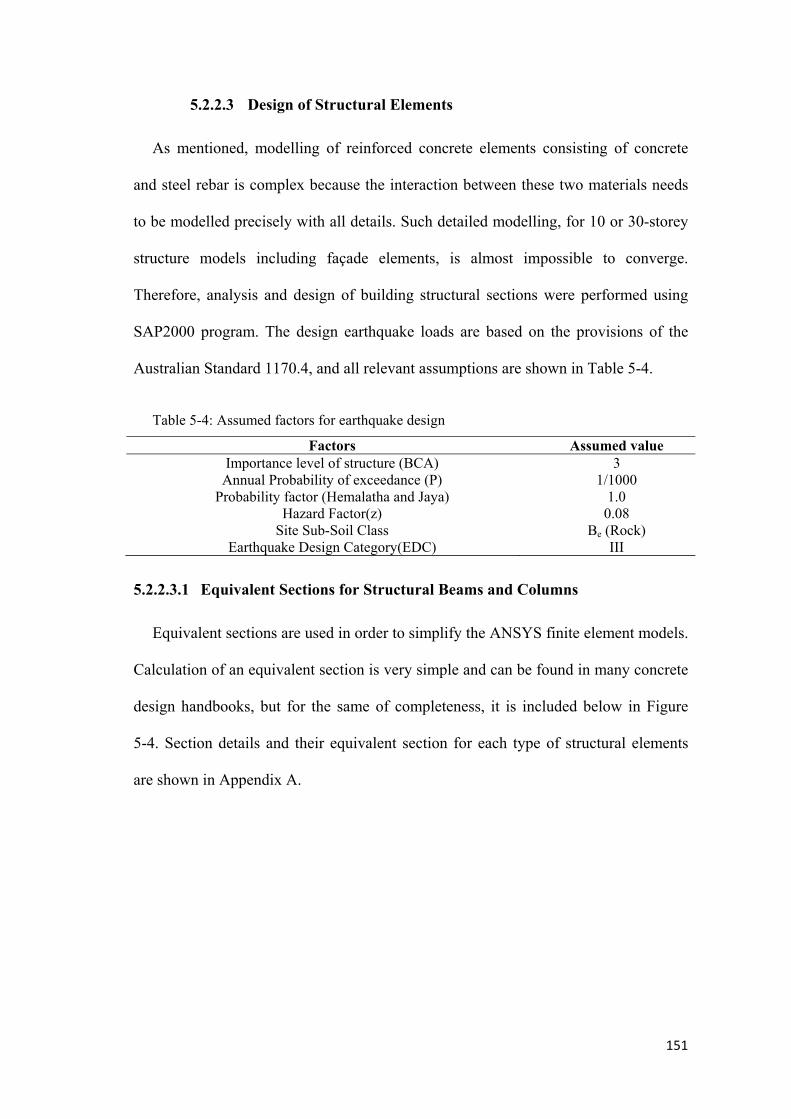
151
5.2.2.3 Design of Structural Elements
As mentioned, modelling of reinforced concrete elements consisting of concrete
and steel rebar is complex because the interaction between these two materials needs
to be modelled precisely with all details. Such detailed modelling, for 10 or 30-storey
structure models including façade elements, is almost impossible to converge.
Therefore, analysis and design of building structural sections were performed using
SAP2000 program. The design earthquake loads are based on the provisions of the
Australian Standard 1170.4, and all relevant assumptions are shown in Table 5-4.
Table 5-4: Assumed factors for earthquake design
Factors Assumed value Importance level of structure (BCA) 3
Annual Probability of exceedance (P) 1/1000 Probability factor (Hemalatha and Jaya) 1.0
Hazard Factor(z) 0.08 Site Sub-Soil Class Be (Rock)
Earthquake Design Category(EDC) III
5.2.2.3.1 Equivalent Sections for Structural Beams and Columns
Equivalent sections are used in order to simplify the ANSYS finite element models.
Calculation of an equivalent section is very simple and can be found in many concrete
design handbooks, but for the same of completeness, it is included below in Figure
5-4. Section details and their equivalent section for each type of structural elements
are shown in Appendix A.
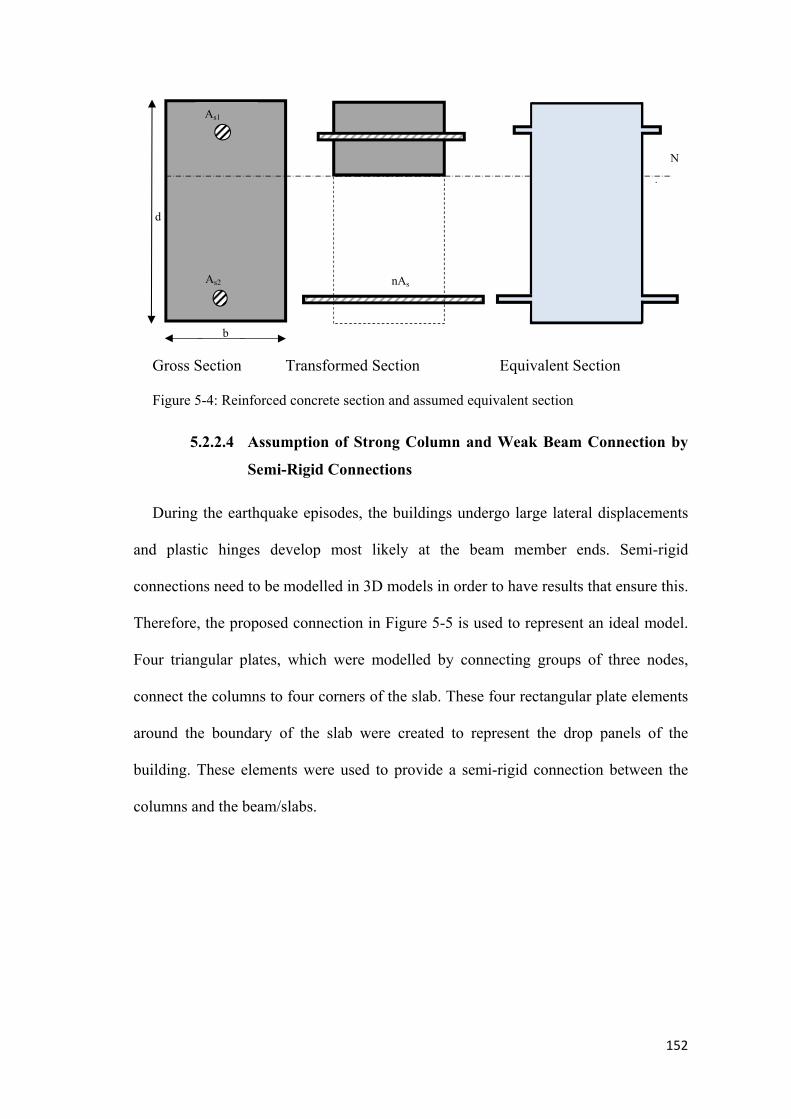
152
Gross Section Transformed Section Equivalent Section
Figure 5-4: Reinforced concrete section and assumed equivalent section
5.2.2.4 Assumption of Strong Column and Weak Beam Connection by
Semi-Rigid Connections
During the earthquake episodes, the buildings undergo large lateral displacements
and plastic hinges develop most likely at the beam member ends. Semi-rigid
connections need to be modelled in 3D models in order to have results that ensure this.
Therefore, the proposed connection in Figure 5-5 is used to represent an ideal model.
Four triangular plates, which were modelled by connecting groups of three nodes,
connect the columns to four corners of the slab. These four rectangular plate elements
around the boundary of the slab were created to represent the drop panels of the
building. These elements were used to provide a semi-rigid connection between the
columns and the beam/slabs.
kd
d-kd
b
d
As2
As1
nAs
N
A
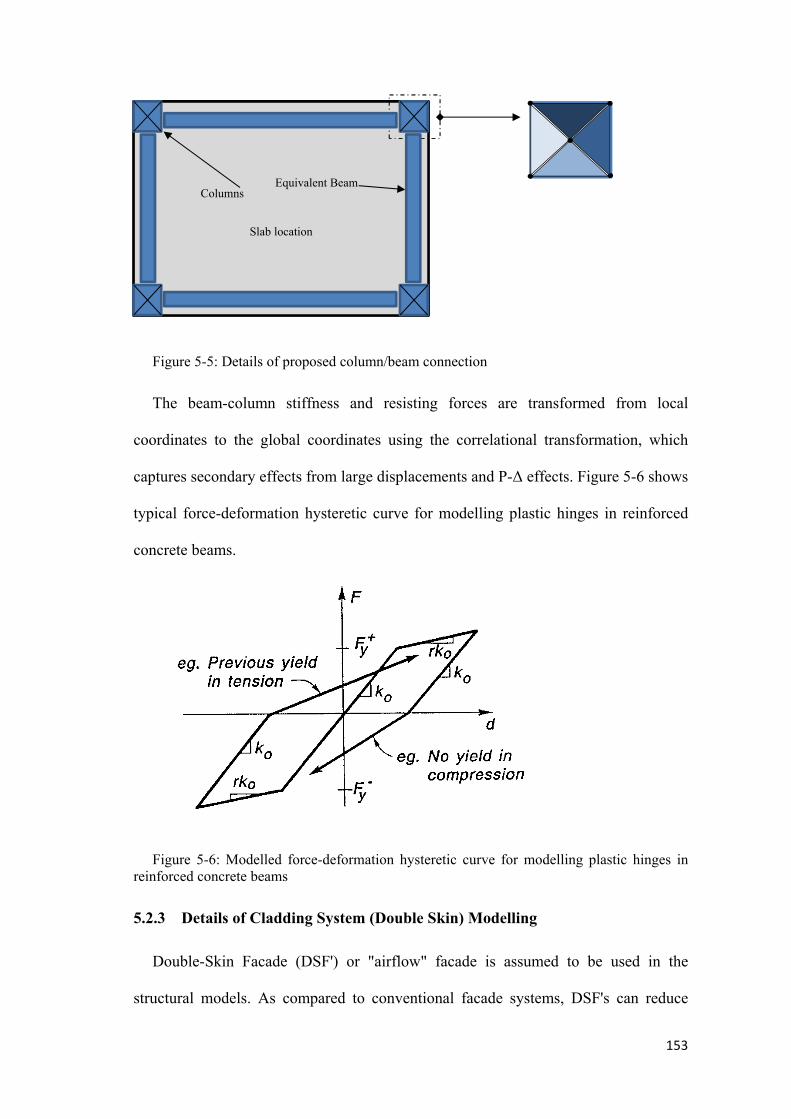
153
Figure 5-5: Details of proposed column/beam connection
The beam-column stiffness and resisting forces are transformed from local
coordinates to the global coordinates using the correlational transformation, which
captures secondary effects from large displacements and P-Δ effects. Figure 5-6 shows
typical force-deformation hysteretic curve for modelling plastic hinges in reinforced
concrete beams.
Figure 5-6: Modelled force-deformation hysteretic curve for modelling plastic hinges in reinforced concrete beams
5.2.3 Details of Cladding System (Double Skin) Modelling
Double-Skin Facade (DSF') or "airflow" facade is assumed to be used in the
structural models. As compared to conventional facade systems, DSF's can reduce
Columns
Slab location
Equivalent Beam

154
energy consumption by 30%. They can provide natural ventilation even in structural
buildings, and providing valuable noise reduction. They also create a visually
transparent architecture that is impossible with conventional curtain wall facades with
similar thermal properties.
5.2.3.1 Material Properties
Generally, glass types are selected depending on their location in the building but
in this research, all glasses are assumed to have same the dimensions and material
properties; and dimensions of window panes are 180 cm in height and 150cm wide. It
is assumed that the insulating glass unit (IGU) panes consist of two 6mm glass panes
with a spacer of 12mm in diameter. It should be noted that 25 mm IGUs are typically
used where safety is not a concern, and heat-strengthened IGUs are used when the
panes are located within 45cm of the ground or within 120cm of a doorway. Material
properties used for numerical modelling are listed in Table 5-5.
Table 5-5: Material properties of façade panel components
Glass (Simax glass)
Rubber Aluminium
Young’s modulus (E) MPa 64,000 0.7 70,000Tensile strength (MPa) 35-100 60 240 Tensile yield strength 33 16 300
Allowable tensile stress (MPa) 3.5 5.5 386 Compressive yield strength (MPa) 150 30 530
Poisson’s ratio 0.2 0.45 0.33 Density (kg/m3) 2230 1100 2700
5.2.3.2 Façade Column Modelling
In order to investigate the effect of the movable cladding on the building response,
accurate finite element models of the cladding systems need to be developed. In order
to have more accurate results and to model the façade panels closer to reality, the
stack joint which connects two consecutive façade columns need to be defined and

155
modelled. The panels are modelled as BEAM188 elements with specific material
properties to represent four of the façade panels in reality. In order to define the joint
in ANSYS, one small element was defined with a length of 100mm. All three
displacements in the X, Y and Z directions are fully restrained at both ends of the
element, but rotations at both ends are allowed which is exactly how an ideal joint
behaves. The façade load bearing elements are assumed rigid, and they are modelled
with two-dimensional frames comprising rigid elastic beam elements. Figure 5-7
illustrates how successive façade panels are modelled as one single beam element in
each storey in ANSYS modelling. It should be noted that, the façade column elements
represent four façade panels in reality in terms of weight and dynamic response
(frequency of movement) in all modelling. Claddings consist of full storey-height
panels and are attached with horizontal bearing connection and flexible lateral
connection to the slab structure (Figure 5-8).

156
(a) Top view (b)Front view (c) Side view
Figure 5-7: Schematic view of facade column element and their configuration in each floor
The bearing connections resist the gravity loads of the panel and flexible lateral
connection allows a controlled lateral deformation between the frame and the outer
layer of cladding panels. The flexible connections are modelled as nonlinear zero-
length spring elements in ANSYS program and have very low modulus of elasticity in
direction perpendicular to applied earthquake direction.
Tributary area of structural column
Equivalent column element
Equivalent column element
Bracket (shear/axial Connector)
Structural column element
Gap between two skins
Panel 4 Panel 3 Panel 1 Panel 2
Equivalent column element
Structural column element
Bracket

157
Figure 5-8: Elevation view of façade connection
It should be mentioned that the rotational capacity of the connections is very small
and can be neglected. Since the bearing connections are very stiff in the horizontal
direction, the horizontal displacement, and rotation of the middle of the panel are
approximately equal to the displacement and rotation of the mid-span of the floor
beam. Therefore, the horizontal bearing connection is transformed into a displacement
constraint in the middle of the panel that Figure 5-8 panel’s displacements to the floor
beam displacements at mid-span. The detailed drawings of the designed bearing
connection and flexible lateral connection are shown in Section 6 in this chapter.
5.2.3.3 Details of Bracket Modelling
In primary numerical modelling, the bracket elements were modelled using
COMBIN element, a spring-damper element, but, in order to have more accurate
results, these elements had been replaced by BEAM188 elements in detailed
numerical modelling. Material properties of the BEAM188 elements were defined in a
Roller support Bottom Supported panel
Top hung panel 2600
90
0 10
0

158
way that they represent and behave in the same way as a COMBIN element in bracket
modelling (axial and shear behaviour). Therefore, literally the bracket elements are a
beam element with spring behaviour. The “rigid” cladding system represents common
systems used in regular multistorey buildings in modern construction. The force-
deformation curve of the axial connection which is for a hyper-elastic material is
shown in
Figure 5-9.
Figure 5-9: Defined Force-deformation curve of the axial connection
Shear brackets consist of two connectors; one is called gravity connection which
behaves like a rigid link and attach the outer skin of the façade system to the structural
slab and the other one is the damper connection which has a low stiffness in axial
direction. The force-deformation curve of the “shear” connection, which is the
modified version of axial connections, is shown in Figure 5-10. This connection is
modelled in a way that provides a rigid connection in compression but with much less
force resistance in lateral direction. The shear bracket consists of a single linear line
instead of multi linear stiffness.
F(N
)
d (mm)
500-1000 N/mm
20 80 100
10-20 N/mm
I II III
K1
K2 K3

159
Figure 5-10: Defined Force-deformation curve of the shear connection
In building structure, it is assumed that the façade panels are attached to the main structure
on all four sides. When applied earthquake is in X direction, bracket façade elements on Side
1 and side 3 move in direction to yellow arrows and most of the bracket forces are axially
induced. Bracket façade elements on side 2 and side 4 move in direction of red arrows and
most of the bracket forces are shear induced. Respectively, if earthquake applies in Y
direction, then behaviour of brackets on sides 1 and 3 will be changed to shear and sides 2 and
4 to axial. The proposed concept is shown in Figure 5-11.
Figure 5-11: Plan view of damper connections to the main structure and their behaviour in applied earthquake
K d (mm)
F (
N)
Linear Stiffness
Side 4
Sid
e 3
Side 2
Sid
e 1
Applied load
X
Y
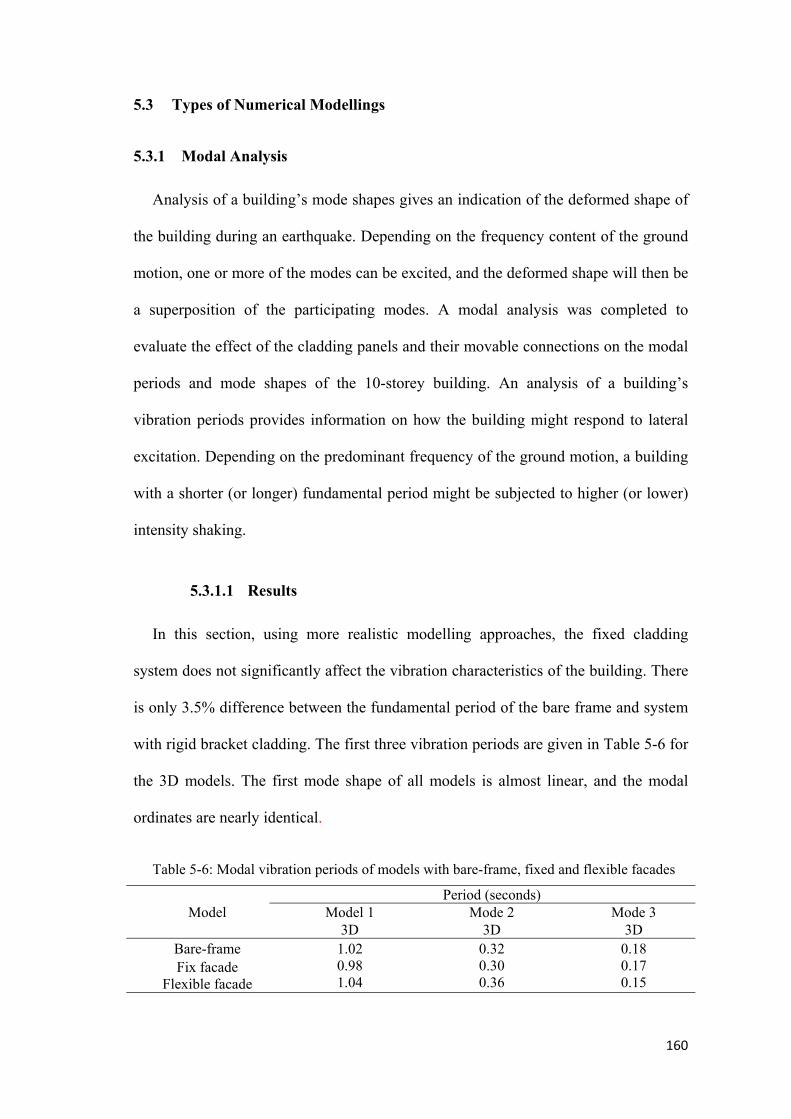
160
5.3 Types of Numerical Modellings
5.3.1 Modal Analysis
Analysis of a building’s mode shapes gives an indication of the deformed shape of
the building during an earthquake. Depending on the frequency content of the ground
motion, one or more of the modes can be excited, and the deformed shape will then be
a superposition of the participating modes. A modal analysis was completed to
evaluate the effect of the cladding panels and their movable connections on the modal
periods and mode shapes of the 10-storey building. An analysis of a building’s
vibration periods provides information on how the building might respond to lateral
excitation. Depending on the predominant frequency of the ground motion, a building
with a shorter (or longer) fundamental period might be subjected to higher (or lower)
intensity shaking.
5.3.1.1 Results
In this section, using more realistic modelling approaches, the fixed cladding
system does not significantly affect the vibration characteristics of the building. There
is only 3.5% difference between the fundamental period of the bare frame and system
with rigid bracket cladding. The first three vibration periods are given in Table 5-6 for
the 3D models. The first mode shape of all models is almost linear, and the modal
ordinates are nearly identical.
Table 5-6: Modal vibration periods of models with bare-frame, fixed and flexible facades
Model Period (seconds)
Model 1 Mode 2 Mode 3 3D 3D 3D
Bare-frame 1.020.98 1.04
0.32 0.30 0.36
0.18 0.17 0.15
Fix facade Flexible facade

161
The effective modal mass percentage is a reliable measure on how much of the
total mass of the structure is participating in each vibration mode. The effective modal
mass percentages for the first three modes are provided in Table 5-7. The higher the
effective modal mass, the more dominant the lateral response of the building for an
arbitrary ground motion. However, there may be specific ground motions (near fault
motions), building sites (directivity effects, soft soil), or structural features (tall
buildings) where second or third mode are also participating just as much or possibly
more than the fundamental mode.
Table 5-7: Participating modal mass percentages
Model Participating modal mass percentages (%)
Model 1 Mode 2 Mode 3
Bare-frame 86.087.1 79.1
9.7 8.3
14.0
3.3 1.6 5.6
Fix facade Flexible facade
The first three modes contribute to approximately 98-99% of the total lateral
response in all the analytical models in this study. This finding indicates that these
three modes capture essentially the entire lateral dynamic response of the building.
Figure 5-12: Comparison of effective modal mass percentages for the first three modes
The first mode contributes over 80% to the total response, which is typical of well-
designed concrete frame buildings with an approximately uniform distribution of
86 87.181.7
9.7 8.314
3.3 1.6 3.6
0
20
40
60
80
100
Bare Frame Fix Façade Frame Flexible façade
Par
tici
pati
ng E
ffec
tive
Mod
al
Mas
s
Mode
Mode 1
Mode 2
Mode 3

162
structural properties and mass. Comparison of participating modal mass percentages
for the first three modes of the 3D structure is shown in Figure 5-12.
5.3.2 Dynamic Time-History Analysis (Holistic Nonlinear Time-History
Analysis)
The time-history analyses give better insight into how the building and cladding
system respond to the applied earthquake ground motions. The consequence of
nonlinear yielding, energy dissipation and damping of the cladding system are better
understood through time-history analyses. The seismic loadings applied to the
structural models in this study were from existing past earthquake records. These
earthquake records are time histories of horizontal ground accelerations. Earthquakes
have various properties such as duration of strong motion, the range of dominant
frequencies and peak ground acceleration (PGA). For that reason, they would have
different effects on the structures. The range of dominant frequencies as well as the
duration of the strong motions were kept similar to achieve a consistent comparison of
the response of a structural model to different earthquakes. It should be mentioned that
dynamic time-history analyses were performed to further investigate the seismic
behaviour of both the structural frame and the cladding connectors. The analyses were
performed using the Newmark integration scheme and 2% Rayleigh damping was
assumed for all hazard levels.
5.3.2.1 Dynamic Interpretation of Energy Content the Selected
Earthquakes (Power Spectral Density)
A 500 year return period (RP) event in high seismicity region is considered for all
seismic evaluations in this section. Four earthquake records as shown in Table 4.8
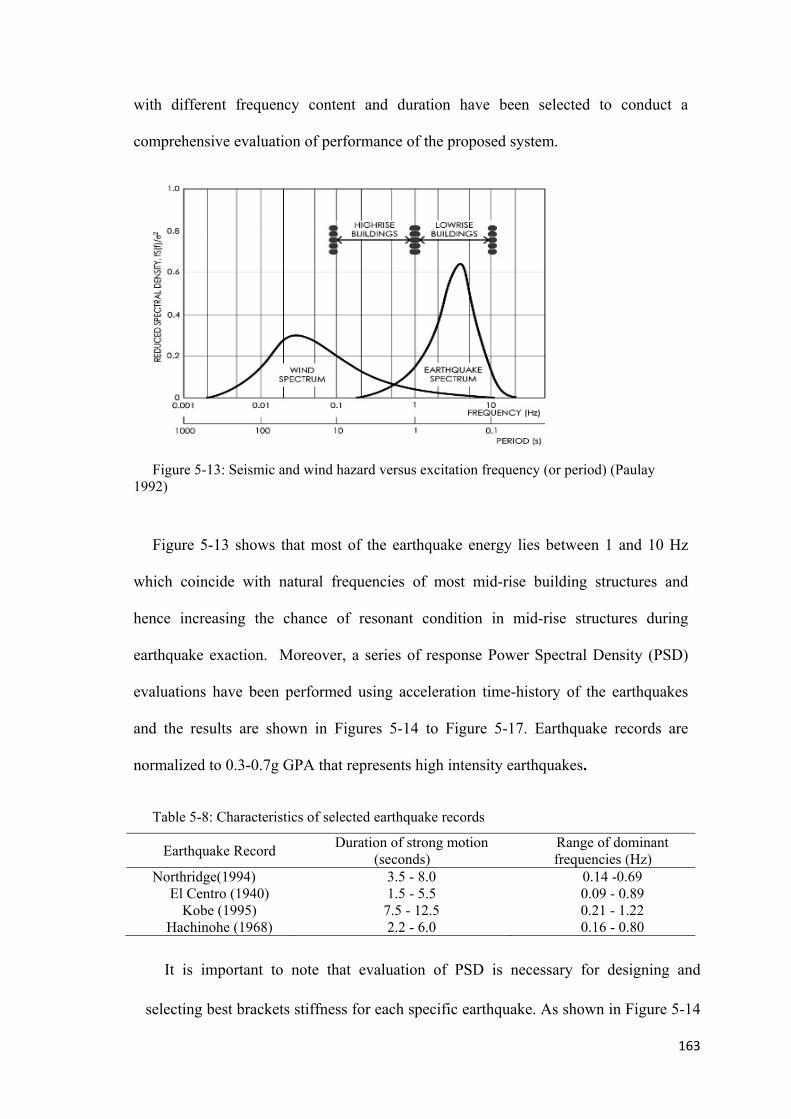
with different frequency content and duration have been selected to conduct a
comprehensive evaluation of performance of the proposed system.
Figure 5-13: Seismic and wind hazard versus excitation frequency (or period) (Paulay 1992)
Figure 5-13 shows that most of the earthquake energy lies between 1 and 10 Hz
which coincide with natural frequencies of most mid-rise building structures and
hence increasing the chance of resonant condition in mid-rise structures during
earthquake exaction. Moreover, a series of response Power Spectral Density (PSD)
evaluations have been performed using acceleration time-history of the earthquakes
and the results are shown in Figures 5-14 to Figure 5-17. Earthquake records are
normalized to 0.3-0.7g GPA that represents high intensity earthquakes.
Table 5-8: Characteristics of selected earthquake records
Earthquake Record Duration of strong motion
(seconds) Range of dominant frequencies (Hz)
Northridge(1994) 3.5 - 8.0 0.14 -0.69 El Centro (1940) 1.5 - 5.5 0.09 - 0.89
Kobe (1995) 7.5 - 12.5 0.21 - 1.22 Hachinohe (1968) 2.2 - 6.0 0.16 - 0.80
It is important to note that evaluation of PSD is necessary for designing and
selecting best brackets stiffness for each specific earthquake. As shown in Figure 5-14
163

164
to Figure 5-17, frequency content of the records spread over a range of frequencies
during excitation. In order to have better understanding of excitations frequency
content, each case is evaluated and interpreted individually as below. The frequency
of façade columns is set up and tuned for each earthquake acceleration record in order
to get the best results.
(a) Whole record (b) Comparision between first 20 secondswith second 20 seconds
Figure 5-14: Displacement Power Spectral Density for 1994 Northridge earthquake
In Northridge earthquake, the dominant frequency that contains significant seismic
energy is concentrated in the first 20 seconds of the record and the next 20 seconds of
the record does not contain much energy. Therefore, bracket stiffness design needs to
be set and tuned according to dominant frequency of Northridge earthquake that
happens in the first half part of the excitation. The maximum value of PSD for
Northridge record is around 50,000 mm2/Hz at frequency of around 0.12 Hz.
0E+0
1E+4
2E+4
3E+4
4E+4
5E+4
6E+4
0 0.2 0.4 0.6 0.8 1
PSD
Dis
plac
emen
t 103
x [m
m^2
/Hz]
Frequency (Hz)
Whole Record
0E+0
1E+4
2E+4
3E+4
4E+4
5E+4
6E+4
7E+4
0 0.2 0.4 0.6 0.8 1
PSD
Dis
plac
emen
t 103
x [m
m^2
/Hz]
Frequency (Hz)
First 20 seconds
Second 20 seconds

165
(a) Whole record (b) Comparison between first 20 secondswith second 20 seconds
Figure 5-15: Displacement Power Spectrum Density for 1940 El-Centro earthquake
The range of dominant frequencies in 1940 El-Centro record is between 0.09 and
0.69 Hz which is close to frequency of the 10-storey structural model. The dominant
frequency that contains significant seismic energy is concentrated in the first 20
seconds of the record, but the rest of the record also affects the dynamic behaviour of
the structural model. So, design of the bracket stiffness needs to be considered and
tuned based on the frequency contents of the whole record. The maximum value of
PSD for 1940 El Centro record is around 130,000 mm2/Hz at frequency of around 0.1
Hz. The range of dominant frequencies in 1995 Kobe record is wider in comparison to
the other two records and it is between 0.11 and 1.22 Hz. The dominant frequency that
contains significant seismic energy is concentrated in the first 20 seconds of the record
as before, and the rest of the record has little effect on dynamic behaviour of the
structural model. So, again the design of the bracket stiffness needs to be considered
and tuned based on dominant frequency, which is in the first 20 seconds of the record.
As shown in Figure 5-17 that frequency content is wide spread during the duration of
Hachinohe record.
00E+0
02E+4
04E+4
06E+4
08E+4
10E+4
12E+4
14E+4
0 0.2 0.4 0.6 0.8 1
PSD
Dis
plac
emen
t 103
x [m
m^2
/Hz]
Frequency (Hz)
Whole Record
00E+0
02E+4
04E+4
06E+4
08E+4
10E+4
12E+4
14E+4
16E+4
18E+4
20E+4
0 0.2 0.4 0.6 0.8 1
PSD
Dis
plac
emen
t 103
x [m
m^2
/Hz]
Frequency (Hz)
First 20 seconds
Second 20 seconds

166
(a) Whole record (b) Comparision between first 20 secondswith second 20 seconds
Figure 5-16: Displacement Power Spectrum Density for 1995 Kobe earthquake
The range of dominant frequency in Hachinohe record is between 0.16 and 0.8 Hz.
So, once again the design of the bracket stiffness need to be considered and tuned
based on frequencies covering the entire duration of Hachinohe earthquake.
(a) Whole record (b) Comparision between first part withsecond part of excitation
Figure 5-17: Displacement Power Spectrum Density for Hachinohe earthquake
5.3.2.2 Judgment on Engineering Demand Parameters
The global behaviour of the concrete moment resisting frame, due to earthquake
excitation, is typically described by maximum deformation, inter-storey drift ratios,
00E+0
05E+4
10E+4
15E+4
20E+4
25E+4
0 0.2 0.4 0.6 0.8 1
PSD
Dis
plac
emen
t 103
x [m
m^2
/Hz]
Frequency (Hz)
Whole Record
00E+0
05E+4
10E+4
15E+4
20E+4
25E+4
30E+4
35E+4
40E+4
0 0.2 0.4 0.6 0.8 1
PSD
Dis
plac
emen
t 103
x [m
m^2
/Hz]
Frequency (Hz)
First 20 seconds
Second 20 seconds
0E+0
5E+3
1E+4
2E+4
2E+4
3E+4
3E+4
0 0.2 0.4 0.6 0.8 1
PSD
Dis
plac
emen
t 103
x [m
m^2
/Hz]
Frequency (Hz)
Whole Record
0E+0
5E+3
1E+4
2E+4
2E+4
3E+4
3E+4
0 0.2 0.4 0.6 0.8 1
PSD
Dis
plac
emen
t 103
x [m
m^2
/Hz]
Frequency (Hz)
First 10 seconds
Second 13seconds
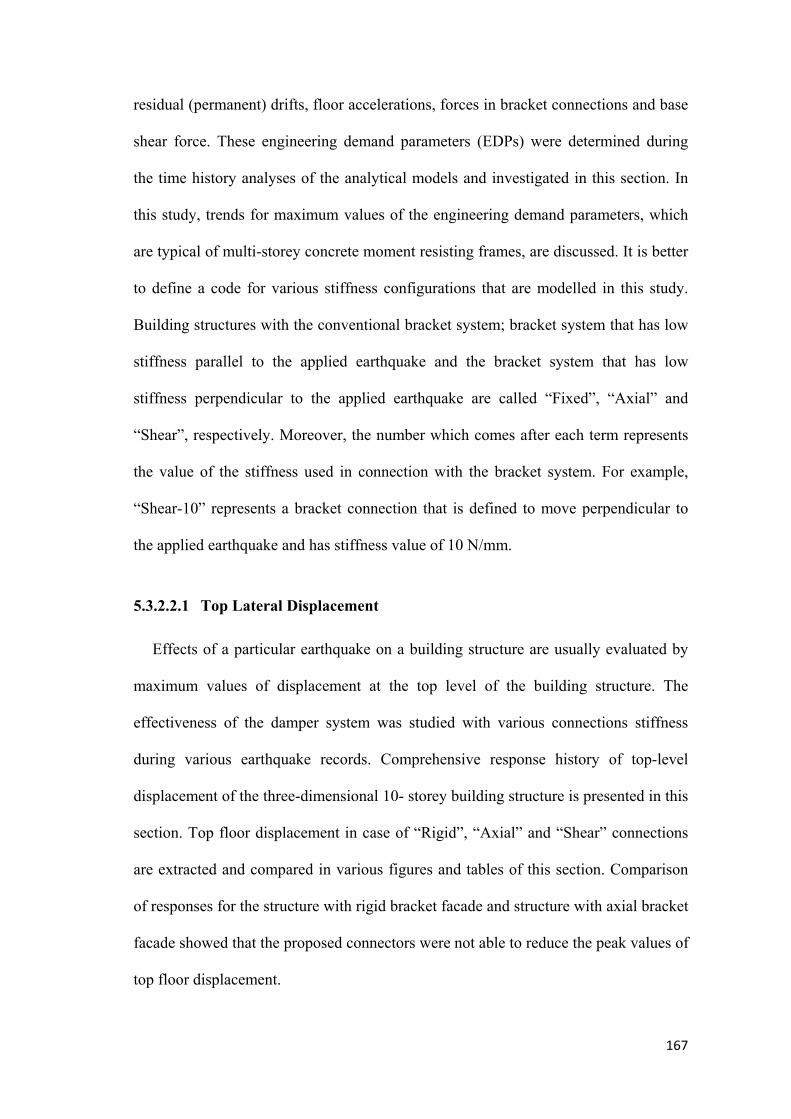
167
residual (permanent) drifts, floor accelerations, forces in bracket connections and base
shear force. These engineering demand parameters (EDPs) were determined during
the time history analyses of the analytical models and investigated in this section. In
this study, trends for maximum values of the engineering demand parameters, which
are typical of multi-storey concrete moment resisting frames, are discussed. It is better
to define a code for various stiffness configurations that are modelled in this study.
Building structures with the conventional bracket system; bracket system that has low
stiffness parallel to the applied earthquake and the bracket system that has low
stiffness perpendicular to the applied earthquake are called “Fixed”, “Axial” and
“Shear”, respectively. Moreover, the number which comes after each term represents
the value of the stiffness used in connection with the bracket system. For example,
“Shear-10” represents a bracket connection that is defined to move perpendicular to
the applied earthquake and has stiffness value of 10 N/mm.
5.3.2.2.1 Top Lateral Displacement
Effects of a particular earthquake on a building structure are usually evaluated by
maximum values of displacement at the top level of the building structure. The
effectiveness of the damper system was studied with various connections stiffness
during various earthquake records. Comprehensive response history of top-level
displacement of the three-dimensional 10- storey building structure is presented in this
section. Top floor displacement in case of “Rigid”, “Axial” and “Shear” connections
are extracted and compared in various figures and tables of this section. Comparison
of responses for the structure with rigid bracket facade and structure with axial bracket
facade showed that the proposed connectors were not able to reduce the peak values of
top floor displacement.

168
Figure 5-18: Time-history of top floor displacements of primary structure coupled with DSFs with different bracket connector stiffness during 1994 Northridge earthquake
But comparison of responses for the structure with rigid bracket facade and
structure with flexible shear bracket facade showed that the advanced connectors were
able to reduce peak values of top floor displacement. Shear-10 is chosen to compare
with rigid and axial bracket façade because it has the best performance and clearly
enhance the performance of proposed system. From Figure 5-18 it can be observed
that the maximum values of displacement occurred between short time intervals of
about 12 seconds up to 18 seconds. In addition, after approximately six seconds of the
1994 Northridge earthquake, the structure with flexible façade system began to
decrease response of the structure. The reduction is continued up to the end of the
record. The results for the same investigated parameter obtained by the frame structure
with the same connection properties in façade brackets under the 1940 El-Centro
earthquake excitation are presented in Figure 5-19.
-200
-150
-100
-50
0
50
100
150
200
0 5 10 15 20 25 30
Lat
eral
dis
palc
emen
t (m
m)
Time (Sec)
Conventional Axial Shear-10
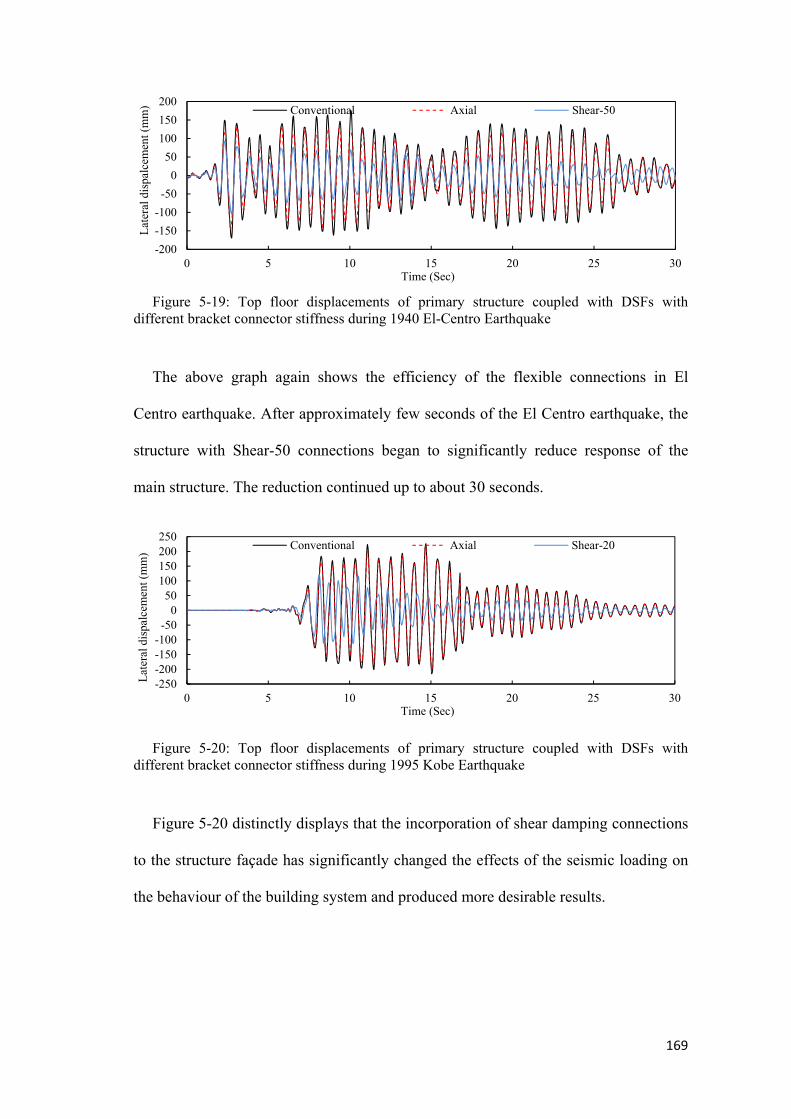
169
Figure 5-19: Top floor displacements of primary structure coupled with DSFs with different bracket connector stiffness during 1940 El-Centro Earthquake
The above graph again shows the efficiency of the flexible connections in El
Centro earthquake. After approximately few seconds of the El Centro earthquake, the
structure with Shear-50 connections began to significantly reduce response of the
main structure. The reduction continued up to about 30 seconds.
Figure 5-20: Top floor displacements of primary structure coupled with DSFs with different bracket connector stiffness during 1995 Kobe Earthquake
Figure 5-20 distinctly displays that the incorporation of shear damping connections
to the structure façade has significantly changed the effects of the seismic loading on
the behaviour of the building system and produced more desirable results.
-200
-150
-100
-50
0
50
100
150
200
0 5 10 15 20 25 30
Lat
eral
dis
palc
emen
t (m
m)
Time (Sec)
Conventional Axial Shear-50
-250-200-150-100-50
050
100150200250
0 5 10 15 20 25 30
Lat
eral
dis
palc
emen
t (m
m)
Time (Sec)
Conventional Axial Shear-20
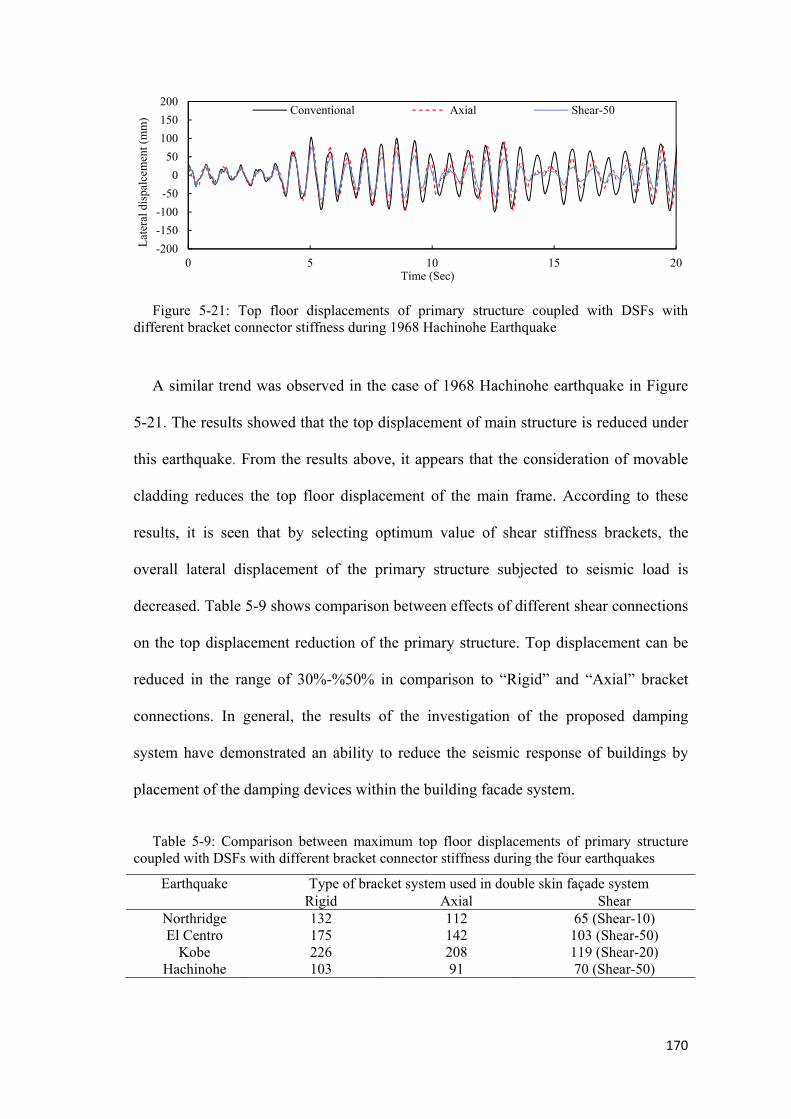
170
Figure 5-21: Top floor displacements of primary structure coupled with DSFs with different bracket connector stiffness during 1968 Hachinohe Earthquake
A similar trend was observed in the case of 1968 Hachinohe earthquake in Figure
5-21. The results showed that the top displacement of main structure is reduced under
this earthquake. From the results above, it appears that the consideration of movable
cladding reduces the top floor displacement of the main frame. According to these
results, it is seen that by selecting optimum value of shear stiffness brackets, the
overall lateral displacement of the primary structure subjected to seismic load is
decreased. Table 5-9 shows comparison between effects of different shear connections
on the top displacement reduction of the primary structure. Top displacement can be
reduced in the range of 30%-%50% in comparison to “Rigid” and “Axial” bracket
connections. In general, the results of the investigation of the proposed damping
system have demonstrated an ability to reduce the seismic response of buildings by
placement of the damping devices within the building facade system.
Table 5-9: Comparison between maximum top floor displacements of primary structure coupled with DSFs with different bracket connector stiffness during the four earthquakes
Earthquake Type of bracket system used in double skin façade system Rigid Axial Shear
Northridge 132 112 65 (Shear-10)El Centro 175 142 103 (Shear-50)
Kobe 226 208 119 (Shear-20)Hachinohe 103 91 70 (Shear-50)
-200
-150
-100
-50
0
50
100
150
200
0 5 10 15 20
Lat
eral
dis
palc
emen
t (m
m)
Time (Sec)
Conventional Axial Shear-50

171
Top floor displacements of primary structure with various shear façade bracket
stiffness during the four Earthquakes are compared and shown in Figure 5-22 to
Figure 5-25 and Table 5-9.
Figure 5-22: Top floor displacements of primary structure coupled with DSFs with different shear connector during 1994 Northridge Earthquake
Bracket elements with shear stiffness of 10 N/mm has similar frequency to
dominant frequency of Northridge excitation and it can be seen from Figure 5-22 that
this connection can produce the highest reduction of top displacement of the main
structure among other shear connections. It is seen that values of 1 and 20 N/mm have
negligible effect on response reduction compared to the value of 10 N/mm. To be
more precise, it has been concluded that the optimum stiffness range is from 5 N/mm
to 15 N/mm for the selected earthquake record.
-200
-150
-100
-50
0
50
100
150
200
0 5 10 15 20 25 30
Lat
eral
dis
palc
emen
t (m
m)
Time (Sec)
Shear-100 Shear-50 Shear-10
-200
-150
-100
-50
0
50
100
150
200
0 5 10 15 20 25 30
Lat
eral
dis
palc
emen
t (m
m)
Time (Sec)
Shear-20 Shear-10 Shear-1
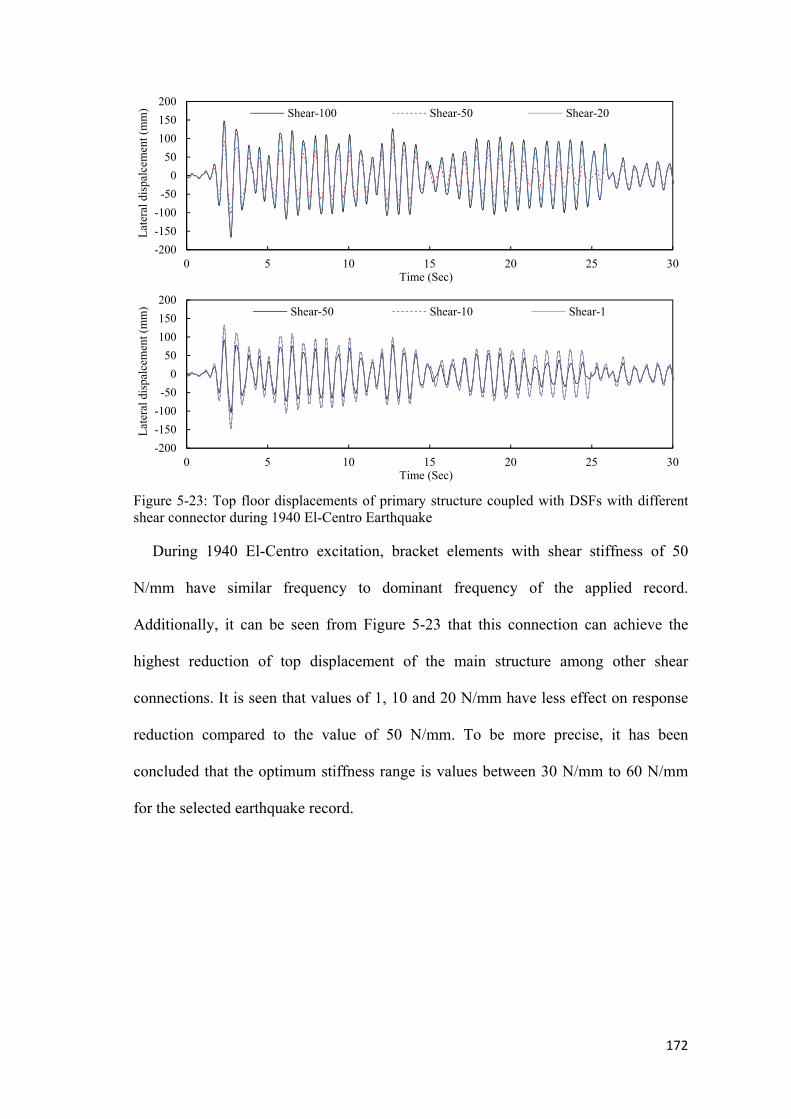
172
Figure 5-23: Top floor displacements of primary structure coupled with DSFs with different shear connector during 1940 El-Centro Earthquake
During 1940 El-Centro excitation, bracket elements with shear stiffness of 50
N/mm have similar frequency to dominant frequency of the applied record.
Additionally, it can be seen from Figure 5-23 that this connection can achieve the
highest reduction of top displacement of the main structure among other shear
connections. It is seen that values of 1, 10 and 20 N/mm have less effect on response
reduction compared to the value of 50 N/mm. To be more precise, it has been
concluded that the optimum stiffness range is values between 30 N/mm to 60 N/mm
for the selected earthquake record.
-200
-150
-100
-50
0
50
100
150
200
0 5 10 15 20 25 30
Lat
eral
dis
palc
emen
t (m
m)
Time (Sec)
Shear-100 Shear-50 Shear-20
-200
-150
-100
-50
0
50
100
150
200
0 5 10 15 20 25 30
Lat
eral
dis
palc
emen
t (m
m)
Time (Sec)
Shear-50 Shear-10 Shear-1

173
Figure 5-24: Top floor displacements of primary structure coupled with DSFs with different shear connector during 1995 Kobe Earthquake
Bracket elements with shear stiffness of 20 N/mm has similar frequency to
dominant frequency of Kobe excitation and it can be seen from Figure 5-24 that this
connection can be responsible for the highest reduction of top displacement of the
main structure among other shear connections. It is seen that values of 1 and 10 N/mm
have promising effect on response reduction of primary structure but less effective
than the optimum value of 20 N/mm. To be more precise, it has been concluded that
the optimum stiffness range is from 15 N/mm to 25 N/mm for the selected earthquake
record.
-250-200-150-100-50
050
100150200250
0 5 10 15 20 25 30
Lat
eral
dis
palc
emen
t (m
m)
Time (Sec)
Shear-100 Shear-50 Shear-20
-250-200-150-100-50
050
100150200250
0 5 10 15 20 25 30
Lat
eral
dis
palc
emen
t (m
m)
Time (Sec)
Shear-20 Shear-10 Shear-1

174
Figure 5-25: Top floor displacements of primary structure coupled with DSFs with different shear connector during 1968 Hachinohe Earthquake
Finally, it is illustrated in Figure 5-25 that bracket elements with shear stiffness of 50
N/mm are most effective in reduction of top displacement of main structure as their
frequency of movement is similar to dominant frequency of Kobe excitation. It is seen
that values of 1 and 10 N/mm have negligible effect on response reduction compared
to the value of 20 N/mm and 50 N/mm. To be more precise, it has been concluded that
the optimum stiffness range is from 15 N/mm to 60 N/mm for the selected earthquake
record. According to these results, it is shown that by selecting the optimum value of
shear stiffness for brackets, the overall lateral displacement of the primary structure
subjected to seismic load is decreased. Table 5-10 shows comparison between effects
of different shear connections on the top displacement reduction of the primary
structure. The maximum top displacement has reduction of around 50% in comparison
to “Rigid and Axial bracket connections.
-200
-150
-100
-50
0
50
100
150
200
0 5 10 15 20
Lat
eral
dis
palc
emen
t (m
m)
Time (Sec)
Shear-100 Shear-50 Shear-20
-200
-150
-100
-50
0
50
100
150
200
0 5 10 15 20
Lat
eral
dis
palc
emen
t (m
m)
Time (Sec)
Shear-20 Shear-10 Shear-1

175
Table 5-10: Comparison between maximum top floor displacements of primary structure with various shear façade bracket stiffness during the four earthquakes
Earthquake
Type of bracket system used in double skin façade system Shear bracket (N/mm)
100 50 20 10 1
Northridge 109 87 83 65 76
El Centro 147 103 132 132 128
Kobe 197 156 119 148 138
Hachinohe 89 70 73 83 81
In general, the results of the investigation of the proposed damping system have
demonstrated an ability to reduce the seismic response of buildings by placement of
the damping devices within the building facade system.
5.3.2.2.2 Root Mean Square (RMS) of Top Displacement (mm)
Root Mean Square (RMS) is a statistical measure of the magnitude of a varying
quantity. To have a better insight into the performance of the proposed damper
system, RMS of top floor displacement using different bracket stiffness is compared in
Table 5-11 for the 3D models correspondingly under different earthquake excitations.
It is illustrated in the table that by using shear connection with stiffness of 10N/mm
the RMS value is almost halved compared to a system with fixed conventional façade
panels during 1994 Northridge earthquakes. From the results of this analysis, it can be
concluded that the inclusion of façade with lateral damping connections in the
structure would inevitably result in great reduction in the response of main structure
during various applied earthquakes.
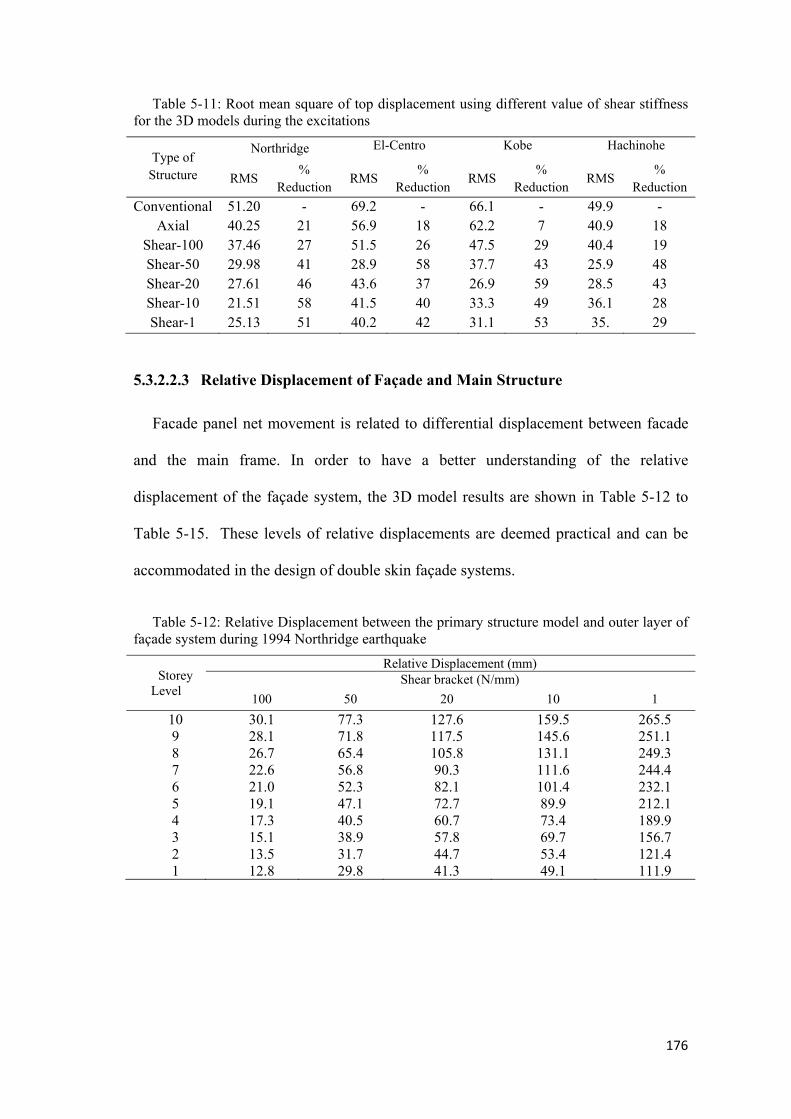
176
Table 5-11: Root mean square of top displacement using different value of shear stiffness for the 3D models during the excitations
Type of Structure
Northridge El-Centro Kobe Hachinohe
RMS %
Reduction RMS
% Reduction
RMS %
Reduction RMS
% Reduction
Conventional 51.20 - 69.2 - 66.1 - 49.9 - Axial 40.25 21 56.9 18 62.2 7 40.9 18
Shear-100 37.46 27 51.5 26 47.5 29 40.4 19 Shear-50 29.98 41 28.9 58 37.7 43 25.9 48 Shear-20 27.61 46 43.6 37 26.9 59 28.5 43 Shear-10 21.51 58 41.5 40 33.3 49 36.1 28 Shear-1 25.13 51 40.2 42 31.1 53 35. 29
5.3.2.2.3 Relative Displacement of Façade and Main Structure
Facade panel net movement is related to differential displacement between facade
and the main frame. In order to have a better understanding of the relative
displacement of the façade system, the 3D model results are shown in Table 5-12 to
Table 5-15. These levels of relative displacements are deemed practical and can be
accommodated in the design of double skin façade systems.
Table 5-12: Relative Displacement between the primary structure model and outer layer of façade system during 1994 Northridge earthquake
Storey Level
Relative Displacement (mm) Shear bracket (N/mm)
100 50 20 10 1
10 30.1 77.3 127.6 159.5 265.59 28.1 71.8 117.5 145.6 251.1 8 26.7 65.4 105.8 131.1 249.37 22.6 56.8 90.3 111.6 244.46 21.0 52.3 82.1 101.4 232.15 19.1 47.1 72.7 89.9 212.14 17.3 40.5 60.7 73.4 189.93 15.1 38.9 57.8 69.7 156.72 13.5 31.7 44.7 53.4 121.41 12.8 29.8 41.3 49.1 111.9
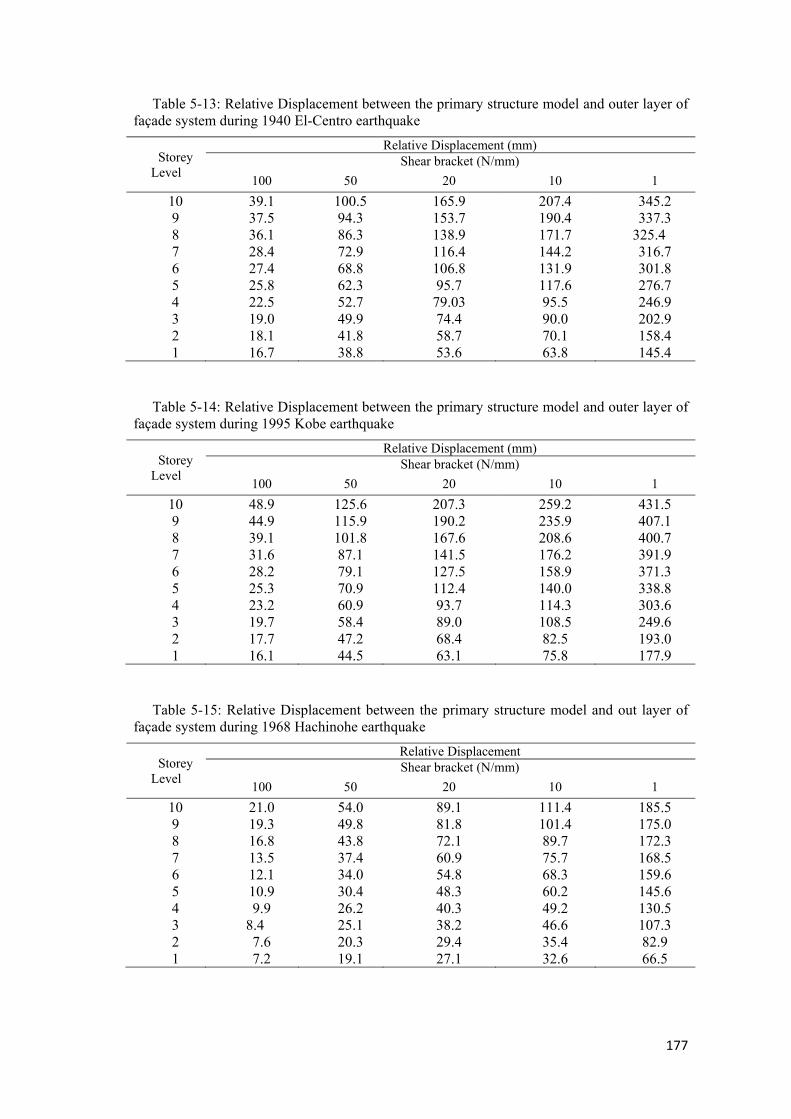
177
Table 5-13: Relative Displacement between the primary structure model and outer layer of façade system during 1940 El-Centro earthquake
Storey Level
Relative Displacement (mm) Shear bracket (N/mm)
100 50 20 10 1
10 39.1 100.5 165.9 207.4 345.29 37.5 94.3 153.7 190.4 337.38 36.1 86.3 138.9 171.7 325.4 7 28.4 72.9 116.4 144.2 316.76 27.4 68.8 106.8 131.9 301.85 25.8 62.3 95.7 117.6 276.74 22.5 52.7 79.03 95.5 246.93 19.0 49.9 74.4 90.0 202.92 18.1 41.8 58.7 70.1 158.41 16.7 38.8 53.6 63.8 145.4
Table 5-14: Relative Displacement between the primary structure model and outer layer of façade system during 1995 Kobe earthquake
Storey Level
Relative Displacement (mm) Shear bracket (N/mm)
100 50 20 10 1
10 48.9 125.6 207.3 259.2 431.59 44.9 115.9 190.2 235.9 407.18 39.1 101.8 167.6 208.6 400.77 31.6 87.1 141.5 176.2 391.96 28.2 79.1 127.5 158.9 371.35 25.3 70.9 112.4 140.0 338.84 23.2 60.9 93.7 114.3 303.63 19.7 58.4 89.0 108.5 249.62 17.7 47.2 68.4 82.5 193.01 16.1 44.5 63.1 75.8 177.9
Table 5-15: Relative Displacement between the primary structure model and out layer of façade system during 1968 Hachinohe earthquake
Storey Level
Relative Displacement Shear bracket (N/mm)
100 50 20 10 1
10 21.0 54.0 89.1 111.4 185.59 19.3 49.8 81.8 101.4 175.08 16.8 43.8 72.1 89.7 172.37 13.5 37.4 60.9 75.7 168.56 12.1 34.0 54.8 68.3 159.65 10.9 30.4 48.3 60.2 145.64 9.9 26.2 40.3 49.2 130.53 8.4 25.1 38.2 46.6 107.3 2 7.6 20.3 29.4 35.4 82.91 7.2 19.1 27.1 32.6 66.5
178
5.3.2.2.4 Structural Inter-Storey Drift
Another very important engineering demand parameter (EDP) for multistorey
concrete frame buildings is the evaluation of storey drifts. The interstorey drift ratio is
an important EDP because it helps to describe global damage to drift sensitive
components of the building such as structural framing, interior partitions, exterior
cladding, and window glazing. In this section, dynamic time-history analyses of the
model were performed to determine the maximum interstorey drift demand in each
storey.
5.3.2.2.4.1 Inter-Storey Drift Calculation and In-Plane Seismic Design
Buildings subjected to seismic excitations experience reverse cyclic swaying and the
resulting deformations induced in buildings may be quantified for the assessment of
façade systems using the inter-storey displacement (Calvi, Pinho et al. 2006). A
schematic diagram of a building sway under earthquake ground motion is illustrated in
Figure 5-26. The inter-storey drift ratio “∆I” at the “ith” floor can be defined as:
∆ ∆ )*x100% (5-1)
where “hi” is the storey height
According to clauses 5.4.4 and 5.5.4 of AS 1170.4 (2007), the inter-storey drift that
is calculated from the forces determined according to strength and stability provisions
at the ultimate limit state shall not be greater than 1.5% of the storey height for each
level (Mwafy and Elnashai 2001). Also cladding and façade panel’s attachment in a
seismic-force-resisting system shall have sufficient deformation and rotational
capacity. Therefore, for a typical floor height of 3600 mm, the maximum allowable
relative storey drift is 54 mm.
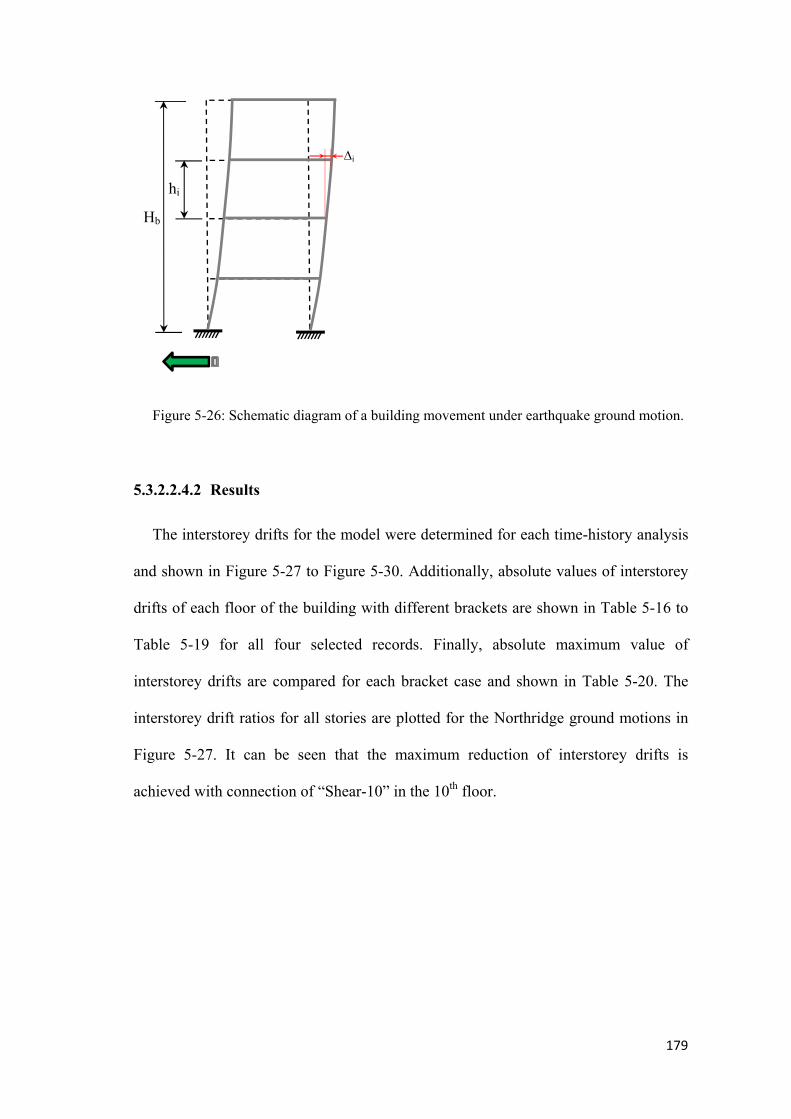
179
Figure 5-26: Schematic diagram of a building movement under earthquake ground motion.
5.3.2.2.4.2 Results
The interstorey drifts for the model were determined for each time-history analysis
and shown in Figure 5-27 to Figure 5-30. Additionally, absolute values of interstorey
drifts of each floor of the building with different brackets are shown in Table 5-16 to
Table 5-19 for all four selected records. Finally, absolute maximum value of
interstorey drifts are compared for each bracket case and shown in Table 5-20. The
interstorey drift ratios for all stories are plotted for the Northridge ground motions in
Figure 5-27. It can be seen that the maximum reduction of interstorey drifts is
achieved with connection of “Shear-10” in the 10th floor.
∆i
Hb
hi
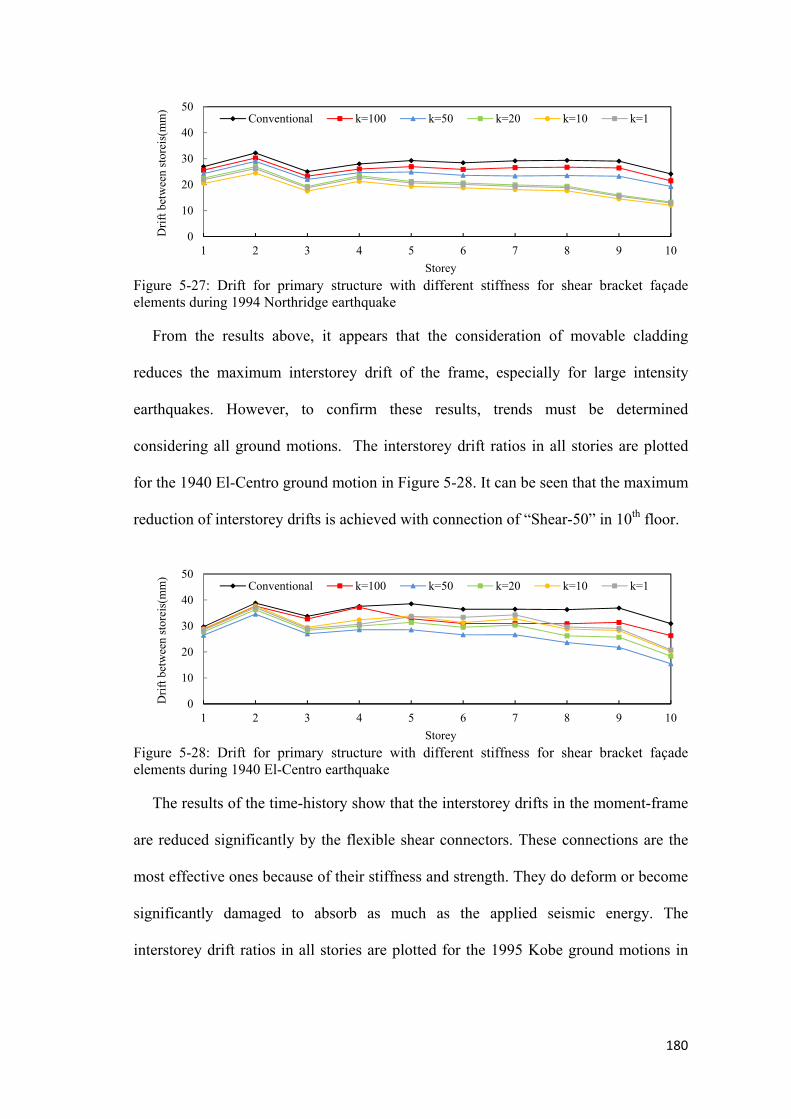
180
Figure 5-27: Drift for primary structure with different stiffness for shear bracket façade elements during 1994 Northridge earthquake
From the results above, it appears that the consideration of movable cladding
reduces the maximum interstorey drift of the frame, especially for large intensity
earthquakes. However, to confirm these results, trends must be determined
considering all ground motions. The interstorey drift ratios in all stories are plotted
for the 1940 El-Centro ground motion in Figure 5-28. It can be seen that the maximum
reduction of interstorey drifts is achieved with connection of “Shear-50” in 10th floor.
Figure 5-28: Drift for primary structure with different stiffness for shear bracket façade elements during 1940 El-Centro earthquake
The results of the time-history show that the interstorey drifts in the moment-frame
are reduced significantly by the flexible shear connectors. These connections are the
most effective ones because of their stiffness and strength. They do deform or become
significantly damaged to absorb as much as the applied seismic energy. The
interstorey drift ratios in all stories are plotted for the 1995 Kobe ground motions in
0
10
20
30
40
50
1 2 3 4 5 6 7 8 9 10
Dri
ft b
etw
een
stor
eis(
mm
)
Storey
Conventional k=100 k=50 k=20 k=10 k=1
0
10
20
30
40
50
1 2 3 4 5 6 7 8 9 10
Dri
ft b
etw
een
stor
eis(
mm
)
Storey
Conventional k=100 k=50 k=20 k=10 k=1
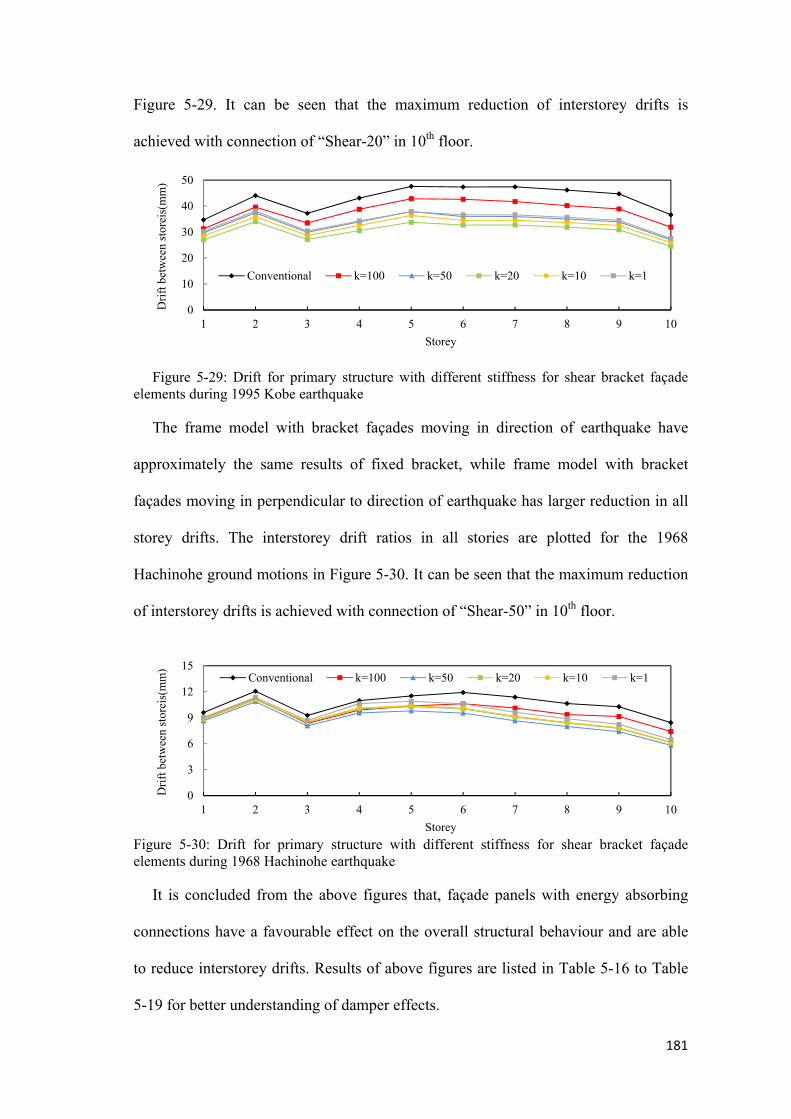
181
Figure 5-29. It can be seen that the maximum reduction of interstorey drifts is
achieved with connection of “Shear-20” in 10th floor.
Figure 5-29: Drift for primary structure with different stiffness for shear bracket façade elements during 1995 Kobe earthquake
The frame model with bracket façades moving in direction of earthquake have
approximately the same results of fixed bracket, while frame model with bracket
façades moving in perpendicular to direction of earthquake has larger reduction in all
storey drifts. The interstorey drift ratios in all stories are plotted for the 1968
Hachinohe ground motions in Figure 5-30. It can be seen that the maximum reduction
of interstorey drifts is achieved with connection of “Shear-50” in 10th floor.
Figure 5-30: Drift for primary structure with different stiffness for shear bracket façade elements during 1968 Hachinohe earthquake
It is concluded from the above figures that, façade panels with energy absorbing
connections have a favourable effect on the overall structural behaviour and are able
to reduce interstorey drifts. Results of above figures are listed in Table 5-16 to Table
5-19 for better understanding of damper effects.
0
10
20
30
40
50
1 2 3 4 5 6 7 8 9 10
Dri
ft b
etw
een
stor
eis(
mm
)
Storey
Conventional k=100 k=50 k=20 k=10 k=1
0
3
6
9
12
15
1 2 3 4 5 6 7 8 9 10
Dri
ft b
etw
een
stor
eis(
mm
)
Storey
Conventional k=100 k=50 k=20 k=10 k=1
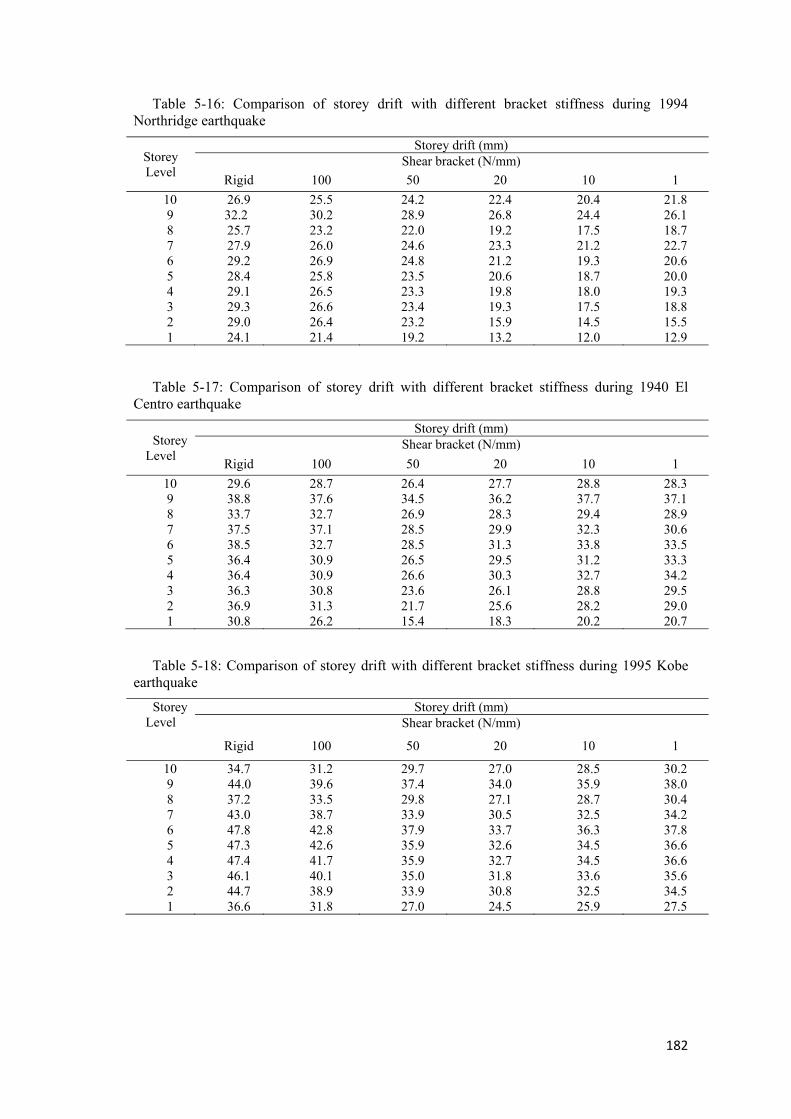
182
Table 5-16: Comparison of storey drift with different bracket stiffness during 1994 Northridge earthquake
Storey Level
Storey drift (mm) Shear bracket (N/mm)
Rigid 100 50 20 10 1
10 26.9 25.5 24.2 22.4 20.4 21.89 32.2 30.2 28.9 26.8 24.4 26.18 25.7 23.2 22.0 19.2 17.5 18.77 27.9 26.0 24.6 23.3 21.2 22.76 29.2 26.9 24.8 21.2 19.3 20.65 28.4 25.8 23.5 20.6 18.7 20.04 29.1 26.5 23.3 19.8 18.0 19.33 29.3 26.6 23.4 19.3 17.5 18.82 29.0 26.4 23.2 15.9 14.5 15.51 24.1 21.4 19.2 13.2 12.0 12.9
Table 5-17: Comparison of storey drift with different bracket stiffness during 1940 El Centro earthquake
Storey Level
Storey drift (mm) Shear bracket (N/mm)
Rigid 100 50 20 10 1
10 29.6 28.7 26.4 27.7 28.8 28.39 38.8 37.6 34.5 36.2 37.7 37.18 33.7 32.7 26.9 28.3 29.4 28.97 37.5 37.1 28.5 29.9 32.3 30.66 38.5 32.7 28.5 31.3 33.8 33.55 36.4 30.9 26.5 29.5 31.2 33.34 36.4 30.9 26.6 30.3 32.7 34.23 36.3 30.8 23.6 26.1 28.8 29.52 36.9 31.3 21.7 25.6 28.2 29.01 30.8 26.2 15.4 18.3 20.2 20.7
Table 5-18: Comparison of storey drift with different bracket stiffness during 1995 Kobe earthquake
Storey Level
Storey drift (mm) Shear bracket (N/mm)
Rigid 100 50 20 10 1
10 34.7 31.2 29.7 27.0 28.5 30.29 44.0 39.6 37.4 34.0 35.9 38.08 37.2 33.5 29.8 27.1 28.7 30.47 43.0 38.7 33.9 30.5 32.5 34.26 47.8 42.8 37.9 33.7 36.3 37.85 47.3 42.6 35.9 32.6 34.5 36.64 47.4 41.7 35.9 32.7 34.5 36.63 46.1 40.1 35.0 31.8 33.6 35.62 44.7 38.9 33.9 30.8 32.5 34.51 36.6 31.8 27.0 24.5 25.9 27.5

183
Table 5-19: Comparison of storey drift with different bracket stiffness during 1968 Hachinohe earthquake
Storey Level
Storey drift (mm) Shear bracket (N/mm)
Rigid 100 50 20 10 1
10 9.5 8.9 8.6 8.8 8.8 9.09 12.1 11.2 10.8 11.0 11.1 11.38 9.2 8.3 8.0 8.4 8.5 8.67 10.9 9.8 9.5 10.0 10.1 10.66 11.5 10.3 9.8 10.2 10.3 10.85 11.9 10.6 9.5 10.0 10.1 10.64 11.3 10.1 8.6 9.0 9.1 9.63 10.6 9.3 7.9 8.3 8.4 8.82 10.2 9.1 7.4 7.7 7.8 8.21 8.4 7.4 5.8 6.1 6.1 6.5
Absolute maximum value of interstorey drifts for each of the earthquakes are
compared for each bracket case in Table 5-20.
Table 5-20: Comparison of absolute maximum value of interstorey drifts for each bracket case
Earthquake
Type of bracket system used in double skin façade system Shear bracket (N/mm)
Rigid 100 50 20 10 1
Northridge 32.2 30.3 28.9 23.3 24.5 22.7
El Centro 38.8 37.7 34.5 36.2 37.7 37.1
Kobe 47.6 42.8 37. 9 33.7 36.4 38.1
Hachinohe 12.1 11.2 10.9 11.1 11.2 11.3s
5.3.2.2.5 Top Lateral Acceleration
The other global engineering demand parameter considered in this study is the
maximum floor acceleration. Floor accelerations are used to predict the damage to
acceleration sensitive components in the building, such as ceiling systems, chimneys,
and mechanical and electrical equipment. Various degrees of effectiveness of the
damping system with various stiffness of the connections for the various earthquake
records were studied. Response history of top floor acceleration of the three-
dimensional 10-storey building structure is presented in this section. Top floor
acceleration in case of rigid, axial and shear connections are extracted and compared
in various figures and tables of this section. Comparison of responses for the structure
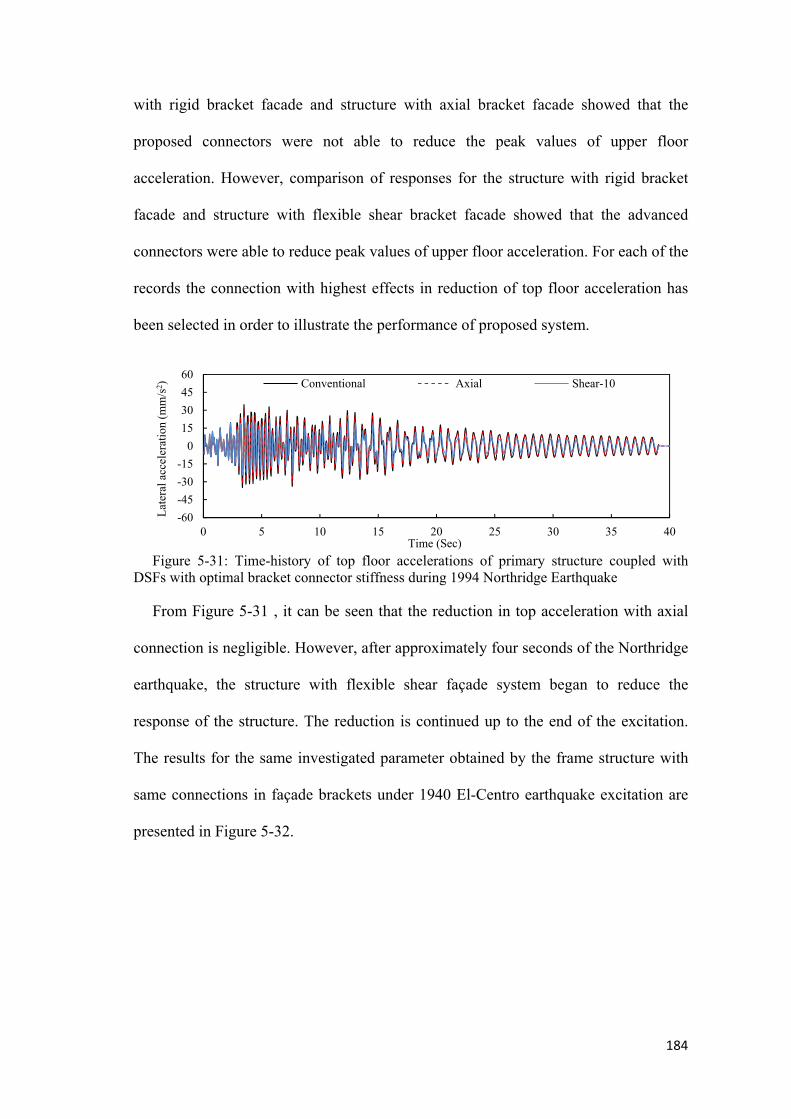
184
with rigid bracket facade and structure with axial bracket facade showed that the
proposed connectors were not able to reduce the peak values of upper floor
acceleration. However, comparison of responses for the structure with rigid bracket
facade and structure with flexible shear bracket facade showed that the advanced
connectors were able to reduce peak values of upper floor acceleration. For each of the
records the connection with highest effects in reduction of top floor acceleration has
been selected in order to illustrate the performance of proposed system.
Figure 5-31: Time-history of top floor accelerations of primary structure coupled with DSFs with optimal bracket connector stiffness during 1994 Northridge Earthquake
From Figure 5-31 , it can be seen that the reduction in top acceleration with axial
connection is negligible. However, after approximately four seconds of the Northridge
earthquake, the structure with flexible shear façade system began to reduce the
response of the structure. The reduction is continued up to the end of the excitation.
The results for the same investigated parameter obtained by the frame structure with
same connections in façade brackets under 1940 El-Centro earthquake excitation are
presented in Figure 5-32.
-60
-45
-30
-15
0
15
30
45
60
0 5 10 15 20 25 30 35 40
Lat
eral
acc
eler
atio
n (m
m/s
2 )
Time (Sec)
Conventional Axial Shear-10

185
Figure 5-32: Time-history top floor accelerations of primary structure coupled with DSFs with optimal bracket connector stiffness during 1940 El-Centro Earthquake
The above graph again shows the efficiency of the flexible connections. After
approximately three seconds of the El-Centro earthquake, the structure with Shear-50
connections began to reduce the response of the main structure. The reduction
continued up to end of the excitation.
Figure 5-33 : Time-history top floor accelerations of primary structure coupled with DSFs with optimal bracket connector stiffness during 1995 Kobe Earthquake
Figure 5-33 distinctly shows that the incorporation of shear damping connections to
the structure façade has changed the effect of the seismic loading on the behaviour of
the building system and produced desirable results.
-60
-45
-30
-15
0
15
30
45
60
0 5 10 15 20 25 30 35 40
Lat
eral
acc
eler
atio
n (m
m/s
2 )
Time (Sec)
Conventional Axial Shear-50
-60
-45
-30
-15
0
15
30
45
60
0 5 10 15 20 25 30 35 40
Lat
eral
acc
eler
atio
n (m
m/s
2 )
Time (Sec)
Conventional Axial Shear-20

186
Figure 5-34: Time-history top floor accelerations of primary structure coupled with DSFs with optimal bracket connector stiffness during Hachinohe Earthquake
A similar trend was observed in the case of 1968 Hachinohe earthquake shown in
Figure 5-34. The results showed that the top displacement of main structure is reduced
under this earthquake. From the results above, it appears that the consideration of
movable cladding reduces the top floor acceleration of the frame. Table 5-21 shows
the efficiency of the proposed damping connections in all stories.
Table 5-21: Comparison between top floor accelerations (mm/sec2) of primary structure coupled with DSFs with optimal bracket connector stiffness during 1994 Northridge Earthquake
Storey Level Type of bracket system used in double skin façade system
Rigid Axial Shear-1010 34.3 30.2 23.99 25.5 22.9 18.38 17.2 15.4 12.77 17.6 15.9 13.06 22.3 20.1 16.15 23.8 21.4 18.14 23.4 21.0 17.93 21.1 19.0 17.42 16.8 15.6 14.41 9.9 9.3 8.7
As can be seen from Table 5-22, the system achieved a very high level of
efficiency especially in upper stories.
-30-24-18-12-606
12182430
0 5 10 15 20
Lat
eral
acc
eler
atio
n (m
m/s
2 )
Time (Sec)
Conventional Axial Shear-20
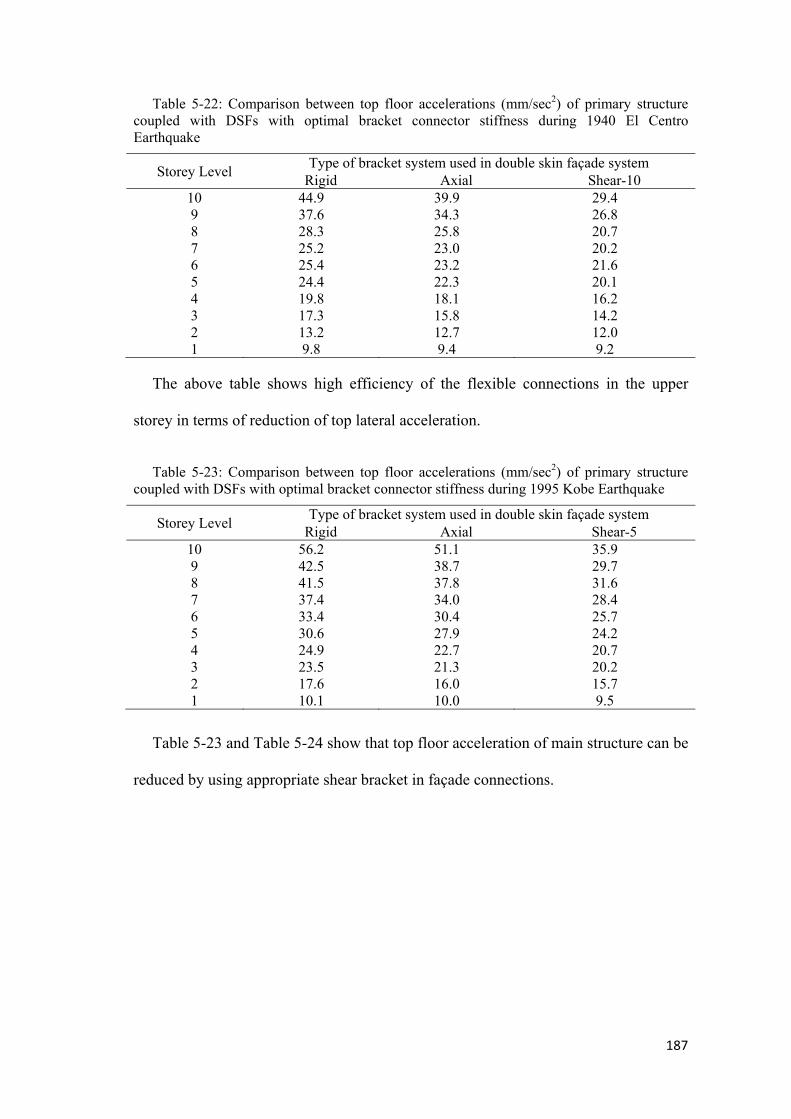
187
Table 5-22: Comparison between top floor accelerations (mm/sec2) of primary structure coupled with DSFs with optimal bracket connector stiffness during 1940 El Centro Earthquake
Storey Level Type of bracket system used in double skin façade system
Rigid Axial Shear-1010 44.9 39.9 29.49 37.6 34.3 26.88 28.3 25.8 20.77 25.2 23.0 20.26 25.4 23.2 21.65 24.4 22.3 20.14 19.8 18.1 16.23 17.3 15.8 14.22 13.2 12.7 12.01 9.8 9.4 9.2
The above table shows high efficiency of the flexible connections in the upper
storey in terms of reduction of top lateral acceleration.
Table 5-23: Comparison between top floor accelerations (mm/sec2) of primary structure coupled with DSFs with optimal bracket connector stiffness during 1995 Kobe Earthquake
Storey Level Type of bracket system used in double skin façade system
Rigid Axial Shear-510 56.2 51.1 35.99 42.5 38.7 29.78 41.5 37.8 31.67 37.4 34.0 28.46 33.4 30.4 25.75 30.6 27.9 24.24 24.9 22.7 20.73 23.5 21.3 20.22 17.6 16.0 15.71 10.1 10.0 9.5
Table 5-23 and Table 5-24 show that top floor acceleration of main structure can be
reduced by using appropriate shear bracket in façade connections.
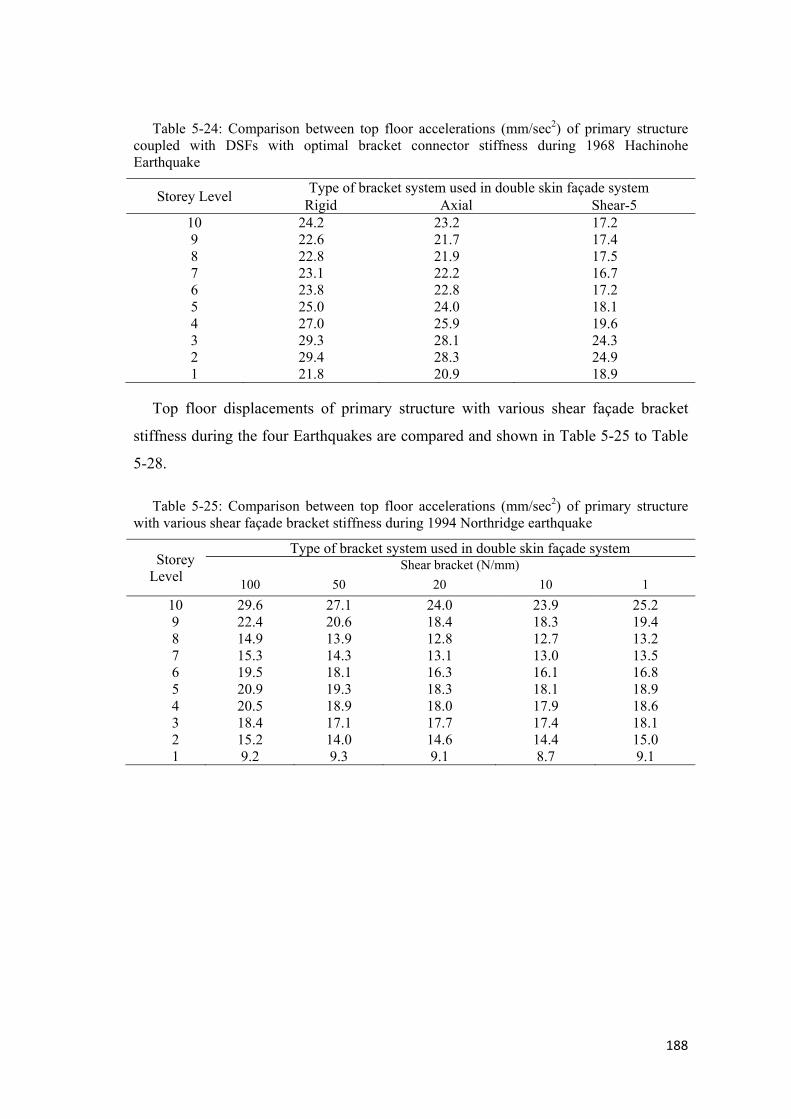
188
Table 5-24: Comparison between top floor accelerations (mm/sec2) of primary structure coupled with DSFs with optimal bracket connector stiffness during 1968 Hachinohe Earthquake
Storey Level Type of bracket system used in double skin façade system
Rigid Axial Shear-510 24.2 23.2 17.29 22.6 21.7 17.48 22.8 21.9 17.57 23.1 22.2 16.76 23.8 22.8 17.25 25.0 24.0 18.14 27.0 25.9 19.63 29.3 28.1 24.32 29.4 28.3 24.91 21.8 20.9 18.9
Top floor displacements of primary structure with various shear façade bracket
stiffness during the four Earthquakes are compared and shown in Table 5-25 to Table
5-28.
Table 5-25: Comparison between top floor accelerations (mm/sec2) of primary structurewith various shear façade bracket stiffness during 1994 Northridge earthquake
Storey Level
Type of bracket system used in double skin façade system Shear bracket (N/mm)
100 50 20 10 1
10 29.6 27.1 24.0 23.9 25.29 22.4 20.6 18.4 18.3 19.48 14.9 13.9 12.8 12.7 13.27 15.3 14.3 13.1 13.0 13.56 19.5 18.1 16.3 16.1 16.85 20.9 19.3 18.3 18.1 18.94 20.5 18.9 18.0 17.9 18.63 18.4 17.1 17.7 17.4 18.12 15.2 14.0 14.6 14.4 15.01 9.2 9.3 9.1 8.7 9.1
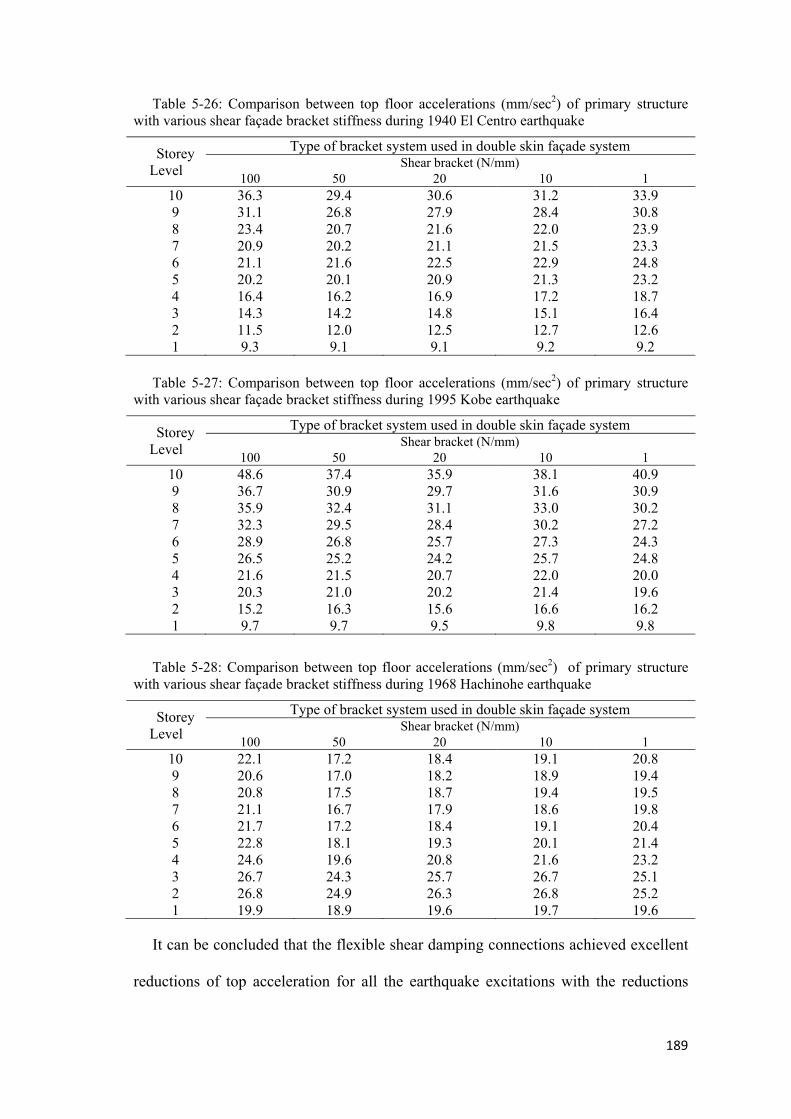
189
Table 5-26: Comparison between top floor accelerations (mm/sec2) of primary structure with various shear façade bracket stiffness during 1940 El Centro earthquake
Storey Level
Type of bracket system used in double skin façade system Shear bracket (N/mm)
100 50 20 10 110 36.3 29.4 30.6 31.2 33.99 31.1 26.8 27.9 28.4 30.88 23.4 20.7 21.6 22.0 23.97 20.9 20.2 21.1 21.5 23.36 21.1 21.6 22.5 22.9 24.85 20.2 20.1 20.9 21.3 23.24 16.4 16.2 16.9 17.2 18.73 14.3 14.2 14.8 15.1 16.42 11.5 12.0 12.5 12.7 12.61 9.3 9.1 9.1 9.2 9.2
Table 5-27: Comparison between top floor accelerations (mm/sec2) of primary structure with various shear façade bracket stiffness during 1995 Kobe earthquake
Storey Level
Type of bracket system used in double skin façade system Shear bracket (N/mm)
100 50 20 10 110 48.6 37.4 35.9 38.1 40.99 36.7 30.9 29.7 31.6 30.98 35.9 32.4 31.1 33.0 30.27 32.3 29.5 28.4 30.2 27.26 28.9 26.8 25.7 27.3 24.35 26.5 25.2 24.2 25.7 24.84 21.6 21.5 20.7 22.0 20.03 20.3 21.0 20.2 21.4 19.62 15.2 16.3 15.6 16.6 16.21 9.7 9.7 9.5 9.8 9.8
Table 5-28: Comparison between top floor accelerations (mm/sec2) of primary structure with various shear façade bracket stiffness during 1968 Hachinohe earthquake
Storey Level
Type of bracket system used in double skin façade system Shear bracket (N/mm)
100 50 20 10 110 22.1 17.2 18.4 19.1 20.89 20.6 17.0 18.2 18.9 19.48 20.8 17.5 18.7 19.4 19.57 21.1 16.7 17.9 18.6 19.86 21.7 17.2 18.4 19.1 20.45 22.8 18.1 19.3 20.1 21.44 24.6 19.6 20.8 21.6 23.23 26.7 24.3 25.7 26.7 25.12 26.8 24.9 26.3 26.8 25.21 19.9 18.9 19.6 19.7 19.6
It can be concluded that the flexible shear damping connections achieved excellent
reductions of top acceleration for all the earthquake excitations with the reductions

190
being slightly higher for the Kobe earthquake excitation than the other three. The
results showed that the lowest reduction in all investigated parameters was achieved
under the Hachinohe earthquake. In general, the results of the investigation of the
proposed damping system have demonstrated an ability to reduce the seismic response
of buildings by placement of the damping devices within the building facade system.
5.3.2.2.6 Root Mean Square (RMS) of Top Acceleration
To have a better appreciation of the damper performance, RMS of top floor
acceleration using different bracket stiffness is compared in Table 5-29 for the 3D
model for different earthquake excitations. It is seen in Table 5-29 that by using shear
stiffness of 50N/mm the RMS value is almost halved compared to a system with fixed
conventional façade panels during Hachinohe earthquake.
Table 5-29: Root mean square of top acceleration using optimal values of shear stiffness for the 3D models during the four excitations
Type of Structure
Northridge El-Centro Kobe Hachinohe
RMS %
Reduction RMS
% Reduction
RMS %
Reduction RMS
% Reduction
Conventional 11.1 - 12.3 - 16.0 - 5.7 - Axial 10.0 9.6 11.1 11.9 14.6 9.03 5.4 4.05
Shear-100 9.7 12.2 10.7 14.6 13.8 13.4 4.9 12.1 Shear-50 8.9 19.9 8.7 31.1 11.1 31.2 2.9 48.6 Shear-20 8.1 27.3 8.9 28.8 9.7 39.5 3.3 41.6 Shear-10 7.7 29.8 9.1 28.0 10.2 36.5 3.5 38.4 Shear-1 7.9 28.0 9.5 24.8 10.7 32.8 3.8 33.1
This reduction in value of RMS is clear in other three earthquake excitations as
well. Maximum reduction happens with “Shear –10”, “Shear –50” and “Shear –20” in
Northridge, El-Centro, and Kobe earthquakes, respectively. From the result of this
analysis, it can be concluded that the inclusion of façade with lateral damping
connections in the structure would inevitably result in great reduction in the response
of the main structure during various earthquakes.
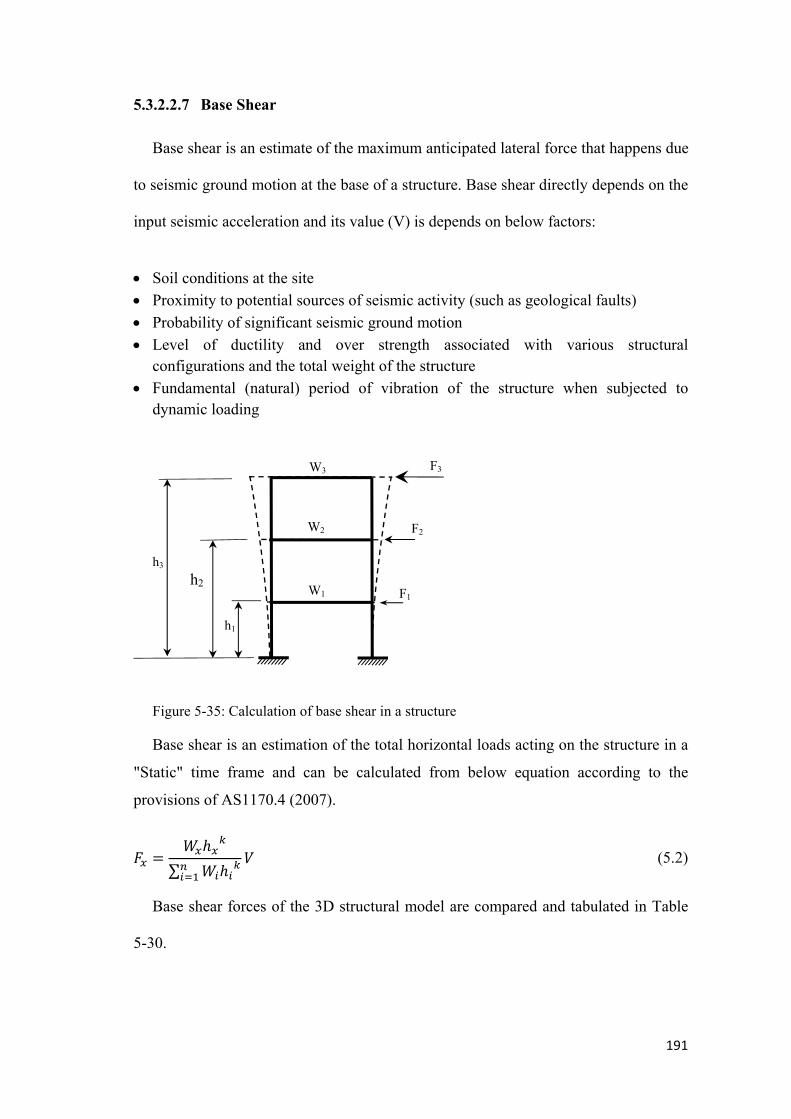
191
5.3.2.2.7 Base Shear
Base shear is an estimate of the maximum anticipated lateral force that happens due
to seismic ground motion at the base of a structure. Base shear directly depends on the
input seismic acceleration and its value (V) is depends on below factors:
Soil conditions at the site
Proximity to potential sources of seismic activity (such as geological faults)
Probability of significant seismic ground motion
Level of ductility and over strength associated with various structuralconfigurations and the total weight of the structure
Fundamental (natural) period of vibration of the structure when subjected todynamic loading
Figure 5-35: Calculation of base shear in a structure
Base shear is an estimation of the total horizontal loads acting on the structure in a
"Static" time frame and can be calculated from below equation according to the
provisions of AS1170.4 (2007).
∑ (5.2)
Base shear forces of the 3D structural model are compared and tabulated in Table
5-30.
h1
W2
W1 F1
F3
h2 h3
F2
W3

192
Table 5-30: Comparison between base shear forces (Knaack, Klein et al.) of the 3-D primary structure in various bracket stiffness
Earthquake Type of bracket system used in double skin façade system
Rigid Shear-100 Shear-50 Shear-20 Shear-10 Shear-1
Northridge 1752 1644 1548 1040 990 1094
El Centro 2323 1920 1411 1599 1674 1870
Kobe 3001 2801 2450 1597 1611 1801
Hachinohe 1367 1219 929 1011 1078 1099
5.4 Findings And Conclusion
The use of energy absorbing connections (damping devices) in facade system to
mitigate the seismic applied force to a ten-storey building was investigated in this
chapter. The analytical results presented in Chapter 5 disclosed that the connection
properties had significant influence on dissipating seismic forces. A considerable
reduction in value of all parameters can be observed from the graphs and tables as the
movable dissipative façade brackets consistently reduced all investigated parameters
of the building structure by a reasonable margin. This chapter concludes that it is
feasible to design facade connections to mitigate part of applied force during seismic
events. The deformations within the shear connectors are drift-sensitive: the larger the
interstorey drift, the larger the deformations in the connections. After establishing the
feasibility of the procedure, the efficiency of the damping connection system and the
technique developed here is going to be investigated in a mid-rise 30 storeys structural
building model in order to have more general understanding of the system
performance.

193
CHAPTER 6
HIGH-RISE 30-STOREY
STRUCTRAL MODELS
194
6.1 Introduction
In this chapter, the performance of the proposed movable façade system models in
mid-rise building structure is comprehensively investigated using modal analyses and
nonlinear dynamic time-history analyses. The overall behaviour of the mid-rise
structural models with movable dissipative cladding is compared to the same structure
with conventional façade system, and the dynamic effects and behaviour of the new
cladding system are compared across the models with different axial and shear
stiffness connections. Analytical calculations in previous chapter have shown that the
movement of cladding system significantly influences the seismic response of mid -
rise structural buildings with movable dissipative cladding in moderate to severe
earthquakes.
In this chapter, the same procedure would be adopted to evaluate the proposed
moveable system in mid-rise building structures with a view to identify any major
differences in response of mid-rise vs high-rise structures with moveable facades and
subjected to earthquake loads. Effects of the movable cladding on the fundamental
period of the building are also discussed in this section. Additionally, effects of the
cladding on inter-storey drifts, floors displacement, floors acceleration, base shear and
plastic hinge rotations in beam/column connections are going to be discussed in this
chapter. Time-history analyses of each model are performed with selected recorded
ground motions to determine the structural reliability of the proposed connections.
Because, most of the modelling assumptions in this chapter are similar to Chapter 5, in
order to avoid repetition, description of some assumptions are not considered in this
chapter. These assumptions are as below:
Modelling approach and assumptions

195
Finite element analysis
Column, beam, slab, bracket and façade column mesh size
Direction of applied loads and building boundary conditions
Material properties
Consideration of seismic mass
Design of structural elements
Equivalent sections for structural beams and columns
Details of cladding system (double skin) modelling and their materialproperties
Façade column modelling
6.2 Assumptions
6.2.1 Element behaviour and structural modelling
In this section, behaviour of the proposed façade system is evaluated, employing a
three-dimensional (3-D) mid-rise structural model. Sectional dimensions used for the
model are listed in Table 6.1 and more details are given in Appendix-A.
Table 6-1: Structural sections for beam and column elements
Moment-resisting frame Storey/Floor Columns (mm) Storey/Floor Beams (mm)
24-30 400X400 26-30 300X40023 400X400
18-25 400X55021-22 450X450
20 500X50013-17 400X600
17-19 550X55012-16 600X600
9-12 400X60010-11 650X650
8-9 700X7001-8 400X600
1-7 800X800
Floor height and total building height are 3.6 meters and 129.6 meters, respectively.

196
Figure 6-1: Front view of exterior elevation of the 3D frame model
The front view of frame structure used for the 3D models in this section is shown in
Figure 6-1. The model has five bays in X and Z directions, respectively. The length of
each bay is considered to be 6 meters for both directions. It is assumed that building
mass is distributed equally at each floor along the height of the structure. Figure 6.2
shows beams and columns layout in the building structure plan.
Figure 6-2: Plan view of the 30m by 30m 3D frame model (dimensions are in mm)
6000 6000 6000 6000 6000
30000
6000
6000
6000
6000
6000
3000
0
Beam Plan
6000 6000 6000 6000 600030000
6000
6000
6000
6000
6000
3000
0
Colum n P lan
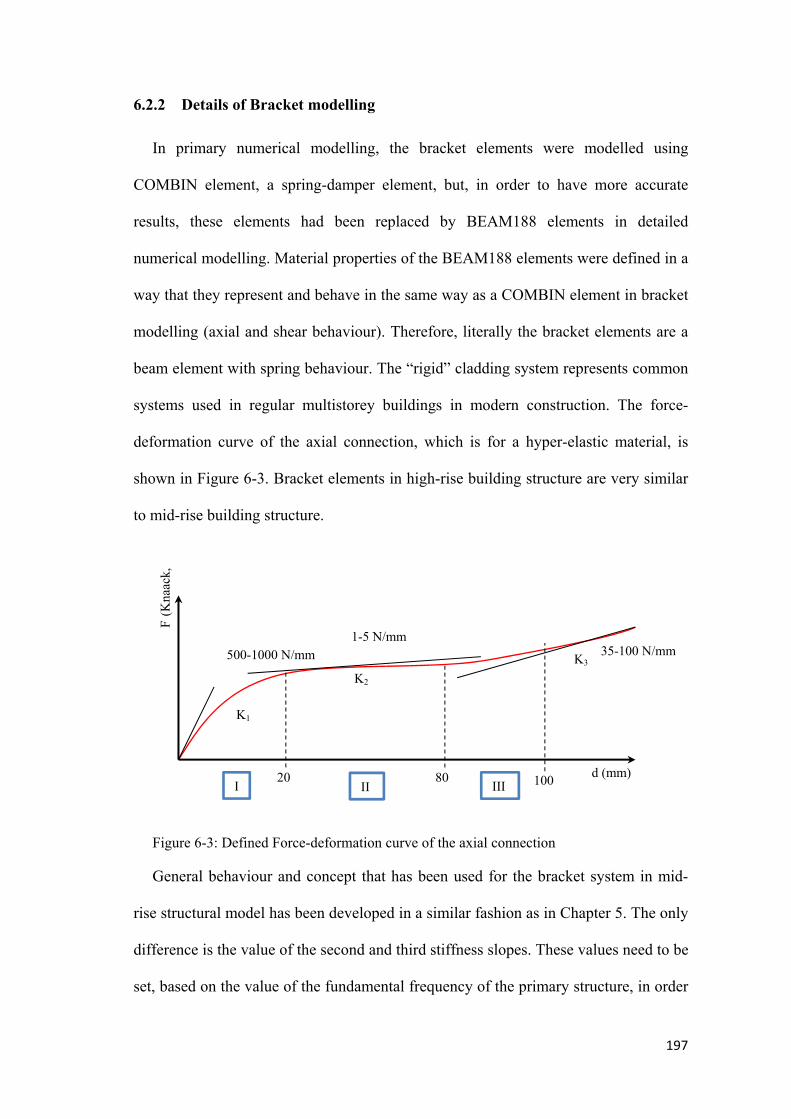
197
6.2.2 Details of Bracket modelling
In primary numerical modelling, the bracket elements were modelled using
COMBIN element, a spring-damper element, but, in order to have more accurate
results, these elements had been replaced by BEAM188 elements in detailed
numerical modelling. Material properties of the BEAM188 elements were defined in a
way that they represent and behave in the same way as a COMBIN element in bracket
modelling (axial and shear behaviour). Therefore, literally the bracket elements are a
beam element with spring behaviour. The “rigid” cladding system represents common
systems used in regular multistorey buildings in modern construction. The force-
deformation curve of the axial connection, which is for a hyper-elastic material, is
shown in Figure 6-3. Bracket elements in high-rise building structure are very similar
to mid-rise building structure.
Figure 6-3: Defined Force-deformation curve of the axial connection
General behaviour and concept that has been used for the bracket system in mid-
rise structural model has been developed in a similar fashion as in Chapter 5. The only
difference is the value of the second and third stiffness slopes. These values need to be
set, based on the value of the fundamental frequency of the primary structure, in order
F (
Kna
ack,
d (mm)
500-1000 N/mm
20 80 100
35-100 N/mm1-5 N/mm
K1
K2
K3
I II III
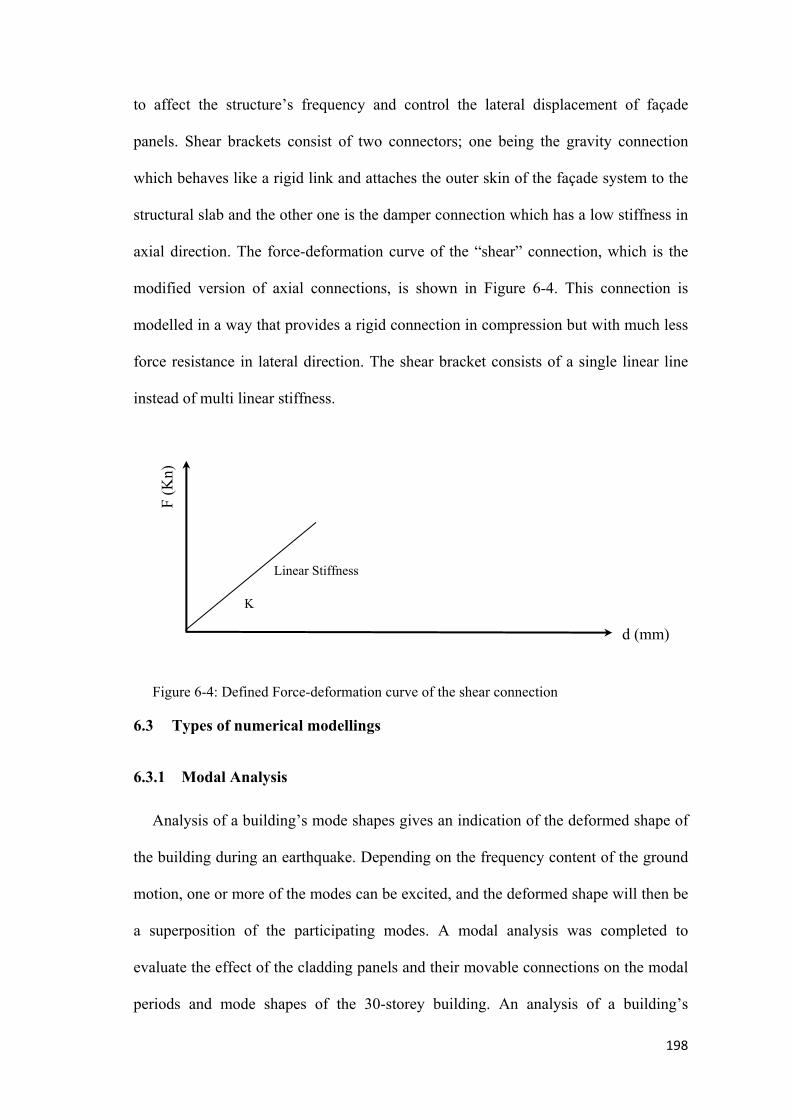
198
to affect the structure’s frequency and control the lateral displacement of façade
panels. Shear brackets consist of two connectors; one being the gravity connection
which behaves like a rigid link and attaches the outer skin of the façade system to the
structural slab and the other one is the damper connection which has a low stiffness in
axial direction. The force-deformation curve of the “shear” connection, which is the
modified version of axial connections, is shown in Figure 6-4. This connection is
modelled in a way that provides a rigid connection in compression but with much less
force resistance in lateral direction. The shear bracket consists of a single linear line
instead of multi linear stiffness.
Figure 6-4: Defined Force-deformation curve of the shear connection
6.3 Types of numerical modellings
6.3.1 Modal Analysis
Analysis of a building’s mode shapes gives an indication of the deformed shape of
the building during an earthquake. Depending on the frequency content of the ground
motion, one or more of the modes can be excited, and the deformed shape will then be
a superposition of the participating modes. A modal analysis was completed to
evaluate the effect of the cladding panels and their movable connections on the modal
periods and mode shapes of the 30-storey building. An analysis of a building’s
d (mm)
Linear Stiffness
F (
Kn)
K
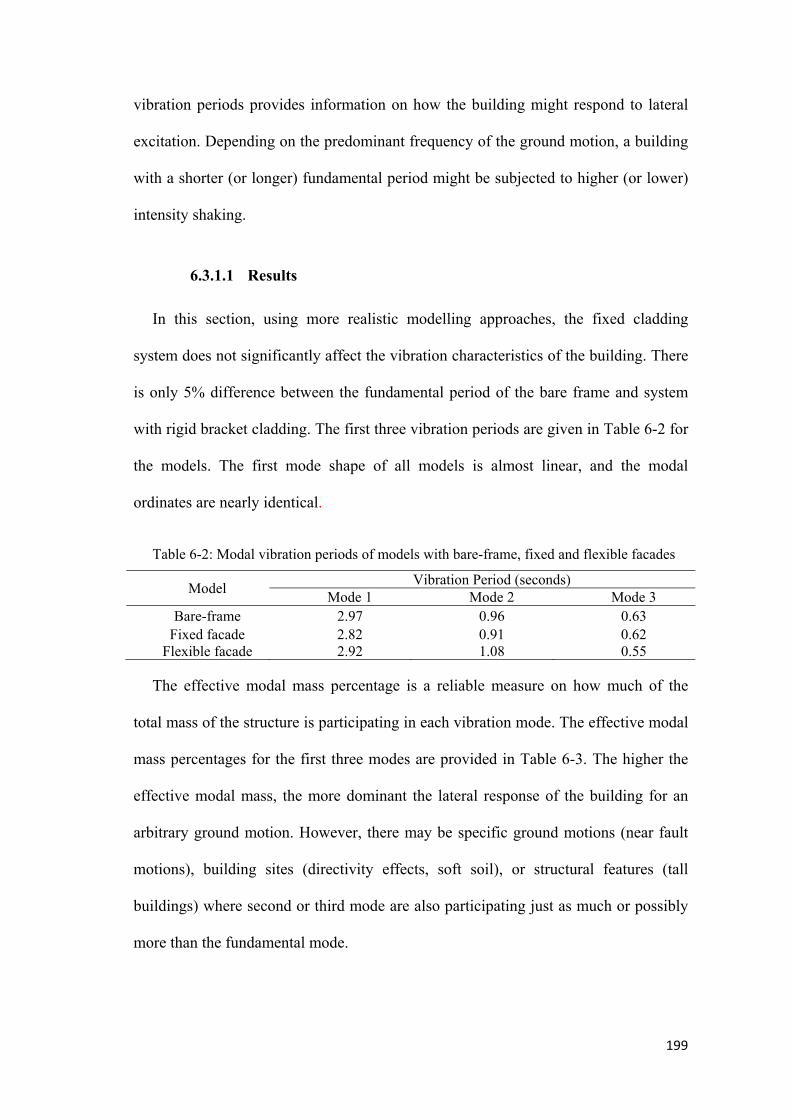
199
vibration periods provides information on how the building might respond to lateral
excitation. Depending on the predominant frequency of the ground motion, a building
with a shorter (or longer) fundamental period might be subjected to higher (or lower)
intensity shaking.
6.3.1.1 Results
In this section, using more realistic modelling approaches, the fixed cladding
system does not significantly affect the vibration characteristics of the building. There
is only 5% difference between the fundamental period of the bare frame and system
with rigid bracket cladding. The first three vibration periods are given in Table 6-2 for
the models. The first mode shape of all models is almost linear, and the modal
ordinates are nearly identical.
Table 6-2: Modal vibration periods of models with bare-frame, fixed and flexible facades
Model Vibration Period (seconds)
Mode 1 Mode 2 Mode 3 Bare-frame 2.97 0.96 0.63
Fixed facade 2.82 0.91 0.62 Flexible facade 2.92 1.08 0.55
The effective modal mass percentage is a reliable measure on how much of the
total mass of the structure is participating in each vibration mode. The effective modal
mass percentages for the first three modes are provided in Table 6-3. The higher the
effective modal mass, the more dominant the lateral response of the building for an
arbitrary ground motion. However, there may be specific ground motions (near fault
motions), building sites (directivity effects, soft soil), or structural features (tall
buildings) where second or third mode are also participating just as much or possibly
more than the fundamental mode.

200
Table 6-3: Participating modal mass percentages
Model Participating modal mass percentages (%)
Mode 1 Mode 2 Mode 3 Bare-frame 81.7 11.34 5.75
Fixed facade 83.62 10.15 5.23 Flexible facade 75.93 16.38 5.68
The first three modes contribute to approximately 98-99% of the total lateral
response in all the analytical models in this study. This finding indicates that these
three modes capture essentially the entire lateral dynamic response of the building.
The first mode contributes over 80% to the total response, which is typical of well-
designed concrete frame buildings with an approximately uniform distribution of
structural properties and mass. Comparison of participating modal mass percentages
for the first three modes of the 3D structure is shown in Figure 6-5.
Figure 6-5: Comparison of effective modal mass percentages for the first three modes
6.3.2 Dynamic Time-History Analysis (Holistic Nonlinear time-history analysis)
The time-history analyses give better insight into how the building and cladding
system respond to the applied earthquake ground motions. The consequence of
nonlinear yielding, energy dissipation and damping of the cladding system are better
understood through time-history analyses. The seismic loadings applied to the
structural models in this study were from existing past earthquake records. These
81.7 83.675.9
11.3 10.216.4
5.8 5.2 5.7
0
20
40
60
80
100
Bare Frame Fixed Façade Frame Flexible façade
Par
tici
pati
ng E
ffec
tive
Mod
al
Mas
s
Mode
Mode 1
Mode 2
Mode 3
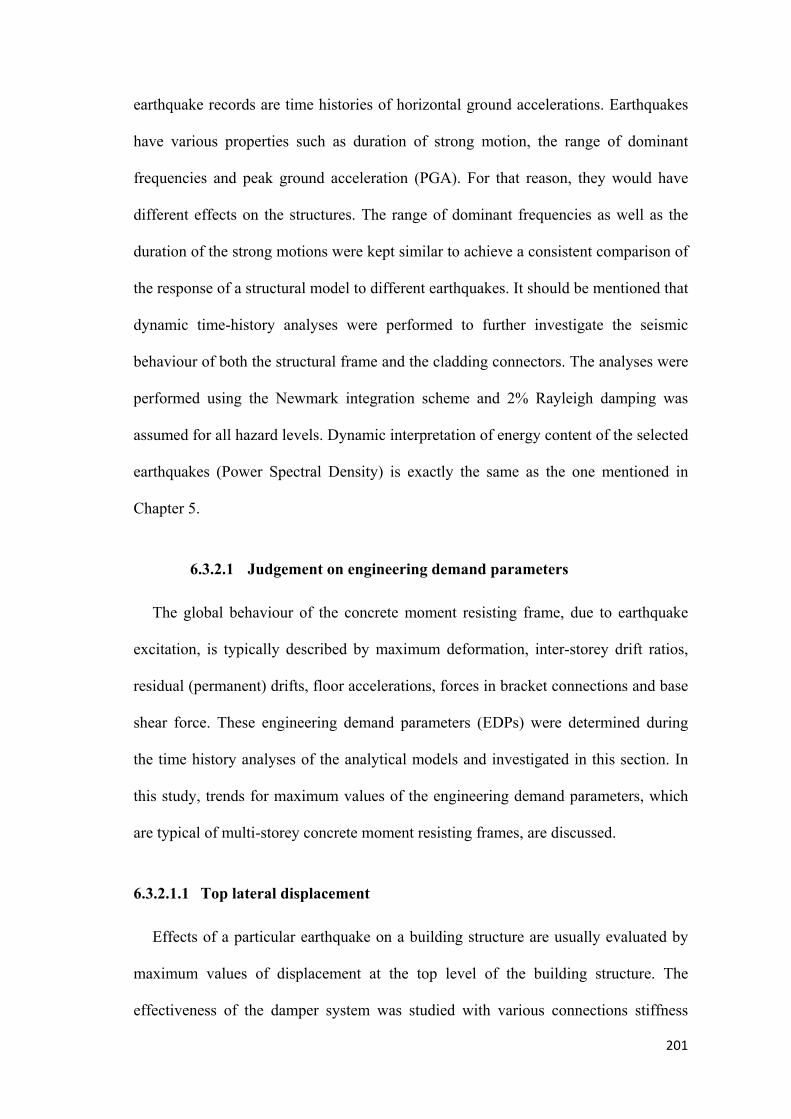
201
earthquake records are time histories of horizontal ground accelerations. Earthquakes
have various properties such as duration of strong motion, the range of dominant
frequencies and peak ground acceleration (PGA). For that reason, they would have
different effects on the structures. The range of dominant frequencies as well as the
duration of the strong motions were kept similar to achieve a consistent comparison of
the response of a structural model to different earthquakes. It should be mentioned that
dynamic time-history analyses were performed to further investigate the seismic
behaviour of both the structural frame and the cladding connectors. The analyses were
performed using the Newmark integration scheme and 2% Rayleigh damping was
assumed for all hazard levels. Dynamic interpretation of energy content of the selected
earthquakes (Power Spectral Density) is exactly the same as the one mentioned in
Chapter 5.
6.3.2.1 Judgement on engineering demand parameters
The global behaviour of the concrete moment resisting frame, due to earthquake
excitation, is typically described by maximum deformation, inter-storey drift ratios,
residual (permanent) drifts, floor accelerations, forces in bracket connections and base
shear force. These engineering demand parameters (EDPs) were determined during
the time history analyses of the analytical models and investigated in this section. In
this study, trends for maximum values of the engineering demand parameters, which
are typical of multi-storey concrete moment resisting frames, are discussed.
6.3.2.1.1 Top lateral displacement
Effects of a particular earthquake on a building structure are usually evaluated by
maximum values of displacement at the top level of the building structure. The
effectiveness of the damper system was studied with various connections stiffness

during various earthquake records. A comprehensive response history of top-level
displacement of the three-dimensional 30- storey building structure is presented in this
section. Top floor displacement, in the case of “Rigid”, “Axial” and “Shear”
connections, are extracted and compared in several figures and tables in this section.
Comparison of responses for the structure with rigid bracket facade and structure with
axial bracket facade showed that the proposed connectors were not able to reduce the
peak values of top floor displacement.
Figure 6-6: Time-history of top floor displacements of primary structure coupled with DSFs with different bracket connector stiffness during 1994 Northridge earthquake
Comparison of responses for the structure with rigid bracket facade and structure
with flexible shear bracket facade showed that the advanced connectors were able to
reduce peak values of top floor displacement. Shear-25 is chosen to compare with
rigid and axial bracket façade because it has the best performance and clearly
enhances the performance of the proposed system. From Figure 6-6, it can be
observed that the maximum values of displacement reduction occurred after 10
seconds of response. Between, 10 and 30 seconds, effectiveness of these kinds of
shear brackets are promising. In addition, compared to the shear brackets, the bracket
system with only axial façade system cannot reduce top lateral displacement of the
primary structure during applied earthquake excitation. Between 12 and 20 seconds,
some of top displacement peaks of the primary structure have negligible reduction.
The results for the same investigated parameter, obtained for the frame structure with
202
-600
-400
-200
0
200
400
600
0 5 10 15 20 25 30
Lat
eral
dis
palc
emen
t (m
m)
Time (Sec)
Conventional Axial Shear-25

203
the same connection properties of façade brackets under the 1940 El-Centro
earthquake excitation, are presented in Figure 6-7.
Figure 6-7: Time-history of top floor displacements of primary structure coupled with DSFs with different bracket connector stiffness during 1940 El Centro earthquake
The above graph again shows the efficiency of the flexible connections in El
Centro earthquake. After approximately few seconds of the El Centro earthquake, the
structure with Shear-80 connections began to significantly reduce the response of the
main structure. The reduction continued up to about 25 seconds. In the middle of this
earthquake excitation, response of the main structure reduces significantly with Shear-
80 connections.
Figure 6-8: Top floor displacements of primary structure coupled with DSFs with different bracket connector stiffness during 1995 Kobe Earthquake
Figure 6-8 distinctly displays that the incorporation of shear damping connections
to the structure façade has significantly changed the effects of the seismic loading on
the behaviour of the building system and produced more desirable results.
-500-400-300-200-100
0100200300400500
0 5 10 15 20 25 30
Lat
eral
dis
palc
emen
t (m
m)
Time (Sec)
Conventional Axial Shear-80
-800
-600
-400
-200
0
200
400
600
800
0 5 10 15 20 25 30
Lat
eral
dis
palc
emen
t (m
m)
Time (Sec)
Conventional Axial Shear-40
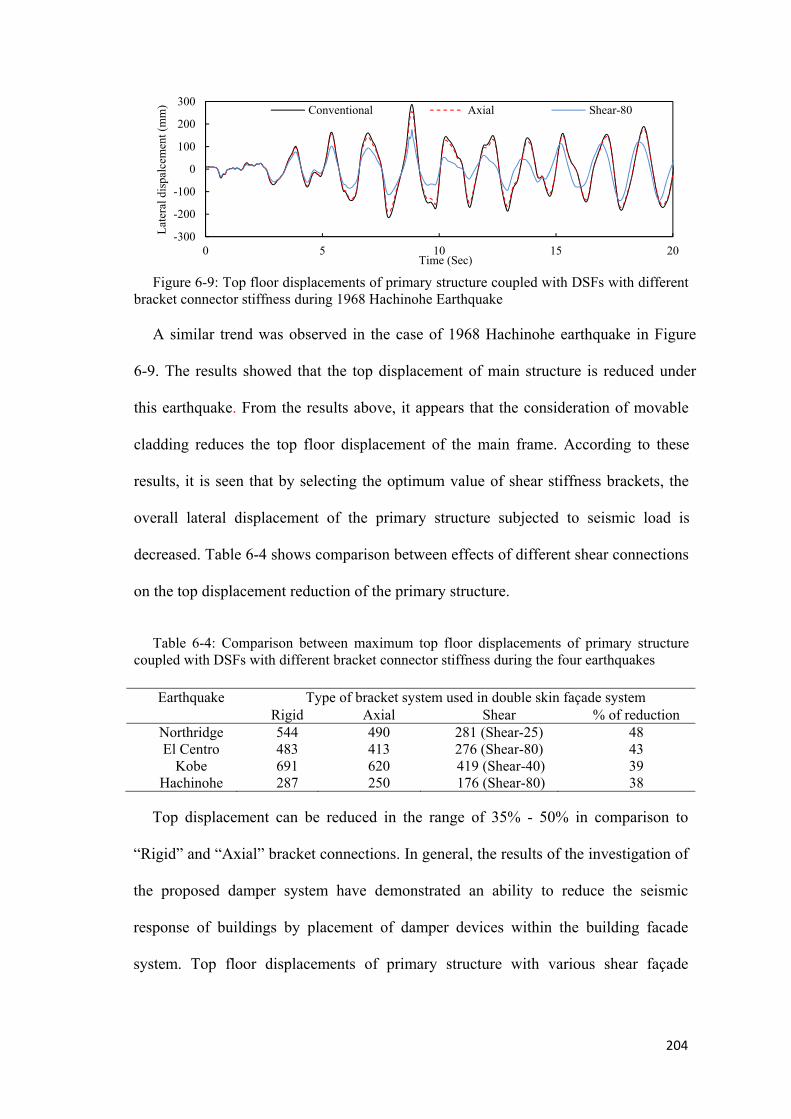
204
Figure 6-9: Top floor displacements of primary structure coupled with DSFs with different bracket connector stiffness during 1968 Hachinohe Earthquake
A similar trend was observed in the case of 1968 Hachinohe earthquake in Figure
6-9. The results showed that the top displacement of main structure is reduced under
this earthquake. From the results above, it appears that the consideration of movable
cladding reduces the top floor displacement of the main frame. According to these
results, it is seen that by selecting the optimum value of shear stiffness brackets, the
overall lateral displacement of the primary structure subjected to seismic load is
decreased. Table 6-4 shows comparison between effects of different shear connections
on the top displacement reduction of the primary structure.
Table 6-4: Comparison between maximum top floor displacements of primary structure coupled with DSFs with different bracket connector stiffness during the four earthquakes
Earthquake Type of bracket system used in double skin façade system Rigid Axial Shear % of reduction
Northridge 544 490 281 (Shear-25) 48 El Centro 483 413 276 (Shear-80) 43
Kobe 691 620 419 (Shear-40) 39 Hachinohe 287 250 176 (Shear-80) 38
Top displacement can be reduced in the range of 35% - 50% in comparison to
“Rigid” and “Axial” bracket connections. In general, the results of the investigation of
the proposed damper system have demonstrated an ability to reduce the seismic
response of buildings by placement of damper devices within the building facade
system. Top floor displacements of primary structure with various shear façade
-300
-200
-100
0
100
200
300
0 5 10 15 20
Lat
eral
dis
palc
emen
t (m
m)
Time (Sec)
Conventional Axial Shear-80

205
bracket stiffness during the four Earthquakes are compared and shown in Figure 6-10
to Figure 6-13 and Table 6-5.
Figure 6-10: Top floor displacements of primary structure coupled with DSFs with different shear connectors during 1994 Northridge Earthquake
Bracket elements with shear stiffness of 25 N/mm displayed similar frequency to
dominant frequency of Northridge excitation and it can be seen from Figure 5-10 that
this connection can produce the highest reduction of top displacement of the main
structure among other shear connections. It is seen that values of 50 and 10 N/mm
have negligible effect on response reduction compared to the value of 25 N/mm. It is
concluded that the optimum stiffness range is from 10N/mm to 50 N/mm for the
selected earthquake record.
-500-400-300-200-100
0100200300400500
0 5 10 15 20 25 30
Lat
eral
dis
palc
emen
t (m
m)
Time (Sec)
Shear-100 Shear-50 Shear-25
-500-400-300-200-100
0100200300400500
0 5 10 15 20 25 30
Lat
eral
dis
palc
emen
t (m
m)
Time (Sec)
Shear-25 Shear-10 Shear-1

206
Figure 6-11: Top floor displacements of primary structure coupled with DSFs with different shear connectors during 1940 El Centro Earthquake
During 1940 El-Centro excitation, bracket elements with shear stiffness of 80
N/mm have similar frequency to dominant frequency of the applied record.
Additionally, it can be seen from Figure 6-11 that this connection can achieve the
highest reduction of top displacement of the main structure among other shear
connectors. It is seen that values of 150 and 25 N/mm have less effect on response
reduction compared to the value of 100, 80 and 50 N/mm. It is concluded that the
optimum stiffness range is values between 50 N/mm to 100 N/mm for the selected
earthquake record. Bracket elements with shear stiffness of 40 N/mm has similar
frequency to dominant frequency of Kobe excitation and it can be seen from Figure 6-
12 that this connection can be responsible for the highest reduction of top
displacement of the main structure among other shear connections.
-500-400-300-200-100
0100200300400500
0 5 10 15 20 25 30
Lat
eral
dis
palc
emen
t (m
m)
Time (Sec)
Shear-150 Shear-100 Shear-80
-500-400-300-200-100
0100200300400500
0 5 10 15 20 25 30
Lat
eral
dis
palc
emen
t (m
m)
Time (Sec)
Shear-80 Shear-50 Shear-25
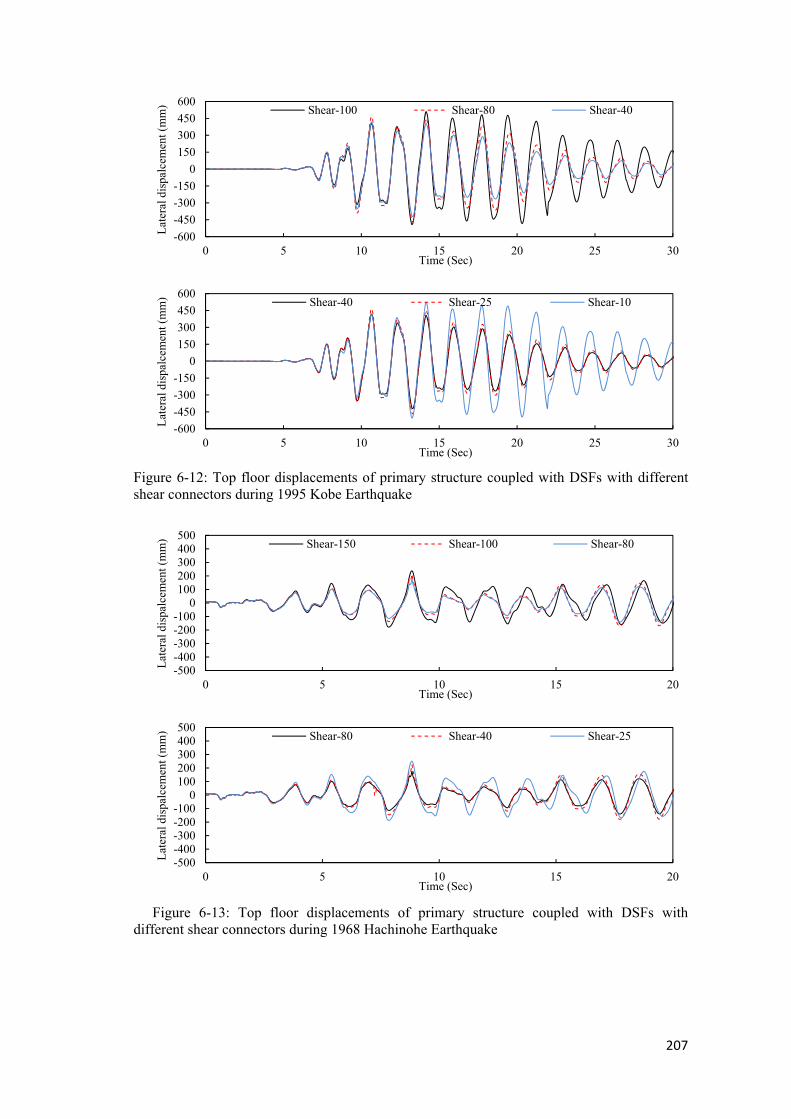
207
Figure 6-12: Top floor displacements of primary structure coupled with DSFs with different shear connectors during 1995 Kobe Earthquake
Figure 6-13: Top floor displacements of primary structure coupled with DSFs with different shear connectors during 1968 Hachinohe Earthquake
-600
-450
-300
-150
0
150
300
450
600
0 5 10 15 20 25 30
Lat
eral
dis
palc
emen
t (m
m)
Time (Sec)
Shear-100 Shear-80 Shear-40
-600
-450
-300
-150
0
150
300
450
600
0 5 10 15 20 25 30
Lat
eral
dis
palc
emen
t (m
m)
Time (Sec)
Shear-40 Shear-25 Shear-10
-500-400-300-200-100
0100200300400500
0 5 10 15 20
Lat
eral
dis
palc
emen
t (m
m)
Time (Sec)
Shear-150 Shear-100 Shear-80
-500-400-300-200-100
0100200300400500
0 5 10 15 20
Lat
eral
dis
palc
emen
t (m
m)
Time (Sec)
Shear-80 Shear-40 Shear-25
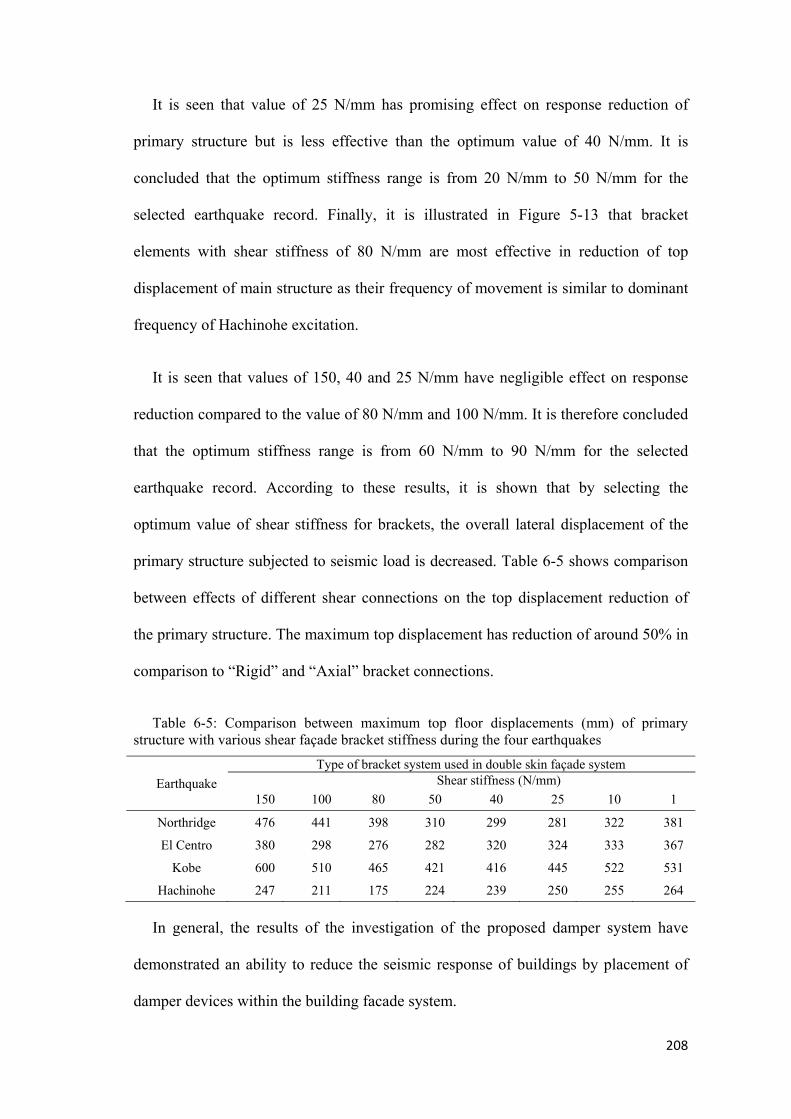
208
It is seen that value of 25 N/mm has promising effect on response reduction of
primary structure but is less effective than the optimum value of 40 N/mm. It is
concluded that the optimum stiffness range is from 20 N/mm to 50 N/mm for the
selected earthquake record. Finally, it is illustrated in Figure 5-13 that bracket
elements with shear stiffness of 80 N/mm are most effective in reduction of top
displacement of main structure as their frequency of movement is similar to dominant
frequency of Hachinohe excitation.
It is seen that values of 150, 40 and 25 N/mm have negligible effect on response
reduction compared to the value of 80 N/mm and 100 N/mm. It is therefore concluded
that the optimum stiffness range is from 60 N/mm to 90 N/mm for the selected
earthquake record. According to these results, it is shown that by selecting the
optimum value of shear stiffness for brackets, the overall lateral displacement of the
primary structure subjected to seismic load is decreased. Table 6-5 shows comparison
between effects of different shear connections on the top displacement reduction of
the primary structure. The maximum top displacement has reduction of around 50% in
comparison to “Rigid” and “Axial” bracket connections.
Table 6-5: Comparison between maximum top floor displacements (mm) of primary structure with various shear façade bracket stiffness during the four earthquakes
Earthquake
Type of bracket system used in double skin façade system Shear stiffness (N/mm)
150 100 80 50 40 25 10 1
Northridge 476 441 398 310 299 281 322 381
El Centro 380 298 276 282 320 324 333 367
Kobe 600 510 465 421 416 445 522 531
Hachinohe 247 211 175 224 239 250 255 264
In general, the results of the investigation of the proposed damper system have
demonstrated an ability to reduce the seismic response of buildings by placement of
damper devices within the building facade system.
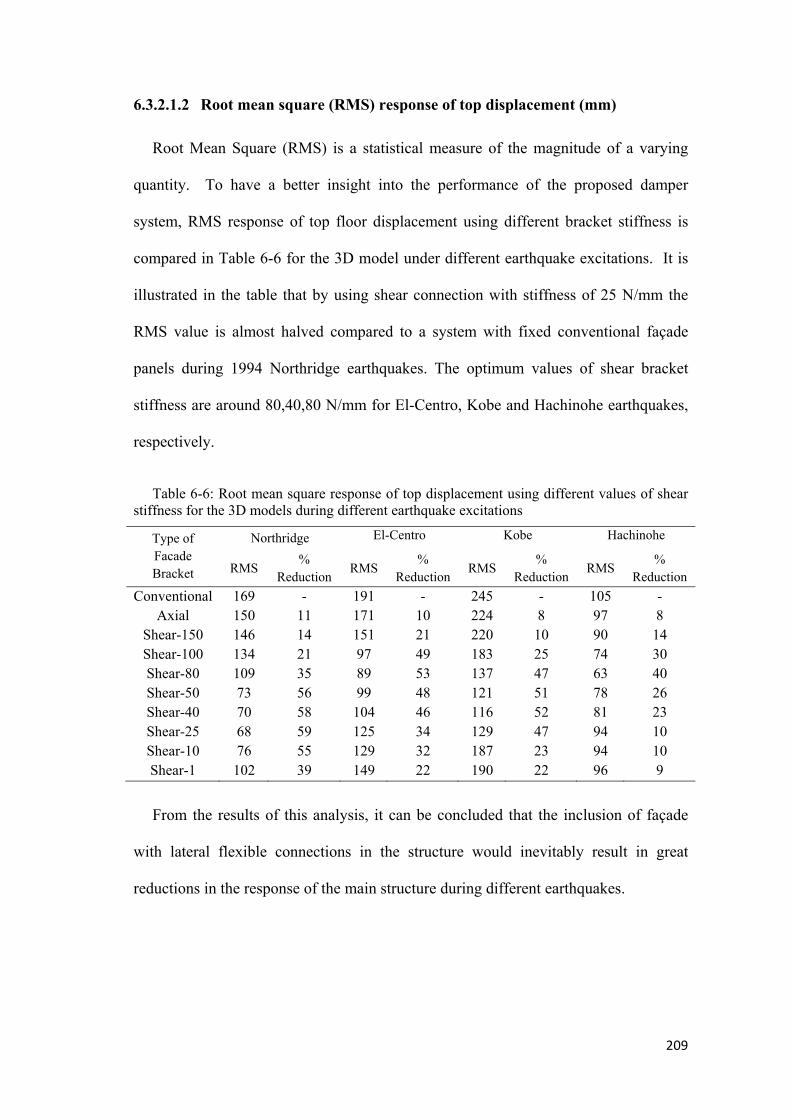
209
6.3.2.1.2 Root mean square (RMS) response of top displacement (mm)
Root Mean Square (RMS) is a statistical measure of the magnitude of a varying
quantity. To have a better insight into the performance of the proposed damper
system, RMS response of top floor displacement using different bracket stiffness is
compared in Table 6-6 for the 3D model under different earthquake excitations. It is
illustrated in the table that by using shear connection with stiffness of 25 N/mm the
RMS value is almost halved compared to a system with fixed conventional façade
panels during 1994 Northridge earthquakes. The optimum values of shear bracket
stiffness are around 80,40,80 N/mm for El-Centro, Kobe and Hachinohe earthquakes,
respectively.
Table 6-6: Root mean square response of top displacement using different values of shear stiffness for the 3D models during different earthquake excitations
Type of Facade Bracket
Northridge El-Centro Kobe Hachinohe
RMS %
Reduction RMS
% Reduction
RMS %
Reduction RMS
% Reduction
Conventional 169 - 191 - 245 - 105 - Axial 150 11 171 10 224 8 97 8
Shear-150 146 14 151 21 220 10 90 14 Shear-100 134 21 97 49 183 25 74 30 Shear-80 109 35 89 53 137 47 63 40 Shear-50 73 56 99 48 121 51 78 26 Shear-40 70 58 104 46 116 52 81 23 Shear-25 68 59 125 34 129 47 94 10 Shear-10 76 55 129 32 187 23 94 10 Shear-1 102 39 149 22 190 22 96 9
From the results of this analysis, it can be concluded that the inclusion of façade
with lateral flexible connections in the structure would inevitably result in great
reductions in the response of the main structure during different earthquakes.

210
6.3.2.1.3 Maximum relative displacement of façade and main structure
Facade panel net movement is related to relative displacement between facade and
the main frame. In order to have a better understanding of the maximum relative
displacement of the façade system, the 3D model results are shown in Table 6-7 to
Table 6-10
Table 6-7: Maximum relative Displacement between 3D structure model and outer layer of façade system during 1994 Northridge earthquake
Storey Level
Maximum relative Displacement (mm) Shear Stiffness (N/mm)
100 50 25 10 1
30 77 197 397 413 63427 72 183 363 377 60524 68 167 326 340 58321 58 145 278 289 56318 54 133 253 263 53315 49 120 223 232 50612 42 98 174 187 4449 27 70 122 139 2706 21 49 80 92 1793 13 30 49 60 104
Table 6-8: Maximum relative Displacement between 3D structure model and outer layer of façade system during 1940 El-Centro earthquake
Storey Level
Maximum relative Displacement (mm) Shear Stiffness (N/mm)
150 100 80 50 25
30 102 238 251 408 56927 98 224 236 379 52324 95 206 217 343 47321 77 175 184 289 39918 74 164 173 266 36615 70 151 159 239 32712 61 124 130 181 2689 39 87 91 152 2536 27 53 55 106 1993 20 39 41 84 182
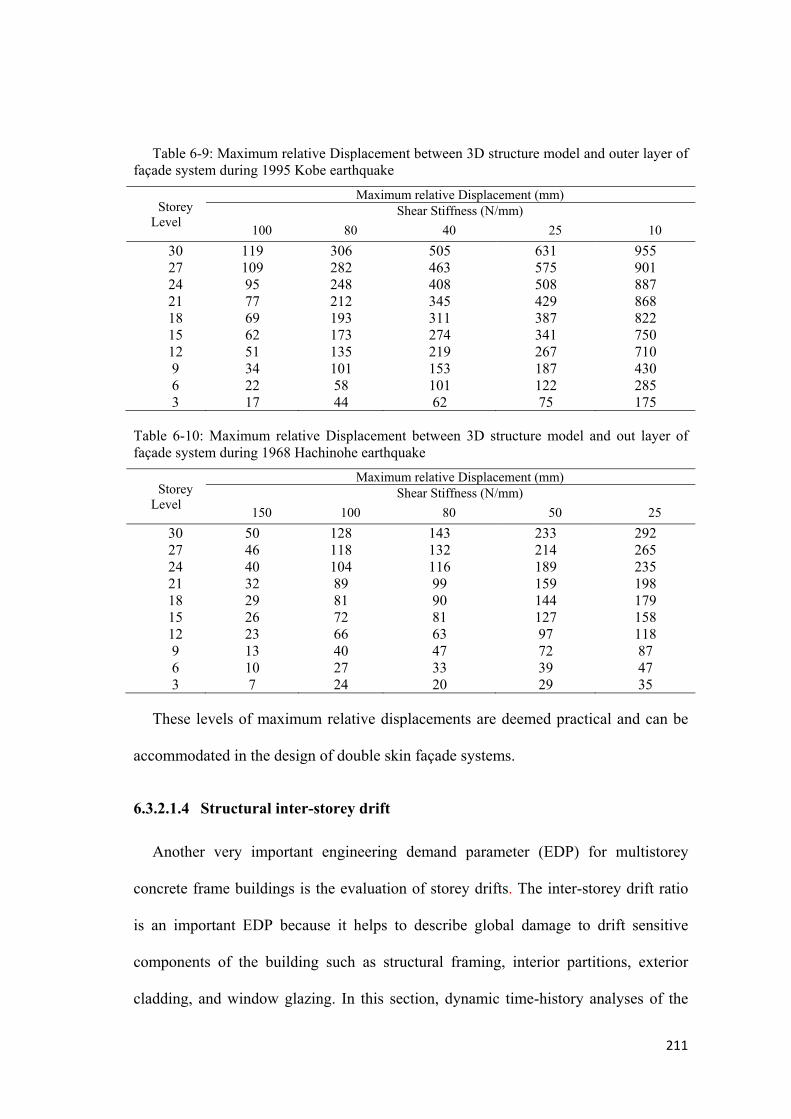
211
Table 6-9: Maximum relative Displacement between 3D structure model and outer layer of façade system during 1995 Kobe earthquake
Storey Level
Maximum relative Displacement (mm) Shear Stiffness (N/mm)
100 80 40 25 10
30 119 306 505 631 95527 109 282 463 575 90124 95 248 408 508 88721 77 212 345 429 86818 69 193 311 387 82215 62 173 274 341 75012 51 135 219 267 7109 34 101 153 187 4306 22 58 101 122 2853 17 44 62 75 175
Table 6-10: Maximum relative Displacement between 3D structure model and out layer of façade system during 1968 Hachinohe earthquake
Storey Level
Maximum relative Displacement (mm) Shear Stiffness (N/mm)
150 100 80 50 25
30 50 128 143 233 29227 46 118 132 214 26524 40 104 116 189 23521 32 89 99 159 19818 29 81 90 144 17915 26 72 81 127 15812 23 66 63 97 1189 13 40 47 72 876 10 27 33 39 473 7 24 20 29 35
These levels of maximum relative displacements are deemed practical and can be
accommodated in the design of double skin façade systems.
6.3.2.1.4 Structural inter-storey drift
Another very important engineering demand parameter (EDP) for multistorey
concrete frame buildings is the evaluation of storey drifts. The inter-storey drift ratio
is an important EDP because it helps to describe global damage to drift sensitive
components of the building such as structural framing, interior partitions, exterior
cladding, and window glazing. In this section, dynamic time-history analyses of the
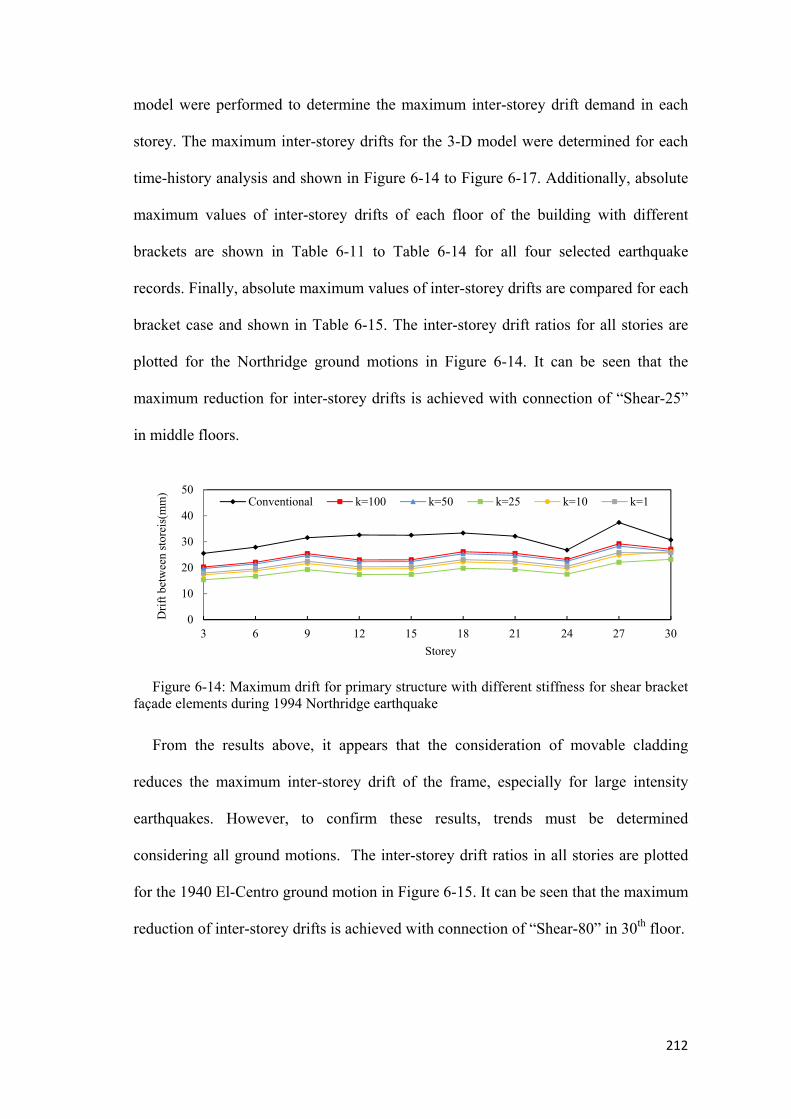
212
model were performed to determine the maximum inter-storey drift demand in each
storey. The maximum inter-storey drifts for the 3-D model were determined for each
time-history analysis and shown in Figure 6-14 to Figure 6-17. Additionally, absolute
maximum values of inter-storey drifts of each floor of the building with different
brackets are shown in Table 6-11 to Table 6-14 for all four selected earthquake
records. Finally, absolute maximum values of inter-storey drifts are compared for each
bracket case and shown in Table 6-15. The inter-storey drift ratios for all stories are
plotted for the Northridge ground motions in Figure 6-14. It can be seen that the
maximum reduction for inter-storey drifts is achieved with connection of “Shear-25”
in middle floors.
Figure 6-14: Maximum drift for primary structure with different stiffness for shear bracket façade elements during 1994 Northridge earthquake
From the results above, it appears that the consideration of movable cladding
reduces the maximum inter-storey drift of the frame, especially for large intensity
earthquakes. However, to confirm these results, trends must be determined
considering all ground motions. The inter-storey drift ratios in all stories are plotted
for the 1940 El-Centro ground motion in Figure 6-15. It can be seen that the maximum
reduction of inter-storey drifts is achieved with connection of “Shear-80” in 30th floor.
0
10
20
30
40
50
3 6 9 12 15 18 21 24 27 30
Dri
ft b
etw
een
stor
eis(
mm
)
Storey
Conventional k=100 k=50 k=25 k=10 k=1

213
Figure 6-15: Maximum drift for primary structure with different stiffness for shear bracket façade elements during 1940 El-Centro earthquake
The results of the time-history analyses show that the inter-storey drifts in the
moment resisting frame are reduced significantly by the flexible shear connectors.
These connections are the most effective ones because of their stiffness and strength.
They do deform or become significantly damaged to absorb as much as the applied
seismic energy. The inter-storey drift ratios in all stories are plotted for the 1995 Kobe
ground motion in Figure 6-16. It can be seen that the maximum reduction of inter-
storey drifts is achieved with connection of “Shear-40” in 30th floor.
Figure 6-16: Maximum drift for primary structure with different stiffness for shear bracket façade elements during 1995 Kobe earthquake
The frame model with bracket façades moving in direction of earthquake have
approximately the same results as fixed bracket, while frame model with bracket
façades moving perpendicular to direction of earthquake offer larger reduction for all
storey drifts. The Maximum inter-storey drift ratios in all stories are plotted for the
0
15
30
45
60
3 6 9 12 15 18 21 24 27 30
Dri
ft b
etw
een
stor
eis(
mm
)
Storey
Conventional k=150 k=100 k=80 k=50 k=25
0
20
40
60
80
3 6 9 12 15 18 21 24 27 30
Dri
ft b
etw
een
stor
eis(
mm
)
Storey
Conventional k=100 k=80 k=40 k=25 k=10

214
1968 Hachinohe ground motion in Figure 6-17. It can be seen that the maximum
reduction of inter-storey drifts is achieved with connection of “Shear-80” in upper
floors.
Figure 6-17: Maximum drift for primary structure with different stiffness for shear bracket façade elements during 1968 Hachinohe earthquake
It is concluded from the above figures that, façade panels with energy absorbing
connections have a favourable effect on the overall structural behaviour and are able
to reduce inter-storey drifts. Results for the above figures are listed in Table 6-11 to
Table 6-14 for better understanding of damper effects.
Table 6-11: Comparison of maximum inter-storey drift with different bracket stiffness during 1994 Northridge earthquake
Storey Level
Maximum inter-storey drift (mm) Shear stiffness (N/mm)
100 50 25 10 1
30 27 26 23 26 2627 29 28 22 25 2624 23 22 18 20 2021 26 25 19 22 2318 26 25 20 22 2315 23 22 17 20 2012 23 22 17 20 209 25 25 19 22 226 22 21 17 19 203 20 20 15 17 18
0
10
20
30
40
50
3 6 9 12 15 18 21 24 27 30
Dri
ft b
etw
een
stor
eis(
mm
)
Storey
Conventional k=150 k=100 k=80 k=50 k=25

215
Table 6-12: Comparison of maximum inter-storey drift with different bracket stiffness during 1940 El-Centro earthquake
Storey Level
Maximum inter-storey drift (mm) Shear stiffness (N/mm)
150 100 80 50 25
30 24 23 24 24 2527 35 29 30 31 3224 34 32 31 34 3521 39 35 34 38 3918 47 38 37 40 4115 46 33 31 36 3712 47 32 31 36 379 44 32 30 36 376 42 30 28 35 363 34 22 21 26 27
Table 6-13: Comparison of maximum inter-storey drift with different bracket stiffness during 1995 Kobe earthquake
Storey Level
Maximum inter-storey drift (mm) Shear stiffness (N/mm)
100 80 40 25 10
30 34 34 32 33 3427 42 40 38 39 4124 43 44 42 43 4521 53 53 51 52 5418 55 53 51 55 5415 54 45 42 45 4712 53 47 43 46 489 50 47 43 46 496 50 46 39 42 453 41 39 31 33 37
Table 6-14: Comparison of maximum inter storey drift with different bracket stiffness during 1968 Hachinohe earthquake
Storey Level
Maximum inter-storey drift (mm) Shear Stiffness (N/mm)
150 100 80 50 25
30 17 16 17 16 1627 18 18 18 18 1824 18 18 18 18 1821 22 22 22 22 2218 23 21 22 23 2315 23 20 21 22 2212 23 19 20 22 229 22 18 19 21 226 21 17 17 20 203 17 14 14 16 17
Absolute maximum values of inter-storey drifts for each of the earthquakes are
compared for each bracket case in Table 6-15.

216
Table 6-15: Comparison of absolute maximum values of inter-storey drifts for each bracket case
Earthquake
Type of bracket system used in double skin façade system Shear Stiffness (N/mm)
Rigid 150 100 80 50 40 25 10 1
Northridge 37 31 29 29 28 23 20 26 22
El Centro 54 47 38 37 40 40 41 43 43
Kobe 64 60 55 53 53 51 55 54 55
Hachinohe 26 23 22 22 23 23 23 23 23
6.3.2.1.5 Top lateral acceleration
The other global engineering demand parameter considered in this study is the
maximum floor acceleration. Floor accelerations are used to predict the damage to
acceleration sensitive components in the building, such as ceiling systems, chimneys,
and mechanical and electrical equipment. Various degrees of effectiveness of the
damper system with various stiffness of the connections for the various earthquake
records were studied. Response history of top floor acceleration of the three-
dimensional 30- storey building structure is presented in this section. Top floor
acceleration in case of rigid, axial and shear connections are extracted and compared
in various figures and tables of this section. Comparison of responses for the structure
with rigid bracket facade and structure with axial bracket facade showed that the
proposed connectors were not able to reduce the peak values of upper floor
acceleration. However, comparison of responses for the structure with rigid bracket
facade and structure with flexible shear bracket facade showed that the advanced
connectors were able to reduce peak values of upper floor acceleration. For each of the
records the connection with highest effects in reduction of top floor acceleration has
been selected in order to illustrate the performance of the proposed system.

217
Figure 6-18: Time-history of top floor accelerations of primary structure coupled with DSFs with optimal bracket connector stiffness during 1994 Northridge Earthquake
From Figure 6-18, it can be seen that the reduction in top acceleration with axial
connection is negligible. However, after approximately 4 seconds of the Northridge
earthquake, the structure with flexible shear façade system began to reduce the
response of the structure. The reduction is continued up to the end of the excitation.
The results for the same investigated parameter obtained by the frame structure with
the same connections in façade brackets under 1940 El-Centro earthquake excitation
are presented in Figure 6-19.
Figure 6-19: Time-history top floor accelerations of primary structure coupled with DSFs with optimal bracket connector stiffness during 1940 El-Centro Earthquake
The above graph again shows the efficiency of the flexible connections. After
approximately three seconds of the El Centro earthquake, the structure with Shear-80
connections began to reduce the response of the main structure. The reduction
continued up to end of the excitation.
-100-80-60-40-20
020406080
100
0 5 10 15 20 25 30
Top
acc
eler
atio
n (m
m/s
2 )
Time (Sec)
Conventional Axial Shear-10
-150
-100
-50
0
50
100
150
0 5 10 15 20 25 30
Top
acc
eler
atio
n (m
m/s
2 )
Time (Sec)
Conventional Axial Shear-10
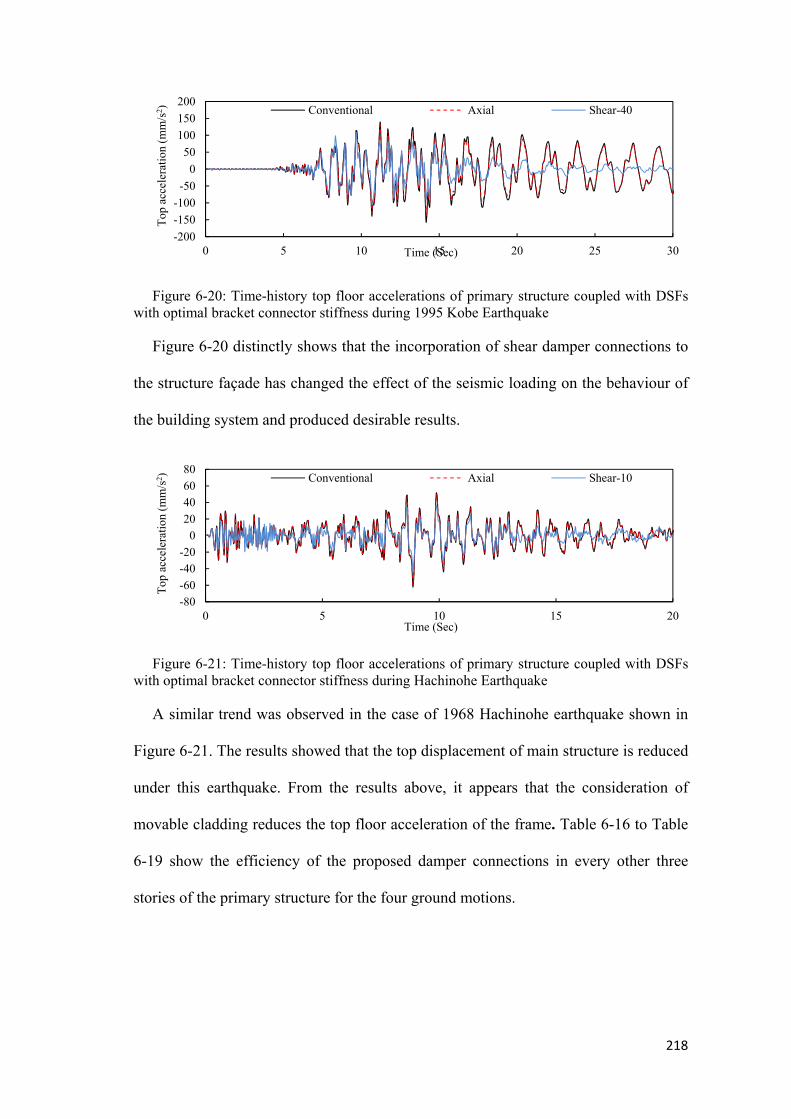
218
Figure 6-20: Time-history top floor accelerations of primary structure coupled with DSFs with optimal bracket connector stiffness during 1995 Kobe Earthquake
Figure 6-20 distinctly shows that the incorporation of shear damper connections to
the structure façade has changed the effect of the seismic loading on the behaviour of
the building system and produced desirable results.
Figure 6-21: Time-history top floor accelerations of primary structure coupled with DSFs with optimal bracket connector stiffness during Hachinohe Earthquake
A similar trend was observed in the case of 1968 Hachinohe earthquake shown in
Figure 6-21. The results showed that the top displacement of main structure is reduced
under this earthquake. From the results above, it appears that the consideration of
movable cladding reduces the top floor acceleration of the frame. Table 6-16 to Table
6-19 show the efficiency of the proposed damper connections in every other three
stories of the primary structure for the four ground motions.
-200
-150
-100
-50
0
50
100
150
200
0 5 10 15 20 25 30
Top
acc
eler
atio
n (m
m/s
2 )
Time (Sec)
Conventional Axial Shear-40
-80-60
-40-20
020
4060
80
0 5 10 15 20
Top
acc
eler
atio
n (m
m/s
2 )
Time (Sec)
Conventional Axial Shear-10
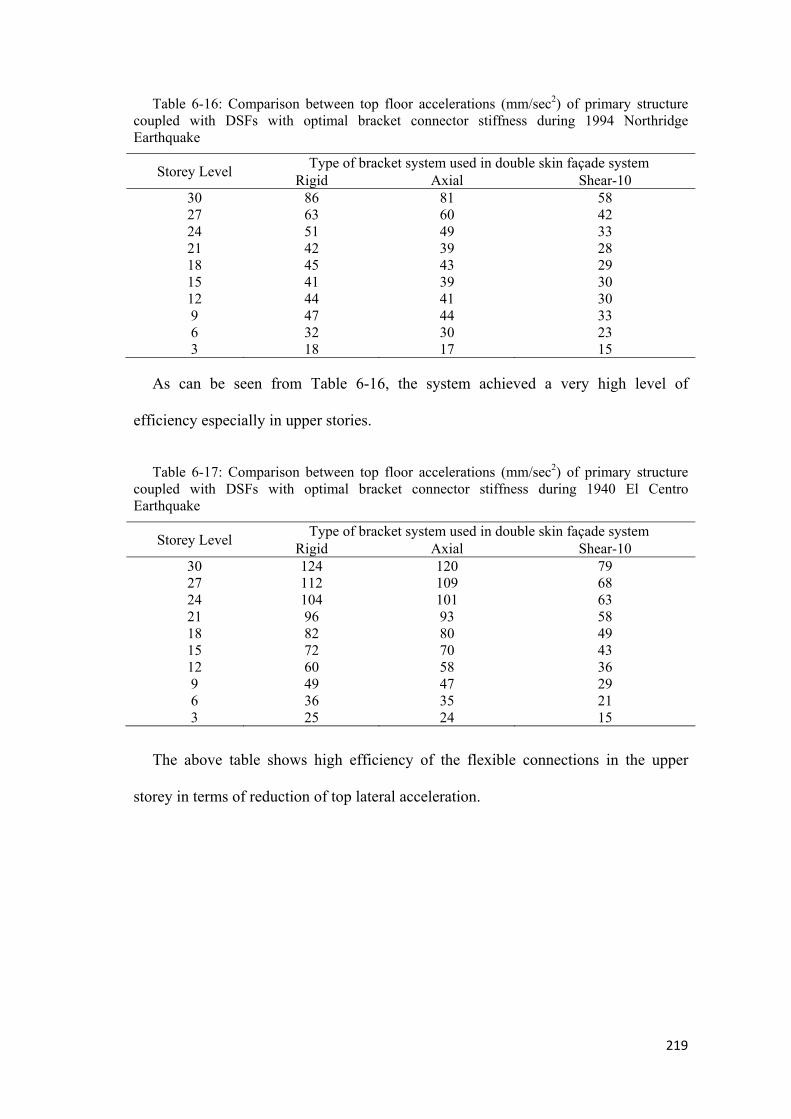
219
Table 6-16: Comparison between top floor accelerations (mm/sec2) of primary structure coupled with DSFs with optimal bracket connector stiffness during 1994 Northridge Earthquake
Storey Level Type of bracket system used in double skin façade system
Rigid Axial Shear-1030 86 81 5827 63 60 4224 51 49 3321 42 39 2818 45 43 2915 41 39 3012 44 41 309 47 44 336 32 30 233 18 17 15
As can be seen from Table 6-16, the system achieved a very high level of
efficiency especially in upper stories.
Table 6-17: Comparison between top floor accelerations (mm/sec2) of primary structure coupled with DSFs with optimal bracket connector stiffness during 1940 El Centro Earthquake
Storey Level Type of bracket system used in double skin façade system
Rigid Axial Shear-1030 124 120 7927 112 109 6824 104 101 6321 96 93 5818 82 80 4915 72 70 4312 60 58 369 49 47 296 36 35 213 25 24 15
The above table shows high efficiency of the flexible connections in the upper
storey in terms of reduction of top lateral acceleration.
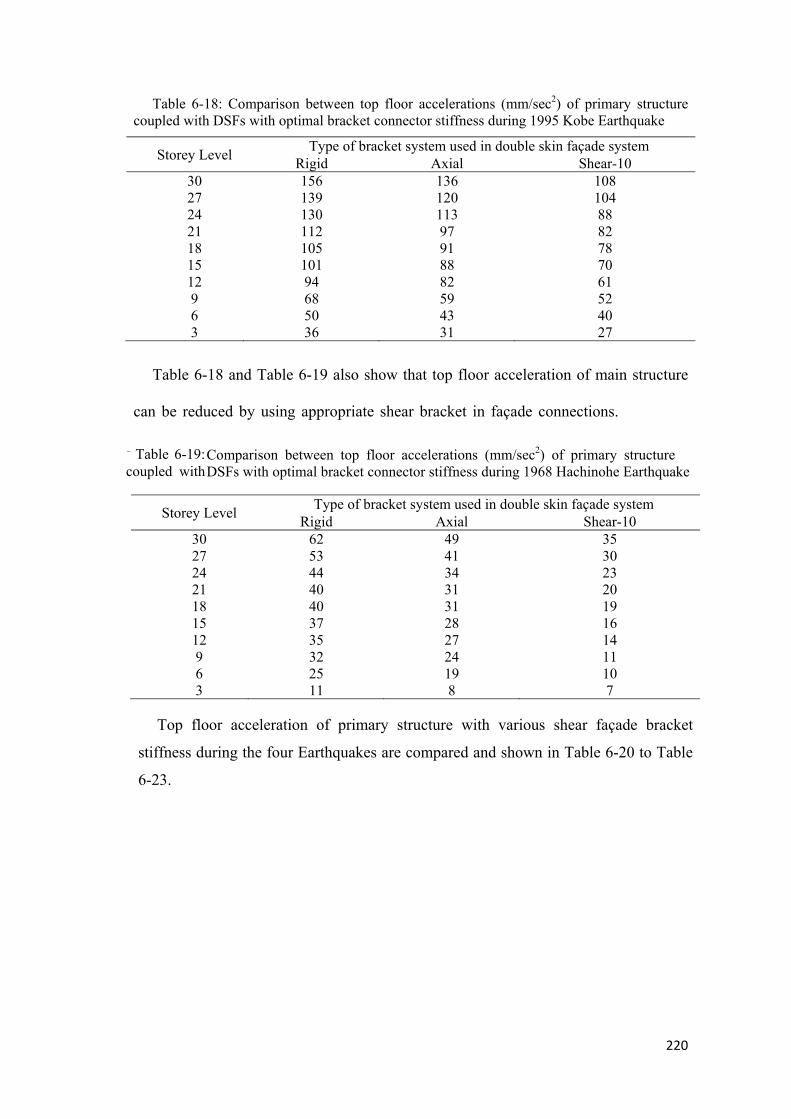
220
Table 6-18: Comparison between top floor accelerations (mm/sec2) of primary structure coupled with DSFs with optimal bracket connector stiffness during 1995 Kobe Earthquake
Storey Level Type of bracket system used in double skin façade system
Rigid Axial Shear-10 30 156 136 108 27 139 120 104 24 130 113 88 21 112 97 82 18 105 91 78 15 101 88 70 12 94 82 61 9 68 59 52 6 50 43 40 3 36 31 27
Table 6-18 and Table 6-19 also show that top floor acceleration of main structure
can be reduced by using appropriate shear bracket in façade connections.
s.Table 6-19: Comparison between top floor accelerations (mm/sec2) of primary structure .Table 6-19:
Comparison between top floor accelerations (mm/sec ) of primary structure cou
coupled with Comparison between top floor accelerations (mm/sec ) of primary structure couDSFs with optimal bracket connector stiffness during 1968 Hachinohe Earthquake
Storey Level Type of bracket system used in double skin façade system
Rigid Axial Shear-10 30 62 49 35 27 53 41 30 24 44 34 23 21 40 31 20 18 40 31 19 15 37 28 16 12 35 27 14 9 32 24 11 6 25 19 10 3 11 8 7
Top floor acceleration of primary structure with various shear façade bracket
stiffness during the four Earthquakes are compared and shown in Table 6-20 to Table
6-23.
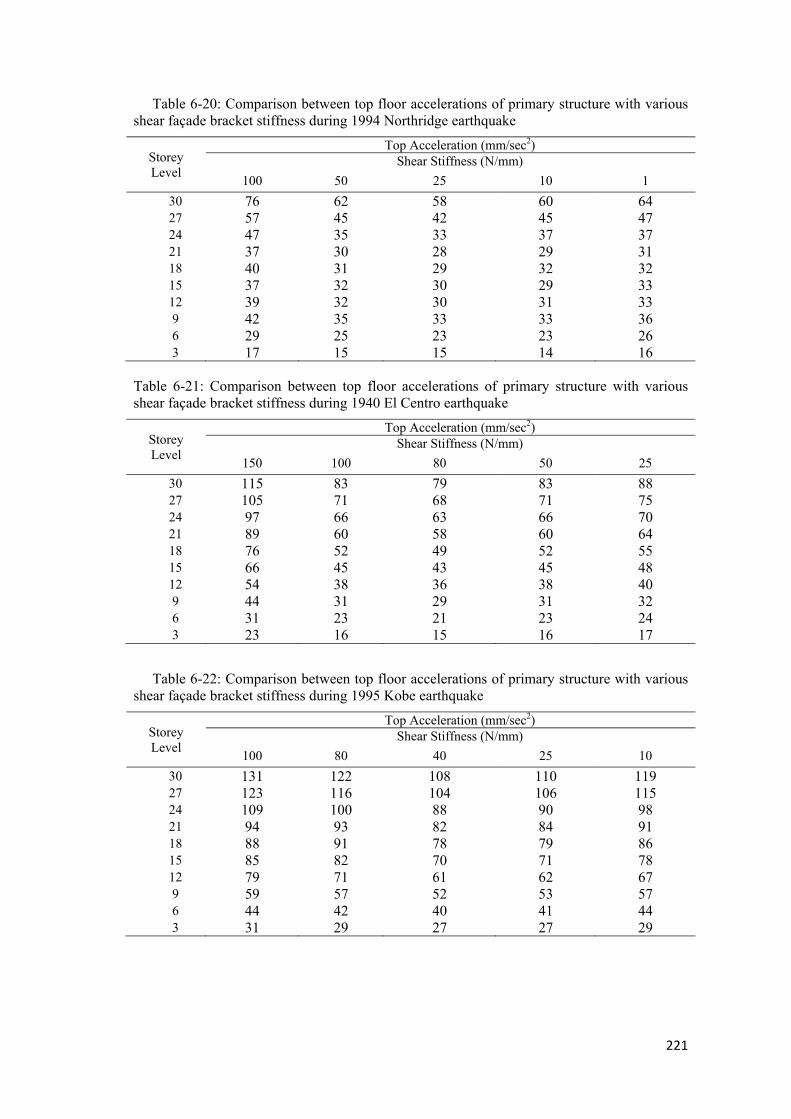
221
Table 6-20: Comparison between top floor accelerations of primary structure with various shear façade bracket stiffness during 1994 Northridge earthquake
Storey Level
Top Acceleration (mm/sec2) Shear Stiffness (N/mm)
100 50 25 10 1
30 76 62 58 60 6427 57 45 42 45 4724 47 35 33 37 3721 37 30 28 29 3118 40 31 29 32 3215 37 32 30 29 3312 39 32 30 31 339 42 35 33 33 366 29 25 23 23 263 17 15 15 14 16
Table 6-21: Comparison between top floor accelerations of primary structure with various shear façade bracket stiffness during 1940 El Centro earthquake
Storey Level
Top Acceleration (mm/sec2) Shear Stiffness (N/mm)
150 100 80 50 25
30 115 83 79 83 8827 105 71 68 71 7524 97 66 63 66 7021 89 60 58 60 6418 76 52 49 52 5515 66 45 43 45 4812 54 38 36 38 409 44 31 29 31 326 31 23 21 23 243 23 16 15 16 17
Table 6-22: Comparison between top floor accelerations of primary structure with various shear façade bracket stiffness during 1995 Kobe earthquake
Storey Level
Top Acceleration (mm/sec2) Shear Stiffness (N/mm)
100 80 40 25 10
30 131 122 108 110 11927 123 116 104 106 11524 109 100 88 90 9821 94 93 82 84 9118 88 91 78 79 8615 85 82 70 71 7812 79 71 61 62 679 59 57 52 53 576 44 42 40 41 443 31 29 27 27 29

222
Table 6-23: Comparison between top floor accelerations of primary structure with various shear façade bracket stiffness during 1968 Hachinohe earthquake
Storey Level
Top Acceleration (mm/sec2) Shear Stiffness (N/mm)
150 100 80 50 25
30 48 41 35 35 3827 41 34 30 30 3224 34 29 23 31 3321 31 26 20 31 3318 31 26 19 32 3415 29 23 16 20 2312 27 16 14 18 219 25 14 11 15 196 20 12 10 14 183 8 7 7 11 13
It can be concluded that the flexible shear damper connections achieved excellent
reductions of top acceleration for all earthquake excitations with the reductions being
slightly higher for the Kobe earthquake excitation than the other three. The results
showed that the lowest reduction in all investigated parameters was achieved under
the Hachinohe earthquake. In general, the results of the investigation of the proposed
damper system have demonstrated the ability to reduce the seismic response of
buildings by placement of the damper devices within the building facade system.
6.3.2.1.6 Root mean square (RMS) of top acceleration response
To have a better appreciation of the damper performance, RMS of top floor
acceleration using different bracket stiffness is also compared in Table 6-24 for the 3D
model for different earthquake excitations. It is seen in Table 6-24 that by using shear
stiffness of 40N/mm the RMS value is almost halved compared to a system with fixed
conventional façade panels during Kobe earthquake.
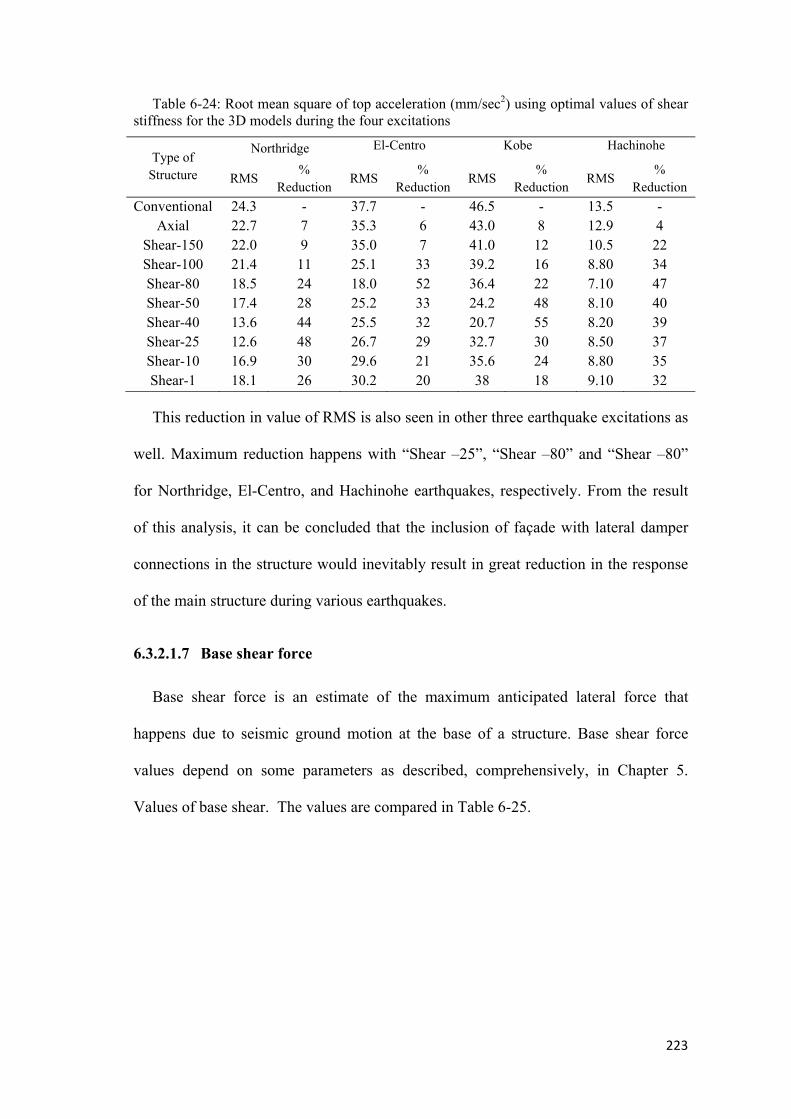
223
Table 6-24: Root mean square of top acceleration (mm/sec2) using optimal values of shear stiffness for the 3D models during the four excitations
Type of Structure
Northridge El-Centro Kobe Hachinohe
RMS %
Reduction RMS
% Reduction
RMS %
Reduction RMS
% Reduction
Conventional 24.3 - 37.7 - 46.5 - 13.5 - Axial 22.7 7 35.3 6 43.0 8 12.9 4
Shear-150 22.0 9 35.0 7 41.0 12 10.5 22 Shear-100 21.4 11 25.1 33 39.2 16 8.80 34 Shear-80 18.5 24 18.0 52 36.4 22 7.10 47 Shear-50 17.4 28 25.2 33 24.2 48 8.10 40 Shear-40 13.6 44 25.5 32 20.7 55 8.20 39 Shear-25 12.6 48 26.7 29 32.7 30 8.50 37 Shear-10 16.9 30 29.6 21 35.6 24 8.80 35 Shear-1 18.1 26 30.2 20 38 18 9.10 32
This reduction in value of RMS is also seen in other three earthquake excitations as
well. Maximum reduction happens with “Shear –25”, “Shear –80” and “Shear –80”
for Northridge, El-Centro, and Hachinohe earthquakes, respectively. From the result
of this analysis, it can be concluded that the inclusion of façade with lateral damper
connections in the structure would inevitably result in great reduction in the response
of the main structure during various earthquakes.
6.3.2.1.7 Base shear force
Base shear force is an estimate of the maximum anticipated lateral force that
happens due to seismic ground motion at the base of a structure. Base shear force
values depend on some parameters as described, comprehensively, in Chapter 5.
Values of base shear. The values are compared in Table 6-25.
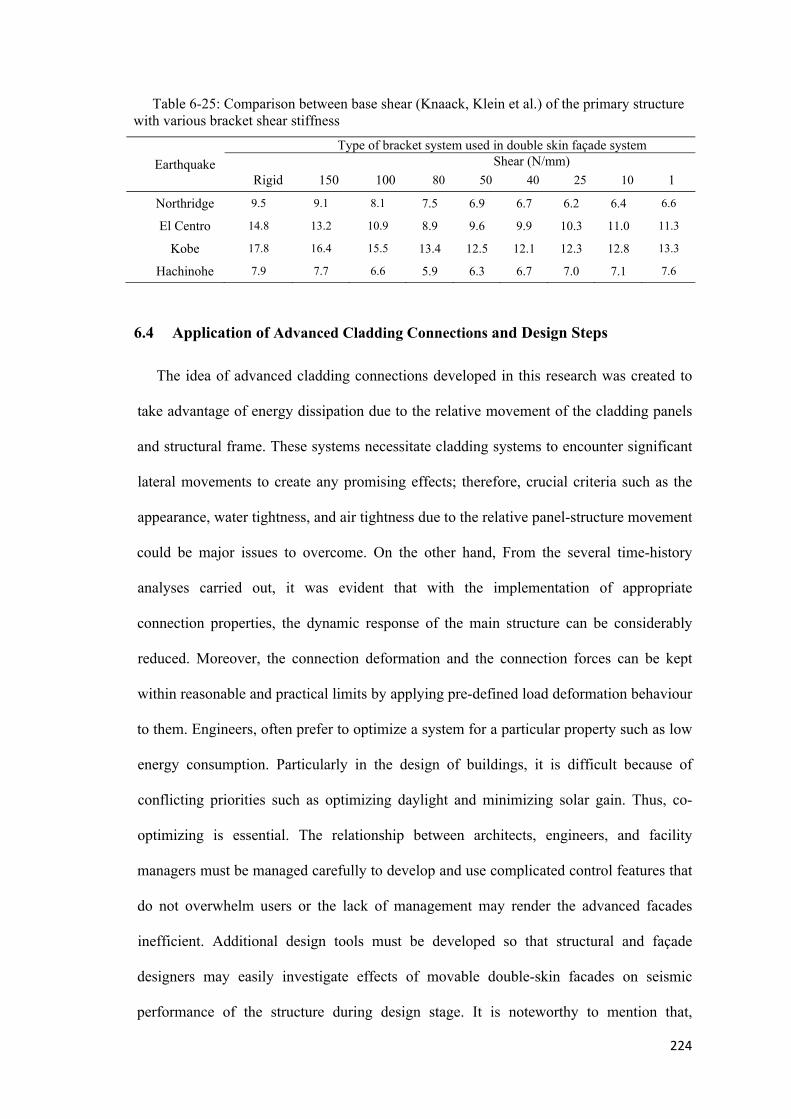
Table 6-25: Comparison between base shear (Knaack, Klein et al.) of the primary structure with various bracket shear stiffness
Earthquake
Type of bracket system used in double skin façade system Shear (N/mm)
Rigid 150 100 80 50 40 25 10 1
Northridge 9.5 9.1 8.1 7.5 6.9 6.7 6.2 6.4 6.6
El Centro 14.8 13.2 10.9 8.9 9.6 9.9 10.3 11.0 11.3
Kobe 17.8 16.4 15.5 13.4 12.5 12.1 12.3 12.8 13.3
Hachinohe 7.9 7.7 6.6 5.9 6.3 6.7 7.0 7.1 7.6
6.4 Application of Advanced Cladding Connections and Design Steps
The idea of advanced cladding connections developed in this research was created to
take advantage of energy dissipation due to the relative movement of the cladding panels
and structural frame. These systems necessitate cladding systems to encounter significant
lateral movements to create any promising effects; therefore, crucial criteria such as the
appearance, water tightness, and air tightness due to the relative panel-structure movement
could be major issues to overcome. On the other hand, From the several time-history
analyses carried out, it was evident that with the implementation of appropriate
connection properties, the dynamic response of the main structure can be considerably
reduced. Moreover, the connection deformation and the connection forces can be kept
within reasonable and practical limits by applying pre-defined load deformation behaviour
to them. Engineers, often prefer to optimize a system for a particular property such as low
energy consumption. Particularly in the design of buildings, it is difficult because of
conflicting priorities such as optimizing daylight and minimizing solar gain. Thus, co-
optimizing is essential. The relationship between architects, engineers, and facility
managers must be managed carefully to develop and use complicated control features that
do not overwhelm users or the lack of management may render the advanced facades
inefficient. Additional design tools must be developed so that structural and façade
designers may easily investigate effects of movable double-skin facades on seismic
performance of the structure during design stage. It is noteworthy to mention that,
224

225
acceptance of the proposed façade system is linked to the additional expense to the
building owner, also architectural and environmental benefits indicated to them.
6.5 Findings and conclusion
The use of energy absorbing connections (damper devices) in facade system to
mitigate the seismic applied force to a thirty-storey building was investigated in this
chapter. The analytical results presented in Chapter 6 indicated that the connection
properties have significant influence on dissipating seismic energy. It is essential to
have the right combination of stiffness and panel mass. Sensitivity analyses were carried
out on changes to stiffness value using low medium, and high stiffness. Up to nine
different stiffness values were chosen to cover most probable and achievable range of
stiffnesses. The supporting analysis, mainly in Chapter 4, identified a practical challenge,
namely requiring the panels to move several meters to be effective. In Chapters 5 and 6,
multi linear behaviour damper was used instead to control the large displacement of the
panels and also display a similar reduction in the response of the main structure. The
second slope (soft stiffness) of the force-displacement behaviour of the damper system
part in the façade damper behaviour system leads the system to behave like a multi tuned
mass damper system. A considerable reduction in value of all parameters can be
observed from the graphs and tables as the movable dissipative façade brackets
consistently reduced all investigated parameters of the building structure by a
reasonable margin. This chapter concludes that it is feasible to design facade
connections to mitigate part of applied energy during seismic events. The
deformations within the shear connectors are drift-sensitive: the larger the inter-storey
drift, the larger the deformations in the connections. By controlling the connector
stiffness and introducing variable stiffness, one could reduce the primary structure
response and also limit the movement of the outer skin of the façade to a practical value.
226
A damper system designed based on applied earthquake force, may have some limitations
in terms of beneficial effects. This system works in a range of frequency content and it
can be demonstrated, based on sensitivity analysis ,performed through different intensity
of earthquake load. Low stiffness path should be designed in a way that façade panels
reach the right frequency to dissipate the input energy. After establishing the feasibility
of the procedure, the efficiency of the damper connection system and the technique
developed here were evaluated by applying them to a mid-rise 30 storeys structural
building model in order to gain a better insight of the system performance. Stiffness
value of shear bracket facades should be selected in a range between 20 N/mm up to
90 N/mm in order to reduce response of primary structure in most cases of applied
excitations.

227
CHAPTER 7
FINANCIAL
CONSIDERATIONS

228
7.1 Introduction
One of the new methods that have been proposed for strengthening and reducing
seismic damage for insufficient earthquake resistance of existing building structures
would be retrofitting. Seismic retrofitting or rehabilitation is the modification or
making changes to the existing structures to make them more resistant to seismic
activity and increase safety for the building’s occupants.
Table 7-1: Existing methods of retrofitting
Available retrofit method
Usage Image
Conventional strengthening
Add walls, brace, columns or enlarging excising structural elements
Innovative material
High performance concrete High performance composites FRP composites
Base isolation Placing flexible isolation system
between foundation and structure
Energy dissipation system
Passive or active structural control to reduce vibration and improve
safety/serviceability

229
The basic concept of retrofitting is to upgrade the lateral strength and increase the
ductility of the structure. The earthquake damaged, and earthquake vulnerable
buildings are classified to be retrofitted by innovative methods tabulated in Table 7-1
7.2 Financial Assessment of movable façade system as a new retrofitting
method
Engineering demand parameters (EDPs) such as the inter-storey drift and the
maximum relative deformations of the cladding connectors are useful for engineers
and researchers. However, the end-users and decision-makers of the systems are not
able to translate these technical EDPs data into useful quantities for making decisions
on practicability and efficiency of the system. The financial feasibility of the
proposed system is going to be discussed in two ways. Firstly, the additional cost of
replacing the conventional bracket system with the proposed system will be discussed,
then advantages of material saving in the building structure will be evaluated and at
the end of this section, conclusions and basis for decision will be shown by comparing
these two costs.
7.3 Additional cost of the movable facade to building structure
7.3.1 Introduction
By introducing this state-of-the-art system, two additional expenses, namely design
and maintenance of the proposed system are expected to add to overall cost of the
building structure. As the system would be new to the façade industry and not many
engineers and technicians are familiar with the system, then, initial training and
workshops need to be conducted to train them for dealing with the new system. It
should be mentioned that, along with aesthetics, a façade must be designed to separate
the interior of a building from the aggressive exterior environment and it must

230
withstand the imposed mechanical and environmental loads. The service life of the
proposed system starts when the construction work is finished. At this stage, bracket
of facades, especially the ones that are designed for double skin façade systems, may
deteriorate during their service life due to effect of various aggressive environment
mechanisms along with applied repetitive environmental loads. Therefore, the
additional costs of replacing the conventional façade system with the proposed system
is going to be discussed in sections 7.3.2 and 7.3.3.
7.3.2 Design or re-design procedure
Depending on building age and request by the building owner, two possible
scenarios are expected to happen as below:
In the first scenario, dynamic analysis of an existing structure shows that the
structure is vulnerable to future earthquakes with a specific return period, and the
owner is concerned. Therefore, besides other possible retrofitting possibilities,
structure/façade contractor of the movable façade system would submit a quote and
the expected percent of dynamic behaviour improvement to the building owner. The
proposal and final submitted quote would be based on the amount of construction
work and replacement of the current façade system. Additionally, similar proposals
can be offered for older existing buildings, which use traditional stick façade system.
In structures with traditional brick veneer façade system with opening windows, the
“In-plane” façade movement concept proposed in Chapter 4 of the thesis can be used
as one of the proposals. But this idea needs more research and validation before being
proposed to industry and become commercially viable. Details of the proposal will be
presented as future work in the next chapter. The second scenario is for new buildings
and a quotation of costs would be submitted to building developer and structural
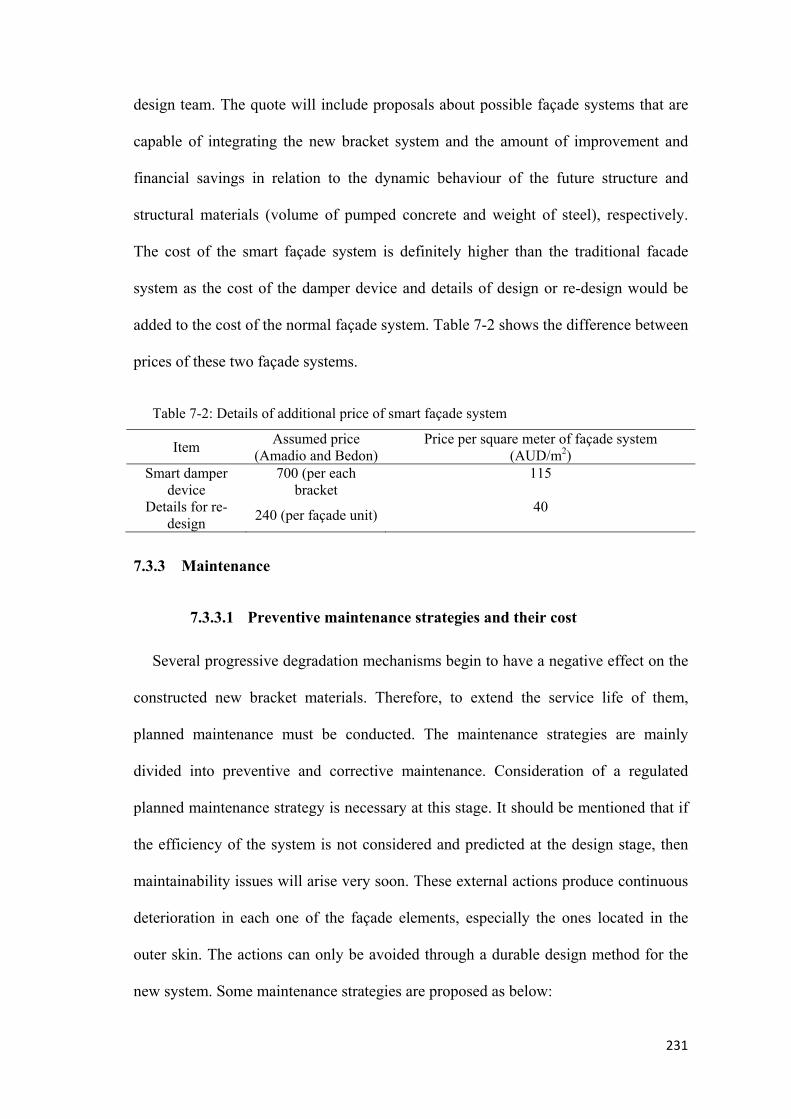
231
design team. The quote will include proposals about possible façade systems that are
capable of integrating the new bracket system and the amount of improvement and
financial savings in relation to the dynamic behaviour of the future structure and
structural materials (volume of pumped concrete and weight of steel), respectively.
The cost of the smart façade system is definitely higher than the traditional facade
system as the cost of the damper device and details of design or re-design would be
added to the cost of the normal façade system. Table 7-2 shows the difference between
prices of these two façade systems.
Table 7-2: Details of additional price of smart façade system
Item Assumed price
(Amadio and Bedon) Price per square meter of façade system
(AUD/m2) Smart damper
device 700 (per each
bracket 115
Details for re-design
240 (per façade unit) 40
7.3.3 Maintenance
7.3.3.1 Preventive maintenance strategies and their cost
Several progressive degradation mechanisms begin to have a negative effect on the
constructed new bracket materials. Therefore, to extend the service life of them,
planned maintenance must be conducted. The maintenance strategies are mainly
divided into preventive and corrective maintenance. Consideration of a regulated
planned maintenance strategy is necessary at this stage. It should be mentioned that if
the efficiency of the system is not considered and predicted at the design stage, then
maintainability issues will arise very soon. These external actions produce continuous
deterioration in each one of the façade elements, especially the ones located in the
outer skin. The actions can only be avoided through a durable design method for the
new system. Some maintenance strategies are proposed as below:

232
a) Various maintenance procedures need to be considered for implementation of the
façade bracket dampers during its service life, including the necessary preventive
and corrective maintenance.
b) The design process of the proposed system should be conducted in a practical and
efficient manner for the adapted maintenance strategy.
c) Maintenance techniques must be performed to guarantee the accomplishment of
the design service life for every component of the facade system.
d) Maintenance operations should be facilitated by the adoption of a simple
geometry for easy access for inspection of hidden parts of the damper components
such as connecting steel joints.
e) Licenced architects or engineers with sound knowledge of the design, material
and construction of the bracket façade should conduct inspections. Periodical
visual and detailed inspections must also be carried out on façade brackets to
ensure the integrity and safety of the proposed systems and if inefficiencies are
detected, corrective maintenance plans, according to the type of deficiency, must
be chosen.
f) Provide access for installation of any needed instruments for testing and
developing information about the future behaviour and performance of the
constructed materials and used components.
g) The building owner should check with the design team to reach an agreement on
selecting the best façade cleaning method that is suitable for their building.
Regular cleaning of the system for proper operation to avoid gradual build up of
deterioration sources (microclimates), especially during the summer season when
severe conditions like high temperature and humidity are dominant. Managing
these cleaning procedures to be performed from time to time is essential, as well
233
as providing guidelines for seasonal cleaning activities for critical zones that can
accumulate salts and other aggressive agents. The cleaning activities for the
damper elements must be considered in preventive maintenance procedures to
decrease the aggressiveness of the microclimates and these steps are as below:
• Cleaning of the expansion joints at the supports to clear the accumulated debris,
dust and water-borne aggressive agents.
• Eliminating or cleaning the accumulated debris, dust and water carrying
aggressive materials underneath the expansion joints.
• Cleaning the fixed and mobile bearings and to maintain them for suitable
conditions to ensure their efficient and proper performance.
7.3.3.2 Quarterly and annual inspection of the proposed system
A team of professionals need to inspect the damper system at least every three
months to check overall performance of the system. Movement of materials, thermal
movements, moisture movements, elastic deformations, creep effects and corrosion
are the issues to be addressed. All deficiencies noted in quarterly reports should be
documented and also included in a yearly report. In this way, primary cause and level
of severity of the issues can clearly be recognised. The severity of the identified
deficiencies can be classified into the following conditions:
1. “Unsafe” is used when the identified deficiency causes a serious threat to
individuals or property and should be immediately brought to the attention of owner(s)
and local authorities by providing potential repair and corrective options.
2. “Requires repair/stabilization” is used for a case that may become unsafe if it is
not scheduled for the next maintenance program.
3. “Ordinary maintenance” recognizes the cases when something is required to be
addressed for the next scheduled inspection program.

234
A proposed spreadsheet, which states condition of each damper component, is
shown in Table 7-3. This spreadsheet would assist the owner/strata manager with
budgeting of future maintenance of the façade connectors based on their severity
classification. The budget evaluation should include all costs of contractor’s labour,
materials, equipment, overhead, and general conditions, as well as the fees for
architecture and engineering services, building administration, and unpredicted events.
Spreadsheet for forecasted costs is listed in Table 7-4.
Table 7-3: Proposed quarterly and yearly spreadsheet for inspection of each damper/connector component
System components Severity classification (Inspected condition)
Unsafe Requires
repair/stabilization Ordinary
maintenance
Rubber Steel layer
Washer Visco-Elastic material
Façade to bracket attachment Bracket to slab attachment
To guide the decision makers for planning the necessary repairs and future
inspections, the report should include a comprehensive survey of history and condition
of the façade panels in a way that can be understood by non-technical people as well.
Table 7-4: Spreadsheet for expected yearly expenses per square meter of façade panel
Item Estimated cost (Amadio and
Bedon)
Contractor’s labour 600
Materials 1,100
Equipment 700
Overhead 300
Fees for architecture and engineering 1,000
Building administration 500
Unpredicted events 20% of all expenses
Total cost 3,840

235
Additionally, the original building construction, alterations, renovations, and
repairs should be included in making a more precise decision. The value for yearly
expenses of the smart façade is going to be compared with conventional façade system
within this chapter.
7.3.4 Importance of thermal performance
One of the main criteria to evaluate the overall performance of a façade system as
an outer skin of building structure is thermal performance. Maintaining the same
thermal performance similar to conventional façade system is an essential element to
convince the developers, building owns and insurance companies of its merits.
Configuration and placement proposal of the damper system in the cavity between
outer and inner layer is a crucial decision to minimize renovation expenses and quoted
construction price for existing and new building structures, respectively.
7.3.5 Damage cost to the façade system after an earthquake
If after an earthquake, the damage is minor, and some joints just need to be sealed,
then the best action would be caulking between wedge-shaped of the system. In this
way, the only issue is the thermal performance of the system, and it is still
dynamically ready for the next earthquake. But, widespread damage will be sustained
by the façade panels, damper system and bracket connection, by excessive movement
of the facade system during large earthquakes. Although saving peoples’ lives by
reducing damage in structural elements is the first object of this system but trying to
find a way to minimize damage in the façade panels is equally worthwhile. Because,
as mentioned before, normal cladding systems cost around 20% of building
construction cost and for movable façade systems, this cost is increased to 25-30% of
building construction cost. Calculated movement of a façade panel from one of the
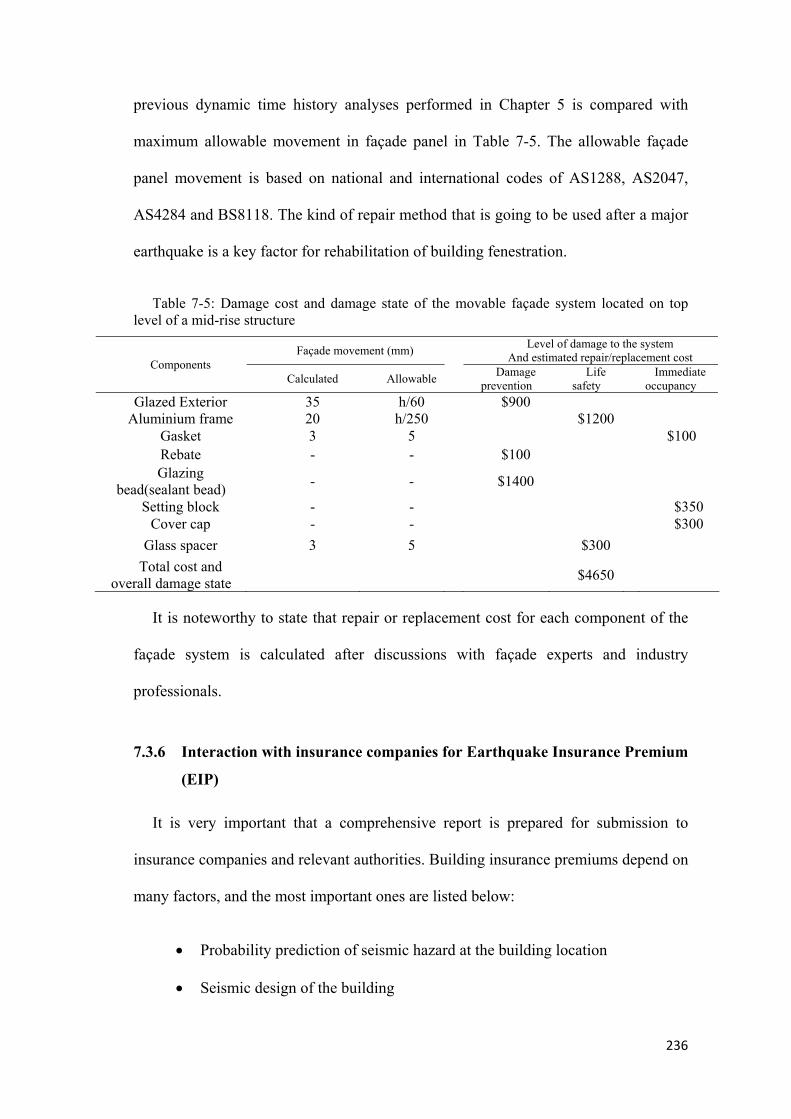
236
previous dynamic time history analyses performed in Chapter 5 is compared with
maximum allowable movement in façade panel in Table 7-5. The allowable façade
panel movement is based on national and international codes of AS1288, AS2047,
AS4284 and BS8118. The kind of repair method that is going to be used after a major
earthquake is a key factor for rehabilitation of building fenestration.
Table 7-5: Damage cost and damage state of the movable façade system located on top level of a mid-rise structure
Components Façade movement (mm)
Level of damage to the system And estimated repair/replacement cost
Calculated Allowable Damage
prevention Life
safety Immediate
occupancy
Glazed Exterior 35 h/60 $900 Aluminium frame 20 h/250 $1200
Gasket 3 5 $100 Rebate - - $100Glazing
bead(sealant bead) - - $1400
Setting block - - $350 Cover cap - - $300
Glass spacer 3 5 $300
Total cost and overall damage state
$4650
It is noteworthy to state that repair or replacement cost for each component of the
façade system is calculated after discussions with façade experts and industry
professionals.
7.3.6 Interaction with insurance companies for Earthquake Insurance Premium
(EIP)
It is very important that a comprehensive report is prepared for submission to
insurance companies and relevant authorities. Building insurance premiums depend on
many factors, and the most important ones are listed below:
Probability prediction of seismic hazard at the building location
Seismic design of the building

237
Building damage
Figure 7-1 shows changes of earthquake insurance premium versus seismic zone
where the structure is located. The figure demonstrates that if the building structure is
designed according to building codes, then EIP is almost constant for all four seismic
zones. But, if the design is not according to building codes, then EIP increases
dramatically with respect to the percentage of building value.
Figure 7-1: Earthquake Insurance Premium versus seismic zone (Permasteelisa 2009)
It is very important that building structures are designed based on the local code of
practice in each earthquake zone. If the structural design is not delicate enough
because of designers’ negligence or financial constraints, then earthquake insurance
premium can rise.
7.4 Cost benefits to the main structure
7.4.1 Introduction
Cost is one of the first things that come to mind when a consultant, general
contractor, or construction manager looks at the potential of additional components for
a building. The design of a movable dissipative facade is the most significant step
towards implementing a sustainable and durable façade system since it influences the
whole service life of the structure, and it has a direct impact on its construction cost. It
0
3
6
9
12
15
1 2 3 4
EIP
(%
of
buil
ding
val
ue)
Seismic zone
Acording to Code Not According to Code

238
is important to understand that there are many factors that determine the price of the
proposed system and it is important to have a system supplier on board early in the
design process. At the very least, making a call or exchanging a few written
communications with some sketches with the damper supplier to discuss up front
budgets can put to rest many fears about the cost of these systems. The overall
construction cost of a building structure is normally affected by many factors such as:
Shape & geometry
Size & regularity of floor plan
Location
Environmental forces (such as earthquake and wind) consideration in design
Market conditions
Seismic consideration
Vertical transportation strategy
Life cycle value
Structural solution
Structural and non-structural components which affect the overall cost are listed as
below:
Structure
Curtain wall (conventional)
Foundation
Mechanical and electrical equipment and other services
Each of these items does add a separate cost independent of other items. For
example, the cost of conventional curtain wall system is completely separate from the
rest and can only be affected by design cost and materials of façade panels. In this
part, parameters listed below, will be investigated financially in mid-rise and high-rise
structures in six metropolitan cities. These items for both a new and existing structure
are as below:

239
For new buildings:
Construction cost
Labour cost
Additional living area by avoiding large damper systems
Rental savings sue to extra living area available
Moreover, for existing buildings:
Retrofitting cost
Earthquake insurance premium
Sydney, Shanghai, Tokyo, Dubai, London and New York, are the selected cities,
indicated by a red dot in Figure 7-2 . Tokyo is located in high seismicity area, but
Shanghai, New York and London, are is low seismic hazard zones. Dubai and Sydney
are also selected because they are both located in medium seismic hazard zones.
Figure 7-2: Location of selected cities
Generally, there are three major approaches in measuring floor area of buildings,
which are tabulated in Table 7-6.
New York
London
Shanghai Tokyo
Sydney
Dubai
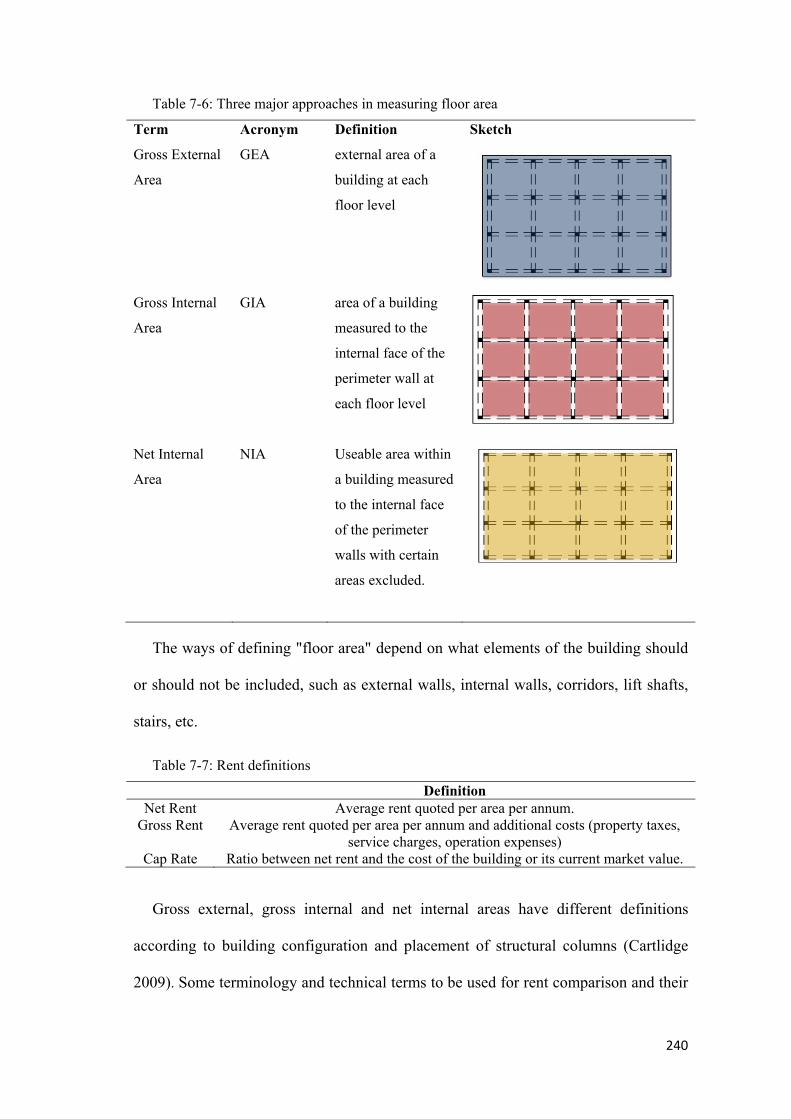
240
Table 7-6: Three major approaches in measuring floor area
Term Acronym Definition Sketch
Gross External
Area
GEA external area of a
building at each
floor level
Gross Internal
Area
GIA area of a building
measured to the
internal face of the
perimeter wall at
each floor level
Net Internal
Area
NIA Useable area within
a building measured
to the internal face
of the perimeter
walls with certain
areas excluded.
The ways of defining "floor area" depend on what elements of the building should
or should not be included, such as external walls, internal walls, corridors, lift shafts,
stairs, etc.
Table 7-7: Rent definitions
Definition Net Rent Average rent quoted per area per annum.
Gross Rent Average rent quoted per area per annum and additional costs (property taxes, service charges, operation expenses)
Cap Rate Ratio between net rent and the cost of the building or its current market value.
Gross external, gross internal and net internal areas have different definitions
according to building configuration and placement of structural columns (Cartlidge
2009). Some terminology and technical terms to be used for rent comparison and their

241
definitions are listed in Table 7-7. Construction cost, labour cost, material cost, and
rental prices for the six different cities are compared and shown in Figure 7-3 to
Figure 7-6 (J Smith and Jaggar 2006).
Figure 7-3: Construction costs
Figure 7-3 compares construction costs between the six selected cities. It can be
clearly seen that the construction cost for both office and residential building
structures in London are highest among the selected cities. The second most
expensive city in terms of construction cost is Tokyo followed by Sydney, which is in
third place. As illustrated, Shanghai is the cheapest for construction of both residential
and office buildings.
Figure 7-4: Labour costs
$0
$2,000
$4,000
$6,000
$8,000
Con
stru
ctio
n co
st (
/m2
of G
IA) Residential Office(class A)
25%33%
23% 22% 21% 19%
8%6%
10% 6% 8% 9%
17%14%
18%20% 18% 19%
50% 47% 49% 52% 53% 53%
0%
20%
40%
60%
80%
100%
Con
stru
ctio
n co
st d
istr
ibut
ion
($/m
2of
G
IA)
Others Façade Foudnation Structure
$0
$20
$40
$60
$80
$100
Sydney shanghai Tokyo Dubai London New York
Lab
our
cos
t (/h
)
General Builder Site foreman
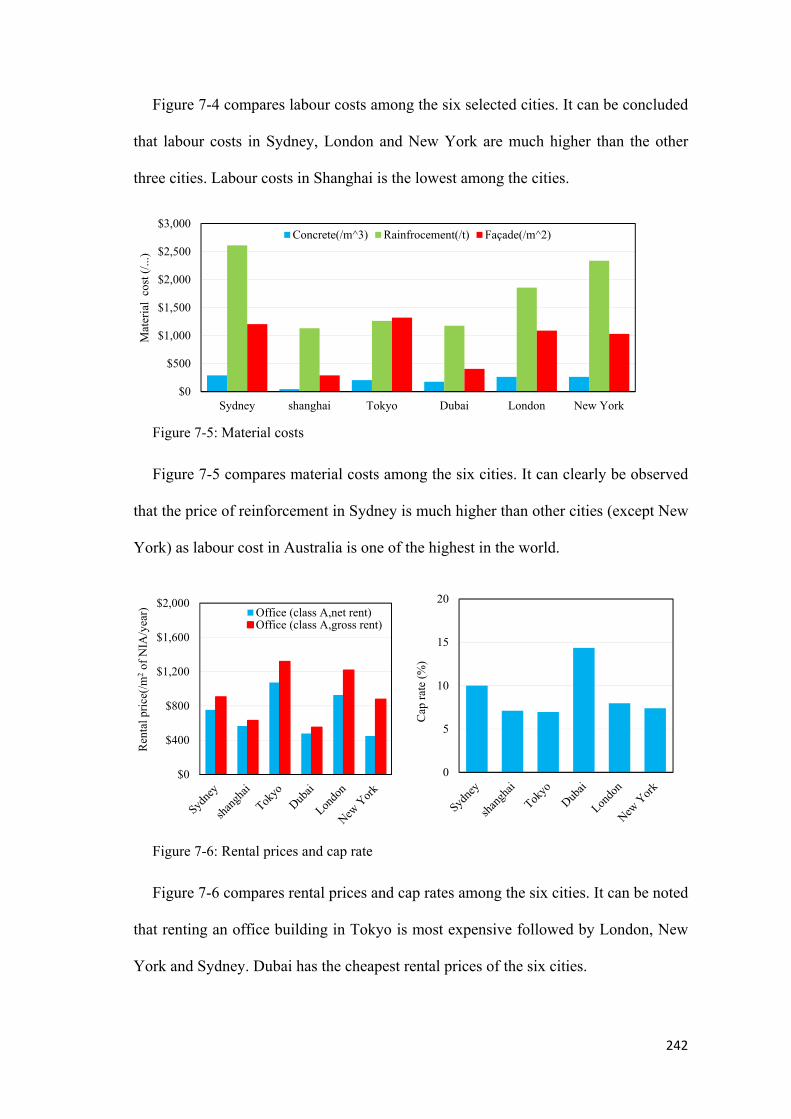
242
Figure 7-4 compares labour costs among the six selected cities. It can be concluded
that labour costs in Sydney, London and New York are much higher than the other
three cities. Labour costs in Shanghai is the lowest among the cities.
Figure 7-5: Material costs
Figure 7-5 compares material costs among the six cities. It can clearly be observed
that the price of reinforcement in Sydney is much higher than other cities (except New
York) as labour cost in Australia is one of the highest in the world.
Figure 7-6: Rental prices and cap rate
Figure 7-6 compares rental prices and cap rates among the six cities. It can be noted
that renting an office building in Tokyo is most expensive followed by London, New
York and Sydney. Dubai has the cheapest rental prices of the six cities.
$0
$500
$1,000
$1,500
$2,000
$2,500
$3,000
Sydney shanghai Tokyo Dubai London New York
Mat
eria
l co
st (
/...)
Concrete(/m^3) Rainfrocement(/t) Façade(/m^2)
$0
$400
$800
$1,200
$1,600
$2,000
Ren
tal p
rice
(/m
2of
NIA
/yea
r) Office (class A,net rent)Office (class A,gross rent)
0
5
10
15
20
Cap
rat
e (%
)
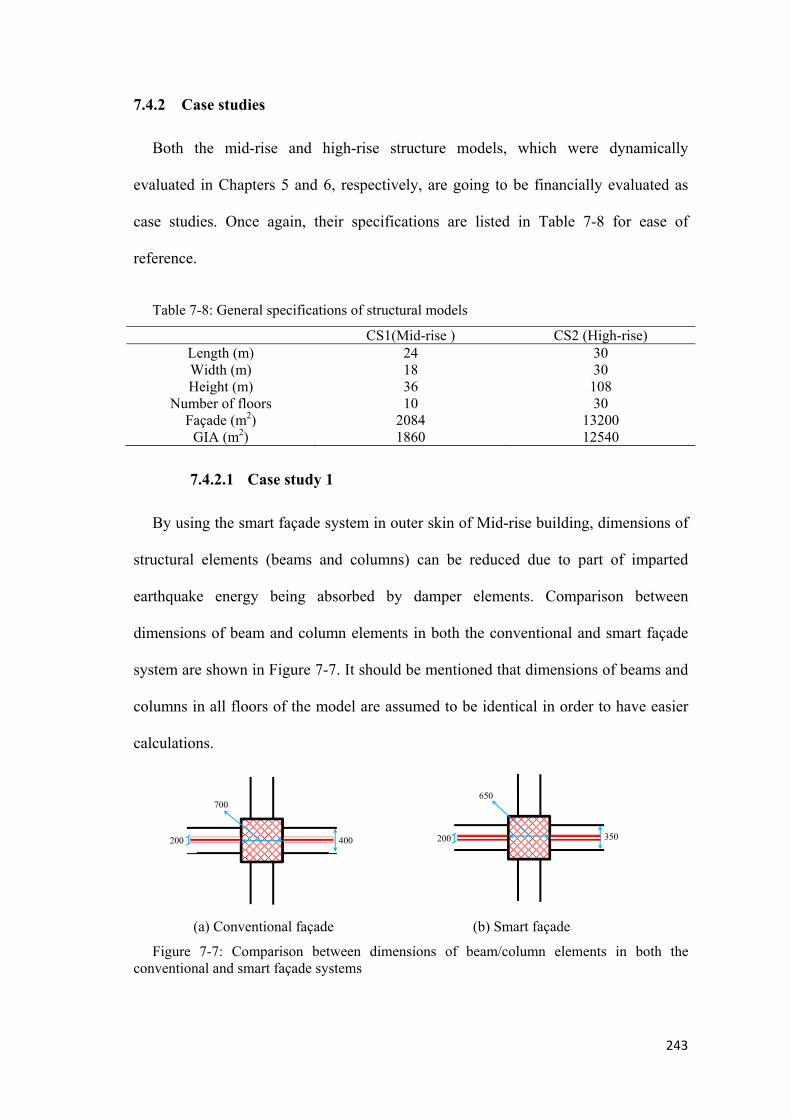
243
7.4.2 Case studies
Both the mid-rise and high-rise structure models, which were dynamically
evaluated in Chapters 5 and 6, respectively, are going to be financially evaluated as
case studies. Once again, their specifications are listed in Table 7-8 for ease of
reference.
Table 7-8: General specifications of structural models
CS1(Mid-rise ) CS2 (High-rise) Length (m) 24 30 Width (m) 18 30 Height (m) 36 108
Number of floors 10 30 Façade (m2) 2084 13200
GIA (m2) 1860 12540
7.4.2.1 Case study 1
By using the smart façade system in outer skin of Mid-rise building, dimensions of
structural elements (beams and columns) can be reduced due to part of imparted
earthquake energy being absorbed by damper elements. Comparison between
dimensions of beam and column elements in both the conventional and smart façade
system are shown in Figure 7-7. It should be mentioned that dimensions of beams and
columns in all floors of the model are assumed to be identical in order to have easier
calculations.
(a) Conventional façade (b) Smart façade
Figure 7-7: Comparison between dimensions of beam/column elements in both the conventional and smart façade systems
700
200 400
650
200 350
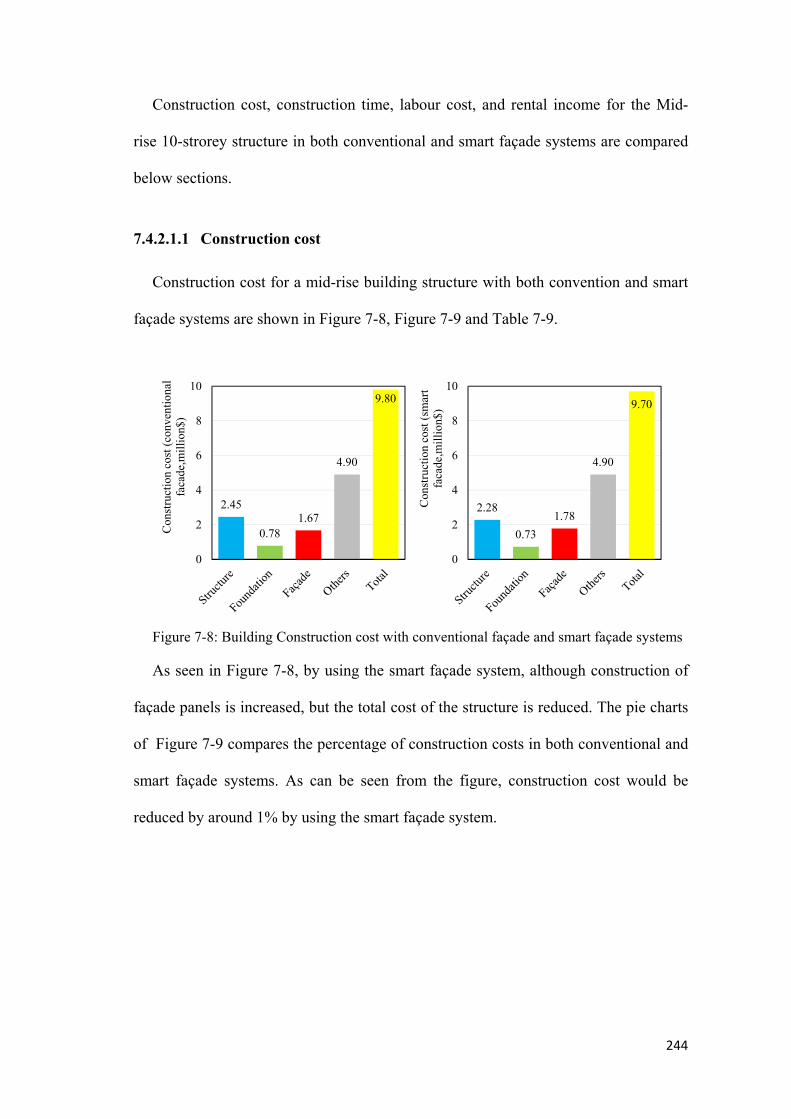
244
Construction cost, construction time, labour cost, and rental income for the Mid-
rise 10-strorey structure in both conventional and smart façade systems are compared
below sections.
7.4.2.1.1 Construction cost
Construction cost for a mid-rise building structure with both convention and smart
façade systems are shown in Figure 7-8, Figure 7-9 and Table 7-9.
Figure 7-8: Building Construction cost with conventional façade and smart façade systems
As seen in Figure 7-8, by using the smart façade system, although construction of
façade panels is increased, but the total cost of the structure is reduced. The pie charts
of Figure 7-9 compares the percentage of construction costs in both conventional and
smart façade systems. As can be seen from the figure, construction cost would be
reduced by around 1% by using the smart façade system.
2.45
0.781.67
4.90
9.80
0
2
4
6
8
10
Con
stru
ctio
n co
st (
conv
enti
onal
fa
cade
,mil
lion
$)
2.28
0.73
1.78
4.90
9.70
0
2
4
6
8
10
Con
stru
ctio
n co
st (
smar
t fa
cade
,mil
lion
$)

245
Figure 7-9: Construction cost distribution with conventional and smart façade systems
Results of Figure 7-8 and Figure 7-9 are tabulated in Table 7-9 to demonstrate
financial impacts of smart façade system in a better way.
Table 7-9: Comparison of economic impacts between conventional and smart façade systems
Structure element
part
Cost (million AU$ ) Economic
impact (million $)
% building expense Economic
impact
Conventional Smart Conventional Smart % change Structure 2.45 2.28 Decrease 0.17 25 23.3 decrease 6.8
Foundation 0.78 0.73 decrease 0.05 8 7.5 decrease 6.3 Façade 1.67 1.78 increase 0.11 17 18.2 increase 6.6 Others 4.90 4.90 - 50 50 -Total 9.8 9.70 decrease 0.1 1% saving
7.4.2.1.2 Construction time
In order to calculate the total construction costs associated with labour, the previous
data must be compared with the required construction time. The construction time is
generally a complex matter, influenced by several sources of random uncertainties. The
hypotheses made in order to evaluate the financial outcome for total time and total
working costs by the input data are shown in Table 7-10 and Table 7-11.
25
817
50
Conventional façade
Structure Foundation
Façade Others
23.3
7.518.2
50
1
Smart façade
Structure Foundation Façade
Others Saving
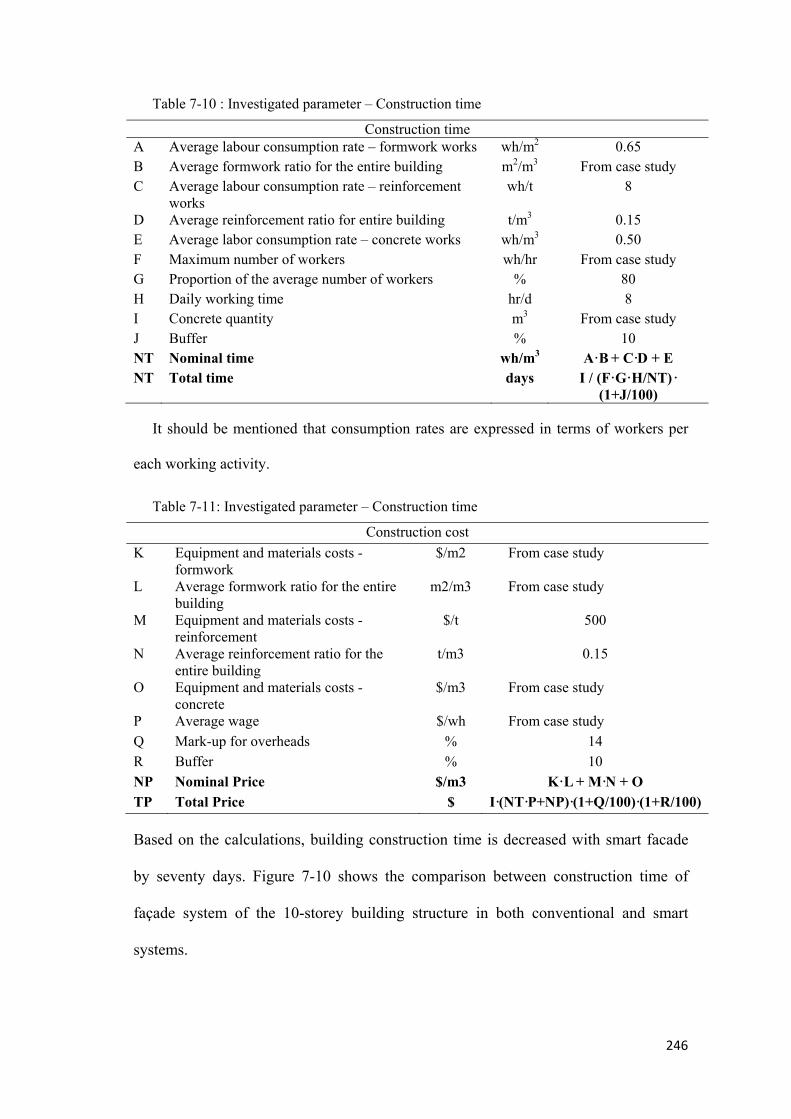
246
Table 7-10 : Investigated parameter – Construction time
Construction time A Average labour consumption rate – formwork works wh/m2 0.65B Average formwork ratio for the entire building m2/m3 From case study C Average labour consumption rate – reinforcement
works wh/t 8
D Average reinforcement ratio for entire building t/m3 0.15E Average labor consumption rate – concrete works wh/m3 0.50F Maximum number of workers wh/hr From case study G Proportion of the average number of workers % 80 H Daily working time hr/d 8 I Concrete quantity m3 From case study J Buffer % 10 NT Nominal time wh/m3 A·B + C·D + E NT Total time days I / (F·G·H/NT) ·
(1+J/100)
It should be mentioned that consumption rates are expressed in terms of workers per
each working activity.
Table 7-11: Investigated parameter – Construction time
Construction cost
K Equipment and materials costs - formwork
$/m2 From case study
L Average formwork ratio for the entire building
m2/m3 From case study
M Equipment and materials costs - reinforcement
$/t 500
N Average reinforcement ratio for the entire building
t/m3 0.15
O Equipment and materials costs - concrete
$/m3 From case study
P Average wage $/wh From case study
Q Mark-up for overheads % 14 R Buffer % 10
NP Nominal Price $/m3 K·L + M·N + O TP Total Price $ I·(NT·P+NP)·(1+Q/100)·(1+R/100)
Based on the calculations, building construction time is decreased with smart facade
by seventy days. Figure 7-10 shows the comparison between construction time of
façade system of the 10-storey building structure in both conventional and smart
systems.
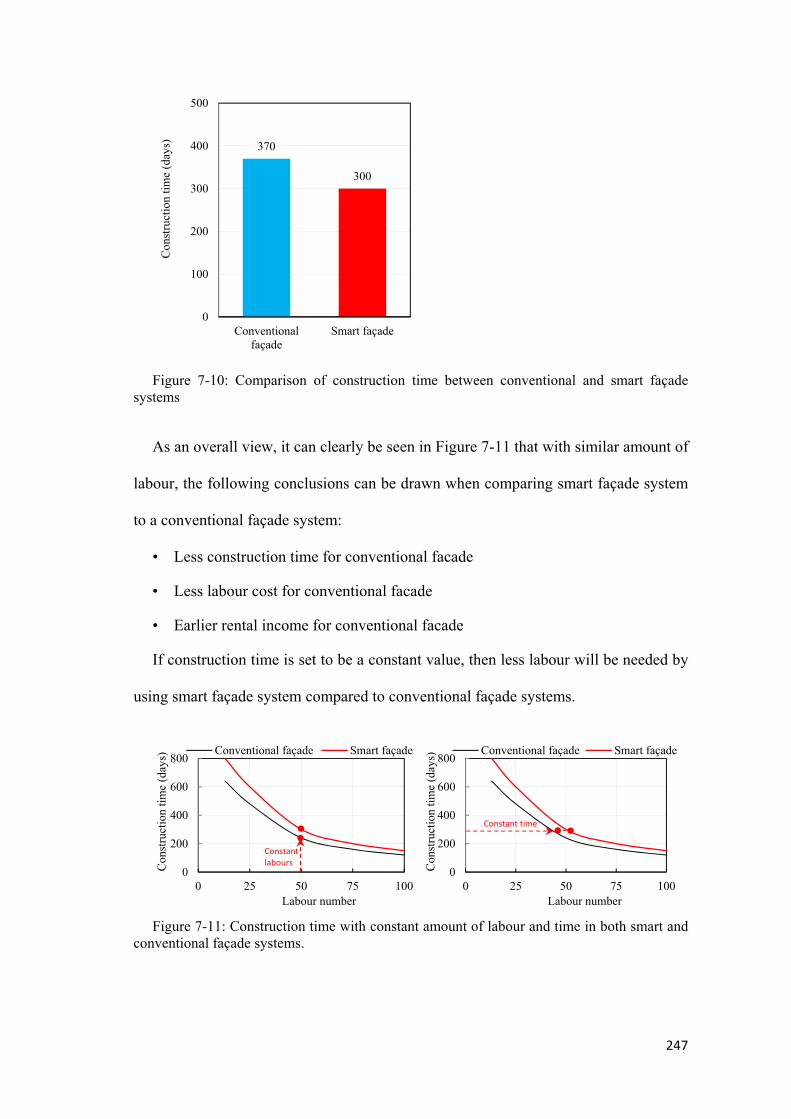
247
Figure 7-10: Comparison of construction time between conventional and smart façade systems
As an overall view, it can clearly be seen in Figure 7-11 that with similar amount of
labour, the following conclusions can be drawn when comparing smart façade system
to a conventional façade system:
• Less construction time for conventional facade
• Less labour cost for conventional facade
• Earlier rental income for conventional facade
If construction time is set to be a constant value, then less labour will be needed by
using smart façade system compared to conventional façade systems.
Figure 7-11: Construction time with constant amount of labour and time in both smart and conventional façade systems.
370
300
0
100
200
300
400
500
Conventionalfaçade
Smart façade
Con
stru
ctio
n ti
me
(day
s)
0
200
400
600
800
0 25 50 75 100
Con
stru
ctio
n ti
me
(day
s)
Labour number
Conventional façade Smart façade
Constant labours
0
200
400
600
800
0 25 50 75 100
Con
stru
ctio
n ti
me
(day
s)
Labour number
Conventional façade Smart façade
Constant time
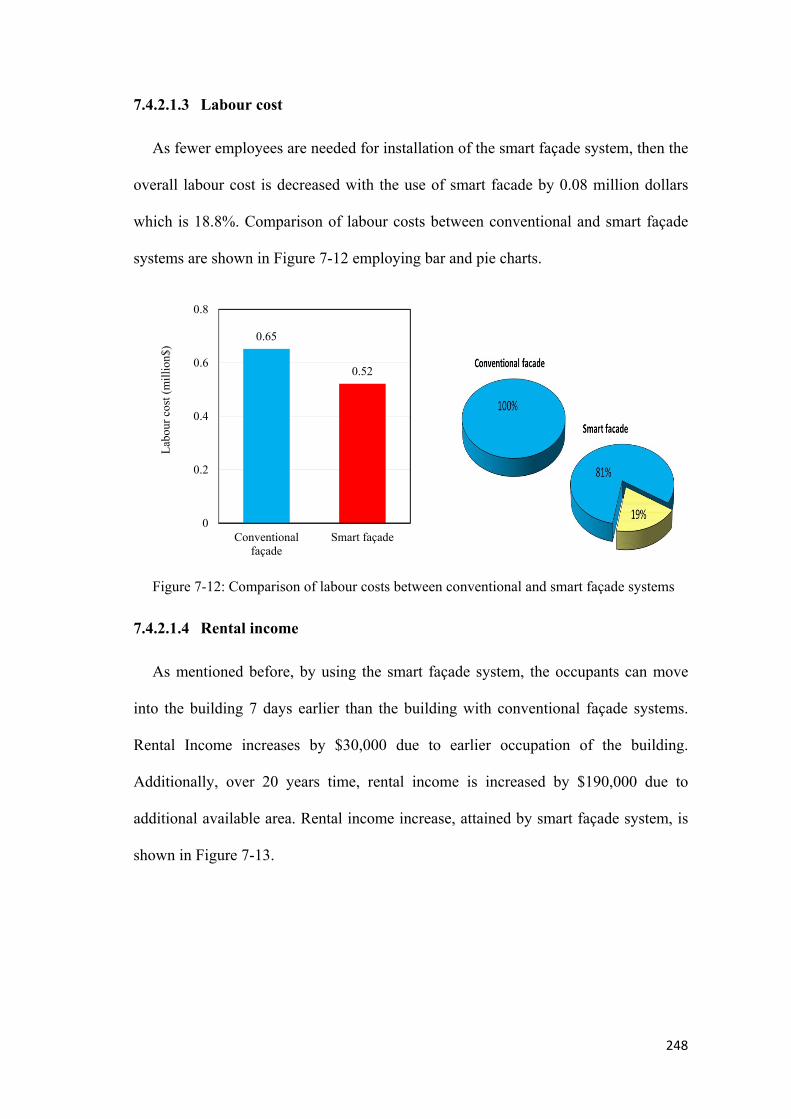
248
7.4.2.1.3 Labour cost
As fewer employees are needed for installation of the smart façade system, then the
overall labour cost is decreased with the use of smart facade by 0.08 million dollars
which is 18.8%. Comparison of labour costs between conventional and smart façade
systems are shown in Figure 7-12 employing bar and pie charts.
Figure 7-12: Comparison of labour costs between conventional and smart façade systems
7.4.2.1.4 Rental income
As mentioned before, by using the smart façade system, the occupants can move
into the building 7 days earlier than the building with conventional façade systems.
Rental Income increases by $30,000 due to earlier occupation of the building.
Additionally, over 20 years time, rental income is increased by $190,000 due to
additional available area. Rental income increase, attained by smart façade system, is
shown in Figure 7-13.
0.65
0.52
0
0.2
0.4
0.6
0.8
Conventionalfaçade
Smart façade
Lab
our
cost
(m
illi
on$)
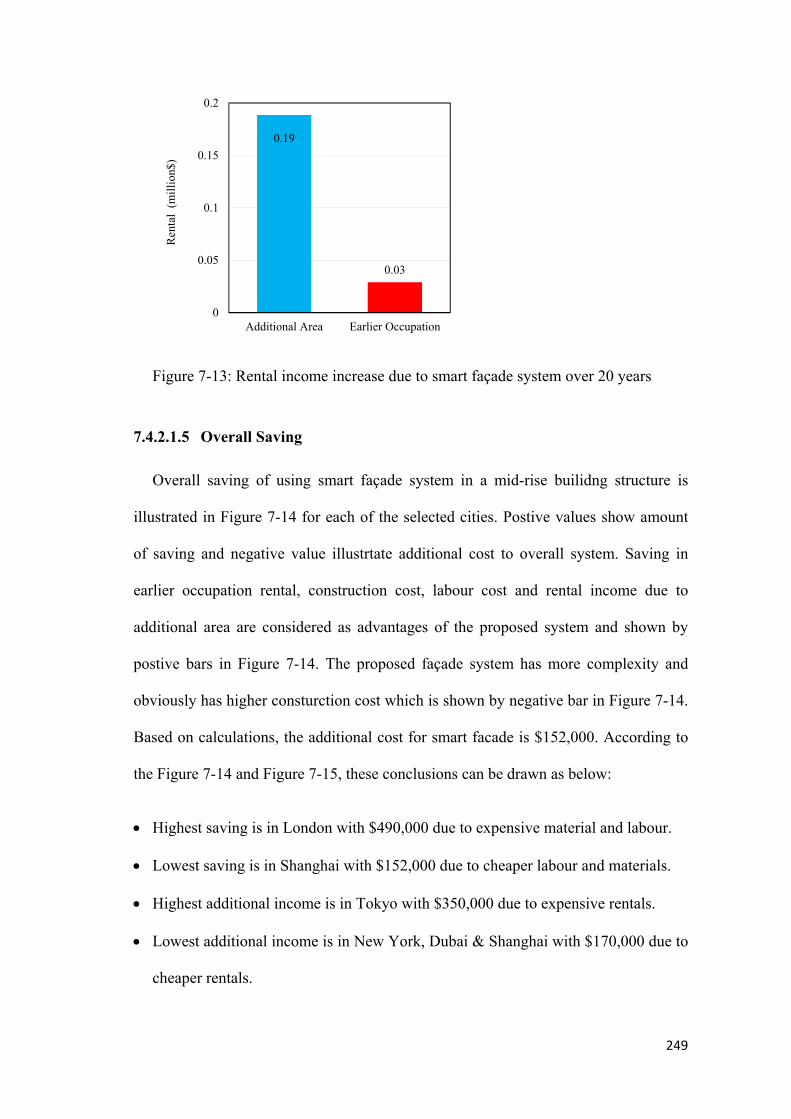
249
Figure 7-13: Rental income increase due to smart façade system over 20 years
7.4.2.1.5 Overall Saving
Overall saving of using smart façade system in a mid-rise builidng structure is
illustrated in Figure 7-14 for each of the selected cities. Postive values show amount
of saving and negative value illustrtate additional cost to overall system. Saving in
earlier occupation rental, construction cost, labour cost and rental income due to
additional area are considered as advantages of the proposed system and shown by
postive bars in Figure 7-14. The proposed façade system has more complexity and
obviously has higher consturction cost which is shown by negative bar in Figure 7-14.
Based on calculations, the additional cost for smart facade is $152,000. According to
the Figure 7-14 and Figure 7-15, these conclusions can be drawn as below:
Highest saving is in London with $490,000 due to expensive material and labour.
Lowest saving is in Shanghai with $152,000 due to cheaper labour and materials.
Highest additional income is in Tokyo with $350,000 due to expensive rentals.
Lowest additional income is in New York, Dubai & Shanghai with $170,000 due to
cheaper rentals.
0.19
0.03
0
0.05
0.1
0.15
0.2
Additional Area Earlier Occupation
Ren
tal
(mil
lion
$)
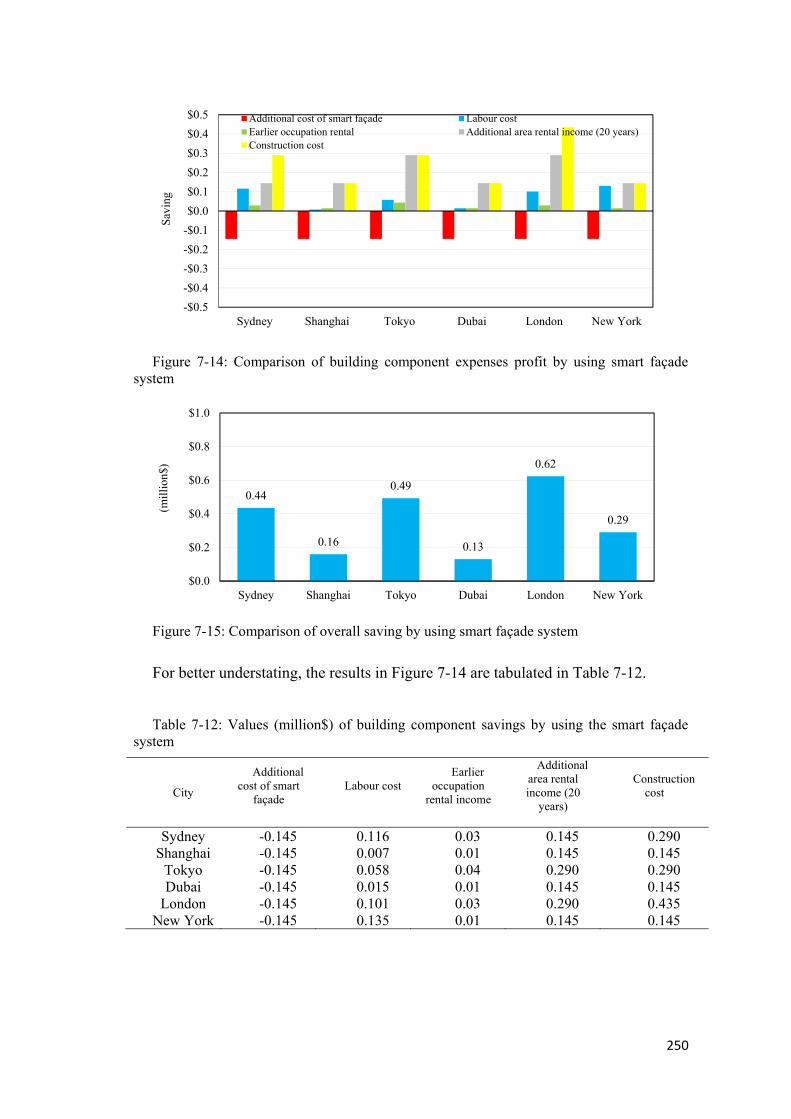
250
Figure 7-14: Comparison of building component expenses profit by using smart façade system
Figure 7-15: Comparison of overall saving by using smart façade system
For better understating, the results in Figure 7-14 are tabulated in Table 7-12.
Table 7-12: Values (million$) of building component savings by using the smart façade system
City
Additional cost of smart
façade Labour cost
Earlier occupation
rental income
Additional area rental income (20
years)
Construction cost
Sydney -0.145 0.116 0.03 0.145 0.290Shanghai -0.145 0.007 0.01 0.145 0.145
Tokyo -0.145 0.058 0.04 0.290 0.290Dubai -0.145 0.015 0.01 0.145 0.145
London -0.145 0.101 0.03 0.290 0.435 New York -0.145 0.135 0.01 0.145 0.145
-$0.5
-$0.4
-$0.3
-$0.2
-$0.1
$0.0
$0.1
$0.2
$0.3
$0.4
$0.5
Sydney Shanghai Tokyo Dubai London New York
Sav
ing
Additional cost of smart façade Labour costEarlier occupation rental Additional area rental income (20 years)Construction cost
0.44
0.16
0.49
0.13
0.62
0.29
$0.0
$0.2
$0.4
$0.6
$0.8
$1.0
Sydney Shanghai Tokyo Dubai London New York
(mil
lion
$)
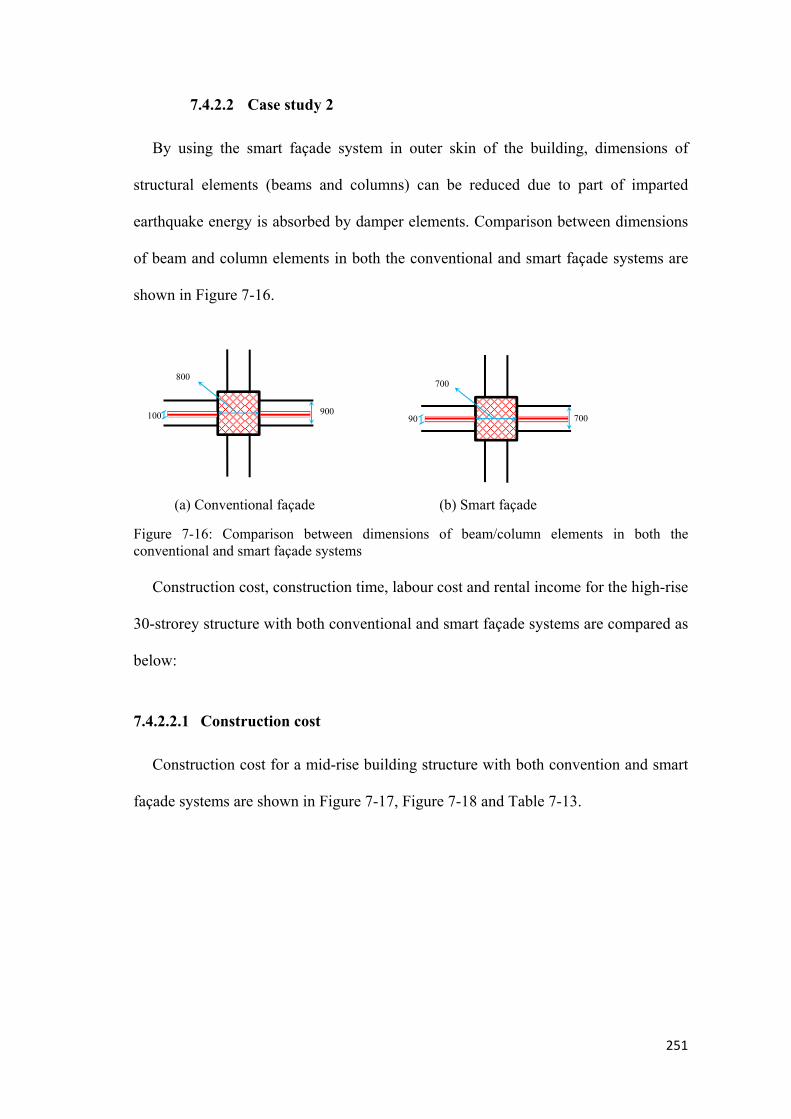
251
7.4.2.2 Case study 2
By using the smart façade system in outer skin of the building, dimensions of
structural elements (beams and columns) can be reduced due to part of imparted
earthquake energy is absorbed by damper elements. Comparison between dimensions
of beam and column elements in both the conventional and smart façade systems are
shown in Figure 7-16.
(a) Conventional façade (b) Smart façade
Figure 7-16: Comparison between dimensions of beam/column elements in both the conventional and smart façade systems
Construction cost, construction time, labour cost and rental income for the high-rise
30-strorey structure with both conventional and smart façade systems are compared as
below:
7.4.2.2.1 Construction cost
Construction cost for a mid-rise building structure with both convention and smart
façade systems are shown in Figure 7-17, Figure 7-18 and Table 7-13.
90 100
700
700
800
900

252
Figure 7-17: Building Construction cost with conventional façade and smart façade systems
As seen in Figure 7-17, by using the smart façade system, although construction cost
of façade panels is increased, but total the cost of the structure is reduced.
Figure 7-18: Construction cost distribution of a mid-rise building with conventional and smart façade systems
The pie charts of Figure 7-18 compare the percentage of construction cost using
both conventional and smart façade systems. As can be seen from the figure,
construction cost would be reduced by around 0.8% by using the smart façade system.
Results of Figure 7-17 and Figure 7-18 are tabulated in Table 7-13 to demonstrate the
financial benefits of the smart façade system.
46.55
14.9431.61
92.95
186.04
0
40
80
120
160
200
Con
stru
ctio
n co
st (
conv
enti
onal
fa
cade
,mil
lion
$)
44.81
14.3632.48
92.95
184.59
0
40
80
120
160
200
Con
stru
ctio
n co
st (
smar
tl
faca
de,m
illi
on$)
25
817
50
Conventional façade
Structure Foundation
Façade Others
24.1
7.717.5
50.0
0.8
Smart façade
Structure Foundation Façade
Others Saving

253
Table 7-13: Comparison of economic benefits of conventional versus smart façade systems
Structure element
part
Cost (million AU$ ) Economic
benefits (million $)
% building cost Economic benefits
Conventional Smart Conventional Smart % change Structure 46.5 44.8 decrease 1.74 25 24.1 decrease 6.9
Foundation 14.9 14.3 decrease 0.59 8 7.7 decrease 6.9 Façade 31.6 32.4 increase 0.87 17 17.5 increase 7.2 Others 92.9 92.9 - 50 50 steadyTotal 186.0 184.5 decrease 1.45 0.8% Saving
7.4.2.2.2 Construction time
Based on the calculations, building construction time is decreased with the use of
smart facade system by 68 days. Figure 7-19 shows the comparison between
construction time of façade system of the 30-storety building structure using both
conventional and smart systems.
Figure 7-19: Comparison of construction time between conventional and smart façade systems
7.4.2.2.3 Labour cost
As fewer employees are needed for installation of the smart façade system, then
overall labour cost is decreased with smart facade by 1.16 million dollars, which is
15.7%. Comparison of labour cost between conventional and smart façade systems are
shown in Figure 7-20 using bar and pie charts.
446
378
0
100
200
300
400
500
Conventionalfaçade
Smart façade
Con
stru
ctio
n ti
me
(day
s)

254
Figure 7-20: Comparison of labour cost between conventional and smart façade systems
7.4.2.2.4 Rental income
As mentioned before, by using the smart façade system as an outer skin of building
structure, the tenants can occupy the building 68 days earlier than when using
conventional façade systems. Rental Income increases by $4.79M due to earlier
occupancy of the building. Additionally, over 20 years, the rental income is increased
by $1.6M due to additional rentable area. Rental additional income attained by smart
façade system, is shown in Figure 7-21.
7.83
6.67
0
2
4
6
8
10
Conventionalfaçade
Smart façade
Lab
our
cost
(m
illi
on$)

255
Figure 7-21: Additional rental income due to using smart façade system
7.4.2.2.5 Overall Profit
The overall savings using smart façade in a mid-rise builidng structure is illustrated
in Figure 7-22 for each of the selected cities. Postive values show amount of savings
and negative values illustrtate additional cost to overall system. Saving in earlier
rental, construction cost, labour cost and rental income due to additional letable area
are considered as advantages of the proposed system and shown by postive bars in
Figure 7-22. The proposed façade system has more complexity and obviously has
higher consturction cost which is shown by negative bars in Figure 7-22. Based on
calculateions, additional cost when employing smart facade is $0.15M. According to
the Figure 7-22 and Figure 7-23 the following conclusions may be drawn:
Highest saving is in London ($0.5M) due to more expensive material and labour.
Lowest saving is in Shanghai ($0.15M) due to cheaper labour and materials.
Highest additional income is in Tokyo ($0.31M) due to more expensive rentals.
Lowest additional income is in New York, Dubai & Shanghai ($0.17M) due to
cheaper rentals.
1.60
4.79
0
1
2
3
4
5
Additional area Earlier occupancy
Ren
tal
(mil
lion
$)

256
Figure 7-22: Comparison of building component expenses/savings by using smart façade system
Figure 7-23: Comparison of overall savings when using smart façade system
For better understating, the results of Figure 7-22 are tabulated in Table 7-14.
Table 7-14: Values (million$) of building component expenses/savingsby using smart façade system
Cities
Additional cost of
smart façade
Labour cost
Earlier rental
occupancy
Additional area rentalincome (20
years)
Construction cost
Sydney -0.87 1.16 4.79 1.595 1.16Shanghai -0.87 0.073 3.63 1.16 0.58
Tokyo -0.87 0.58 6.82 2.32 1.305Dubai -0.87 0.145 2.90 1.015 0.58
London -0.87 1.02 6.09 2.03 1.885New York -0.87 1.305 2.90 1.015 0.725
-$2
$0
$2
$4
$6
$8
$10
Sydney Shangai Tokyo Dubai London New York
Pro
fit
Additional cost of smart façade Labour costEarlier occupation rental Additional area rental income (20 years)Construction cost
7.83
4.50
10.01
3.63
10.01
4.93
$0.0
$2.0
$4.0
$6.0
$8.0
$10.0
$12.0
Sydney Shangai Tokyo Dubai London New York
Sav
ing
(mil
lion
$)
257
7.5 Strategies and approaches
Any project requirements such as seismic loads, wind loads, live load deflections,
acoustics, and any impact or blast resistance criteria need to be considered and
analysed before any budget pricing takes place. The system needs to be designed
specifically on a case-by-case basis and be tailored to individual project requirements.
Therefore, not all projects use the same fittings. They are customized as required, but
work of a similar design concept. Without discussing the project with a structural
glass vendor, it is entirely possible that the design proposal will not be possible as
envisioned. The façade engineering team needs to review the test reports from the
damper system manufacturers to ensure these systems meet or exceed the design
criteria for a specific project. If these reports are not satisfactory or readily available,
the team needs to require that specific tests be performed in relation to the
specifications. This will ensure building owners will receive the highest quality
product to limit potential liabilities down the road.
7.6 Summary and conclusions
The design principles for the smart facade system were proven through extensive
numerical analysis. The proposed system like any other material will degrade and lose
their functionality over time. Despite the fact that, deterioration of façade materials is
an unavoidable phenomenon, but service life of the damper material can be extended
to an optimum value by considering possible durability issues at the stages of design,
construction, operation, maintenance and repair. These stages are discussed briefly
below:

258
1. Design:
Design of the system should be in a way that steel layers of the damper system
have minimum contact to open air and surrounding environment. Based on various
climates and regions in which the damper is going to be installed, different strategies
need to be considered at the design stage to avoid any deterioration that may be caused
by environmental factors. The designer must focus on detailing the system in such a
way to minimize the probability of premature degradation of the components. Finally,
effects of such factors as resisting structural and environmental loads, heat and air
transfer, preventing water and moisture infiltration, and acoustics should be
considered in façade design.
2. Construction
The damper layers need to be ordered from a reputable and experienced company,
for example the 3M company which is one of the few companies in the world that can
make the delicate viscoelastic damper layers. Construction and assembly of the
damper system would be done in a workshop for lower quantities or in a factory for
mass production depending on budget allocated to the project. For this reason,
supervision by a specialist is quite essential during construction activities to ensure
that the installation work is conducted in accordance with the original design and
specifications. Depending on types of structure, namely, as existing or a new building
structure, a careful attention needs to be paid during the installation process of the
façade damper systems. High standard of workmanship is needed to minimize the
issues arising from poor installation of the panels.

259
3. Operation and maintenance
The higher is the quality of the layers, the more durable is the system. For that
reason, regular quality control inspections is paramount during service life of the
system to ensure that performance of the system is in line with the original design and
specifications. Inspections need to be done by fully trained technicians under the
supervision of façade/material experts. The manager should keep a record of the
results of all inspections throughout the service life of the damper system and should
assess the safety of street-level facilities by referring to these records. Any
deteriorating salts or ions need to be removed promptly to enable the assessors to
perform a better visual inspection. If serious deteriorations take place before the end
of the service life, and no maintenance work is conducted to correct the deterioration,
the system may lose its functionality and cause serious issues. Corrective maintenance
would be needed, only if a detailed inspection reveals that rehabilitation work is
needed. Therefore, planned maintenance must be performed to ensure safety and
serviceability of the whole system.
4. Repair:
In the absence of regular maintenance, the façade bracket elements would continue
to deteriorate, and finally its repair/ rehabilitation could become expensive, requiring
replacement of the damper system. A specialist needs to consultant with the designer
and decide the best rehabilitation process for restoring the bracket damper to its
original condition. Replacement of components is necessary at the end of their service
life to ensure maximum dynamic performance. It should be said that, the module
width and height, number of support points, glass make-up (thickness and
performance) required, back-up structure, are all important factors which depend on

260
needs of the client and would change in each smart façade system contract. System
pricing can vary greatly depending on the requirements. The facade inspector should
be experienced in the field of stability, defect deterioration, forensic investigation,
remedial engineering mechanisms and expert witness relating to specific materials and
facade assembly.
The design team can advise building owners of potential cost saving measures by
modifications in design if there is a budget range in mind. Post-earthquake repair costs
and repair time are two crucial parameters, which need more research. Because,
detachment of façade components from the building may lead to social and economic
issues, as well as increase in injury or death to the occupants and pedestrians. Smart
façade systems, if designed and installed properly, possess a better economy of scale
on a cost per square meter basis.
Using the smart façade system has the following benefits and advantages.
1. Additional rentable area
Rental area losses are when using large scale dampers but there would be no loss in
the rental area when smart façade system is used to enhance dynamic response of
the main structure.
2. windows or/and doors
No closing or opening process is needed in smart façade panels.
3. Time
No temporary loss of rental income happens when using the smart façade system,
but tenants need to move out of the offices when other retrofit techniques are
selected.
4. Re-design costs

261
No structural modification is needed to the building structure when smart façade
system is selected as a method of retrofit.

262
CHAPTER 8
CONCLUSION AND FUTURE
WORK
263
In this chapter, the considerable results and conclusions of the research presented in
this dissertation are outlined. The outcomes of this research are utilized to form
recommendations for practical design of the proposed bracket system. Moreover, an
experimental test plan to investigate the three-dimensional behaviour of a corner
cladding system is proposed as future work.
8.1 General conclusions
The main purpose of the research discussed in this dissertation was to study the
effect that movable dissipative cladding system (energy absorbing damping device)
has on the multistorey building structures seismic response. These systems can be
effective and are considered in order to mitigate the seismic effect on various
structural building systems when the dominant seismic frequencies are close to the
natural frequencies of the main structure. The feasibility of the proposed system was
proven by numerous computer analyses. In this thesis, analytical models were created
in ANSYS APDL to study the effects that movable cladding systems have on the
seismic response of multistorey building structures.
A number of different structural models incorporated with energy absorbing
connections and under different earthquake records were modelled to attain a
comprehensive understanding of the efficiency of the proposed damper connections.
A 10-storey and a 30-storey building with facade systems, in both 2D and 3D with and
without energy absorbing connections, were investigated under four different
benchmark earthquake records suggested by the International Association for
Structural Control and Monitoring. It is necessary to mention that the results of the
comprehensive analysis on 2D structural models are not included in this thesis in order
to avoid undue increase in the size of this thesis. In addition, the results obtained from

264
2D studies were consistent and a subset of those presented in the thesis for 3D
buildings. Each of the studied building facade systems with energy absorbing
connections behaved in a different manner, and the effectiveness of the energy
absorbing connections varied under different earthquake motions. This can be
attributed to the varying intensity and frequency content of the applied earthquakes.
The effects of the cladding on the seismic response of the frame structure were
evaluated by performing modal analyses and dynamic time-history analyses of the
analytical models.
For the mid-rise building structure, the fundamental period of the frame structure
with conventional façade panels was 0.98 seconds, while the fundamental period of
these models with movable cladding was 1.04 seconds. Thus, the movable cladding
systems increased the fundamental period of the models by a maximum of 5.7%,
compared to the frame structure with fixed façade panels. For the high-rise building
structure, the fundamental period of frame structure with conventional façade panels
was 2.82 seconds, while the fundamental period of these models with movable
cladding was 2.92.
Thus, the movable cladding systems increased the fundamental period of the
models by a maximum of 3.5%, compared to the frame structure with fixed façade
panels. It was noticed that, the mode shapes and effective modal mass percentages
were also not significantly affected by the movable facade systems. Time-history
analyses were performed to evaluate the nonlinear dynamic response of the frames
excited by ground motions with a wide range of intensities. Four ground motions were
selected to perform the time-history analyses. The parameters recorded during the
analyses included top floor displacement, maximum inter-storey drifts, maximum
265
floor accelerations, maximum plastic hinge rotations, and base shear force. The time-
history results were plotted in several combinations. Detailed analytical models of the
buildings with cladding systems were shown in Chapters 5 and 6. The force-
deformation relationship of the cladding connectors were obtained from experience
and prior studies of the industry partner, Permasteelisa company. The results showed
that the integration of the dissipative damper connection to the building facade
systems enhanced the energy absorption effectiveness and decreased the seismic effect
on all levels of the structure.
Additionally, façade connection properties had significant influence on seismic
response of the primary building structure. The closer investigation of the structural
buildings showed that a reduction in the axial stiffness (parallel to applied earthquake)
of the proposed bracket system did not have much influence in controlling the seismic
response of the main structure. However, reduction in shear stiffness with the
optimum value has shown to have a major impact in reducing response in all seismic
response parameters. Beyond this optimum value, the seismic response of the main
structure, started to increase. From the results, it is also evident that incorporation of
dissipative damper system in the facade system played an important role in altering
drift between stories of the main structure. Results have shown that the connection
stiffness and energy absorption capacity have a great influence in mitigating the
adverse effects of earthquakes. To conclude, the main findings of the study are
presented here:
1. It is feasible to use energy-absorbing connections in building facade system to
control response of main structure by dissipating part of the imparted seismic
energy. Viscoelastic dampers have proven to be very efficient for this purpose and
266
the connection properties have significant influence on the response. They display
optimum values of stiffness and damping based on intensity and kind of
earthquake record.
2. The energy absorbing connections placed in direction perpendicular to applied
earthquake force were able to control the deformation and forces in structural
elements with reasonable differential displacement between the frame and the
façade.
3. The influence of façade mass on the seismic mitigation was investigated as
well. Results showed that increase in the mass ratio resulted in higher reductions
in relative building response. However, the increase in the mass ratio is not
economical.
4. Seismic mitigation of the building system response was possible when the
natural frequencies of the structure were within the range of dominant frequencies
of the earthquakes.
5. The damping connections with shear deformation in the majority of cases were
able to produce remarkably high improvement and reduced the seismic effect on
the building structure at all levels. The results showed that the best performance
of VE damper connections in most cases was observed to be achieved in the
upper storeys in comparison to the lower and middle storeys. As noted before,
placement of the system in the top storey levels has reduced the magnitude of the
measured response parameters.
6. In some cases, in both mid-rise and high-rise building structures, in lower
storey levels and under the applied earthquake excitations, the VE damper
connections were not as effective as top floors and an increase in the magnitude
of the response parameters were noted. This can be explained by the fact that

some of the applied earthquakes have an unusually low dominant frequency range
in some parts of their excitation.
7. Bracket elements with value of shear stiffness between 10-90 N/mm can be
effective in reducing the response of the main structure in both mid-rise and high-
rise building structures. As it is impossible to install bracket elements with
different values of shear stiffness because of complexity of their design, then
implementing a semi-active or active control system is needed for the proposed
concept.
Overall, the use of the comprehensive time-history analyses in Chapter 5 and 6
coupled with financial feasibility and assessment of the proposed system in Chapter 7
provide a rational framework for selecting appropriate stiffness for designing the
cladding in various geographical areas.
8.1.1 Application and contribution of this research to design
Double-skin Facades have made a rapid dispersal into the commercial markets such
as Australia, North America and specially the Middle East. In seismic analyses and
design, structural engineers have typically disregarded the extra stiffness and damping
that the cladding system may add, which could be beneficial to the building’s seismic
performance. This study has indicated the possibility of developing new façade
connections with appropriate properties to reduce the response of the main structure
during earthquakes. The idea of advanced cladding connections developed in this
research came from the wish to take advantage of energy dissipation due to relative
movement of the cladding panels and structural frame.
However, these systems necessitate cladding systems to encounter significant
lateral movements to create any promising effects; therefore, crucial criteria such as
267
268
the appearance, water tightness, and air tightness due to the relative panel-structure
movement could be threatening to the concept. On the other hand, earthquake
excitations are not as common as wind forces which impact the structure more
frequently. Therefore, except for any possible damage to the façade system, reduction
in structural response and consequently decrease in rate of casualties, will be
welcomed by engineers, building owners and the community. From the several time-
history analyses carried out here, it was evident that with the implementation of
appropriate connection properties, the seismic response of the main structure can be
considerably reduced. Moreover, the connection deformation and the connection
forces can be kept within reasonable and practical limits by applying pre-defined load
deformation behaviour to them. Engineers, often, would prefer to optimize a system
for a particular property such as low energy consumption. Particularly in the design of
buildings, this is difficult because of conflicting requirements such as optimizing
daylight and minimizing solar gain.
Thus, co-optimizing is essential. The relationship between architects, engineers,
and facility managers must be managed carefully to develop and use advanced control
features that do not overwhelm users or the lack of management may render the
advanced facades inefficient. Additional design tools must be developed so that
structural and façade designers may easily investigate effects of movable double-skin
facades on seismic performance of the structure during design stage. It is noteworthy
to mention that, acceptance of the proposed façade system is linked to the additional
expense to the building owner as well as the architectural and environmental benefits
indicated.
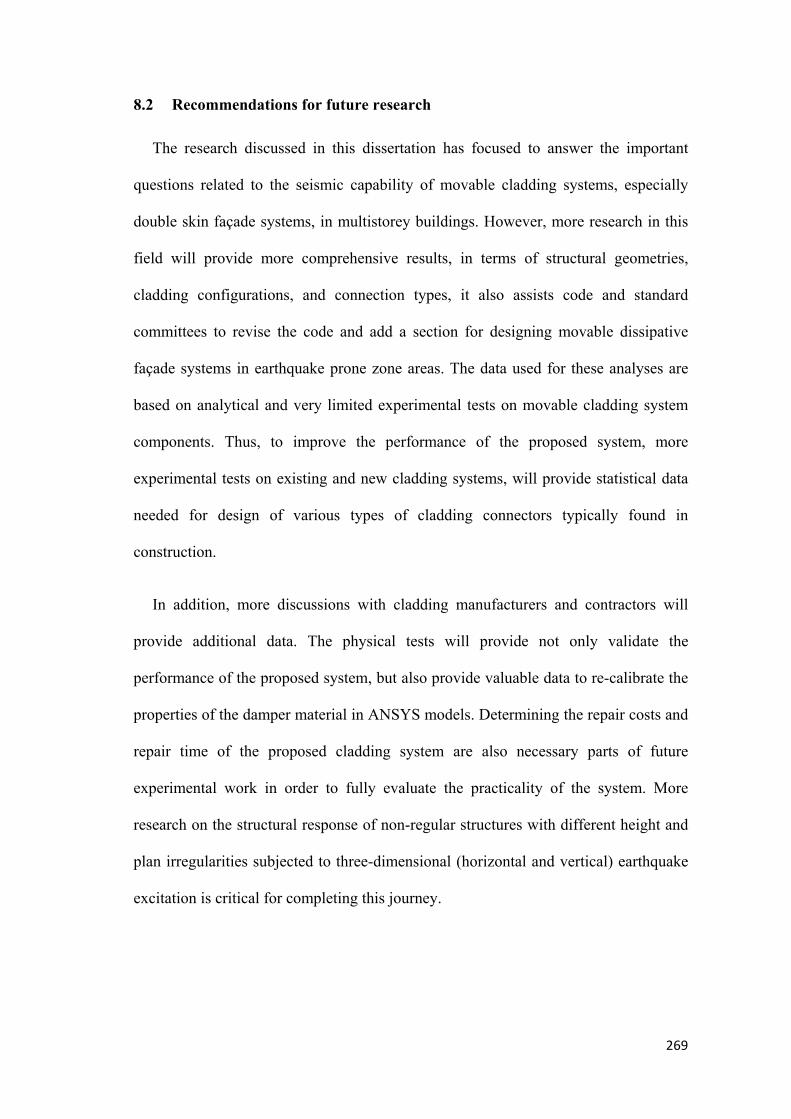
269
8.2 Recommendations for future research
The research discussed in this dissertation has focused to answer the important
questions related to the seismic capability of movable cladding systems, especially
double skin façade systems, in multistorey buildings. However, more research in this
field will provide more comprehensive results, in terms of structural geometries,
cladding configurations, and connection types, it also assists code and standard
committees to revise the code and add a section for designing movable dissipative
façade systems in earthquake prone zone areas. The data used for these analyses are
based on analytical and very limited experimental tests on movable cladding system
components. Thus, to improve the performance of the proposed system, more
experimental tests on existing and new cladding systems, will provide statistical data
needed for design of various types of cladding connectors typically found in
construction.
In addition, more discussions with cladding manufacturers and contractors will
provide additional data. The physical tests will provide not only validate the
performance of the proposed system, but also provide valuable data to re-calibrate the
properties of the damper material in ANSYS models. Determining the repair costs and
repair time of the proposed cladding system are also necessary parts of future
experimental work in order to fully evaluate the practicality of the system. More
research on the structural response of non-regular structures with different height and
plan irregularities subjected to three-dimensional (horizontal and vertical) earthquake
excitation is critical for completing this journey.

270
8.2.1 Further research that would improve and complement this thesis
It has been observed from the contents of this research that the focus of this PhD is
on numerical modelling and verification of the proposed concept. Further tasks need
to be considered which are listed as below:
a. Façade panel distortion, local and general deformation in connections need to be
looked at
b. Micro modelling of the proposed attachment which is shown in Figure 8-1 is
needed. The modelling needs to be sketched in Solid Works program and
exported to ANSYS or ABAQUS for further and accurate analysis.
Figure 8-1: Details of proposed connection for attachment of façade outer skin to slab of main structure

271
c. Gap width between outer and inner façade layers need to be optimized. The
random variable consists of length of axial damper element and needs to be
evaluated numerically and experimentally.
8.2.2 Proposed experimental test program
The major part of the research in this dissertation focused on computer simulations
of cladding systems and parametric studies. To gain additional insight into the seismic
performance of multistorey buildings with movable cladding system, an experimental
test needs to be performed. The proposed experimental testing program will provide
insight into the three-dimensional behaviour of the movable cladding systems. This
section outlines a proposed testing program to evaluate the response of a full-scale
portion of a movable cladding system.
The goals of the tests are to understand how the cladding system components
interact with the main structure and understand their dynamic behaviour. Additionally,
their interaction together as a uniform layer is very crucial to avoid possible collision
and internal damage and needs to be monitored carefully. The results of the tests
should provide some validation to the analytical results presented in this dissertation.
The simulation needs to provide insight into how panels and connectors behave during
an earthquake along the entire height of the building and to validate the analytical
models developed in ANSYS APDL. Locations of possible damage and identification
of the failure modes of the connections need to be determined as well.
8.2.2.1 Test setup, specimen design and terminology
The building will be indicative of mid-rise, moment resisting frame structures
common in commercial real estate. Although the material of the building structure was

reinforced concrete in the numerical analysis, but in order to have an easier set up and
installation, a steel structural frame can be built with pinned connections so that the
frame has less lateral resistance. The beams and columns are considered to be box
sections. A sketch of the south-west elevation of a corner specimen is illustrated in
Figure 8.2. Two panels, which are in red colour on top level of building structure, are
selected for experimental test analysis. They can be attached to the main frame
individually or ideally together to evaluate their interaction with primary structure and
with each other. Details of the proposed experimental test model in different angels
are shown in Figure 8-2 to Figure 8-7.
Figure 8-2: South-west sketch of the building structure and elevation of the specimen
Although the test specimen does not represent all kinds of cladding panels for the
mid-rise and the high-rise structural buildings, but the full-scale corner specimen
provides a unique opportunity to evaluate the interaction between the movable facade
panels as the frame moves. Corner subassembly experiences largest inter-storey drift
and largest post-yield drifts during seismic loading. Additionally, dynamic response
and panel interaction at the corners of the building structure are difficult to understand
272

273
and it would be a good opportunity to evaluate this interaction. The façade system,
connection types, and connection locations need to be considered the same as those
discussed in this dissertation. Full-scale cladding assemblies measuring 3600mm
(one storey) tall by 1500mm wide should be tested to investigate the interaction of the
cladding panels, in plane and out of plane. Two quasi-statically tested specimens are
expected to provide information about the overall behaviour of the system,
connector’s behaviour, the interaction of façade panels at the corners, and the
progression of damage in dissipative damper device.
Figure 8-3: Sketch of details of experimental model

274
Figure 8-4: Sketch of details of experimental model
Figure 8-5: Sketch of details of experimental model
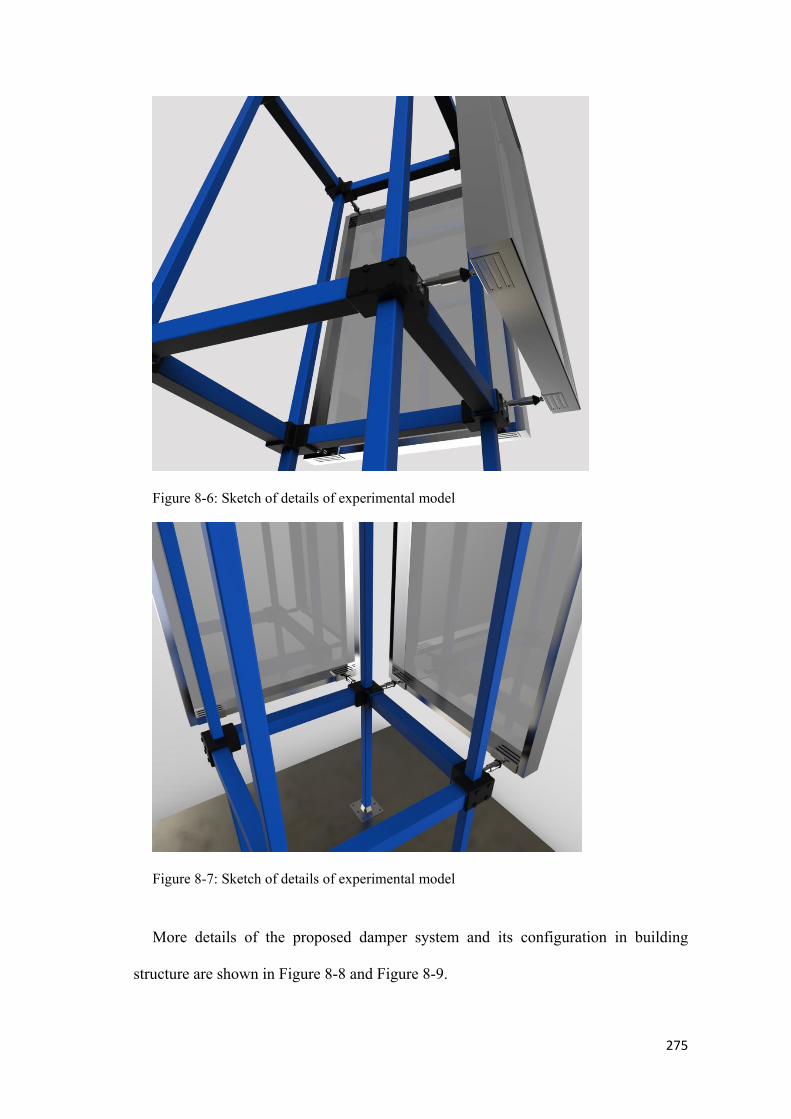
275
Figure 8-6: Sketch of details of experimental model
Figure 8-7: Sketch of details of experimental model
More details of the proposed damper system and its configuration in building
structure are shown in Figure 8-8 and Figure 8-9.

276
Figure 8-8: Side views of attachment of the proposed damper system to slab of primary structure

277
Figure 8-9: Top view of attachment of damper system to slab of primary structure
278
APPENDIX A
SECTIONS OF THE
STRUCTURAL MODELS

279
Midrise Structural Model
Beam Levels Beam section Equivalent Section
1-3
4-6
7-9

280
Beam Levels Beam section Equivalent Section
10

281
Column Levels Column section Equivalent Section
1
2-3

282
Column Levels Column section Equivalent Section
4
5
6

283
Column Levels Column section Equivalent Section
7-8
9-10

284
Highrise Structural Model
Beam Level Beam section Equivalent Section
1-10
11-17
18-30
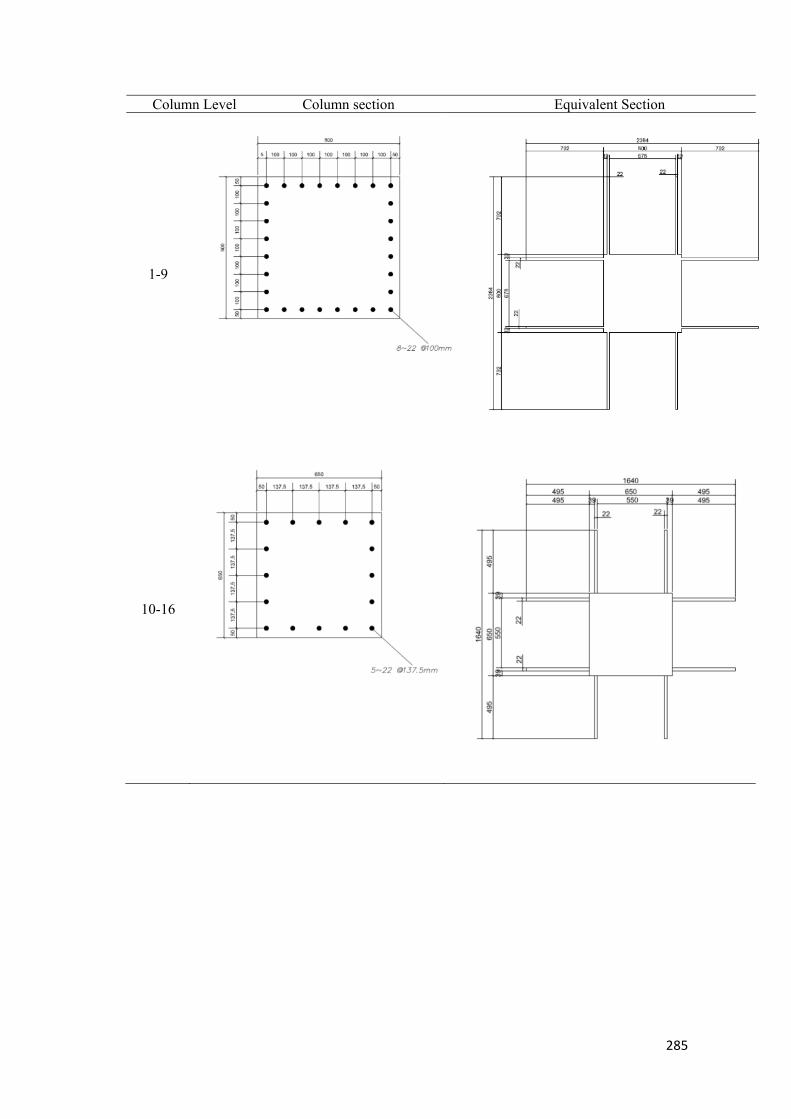
285
Column Level Column section Equivalent Section
1-9
10-16

286
Column Level Column section Equivalent Section
17-19
20-23
24-30

287
APPENDIX B
THESIS TERMINOLOGY

288
1. Movable concept: the idea to define/allow the outer skin of DSF system to move
back and forth in both in-plane and out-of-plane directions during applied earthquake.
2. Optimum dynamic properties for façade brackets: refer to dynamic behaviourand energy dissipation capabilities of connections during applied earthquake. Optimum properties have more effects on reduction of dynamic response of structure building during applied earthquake.
3. Advanced connectors: Bracket system which has capability to dissipate part ofapplied load by moving back and forth in both in-plane and out-of-plane directions during applied earthquake.
4. Elastic Conventional façade bracket: Structure with an elastic behaviour inwhich dimensions of structural elements are designed and calculated so that only minor damage is sustained during earthquake excitation. The façade system used in this model has fix(conventional) brackets.
5. Plastic Conventional façade bracket: Structure system with elements (beam &column) which has plastic behaviour at both ends. Dimensions of structural elements are designed and calculated so that damage occurs mainly in beam elements during earthquake excitation. The façade system used in this model has fixed (conventional) brackets.
6. Conventional bracket: or rigid bracket or fixed connector is an element whichhas mechanical properties of (modulus of elasticity, strength) stainless steel. The element is only allowed to move few millimetre which is similar to what is recommended in cladding industry.
7. Bracket: element which connects façade panel to main structure or secondarysteel support system.
8. Façade frame: is referred to curtain wall frame. Façade frame is the outercovering of a building in which the outer walls are non-structural, utilized to keep the weather out and the occupants in.
9. Façade column: the vertical elements mainly made of aluminium and are alsonamed mullion.
10. Main façade frame: steel support for the outer layer of double skin façadesystem.
11. Fix façade: Façade system which is connected to the main structure withconventional (fixed or rigid) bracket system.
12. Flexible façade: façade system which is connected to the main structure withadvanced connectors.

289
13. Low axial stiffness: façade bracket elements which can move out of plane (backand forth) due to force
14. Damper device: a dissipative element which is replaced by the conventionalbracket and connect the façade system to the main structure.
15. Plastic joints: introducing a bracket system which is capable of having plasticdeformation. Plastic joints forms in the bracket element to dissipate part of the applied forces.

290
REFERENCE

291
AAMA 501.4 (2000). Recommended Static Testing Method for Evaluating Curtain Wall and Storefront Systems Subjected to Seismic and Wind Induced Interstory Drift: Recommended Dynamic Test Method for Determining the Seismic Drift Causing Glass Fallout from a Wall System. Illinous American Architectural Manufacturers Association.
Abe, M., & Fujino, Y. (1994). Dynamic characterization of multiple tuned mass dampers and some design formulas. Earthquake engineering & structural dynamics, 23(8), 813-835.
Abe, M., & Igusa, T. (1995). Tuned mass dampers for structures with closely spaced natural frequencies. Earthquake engineering & structural dynamics, 24(2), 247-261.
Abe, M., & Igusa, T. (1996). Semi-active dynamic vibration absorbers for controlling transient response. Journal of Sound and Vibration, 198(5), 547-569.
Abtahi, P., B. Samali, M. Zobec and T. Ngo (2012). "Application of flexible façade systems in reducing the lateral displacement of concrete frames subjected to seismic loads." From Materials to Structures: Advancement through Innovation: 241.
Agrawal, A. K., Y. Fujino and B. K. Bhartia (1993). "Instability due to time delay and its compensation in active control of structures." Earthquake engineering & structural dynamics 22(3): 211-224.
Aiken, I. D., Nims, D. K., Whittaker, A. S., Kelly, J .M, (1999). "Testing of Passive Energy Dissipation Systems." Earthquake Spectra 9(Earthquake Engineering Research Institute,).
Aldemir, U. (2003). "Optimal control of structures with semiactive-tuned mass dampers." Journal of sound and vibration 266(4): 847-874.
Allinson, K. (2007). London's Contemporary Architecture, Routledge.
Amadio, C. and C. Bedon (2012). "Viscoelastic spider connectors for the mitigation of cable-supported façades subjected to air blast loading." Engineering Structures 42: 190-200.
Arons, D. M. (2000). Properties and applications of double-skin building facades, Massachusetts Institute of Technology.
AS1170.1 (2002). Australian / New Zealand Standard AS/NZS 1170.1: 2002. Structural design actions,Part 1: Permanent, imposed and other actions.. 1, Australia Standards.
AS1170.4 (2007). Structural design actions Part 4: Earthquake actions in Australia. 4. Australia.
AS1288.4 (2006). Glass in building-Selection and installation. 4. Australia Standards Australia
AS/NZS4284 (2008). Testing of building facade. AS/NZS4284. Australia Standards Australia
292
Asadi, E., M. G. Da Silva, C. H. Antunes and L. Dias (2012). "Multi-objective optimization for building retrofit strategies: a model and an application." Energy and Buildings 44: 81-87.
Arnold, F. R. (1955). Steady-state behavior of systems provided with nonlinear dynamic vibration absorbers. Journal of Applied Mechanics, 22(4).
B. Samali, P. A. (2014). Control of earthquake-induced motion of midrise buildingsusing smart façade systems. 6th World Conference on Structural Control andMonitoring, Barcelona,Spain.
B. Samali, P. A. (2014). Evaluation of in-plane and out-of-plane movement of façadepanels to reduce structure response during earthquake excitation 23th AustralianConference of the Mechanics of Structure and Material, Byron Bay, Australia.
Baird, A., R. Diaferia, A. Palermo and S. Pampanin (2011). Parametric investigation of seismic interaction between precast concrete cladding systems and moment resisting frames. Structures Congress.
Baird, A., A. Palermo and S. Pampanin (2011). "Facade damage assessment of multi-storey buildings in the 2011 Christchurch earthquake." Bulletin of the New Zealand Society for earthquake engineering 44(4): 368-376.
Baird, A., A. Palermo and S. Pampanin (2012). "Façade damage assessment of concrete buildings in the 2011 Christchurch earthquake." Structural Concrete 13(1): 3-13.
Baird, A., A. Palermo, S. Pampanin, P. Riccio and A. Tasligedik (2011). "Focusing on reducing the earthquake damage to Façade systems." Bulletin of the New Zealand Society for Earthquake Engineering 44(2): 108.
Behr, R., A. Belarbi and J. Culp (1995). "Dynamic racking tests of curtain wall glass elements with in‐plane and out‐of‐plane motions." Earthquake engineering & structural dynamics 24(1): 1-14.
Behr, R. A. (1998). "Seismic performance of architectural glass in mid-rise curtain wall." Journal of Architectural Engineering 4(3): 94-98.
Behr, R. A. (2006). "Design of architectural glazing to resist earthquakes." Journal of architectural engineering 12(3): 122-128.
Behr, R. A. and A. Belarbi (1996). "Seismic Test Methods for Architectural Glazing Systems." Earthquake Spectra 12(1): 129-143.
Braham, W. (2005). "Active Glass Walls: A Typological and Historical Account."
Brookes, A. J. and C. Grech (2013). The building envelope: applications of new technology cladding, Butterworth-Heinemann.
Calvi, G. M., R. Pinho, G. Magenes, J. J. Bommer, L. F. Restrepo-Vélez and H. Crowley (2006). "Development of seismic vulnerability assessment methodologies over the past 30 years." ISET journal of Earthquake Technology 43(3): 75-104.
293
Carlson, J. D. and M. R. Jolly (2000). "MR fluid, foam and elastomer devices." mechatronics 10(4): 555-569.
Carmody, J., S. Selkowitz, E. Lee, D. Arasteh and T. Willmert (2004). Window System for High-Performance Buildings, W. W. Norton & Company.
Cartlidge, u. (2009). " Quantity Surveyor's Pocket Book." Butterworth-Heinemann(London).
Chandler, A. M. and P. A. Mendis (2000). "Performance of reinforced concrete frames using force and displacement based seismic assessment methods." Engineering Structures 22.4 (2000): 352-363." 22 4: 11.
Chen, G., & Wu, J. (2003). Experimental study on multiple tuned mass dampers to reduce seismic responses of a three‐storey building structure. Earthquake engineering & structural dynamics, 32(5), 793-810
Chew, M., S. Tan and K. Kang (2004). "A technical evaluation index for curtain wall and cladding facades." Structural Survey 22(4): 210-227.
Clark, A. J. (1988). Multiple passive tuned mass damper for reducing earthquake induced building motion. Proc.
D. Saelens, S. R., H. Hens (2003). On the influence of the inlet temperature inmultiple-skin facade modeling. Eighth International IBPSA Conference,, Eindhoven,Netherlands.
da Silva, F. M. and M. G. Gomes (2008). "Gap inner pressures in multi-storey double skin facades." Energy and Buildings 40(8): 1553-1559.
Datta, T. (2003). "A state-of-the-art review on active control of structures." ISET Journal of earthquake technology 40(1): 1-17.
De Matteis, G. (2005). "Effect of lightweight cladding panels on the seismic performance of moment resisting steel frames." Engineering structures 27(11): 1662-1676.
Doedel, E. (1986). AUTO: Software for Continuation and Bifurcation Problems in Ordinary Differential Equations; Including the AUTO 86 User Manual.
Doedel, E., Keller, H. B., & Kernevez, J. P. (1991). Numerical analysis and control of bifurcation problems (II): Bifurcation in infinite dimensions. International Journal of Bifurcation and Chaos, 1(04), 745-772.
Doherty, K., M. C. Griffith, N. Lam and J. Wilson (2002). "Displacement‐based seismic analysis for out‐of‐plane bending of unreinforced masonry walls." Earthquake engineering & structural dynamics 31(4): 833-850.
Eicker, U. and D. Pietruschka (2009). "Design and performance of solar powered absorption cooling systems in office buildings." Energy and Buildings 41(1): 81-91.
294
Elghazouli, A. (2009). Seismic design of buildings to Eurocode 8, CRC Press.
Fajfar, P. (2000). "A nonlinear analysis method for performance-based seismic design." Earthquake spectra 16(3): 573-592.
FEMA356 (2000). Prestandard and commentary for the seismic rehabilitation of buildings. Report , Washington, DC. B. S. S. Council.
FEMA-389 (2004). Primer for design professionals: communicating with owners and managers of new buildings on earthquake risk(risk management series. Council, Building Seismic Safety. Chapter2.
Fu, Y. and K. Kasai (1998). "Comparative study of frames using viscoelastic and viscous dampers." Journal of Structural Engineering 124(5): 513-522.
Fujino, Y., L. Sun, B. M. Pacheco and P. Chaiseri (1992). "Tuned liquid damper (TLD) for suppressing horizontal motion of structures." Journal of Engineering Mechanics 118(10): 2017-2030.
G. James Glass and Aluminium Pty Ltd (2003). Brisbane Australia.
Georgiou, J. (2010). "Verification of a building defect classification system for housing." Structural Survey 28(5): 370-383.
Ghobarah, A. (2001). "Performance-based design in earthquake engineering: state of development." Engineering structures 23(8): 878-884.
Goodno B. J., P. J.-P. a. C. J. I. (1996). An Optimal Design Approach for Passive Damping of building structures using architectural Cladding. Eleventh World Conference on Earthquake Engineering. Acapulco, Mexico, Pergamon: 1453-1460.
Goodno, B. J. and H. Palsson (1986). "Analytical studies of building cladding." Journal of structural engineering 112(4): 665-676.
Gratia, E. and A. De Herde (2007). "Are energy consumptions decreased with the addition of a double-skin?" Energy and Buildings 39(5): 605-619.
Hareer, R. W. (2007). "Seismic response of building façade system with energy absorbing connections."
He, H. S. (2005). IFC-based framework for evaluating building envelope performance, Concordia University.
Hemalatha, G. and K. Jaya (2008). "Water tank as passive TMD for seismically excited structures." Asian journal of civil engineering (building and housing) 9(4): 349-366.
Hemalatha, G., Jaya, K. P, "Water Tank as Passive TMD for Seismically Excited Structures." Asian Journal of Civil Engineering (Building and Housing) 9(4): 18.
Hensen, J., M. Bartak and F. Drkal (2002). "Modeling and simulation of a double-skin façade system." ASHRAE Transactions 108(2): 1251-1259.

295
Hinman, E. and C. Arnold (2010). "10 Building Envelope and Glazing." Handbook for Blast-Resistant Design of Buildings: 263.
Holodniok, M., & Kubíček, M. (1984). DERPER—An algorithm for the continuation of periodic solutions in ordinary differential equations. Journal of Computational Physics, 55(2), 254-267.
Houston, J. H. (2011). DEVELOPING DENDRIFORM FAÇADES USING FLOW NETS AS A DESIGN AID, Citeseer.
Hunt, J. B., & Nissen, J. C. (1982). The broadband dynamic vibration absorber. Journal of sound and vibration, 83(4), 573-578.
Hunt, J. P. (2010). "Seismic performance assessment and probabilistic repair cost analysis of precast concrete cladding systems for multistory buildings."
Igusa, T., & Xu, K. (1991). Wide-band response of multiple subsystems with high modal density. Stochastic Structural Dynamics: New theoretical developments, 1, 131
Iwanami, K., and K. Seto. "Optimum design of dual tuned mass dampers and their effectiveness." (1984): 44-52.
J Smith and D. Jaggar (2006). " Building Cost Planning for the Design Team." Butterworth-Heinemann(London).
Jagadish, K., B. Prasad and P. V. Rao (1979). "The inelastic vibration absorber subjected to earthquake ground motions." Earthquake Engineering & Structural Dynamics 7(4): 317-326.
Jangid, R. and J. Kelly (2001). "Base isolation for near‐fault motions." Earthquake engineering & structural dynamics 30(5): 691-707.
Ji, H.-R., Y.-J. Moon, C.-H. Kim and I.-W. Lee (2005). Structural vibration control using semiactive tuned mass damper. The eighteenth KKCNN symposium on civil engineering-KAIST6, Taiwan.
JohnC, B. (2003). Numerical methods for ordinary differential equations
Jordanov, I. N., & Cheshankov, B. I. (1988). Optimal design of linear and non-linear dynamic vibration absorbers. Journal of Sound and Vibration, 123(1), 157-170.
Kareem, A. (1992). "Dynamic response of high-rise buildings to stochastic wind loads." Journal of Wind Engineering and Industrial Aerodynamics 42(1-3): 1101-1112.
Kareem, A., Kijewski, T., & Tamura, Y. (1999). Mitigation of motions of tall buildings with specific examples of recent applications. Wind and structures, 2(3), 201-251.
Kareem, A., & Kline, S. (1995). Performance of multiple mass dampers under random loading. Journal of structural engineering, 121(2), 348-361.

296
Kaynia, A. M., Biggs, J. M., & Veneziano, D. (1981). Seismic effectiveness of tuned mass dampers. Journal of the Structural Division, 107(8), 1465-1484.
Khoraskani, R. A. (2015). Advanced Connection Systems for Architectural Glazing, Springer.
Kitagawa, Y. and M. Midorikawa (1998). "Seismic isolation and passive response-control buildings in Japan." Smart materials and structures 7(5): 581.
Knaack, U., T. Klein, M. Bilow and T. Auer (2014). Façades: principles of construction, Birkhäuser.
Kragh, M. and P. A. Components (2001). "Monitoring of Advanced Facades and Environmental Systems." whole-life performance of facades University of Bath, CWCT.
Lee, E., S. Selkowitz, V. Bazjanac, V. Inkarojrit and C. Kohler (2002). "High-performance commercial building facades." Lawrence Berkeley National Laboratory.
Lee, W. K., & Park, H. D. (1999). Second-order approximation for chaotic responses of a harmonically excited spring–pendulum system. International journal of non-linear mechanics, 34(4), 749-757.
Li, B., G. L. Hutchinson and C. F. Duffield (2011). "The influence of non‐structural components on tall building stiffness." The Structural Design of Tall and Special Buildings 20(7): 853-870.
Li, C. (2000). "Performance of multiple tuned mass dampers for attenuating undesirable oscillations of structures under the ground acceleration." Earthquake Engineering & Structural Dynamics 29(9): 1405-1421.
Li, C. (2002). "Optimum multiple tuned mass dampers for structures under the ground acceleration based on DDMF and ADMF." Earthquake engineering & structural dynamics 31(4): 897-919.
Li, C., Lio, Y, (2002). "Further Characteristics for Multiple Tuned Mass Dampers." Journal of Structural Engineering 128: 6.
Lindow, E. S. and L. F. Jasinski (2003). Panelized wall construction: Design, testing, and construction procedures. Performance of exterior building walls, ASTM International.
Lukkunaprasit, P. and A. Wanitkorkul (2001). "Inelastic buildings with tuned mass dampers under moderate ground motions from distant earthquakes." Earthquake engineering & structural dynamics 30(4): 537-551.
Ma, Z., P. Cooper, D. Daly and L. Ledo (2012). "Existing building retrofits: Methodology and state-of-the-art." Energy and buildings 55: 889-902.
Mahmoodi, P., L. Robertson, M. Yontar, C. Moy and L. Feld (1987). Performance of viscoelastic dampers in world trade center towers. Dynamics of structures, ASCE.

297
Masri, S. F. (1972). Forced vibration of a class of non-linear two-degree-of-freedom oscillators. International Journal of Non-Linear Mechanics, 7(6), 663-674.
Martinez-Rodrigo, M. and M. Romero (2003). "An optimum retrofit strategy for moment resisting frames with nonlinear viscous dampers for seismic applications." Engineering Structures 25(7): 913-925.
Matta, E., De Stefano, A., & Spencer, B. F. (2009). A new passive rolling‐pendulum vibration absorber using a non‐axial‐symmetrical guide to achieve bidirectional tuning. Earthquake Engineering & Structural Dynamics, 38(15), 1729-1750.
Mazzoni, R. J., G. H. Bowser and R. R. Lewchuk (1976). Add-on multiple glazing with hygroscopic material, Google Patents.
McNamara and R. J (1977). "Tuned mass dampers for buildings." Journal of the Structural Division 103(9): 1785-1798.
McNamara, R. J., D. W. Boggs, M.-L. Lai, N. Makris, E. J. Nielsen and J. E. Cermak (1997). Tailoring of damping in structures: Design issues. Building to Last, ASCE.
Memari, A. M., R. A. Behr and P. A. Kremer (2003). "Seismic behavior of curtain walls containing insulating glass units." Journal of architectural engineering 9(2): 70-85.
Metelli, G. and P. Riva (2007). Behaviour of a support system for pre-cast concrete panels. Proceedings of the Sixth Conference on Fracture Mechanics of Concrete and Concrete Structures, Ed. Francis & Taylor Catania,, Italy.
Mohotti, D., R. Lunmantara, T. Ngo and P. Mendis (2013). "Improving the safety of buildings through an innovative sustainable façade system."
Mondal, J., H. Nimmala, S. Abdulla and R. Tafreshi (2014). Tuned Liquid Damper. The 3rd International Conference on Mechanical Engineering and Mechatronics, Prague.
Moon, K.-S. (2005). Dynamic interrelationship between technology and architecture in tall buildings, Massachusetts Institute of Technology.
Moon, K. (2009). "Tall building motion control using double skin façades." Journal of architectural engineering 15(3): 84-90.
Murray, S. C. (2009). Contemporary curtain wall architecture, Princeton Architectural Press.
Mwafy, A. and A. Elnashai (2001). "Static pushover versus dynamic collapse analysis of RC buildings." Engineering structures 23(5): 407-424.
Nagarajaiah, S. (1994, August). Fuzzy controller for structures with hybrid isolation system. In Proc., 1st World Conf. on Structural Control (pp. 67-76). Los Angeles: International Association for Structural Control.
298
Natsiavas, S. (1992). Steady state oscillations and stability of non-linear dynamic vibration absorbers. Journal of Sound and Vibration, 156(2), 227-245.
Nayfeh, A. H., & Balachandran, B. (2008). Applied nonlinear dynamics: analytical, computational and experimental methods. John Wiley & Sons.
Nissen, J. C., Popp, K., & Schmalhorst, B. (1985). Optimization of a non-linear dynamic vibration absorber. Journal of Sound and Vibration, 99(1), 149-154.
NZS1170.5 (2004). Structural design actions Part 5: EARTHQUAKE ACTIONS New Zealand, Standard New Zealand.
Olanders Window Replacement (2011). http://www.olanderswindow.com/our-windows-doors-services/windows/. USA.
Otani, S. (1981). "Hysteresis models of reinforced concrete for earthquake response analysis." Journal of Faculty of Engineering 36(2): 407-441.
Palermo, A., S. Pampanin, A. Baird and P. Riccio (2010). Focusing on reducing the earthquake damage to non-structural components in buildings. Proceeding of NZSEE Conference on Earthquake Prone Buildings: How Ready Are We?, Paper No. 70, 28-26 March.
Patterson, M. (2011). Structural glass facades and enclosures, John Wiley & Sons.
Paulay, T., Priestley, M.J.N, (1992). "Seismic design of reinforced concrete and masonry buildings." (ohn Wiley and Sons).
Permasteelisa (2009). Design Handbook-Curtain Walling Typologies.
Pinelli, J.-P., J. I. Craig and B. J. Goodno (1995). "Energy-based seismic design of ductile cladding systems." Journal of Structural Engineering 121(3): 567-578.
Pipes, L. A. (1953). Analysis of a nonlinear dynamic vibration absorber. JOURNAL OF APPLIED MECHANICS-TRANSACTIONS OF THE ASME, 20(4), 515-518.
Poirazis, H. (2008). "Single and Double Skin Glazed Office Buildings." Analyses of Energy Use and Indoor.
Poizaris, H. (2004). Double skin facades for office buildings, Division of Energy and Building Design. Department of Architecture and Built Environment. Lund University.
Priestley, M. (2000). "Performance based seismic design." Bulletin of the New Zealand society for earthquake engineering 33(3): 325-346.
Priwer, S. and C. Phillips (2014). Skyscrapers and High Rises, Routledge.
Rajgopal, K. and S. A. Jayachandran (2012). "Investigation of glass as a structural material and comparative study of diffrent types of glass."

299
Rana, R. and T. Soong (1998). "Parametric study and simplified design of tuned mass dampers." Engineering structures 20(3): 193-204.
Reed, D., J. Yu, H. Yeh and S. Gardarsson (1998). "Investigation of tuned liquid dampers under large amplitude excitation." Journal of engineering mechanics 124(4): 405-413.
Rice, E. O. (2006). Daylight in façade renewal: using new metrics to inform the retrofitting of aging modern-ear façade types, Massachusetts Institute of Technology.
Roberson, R. E. (1952). Synthesis of a nonlinear dynamic vibration absorber. Journal of the Franklin Institute, 254(3), 205-220.
Roth, K., Lawrence, T. & Brodrick, (2007). "Double-Skin Façades. ." American Society of Heating, Refrigerating and Air-Conditioning Engineers.
Sacks, R., C. M. Eastman, G. Lee and D. Orndorff (2005). "A target benchmark of the impact of three-dimensional parametric modeling in precast construction." PCI journal 50(4): 126.
Sadek, F., B. Mohraz, A. W. Taylor and R. M. Chung (1997). "A method of estimating the parameters of tuned mass dampers for seismic applications." Earthquake Engineering and Structural Dynamics 26(6): 617-636.
Saelens, D., B. Blocken, S. Roels and H. Hens (2005). Optimization of the energy performance of multiple-skin facades. Proceedings of IBPSA International Conference on Building Simulation.
Saelens, D., S. Roels and H. Hens (2003). "On the Influence of the inlet temperature as a boundary condition for multiple-skin facade modelling." Energy and Buildings 36(8): 825-835.
Saelens, D., S. Roels and H. Hens (2003). On the influence of the inlet temperature in multi-skin facade modelling. Optimization of the Energy Performance of Multiple-Skin Facades. Netherlands: 7.
Sanders, R. M. (2006). "Curtain walls: not just another pretty facade." Journal of Architectural Technology 23(1): 1-8.
Seki, M., R. Vacareanu and A. Chesca (2008). Analytical study on the application of seismic isolation technology to the vulnearable buildings in Romenia. The 14th World Conference on Earthquake Engineering, Beijing, China.
Shameri, M., M. Alghoul, K. Sopian, M. F. M. Zain and O. Elayeb (2011). "Perspectives of double skin façade systems in buildings and energy saving." Renewable and Sustainable Energy Reviews 15(3): 1468-1475.
Shiba, K., S. Mase, Y. Yabe and K. Tamura (1998). "Active/passive vibration control systems for tall buildings." Smart materials and structures 7(5): 588.
Sivagnanasundram, S. ( 2011). In-Plane Seismic Performance of Glass Facade Systems. Doctor of Philosophy, Swinburne University of Technology.
300
Sivanerupan, S., J. Wilson, E. Gad and L. NTK (2008). Drift Performance of Facade Systems. AEES. Ballarat,Victoria,Ausrtalia.
Smith, B. S., A. Coull and B. S. Stafford-Smith (1991). Tall building structures: analysis and design, Wiley New York.
Snowdon, J. C. (1959). Steady‐State Behavior of the Dynamic Absorber. The Journal of the Acoustical Society of America, 31(8), 1096-1103.
Soong, T. and B. Spencer (2002). "Supplemental energy dissipation: state-of-the-art and state-of-the-practice." Engineering Structures 24(3): 243-259.
Soong, T. T. and G. F. Dargush (1997). "Passive energy dissipation systems in structural engineering."
Song, Y., Sato, H., Iwata, Y., & Komatsuzaki, T. (2003). The response of a dynamic vibration absorber system with a parametrically excited pendulum. Journal of Sound and Vibration, 259(4), 747-759.
Speck, J. A. (2010). Hybrid window wall/curtain wall system and method of installation, Google Patents.
Spencer Jr, B. and S. Nagarajaiah (2003). "State of the art of structural control." Journal of structural engineering 129(7): 845-856.
Streicher, W., R. Heimrath, H. Hengsberger and T. Mach (2007). "On the typology, costs, energy performance, environmental quality and operational characteristics of double skin façades in European buildings." Advances in Building Energy Research 1(1): 1-28.
Streicher, W., R. Heimrath, H. Hengsberger, T. Mach, R. Waldner, G. Flamant, X. Loncour, G. Guarracino, H. Erhorn, H. Erhorn-Kluttig, M. Santamouris, I. Farou, S. Zerefos, M. Assimakopoulos, R. Duarte, Å. Blomsterberg, L. Sjöberg and C. Blomquist (2007). "On the Typology, Costs, Energy Performance, Environmental Quality and Operational Characteristics of Double Skin Façades in European Buildings." Advances in Building Energy Research 1: 28.
Symans, M. D. C., M .C, (1999). "Semi-active control systems for seismic protection of structures" 21, , PP. 469–487." Engineering Structures 21: 19.
Sun, C., Eason, R. P., Nagarajaiah, S., & Dick, A. J. (2013). Hardening Düffing oscillator attenuation using a nonlinear TMD, a semi-active TMD and multiple TMD. Journal of sound and vibration, 332(4), 674-686.
Sun, C., & Nagarajaiah, S. (2014). Study on semi‐active tuned mass damper with variable damping and stiffness under seismic excitations. Structural Control and Health Monitoring, 21(6), 890-906.
Sun, C., Nagarajaiah, S., & Zou, K. (2013). Study of a novel adaptive passive stiffness device and its application for seismic protection. Earthquake Engineering and Structural Dynamics, vol. submitted.

301
Tabuada, P. (2009). Verification and control of hybrid systems: a symbolic approach, Springer Science & Business Media.
Tasligedik, A., S. Pampanin and A. Palermo (2012). "Damage states and cyclic behaviour of drywalls infilled within RC frames." Bulletin of the New Zealand Society for Earthquake Engineering 45(2): 84-94.
Taylor, D. and P. Duflot (2005). Fluid viscous dampers used for seismic energy dissipation in structures, Taylor Device Inc, Technical Article.
Taylor, D. P. and M. C. Constantinou (1998). Fluid dampers for applications of seismic energy dissipation and seismic isolation, Taylor Devices, Incorporated.
Thambiratnam, D. (2010). Seismic mitigation of building structural systems using passive dampers. Proceedings of the 9th US National and 10th Canadian Conference on Earthquake Engineering, Earthquake Engineering Research Institute & Canadian Association for Earthquake Engineering.
Toledo Arias, C. A. (2013). "Seismic analysis of nonstructural elements."
Traulsen, S. and R. McClellan (2010). Prefabricated reinforced concrete panel curtain-wall system, Google Patents.
Tsai, H. C. and G. C. Lin (1993). "Optimum tuned‐mass dampers for minimizing steady‐state response of support‐excited and damped systems." Earthquake engineering & structural dynamics 22(11): 957-973.
Uang, C. M. and V. V. Bertero (1990). "Evaluation of seismic energy in structures." Earthquake Engineering & Structural Dynamics 19(1): 77-90.
Vyzantiadou, M. and A. Avdelas (2004). "Point fixed glazing systems: technological and morphological aspects." Journal of Constructional Steel Research 60(8): 1227-1240.
W. Bush, F. J., S. Steinberg and C. Kaliniak (2004). Glazing and Security GlassApplications. Building Security, Digital Engineering Library: 18.
Walker III, J. R., D. A. Niemoeller and M. Michno (2011). Curtainwall system, Google Patents.
Webb, W. (1989). Exterior wall panel, Google Patents.
Wellershoff, F. and G. Sedlacek (2003). Glass Pavilion Rheinbach–Stability of Glass Columns. The Leading International Glass Conference “Glass Processing Days 2003”, Tampere, Finland, June 15-18.
Wilkinson, S. and R. Hiley (2006). "A non-linear response history model for the seismic analysis of high-rise framed buildings." Computers & structures 84(5): 318-329.
302
Yamaguchi, H., & Harnpornchai, N. (1993). Fundamental characteristics of multiple tuned mass dampers for suppressing harmonically forced oscillations. Earthquake engineering & structural dynamics, 22(1), 51-62.
Yang, J. and T. Soong (1988). "Recent advances in active control of civil engineering structures." Probabilistic Engineering Mechanics 3(4): 179-188.
Yang, J. N. and A. K. Agrawal (2002). "Semi-active hybrid control systems for nonlinear buildings against near-field earthquakes." Engineering Structures 24(3): 271-280.
Yankelevsky, D. Z., S. Schwarz and Y. Karinski (2011). "Theory and Practice in Reducing the Vulnerability of Residential Buildings Subjected to Extreme Loads-a Multi Hazard Perspective." Applied Mechanics and Materials 82: 3-14.
Yee, A. A. and P. H. D. Eng (2001). "Structural and economic benefits of precast/prestressed concrete construction." PCI journal 46(4): 34-43.
Zhang, Z., J. L. Provis, A. Reid and H. Wang (2014). "Geopolymer foam concrete: an emerging material for sustainable construction." Construction and Building Materials 56: 113-127.
Zhou, F. and Q. Xian (2001). "Recent development on seismic isolation, energy dissipation, passive and semi-active control of structures in PR China." Earthquake Engineering Frontiers in the New Millennium: 279.
Zhou, J. and Y. Chen (2010). "A review on applying ventilated double-skin facade to buildings in hot-summer and cold-winter zone in China." Renewable and Sustainable Energy Reviews 14(4): 1321-1328.
Zuo, L. (2009). Effective and robust vibration control using series multiple tuned-mass dampers. Journal of Vibration and Acoustics, 131(3), 031003.
Xu, K., and Igusa, T. (1992). "Dynamic characteristics of multiple substructures with closely spaced frequencies. Earthquake engineering & structural dynamics, 21(12), 1059-1070.
Copyright © 2022 FDOKUMEN