Optics based biohashing using joint transform correlator
9
Optics based biohashing using joint transform correlator Nirmala Saini, Aloka Sinha * Department of Physics, Indian Institute of Technology Delhi, Hauz Khas, New Delhi 110 016, India article info Article history: Received 27 July 2009 Received in revised form 9 November 2009 Accepted 9 November 2009 Keywords: Biohashing Joint transform correlator Biometrics Feature extraction Face recognition abstract Most authentication process uses password and personal identification numbers (PIN) for security pur- poses. In order to remove the problem of hacking or stealing of the password and PIN numbers, there has been an increased interest in the utilization of specific biometric feature of the user. Recently, bio- hashing systems have been introduced for automatic biometric recognition. In a biohashing system, bio- hash codes are generated using the feature of the biometric. A basic biohashing system involves two steps. First is the extraction of the feature from the input biometric image and second is the discretisation of the obtained feature vector by using ortho-normalized random numbers. In this paper, a new biohash- ing system has been proposed in which joint transform correlator (JTC) has been used for extraction of the specific feature of the biometric. In the enrolment process, a biohash code has been generated by using a single face image and then stored. In the verification process, this biohash code is matched with the verification codes for recognition purpose. The main advantage of the proposed biohashing method is the possibility of the optical implementation of the feature extraction of the face image. Experimental as well as simulation results have been given to validate the proposed technique. Normalized Hamming dis- tance has been calculated to discriminate the genuine and impostor face images. By varying the dimen- sion of the feature matrix, the study of the variation of the normalized Hamming distance with the density of the population has been undertaken. For the performance evaluation of the proposed tech- nique the false rejection ratio (FRR) and false acceptance ratio (FAR) have also been calculated. Ó 2009 Elsevier B.V. All rights reserved. 1. Introduction In recent time, data security has become a fundamental need for everyone. So there is an increased interest to secure data [1]. Opti- cal systems have recently received increasing attention for the dis- tinct advantages of processing complex two-dimensional data in parallel and transmission at great speed. Various optical image encryption algorithms have been proposed to secure data [2,3]. Pattern recognition techniques are also being used these days for authentication purposes. Currently, there are three methods to authenticate a person: (1) through something that an user knows and can remember, for example, personal identification number (PIN) and password; (2) by using something that an user has, such as key or token as well as magnetic stripe cards; and (3) based on individual physiological or behavioural characteristics that an user is, such as biometric features [4]. The first two conventional secu- rity systems are more vulnerable because the password, PIN or to- ken can be lost or forgotten by the users. These can also be shared among users of a system and co-workers. The use of the biometric can remove these problems due to their automatic personal iden- tification and authentication. The recognition process demands that the person to be identified is physically present at the point of authentication. In addition, biometric authentication cannot be transferred or shared. The concept of cancellable biometric was introduced by Ratha et al. [5] and Bolle et al. [6]. Various biometric verification and recognition algorithms such as face authentication, fingerprint verification and iris recognition algorithms have been proposed for automatic recognition [7–13]. A biometric verifica- tion system has been proposed in which the system tries to match an input biometric (such as fingerprint, face image, or iris image) with a stored biometric template [7]. New authentication systems based on the palmprint have also been proposed [14–16]. Kong et al. proposed a feature-level fusion approach for improving the efficiency of palmprint identification [16]. Along with various advantages, biometric technology also suf- fers from some inherent biometric-specific threats [6]. If a biomet- ric is compromised, a new template cannot be assigned and it will be unusable, just like passwords. In order to solve this problem two-factor or more authenticator can be combined with the bio- metric. For example biometric such as fingerprint, palmprint and face image can be combined with a token to provide more security. A token is a portable device like an ATM card or smart card that can be used to store long challenging code words. Recently, various cancellable biometric formulations known as biohashing have been proposed in which biohash codes have been generated by 0030-4018/$ - see front matter Ó 2009 Elsevier B.V. All rights reserved. doi:10.1016/j.optcom.2009.11.003 * Corresponding author. Tel.: +91 9717050954. E-mail address: [email protected] (A. Sinha). Optics Communications 283 (2010) 894–902 Contents lists available at ScienceDirect Optics Communications journal homepage: www.elsevier.com/locate/optcom
Transcript of Optics based biohashing using joint transform correlator
Optics Communications 283 (2010) 894–902
Contents lists available at ScienceDirect
Optics Communications
journal homepage: www.elsevier .com/ locate/optcom
Optics based biohashing using joint transform correlator
Nirmala Saini, Aloka Sinha *
Department of Physics, Indian Institute of Technology Delhi, Hauz Khas, New Delhi 110 016, India
a r t i c l e i n f o
Article history:Received 27 July 2009Received in revised form 9 November 2009Accepted 9 November 2009
Keywords:BiohashingJoint transform correlatorBiometricsFeature extractionFace recognition
0030-4018/$ - see front matter � 2009 Elsevier B.V. Adoi:10.1016/j.optcom.2009.11.003
* Corresponding author. Tel.: +91 9717050954.E-mail address: [email protected] (A. Sinh
a b s t r a c t
Most authentication process uses password and personal identification numbers (PIN) for security pur-poses. In order to remove the problem of hacking or stealing of the password and PIN numbers, therehas been an increased interest in the utilization of specific biometric feature of the user. Recently, bio-hashing systems have been introduced for automatic biometric recognition. In a biohashing system, bio-hash codes are generated using the feature of the biometric. A basic biohashing system involves twosteps. First is the extraction of the feature from the input biometric image and second is the discretisationof the obtained feature vector by using ortho-normalized random numbers. In this paper, a new biohash-ing system has been proposed in which joint transform correlator (JTC) has been used for extraction ofthe specific feature of the biometric. In the enrolment process, a biohash code has been generated byusing a single face image and then stored. In the verification process, this biohash code is matched withthe verification codes for recognition purpose. The main advantage of the proposed biohashing method isthe possibility of the optical implementation of the feature extraction of the face image. Experimental aswell as simulation results have been given to validate the proposed technique. Normalized Hamming dis-tance has been calculated to discriminate the genuine and impostor face images. By varying the dimen-sion of the feature matrix, the study of the variation of the normalized Hamming distance with thedensity of the population has been undertaken. For the performance evaluation of the proposed tech-nique the false rejection ratio (FRR) and false acceptance ratio (FAR) have also been calculated.
� 2009 Elsevier B.V. All rights reserved.
1. Introduction
In recent time, data security has become a fundamental need foreveryone. So there is an increased interest to secure data [1]. Opti-cal systems have recently received increasing attention for the dis-tinct advantages of processing complex two-dimensional data inparallel and transmission at great speed. Various optical imageencryption algorithms have been proposed to secure data [2,3].Pattern recognition techniques are also being used these days forauthentication purposes. Currently, there are three methods toauthenticate a person: (1) through something that an user knowsand can remember, for example, personal identification number(PIN) and password; (2) by using something that an user has, suchas key or token as well as magnetic stripe cards; and (3) based onindividual physiological or behavioural characteristics that an useris, such as biometric features [4]. The first two conventional secu-rity systems are more vulnerable because the password, PIN or to-ken can be lost or forgotten by the users. These can also be sharedamong users of a system and co-workers. The use of the biometriccan remove these problems due to their automatic personal iden-tification and authentication. The recognition process demands
ll rights reserved.
a).
that the person to be identified is physically present at the pointof authentication. In addition, biometric authentication cannot betransferred or shared. The concept of cancellable biometric wasintroduced by Ratha et al. [5] and Bolle et al. [6]. Various biometricverification and recognition algorithms such as face authentication,fingerprint verification and iris recognition algorithms have beenproposed for automatic recognition [7–13]. A biometric verifica-tion system has been proposed in which the system tries to matchan input biometric (such as fingerprint, face image, or iris image)with a stored biometric template [7]. New authentication systemsbased on the palmprint have also been proposed [14–16]. Konget al. proposed a feature-level fusion approach for improving theefficiency of palmprint identification [16].
Along with various advantages, biometric technology also suf-fers from some inherent biometric-specific threats [6]. If a biomet-ric is compromised, a new template cannot be assigned and it willbe unusable, just like passwords. In order to solve this problemtwo-factor or more authenticator can be combined with the bio-metric. For example biometric such as fingerprint, palmprint andface image can be combined with a token to provide more security.A token is a portable device like an ATM card or smart card that canbe used to store long challenging code words. Recently, variouscancellable biometric formulations known as biohashing havebeen proposed in which biohash codes have been generated by
Random Numbers
=
r11 . . . . . . rm1
. . . . . . . . .
. . . . . . . . . r1n . . . . . . rmn
or11 . . . . orm1
. . . . . . . . .
. . . . . . . . . or1n . . . . ormn
X1
X2
.
.
X3
0 if xr i < 0 1 if xr i > 0
b1
b2
.
. bm
Feature Vector
Inner Product and threshold binarization
Biohash Code: bitvector b {0, 1}
Ortho-normalizedRandom Number
bi
r11 . . . . . . rm1
. . . . . . . . .
. . . . . . . . . r1n . . . . . . rmn
. . . . . . . . . . . . . . . . . . . . . .
. . . .
X1
X2
.
.
X3
b1
b2
.
. bm
Fig. 1. The base Biohashing method.
N. Saini, A. Sinha / Optics Communications 283 (2010) 894–902 895
the inner product of the tokenized pseudo random number withthe specific biometric features [4,17–23]. Multi-modal biometricsystems can also overcome some of the limitations of a single bio-metric resulting in a substantial performance improvement[20,21]. A cancellable palmprint authentication system has beenproposed based on the idea that none of the same verificationkey is applied in two different applications and a new verificationkey can be reissued when compromised [23].
In the biohashing algorithms in order to generate the biohashcode different feature extraction algorithms such as discrete cosinetransform [17], principle component analysis (PCA), Fisher dis-criminant analysis (FDA) [4] have been used. All these featureextraction methods are not optically implementable. Joint wavelettransform correlation-based technique has also been proposed forfeature extraction such as the detection of edges in an unknown in-put scene [24]. Javidi et al. suggested a single binary spatial lightmodulator (SLM) to read in sequentially the binarized input signaland the binarized Fourier transform interference intensity in theJTC [25]. Wang et al. have proposed a joint wavelet-transform cor-relator for image feature extraction [26]. Non-linear joint trans-form correlator has been introduced in order to enhance thediscrimination between the subjects [27–29]. A non-linear jointtransform correlator-based two-layer neural network has alsobeen described for real-time face recognition [29]. The JTC tech-nique can be used for both real-time pattern recognition, as wellas image processing operations such as feature extraction.
A basic biohashing system involves two major processes. First isthe extraction of the feature from the input biometric image andsecond is the discretisation of the obtained data (feature vector)by using ortho-normalized random numbers. In this paper, a newbiohashing algorithm has been proposed in which the biohashcode has been generated by an optical method. In earlier proposedbiohashing techniques, the feature of the input biometric is ex-tracted by using digital approaches such as PCA, FDA, DCT. Forthe first time, a new biohashing system has been proposed inwhich JTC is being used to extract the feature of the input image.The inner product of the pseudo random number with this featurevector results in the generation of the biohash code. The paper isorganised as follows: Section 2 gives a brief explanation of the pro-pose technique. Simulation results are explained in Section 3. Theexperimental setup and experimental results are explained in Sec-tions 4 and 5, respectively. Section 6 includes the detail studies. Fi-nally, the paper is concluded in Section 7.
2. Proposed technique
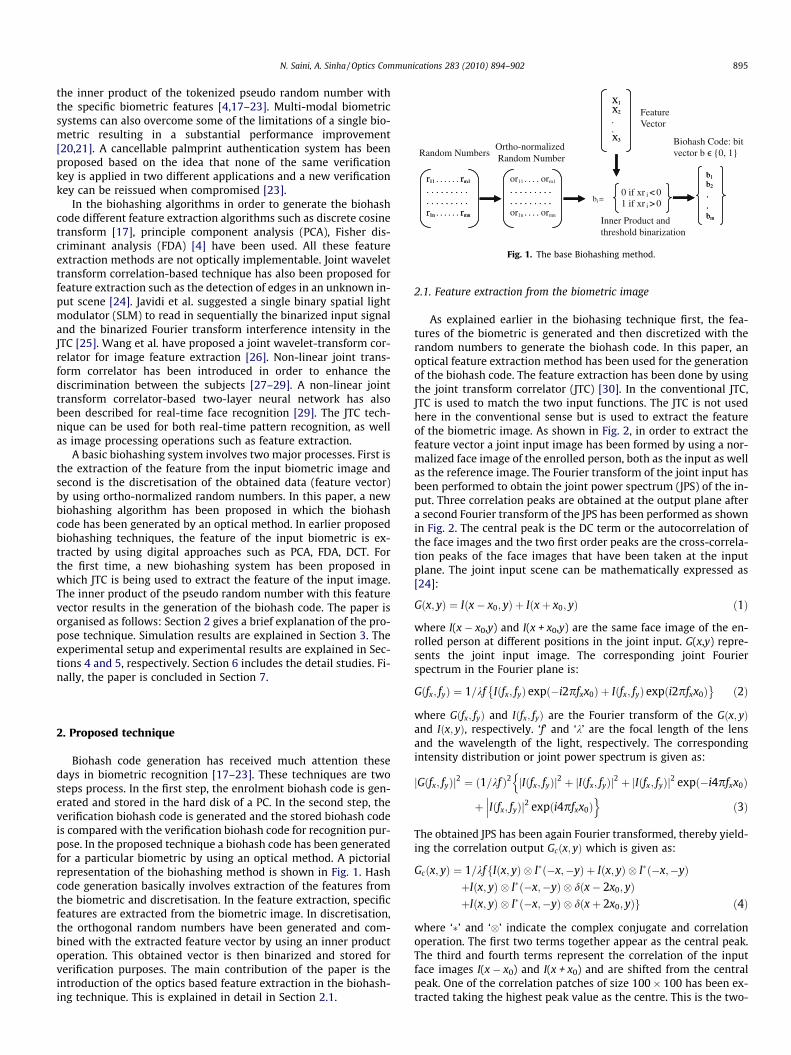
Biohash code generation has received much attention thesedays in biometric recognition [17–23]. These techniques are twosteps process. In the first step, the enrolment biohash code is gen-erated and stored in the hard disk of a PC. In the second step, theverification biohash code is generated and the stored biohash codeis compared with the verification biohash code for recognition pur-pose. In the proposed technique a biohash code has been generatedfor a particular biometric by using an optical method. A pictorialrepresentation of the biohashing method is shown in Fig. 1. Hashcode generation basically involves extraction of the features fromthe biometric and discretisation. In the feature extraction, specificfeatures are extracted from the biometric image. In discretisation,the orthogonal random numbers have been generated and com-bined with the extracted feature vector by using an inner productoperation. This obtained vector is then binarized and stored forverification purposes. The main contribution of the paper is theintroduction of the optics based feature extraction in the biohash-ing technique. This is explained in detail in Section 2.1.
2.1. Feature extraction from the biometric image
As explained earlier in the biohasing technique first, the fea-tures of the biometric is generated and then discretized with therandom numbers to generate the biohash code. In this paper, anoptical feature extraction method has been used for the generationof the biohash code. The feature extraction has been done by usingthe joint transform correlator (JTC) [30]. In the conventional JTC,JTC is used to match the two input functions. The JTC is not usedhere in the conventional sense but is used to extract the featureof the biometric image. As shown in Fig. 2, in order to extract thefeature vector a joint input image has been formed by using a nor-malized face image of the enrolled person, both as the input as wellas the reference image. The Fourier transform of the joint input hasbeen performed to obtain the joint power spectrum (JPS) of the in-put. Three correlation peaks are obtained at the output plane aftera second Fourier transform of the JPS has been performed as shownin Fig. 2. The central peak is the DC term or the autocorrelation ofthe face images and the two first order peaks are the cross-correla-tion peaks of the face images that have been taken at the inputplane. The joint input scene can be mathematically expressed as[24]:
Gðx; yÞ ¼ Iðx� x0; yÞ þ Iðxþ x0; yÞ ð1Þ
where I(x � x0,y) and I(x + x0,y) are the same face image of the en-rolled person at different positions in the joint input. G(x,y) repre-sents the joint input image. The corresponding joint Fourierspectrum in the Fourier plane is:
Gðfx; fyÞ ¼ 1=kf Iðfx; fyÞ expð�i2pfxx0Þ þ Iðfx; fyÞ expði2pfxx0Þ� �
ð2Þ
where Gðfx; fyÞ and Iðfx; fyÞ are the Fourier transform of the Gðx; yÞand Iðx; yÞ, respectively. ‘f’ and ‘k’ are the focal length of the lensand the wavelength of the light, respectively. The correspondingintensity distribution or joint power spectrum is given as:
jGðfx; fyÞj2 ¼ ð1=kf Þ2 jIðfx; fyÞj2 þ jIðfx; fyÞj2 þ jIðfx; fyÞj2 expð�i4pfxx0Þn
þ Iðfx; fyÞj2 expði4pfxx0Þ���
oð3Þ
The obtained JPS has been again Fourier transformed, thereby yield-ing the correlation output Gcðx; yÞ which is given as:
Gcðx; yÞ ¼ 1=kf Iðx; yÞ � I�ð�x;�yÞ þ Iðx; yÞ � I�ð�x;�yÞfþIðx; yÞ � I�ð�x;�yÞ � dðx� 2x0; yÞþIðx; yÞ � I�ð�x;�yÞ � dðxþ 2x0; yÞg ð4Þ
where ‘�’ and ‘�’ indicate the complex conjugate and correlationoperation. The first two terms together appear as the central peak.The third and fourth terms represent the correlation of the inputface images I(x � x0) and I(x + x0) and are shifted from the centralpeak. One of the correlation patches of size 100� 100 has been ex-tracted taking the highest peak value as the centre. This is the two-
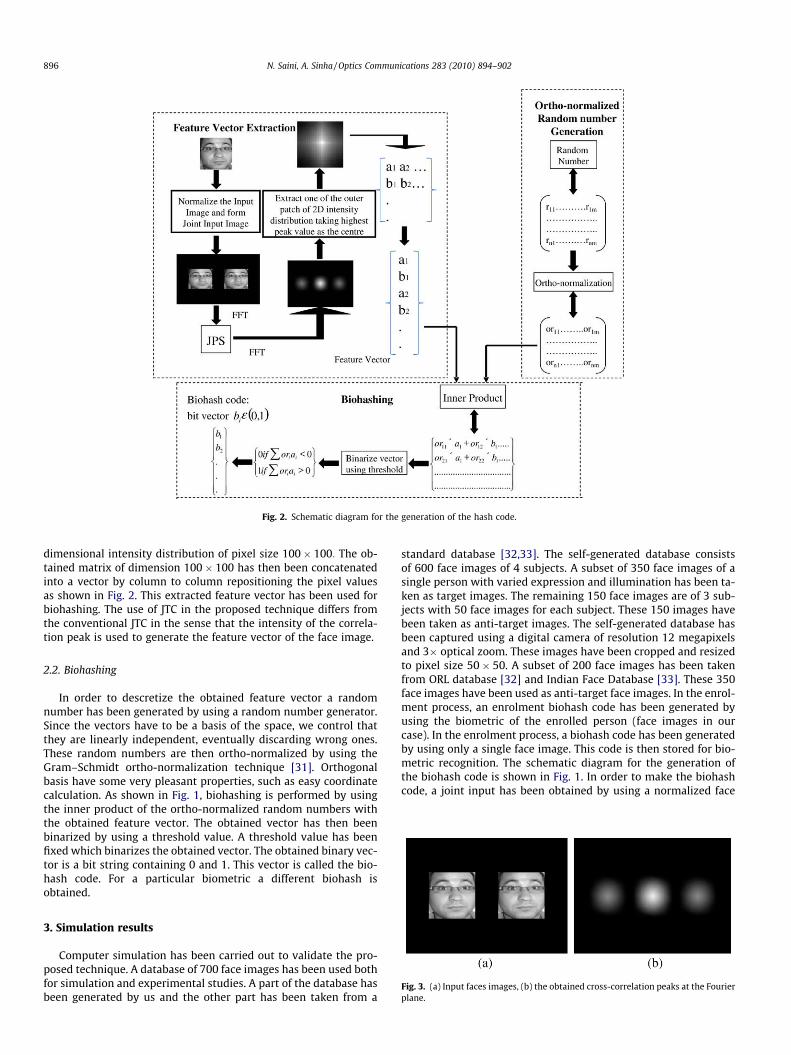
Fig. 2. Schematic diagram for the generation of the hash code.
896 N. Saini, A. Sinha / Optics Communications 283 (2010) 894–902
dimensional intensity distribution of pixel size 100� 100: The ob-tained matrix of dimension 100� 100 has then been concatenatedinto a vector by column to column repositioning the pixel valuesas shown in Fig. 2. This extracted feature vector has been used forbiohashing. The use of JTC in the proposed technique differs fromthe conventional JTC in the sense that the intensity of the correla-tion peak is used to generate the feature vector of the face image.
2.2. Biohashing
In order to descretize the obtained feature vector a randomnumber has been generated by using a random number generator.Since the vectors have to be a basis of the space, we control thatthey are linearly independent, eventually discarding wrong ones.These random numbers are then ortho-normalized by using theGram–Schmidt ortho-normalization technique [31]. Orthogonalbasis have some very pleasant properties, such as easy coordinatecalculation. As shown in Fig. 1, biohashing is performed by usingthe inner product of the ortho-normalized random numbers withthe obtained feature vector. The obtained vector has then beenbinarized by using a threshold value. A threshold value has beenfixed which binarizes the obtained vector. The obtained binary vec-tor is a bit string containing 0 and 1. This vector is called the bio-hash code. For a particular biometric a different biohash isobtained.
Fig. 3. (a) Input faces images, (b) the obtained cross-correlation peaks at the Fourierplane.
3. Simulation results
Computer simulation has been carried out to validate the pro-posed technique. A database of 700 face images has been used bothfor simulation and experimental studies. A part of the database hasbeen generated by us and the other part has been taken from a
standard database [32,33]. The self-generated database consistsof 600 face images of 4 subjects. A subset of 350 face images of asingle person with varied expression and illumination has been ta-ken as target images. The remaining 150 face images are of 3 sub-jects with 50 face images for each subject. These 150 images havebeen taken as anti-target images. The self-generated database hasbeen captured using a digital camera of resolution 12 megapixelsand 3� optical zoom. These images have been cropped and resizedto pixel size 50� 50. A subset of 200 face images has been takenfrom ORL database [32] and Indian Face Database [33]. These 350face images have been used as anti-target face images. In the enrol-ment process, an enrolment biohash code has been generated byusing the biometric of the enrolled person (face images in ourcase). In the enrolment process, a biohash code has been generatedby using only a single face image. This code is then stored for bio-metric recognition. The schematic diagram for the generation ofthe biohash code is shown in Fig. 1. In order to make the biohashcode, a joint input has been obtained by using a normalized face
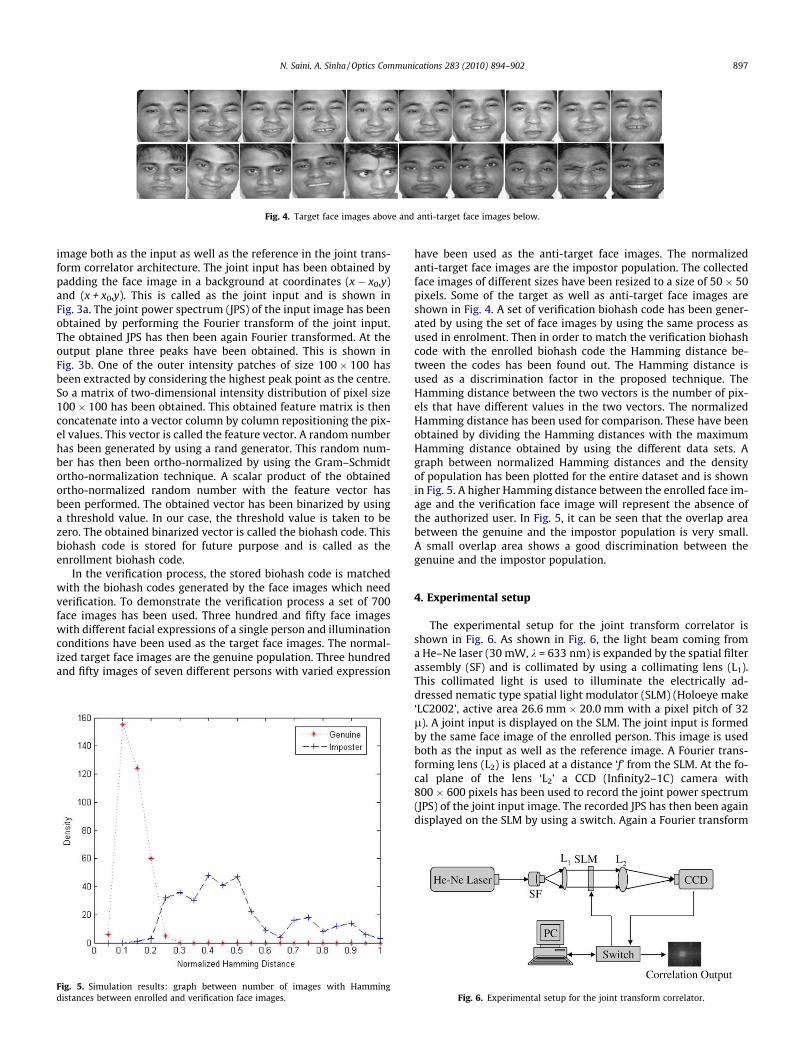
Fig. 4. Target face images above and anti-target face images below.
N. Saini, A. Sinha / Optics Communications 283 (2010) 894–902 897
image both as the input as well as the reference in the joint trans-form correlator architecture. The joint input has been obtained bypadding the face image in a background at coordinates (x � x0,y)and (x + x0,y). This is called as the joint input and is shown inFig. 3a. The joint power spectrum (JPS) of the input image has beenobtained by performing the Fourier transform of the joint input.The obtained JPS has then been again Fourier transformed. At theoutput plane three peaks have been obtained. This is shown inFig. 3b. One of the outer intensity patches of size 100� 100 hasbeen extracted by considering the highest peak point as the centre.So a matrix of two-dimensional intensity distribution of pixel size100� 100 has been obtained. This obtained feature matrix is thenconcatenate into a vector column by column repositioning the pix-el values. This vector is called the feature vector. A random numberhas been generated by using a rand generator. This random num-ber has then been ortho-normalized by using the Gram–Schmidtortho-normalization technique. A scalar product of the obtainedortho-normalized random number with the feature vector hasbeen performed. The obtained vector has been binarized by usinga threshold value. In our case, the threshold value is taken to bezero. The obtained binarized vector is called the biohash code. Thisbiohash code is stored for future purpose and is called as theenrollment biohash code.
In the verification process, the stored biohash code is matchedwith the biohash codes generated by the face images which needverification. To demonstrate the verification process a set of 700face images has been used. Three hundred and fifty face imageswith different facial expressions of a single person and illuminationconditions have been used as the target face images. The normal-ized target face images are the genuine population. Three hundredand fifty images of seven different persons with varied expression
Fig. 5. Simulation results: graph between number of images with Hammingdistances between enrolled and verification face images.
have been used as the anti-target face images. The normalizedanti-target face images are the impostor population. The collectedface images of different sizes have been resized to a size of 50� 50pixels. Some of the target as well as anti-target face images areshown in Fig. 4. A set of verification biohash code has been gener-ated by using the set of face images by using the same process asused in enrolment. Then in order to match the verification biohashcode with the enrolled biohash code the Hamming distance be-tween the codes has been found out. The Hamming distance isused as a discrimination factor in the proposed technique. TheHamming distance between the two vectors is the number of pix-els that have different values in the two vectors. The normalizedHamming distance has been used for comparison. These have beenobtained by dividing the Hamming distances with the maximumHamming distance obtained by using the different data sets. Agraph between normalized Hamming distances and the densityof population has been plotted for the entire dataset and is shownin Fig. 5. A higher Hamming distance between the enrolled face im-age and the verification face image will represent the absence ofthe authorized user. In Fig. 5, it can be seen that the overlap areabetween the genuine and the impostor population is very small.A small overlap area shows a good discrimination between thegenuine and the impostor population.
4. Experimental setup
The experimental setup for the joint transform correlator isshown in Fig. 6. As shown in Fig. 6, the light beam coming froma He–Ne laser (30 mW, k = 633 nm) is expanded by the spatial filterassembly (SF) and is collimated by using a collimating lens (L1).This collimated light is used to illuminate the electrically ad-dressed nematic type spatial light modulator (SLM) (Holoeye make‘LC2002’, active area 26.6 mm � 20.0 mm with a pixel pitch of 32l). A joint input is displayed on the SLM. The joint input is formedby the same face image of the enrolled person. This image is usedboth as the input as well as the reference image. A Fourier trans-forming lens (L2) is placed at a distance ‘f’ from the SLM. At the fo-cal plane of the lens ‘L2’ a CCD (Infinity2–1C) camera with800 � 600 pixels has been used to record the joint power spectrum(JPS) of the joint input image. The recorded JPS has then been againdisplayed on the SLM by using a switch. Again a Fourier transform
Fig. 6. Experimental setup for the joint transform correlator.
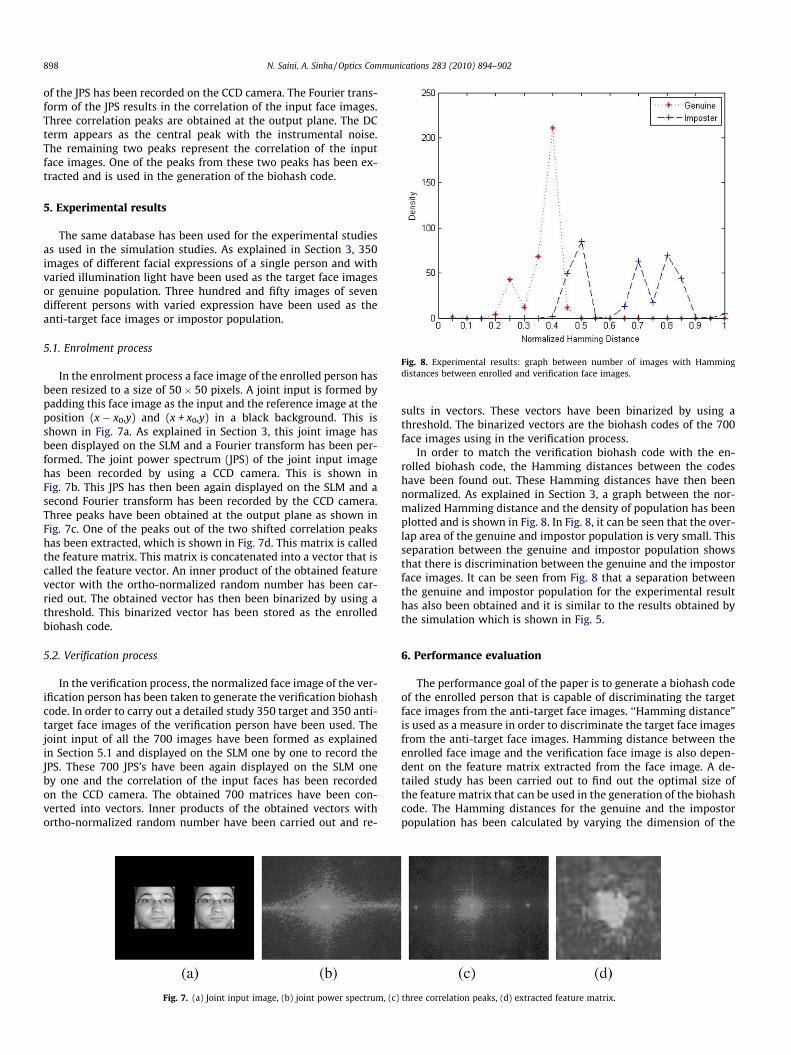
Fig. 8. Experimental results: graph between number of images with Hammingdistances between enrolled and verification face images.
898 N. Saini, A. Sinha / Optics Communications 283 (2010) 894–902
of the JPS has been recorded on the CCD camera. The Fourier trans-form of the JPS results in the correlation of the input face images.Three correlation peaks are obtained at the output plane. The DCterm appears as the central peak with the instrumental noise.The remaining two peaks represent the correlation of the inputface images. One of the peaks from these two peaks has been ex-tracted and is used in the generation of the biohash code.
5. Experimental results
The same database has been used for the experimental studiesas used in the simulation studies. As explained in Section 3, 350images of different facial expressions of a single person and withvaried illumination light have been used as the target face imagesor genuine population. Three hundred and fifty images of sevendifferent persons with varied expression have been used as theanti-target face images or impostor population.
5.1. Enrolment process
In the enrolment process a face image of the enrolled person hasbeen resized to a size of 50� 50 pixels. A joint input is formed bypadding this face image as the input and the reference image at theposition (x � x0,y) and (x + x0,y) in a black background. This isshown in Fig. 7a. As explained in Section 3, this joint image hasbeen displayed on the SLM and a Fourier transform has been per-formed. The joint power spectrum (JPS) of the joint input imagehas been recorded by using a CCD camera. This is shown inFig. 7b. This JPS has then been again displayed on the SLM and asecond Fourier transform has been recorded by the CCD camera.Three peaks have been obtained at the output plane as shown inFig. 7c. One of the peaks out of the two shifted correlation peakshas been extracted, which is shown in Fig. 7d. This matrix is calledthe feature matrix. This matrix is concatenated into a vector that iscalled the feature vector. An inner product of the obtained featurevector with the ortho-normalized random number has been car-ried out. The obtained vector has then been binarized by using athreshold. This binarized vector has been stored as the enrolledbiohash code.
5.2. Verification process
In the verification process, the normalized face image of the ver-ification person has been taken to generate the verification biohashcode. In order to carry out a detailed study 350 target and 350 anti-target face images of the verification person have been used. Thejoint input of all the 700 images have been formed as explainedin Section 5.1 and displayed on the SLM one by one to record theJPS. These 700 JPS’s have been again displayed on the SLM oneby one and the correlation of the input faces has been recordedon the CCD camera. The obtained 700 matrices have been con-verted into vectors. Inner products of the obtained vectors withortho-normalized random number have been carried out and re-
Fig. 7. (a) Joint input image, (b) joint power spectrum, (c)
sults in vectors. These vectors have been binarized by using athreshold. The binarized vectors are the biohash codes of the 700face images using in the verification process.
In order to match the verification biohash code with the en-rolled biohash code, the Hamming distances between the codeshave been found out. These Hamming distances have then beennormalized. As explained in Section 3, a graph between the nor-malized Hamming distance and the density of population has beenplotted and is shown in Fig. 8. In Fig. 8, it can be seen that the over-lap area of the genuine and impostor population is very small. Thisseparation between the genuine and impostor population showsthat there is discrimination between the genuine and the impostorface images. It can be seen from Fig. 8 that a separation betweenthe genuine and impostor population for the experimental resulthas also been obtained and it is similar to the results obtained bythe simulation which is shown in Fig. 5.
6. Performance evaluation
The performance goal of the paper is to generate a biohash codeof the enrolled person that is capable of discriminating the targetface images from the anti-target face images. ‘‘Hamming distance”is used as a measure in order to discriminate the target face imagesfrom the anti-target face images. Hamming distance between theenrolled face image and the verification face image is also depen-dent on the feature matrix extracted from the face image. A de-tailed study has been carried out to find out the optimal size ofthe feature matrix that can be used in the generation of the biohashcode. The Hamming distances for the genuine and the impostorpopulation has been calculated by varying the dimension of the
three correlation peaks, (d) extracted feature matrix.
N. Saini, A. Sinha / Optics Communications 283 (2010) 894–902 899
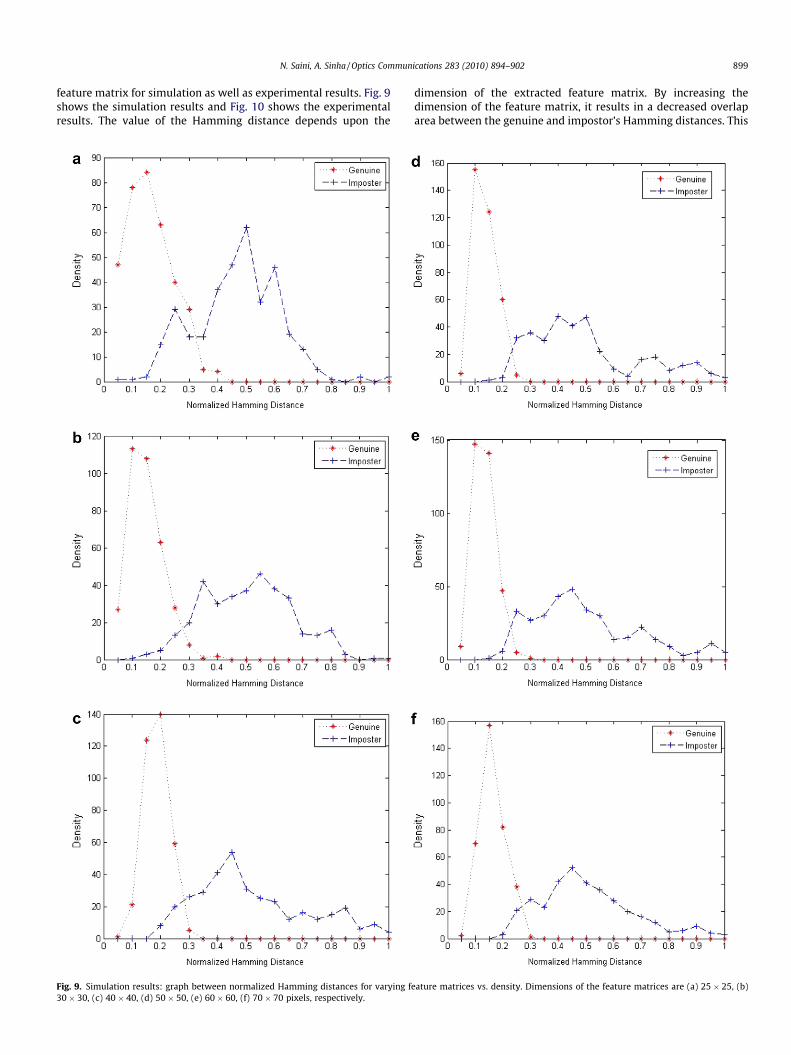
feature matrix for simulation as well as experimental results. Fig. 9shows the simulation results and Fig. 10 shows the experimentalresults. The value of the Hamming distance depends upon the
Fig. 9. Simulation results: graph between normalized Hamming distances for varying f30� 30, (c) 40� 40, (d) 50� 50, (e) 60� 60, (f) 70� 70 pixels, respectively.
dimension of the extracted feature matrix. By increasing thedimension of the feature matrix, it results in a decreased overlaparea between the genuine and impostor’s Hamming distances. This
eature matrices vs. density. Dimensions of the feature matrices are (a) 25� 25, (b)
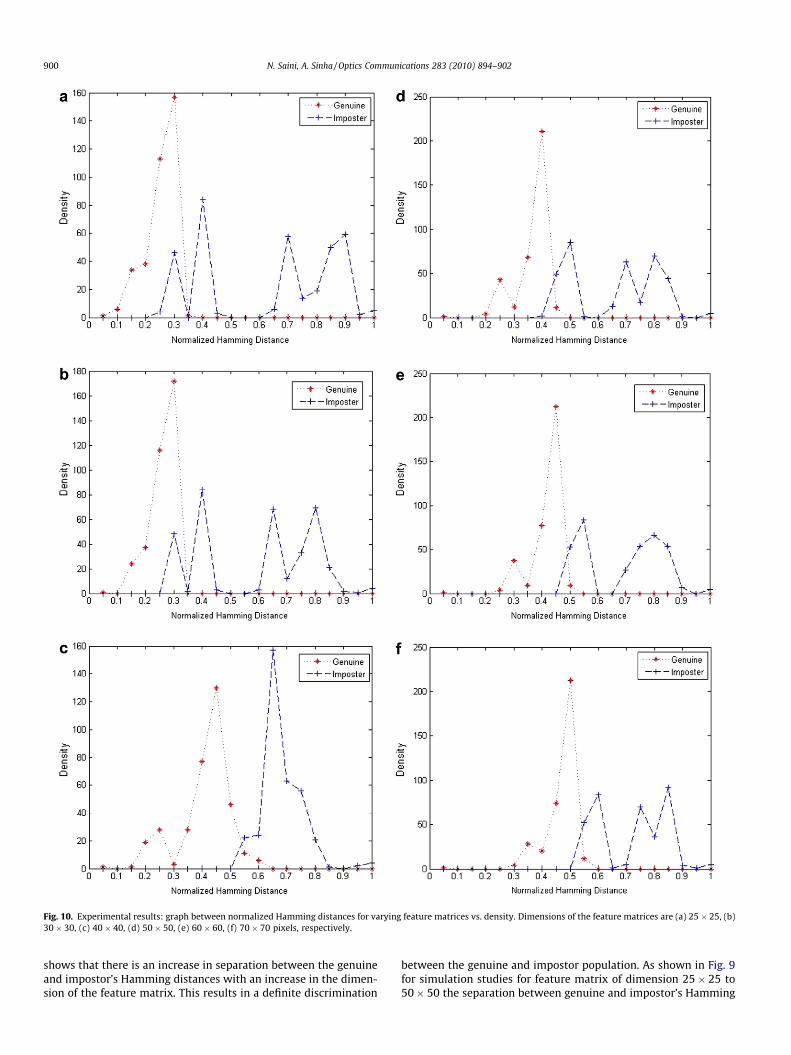
Fig. 10. Experimental results: graph between normalized Hamming distances for varying feature matrices vs. density. Dimensions of the feature matrices are (a) 25� 25, (b)30� 30, (c) 40� 40, (d) 50� 50, (e) 60� 60, (f) 70� 70 pixels, respectively.
900 N. Saini, A. Sinha / Optics Communications 283 (2010) 894–902
shows that there is an increase in separation between the genuineand impostor’s Hamming distances with an increase in the dimen-sion of the feature matrix. This results in a definite discrimination
between the genuine and impostor population. As shown in Fig. 9for simulation studies for feature matrix of dimension 25� 25 to50� 50 the separation between genuine and impostor’s Hamming
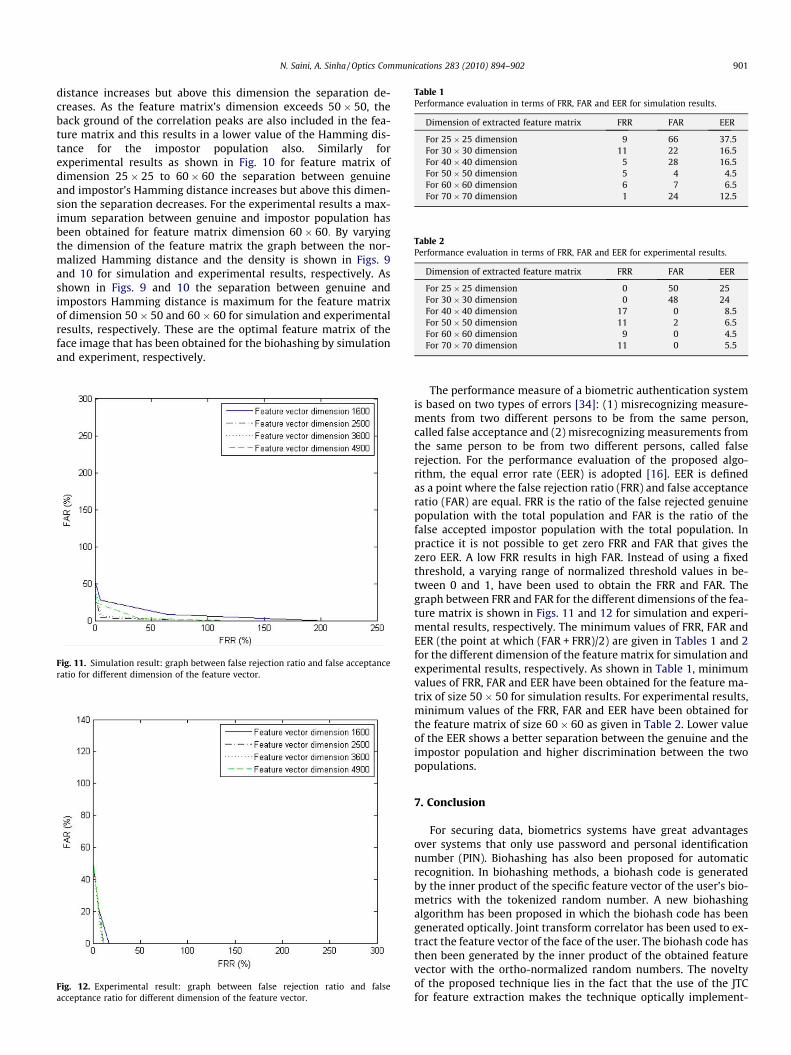
Table 1Performance evaluation in terms of FRR, FAR and EER for simulation results.
Dimension of extracted feature matrix FRR FAR EER
For 25� 25 dimension 9 66 37.5For 30� 30 dimension 11 22 16.5For 40� 40 dimension 5 28 16.5For 50� 50 dimension 5 4 4.5For 60� 60 dimension 6 7 6.5For 70� 70 dimension 1 24 12.5
Table 2Performance evaluation in terms of FRR, FAR and EER for experimental results.
Dimension of extracted feature matrix FRR FAR EER
For 25� 25 dimension 0 50 25For 30� 30 dimension 0 48 24For 40� 40 dimension 17 0 8.5For 50� 50 dimension 11 2 6.5For 60� 60 dimension 9 0 4.5For 70� 70 dimension 11 0 5.5
N. Saini, A. Sinha / Optics Communications 283 (2010) 894–902 901
distance increases but above this dimension the separation de-creases. As the feature matrix’s dimension exceeds 50� 50, theback ground of the correlation peaks are also included in the fea-ture matrix and this results in a lower value of the Hamming dis-tance for the impostor population also. Similarly forexperimental results as shown in Fig. 10 for feature matrix ofdimension 25� 25 to 60� 60 the separation between genuineand impostor’s Hamming distance increases but above this dimen-sion the separation decreases. For the experimental results a max-imum separation between genuine and impostor population hasbeen obtained for feature matrix dimension 60� 60: By varyingthe dimension of the feature matrix the graph between the nor-malized Hamming distance and the density is shown in Figs. 9and 10 for simulation and experimental results, respectively. Asshown in Figs. 9 and 10 the separation between genuine andimpostors Hamming distance is maximum for the feature matrixof dimension 50� 50 and 60� 60 for simulation and experimentalresults, respectively. These are the optimal feature matrix of theface image that has been obtained for the biohashing by simulationand experiment, respectively.
Fig. 12. Experimental result: graph between false rejection ratio and falseacceptance ratio for different dimension of the feature vector.
Fig. 11. Simulation result: graph between false rejection ratio and false acceptanceratio for different dimension of the feature vector.
The performance measure of a biometric authentication systemis based on two types of errors [34]: (1) misrecognizing measure-ments from two different persons to be from the same person,called false acceptance and (2) misrecognizing measurements fromthe same person to be from two different persons, called falserejection. For the performance evaluation of the proposed algo-rithm, the equal error rate (EER) is adopted [16]. EER is definedas a point where the false rejection ratio (FRR) and false acceptanceratio (FAR) are equal. FRR is the ratio of the false rejected genuinepopulation with the total population and FAR is the ratio of thefalse accepted impostor population with the total population. Inpractice it is not possible to get zero FRR and FAR that gives thezero EER. A low FRR results in high FAR. Instead of using a fixedthreshold, a varying range of normalized threshold values in be-tween 0 and 1, have been used to obtain the FRR and FAR. Thegraph between FRR and FAR for the different dimensions of the fea-ture matrix is shown in Figs. 11 and 12 for simulation and experi-mental results, respectively. The minimum values of FRR, FAR andEER (the point at which (FAR + FRR)/2) are given in Tables 1 and 2for the different dimension of the feature matrix for simulation andexperimental results, respectively. As shown in Table 1, minimumvalues of FRR, FAR and EER have been obtained for the feature ma-trix of size 50� 50 for simulation results. For experimental results,minimum values of the FRR, FAR and EER have been obtained forthe feature matrix of size 60� 60 as given in Table 2. Lower valueof the EER shows a better separation between the genuine and theimpostor population and higher discrimination between the twopopulations.
7. Conclusion
For securing data, biometrics systems have great advantagesover systems that only use password and personal identificationnumber (PIN). Biohashing has also been proposed for automaticrecognition. In biohashing methods, a biohash code is generatedby the inner product of the specific feature vector of the user’s bio-metrics with the tokenized random number. A new biohashingalgorithm has been proposed in which the biohash code has beengenerated optically. Joint transform correlator has been used to ex-tract the feature vector of the face of the user. The biohash code hasthen been generated by the inner product of the obtained featurevector with the ortho-normalized random numbers. The noveltyof the proposed technique lies in the fact that the use of the JTCfor feature extraction makes the technique optically implement-

902 N. Saini, A. Sinha / Optics Communications 283 (2010) 894–902
able. The use of the optics makes the proposed system very usefulbecause of the distinct advantage of processing two-dimensionalcomplex data in parallel and carry out otherwise time costly oper-ations at great speeds. So, after the basic experimental setup ismade the feature vector of an extremely large data set can be ob-tained very easily. Experiment as well as simulation studies havebeen carried out to validate the proposed technique. The Hammingdistance is used as a discrimination factor in the proposed tech-nique. The performance goal has been demonstrated by plottingthe normalized Hamming distance with the density of the popula-tion. A good separation has been obtained between genuine andimpostor population. The equal error rate (EER), false acceptanceratio (FAR) and the false rejection ratio (FRR) has also been calcu-lated. A detailed study has been carried out to optimize the featurematrix, for which a maximum discrimination between the targetface images and the anti-target face images has been obtained.An optimal feature matrix of dimension 50� 50 and 60� 60 hasbeen obtained, for which a maximum separation between the gen-uine and the impostor population and minimum FRR, FAR and EERhas been obtained by simulation and experimental studied.
References
[1] A.S. Patrick, M. Young (Eds.), Nineth International Conference, FC 2005 Roseau,The Commonwealth of Dominica, February/March, Revised Papers, Springer,2005.
[2] P. Refregier, B. Javidi, Opt. Lett. 20 (1995) 767.[3] W. Jin, C. Yan, Optik 118 (2007) 38.[4] T. Connie, A. Teoh, M. Goh, D. Ngo, Pattern Anal. Appl. 7 (2004) 255.[5] N. Ratha, J. Connell, R.M. Bolle, IBM Syst. J. 40 (2001) 614.[6] R.M. Bolle, J.H. Connell, N.K. Ratha, Pattern Recog. 35 (2002) 2727.
[7] B.V.K. Vijaya Kumar, M. Savvides, C. Xie, K. Venkataramani, J. Thornton, A.Mahalanobis, Appl. Opt. 43 (2004) 391.
[8] X. Liu, T. Chen, B.V.K. Vijaya Kumar, Pattern Recog. 36 (2003) 313.[9] A. Jain, L. Hong, R. Bolle, IEEE Trans. Pattern Anal. Mach. Intell. 19 (1997) 302.
[10] A. Jain, L. Hong, S. Pankati, R. Bolle, Proc. IEEE 85 (1997) 1365.[11] C.-C. Tsai, J. Taur, C.-W. Tao, Opt. Eng. 47 (2008) 097202.[12] J.-C. Lee, P.S. Huang, J.-C. Chang, C.-P. Chang, T.-M. Tu, Opt. Eng. 47 (2008)
067205.[13] B.J. Kang, K.R. Park, Opt. Eng. 47 (2008) 117202.[14] D. Hu, G. Feng, Z. Zhou, Pattern Recog. 40 (2007) 339.[15] A. Kong, D. Zhang, M. Kamel, Pattern Recog. 41 (2008) 1329.[16] A. Kong, D. Zhang, M. Kamel, Pattern Recog. 39 (2006) 478.[17] A. Lumini, L. Nanni, Pattern Recog. 40 (2007) 1057.[18] A.T.B. Jin, D.N.C. Ling, A. Goh, Pattern Recog. 37 (2004) 2245.[19] A. Kong, K.-H. Cheung, D. Zhang, M. Kamel, J. You, Pattern Recog. 39 (2006)
1359.[20] L. Nanni, A. Lumini, Pattern Recog. Lett. 29 (2008) 1344.[21] A. Lumini, L. Nanni, Neurocomputing 69 (2006) 1706.[22] L. Nanni, A. Lumini, Neurocomputing 69 (2006) 2390.[23] Y.-H. Pang, A.T.B. Jin, D.N.C. Ling, Int. J. Signal Process. 1 (2) (2005). Available
from: <www.waset.org>.[24] B.Y. Soon, M.S. Alam, M.A. Karim, Appl. Opt. 37 (1998) 821.[25] B. Javidi, J.L. Horner, Appl. Opt. 28 (1989) 1027.[26] W. Wang, G. Jin, Y. Yan, M. Wu, Appl. Opt. 34 (1995) 370.[27] B. Javidi, Appl. Opt. 28 (1989) 2358.[28] B. Javidi, Appl. Opt. 28 (1989) 2490.[29] B. Javidi, J. Li, Q. Tang, Appl. Opt. 34 (1995) 3950.[30] J.W. Goodman, Introduction to Fourier Optics, third ed., Roberts & Company
Publishers, 2004.[31] G. Allaire, S.M. Kaber, Numerical Linear Algebra, Series: Texts in Applied
Mathematics, Springer Verlag, New York, 2008.[32] AT&T Laboratories Cambridge, The ORL Database of Faces, http://www.cam-orl.
co.uk/facedatabase.html.[33] V. Jain, A. Mukherjee, The Indian Face Database, 2002. http://vis-www.cs.
umass.edu/~vidit/IndianFaceDatabase/.[34] A.K. Jain, A. Ross, S. Prabhakar, IEEE Trans. Circuits Syst. Video Technol. 14
(2004) 4.