Optical characterization of porous silicon microcavities for glucose oxidase biosensing
10
OPTICAL CHARACTERIZATION OF POROUS SILICON MICROCAVITIES FOR GLUCOSE OXIDASE BIOSENSING. G. Palestino a,b , V. Agarwal C , D.B. Garcia C , R. Legros a , E. Pérez e , C. Gergely* a . a GES-UMR 5650, CNRS- Université Montpellier II, Montpellier Cedex 5, France; b Facultad de Ciencias Químicas, Universidad Autónoma de San Luis Potosí, Mexico; c CIICAP-UAEM, Av. Universidad 1001, Col Chamilpa, Cuernavaca, Mor., Mexico; e Instituto de Física, Universidad Autónoma de San Luis Potosí, SLP, Mexico Abstract PSi microcavity (PSiMc) is characterized by a narrow resonance peak in the optical spectrum that is very sensitive to small changes in the refractive index. We report that the resonant optical cavities of PSi structures can be used to enhance the detection of labeled fluorescent biomolecules. Various PSi configurations were tested in order to compare the optical response of the PSi devices to the capture of organic molecules. Morphological and topographical analyses were performed on PSiMc using Atomic Force (AFM) and Scanning Electron (SEM) microscopies. The heterogeneity in pores lengths resulting from etching process assures a better penetration of larger molecules into the pores and sensor sensitivity depends on the pore size. Molecular detection is monitored by the successive red shifts in the reflectance spectra after the stabilization of PSiMc with 3-aminopropyltriethoxysilane (APTES). The glucose oxidase was cross- linked into the PSiMc structures following a silane-glutaraldehyde (GTA) chemistry. 1. Introduction Immobilization of proteins on solid support constitutes a research area of considerable importance in research disciplines ranging from geophysics and materials science to biomedical engineering and technologies employing biocatalytic and biorecognition events. The ability to immobilize functionally bioselective elements that leads to the development of bioreactors or biological sensor required for medical applications should have some strict requirements such as selectivity, high sensivity, fast response, small dimensions, low cost and also the possibility of remote sensing. Due to their exclusive features covering all these demands, optical sensors offer a very attractive solution in a device performance. Using the optical properties of photonic materials, detection relies on a change in the wavelength of reflected light induced by refractive index changes upon biorecognition. This approach allows more control over optical path lengths, avoiding light scattering effects common to fiberoptic transduction enabling a simple method for real time monitoring. [1] Thus, novel biosensor techniques based on molecular photoluminescence and nanoparticle surface plasmon resonance (SPR) and other evanescent field techniques hold promise for label-free analysis because the detection signal originates directly from target binding and labeling the target biomolecule is not required. [2] However, how this translates to the number of target molecules that must bind within the acceptance geometry of the device, it is not always clear, still lacking a well understanding of the operating parameters that impact the signal transduction mechanism of the detector. An essential requirement for the selection of the support matrix in biosensor applications is that it should maintain the activity of biomolecules while enabling direct optical recognition of the sensor response. Porous silicon (PSi) is an inorganic material that has been extensively studied in the last 14 years, [3] due its efficient visible photoluminescence, the capability to infiltrate its matrix with large internal surface area (>200 m 2 /cm 3 ), [4] its compatibility with standard silicon processes for integrated optoelectronics and as a promising material for photonic applications. Thus, a variety of porous silicon sensor modalities have been studied (including Bragg mirrors, [5] single-layer Fabry-Perot films, [6],[7] double layers, [8] and rugate filters [9] ). These studies highlight many of the advantages of porous silicon, which includes ease of fabrication, the amplifying of the detection sensibility of molecules trapped within the porous structure and large internal surface area, which depending upon depth can easily exceed 1000 times that of a planar surface of equal diameter. [2] Biophotonics: Photonic Solutions for Better Health Care, edited by Jürgen Popp, Wolfgang Drexler, Valery V. Tuchin, Dennis L. Matthews, Proc. of SPIE Vol. 6991, 69911Y, (2008) · 1605-7422/08/$18 · doi: 10.1117/12.781045 Proc. of SPIE Vol. 6991 69911Y-1 2008 SPIE Digital Library -- Subscriber Archive Copy
-
Upload
independent -
Category
Documents
-
view
2 -
download
0
Transcript of Optical characterization of porous silicon microcavities for glucose oxidase biosensing

OPTICAL CHARACTERIZATION OF POROUS SILICON MICROCAVITIES FOR GLUCOSE OXIDASE BIOSENSING.
G. Palestinoa,b, V. AgarwalC, D.B. GarciaC, R. Legrosa, E. Péreze, C. Gergely*a.
aGES-UMR 5650, CNRS- Université Montpellier II, Montpellier Cedex 5, France; bFacultad de Ciencias Químicas, Universidad Autónoma de San Luis Potosí, Mexico; cCIICAP-UAEM, Av. Universidad 1001, Col Chamilpa, Cuernavaca, Mor., Mexico; eInstituto de Física, Universidad Autónoma de San Luis Potosí, SLP, Mexico
Abstract
PSi microcavity (PSiMc) is characterized by a narrow resonance peak in the optical spectrum that is very sensitive to small changes in the refractive index. We report that the resonant optical cavities of PSi structures can be used to enhance the detection of labeled fluorescent biomolecules. Various PSi configurations were tested in order to compare the optical response of the PSi devices to the capture of organic molecules. Morphological and topographical analyses were performed on PSiMc using Atomic Force (AFM) and Scanning Electron (SEM) microscopies. The heterogeneity in pores lengths resulting from etching process assures a better penetration of larger molecules into the pores and sensor sensitivity depends on the pore size. Molecular detection is monitored by the successive red shifts in the reflectance spectra after the stabilization of PSiMc with 3-aminopropyltriethoxysilane (APTES). The glucose oxidase was cross-linked into the PSiMc structures following a silane-glutaraldehyde (GTA) chemistry.
1. Introduction
Immobilization of proteins on solid support constitutes a research area of considerable importance in research disciplines ranging from geophysics and materials science to biomedical engineering and technologies employing biocatalytic and biorecognition events. The ability to immobilize functionally bioselective elements that leads to the development of bioreactors or biological sensor required for medical applications should have some strict requirements such as selectivity, high sensivity, fast response, small dimensions, low cost and also the possibility of remote sensing. Due to their exclusive features covering all these demands, optical sensors offer a very attractive solution in a device performance. Using the optical properties of photonic materials, detection relies on a change in the wavelength of reflected light induced by refractive index changes upon biorecognition. This approach allows more control over optical path lengths, avoiding light scattering effects common to fiberoptic transduction enabling a simple method for real time monitoring.[1] Thus, novel biosensor techniques based on molecular photoluminescence and nanoparticle surface plasmon resonance (SPR) and other evanescent field techniques hold promise for label-free analysis because the detection signal originates directly from target binding and labeling the target biomolecule is not required.[2] However, how this translates to the number of target molecules that must bind within the acceptance geometry of the device, it is not always clear, still lacking a well understanding of the operating parameters that impact the signal transduction mechanism of the detector. An essential requirement for the selection of the support matrix in biosensor applications is that it should maintain the activity of biomolecules while enabling direct optical recognition of the sensor response. Porous silicon (PSi) is an inorganic material that has been extensively studied in the last 14 years,[3] due its efficient visible photoluminescence, the capability to infiltrate its matrix with large internal surface area (>200 m2/cm3),[4] its compatibility with standard silicon processes for integrated optoelectronics and as a promising material for photonic applications. Thus, a variety of porous silicon sensor modalities have been studied (including Bragg mirrors, [5] single-layer Fabry-Perot films,[6],[7] double layers,[8] and rugate filters [9]). These studies highlight many of the advantages of porous silicon, which includes ease of fabrication, the amplifying of the detection sensibility of molecules trapped within the porous structure and large internal surface area, which depending upon depth can easily exceed 1000 times that of a planar surface of equal diameter.[2]
Biophotonics: Photonic Solutions for Better Health Care, edited byJürgen Popp, Wolfgang Drexler, Valery V. Tuchin, Dennis L. Matthews,
Proc. of SPIE Vol. 6991, 69911Y, (2008) · 1605-7422/08/$18 · doi: 10.1117/12.781045
Proc. of SPIE Vol. 6991 69911Y-12008 SPIE Digital Library -- Subscriber Archive Copy

1.1 Porous silicon microcavities: state of the art
Porous silicon microcavity (PSiMc) is one dimensional structure that can be made by confining an optically active central layer between two multilayer mirrors.[3] The typical reflectance spectrum for a microcavity resonator has a double peak, with a sharp dip (resonance peak) between the two maxima. The resonance peak of the PSiMc is highly sensitive to a small change in the refractive index within the multilayered structure, such as that obtained when a molecule is attached to the large internal surface of porous silicon. Thus after molecular infiltration a red shift in the reflectance spectra is expected because the pores are filled with organic material of larger refractive index. Microcavity structures are like Fabry-Perot_filters which have a typical figure of merit called as the quality factor, defined as Q= λ/∆λ, where λ is the wavelength of the resonance peak, and ∆λ is the resonance peak width. The Q factor of a microcavity is used to evaluate how effectively light is confined within the PSiMc.[10] In sensing applications, where the shift of the reflectance spectra is monitored, increasing the Q factor of the microcavity increases the ability to resolve a small wavelength shift. A second feature of PSiMc is that its resonance peak corresponds to a transmittance peak for light originated at the luminescent resonant layer (active layer). Hence, only the photoluminescent (PL) emission within this narrow wavelength range will reach the surface and escape, thus filtering the emission.[11] Therefore, PSiMc devices possess the unique characteristics of line narrowing, luminescence enhancement[12] and optical response.
The advantage of using PSi microcavities is that the position of the resonance peak (emission peak) is completely
tunable by changing the properties of the central layer (i.e. porosity and thickness) during the electrochemical etching condition and by the infiltration of organic molecules. This permits the control of the frequency of the electromagnetic field of the cavity mode, which produces the enhancement of the PSiMc optical response. Fig. 1 shows a scheme of a typical microcavity structure consisting in an active layer (luminescent layer) sandwiched between two-3 period Bragg reflectors (PSi mirrors). The number of periods of the Bragg mirrors and the refractive index contrast between the layers define the Q factor of the microcavity. Thus, the increase of these values will increase the Q factor. However, in practice the number of periods cannot be increased arbitrarily, as uniform infiltration of the molecules becomes more difficult for thicker devices. Besides, the highest Q factor value is also limited by the maximum porosity contrast that should be still suitable to admit biological molecules inside the PSiMc structure. Thus, in the development of PSiMc based sensors the number of periods in the Bragg mirrors and the contrast between the layers should be as low as possible, while a reasonable Q value would be achieved.
Fig. 1. Schematic presentation of porous silicon-based microcavity, showing the air-surface interface reflection and the photoluminescence (PL) emission of the active layer.
The physical characteristics of the PSiMc and the signal transduction mechanism that produces optical shifts in both
the photoluminescence and the white light reflection detection modes have been widely documented.[2] PSiMc-based structures have also been investigated by many groups as an optical label-free sensing platform for chemical and
Active layer
BBulk Si
High porosity/low refractive index
Lowporosity/High refractive index
Incominglight
λ/4Top mirror
λ/4Botton mirror
λ/2 Fabry-PerotOptical Cavity
PLMultiple reflections
of light
Proc. of SPIE Vol. 6991 69911Y-2

biological detection. Examples include antibodies such as IgG[13], enzymes such as glutathione-s-transferases[2], short oligonucleotides of DNA[12],[14], and complex biological systems such as gram (-) bacteria[15] between others. The advantage of using PSiMc includes besides ease of fabrication and compatibility with silicon microelectronics technology,[16] concerns linear response profiles to changes in the refractive index environment [17] that allow perform the quantification of the optical response of the device and the strong enhancement of the emission at the microcavity resonance wavelength.[18] In this paper we show that the optical resonances of PSiMc structures can be used to enhance detection of fluorescent biomolecules at low concentration. As a model protein, we have selected the glucose oxidase (GOX) because of its natural fluorescence in the visible region, which is produced by the FAD chromophore moiety. The FAD chomophore presents absorption bands at 333 nm and 450 nm, and when the protein is excited at 450 nm, a green fluorescent emission at 525 nm is induced. The stabilization and activation of the PSiMc structures towards protein immobilization was performed using 3-aminopropyltriethoxysilane (APTES) and following a silane-glutaraldehyde (GTA) chemistry procedure.
2. Experimental 2.1 Porous silicon preparation
All porous silicon samples were prepared by wet electrochemical etching process of highly (boron) doped, p-type silicon wafers (thickness 500-550 µm) with a 0.002-0.004 ohm-cm-1 resistivity, and with the crystallographic orientation of (100). The electrolyte consisted in a mixture of hydrofluoric acid (48 wt%), ethanol (98%) and glycerol (98%) in the volumetric ratio of 3:7:1. [3],[19] The anodization time and current density were controlled by a computer interfaced electronic circuit. Samples were fabricated in dark, and freshly etched samples were washed with ethanol and dried with pentane before use. The accessibility of APTES, GTA and GOX to the mesoporous and macroporous microcavities was experimentally studied in order to verify the required optimal pore size for molecular infiltration as well as for a suitable optical response of the GOX-PSiMc biosensor that allows quantitative characterization. Two different types of PSi microcavities labeled as 70PSiMc and 45PSiMc were produced:
a) 70PSiMc microcavities were fabricated using the current density of 70 mA/cm2 (H) -for high and 25 mA/cm2 (L) - for low current density. The anodization times of 6.4s and 11.5s, for H and for L, respectively, were used for the fabrication of multilayer structures [19] (optical thickness of each layer being one quarter of the wavelength). The microcavity structures (cavity mode in the range of 740-810 nm) were fabricated with one active single-layer sandwiched between two Bragg mirrors with 5 periods each one. The microcavity configuration was (HL)X5 HH (LH)X5.[20] To ensure a good penetration, the multilayers were prepared with the first layer as a high porosity one. To complete the analysis, corresponding single-layers (70PSim, 25PSim), bilayers (70/25PSib), cavity single-layer (C-70PSim) and mirrors (PSiM) were also fabricated with the respective layer configuration of (H), (L), (HL), (HH), and (HLX5).
b) 45PSiMc microcavities: the only differences in the fabrication conditions of 45PSiMc and 70PSiMc were the current densities and the configuration. The 45PSiMc structure was fabricated with the configuration of (HL)X5 HHHH (LH)X5, where H and L mean 45 mA/cm2 and 5 mA/cm2 current density. The corresponding single-layers (45PSim, 5PSim), bilayers (45/5PSib), cavity single-layer (C-45PSim) and mirrors (45PSiM) were also fabricated with the respective layer configuration of (H), (L), (HL), (HHHH), and (HLX5). The numbers 5, 25, 45 and 70 in the names of each structure refer to the electrical current density used during the etching process of the first PSi layer. 2.2 Bio-functionalization of Porous silicon devices
The as etched PSi structures were stabilized dipping them in 5 % of APTES diluted in toluene for 1.5 hr and subsequently rinsing them with a toluene/ethanol mixture (1:1) and then ethanol. The samples were dried under a stream of N2 and baked in oven at 100 ºC for 15 min. The activation of the amine group was performed by the incubation of PSi-silanized samples in 2.5% glutaraldehyde for 20 min. The PSi-APTES-GTA modified samples were rinsed with PBS buffer and dried under a stream of N2. The PSi-APTES-GTA derivatized samples were then exposed for 2 hr to various concentrations of glucose oxidase protein (type VII from Aspergillus Niger, Sigma-Aldrich) diluted in 8.3 mM PBS, pH 7.2 buffer (Sigma). The non-bound protein was removed through rinsing the GOX-labeled structures with phosphate
Proc. of SPIE Vol. 6991 69911Y-3

buffer. Then, the samples were gently dried under a stream of N2 and stored at 4 ºC until analysis. Fig. 2 shows the steps of the surface modification..
3-Aminopropyltriethoxysilane(APTES)
PSi
Glutaraldehyde(GTA)
Glucose Oxidase (GOX)
+O SiO
ONH2
O
H
C
O
HC+ LysinePSi
O SiO
OC C NN
PSiMc-APTES-GTA-GOX modified device
Fig. 2. Silanization and biofunctionalisation strategy of the modified PSi devices.
3. Results
3.1 The optical response of the PSi structures
The reflectance spectra of PSi architectures were recorded in a Bruker 66V Fourier Transform Infrared
Spectrophotometer coupled with a specular reflection unit (with a fixed angle of 11º) after each modification step. The shifts in the reflectance spectra after infiltration of APTES, GTA, and GOX are gathered in the corresponding reflectance spectra (Fig.3). A red shift is already noticed during APTES infiltration into all the different PSi structures, which was expected due to the small dimensions of this organic molecule. However, no optical response was observed after exposition of 5PSim layer to GTA and GOX solutions (Fig. 3a), suggesting that no molecular infiltration is produced due to the reduced pore dimensions of the 5PSim structure. In contrast, for 45PSim (Fig. 3b), 45/5-PSib (Fig. 3c) and 45C-PSim (Fig. 3d) devices a well resolved red shift is observed after each modification step. In particular, the result obtained for 45/5PSib relates us that in the case of this double-layer the silane molecule can penetrate both the 45 and 5 PSi layers but the optical response due to the capture of GOX and GTA molecules is produced just by the first layer comporting larger pores. Moreover, the smaller pore sized layers were limiting the confinement of GOX in the 45PSiM mirror (Fig. 3e) and 45PSiMc microcavity (Fig. 3f) as no red shift was observed when these structures were exposed to protein solution. This negative result indicates that penetration of the molecules within the internal layers of PSiM and PSiMc is essential to increase the effective refractive index, capable to produce a detectable optical signal. Furthermore, the position of the cavity mode in the PSiMc is determined by the optical thickness of the active layer, thus to change its value, the capture of the molecules inside the active layer of the PSiMc structure has to be assured. To probe this fact, a second set of experiments were performed with PSi structures composed by layers of higher porosity and larger pore sizes (~ 200 nm). A first red shift in the reflectance spectra is observed after stabilization of PSi structures with 3-aminopropyltriethoxysilane (APTES), followed by successive red shifts when glutaraldehyde and glucose oxidase were cross-linked into the porous structures. Table 1 gathers the obtained results. Comparison of the optical response of top and second single-layers of the PSi microcavity, respectively, show a strong difference in the red shift directly related to the porosity (70-85 %, 45-50%) and the thickness (180-200 nm, 110-120 nm,) of each PSi structure. The 25PSim monolayer is admitting less amount of the organic material than the 70PSim; hence the infiltration of the organic molecules in the multilayered structure is limited by the pore dimensions of the second layer. However, the architecture of the PSi device highly influences the optical response too. To test all this, we monitored the optical response of 70PSiM Bragg mirrors and 70PSiMc microcavities. The results are also shown in table 1. By the comparison of the observed red shifts, we can note a quite similar optical response after APTES and GTA infiltration into the PSiM and PSiMc structures, but after GOX binding the optical response of these devices reveal a drastic difference: a small red shift in the case of the mirror structures is observed (4 nm) contrary to the larger red shift of 17 nm observed in the reflectance spectra of the PSiMc structure. Despite the infiltration limiting action of the pores is the same for the both structures, a better optical response was observed for the microcavity structure, proving that the configuration of the
Proc. of SPIE Vol. 6991 69911Y-4

porous structure itself is playing an important role. The larger optical response in the case of the microcavity is produced due to the capture of organic material inside of the active layer of the 70PSiMc, where the optical field intensity is large. Thus, 70PSiMc has two advantages over 70PSiM, 45PSiMc, and the rest of the PSi structures: (i) size molecular selectivity, due to the second layer that act like molecular filter, allowing the infiltration of the chemical and biological molecules and avoiding the infiltration of aggregates and (ii) optical response enhancement because the active layer of the microcavity can be used to amplify the optical response of the PSi device. These results confirm that when sensing is performed with microcavity type structures, the optical response is do originating in the molecules that successfully penetrated the multilayered structure and arrived to the middle cavity layer.
400 500 600 700 8000.2
0.4
0.6
0.8
1.0
Ref
lect
ance
(a.u
.)
Wavelength (nm)
(a)
∆λ APTES= 6 nm∆λGTA = 0 nm∆λGOX = 0 nm
500 600 700 800 9000.0
0.2
0.4
0.6
0.8
1.0
Ref
lect
ance
(a.u
.)
Wavelength (nm)
(d)
∆λ APTES= 13 nm∆λGTA = 12 nm∆λGOX = 6 nm
650 700 750 800 850 9000.0
0.2
0.4
0.6
0.8
1.0
Ref
lect
ance
(a.u
.)
Wavelength (nm)
(e)
∆λ APTES= 5 nm∆λGTA = 7 nm∆λGOX = 0 nm
700 750 800 850 900 9500.0
0.2
0.4
0.6
0.8
1.0
Ref
lect
ance
(a.u
.)
Wavelength (nm)
(f)
∆λ APTES= 16 nm∆λGTA = 18 nm∆λGOX = 0 nm
400 600 800 10000.0
0.2
0.4
0.6
0.8
1.0
Ref
leca
nce
(a.u
.)
Wavelength (nm)
(b)
∆λ APTES= 14 nm∆λGTA = 8 nm∆λGOX = 8 nm
400 600 800 10000.0
0.2
0.4
0.6
0.8
1.0
Ref
lect
ance
(a.u
)
Wavelength(nm)
(c)
∆λ APTES= 11 nm∆λGTA = 8 nm∆λGOX = 6 nm
Fig. 3. Reflectance spectra of various porous silicon structures: (a) PSi monolayer etched at 5 mA/cm2, (b) PSi monolayer etched at 45 mA/cm2, (c) PSi bilayer etched at 45 respectively 5 mA/cm2, (d) PSi monolayer with the thickness equivalent to the cavity of the microcavity etched at 45 mA/cm2, (e) PSi mirror composed by a stack of bilayers like in (c), (f) PSi microcavity. Each line corresponds to: (__) as etched PSi sample; (..) PSi sample after silaneization; (.._..), the silanized-PSi sample after glutaraldehyde coupling and (_ _) the glutaraldehyde-silane-PSi structure after protein (GOX) binding. Table 1. Comparison of PSi optical response for various architectures. The red shift (∆λ) was obtained from the recorded reflectance spectra after APTES, GTA and GOX modification steps.
PSi [ structure] ∆λ APTES[nm] ∆λ GTA[nm] ∆λGOX[nm]
70PSim 26 27 32
25PSim 9 7 14
70/25-PSib 26 21 35
70C-PSim 17 17 24
PSiM 3 15 4
PSiMc 3 15 17
Proc. of SPIE Vol. 6991 69911Y-5
tt .n;__;, ;: .
3.2 Characterization of PSi microcavities 3.2.1 Scanning Electron Microscopy (SEM)
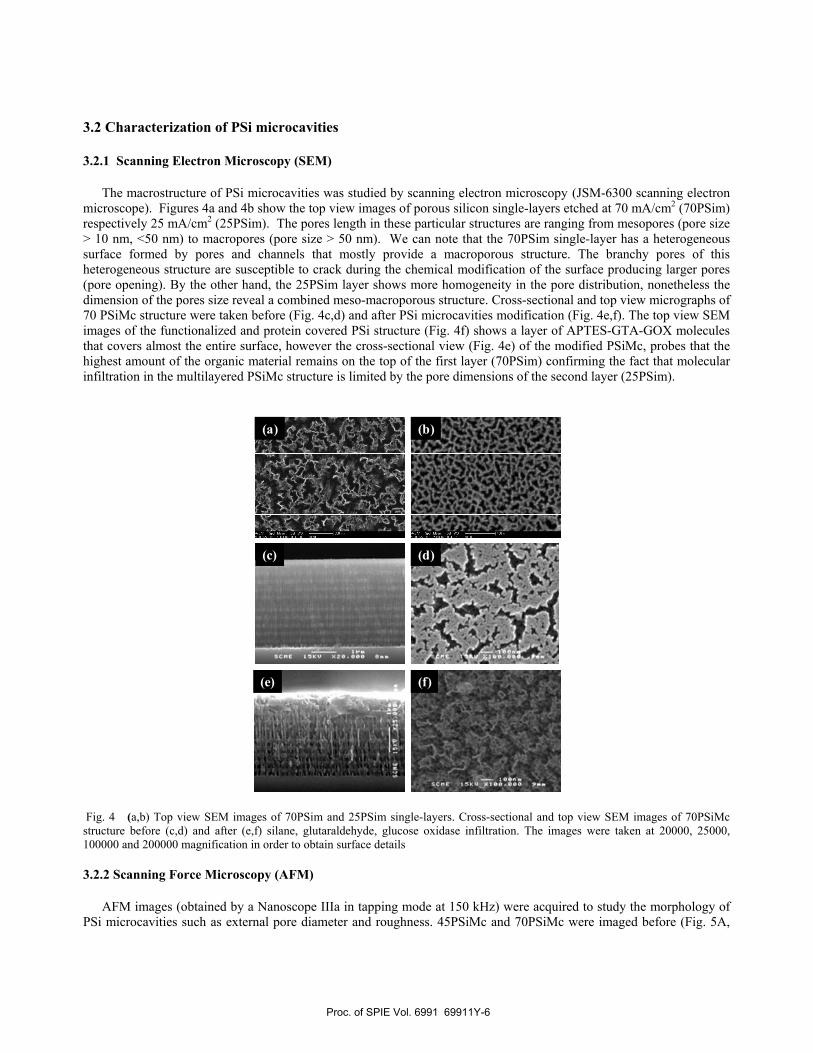
The macrostructure of PSi microcavities was studied by scanning electron microscopy (JSM-6300 scanning electron microscope). Figures 4a and 4b show the top view images of porous silicon single-layers etched at 70 mA/cm2 (70PSim) respectively 25 mA/cm2 (25PSim). The pores length in these particular structures are ranging from mesopores (pore size > 10 nm, <50 nm) to macropores (pore size > 50 nm). We can note that the 70PSim single-layer has a heterogeneous surface formed by pores and channels that mostly provide a macroporous structure. The branchy pores of this heterogeneous structure are susceptible to crack during the chemical modification of the surface producing larger pores (pore opening). By the other hand, the 25PSim layer shows more homogeneity in the pore distribution, nonetheless the dimension of the pores size reveal a combined meso-macroporous structure. Cross-sectional and top view micrographs of 70 PSiMc structure were taken before (Fig. 4c,d) and after PSi microcavities modification (Fig. 4e,f). The top view SEM images of the functionalized and protein covered PSi structure (Fig. 4f) shows a layer of APTES-GTA-GOX molecules that covers almost the entire surface, however the cross-sectional view (Fig. 4e) of the modified PSiMc, probes that the highest amount of the organic material remains on the top of the first layer (70PSim) confirming the fact that molecular infiltration in the multilayered PSiMc structure is limited by the pore dimensions of the second layer (25PSim).
(a) (b)
(c) (d)
(e) (f)
Fig. 4 (a,b) Top view SEM images of 70PSim and 25PSim single-layers. Cross-sectional and top view SEM images of 70PSiMc structure before (c,d) and after (e,f) silane, glutaraldehyde, glucose oxidase infiltration. The images were taken at 20000, 25000, 100000 and 200000 magnification in order to obtain surface details 3.2.2 Scanning Force Microscopy (AFM)
AFM images (obtained by a Nanoscope IIIa in tapping mode at 150 kHz) were acquired to study the morphology of PSi microcavities such as external pore diameter and roughness. 45PSiMc and 70PSiMc were imaged before (Fig. 5A,
Proc. of SPIE Vol. 6991 69911Y-6

respectively Fig. 5B) and after silanization, activation by glutaraldehyde and protein binding (Figs. 6A, 6B and 6C). The results of the surface roughness quantified in terms of root-mean-square (Rrms) and the average pore length of both structures is summarized in the table 2. We can note that the average pore length of 45PSiMc structure is lightly increasing after molecular infiltration. Comparison of the corresponding histograms for the bare and biofunctionalized 45PSiMc structure (Figs. 5A,, respectively Fig 6A-I), show that chemical modification affects pore size; the smaller pores disappear or become larger. Surprisingly in the case of 70PSiMc microcavity the pore length becomes about twice of its initial value (Figs. 6B, 6B-I). In this case the results can be only interpreted in terms of fused PSi material that produced loss of Si from the cracked layer. The cracked layer is produced on the top of the surface during the etching procedure and becomes more important when high current density is used, that is the case of 70PSiMc structure. Therefore, it is possible that during the silanization step the dissolution of the cracked layer would have been produced. Besides, the analysis of the surface roughness shows that chemical and biological modification of PSiMc structures produce an increase of the PSi surface roughness, due to molecular infiltration. However, it is important to mention that for the 45PSiMc no optical response was obtained when exposed to GOX , which denotes that the protein adsorbed only on the top layer of 45PSiMc device, explaining the apparition of molecular agglomerates on the 45PSiMc surface (Fig. 6A-II).
Table 2. Summary of Surface Roughness and Average Pore Length for unmodified and Silane-Glutaraldehyde-Glucose Oxidase modified PSi microcavities.
The topology of a second 70PSiMc structure (Fig. C), having the same porosity but different pore length,
compared to the first set of 70PSiMc sample (Fig.B), was also studied. The idea is to evaluate how the pore size of the PSi microcavities can be also used as molecular sieve allowing the infiltration of organic molecules with well defined size and excluding the infiltration of larger molecular agglomerates, which might produce a false positive in the optical response of the PSiMc devices. Thus, the used concentration of the protein solution was higher (28µΜ) in this case compared to the one used for the first set of 70PSiMc samples (5.5 µΜ). We can note after a closer examination of the 70PSiMc structure that molecular agglomerates remain on the surface and the small pores of microcavity were completely filled (Fig. 6C and the zoom). This was not observed at lower protein concentrations (Fig. 6B-II).
This result outlines the fact that for biosensing applications, where the contact between the modified based PSiMc device with a target molecule is necessary to produce the sensing response, the choice of the adequate pore size is an essential parameter. 3.3 Fourier Transform Infrared Spectroscopy (FTIR)
The correct silanization and biofunctionalization of PSi samples was monitored by Fourier Transform Infrared Spectrometry in Attenuated Total Reflectance mode using a ThermoNicolet AVATAR 330 spectrophotometer coupled with an ATR diamond cell in horizontal reflexion mode (HATR). The Infrared spectra recorded for 45PSiMc and 70PsiMc microcavities before and after modification with APTES-Glutaraldehyde–Glucose Oxidase surfaces are shown in Fig. 7. The FTIR spectrum displays characteristics bands of amide I υ(C=O) at 1644 cm-1 and amide II δ(N-H) at 1545 cm-1. This experiment confirms that GOX protein is adsorbed on the top layer of the both 45PSiMc and 70PSiMc structures. However, red shift in the reflectance spectra was only found in the case of 70PSiMc, which proves that molecular infiltration within the pores (at least until the active layer) is necessary in order to obtain an optical response of the device. Deconvolution of the amide I band provides valuable information on the secondary structure of the enzyme . Thus, to investigate whether the GOX cross-linked by GTA into the PSi structures retains its native conformation, the amide I band was deconvoluted by fitting it with Lorentzian-shaped components after smoothing and localization of the minima of the second derivative spectrum, which correspond to the positions of peaks within the band.[21] Four components were found for the adsorbed GOX that correspond to the four major secondary structures of proteins: α-helix, β-sheet, β-turn and random structure.
Average pore length Surface roughness (Rrms) Microcavity Unmodified Modified Unmodified Modified
45PSiMc 21±9 27±8 1±0.4 4±0.4 70PSiMc 197±62 479±122 25±3 65±5
Proc. of SPIE Vol. 6991 69911Y-7

yr ai1'
lOOrnu
100 200 300 400
Num
ber o
f por
es (a
.u.)
Pore diameter (nm)10 20 30 40 50 60
Pore diameter (nm)
Num
ber o
f por
es (a
.u.)
(B)(A)
Fig. 5. 3D-AFM (tapping mode) images with the corresponding pore length histograms of unmodified 45PSiMc (A) and 70PSiMc (B) microcavities.
B-II
150 300 450 600 750
Num
ber o
f por
es (a
.u.)
Pore diameter (nm)
75 150 225 300
Num
ber o
f por
es (a
.u.)
Pore diameter (nm)
0 10 20 30 40 50
Num
ber o
f por
es (a
.u.)
Pore diameter (nm)
A-IIA-I
B-I
C-I C-II
Fig. 6 2D-AFM images (tapping mode) of 45PSiMc (A-II) and 70PSiMc (B-II, CII) microcavities and the corresponding histograms (AI, BI,CI) after silane stabilization, aminoactivation with Glutaraldehyde and Glucose Oxidase binding. GOX was adsorbed from a solution at 5.5 µM (B-II) and 28 µM (C-II) concentration in 8.3 mM PBS buffer at pH 7.2 .
Proc. of SPIE Vol. 6991 69911Y-8

Fig 7. FTIR-HATR infrared absorbance spectrum of 45PSiMc and 70PSiMc microcavities before (___) and after surface modification of the 45PSiMc (----), respectively 70PSiMc (___) structures. Glucose oxidase was adsorbed at 5.5 µM concentration in 8.3 mM, pH 7.2 PBS buffer. 3.4 Photoluminescence on various GOX labeled PSi Devices
The intrinsic fluorescence of the glucose oxidase was used to provide information about the advantages to use PSi microcavities structures as optical amplifiers. The aim was to test light enhancement of GOX adsorbed within the PSi structures. Toward this goal the fluorescent emission of GOX labeled single-layers were compared with the fluorescent emission of PSiMc microcavity.
37 µm 37 µm 37 µm
(a) (b) (c)
Fig. 8 Top view fluorescence microscopy images of different PSi structures after APTES, Glutaraldehyde and GOX modification. The images respectively correspond to: (a) PSi single-layers, (b) PSi microcavity observed focalising on the surface and (c) after surface cross-sectional cutting focalising the objective on the border of the surface. (Excitation wavelength 450 nm, 40x objective and 162 x125 µm2 image size).
The comparison of GOX fluorescent intensity on PSi structures with different configurations, reveal a localized light fluorescence when GOX adsorbed on PSi single-layers (Fig. 8a), contrary to the observed enhanced fluorescence response when GOX is adsorbed on the PSi microcavity (Fig. 8b). The border of the GOX-PSiMc modified surface was observed after performing a transversal cutting through the PSiMc structure and the image is shown in Fig. 6c. We can note a bright fluorescent green light arising from the cut line, suggesting that the fluorescence is amplified within the PSiMc structure. This result corroborates that a cooperative effect is produced in the internal structure of the PSiMc that is responsible for the enhancement of the fluorescent emission of the protein.
Infrared region cm-1 Secondary structure Theoretical Experimental α-helix 1662-1645 1653 β-turn 1882-1662 1669 β-sheet 1637-1613 1623 Random 1645-1637 1639
1700 1600 1500 14000.000
0.002
0.004
0.006
0.008
0.010 Amide band II -NH
Abs
orba
nce
Wavenumber [cm-1]
Amide band I -C=O Table 3. Major secondary structures of the adsorbed GOX protein.
Proc. of SPIE Vol. 6991 69911Y-9

Conclusions
In this work we demonstrate the usefulness of the porous silicon microcavity resonator structure as a biosensor. We report on the fabrication of heavily doped p-type PSiMc structures with pore diameters in the range of 25-400 nm. We show that the optical resonant cavities of PSi structures can be used to enhance detection of labeled fluorescent biomolecules. The obtained results reveal that the penetration of the biomolecule into the central layer of the structure is necessary to obtain a microcavity optical response. However, the configuration of porous silicon devices by itself plays an essential role in the observed fluorescent enhancement. The heterogeneity in pores sizes (mesopores and macropores) resulting from etching process assures a better penetration of larger molecules into the pores but also a sieve effect for the unwanted penetration of molecular aggregates. However, the dependence of the sensor sensitivity is strongly dependent on the pore size.
Acknowledgements
This work was supported by the Phoremost European Network of Excellence, Project Nr. 511616: "NanoPhotonics to Realise Molecular Scale Technologies", the M06P01 Ecos-North French-Mexican and CONACyT (57631) program. Gabriela Palestino thanks PROMEP support.
References
1. K. -A. Killian, T, Bocking, S. Ilyas, K. Gaus, W. Jessup, M. Gal, J. Gooding, Adv. Funct. Mater., 00, pp.1-8
(2007) 2. L. A. DeLouise, P. M. Kou, B. L. Miller, Anal. Chem., 77, pp.3222-3230( 2005). 3. V. Agarwal, J.A. del Río, International Journal of Modern Physics B, 20(1), pp.99-110 (2006). 4. L. A. De Louise, B. L. Miller, Anal. Chem.,76, 6915-6920(2004). 5. A.G. Palestino, M.B. de la Mora, J.A. del Río, C. Gergely, E. Pérez, Appl. Phys. Lett., 91, pp.121909-1-3(
2007). 6. A. Janshoff, K-P.S. Dancil, C. Steinem, D.P. Greiner, V.S-Y. Lin, Ch. Gurtner, K. Motesharei,M.J. Sailor, M.R.
Ghadiri, J. Am. Chem. Soc., 120, pp.12108-12116(1998). 7. V.S.-Y. Lin, K. Motesharei, K-P.S. dancil, M.J. Sailor, M.R. Ghadiri, Science, 278, pp.840-843(1997). 8. C. Palchoski, M. Sartor, M.J. Sailor, F. Cunin, G.M. Miskelly, J. Am. Chem. Soc., 127, pp.11636-11645(2005). 9. S. Ilyas, T. Bocking, K. Kilian, P.J. Reece, J. Gooding, K. Gaus, M.Gal, Optical Materials, 29 pp.619-
622(2007),. 10. H. Ouyang, P. M. Fauchet, Proc. SPIE 6005, pp.600508-1(2005). 11. V. Torres-Costa, F. Agulló-Rueda, R.J. Martín-Palma, J.M. Martínez-Duart, Optical Materials, 27, pp.1084-
1087(2005). 12. S. Chan, P.M. Fauchet, Y. Li, L.J. Rothberg, B.L. Miller, Phys. Stat. Sol. (a), 182, pp.541-546(2000). 13. H. Ouyang, M. Cristophersen, R. Viard, B-L. Miller, P-M. Fauchet, Adv. Funct. Mater., 15, pp.1851(2005). 14. S. Chan, Y. Li, L.J. Rothberg, B.L. Miller, P.M. Fauchet, Materials Science and Engineering C, 15, pp.277-
282(2001). 15. S. Chan, S. R. Horner, P. Fauchet, B.L. Miller, J. Am. Chem. Soc., 123, pp.11797-11798(2001). 16. H. Ouyang, L.A. De Louise, B. Miller, P. M. Fauchet, 79, pp.1502-1506(2007). 17. H. Ouyang, C. Striemer, P. Fauchet, Appl. Phys. Lett., 88, pp.163108-1-3(2006). 18. P.J. Reece, G. Lerondel, J. Mulders, W.H. Zheng, M.Gal, physt. stat. sol. (a), 197(2), pp.321-325(2003). 19. V. Agarwal, J.A. del Río, Appl. Phys.Lett., 82(10), pp.1512-1514(2003). 20. I.N. Lees, H. Lin, CH. A. Canaria, CH. Gurtner, M.J. Sailor, G.M. Miskelly, Langmuir, 19, pp.9812-
9817(2003). 21. A. Haouz, CH. Twist, CH. Zentz, P. Tauc, B. Alpert, Eur. Biophys. J., 27, pp.19(1998).
Proc. of SPIE Vol. 6991 69911Y-10