Opposite ends of the same stick? Multi-method test of the dimensionality of individualism and...
33
Journal of Cross-Cultural Psychology XX(X) 1–33 © The Author(s) 2013 Reprints and permissions: sagepub.com/journalsPermissions.nav DOI: 10.1177/0022022113509132 jccp.sagepub.com Article Opposite Ends of the Same Stick? Multi-Method Test of the Dimensionality of Individualism and Collectivism Vas Taras 1 , Riikka Sarala 1 , Paul Muchinsky 1 , Markus Kemmelmeier 2 , Theodore M. Singelis 3 , Andreja Avsec 4 , Heather M. Coon 5 , Dale L. Dinnel 6 , Wendi Gardner 7 , Sherry Grace 8 , Erin E. Hardin 9 , Sandy Hsu 10 , Joel Johnson 11 , Zahide Karakitapoğlu Aygün 12 , Emiko S. Kashima 13 , Arnulf Kolstad 14 , Taciano L. Milfont 15 , John Oetzel 16 , Sumie Okazaki 17 , Tahira M. Probst 18 , Toru Sato 19 , Maggie Shafiro 20 , Seth J. Schwartz 21 , and H. Colleen Sinclair 22 Abstract The construct of individualism–collectivism (IND-COL) has become the definitive standard in cross-cultural psychology, management, and related fields. It is also among the most controversial, in particular, with regard to the ambiguity of its dimensionality: Some view IND and COL as the 1 University of North Carolina at Greensboro, USA 2 University of Nevada, Reno, USA 3 California State University, Chico, USA 4 University of Ljubljana, Slovenia 5 North Central College, Naperville, IL, USA 6 Western Washington University, Bellingham, USA 7 Northwestern University, Evanston, IL, USA 8 York University, Toronto, Ontario, Canada 9 Texas Tech University, Lubbock, USA 10 University of Wyoming, Laramie, USA 11 University of California, Davis, USA 12 Bilkent University, Ankara, Turkey 13 La Trobe University, Melbourne, Victoria, Australia 14 Norwegian University of Science and Technology, Trondheim, Norway 15 Victoria University of Wellington, New Zealand 16 University of New Mexico, Albuquerque, USA 17 New York University, USA 18 Washington State University, Vancouver, USA 19 Shippensburg University, PA, USA 20 Morehead Associates, Charlotte, NC, USA 21 University of Miami School of Medicine, FL, USA 22 Mississippi State University, Starkville, USA Corresponding Author: Vas Taras, Bryan School of Business and Economics, University of North Carolina at Greensboro, 349 Bryan, P.O. Box 26165, Greensboro, NC 27402-6165, USA. Email: [email protected] 509132JCC XX X 10.1177/0022022113509132Journal of Cross-Cultural PsychologyTaras et al. research-article 2013 at UNIV OF NEVADA RENO on November 29, 2013 jcc.sagepub.com Downloaded from
-
Upload
nevada-reno -
Category
Documents
-
view
1 -
download
0
Transcript of Opposite ends of the same stick? Multi-method test of the dimensionality of individualism and...
Journal of Cross-Cultural PsychologyXX(X) 1 –33
© The Author(s) 2013Reprints and permissions:
sagepub.com/journalsPermissions.nav DOI: 10.1177/0022022113509132
jccp.sagepub.com
Article
Opposite Ends of the Same Stick? Multi-Method Test of the Dimensionality of Individualism and Collectivism
Vas Taras1, Riikka Sarala1, Paul Muchinsky1, Markus Kemmelmeier2, Theodore M. Singelis3, Andreja Avsec4, Heather M. Coon5, Dale L. Dinnel6, Wendi Gardner7, Sherry Grace8, Erin E. Hardin9, Sandy Hsu10, Joel Johnson11, Zahide Karakitapoğlu Aygün12, Emiko S. Kashima13, Arnulf Kolstad14, Taciano L. Milfont15, John Oetzel16, Sumie Okazaki17, Tahira M. Probst18, Toru Sato19, Maggie Shafiro20, Seth J. Schwartz21, and H. Colleen Sinclair22
AbstractThe construct of individualism–collectivism (IND-COL) has become the definitive standard in cross-cultural psychology, management, and related fields. It is also among the most controversial, in particular, with regard to the ambiguity of its dimensionality: Some view IND and COL as the
1University of North Carolina at Greensboro, USA2University of Nevada, Reno, USA3California State University, Chico, USA4University of Ljubljana, Slovenia5North Central College, Naperville, IL, USA6Western Washington University, Bellingham, USA7Northwestern University, Evanston, IL, USA8York University, Toronto, Ontario, Canada9Texas Tech University, Lubbock, USA10University of Wyoming, Laramie, USA11University of California, Davis, USA12Bilkent University, Ankara, Turkey13La Trobe University, Melbourne, Victoria, Australia14Norwegian University of Science and Technology, Trondheim, Norway15Victoria University of Wellington, New Zealand16University of New Mexico, Albuquerque, USA17New York University, USA18Washington State University, Vancouver, USA19Shippensburg University, PA, USA20Morehead Associates, Charlotte, NC, USA21University of Miami School of Medicine, FL, USA22Mississippi State University, Starkville, USA
Corresponding Author:Vas Taras, Bryan School of Business and Economics, University of North Carolina at Greensboro, 349 Bryan, P.O. Box 26165, Greensboro, NC 27402-6165, USA. Email: [email protected]
509132 JCCXXX10.1177/0022022113509132Journal of Cross-Cultural PsychologyTaras et al.research-article2013
at UNIV OF NEVADA RENO on November 29, 2013jcc.sagepub.comDownloaded from
2 Journal of Cross-Cultural Psychology XX(X)
opposites of a single continuum, whereas others argue that the two are independent constructs. We explored the issue through seven different tests using original individual-level data from 50 studies and meta-analytic data from 149 empirical publications yielding a total of 295 sample-level observations that were collected using six established instruments for assessing IND and COL as separate constructs. Results indicated that the dimensionality of IND-COL may depend on (a) the specific instrument used to collect the data, (b) the sample characteristics and the cultural region from which the data were collected, and (c) the level of analysis. We also review inconsistencies, deficiencies, and challenges of conceptualizing IND-COL and provide guidelines for developing and selecting instruments for measuring the construct, and for reporting and meta-analyzing results from this line of research.
Keywordsvalues, attitudes, beliefs, cultural psychology, history of psych
Since the publication of Hofstede’s (1980) highly influential book Culture’s Consequences, cul-ture has become a crucial construct for research conducted in business, management, psychology, communication, education, and sociology. The number of citations to his book—about 40,000 according to Google Scholar—speaks to its profound effect on subsequent research. Hofstede’s framework has become a foundation for further cross-cultural research, and the four cultural dimensions originally presented in his model—power distance, uncertainty avoidance, individualism–collectivism, and masculinity–femininity—appear in most subsequent models of culture.
Of the four dimensions in Hofstede’s model, individualism–collectivism (hereafter IND-COL) stands out for its unmatched popularity in cross-cultural research (Kirkman, Lowe, & Gibson, 2006; Tsui, Nifadkar, & Ou, 2007). More than two thirds of all existing instruments for measuring cultural values include measures analogous to Hofstede’s IND-COL (Taras, Rowney, & Steel, 2009). Furthermore, a recent meta-analytic review of more than 500 empirical studies on the effects of culture in the workplace reported that IND-COL accounts for about 88% of all reported effects of cultural values in the empirical cross-cultural literature (Taras, Kirkman, & Steel, 2010). In fact, countries are often selected for inclusion in research based on their relative standing on IND-COL. As such, it can be concluded that cross-cultural research of the past decades has been, to a large degree, research on IND-COL.
IND-COL is not only the most popular cultural construct but also the most controversial one. First, as Oyserman, Coon, and Kemmelmeier (2002) discussed, what is commonly known as IND-COL appears in literature under different names, including independent–interdependent self-construal (Markus & Kitayama, 1991), idiocentrism–allocentrism (Triandis, 1983), and private–collective self (Trafimow, Triandis, & Goto, 1991), as well as numerous subtypes of the construct such as vertical and horizontal IND-COL (e.g., Singelis, Triandis, Bhawuk, & Gelfand, 1995) and institutional and in-group collectivism (House, Hanges, Javidan, Dorfman, & Gupta, 2004). The inconsistent terminology often leads to confusion and makes integration of extant research challenging. Second, a number of authors have questioned the validity and utility of IND-COL, mainly due to the ambiguity of the construct boundaries and scope (e.g., Kim & Sharkey, 1995; Levine et al., 2003; Voronov & Singer, 2002). However, perhaps the biggest controversy sur-rounding the construct is the uncertainty of the relationship between IND and COL.
The conception of IND-COL as a facet of culture was introduced at least half a century ago (e.g., Kluckhohn & Strodtbeck, 1961; Kuhn & McPartland, 1954), but it was Hofstede who established the explanatory potential of the construct and who is widely regarded as the “father” of IND-COL. Hofstede interpreted IND and COL as the opposite poles of one continuum, mean-ing that low IND is functionally equivalent to high COL. However, the unidimensional interpre-tation of IND-COL was later challenged by a number of scholars who suggested that IND and
at UNIV OF NEVADA RENO on November 29, 2013jcc.sagepub.comDownloaded from
Taras et al. 3
COL can actually represent two independent continua (e.g., Markus & Kitayama, 1991; Oyserman, 1993; Singelis, 1994; Triandis, 1994). A bidimensional view of IND and COL assumes orthogonality between the two, indicating that one’s position on the IND continuum is indepen-dent of one’s position on the COL continuum. Thus, one could simultaneously score high (or low) on both dimensions.1
The ambiguity regarding the dimensionality is not unique to IND-COL. For example, intro-version–extraversion, happiness–unhappiness, negative and positive affect, masculinity–femininity, and work–life balance were also originally seen as bipolar unidimensional constructs. As with IND-COL, it was later suggested that perhaps one could be both—introvert and extro-vert, masculine and feminine, happy and unhappy, or score high on work and personal life involvement—at the same time (e.g., Carrigan, 1960; Constantinople, 1973; Green & Salovey, 1999). As such, the debate on the factor structure of these constructs also continues.
Given the prevalence and importance of the IND-COL construct, it is not surprising that the question of its dimensionality has been a topic of a heated debate. Unfortunately, the literature presents mixed evidence on the issue. According to meta-analytic reviews by Oyserman et al. (2002) and Taras et al. (2010), the number of empirical studies that use unidimensional measures of IND-COL (instruments that yield a single IND-COL score) is roughly equal to that of studies that rely on instruments measuring IND-COL as two independent constructs (and yield two sepa-rate scores for IND and COL). Further complicating the matter, some of the studies that measured IND and COL separately found near-zero correlations (e.g., Singelis, 1994), negative correla-tions (e.g., Lam, Chen, & Schaubroeck, 2002), or even positive correlations (e.g., Bresnahan et al., 2005) between IND and COL.
The uncertainty regarding the relationship between IND and COL poses a challenge for inter-preting, comparing, and meta-analyzing findings reported in the literature. For example, it is unclear whether findings from studies that used instruments designed to measure IND-COL as a unidimensional construct are comparable to the findings of studies that used instruments that assess IND and COL as independent constructs. Should measures of both constructs be reported in studies, or would reporting only one be sufficient? If a study finds that IND has a positive effect on a particular outcome, can it be assumed that the effect of COL on the outcome is negative? If one scores high on IND, can it be assumed that one would score low on COL? Should the IND and COL scores be combined in a single index for the meta-analysis purposes, or should the two be kept separate? Do the answers to these questions depend on which instrument is used to quantify IND-COL, the level of analysis, or the sample characteristics on which the results are based?
The present study addressed these questions through a series of seven tests of the IND-COL dimensionality. The analyses were based on meta-analytic data from 149 publications and 50 original individual-level datasets shared by authors of studies that reported separate IND and COL means and correlations. The findings of this study could help classify, interpret, and gener-alize the findings from the wealth of published research on IND-COL.
We begin with a brief qualitative review of IND-COL conceptualization, including its defini-tions, related hypotheses, and survey items used to operationalize the construct. After describing our data, we detail the methodology and findings of each of the seven tests that were used to assess the relationship between IND and COL. We then explore how the sample characteristics and the cultural region represented by the data may affect the dimensionality of IND-COL. Finally, we conclude with an integrative summary and discussion of the results of our multi-method study, review their implications, and offer guidelines for future research.
IND-COL Conceptualization
There is no single commonly accepted definition of IND-COL. Hofstede (1980) defined IND as “a loosely knit social framework in which people are supposed to take care of themselves and of
at UNIV OF NEVADA RENO on November 29, 2013jcc.sagepub.comDownloaded from
4 Journal of Cross-Cultural Psychology XX(X)
their immediate families only,” and COL as “a tight social framework in which people distin-guish between ingroups and outgroups, [and] expect their ingroups to look after them, and in exchange for that they feel they owe absolute loyalty to it” (p. 45). Although Hofstede provided two seemingly independent definitions for IND and COL, he interpreted them as the opposite poles of one continuum. These definitions, however, never gained acceptance among scholars who view IND and COL as orthogonal constructs. Instead, authors who use a bidimensional framework of IND-COL typically cite definitions offered by Markus and Kitayama (1991), Singelis (1994), and other pioneers of the orthogonal interpretation of IND-COL.
Of the 149 papers in our meta-analytic sample, 126 provided formal operational definitions of IND-COL. The definition offered by Singelis (1994) is among the most frequently cited, which defined IND as a “bounded, unitary, and stable self that is separate from social context” and COL as a “flexible, variable self that emphasizes statuses,. . . roles, and relationships, belonging and fitting in, [and] being indirect in communication” (p. 581). In most cases, however, a combina-tion of derivatives from earlier definitions is provided to offer a more comprehensive definition.
One glaring inconsistency throughout the literature is how IND-COL is conceptualized and defined. A review of the publications included in the meta-analytic sample used in the present study revealed that although the possibility of the independence of IND and COL was explicitly acknowledged in 38% of the sample (and implied in the rest of the papers), most definitions were either entirely composed of (or amended with) summaries of key attributes of IND and COL that highlight the opposite and often mutually exclusive nature of the two, such as independence versus interconnectedness, focus on individual versus group goals, uniqueness versus fitting in, and the like. Furthermore, to indicate the inversely related nature of the two, 82.7% of the defini-tions of IND and COL used wording such as “in contrast,” “conversely,” or “as opposed to” in an apparent attempt to highlight that one is the reverse of the other. We acknowledge that such word-ing is not necessarily indicative of the author’s perception of IND and COL as the extremes of a single continuum or mutually exclusive constructs, but it is hard to interpret it in any other way.
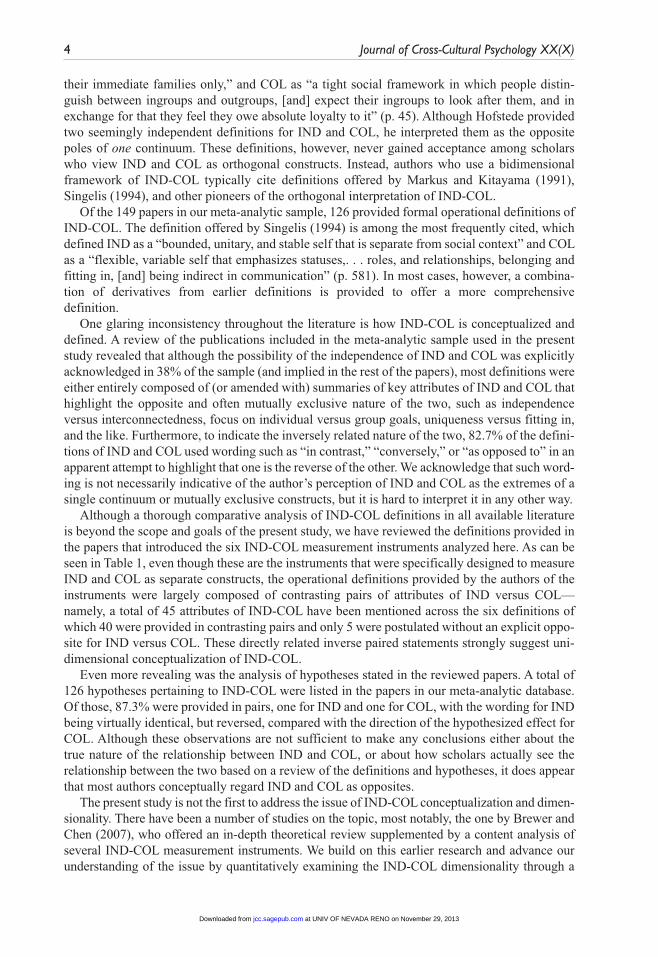
Although a thorough comparative analysis of IND-COL definitions in all available literature is beyond the scope and goals of the present study, we have reviewed the definitions provided in the papers that introduced the six IND-COL measurement instruments analyzed here. As can be seen in Table 1, even though these are the instruments that were specifically designed to measure IND and COL as separate constructs, the operational definitions provided by the authors of the instruments were largely composed of contrasting pairs of attributes of IND versus COL—namely, a total of 45 attributes of IND-COL have been mentioned across the six definitions of which 40 were provided in contrasting pairs and only 5 were postulated without an explicit oppo-site for IND versus COL. These directly related inverse paired statements strongly suggest uni-dimensional conceptualization of IND-COL.
Even more revealing was the analysis of hypotheses stated in the reviewed papers. A total of 126 hypotheses pertaining to IND-COL were listed in the papers in our meta-analytic database. Of those, 87.3% were provided in pairs, one for IND and one for COL, with the wording for IND being virtually identical, but reversed, compared with the direction of the hypothesized effect for COL. Although these observations are not sufficient to make any conclusions either about the true nature of the relationship between IND and COL, or about how scholars actually see the relationship between the two based on a review of the definitions and hypotheses, it does appear that most authors conceptually regard IND and COL as opposites.
The present study is not the first to address the issue of IND-COL conceptualization and dimen-sionality. There have been a number of studies on the topic, most notably, the one by Brewer and Chen (2007), who offered an in-depth theoretical review supplemented by a content analysis of several IND-COL measurement instruments. We build on this earlier research and advance our understanding of the issue by quantitatively examining the IND-COL dimensionality through a
at UNIV OF NEVADA RENO on November 29, 2013jcc.sagepub.comDownloaded from
5
Tab
le 1
. D
efin
ition
s Pr
ovid
ed b
y th
e A
utho
rs o
f the
Rev
iew
ed In
divi
dual
ism
–Col
lect
ivis
m M
easu
rem
ent
Inst
rum
ents
.
Gud
ykun
stK
im, L
eung
Oys
erm
anSi
ngel
isT
akat
aT
rian
dis
Inst
rum
ent
Def
initi
on a
ttri
bute
IND
CO
LIN
DC
OL
IND
CO
LIN
DC
OL
IND
CO
LIN
DC
OL
Inde
pend
ence
—C
onne
cted
ness
II
II
II
XI
IG
roup
goa
ls, n
eeds
—In
divi
dual
goa
ls, n
eeds
II
II
II
II
II
Focu
s on
the
tas
k—fo
cus
on t
he p
eopl
eI
I
Self-
relia
nce—
grou
p lo
yalty
and
rel
ianc
e on
gro
upI
IX
II
X
Uni
quen
ess,
Sta
ndin
g ou
t, Pe
rson
al id
entit
y—Fi
ttin
g in
, Har
mon
y, S
ocia
l nor
ms
and
orde
rI
II
II
II
I
Indi
vidu
al a
chie
vem
ent,
Com
petit
ion—
Solid
arity
, Coo
pera
tion
II
XI
IX
Ex
chan
ge-b
ased
—C
omm
unal
rel
atio
nshi
psI
I
Not
e. I
= t
he d
efin
ition
att
ribu
te is
pro
vide
d as
a p
art
of a
con
tras
ting
pair
of a
ttri
bute
s, o
ne fo
r In
divi
dual
ism
and
one
for
Col
lect
ivis
m. X
= t
he d
efin
ition
ele
men
t is
pro
vide
d w
ithou
t a
cont
rast
ing
pair
for
Indi
vidu
alis
m v
ersu
s C
olle
ctiv
ism
. IN
D =
Indi
vidu
alis
m; C
OL
= C
olle
ctiv
ism
.
at UNIV OF NEVADA RENO on November 29, 2013jcc.sagepub.comDownloaded from
6 Journal of Cross-Cultural Psychology XX(X)
series of seven tests, four at the individual, two at the group, and one at the national level of analy-sis. We focus on six popular instruments that operationalized IND and COL as separate constructs. It is particularly challenging to integrate the findings when some studies separate IND and COL while other studies take the traditional unidimensional approach. We seek to test whether one-factor or two-factor solutions provide a better fit for the data collected using these instruments and examine how the dimensionality of IND and COL may vary across various instruments, as well as across samples, cultural regions, and level of analysis.
Method
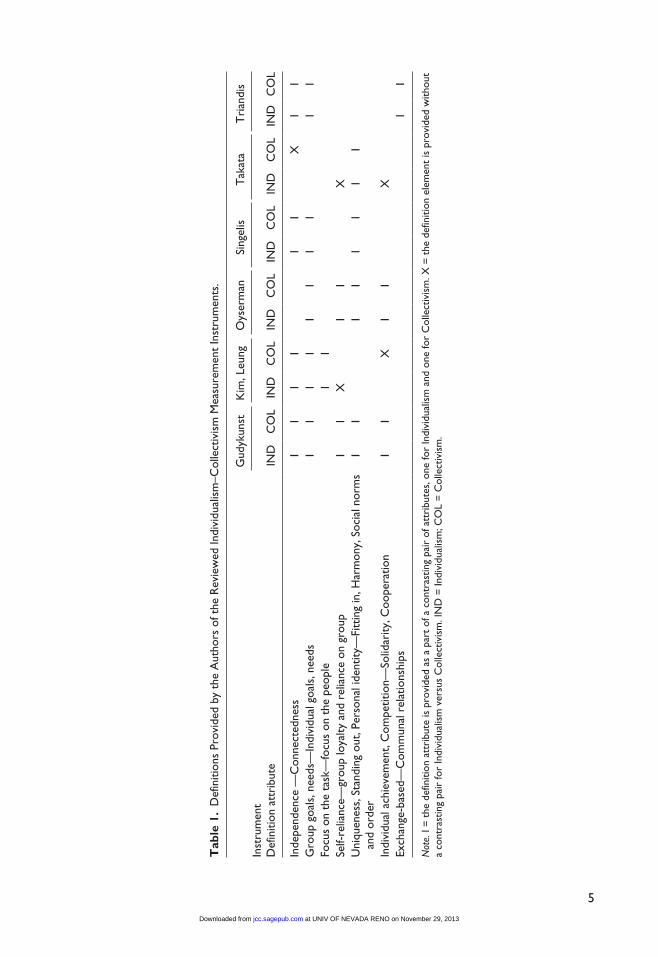
Two different sources of data were used in the present study. First, a meta-analytic database was created by coding data from 149 empirical papers that used instruments for measurement of IND and COL as separate constructs and that yielded separate scores for IND and COL. Second, to further validate our findings, all (co)authors of the 149 papers were contacted with a request for their original individual-level data. In response, a total of 50 original datasets were shared for further evaluation. The reliability and validity of studies that rely on original data are usually considered superior to those that use meta-analytic approach (Gudykunst, Matsumoto, Ting-Toomey, & Nishida, 1996). However, the meta-analytic approach allows for a larger and more representative sample and moderator variable analyses that cannot be conducted using a single original dataset. Therefore, both databases (meta-analytic and original data) were used in the present study. Table 2 provides characteristics of respondents in each dataset.
Meta-analytic data. A review of earlier meta-analyses on IND-COL (Coon & Kemmelmeier, 2001; Levine et al., 2003; Oyserman et al., 2002; Steel & Taras, 2010; Taras et al., 2010; Taras et al., 2012) and publicly available descriptions of instruments for measuring cultural values (Taras, 2013) suggested that six instruments for measuring IND and COL as two separate con-structs have been commonly used by cross-cultural scholars. They are those offered by Gudykunst and colleagues (1996), Kim and Leung (1997), Oyserman (1993), Singelis (1994)2, Takata (1993), and Triandis (1994). The appendix lists original items in each instrument. Our literature search was designed to locate published and unpublished studies that used these survey instru-ments. We first conducted an electronic search through Google Scholar and more specialized databases such as EBSCO, PsycINFO, and ProQuest for studies that involved empirical assess-ment of IND-COL. Second, the references in each article in our initial pool were reviewed for links to publications potentially containing relevant data. Third, our review revealed that some studies involved measurement of IND and COL but reported no IND-COL means or correlations. Therefore, 28 (co)authors of 17 articles were contacted and asked for additional data. Of those, 21 replied and 11 provided the requested data. The final pool of studies that met our meta-analy-sis selection criteria included 149 journal articles, book chapters, dissertations, conference pre-sentations, and unpublished studies that provided a total of 295 sample-level data points.3
Each study was reviewed and the following information, when available, was recorded: instrument type, measurement reliabilities, IND and COL means, correlations between IND and COL (as well as correlations between each of the constructs and external variables), sample sizes, and sample demographics. All studies were independently coded at least twice. In a few cases of coding inconsistencies, further reviews were conducted to reach agreement. If other measures of statistical association were used to describe the relationships between IND-COL and external variables (e.g., d-scores, t, or F statistics), they were converted to product–moment correlations (Schmidt & Hunter, 2004).
Individual-level data. Recognizing limitations of meta-analytic data, we subsequently attempted to obtain original individual-level data from the studies included in our meta-analysis. We contacted
at UNIV OF NEVADA RENO on November 29, 2013jcc.sagepub.comDownloaded from
7
Tab
le 2
. Sa
mpl
e D
escr
iptio
n.
Inst
rum
ent
Gud
ykun
stK
im, L
eung
Oys
erm
anSi
ngel
isT
akat
aT
rian
dis
Sam
ple
MA
O-IL
MA
O-IL
MA
O-IL
MA
O-IL
MA
O-IL
MA
O-IL
Tot
al N
1,96
51,
217
3,48
918
71,
050
528
26,2
0721
,818
329
659
3,24
910
5k
(met
a-an
alys
is o
nly)
614
510
2
517
%
Nor
th A
mer
ica
(vs.
Oth
er)
85.0
25.2
65.9
100
100
100
79.5
90.6
0.0
0.0
50.1
52.
4%
Wes
t (v
s. E
ast)
80.3
47.6
65.2
100
100
100
60.5
95.4
0.0
65.6
51.8
100.
0A
vera
ge a
ge22
.821
.624
.020
.919
.918
.723
.422
.521
.523
.322
.420
.6%
Mal
e26
.524
.730
.443
.644
.543
.940
.241
.346
.649
.628
.5N
A%
Stu
dent
97.8
63.1
169
.910
010
100
86.2
93.6
100
100
82.6
100
% W
hite
NA
8.05
NA
16.9
NA
58.9
35.3
58.4
0.0
NA
NA
100
Cro
nbac
h’s
alph
a (In
d/C
ol)
0.71
/0.6
50.
75/0
.64
0.81
/0.8
40.
69/0
.72
0.77
/0.7
40.
56/0
.65
Not
e. M
A =
met
a-an
alyt
ic s
ampl
e. A
diff
eren
t nu
mbe
r of
dat
a po
ints
wer
e av
aila
ble
for
each
met
a-an
alyt
ic t
est;
the
valu
es h
ere
are
aver
ages
acr
oss
all m
eta-
anal
ytic
tes
ts. O
-IL =
or
igin
al in
divi
dual
-leve
l dat
a; N
A =
not
app
licab
le; I
ND
= In
divi
dual
ism
; CO
L =
Col
lect
ivis
m.
at UNIV OF NEVADA RENO on November 29, 2013jcc.sagepub.comDownloaded from
8 Journal of Cross-Cultural Psychology XX(X)
all the authors (except for a few who could not be located) of the 149 papers included in our meta-analytic database with request for their original data. A total of 50 datasets representing 24,514 individuals, collected using six different instruments, were shared for further individual-level analysis. In addition to the IND-COL item and composite scores, we also retained, when available, variables representing respondent characteristics, such as age, gender, country of ori-gin, ethnicity, and student status for moderator variable analysis. The datasets were merged item by item into one large database. Subsets representing different IND-COL measurement instru-ments were analyzed separately.
Data standardization to account for differences in response styles. Prior research has demonstrated that samples from different cultures may yield different results not only because of the true underlying respondent differences but also because of the differences in the response styles in these different cultures, such as acquiescent and extreme responding styles (Harzing, 2006; Hui & Triandis, 1989; Smith, 2004). Cross-cultural differences in response styles are of particular concern when the purpose of the study is to compare means across populations because they may lead to misleading conclusions about intergroup differences. Response set may also affect the relationships among the constructs, typically inflating the correlations.
Recognizing the problem, a number of methods for correcting for response sets in cross-cultural data have been suggested (for reviews, see Fischer, 2004; Fischer & Milfont, 2010; Smith & Fischer, 2008). Mean adjustment is typically used to account for acquiescence bias, whereas dispersion adjustment (commonly standard deviation or range) is used to correct for extreme response style. Adjustments can be made within subjects, within groups (typically sam-ple or study), or within culture, depending on how the response styles are believed to be clus-tered. For example, if it is believed that the response style systematically differs across cultures, within-culture standardization is used. If it is believed that there may be differences in response styles across individual respondents, within-subject standardization is used. Furthermore, adjust-ments could be performed using covariates through such approaches as partial correlations or one-way AN(C)OVA. A single correction method, or a combination of correction methods, can be used. Unfortunately, as with any data manipulation, data standardization may distort underly-ing interitem relationships. As noted by Fischer (2004), standardized data have “various undesir-able properties, especially for statistical techniques involving correlations” (p. 278) and other multivariate analyses. Results and interpretation based on standardization may be ambiguous and even misleading.
Rather than relying on a single standardization method to account for individual and cross-cultural response style differences, we used several standardization techniques that appeared relevant in the context of the present study. Whenever possible, we conducted our analyses in six different ways using (a) unstandardized data, (b) within-subject mean, (c) within-culture/country mean, (d) within-country dispersion, (e) within-subject dispersion, and (f) within-country mean and dispersion standardization. We used neither within-subject double standardization (mean and dispersion), as this approach renders data unsuitable for correlational analysis, nor covariate adjustment, as we did not have the data necessary for this kind of adjustment. In addition, we tried within-study standardization, but the results were almost identical to those obtained using unstandardized data, and, thus, these findings will not be discussed.
Statistical analyses. A wide range of tests is available to assess dimensionality of a construct. Unfortunately, no single test can provide a conclusive answer to the question of construct dimensionality. Even the most rigorous tests, such as confirmatory factor analysis, leave room for ambiguity and subjectivity in the interpretation of the results. Therefore, we used a series of seven different tests—namely, at the individual level of analysis, we used (a) correlations using original data, (b) correlations using meta-analytic data, (c) exploratory factor analysis,
at UNIV OF NEVADA RENO on November 29, 2013jcc.sagepub.comDownloaded from
Taras et al. 9
and (d) confirmatory factor analysis; at the group level of analysis, (e) correlation analysis using meta-analytic data and (f) criterion validity assessment; and at the national level of analysis, (g) analysis of correlations between various measures of IND and COL. Furthermore, to examine how the relationship between IND and COL may vary across contexts, each test was repeated using data subsets representing different instruments, cultural regions, demo-graphic groups, and levels of analysis. When possible, the data were also standardized to account for response style differences. Descriptions of the methodology and summaries of findings of each test are as follows.
Correlation Analysis Using Original Individual-Level Data
Assessing the correlation between IND and COL composite scores is the most direct way to assess the relationship between the two constructs. Correlation coefficients near zero would indi-cate that the two constructs are orthogonal. Strong negative correlations would indicate that the two constructs represent the opposite ends of a single continuum. Strong positive correlations would indicate that the two are measures of the same construct. Although most research methods references (e.g., Cohen & Cohen, 1983) provide guidelines for classifying correlation coeffi-cients into “small,” “moderate,” and “strong” effect categories (typically r of less than .30, .30-.50, greater than .50, respectively), there is no commonly accepted threshold for what would constitute a correlation coefficient small enough to indicate orthogonal constructs or strong enough to indicate overlapping constructs. A correlation of zero would clearly indicate unrelated constructs. A correlation (absolute value) close to the commonly accepted internal consistency reliability threshold of .70 (e.g., Nunnally, 1978) would suggest that the measures assess the same construct. Unfortunately, statistical significance tests provide little guidance because their results are greatly affected by sample size. With large samples as in the present research, even smaller coefficients would likely be statistically significant but of questionable practical signifi-cance. In addition, the commonly used statistical significance cutoff points are rather arbitrary (Lance, Butts, & Michaels, 2006).
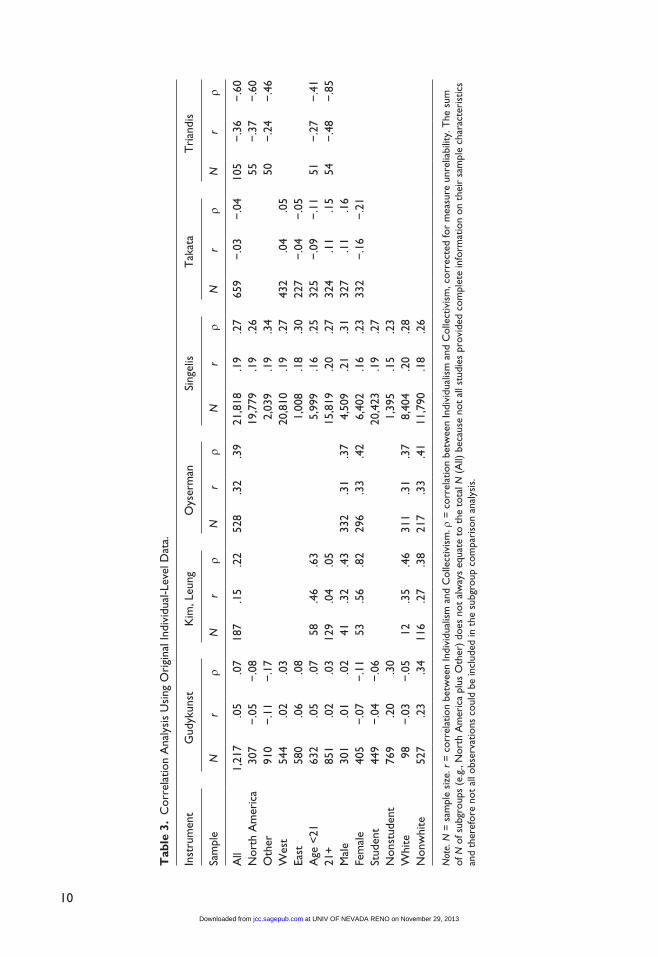
Furthermore, given that measurement of IND-COL relies on multi-item self-report question-naires, measurement unreliability may distort the true relationships between the constructs. Table 3 also provides correlation coefficients (ρ) corrected for attenuation (Spearman, 1910). However, the practice of correcting correlation coefficients for unreliability is not without controversy (c.f. Muchinsky, 1996), and such findings should be interpreted with caution.
For the purpose of the present study, we proposed that absolute uncorrected correlation of less than .20 (less than 4% of shared variance) be interpreted as indicative of IND and COL indepen-dence, while absolute correlations greater than .30 (more than 9% of shared variance) indicate nonindependence. Obviously, the use of other statistical thresholds for interpreting the relation-ship between the constructs could lead to different conclusions.
Our data allow for testing the correlations at the individual level of analysis using original and meta-analytic data. Correlations were close to zero for the instruments by Gudykunst, Kim, and Leung, Singelis, and Takata, indicating that these four instruments may be measuring two inde-pendent constructs (Table 3). On the other hand, for the instruments designed by Triandis and Oyserman, the correlations were stronger than our threshold of .30, indicating that IND and COL as measured by these two instruments may represent opposite ends of the same construct.
Curiously, the correlations were negative for the instrument by Triandis, clearly indicating that IND and COL, as measured by this instrument, are the opposite extremes of a single con-tinuum. In constrast, the correlations for Oyserman’s instrument were positive, as were the cor-relations for the instrument by Singelis and by Kim and Leung, although in the latter cases, they were less than our .30 threshold. From the purely statistical perspective, the direction of the cor-relations is of little concern as negative and positive correlations indicate nonindependence. In
at UNIV OF NEVADA RENO on November 29, 2013jcc.sagepub.comDownloaded from
10
Tab
le 3
. C
orre
latio
n A
naly
sis
Usi
ng O
rigi
nal I
ndiv
idua
l-Lev
el D
ata.
Inst
rum
ent
Gud
ykun
stK
im, L
eung
Oys
erm
anSi
ngel
isT
akat
aT
rian
dis
Sam
ple
Nr
ρN
rρ
Nr
ρN
rρ
Nr
ρN
rρ
All
1,21
7.0
5.0
718
7.1
5.2
252
8.3
2.3
921
,818
.19
.27
659
−.0
3−
.04
105
−.3
6−
.60
Nor
th A
mer
ica
307
−.0
5−
.08
19,7
79.1
9.2
655
−.3
7−
.60
Oth
er91
0−
.11
−.1
72,
039
.19
.34
50−
.24
−.4
6W
est
544
.02
.03
20,8
10.1
9.2
743
2.0
4.0
5
East
580
.06
.08
1,00
8.1
8.3
022
7−
.04
−.0
5
Age
<21
632
.05
.07
58.4
6.6
35,
999
.16
.25
325
−.0
9−
.11
51−
.27
−.4
121
+85
1.0
2.0
312
9.0
4.0
515
,819
.20
.27
324
.11
.15
54−
.48
−.8
5M
ale
301
.01
.02
41.3
2.4
333
2.3
1.3
74,
509
.21
.31
327
.11
.16
Fe
mal
e40
5−
.07
−.1
153
.56
.82
296
.33
.42
6,40
2.1
6.2
333
2−
.16
−.2
1
Stud
ent
449
−.0
4−
.06
20,4
23.1
9.2
7
Non
stud
ent
769
.20
.30
1,39
5.1
5.2
3
Whi
te98
−.0
3−
.05
12.3
5.4
631
1.3
1.3
78,
404
.20
.28
N
onw
hite
527
.23
.34
116
.27
.38
217
.33
.41
11,7
90.1
8.2
6
Not
e. N
= s
ampl
e si
ze. r
= c
orre
latio
n be
twee
n In
divi
dual
ism
and
Col
lect
ivis
m. ρ
= c
orre
latio
n be
twee
n In
divi
dual
ism
and
Col
lect
ivis
m, c
orre
cted
for
mea
sure
unr
elia
bilit
y. T
he s
um
of N
of s
ubgr
oups
(e.
g., N
orth
Am
eric
a pl
us O
ther
) do
es n
ot a
lway
s eq
uate
to
the
tota
l N (
All)
bec
ause
not
all
stud
ies
prov
ided
com
plet
e in
form
atio
n on
the
ir s
ampl
e ch
arac
teri
stic
s an
d th
eref
ore
not
all o
bser
vatio
ns c
ould
be
incl
uded
in t
he s
ubgr
oup
com
pari
son
anal
ysis
.
at UNIV OF NEVADA RENO on November 29, 2013jcc.sagepub.comDownloaded from
Taras et al. 11
the context of our study, the positive correlation is unexpected. It suggests that IND and COL, as measured by these instruments, are not independent and that the measures may represent the same or significantly overlapping constructs. Note, the positive correlations may also be an arti-fact of the survey response set, as well as the use of a unipolar response scale, unreliable responses, and shared method variance, or indicate other problems with the measures.
The correlation results obtained using standardized data (not reported here due to page con-straints) reverse the direction of the relationship for the instrument by Gudykunst. Although the uncorrected correlations were .05 overall, and generally fluctuated from approximately .02 to .20 depending on subsample, the within-culture mean and mean-dispersion standardizations reversed correlation from −.10 to −.17, suggesting that the positive correlations may have been observed due to differences in acquiescence and socially desirable response bias across cultures. The dis-persion corrections, commonly used to correct for extreme response bias, did not result in nega-tive correlations and even made the positive correlations stronger. The corrections, however, had no appreciable effect on the IND-COL correlations observed for the other instruments.
Individual-Level Correlation Analysis Between IND and COL Using Meta-Analytic Data
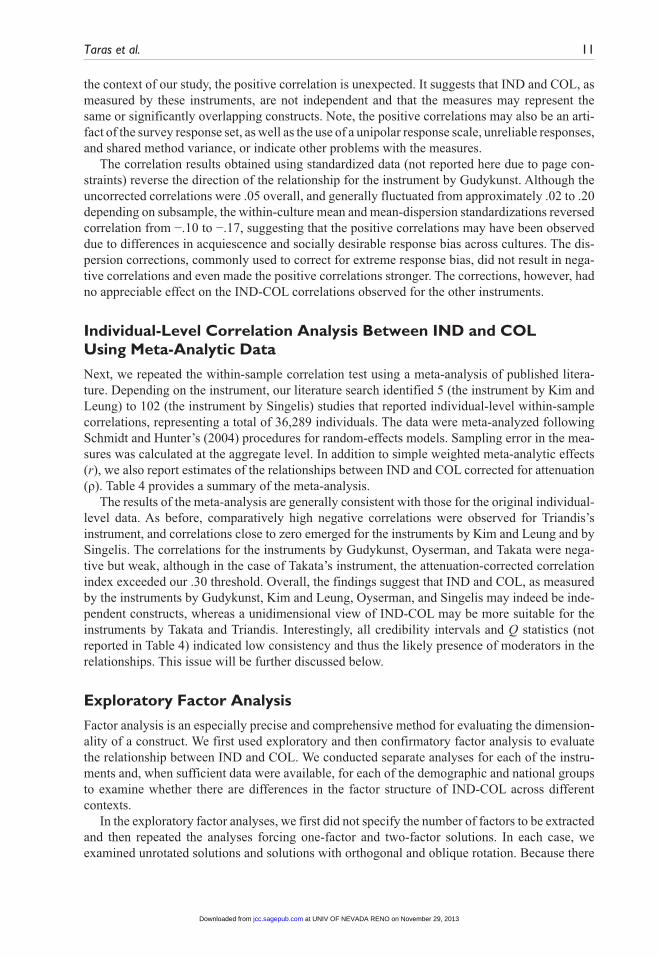
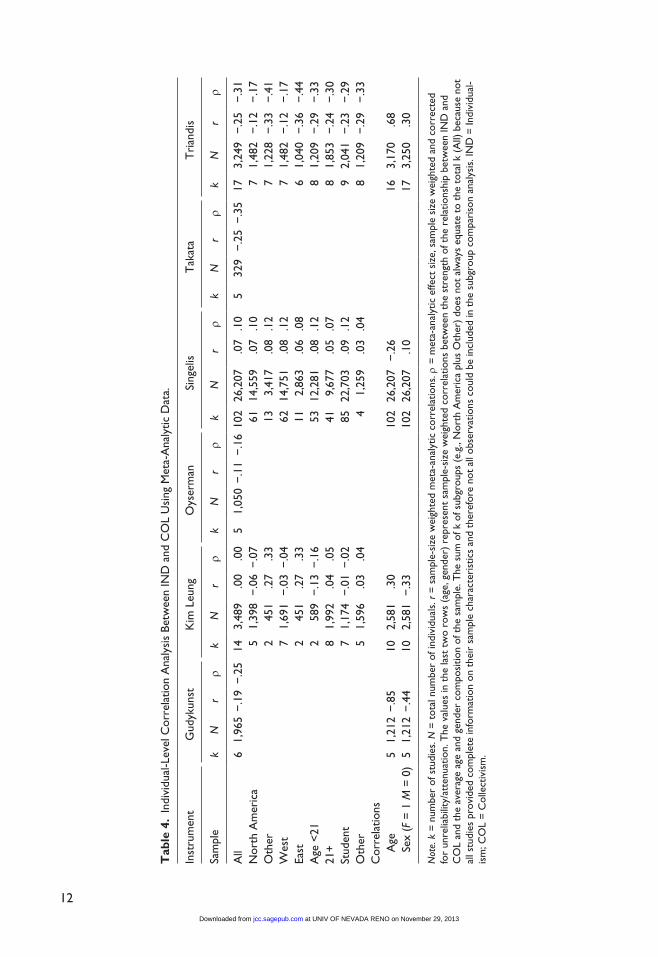
Next, we repeated the within-sample correlation test using a meta-analysis of published litera-ture. Depending on the instrument, our literature search identified 5 (the instrument by Kim and Leung) to 102 (the instrument by Singelis) studies that reported individual-level within-sample correlations, representing a total of 36,289 individuals. The data were meta-analyzed following Schmidt and Hunter’s (2004) procedures for random-effects models. Sampling error in the mea-sures was calculated at the aggregate level. In addition to simple weighted meta-analytic effects (r), we also report estimates of the relationships between IND and COL corrected for attenuation (ρ). Table 4 provides a summary of the meta-analysis.
The results of the meta-analysis are generally consistent with those for the original individual-level data. As before, comparatively high negative correlations were observed for Triandis’s instrument, and correlations close to zero emerged for the instruments by Kim and Leung and by Singelis. The correlations for the instruments by Gudykunst, Oyserman, and Takata were nega-tive but weak, although in the case of Takata’s instrument, the attenuation-corrected correlation index exceeded our .30 threshold. Overall, the findings suggest that IND and COL, as measured by the instruments by Gudykunst, Kim and Leung, Oyserman, and Singelis may indeed be inde-pendent constructs, whereas a unidimensional view of IND-COL may be more suitable for the instruments by Takata and Triandis. Interestingly, all credibility intervals and Q statistics (not reported in Table 4) indicated low consistency and thus the likely presence of moderators in the relationships. This issue will be further discussed below.
Exploratory Factor Analysis
Factor analysis is an especially precise and comprehensive method for evaluating the dimension-ality of a construct. We first used exploratory and then confirmatory factor analysis to evaluate the relationship between IND and COL. We conducted separate analyses for each of the instru-ments and, when sufficient data were available, for each of the demographic and national groups to examine whether there are differences in the factor structure of IND-COL across different contexts.
In the exploratory factor analyses, we first did not specify the number of factors to be extracted and then repeated the analyses forcing one-factor and two-factor solutions. In each case, we examined unrotated solutions and solutions with orthogonal and oblique rotation. Because there
at UNIV OF NEVADA RENO on November 29, 2013jcc.sagepub.comDownloaded from
12
Tab
le 4
. In
divi
dual
-Lev
el C
orre
latio
n A
naly
sis
Betw
een
IND
and
CO
L U
sing
Met
a-A
naly
tic D
ata.
Inst
rum
ent
Gud
ykun
stK
im L
eung
Oys
erm
anSi
ngel
isT
akat
aT
rian
dis
Sam
ple
kN
rρ
kN
rρ
kN
rρ
kN
rρ
kN
rρ
kN
rρ
All
61,
965
−.1
9−
.25
143,
489
.00
.00
51,
050
−.1
1−
.16
102
26,2
07.0
7.1
05
329
−.2
5−
.35
173,
249
−.2
5−
.31
Nor
th A
mer
ica
51,
398
−.0
6−
.07
6114
,559
.07
.10
71,
482
−.1
2−
.17
Oth
er2
451
.27
.33
133,
417
.08
.12
71,
228
−.3
3−
.41
Wes
t7
1,69
1−
.03
−.0
462
14,7
51.0
8.1
27
1,48
2−
.12
−.1
7Ea
st2
451
.27
.33
112,
863
.06
.08
61,
040
−.3
6−
.44
Age
<21
258
9−
.13
−.1
653
12,2
81.0
8.1
28
1,20
9−
.29
−.3
321
+8
1,99
2.0
4.0
541
9,67
7.0
5.0
78
1,85
3−
.24
−.3
0St
uden
t7
1,17
4−
.01
−.0
285
22,7
03.0
9.1
29
2,04
1−
.23
−.2
9O
ther
51,
596
.03
.04
41,
259
.03
.04
81,
209
−.2
9−
.33
Cor
rela
tions
A
ge5
1,21
2−
.85
102,
581
.30
102
26,2
07−
.26
163,
170
.68
Sex
(F =
1 M
= 0
)5
1,21
2−
.44
102,
581
−.3
310
226
,207
.10
173,
250
.30
Not
e. k
= n
umbe
r of
stu
dies
. N =
tot
al n
umbe
r of
indi
vidu
als.
r =
sam
ple-
size
wei
ghte
d m
eta-
anal
ytic
cor
rela
tions
. ρ =
met
a-an
alyt
ic e
ffect
siz
e, s
ampl
e si
ze w
eigh
ted
and
corr
ecte
d fo
r un
relia
bilit
y/at
tenu
atio
n. T
he v
alue
s in
the
last
tw
o ro
ws
(age
, gen
der)
rep
rese
nt s
ampl
e-si
ze w
eigh
ted
corr
elat
ions
bet
wee
n th
e st
reng
th o
f the
rel
atio
nshi
p be
twee
n IN
D a
nd
CO
L an
d th
e av
erag
e ag
e an
d ge
nder
com
posi
tion
of t
he s
ampl
e. T
he s
um o
f k o
f sub
grou
ps (
e.g.
, Nor
th A
mer
ica
plus
Oth
er)
does
not
alw
ays
equa
te t
o th
e to
tal k
(A
ll) b
ecau
se n
ot
all s
tudi
es p
rovi
ded
com
plet
e in
form
atio
n on
the
ir s
ampl
e ch
arac
teri
stic
s an
d th
eref
ore
not
all o
bser
vatio
ns c
ould
be
incl
uded
in t
he s
ubgr
oup
com
pari
son
anal
ysis
. IN
D =
Indi
vidu
al-
ism
; CO
L =
Col
lect
ivis
m.
at UNIV OF NEVADA RENO on November 29, 2013jcc.sagepub.comDownloaded from
Taras et al. 13
is no single statistical criterion to conclusively interpret the results of factor analyses, a number of indicators must be considered in reaching a conclusion, but even then the final decision may not be self-evident. To determine the preferred solution, we evaluated the Eigenvalues, scree plots, factor loadings, and other relevant statistics. With a total of almost over 8,000 result sets (up to 13 different subsamples by demographics and region; unrestricted, forced one-factor and two-factor solutions; unrotated and both orthogonally and obliquely rotated solutions, using raw and standardized data, for each of the six instruments), we provide here only a summary of our findings.
Overall, the results were somewhat troubling: For none of the six instruments could we obtain a neat one-factor or two-factor solution with all items loading on their respective factors. In most cases, regardless of whether standardized or unstandardized data and unrotated or rotated solu-tions were used, the items loaded on at least two, and more often three or more, factors. A forced two-factor solution usually resulted in only about 60% to 80% of the items loading on their respective latent factors, with the results being somewhat better for the rotated solutions. The item loadings for the instruments by Gudykunst, Takata, Triandis, and Singelis were closer to what would be expected based on the hypothesized two-factor model (on average, about 70% to 90% of the items loading as expected), whereas the results for the instruments by Kim and Leung and by Oyserman could only be described as unacceptable (on average, only 50% of the items loading as expected).
Overall, it appears that for the instruments by Gudykunst, Singelis, and Takata, the two-factor solution is a preferred one, although more complex multifactor solutions could not be dismissed. For the instrument by Triandis, the unstandardized data appeared to better match the two-factor model, although oblique rotation provided consistently better results suggesting that the IND and COL factors are not independent. Furthermore, the one-factor model was a better fit for the within-culture standardized data. No definitive conclusions could be drawn for Kim and Leung’s and Oysterman’s instruments.
Confirmatory Factor Analysis
Next, we subjected the data to confirmatory factor analysis. Using structural equation modeling, we focused on comparing three different solutions: one factor, two independent factors, and two correlated factors. Confirmatory factor analysis yields a wide range of indicators that could pro-vide evidence in support of the hypothesized underlying factor structure of the construct in ques-tion, from goodness-of-fit indices to factor loadings. We primarily relied on a comparison of chi-square, GFI, and RMSEA indices, as well as the reported relationships between the latent IND and COL constructs (Tabachnick & Fidell, 2001). As before, for each instrument, the tests were repeated for each of the demographics and cultural region subsamples using unstandardized data and data standardized in five different ways. With more than 1,400 different result sets, we can report only a summary of our findings.
Several trends emerged from the analyses. First, virtually no solution, irrespective of the instrument or specific subsample, provided a good fit for the data. The GFI and RMSEA rarely reached the conventional goodness-of-fit standards. For example, GFI indices averaged .77 and .82, and the RMSEA indices averaged .09 and .08 for one- and two-factor solutions, respectively. The standardized data provided similar goodness-of-fit statistics. The indices were compara-tively better for the instruments by Singelis and Triandis, although still generally below the rec-ommended cutoff levels (Kline, 1998). The data fit was rather poor for the other instruments, because all goodness-of-fit indicators were lower, at times substantially, than the accepted thresholds.
Second, based on the comparison of one- versus two-factor solutions, the results indicated that a two-factor solution produced better data-fit indices for all instruments. However, whereas the
at UNIV OF NEVADA RENO on November 29, 2013jcc.sagepub.comDownloaded from
14 Journal of Cross-Cultural Psychology XX(X)
two-factor solution was substantially better for the instruments by Gudykunst, Singelis, and Takata, the differences were negligible for the instruments by Kim and Leung, Oyserman, and Triandis.
Third, the two-factor solution that allowed for correlation between IND and COL latent fac-tors was almost always preferred to the solution that assumed IND-COL independence. The dif-ference was particularly noticeable for the instruments by Takata and Triandis, suggesting that in the case of these two instruments, IND and COL are not truly independent.
Furthermore, the correlations between latent constructs representing IND and COL were strong and negative for the instrument by Triandis (around −.90) and negative, albeit weaker, for the instrument by Takata (around −.20). The IND-COL correlations for the instruments by Gudykunst and by Kim and Leung were close to zero, providing further support for the inde-pendence of the two constructs when measured by these instruments. Consistent with earlier findings, the correlations for the instruments by Oyserman and Singelis were strong and posi-tive (around .50 and .40, respectively). However, when within-culture standardized data were used, the correlations dropped to around .30 for the Oyserman’s and around −.10 for Singelis’s instruments, suggesting that the positive correlations may, at least partially, be a response set artifact.
Group-Level Correlations
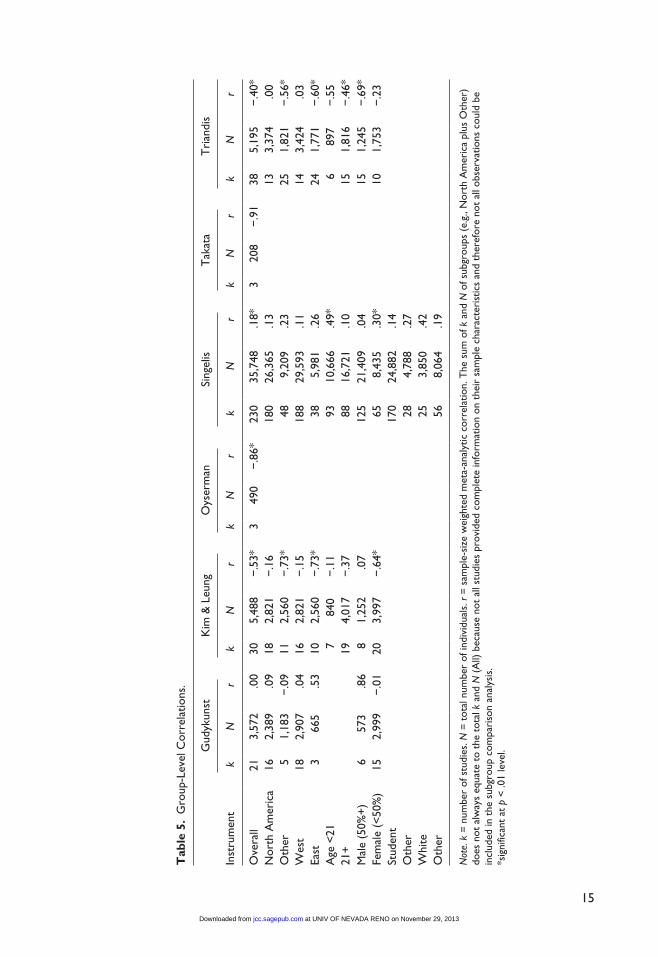
Our last three tests evaluate the relationship between IND and COL at the aggregate level, two at the sample and one at the national level of analysis. First, we consider the group-level correla-tions between the two constructs. In addition to reporting individual-level within-sample correla-tions, most studies in our meta-analytic sample also reported sample means for the IND and COL dimensions that could be used to test the relationship between the two at the group level. Here, we used the same approach as in an earlier test, but instead of using individual-level data, we correlated sample means for IND and COL.
The results at the group-level analysis (Table 5) are generally consistent with the individual-level findings, although the correlations are stronger, which is common for aggregated-level data. Consistent with our earlier findings, the correlations were close to zero for the instruments devel-oped by Gudykunst and Singelis, providing further support to the interpretation that the IND and COL scores represent independent constructs when measured by these instruments. Furthermore, we found a strong negative correlation between IND and COL for the instruments developed by Oyserman and Triandis, confirming earlier findings of unidimensional nature of IND-COL when measured using these instruments. Unexpectedly, we also found strong negative correlations for the instruments by Kim and Leung and by Takata, which, contrary to earlier findings, suggested a unidimensional structure to the data. These results suggest that the factor structure of IND-COL at the group level may differ from that at the individual level, at least for some of the instruments. Unfortunately, only a few data points were available for these analyses, which limits the reliabil-ity and generalizability of our findings.
Criterion Analysis: Correlations Between IND and COL and External Variables
We noted earlier that the vast majority (87.3%) of the hypotheses listed in the 149 papers in our database were provided in pairs, predicting the effect of IND to be opposite to that of COL. Although the hypotheses can only tell us, at best, how the authors of the studies conceptualized IND-COL within a larger nomological net, our next test offers empirical evaluations of how IND and COL relate to external constructs, which can help clarify how the two relate to each other.
at UNIV OF NEVADA RENO on November 29, 2013jcc.sagepub.comDownloaded from
15
Tab
le 5
. G
roup
-Lev
el C
orre
latio
ns.
Gud
ykun
stK
im &
Leu
ngO
yser
man
Sing
elis
Tak
ata
Tri
andi
s
Inst
rum
ent
kN
rk
Nr
kN
rk
Nr
kN
rk
Nr
Ove
rall
213,
572
.00
305,
488
−.5
3*3
490
−.8
6*23
035
,748
.18*
320
8−
.91
385,
195
−.4
0*N
orth
Am
eric
a16
2,38
9.0
918
2,82
1−
.16
180
26,3
65.1
313
3,37
4.0
0O
ther
51,
183
−.0
911
2,56
0−
.73*
489,
209
.23
251,
821
−.5
6*W
est
182,
907
.04
162,
821
−.1
518
829
,593
.11
143,
424
.03
East
366
5.5
310
2,56
0−
.73*
385,
981
.26
241,
771
−.6
0*A
ge <
217
840
−.1
193
10,6
66.4
9*6
897
−.5
521
+19
4,01
7−
.37
8816
,721
.10
151,
816
−.4
6*M
ale
(50%
+)
657
3.8
68
1,25
2.0
712
521
,409
.04
151,
245
−.6
9*Fe
mal
e (<
50%
)15
2,99
9−
.01
203,
997
−.6
4*65
8,43
5.3
0*10
1,75
3−
.23
Stud
ent
170
24,8
82.1
4
Oth
er28
4,78
8.2
7
Whi
te25
3,85
0.4
2
Oth
er56
8,06
4.1
9
Not
e. k
= n
umbe
r of
stu
dies
. N =
tot
al n
umbe
r of
indi
vidu
als.
r =
sam
ple-
size
wei
ghte
d m
eta-
anal
ytic
cor
rela
tion.
The
sum
of k
and
N o
f sub
grou
ps (
e.g.
, Nor
th A
mer
ica
plus
Oth
er)
does
not
alw
ays
equa
te t
o th
e to
tal k
and
N (
All)
bec
ause
not
all
stud
ies
prov
ided
com
plet
e in
form
atio
n on
the
ir s
ampl
e ch
arac
teri
stic
s an
d th
eref
ore
not
all o
bser
vatio
ns c
ould
be
incl
uded
in t
he s
ubgr
oup
com
pari
son
anal
ysis
.*s
igni
fican
t at
p <
.01
leve
l.
at UNIV OF NEVADA RENO on November 29, 2013jcc.sagepub.comDownloaded from
16 Journal of Cross-Cultural Psychology XX(X)
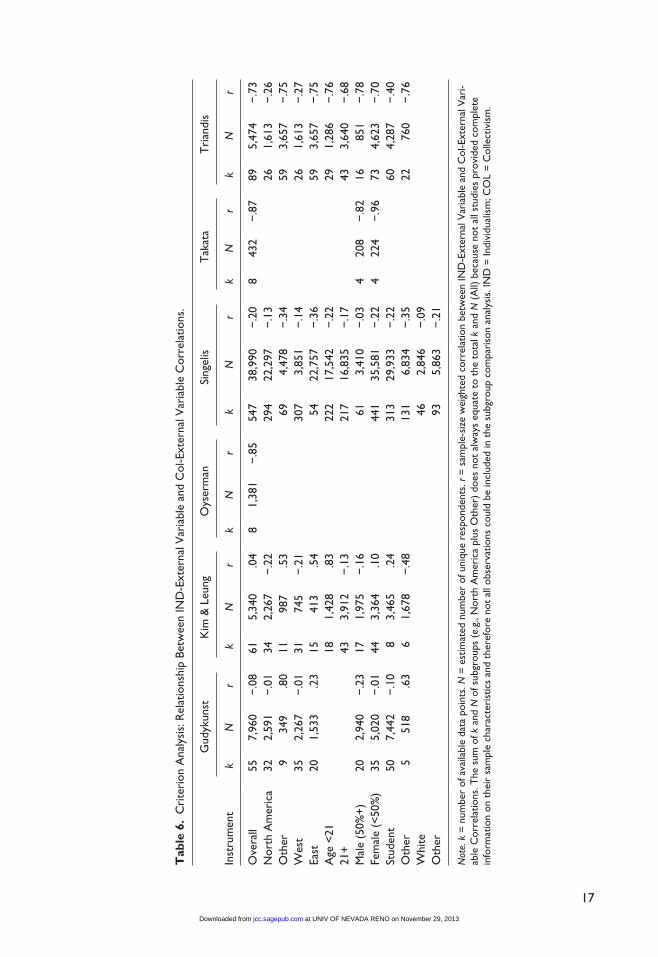
This is probably the most useful test as far as interpreting and integrating the findings from ear-lier studies. It tests whether the effects of IND and COL on third constructs can be assumed to be opposite.
Of the 149 papers in our sample, 105 provided paired correlations between IND and COL and other variables included in the studies. A total of 768 pairs of correlations were available for analysis, each represented by a correlation coefficient between IND and the criterion and COL and the same criterion. Our analysis was based on an evaluation of the relationship between each pair of correlations. A negative relationship between the IND-criterion and COL-criterion cor-relation coefficients would indicate that the relationship between IND and the criterion tends to be opposite to that between COL and the criterion. Cases such as this would provide support for a unidimensional view of IND-COL and would essentially indicate that the effects of IND could be reversely generalized to the effects of COL. A positive relationship between the correlations would suggest that the relationship between IND and COL with the criterion is the same in terms of the direction, suggesting that the two represent the same (or closely overlapping) constructs. Finally, nonsignificant relationships between the pairs of correlations would suggest that IND and COL are independent constructs and should be interpreted separately.
Table 6 summarizes the results of our analysis. The results are generally consistent with those of the tests at the individual level of analysis. We found strong negative correlations for the instruments by Oyserman, Takata, and Triandis, which provided support for the unidimensional nature of IND-COL as measured by these instruments. In addition, as per our previous tests, the correlations were close to zero for the instruments by Gudykunst, Kim and Leung, and Singelis, further corroborating a bidimensional view of IND-COL for these instruments. The results indi-cate that, similar to the individual level of analysis, at the group level, IND and COL are indepen-dent constructs when measured by these instruments. In other words, the strong negative correlations for the instruments by Oyserman, Takata, and Triandis indicate that the observed effects of IND could be generalized to that of COL with the opposite sign. On the other hand, the very weak correlations for the instruments by Gudykunst, Kim and Leung, and Singelis indicate that such generalizations would not be valid as the effects of IND and COL are likely indepen-dent from one another.
Relationship Between Unidimensional Versus Bidimensional Models of IND-COL
When comparing findings on IND-COL from studies that used the Hofstedean unidimensional conception of IND-COL and those that treated IND and COL as separate constructs, it is often not clear how these bodies of research findings can be integrated and compared with each other. When coding data for meta-analytic purposes, can data from studies that used these two compet-ing frameworks be combined, or should they be coded separately? Our final test addresses this question by evaluating the relationship between the unidimensional and bidimensional IND-COL indices. Unfortunately, we could not locate any studies or datasets that involved measure-ment of IND-COL using both unidimensional and bidimensional instruments within the same sample. Therefore, the test could only be conducted at the national level of analysis. Based on the available bidimensional IND-COL data, we calculated national IND and COL averages as mea-sured using Singelis’s instrument. The other instruments have only been used in one to four countries and, thus, could not yield data for a large enough sample for such an analysis. Therefore, the findings presented here apply only to the instrument by Singelis and may not generalize to other instruments.
We assessed the relationship between IND and COL as measured by the Singelis’s instrument and IND-COL as measured by Hofstede’s instrument at the national level of analysis. We used
at UNIV OF NEVADA RENO on November 29, 2013jcc.sagepub.comDownloaded from
17
Tab
le 6
. C
rite
rion
Ana
lysi
s: R
elat
ions
hip
Betw
een
IND
-Ext
erna
l Var
iabl
e an
d C
ol-E
xter
nal V
aria
ble
Cor
rela
tions
.
Gud
ykun
stK
im &
Leu
ngO
yser
man
Sing
elis
Tak
ata
Tri
andi
s
Inst
rum
ent
kN
rk
Nr
kN
rk
Nr
kN
rk
Nr
Ove
rall
557,
960
−.0
861
5,34
0.0
48
1,38
1−
.85
547
38,9
90−
.20
843
2−
.87
895,
474
−.7
3N
orth
Am
eric
a32
2,59
1−
.01
342,
267
−.2
229
422
,297
−.1
326
1,61
3−
.26
Oth
er 9
349
.80
1198
7.5
369
4,47
8−
.34
593,
657
−.7
5W
est
352,
267
−.0
131
745
−.2
130
73,
851
−.1
426
1,61
3−
.27
East
201,
533
.23
1541
3.5
454
22,7
57−
.36
593,
657
−.7
5A
ge <
2118
1,42
8.8
322
217
,542
−.2
229
1,28
6−
.76
21+
433,
912
−.1
321
716
,835
−.1
743
3,64
0−
.68
Mal
e (5
0%+
)20
2,94
0−
.23
171,
975
−.1
661
3,41
0−
.03
420
8−
.82
1685
1−
.78
Fem
ale
(<50
%)
355,
020
−.0
144
3,36
4.1
044
135
,581
−.2
24
224
−.9
673
4,62
3−
.70
Stud
ent
507,
442
−.1
08
3,46
5.2
431
329
,933
−.2
260
4,28
7−
.40
Oth
er 5
518
.63
61,
678
−.4
813
16,
834
−.3
522
760
−.7
6W
hite
462,
846
−.0
9
Oth
er93
5,86
3−
.21
Not
e. k
= n
umbe
r of
ava
ilabl
e da
ta p
oint
s. N
= e
stim
ated
num
ber
of u
niqu
e re
spon
dent
s. r
= s
ampl
e-si
ze w
eigh
ted
corr
elat
ion
betw
een
IND
-Ext
erna
l Var
iabl
e an
d C
ol-E
xter
nal V
ari-
able
Cor
rela
tions
. The
sum
of k
and
N o
f sub
grou
ps (
e.g.
, Nor
th A
mer
ica
plus
Oth
er)
does
not
alw
ays
equa
te t
o th
e to
tal k
and
N (
All)
bec
ause
not
all
stud
ies
prov
ided
com
plet
e in
form
atio
n on
the
ir s
ampl
e ch
arac
teri
stic
s an
d th
eref
ore
not
all o
bser
vatio
ns c
ould
be
incl
uded
in t
he s
ubgr
oup
com
pari
son
anal
ysis
. IN
D =
Indi
vidu
alis
m; C
OL
= C
olle
ctiv
ism
.
at UNIV OF NEVADA RENO on November 29, 2013jcc.sagepub.comDownloaded from
18 Journal of Cross-Cultural Psychology XX(X)
national sample-size-weighted IND and COL averages derived based on the data from the studies that used Singelis’s instrument and Individualism national scores offered by Hofstede. The results at the national level of analysis are consistent with our earlier findings. The correlation between IND and COL remains close to zero for the instrument by Singelis (r = −.13), which reveals a remarkably robust bidimensional structure of the data collected with this instrument across indi-vidual, group, and national levels. As for the relationship between bidimensional and unidimen-sional IND-COL scores, Hofstede’s IND correlates positively with Singelis’s IND (r = .42) and negatively with COL (r = −.61). The correlations may not be strong enough to indicate functional equivalence, but the results clearly suggest a substantial overlap between unidimensional and bidimensional frameworks of IND-COL at the national level. Given that data for only one instru-ment and representing only a small number of countries were available for the analysis, the reli-ability and generalizability of these findings may be limited. However, this first-of-its-kind analysis provides some initial insights into the relationship between different frameworks of IND-COL. Hopefully, future research will explore the issue in more depth.
Moderator Analysis
The analyses performed so far examined the dimensionality of IND-COL in a broad context. However, just as the IND-COL values vary across different populations, so may the dimensional-ity of the construct (Triandis, 1989). Earlier research on IND-COL identified a number of factors that may affect the IND-COL values. For example, IND-COL has been commonly discussed in the context of the West versus East (e.g., Earley, 1993). A meta-analysis by Oyserman et al. (2002) refined the focus and contrasted IND-COL values of European Americans versus those of other demographic groups. Although the focus here was on the mean differences, structural dif-ferences may exist as well. For example, a recent debate (see Hofstede, 2006; Javidan, House, Dorfman, Hanges, & Sully de Luque, 2006) on strengths and limitations of existing cultural models, among other things, has addressed the “American” origin of the models, either by the virtue of the sample (e.g., IBM employees in Hofstede’s study) or by institutional affiliation of the lead scholars on the project. One of the implications of the debate was that the models com-monly used for studying IND-COL may not apply in non-North American or non-Western cul-tures. Initial empirical support for the notion that the dimensionality of IND-COL may vary across ethnic groups was provided by Rhee, Uleman, and Lee (1996), who found that the IND-COL attitudes toward kin seemed to converge along one bipolar dimension in the Korean and European American samples, but two factors seems to fit the data better in the Asian American sample; and by Komarraju and Cokley (2008), who showed that the relationship between IND and COL may be different in African American and European American populations (cf. Vargas & Kemmelmeier, 2013).
Furthermore, cultural values, and possibly the structure of these values, may vary not only across cultural regions but also across demographic groups. For example, demographic charac-teristics such as gender, age, education, and socioeconomic status may not only shape cultural orientation (e.g., Steel & Taras, 2010) but also value structure (e.g., Fischer, Milfont, & Gouveia, 2011; Fontaine, Poortinga, Delbeke, & Schwartz, 2008). Last, the use of student samples in social research has been questioned on the grounds that such sampling may provide results that are not generalizable to larger populations (Deshpande, Joseph, & Viswesvaran, 1994).
Hofstede repeatedly emphasized that his framework applies only at the national level of analysis. In contrast, the authors of bidimensional IND-COL instruments presented them as individual-level measures. Thus, it is possible that the structure of IND-COL varies at different levels of analysis.
Although a topic of much debate and speculation, no clearly formulated theory has been put forth as to how IND and COL should relate to each other in different contexts. Even studies that addressed the issue of IND-COL dimensionality directly (e.g., Rhee et al., 1996) provided no
at UNIV OF NEVADA RENO on November 29, 2013jcc.sagepub.comDownloaded from
Taras et al. 19
compelling theoretical rationale for the observed differences in IND-COL value structure in dif-ferent populations. Therefore, we offer no hypotheses regarding moderators of the dimensional-ity of IND-COL. Rather, we approached the issue as a research question and simply compared unidimensional versus bidimensional models within different contexts.
The available data allowed us to examine possible IND-COL dimensionality differences across major cultural regions and demographic groups. Specifically, we reanalyzed the data across the following subsamples: Eastern versus Western culture countries (Asia vs. North America, Western Europe, and Australia), North America versus other regions, age groups (younger vs. older than 21), male versus female, students versus others, and Europeans (White) versus others. In addition to the results for entire samples, Tables 2 to 7 provide the results by each of these subsamples. Several distinct trends emerged based on the comparison of the results across different contexts. We discuss them in detail below.
Instrument
First, the choice of the instrument has an effect on the dimensionality of IND-COL. The unidi-mensional solution was consistently preferred for the instrument by Triandis, whereas the results for the instruments by Gudykunst, Kim and Leung, and Singelis consistently favored a bidimen-sional view of IND-COL. The results for the instruments by Oyserman and Takata were mixed, with three of the six tests supporting a one-factor solution, one test supporting a two-interrelated-factor solution, and two tests supporting a two-factor solution.
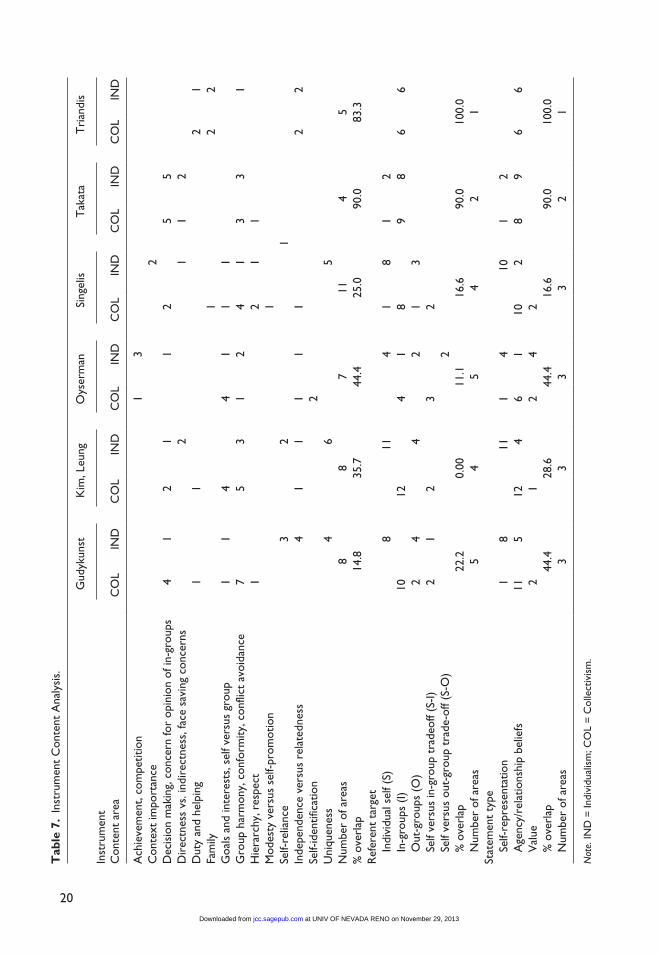
We conducted a series of post hoc tests to explore why different instruments yield IND-COL data that have a different factor structure (Table 7). Similar to Brewer and Chen (2007), we reviewed the items in each instrument and classified them with respect to (a) the content area, (b) reference target, and (c) statement type (e.g., self-identification, agency beliefs, and values). Furthermore, for each of the analyses, we calculated the overlap between IND and COL items with respect to their classification, as well as the number of different item types included in each instrument.
Several instrument characteristics appear to affect instrument dimensionality. First, complex-ity of the instrument content, as measured by the number of content areas, had a clear effect on the construct dimensionality. Three of the instruments characterized by a unidimensional struc-ture covered only four to seven different domain areas (Takata, Triandis, and Oyserman with four, five, and seven areas covered, respectively). The other instruments that consistently showed a better fit for the two-factor solution covered 8 to 11 areas.
Second, the IND-COL item pairing or overlap had a clear and strong effect on the instrument dimensionality. In the instruments by Triandis and Takata, which consistently showed a better fit for the unidimensional view of IND-COL, 83.3% and 90.0% of the items were provided in matching contrasting pairs; that is, for almost every IND item there was a reverse COL item. The overlap was lower but still substantial for the instrument by Oyserman (44.4%), which also gen-erally fit a unidimensional view of IND-COL better. In contrast, the overlap was only 14.8% to 35.7% for the other instruments that were shown to fit a bidimensional view of IND-COL.
The findings were the same based on the analysis of the items with respect to the item referent target and item type. In the instruments by Triandis and Takata, which provided a closer fit with a unidimensional view of IND-COL, the items had one (in-group) and two (in-group and indi-vidual self) referent targets, respectively. Likewise, the items in these instruments clustered into only one or two different types (e.g., agency/relationship beliefs). Furthermore, the IND-COL item overlap was 90% to 100% for these two instruments. In contrast, the other instruments had four or more referent targets and were of three different types. In addition, only 11.1% to 22.2% of the items were paired with respect to the item referent target and up to 44.4% with respect to the item type.
at UNIV OF NEVADA RENO on November 29, 2013jcc.sagepub.comDownloaded from
20
Tab
le 7
. In
stru
men
t C
onte
nt A
naly
sis.
Gud
ykun
stK
im, L
eung
Oys
erm
anSi
ngel
isT
akat
aT
rian
dis
Inst
rum
ent
Con
tent
are
aC
OL
IND
CO
LIN
DC
OL
IND
CO
LIN
DC
OL
IND
CO
LIN
D
Ach
ieve
men
t, co
mpe
titio
n1
3
Con
text
impo
rtan
ce 2
D
ecis
ion
mak
ing,
con
cern
for
opin
ion
of in
-gro
ups
41
2 1
1 2
55
D
irec
tnes
s vs
. ind
irec
tnes
s, fa
ce s
avin
g co
ncer
ns 2
11
2
Dut
y an
d he
lpin
g 1
12
1Fa
mily
12
2G
oals
and
inte
rest
s, s
elf v
ersu
s gr
oup
11
44
1 1
1
Gro
up h
arm
ony,
con
form
ity, c
onfli
ct a
void
ance
7 5
31
2 4
13
31
Hie
rarc
hy, r
espe
ct 1
2 1
1
Mod
esty
ver
sus
self-
prom
otio
n 1
Se
lf-re
lianc
e3
21
In
depe
nden
ce v
ersu
s re
late
dnes
s4
1 1
11
12
2Se
lf-id
entif
icat
ion
2
Uni
quen
ess
4 6
5
Num
ber
of a
reas
88
711
45
% o
verl
ap14
.835
.744
.425
.090
.083
.3R
efer
ent
targ
et
Indi
vidu
al s
elf (
S)8
114
1 8
12
In-g
roup
s (I)
1012
41
89
86
6
Out
-gro
ups
(O)
24
42
1 3
Self
vers
us in
-gro
up t
rade
off (
S-I)
21
23
2
Se
lf ve
rsus
out
-gro
up t
rade
-off
(S-O
)2
% o
verl
ap22
.20.
0011
.116
.690
.010
0.0
N
umbe
r of
are
as5
45
42
1St
atem
ent
type
Se
lf-re
pres
enta
tion
18
111
410
12
Age
ncy/
rela
tions
hip
belie
fs11
512
46
110
28
96
6
Val
ue 2
1
24
2
%
ove
rlap
44.4
28.6
44.4
16.6
90.0
100.
0
Num
ber
of a
reas
33
33
21
Not
e. IN
D =
Indi
vidu
alis
m; C
OL
= C
olle
ctiv
ism
.
at UNIV OF NEVADA RENO on November 29, 2013jcc.sagepub.comDownloaded from

Taras et al. 21
Our conclusions are fairly simple and expected. First, instruments that contain less diverse items with respect to the item domain, referent target, and type tend to yield data that fit simpler, unidimensional views of IND-COL, whereas greater item diversity results in data with multidi-mensional factor structure. Second, a unidimensional view of IND-COL fits better the instru-ments that are based on paired IND and COL items.
Cultural Context
The analyses indicate that IND and COL may have a different structure in North American versus non-North American and Western versus Eastern samples. In most cases when such a comparison could be made, the results for the non-North American sample were closer to the one-factor solu-tion than were the results for the North American sample. The same result was found for samples from Western versus Eastern countries. This trend was observed for all six instruments, although the difference was not as pronounced for some instruments as for others. Even though the mod-erating effect of region (North America vs. Others, East versus West) was not strong enough to change the dimensionality of IND-COL in some cases, the support for a two-factor solution was clearly weaker in non-North American/Eastern subsamples.
Demographics
The moderating effects of demographics were less pronounced. Different analyses provided sup-port for different interpretations, and no reliable conclusions could be drawn. For example, there were a number of indications that the one-factor solution may be a preferred (or second best option) in younger (less than 21) compared with older (21 and older) samples and for student samples compared with nonstudent samples. However, such interpretations were not definitive as opposite trends were also evident. The differences for gender and ethnicity were even more inconsistent, indicating that the IND-COL structure does not systematically differ across these sample characteristics.
Level of Analysis
Finally, based on a comparison of the results of the tests at the individual (Tests 1-4) versus group (Tests 5-7) level of analysis, fairly consistent evidence emerged that the dimensionality of IND-COL leans toward a unidimensional solution at the group level compared with that at the indi-vidual level. For the instruments by Triandis, Takata, and Oyserman, the group-level analyses clearly supported a unidimensional view of IND-COL, and at least some evidence led to the same conclusion for the instruments by Kim and Leung and by Gudykunst. The instrument by Singelis consistently produced results that supported a bidimensional view of IND-COL at the individual and group level, but the national-level analyses provided support for the unidimensional view of the construct.
Discussion
IND-COL has been the cornerstone of cross-cultural psychology over the past several decades. Despite its popularity, the construct is not without controversies, the most notable of which is the issue of dimensionality of IND-COL. Some scholars regard IND and COL as the opposites of a single continuum. Others regard IND and COL as orthogonal factors and believe that they are independent constructs. The confusion about how IND and COL relate to each other leads to a concomitant ambiguity about the interpretation and generalizability of research findings. For example, it is unclear how to meta-analyze the wealth of research on IND and COL and integrate
at UNIV OF NEVADA RENO on November 29, 2013jcc.sagepub.comDownloaded from
22 Journal of Cross-Cultural Psychology XX(X)
findings from studies that treat IND-COL as a single bipolar construct versus those that approach IND and COL as two orthogonal dimensions.
Integrative Overview of the Findings
As discussed by Meehl (1978), in “hard” natural sciences, there tends to be a clear understanding of what a phenomenon is and one agreed-on instrument for its measurement. In “soft” social sci-ences, however, for just about any construct, there seem to be multiple definitions and various measurement instruments. Our review clearly shows that, as it stands, IND-COL is certainly one of those “soft” constructs. There are more than 100 competing instruments for measuring IND-COL, with some of them operationalizing it as a single bipolar construct and others treating IND and COL as independent factors. Some models further split IND and COL into horizontal and vertical facets (e.g., Singelis et al., 1995), or measure them separately with respect to different domains of relationships (e.g., family, friends, neighbors, etc., Hui, 1988).
Our multi-method review also showed that the dimensionality of IND-COL systematically varies across instruments used to collect the data, cultural regions, level of analysis, and, possi-bly, demographic characteristics of the sample. First, differences in the dimensionality of IND-COL were discovered across the analyzed instruments. A bidimensional structure of IND-COL has been consistently observed for the instruments by Gudykunst, Kim, and Leung, and Singelis. On the other hand, the results for the instruments by Triandis, and somewhat less consistently for the instruments by Oyserman and Takata, provided support for a unidimensional structure. The instrument content, as characterized by the item diversity with respect to the domain, referent target, and item type, as well as pairing of IND and COL reverse-worded items explains, at least partially, the resulting differences in the data dimensionality.
Second, even though IND-COL emerged as a bidimensional construct for some of the ana-lyzed instruments and as a unidimensional construct for others, both sets of instruments revealed systematic deviations in the factor structure across cultural regions. Specifically, evidence for a bidimensional structure was much more consistent in North American and Western samples, whereas more evidence for a unidimensional structure was usually provided in non-North American and Eastern samples. Although in most cases, the difference was not strong enough to completely reverse the dimensionality of IND-COL, we consistently detected systematic devia-tions from the overall solution across different cultural regions. It should be kept in mind that the vast majority of the samples in our database were drawn from student populations, which mini-mized variation in age, socioeconomic status, and, possibly, world outlook. IND-COL dimen-sionality differences would likely be greater if the samples from each cultural region were more representative of their general populations.
Third, initial evidence suggested that demographics may moderate the dimensionality of IND-COL. Our results indicated that the construct dimensionality may vary across age cohorts, gen-der, ethnicity, and student/nonstudent status of the respondents, although findings were mixed. While our tests provided no conclusive answers about the moderating effect of demographics, based on the fact that some of the tests clearly suggested a difference, future research into the issue may be more fruitful.
Fourth, our findings also provided evidence that IND-COL structure may vary across the lev-els of analysis. The results at the group and national levels of analysis tended to fit a unidimen-sional solution, whereas individual-level tests generally favored a bidimensional view of IND-COL. In other words, at the individual level of analysis, IND and COL may be independent constructs. However, as we move up to the aggregate levels of analysis, the relationship between IND and COL becomes more pronounced, and they lean toward becoming the opposites of a single continuum. This may explain why studies focused on national cultures, such as those by Hofstede (1980) or the GLOBE team (House et al., 2004), settled for a unidimensional view of
at UNIV OF NEVADA RENO on November 29, 2013jcc.sagepub.comDownloaded from
Taras et al. 23
IND-COL. Due to limited data availability, we could not explore the issue in sufficient depth, and further research is warranted to provide more conclusive answers.
Finally, one of the unexpected and interesting findings from the study is a strong positive cor-relation between IND and COL in some instances. This contradicts the unidimensional view that would result in a strong negative correlation, and the bidimensional view that would result in a near-zero correlation. Our results suggest that the positive correlations, at least partially, may be explained by extreme responding, acquiescence bias, and socially desirable responding. Other factors that could contribute to the positive correlations may include common data source and the nature of the response scale.
It is important, however, to consider another explanation for the unexpected positive correlations and volatile changes in results in response to minor changes in context: The commonly used IND-COL measures may simply lack validity. Of the most important albeit unpredicted findings from the present study is that there is a clear disconnect between how IND-COL is defined and hypoth-esized to affect attitudes, behaviors, and organizational processes and how it is measured. Furthermore, psychometric properties of the reviewed IND-COL instruments are generally poor. The internal consistency indices rarely meet or exceeded the commonly accepted criterion of .70 (Nunnally, 1978), and exploratory and confirmatory factor analyses almost never produce adequate goodness-of-data-fit indices and item loadings. Based on the available evidence, we simply cannot be certain that the existing instruments of IND-COL measure the theoretical constructs they are expected to measure—and whatever they measure, they do so with low precision and reliability.
These results are troubling, as they suggest that one of the key constructs within cross-cultural psychology and management, namely IND-COL, may be the proverbial “naked emperor.” It has enjoyed unmatched popularity and admiration; yet, the numbers that we so readily use to explain all sorts of cross-cultural phenomena may not adequately represent the underlying theoretical construct IND-COL and may be not much more than just quantitative noise (c.f. Bresnahan et al., 2005; Levine et al., 2003).
Limitations
Despite our use of multiple samples and methods, we cannot be sure that the findings of the pres-ent study are conclusive and generalizable. The debate on the concept and dimensionality of IND-COL is far too complex to be resolved in a single study. It was not our goal to review all available instruments for measuring IND and COL, which are more than 100. Rather, we focused on six popular instruments that operationalize IND and COL as separate constructs, which is dif-ferent from the majority of the instruments that yield a single IND-COL score. We did not review the psychometric properties and factor structure of the data collected using instruments that mea-sure IND-COL as a single construct.
The present study was based on a large multisource database and used a series of different tests to evaluate the issue from every perspective. However, our sample size for some of the tests was rather low, and the characteristics of the data posed threats to validity of our findings. First, much of the data, original and meta-analytic, was collected using convenience sampling. Analysis of the IND-COL dimensionality as measured by some of the instruments was conducted pre-dominantly based on student samples, and it is not certain whether the findings would generalize to the larger population.
Second, range restriction may have been a factor in some tests. Particularly, when student samples were used, limited variation in demographics and socioeconomic backgrounds of the respondents could also be associated with limited variation in worldviews and values. If this was indeed the case, the association statistics reported here could be underestimated or distorted.
Of particular concern are the results of the tests conducted at the group level of analysis. Here, sample averages were the observations. If true IND-COL scores in the samples in a particular
at UNIV OF NEVADA RENO on November 29, 2013jcc.sagepub.comDownloaded from
24 Journal of Cross-Cultural Psychology XX(X)
group (e.g., North America) did not vary significantly, any resulting correlations could be mis-leading. Although the observed variation in IND-COL was rather large across samples in all arrays used in our moderator analysis, much of the variation could have been due to measurement error, which may explain low and positive correlations, as well as unstable results obtained using the group-level data.
Furthermore, our analyses were generally limited to comparing one-factor versus two-factor solutions. It is conceivable, however, as some of our results suggest, that a more complex struc-ture may fit the data better. Indeed, especially evidence pertaining to Oyserman and Kim and Leung clearly indicated that multifactorial solutions would produce a better fit for these data. In addition, we did not consider how removing or regrouping items could change instrument prop-erties and dimensionality. This likely would be a fruitful venue for future research.
One of the major contributions of the present study is that it illustrated not only the ways in which the dimensionality of IND-COL varies across the reviewed instruments and samples but also what may be causing the differences. Our tests revealed that the instrument content and design, sample characteristics, and the level of analysis may systematically affect the dimension-ality of the data and cross-study generalizations may be invalid. However, although we have discovered a number of possible moderators of IND-COL dimensionality, due to limited data availability, many seemingly relevant moderators could not be tested, such as the survey lan-guage or the respondent’s fluency in the survey language.
Implications and Direction for Future Research
Despite its limitations, the present study clarifies a number of issues and ambiguities surrounding the issues of the dimensionality of IND-COL and sets a stage for better understanding and devel-opment of more precise instruments for measuring the construct(s). Our findings have several important implications for future research.
Selecting an IND-COL Instrument
Based on the results of our study, none of the reviewed measures is completely satisfying for measuring IND-COL. Content, dimensionality, and psychometric properties must be carefully considered to select the instrument that fits best the needs of a particular study.
First, if the goal is to compare the findings with those from prior studies, the same scale must be selected. The available instruments vary dramatically in many respects, and the data collected using different instruments may not be compatible, thereby precluding meaningful replication studies.
Second, the choice of the IND-COL instrument must be driven by the theoretical dimensional-ity. The underlying theoretical model must clearly specify how IND-COL is conceptualized—unidimensional, bidimensional, or perhaps a more complex view—and instruments should be selected based on how well they match this conceptualization.
Third, psychometric properties of the candidate instruments should be carefully evaluated not only based on the reports in publications that originally introduced the instruments but also using data from subsequent studies that used the instruments. Our review shows that factor structures and reliability measures may vary dramatically across different studies.
Fourth, when original data are collected, it is imperative that the psychometric properties are again carefully evaluated, in particular with respect to the data factor structure. The assessment should not be limited to a confirmatory factor analysis of the final model but should explicitly compare unidimensional, multidimensional, and more complex solutions. Researchers should also report statistical information on factor loadings and model fit in their samples as these data may be critical in interpreting the results and comparing them with findings from other studies.
at UNIV OF NEVADA RENO on November 29, 2013jcc.sagepub.comDownloaded from
Taras et al. 25
It is not our goal to endorse a particular instrument for future research. However, based on the evaluation of the properties of the six reviewed instruments using the consolidated origi-nal and meta-analytic data, the instrument by Singelis (1994) emerged as a better choice for the bidimensional measurement of IND-COL. Compared with the other instruments reviewed here, it showed better psychometric properties and a more robust bidimensional structure across various contexts. The instruments by Triandis (1994) and, somewhat less consistently, by Takata (1993) showed a good fit for a unidimensional conceptualization of IND-COL and acceptable psychometric properties. It should also be noted that there are many scales designed to measure IND-COL unidimensionally (for a catalog of more than 100 instruments, see Taras, 2013). As they were not evaluated in this study, we cannot offer specific recommenda-tions, but these instruments could also be considered for unidimensional measurement of IND-COL.
Interpreting Earlier Findings
When interpreting findings from earlier literature, first, it is important to pay attention to the properties of the specific instrument that were used to operationalize the construct. As noted earlier, the present study shows that, despite identical construct dimension labels, the use of dif-ferent instruments produces findings that are not always compatible.
Second, when interpreting and comparing findings from earlier studies, researchers should be cognizant of the moderating effects of the sample characteristics and study design. The results may be affected not only by the choice of the instrument but also by the demographics of the sample, region where the data were collected, and the level of analysis.
Third, for meta-analytic purposes, if a study reports separate IND and COL scores or correla-tions, it would be advised to code them separately rather than combining them into a single IND-COL score. A subsequent analysis of convergence of unidimensional and bidimensional IND-COL scores would be needed to determine whether the two sets of scores should be kept separate or could be integrated by converting the two separate IND and COL scores to a compos-ite IND-COL index.
Developing New IND-COL Models and Instruments
Evidently, we are still far from full understanding and precise measurement of IND-COL, and improved IND-COL scales are needed. Although we have made considerable progress in research on IND-COL, some fundamental questions remain unanswered, such as whether the commonly used self-report Likert-type scales are the best or adequate approach for quantifying IND-COL. Researchers seeking to develop new measures of the constructs must, first, appreci-ate that it may not be possible to develop a single conceptualization and measure of IND-COL that is valid across the variety of cultures, languages, life domains, and demographics that they may want to explore.
Second, theory should guide development and use of the instrument. There must be consis-tency in how IND-COL is defined, presented in the hypotheses, analyzed, and interpreted in the findings. If it is assumed that IND and COL are the opposites of a single continuum, then there is no need to define, measure, and analyze the two scores separately. If, on the other hand, it is assumed that IND-COL is multidimensional, then the definitions and hypotheses should reflect this plurality, and the study analyses should examine separately the effects of IND and COL on other constructs included in the model.
Third, unidimensional and bidimensional conceptualizations of IND-COL dominate research in the area. Our findings suggest that more complex factor structures may be needed to fully capture the nuanced nature of the construct. For example, models that differentiate between horizontal and
at UNIV OF NEVADA RENO on November 29, 2013jcc.sagepub.comDownloaded from

26 Journal of Cross-Cultural Psychology XX(X)
vertical IND-COL are gaining popularity (e.g., Singelis et al., 1995), and it is possible that other more complex solutions may be superior to commonly used uni- and bidimensional models.
Fourth, regardless of the original conceptualization, the factor structure and psychometric properties of the newly developed instrument should be evaluated under unidimensional and multidimensional assumptions. Our findings show that data collected using popular instruments that have been previously shown to have bidimensional factor structure may actually better fit unidimensional or more complex multifactorial structures.
Fifth, when collecting IND-COL data, it is critical to remember that the way questions are asked often influences the answers (Clark & Schober, 1992). The way the introduction to the survey and the scale items are phrased, the response options, the type of the questions, and even the language of the survey can influence answers leading to erroneous conclusions (for a review, see Taras et al., 2009). For example, explicitly contrasting IND and COL by the use of words such as “in contrast,” “conversely,” or “as opposed to,” or providing IND and COL items neatly paired in contrasting statements, can provide artificial points of reference and shape the respon-dent’s perception about the IND-COL construct and influence the responses.
Sixth, we strongly recommend that more precise terminology be used to label what we com-monly refer to as facets of IND-COL. As our content analysis revealed, the boundaries of IND-COL have been too vague: Concepts as diverse as concerns for personal interest, preference for teamwork, importance of family, need for uniqueness, and many more have been aggregated under one label. The items within the same scale also often vary with respect to their referent target (e.g., individual, group, societal issues) and statement type (e.g., self-identification, agency beliefs, values). As has been shown, such aggregation may not be justifiable as the individual components may represent separate domains that should be analyzed separately. We reflexively label them all as IND-COL and, as our review of definitions and hypotheses in extant literature has shown, largely perceive them as closely related or synonymous constructs. However, these different constructs may represent phenomena that are not only independent empirically but also represent completely unrelated orientations. More precise terminology, such as Preference for Teamwork, Importance of Family, or Need for Uniqueness, would reduce unjustified generaliza-tions and misleading conclusions. Such domain specificity, along with more attention to item wording may help ascertain the dimensionality of IND-COL independently of the ways in which it is measured.
That brings us to our last point. The enormous popularity of IND-COL appears to have created a situation when any and every cross-cultural difference in practices, preferences, and assump-tions are ascribed to the effects of IND-COL differences. Much cross-cultural research has been conducted based on the “passport” research design where respondents from two countries are compared on a given attribute and the difference is automatically assumed to be a result of IND-COL variations (c.f., Taras et al., 2009). While International Business and Management research-ers have been developing multidimensional models of cultural values (e.g., four types of values in Hofstede’s original model, eight types in the GLOBE model), Cross-Cultural Psychology scholars hardly ever stepped outside the institutionalized IND-COL boundaries. Even when empirical evidence strongly suggested more than one (or two) dimensions, IND-COL’s monop-oly was retained by labeling the newly discovered dimensions “Horizontal” and “Vertical” IND-COL or IND-COL with respect to “Family” or “Coworkers.” A comparison of the items representing each of these facets, however, suggests that Vertical IND is what is known in other models as Achievement Orientations and Coworker IND-COL is Power Distance (e.g., compare Hui, 1988 and Dorfman & Howell, 1988). Such fixation on IND-COL and narrow mindedness in the views of cultural value differences may be doing a disservice to the field of Cross-Cultural Psychology. More sophisticated research designs, collaboration across fields of studies, and more complex conceptualizations are needed to fully understand the fascinating and important phe-nomenon of culture.
at UNIV OF NEVADA RENO on November 29, 2013jcc.sagepub.comDownloaded from
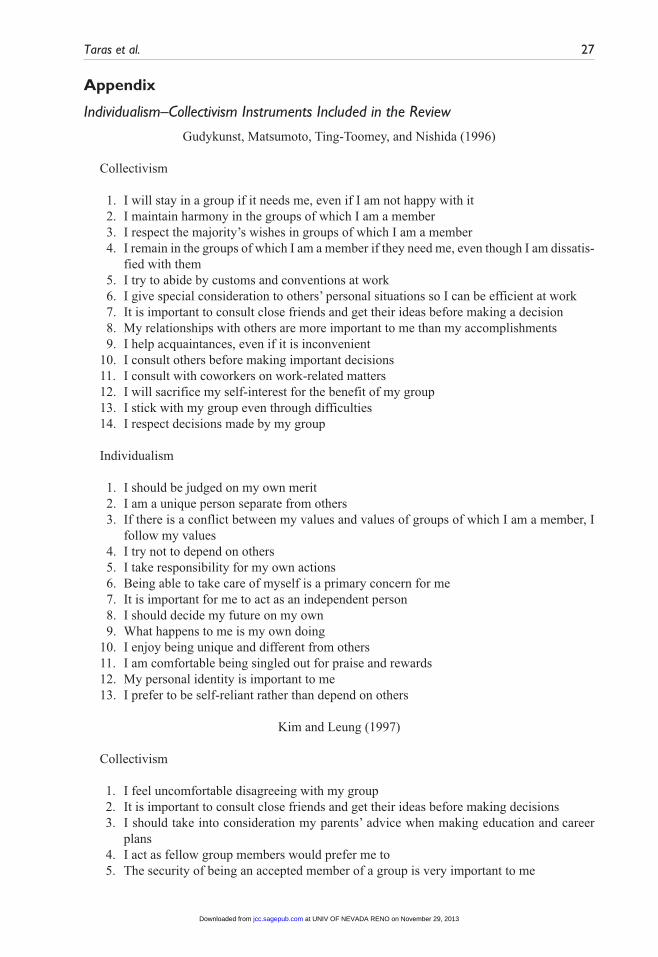
Taras et al. 27
Appendix
Individualism–Collectivism Instruments Included in the Review
Gudykunst, Matsumoto, Ting-Toomey, and Nishida (1996)
Collectivism
1. I will stay in a group if it needs me, even if I am not happy with it 2. I maintain harmony in the groups of which I am a member 3. I respect the majority’s wishes in groups of which I am a member 4. I remain in the groups of which I am a member if they need me, even though I am dissatis-
fied with them 5. I try to abide by customs and conventions at work 6. I give special consideration to others’ personal situations so I can be efficient at work 7. It is important to consult close friends and get their ideas before making a decision 8. My relationships with others are more important to me than my accomplishments 9. I help acquaintances, even if it is inconvenient10. I consult others before making important decisions11. I consult with coworkers on work-related matters12. I will sacrifice my self-interest for the benefit of my group13. I stick with my group even through difficulties14. I respect decisions made by my group
Individualism
1. I should be judged on my own merit 2. I am a unique person separate from others 3. If there is a conflict between my values and values of groups of which I am a member, I
follow my values 4. I try not to depend on others 5. I take responsibility for my own actions 6. Being able to take care of myself is a primary concern for me 7. It is important for me to act as an independent person 8. I should decide my future on my own 9. What happens to me is my own doing10. I enjoy being unique and different from others11. I am comfortable being singled out for praise and rewards12. My personal identity is important to me13. I prefer to be self-reliant rather than depend on others
Kim and Leung (1997)
Collectivism
1. I feel uncomfortable disagreeing with my group 2. It is important to consult close friends and get their ideas before making decisions 3. I should take into consideration my parents’ advice when making education and career
plans 4. I act as fellow group members would prefer me to 5. The security of being an accepted member of a group is very important to me
at UNIV OF NEVADA RENO on November 29, 2013jcc.sagepub.comDownloaded from
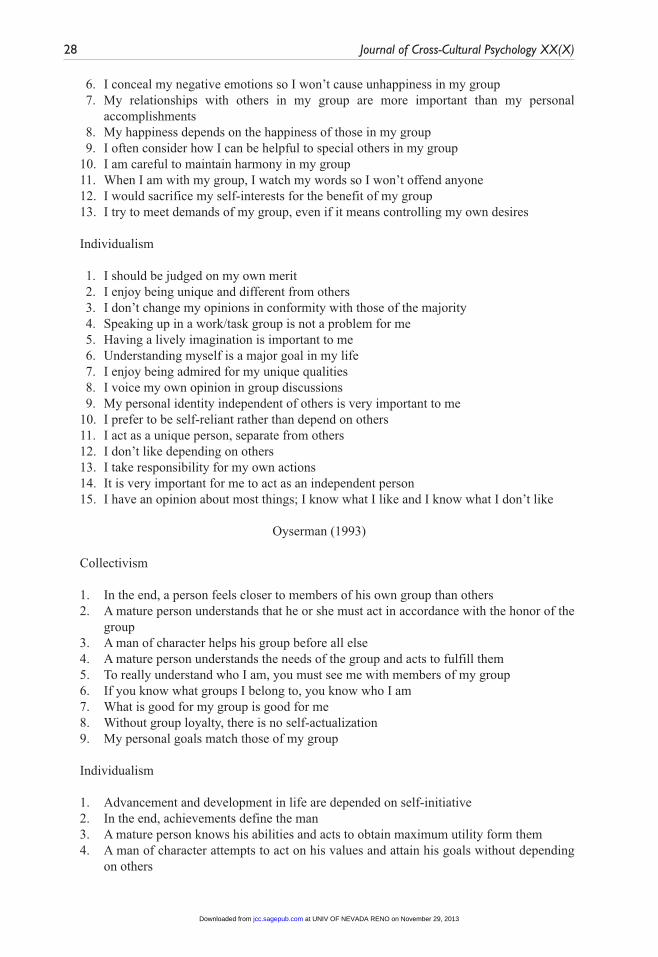
28 Journal of Cross-Cultural Psychology XX(X)
6. I conceal my negative emotions so I won’t cause unhappiness in my group 7. My relationships with others in my group are more important than my personal
accomplishments 8. My happiness depends on the happiness of those in my group 9. I often consider how I can be helpful to special others in my group10. I am careful to maintain harmony in my group11. When I am with my group, I watch my words so I won’t offend anyone12. I would sacrifice my self-interests for the benefit of my group13. I try to meet demands of my group, even if it means controlling my own desires
Individualism
1. I should be judged on my own merit 2. I enjoy being unique and different from others 3. I don’t change my opinions in conformity with those of the majority 4. Speaking up in a work/task group is not a problem for me 5. Having a lively imagination is important to me 6. Understanding myself is a major goal in my life 7. I enjoy being admired for my unique qualities 8. I voice my own opinion in group discussions 9. My personal identity independent of others is very important to me10. I prefer to be self-reliant rather than depend on others11. I act as a unique person, separate from others12. I don’t like depending on others13. I take responsibility for my own actions14. It is very important for me to act as an independent person15. I have an opinion about most things; I know what I like and I know what I don’t like
Oyserman (1993)
Collectivism
1. In the end, a person feels closer to members of his own group than others2. A mature person understands that he or she must act in accordance with the honor of the
group3. A man of character helps his group before all else4. A mature person understands the needs of the group and acts to fulfill them5. To really understand who I am, you must see me with members of my group6. If you know what groups I belong to, you know who I am7. What is good for my group is good for me8. Without group loyalty, there is no self-actualization9. My personal goals match those of my group
Individualism
1. Advancement and development in life are depended on self-initiative2. In the end, achievements define the man3. A mature person knows his abilities and acts to obtain maximum utility form them4. A man of character attempts to act on his values and attain his goals without depending
on others
at UNIV OF NEVADA RENO on November 29, 2013jcc.sagepub.comDownloaded from
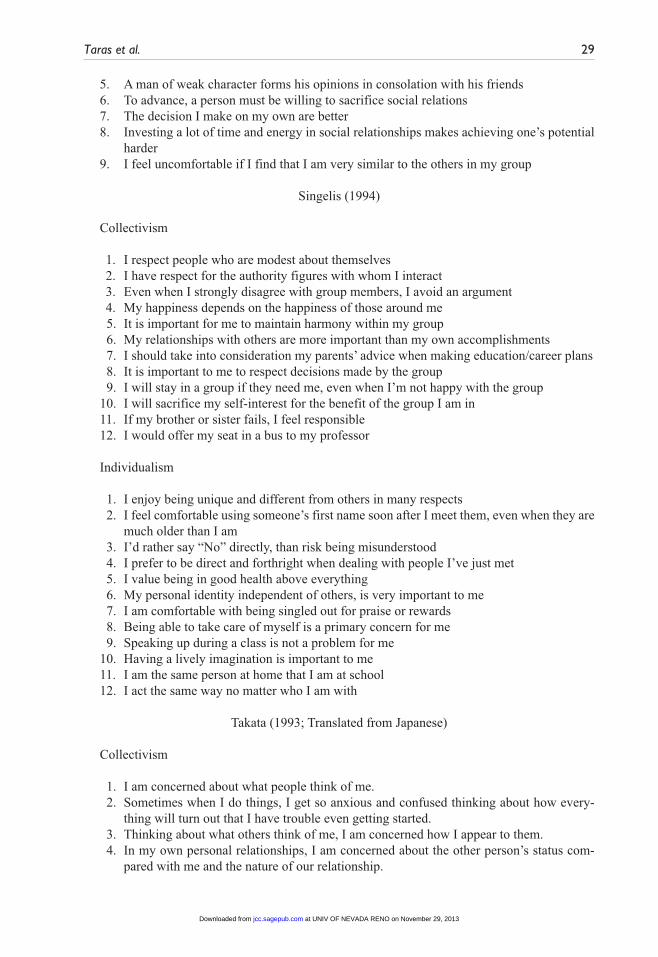
Taras et al. 29
5. A man of weak character forms his opinions in consolation with his friends6. To advance, a person must be willing to sacrifice social relations7. The decision I make on my own are better8. Investing a lot of time and energy in social relationships makes achieving one’s potential
harder9. I feel uncomfortable if I find that I am very similar to the others in my group
Singelis (1994)
Collectivism
1. I respect people who are modest about themselves 2. I have respect for the authority figures with whom I interact 3. Even when I strongly disagree with group members, I avoid an argument 4. My happiness depends on the happiness of those around me 5. It is important for me to maintain harmony within my group 6. My relationships with others are more important than my own accomplishments 7. I should take into consideration my parents’ advice when making education/career plans 8. It is important to me to respect decisions made by the group 9. I will stay in a group if they need me, even when I’m not happy with the group10. I will sacrifice my self-interest for the benefit of the group I am in11. If my brother or sister fails, I feel responsible12. I would offer my seat in a bus to my professor
Individualism
1. I enjoy being unique and different from others in many respects 2. I feel comfortable using someone’s first name soon after I meet them, even when they are
much older than I am 3. I’d rather say “No” directly, than risk being misunderstood 4. I prefer to be direct and forthright when dealing with people I’ve just met 5. I value being in good health above everything 6. My personal identity independent of others, is very important to me 7. I am comfortable with being singled out for praise or rewards 8. Being able to take care of myself is a primary concern for me 9. Speaking up during a class is not a problem for me10. Having a lively imagination is important to me11. I am the same person at home that I am at school12. I act the same way no matter who I am with
Takata (1993; Translated from Japanese)
Collectivism
1. I am concerned about what people think of me. 2. Sometimes when I do things, I get so anxious and confused thinking about how every-
thing will turn out that I have trouble even getting started. 3. Thinking about what others think of me, I am concerned how I appear to them. 4. In my own personal relationships, I am concerned about the other person’s status com-
pared with me and the nature of our relationship.
at UNIV OF NEVADA RENO on November 29, 2013jcc.sagepub.comDownloaded from

30 Journal of Cross-Cultural Psychology XX(X)
5. I think it is important to keep good relations among one’s acquaintances. 6. It is important for me to be liked by others. 7. How I feel depends on the people who I am with and the situation I am in. 8. I avoid having conflicts with members of my group. 9. When my opinion is in conflict with that of another person’s, I often accept the other’s
opinion.10. Depending on the situation and the people who are present, I will sometimes change my
attitude or behavior.
Individualism
1. I always try to have my own opinion. 2. I think the best decisions are the ones I make by myself. 3. If I think something is good, then I do not really care what others think. 4. Even if people around me have different ideas, I stick to my beliefs. 5. In general, I make my own decision. 6. I think whether something is good or bad depends on how I feel about it. 7. I always know what I want to do. 8. I am not concerned if my ideas or behavior are different from those of other people. 9. I always express my opinions clearly.10. I always speak and act confidently.
Triandis (1994)Are you a person who is likely toCollectivism
1. Stay with friends, rather than at a hotel, when you go to another town (even if you have plenty of money)
2. Take time off from work to visit an ailing friend3. Ask close relatives for a loan4. Entertain visitors even if they drop in at odd hours5. Entertain even unwelcome guests6. Have parents who consult your fiancée’s parents extensively, before they decide whether
you two should get married
Individualism
1. Spend money (e.g., send flowers) rather than take the time to visit an ailing friend2. Live far from your parents3. Show resentment toward visitors who interrupt your work4. Place your parents in an old people’s home or nursing home5. Prefer to stay in a hotel rather than with distant friends when visiting another town6. Prefer going to a cocktail party rather than going to dinner with four of your close friends
Acknowledgments
We thank Veronica Benet-Martinez, Amy Lam, Maria Lapinski, Tim Levine, David Moscovitch, Reddy Sulochana, Ann Marie Ryan, Naomi Sugimoto, Toshitake Takata, David Tannenbaum, Ann Marie Yamada, and Nolan Zane, who graciously shared their data, commented on earlier versions of the manuscript, and provided other support for this study.
at UNIV OF NEVADA RENO on November 29, 2013jcc.sagepub.comDownloaded from
Taras et al. 31
Declaration of Conflicting Interests
The author(s) declared no potential conflicts of interest with respect to the research, authorship, and/or publication of this article.
Funding
The author(s) received no financial support for the research, authorship, and/or publication of this article.
Notes
1. Of note, some scholars suggested that the Individualism–Collectivism (IND-COL) construct may be composed of more than two factors, such as vertical individualism, horizontal individualism, vertical collectivism, and horizontal collectivism (Singelis, Triandis, Bhawuk, & Gelfand, 1995; Triandis & Gelfand, 1998) or a series of bipolar IND-COL dimensions each corresponding to a different domain of life, including Spouse, Coworker, Kin, Friend, Neighbor, and Parent (Hui, 1988). These more com-plex models are not reviewed here and will be a subject of a separate research project.
2. The original version of Singelis’s Self-Construal Scale was based on 24 items. Later 28- and 30-item versions of the instrument were offered. Because the results for the three versions of the instrument were virtually identical in all our tests, we report findings only for the original 24-item scale.
3. The complete list of the studies could not be provided here due to space constraints—it is available from the lead author on request.
References
Bresnahan, M. J., Levine, T. R., Shearman, S. M., Lee, S. Y., Park, C.-Y., & Kiyomiya, T. (2005). A multi-method multi-trait validity assessment of self-construal in Japan, Korea, and the United States. Human Communication Research, 31, 33-59.
Brewer, M. B., & Chen, Y. (2007). Where (who) are collectives in collectivism? Toward conceptual clari-fication of individualism and collectivism. Psychological Review, 114, 133-151.
Carrigan, P. M. (1960). Extraversion-introversion as a dimension of personality: A reappraisal. Psychological Bulletin, 57, 329-360.
Clark, H. H., & Schober, M. F. (1992). Asking questions and influencing answers. In J. M. Tanur (Ed.), Questions about questions: Inquiries into the cognitive bases of surveys (pp. 15-48). New York, NY: Russell Sage Foundation.
Cohen, J., & Cohen, P. (1983). Applied multiple regression/correlation analysis for the behavioral sci-ences. New York, NY: Lawrence Erlbaum.
Constantinople, A. (1973). Masculinity-femininity: An exception to a famous dictum? Psychological Bulletin, 80, 389-407.
Coon, H. M., & Kemmelmeier, M. (2001). Cultural orientations in the United States: (Re)examining differ-ences among ethnic groups. Journal of Cross-Cultural Psychology, 32, 348-364.
Deshpande, S. P., Joseph, J., & Viswesvaran, C. (1994). Does use of student samples affect results of stud-ies in cross-cultural training? A meta-analysis. Psychological Reports, 74, 779-785.
Dorfman, P., & Howell, J. P. (1988). Dimensions of national culture and effective leadership patterns: Hofstede revisited. In R. N. Farmer & E. G. McGoun (Eds.), Advances in international comparative management (pp. 127-150). London, England: JAI Press.
Earley, P. C. (1993). East meets West meets Mideast: Further explorations of collectivistic and individual-istic work groups. Academy of Management Journal, 36, 319-348.
Fischer, R. (2004). Standardization to account for cross-cultural response bias. Journal of Cross-Cultural Psychology, 35, 263-282.
Fischer, R., & Milfont, T. L. (2010). Standardization in psychological research. International Journal of Psychological Research, 3, 88-96.
Fischer, R., Milfont, T. L., & Gouveia, V. V. (2011). Does social context affect value structures? Testing the intra-cultural stability of value structures with a functional theory of values. Journal of Cross-Cultural Psychology, 42, 253-270.
at UNIV OF NEVADA RENO on November 29, 2013jcc.sagepub.comDownloaded from

32 Journal of Cross-Cultural Psychology XX(X)
Fontaine, J. R. J., Poortinga, Y. H., Delbeke, L., & Schwartz, S. H. (2008). Structural equivalence of the values domain across cultures. Journal of Cross-Cultural Psychology, 39, 345-365.
Green, D. P., & Salovey, P. (1999). In what sense are positive and negative affect independent? A reply to Tellegen, Watson, and Clark. Psychological Science, 10, 304-312.
Gudykunst, W. G., Matsumoto, Y., Ting-Toomey, S., & Nishida, T. (1996). The influence of cultural individualism-collectivism, self-construals, and individual values on communication styles across cul-tures. Human Communication Research, 22, 510-543.
Harzing, A.-W. (2006). Response styles in cross-national survey research: A 26-country study. International Journal of Cross Cultural Management, 6, 243-264.
Hofstede, G. (1980). Culture’s consequences: International differences in work-related values. Beverly Hills, CA: SAGE.
Hofstede, G. (2006). What did GLOBE really measure? Researchers’ minds versus respondents’ minds. Journal of International Business Studies, 37, 882-897.
House, R. J., Hanges, P. J., Javidan, M., Dorfman, P. W., & Gupta, V. (Eds.). (2004). Culture, leadership, and organizations: The GLOBE study of 62 societies. Thousand Oaks, CA: SAGE.
Hui, C. H. (1988). Measurement of individualism-collectivism. Journal of Research in Personality, 22, 17-36.
Hui, C. H., & Triandis, H. C. (1989). Effects of culture and response format on extreme response style. Journal of Cross-Cultural Psychology, 20, 296-309.
Javidan, M., House, R. J., Dorfman, P. W., Hanges, P. J., Sully de & Luque, M. (2006). Conceptualizing and measuring cultures and their consequences: A comparative review of GLOBE’s and Hofstede’s approaches. Journal of International Business Studies, 37, 897-914.
Kim, M. S., & Leung, K. (1997). A revised Self-Construal Scale. Unpublished manuscript, University of Hawaii at Manoa, Honolulu.
Kim, M. S., & Sharkey, W. F. (1995). Independent and interdependent construals of self: Explaining cul-tural patterns of interpersonal communication in multicultural organizational settings. Communication Quarterly, 43, 20-38.
Kirkman, B. L., Lowe, K. B., & Gibson, C. B. (2006). A quarter century of culture’s consequences: A review of empirical research incorporating Hofstede’s cultural values framework. Journal of International Business Studies, 37, 285-320.
Kline, R. B. (1998). Principles and practice of structural equation modeling. New York, NY: Guilford.Kluckhohn, F. R., & Strodtbeck, F. L. (1961). Variations in value orientations. Evanston, IL: Row, Peterson.Komarraju, M., & Cokley, K. O. (2008). Horizontal and vertical dimensions of individualism-collectivism:
A comparison of African Americans and European Americans. Cultural Diversity & Ethnic Minority Psychology, 14, 336-343.
Kuhn, M. H., & McPartland, R. (1954). An empirical investigation of self-attitudes. American Sociological Review, 19, 68-76.
Lam, S. S. K., Chen, X.-P., & Schaubroeck, J. (2002). Participative decision making and employee perfor-mance in different cultures: The moderating effects of allocentrism/idiocentrism and efficacy. Academy of Management Journal, 45, 905-914.
Lance, C. E., Butts, M. M., & Michaels, L. C. (2006). The sources of four commonly reported cutoff crite-ria: What did they really say? Organizational Research Methods, 9, 202-220.
Levine, T. R., Bresnahan, M. J., Park, H. S., Lapinski, M. K., Wittenbaum, G. M., Shearman, S. M., . . .Ohashi, R. (2003). Self-construal scales lack validity. Human Communication Research, 29, 210-252.
Markus, H. R., & Kitayama, S. (1991). Culture and the self: Implications for cognition, emotion, and moti-vation. Psychological Review, 98, 224-253.
Meehl, P. E. (1978). Theoretical risks and tabular asterisks: Sir Karl, Sir Ronald, and the slow progress of soft psychology. Journal of Consulting and Clinical Psychology, 46, 806-834.
Muchinsky, P. M. (1996). The correction for attenuation. Educational and Psychological Measurement, 56, 63-75.
Nunnally, J. C. (1978). Psychometric theory (2nd ed.). New York, NY: McGraw-Hill.Oyserman, D. (1993). The lens of personhood: Viewing the self and others in a multicultural society.
Journal of Personality and Social Psychology, 65, 993-1009.
at UNIV OF NEVADA RENO on November 29, 2013jcc.sagepub.comDownloaded from

Taras et al. 33
Oyserman, D., Coon, H. M., & Kemmelmeier, M. (2002). Rethinking individualism and collectivism: Evaluation of theoretical assumptions and meta-analyses. Psychological Bulletin, 128, 3-72.
Rhee, E., Uleman, J. S., & Lee, H. K. (1996). Variations in collectivism and individualism by ingroup and culture: Confirmatory factor analyses. Journal of Personality and Social Psychology, 71, 1037-1053.
Schmidt, F. L., & Hunter, J. (2004). General mental ability in the world of work: Occupational attainment and job performance. Journal of Personality and Social Psychology, 86, 162-173.
Singelis, T. M. (1994). The measurement of independent and interdependent self-construals. Personality and Social Psychology Bulletin, 20, 580-591.
Singelis, T. M., Triandis, H. C., Bhawuk, D. P. S., & Gelfand, M. J. (1995). Horizontal and vertical dimen-sions of individualism and collectivism: A theoretical and measurement refinement. Cross-Cultural Research, 29, 240-275.
Smith, P. B. (2004). In search of acquiescent response bias. Journal of Cross-Cultural Psychology, 35, 50-61.
Smith, P. B., & Fischer, R. (2008). Acquiescence, extreme response bias, and culture: A multilevel analysis. In F. R. van de Vijver, D. A. van Hemert, & Y. H. Poortinga (Eds.), Multilevel analysis of individuals and cultures (pp. 285-314). New York, NY: Taylor & Francis.
Spearman, C. (1910). Correlation calculated from faulty data. American Journal of Psychology, 15, 72-101.Steel, P., & Taras, V. (2010). Culture as a consequence: A multilevel multivariate meta-analysis of the
effects of individual and country characteristics on work-related cultural values. Journal of International Management, 16, 211-233.
Tabachnick, B. G., & Fidell, L. S. (2001). Using multivariate statistics (4th ed.). Needham Heights, MA: Allyn & Bacon.
Takata, T. (1993). Social comparison and formation of self-concept in adolescent: Some findings about Japanese college students. Japanese Journal of Educational Psychology, 41, 339-348.
Taras, V. (2013). Catalogue of instruments for measuring culture. Retrieved from http://www.vtaras.com/Culture_Survey_Catalogue.pdf
Taras, V., Kirkman, B. L., & Steel, P. (2010). Examining the impact of culture’s consequences: A three-decade, multilevel, meta-analytic review of Hofstede’s cultural value dimensions. Journal of Applied Psychology, 95, 405-439.
Taras, V., Rowney, J., & Steel, P. (2009). Half a century of measuring culture: Approaches, challenges, limitations, and suggestions based on the analysis of 112 instruments for quantifying culture. Journal of International Management, 15, 357-373.
Taras, V., Steel, P., & Kirkman, B. L. (2012). The times they are A-Changin’: Improving cultural indices and rankings based on a meta-analysis of Hofstede’s dimensions. Journal of World Business, 47(3), 329-341.
Trafimow, D., Triandis, H. C., & Goto, S. G. (1991). Some tests of the distinction between the private self and the collective self. Journal of Personality and Social Psychology, 60, 649-665.
Triandis, H. C. (1983). Allocentric vs. idiocentric social behavior: A major cultural difference between Hispanics and mainstream (Technical reports). Champaign: Department of Psychology, University of Illinois.
Triandis, H. C. (1989). The self and social behavior in differing cultural contexts. Psychological Review, 96, 506-520.
Triandis, H. C. (1994). INDCOL (Unpublished research scale on individualism and collectivism). Champaign: University of Illinois.
Triandis, H. C., & Gelfand, M. J. (1998). Converging measurement of horizontal and vertical individualism and collectivism. Journal of Personality and Social Psychology, 74, 118-128.
Tsui, A. S., Nifadkar, S. S., & Ou, A. Y. (2007). Cross-national, cross-cultural organizational behavior research: Advances, gaps, and recommendations. Journal of Management, 33, 426-478.
Vargas, J. H., & Kemmelmeier, M. (2013). Ethnicity and contemporary American culture: A meta-analytic investigation of horizontal-vertical individualism-collectivism. Journal of Cross-Cultural Psychology, 44, 195-222.
Voronov, M., & Singer, J. A. (2002). The myth of individualism-collectivism: A critical review. Journal of Social Psychology, 142, 461-480.
at UNIV OF NEVADA RENO on November 29, 2013jcc.sagepub.comDownloaded from