
Operative risk management in automotive ramp-ups
122
Andreas Johann Diess, BSc Operative risk management in automotive ramp-ups Master’s thesis to achieve the academic degree of Diplom-Ingenieur Master’s degree program: Production Science and Management submitted to Graz University of Technology Supervisor Dipl.-Ing. Martin Kremsmayr Institute of Innovation and Industrial Management Univ.-Prof. Dipl.-Ing. Dr.techn. Christian Ramsauer Graz, October 2017
-
Upload
khangminh22 -
Category
Documents
-
view
0 -
download
0
Transcript of Operative risk management in automotive ramp-ups

Andreas Johann Diess, BSc
Operative risk management in automotive ramp-ups
Master’s thesis
to achieve the academic degree of Diplom-Ingenieur
Master’s degree program: Production Science and Management
submitted to
Graz University of Technology
Supervisor Dipl.-Ing. Martin Kremsmayr
Institute of Innovation and Industrial Management Univ.-Prof. Dipl.-Ing. Dr.techn. Christian Ramsauer
Graz, October 2017
I
Affidavit I declare that I have authored this thesis independently, that I have not used other than the declared sources/resources, and that I have explicitly indicated all material which has been quoted either literally or by content from the sources used. The text document uploaded to TUGRAZonline is identical to the present master’s thesis dissertation. …………………………… ….……………………………………………
Date Signature
II
Acknowledgement
I would like to express my special appreciation to my advisor Dipl.-Ing. Martin Kremsmayr for his support and encouragement throughout the learning process of this master’s thesis. I am also grateful to Univ.-Prof. Dipl.-Ing. Dr.techn. Christian Ramsauer, lecturer, at the Institute of Innovation and Industrial Management. A great thank you also goes to my colleagues at Volkswagen, especially to my mentor Manuel Oliveira for his guidance and endorsement. I also want to thank all my fellow students at the Maschinenbau Zeichensaal, whose help and companionship have motivated me throughout my studies. In addition, I would like to express my gratitude to my parents and sisters for their love and continuous support. This accomplishment would not have been possible without them. Thank you.
III
Abstract
Shortened product lifecycles in the automotive industry have increased the economic importance of production ramp-ups, the transition phase between product development and series production, to a product’s success. Furthermore, increased outsourcing of the manufacturing of component parts in the past decades has led to an important determinate of a series production ramp-up’s success not lying under the direct internal influence of the OEMs. Purchased parts themselves undergo a ramp-up and can only be used in series production if the required quality is fulfilled and they have a serial delivery release. Despite various management tools being common practice, serial delivery release is not always granted before SOP. This leads to trouble-shooting often resulting in the reworking of vehicles or, in the worst case, a production stop, causing a loss of time and additional costs. An analysis of existing approaches in the relevant literature has identified risk management as a proven method for dealing with uncertainties in a production ramp-up. A clear and structured operative risk management methodology focusing on the serial delivery release of parts and the consequences if this is not granted in time is developed and implemented in the production ramp-up of the Volkswagen T-Roc at the production plant Autoeuropa. This risk management consists of the framework, defining the integration into the organisation, the operationalisation in the form of a process performed in a weekly meeting by a cross-functional team, as well as an Excel-based tool. The tool is developed to support the process steps—risk identification, risk assessment and risk treatment—by performing calculations, tracking and visualisation. As a result of this implementation a decrease of critical parts and risk of rework was achieved in the weeks before SOP through preventive measures initiated on the basis of information acquired by the risk management team. For all parts without a serial delivery release before SOP measures in the form of rework and exemption permits were decided, ensuring the fulfilment of the ramp-ups production targets.
IV
Kurzfassung Aufgrund kürzer werdender Produktlebenszyklen in der Automobilindustrie nimmt der Anteil des Produktionsanlaufs, der Übergangsphase zwischen Produktentwicklung und Serienproduktion, am wirtschaftlichen Erfolg eines Produktes stetig zu. Außerdem hat die zunehmende Auslagerung der Produktion von Bauteilen dazu geführt, dass ein wichtiger Bestandteil des Erfolges eines Serienanlaufs nicht mehr im direkten Einflussbereich der Automobilhersteller liegt. Kaufteile durchlaufen gleichermaßen einen Produktionsanlauf und dürfen nur in Serienfahrzeugen verwendet werden, wenn sie die Qualitätsanforderungen erfüllen und eine Serienlieferfreigabe erhalten. Trotz verschiedener praktizierter Methoden ist dies nicht immer der Fall. Um den Produktionsstopp zu vermeiden, ist Fehlerbehebung notwendig. Diese wird häufig in der Form von Nacharbeit geleistet, was wiederum Zeitverlust oder zusätzliche Kosten verursacht. Bei der Analyse relevanter Fachliteratur zu bestehenden Ansätzen wurde deutlich, dass Risikomanagement eine nachgewiesene Methode ist, um mit Unsicherheiten im Produktionsanlauf umzugehen. Für den Produktionsanlauf des Volkswagen T-Roc im Werk Autoeuropa wurde ein verständliches und strukturiertes operatives Risikomanagement-Konzept geschaffen und umgesetzt. Dessen Fokus liegt auf der Serienlieferfreigabe von Bauteilen und den Konseqenzen, falls diese nicht vor Serienproduktionsstart erteilt wird. Das Risikomanagement besteht aus dem Framework, in der die Eingliederung ins Unternehmen beschrieben wird, der Operationalisierung als Prozess, welcher durch ein funktionsübergreifendes Team in einem wöchentlichen Meeting umgesetzt wird, sowie aus einem Excel-basiertem Tool. Dieses Tool wurde entwickelt um die Prozessschritte—Risikoidentifizierung, Risikobewertung und Risikohandhabung—durch Berechnungen, Verfolgung und Visualisierung zu unterstützen. Das Ergebnis der Implementierung des Risikomanagements ist eine deutliche Verringerung der kritischen Bauteile und des Risikos der Nacharbeit in den Wochen vor Serienproduktionsstart durch präventive Maßnahmen, welche mit Hilfe vom Risikomanagementteam gesammelter Informationen initiiert wurden. Für alle Bauteile, die keine Serienlieferfreigabe vor Serienproduktionsstart bekommen haben, wurden Maßnahmen in der Form von Nacharbeit oder Ausnahmenregelungen entschieden, wodurch das Erreichen der Anlaufziele sichergestellt wurde.

V
Table of contents
List of abbreviations ...................................................................................................... VII List of tables ................................................................................................................. VIII List of figures ................................................................................................................. IX List of equations ............................................................................................................. XI 1 Introduction .................................................................................................................... 1
1.1 Volkswagen and Volkswagen Autoeuropa ........................................................ 1 1.2 Problem description and objectives ................................................................... 4 1.3 Structure of the thesis ......................................................................................... 8
2 Theory ........................................................................................................................... 10 2.1 Theoretical basics ............................................................................................. 10
2.1.1 The product development process .................................................. 11 2.1.2 Ramp-up management .................................................................... 12 2.1.3 Quality management ....................................................................... 25 2.1.4 Risk management ............................................................................ 29
2.2 Approaches relevant to the problem at hand .................................................... 40 2.3 Interim conclusion ............................................................................................ 46
3 Analysis of current state ............................................................................................... 47 3.1 Research approach and goal ............................................................................. 47 3.2 Vehicle project management at Volkswagen ................................................... 48
3.2.1 The Volkswagen PEP ..................................................................... 49 3.2.1 Project organisation ........................................................................ 53
3.3 Ramp-up management at Volkswagen............................................................. 55 3.3.1 Ramp-up at Volkswagen Autoeuropa ............................................. 55 3.3.2 Launch management ....................................................................... 56 3.3.3 Launch organisation ........................................................................ 57 3.3.4 Engineering change management ................................................... 58 3.3.5 New part process ............................................................................. 59
3.3.5.1 General procedure of new parts .......................................................... 60 3.3.5.2 Delay of serial delivery release ........................................................... 62 3.3.5.3 Procedure if serial release is not achieved before SOP ....................... 63
3.3.6 Handling of deviations .................................................................... 65 3.3.7 Rework capacity planning............................................................... 66
3.4 Conclusion of current-state analysis and required action ................................ 67 4 Concept for an operational risk management in automotive ramp-ups ........................ 69
4.1 Objective .......................................................................................................... 69 4.2 Concept overview............................................................................................. 70
VI
4.3 Risk management framework .......................................................................... 71 4.3.1 Mandate........................................................................................... 71 4.3.2 Design of framework for managing risk ......................................... 71
4.3.2.1 Scope ................................................................................................... 71 4.3.2.2 Integration into ramp-up management ................................................ 72 4.3.2.3 Timing ................................................................................................. 73 4.3.2.4 The risk management team ................................................................. 74 4.3.2.5 Communicating, reporting and tracking ............................................. 74
4.3.3 Constant review and improvement of the concept .......................... 75 4.4 Risk management operationalization ............................................................... 75
4.4.1 Definition of context ....................................................................... 76 4.4.2 Risk identification ........................................................................... 80 4.4.3 Risk assessment .............................................................................. 81 4.4.4 Risk treatment ................................................................................. 81 4.4.5 Weekly risk management meeting .................................................. 82 4.4.6 Excel-based risk management tool ................................................. 83
5 Implementation of the concept ..................................................................................... 85 5.1 Implementation of the risk management framework ....................................... 86 5.2 Implementation of the risk management tool................................................... 86 5.3 Implementation of the risk management process ............................................. 90
5.3.1 First phase of implementation ......................................................... 91 5.3.2 Second phase of implementation .................................................... 93 5.3.3 Third phase of implementation ....................................................... 99
5.4 Review of the implementation ......................................................................... 99 6 Summary and outlook ................................................................................................. 103 Bibliography .................................................................................................................. 105
VII
List of abbreviations
APAQ Advanced Product Quality Planning AWE Abweicherlaubnis (Deviation permit) BMG Baumustergenehmigung (Build type approval) CEO Chief Executive Officer ERM Enterprise Risk Management FMEA Failure Mode and Effect Analysis FRC First Run Capability IATF International Automotive Task Force ISO International Standards Organisation IT Information Technology OEM Original Equipment Manufacturer PEP Product Emergence Process PPAP Production Part Approval Process PPF Produktionsprozess und Produktfreigabe QMS Quality Management Systems RM Risk Management SOP Start of Production SUV Sports Utility Vehicle VW Volkswagen

VIII
List of tables
Table 1: Lead time – Tool creation to serial delivery release ........................................ 60 Table 2: Definition of part Note ..................................................................................... 61 Table 3: Risk assessment categories ............................................................................... 77 Table 4: RM meeting agenda.......................................................................................... 82 Table 5: Requirements – Risk management tool ............................................................ 84 Table 6: RM tool – example of input and calculated parameters ................................... 88 Table 7: Risk assessment criteria – phase 1 ................................................................... 92 Table 8: Risk assessment criteria – phase 2 ................................................................... 94
IX
List of figures
Figure 1: The brands of the Volkswagen Group .............................................................. 1 Figure 2: Autoeuropa production timeline ....................................................................... 3 Figure 3: Definition of ramp-up ....................................................................................... 4 Figure 4: Accelerated ramp-up curve ............................................................................... 5 Figure 5: Attainment of ramp-up goals in the European automotive industry ................. 6 Figure 6: Target dimensions in ramp-up .......................................................................... 7 Figure 7: Shift of value added and development .............................................................. 8 Figure 8: Structure of thesis ............................................................................................. 9 Figure 9: Product development funnel ........................................................................... 12 Figure 10:Phases of a production ramp-up ..................................................................... 14 Figure 11: Influences on the generation of profit in the product life cycle .................... 16 Figure 12: St. Gallener ramp-up management model..................................................... 18 Figure 13: The Aachener model of interdisciplinary ramp-up management.................. 19 Figure 14: Integrated ramp-up management .................................................................. 20 Figure 15: Ramp-up strategy factors .............................................................................. 21 Figure 16: Supplier pyramid in the automotive industry ................................................ 23 Figure 17: Production process and product release for serial delivery........................... 28 Figure 18: Types of production risks .............................................................................. 31 Figure 19: ISO 31000 overview ..................................................................................... 33 Figure 20: Example of Ishikawa diagram for ramp-up .................................................. 36 Figure 21: Risk matrix for risk assessment .................................................................... 37 Figure 22: Enterprise Risk Management cube: objectives, components, perspective.... 40 Figure 23: Ramp-up RM literature classification ........................................................... 41 Figure 24: Master thesis project timeline ....................................................................... 47 Figure 25: Interview partners ......................................................................................... 48 Figure 26: The Volkswagen product process ................................................................. 49 Figure 27: VW PEP milestones ...................................................................................... 50 Figure 28: Product and project management processes.................................................. 52 Figure 29: Matrix organisation Baureihe ....................................................................... 53 Figure 30: Project committees—Matrix organisation .................................................... 55 Figure 31: Launch management process and committees .............................................. 57 Figure 32: Engineering change process .......................................................................... 59 Figure 33: Sampling Note determination ....................................................................... 62 Figure 34: Cause of Note 1 issuing after SOP ................................................................ 63 Figure 35: Assembly procedure when part is not approved ........................................... 64 Figure 36: Risk management concept ............................................................................ 70 Figure 37: Integration of risk management into the ramp-up management ................... 72 Figure 38: Risk management timing .............................................................................. 73 Figure 39: Risk management process ............................................................................. 76

X
Figure 40: Rework capacity analysis .............................................................................. 79 Figure 41: Relationship between risk assessment and risk treatment ............................ 80 Figure 42: Implementation timing .................................................................................. 85 Figure 43: Example of top 20 critical parts .................................................................... 89 Figure 44: Interim goal-tracking example ...................................................................... 90 Figure 45: Implementation phases overview .................................................................. 90 Figure 46: Weekly risk assessment—phase 1 ................................................................ 93 Figure 47: Rework capacity analysis—5 weeks before SOP ......................................... 95 Figure 48: Weekly risk assessment—phase 2 ................................................................ 96 Figure 49: Rework capacity analysis—2 weeks before SOP ......................................... 97 Figure 50: Rework breakdown—2 weeks before SOP ................................................... 98

XI
List of equations
Equation 1: Total rework calculation ........................................................................... 66 Equation 2: Rework of a current product ..................................................................... 66 Equation 3: Rework of the new product ...................................................................... 66

1 Introduction
1
1 Introduction
First, Volkswagen and the production plant Volkswagen Autoeuropa are presented. Then, the general problem as well as the objective of the thesis are depicted. Finally, the structure of the thesis is illustrated in this chapter.
1.1 Volkswagen and Volkswagen Autoeuropa The Volkswagen Group with its 12 brands from seven different European countries is one of the world`s largest car manufacturers and Europe’s largest carmaker. Founded in Berlin in 1937, the headquarters are now located in Wolfsburg (Germany).
Figure 1: The brands of the Volkswagen Group1
The Group consists of the automotive division and the financial services division. The Volkswagen Group differentiates between both divisions as follows: “The activities of the automotive division comprise the development of vehicles and engines, the production and sale of passenger cars, light commercial vehicles, trucks, buses and motorcycles, as well as genuine parts. The Financial Services Division combines dealer and customer financing, leasing, banking and insurance activities, fleet management and the mobility offerings.”2 The group employs more than 625,000 employees worldwide. Cars are being produced in 120 production plants located in 20 European countries as well as 1 Volkswagen, 2017a, p.5 2 Volkswagen, 2017a, p.21

1 Introduction
2
11 countries in Asia, the Americas and Africa. In 2016 the group sold 10,391 million vehicles, becoming the largest automaker in the world. This resulted in a sales revenue of 217 billion euros and an operating result of 7.1 billion euros.3 Focusing on the Volkswagen brand, the sales volume was 4.3 million vehicles in 2016 (without sales of VW China). VW is, with 42% the largest contributor to the groups’ sales. Its contribution to the group’s operating result of 2016 has been with 1.9 billion euros only 12.7%.4 In an effort to increase efficiency and thereby the operating result for the Volkswagen Group, Volkswagen has initiated in 2017 a new strategy—Together 2025. Along with the financial goals of Together 2025, which are an operating return of 7–8% and a return on investment of more than 15% in the year 2025, the strategy focuses on overcoming the diesel scandal, preparing the enterprise for future trends in the automotive industry and spreading a new mindset within the enterprise.5 In order to achieve these goals, the Volkswagen brand optimises its product portfolio and extends it in the fastest growing market segments—SUVs and electric vehicles. Additionally, a focus lies on integrating digitalisation into the vehicles more systematically. For the year 2017 this means the launch of the revamped Golf, Golf Estate and e-Golf, the new Polo, a new compact crossover SUV, the T-ROC, the mid-size SUV Terramont, the large SUV Atlas for the American market, a long wheelbase version of the Tiguan, a new sporty four-door coupe, the Arteon as well as three new electric vehicles in China. Together with the other brands of the group, 60 new vehicles will be launched in 2017.6 The Volkswagen T-Roc builds a part of the new SUV offensive. As a technical base, it uses the VW Golf 7 Facelift platform. It adopts Golf engines, gearboxes, electronics, infotainment and driver assistance systems and is priced similarly to the Golf. With a length of 4.3 metres the T-Roc bridges the gap in the product portfolio between the Tiguan and the Polo SUV planned for 2018.7 As a result of the SUV offence, from 2018 onwards, VW will be represented in every relevant SUV segment.8 Other brands in the group already have a vehicle on the market in the T-Roc segment, the Audi Q2 and the SEAT Ateca.
3 Volkswagen, 2017a, p.2 4 Volkswagen, 2017a, p.23 5 Volkswagen, 2016c 6 Volkswagen, 2017a, p.176 7 Wittich, 2017 8 Specht, 2016

1 Introduction
3
The production of the T-Roc will take place at the production site Volkswagen Autoeuropa in Palmela, Portugal. VW Autoeuropa Lda. (limited liability company) is an automotive assembly plant and a subsidiary of the Volkswagen Group. With a 1.97 million € initial investment, it is the largest foreign investment in Portugal.9 The plant opened in 1995 as a 50-50 joint venture between Ford and the VW Group with the production of the multi-purpose vehicles Volkswagen Sharan, Seat Alhambra and Ford Galaxy. In the year 1999 Ford left the joint venture and Volkswagen completely took over the production site. The Ford Galaxy was produced at Autoeuropa until 2006.10 Production volume dropped during 2001 and 2005 until the plant was contracted for the production of the EOS, and later the third generation Scirocco. In 2010 the first generation of the Sharan and Alhambra were superseded by the second generation after being produced for 15 years. Production of the EOS ended after 9 years in 2015, and the production of the Scirocco is due to end in 2017. The plant Autoeuropa is a plant with a high degree of specialisation and always produced vehicles with a low demand compared to other Volkswagen vehicles.11 As shown in Figure 2 the plant has never reached its maximum installed capacity of 172,500 vehicles per year during its existence.12,13
Figure 2: Autoeuropa production timeline14
In order to modernise the plant and adapt it to the production platform “Modularer Querbaukasten” (MQB), Volkswagen has invested 677 million euros for the production of the new T-Roc. For the year 2018 a production volume of 200,000 9 Espirito Santo, 2017 10 Volkswagen, 2014 11 AHK Portugal, 2015 12 Volkswagen, 2014 13 Volkswagen, 2016d 14 Volkswagen, 2014
Sharan 1 / Alhambra 1 SOP Facelift Facelift EOP
Galaxy SOP Facelift Facelift EOP
EOS SOP Facelift EOP
Scirocco 3 SOP Facelift EOP
Sharan 2 / Alhambra 2 SOP Facelift
T-Roc SOP
1995 1996 1997 1998 1999 2000 2001 2002 2003 2004 2005 2006 2007 2008 2009 2010 2011 2012 2013 2014 2015 2016 201742 119 131 139 138 126 137 130 110 96 80 82 94 94 86 101 133 113 91 102 102 85
24% 69% 76% 81% 80% 73% 79% 75% 64% 56% 46% 48% 54% 54% 50% 59% 77% 66% 53% 59% 59% 49%
Model
Plant Production Volume [thousand vehicles]
Plant Utilisation
Year

1 Introduction
4
vehicles is estimated. This will be achieved by producing vehicles in 3 shifts and will result in 500 new jobs.15
1.2 Problem description and objectives The automotive industry has undergone a never-before-seen dynamic in the configuration of its product range in the last decade. Competition for market shares as well as attractive niche segments and fast-growing new segments have led to an innovation race among manufacturers. This has forced manufacturers to shorten product life cycles and to add new models to their product portfolios. These trends have led to an increase in the number of production ramp-ups and a shortened interval between them.16,17 The term ramp-up is typically defined as the transition phase between development and serial production as shown in Figure 3.18
Figure 3: Definition of ramp-up19
For production ramp-ups, automotive companies follow the strategy of introducing product innovations into the market (time to market) as fast as possible and of maximising the production volume (time to volume) with a steep ramp-up curve, or in other words a short time from start of production (SOP) to full-capacity production. Through the early introduction of an innovative product onto the market, manufacturers can achieve a temporary monopoly position, ensuring a competitor’s advantage. By maximising the production capacity as fast as possible, the amortisation is reached earlier and a product’s profit can be maximised.20
15 AHK Portugal, 2015 16 Schuh, Stölzle & Straube, 2008, p. VII 17 Tuecks, 2010, p.1 18 Nagel, 2011, pp. 4–6 19 Nagel, 2011, p. 7 20 Peters & Hofstetter, 2008, p. 10

1 Introduction
5
Figure 4: Accelerated ramp-up curve21
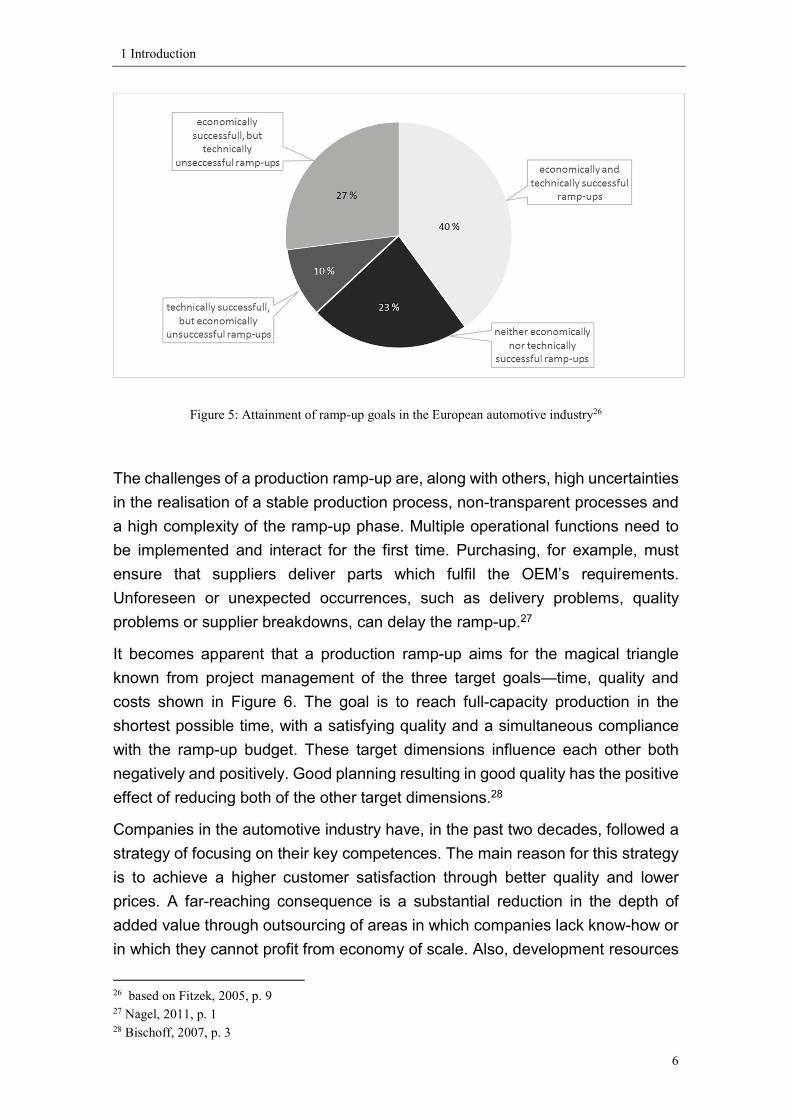
This becomes even more important when taking the trend of shortened product life cycles into consideration, further reducing the profit-generating phase. Timing deviations as well as unexpected costs during the ramp-up have a direct influence on a product’s economic success.22 This is further backed by previous BMW CEO Norbert Reithofer’s statement which defines normal ramp-up time and the effect of a possible 66% reduction: “If we can bring a new product to full production capacity in 3 months instead of 9 months, this means pure cash for the company.”23 As a result of these trends, the importance of the production ramp-up has gained relevance for a product’s economic success. According to expert opinion, up to five percent of the return on investment (ROI) of a product can be realised through an efficient ramp-up. In comparison to that, the ROI of a model over its lifecycle in the automotive industry currently ranges between 2–15%.24 Between the desired ramp-up results and the reality lies a big gap. According to an international study of which the results are shown in Figure 5, two thirds of the production ramp-ups in the European automotive industry have missed their targets. 50% have missed their technical targets and 33% have missed their economic targets.25
21 translated from Bischoff, 2007, p. 9 22 Peters & Hofstetter, 2008, p. 10 23 Reithofer, 2002 24 Kuhn, Wiendahl, Eversheim, & Schuh, 2002; Schuh, 2005, p. 405 25 Fitzek, 2005, p. 9
1 Introduction
6
Figure 5: Attainment of ramp-up goals in the European automotive industry26
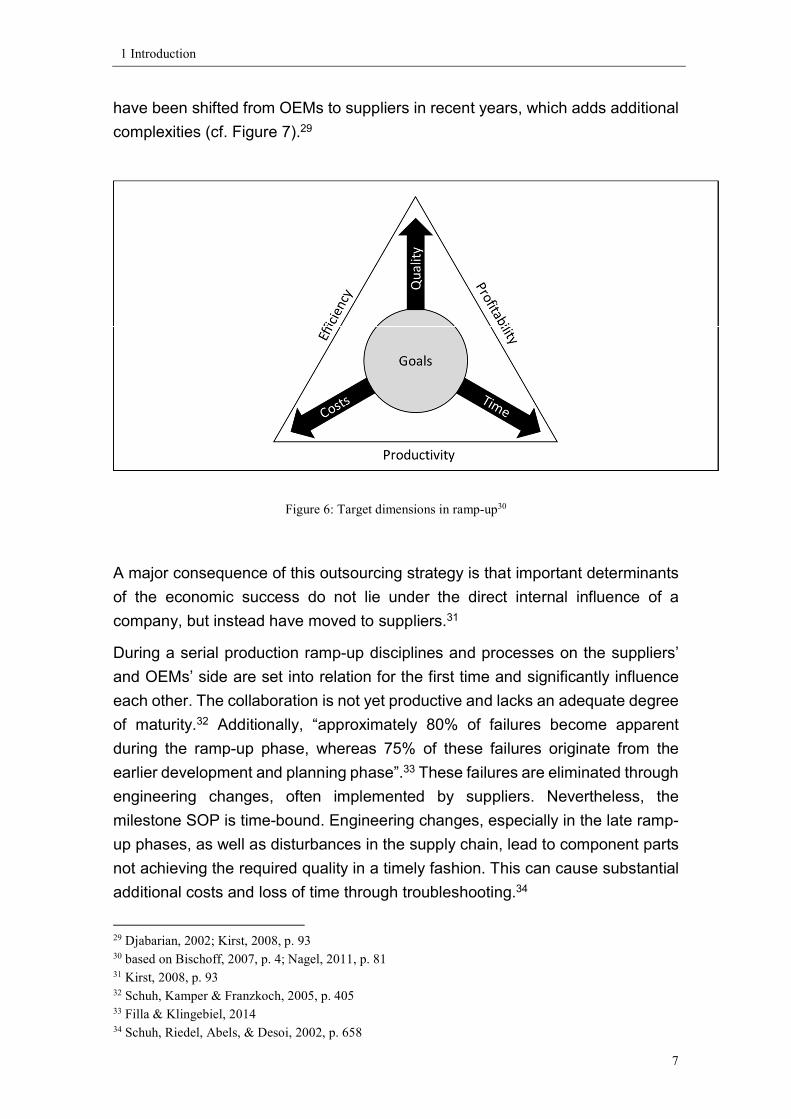
The challenges of a production ramp-up are, along with others, high uncertainties in the realisation of a stable production process, non-transparent processes and a high complexity of the ramp-up phase. Multiple operational functions need to be implemented and interact for the first time. Purchasing, for example, must ensure that suppliers deliver parts which fulfil the OEM’s requirements. Unforeseen or unexpected occurrences, such as delivery problems, quality problems or supplier breakdowns, can delay the ramp-up.27 It becomes apparent that a production ramp-up aims for the magical triangle known from project management of the three target goals—time, quality and costs shown in Figure 6. The goal is to reach full-capacity production in the shortest possible time, with a satisfying quality and a simultaneous compliance with the ramp-up budget. These target dimensions influence each other both negatively and positively. Good planning resulting in good quality has the positive effect of reducing both of the other target dimensions.28 Companies in the automotive industry have, in the past two decades, followed a strategy of focusing on their key competences. The main reason for this strategy is to achieve a higher customer satisfaction through better quality and lower prices. A far-reaching consequence is a substantial reduction in the depth of added value through outsourcing of areas in which companies lack know-how or in which they cannot profit from economy of scale. Also, development resources 26 based on Fitzek, 2005, p. 9 27 Nagel, 2011, p. 1 28 Bischoff, 2007, p. 3
1 Introduction
7
have been shifted from OEMs to suppliers in recent years, which adds additional complexities (cf. Figure 7).29
Figure 6: Target dimensions in ramp-up30
A major consequence of this outsourcing strategy is that important determinants of the economic success do not lie under the direct internal influence of a company, but instead have moved to suppliers.31 During a serial production ramp-up disciplines and processes on the suppliers’ and OEMs’ side are set into relation for the first time and significantly influence each other. The collaboration is not yet productive and lacks an adequate degree of maturity.32 Additionally, “approximately 80% of failures become apparent during the ramp-up phase, whereas 75% of these failures originate from the earlier development and planning phase”.33 These failures are eliminated through engineering changes, often implemented by suppliers. Nevertheless, the milestone SOP is time-bound. Engineering changes, especially in the late ramp-up phases, as well as disturbances in the supply chain, lead to component parts not achieving the required quality in a timely fashion. This can cause substantial additional costs and loss of time through troubleshooting.34 29 Djabarian, 2002; Kirst, 2008, p. 93 30 based on Bischoff, 2007, p. 4; Nagel, 2011, p. 81 31 Kirst, 2008, p. 93 32 Schuh, Kamper & Franzkoch, 2005, p. 405 33 Filla & Klingebiel, 2014 34 Schuh, Riedel, Abels, & Desoi, 2002, p. 658

1 Introduction
8
Figure 7: Shift of value added and development35
The objective of this thesis is to analyse existing risk management methods and develop a concept which detects troubleshooting of delayed parts early and takes proactive measures in order for a production ramp-up to reach its goals. The developed concept is implemented at an operational level in the ramp-up of the Volkswagen T-Roc at Autoeuropa.
1.3 Structure of the thesis The structure of the thesis is illustrated in Figure 8. Following the introduction composed of the presentation of Volkswagen and the problem description, the theoretical fundamentals for the concept development and implementation are determined. This includes an overview of product development as well as the definitions of ramp-up, quality and risk in addition to the fundamentals of ramp-up management, quality management and risk management. Subsequently approaches in literature for handling the problem at hand are analysed and risk management is identified as a proven method for dealing with the problem. In the third chapter ramp-up management at Volkswagen and the plant Autoeuropa are analysed and a need for action is determined. The analysis includes the Volkswagen product emergence process and vehicle project management at Volkswagen, and then focuses on the framework, organisation
35 based on VDA, 2000, p. 52

1 Introduction
9
and processes at the production plant. The current handling of deviations is analysed and possible improvements determined.
Figure 8: Structure of thesis
Following that, the risk management concept for dealing with the problem at hand is developed. The fourth chapter starts with an introduction to the aim of this concept and how it is integrated into an organisation. The general framework and the operationalisation of the concept are defined. The fifth chapter describes the implementation of the developed concept at the production plant Autoeuropa in the ramp-up of the new product. The results of the implementation are presented and a critical review performed. Finally, the thesis is concluded with a summary and outlook.

2 Theory
10
2 Theory
In the following chapter, the necessary fundamentals for the concept development are explained. This includes product development, ramp-up management, quality management and risk management. Subsequently, theoretical approaches for dealing with disturbances resulting from engineering changes and supply chain problems during the production ramp-up are assessed.
2.1 Theoretical basics To create a common basis terms used in the thesis are defined. Further definitions follow in the sub-chapters. German definitions are translated and the originally defined term is set in brackets behind the term translated into English. Juran (1992) defines a product as: “the output of any process” and classifies into services, physical goods and software.36 He further defines a process as: “a systematic series of actions directed to the achievement of a goal”.37 Research and development is defined by Bosworth, Wilson and Young (1993) as: “Creative work undertaken on a systematic basis to increase the stock of scientific and technical knowledge and to use this stock of knowledge to devise new practical applications”.38 Pfahl and Beitz (2005) define product development (“Produktentwicklung”) as: “the totality of activities to solve all technical problems which lead to a marketable product”.39 Production (“Produktion”) is described by Dyckhoff (1994) as: “a transformation process of objects with defined input and output, prompted and controlled by humans and systematically executed to creates more value than it destroys”. He differentiates the operational production which is performed in a company.40 The series production (“Serienproduktion”) is described by Dyckhoff and Spengler (2010) as: “the production of larger batches of a product type which are 36 Juran, 1992, p. 5 37 Juran, 1992, p. 219 38 Bosworth, Wilson, & Young, 1993, p. 26 39 Pfahl & Beitz, 2005, p. 10 40 Dyckhoff, 1994, pp. 6-7,49

2 Theory
11
produced without interruption in a given planning period”.41 Borowski and Henning (2013) refer to series production as “the phase after the ramp-up”.42 A term often used in the context of production is manufacturing (“Fertigung”). It’s main tasks according to Eversheim (1998) is “creating a clearly visible working progress by changing the form and properties of used raw materials”.43 In this thesis the terms are used as synonyms. Eversheim (1998) describes assembly (“Montage”) as “joining workpieces to form assemblies, modules or finished products”.44 A prototype according to Blackwell and Manner (2015) is an “initial model of an object built to test a design.”45
2.1.1 The product development process
In order to plan and manage product development projects, organisations have, alongside other project management methods, established product development processes. These define the chronological course of development projects and assign focal points and interfaces to the development phases. The outcome of a product development process is the successful placement of a new product on the market. 46 Processes including the phases idea generation and selection, as well as product development and ending with introducing the developed product onto the market are typically described as innovation processes. Development processes on the other hand cover the phases product and process development. These processes are described and structured in procedure models with defined phases. A procedure model structures the phases and corresponding tasks into a logical order. 47 A generic procedure model of an innovation process is provided by Wheelwright and Clark (1995) in the shape of the development funnel as shown in Figure 9. The funnel ranges from idea generation to bringing a commercial good onto the
41 Dyckhoff & Spengler, 2010, p. 25 42 Borowski & Henning, 2013, p. 28 43 Eversheim, 1998, p. 7 44 Eversheim, 1998, p. 1 45 Blackwell & Manner, 2015 46 Schuh, Müller, & Rauhut, 2012, p. 161 47 Schuh et al., 2012, pp. 162–163; Werner, 2002, p. 26

2 Theory
12
market. It is organised as a sequence of activities structured in phases with defined milestones and decision points.48
Figure 9: Product development funnel49
In the first phase of the product development funnel a large number of ideas are generated. The most promising ideas are selected and organised into potential projects. The best of these ideas are taken and a project plan is created. The projects are further specified into concepts. Resources are invested and the projects get refined into a product which is appropriate for market introduction. Along this funnel, screens at defined milestones are performed where projects are reviewed and decisions are taken. This ensures “that the right ideas become the substance of the right projects that produce the right products which enter the market as planned and have their desired impact.”50
2.1.2 Ramp-up management
Uniform definitions for the terms ramp-up and ramp-up management do not exist in literature.51 In praxis as well as science different terms for the phase between
48 Wheelwright & Clark, 1995, p. 68 49 Wheelwright & Clark, 1995, S. 68 50 Wheelwright & Clark, 1995, S. 65 51 Filla & Klingebiel, 2014, p. 45
2 Theory
13
product development and serial production are used.52 In the following different definitions for ramp-up and other terms in the context of ramp-up are presented. Wagenheim (1998) characterises as follows: “The series ramp-up describes the transition of development to series production and ends when a secured production is reached”.53 Whereas Wheelwright and Clark (1992) describe it as: “In the ramp-up, the firm starts commercial production at a relatively low level of volume; as the organisation develops confidence in its (and its suppliers’) ability to execute production consistently and in marketing’s ability to sell the product, the volume increases. At the conclusion of the ramp-up phase, the production system has achieved its target levels of volume, cost and quality”.54 Casamento (1992) defines it as “Ramp-up is the time from the production of the first item to the achievement of a steady-state output rate”.55 Terwiesch and Bohn (1998) define: “The period between completion of development and full capacity utilization is known as production ramp-up”56 Fleischer et al (2003) describe the scale-up (“Hochlauf”) as follows: “In the last phase of the ramp-up (the scale-up), the series product is made under series conditions. In the scale-up the daily quantity is increased from the “job number one” to the planned target quantity.57 The job number one (/ job No. 1) is a synonym for the start of production and represents the first product which can be sold to the end customer.58 The ramp-up curve (“Anlaufkurve”) is referred to as ”the graphical representation of the production volume over the ramp-up period”59, by Peters and Hofstetter (2008). Dyckhoff et al (2012) further differentiates “the scale-up curve is part of the ramp-up curve. It starts with the start of production and ends with the end of the ramp-up viz. reaching the stable and planned production output.”60
52 Nagel, 2011, p. 4; Ulrich, 2016, p. 15 53 Wagenheim, 1998, pp. 2–3 54 Wheelwright & Clark, 1992, p. 8 55 Casamento, 1992, p. 12 56 Terwiesch & Bohn, 1998, p. 2 57 Fleischer, Spath, & Lanza, 2003 58 Schuh, Stölzle, & Straube, 2008, p. 2 59 Peters & Hofstetter, 2008, p. 10 60 Dyckhoff, Müser, & Renner, 2012, p. 1430

2 Theory
14
Terwiesch and Bohn (1998) define the time to volume as the “time it takes to reach full capacity utilization/ production volume”, and the time to market as “development time”.61 In the context of this thesis the phase model approach by Dyckhoff (2012) and Nagel (2011), defining and structuring the phases of the ramp-up is used, as it corresponds to the model used at Volkswagen (See 3.2.1 The Volkswagen PEP). The production ramp-up or ramp-up is the phase between product development and serial production. It begins with the initial operations of the production facilities and ends with a steady output production. The production ramp-up is split into the phases pre-series, pilot series—also often referred to as zero series—and the scale-up.62
Figure 10:Phases of a production ramp-up63
During the pre-series, prototypes are manufactured in conditions close to the series. The production is performed on the series’ production lines or on specially built pilot lines. In the pre-series, the production procedures and testing equipment are tested and employees are trained. It serves to identify problems at an early stage. In some cases, special pre-series tools are used. A larger share of serial tools used in the pre-series allows for a more qualified prediction of the 61 Terwiesch & Bohn, 1998, pp. 1-2 62 Dyckhoff, Müser, & Renner, 2012, p. 1430; Nagel, 2011, pp. 5–7 63 based on Dyckhoff et al., 2012, p. 1430; Kremsmayr, Dornhofer, Mitterer, & Ramsauer, 2016
2 Theory
15
serial production. The pre-series is accomplished with the series-readiness of the tools. This is achieved when the product requirements are fulfilled.64 In the pilot series—also referred to as zero series—only tools which are also used in serial production are used. Additionally, all parts purchased at suppliers are produced with serial production tools. The zero series also serve to identify deficiencies and eliminate them. Production workers are trained in order to take over the function as trainers for other workers. The zero series ends with the first customer-suitable product.65 The end of the zero series is referred to as start of production (SOP) at which point the scale-up begins. The scale-up is the phase during which the production output is increased to the maximum capacity. The curve at which the production output is increased is referred to as ramp-up curve. The scale-up phase ends with a stable production characterised by a:66
defined minimum facility availability suitable product quality given throughput time production according to defined costs per unit
The ramp-up management of a serial product comprises all activities and measures for planning, controlling and performing the ramp-up with the related production system. The production system includes the resources, operating equipment, space, staff, material and information. The ramp-up management begins with the release for pre-series production and ends with achieving the planned production output, taking into account upstream and downstream processes and given a suitable product and process maturity.67 The ramp-up management can be structured into operative and strategic. Specht et al (2004) describe the operative ramp-up management as, “the operative transfer of a product from a development state into the series production”.68 The strategic ramp-up management according to Weinzierl (2006) “includes all activities in the product development, which are necessary to prematurely identify any deficits in the product maturity”.69
64 Nagel, 2011, p. 16; Schuh et al., 2008, p. 8 65 Nagel, 2011, p. 17; Schuh et al., 2008, p. 2 66 Nagel, 2011, p. 18-20; Schuh et al., 2008, p. 2 67 Kuhn, Wiendahl, Eversheim, & Schuh, 2002 68 Specht, Nagel, & Frischke, 2004, p. 71 69 Weinzierl, 2006
2 Theory
16
Figure 11: Influences on the generation of profit in the product life cycle70
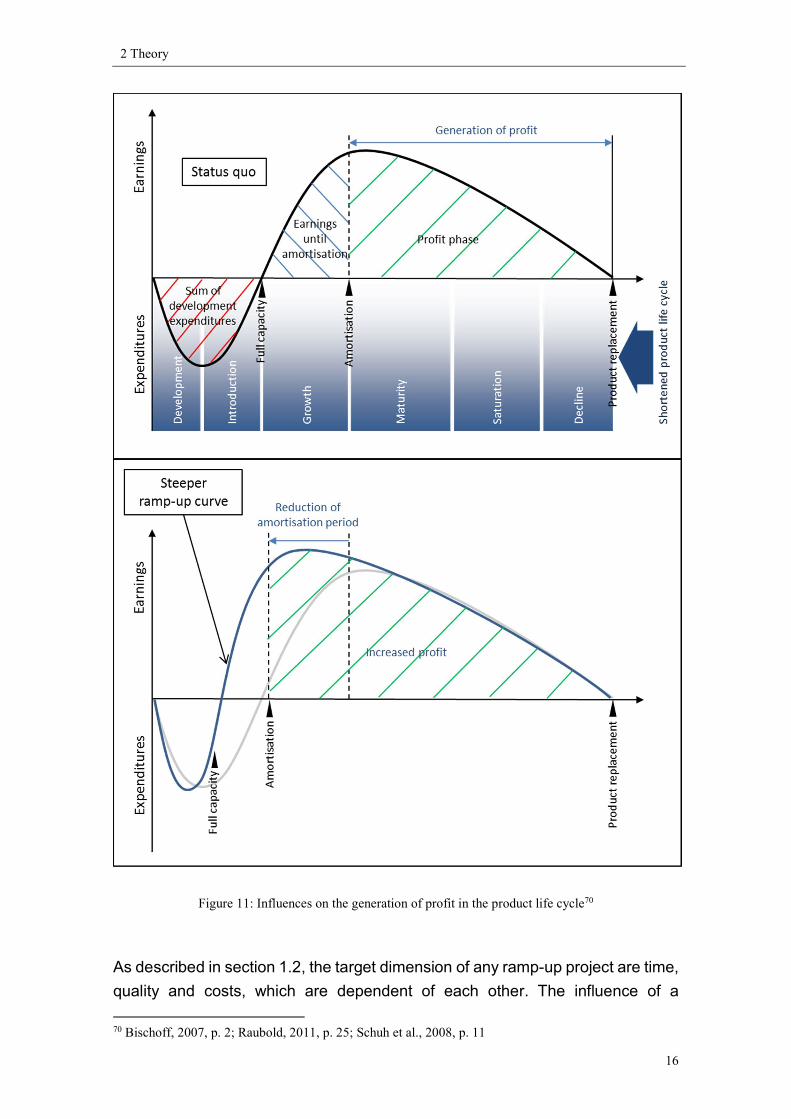
As described in section 1.2, the target dimension of any ramp-up project are time, quality and costs, which are dependent of each other. The influence of a 70 Bischoff, 2007, p. 2; Raubold, 2011, p. 25; Schuh et al., 2008, p. 11

2 Theory
17
shortened product lifecycle and strategy of a fast ramp-up to full utilisation on the profit of a project over its lifetime is shown in Figure 11. Through a shortened product lifecycle, the profit generation phase reduces. A maximisation of this phase and therefore the products profit is achieved through a faster ramp-up, or in other words a ramp-up with a steeper ramp-up curve.71 Achieving the ramp-ups goals is the task of the ramp-up management. For this various models, methods and approaches exists in literature, gathering the important aspects and fields of activity to manage a successful ramp-up. Three of these are presented in the following. Following that, the dimensions used in these models as well as approaches and instruments of these dimensions are described. St. Gallener ramp-up management model The St. Gallener ramp-up management model, described by Fitzek (2005), is a recommended framework for the creation of an interorganisational management of a ramp-up. It is developed by researchers and practitioners for the automotive industry. The structure for the visualisation of the framework is based on the St. Gallener management model.72 See Figure 12: St. Gallener ramp-up management model. Over the three phases (pre-series, zero-series and scale-up) the model suggest five relevant organisational dimensions (ramp-up organisation, ramp-up planning, maturity level controlling, engineering change management and knowledge management) for the interorganisational management of serial production ramp-ups in a value adding network of the automotive industry. Each dimension is detailed with methods, instruments and approaches in order to enable inter-organisational learning and planning.73
71 Schuh, et al., 2008, p. 10 72 Fitzek, 2005, p. 153 73 Fitzek, 2005, p. 154

2 Theory
18
Figure 12: St. Gallener ramp-up management model74
The Aachener model of interdisciplinary ramp-up management The Aachener model of interdisciplinary ramp-up management is a framework, which does not try to cope with the complexity of the series production ramp-up through a central organisational approach, but instead decentralised through the systematic improvement of individual decisions. According to Schmitt et al (2010) this approach is expedient because “the central challenge in ramp-up management is making a large number of interdependent decisions in a dynamic and interdisciplinary environment in the shortest possible time and with the highest possible quality.”75 To achieve this, three premises (basis of decision making, unitary target system and decision-making ability) for a successful interdisciplinary ramp-up management are defined. These premises for decision making frame the seven core functions (Supplier management, Logistic management, Production management, Product development, Cost management, Quality management, Sales and Marketing) of the ramp-up management.76
74 translated from Fitzek, 2005, p. 153 75 Schmitt, Schuh, Gartzen, & Schmitt, 2010, p. 318 76 Schmitt, Schuh, Gartzen, & Schmitt, 2010, pp. 319-320

2 Theory
19
Figure 13: The Aachener model of interdisciplinary ramp-up management77
Integrated ramp-up management The integrated ramp-up management model was developed at German and Swiss Universities in cooperation with the automotive industry which embraces the following three components:78
involved parties of the ramp-up (suppliers, internal areas and customers) management dimensions of the ramp-up target dimensions of the ramp-up (quality, time and costs)
As shown in Figure 14 the seven critical elements (Ramp-up strategy, Ramp-up organisation, Supplier management, Logistic management, Production management, Engineering change management, and Cost management) for performing a successful ramp-up management are identified and methods and instruments for these are provided by Schuh et al (2008).79
77 translated from Schmitt, Schuh, Gartzen, & Schmitt, 2010, p. 320 78 Schuh et al., 2008, p. 3 79 Schuh, et al., 2008, pp. 3-4
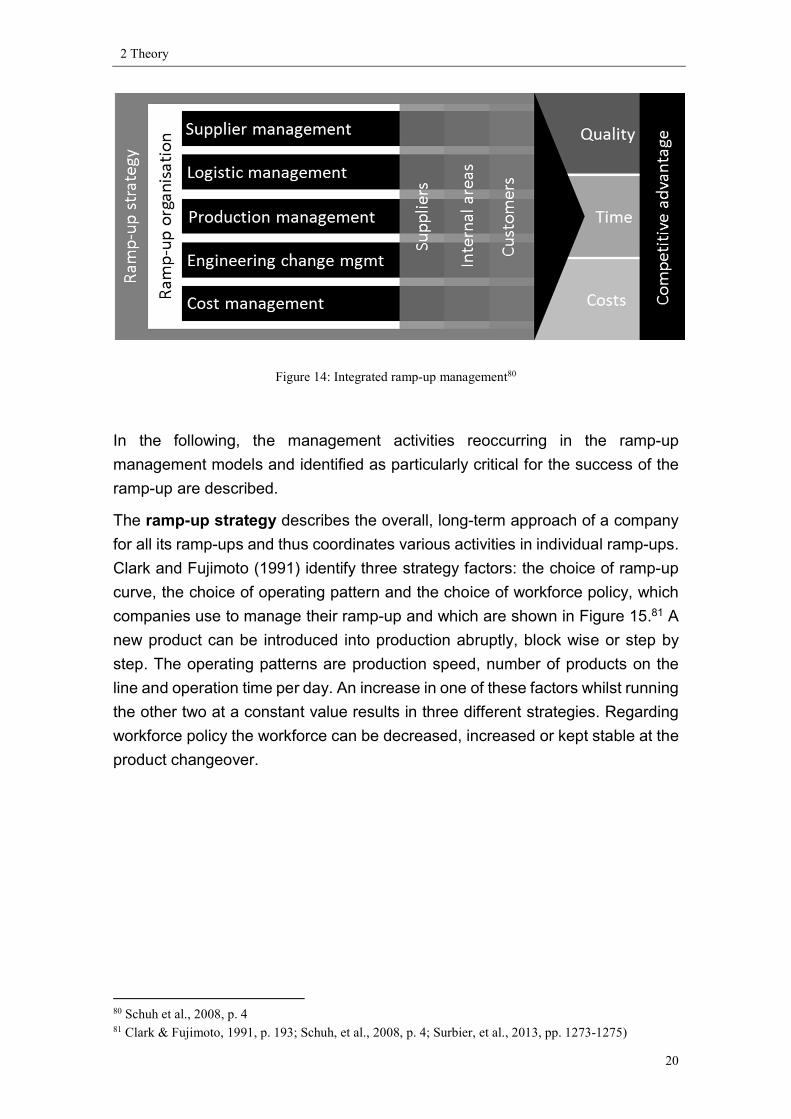
2 Theory
20
Figure 14: Integrated ramp-up management80
In the following, the management activities reoccurring in the ramp-up management models and identified as particularly critical for the success of the ramp-up are described. The ramp-up strategy describes the overall, long-term approach of a company for all its ramp-ups and thus coordinates various activities in individual ramp-ups. Clark and Fujimoto (1991) identify three strategy factors: the choice of ramp-up curve, the choice of operating pattern and the choice of workforce policy, which companies use to manage their ramp-up and which are shown in Figure 15.81 A new product can be introduced into production abruptly, block wise or step by step. The operating patterns are production speed, number of products on the line and operation time per day. An increase in one of these factors whilst running the other two at a constant value results in three different strategies. Regarding workforce policy the workforce can be decreased, increased or kept stable at the product changeover.
80 Schuh et al., 2008, p. 4 81 Clark & Fujimoto, 1991, p. 193; Schuh, et al., 2008, p. 4; Surbier, et al., 2013, pp. 1273-1275)

2 Theory
21
Figure 15: Ramp-up strategy factors82
The ramp-up organisation deals with interdisciplinary collaboration, how it can be facilitated and how efficiency and effectiveness at the interfaces of functional areas can be improved. Furthermore, it defines the organisational structures 82 Surbier, Gülgün, & Blanco, 2013, pp. 1274-1275; Clark & Fujimoto, 1991, p. 193

2 Theory
22
during ramp-up management and how they can be integrated into existing organisational structures.83 Following Wheelwright and Clark (1995) four basic types of organisational structures are used in companies.84
1) A ramp-up team with completely flexible employee assignment: Employees from the line organisation additionally take over tasks from the ramp-up management team.
2) A ramp-up team with fixed employee assignment: Employees are temporarily removed from the line organisation to take part in a ramp-up project. The employees do not perform tasks from the line organisation.
3) Independent functional units exist in the line organisation. They perform selected core tasks for all ramp-ups within the company.
4) Independent functional units exist in the line organisation. They methodically support all ramp-up activities of all ramp-ups within the company.
Supplier management focuses on early identification and integration of critical suppliers. Suppliers constitute an enhanced risk in the ramp-up phase because they themselves are performing a ramp-up and are dependent from their suppliers (cf. Figure 16). This potentiates the risks. In order to protect one’s own ramp-up from the mistakes of the supplier base, critical supplies are further integrated into the processes and closely managed to achieve the required product and process maturity.85 As shown in Figure 7, the trend in the automotive industry in the past decades has been focussing on the key competences and outsourcing development as well as production of parts, systems and modules to suppliers. These trends lead to an increasing importance of supplier management.
83 Schuh, et al., 2008, pp. 4-5 84 Franzkoch & Gottschalk, 2008, pp. 57-60; Wheelwright & Clark, 1995, pp. 82-85; Fitzek, 2005, pp. 159-162 85 Schuh et al., 2008, p. 4

2 Theory
23
Figure 16: Supplier pyramid in the automotive industry86
The logistic management during the ramp-up is characterised by a high complexity and the need for stable standardised logistical processes. Logistics are responsible for the material flow from the supplier to the point of fit of a component. Complexity is aggravated by an increased number of variants of products and engineering changes. Interfaces between other areas as well as logistics themselves gain importance during the ramp-up due to the integrative character of logistics management. Logistics management occupies a central coordinative instance during ramp-up.87 Production management in the ramp-up phase deals with planning the plant structure and production equipment. Typically, a new product needs to be integrated into an already existing and running production environment without disturbing the ongoing production. Production management needs to provide high flexibility to production resources due to not yet matured production processes and capacity fluctuations. Moreover, production management is responsible for training the production staff. In order to reduce complexity, a standardisation of work in the ramp-up is required. A major difficulty is presented by the novelty of the introduced processes and products. This is increased by the number of variants and possible configurations of a product. This complexity is reduced by a release management, also known as a sequential variant
86 translated from Schuh, Kamper, & Franzkoch, 2005, p. 405 87 Doch, Rösch, & Mayer, 2008, p. 143

2 Theory
24
management, which gathers vehicle types and configurations in packages which are timely phased and ramped-up one after another. 88 The tasks of engineering change management are to ensure the timeliness of the engineering change processes and reduce their lead time. Engineering changes are defined as any changes to already released working results. They can be product or process changes. Engineering changes are nowadays common practice within product development.89 According to current standards changes need to be tested, authorised and documented. The triggers for engineering changes are among others:90
errors in development errors in planning (insufficient planning) changing customer requirements cost savings quality improvements changing market requirements change of supplier
Engineering changes cannot only be seen as a disruptive factor, as they can be necessary and sensible to maximise potential for optimisation. Nevertheless, engineering changes in late product development phases present a major disturbance threat to the ramp-up.91 The engineering change management process is described with the example of Volkswagen in section 3.3.4 Engineering change management. Cost management deals with the target dimension costs. The dimension quality is a requirement. The timely targets need to be fulfilled and minimised. With respect to costs, ramp-up costs (tools, trainings, etc.) as well as consequential costs in the series (engineering change costs, etc.) need to be minimised. There is often a trade-off between ramp-up costs and consequential costs for the series which has to be assessed by cost management.92
88 Gottschalk & Höschen, 2008, pp. 177-181; Peters & Hofstetter, 2008, p. 24; Fisher & Ittner, 1999, p. 771 89 Schuh et al., 2002, p. 658 90 Rösch, Mayer, & Doch,, 2008, pp. 215-216; Schuh et al., 2002, p. 658) 91 Schuh et al., 2002, p. 658 92 Schuh et al., 2008, p. 243; Möller & Stirzel, 2008

2 Theory
25
2.1.3 Quality management
The term “quality” originates from the Latin word “qualis” or rather “qualitas” which describes the condition of an object.93 There are many definitions of the term quality. A sensible summary is provided by Prof David A. Gravins (Harvard) who provides five approaches to the definition:94
1) In the transcendent approach quality is unique and absolute. It is not measurable but only experienceable. This approach does not provide practical support for businesses.
2) In the product-based approach quality is the differentiation of a measurable characteristic of a product. A chocolate, for example, with a larger amount of cocoa has more quality. Here quality is an objective property. A consequence is that quality is only achievable with higher costs.
3) The user-related approach assumes that quality is in the eye of the beholder. As a consequence, the product which most completely fulfils the customer’s requirements has the highest quality. The issue with this approach is that quality and compliance with customer requirements are put on the same level, which is not necessarily the case.
4) In the production-related approach quality is the conformance to requirements. Deviations from the specification therefore result in a reduced quality. The issue with this approach is that a product which fulfils its production requirements is not necessarily a product with a high quality in the eyes of the consumer.
5) The value-oriented approach defines quality with cost and price. A quality product is a product which offers a certain performance at an acceptable price. The problem with this approach is that a television costing 10,000 euros, no matter how well manufactured, can never be a high-quality product.
The ambiguity of the term quality can lead to conflicts within businesses. Marketing and sales departments often view quality with a product-based and user-related approach, whereas development and production typically use the production-related approach. For companies, it is therefore important to focus not
93 Czaja, 2009, p. 295 94 Oess, 1991, pp. 31–32
2 Theory
26
only on one approach, but to be aware of all perspectives of quality.95 For suppliers, quality is the fulfilment of the customers’ as well as their own requirements.96 Quality management concludes all activities to guide and lead an organisation regarding quality. Its task is to prevent any errors from arising or rather systematically eliminating possible sources of error. In order to methodically realise these goals, businesses have developed quality management systems (QMS). A certified QMS requires that quality-relevant processes and activities are documented. Goals and procedures must be known and performed within the organisation.97 OEMs require suppliers to have a certified QMS in order to enter a supply relationship and to purchase parts for serial production. The specifications of QMS for suppliers in the automotive industry are defined in the IAFT 16949 which is based on ISO 9001. The quality management standard IATF 16949 merges various national standards, such as QS 9000 (USA), VDA (Germany), EAQF (France), AVSQ (Italy) into one so that suppliers only require one certification. The IATF standard is accepted by OEMs worldwide. For an IATF 16949 certification a business must have an implemented QMS. An independent institution examines whether the employees of the business know and use the standards provided, procedures and methods.98 The standard is relevant for all suppliers in the automotive industry but is only applicable where production and spare parts are produced. The goal of the standard is a QMS which continuously improves. The main focus lies on the avoidance of mistakes and the reduction of dispersion and waste in the supply chain. The standard provides further requirements and suggestions for quality assurance. It encourages a process-oriented approach for the development realisation and improvement of a QMS. Meeting customer requirements is the focus. Its target is a process-oriented QMS accompanied by continuous improvement with total focus on high customer satisfaction. Ultimately the standard intends to increase the OEM’s trust in suppliers and their own business and to certify qualitative work.99 A standard for error source detection, error prevention as well as product and quality planning is the advanced product quality planning (APQP). It provides a 95 Oess, 1991, p. 32 96 Schuh et al., 2008, p. 16 97 Czaja, 2009, pp. 291–298 98 IAFT, 2016; Schuh et al., 2008, p. 16 99 IAFT, 2016
2 Theory
27
structured approach with standardised tools which ensures the transfer of customer requirements into the supplier’s QMS and the punctual completion of steps in the product development. APQP plans, controls and documents every phase of the product development and is supported by a quality gate systematic. Its approach is not to verify quality at the end of the product development, but to achieve it at every phase of it. The tools of APQP are:100
fault tree analysis design of experiments (DoE) fishbone diagram (Ishikawa) quality function deployment (QFD) failure mode and effects analysis (FMEA) poka-yoke (mistake proofing) statistical process control (SPC) production part approval process (PPAP) or production process and
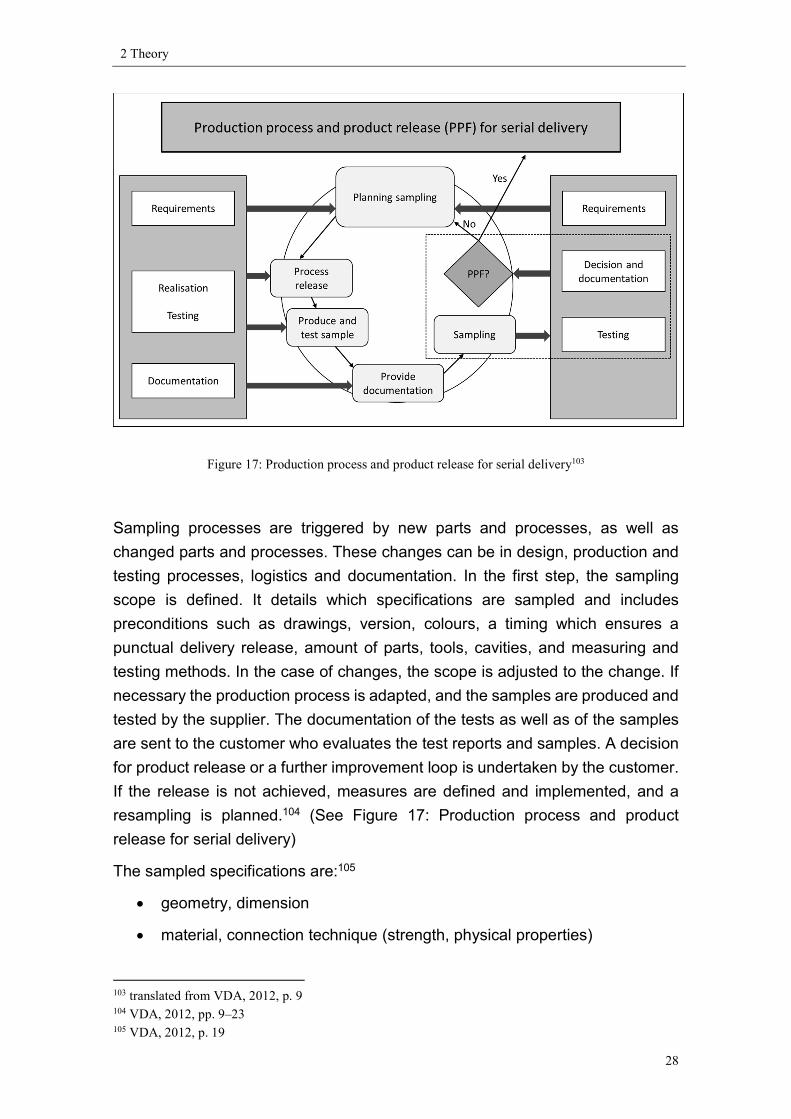
product release (PPF – “Produktionsprozess und Produktfreigabe”) The “VDA Reifegradabsicherung fuer Neuteile” which can be translated as “securing the maturity level of a new part” is the German automotive industries’ equivalent to APQP. It is used by VW. Both standards are non-obligatory recommendations of the IATF 16949 which are required by many OEMs. The VDA Reifegradabsicherung fuer Neuteile standard identifies critical suppliers who go through an eight-milestone process which is aligned with the product development process of the OEM. Its main goal is securing the ramp-up and improving the product quality. Its seventh milestone is the production process and product release.101 PPF is a procedure to sample serial production parts before they go into production in order to verify the fulfilment of the agreed-upon customer requirements. Sampling includes the evaluation of the product as well as the manufacturing process. Samples must be produced with serial production equipment and under serial production conditions. A positive sampling results in the delivery release of the product for serial production. PPF is a key ramp-up tool for quality assurance. The general procedure of a sampling process is described in the following.102
100 Schuh et al., 2008, pp. 16–17 101 VDA, 2009 102 VDA, 2012
2 Theory
28
Figure 17: Production process and product release for serial delivery103
Sampling processes are triggered by new parts and processes, as well as changed parts and processes. These changes can be in design, production and testing processes, logistics and documentation. In the first step, the sampling scope is defined. It details which specifications are sampled and includes preconditions such as drawings, version, colours, a timing which ensures a punctual delivery release, amount of parts, tools, cavities, and measuring and testing methods. In the case of changes, the scope is adjusted to the change. If necessary the production process is adapted, and the samples are produced and tested by the supplier. The documentation of the tests as well as of the samples are sent to the customer who evaluates the test reports and samples. A decision for product release or a further improvement loop is undertaken by the customer. If the release is not achieved, measures are defined and implemented, and a resampling is planned.104 (See Figure 17: Production process and product release for serial delivery) The sampled specifications are:105
geometry, dimension material, connection technique (strength, physical properties)
103 translated from VDA, 2012, p. 9 104 VDA, 2012, pp. 9–23 105 VDA, 2012, p. 19
2 Theory
29
function reliability (fatigue strength, …) appearance (colour, gloss) surface (structure) feel acoustics smell emissions weight
These specifications need to be clearly indicated, and assigned nominal values and tolerances. In addition, a production performance test to validate the production process is performed. It evaluates process performance and quality capability in serial production conditions (tools, equipment, cycle time, staff, etc.). This is the last step to achieve production process and product serial delivery release and is typically performed after the zero series. Provided serial delivery is achieved, it is ensured that the supplier can deliver the required quantity according to the specification regarding time.106
2.1.4 Risk management
For the term “risk” various definitions exist. Götze and Henselmann summarise them into two definitions:107 Risk as a threat of a loss or a damage has the effect of compromising the possible performance of a business. The term threat of loss does not necessarily imply a threat of negative results but refers to the negative deviation from an earlier defined reference value. This definition to risk is chosen in this thesis.108 The second definition is based on the future of decisions—risk as a threat of a wrong decision. When combining this approach with the threat of loss, this results in risk as a threat of a wrong decision consequently causing damage.
106 VDA, 2012 107 Götze & Henselmann, 2001, p. 5 108 Götze & Henselmann, 2001, p. 5; Rogler, 2002, p. 5
2 Theory
30
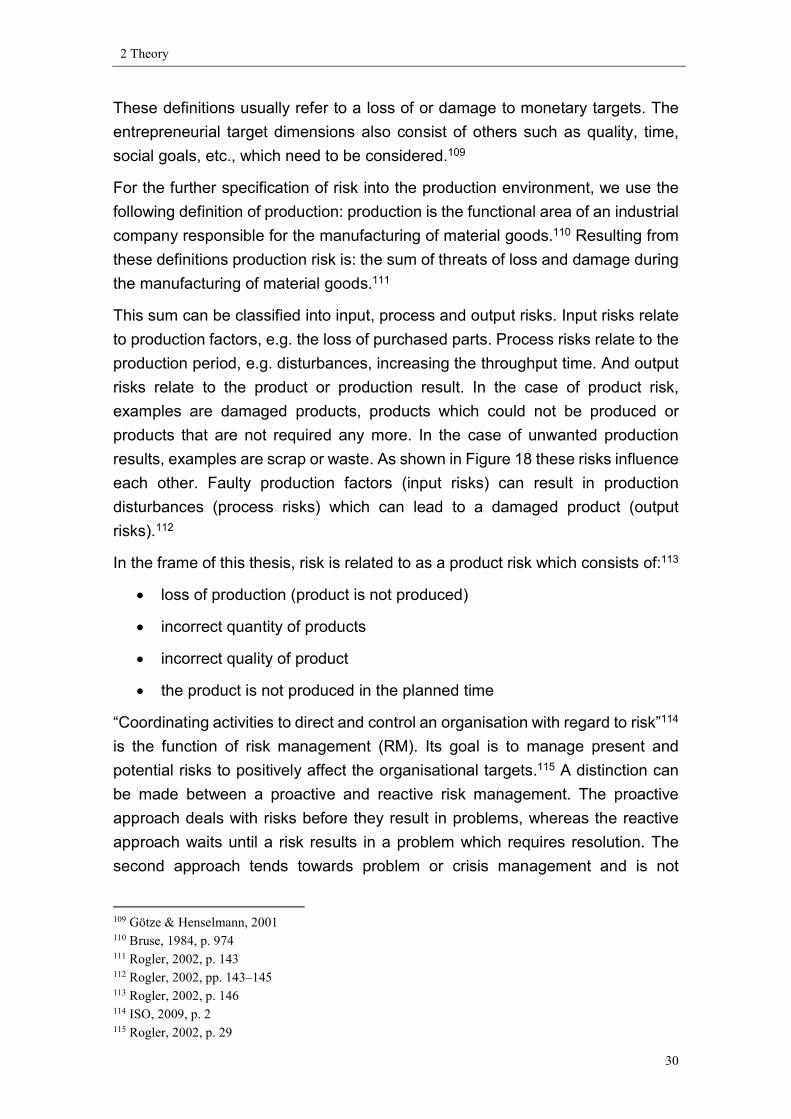
These definitions usually refer to a loss of or damage to monetary targets. The entrepreneurial target dimensions also consist of others such as quality, time, social goals, etc., which need to be considered.109 For the further specification of risk into the production environment, we use the following definition of production: production is the functional area of an industrial company responsible for the manufacturing of material goods.110 Resulting from these definitions production risk is: the sum of threats of loss and damage during the manufacturing of material goods.111 This sum can be classified into input, process and output risks. Input risks relate to production factors, e.g. the loss of purchased parts. Process risks relate to the production period, e.g. disturbances, increasing the throughput time. And output risks relate to the product or production result. In the case of product risk, examples are damaged products, products which could not be produced or products that are not required any more. In the case of unwanted production results, examples are scrap or waste. As shown in Figure 18 these risks influence each other. Faulty production factors (input risks) can result in production disturbances (process risks) which can lead to a damaged product (output risks).112 In the frame of this thesis, risk is related to as a product risk which consists of:113
loss of production (product is not produced) incorrect quantity of products incorrect quality of product the product is not produced in the planned time
“Coordinating activities to direct and control an organisation with regard to risk”114 is the function of risk management (RM). Its goal is to manage present and potential risks to positively affect the organisational targets.115 A distinction can be made between a proactive and reactive risk management. The proactive approach deals with risks before they result in problems, whereas the reactive approach waits until a risk results in a problem which requires resolution. The second approach tends towards problem or crisis management and is not 109 Götze & Henselmann, 2001 110 Bruse, 1984, p. 974 111 Rogler, 2002, p. 143 112 Rogler, 2002, pp. 143–145 113 Rogler, 2002, p. 146 114 ISO, 2009, p. 2 115 Rogler, 2002, p. 29
2 Theory
31
preferable.116 Additionally a division into strategical and operational risk management can be made.117
Figure 18: Types of production risks118
The strategical risk management aims towards the determination, securing and controlling of the long-term company development or in other words targets the conservation of the company. Herein the strategy of the company determines to which risks a company is exposed. The strategic risk is essentially the risk of not achieving the business goal determined by the management or board. They arise from management decisions and strategy. Therefore, the management has the responsibility for a strategic risk management. Strategic risks need to be taken in order for a company to grow. They include internal and external factors such as technology, environment and market. The ultimate goal of strategic risk management is increasing and protecting shareholder value. Strategic risk management builds the primary component of an organisations overall enterprise risk management (ERM), with which it is often confused. A classification of strategic risks can be done into business risks and non-business risks. 119
116 Ahrendts & Marton, 2002, p. 11 117 Nagel, 2011, p. 47 118 translated from Rogler, 2002, p. 146 119 Nagel, 2011, pp. 47–48; Frigo & Anderson, 2011

2 Theory
32
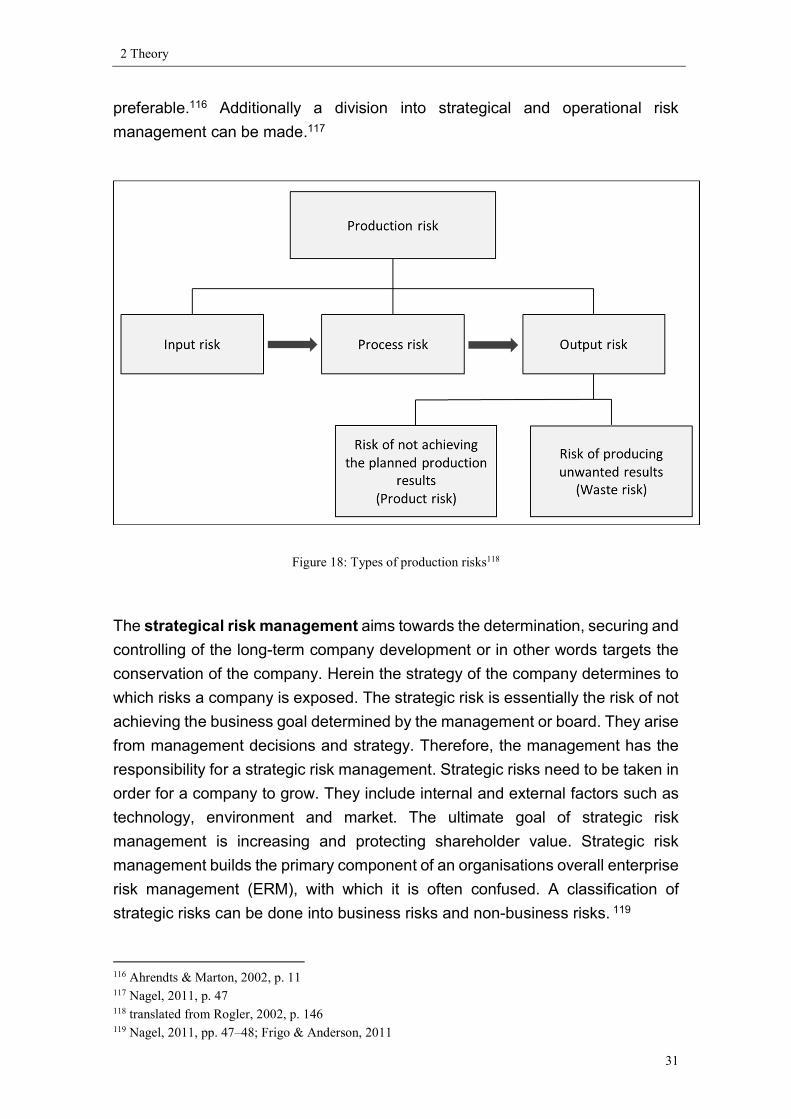
The business risks are those arising from the decisions the management takes regarding their products and services, such as developing, producing and marketing a new product. They further include economic and technological risks influencing the sales and costs. Non-business risks are risks which do not directly arise from the products and services of a company. These are risks such as environmental risks (e.g. environmental catastrophes) or financial risks, influencing the long-term financing. They also include competitors, which can have influence on sales and costs as well as new technologies, which can result in products running out-of-date. Legal and regulatory changes are also classified as strategic, non-business risks. These non-business risks do not primarily emerge from the decisions of the management but are nevertheless strategic risks.120 The operative risk management is oriented for the short term towards direct success of a company or project. Its main tasks lie in the identification, assessment and treatment of operative risks. Operative risks are risks regarding internal resources, processes, systems and employees. Here the responsibility for performing such a risk management is not with the board, as it cannot control all operational functions, but for example with area managers. Nevertheless, the board is responsible for establishing control systems which allow the operative risks management to be performed successfully, as the effects of such risks materialising can have a negative influence on the company reaching its goals. Like the strategic risk management, the operative risk management is a component of an organisations enterprise risk management. It can be applied to an entire organisation as well as to specific functions, projects and activities. Its focus lies in the design of the risk management processes within an organisation.121 The risk management process is, among others, described in the standard ISO 31000, which is summarised in the following. The ISO 31000 standard provides generic principles and guidelines for managing any form of risk in a systematic, transparent and credible manner. It is intended for developing risk management policies within an organisation, as a support for those responsible for managing risks along with evaluating an organisation’s effectiveness in managing risks. The standard refers to “risk management” as the architecture for managing risks effectively. The architecture is composed of the principles, framework and process.122 (See Figure 19: ISO 31000 overview) 120 Weller, 2015; Nagel, 2011, p. 48 121 ISO, 2009, p. V; Nagel, 2011, p. 48; Weller, 2015 122 ISO, 2009, pp. IV–V
2 Theory
33
Figure 19: ISO 31000 overview123
The guideline provides the principles with which to comply in order to be effective with successful risk management. The framework provides the foundations and arrangements that embed risk management throughout the organisation. It ensures that risks derived from the risk management process are adequately reported in the organisation. The framework is not intended as a prescribed management system, but assists in integrating RM. Organisations should instead adapt the components of the framework to their specific needs.124 According to the ISO 31000 risk management is implemented in the form of a process which is composed of the following components:125
communication and consultation: should take place at all stages of the RM establish context: articulate objective, define parameters, define scope
and risk criteria risk assessment: overall process of identification, analysis and evaluation risk treatment: selecting options to modify or treat risks
123 ISO, 2009, p. VII 124 ISO, 2009, pp. 1–12 125 ISO, 2009, pp. 13–21
2 Theory
34
monitor and review: regularly monitor and review risks The results of the RM process should in return initiate decisions on how the RM can be continuously improved. Risk management process and methods In risk management literature, approaches to structure the risk management process commonly consist of the process steps:126
Establishing the risk management policy Risk analysis with the sub-process steps:
- risk identification - analysis of cause, effect and probability of occurrence - risk assessment
Risk treatment For the support of these process steps a large variety of methods and tools exist. An overview of the process steps and methods is provided in the following. Establishing the risk management policy The risk management policy records a company’s objectives for managing risks. It contains the:
“organisations rationale for managing risks definition of risk acceptance criteria links between the organisations objectives and the RM policy accountabilities and responsibilities for managing risks how conflict interests are dealt with the commitment to provide the necessary resources for managing risks the way in which risk management performance is measured and
reported”127 126 Rogler, 2002, p. 29; Mikus, 2001, p. 13; Nagel, 2011, p. 49; ISO, 2009 127 ISO, 2009, pp. 10-11

2 Theory
35
Risk identification A wide-ranging, as complete as possible identification of risks is required, as risks which appear small at first can increase in combination with other risks or when further analysed. Existing methods are listed in the following (some methods, such as fault tree analysis and Ishikawa are used for risk identification as well as analysis of cause and effect and risk treatment):128
Risk checklist – list of risks and measures from earlier risk identifications. SWOT analysis (strength, weaknesses, opportunities and threats) –
detects a company’s problematic fields and thereby also risks. Brainstorming/ brainwriting of possible risks Cause and effect diagram (Ishikawa) – is a method for identifying possible
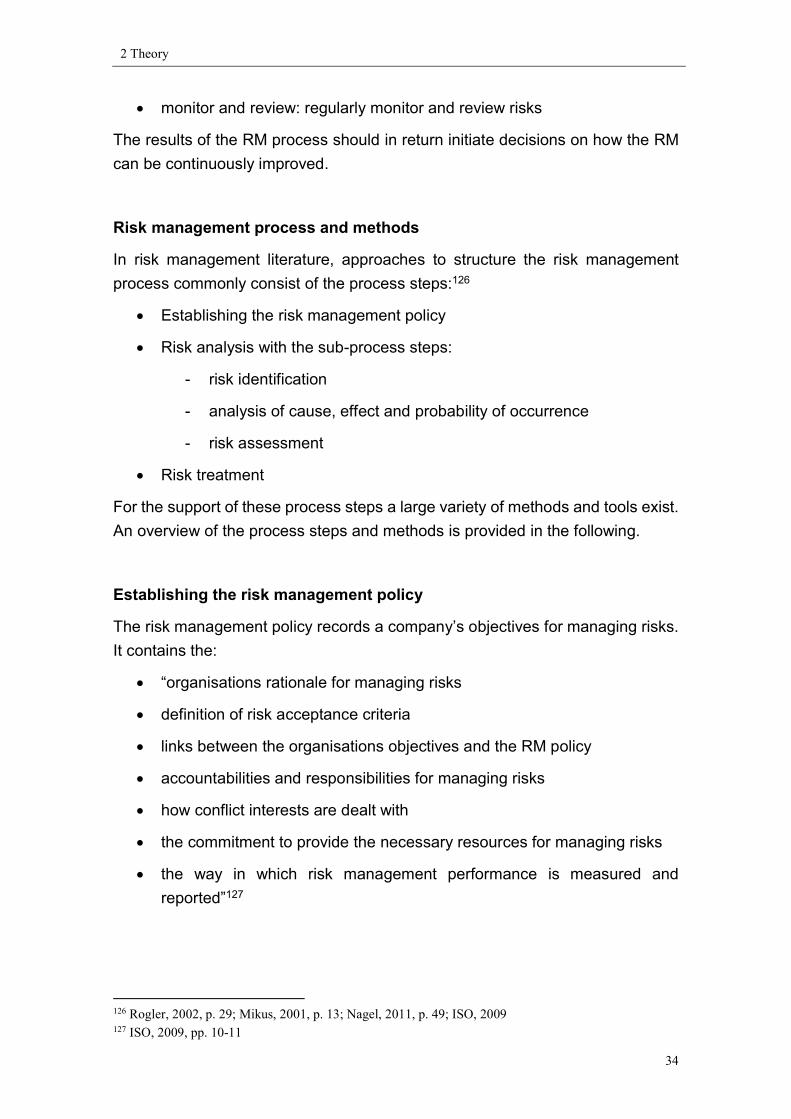
causes of a problem or risk. Starting with the problem possible major and minor influence variables are analysed and categorized. The categories are usually: human, machine, material and method, but vary according to the problem. The result offers a visualization of risks and its influencing factors, helpful for gaining knowledge of a problem. See Figure 20: Example of Ishikawa diagram for ramp-up.
Fault tree analysis – is, like the Ishikawa diagram, a method to understand cause and effects. The starting point is an unwanted event of which through a deductive method all causes and their interactions are identified.
Flow charts – show weaknesses, bottlenecks, and dependencies in organisational processes which can be identified as risks.
document analysis – by examining internal and external documents such as accounting documents and organisational plans risks can be identified.
Delphi method – is a multi-staged expert interview with feedback rounds for consensus finding. Questions can be regarding, risk sources and types, probability of occurrence, extent of loss and risk treatment.
Expert interviews – gathering potential risk sources through expert opinions.
128 Nagel, 2011, pp. 151-161; Mikus, 2001, p. 19; Rogler, 2002, p. 29; Bischoff, 2007, p. 41
2 Theory
36
Figure 20: Example of Ishikawa diagram for ramp-up129
Analysis of cause, effect and probability of occurrence Methods for analysing cause, effect and probability of occurrence can be grouped into the three categories:130
Empirical methods analyse losses and occurred risks and wrong decisions in the past to gain knowledge on cause and effect of similar current risks. This is achieved with the evaluation of statistics or individual cases.
Analytical methods not only take past values into consideration but asses a potential future loss of identified risk This is achieved with methods such as the fault tree analysis, Failure Mode and Effect Analysis (FMEA) and the cause and effect diagram (Ishikawa).
System oriented methods do not only take the technical component of a risk but also the management system into consideration (e.g. Quality management systems).
Risk assessment For risk assessment, first of all risk criteria are defined. The decision on criteria should at least include the criteria: probability of occurrence as well as the extent of loss of a risk. Subsequently these criteria are calculated in. Then a scale suitable to the precision of the information determined. A holistic multidimensional assessment of the risk, taking into consideration the defined criteria is performed. 129 based on Nagel, 2011, p. 157 130 Mikus, 2001, pp. 21-22
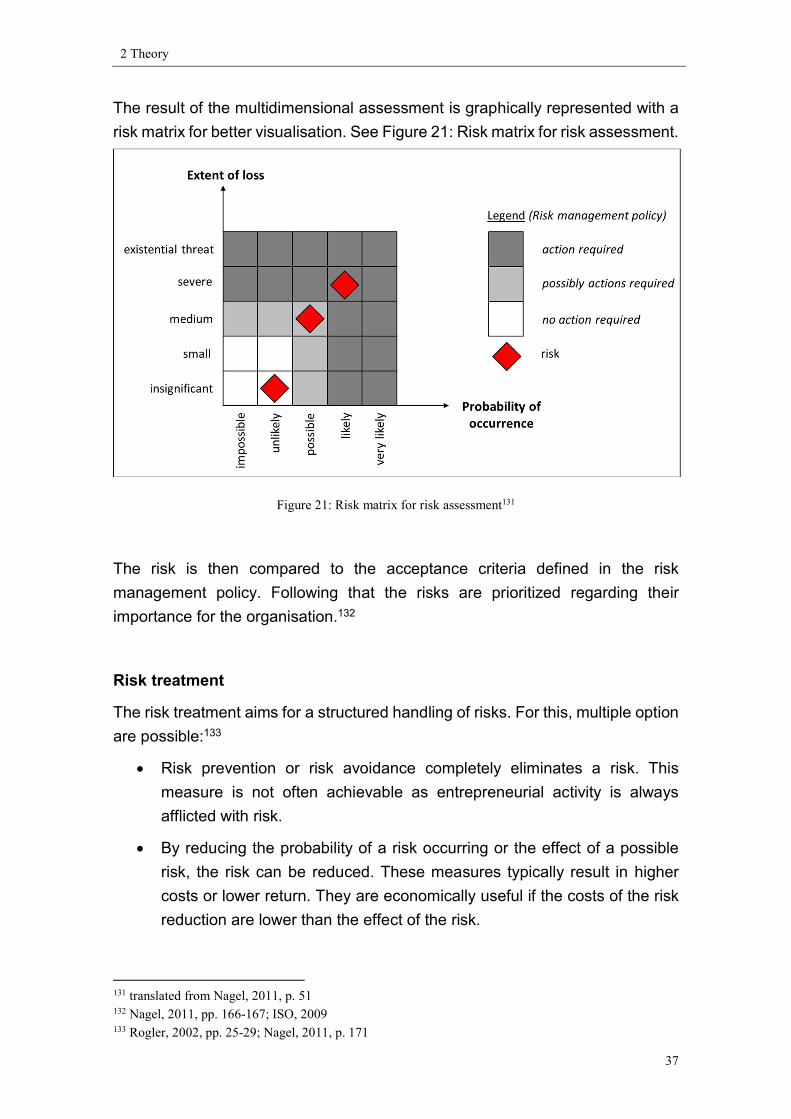
2 Theory
37
The result of the multidimensional assessment is graphically represented with a risk matrix for better visualisation. See Figure 21: Risk matrix for risk assessment.
Figure 21: Risk matrix for risk assessment131
The risk is then compared to the acceptance criteria defined in the risk management policy. Following that the risks are prioritized regarding their importance for the organisation.132 Risk treatment The risk treatment aims for a structured handling of risks. For this, multiple option are possible:133
Risk prevention or risk avoidance completely eliminates a risk. This measure is not often achievable as entrepreneurial activity is always afflicted with risk.
By reducing the probability of a risk occurring or the effect of a possible risk, the risk can be reduced. These measures typically result in higher costs or lower return. They are economically useful if the costs of the risk reduction are lower than the effect of the risk.
131 translated from Nagel, 2011, p. 51 132 Nagel, 2011, pp. 166-167; ISO, 2009 133 Rogler, 2002, pp. 25-29; Nagel, 2011, p. 171

2 Theory
38
Measures for limiting the loss of a risk can be achieved by splitting up a risk. Examples for this are multiple suppliers for one part, or multiple storages.
A further risk treatment possibility is the transfer of risks to outside suppliers or insurances who cover the risk. As with the risk reduction a basic cost-benefit analysis is required.
Risk acceptance is not a real treatment, as no actions are taken. Nevertheless, it is an option.
After a risk treatment method is chosen, the measures and activities need to be coordinated and performed. A critical assessment of the success of the activities is required.134 Enterprise Risk Management (ERM) Due to various economic scandals and corporate collapses, creating major losses for employees, investors and other stakeholders the urge for better corporate governance and risk management as well as new laws and regulations for stock exchange listed companies emerged. In Germany, such regulations where introduced in 1998 through the “Gesetz zur Kontrolle und Transparenz im Unternehmensbereich” (KonTraG), a law obliging the management of companies to a risk oriented corporate governance. In order to fulfil these regulations, the management of a company must prove the installation and functionality of internal control systems managing risks. Creating a guideline for practical implementation is difficult as the such a risk management is complex and depends of the risks an organisation is exposed to. Nevertheless, enterprise risk management frameworks, supporting the management with a clear and structured guideline to consistently manage risks, such as the Casualty Actuarial Society framework and the COSO (The Committee of Sponsoring Organizations of the Treadway Commission) ERM framework, have been created and are used to prove existing ERMs. The enterprise risk management herein supports the organisation strategy in achieving its objectives. It acts as a preventive measure avoiding unwanted events for the organisation. The goals and components of such an enterprise risk management are described using the COSO ERM framework.135 A holistic ERM of an organisation includes the following fundamentals:136
134 Nagel, 2011, p. 177 135 Berry & Phillips, 1998; COSO, 2004; Rogler, 2002, p. 1 136 COSO, 2004, p. 3

2 Theory
39
Management considers the risk appetite and strategy when evaluating strategic alternatives, setting targets and creating mechanism for monitoring the taken risks
Improvement of risk relevant decisions by providing procedures for finding and choosing alternative reactions to risks
Reduction of surprises and losses in the operative area Identifying and controlling risks affecting multiple units or business area
and risks occurring in similar manner in different units. Understanding dependencies as well as defining overall risk treatment solutions.
By considering all possible events, management can identify chances and proactively realise them.
Improving the capital allocation by obtaining reliable risk information to asses overall required capital resources
The focus of an ERM lies on the achievement of the objectives which are specified through the top management through strategy, vision or mission. A classification of the objectives into four distinct categories is performed in the COSO ERM model (other models also categories but categories vary), which allows for a better distinction regarding responsibilities.137
Strategic – high level goals, aligned with and supporting its mission Operations – effective and efficient use of its resources Reporting – reliability of reporting Compliance – compliance with applicable laws and regulations138
The objective is followed up in different components by different organisational units. There is a relation between the business unit or entity, what objectives they need to achieve and which tool or component they require to achieve this. In other models such as the CAS ERM the components are referred to as process steps and are executed as a process by the organisational unit. This interrelation is visualized in Figure 22. For the risk management to be effective the eight components need to be executed effectively by the organisations units.139
137 COSO, 2004, p. 5; CAS, 2003, pp. 9-10 138 COSO, 2004, p. 5 139 COSO, 2004, pp. 5-7; CAS, 2003, pp. 11-15
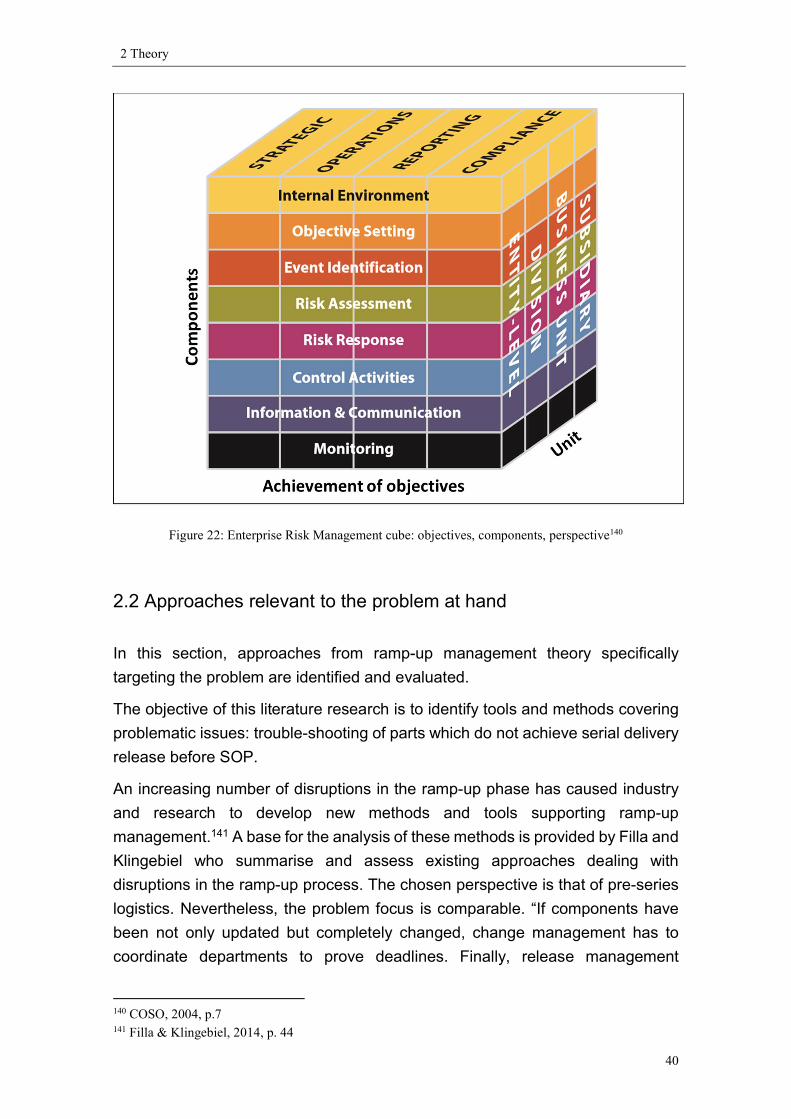
2 Theory
40
Figure 22: Enterprise Risk Management cube: objectives, components, perspective140
2.2 Approaches relevant to the problem at hand In this section, approaches from ramp-up management theory specifically targeting the problem are identified and evaluated. The objective of this literature research is to identify tools and methods covering problematic issues: trouble-shooting of parts which do not achieve serial delivery release before SOP. An increasing number of disruptions in the ramp-up phase has caused industry and research to develop new methods and tools supporting ramp-up management.141 A base for the analysis of these methods is provided by Filla and Klingebiel who summarise and assess existing approaches dealing with disruptions in the ramp-up process. The chosen perspective is that of pre-series logistics. Nevertheless, the problem focus is comparable. “If components have been not only updated but completely changed, change management has to coordinate departments to prove deadlines. Finally, release management 140 COSO, 2004, p.7 141 Filla & Klingebiel, 2014, p. 44

2 Theory
41
represents the last board before component volumes are approved for series production, i.e. components have to fulfil the defined customer’s acceptable quality from here. The highly complex information structure and fast-changing quality gates cause short-term disruptions. Here, risk management approaches can provide suitable methods and tools.”142 The increasing importance and confirmed applicability of risk management methods, due to an increasing technological challenge is identified.143 In the next step, Filla and Klingebiel (2014) classify risk management ramp-up state of the art into two clusters: whether it is a measurement or controlling and forecasting approach and whether the approach is product or process oriented. This classification as well as the for this thesis relevant approaches are shown in Figure 23.
Figure 23: Ramp-up RM literature classification144
In the following the approaches relevant for this thesis are discussed as they consider the problem at hand. They are dissertations and research papers which deal with ramp-up management, serial delivery release of parts, engineering changes during ramp-up, handling of deviations during ramp-up as well as risk management during ramp-up. 142 Filla & Klingebiel, 2014, p. 46 143 Filla & Klingebiel, 2014, p. 44; Hegner, 2010, pp. 1–2; Nagel, 2011, p. 1) 144 based on Filla & Klingebiel, 2014
2 Theory
42
Nagel (2011) – “Risikoorientiertes Anlaufmanagement”– Dissertation The most holistic approach on risk management in ramp-up is provided by Nagel in his dissertation: Risk oriented ramp-up management. He discusses operative RM as an approach in pre-series and zero series to detect potential threats to the scale-up. He relates to product quality risks and procurement risk for which through early risk identification an early warning mechanism is established. The adaptation of this new perspective supports the operative ramp-up management in planning and decision-making by creating transparency and a better understanding of a dangerous situation. Risk assessment fundamental criteria are determined and solutions for risk handling are provided. These relate to supply chain risks for which the preventive measures of supplier audits and continuous quality control are recommended. Engineering change management is not referred to.145 Weinzierl (2006) – “Produktreifegrad-Management in unternehmens-übergreifenden Entwicklungsnetzwerken” – Dissertation Weinzierl develops a tool to support the decision making in the strategic ramp-up in his thesis: Degree of product maturity management in cross-company development networks. He uses degree of product maturity measurement which is identifies as a key and central success factor for organisations and ramp-ups. The degree of maturity measurement provides information on the entire project by taking the four dimensions time (from concept development to SOP), vehicle structure (from entire vehicle to single part) business unit (from development to assembly and supply chain (from OEM to single part supplier) into account and defining quantitative criteria which can be measured objectively. Internal and external parts as well as production processes are measured. The criteria are adapted for each phase of the ramp-up and calculated. Following that a target-actual comparison is performed and the result visualized with a traffic light system (red – major deviation, yellow – minor deviation, green – criteria fulfilled). In cases of deviations measures are defined and scheduled and a prognosis on recovery performed. By this, deviations can be detected in early product development phases and recovered. Furthermore, degree of product maturity measurement serves as a tool to visualise the project status and reporting. As in the project at hand the feasibility and usability of the tool is demonstrated with a pilot-project.146
145 Nagel, 2011 146 Weinzierl, 2006
2 Theory
43
The developed tool supports the ramp-up management by providing transparency and an improved overview of the situation. It provokes an early detection of deviations, reduces the effort for reporting and helps set clear targets for achieving the agreed upon criteria at the right time. Despite there being a clear differentiation between the methods, degree of product maturity management and risk management the goals on how to support management are similar.147 Klein (2013) – “Logistikkostenrisiken bei Fahrzeugneuprojekten der Volkswagen AG” – Chapter in Automobillogistik In the chapter: Logistics costs risk in new vehicle projects in the Volkswagen group, in the book Automobile logistics Klein (2013) describes the supply chain risk management at Volkswagen as well as applied strategies to reduce risks and risk treatment possibilities. He refers to the entire Volkswagen product development process, however does not specify the production ramp-up. According to Klein risks during the Volkswagen product development process are often only determined when there is a threat of a financial loss. This can be improved through a risk management. A classical risk assessment, calculating the probability of occurrence and the effect proves difficult as probabilities of occurrence often cannot be determined. He therefore recommends risk reduction strategies such as a systematic supplier nomination or a nomination of multiple supplier (multiple sourcing). Nevertheless, supply chain risks such as supply disruption and supply delays are discussed, which have similar effects for the production – they cannot produce vehicles.148 A differentiation between short-term and long-term supply disruptions is made. For long-term disruptions, possible measures are:149
leaving the production of the part with the supplier in the same plant (e.g. when tool breaks down and a new tool is required)
leaving the production of the part with the supplier but in a different plant nominating a new supplier for the production of the part procuring the part from a different supplier (only possible if the part has the
same specifications and capacity is available) For short-term supply disruptions, the options above are also valid. Additionally, the disruption can be accepted and the production paused as with short 147 Weinzierl, 2006 148 Klein, 2013 149 Klein, 2013, p. 170

2 Theory
44
disruptions of one or two days these options often do not make sense economically. A bridging of such a short-term disruption by retrofitting parts after the assembly is not mentioned.150 Bischoff (2007) – “Anlaufmanagement: Schnittstelle zwischen Projekt und Serie” – Konstanzer Managementschriften In his work: Ramp-up management: interface between project and series, Bischoff describes areas of activities in the field of ramp-up management. Next to planning, controlling and organisation of ramp-ups, ramp-up robust production systems, cooperation- and reference models for the ramp-up, knowledge- and human resource management and strategic project choice the two areas engineering change management and risk management in the ramp-up are mentioned.151 As any project is inevitably associated with risk and companies are obliged to manage risks, risk management plays a role in the ramp-up management. It serves as an early detection method for current and future threats. Bischoff describes a classical risk management with the process steps: risk identification, risk assessment, risk controlling and risk monitoring and takes product and process risks into consideration. He further mentions useful methods for these process steps, such as FMEA, Fault tree analysis and the Ishikawa diagram.152 Risks and their probability and effect change in the course of the project. In the ideal situation, some disappear. In reality, with increasing product maturity new risks arise and are identified. These require assessment, treatment and control. Therefor it is important to establish risk management as a recurring task or preferable as a continuous process. He does not further specify ramp-up risk management.153 In addition to risk management, the importance of engineering change management is discussed. Bischoff sees one problem of engineering changes during the ramp-up caused by the loss of time for resampling and a newly required serial delivery release. He suggests determining the critical aspects of an engineering change to speed up the process. Furthermore, techniques improving the planning of samples are presented.154 150 Klein, 2013 151 Bischoff, 2007 152 Bischoff, 2007, pp. 40-42 153 Bischoff, 2007, p. 42 154 Bischoff, 2007, pp. 22-25
2 Theory
45
Czaja (2008) – “Qualitätsfrühwarnsysteme in der Automobilindustrie” – Dissertation In his dissertation: early warning system for quality in the automotive industry, Czaja develops an early warning system for an automotive supply chain. He describes different types of supply chain management forms and characterises them. Subsequently a supply chain risk management including a classification of risks is explained. Among the risks he describes the supply risks, which occur if a delivery deviates in amount, time, quality, location and price.155 He then performs an empirical study on supply chain disturbances in the automotive industry. This identifies the critical indicators for an early warning system. Among these are engineering changes and their effect on the serial delivery release which, in the case of severe supply disruptions have in some instances occurred beforehand. To cope with the supply chain risks he develops an indicator based early warning system.156 Risse (2003) – “Time-to-Market-Management in der Automobilindustrie – Dissertation In the dissertation: Time-to-market management in the automotive industry, Risse develops a framework for a logistics oriented ramp-up management. He does so by determining the success factors of time-to-market management and analysing time wasters and optimizing potentials. The developed concept consists of ramp-up strategy and -planning, a framework for pre-series logistics as well as methods for common areas of activity in a logistics oriented ramp-up management. These are among others sequential variant management, engineering change management, tool tracking and preventive supplier management.157 In the discussion of problems occurring through engineering changes he mentions rework as well as loss of time through rework of parts. For engineering changes, he develops a method called SÄM – “System für das Änderungsmanagement” – system for engineering change management. This consists of express engineering changes which have an improved lead time as well as a database which gathers all information relevant on the change and informs affected employees. It ensures all engineering changes affecting
155 Czaja, 2009 156 Czaja, 2009 157 Risse, 2003
2 Theory
46
neighbouring parts are coordinated and that the correct version of a part is used.158 The method for preventive supplier management incudes integrating the suppliers’ IT-Systems into the OEMs data system improving transparency and communication of dates, maturity levels, design status and costs. Other recommended methods are supplier audits, ramp-up controlling, tool management as well as a regular communication and support.159
2.3 Interim conclusion In the first part of this chapter the fundamental theoretical basics of product development, ramp-up management, quality management and risk management are discussed. These are necessary for the current state analysis and serve as a guideline for the concept development. Following that the approaches relevant to the problem at hand are discussed. These include scientific papers dealing with ramp-up management and the avoiding and handling of problems during ramp-up. The review of existing literature has shown no sufficient adequate approaches for the scope of the problem at hand exist. The evaluated approaches do not deal with the operational depth, but are mostly from a strategic perspective and do not explore the depth of the existing problem. In order to derive requirements to the concept dealing with the problem the current state is analysed in the following chapter.
158 Risse, 2003, pp. 218-227 159 Risse, 2003, pp. 232-233

3 Analysis of current state
47
3 Analysis of current state
In the first section of this chapter the method of information retrieval for the current-state analysis is described. Subsequently, vehicle project management, including the VW product emergence process and project organisation, are presented. Next, ramp-up management at Volkswagen Autoeuropa is described. This includes the reasons for parts not achieving serial delivery release before SOP, and how this is handled. The chapter is concluded with the demands of the subsequently developed concept.
3.1 Research approach and goal The hereinafter presented information was gathered during a six-month stay at the production plant where the ramp-up occurred. The task was to analyse the current situation, develop an understanding for the problem, propose a method of handling the problem and implement this method in the ramp-up. The stay at the production plant started during the first pre-series phase and ended shortly before SOP as shown in Figure 24. The organisational location was the launch management team, which only existed during the ramp-up and was led by the launch manager. He reported to the plant manager and his team consisted of 6 employees. Launch management is the term used within Volkswagen for ramp-up management.
Figure 24: Master thesis project timeline
For the situation analysis, the information acquisition was achieved by semi-structured interviews, analysis of project and process manuals as well as project reports.

3 Analysis of current state
48
A semi-structured interview is a formal interview in which a list of topics or questions are covered. As the questions are open ended the respondent may stray from the interview guide, which provides the opportunity for identifying new ways of seeing and understanding the topic. Semi-structured interviews allow the respondent the freedom to express their views in their own terms. This provides reliable qualitative data.160 An overview of the interview partners, the areas they belong to and whether they are managers or staff members is illustrated in Figure 25.
Figure 25: Interview partners
The interview topics can be summarised as: scope of functions regarding the problem, technique or procedure, means of communication, point of view regarding the problem, required and recommended changes to handling the current problem.
3.2 Vehicle project management at Volkswagen The vehicle project management describes all planning, performing and controlling actions in the scope of product creation. The product emergence process creates the sequential structure for project work at Volkswagen.
160 Cohen & Crabtree, 2006

3 Analysis of current state
49
3.2.1 The Volkswagen PEP
The Volkswagen process model structures all processes within the company. The core process according to which all subordinate support processes for vehicle project management and functional division processes are arranged is the product emergence process, also referred to as PEP.161 The PEP is integrated in the product process, which incorporates the entire life cycle of a product, from the definition of the product strategy to the product emergence process and on to the production support process which ends with the end of production (cf. Figure 26). The product process regulates all activities of the departments and divisions required for determining the product portfolio, defining the product, and ensuring and implementing product development, as well as the series support phase.
Figure 26: The Volkswagen product process162
The product strategy process describes the aspects of research, pre-development, market, customers, regulations and innovation in order to ensure targeted strategic portfolio planning. The PEP describes a mandatory standard procedure for new vehicle projects. It includes the project definition, the concept and series development, the start of production and ends with the market launch. The PEP is a reference process with a fixed sequence and timing of milestones with defined content.163 The series production-support process begins during the PEP production preparation and finishes with the end of production. It describes the changes in ongoing production.
161 Volkswagen, 2016b, p. 6 162 translated from Volkswagen, 2012, p. 3 163 Volkswagen, 2012, pp. 4–5
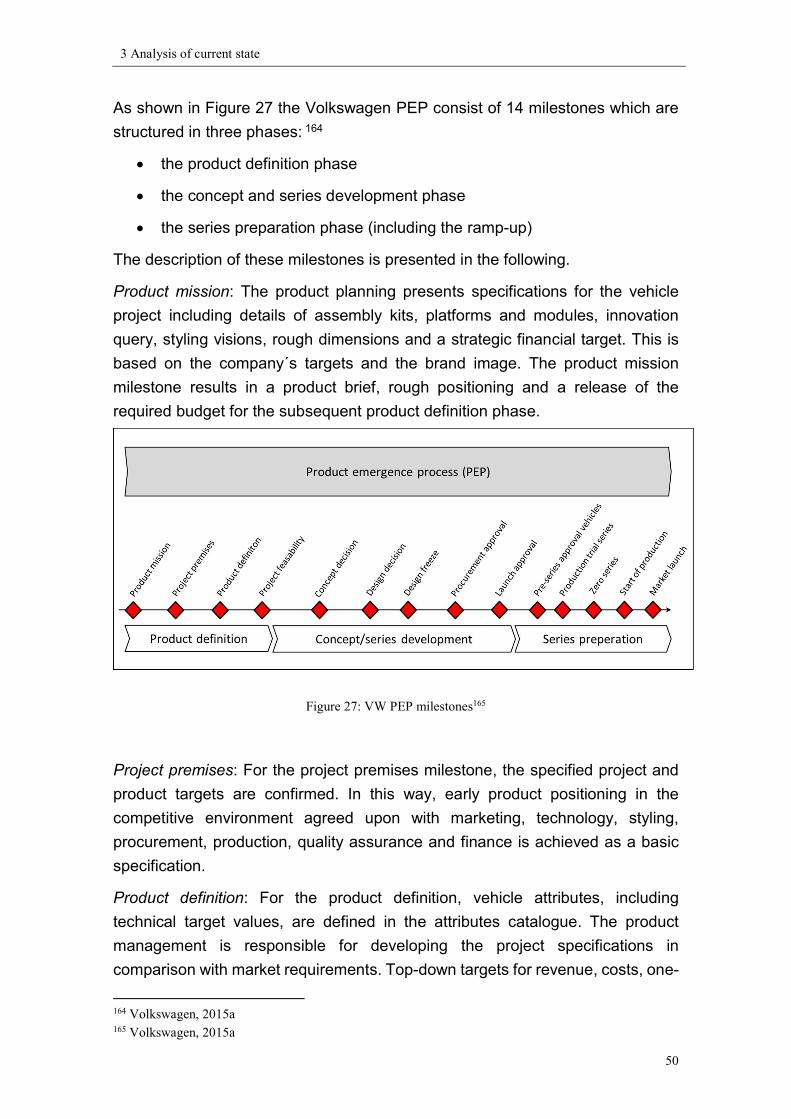
3 Analysis of current state
50
As shown in Figure 27 the Volkswagen PEP consist of 14 milestones which are structured in three phases: 164
the product definition phase the concept and series development phase the series preparation phase (including the ramp-up)
The description of these milestones is presented in the following. Product mission: The product planning presents specifications for the vehicle project including details of assembly kits, platforms and modules, innovation query, styling visions, rough dimensions and a strategic financial target. This is based on the company´s targets and the brand image. The product mission milestone results in a product brief, rough positioning and a release of the required budget for the subsequent product definition phase.
Figure 27: VW PEP milestones165
Project premises: For the project premises milestone, the specified project and product targets are confirmed. In this way, early product positioning in the competitive environment agreed upon with marketing, technology, styling, procurement, production, quality assurance and finance is achieved as a basic specification. Product definition: For the product definition, vehicle attributes, including technical target values, are defined in the attributes catalogue. The product management is responsible for developing the project specifications in comparison with market requirements. Top-down targets for revenue, costs, one- 164 Volkswagen, 2015a 165 Volkswagen, 2015a

3 Analysis of current state
51
time expenses as well as the release of the technical concept description are presented. Basic project conditions, reference architecture, production and location premises are decided upon as an evaluation basis for the expected actual value of invest of the project. Project feasibility: The financial feasibility of the project is confirmed by all divisions with the agreed project specification decided on in the product definition. The production location is selected. Concept decision: The concept development phase is concluded with the concept decision. This results in a binding interior and exterior design model with confirmed technical feasibility. All concept packages are submitted to the project organisation team of the product development phase. Design decision: The further developed and merged interior and exterior design model with technical feasibility is decided for the styling decision. The technical status is reconciled and the shaping of the main surfaces concluded. Design freeze: For the design freeze milestone, the shaping of all surfaces and details is concluded. The production and construction feasibility are confirmed. The virtual whole vehicle acceptance and the virtual prototype are concluded. Procurement approval: For the milestone procurement approval, prioritised parts are issued procurement releases. The vehicle is given a name. The first prototype is produced. Launch approval: For the milestone launch approval, the procurement releases and forward sourcing for supply parts are concluded. The part availability and quality for production according to the market introduction plans are confirmed. The launch release serves to ensure the start of production with defined actions to be taken in the event of target deviations. Market introduction dates are confirmed and life-cycle planning begins. Pre-series approval vehicles: For the milestone pre-series approval vehicles, vehicles are assembled using the production facilities in order to optimise production systems and processes, to identify part problems and production problems early, and to test the fit and dimensional stability of parts. The part version used is unsampled and documented. Production trial series: In the production trial series, serial tool parts with specific Note 3 (See 3.3.5) are used in the production facilities. The function of all individual pieces of production equipment and assembly equipment is tested on non-interlinked systems. The completeness and plausibility of the bill of materials are checked.
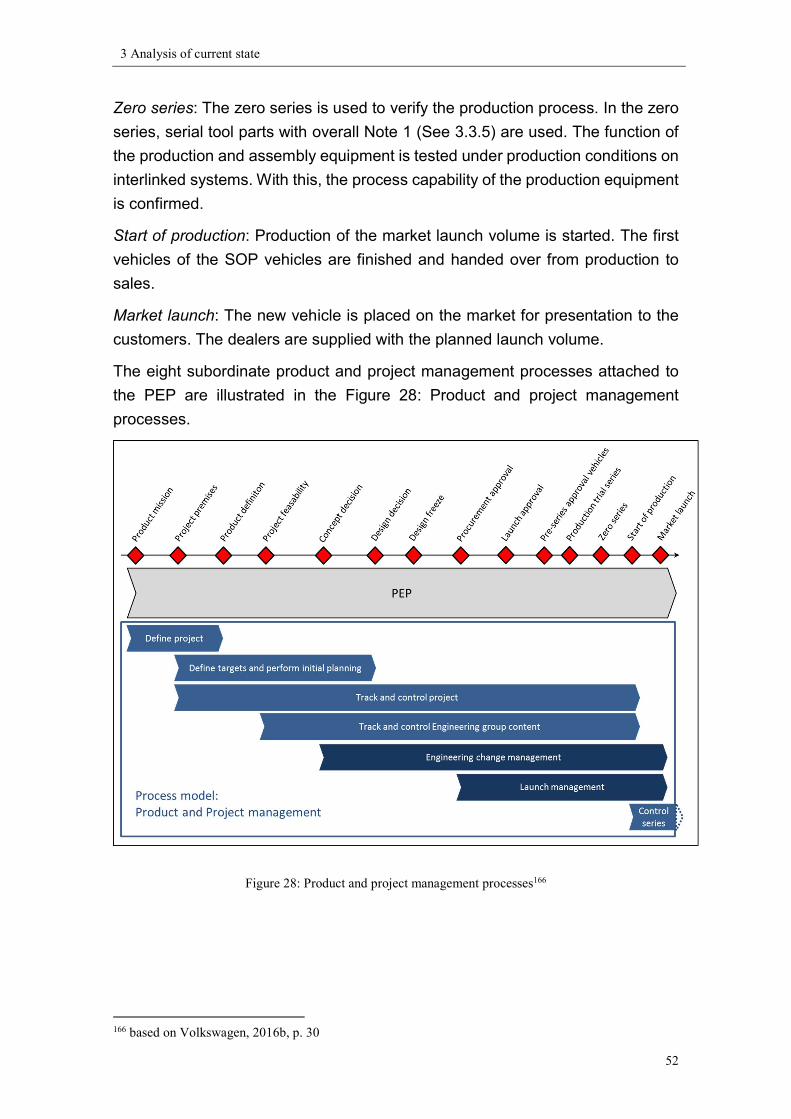
3 Analysis of current state
52
Zero series: The zero series is used to verify the production process. In the zero series, serial tool parts with overall Note 1 (See 3.3.5) are used. The function of the production and assembly equipment is tested under production conditions on interlinked systems. With this, the process capability of the production equipment is confirmed. Start of production: Production of the market launch volume is started. The first vehicles of the SOP vehicles are finished and handed over from production to sales. Market launch: The new vehicle is placed on the market for presentation to the customers. The dealers are supplied with the planned launch volume. The eight subordinate product and project management processes attached to the PEP are illustrated in the Figure 28: Product and project management processes.
Figure 28: Product and project management processes166
166 based on Volkswagen, 2016b, p. 30
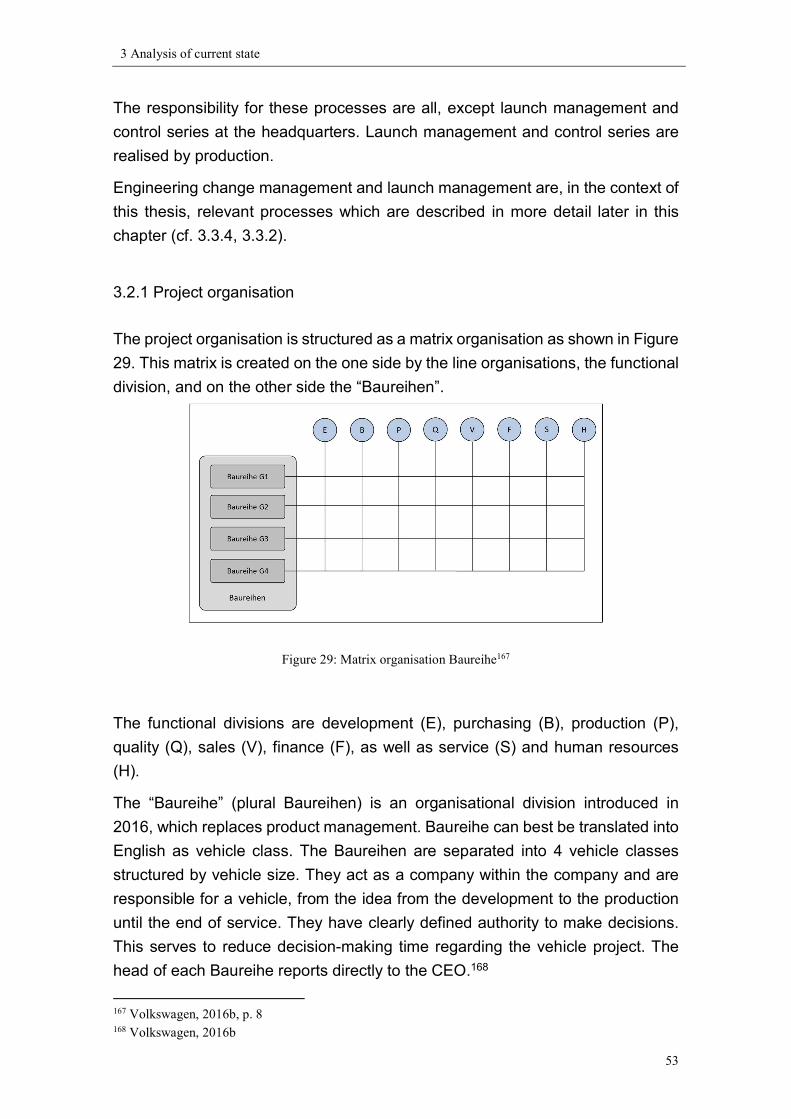
3 Analysis of current state
53
The responsibility for these processes are all, except launch management and control series at the headquarters. Launch management and control series are realised by production. Engineering change management and launch management are, in the context of this thesis, relevant processes which are described in more detail later in this chapter (cf. 3.3.4, 3.3.2).
3.2.1 Project organisation
The project organisation is structured as a matrix organisation as shown in Figure 29. This matrix is created on the one side by the line organisations, the functional division, and on the other side the “Baureihen”.
Figure 29: Matrix organisation Baureihe167
The functional divisions are development (E), purchasing (B), production (P), quality (Q), sales (V), finance (F), as well as service (S) and human resources (H). The “Baureihe” (plural Baureihen) is an organisational division introduced in 2016, which replaces product management. Baureihe can best be translated into English as vehicle class. The Baureihen are separated into 4 vehicle classes structured by vehicle size. They act as a company within the company and are responsible for a vehicle, from the idea from the development to the production until the end of service. They have clearly defined authority to make decisions. This serves to reduce decision-making time regarding the vehicle project. The head of each Baureihe reports directly to the CEO.168 167 Volkswagen, 2016b, p. 8 168 Volkswagen, 2016b
3 Analysis of current state
54
The tasks of the Baureihen in a vehicle project are:169 ensuring and realising the entrepreneurial objectives of the company
through a holistic, strategic view entrepreneurial controlling of vehicle projects over the entire life cycle coordinating the functional divisions continuously controlling the projects progress and interfering in the case
of deviations to the target creating the environment for efficient work by the divisions through clear
and consistent tasks. The tasks of the functional divisions in a vehicle project are:170
entrepreneurial responsibility for the ideal implementation of systems and functions
proposal of innovative economic concepts realising the defined targets through disciplinary and professional control
of the resources making the agreed activities transparent and pinpointing deviations supporting the projects through constructive solutions or compromises and
good communication This matrix organisation arranges a clear distribution of responsibility. The Baureihe provides the demand and the schedule—what and when—the divisions decide on the responsibility and execution—who and how. This project organisation provides the frame for vehicle project work at VW. The structure institutionalises a cross-functional team as an organisational unit. These units are committees or working teams which have a regular occurrence, a clearly defined objective and authority to make decisions. As shown in Figure 30 they are attended by a representative of each division. The committees and working teams meet at the headquarters. The interests of the production and thereby of the plant are represented by a production representative, who is either located in the headquarter or joins via video conference. The team member is chosen according to the organisational level of the committee.
169 Volkswagen, 2016b 170 Volkswagen, 2016b
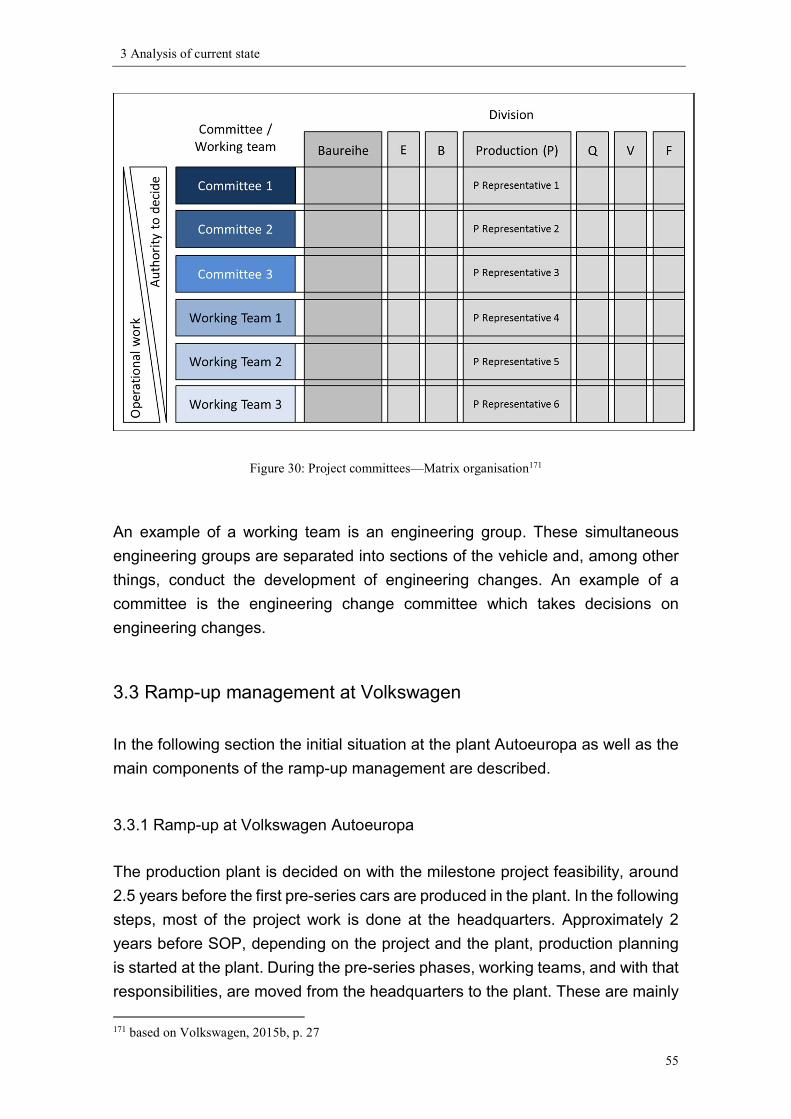
3 Analysis of current state
55
Figure 30: Project committees—Matrix organisation171
An example of a working team is an engineering group. These simultaneous engineering groups are separated into sections of the vehicle and, among other things, conduct the development of engineering changes. An example of a committee is the engineering change committee which takes decisions on engineering changes.
3.3 Ramp-up management at Volkswagen In the following section the initial situation at the plant Autoeuropa as well as the main components of the ramp-up management are described.
3.3.1 Ramp-up at Volkswagen Autoeuropa
The production plant is decided on with the milestone project feasibility, around 2.5 years before the first pre-series cars are produced in the plant. In the following steps, most of the project work is done at the headquarters. Approximately 2 years before SOP, depending on the project and the plant, production planning is started at the plant. During the pre-series phases, working teams, and with that responsibilities, are moved from the headquarters to the plant. These are mainly 171 based on Volkswagen, 2015b, p. 27
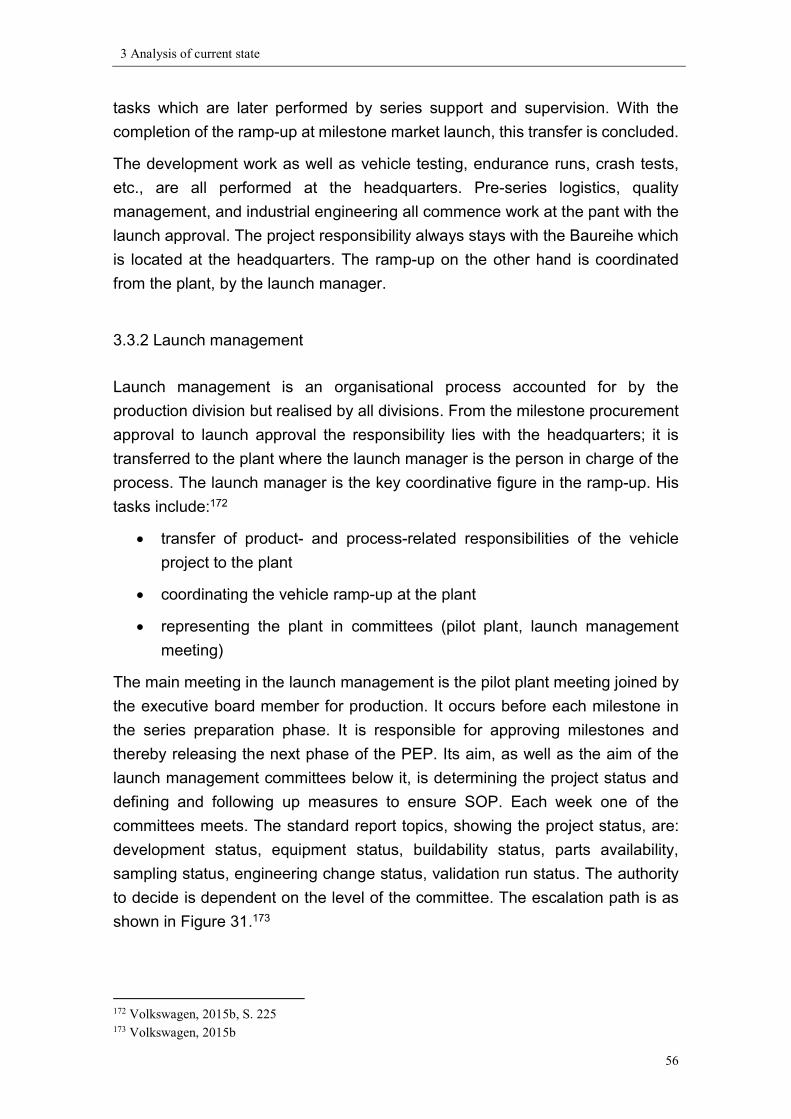
3 Analysis of current state
56
tasks which are later performed by series support and supervision. With the completion of the ramp-up at milestone market launch, this transfer is concluded. The development work as well as vehicle testing, endurance runs, crash tests, etc., are all performed at the headquarters. Pre-series logistics, quality management, and industrial engineering all commence work at the pant with the launch approval. The project responsibility always stays with the Baureihe which is located at the headquarters. The ramp-up on the other hand is coordinated from the plant, by the launch manager.
3.3.2 Launch management
Launch management is an organisational process accounted for by the production division but realised by all divisions. From the milestone procurement approval to launch approval the responsibility lies with the headquarters; it is transferred to the plant where the launch manager is the person in charge of the process. The launch manager is the key coordinative figure in the ramp-up. His tasks include:172
transfer of product- and process-related responsibilities of the vehicle project to the plant
coordinating the vehicle ramp-up at the plant representing the plant in committees (pilot plant, launch management
meeting) The main meeting in the launch management is the pilot plant meeting joined by the executive board member for production. It occurs before each milestone in the series preparation phase. It is responsible for approving milestones and thereby releasing the next phase of the PEP. Its aim, as well as the aim of the launch management committees below it, is determining the project status and defining and following up measures to ensure SOP. Each week one of the committees meets. The standard report topics, showing the project status, are: development status, equipment status, buildability status, parts availability, sampling status, engineering change status, validation run status. The authority to decide is dependent on the level of the committee. The escalation path is as shown in Figure 31.173
172 Volkswagen, 2015b, S. 225 173 Volkswagen, 2015b

3 Analysis of current state
57
Figure 31: Launch management process and committees174
3.3.3 Launch organisation
In the following the involved divisions and departments and their role in the ramp-up are described. The development department is located exclusively at the headquarters. It is responsible for the further development of the vehicle in the ramp-up phase. It develops the solutions for engineering changes, independent of the originator of the problem. The development division is the customer of approximately half of the pre-series vehicles which undergo extensive testing. Single parts and assemblies are also tested by them, for which they are responsible for issuing the build type approvals (BMG) (See section 3.3.5.1 General procedure). Development reports on the status of the BMGs and the status of engineering changes in the weekly launch management meeting. The purchasing division is located at the headquarters. It has a subsidy department, technical purchasing, in the plant. The headquarters purchasing is responsible for sourcing and commissioning suppliers. They negotiate prices and the timing of engineering changes with the suppliers. The technical purchasing acts as a local support for the purchasing which visits, controls and supports
174 Volkswagen, 2015b

3 Analysis of current state
58
suppliers. The technical purchasing is also responsible for communicating initial sampling dates. The quality management is located at the headquarters and at the plant. The headquarters division is responsible for testing the other half of the pre-series vehicles. The plant is responsible for the quality management of buy-parts (parts purchased from suppliers), auditing the vehicles and the final acceptance of the vehicles. The quality buy-parts area samples parts and issues their serial delivery release. After the initial sampling, they agree on the further improvement loops with the suppliers and on resampling dates. Part Notes and their planned issuing date are reported by quality buy-parts. Final acceptance inspects the vehicles after production and is the last inspection before vehicles can leave the plant. They decide whether or not a vehicle is delivered to the customer. The pre-series logistics of the logistics department is located at the plant. It provides the parts to the production line. They ensure that engineering changes which affect multiple parts are coordinated and that the correct maturity degree of a part is used. The detailed implementation timing of engineering changes and ensuring the correct version of a part is coordinated by them. In the weekly launch management meeting, they report on missing parts and the implementation status of engineering changes. The production in the plant is responsible for manufacturing the vehicles. This includes the reworking of vehicles. In the first and second pre-series, this is performed by the pilot plant. Starting with the zero series production takes over. They detect any buildability issues and equipment issues and originate engineering changes. The industrial engineering department is located at the plant and plans and improves the operators’ workflow. It is responsible for operator capacity planning within the entire plant. This also includes the rework capacity planning, for which they have the goal of a holistic approach to determine weekly required reworking for all phases of the ramp-up and the first months after SOP in all subareas of production. In the case of identified capacity deficits, this includes industrial engineering plan measures to increase these by overtime, extra shifts or extra manpower.
3.3.4 Engineering change management
As described in section 2.1.2, engineering changes are changes to already released parts. The changes referred to in this context are changes to parts after the milestone procurement approval but before market launch. For affected parts,

3 Analysis of current state
59
this means that suppliers are working on the tools or parts have already been produced with these tools. Changes can be initiated by everyone in the project. Initiation implies a problem description, a cause analysis and a solution idea. The process is supported by software in which a request is created. This request is reviewed by the engineering change management committee and if accepted proceeds. In the third step, the engineering groups develop a detailed technical solution and prepare the necessary information and documentation for evaluation. This includes the planned implementation date of the change. All functional divisions then evaluate the change regarding engineering, costs, expenditures, timing, quality, weight and influence on CO2 emissions. The change is either accepted or declined by the authorisation committee. This is led by the Baureihe. It assesses the necessity, expenditures and benefits of a change. If it is accepted, the changed part’s number is updated, indicating the new version and the bill of material released. The operational implementation starts with the commissioning of a supplier who implements the change. The tool is changed or a new tool created. Before the change is implemented in the production, the affected parts are sampled. (See Figure 32: Engineering change process)
Figure 32: Engineering change process175
Standard lead time from the creation of the request until the bill of material is released is 7 weeks. Lead time from commissioning to implementation is dependent on the extent of the change. It is negotiated with the implementing supplier.
3.3.5 New part process
In this subsection the process new parts undergo from creating the tools with which they are produced to the serial delivery release of a part as well as deviations to the standard process are described.
175 Volkswagen, 2016a
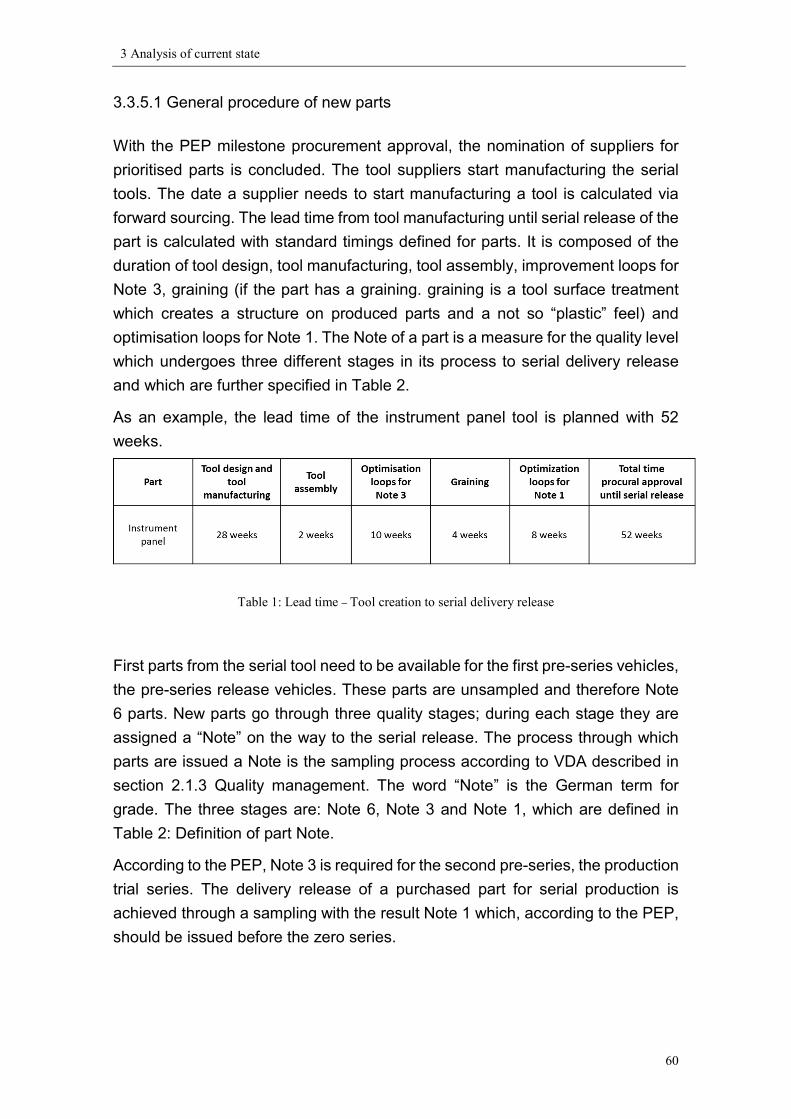
3 Analysis of current state
60
3.3.5.1 General procedure of new parts With the PEP milestone procurement approval, the nomination of suppliers for prioritised parts is concluded. The tool suppliers start manufacturing the serial tools. The date a supplier needs to start manufacturing a tool is calculated via forward sourcing. The lead time from tool manufacturing until serial release of the part is calculated with standard timings defined for parts. It is composed of the duration of tool design, tool manufacturing, tool assembly, improvement loops for Note 3, graining (if the part has a graining. graining is a tool surface treatment which creates a structure on produced parts and a not so “plastic” feel) and optimisation loops for Note 1. The Note of a part is a measure for the quality level which undergoes three different stages in its process to serial delivery release and which are further specified in Table 2. As an example, the lead time of the instrument panel tool is planned with 52 weeks.
Table 1: Lead time – Tool creation to serial delivery release
First parts from the serial tool need to be available for the first pre-series vehicles, the pre-series release vehicles. These parts are unsampled and therefore Note 6 parts. New parts go through three quality stages; during each stage they are assigned a “Note” on the way to the serial release. The process through which parts are issued a Note is the sampling process according to VDA described in section 2.1.3 Quality management. The word “Note” is the German term for grade. The three stages are: Note 6, Note 3 and Note 1, which are defined in Table 2: Definition of part Note. According to the PEP, Note 3 is required for the second pre-series, the production trial series. The delivery release of a purchased part for serial production is achieved through a sampling with the result Note 1 which, according to the PEP, should be issued before the zero series.
3 Analysis of current state
61
Table 2: Definition of part Note176
The sampled specifications (described in 2.1.3) are grouped into the three categories: dimension, laboratory, function. They are assessed independently by quality management and given an individual Note. The overall rating of the part, the Note, is the worst individual Note. In addition to sampling, some parts require a build type approval (BMG—“Baumustergenehmigung”) issued by development. The affected parts are individual parts or assemblies requiring special development or manufacturing know-how. Their properties and functional behaviour cannot be fully described in drawings or technical delivery terms. All relevant safety parts and parts requiring coordination with other parts require a BMG.
176 VDA, 2012, p. 25
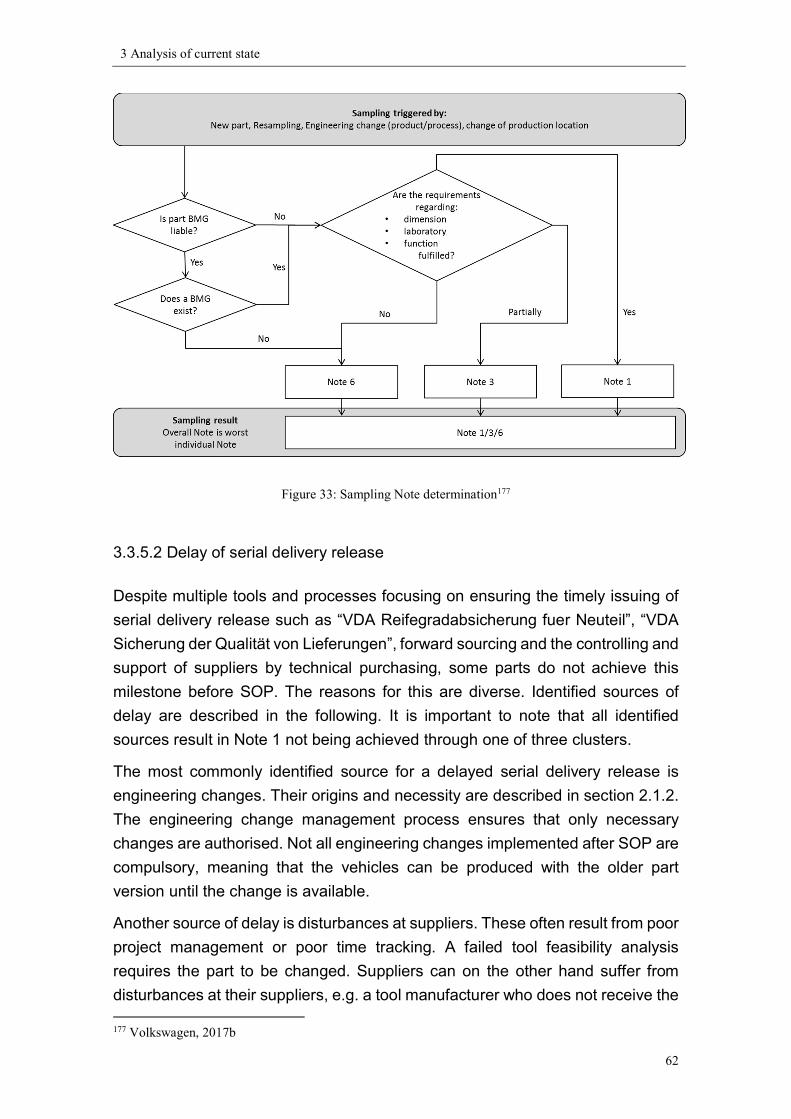
3 Analysis of current state
62
Figure 33: Sampling Note determination177
3.3.5.2 Delay of serial delivery release Despite multiple tools and processes focusing on ensuring the timely issuing of serial delivery release such as “VDA Reifegradabsicherung fuer Neuteil”, “VDA Sicherung der Qualität von Lieferungen”, forward sourcing and the controlling and support of suppliers by technical purchasing, some parts do not achieve this milestone before SOP. The reasons for this are diverse. Identified sources of delay are described in the following. It is important to note that all identified sources result in Note 1 not being achieved through one of three clusters. The most commonly identified source for a delayed serial delivery release is engineering changes. Their origins and necessity are described in section 2.1.2. The engineering change management process ensures that only necessary changes are authorised. Not all engineering changes implemented after SOP are compulsory, meaning that the vehicles can be produced with the older part version until the change is available. Another source of delay is disturbances at suppliers. These often result from poor project management or poor time tracking. A failed tool feasibility analysis requires the part to be changed. Suppliers can on the other hand suffer from disturbances at their suppliers, e.g. a tool manufacturer who does not receive the 177 Volkswagen, 2017b

3 Analysis of current state
63
steel block on time. Additionally, changing project volumes often cause capacity bottlenecks. A delay of early part milestones such as procurement approval due to unfinished development or the nomination of suppliers due to ongoing price negotiations cause delays which are difficult to recover from and often result in later milestones not being achieved. The result of all disturbances is that the part is not issued a Note 1 before SOP. Their consequence for production, independent of the cause of the delay is the same. Parts without a serial delivery release cannot be used in vehicles which go to the end customer, hence not in vehicles produced after SOP. A Note 1 after SOP can be categorised into one of the three following clusters which are also shown in Figure 34:
1) The requirements tested by development are not fulfilled before SOP resulting in no BMG being issued for the part.
2) The requirements tested by the quality department are not fulfilled before SOP resulting in the part having a Note 3 or Note 6 status and therefore not a Note 1.
3) The part is not yet available for sampling due to an engineering change which means it has a Note 6 as it is unsampled.
Figure 34: Cause of Note 1 issuing after SOP
3.3.5.3 Procedure if serial release is not achieved before SOP Under specific circumstances a part without serial delivery release can be used for serial production. This is achieved with an AWE— “Abweicherlaubnis” which translates to deviation permit. Parts with a Note 3 can be used in serial production for a limited period of time. They can be used for the ramp-up until Note 1 parts are available. Deviation permits are issued by the department testing the requirements which are not fulfilled. An AWE for a missing BMG is issued by development. This can be done if not all formalities are concluded or if a test is not completed but the risk of failure is low.
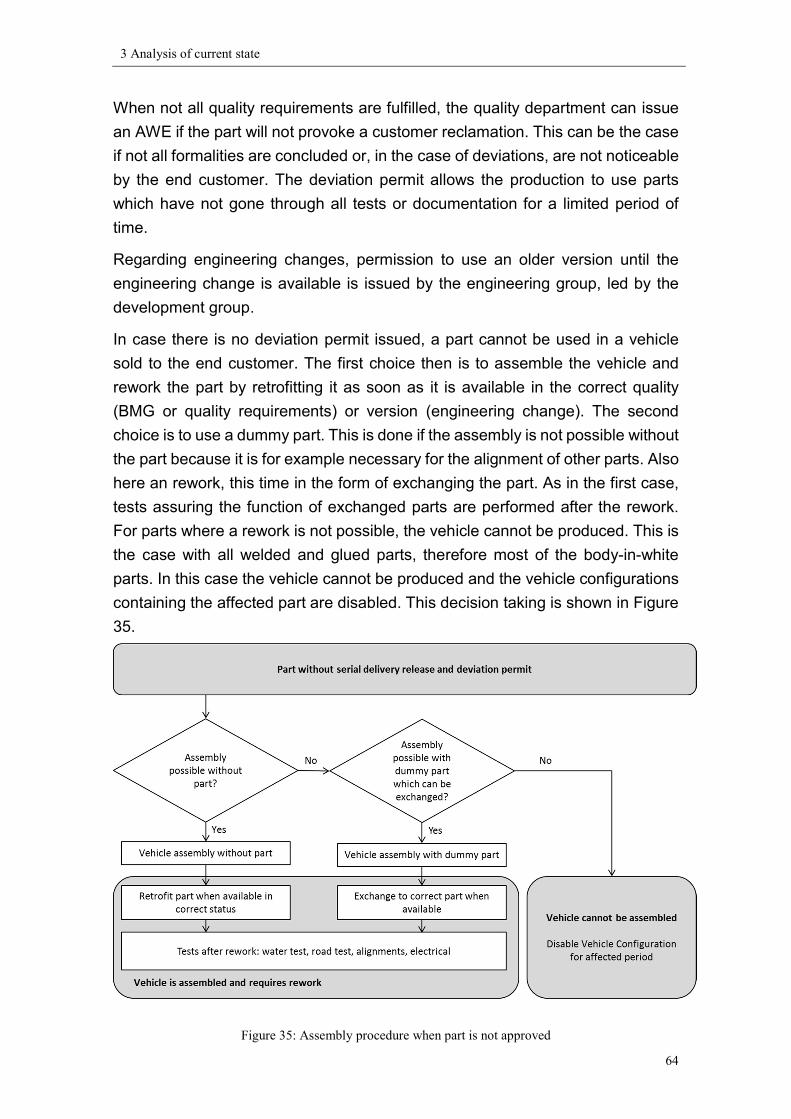
3 Analysis of current state
64
When not all quality requirements are fulfilled, the quality department can issue an AWE if the part will not provoke a customer reclamation. This can be the case if not all formalities are concluded or, in the case of deviations, are not noticeable by the end customer. The deviation permit allows the production to use parts which have not gone through all tests or documentation for a limited period of time. Regarding engineering changes, permission to use an older version until the engineering change is available is issued by the engineering group, led by the development group. In case there is no deviation permit issued, a part cannot be used in a vehicle sold to the end customer. The first choice then is to assemble the vehicle and rework the part by retrofitting it as soon as it is available in the correct quality (BMG or quality requirements) or version (engineering change). The second choice is to use a dummy part. This is done if the assembly is not possible without the part because it is for example necessary for the alignment of other parts. Also here an rework, this time in the form of exchanging the part. As in the first case, tests assuring the function of exchanged parts are performed after the rework. For parts where a rework is not possible, the vehicle cannot be produced. This is the case with all welded and glued parts, therefore most of the body-in-white parts. In this case the vehicle cannot be produced and the vehicle configurations containing the affected part are disabled. This decision taking is shown in Figure 35.
Figure 35: Assembly procedure when part is not approved
3 Analysis of current state
65
Rework is performed by production in the final assembly repair area. Industrial engineering and production assess the extent and undertake the necessary measures to perform the rework. Logistics provides the parts. Quality final acceptance decides what tests are necessary after this rework to verify the fulfilment of customer requirements.
3.3.6 Handling of deviations
In this section, the identification of delayed serial delivery releases and the current handling of these delays is described. The problem of the current procedure is demonstrated and the requirements for a new method are derived. Identifying, handling and reporting of delayed serial delivery releases is divided into the three clusters described in section 3.3.5.2.
1) BMG: All information regarding build type approvals is gathered by development and reported on at the launch meeting. This includes all parts with a scheduled BMG issuing after SOP. For these parts, a risk assessment is performed. The assessment criterion is end customer suitability. If this is provided, a deviation permit is issued which is also reported. BMG issuing dates affected by engineering changes are included in this report and assessment. A necessary rework is communicated to the launch manager who coordinates it.
2) Quality deviations: The most important role of detecting problems at an early phase is technical purchasing, as they control and supervise the suppliers in all phases from tool creation to Note 3. If timings of parts or milestones are delayed or the supplier has other problems, they assess whether the supplier will manage to recover the time or whether other measures like ordering a prototype or small series tool to ensure the ramp-up are necessary. They agree on initial sampling dates with suppliers and communicate these in the project. Quality management buy-parts reports an overview of sampling results of all parts in the weekly launch management meeting. Resampling dates are agreed upon between quality management and the supplier. These dates are not communicated within the project. In the case of Note 6 parts at SOP without AWE they inform the production on the rework and coordinate it. There is no specified process that this has to be done within a certain time in advance. Information could come at short notice.
3 Analysis of current state
66
Capacity deficits are detected by technical purchasing or by quality management through production capacity tests. These are introduced into the project in the launch management meeting.
3) Engineering changes: The development of technical solutions to engineering changes is performed by the engineering group, led by the development department. The purchasing responsible within the group negotiates the implementation timing with the supplier. All changes at this process step are assessed weekly by the launch management team. The information for this analysis is provided by logistics. Changes implemented after SOP are escalated to the launch management meeting where the engineering group reports to the procedure of vehicles produced without the changed part. If a rework is necessary, this is communicated to the involved departments by the launch manager.
3.3.7 Rework capacity planning
The total rework of a production area calculates as the sum of rework of the currently produced products plus the rework of the new, ramped-up product.
Equation 1: Total rework time
To calculate the rework of any product, current or new, a further parameter, the first run capability (FRC) is defined. FRC is the percentage of vehicles from one product which go through a rework area without requiring rework. As an example: If 1 in 4 VW Sharans require rework then the first run capability is 75%. The rework of a certain product is calculated by multiplying the vehicles which require rework (1-FRC) with the average rework time and the production volume of the week. In Equations 2 and 3 this calculation is shown for the current as well as the new product.
Equation 2: Rework of a current product
Equation 3: Rework of the new product
3 Analysis of current state
67
The FRC and average rework time for the current products have low fluctuations as long as the production process is stable. To determine the values of the new product, the target values of a stable process and the currents week’s values are taken. The values in between are calculated using the curve of a similar and recently ramped-up vehicle, the Tiguan. A rework provoked through parts without serial delivery release is not included in the forecast. As soon as a rework is confirmed and communicated to industrial engineering, the capacity analysis and planning starts.
3.4 Conclusion of current-state analysis and required action The departments involved in the ramp-up at the production plant and headquarters identify the delay of a part from its designated schedule through one of the following reasons: engineering change, quality requirement or BMG. The information is not gathered in a central instance. Some delays are reported in the weekly launch management meeting. There are no defined criteria for reporting nor escalation routes for delays. The assessment of when a part presents a threat to the successful achievement of the ramp-up goals is taken by each department instead of all departments merging their information and then assessing. Assessment is performed in the departments under different perspectives. This is considered to be inefficient and non-transparent and can cause problems ranging from being late or not at all. On the other hand, there is also no filter for gathered information. Standard reports of critical parts of the departments usually show long lists of parts without any evaluation of threat to the project. Decision-making and focus on critical parts is complicated by this lack of transparency. In the case of a confirmed rework, there is no defined procedure regarding when this has to be reported and planned. This can result in short-notice and last-minute troubleshooting, thus increasing costs. Derived from this analysis, the requirements for a new concept become clear. It has to gather all information regarding delayed serial delivery release of parts and asses their threat to the project in a clearly defined, understandable and reasonable manner. It has to support the ramp-up management with transparency, compiling the information from all sources and filtering the critical parts. Additionally, it has to provide information on rework affecting the rework capacity analysis. As detected in section 2.3, risk management is a proven tool

3 Analysis of current state
68
for handling disturbances in the ramp-up. In the following chapter, the developed operational risk management concept which aims to fulfil the requirements detected in this section is presented.
4 Concept for an operational risk management in automotive ramp-ups
69
4 Concept for an operational risk management in automotive ramp-ups
4.1 Objective The strategic ramp-up management focuses on the target times, costs and quality. The operational ramp-up management ensures the achievement of the strategic targets by allocating resources to defined objectives, activities and measures. Operational risk management acts as one component of the operational ramp-up management.178 A production ramp-up is characterised by a high number of influencing factors such as technologies, products, processes, production systems, personnel and supply chains.179 Among the factor supply chains are parts provided by suppliers, who themselves are performing a ramp-up. A delayed serial approval delivery release can have an influence on achieving the strategic goals. The operational risk management identifies deviations early in order to initiate preventive actions to assure the achievement of the strategic goals.180 It provides a new view on critical situations with the perspective of risk for the production and helps in identifying threats. By creating transparency, the risk management supports the ramp-up in focusing on the right points and in realising the ramp-up process. The risk management decreases losses and improves operational effectiveness and efficiency by implementing preventive actions.181 Due to engineering changes and insufficient quality or a missing build type approval some component parts do not achieve serial release status before SOP. In order to keep up the production of vehicles which are saleable to the final customer the part is retrofitted or exchanged as soon as it is available. This rework is the focal point of the concept. Rework activities which exceed the rework capacity require early detection and purposeful countermeasures. If these measures are not conducted, the ramp-up project misses its targets. The objective of the risk management is to identify all parts with late serial release which provokes rework, analysing whether this rework exceeds the rework capacity, and performing measures to prevent or conduct the rework. 178 Nagel, 2011, p. 139 179 Schuh et al., 2008, p. 3 180 Nagel, 2011, p. 139 181 ISO, 2009, p. v

4 Concept for an operational risk management in automotive ramp-ups
70
4.2 Concept overview For developing and implementing an operative risk management concept, the ISO 31000 Risk management—principles and guidelines standard is taken as a basis.182 It is adapted and tailored to fit the organisation and the needs of the project. The concept is composed of the elements risk management framework and risk management operationalisation hereinafter referred to as RM framework and RM operationalisation which further includes the risk management process and a Excel-based tool (RM tool) which supports the performing of this process (cf. Figure 36). The framework defines the integration of the risk management into the organisation and sets the conditions under which the implementation takes place. The operationalisation conducts the activities associated with risk management.
Figure 36: Risk management concept
182 ISO, 2009, p. 1

4 Concept for an operational risk management in automotive ramp-ups
71
4.3 Risk management framework
4.3.1 Mandate
The risk management aims to support the ramp-up management coordinated by the launch manager at the plant. It creates a component of a proactive ramp-up management, where it is therefore organisationally allocated. The mandate is the commission of the launch manager to develop and implement the risk management, which at first is given to the student and is later carried out by a member of the launch management team. The risk management bears the responsibility for developing and implementing such a tool, and defines the policy and scope. Regular consultation between those responsible for implementation and the launch manager assures that the concept fulfils the objective and supports the ramp-up.
4.3.2 Design of framework for managing risk 4.3.2.1 Scope To use a sensible amount of corporate resources and to be able to assign responsibilities for identifying risks is how the scope of the risk management is defined. The scope contains what kind of influencing factors should be considered as risk sources, with what perspective these are assessed and who bears the responsibility and authority for treating the risks. The following factors are taken into consideration as risk factors in the context of risk management:
all component parts provided by suppliers and used in the product which do not have a serial delivery release status
all engineering changes that influence component parts The risk management has the responsibility to identify, gather and track the development of all the above-mentioned risk factors because they can lead to rework. An assessment of these risk factors is made from a production point of view. The following questions form a guideline for the assessment:
Is it possible to produce vehicles?
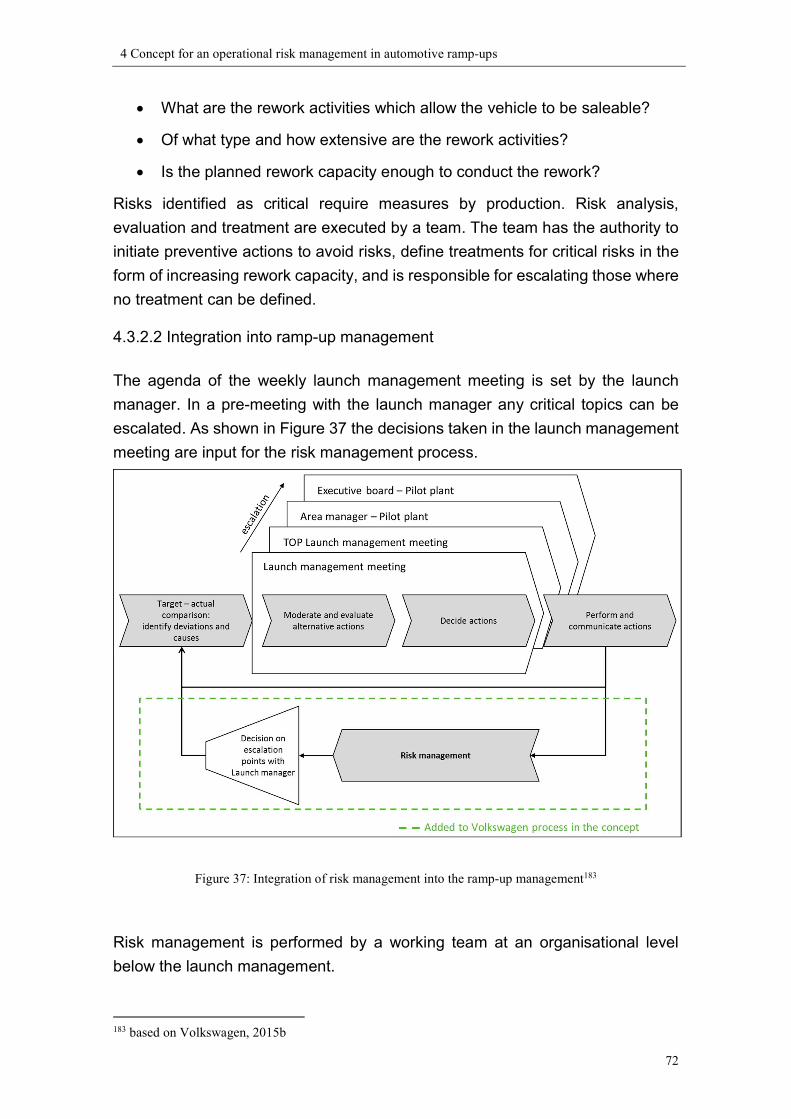
4 Concept for an operational risk management in automotive ramp-ups
72
What are the rework activities which allow the vehicle to be saleable? Of what type and how extensive are the rework activities? Is the planned rework capacity enough to conduct the rework?
Risks identified as critical require measures by production. Risk analysis, evaluation and treatment are executed by a team. The team has the authority to initiate preventive actions to avoid risks, define treatments for critical risks in the form of increasing rework capacity, and is responsible for escalating those where no treatment can be defined. 4.3.2.2 Integration into ramp-up management The agenda of the weekly launch management meeting is set by the launch manager. In a pre-meeting with the launch manager any critical topics can be escalated. As shown in Figure 37 the decisions taken in the launch management meeting are input for the risk management process.
Figure 37: Integration of risk management into the ramp-up management183
Risk management is performed by a working team at an organisational level below the launch management.
183 based on Volkswagen, 2015b

4 Concept for an operational risk management in automotive ramp-ups
73
4.3.2.3 Timing The risk management is implemented at the beginning of the first pre-series phase (pre-series approval vehicles). The pre-series production process deviates from the serial process. Before the pre-series vehicles are handed over to the customer, they are finished in the pilot plant. Series vehicles are finished in the production repair area. Due to the low quantity of pre-series vehicles, the total rework time is lower than in serial production. Rework capacity problems occur in the scale-up when the weekly production volume increases. Therefore, the concept focuses on the serial production. The risk management is part of the launch management and ends together with it, as well as with the engineering change management phase.
Figure 38: Risk management timing184
The reason for the implementation of three PEP milestones before SOP is that there is sufficient time for preventive actions to avoid risks. A risk management implemented just shortly before SOP is not effective in taking preventive measures as implementation time for this is short or non-existent. Early risk 184 based on Volkswagen 2012
4 Concept for an operational risk management in automotive ramp-ups
74
detection and therefore early implementation of the risk management are key for the method to achieve its target. In the first phase (1) of the risk management, the focus lies on preventive actions of parts with a scheduled delivery serial release after SOP, whereas in the phase shortly before SOP and after SOP (2), recovering time on the schedule of critical parts is not possible anymore (cf. Figure 38). Here, the focus lies on preparing the production for undisturbed performing of the actions to produce vehicles. 4.3.2.4 The risk management team Risk management should be conducted by a team composed of members from the following departments:
Launch management team Quality—buy-parts Quality—final acceptance Pre-series logistics Development Production—finish area Pilot plant Industrial engineering
This assures the representation of the affected department’s interest and allows for assigning tasks according to area of responsibility. 4.3.2.5 Communicating, reporting and tracking The framework and changes to it are communicated within the team to provide information on responsibilities. In order to provide a common status on risks and activities for all team members, the communication is performed by:
weekly team meetings (See 4.4.5) standard reports aligned with reporting within the organisation (See 4.4.6)
Risk management activities and evolution of risks are controlled with a tracking system. The system, the risk management tool, is realised as an Excel-based tool which gathers all relevant information required for analysing risks.

4 Concept for an operational risk management in automotive ramp-ups
75
4.3.3 Constant review and improvement of the concept
Regular reviews ensure that the concept is able to cope with changing objectives. Detected improvements are implemented into the framework and operationalisation. The concept which is described in this chapter differs from the initially created idea and contains implemented improvement loops. The improvements are enabled by the early implementation of the risk management. This allows all team members to understand their role and involvement. In the team meetings, the framework and model are reviewed, solutions for improvement generated and in the case that they are agreed upon, are implemented.
4.4 Risk management operationalization The task of the risk management is to initiate and implement a routine for identifying, assessing and deriving measures of risks in order to treat them and control these measures. This routine is described by the RM process. To perform the RM process steps, instructions are specified in the first step of the operationalisation “definition of context”. The second step, “risk identification”, is a continuous activity whereas steps three and four, “risk assessment” and “risk treatment”, take place in the weekly risk management meeting (cf. Figure 39).185,186
In the following these components of the RM operationalization are described: 1) Definition of context 2) Risk identification 3) Risk assessment 4) Risk treatment 5) The weekly RM meeting 6) Excel-based RM tool
185 ISO, 2009 186 Nagel, 2011, p. 141

4 Concept for an operational risk management in automotive ramp-ups
76
Figure 39: Risk management process
4.4.1 Definition of context
The first step of the RM operationalisation “definition of context” defines explicit rules for the RM process. The rules specify risk sources, define the methodology for risk assessment and illustrate the treatment options. Thus, responsibilities for tasks within the RM process can be assigned to the team members. The following factors are taken into consideration as risk sources, demanding to be identified by the risk management. All parts with:
Note 1 scheduled after the due date for supplying parts for SOP Build type approval (BMG) scheduled after the due date for supplying parts
for SOP All engineering changes with change of part or introduction of a new part and with:
Implementation after production trial series and relevance for testing, approval and homologation
Introduction after zero series All identified risk sources are assessed by the team. The assessment consists of the risk analysis and risk evaluation.

4 Concept for an operational risk management in automotive ramp-ups
77
Parts are analysed by identifying their scheduled serial delivery release date and when the released part is available. The reasons why a serial delivery release is not achieved are investigated. It is defined whether the parts can be used for serial production. Next it is determined whether the vehicles produced until the availability of the serial released part need to be reworked in order to be sold to the end customer. Important for the analysis of engineering changes is the implementation date of the new or changed parts. Also, it needs to be determined here whether the vehicles produced until the availability of the serial delivery released part need to be reworked in order to be sold to the end customer. In order to provide the necessary information for the risk evaluation, the risk analysis determines:
the time frame in which the risk is present when serial released parts are available if the risk source provokes rework a rework procedure and its duration the number of affected vehicles the total rework times
The risk evaluation classifies the analysed parts into predetermined categories. The categorisation helps to visualise and prioritise risks which require treatment. The categories get defined as critical, very critical and non-critical parts.
Table 3: Risk assessment categories

4 Concept for an operational risk management in automotive ramp-ups
78
Parts assessed as critical or very critical require a rework of the vehicle. Otherwise, the vehicle is not saleable to the end customer. The differentiation between critical and very critical parts is made by number of affected vehicles and total rework time. The limiting values for total rework time (1000 hours) and number of affected vehicles (500) are agreed as sensible by the team after considering production volume, rework capacity and parking places at the plant. These values do not influence the decision regarding treatment but serve as support for prioritisation. Parts which cannot be reworked are job stoppers and always categorised as very critical parts. Parts assessed as non-critical allow for a production without rework and for the vehicle equipped with this part to be sold to final customer. This is the case with a deviation permit, which is given when the concerned parts are capable of being sold to the final customer. Before a risk treatment is defined, an analysis of the rework capacity is performed. The goal of the capacity analysis is to determine whether the currently planned rework capacity is enough to perform the rework. (See Table 3: Risk assessment categories) Retrofitting and the exchanging of parts are performed in the assembly repair area. The capacity of the repair area is planned by industrial engineering. It is calculated by multiplying the number of collaborators with the working hours per week (See section 3.3.7) The rework generated by a critical part is (1) summed up over the affected period until the serial release part is available, which is when the rework can be performed (2). This RM rework is added to the forecasted rework to determine the total rework in the assembly repair area (3) and is compared to the capacity (4) (cf. Figure 40). Figure 40 visualises this capacity analysis for one part. In the concept, this calculation is done for each part.
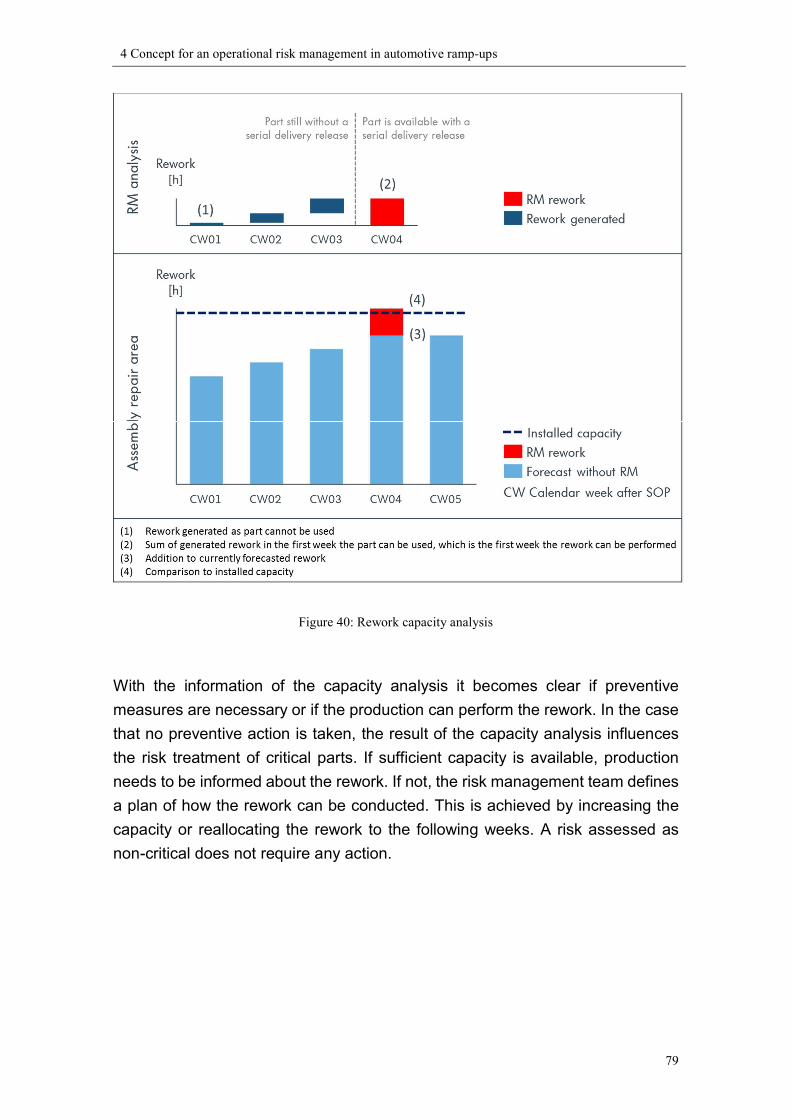
4 Concept for an operational risk management in automotive ramp-ups
79
Figure 40: Rework capacity analysis
With the information of the capacity analysis it becomes clear if preventive measures are necessary or if the production can perform the rework. In the case that no preventive action is taken, the result of the capacity analysis influences the risk treatment of critical parts. If sufficient capacity is available, production needs to be informed about the rework. If not, the risk management team defines a plan of how the rework can be conducted. This is achieved by increasing the capacity or reallocating the rework to the following weeks. A risk assessed as non-critical does not require any action.

4 Concept for an operational risk management in automotive ramp-ups
80
Figure 41: Relationship between risk assessment and risk treatment
4.4.2 Risk identification
The responsibility for risk identification lies with the team. This includes identifying all parts according to the three clusters: engineering changes, quality requirements and build type approval. The scheduled date for a part fulfilling its quality requirements is provided by quality management buy-parts and reported to the risk management through the standard weekly report created by them. The same also applies to build type approvals reported by development. All engineering changes are tracked by the pre-series logistics. This includes their implementation date. Again, the information is provided and extracted from the standard weekly engineering change report. Additionally, deviation permits for critical parts are identified by the area responsible and the content of these is examined to ensure their validity. Due to the high dynamic of scheduled dates for parts within a ramp-up project, these dates need to be followed up permanently. The responsibility for structuring the gathered information lies with those responsible for the risk management

4 Concept for an operational risk management in automotive ramp-ups
81
within the launch management. This structuring of all relevant information is important to perform the next process step and is achieved with a RM tool specially created for the risk management of parts in a ramp-up project, described in section 4.4.6 Excel-based risk management tool in the Table 5: Requirements – Risk management tool.
4.4.3 Risk assessment
During the identification of risks the information on the timing of the serial delivery release of parts has been gathered. The assessment’s goal is to determine the effect on the production if these timings eventuate, and the possible effect of the risk on the objective of the project, or in other words, what happens if no preventive measures are taken. This determines the way a risk is handled in the risk treatment. For this, a possible rework procedure is defined. Until the zero series, the pilot plant, and after that the production, is responsible for providing this information to the weekly team meeting. Affected vehicles, so vehicles produced with this part until the serial released part is available, are determined by the RM tool and the production volumes and vehicle configurations provided by logistics. The information for the rework capacity analysis, forecasted rework and installed rework capacity are provided by industrial engineering and are also inserted into the RM tool. The risk assessment of all risks is performed on a weekly basis in the risk management meeting by the entire team. Each area provides the necessary information, which is inserted into the RM tool, which then performs the calculations on total rework times, affected vehicles and required capacity for the rework. Resulting from that, the team categorises each part into the predefined criteria. Changing schedules on parts can result in a different assessment result and therefore how a risk is handled. This weekly assessment provides the team as well as the launch management with a development of risks.
4.4.4 Risk treatment
As described in section 4.4.1, the risk treatment splits into two approaches: preventing the risk from occurring or performing rework by retrofitting or exchanging parts. Risks assessed as critical and very critical are discussed in the decision on escalation points meeting with the launch manager in the week they are identified. If agreed on, they are escalated to the launch management
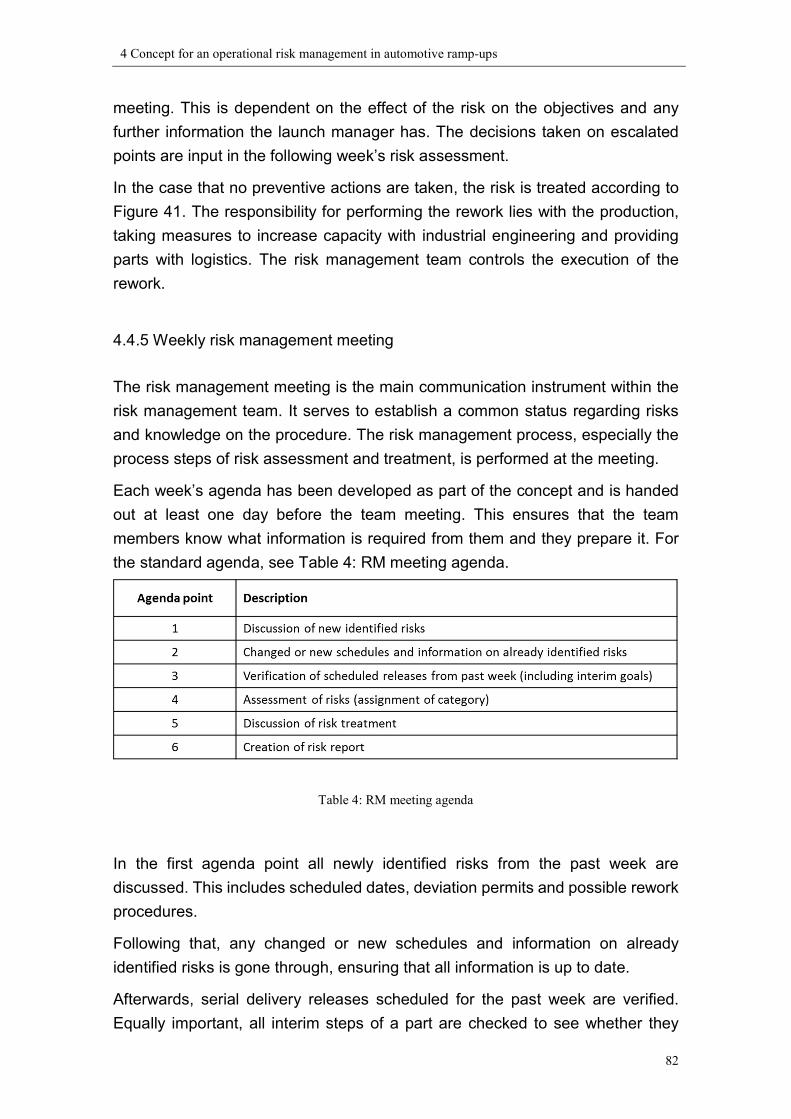
4 Concept for an operational risk management in automotive ramp-ups
82
meeting. This is dependent on the effect of the risk on the objectives and any further information the launch manager has. The decisions taken on escalated points are input in the following week’s risk assessment. In the case that no preventive actions are taken, the risk is treated according to Figure 41. The responsibility for performing the rework lies with the production, taking measures to increase capacity with industrial engineering and providing parts with logistics. The risk management team controls the execution of the rework.
4.4.5 Weekly risk management meeting
The risk management meeting is the main communication instrument within the risk management team. It serves to establish a common status regarding risks and knowledge on the procedure. The risk management process, especially the process steps of risk assessment and treatment, is performed at the meeting. Each week’s agenda has been developed as part of the concept and is handed out at least one day before the team meeting. This ensures that the team members know what information is required from them and they prepare it. For the standard agenda, see Table 4: RM meeting agenda.
Table 4: RM meeting agenda
In the first agenda point all newly identified risks from the past week are discussed. This includes scheduled dates, deviation permits and possible rework procedures. Following that, any changed or new schedules and information on already identified risks is gone through, ensuring that all information is up to date. Afterwards, serial delivery releases scheduled for the past week are verified. Equally important, all interim steps of a part are checked to see whether they
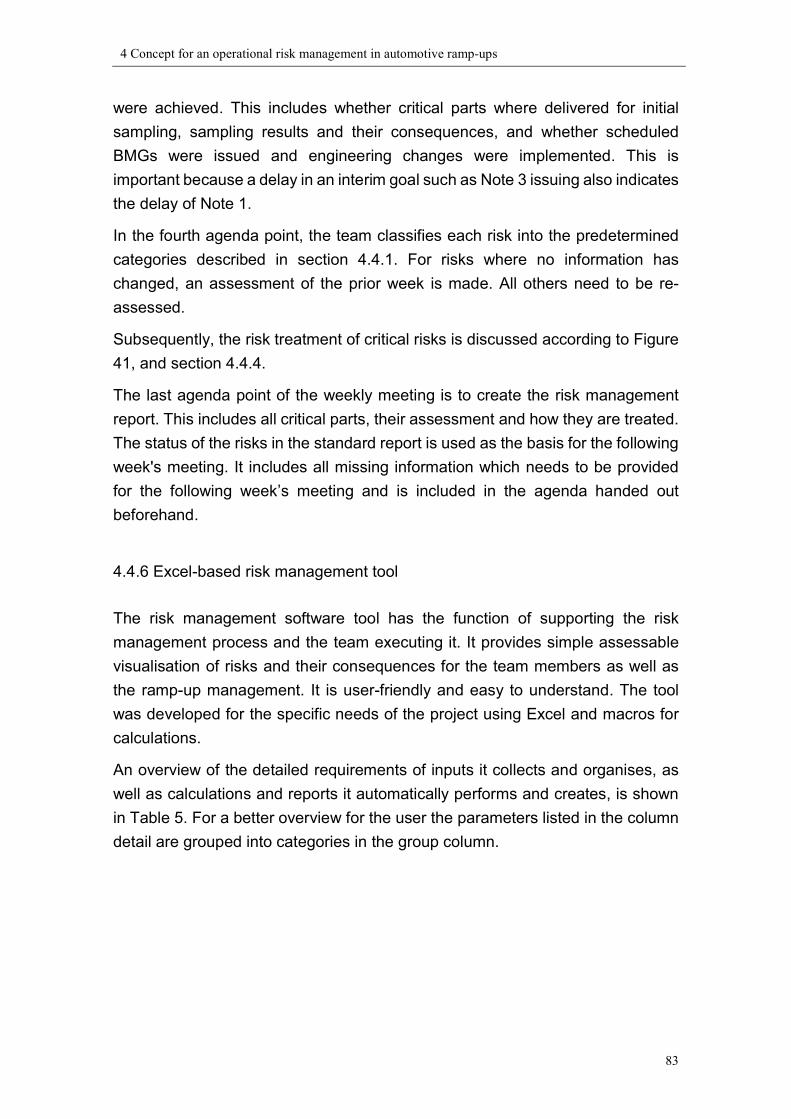
4 Concept for an operational risk management in automotive ramp-ups
83
were achieved. This includes whether critical parts where delivered for initial sampling, sampling results and their consequences, and whether scheduled BMGs were issued and engineering changes were implemented. This is important because a delay in an interim goal such as Note 3 issuing also indicates the delay of Note 1. In the fourth agenda point, the team classifies each risk into the predetermined categories described in section 4.4.1. For risks where no information has changed, an assessment of the prior week is made. All others need to be re-assessed. Subsequently, the risk treatment of critical risks is discussed according to Figure 41, and section 4.4.4. The last agenda point of the weekly meeting is to create the risk management report. This includes all critical parts, their assessment and how they are treated. The status of the risks in the standard report is used as the basis for the following week's meeting. It includes all missing information which needs to be provided for the following week’s meeting and is included in the agenda handed out beforehand.
4.4.6 Excel-based risk management tool
The risk management software tool has the function of supporting the risk management process and the team executing it. It provides simple assessable visualisation of risks and their consequences for the team members as well as the ramp-up management. It is user-friendly and easy to understand. The tool was developed for the specific needs of the project using Excel and macros for calculations. An overview of the detailed requirements of inputs it collects and organises, as well as calculations and reports it automatically performs and creates, is shown in Table 5. For a better overview for the user the parameters listed in the column detail are grouped into categories in the group column.
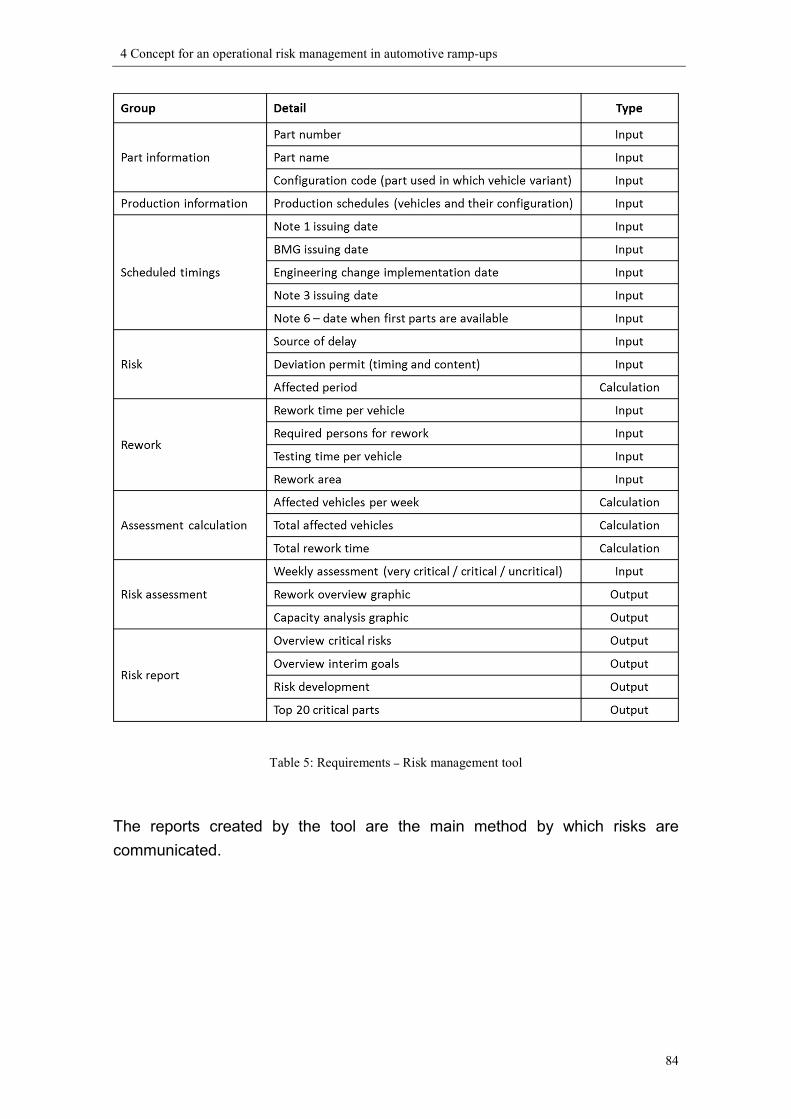
4 Concept for an operational risk management in automotive ramp-ups
84
Table 5: Requirements – Risk management tool
The reports created by the tool are the main method by which risks are communicated.
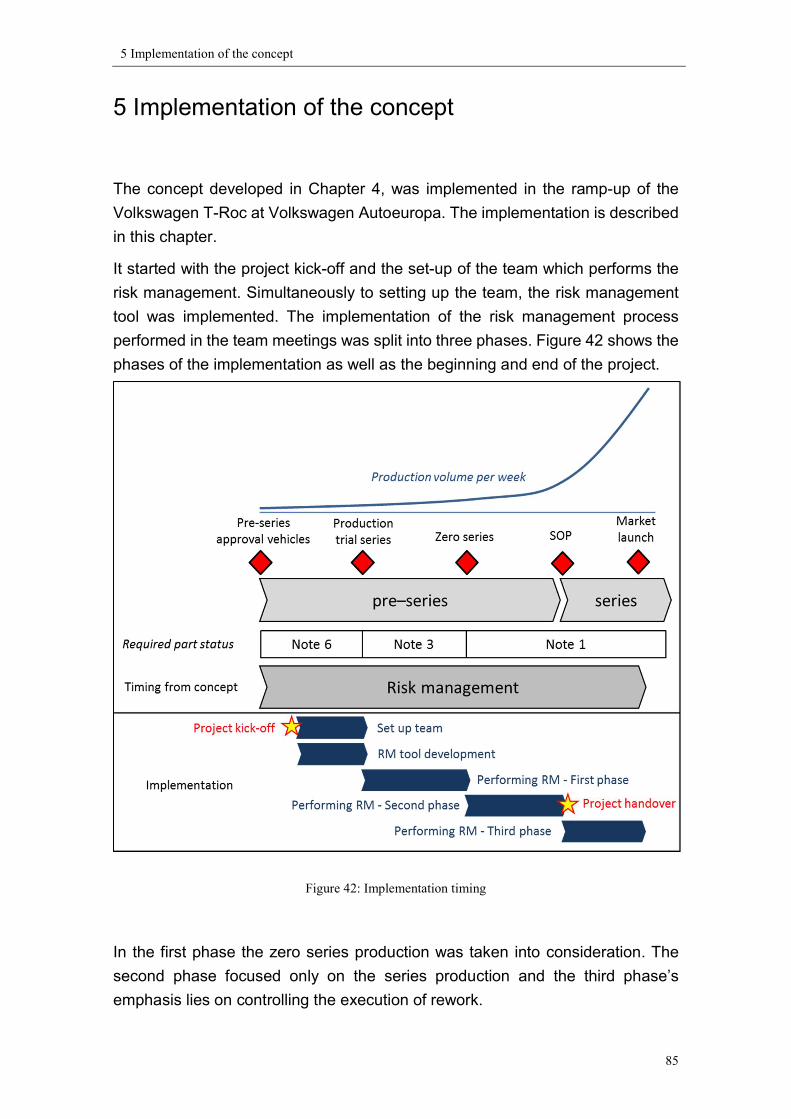
5 Implementation of the concept
85
5 Implementation of the concept
The concept developed in Chapter 4, was implemented in the ramp-up of the Volkswagen T-Roc at Volkswagen Autoeuropa. The implementation is described in this chapter. It started with the project kick-off and the set-up of the team which performs the risk management. Simultaneously to setting up the team, the risk management tool was implemented. The implementation of the risk management process performed in the team meetings was split into three phases. Figure 42 shows the phases of the implementation as well as the beginning and end of the project.
Figure 42: Implementation timing
In the first phase the zero series production was taken into consideration. The second phase focused only on the series production and the third phase’s emphasis lies on controlling the execution of rework.
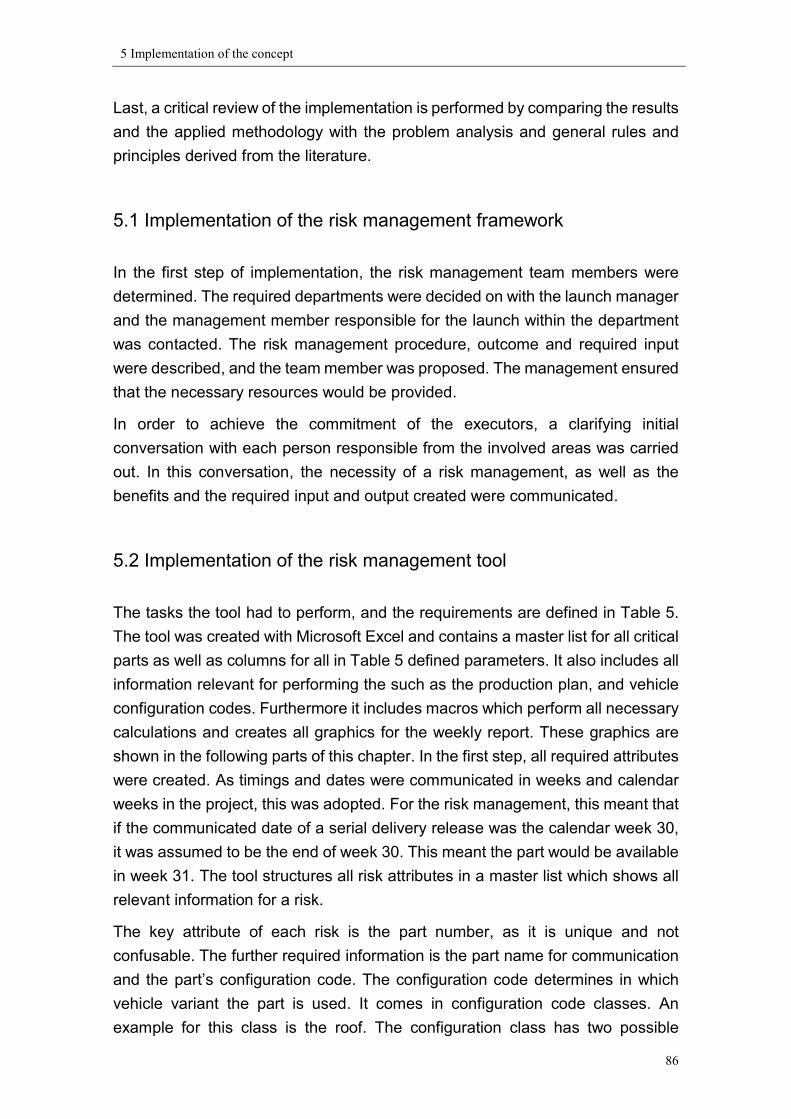
5 Implementation of the concept
86
Last, a critical review of the implementation is performed by comparing the results and the applied methodology with the problem analysis and general rules and principles derived from the literature.
5.1 Implementation of the risk management framework In the first step of implementation, the risk management team members were determined. The required departments were decided on with the launch manager and the management member responsible for the launch within the department was contacted. The risk management procedure, outcome and required input were described, and the team member was proposed. The management ensured that the necessary resources would be provided. In order to achieve the commitment of the executors, a clarifying initial conversation with each person responsible from the involved areas was carried out. In this conversation, the necessity of a risk management, as well as the benefits and the required input and output created were communicated.
5.2 Implementation of the risk management tool The tasks the tool had to perform, and the requirements are defined in Table 5. The tool was created with Microsoft Excel and contains a master list for all critical parts as well as columns for all in Table 5 defined parameters. It also includes all information relevant for performing the such as the production plan, and vehicle configuration codes. Furthermore it includes macros which perform all necessary calculations and creates all graphics for the weekly report. These graphics are shown in the following parts of this chapter. In the first step, all required attributes were created. As timings and dates were communicated in weeks and calendar weeks in the project, this was adopted. For the risk management, this meant that if the communicated date of a serial delivery release was the calendar week 30, it was assumed to be the end of week 30. This meant the part would be available in week 31. The tool structures all risk attributes in a master list which shows all relevant information for a risk. The key attribute of each risk is the part number, as it is unique and not confusable. The further required information is the part name for communication and the part’s configuration code. The configuration code determines in which vehicle variant the part is used. It comes in configuration code classes. An example for this class is the roof. The configuration class has two possible
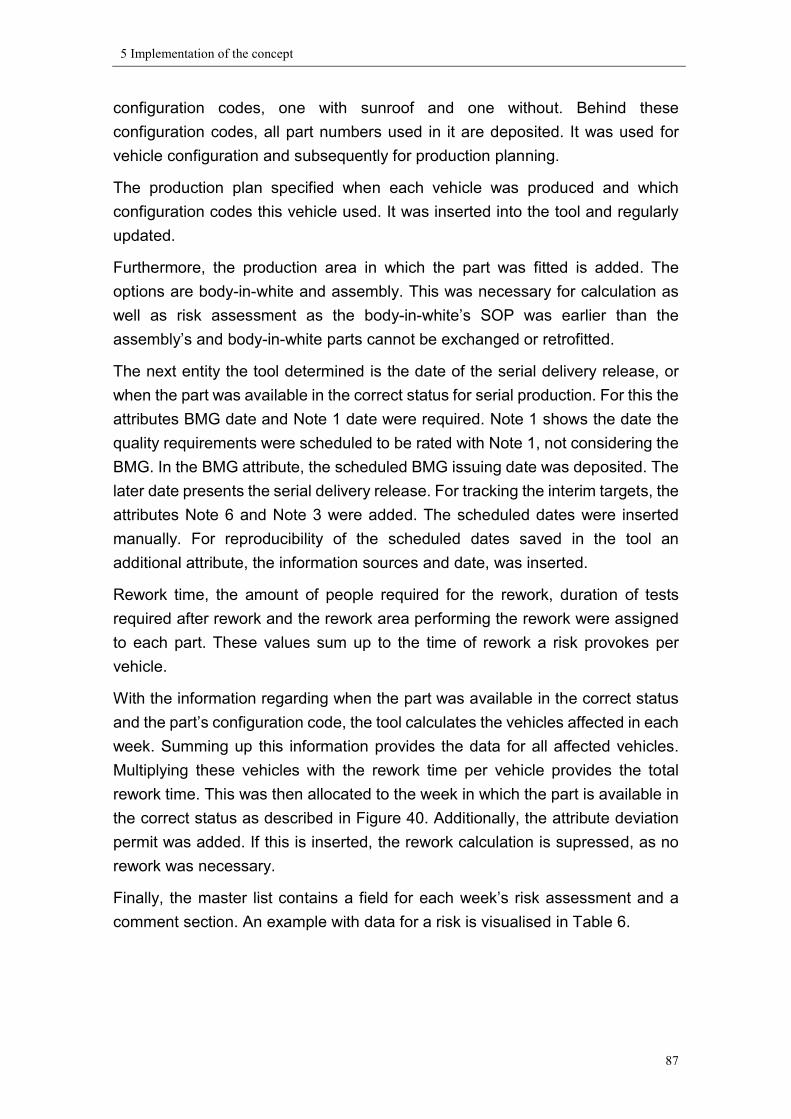
5 Implementation of the concept
87
configuration codes, one with sunroof and one without. Behind these configuration codes, all part numbers used in it are deposited. It was used for vehicle configuration and subsequently for production planning. The production plan specified when each vehicle was produced and which configuration codes this vehicle used. It was inserted into the tool and regularly updated. Furthermore, the production area in which the part was fitted is added. The options are body-in-white and assembly. This was necessary for calculation as well as risk assessment as the body-in-white’s SOP was earlier than the assembly’s and body-in-white parts cannot be exchanged or retrofitted. The next entity the tool determined is the date of the serial delivery release, or when the part was available in the correct status for serial production. For this the attributes BMG date and Note 1 date were required. Note 1 shows the date the quality requirements were scheduled to be rated with Note 1, not considering the BMG. In the BMG attribute, the scheduled BMG issuing date was deposited. The later date presents the serial delivery release. For tracking the interim targets, the attributes Note 6 and Note 3 were added. The scheduled dates were inserted manually. For reproducibility of the scheduled dates saved in the tool an additional attribute, the information sources and date, was inserted. Rework time, the amount of people required for the rework, duration of tests required after rework and the rework area performing the rework were assigned to each part. These values sum up to the time of rework a risk provokes per vehicle. With the information regarding when the part was available in the correct status and the part’s configuration code, the tool calculates the vehicles affected in each week. Summing up this information provides the data for all affected vehicles. Multiplying these vehicles with the rework time per vehicle provides the total rework time. This was then allocated to the week in which the part is available in the correct status as described in Figure 40. Additionally, the attribute deviation permit was added. If this is inserted, the rework calculation is supressed, as no rework was necessary. Finally, the master list contains a field for each week’s risk assessment and a comment section. An example with data for a risk is visualised in Table 6.

5 Implementation of the concept
88
Table 6: RM tool – example of input and calculated parameters
This example is dated to calendar week 4. The information concerning the risk is inserted and the tool calculates a risk of rework of 70 vehicles and 75.8 hours. According to the risk assessment criteria described in Table 3, the risk is evaluated as critical in calendar week four.
Attribute DataManual input Part number 1001Manual input Part name Interior panel 1Manual input Origin of delay Engineering change due to malfunction of assembly clipManual input Configuration code ALL vehiclesManual input Point of fit AssemblyManual input Deviation permit NoManual input Note 6 [CW] 3Manual input Note 3 [CW] 11Manual input BMG [CW] 13Manual input Note 1 [CW] 16Manual input Information source Logistics report CW4Manual input Date of information source 27.01.Manual input Rework time per vehicle [minutes] 45Manual input Testing time after rework [minutes] 20Manual input Required manpower for rework 1Manual input Rework area Assembly final repair
Calculated by the tool SOP [CW] 13Calculated by the tool Risk of Rework until week 16Calculated by the tool Risk-affected period [weeks] 4Calculated by the tool Total amount of affected vehicles 70Calculated by the tool Total rework time [hours] 75,8
CommentManual weekly assessment CW4 critical
CW5CW6

5 Implementation of the concept
89
Every newly identified part and the necessary information from a risk perspective were added. An Excel macro was added to determine the top 20 critical parts, visualised in a graphic and forming part of the standard weekly report. An example for this is shown in Figure 43.
Figure 43: Example of top 20 critical parts
The tracking of the interim goals, whether a part was delivered for sampling and whether the intended result was achieved, was performed via the tracking list. Figure 44, shows this with an example. Here, the part is available in Note 6 status from calendar week 2 onwards. In week eight, it is delivered for sampling of Note 3 which is achieved. In week eleven, it should have been issued a BMG which is not achieved. Additionally, the samples for Note 1 are due in week 14.
5 Implementation of the concept
90
Figure 44: Interim goal-tracking example
All further reports, visualisations and capacity analyses shown in the following sections are then automatically created by the tool through calculations and macros.
5.3 Implementation of the risk management process The three phases of the risk management implementation allocate to the phases of the Volkswagen PEP as shown in Figure 45.
Figure 45: Implementation phases overview
Interim goal-tracking example in calender week 12 (CW) team meeting
Part number Note 6 [CW]
Note 3 [CW]
BMG [CW]
Note 1 [CW]
1002 2 8 11 14
Legend:XX Part was delivered for sampling in week XXXX Part was not delivered for sampling in the scheduled week XXXX Sampling scheduled for week XX
Note 6/3/1 or BMG is issuedNote 6/3/1 or BMG is not issued
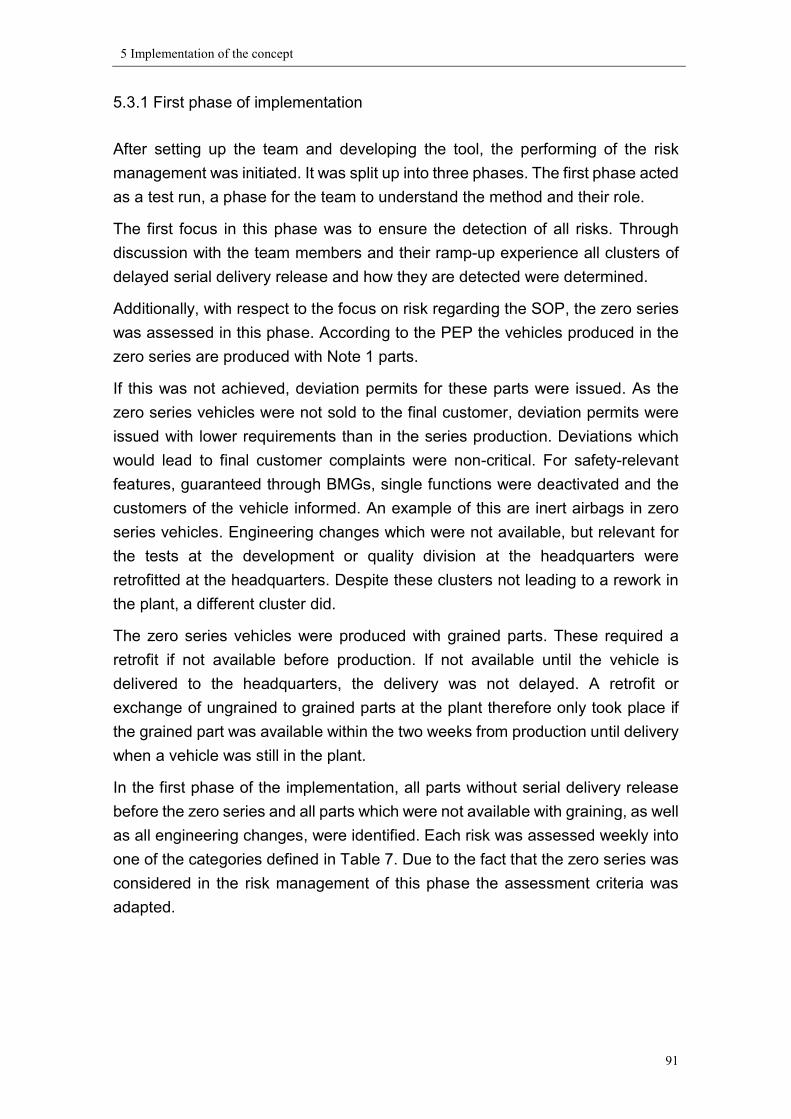
5 Implementation of the concept
91
5.3.1 First phase of implementation
After setting up the team and developing the tool, the performing of the risk management was initiated. It was split up into three phases. The first phase acted as a test run, a phase for the team to understand the method and their role. The first focus in this phase was to ensure the detection of all risks. Through discussion with the team members and their ramp-up experience all clusters of delayed serial delivery release and how they are detected were determined. Additionally, with respect to the focus on risk regarding the SOP, the zero series was assessed in this phase. According to the PEP the vehicles produced in the zero series are produced with Note 1 parts. If this was not achieved, deviation permits for these parts were issued. As the zero series vehicles were not sold to the final customer, deviation permits were issued with lower requirements than in the series production. Deviations which would lead to final customer complaints were non-critical. For safety-relevant features, guaranteed through BMGs, single functions were deactivated and the customers of the vehicle informed. An example of this are inert airbags in zero series vehicles. Engineering changes which were not available, but relevant for the tests at the development or quality division at the headquarters were retrofitted at the headquarters. Despite these clusters not leading to a rework in the plant, a different cluster did. The zero series vehicles were produced with grained parts. These required a retrofit if not available before production. If not available until the vehicle is delivered to the headquarters, the delivery was not delayed. A retrofit or exchange of ungrained to grained parts at the plant therefore only took place if the grained part was available within the two weeks from production until delivery when a vehicle was still in the plant. In the first phase of the implementation, all parts without serial delivery release before the zero series and all parts which were not available with graining, as well as all engineering changes, were identified. Each risk was assessed weekly into one of the categories defined in Table 7. Due to the fact that the zero series was considered in the risk management of this phase the assessment criteria was adapted.

5 Implementation of the concept
92
Table 7: Risk assessment criteria – phase 1
As the quantity of produced vehicles in the zero series was low, no rework capacity analysis for the first phase was performed. An overview of the identified risks and their weekly assessment in the first implementation phase is provided in Figure 46. The last week displayed, week “SOP minus 9 weeks” is the first week of zero series production.
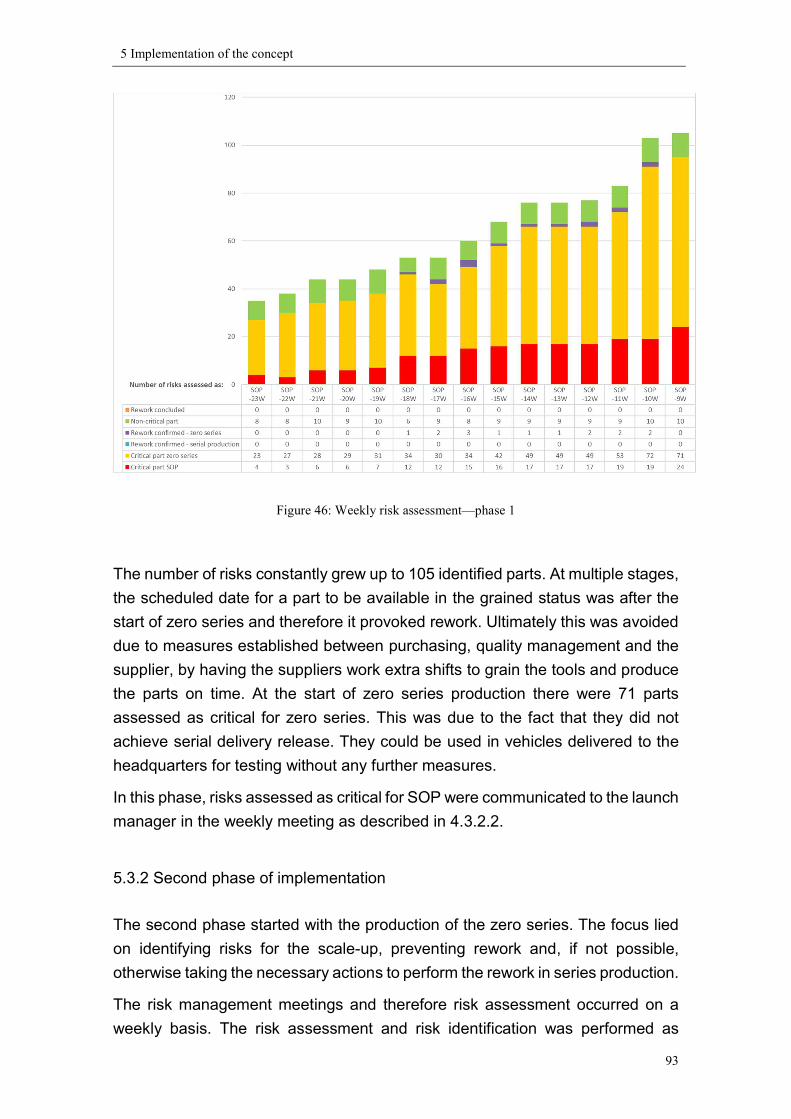
5 Implementation of the concept
93
Figure 46: Weekly risk assessment—phase 1
The number of risks constantly grew up to 105 identified parts. At multiple stages, the scheduled date for a part to be available in the grained status was after the start of zero series and therefore it provoked rework. Ultimately this was avoided due to measures established between purchasing, quality management and the supplier, by having the suppliers work extra shifts to grain the tools and produce the parts on time. At the start of zero series production there were 71 parts assessed as critical for zero series. This was due to the fact that they did not achieve serial delivery release. They could be used in vehicles delivered to the headquarters for testing without any further measures. In this phase, risks assessed as critical for SOP were communicated to the launch manager in the weekly meeting as described in 4.3.2.2.
5.3.2 Second phase of implementation
The second phase started with the production of the zero series. The focus lied on identifying risks for the scale-up, preventing rework and, if not possible, otherwise taking the necessary actions to perform the rework in series production. The risk management meetings and therefore risk assessment occurred on a weekly basis. The risk assessment and risk identification was performed as
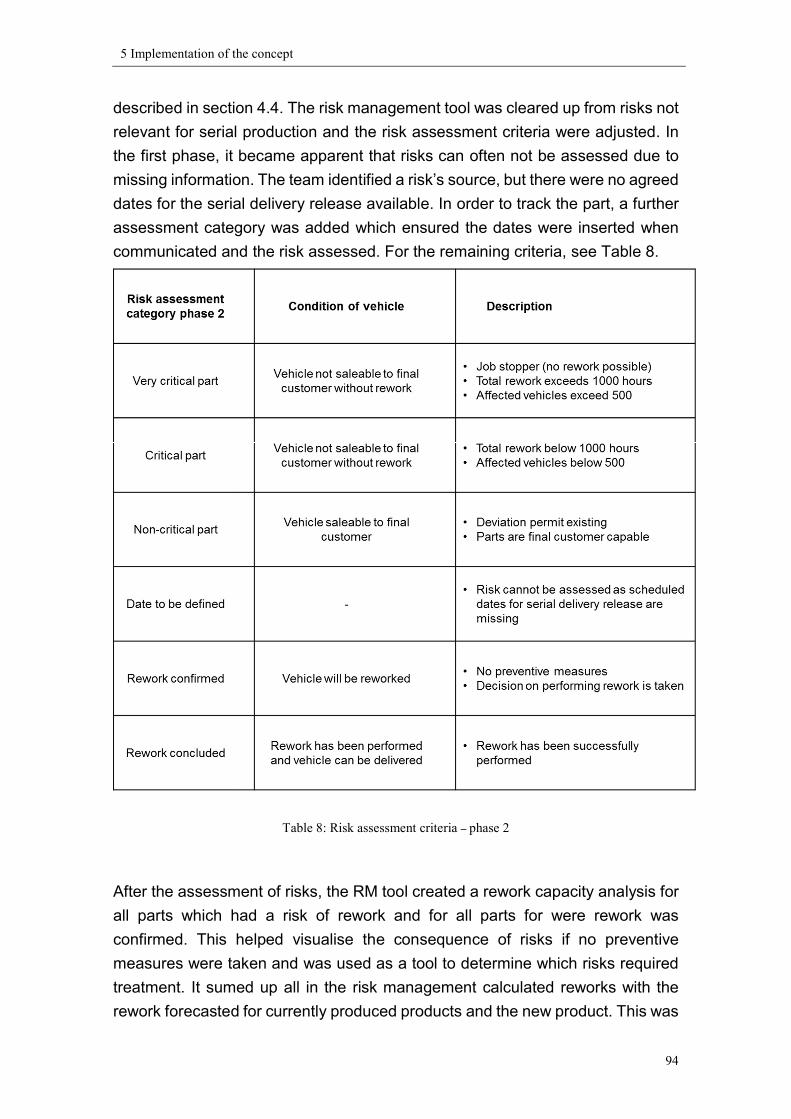
5 Implementation of the concept
94
described in section 4.4. The risk management tool was cleared up from risks not relevant for serial production and the risk assessment criteria were adjusted. In the first phase, it became apparent that risks can often not be assessed due to missing information. The team identified a risk’s source, but there were no agreed dates for the serial delivery release available. In order to track the part, a further assessment category was added which ensured the dates were inserted when communicated and the risk assessed. For the remaining criteria, see Table 8.
Table 8: Risk assessment criteria – phase 2
After the assessment of risks, the RM tool created a rework capacity analysis for all parts which had a risk of rework and for all parts for were rework was confirmed. This helped visualise the consequence of risks if no preventive measures were taken and was used as a tool to determine which risks required treatment. It sumed up all in the risk management calculated reworks with the rework forecasted for currently produced products and the new product. This was

5 Implementation of the concept
95
compared with the installed capacity in the assembly repair area. It then calculated how much additional manpower would be necessary to perform the rework and shows the capacity with the extra manpower. The capacity forecast from five weeks before SOP for the week of the SOP and the 21 following weeks is shown in Figure 47.
Figure 47: Rework capacity analysis—5 weeks before SOP
A decrease and increase in the installed capacity is provoked by production changing from 1.5 shifts to one shift, back to 1.5 shifts. In week 13 after SOP, production is increased from 1.5 to 2 shifts. In week 19 after SOP, a third shift is introduced. The installed capacity for the ramp-up was higher than in series production and already provided extra manpower. The analysis shows a capacity deficit in the weeks 3–6, 8–10 and week 18 after SOP. A further graph breaks down the rework to the parts provoking them. An example of this breakdown is shown for the rework status 2 weeks before SOP, see Figure 50. The very critical risks and those provoking a capacity deficit were reported to the launch manager each week and documented with the reports created. A decision on risks requiring preventive actions and an escalation to the launch management meeting, where these actions were decided, was taken with the launch manager. The preventive measures decided at the launch management meeting were:
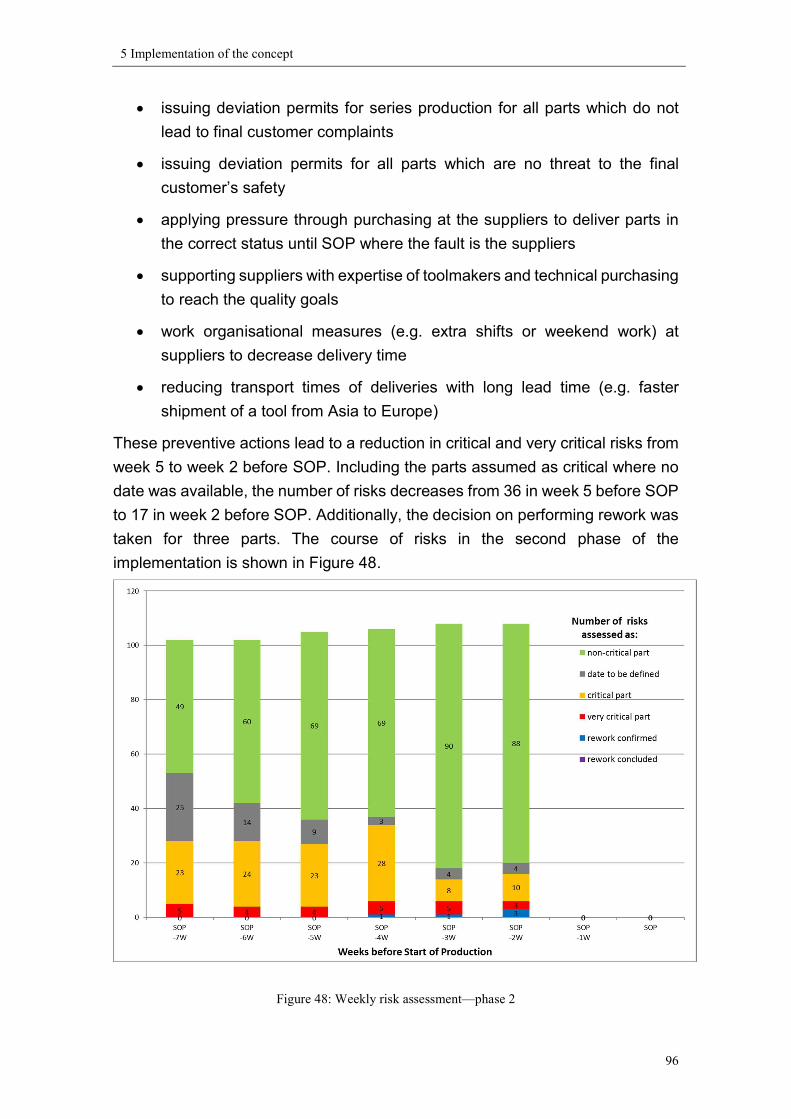
5 Implementation of the concept
96
issuing deviation permits for series production for all parts which do not lead to final customer complaints
issuing deviation permits for all parts which are no threat to the final customer’s safety
applying pressure through purchasing at the suppliers to deliver parts in the correct status until SOP where the fault is the suppliers
supporting suppliers with expertise of toolmakers and technical purchasing to reach the quality goals
work organisational measures (e.g. extra shifts or weekend work) at suppliers to decrease delivery time
reducing transport times of deliveries with long lead time (e.g. faster shipment of a tool from Asia to Europe)
These preventive actions lead to a reduction in critical and very critical risks from week 5 to week 2 before SOP. Including the parts assumed as critical where no date was available, the number of risks decreases from 36 in week 5 before SOP to 17 in week 2 before SOP. Additionally, the decision on performing rework was taken for three parts. The course of risks in the second phase of the implementation is shown in Figure 48.
Figure 48: Weekly risk assessment—phase 2
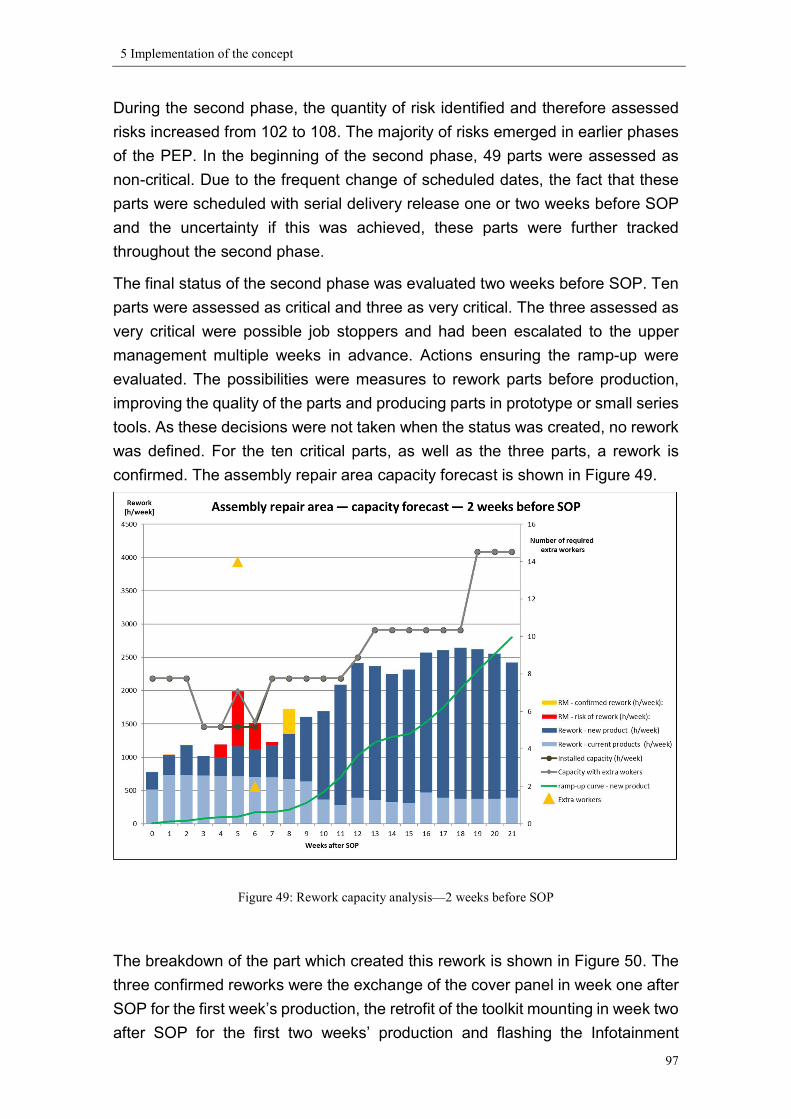
5 Implementation of the concept
97
During the second phase, the quantity of risk identified and therefore assessed risks increased from 102 to 108. The majority of risks emerged in earlier phases of the PEP. In the beginning of the second phase, 49 parts were assessed as non-critical. Due to the frequent change of scheduled dates, the fact that these parts were scheduled with serial delivery release one or two weeks before SOP and the uncertainty if this was achieved, these parts were further tracked throughout the second phase. The final status of the second phase was evaluated two weeks before SOP. Ten parts were assessed as critical and three as very critical. The three assessed as very critical were possible job stoppers and had been escalated to the upper management multiple weeks in advance. Actions ensuring the ramp-up were evaluated. The possibilities were measures to rework parts before production, improving the quality of the parts and producing parts in prototype or small series tools. As these decisions were not taken when the status was created, no rework was defined. For the ten critical parts, as well as the three parts, a rework is confirmed. The assembly repair area capacity forecast is shown in Figure 49.
Figure 49: Rework capacity analysis—2 weeks before SOP
The breakdown of the part which created this rework is shown in Figure 50. The three confirmed reworks were the exchange of the cover panel in week one after SOP for the first week’s production, the retrofit of the toolkit mounting in week two after SOP for the first two weeks’ production and flashing the Infotainment
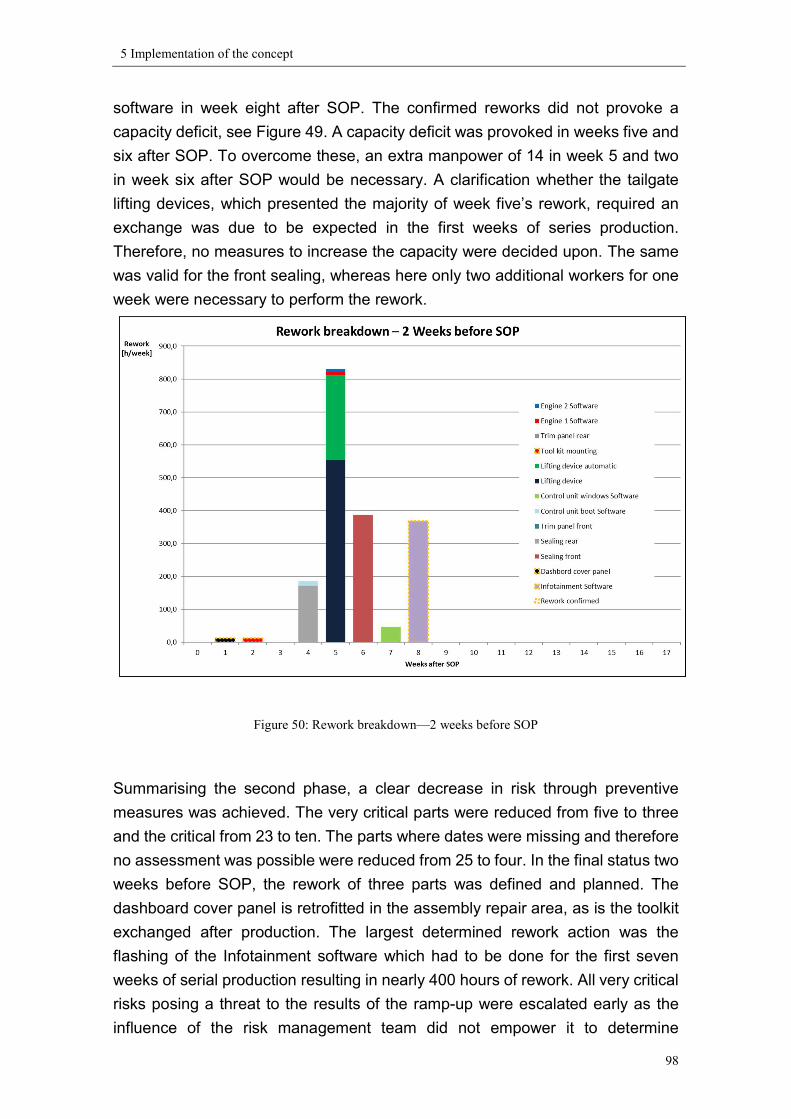
5 Implementation of the concept
98
software in week eight after SOP. The confirmed reworks did not provoke a capacity deficit, see Figure 49. A capacity deficit was provoked in weeks five and six after SOP. To overcome these, an extra manpower of 14 in week 5 and two in week six after SOP would be necessary. A clarification whether the tailgate lifting devices, which presented the majority of week five’s rework, required an exchange was due to be expected in the first weeks of series production. Therefore, no measures to increase the capacity were decided upon. The same was valid for the front sealing, whereas here only two additional workers for one week were necessary to perform the rework.
Figure 50: Rework breakdown—2 weeks before SOP
Summarising the second phase, a clear decrease in risk through preventive measures was achieved. The very critical parts were reduced from five to three and the critical from 23 to ten. The parts where dates were missing and therefore no assessment was possible were reduced from 25 to four. In the final status two weeks before SOP, the rework of three parts was defined and planned. The dashboard cover panel is retrofitted in the assembly repair area, as is the toolkit exchanged after production. The largest determined rework action was the flashing of the Infotainment software which had to be done for the first seven weeks of serial production resulting in nearly 400 hours of rework. All very critical risks posing a threat to the results of the ramp-up were escalated early as the influence of the risk management team did not empower it to determine
5 Implementation of the concept
99
preventive actions. The rework of these was determined and the production informed and prepared if they had to be performed.
5.3.3 Third phase of implementation
The third phase takes place after the end of the project. Nevertheless, it was prepared and the focal points are described in this section. The team works on determining whether the rework for the remaining risks needs to be performed and continues identifying new risks. These new risks emerge through parts with a scheduled serial delivery release just before SOP not achieved or further engineering changes which are still occurring in this phase of the PEP. The focus of the last phase lies on ensuring the trouble-free performance of the rework. This is achieved by:
providing the assembly repair area with the correct parts ensuring sufficient rework capacity providing rework instructions determining the correct testing procedures to evaluate the customer
requirements are fulfilled after the rework planning the flow of the vehicles from the parking, where they are stopped
waiting for rework to the assembly repair area, then through the testing area and finally the delivery of these vehicles
5.4 Review of the implementation In the following, a critical review of the implementation is discussed. The implementation is compared to the defined targets in the current-state analysis; the RM process steps as well as the team meetings and the RM tool are reviewed. Finally, a comparison to the principles provided in the ISO31000, which a successful risk management should fulfil, is performed. The aims determined in section 3.4, for the developed and implemented method are:
gathering all information regarding delayed serial delivery releases of parts assessing their threat to the project in a clearly defined manner supporting the ramp-up management in decision making by creating
transparency, compiling information and highlighting critical problems
5 Implementation of the concept
100
providing information on rework for holistic rework capacity analysis performed by industrial engineering
The identification of all parts with a delayed serial delivery release is ensured through identifying the processes of organisational areas influencing the serial delivery release, gathering their information and determining when all criteria for a release are fulfilled. The risk management is dependent on the information provided by the departments and working teams. A confirmation of the identification of all risks of delayed serial delivery release can only be done after SOP as the information provided are scheduled dates. For the assessment of delayed parts, a risk assessment methodology with clearly defined criteria and treatment is created and followed. Criteria and treatment are adapted multiple times to reach the final status presented in the thesis, which is easily understandable and leaves little room for implementation as quantitative values are defined. The identified risks are assessed and presented weekly to the launch manager, the central coordinating figure of the ramp-up. The information is compiled, and the critical points highlighted through reports and graphics such as the rework capacity analysis. A suggestion for risks requiring escalation is provided. The final aim is providing the information concerning rework provoked by parts without serial delivery release, which is provided through calculations performed by the RM tool. One demand of the risk management, and an option for the risk treatment are preventive measures to prevent risk from occurring. The risk management team provokes these, but does not determine and decide them. This is due to the fact that the team is established on a low organisational level which does not have the authority to decide upon them. Implementing the risk management at a higher level would ensure all process steps could be executed by the same team, thus improving the efficiency and effectiveness of the risk management. The treatment performed by the risk management is planning and performing rework, a counteractive risk treatment method. The risk management is performed by the RM team in weekly team meetings which occur at the same time and location. The team serves a clear purpose—to perform the RM process. For preparation, the current status and a list of information which needs to be provided or verified and which is addressed directly to a team member is distributed. The meeting follows an agenda with the outcome of a risk report. This has proven to be a transparent method of ensuring all risk-relevant information is communicated to the entire team.

5 Implementation of the concept
101
The developed tools should aim to support the team in performing the process, structuring all risk-relevant information, providing the necessary calculations to assess risk and creating the graphs and documents with which risks are created. All this is achieved by the tool. Identified risks require information to be inserted manually. Also, any changes in scheduled dates need to be checked and inserted manually. The tool has the potential to be further optimised, reducing this manual effort to a certain extent. This could be achieved by downloading scheduled dates from the supporting logistics and quality IT systems main source. In this project this has limited potential as the information on critical risks is often not communicated through the IT systems, and if it is, this is done with a delay. Nevertheless, an easily understandable and useable tool which can be used for any ramp-up project was created and demonstrated to work. According to the ISO 31000 an effective and successful risk management must fulfil certain principles.187 In the following, the principles are mentioned and a review of whether the implemented concept fulfils these is performed. Risk management creates and protects value The implemented risk management helps the project to achieve its targets. It avoids losses by structuring and creating information for decision-making. Risk management is an integral part of organisational processes The implemented risk management is not a stand-alone activity separated from organisational processes. Nevertheless, it is not an integral part performed by management but is executed as a parallel supporting process. Risk management is part of decision-making Yes, the risk management is part of decision-making. The authority for taking decisions for preventive actions is not within the team performing the risk management. The information provided by the risk management as well as a suggestion for risk treatment is part of decision-making. Risk management explicitly addresses uncertainty No, the implemented risk management addresses the consequence of scheduled events if no counteractive measures are taken. For explicitly addressing uncertainty, the risk management needs to integrate the probability of parts achieving their scheduled serial delivery date. Risk management is systematic, structured and timely
187 ISO, 2009, pp. 7–8

5 Implementation of the concept
102
A clear system in the form of the RM process was created and communicated. The risk management was introduced at the beginning of the ramp-up and executed as a weekly routine. Risk management is based on the best available information Yes; nevertheless, the information is often missing and rapidly changing. The communicated scheduled dates are often too optimistic and cannot be achieved. Risk management is tailored The risk management is adapted to fit the organisation and the problem at hand. Risk management takes human and cultural factors into account The implemented risk management does not include any human or cultural factors. Risk management is transparent and inclusive The risk management is transparent by providing each week’s status to the project. It includes all stakeholders in the definition of the assessment criteria. It does not include all stakeholders at all levels of the organisation. Risk management is dynamic, iterative and responsive to change The risk management’s context is adapted throughout the project with a change of knowledge and understanding of the problem at hand. New risks are constantly identified; information about risks often changes and is recorded. Risk management facilitates continual improvement and enhancement of the organisation The risk management itself is constantly reviewed and improved. It matures to manage risks more effectively. In summarising the review of the implementation, it can be said that the aims determined in the current-state analysis are achieved by the risk management and the developed concept successfully implemented. The principles for a risk management to be effective are partially fulfilled.

6 Summary and outlook
103
6 Summary and outlook
Due to increased outsourcing of manufacturing component parts in the automotive industry in the past decades, an important determinate to a ramp-up’s success does not lie under the direct internal influence of the OEMs. Despite management tools such as the “VDA Reifegradabsicherung von Neuteilen” being a common practice, suppliers in some cases do not achieve the required quality of parts for a serial delivery release before SOP. This leads to trouble-shooting which often results in the rework of vehicles or in the worst case a production stop. This creates a loss of time and costs, ultimately provoking the ramp-up to miss its target regarding quality, time and costs. The analysis of existing approaches in the relevant literature did not provide any concrete approach with the operational depth required. Nevertheless, risk management was identified as a proven method of dealing with uncertainties in the ramp-up. The current-state analysis performed with semi-structured interviews provided the requirements for the operative risk management which was developed and implemented. By merging the information of all organisational processes influencing the serial delivery release, it created transparency and supported the ramp-up management focus on the right points. It identified deviations early in order to initiate preventive actions. Furthermore, the risk management identified rework provoked by these parts, thus supporting rework capacity planning. A clear and structured risk management methodology tailored for the problem at hand was created. Subsequently this methodology was implemented in the production ramp-up of the Volkswagen T-Roc at Volkswagen Autoeuropa. It was performed in the form of a process on a weekly basis by a cross-functional team. The process steps were risk identification, risk assessment and risk treatment. This is supported by the developed risk management tool, which gathered all relevant information, performed the necessary calculations for risk assessment and created reports for communicating risks. As a result of the implementation, the final status from two weeks before SOP is considered. At this point a total of 109 parts with a serial delivery release after SOP were identified. Of these the rework of three parts was confirmed in the first weeks after SOP. The rework was planned by the team. Another three parts were assessed as possible job stoppers and had been prematurely escalated to the

6 Summary and outlook
104
upper management, which decided actions preventing a delay of SOP. Finally, ten parts were still assessed as critical, possibly provoking rework and requiring further observation. Possibilities of a capacity increase for performing this rework were defined. All in all a clear reduction of critical parts (from 23 to 10) and very critical parts (from 5 to 3) was achieved through the implementation of the operative risk management and the further necessary measures to deal with these parts were defined. Difficulties in the implementation occurred during the beginning phase, when the team was set up. The initial reaction of the team performing the risk management can be summarised as: “why do we need yet another weekly meeting and process?” After discussing input and output and visualising the results through the developed tool, the aim became clearer and the risk management found acceptance and support. Once implemented, the accrual of required information which is up to date proved to be difficult. This is often caused by departments not using the intended software tools and making information accessible to the entire project, but rather communicating it internally. The tool used within VW to communicate all dates regarding parts is the tool LION (“Lieferanten Online”—Suppliers online). The use of this tool by all departments and suppliers makes the acquisition of information easier and capable of being automated. Another improvement already foreseen within Volkswagen is the introduction of a further milestone, the “K-Freigabe”, the customer release. This is the date a part fulfils all requirements necessary to be used in vehicles sold to the final customer. It includes the Note 1 and BMG. This has already been implemented in the developed tool for further projects. Finishing off, it can be said that the developed and implemented concept for an operative risk management achieved its goals. A routine has been established, preventive measure taken and rework prepared. In order to further increase the risk management effectiveness, it requires implementation on a higher organisational level, including the management.
Bibliography
105
Bibliography
AHK Portugal. (2015). Deutsch Portugiesische Industrie- und Handelskammer. Retrieved 2017, September 6th from http://www.ccila-portugal.com/aktuelles/news/artikel/volkswagen-autoeuropa-investiert-677-mio-euro-in-produktion-eines-neuen-modells/
Ahrendts, F., & Marton, A. (2002). IT-Risikomanagement leben! Heidelberg Berlin: Springer Verlag.
Berry, A., & Phillips, J. (1998). Enterprise Risk Management: Pullling it together. Retrieved 2017, August 31st from newportrisk: http://www.newportrisk.com/Berry%20-%20RM0998.pdf
Bischoff, R. (2007). Anlaufmanagement - Schnittstelle zwischen Projekt und Serie. Deutsche Nationalbibliographie.
Blackwell, A., & Manner, E. (2015). UXL Encyclopedia of Science (3rd ed.). Retrieved 2017, August 17th from link.galegroup.com/apps/doc/ENKDZQ347975681/SCIC?u=dclib_main&xid=0c8f739d
Borowski, E., & Henning, K. (2013). Agile Prozessgestaltung und Erfolgsfaktoren im Produktionsanlauf als komplexer Prozess. In Automation, Communication and Cybernetics in Science and Engineering (pp. 27-40). Berlin Heidelberg: Springer-Verlag.
Bosworth, D., Wilson, R., & Young, A. (1993). Research and Development. London: Chapman and Hall.
Bruse, H. (1984). Das Unternehmensrisiko - Eine theoretische und empirische Untersuchung. Zeitschrift fuer Betriebswirtschaft, 964 - 996.
CAS, Casualty Actual Society (2003). Overview of Enterprise Risk Management. Retrieved 2017, September 1st from Enterprise Risk Management Committee: https://www.casact.org/area/erm/overview.pdf
Clark, K., & Fujimoto, T. (1991). Product Development Performance: Strategy, Organisation and Management in the World Auto Industry. Boston: Harvard Business School Press.
Cohen, D., & Crabtree, B. (2006). Qualitative Research Guidelines Project. Retrieved 2017, September 06th from http://www.qualres.org/HomeSemi-3629.html
COSO. (2004). Retrieved 2017, August 31st from COSO Committee of sponsoring: https://www.coso.org/documents/Framework%20Reference%20Secured.pdf
Bibliography
106
Czaja, L. (2009). Qualitätsfrühwarnsysteme für die Automoblindustrie. Doctoral Dissertation: Friedrich-Alexander-Universität Erlangen-Nürnberg.
Djabarian, E. (2002). Die strategische Gestaltung der Fertigungstiefe. Wiesbaden: Gabler Verlag.
Doch, S., Rösch, F., & Mayer, A. (2008). Logistikmanagement im Anlauf. In Schuh, G., Stölzle, W. & Straube, F. Anlaufmangement in der Automobilindustrie erfolgreich umsetzen (pp. 143-150). Berlin Heidelberg: Springer Verlag.
Dyckhoff, H. (1994). Betriebliche Produktion: Theoretische Grundlagen einer umweltorientierten Produktionswirtschaft. Berlin: Springer-Verlag.
Dyckhoff, H., & Spengler, T. (2010). Produktionswirtschaft. Heidelberg: Springer Verlag.
Dyckhoff, H., Müser, M., & Renner, T. (2012). Ansätze einer Produktionstheorie des Serienanlaufs. Zeitschrift für Betriebswirtschaft, 1428 - 1456.
Espirito Santo, H. (2017). Razao Automovel. Retrieved 2017, July 04th from http://razaoautomovel.com/2017/04/volkswagen-t-roc-antevisao-portugal
Eversheim, W. (1998). Organisation in der Produktionstechnik: Fertigung und Montage. Düsseldorf: VDI Verlag.
Filla, P., & Klingebiel, K. (2014). Risk profiles for the pre-series logisitcs in automotive ramp-up processes. Procedia CIRP 20, 44-49
Fisher, M. L., & Ittner, C. D. (1999). The Impact of Product Variety on Automobile Assembly Operations: Empirical Evidence and Simulation Analysis. Management Science Vol.45, 771-786.
Fitzek, D. (2005). Anlaufmanagement in Netzwerken - Grundlagen, Erfolgsfaktoren und Gestaltungsempfehlungen für die Automobilindustrie. Bern Stuttgart Wien: Haupt Verlag.
Fleischer, J., Spath, D., & Lanza, G. (2003). Qualitätssimulation im Serienanlauf: Vorbestimmte Qualitätsfähigkeitskurven von Elementarprozessen. Werkstattstechnik online 93 (1/2), pp. 50-54.
Franzkoch, B., & Gottschalk, S. (2008). Anlauforganisation. In Schuh, G., Stölzle, W. & Straube, F. Anlaufmanagement in der Automobilindustrie erfolgreich umsetzen (pp. 55-64). Berlin Heidelberg: Springer Verlag.
Frigo, L., & Anderson, R. (2011). Strategic management. Strategic finance, April 2011. Retrieved 2017, August 30th from http://www.markfrigo.org/What_is_Strategic_Risk_Management_-_Strategic_Finance_-_April_2011.pdf

Bibliography
107
Gottschalk, S., & Höschen, A. (2008). Produktionsmanagement im Anlauf. In Schuh, G., Stölzle, W. & Straube, F. Anlaufmanagement in der Automobilindustrie erfolgreich umsetzen (pp. 177-186). Berlin Heidelberg: Springer Verlag.
Götze, U., & Henselmann, K. (2001). Risikomanagement. Heidelberg: Springer Verlag. Hegner, C. (2010). Modellbasierte Vernetzung strategischer und operativer
Anlaufgrössen von interdependenten Fahrzeugprojekten. Doktoral Dissertation: TU Chemnitz.
Huth, M. (2003). Risikomanagement in der Logistik (Teil 3). Retrieved 2017, September 06th from risknews.de: http://www.risknet.de/fileadmin/eLibrary/Huth-T3-RiskNEWS-05-2003.pdf
IAFT. (2016). IAFT 16949:2016. Berlin: VDA-QMC. ISO. (2009). ISO 31000:2009(E). Switzerland: ISO copyright office. Juran, J. (1992). Quality by Design: The New Steps for Planning Quality into Goods and
Services. New York: The Free Press. Kirst, P. (2008). Lieferantenintegration im Produktentstehungsprozess. In Schuh, G.,
Stölzle, W. & Straube, F. Anlaufmanagement in der Automobilindustrie erfolgreich umsetzen (pp. 93-106). Berlin Heidelberg: Springer Verlag.
Klein, H. (2013). Logistikkostenrisiken bei Fahrzeugneuprojekten der Volkswagen AG. In I. Göpfert, D. Braun, & M. Schulz, Automobillogistik: Stand und Zukunftstrends (pp. 160-176). Wiesbaden: Springer Gabler.
Kremsmayr, M., Dornhofer, A., Mitterer, N., & Ramsauer, C. (2016). On the application of agility principles in ramp-up management: Approaching the challenges in the high-end power metallurgy industry. Procedia CIRP, 51, 85-92.
Kuhn, A., Wiendahl, H.-P., Eversheim, W., & Schuh, G. (2002). Fast Ramp-up - Schneller Produktionsanlauf von Serienprodukten. Dortmund: Verlag Praxiswissen.
Mikus, B. (2001). Risiken und Risikomanagement - ein Überblick. In Götze, U., Henselmann, K. & Mikus, B. Risikomanagement (pp. 3-28). Berlin Heidelberg: Springer Verlag.
Möller, K., & Stirzel, M. (2008). Kostenmanagement im Anlauf - Aufgaben und Instrumente. In Schuh, G., Stölzle, W. & Straube, F. Anlaufmanagement in der Automobilindustrie erfolgreich umsetzen (pp. 243-262). Berlin Heidelberg: Springer Verlag.
Nagel, J. (2011). Risikoorientiertes Anlaufmanagement. Wiesbaden: Gabler Verlag. Oess, A. (1991). Total Quality Management (2nd ed.). Wiesbaden: Gabler.
Bibliography
108
Peters, N., & Hofstetter, J. (2008). Konzepte und Erfolgsfaktoren für Anlaufstrategien in Netzwerken der Automobilindustrie. In Schuh, G., Stölzl, W. & Straube, F. Anlaufmanagement in der Automobilindustrie erfolgreich umsetzen (pp. 9-29). Berlin Heidelberg: Springer Verlag.
Pfahl, G., & Beitz, W. (2005). Konstruktionslehre: Grundlagen erfolgreicher Produktentwicklung, Methoden und Anwendungen. Berlin: Springer Verlag.
Pfohl, H., & Gareis, K. (2000, November). Die Rolle der Logistik in der Anlaufphase. Zeitschrift für Betriebswirtschaft, pp. 1198 - 1214.
Raubold, U. (2011). Lebenszyklusmanagement in der Automobilindustrie. Wiesbaden: Gabler Verlag.
Reithofer, N. (2002). Produktion: BMW-Produktionsvorstand verrät die Erfolgskonzepte des Automobilbaus. VDI-Nachrichten, 07.06.2002 Nr. 23, 23–24.
Risse, J. (2003). Time-to-Market-Management in der Automobilindustrie: Ein Gestaltungsrahmen für logistikorientiertes Anlaufmanagement. Doctoral Dissertation: TU Berlin.
Rogler, S. (2002). Risikomanagement im Industriebetrieb. Wiesbaden: Springer Fachmedien.
Rösch, F., Mayer, A., & D. S. (2008). Grundlagen des Änderungsmanagement. In Schuh, G., Stölzle, W. & Straube, F. Anlaufmanagement in der Automobilindustrie erfolgreich umsetzen (pp. 215-220). Berlin Heidelberg: Springer Verlag.
Schmitt, R., Schuh, G., Gartzen, T., & Schmitt, S. (2010). Das Aachener Modell zum interdisziplinären Anlaufmanagement: Entwicklung von Entscheidungsmodellen im Produktionsanlauf. Werkstatttechnik online, Jahrgang 100, pp. 317-322.
Schuh, G., Kamper, A., & Franzkoch, B. (2005). Anlaufmanagement, Kosten senken - Anlaufzeit verkürzen - Qualität sichern. Werkstatttechnik online, pp. 405 - 409.
Schuh, G., Müller, J., & Rauhut, M. (2012). Gestaltung von Produktentwicklungsprozessen. In Schuh, G. Innovationsmanagement (pp. 161 - 234). Berlin Heidelberg: Springer Verlag.
Schuh, G., Riedel, H., Abels, I., & Desoi, J. (2002). Serienanlauf in branchenübergreifenden Netzwerken - Eine komplexe Plnungs- und Kontrollaufgabe. Werkstatttechnik online, pp. 656 - 661.
Schuh, G., Stölzle, W., & Straube, F. (2008). Grundlagen des Anlaufmanagements: Entwicklungen und Trends, Definitionen und Begriffe, Integriertes Anlaufmanagementmodell . In Schuh, G., Stölzle,W. & Straube, F. Anlaufmanagement in der Automobilindustrie erfolgreich umsetzen (pp. 1-92). Berlin Heidelberg: Springer Verlag.

Bibliography
109
Specht, D., Nagel, J., & Frischke, S. (2004). Integrationsmodell für Anlaufprozesse. München: TCW.
Specht, M. (2016). VW Produktoffensive, Interview Thomas Treptow, Leiter Produktmarketing. Retrieved 2017, July 4th from welt.de: https://www.welt.de/motor/modelle/article155312860/VW-startet-die-grosse-SUV-Offensive.html
Surbier, L., Gülgün, A., & Blanco, E. (2013). A comparititve study on production ramp-up: state-of-the art and new challanges. In Production Planning & Control: The Management of Operations (pp. 1264-1286). Grenoble: Taylor and Francis Group.
Terwiesch, C., & Bohn, R. (1998). Learning and Process Improvement during Production Ramp-Up. International journal of production economics, 70(1).
Tuecks, G. (2010). Ramp-up Management in der Automobilindustrie. Doktoral Dissertation: RWTH Aachen.
Ulrich, S. (2016). Umgang mit Störungen im Produktionsanlauf: Adaption ausgewählter Methoden von Einsatzorganisationen auf den Produktionsanlauf. Lohmar: Josef Eul Verlag.
VDA (2000). Jahresbericht 2000. Frankfurt am Main: Verband der Automobilindustrie eV.
VDA (2009). Reifegradabsicherung fuer Neuteile. Oberursel: VDA QMC. VDA (2012). Sicherung der Qualität von Lieferungen. Frankfurt am Main: Verband der
Automobilindustrie eV (VDA). Volkswagen (2012). The product emergence process. internal document. Wolfsburg:
Volkswagen AG. Volkswagen (2014). Volkswagen Autoeuropa. Retrieved 2017, July 4th from
https://web.archive.org/web/20140517225734/http://www.volkswagenautoeuropa.pt:80/empresa/historia
Volkswagen (2015a). Definition PEP Milestones. internal document. Wolfsburg: Volkswagen AG.
Volkswagen (2015b). Fahrzeugprojektmanagementhandbuch PM Basismodel. internal document. Wolfsburg: Volkswagen AG.
Volkswagen (2016a). Aenderungsmanagement Konzern. internal document. Wolfsburg: Volkswagen AG.
Volkswagen (2016b). Handbuch Baureihenorganisation. internal document. Wolfsburg: Volkswagen AG.

Bibliography
110
Volkswagen (2016c). Together 2025. Retrieved 2017, July 3rd from http://together.volkswagenag.com/
Volkswagen (2016d). Volkswagen Navigator. Retrieved 2017, July 4th from http://navigator.volkswagenag.com/index.html
Volkswagen (2017a). Volkswagen Anual Report 2016. Retrieved 2017, March 28th from http://www.volkswagenag.com/presence/investorrelation/publications/annual-reports/2017/volkswagen/en/Y_2016_e.pdf
Volkswagen (2017b). BTV Handbuch. internal document. Wolfsburg: Volkswagen AG. Wagenheim, S. (1998). Planung und Steuerung des Serienanlaufs komplexer Produkte.
Doktoral Dissertation: Universität Stuttgart. Weinzierl, J. (2006). Produktreifegrad-Management in unternehmensübergreifenden
Entwicklungsnetzwerken: ein ganzheitlicher Ansatz zur Entscheidungsunterstützung im strategischen Anlaufmanagement. Doktoral Dissertation: Universität Dortmund.
Weller, N. (2015). Strategic and operational risks. Retrieved 2017, September 06th from ACCA Global: http://www.accaglobal.com/sg/en/student/exam-support-resources/professional-exams-study-resources/p1/technical-articles/strategic-operational-risks.html
Werner, B. (2002). Messung und Bewertung der Leistung von Forschung und Entwicklung im Innovationsprozess. Darmstadt: Technische Universität Darmstadt - Doktorarbeit.
Wheelwright, S., & Clark, K. (1992). Revolutionizing product development - Quantum leaps in Speed, Efficiency, and Quality. New York: The free press.
Wheelwright, S., & Clark, K. (1995). Leading Product Development. New York: The free press.
Wittich, H. (2017). Auto Motor Sport. Retrieved 2017, July 4th from http://www.auto-motor-und-sport.de/news/vw-golf-suv-t-roc-2017-infos-bilder-preise-8163598.html