Operationalizing Ecosystem Services for Restoration TABLE OF CONTENTS
68
Operationalizing Ecosystem Services for Restoration
Transcript of Operationalizing Ecosystem Services for Restoration TABLE OF CONTENTS

Operationalizing
Ecosystem Services
for Restoration

1
Harte Research Institute
TABLE OF CONTENTS
EXECUTIVE SUMMARY ................................................................................................................................. 2
INTRODUCTION ............................................................................................................................................ 5
Background and Purpose ................................................................................................................. 5
BENEFITS ....................................................................................................................................................... 7
HOW TO USE THE FRAMEWORK .................................................................................................................. 8
DEFINITIONS ............................................................................................................................................... 10
FRAMEWORK .............................................................................................................................................. 12
PHASE I: IDENTIFICATION ............................................................................................................... 12
Step 1: Establish human well-being and biophysical needs ............................................. 12
Step 2: Define ecological and socioeconomic goals and objectives ................................. 18
Step 3: Acquire baseline information ............................................................................... 24
Step 4: Identify project alternatives ................................................................................. 29
PHASE II: ANALYSIS ........................................................................................................................ 32
Step 5: Perform trade-off analyses ................................................................................... 32
Step 6: Analyze the legal framework ................................................................................ 36
Step 7: Choose project alternative to implement ............................................................ 39
PHASE II: IMPLEMENTATION AND EVALUATION ........................................................................... 42
Step 8: Implement selected project alternative ............................................................... 42
Step 9: Monitor and measure performance ..................................................................... 45
Step 10: Adjust .................................................................................................................. 54
Step 11: Communicate project results ............................................................................. 57
APPENDIX ................................................................................................................................................... 62
REFERENCES ................................................................................................................................................ 63
Suggested citation Yoskowitz, D., C. Carollo, and C. Santos. Operationalizing Ecosystem Services for Restoration. Harte Research Institute. September 2013. 67 pages. We appreciate the comments of Becky Allee of NOAA and Debbie Devore of USFWS.
2
Operationalizing Ecosystem Services for Restoration
EXECUTIVE SUMMARY The framework presented here is designed as an adaptive strategy to allow for the explicit consideration
of ecosystem services throughout the life cycle of a conservation project, from conceptualization to
implementation and evaluation. First and foremost, through this guided step-by-step approach,
practitioners are able to create a link between ecosystems, the provision of services, and human well-
being. Establishing such a link is beneficial in that it may result in a heightened desire to invest in, and
improve the success of, conservation of natural resources to maintain or increase human well-being.
The devised multidisciplinary approach also provides guidance on (1) designing projects based on clearly
defined socio-economic and biophysical goals; (2) performing trade-off analyses among different
management scenarios of natural resources, ecosystem functions, and ecosystem goods and services;
and (3) communicating to stakeholders the benefits derived from ecological processes, thus increasing
awareness about ecosystem services.
The framework provides a structured methodology to easily include ecosystem services into
conservation projects by considering and adding the human component. It is adaptive, compatible with
and applicable to existing planning processes, and can be used at different temporal and spatial scales. It
includes examples that either illustrate a methodology or provide additional material to carry out
specific activities.
The step-by-step approach is tailored towards practitioners interested in integrating ecosystem services
in conservation projects. These practitioners should use this framework to guide their conservation
efforts and include ecosystem services in their decision-making process. Depending on the agency or
employer, practitioners can either follow each step sequentially, or adapt and apply relevant steps to
already existing frameworks.
The framework is made of eleven steps organized in three phases. The first phase, Identification, is
made of four steps that guide practitioners to (1) establish human well-being and biophysical needs,
thus breaking with the traditional arguments in favor of ecological conservation that failed to capture
the dependence of human well-being on natural resources; (2) determine which ecosystem services are
responsible for addressing the identified community needs by understanding the relationship between
supply of, and demand for, ecosystem services and linking natural resources to human well-being thus
possibly increasing the project’s public acceptance, societal implications, and responsiveness to what
people require to define ecological and socio-economic goals, based on the identified needs, as well as
specific, measurable, achievable, realistic, and time-bound objectives; (3) acquire ecological and socio-
economic baseline information on a number of attributes or parameters against which to measure post-
implementation changes; and (4) identify project alternatives.

3
Harte Research Institute
PHASE I: IDENTIFICATION
Step 1: Establish human well-being and biophysical needs Task 1: Human and biophysical needs are identified. Task 2: Ecosystem services addressing human needs are determined. Task 3: A link between ecosystem services and human well-being is established. Step 2: Define ecological and socioeconomic goals and objectives Task 1: Basic ecosystem and socioeconomic information is gathered.
Task 2: Overall ecological and socio-economic goals of the conservation project are defined. Task 3: Specific objectives to accomplish the overall goals of the project are set.
Step 3: Acquire baseline information Step 4: Identify project alternatives
PHASE II: ANALYSIS Step 5: Perform trade-off analyses Task 1: Criteria used to compare project alternatives are identified. Task 2: A suite of project alternatives is selected for possible implementation. Step 6: Analyze the legal framework Step 7: Choose project alternative to implement
PHASE III: IMPLEMENTATION AND EVALUATION
Step 8: Implement the selected project alternative Step 9: Monitor and measure performance Task 1: Establish monitoring plan. Task 2: Measure project performance. Step 10: Adjust Step 11: Communicate project results
The second phase, Analysis, is made up of three steps that guide practitioners to (5) identify the criteria
to be used to compare project alternatives and perform ecosystem services trade-off analyses to select
a suite of project alternatives for possible implementation; (6) perform a search of existing regulations,
property rights, and social norms that are within the context of the identified suite of projects to ensure
that the project is compatible with current environmental law and policy; and (7) select the project
alternative to implement. The planning team is responsible for the first two phases. However,
stakeholders’ involvement and consultation with social scientists are key components of successful
project planning.
The last phase, Implementation and Evaluation, is made up of four steps that guide practitioners to (8)
implement the selected project after fulfilling requirements such as secure funding, develop a realistic
timeline, obtain permits, define roles and responsibilities, acquire necessary materials, equipment, and
supplies, etc.; (9) establish a monitoring plan to monitor progress and measure performance including
elements that offer a better assessment of whether the target ecosystem is providing the desired

4
Operationalizing Ecosystem Services for Restoration
services; (10) adjust project activities to achieve goals and objectives if monitoring shows that the
activities undertaken did not achieve the expected results; and (11) communicate the results of the
implemented restoration project to the public to increase awareness of the benefits communities will
derive. In fact, it is strongly encouraged that communication should occur throughout the project to
keep stakeholders, affected by the activities undertaken, informed.
Figure 1: Manta Ray in the Flower Garden Banks. Source: NOAA

5
Harte Research Institute
INTRODUCTION
BACKGROUND AND PURPOSE
The framework described herein fills a void in the growing body of ecosystem services literature where
there is a need to describe how ecosystem services can be operationalized in the decision making
process, specifically as it applies to restoration and protection decisions in a coastal and marine
environment. Several “frameworks” are already
available through peer-reviewed publications. The
Ecosystem Services Framework developed by Daily
(2000) integrates biophysical and social dimensions
of environmental protection and is used for
describing, monitoring, and managing ecosystem
changes and their impacts on society. A few years
later, this framework was expanded to include the
identification of a driving issue; the social, economic,
and politico-cultural contexts at the appropriate
scale; modeling; mapping; and valuation (Turner and
Daily 2008). Hein et al. (2006) established a
framework for the valuation of ecosystem services,
with specific attention given to stakeholders. Part of the Hein et al. framework is a procedure to assess
the value of regulating services that avoids double counting. Yet another framework is provided by Tallis
et al. (2008) for anticipating win–win, lose–lose, and win–lose outcomes as a result of how people
manage ecosystem services. The Tallis et al. framework was built upon detailed explorations of several
case studies in which biodiversity conservation and economic development coincided and cases in which
there was joint failure. More recently Helming et al. (2013) proposed a framework to link the policy
impact assessment to the analytical approach of ecosystem service assessment. Specifically, their aim
was to mainstream information and concerns related to ecosystem services into the impact assessment
procedure of European policies by addressing two questions: 1) Where in the process of policy impact
assessment can ecosystem services be mainstreamed and 2) How can the effects on ecosystem services
properly be accounted for? Several more examples of ecosystem services frameworks could be
presented; so the question becomes is there really a need for one more framework? We believe so;
particularly since none of the currently available frameworks were designed as adaptive strategies with
the specific goal to explicitly consider ecosystem services throughout the whole life cycle of a project,
from conceptualization to implementation and evaluation.
The framework object of this publication was conceived at a NOAA sponsored workshop in January 2012
to structurally integrate ecosystem services in natural resource management and decision-making (de
Figure 2: Green Turtle. Source: Caroline Rogers. USGS

6
Operationalizing Ecosystem Services for Restoration
A multidisciplinary approach
“An ecosystem services framework should include a multidisciplinary and transdisciplinary approach,
mostly because planning for ecosystem services requires expertise in economics, biology, ecology,
geosciences, and especially analytical tools; an interdisciplinary team (research between teams) is not
sufficient. Consequently, the incorporation of expert knowledge and theoretical understanding of
these disciplines requires a multidisciplinary team to work in close communication (Chan, 2006) and
across disciplines.
According to the National Oceanic and Atmospheric Administration’s Science-based Restoration
Monitoring of Coastal Habitats (2003), a statistician should be consulted early in the process, followed
by ecologists, botanists, hydrologists, economists, or any other scientists with appropriate knowledge.
These scientists should review the plan and provide expertise on appropriate methodologies. For
valuable information on project performance and past experiences, resource managers conducting
similar research should also be contacted. Rather than working in isolation, practitioners developing a
conservation plan should consult other agencies or experts.”
Source: Thayer et al., 2003.
Groot et al. 2009; Bickel et al. 2012), thus allowing practitioners to operationalize ecosystem services
into conservation projects1.
The framework is a multidisciplinary approach that demonstrates how to incorporate the concept of
ecosystem services in the decision-making process through scientific assessment, policy tools, and
expert knowledge.
The framework provides a resource for practitioners to investigate stakeholders’ dependence and
impact on ecosystem services. By addressing stakeholders’ needs, usually exacerbated by degraded
ecological conditions, practitioners will be able to link human well-being to healthy ecosystems and the
provision of services. The steps detailed in this document will help natural resource managers, decision
makers in governmental and non-governmental organizations (NGOs) at the local, state, and federal
level, and other stakeholders to explicitly include ecosystem services into environmental decisions, thus
strengthening the resulting management process by making it more complete and defensible.
1 Although conservation includes restoration efforts, for practical purposes the terms restoration and conservation
will be used interchangeably in this framework.

7
Harte Research Institute
Figure 3: Linking ecosystem services to human well-being: aesthetics; scenic views. Source: C. Santos
BENEFITS
The application of an ecosystem services framework, such as the one presented here, helps
practitioners identify critical ecosystem functions and processes and the long-term need to maintain
healthy ecosystems in the sustainable provision of human well-being, economic development, and
poverty mitigation (Turner and Daily, 2008). Therefore, one of the benefits of this framework is to
demonstrate the economic advantages of conservation compared to alternative uses (Simpson, 2011).
The framework requires ecosystem services to be quantified and valued. The quantification of services
produces a value that is more easily understood than the services themselves. Ecosystem service values
are meaningful to both the direct beneficiaries and governmental agencies and other organizations that
would have to pay for a substitute if the provision of those services was disrupted. Recognizing the
paramount importance of ecosystem services can
heighten the desire to invest in conservation to
avoid paying for alternative solutions or
restoration in the future. In fact, governments and
other entities are more likely to invest in the
protection of ecosystem services when there is
clear information that crucial services, such as the
provision of clean water or disturbance
regulation, are impaired (Tallis et al., 2008). The
focus on ecosystem services may also improve
the success of a project whose main goal is the
conservation of natural resources by promoting a
market for goods and services that beneficiaries
derive from ecosystems (Tallis et al., 2008). This process ties the outcomes to human well-being, hence
making conservation projects more widely accepted as they improve human welfare.
Furthermore, following the steps of the framework helps practitioners identify the impacts a project
may have on the surrounding population and the potential trade-offs among services provided,
addressing a bundle of services, rather than focusing on one service. Lastly, the application of the
framework allows for a more complete and explicit accounting of the costs and benefits of different
management scenarios (Smith et al., 2011).
In summary, the approach described in this publication can help managers:
1) Recognize and communicate the link between benefits to human well-being and ecological processes,
2) Establish management priorities,
3) Perform trade-off analyses among different management scenarios of natural resources, ecosystem
functions, and ecosystem goods and services, and
4) Support project designs that are based on clearly articulated goals and outcomes.

8
Operationalizing Ecosystem Services for Restoration
HOW TO USE THE FRAMEWORK
This ecosystem services framework can be tailored to fit different practitioners’ missions and goals. It is
general enough to be used by a broad audience, including conservation professionals in the academia
and industry, federal, state, local, and tribal governments, scientists, non-scientists, stakeholders, and
practitioners interested in integrating ecosystem services in their conservation project.
This step-by-step approach provides a logical sequence of stages required to achieve desired goals and
objectives for conservation purposes. However, it does not offer specific technical details, such as how
to collect data or conduct surveys.
The developed approach allows for the explicit
inclusion of ecosystem services at the front end as well
as at the back end of the decision-making process and
it can be used at different temporal and spatial scales.
It is adaptive, compatible with, and applicable to
existing planning processes (e.g. the existing Council
on Environmental Quality’s “Principles and
Requirements for Federal Investments in Water
Resources”, CEQ, 2013). It provides a structured
methodology to easily include ecosystem services into
conservation projects by considering and adding the
human component (i.e. the link between human well-
being and the integrity of ecosystems and the services
they provide). This framework also contains a
communication component to engage stakeholders and increase awareness about nature conservation.
Interested practitioners should use this framework to guide their conservation efforts and include
ecosystem services in their decision-making process. Practitioners can either follow each step
sequentially, or adapt and apply relevant steps to already existing frameworks.
Throughout the framework there are several “boxes” generated from the literature that either give
examples (each called Example followed by a number indicating that it is the nth Example) or provide
additional material to carry out specific activities (called Process followed by a number indicating it is
the nth Process). Also, at the end of each step there is a box demonstrating the practical application of
the step and tasks being discussed. This is a hypothetical “case study application” that has been broken
down in 11 steps.
Figure 4: Barrier Island, Louisiana. Source: NOAA-CWPPRA-W-LA240.

9
Harte Research Institute
Ecosystem services as a framework for forest stewardship
1. “Describe to the public and to Congress the value of national forests to the American people.
2. Characterize Forest Service management activities in terms of ecosystem services outcomes to
complement output-related target required by Congress.
3. Assess whether particular ecosystem service flows are in decline over time, and if they are, assemble
the widest possible range of management alternatives and policies to stem those losses.
4. Strengthen relationships with communities, tribes, private stakeholders, and non-governmental
organizations by defining common natural resource stewardship objectives.”
Source: Smith et al., 2011.
Figure 5: Kemps Ridley with biologist. Source: NOAA
Fisheries Protected Resources.

10
Operationalizing Ecosystem Services for Restoration
DEFINITIONS
Conservation is the protection, preservation, management, or restoration of wildlife and of natural
resources (The American Heritage® Dictionary of the English Language, 2009).
Cultural services enhance emotional, cognitive, and psychological well-being. They include recreational
opportunities, aesthetics and science and education (Farber et al., 2006).
Ecosystem services are the contributions from marine and coastal ecosystems that support, sustain, and
enrich human life (Yoskowitz et al., 2010). This concept has developed as a way of describing the wide-
ranging set of benefits people receive from nature (Smith et al., 2011). Ecosystem services can be
divided into two categories: intermediate and final.
Ecosystem services quantification provides standard metrics for expressing benefits of the services
provided by the ecosystem. The metrics may be monetary or non-monetary.
Practitioner is anyone actively involved in conservation projects.
Preservation is the process of working to protect natural resources so that they are not damaged or
destroyed; the process of trying to make a situation or state endure without being impaired (MacMillan
Dictionary Thesaurus, 2012).
Provisioning services include common commodities such as clean water, food, timber, shells, and many
pharmaceutical products for human use (Smith et al., 2011).
Regulating services are the benefits derived from the ecosystem’s influence in maintaining essential
ecological processes and life support systems for human welfare. These include gas regulation,
disturbance regulation, and waste regulation (Farber et al., 2006).
Restoration is the process of augmenting the recovery of degraded, damages, or destroyed ecosystems
(Reynolds, McGlathery, and Waycott, 2012).
Supporting services are essential processes that sustain the conditions for life on Earth. They include net
primary production, nutrient cycling, and habitat (Smith et al., 2011).

11
Harte Research Institute
Final versus intermediate services
“The distinction between end-products and intermediate products is fundamental to welfare
accounting. If intermediate and final goods are not distinguished, the value of intermediate goods is
double-counted because the value of intermediate goods is embodied in the value of final goods.
Consider a conventional market good like a car. GDP only counts the car’s value, not the value of the
steel used to make the car. The value of steel used in the car is already part of the car’s total value.
The same principle holds with ecosystem services. Clean drinking water, which is consumed directly by
a household, is dependent on a range of intermediate ecological goods, but these intermediate goods
should not be counted in an ecosystem service welfare account.”
Source: Boyd and Banzhaf, 2006.
“Final goods and services are the entities that are valued; other ecosystem features…intermediate
ecosystem goods and services produce these final goods and services. Their value is embodied in the
value of the final goods or services.”
Source: Ringold et al., 2010.
Conceptual relationship between intermediate and final services, also showing how joint products (benefits) can stem
from individual services. Intermediate services can stem from complex interactions between ecosystem structure and
processes and lead to final services, which in combination with other forms of capital provide human welfare benefits.
Source: Fisher et al., 2009.
12
Operationalizing Ecosystem Services for Restoration
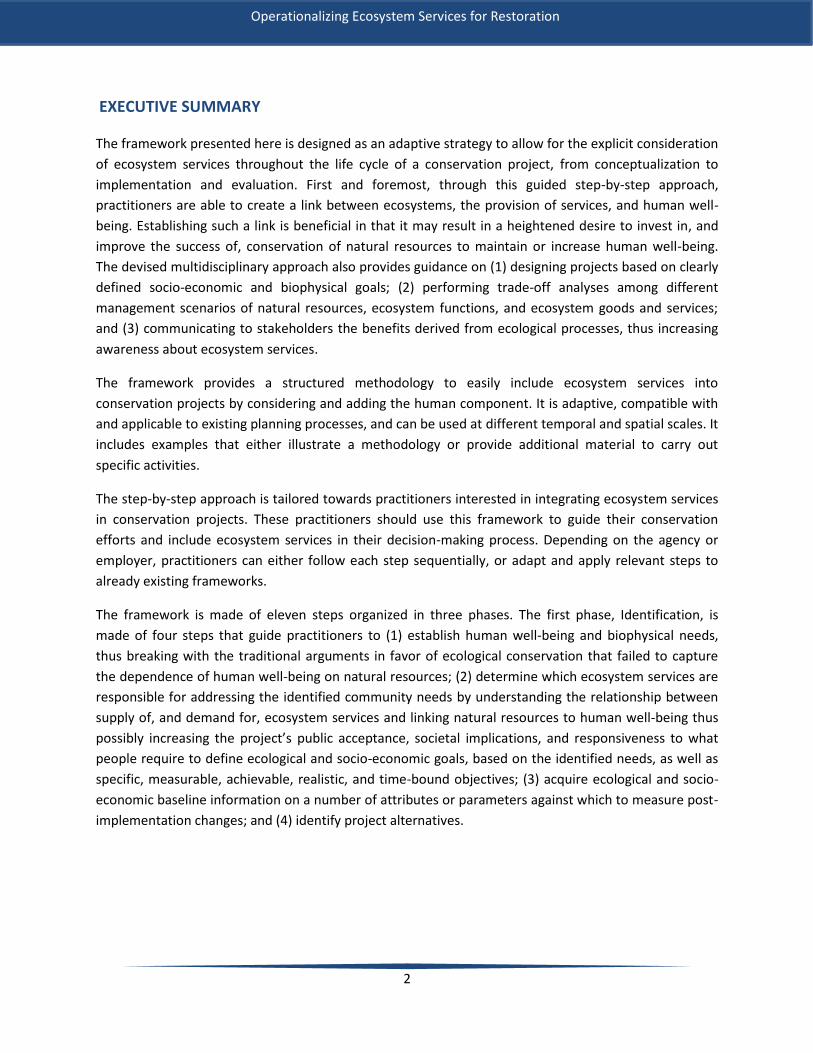
Outputs
Human and biophysical needs are identified.
Ecosystem services addressing human needs are determined.
A link between ecosystem services and human well-being is established.
Example 1: Short-term, quick economic returns versus long-term, slow changes in ecosystem
functions
“Heavy fertilizer was applied in the Mississippi River valley to increase agricultural productivity. The
economic benefits were immediate. However, the dead zone in the Gulf of Mexico, a consequence of
the heavy fertilizer, was not recorded until 20 years after the initial economic gains derived from
increased productivity. Different ecosystem’s functions and processes respond on different temporal
and spatial scales; trying to anticipate those responses will require the inclusion of temporal and
spatial analysis.”
Source: Tallis et al., 2008.
FRAMEWORK
PHASE I: IDENTIFICATION
Step 1: Establish human well-being and biophysical needs
Turner and Daily (2008) identifies three reasons why investment in conservation projects is still
relatively low: (1) “information failure”, (2) “institutional failure”, and (3) “market failure”. “Information
failure” is the lack of detailed information about ecosystem service flows and benefits to communities
from specific services. “Institutional failure” arises when ecosystem services beneficiaries are different
and distant from those who monetarily gain from ecosystem conservation. Lastly, “market failure”
occurs because most ecosystem services are not traded in a market and, consequently, are not provided
with a monetary value. Additionally, markets typically reward short-term monetary values of
ecosystems in detriment to long-term ecological health and human well-being (Turner and Daily, 2008).
Markets, along with regulations, should be designed not with instantaneous outputs in mind, but with
long-term goals that will ensure a sustainable flow of ecosystem services (Smith et al., 2011; Example 1).
This step will guide practitioners in establishing a link between ecosystem services and human well-
being, thus addressing both the “information failure” and “institutional failure” above.
Human activities are increasingly putting pressures on, and thus damaging, our natural resources. The
traditional arguments in favor of ecological conservation have not captured the dependence of human

13
Harte Research Institute
Process 1: Establish a clear link between ecosystems and human well-being
“Society lacks many of the prerequisites for goals that are technically, scientifically, and socially
feasible. Because both adequate background knowledge and reliable methods are lacking for many
restoration problems, large-scale projects will continue to be technically challenging. But these
shortcomings are unlikely to be addressed without first addressing the gap in social feasibility. The most
successful restoration projects (e.g. the Kissimmee River in FL, the Hackensack River Meadowlands in
NJ, and the Guanacaste dry forest in Costa Rica) have had adequate social support and have shared an
approach that integrates people into the restoration. The impetus for many of these projects was the
sense of loss felt by people living and working in or near the damaged ecosystems. The people most
affected must hold the system in considerable esteem to be willing to effect repairs and protect the
system from further damage.
In order to facilitate the social commitments necessary for restoration, the linkages between
restoration and quality of life must be made increasingly obvious at every scale, from local to global.
One approach is to rephrase some restoration goals in terms of ecosystem services.”
Source: Cairns, 2000.
well-being on natural resources, thus failing to make the case for investment to match the conservation
rhetoric (Turner and Daily, 2008). Traditionally, coastal restoration has been targeting the functional
characteristics of an ecosystem such as biological, physical, and chemical elements. However, from a
human perspective, the target should be on identifying and understanding how people use, benefit
from, and value our natural resources. Ecological and biophysical aspects are very important for the
success of a restoration activity; nevertheless, it is the human dimension of the project that will
determine stakeholders’ acceptance and well-being.
Failure to address the community’s needs and wants results in the project’s rejection by the same
community the project is intended to benefit (Thayer et al., 2005). To avoid failure, it is crucial to
establish a clear link between ecosystems, the benefits they provide to humans, and human well-being
(Process 1).

14
Operationalizing Ecosystem Services for Restoration
Task 1: Human and biophysical needs are identified.
First, practitioners must identify the community needs
and wants. Depending upon time and resources, this
task can be accomplished by using existing information
that local officials might already have gathered for other
conservation projects or by involving local communities
in public meetings. The latter is preferred. In fact, broad-
based stakeholders’ input adds credibility to the project
and increases acceptance amongst the community.
Possible community needs include, but are not limited
to, protection from extreme weather events (such as
hurricanes and flooding), increased food availability,
and/or enhanced water quality.
Also, biophysical needs must be accounted for. Does a
specific ecological function need to be restored? Is a
particular species in need of protection? Little guidance
is offered on this sub-task since practitioners have
traditionally been successfully doing this for decades,
neglecting to identify human needs.
The identification of both human and biophysical needs will help practitioners set their project goals and
objectives in Step 2.
Task 2: Ecosystem services addressing human needs are determined.
Once Task 1 has been completed, practitioners must determine which final ecosystem services are
responsible for addressing the identified community needs. The needs listed as examples in Task 1
(protection from extreme weather events, increased food availability, and/or enhanced water quality)
could be addressed by intermediate services such as soil retention, waste regulation, and nutrient
cycling. Final goods and services are what are valued (directly or indirectly) buy humans whereas
intermediate ecosystem goods and services produce these final goods and services. Their value is
embodied in the value of the final goods or services (Ringold et al., 2010).
At this point, it would be advantageous to understand the relationship between supply of and demand
for the ecosystem services of interest to the project and explore how to manage service flows
sustainably, while, at the same time, conserving natural resources. Additional useful information
includes the provision of those services (has it been previously impaired or disrupted?) and past projects
that might have had any effects on the services of interest.
Figure 6: Interviewing stakeholders. Source: HRI

15
Harte Research Institute
Example 2: River restoration: public attitudes and expectations
“The local public judged the success of the restorations in their own terms, mainly in terms of the
recreational, landscape, and wildlife benefits derived from project implementation. Where sites are
inaccessible or little known and used by the public, generating public interest and support for
restoration may be more problematical. Key benefits that local people would like from restoration,
such as hard surfaced paths, improved safety and a ‘tidy’ riverside, may have little to do with the
scientific restoration aims of managers.”
Source: Tunstall et al., 2007.
Task 3: A link between ecosystem services and human
well-being is established.
Task 2 provides a basis for practitioners to illustrate
that human well-being depends upon nature’s ability
to provide services and products such as clean water,
edible plants, fish, and fuel wood. When looking at
protecting or restoring natural resources, the
advantage of focusing on ecosystem services, rather
than only on biophysical functions, is the ability to link
natural resources to human well-being.
Practitioners should establish the link between needs
and services to easily define project goals and
objectives and illustrate it to the public during the
communication step.
This strong link to human well-being can increase the
project’s public acceptance, societal implications, and
responsiveness to what people require and can help
secure funding. Through this process, decision-makers
will also gain a better understanding of the impact of their management choices, hence making their
decisions more robust and defensible. A situation where there are clear winners (e.g. impoverished
populations benefiting from improved water quality) and where possible losers can be compensated
(e.g. land owners being compensated for restriction in agricultural development) is likely to generate
public acceptance (Bickel et al., 2012) as much as a situation where the local community can directly
experience restoration (Example 2).
Figure 7: Linking ecosystem services and human well-being: Recreational Fishing. Source: S. Flory

16
Operationalizing Ecosystem Services for Restoration
Example 3: Restoration initiatives addressing both human and biophysical needs
“Rather than considering a cause-effect relationship between biodiversity and ecosystem services, we
suggest that restoration projects should be designed with consideration of how biodiversity and
ecosystem services will respond to possible management actions and whether these responses will
coincide or conflict.
Examples exist of restoration initiatives that benefit both biodiversity and provision of ecosystem
services. For example, the restoration of native jarrah forest on bauxite mines in Western Australia
enhanced plant and vertebrate diversity as well as carbon sequestration and water storage.
Restoration management of the Arkansas River, by the cessation of heavy metal inputs, increased
water quality and enabled the recovery of fish and invertebrate populations. Reinstatement of
meanders in German rivers both decreased flooding risk and increased the diversity of the
invertebrate fauna.”
Source: Bullock et al., 2011.
Process 2: Questions to help identify human well-being and biophysical needs
1. What ecosystems provide which services? 2. Who benefits and over what scales of time and space? 3. What are the impacts of humans upon the supply of services? 4. How is the supply of services related to the condition of ecosystems? 5. How much damage has been done already? 6. What is needed to repair damaged ecosystems? 7. Where are the problems geographically? 8. How interdependent are ecosystem services? 9. How reliant are the services on biological diversity? 10. How much can technology substitute for ecosystem services?
Source: PCAST, 1998; Daily, 1999; Cork et al, 2001.
Incompatibilities between human and ecosystem needs may arise. However, through conflict resolution
and stakeholders’ involvement they can be resolved. To address concerns that practitioners may have
about these conflicts, examples of restoration projects that successfully addressed both are provided
(Example 3).
Practitioners can use the questions provided in Process 2 to accomplish tasks 1-3.

17
Harte Research Institute
Figure 8: Linking ecosystem services with human well-being: spiritual
heritage. Source: Dedda71. Wikimedia Commons
Case Study Application – Background and Step 1
On the barrier island considered for this case study wetland vegetation has been deteriorating for
several years due to both natural phenomena and anthropogenic modifications. Natural resource
managers met with decision makers and an agreement was reached to restore marsh vegetation.
However, the requirement was put forward that the project has to allow for the consideration of
ecosystem services throughout its duration, from planning to implementation and monitoring. A budget
of $95M has been allocated to cover all the phases of the project.
Task 1 - Human and biophysical needs: increase protection from storms; restore deteriorating wetland
habitat. Human needs are identified through public meetings held at local venues to allow for
community participation. Biophysical needs are identified by a team of scientists including ecologists,
biologists, geologists, and hydrologists.
Task 2 - Ecosystem services responsible for addressing the identified community needs: disturbance
regulation; habitat.
These services are identified by social scientists, called in to join the planning team and provide their
support and expertise.
Task 3 - Link between natural resources and human well-being: increasing dunes and wetland area will
reduce storm surge, thus protecting the community living behind the restored ecosystem and increasing
their safety.
The planning team establishes this link and informs the local community of the benefits of the
restoration project to be implemented.

18
Operationalizing Ecosystem Services for Restoration
Outputs
Basic ecosystem information is gathered.
Overall ecological and socio-economic goals of the conservation project are defined.
Specific objectives to accomplish the overall goals of the project are set.
Example 4: Traditional restoration projects
“River restoration projects are often based upon structural elements such as channel width, depth, and
sinuosity; it is, however, a flawed assumption that the integrity of ecological functions will follow. How
an ecosystem appears does not always reflect how it processes nutrients or supports life: restoring
structural elements will not necessarily restore functional elements.”
Source: Palmer and Filoso, 2009.
Step 2: Define ecological and socioeconomic goals and objectives
Traditionally, conservation/restoration projects have not been process-based, but instead structure-
based (Example 4). This means that in the past, projects aimed at conservation of ecosystem structures
rather than ecosystem processes and functions. At best, designs have been based upon structural
features that may be necessary, with no focus on the provision of ecosystem services (Palmer and
Filoso, 2009). To have successful conservation, project designs need to focus on ecological functions that
support the provision of specific ecosystem services. Those functions will determine the ecological goals
and the metrics to be used to monitor and evaluate the project’s performance (Palmer and Filoso,
2009).
Task 1: Basic ecosystem and socioeconomic information is gathered.
Before setting goals, practitioners must gather basic information to define and describe the target
ecosystem, its structure, functions, and processes spatially and temporally. A dedicated data collection
step is described below (Step 3). However, it is recommended that basic biophysical and socioeconomic
information be considered prior to identifying ecological and socio-economic goals in order to make for
fully informed decisions.

19
Harte Research Institute
Process 3: Ecological goal setting
“In this example, the ecosystem services to be restored are clean water, recreation and
aesthetic, flood and erosion control, and food. During the actual project, practitioners start
from the “restoration toolbox”, a series of actions that can restore or improve biophysical
processes such as removal of excess dissolved nitrogen or infiltration of rainwater into soils.
Unfortunately, the relevant supporting ecological processes are not currently well known for all
the ecosystem services.”
During the goal setting step, practitioners need to work through this diagram in reverse order (from
services, to functions, to restoration actions).
Source: Palmer and Filoso, 2009.
Task 2: Overall ecological and socio-economic goals of the conservation project are defined.
Practitioners ought to keep in mind that the ultimate goal of a conservation project should be to
maintain, restore or improve ecological functions rather than structure. Understanding both structure
and functions of an ecosystem is crucial to select the parameters, metrics, and methodology most
appropriate to first set and then accomplish the goals of the project (Thayer et al., 2003). First,
practitioners need to define the target of the restoration project, the ecosystem services to be
potentially supplied and the ecological goal, based upon the needs identified in Step 1 (Process 3).

20
Operationalizing Ecosystem Services for Restoration
Process 4: Key elements in assessing and valuing ecosystem services
“A process beginning with an ecosystem services inventory by stakeholders, followed by ecological,
social, and economic analysis has been proposed. It requires learning from scientists, communities,
agencies, industry, and economists as well as an effective communication plan. Ecosystem services
need to be discussed in terms of what they mean to people in the affected communities; this will
depend on people’s perceptions and needs for services, thus creating a bias in the number of services
that people identify. In fact, some stakeholders might understand better the meaning of “production
and maintenance of fertile soil” than “nutrient cycling” or “organic matter decomposition”. When
this happens, scientists need to step in and educate stakeholders about other important, but maybe
harder to understand ecosystem services.”
Source: Cork, 2001.
The overarching ecological goal should be phrased like “maintain or restore a specific ecosystem service
or a bundle of services”. In fact, a stronger case for conservation can be made when there is more
robust scientific evidence that specific actions or functions will lead to an improved or restored
provision of ecosystem services (Bickel, 2012).
Having identified the target ecosystem services and their links to human well-being (Step 1),
practitioners should not forget setting socio-economic goals. Defining socio-economic goals involves
finding approaches to determine what communities’ value. In fact, local communities are directly
affected by restoration projects in terms of recreational opportunities, aesthetics, culture, and
economics output. For effective goal setting, social scientists should be involved with the task to identify
specific beneficiaries and changes in socio-economic factors due to project implementation. Indeed, a
restoration project can bring additional socio-economic value to a community if it either allows for the
provision of new services (that did not exist prior to the project) or the increase of existing services or
other economic activities that depend on ecosystem condition. If the value of the benefits exceeds the
costs of restoration, then the restoration project can be justified because it generates net economic
benefits (Pendleton, 2010). An appropriate way to inform stakeholders about the ecosystem services at
stake should be devised (Process 4).

21
Harte Research Institute
Example 5: Setting SMART objectives
“Case: A 2m high weir, which is an obstacle to salmonid fish, is beginning to degrade in a flashy, high
energy catchment with gravel-bedded channels. There is an opportunity to remove this weir. The
amount and possible impact of extensive fine and gravel sediment accumulation behind the weir will
need to be investigated. It is anticipated that additional work will be needed to narrow the channel
where the weir pool is currently.
Main targets:
• Remove weir structure to restore fish passage to upstream gravel beds.
• Narrow the river to maintain clean gravels in weir location.
SMART objectives:
• Increase total number of Brown Trout spawning on upstream gravels within two seasons.
• Increase the total number of fish (abundance) passing through the reach in November.
• Reduce channel width by 30% for 60 m upstream of weir location using locally-sourced, tethered
wood (as a result of the project; i.e. following groundwork completion).”
Source: The River Restoration Centre, 2011.
Task 3: Specific objectives to accomplish the overall goals of the project are set.
Once the overall goals are determined, practitioners need to set specific objectives. To do this, outputs
must be determined starting with the broadest or long-term objectives then adding the mid- and short-
term. Practitioners ought to create a list of the activities and resources needed to achieve each specific
output; these should be stated as objectives. These should be written as “SMART” objectives:
Specific- use precise verbs that define observable changes in the output.
Measurable- add a numerical goal to the objective, something that can be counted.
Achievable- objectives need to be attainable.
Realistic- the objective should be plausible and attainable.
Time-bound- there should be a time limit to accomplish the objective.
An example of SMART objectives is provided in Example 5.

22
Operationalizing Ecosystem Services for Restoration
Example 6: Restoring ecosystem services in an impaired river basin
“The South Platte River basin (Colorado), like many other river basins in the world, has been altered
by water diversions, contiguous land use, and pollution, resulting in damaged ecosystem services,
including its fisheries. Partially due to the absence of riparian vegetation to filter pollutants, the
South Platte is the number one river for contamination by ammonia and nitrates, among the 20
major rivers in the U.S. The major issues of the basin are polluted water, erosion of the stream banks,
reduction of instream water by agricultural use, and irrigation return flows.
In an effort to improve the quality of the river and its associated services, an ecosystem services
approach to restoration was undertaken. During the first year, ecologists worked with economists to
determine which ecosystem services were provided by the South Platte River and how those services
could be represented in diagrams and figures. The services identified were: dilution of wastewater,
purification of water, erosion control, habitat for fish and wildlife, and recreation.
Subsequently, the management actions needed to achieve the ecological goals that would lead to
increased provision of ecosystem services were determined:
Create a ten-mile wide conservation easement along 45 miles of the River.
Restore native vegetation along the river as buffer strips.
Eliminate cropland and cattle grazing in the buffer strip area.
Reduce water diversions to agriculture from current 75% -50% of the total flow to 17%-42%.
These actions were believed to restore the ecosystem’s ecological functions and improve the
provision of its services. The funding for the restoration project was obtained through a tax added to
each household’s water bill, which had to be accepted by local households. To improve awareness
and acceptance of this measure, the team developed drawings and narrative that communicated the
current and improved state of the basin and the meaning of increased ecosystem services.”
Source: Loomis et al., 2000.
An example (Example 6) of goal and objective setting for a restoration project is provided here to illustrate
the process practitioners should follow in this step.

Case Study Application – Step 2
Task 1 - Basic ecosystem information is gathered to understand the structures and functions of the
wetland to be restored and causes of degradation. In this case, the salt marsh is made up of Spartina
Patens, which is less tolerant of flooding, more productive in irregularly-inundated habitats, and
supports a variety of organisms from mollusks to birds. Its deterioration is mostly due to anthropogenic
modifications that have both reduced sediment accretion and increased saltwater intrusion but also to
natural causes such as erosion. Loss per year is documented to be 2.5% over the past 45 years.
Task 2 - Ecological and socio-economic goals: Increase storm surge protection for communities living
behind a deteriorated marsh area. Create and restore 300 acres of marsh in a rapidly deteriorating
area of the barrier island that is currently open water.
Task 3 - Specific project objectives: Within a month identify sources of sediments to be utilized; within 2
months consult with engineers to define building and hydraulic specs; within 3 months have sediments
available at restoration site; within 6 months start building containment dikes and elevated plateau for
new vegetation; within 1 year start planting new marshes; etc.
Figure 9: Gathering ecosystem data. Source: HRI

24
Operationalizing Ecosystem Services for Restoration
Outputs
Baseline information is acquired.
Step 3: Acquire baseline information
It has been documented that the success of a project can be evaluated against a reference state (Bullock
et al., 2011). Therefore, practitioners ought to acquire baseline information prior to project
implementation (Example 7 and 8). This step, referred to as pre-implementation monitoring, involves
gathering baseline information to later allow for comparisons with post-implementation data to monitor
the progress of the project (Thayer, et al., 2005) and/or goal achievement. This entails acquiring
information on a number of attributes or parameters to record a baseline against which to measure
changes. These parameters should be selected based upon the project goals and objectives. Consulting
case studies and examples of current and past projects could help practitioners identify their data
needs.
Figure 10: Acquiring baseline information. Source: HRI

25
Harte Research Institute
Example 7: Restoration and management of riparian ecosystems: a catchment perspective
“The availability of baseline data is a prerequisite for evaluating changes that might be initiated by a
restoration effort. The collection of such data, often at a catchment-wide level, must begin prior to
project design and implementation. The initial step is to review ecological objectives and to select the
appropriate variables (physical and biological) for measurement. If an objective involves the re-
establishment of pre-anthropogenic disturbance conditions for riparian areas and flow regimes, the
information necessary could be obtained from historical hydrological records and aerial photographs,
which allow the evaluation of long-term changes in hydrologic, channel, and riparian conditions. For
example, flow records are often needed for defining flood frequency and magnitude. A time series of
aerial photographs can be used to determine both the chronosequence of spatial changes in riparian
forest stands and detect long-term channel adjustments (e.g. widths and sinuosity) following
disturbances. Once baseline data have been collected and analyzed, the development of a restoration
plan and procedures for implementation and evaluation can commence.”
Source: Wissmar and Beschta, 1998.
In this step the words “data” and “information” encompass documented qualitative or quantitative
information about the ecosystem of interest from published or unpublished research, experts,
stakeholders, or local knowledge holders. Practitioners’ efforts must be focused on accessing the best
available science through existing databases, portals, or clearing houses. Data might be available
through non-conventional sources such as tribal or community members. Data can be drawn from basic
ecosystem understanding of community members, synthesis from disparate or informal sources, and
understanding from similar ecosystems and societies. Ideally, a stakeholder process will engage a cross-
section of all available perspectives including those of resource users, citizens, managers, and experts or
specialized knowledge-holders (Example 9). If data availability poses a challenge due to few data or
existing knowledge not documented in a traceable and accessible way, then practitioners need to
acquire and prepare new data. However, this will require additional funding and delay the project. In
some cases model outputs can be used as substitute to reveal which connections in the system are
strongest and most affected by changes in management (Tallis et al. 2010).

26
Operationalizing Ecosystem Services for Restoration
Example 8: Baseline data for effective evaluation of stream restoration
“Project success can be evaluated only in reference to objective measures of environmental change,
and these require good baseline data. Baseline data collection should begin as long before project
construction as possible. To document geomorphic change, pre-project channel conditions can be
documented immediately before project construction. But many rivers are so dynamic that they can
be understood only by conducting a historical study to detect long-term adjustments to perturbations
or cyclical changes characteristic of a given river.
The choice of variables to measure as baseline should follow logically from the project objectives, and
the job of the post-project evaluator should be anticipated: what pre-project data will the
investigator need to adequately evaluate project success in achieving specific objectives? A great
deal of effort collecting baseline data may prove useless if the right data are not collected. For
example, extensive baseline data were collected for a stream restoration project recently completed
in northern California, but success in meeting some project goals could not be evaluated because the
pre-project data collected were not appropriate. One goal, to increase average pool depth by 50%,
could not be evaluated because pre-project data consisted of depths measured at regular intervals
along the channel, without regard for habitat type and without reference to permanent benchmarks.
Thus, there was no set of pre-project average pool depths with which the post-project depths could
be compared, and the lack of permanent benchmarks precluded repeat measurements at exactly the
same sites used in the pre-project depth measurements.”
Source: Kondolf, 2006.
If practitioners need to acquire and prepare new data, then data should be collected in a consistent
manner, i.e. collected following the same methodology at the different sites (with and without
restoration, i.e., control sites) and time intervals to allow for better comparisons. Also, practitioners
should collect baseline data in a reasonable period of time prior to project implementation to record
changes due to restoration. This is important because data are often not collected long enough before
and after the project to account for changes caused by restoration. For example, to capture the effects
of marsh restoration on recreational uses and home values, data collected one year before and after the
project might not be enough (Pendleton, 2010).

27
Harte Research Institute
Example 9: Ecosystem services data collection through stakeholders
“A scoping exercise was carried out to identify ecosystem service benefits possibly affected by
brownification. Key informants were contacted and data collected. This was done to identify those
ecosystem service benefits most likely affected. Two groups of stakeholders were subsequently chosen
for further study. We use “ecosystem service benefits” to mean benefits directly used by humans.”
Ecosystem service benefit Local key informants and data collection Conclusion
bathing in lakes Head of Kristianstad tourist office; municipality website with data on location and status of water quality for outdoor bathing facilities run by the municipality; interview.
No outdoor bathing facilities run by the municipality are affected by River Helge ǎ. Unofficial outdoor baths not explored.
bathing in the sea Owner of largest shorefront Hotel, head of Kristianstad tourist office, managers Biosphere Office; interview.
No indication of change in bathing number or behavior and no complaints. 15,000 people may visit the beach on a sunny day.
recreational fishing Chair of regional recreational fishing association; two reports from the Biosphere Office on status of freshwater fish; interview.
No indication of change in the number of fishing licenses sold or interest in recreational fishing.
bird watching Manager from Biosphere Office; two reports from the Biosphere Office on bird populations; interview.
No indication of change in bird watching behavior
attractiveness of the coastline
Owner of largest shorefront Hotel, head of Kristianstad tourist office, municipality data on level of tourism in the region; interview.
No indication of change in tourism to the coast linked to brownification.
grazing and haymaking on the meadows
Farmers on the meadows; interview with two farmers.
Brown deposition on grass noticed. Expressed concern for brownification affecting farming.
irrigation for crops Former chair of the largest irrigation system in the area (and Sweden); maps on irrigation systems; interview.
No indication of brownification affecting irrigation behavior.
ecotourism Manager from Biosphere Office; head of Kristianstad tourist office; owner of largest shorefront Hotel; interview, web search.
14 businesses were identified as ecotourism by the tourist office. The link to water quality and brownification was judged weak.
eel fishing Eel fishers; map of placement of fishing gear; interview with two fishers.
Strokes of brown water noticed, expressed concern for brownification affecting catch.
drinking water Municipality representative responsible for water; interview, municipality website on water.
No indication of brownification affecting municipality drinking water supply. Kristianstad municipality switched to using ground water in 1941.
Source: Tuvendal and Elmqvist, 2011.

28
Operationalizing Ecosystem Services for Restoration
Case Study Application – Step 3
Baseline information is acquired through the local and state management agencies and
historical knowledge from the local community.
A series of maps is available for the barrier island at intervals of 3/7 years. Maps were
created by different entities using data gathered through different techniques. This is not
ideal; however, it is the best available information and the map series shows wetland loss
and allows identifying specific areas to be restored. Also, utilizing the available maps will
limit project costs while allowing for post-project comparison with historical information.
The planning team is also assembling historical and socio-economic information related to
the local community, specifically real estate values of properties located on the back side
($250 to $400 per square foot), recreational uses (such as recreational fishing), and passive
use value of the deteriorating wetlands.
Practitioners should not just focus on biophysical information. Supplemental data such as social and
economic can include change in natural resource use or change in value (Example 9). While systematic
data will be used to evaluate the outputs of the project once completed, supplemental data will help
demonstrate the “why and how” of the project-output relationship (Pendleton, 2010).
Figure 11: Sabine National Wildlife Refuge. Source: USFWS

29
Harte Research Institute
Output
Possible project alternatives are identified.
Example 10: Environmental consideration for assessing dam removal alternatives for river
restoration
“Dam removal has received increasing attention over the last several years as a viable alternative to
the rehabilitation of unsafe dams and for consideration as many hydroelectric dams are due to be
relicensed in the U.S. The impacts of dam removal are compared with those expected by retaining and
actively managing the reservoir for fish and wildlife. The research approach described here for
addressing alternatives is recommended as a holistic procedure in which to make an environmentally
based decision regarding dam removal. A comprehensive environmental assessment of dam removal
and reservoir retention alternatives is necessary to overcome both the often simplistic view of dam
removal and to establish a more complete understanding of both restoration and retention
alternatives. The four restoration and retention alternatives are:
(1) full restoration-to restore river hydrology and floodplain function and remove all structures and
return topography to pre-construction conditions;
(2) partial restoration-to restore river hydrology and floodplain function with limited removal of
structures and alteration of topography;
(3) partial retention-reducing the size of the impoundment while restoring a portion of the now-
impounded river; and
4) full retention-retaining the dam and reservoir with active management for fish and wildlife
resources.”
Source: Shuman, 1995.
Step 4: Identify project alternatives
In this step, practitioners should identify all possible project alternatives that address the overall goal
and objectives defined in the previous step. To allow practitioners to successfully complete this step two
examples are provided below (Example 10 and 11).

30
Operationalizing Ecosystem Services for Restoration
Example 11: Alternative states and positive feedbacks in restoration ecology
“Models of alternative ecosystem states that incorporate system thresholds and feedbacks are
now being applied to the dynamics of recovery in degraded systems and are suggesting ways in
which restoration can identify, prioritize, and address these constraints. Given the risk of
inappropriate management sending the degraded system in an unintended direction, it might be
more costly to assume that a single dimension controls system dynamics rather than that
alternative states exist and are determined by interactions among many factors. Three alternative
restoration scenarios are considered: two that meet their restoration goals (a and c) and one that
does not (b). In case (a), changes in the system result primarily from alterations of historic
environment (e.g. the disturbance regime or abiotic conditions), and re-establishment of historic
environmental conditions returns the system along a successional trajectory (from the light-green
to the dark-green square). In case (b), changes in the historic environment are accompanied by
changes biotic processes that shift the internal dynamics of the system (e.g. shifts in plant–soil
feedbacks or limitation of propagules). The re-establishment of the historical environmental
conditions can have unintended (or no) effects on the system state and can shift the system along
another trajectory (to the red square). The restoration goal is not met. In case (c), biotic
constraints are addressed, shifting the internal feedbacks in the system (from the purple to light-
green square). Then, disturbance/abiotic re-establishment might be sufficient to return the system
to historical conditions. The major difference among these cases is the presence (and strength) of
internal controls within the degraded system. Recent work suggests that system thresholds and
feedbacks are common in degraded systems and restoration that takes these controls into account
(i.e. case c) is often very effective. Although these scenarios assume that the goal of the restoration
is to a state approximating pre-degradation conditions, these scenarios also apply to other goals
(i.e. designed ecosystems).”
Source: Suding et al., 2004.

31
Harte Research Institute
Case Study Application – Step 4
Project alternatives are identified and listed as follows:
Restore marsh with inclusion of tidal ponds and creeks (20% of the area);
Restore marsh and create a 70 ft. buffer of shrub vegetation;
Restore marsh and place additional sediments on existing dune system;
Restore marsh with inclusion of tidal ponds and creeks (12% of the area) and dune system
enhancement with vegetative planting.
Figure 12: Vegetated dunes at the Padre Island National Seashore. Source: S. Flory

32
Operationalizing Ecosystem Services for Restoration
Outputs
Criteria used to compare project alternatives are identified.
A suite of project alternatives is selected for possible implementation.
PHASE II: ANALYSIS
Step 5: Perform trade-off analyses
Practitioners face the challenge of determining which project alternative maximizes human well-being while addressing the mission of the specific organization that is commissioning the project. Therefore, trade-off analyses are called for. These analyses require looking at each individual project to determine if it increases or decreases the provision of the identified services of interest (Step 1). The project alternative that provides the most benefits should be the one considered for implementation. It is critical to carry out trade-off analyses so that informed decisions can be made concerning natural resources.
Task 1: Criteria used to compare project alternatives are identified.
First, practitioners must identify the criteria to be used to
compare project alternatives. What are the major attributes
of the projects? What are the uncertainties? What are the
impacts? What are the biophysical functions involved? What is
the value of the ecosystem services? What is the cost?
The loss of one service over another depends on the nature
and strength of their interaction. Not all services are lost due
to the increase in the provision of others; some services are
compatible. Literature review, ecosystem services valuation,
modeling, and mapping can help understand the effects of a
specific alternative on individual services and a bundle of
services. Practitioners need to remember that some services are not traded in a market and,
consequently, lack a monetary value, which would allow straightforward comparisons with other
services or economic activities (Lester et al., 2012). However, an ecosystem services valuation can be
carried out and the results expressed in non-monetary terms.
The major challenges are issues of spatial and temporal scale. Not all services are enjoyed locally or
immediately. Some services such as erosion control may be felt downstream in the form of improved
water quality, while for other services such as recreation beneficiaries are local. This underlines the
need to understand how services flow from one area to another, who the beneficiaries are and where
they are located, and who needs to be compensated for the loss of those services (Tallis et al., 2008).
Figure 13: Prioritization of ecosystem services provided by Gulf of Mexico ecological units. Source: HRI

33
Harte Research Institute
Example 12: Ecosystem services trade-off analysis for a sustainable ecotourism project
“Ecotourism may potentially give rise to a win-win situation (scenario b) for natural resources and
communities if it brings economic benefits to local communities thus leading to better community
stewardship of the natural resources. However, excessive development to support ecotourism and
excessive ecotourism activities such as fishing and hiking can lead to a decline in services provision and
of the natural resources that attracted tourists in the first place thus leading to a lose-lose situation for
communities and natural resources involved (scenario a). As an example, excessive ecotourism
activities and infrastructure development to support trekking in Nepal has led to an unsustainable
overharvest of firewood for cooking, consequently damaging local habitats. The way in which
ecosystems and the provision of different services are managed can result in win-win, lose-lose, or
trade-off scenarios (scenario c).”
“Under scenario (a) unrestricted ecotourism can lead to excessive infrastructure development and
tourist presence thus damaging many ecosystem services and forcing the collapse of ecotourism.
Under scenario (b) ecotourism is based upon good management of biodiversity and ecosystem
services, so that income is gained from ecotourism, biodiversity is enhanced, and ecosystem services
are preserved. Under scenario (c) ecotourism develops and biodiversity is protected in nature reserves,
but the increase in roads and hotels undermines water quality and fisheries, causing trade-offs among
ecosystem services and development.”
Source: Tallis et al., 2008.
Several methods exist to perform trade-off analyses; amongst those are the following: map comparison,
scenario analysis, and trade-off analysis using optimized landscapes (Lautenbach et al., 2010). The two
examples provided below (Example 12 and Process 5) demonstrate how to apply trade-off analyses to a
specific ecotourism case study and to a generic case comparing two services at a time using the frontier
analysis.

34
Operationalizing Ecosystem Services for Restoration
Process 5: Ecosystem services trade-off analysis using frontier shapes
“These frontier shapes allow for the comparison of only two ecosystem services (x and y axis), thus
oversimplifying the trade-off analysis. Management decisions usually affect multiple services
simultaneously, but in a frontier shape it is harder to visualize more than two services at once.”
Note: The shape of the frontier highlights the optimal management decisions, narrowing down the number of possible management scenarios. Source: Lester et al., 2012.

35
Harte Research Institute
Case Study Application – Step 5
Task 1 - Criteria used to compare project alternatives are identified as follows: elevation of restored
marsh; inundation frequency; vegetated or non-vegetated buffer; restored fish habitat; restored bird
habitat; cost.
Task 2 - A suite of project alternatives is selected for possible implementation according to the criteria
listed above. Only three alternatives are retained.
Restore marsh with inclusion of tidal ponds and creeks (20% of the area);
Restore marsh and create a 70 ft. buffer of shrub vegetation;
Restore marsh with inclusion of tidal ponds and creeks (12% of the area) and dune system
enhancement with vegetative planting.
The fourth alternative is discarded for several reasons, the major two being: it would not allow for an
additional vegetated buffer since it only plans for sediments to be added to the existing dunes; it would
require an increased amount of sediments, thus increasing project costs.
Task 2: A suite of project alternatives is selected for possible implementation.
Practitioners must select a suite of project alternatives for possible implementation among the set of
optimal project alternatives identified during trade-off analyses. This suite will be refined in the next
steps.

36
Operationalizing Ecosystem Services for Restoration
Outputs
Compatibility between selected suite of project alternatives and legal framework is tested.
Step 6: Analyze the legal framework
In this step, practitioners perform a search of existing regulations, property rights, and social norms that
are within the context of the identified suite of project alternatives (ecology, geography, and economics)
to ensure that the project alternative is compatible with current environmental law and policy
(Example 13). Amongst those regulations are the Clean Water Act, Clean Air Act, Endangered Species
Act, National Forest Management Act, and the National Environmental Policy Act to mention a few.
A conservation project whose main goal is to maintain ecosystem services provision is more likely to
succeed if legal, social, institutional, political and economic conditions provide a supportive and
appropriate background. However, there is a lack of ecosystem service-specific regulations.
Specifications are being written for the inclusion of ecosystem services in existing laws (Process 6).
Example 13: Protection and restoration of submerged aquatic vegetation in the Chesapeake Bay, USA
“Seagrasses along with many other species of freshwater rooted submerged macrophytes in Chesapeake
Bay (collectively called submerged aquatic vegetation, SAV) underwent serious declines in population
abundances in the 1970s and have not as yet rebounded to previous levels. Cooperative efforts by
scientists, politicians, federal and state resource managers, and the general public have developed
policies and plans to protect, preserve, and enhance SAV populations of Chesapeake Bay. These include
the Chesapeake Bay Agreements (1983, 1987, 1992, 1993, 2000), an SAV Management Policy and
Implementation Plan for Chesapeake Bay and Tidal Tributaries (1989 and 1990), Chesapeake Bay Blue
Crab Fishery Management Plan (1997), as well as federal and state guidelines for protecting SAV
communities from direct human impacts such as dredge and fill operations. The foundation for many of
these management efforts has been the recognition of the habitat value of SAV to many fish and
shellfish, and the elucidation of linkages between water quality conditions and the continuing occurrence
of SAV as established by minimal water quality habitat requirements for growth and survival. Because of
these linkages, the distribution of SAV in the Bay and its tidal tributaries is being used as an initial
measure of progress in the restoration of living resources and water quality. Restoration targets and
goals have been established to link demonstrable improvements in water quality to increases in SAV
abundance. The major challenge facing the Chesapeake Bay community will be to restore SAV habitat
and ecosystem functions to historic levels. However, the recent success in the development of policies,
plans, regulations and laws highlighting the importance of SAV communities in Chesapeake Bay and their
protection and restoration, is an excellent example of effective communication linkages and adaptive
management principles between scientists, resource managers, politicians and the public in the
Chesapeake Bay region. Only through these interactions will SAV restoration become a reality.”
Source: Orth et al. 2002.

37
Harte Research Institute
Process 6: Principles and Requirements for Federal Investments in Water Resources
“These Principles and Requirements are established pursuant to the Water Resources Planning Act of
1965 (Public Law 89-8), as amended (42 U.S.C.1962a-2) and consistent with Section 2031 of the
Water Resources Development Act of 2007 (Public Law 110-114). These Principles and Requirements,
and the supporting Guidelines, are intended to provide a common framework for analyzing a diverse
range of water resources projects, programs, activities, and related actions involving Federal
investment as identified by the agencies in the context of their missions and authorities. It is intended
that these Principles and the supporting Requirements and Guidelines be applied to a broad range of
Federal investments that by purpose, either directly or indirectly, affect water quality or water
quantity, including ecosystem restoration or land management activities.
[…]It is important that potential Federal investments be evaluated for their performance with respect
to the Federal Objective using a common framework. This common framework will allow for
comparison among potential Federal investments and facilitate the overall decision making process.
Evaluation methods should be designed to ensure that potential Federal investments in water
resources are justified by public benefits, particularly in comparison to costs associated with those
investments. Such methods should apply an ecosystem services approach in order to appropriately
capture all effects (economic, environmental and social) associated with a potential Federal water
resources investment. By design, such an approach traces the effects of a potential action through
the watershed or ecosystem in order to capture its effects and feedbacks and better captures the
values that ecosystems or watersheds contribute to our economy and well-being. The ecosystems
services approach is a way to organize all the potential effects of an action (economic, environmental
and social) within a framework that explicitly recognizes their interconnected nature. The services
considered under this approach include those flowing directly from the environment and those
provided by human actions. Services and effects of potential interest in water resource evaluations
could include, but are not limited to: water quality; nutrient regulation; mitigation of floods and
droughts; water supply; aquatic and riparian habitat; maintenance of biodiversity; carbon storage;
food and agricultural products; raw materials; transportation; public safety; power generation;
recreation; aesthetics; and educational and cultural values. Changes in ecosystem services are
measured monetarily and non-monetarily, and include quantified and unquantified effects. Existing
techniques, including traditional benefit costs analyses, are capable of valuing a subset of the full
range of services, and over time, as new methods are developed, it is expected that a more robust
ecosystem services based evaluation framework will emerge.”
Source: CEQ, 2013.

38
Operationalizing Ecosystem Services for Restoration
Case Study application – Step 6
Compatibility between selected suite of project alternatives and legal framework is tested. The three
alternatives are compatible with the current laws. The following federal acts and implementing
regulations have been taken into consideration:
National Environmental Policy Act (NEPA): requires federal agencies to integrate
environmental values into their decision making processes by considering the environmental
impacts of their proposed actions and reasonable alternatives to those actions
Clean Water Act - Section 404: an application for a construction permit will be submitted to
the U.S. Army Corps of Engineers for construction;
Endangered Species Act: the three alternatives selected will not affect any endangered or
threatened species;
Coastal Zone Management Act: an application for federal and state licenses will be
submitted to guarantee consistency with the Act;
National Historic Preservation Act - Section 106: the three alternatives selected will not affect
any property with historic, architectural, archeological, or cultural value that is listed on or
eligible for listing on the National Register of Historic Places (NRHP).
Figure 14: Restored wetland in Vermillion, Louisiana. Source: NOAA

39
Harte Research Institute
Example 14: Restoration of grazing lands in South Africa
“An hydrology-ecology-economic model was developed to better manage the natural capital of
Ukombe, South Africa. Ukombe is located in the Maloti-Drakensberg mountains that supply much
ofthe water to the country through rivers and interbasin transfers. The grassland cover of these
ranges is essential for maintaining a regular flow of clean water, but it has been transformed
through various unsustainable land uses. The results of the model showed that restoration efforts
focused on the provision of a suite of ecosystem services generated higher net returns compared to
current management practices (i.e. intensive grazing- one service). Furthermore, the economic return
on the water flow far exceeded that of conventional water development programs.”
Source: Bullock et al., 2011.
Step 7: Choose project alternative to implement
After project alternatives have been identified, trade-off analyses performed, and a legal framework
examined, practitioners must select the project alternative to implement. The project should be chosen
amongst the suite of optimal alternatives compatible with existing laws and regulations to reach the
overall socio-economic and ecological goals. At this point practitioners should have all the elements and
criteria necessary to proceed with the selection process. The case below (Example 14) illustrates how
net return was taken into consideration in support of restoration versus current land management. This
approach could be adapted to test alternatives and select the most viable project to implement.
Outputs
Preferred project alternative to implement is selected.

40
Operationalizing Ecosystem Services for Restoration
Example 15: Investing in natural capital for flood protection “The approach of Napa, California, to invest in nature for flood protection is now an example of
success, but it was implemented after 28 major floods and over U.S.$500 million in damages since
the beginning of record-keeping in 1862.
During late 1990s, Napa residents decided to take a new approach to flooding. Rather than investing
in physical capital to protect themselves against flooding, i.e. reinforcing levees and concrete
barriers, they adopted an ecosystem services framework and invested in increasing the capabilities of
the river to provide protection against floods. The plan included moving nine bridges and over 100
buildings and restoring 250 ha of floodplain. Replacing the bridges eliminated obstacles to high
flows, terracing banks rejoined the river to its historic flood plain, and easements and acquisitions
removed especially susceptible structures from being destroyed. In total, the project diminishes
flooding over six of the 55 miles of the Napa River.
Interestingly, this ecosystem services approach was more costly (U.S.$200 million) than the physical
capital alternative (U.S.$150 million) and residents had to pay part of that difference. Nevertheless,
this approach was chosen in anticipation of the ancillary benefits the project would bring, including
restoration of fisheries, improved aesthetics, and increased recreation, tourism, and associated
commerce.
Since the investment, the town has rejuvenated with increased boating, hiking, fine dining, and other
amenities that the residents could not imagine enjoying when the city was fighting the flooding. The
city’s Economic Development Office has confirmed that after the project was approved, there was a
major increase in private investment, totaling U.S.$193 million in private construction from 1999 to
2005.”
Source: Turner and Daily, 2008.
The example below (Example 15) provides an insight into an ecosystem services approach to flooding
chosen by a community. Stakeholders decided that investing in natural capital, rather than in physical
capital, provided more benefits to the community, even if the monetary costs were initially higher.

41
Harte Research Institute
Case Study Application – Step 7
The preferred project alternative is selected for implementation: Restore marsh with inclusion of tidal
ponds and creeks (12% of the area) and dune system enhancement with vegetative planting. The
reason for selecting this alternative is twofold:
It provides the most restored habitat for bird species since not only new marsh will be
constructed, but additional vegetation will be planted on the dune system for stabilization.
Additionally, this will increase the opportunities for bird-watching, a recreational activity
that was not originally considered in the planning steps and adds enhanced opportunity for
recreational fishing;
It provides the highest and most long-term storm protection to the local community since
the enhanced dune system will protect the newly created marsh for several years to come.
Figure 15: Local community involved in oyster reef restoration. Source: HRI
42
Operationalizing Ecosystem Services for Restoration
PHASE III: IMPLEMENTATION AND EVALUATION
Step 8: Implement the selected project alternative
At this point practitioners should implement the selected project alternative, thus converting the plan
created into an actual operating program. An example of project implementation designed to restore
specific ecosystem services is provided in Example 16.
Below are some of the elements necessary for project implementation. This is not a comprehensive list.
Projects may have different and/or additional requirements.
Secure funding and develop an operational budget.
Develop a realistic project timeline that includes beginning and end date for each task together with
milestones, both short and long term.
Define requirements to ensure compliance such that personnel involved in project implementation
are aware of what is needed to comply with current laws and regulations. Provide both field
personnel and management with specific techniques and methods to follow.
Secure permits required by government agencies (if applicable). Certain tasks may require a permit;
these are, but not limited to, the excavation or filling of streams and wetlands, other earthwork
activities, herbicide use, and prescribed burning. Other permits may be applicable for the protection
of endangered species, historic sites, etc. (Clewell et al., 2005).
Define roles and responsibilities of field personnel and management. The planning team is not
necessarily going to be involved in on-the-ground activities. Therefore, additional resources and
team members with different skill sets need to be identified and brought in (U.S. EPA, 2008). The
restoration team will include the restoration ecologist, the project manager, other technical
personnel who may contribute to the project, and anyone else whose input will critically affect the
project. Also, individual responsibilities need to be clearly assigned (Clewell et al., 2005).
Schedule tasks needed to fulfill each project objective to streamline the process and ultimately
achieve the project goals. Identify personnel and/or organizations responsible to implement the
tasks.
Acquire necessary materials, equipment, and supplies.
Continue stakeholder involvement. Stakeholders may or may not be involved in on-the-ground
activities. If they are there needs to be a coordinated effort. In either case, stakeholders and the
public at large should be kept updated on the status and results of the activities (U.S. EPA, 2008).
Measure progress against set milestones. Prepare work plans and keep track of the tasks that have
been accomplished and activities that still need to be implemented (U.S. EPA, 2008).
Outputs
The selected project alternative is implemented.

43
Harte Research Institute
Example 16: 100-1000: Restore coastal Alabama
“Over the last several decades, Mobile Bay has experienced significant loss of oyster reefs, seagrass
beds, and coastal marsh habitats from dredge-and-fill activities, seawall and jetties, erosion, storm
events, and other causes. Despite these challenges, coastal Alabama represents one of the largest
potential areas for outright restoration, replacement, and enhancement of these lost habitats on the
northern Gulf Coast due to the size of the estuary, historic distribution of oysters, high natural oyster
spat sets, and warm water for fast growth.
Oyster reef breakwaters/living shorelines are the foundation of a healthy and resilient coastal
ecosystem, providing valuable services to both people and nature, including:
Reduction in shoreline erosion and subsequent property loss;
Habitat for oyster larvae to settle and colonize;
Nursery habitat for commercially and recreationally important finfish and shellfish;
Stabilization of sediments and decrease in turbidity;
Improved or expanded tourism opportunities;
Removal of nutrients which cause algal blooms, impacting fisheries and tourism.
Oyster reefs are an investment. They rebuild the natural capital and by harvesting only the yearly
interest, the principal is left untouched, ensuring we have oysters, fisheries, marshes, and shoreline
protection for the future. Restoring the environment helps restore local economies. An investment in
oyster reef restoration will have a considerable return on investment in terms of recreational and
commercial fisheries and protection of property and public infrastructure. The restoration may also
indirectly influence water quality and tourism. All of these factors combined strengthen Gulf Coast
communities and economies and make them more resilient.
Restoration is done using concrete, rebar, and other materials; breakwater reefs are placed along the
shoreline. In areas where oyster colonization is high, oyster shell is used because oysters prefer to
attach to other oysters. Several different types of reefs can be constructed. Based on past projects, for
every mile of breakwater reef/living shoreline we create, we conservatively protect approximately 10
acres of intertidal habitat between the reefs and shore. By building 100 miles of oyster reef
breakwaters/living shorelines, we will protect and promote the growth of more than 1000 acres of
coastal marsh and seagrass. So far, two projects have already been implemented at Helen Wood Park
(in 2011) and Pelican Point (in 2013). In 2011 over 500 volunteers used 16,000 bags of oyster shells to
construct 1/4 mile of reef that helps preserve the coastline, serves as new habitat for a variety of
marine life, and combats the degradation that this region has experienced.”
Source: 100-1000: Restore Coastal Alabama, 2013.

44
Operationalizing Ecosystem Services for Restoration
Case Study Application – Step 8
The selected project alternative is implemented.
Experts estimate that on the barrier island healthy marsh elevation is approximately +1.3 feet NAVD
88 (North American Vertical Datum of 1988). Therefore, to allow for desirable marsh elevation for
most of the project life (estimated to be about 20 years), a fill elevation of +2.0 feet NAVD 88 is
chosen. The elevation of the restored marsh is a critical factor in that it controls flooding frequency
and duration. Based upon 10 years of data, it is calculated that at this elevation the restored marsh
would be inundated approximately 25% of the time, suitable for the locally-dominant Spartina
patens. 2.57 million cubic yards of sediments are transported from a nearby site where the local port
authority is deepening the navigational channel; this limits project costs and allows for beneficial use
of dredged material. Following engineers’ recommendations, containment dikes are also built with a
crown elevation of +3.0 feet NAVD 88, a crown width of 6 feet, and side slopes of 1(V):3(H).
Tidal ponds and creeks (12% of the total restoration area) are created to guarantee inundation
throughout the restored marsh platform. Vegetation is immediately planted on the newly created
platform to stabilize the sediment and prevent its loss from erosive processes. Vegetation is also
planted on the dunes to stabilize the system thus providing additional protection for the restored
marsh against overwash and breaching. The time of planting is advertised and several members of
the local community volunteer to help the project team with this activity.
Figure 16: Marsh restoration in Louisiana. Source: www.wlf.louisiana.gov

45
Harte Research Institute
Process 7: Adaptive management
“The adaptive-management approach requires that the responses of the ecosystem to the
management action, as characterized by a suite of key valued ecosystem components and services, be
monitored at a sufficient spatial and temporal resolution and for a sufficient length of time to
determine if the action is creating the desired effect. This monitoring/evaluation process must have
adequate power to detect ecosystem changes in the presence of natural variability. If monitoring
shows that the ecosystem has reached its established goals, then maintenance monitoring can be used
to identify deviations over time. If monitoring shows that the ecosystem has not reached the goals for
the system but is on the expected trajectory toward those goals, then additional time can be given to
see if the ecosystem will reach the desired endpoints. If, however, the ecosystem does not appear to be
responding as desired or if it is moving away from the desired goals, this implies either that some
aspect of the conceptualization of the ecosystem and its drivers and stressors requires refinement, or
that the quantitative model developed based on the qualitative conceptual model needs modification,
additional data, or other refinements. The appropriate conceptual and/or numerical models can be
modified and rebuilt to take this new monitoring data into account, and the scenario analysis then
repeated with the new, improved models. In this way, the overall process has the capability to “learn”
from new data, experience, or scientific understanding, and the manager can take that improved
information into account when making future management choices on this or other related issues.
Likewise, a change in goals for the ecosystem (for example, if it becomes clear from monitoring that
the goals set for the ecosystem are unachievable, or if political changes result in new management
constraints) can be incorporated into the process in much the same way.”
Source: Reiter et al., 2013.
Step 9: Monitor and measure performance
This step and step 10 are part of the adaptive management approach (Process 7). Adaptive
management, or learning by doing, is a systematic approach for monitoring progress and outputs to
understand the system and its responses. It is an iterative process that allows practitioners to make the
necessary adjustments to enhance effectiveness and reach project goals. The approach helps maintain
flexibility by incorporating opportunities for changes (U.S. DOI, 2010).
Outputs
A monitoring plan is established.
Project performance is measured.

46
Operationalizing Ecosystem Services for Restoration
Task 1: Establish monitoring plan.
Prior to carrying out monitoring, practitioners should establish a monitoring plan (Process 8), specifying
sampling design, scale, variables, and methods. Sampling design should be sufficient to detect effects
that are environmentally important, given the natural, spatial, and temporal variation of indicators. In
selecting adequate indicators, practitioners must consider the response time to treatment and the
likelihood of detecting undesirable changes before they become irreversible (Murray and Marmorek,
2003).
Figure 17: Monitoring restoration results. Source: www.tpdw.state.tx.us
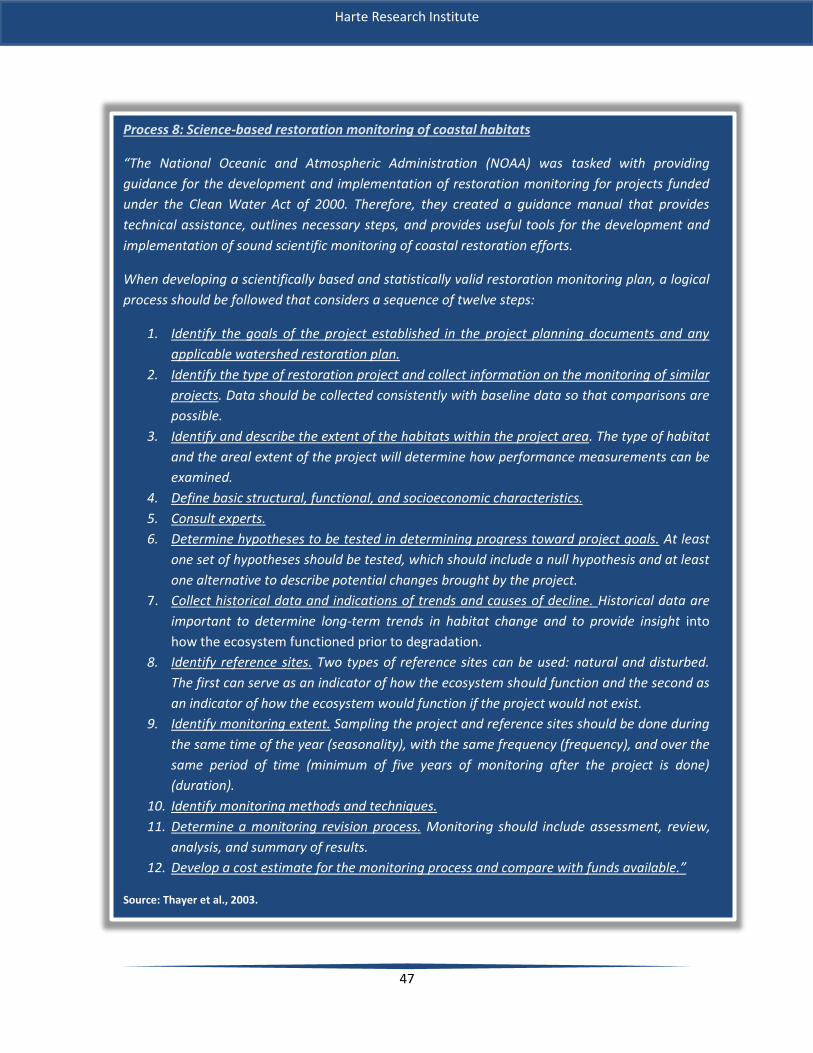
47
Harte Research Institute
Process 8: Science-based restoration monitoring of coastal habitats
“The National Oceanic and Atmospheric Administration (NOAA) was tasked with providing
guidance for the development and implementation of restoration monitoring for projects funded
under the Clean Water Act of 2000. Therefore, they created a guidance manual that provides
technical assistance, outlines necessary steps, and provides useful tools for the development and
implementation of sound scientific monitoring of coastal restoration efforts.
When developing a scientifically based and statistically valid restoration monitoring plan, a logical
process should be followed that considers a sequence of twelve steps:
1. Identify the goals of the project established in the project planning documents and any
applicable watershed restoration plan.
2. Identify the type of restoration project and collect information on the monitoring of similar
projects. Data should be collected consistently with baseline data so that comparisons are
possible.
3. Identify and describe the extent of the habitats within the project area. The type of habitat
and the areal extent of the project will determine how performance measurements can be
examined.
4. Define basic structural, functional, and socioeconomic characteristics.
5. Consult experts.
6. Determine hypotheses to be tested in determining progress toward project goals. At least
one set of hypotheses should be tested, which should include a null hypothesis and at least
one alternative to describe potential changes brought by the project.
7. Collect historical data and indications of trends and causes of decline. Historical data are
important to determine long-term trends in habitat change and to provide insight into
how the ecosystem functioned prior to degradation.
8. Identify reference sites. Two types of reference sites can be used: natural and disturbed.
The first can serve as an indicator of how the ecosystem should function and the second as
an indicator of how the ecosystem would function if the project would not exist.
9. Identify monitoring extent. Sampling the project and reference sites should be done during
the same time of the year (seasonality), with the same frequency (frequency), and over the
same period of time (minimum of five years of monitoring after the project is done)
(duration).
10. Identify monitoring methods and techniques.
11. Determine a monitoring revision process. Monitoring should include assessment, review,
analysis, and summary of results.
12. Develop a cost estimate for the monitoring process and compare with funds available.”
Source: Thayer et al., 2003.

48
Operationalizing Ecosystem Services for Restoration
Task 2: Measure project performance.
After establishing a plan, practitioners must monitor progress and measure project performance.
Without this step, projects are prone to risks. For example, managers might fail to identify early
warnings that the project is not on track (Thayer et al., 2005). Since measuring performance is closely
tied to project goals and objectives, the spatial and temporal scales of monitoring ought to be designed
and carried out based upon those goals and objectives.
Monitoring should include measures of structural elements, such as sediment grain size, topography and
bathymetry, and water source and velocity, but also of functional elements, like nutrient cycling,
primary productivity, pollination, and erosion control. Traditionally, structural elements have been the
focus of monitoring practices to measure the performance of restoration projects. However, structural
elements are not enough to estimate the economic value of restoration or the impact on the potential
supply of ecosystem services. Factors like how communities use the ecosystem, what benefits people
receive from it, and what attributes of the habitat generate passive use value can help us understand
what is determining the specific ecological outcome elements of restoration that are needed to estimate
its economic value (Pendleton, 2010). Functional characteristics (Example 17) offer a better assessment
of whether the ecosystem is providing the desired ecosystem services, thus meeting project goals and
objectives (Thayer et al., 2005). Monitoring should take into consideration socio-economic metrics, such
as the economic value and the added social benefits provided by restoration (Example 18). Therefore, as
part of this task ecosystem services identification and valuation would be necessary (Example 19 and
20), for which results can be expressed either in monetary or non-monetary terms. Specifically,
practitioners should consider both use value- the willingness of society to pay for the direct or indirect
use of an ecosystem- and passive use value- the willingness of society to pay for the existence or
improvement of an ecosystem, whether now or in the future. With these data, practitioners can attempt
to isolate the economic impacts of restoration from other factors and provide convincing evidence that
indeed restoration provides economic benefits to local communities (Pendleton, 2010).

49
Harte Research Institute
Example 17: Parameters associated with the functional characteristic “Provides feeding grounds”
“This example shows identified potential parameters to be measured in the monitoring of a coastal
restoration project. Although most projects will have multiple goals, this will pertain to the single goal
“increase the acreage of marsh habitat within the project area as a means of supporting an
endangered terrapin population”.
Geographical
Acreage of habitat types (associated with the structural element of the goals)
Biological
Plants
Interspersion of habitat types (allows access to marsh habitat)
Herbaceous species composition and percent cover (type and density of marsh plants is one
aspect of the quality of the habitat)
Animals
Species, composition, and abundance of:
o Fish (potential prey items)
o Invertebrates (potential prey items)
o Reptiles (terrapins)
Hydrological
Physical
Water level fluctuation over time (important for marsh health, as well as aspect of terrapin
biology including breeding and feeding)
Soil/Sediment
Physical
Basin elevations (important aspect of habitat quality and accessibility)
Geomorphology, including slope and cross section (important for marsh diversity and
accessibility).”
Source: Thayer et al., 2003.

50
Operationalizing Ecosystem Services for Restoration
Example 18: Performance measures
“The Forest Service currently reports its program accomplishments in metrics required by Congress
(acres treated, miles of stream restored, etc.), but these do not fully capture the outcomes of
management activities from an ecosystem services perspective. This table provides for specific
management activities current output-based metrics compared to potential ecosystem service
outcomes that could result from the projects or action listed. These lists are not complete or fully
representative.”
Recreation
Activity Target/Metric FY08 accomplishment
Examples of ecosystem service outcomes
Trail Miles 9 Recreational experiences (hiking, biking, hunting, etc.)
construction or Aesthetics and spiritual experiences
reconstruction Sense of place
Cultural heritage values
Protection of fragile ecosystems (wetlands, streams, etc.)
Visitor use Number 1.9 million Recreational experiences (hiking, biking, hunting, etc.)
of visits (FY08 National Aesthetics and spiritual experiences Visitor Use Sense of place
Monitoring Cultural heritage values
Survey) Community economic development and higher real estate values
Fuel treatment – reducing fuel with the intent of decreasing fire risk and improving forest health
Activity Target/Metric FY08 accomplishment
Examples of ecosystem service outcomes
Fuel reduction Acres 25,000 Increased forest resilience to disturbance, resulting in sustained vegetation cover and subsequent provisioning, regulating, supporting, and cultural services
Enhancement of wildlife habitat
Community safety
Economic benefits (property protection)
Watershed restoration
Activity Target/Metric FY08 accomplishment
Examples of ecosystem service outcomes
Watershed Acres 44 Fresh water
restoration Climate, water, and erosion regulation
Fish and wildlife habitat
Recreational Opportunities
Aesthetics and spiritual experiences
Economic benefits from irrigation
Water quality improvements
Enhanced nutrient cycling
Soil restoration Acres 1,966 Improved plant growth, resulting in provisioning, regulating, supporting, and cultural services
Regulation of water flow
Filtration of nutrients and pollutants resulting in improved water quality
Source: Smith et al., 2011.

51
Harte Research Institute
Example 19: Coastal protection and stabilization valuation
“In Thailand mangrove deforestation has focused attention on the two principal services provided
by mangrove ecosystems, their role as nursery and breeding habitats for offshore fisheries and as
natural ‘storm barriers’ to periodic coastal storm events, such as wind storms, tsunamis, storm
surges and typhoons. The use of the replacement cost method is compared to the expected damage
function approach to estimate the coastal protection and stabilization value provided by mangroves
in southern Thailand.
According to the Harbor Department of the Royal Thai Ministry of Communications and Transport,
the unit cost of constructing artificial breakwaters to prevent coastal erosion and damages from
storm surges is estimated to be US$1,011 (in 1996 prices) per meter of coastline. Based on this
estimate, the authors calculate the equivalent cost of protecting the shoreline with a 75-meter
width stand of mangrove is approximately US$13.48 per m2, or US$134,801 per ha (1996 prices).
Over a 20-year period and assuming a 10% discount rate, the annualized value of this cost amounts
to $14,169 per ha. The analysis uses this replacement cost value to calculate the annual and net
present value welfare losses associated with the two mangrove deforestation estimates for
Thailand over 1996–2004. For the Food and Agricultural Organization (FAO) mangrove
deforestation estimate of 18km2 per year over 1996–2004, the annual welfare loss in storm
protection service is around US$25.5 million, and the net present value of this loss over the entire
period ranges from US$121.7 to146.9 million. For the Thailand deforestation estimation of 3.4km2
per year, the annual welfare loss in storm protection is about US$4.9 million and the net present
value of this loss over the entire period ranges from US$23.2 to 28 million.
The expected damage function approach, which is a special category of ‘valuing’ the environment
as ‘input’, is nominally straightforward; it assumes that the value of an asset that yields a benefit in
terms of reducing the probability and severity of some economic damage is measured by the
reduction in the expected damage. For the FAO mangrove deforestation estimate of 18km2 per year
over 1996–2004, the expected damage function approach estimates the annual welfare loss in
storm protection service to be around US$3.4 million ($2.3 to 5.8 million with 95% confidence), and
the net present value of this loss over the entire period ranges from US$16.1 to 19.5 million ($11.2
to 33.4 million with 95% confidence). For the Thailand deforestation estimation of 3.4km2 per year,
the annual welfare loss in storm protection is over US$0.65 million ($0.45 to 1.1 million with 95%
confidence), and the net present value of this loss over the entire period ranges from US$3.1 to 3.7
million ($2.1 to 6.4 million with 95% confidence).”
Source: Barbier, 2007.

52
Operationalizing Ecosystem Services for Restoration
Example 20: The value of wetlands in protecting southeast Louisiana from hurricane storm surges
“A storm surge analysis was performed along a transect in southeast Louisiana. The transect
orientation and location were determined by a previous study derived from validated numerical
models, developed to simulate hurricane storm surge, tides, and river flow in the Gulf Coast region
in support of flood protection and restoration. The time-dependent surge elevations for the entire
duration of each modeled storm were used to define the maximum storm surge elevation gradients
along the transect. 12 locations were selected where time-dependent storm surge data for each
storm were available from the simulations. The analysis was based on storm surge simulations for
four hypothetical hurricanes traversing the transect. The distances between the 12 locations were
sub-sampled at equal intervals to yield 100 points (from sea to land). At each point were calculated
the wetland-water ratios, which serve as the measure of wetland continuity (WL), ranging from
open water (WL= 0) to solid marsh (WL =1), and wetland roughness (WR), a measure of the bottom
friction caused by the presence of wetland vegetation, ranging from no vegetation (WR= 0.02) to
high dense vegetation (WR= 0.045). With each segment having unique WL and WR, it was possible
to determine how these characteristics attenuate storm surge as it traverses each transect
segment. The simulations indicated that storm surges associated with these four hurricanes would
impact residential property in 15 southeastern Louisiana parishes. The property damage analysis
was conducted with USACE data from 312 potentially affected sub-planning units (SPUs) across
these parishes, which average approximately 1,780 households per SPU with a mean residential
property value of $170,701. The expected damage function approach was employed to determine
the marginal value of wetland continuity and vegetation in terms of reducing storm damage to
residential property in the 312 potentially affected SPUs of southeastern Louisiana.
A 1% increase in the wetland-water ratio along each segment will reduce storm surge by 8.4% to
11.2%. A 1% increase in wetland roughness will decrease storm surge by 15.4% to 28.1%. These
estimates suggest that storm surge will be reduced by 1 m per 9.4 to 12.6 km of additional wetlands
along the transect analyzed. A 0.1 increase in WL will reduce flood damages by $99 to $133 for the
average SPU, and a 0.001 increase in WR will reduce damages by $24 to $43. An equivalent
marginal increase in wetland continuity over approximately 6 km (the average length of one of the
transect segments) would lower residential property flood damages by $592,000 to $792,100 for
the average SPU, whereas the marginal increase in bottom friction over 6 km would reduce flood
damages by $141,000 to $258,000 for the average SPU. Given the mean residential property value
of $170,701 per SPU, these latter values of a marginal change in wetland continuity and vegetation
roughness are equivalent to saving 3 to 5 and 1 to 2 properties per storm, respectively.
These findings show that investments in wetland conservation and restoration could reduce the
future vulnerability of the coast to periodic hurricane storm surges and decrease the risk of
substantial flood damages to residential property. The value of temperate wetlands in protecting
coastal property from storm surges may prove to be the most significant benefit, as this case study of
southeastern Louisiana shows.”
Source: Barbier et al., 2013.

53
Harte Research Institute
Case Study Application – Step 9
Task 1 - A monitoring plan is in place and includes the following criteria: resistance to erosion,
flooding frequency, plant mortality, recreational uses, bird species counts,…
Task 2 - Progress is monitored and project performance is measured. Initial monitoring of the newly
created marsh shows that there is enough hydrologic exchange between the marsh and adjacent
water bodies. However, the marsh is not colonizing the internal part of the platform. The assumption
that planting only the perimeter of the created marsh platform would suffice to provide a source of
propagules for the remainder of the area, so that vegetative colonization could occur on a more
natural progression, is disproved. Therefore, further plantings are required.
Herons and plovers are returning to the area; however, more species are expected to be present once
the platform is fully planted.
A sample of local residents is systematically surveyed to elicit their preferences for the non-market
values associated with the restored ecosystem services, such as passive use values (e.g., spiritual and
historical values and aesthetics and existence, among others). The recreational value of the restored
area is calculated based upon the substantial revealed preference valuation literature.
Monitoring activities are set to continue at 5 year intervals until the end of the project.
Figure 18: Monitoring beach erosion. Source: HRI

54
Operationalizing Ecosystem Services for Restoration
Case Study Application – Step 10
An adjustment to project activities is carried out. Additional planting is under way on the internal
part of the newly created platform. In fact, planting of the perimeter is proved insufficient for
colonization of the whole area. This requires additional funding and sets the project behind schedule;
however, this adjustment is necessary to meet the objectives and the goals set for this project.
Step 10: Adjust
Based upon the results of monitoring, practitioners may need to adjust project activities to achieve
goals and objectives. If monitoring shows that the activities undertaken did not achieve the expected
results changes need to be implemented before performing a new assessment (Example 21 and 22).
There could be multiple reasons for not achieving the results: changing environmental conditions,
assumptions, faulty instruments, and so on. Practitioners must identify the cause(s) of the issue prior to
making adjustments.
Outputs
Project activities are adjusted based upon monitoring results (if applicable).
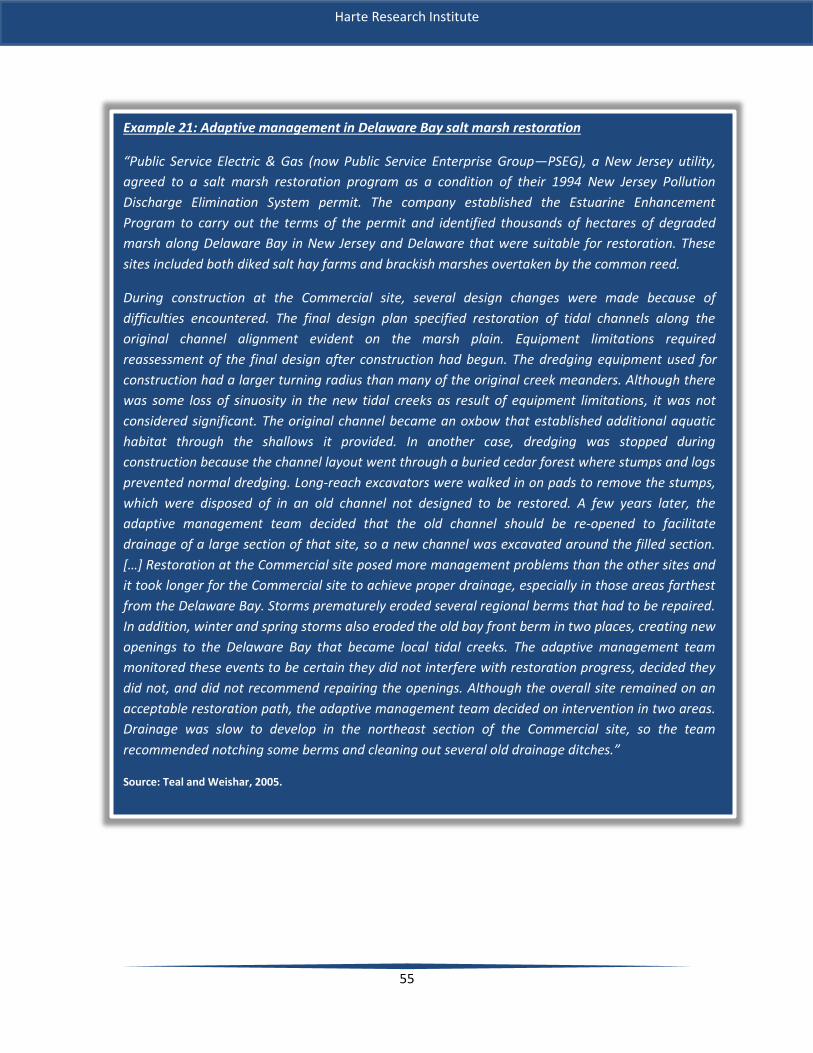
55
Harte Research Institute
Example 21: Adaptive management in Delaware Bay salt marsh restoration
“Public Service Electric & Gas (now Public Service Enterprise Group—PSEG), a New Jersey utility,
agreed to a salt marsh restoration program as a condition of their 1994 New Jersey Pollution
Discharge Elimination System permit. The company established the Estuarine Enhancement
Program to carry out the terms of the permit and identified thousands of hectares of degraded
marsh along Delaware Bay in New Jersey and Delaware that were suitable for restoration. These
sites included both diked salt hay farms and brackish marshes overtaken by the common reed.
During construction at the Commercial site, several design changes were made because of
difficulties encountered. The final design plan specified restoration of tidal channels along the
original channel alignment evident on the marsh plain. Equipment limitations required
reassessment of the final design after construction had begun. The dredging equipment used for
construction had a larger turning radius than many of the original creek meanders. Although there
was some loss of sinuosity in the new tidal creeks as result of equipment limitations, it was not
considered significant. The original channel became an oxbow that established additional aquatic
habitat through the shallows it provided. In another case, dredging was stopped during
construction because the channel layout went through a buried cedar forest where stumps and logs
prevented normal dredging. Long-reach excavators were walked in on pads to remove the stumps,
which were disposed of in an old channel not designed to be restored. A few years later, the
adaptive management team decided that the old channel should be re-opened to facilitate
drainage of a large section of that site, so a new channel was excavated around the filled section.
[…] Restoration at the Commercial site posed more management problems than the other sites and
it took longer for the Commercial site to achieve proper drainage, especially in those areas farthest
from the Delaware Bay. Storms prematurely eroded several regional berms that had to be repaired.
In addition, winter and spring storms also eroded the old bay front berm in two places, creating new
openings to the Delaware Bay that became local tidal creeks. The adaptive management team
monitored these events to be certain they did not interfere with restoration progress, decided they
did not, and did not recommend repairing the openings. Although the overall site remained on an
acceptable restoration path, the adaptive management team decided on intervention in two areas.
Drainage was slow to develop in the northeast section of the Commercial site, so the team
recommended notching some berms and cleaning out several old drainage ditches.”
Source: Teal and Weishar, 2005.

56
Operationalizing Ecosystem Services for Restoration
Example 22: Cote Blanche hydrologic restoration (TV-04)
“Problems: Construction of several oilfield canals altered the hydrologic regime of Cote Blanche
project area marshes, thus increasing water exchange between interior marsh areas and East and
West Cote Blanche Bays that directly contributed to marsh deterioration and loss. Also, shoreline
erosion has been a major problem, and breaches along the shoreline have begun to provide
additional exchange points between interior marshes and the bays.
Restoration Strategy: Low-level weirs were constructed in the Cote Blanche system to reduce the
water exchange between the system's interior marsh and the outer bays, thereby preventing
continued scouring of the marsh substrate and conversion to open water. The lower energy
hydrologic regime also encourages accretion of available sediment. In addition, a PVC sheet-pile
wall was constructed along 4,140 linear feet of shoreline between Jackson Bayou and the British
American Canal to minimize wave-induced erosion.
Project Effectiveness: The project construction was completed in January 1999. Monitoring is
ongoing, and preliminary field data have been gathered. The most notable effect of the project was
a reduction in the range of water level fluctuation. Project completion was followed by two years of
historic drought conditions so significant biological response to the structures has likely not
occurred. The hydrologic response to the structures appears positive under these conditions, and
longer datasets will be necessary to better discern whether the project is performing as planned.
Recommended Improvements:
Additional monitoring elements that should be considered are water velocity, vegetation,
and sediment accretion.
The shoreline protection should be extended further west. Shoreline protection should be
added to prevent erosion from circumventing the structures in Mud and Jackson Bayous
and Humble-F Canal. Shoreline protection should be investigated where East Cote Blanche
Bay is encroaching on School Bus Bayou as well as the enlargement of some of the openings
from the Gulf Intracoastal Waterway to allow more sediment delivery into the project area.
Project recommendations should be integrated with the landowner needs.
Lessons Learned:
Project planners constantly find that water level, elevation, salinity, and other data to
better understand project area systems and develop appropriate project plans are lacking.
Sufficient geotechnical investigations (done for this project) and hydrologic modeling should
be built into the design and evaluation of projects of this type.
Agencies’ Monitoring Plan Goals and Objectives should have been more consistent.
It was difficult to find a satisfactory reference area for this project, hence an area
embedded inside the project boundaries was chosen.
Source: Raynie and Visser, 2002.

57
Harte Research Institute
Step 11: Communicate project results
As the last step, practitioners need to communicate the results of the implemented restoration to the
public to increase awareness of the benefits communities will derive from the project. Throughout the
life of the project stakeholders directly affected have been involved in different ways (setting goals,
identifying baseline information, etc.). At this point, it is critical to present project outputs and their
tangible links to human well-being so a non-scientific, non-technical audience can understand.
Oftentimes, when communicating with the public, practitioners use technical and scientific terms thus
limiting the understanding of the importance of some ecosystem services. In practical terms, most
people are familiar with and recognize as important “production and maintenance of fertile soil”
because they know fertile soil is needed for agriculture and food production. On the other hand, most
people would not understand the terms “nutrient cycling” or “organic matter decomposition” in spite of
their roles in supporting the provision of clean water (Cork et al, 2001). Therefore, the language used
matters and can make the difference in stakeholders’ engagement and appreciation. Practitioners
should consider discussing ecosystem services in terms related to people’s perceptions and needs for
services from the environment rather than scientific or economic theory (Cork et al., 2001). A way to
simplify the ecological complexity of ecosystems and focus on helping people understand the
relationship between ecosystems and the provision of goods and services is shown in Process 9.
It is recommended that practitioners develop a communication plan that is based upon and/or takes
into consideration of the following elements:
Understand and explain why the project and its outputs are important to the public;
Simplify links between natural resources and human well-being (Process 9);
Demonstrate how the value of ecosystem services benefits society;
Improve communication through the use of successful examples (Example 23);
Present relevant examples;
Provide most up to date information;
Develop key messages (Example 24);
Identify delivery mechanisms (Process 10);
Create and make available materials to target audience (Example 23).
Outputs
The results of the project are communicated to the public.

58
Operationalizing Ecosystem Services for Restoration
Process 9: Communicating ecosystem services to stakeholders
“This diagram was developed as a way to simplify ecological complexity and to focus people’s
thinking about the relationship between natural assets, ecological goods and other products, and the
services that emerge through transformations between assets and products. In this framework,
ecosystem services contribute to the economic and social wellbeing of people in two ways:
• Through the use of natural assets to provide inputs to production. For example, fruit
production is dependent on the service of pollination, which in turn is dependent on the
natural asset of biota to provide insect pollinators. Similarly, crops are dependent on the
service of nutrient cycling, which uses the natural asset of soil.
• By maintaining natural assets through regenerating the assets (e.g. maintaining soil health
through nutrient recycling) and through the assimilation of by-products arising from
production processes or from consumption of goods (e.g. assimilation of carbon dioxide from
industry by vegetation or detoxification of chemicals by soil micro-organisms).”
Source: Cork et al., 2001.
Example 23 shows a one page summary fact sheet that introduces the services “water purification.” This
was developed for public dissemination. It is part of a more comprehensive toolkit that includes key
points, a science summary, resources, and case studies; a similar toolkit is available for “pollination” (ESA
and UCS, 2013).

59
Harte Research Institute
Example 23: Materials: fact sheet
WATER PURIFICATION FACT SHEET
WATER PURIFICATION: An Essential Ecosystem Service We all need Water to Survive Water purification is one of the many services provided by ecosystems. Pollutants such as metals, viruses, oils, excess nutrients, and sedimentation are processed and filtered out as water moves through wetland areas, forests, and riparian zones. This purification process provides clean drinking water and water suitable for industrial uses, recreation, and wildlife habitat.
Economic Benefits. The United States spends more than $2 billion annually for clean water initiatives. It’s much easier to prevent pollution than to clean contaminated water. For example, rather than spend $8billion on a water treatment facility in New York City, New York State opted to spend $1 billion to restore the watershed that provides the City’s drinking water.
Health. Once in water, pathogens that are harmful to humans can be difficult to remove; but natural purification processes can often keep them from even reaching source water. Giardia, an intestinal parasite that is difficult to remove from drinking water sources, occurs in higher concentrations in water receiving urban pollution than water flowing through protected forested watersheds.
Eutrophication Reduction. The excessive input of nutrients, eutrophication, is a major cause of fish kills. It accounts for about half of the damaged lake area and 60% of the damaged rivers in the United States.
Recreation. More than half of all the U.S. adults hunt, fish, birdwatch, or photograph wildlife. U.S. fishing related expenditures alone totaled more than $37 billion in 1996. The U.S. Fish and Wild Service estimates that up to 43% of threatened and endangered species rely directly or indirectly on wetlands for their survival.
How Natural Water Purification Works Water purification depends on filtration by soil particles and living organisms in the water and soil. Human activities that compact soil, contaminate the water or alter the composition of organisms, degrade the purification process and can accelerate movement of unfiltered water through the system and into our water supplies.
Wetlands. Wetlands can remove 20% to 60% of metals in the water, trap and retain 80 to 90% of sediment from runoff and eliminate 70 to 90% of entering nitrogen. Many types of plants are specially adapted to different kinds of wetlands, and a large percentage of the nation’s imperiled plants and animals depend on wetlands for at least part of their life cycle.
Riparian Forests. Riparian (streamside) forests act as “living filters” that intercept and absorb sediments, and store and transform excess nutrients and pollutants carried in runoff from adjacent lands. They can reduce the nitrogen concentration in water runoff and floodwater by up to 90%, and can reduce phosphorous by as much as 50%.
Microorganisms. Microorganisms are the natural chemical engineers of the ecosystem. Bacteria and other organisms utilize or break down nutrients, metals, and other chemical contaminants in the water.
Constructed Wetlands. Constructed wetlands mimic some of the filtration power of natural systems. They can be cost efficient for small communities but cannot replace natural wetlands, and may not provide the many other wetland services (such as flood control and fish and wildlife habitat).
Note: this fact sheet is part of a series of materials on ecosystem services available through the Ecological Society of America and the Union of Concerned Scientists’ “Communicating Ecosystem Services Project” Source: Taken from ESA and UCS, 2013

60
Operationalizing Ecosystem Services for Restoration
Example 24: Key messages “We don’t even know what we are losing.
We only care for what we value.
We can’t have it all, but there are win-wins.
To get ahead we need to keep an eye to the future.”
Source: COMPASS, 2010.
Process 10: Delivery mechanism: the message triangle
The Message Triangle is a tool to help you stick to what’s persuasive to voters, what’s important to
them, and helps you repeat it so it will be heard.
Source: Morris, 2010.

61
Harte Research Institute
Case Study Application – Step 11
The results of the project are communicated to the public.
The local community has been involved throughout the life of the project from needs
identification, to data gathering, and vegetation planting. It is important nonetheless to
communicate the results of the project in a clear way. A video showing the different steps of the
project and related benefits to the local community is developed with middle school students.
The video is used for both outreach and educational purposes and showed at community events
such as festivals and meetings and used in classrooms.
Figure 19: Community restoring oyster reefs. Source: HRI

62
Operationalizing Ecosystem Services for Restoration
APPENDIX
Workshop Participant List
Moderator Institution
Ann Weaver NOAA
Name of Participant Institution
Allee, Rebecca J. NOAA
Altsman, Diane EPA
Brenner, Jorge The Nature Conservancy
Carollo, Cristina Harte Research Institute
Cebrian, Just Dauphin Island Sea Lab
Devore, Debbie U.S. Fish & Wildlife Service South Florida/Everglades
Fikes, Ryan Gulf of Mexico Foundation
Giles Simon, Suzanne Restore America's Estuaries
Greening, Holly S. Tampa Bay Estuary Program, Executive Director
Harris, Bob Alabama Port Authority
Henderson, Jim U.S. Army Corps of Engineers
Hensley, Rebecca Texas Parks and Wildlife
Herrmann, Jason Alabama Marine Resources Division
Khalil, Syed Louisiana Office of Coastal Protection and Restoration
Montagna, Paul Harte Research Institute
Norris, Henry Florida Fish & Wildlife Conservation Commission
Pace, Niki Mississippi-Alabama Sea Grant Consortium Legal Program
Plotkin, Pamela Texas Sea Grant College Program
Richards, Carol Louisiana Office of Coastal Protection and Restoration
Ritchie, Jay Mississippi State University
Santos, Carlota P. Harte Research Institute
Swafford, Rusty NOAA- National Marine Fisheries Service
Vogt, Craig Craig Vogt Inc.
Woodrow, Woody Fish and Wildlife Biologist at U. S. Fish and Wildlife Service
Yoskowitz, David Harte Research Institute
Workshop Organizing Committee:
Rebecca J. Allee, Cristina Carollo, Jim Henderson, Steve Jordan, Jay Ritchie, Carlota Santos, David W.
Yoskowitz.

63
Harte Research Institute
REFERENCES
100-1000: Restore Coastal Alabama [WWW Document]. http://100-1000.org/ Accessed on April 08,
2013.
Barbier, E. B. 2007. Valuing ecosystem services as productive inputs. Economic Policy, 22: 177-229.
Barbier, E. B., I. Y. Georgiou, B. Enchelmeyer, and D. J. Reed. 2013. The value of wetlands in protecting
southeast Louisiana from hurricane storm surges. PLoS ONE 8(3): e58715.
Doi:10.1371/journal.pone.0058715.
Bickel, R., E. McKenzie, B. Morris, and B. McKenney. 2012. Ecosystem Services: can ecosystem services
work for your conservation project? Conservation Learning Exchange. The Nature Conservancy.
Natural Capital Project.
Boyd, J. and S. Banzhaf. 2006. What are ecosystem services? The need for standardized accounting
units. Resources for the Future. RFF DP 06-02. 26 pp.
Bullock, J.M., J. Aronson, A. C. Newton, R. F. Pywell, and J. M. Rey-Benayas. 2011. Restoration of
ecosystem services and biodiversity: conflicts and opportunities. Trends in Ecology & Evolution 26:
541–549.
Cairns Jr, J. 2000. Setting ecological restoration goals for technical feasibility and scientific validity.
Ecological Engineering 15: 171-180.
[CEQ] Council on Environmental Quality. 2013. Principles and requirements for federal investments in
water resources. Washington, DC. 16 pp.
Clewell, A., J. Rieger, and J. Munro. 2005. A society for ecological restoration publication: Guidelines for
developing and managing ecological restoration projects. Society for Ecological Restoration
International. http://www.ser.org/resources/resources-detail-view/guidelines-for-developing-and-
managing-ecological-restoration-projects Accessed on April 08, 2013.
[COMPASS] Communication Partnership for Science and the Sea. 2010. Communicating the science of
ecosystem services to decision makers. 2-3 December. 1 p.
Cork, S., D. Shelton, C. Binning, and R. Parry. 2001. Third Australian stream management conference
August 27-29. Rutherford, I., Sheldon, F., Brierley, G., and Kenyon, C. (Editors). Cooperative Research
Centre for Catchment Hydrology: Brisbane. 157-162.
Daily, G. C. 1999. Developing a scientific basis for managing Earth's life support systems. Conservation
Ecology. 3:14.
Daily, G. C. 2000. Management objectives for the protection of ecosystem services. Environmental
Science and Policy. 3: 333-339.

64
Operationalizing Ecosystem Services for Restoration
de Groot, R.S., R. Alkemade, L. Braat, L. Hein, and L. Willemen, 2009. Challenges in integrating the
concept of ecosystem services and values in landscape planning, management and decision making.
Ecological Complexity In press, Corrected Proof.
[ESA] Ecological Society of America and [UCS] Union of Concerned Scientists. 2013. Communicating
ecosystem services project [WWW Document]. http://esa.org/ecoservices/wate/body.wate.fact.html
Accessed on April 14, 2013.
Farber, S., R. Costanza, D. L. Childers, J. Erickson, K. Gross, M. Grove, C. S. Hopkinson, J. Kahn, S. Pincetl,
A. Troy, P. Warren, and M. Wilson. 2006. Linking ecology and economics for ecosystem management.
BioScience 56: 121–133.
Fisher, B., R. K. Turner, and P. Morling. 2009. Defining and classifying ecosystem services for decision
making. Ecological economics. 68: 643-653.
Hein, L., K. van Koppen, R. S. de Groot, and E. C. van Ierland. 2006. Spatial scales, stakeholders and the
valuation of ecosystem services. Ecological economics 57: 209-228.
Helming, K., K. Diehl, D. Geneletti, and H. Wiggering. 2013. Mainstreaming ecosystem services in
European policy impact assessment. Environmental Impact Assessment Review. In press.
Kondolf, G. M. 2006. Five elements of effective evaluation of stream restoration. Restoration Ecology. 3:
133-136.
Lautenbach, S., M. Volk, B. Gruber, C. F. Dormann, M. Strauch, and R. Seppelt. 2010. Quantifying
ecosystem services trade-offs. In: International Environmental Modelling and Software Society “2010
International Congress on Environmental Modelling and Software – Modelling for Environment’s
Sake”. Fifth Biennial Meeting, Ottawa Canada. D. A. Swayne, W. Yang, A. A. Voinov, A. Rizzoli, and T.
Filatova (Eds). http://www.iemss.org/iemss2010/proceedings.html
Lester, S.E., C. Costello, B. S. Halpern, S. D. Gaines, C. White, and J. A. Barth. 2012. Evaluating tradeoffs
among ecosystem services to inform marine spatial planning. Marine Policy. 38: 80-89.
http://dx.doi.org/10.1016/j.marpol.2012.05.022
Loomis, J. 2000. Vertically Summing Public Good Demand Curves: An Empirical Comparison of Economic
versus Political Jurisdictions. Land Economics, 76 (2): 312-321.
MacMillan Dictionary Thesaurus, 2012. Online American English Thesaurus from Macmillan Publishers
Limited.
Morris E. 2010. Nature’s value: measuring nature’s benefits when communicating about nature. The
Nature Conservancy. 12 p.
Murray, C. and D. Marmorek. 2003. Adaptive management and ecological restoration. Chapter 24, in:
Freiderici, P. (ed.). 2003. Ecological restoration of Southwestern Ponderosa Pine Forests. Island Press
(Washington, Covelo CA, London), pp. 417-428.

65
Harte Research Institute
Orth R. J., R. A. Batiuk, P. W. Bergstrom, and K. A. Moore, 2002. A perspective on two decades of policies
and regulations influencing the protection and restoration of submerged aquatic vegetation in
Chesapeake Bay, USA. Bulletin of Marine Science 71: 1391-1403.
Palmer M. A. and S. Filoso. 2009. Restoration of ecosystem services for environmental markets. Science
325: 575-576. DOI: 10.1126/science.1172976
PCAST. 1998. Teaming with life: Investing in science to understand and use America's living capital.
President's Committee of Advisors for Science and Technology, Washington D.C.
Pendleton, L. 2010. Measuring and monitoring the economic effects of habitat restoration: a summary
of a NOAA Blue Ribbon Panel. Nicholas Institute for Environmental Policy Solutions, Duke University in
partnership with Restore America’s Estuaries. 58 pp.
Raynie, R. C. and J. M. Visser. 2002. CWPPRA adaptive management review – Final report. Prepared for
the CWPPRA Planning and evaluation subcommittee, technical committee, and task force. 47pp.
Reiter M.A., G. C. Matlock, J. H. gentile, M. A. Harwell, R. Kelty, J. W. Barko, S. Baker, and G. Scott. 2013.
An integrated framework for informing coastal and marine ecosystem management decisions. Journal
of Environmental Assessment Policy and Management. 15, 1350003 (22 pages). DOI:
10.1142/S1464333213500038
Reynolds, L.K., K. J. McGlathery, and M. Waycott. 2012. Genetic diversity enhances restoration success
by augmenting ecosystem services. PLoS ONE 7, e38397.
Ringold, P. L., A. M. Nahlik, J. Boyd, and D. Bernard. 2010. Report from the workshop on indicators of
final ecosystem goods and services for wetlands and estuaries. Environmental Protection Agency.
EPA/600/X-11/014. 38 pp.
Shuman, J.R. 1995. Environmental considerations for assessing dam removal alternatives for river
restoration. Regulated Rivers: Research and Management. 11: 249-261.
Simpson, D.R. 2011. The Ecosystem Service Framework: A critical assessment. Ecosystem Services
Economics Working Paper Series. Paper n. 5. The United Nations Environment Programme. 23pp.
Smith, N., R. Deal, J. Kline, D. Blahna, T. Patterson, T. A. Spies, and K. Bennett. 2011. Ecosystem services
as a framework for forest stewardship: Deschutes National Forest overview. United States
Department of Agriculture. Forest Service. General Technical Report PNW-GTR-852.
Suding, K. N., K. L. Gorss, and G. R. Houseman, 2004. Alternative states and positive feedbacks in
restoration ecology. Trends in Ecology and Evolution. 19: 46 -53.
Tallis, H., P. Kareiva, M. Marvier, and A. Chang. 2008. An ecosystem services framework to support both
practical conservation and economic development. Proceedings of the National Academy of Sciences
of the United States of America 105.28: 9457-464.

66
Operationalizing Ecosystem Services for Restoration
Tallis, H., P. S. Levin, M. Ruckelshuas, S. E. Lester, K. L. McLeod, D. L. Fluharty, and B. S. Halpern. 2010.
The many faces of ecosystem-based management: Making the process work today in real places.
Marine Policy. 34, 340-348.
Teal, J. M. and L. Weishar. 2005. Ecological engineering, adaptive management, and restoration
management in Delaware Bay salt marsh restoration. Ecological Engineering, 25: 304-314.
Thayer, G.W., T. A. McTigue, R. J. Bellner, F. M. Burrows, D. H. Merkey, A. D. Nickens, S. J. Lozano, P. F.
Gayaldo, P. J. Polmateer, and P. T. Pinit. 2003. Science-based restoration monitoring of coastal
habitats. Volume One: A framework for monitoring plans under the Estuaries and Clean Water Act of
2000 (Public law 160-457). U.S. Department of Commerce. National Oceanic and Atmospheric
Administration.
Thayer, G.W., T. A. McTigue, R. J. Salz, D. H. Merkey, F. M. Burrows, and P. F. Gayaldo. 2005. Science-
based restoration monitoring of coastal habitats. Volume Two: Tools for monitoring coastal habitats.
U.S. Department of Commerce. National Oceanic and Atmospheric Administration.
The river Restoration Centre. 2011. Practical river restoration appraisal guidance for monitoring options
(PRAGMO). Guidance Document on suitable monitoring for river and floodplain restoration projects.
Cranfield, UK. 320 pp.
The American Heritage® Dictionary of the English Language, Fourth Edition copyright ©2000 by
Houghton Mifflin Company. Updated in 2009. Published by Houghton Mifflin Company. All rights
reserved.
Tunstall, S. M., E. C. Penning-Roswell, S. M. Tapsell, and S. E. Eden. 2007. River restoration: Public
attitudes and expectations. Water and Environmental Journal. 14: 363-370.
Turner, R.K. and D. G. Daily. 2008. The ecosystem services framework and natural capital conservation.
Environmental and Resource Economics. 39: 25–35.
Tuvendal, M. and T. Emqvist. 2011. Ecosystem services linking social and ecological systems: river
brownification and the response of downstream stakeholders. Ecology and Society. 16: 21-37.
[U. S. DOI] U.S. Department of the Interior, 2010. Adaptive management [WWW Document]. U.S.
Department of the Interior. URL http://www.doi.gov/initiatives/AdaptiveManagement/whatis.html
[U. S. EPA] United States Environmental Protection Agency. 2008. Handbook for developing watershed
plans to restore and protect waters. Office of water. Nonpoint Source Control Branch. Washington,
D.C. EPA 841-B-08-002.
Wissmar, R. C. and R. L. Beschta. 1998. Restoration and management of riparian ecosystems: a
catchment perspective. Freshwater biology. 40: 571-585.

67
Harte Research Institute
Yoskowitz, D., C. Santos, B. Allee, C. Carollo, J. Henderson, S. Jordan, and J. Ritchie 2010. Proceedings of
the Gulf of Mexico Ecosystem Services Workshop: Bay St. Louis, Mississippi, June 16-18, 2010. October.
16 pages. Harte Research Institute for Gulf of Mexico Studies. Texas A&M University-Corpus Christi.