
Operation of Norwegian Hydropower Plants and Its Effect on ...
20
water Article Operation of Norwegian Hydropower Plants and Its Effect on Block Fall Events in Unlined Pressure Tunnels and Shafts Bibek Neupane 1, *, Kaspar Vereide 2 and Krishna Kanta Panthi 1 Citation: Neupane, B.; Vereide, K.; Panthi, K.K. Operation of Norwegian Hydropower Plants and Its Effect on Block Fall Events in Unlined Pressure Tunnels and Shafts. Water 2021, 13, 1567. https://doi.org/10.3390/ w13111567 Academic Editors: Jochen Aberle and Robert Boes Received: 30 April 2021 Accepted: 30 May 2021 Published: 1 June 2021 Publisher’s Note: MDPI stays neutral with regard to jurisdictional claims in published maps and institutional affil- iations. Copyright: © 2021 by the authors. Licensee MDPI, Basel, Switzerland. This article is an open access article distributed under the terms and conditions of the Creative Commons Attribution (CC BY) license (https:// creativecommons.org/licenses/by/ 4.0/). 1 Department of Geoscience and Petroleum, Norwegian University of Science and Technology (NTNU), Petroleumsteknisk Senter, F 410, Valgrinda, S.P Andersens Vei 15a, 7031 Trondheim, Norway; [email protected] 2 Department of Civil and Environmental Engineering, Norwegian University of Science and Technology (NTNU), Vassbygget, 322, Valgrinda, S. P. Andersens veg 5, 7031 Trondheim, Norway; [email protected] * Correspondence: [email protected] Abstract: The main objective of this study is to investigate the effect of hydropower plant operation on the long-term stability of unlined pressure tunnels of hydropower plants in Norway. The authors analyzed the past production data of some hydropower plants to find out the number of starts/stops and the frequency and magnitude of load changes. The study demonstrates that an average of 200–400 start/stop events are occurring per turbine per year for the analyzed period, with an increas- ing trend. Currently, 150–200 large load changes per turbine smaller than 50 MW are occurring every year, and this is expected to increase by 30–45% between 2025 and 2040 for one of the studied power plants. Most importantly, the monitored pressure transients and pore pressure response in the rock mass during real-time operation at Roskrepp power plant are presented. A new method is proposed to calculate and quantify the hydraulic impact (HI) of pressure transients on rock joints and the effect of duration of shutdown/opening, which is found to be the most dominant parameter affecting the magnitude. The results show that faster shutdown sequences cause unnecessary stress in rock mass surrounding pressure tunnel. The hydraulic impact (HI) can be more than 10 times higher when the shutdown duration is reduced by 50 percent. The study recommends that duration of normal shutdowns/openings in hydropower plants should be slower so that hydraulic impacts on the rock joints are reduced and cyclic hydraulic fatigue is delayed, prolonging the lifetime of unlined pressure tunnels and shafts. Keywords: hydropower; unlined pressure tunnels; hydraulic transients; hydraulic impact; long-term stability; cyclic fatigue; block falls 1. Introduction The world energy market is going through a monumental shift from a fossil-fuel-based system to a renewable energy-based system, following the Paris agreement signed in 2015. According to [1], the share of renewable energy in the power sector would increase from 25% in 2017 to 85% by 2050, mostly through growth in solar and wind power generation. In the Nordic and European power market, the share of solar and wind power is expected to increase from about 20% to over 55% between 2018 and 2040 [2]. Technological advances in the field of wind turbines, solar panels, and batteries are increasing the efficiency of these systems and thus reducing their levelized unit cost of energy (LCOE). According to [1], it will be possible to build wind farms at 25 euros/MWh within 10 years. The inclusion of larger amount of wind and solar power causes price volatility due to surplus or deficit of energy at any given time. This also applies for Norway because the share of its regulated production is falling, as the growth in consumption is primarily covered by wind power [3]. This calls for the need to increase flexibility in operation of the existing power production and storage systems. Flexibility is the ability to Water 2021, 13, 1567. https://doi.org/10.3390/w13111567 https://www.mdpi.com/journal/water
-
Upload
khangminh22 -
Category
Documents
-
view
4 -
download
0
Transcript of Operation of Norwegian Hydropower Plants and Its Effect on ...

water
Article
Operation of Norwegian Hydropower Plants and Its Effect onBlock Fall Events in Unlined Pressure Tunnels and Shafts
Bibek Neupane 1,*, Kaspar Vereide 2 and Krishna Kanta Panthi 1
�����������������
Citation: Neupane, B.; Vereide, K.;
Panthi, K.K. Operation of Norwegian
Hydropower Plants and Its Effect on
Block Fall Events in Unlined Pressure
Tunnels and Shafts. Water 2021, 13,
1567. https://doi.org/10.3390/
w13111567
Academic Editors: Jochen Aberle and
Robert Boes
Received: 30 April 2021
Accepted: 30 May 2021
Published: 1 June 2021
Publisher’s Note: MDPI stays neutral
with regard to jurisdictional claims in
published maps and institutional affil-
iations.
Copyright: © 2021 by the authors.
Licensee MDPI, Basel, Switzerland.
This article is an open access article
distributed under the terms and
conditions of the Creative Commons
Attribution (CC BY) license (https://
creativecommons.org/licenses/by/
4.0/).
1 Department of Geoscience and Petroleum, Norwegian University of Science and Technology (NTNU),Petroleumsteknisk Senter, F 410, Valgrinda, S.P Andersens Vei 15a, 7031 Trondheim, Norway;[email protected]
2 Department of Civil and Environmental Engineering, Norwegian University of Science andTechnology (NTNU), Vassbygget, 322, Valgrinda, S. P. Andersens veg 5, 7031 Trondheim, Norway;[email protected]
* Correspondence: [email protected]
Abstract: The main objective of this study is to investigate the effect of hydropower plant operationon the long-term stability of unlined pressure tunnels of hydropower plants in Norway. The authorsanalyzed the past production data of some hydropower plants to find out the number of starts/stopsand the frequency and magnitude of load changes. The study demonstrates that an average of200–400 start/stop events are occurring per turbine per year for the analyzed period, with an increas-ing trend. Currently, 150–200 large load changes per turbine smaller than 50 MW are occurring everyyear, and this is expected to increase by 30–45% between 2025 and 2040 for one of the studied powerplants. Most importantly, the monitored pressure transients and pore pressure response in the rockmass during real-time operation at Roskrepp power plant are presented. A new method is proposedto calculate and quantify the hydraulic impact (HI) of pressure transients on rock joints and the effectof duration of shutdown/opening, which is found to be the most dominant parameter affecting themagnitude. The results show that faster shutdown sequences cause unnecessary stress in rock masssurrounding pressure tunnel. The hydraulic impact (HI) can be more than 10 times higher whenthe shutdown duration is reduced by 50 percent. The study recommends that duration of normalshutdowns/openings in hydropower plants should be slower so that hydraulic impacts on the rockjoints are reduced and cyclic hydraulic fatigue is delayed, prolonging the lifetime of unlined pressuretunnels and shafts.
Keywords: hydropower; unlined pressure tunnels; hydraulic transients; hydraulic impact; long-termstability; cyclic fatigue; block falls
1. Introduction
The world energy market is going through a monumental shift from a fossil-fuel-basedsystem to a renewable energy-based system, following the Paris agreement signed in 2015.According to [1], the share of renewable energy in the power sector would increase from25% in 2017 to 85% by 2050, mostly through growth in solar and wind power generation.In the Nordic and European power market, the share of solar and wind power is expectedto increase from about 20% to over 55% between 2018 and 2040 [2].
Technological advances in the field of wind turbines, solar panels, and batteries areincreasing the efficiency of these systems and thus reducing their levelized unit cost ofenergy (LCOE). According to [1], it will be possible to build wind farms at 25 euros/MWhwithin 10 years. The inclusion of larger amount of wind and solar power causes pricevolatility due to surplus or deficit of energy at any given time. This also applies for Norwaybecause the share of its regulated production is falling, as the growth in consumptionis primarily covered by wind power [3]. This calls for the need to increase flexibility inoperation of the existing power production and storage systems. Flexibility is the ability to
Water 2021, 13, 1567. https://doi.org/10.3390/w13111567 https://www.mdpi.com/journal/water

Water 2021, 13, 1567 2 of 20
make quick changes in operation at any time such that the balance between productionand consumption can always be maintained, with lowest possible cost for carrying outsuch changes. The need for such flexibility can be both short-term, where changes areneeded to balance the system within hours, minutes, and seconds, or long-term, in order tobalance the system for days or weeks. There are various solutions that compete to provideflexibility, such as hydropower, hydrogen, and batteries. Among these solutions, regulatedhydropower can provide both short- and long-term flexibility.
Norway has almost half of the reservoir capacity in Europe [4], and thus has a greatpotential for providing the much-needed flexibility for the European power market in thefuture. Various studies are being conducted to explore this possibility [5–8]. The resultsindicate that a high proportion of hydropower with large reservoirs has so far resulted inrelatively low short-term price volatility in the Nordic region. However, the price volatilityis currently increasing, and the operation of the hydropower plants is becoming moredynamic. Operating the existing and new power plants with dynamic operational regimecomes with various technical challenges and operational risks. The Norwegian ResearchCentre for Hydropower Technology (HydroCen) [9] is conducting research in a numberof areas to assess such technical difficulties and provide sustainable solutions to meet thefuture flexibility requirements in Norwegian hydropower system. Its scope of work rangesfrom long-term stability of structures, electrical and mechanical systems, environmentalimpacts, and market conditions.
In this article, the authors analyze the production data of some Norwegian powerplants to establish some operational trends in order to explore how the operational regimesmay influence the long-term stability of unlined hydropower pressure tunnels. Suchtunnels constitute the majority of water conveyance system in Norwegian hydropowerplants, with a total length of more than 4300 km and pressurized up to 1047 m of waterpressure [10,11]. Since tunnels are unlined, water is in direct contact with the rock mass andthe pressure transients resulting from operational changes directly affect the discontinuitiesin the rock mass, which in the long-term, cause block falls as a result of cyclic fatigue dueto frequent pressure pulsations. Further, the authors analyze a two-year long real-timemonitoring data [12] consisting of tunnel water pressure and rock mass pore pressurefrom the unlined headrace tunnel of Roskrepp hydropower plant in Southern Norway.The results are discussed, and the implications of powerplant operation regarding blockinstabilities in the pressure tunnels are discussed. A recommendation to reconsider theshutdown/opening duration is made based on the findings.
2. Operation of Hydropower Plants2.1. Data Set
The data set consists of hourly production data for 10 hydropower plants of differentinstalled capacities ranging from 35 to 960 MW. A total of 21 units ranging from 35 to320 MW were analyzed, the details of which are shown in Figure 1. The number ofstarts/stops for all power plants were available for 19 years. However, the amount ofproduction data per hour (MWh) available for each hydropower plant is different. In total,19 years of data series were available for Roskrepp, Ulset, Brattset, and Driva; 16 years ofdata were available for Duge; and 6 years of data were available for all the other powerplants. Driva, Brattset, and Ulset are located in central Norway in Orkla and Driva riversand all other power plants are located in Sira and Kvina river valleys in southern Norway,which are connected through a series of reservoirs. The data set for Ulset, Brattset, andDriva was provided by Trønder Energi, and the data set for other power plants wasprovided by Sira-Kvina Kraftselskap.
In the Norwegian hydropower industry, one of the conditions for issuing a licensemay be that the hydropower plant is restricted from carrying out sudden and frequentstart/stop production, commonly referred to as hydropeaking. This condition specificallyapplies to hydropower plants with a tailrace directly discharging into a river reach withvulnerable fish species or downstream water use. This requires the hydropower plant to

Water 2021, 13, 1567 3 of 20
be run smoothly and that load changes occur gradually so that sudden changes in theoutlet water level are avoided. Evidently, such conditions affect the operational regimeof the hydropower plant, which is also of interest in relation to long-term stability ofunlined pressure tunnels used to convey the discharge. Out of the hydropower plantsthat have been used in this analysis, Driva and Brattset have such restrictions againsthydropeaking. All the other power plants discharge into downstream reservoirs and haveno operational restrictions.
Figure 1. Details of power plant units in the data set.
2.2. Analysis Method
The main objective of analysis is to investigate the nature of load changes over theyears and to gain knowledge about the magnitude and frequency of such load changes.The finest resolution of production data available is hourly resolution which creates somelimitations to do precise calculations of magnitude and frequency of load changes in MW.For example, a production value of 40 MWh could be the result of the power plant beingoperated at 40 MW for an hour (no load change) or operated at 30 MW and 50 MW for30 min each (one load change). Hence, it is assumed that every change in production perhour, larger than the minimum threshold, is a result of a single load-change event. It resultsin a conservative number of load-change events if more than one event occurs within anhour. However, the results still provide an insight into the nature of load-change events.Further, continuous measurement of water pressure with 10 Hz frequency at the Roskreppheadrace tunnel for two years (Section 3) shows that multiple load changes within anhour are not frequent; such events occurred seven times during the measurement duration.Hence, the production data were analyzed to count the number of events which matchedthe load-change types presented in Table 1.
For example, for a 100 MW unit, the maximum possible production per hour is100 MWh. If the change in production between two consecutive hours is higher than75 MWh, it is counted as one event larger than 75%. Depending upon unit capacity,changes in production smaller than a minimum threshold of 2–5 MWh are neglectedbecause small changes may simply occur as a result of change of flow in the brook intakeor changing reservoir levels and not necessarily due to turbine operation. The first type,LC1 provides an insight into how frequently the load changes are occurring and its overalltrend over the years. The other types provide information about the magnitude of suchload changes. Figure 2 illustrates these criteria with some examples.

Water 2021, 13, 1567 4 of 20
Table 1. Load-change types considered for analysis of production data.
Load-Change Type Description
LC1 Start/Stop
Number of starts/stops regardless of the production value when the hydropowerplant is in operation. For example, a load-change event from 0 to any value higherthan 0 is counted as one start event, regardless of the load in the second hour, and
vice versa for a stop event.Number of load changes between consecutive hours when the magnitude of change is
LC2 LC < 25% smaller than 25%LC3 25% < LC < 50% between 25% and 50%,LC4 50% < LC < 75% between 50% and 75%,LC5 LC > 75% larger than 75%
Figure 2. Illustration of the analysis method.
2.3. Results2.3.1. Starts/Stops
Figure 3 shows the number of starts/stops for all hydropower plants over the years.Figure 3c shows the results for Tonstad units, which have significantly large capacitiesas compared to other units in Figure 3a,b,d. Figure 3d shows the results for units withoperational restrictions, except for Ulset. It can be seen that there are large variations in thestart/stop numbers over the years, especially for the hydropower plants without opera-tional restrictions. The main reason for such variations is the power market [13], whereproduction is directly connected to the power prices and financial benefit is the dominantfactor. The results also show a general increasing trend in the number of starts/stopsafter 2009 for all the hydropower plants except Driva, Brattset, and Tonstad. This trendis stronger for smaller hydropower plants. Even with large turbine units, all units ofTonstad still undergo an average of 300–400 starts/stops every year. For power plants withoperational restrictions, i.e., Driva and Brattset, the variations are much smaller, and thenumbers of total events are also much smaller. This is in agreement with the conditionsimposed by environmental regulations as explained before. A similar study carried outby [14] for 256 power plants in Norway with plant capacities up to 15 MW revealed that thenumber of starts varied from just 1 start to more than 250 starts. The study also concludedthat the restrictions on hydropeaking did not really affect the number of starts.
Figure 4 presents statistical values of starts/stops (LC1) events in the power plants.A clear distinction in results is seen between hydropower plants with or without op-erational restrictions. Both average values and standard deviation are much smaller forhydropower plants with operational restrictions. The lowest number of starts/stops amongall power plants is 65 per year per unit for Brattset. All other units experience an averageof 200–400 starts/stops every year on average, and there is a large standard deviation inthe data set.

Water 2021, 13, 1567 5 of 20
Figure 3. Number of start/stops of various powerplants between 2001 and 2019.
Figure 4. Statistical values of start/stops for various power plants.
Further, it should be noted that for hydropower plants with multiple units, the totalnumber of pressure transients in the waterway caused by starts/stops is the sum of thenumber of events from all the units. This is because station-wide shutdowns are extremelyrare emergency situations. For example, Åna-Sira and Tonstad waterways experiencean average of 1100 and 1750 starts/stop events from single-unit operations every year,respectively. This also applies for load changes of various magnitudes, i.e., LC2 to LC5.It is difficult to ascertain whether any station-wide shutdowns had occurred during theperiod of analysis because of the 1 hr resolution data. For example, in Åna-Sira, one cansee that all three units have been shut down from 42 MWh to 0 within an hour, but thereare no sufficient data to decide whether all three units were shutdown simultaneously orwith some time interval between them.
2.3.2. Frequency and Magnitude of Load Changes
Figure 5 presents some statistical values of load-change events that meet the criteria

Water 2021, 13, 1567 6 of 20
presented in Table 1. Results for only the first unit of all power plants are presented forthe sake of clarity, because the units have the same capacity (except Tonstad G5) and theresults for such units are almost similar.
Figure 5. Percentage of load changes of different magnitudes.
For all power plants, the general trend is that there are higher numbers of smallerload changes (LC2) and relatively smaller numbers of larger load changes (LC5). It canbe seen that the total number of load changes increases with increasing unit capacity, thehighest number being close to 4000 for Tonstad G5. Smaller load changes (LC2) amountfrom 50% to 90% of the total and generally increase with unit capacity. On the contrary,larger load changes (LC5) decrease with the unit capacity. For smaller units such as Ulsetand Åna-Sira, the number of LC5 events is more than 15% of the total, while for large units,it is as low as 5%, with the lowest being 1%. In all cases, the number of medium loadchanges (LC3 and LC4) are relatively smaller than small load changes (LC1), but they arealso in higher proportion for smaller power plants. The results seem logical because forsmaller turbines, a relatively smaller change in power price requires a load change whichcan be relatively larger compared to its capacity. For a larger turbine, a similar changecan be handled by making a minor load change. For example, a load change of 30 MW isa large load change for Ulset, medium load change for Roskrepp/Åna-Sira, but a smallload change for Tonstad G5. Power plants with operational restrictions, especially Brattset,show a different trend even though they have a small unit capacity; the share of large loadchanges is significantly smaller (1% of total) than other small units. This also applies forgenerating mode of Duge because it is primarily operated to serve the purpose of pumping.For Duge pumping mode, the share of large load change is the highest, which is logicalbecause pumping is only possible at full capacity (synchronous generator-motor).
Hence, it can be concluded that power plants with larger units experience moreload changes every year but of small magnitudes. Power plants with smaller units, how-ever, experience fewer load changes annually, but the percentage of large load changes ismuch higher.
2.3.3. Future Trend in Power Plant Operation
As discussed in the introduction section, predictions made regarding future energymix indicate a greater variability in operating condition. With regards to the long-termstability of pressure tunnels and shafts, it is of interest to see how the power prices affect thenumber of start/stops and frequency of load changes of various magnitudes as describedin Table 1. This section presents the results of a production simulation for Roskrepphydropower plant carried out by Statkraft Energy for different price levels representingthe years 2025, 2030, and 2040. Statkraft Energy is also the source of data for the analysispresented in this section. The analysis is carried out using an hourly resolution withhydrological data for a period of 88 years and included all the power plants in the Sira–Kvina scheme. Four different alternatives were analyzed, including possible upgrading of

Water 2021, 13, 1567 7 of 20
the power plant to pumped storage plant with different capacities as shown in Table 2, andthe results are presented in Figure 6.
Table 2. Alternatives for production simulation of Roskrepp hydropower plant.
Case Description
A0 Existing situation (50 MW generation only)A1 Pumped storage plant with 50 MW generation and 50 MW pumping capacityA2 Pumped storage plant with 50 MW generation and 30 MW pumping capacityA3 Pumped storage plant with 50 MW generation and 10 MW installed capacity
Figure 6. Trend of load changes of different magnitudes with future price levels.
The results show that for all cases of generating mode, the total number of load-changeevents increases, except for case A0. However, it can be seen that the increase in numberof large load changes is the highest between 2025 and 2040 for this case. It can also beseen that the number of large changes (LC5) for all cases increases by 30–45% between2025 and 2030 but slightly decreases or remains almost constant between 2030 and 2040.The number of starts/stops for all cases of generating mode is increasing with time. Forall cases of pumping mode, almost all load changes are LC5 since pumping is done withfull capacity (synchronous unit). Hence, the number of LC5 events is also equal to thenumber of starts/stops. It can be seen that the number of LC5 load changes for pumpingmode also increases with time, but the rate of increase flattens between 2030 and 2040.A general conclusion that can be drawn from this analysis is that both the number ofload changes and their magnitude are likely to increase significantly over the years. Thisfurther emphasizes the fact that tunnels will experience stronger transients with increasedfrequency in the future.
3. Tunnel Hydraulics and Hydraulic Impact3.1. Data Set
The analysis in this section is conducted on the data set acquired from real-timemonitoring of unlined headrace tunnel of Roskrepp hydropower plant in southern Norwayfor a period of two years. The experimental setup is designed by the authors and isdescribed in detail in [12]. The waterway longitudinal section, instrumentation location,and setup are presented in Figure 7a–c, respectively. Figure 7d,e show the instrumentedtunnel section and the pressure sensors and datalogger.

Water 2021, 13, 1567 8 of 20
Figure 7. Longitudinal section of Roskrepp waterway (a), instrumentation location (b), and detailed view of the setup withboreholes BH1–BH5 (c), view of the instrumented tunnel section, looking upstream (d), and view of pressure sensors anddatalogger in the access tunnel (e).
The rock mass at this location consists of weakly schistose granitic gneiss with threemajor joint sets. Five boreholes (BH1–BH5) were drilled in the tunnel walls such that theyintersect a particular joint set almost perpendicularly. Stainless steel pipes were fixed inthe boreholes using packers at different lengths in the borehole and the pipes were takenout of the tunnel to a dry area in the access tunnel, where they were fitted with pressuresensors and datalogger. The section of boreholes ahead of the packers collects water fromthe rock joints and are connected to the pressure sensors through the steel pipes, thusrecording the rock mass pore pressure. Simultaneous readings of the tunnel water pressureare also recorded from a pipe installed at the junction between the headrace tunnel andaccess tunnel.
3.2. Shutdown Procedure
Figure 8 shows a pressure transient in the tunnel and the rock mass pore pressuresduring a typical shutdown event at Roskrepp hydropower plant. The rock mass porepressure measured in three boreholes, along with the hydraulic impact during the transient(explained in following section) are shown in the figure. Both water hammer and massoscillation are recorded by the pressure sensor because the measurement is done at alocation between the turbine and the surge shaft.
Shutdowns in hydropower plants can be done in two different ways. An emergencyshutdown is the fastest possible closing time for a particular unit and usually only occurswhen the unit is stopped by the protection systems or if the unit is disconnected fromthe power grid during operation. Emergency shutdowns cause strong transients withlarge pressure amplitudes but are rare. During a normal shutdown, the unit is de-loadedmanually in steps by the power plant operator. The purpose in this category of shutdownis to make soft shutdowns in several steps to reduce stresses on the electromechanicalcomponents. Both the emergency and normal shutdowns can be divided into two parts:
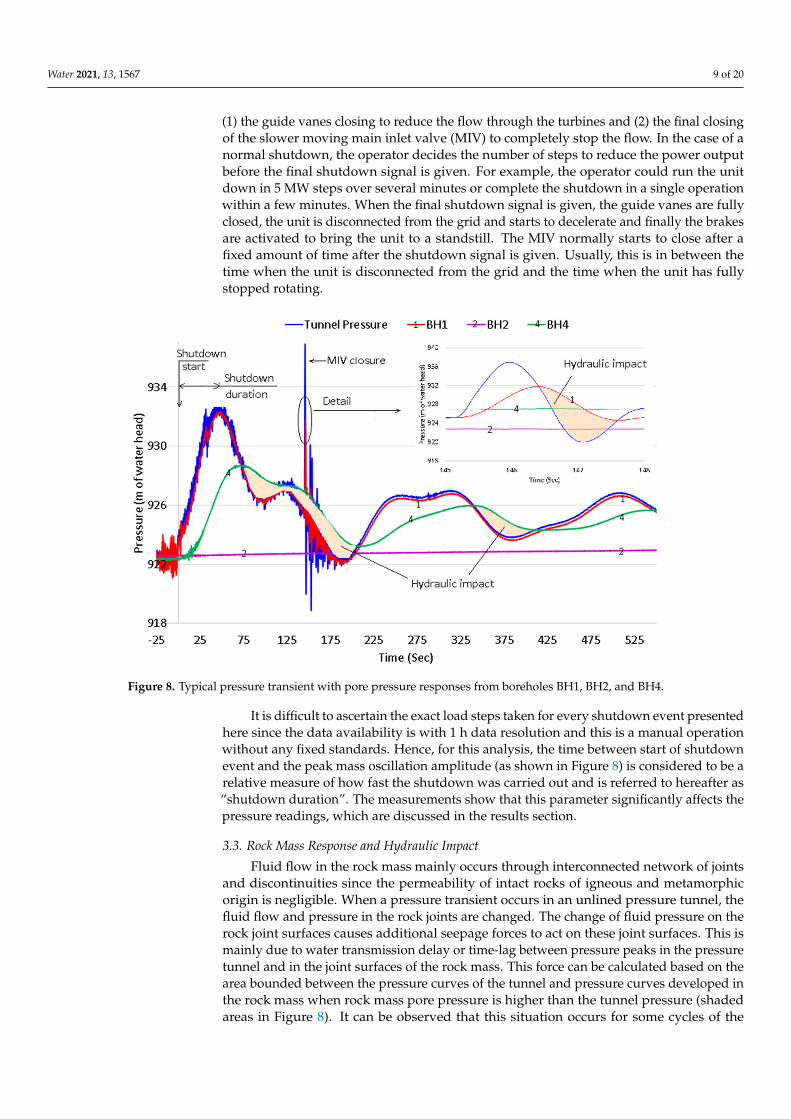
Water 2021, 13, 1567 9 of 20
(1) the guide vanes closing to reduce the flow through the turbines and (2) the final closingof the slower moving main inlet valve (MIV) to completely stop the flow. In the case of anormal shutdown, the operator decides the number of steps to reduce the power outputbefore the final shutdown signal is given. For example, the operator could run the unitdown in 5 MW steps over several minutes or complete the shutdown in a single operationwithin a few minutes. When the final shutdown signal is given, the guide vanes are fullyclosed, the unit is disconnected from the grid and starts to decelerate and finally the brakesare activated to bring the unit to a standstill. The MIV normally starts to close after afixed amount of time after the shutdown signal is given. Usually, this is in between thetime when the unit is disconnected from the grid and the time when the unit has fullystopped rotating.
Figure 8. Typical pressure transient with pore pressure responses from boreholes BH1, BH2, and BH4.
It is difficult to ascertain the exact load steps taken for every shutdown event presentedhere since the data availability is with 1 h data resolution and this is a manual operationwithout any fixed standards. Hence, for this analysis, the time between start of shutdownevent and the peak mass oscillation amplitude (as shown in Figure 8) is considered to be arelative measure of how fast the shutdown was carried out and is referred to hereafter as“shutdown duration”. The measurements show that this parameter significantly affects thepressure readings, which are discussed in the results section.
3.3. Rock Mass Response and Hydraulic Impact
Fluid flow in the rock mass mainly occurs through interconnected network of jointsand discontinuities since the permeability of intact rocks of igneous and metamorphicorigin is negligible. When a pressure transient occurs in an unlined pressure tunnel, thefluid flow and pressure in the rock joints are changed. The change of fluid pressure on therock joint surfaces causes additional seepage forces to act on these joint surfaces. This ismainly due to water transmission delay or time-lag between pressure peaks in the pressuretunnel and in the joint surfaces of the rock mass. This force can be calculated based on thearea bounded between the pressure curves of the tunnel and pressure curves developed inthe rock mass when rock mass pore pressure is higher than the tunnel pressure (shadedareas in Figure 8). It can be observed that this situation occurs for some cycles of the

Water 2021, 13, 1567 10 of 20
pressure transient and the number of such cycles depends on the magnitude of time-lag. Itgradually decreases as the transient attenuates and both pressures become almost equal orthe pressure in the tunnel is higher. This additional force is hereafter named as “hydraulicimpact” (HI) and has a unit of MPa.s and is similar to dynamic viscosity or the force actingon the joint surfaces per unit area over time. The hydraulic impact (HI) is a destabilizingforce, and the authors regard it to be the main driver for rock block destabilization in thetunnel periphery due to hydraulic transients and may cause rock falls and potentiallytunnel collapse.
It can be seen in Figure 8 that the boreholes which intersect the conductive jointsin the rock mass, i.e., BH1 and BH4, strongly respond to pressure transients, whereasthe others are nonresponsive, since they do not have direct hydraulic contact with theconductive joints. BH1 registers a stronger response to pressure transients, but there isvery little time-lag during mass oscillation, resulting in very little to zero hydraulic impactduring mass oscillation and significant hydraulic impact during water hammer. For BH4on the other hand, a clear time-lag is registered during both mass oscillation and waterhammer. However, the amplitude of pore pressure in BH4 in response to the water hammeris smaller as compared to BH1. This difference in the response is due to different resistanceto the flow through joints in the rock mass, which is a function of void geometry of jointsand the length of flow path, i.e., joint length between tunnel wall and its intersection pointswith individual boreholes. The distance between tunnel wall and boreholes (length forflow path) BH1 and BH4 are 2.3 and 8 m, respectively.
From a theoretical standpoint, it can be deduced that the hydraulic impact on rockjoints is dependent on the magnitude of change of discharge during shutdown and theduration of shutdown event. These two parameters govern the nature of transient pressurepulses which travel inside the rock joints causing additional forces on the joint surfaces.Another important parameter is the static pressure before transient which governs the re-sistance to flow through joints during transients. The joint hydraulic aperture is influencedby the effective stress across joints. During the operation of a power plant, the effectivestress across the joints can vary depending on reservoir levels, which may change the initialhydraulic aperture before transients. Hence, the effect of these three parameters on thehydraulic impact is further analyzed.
3.4. Method for Calculating Hydraulic Impact
The total hydraulic impact due to a pressure transient is divided into two parts: due towater hammer and mass oscillation. The hydraulic impact due to water hammer is the sumof the pressure pulses that start when the guide vanes start closing and ends after the MIVhas closed. The largest pressure pulse occurs when the MIV is finally closed, and pulsescontinue to travel between the turbine and surge shaft, until they dissipate after some time(Figure 8). The pressure sensors also register some noise introduced by the vibration ofsteel pipe caused by the deceleration of the water and turbulence during the shutdownuntil the final closure of MIV.
3.4.1. Total Hydraulic Impact
The total hydraulic impact for each borehole in the rock mass is then calculated asthe pressure difference integrated over time between pressure signals at the tunnel andin the boreholes, after removing the noise due to pipe vibration in the pressure signals(the area indicated in Figure 8). A Butterworth filter with low-pass frequency [15] hasbeen used to filter the noise which occurs due to sudden deceleration of water duringthe guide vane closing phase. A low-pass cutoff frequency of 3 Hz has been selected.This cutoff frequency is decided using theoretically calculated water-hammer frequency,assuming the wave speed from 800 to 1200 m/s and a distance of 87 m between the turbineand the sensor. The reason for selecting this cutoff frequency is that any pressure waveoriginating from the turbine which has a frequency higher than this would not be picked upby the sensor because they would not reach the sensor location. Such signals are the result

Water 2021, 13, 1567 11 of 20
of parts of water hammer being reflected by various physical structures and transitionsbetween sensor location and turbine. They would only be recorded if the measurementswere done close to the turbine. Hence, the major source of such high-frequency signalsin the measurements is mostly pipe vibration. This argument is supported by the factthat signals with frequency higher than 3 Hz are drastically reduced when the MIV iscompletely closed. After MIV closure, the net water flow toward the turbines is zero, andhence, there is limited vibration of the pipes. A comparison of HI values due to waterhammer computed with and without using the noise filter resulted in a difference of 11%for BH1 and 2% for BH4.
3.4.2. Hydraulic Impact Due to Water Hammer and Mass Oscillation
The water-hammer pulses are superimposed with the mass oscillation, and thus, theyneed to be isolated in order to calculate their hydraulic impacts separately. Fast Fouriertransformation (FFT) of the pressure signal (Figure 9) shows that there are three massoscillation frequencies corresponding to time periods of 3.4, 1.6, and 1.1 min, movingbetween reservoir and the surge shaft, between reservoir and brook intake, and betweenbrook intake and surge shaft, respectively. The strongest frequency corresponds to theone that occurs between the reservoir and surge tank, which is also the slowest of thethree pulses. The water-hammer pulses were filtered from the pressure signals using theButterworth filter of cutoff frequency 0.0167 Hz, i.e., time period of 60 s, which is closeto the fastest mass oscillation frequency of 0.015 Hz. The area between pressure pulsescalculated after using this filter gives the HI value for mass oscillation. The HI value forthe water hammer is then calculated by subtracting the mass oscillation HI from total HI.
Figure 9. Result of FFT analysis of mass oscillation.
3.5. Results3.5.1. Effect of Shutdown Duration
As a result of the differences in the shutdown procedures, normal shutdowns arerarely similar with each other since it is a manual operation and depends on the operator.An example of the effect of such difference is illustrated in Figure 10, which shows pressuresignals from two shutdown events with similar durations until MIV closure and similarhead loss before transients but producing different pressure signals.
It can be seen that Transient 1 is a result of a gradual de-loading and shutdown,whereas Transient 2 is a faster shutdown, before the MIV closure which occurs almostat similar durations indicated by the largest water-hammer pulses. The mass oscillationamplitude for Transient 2 is larger than Transient 1, and the peak is reached much fasterthan Transient 1, which is the result of a faster shutdown. Shorter shutdown duration

Water 2021, 13, 1567 12 of 20
(Transient 2) results in a steeper mass oscillation curve which causes a larger time-lagbetween the pressure peaks in the tunnel and in the rock mass (Figure 10b), since it allowsshorter time for the rock mass pore pressure to increase. The time-lag for the first pressurepeaks for Transient 1 and Transient 2 are 8.5 and 26 s, respectively. A higher time-lagcombined with a larger oscillation magnitude during short shutdown duration results in alarger HI.
Figure 10. Comparison of pressure signals of two normal shutdowns (a) and enlarged view until 250 sec (b).
Figure 11 shows the hydraulic impact of 161 recorded shutdown events, in relationto their shutdown durations in chronological order. It presents the HI caused by waterhammer and mass oscillation for BH4 along with the shutdown durations and the time-lagof the first mass oscillation pulse for each transient. It can be seen that the time-lag increasessignificantly with shorter shutdown duration, which consequently increases the HI dueto mass oscillation. It is interesting to note the sudden decrease in shutdown durationbetween event 118 and 119. These two events have occurred within 24 h, and thus the headloss and static pressure before transient for these events are only marginally different. Thishas caused a sharp increase in time-lag from 6 to 10 s, and in addition, the HI value hasincreased from 0.8 to 1.9 MPa.s. An even higher increase in time-lag and HI is seen afterevent 129. The time-lag and HI after event 129 are larger than 20 s and 3 MPa.s, respectively.
Figure 11. HI for BH4 during various transients in chronological order (a) and corresponding discharge change magnitudeand static pressure before transient (b).
The hydraulic impact due to water-hammer increases with longer shutdown duration(Figure 12) because longer shutdown duration allows more water-hammer pulses to occurbefore the MIV closure. Further, the water-hammer pulses after MIV closure also havesome time-lag which contributes to additional HI. It can be seen that mass oscillation causesalmost no hydraulic impact for BH1.This is because the time period of mass oscillation ismuch slower, and thus, it allows pore pressure build-up in the borehole almost with thesame rate as the pressure pulse, thus preventing any time-tag. This shows that the rock

Water 2021, 13, 1567 13 of 20
mass can respond differently for varying time periods even with same joint conditionsor flow resistance. The effect of the time period on HI and joint deformation has beenanalyzed in detail in [16] using numerical simulation.
Figure 12. Effect of shutdown duration on hydraulic impact (a) for BH1 and for BH4 (b).
For BH4, HI caused by water hammer is in a similar range as for BH1. The HI causedby mass oscillation is significant for BH4 because the flow resistance is higher, as thelength of flow path is larger than for BH1 and thus causes significant time-lag. It canbe seen that faster shutdowns cause larger HI, and it is more than 10 times higher whenthe shutdown duration decreases from 130 to 65 s. Further, it is interesting to note thecontribution of water hammer in the total hydraulic impact during pressure transients. Forlonger shutdown durations (125 to 200 s), water hammer contributes 40% of the total HI onaverage, the minimum and maximum values being 3% and 65%, respectively. However,for faster shutdowns (below 75 s) the average, minimum, and maximum values are 7%,1%, and 20%, respectively.
3.5.2. Effect of the Discharge Change Magnitude
The head loss between the reservoir and the measurement location before the shut-down event is a measure of the magnitude of discharge change in the waterway. Largerhead loss means larger change in discharge and large load change during a shutdownevent. Calculation of the discharge during each transient is not attempted because thedischarge added in the tunnel from the unregulated brook intake introduces uncertaintiesin the calculation. In general, a shutdown from a larger discharge should result in a largermass oscillation. However, a distinct relation between the discharge change magnitudeand HI due to mass oscillation was not observed as was the case for shutdown duration.Figure 13 shows two different clusters of HI values for mass oscillation which are stronglyinfluenced by shutdown duration.
Most of the HI values above 2 MPa.s (Figure 13a) correspond to shutdown durationssmaller than 75 s and show a somewhat increasing trend with larger head loss before atransient. The majority of values below 2 MPa.s correspond to shutdown durations longerthan 125 s and tend to show a decreasing trend with increase in head loss. However, ashutdown from a larger discharge should result in a larger mass oscillation and hencelarger HI. This opposite trend can be explained by the fact that there is a greater variationin shutdown duration larger than 125 s (Figure 13b). Hence, it is concluded that shutdownduration is more dominant parameter as compared to the discharge change magnitude.This is because the gradient of pressure change is more important than magnitude, as seenfrom the measurements.

Water 2021, 13, 1567 14 of 20
Figure 13. Hydraulic impact in relation to the magnitude of discharge change (a) and magnitude of discharge change vs.shutdown duration (b).
3.5.3. Effect of Static Pressure before Transient
The static pressure before transient can have some influence in the shape of the massoscillation curves because of two reasons: (1) it decides from which water level in the surgetank and brook intake that the oscillation starts, and (2) different static heads may meandifferent water levels in the reservoir. This could affect the HI due to mass oscillation tosome extent. However, Figure 14 shows that the HI values are unaffected by the increasein static pressure. The largest values inside the oval are from the events with the shortestshutdown duration (event 118 to 161).
Figure 14. Effect of static head before transient on hydraulic impact.
The explanation to why the result is almost unaffected by the static pressure is mostlikely because effective stresses are much larger as compared to the change in static headand static pressure and are not large enough to cause significant changes in the jointaperture. Further, the high stiffness of the joint surface for hard rocks can prevent noticeablechanges in the joint aperture.
3.5.4. Effect of Tunnel Dewatering
As shown in Figure 15a, the tunnel was dewatered after event 126 in spring, and thenthe refilling was done after two months during summer and event 127 occurred in autumn.According to [17], the controlled tunnel filling or dewatering in Norwegian unlined pres-sure tunnels and shafts is generally carried out at a rate of 15 m head increase/decrease per

Water 2021, 13, 1567 15 of 20
hour with a stop for minimum 2 h per 150 m head change and maximum head of 300 m perday. This is done in order to reduce excess hydraulic impact on rock mass around tunnelduring filling and dewatering. The static head at the measurement location in the Roskrepptunnel before dewatering was 80 m, and the dewatering was conducted in two stageswithin a duration of 7 h. The pore pressure sensors connected to BH1 and BH4 record HIvalues of 3 and 20 MPa.s, respectively, over the dewatering duration.
Figure 15. Discharge change magnitude and static pressure before transient for events 110–145 in chronological order (a)and corresponding HI for various transients (b).
It is observed that normal shutdowns after event 127 show increased HI values whichare greater than 1.5 MPa.s, whereas the values before this event were in the range of0.5–1 MPa.s. (Figure 15b). The static head before transient has significantly increasedbecause event 127 occurred in autumn, after the reservoir had been filled by snowmeltduring the spring and summer. However, as discussed in the previous section, this has nosignificant influence on the HI. Hence, it shows that dewatering is the reason for increasein HI values after event 127. Sudden increase in hydraulic impact (HI) after dewateringsuggests that it has caused irreversible changes in the joint void geometry possibly causedby shear displacement, increasing the joint permeability, and thus allowing more flow intothe joint during transients. This is a reasonable explanation because tunnel dewatering isknown to cause macroscopic joint displacements and block falls, because the draining ofrock joints takes time and rock mass pore pressure exceeds the tunnel pressure during suchevents. This occurs until the rock mass is fully drained and pressures are equalized.
Further, it should be noted the events 126 and 127 are emergency shutdowns with shut-down durations of 7 s, which caused significantly high hydraulic impacts (2.5 and 3.8 MPa.s)as compared to previous events. A similar phenomenon was also reported by [18] in theair cushion surge chamber of Osa power plant where significant increase in air loss wasexperienced after a few turbine rejections with pressure rise as high as 20% of static pres-sure Hence, the difference in HI values could thus be linked to both dewatering as wellas contribution from the emergency shutdowns. Nevertheless, more measurements areneeded to investigate whether emergency shutdowns alone can cause a noticeable changein behavior.
4. Discussion
The underlying axiom of block theory is that the failure of an excavation begins at theboundary with the movement of a block into the excavated space [19]. This implies thatthe orientation of joints should be conducive to create a wedge in order to cause a blockfall. Further, removal of key blocks could result in extended fallouts. The existing blocktheory is still applicable for assessing the block falls due to tunnel operation, except for thefact that additional destabilizing forces are created during hydropower plant operation.This is not a one-time event but a cumulative effect of many small events, referred toas cyclic fatigue, which occurs over the course of hydropower plant operation. During

Water 2021, 13, 1567 16 of 20
tunnel excavation, potentially unstable wedges are identified, and adequate support isprovided. However, relatively stable and unsupported blocks during construction maybe destabilized as a result of weakened joints due to long-term fatigue over the years ofhydropower plant operation. In some occasion, the potential rock blocks are not detectedduring construction. More importantly, some blocks may be held together by an intactrock bridge posing no threat of block falls during construction. Such intact rock bridgescan gradually weaken due to the cumulative effect of HI and eventual rupture causingblock falls. Similar findings have been highlighted by Preisig et al. [20] where the ruptureof intact rock bridges due to seasonal pore pressure changes are attributed as the cause ofprogressive failure and fatigue in deep-seated landslides.
Figure 16 shows an example of a block fall witnessed in the TBM section of the 4.5 mdiameter unlined headrace tunnel of Ulset power plant, which has been in operation since1985. Unlined tunnels are generally dewatered for inspection after one year of operation toinvestigate if there are large block falls which could pose major stability issues in the future.The first inspection of this tunnel was conducted in 1986 after one year of operation, whichrevealed no major instabilities but showed some minor block falls [21]. For unlined pressuretunnels, minor block falls are expected during the first inspection because the rock mass issubjected to a new ground water regime and reduced effective stresses after tunnel filling.The washing of joint infilling material also reduces joint stiffness, which further contributesto block falls. The situation stabilizes after a new equilibrium is reached. The secondinspection report carried out in 1992 [22,23] also does not show any serious instabilityissues. The last inspection was conducted by the first and third author of this article in2017. During this inspection, several block falls similar to the one shown in Figure 16 wereobserved along the whole TBM tunnel length. From the Roskrepp measurements, it isnow evident that additional load or hydraulic impact occurs during load changes. Hence,it is postulated herein that such block falls are the result of rock mass fatigue caused bycumulative HI due to transient events with load changes over the years. It is noted that theoperational regime of Norwegian hydropower plants has changed after the deregulation ofpower market in 1991 [13]. This is most likely a contributing factor for the observed blockfalls because the deregulation has resulted in more start/stops and load-change events.
The results presented in previous sections clearly indicate that additional load onrock joints or HI due to hydropower plant operation depends on the shutdown durationand the magnitude of load changes. With the increase in intermittent energy in the futurepower system, it is very likely that both these parameters will be affected. Results fromthe analysis of production data show that both the number of starts/stops and frequencyand magnitude of load changes will increase in the future. This means that the tunnelswill experience stronger transients with increased frequency, causing more transient cycleswith higher HI and accelerated fatigue.
The analyses show that hydropower plants with smaller units experience smallernumber of load changes every year, but the proportion of large load changes relative totheir plant capacities are much higher. This means that their waterways experience moretransients with larger amplitudes relative to the static pressure. The minimum designfactor of safety against mass oscillations in unlined pressure tunnels is 1.3 [24], meaningthe normal stress acting against a critical joint must be at least 1.3 MPa if the design tunnelstatic pressure is 1 MPa. A larger load change causes bigger mass oscillation amplitudeswhich are closer to critical normal stress (or reduced factor of safety). Frequent events withsuch oscillation pressures close to critical normal stress contribute to accelerating the cyclicfatigue, especially if the transients occur when the tunnel static pressure is close to designstatic pressure. On the other hand, small transients even though in larger numbers maynot necessarily have a higher impact on the rock mass. This could suggest that the rockmass around the tunnel in smaller hydropower plants may experience fatigue at a fasterrate, assuming similar rock mass and effective stress conditions. However, it is difficultto ascertain in absolute terms whether a relatively strong transient in hydropower plantswith low static head is more damaging than relatively weaker transient in hydropower

Water 2021, 13, 1567 17 of 20
plant with high static head. It is highlighted that the HI is dependent on the resistance toflow through joints, which is a function of void geometry of joints in the rock mass andthe length of flow path, i.e., length between tunnel wall and any particular point in therock joint inside the tunnel wall. Hence, the HI values presented in the results are specificfor the length of joint between tunnel wall and BH1/BH4. The variation of HI along jointlength with different rock–mechanical properties such as joint stiffness, friction angle anddilation, and effective stresses is studied in detail by [16] using numerical simulation.
Figure 16. Example of block fall witnessed in Ulset headrace tunnel in 2017.
The analysis shows that shutdown duration is the most dominant parameter affectinghydraulic impact (HI) on rock joints. The results presented in this work are only fromshutdown or reduction of load in the hydropower plant. Pressure transients also occur inthe system when increasing load or opening the turbine valves, which also cause significanthydraulic impact. It can be inferred that similar to shutdown duration, the duration ofopening has a significant impact since it also affects how the mass oscillation pressuredevelops during the transient.
A larger share of intermittent energy demands for increased flexibility in operation,which may mean that power plants need to change load faster, hence affecting the shutdownduration. However, it is uncertain to what extent the shutdown duration is affected owingto higher flexibility needs. As seen from the measurement and analysis, the current trendof shutdown duration as seen in Roskrepp is still contributing to accelerate the rock massfatigue, which is explained below.
Based on the results, it would be logical that for larger load changes, both shutdownand opening should be carried out slowly to avoid stronger transients. However, it isdependent on the individual power plant operators due to lack of standard procedure fornormal load-change operations. In Figure 13b, we can see that the shutdown durationis irrespective of head loss before the transient and three distinct clusters of shutdowndurations are seen for similar head loss values. As seen in the results, faster shutdowncauses significantly larger HI, which could be reduced by a slower shutdown. For example,
Water 2021, 13, 1567 18 of 20
for head loss of 3 m, the shutdown durations vary from 170 to 65 s, and the HI due tomass oscillation are 3–9 times higher (Figure 12). This could be avoided by having a slowernormal shutdown. The idea is to carry out normal shutdowns/openings based on themagnitude of load changes such that larger load changes take longer shutdown/openingdurations. These durations should be long enough for the rock mass pore pressure toclosely follow the change in pressure in the tunnel during a transient. The optimumshutdown duration must be decided individually for each hydropower plant since thehydropower plants are unique in terms of parameters such as rock joint conditions inthe tunnel contour, design head and discharge, length of the waterway, and number ofbrook intakes, contributing to different nature of the mass oscillations. As seen from theRoskrepp measurements, shutdown durations larger than 200 s seem to give the lowestpossible impact with respect to shutdown from full load and is the recommended shutdownduration from full load for this power plant to reduce the hydraulic impact.
For hydropower plants to be constructed in the future or upgraded, a larger surge tankcan be designed to reduce the pressure rise and also the time between start of shutdownand maximum mass oscillation amplitude, i.e., the shutdown duration becomes longer.In the case of pre-existing hydropower plants, slower operation of the units may be themost reasonable solution to reduce the hydraulic impact on rock mass around unlinedpressure tunnels.
Slower shutdowns/openings cause lower hydraulic impact on the rock mass, whichwould help slow down the fatigue process. It is envisaged that such slow shutdowns/openingscould be done in two different ways: (1) by standardizing a slow manual loading/de-loading of the units or (2) by using a slow preprogrammed and automated governoroperation routine. Such measures may help to reduce the number of block falls andprolong the serviceable lifetime of unlined pressure tunnels and shafts.
Prediction of block falls due to transient events is a challenging issue because of thelack of a governing equation that defines the process of cyclic fatigue due to external(hydraulic) and internal (gravitational, friction and shear) forces that cause the failure ofrock joints and intact rock bridges. Large variation in the hydromechanical properties ofrock joints and in situ rock stresses add challenges in quantifying the hydraulic impactand the eventual fatigue. Further, the cumulative effect of HI is difficult to quantifyin real cases since no monitoring systems are installed to record the pore pressure andlong-term deformation in the rock mass. However, back analysis of particular blockfall cases may be carried out using advanced numerical modelling with specific inputparameters such as joint orientations, hydromechanical properties, in situ stress conditions,and pressure oscillations, which would help to gain more knowledge to address theaforementioned challenges.
5. Conclusions
The production data of some Norwegian hydropower plants shows that there is alarge variation of start/stop events for each hydropower plant every year and also betweendifferent hydropower plants. The hydropower plants without operational restrictions haveaverage annual start/stop events between 200 and 400 per unit, with a standard deviationup to 150. It is also seen that the number of start/stop events are in increasing order after theyear 2009, and this increasing trend is significant for smaller hydropower plants. Further,the study of the magnitude of load changes in these hydropower plants suggests that thereare higher numbers of smaller load changes (smaller than 25% of full capacity per hour)and smaller numbers of larger load changes (larger than 75% of full capacity per hour).More importantly, larger load changes are in higher proportion (more than 15% of totalload-change events) for smaller power plants as compared to larger hydropower plants.This amounts to about 150–200 large load changes per turbine with installed capacitysmaller than 50 MW. The production forecast for Roskrepp hydropower plant suggests thatstart/stop events and large load changes will increase by 30–45% between 2025 and 2040.From these observations, the authors conclude that dynamic operation of hydropower

Water 2021, 13, 1567 19 of 20
plants shows an increasing trend which can lead to larger destabilizing forces in the rockjoints and accelerated fatigue of the rock mass in the future.
The monitored pressure transients and the pore pressure response in the rock massduring real-time operation at Roskrepp power plant have been used to develop a newmethod to quantify the effect of hydraulic transients on rock joints, referred to as thehydraulic impact (HI). The hydraulic impact is a destabilizing force that is regarded tobe the main driver for instability, rock blocks fall, and potential tunnel collapses causedby hydraulic transients. The authors conclude that the duration of shutdown during aload reduction event is the most dominant parameter regarding the hydraulic impact,followed by the magnitude of load change. The faster the shutdown event, the higherthe hydraulic impact, and it is more than 10 times higher when the shutdown duration ishalved (i.e., from 130 to 65 s). The measurements show that tunnel dewatering has alsocaused significant increase in hydraulic impact, indicating irreversible changes in the jointvoid geometry and increase in the joint permeability, which can contribute to block fallsover long-term operation.
It is observed that there is a large variation in shutdown duration, even for similarmagnitude of load changes, ranging from 60 s to 200 s, because there is no standardprocedure for shutdown duration and is entirely up to the operators to decide. Based onthe results in this work, the authors recommend that durations of normal shutdowns/openings should be longer than current practice so that changes in pore pressure in the rockmass are more gradual. Normal shutdowns/openings should be carried out based on themagnitude of load changes such that larger load changes take longer shutdown/openingdurations. Slower shutdowns/openings cause a slower pressure increase in tunnels andshafts and, thus, a lower hydraulic impact on the rock mass, which would help slow downthe cyclic fatigue process.
Author Contributions: Conceptualization, B.N., K.V. and K.K.P.; methodology, B.N.; formal analysis,B.N.; data investigation, B.N.; resources, K.V. and K.K.P.; data curation, B.N. and K.V; writing—original draft preparation, B.N.; writing—review and editing, K.V. and K.K.P.; visualization, B.N.;supervision, K.K.P. and K.V.; project administration, K.K.P.; funding acquisition, K.K.P. and K.V.; Allauthors have read and agreed to the published version of the manuscript.
Funding: This research is conducted and financed as a part of the Norwegian Research Centre forHydropower Technology (HydroCen).
Institutional Review Board Statement: Not Applicable.
Informed Consent Statement: Not Applicable.
Data Availability Statement: Data cannot be shared due to confidentiality.
Acknowledgments: The authors grateful to Sira-Kvina kraftselskap, TrønderEnergi for providingthe power plant production data. The authors are also thankful to Statkraft Energy for providing theproduction prognosis for future operation of the Roskrepp power plant. The authors express theirgratitude to Sira-Kvina kraftselskap for allowing the access and instrumentation at Roskrepp powerplant and funding the site installation, and Torkjell Breivik, Senior Engineer at the Department ofGeoscience of Petroleum for his work in LabVIEW for the data acquisition and visual interface.
Conflicts of Interest: The authors declare no conflict of interest. The funders had no role in the designof the study; in the collection, analyses, or interpretation of data; in the writing of the manuscript, orin the decision to publish the results.
References1. International Renewable Energy agency (IRENA). Global energy transformation. A roadmap to 2050. 2018. Available online:
https://irena.org/publications/2018/Apr/Global-Energy-Transition-A-Roadmap-to-2050 (accessed on 6 April 2021).2. Statnett. Long-Term Market Analysis. The Nordic countries and Europe 2018–2040. (In Norwegian). Available online:
https://www.statnett.no/globalassets/for-aktorer-i-kraftsystemet/planer-og-analyser/langsiktig-markedsanalyse-norden-og-europa-2018-40.pdf (accessed on 29 March 2021).

Water 2021, 13, 1567 20 of 20
3. Energy Facts Norway. Available online: https://energifaktanorge.no/en/norsk-energiforsyning/kraftproduksjon/#wind-power(accessed on 6 April 2021).
4. Statkraft. Available online: https://www.statkraft.com/what-we-do/hydropower/ (accessed on 29 March 2021).5. Pitorac, L.; Vereide, K.; Lia, L. Technical Review of Existing Norwegian Pumped Storage Plants. Energies 2020, 13, 4918. [CrossRef]6. Statkraft. Global Energy Trends. Statkraft’s Low Emissions Scenario 2019. Available online: https://www.statkraft.com/
globalassets/1-statkraft-public/lavutslipsscenario/low-emissions-scenario-2019.pdf (accessed on 29 March 2021).7. Statnett. Flexibility in the Norwegian Power Market 2018–2040. 2018. (In Norwegian). Available online: https://www.statnett.
no/globalassets/for-aktorer-i-kraftsystemet/planer-og-analyser/2018-Fleksibilitet-i-det-nordiske-kraftmarkedet-2018-2040 (ac-cessed on 29 March 2021).
8. Graabak, I.; Jaehnert, S.; Korpås, M.; Mo, B. Norway as a Battery for the Future European Power System—Impacts on theHydropower System. Energies 2017, 10, 2054. [CrossRef]
9. Hydrocen. Norwegian Research Centre for Hydropower Technology. Available online: https://www.ntnu.edu/hydrocen(accessed on 24 February 2021).
10. Norwegian Tunnelling Society. Norwegian Hydropower Tunnelling II, Publication 22. 2013. Available online: https://nff.no/wp-content/uploads/sites/2/2020/04/Publication-22.pdf (accessed on 29 March 2021).
11. Panthi, K.K.; Basnet, C.B. State-of-the-art design guidelines in the use of unlined pressure tunnels/shafts for hydropowerscheme. In Proceedings of the 10th Asian Rock Mechanics Symposium (ARMS10), Singapore, 29 October–3 November 2018;ISBN 978-981-11-9003-2.
12. Neupane, B.; Panthi, K.K.; Vereide, K. Effect of Power Plant Operation on Pore Pressure in Jointed Rock Mass of an UnlinedHydropower Tunnel: An Experimental Study. Rock Mech. Rock Eng. 2020, 53, 3073–3092. [CrossRef]
13. Bye, T.; Hope, E. Deregulation of electricity markets: The Norwegian experience. Econ. Political Wky. 2005, 40, 5269–5278.14. L’Abée-Lund, J.H.; Otero, J. Hydropeaking in small hydropower in Norway—Compliance with license conditions? River Res.
Aplic. 2018, 34, 372–381. [CrossRef]15. National Instruments. Available online: https://zone.ni.com/reference/en-XX/help/371361R-01/lvanls/butterworth_filter/
(accessed on 29 March 2021).16. Neupane, B.; Panthi, K.K. Evaluation on the effect of pressure transients on rock joints in unlined hydropower tunnel using
numerical simulation. Rock Mech. Rock Eng. 2021. [CrossRef]17. Palmstrøm, A.; Broch, E. The design of unlined hydropower tunnels and shafts: 100 years of Norwegian experience. Hydropower
Dams 2017, 3, 1–9.18. Kjørholt, H. Gas Tightness of Unlined Hard Rock Caverns. Ph.D. Thesis, Norges Tekniske Høgskøle (Now: Norwegian University
of Science and Technology), Trondheim, Norway, 1991.19. Goodman, R.E. Block theory and its applications. Geotechnique 1995, 45, 383–423. [CrossRef]20. Preisig, G.; Eberhardt, E.; Smithyman, M.; Preh, A.; Bonzanigo, L. Hydromechanical Rock Mass Fatigue in Deep-Seated Landslides
Accompanying Seasonal Variations in Pore Pressures. Rock Mech. Rock Eng. 2016, 49, 2333–2351. [CrossRef]21. Bardal, R.; Bruland, A. Tunnel inspection in headrace tunnel of Ulset Hydropower Station 20.06.1986 (In Norwegian), Part of
research project on” Rock support of Water Tunnels” for the Norwegian Hydropower Owners Association. Unpublished.22. Forodden, H. Tunnel inspection—Headrace tunnel Ulset Hydropower Station 19.8.1992 (In Norwegian), for Sør-Trøndelag
kraftselskap, KVO. Unpublished.23. Døvle, L. Study on the long-term stability issues of the headrace tunnel of Ulset Hydropower Project. Master’s Thesis, Norwegian
University of Science and Technology, Trondheim, Norway, 2019.24. Benson, R. Design of unlined and lined pressure tunnels. Tunn. Undergr. Space Technol. 1989, 4, 155–170. [CrossRef]