Operating leases and the assessment of lease–debt substitutability
60
Beattie, V. and Goodacre, A. and Thomson, S. (2000) Operating leases and the assessment of lease-debt substitutability. Journal of Banking and Finance 24(3):427-470. http://eprints.gla.ac.uk/archive/00000782/ Glasgow ePrints Service http://eprints.gla.ac.uk
Transcript of Operating leases and the assessment of lease–debt substitutability
Beattie, V. and Goodacre, A. and Thomson, S. (2000) Operating leases and the assessment of lease-debt substitutability. Journal of Banking and Finance 24(3):427-470.
http://eprints.gla.ac.uk/archive/00000782/
Glasgow ePrints Service http://eprints.gla.ac.uk

Operating leases and the assessment of
lease-debt substitutability
Vivien Beattie, Alan Goodacre* and Sarah Thomson
Department of Accounting, Finance and Law, University of Stirling, Stirling FK9 4LA, Scotland, UK.
26 March 1999 Abstract Operating leases are estimated in the current paper to be approximately thirteen times larger than
finance leases, on average. In recognition of this, the paper investigates the degree of
substitutability between leasing and non-lease debt using a comprehensive measure of leasing,
improving on the partial measures used in prior research. Operating lease liabilities are
estimated using the ‘constructive capitalisation’ approach suggested by Imhoff et al. (1991),
modified to incorporate company-specific and UK-relevant assumptions. The results imply
that leasing and debt are partial substitutes, with £1 of leasing displacing approximately
£0.23 of non-lease debt, on average, consistent with the argument that lessors bear some risks
which are not inherent in debt contracts. These findings suggest that substitution effects are
not uniform across lease types.
JEL classification: G32 Keywords: Operating leases; capital structure; lease-debt substitutability
* Corresponding Author: Tel: 0044 1786 467291; Fax: 0044 1786 467308; e-mail: [email protected] Approximate number of characters per page = 1600 . Acknowledgements
The financial support of the Research Board of the Institute of Chartered Accountants in England and Wales is
gratefully acknowledged. The authors also wish to acknowledge helpful comments from Tony Appleyard, Robin
Limmack, Richard Taffler, and three anonymous referees.
Operating leases and the assessment of lease-debt substitutability 1. Introduction
In recent years, significant progress has been made in understanding the determinants of
corporate capital structure with an increased emphasis on financial contracting theory (see, for
example, Smith and Wakeman, 1985; Barclay and Smith, 1995; Sharpe and Nguyen, 1995;
Mehran et al., 1997; Graham et al., 1998 and, for an international view, Rajan and Zingales,
1995). This theory suggests that firm characteristics such as business risk and investment
opportunity set affect contracting costs. In turn, these costs impact on the choice between
alternative forms of finance such as debt and equity, and between different classes of fixed-claim
finance such as debt and leasing.
However, our understanding of the relationship between leasing and debt is far from complete
and the degree of substitutability (or, indeed, complementarity) between the two remains
unresolved. Finance theory generally predicts that leasing and debt are substitutes, to a greater or
lesser extent. Yet Ang and Peterson (1984), in their seminal empirical study using financial
statement data, failed to confirm this prediction, instead finding a complementary
relationship. They referred to this result as the ‘leasing puzzle’. Although subsequent
analytical work by Lewis and Schallheim (1992) demonstrated the theoretical possibility of
complementarity, more recent empirical papers have supported substitutability (Marston and
Harris,1988 and Adedeji and Stapleton, 1996) although the evidence in Mehran et al., (1997)
is mixed.
A major obstacle to resolving this issue is the difficulty in measuring lease liabilities from
sources which are publicly available. This arises because companies are currently required to
include only finance (capital) leases on their balance sheets, and not assets that have been
financed by operating leases. Thus, explanatory models of the lease ratio suffer from major
measurement error of the dependent variable. None of the previous studies has fully considered
the issue of how to incorporate operating leases in their measure of leasing. Marston and Harris
(1988) had to use a fairly crude assumption, while Sharpe and Nguyen (1995) and Mehran et al.,
(1997) used an approximation based on the ratio of lease payments to an estimate of total capital
costs in a given year. Other studies, including Ang and Peterson (1984) and Adedeji and
1

Stapleton (1996) are
2
partial analyses incorporating only finance leases.
In the UK, the lease accounting standard, SSAP 21 (ASC, 1984), introduced the distinction
between operating and finance leases. Since the standard came into operation, company
management have tended to switch the contractual nature of their leases towards operating
leases. Recent UK research (Beattie et al., 1998) has identified that operating leases are now
a major source of long-term debt-type financing and are considerably more important than
finance leases; similar results have emerged from the US (Marston and Harris, 1988; Imhoff et
al., 1991; Graham et al., 1998). Thus, a substantial contribution can be made to the lease-debt
substitutability literature by using a comprehensive measure of leasing which includes
operating lease finance.
The aim of the present study is to investigate the degree of substitutability between lease and
non-lease debt financing using comprehensive measures of leasing and debt.1 The primary focus
is to explain the observed lease ratio for a cross-section of firms, following the methods of
Ang and Peterson (1984), as amended by Adedeji and Stapleton (1996). Given the limited
information on operating lease liabilities disclosed in published financial statements, we use
an estimate of total operating lease liabilities based on the method of ‘constructive
capitalisation’ suggested
1 A basic premise of the paper is that operating leases can be, indeed should be, pooled with finance (capital)
leases. This can be justified on three grounds. First, lease contract terms lie on a ‘continuum’. At one extreme is
the contract in which it is clear that the lessor is essentially providing finance for the purchase of an asset by the
lessee. At the other, the nature of the contract is that the lessee is paying a rental for the use of the asset, usually
over a short period with no commitment other than the rental payment. However, the vast majority of contracts
lie in the middle of the continuum and do not fit neatly into either category. The distinction between the two
lease types often does not relate to a fundamental difference in their characteristics. Rather, it relates to a desire
to meet the essentially ‘arbitrary’ accounting classification criteria in order to keep leased assets and liabilities
off the balance sheet. Second, there is convincing empirical evidence that all leases are viewed similarly by the
market as giving rise to assets and liabilities, with Ely (1995) finding that her results ‘support the treatment of
operating leases as property rights’. Third, the potentially distinguishing feature of ‘cancellability’ of operating
leases is deceptive. The disclosure in published financial statement is of non-cancellable operating leases;
further, even cancellable leases often carry a punitive termination penalty. We are grateful to an anonymous
referee for suggesting the inclusion of this justification.
3
by Imhoff et al. (1991). This basic approach has been modified to incorporate company-
specific and UK-relevant assumptions using the procedures developed by Beattie et al.
(1998).
The remainder of this paper is structured as follows. Section two provides a brief discussion
of capital structure theories and the determinants of fixed-claim financing, to support the
variables selected to model the lease-debt relationship. Section three reviews the literature
on lease-debt substitutability and presents the models tested in the present study. Methods,
including a description of the approach used to capitalise operating leases, are outlined in
section four. Results, based on both the partial and comprehensive lease ratios, are presented
and compared in section five. The final section summarises and concludes.
2. Fixed-claim financing
2.1 Capital structure theories
The traditional Static Trade-Off Theory can be characterised by the assumption that capital
structure is optimised year by year with management weighing up the relative advantage of
the tax-shield benefits of debt against the increased likelihood of incurring debt-related
bankruptcy costs. However, in reality, managers do not appear to determine capital structure
in this way but rather as part of a dynamic process. Consequently, at any particular time, a
firm may deviate from its optimal or target debt ratio.
Early recognition of this dynamic process was demonstrated by Donaldson (1961), in what he
described as the Pecking-Order Theory of financial choices. He observed that managers
preferred to fund investment initially from retained profits rather than use outside funds. This
preference led firms to adopt dividend policies that reflected their anticipated need for
investment funds, policies which managers were reluctant to substantially change. If retained
profits exceeded investment needs then debt would be repaid. If external finance was
required firms tended first to issue the safest security, debt, and only issued equity as a last
resort.
4
Several possible theoretical explanations for this observed behaviour have been proposed.
First, taxes and transaction costs favour the use of retained earnings and favour debt over the
issuing of new equity. Second, Myers and Majluf (1984) argue that, under asymmetric

information, equity issues are rationally interpreted as ‘bad news’ on average, since managers
5

are reluctant to issue stock when they believe the shares are undervalued. Empirical evidence
confirms that announcements of new issues are associated with declines in stock price, which
at least partly explains the relatively small number of new equity issues. This asymmetric
information argument also extends to the use of dividends as a signalling mechanism.
Consequently, managers are averse to reducing dividends, thereby limiting access to retained
earnings which, in certain periods, leads to the use of external funds to finance investment.
The Stakeholder Theory suggests that the way in which a firm and its non-financial
stakeholders (i.e. customers, suppliers, employees and the community at large) interact is an
important additional determinant of the firm’s optimal capital structure (Grinblatt and
Titman, 1998, Ch. 16). This theory argues that the indirect costs of financial distress are
higher for certain types of firm than for others. They are especially costly for firms
characterised by products whose quality is important yet unobservable, or by products that
require future servicing, or by stakeholders who require specialised capital or training. Such
firms should have relatively less debt in their capital structure. On the other hand, financial
distress should be less costly for firms that sell non-durable goods and services, that are
relatively less specialised and whose quality can easily be assessed. It is expected that these
firms will have relatively higher debt levels. This theory helps to explain why some firms
choose not to borrow even when lenders are willing to provide finance on attractive terms.
Modelling the lease-debt relationship first requires some understanding of the determinants
of fixed-claim financing. The above theoretical arguments lead to predictions about the
factors that determine the level of fixed-claim financing within a firm; discussion of these
predictions and the empirical support for them is presented below.
2.2 Determinants of fixed-claim financing
Profit
The static theory suggests that debt ratios ought to be positively correlated with profitability.
More profitable firms have more income to shelter, are more likely to have high marginal tax
rates and are less susceptible to bankruptcy. However, this result has not been observed
empirically (e.g. Titman and Wessels, 1988); in fact, those firms with the highest taxable
earnings tend to have the lowest debt ratios. This is consistent with the pecking-order theory
and the observed relative infrequency of new equity issues.
6
Asset structure
Agency arguments suggest that shareholders of leveraged firms have an incentive to invest
sub-optimally to expropriate wealth from the providers of debt. Further, the asymmetric
information model implies that issuing debt in a situation where a firm’s managers have
better information than the debt provider may increase the cost of such debt. Issuing debt
secured on property with known values avoids such costs and also reduces the
underinvestment problem. Thus, firms with assets that can be used as collateral are likely to
issue more debt.
Investment opportunity set
Titman and Wessels (1988) note that growth opportunities are capital assets that increase
firm value, but these are not reflected in the book value of assets or in current profits. Thus,
the assets cannot be used as collateral for debt and do not increase the profit available to
absorb tax-shielding interest. Both arguments suggest a negative relationship between
growth opportunities and debt levels. Further, the costs associated with underinvestment, as a
result of the agency relationship referred to in the previous section, are likely to be higher for
firms in growing industries as there is greater flexibility in future investment choice. This
also implies that debt levels will be negatively correlated with expected future growth.
However, Myers (1977) notes that this agency problem is reduced if the firm issues short-
term rather than long-term debt. Overall, these arguments suggest that long-term debt will be
negatively related to growth rates but that short-term debt will be positively related to growth
rates. The net effect on total debt will depend on the relative use of long and short-term debt
by growing firms.
Size
A number of authors have suggested that debt ratios may be related to firm size. Large firms
tend to be relatively more diversified and, therefore, less liable to suffer financial distress.
Also, the costs of issuing new long-term debt and equity securities tend to include a large
fixed element which militates against small firms using such finance. Both arguments
suggest that long-term debt ratios should be positively related to firm size. In contrast, small
firms tend to borrow short-term (through bank loans) because of the lower associated costs
(see Marsh, 1982).
7
2.3 Determinants of leasing
Much of the above discussion relating to debt finance relates equally to leasing. However,
the collateralised nature of leasing leads to four differences that affect managers’ financing
choice. First, the characteristics of a firm’s current and future assets, and in particular asset
specificity, can influence financing. Stulz and Johnson (1985) show that high-priority claims,
such as leasing, can mitigate the underinvestment problem relative to other forms of debt,
because the senior claims on the new project assets limit the transfer of wealth from
shareholders to existing debt-providers. Following this line, Barclay and Smith (1995) argue
that, for a given amount of fixed claim financing, firms with more growth opportunities might
be expected to rely more heavily on lease financing than on lower priority forms of debt.
Smith and Wakeman (1985) suggest that firms are more likely to buy, than lease, assets
which are highly specific to the firm. This results from conflicts and agency costs between
lessor and lessee which arise in the bilateral monopoly that is created when the lease is
negotiated. Consequently, they suggest that firms are more likely to lease general facilities
(such as offices) than firm-specific production or research facilities. Similarly, Williamson
(1988) argues that assets which are more easily redeployable, such as aircraft or trucks, are
better suited for leasing and for use as collateral in debt contracts. In combination, these
arguments suggest that, for a given level of fixed-claim financing, firms that have a high
proportion of growth opportunities, and/or whose assets are not firm-specific, are likely to
employ more leasing.
Second, firm size may have a differential influence on leasing relative to other forms of debt-
type finance. Grinblatt and Titman (1998) argue that the debt holder-equity holder conflict
may be worse for small firms. Smaller firms may be more flexible and thus better able to
increase the risk of their investment projects. The potentially higher return from accepting
this risk accrues to shareholders only, while the increased risk is shared by debt-providers;
this will reduce the willingness of lenders to provide debt finance. Moreover, top managers of
small firms are more likely to be major shareholders and may, therefore, prefer the lower
personal risk associated with low debt levels. These arguments reinforce the view that small
firms will have lower debt ratios. However, they also suggest small companies may favour
leasing over debt, as creditors obtain more security and a manager with a large ownership
interest may prefer leasing to reduce personal exposure to obsolescence or other asset-
specific risks.
8
Third, tax considerations may be important in the choice between debt and leasing. Leasing
provides the option of ‘selling’ tax allowances to a lessor, in exchange for lower rental
payments. Most empirical work has failed to provide evidence consistent with theory, until
the recent study by Graham et al. (1998). The authors suggest that this failure reflects the fact
that corporate tax status is endogenous to financing decisions. Using a forward-looking
estimate of before-financing corporate marginal tax rates, they document a negative relation
between operating leases and tax rates, and a positive relation between debt levels and tax
rates. They argue that their results provide unambiguous evidence supporting the hypothesis
that low tax rate firms lease more, and have lower debt levels, than high tax rate firms.
Finally, poor liquidity and cash flow problems have been found to be an important influence
in the decision to lease (Drury and Braund 1990, Adedeji and Stapleton, 1996); the collateral
of the asset increases the availability of lease finance in situations where unsecured debt
would be too risky.
3. Lease-debt substitutability
3.1 Theories
Prevailing finance theory generally suggests that leases and non-lease debt are substitutes. Thus,
an increase in one should lead to a compensating decrease in the other. There are three variants
of this theory, which imply different magnitudes for the substitution coefficient. Traditional
finance theory treats cash flows from lease obligations as equivalent to debt cash flows, thus the
trade-off between debt and leases is one-to-one. Some theorists argue that differences between
the nature and terms of lease and debt contracts lead to a lease using less debt capacity than an
equivalent amount of non-lease debt (i.e. the substitution coefficient is less than 1). Finally,
others argue that since leased assets may be firm-specific, the risk of moral hazard may be great,
resulting in a substitution coefficient of more than one (see Ang and Peterson (1984) and
references therein).
9
In contrast to this accepted wisdom, Lewis and Schallheim (1992) demonstrate analytically that
debt and leasing can be complements. They argue that leasing is a mechanism for selling excess
tax deductions that can motivate lessee firms to increase the proportion of debt in their capital
structure. They also show that lessee firms can derive a benefit from leasing even with an
assumption that the marginal tax rate is the same for lessor and lessee. This contrasts with most
existing models where the only situation in which leasing provides an advantage is when the
marginal tax rates differ.
The following equation captures these opposing views and their variants:
DRNL = DRL + α LRL (1)
where DR = debt ratio;
LR = lease ratio;
NL = a company which does not lease;
L = a company which does lease, and
α = the lease-debt substitution coefficient
The above substitution arguments correspond to α values of exactly 1, of 0 < α < 1, and of α >
1 respectively; all three share the view that leases are expected to reduce debt capacity (i.e. α
> 0). Complementarity between leases and debt corresponds to a negative α.
3.2 Empirical evidence
There are three possible approaches to investigating the relationship between leasing and debt:
first, by using historical financial statement data; second, by invoking an experimental design
with firm managers or finance-providers as subjects 2 and third, by directly obtaining the views
of managers and providers using a survey method 3. The focus of the current paper is studies
adopting the first of these approaches. In this, it must be assumed either that firms are operating
at (or near) their optimal capital structure, on average, or that the model must somehow
accommodate deviations from the optimal structure. The approach must also include adequate
control for the differences in debt capacity across firms. Otherwise, observed lease ratios and
debt ratios will reflect differences
2 For example, an experimental approach was used by Wilkins and Zimmer (1983a, 1983b) and Wilkins (1984) to
explore the effect of alternative accounting methods for leases (capitalisation versus footnote-only disclosure) using
Singapore-based bank loan officers and investment analysts as subjects. They found that the decisions of loan
officers were affected by levels of leverage but not by either the method of accounting for financial leases or whether
the financing was by loan or lease, implying that debt and leases were viewed as substitutes.
10
3 For example, survey evidence concerning UK company managers’ perceptions of leasing (Drury and Braund,
1990) found that the majority of firms considered that leasing reduces borrowing capacity by a smaller amount than
an equivalent loan (implying a substitution coefficient, α < 1).
in debt capacity, or usage of debt capacity, as well as debt displacement.
Ang and Peterson (1984) (hereafter AP) adopted the first approach and used Tobit analysis on
financial statement data drawn from 600 US firms between 1976-81. They concluded that,
contrary to much accepted theory, leases and debt are complements rather than substitutes; lessee
firms used more long-term debt than did non-leasing firms (i.e. α < 0). They attempted to
control for differences in debt capacity by including six additional financial variables in the
regression model: operating leverage, sales variability, profitability, expected growth, size and
liquidity. Only operating leverage and profitability were found to be significant negative
explanatory factors for the level of leasing. This latter result is consistent with Kare and Herbst’s
(1990) survey evidence that more profitable firms, having easier access to low cost debt, prefer
debt to leasing. The tax rates of leasing firms were found by AP to be consistently higher than
non-leasing firms, suggesting that tax asymmetries between lessors and lessees are not a
significant cause of leasing activity. Smith and Wakeman (1985) suggested the following partial
explanation for AP’s ‘complements’ result: ‘although leases and debt are substitutes for a given
firm, looking across firms, characteristics ... which provide high debt capacity also tend to
provide more profitable leasing opportunities’ (p. 907).
Bayless and Diltz (1986) criticised the AP method on the grounds of its fundamental
assumptions, in particular, of the difficulty in satisfactorily controlling for cross-sectional
differences in debt capacity. Instead, they adopted the second approach, and used an
experimental design to control for variation in firms’ debt-capacity, finding that lending officers
reduced their willingness to lend when a firm took on lease obligations. Consequently, they
estimated a very close substitutability between debt and leasing with capital lease obligations
displacing between 10% and 26% more debt capacity than debt finance (i.e. α > 1). Whilst the
experimental approach avoids the problem of controlling for debt capacity, it has its own
limitations. In particular, achieving reliable subject response in the artificial experimental
situation is difficult and generalisation to other groups not specifically included as experimental
subjects is hazardous.
11
Marston and Harris (1988) tried to reconcile these two studies’ conflicting results using financial
statement data. They used an OLS regression approach based on changes (rather than levels) of
lease and debt finance and also used comprehensive measures of leasing (capitalised plus non-
capitalised) and debt (short-term and long-term). The changes were measured relative to a policy
of maintaining a constant proportion of assets financed by leasing and by debt, with the

proportion
12
measured as the average over a pre-study 3-year period. Their model also allowed for changes in
debt levels independent of any lease changes. The results were consistent with the findings of
AP (1984), viz. the use of leasing tends to be associated with the use of non-lease debt.
However, they also found support for Smith and Wakeman’s observation that certain firm
characteristics simultaneously provide for use of both leasing and non-lease debt. In
combination, these findings suggest strongly that AP’s results reflect differences in debt capacity
rather than complementarity. Importantly, the estimated coefficient of substitution between
leasing and non-lease debt was significantly positive, demonstrating that, at the margin, use of
lease financing substitutes for other forms of both short-term and long-term debt. On average,
firms reduced non-lease debt when leasing increased but did so on less than a dollar-for-dollar
basis, with $1 of leases substituting for about $0.6 of non-lease debt (i.e. 0 < α < 1). This may be
value creating if firms are able to expand their debt capacity or it may reflect a difference in the
risk characteristics of the two instruments. They also estimated that non-capitalised leases
accounted for about 65% of total leasing in 1982 (i.e. post-SFAS 13), thus arguing that it is
important for empirical studies to use a comprehensive measure of leases.
Adedeji and Stapleton (1996) (hereafter A&S) replicate the AP (1984) study in the UK. They
define lease and debt ratios with total assets as the denominator rather than the book value of
equity used by AP, since the latter introduces a bias in favour of a positive relationship
between lease and debt ratios. The control variables used were price earnings ratio, liquidity,
size and tax rate. These differ from those used by AP in that, operating leverage, sales
variability and profitability were omitted but tax rate was included. Operating leases were
excluded from the lease ratio measure due to data unavailability. In the light of evidence
regarding the importance of operating leases in corporate financing from both the UK
(Beattie et al., 1998) and the US (Marston and Harris, 1988; Graham et al., 1998), this
omission is a serious limitation.
To serve as a benchmark, A&S replicate the AP study using a Tobit regression of the full
sample in which 44% of companies had no finance leases. Consistent with AP, they find that
the lease ratio had a generally positive, but insignificant, relationship with the debt ratio,
which implies a complementary relationship. The only significant control variable was
liquidity (a negative relationship, as predicted). A&S investigate whether the positive
relationship between lease and debt ratios is attributable to poor control for the differences
between the debt
13

capacities of leasing and non-leasing firms, by re-estimating the regression model on the sub-
sample of firms which undertook leasing. The OLS method is used as the dependent variable
is no longer truncated.
In contrast with the Tobit results, OLS regression showed the lease ratio to be significantly
negatively related to the debt ratio in each of the three years of the study. A&S concluded
that debt and finance leases are indeed substitutes with, on average, £1 of finance lease
displacing approximately £0.55 of debt over the period studied. In addition, the lease ratio
was significantly negatively related to liquidity and tax rate for each of the three years and to
the price earnings ratio for two out of three years.
A&S’s results appear to support suggestions that liquidity has a negative effect on leasing
(Hull and Hubbard, 1980 and Drury and Braund, 1990) and that expected growth (measured
by A&S as the price earnings ratio) is a negative debt determinant (Myers, 1977). A&S did
not find size to be a significant explanatory variable, in contrast with previous studies of UK
debt financing (Marsh 1982). Arguments presented earlier suggest that a negative
relationship between size and debt is expected but that leasing may be attractive to small
firms, implying a positive relationship between size and leasing. Thus, the lack of
significance for the size variable may be attributable to offsetting influences. Alternatively, it
may be due to the particular size proxy used; Sharpe and Nguyen (1995) argue that total
assets could be inappropriate, due to its lack of independence from the leasing choice.
A further aspect of the lease decision examined by A&S was industry influence. Several
studies on the use of debt have concluded that industry classification has a significant
influence (see, for example, Scott, 1972; Remmers et al., 1975; Ferri and Jones, 1979 and
Bradley, Jarrell and Kim, 1984). To investigate whether this influence extended to the use of
leasing, A&S modified their model to include industry dummy variables. However, these
variables were found to be generally insignificant.
The impact of a firm’s ownership structure on the decision to lease assets has recently been
examined using historical financial statement data by Mehran et al. (1997). Consistent with
theoretical arguments, they find that Chief Executive Officer share ownership is positively
14
related to leasing activity. Their results also provide mixed evidence on the relationship
between debt and leasing, with OLS estimates suggesting a complementary relationship
between debt and capitalised leases but a logit analysis suggested that the two forms of
financing are substitutes. They found no evidence of an interaction between debt and
operating leases.
In summary, there is considerable diversity of evidence regarding lease-debt substitutability. This
may result from the use of small samples, failure to properly account for differences in firms’
debt capacity and/or failure to use a comprehensive measure of leasing (i.e. one which includes
operating leases).
4. Methods
4.1 Lease-debt substitutability models
The estimation model to determine lease-debt substitutability is derived from the definition of
the debt-to-lease displacement ratio α (equation (1) above). Assuming that the debt ratio of a
non-leasing firm (DRNL
) is a function of a number of control variables which reflect the
characteristics that determine a firm’s debt ratio, then equation (1) can be rewritten as:
C(Control variables) = DRL
+ αLRL (2)
Rearranging the above, it follows that the lease ratio of a firm is:
LRL = -1/α DR
L + 1/α C(Control variables) (3)
with the resulting equation to be estimated:
LR = b0 + b
1(DR) + b
i+1(Control variable i) (4)
If lease and debt finance are substitutes, irrespective of the degree, α will be greater than zero
and consequently b1, the debt ratio coefficient, will be negative4.
Throughout this study, equation (4) was estimated in two ways. Tobit regression was applied
to the full sample to accommodate the truncated dependent variable and OLS regression was
4 The value of b1, however, is a measure of the lease-to-debt displacement ratio rather than the debt-to-lease
displacement ratio, α. Alpha cannot be determined by simply taking the inverse of b1 due to the presence of the
constant and other independent variables in the regression model. However, should a substitutability
relationship arise, A&S proposed that α can easily be determined by swapping the lease ratio and debt ratio in
the above equation to treat the debt ratio as the dependent variable.
15

applied to the restricted sub-sample of companies with positive leasing.
4.2 Variable measurement
The experimental variables under consideration are measures of leasing and non-leasing debt.
Leasing. Two ratios were used. The first, which we call the partial lease ratio (LRP),
represents long-term finance (capital) leases as a proportion of total assets. The second,
which we call the comprehensive lease ratio (LRC), is the ratio of total long-term leases,
including the estimated long-term operating lease liability, to total assets.
Debt. The debt ratio was measured as the ratio of (the book value of) long-term and short-
term debt, net of finance leases, to total assets.
To control for differences in debt capacity and its usage across firms, several explanatory
variables which are likely to influence the debt ratio of a non-leasing firm are chosen,
consistent with the arguments presented earlier.
Profitability. Firms with higher profitability will generally be able to make greater use of the
tax-shielding effect of debt and will also have a lower risk of bankruptcy, so would be
expected to have higher debt levels. The measure of profitability adopted here was return on
capital employed (PROF).
Asset structure. Firms with assets that can be used as security may be likely to issue more
debt. A simple proxy for the relative collateral value in a firm’s assets structure is the
proportion of fixed assets to total assets (FAPROP).
Growth opportunities. Two proxies for potential growth opportunities were adopted. The
first was a historical measures of the average percentage change, over the past four years, in
total assets (TAGROW).5 The second indicator of growth was the price earnings ratio (PE). 5 Another historical proxy was used. This measured the average percentage change, over the past four years, in
total sales (SALEGROW). There was a strong positive association (correlation coefficient of 0.75) between
this and the TAGROW variable so to reduce potential multicollinearity problems only TAGROW was included
in the modelling stage.
16

The advantage of this measure is that it represents the stock market’s forward looking
assessment of growth prospects. However, it is determined in part by the firm’s leverage and
is therefore subject to some bias due to reverse causality (Titman and Wessels, 1988).
Size. Consistent with many previous studies, size was measured as the natural log of total
assets (LNSZ). An alternative specification which allows for non-linearities was also adopted
by including both size (SZ), measured as total assets, and its square (SZSQ) in the model.
Industry classification. In our model, a dummy variable for the industrial classification of the
firm was adopted as a proxy for the nature of the firm’s assets and its stakeholder
relationships. Industries were split between those where the number of sample constituents
might be sufficiently large to capture any specific industry effects, and the rest. Five
industries contain, on average, 14 or more companies and were classed as large. Firms within
these five industry groups were identified with separate dummies (building, retail,
engineering, electrical and leisure), taking the value of 1 if the firm is within the sector and
zero otherwise. The remaining ‘control group’ firms were accommodated within the intercept
term. Thus, the industry dummy coefficient should be viewed as an impact relative to the
average control group firm. The non-specific nature of assets employed in retailing and
leisure (e.g. shop space) suggests that these industries will use more leasing (positive
coefficients). By contrast, the likely firm-specific assets in the engineering and electrical
industries imply negative coefficients; assets in the building sector are more varied and the
expected sign is uncertain.
Tax. The tax-paying status of the firm was proxied by calculating the effective tax rate,
measured as the current year reported tax charge divided by profit before tax (TR). 6
Liquidity. This variable (LQ) was measured as the firm’s current ratio (i.e. current
assets/current liabilities).
6 A second tax rate variable (TRAVE), the average of the TR measure over the last three years, was also
investigated. Results for the separate models incorporating TR and TRAVE were almost identical so only
results using TR are presented.
17

When the comprehensive lease ratio (LRC) was used as the dependent variable, the
explanatory variables were adjusted for the effect of operating lease capitalisation.7
4.3 Sample selection
A randomly selected sample of 300 listed industrial and commercial companies was originally
selected for analysis and steps were taken to minimise survivorship bias.8 Financial companies
were excluded as our analysis of the Extel Company Analysis database showed this sector to
employ minimal leasing. This original sample of 300 companies comprised 53 ‘dead’
companies, 122 ‘new’ companies, and 125 companies which had existed from 1981 to 1994.
Over the 1990-94 period of our study this gave between 217 (1990) and 232 (1994) companies
in existence in
7 Two variables were not adjusted, namely FAPROP and TAGROW. Adjustment to FAPROP requires the
addition of the total operating lease asset to the fixed assets numerator of the variable and also to the total assets
denominator. The lease ratio dependent variable (LRP) requires a very similar ‘adjustment’ as it is measured as
finance lease liability plus operating lease liability / total assets (including operating lease asset). The operating
lease asset and liability are of similar size, differing only in the cumulative net profit effect on equity, and are
both of relatively large magnitude, on average. The adjustment introduces a significant positive bias in the
correlation between FAPROP and (LRP). Similar arguments apply to the TAGROW variable.
8 The UKQI list current in 1995 (the year in which the sampling was undertaken) was used as the initial sampling
frame. This Datastream listing of approximately 1300 companies contains all of the UK industrial and commercial
companies for which Datastream has accounting information. A particular methodological problem in studies
concerning performance is survivorship bias, which refers to the use of samples which are biased towards long-
surviving companies (see, for example, Brown et al. (1992) for a review of this problem). This is also important in a
leasing context, as previous research findings suggest that leasing may be the only option in acquiring the use of
assets for unprofitable, or high growth, companies which have exhausted all alternative sources of finance. To
overcome this problem, the 1995 UKQI list was augmented by a group of approximately 250 ‘dead’ companies
(failed, taken over, or gone private), identified from a comparison of the Times 1000 1981/82 top UK companies (no
historic UKQI list being available) with the 1995 UKQI list. The year 1981 was selected for comparison purposes
because it is the year in which ED 29 was published, and some of our analysis therefore covers the fourteen year
period 1981 to 1994. Sample representativeness checks were performed, based on total assets (item 392) and share
capital and reserves (item 307). This showed that the company size distribution and industry sector distribution of the
sample approximated closely to that of the population.
18

each particular year. The data requirements of the models, especially for variables such as
growth proxies measured over several years, reduced the sample size for the models presented
here. 9
Panel A of Table 1 gives details of the sample composition over the study period, while Panel B
provides an analysis of sample companies by industry for 1994. Panel A shows that between
179 and 206 companies each year possessed all the relevant data. It also indicates the number
of companies which used just finance leases and those which used operating and/or finance
leases. For example, in 1994, 105 companies (51%) used finance leases but this increased to
188 (91%) once operating leases were considered. This suggests that most companies adopt
some form of leasing to finance the use of assets.
< TABLE 1 about here >
4.4 Data collection
Eleven profit and loss and balance sheet items and industry group membership were extracted
from Datastream (see Table 2, column 3) to calculate the regression variables. Leasing data to
support the operating lease capitalisation procedure is contained in the notes to the accounts (not
available in Datastream) and was extracted manually from company financial statements on
microfiches. Detailed specification of variables is presented in Table 2.
< TABLE 2 about here >
4.5 Operating lease capitalisation procedure
The basis of the procedure developed by Imhoff et al. (1991) for ‘constructive capitalisation’ of
operating leases is the schedule of minimum total future operating lease payments disclosed by
US companies in a note to the financial statements. The total commitment is analysed by time
period (amounts payable in each of the next five years and after five years). Estimation of the
present value of the unrecorded lease liability requires assumptions to be made regarding the 9 Models were also estimated on the full sample set by excluding such multi-year variables. The results (not
presented here) were almost identical, confirming that bias resulting from data needs is not a significant issue.
19

appropriate interest
20

rate and the average remaining lease life of leases whose remaining lease life exceeds five years.
Estimation of the present value of the unrecorded lease asset requires further assumptions to be
made regarding the weighted average total lease life and the depreciation method which would
be used. Finally, the impact of capitalisation on deferred tax, and hence balance sheet measures,
requires an assumption to be made regarding the appropriate tax rate.
The operating lease information disclosed by UK companies in a note to the financial statements
is a schedule of next year’s operating lease payments (compared to the minimum total future
payments disclosed by US companies). This figure is analysed by asset category (i.e. ‘land and
buildings’ and ‘other’) and by lease expiry date (i.e. leases expiring within one year, between
one and five years, and after five years). Although generally less complete than US disclosures,
UK disclosures do have the advantage of giving a more reliable picture of the company’s pattern
of remaining lease lives.
In the present study, the ‘constructive capitalisation’ procedure was adapted to take into account
the different operating lease disclosure requirements in the UK. In addition, preliminary analysis
based on a set of six common assumptions similar to those of Imhoff et al. failed to produce
reasonable and consistent results, due to the considerable variation in leasing patterns within our
sample companies.10 We therefore developed the method to incorporate company-specific
10 The pattern of operating lease commitments over the period 1985 through 1994 was analyzed for a small sub-
sample of companies. This identified some companies with commitments predominantly in the ‘> 5 years’ category,
some predominantly spread over the two ‘< 5 years’ categories, and some spread over all three expiry categories.
Thus, some companies take on only short- to medium-term leases, some mainly long-term leases, and some the
whole range of lease durations. Imhoff et al.’s assumption of uniform total and remaining lease lives is unable to
capture such diversity. In particular, calculation of the impact of capitalisation on the profit and loss account (not
discussed by the authors until their later paper Imhoff et al., 1997) would be severely distorted. For example,
imagine a company which takes on only medium-term leases of, say, 5 years. In a steady-state, the average
remaining life for the company's leases would be approximately three years. Imhoff et al. suggested a uniform
assumption of 15 year remaining lease life. If this were applied to such a company, the depreciation charge in the
P&L account upon capitalisation of the operating leases would be one-fifteenth of the asset value (assuming straight-
line method) rather than one-third and would give a large understatement of the effect on operating and pre-tax
profit.
21
assumptions in respect of the remaining lease life, the asset proportion, and the effective tax rate.
We also distinguish in our analysis between asset categories and lease expiry categories,
performing separate calculations of remaining lease life and asset proportion for each. Further
details of our capitalisation procedure, and an illustration of its application to a particular
company, are given in Appendices 1 and 2.
Company financial statements will be affected in several ways by the capitalisation of
operating leases. The effect on the variables in this study is summarised in Table 2 (columns
4 and 5). On the balance sheet, fixed assets will increase by the capitalised leased asset and
liabilities will increase by the liability to make future lease payments, split between the
current portion due within one year (current liability) and the longer-term portion.
Shareholders’ equity (retained profit) will be changed by the cumulative profit and loss effect
of capitalisation and deferred tax will also be affected. In the profit and loss account the full
operating lease rental (OLR) payments are charged against operating profit as a tax-
deductible expense. On capitalisation of the leased asset, depreciation will be charged
against operating profit and the interest element of the OLR will be included under interest
charges. The impact is that operating profit is likely to be higher (depreciation < OLR).
Profit before tax will be lower in the early years of a lease, or lease portfolio, (depreciation +
interest > OLR) and higher in the later years as the interest element of OLR declines
(depreciation + interest < OLR). Under current tax rules, the amount of tax paid will be
unchanged, but the tax charged in the profit and loss account will be lower in the early years
of the lease portfolio and higher in the later years. This was accommodated by adjustments
to deferred tax.
5. Results
5.1 Descriptive Statistics
22
The ‘constructive capitalisation’ process outlined above and in the Appendices allows the
relative size of finance leases and operating leases to be assessed. For example, in 1994, the
mean total liability in respect of finance leases was £3.8million and for operating leases
£50.8million, of which £8.3million would be categorised as short-term (< 1 year) and
£42.5million long-term (> 1 year). This suggests that, on average, the operating leased
liability is approximately 13 times larger than the liability in respect of finance leased assets.
This reinforces the need for lease-debt substitutability research to incorporate operating

leases.
23
Table 3 provides summary statistics for the variables, subscripted C to denote their relevance
to the comprehensive leasing measure, i.e. after they had been adjusted to take account of the
capitalisation of operating leases.11 Statistics for variables based on the partial lease measure
are also provided for comparison (subscripted P). The mean value of the adjusted lease ratio
LRC is approximately 9.5% of total assets on average over the five years, compared to 0.7%
when considering only the use of finance leases.12 This is consistent with the above
multiplier of approximately 13. The maximum value of LRC for any single company is 75%
(in 1992), compared to a maximum of 18% (in 1991) for LRP, when only finance leases are
considered. A similar pattern for debt ratios DRC and DRP is observed with a decreasing
trend in the mean DRC from a peak of 17.3% in 1991 down to 14.2% in 1994. The DRC
values remain higher than LRC, but are slightly lower than DRP, when finance leases alone
were considered. This occurs because capitalisation of operating leased assets leads to an
increase in total assets and a commensurate reduction in the debt ratio (debt to total assets).
< TABLE 3 about here >
Adjusted PEC ratios have slightly higher mean values than before. This implies that earnings
per share is reduced on average, due to the depreciation plus interest (after capitalisation)
being a greater charge against profit than the operating lease rental (before capitalisation).
Adjusted LQC ratios have lower mean values due to the increase in current liabilities caused
by the short term element of operating lease commitments. The average company size
increases by about 6% on average on adjustment for operating leased assets. The mean
adjusted TRC does not significantly change but, on average, the tax charge is slightly lower in
line with a corresponding reduction in earnings. The observed trends in profitability (PROF)
and total
11 The 1990-94 study period included a recession during which some companies reported losses or very small
profits. This situation can distort relationships and two variables, in particular, required adjustment to minimise
the impact. Negative PE ratios were set to 100 for consistency with companies experiencing low profits (which
explains the relatively high mean PE ratios reported in Table 3) and PE ratios greater than 100 were set equal to
100. Companies reporting a negative tax charge (i.e. repayment) associated with negative earnings gives a
positive effective tax rate. Such companies need to be recognised as ‘low’ tax payers so TR was set equal to 0.
For companies with a negative effective tax rate, TR was also set to 0, and high TR values in excess of 1 were
set equal to 1. 12 A&S report a finance LR of 0.9% of total assets in their sample.
24
asset growth (TAGROW) variables reflect the impact of the recession during the study
period.13
5.2 Correlation analysis for capitalisation-adjusted variables
Table 4 provides details of the correlations between the variables after adjustment for
operating lease capitalisation; these are generally as predicted. First, consider the control
variables, seven of which are significantly correlated with the debt ratio. The debt ratio is
negatively related to profitability (PROFC) and to tax rate (TRC), contrary to the static trade-
off theory but consistent with the pecking order theory. The positive association with
FAPROP suggests an increased use of debt by firms with assets which can be used as
collateral for loans. The proxies for growth give mixed signals; the weak negative
association with historical measure TAGROW is consistent with the predicted lower use of
debt by growth firms. However, the positive correlation between debt and PE ratio suggests
that PEC may be capturing a different characteristic to the other growth variables; indeed, the
correlations between PEC and these are significantly negative. Size (SZC) is expected to be
positively related to long-term and inversely related to short-term debt. Our DRC measure
includes both short-term and long-term debt so the expected association is uncertain. The
observed relationship is positive and significant. Splitting the debt ratio between short- and
long-term reveals that the expected relationships do hold, with a significant correlation of
0.28 between size and long-term debt, and an insignificant -0.10 between size and short-term
debt. Marsh (1982) also cites similar evidence that large companies tend to use more long-
term debt and small companies more short-term debt.
< TABLE 4 about here >
25
13 We also carried out tests to see if there were any significant differences between variables for the three
groups of firms (i.e. ‘dead’, ‘new’ and ‘continuing’) in our sample. For each of the five years, the lease ratio
and the debt ratio were tested for both partial and comprehensive measures. Unfortunately, there were
insufficient numbers of ‘dead’ firms in each year’s sample for reliable estimation of variable means. No
significant differences between ‘new’ and ‘continuing’ firms were found for the mean partial lease ratio (LRP)
or for either of the debt ratios (DRP, DRC). However, the mean comprehensive lease ratio (LRC) was
significantly higher (at the 5% level) for ‘new’ firms than for ‘continuing’ firms, in each of the five years. This
is consistent with the growth of the UK services sector, which contains high users of operating leases. This
growth is reflected our sample. We are grateful to an anonymous referee for suggesting this additional analysis.
Second, consider the lease ratio (LRC) variable. It has a significant negative relationship with
the debt ratio (DRC), indicating substitutability. The significant negative coefficient with
liquidity (LQC) is as expected with poor liquidity firms engaging in more leasing. The
positive coefficient with PEC suggests that growth firms undertake more leasing, but the
historical growth measures give opposite indications. The positive association with the asset
structure variable (FAPROP) supports the Smith and Wakeman (1985) contention that firms
with certain types of assets will find it easier to engage in both leasing and debt finance. The
size effect is weakly negative, but is consistent with smaller firms using more leasing, on
average.
Two separate models were estimated: first, with size proxied using LNSZ and, second, to
accommodate potential non-linearities, including both SZ and SZSQ. As almost identical
results were obtained, only the model with the LNSZ proxy is presented here.
5.3 Regression estimates based on partial lease ratio
Initially, to give a benchmark for later comparisons, we replicate the A&S study which
considered a partial measure of leases only (i.e. finance leases) but we include three
additional control variables (PROF, TAGROW and FAPROP). For comparison with the A&S
results, equation (4) was first estimated excluding industry dummies (Model I) and then
including them (Model II). Tobit regression was used for the full sample and OLS regression
for only those companies which used finance leases. Cross-sectional regressions were carried
out separately for each of the five years 1990 through 1995 and pooled over the entire five
years. The pooled regressions provide a useful means of summarising the results and are
reported in Table 5. The significance levels from these regressions are subject to bias and are
likely to be overstated; they should, therefore, be viewed with caution. To aid interpretation
of significance, the number of times, out of five, in which the variable appeared as significant
(at the 10% level) in the annual regressions is also reported.
< TABLE 5 about here >
26
The explanatory power of the annual regressions was low (mean adj. R2 of approximately
3%), and did not greatly improve in the pooled regressions. In both the Tobit and OLS
regression models, the debt ratio coefficient was generally positive, consistent with
complementarity, but was not significant. Only the liquidity variable, LQ, (in the Tobit
regressions) and the asset structure variable, FAPROP, (in the OLS regressions) were
generally significant with the expected sign. Thus, there is weak evidence that companies
with poor liquidity, and those with assets which can be used as collateral, take on relatively
more finance leases.
The coefficients on the industry dummies are generally insignificant in the annual
regressions, though significantly negative for retail in the pooled regression. This provides
weak evidence that the retail sector employs relatively less finance leases than most sectors.
Given the general, rather than firm-specific, nature of assets within the retail sector this result
is counter-intuitive.
Overall, these results provide no support for a substitutability relationship between finance
leases and debt and are consistent with the initial observations by A&S (and AP) that finance
leases and debt appear to be complements. For both Model I and Model II in the annual
regressions, the lease ratio has a positive but insignificant relationship with the debt ratio for
four (three) years out of five for Tobit (OLS) regressions. Our positive OLS results in 1990
and 1991 differ from those of A&S 14, who found a consistent significantly negative
relationship between LR and DR, for each of the years 1990 through 1992, based on their
sample of approximately 315 companies that had finance leases. This contrasted with their
finding of a generally positive relationship in the Tobit analysis of the full sample of
approximately 565 companies. These observations led them to conclude that the large
proportion of non-leasing firms in their full sample, firms which also had low debt ratios,
14 This difference remains puzzling. We investigated further by re-estimating both Tobit and OLS regressions
with our three additional control variables removed. The sign and significance of DRP for 1990-92 were
unchanged. In particular, the DRP coefficient was insignificantly positive for 1990 and 1991 in contrast with
A&S. We also ran a crude check to see if our results might be sample-specific by splitting our sample in two
and re-estimating the regressions. The sign of the DRP coefficient remained positive for both of the sub-
samples. It is also worth noting that A&S report a positive correlation for 1991 and 1992 between LR and DR
for their finance lease sub-sample (Table A2, p. 83) despite finding a significant negative coefficient linking the
variables in their OLS regression model.
27
explained the Tobit-based ‘complements’ result.15
5.4 Regression estimates based on comprehensive lease ratio
Equation (4) was estimated first, for the full sample, using the Tobit regression technique and
then for the sub-sample of companies undertaking any form of leasing using OLS. Given the
relatively small proportion of companies that were not engaged in any leasing (approximately
12% on average) the almost identical results from the two techniques are not surprising. In
view of the similarity, only OLS estimates are reported. Table 6 uses pooled cross-sectional
regressions to summarise results and facilitate comparison between partial and
comprehensive lease ratio models. Table 7 provides the detailed annual regression results for
the comprehensive lease ratio based on Model II (i.e. including industry dummies).
< TABLE 6 about here >
< TABLE 7 about here >
First, these tables show that the explanatory power of the regressions is much greater for the
comprehensive lease ratio with adjusted R2 for the pooled regressions of 17.9% and 46.1%
for Model I and Model II respectively, compared with 6.3% and 7.1% for the partial lease
ratio. The adjusted R2 for the annual Model II regressions range between 42.2% and 55.0%.
Second, they indicate that the comprehensive lease ratio LRC has a significantly negative
relationship with the debt ratio DRC in the pooled results and in every year of the study;
significance is at the 1% level in four years and at the 5% level in one year. Thus, there is
28
15 Footnote 13 provides evidence that our sample selection approach itself is not influencing the difference
between our partial (i.e. finance) lease ratio results and those of A&S. However, there are other potential
explanatory factors. A&S included all companies which had the relevant data and which were in ‘non-financial
and fairly large industries’ (A&S, 1996, p.74). In particular they excluded companies for which data on ‘finance
leases and especially the book value of short-term investments’ was missing on the Datastream database. Our
random sample selection process was less data-dependent since we extracted lease data from the primary source
(published financial statements). It is possible that these two approaches give different industry representation
within the samples; indeed comparison of our Table 1 and A&S Table 1 supports this contention. There is also
the possibility that, in the context of companies’ overall financing decisions, finance leases are of little
significance. This might cause the results in relation to finance leases alone to be unstable and, potentially, to be
quite sample-specific.
evidence of a persistent substitutability relationship between our comprehensive measure of
leasing and debt. Given the small magnitude of finance leases relative to operating leases,
this implies that operating leases and debt are substitutes. This contrasts with Mehran et al.
(1997) who found no evidence of such an interaction using US data.
In the comprehensive lease ratio models, liquidity LQC is consistently negative and highly
significant (as expected) but PEC has a significantly positive relationship with the lease ratio
(‘uncertain’ relationship expected). The relationship between lease ratio and the other non-
dummy control variables is time varying both in sign and significance.
Comparing the comprehensive lease ratio results excluding and including industry dummies
(Model I compared with Model II) three major observations can be made. First, inclusion of
the industry dummies raises the explanatory power of the regression significantly, with
adjusted R2 improving from 17.9% to 46.1% for the pooled regressions. Second, the
FAPROP variable changes sign and is significantly negative in Model II. This suggests that a
genuine underlying negative relationship between the comprehensive lease ratio and
FAPROP is possibly being masked by the strong retail sector relationship which is not being
explicitly modelled in Model I. Pooled cross-sectional results with retail company data
excluded confirm this, producing coefficients of FAPROP for Models I and II of -5.46 and
-7.45 respectively, both significant at the 1% level. This negative relationship is contrary to
expectations since firms with assets available as collateral are likely to take on more leasing.
However, as it was not possible to adjust the FAPROP variable for assets acquired under
operating leases (see footnote 7), the proportion of fixed assets to total assets is understated
by those assets which remain off-balance sheet. Therefore, firms which use a high level of
operating lease finance are likely to show a relatively low level of on-balance sheet fixed
assets, which would explain the observed negative relationship.
Third, the dummy for the retail sector is consistently positive and highly significant (at the
1% level) throughout.16 Although the size of the industry dummy coefficients, with the
exception of retail, is generally insignificant, the signs are as expected and are generally
consistent over
16 This analysis was repeated using a revised cut-off of nine industries classed as large (i.e., those with, on
average, 10 or more companies). The results were very similar and are not reported here.
29

time. These results suggest that there are significant differences in the usage of leases across
different industries.
For Model II using the partial lease ratio (LRP), the coefficient of the retail industry dummy
variable was consistently negative, though mainly insignificant, in the annual Tobit and OLS
regressions; in the pooled results it was significantly negative in both (see Table 5). This,
together with the large significant positive coefficient when using the comprehensive
measure of leasing (LRC), implies that companies are influenced to enter into operating lease
agreements as a result of functioning in the retail trade. These results are consistent with
those of Kare and Herbst (1990) who also found that retail firms employ more leases. As
suggested earlier, retail assets are relatively standard (city-centre shops, out-of-town
shopping developments, offices and the like), which makes them more suitable for leasing
than the more specialised assets often used in other industries. Further, such non-specialised
retail assets are especially suitable for financing using operating lease contracts. A major
difference between finance and operating leases is that the lessor bears ‘residual value’ risk in
operating leases. At the end of the operating lease the asset reverts back to the lessor. The
‘residual value’ on reversion has to be estimated by the lessor at the start of the lease contract
when determining the appropriate lease rentals. This residual value will depend on the
likelihood that the asset can be re-let or sold by the lessor, and the state of the market for such
assets at the date of reversion. The standardised nature of, for example, an out-of-town
shopping development means that it is fairly simple to convert it, at relatively low cost, for
use by a new lessee. Additionally, there has been considerable growth in out-of-town
retailing in the UK with demand for such sites in excess of supply as a result of planning
controls. Thus, there is likely to be a ready market for selling or re-letting the asset.
30
There may also be a tax-based argument to partly explain the attraction of operating lease
finance for retail assets. There are generally no tax allowances in the UK for the purchase of
retail properties. But, if a retail company finances such properties using an operating lease,
then tax relief is available on the full operating lease rental. There would be no tax advantage
to such leases if the lessor suffers tax on receipt of the rental. However, if the lessor is a non-
tax payer (e.g. a pension fund), then there is a reduction in total tax payable by lessor and
lessee, to the detriment of the Inland Revenue only; this tax benefit can be shared between
lessee and lessor by the lessee accepting a slightly higher before-tax rental charge. Thus,
there is a tax incentive to lease rather than buy such retail properties. This incentive does not
depend
on the lessee being a low or non-tax payer, the usual situation for tax incentives to lease;
rather it depends on the non-tax paying nature of the lessor. This might partly explain why
the tax rate (TR) variable does not seem to be helpful in explaining the lease ratio.
To gain further insight into the pattern of leasing, a descriptive breakdown of the use of
leasing and its relationship with the explanatory variables was undertaken. The companies
were separated between leasing and non-leasing, and companies with leasing were sorted on
the size of lease ratio (LRC) and split into quintiles. By way of illustration, the mean values
for the lease ratio and associated explanatory variables for 1994 are reported in Table 8.17
This stratification highlights the heavy use of leasing by some companies. The top 20% of
leasing users finance, on average, approximately 32% of their total assets in this way.
< TABLE 8 about here >
The table shows that a typical non-leasing company (first column of data, mean LRC = 0.0%)
has low debt (DRC), average expected and historical growth (PEC and TAGROWC), very high
liquidity (LQC), is very small (SZC), has an average tax rate (TRC), has relatively high
profitability (PROFC), and a lower than average proportion of fixed assets (FPROP). By
contrast, a typical high leasing company (quintile 5) is likely to have low levels of debt
(DRC), high growth prospects as measured by PEC but low historic growth TAGROWC, poor
liquidity (LQC), will be small-to-medium sized (SZC), have a slightly low tax rate (TRC),
relatively high profitability (PROFC), and a high proportion of fixed assets (FPROP).
Within the subset of leasing companies there are decreasing near-monotonic relationships
between the quintile mean lease ratios and debt ratio, liquidity and size18 and an increasing
relationship with PE. There are no clear patterns with the other variables.
17 The relationships are very similar for the other four years and are not reported to save space and for ease of
exposition.
18 The size-related pattern of lease use indicated in Table 8 for companies which undertake leasing suggests a
negative relationship. The implied negative sign for LNSZC is observed in four out of five years in the annual
OLS regressions for Model II including industry dummies, though only in 1991 is the coefficient significant.
For Model I which excludes industry dummies, the coefficient of LNSZC was consistently positive though
insignificant, probably as a result of the size variable proxying for other factors.
31
This description is consistent with greater use of leasing by companies which are generally
short of finance, have poor recent growth, yet are profitable with good future prospects which
presumably needs financing. The relationship between leasing and size illustrated in Table 8
is also informative. It suggests that small companies do not generally use leasing finance. At
the other extreme, large companies also do not use a great deal of leasing, perhaps because
they have less need to do so as they have easier access to other cheaper forms of debt finance.
So it is medium-sized companies which are the heaviest users of leasing. They have less easy
access to large amounts of debt-type finance, but a great need to finance growth, and
presumably are able, and willing, to employ slightly more expensive lease finance.
5.5 Robustness checks Given the limited disclosure of operating lease liabilities in UK financial statements, the method
of constructive capitalisation necessarily involves subjective assumptions and judgement. To
test whether the results were influenced by the specific assumptions adopted here, the methods
were reapplied independently for a series of alternatives.
First, the base assumption of a 10% interest rate to discount the estimated future lease payments
was varied by ± 2%. Second, the base estimates of remaining and total lease lives were replaced
with two sets of more extreme estimates; one set placed the leases at a much earlier stage of a
shorter lease life, while the other placed the leases at a much later stage of a longer total life.
Third, three slightly different assumptions in the capitalisation procedure were adopted. In one,
the operating lease rental was taken as the reported operating lease rental expense, rather than
next year’s operating lease commitment. In the next, the operating lease liability for each asset
category was estimated based on the overall average remaining life, rather than considering
expiry categories individually; this allows the historic lease obligation profile to be reflected in
both asset and liability estimates. Finally, the relationship between lease asset and liability was
estimated for each expiry category, rather than using the overall average remaining and total
lease lives.
With one or two minor exceptions the signs and significance of the regression coefficients were
unaltered by these alternative measurements and, therefore, the reported results are considered
robust to the estimates involved in the operating lease capitalisation procedure.
32

The comprehensive lease ratio LRC employed in the study comprises the long-term elements
only of finance and operating leases; i.e. short-term elements were excluded. The sensitivity
of the results to a different measure of the lease ratio variable was also investigated. The
regression coefficients were re-estimated with LRC defined to include short-term elements of
both finance and operating lease liabilities. Again, the signs and significance of coefficients
essentially remained unchanged, though the magnitude of the DRC coefficient increased by
approximately 20%, on average. This suggests a closer degree of substitution between
leasing and debt finance when short-term obligations are included.
The use of total assets as a proxy for company size has been criticised by Sharpe and Nguyen
(1995) in view of its dependence on the lease accounting decision. The regression
coefficients were estimated with the number of employees (Datastream item 219) as an
alternative size measure. The signs and significance of coefficients were unaltered, and the
size variable remained as in Table 7, generally negative but insignificant. This suggests that
the total assets proxy did not greatly affect the results.
Finally, in view of the observation that leasing is used least by small and by large companies
and most by medium sized companies, the possibility of capturing this non-linearity with the
size control variable was investigated. Rather than natural log of size (LNSZ), size (SZ) and
its square (SZSQ) were incorporated in the regression models with expected positive and
negative signs, respectively, for an inverted parabolic relationship. For the ‘comprehensive
leasing’ models (with LRC as dependent variable) the signs and significance of other
variables were very similar though the explanatory power was very slightly increased. The
SZ variable coefficient was consistently negative and was significant in two of the five
annual, and in the pooled, OLS regressions; SZSQ was consistently positive and only
significant in the pooled regression. The signs are opposite to those expected if the inverted
parabolic relationship pertains, suggesting that the simpler negative size relationship for
companies undertaking leasing (see Table 8) is dominant.
5.6 Determination of the debt-to-lease displacement ratio
Finding a negative value for the debt ratio coefficient provides evidence that total lease and
debt finance are substitutes. However, this coefficient is a measure of the lease-to-debt
33
displacement ratio, rather than the debt-to-lease displacement ratio α. The latter cannot be
determined by taking the inverse of the coefficient due to the presence of the constant and
other independent variables in the regression equation. The regression relationship must
instead be re-estimated with DRC as the dependent variable and LRC as one of the
independent variables. OLS regression was used on the sub-sample of leasing companies for
the comprehensive measure of leasing with the same control variables and industry dummies
as previously. This was carried out for each of the five years 1990 through 1994 and pooled
over all five years.19 The estimated values of the debt-to-lease displacement coefficient for
each of the years are approximately -22% , -28%, -18% , -24% and -23%, giving an average
value of -23% over the five years; the pooled cross-sectional regression yields -22%. This
indicates that £1 of leases (finance and/or operating leases) displaced on average
approximately £0.23 of debt over the period of the study.
While there was no evidence of substitutability between debt and finance leases in the current
study (see section 5.3), Adedeji and Stapleton (1996) found that £1 of finance lease displaced
about £0.55 of debt, on average, during 1990 to 1992. We do, however, find evidence of
substitutability between debt and all leases, suggesting that the substitution effect is not
uniform across lease types. To test this further, we ran five annual OLS regressions with
DRC as the dependent variable (and the same control variables as in Table 7) but with two
separate lease ratio variables, one for finance leases (LRP) and one for operating leases
(LROP). As expected, given the major importance of operating leases relative to finance
leases, the coefficients on LROP were almost identical to those obtained for LRC. They were
all significantly negative, ranging between -19% (1992) and -30% (1991) and averaging -
23.7%. However, the coefficients on LRP were not significant and were extremely variable
over the five year period, ranging between -58% (1993) and +73% (1990). This lack of any
significant relationship between debt and finance leases is somewhat puzzling, since finance
leases possess similar characteristics to debt. One possible explanation is that the relatively
19 Adjusted R2 was much lower than the model estimated with LRC as dependent variable, averaging 25.6%
over the five years, with 24.9% for the pooled regression. The reduction arises mainly from a much less
pronounced ‘industry effect’ for debt. Some caution must be exercised in the interpretation of this model with
DRC as dependent variable. The LRC variable, now treated as an independent variable, is subject to
measurement error and an ‘errors-in-variable’ problem arises. With LRC as dependent variable this is less of a
problem as the impact is likely to be reflected in R2 as the error term in the regression ‘absorbs’ the
measurement errors in LRC.
34

low level
35

of finance leasing which remains in UK firms’ financial statements may not be the result of
systematic decisions by firm management. Rather, it may reflect a random ‘residual’
resulting from managers’ inability to restructure some old contracts from finance to operating
lease formats.
One further aspect of the relationship between lease and debt ratios was investigated. In the
notes to their financial statements, UK companies are required to analyse next year’s
operating lease commitment between ‘land and buildings’ and ‘other’ (though a few
companies fail to provide the split). This enabled the estimated total lease asset and liability
to be similarly partitioned. To assess whether the degree of substitutability is related to the
type of asset leased, the comprehensive lease ratio was split between these two categories,
and an ‘unclassified’ category. These variables were then incorporated in an OLS regression
with the debt ratio as dependent variable and the same control variables including industry
dummies as before. The estimated ‘land and buildings’ displacement coefficient averaged -
20.0% over the five years, slightly lower than the overall figure of -23% reported above; it
was significant at the 5% in all five years. The coefficients for ‘others’ were variable in both
sign and size and were statistically insignificant; the ‘unclassified’ coefficient was negative
and close to its average of -35.0% in all five years but was statistically insignificant. These
results suggest that the nature and terms of operating lease contracts on land and buildings
are such as to consume slightly less debt capacity than contracts on other assets. Operating
leases, generally, appear to consume much less debt capacity than an equivalent amount of
non-lease debt.
6. Summary and conclusions
36
Operating leases are an important element of fixed-claim financing in the UK but they have
been ignored in previous studies concerning capital structure and, in particular, in studies of
lease-debt substitutability. This study estimates the total liability in respect of operating
leases at the individual company level and incorporates this, together with the finance lease
liability in a comprehensive measure of leasing. This measure is used in an investigation of
the relationship between leasing and non-lease debt. The empirical results support the
contention that leasing and debt are partial substitutes, with £1 of leasing displacing
approximately £0.23 of non-lease debt, on average. This is consistent with the argument that
lessors bear some risks which are not inherent in debt contracts. For operating leases a major
source of such risk for the lessor is ‘residual value risk’. The residual value of the asset at the

end of the leases
37
must be estimated in determining the appropriate lease rentals. If, at the end of the lease, the
asset cannot be either sold or leased at equivalent present value then the lessor will make a
loss.
Liquidity is an important determinant of leasing, and there is some weak evidence to suggest
that the use of leasing is size-related with small and large firms taking on less leasing than
medium-sized firms. Firms with high growth prospects (proxied by the PE ratio) seem to use
more lease finance, consistent with the argument that leasing can help to mitigate the
underinvestment problems associated with debt usage. This might also be related to the
nature of high growth firms. It is likely that there are more high growth firms in the service
sector than in manufacturing and service providers are expected to use general, rather than
firm-specific, assets. Such assets are more conducive to financing by leases, especially by
operating leases where the lessor bears the residual value risk.
Industry membership is a significant explanatory factor for the level of leasing, as it has been
found to be for debt in previous studies. In particular, the retail sector undertakes a greater
level of operating leasing than average. Retail assets are relatively standard and this,
combined with the growth in out-of-town shopping developments in the UK, again leads to
relatively low ‘residual value risk’ for the lessor. The benefit of this low-risk should be to
reduce the cost to lessees. There may also be a tax-based benefit arising from tax asymmetry
between lessor and lessee but requiring the lessor to be non- or low-tax paying. The tax
benefit enjoyed by the lessee can in effect be shared with the lessor. Either or both of these
will bring the cost of leasing more into line with cheaper non-leasing debt finance and
increase the attractiveness of leasing.
Further analysis of the categories of operating leased assets for 1994 reveals that ‘land and
buildings’ constitutes at least 80% of the total value of leased assets.20 Thus, real estate
forms a major part of assets financed by operating lease contracts. Such leases tend to run for
long periods within which the rent is periodically reviewed. Ward (1983) provides an
analysis of the real estate lease-or-buy decision in a UK institutional and tax context. He
demonstrates 20 For 1994, we measured the proportion of the total value of operating leased assets represented in the
categories ‘land and buildings’, ‘other’ and those which were not categorised. The proportions were 77%, 9%
and 14% respectively which suggests that, unless the non-categorised were mainly ‘other’, over 80% are likely
38
that, although the tax positions of lessor and lessee appear to negate the benefits of leases to
the lessee, the likely patterns of income flows themselves are sufficient to provide real
benefits to the lessee. He also shows that the benefits to the lessee increase substantially if
leasing displaces less than an equal amount of debt. The evidence in the current paper that £1
of leasing tends to displace £0.23 of debt implies that there is a strong incentive for lessees to
lease rather than buy real estate.
The current UK accounting treatment of leases is broadly the same in many countries,
including the US. Those leases categorised as ‘finance’ or capital leases feature as assets and
liabilities on the balance sheet of the lessee rather than the lessor; by contrast, operating
leased assets remain on the lessor’s balance sheet with limited footnote disclosure in the
lessee’s financial statements. Accounting standard-setters in the UK, US, Australia, and New
Zealand, together with the IASC, have published a discussion paper ‘Accounting for Leases: A
New Approach’, which proposes that all leases be capitalised (McGregor, 1996). In addition to
other impacts, the apparent differences in debt displacement between ‘finance’ and operating
leases suggest that this proposal may have important economic consequences for both lessees
and lessors. It is possible that the inclusion of all leases on the balance sheet will affect the cost
of capital which firms use in capital budgeting decisions and which analysts use to estimate firm
equity values. In turn, this may affect firms’ future financing choices. Further research is
required to assess these potential effects prior to the promulgation of any new accounting
standards.
Our results have implications for both company managers and researchers. They suggest that
managers should be aware that leases consume debt capacity, albeit on a less than one-for-
one basis. Indeed, there is evidence that managers may already recognise this (Drury and
Braund, 1990) but perhaps not in relation to operating leases. Academic researchers need to
be aware that non-capitalised operating lease finance is an important source of finance which
should be included in future studies on capital structure.
to be ‘land and buildings’.
39
References
Adedeji, A., Stapleton, R.C., 1996. Leases, debt and taxable capacity, Applied Financial
Economics 6, 71-83.
Ang, J., Peterson, P.P., 1984. The leasing puzzle, Journal of Finance 39, 1055-1065.
ASC, 1984. Accounting for leases and hire purchase contracts, Statement of Standard
Accounting Practice No. 21, Accounting Standards Committee, London.
Barclay, M.J., Smith Jr., C.W., 1995. The priority structure of corporate liabilities, Journal of
Finance 50, 899-917.
Bayless, M.E., Diltz, J.D., 1986. An empirical study of the debt displacement effects of leasing,
Financial Management 15, 53-60.
Beattie, V.A., Edwards, K., Goodacre, A., 1998. The impact of constructive operating lease
capitalisation on key accounting ratios, Accounting and Business Research 28, 233-254.
Bradley, M., Jarrell, G., Kim, E., 1984. On the existence of an optimal capital structure: theory
and evidence, Journal of Finance 39, 857-78.
Brown, S.J., Goetzmann, W., Ibbotson, R.G., Ross, S.A., 1992. Survivorship bias in performance
studies, Review of Financial Studies 5, 553-580.
Donaldson, G., 1961. Corporate debt capacity: A study of corporate debt policy and the
determination of corporate debt capacity, Harvard Graduate School of Business
Administration, Boston.
Drury, C., Braund, S., 1990. The leasing decision: a comparison of theory and practice,
Accounting and Business Research 20, 179-191. Ely, K.M., 1995. Operating lease accounting and the market’s assessment of equity risk,
Journal of Accounting Research 33(2), Autumn, 397-415.
40
Ferri, M., Jones, W., 1979. Determinants of financial structure: a new methodological approach,
Journal of Finance 33, 657-69.
Graham, J.R., Lemmon, M.L., Schallheim, J.S., 1998. Debt, leases, taxes and the endogeneity of
corporate tax status, Journal of Finance 53, 131-162.
Grinblatt, M., Titman, S., 1998. Financial markets and corporate strategy, Irwin/McGraw-
Hill, USA.
Hull, J.C., Hubbard, G.L., 1980. Lease evaluation in the UK: current theory and practice, Journal
of Business Finance and Accounting 7, 619-37.
Imhoff, E.A., Lipe, R.C., Wright, D.W., 1991. Operating leases: impact of constructive
capitalization, Accounting Horizons 5, 51-63.
Imhoff, E.A., Lipe, R.C., Wright, D.W., 1997. Operating leases: income effects of constructive
capitalization, Accounting Horizons 11, 12-32.
Kare, D.D., Herbst, A.F., 1990. The influence of profitability on a firm’s lease-or borrow
decision, Advances in Accounting 8, 25-36.
Lewis, C.M., Schallheim, J.S., 1992. Are debt and leases substitutes?, Journal of Financial and
Quantitative Analysis 27, 497-512.
Marsh, P., 1982. The choice between equity and debt: an empirical study, Journal of Finance 37,
121-144.
Marston, F., Harris, R.S., 1988. Substitutability of leases and debt in corporate capital structures,
Journal of Accounting, Auditing and Finance 3, 147-164.
McGregor, W., 1996. Accounting for leases: a new approach., Financial Accounting Standards
Board, Stamford, CT.
41

Mehran, H., Taggart, R.A., Yermack, D., 1997. CEO ownership, leasing and debt financing,
Working Paper.
Myers, S.C., 1977. Determinants of corporate borrowing, Journal of Financial Economics 5,
147-76.
Myers, S., Majluf, N., 1984. Corporate financing and investment decisions when firms have
information investors do not have, Journal of Financial Economics 13, 187-221.
Rajan, R.G., Zingales, L., 1995. What do we know about capital structure choice? Some
evidence from international data, Journal of Finance 50, 1421-1460.
Remmers, L., Stonehill, A., Wright, R., Beekhuisen, T., 1975. Industry and size as debt ratio
determinants in manufacturing internationally, Financial Management 3, 24-32.
Scott. Jr,. D.F., 1972. Evidence on the importance of financial structure, Financial Management
1, 45-50.
Sharpe, S.A., Nguyen, N.H., 1995. Capital market imperfections and the incentive to lease,
Journal of Financial Economics 39, 271-294.
Smith, C.W., Wakeman, L.M., 1985. Determinants of corporate leasing policy, Journal of
Finance 40, 895-908.
Stulz, R.M., Johnson, H., 1985. An analysis of secured debt, Journal of Financial Economics
14, 501-521.
Titman, S., Wessels, R., 1988. The determinants of capital structure choice, Journal of
Finance 43, 1-19.
Ward, C.W.R., 1983. Property lease-or-buy decisions, Accounting and Business Research 13,
143-149.
42

White, H., 1980. A heteroskedasticity-covariance matrix estimator and a direct test for
heteroskedasticity, Econometrica 48, 817-838.
Wilkins, T., Zimmer, I., 1983a. The effect of leasing and different methods of accounting for
leases on credit evaluations, The Accounting Review 58, 749-764.
Wilkins, T., Zimmer, I., 1983b, The effects of alternative methods of accounting for leases - an
experimental study, Abacus 19, 64-75.
Wilkins, T., 1984. A behavioural investigation of alternative methods of financing capital
acquisitions and lease capitalisation, Accounting and Business Research 14, 359-366.
Williamson, O.E., 1988. Corporate finance and corporate governance, Journal of Finance 43,
567-591.
43
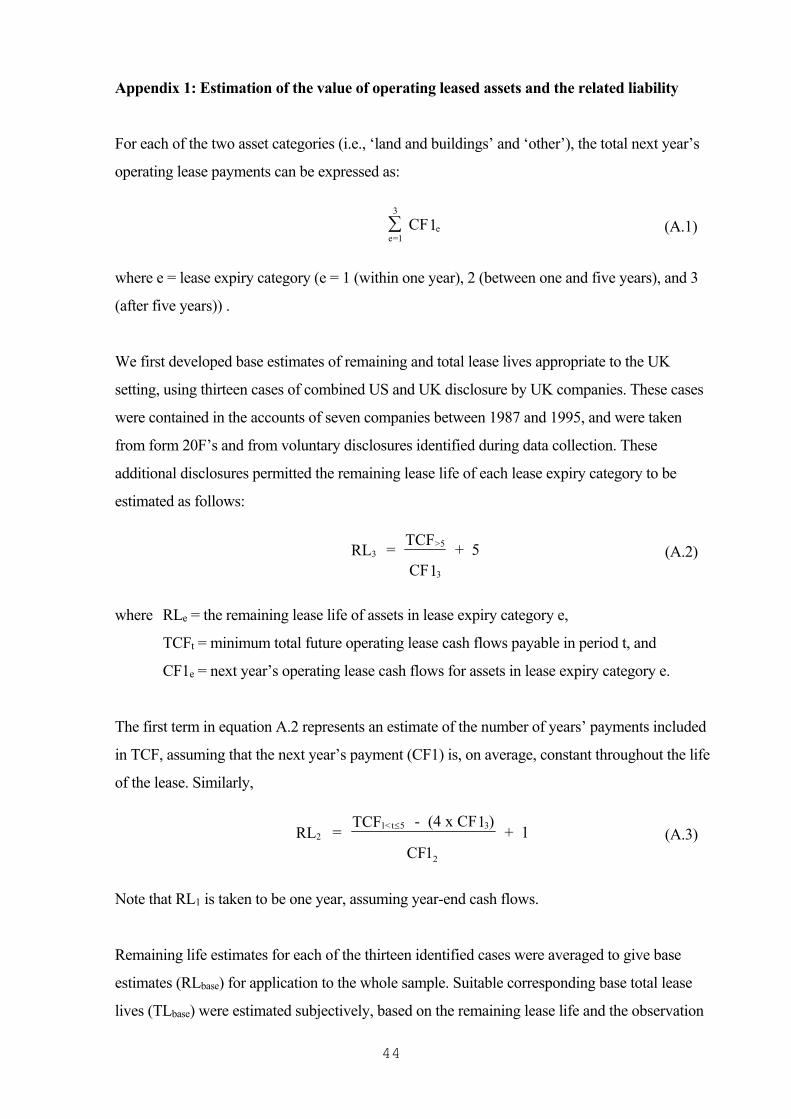
Appendix 1: Estimation of the value of operating leased assets and the related liability
For each of the two asset categories (i.e., ‘land and buildings’ and ‘other’), the total next year’s
operating lease payments can be expressed as:
(A.1) e=1
3
e CF1∑
where e = lease expiry category (e = 1 (within one year), 2 (between one and five years), and 3
(after five years)) .
We first developed base estimates of remaining and total lease lives appropriate to the UK
setting, using thirteen cases of combined US and UK disclosure by UK companies. These cases
were contained in the accounts of seven companies between 1987 and 1995, and were taken
from form 20F’s and from voluntary disclosures identified during data collection. These
additional disclosures permitted the remaining lease life of each lease expiry category to be
estimated as follows:
3>5
3
RL = TCF
CF1 + 5 (A.2)
where RLe = the remaining lease life of assets in lease expiry category e,
TCFt = minimum total future operating lease cash flows payable in period t, and
CF1e = next year’s operating lease cash flows for assets in lease expiry category e.
The first term in equation A.2 represents an estimate of the number of years’ payments included
in TCF, assuming that the next year’s payment (CF1) is, on average, constant throughout the life
of the lease. Similarly,
21<t 5 3RL =
TCF - (4 x CF1 )
CF + 1 ≤
12
(A.3)
Note that RL1 is taken to be one year, assuming year-end cash flows.
Remaining life estimates for each of the thirteen identified cases were averaged to give base
estimates (RLbase) for application to the whole sample. Suitable corresponding base total lease
lives (TLbase) were estimated subjectively, based on the remaining lease life and the observation
44

that the lease portfolio of our companies was generally quite young. These estimated lease lives
are shown in the table below.
45
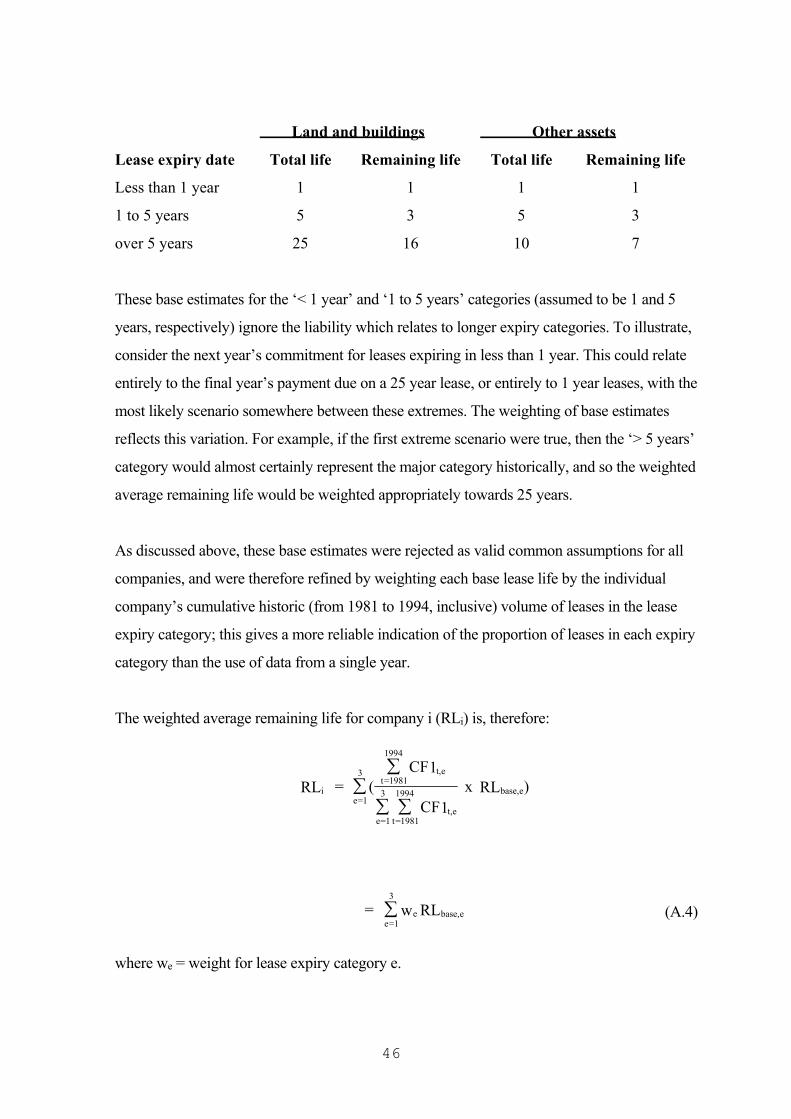
Land and buildings Other assets
Lease expiry date Total life Remaining life Total life Remaining life
Less than 1 year 1 1 1 1
1 to 5 years 5 3 5 3
over 5 years 25 16 10 7
These base estimates for the ‘< 1 year’ and ‘1 to 5 years’ categories (assumed to be 1 and 5
years, respectively) ignore the liability which relates to longer expiry categories. To illustrate,
consider the next year’s commitment for leases expiring in less than 1 year. This could relate
entirely to the final year’s payment due on a 25 year lease, or entirely to 1 year leases, with the
most likely scenario somewhere between these extremes. The weighting of base estimates
reflects this variation. For example, if the first extreme scenario were true, then the ‘> 5 years’
category would almost certainly represent the major category historically, and so the weighted
average remaining life would be weighted appropriately towards 25 years.
As discussed above, these base estimates were rejected as valid common assumptions for all
companies, and were therefore refined by weighting each base lease life by the individual
company’s cumulative historic (from 1981 to 1994, inclusive) volume of leases in the lease
expiry category; this gives a more reliable indication of the proportion of leases in each expiry
category than the use of data from a single year.
The weighted average remaining life for company i (RLi) is, therefore:
ie=1
3t=1981
1994
t,e
e=1
3
t=1981
1994
t,e
base,eRL = (CF1
CF1 x RL )∑
∑
∑ ∑
(A.4) = w RLe=1
3
e base,e∑
where we = weight for lease expiry category e.
46
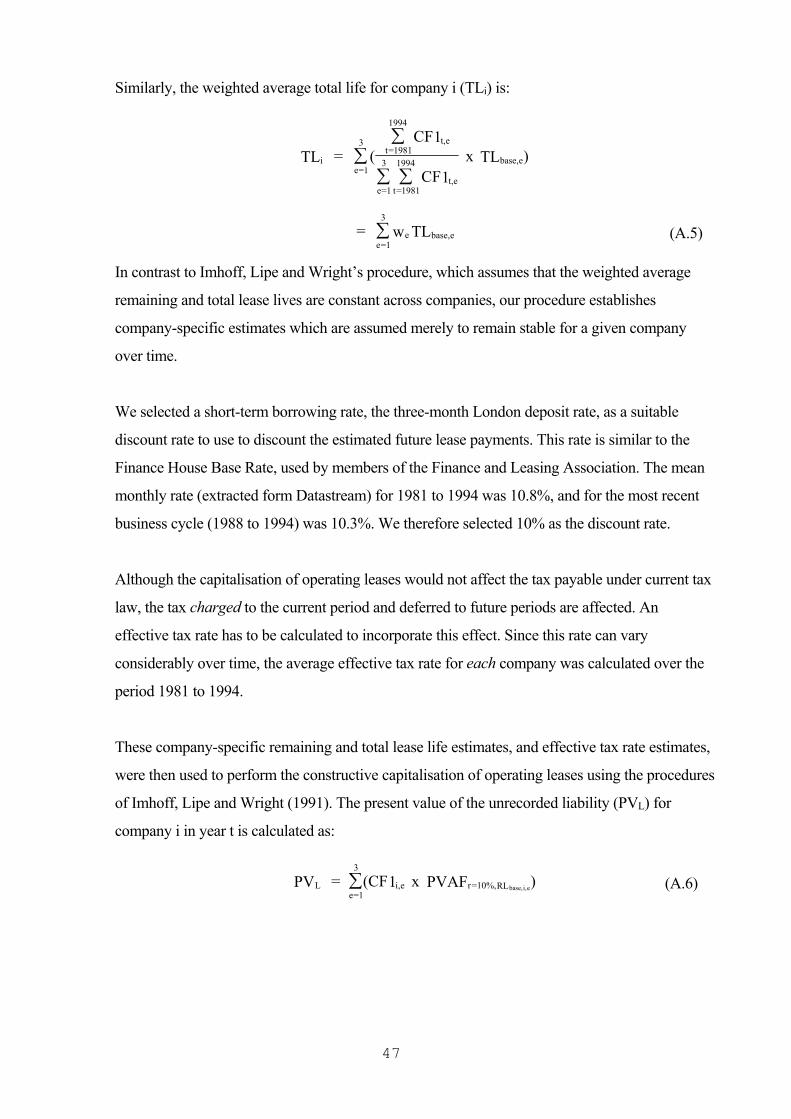
Similarly, the weighted average total life for company i (TLi) is:
ie=1
3t=1981
t,e
e=1
3
t=1981
1994
t,e
base,eTL = (CF1
x TL )∑∑ ∑
1994
CF1∑
(A.5) = w TLe=1
3
e base,e∑
In contrast to Imhoff, Lipe and Wright’s procedure, which assumes that the weighted average
remaining and total lease lives are constant across companies, our procedure establishes
company-specific estimates which are assumed merely to remain stable for a given company
over time.
We selected a short-term borrowing rate, the three-month London deposit rate, as a suitable
discount rate to use to discount the estimated future lease payments. This rate is similar to the
Finance House Base Rate, used by members of the Finance and Leasing Association. The mean
monthly rate (extracted form Datastream) for 1981 to 1994 was 10.8%, and for the most recent
business cycle (1988 to 1994) was 10.3%. We therefore selected 10% as the discount rate.
Although the capitalisation of operating leases would not affect the tax payable under current tax
law, the tax charged to the current period and deferred to future periods are affected. An
effective tax rate has to be calculated to incorporate this effect. Since this rate can vary
considerably over time, the average effective tax rate for each company was calculated over the
period 1981 to 1994.
These company-specific remaining and total lease life estimates, and effective tax rate estimates,
were then used to perform the constructive capitalisation of operating leases using the procedures
of Imhoff, Lipe and Wright (1991). The present value of the unrecorded liability (PVL) for
company i in year t is calculated as:
(A.6) Le=1
3
i,e r=10%,RLPV = (CF1 x PVAF )base,i,e∑
47

The corresponding present value of the unrecorded asset PVA for company i in year t is:
A Li r=10%,TL
i r=10 RL
PV = PV x RL x PVAF
TL x PVAF
i
i%,
(A.7)
where PVAFr,n represents the present value of an annuity of £1 for n periods at interest rate r%.
PVL and PVA are calculated separately for both asset categories (i.e., for ‘land and buildings’ and
‘other’) and summed to give total unrecorded liabilities and assets. An illustration of the
constructive capitalisation procedure applied to a specific company is given in Appendix 2.
48
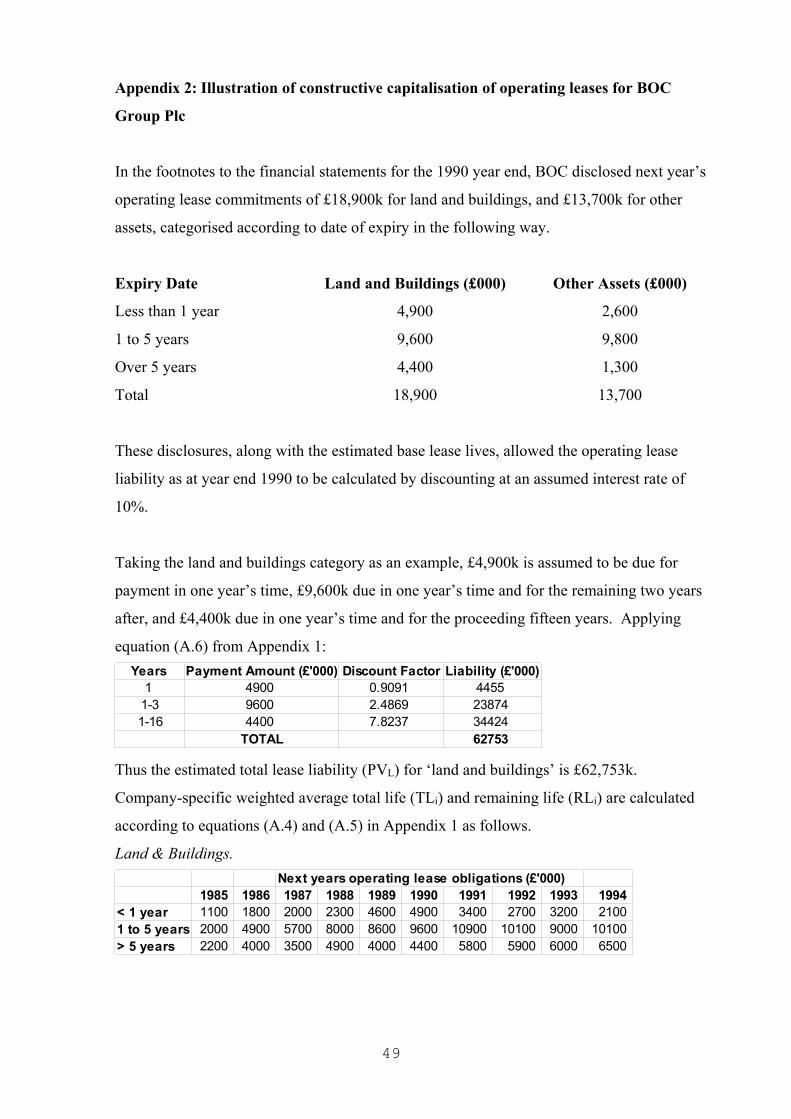
Appendix 2: Illustration of constructive capitalisation of operating leases for BOC
Group Plc
In the footnotes to the financial statements for the 1990 year end, BOC disclosed next year’s
operating lease commitments of £18,900k for land and buildings, and £13,700k for other
assets, categorised according to date of expiry in the following way.
Expiry Date Land and Buildings (£000) Other Assets (£000)
Less than 1 year 4,900 2,600
1 to 5 years 9,600 9,800
Over 5 years 4,400 1,300
Total 18,900 13,700
These disclosures, along with the estimated base lease lives, allowed the operating lease
liability as at year end 1990 to be calculated by discounting at an assumed interest rate of
10%.
Taking the land and buildings category as an example, £4,900k is assumed to be due for
payment in one year’s time, £9,600k due in one year’s time and for the remaining two years
after, and £4,400k due in one year’s time and for the proceeding fifteen years. Applying
equation (A.6) from Appendix 1: Years Payment Amount (£'000) Discount Factor Liability (£'000)
1 4900 0.9091 44551-3 9600 2.4869 23871-16 4400 7.8237 3442
TOTAL 62753
4 4
Thus the estimated total lease liability (PVL) for ‘land and buildings’ is £62,753k.
Company-specific weighted average total life (TLi) and remaining life (RLi) are calculated
according to equations (A.4) and (A.5) in Appendix 1 as follows.
Land & Buildings. Next years operating lease obligations (£'000)
1985 1986 1987 1988 1989 1990 1991 1992 1993 1994 < 1 year 1100 1800 2000 2300 4600 4900 3400 2700 3200 2100 1 to 5 years 2000 4900 5700 8000 8600 9600 10900 10100 9000 10100 > 5 years 2200 4000 3500 4900 4000 4400 5800 5900 6000 6500
49

Total TL RL28100 1 1 78900 5 3 47200 25 16
154200
TLi = [(1 x 28,100) + (5 x 78,900) + (25 x 47,200)] / 154,200.
= 10.4 years.
RLi = [(1 x 28,100) + (3 x 78,900) + (16 x 47,200)] / 154,200.
= 6.6 years.
Substitution of these in equation (A.7) from Appendix 1 gives the present value of the
unrecorded asset for ‘land and buildings’:
PVA = PVL x 85.56% = £62,753k x 85.56% = £53,692k
Depreciation on the unrecorded leased asset is assumed to be calculated on a straight line
basis with zero residual value. Hence, the depreciation charge deducted from income as a
result of operating lease capitalisation is simply calculated by dividing the asset balance by
the average remaining life (i.e., £53,692k / 6.6 years = £8,135k). For consistency within the
model, the operating lease rental (OLR) added back to income, is taken as £18,900k, the total
next year’s liability as at the 1990 year end. The interest portion of the OLR, deducted from
income, is calculated as 10% of the liability at the beginning of 1990, i.e.
Interest = 10% x Liabilitystart 1990
= 10% x (Liabilityend 1990
+ OLR) / 1.1
= 10% x (62,753k + 18,900k) / 1.1
= £7,423k
Thus, of the £18,900k operating lease rental liability, £7,423k relates to interest and the
remaining £11,477k represents capital repayment.
50

Table 1 Composition of sample for 1990 through 1994
Number of Companies with:Finance Operating Any Noleases leases leases leases Total
(only)
Panel A: Analysis of leasing by year
1990 95 60 155 24 1791991 97 68 165 24 1891992 97 72 169 24 1931993 101 75 176 21 1971994 105 83 188 18 206
Panel B: Analysis of leasing by industry for 1994
Five largest industry groups (incorporated as dummy variables)Building 11 12 23 3 26Retail 10 12 22 1 23Electrical/tronic 6 11 17 1 18Engineering 11 6 17 0 17Leisure 9 4 13 1 14Sub-total A 47 45 92 6 98
Smaller industry groups (treated as control group)Motor 8 0 8 3 11Textiles 5 4 9 2 11Breweries 2 5 7 3 10Household Goods 5 3 8 2 10Utilities 5 4 9 0 9Business Support 4 2 6 1 7Food Manufacturing 5 2 7 0 7Publishing & Printing 6 1 7 0 7Chemicals 2 2 4 1 5Computer Services 5 0 5 0 5Diversified industrials 2 3 5 0 5Distribution 2 2 4 0 4Health 2 2 4 0 4Media and agencies 2 1 3 0 3Oil 0 3 3 0 3Paper & packaging 1 2 3 0 3Metals 1 0 1 0 1Mining 0 1 1 0 1Transport 0 1 1 0 1Waste Control 1 0 1 0 1Sub-total B 58 38 96 12 108
Total (A + B) 105 83 188 18 206 The pattern across industries was very similar for 1990 through 1993 and, therefore, details are not reported here.
51
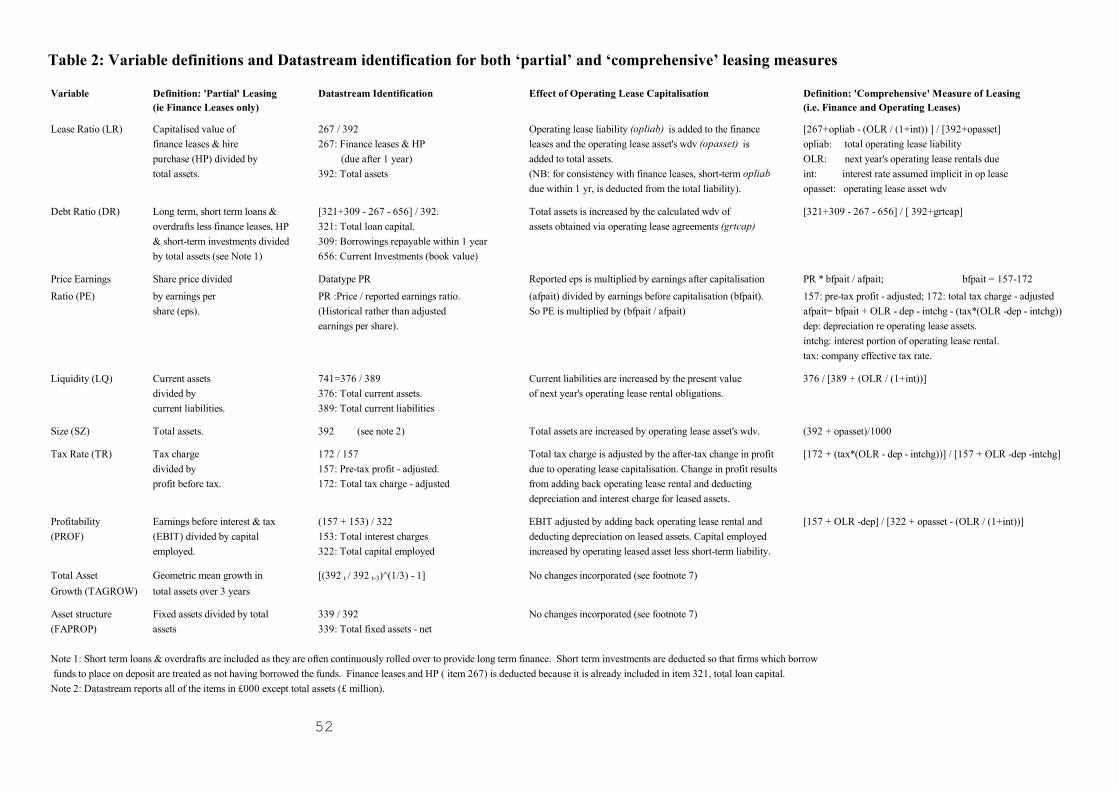
Table 2: Variable definitions and Datastream identification for both ‘partial’ and ‘comprehensive’ leasing measures Variable Definition: 'Partial' Leasing Datastream Identification Effect of Operating Lease Capitalisation Definition: 'Comprehensive' Measure of Leasing
(ie Finance Leases only) (i.e. Finance and Operating Leases)
Lease Ratio (LR) Capitalised value of 267 / 392 Operating lease liability (opliab) is added to the finance [267+opliab - (OLR / (1+int)) ] / [392+opasset]finance leases & hire 267: Finance leases & HP leases and the operating lease asset's wdv (opasset) is opliab: total operating lease liabilitypurchase (HP) divided by (due after 1 year) added to total assets. OLR: next year's operating lease rentals duetotal assets. 392: Total assets (NB: for consistency with finance leases, short-term opliab int: interest rate assumed implicit in op lease
due within 1 yr, is deducted from the total liability). opasset: operating lease asset wdv
Debt Ratio (DR) Long term, short term loans & [321+309 - 267 - 656] / 392. Total assets is increased by the calculated wdv of [321+309 - 267 - 656] / [ 392+grtcap]overdrafts less finance leases, HP 321: Total loan capital. assets obtained via operating lease agreements (grtcap)& short-term investments divided 309: Borrowings repayable within 1 yearby total assets (see Note 1) 656: Current Investments (book value)
Price Earnings Share price divided Datatype PR Reported eps is multiplied by earnings after capitalisation PR * bfpait / afpait; bfpait = 157-172
Ratio (PE) by earnings per PR :Price / reported earnings ratio. (afpait) divided by earnings before capitalisation (bfpait). 157: pre-tax profit - adjusted; 172: total tax charge - adjustedshare (eps). (Historical rather than adjusted So PE is multiplied by (bfpait / afpait) afpait= bfpait + OLR - dep - intchg - (tax*(OLR -dep - intchg))
earnings per share). dep: depreciation re operating lease assets.intchg: interest portion of operating lease rental.tax: company effective tax rate.
Liquidity (LQ) Current assets 741=376 / 389 Current liabilities are increased by the present value 376 / [389 + (OLR / (1+int))]divided by 376: Total current assets. of next year's operating lease rental obligations.current liabilities. 389: Total current liabilities
Size (SZ) Total assets. 392 (see note 2) Total assets are increased by operating lease asset's wdv. (392 + opasset)/1000
Tax Rate (TR) Tax charge 172 / 157 Total tax charge is adjusted by the after-tax change in profit [172 + (tax*(OLR - dep - intchg))] / [157 + OLR -dep -intchg]divided by 157: Pre-tax profit - adjusted. due to operating lease capitalisation. Change in profit resultsprofit before tax. 172: Total tax charge - adjusted from adding back operating lease rental and deducting
depreciation and interest charge for leased assets.
Profitability Earnings before interest & tax (157 + 153) / 322 EBIT adjusted by adding back operating lease rental and [157 + OLR -dep] / [322 + opasset - (OLR / (1+int))](PROF) (EBIT) divided by capital 153: Total interest charges deducting depreciation on leased assets. Capital employed
employed. 322: Total capital employed increased by operating leased asset less short-term liability.
Total Asset Geometric mean growth in [(392 t / 392 t-3)^(1/3) - 1] No changes incorporated (see footnote 7)Growth (TAGROW) total assets over 3 years
Asset structure Fixed assets divided by total 339 / 392 No changes incorporated (see footnote 7)(FAPROP) assets 339: Total fixed assets - net
Note 1: Short term loans & overdrafts are included as they are often continuously rolled over to provide long term finance. Short term investments are deducted so that firms which borrow funds to place on deposit are treated as not having borrowed the funds. Finance leases and HP ( item 267) is deducted because it is already included in item 321, total loan capital.Note 2: Datastream reports all of the items in £000 except total assets (£ million).
52
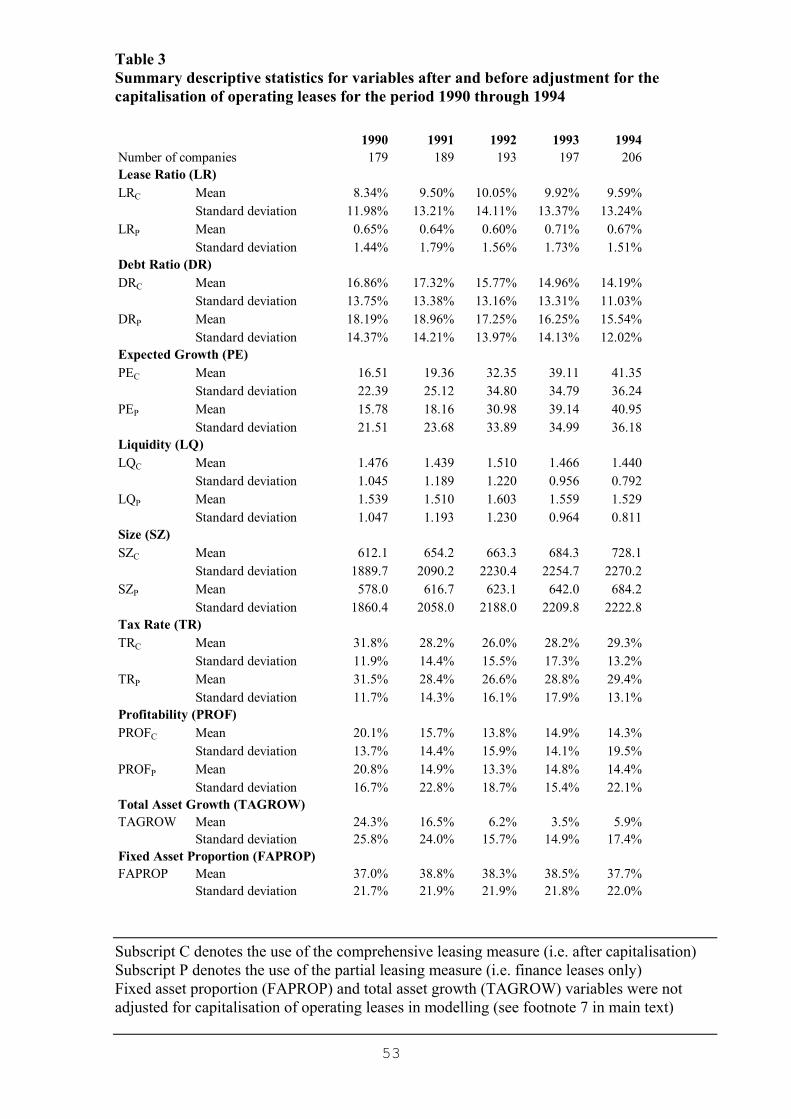
Table 3 Summary descriptive statistics for variables after and before adjustment for the capitalisation of operating leases for the period 1990 through 1994
1990 1991 1992 1993 1994Number of companies 179 189 193 197 206Lease Ratio (LR)LRC Mean 8.34% 9.50% 10.05% 9.92% 9.59%
Standard deviation 11.98% 13.21% 14.11% 13.37% 13.24%LRP Mean 0.65% 0.64% 0.60% 0.71% 0.67%
Standard deviation 1.44% 1.79% 1.56% 1.73% 1.51%Debt Ratio (DR)DRC Mean 16.86% 17.32% 15.77% 14.96% 14.19%
Standard deviation 13.75% 13.38% 13.16% 13.31% 11.03%DRP Mean 18.19% 18.96% 17.25% 16.25% 15.54%
Standard deviation 14.37% 14.21% 13.97% 14.13% 12.02%Expected Growth (PE)PEC Mean 16.51 19.36 32.35 39.11 41.35
Standard deviation 22.39 25.12 34.80 34.79 36.24PEP Mean 15.78 18.16 30.98 39.14 40.95
Standard deviation 21.51 23.68 33.89 34.99 36.18Liquidity (LQ)LQC Mean 1.476 1.439 1.510 1.466 1.440
Standard deviation 1.045 1.189 1.220 0.956 0.792LQP Mean 1.539 1.510 1.603 1.559 1.529
Standard deviation 1.047 1.193 1.230 0.964 0.811Size (SZ)SZC Mean 612.1 654.2 663.3 684.3 728.1
Standard deviation 1889.7 2090.2 2230.4 2254.7 2270.2SZP Mean 578.0 616.7 623.1 642.0 684.2
Standard deviation 1860.4 2058.0 2188.0 2209.8 2222.8Tax Rate (TR)TRC Mean 31.8% 28.2% 26.0% 28.2% 29.3%
Standard deviation 11.9% 14.4% 15.5% 17.3% 13.2%TRP Mean 31.5% 28.4% 26.6% 28.8% 29.4%
Standard deviation 11.7% 14.3% 16.1% 17.9% 13.1%Profitability (PROF)PROFC Mean 20.1% 15.7% 13.8% 14.9% 14.3%
Standard deviation 13.7% 14.4% 15.9% 14.1% 19.5%PROFP Mean 20.8% 14.9% 13.3% 14.8% 14.4%
Standard deviation 16.7% 22.8% 18.7% 15.4% 22.1%Total Asset Growth (TAGROW)TAGROW Mean 24.3% 16.5% 6.2% 3.5% 5.9%
Standard deviation 25.8% 24.0% 15.7% 14.9% 17.4%Fixed Asset Proportion (FAPROP)FAPROP Mean 37.0% 38.8% 38.3% 38.5% 37.7%
Standard deviation 21.7% 21.9% 21.9% 21.8% 22.0%
Subscript C denotes the use of the comprehensive leasing measure (i.e. after capitalisation) Subscript P denotes the use of the partial leasing measure (i.e. finance leases only) Fixed asset proportion (FAPROP) and total asset growth (TAGROW) variables were not adjusted for capitalisation of operating leases in modelling (see footnote 7 in main text)
53
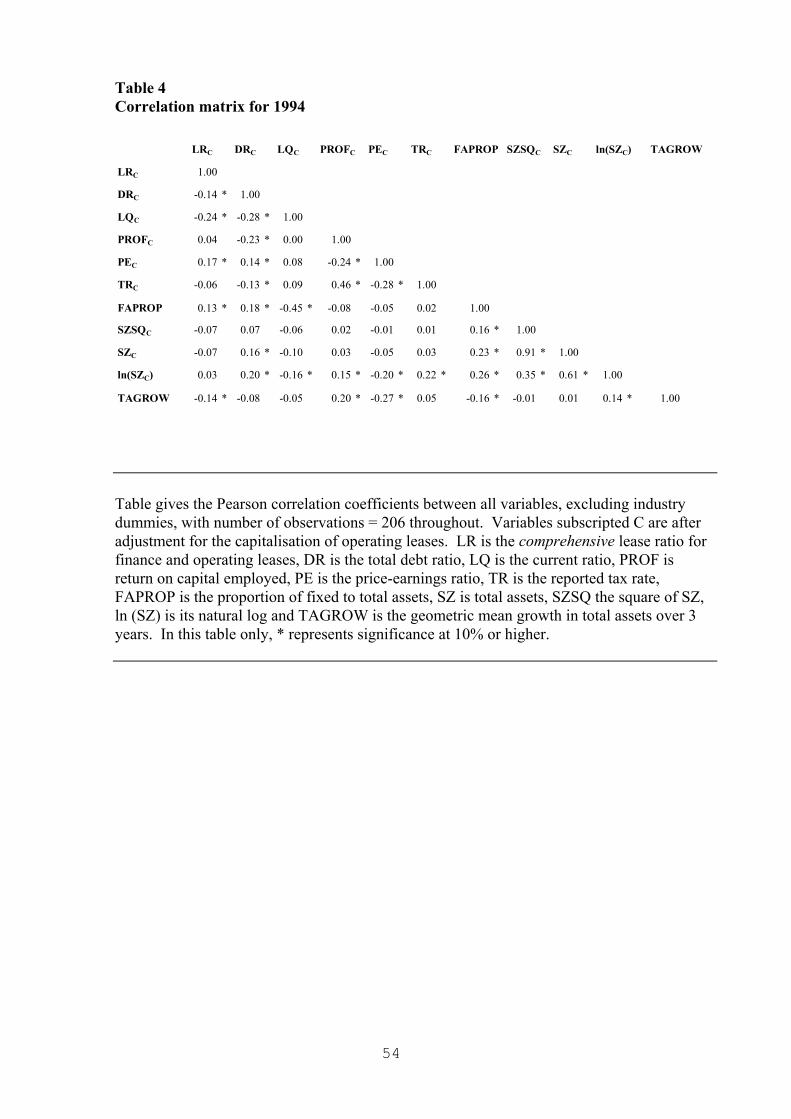
Table 4 Correlation matrix for 1994
LRC DRC LQC PROFC PEC TRC FAPROP SZSQC SZC ln(SZC) TAGROW
LRC 1.00
DRC -0.14 * 1.00
LQC -0.24 * -0.28 * 1.00
PROFC 0.04 -0.23 * 0.00 1.00
PEC 0.17 * 0.14 * 0.08 -0.24 * 1.00
TRC -0.06 -0.13 * 0.09 0.46 * -0.28 * 1.00
FAPROP 0.13 * 0.18 * -0.45 * -0.08 -0.05 0.02 1.00
SZSQC -0.07 0.07 -0.06 0.02 -0.01 0.01 0.16 * 1.00
SZC -0.07 0.16 * -0.10 0.03 -0.05 0.03 0.23 * 0.91 * 1.00
ln(SZC) 0.03 0.20 * -0.16 * 0.15 * -0.20 * 0.22 * 0.26 * 0.35 * 0.61 * 1.00
TAGROW -0.14 * -0.08 -0.05 0.20 * -0.27 * 0.05 -0.16 * -0.01 0.01 0.14 * 1.00
Table gives the Pearson correlation coefficients between all variables, excluding industry dummies, with number of observations = 206 throughout. Variables subscripted C are after adjustment for the capitalisation of operating leases. LR is the comprehensive lease ratio for finance and operating leases, DR is the total debt ratio, LQ is the current ratio, PROF is return on capital employed, PE is the price-earnings ratio, TR is the reported tax rate, FAPROP is the proportion of fixed to total assets, SZ is total assets, SZSQ the square of SZ, ln (SZ) is its natural log and TAGROW is the geometric mean growth in total assets over 3 years. In this table only, * represents significance at 10% or higher.
54
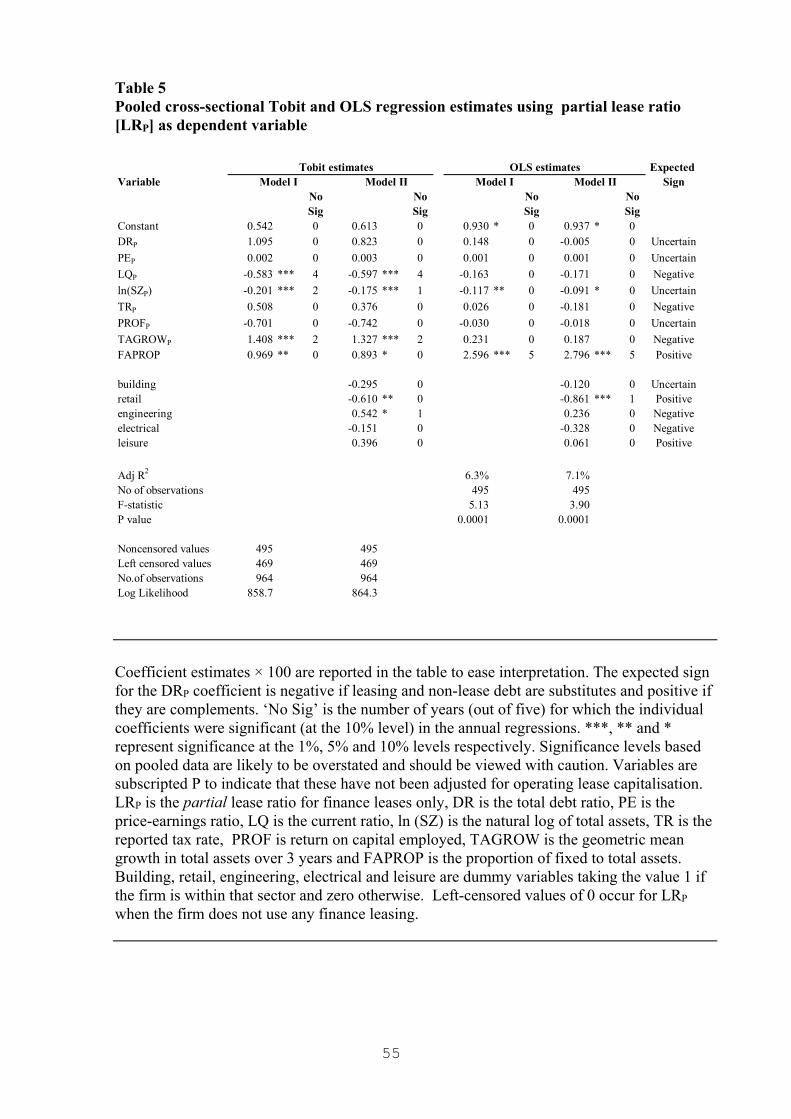
Table 5 Pooled cross-sectional Tobit and OLS regression estimates using partial lease ratio [LRP] as dependent variable
Tobit estimates OLS estimates Expected Variable Model I Model II Model I Model II Sign
No No No NoSig Sig Sig Sig
Constant 0.542 0 0.613 0 0.930 * 0 0.937 * 0DRP 1.095 0 0.823 0 0.148 0 -0.005 0 UncertainPEP 0.002 0 0.003 0 0.001 0 0.001 0 UncertainLQP -0.583 *** 4 -0.597 *** 4 -0.163 0 -0.171 0 Negativeln(SZP) -0.201 *** 2 -0.175 *** 1 -0.117 ** 0 -0.091 * 0 UncertainTRP 0.508 0 0.376 0 0.026 0 -0.181 0 NegativePROFP -0.701 0 -0.742 0 -0.030 0 -0.018 0 UncertainTAGROWP 1.408 *** 2 1.327 *** 2 0.231 0 0.187 0 NegativeFAPROP 0.969 ** 0 0.893 * 0 2.596 *** 5 2.796 *** 5 Positive
building -0.295 0 -0.120 0 Uncertainretail -0.610 ** 0 -0.861 *** 1 Positiveengineering 0.542 * 1 0.236 0 Negativeelectrical -0.151 0 -0.328 0 Negativeleisure 0.396 0 0.061 0 Positive
Adj R2 6.3% 7.1%No of observations 495 495F-statistic 5.13 3.90P value 0.0001 0.0001
Noncensored values 495 495Left censored values 469 469No.of observations 964 964Log Likelihood 858.7 864.3
Coefficient estimates × 100 are reported in the table to ease interpretation. The expected sign for the DRP coefficient is negative if leasing and non-lease debt are substitutes and positive if they are complements. ‘No Sig’ is the number of years (out of five) for which the individual coefficients were significant (at the 10% level) in the annual regressions. ***, ** and * represent significance at the 1%, 5% and 10% levels respectively. Significance levels based on pooled data are likely to be overstated and should be viewed with caution. Variables are subscripted P to indicate that these have not been adjusted for operating lease capitalisation. LRP is the partial lease ratio for finance leases only, DR is the total debt ratio, PE is the price-earnings ratio, LQ is the current ratio, ln (SZ) is the natural log of total assets, TR is the reported tax rate, PROF is return on capital employed, TAGROW is the geometric mean growth in total assets over 3 years and FAPROP is the proportion of fixed to total assets. Building, retail, engineering, electrical and leisure are dummy variables taking the value 1 if the firm is within that sector and zero otherwise. Left-censored values of 0 occur for LRP when the firm does not use any finance leasing.
55
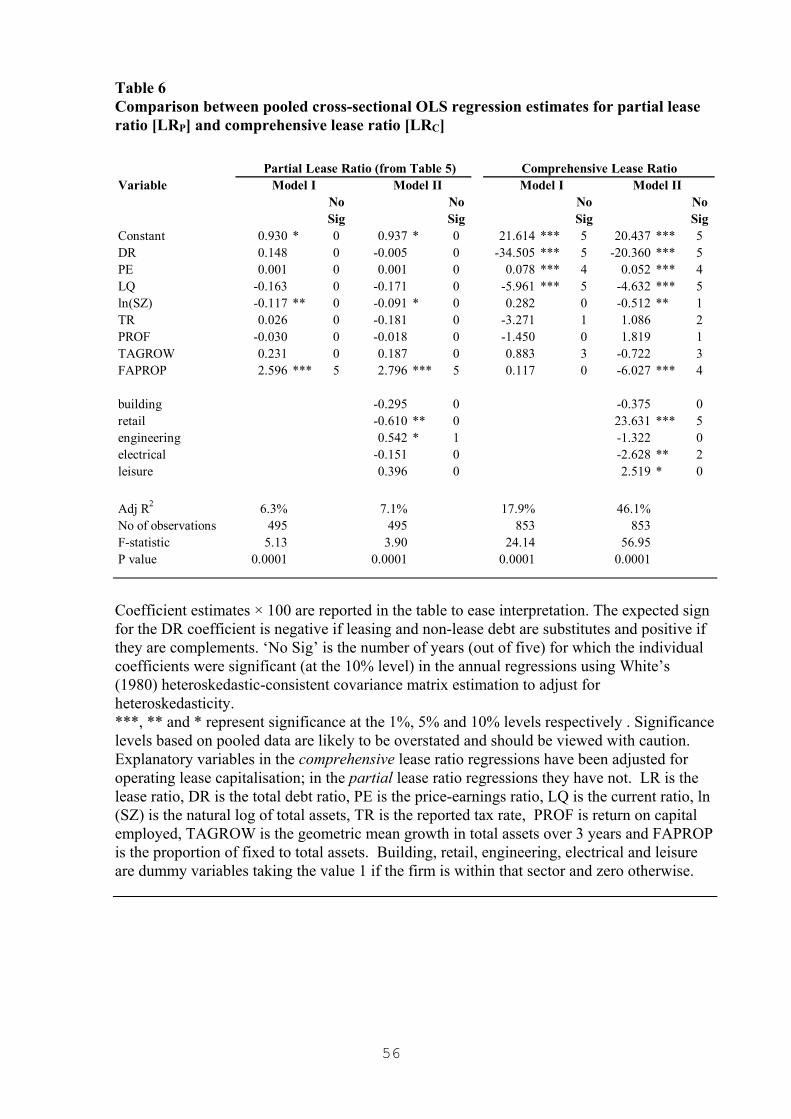
Table 6 Comparison between pooled cross-sectional OLS regression estimates for partial lease ratio [LRP] and comprehensive lease ratio [LRC]
Partial Lease Ratio (from Table 5) Comprehensive Lease RatioVariable Model I Model II Model I Model II
No No No NoSig Sig Sig Sig
Constant 0.930 * 0 0.937 * 0 21.614 *** 5 20.437 *** 5DR 0.148 0 -0.005 0 -34.505 *** 5 -20.360 *** 5PE 0.001 0 0.001 0 0.078 *** 4 0.052 *** 4LQ -0.163 0 -0.171 0 -5.961 *** 5 -4.632 *** 5ln(SZ) -0.117 ** 0 -0.091 * 0 0.282 0 -0.512 ** 1TR 0.026 0 -0.181 0 -3.271 1 1.086 2PROF -0.030 0 -0.018 0 -1.450 0 1.819 1TAGROW 0.231 0 0.187 0 0.883 3 -0.722 3FAPROP 2.596 *** 5 2.796 *** 5 0.117 0 -6.027 *** 4
building -0.295 0 -0.375 0retail -0.610 ** 0 23.631 *** 5engineering 0.542 * 1 -1.322 0electrical -0.151 0 -2.628 ** 2leisure 0.396 0 2.519 * 0
Adj R2 6.3% 7.1% 17.9% 46.1%No of observations 495 495 853 853F-statistic 5.13 3.90 24.14 56.95P value 0.0001 0.0001 0.0001 0.0001
Coefficient estimates × 100 are reported in the table to ease interpretation. The expected sign for the DR coefficient is negative if leasing and non-lease debt are substitutes and positive if they are complements. ‘No Sig’ is the number of years (out of five) for which the individual coefficients were significant (at the 10% level) in the annual regressions using White’s (1980) heteroskedastic-consistent covariance matrix estimation to adjust for heteroskedasticity. ***, ** and * represent significance at the 1%, 5% and 10% levels respectively . Significance levels based on pooled data are likely to be overstated and should be viewed with caution. Explanatory variables in the comprehensive lease ratio regressions have been adjusted for operating lease capitalisation; in the partial lease ratio regressions they have not. LR is the lease ratio, DR is the total debt ratio, PE is the price-earnings ratio, LQ is the current ratio, ln (SZ) is the natural log of total assets, TR is the reported tax rate, PROF is return on capital employed, TAGROW is the geometric mean growth in total assets over 3 years and FAPROP is the proportion of fixed to total assets. Building, retail, engineering, electrical and leisure are dummy variables taking the value 1 if the firm is within that sector and zero otherwise.
56
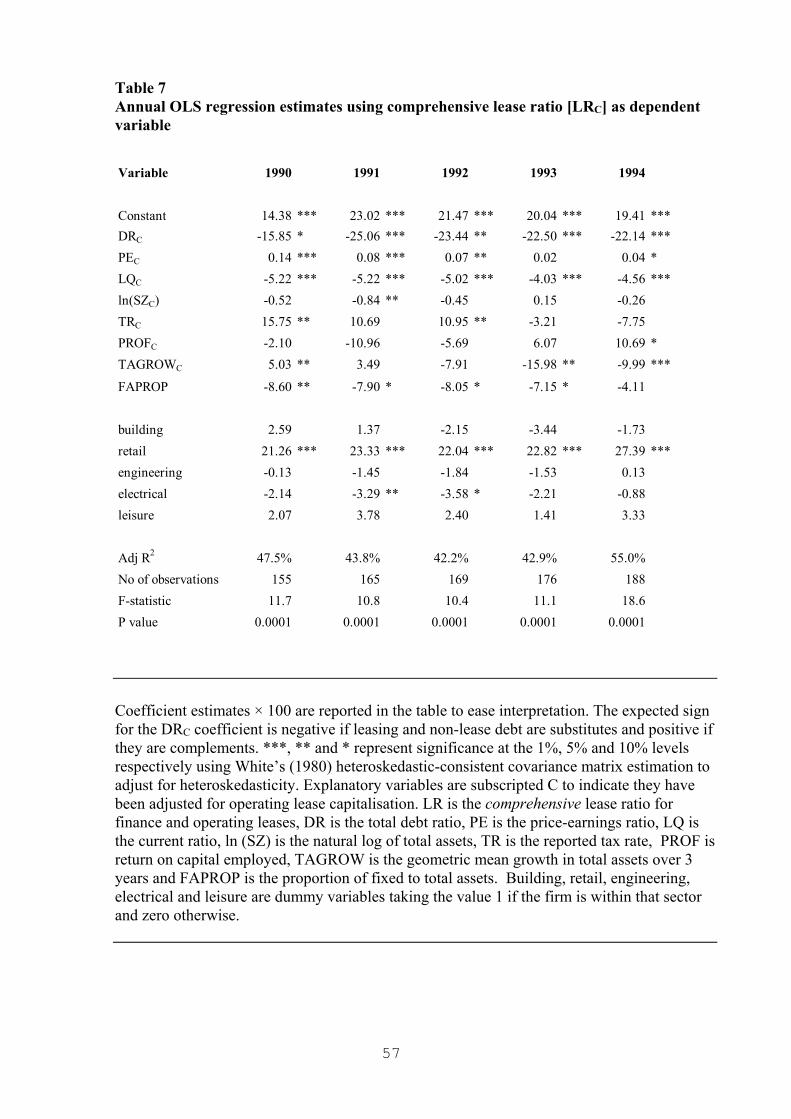
Table 7 Annual OLS regression estimates using comprehensive lease ratio [LRC] as dependent variable
Variable 1990 1991 1992 1993 1994
Constant 14.38 *** 23.02 *** 21.47 *** 20.04 *** 19.41 ***DRC -15.85 * -25.06 *** -23.44 ** -22.50 *** -22.14 ***PEC 0.14 *** 0.08 *** 0.07 ** 0.02 0.04 *LQC -5.22 *** -5.22 *** -5.02 *** -4.03 *** -4.56 ***ln(SZC) -0.52 -0.84 ** -0.45 0.15 -0.26TRC 15.75 ** 10.69 10.95 ** -3.21 -7.75PROFC -2.10 -10.96 -5.69 6.07 10.69 *TAGROWC 5.03 ** 3.49 -7.91 -15.98 ** -9.99 ***
FAPROP -8.60 ** -7.90 * -8.05 * -7.15 * -4.11
building 2.59 1.37 -2.15 -3.44 -1.73retail 21.26 *** 23.33 *** 22.04 *** 22.82 *** 27.39 ***engineering -0.13 -1.45 -1.84 -1.53 0.13electrical -2.14 -3.29 ** -3.58 * -2.21 -0.88leisure 2.07 3.78 2.40 1.41 3.33
Adj R2 47.5% 43.8% 42.2% 42.9% 55.0%No of observations 155 165 169 176 188F-statistic 11.7 10.8 10.4 11.1 18.6P value 0.0001 0.0001 0.0001 0.0001 0.0001 Coefficient estimates × 100 are reported in the table to ease interpretation. The expected sign for the DRC coefficient is negative if leasing and non-lease debt are substitutes and positive if they are complements. ***, ** and * represent significance at the 1%, 5% and 10% levels respectively using White’s (1980) heteroskedastic-consistent covariance matrix estimation to adjust for heteroskedasticity. Explanatory variables are subscripted C to indicate they have been adjusted for operating lease capitalisation. LR is the comprehensive lease ratio for finance and operating leases, DR is the total debt ratio, PE is the price-earnings ratio, LQ is the current ratio, ln (SZ) is the natural log of total assets, TR is the reported tax rate, PROF is return on capital employed, TAGROW is the geometric mean growth in total assets over 3 years and FAPROP is the proportion of fixed to total assets. Building, retail, engineering, electrical and leisure are dummy variables taking the value 1 if the firm is within that sector and zero otherwise.
57
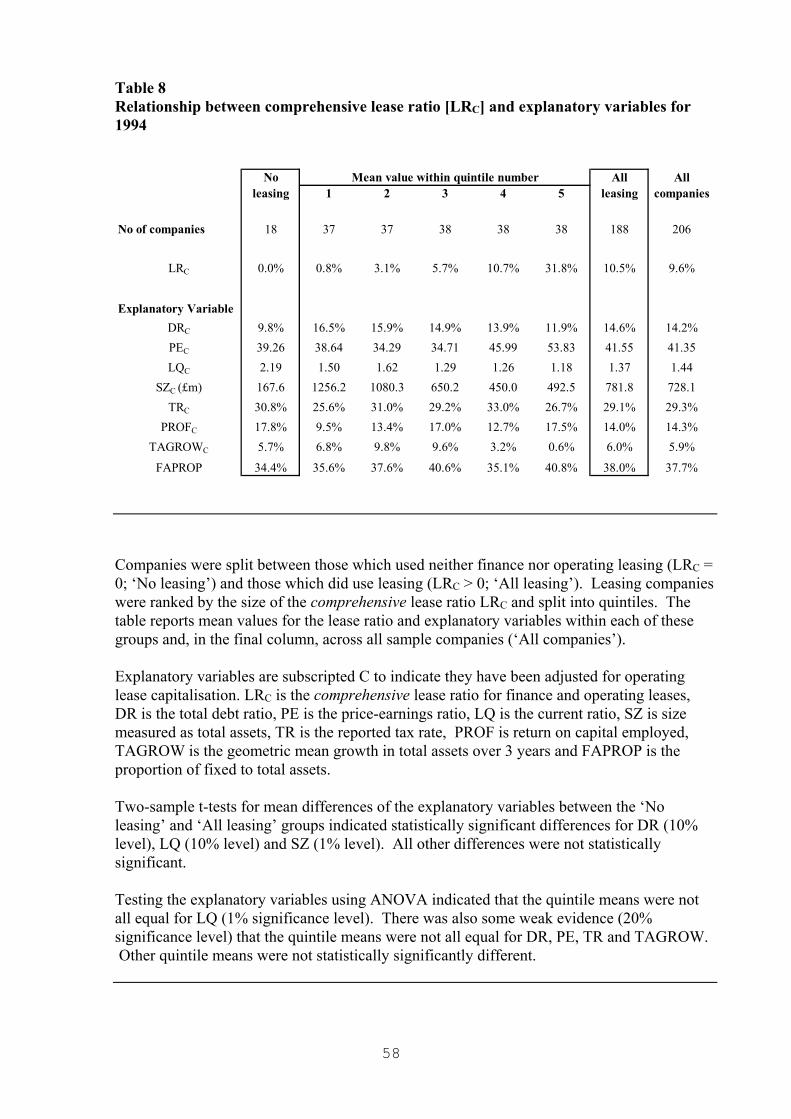
Table 8 Relationship between comprehensive lease ratio [LRC] and explanatory variables for 1994
No Mean value within quintile number All Allleasing 1 2 3 4 5 leasing companies
No of companies 18 37 37 38 38 38 188 206
LRC 0.0% 0.8% 3.1% 5.7% 10.7% 31.8% 10.5% 9.6%
Explanatory VariableDRC 9.8% 16.5% 15.9% 14.9% 13.9% 11.9% 14.6% 14.2%PEC 39.26 38.64 34.29 34.71 45.99 53.83 41.55 41.35LQC 2.19 1.50 1.62 1.29 1.26 1.18 1.37 1.44
SZC (£m) 167.6 1256.2 1080.3 650.2 450.0 492.5 781.8 728.1TRC 30.8% 25.6% 31.0% 29.2% 33.0% 26.7% 29.1% 29.3%
PROFC 17.8% 9.5% 13.4% 17.0% 12.7% 17.5% 14.0% 14.3%TAGROWC 5.7% 6.8% 9.8% 9.6% 3.2% 0.6% 6.0% 5.9%
FAPROP 34.4% 35.6% 37.6% 40.6% 35.1% 40.8% 38.0% 37.7% Companies were split between those which used neither finance nor operating leasing (LRC = 0; ‘No leasing’) and those which did use leasing (LRC > 0; ‘All leasing’). Leasing companies were ranked by the size of the comprehensive lease ratio LRC and split into quintiles. The table reports mean values for the lease ratio and explanatory variables within each of these groups and, in the final column, across all sample companies (‘All companies’). Explanatory variables are subscripted C to indicate they have been adjusted for operating lease capitalisation. LRC is the comprehensive lease ratio for finance and operating leases, DR is the total debt ratio, PE is the price-earnings ratio, LQ is the current ratio, SZ is size measured as total assets, TR is the reported tax rate, PROF is return on capital employed, TAGROW is the geometric mean growth in total assets over 3 years and FAPROP is the proportion of fixed to total assets. Two-sample t-tests for mean differences of the explanatory variables between the ‘No leasing’ and ‘All leasing’ groups indicated statistically significant differences for DR (10% level), LQ (10% level) and SZ (1% level). All other differences were not statistically significant. Testing the explanatory variables using ANOVA indicated that the quintile means were not all equal for LQ (1% significance level). There was also some weak evidence (20% significance level) that the quintile means were not all equal for DR, PE, TR and TAGROW. Other quintile means were not statistically significantly different.
58