Onshore-offshore gradient in metacommunity turnover emerges only over macroevolutionary time-scales
11
, 20141533, published 8 October 2014 281 2014 Proc. R. Soc. B Adam Tomasových, Stefano Dominici, Martin Zuschin and Didier Merle emerges only over macroevolutionary time-scales offshore gradient in metacommunity turnover - Onshore Supplementary data tml http://rspb.royalsocietypublishing.org/content/suppl/2014/10/07/rspb.2014.1533.DC1.h "Data Supplement" References http://rspb.royalsocietypublishing.org/content/281/1795/20141533.full.html#ref-list-1 This article cites 66 articles, 34 of which can be accessed free Subject collections (194 articles) palaeontology (1910 articles) evolution (1773 articles) ecology Articles on similar topics can be found in the following collections Email alerting service here right-hand corner of the article or click Receive free email alerts when new articles cite this article - sign up in the box at the top http://rspb.royalsocietypublishing.org/subscriptions go to: Proc. R. Soc. B To subscribe to on October 8, 2014 rspb.royalsocietypublishing.org Downloaded from on October 8, 2014 rspb.royalsocietypublishing.org Downloaded from
Transcript of Onshore-offshore gradient in metacommunity turnover emerges only over macroevolutionary time-scales
20141533 published 8 October 2014281 2014 Proc R Soc B Adam Tomasovyacutech Stefano Dominici Martin Zuschin and Didier Merle emerges only over macroevolutionary time-scales
offshore gradient in metacommunity turnoverminusOnshore
Supplementary data
tml httprspbroyalsocietypublishingorgcontentsuppl20141007rspb20141533DC1h
Data Supplement
Referenceshttprspbroyalsocietypublishingorgcontent281179520141533fullhtmlref-list-1
This article cites 66 articles 34 of which can be accessed free
Subject collections
(194 articles)palaeontology (1910 articles)evolution
(1773 articles)ecology Articles on similar topics can be found in the following collections
Email alerting service hereright-hand corner of the article or click Receive free email alerts when new articles cite this article - sign up in the box at the top
httprspbroyalsocietypublishingorgsubscriptions go to Proc R Soc BTo subscribe to
on October 8 2014rspbroyalsocietypublishingorgDownloaded from on October 8 2014rspbroyalsocietypublishingorgDownloaded from
on October 8 2014rspbroyalsocietypublishingorgDownloaded from
rspbroyalsocietypublishingorg
ResearchCite this article Tomasovych A Dominici S
Zuschin M Merle D 2014 Onshore ndash offshore
gradient in metacommunity turnover emerges
only over macroevolutionary time-scales
Proc R Soc B 281 20141533
httpdxdoiorg101098rspb20141533
Received 21 June 2014
Accepted 9 September 2014
Subject Areaspalaeontology ecology evolution
Keywordsmacroevolution macroecology stasis temporal
turnover niche conservatism Mollusca
Author for correspondenceAdam Tomasovych
e-mail geoltomasavbask
Electronic supplementary material is available
at httpdxdoiorg101098rspb20141533 or
via httprspbroyalsocietypublishingorg
amp 2014 The Author(s) Published by the Royal Society All rights reserved
Onshore ndash offshore gradient inmetacommunity turnover emerges onlyover macroevolutionary time-scales
Adam Tomasovych1 Stefano Dominici2 Martin Zuschin3 and Didier Merle4
1Slovak Academy of Sciences Geological Institute Dubravska cesta 9 Bratislava 84005 Slovakia2Sezione di Geologia e Paleontologia Museo di Storia Naturale Universita di Firenze Via La Pira 4Firenze 50121 Italy3Department of Palaeontology University of Vienna Althanstrasse 14 Vienna 1090 Austria4CR2P - MNHN CNRS Sorbonne Universites UPMC Paris 6 France
Invertebrate lineages tend to originate and become extinct at a higher rate in
onshore than in offshore habitats over long temporal durations (more than
10 Myr) but it remains unclear whether this pattern scales down to durations
of stages (less than 5 Myr) or even sequences (less than 05 Myr) We assess
whether onshorendashoffshore gradients in long-term turnover between the tropi-
cal Eocene and the warm-temperate Plio-Pleistocene can be extrapolated from
gradients in short-term turnover using abundances of molluscan species from
bulk samples in the northeast Atlantic Province We find that temporal turn-
over of metacommunities does not significantly decline with depth over short
durations (less than 5 Myr) but significantly declines with depth between the
Eocene and Plio-Pleistocene (approx 50 Myr) This decline is determined by a
higher onshore extinction of Eocene genera and families by a higher onshore
variability in abundances of genera and families and by an onshore expan-
sion of genera and families that were frequent offshore in the Eocene
Onshorendashoffshore decline in turnover thus emerges only over long temporal
durations We suggest that this emergence is triggered by abrupt and spatially
extensive climatic or oceanographic perturbations that occurred between the
Eocene and Plio-Pleistocene Plio-Pleistocene metacommunities show a high
proportion of bathymetric generalists in contrast to Eocene metacommunities
Accordingly the net cooling and weaker thermal gradients may have allowed
offshore specialists to expand into onshore habitats and maintain their
presence in offshore habitats
1 IntroductionThe ecological and evolutionary dynamics of marine metacommunities gener-
ate a variety of outcomes at 10 kyr to 10 Myr scales ranging from temporally
stable metacommunities that exhibit stasis [1ndash5] up to temporally variable
species combinations that do not have analogues in present-day ecosystems
especially in the Pleistocene [6ndash8] Although differences in temporal scale can
contribute to different degrees of stasis [9] some variation observed in
marine environments can be also caused by onshorendashoffshore gradients in
demographic and evolutionary rates (or by other types of environmental gradi-
ents [10ndash13]) Extinction rates of Palaeozoic genera [1415] and origination rates
of TriassicndashJurassic genera [16] tend to be higher onshore (ie above storm-
wave base) and superfamilies and orders exhibit a higher number of orig-
inations onshore than offshore at temporal scales that exceed the duration of
geological stages [1718] These observations imply that temporal metacommu-
nity turnover declines from onshore to offshore The turnover along onshorendash
offshore gradients can be further modulated by latitude which represents a
major correlate of evolutionary rates [1920] because thermal gradients are stee-
per and bathymetric ranges smaller in the tropics [21] Some studies imply that
the onshorendashoffshore decline in turnover reflects a decline in the frequency of
major evolutionary innovations but does not necessarily scale down to
rspbroyalsocietypublishingorgProcRSocB
28120141533
2
on October 8 2014rspbroyalsocietypublishingorgDownloaded from
species-level gradients (frequency of species originations
does not peak onshore [22]) Therefore estimates of temporal
turnover measured over intervals varying in the duration at
multiple taxonomic levels and partitioned according to
depth and latitude are needed to understand temporal
dynamics of metacommunities It is also necessary to identify
the components of turnover that generate such onshorendash
offshore gradients (eg variability in population sizes extinction
rates and origination rates [23])
It can be expected that onshore metacommunities should be
more volatile than their offshore counterparts because onshore
habitats (i) are environmentally steeper along a latitudinal
gradient [24] and (ii) exhibit higher temporal environmental
variability (eg greater annual temperature range at each
latitude [25]) Nonetheless these two factors can select for
larger niche breadth [26ndash29] and thus seem to generate an
increase in the proportion of eurytopic species in onshore envir-
onmentally steeper habitats with higher seasonality and higher
frequency of storm disturbances [3031] The simple expectation
about the higher volatility of onshore metacommunities thus
can be reversed by selection for eurytopic strategies that can
increase resistance or resilience to temporal environmental fluc-
tuations in variable (onshore) habitats [32ndash35] or by fluctuating
selection that protects genetic variance [36]
Here we assess for the first time to our knowledge
whether the onshorendashoffshore gradients in temporal turnover
can be observed at short time-scales and how they scale up to
long time-scales A key issue is whether an onshorendashoffshore
gradient in long-term turnover simply follows from incremen-
tal additions of short-term turnovers of small magnitude or
whether it is driven by more abrupt turnovers of higher mag-
nitude We focus on a time interval that (i) encompasses
climatic and palaeogeographical changes that may be needed
to cause significant macroevolutionary changes and (ii) is
sufficiently long so that it naturally separates time-scales of
recurrent orbitally forced oscillations (10ndash100 thousand
years [26]) from environmental perturbations occurring over
million-year time-scales Environmental conditions generated
by such perturbations are effectively outside of evolutionary
history of individual species (lifetimes of bivalve species typi-
cally exceed 5 Myr [37]) and can have disproportionate
consequences for evolutionary trajectories of onshore and
offshore lineages We therefore focus on turnover along
onshorendashoffshore gradients between the tropical Eocene and
warm-temperate Plio-Pleistocene in the northeast Atlantic
and Mediterranean using a unique field-based dataset with
molluscs representing a highly diverse clade and a proxy of
the evolution of marine ectotherms [20] This region under-
went significant climatic and palaeogeographical changes
during the Oligocene Miocene and Pliocene resulting in the
loss of coral reefs and mangroves [38] Although we expect
that such intervening changes must accentuate long-term turn-
over relative to within-stage turnover at any depth along an
onshorendashoffshore gradient it remains unclear whether meta-
communities along onshorendashoffshore gradients respond
differently to such changes
First we measure temporal turnover in molluscan marine
metacommunities along onshorendashoffshore transects (i) at
short (within-stage) time-scales within the Ypresian (Lower
Eocene) within the Lutetian (Middle Eocene) and within
the PiacenzianndashGelasian (Plio-Pleistocene) (less than 5 Myr)
and (ii) at long (between-epoch) time-scales between the
Lower-Middle Eocene and the Plio-Pleistocene (more than
5 Myr) and assess whether a gradient in turnover is related
to gradients in variability in abundance extinction and orig-
ination Second we evaluate onshorendashoffshore shifts in the
abundance of genera and families that persisted from the
Eocene to the Plio-Pleistocene and onshorendashoffshore
gradients in bathymetric breadth
2 Material and methodsWe evaluate onshorendashoffshore gradients in temporal turnover of
molluscan species genera and families (bivalves gastropods
scaphopods) within the Eocene tropical successions (30ndash358 N)
and within the Plio-Pleistocene warm-temperate successions
(40ndash438 N) in the northeast Atlantic Province We measure the
turnover between these epochs at the genus level because they
do not share any species in common We also evaluate turnover
in families to ensure that the findings do not depend on genus-
level classification which remains in flux The fossil assemblages
are represented by bulk samples collected at bed resolution and
sieved with 1 mm mesh size We assign the assemblages to four
depths using sedimentological criteria including two onshore
habitats (peritidal and nearshore) and two offshore habitats
close to and below storm-wave base (inner shelf and outer
shelf see the electronic supplementary material) The Eocene is
represented by the Ypresian deposits of the Pyrenean Foreland
(93 assemblages [39]) and the Aquitaine Basin (four assem-
blages) and by new bulk samples collected in the Lutetian
deposits of the Paris Basin (nine assemblages) Ypresian assem-
blages correspond to fully tropical conditions with corals large
foraminifers and mangrove habitats [39] Lutetian assemblages
capture slightly lower temperatures [40] but still reflect tropical
conditions with corals and large foraminifers (with mean temp-
eratures not falling below 17ndash188C) The Plio-Pleistocene is
represented by 35 bulk samples collected in the Piacenzian
siliciclastic deposits of Lower Arno basins and 13 bulk samples
from the PiacenzianndashGelasian of Piedmont-Padan basins on
two opposite sides of the Northern Apennines These deposits
bracket the mid Pliocene warm interval and cooling after the
PiacenzianGelasian boundary [41] The Eocene is represented
by the total of 47 410 individuals 625 species and 149 families
The Plio-Pleistocene is represented by the total of 109 771
individuals 445 species and 108 families
We use BrayndashCurtis dissimilarity to quantify temporal turn-
over in species genus and family abundance [42] using square-
root transformed proportional abundance data and plot dissim-
ilarities on a logit scale because they effectively represent
proportions [43] We measure dissimilarity at each of the four
depths (i) at local scale of individual assemblages and (ii) at
regional scale by pooling a constant number of assemblages
per sequence per stage and per epoch at each depth
Short-term turnover at each depth is measured as (i) turnover
between composite depositional sequences (approx 015ndash05 Myr
sequences in the Eocene and approx 025 Myr sequences in the
Plio-Pleistocene table 1) and (ii) within-stage turnover within
the Ypresian Lutetian and PiacenzianndashGelasian (less than
5 Myr) Long-term turnover is measured as turnover between
the two epochs (between Lower-Middle Eocene and Plio-Pleisto-
cene) The first measure of short-term turnover allows testing of
whether turnover increases with temporal separation between
sequences The second measure of short-term turnover allows
comparison with onshorendashoffshore gradients in long-term turn-
over and this comparison is visualized by non-metric multi-
dimensional scaling (NMDS) of assemblages coded by habitat
stage and epoch
Local-scale short-term turnover within each depth is based on
an average of all pairwise dissimilarities between assemblages
(i) from two sequences (each with four assemblages standardized
Table 1 Time-environment table showing the number of assemblage samples at each depth for each depositional sequence stage and epoch (The numbers inparentheses show the number of samples with more than 50 specimens (sequences) and with more than 100 specimens (stages) that were used in size-standardized analyses Four outer shelf samples in the Eocene did not allow the analysis of short-term turnover between sequences Two samples from Eocenewere not assigned to sequences and were thus used in analyses of stages only)
epoch (stage) sequencesage midpoint(Myr) duration (yr) peritidal nearshore
innershelf
outershelf
Pleistocene (Gelasian) San Miniato S6 255 220 000 3 (3) 2 (0) 5 (5) 0
Pliocene (Piacenzian) Ponte e Elsae S5 28 220 000 0 3 (3) 6 (6) 0
Pliocene (Piacenzian) Pietrafita S4 325 150 000 4 (4) 5 (5) 3 (3) 4 (4)
Pliocene (Piacenzian) Certaldo S3 345 200 000 0 0 1 (0) 12 (4)
epoch (stage) sequencesage midpoint(Myr) duration (yr) peritidal nearshore
innershelf
outershelf
Eocene (Lutetian) Paris Basin A8 ndash A10 45 100 000 0 0 4 (4) 0
Eocene (Lutetian) Paris Basin A6 ndash A7 45 100 000 0 0 4 (4) 0
Eocene (Ypresian) Castigaleu H ndash I 4945 280 000 4 (4) 1 (1) 1 (0) 0
Eocene (Ypresian) Castigaleu F ndash G 4975 280 000 4 (4) 5 (5) 1 (1) 0
Eocene (Ypresian) Castigaleu C ndash D 5015 280 000 0 17 (11) 2 (0) 0
Eocene (Ypresian) Castigaleu A ndash B 5045 280 000 0 15 (10) 1 (1) 0
Eocene (Ypresian) FigolsmdashC 509 500 000 17 (16) 2 (2) 0 0
Eocene (Ypresian) FigolsmdashB 515 500 000 9 (9) 3 (3) 0 0
Eocene (Ypresian) FigolsmdashA 521 500 000 9 (8) 1 (0) 0 0
epoch stageage midpoint(Myr) duration (yr) peritidal nearshore
innershelf
outershelf
Plio-Pleistocene Piacenzian ndash Gelasian 305 1 100 000 7 (7) 10 (10) 15 (14) 16 (11)
Eocene Lutetian (Middle) 4351 3 680 000 0 0 14 (9) 0
Eocene Ypresian (Late) 508 3 400 000 43 (24) 45 (21) 0 4 (4)
rspbroyalsocietypublishingorgProcRSocB
28120141533
3
on October 8 2014rspbroyalsocietypublishingorgDownloaded from
to n frac14 50 individuals) and (ii) from one stage (with four
assemblages standardized to n frac14 100) Local-scale short-term
turnover within each depth is based on an average of all pairwise
dissimilarities between assemblages from two epochs (Lower-
Middle Eocene and Plio-Pleistocene) (each with four assemblages
standardized to n frac14 100) Regional-scale short-term and long-term
turnover within each depth is based on a single dissimilarity four
local assemblages are randomly drawn from each sequence stage
and epoch resampled (without replacement) to the same sample
size (n) per assemblage and pooled into one regional-scale assem-
blage per sequence (n frac14 200) per stage (n frac14 400) and per epoch
(n frac14 400) We test the significance of onshorendashoffshore difference
in turnover with pairwise between-habitat tests of homogeneity
in multivariate dispersions (HMD [44]) Multivariate dispersion
corresponds to mean BrayndashCurtis dissimilarity between assem-
blages (from one stage in within-stage turnover and from two
epochs in between-epoch turnover) and their centroid HMD
tests whether multivariate dispersions are larger onshore than
offshore within stages and between epochs To assess the contri-
bution of species-level processes to temporal turnover in genus
and family abundance we further compute turnover where
BrayndashCurtis dissimilarity is based (i) on per-genus and per-
family median species (proportional) abundance and (ii) on
per-genus and per-family species richness At regional scales we
also use Spearmanrsquos rank correlation to test the relation in species
genus and family rank abundances between sequences and
between epochs and the Mantel test to test whether Brayndash
Curtis dissimilarity increases and Spearmanrsquos rank correlation
decreases with increasing temporal separation between sequences
at regional scales separately within onshore and offshore habitats
In analyses of dissimilarities rank correlations and the
Mantel test we double-standardize abundance data by random
sampling of the same number of individuals per assemblage
and by random sampling of the same number of assemblages
per depth and per time interval Standardizations are repeated
1000 times generating means and 25th and 975th percentiles
on summary statistics The subsets of assemblages and individ-
uals drawn in consecutive standardizations are not mutually
exclusive To assess significance of tests that are computed
with standardized data we thus compute a combined p-value
with averaging approach rather than using the product of
p-values as in Fisherrsquos approach [45]
We quantify relative utilization of onshore habitats by genera
and families as the proportion of a taxonrsquos individuals found
onshore (relative to the taxonrsquos total abundance) to assess tem-
poral changes in utilization of onshorendashoffshore gradients by
genera and families that persist from the Eocene to Plio-Pleisto-
cene We measure a bathymetric breadth of individual species
with Hurlbertrsquos measure [46] which weights bathymetric range
by abundance and by frequency of samples at each depth
3 Results(a) Onshore ndash offshore gradients in temporal turnover
within stagesSpearmanrsquos rank correlations in proportional abundances
between sequences are moderately high in the Eocene
(r [species] frac14 036 r [genera] frac14 04 r [families] frac14 055) and
within-stage turnover
genusabundance
(a) (c) (e) (g)
peri
tidal
with
in-s
tage
Bra
yndashC
urtis
dis
sim
ilari
ty
near
shor
e
inne
r sh
elf
oute
r sh
elf
peri
tidal
near
shor
e
inne
r sh
elf
oute
r sh
elf
peri
tidal
near
shor
e
inne
r sh
elf
oute
r sh
elf
peri
tidal
near
shor
e
inne
r sh
elf
oute
r sh
elf
01
03
06
09
10
betw
een-
stag
e B
rayndash
Cur
tis d
issi
mila
rity
01
03
06
09
10
peri
tidal
with
in-s
tage
Bra
yndashC
urtis
dis
sim
ilari
ty
near
shor
e
inne
r sh
elf
oute
r sh
elf
peri
tidal
near
shor
e
inne
r sh
elf
oute
r sh
elf
peri
tidal
near
shor
e
inne
r sh
elf
oute
r sh
elf
peri
tidal
near
shor
e
inne
r sh
elf
oute
r sh
elf
01
Eoc
ene
Plio
cene
Eoc
ene
Plio
cene
Eoc
ene
Plio
cene
Eoc
ene
Plio
cene
loca
lre
gion
allo
cal
regi
onal
loca
lre
gion
allo
cal
regi
onal
loca
lre
gion
allo
cal
regi
onal
loca
lre
gion
allo
cal
regi
onal
loca
lre
gion
allo
cal
regi
onal
loca
lre
gion
allo
cal
regi
onal
shallow deep shallow deep shallow deep shallow deep
03
06
09
10
betw
een-
stag
e B
rayndash
Cur
tis d
issi
mila
rity
01
03
06
09
10
genusabundance
per-genusmedian species
abundance
per-genusmean species
richness
familyabundance
(b) (d) ( f ) (h)familyabundance
per-familymedian species
abundance
per-familymean species
richness
between-epoch turnover
Figure 1 Short-term turnover within stages (within Ypresian Lutetian and Piacenzian ndash Gelasian) does not consistently vary with depth (ab) Long-term turnover(between the Eocene and Plio-Pleistocene) markedly declines between nearshore and inner shelf at both local and regional scales (cd ) using all genera and families(small symbols) and persisting genera and families (large symbols) This decline is related to a decrease in turnover in per-lineage median species abundance(ef ) and in per-lineage species richness (gh) Bray ndash Curtis dissimilarities are based on square-root transformed proportional abundances Error bars represent25th and 975th percentiles derived from 1000 standardizations Dissimilarities are plotted on a logit scale
rspbroyalsocietypublishingorgProcRSocB
28120141533
4
on October 8 2014rspbroyalsocietypublishingorgDownloaded from
rather low in the Plio-Pleistocene (r [species] frac14 017r [genera] frac14
023 r [families]frac14 034) (electronic supplementary material
table S1) Significant correlations between sequences occur in
most Eocene comparisons (20ndash23 out of 29 comparisons at
Bonferroni-corrected a frac14 00017) and are less frequent in the
Plio-Pleistocene (3ndash5 out of 16 comparisons at Bonferroni-
corrected a frac14 0003) Spearmanrsquos rank correlations do not
decline and BrayndashCurtis dissimilarities do not increase with
increasing separation between sequences (electronic
supplementary material figure S1 and table S2) Among-
sequence dissimilarities are reduced at all depths when
local assemblages at each depth are pooled (figure 1ab)
Multivariate dispersions of individual habitats along onshorendash
offshore gradients in a double-standardized NMDS do not
visibly decline within the Eocene or within the Plio-Pleistocene
(figure 2) and pairwise onshorendashoffshore differences in
within-stage turnover are close to zero and never significantly
positive (table 2 and figure 1ab) The short-term turnover in
abundance at genus and family level thus does not decline
with depth within the Eocene or Plio-Pleistocene
(b) Onshore ndash offshore gradients in temporal turnoverbetween epochs
The turnover between the Eocene and Plio-Pleistocene in abun-
dance of genera and families is higher onshore than in offshore
The differences between peritidal and nearshore and between
inner shelf and outer shelf are weak but other comparisons
show significantly higher long-term turnover in onshore habi-
tats This demonstrates that the major decline in turnover
occurs in inner shelf close to the storm-wave base (table 3
and figure 1cd electronic supplementary material figures
S2ndashS4) The decline in turnover applies to abundances of
genera and families that persist from the Eocene to Plio-Pleisto-
cene and is thus not driven solely by decline in extinction and
origination but also by higher offshore conservatism in
ndash2
stress 015 stress 018
stress 013 stress 018
ndash15
ndash05
05
10
15
Eocene
genera (all samples)
NM
DS
axis
2
Plio-Pleistocene
0
ndash1 0 1 ndash10
ndash10
ndash05
05
10
Eocene
families (all samples)
Plio-Pleistocene
0
ndash05 0 1005
ndash10ndash15ndash20
ndash10
ndash05
05
10
Eocene
genera (4 samples per habitat)
NM
DS
axis
2
Plio-Pleistocene
0
ndash05 0
NMDS axis 1
1505 10 ndash10
ndash10
ndash05
05
Eocene
peritidalnearshore
outer shelfinner shelf
families (4 samples per habitat)
Plio-Pleistocene
0
ndash05 0
NMDS axis 1
05
Figure 2 NMDS showing that Eocene and Plio-Pleistocene offshore habitats (inner shelf and outer shelf are coded light grey and white respectively) are moresimilar to each other in abundance of persisting genera and families than Eocene and Plio-Pleistocene onshore habitats ( peritidal and nearshore coded by dark greyshading) using Bray ndash Curtis dissimilarity based on square-root transformed proportional abundances Ordinations in the upper plots show all assemblages ordina-tions in the lower plots show one ordination standardized to four assemblages per habitat and per epoch and to n frac14 100 individuals per assemblage Arrowsvisualize Eocene and Plio-Pleistocene onshore ndash offshore gradients they start in centroids of shallower habitats and terminate in centroids of deeper habitats
rspbroyalsocietypublishingorgProcRSocB
28120141533
5
on October 8 2014rspbroyalsocietypublishingorgDownloaded from
abundance NMDS visualizes this decline in temporal turnover
in genus and family abundance between the Eocene and Plio-
Pleistocene showing a marked segregation of onshore commu-
nities from Eocene and Plio-Pleistocene whereas offshore
communities from these two time intervals are close to each
other (figure 2) The onshorendashoffshore decline in temporal
turnover in abundance scales down to species-level abundance
patterns with a smaller offshore turnover (i) in per-genus and
per-family median species abundance and (ii) in per-genus
and per-family richness (figure 1endashh) Spearmanrsquos rank corre-
lation between Eocene and Plio-Pleistocene genus and family
abundances within a single habitat is significantly positive in
inner shelf (r [genera]frac14 031 p 0011 r [families]frac14 046
p 0001) and becomes insignificant in peritidal (r [genera]frac14
018 pfrac14 04 r [families]frac14 014 pfrac14 038) and nearshore
(r [genera]frac14 003 pfrac14 082 r [families]frac14 016 pfrac14 022) but
also in outer shelf habitats (r [genera]frac14 2016 pfrac14 027
r [families]frac14 2014 pfrac14 028)
A total of 82ndash88 of genera (42ndash52 of families) inhab-
iting peritidal and nearshore habitats in the Eocene
disappear in the Plio-Pleistocene of the northeast Atlantic Pro-
vince In comparison 72ndash80 of genera (33ndash36 of families)
disappear from inner shelf and outer shelf Although the pro-
portions of persisting genera and families are not very high
these taxa contribute 49 and 90 of individuals respect-
ively to the total abundance when both epochs are pooled
The percentages appearing in the Plio-Pleistocene are similar
between onshore (67ndash68 of genera and 16ndash25 of families)
and offshore (64ndash70 and 19ndash26 respectively)
Ampullinidae and Batillariidae primarily contribute to
high onshore turnover They are dominant in onshore habitats
during the Eocene but are absent in the Plio-Pleistocene of the
northeast Atlantic and Mediterranean Ampullinidae are pre-
sently represented by a single species occurring in the
Philippines [47] and Batillariidae disappeared from the north-
east Atlantic Province at the end of the Miocene [48] In
onshore habitats Potamididae are strongly reduced whereas
Rissoidae Pyramidellidae Arcidae Semelidae Tellinidae Car-
diidae and Veneridae increase in abundance Rissoidae radiate
during the Miocene and are presently the most species-rich in
the warm-temperate Mediterranean and eastern Atlantic [49]
Although some Eocene families with tropical affinities
declined in abundance (Turridae Conidae Costellariidae
Cylichnidae) or went regionally extinct in offshore habitats
(eg Marginellidae which presently extend to the southern-
most parts of the Mediterranean and to the Ibero-Moroccan
Gulf [50]) most families achieved similar abundance in the
Eocene and Plio-Pleistocene in offshore habitats
Tabl
e2
Shor
t-ter
mtu
rnov
erw
ithin
Eoce
nean
dw
ithin
Plio-
Pleis
toce
nein
genu
san
dfa
mily
abun
danc
esis
not
signi
fican
tlyhi
gher
onsh
ore
than
offsh
ore
usin
gth
ete
stof
HMD
(The
sum
mar
ysta
tistic
san
dth
eco
mbi
ned
p-va
lue
betw
een
onsh
ore
and
offsh
ore
and
the
25
and
975
thpe
rcent
iles
are
base
don
1000
runs
stand
ardi
zed
tofo
uras
sem
blag
espe
rhab
itata
ndnfrac14
100
indi
vidua
lspe
rass
embl
age)
habi
tat
com
paris
onle
vel
mea
non
shor
endashof
fsho
redi
ffere
nce
indi
sper
sion
25t
hpe
rcen
tile
975
thpe
rcen
tile
com
bine
dp-
valu
ele
vel
mea
non
shor
endashof
fsho
redi
ffere
nce
indi
sper
sion
25t
hpe
rcen
tile
975
thpe
rcen
tile
com
bine
dp-
valu
e
Eoce
nepe
ritid
al
versu
sne
arsh
ore
gene
ra0
087
003
30
145
021
7fa
milie
s0
072
001
20
138
030
7
Eoce
nepe
ritid
al
versu
sin
ners
helf
gene
ra2
009
02
013
82
003
61
fam
ilies
20
039
20
100
002
50
941
Eoce
nepe
ritid
al
versu
sou
ters
helf
gene
ra2
004
52
008
02
001
00
997
fam
ilies
20
044
20
081
20
006
099
5
Eoce
nene
arsh
ore
versu
sin
ners
helf
gene
ra2
017
72
024
22
011
01
fam
ilies
20
111
20
193
20
032
099
9
Eoce
nene
arsh
ore
versu
sou
ters
helf
gene
ra2
013
22
019
12
007
81
fam
ilies
20
117
20
182
20
058
1
Eoce
nein
ners
helf
versu
sou
ters
helf
gene
ra0
045
20
003
009
30
246
fam
ilies
20
005
20
066
005
50
729
Plio-
Plp
eriti
dal
versu
sne
arsh
ore
gene
ra0
054
20
049
015
50
325
fam
ilies
008
22
003
30
185
023
1
Plio-
Plp
eriti
dal
versu
sin
ners
helf
gene
ra0
026
20
106
017
30
545
fam
ilies
004
42
009
30
170
042
5
Plio-
Plp
eriti
dal
versu
sou
ters
helf
gene
ra0
143
001
40
266
013
1fa
milie
s0
138
000
70
265
014
1
Plio-
Pln
earsh
ore
versu
sin
ners
helf
gene
ra2
002
82
014
80
120
078
4fa
milie
s2
003
82
015
80
079
082
7
Plio-
Pln
earsh
ore
versu
sou
ters
helf
gene
ra0
089
20
036
020
70
260
fam
ilies
005
52
006
00
163
036
0
Plio-
Pli
nner
shelf
versu
sou
ters
helf
gene
ra0
116
20
056
026
40
221
fam
ilies
009
32
004
60
229
025
2
rspbroyalsocietypublishingorgProcRSocB
28120141533
6
on October 8 2014rspbroyalsocietypublishingorgDownloaded from
Tabl
e3
Turn
over
betw
een
Eoce
nean
dPl
io-Pl
eisto
cene
inge
nus
and
fam
ilyab
unda
nces
decre
ases
towa
rds
offsh
ore
envir
onm
ents
usin
gall
taxa
and
persi
sting
taxa
(Th
ete
stof
HMD
show
sth
atalt
houg
htu
rnov
eris
not
signi
fican
tlyhi
gher
intw
opa
irsof
close
lysp
aced
habi
tats
(per
itida
lcom
pare
dw
ithne
arsh
ore
and
inne
rsh
elfco
mpa
red
with
oute
rshe
lf)o
nsho
retu
rnov
eris
signi
fican
tlyhi
gher
inot
herc
ompa
rison
sw
ithof
fshor
eha
bita
tsTh
em
ean
diffe
renc
ein
mul
tivar
iate
disp
ersio
nbe
twee
non
shor
ean
dof
fshor
een
viron
men
tsan
dth
e2
5an
d97
5th
perce
ntile
sar
eba
sed
on10
00ru
nssta
ndar
dize
dto
four
asse
mbl
ages
perh
abita
tand
pere
poch
and
nfrac14
100
indi
vidua
lspe
rass
embl
age)
habi
tat
com
paris
onle
vel
mea
non
shor
endashof
fsho
re
diffe
renc
ein
disp
ersio
n
25t
h
perc
entil
e
975
th
perc
entil
e
com
bine
dp-
valu
ele
vel
mea
non
shor
endashof
fsho
re
diffe
renc
ein
disp
ersio
n
25t
h
perc
entil
e
975
th
perc
entil
e
com
bine
dp-
valu
e
perit
idal
versu
sne
arsh
ore
gene
ra0
007
20
008
002
70
962
fam
ilies
004
50
004
009
00
267
perit
idal
versu
sin
ners
helf
gene
ra0
032
000
80
064
000
6fa
milie
s0
198
013
30
268
000
3
perit
idal
versu
sou
ters
helf
gene
ra0
189
015
80
220
000
1fa
milie
s0
242
020
70
275
000
1
near
shor
eve
rsus
inne
rshe
lfge
nera
002
52
000
60
061
000
6fa
milie
s0
153
007
90
232
000
4
near
shor
eve
rsus
oute
rshe
lfge
nera
018
30
147
021
80
001
fam
ilies
019
70
139
024
30
002
inne
rshe
lfve
rsus
oute
rshe
lfge
nera
015
70
114
019
70
039
fam
ilies
004
42
003
10
115
087
3
perit
idal
versu
ssh
ore
face
pers
gene
ra0
013
20
019
005
80
994
pers
fam
ilies
004
72
000
10
098
043
6
perit
idal
versu
sin
ners
helf
pers
gene
ra0
077
002
10
143
005
8pe
rsfa
milie
s0
211
013
90
286
000
5
perit
idal
versu
sou
ters
helf
pers
gene
ra0
387
033
70
438
000
1pe
rsfa
milie
s0
270
021
60
326
000
2
near
shor
eve
rsus
inne
rshe
lfpe
rsge
nera
006
52
000
60
136
001
3pe
rsfa
milie
s0
164
007
90
248
000
8
near
shor
eve
rsus
oute
rshe
lfpe
rsge
nera
037
50
310
043
60
001
pers
fam
ilies
022
40
151
029
00
002
inne
rshe
lfve
rsus
oute
rshe
lfpe
rsge
nera
031
00
229
038
60
019
pers
fam
ilies
005
92
003
10
153
072
4
peritidal
EocenePlio-Pleistocene
0
0
100
200
300
04
08
12
nearshore
Hur
lber
t bat
hym
etri
c br
eadt
h O
regi
onal
spe
cies
ric
hnes
s
innershelf
outershelf
Figure 3 Hurlbert bathymetric breadth of Eocene species (black circles) onaverage declines towards offshore whereas Hurlbert breadth of Plio-Pleistocenespecies (grey circles) changes weakly Hurlbert breadth of offshore species issignificantly higher in the Plio-Pleistocene than in the Eocene Species richness(rarefied to 2477 individuals per habitat) increases towards inner shelf at bothtime intervals and this increase is less steep during the Plio-Pleistocene (greysquares) than during the Eocene (black squares)
rspbroyalsocietypublishingorgProcRSocB
28120141533
7
on October 8 2014rspbroyalsocietypublishingorgDownloaded from
(c) Onshore ndash offshore shifts in abundance andbathymetric breadth between epochs
Although species richness increases towards inner shelf at
both time intervals the onshorendashoffshore gradient in
bathymetric breadth changes markedly between the Eocene
and Plio-Pleistocene (figure 3) The Eocene species show
a significantly smaller Hurlbertrsquos index (mean frac14 012 95
CI frac14 011ndash013) than Plio-Pleistocene species (mean frac14 023
95 CI frac14 021ndash024) This change is associated with a
higher proportion of species occurring onshore and offshore
(generalists) in the Plio-Pleistocene 27 species (4) belong
to generalists in the Eocene whereas 163 species (37)
belong to generalists in the Plio-Pleistocene In contrast to
the Eocene Hurlbertrsquos index does not decline with depth in
the Plio-Pleistocene because Plio-Pleistocene offshore species
show a significantly higher index than Eocene offshore
species (figure 3) The differences in onshore utilization by
genera and families between Plio-Pleistocene and Eocene
are significantly positive persisting genera and families are
more frequent onshore in the Plio-Pleistocene than onshore
in the Eocene (figure 4) These relative onshore expansions
of genera and families are caused by an increase in abun-
dance of their constituent species as well as by an increase
in their species richness (figure 4)
4 Discussion(a) Onshore ndash offshore gradients at short time-scalesThe moderately high between-sequence rank correlations in the
Eocene and the lack of relation with time imply that the
short-term turnover is coupled with some degree of recurrence
in abundance patterns at individual depths as observed in
many other time series with benthic assemblages in the fossil
record [5152] The smaller dissimilarity at regional scales at
each depth implies that this recurrence is related to processes
operating at larger spatial scales that can reduce extinction
risk and slow down temporal change in metacommunity com-
position Such processes include those that allow broad
geographical range size via high dispersal or high effective habi-
tat area [53ndash56] Geographical range size is a key predictor of
ndash10
0
10
20
30
40
0 10
no g
ener
a
offs
hore
exp
ansi
on
onsh
ore
expa
nsio
n
ndash10 0difference in onshore utilization
between Eocene and Plio-Pleistocene
ndash5 0 5 1010
abundance(a) species richnessmedian sp abundance
ndash10
0
10
20
30
40
0 10
no f
amili
es
offs
hore
exp
ansi
on
onsh
ore
expa
nsio
n
ndash10 0difference in onshore utilization
between Eocene and Plio-Pleistocene
ndash10 10 3010
abundance(b) species richnessmedian sp abundance
Figure 4 Frequency distributions of Plio-Pleistocene ndash Eocene differences in onshore utilization of (a) genera and (b) families that persist from Eocene to Plio-Pleistocene show that genera and families abundant in offshore habitats during Eocene expanded to onshore habitats in Plio-Pleistocene The onshore increasein abundance also applies to an increase in per-genus and per-family median species abundance and to an increase in per-genus and per-family species richnessThin dashed lines separate relative onshore expansion from relative offshore expansion Thick solid and dashed lines correspond to means and bootstrapped 95 CIsA value of zero means no difference between Eocene and Plio-Pleistocene and positive values mean that persisting genera and families are more abundant andmore species-rich onshore in the Plio-Pleistocene than in the Eocene
rspbroyalsocietypublishingorgProcRSocB
28120141533
8
on October 8 2014rspbroyalsocietypublishingorgDownloaded from
extinction [57] and its role in reducing extinction risk is gener-
ally much stronger than the role of eurytopy [58] The onshorendash
offshore decline in the steepness of latitudinal temperature
gradients may contribute to the lack of onshorendashoffshore gradi-
ents in geographical range size (and thus in extinction rate at
short time-scales) because the latitudinal range of shallow habi-
tats (0ndash50 m) along the eastern ocean margins [59] remains on
average within a 58C range for approximately 1500 km whereas
the latitudinal range of deeper habitats (100ndash200 m) remains on
average within a 58C range for approximately 2500ndash3000 km
(electronic supplementary material figure S7) and spatial
variation in seawater temperature drives the large-scale distri-
bution of ectotherms [6061] Therefore marine ectotherms
inhabiting onshore temporally variable habitats can achieve
broad geographical ranges because they are eurytopic [30]
whereas offshore temperature-specialized species can attain
broad geographical ranges because they face milder latitudinal
climatic gradients [62]
(b) Onshore extinction at long time-scalesThe emergence of an onshorendashoffshore decline in temporal
turnover over longer time-scales together with the lack of
relationship between the short-term turnover and temporal
separation between sequences over Myr scales implies that
the onshore increase in turnover between the Eocene and
the Plio-Pleistocene is not a simple extrapolation of small
incremental changes that can be observed from sequence to
sequence Rather the decline in turnover depends on climatic
or oceanographic perturbations that occurred between the
Eocene and Plio-Pleistocene and affected onshore lineages
more strongly than offshore lineages as revealed (i) by a
smaller offshore proportion of extinct genera and families
(ii) by a smaller variability in offshore abundance of persist-
ing genera and families and (iii) by a smaller variability in
offshore abundance of their constituent species Therefore
this decline is not merely a function of declining extinction
rates but also a function of declining variability in population
abundances leading to a higher ecological conservatism
of offshore lineages Climatic changes may contribute to
higher long-term onshore volatility because (i) Cenozoic
environments show larger temperature fluctuations in the
superficial waters than in the deep-shelf not only at short
but also at long time-scales [24] and (ii) the Cenozoic
record shows a higher long-term persistence of milder latitu-
dinal gradients in mean temperature at 200 m than at the
surface during the Cenozoic [63] Multiple climatic reversals
between YpresianndashLutetian and Plio-Pleistocene including
Lutetian cooling Mid-Eocene climatic optimum glaciation
at the EoceneOligocene boundary and mid-Miocene cli-
matic optimum [64] could thus contribute to the higher
extinction and population variability in the onshore habitats
Temporal fluctuations in the location and extent of oxygen
minimum zones can generate instability that is larger offshore
than onshore [65] but the Eocene and Plio-Pleistocene assem-
blages of the northeast Atlantic and Mediterranean do not
occur in dysoxic habitats The Pliocene molluscan commu-
nities in the Mediterranean were assembled primarily from
the tropical eastern Atlantic province along western Africa
(that was formed after the closure of the Indo-Pacific
seaway during the Early-Middle Miocene) but offshore and
onshore lineages should be not affected differently by such
oceanographic changes Regardless of the actual climatic or
oceanographic causes we suggest that onshore lineages face
abrupt and high-amplitude regional-scale perturbations
over longer durations that are not experienced over shorter
durations [66] Present-day offshore and bathyal habitats
apparently support deep-water lineages since the Mesozoic
also suggesting that offshore lineages can be less affected
by such perturbations and thus can conserve their niches
more strongly than onshore lineages [6768]
(c) Onshore expansion at long time-scalesPlio-Pleistocene genera and families that were frequent off-
shore during the Eocene expanded onshore during the Plio-
rspbroyalsocietypublishingorg
9
on October 8 2014rspbroyalsocietypublishingorgDownloaded from
Pleistocene and also maintained their presence offshore An
increase in the proportion of bathymetric generalists and the
flattening of the onshorendashoffshore gradient in bathymetric
breadth imply that this long-term onshore expansion observed
in our study can be modulated by climatic changes that led to
the net shift from tropical Eocene to warm-temperate Plio-
Pleistocene conditions Poleward latitudinal shifts are typically
associated with the emergence of colder deep-shelf waters and
with declining steepness of thermal bathymetric gradients at
higher latitudes Such changes in temperature and in the struc-
ture of the thermal bathymetric gradient produce a latitudinal
increase in the bathymetric range size of marine ectotherms
and their shallow-water emergence at higher latitudes [6970]
Data accessibility Source data are available at dxdoiorg105061dryad943j7
Acknowledgements We thank P Novack-Gottshall and T D Olszewskifor critical reviews M Stachowitsch for comments and S Danisefor help with sample processing This work benefited from visits toParis and Vienna museum collections under the Synthesys program
Funding statement This work was supported by the Austrian ScienceFund (FWF) projects P19013-Bio the Slovak Research and Develop-ment Agency (APVV 0644ndash10) the Slovak Scientific Grant Agency(VEGA 0068ndash10) and the NSF (DEB-0919451)
ProcRSoc
References
B28120141533
1 Pandolfi JM 1996 Limited membership inPleistocene reef coral assemblages from the HuonPeninsula Papua New Guinea constancy duringglobal change Paleobiology 22 152 ndash 176
2 Ivany LC Brett CE Wall HLB Wall PD Handley JC2009 Relative taxonomic and ecologic stability inDevonian marine faunas of New York State a test ofcoordinated stasis Paleobiology 35 499 ndash 524(doi1016660094-8373-354499)
3 Holland SM Zaffos A 2011 Niche conservatismalong an onshore ndash offshore gradient Paleobiology37 270 ndash 286 (doi101666100321)
4 Buzas M Hayek LC Culver SJ Hayward BWOsterman LE 2014 Ecological and evolutionaryconsequences of benthic community stasis in thevery deep sea (1500m) Paleobiology 40102 ndash 112 (doi10166613010)
5 Zuschin M Harzhauser M Hengst B Mandic ORoetzel R 2014 Long-term ecosystem stability in aLower Miocene estuarine succession Geology 421 ndash 4 (doi101130G347611)
6 Roy K Jablonski D Valentine JW 1995 Thermallyanomalous assemblages revisited patterns in theextraprovincial latitudinal range shifts ofPleistocene marine mollusks Geology 231071 ndash 1074 (doi1011300091-7613(1995)0231071TAARPI23CO2)
7 Jackson ST Overpeck JT 2000 Responses of plantpopulations and communities to environmentalchanges of the Late Quaternary Paleobiology26(Suppl 4) 194 ndash 220 (doi1016660094-8373(2000)26[194ROPPAC]20CO2)
8 Yasuhara M Hunt G Cronin TM Okahashi H 2009Temporal latitudinal-gradient dynamics and tropicalinstability of deep-sea species diversity Proc NatlAcad Sci USA 106 21 717 ndash 21 720 (doi101073pnas0910935106)
9 Tomasovych A Kidwell SM 2010 The effects oftemporal resolution on species turnover and ontesting metacommunity models Am Nat 175587 ndash 606 (doi101086651661)
10 Roy K 2001 Analyzing temporal trends in regionaldiversity a biogeographic perspective Paleobiology24 631 ndash 645 (doi1016660094-8373(2001)0270631ATTIRD20CO2)
11 Roy K Goldberg EE 2007 Origination extinctionand dispersal integrative models for understanding
present-day diversity gradients Am Nat 170S71 ndash S85 (doi101086519403)
12 Holland SM Patzkowsky M 2007 Gradient ecologyof a biotic invasion biofacies of the typeCincinnatian series (Upper Ordovician) CincinnatiOhio region USA Palaios 22 392 ndash 407 (doi102110palo2006p06-066r)
13 Miller AI Foote M 2009 Epicontinental seas versusopen-ocean settings the kinetics of mass extinctionand origination Science 326 1106 ndash 1109 (doi101126science1180061)
14 Sepkoski Jr JJ 1987 Environmental trends inextinction during the Phanerozoic Science 23564 ndash 66 (doi101126science11539724)
15 Sepkoski Jr JJ 1991 A model on onshore-offshorechange in faunal diversity Paleobiology 17 58 ndash 77
16 Kiessling W Aberhan M 2007 Environmentaldeterminants of marine benthic biodiversitydynamics through Triassic-Jurassic timesPaleobiology 33 414 ndash 434 (doi101666060691)
17 Bottjer DJ Jablonski D 1988 Paleoenvironmentalpatterns in the evolution of post-Paleozoic benthicmarine invertebrates Palaios 3 540 ndash 560 (doi1023073514444)
18 Jablonski D Lidgard S Taylor PS 1997 Comparativeecology of bryozoan radiations origin of noveltiesin cyclostomes and cheilostomes Palaios 12505 ndash 523 (doi1023073515408)
19 Kiessling W Simpson C Foote M 2010 Reefs ascradles of evolution and sources of biodiversity inthe Phanerozoic Science 327 196 ndash 198 (doi101126science1182241)
20 Jablonski D Belanger CL Berke SK Huang S KrugAZ Roy K Tomasovych A Valentine JW 2013 Outof the tropics but how Fossils bridge species andthermal ranges in the dynamics of the marinelatitudinal diversity gradient Proc Natl Acad SciUSA 110 10 487 ndash 10 494 (doi101073pnas1308997110)
21 Smith KF Gaines SD 2003 Rapoportrsquos bathymetricrule and the latitudinal species diversity gradient fornortheast Pacific fishes and northwest Atlanticgastropods evidence against a causal linkJ Biogeogr 30 1153 ndash 1159 (doi101046j1365-2699200300898x)
22 Jablonski D 2005 Evolutionary innovations in thefossil record the intersection of ecology
development and macroevolution J Exp Zool304B 504 ndash 519 (doi101002jezb21075)
23 Stanley SM Wetmore KL Kennett JP 1988Macroevolutionary differences between the twomajor clades of Neogene planktonic ForaminiferaPaleobiology 14 235 ndash 249
24 Nikolaev SD Oskina NS Blyum NS BubenshchikovaNV 1998 Neogene-Quaternary variations of thelsquoPole-Equatorrsquo temperature gradient of the surfaceoceanic waters in the north Atlantic and northPacific Glob Planet Change 18 85 ndash 111 (doi101016S0921-8181(98)00009-5)
25 Stevens GC 1996 Extending Rapoportrsquos rule toPacific marine fishes J Biogeogr 23 149 ndash 154(doi101046j1365-2699199600977x)
26 Dynesius M Jansson R 2000 Evolutionaryconsequences of changes in speciesrsquogeographical distributions driven byMilankovitch climate oscillations Proc Natl AcadSci USA 97 9115 ndash 9120 (doi101073pnas97169115)
27 Holt RD Barfield M Gomulkiewicz R 2004Temporal variation can facilitate niche evolution inharsh sink environments Am Nat 164 187 ndash 200(doi101086422343)
28 Rangel TFLVB Diniz-Filho AF 2005 An evolutionarytolerance model explanining spatial patterns inspecies richness under environmental gradients andgeometric constraints Ecography 25 253 ndash 263(doi101111j0906-7590200504038x)
29 Ghalambor CK Huey RB Martin PR Tewksbury JJWang G 2006 Are mountain passes higher in thetropics Janzenrsquos hypothesis revisited Integr CompBiol 46 5 ndash 17 (doi101093icbicj003)
30 Jackson JBC 1974 Biogeographic consequences ofeurytopy and stenotopy among marine bivalvesand their evolutionary significance Am Nat 108541 ndash 560 (doi101086282933)
31 Jablonski D Valentine JW 1981 Onshore-offshoregradients in Recent eastern Pacific shelf faunas andtheir paleobiogeographic significance In Evolutiontoday (eds GCE Scudder JL Reveal) pp 441 ndash 453Pittsburg PA Carnegie-Mellon University HuntInstitute of Botany Documents
32 Allmon WD 2001 Nutrients temperaturedisturbance and evolution a model for the lateCenozoic marine record of the western Atlantic
rspbroyalsocietypublishingorgProcRSocB
28120141533
10
on October 8 2014rspbroyalsocietypublishingorgDownloaded from
Palaeogeogr Palaeoclim Palaeoecol 166 9 ndash 26(doi101016S0031-0182(00)00199-1)
33 Harley CDG Smith KF Moore VL 2003Environmental variability and biogeographythe relationship between bathymetricdistribution and geographical range size inmarine algae and gastropods Glob Ecol Biogeogr12 499 ndash 506 (doi101046j1466-822X200300062x)
34 Escarguel G Brayard A Bucher H 2008 Evolutionaryrates do not drive latitudinal diversity gradientsJ Zool Syst Evol Res 46 82 ndash 86 (doi101111j1439-0469200700443x)
35 Sunday JM Bates AE Dulvy NK 2011 Globalanalysis of thermal tolerance and latitude inectotherms Proc R Soc B 278 1823 ndash 1830(doi101098rspb20101295)
36 Bell G 2010 Fluctuating selection the perpetualrenewal of adaptation in variable environmentsPhil Trans R Soc B 365 87 ndash 97 (doi101098rstb20090150)
37 Foote M Raup D 1996 Fossil preservation and thestratigraphic ranges of taxa Paleobiology 22 121 ndash 140
38 Raffi S Stanley SM Marasti R 1985 Biogeographicpatterns and Plio-Pleistocene extinction of Bivalviain the Mediterranean and southern North SeaPaleobiology 11 368 ndash 388
39 Dominici S Kowalke T 2007 Depositional dynamicsand the record of ecosystem stability Early Eocenefaunal gradients in the Pyrenean Foreland SpainPalaios 22 268 ndash 284 (doi102110palo2005p05-022r)
40 Huyghe D Merle D Lartaud F Cheype F EmmanuelL 2012 Middle Lutetian climate in the Paris Basinimplications for a marine hotspot ofpaleobiodiversity Facies 58 587 ndash 604 (doi101007s10347-012-0307-3)
41 Draut AE Raymo ME McManus JF Oppo DW 2003Climate stability during the Pliocene warm periodPaleoceanography 18 1078 (doi1010292003PA000889)
42 Blois JL Williams JW Fitzpatrick MC Jackson STFerrier S 2013 Space can substitute for time inpredicting climate-change effects on biodiversityProc Natl Acad Sci USA 110 9374 ndash 9379 (doi101073pnas1220228110)
43 Mellin C Bradshaw CJA Fordham DA Caley MJ2014 Strong but opposing b diversitymdashstabilityrelationships in coral reef fish communitiesProc R Soc B 281 20131993 (doi101098rspb20131993)
44 Anderson MJ Ellingsen KE McArdle BH 2006Multivariate dispersion as a measure of betadiversity Ecol Lett 9 683 ndash 693 (doi101111j1461-0248200600926x)
45 Vovk V 2012 Combining p-values via averaging Seehttparxivorgabs12124966
46 Hurlbert SH 1978 The measurement of nicheoverlap and some relatives Ecology 59 67 ndash 77(doi1023071936632)
47 Caze B Merle D Le Meur M Pacaud J-M Ledon DSaint Martin J-P 2011 Taxonomic implications ofthe residual colour patterns of ampullinidgastropods and their contribution to thediscrimination from naticids Acta Palaeontol Pol56 329 ndash 347 (doi104202app20090084)
48 Ozawa T Kohler F Reid DG Glaubrecht M 2009 Tethyanrelicts on continental coastlines of the northwesternPacific Ocean and Australasia molecular phylogeny andfossil record of batillariid gastropods (CaenogastropodaCerithioidea) Zool Scr 38 503 ndash 525 (doi101111j1463-6409200900390x)
49 Kowalke T Harzhauser M 2004 Early ontogeny andpalaeoecology of the Mid-Miocene rissoidgastropods of the Central Paratethys ActaPalaeontol Pol 49 111 ndash 134
50 Silva CMD Landau B La Perna R 2011Biogeography of Iberian Atlantic Neogenemarginelliform gastropods (MarginellidaeCystiscidae) global change and transatlanticcolonization J Paleontol 85 1052 ndash 1066 (doi10166611-1041)
51 Olszewski TD Patzkowsky ME 2001 Measuringrecurrence of marine biotic gradients a case studyfrom the Pennsylvanian-Permian MidcontinentPalaios 16 440 ndash 460 (doi1016690883-1351(2001)0160444MROMBG20CO2)
52 Pandolfi JM Jackson JBC 2006 Ecologicalpersistence interrupted in Caribbean coral reefsEcol Lett 9 818 ndash 826 (doi101111j1461-0248200600933x)
53 Loreau M Mouquet N Gonzalez A 2003Biodiversity as spatial insurance in heterogeneouslandscapes Proc Natl Acad Sci USA 100 12 765 ndash12 770 (doi101073pnas2235465100)
54 Volkov I Banavar JR Hubbell SP Maritan A 2007Patterns of relative species abundance in rainforestsand coral reefs Nature 450 45 ndash 49 (doi101038nature06197)
55 Olszewski TD 2012 Persistence of high diversity innon-equilibrium ecological communities implicationsfor modern and fossil ecosystems Proc R Soc B 279230 ndash 236 (doi101098rspb20110936)
56 Foote M 2014 Environmental controls ongeographic range size in marine animal generaPaleobiology 40 440 ndash 458 (doi10166613056)
57 Payne JL Finnegan S 2007 The effect of geographicrange on extinction risk during background andmass extinction Proc Natl Acad Sci USA 104 10506 ndash 10 511 (doi101073pnas0701257104)
58 Harnik PG Simpson C Payne JL 2012 Long-termdifferences in extinction risk among the seven formsof rarity Proc R Soc B 279 4969 ndash 4976 (doi101098rspb20121902)
59 Locarnini RA Mishonov AV Antonov JI Boyer TP GarciaHE Baranova OK Zweng MM Johnson DR 2010 Worldocean atlas 2009 volume 1 temperature In NOAA AtlasNESDIS 68 (ed S Levitus) pp 1 ndash 184 Washington DCUS Government Printing Office
60 Belanger CL Jablonski D Roy K Berke SK Krug AZValentine JW 2012 Global environmental predictorsof benthic marine biogeographic structure ProcNatl Acad Sci USA 109 14 046 ndash 14 051 (doi101073pnas1212381109)
61 Buckley LB Hurlbert AH Jetz W 2012 Broad-scaleecological implications of ectothermy andendothermy in changing environments Glob EcolBiogeogr 21 873 ndash 885 (doi101111j1466-8238201100737x)
62 Jocque M Field R Brendonck L De Meester L 2010Climatic control of dispersal-ecological specializationtrade-offs a metacommunity process at the heart ofthe latitudinal diversity gradient Glob Ecol Biogeogr19 244 ndash 252 (doi101111j1466-8238200900510x)
63 Zachos JC Stott LD Lohmann KC 1994 Evolution ofearly Cenozoic marine temperatures Paleoceanography9 353 ndash 387 (doi10102993PA03266)
64 Zachos J Pagani M Sloan L Thomas E Billups K2003 Trends rhythms and aberrations in globalClimate 65 Ma to present Science 292 686 ndash 693(doi101126science1059412)
65 Jacobs DK Lindberg DR 1998 Oxygen and evolutionarypatterns in the sea onshoreoffshore trends and recentrecruitment of deep-sea faunas Proc Natl Acad Sci USA95 9396 ndash 9401 (doi101073pnas95169396)
66 Liow LH Skaug HJ Ergon T Schweder T 2010Global occurrence trajectories of microfossilsenvironmental variability and the rise and fall ofindividual species Paleobiology 36 224 ndash 252(doi101666080801)
67 Lindner A Cairns SD Cunningham CW 2008From offshore to onshore multiple originsof shallow-water corals from deep-sea ancestorsPLoS ONE 3 e2429 (doi101371journalpone0002429)
68 Thuy B Gale AS Kroh A Kucera M Numberger-Thuy LD Reich M Stohr S 2013 Ancient origin ofthe modern deep-sea fauna PLoS ONE 7 e46913(doi101371journalpone0046913)
69 Carney RS 2005 Zonation of deep biota oncontinental margins Oceanogr Mar Biol 43211 ndash 278 (doi1012019781420037449ch6)
70 Menzies RJ George RY Rowe GT 1973 Abyssalenvironment and ecology of the world oceansNew York NY John Wiley amp Sons

on October 8 2014rspbroyalsocietypublishingorgDownloaded from
rspbroyalsocietypublishingorg
ResearchCite this article Tomasovych A Dominici S
Zuschin M Merle D 2014 Onshore ndash offshore
gradient in metacommunity turnover emerges
only over macroevolutionary time-scales
Proc R Soc B 281 20141533
httpdxdoiorg101098rspb20141533
Received 21 June 2014
Accepted 9 September 2014
Subject Areaspalaeontology ecology evolution
Keywordsmacroevolution macroecology stasis temporal
turnover niche conservatism Mollusca
Author for correspondenceAdam Tomasovych
e-mail geoltomasavbask
Electronic supplementary material is available
at httpdxdoiorg101098rspb20141533 or
via httprspbroyalsocietypublishingorg
amp 2014 The Author(s) Published by the Royal Society All rights reserved
Onshore ndash offshore gradient inmetacommunity turnover emerges onlyover macroevolutionary time-scales
Adam Tomasovych1 Stefano Dominici2 Martin Zuschin3 and Didier Merle4
1Slovak Academy of Sciences Geological Institute Dubravska cesta 9 Bratislava 84005 Slovakia2Sezione di Geologia e Paleontologia Museo di Storia Naturale Universita di Firenze Via La Pira 4Firenze 50121 Italy3Department of Palaeontology University of Vienna Althanstrasse 14 Vienna 1090 Austria4CR2P - MNHN CNRS Sorbonne Universites UPMC Paris 6 France
Invertebrate lineages tend to originate and become extinct at a higher rate in
onshore than in offshore habitats over long temporal durations (more than
10 Myr) but it remains unclear whether this pattern scales down to durations
of stages (less than 5 Myr) or even sequences (less than 05 Myr) We assess
whether onshorendashoffshore gradients in long-term turnover between the tropi-
cal Eocene and the warm-temperate Plio-Pleistocene can be extrapolated from
gradients in short-term turnover using abundances of molluscan species from
bulk samples in the northeast Atlantic Province We find that temporal turn-
over of metacommunities does not significantly decline with depth over short
durations (less than 5 Myr) but significantly declines with depth between the
Eocene and Plio-Pleistocene (approx 50 Myr) This decline is determined by a
higher onshore extinction of Eocene genera and families by a higher onshore
variability in abundances of genera and families and by an onshore expan-
sion of genera and families that were frequent offshore in the Eocene
Onshorendashoffshore decline in turnover thus emerges only over long temporal
durations We suggest that this emergence is triggered by abrupt and spatially
extensive climatic or oceanographic perturbations that occurred between the
Eocene and Plio-Pleistocene Plio-Pleistocene metacommunities show a high
proportion of bathymetric generalists in contrast to Eocene metacommunities
Accordingly the net cooling and weaker thermal gradients may have allowed
offshore specialists to expand into onshore habitats and maintain their
presence in offshore habitats
1 IntroductionThe ecological and evolutionary dynamics of marine metacommunities gener-
ate a variety of outcomes at 10 kyr to 10 Myr scales ranging from temporally
stable metacommunities that exhibit stasis [1ndash5] up to temporally variable
species combinations that do not have analogues in present-day ecosystems
especially in the Pleistocene [6ndash8] Although differences in temporal scale can
contribute to different degrees of stasis [9] some variation observed in
marine environments can be also caused by onshorendashoffshore gradients in
demographic and evolutionary rates (or by other types of environmental gradi-
ents [10ndash13]) Extinction rates of Palaeozoic genera [1415] and origination rates
of TriassicndashJurassic genera [16] tend to be higher onshore (ie above storm-
wave base) and superfamilies and orders exhibit a higher number of orig-
inations onshore than offshore at temporal scales that exceed the duration of
geological stages [1718] These observations imply that temporal metacommu-
nity turnover declines from onshore to offshore The turnover along onshorendash
offshore gradients can be further modulated by latitude which represents a
major correlate of evolutionary rates [1920] because thermal gradients are stee-
per and bathymetric ranges smaller in the tropics [21] Some studies imply that
the onshorendashoffshore decline in turnover reflects a decline in the frequency of
major evolutionary innovations but does not necessarily scale down to
rspbroyalsocietypublishingorgProcRSocB
28120141533
2
on October 8 2014rspbroyalsocietypublishingorgDownloaded from
species-level gradients (frequency of species originations
does not peak onshore [22]) Therefore estimates of temporal
turnover measured over intervals varying in the duration at
multiple taxonomic levels and partitioned according to
depth and latitude are needed to understand temporal
dynamics of metacommunities It is also necessary to identify
the components of turnover that generate such onshorendash
offshore gradients (eg variability in population sizes extinction
rates and origination rates [23])
It can be expected that onshore metacommunities should be
more volatile than their offshore counterparts because onshore
habitats (i) are environmentally steeper along a latitudinal
gradient [24] and (ii) exhibit higher temporal environmental
variability (eg greater annual temperature range at each
latitude [25]) Nonetheless these two factors can select for
larger niche breadth [26ndash29] and thus seem to generate an
increase in the proportion of eurytopic species in onshore envir-
onmentally steeper habitats with higher seasonality and higher
frequency of storm disturbances [3031] The simple expectation
about the higher volatility of onshore metacommunities thus
can be reversed by selection for eurytopic strategies that can
increase resistance or resilience to temporal environmental fluc-
tuations in variable (onshore) habitats [32ndash35] or by fluctuating
selection that protects genetic variance [36]
Here we assess for the first time to our knowledge
whether the onshorendashoffshore gradients in temporal turnover
can be observed at short time-scales and how they scale up to
long time-scales A key issue is whether an onshorendashoffshore
gradient in long-term turnover simply follows from incremen-
tal additions of short-term turnovers of small magnitude or
whether it is driven by more abrupt turnovers of higher mag-
nitude We focus on a time interval that (i) encompasses
climatic and palaeogeographical changes that may be needed
to cause significant macroevolutionary changes and (ii) is
sufficiently long so that it naturally separates time-scales of
recurrent orbitally forced oscillations (10ndash100 thousand
years [26]) from environmental perturbations occurring over
million-year time-scales Environmental conditions generated
by such perturbations are effectively outside of evolutionary
history of individual species (lifetimes of bivalve species typi-
cally exceed 5 Myr [37]) and can have disproportionate
consequences for evolutionary trajectories of onshore and
offshore lineages We therefore focus on turnover along
onshorendashoffshore gradients between the tropical Eocene and
warm-temperate Plio-Pleistocene in the northeast Atlantic
and Mediterranean using a unique field-based dataset with
molluscs representing a highly diverse clade and a proxy of
the evolution of marine ectotherms [20] This region under-
went significant climatic and palaeogeographical changes
during the Oligocene Miocene and Pliocene resulting in the
loss of coral reefs and mangroves [38] Although we expect
that such intervening changes must accentuate long-term turn-
over relative to within-stage turnover at any depth along an
onshorendashoffshore gradient it remains unclear whether meta-
communities along onshorendashoffshore gradients respond
differently to such changes
First we measure temporal turnover in molluscan marine
metacommunities along onshorendashoffshore transects (i) at
short (within-stage) time-scales within the Ypresian (Lower
Eocene) within the Lutetian (Middle Eocene) and within
the PiacenzianndashGelasian (Plio-Pleistocene) (less than 5 Myr)
and (ii) at long (between-epoch) time-scales between the
Lower-Middle Eocene and the Plio-Pleistocene (more than
5 Myr) and assess whether a gradient in turnover is related
to gradients in variability in abundance extinction and orig-
ination Second we evaluate onshorendashoffshore shifts in the
abundance of genera and families that persisted from the
Eocene to the Plio-Pleistocene and onshorendashoffshore
gradients in bathymetric breadth
2 Material and methodsWe evaluate onshorendashoffshore gradients in temporal turnover of
molluscan species genera and families (bivalves gastropods
scaphopods) within the Eocene tropical successions (30ndash358 N)
and within the Plio-Pleistocene warm-temperate successions
(40ndash438 N) in the northeast Atlantic Province We measure the
turnover between these epochs at the genus level because they
do not share any species in common We also evaluate turnover
in families to ensure that the findings do not depend on genus-
level classification which remains in flux The fossil assemblages
are represented by bulk samples collected at bed resolution and
sieved with 1 mm mesh size We assign the assemblages to four
depths using sedimentological criteria including two onshore
habitats (peritidal and nearshore) and two offshore habitats
close to and below storm-wave base (inner shelf and outer
shelf see the electronic supplementary material) The Eocene is
represented by the Ypresian deposits of the Pyrenean Foreland
(93 assemblages [39]) and the Aquitaine Basin (four assem-
blages) and by new bulk samples collected in the Lutetian
deposits of the Paris Basin (nine assemblages) Ypresian assem-
blages correspond to fully tropical conditions with corals large
foraminifers and mangrove habitats [39] Lutetian assemblages
capture slightly lower temperatures [40] but still reflect tropical
conditions with corals and large foraminifers (with mean temp-
eratures not falling below 17ndash188C) The Plio-Pleistocene is
represented by 35 bulk samples collected in the Piacenzian
siliciclastic deposits of Lower Arno basins and 13 bulk samples
from the PiacenzianndashGelasian of Piedmont-Padan basins on
two opposite sides of the Northern Apennines These deposits
bracket the mid Pliocene warm interval and cooling after the
PiacenzianGelasian boundary [41] The Eocene is represented
by the total of 47 410 individuals 625 species and 149 families
The Plio-Pleistocene is represented by the total of 109 771
individuals 445 species and 108 families
We use BrayndashCurtis dissimilarity to quantify temporal turn-
over in species genus and family abundance [42] using square-
root transformed proportional abundance data and plot dissim-
ilarities on a logit scale because they effectively represent
proportions [43] We measure dissimilarity at each of the four
depths (i) at local scale of individual assemblages and (ii) at
regional scale by pooling a constant number of assemblages
per sequence per stage and per epoch at each depth
Short-term turnover at each depth is measured as (i) turnover
between composite depositional sequences (approx 015ndash05 Myr
sequences in the Eocene and approx 025 Myr sequences in the
Plio-Pleistocene table 1) and (ii) within-stage turnover within
the Ypresian Lutetian and PiacenzianndashGelasian (less than
5 Myr) Long-term turnover is measured as turnover between
the two epochs (between Lower-Middle Eocene and Plio-Pleisto-
cene) The first measure of short-term turnover allows testing of
whether turnover increases with temporal separation between
sequences The second measure of short-term turnover allows
comparison with onshorendashoffshore gradients in long-term turn-
over and this comparison is visualized by non-metric multi-
dimensional scaling (NMDS) of assemblages coded by habitat
stage and epoch
Local-scale short-term turnover within each depth is based on
an average of all pairwise dissimilarities between assemblages
(i) from two sequences (each with four assemblages standardized
Table 1 Time-environment table showing the number of assemblage samples at each depth for each depositional sequence stage and epoch (The numbers inparentheses show the number of samples with more than 50 specimens (sequences) and with more than 100 specimens (stages) that were used in size-standardized analyses Four outer shelf samples in the Eocene did not allow the analysis of short-term turnover between sequences Two samples from Eocenewere not assigned to sequences and were thus used in analyses of stages only)
epoch (stage) sequencesage midpoint(Myr) duration (yr) peritidal nearshore
innershelf
outershelf
Pleistocene (Gelasian) San Miniato S6 255 220 000 3 (3) 2 (0) 5 (5) 0
Pliocene (Piacenzian) Ponte e Elsae S5 28 220 000 0 3 (3) 6 (6) 0
Pliocene (Piacenzian) Pietrafita S4 325 150 000 4 (4) 5 (5) 3 (3) 4 (4)
Pliocene (Piacenzian) Certaldo S3 345 200 000 0 0 1 (0) 12 (4)
epoch (stage) sequencesage midpoint(Myr) duration (yr) peritidal nearshore
innershelf
outershelf
Eocene (Lutetian) Paris Basin A8 ndash A10 45 100 000 0 0 4 (4) 0
Eocene (Lutetian) Paris Basin A6 ndash A7 45 100 000 0 0 4 (4) 0
Eocene (Ypresian) Castigaleu H ndash I 4945 280 000 4 (4) 1 (1) 1 (0) 0
Eocene (Ypresian) Castigaleu F ndash G 4975 280 000 4 (4) 5 (5) 1 (1) 0
Eocene (Ypresian) Castigaleu C ndash D 5015 280 000 0 17 (11) 2 (0) 0
Eocene (Ypresian) Castigaleu A ndash B 5045 280 000 0 15 (10) 1 (1) 0
Eocene (Ypresian) FigolsmdashC 509 500 000 17 (16) 2 (2) 0 0
Eocene (Ypresian) FigolsmdashB 515 500 000 9 (9) 3 (3) 0 0
Eocene (Ypresian) FigolsmdashA 521 500 000 9 (8) 1 (0) 0 0
epoch stageage midpoint(Myr) duration (yr) peritidal nearshore
innershelf
outershelf
Plio-Pleistocene Piacenzian ndash Gelasian 305 1 100 000 7 (7) 10 (10) 15 (14) 16 (11)
Eocene Lutetian (Middle) 4351 3 680 000 0 0 14 (9) 0
Eocene Ypresian (Late) 508 3 400 000 43 (24) 45 (21) 0 4 (4)
rspbroyalsocietypublishingorgProcRSocB
28120141533
3
on October 8 2014rspbroyalsocietypublishingorgDownloaded from
to n frac14 50 individuals) and (ii) from one stage (with four
assemblages standardized to n frac14 100) Local-scale short-term
turnover within each depth is based on an average of all pairwise
dissimilarities between assemblages from two epochs (Lower-
Middle Eocene and Plio-Pleistocene) (each with four assemblages
standardized to n frac14 100) Regional-scale short-term and long-term
turnover within each depth is based on a single dissimilarity four
local assemblages are randomly drawn from each sequence stage
and epoch resampled (without replacement) to the same sample
size (n) per assemblage and pooled into one regional-scale assem-
blage per sequence (n frac14 200) per stage (n frac14 400) and per epoch
(n frac14 400) We test the significance of onshorendashoffshore difference
in turnover with pairwise between-habitat tests of homogeneity
in multivariate dispersions (HMD [44]) Multivariate dispersion
corresponds to mean BrayndashCurtis dissimilarity between assem-
blages (from one stage in within-stage turnover and from two
epochs in between-epoch turnover) and their centroid HMD
tests whether multivariate dispersions are larger onshore than
offshore within stages and between epochs To assess the contri-
bution of species-level processes to temporal turnover in genus
and family abundance we further compute turnover where
BrayndashCurtis dissimilarity is based (i) on per-genus and per-
family median species (proportional) abundance and (ii) on
per-genus and per-family species richness At regional scales we
also use Spearmanrsquos rank correlation to test the relation in species
genus and family rank abundances between sequences and
between epochs and the Mantel test to test whether Brayndash
Curtis dissimilarity increases and Spearmanrsquos rank correlation
decreases with increasing temporal separation between sequences
at regional scales separately within onshore and offshore habitats
In analyses of dissimilarities rank correlations and the
Mantel test we double-standardize abundance data by random
sampling of the same number of individuals per assemblage
and by random sampling of the same number of assemblages
per depth and per time interval Standardizations are repeated
1000 times generating means and 25th and 975th percentiles
on summary statistics The subsets of assemblages and individ-
uals drawn in consecutive standardizations are not mutually
exclusive To assess significance of tests that are computed
with standardized data we thus compute a combined p-value
with averaging approach rather than using the product of
p-values as in Fisherrsquos approach [45]
We quantify relative utilization of onshore habitats by genera
and families as the proportion of a taxonrsquos individuals found
onshore (relative to the taxonrsquos total abundance) to assess tem-
poral changes in utilization of onshorendashoffshore gradients by
genera and families that persist from the Eocene to Plio-Pleisto-
cene We measure a bathymetric breadth of individual species
with Hurlbertrsquos measure [46] which weights bathymetric range
by abundance and by frequency of samples at each depth
3 Results(a) Onshore ndash offshore gradients in temporal turnover
within stagesSpearmanrsquos rank correlations in proportional abundances
between sequences are moderately high in the Eocene
(r [species] frac14 036 r [genera] frac14 04 r [families] frac14 055) and
within-stage turnover
genusabundance
(a) (c) (e) (g)
peri
tidal
with
in-s
tage
Bra
yndashC
urtis
dis
sim
ilari
ty
near
shor
e
inne
r sh
elf
oute
r sh
elf
peri
tidal
near
shor
e
inne
r sh
elf
oute
r sh
elf
peri
tidal
near
shor
e
inne
r sh
elf
oute
r sh
elf
peri
tidal
near
shor
e
inne
r sh
elf
oute
r sh
elf
01
03
06
09
10
betw
een-
stag
e B
rayndash
Cur
tis d
issi
mila
rity
01
03
06
09
10
peri
tidal
with
in-s
tage
Bra
yndashC
urtis
dis
sim
ilari
ty
near
shor
e
inne
r sh
elf
oute
r sh
elf
peri
tidal
near
shor
e
inne
r sh
elf
oute
r sh
elf
peri
tidal
near
shor
e
inne
r sh
elf
oute
r sh
elf
peri
tidal
near
shor
e
inne
r sh
elf
oute
r sh
elf
01
Eoc
ene
Plio
cene
Eoc
ene
Plio
cene
Eoc
ene
Plio
cene
Eoc
ene
Plio
cene
loca
lre
gion
allo
cal
regi
onal
loca
lre
gion
allo
cal
regi
onal
loca
lre
gion
allo
cal
regi
onal
loca
lre
gion
allo
cal
regi
onal
loca
lre
gion
allo
cal
regi
onal
loca
lre
gion
allo
cal
regi
onal
shallow deep shallow deep shallow deep shallow deep
03
06
09
10
betw
een-
stag
e B
rayndash
Cur
tis d
issi
mila
rity
01
03
06
09
10
genusabundance
per-genusmedian species
abundance
per-genusmean species
richness
familyabundance
(b) (d) ( f ) (h)familyabundance
per-familymedian species
abundance
per-familymean species
richness
between-epoch turnover
Figure 1 Short-term turnover within stages (within Ypresian Lutetian and Piacenzian ndash Gelasian) does not consistently vary with depth (ab) Long-term turnover(between the Eocene and Plio-Pleistocene) markedly declines between nearshore and inner shelf at both local and regional scales (cd ) using all genera and families(small symbols) and persisting genera and families (large symbols) This decline is related to a decrease in turnover in per-lineage median species abundance(ef ) and in per-lineage species richness (gh) Bray ndash Curtis dissimilarities are based on square-root transformed proportional abundances Error bars represent25th and 975th percentiles derived from 1000 standardizations Dissimilarities are plotted on a logit scale
rspbroyalsocietypublishingorgProcRSocB
28120141533
4
on October 8 2014rspbroyalsocietypublishingorgDownloaded from
rather low in the Plio-Pleistocene (r [species] frac14 017r [genera] frac14
023 r [families]frac14 034) (electronic supplementary material
table S1) Significant correlations between sequences occur in
most Eocene comparisons (20ndash23 out of 29 comparisons at
Bonferroni-corrected a frac14 00017) and are less frequent in the
Plio-Pleistocene (3ndash5 out of 16 comparisons at Bonferroni-
corrected a frac14 0003) Spearmanrsquos rank correlations do not
decline and BrayndashCurtis dissimilarities do not increase with
increasing separation between sequences (electronic
supplementary material figure S1 and table S2) Among-
sequence dissimilarities are reduced at all depths when
local assemblages at each depth are pooled (figure 1ab)
Multivariate dispersions of individual habitats along onshorendash
offshore gradients in a double-standardized NMDS do not
visibly decline within the Eocene or within the Plio-Pleistocene
(figure 2) and pairwise onshorendashoffshore differences in
within-stage turnover are close to zero and never significantly
positive (table 2 and figure 1ab) The short-term turnover in
abundance at genus and family level thus does not decline
with depth within the Eocene or Plio-Pleistocene
(b) Onshore ndash offshore gradients in temporal turnoverbetween epochs
The turnover between the Eocene and Plio-Pleistocene in abun-
dance of genera and families is higher onshore than in offshore
The differences between peritidal and nearshore and between
inner shelf and outer shelf are weak but other comparisons
show significantly higher long-term turnover in onshore habi-
tats This demonstrates that the major decline in turnover
occurs in inner shelf close to the storm-wave base (table 3
and figure 1cd electronic supplementary material figures
S2ndashS4) The decline in turnover applies to abundances of
genera and families that persist from the Eocene to Plio-Pleisto-
cene and is thus not driven solely by decline in extinction and
origination but also by higher offshore conservatism in
ndash2
stress 015 stress 018
stress 013 stress 018
ndash15
ndash05
05
10
15
Eocene
genera (all samples)
NM
DS
axis
2
Plio-Pleistocene
0
ndash1 0 1 ndash10
ndash10
ndash05
05
10
Eocene
families (all samples)
Plio-Pleistocene
0
ndash05 0 1005
ndash10ndash15ndash20
ndash10
ndash05
05
10
Eocene
genera (4 samples per habitat)
NM
DS
axis
2
Plio-Pleistocene
0
ndash05 0
NMDS axis 1
1505 10 ndash10
ndash10
ndash05
05
Eocene
peritidalnearshore
outer shelfinner shelf
families (4 samples per habitat)
Plio-Pleistocene
0
ndash05 0
NMDS axis 1
05
Figure 2 NMDS showing that Eocene and Plio-Pleistocene offshore habitats (inner shelf and outer shelf are coded light grey and white respectively) are moresimilar to each other in abundance of persisting genera and families than Eocene and Plio-Pleistocene onshore habitats ( peritidal and nearshore coded by dark greyshading) using Bray ndash Curtis dissimilarity based on square-root transformed proportional abundances Ordinations in the upper plots show all assemblages ordina-tions in the lower plots show one ordination standardized to four assemblages per habitat and per epoch and to n frac14 100 individuals per assemblage Arrowsvisualize Eocene and Plio-Pleistocene onshore ndash offshore gradients they start in centroids of shallower habitats and terminate in centroids of deeper habitats
rspbroyalsocietypublishingorgProcRSocB
28120141533
5
on October 8 2014rspbroyalsocietypublishingorgDownloaded from
abundance NMDS visualizes this decline in temporal turnover
in genus and family abundance between the Eocene and Plio-
Pleistocene showing a marked segregation of onshore commu-
nities from Eocene and Plio-Pleistocene whereas offshore
communities from these two time intervals are close to each
other (figure 2) The onshorendashoffshore decline in temporal
turnover in abundance scales down to species-level abundance
patterns with a smaller offshore turnover (i) in per-genus and
per-family median species abundance and (ii) in per-genus
and per-family richness (figure 1endashh) Spearmanrsquos rank corre-
lation between Eocene and Plio-Pleistocene genus and family
abundances within a single habitat is significantly positive in
inner shelf (r [genera]frac14 031 p 0011 r [families]frac14 046
p 0001) and becomes insignificant in peritidal (r [genera]frac14
018 pfrac14 04 r [families]frac14 014 pfrac14 038) and nearshore
(r [genera]frac14 003 pfrac14 082 r [families]frac14 016 pfrac14 022) but
also in outer shelf habitats (r [genera]frac14 2016 pfrac14 027
r [families]frac14 2014 pfrac14 028)
A total of 82ndash88 of genera (42ndash52 of families) inhab-
iting peritidal and nearshore habitats in the Eocene
disappear in the Plio-Pleistocene of the northeast Atlantic Pro-
vince In comparison 72ndash80 of genera (33ndash36 of families)
disappear from inner shelf and outer shelf Although the pro-
portions of persisting genera and families are not very high
these taxa contribute 49 and 90 of individuals respect-
ively to the total abundance when both epochs are pooled
The percentages appearing in the Plio-Pleistocene are similar
between onshore (67ndash68 of genera and 16ndash25 of families)
and offshore (64ndash70 and 19ndash26 respectively)
Ampullinidae and Batillariidae primarily contribute to
high onshore turnover They are dominant in onshore habitats
during the Eocene but are absent in the Plio-Pleistocene of the
northeast Atlantic and Mediterranean Ampullinidae are pre-
sently represented by a single species occurring in the
Philippines [47] and Batillariidae disappeared from the north-
east Atlantic Province at the end of the Miocene [48] In
onshore habitats Potamididae are strongly reduced whereas
Rissoidae Pyramidellidae Arcidae Semelidae Tellinidae Car-
diidae and Veneridae increase in abundance Rissoidae radiate
during the Miocene and are presently the most species-rich in
the warm-temperate Mediterranean and eastern Atlantic [49]
Although some Eocene families with tropical affinities
declined in abundance (Turridae Conidae Costellariidae
Cylichnidae) or went regionally extinct in offshore habitats
(eg Marginellidae which presently extend to the southern-
most parts of the Mediterranean and to the Ibero-Moroccan
Gulf [50]) most families achieved similar abundance in the
Eocene and Plio-Pleistocene in offshore habitats
Tabl
e2
Shor
t-ter
mtu
rnov
erw
ithin
Eoce
nean
dw
ithin
Plio-
Pleis
toce
nein
genu
san
dfa
mily
abun
danc
esis
not
signi
fican
tlyhi
gher
onsh
ore
than
offsh
ore
usin
gth
ete
stof
HMD
(The
sum
mar
ysta
tistic
san
dth
eco
mbi
ned
p-va
lue
betw
een
onsh
ore
and
offsh
ore
and
the
25
and
975
thpe
rcent
iles
are
base
don
1000
runs
stand
ardi
zed
tofo
uras
sem
blag
espe
rhab
itata
ndnfrac14
100
indi
vidua
lspe
rass
embl
age)
habi
tat
com
paris
onle
vel
mea
non
shor
endashof
fsho
redi
ffere
nce
indi
sper
sion
25t
hpe
rcen
tile
975
thpe
rcen
tile
com
bine
dp-
valu
ele
vel
mea
non
shor
endashof
fsho
redi
ffere
nce
indi
sper
sion
25t
hpe
rcen
tile
975
thpe
rcen
tile
com
bine
dp-
valu
e
Eoce
nepe
ritid
al
versu
sne
arsh
ore
gene
ra0
087
003
30
145
021
7fa
milie
s0
072
001
20
138
030
7
Eoce
nepe
ritid
al
versu
sin
ners
helf
gene
ra2
009
02
013
82
003
61
fam
ilies
20
039
20
100
002
50
941
Eoce
nepe
ritid
al
versu
sou
ters
helf
gene
ra2
004
52
008
02
001
00
997
fam
ilies
20
044
20
081
20
006
099
5
Eoce
nene
arsh
ore
versu
sin
ners
helf
gene
ra2
017
72
024
22
011
01
fam
ilies
20
111
20
193
20
032
099
9
Eoce
nene
arsh
ore
versu
sou
ters
helf
gene
ra2
013
22
019
12
007
81
fam
ilies
20
117
20
182
20
058
1
Eoce
nein
ners
helf
versu
sou
ters
helf
gene
ra0
045
20
003
009
30
246
fam
ilies
20
005
20
066
005
50
729
Plio-
Plp
eriti
dal
versu
sne
arsh
ore
gene
ra0
054
20
049
015
50
325
fam
ilies
008
22
003
30
185
023
1
Plio-
Plp
eriti
dal
versu
sin
ners
helf
gene
ra0
026
20
106
017
30
545
fam
ilies
004
42
009
30
170
042
5
Plio-
Plp
eriti
dal
versu
sou
ters
helf
gene
ra0
143
001
40
266
013
1fa
milie
s0
138
000
70
265
014
1
Plio-
Pln
earsh
ore
versu
sin
ners
helf
gene
ra2
002
82
014
80
120
078
4fa
milie
s2
003
82
015
80
079
082
7
Plio-
Pln
earsh
ore
versu
sou
ters
helf
gene
ra0
089
20
036
020
70
260
fam
ilies
005
52
006
00
163
036
0
Plio-
Pli
nner
shelf
versu
sou
ters
helf
gene
ra0
116
20
056
026
40
221
fam
ilies
009
32
004
60
229
025
2
rspbroyalsocietypublishingorgProcRSocB
28120141533
6
on October 8 2014rspbroyalsocietypublishingorgDownloaded from
Tabl
e3
Turn
over
betw
een
Eoce
nean
dPl
io-Pl
eisto
cene
inge
nus
and
fam
ilyab
unda
nces
decre
ases
towa
rds
offsh
ore
envir
onm
ents
usin
gall
taxa
and
persi
sting
taxa
(Th
ete
stof
HMD
show
sth
atalt
houg
htu
rnov
eris
not
signi
fican
tlyhi
gher
intw
opa
irsof
close
lysp
aced
habi
tats
(per
itida
lcom
pare
dw
ithne
arsh
ore
and
inne
rsh
elfco
mpa
red
with
oute
rshe
lf)o
nsho
retu
rnov
eris
signi
fican
tlyhi
gher
inot
herc
ompa
rison
sw
ithof
fshor
eha
bita
tsTh
em
ean
diffe
renc
ein
mul
tivar
iate
disp
ersio
nbe
twee
non
shor
ean
dof
fshor
een
viron
men
tsan
dth
e2
5an
d97
5th
perce
ntile
sar
eba
sed
on10
00ru
nssta
ndar
dize
dto
four
asse
mbl
ages
perh
abita
tand
pere
poch
and
nfrac14
100
indi
vidua
lspe
rass
embl
age)
habi
tat
com
paris
onle
vel
mea
non
shor
endashof
fsho
re
diffe
renc
ein
disp
ersio
n
25t
h
perc
entil
e
975
th
perc
entil
e
com
bine
dp-
valu
ele
vel
mea
non
shor
endashof
fsho
re
diffe
renc
ein
disp
ersio
n
25t
h
perc
entil
e
975
th
perc
entil
e
com
bine
dp-
valu
e
perit
idal
versu
sne
arsh
ore
gene
ra0
007
20
008
002
70
962
fam
ilies
004
50
004
009
00
267
perit
idal
versu
sin
ners
helf
gene
ra0
032
000
80
064
000
6fa
milie
s0
198
013
30
268
000
3
perit
idal
versu
sou
ters
helf
gene
ra0
189
015
80
220
000
1fa
milie
s0
242
020
70
275
000
1
near
shor
eve
rsus
inne
rshe
lfge
nera
002
52
000
60
061
000
6fa
milie
s0
153
007
90
232
000
4
near
shor
eve
rsus
oute
rshe
lfge
nera
018
30
147
021
80
001
fam
ilies
019
70
139
024
30
002
inne
rshe
lfve
rsus
oute
rshe
lfge
nera
015
70
114
019
70
039
fam
ilies
004
42
003
10
115
087
3
perit
idal
versu
ssh
ore
face
pers
gene
ra0
013
20
019
005
80
994
pers
fam
ilies
004
72
000
10
098
043
6
perit
idal
versu
sin
ners
helf
pers
gene
ra0
077
002
10
143
005
8pe
rsfa
milie
s0
211
013
90
286
000
5
perit
idal
versu
sou
ters
helf
pers
gene
ra0
387
033
70
438
000
1pe
rsfa
milie
s0
270
021
60
326
000
2
near
shor
eve
rsus
inne
rshe
lfpe
rsge
nera
006
52
000
60
136
001
3pe
rsfa
milie
s0
164
007
90
248
000
8
near
shor
eve
rsus
oute
rshe
lfpe
rsge
nera
037
50
310
043
60
001
pers
fam
ilies
022
40
151
029
00
002
inne
rshe
lfve
rsus
oute
rshe
lfpe
rsge
nera
031
00
229
038
60
019
pers
fam
ilies
005
92
003
10
153
072
4
peritidal
EocenePlio-Pleistocene
0
0
100
200
300
04
08
12
nearshore
Hur
lber
t bat
hym
etri
c br
eadt
h O
regi
onal
spe
cies
ric
hnes
s
innershelf
outershelf
Figure 3 Hurlbert bathymetric breadth of Eocene species (black circles) onaverage declines towards offshore whereas Hurlbert breadth of Plio-Pleistocenespecies (grey circles) changes weakly Hurlbert breadth of offshore species issignificantly higher in the Plio-Pleistocene than in the Eocene Species richness(rarefied to 2477 individuals per habitat) increases towards inner shelf at bothtime intervals and this increase is less steep during the Plio-Pleistocene (greysquares) than during the Eocene (black squares)
rspbroyalsocietypublishingorgProcRSocB
28120141533
7
on October 8 2014rspbroyalsocietypublishingorgDownloaded from
(c) Onshore ndash offshore shifts in abundance andbathymetric breadth between epochs
Although species richness increases towards inner shelf at
both time intervals the onshorendashoffshore gradient in
bathymetric breadth changes markedly between the Eocene
and Plio-Pleistocene (figure 3) The Eocene species show
a significantly smaller Hurlbertrsquos index (mean frac14 012 95
CI frac14 011ndash013) than Plio-Pleistocene species (mean frac14 023
95 CI frac14 021ndash024) This change is associated with a
higher proportion of species occurring onshore and offshore
(generalists) in the Plio-Pleistocene 27 species (4) belong
to generalists in the Eocene whereas 163 species (37)
belong to generalists in the Plio-Pleistocene In contrast to
the Eocene Hurlbertrsquos index does not decline with depth in
the Plio-Pleistocene because Plio-Pleistocene offshore species
show a significantly higher index than Eocene offshore
species (figure 3) The differences in onshore utilization by
genera and families between Plio-Pleistocene and Eocene
are significantly positive persisting genera and families are
more frequent onshore in the Plio-Pleistocene than onshore
in the Eocene (figure 4) These relative onshore expansions
of genera and families are caused by an increase in abun-
dance of their constituent species as well as by an increase
in their species richness (figure 4)
4 Discussion(a) Onshore ndash offshore gradients at short time-scalesThe moderately high between-sequence rank correlations in the
Eocene and the lack of relation with time imply that the
short-term turnover is coupled with some degree of recurrence
in abundance patterns at individual depths as observed in
many other time series with benthic assemblages in the fossil
record [5152] The smaller dissimilarity at regional scales at
each depth implies that this recurrence is related to processes
operating at larger spatial scales that can reduce extinction
risk and slow down temporal change in metacommunity com-
position Such processes include those that allow broad
geographical range size via high dispersal or high effective habi-
tat area [53ndash56] Geographical range size is a key predictor of
ndash10
0
10
20
30
40
0 10
no g
ener
a
offs
hore
exp
ansi
on
onsh
ore
expa
nsio
n
ndash10 0difference in onshore utilization
between Eocene and Plio-Pleistocene
ndash5 0 5 1010
abundance(a) species richnessmedian sp abundance
ndash10
0
10
20
30
40
0 10
no f
amili
es
offs
hore
exp
ansi
on
onsh
ore
expa
nsio
n
ndash10 0difference in onshore utilization
between Eocene and Plio-Pleistocene
ndash10 10 3010
abundance(b) species richnessmedian sp abundance
Figure 4 Frequency distributions of Plio-Pleistocene ndash Eocene differences in onshore utilization of (a) genera and (b) families that persist from Eocene to Plio-Pleistocene show that genera and families abundant in offshore habitats during Eocene expanded to onshore habitats in Plio-Pleistocene The onshore increasein abundance also applies to an increase in per-genus and per-family median species abundance and to an increase in per-genus and per-family species richnessThin dashed lines separate relative onshore expansion from relative offshore expansion Thick solid and dashed lines correspond to means and bootstrapped 95 CIsA value of zero means no difference between Eocene and Plio-Pleistocene and positive values mean that persisting genera and families are more abundant andmore species-rich onshore in the Plio-Pleistocene than in the Eocene
rspbroyalsocietypublishingorgProcRSocB
28120141533
8
on October 8 2014rspbroyalsocietypublishingorgDownloaded from
extinction [57] and its role in reducing extinction risk is gener-
ally much stronger than the role of eurytopy [58] The onshorendash
offshore decline in the steepness of latitudinal temperature
gradients may contribute to the lack of onshorendashoffshore gradi-
ents in geographical range size (and thus in extinction rate at
short time-scales) because the latitudinal range of shallow habi-
tats (0ndash50 m) along the eastern ocean margins [59] remains on
average within a 58C range for approximately 1500 km whereas
the latitudinal range of deeper habitats (100ndash200 m) remains on
average within a 58C range for approximately 2500ndash3000 km
(electronic supplementary material figure S7) and spatial
variation in seawater temperature drives the large-scale distri-
bution of ectotherms [6061] Therefore marine ectotherms
inhabiting onshore temporally variable habitats can achieve
broad geographical ranges because they are eurytopic [30]
whereas offshore temperature-specialized species can attain
broad geographical ranges because they face milder latitudinal
climatic gradients [62]
(b) Onshore extinction at long time-scalesThe emergence of an onshorendashoffshore decline in temporal
turnover over longer time-scales together with the lack of
relationship between the short-term turnover and temporal
separation between sequences over Myr scales implies that
the onshore increase in turnover between the Eocene and
the Plio-Pleistocene is not a simple extrapolation of small
incremental changes that can be observed from sequence to
sequence Rather the decline in turnover depends on climatic
or oceanographic perturbations that occurred between the
Eocene and Plio-Pleistocene and affected onshore lineages
more strongly than offshore lineages as revealed (i) by a
smaller offshore proportion of extinct genera and families
(ii) by a smaller variability in offshore abundance of persist-
ing genera and families and (iii) by a smaller variability in
offshore abundance of their constituent species Therefore
this decline is not merely a function of declining extinction
rates but also a function of declining variability in population
abundances leading to a higher ecological conservatism
of offshore lineages Climatic changes may contribute to
higher long-term onshore volatility because (i) Cenozoic
environments show larger temperature fluctuations in the
superficial waters than in the deep-shelf not only at short
but also at long time-scales [24] and (ii) the Cenozoic
record shows a higher long-term persistence of milder latitu-
dinal gradients in mean temperature at 200 m than at the
surface during the Cenozoic [63] Multiple climatic reversals
between YpresianndashLutetian and Plio-Pleistocene including
Lutetian cooling Mid-Eocene climatic optimum glaciation
at the EoceneOligocene boundary and mid-Miocene cli-
matic optimum [64] could thus contribute to the higher
extinction and population variability in the onshore habitats
Temporal fluctuations in the location and extent of oxygen
minimum zones can generate instability that is larger offshore
than onshore [65] but the Eocene and Plio-Pleistocene assem-
blages of the northeast Atlantic and Mediterranean do not
occur in dysoxic habitats The Pliocene molluscan commu-
nities in the Mediterranean were assembled primarily from
the tropical eastern Atlantic province along western Africa
(that was formed after the closure of the Indo-Pacific
seaway during the Early-Middle Miocene) but offshore and
onshore lineages should be not affected differently by such
oceanographic changes Regardless of the actual climatic or
oceanographic causes we suggest that onshore lineages face
abrupt and high-amplitude regional-scale perturbations
over longer durations that are not experienced over shorter
durations [66] Present-day offshore and bathyal habitats
apparently support deep-water lineages since the Mesozoic
also suggesting that offshore lineages can be less affected
by such perturbations and thus can conserve their niches
more strongly than onshore lineages [6768]
(c) Onshore expansion at long time-scalesPlio-Pleistocene genera and families that were frequent off-
shore during the Eocene expanded onshore during the Plio-
rspbroyalsocietypublishingorg
9
on October 8 2014rspbroyalsocietypublishingorgDownloaded from
Pleistocene and also maintained their presence offshore An
increase in the proportion of bathymetric generalists and the
flattening of the onshorendashoffshore gradient in bathymetric
breadth imply that this long-term onshore expansion observed
in our study can be modulated by climatic changes that led to
the net shift from tropical Eocene to warm-temperate Plio-
Pleistocene conditions Poleward latitudinal shifts are typically
associated with the emergence of colder deep-shelf waters and
with declining steepness of thermal bathymetric gradients at
higher latitudes Such changes in temperature and in the struc-
ture of the thermal bathymetric gradient produce a latitudinal
increase in the bathymetric range size of marine ectotherms
and their shallow-water emergence at higher latitudes [6970]
Data accessibility Source data are available at dxdoiorg105061dryad943j7
Acknowledgements We thank P Novack-Gottshall and T D Olszewskifor critical reviews M Stachowitsch for comments and S Danisefor help with sample processing This work benefited from visits toParis and Vienna museum collections under the Synthesys program
Funding statement This work was supported by the Austrian ScienceFund (FWF) projects P19013-Bio the Slovak Research and Develop-ment Agency (APVV 0644ndash10) the Slovak Scientific Grant Agency(VEGA 0068ndash10) and the NSF (DEB-0919451)
ProcRSoc
References
B28120141533
1 Pandolfi JM 1996 Limited membership inPleistocene reef coral assemblages from the HuonPeninsula Papua New Guinea constancy duringglobal change Paleobiology 22 152 ndash 176
2 Ivany LC Brett CE Wall HLB Wall PD Handley JC2009 Relative taxonomic and ecologic stability inDevonian marine faunas of New York State a test ofcoordinated stasis Paleobiology 35 499 ndash 524(doi1016660094-8373-354499)
3 Holland SM Zaffos A 2011 Niche conservatismalong an onshore ndash offshore gradient Paleobiology37 270 ndash 286 (doi101666100321)
4 Buzas M Hayek LC Culver SJ Hayward BWOsterman LE 2014 Ecological and evolutionaryconsequences of benthic community stasis in thevery deep sea (1500m) Paleobiology 40102 ndash 112 (doi10166613010)
5 Zuschin M Harzhauser M Hengst B Mandic ORoetzel R 2014 Long-term ecosystem stability in aLower Miocene estuarine succession Geology 421 ndash 4 (doi101130G347611)
6 Roy K Jablonski D Valentine JW 1995 Thermallyanomalous assemblages revisited patterns in theextraprovincial latitudinal range shifts ofPleistocene marine mollusks Geology 231071 ndash 1074 (doi1011300091-7613(1995)0231071TAARPI23CO2)
7 Jackson ST Overpeck JT 2000 Responses of plantpopulations and communities to environmentalchanges of the Late Quaternary Paleobiology26(Suppl 4) 194 ndash 220 (doi1016660094-8373(2000)26[194ROPPAC]20CO2)
8 Yasuhara M Hunt G Cronin TM Okahashi H 2009Temporal latitudinal-gradient dynamics and tropicalinstability of deep-sea species diversity Proc NatlAcad Sci USA 106 21 717 ndash 21 720 (doi101073pnas0910935106)
9 Tomasovych A Kidwell SM 2010 The effects oftemporal resolution on species turnover and ontesting metacommunity models Am Nat 175587 ndash 606 (doi101086651661)
10 Roy K 2001 Analyzing temporal trends in regionaldiversity a biogeographic perspective Paleobiology24 631 ndash 645 (doi1016660094-8373(2001)0270631ATTIRD20CO2)
11 Roy K Goldberg EE 2007 Origination extinctionand dispersal integrative models for understanding
present-day diversity gradients Am Nat 170S71 ndash S85 (doi101086519403)
12 Holland SM Patzkowsky M 2007 Gradient ecologyof a biotic invasion biofacies of the typeCincinnatian series (Upper Ordovician) CincinnatiOhio region USA Palaios 22 392 ndash 407 (doi102110palo2006p06-066r)
13 Miller AI Foote M 2009 Epicontinental seas versusopen-ocean settings the kinetics of mass extinctionand origination Science 326 1106 ndash 1109 (doi101126science1180061)
14 Sepkoski Jr JJ 1987 Environmental trends inextinction during the Phanerozoic Science 23564 ndash 66 (doi101126science11539724)
15 Sepkoski Jr JJ 1991 A model on onshore-offshorechange in faunal diversity Paleobiology 17 58 ndash 77
16 Kiessling W Aberhan M 2007 Environmentaldeterminants of marine benthic biodiversitydynamics through Triassic-Jurassic timesPaleobiology 33 414 ndash 434 (doi101666060691)
17 Bottjer DJ Jablonski D 1988 Paleoenvironmentalpatterns in the evolution of post-Paleozoic benthicmarine invertebrates Palaios 3 540 ndash 560 (doi1023073514444)
18 Jablonski D Lidgard S Taylor PS 1997 Comparativeecology of bryozoan radiations origin of noveltiesin cyclostomes and cheilostomes Palaios 12505 ndash 523 (doi1023073515408)
19 Kiessling W Simpson C Foote M 2010 Reefs ascradles of evolution and sources of biodiversity inthe Phanerozoic Science 327 196 ndash 198 (doi101126science1182241)
20 Jablonski D Belanger CL Berke SK Huang S KrugAZ Roy K Tomasovych A Valentine JW 2013 Outof the tropics but how Fossils bridge species andthermal ranges in the dynamics of the marinelatitudinal diversity gradient Proc Natl Acad SciUSA 110 10 487 ndash 10 494 (doi101073pnas1308997110)
21 Smith KF Gaines SD 2003 Rapoportrsquos bathymetricrule and the latitudinal species diversity gradient fornortheast Pacific fishes and northwest Atlanticgastropods evidence against a causal linkJ Biogeogr 30 1153 ndash 1159 (doi101046j1365-2699200300898x)
22 Jablonski D 2005 Evolutionary innovations in thefossil record the intersection of ecology
development and macroevolution J Exp Zool304B 504 ndash 519 (doi101002jezb21075)
23 Stanley SM Wetmore KL Kennett JP 1988Macroevolutionary differences between the twomajor clades of Neogene planktonic ForaminiferaPaleobiology 14 235 ndash 249
24 Nikolaev SD Oskina NS Blyum NS BubenshchikovaNV 1998 Neogene-Quaternary variations of thelsquoPole-Equatorrsquo temperature gradient of the surfaceoceanic waters in the north Atlantic and northPacific Glob Planet Change 18 85 ndash 111 (doi101016S0921-8181(98)00009-5)
25 Stevens GC 1996 Extending Rapoportrsquos rule toPacific marine fishes J Biogeogr 23 149 ndash 154(doi101046j1365-2699199600977x)
26 Dynesius M Jansson R 2000 Evolutionaryconsequences of changes in speciesrsquogeographical distributions driven byMilankovitch climate oscillations Proc Natl AcadSci USA 97 9115 ndash 9120 (doi101073pnas97169115)
27 Holt RD Barfield M Gomulkiewicz R 2004Temporal variation can facilitate niche evolution inharsh sink environments Am Nat 164 187 ndash 200(doi101086422343)
28 Rangel TFLVB Diniz-Filho AF 2005 An evolutionarytolerance model explanining spatial patterns inspecies richness under environmental gradients andgeometric constraints Ecography 25 253 ndash 263(doi101111j0906-7590200504038x)
29 Ghalambor CK Huey RB Martin PR Tewksbury JJWang G 2006 Are mountain passes higher in thetropics Janzenrsquos hypothesis revisited Integr CompBiol 46 5 ndash 17 (doi101093icbicj003)
30 Jackson JBC 1974 Biogeographic consequences ofeurytopy and stenotopy among marine bivalvesand their evolutionary significance Am Nat 108541 ndash 560 (doi101086282933)
31 Jablonski D Valentine JW 1981 Onshore-offshoregradients in Recent eastern Pacific shelf faunas andtheir paleobiogeographic significance In Evolutiontoday (eds GCE Scudder JL Reveal) pp 441 ndash 453Pittsburg PA Carnegie-Mellon University HuntInstitute of Botany Documents
32 Allmon WD 2001 Nutrients temperaturedisturbance and evolution a model for the lateCenozoic marine record of the western Atlantic
rspbroyalsocietypublishingorgProcRSocB
28120141533
10
on October 8 2014rspbroyalsocietypublishingorgDownloaded from
Palaeogeogr Palaeoclim Palaeoecol 166 9 ndash 26(doi101016S0031-0182(00)00199-1)
33 Harley CDG Smith KF Moore VL 2003Environmental variability and biogeographythe relationship between bathymetricdistribution and geographical range size inmarine algae and gastropods Glob Ecol Biogeogr12 499 ndash 506 (doi101046j1466-822X200300062x)
34 Escarguel G Brayard A Bucher H 2008 Evolutionaryrates do not drive latitudinal diversity gradientsJ Zool Syst Evol Res 46 82 ndash 86 (doi101111j1439-0469200700443x)
35 Sunday JM Bates AE Dulvy NK 2011 Globalanalysis of thermal tolerance and latitude inectotherms Proc R Soc B 278 1823 ndash 1830(doi101098rspb20101295)
36 Bell G 2010 Fluctuating selection the perpetualrenewal of adaptation in variable environmentsPhil Trans R Soc B 365 87 ndash 97 (doi101098rstb20090150)
37 Foote M Raup D 1996 Fossil preservation and thestratigraphic ranges of taxa Paleobiology 22 121 ndash 140
38 Raffi S Stanley SM Marasti R 1985 Biogeographicpatterns and Plio-Pleistocene extinction of Bivalviain the Mediterranean and southern North SeaPaleobiology 11 368 ndash 388
39 Dominici S Kowalke T 2007 Depositional dynamicsand the record of ecosystem stability Early Eocenefaunal gradients in the Pyrenean Foreland SpainPalaios 22 268 ndash 284 (doi102110palo2005p05-022r)
40 Huyghe D Merle D Lartaud F Cheype F EmmanuelL 2012 Middle Lutetian climate in the Paris Basinimplications for a marine hotspot ofpaleobiodiversity Facies 58 587 ndash 604 (doi101007s10347-012-0307-3)
41 Draut AE Raymo ME McManus JF Oppo DW 2003Climate stability during the Pliocene warm periodPaleoceanography 18 1078 (doi1010292003PA000889)
42 Blois JL Williams JW Fitzpatrick MC Jackson STFerrier S 2013 Space can substitute for time inpredicting climate-change effects on biodiversityProc Natl Acad Sci USA 110 9374 ndash 9379 (doi101073pnas1220228110)
43 Mellin C Bradshaw CJA Fordham DA Caley MJ2014 Strong but opposing b diversitymdashstabilityrelationships in coral reef fish communitiesProc R Soc B 281 20131993 (doi101098rspb20131993)
44 Anderson MJ Ellingsen KE McArdle BH 2006Multivariate dispersion as a measure of betadiversity Ecol Lett 9 683 ndash 693 (doi101111j1461-0248200600926x)
45 Vovk V 2012 Combining p-values via averaging Seehttparxivorgabs12124966
46 Hurlbert SH 1978 The measurement of nicheoverlap and some relatives Ecology 59 67 ndash 77(doi1023071936632)
47 Caze B Merle D Le Meur M Pacaud J-M Ledon DSaint Martin J-P 2011 Taxonomic implications ofthe residual colour patterns of ampullinidgastropods and their contribution to thediscrimination from naticids Acta Palaeontol Pol56 329 ndash 347 (doi104202app20090084)
48 Ozawa T Kohler F Reid DG Glaubrecht M 2009 Tethyanrelicts on continental coastlines of the northwesternPacific Ocean and Australasia molecular phylogeny andfossil record of batillariid gastropods (CaenogastropodaCerithioidea) Zool Scr 38 503 ndash 525 (doi101111j1463-6409200900390x)
49 Kowalke T Harzhauser M 2004 Early ontogeny andpalaeoecology of the Mid-Miocene rissoidgastropods of the Central Paratethys ActaPalaeontol Pol 49 111 ndash 134
50 Silva CMD Landau B La Perna R 2011Biogeography of Iberian Atlantic Neogenemarginelliform gastropods (MarginellidaeCystiscidae) global change and transatlanticcolonization J Paleontol 85 1052 ndash 1066 (doi10166611-1041)
51 Olszewski TD Patzkowsky ME 2001 Measuringrecurrence of marine biotic gradients a case studyfrom the Pennsylvanian-Permian MidcontinentPalaios 16 440 ndash 460 (doi1016690883-1351(2001)0160444MROMBG20CO2)
52 Pandolfi JM Jackson JBC 2006 Ecologicalpersistence interrupted in Caribbean coral reefsEcol Lett 9 818 ndash 826 (doi101111j1461-0248200600933x)
53 Loreau M Mouquet N Gonzalez A 2003Biodiversity as spatial insurance in heterogeneouslandscapes Proc Natl Acad Sci USA 100 12 765 ndash12 770 (doi101073pnas2235465100)
54 Volkov I Banavar JR Hubbell SP Maritan A 2007Patterns of relative species abundance in rainforestsand coral reefs Nature 450 45 ndash 49 (doi101038nature06197)
55 Olszewski TD 2012 Persistence of high diversity innon-equilibrium ecological communities implicationsfor modern and fossil ecosystems Proc R Soc B 279230 ndash 236 (doi101098rspb20110936)
56 Foote M 2014 Environmental controls ongeographic range size in marine animal generaPaleobiology 40 440 ndash 458 (doi10166613056)
57 Payne JL Finnegan S 2007 The effect of geographicrange on extinction risk during background andmass extinction Proc Natl Acad Sci USA 104 10506 ndash 10 511 (doi101073pnas0701257104)
58 Harnik PG Simpson C Payne JL 2012 Long-termdifferences in extinction risk among the seven formsof rarity Proc R Soc B 279 4969 ndash 4976 (doi101098rspb20121902)
59 Locarnini RA Mishonov AV Antonov JI Boyer TP GarciaHE Baranova OK Zweng MM Johnson DR 2010 Worldocean atlas 2009 volume 1 temperature In NOAA AtlasNESDIS 68 (ed S Levitus) pp 1 ndash 184 Washington DCUS Government Printing Office
60 Belanger CL Jablonski D Roy K Berke SK Krug AZValentine JW 2012 Global environmental predictorsof benthic marine biogeographic structure ProcNatl Acad Sci USA 109 14 046 ndash 14 051 (doi101073pnas1212381109)
61 Buckley LB Hurlbert AH Jetz W 2012 Broad-scaleecological implications of ectothermy andendothermy in changing environments Glob EcolBiogeogr 21 873 ndash 885 (doi101111j1466-8238201100737x)
62 Jocque M Field R Brendonck L De Meester L 2010Climatic control of dispersal-ecological specializationtrade-offs a metacommunity process at the heart ofthe latitudinal diversity gradient Glob Ecol Biogeogr19 244 ndash 252 (doi101111j1466-8238200900510x)
63 Zachos JC Stott LD Lohmann KC 1994 Evolution ofearly Cenozoic marine temperatures Paleoceanography9 353 ndash 387 (doi10102993PA03266)
64 Zachos J Pagani M Sloan L Thomas E Billups K2003 Trends rhythms and aberrations in globalClimate 65 Ma to present Science 292 686 ndash 693(doi101126science1059412)
65 Jacobs DK Lindberg DR 1998 Oxygen and evolutionarypatterns in the sea onshoreoffshore trends and recentrecruitment of deep-sea faunas Proc Natl Acad Sci USA95 9396 ndash 9401 (doi101073pnas95169396)
66 Liow LH Skaug HJ Ergon T Schweder T 2010Global occurrence trajectories of microfossilsenvironmental variability and the rise and fall ofindividual species Paleobiology 36 224 ndash 252(doi101666080801)
67 Lindner A Cairns SD Cunningham CW 2008From offshore to onshore multiple originsof shallow-water corals from deep-sea ancestorsPLoS ONE 3 e2429 (doi101371journalpone0002429)
68 Thuy B Gale AS Kroh A Kucera M Numberger-Thuy LD Reich M Stohr S 2013 Ancient origin ofthe modern deep-sea fauna PLoS ONE 7 e46913(doi101371journalpone0046913)
69 Carney RS 2005 Zonation of deep biota oncontinental margins Oceanogr Mar Biol 43211 ndash 278 (doi1012019781420037449ch6)
70 Menzies RJ George RY Rowe GT 1973 Abyssalenvironment and ecology of the world oceansNew York NY John Wiley amp Sons

rspbroyalsocietypublishingorgProcRSocB
28120141533
2
on October 8 2014rspbroyalsocietypublishingorgDownloaded from
species-level gradients (frequency of species originations
does not peak onshore [22]) Therefore estimates of temporal
turnover measured over intervals varying in the duration at
multiple taxonomic levels and partitioned according to
depth and latitude are needed to understand temporal
dynamics of metacommunities It is also necessary to identify
the components of turnover that generate such onshorendash
offshore gradients (eg variability in population sizes extinction
rates and origination rates [23])
It can be expected that onshore metacommunities should be
more volatile than their offshore counterparts because onshore
habitats (i) are environmentally steeper along a latitudinal
gradient [24] and (ii) exhibit higher temporal environmental
variability (eg greater annual temperature range at each
latitude [25]) Nonetheless these two factors can select for
larger niche breadth [26ndash29] and thus seem to generate an
increase in the proportion of eurytopic species in onshore envir-
onmentally steeper habitats with higher seasonality and higher
frequency of storm disturbances [3031] The simple expectation
about the higher volatility of onshore metacommunities thus
can be reversed by selection for eurytopic strategies that can
increase resistance or resilience to temporal environmental fluc-
tuations in variable (onshore) habitats [32ndash35] or by fluctuating
selection that protects genetic variance [36]
Here we assess for the first time to our knowledge
whether the onshorendashoffshore gradients in temporal turnover
can be observed at short time-scales and how they scale up to
long time-scales A key issue is whether an onshorendashoffshore
gradient in long-term turnover simply follows from incremen-
tal additions of short-term turnovers of small magnitude or
whether it is driven by more abrupt turnovers of higher mag-
nitude We focus on a time interval that (i) encompasses
climatic and palaeogeographical changes that may be needed
to cause significant macroevolutionary changes and (ii) is
sufficiently long so that it naturally separates time-scales of
recurrent orbitally forced oscillations (10ndash100 thousand
years [26]) from environmental perturbations occurring over
million-year time-scales Environmental conditions generated
by such perturbations are effectively outside of evolutionary
history of individual species (lifetimes of bivalve species typi-
cally exceed 5 Myr [37]) and can have disproportionate
consequences for evolutionary trajectories of onshore and
offshore lineages We therefore focus on turnover along
onshorendashoffshore gradients between the tropical Eocene and
warm-temperate Plio-Pleistocene in the northeast Atlantic
and Mediterranean using a unique field-based dataset with
molluscs representing a highly diverse clade and a proxy of
the evolution of marine ectotherms [20] This region under-
went significant climatic and palaeogeographical changes
during the Oligocene Miocene and Pliocene resulting in the
loss of coral reefs and mangroves [38] Although we expect
that such intervening changes must accentuate long-term turn-
over relative to within-stage turnover at any depth along an
onshorendashoffshore gradient it remains unclear whether meta-
communities along onshorendashoffshore gradients respond
differently to such changes
First we measure temporal turnover in molluscan marine
metacommunities along onshorendashoffshore transects (i) at
short (within-stage) time-scales within the Ypresian (Lower
Eocene) within the Lutetian (Middle Eocene) and within
the PiacenzianndashGelasian (Plio-Pleistocene) (less than 5 Myr)
and (ii) at long (between-epoch) time-scales between the
Lower-Middle Eocene and the Plio-Pleistocene (more than
5 Myr) and assess whether a gradient in turnover is related
to gradients in variability in abundance extinction and orig-
ination Second we evaluate onshorendashoffshore shifts in the
abundance of genera and families that persisted from the
Eocene to the Plio-Pleistocene and onshorendashoffshore
gradients in bathymetric breadth
2 Material and methodsWe evaluate onshorendashoffshore gradients in temporal turnover of
molluscan species genera and families (bivalves gastropods
scaphopods) within the Eocene tropical successions (30ndash358 N)
and within the Plio-Pleistocene warm-temperate successions
(40ndash438 N) in the northeast Atlantic Province We measure the
turnover between these epochs at the genus level because they
do not share any species in common We also evaluate turnover
in families to ensure that the findings do not depend on genus-
level classification which remains in flux The fossil assemblages
are represented by bulk samples collected at bed resolution and
sieved with 1 mm mesh size We assign the assemblages to four
depths using sedimentological criteria including two onshore
habitats (peritidal and nearshore) and two offshore habitats
close to and below storm-wave base (inner shelf and outer
shelf see the electronic supplementary material) The Eocene is
represented by the Ypresian deposits of the Pyrenean Foreland
(93 assemblages [39]) and the Aquitaine Basin (four assem-
blages) and by new bulk samples collected in the Lutetian
deposits of the Paris Basin (nine assemblages) Ypresian assem-
blages correspond to fully tropical conditions with corals large
foraminifers and mangrove habitats [39] Lutetian assemblages
capture slightly lower temperatures [40] but still reflect tropical
conditions with corals and large foraminifers (with mean temp-
eratures not falling below 17ndash188C) The Plio-Pleistocene is
represented by 35 bulk samples collected in the Piacenzian
siliciclastic deposits of Lower Arno basins and 13 bulk samples
from the PiacenzianndashGelasian of Piedmont-Padan basins on
two opposite sides of the Northern Apennines These deposits
bracket the mid Pliocene warm interval and cooling after the
PiacenzianGelasian boundary [41] The Eocene is represented
by the total of 47 410 individuals 625 species and 149 families
The Plio-Pleistocene is represented by the total of 109 771
individuals 445 species and 108 families
We use BrayndashCurtis dissimilarity to quantify temporal turn-
over in species genus and family abundance [42] using square-
root transformed proportional abundance data and plot dissim-
ilarities on a logit scale because they effectively represent
proportions [43] We measure dissimilarity at each of the four
depths (i) at local scale of individual assemblages and (ii) at
regional scale by pooling a constant number of assemblages
per sequence per stage and per epoch at each depth
Short-term turnover at each depth is measured as (i) turnover
between composite depositional sequences (approx 015ndash05 Myr
sequences in the Eocene and approx 025 Myr sequences in the
Plio-Pleistocene table 1) and (ii) within-stage turnover within
the Ypresian Lutetian and PiacenzianndashGelasian (less than
5 Myr) Long-term turnover is measured as turnover between
the two epochs (between Lower-Middle Eocene and Plio-Pleisto-
cene) The first measure of short-term turnover allows testing of
whether turnover increases with temporal separation between
sequences The second measure of short-term turnover allows
comparison with onshorendashoffshore gradients in long-term turn-
over and this comparison is visualized by non-metric multi-
dimensional scaling (NMDS) of assemblages coded by habitat
stage and epoch
Local-scale short-term turnover within each depth is based on
an average of all pairwise dissimilarities between assemblages
(i) from two sequences (each with four assemblages standardized
Table 1 Time-environment table showing the number of assemblage samples at each depth for each depositional sequence stage and epoch (The numbers inparentheses show the number of samples with more than 50 specimens (sequences) and with more than 100 specimens (stages) that were used in size-standardized analyses Four outer shelf samples in the Eocene did not allow the analysis of short-term turnover between sequences Two samples from Eocenewere not assigned to sequences and were thus used in analyses of stages only)
epoch (stage) sequencesage midpoint(Myr) duration (yr) peritidal nearshore
innershelf
outershelf
Pleistocene (Gelasian) San Miniato S6 255 220 000 3 (3) 2 (0) 5 (5) 0
Pliocene (Piacenzian) Ponte e Elsae S5 28 220 000 0 3 (3) 6 (6) 0
Pliocene (Piacenzian) Pietrafita S4 325 150 000 4 (4) 5 (5) 3 (3) 4 (4)
Pliocene (Piacenzian) Certaldo S3 345 200 000 0 0 1 (0) 12 (4)
epoch (stage) sequencesage midpoint(Myr) duration (yr) peritidal nearshore
innershelf
outershelf
Eocene (Lutetian) Paris Basin A8 ndash A10 45 100 000 0 0 4 (4) 0
Eocene (Lutetian) Paris Basin A6 ndash A7 45 100 000 0 0 4 (4) 0
Eocene (Ypresian) Castigaleu H ndash I 4945 280 000 4 (4) 1 (1) 1 (0) 0
Eocene (Ypresian) Castigaleu F ndash G 4975 280 000 4 (4) 5 (5) 1 (1) 0
Eocene (Ypresian) Castigaleu C ndash D 5015 280 000 0 17 (11) 2 (0) 0
Eocene (Ypresian) Castigaleu A ndash B 5045 280 000 0 15 (10) 1 (1) 0
Eocene (Ypresian) FigolsmdashC 509 500 000 17 (16) 2 (2) 0 0
Eocene (Ypresian) FigolsmdashB 515 500 000 9 (9) 3 (3) 0 0
Eocene (Ypresian) FigolsmdashA 521 500 000 9 (8) 1 (0) 0 0
epoch stageage midpoint(Myr) duration (yr) peritidal nearshore
innershelf
outershelf
Plio-Pleistocene Piacenzian ndash Gelasian 305 1 100 000 7 (7) 10 (10) 15 (14) 16 (11)
Eocene Lutetian (Middle) 4351 3 680 000 0 0 14 (9) 0
Eocene Ypresian (Late) 508 3 400 000 43 (24) 45 (21) 0 4 (4)
rspbroyalsocietypublishingorgProcRSocB
28120141533
3
on October 8 2014rspbroyalsocietypublishingorgDownloaded from
to n frac14 50 individuals) and (ii) from one stage (with four
assemblages standardized to n frac14 100) Local-scale short-term
turnover within each depth is based on an average of all pairwise
dissimilarities between assemblages from two epochs (Lower-
Middle Eocene and Plio-Pleistocene) (each with four assemblages
standardized to n frac14 100) Regional-scale short-term and long-term
turnover within each depth is based on a single dissimilarity four
local assemblages are randomly drawn from each sequence stage
and epoch resampled (without replacement) to the same sample
size (n) per assemblage and pooled into one regional-scale assem-
blage per sequence (n frac14 200) per stage (n frac14 400) and per epoch
(n frac14 400) We test the significance of onshorendashoffshore difference
in turnover with pairwise between-habitat tests of homogeneity
in multivariate dispersions (HMD [44]) Multivariate dispersion
corresponds to mean BrayndashCurtis dissimilarity between assem-
blages (from one stage in within-stage turnover and from two
epochs in between-epoch turnover) and their centroid HMD
tests whether multivariate dispersions are larger onshore than
offshore within stages and between epochs To assess the contri-
bution of species-level processes to temporal turnover in genus
and family abundance we further compute turnover where
BrayndashCurtis dissimilarity is based (i) on per-genus and per-
family median species (proportional) abundance and (ii) on
per-genus and per-family species richness At regional scales we
also use Spearmanrsquos rank correlation to test the relation in species
genus and family rank abundances between sequences and
between epochs and the Mantel test to test whether Brayndash
Curtis dissimilarity increases and Spearmanrsquos rank correlation
decreases with increasing temporal separation between sequences
at regional scales separately within onshore and offshore habitats
In analyses of dissimilarities rank correlations and the
Mantel test we double-standardize abundance data by random
sampling of the same number of individuals per assemblage
and by random sampling of the same number of assemblages
per depth and per time interval Standardizations are repeated
1000 times generating means and 25th and 975th percentiles
on summary statistics The subsets of assemblages and individ-
uals drawn in consecutive standardizations are not mutually
exclusive To assess significance of tests that are computed
with standardized data we thus compute a combined p-value
with averaging approach rather than using the product of
p-values as in Fisherrsquos approach [45]
We quantify relative utilization of onshore habitats by genera
and families as the proportion of a taxonrsquos individuals found
onshore (relative to the taxonrsquos total abundance) to assess tem-
poral changes in utilization of onshorendashoffshore gradients by
genera and families that persist from the Eocene to Plio-Pleisto-
cene We measure a bathymetric breadth of individual species
with Hurlbertrsquos measure [46] which weights bathymetric range
by abundance and by frequency of samples at each depth
3 Results(a) Onshore ndash offshore gradients in temporal turnover
within stagesSpearmanrsquos rank correlations in proportional abundances
between sequences are moderately high in the Eocene
(r [species] frac14 036 r [genera] frac14 04 r [families] frac14 055) and
within-stage turnover
genusabundance
(a) (c) (e) (g)
peri
tidal
with
in-s
tage
Bra
yndashC
urtis
dis
sim
ilari
ty
near
shor
e
inne
r sh
elf
oute
r sh
elf
peri
tidal
near
shor
e
inne
r sh
elf
oute
r sh
elf
peri
tidal
near
shor
e
inne
r sh
elf
oute
r sh
elf
peri
tidal
near
shor
e
inne
r sh
elf
oute
r sh
elf
01
03
06
09
10
betw
een-
stag
e B
rayndash
Cur
tis d
issi
mila
rity
01
03
06
09
10
peri
tidal
with
in-s
tage
Bra
yndashC
urtis
dis
sim
ilari
ty
near
shor
e
inne
r sh
elf
oute
r sh
elf
peri
tidal
near
shor
e
inne
r sh
elf
oute
r sh
elf
peri
tidal
near
shor
e
inne
r sh
elf
oute
r sh
elf
peri
tidal
near
shor
e
inne
r sh
elf
oute
r sh
elf
01
Eoc
ene
Plio
cene
Eoc
ene
Plio
cene
Eoc
ene
Plio
cene
Eoc
ene
Plio
cene
loca
lre
gion
allo
cal
regi
onal
loca
lre
gion
allo
cal
regi
onal
loca
lre
gion
allo
cal
regi
onal
loca
lre
gion
allo
cal
regi
onal
loca
lre
gion
allo
cal
regi
onal
loca
lre
gion
allo
cal
regi
onal
shallow deep shallow deep shallow deep shallow deep
03
06
09
10
betw
een-
stag
e B
rayndash
Cur
tis d
issi
mila
rity
01
03
06
09
10
genusabundance
per-genusmedian species
abundance
per-genusmean species
richness
familyabundance
(b) (d) ( f ) (h)familyabundance
per-familymedian species
abundance
per-familymean species
richness
between-epoch turnover
Figure 1 Short-term turnover within stages (within Ypresian Lutetian and Piacenzian ndash Gelasian) does not consistently vary with depth (ab) Long-term turnover(between the Eocene and Plio-Pleistocene) markedly declines between nearshore and inner shelf at both local and regional scales (cd ) using all genera and families(small symbols) and persisting genera and families (large symbols) This decline is related to a decrease in turnover in per-lineage median species abundance(ef ) and in per-lineage species richness (gh) Bray ndash Curtis dissimilarities are based on square-root transformed proportional abundances Error bars represent25th and 975th percentiles derived from 1000 standardizations Dissimilarities are plotted on a logit scale
rspbroyalsocietypublishingorgProcRSocB
28120141533
4
on October 8 2014rspbroyalsocietypublishingorgDownloaded from
rather low in the Plio-Pleistocene (r [species] frac14 017r [genera] frac14
023 r [families]frac14 034) (electronic supplementary material
table S1) Significant correlations between sequences occur in
most Eocene comparisons (20ndash23 out of 29 comparisons at
Bonferroni-corrected a frac14 00017) and are less frequent in the
Plio-Pleistocene (3ndash5 out of 16 comparisons at Bonferroni-
corrected a frac14 0003) Spearmanrsquos rank correlations do not
decline and BrayndashCurtis dissimilarities do not increase with
increasing separation between sequences (electronic
supplementary material figure S1 and table S2) Among-
sequence dissimilarities are reduced at all depths when
local assemblages at each depth are pooled (figure 1ab)
Multivariate dispersions of individual habitats along onshorendash
offshore gradients in a double-standardized NMDS do not
visibly decline within the Eocene or within the Plio-Pleistocene
(figure 2) and pairwise onshorendashoffshore differences in
within-stage turnover are close to zero and never significantly
positive (table 2 and figure 1ab) The short-term turnover in
abundance at genus and family level thus does not decline
with depth within the Eocene or Plio-Pleistocene
(b) Onshore ndash offshore gradients in temporal turnoverbetween epochs
The turnover between the Eocene and Plio-Pleistocene in abun-
dance of genera and families is higher onshore than in offshore
The differences between peritidal and nearshore and between
inner shelf and outer shelf are weak but other comparisons
show significantly higher long-term turnover in onshore habi-
tats This demonstrates that the major decline in turnover
occurs in inner shelf close to the storm-wave base (table 3
and figure 1cd electronic supplementary material figures
S2ndashS4) The decline in turnover applies to abundances of
genera and families that persist from the Eocene to Plio-Pleisto-
cene and is thus not driven solely by decline in extinction and
origination but also by higher offshore conservatism in
ndash2
stress 015 stress 018
stress 013 stress 018
ndash15
ndash05
05
10
15
Eocene
genera (all samples)
NM
DS
axis
2
Plio-Pleistocene
0
ndash1 0 1 ndash10
ndash10
ndash05
05
10
Eocene
families (all samples)
Plio-Pleistocene
0
ndash05 0 1005
ndash10ndash15ndash20
ndash10
ndash05
05
10
Eocene
genera (4 samples per habitat)
NM
DS
axis
2
Plio-Pleistocene
0
ndash05 0
NMDS axis 1
1505 10 ndash10
ndash10
ndash05
05
Eocene
peritidalnearshore
outer shelfinner shelf
families (4 samples per habitat)
Plio-Pleistocene
0
ndash05 0
NMDS axis 1
05
Figure 2 NMDS showing that Eocene and Plio-Pleistocene offshore habitats (inner shelf and outer shelf are coded light grey and white respectively) are moresimilar to each other in abundance of persisting genera and families than Eocene and Plio-Pleistocene onshore habitats ( peritidal and nearshore coded by dark greyshading) using Bray ndash Curtis dissimilarity based on square-root transformed proportional abundances Ordinations in the upper plots show all assemblages ordina-tions in the lower plots show one ordination standardized to four assemblages per habitat and per epoch and to n frac14 100 individuals per assemblage Arrowsvisualize Eocene and Plio-Pleistocene onshore ndash offshore gradients they start in centroids of shallower habitats and terminate in centroids of deeper habitats
rspbroyalsocietypublishingorgProcRSocB
28120141533
5
on October 8 2014rspbroyalsocietypublishingorgDownloaded from
abundance NMDS visualizes this decline in temporal turnover
in genus and family abundance between the Eocene and Plio-
Pleistocene showing a marked segregation of onshore commu-
nities from Eocene and Plio-Pleistocene whereas offshore
communities from these two time intervals are close to each
other (figure 2) The onshorendashoffshore decline in temporal
turnover in abundance scales down to species-level abundance
patterns with a smaller offshore turnover (i) in per-genus and
per-family median species abundance and (ii) in per-genus
and per-family richness (figure 1endashh) Spearmanrsquos rank corre-
lation between Eocene and Plio-Pleistocene genus and family
abundances within a single habitat is significantly positive in
inner shelf (r [genera]frac14 031 p 0011 r [families]frac14 046
p 0001) and becomes insignificant in peritidal (r [genera]frac14
018 pfrac14 04 r [families]frac14 014 pfrac14 038) and nearshore
(r [genera]frac14 003 pfrac14 082 r [families]frac14 016 pfrac14 022) but
also in outer shelf habitats (r [genera]frac14 2016 pfrac14 027
r [families]frac14 2014 pfrac14 028)
A total of 82ndash88 of genera (42ndash52 of families) inhab-
iting peritidal and nearshore habitats in the Eocene
disappear in the Plio-Pleistocene of the northeast Atlantic Pro-
vince In comparison 72ndash80 of genera (33ndash36 of families)
disappear from inner shelf and outer shelf Although the pro-
portions of persisting genera and families are not very high
these taxa contribute 49 and 90 of individuals respect-
ively to the total abundance when both epochs are pooled
The percentages appearing in the Plio-Pleistocene are similar
between onshore (67ndash68 of genera and 16ndash25 of families)
and offshore (64ndash70 and 19ndash26 respectively)
Ampullinidae and Batillariidae primarily contribute to
high onshore turnover They are dominant in onshore habitats
during the Eocene but are absent in the Plio-Pleistocene of the
northeast Atlantic and Mediterranean Ampullinidae are pre-
sently represented by a single species occurring in the
Philippines [47] and Batillariidae disappeared from the north-
east Atlantic Province at the end of the Miocene [48] In
onshore habitats Potamididae are strongly reduced whereas
Rissoidae Pyramidellidae Arcidae Semelidae Tellinidae Car-
diidae and Veneridae increase in abundance Rissoidae radiate
during the Miocene and are presently the most species-rich in
the warm-temperate Mediterranean and eastern Atlantic [49]
Although some Eocene families with tropical affinities
declined in abundance (Turridae Conidae Costellariidae
Cylichnidae) or went regionally extinct in offshore habitats
(eg Marginellidae which presently extend to the southern-
most parts of the Mediterranean and to the Ibero-Moroccan
Gulf [50]) most families achieved similar abundance in the
Eocene and Plio-Pleistocene in offshore habitats
Tabl
e2
Shor
t-ter
mtu
rnov
erw
ithin
Eoce
nean
dw
ithin
Plio-
Pleis
toce
nein
genu
san
dfa
mily
abun
danc
esis
not
signi
fican
tlyhi
gher
onsh
ore
than
offsh
ore
usin
gth
ete
stof
HMD
(The
sum
mar
ysta
tistic
san
dth
eco
mbi
ned
p-va
lue
betw
een
onsh
ore
and
offsh
ore
and
the
25
and
975
thpe
rcent
iles
are
base
don
1000
runs
stand
ardi
zed
tofo
uras
sem
blag
espe
rhab
itata
ndnfrac14
100
indi
vidua
lspe
rass
embl
age)
habi
tat
com
paris
onle
vel
mea
non
shor
endashof
fsho
redi
ffere
nce
indi
sper
sion
25t
hpe
rcen
tile
975
thpe
rcen
tile
com
bine
dp-
valu
ele
vel
mea
non
shor
endashof
fsho
redi
ffere
nce
indi
sper
sion
25t
hpe
rcen
tile
975
thpe
rcen
tile
com
bine
dp-
valu
e
Eoce
nepe
ritid
al
versu
sne
arsh
ore
gene
ra0
087
003
30
145
021
7fa
milie
s0
072
001
20
138
030
7
Eoce
nepe
ritid
al
versu
sin
ners
helf
gene
ra2
009
02
013
82
003
61
fam
ilies
20
039
20
100
002
50
941
Eoce
nepe
ritid
al
versu
sou
ters
helf
gene
ra2
004
52
008
02
001
00
997
fam
ilies
20
044
20
081
20
006
099
5
Eoce
nene
arsh
ore
versu
sin
ners
helf
gene
ra2
017
72
024
22
011
01
fam
ilies
20
111
20
193
20
032
099
9
Eoce
nene
arsh
ore
versu
sou
ters
helf
gene
ra2
013
22
019
12
007
81
fam
ilies
20
117
20
182
20
058
1
Eoce
nein
ners
helf
versu
sou
ters
helf
gene
ra0
045
20
003
009
30
246
fam
ilies
20
005
20
066
005
50
729
Plio-
Plp
eriti
dal
versu
sne
arsh
ore
gene
ra0
054
20
049
015
50
325
fam
ilies
008
22
003
30
185
023
1
Plio-
Plp
eriti
dal
versu
sin
ners
helf
gene
ra0
026
20
106
017
30
545
fam
ilies
004
42
009
30
170
042
5
Plio-
Plp
eriti
dal
versu
sou
ters
helf
gene
ra0
143
001
40
266
013
1fa
milie
s0
138
000
70
265
014
1
Plio-
Pln
earsh
ore
versu
sin
ners
helf
gene
ra2
002
82
014
80
120
078
4fa
milie
s2
003
82
015
80
079
082
7
Plio-
Pln
earsh
ore
versu
sou
ters
helf
gene
ra0
089
20
036
020
70
260
fam
ilies
005
52
006
00
163
036
0
Plio-
Pli
nner
shelf
versu
sou
ters
helf
gene
ra0
116
20
056
026
40
221
fam
ilies
009
32
004
60
229
025
2
rspbroyalsocietypublishingorgProcRSocB
28120141533
6
on October 8 2014rspbroyalsocietypublishingorgDownloaded from
Tabl
e3
Turn
over
betw
een
Eoce
nean
dPl
io-Pl
eisto
cene
inge
nus
and
fam
ilyab
unda
nces
decre
ases
towa
rds
offsh
ore
envir
onm
ents
usin
gall
taxa
and
persi
sting
taxa
(Th
ete
stof
HMD
show
sth
atalt
houg
htu
rnov
eris
not
signi
fican
tlyhi
gher
intw
opa
irsof
close
lysp
aced
habi
tats
(per
itida
lcom
pare
dw
ithne
arsh
ore
and
inne
rsh
elfco
mpa
red
with
oute
rshe
lf)o
nsho
retu
rnov
eris
signi
fican
tlyhi
gher
inot
herc
ompa
rison
sw
ithof
fshor
eha
bita
tsTh
em
ean
diffe
renc
ein
mul
tivar
iate
disp
ersio
nbe
twee
non
shor
ean
dof
fshor
een
viron
men
tsan
dth
e2
5an
d97
5th
perce
ntile
sar
eba
sed
on10
00ru
nssta
ndar
dize
dto
four
asse
mbl
ages
perh
abita
tand
pere
poch
and
nfrac14
100
indi
vidua
lspe
rass
embl
age)
habi
tat
com
paris
onle
vel
mea
non
shor
endashof
fsho
re
diffe
renc
ein
disp
ersio
n
25t
h
perc
entil
e
975
th
perc
entil
e
com
bine
dp-
valu
ele
vel
mea
non
shor
endashof
fsho
re
diffe
renc
ein
disp
ersio
n
25t
h
perc
entil
e
975
th
perc
entil
e
com
bine
dp-
valu
e
perit
idal
versu
sne
arsh
ore
gene
ra0
007
20
008
002
70
962
fam
ilies
004
50
004
009
00
267
perit
idal
versu
sin
ners
helf
gene
ra0
032
000
80
064
000
6fa
milie
s0
198
013
30
268
000
3
perit
idal
versu
sou
ters
helf
gene
ra0
189
015
80
220
000
1fa
milie
s0
242
020
70
275
000
1
near
shor
eve
rsus
inne
rshe
lfge
nera
002
52
000
60
061
000
6fa
milie
s0
153
007
90
232
000
4
near
shor
eve
rsus
oute
rshe
lfge
nera
018
30
147
021
80
001
fam
ilies
019
70
139
024
30
002
inne
rshe
lfve
rsus
oute
rshe
lfge
nera
015
70
114
019
70
039
fam
ilies
004
42
003
10
115
087
3
perit
idal
versu
ssh
ore
face
pers
gene
ra0
013
20
019
005
80
994
pers
fam
ilies
004
72
000
10
098
043
6
perit
idal
versu
sin
ners
helf
pers
gene
ra0
077
002
10
143
005
8pe
rsfa
milie
s0
211
013
90
286
000
5
perit
idal
versu
sou
ters
helf
pers
gene
ra0
387
033
70
438
000
1pe
rsfa
milie
s0
270
021
60
326
000
2
near
shor
eve
rsus
inne
rshe
lfpe
rsge
nera
006
52
000
60
136
001
3pe
rsfa
milie
s0
164
007
90
248
000
8
near
shor
eve
rsus
oute
rshe
lfpe
rsge
nera
037
50
310
043
60
001
pers
fam
ilies
022
40
151
029
00
002
inne
rshe
lfve
rsus
oute
rshe
lfpe
rsge
nera
031
00
229
038
60
019
pers
fam
ilies
005
92
003
10
153
072
4
peritidal
EocenePlio-Pleistocene
0
0
100
200
300
04
08
12
nearshore
Hur
lber
t bat
hym
etri
c br
eadt
h O
regi
onal
spe
cies
ric
hnes
s
innershelf
outershelf
Figure 3 Hurlbert bathymetric breadth of Eocene species (black circles) onaverage declines towards offshore whereas Hurlbert breadth of Plio-Pleistocenespecies (grey circles) changes weakly Hurlbert breadth of offshore species issignificantly higher in the Plio-Pleistocene than in the Eocene Species richness(rarefied to 2477 individuals per habitat) increases towards inner shelf at bothtime intervals and this increase is less steep during the Plio-Pleistocene (greysquares) than during the Eocene (black squares)
rspbroyalsocietypublishingorgProcRSocB
28120141533
7
on October 8 2014rspbroyalsocietypublishingorgDownloaded from
(c) Onshore ndash offshore shifts in abundance andbathymetric breadth between epochs
Although species richness increases towards inner shelf at
both time intervals the onshorendashoffshore gradient in
bathymetric breadth changes markedly between the Eocene
and Plio-Pleistocene (figure 3) The Eocene species show
a significantly smaller Hurlbertrsquos index (mean frac14 012 95
CI frac14 011ndash013) than Plio-Pleistocene species (mean frac14 023
95 CI frac14 021ndash024) This change is associated with a
higher proportion of species occurring onshore and offshore
(generalists) in the Plio-Pleistocene 27 species (4) belong
to generalists in the Eocene whereas 163 species (37)
belong to generalists in the Plio-Pleistocene In contrast to
the Eocene Hurlbertrsquos index does not decline with depth in
the Plio-Pleistocene because Plio-Pleistocene offshore species
show a significantly higher index than Eocene offshore
species (figure 3) The differences in onshore utilization by
genera and families between Plio-Pleistocene and Eocene
are significantly positive persisting genera and families are
more frequent onshore in the Plio-Pleistocene than onshore
in the Eocene (figure 4) These relative onshore expansions
of genera and families are caused by an increase in abun-
dance of their constituent species as well as by an increase
in their species richness (figure 4)
4 Discussion(a) Onshore ndash offshore gradients at short time-scalesThe moderately high between-sequence rank correlations in the
Eocene and the lack of relation with time imply that the
short-term turnover is coupled with some degree of recurrence
in abundance patterns at individual depths as observed in
many other time series with benthic assemblages in the fossil
record [5152] The smaller dissimilarity at regional scales at
each depth implies that this recurrence is related to processes
operating at larger spatial scales that can reduce extinction
risk and slow down temporal change in metacommunity com-
position Such processes include those that allow broad
geographical range size via high dispersal or high effective habi-
tat area [53ndash56] Geographical range size is a key predictor of
ndash10
0
10
20
30
40
0 10
no g
ener
a
offs
hore
exp
ansi
on
onsh
ore
expa
nsio
n
ndash10 0difference in onshore utilization
between Eocene and Plio-Pleistocene
ndash5 0 5 1010
abundance(a) species richnessmedian sp abundance
ndash10
0
10
20
30
40
0 10
no f
amili
es
offs
hore
exp
ansi
on
onsh
ore
expa
nsio
n
ndash10 0difference in onshore utilization
between Eocene and Plio-Pleistocene
ndash10 10 3010
abundance(b) species richnessmedian sp abundance
Figure 4 Frequency distributions of Plio-Pleistocene ndash Eocene differences in onshore utilization of (a) genera and (b) families that persist from Eocene to Plio-Pleistocene show that genera and families abundant in offshore habitats during Eocene expanded to onshore habitats in Plio-Pleistocene The onshore increasein abundance also applies to an increase in per-genus and per-family median species abundance and to an increase in per-genus and per-family species richnessThin dashed lines separate relative onshore expansion from relative offshore expansion Thick solid and dashed lines correspond to means and bootstrapped 95 CIsA value of zero means no difference between Eocene and Plio-Pleistocene and positive values mean that persisting genera and families are more abundant andmore species-rich onshore in the Plio-Pleistocene than in the Eocene
rspbroyalsocietypublishingorgProcRSocB
28120141533
8
on October 8 2014rspbroyalsocietypublishingorgDownloaded from
extinction [57] and its role in reducing extinction risk is gener-
ally much stronger than the role of eurytopy [58] The onshorendash
offshore decline in the steepness of latitudinal temperature
gradients may contribute to the lack of onshorendashoffshore gradi-
ents in geographical range size (and thus in extinction rate at
short time-scales) because the latitudinal range of shallow habi-
tats (0ndash50 m) along the eastern ocean margins [59] remains on
average within a 58C range for approximately 1500 km whereas
the latitudinal range of deeper habitats (100ndash200 m) remains on
average within a 58C range for approximately 2500ndash3000 km
(electronic supplementary material figure S7) and spatial
variation in seawater temperature drives the large-scale distri-
bution of ectotherms [6061] Therefore marine ectotherms
inhabiting onshore temporally variable habitats can achieve
broad geographical ranges because they are eurytopic [30]
whereas offshore temperature-specialized species can attain
broad geographical ranges because they face milder latitudinal
climatic gradients [62]
(b) Onshore extinction at long time-scalesThe emergence of an onshorendashoffshore decline in temporal
turnover over longer time-scales together with the lack of
relationship between the short-term turnover and temporal
separation between sequences over Myr scales implies that
the onshore increase in turnover between the Eocene and
the Plio-Pleistocene is not a simple extrapolation of small
incremental changes that can be observed from sequence to
sequence Rather the decline in turnover depends on climatic
or oceanographic perturbations that occurred between the
Eocene and Plio-Pleistocene and affected onshore lineages
more strongly than offshore lineages as revealed (i) by a
smaller offshore proportion of extinct genera and families
(ii) by a smaller variability in offshore abundance of persist-
ing genera and families and (iii) by a smaller variability in
offshore abundance of their constituent species Therefore
this decline is not merely a function of declining extinction
rates but also a function of declining variability in population
abundances leading to a higher ecological conservatism
of offshore lineages Climatic changes may contribute to
higher long-term onshore volatility because (i) Cenozoic
environments show larger temperature fluctuations in the
superficial waters than in the deep-shelf not only at short
but also at long time-scales [24] and (ii) the Cenozoic
record shows a higher long-term persistence of milder latitu-
dinal gradients in mean temperature at 200 m than at the
surface during the Cenozoic [63] Multiple climatic reversals
between YpresianndashLutetian and Plio-Pleistocene including
Lutetian cooling Mid-Eocene climatic optimum glaciation
at the EoceneOligocene boundary and mid-Miocene cli-
matic optimum [64] could thus contribute to the higher
extinction and population variability in the onshore habitats
Temporal fluctuations in the location and extent of oxygen
minimum zones can generate instability that is larger offshore
than onshore [65] but the Eocene and Plio-Pleistocene assem-
blages of the northeast Atlantic and Mediterranean do not
occur in dysoxic habitats The Pliocene molluscan commu-
nities in the Mediterranean were assembled primarily from
the tropical eastern Atlantic province along western Africa
(that was formed after the closure of the Indo-Pacific
seaway during the Early-Middle Miocene) but offshore and
onshore lineages should be not affected differently by such
oceanographic changes Regardless of the actual climatic or
oceanographic causes we suggest that onshore lineages face
abrupt and high-amplitude regional-scale perturbations
over longer durations that are not experienced over shorter
durations [66] Present-day offshore and bathyal habitats
apparently support deep-water lineages since the Mesozoic
also suggesting that offshore lineages can be less affected
by such perturbations and thus can conserve their niches
more strongly than onshore lineages [6768]
(c) Onshore expansion at long time-scalesPlio-Pleistocene genera and families that were frequent off-
shore during the Eocene expanded onshore during the Plio-
rspbroyalsocietypublishingorg
9
on October 8 2014rspbroyalsocietypublishingorgDownloaded from
Pleistocene and also maintained their presence offshore An
increase in the proportion of bathymetric generalists and the
flattening of the onshorendashoffshore gradient in bathymetric
breadth imply that this long-term onshore expansion observed
in our study can be modulated by climatic changes that led to
the net shift from tropical Eocene to warm-temperate Plio-
Pleistocene conditions Poleward latitudinal shifts are typically
associated with the emergence of colder deep-shelf waters and
with declining steepness of thermal bathymetric gradients at
higher latitudes Such changes in temperature and in the struc-
ture of the thermal bathymetric gradient produce a latitudinal
increase in the bathymetric range size of marine ectotherms
and their shallow-water emergence at higher latitudes [6970]
Data accessibility Source data are available at dxdoiorg105061dryad943j7
Acknowledgements We thank P Novack-Gottshall and T D Olszewskifor critical reviews M Stachowitsch for comments and S Danisefor help with sample processing This work benefited from visits toParis and Vienna museum collections under the Synthesys program
Funding statement This work was supported by the Austrian ScienceFund (FWF) projects P19013-Bio the Slovak Research and Develop-ment Agency (APVV 0644ndash10) the Slovak Scientific Grant Agency(VEGA 0068ndash10) and the NSF (DEB-0919451)
ProcRSoc
References
B28120141533
1 Pandolfi JM 1996 Limited membership inPleistocene reef coral assemblages from the HuonPeninsula Papua New Guinea constancy duringglobal change Paleobiology 22 152 ndash 176
2 Ivany LC Brett CE Wall HLB Wall PD Handley JC2009 Relative taxonomic and ecologic stability inDevonian marine faunas of New York State a test ofcoordinated stasis Paleobiology 35 499 ndash 524(doi1016660094-8373-354499)
3 Holland SM Zaffos A 2011 Niche conservatismalong an onshore ndash offshore gradient Paleobiology37 270 ndash 286 (doi101666100321)
4 Buzas M Hayek LC Culver SJ Hayward BWOsterman LE 2014 Ecological and evolutionaryconsequences of benthic community stasis in thevery deep sea (1500m) Paleobiology 40102 ndash 112 (doi10166613010)
5 Zuschin M Harzhauser M Hengst B Mandic ORoetzel R 2014 Long-term ecosystem stability in aLower Miocene estuarine succession Geology 421 ndash 4 (doi101130G347611)
6 Roy K Jablonski D Valentine JW 1995 Thermallyanomalous assemblages revisited patterns in theextraprovincial latitudinal range shifts ofPleistocene marine mollusks Geology 231071 ndash 1074 (doi1011300091-7613(1995)0231071TAARPI23CO2)
7 Jackson ST Overpeck JT 2000 Responses of plantpopulations and communities to environmentalchanges of the Late Quaternary Paleobiology26(Suppl 4) 194 ndash 220 (doi1016660094-8373(2000)26[194ROPPAC]20CO2)
8 Yasuhara M Hunt G Cronin TM Okahashi H 2009Temporal latitudinal-gradient dynamics and tropicalinstability of deep-sea species diversity Proc NatlAcad Sci USA 106 21 717 ndash 21 720 (doi101073pnas0910935106)
9 Tomasovych A Kidwell SM 2010 The effects oftemporal resolution on species turnover and ontesting metacommunity models Am Nat 175587 ndash 606 (doi101086651661)
10 Roy K 2001 Analyzing temporal trends in regionaldiversity a biogeographic perspective Paleobiology24 631 ndash 645 (doi1016660094-8373(2001)0270631ATTIRD20CO2)
11 Roy K Goldberg EE 2007 Origination extinctionand dispersal integrative models for understanding
present-day diversity gradients Am Nat 170S71 ndash S85 (doi101086519403)
12 Holland SM Patzkowsky M 2007 Gradient ecologyof a biotic invasion biofacies of the typeCincinnatian series (Upper Ordovician) CincinnatiOhio region USA Palaios 22 392 ndash 407 (doi102110palo2006p06-066r)
13 Miller AI Foote M 2009 Epicontinental seas versusopen-ocean settings the kinetics of mass extinctionand origination Science 326 1106 ndash 1109 (doi101126science1180061)
14 Sepkoski Jr JJ 1987 Environmental trends inextinction during the Phanerozoic Science 23564 ndash 66 (doi101126science11539724)
15 Sepkoski Jr JJ 1991 A model on onshore-offshorechange in faunal diversity Paleobiology 17 58 ndash 77
16 Kiessling W Aberhan M 2007 Environmentaldeterminants of marine benthic biodiversitydynamics through Triassic-Jurassic timesPaleobiology 33 414 ndash 434 (doi101666060691)
17 Bottjer DJ Jablonski D 1988 Paleoenvironmentalpatterns in the evolution of post-Paleozoic benthicmarine invertebrates Palaios 3 540 ndash 560 (doi1023073514444)
18 Jablonski D Lidgard S Taylor PS 1997 Comparativeecology of bryozoan radiations origin of noveltiesin cyclostomes and cheilostomes Palaios 12505 ndash 523 (doi1023073515408)
19 Kiessling W Simpson C Foote M 2010 Reefs ascradles of evolution and sources of biodiversity inthe Phanerozoic Science 327 196 ndash 198 (doi101126science1182241)
20 Jablonski D Belanger CL Berke SK Huang S KrugAZ Roy K Tomasovych A Valentine JW 2013 Outof the tropics but how Fossils bridge species andthermal ranges in the dynamics of the marinelatitudinal diversity gradient Proc Natl Acad SciUSA 110 10 487 ndash 10 494 (doi101073pnas1308997110)
21 Smith KF Gaines SD 2003 Rapoportrsquos bathymetricrule and the latitudinal species diversity gradient fornortheast Pacific fishes and northwest Atlanticgastropods evidence against a causal linkJ Biogeogr 30 1153 ndash 1159 (doi101046j1365-2699200300898x)
22 Jablonski D 2005 Evolutionary innovations in thefossil record the intersection of ecology
development and macroevolution J Exp Zool304B 504 ndash 519 (doi101002jezb21075)
23 Stanley SM Wetmore KL Kennett JP 1988Macroevolutionary differences between the twomajor clades of Neogene planktonic ForaminiferaPaleobiology 14 235 ndash 249
24 Nikolaev SD Oskina NS Blyum NS BubenshchikovaNV 1998 Neogene-Quaternary variations of thelsquoPole-Equatorrsquo temperature gradient of the surfaceoceanic waters in the north Atlantic and northPacific Glob Planet Change 18 85 ndash 111 (doi101016S0921-8181(98)00009-5)
25 Stevens GC 1996 Extending Rapoportrsquos rule toPacific marine fishes J Biogeogr 23 149 ndash 154(doi101046j1365-2699199600977x)
26 Dynesius M Jansson R 2000 Evolutionaryconsequences of changes in speciesrsquogeographical distributions driven byMilankovitch climate oscillations Proc Natl AcadSci USA 97 9115 ndash 9120 (doi101073pnas97169115)
27 Holt RD Barfield M Gomulkiewicz R 2004Temporal variation can facilitate niche evolution inharsh sink environments Am Nat 164 187 ndash 200(doi101086422343)
28 Rangel TFLVB Diniz-Filho AF 2005 An evolutionarytolerance model explanining spatial patterns inspecies richness under environmental gradients andgeometric constraints Ecography 25 253 ndash 263(doi101111j0906-7590200504038x)
29 Ghalambor CK Huey RB Martin PR Tewksbury JJWang G 2006 Are mountain passes higher in thetropics Janzenrsquos hypothesis revisited Integr CompBiol 46 5 ndash 17 (doi101093icbicj003)
30 Jackson JBC 1974 Biogeographic consequences ofeurytopy and stenotopy among marine bivalvesand their evolutionary significance Am Nat 108541 ndash 560 (doi101086282933)
31 Jablonski D Valentine JW 1981 Onshore-offshoregradients in Recent eastern Pacific shelf faunas andtheir paleobiogeographic significance In Evolutiontoday (eds GCE Scudder JL Reveal) pp 441 ndash 453Pittsburg PA Carnegie-Mellon University HuntInstitute of Botany Documents
32 Allmon WD 2001 Nutrients temperaturedisturbance and evolution a model for the lateCenozoic marine record of the western Atlantic
rspbroyalsocietypublishingorgProcRSocB
28120141533
10
on October 8 2014rspbroyalsocietypublishingorgDownloaded from
Palaeogeogr Palaeoclim Palaeoecol 166 9 ndash 26(doi101016S0031-0182(00)00199-1)
33 Harley CDG Smith KF Moore VL 2003Environmental variability and biogeographythe relationship between bathymetricdistribution and geographical range size inmarine algae and gastropods Glob Ecol Biogeogr12 499 ndash 506 (doi101046j1466-822X200300062x)
34 Escarguel G Brayard A Bucher H 2008 Evolutionaryrates do not drive latitudinal diversity gradientsJ Zool Syst Evol Res 46 82 ndash 86 (doi101111j1439-0469200700443x)
35 Sunday JM Bates AE Dulvy NK 2011 Globalanalysis of thermal tolerance and latitude inectotherms Proc R Soc B 278 1823 ndash 1830(doi101098rspb20101295)
36 Bell G 2010 Fluctuating selection the perpetualrenewal of adaptation in variable environmentsPhil Trans R Soc B 365 87 ndash 97 (doi101098rstb20090150)
37 Foote M Raup D 1996 Fossil preservation and thestratigraphic ranges of taxa Paleobiology 22 121 ndash 140
38 Raffi S Stanley SM Marasti R 1985 Biogeographicpatterns and Plio-Pleistocene extinction of Bivalviain the Mediterranean and southern North SeaPaleobiology 11 368 ndash 388
39 Dominici S Kowalke T 2007 Depositional dynamicsand the record of ecosystem stability Early Eocenefaunal gradients in the Pyrenean Foreland SpainPalaios 22 268 ndash 284 (doi102110palo2005p05-022r)
40 Huyghe D Merle D Lartaud F Cheype F EmmanuelL 2012 Middle Lutetian climate in the Paris Basinimplications for a marine hotspot ofpaleobiodiversity Facies 58 587 ndash 604 (doi101007s10347-012-0307-3)
41 Draut AE Raymo ME McManus JF Oppo DW 2003Climate stability during the Pliocene warm periodPaleoceanography 18 1078 (doi1010292003PA000889)
42 Blois JL Williams JW Fitzpatrick MC Jackson STFerrier S 2013 Space can substitute for time inpredicting climate-change effects on biodiversityProc Natl Acad Sci USA 110 9374 ndash 9379 (doi101073pnas1220228110)
43 Mellin C Bradshaw CJA Fordham DA Caley MJ2014 Strong but opposing b diversitymdashstabilityrelationships in coral reef fish communitiesProc R Soc B 281 20131993 (doi101098rspb20131993)
44 Anderson MJ Ellingsen KE McArdle BH 2006Multivariate dispersion as a measure of betadiversity Ecol Lett 9 683 ndash 693 (doi101111j1461-0248200600926x)
45 Vovk V 2012 Combining p-values via averaging Seehttparxivorgabs12124966
46 Hurlbert SH 1978 The measurement of nicheoverlap and some relatives Ecology 59 67 ndash 77(doi1023071936632)
47 Caze B Merle D Le Meur M Pacaud J-M Ledon DSaint Martin J-P 2011 Taxonomic implications ofthe residual colour patterns of ampullinidgastropods and their contribution to thediscrimination from naticids Acta Palaeontol Pol56 329 ndash 347 (doi104202app20090084)
48 Ozawa T Kohler F Reid DG Glaubrecht M 2009 Tethyanrelicts on continental coastlines of the northwesternPacific Ocean and Australasia molecular phylogeny andfossil record of batillariid gastropods (CaenogastropodaCerithioidea) Zool Scr 38 503 ndash 525 (doi101111j1463-6409200900390x)
49 Kowalke T Harzhauser M 2004 Early ontogeny andpalaeoecology of the Mid-Miocene rissoidgastropods of the Central Paratethys ActaPalaeontol Pol 49 111 ndash 134
50 Silva CMD Landau B La Perna R 2011Biogeography of Iberian Atlantic Neogenemarginelliform gastropods (MarginellidaeCystiscidae) global change and transatlanticcolonization J Paleontol 85 1052 ndash 1066 (doi10166611-1041)
51 Olszewski TD Patzkowsky ME 2001 Measuringrecurrence of marine biotic gradients a case studyfrom the Pennsylvanian-Permian MidcontinentPalaios 16 440 ndash 460 (doi1016690883-1351(2001)0160444MROMBG20CO2)
52 Pandolfi JM Jackson JBC 2006 Ecologicalpersistence interrupted in Caribbean coral reefsEcol Lett 9 818 ndash 826 (doi101111j1461-0248200600933x)
53 Loreau M Mouquet N Gonzalez A 2003Biodiversity as spatial insurance in heterogeneouslandscapes Proc Natl Acad Sci USA 100 12 765 ndash12 770 (doi101073pnas2235465100)
54 Volkov I Banavar JR Hubbell SP Maritan A 2007Patterns of relative species abundance in rainforestsand coral reefs Nature 450 45 ndash 49 (doi101038nature06197)
55 Olszewski TD 2012 Persistence of high diversity innon-equilibrium ecological communities implicationsfor modern and fossil ecosystems Proc R Soc B 279230 ndash 236 (doi101098rspb20110936)
56 Foote M 2014 Environmental controls ongeographic range size in marine animal generaPaleobiology 40 440 ndash 458 (doi10166613056)
57 Payne JL Finnegan S 2007 The effect of geographicrange on extinction risk during background andmass extinction Proc Natl Acad Sci USA 104 10506 ndash 10 511 (doi101073pnas0701257104)
58 Harnik PG Simpson C Payne JL 2012 Long-termdifferences in extinction risk among the seven formsof rarity Proc R Soc B 279 4969 ndash 4976 (doi101098rspb20121902)
59 Locarnini RA Mishonov AV Antonov JI Boyer TP GarciaHE Baranova OK Zweng MM Johnson DR 2010 Worldocean atlas 2009 volume 1 temperature In NOAA AtlasNESDIS 68 (ed S Levitus) pp 1 ndash 184 Washington DCUS Government Printing Office
60 Belanger CL Jablonski D Roy K Berke SK Krug AZValentine JW 2012 Global environmental predictorsof benthic marine biogeographic structure ProcNatl Acad Sci USA 109 14 046 ndash 14 051 (doi101073pnas1212381109)
61 Buckley LB Hurlbert AH Jetz W 2012 Broad-scaleecological implications of ectothermy andendothermy in changing environments Glob EcolBiogeogr 21 873 ndash 885 (doi101111j1466-8238201100737x)
62 Jocque M Field R Brendonck L De Meester L 2010Climatic control of dispersal-ecological specializationtrade-offs a metacommunity process at the heart ofthe latitudinal diversity gradient Glob Ecol Biogeogr19 244 ndash 252 (doi101111j1466-8238200900510x)
63 Zachos JC Stott LD Lohmann KC 1994 Evolution ofearly Cenozoic marine temperatures Paleoceanography9 353 ndash 387 (doi10102993PA03266)
64 Zachos J Pagani M Sloan L Thomas E Billups K2003 Trends rhythms and aberrations in globalClimate 65 Ma to present Science 292 686 ndash 693(doi101126science1059412)
65 Jacobs DK Lindberg DR 1998 Oxygen and evolutionarypatterns in the sea onshoreoffshore trends and recentrecruitment of deep-sea faunas Proc Natl Acad Sci USA95 9396 ndash 9401 (doi101073pnas95169396)
66 Liow LH Skaug HJ Ergon T Schweder T 2010Global occurrence trajectories of microfossilsenvironmental variability and the rise and fall ofindividual species Paleobiology 36 224 ndash 252(doi101666080801)
67 Lindner A Cairns SD Cunningham CW 2008From offshore to onshore multiple originsof shallow-water corals from deep-sea ancestorsPLoS ONE 3 e2429 (doi101371journalpone0002429)
68 Thuy B Gale AS Kroh A Kucera M Numberger-Thuy LD Reich M Stohr S 2013 Ancient origin ofthe modern deep-sea fauna PLoS ONE 7 e46913(doi101371journalpone0046913)
69 Carney RS 2005 Zonation of deep biota oncontinental margins Oceanogr Mar Biol 43211 ndash 278 (doi1012019781420037449ch6)
70 Menzies RJ George RY Rowe GT 1973 Abyssalenvironment and ecology of the world oceansNew York NY John Wiley amp Sons

Tabl
e2
Shor
t-ter
mtu
rnov
erw
ithin
Eoce
nean
dw
ithin
Plio-
Pleis
toce
nein
genu
san
dfa
mily
abun
danc
esis
not
signi
fican
tlyhi
gher
onsh
ore
than
offsh
ore
usin
gth
ete
stof
HMD
(The
sum
mar
ysta
tistic
san
dth
eco
mbi
ned
p-va
lue
betw
een
onsh
ore
and
offsh
ore
and
the
25
and
975
thpe
rcent
iles
are
base
don
1000
runs
stand
ardi
zed
tofo
uras
sem
blag
espe
rhab
itata
ndnfrac14
100
indi
vidua
lspe
rass
embl
age)
habi
tat
com
paris
onle
vel
mea
non
shor
endashof
fsho
redi
ffere
nce
indi
sper
sion
25t
hpe
rcen
tile
975
thpe
rcen
tile
com
bine
dp-
valu
ele
vel
mea
non
shor
endashof
fsho
redi
ffere
nce
indi
sper
sion
25t
hpe
rcen
tile
975
thpe
rcen
tile
com
bine
dp-
valu
e
Eoce
nepe
ritid
al
versu
sne
arsh
ore
gene
ra0
087
003
30
145
021
7fa
milie
s0
072
001
20
138
030
7
Eoce
nepe
ritid
al
versu
sin
ners
helf
gene
ra2
009
02
013
82
003
61
fam
ilies
20
039
20
100
002
50
941
Eoce
nepe
ritid
al
versu
sou
ters
helf
gene
ra2
004
52
008
02
001
00
997
fam
ilies
20
044
20
081
20
006
099
5
Eoce
nene
arsh
ore
versu
sin
ners
helf
gene
ra2
017
72
024
22
011
01
fam
ilies
20
111
20
193
20
032
099
9
Eoce
nene
arsh
ore
versu
sou
ters
helf
gene
ra2
013
22
019
12
007
81
fam
ilies
20
117
20
182
20
058
1
Eoce
nein
ners
helf
versu
sou
ters
helf
gene
ra0
045
20
003
009
30
246
fam
ilies
20
005
20
066
005
50
729
Plio-
Plp
eriti
dal
versu
sne
arsh
ore
gene
ra0
054
20
049
015
50
325
fam
ilies
008
22
003
30
185
023
1
Plio-
Plp
eriti
dal
versu
sin
ners
helf
gene
ra0
026
20
106
017
30
545
fam
ilies
004
42
009
30
170
042
5
Plio-
Plp
eriti
dal
versu
sou
ters
helf
gene
ra0
143
001
40
266
013
1fa
milie
s0
138
000
70
265
014
1
Plio-
Pln
earsh
ore
versu
sin
ners
helf
gene
ra2
002
82
014
80
120
078
4fa
milie
s2
003
82
015
80
079
082
7
Plio-
Pln
earsh
ore
versu
sou
ters
helf
gene
ra0
089
20
036
020
70
260
fam
ilies
005
52
006
00
163
036
0
Plio-
Pli
nner
shelf
versu
sou
ters
helf
gene
ra0
116
20
056
026
40
221
fam
ilies
009
32
004
60
229
025
2
rspbroyalsocietypublishingorgProcRSocB
28120141533
6
on October 8 2014rspbroyalsocietypublishingorgDownloaded from
Tabl
e3
Turn
over
betw
een
Eoce
nean
dPl
io-Pl
eisto
cene
inge
nus
and
fam
ilyab
unda
nces
decre
ases
towa
rds
offsh
ore
envir
onm
ents
usin
gall
taxa
and
persi
sting
taxa
(Th
ete
stof
HMD
show
sth
atalt
houg
htu
rnov
eris
not
signi
fican
tlyhi
gher
intw
opa
irsof
close
lysp
aced
habi
tats
(per
itida
lcom
pare
dw
ithne
arsh
ore
and
inne
rsh
elfco
mpa
red
with
oute
rshe
lf)o
nsho
retu
rnov
eris
signi
fican
tlyhi
gher
inot
herc
ompa
rison
sw
ithof
fshor
eha
bita
tsTh
em
ean
diffe
renc
ein
mul
tivar
iate
disp
ersio
nbe
twee
non
shor
ean
dof
fshor
een
viron
men
tsan
dth
e2
5an
d97
5th
perce
ntile
sar
eba
sed
on10
00ru
nssta
ndar
dize
dto
four
asse
mbl
ages
perh
abita
tand
pere
poch
and
nfrac14
100
indi
vidua
lspe
rass
embl
age)
habi
tat
com
paris
onle
vel
mea
non
shor
endashof
fsho
re
diffe
renc
ein
disp
ersio
n
25t
h
perc
entil
e
975
th
perc
entil
e
com
bine
dp-
valu
ele
vel
mea
non
shor
endashof
fsho
re
diffe
renc
ein
disp
ersio
n
25t
h
perc
entil
e
975
th
perc
entil
e
com
bine
dp-
valu
e
perit
idal
versu
sne
arsh
ore
gene
ra0
007
20
008
002
70
962
fam
ilies
004
50
004
009
00
267
perit
idal
versu
sin
ners
helf
gene
ra0
032
000
80
064
000
6fa
milie
s0
198
013
30
268
000
3
perit
idal
versu
sou
ters
helf
gene
ra0
189
015
80
220
000
1fa
milie
s0
242
020
70
275
000
1
near
shor
eve
rsus
inne
rshe
lfge
nera
002
52
000
60
061
000
6fa
milie
s0
153
007
90
232
000
4
near
shor
eve
rsus
oute
rshe
lfge
nera
018
30
147
021
80
001
fam
ilies
019
70
139
024
30
002
inne
rshe
lfve
rsus
oute
rshe
lfge
nera
015
70
114
019
70
039
fam
ilies
004
42
003
10
115
087
3
perit
idal
versu
ssh
ore
face
pers
gene
ra0
013
20
019
005
80
994
pers
fam
ilies
004
72
000
10
098
043
6
perit
idal
versu
sin
ners
helf
pers
gene
ra0
077
002
10
143
005
8pe
rsfa
milie
s0
211
013
90
286
000
5
perit
idal
versu
sou
ters
helf
pers
gene
ra0
387
033
70
438
000
1pe
rsfa
milie
s0
270
021
60
326
000
2
near
shor
eve
rsus
inne
rshe
lfpe
rsge
nera
006
52
000
60
136
001
3pe
rsfa
milie
s0
164
007
90
248
000
8
near
shor
eve
rsus
oute
rshe
lfpe
rsge
nera
037
50
310
043
60
001
pers
fam
ilies
022
40
151
029
00
002
inne
rshe
lfve
rsus
oute
rshe
lfpe
rsge
nera
031
00
229
038
60
019
pers
fam
ilies
005
92
003
10
153
072
4
peritidal
EocenePlio-Pleistocene
0
0
100
200
300
04
08
12
nearshore
Hur
lber
t bat
hym
etri
c br
eadt
h O
regi
onal
spe
cies
ric
hnes
s
innershelf
outershelf
Figure 3 Hurlbert bathymetric breadth of Eocene species (black circles) onaverage declines towards offshore whereas Hurlbert breadth of Plio-Pleistocenespecies (grey circles) changes weakly Hurlbert breadth of offshore species issignificantly higher in the Plio-Pleistocene than in the Eocene Species richness(rarefied to 2477 individuals per habitat) increases towards inner shelf at bothtime intervals and this increase is less steep during the Plio-Pleistocene (greysquares) than during the Eocene (black squares)
rspbroyalsocietypublishingorgProcRSocB
28120141533
7
on October 8 2014rspbroyalsocietypublishingorgDownloaded from
(c) Onshore ndash offshore shifts in abundance andbathymetric breadth between epochs
Although species richness increases towards inner shelf at
both time intervals the onshorendashoffshore gradient in
bathymetric breadth changes markedly between the Eocene
and Plio-Pleistocene (figure 3) The Eocene species show
a significantly smaller Hurlbertrsquos index (mean frac14 012 95
CI frac14 011ndash013) than Plio-Pleistocene species (mean frac14 023
95 CI frac14 021ndash024) This change is associated with a
higher proportion of species occurring onshore and offshore
(generalists) in the Plio-Pleistocene 27 species (4) belong
to generalists in the Eocene whereas 163 species (37)
belong to generalists in the Plio-Pleistocene In contrast to
the Eocene Hurlbertrsquos index does not decline with depth in
the Plio-Pleistocene because Plio-Pleistocene offshore species
show a significantly higher index than Eocene offshore
species (figure 3) The differences in onshore utilization by
genera and families between Plio-Pleistocene and Eocene
are significantly positive persisting genera and families are
more frequent onshore in the Plio-Pleistocene than onshore
in the Eocene (figure 4) These relative onshore expansions
of genera and families are caused by an increase in abun-
dance of their constituent species as well as by an increase
in their species richness (figure 4)
4 Discussion(a) Onshore ndash offshore gradients at short time-scalesThe moderately high between-sequence rank correlations in the
Eocene and the lack of relation with time imply that the
short-term turnover is coupled with some degree of recurrence
in abundance patterns at individual depths as observed in
many other time series with benthic assemblages in the fossil
record [5152] The smaller dissimilarity at regional scales at
each depth implies that this recurrence is related to processes
operating at larger spatial scales that can reduce extinction
risk and slow down temporal change in metacommunity com-
position Such processes include those that allow broad
geographical range size via high dispersal or high effective habi-
tat area [53ndash56] Geographical range size is a key predictor of
ndash10
0
10
20
30
40
0 10
no g
ener
a
offs
hore
exp
ansi
on
onsh
ore
expa
nsio
n
ndash10 0difference in onshore utilization
between Eocene and Plio-Pleistocene
ndash5 0 5 1010
abundance(a) species richnessmedian sp abundance
ndash10
0
10
20
30
40
0 10
no f
amili
es
offs
hore
exp
ansi
on
onsh
ore
expa
nsio
n
ndash10 0difference in onshore utilization
between Eocene and Plio-Pleistocene
ndash10 10 3010
abundance(b) species richnessmedian sp abundance
Figure 4 Frequency distributions of Plio-Pleistocene ndash Eocene differences in onshore utilization of (a) genera and (b) families that persist from Eocene to Plio-Pleistocene show that genera and families abundant in offshore habitats during Eocene expanded to onshore habitats in Plio-Pleistocene The onshore increasein abundance also applies to an increase in per-genus and per-family median species abundance and to an increase in per-genus and per-family species richnessThin dashed lines separate relative onshore expansion from relative offshore expansion Thick solid and dashed lines correspond to means and bootstrapped 95 CIsA value of zero means no difference between Eocene and Plio-Pleistocene and positive values mean that persisting genera and families are more abundant andmore species-rich onshore in the Plio-Pleistocene than in the Eocene
rspbroyalsocietypublishingorgProcRSocB
28120141533
8
on October 8 2014rspbroyalsocietypublishingorgDownloaded from
extinction [57] and its role in reducing extinction risk is gener-
ally much stronger than the role of eurytopy [58] The onshorendash
offshore decline in the steepness of latitudinal temperature
gradients may contribute to the lack of onshorendashoffshore gradi-
ents in geographical range size (and thus in extinction rate at
short time-scales) because the latitudinal range of shallow habi-
tats (0ndash50 m) along the eastern ocean margins [59] remains on
average within a 58C range for approximately 1500 km whereas
the latitudinal range of deeper habitats (100ndash200 m) remains on
average within a 58C range for approximately 2500ndash3000 km
(electronic supplementary material figure S7) and spatial
variation in seawater temperature drives the large-scale distri-
bution of ectotherms [6061] Therefore marine ectotherms
inhabiting onshore temporally variable habitats can achieve
broad geographical ranges because they are eurytopic [30]
whereas offshore temperature-specialized species can attain
broad geographical ranges because they face milder latitudinal
climatic gradients [62]
(b) Onshore extinction at long time-scalesThe emergence of an onshorendashoffshore decline in temporal
turnover over longer time-scales together with the lack of
relationship between the short-term turnover and temporal
separation between sequences over Myr scales implies that
the onshore increase in turnover between the Eocene and
the Plio-Pleistocene is not a simple extrapolation of small
incremental changes that can be observed from sequence to
sequence Rather the decline in turnover depends on climatic
or oceanographic perturbations that occurred between the
Eocene and Plio-Pleistocene and affected onshore lineages
more strongly than offshore lineages as revealed (i) by a
smaller offshore proportion of extinct genera and families
(ii) by a smaller variability in offshore abundance of persist-
ing genera and families and (iii) by a smaller variability in
offshore abundance of their constituent species Therefore
this decline is not merely a function of declining extinction
rates but also a function of declining variability in population
abundances leading to a higher ecological conservatism
of offshore lineages Climatic changes may contribute to
higher long-term onshore volatility because (i) Cenozoic
environments show larger temperature fluctuations in the
superficial waters than in the deep-shelf not only at short
but also at long time-scales [24] and (ii) the Cenozoic
record shows a higher long-term persistence of milder latitu-
dinal gradients in mean temperature at 200 m than at the
surface during the Cenozoic [63] Multiple climatic reversals
between YpresianndashLutetian and Plio-Pleistocene including
Lutetian cooling Mid-Eocene climatic optimum glaciation
at the EoceneOligocene boundary and mid-Miocene cli-
matic optimum [64] could thus contribute to the higher
extinction and population variability in the onshore habitats
Temporal fluctuations in the location and extent of oxygen
minimum zones can generate instability that is larger offshore
than onshore [65] but the Eocene and Plio-Pleistocene assem-
blages of the northeast Atlantic and Mediterranean do not
occur in dysoxic habitats The Pliocene molluscan commu-
nities in the Mediterranean were assembled primarily from
the tropical eastern Atlantic province along western Africa
(that was formed after the closure of the Indo-Pacific
seaway during the Early-Middle Miocene) but offshore and
onshore lineages should be not affected differently by such
oceanographic changes Regardless of the actual climatic or
oceanographic causes we suggest that onshore lineages face
abrupt and high-amplitude regional-scale perturbations
over longer durations that are not experienced over shorter
durations [66] Present-day offshore and bathyal habitats
apparently support deep-water lineages since the Mesozoic
also suggesting that offshore lineages can be less affected
by such perturbations and thus can conserve their niches
more strongly than onshore lineages [6768]
(c) Onshore expansion at long time-scalesPlio-Pleistocene genera and families that were frequent off-
shore during the Eocene expanded onshore during the Plio-
rspbroyalsocietypublishingorg
9
on October 8 2014rspbroyalsocietypublishingorgDownloaded from
Pleistocene and also maintained their presence offshore An
increase in the proportion of bathymetric generalists and the
flattening of the onshorendashoffshore gradient in bathymetric
breadth imply that this long-term onshore expansion observed
in our study can be modulated by climatic changes that led to
the net shift from tropical Eocene to warm-temperate Plio-
Pleistocene conditions Poleward latitudinal shifts are typically
associated with the emergence of colder deep-shelf waters and
with declining steepness of thermal bathymetric gradients at
higher latitudes Such changes in temperature and in the struc-
ture of the thermal bathymetric gradient produce a latitudinal
increase in the bathymetric range size of marine ectotherms
and their shallow-water emergence at higher latitudes [6970]
Data accessibility Source data are available at dxdoiorg105061dryad943j7
Acknowledgements We thank P Novack-Gottshall and T D Olszewskifor critical reviews M Stachowitsch for comments and S Danisefor help with sample processing This work benefited from visits toParis and Vienna museum collections under the Synthesys program
Funding statement This work was supported by the Austrian ScienceFund (FWF) projects P19013-Bio the Slovak Research and Develop-ment Agency (APVV 0644ndash10) the Slovak Scientific Grant Agency(VEGA 0068ndash10) and the NSF (DEB-0919451)
ProcRSoc
References
B28120141533
1 Pandolfi JM 1996 Limited membership inPleistocene reef coral assemblages from the HuonPeninsula Papua New Guinea constancy duringglobal change Paleobiology 22 152 ndash 176
2 Ivany LC Brett CE Wall HLB Wall PD Handley JC2009 Relative taxonomic and ecologic stability inDevonian marine faunas of New York State a test ofcoordinated stasis Paleobiology 35 499 ndash 524(doi1016660094-8373-354499)
3 Holland SM Zaffos A 2011 Niche conservatismalong an onshore ndash offshore gradient Paleobiology37 270 ndash 286 (doi101666100321)
4 Buzas M Hayek LC Culver SJ Hayward BWOsterman LE 2014 Ecological and evolutionaryconsequences of benthic community stasis in thevery deep sea (1500m) Paleobiology 40102 ndash 112 (doi10166613010)
5 Zuschin M Harzhauser M Hengst B Mandic ORoetzel R 2014 Long-term ecosystem stability in aLower Miocene estuarine succession Geology 421 ndash 4 (doi101130G347611)
6 Roy K Jablonski D Valentine JW 1995 Thermallyanomalous assemblages revisited patterns in theextraprovincial latitudinal range shifts ofPleistocene marine mollusks Geology 231071 ndash 1074 (doi1011300091-7613(1995)0231071TAARPI23CO2)
7 Jackson ST Overpeck JT 2000 Responses of plantpopulations and communities to environmentalchanges of the Late Quaternary Paleobiology26(Suppl 4) 194 ndash 220 (doi1016660094-8373(2000)26[194ROPPAC]20CO2)
8 Yasuhara M Hunt G Cronin TM Okahashi H 2009Temporal latitudinal-gradient dynamics and tropicalinstability of deep-sea species diversity Proc NatlAcad Sci USA 106 21 717 ndash 21 720 (doi101073pnas0910935106)
9 Tomasovych A Kidwell SM 2010 The effects oftemporal resolution on species turnover and ontesting metacommunity models Am Nat 175587 ndash 606 (doi101086651661)
10 Roy K 2001 Analyzing temporal trends in regionaldiversity a biogeographic perspective Paleobiology24 631 ndash 645 (doi1016660094-8373(2001)0270631ATTIRD20CO2)
11 Roy K Goldberg EE 2007 Origination extinctionand dispersal integrative models for understanding
present-day diversity gradients Am Nat 170S71 ndash S85 (doi101086519403)
12 Holland SM Patzkowsky M 2007 Gradient ecologyof a biotic invasion biofacies of the typeCincinnatian series (Upper Ordovician) CincinnatiOhio region USA Palaios 22 392 ndash 407 (doi102110palo2006p06-066r)
13 Miller AI Foote M 2009 Epicontinental seas versusopen-ocean settings the kinetics of mass extinctionand origination Science 326 1106 ndash 1109 (doi101126science1180061)
14 Sepkoski Jr JJ 1987 Environmental trends inextinction during the Phanerozoic Science 23564 ndash 66 (doi101126science11539724)
15 Sepkoski Jr JJ 1991 A model on onshore-offshorechange in faunal diversity Paleobiology 17 58 ndash 77
16 Kiessling W Aberhan M 2007 Environmentaldeterminants of marine benthic biodiversitydynamics through Triassic-Jurassic timesPaleobiology 33 414 ndash 434 (doi101666060691)
17 Bottjer DJ Jablonski D 1988 Paleoenvironmentalpatterns in the evolution of post-Paleozoic benthicmarine invertebrates Palaios 3 540 ndash 560 (doi1023073514444)
18 Jablonski D Lidgard S Taylor PS 1997 Comparativeecology of bryozoan radiations origin of noveltiesin cyclostomes and cheilostomes Palaios 12505 ndash 523 (doi1023073515408)
19 Kiessling W Simpson C Foote M 2010 Reefs ascradles of evolution and sources of biodiversity inthe Phanerozoic Science 327 196 ndash 198 (doi101126science1182241)
20 Jablonski D Belanger CL Berke SK Huang S KrugAZ Roy K Tomasovych A Valentine JW 2013 Outof the tropics but how Fossils bridge species andthermal ranges in the dynamics of the marinelatitudinal diversity gradient Proc Natl Acad SciUSA 110 10 487 ndash 10 494 (doi101073pnas1308997110)
21 Smith KF Gaines SD 2003 Rapoportrsquos bathymetricrule and the latitudinal species diversity gradient fornortheast Pacific fishes and northwest Atlanticgastropods evidence against a causal linkJ Biogeogr 30 1153 ndash 1159 (doi101046j1365-2699200300898x)
22 Jablonski D 2005 Evolutionary innovations in thefossil record the intersection of ecology
development and macroevolution J Exp Zool304B 504 ndash 519 (doi101002jezb21075)
23 Stanley SM Wetmore KL Kennett JP 1988Macroevolutionary differences between the twomajor clades of Neogene planktonic ForaminiferaPaleobiology 14 235 ndash 249
24 Nikolaev SD Oskina NS Blyum NS BubenshchikovaNV 1998 Neogene-Quaternary variations of thelsquoPole-Equatorrsquo temperature gradient of the surfaceoceanic waters in the north Atlantic and northPacific Glob Planet Change 18 85 ndash 111 (doi101016S0921-8181(98)00009-5)
25 Stevens GC 1996 Extending Rapoportrsquos rule toPacific marine fishes J Biogeogr 23 149 ndash 154(doi101046j1365-2699199600977x)
26 Dynesius M Jansson R 2000 Evolutionaryconsequences of changes in speciesrsquogeographical distributions driven byMilankovitch climate oscillations Proc Natl AcadSci USA 97 9115 ndash 9120 (doi101073pnas97169115)
27 Holt RD Barfield M Gomulkiewicz R 2004Temporal variation can facilitate niche evolution inharsh sink environments Am Nat 164 187 ndash 200(doi101086422343)
28 Rangel TFLVB Diniz-Filho AF 2005 An evolutionarytolerance model explanining spatial patterns inspecies richness under environmental gradients andgeometric constraints Ecography 25 253 ndash 263(doi101111j0906-7590200504038x)
29 Ghalambor CK Huey RB Martin PR Tewksbury JJWang G 2006 Are mountain passes higher in thetropics Janzenrsquos hypothesis revisited Integr CompBiol 46 5 ndash 17 (doi101093icbicj003)
30 Jackson JBC 1974 Biogeographic consequences ofeurytopy and stenotopy among marine bivalvesand their evolutionary significance Am Nat 108541 ndash 560 (doi101086282933)
31 Jablonski D Valentine JW 1981 Onshore-offshoregradients in Recent eastern Pacific shelf faunas andtheir paleobiogeographic significance In Evolutiontoday (eds GCE Scudder JL Reveal) pp 441 ndash 453Pittsburg PA Carnegie-Mellon University HuntInstitute of Botany Documents
32 Allmon WD 2001 Nutrients temperaturedisturbance and evolution a model for the lateCenozoic marine record of the western Atlantic
rspbroyalsocietypublishingorgProcRSocB
28120141533
10
on October 8 2014rspbroyalsocietypublishingorgDownloaded from
Palaeogeogr Palaeoclim Palaeoecol 166 9 ndash 26(doi101016S0031-0182(00)00199-1)
33 Harley CDG Smith KF Moore VL 2003Environmental variability and biogeographythe relationship between bathymetricdistribution and geographical range size inmarine algae and gastropods Glob Ecol Biogeogr12 499 ndash 506 (doi101046j1466-822X200300062x)
34 Escarguel G Brayard A Bucher H 2008 Evolutionaryrates do not drive latitudinal diversity gradientsJ Zool Syst Evol Res 46 82 ndash 86 (doi101111j1439-0469200700443x)
35 Sunday JM Bates AE Dulvy NK 2011 Globalanalysis of thermal tolerance and latitude inectotherms Proc R Soc B 278 1823 ndash 1830(doi101098rspb20101295)
36 Bell G 2010 Fluctuating selection the perpetualrenewal of adaptation in variable environmentsPhil Trans R Soc B 365 87 ndash 97 (doi101098rstb20090150)
37 Foote M Raup D 1996 Fossil preservation and thestratigraphic ranges of taxa Paleobiology 22 121 ndash 140
38 Raffi S Stanley SM Marasti R 1985 Biogeographicpatterns and Plio-Pleistocene extinction of Bivalviain the Mediterranean and southern North SeaPaleobiology 11 368 ndash 388
39 Dominici S Kowalke T 2007 Depositional dynamicsand the record of ecosystem stability Early Eocenefaunal gradients in the Pyrenean Foreland SpainPalaios 22 268 ndash 284 (doi102110palo2005p05-022r)
40 Huyghe D Merle D Lartaud F Cheype F EmmanuelL 2012 Middle Lutetian climate in the Paris Basinimplications for a marine hotspot ofpaleobiodiversity Facies 58 587 ndash 604 (doi101007s10347-012-0307-3)
41 Draut AE Raymo ME McManus JF Oppo DW 2003Climate stability during the Pliocene warm periodPaleoceanography 18 1078 (doi1010292003PA000889)
42 Blois JL Williams JW Fitzpatrick MC Jackson STFerrier S 2013 Space can substitute for time inpredicting climate-change effects on biodiversityProc Natl Acad Sci USA 110 9374 ndash 9379 (doi101073pnas1220228110)
43 Mellin C Bradshaw CJA Fordham DA Caley MJ2014 Strong but opposing b diversitymdashstabilityrelationships in coral reef fish communitiesProc R Soc B 281 20131993 (doi101098rspb20131993)
44 Anderson MJ Ellingsen KE McArdle BH 2006Multivariate dispersion as a measure of betadiversity Ecol Lett 9 683 ndash 693 (doi101111j1461-0248200600926x)
45 Vovk V 2012 Combining p-values via averaging Seehttparxivorgabs12124966
46 Hurlbert SH 1978 The measurement of nicheoverlap and some relatives Ecology 59 67 ndash 77(doi1023071936632)
47 Caze B Merle D Le Meur M Pacaud J-M Ledon DSaint Martin J-P 2011 Taxonomic implications ofthe residual colour patterns of ampullinidgastropods and their contribution to thediscrimination from naticids Acta Palaeontol Pol56 329 ndash 347 (doi104202app20090084)
48 Ozawa T Kohler F Reid DG Glaubrecht M 2009 Tethyanrelicts on continental coastlines of the northwesternPacific Ocean and Australasia molecular phylogeny andfossil record of batillariid gastropods (CaenogastropodaCerithioidea) Zool Scr 38 503 ndash 525 (doi101111j1463-6409200900390x)
49 Kowalke T Harzhauser M 2004 Early ontogeny andpalaeoecology of the Mid-Miocene rissoidgastropods of the Central Paratethys ActaPalaeontol Pol 49 111 ndash 134
50 Silva CMD Landau B La Perna R 2011Biogeography of Iberian Atlantic Neogenemarginelliform gastropods (MarginellidaeCystiscidae) global change and transatlanticcolonization J Paleontol 85 1052 ndash 1066 (doi10166611-1041)
51 Olszewski TD Patzkowsky ME 2001 Measuringrecurrence of marine biotic gradients a case studyfrom the Pennsylvanian-Permian MidcontinentPalaios 16 440 ndash 460 (doi1016690883-1351(2001)0160444MROMBG20CO2)
52 Pandolfi JM Jackson JBC 2006 Ecologicalpersistence interrupted in Caribbean coral reefsEcol Lett 9 818 ndash 826 (doi101111j1461-0248200600933x)
53 Loreau M Mouquet N Gonzalez A 2003Biodiversity as spatial insurance in heterogeneouslandscapes Proc Natl Acad Sci USA 100 12 765 ndash12 770 (doi101073pnas2235465100)
54 Volkov I Banavar JR Hubbell SP Maritan A 2007Patterns of relative species abundance in rainforestsand coral reefs Nature 450 45 ndash 49 (doi101038nature06197)
55 Olszewski TD 2012 Persistence of high diversity innon-equilibrium ecological communities implicationsfor modern and fossil ecosystems Proc R Soc B 279230 ndash 236 (doi101098rspb20110936)
56 Foote M 2014 Environmental controls ongeographic range size in marine animal generaPaleobiology 40 440 ndash 458 (doi10166613056)
57 Payne JL Finnegan S 2007 The effect of geographicrange on extinction risk during background andmass extinction Proc Natl Acad Sci USA 104 10506 ndash 10 511 (doi101073pnas0701257104)
58 Harnik PG Simpson C Payne JL 2012 Long-termdifferences in extinction risk among the seven formsof rarity Proc R Soc B 279 4969 ndash 4976 (doi101098rspb20121902)
59 Locarnini RA Mishonov AV Antonov JI Boyer TP GarciaHE Baranova OK Zweng MM Johnson DR 2010 Worldocean atlas 2009 volume 1 temperature In NOAA AtlasNESDIS 68 (ed S Levitus) pp 1 ndash 184 Washington DCUS Government Printing Office
60 Belanger CL Jablonski D Roy K Berke SK Krug AZValentine JW 2012 Global environmental predictorsof benthic marine biogeographic structure ProcNatl Acad Sci USA 109 14 046 ndash 14 051 (doi101073pnas1212381109)
61 Buckley LB Hurlbert AH Jetz W 2012 Broad-scaleecological implications of ectothermy andendothermy in changing environments Glob EcolBiogeogr 21 873 ndash 885 (doi101111j1466-8238201100737x)
62 Jocque M Field R Brendonck L De Meester L 2010Climatic control of dispersal-ecological specializationtrade-offs a metacommunity process at the heart ofthe latitudinal diversity gradient Glob Ecol Biogeogr19 244 ndash 252 (doi101111j1466-8238200900510x)
63 Zachos JC Stott LD Lohmann KC 1994 Evolution ofearly Cenozoic marine temperatures Paleoceanography9 353 ndash 387 (doi10102993PA03266)
64 Zachos J Pagani M Sloan L Thomas E Billups K2003 Trends rhythms and aberrations in globalClimate 65 Ma to present Science 292 686 ndash 693(doi101126science1059412)
65 Jacobs DK Lindberg DR 1998 Oxygen and evolutionarypatterns in the sea onshoreoffshore trends and recentrecruitment of deep-sea faunas Proc Natl Acad Sci USA95 9396 ndash 9401 (doi101073pnas95169396)
66 Liow LH Skaug HJ Ergon T Schweder T 2010Global occurrence trajectories of microfossilsenvironmental variability and the rise and fall ofindividual species Paleobiology 36 224 ndash 252(doi101666080801)
67 Lindner A Cairns SD Cunningham CW 2008From offshore to onshore multiple originsof shallow-water corals from deep-sea ancestorsPLoS ONE 3 e2429 (doi101371journalpone0002429)
68 Thuy B Gale AS Kroh A Kucera M Numberger-Thuy LD Reich M Stohr S 2013 Ancient origin ofthe modern deep-sea fauna PLoS ONE 7 e46913(doi101371journalpone0046913)
69 Carney RS 2005 Zonation of deep biota oncontinental margins Oceanogr Mar Biol 43211 ndash 278 (doi1012019781420037449ch6)
70 Menzies RJ George RY Rowe GT 1973 Abyssalenvironment and ecology of the world oceansNew York NY John Wiley amp Sons

Tabl
e3
Turn
over
betw
een
Eoce
nean
dPl
io-Pl
eisto
cene
inge
nus
and
fam
ilyab
unda
nces
decre
ases
towa
rds
offsh
ore
envir
onm
ents
usin
gall
taxa
and
persi
sting
taxa
(Th
ete
stof
HMD
show
sth
atalt
houg
htu
rnov
eris
not
signi
fican
tlyhi
gher
intw
opa
irsof
close
lysp
aced
habi
tats
(per
itida
lcom
pare
dw
ithne
arsh
ore
and
inne
rsh
elfco
mpa
red
with
oute
rshe
lf)o
nsho
retu
rnov
eris
signi
fican
tlyhi
gher
inot
herc
ompa
rison
sw
ithof
fshor
eha
bita
tsTh
em
ean
diffe
renc
ein
mul
tivar
iate
disp
ersio
nbe
twee
non
shor
ean
dof
fshor
een
viron
men
tsan
dth
e2
5an
d97
5th
perce
ntile
sar
eba
sed
on10
00ru
nssta
ndar
dize
dto
four
asse
mbl
ages
perh
abita
tand
pere
poch
and
nfrac14
100
indi
vidua
lspe
rass
embl
age)
habi
tat
com
paris
onle
vel
mea
non
shor
endashof
fsho
re
diffe
renc
ein
disp
ersio
n
25t
h
perc
entil
e
975
th
perc
entil
e
com
bine
dp-
valu
ele
vel
mea
non
shor
endashof
fsho
re
diffe
renc
ein
disp
ersio
n
25t
h
perc
entil
e
975
th
perc
entil
e
com
bine
dp-
valu
e
perit
idal
versu
sne
arsh
ore
gene
ra0
007
20
008
002
70
962
fam
ilies
004
50
004
009
00
267
perit
idal
versu
sin
ners
helf
gene
ra0
032
000
80
064
000
6fa
milie
s0
198
013
30
268
000
3
perit
idal
versu
sou
ters
helf
gene
ra0
189
015
80
220
000
1fa
milie
s0
242
020
70
275
000
1
near
shor
eve
rsus
inne
rshe
lfge
nera
002
52
000
60
061
000
6fa
milie
s0
153
007
90
232
000
4
near
shor
eve
rsus
oute
rshe
lfge
nera
018
30
147
021
80
001
fam
ilies
019
70
139
024
30
002
inne
rshe
lfve
rsus
oute
rshe
lfge
nera
015
70
114
019
70
039
fam
ilies
004
42
003
10
115
087
3
perit
idal
versu
ssh
ore
face
pers
gene
ra0
013
20
019
005
80
994
pers
fam
ilies
004
72
000
10
098
043
6
perit
idal
versu
sin
ners
helf
pers
gene
ra0
077
002
10
143
005
8pe
rsfa
milie
s0
211
013
90
286
000
5
perit
idal
versu
sou
ters
helf
pers
gene
ra0
387
033
70
438
000
1pe
rsfa
milie
s0
270
021
60
326
000
2
near
shor
eve
rsus
inne
rshe
lfpe
rsge
nera
006
52
000
60
136
001
3pe
rsfa
milie
s0
164
007
90
248
000
8
near
shor
eve
rsus
oute
rshe
lfpe
rsge
nera
037
50
310
043
60
001
pers
fam
ilies
022
40
151
029
00
002
inne
rshe
lfve
rsus
oute
rshe
lfpe
rsge
nera
031
00
229
038
60
019
pers
fam
ilies
005
92
003
10
153
072
4
peritidal
EocenePlio-Pleistocene
0
0
100
200
300
04
08
12
nearshore
Hur
lber
t bat
hym
etri
c br
eadt
h O
regi
onal
spe
cies
ric
hnes
s
innershelf
outershelf
Figure 3 Hurlbert bathymetric breadth of Eocene species (black circles) onaverage declines towards offshore whereas Hurlbert breadth of Plio-Pleistocenespecies (grey circles) changes weakly Hurlbert breadth of offshore species issignificantly higher in the Plio-Pleistocene than in the Eocene Species richness(rarefied to 2477 individuals per habitat) increases towards inner shelf at bothtime intervals and this increase is less steep during the Plio-Pleistocene (greysquares) than during the Eocene (black squares)
rspbroyalsocietypublishingorgProcRSocB
28120141533
7
on October 8 2014rspbroyalsocietypublishingorgDownloaded from
(c) Onshore ndash offshore shifts in abundance andbathymetric breadth between epochs
Although species richness increases towards inner shelf at
both time intervals the onshorendashoffshore gradient in
bathymetric breadth changes markedly between the Eocene
and Plio-Pleistocene (figure 3) The Eocene species show
a significantly smaller Hurlbertrsquos index (mean frac14 012 95
CI frac14 011ndash013) than Plio-Pleistocene species (mean frac14 023
95 CI frac14 021ndash024) This change is associated with a
higher proportion of species occurring onshore and offshore
(generalists) in the Plio-Pleistocene 27 species (4) belong
to generalists in the Eocene whereas 163 species (37)
belong to generalists in the Plio-Pleistocene In contrast to
the Eocene Hurlbertrsquos index does not decline with depth in
the Plio-Pleistocene because Plio-Pleistocene offshore species
show a significantly higher index than Eocene offshore
species (figure 3) The differences in onshore utilization by
genera and families between Plio-Pleistocene and Eocene
are significantly positive persisting genera and families are
more frequent onshore in the Plio-Pleistocene than onshore
in the Eocene (figure 4) These relative onshore expansions
of genera and families are caused by an increase in abun-
dance of their constituent species as well as by an increase
in their species richness (figure 4)
4 Discussion(a) Onshore ndash offshore gradients at short time-scalesThe moderately high between-sequence rank correlations in the
Eocene and the lack of relation with time imply that the
short-term turnover is coupled with some degree of recurrence
in abundance patterns at individual depths as observed in
many other time series with benthic assemblages in the fossil
record [5152] The smaller dissimilarity at regional scales at
each depth implies that this recurrence is related to processes
operating at larger spatial scales that can reduce extinction
risk and slow down temporal change in metacommunity com-
position Such processes include those that allow broad
geographical range size via high dispersal or high effective habi-
tat area [53ndash56] Geographical range size is a key predictor of
ndash10
0
10
20
30
40
0 10
no g
ener
a
offs
hore
exp
ansi
on
onsh
ore
expa
nsio
n
ndash10 0difference in onshore utilization
between Eocene and Plio-Pleistocene
ndash5 0 5 1010
abundance(a) species richnessmedian sp abundance
ndash10
0
10
20
30
40
0 10
no f
amili
es
offs
hore
exp
ansi
on
onsh
ore
expa
nsio
n
ndash10 0difference in onshore utilization
between Eocene and Plio-Pleistocene
ndash10 10 3010
abundance(b) species richnessmedian sp abundance
Figure 4 Frequency distributions of Plio-Pleistocene ndash Eocene differences in onshore utilization of (a) genera and (b) families that persist from Eocene to Plio-Pleistocene show that genera and families abundant in offshore habitats during Eocene expanded to onshore habitats in Plio-Pleistocene The onshore increasein abundance also applies to an increase in per-genus and per-family median species abundance and to an increase in per-genus and per-family species richnessThin dashed lines separate relative onshore expansion from relative offshore expansion Thick solid and dashed lines correspond to means and bootstrapped 95 CIsA value of zero means no difference between Eocene and Plio-Pleistocene and positive values mean that persisting genera and families are more abundant andmore species-rich onshore in the Plio-Pleistocene than in the Eocene
rspbroyalsocietypublishingorgProcRSocB
28120141533
8
on October 8 2014rspbroyalsocietypublishingorgDownloaded from
extinction [57] and its role in reducing extinction risk is gener-
ally much stronger than the role of eurytopy [58] The onshorendash
offshore decline in the steepness of latitudinal temperature
gradients may contribute to the lack of onshorendashoffshore gradi-
ents in geographical range size (and thus in extinction rate at
short time-scales) because the latitudinal range of shallow habi-
tats (0ndash50 m) along the eastern ocean margins [59] remains on
average within a 58C range for approximately 1500 km whereas
the latitudinal range of deeper habitats (100ndash200 m) remains on
average within a 58C range for approximately 2500ndash3000 km
(electronic supplementary material figure S7) and spatial
variation in seawater temperature drives the large-scale distri-
bution of ectotherms [6061] Therefore marine ectotherms
inhabiting onshore temporally variable habitats can achieve
broad geographical ranges because they are eurytopic [30]
whereas offshore temperature-specialized species can attain
broad geographical ranges because they face milder latitudinal
climatic gradients [62]
(b) Onshore extinction at long time-scalesThe emergence of an onshorendashoffshore decline in temporal
turnover over longer time-scales together with the lack of
relationship between the short-term turnover and temporal
separation between sequences over Myr scales implies that
the onshore increase in turnover between the Eocene and
the Plio-Pleistocene is not a simple extrapolation of small
incremental changes that can be observed from sequence to
sequence Rather the decline in turnover depends on climatic
or oceanographic perturbations that occurred between the
Eocene and Plio-Pleistocene and affected onshore lineages
more strongly than offshore lineages as revealed (i) by a
smaller offshore proportion of extinct genera and families
(ii) by a smaller variability in offshore abundance of persist-
ing genera and families and (iii) by a smaller variability in
offshore abundance of their constituent species Therefore
this decline is not merely a function of declining extinction
rates but also a function of declining variability in population
abundances leading to a higher ecological conservatism
of offshore lineages Climatic changes may contribute to
higher long-term onshore volatility because (i) Cenozoic
environments show larger temperature fluctuations in the
superficial waters than in the deep-shelf not only at short
but also at long time-scales [24] and (ii) the Cenozoic
record shows a higher long-term persistence of milder latitu-
dinal gradients in mean temperature at 200 m than at the
surface during the Cenozoic [63] Multiple climatic reversals
between YpresianndashLutetian and Plio-Pleistocene including
Lutetian cooling Mid-Eocene climatic optimum glaciation
at the EoceneOligocene boundary and mid-Miocene cli-
matic optimum [64] could thus contribute to the higher
extinction and population variability in the onshore habitats
Temporal fluctuations in the location and extent of oxygen
minimum zones can generate instability that is larger offshore
than onshore [65] but the Eocene and Plio-Pleistocene assem-
blages of the northeast Atlantic and Mediterranean do not
occur in dysoxic habitats The Pliocene molluscan commu-
nities in the Mediterranean were assembled primarily from
the tropical eastern Atlantic province along western Africa
(that was formed after the closure of the Indo-Pacific
seaway during the Early-Middle Miocene) but offshore and
onshore lineages should be not affected differently by such
oceanographic changes Regardless of the actual climatic or
oceanographic causes we suggest that onshore lineages face
abrupt and high-amplitude regional-scale perturbations
over longer durations that are not experienced over shorter
durations [66] Present-day offshore and bathyal habitats
apparently support deep-water lineages since the Mesozoic
also suggesting that offshore lineages can be less affected
by such perturbations and thus can conserve their niches
more strongly than onshore lineages [6768]
(c) Onshore expansion at long time-scalesPlio-Pleistocene genera and families that were frequent off-
shore during the Eocene expanded onshore during the Plio-
rspbroyalsocietypublishingorg
9
on October 8 2014rspbroyalsocietypublishingorgDownloaded from
Pleistocene and also maintained their presence offshore An
increase in the proportion of bathymetric generalists and the
flattening of the onshorendashoffshore gradient in bathymetric
breadth imply that this long-term onshore expansion observed
in our study can be modulated by climatic changes that led to
the net shift from tropical Eocene to warm-temperate Plio-
Pleistocene conditions Poleward latitudinal shifts are typically
associated with the emergence of colder deep-shelf waters and
with declining steepness of thermal bathymetric gradients at
higher latitudes Such changes in temperature and in the struc-
ture of the thermal bathymetric gradient produce a latitudinal
increase in the bathymetric range size of marine ectotherms
and their shallow-water emergence at higher latitudes [6970]
Data accessibility Source data are available at dxdoiorg105061dryad943j7
Acknowledgements We thank P Novack-Gottshall and T D Olszewskifor critical reviews M Stachowitsch for comments and S Danisefor help with sample processing This work benefited from visits toParis and Vienna museum collections under the Synthesys program
Funding statement This work was supported by the Austrian ScienceFund (FWF) projects P19013-Bio the Slovak Research and Develop-ment Agency (APVV 0644ndash10) the Slovak Scientific Grant Agency(VEGA 0068ndash10) and the NSF (DEB-0919451)
ProcRSoc
References
B28120141533
1 Pandolfi JM 1996 Limited membership inPleistocene reef coral assemblages from the HuonPeninsula Papua New Guinea constancy duringglobal change Paleobiology 22 152 ndash 176
2 Ivany LC Brett CE Wall HLB Wall PD Handley JC2009 Relative taxonomic and ecologic stability inDevonian marine faunas of New York State a test ofcoordinated stasis Paleobiology 35 499 ndash 524(doi1016660094-8373-354499)
3 Holland SM Zaffos A 2011 Niche conservatismalong an onshore ndash offshore gradient Paleobiology37 270 ndash 286 (doi101666100321)
4 Buzas M Hayek LC Culver SJ Hayward BWOsterman LE 2014 Ecological and evolutionaryconsequences of benthic community stasis in thevery deep sea (1500m) Paleobiology 40102 ndash 112 (doi10166613010)
5 Zuschin M Harzhauser M Hengst B Mandic ORoetzel R 2014 Long-term ecosystem stability in aLower Miocene estuarine succession Geology 421 ndash 4 (doi101130G347611)
6 Roy K Jablonski D Valentine JW 1995 Thermallyanomalous assemblages revisited patterns in theextraprovincial latitudinal range shifts ofPleistocene marine mollusks Geology 231071 ndash 1074 (doi1011300091-7613(1995)0231071TAARPI23CO2)
7 Jackson ST Overpeck JT 2000 Responses of plantpopulations and communities to environmentalchanges of the Late Quaternary Paleobiology26(Suppl 4) 194 ndash 220 (doi1016660094-8373(2000)26[194ROPPAC]20CO2)
8 Yasuhara M Hunt G Cronin TM Okahashi H 2009Temporal latitudinal-gradient dynamics and tropicalinstability of deep-sea species diversity Proc NatlAcad Sci USA 106 21 717 ndash 21 720 (doi101073pnas0910935106)
9 Tomasovych A Kidwell SM 2010 The effects oftemporal resolution on species turnover and ontesting metacommunity models Am Nat 175587 ndash 606 (doi101086651661)
10 Roy K 2001 Analyzing temporal trends in regionaldiversity a biogeographic perspective Paleobiology24 631 ndash 645 (doi1016660094-8373(2001)0270631ATTIRD20CO2)
11 Roy K Goldberg EE 2007 Origination extinctionand dispersal integrative models for understanding
present-day diversity gradients Am Nat 170S71 ndash S85 (doi101086519403)
12 Holland SM Patzkowsky M 2007 Gradient ecologyof a biotic invasion biofacies of the typeCincinnatian series (Upper Ordovician) CincinnatiOhio region USA Palaios 22 392 ndash 407 (doi102110palo2006p06-066r)
13 Miller AI Foote M 2009 Epicontinental seas versusopen-ocean settings the kinetics of mass extinctionand origination Science 326 1106 ndash 1109 (doi101126science1180061)
14 Sepkoski Jr JJ 1987 Environmental trends inextinction during the Phanerozoic Science 23564 ndash 66 (doi101126science11539724)
15 Sepkoski Jr JJ 1991 A model on onshore-offshorechange in faunal diversity Paleobiology 17 58 ndash 77
16 Kiessling W Aberhan M 2007 Environmentaldeterminants of marine benthic biodiversitydynamics through Triassic-Jurassic timesPaleobiology 33 414 ndash 434 (doi101666060691)
17 Bottjer DJ Jablonski D 1988 Paleoenvironmentalpatterns in the evolution of post-Paleozoic benthicmarine invertebrates Palaios 3 540 ndash 560 (doi1023073514444)
18 Jablonski D Lidgard S Taylor PS 1997 Comparativeecology of bryozoan radiations origin of noveltiesin cyclostomes and cheilostomes Palaios 12505 ndash 523 (doi1023073515408)
19 Kiessling W Simpson C Foote M 2010 Reefs ascradles of evolution and sources of biodiversity inthe Phanerozoic Science 327 196 ndash 198 (doi101126science1182241)
20 Jablonski D Belanger CL Berke SK Huang S KrugAZ Roy K Tomasovych A Valentine JW 2013 Outof the tropics but how Fossils bridge species andthermal ranges in the dynamics of the marinelatitudinal diversity gradient Proc Natl Acad SciUSA 110 10 487 ndash 10 494 (doi101073pnas1308997110)
21 Smith KF Gaines SD 2003 Rapoportrsquos bathymetricrule and the latitudinal species diversity gradient fornortheast Pacific fishes and northwest Atlanticgastropods evidence against a causal linkJ Biogeogr 30 1153 ndash 1159 (doi101046j1365-2699200300898x)
22 Jablonski D 2005 Evolutionary innovations in thefossil record the intersection of ecology
development and macroevolution J Exp Zool304B 504 ndash 519 (doi101002jezb21075)
23 Stanley SM Wetmore KL Kennett JP 1988Macroevolutionary differences between the twomajor clades of Neogene planktonic ForaminiferaPaleobiology 14 235 ndash 249
24 Nikolaev SD Oskina NS Blyum NS BubenshchikovaNV 1998 Neogene-Quaternary variations of thelsquoPole-Equatorrsquo temperature gradient of the surfaceoceanic waters in the north Atlantic and northPacific Glob Planet Change 18 85 ndash 111 (doi101016S0921-8181(98)00009-5)
25 Stevens GC 1996 Extending Rapoportrsquos rule toPacific marine fishes J Biogeogr 23 149 ndash 154(doi101046j1365-2699199600977x)
26 Dynesius M Jansson R 2000 Evolutionaryconsequences of changes in speciesrsquogeographical distributions driven byMilankovitch climate oscillations Proc Natl AcadSci USA 97 9115 ndash 9120 (doi101073pnas97169115)
27 Holt RD Barfield M Gomulkiewicz R 2004Temporal variation can facilitate niche evolution inharsh sink environments Am Nat 164 187 ndash 200(doi101086422343)
28 Rangel TFLVB Diniz-Filho AF 2005 An evolutionarytolerance model explanining spatial patterns inspecies richness under environmental gradients andgeometric constraints Ecography 25 253 ndash 263(doi101111j0906-7590200504038x)
29 Ghalambor CK Huey RB Martin PR Tewksbury JJWang G 2006 Are mountain passes higher in thetropics Janzenrsquos hypothesis revisited Integr CompBiol 46 5 ndash 17 (doi101093icbicj003)
30 Jackson JBC 1974 Biogeographic consequences ofeurytopy and stenotopy among marine bivalvesand their evolutionary significance Am Nat 108541 ndash 560 (doi101086282933)
31 Jablonski D Valentine JW 1981 Onshore-offshoregradients in Recent eastern Pacific shelf faunas andtheir paleobiogeographic significance In Evolutiontoday (eds GCE Scudder JL Reveal) pp 441 ndash 453Pittsburg PA Carnegie-Mellon University HuntInstitute of Botany Documents
32 Allmon WD 2001 Nutrients temperaturedisturbance and evolution a model for the lateCenozoic marine record of the western Atlantic
rspbroyalsocietypublishingorgProcRSocB
28120141533
10
on October 8 2014rspbroyalsocietypublishingorgDownloaded from
Palaeogeogr Palaeoclim Palaeoecol 166 9 ndash 26(doi101016S0031-0182(00)00199-1)
33 Harley CDG Smith KF Moore VL 2003Environmental variability and biogeographythe relationship between bathymetricdistribution and geographical range size inmarine algae and gastropods Glob Ecol Biogeogr12 499 ndash 506 (doi101046j1466-822X200300062x)
34 Escarguel G Brayard A Bucher H 2008 Evolutionaryrates do not drive latitudinal diversity gradientsJ Zool Syst Evol Res 46 82 ndash 86 (doi101111j1439-0469200700443x)
35 Sunday JM Bates AE Dulvy NK 2011 Globalanalysis of thermal tolerance and latitude inectotherms Proc R Soc B 278 1823 ndash 1830(doi101098rspb20101295)
36 Bell G 2010 Fluctuating selection the perpetualrenewal of adaptation in variable environmentsPhil Trans R Soc B 365 87 ndash 97 (doi101098rstb20090150)
37 Foote M Raup D 1996 Fossil preservation and thestratigraphic ranges of taxa Paleobiology 22 121 ndash 140
38 Raffi S Stanley SM Marasti R 1985 Biogeographicpatterns and Plio-Pleistocene extinction of Bivalviain the Mediterranean and southern North SeaPaleobiology 11 368 ndash 388
39 Dominici S Kowalke T 2007 Depositional dynamicsand the record of ecosystem stability Early Eocenefaunal gradients in the Pyrenean Foreland SpainPalaios 22 268 ndash 284 (doi102110palo2005p05-022r)
40 Huyghe D Merle D Lartaud F Cheype F EmmanuelL 2012 Middle Lutetian climate in the Paris Basinimplications for a marine hotspot ofpaleobiodiversity Facies 58 587 ndash 604 (doi101007s10347-012-0307-3)
41 Draut AE Raymo ME McManus JF Oppo DW 2003Climate stability during the Pliocene warm periodPaleoceanography 18 1078 (doi1010292003PA000889)
42 Blois JL Williams JW Fitzpatrick MC Jackson STFerrier S 2013 Space can substitute for time inpredicting climate-change effects on biodiversityProc Natl Acad Sci USA 110 9374 ndash 9379 (doi101073pnas1220228110)
43 Mellin C Bradshaw CJA Fordham DA Caley MJ2014 Strong but opposing b diversitymdashstabilityrelationships in coral reef fish communitiesProc R Soc B 281 20131993 (doi101098rspb20131993)
44 Anderson MJ Ellingsen KE McArdle BH 2006Multivariate dispersion as a measure of betadiversity Ecol Lett 9 683 ndash 693 (doi101111j1461-0248200600926x)
45 Vovk V 2012 Combining p-values via averaging Seehttparxivorgabs12124966
46 Hurlbert SH 1978 The measurement of nicheoverlap and some relatives Ecology 59 67 ndash 77(doi1023071936632)
47 Caze B Merle D Le Meur M Pacaud J-M Ledon DSaint Martin J-P 2011 Taxonomic implications ofthe residual colour patterns of ampullinidgastropods and their contribution to thediscrimination from naticids Acta Palaeontol Pol56 329 ndash 347 (doi104202app20090084)
48 Ozawa T Kohler F Reid DG Glaubrecht M 2009 Tethyanrelicts on continental coastlines of the northwesternPacific Ocean and Australasia molecular phylogeny andfossil record of batillariid gastropods (CaenogastropodaCerithioidea) Zool Scr 38 503 ndash 525 (doi101111j1463-6409200900390x)
49 Kowalke T Harzhauser M 2004 Early ontogeny andpalaeoecology of the Mid-Miocene rissoidgastropods of the Central Paratethys ActaPalaeontol Pol 49 111 ndash 134
50 Silva CMD Landau B La Perna R 2011Biogeography of Iberian Atlantic Neogenemarginelliform gastropods (MarginellidaeCystiscidae) global change and transatlanticcolonization J Paleontol 85 1052 ndash 1066 (doi10166611-1041)
51 Olszewski TD Patzkowsky ME 2001 Measuringrecurrence of marine biotic gradients a case studyfrom the Pennsylvanian-Permian MidcontinentPalaios 16 440 ndash 460 (doi1016690883-1351(2001)0160444MROMBG20CO2)
52 Pandolfi JM Jackson JBC 2006 Ecologicalpersistence interrupted in Caribbean coral reefsEcol Lett 9 818 ndash 826 (doi101111j1461-0248200600933x)
53 Loreau M Mouquet N Gonzalez A 2003Biodiversity as spatial insurance in heterogeneouslandscapes Proc Natl Acad Sci USA 100 12 765 ndash12 770 (doi101073pnas2235465100)
54 Volkov I Banavar JR Hubbell SP Maritan A 2007Patterns of relative species abundance in rainforestsand coral reefs Nature 450 45 ndash 49 (doi101038nature06197)
55 Olszewski TD 2012 Persistence of high diversity innon-equilibrium ecological communities implicationsfor modern and fossil ecosystems Proc R Soc B 279230 ndash 236 (doi101098rspb20110936)
56 Foote M 2014 Environmental controls ongeographic range size in marine animal generaPaleobiology 40 440 ndash 458 (doi10166613056)
57 Payne JL Finnegan S 2007 The effect of geographicrange on extinction risk during background andmass extinction Proc Natl Acad Sci USA 104 10506 ndash 10 511 (doi101073pnas0701257104)
58 Harnik PG Simpson C Payne JL 2012 Long-termdifferences in extinction risk among the seven formsof rarity Proc R Soc B 279 4969 ndash 4976 (doi101098rspb20121902)
59 Locarnini RA Mishonov AV Antonov JI Boyer TP GarciaHE Baranova OK Zweng MM Johnson DR 2010 Worldocean atlas 2009 volume 1 temperature In NOAA AtlasNESDIS 68 (ed S Levitus) pp 1 ndash 184 Washington DCUS Government Printing Office
60 Belanger CL Jablonski D Roy K Berke SK Krug AZValentine JW 2012 Global environmental predictorsof benthic marine biogeographic structure ProcNatl Acad Sci USA 109 14 046 ndash 14 051 (doi101073pnas1212381109)
61 Buckley LB Hurlbert AH Jetz W 2012 Broad-scaleecological implications of ectothermy andendothermy in changing environments Glob EcolBiogeogr 21 873 ndash 885 (doi101111j1466-8238201100737x)
62 Jocque M Field R Brendonck L De Meester L 2010Climatic control of dispersal-ecological specializationtrade-offs a metacommunity process at the heart ofthe latitudinal diversity gradient Glob Ecol Biogeogr19 244 ndash 252 (doi101111j1466-8238200900510x)
63 Zachos JC Stott LD Lohmann KC 1994 Evolution ofearly Cenozoic marine temperatures Paleoceanography9 353 ndash 387 (doi10102993PA03266)
64 Zachos J Pagani M Sloan L Thomas E Billups K2003 Trends rhythms and aberrations in globalClimate 65 Ma to present Science 292 686 ndash 693(doi101126science1059412)
65 Jacobs DK Lindberg DR 1998 Oxygen and evolutionarypatterns in the sea onshoreoffshore trends and recentrecruitment of deep-sea faunas Proc Natl Acad Sci USA95 9396 ndash 9401 (doi101073pnas95169396)
66 Liow LH Skaug HJ Ergon T Schweder T 2010Global occurrence trajectories of microfossilsenvironmental variability and the rise and fall ofindividual species Paleobiology 36 224 ndash 252(doi101666080801)
67 Lindner A Cairns SD Cunningham CW 2008From offshore to onshore multiple originsof shallow-water corals from deep-sea ancestorsPLoS ONE 3 e2429 (doi101371journalpone0002429)
68 Thuy B Gale AS Kroh A Kucera M Numberger-Thuy LD Reich M Stohr S 2013 Ancient origin ofthe modern deep-sea fauna PLoS ONE 7 e46913(doi101371journalpone0046913)
69 Carney RS 2005 Zonation of deep biota oncontinental margins Oceanogr Mar Biol 43211 ndash 278 (doi1012019781420037449ch6)
70 Menzies RJ George RY Rowe GT 1973 Abyssalenvironment and ecology of the world oceansNew York NY John Wiley amp Sons
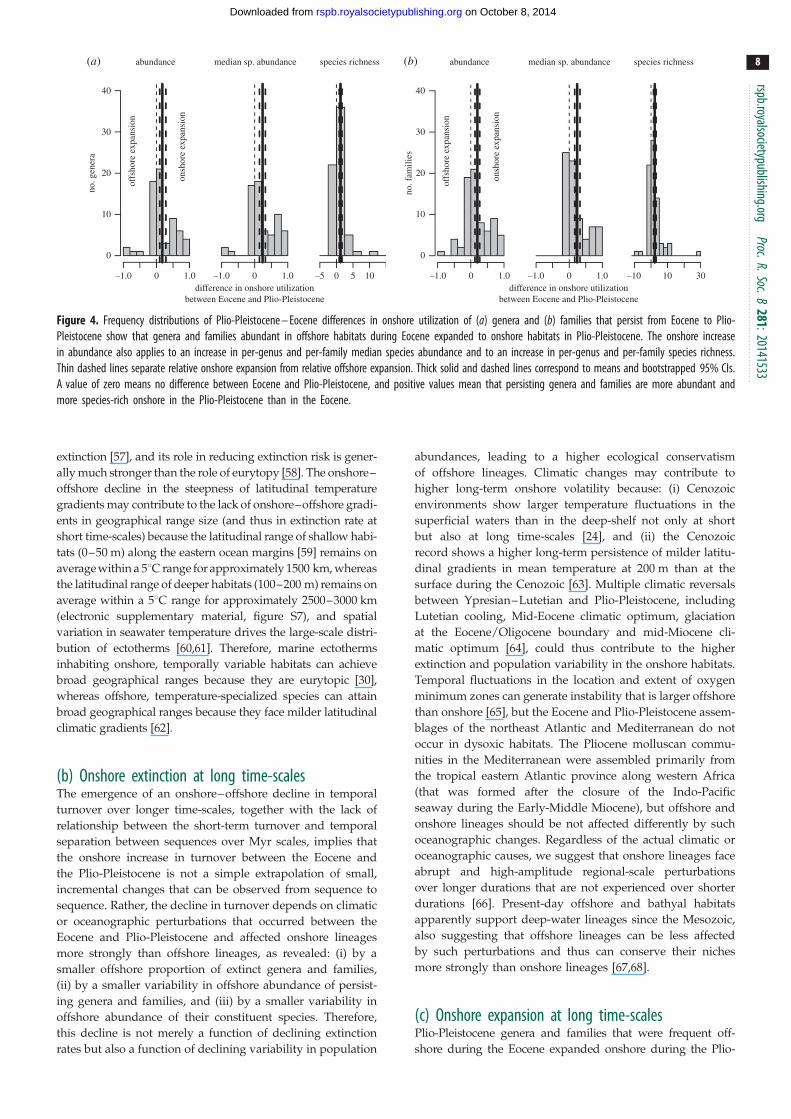
ndash10
0
10
20
30
40
0 10
no g
ener
a
offs
hore
exp
ansi
on
onsh
ore
expa
nsio
n
ndash10 0difference in onshore utilization
between Eocene and Plio-Pleistocene
ndash5 0 5 1010
abundance(a) species richnessmedian sp abundance
ndash10
0
10
20
30
40
0 10
no f
amili
es
offs
hore
exp
ansi
on
onsh
ore
expa
nsio
n
ndash10 0difference in onshore utilization
between Eocene and Plio-Pleistocene
ndash10 10 3010
abundance(b) species richnessmedian sp abundance
Figure 4 Frequency distributions of Plio-Pleistocene ndash Eocene differences in onshore utilization of (a) genera and (b) families that persist from Eocene to Plio-Pleistocene show that genera and families abundant in offshore habitats during Eocene expanded to onshore habitats in Plio-Pleistocene The onshore increasein abundance also applies to an increase in per-genus and per-family median species abundance and to an increase in per-genus and per-family species richnessThin dashed lines separate relative onshore expansion from relative offshore expansion Thick solid and dashed lines correspond to means and bootstrapped 95 CIsA value of zero means no difference between Eocene and Plio-Pleistocene and positive values mean that persisting genera and families are more abundant andmore species-rich onshore in the Plio-Pleistocene than in the Eocene
rspbroyalsocietypublishingorgProcRSocB
28120141533
8
on October 8 2014rspbroyalsocietypublishingorgDownloaded from
extinction [57] and its role in reducing extinction risk is gener-
ally much stronger than the role of eurytopy [58] The onshorendash
offshore decline in the steepness of latitudinal temperature
gradients may contribute to the lack of onshorendashoffshore gradi-
ents in geographical range size (and thus in extinction rate at
short time-scales) because the latitudinal range of shallow habi-
tats (0ndash50 m) along the eastern ocean margins [59] remains on
average within a 58C range for approximately 1500 km whereas
the latitudinal range of deeper habitats (100ndash200 m) remains on
average within a 58C range for approximately 2500ndash3000 km
(electronic supplementary material figure S7) and spatial
variation in seawater temperature drives the large-scale distri-
bution of ectotherms [6061] Therefore marine ectotherms
inhabiting onshore temporally variable habitats can achieve
broad geographical ranges because they are eurytopic [30]
whereas offshore temperature-specialized species can attain
broad geographical ranges because they face milder latitudinal
climatic gradients [62]
(b) Onshore extinction at long time-scalesThe emergence of an onshorendashoffshore decline in temporal
turnover over longer time-scales together with the lack of
relationship between the short-term turnover and temporal
separation between sequences over Myr scales implies that
the onshore increase in turnover between the Eocene and
the Plio-Pleistocene is not a simple extrapolation of small
incremental changes that can be observed from sequence to
sequence Rather the decline in turnover depends on climatic
or oceanographic perturbations that occurred between the
Eocene and Plio-Pleistocene and affected onshore lineages
more strongly than offshore lineages as revealed (i) by a
smaller offshore proportion of extinct genera and families
(ii) by a smaller variability in offshore abundance of persist-
ing genera and families and (iii) by a smaller variability in
offshore abundance of their constituent species Therefore
this decline is not merely a function of declining extinction
rates but also a function of declining variability in population
abundances leading to a higher ecological conservatism
of offshore lineages Climatic changes may contribute to
higher long-term onshore volatility because (i) Cenozoic
environments show larger temperature fluctuations in the
superficial waters than in the deep-shelf not only at short
but also at long time-scales [24] and (ii) the Cenozoic
record shows a higher long-term persistence of milder latitu-
dinal gradients in mean temperature at 200 m than at the
surface during the Cenozoic [63] Multiple climatic reversals
between YpresianndashLutetian and Plio-Pleistocene including
Lutetian cooling Mid-Eocene climatic optimum glaciation
at the EoceneOligocene boundary and mid-Miocene cli-
matic optimum [64] could thus contribute to the higher
extinction and population variability in the onshore habitats
Temporal fluctuations in the location and extent of oxygen
minimum zones can generate instability that is larger offshore
than onshore [65] but the Eocene and Plio-Pleistocene assem-
blages of the northeast Atlantic and Mediterranean do not
occur in dysoxic habitats The Pliocene molluscan commu-
nities in the Mediterranean were assembled primarily from
the tropical eastern Atlantic province along western Africa
(that was formed after the closure of the Indo-Pacific
seaway during the Early-Middle Miocene) but offshore and
onshore lineages should be not affected differently by such
oceanographic changes Regardless of the actual climatic or
oceanographic causes we suggest that onshore lineages face
abrupt and high-amplitude regional-scale perturbations
over longer durations that are not experienced over shorter
durations [66] Present-day offshore and bathyal habitats
apparently support deep-water lineages since the Mesozoic
also suggesting that offshore lineages can be less affected
by such perturbations and thus can conserve their niches
more strongly than onshore lineages [6768]
(c) Onshore expansion at long time-scalesPlio-Pleistocene genera and families that were frequent off-
shore during the Eocene expanded onshore during the Plio-
rspbroyalsocietypublishingorg
9
on October 8 2014rspbroyalsocietypublishingorgDownloaded from
Pleistocene and also maintained their presence offshore An
increase in the proportion of bathymetric generalists and the
flattening of the onshorendashoffshore gradient in bathymetric
breadth imply that this long-term onshore expansion observed
in our study can be modulated by climatic changes that led to
the net shift from tropical Eocene to warm-temperate Plio-
Pleistocene conditions Poleward latitudinal shifts are typically
associated with the emergence of colder deep-shelf waters and
with declining steepness of thermal bathymetric gradients at
higher latitudes Such changes in temperature and in the struc-
ture of the thermal bathymetric gradient produce a latitudinal
increase in the bathymetric range size of marine ectotherms
and their shallow-water emergence at higher latitudes [6970]
Data accessibility Source data are available at dxdoiorg105061dryad943j7
Acknowledgements We thank P Novack-Gottshall and T D Olszewskifor critical reviews M Stachowitsch for comments and S Danisefor help with sample processing This work benefited from visits toParis and Vienna museum collections under the Synthesys program
Funding statement This work was supported by the Austrian ScienceFund (FWF) projects P19013-Bio the Slovak Research and Develop-ment Agency (APVV 0644ndash10) the Slovak Scientific Grant Agency(VEGA 0068ndash10) and the NSF (DEB-0919451)
ProcRSoc
References
B28120141533
1 Pandolfi JM 1996 Limited membership inPleistocene reef coral assemblages from the HuonPeninsula Papua New Guinea constancy duringglobal change Paleobiology 22 152 ndash 176
2 Ivany LC Brett CE Wall HLB Wall PD Handley JC2009 Relative taxonomic and ecologic stability inDevonian marine faunas of New York State a test ofcoordinated stasis Paleobiology 35 499 ndash 524(doi1016660094-8373-354499)
3 Holland SM Zaffos A 2011 Niche conservatismalong an onshore ndash offshore gradient Paleobiology37 270 ndash 286 (doi101666100321)
4 Buzas M Hayek LC Culver SJ Hayward BWOsterman LE 2014 Ecological and evolutionaryconsequences of benthic community stasis in thevery deep sea (1500m) Paleobiology 40102 ndash 112 (doi10166613010)
5 Zuschin M Harzhauser M Hengst B Mandic ORoetzel R 2014 Long-term ecosystem stability in aLower Miocene estuarine succession Geology 421 ndash 4 (doi101130G347611)
6 Roy K Jablonski D Valentine JW 1995 Thermallyanomalous assemblages revisited patterns in theextraprovincial latitudinal range shifts ofPleistocene marine mollusks Geology 231071 ndash 1074 (doi1011300091-7613(1995)0231071TAARPI23CO2)
7 Jackson ST Overpeck JT 2000 Responses of plantpopulations and communities to environmentalchanges of the Late Quaternary Paleobiology26(Suppl 4) 194 ndash 220 (doi1016660094-8373(2000)26[194ROPPAC]20CO2)
8 Yasuhara M Hunt G Cronin TM Okahashi H 2009Temporal latitudinal-gradient dynamics and tropicalinstability of deep-sea species diversity Proc NatlAcad Sci USA 106 21 717 ndash 21 720 (doi101073pnas0910935106)
9 Tomasovych A Kidwell SM 2010 The effects oftemporal resolution on species turnover and ontesting metacommunity models Am Nat 175587 ndash 606 (doi101086651661)
10 Roy K 2001 Analyzing temporal trends in regionaldiversity a biogeographic perspective Paleobiology24 631 ndash 645 (doi1016660094-8373(2001)0270631ATTIRD20CO2)
11 Roy K Goldberg EE 2007 Origination extinctionand dispersal integrative models for understanding
present-day diversity gradients Am Nat 170S71 ndash S85 (doi101086519403)
12 Holland SM Patzkowsky M 2007 Gradient ecologyof a biotic invasion biofacies of the typeCincinnatian series (Upper Ordovician) CincinnatiOhio region USA Palaios 22 392 ndash 407 (doi102110palo2006p06-066r)
13 Miller AI Foote M 2009 Epicontinental seas versusopen-ocean settings the kinetics of mass extinctionand origination Science 326 1106 ndash 1109 (doi101126science1180061)
14 Sepkoski Jr JJ 1987 Environmental trends inextinction during the Phanerozoic Science 23564 ndash 66 (doi101126science11539724)
15 Sepkoski Jr JJ 1991 A model on onshore-offshorechange in faunal diversity Paleobiology 17 58 ndash 77
16 Kiessling W Aberhan M 2007 Environmentaldeterminants of marine benthic biodiversitydynamics through Triassic-Jurassic timesPaleobiology 33 414 ndash 434 (doi101666060691)
17 Bottjer DJ Jablonski D 1988 Paleoenvironmentalpatterns in the evolution of post-Paleozoic benthicmarine invertebrates Palaios 3 540 ndash 560 (doi1023073514444)
18 Jablonski D Lidgard S Taylor PS 1997 Comparativeecology of bryozoan radiations origin of noveltiesin cyclostomes and cheilostomes Palaios 12505 ndash 523 (doi1023073515408)
19 Kiessling W Simpson C Foote M 2010 Reefs ascradles of evolution and sources of biodiversity inthe Phanerozoic Science 327 196 ndash 198 (doi101126science1182241)
20 Jablonski D Belanger CL Berke SK Huang S KrugAZ Roy K Tomasovych A Valentine JW 2013 Outof the tropics but how Fossils bridge species andthermal ranges in the dynamics of the marinelatitudinal diversity gradient Proc Natl Acad SciUSA 110 10 487 ndash 10 494 (doi101073pnas1308997110)
21 Smith KF Gaines SD 2003 Rapoportrsquos bathymetricrule and the latitudinal species diversity gradient fornortheast Pacific fishes and northwest Atlanticgastropods evidence against a causal linkJ Biogeogr 30 1153 ndash 1159 (doi101046j1365-2699200300898x)
22 Jablonski D 2005 Evolutionary innovations in thefossil record the intersection of ecology
development and macroevolution J Exp Zool304B 504 ndash 519 (doi101002jezb21075)
23 Stanley SM Wetmore KL Kennett JP 1988Macroevolutionary differences between the twomajor clades of Neogene planktonic ForaminiferaPaleobiology 14 235 ndash 249
24 Nikolaev SD Oskina NS Blyum NS BubenshchikovaNV 1998 Neogene-Quaternary variations of thelsquoPole-Equatorrsquo temperature gradient of the surfaceoceanic waters in the north Atlantic and northPacific Glob Planet Change 18 85 ndash 111 (doi101016S0921-8181(98)00009-5)
25 Stevens GC 1996 Extending Rapoportrsquos rule toPacific marine fishes J Biogeogr 23 149 ndash 154(doi101046j1365-2699199600977x)
26 Dynesius M Jansson R 2000 Evolutionaryconsequences of changes in speciesrsquogeographical distributions driven byMilankovitch climate oscillations Proc Natl AcadSci USA 97 9115 ndash 9120 (doi101073pnas97169115)
27 Holt RD Barfield M Gomulkiewicz R 2004Temporal variation can facilitate niche evolution inharsh sink environments Am Nat 164 187 ndash 200(doi101086422343)
28 Rangel TFLVB Diniz-Filho AF 2005 An evolutionarytolerance model explanining spatial patterns inspecies richness under environmental gradients andgeometric constraints Ecography 25 253 ndash 263(doi101111j0906-7590200504038x)
29 Ghalambor CK Huey RB Martin PR Tewksbury JJWang G 2006 Are mountain passes higher in thetropics Janzenrsquos hypothesis revisited Integr CompBiol 46 5 ndash 17 (doi101093icbicj003)
30 Jackson JBC 1974 Biogeographic consequences ofeurytopy and stenotopy among marine bivalvesand their evolutionary significance Am Nat 108541 ndash 560 (doi101086282933)
31 Jablonski D Valentine JW 1981 Onshore-offshoregradients in Recent eastern Pacific shelf faunas andtheir paleobiogeographic significance In Evolutiontoday (eds GCE Scudder JL Reveal) pp 441 ndash 453Pittsburg PA Carnegie-Mellon University HuntInstitute of Botany Documents
32 Allmon WD 2001 Nutrients temperaturedisturbance and evolution a model for the lateCenozoic marine record of the western Atlantic
rspbroyalsocietypublishingorgProcRSocB
28120141533
10
on October 8 2014rspbroyalsocietypublishingorgDownloaded from
Palaeogeogr Palaeoclim Palaeoecol 166 9 ndash 26(doi101016S0031-0182(00)00199-1)
33 Harley CDG Smith KF Moore VL 2003Environmental variability and biogeographythe relationship between bathymetricdistribution and geographical range size inmarine algae and gastropods Glob Ecol Biogeogr12 499 ndash 506 (doi101046j1466-822X200300062x)
34 Escarguel G Brayard A Bucher H 2008 Evolutionaryrates do not drive latitudinal diversity gradientsJ Zool Syst Evol Res 46 82 ndash 86 (doi101111j1439-0469200700443x)
35 Sunday JM Bates AE Dulvy NK 2011 Globalanalysis of thermal tolerance and latitude inectotherms Proc R Soc B 278 1823 ndash 1830(doi101098rspb20101295)
36 Bell G 2010 Fluctuating selection the perpetualrenewal of adaptation in variable environmentsPhil Trans R Soc B 365 87 ndash 97 (doi101098rstb20090150)
37 Foote M Raup D 1996 Fossil preservation and thestratigraphic ranges of taxa Paleobiology 22 121 ndash 140
38 Raffi S Stanley SM Marasti R 1985 Biogeographicpatterns and Plio-Pleistocene extinction of Bivalviain the Mediterranean and southern North SeaPaleobiology 11 368 ndash 388
39 Dominici S Kowalke T 2007 Depositional dynamicsand the record of ecosystem stability Early Eocenefaunal gradients in the Pyrenean Foreland SpainPalaios 22 268 ndash 284 (doi102110palo2005p05-022r)
40 Huyghe D Merle D Lartaud F Cheype F EmmanuelL 2012 Middle Lutetian climate in the Paris Basinimplications for a marine hotspot ofpaleobiodiversity Facies 58 587 ndash 604 (doi101007s10347-012-0307-3)
41 Draut AE Raymo ME McManus JF Oppo DW 2003Climate stability during the Pliocene warm periodPaleoceanography 18 1078 (doi1010292003PA000889)
42 Blois JL Williams JW Fitzpatrick MC Jackson STFerrier S 2013 Space can substitute for time inpredicting climate-change effects on biodiversityProc Natl Acad Sci USA 110 9374 ndash 9379 (doi101073pnas1220228110)
43 Mellin C Bradshaw CJA Fordham DA Caley MJ2014 Strong but opposing b diversitymdashstabilityrelationships in coral reef fish communitiesProc R Soc B 281 20131993 (doi101098rspb20131993)
44 Anderson MJ Ellingsen KE McArdle BH 2006Multivariate dispersion as a measure of betadiversity Ecol Lett 9 683 ndash 693 (doi101111j1461-0248200600926x)
45 Vovk V 2012 Combining p-values via averaging Seehttparxivorgabs12124966
46 Hurlbert SH 1978 The measurement of nicheoverlap and some relatives Ecology 59 67 ndash 77(doi1023071936632)
47 Caze B Merle D Le Meur M Pacaud J-M Ledon DSaint Martin J-P 2011 Taxonomic implications ofthe residual colour patterns of ampullinidgastropods and their contribution to thediscrimination from naticids Acta Palaeontol Pol56 329 ndash 347 (doi104202app20090084)
48 Ozawa T Kohler F Reid DG Glaubrecht M 2009 Tethyanrelicts on continental coastlines of the northwesternPacific Ocean and Australasia molecular phylogeny andfossil record of batillariid gastropods (CaenogastropodaCerithioidea) Zool Scr 38 503 ndash 525 (doi101111j1463-6409200900390x)
49 Kowalke T Harzhauser M 2004 Early ontogeny andpalaeoecology of the Mid-Miocene rissoidgastropods of the Central Paratethys ActaPalaeontol Pol 49 111 ndash 134
50 Silva CMD Landau B La Perna R 2011Biogeography of Iberian Atlantic Neogenemarginelliform gastropods (MarginellidaeCystiscidae) global change and transatlanticcolonization J Paleontol 85 1052 ndash 1066 (doi10166611-1041)
51 Olszewski TD Patzkowsky ME 2001 Measuringrecurrence of marine biotic gradients a case studyfrom the Pennsylvanian-Permian MidcontinentPalaios 16 440 ndash 460 (doi1016690883-1351(2001)0160444MROMBG20CO2)
52 Pandolfi JM Jackson JBC 2006 Ecologicalpersistence interrupted in Caribbean coral reefsEcol Lett 9 818 ndash 826 (doi101111j1461-0248200600933x)
53 Loreau M Mouquet N Gonzalez A 2003Biodiversity as spatial insurance in heterogeneouslandscapes Proc Natl Acad Sci USA 100 12 765 ndash12 770 (doi101073pnas2235465100)
54 Volkov I Banavar JR Hubbell SP Maritan A 2007Patterns of relative species abundance in rainforestsand coral reefs Nature 450 45 ndash 49 (doi101038nature06197)
55 Olszewski TD 2012 Persistence of high diversity innon-equilibrium ecological communities implicationsfor modern and fossil ecosystems Proc R Soc B 279230 ndash 236 (doi101098rspb20110936)
56 Foote M 2014 Environmental controls ongeographic range size in marine animal generaPaleobiology 40 440 ndash 458 (doi10166613056)
57 Payne JL Finnegan S 2007 The effect of geographicrange on extinction risk during background andmass extinction Proc Natl Acad Sci USA 104 10506 ndash 10 511 (doi101073pnas0701257104)
58 Harnik PG Simpson C Payne JL 2012 Long-termdifferences in extinction risk among the seven formsof rarity Proc R Soc B 279 4969 ndash 4976 (doi101098rspb20121902)
59 Locarnini RA Mishonov AV Antonov JI Boyer TP GarciaHE Baranova OK Zweng MM Johnson DR 2010 Worldocean atlas 2009 volume 1 temperature In NOAA AtlasNESDIS 68 (ed S Levitus) pp 1 ndash 184 Washington DCUS Government Printing Office
60 Belanger CL Jablonski D Roy K Berke SK Krug AZValentine JW 2012 Global environmental predictorsof benthic marine biogeographic structure ProcNatl Acad Sci USA 109 14 046 ndash 14 051 (doi101073pnas1212381109)
61 Buckley LB Hurlbert AH Jetz W 2012 Broad-scaleecological implications of ectothermy andendothermy in changing environments Glob EcolBiogeogr 21 873 ndash 885 (doi101111j1466-8238201100737x)
62 Jocque M Field R Brendonck L De Meester L 2010Climatic control of dispersal-ecological specializationtrade-offs a metacommunity process at the heart ofthe latitudinal diversity gradient Glob Ecol Biogeogr19 244 ndash 252 (doi101111j1466-8238200900510x)
63 Zachos JC Stott LD Lohmann KC 1994 Evolution ofearly Cenozoic marine temperatures Paleoceanography9 353 ndash 387 (doi10102993PA03266)
64 Zachos J Pagani M Sloan L Thomas E Billups K2003 Trends rhythms and aberrations in globalClimate 65 Ma to present Science 292 686 ndash 693(doi101126science1059412)
65 Jacobs DK Lindberg DR 1998 Oxygen and evolutionarypatterns in the sea onshoreoffshore trends and recentrecruitment of deep-sea faunas Proc Natl Acad Sci USA95 9396 ndash 9401 (doi101073pnas95169396)
66 Liow LH Skaug HJ Ergon T Schweder T 2010Global occurrence trajectories of microfossilsenvironmental variability and the rise and fall ofindividual species Paleobiology 36 224 ndash 252(doi101666080801)
67 Lindner A Cairns SD Cunningham CW 2008From offshore to onshore multiple originsof shallow-water corals from deep-sea ancestorsPLoS ONE 3 e2429 (doi101371journalpone0002429)
68 Thuy B Gale AS Kroh A Kucera M Numberger-Thuy LD Reich M Stohr S 2013 Ancient origin ofthe modern deep-sea fauna PLoS ONE 7 e46913(doi101371journalpone0046913)
69 Carney RS 2005 Zonation of deep biota oncontinental margins Oceanogr Mar Biol 43211 ndash 278 (doi1012019781420037449ch6)
70 Menzies RJ George RY Rowe GT 1973 Abyssalenvironment and ecology of the world oceansNew York NY John Wiley amp Sons