Ocean acidification risk assessment for Alaska's fishery sector
1 3
Mar BiolDOI 10.1007/s00227-014-2493-8
OrIgInal PaPer
One size fits all: stability of metabolic scaling under warming and ocean acidification in echinoderms
Nicholas Carey · Sam Dupont · Bengt Lundve · Julia D. Sigwart
received: 25 February 2014 / accepted: 1 July 2014 © Springer-Verlag Berlin Heidelberg 2014
stability in metabolic scaling under different abiotic condi-tions; the mass scaling exponent (b) varied in value between species, but not within species under different conditions. additionally, we found no effect of Oa on metabolic rates in any species. These data suggest responses to abiotic stressors are not modulated by body size in these species, as reflected in the stability of the metabolic scaling relationship. Such equivalence in response across ontogenetic size ranges has important implications for the stability of ecological food webs.
Introduction
In the marine environment, the most serious anthropogenic stressors are a consequence of increasing atmospheric CO2, which has two major impacts; increased retention of heat in the atmosphere, the great majority of which is sub-sequently passed to the oceans (Bindoff et al. 2007); and absorption of increased amounts of CO2 at the sea surface, forming carbonic acid and decreasing seawater pH, a pro-cess commonly known as ocean acidification (Oa) (Doney et al. 2009). While major changes to temperature and ocean pH have occurred over geological timescales, the present changes are unprecedented in their rapidity (Doney et al. 2009; Diffenbaugh and Field 2013), and there remains substantial uncertainty as to how natural communities may be affected, and the potential for species to adapt to new conditions. Of these two facets, Oa may be the more per-vasive; many organisms, at least those in temperate and tropical regions, may avoid higher temperatures by shift-ing their ranges polewards towards colder latitudes (Wer-nberg et al. 2012), or through vertical migration to deeper, colder waters (Perry et al. 2005). Though seawater pH is highly variable on a regional scale (Mcelhany and Busch
Abstract responses by marine species to ocean acidi-fication (Oa) have recently been shown to be modulated by external factors including temperature, food supply and salinity. However the role of a fundamental biological param-eter relevant to all organisms, that of body size, in govern-ing responses to multiple stressors has been almost entirely overlooked. recent consensus suggests allometric scaling of metabolism with body size differs between species, the commonly cited ‘universal’ mass scaling exponent (b) of ¾ representing an average of exponents that naturally vary. One model, the Metabolic-level Boundaries hypothesis, provides a testable prediction: that b will decrease within species under increasing temperature. However, no previous stud-ies have examined how metabolic scaling may be directly affected by Oa. We acclimated a wide body-mass range of three common ne atlantic echinoderms (the sea star Aste-rias rubens, the brittlestars Ophiothrix fragilis and Amphiura filiformis) to two levels of pCO2 and three temperatures, and metabolic rates were determined using closed-chamber respirometry. The results show that contrary to some mod-els these echinoderm species possess a notable degree of
Communicated by H.O. Pörtner.
n. Carey (*) · J. D. Sigwart Marine laboratory, Queen’s University Belfast, 12-13 The Strand, Portaferry, County Down BT22 1PF, northern Ireland, UKe-mail: [email protected]
n. Carey · J. D. Sigwart School of Biological Sciences, Queen’s University Belfast, lisburn road, Belfast BT9 7Bl, northern Ireland, UK
S. Dupont · B. lundve Department of Marine ecology, Sven lovén Centre for Marine Sciences, University of gothenburg, Kristineberg, Sweden
Mar Biol
1 3
2013), Oa will be a ubiquitous condition, and through ver-tical mixing of the oceans will eventually affect the entire marine ecosystem.
Physiological responses of species to these combined stressors will determine future survival, distribution, and ecological interactions (Pörtner and Farrell 2008; Widdi-combe and Spicer 2008; Kelly and Hofmann 2012). The great majority of organisms in the marine environment are ectothermic, their metabolic rates chiefly determined by two factors; the temperature of the surrounding seawater, and their body size. Higher metabolic rates require organ-isms to increase their uptake of resources, and a shortfall between metabolic requirements and resource intake will lead to trade-offs between physiological processes requir-ing energy. Such trade-offs may lead to reduced fitness and survival (Morley et al. 2009). In addition, an increase in metabolism, and subsequent increased requirement for oxygen, may lead to reduction in aerobic scope (Morley et al. 2009), and may also be compounded by the fact that warmer water holds less dissolved oxygen (Clark et al. 2013).
The other major factor affecting metabolic rate is body size. How metabolism changes with body size has been a subject of much historical debate (agutter and Wheat-ley 2004). Metabolic rates (R) typically increase relative to organismal body size according to the power function R = aMb, where M is body mass, a is a normalisation coef-ficient which varies with metabolic level, and b is a scaling exponent (Krogh 1916; Kleiber 1932; Bokma 2004). The same relationship can be represented as a linear regres-sion with slope b on a log–log plot of M against R (gla-zier 2010). The value of b has historically been considered a fundamental property related to internal body design (Kleiber 1947; Schmidt-nielsen 1984; West et al. 1997), and much of the debate surrounding metabolic scaling has centred on different values for b, and the various models proposed to explain these values. rubner (1883) suggested two-thirds (0.667), based on the surface-area-to-volume ratio of three-dimensional objects. However, the value of three-quarters (0.75) was more commonly observed in empirical studies (Kleiber 1932; Hemmingsen 1960; Peters 1983). West et al. (1997) proposed a prominent theoreti-cal framework explaining the value of 0.75 based on the fractal nature of biological resource distribution networks (the WBe model), but this model has been the subject of much criticism for its broad assumptions and reductionism of biological complexity (Dodds et al. 2001; Darveau et al. 2002; Symonds and elgar 2002; White and Seymour 2003; agutter and Wheatley 2004; Bokma 2004; Suarez et al. 2004; Savage et al. 2008; White and Kearney 2013).
There appears however to be much variability around the value of 0.75 (glazier 2005), and this value may simply represent an interspecies ‘average’ of a
variable physiological parameter (riisgård 1998; agut-ter and Wheatley 2004; Bokma 2004; Suarez et al. 2004; glazier 2006; Seibel 2007; Duncan et al. 2007; Brey 2010; White 2011). The value of b may have a systematic vari-ation within certain boundaries related to physiological, ecological and environmental factors (White and Kearney 2013). One proposed model, the Metabolic-level Bounda-ries (MlB) hypothesis (glazier 2005, 2010), suggests b varies between 0.667 and 1.0 according to metabolic and activity levels of organisms. Other models, such as the ‘cell size’ (Kozłowski et al. 2003), and ‘dynamic energy budget’ (Kooijman 2010) models also predict a 0.667–1.0 variation in scaling exponents. Many of the competing models (though they are not necessarily exclusive of each other) predict similar boundary values and variability for b, and many also predict a central tendency close to 0.75, which means experimental tests of particular models are problematic (White and Kearney 2013). One prediction of the MlB model however, is that because of the expo-nential effect of temperature on metabolism in ectotherms, as temperature increases the value of b should decrease (Killen et al. 2010; Ohlberger et al. 2012). Killen et al. (2010) showed support for this prediction interspecifically through meta-analysis on fish species. a negative tem-perature dependency of b has also been observed in some experimental studies (luo and Wang 2012; Ohlberger et al. 2012; Doyle et al. 2012; Weldon et al. 2013). This is not a universal pattern however, and the relationship between temperature and scaling has been found to be highly vari-able (glazier 2005).
Models such as the MlB provide a direct mechanistic link between ecology and metabolic scaling, because an ecological factor affecting routine metabolism could poten-tially affect the value of b (Killen et al. 2010). Metabolic rates (and hence body size) have been used to explain broad scale patterns in ecology, such as in the Metabolic Theory of ecology (MTe) (Brown et al. 2004). Such large-scale predictive models frequently use single ‘universal’ scaling values (most commonly 0.75), effectively under the assumption that there is no natural variation in b. In addi-tion, such models assume that the effects of body size and temperature on metabolism are independent of each other (Killen et al. 2010; Ohlberger et al. 2012). If, as the MlB suggests, there is an interaction between temperature and metabolic scaling, such models will require revision.
The effect of ocean acidification (Oa) on metabolism, if one is observed, varies between species (Kroeker et al. 2013), and even within species under different combi-nations of other stressors (e.g. Christensen et al. 2011). Therefore, unlike with temperature, we lack a theoretical framework for predicting its direct effect on metabolic scal-ing. One previous study, on a freshwater fish, has examined changes to metabolic allometry under a severe pH change
Mar Biol
1 3
of 3.5 units (Vaca and White 2010), however the present study is the first to consider the direct effects on meta-bolic scaling of the complex changes to seawater carbonate chemistry under Oa.
echinoderms are major components of the marine eco-system (Dupont et al. 2010), often shaping ecological assemblages (Paine 1966) and dominating benthic commu-nity biomass (Hughes et al. 2011). Warming and Oa have shown generally negative impacts to development and sur-vival in echinoderm larvae (reviewed in Byrne et al. 2013; Dupont and Thorndyke 2013), but effects on adults appear to be variable (Christensen et al. 2011). Here we examine the effects of temperature and pCO2 on metabolism in three common atlantic asteroid and ophiuroid species. Using broad body size ranges, we aim to determine metabolic scaling (b) in these species, whether scaling is variable under different conditions, and test the specific prediction of the MlB hypothesis that the value of b decreases with increasing temperature.
Materials and methods
Three common eastern atlantic echinoderm species were chosen for experiments; the sea star Asterias rubens (lin-naeus, 1758), the brittlestars Ophiothrix fragilis (abild-gaard, 1789) and Amphiura filiformis (O F Müller, 1776). all specimens were collected by dredge in gullmar Fjord, Sweden, and held in natural flowthrough seawater (salin-ity 32 ‰) at the Sven lovén Centre for Marine Sciences, Kristineberg, University of gothenburg. Individuals miss-ing arms or undergoing arm regeneration were excluded. Within each species, specimens were sorted into six treat-ment groups of approximately 20–25 individuals represent-ing wide body size ranges. each group was allocated to one of six treatments (2 pCO2 × 3 temperatures): control pCO2 (~pH 8.0), or elevated pCO2 (~pH 7.5); in low (~10 °C), medium (~15 °C), and high (~20 °C) temperatures. all experimental animals were acclimated to treatment con-ditions for 1 week while starved, prior to experimental
recordings. each treatment comprised two replicate 20 l tanks, and the treatment specimen group was divided ran-domly between the two tanks. Temperature was main-tained through a temperature-controlled seawater supply (±0.2 °C). Seawater carbonate chemistry was maintained using a computerised feedback system (aquaMedic, Bis-sendorf, germany) that regulates pH by addition of pure gaseous CO2 directly into the seawater (±0.02 pH units). The apparatus was contained in a constant temperature facility that maintained air and seawater temperature, and temperature was recorded daily. Seawater samples for pHT (total scale) and total alkalinity (aT) were collected twice weekly. aT was determined on filtered water samples with a titration system (Titroline alpha Plus, SI analytics). pHT was measured using a Metrohm (827 pH lab) electrode and were adjusted for pH measurements on the total scale using Tris (Tris/HCl) and aMP (2-aminopyridine/HCl) buffer solutions with a salinity of 32 (provided by Unité d’Océanographie Chimique, Université de liège, Bel-gium). Seawater carbonate system speciation (Table 1) was calculated from pHT and aT with CO2Calc (version 1.0 for Mac OS X) using the dissociation constants by Mehrbach et al. (1973) as refitted by Dickson and Millero (1987).
after 1 week of acclimation, respiratory rates (VO2, mgO2 h−1) and subsequently ash-free dry mass (aFDM, g) of each specimen were determined as per the protocol described in Carey et al. (2013). Briefly, specimens were sealed in perspex respirometry chambers fitted with small stirbars and placed in a waterbath at the appropriate treat-ment temperature situated above magnetic stirring plates. Oxygen concentrations were recorded at one-second inter-vals using optical oxygen probes (FOXY system, Ocean Optics, Dunedin, Fl, USa). recordings from chambers with seawater but no specimen were used to quantify background rates of oxygen consumption by microbial action, and a correction based on these was applied to experimental calculations. after experiments, specimens were dried at 60 °C for 24 h and weighed, then incin-erated in a muffle furnace at 500 °C for two hours and reweighed, the difference in mass representing ash-free
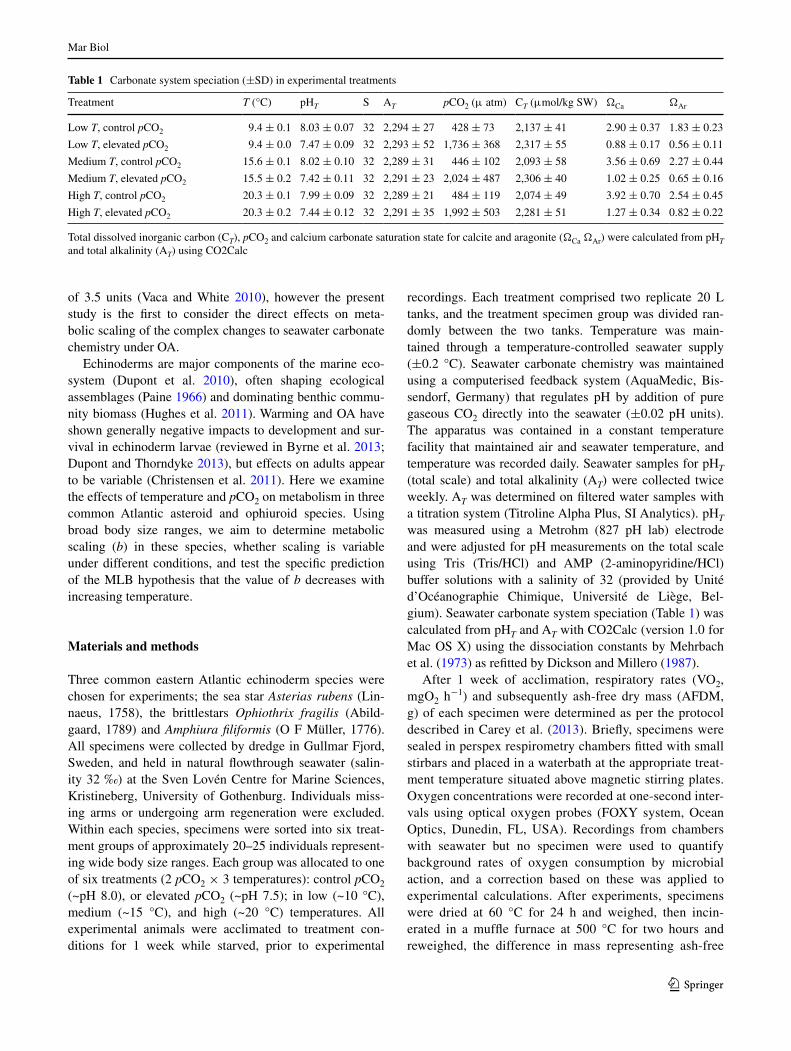
Table 1 Carbonate system speciation (±SD) in experimental treatments
Total dissolved inorganic carbon (CT), pCO2 and calcium carbonate saturation state for calcite and aragonite (ΩCa Ωar) were calculated from pHT and total alkalinity (aT) using CO2Calc
Treatment T (°C) pHT S aT pCO2 (μ atm) CT (μmol/kg SW) ΩCa Ωar
low T, control pCO2 9.4 ± 0.1 8.03 ± 0.07 32 2,294 ± 27 428 ± 73 2,137 ± 41 2.90 ± 0.37 1.83 ± 0.23
low T, elevated pCO2 9.4 ± 0.0 7.47 ± 0.09 32 2,293 ± 52 1,736 ± 368 2,317 ± 55 0.88 ± 0.17 0.56 ± 0.11
Medium T, control pCO2 15.6 ± 0.1 8.02 ± 0.10 32 2,289 ± 31 446 ± 102 2,093 ± 58 3.56 ± 0.69 2.27 ± 0.44
Medium T, elevated pCO2 15.5 ± 0.2 7.42 ± 0.11 32 2,291 ± 23 2,024 ± 487 2,306 ± 40 1.02 ± 0.25 0.65 ± 0.16
High T, control pCO2 20.3 ± 0.1 7.99 ± 0.09 32 2,289 ± 21 484 ± 119 2,074 ± 49 3.92 ± 0.70 2.54 ± 0.45
High T, elevated pCO2 20.3 ± 0.2 7.44 ± 0.12 32 2,291 ± 35 1,992 ± 503 2,281 ± 51 1.27 ± 0.34 0.82 ± 0.22

Mar Biol
1 3
dry mass (aFDM). Oxygen consumption was determined for each specimen by averaging the uptake rate over the period in which oxygen was reduced from 95 to 90 % of air-saturated concentrations. This allowed adequate time for the specimen to become accustomed to the experi-mental apparatus, but without inhibition to O2 uptake due to increasing hypoxia. Values for VO2 and aFDM were log-transformed and linear ordinary least squares (OlS) regression analysis performed on these data. To compare slope (b) and elevation of the resulting linear models, analysis of covariance (anCOVa) was performed with mass as primary variable, and treatment, species iden-tity, temperature, pCO2 level, or combinations thereof as covariates as appropriate. Tank identity was included as a nested factor within treatment, but no tank effects were observed so this was removed from further analysis. Post hoc tests were performed by rerunning each anCOVa analysis while varying the initial comparison factor(s) and examining the resulting pairwise comparisons between treatment groups. all data met the homogeneity of vari-ance and normality assumptions of the anCOVa tests (Bartlett and D’agostino tests, respectively). regression slope values (b) were also tested against commonly pro-posed standard or boundary values of 0.667, 0.75 and 1.0 (Table 2).
In order to examine changes to metabolic rates at a rep-resentative standard mass, the metric Lm was calculated for each treatment group according to the method described by Killen et al. (2010), this being the mass-specific met-abolic rate predicted by the linear model at the midpoint mass of the species mass range in log space. around this point, changes to the value of the slope have minimal effect on predicted elevation along the y axis, and allow for comparisons of metabolic rate between treatment groups at a standard mass (Fig. 1). Q10 values were also deter-mined at this same log-midpoint mass using the equation Q10 = (LmB/LmA)10/TB–Ta, where LmA is the Lm in the higher temperature (Ta), and LmB that in the lower temperature (TB). all statistical analyses were implemented in r (r Core Development Team 2013), and slope tests performed using the SMaTr package (Warton et al. 2012).
Results
Metabolic rates
Temperature was the major factor affecting metabolic rates in the species examined; in all three species metab-olism increased with increasing temperature (Fig. 1)
Table 2 experiment summary data
For each treatment; sample size (n); mass range (minimum to maximum specimen aFDM in each treatment group); and mass-against-VO2 lin-ear model parameters (±95 % CI) of the form ln VO2 = ln M * b + ln a, where VO2 is oxygen uptake (mgO2 h
−1) and M is ash-free dry mass (aFDM, g). Final three columns show tests of slope b against commonly proposed ‘universal’ and boundary values (nS = no significant differ-ence)
Species Temperature treatment
pCO2 treatment
n Mass range ln a b R 0.667 0.75 1.00
Asterias rubens
low Control 20 0.043–5.660 −1.29 ± 0.08 0.76 ± 0.05 0.99 P = 0.002 nS P < 0.001
elevated 23 0.019–5.575 −1.22 ± 0.07 0.85 ± 0.04 0.99 P < 0.001 P < 0.001 P < 0.001
Medium Control 25 0.028–5.421 −0.83 ± 0.10 0.90 ± 0.05 0.99 P < 0.001 P < 0.001 P = 0.001
elevated 22 0.010–2.129 −1.01 ± 0.16 0.76 ± 0.07 0.98 P = 0.014 nS P < 0.001
High Control 23 0.022–7.711 −0.55 ± 0.13 0.73 ± 0.08 0.97 nS nS P < 0.001
elevated 16 0.149–4.971 −0.61 ± 0.06 0.76 ± 0.06 0.99 P = 0.012 nS P < 0.001
Ophiothrix fragilis
low Control 22 0.007–0.222 −1.94 ± 0.19 0.69 ± 0.07 0.97 nS nS P < 0.001
elevated 22 0.011–0.294 −2.12 ± 0.17 0.62 ± 0.06 0.97 nS P < 0.001 P < 0.001
Medium Control 22 0.007–0.205 −1.52 ± 0.27 0.63 ± 0.10 0.94 nS P = 0.032 P < 0.001
elevated 20 0.021–0.223 −1.33 ± 0.44 0.71 ± 0.17 0.89 nS nS P = 0.003
High Control 20 0.043–0.222 −1.31 ± 0.31 0.73 ± 0.14 0.93 nS nS P = 0.001
elevated 23 0.004–0.246 −1.20 ± 0.23 0.72 ± 0.08 0.96 nS nS P < 0.001
Amphiura filiformis
low Control 19 0.005–0.035 −1.70 ± 1.19 0.92 ± 0.29 0.84 nS nS nS
elevated 22 0.002–0.036 −3.22 ± 0.98 0.56 ± 0.23 0.73 nS nS P = 0.001
Medium Control 23 0.010–0.044 −3.18 ± 1.55 0.46 ± 0.38 0.46 nS nS P = 0.012
elevated 22 0.007–0.050 −1.71 ± 1.22 0.83 ± 0.30 0.77 nS nS nS
High Control 22 0.006–0.039 −0.31 ± 0.98 1.05 ± 0.23 0.89 P = 0.004 P = 0.021 nS
elevated 22 0.002–0.030 −1.95 ± 1.22 0.68 ± 0.27 0.74 nS nS P = 0.031
Mar Biol
1 3
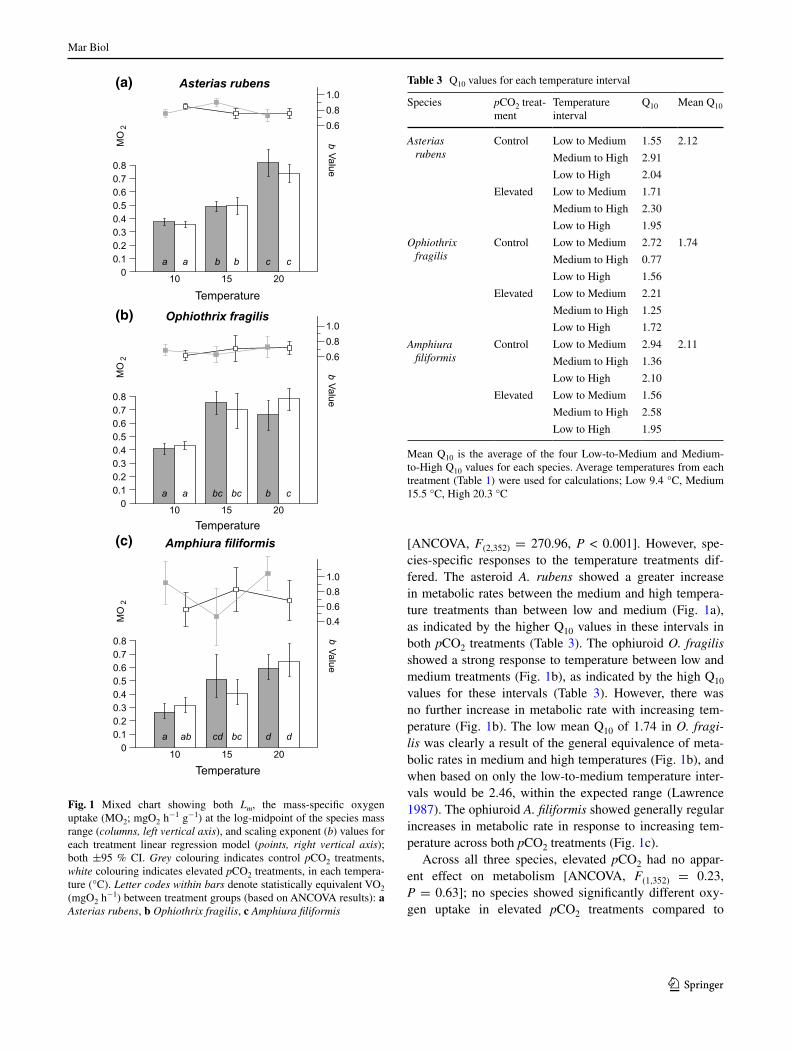
[anCOVa, F(2,352) = 270.96, P < 0.001]. However, spe-cies-specific responses to the temperature treatments dif-fered. The asteroid A. rubens showed a greater increase in metabolic rates between the medium and high tempera-ture treatments than between low and medium (Fig. 1a), as indicated by the higher Q10 values in these intervals in both pCO2 treatments (Table 3). The ophiuroid O. fragilis showed a strong response to temperature between low and medium treatments (Fig. 1b), as indicated by the high Q10 values for these intervals (Table 3). However, there was no further increase in metabolic rate with increasing tem-perature (Fig. 1b). The low mean Q10 of 1.74 in O. fragi-lis was clearly a result of the general equivalence of meta-bolic rates in medium and high temperatures (Fig. 1b), and when based on only the low-to-medium temperature inter-vals would be 2.46, within the expected range (lawrence 1987). The ophiuroid A. filiformis showed generally regular increases in metabolic rate in response to increasing tem-perature across both pCO2 treatments (Fig. 1c).
across all three species, elevated pCO2 had no appar-ent effect on metabolism [anCOVa, F(1,352) = 0.23, P = 0.63]; no species showed significantly different oxy-gen uptake in elevated pCO2 treatments compared to
(a)
(b)
(c)
Fig. 1 Mixed chart showing both Lm, the mass-specific oxygen uptake (MO2; mgO2 h
−1 g−1) at the log-midpoint of the species mass range (columns, left vertical axis), and scaling exponent (b) values for each treatment linear regression model (points, right vertical axis); both ±95 % CI. Grey colouring indicates control pCO2 treatments, white colouring indicates elevated pCO2 treatments, in each tempera-ture (°C). Letter codes within bars denote statistically equivalent VO2 (mgO2 h
−1) between treatment groups (based on anCOVa results): a Asterias rubens, b Ophiothrix fragilis, c Amphiura filiformis
Table 3 Q10 values for each temperature interval
Mean Q10 is the average of the four low-to-Medium and Medium-to-High Q10 values for each species. average temperatures from each treatment (Table 1) were used for calculations; low 9.4 °C, Medium 15.5 °C, High 20.3 °C
Species pCO2 treat-ment
Temperature interval
Q10 Mean Q10
Asterias rubens
Control low to Medium 1.55 2.12
Medium to High 2.91
low to High 2.04
elevated low to Medium 1.71
Medium to High 2.30
low to High 1.95
Ophiothrix fragilis
Control low to Medium 2.72 1.74
Medium to High 0.77
low to High 1.56
elevated low to Medium 2.21
Medium to High 1.25
low to High 1.72
Amphiura filiformis
Control low to Medium 2.94 2.11
Medium to High 1.36
low to High 2.10
elevated low to Medium 1.56
Medium to High 2.58
low to High 1.95
Mar Biol
1 3
control pCO2 at any temperature, the one exception being O. fragilis in the high-temperature treatments, where there was a significant difference in oxygen uptake across pCO2 treatments [anCOVa, F(1,39) = 8.45, P = 0.006]. How-ever, uptake rates in these same two high-temperature treat-ments were not significantly different to those in either of the medium-temperature treatments (Fig. 1b), and this par-ticular significant difference across pCO2 levels was clearly not part of any overall pattern.
Scaling of metabolism
across all species, the metabolic scaling exponent b did not significantly vary with either temperature [anCOVa, F(2,376) = 0.46, P = 0.63] or pCO2 [anCOVa, F(1,376) = 0.63, P = 0.43]. Particular pairwise compari-sons of slope across pCO2 or temperature level occasion-ally showed significant differences in the value of b [e.g. in A. rubens, across pCO2 treatments in medium temper-atures; F(1,43) = 10.89, P = 0.002]; however, there was no consistent trend in b value with either of these fac-tors and, overall, differences were not significant in any species.
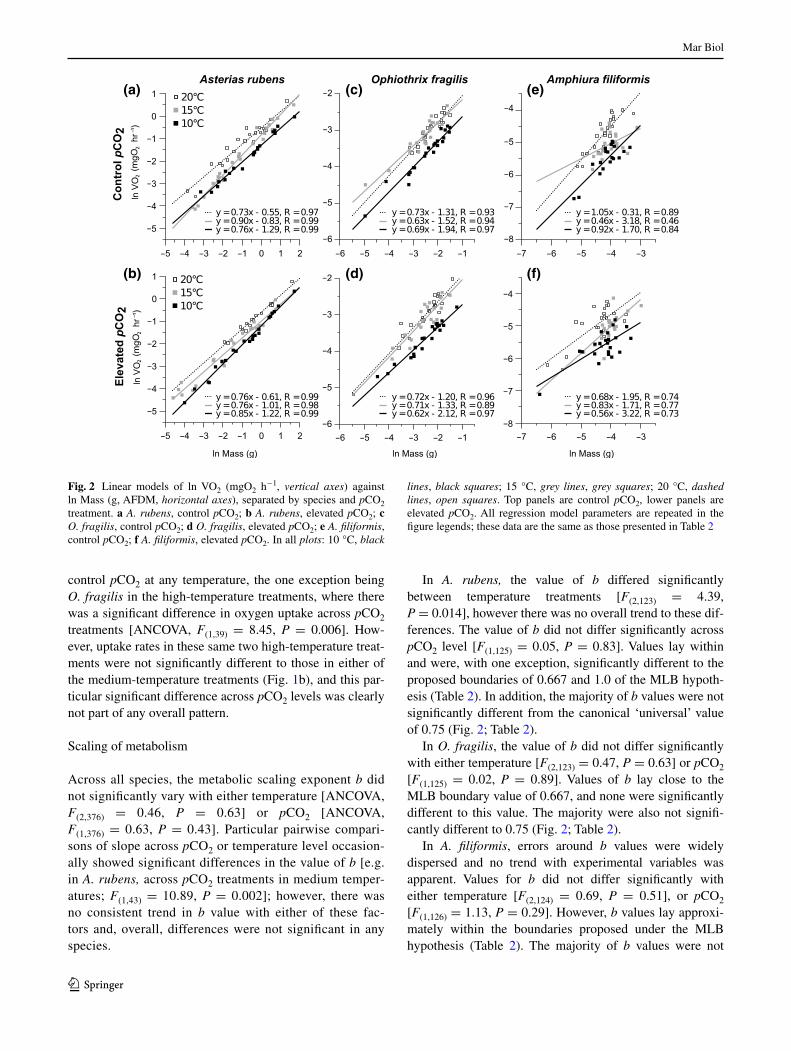
In A. rubens, the value of b differed significantly between temperature treatments [F(2,123) = 4.39, P = 0.014], however there was no overall trend to these dif-ferences. The value of b did not differ significantly across pCO2 level [F(1,125) = 0.05, P = 0.83]. Values lay within and were, with one exception, significantly different to the proposed boundaries of 0.667 and 1.0 of the MlB hypoth-esis (Table 2). In addition, the majority of b values were not significantly different from the canonical ‘universal’ value of 0.75 (Fig. 2; Table 2).
In O. fragilis, the value of b did not differ significantly with either temperature [F(2,123) = 0.47, P = 0.63] or pCO2 [F(1,125) = 0.02, P = 0.89]. Values of b lay close to the MlB boundary value of 0.667, and none were significantly different to this value. The majority were also not signifi-cantly different to 0.75 (Fig. 2; Table 2).
In A. filiformis, errors around b values were widely dispersed and no trend with experimental variables was apparent. Values for b did not differ significantly with either temperature [F(2,124) = 0.69, P = 0.51], or pCO2 [F(1,126) = 1.13, P = 0.29]. However, b values lay approxi-mately within the boundaries proposed under the MlB hypothesis (Table 2). The majority of b values were not
(a)
(b)
(c)
(d)
(e)
(f)
Fig. 2 linear models of ln VO2 (mgO2 h−1, vertical axes) against ln Mass (g, aFDM, horizontal axes), separated by species and pCO2 treatment. a A. rubens, control pCO2; b A. rubens, elevated pCO2; c O. fragilis, control pCO2; d O. fragilis, elevated pCO2; e A. filiformis, control pCO2; f A. filiformis, elevated pCO2. In all plots: 10 °C, black
lines, black squares; 15 °C, grey lines, grey squares; 20 °C, dashed lines, open squares. Top panels are control pCO2, lower panels are elevated pCO2. all regression model parameters are repeated in the figure legends; these data are the same as those presented in Table 2

Mar Biol
1 3
significantly different from either of the commonly pro-posed ‘universal’ values of 0.667 and 0.75 (Fig. 2; Table 2).
Discussion
effects of temperature and pCO2 on metabolic scaling
Following a lively historical debate over particular val-ues for the metabolic mass scaling exponent (agutter and Wheatley 2004), recent consensus has recognised that the value of b varies between species, within certain bounda-ries (glazier 2005; Kolokotrones et al. 2010; Isaac and Carbone 2010; White 2011; White and Kearney 2013). The data presented here would appear to support the his-torically accepted view that b = 0.75. However, the three species examined here comprise a small contribution to the entire dataset of organismal scaling, and there is ample evi-dence that scaling exponents show variation between taxa (glazier 2005; Seibel 2007; Killen et al. 2010; White and Kearney 2013). Metabolic scaling may also vary within taxa during different life stages (gaitán-espitia et al. 2013; Jensen et al. 2013), and under different abiotic conditions, such as higher temperatures (Killen et al. 2010; luo and Wang 2012; Ohlberger et al. 2012; Doyle et al. 2012; Wel-don et al. 2013).
Our data show that the echinoderms examined here pos-sess a remarkable degree of consistency in metabolic scal-ing under different physical and chemical seawater condi-tions (Fig. 1). One aim of this study was to test a specific prediction of the MlB hypothesis (glazier 2010) that due to the exponential effects of temperature on metabolic rates, the metabolic scaling exponent b will decrease with increasing temperature (Killen et al. 2010; Ohlberger et al. 2012; gifford et al. 2013). This work also represents the first empirical study testing the direct effects of Oa condi-tions on metabolic scaling.
The values for b found here are consistent with the com-mon range in echinoderms of 0.6–0.8 noted by lawrence and lane (1982), although some values in the asteroid A. rubens were higher, and some in the ophiuroid A. filiformis both higher and lower (but with large error) (Table 2). The general values of b here are consistent with those found for deep-sea echinoderms by Hughes et al. (2011), of 0.90 for asteroidea (represented here by A. rubens), and 0.68 for Ophiuroidea (represented here by O. fragi-lis and A. filiformis). lawrence and lane (1982, Table 2) also present values that are in general substantially higher in asteroids than in ophiuroids. although values of b in A. rubens and O. fragilis were not significantly different from 0.75 (Table 2), values for A. rubens were higher than those for O. fragilis (with one exception where they were equal) and suggests that these two species possess different
species-specific scaling exponent values. This is supported by anCOVa post hoc pairwise comparisons, where all but the lowest b values in A. rubens are significantly different from the values for O. fragilis. as such, the differences in the value of b between species observed here, but no appar-ent effect of the abiotic factors, may reflect taxonomic dif-ferences in physiology rather than environmentally-driven changes to intraspecific metabolic patterns.
Scaling exponent values in the other ophiuroid species, A. filiformis, had much wider errors than those in the other two species, obscuring any potential trend in the value of b with the experimental treatments. This large error likely comes from the fact that this species is much smaller than the other two (maximum aFDM was 0.05 g compared to 0.29 g in O. fragilis and 7.71 g in the asteroid A. rubens; Table 2) and reflects the experimental challenges of small body sizes. When body size ranges are small, residual varia-tion has a large influence on the estimates of b; mass ranges of two to three orders of magnitude are recommended for providing more robust estimations of metabolic scaling slope (Sokal and rohlf 1995; Moses et al. 2008; White and Kearney 2014). Here, the mass ranges of A. filiformis treatment groups were in general within one order of mag-nitude (Table 2), likely explaining the wide errors around estimates of the slope in the linear regressions (Fig. 2). This was not an issue with the other two species where mass ranges were two to three orders of magnitude. Figure 2e, f shows that in some A. filiformis treatment groups (particu-larly medium temperatures), regression slope estimates are probably not particularly robust. However, the general elevations of the regression models are clearly higher as a result of increasing temperatures, indicating higher meta-bolic rates, as confirmed by anCOVa analysis and com-parisons using the Lm metric. Conclusions, however, about the nature of variation in b are difficult to make from these data in A. filiformis.
Our results do not support the prediction of the MlB hypothesis that b should depend on temperature. This apparent stability in metabolic scaling under different temperatures conflicts with several other recent studies. Killen et al. (2010) in a large meta-analysis of fish spe-cies showed scaling of metabolism (that is, the value of b) is inversely related to temperature. a negative effect of increasing temperature on metabolic scaling has occa-sionally been reported in experimental studies on various ectotherms, including in fish (Hölker 2003; luo and Wang 2012; Ohlberger et al. 2012), an onychophoran (Weldon et al. 2013), and an amphipod (Doyle et al. 2012). How-ever, the effects of temperature on b can be highly vari-able between species (glazier 2005), including positive (newell 1973), and, as with the present data, no apparent effects in some species (Ohlberger et al. 2012; gifford et al. 2013).

Mar Biol
1 3
The MlB hypothesis, however, describes large-scale patterns in physiology, and it is to be expected that limited datasets could produce exceptions and outliers that appear to be inconsistent with its predictions. Ohlberger et al. (2012) found that plasticity in b with temperature differed at the family level in the four fish species examined, two species showing a negative association of b with tempera-ture, but two others showing no association. But the two groups of fishes represent different habitats as well as sys-tematic groupings, so plasticity of responses to temperature may also be related to species’ ecology (Ohlberger et al. 2012). The populations sampled in the present study live in relatively stable thermal conditions. Two species examined here, the asteroid A. rubens and the ophiuroid O. fragilis, are ubiquitous north atlantic intertidal and shallow-water coastal species, and the intertidal is a naturally highly vari-able habitat experiencing large, twice-daily temperature fluxes (Truchot and Duhamel-Jouve 1980). However, the collection site for our experiments, a Swedish fjord, expe-riences very little tidal height variation, effectively pos-sessing no intertidal zone. The particular specimens of O. fragilis examined here were collected from below the pycnocline, which delineates the highly thermally stable bottom waters (5–15 °C annual range) from the more vari-able surface waters (0–25 °C annual range, with often sub-stantial diurnal changes). O. fragilis was the species with the most stable metabolic scaling value across the experi-mental treatments (Fig. 1). Specimens of A. rubens col-lected from the more thermally variable surface waters, ca. 5–10 m depth showed marginally more variation in b value than O. fragilis (Fig. 1). These surface waters, while more seasonally thermally variable than those below the pycno-cline, are however still stable in comparison with the tem-peratures experienced in the intertidal or shallow subtidal in other coastal regions where wide temperature extremes can be experienced twice daily. By contrast, Doyle et al. (2012) found a strong negative relationship between tem-perature and the value of b in an antarctic amphipod, this also being in a region with extremely narrow aquatic thermal variability (~1.6 °C annually, Doyle et al. 2012), but also note this species colonises the intertidal in sum-mer months where it may experience temperatures of up to 8 °C. These patterns of stability in b value correlated with low variability in habitat temperature are intriguing, but at present circumstantial. How natural temperature exposure and habitat may affect plasticity in b is a promising avenue for future research and may inform on the validity of par-ticular models and theories. Strong patterns in the value of b with habitat parameters have previously been observed, such as in cephalopods where b appears to decrease with depth (and hence with lifestyle type and activity) (Seibel 2007), and such patterns provide considerable support for the MlB model (glazier 2010). The lack of response of b
may also potentially be explained through the temperature range the species were exposed to. While Q10 values were typical for ectotherms (Table 3), there was substantial vari-ation in metabolic responses between different temperature treatments (Fig. 1), with both large and minor metabolic changes observed with each 5 °C increase within a species. It is possible that acclimation to a greater temperature dif-ferential over a longer time frame would lead to both more consistent responses to temperature, and a detectable effect on the value of b.
A. rubens and O. fragilis appear to have different scaling exponent values, b being substantially higher in A. rubens (Table 2), and this may provide some support for the MlB hypothesis from these data. anecdotally, we observed A. rubens as being much more active than O. fragilis, and it also had much higher mass-specific metabolic rates at equivalent mass and temperature (data not shown). Under the MlB hypothesis (glazier 2010), b shows a positive association with metabolic level and activity. While there is strong empirical support for this pattern in other taxa (gla-zier 2006; White et al. 2006; Seibel and Drazen 2007), the results observed here between only two species are intrigu-ing, but not sufficient at present to draw strong conclusions about the relationship between metabolic level and the value of b in these echinoderms.
It is also important to consider that allometric relation-ships may differ under different activity or performance states. Our data examined only resting metabolism; it is possible that substantial differences in allometric scaling of metabolism may become apparent under other states, such as under high activity, or within narrowed aerobic scope and performance under temperature extremes (Pörtner and Farrell 2008).
like temperature, elevated pCO2 conditions also had no effect on the value of b. This is not unexpected, as pCO2 in general had no effect on metabolism in these species; meta-bolic rates in elevated pCO2 treatments were not different from those in control pCO2 in any of the tested species at any temperature (with one exception). Temperature was by far the most important abiotic factor affecting metabolism.
effects of temperature on metabolism
The overall effect of temperature on metabolic rates was similar to that reported for other echinoderms, with Q10 values lying broadly around the lower end of the range of 2–3 suggested by lawrence (1987) as typical of echino-derms (Table 3). The high temperature used here (20 °C) was selected to be outside the typical range experienced by our experimental animals in their natal habitats; our medium temperature (15 °C) is at the upper end of the natu-rally experienced thermal range (Dupont and lundve, pers. comm.). Yet scaling relationships remained stable at these

Mar Biol
1 3
higher temperatures, suggesting no systematic ontogenetic difference in response. In other words, for the body mass to metabolism relationship to maintain the same slope val-ues, metabolism across all body sizes must have changed by a relatively equal amount. additionally, physiological responses suggest that at least two of these species (the asteroid A. rubens and the ophiuroid A. filiformis) were not unduly stressed by high temperatures, indicated by the generally regular increases in metabolic rate between temperature treatments (Fig. 1; Table 3), and the absence of stress-induced arm autotomisation in the ophiuroid dur-ing experiments. larvae of A. rubens have been shown to be tolerant of temperatures up to 20 °C (Benitez Villalobos et al. 2006). While temperature-driven increases to metabo-lism and the associated increased energetic requirements may cause trade-offs between physiological processes, responses here suggest that the direct effects of changes to ambient temperatures may not be severe in these two spe-cies. all three taxa are ubiquitous along the ne atlantic coast and are found in warmer waters to the south (Hay-ward and ryland 1996), so are in general comfortable in higher environmental temperatures.
effects of pCO2 on metabolism
numerous studies show that responses to high pCO2 are complex and modulated by external factors such as tem-perature (Byrne 2011; gianguzza et al. 2014), food supply (Cohen and Holcomb 2009; Hettinger et al. 2013), salin-ity (Dickinson et al. 2013), or body size (Waldbusser et al. 2010). Organisms in the coastal zone and intertidal may experience frequent pulses of low pH (Christensen et al. 2011; Mcelroy et al. 2012). elevated pCO2 has been shown to induce a ‘narcotic’ effect in some echinoderms at cer-tain environmental temperatures (Byrne 2011; Christensen et al. 2011), likely a specific response by some intertidal organisms to conserve resources during these periodic low hypercapnic events (Fabry et al. 2008; Pörtner and Far-rell 2008; Byrne 2011; Christensen et al. 2011). Other invertebrates may instead show elevated metabolic rates at low pH (Wood et al. 2008, 2010; Stumpp et al. 2011, 2012; Catarino et al. 2012) that may be explained through metabolic upregulation to compensate for tissue acidosis (Stumpp et al. 2012), although not all species are capa-ble of this response (Pane and Barry 2007; Hernroth et al. 2011; Dupont and Thorndyke 2012). Two of the species examined here, the asteroid A. rubens and the ophiuroid A. filiformis, are known to be incapable of compensating for tissue acidosis (Hernroth et al. 2011; Hu et al. 2014).
We did not record a metabolic response to elevated pCO2, either in isolation or in combination with tempera-ture for any of the three study species. Yet previous experi-ments have suggested that the same species are vulnerable
to Oa conditions. long-term exposure (6 months) to Oa has been shown to impact the immune response of A. rubens (Hernroth et al. 2011), with implications for vul-nerability to pathogens in future oceans (Matozzo et al. 2012; Dupont and Thorndyke 2012). Collard et al. (2013) apparently found a significant decrease in metabolic rate in A. rubens after 3 weeks acclimation to lower pH; how-ever, this effect appeared marginal. Conversely, Wood et al. (2008) found that metabolism increased in A. fili-formis under increased pCO2. Our results here support neither of these findings. High pCO2 (though greatly higher than that examined here; ~3,500 ppm) caused severe retardation to growth rates and disturbance to feed-ing behaviour in A. rubens (appelhans et al. 2012). These studies on A. rubens (appelhans et al. 2012; Collard et al. 2013) concluded, however, that in general this aster-oid is robust to near-future conditions of elevated pCO2. Our data (showing no metabolic response of post-larval adults to a greater increase in pCO2) could also be taken as an indicator of the robustness of this species to Oa. However, vulnerability at only one life stage could have severe repercussions to the fitness of species (Byrne 2011; Dupont et al. 2012). In the larvae of O. fragilis, a mod-erate increase in pCO2 (a decrease of ~0.2 pH) caused high mortality and increased developmental abnormality (Dupont et al. 2008).
Conclusions
The evidence presented here that b values are stable under different stressors is an indication that any responses to rea-sonable predictions of near-future environmental change are not body size dependent in these species; responses, if observed, were relatively equivalent across ontogeny. a change in the value of b would represent a differential response of metabolism to stressors in different body sizes. The consequence of this is that relative changes to metabo-lism are preserved across the species size range; the eleva-tion of the regression model is raised (or lowered) equally along its length, thereby maintaining the slope. This is an indication that the physiological effect of the stressor is equal regardless of the size of the animal. In other words, smaller individuals are no more resilient or vulnerable to the stressor than larger individuals. Such stability in responses across size ranges has important implications for the stability of ecological food webs. Size-dependent changes to metabolic rates have been noted as potentially causing cascading effects through trophic levels (Kil-len et al. 2010; Ohlberger et al. 2012). Potential changes to metabolic scaling are important from an ecological perspective as they may cause altered size dependency in ecological interactions (Ohlberger et al. 2012), or alter

Mar Biol
1 3
processes which are intrinsically linked to metabolic rates, such as carbon cycling (Kagata and Ohgushi 2012).
While our data show equivalent metabolic responses across the body size range in these species, there is abun-dant evidence that body size will play a substantial role in determining responses to climate change stressors. larger individuals may be more sensitive to extreme tempera-tures (Pörtner and Knust 2007), and species, particularly aquatic ones, may become smaller under climate warm-ing (Sheridan and Bickford 2011; Forster et al. 2012). Body size dependent responses to climate change stress-ors, such as hypoxia or increases in pCO2 and temperature, have however been observed in other taxa (Killen et al. 2010; Ohlberger et al. 2012), and in other physiological and behavioural phenomena other than metabolism (Wald-busser et al. 2010; Clark et al. 2013). In experimental stud-ies, it is common practice to use a ‘standard’ or narrow size range of an organism in order to reduce the ‘confounding’ effect of body size on responses (e.g. Wood et al. 2010; Melatunan et al. 2011). However, body size and potential differences in effects across ontogeny are an important var-iable in species’ responses to climate change and should be not be ignored through the desire to simplify future experi-mental work.
Acknowledgments This research was supported by the european Community—research Infrastructure action under the FP7 “Capaci-ties” Programme aSSeMBle [227799] for fieldwork and laboratory work at the Sven lovén Centre for Marine Sciences, Kristineberg, and by the Department of employment and learning, n. Ireland, and Queen’s University Belfast Marine laboratory. SD is funded by the linnaeus Centre for Marine evolutionary Biology at the University of gothenburg and supported by a linnaeus grant from the Swedish research Councils Vr and Formas. Thanks to Isabel Casties for assis-tance with water chemistry analysis. Three anonymous reviewers pro-vided thoughtful and helpful suggestions that substantially improved an earlier version of this manuscript.
References
agutter PS, Wheatley Dn (2004) Metabolic scaling: consensus or controversy? Theor Biol Med Model 1:1–13
appelhans YS, Thomsen J, Pansch C et al (2012) Sour times: seawa-ter acidification effects on growth, feeding behaviour and acid–base status of Asterias rubens and Carcinus maenas. Mar ecol Prog Ser 459:85–98. doi:10.3354/meps09697
Benitez Villalobos F, Tyler Pa, Young CM (2006) Temperature and pressure tolerance of embryos and larvae of the atlantic sea stars Asterias rubens and Marthasterias glacialis (echinoder-mata: asteroidea): potential for deep-sea invasion. Mar ecol Prog Ser 314:109–117. doi:10.3354/meps314109
Bindoff nl, Willebrand J, artale V et al (2007) Observations: oceanic climate change and sea level. In: Climate and change 2007: the physical science basis. Contribution of working group I to the fourth assessment report of the intergovernmental panel on cli-mate change
Bokma F (2004) evidence against universal metabolic allometry. Funct ecol 18:184–187. doi:10.1111/j.0269-8463.2004.00817.x
Brey T (2010) an empirical model for estimating aquatic invertebrate respiration. Methods ecol evol 1:92–101. doi:10.1111/j.2041-210X.2009.00008.x
Brown JH, gillooly JF, allen aP et al (2004) Toward a metabolic the-ory of ecology. ecology 85:1771–1789. doi:10.1890/03-9000
Byrne M (2011) Impact of ocean warming and ocean acidification on marine invertebrate life history stages: vulnerabilities and potential for persistence in a changing ocean. Oceanogr Mar Biol annu rev 49:1–42
Byrne M, lamare M, Winter D et al (2013) The stunting effect of a high CO2 ocean on calcification and development in sea urchin larvae: a synthesis from the tropics to the poles. Philos Trans r Soc B Biol Sci 368:20120439. doi:10.1098/rstb.2012.0439
Carey n, Sigwart JD, richards Jg (2013) economies of scaling: more evidence that allometry of metabolism is linked to activ-ity, metabolic rate and habitat. J exp Mar Bio ecol 439:7–14. doi:10.1016/j.jembe.2012.10.013
Catarino aI, Bauwens M, Dubois P (2012) acid–base balance and metabolic response of the sea urchin Paracentrotus lividus to different seawater pH and temperatures. environ Sci Pollut res Int 19:2344–2353. doi:10.1007/s11356-012-0743-1
Christensen aB, nguyen HD, Byrne M (2011) Thermotolerance and the effects of hypercapnia on the metabolic rate of the ophiuroid Ophionereis schayeri: inferences for survivor-ship in a changing ocean. J exp Mar Bio ecol 403:31–38. doi:10.1016/j.jembe.2011.04.002
Clark MS, Husmann g, Thorne MaS et al (2013) Hypoxia impacts large adults first: consequences in a warming world. glob Chang Biol 19:2251–2263. doi:10.1111/gcb.12197
Cohen al, Holcomb M (2009) Why corals care about ocean acidifi-cation: uncovering the mechanism. Oceanography 22:118–127. doi:10.5670/oceanog.2009.102
Collard M, Catarino aI, Bonnet S et al (2013) effects of CO2-induced ocean acidification on physiological and mechanical properties of the starfish Asterias rubens. J exp Mar Bio ecol 446:355–362. doi:10.1016/j.jembe.2013.06.003
Darveau Ca, Suarez rK, andrews rD, Hochachka PW (2002) allo-metric cascade as a unifying principle of body mass effects on metabolism. nature 417:166–170
Dickinson gH, Matoo OB, Tourek rT et al (2013) environmental salinity modulates the effects of elevated CO2 levels on juve-nile hard-shell clams, Mercenaria mercenaria. J exp Biol 216:2607–2618. doi:10.1242/jeb.082909
Dickson ag, Millero FJ (1987) a comparison of the equilibrium con-stants for the dissociation of carbonic acid in seawater media. Deep Sea res 34:1733–1743
Diffenbaugh nS, Field CB (2013) Changes in ecologically critical ter-restrial climate conditions. Science 341:486–492. doi:10.1126/science.1237123
Dodds PS, rothman DH, Weitz JS (2001) re-examination of the “¾-law” of metabolism. J Theor Biol 209:9–27. doi:10.1006/jtbi.2000.2238
Doney SC, Fabry VJ, Feely ra, Kleypas Ja (2009) Ocean acidifi-cation: the other CO2 problem. ann rev Mar Sci 1:169–192. doi:10.1146/annurev.marine.010908.163834
Doyle Sr, Momo Fr, Brêthes J-C, Ferreyra ga (2012) Metabolic rate and food availability of the antarctic amphipod Gondoge-neia antarctica (Chevreux 1906): seasonal variation in allomet-ric scaling and temperature dependence. Polar Biol 35:413–424. doi:10.1007/s00300-011-1089-8
Duncan rP, Forsyth DM, Hone J (2007) Testing the metabolic theory of ecology: allometric scaling exponents in mammals. ecology 88:324–333. doi:10.1890/0012-9658(2007)88[324:TTMTOe]2.0.CO;2
Dupont ST, Thorndyke MC (2012) relationship between CO2-driven changes in extracellular acid–base balance and cellular immune
Mar Biol
1 3
response in two polar echinoderm species. J exp Mar Bio ecol 424–425:32–37. doi:10.1016/j.jembe.2012.05.007
Dupont ST, Thorndyke MC (2013) Direct impacts of near-future ocean acidification on sea urchins. In: Fernández-Palacios JM, de nascimiento l, Hernández JC, et al. (eds) Climate change perspectives from the atlantic:past, present, and future. Servicio de Publicaciones de la Universidad de la laguna, San Cristo-bal de la laguna, pp 461–485
Dupont ST, Havenhand Jn, Thorndyke W et al (2008) near-future level of CO2-driven ocean acidification radically affects larval survival and development in the brittlestar Ophiothrix fragilis. Mar ecol Prog Ser 373:285–294. doi:10.3354/meps07800
Dupont ST, Ortega-Martinez O, Thorndyke MC (2010) Impact of near-future ocean acidification on echinoderms. ecotoxicology 19:449–462. doi:10.1007/s10646-010-0463-6
Dupont ST, Dorey n, Stumpp M et al (2012) long-term and trans-life-cycle effects of exposure to ocean acidification in the green sea urchin Strongylocentrotus droebachiensis. Mar Biol 160:1835–1843. doi:10.1007/s00227-012-1921-x
Fabry VJ, Seibel Ba, Feely ra (2008) Impacts of ocean acidifica-tion on marine fauna and ecosystem processes. ICeS J Mar Sci 65:414–432. doi:10.1093/icesjms/fsn048
Forster J, Hirst ag, atkinson D (2012) Warming-induced reduc-tions in body size are greater in aquatic than terrestrial spe-cies. Proc natl acad Sci 109:19310–19314. doi:10.1073/pnas.1210460109
gaitán-espitia JD, Bruning a, Mondaca F, nespolo rF (2013) Intraspecific variation in the metabolic scaling exponent in ectotherms: testing the effect of latitudinal cline, ontogeny and transgenerational change in the land snail Cornu aspersum. Comp Biochem Physiol Part a Mol Integr Physiol 165:169–177. doi:10.1016/j.cbpa.2013.03.002
gianguzza P, Visconti g, gianguzza F et al (2014) Temperature mod-ulates the response of the thermophilous sea urchin Arbacia lixula early life stages to CO2-driven acidification. Mar environ res 93:70–77. doi:10.1016/j.marenvres.2013.07.008
gifford Me, Clay Ta, Peterman We (2013) The effects of tempera-ture and activity on intraspecific scaling of metabolic rates in a lungless salamander. J exp Zool Part a ecol genet Physiol 319:230–236. doi:10.1002/jez.1787
glazier DS (2005) Beyond the “¾ power law”: variation in the intra- and interspecific scaling of metabolic rate in animals. Biol rev 80:611–662
glazier DS (2006) The ¾-power law is not universal: evolution of iso-metric, ontogenetic metabolic scaling in pelagic animals. Bio-science 56:325–332. doi:10.1641/0006-3568(2006)56[325:TPlInU]2.0.CO;2
glazier DS (2010) a unifying explanation for diverse meta-bolic scaling in animals and plants. Biol rev 85:111–138. doi:10.1111/j.1469-185X.2009.00095.x
Hayward PJ, ryland JS (1996) Handbook of the Marine Fauna of north-West europe, p 800
Hemmingsen aM (1960) energy metabolism as related to body size and respiratory surfaces, and its evolution. Steno Meml Hosp nord Insul laboratosium 9:6–110
Hernroth B, Baden S, Thorndyke MC, Dupont ST (2011) Immune suppression of the echinoderm Asterias rubens (l.) following long-term ocean acidification. aquat Toxicol 103:222–224. doi:10.1016/j.aquatox.2011.03.001
Hettinger a, Sanford e, Hill TM et al (2013) The influence of food supply on the response of Olympia oyster larvae to ocean acidification. Biogeosci Discuss 10:5781–5802. doi:10.5194/bgd-10-5781-2013
Hölker F (2003) The metabolic rate of roach in relation to body size and temperature. J Fish Biol 62:565–579. doi:10.1046/j.1095- 8649.2003.00048.x
Hu MY, Casties I, Stumpp M et al (2014) energy metabolism and regeneration impaired by seawater acidification in the infau-nal brittlestar, Amphiura filiformis. J exp Biol. doi:10.1242/jeb.100024
Hughes SJM, ruhl Ha, Hawkins le et al (2011) Deep-sea echino-derm oxygen consumption rates and an interclass comparison of metabolic rates in asteroidea, Crinoidea, echinoidea, Holo-thuroidea and Ophiuroidea. J exp Biol 214:2512–2521. doi:10.1242/jeb.055954
Isaac nJB, Carbone C (2010) Why are metabolic scaling exponents so controversial? Quantifying variance and testing hypotheses. ecol lett 13:728–735. doi:10.1111/j.1461-0248.2010.01461.x
Jensen Ma, Fitzgibbon QP, Carter Cg, adams lr (2013) effect of body mass and activity on the metabolic rate and ammonia-n excretion of the spiny lobster Sagmariasus verreauxi during ontogeny. Comp Biochem Physiol Part a Mol Integr Physiol 166:191–198. doi:10.1016/j.cbpa.2013.06.003
Kagata H, Ohgushi T (2012) Carbon to nitrogen excretion ratio in lepidopteran larvae: relative importance of ecological stoi-chiometry and metabolic scaling. Oikos 121:1869–1877. doi:10.1111/j.1600-0706.2012.20274.x
Kelly MW, Hofmann ge (2012) adaptation and the physiology of ocean acidification. Funct ecol 27:980–990. doi:10.1111/j.1365-2435. 2012.02061.x
Killen SS, atkinson D, glazier DS (2010) The intraspecific scaling of metabolic rate with body mass in fishes depends on lifestyle and temperature. ecol lett 13:184–193. doi:10.1111/j.1461-0248. 2009.01415.x
Kleiber M (1932) Body size and metabolism. Hilgardia 6:315–353Kleiber M (1947) Body size and metabolic rate. Physiol rev
27:511–541Kolokotrones T, Savage VM, Deeds eJ, Fontana W (2010) Curva-
ture in metabolic scaling. nature 464:753–756. doi:10.1038/nature08920
Kooijman SalM (2010) Dynamic energy budget theory for meta-bolic organisation, Cambridge University Press, Cambridge, p 66
Kozłowski J, Konarzewski M, gawelczyk aT (2003) Cell size as a link between noncoding Dna and metabolic rate scaling. Proc natl acad Sci 100:14080–14085
Kroeker KJ, Kordas rl, Crim r et al (2013) Impacts of ocean acidi-fication on marine organisms: quantifying sensitivities and interaction with warming. glob Chang Biol 19:1884–1896. doi:10.1111/gcb.12179
Krogh a (1916) The respiratory exchange of animals and man. Int zeits Phys chem Biol 1:173
lawrence JM (1987) a functional biology of the echinoderms, Johns Hopkins University Press, Baltimore, p 340
lawrence JM, lane JM (1982) The utilization of nutrients by post-metamorphic echinoderms. In: Jangoux M, lawrence JM (eds) echinoderm nutrition. Balkema, rotterdam, pp 331–371
luo YP, Wang QQ (2012) effects of body mass and temperature on routine metabolic rate of juvenile largemouth bronze gudgeon Coreius guichenoti. J Fish Biol 80:842–851. doi:10.1111/j.1095-8649.2012.03229.x
Matozzo V, Chinellato a, Munari M et al (2012) First evidence of immunomodulation in bivalves under seawater acidification and increased temperature. PloS One 7:e33820. doi:10.1371/journal.pone.0033820
Mcelhany P, Busch DS (2013) appropriate pCO2 treatments in ocean acidification experiments. Mar Biol 160:1807–1812. doi:10.1007/s00227-012-2052-0
Mcelroy DJ, nguyen HD, Byrne M (2012) respiratory response of the intertidal seastar Parvulastra exigua to contemporary and near-future pulses of warming and hypercapnia. J exp Mar Bio ecol 416–417:1–7. doi:10.1016/j.jembe.2012.02.003

Mar Biol
1 3
Mehrbach C, Culberson CH, Hawley Je, Pytkowicz rM (1973) Measurement of the apparent dissociation constants of carbonic acid in seawater at atmospheric pressure. limnol Oceanogr 18:897–907
Melatunan S, Calosi P, rundle SD et al (2011) exposure to elevated temperature and pCO2 reduces respiration rate and energy sta-tus in the periwinkle Littorina littorea. Physiol Biochem Zool 84:583–594. doi:10.1086/662680
Morley Sa, Hirse T, Pörtner HO, Peck lS (2009) geographical vari-ation in thermal tolerance within Southern Ocean marine ecto-therms. Comp Biochem Physiol Part a Mol Integr Physiol 153:154–161
Moses Me, Hou C, Woodruff WH et al (2008) revisiting a model of ontogenetic growth: estimating model parameters from theory and data. am nat 171:632–645. doi:10.1086/587073
newell rC (1973) Factors affecting the respiration of intertidal inver-tebrates. am Zool 13:513–528. doi:10.1093/icb/13.2.513
Ohlberger J, Mehner T, Staaks g, Hölker F (2012) Intraspecific tem-perature dependence of the scaling of metabolic rate with body mass in fishes and its ecological implications. Oikos 121:245–251. doi:10.1111/j.1600-0706.2011.19882.x
Paine rT (1966) Food web complexity and species diversity. am nat 100:65–75. doi:10.1086/282400
Pane eF, Barry JP (2007) extracellular acid-base regulation during short-term hypercapnia is effective in a shallow-water crab, but ineffective in a deep-sea crab. Mar ecol Prog Ser 334:1–9
Perry al, low PJ, ellis Jr, reynolds JD (2005) Climate change and distribution shifts in marine fishes. Science 308:1912–1915. doi:10.1126/science.1111322
Peters rH (1983) The ecological implications of body size. Cam-bridge University Press, Cambridge
Pörtner HO, Farrell aP (2008) Physiology and climate change. Sci-ence 322:690–692. doi:10.1126/science.1163156
Pörtner HO, Knust r (2007) Climate change affects marine fishes through the oxygen limitation of thermal tolerance. Science 315:95–97. doi:10.1126/science.1135471
r Core Development Team (2013) r: a language and environment for statistical computing
riisgård HU (1998) no foundation of a “¾ power scaling law” for res-piration in biology. ecol lett 1:71–73. doi:10.1046/j.1461-0248. 1998.00020.x
rubner M (1883) Über den einfluss der Körpergrösse auf Stoff- und Kraftwechsel. Z Biol 19:535–562
Savage VM, Deeds eJ, Fontana W (2008) Sizing up allometric scal-ing theory. PloS Comput Biol 4:e1000171. doi:10.1371/journal.pcbi.1000171
Schmidt-nielsen K (1984) Scaling: Why is animal size so important?. Cambridge University Press, Cambridge, p 256
Seibel Ba (2007) On the depth and scale of metabolic rate variation: scaling of oxygen consumption rates and enzymatic activity in the Class Cephalopoda (Mollusca). J exp Biol 210:1–11
Seibel Ba, Drazen JC (2007) The rate of metabolism in marine animals: environmental constraints, ecological demands and energetic opportunities. Philos Trans r Soc B Biol Sci 362:2061–2078
Sheridan Ja, Bickford D (2011) Shrinking body size as an ecological response to climate change. nat Clim Chang 1:401–406. doi:10. 1038/nclimate1259
Sokal rr, rohlf FJ (1995) Biometry, 3rd ed. 887Stumpp M, Wren J, Melzner F et al (2011) CO2 induced seawater
acidification impacts sea urchin larval development I: elevated metabolic rates decrease scope for growth and induce develop-mental delay. Comp Biochem Physiol Part a Mol Integr Physiol 160:331–340. doi:10.1073/pnas.1209174109
Stumpp M, Hu MY, Melzner F, et al. (2012) acidified seawater impacts sea urchin larvae pH regulatory systems relevant for cal-cification. Proc natl acad Sci 109:18192–18197.doi:10.1073/ pnas.1209174109
Suarez rK, Darveau Ca, Childress JJ (2004) Metabolic scaling: a many-splendoured thing. Comp Biochem Physiol Part B Bio-chem Mol Biol 139:531–541
Symonds Mre, elgar Ma (2002) Phylogeny affects estima-tion of metabolic scaling in mammals. evol Int J Org evol 56:2330–2333
Truchot J-P, Duhamel-Jouve a (1980) Oxygen and carbon dioxide in the marine intertidal environment: diurnal and tidal changes in rockpools. respir Physiol 39:241–254
Vaca HF, White Cr (2010) environmental modulation of metabolic allometry in ornate rainbowfish Rhadinocentrus ornatus. Biol lett 6:136–138. doi:10.1098/rsbl.2009.0610
Waldbusser gg, Bergschneider H, green Ma (2010) Size-dependent pH effect on calcification in post-larval hard clam Mercenaria spp. Mar ecol Prog Ser 417:171–182. doi:10.3354/meps08809
Warton DI, Duursma ra, Falster DS, Taskinen S (2012) SMaTr 3—an r package for estimation and inference about allometric lines. Methods ecol evol 3:257–259. doi:10.1111/j.2041-210X. 2011.00153.x
Weldon CW, Daniels Sr, Clusella-Trullas S, Chown Sl (2013) Meta-bolic and water loss rates of two cryptic species in the african velvet worm genus Opisthopatus (Onychophora). J Comp Phys-iol B 183:323–332. doi:10.1007/s00360-012-0715-2
Wernberg T, Smale Da, Thomsen MS (2012) a decade of climate change experiments on marine organisms: procedures, patterns and prob-lems. glob Chang Biol 18:1491–1498. doi:10.1111/j.1365-2486. 2012.02656.x
West gB, Brown JH, enquist BJ (1997) a general model for the ori-gin of allometric scaling laws in biology. Science 276:122–126. doi:10.1126/science.276.5309.122
White Cr (2011) allometric estimation of metabolic rates in animals. Comp Biochem Physiol Part a Mol Integr Physiol 158:346–357. doi:10.1016/j.cbpa.2010.10.004
White Cr, Kearney Mr (2013) Determinants of inter-specific vari-ation in basal metabolic rate. J Comp Physiol B 183:1–26. doi:10.1007/s00360-012-0676-5
White Cr, Kearney Mr (2014) Metabolic scaling in animals: meth-ods, empirical results, and theoretical explanations. Compr Physiol 4:231–256. doi:10.1002/cphy.c110049
White Cr, Seymour rS (2003) Mammalian basal metabolic rate is proportional to body mass 2/3. Proc natl acad Sci 100:4046–4049. doi:10.1073/pnas.0436428100
White Cr, Phillips nF, Seymour rS (2006) The scaling and tempera-ture dependence of vertebrate metabolism. Biol lett 2:125–127. doi:10.1098/rsbl.2005.0378
Widdicombe S, Spicer JI (2008) Predicting the impact of ocean acidi-fication on benthic biodiversity: What can animal physiology tell us? J exp Mar Bio ecol 366:187–197. doi:10.1016/j.jembe.2008. 07.024
Wood Hl, Spicer JI, Widdicombe S (2008) Ocean acidification may increase calcification rates, but at a cost. Proc r Soc B Biol Sci 275:1767–1773. doi:10.1098/rspb.2008.0343
Wood Hl, Spicer JI, lowe DM, Widdicombe S (2010) Interaction of ocean acidification and temperature; the high cost of survival in the brittlestar Ophiura ophiura. Mar Biol 157:2001–2013. doi:10.1007/s00227-010-1469-6
Copyright © 2022 FDOKUMEN