ONE-DIMENSIONAL NANOFIBERS - DSpace TUL
177
ONE-DIMENSIONAL NANOFIBERS: APPLICATION IN MEMBRANE TECHNOLOGY Habilitation Thesis MSc. Fatma Yalcinkaya, PhD. November 2020
-
Upload
khangminh22 -
Category
Documents
-
view
4 -
download
0
Transcript of ONE-DIMENSIONAL NANOFIBERS - DSpace TUL

ONE-DIMENSIONAL NANOFIBERS:
APPLICATION IN MEMBRANE TECHNOLOGY
Habilitation Thesis
MSc. Fatma Yalcinkaya, PhD.
November 2020

Acknowledgment
The results given in this thesis were obtained in cooperation with colleagues from several
departments, institutions and countries. I want to express my gratitude to all co-authors for their
collaboration and contribution to my journey to academic life.
I have a great opportunity of being a member of the Department of Environmental Technology at the
Institute for Nanomaterials Advanced Technologies and Innovation of the Technical University of
Liberec (CXI, TUL) and the Institute of Mechatronics and Computer Engineering at the Faculty of
Mechatronics, Informatics and Interdisciplinary Studies of the Technical University of Liberec (FM-
TUL). My research in CXI-TUL has started the Department of nanotechnology and informatics at the
Institute for Nanomaterials Advanced Technologies and Innovation of the Technical University of
Liberec (CXI-TUL) in 2015. I want to express my gratitude to my former boss Prof. Jiri Maryska,
who allowed me to conduct my research and encourage me to prepare my habilitation thesis.
My professional research journey started in 2010, Department of Nonwovens and Nanofibrous
Materials in Faculty of Textile of the Technical University of Liberec under the supervision of Prof.
Oldrich Jirsak, who is one of the fathers of Nanofiber World. I would like to express my deep
gratitude to my whole-life supervisor and guide, Prof. Oldrich Jirsak, who gave me many inspiring for
being a researcher.
Some of my research has been done in the Department of Process Engineering and Technology of
Polymer and Carbon Materials, Faculty of Chemistry of Wroclaw University of Science and
Technology under the guidance of Prof. Marek Bryjak. I would like to thanks Prof. Bryjak for his
patient and friendly guidance and Dr. Anna Siekierka to open laboratories and to be such an excellent
lab-mate to conduct our ideas into research.
I would like to express my gratitude to Prof. Andrea Ehrmann in Bielefeld University of Applied
Sciences, Germany, who always support and encourage me to write my habilitation thesis and
cooperate in preparing international projects.
I would also like to thank all my students, interns, and junior researcher from our research group
during my research journey: Remi Roche, Nontawat Wutthikunthanaroj, Evren Boyraz, Izabela
Gallus, Nazrul Islam, Selingul Isik, and Aysegul Gunduz. I wish you the best of luck on your research
path.
I would like to thank the companies Mogul Nonwovens (Gaziantep, Turkey), Elmarco (Liberec,
Czech Republic), and NanoMedical s.r.o. (Liberec, Czech Republic) for sharing data related to their
product properties. A special thanks to Mr. Fatih Bayindirli and Berat Kemal Boso from Mogul
Nonwovens (Gaziantep, Turkey), Katerina Rubackova and David Brokl from Elmarco (Liberec,
Czech Republic), and Marcela Munzarova from NanoMedical s.r.o. (Liberec, Czech Republic) for
their kind communication during the preparation of the thesis.
I am also grateful to my colleagues, Dr. Jakub Hruza, Ms. Klara Kucerova, and Mrs. Irena Berankova
for their support. Special thanks to Frederick Tungshing Fung for the language-proofreading.
Special thanks to my parents in Turkey, my brothers, sisters, and all the family for their love and
support even though they do not understand what I am working on. And, of course, I would like to
thank my beloved husband, Dr. Baturalp Yalcinkaya, for being there. Without the understanding and
support of him, it would not be possible to write my habilitation thesis.

Abstract:
This habilitation thesis is prepared based on the author's contributions to the nanofiber membranes in
water treatment. First, the author tried to determine the main problems why the nanofibers cannot use
in water domain applications in the market, then tried to suggest solutions, solve and clarify each
problem. The thesis provides a comprehensive description of the issue based on the current state of
knowledge.
The structure of the thesis is as follows: Chapter 1 is a general introduction that shows the main
problems why the nanofibers cannot take place in liquid filtration. In Chapter 2, electrospinning
process and parameters for the forming of the nanofiber web are introduced. We discuss the needle-
free electsopinning system developed by the Technical University of Liberec (TUL). Chapter 3
focuses on membrane technology and nanofibers in membrane technology. Chapter 4 is represented
the work of the author in cooperation with several authors from different institutions and countries in
the field of nanofiber web formation, membrane preparation, application, and comment on their
contribution to the scientific community. Chapter 5 is the conclusion of the work. In the Appendix
part, the author includes scientific publications together with co-authors from the same or different
institutions.

Content
CHAPTER 1-INTRODUCTION ......................................................................................................... 2
CHAPTER 2-NANOFIBER TECHNOLOGY ................................................................................... 4
2.1. ELECTROSPUN NANOFIBERS ........................................................................................................ 4
2.1.1. Single-Needle Electrospinning System .................................................................................. 4
2.1.2. Needle-Free electrospinning system (Roller electrospinning) .............................................. 5
2.1.2.1. Selected electrospinning parameters .............................................................................. 6
2.2. APPLICATION OF NANOFIBERS ..................................................................................................... 9
CHAPTER 3-NANOFIBROUS MEMBRANES .............................................................................. 11
3.1. MEMBRANE TECHNOLOGY ......................................................................................................... 11
3.1.1. Membrane Morphology....................................................................................................... 12
3.1.1.1. Symmetric Membranes ................................................................................................ 12
3.1.1.2. Asymmetric Membranes .............................................................................................. 12
3.1.2. Membrane Separation Regime ............................................................................................ 13
3.1.2.1. Microfiltration .............................................................................................................. 14
3.1.2.2. Polymeric Membrane Preparation Methods ................................................................. 17
3.2. MEMBRANE STRUCTURAL PROPERTIES ..................................................................................... 18
3.2.1. Polymer Crystallinity .......................................................................................................... 18
3.2.2. Membrane Porous Structure ............................................................................................... 18
3.2.3. Membrane Surface Hydrophilicity/Hydrophobicity ............................................................ 19
3.2.4 Membrane Surface Roughness ............................................................................................. 19
3.2.5 Membrane Surface Charge .................................................................................................. 19
3.3. MEMBRANE TRANSPORT THEORY ............................................................................................. 20
3.3.1. Pore-flow and Permeation in Microfiltration Membranes ................................................. 20
3.4. CONCERTATION POLARIZATION ................................................................................................. 22
3.5. MEMBRANE FOULING ................................................................................................................. 22
3.5.1. Membrane Antifouling Mechanism ..................................................................................... 23
3.5.2. Surface Modification of Synthetic Polymeric Membranes .................................................. 23
3.5.2.1. Blending ....................................................................................................................... 24
3.5.2.2. Coating ......................................................................................................................... 24
3.5.2.4. Chemical Reaction ....................................................................................................... 25
3.5.2.4. Irradiation of High Energy Particles ............................................................................ 25
3.5.2.5. Plasma Treatment ......................................................................................................... 25
3.5.2.6. Other Techniques ......................................................................................................... 25
3.6. NANOFIBERS IN MEMBRANE TECHNOLOGY ............................................................................... 25
3.6.1. Preparation of Nanofiber Membranes ................................................................................ 28
3.6.1.1. Mechanically Enhanced Nanofiber Membranes .......................................................... 28
3.6.1.2. Characterization of Nanofiber Membranes .................................................................. 31
3.6.2. Surface Modification of Nanofiber Membranes .................................................................. 32
3.6.3. Current Research on Nanofiber Membranes ...................................................................... 34
3.7. RECYCLING AND DISPOSAL OF NANOFIBER MEMBRANES ......................................................... 36
3.8. POSSIBLE RISKS .......................................................................................................................... 36
CHAPTER 4- PRESENTED WORKS AND THEIR NOVELTIES .............................................. 37
4.1. IMPROVING NANOFIBER QUALITY FOR WATER FILTRATION .................................................... 37
1
4.2. MECHANICAL ENHANCEMENT OF NANOFIBER WEBS AND THEIR APPLICATION IN
WASTEWATER TREATMENT .............................................................................................................. 49
4.3. SURFACE MODIFICATION AND APPLICATION OF NANOFIBER MEMBRANES IN WATER
TREATMENT ...................................................................................................................................... 84
5. CONCLUSION ............................................................................................................................. 162
REFERENCES ............................................................................................................................... 163
APPENDIX-LIST OF PUBLICATIONS ........................................................................................ 168
A.1. PUBLICATIONS IN WOS -IMPACTED JOURNALS ....................................................................... 168
A.2. PUBLISHED IN REFEREED JOURNALS, TECHNICAL NOTES, LETTERS TO THE EDITOR,
DISCUSSION, CASE REPORTS AND A SUMMARY OF PUBLICATIONS OTHER THAN THE TYPE OF
ARTICLE ........................................................................................................................................... 170
A.3. INTERNATIONAL CONFERENCE BY PRESENTING PAPERS PUBLISHED IN FULL TEXT ................ 171
A.4. INTERNATIONAL CONFERENCE BY PRESENTING PAPERS PUBLISHED IN ABSTRACT ................ 172
A.5. PATENTS .................................................................................................................................. 173
A.6. BOOK CHAPTERS ..................................................................................................................... 173

2
CHAPTER 1-INTRODUCTION
One-dimensional (1-D) nanostructures such as rods, tubes, wires, and fibers have attracted a great deal
of attention because of their numerous applications in sensors, energy storage and generation,
pharmaceutical and textile industries, air filtration, water purification, and environmental remediation.
These nanostructures can provide unique advantages such as specific surface area, superior
mechanical properties, nanoporosity, and improved surface characteristics. 1-D electrospun
nanostructures-nanofibers are rapidly emerging as key enabling components in filtration application
due to their unique specific surface area, tight pore size and highly porous structure, finer degree of
filtration and better filter efficiency, the low-pressure drop across the filtration media, flexibility in
filter configuration, and easy to modified surface.
Currently, nanofibers have a significant market in air filtration such as turbine air filters, dust air
filters, engine air intake filters, and vacuum bag filters, with an annual growth rate of around 35%
[1,2]. Despite to huge potential of nanofibers in filtration technology, water domain applications are
limited, require extensive investigation and development. To apply the nanofibers into water filtration,
there is a great need to develop a novel nanofibrous structure with good mechanical strength and high
permeability. The main problems why the nanofibers cannot take place in liquid filtration are given
as;
P.1. Not all polymers can form detect-free nanofibers: All polymeric materials that are currently
used in membrane technology are not able to form nanofiber web.
P.2. Not all the hydrophilic nanofiber is suitable to use in water filtration: Many of polymers used
in nanofiber technology (polyvinyl alcohol, polyethylene oxide, polyvinyl pyrrolidone,
poly(acrylic acid), cellulose acetate, chitosan, gelatin, etc.) can be dissolved, swollen or
degradable underwater.
P.3. Mechanical weakness of nanofibers underwater: Any slight tension can cause damage to the
nanofiber surface.
P.4. Higher cost compared to conventional nonwovens: significant cost differences of nanofibers
compared to other traditional textile materials.
P.5. Lack of selectivity for liquid-liquid separation: After forming hybrid structure, the selectivity
of nanofiber membrane can be altered. In many cases, selectivity needs to improve.
P.6. Life-span: Due to membrane fouling, the life-span of membranes reduces significantly.
P.7. Cleaning: Cleaning is needed when the nanofibrous membranes fouled. So far, no cleaning
method has been submitted for the nanofibrous membranes.
P.8. Recycling and disposal: Since the final product is in a hybrid structure, recycling and
disposal of the membranes are limited.
P.9. Environmental effect: Chemicals and side products, risk of nanomaterials.
The main aims of this thesis are to address each problem mentioned above and try to suggest a
possible solution to solve each problem. Even though many scientists have already focused on

3
nanofibrous membrane filtration and have appropriate extensive specialized knowledge and
techniques to the issues, it is significant to continue working in this field to commercialize the
application area for the future market.
The author follows a pattern to clarify each problem: First, the author introduces nanofibers and their
preparation method using an industrial scale device. Then, the author’s contribution to parameters on
this device to improve the quality of the nanofiber web which has been mentioned. After that,
membrane technology, the requirement for a membrane, membrane modules, and separation systems
have been explained to clarify what are the current situation of membrane technology in the market
and how to improve it. The preparation of nanofiber membranes is explained step by step. The first
step is focused on the preparation of nanofiber webs; the second step is related to how to improve
mechanical strength to adapt nanofiber technology in membrane technology; the third step is to
characterized methods that can be used for nanofiber membranes, and the fourth step is related to the
improvement of surfaces for a better flux, selectivity, and anti-fouling property. In the fifth step, some
of the current studies on nanofiber membranes are chosen for discussion; the disposal and the
environmental effect of nanofiber membranes. As the last step, the author included own selected
publications related to nanofiber membranes, how to enhance the application of various polymeric
materials, and the mechanical properties of nanofibers using the lamination method. Also, nanofiber
membranes at different liquid separations from seawater to oil/water emulsion have been included.
The author mainly focuses on the nanofiber membranes as microfilter and their surface modification.
The ultimate goal of the author is to clarify the problems and offer solutions for the application of
nanofibers in liquid filtration. The author, therefore, publishes this thesis to introduce nanofiber webs
into membrane technology. The author nevertheless extends the apologies to those scientists whose
research findings have not been cited or discussed in this thesis. The present thesis shall be of interest
to those scientists and company researchers engaged in nanofibers and applications in liquid
separation.

4
CHAPTER 2-NANOFIBER TECHNOLOGY
2.1. Electrospun Nanofibers
The word “nano” comes from the Greek word “Nanos” which has meaning “dwarf”. In science,
nanotechnology refers to a particle size smaller than 1 micron (1000 nm). Nano dimension is a
billionth of a meter. According to dimension, nanomaterials can be classified in four groups as (a)
zero-dimension (0-D) in which all three dimensions are in the range of 1 to 100 nm, (b) one-
dimension (1-D) in which one of the dimensions is limited to the nanometer scale, (c) two-dimension
(2-D) in which two dimensions larger than 100 nm, (d) three-dimension (3-D) in which three
dimensions larger than 100 nm, but components of their microstructures are at nanoscale.
Nanofibers are a 1-D structure that has a fiber diameter below 1 μm. Nanofibers have ultimate
properties compared to conventional fibrous structures. Such properties are low basis weight, high
specific surface area (high surface-to-volume ratio), tight pore size and pose size distribution, porous
structure, high permeability and gas diffusivity, good reproducibility, tunable size, and well-controlled
orientation. Envied by those unique advantages, remarkable growth and interest have been engaged in
filtration applications.
Nanofibers can be fabricated using several technologies like island-in the sea, centrifugal spinning,
melt-blown, phase-separation, freeze-drying, template synthesis, drawing, self-assembly, force-
spinning, and electrospinning. Among all technologies, electrospinning is the most common technique
which is easy and simple to fabricate nanofiber webs. Even though the first electrostatic attraction of a
liquid was observed in the 1600s [3], electrospinning technology has been patented first time in 1900s
[4], since then the number of patents and publications about electrospinning has been increasing
exponentially.
2.1.1. Single-Needle Electrospinning System
Electrospinning is an easy set-up that contains 3 major components; high voltage supplier (AC or
DC), a solution feeding unit, and a collector (charged or grounded). A lab-scale electrospinning
system is demonstrated in Figure 2.1. Basically, a high voltage supply is connected to a polymer
feeding unit polymer. The collector is grounded or oppositely charged to the feeding unit. Under the
applied voltage, if the electrostatic field overcomes to surface tension of polymeric solution/melt, the
solution is accelerated and ejected towards to collector with whipping or splitting with reducing size.
The solution is evaporated during ejection, and a solid fiber is collected onto the collector.
Figure 2.1. Schematic illustration of electrospinning set-up [5]

5
Spinnability, defect-free structure, and uniformity of the fiber diameter are challenges of
electrospinning technology. To address this problem, the effect of process and the solution parameters
on electrospun nanofiber are studied.
Parameters that can be changed by equipment setting are called as process parameters. These
parameters are mainly applied voltage, the feed rate of the polymer solution, the distance between the
collector and the needle tip, temperature of the solution, and ambient parameters. Parameters that are
related to solution properties are called as solution or system parameters. Viscosity, concentration,
molecular weight, surface tension, conductivity, and dielectric properties of polymer solution are the
main system parameters. More information is given in the needle-free electrospinning system part.
Single needle electrospinning system is only suitable for lab-scale production; highly productive
systems have been developed to fulfill industry needs. One of the important electrospinning systems
for bulk production has been developed and patented by the Technical University of Liberec in 2005
[6] and commercialized in Elmarco s.r.o. Company with the trade name first generation of
Nanospider. Since then, the application of nanofiber material in our daily life is fastened in the Czech
Republic.
In the following sub-title, we focus on the needle-free electrospinning system in detail, which brings
us to the point where we are today. There is plenty of new technology for the industrial production of
the nanofiber. However, the author would like to focus on the roller electrospinning system to show
each step of its’ contribution to the roller electrospinning parameters to the end-use of nanofibers in
membrane technology. Thanks to the developments of industrial production devices, we are able to
use nanofibers in our daily life.
2.1.2. Needle-Free electrospinning system (Roller electrospinning)
In 2003, Jirsak et al. tried to develop needle-free roller electrospinning system for the bulk production
of nanofibers and a new nanofiber production method was developed [6]. In roller electrospinning
system, there is a rotating roller immersed in a solution bath which is connected to high voltage
supplier. On the opposite side, a metallic collector (grounded or charged) is placed under a conveyer
supporting material (antistatic nonwoven or silicon paper) as shown in Figure 2.2. Different from
single needle, many Taylor’s cone are forming on the surface of the roller at the same time to fasten
production.
Figure 2.2. Schematic diagram of roller-electrospinning system [5].

6
Parameters of roller electrospinning system are more complicated compared to needle electrospinning
systems due to different technological approaches. In the roller system, the parameters are classified
as (a) independent parameters and (b) dependent parameters, as shown in Table 2.1. All these
parameters are related to “Chapter 1-Introduction, P1”. To solve “P1”, one should focus on the
parameters of the electrospinning system. Since there are plenty of parameters, herein, we described
only selected parameters. It should be noted that, all these parameters affect the spinnability and
quality of the nanofiber webs.
Table 2.1. Dependent and independent parameters of roller electrospinning system [7]
Independent Parameters Dependent Parameters
Polymer solution properties
(concentration, viscosity,
composition, surface tension,
conductivity, molecular weight)
Applied voltage
Distance between electrodes
The velocity of rotating roller*
The velocity of take-up fabric
Geometry of electrode
Geometry of collector
Ambient conditions (temperature,
relative humidity)
Number of cones, the density of jets
Lifetime of jets
Spinning performance, spinning
performance/per jet
Total average current, current/jet*
The thickness of the polymer solution
layer on the surface of the roller*
Force acting on a jet*
Spinning area*
Distance between neighboring jets*
Jet length in the stable zone
Diameter and distribution of
nanofiber
Non-fibrous area
Launching time of jets
*The parameters defined or studied by the author and introduced to literature.
2.1.2.1. Selected electrospinning parameters
Concentration/Molecular Weight /Viscosity: The electrospinning process requires high molecular
weight polymers to initiate the spinning process. During electrospinning, a certain amount of chain
entanglement is needed to keep the solution jet coherent. At low concentration or molecular weight,
the jets break and create beads instead of fibers. As a result, spinning quality decreased. At high
concentration or molecular weight, the charged jet does not break up into small droplets due to an
increase in the viscoelastic force and thick fibers or non-fiber structures form. Shenoy et al. suggested
the number of entanglements/chain must be bigger than 2.5 to fabricate nanofibers [8]. The viscosity
of the solution depends on concentration, molecular weight, solvent type, shear rate, pressure, and
temperature. The intrinsic viscosity [η] of many polymer solutions is given by the Mark-Houwink
equation (2.1);
[η]= KMα (2.1)
where M is the molecular weight, and K and α are constants for particular kinds of polymer and
solvent. The value of α varies from 0.5 for a random coil to 2 for a rigid rod [9].
The relationship between solution concentration-molecular weight and fiber structure is studied by
Author [7], as shown in Figure 2.3.

7
Figure 2.3. The changes in the surface morphology of nanofibers by molecular weight and
concentration [7].
The image indicates that bead structure, fiber quality, and spinnability of polyvinyl butyral (PVB)
nanofibers are very much changed by the molecular weight and concentration of the polymers.
Surface Tension: The electrospinning process initiates once the electrostatic force on polymeric
solution overcomes to surface tension and forms a cone called as “Taylor’s cone”. For a higher
surface tension, a stronger electric field is required. To avoid a high electric field, generally,
surfactants are used in the polymer solution to reduce surface tension. A higher amount of surfactant
can cause polymer droplets during spinning, which can result in a bad quality of nanofibers. The
relationship between the amount of non-ionic surfactant and polyvinyl alcohol (PVA) nanofiber
surface morphology is studied by the Author as shown in Figure 2.4 [7].
Figure 2.4. Effect of surfactant concentration on the surface morphology of PVA nanofibers.
Conductivity and permittivity: during the electrospinning, the stretching and whipping or splitting of a
Taylor’s cone is controlled by the Coulombic forces between charges and the electric field. The

8
surface charge of the Taylor’s cone can be changed by changing the solution conductivity. Uniform,
defect-free and thinner nanofibers can be fabricated by controlling the conductivity of the solution. In
literature, it was suggested that an acceptable range of conductivity in electrospinning is changing
from 10-6 to 10-2 (Ω.m)-1 [10]. By lowering the permittivity, the electric charge transfer is getting
higher in the solution. It was also suggested that the best relative permittivity value for the
electrospinning is between 5 and 30, with a limit not exceeding 100 [10]. To increase the conductivity
of the polymeric solution, generally salt is used.
The velocity of rotating roller*: Rotating roller speed is associated with the feed-rate of the solution.
High rotating speeds mean more solution can carry to the surface, but also fast-moving of roller.
When the roller is too fast, there will be not enough time to born a new Taylor’s cone or less amount
of cones are formed. Oppositely, the low speed of the roller can cause not enough feed on the roller
surface, and as a result, no fibers form (Figure 2.5). The feed rate controls the quality, spinnability and
the amount of fibers formed on the support.
Figure 2.5. Relationship between roller speeds, feed rate fiber surface morphology [5].
The feed rate calculated by the equations 2.2-2.4:
the linear-velocity of the roller surface (ν) is equal to
ν = Ꞷ*π*d/60 (m/s) (2.2)
and the voluminous feed rate ύ
ύ = h* ν* ℓ = h*Ꞷ*π*d* ℓ/60 (m3/s) (2.3)
The voluminous feed rate of polymer solution per 1 meter length of roller ύ/ ℓ is equal to
ύ/ ℓ = h*Ꞷ*π*d /60 (m3/s/m) (2.4)
where, h is the thickness of solution layer (m), Ꞷ is the angular speed of roller (rpm), d is the roller
diameter (m), ℓ is the roller length (m).

9
Total average current, current/jet: Many researchers tried to focus on the current-voltage relationship
in electrospinning process. Fallahi et al. used power law and showed current ~ (voltage)2.53 [11]. In
another approach, it was shown that the current did not only depend on voltage but also conductivity
[12]. The relationship between current-voltage-conductivity was shown as I~E*Q0.5*K0.4. Some other
works indicate that the feeding rate also has an importance on the jet current [13,14]. In our case, we
tried to measure the total current of the electrospinning process since there is more than one Taylor’s
cone forming and then they are divided into the number of cones for evaluating the current per one jet.
For this aim, the following set-up was built, as shown in Figure 2.6. The number of Taylor’s cone on
the whole surface of the roller was counted using a high-speed camera simultaneously with a digital
multimeter, which measures the total current.
Figure 2.6. Measurement of total current on roller electrospinning system [5].
This work is currently used on nanofiber production devices to determine the stability of the spinning
process. If the process is stable, the total current does not change. In case any problem happens during
spinning (such as not enough feed, changes of humidity or temperature, breaking of wire on wire
spinning, etc.), the total current changes are due to changes in total number of Taylor’s cone. The
operator generally stops the process and controls all parameters. Our contribution to the nanofiber
web is to control the stability of the process.
Besides the used electrospinning technology, the type and the property of the material are very
important in nanofiber preparation. For instance, not all polymeric materials can form nanofibers. To
improve fiber-forming, many authors tried to change the solution properties (conductivity, viscosity,
surface tension, so on), cross-linking, or prepare a polymer mixture with a suitable spinnable polymer.
Polymer mixing offers not only spinnability but also an easy way to obtain new materials by
combining various polymers. The polymer mixture is generally used to improve chemical and
mechanical resistance, strength, and thermal stability. Using the mixture method, one can try to
overcome the problem in “Chapter 1- P1, P2”. For this purpose, the author prepared a series of
experimental work published in [15]. More details are given in “Chapter 4-4.1.1. Improving
Nanofiber Quality for Water Filtration”.
2.2. Application of Nanofibers
The technology of the electrospinning was first patented in 1931 [16], since then a series of
technology development has been continuing untill now. Electrospinning allows a wide range of
material from natural to synthetic, ceramics, metals, metal oxides. In the past few decades, the
electrospun nanofibers has been successfully exploited with a wide variety of applications includes
the textile application, sensors, batteries, catalysis, biomedical application, defense, optical
electronics, environmental protection, air and liquid filtration, etc. Compared to traditional fibrous
materials nanofiber market has limited the growth of polymer nanofibers in the global market due to
high production cost. Nowadays, highly productive industrial devices are developed to compete
current materials in the market that brings the solution for the “Chapter 1-P4”. Some of the selected

10
key players/manufacturers mentioned in the global market research report are; Elmarco (CZ), DuPont
(US), Hollingsworth & Vose (US), Yamashin (JP), Respilon Ltd (CZ), Donaldson Company, Inc.
(US), Teijin Limited (JP), Ahlstrom Corporation (Finland), ACS Material (US), Verdex Technologies
(US), Inovenso (TR), eSpin Technologies (US), SNS Nano Fiber Technology (US), Finetex (Korea),
Revolution Fibres (NZ), Nafigate (CZ), Toray Industries, INC. (Japan), Nanoflux Pte Ltd (Singapore),
Nanovia (CZ), Nano Medical s.r.o (CZ).
Nanofibers have 80-95 % porous structure, which makes it very suitable to remove dust particles,
aerosols, fine particles in micron sizes, fine liquid droplets. Consequently, nanofibers find their place
in the air filtration market. There is still lack of application for liquid filtration. The reason has been
discussed in “Chapter 1” under the main problems. Liquid filtration is a topic that is of enormous
importance around the world. Only a few companies tried to commercialized nanofibers in water
purification. These companies are Liquidity Nanotech Corporation, Coway, Pardam Nanotechnology,
and SPUR Nanotechnologies [17]. There is a need for research on the topic of nanofibers in water
filtration. In the following chapters, nanofiber in membrane technology and how to prepare nanofiber
membranes are discussed in detail.

11
CHAPTER 3-NANOFIBROUS MEMBRANES
3.1. Membrane Technology
Membrane technology is playing an important role in chemical technology and is used in a broad
range of applications, including water treatment for domestic and industrial water supply, beverages,
food, dairy, paper and pulp, biotechnological, chemical, pharmaceutical, metallurgy, automotive,
textile, and other separation processes. Membrane technology has a short but expedited history in
commercialization. Even though the first microporous membrane was prepared in the early 1900s
[18], the first asymmetric membranes have been developed in the 1960s [19] for industrial scale-
application. The period from the 1960s to 1980s, membrane technology blossomed, and significant
changes were produced [20]. The main problems had been studied and addressed during past years on
membrane-based separation processes were too unreliable, very slow, unselective, and too expensive.
Over the years, modern membrane science has been focused on the main problems, and significant
improvement has been achieved.
The membrane (which is prepared from polymers, inorganics, or metals) is a permeable or semi-
permeable barrier that restricts intimate contact between two homogeneous phases and prevents the
movement of certain species across their structure. There are many ways to classify the membranes:
(a) by composition: natural, polymeric, ceramic, and metallic, (b) by form: solid or liquid, (c) by
morphology: symmetric (isotropic) or asymmetric (anisotropic) membranes (Figure 3.1) (d) by
separation regime: reverse of forward osmosis, distillation, dialysis, electrodialysis, electrofiltration,
pervaporation, nanofiltration, ultrafiltration, and microfiltration, (e) by geometric shape: flat, spiral,
tubular, or hallow, and (f) by charge: electrically charged or neutral, [21]. Some of the membrane
classifications are discussed in the following sections.
Figure 3.1. Symmetric and Asymmetric membranes
Although the membrane technology offers a solution for separation technology, there are still some
problems that require to be solved, such as;
Flux: the flux of membranes decreases in time due to fouling, which reduces
membrane life-span and increases the cost.
Lack of selectivity: in many cases, selectivity needs to improve
High cost: Membranes and the overall separation system can be costly.

12
Mechanical resistance: some of the materials cannot withstand abrasion, temperature,
and pressure.
Chemical resistance: some of the polymeric membranes cannot withstand chemicals.
More information is given in the following sections for a better understanding of membrane
technology.
3.1.1. Membrane Morphology
3.1.1.1. Symmetric Membranes
Symmetric or isotropic membranes are described as the membranes with pore size, morphology, and
composition close to a uniform and homogenous structure throughout the depth of the membrane and
are generally used in dialysis, microfiltration (MF), and ultrafiltration (UF) applications. Symmetric
membranes can be prepared in the form of microporous, non-porous dense or electrically charged, as
shown in Figure 3.1.
Symmetric microporous membranes are highly voided structure, randomly distributed pores with pore
diameter changes from 0.01-10 µm, and have rigid structure [22]. The pore structure is straight and
sponge-like, and the membrane can be dense. Most MF and UF membranes use symmetric
microporous membranes to perform the separation.
Non-porous or dense membranes have dense film through. Dense films are prepared by solution
casting followed by solvent evaporation or melt extrusion. The permeate transport is controlled by
diffusion under the driving force of pressure, concentration, or electrical potential gradient. These
types of membranes are generally used in gas separation, pervaporation, and reverse osmosis.
Electrically charged membranes have positively or negatively charged ion in their pore walls, which
have a dense and porous structure. The concentration and the charge of ions are affected by the
separation process. Membranes with positively charged ions are called anion-exchange membranes
due to the binding of anions in the feed solution. Membranes with negatively charged ions are called
as cation-exchange membranes. These types of membranes are mostly used for processing electrolyte
solutions in electrodialysis.
3.1.1.2. Asymmetric Membranes
In asymmetric membranes, the transport rate of permeate through the membrane is inversely
proportional to the membrane thickness. Pore diameter and porosity change considerably through the
membrane cross-section. Generally, the skin layer of 0.5-5 µm is on the top of a porous support layer
of 50-200 µm thickness. The top skin layer is used as a selective layer for the separation process.
Because of the thin selective layer, the flux and permeability are usually very high. The porous
membrane support layer under the thin film is to provide mechanical stability. Asymmetric
membranes are mostly used in reverse osmosis (RO), nanofiltration (NF), ultrafiltration (UF) and
microfiltration (MF). Asymmetric membranes can be prepared in the form of Loeb-Sourirajan
structure or thin-film composite structure, as shown in Figure 3.1.
In 1963, Leob and Sourirajan developed the first asymmetric membranes using the phase inversion
method by applying a single polymer in which porosity and pore size changed through the wall of the
membrane [19]. These membranes are prepared by casting a polymeric solution to form a film and
13
immersing the prepared film into a non-solvent system. Mainly hydrophobic polymers are used in the
phase separation technique; water is used as non-solvent.
Thin film composite membranes usually have highly porous substrate coated with a thin dense film of
a different polymer. There are several methods to prepare thin film composites which are including
interfacial polymerization, plasma polymerization, solution coating, or surface treatment [21].
The disadvantages of asymmetric membranes are (a) using a single polymer, (b) preparation of high
customized polymers is costly, and (c) only a small amount is produced [23]. To overcome all these
problems, composite membranes are produced. In the composite structure of asymmetric membranes,
at least two different layers are used, as the author uses in this thesis. The top thin layer is the
selective layer, while the porous bottom layer supports mechanical stability. The advantage of the
asymmetric composite layer is the high flux, and almost all commercial process uses such
membranes. Compared to symmetric membranes, asymmetric membranes have several advantages
such as:
The skin layer of asymmetric membranes plays a screen filter role which not allows to
particulate matter within the membrane itself.
Asymmetric membranes seldomly block in the same way as do symmetric membranes.
Since the residual particles collected only on the surface, not the entire membrane cross-
section, that cleaning is relatively straightforward.
3.1.2. Membrane Separation Regime
The membrane separation process changes according to type and configuration, mechanism of feed
component transport, pore size and, the nature of driving force [23]. Membrane operation can be
categorized as;
Pressure-driven separation process: reverse osmosis (RO), nanofiltration (NF), ultrafiltration
(UF), and microfiltration (MF).
Partial-pressure-driven processes: such as pervaporation (PV)
Concentration-driven processes: such as dialysis and forward osmosis (FO).
Temperature driven processes: such as membrane distillation (MD).
Electrical-potential-driven processes: such as elctrodialysis (ED).
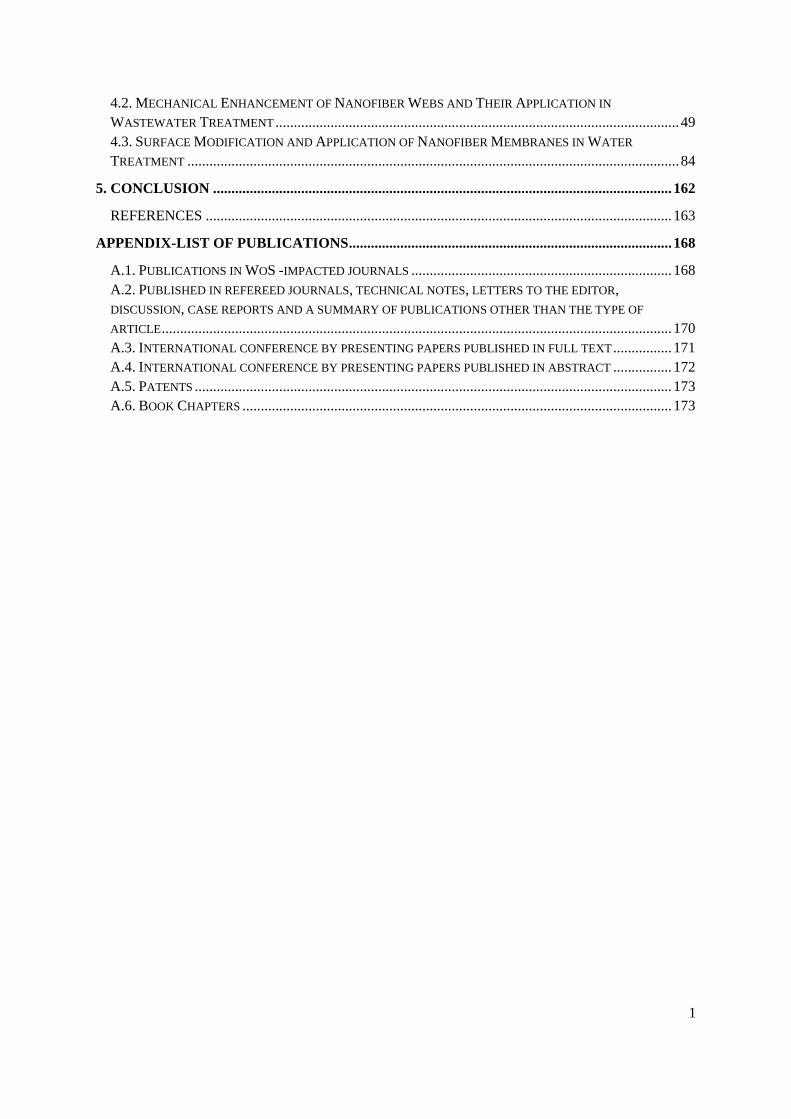
In this thesis, we focus on the pressure-driven separation-process for the nanofibrous membranes. For
this aim, the rest of the work concentrates only on microfilters to avoid excessive information related
to membrane technology. The differences in the pressure-driven membrane process are their pore size
and related selectivity, as shown in Figure 3.2. Because of pressure on the feed solution, a major
portion of the solution can pass through the semi-permeable pressure-driven membranes.
Figure 3.2. Type of membrane separation process and their selectivity according to pore size [24].

14
Due to the smallest pore size, RO system can remove ions and monovalent. NF system is suitable to
remove ions, dissolved organics and low-molecular-weight contaminants. UF system is suitable to
remove macromolecules, such as proteins and small colloids, and viruses. MF is suitable to remove
particulates, bacteria, oil emulsion and other larger colloids.
3.1.2.1. Microfiltration
Microfiltration (MF) is a process mainly made from polymeric materials with a highly porous
structure (80% and up) and uniform pore size. The suspended particles or molecules with the
diameters ranging from 0.1-10 µm can be separated using microfilters under the pressure range 1-4
bar [25]. MF is suitable for symmetric and asymmetric membranes and separation processes typically
based in the sieving mechanism (physical separation of the particle due to smaller pore size). Particle
separation is influenced by interactions between the membrane surface and the solution. Since the
membrane structure highly porous, the flux is high and hydrodynamic resistance is low. The
membrane flux is directly proportional to the applied pressure difference. The key parameters of
membrane performance are its flux and retention characteristics.
The liquid flow model is described by Poiseuille’s law, equation 3.1.
𝑞 =𝜋𝑑4
128𝜇𝑙. ∆𝑝 (3.1)
where, 𝑑 is a series of cylindrical capillary pores of diameter, 𝑞 is flow through a pore, ∆𝑝 is the
pressure difference across the pore, 𝜇 is the liquid viscosity, 𝑙 is the pore length. The flux (𝐽) is the
sum of all the flows through the individual pores is given in equation 3.2, and the number of pores per
square centimeter (𝑛) is given in equation 3.3 [21].
𝐽 = 𝑛.𝜋𝑑4
128𝜇𝑙. ∆𝑝 (3.2), 𝑛 = 𝜀.
4
𝜋𝑑2 (3.3)
After the combination of equation 3.2 and 3.3., the flux is (3.4);
𝐽 =∆𝑝
32𝜇𝑙. 𝑑2 (3.4)
Ideally, the membrane would be capable of rejecting all particulate matters above a specified size or
molecular weight completely. Due to the different pore diameters in real membranes, the cut-off is
imperfect, and some particles may be passing through the membrane and retentate. Membrane
rejection (selectivity) is calculated according to equation 3.5.
𝑅 =𝐶𝑟−𝐶𝑝
𝐶𝑟 (3.5)
where, 𝑅 is rejection, 𝐶𝑟 and 𝐶𝑝 are the concentration of particle in the retentate and the permeate at
any point during the filtration process.
Dead-end filtration widely used in the microfilters. In dead-end filtration, the feed and permeate are
both perpendicular to the surface of the membrane, and the retained materials accumulate on the
surface. As a result, a layer of retained particles forms a cake layer—the cake layer thickness
increases in time and prone to fouling. Eventually, membrane flux decreased and needs to clean
(backwashing is suggested) or replaced membranes that affect the cost.

15
Another filtration system used in microfilters is cross-flow. In this system, the feed stream flows
parallel to the membrane's surface, thereby reduces resistance to flow. The cake layer is lower than
the dead-end due to the shear force exerted by the flowing feed stream on the membrane surface. To
minimize the impact of the accumulation of particulate material, the velocity of the cross-flow can be
lowered to several meters per second—still, membranes flux decline in time due to membrane
fouling. Occasionally, membrane cleaning and sterilization is needed. Generally, organic polymers,
inorganic materials (such as ceramics, carbon, metals, and glass) are used in microfiltration, which
must be able to resist the mechanical, the chemical, and the thermal stresses after cleaning and
sterilization.
The proper filtration mode should be selected according to fluid composition, membrane material, the
selectivity of the membrane, filtration module geometry, and cleaning methods. The differences
between dead-end and cross-flow filtration can be summarized in Table 3.1.
Table 3.1. Differences between dead-end and cross-flow filtration.
Dead-end system Cross-flow system
The feed direction is perpendicular to the surface
of the membrane
The feed direction is parallel to the surface of the
membrane
Requires frequently backwash Less frequent requirement for backwash
Require higher backwash flux rates Lower backwash flux rates
Require low energy Higher liquid removal rate
Require for higher flushing flux rates Lower flushing flux rates
No recirculation Higher membrane life-span
Microfiltration is suitable for;
removing oil from oilfield-produced water,
removing of particles from liquid and gas streams,
clarification, separation, and purification of proteins,
clarification and sterile filtration of heat-sensitive solutions,
clarification of fruit juice, wine, beer, etc.
purification, gas filtration, process solvent recovery in the chemical industry,
production of pure water in the electronics industry,
wastewater treatment
Microfiltration is used as a primary step for the process of drinkable water and is employed in the
food and dairy industry, the metal industry, the pharmaceutical industry, and the textile industry.
In this thesis, polymeric electrospun materials are used to prepare membrane microfiltration. Suitable
polymeric materials in membrane technology and their properties in terms of advantages and
disadvantages are given in Table 3.2.
The selection of polymeric material should be made according to availability, stability under a range
of chemical conditions, formable (withstand stretching), must be approved for food or water contact
for certain markets.

16
Table 3.2. Commonly used polymers in membrane technology
Polymer Properties
Polyvinylidene fluoride (PVDF) High chemical and thermal stability, high
tolerance to oxidizing agents.
Highly hydrophobic
Polysulfone (PSf) o Stable structure, pH and temperature
resistance, good chlorine resistance, good
chemical resistance and easy to prepare.
o Low mechanical strength
Polyacrylonitrile (PAN) High resistance to oxidation, high
resistance to hydrolysis,
Hydrophobic, require co-polymer to
make less brittle
poly (tetrafluoroethylene) (PTFE) o High chemical and thermal stability
o Highly hydrophobic, difficult to
processing in phase-inversion
Polyamide (PA) pH and temperature tolerance.
Not good with regards to chlorine
tolerance and biofouling tendencies
Polypropylene (PP), polyethylene (PE) o Inexpensive
o Hydrophobic, low thermal stability
Cellulose acetate (CA) Hydrophobic, good for reducing the
membrane fouling, pore size can be
varied, easy to prepare, inexpensive.
Very sensitive to temperature and
pressure, narrow pH range to work
between 3-6, highly biodegradable.
polyethersulfone (PES) o Favorable selectivity-permeability
characteristics, easy to processing, good
mechanical and thermal properties,
dimensionally stable
o Hydrophobic, high cost, processing at
high temperature and pressure, low UV
resistance.

17
Membrane modules are designed to achieve an efficiency of membrane fouling prevention, different
characteristics on the hydrodynamic conditions, energy consumptions, etc. Four types of modules are
used in membrane technology: flat-sheet, spiral wound, tubular, and hollow fiber.
The flat-sheet module is the simplest configuration, consisting of two end plates at the bottom, the
selective flat sheet membrane on the top, and spacers. Compared to energy consumption, cost, and
packing density, flat-sheet modules lie in between spiral-wound modules and tubular modules.
Spiral-wound modules are similar to that of flat sheet modules consisting of a membrane envelope
wrapped around a perforated central collection tube in a spiral configuration. A mesh-like spacer
separates two membrane sheets. Pressure drop is relatively high, high surface area, and it has the
lowest capital cost compared to other systems. Also, the particles can block mesh-like spencer and
feed channels easily. Therefore, this type of module requires the minimum content of suspended
particles in the feed.
In tubular modules, are a certain number of membrane tubes assembled in one tube (internal diameter
is 5 - 25 mm, length is 0.6 - 6 m), and the feed solution is pumped through the tube. Using mechanical
or chemical cleaning methods, this type of module can be easily clean. Compares to other modules,
tubular modules have the lowest surface-area-to-volume ratio.
Hollow fiber modules used for seawater desalination consist of 50–3000 individual hollow fibers,
which are bundled and sealed together on each end with epoxy and placed in a pressure vessel.
Compared to other modules, hollow fiber modules have the highest surface-area-to-volume ratio and
economical energy consumption. However, the big particles may block the fibers in the cleaning
process.
3.1.2.2. Polymeric Membrane Preparation Methods
Several parameters affect the membrane preparation method, which is depended on the selection of
polymer type and the desired structure of the membrane. The preparation method can be categorized
as phase inversion, interfacial polymerization, track-etching, stretching, and electrospinning. The
phase-inversion method is the most common technique among all.
The phase-inversion method is a demixing process in which the process of controlled polymer
transformation from a liquid phase to a solid phase. This technique allows us to prepare a porous
membrane with a large form of structure, and it was first suggested in 1977 [26]. Selected polymer
and additives used in the casting solution affects the membrane structure and properties. Phase
inversion membranes can be prepared in various ways as (a) wet process, (b) dry process, and (c)
thermal inversion process. (a) In wet phase-inversion process, the polymeric solution forms a film by
casting method, and the solvent partly evaporated before immersing into a non-solvent water system.
Precipitation takes place due to solvent and non-solvent exchange. Then membranes are heated to 70-
90 °C to form a void structure. (b) In the dry phase-inversion method, a solvent and non-solvent in
different evaporation rates are used to prepare a polymeric solution. After thin film casting, a more
volatile solvent evaporates faster and creates voids and pores. (c) In the thermal phase-inversion
method, a mixed or single solvent polymer solution is first heated to form a single-phase and then
cooled down to induce phase separation and solidify the polymer. Later, the solvent is removed
solvent extraction to form a porous structure.

18
The interfacial polymerization method is used to form thin film composite membranes that the method
is mainly for RO and NF. This method was developed in 1980 [27]. In this method, two reactive
monomers are used. First, the supporting material is immersed into an aqueous solution of diamine or
polyamine, and then the amine-impregnated membrane immersed into the second monomer solution
of a diisocyanate in hexane. These two reactive monomers react at the organic/aqueous interface and
form a PA thin layer. The final membrane is treated with heat to form cross-linking at 100-110 °C.
Generally, the thickness of the thin film is between 100-300 nm. Membrane thickness, surface
roughness, morphology, and surface charge determine membrane permeability and selectivity
[23,28].
The Track-etching method is used to form pores on a dense film of a polymer by producing latent
tracks via irradiation with high-energy, heavy ions followed by preferential chemical etching of the
particle tracks and available since the 1970s [29]. Using this technique, it is possible to form uniform
pores with cylindrical geometry [30]. Porosity and the pore size are depending on the duration of
irradiation, etching time, and temperature.
The stretching method is used extruded dense films of semi-crystalline polymers such as PE, PP, and
PTFE to prepare porous membranes. Pores are formed due to the stretching of the film—pore size
changes between 0.1-3 µm [30]. The polymer includes melt-extruded, annealing, stretching, and heat
treatment. The structure of the membrane depends on the polymer type, extrusion draw ratio,
stretching rate, and the temperature.
The electrospinning method is an easy and versatile method to prepare highly porous (more than 80%
void structure) webs with tight pore size. Electrospun membranes show excellent performance over
conventional membranes due to high porosity, tight and adjustable pore size with a narrow pore-size
distribution, and functionalized surface. More information related to the preparation of electrospun
nanofiber webs is given in Chapter 2. A separate sub-title is prepared in this chapter for the role of
nanofibers in membrane technology and preparation method.
3.2. Membrane Structural Properties
Besides the membrane module configuration and operation conditions, membrane performance,
selectivity, permeability, and fouling are affected by membrane crystallinity, porous structure,
hydrophilicity/hydrophobicity, surface roughness, and membrane charge.
3.2.1. Polymer Crystallinity
For the non-porous membranes, the permeability and mechanical stability are mainly determined by
the polymer crystallinity. The molecular weight and type of the polymer, growth condition, chain
flexibility, chain configuration, chain interaction, and branch structure determines the polymer
crystallinity. Most of the polymer has a semi-crystalline structure. In RO system, the liquid separation
is done by sorption and diffusion through a permeable membrane. The crystallites of polymer create a
compact packed structure in which liquid cannot penetrate. The liquid transports through the
amorphous layer. The swelling of the membrane takes place in an amorphous state. Increasing
crystallinity decreases diffusion.
3.2.2. Membrane Porous Structure
Membrane pore structure indicates pore size, pore size distribution, porosity, and pore tortuosity of
the membranes. Track-etched membranes offer parallel-cylindrical pores perpendicular to the

19
membrane surface along with the thickness of the membranes. The relationship between this type of
pore geometry and flux is given by the Hagen-Poiseuille equation as equation (3.6) [23].
𝐽 =𝜀𝑟2∆𝑃
8𝜇𝜏∆𝑥 (3.6)
where, 𝐽 is the flux, 𝜀 is the surface porosity, 𝑟 is the pore radius, ∆𝑃 is the pressure difference across
the membrane of thickness ∆𝑥, 𝜇 is the solution viscosity, and τ is the pore tortuosity. The membrane
tortuosity (τ) indicates the length of the average pore compared to the membrane thickness.
In membrane technology, many membranes prepared phase inversion, stretching, solution casting, or
electrospinning techniques that do not have parallel-cylindrical pores. They have irregular pore
geometry and tortuosity. In this case, Kozeny-Carman model tries to explain the relationship between
membrane pore geometry and flux, as shown in equation 3.7 [23].
𝐽 =𝜖3∆𝑃
𝐾𝜇𝑆2(1−𝜖)2∆𝑥 (3.7)
Where, 𝜖 is the volume fraction of pores, 𝐾 is the Kozeny-Carman constant (depends on the shape of
the pores and tortuosity), and 𝑆 is the internal surface area of the membrane pores.
3.2.3. Membrane Surface Hydrophilicity/Hydrophobicity
Hydrophobic membranes tend to foul easier compared to hydrophilic membranes. In other words,
hydrophobic membranes have no interaction with water but hydrophobic compounds, while
hydrophilic membranes can form hydrogen-bonds with water. Hydrophilic membranes have less
interaction with organic substances, microorganisms, and charged inorganic particles, which reduce
membrane fouling. On the other hand, highly polar compounds can be sorbed into hydrophilic
membranes via hydrogen bonding. They can cause the greatest decline in flux through pore blocking
or the adsorption within the pores.
Membrane hydrophilicity is measured by water contact angle (WCA) measurement. If WCA is
greater than 90C, membranes are counted as hydrophobic [31]. Hydrophilicity is related to the
functional groups on the membrane surface, the roughness of the surface, and zeta-potential. The
hydrophilic groups such as –OH, COO–, and -NH2 are mainly used to improve membrane surface
hydrophilicity. Many commercial membranes are in hydrophobic nature and prone to fouling.
3.2.4 Membrane Surface Roughness
Membrane surface roughness is determined by the measurement of surface texture. Roughness plays
an important role to understand the interaction between membrane surfaces in its environment.
Hydrophobic membranes with surface roughness are prone to fouling compared to the hydrophilic
smooth membrane surface. Higher surface roughness means a higher surface area to which foulants
can be attached and caused fouling.
3.2.5 Membrane Surface Charge
Membrane surface charge determines the electrostatic interaction between charged foulant and the
membrane surface. It is important for the rejection mechanism. Depend on the membrane charge, the
interaction between charged foulant and membrane surface can be quantified by zeta potential
measurements.

20
Negatively charged membrane surface helps to reject dissolved salts, microorganisms and minimize
the adsorption of negatively charged organic foulants. This type of membrane surface can be prepared
by sulfonic and/or carboxylic acid groups on the surface of the membrane, which may be
deprotonated in feed solution by increasing the pH of feed solutions. Since the pH changes are
needed, the flux, pore size, and pore structure can be affected by pH value. Charged membranes are
important for the fouling resistance when the foulants are charged. Similar charged solute and
membrane surface repulses each other and reduces the membrane fouling. Most of the colloidal
particles are negatively charged, which requires charged membranes. Cationic charged membranes are
more suitable for the cationic macromolecules in biotechnology.
3.3. Membrane Transport Theory
There is two suggested model for permeation of different species, as shown in Figure 3.3. The first
model is the pore-flow model in which permeants are transported and pass through pores by the
pressure-driven mechanism. The second model is the solution-diffusion model, in which permeants
dissolve in the membrane material and then diffuse through the membrane cross-section. The
difference between the two mechanisms is the relative size and permanence of the pores—pore-flow
membranes have better flux than simple diffusion membranes.
Since this thesis is about the porous nanofiber membrane, we only focus on the pore-flow model.
The transport of permeant in the pore-flow model is explained by Darcy’s law, as shown in equation
3.8 [32].
𝐽𝑖 = 𝐾′𝑐𝑖 .𝑑𝑝
𝑑𝑥 (3.8)
where, 𝐽𝑖 is the flow in a capillary or porous medium, 𝐾′ is a coefficient reflecting the nature of the
medium, 𝑐𝑖 is the concentration of component 𝑖 in the medium, 𝑑𝑝/𝑑𝑥 is the pressure gradient
existing in the porous medium.
Figure 3.3. Permeation models of different membrane (a) microporous membranes separated by
molecular filtration, (b) dense membranes separated by solution diffusion [33]
3.3.1. Pore-flow and Permeation in Microfiltration Membranes
Even though there are a lot of theories about diffusion membranes, no unified theory to describe the
transport mechanism in microporous membranes which have been developed due to the extremely
heterogeneous nature of microporous membranes. Even the microporous membranes can show similar
separation, their porous structure and the mechanism of the separation can be different. For instance,
the porosity of the membrane can vary from place to place or different in each layer for asymmetric
membranes. As a result, the parameters to characterize the complexity of microporous membranes are
incomplete. Also, the membrane tortuosity (τ) which is a cylindrical pore which has a right angle to

21
the membrane surface and has a tortuosity of one, which means the average length of the pores is
equal to the membrane thickness. However, in asymmetric membranes, the pores take a more
meandering path through the membrane cross-section and the tortuosity changes in the range from
1.5–2.5. The pore diameter is another important parameter that needs to be taken into account. The
asymmetric membranes contain a range of pore sizes. In microfilters, the pore diameter is described
by the biggest particle which can penetrate the membrane: and the membrane might be much smaller
than the pore diameter observed under microscopic examination.
Figure 3.4. Screen and depth filtration mechanism
Based on the filtration type, membranes can filter the particle in two ways:
The surface or screen filter has surface pores smaller than the particles to be removed. As a result,
particles captured and accumulate only on the surface, as shown in Figure 3.4. Particles that are
smaller than the pores and able to pass through the membrane are not captured by the interior
membrane pores. These types of membranes are in the asymmetric structure and generally use a tiny,
porous structure layer on the top and larger pore size support at the bottom. Surface/screen filters can
be used as either pre-filters or clarifying filters.
The rejection mechanism for screen filters has been developed by Ferry [34] and Renkin [35] as
Ferry-Renkin equation shown in equation (3.9):
𝑅 = [1 − 2 (1 −𝑎
𝑟)
2+ (1 −
𝑎
𝑟)
4] × 100 % (3.9)
where, 𝑅 is the rejection percentage, 𝑎 is solute molecule radius, and 𝑟 is pore radius. The Ferry–
Renkin model can be used to estimate the pore size of ultrafiltration membranes.
In screen filters, the initial rejection 60-70% can be achieved to 100% after the cake layer formed on
the membrane surface.
The depth filter has a large pore size on the surface that allows the particles to enter the membrane and
captured in the interior of the membrane (Figure 3.4). Some particles are trapped in the interior
membrane; others are adsorbed in a tortuous path. Depth filters are usually symmetric and used in
microfilters as pre-filters to remove particles and protect downstream equipment from fouling or
clogging.
The depth filter mechanism is more complicated than the screen filter. The particles are not only
captured by the membrane pore, but also adsorption can take place. Four mechanisms can be
suggested for the particle capturing in the depth filters: sieving (capture of particles on small
constrictions within the membrane), inertial impaction, Brownian diffusion, and electrostatic

22
adsorption. In every case, particles smaller than the diameter of the depth filter pores are trapped by
adsorption in the interior membrane surface.
The sieving mechanism is the simple capture of particles at pore constructions in the interior of the
membrane. In internal capture, particles are bigger than the membrane’s tortuous pores and trapped
inside the membrane. This capture mechanism is more suitable for big particles. Brownian diffusion
mechanism is more suitable for small particles. While the small particles move along the pores, they
are subjected to Brownian motion (random motions of particles suspended in permeate) that creates
contact with pore walls. As a result, particles are captured to the surface by adsorption. Electrostatic
adsorption is the capture of charged particles by a membrane which has surface-charged groups.
Many colloidal particles carry a slight negative charge. A positively charged membrane can help the
rejection process. During the filtration process, the adsorption capacity of the charged membrane is
exhausted in time, and rejection decreases.
Screen filters are more commonly used and less expensive than depth filters. On the other hand, depth
filters have a larger available surface area than a screen filter, allowing them to have higher loading
capacity before fouling.
3.4. Concertation Polarization
Concentration polarization is formed as a natural consequence of membrane selectivity and negative
effect on the overall process efficiency of the membrane. Concentration polarization is observed when
the concentration of a specific component decreases or increases at the boundary layer closes to the
membrane surface. Concentration gradients form in the fluids on both sides of the membrane.
Membrane performance in ultrafiltration, electrodialysis, and some pervaporation processes is
suffered by concentration polarization.
Concentration polarization has a negative effect on membrane flux and membrane separation
properties due to high surface concentration that exceeds the solubility limit. Its impact on rejection is
an open question. It may reduce retention for the low molecular weight solutes while opposite for
macromolecular solutes [36]. The design and operating conditions of the membrane module are
important to minimize the effect of concentration polarization.
Concentration polarization is affected by membrane boundary layer thickness, the membrane
enrichment, the volume flux through the membrane, and the diffusion coefficient of the solute in the
boundary layer fluid. Among the all, the changing of the boundary layer thickness is easy by reducing
the boundary thickness minimizes the concentration polarization.
3.5. Membrane Fouling
Membrane fouling is one of the biggest problems in membrane technology. Membrane fouling is a
consequence of concentration polarization and gradual decrease of flux due to blocking of pores on
the surface or in the membrane with contaminants. Fouling reduces membrane performance
significantly as a reduction in flux, shortening of the membrane life span, and increasing the cost.
Foulants are generally in the form of organic, inorganic, biological, and colloidal structure. The
common and the most problematic fouling is colloidal one. Organic fouling forms as a consequence
of natural organic matter (NOM) appear during the filtration. Inorganic fouling forms as a
consequence of precipitation of deposits on the membrane, which results in bulk and membrane
crystallization. Biological fouling forms as a consequence of biofilm on the surface.

23
The fouling layer can be grouped as reversible and irreversible parts. Reversible part consists of the
easily removable portion of the foulants, and the irreversible fouling part consists of the remaining
portion. During the separation process, membrane resistance increases, and flux decreases. The
decrease in flux can be due to clogging of the membrane pores, adsorption in interior membrane
pores, concentration polarization, and gel layer formation.
Factors that affect the fouling can be categorized as;
Membrane properties: membrane material, pore size, pore size distribution, hydrophobicity.
Feed properties: concentration of components in the feed, size, and nature of components.
Operating conditions: flow rate, pressure, pH, and temperature.
Frequently membrane cleaning can reduce the membrane fouling and improve the flux. A proper
cleaning method must be developed according to membrane type, structure, feed properties, and the
membrane module. To maintain membrane performance, many cleaning processes have been
developed as biological, chemical, and physical treatments or combinations. Biological cleaning is
containing bioactive species such as enzymes to clean the membrane surface. The chemical cleaning
process is used to remove the adhered particles while the physical cleaning process can remove loose
particles attached on the membrane surface. Combination of both chemical and physical cleaning can
be suggested for the cleaning of nanofiber membranes which may offer solution for “Chapter 1-P7”.
3.5.1. Membrane Antifouling Mechanism
Antifouling membranes are a new trend to reduce the cost of operation, chemical and biological
cleaners, and wasted time during the cleaning process. There are three ways to reduce fouling;
(a) Improve membrane hydrophilicity to minimize the adsorption and deposition of hydrophobic
foulants on the membrane surface. A highly hydrophilic surface is more attractive for water molecules
to attach than hydrophobic foulants.
(b) Changing of surface charge, as mentioned in sub-title “Membrane Surface Charge”. Electrostatic
repulsive force helps to reduce fouling when the foulant and membrane surface is charged similarly.
(c) Grafting of hydrophilic polymer chains on the membrane surface will exert steric repulsion to
hydrophobic proteins. Due to the loss of configurational entropy, volume restriction and/or osmotic
repulsion between the overlapping polymer layers results in steric repulsion [23].
Antifouling membranes are in great interest. Many polymeric membranes are hydrophobic, which
cause fouling problems. For this aim, researchers have been focused on changing the surface of
polymeric membranes. More details are given in the following section.
3.5.2. Surface Modification of Synthetic Polymeric Membranes
The main aim of surface modification is to prevent contact between membrane and pollutants as well
as improve the selectivity and permeability by enhancing the hydrophilicity of existing polymeric
membranes. Modification can be done physically or chemically: (a) by blending or adding some other
component(s) into the polymeric material, (b) by coating the surface of the membrane with some
other polymer including grafting and in situ polymerization, (c) by altering the membrane surface via
chemical reaction (d) by radiation via high energy particles, (e) plasma treatment, and (f) by other
methods [37].
24
Physical modification focuses on physical interaction (not covalent bonding) of hydrophilic modifiers
on the polymeric membrane surface. The chemical composition of the polymeric membrane is not
changed. There are two ways to produce a physical modification, (a) direct coating or depositing of
hydrophilic polymer on the surface of the membrane, (b) immersion of membrane into chemically
active monomer, then immobilized by crosslinking or polymerization reaction with no chemical
participation of the pristine membrane.
Chemical modification focuses on a chemically modified surface by a covalent bond. The polymeric
membrane chains are activated by chemical reaction or high-energy radiation. Then, hydrophilic
modifiers are grafting. This method improves the membrane surface, not the bulk structure.
Comparing to the physical modification, this method offers long-term chemical stability.
3.5.2.1. Blending
One of the easy methods of the modified membrane is the blending of the polymer with polymeric
additives to improve surface hydrophilicity and pore interconnectivity. A hydrophilic additive adds
into a hydrophobic polymer can improve the membrane hydrophilicity and reduce fouling.
Another method is the preparation of polymer/inorganic membrane by inorganic filler embedded in a
polymer matrix. Incorporating nano-size particles into membranes can improve optical, mechanical,
electrical, magnetic, rheological, and fire retardancy properties.
3.5.2.2. Coating
Interfacial polymerization was introduced the first time in the 1960s [38] and developed in the 1980s
[27]. Using this method, a thin PA film can form on the membrane surface for a good permeability
and selectivity. More details are given in the sub-section “Polymeric Membrane Preparation
Methods”.
Layer by layer coating is another method for the fabrication of ultrathin polyelectrolyte multilayer
(PEM) film to prepare multilayer membranes. This method includes alternating sequential adsorption
of polycations and polyanions on a substrate. After each adsorption, a rising step takes place to
remove weakly associated polymer chains. The thin film is formed due to electrostatic interaction
between the positive and negative charges. This type of membrane possesses high selectivity and
permeability.
Sol-gel coating is used to fabricate materials from a chemical precursor solution for an integrated
network (or gel) of either discrete particles or network polymers. The sol-gel process involves both
physical and chemical reactions such as hydrolysis, condensation, drying, and densification. The sol is
prepared by hydrolysis and condensation at room temperature. The prepared sol is deposited on the
membrane surface using spray coating, dip coating, or spin coating followed by annealing, sintering,
or calcination under heat. The sol-gel process is a route for preparing complex oxides at low
temperatures [39]. Different sizes and shaped particles, fibers, porous materials, membranes, coatings
can be produced.
The spin coating technique is suitable for composite membrane preparation but in lab-scale with the
thickness in the range of 0.5–30 μm. In this technique, a polymeric solution is applied to the center of
a circular plate, which rotates at a given angular velocity and duration of spinning. Due to centrifugal
force, the polymeric solution flows radially and helps the solution to be ejected off the edge of the
plate. An ultrathin layer of film is formed after solvent evaporation. The thin film on the plate is
immersed in a water coagulation bath together with the plate in which phase inversion occurs and a
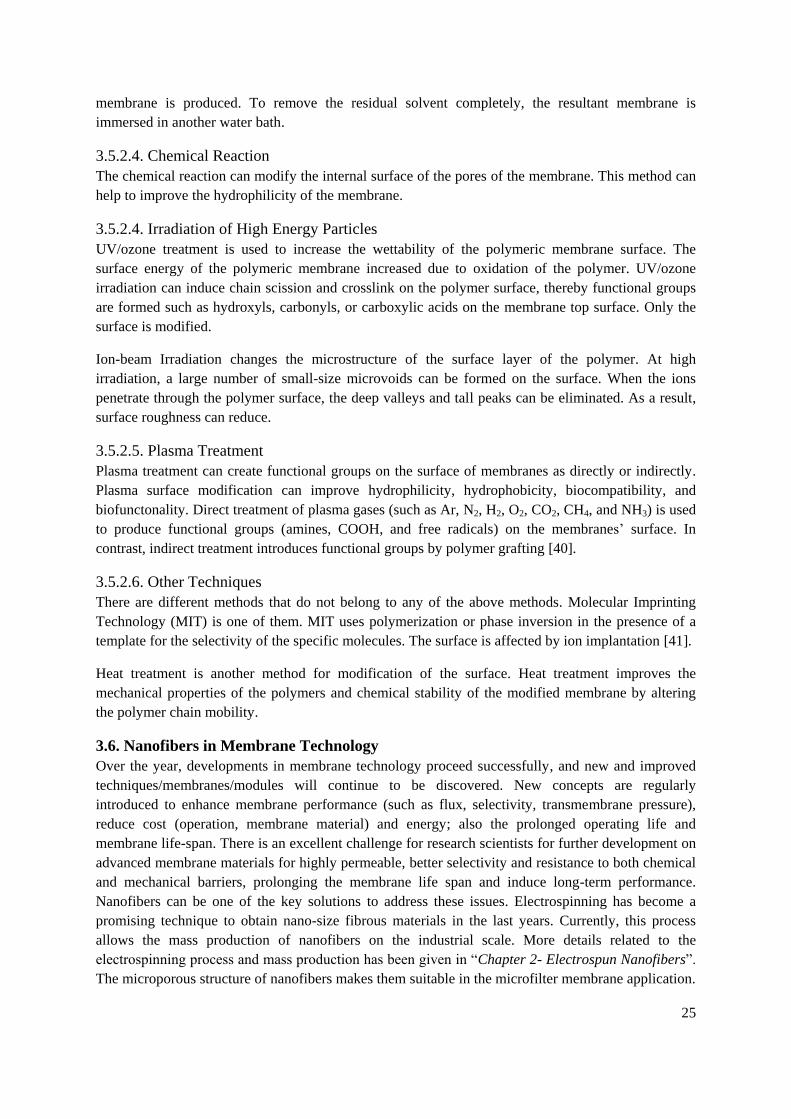
25
membrane is produced. To remove the residual solvent completely, the resultant membrane is
immersed in another water bath.
3.5.2.4. Chemical Reaction
The chemical reaction can modify the internal surface of the pores of the membrane. This method can
help to improve the hydrophilicity of the membrane.
3.5.2.4. Irradiation of High Energy Particles
UV/ozone treatment is used to increase the wettability of the polymeric membrane surface. The
surface energy of the polymeric membrane increased due to oxidation of the polymer. UV/ozone
irradiation can induce chain scission and crosslink on the polymer surface, thereby functional groups
are formed such as hydroxyls, carbonyls, or carboxylic acids on the membrane top surface. Only the
surface is modified.
Ion-beam Irradiation changes the microstructure of the surface layer of the polymer. At high
irradiation, a large number of small-size microvoids can be formed on the surface. When the ions
penetrate through the polymer surface, the deep valleys and tall peaks can be eliminated. As a result,
surface roughness can reduce.
3.5.2.5. Plasma Treatment
Plasma treatment can create functional groups on the surface of membranes as directly or indirectly.
Plasma surface modification can improve hydrophilicity, hydrophobicity, biocompatibility, and
biofunctonality. Direct treatment of plasma gases (such as Ar, N2, H2, O2, CO2, CH4, and NH3) is used
to produce functional groups (amines, COOH, and free radicals) on the membranes’ surface. In
contrast, indirect treatment introduces functional groups by polymer grafting [40].
3.5.2.6. Other Techniques
There are different methods that do not belong to any of the above methods. Molecular Imprinting
Technology (MIT) is one of them. MIT uses polymerization or phase inversion in the presence of a
template for the selectivity of the specific molecules. The surface is affected by ion implantation [41].
Heat treatment is another method for modification of the surface. Heat treatment improves the
mechanical properties of the polymers and chemical stability of the modified membrane by altering
the polymer chain mobility.
3.6. Nanofibers in Membrane Technology
Over the year, developments in membrane technology proceed successfully, and new and improved
techniques/membranes/modules will continue to be discovered. New concepts are regularly
introduced to enhance membrane performance (such as flux, selectivity, transmembrane pressure),
reduce cost (operation, membrane material) and energy; also the prolonged operating life and
membrane life-span. There is an excellent challenge for research scientists for further development on
advanced membrane materials for highly permeable, better selectivity and resistance to both chemical
and mechanical barriers, prolonging the membrane life span and induce long-term performance.
Nanofibers can be one of the key solutions to address these issues. Electrospinning has become a
promising technique to obtain nano-size fibrous materials in the last years. Currently, this process
allows the mass production of nanofibers on the industrial scale. More details related to the
electrospinning process and mass production has been given in “Chapter 2- Electrospun Nanofibers”.
The microporous structure of nanofibers makes them suitable in the microfilter membrane application.

26
Even though nanofibers look limitless from the applications' point of view, development is needed,
especially in the water domain area. The pros and cons of nanofibers to use in liquid filtration are
given in Table 3.3.
Table 3.3.The Pros and cons of nanofibers in liquid filtration.
Pros Cons
Highly porous structure (more than 80%)
helps to improve permeability.
Low mechanical strength requires additional
support to provide strength.
Tight pore size improves selectivity. High cost due to low production speed.
Narrow pore size distribution helps to have
high selectivity for the determined size of
particles.
Not all polymers can form nano-sized fibers.
The large surface-to-volume ratio of the
nanofibers can enhance their sorbent
performance for heavy metals and desired
pollutants.
Not all the hydrophilic nanofibers are suitable
for membrane (dissolving or swelling
problem).
Thin nanofiber layer can enhance the flux. Almost all spinnable polymers hydrophobic.
Multiple choice of material (cellulose nitrate,
cellulose acetate, polyvinylchloride,
polyacrylonitrile, polyamide, polyurethane,
polyamide, polysulfone, polycarbonate,
polydimethylsiloxane, polytetrafluoro
ethylene, polyvinylidene fluoride, etc) can
enhance separation application depends on
selectivity.
The possibility of incorporating a variety of
polymers can improve mechanical properties,
increase selectivity and flux, and a broader
range of environmental applications.
The mechanical problem of the nanofiber membranes is tried to be solved by various researchers.
Heat treatment is one of the suggested processes to improve the mechanical strength of nanofiber,
which can promote crystallinity. Moreover, heat treatment can remove the residual solvent in the
nanofiber web. Heat treatment itself is not enough to use nanofibers in liquid separation. A support
layer is needed to adhere to nanofibers. In this thesis, the author suggests the lamination method by
using heat treatment to prepare mechanically stable nanofiber hybrid membranes. The lamination
process may offer a solution to the problem in “Chapter 1-P3”.
Not all the engineered polymers with unique features can form nanofibers. Thus polymer mixtures can
solve this problem. Polymers with the same solvent system can be mix at various ratios. A study is
submitted in the “Presented Works and Their Novelties - Preparation of various nanofiber layers
using wire electrospinning system”. Mixing of chitosan (CH) into PA6 polymeric solution improves
the spinnability of the CH. The mixing/blending method may suggest a solution for the problem in
“Chapter 1-P1”.

27
Some of the electrospun nanofibers such as polyvinyl alcohol (PVA), polyethylene oxide (PEO),
polyvinylpyrrolidone (PVP) can quickly dissolve in aqueous media. Not only dissolving but also
swelling of fibers can create problems during filtration. For this reason, proper cross-linking is
required, which might increase the cost of material and chemical waste. Cross-linking of water-
soluble nanofibers may suggest a solution for the problem in “Chapter 1-P2”.
The preparation of nanofibers is costly due to low productivity. Fortunately, more and more industrial
production equipment is developed addressing this issue. The wire electrode electrospinning system
(Nanospider) is one of the bulk production methods. The price comparison of nanofiber webs
prepared by wire electrospinning system and commercial microfilter membranes are given in Table
3.4. Information was taken from suppliers and their web pages.
Table 3.4. Comparison of cost of nanofibrous membranes and commercial microfilters.
Membrane Price Manufacturer Properties
PVDF nanofibrous
membrane
Estimated as 24 €/m2 Our membranes
prepared in our labs
3-3.5 g/m2 nanofiber
on PET spunbond-
between 0.5-0.7 µm
pore size
PA6 nanofiber 1.7-5.4 €/m2 Elmarco 1-3 g/m2 PA6
nanofiber without
substrate
PVDF nanofiber 3.3 €/m2 Elmarco 3 g/m2 PVDF nanofiber
without substrate
PA6 nanofiber 3.9-5.7 €/m2 Nano Medical s.r.o. PA6 nanofibers with
21-43 L/(m2s) air
permeability
Synder Flat Sheet
Membrane
67.64 $/ 47 mm x5
package
Sterlitech PVDF-0.2 µm pore
size
TriSep Flat Sheet
Membrane
122.99 $/ 1016 X 305
mm size
Sterlitech PVDF-0.2 µm pore
size
PVDF Transfer
Membrane
365 €/m2 Thermofisher PVDF-0.45 µm pore
size
Hydrophobic PVDF
membrane-
HAWP04700
129 $/m2 Membrane Solutions,
LLC.
PVDF-0.45 µm pore
size
Hydrophilic PVDF
membrane-
MSPVDF260045L
209 $/m2 Membrane Solutions,
LLC.
PVDF-0.45 µm pore
size

28
Nylon membrane-
MSNY300080
65 $/m2 Membrane Solutions,
LLC.
Nylon on PET -0.8 µm
pore size
Nylon membrane-
MSNY3000100
65 $/m2 Membrane Solutions,
LLC.
Nylon on PET-1.0 µm
pore size
Nylon membrane-
MSNY300045
52 $/m2 Membrane Solutions,
LLC.
Nylon on PET-0.45 µm
pore size
MF010, MF022,
MF045
30-100$/m2 RisingSun Membrane PVDF-0.1 to 0.45 µm
pore size
Based on the information from Table 3.4, it is possible to say that price of nanofibers (produced via
Nanospider device) is comparable to commercial membranes. The prices of nanofibers in our
laboratory, Elmarco and Nanomedical s.r.o are calculated by production cost, not the market price.
Using an industrial scale nanofiber production device may solve the problem in “Chapter 1-P4”.
Many polymeric nanofibers are hydrophobic that can cause membrane fouling. For this reason,
hydrophilic modification is required. The attempts to surface-modified nanofiber membranes have
been made, as shown in “Presented Works and Their Novelties”. Surface modification improves the
membrane permeability and selectivity, which may solve the problem in “Chapter 1-P5”.
3.6.1. Preparation of Nanofiber Membranes
1-D structure nanofiber can be prepared by various methods mentioned in “Chapter 2”. Either
polymeric solution or melt can be used to fabricate nanofiber layers. Recently, the industrial scale
nanofiber production methods have been developed drastically, allowing nanofiber preparation in
bulk. Since the limitation of production is over, many end-applications have started to use nanofibers
in real life. Membrane technology is one of the promising areas to conduct nanofiber webs. The
structural property of nanofibers allows them to use as microfilter due to micron-size pores. Based on
the additional process (such as thin-film covering), nanofibers can be used as a support layer for
nanofilters, ultrafilters, and reverse osmosis. Unfortunately, the mechanical weakness and ease
abrasion structure of nanofiber webs, nanofibers cannot be used in water domain applications without
any support. For this reason, many researchers have been focusing on the combination of the
nanofiber layer onto a support layer using various methods. These methods are discussed in the
following section.
3.6.1.1. Mechanically Enhanced Nanofiber Membranes
Nanofibers are randomly oriented anisotropic structures and can filter particles by a size-exclusion
mechanism that one molecule fits in the pores and can pass through the membrane. In contrast, the
other type of molecule is quite big to fit in the pores. However, the weak interaction among the
nanofibers results in loose fiber packing, which may result in poor mechanical properties. The
mechanical weakness of the nanofiber web limited their application in liquid filtration. To improve
nanofiber membrane tensile properties, various attempts have been made. Some of the methods are
explained as;
29
Blending with other materials: polymeric, metallic, organic, or inorganic material can be mix with a
polymer solution of nanofibers to change their elastic modulus, tensile strength, hardness, and so on.
Plasticizers can be added to the polymeric solution to improve the flexibility and durability of the
nanofibers. For instance, the mixing of low molecular weight poly(ethylene glycol) (PEG) as a
plasticizer to silk fibroin solution improves the strain by 300 % times, and the stress almost doubled
[42]. Gelatin was used with poly(butylene succinate) (PBS) to improve the mechanical properties of
the PBS membrane due to changes in the crystallinity of PBS, the interaction between PBS and
gelation or possible interaction between adjacent fibers [43]. One approach has been made by adding
carbon nanotubes into the polymeric solution [44]. Functionalized single-walled carbon nanotube
(SWNT) has been electrospun with polyurethane (PU) to enhance tensile strength which results in a
104% higher when it compares to the pristine polyurethane membranes. However, these methods can
be complicated and costly, and for some cases, the mechanical strength cannot be strong enough to
fulfill the desired membrane’s condition.
Epoxy lamination: Epoxy is used to improve the mechanical properties of nanofibers via
impregnation. A heat curing process is following the epoxy impregnation. Good adhesion between
nanofiber and matrix in composites can be achieved. Some of the studies related to epoxy reinforced
nanofibers are given in [45–48]. However, porosity and permeability can be reduced significantly.
Moreover, this method is time-consuming and requires energy to cure epoxy for a long period.
Dip-coating: this method is simple and reproducible that includes the deposition of a film by
immersion of the membrane into a solution. Generally, dip-coating is used to enhance the surface
functionality of nanofiber webs to achieve some properties as hydrophilic, hydrophobic, antibacterial,
antifouling, etc. Besides surface improvement, the dip-coating method can improve the mechanical
properties of the nanofiber. The dip-coating method has been employed in fibrous materials to
improve abrasion resistance during weaving [49]. Soaking of nanofiber web into solvent can enhance
the bonding of junction points by welding or soldering by changing the degree of molecular
orientation [50].
Thermal treatment: In this first method the nanofiber web is heated above glass transition temperature
but below the melting point. As a result, inter-fiber fusion takes place that improves the welded fiber-
fiber junctions and mechanical properties. For instance, the PVDF nanofibers were thermally treated
at 150–160 °C [51]. Tensile strength, modulus, and elongation at break of the thermally treated PVDF
nanofibers were much higher than those of the untreated pristine PVDF nanofibers due to increased
crystallinity, shrinkage of the web, and nanofiber thickening. The disadvantage is that dimensional
shrinkage of heat-applied membranes may be caused by entropic relaxation of stretched polymer
chains [52,53].
Ultrasonic-welding: Ultrasonic seaming has been used for the first time in the textile industry in the
1960s [54]. The lamination of nanofibers using ultra-sonic welding has been reported recently
[55,56]. Using this method, the fibrous materials can bond on other support materials along with
defined seam areas while the other regions kept original form. During ultrasonic welding, high-
frequency vibration and heat are applied to bond and seal two different materials. This method is still
required optimization for the fragile nanofiber webs.
Heat-press lamination: Heat-press lamination is also a common method used in the textile industry to
combine at least two different surfaces. For an adhesion, intrinsic adhesion forces need to be
established between the adhesive material and substrates. Adhesion requires physical and chemical

30
bonding. Chemical bonding consists of covalent bonds between the molecules of the adhesive and the
surface material. On the other hand, physical bonding consists of four types of theory; mechanical
interlocking, adsorption, diffusion theory, and electrostatic. Mechanical interlocking is when an
adhesive penetrates the pores and holes, it locks mechanically to the substrate. Adsorption theory
includes intermolecular attraction (such as van der Waals bonding or permanent dipole) between the
adhesive and the substrate. The diffusion model explains the adhesion concept by the compatibility
between polymers and the movements of polymer chains, such as partial penetration between the
materials. Electrostatic forces contain polar molecules or permanent dipoles in the adhesive and
substrate that form electrostatic bonding.
In heat-press lamination, a hot-melt adhesive (such as glue, web, or powder) that has a lower melting
point compared to other surfaces is applied in between two surfaces under heat and force. In this
method; properties of materials, applied heat, force, and time of contact during lamination are
important factors that affect the lamination quality. For instance, insufficient heat and applied force
can cause less adhesion and the adhered area between nanofiber and substrate. In this case, under a
slight pressure, layers can easily separate. The high applied force can cause damages or changes on
the nanofiber surface. High temperatures can cause the melting of nanofiber or substrate and damage
the membrane. Moreover, excessive melting of the adhesive web can fill all pores on of nanofiber
web, which can reduce porosity and permeability. For proper adhesion, the adhesive web should
partly over the surface of nanofibers as shown in Figure 3.5. When using the heat-lamination process,
it is possible to prepare a nanofiber that is suitable to use in pressure-driven water filtration. Besides
adhesion of layers, the heat lamination can help to remove residual solvents and allow crystallinity for
the electrospun nanofibers, which in turn improves mechanical strength.
Figure 3.5. Images of laminated nanofiber webs on a substrate under a scanning electron microscope
at various magnifications.

31
After the preparation of nanofiber membranes, characterization is needed to evaluate if the nanofiber
membranes are suitable for the liquid filtration or not.
3.6.1.2. Characterization of Nanofiber Membranes
To understand the behavior of nanofiber membranes in filtration technology, characterizing is needed.
The characterization methods can be divided into several groups, such as physical characteristics
(morphology, mechanical properties, charge, etc.), chemical (structure and composition), transport
characteristics, bulk characteristics, porosity, and surface characteristics [57]. Herein, the author
discusses some of the most commonly used techniques for the characterization of nanofiber
membranes.
Scanning electron microscope (SEM): SEM is a useful tool to detect membrane surface at various
magnification. SEM is used to characterize membrane properties quantitatively (such as surface
porosity, pore shape, pore size, and pore density) and qualitatively.
Energy‐dispersive X‐ray spectroscopy (EDS or EDX): EDX combined with SEM imaging can
examine chemically distinct regions within composite membranes and on the surface of fouled
membranes.
Water contact angle (WCA): WCA is used to determine the wettability and surface energy of the
membrane surface.
Fourier-transform infrared spectroscopy (FTIR): The attenuated total reflection (ATR)-FTIR is the
most popular in membrane research (ATR-FTIR). This method is suitable to detect chemical changes
in the top layer of the membrane, such as hydrolysis, chlorination, irradiation, or comparison with
other membranes.
Differential scanning calorimetry (DSC): DCS can indicate useful information about structural
transport relationships of the membranes that can help to identify the best-performing membranes.
Atomic force microscopy (AFM): AFM performs topographic scans on the membrane surface for
surface examination and characterizes the surfaces physically. Moreover, AFM may determine
membrane thickness in dry and swollen states via scanning across stripes of a membrane both in dry
and wet conditions.
Nuclear Magnetic Resonance (NMR): NMR is used to characterize the chemical structure of the
modified membranes and the structure of the modifying agent.
Thermal Gravitational Analysis (TGA): TGA is used to determine the thermal stability of membranes
or thermal degradation behavior of membranes.
Brunauer–Emmett–Teller (BET): BET is generally used to determine porosity, pore geometry, the
uniformity of pore sizes, and surface area of microporous and mesoporous materials.
Membrane Fouling Tests: Dynamic and static testing modes are useful for fouling experiments with
real membranes. In the dynamic test, the feed is moved along the membrane in cross-flow mode. The
hydrodynamic conditions (feed velocity, pressure, the permeate flux, and concentration polarization)
are important in this type of test. Deionized (DI) water is used as first feed until a constant flux is

32
obtained. Then the feed solution containing foulants is used in a determined time, and later the feed is
again replaced with DI water. Membrane cleaning can be introduced before and after fouling. The
difference between the membrane flux and rejection before and after the filtration cycle and cleaning
process shows membrane fouling and reversibility and efficiency of the cleaning process. A static test
is suitable for biofouling or organic fouling. In this test, the membrane is immersed in a feed solution
with bacteria or foulants at defined conditions and time. Then the membrane is removed and rinsed.
The grown biofilm or amount of adsorbed foulant is examined.
Bubble Point: This measurement is used to measure membrane pore size. The pore size found via
bubble point corresponds to the largest pore.
Total Organic Carbon (TOC), Dissolved Organic Carbon (DOC), and Chemical Oxygen Demand
(COD): These methods are used to measure organic compounds, in the total amount of carbon,
organic matter, and oxygen demand within water or wastewater.
To reduce the cleaning process and to improve membrane permeability and selectivity, surface
modification is needed. Surface modified nanofiber membranes can suggest a solution for the
“Chapter 1-P5, P6 and P7”.
3.6.2. Surface Modification of Nanofiber Membranes
Mechanically enhanced nanofibers are a big step for water domain applications. However, many
polymeric nanofiber membranes are hydrophobic, which might cause fouling quickly during water
treatment. To enhance the functionality of the nanofiber membranes and reduce the fouling, surface
modification can be suggested. The high surface area of nanofibers allows better modification on the
whole surface. The surface modification can be done as physically (blending or coating, high energy
irradiation, heat and plasma treatments), chemically (chemical grafting, adding functional groups,
chemical vapor deposition, and co-polymerization), or both physically and chemically (Figure 3.6).
The main aim of surface modification is to alter surfaces by either physically or chemically altering
the atoms/molecules on the surface, coating the surface with new materials, or changing the surface
topography. Some of these methods are;
Figure 3.6. Modification of nanofiber membranes (A) co-polymer grafting, (B) NPs casting, (C) NPs
grafting.

33
Blending and coating: It is a simple physical method, no chemical attachment or interaction between
the functional material and the polymer occurs. At least two different materials are blended or surface
coated to get the desired properties of functional material. Combining additives with polar groups to a
nonpolar matrix in the electrospinning process can result in the forming of polar groups at the
nanofibers' surface. Including hydrophilic poly(vinyl alcohol) (PVA) into hydrophobic polyvinylidene
fluoride (PVDF) polymer into electrospinning solution improved not only water flux but also fouling
resistance of the nanofiber membrane [58]. However, controlling and re-productivity of this method is
difficult [59].
Sol-gel Method: Sol-gel process is a wet chemical method for forming inorganic structures from a
colloidal suspension of inorganic or metal and organic precursors. This method consists of four steps:
(a) hydrolysis of the inorganic or organic precursor in the acidic or basic mediums and condensation
reactions of precursors, (b) agglomeration/clustering of sol constituents, (c) drying of the gel, (d) and
sintering to form inorganic phases and structures with desired characteristics. The advantage of this
method is to obtain high surface area and stable surfaces while possible disadvantages are shrinkage
during drying, cracking formation problems, and relatively low production rate.
Plasma: Plasma treatment is a common method to achieve hydrophilic or hydrophobic electrospun
nanofiber mats. In this technology, a reactive treatment process takes place for creating or reducing
positive ions, negative ions, and radicals on polymer surfaces using various plasma sources. This
method requires shorter treatment time as compared to other surface modification methods. Plasma
modification forms functional groups, molecular crosslinking, graft polymerization, and coating
without changing the fiber surface. The adhesion property of plasma-modified polymer surfaces can
be enhanced by increasing the charge density. Previously, the author tried to improve membrane
surface hydrophilicity using low vacuum microwave plasma treatment with argon (Ar) gas [60]. For
this reason, various polymeric nanofiber membranes such as polyurethane (PUR), PVDF, PAN, and
polyamide 6 (PA6) were used. WCA measurement was used to determine the contact angle. The
water contact angle was measured occasionally during 55 days to observe the stability of surface
hydrophilicity. Results showed that the stability of the contact angle is changed depend on the
polymeric material. The plasma-treated PAN, PA6, and PUR membranes lost their plasma effect on
13th, 17th, and 17th days respectively; and they had similar contact angles before plasma treatment.
PVDF did not show the same contact angle as neat polymeric nanofibers over 55 days. The
hydrophilic effect of plasma is not long-lasting, and stability is changes depend on the polymeric
material.
Graft Polymerization: Surface grafting is easy, useful, and controllable process to improve the
nanofiber membrane surface. Surface modification can be achieved by grafting-to or grafting-from. In
the grafting-to (grafting onto) method, a functionalized polymer must react with the membrane
surface to produce polymer brushes. In the grafting-from, initiators are used and immobilized on the
membrane surface that allows monomer polymerization.
Radiation-Induced Graft Co-Polymerization: This method can be grouped into two categories, such as
low and high energy radiation. Visible light and UV radiation with particle energy of up to about 50
eV is called low energy radiation which is suitable for nanofibers. In high energy radiation, the
ionization mechanism is induced which leads to the formation of ions with different signs. UV and
high energy radiation can lead to physical and chemical modification via cross-linking and grafting on
the surface of the polymers. On the other hand, it can cause the breaking of bonds and damage the

34
polymer, especially for biodegradable polymers. In some cases, this can be an advantage. For
instance, electron beam irradiation has been used to fasten the degradation of poly L-lactide acid/
carboxymethyl starch/β-tricalcium phosphate (PLLA/CMS/β-TCP) composite nanofibers for tissue
engineering [61].
Wet-Chemistry: This method is based on the reaction between the chemical compound in the solution
and the surface of the nanofiber web. Hydrolysis can generate carboxyl or hydroxyl groups on the
nanofiber. Potassium hydroxide (KOH) has been used to promote hydroxyl groups to the surface of
PVDF nanofiber membranes, which increase water permeability and fouling resistance [62,63]. An
alkaline treatment may lead to swelling of the nanofibers and reduce pore size or the destruction of the
open fibrous structure and formation of gel-like materials [64,65]. In some cases, two or more
modification is needed to improve wettability or provide stable modification [66,67]. In this method,
degradation, non-reproducible, irregular etching, and non-uniformity are the disadvantages.
The author includes surface modified nanofiber membranes for separation of wastewater in the part
“Presented Works and Their Novelties”.
3.6.3. Current Research on Nanofiber Membranes
Nanofibers are one of the safest nanomaterials serve as a promising candidate for water treatment.
Many papers have been published more recently regarding nanofiber applications in membrane
technology. There is an exponential growth of documents dealing with nanofiber membranes in water
applications published in the last decade (Figure 3.7.). Nanofiber webs have high porosity; almost
more than 80% void structure, and tight pore size from 40nm to 1000 nm. The lower fiber diameter
increases filtration efficiency and increases the pressure drop that negatively affects the quality factor
of air filtration. The particles in the wastewater are mainly deposited and attach the nanofiber surface
by mechanically or electrostatically. Compared to commercially available microfilters, nanofibers can
have 4-100 times smaller pore size and several times higher surface area [68].
Application of nanofibers in water treatment varies from membrane distillation, microfiltration,
ultrafiltration, nanofiltration, reverse osmosis, and oil/water separation.

35
Figure 3.7. Papers on nanofiber membrane in water application (according to WoS, September 2020)
Membrane distillation (MD) is a non-isothermal membrane process driven by the vapor pressure
difference across the membrane caused by the temperature gradient between feed and permeation
solutions. In essence, the high cost of MD modules, relatively low permeate flux (caused by
concentration polarization) in comparison with pressure-based membrane processes, water loss due to
conduction through the polymeric membrane, membrane pollution, pore wetting, and high thermal
energy consumption did not allow expanding of the technology. The preparation of nanofiber
membranes provides better control of the membrane parameters, such as pore size, porosity, and
thickness, these characteristics that are crucial for the high efficiency of MD [24]. Membrane
distillation modules supported by nanofiber membranes offer significant advantages over commercial
MD membranes. Specifically, nanofiber products provide an enormous amount of specific surface
area and controlled porosity and narrowed pore size, which is certainly necessary for MD membranes.
PVDF nanofiber surface was covered with polydimethylsiloxane (PDMS) to reduce surface energy by
the dip-coating method and used in MD [69]. Improved nanofibers exhibited high water contact angle
as148.7° and strong intrinsic hydrophobicity. The water flux was 30.2 kg/(m2 h) and excellent stability
in 22 hours of operation. Polyurethane nanofibers exhibited extremely high salt retention above 99%
and flux up to 12 kg/(m2 h) [70].
Nanofiber in micron size pore is suitable for microfiltration. Microfilter membranes can separate
particles between 0.1 and 10 µm. Nanofibers increase the water permeability by reducing the
membrane resistance against water flow. Mechanically enhanced poly(trimethylene terephthalate)
(PTT) nanofiber membrane as microfiltration media is used for the separation of 100 µm TiO2
nanoparticles [71]. Apparently, heat-treated nanofibers have a particle rejection above 99.6%.
Carbonaceous microspheres were covalently attached to the PAN nanofiber surface [72]. Later silver
nanoparticles were trapped via in situ reductions to form carbonaceous-silver nanofibrous membrane
for separation of complex oil/water separation and removal of heavy metal ions, organic dyes, and
bacteria. The membrane had high permeability of 45612 ± 430 L/(m2hbar) for toluene-in-water
emulsion with separation efficiency of higher than 99% and removed above 90% Pb2+ through the
adsorption of covalently attached carbonaceous microspheres and nearly 100% methylene blue
through the Fenton-like oxidation of embedded silver nanoparticles. Moreover, silver nanoparticles
showed excellent antibacterial properties against E. coli.
Electrically conductive, superhydrophilic nanofiber composite membrane was prepared by acidified
carbon nanotubes (ACNTs) decoration onto polyurethane (PU) nanofibers and subsequent
polydopamine (PDA) modification [73]. Results indicated superior anti-fouling property with high
flux (4195 L/(m2h) and rejection (99.9%) and can be used for high-efficiency separation of an oil-in-
water emulsion.
Manganese dioxide (MnO2)-coated cellulose nanofibers have been used to remove methylene blue,
resulting in high adsorption and oxidation efficiency in the decolorization of methylene blue [74].
Electrospun nanofibers are mainly used as a support layer for the thin film UF and NF. For instance,
nanofiber has been used as a microporous structure for forward osmosis and membrane distillation
[75]. Thin film composite (TFC) membrane was prepared from PAN nanofibers to support a
hydrophilic PAN-coating layer for arsenate removal from contaminated water [76]. Due to high

36
porosity, the prepared membrane showed 172–520% higher flux and 1.1–1.3 times more efficient in
rejecting arsenate ions than the UF membrane.
A hydrophilic poly(vinyl alcohol‐co‐ethylene) (PVA‐co‐PE) nanofiber membrane was prepared as
support layer for TFC membranes for nanofiltration to separate different metal ions as NaCl, Na2SO4,
CaCl2, CuCl2, CuSO4, and methyl orange solutions [77]. The rejection was found 87.9%, 93.4%,
92.0%, 93.1%, 95.8%, and 100%, respectively.
All the research shows there is an excellent potential for nanofiber membranes in the water domain
application. More example related to nanofibers as microfilter is given in “Presented Works and Their
Novelties”.
3.7. Recycling and Disposal of Nanofiber Membranes
Recycling of the membranes is mainly done by the cleaning process. Nanofibers are a relatively new
technology. For this reason, there is no clear policy and standard about nanofiber recycling and
disposal due to the large variety of nanomaterials that exist in various applications and the varying
approaches required for each.
3.8. Possible Risks
During the preparation of nanofibers, there may be little hazard posed by exposure of chemicals that
users in particular need to be aware of. At the industrial level, proper training is needed for the
workers. The effect of nanofibers in human health is debatable. It was found that lung cells were not
affected by short fibers (less than five-thousandths of a millimeter long) while long fibers can reach
the lung cavity and cause disease [78]. Nanofibers might pose a risk because they have a similar shape
to asbestos. It is necessary to have more researches on nanofiber effects on environment and human
health. Toxicity tests of the nanoparticles used as surface modification should be done correctly. The
nano dimension of NPs makes it challenging to track and monitor both the environment and the
human body and observe the hazards.
Nanofiber membrane has to have good selectivity, high mechanical, chemical, and/or thermal
resistance, and reusability to increase the separation performance and to reduce the material and labor
costs. Commercialization of nanofiber still needs some developments as; compatibility with the
existing infrastructures, potential environmental and human risks, optimized cleaning process during
filtration and operating cost. All these developments are temporary, and a considerable effort is
needed between research institutions, industry, and stakeholders. In 2011, the International
Organization for Standardization (ISO) developed the ISO/TR 13121:2011 (10) standard, which
relates to Nanomaterial risk evaluation [79]. To ensure the health and safety protection of the public,
consumers, workers and the environment, this standard is evaluating, addressing, making decisions
about, and communicating the potential risks of developing and using manufactured nanomaterials.
There is not enough defined policy or testing methods to evaluate risks associated with nanomaterials
and nanofibers. However, researchers, industrial producers, and lawmakers are collaborating to
identify and eliminate potential hazards in nanotechnology.

37
CHAPTER 4- PRESENTED WORKS AND THEIR NOVELTIES The last chapter includes the selected works documenting the author's contribution to nanofiber
membranes in liquid filtration applications.
The represented publications in this chapter are not placed in chronological order due to different
journals’ publication and evaluation policy, differences in manuscript preparation time, prioritizing
the publication of finished projects, etc. The publications are placed in the order of scientific research
from nanofiber preparation to end application as;
Improve fiber morphology, spinnability, and selected properties of some polymeric solutions
for possible application of nanofibers include water filtration.
Enhancement of mechanical properties of nanofiber web and investigation of lamination
conditions on the nanofiber membrane.
Surface modification and application of nanofiber membranes in various water treatment
(Sea-water desalination, oily water separation, wastewater treatment, separation of racemic
compounds).
The novelty of works:
4.1. Improving Nanofiber Quality for Water Filtration
Polymer blends are mainly used to obtain new material with the desired strength, chemical and
mechanical resistance, thermal stability, and biological properties. Polymer blending offers an easy
way to obtain new materials by combining various polymers. In electrospinning technology, polymer
blending is very often used to improve nanofiber quality by incorporating the unique properties of
each polymer. The blending of polymers is typically achieved by using the polymers which can be
dissolved in the same solvent system.
The Author’s contribution to this field is to use various water-insoluble polymers and their mixture for
a better fiber surface morphology, improve spinnability, and enhance the properties of nanofiber web
via an industrial-scale electrospinning device. This work shows that some of the polymers and their
mixtures can be electrospun and use in industrial applications. The work has considerable practical
relevance in a multidisciplinary field (e.g., pharmaceutical industry, wastewater filtering). The
screening of the polymers and polymer composites from the point of their spinning ability is of
impact. Although the electrospinning process has been reported several years before, the research
content of the paper is still very interested because 1) the preparation of nanofibers on a large scale is
a hot topic in this field presently, 2) polymer blends and solvent mixtures are explored as a way to
improve electrospinnability of polymer solutions, and 3) this work does provide insight for industrial
applications.
Reprint:
1. Yalcinkaya F. Preparation of various nanofiber layers using wire electrospinning system.
Arabian Journal of Chemistry. 2019 Dec 1;12(8):5162-72.

38
King Saud University
Arabian Journal of Chemistry
www.ksu.edu.sa www.sciencedirect.com
Arabian Journal of Chemistry (2019) 12, 5162–5172
ORIGINAL ARTICLE
Preparation of various nanofiber layers using wire
electrospinning system
Fatma Yalcinkaya
Centre for Nanomaterials, Advanced Technology and Innovation, Technical University of Liberec,
Studentska 2, 46117 Liberec, Czech Republic
Received 7 September 2016; accepted 16 December 2016
Available online 26 December 2016
Abstract This study focuses on the preparation of various polymeric nanofibers
using new indus- trial production equipment – a wire electrospinning system.
The disadvantages of each polymeric nanofiber were improved by mixing
suitable polymer/polymer-solvent/solvent systems. A total of 9 types of
polymers (polyamide, polyvinylidene fluoride, polyacrylonitrile, polyurethane,
polysul- fone, chitosan, cellulose acetate, polyvinyl butyral, and
polycaprolactone) and their mixtures were electrospun using a wire
electrospinning system. The resultant fiber surface morphology showed that the
wire electrospinning method is suitable for the production of various polymers
on an indus- trial scale. Moreover, polymer mixtures changed the adhesion
properties, increased productivity and reduced the fiber diameter of nanofibers.
2016 The Author. Production and hosting by Elsevier B.V. on behalf of King Saud
University. This is an open access article under the CC BY-NC-ND license
(http://creativecommons.org/licenses/by-nc-nd/4.0/).
1. Introduction
Abbreviations: CA, cellulose acetate; PCL, polycaprolactone; CH,
chitosan; PA6, polyamide 6; PSU, polysulfone; PVDF, polyvinylidene
fluoride; PU, polyurethane; PAN, polyacrylonitrile; AA, acetic acid;
DAA, diluted acetic acid; FA, formic acid; DMF, dimethylformamide;
DMAC, dimethylacetamide; SEM, scanning electron microscope; Aw,
area weight of nanofiber; G, weight of nanofiber at given area in gram;
A, measured area of the web in square meter; HOB, human
osteoblastic
E-mail address: [email protected]
Peer review under responsibility of King Saud University.
http://dx.doi.org/10.1016/j.arabjc.2016.12.012
The application area of polymeric nanofibers has been increased since
the late 20th century due to their highly porous structure and high
aspect ratio and the new design of materials. The nanofibers can be
produced easily using needle and needleless electrospinning, force spin-
ning, melt-blown, island-in-the-sea, drawing, etc. (Torobin and
Findlow, 2001; Huang et al., 2012; Fabbricante et al., 2000; Huang,
2009; Nain et al., 2006; Jirsak et al., 2004). The biggest challenges
for creating nanofibers are mass production and complicated struc-
tures from multiple-fluid spinning processes (Wen et al., 2016; Yang
et al., 2016a; Yu et al., 2016). Among the various techniques reported
in the literature, the free surface electrospinning system using Nanospi-
der electrospinning technology is one of the most demanded technolo-
gies for the continuous and mass production of nanofiber layers. The
Nanospider technology was firstly developed by Jirsak et al. (2004),
and then the new models were improved by Elmarco (Petras et al.,
2010, 2009a, 2009b). The principle of the Nanospider equipment is
based on a rotating electrode immersed into a polymer bath. The role
of the rotating roller electrode is to feed the solution on the surface of
Production and hosting by Elsevier
KEYWORDS
Nanofiber;
Mass production;
Nanospider;
Chitosan;
Cellulose acetate

39
Preparation of various nanofiber layers 5163
Table 1 Polymer and polymer mixture solutions.
Polymers Polymer ratio (% wt.) Solvent ratio (% wt.) Total concentration of polymer in solution (% wt.)
PA6 AA:FA (2:1) 8
PVB AA 11
PCL AA:FA (2:1) 12
CH DAA 8
CA AA 9
PSU DMAC 10
PVDF DMAC 13
PAN DMAC 8
PU DMF 13
CA:PVB 1:1 AA 10
CA:PA6 1:1 AA:FA 8.5
PA6:CH 1:1 AA:FA:DAA 8
PA6:PCL 1:1 AA:FA 10
PA6:PVB 1:1 AA:FA 9.5
PCL:PVB 1:1 AA:FA 11.5
CH:PVB 1:1 AA:DAA 9.5
PCL:CH 1:1 AA:FA:DAA 10
PU:PSU 1:1 DMF:DMAC 11.5
PVDF:PAN 1:1 DMAC 10.5
Table 2 Spinning conditions of solution on wire electrospinning system.
Solution Applied voltage/
distance (kV/cm)
Relative humidity-
Temperature (%- C)
Wide of
substrate (cm)
Speed of substrate
(mm/min)
Diameter of
wire (mm)
PA6, CA:PA6, PA6:PCL 3.28 30–22.5 40 13 0.2
PVB, CA:PVB, PA6: 3.28 30–22.5 40 13 0.2
PVB, PCL:PVB
PCL 3.28 30–22.5 40 13 0.2
CH, PA6:CH, PCL:CH 3.28 30–22.5 40 13 0.2
CA 3.28 30–22.5 40 13 0.2
PSU, PU:PSU 3.88 26–22.0 40 13 0.2
PVDF, PVDF:PAN 3.80 33–22.5 40 13 0.2
PAN 3.80 33–22.5 40 13 0.2
PU 3.88 26–22.0 40 13 0.2
Figure 1 Schematic illustration of a Nanospider
new generation electrospinning device, (A) a
solution tank feeds the solution toward the wire,
(B) wire electrode, (C) spinning area, (D) take-
up cylinder connected to backing material, and
(E) high voltage supply.
Table 3 Spinning performance of nanofiber webs.
Polymers Aw (g/m2)
PA6 0.800
PVB 3.53
PCL 5.00
CH Not spinnable
CA 3.50
PSU 8.20
PVDF 6.80
PAN 3.50
PU 5.40
CA:PVB 3.62
CA:PA6 3.83
PA6:CH 0.40
PA6:PCL 1.70
PA6:PVB 8.20
PCL:PVB 7.10
CH:PVB Solution precipitate
PCL:CH Droplets, no fiber
PU:PSU 13.80
PVDF:PAN 6.98

40
Figure 2 Preparation of nanofiber webs to
calculate Aw.
Figure 3 SEM images of the PA6/CH mixture
electrospun nanofiber.
the roller. The biggest difference between the first (roller electrospin-
ning) and the new generation Nanospider (wire electrospinning) is
the type of electrode and feeding unit. In new generation technology,
there is a conveyor wire electrode and a close bath unit conveyed on
the wire for the feeding of the solution. The effective electrostatic field
on a thin wire is higher than roller surface which might affect the
spinnability of various polymeric solutions. Moreover, the closed feed-
ing system makes it possible to keep solution viscosity stable over time.
On the open surface, some hygroscopic polymer solutions can easily
absorb the humidity and change the viscosity and properties of the
solution over time. Using a wire electrode the Nanospider equipment
prevents the undesirable variations in the polymer solution during

41
long-term usage. The use of the conveyor wire can easily remove the
ex-solution, and the new fresh solution is always supplied to the
electrode.
The wire electrospinning system has great advantages compared to
many mass production methods. Roller, disk or spring electrospinning
systems have high productivity rates, with the fiber diameters varying
between 80 and 700 nm with a standard deviation of ±50 nm. How-
ever, the solution is on an open surface and it is difficult to maintain
the solution’s viscosity stable over time. In the force spinning method,
productivity is very high but the controlling of the fiber diameter and
diameter distribution is not easy. In melt electrospinning, productivity
is high but the fiber diameter and diameter distribution are wide. The
drawing method has very low productivity rates while the fiber diam-
eter is high. In the island-in-the-sea method, the fibers are produced in
entanglement form and the fiber diameter varies between 800 and
2500 nm with a standard deviation of ±200 nm.
Figure 4 SEM images of (A) CA, (B) CA + PVB, (C) CA + PA6.

42
The advantage of using the wire electrode Nanospider equipment is
the easy formation of nanofibers on a thin wire ( 0.2 mm). The pro-
ductivity rate is very high; the fibers are thin (80–700 nm) and have
a narrow standard deviation (±30 nm).
In this study, various electrospun polymeric nanofibers were fabri-
cated using wire electrospinning. Unlike in the case of roller electrode
Nanospider electrospinning (Yalcinkaya et al., 2014, 2016a, 2016b,
2015; Yener et al., 2013; Yener and Jirsak, 2012; Cengiz et al., 2010;
Sasithorn and Martinova, 2014; Jirsak et al., 2010), there is not enough
information about the production of nanofibers using wire electrospin-
ning in the literature. Herein, a wide range of polymer and polymer
mixtures were fabricated and the disadvantages of each polymer were
eliminated and new features added by using polymer mixtures. The
improvement of the various nanofiber webs’ disadvantages was studied
for the first time.
The fiber diameter of nanofibers can be changed through electro-
spinning parameters. However, controlling the fiber diameter is not
an easy process. Changing the spinning parameters (applied voltage,
Figure 5 SEM images of (A) PVB, (B) PA6, (C) PA6 + PVB nanofibers.

43
distance between electrodes, solution properties and speed of carriage)
can make changes on the fiber diameter but parameters alone are not
sufficient to obtain nanofibers without beads. Herein, some of the
polymer mixtures were used to change the surface morphology of
the nanofiber layers.
The diversity of spinnable polymers showed that the use of the wire
electrode Nanospider equipment had big advantages for the continu-
ous mass production of nanofibers. The resulting nanofibers are suit-
able for application in air filtration, water filtration, ion-battery
separation, bio-medical application, cosmetics, etc. (Bella, 2015;
Figure 6 SEM images of (A) PCL, (B) PCL + PA6, (C) PCL + PVB nanofibers.

44
Figure 7 SEM images of (A) PSU, (B) PU, (C) PVDF, (D) PAN nanofibers.
Bella et al., 2015; Yalcin Enis and Gok Sadikoglu, 2016; Yalcinkaya
et al., 2016a, 2016b; Yang et al., 2016b). The aim of the preparation
of mixture fibers was to eliminate disadvantages such as weakness,
abrasion, hydrophilicity/hydrophobicity, and oleophilicity/oleopho-
bicity and improve and combine the advantages of polymers. The
blended nanofibers are more advantageous compared to single electro-
spun nanofibers for improving the mechanical, structural, antibacte-
rial, biocompatible and engineered properties of materials.
1. Experimental
50.000 g/mol cellulose acetate (CA) and 45.000 g/mol poly-
caprolactone (PCL) were purchased from Sigma–Aldrich; veg-
etal chitosan (CH) was purchased from KitoZyme;
60.000 g/mol polyvinyl butyral was purchased from Mowital;
ultra-aramid B24 polyamide 6 and Ultrason E600P polysul-
fone (PSU) were purchased from BASF; Polyvinylidene fluo-
ride (PVDF) was donated by Kynar 761A; polyurethane was
purchased from Larithane LS 1086; 150.000 g/mol polyacry-
lonitrile (PAN) was purchased from Dimachema Pigment Cor-
poration. The solvents, %99 acetic acid (AA) and %56 diluted
acetic acid (DAA), formic acid (FA), dimethylformamide
(DMF), and dimethylacetamide (DMAC) were purchased
from Penta s.r.o. The polymers were dissolved in the solvent
for 30 h and mixed to form a homogenous solution. The per-
centages of the prepared solutions and mixtures are shown in
Table 1. For the solution mixtures, first the single polymer
solution was prepared, and then the polymer blends were pre-
pared at a given weight ratio according to Table 1 and mixed
overnight. The concentration ratio was determined according
to our previous experiments and known-how.
The spinning conditions kept stable during process are
shown in Table 2. The schematic figure of the new generation
Nanospider equipment is shown in Fig. 1.
The solution is placed into a feed unit (A, B). The wire is
placed in the middle of the solution tank. The feed unit is mov-
ing back and forth and the solution is feeding on the wire. The
upward part has a second wire electrode, which generally has
the opposite charge to the downward wire electrode or is
grounded. If the electrical field between the electrodes over-
comes the surface tension of the polymer solution, fibers are
formed (C). A conveyer backing/supporting material is placed
in between the two electrodes to collect the fibers, moving at a
desired speed using take-up cylinders (D).
The nanofibers were analyzed using a scanning electron
microscope (SEM, Tescan Vega3 SB). All samples were gold-
coated for 60 s and 7 nm thickness before SEM imaging to
reduce the effect of charging. The Image-J software was used
to measure the average fiber diameter from more than 50 dif-
ferent randomly selected fibers.
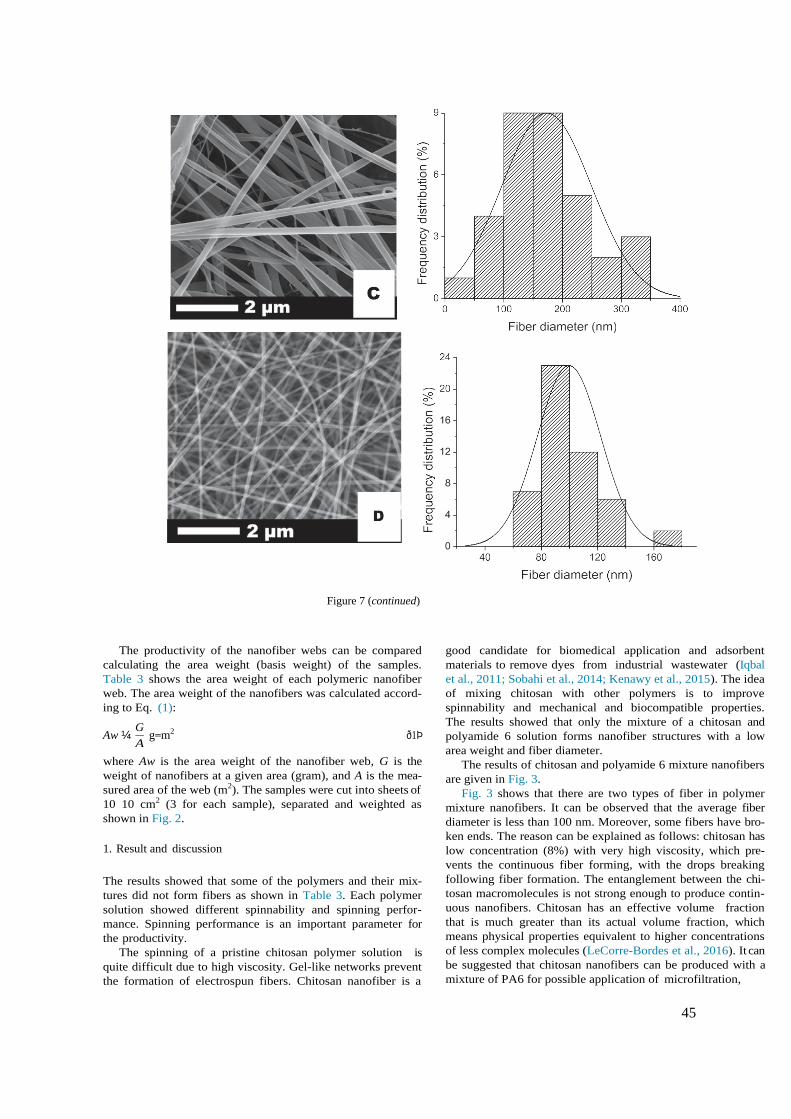
45
A
Figure 7 (continued)
The productivity of the nanofiber webs can be compared
calculating the area weight (basis weight) of the samples.
Table 3 shows the area weight of each polymeric nanofiber
web. The area weight of the nanofibers was calculated accord-
ing to Eq. (1):
Aw ¼ G
g=m2 ð1Þ
where Aw is the area weight of the nanofiber web, G is the
weight of nanofibers at a given area (gram), and A is the mea-
sured area of the web (m2). The samples were cut into sheets of
10 10 cm2 (3 for each sample), separated and weighted as
shown in Fig. 2.
1. Result and discussion
The results showed that some of the polymers and their mix-
tures did not form fibers as shown in Table 3. Each polymer
solution showed different spinnability and spinning perfor-
mance. Spinning performance is an important parameter for
the productivity.
The spinning of a pristine chitosan polymer solution is
quite difficult due to high viscosity. Gel-like networks prevent
the formation of electrospun fibers. Chitosan nanofiber is a
good candidate for biomedical application and adsorbent
materials to remove dyes from industrial wastewater (Iqbal
et al., 2011; Sobahi et al., 2014; Kenawy et al., 2015). The idea
of mixing chitosan with other polymers is to improve
spinnability and mechanical and biocompatible properties.
The results showed that only the mixture of a chitosan and
polyamide 6 solution forms nanofiber structures with a low
area weight and fiber diameter.
The results of chitosan and polyamide 6 mixture nanofibers
are given in Fig. 3.
Fig. 3 shows that there are two types of fiber in polymer
mixture nanofibers. It can be observed that the average fiber
diameter is less than 100 nm. Moreover, some fibers have bro-
ken ends. The reason can be explained as follows: chitosan has
low concentration (8%) with very high viscosity, which pre-
vents the continuous fiber forming, with the drops breaking
following fiber formation. The entanglement between the chi-
tosan macromolecules is not strong enough to produce contin-
uous nanofibers. Chitosan has an effective volume fraction
that is much greater than its actual volume fraction, which
means physical properties equivalent to higher concentrations
of less complex molecules (LeCorre-Bordes et al., 2016). It can
be suggested that chitosan nanofibers can be produced with a
mixture of PA6 for possible application of microfiltration,

46
Figure 8 SEM images of (A) PSU + PU and (B) PVDF + PAN.
enzyme immobilization (Li et al., 2014; Maryskova et al.,
2016) or human osteoblastic (HOB) cell culture applications
(Nirmala et al., 2011).
Cellulose acetate nanofibers are biocompatible and have
high hydrophilicity, which make them a good candidate for
water treatment. It has been mentioned that spinning of CA
solutions is not easy to control (Liu et al., 2016). Despite
changing process parameters, beads form easily. As shown in
Fig. 4(A), we also observed many beads on the surface of
the web. The easy way to eliminate the bead structure is mixing
with other polymer. In this way, not only are the beads elimi-
nated, but it is also possible to enhance the advantages of
nanofibers.
The idea of mixing CA with PA6 or PVB polymers is to
reduce the bead structure and improve surface morphology
(Fig. 4). CA + PVB nanofibers have almost 5 times higher
fiber diameters than pristine CA nanofibers, while CA
+ PA6 nanofiber diameters are almost equal to pristine CA.
The PVB nanofibers have an average nanofiber diameter of
around 350–370 nm, PA6 of around 40–60 nm (Fig. 5), and
their mixture of around 180–200 nm. The results indicate that
an additional polymer has a huge effect on the final polymer
diameter and the bead structure as well. The mixture of CA
with PA6 or PVB did not change the spinning performance
of pristine CA nanofibers. Among all CA and mixtures, CA
+ PA6 nanofibers are an excellent candidate for air
(Matulevicius et al., 2016; Nicosia et al., 2016) and water filtra-
tion (Carpenter et al., 2015; Zhou et al., 2016).
It was observed that during spinning PVB nanofibers have
the ability to stick to all the surfaces of the spinning unit, take-
up cylinders and the feed tank, which leads to difficulty in
keeping nanofibers on the surface of backing materials. The
mixing of PVB with PA6 nanofibers has the advantage of
decreasing the average fiber diameter and leads to narrower
fiber diameter distribution. Moreover, the adhesion problem
of the PVB nanofibers was eliminated and the area weight
was increased almost 2.3 times, which translates into lower
energy costs.
Polycaprolactone is a low-cost, biodegradable polyester.
Studies showed that the biocompatibility of PCL nanofibers
has a promising future in biomedical applications (Mahjour
et al., 2016; Venugopal et al. (2005); Thorvaldsson et al.,

47
2008; Pajoumshariati et al., 2016). It was found that the adhe-
sion property of PCL nanofibers is much lower than that of
protein nanofibers, which might be a disadvantage for the lam-
ination process (Baker et al., 2016). To improve the adhesion
properties of PCL nanofibers, the mixture of PCL + PA6
and PCL + PVB was prepared. PVB has excellent adhesion
properties and is very cheap compared to PCL and PA6.
The results of SEM are shown in Fig. 6.
Fig. 6 shows that the mixture of PCL and PA6 solutions
increases the bead structure of nanofibers while the spinning
performance decreases dramatically. On the other hand, mix-
ing PVB with PCL decreases the formation of beads on the
surface of the layer but increases the average fiber diameter 3
times. The area weight of PCL was increased by adding
PVB. If the adhesion properties of PVB nanofibers are consid-
ered, it can be concluded that nanofibers from the mixture of
PCL with PVB would have increased adhesion properties
and also a decreased bead structure of nanofiber layers.
Polysulfone, polyurethane, polyvinylidene fluoride and
polyacrylonitrile are good candidates for wastewater filtration,
reverse and forward osmosis and membrane distillation. All
the polymers were easily electrospun into nanofibers using
the wire electrospinning system. The SEM results of the vari-
ous polymers are shown in Fig. 7.
In our previous experiments, we found that PSU nanofibers
are not good in terms of their mechanical and abrasion prop-
erties. PSU nanofibers are damaged and removed from the
backing material very easily under slight tension. PU nanofi-
bers have good tensile properties and elasticity, and are insol-
uble in water. A mixture of PU with PSU improved the
mechanical and abrasion properties of nanofibers. When exter-
nal tension was applied, the PU/PSU nanofibers were not
damaged or removed from the backing material (Fig. 8).
PAN has highly polar groups in the backbone that improve
the hydrophilicity of the materials and are advantageous for
wastewater treatment as they decreased the fouling effect.
PVDF nanofibers are quite strong but highly hydrophobic.
Combining PVDF with PAN can improve the hydrophilicity
and mechanical properties of nanofibers. The mixture of nano-
fiber layers is shown in Fig. 8.
Pristine PU and PVDF nanofibers have a larger fiber diam-
eter and diameter distribution in comparison with PSU and
PAN. Both PSU and PAN nanofibers have a diameter of less
than 100 nm, which is promising for air and water filtration.
On the other hand, the mechanical properties and hydropho-
bicity of PSU and PVDF are disadvantages and can be easily
eliminated by mixing with PU and PAN respectively. The mix-
ture of PSU + PU nanofibers has an average fiber diameter of
around 120–140 nm while that of the PAN + PVDF mixture
is around 120 nm. Both results of the mixture showed signifi-
cant surface morphology and small fiber diameters, which
make them a good candidate for water and air filtration. The
mixing of PSU/PU increased the area weight of PSU and
PU 1.68 and 2.5 times respectively, while the mixture of
PAN/PVDF increased PAN and PVDF to 1.99 and 1.02
respectively.
The main results of the work can be summarized as follows:
Mixing a chitosan polymer with PA6 can form nanofibers
while a mixture of CH + PVB and CH + PCL did not form
nanofibers.
Bead-free cellulose acetate nanofibers were produced by
mixing with PA6 and PVB polymers. The CA + PA6 nanofi-
bers have a small fiber diameter of around 60 nm, which sug-
gests a potential application area for high-efficiency air
filtration.
The PA6 and PVB nanofibers were electrospun with aver-
age fiber diameters of around 50 and 400 nm respectively.
PVB is quite a cheap polymer compared to other polymers
and is easy to process and handle. There are not many studies
about the application of PVB nanofibers. Based on the appli-
cation area, the fiber diameter of PVB nanofibers can be
reduced and the spinning performance can be increased by
mixing with PA6.
PCL was mixed with PA6 and PVB. The resulting electro-
spun fibers showed that a mixture of PCL + PA6 creates
beads on the surface of the nanofiber. On the other hand, a
mixture of PCL + PVB nanofibers has good surface morphol-
ogy and very high productivity. Using the adhesion properties
of PVB, the adhesion properties of PCL nanofibers can be
improved.
PSU, PU, PVDF and PAN all have special properties for
various application areas. The mechanical properties and the
area weight of PSU and PAN nanofibers were improved by
mixing with PU and PVDF respectively.
Figure 9 Comparison of various nanofiber webs according to
their (A) fiber diameter and (B) area weight.
48
Hereby, Fig. 9 shows the area weight and the fiber diameter
of all polymers and polymer mixtures. The idea of mixing
polymers mainly showed advantages with respect to fiber
diameter, diameter distribution and area weight.
1. Conclusion
The production of nanofibers using wire electrospinning has not been
yet investigated in detail, although this technology has been utilized on
an industrial scale. Wire electrospinning systems are superior to many
production methods in the market due to their high productivity and
ease of setting up and cleaning. Almost all polymers that form nanofi-
bers in the needle electrospinning system can be electrospun using
needle-free wire electrospinning at higher production efficiency rates.
It can be concluded that most common polymers in the market
could be easily electrospun to produce nanofibers using the wire elec-
trospinning system. The results of this work provide an insight into the
industrial application of nanofibers. The optimization of nanofiber lay-
ers is time consuming and costly. The optimization process was almost
completed by mixing of various spinnable polymers and the disadvan-
tages and productivity of each nanofiber layer were improved by mix-
ing of polymers.
Acknowledgment
The results of this project LO1201 were obtained through the
financial support of the Ministry of Education, Youth and
Sports in the framework of the targeted support of the
‘‘National Programme for Sustainability I”. Special thanks
to Ms. Tamara Pavlovova and Mr. Jerome Chauveau, Kynar
Arkema (Bratislava and France) for their kind cooperation.
References
Baker, S.R., Banerjee, S., Bonin, K., Guthold, M., 2016. Mater. Sci.
Eng. C. 59, 203.
Bella, F., 2015. Electrochim. Acta 175, 151.
Bella, F., Sacco, A., Massaglia, G., Chiodoni, A., Pirri, C.F., Quaglio,
M., 2015. Nanoscale 7 (28), 12010.
Carpenter, A.W., de Lannoy, C.F., Wiesner, M.R., 2015. Environ. Sci.
Technol. 49, 5277.
Cengiz, F., Dao, T.A., Jirsak, O., 2010. Polym. Eng. Sci. 50, 936.
Fabbricante, A.S., Ward, G.F., Fabbricante, T.J., 2000. US Patents,
6114017.
Huang, T., Marshall, L.R., Armantrout, J.E., Yembrick, S., Dunn, H.,
Oconnor, J.M., Mueller, T., Avgousti, M., Wetzel, M.D., 2012. U.
S. Patent, 8277271.
Huang, T., 2009. US Patents, 20090160099.
Iqbal, J., Wattoo, F.H., Wattoo, M.H.S., Malik, R., Tirmizi, S.A.,
Imran, M., Ghangro, A.B., 2011. Arab. J. Chem. 4 (4), 389.
Jirsak, O., Sanetrnik, F., Lukas, D., Kotek, V., Martinova, L.,
Chaloupek, J., 2004. US Patent, 7585437.
Jirsak, O., Sysel, P., Sanetrnik, F., Hruza, J., Chaloupek, J., 2010. J.
Nanomater., 6 Article ID 842831
Kenawy, E.R.S., Azaam, M.M., Saad-Allah, K.M., 2015. Arab. J.
Chem. 8 (3), 427.
LeCorre-Bordes, D., Tucker, N., Huber, T., Buunk, N., Staiger, M.P.,
2016. J. Mater. Sci. 51 (14), 6686.
Li, C.J., Zhang, S.S., Wang, J.N., Liu, T.Y., 2014. Catal. Today 224,
94.
Liu, C., Li, X., Liu, T., Liu, Z., Li, N., Zhang, Y., Xiao, C., Feng, X.,
2016. J. Membrane Sci. 512, 1.
Mahjour, S.B., Sefat, F., Polunin, Y., Wang, L., Wang, H., 2016. J.
Biomed. Mater. Res. A. 104, 1479.
Maryskova, M., Ardao, I., Garcia-Gonzalez, C.A., Martinova, L.,
Rotkova, J., Sevcu, A., 2016. Enzyme Microb. Tech. 89, 31.
Matulevicius, J., Kliucininkas, L., Prasauskas, T., Buivydiene, D.,
Martuzevicius, D., 2016. J. Aerosol. Sci. 92, 27.
Nain, A.S., Wong, J.C., Amon, C., Sitti, M., 2006. Appl. Phys. Lett. 89
(18), 183105.
Nicosia, A., Keppler, T., Mu¨ ller, F.A., Vazquez, B., Ravegnani, F.,
Monticelli, P., Belosi, F., 2016. Chem. Eng. Sci. 153, 284.
Nirmala, R., Navamathavan, R., Kang, H.S., El-Newehy, M.H., Kim,
H.Y., 2011. Colloid. Surface. B 83, 173.
Pajoumshariati, S., Yavari, S.K., Shokrgozar, M.A., 2016. Ann.
Biomed. Eng. 44, 1808.
Petras, D., Maly, M., Kovac, M., Stromsky, V., Pozner, J., Trdlicka,
J., Mares, L., Cmelik, J., Jakubek, F., 2009. WO Patents,
2009010020.
Petras, D., Mares, L., Cmelik, J., Fiala, K., 2009. WO Patents,
2007137530.
Petras, D., Maly, M., Pozner, J., Trdlicka, J., Kovac, M., 2010. US
Patents, 20100034914.
Sasithorn, N., Martinova, L., 2014. J. Nanomater., 9 Article ID
947315
Sobahi, T.R.A., Abdelaal, M.Y., Makki, M.S.I., 2014. Arab. J. Chem.
7 (5), 741.
Thorvaldsson, A., Stenhamre, H., Gatenholm, P., Walkenstro¨ m, P.,
2008. Biomacromolecules 9, 1044.
Torobin, L., Findlow, R.C., 2001. US Patents, 6183670.
Venugopal, J., Ma, L.L., Yong, T., Ramakrishna, S., 2005. Cell Biol.
Int. 29, 861.
Wen, H.F., Yang, C., Yu, D.G., Li, X.Y., Zhang, D.F., 2016. Chem.
Eng. J. 290, 263.
Yalcin Enis, I., Gok Sadikoglu, T., 2016. J. Ind. Text. http://dx.doi.
org/10.1177/1528083716654470.
Yalcinkaya, B., Cengiz-Callioglu, F., Yener, F., 2014. Text. Res. J. 84
(16), 1720.
Yalcinkaya, F., Yalcinkaya, B., Jirsak, O., 2015. J. Nanomater., 12
Article ID 134251
Yalcinkaya, B., Yalcinkaya, F., Chaloupek, J., 2016a. Nanomaterials,
12 Article ID 2694373.
Yalcinkaya, F., Komarek, M., Lubasova, D., Sanetrnik, F., Maryska,
J., 2016b. J. Nanomater., 7 Article ID 7565972
Yang, C., Yu, D.G., Pan, D., Liu, X.K., Wang, X., Bligh, S.W.A.,
Williams, G.R., 2016a. Acta Biomater. 35, 77.
Yang, T., Chen, Z., Zhang, H., Zhang, M., Wang, T., 2016b.
Electrochim. Acta 217, 55.
Yener, F., Jirsak, O., 2012. J. Nanomater., 6 Article ID 839317
Yener, F., Yalcinkaya, B., Jirsak, O., 2013. J. Nanosci. Nanotechnol.
13, 4672.
Yu, D.G., Yang, C., Jin, M., Williams, G.R., Zou, H., Wang, X.,
Annie Bligh, S.W., 2016. Colloid. Surface. B 138, 110.
Zhou, Z., Lin, W., Wu, X.-F., 2016. Colloid. Surface. A 494, 21.

49
4.2. Mechanical Enhancement of Nanofiber Webs and Their Application in Wastewater
Treatment
Nanofiber membranes have been tested in laboratories for so many years and showed great interest in
water treatment. However, preparation in large-scale and commercialization still varies widely. Some
of the products are already on the market (very limited amount), and some products are still on the
way of commercialization that requires deep research before they can be considered for large-scale
production due to some technical obstacles (such as compatibility with the existed membranes,
operating cost, and potential environmental and health risks). To overcome these temporary technical
obstacles, a concerted effort and collaboration are needed between universities, research institutions,
government, industry, and stakeholders. As a result of efforts and collaborations, nanofiber
membranes will provide consolidated solutions to water treatment.
In the following papers, we attempt to deal with the problem rigorously, starting by enhancement of
mechanical properties of nanofiber membranes using lamination onto a support layer. Different
adhesion method with different support has been selected to see their effect on overall membrane flux
and selectivity. We investigated that the supporting layer, type of adhesion method, type of polymeric
nanofiber, and density of the nanofiber layer have an impact on the water permeability and the
rejection. The polymer type, supporting layer, and adhesion methods are the key parameters for the
nanofiber membrane preparation. Based on the first reprint, the adhesive web lamination method was
selected for membrane preparation. In the second and third paper, we tried to optimize the lamination
conditions (such as heat, applied pressure, and time) for different polymeric nanofiber webs (PVDF
and PAN), which are highly used in water treatment. Lamination effect on membrane
characterization and membrane permeability has been introduced to literature. These two reprints (2
and 3) include a comprehensive study on lamination optimization and conditions for nanofibers
membrane technology.
The contribution of the papers to the scientific community is based on the following results:
Determination of polymer type, adhesion method and support layer effects on the nanofiber
membranes’ water permeability and particle rejection. This is a major step for membrane preparation
to select the right material and preparation method.
Investigate the lamination condition on the membrane performance and optimization of the lamination
method. The lamination process is important to use nanofiber webs in membrane applications. For
this reason, it is crucial to understand the lamination effects and optimization process.
Reprint:
1. Yalcinkaya F, Yalcinkaya B, Hruza J, Hrabak P. Effect of nanofibrous membrane
structures on the treatment of wastewater microfiltration. Science of Advanced
Materials. 2017 May 1;9(5):747-57.
2. Yalcinkaya F, Hruza J. Effect of laminating pressure on polymeric multilayer
nanofibrous membranes for liquid filtration. Nanomaterials. 2018 May;8(5):272.
3. Roche R, Yalcinkaya F. Electrospun Polyacrylonitrile Nanofibrous Membranes for
Point‐of‐Use Water and Air Cleaning. ChemistryOpen. 2019 Jan;8(1):97-103.

50
∼
∼
Copyright © 2017 by American Scientific Publishers
All rights reserved.
Printed in the United States of America
Science of
Advanced Materials Vol. 9, pp. 747–757, 2017
www.aspbs.com/sam
Effect of Nanofibrous Membrane Structures on
the Treatment of Wastewater Microfiltration
Fatma Yalcinkaya∗, Baturalp Yalcinkaya, Jakub Hruza, and Pavel Hrabak
Centre for Nanomaterials, Advanced Technologies and Innovation, Technical University of Liberec,
Studentska 2, 46117, Liberec, Czech Republic
ABSTRACT
An experimental study for industrial wastewater was carried out using a cross-flow microfiltration unit. The
effect of various nanofibrous membrane structures on the membrane permeability was investigated.
Analysis of variations in nanofiber area weight, supporting material, the hydrophilicity of membranes, and
the polymeric structure of the nanofiber layer revealed considerable effects on membrane permeability,
the total amount of filtrated permeate and the total amount of carbon in the permeate solution. The removal of total organic carbon (TOC) was gradually decreased with the increasing area weight of the nanofiber layer. Low area weight nanofiber composite membranes were superior over high area weight ones, as a higher membrane permeability was maintained during the 15 hour test. The results indicate that the selection of the area weight of the nanofiber layers as well as the supporting layer are a key factor for
increasing the flux and permeability.
KEYWORDS: Nanofibrous, Microfiltration, Wastewater, Nanofiber, Polyamide, Polyacrylonitrile.
1. INTRODUCTION Wastewater reclamation is important for several industries,
e.g., textile dyeing and finishing, pharmaceutical, marine
and food.1–8 New materials for wastewater filtration are
constantly being designed due to the insufficient water
resources and imbalance between water supply and con-
sumption. The development of membrane technologies has
recently reified applications in the treatment of wastewater.
Membrane technologies may help to solve characteristic
problems with traditional water treatment methods.
The importance of microfiltration (MF) technologies in
the recycling of municipal or industrial wastewater using
membrane processes is increasing.9–12 MF is an effective
process used to remove finely dispersed particles from
waters. Reportedly, this technology is particularly effective
in separating small particles of differing size and dissolved
organic matter.
The polymeric nanofiber structures produced by the
electrospinning method can help design improved types of
microfiltration materials.13–15 The use of nanofiber mem-
branes for microfiltration is beneficial in particular as they
demonstrate high permeability, enormous filtration effi-
ciency due to highly porous structure, small pore size
(0 1 10 m). They also effectively separate impurities
without adding reagents and have no by-products effected
∗Author to whom correspondence should be addressed. Email: [email protected]
Received: 10 August 2016
Accepted: 27 October 2016
by chemical reactions.16–18 Membranes with a pore-size of
0 1 0 5 m or less almost completely filter not only bac-
teria but also viruses from water.19–22
Membrane fouling is the most serious problem affect-
ing performance.23–25 Characteristics, such as hydropho-
bicity, component materials, surface charge and roughness,
operating conditions, pore sizes, the relationships between
the size of solute and membrane pore size and the solute-
membrane material affinity are the main reasons for
membrane fouling.26–29 It has been suggested that a mem-
brane with a medium polysulfide pore should be used to
obtain good membrane performance as well as to maintain
the high rejection of colorant substances.30 The nanofiber
structure might be a solution to providing a high contact
surface for the flocculant to interact with the particles and
to be held inside the bioreactor by a membrane. More-
over, nanofibers may enhance the rigidity of the cake layer
formed on the membrane surface by entangling with the
bioflocs and make the cake layer less compressible under
filtration pressure.
There are various types of membrane filtration units
such as bundled hollow or parallel flat fiber units.31 These
units may be applied in wastewater treatment either in a
submerged32 or cross-flow mode.33 34 In this work, a par-
allel flat cross-flow system was used, whereby water is
circulated through the module using an external pump.
A circulation pump can be used to achieve high cross-
flow velocity. As a result, higher permeation flux can be
obtained with a longer operation time. The advantage of
using a cross-flow system is a reduction in the amount
Sci. Adv. Mater. 2017, Vol. 9, No. 5 1947-2935/2017/9/747/011 doi:10.1166/sam.2017.3027 747
AR
TIC
LE
51
748 Sci. Adv. Mater., 9, 747–757, 2017
Effect of Nanofibrous Membrane Structures on the Treatment of Wastewater Microfiltration Yalcinkaya et
al.
of solid suspended particles on the membrane surface.
Several studies have reported that cross-flow membrane
microfiltration is an effective processes in wastewater
reclamation.35 36
This paper presents the results of research investi-
gations on the application of polymeric microfiltration
membranes of various nanofibrous membrane structures
for the removal of impurities from industrial wastew-
ater using the cross-flow system. The filtration perfor-
mance of various nanofibrous microfiltration membranes
was compared according to their polymeric structure, area
weight, hydrophilicity, and supporting layers. Microfiltra-
tion polymeric nanofibrous membranes were made from
polyacrylonitrile (PAN) and polyamide 6 (PA6), whereas
a lab-scale capillary MF module was built in our labo-
ratory. PA6 was selected as the polymer due to the fact
that the amide groups in PA6 provide high hydrogen bond-
ing, which improves the thermal stability and mechanical
strength. Polyacrylonitrile (PAN) has good characteristics
including thermal stability (up to 130 C), tolerance to most
solvents, and commercial availability. Both PA6 and PAN
have superior fiber forming ability.
The greatest disadvantages of using nanofiber layer is
its poor mechanical properties, which is a problem of
application and long term usage. Nanofibrous membranes
have not found any real applications due to the weaken-
ing high pressure commonly used in water treatment.37 To
address the weakening problem, the mechanical properties
of nanofibrous material were improved using various types
of lamination on various supporting layers. In this work,
the effect of nanofiber area weight on the membrane per-
meability has been studied for the first time.
Another novelty of this paper is, that nanofiber lay-
ers were produced by using the Nanospider38 industrial
equipment, and that the layers strongly adhered on the
supporting layer without any damage using various lam-
ination technology to improve application in wastewater
treatment. This study explored the feasibility of applying
the nanofiber technology during industrial usage.
1. EXPERIMENTAL DETAILS
1.1. Materials
Polyacrylonitrile (PAN) with an average molecular weight
(Mw) of 150 kDa was purchased from Dimachema
Pigment Corporation; N N -dimethylformamide (DMF),
99.8% acetic acid (AA) and 98% formic acid (FA) were
purchased from Penta s.r.o; polyamide 6 (PA6) was pur-
chased from BASF-Ultramid B24 N 02. The supporting
layers; 20 g/m2 polyethylene terephthalate (PET) spun
bond nonwoven and 45 g/m2 PET woven webs were
obtained from Hänsel and Co., GmbH (Germany) and the
polyethylene/polypropylene (20/80) spun bond nonwoven
bicomponents were obtained from Pegas Nonwovens.
The wastewater was obtained from an industrial com-
pany in the Czech Republic which produces pitch and
tar oils.
1.2. Preparation of Nanofibrous
Membranes for Microfiltration
The preparation procedures to fabricate nanofibrous mem-
branes are as follows.
PAN solutions of 8 wt.% were prepared by dissolv-
ing polymer powder in DMF and stirring the solution
at room temperature for 24 h until the solutions were
homogeneous.
PA6 solutions of 12 wt.% were prepared by dissolv-
ing polymer pellet in an AA/FA (2/1) mixture and stirring
the solution at 50 C for 24 h until the solutions were
homogeneous.
The solutions were electrospun directly onto a silicon
paper substrate using a NS 1S500U Nanospider unit. All
of the process conditions were kept stable.
The electrospun nanofibers were laminated on
(a) 20 g/m2 spunbond nonwoven polyethylene terephtha-
late (PET),
(b) 45 g/m2 woven PET,
(c) 20 g/m2 bicomponent spunbond (PE/PP).
A Meyer RPS-L Mini fusing machine was used to lam-
inate the nanofibers with the supporting layers under heat
(125 C) and pressure (15 N/cm) at a specific contact time
(1.7 m/min).
One of the PA6 nanofiber layers (1.11 g/m2) was
immersed into surfactant water mixture (sodium stearate)
for 2 minutes to improve hydrophilicity, then dried and
laminated with woven web. The results showed that the
nanofibrous membrane is totally hydrophilic with a con-
tact angle of “0” which can be regarded as being “super
hydrophilic.”39
1.3. Other Analytical Methods and Equipment
The zero-shear viscosity of the polymer solutions was
measured using a Fungilab Expert viscometer at 23 C.
The following parameters of the electrospun layer in
the nanofibrous membranes, such as average fiber diam-
eter and surface pore size, were analysed using a scan-
ning electron microscope (SEM, Tescan Vega3 SB). All
of the samples were coated for 60 s with a 7 nm layer of
gold before SEM imaging to reduce the effect of charging.
Image-J software was used to measure surface porosity and
the average fiber diameter from more than 50 randomly
selected fibers.
The contact angle was measured at different places of
the samples at room temperature using a Kruss Drop Shape
Analyzer DS4. A total of 2 l of distilled water was placed
on the surface of a clean and dry membrane surface, and
the average values were calculated.
Porosity, also known as packing density, defined the
ratio of void volume to bulk volume.13 The porosity of the
AR
TIC
LE
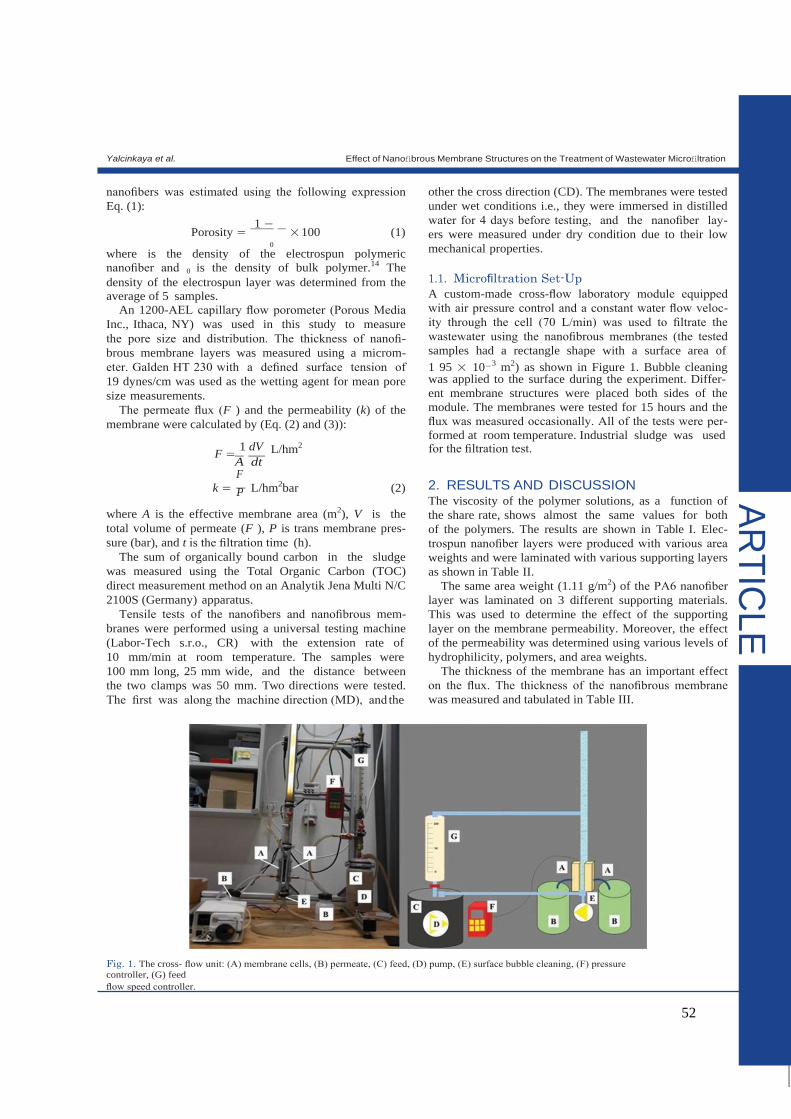
52
Effect of Nanofibrous Membrane Structures on the Treatment of Wastewater Microfiltration Yalcinkaya et al.
P
nanofibers was estimated using the following expression
Eq. (1):
Porosity = 1 −
× 100 (1) 0
where is the density of the electrospun polymeric
nanofiber and 0 is the density of bulk polymer.14 The
density of the electrospun layer was determined from the
average of 5 samples.
An 1200-AEL capillary flow porometer (Porous Media
Inc., Ithaca, NY) was used in this study to measure
the pore size and distribution. The thickness of nanofi-
brous membrane layers was measured using a microm-
eter. Galden HT 230 with a defined surface tension of
19 dynes/cm was used as the wetting agent for mean pore
size measurements.
The permeate flux (F ) and the permeability (k) of the
membrane were calculated by (Eq. (2) and (3)):
other the cross direction (CD). The membranes were tested
under wet conditions i.e., they were immersed in distilled
water for 4 days before testing, and the nanofiber lay-
ers were measured under dry condition due to their low
mechanical properties.
1.1. Microfiltration Set-Up
A custom-made cross-flow laboratory module equipped
with air pressure control and a constant water flow veloc-
ity through the cell (70 L/min) was used to filtrate the
wastewater using the nanofibrous membranes (the tested
samples had a rectangle shape with a surface area of
1 95 × 10−3 m2) as shown in Figure 1. Bubble cleaning was applied to the surface during the experiment. Differ-
ent membrane structures were placed both sides of the
module. The membranes were tested for 15 hours and the
flux was measured occasionally. All of the tests were per-
formed at room temperature. Industrial sludge was used
F = 1 dV L/hm2 for the filtration test.
A dt F
k = L/hm2bar (2)
where A is the effective membrane area (m2), V is the
total volume of permeate (F ), P is trans membrane pres-
sure (bar), and t is the filtration time (h).
The sum of organically bound carbon in the sludge
was measured using the Total Organic Carbon (TOC)
direct measurement method on an Analytik Jena Multi N/C
2100S (Germany) apparatus.
Tensile tests of the nanofibers and nanofibrous mem-
branes were performed using a universal testing machine
(Labor-Tech s.r.o., CR) with the extension rate of
10 mm/min at room temperature. The samples were
100 mm long, 25 mm wide, and the distance between
the two clamps was 50 mm. Two directions were tested.
The first was along the machine direction (MD), and the
2. RESULTS AND DISCUSSION The viscosity of the polymer solutions, as a function of
the share rate, shows almost the same values for both
of the polymers. The results are shown in Table I. Elec-
trospun nanofiber layers were produced with various area
weights and were laminated with various supporting layers
as shown in Table II.
The same area weight (1.11 g/m2) of the PA6 nanofiber
layer was laminated on 3 different supporting materials.
This was used to determine the effect of the supporting
layer on the membrane permeability. Moreover, the effect
of the permeability was determined using various levels of
hydrophilicity, polymers, and area weights.
The thickness of the membrane has an important effect
on the flux. The thickness of the nanofibrous membrane
was measured and tabulated in Table III.
Fig. 1. The cross- flow unit: (A) membrane cells, (B) permeate, (C) feed, (D) pump, (E) surface bubble cleaning, (F) pressure
controller, (G) feed
flow speed controller.
AR
TIC
LE

53
750 Sci. Adv. Mater., 9, 747–757, 2017
AR
TIC
LE
Table I. Viscosity of PAN and PA6 solutions.
Sample Viscosity (Pa · s)
PAN 0 1909
PA6 0 1277
The results of Table III show that the difference in the
thickness of the membrane increases slightly with the area
weight of the nanofiber layer. All of the used support-
ing layers were thinner than 1 mm. The woven supporting
layer has the greatest thickness of all the supporting lay-
ers. In general, it can be said that there is no considerable
difference in the thickness and the values of the materials
are very close to each other.
1.1. Tensile Strength
The mechanical properties of the nanofibrous membranes
were strongly influenced by the mechanical properties
of the supporting layers. The nanofiber layers were bro-
ken when the maximum tensile strength was applied
to them. After lamination with strong supporting layers,
the mechanical properties of the nanofibrous membranes
were largely reinforced. Table IV shows the resulting
tensile strength and elongation at the breaking point of
the nanofiber layers and the nanofibrous membranes. The
nanofiber layers showed much weaker mechanical proper-
ties compared with the nanofibrous membranes. The ten-
sile strength of the nanofiber layers was increased from 3
to 24 times by the lamination of the supporting layers.
1.2. Membrane Characterization
1.2.1. Membrane Hydrophilicity
The contact angle is an important parameter in membrane
sciences. Measurement of the contact angle ( ; [ ]) deter-
mines the hydrophilicity of the membrane. The contact
angle values of the nanofibrous membranes are shown in
Figure 2. It was found that the hydrophilicity of the mem-
brane surface has an important influence on the mem-
brane water flux and antifouling properties.40 41 The lower
the contact angle, the higher the membrane pure water
flux. Nanoparticle-loaded hydrophilic polysulfone (PSf)
increased the water flux by >600% in comparison to the
plain PSf membrane, and also increased the oil rejection
and antifouling against the formation of an oil layer on
the surface of the membrane.42 A cake model was stud-
ied to evaluate the drop in the PMMA membrane flux.
The results showed that a higher hydrophilic character pro-
duces a lower rate of membrane fouling.43
Figure 2 indicates that two of the materials show
a hydrophilic structure (contact angle < 90 ). Synthetic
polymers with hydrophilic groups such as hydroxyl, car-
boxyl and carbonyl groups have either a strong or weak
interaction with water. PA6 hydrophilic groups such as the
hydroxyl group have a high affinity for moisture adsorp-
tion and are applied to the membrane technology, which
increases the hydrophilicity of PA6 nanofibers.
PAN has a hydrophilic nature. PAN is a semi-crystalline
polymer with high polarity. Its polar nitrile groups possess
a high dipole moment around 3.9 D.44 Polar compounds
with a large dipole moment tend to be soluble in water,
while those with a near zero dipole moment are called
non–polar and tend to be insoluble in water. The high
polarity of the PAN polymer increases the hydrophilicity
of the nanofiber layer.
The dot-lamination of PA6 with the co-polyamide adhe-
sive showed hydrophilic characteristics. It was found
that hydrophilic membranes can be produced using co-
polyamide polymers.45 During the hot press in fusing
equipment, the dot-shaped co-polyamide adhesives melted,
passed through the pores of the nanofiber layer and cov-
ered the surface as shown in Figure 3. The co-polyamides
Table II. Prepared membranes and abbreviations.
Nanofiber
Area weight
(g/m2)
Supporting
layer
Abbreviation
PA6 1 11 – PA6-1.11
Bicomponent PA6-1.11 bico
PET nonwoven PA6-1.11 aw
PET woven PA6-1.11 dot
2 31 – PA6-2.31
Bicomponent PA6-2.31 bico
PAN 3 21 – PAN-3.21
Bicomponent PAN-3.21 bico
PA6-super 1 11 PET woven PA6-1.11 SH dot
hydrophilic
Table III. Thickness of nanofibrous membranes.
Membran e Thickness (mm)
PA6-SH do t 0 106
PA6-1.11 dot 0 118
PA6-1.11 aw 0 088
PA6-1.11 bico 0 068
PA6-2.31 bico 0 081
PAN-3.21 bico 0 086

54
Fig. 2. Contact angle values of membranes.
on the surface increased the hydrophilicity of the
membrane.
1.1.1. Membrane Surface Morphology Evaluation
Based on the SEM images, the membrane surface pore
sizes, fiber diameter and distribution were analysed using
Image J software. Image J porosity measurements are
done in a 2D way (from SEM images) on the surface of
membranes. To understand the effect of various polymeric
nanofibers on the membrane morphological characteristics,
the fiber diameter, fiber diameter distribution and surface
porosity were determined as shown in Figures 4, 5 and
Table IV. The porosity of the polymeric nanofiber layer
was calculated using Eq. (1).
As shown in Figure 4 and 5 the fiber diameter of PA6
did not considerably change, whereas PAN increased after
lamination. PAN nanofibers changed their round shape to
a flattened shape after the heat and pressure of the lami-
nation process, which may decrease the size of the pores.
Table V presents the results for the surface poros-
ity, porosity and mean pore size of the nanofiber layers.
The surface porosity indicated that the measurements were
taken from the surface of the material.
Fig. 3. Co-polyamide adhesive dots before and after the lamination
process.
Fig. 4. Fiber diameter of nanofiber layers before and after the lamina-
tion process.
The nanofiber layers with lamination presented the low-
est surface porosity and pore size, probably because of the
hot press in the fusing equipment. It can be noted that the
hot press lamination slightly affects both the fiber diame-
ter, pore size, and the surface porosity. Moreover, immers-
ing the PA6 nanofiber layer into a surfactant decreases the
surface porosity of the membrane. There is no consider-
able difference in between pore size of the membranes.
This could be due to changes in the orientation and
swelling of the fibers in the surfactant-water solution.
It was not possible to measure the total membrane compos-
ite porosity due to the unknown density of the adhesives.
Only the porosity of the nanofiber layers was measured.
It can be concluded that the area weight plays an important
role in the porosity of layers and slightly on mean pore
size. A higher area weight yields a lower porous structure
due to the compact packing density.
1.2. Microfiltration Process Results
1.2.1. Effect of Supporting Layer
Microfiltration experiments were carried out to study
the permeability properties of the nanofibrous composite
membranes. The flux and the permeability of permeate
was calculated using Eqs. (2) and (3). The trans mem-
brane pressure was almost the same for all the membranes
whereas flux of permeate showed differences. Various sup-
porting layers were used with their specific lamination
technology. The supporting layers had almost the same
thickness. The cross flow membrane filtration system was
used during a 15-hour operating time as shown in Figure 1.
Figure 6 shows the permeability of the membrane as a
function of time for the various supporting layers.
The results showed that the supporting layer has an
important role for the beginning of the process. Obviously,
the permeability is initially high and falls off rapidly
with filtration and permeability attenuation becomes more
AR
TIC
LE

55
AR
TIC
LE
Fig. 5. SEM images and fiber diameter distribution of nanofiber layers before and after the lamination process, (A) PA6-1.11, (B) PA6-
1.11 bico, (C) PA6-1.11 aw, (D) PA6-1.11 dot, (E) PA6-2.31, (F) PA6-2.31 bico, (G) PAN-3.21, (H) PAN-3.21 bico, (I) PA6-1.11 SH
dot.
and more rapid over time. Many studies have shown that
the flux decreases with operating time and reaches stable
flux attenuation.29 46–48 A similar permeability decline was
observed for all of the membranes. The main reason is
membrane fouling. Membrane fouling increases resistance
to the flow of the continuous phase through the membrane
due to blocking of the pores and deposition of a cake layer
on the surface. Moreover, solid particle deposition within
the membrane pores can affect membrane fouling. The
flux is affected by the formed cake layer that changes the
pore size distribution and resistance to the permeate flow
until it attains a steady state as the cake layer reaches the
equilibrium thickness.
It can be seen from Figure 6 that the permeability of the
membranes is almost steady after 11 hours of filtration.
The PA6-1.11 bico and PA6-1.11 dot membranes reach

56
Fig. 6. Membrane permeability as a function of time for the various supporting layers.
almost the same permeability value after 13 hours filtration
whereas PA6-1.11 aw has higher than others.
The packing density of the material is very important
for the permeate flux and the membrane permeability. The
results showed that not only the nanofiber layer on the
surface but also supporting layer plays a big role for flux
efficiency.
Figure 7 shows the supporting layers and their surface
porosity calculated by image J program. The PET spun-
bond has a very open structure, which helps to increase
the permeate flux and permeability compared to the other
supporting layers. It is evident that the supporting layer
under the nanofiber layer is an important parameter for the
membrane filtration process.
1.1.1. Effect of Nanofiber Area Weight
The effect of the nanofiber area weight on the permeate
flux and the membrane permeability has not been studied
Fig. 7. Supporting layers and surface porosity in %; (A) PET spunbond
nonwoven, (B) bicomponent spunbond nonwoven, (C) PET woven web.
properly yet. Packing density, basis weight (area weight),
fiber diameter and thickness of the nanofiber layer all
effect permeate flux efficiency. It is well known that pack-
ing density plays an important role on the porosity and the
bubble point of the nanofiber layer.49–51 Packing is directly
related to the area weight of the nanofibrous material.
Figures 4 and 5 show that the diameters of the nanofiber
layers are close to each other. Permeability was compared
according to various area weights of the nanofibers as
shown in Figure 8.
PA6-1.11 and PA6-2.31 are the same material. The area
weight of the layers was arranged by changing the speed of
the backing paper on the Nanospider equipment. A slower
speed of the backing paper leads to more fibers being col-
lected on the surface of the paper. Figure 8 shows that the
area weight of the nanofibers is an important parameter for
wastewater treatment. The permeability of PA6-1.11 bico
was almost four times higher than PA6-2.31 at the end of
the 15-hour operation time. The results show that low area
weights of the nanofiber layers tend to have higher per-
meability, but the retention efficiency of the solid particles
can be compromised.
AR
TIC
LE
Table V. Porosity, surface porosity and pore size of nanofiber layers.
Membrane
Surface
porosity (%)
Porosity
nanofiber
of
(%)
Mean pore
size (nm)
PA6-1.11 30 76 88 86 755 01 ± 350 60
PA6-1.11 bico 20 01 88 86 753 01 ± 350 32
PA6-1.11 aw 29 76 88 86 808 80 ± 348 10
PA6-1.11 dot 28 08 88 86 775 12 ± 351 05
PA6-1.11 SH dot 17 7 88 86 786 36 ± 349 75
PA6-2.31 29 97 87 02 762 35 ± 351 60
PA6-2.31 bico 25 61 87 02 727 01 ± 352 30
PAN-3.21 20 83 85 15 758 45 ± 345 80
PAN-3.21 bico 19 93 85 15 710 60 ± 343 70

57
AR
TIC
LE
≈
Fig. 8. Membrane permeability as a function of the time of the various
area weight of nanofiber layers.
1.1.1. Effect of Polymer Type
Pore blockage, rejection of solid compounds and the
permeate flux characteristics of the membrane strongly
depend on the chemical structure of the active layer and
the features of the surface where the primary separation of
solutes occurs. Different membrane types can show differ-
ent levels of permeability.52 53 Lehman et al. showed that
the use of a ceramic membrane can lead to a high flux due
to less membrane fouling.54 A comparison of the different
polymers is shown in Figure 9.
PA6-2.31 bico and PAN-3.21 bico nanofiber layers had
very similar profiles throughout the period of filtration.
Figure 9 shows that the permeability of high area weight
PA6-2.31 bico and PAN-3.21 bico membranes are almost
the same after 4 hours of filtration. The low area weight
PA6-1.11 bico membrane had a 4-times higher permeabil-
ity than high area weight PA6-2.31 bico and PAN-3.21
bico membranes even after 14 hours of filtration. The
result shows that area weight is much more important for
permeability than the type of polymer.
Fig. 9. Membrane permeability as a function of the time of the various
polymeric nanofiber layers.
1.1.2. Effect of Hydrophilicity
In water treatment, hydrophilic membranes show resis-
tance to fouling because of their affinity for water.55 56
Figure 10, shows the permeability of the same material
with different contact angles. PA6-1.11 SH dot is super
hydrophilic, and PA6-11 dot is hydrophilic. The results
of the test showed that super hydrophilic material has a
slightly less permeability than hydrophilic material. Unlike
the literature, increasing the hydrophilicity of the same
membrane did not increase flux. It is evident that super
hydrophilic membranes increase fouling due to blocking of
the pores with solid compounds. Water is strongly bound
to a highly hydrophilic membrane surface, and foulants
penetrate through the pores.
To compare the permeability, PA6 (1.11 g/m2) nanofiber
composite membranes with various contact angles were
studied as shown in Figure 11. The results show that
hydrophilic membranes PA6-1.11 SH dot and PA6-1.11
dot have a lower permeability than hydrophobic PA6-1.11
aw (CA 1100). Increasing the hydrophilicity of same
nanofiber layer with the same area weight did not increase
the permeability of the membrane. The supporting layer
has a greater influence on the membrane permeate flux
and permeability than the hydrophilicity of the membrane
under the same operating conditions.
The amounts of total filtrated permeate during a con-
stant time according to membrane structure are given in
Figure 12.
The results show that the supporting layer and a low
area weight have an important impact on total separation
in wastewater, which has a direct effect on the cost of
operation.
1.2. TOC Test Results
The separation of wastewater can be easily observed. The
difference between feed and permeate water is illustrated
in Figure 13(A). The membrane before and after filtra-
tion is shown in Figure 13(B). Figure 13 shows that black
Fig. 10. Membrane permeability as a function of time (hydrophilic and
super hydrophilic membrane).

58
Fig. 11. Membrane permeability as a function of time (membranes with various contact angles (CA)).
solid compounds were caught by the nanofiber composite
membrane and the sludge separated.
Qualitative measurement is not sufficient to determine
the efficiency of separation. TOC tests were run for quan-
titative measurement (Fig. 14). The TOC was used to
measure the sum of all organic carbons within the feed
and permeate water, representing the concentration of
mg/L. TOC analysis is a quick and reliable method for
the measurement of dissolved organic pollution of indus-
trial wastewater. Before measuring the TOC of wastewater
(feed solution), a rough filtration (pore size of the filter is
0 45 m) was performed to eliminate any large particles.
Figure 14 shows the TOC rejection of the membranes.
The high area weight nanofibrous membranes had very
Fig. 12. Amount of permeate after 15 hours of operating time.
good TOC retention of more than 70%. However, the low-
est area weight nanofiber membranes (PA6-1.11 dot and
PA6-1.11 aw) had a lower retention of approximately 40%.
When the TOC results are compared with the results of the
total amount of filtrated permeate and surface porosity and
the mean pore size, the relation is visible. The nanofibrous
membranes with a more open and porous structure not
only increase the amount of filtrated permeate and flux but
also increase the amount of solid particles passing through
the membrane. It should be taken into consideration that
the feed solution was filtrated before TOC measurement
due to the high amount of organic compounds.
It was found that the use of a nanofiber membrane
decreases the TOC value from 5057 mg/L to 14.8 mg/L.57
In another work using a ceramic membrane microfilter,
a retention in TOC of 64% was achieved.58 Surely, the
TOC retention of all the samples higher than 40% which
is compatible with literature.57 58 Surprisingly, a compar-
ison of the results of PA6-11 dot and PA6-1.11 SH dot
showed that the hydrophilicity of the membranes increases
the retention of total organic carbon from the feed solution.
AR
TIC
LE

59
756 Sci. Adv. Mater., 9, 747–757, 2017
AR
TIC
LE
Effect of Nanofibrous Membrane Structures on the Treatment of Wastewater Microfiltration Yalcinkaya et al.
Fig. 14. The TOC retention by membranes.
There can be two explanations; firstly, the highly absorbent
PA6-1.11 SH dot membrane allows the feed solution to
pass through the membrane very quickly and solid parti-
cles in the feed solution stick to the membrane surface and
block the pores. Secondly, due to swelling of the PA6-1.11
SH dot nanofiber layer in chemical treatment, the diameter
of the pores is reduced after lamination.
1. CONCLUSION In this study, the influence of the structure of nanofibrous
membranes on microfiltration was studied. The fiber diam-
eter of membranes was changed to between 90–150 nm
without altering the porosity. The operating conditions
were kept stable during the process. Based on the results
of the evaluation tests we can state that:
— The same nanofiber layer on various supporting lay-
ers was laminated, and the membrane permeability was
measured. It was observed that an open structure sup-
porting layer slightly increases the membrane permeabil-
ity while the total amount of filtrated permeate increases
dramatically.
— Nanofiber layers with various area weights reflected the
fact that it is very important to arrange the area weight of
the nanofiber layer. A more compact nanofiber composite
membrane means low flux of permeate. The results indi-
cate that the area weight of the nanofiber layer has the
most important effect on the permeate flux performance
and membrane permeability.
— Both PA6 and PAN nanofiber layers have almost the
same permeability when the area weight is above 2 g/m2.
It was found that area weight has a bigger impact on mem-
brane permeability.
— Unlike the literature, it was found that increasing
hydrophilicity of the same type of membrane did not
increase the flux. Furthermore, permeate flux and perme-
ability decrease slightly due to blocking the pores from
the beginning of the filtration process. Hydrophilicity is
not responsible for improvements in performance.
— For all the membrane types, the permeability decreased
sharply at the start, presumably due to pore blockage by a
cake layer on the surface. Nevertheless, the permeability
reached a steady state after a while, indicating that a stable
dynamic layer was formed.
— TOC results showed that the nanofibrous membranes
are able to retain organic compounds well. It was found
that not only the higher area weight nanofiber layer but
also the hydrophilicity of the membrane increases the
retention of organic compounds.
Solid particles of a small size easily penetrated the pores of
the nanofibrous membrane and then block them by adsorp-
tion on the membrane surface. Because of fouling, the flux
of the membranes declines and reaches stable flux attenu-
ation after a while, which results in increases in the cost
of the operation of the membrane. The best results were
obtained for a PA6-1.11 g/m2 laminated with PET non-
woven membrane (PA6-1.11 aw). By changing the opera-
tional conditions and using additives, the fouling effect can
be minimized. A PA6 nanofiber composite membrane with
low area weight shows good potential for microfiltration
processes in industrial application.
Acknowledgments: The results of this project LO1201
were obtained through the financial support of the Min-
istry of Education, Youth and Sports in the framework
of the targeted support of the “National Programme for
Sustainability I” and the OPR&DI project Centre for
Nanomaterials, Advanced Technologies and Innovation
CZ.1.05/2.1.00/01.0005.
References and Notes 1. V. Jegatheesan, B. K. Pramanik, J. Chen, D. Navaratna, C. Y. Chang,
and L. Shu, Bioresour. Technol. 204, 202 (2016).
2. D. S. Patil, S. M. Chavan, and J. U. K. Oubagaranadin, Journal of
Environmental Chemical Engineering 4, 468 (2016).
3. A. Majouli, S. Tahiri, S. Alami Younssi, H. Loukili, and A. Albizane,
Ceram. Int. 38, 4295 (2012).
4. N. Tahri, G. Masmoudi, E. Ellouze, A. Jrad, P. Drogui, and R. Ben
Amar, Journal of Cleaner Production 33, 226 (2012).
5. N. A. Weerasekara, K.-H. Choo, and S.-J. Choi, J. Membrane Sci.
447, 87 (2013).
6. V. V. Ranade and V. M. Bhandari, Chapter 1-Industrial wastewater
treatment, Recycling, and Reuse: An Overview: Industrial Wastew-
ater Treatment, Recycling and Reuse, Butterworth-Heinemann,
Oxford (2014), pp. 1–80.
7. S. O. Ganiyu, E. D. van Hullebusch, M. Cretin, G. Esposito, and
M. A. Oturan, Sep. Purif. Technol. 156, 891 (2015).
8. S. Chen, J. Yu, H. Wang, H. Yu, and X. Quan, Desalination 363, 37
(2015).
9. A. Gallego-Molina, J. A. Mendoza-Roca, D. Aguado, and M. V.
Galiana-Aleixandre, Chem. Eng. Res. Des. 91, 369 (2013).
10. A. G. Fane, C. Y. Tang, and R. Wang, 4.11—Membrane technology
for water: Microfiltration, Ultrafiltration, Nanofiltration, and Reverse
Osmosis A2, Treatise on Water Science, edited by Wilderer, Peter,
Elsevier, Oxford (2011), pp. 301–335.
11. X. Shang, H. C. Kim, J. H. Huang, and B. A. Dempsey, Sep. Purif.
Technol. 147, 44 (2015).
12. B. K. Pramanik, F. A. Roddick, and L. Fan, J. Membrane Sci.
475, 147 (2015).

60
1. R. S. Barhate, C. K. Loong, and S. Ramakrishna, J. Membrane Sci.
283, 209 (2006).
2. R. Wang, Y. Liu, B. Li, B. S. Hsiao, and B. Chu, J. Membrane Sci.
392–393, 167 (2012).
3. P. Gibson, H. Schreuder-Gibson, and D. Rivin, Colloids and Surfaces
A: Physicochemical and Engineering Aspects 187–188, 469 (2001).
4. H. Ma, B. Chu, and B. S. Hsiao, 15-Functional nanofibers for water
purification A2-Wei, Qufu, Functional Nanofibers and their Appli-
cations, Woodhead Publishing (2012), pp. 331–370.
5. A. Dasari, J. Quirós, B. Herrero, K. Boltes, E. García-Calvo, and
R. Rosal, J. Membrane Sci. 405–406, 134 (2012).
6. H. M. Li, Q. G. Zhang, N. N. Guo, A. M. Zhu, and Q. L. Liu, Chem.
Eng. J. 264, 329 (2015).
7. S. M. Lemma, A. Esposito, M. Mason, L. Brusetti, S. Cesco, and
M. Scampicchio, J. Food Eng. 157, 1 (2015).
8. D. Bjorge, N. Daels, S. De Vrieze, P. Dejans, T. Van Camp,
W. Audenaert, J. Hogie, P. Westbroek, K. De Clerck, and S. W. H.
Van Hulle, Desalination 249, 942 (2009) .
9. X. Mi, K. S. Vijayaragavan, and C. L. Heldt, Carbohyd. Res. 387, 24
(2014).
10. W. Huang, Y. Wang, C. Chen, J. L. M. Law, M. Houghton, and
L. Chen, Carbohyd. Polym. 143, 9 (2016).
11. K. J. Howe and M. M. Clark, Environ. Sci. Technol. 36, 3571 (2002).
12. A. W. Zularisam, A. F. Ismail, and R. Salim, Desalination 194, 211
(2006).
13. I. Rosas, S. Collado, A. Gutiérrez, and M. Díaz, J. Membrane Sci.
465, 27 (2014).
14. I. S. Chang, P. Le Clech, B. Jefferson, and S. Judd, J. Environ. Eng-
Asce 128, 1018 (2002).
15. B. Lesjean, S. Rosenberger, C. Laabs, M. Jekel, R. Gnirss, and
G. Amy, Water Sci. Technol. 51, 1 (2005).
16. V. M. Monsalvo, J. Lopez, M. M. Somer, A. F. Mohedano, and J. J.
Rodriguez, Desalin. Water Treat 56, 3599 (2015).
17. R. W. Field, D. Wu, J. A. Howell, and B. B. Gupta, J. Membrane
Sci. 100, 259 (1995).
18. M. R. Bilad, P. Declerck, A. Piasecka, L. Vanysacker, X. Yan, and
I. F. J. Vankelecom, Sep. Purif. Technol. 78, 105 (2011).
19. S. Judd, Trends Biotechnol. 26, 109 (2008).
20. W. Lee, S. Kang, and H. Shin, J. Membrane Sci. 216, 217 (2003).
21. S. Guo, H. Kiefer, D. Zhou, Y. H. Guan, S. Wang, H. Wang, Y. Lu,
and Y. Zhuang, J. Biotechnol. 221, 25 (2016).
22. K. J. Hwang and P. Y. Sz, J. Membrane Sci. 347, 75 (2010).
23. R. L. Goldsmith, Cross-flow filtration device with filtrate flow con-
duits and method of forming same, in, Google Patents (1988).
24. N. Rossignol, L. Vandanjon, P. Jaouen, and F. Quéméneur, Aquacul-
tural Engineering 20, 191 (1999).
25. S. Homaeigohar and M. Elbahri, Nanocomposite Electrospun
Nanofiber Membranes for Environmental Remediation, Materials
7, 1017 (2014).
26. O. Jirsak, F. Sanetrnik, D. Lukas, V. Kotek, L. Martinova, and
J. Chaloupek, A Method of Nanofibres Production From a Polymer
Solution Using Electrostatic Spinning and a Device for Carrying Out
the Method, in, US Patent 20060290031 (2005).
27. J. Drelich and E. Chibowski, Langmuir 26, 18621 (2010).
28. L. Na, L. Zhongzhou, and X. Shuguang, J. Membrane Sci. 169, 17
(2000).
29. M. Ulbricht, H. Matuschewski, A. Oechel, and H. G. Hicke, J. Mem-
brane Sci. 115, 31 (1996).
30. R. Jamshidi Gohari, F. Korminouri, W. J. Lau, A. F. Ismail,
T. Matsuura, M. N. K. Chowdhury, E. Halakoo, and M. S. Jamshidi
Gohari, Sep. Purif. Technol. 150, 13 (2015).
31. N. A. Ochoa, M. Masuelli, and J. Marchese, J. Membrane Sci.
226, 203 (2003).
32. Q. Y. Wu, X. N. Chen, L. S. Wan, and Z. K. Xu, The Journal of
Physical Chemistry B 116, 8321 (2012).
33. R. Wagener, J. Schneider, U. Delius, F. Herold, G. E. Miess,
and U. Meyer-Blumenroth, Hydrophilic, asymmetric, chemically-
resistant polyaramide membrane, in, US Patent 5536408 A (1996).
34. K. Scott, R. J. Jachuck, and D. Hall, Sep. Purif. Technol. 22–23, 431
(2001).
47. L. Song, J. Membrane Sci. 139, 183 (1998).
48. M. Zhang and L. Song, Environ. Sci. Technol. 34, 3767 (2000).
49. S. Soliman, S. Sant, J. W. Nichol, M. Khabiry, E. Traversa, and
A. Khademhosseini, J. Biomed. Mater Res. A 96, 566 (2011).
50. J. Matulevicius, L. Kliucininkas, D. Martuzevicius, E. Krugly,
M. Tichonovas, and J. Baltrusaitis, J. Nanomater. 2014, 13 (2014).
51. J. Sirc, R. Hobzova, N. Kostina, M. Munzarova, M. Juklickova,
M. Lhotka, S. Kubinova, A. Zajicova, and J. Michalek, J. Nanomater.
2012, 14 (2012).
52. A. Swierczynska and J. Bohedziewicz, Membranes and Membrane
Processes in Environmental Protection 119, 209 (2014).
53. M. Bodzek and K. Konieczny, Sep. Purif. Technol. 14, 69 (1998).
54. S. G. Lehman, S. Adham, and L. Liu, J. Environ. Eng. Manage.
18, 257 (2008).
55. J. S. Louie, I. Pinnau, I. Ciobanu, K. P. Ishida, A. Ng, and
M. Reinhard, J. Membrane Sci. 280, 762 (2006).
56. A. L. Ahmad, B. S. Ooi, A. W. Mohammad, and J. P. Choudhury,
Desalination 168, 215 (2004).
57. B. Chen, X. Xiong, Z. Yao, N. Yin, Z.-X. Low, and Z. Zhong,
Desalination 355, 147 (2015).
58. A. Bottino, C. Capannelli, A. Del Borghi, M. Colombino, and
O. Conio, Desalination 141, 75 (2001).
AR
TIC
LE

61
ID
nanomaterials
Article
Effect of Laminating Pressure on Polymeric Multilayer Nanofibrous Membranes for Liquid Filtration
Fatma Yalcinkaya 1,2,* and Jakub Hruza 1,2
1 Department of Nanotechnology and Informatics, Institute of Nanomaterials, Advanced Technologies
and Innovation, Technical University of Liberec, Studentska 1402/2, 46117 Liberec, Czech Republic;
[email protected] 2 Institute for New Technologies and Applied Informatics, Faculty of Mechatronics, Studentska 1402/2,
46117 Liberec, Czech Republic
* Correspondence: [email protected]; Tel.: +420-485-353-389
Received: 8 February 2018; Accepted: 23 April 2018; Published: 24 April 2018
Abstract: In the new century, electrospun nanofibrous webs are widely employed in various
applications due to their specific surface area and porous structure with narrow pore size.
The mechanical properties have a major influence on the applications of nanofiber webs.
Lamination technology is an important method for improving the mechanical strength of
nanofiber webs. In this study, the influence of laminating pressure on the properties of
polyacrylonitrile (PAN) and polyvinylidene fluoride (PVDF) nanofibers/laminate was
investigated. Heat-press lamination was carried out at three different pressures, and the surface
morphologies of the multilayer nanofibrous membranes were observed under an optical
microscope. In addition, air permeability, water filtration, and contact angle experiments were
performed to examine the effect of laminating pressure on the breathability, water permeability
and surface wettability of multilayer nanofibrous membranes. A bursting strength test was
developed and applied to measure the maximum bursting pressure of the nanofibers from the
laminated surface. A water filtration test was performed using a cross-flow unit. Based on the
results of the tests, the optimum laminating pressure was determined for both PAN and PVDF
multilayer nanofibrous membranes to prepare suitable microfilters for liquid filtration.
Keywords: nanofiber; lamination; water filtration
1. Introduction
Electrospun polymeric nanofiber web has gained increasing importance in the production of
engineered surfaces with sub-micron to nano-scale fibers. The widely employed areas of
electrospun nanofibers are tissue engineering [1,2], wound healing [3], drug delivery systems [4],
composites [5], solar cells [6], protective clothing [7], lithium-ion batteries [8,9], sensors [10–12], gas
sensors and separators [13,14], and air and water filtration [15–19], owing to their high surface-
area-to-volume ratio, highly porous structure and extremely narrow pore size. The main factor
influencing the application of nanofibers is their mechanical properties. An electrospun nanofiber
has very poor mechanical strength due to low contact and adhesion between the fibers.
Several methods have been developed to provide suitable mechanical strength to electrospun
nanofibers. One of the most common methods is to blend several polymers, the advantage of
which is that it is easy and low-cost. However, it is necessary to use polymers which can dissolve
in the same solvent system, of which there are only a few [20,21]. In another method,
lamination was achieved using an epoxy composite. In this method, an electrospun layer
was laid on the
Nanomaterials 2018, 8, 272; doi:10.3390/nano8050272 www.mdpi.com/journal/nanomaterials

62
Nanomaterials 2018, 8, 272 2 of 16
epoxy/curing agent in a mold and then the curing process was performed for a period of 16 h [22]. Nanofiber
reinforced nanomaterials such as carbon nanotubes and graphene represent another route for improving the
mechanical strength of nanofibers. However, this method is costly and in some cases has a low efficiency
[23,24]. Charles et al. [25] used a dip coating method to improve the mechanical strength of nanofibers. They
described the mechanical properties of a composite system comprising hydroxyapatite (HA)-coated poly (L-
lactic acid) (PLLA) fibers in a poly (ε-caprolactone) (PCL) matrix. A biomimetic method was used to coat the
fibers with HA, and a dip-coating procedure served for the application of PCL to the coated fibers. The
composite was formed into a bar using compression molding at low temperatures. The disadvantage of this
method is that it is a time- and chemical-consuming procedure. Xu et al. [26] developed a self-reinforcing
method to enhance the strength of polycarbonate (PC) membranes. In this method, the PC nanofibers were
immersed into a solvent (30%) and non-solvent (70%) mixture, which resulted in enhancement in the strength
(128%) owing to the fusion of junction points. The entire porous structure on the PC nanofibers was destroyed,
which greatly impaired the application of the membranes. The thermal lamination method is one of the most
reliable, repeatable, time-saving, environmentally friendly and cost-effective methods used to adhere two
surfaces. In this method, an adhesive polymer or web is usually applied between two surfaces. Using heat and
pressure, the surfaces adhere to each other. There is a large amount of research related to improving the
strength of nanofibers; however, the number of reports is still limited compared to those dealing with
lamination technology. Jiricek [27,28] and Yalcinkaya et al. [29,30] used a bi-component polyethylene
(PE)/polypropylene (PP) spunbond as a supporting layer for nanofiber layers. A fusing machine was used for
the lamination process. A nanofiber layer was adhered on the outer surface of the bi-component due to the
low melting point of PE. The resultant multilayer nanofibrous membranes were used for micro and nanofilters.
The supporting material and the density of the nanofibers have an influence on the water and air permeability
of the multilayer materials. Yoon et al. [7] laminated nanofibers with various densities of polyurethane (PUR)
fiber onto different textile surfaces using an adhesive web. The results showed that the various multilayer
nanofibrous membrane structure designs had a considerable influence on the degrees of breathability and
waterproofness of the textile surfaces. In our previous work [31], it was observed that both the supporting
material and the density of the nanofiber web have an influence on the water permeability of the multilayer
nanofibrous membranes. The lower area weight with open structure supporting materials has higher water
flux and permeability. Kanafchian et al. [32] used a heat-press technique to laminate the polyacrylonitrile (PAN)
nanofiber on a polypropylene spunbond at various laminating temperatures. It was observed that, when the
applied temperature is lower than the melting point of polypropylene spunbond, the nanofiber web remains
unchanged. Moreover, the increase in temperature increased the adhesion between nanofiber while decreasing
the air permeability.
Although the system and parameters of the electrospinning process have been well analyzed, there
is still a lack of information about a proper lamination technique for nanofiber webs. So far, mainly the effect of
temperature on the lamination of electrospun nanofiber webs has been investigated using heat-press methods
[32–34]. Yao et al. [33] studied the effect of the heat-press temperature, pressure, and duration on the
morphological and mechanical characteristics of an electrospun membrane for membrane distillation. The
results showed that the temperature and duration of the heat-press play more important roles than the
pressure in the heat-press treatment. However, the pressure varied between 0.7 and 9.8 kPa at 150 ◦C during a
2-h period, which is time- and energy-consuming and therefore a more comprehensive parametric study is
required. The aim of this study is to consider the influence of laminating pressure on the properties of
multilayer nanofibrous membranes. Polyvinylidene (PVDF) and polyacrylonitrile (PAN) are the most
commonly used nanofiber layers owing to their chemical and thermal stability. Herein, both polymers were
electrospun using a semi-industrial scale nanofiber production method. The nanofiber layers were laminated
onto a nonwoven surface to improve their mechanical strength via the heat-press method, which is easy to
scale and is an energy-saving method at various applied pressures. Other conditions, such as

63
temperature and the duration of lamination, were kept stable. The effect of the laminating pressure on the
nanofiber web has not yet been well reported. To investigate the effect of the pressure on the
nanofiber/laminate process, surface morphology under an optical microscope, the minimum bursting pressure,
air permeability, water permeability and contact angle tests were applied. Our objective was to optimize the
lamination technology and produce multilayer nanofibrous membranes for suitable application in liquid
filtration. Another novelty of this paper is that nanofiber layers were produced by using the industrial
equipment, and that the layers strongly adhered on the supporting layer without any damage using various
lamination pressures to improve their application in liquid filtration.
1. Materials and Methods
1.1. Preparation of Nanofibre Webs
13 wt. % PVDF (Solef 1015, Bruxelles, Belgium) was prepared in N,N-dimethylacetamide (DMAC) and 8
wt. % PAN (150 kDa H-polymer, Elmarco, Liberec, Czech Republic) was prepared in N,N-dimethylformamide.
The solvents were purchased from Penta s.r.o. (Prague, Czech Republic). The solutions were stirred overnight
using a magnetic stirrer. Nanofiber webs were prepared using the semi-industrial Nanospider electrospinning
device (Elmarco, Liberec, Czech Republic) as shown in Figure 1.
Figure 1. Schematic diagram of an electrospinning unit.
The solution is placed in a solution tank, which is a closed system and connected to a solution bath. The
wire electrode passes along a metal orifice in the middle of the solution bath. The solution bath is moved back
and forward to feed the surface of the wire electrode. The solution bath feeds the polymer solution on a
moving stainless steel wire. The speed of the bath is 240 mm/s. A high voltage supplier is connected to a
positively charged wire electrode (55 kV). A second wire electrode, which is connected to a negatively charged
voltage supplier (−15 kV), is placed on the top of the spinning unit. A conveyor backing material is placed
between the two electrodes. The spinning takes place between the two electrodes. The nanofiber web is
collected on baking paper moving in front of the collector electrode. The distance between the electrodes is 188
mm. The distance between the second electrode and the supporting backing material is 2 mm. The speed of the
backing material for PAN and PVDF is 15 mm/min and 20 mm/min, respectively. The amount of solution on
the wire is controlled with the speed of the solution bath, the diameter of the wire (0.2 mm) and the diameter of

64
×
the metal orifice (0.6 mm) in the middle of the solution bath. No solution dipping was observed. An air conditioning unit is used to control the humidity and temperature of the spinning in a closed chamber. The temperature and
humidity of the input air are set to 23 ◦C and 20% by the air-conditioning system. The volumes of air input and
output are 100 and 115 m3/h, respectively. The area weight of the PVDF and PAN nanofibers was set at 3 g/m2.
1.1. Lamination of Nanofibre Webs
The prepared nanofiber webs were cut into A4 size (210 297 mm2). As a supporting layer, 120 g/m2 of
polyethylene terephthalate spunbond nonwoven and 12 g/m2 of adhesive web were used (the supplier information
is not given). Heat-press equipment (Pracovni Stroje, Teplice, Czech Republic) was used for the lamination process
(Figure 2). In this equipment there are two metallic hot plates (upper and lower) used under pressure. The
nanofibers, a copolyamide adhesive web and a polyethylene terephthalate spunbond supporting layer were
placed between the two hot plates. Two silicon layers were used to block direct contact between the multilayer
nanofibrous membranes and the hot plates. The heat was applied (130 ◦C) for a duration of 3 min. Pressures of 50, 75
and 100 kN were applied between the upper and lower plates. For each pressure, PVDF and PAN nanofiber webs
were used. The resultant multilayer nanofibrous membranes were termed PAN50, PAN75, PAN100, PVDF50,
PVDF75, and PVDF100 according to the pressure value.
Figure 2. Schematic design of the heat-press equipment and replacement of the multilayer nanofibrous
membranes.
1.2. Characterization of the Multilayer Nanofibrous Membranes
The surface morphology of the electrospun fibers and laminated multilayer nanofibrous membranes was
observed using a scanning electron microscope (SEM, Vega 3SB, Brno, Czech Republic). From each sample, at least 50
fibers were measured. The fiber diameter was analyzed using the Image-J program (free online program). The
Origin-Lab program was used to evaluate the diameter distribution. The surface contact angle of the samples was
measured using a Krüss Drop Shape Analyzer DS4 (Krüss GmbH, Hamburg, Germany), at five different points,
using distilled water (surface tension
72.0 mN m−1) and ethylene glycol (surface tension 47.3 mN m−1) on the clean and dry samples at room
temperature. The air permeability of the multilayer nanofibrous membranes was tested using an SDL

65
ATLAS Air Permeability Tester (@200 Pa and 20 cm2, Rock Hill, SC, USA). At least three measurements were taken for
each sample.
The maximum, average and minimum pore sizes were determined by a bubble point measurement device, which
was developed in our laboratory. The bubble point test allowed the size of the pores of the porous material to be
measured. The pore flow means a set of continuous hole channels connecting the opposite sides of the porous material
(see Figure 3). At least three measurements were taken.
Figure 3. Schematic diagram of pore flow and forces acting on a pore.
The main part of the method was to control the pressure needed to pass a liquid through the tested porous
material and for wetting the sample. This is because the wetting force (and hence the opposite force required to
extrude the liquid) depends on the pore circumference. The principle for calculating the pore size is shown in Figure
3 and Equations (1) and (2).
Fγ = γπD (1)
Fp = pS (2)
where Fγ is the force given by surface tension γ of the liquid around the perimeter of πD. The force Fp is given by
external pressure p displacing the liquid from the pores and acting on the surface of pore S. It is possible to calculate the
magnitude of the force given by the surface tension and the force given by the pore pressurizing fluid. By increasing
the air pressure and measuring its flow through the sample, the size of the average and minimum pores can also be
determined. In this case, it is necessary to compare the pressure curve of the wet sample with the pressure curve of the
dry sample (see Figure 4). The dry sample pressure curve required to determine the mean and minimum pores is also
applicable for determining the air permeability coefficient (K) of the sample calculated according
to the relation (Equation (3)):
K = Q/(∆p A) (3)
where Q is the air flow rate (m2/s), ∆p is the pressure drop of the sample, and A is the area of air flow (m2).
When the pressure increases in the dry sample, the flow rate also increases. Conversely, in the wet sample, at the
beginning, there is no flow because all the pores are filled with the liquid. At a certain pressure, the gas empties the
largest pore, which determines the minimum pore size, and gas begins to flow through the wet sample. The
intersection between the calculated half-dry and the wet sample gives the mean flow pore size. When all the pores
are emptied, an intersection between the wet and dry curve will be observed. This means the relation between the
applied pressure and the detected
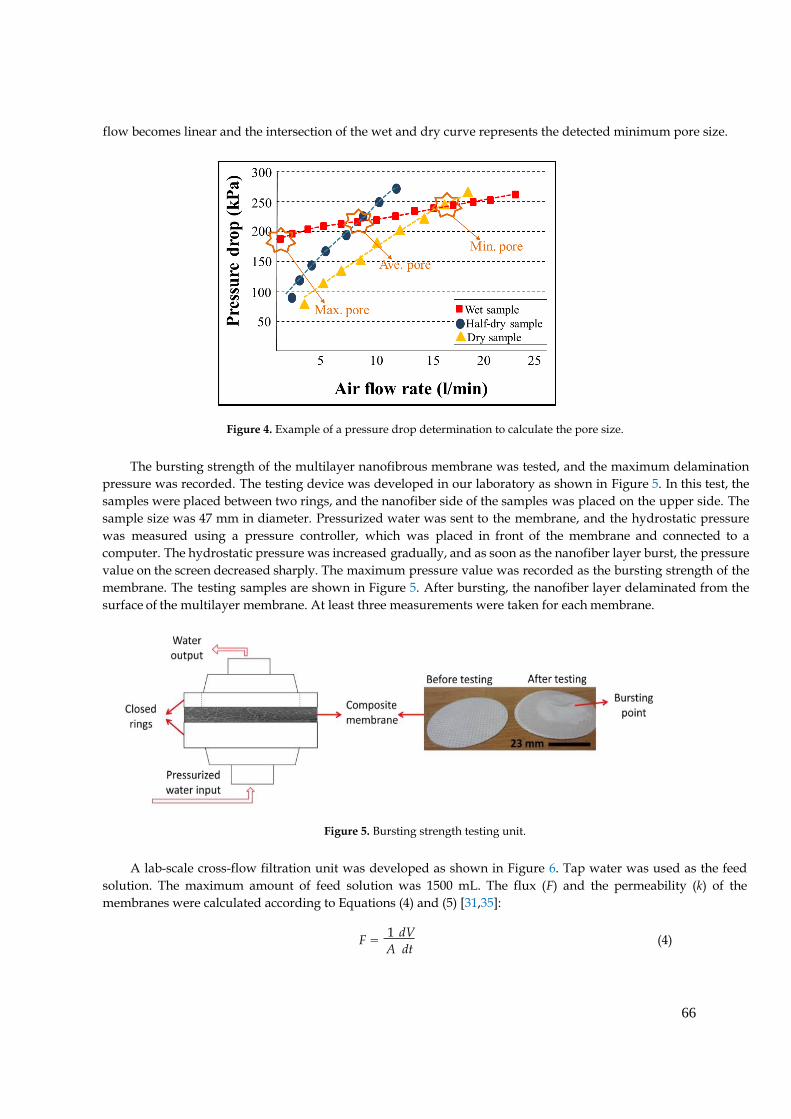
66
flow becomes linear and the intersection of the wet and dry curve represents the detected minimum pore size.
Figure 4. Example of a pressure drop determination to calculate the pore size.
The bursting strength of the multilayer nanofibrous membrane was tested, and the maximum delamination
pressure was recorded. The testing device was developed in our laboratory as shown in Figure 5. In this test, the
samples were placed between two rings, and the nanofiber side of the samples was placed on the upper side. The
sample size was 47 mm in diameter. Pressurized water was sent to the membrane, and the hydrostatic pressure
was measured using a pressure controller, which was placed in front of the membrane and connected to a
computer. The hydrostatic pressure was increased gradually, and as soon as the nanofiber layer burst, the pressure
value on the screen decreased sharply. The maximum pressure value was recorded as the bursting strength of the
membrane. The testing samples are shown in Figure 5. After bursting, the nanofiber layer delaminated from the
surface of the multilayer membrane. At least three measurements were taken for each membrane.
Figure 5. Bursting strength testing unit.
A lab-scale cross-flow filtration unit was developed as shown in Figure 6. Tap water was used as the feed
solution. The maximum amount of feed solution was 1500 mL. The flux (F) and the permeability (k) of the
membranes were calculated according to Equations (4) and (5) [31,35]:
F = 1 dV
A dt
(4)

67
𝑘 = 𝐹/𝑝 (5)
where A is the effective membrane area (m2), V is the total volume of the permeate (L), p is the
transmembrane pressure (bar), and t is the filtration time.
Figure 6. A cross-flow unit: (A) membrane cells; (B) permeate; (C) feed; (D) pump; (E) surface bubble
cleaning; (F) pressure controller; (G) feed flow speed controller.
1. Results and Discussion
1.1. Characterization of Nanofibre Webs and Laminated Multilayer Nanofibrous Membranes
To characterize the nanofiber webs into the format of multilayer nanofibrous membranes,
various aspects of their material properties were carefully considered. These properties include
the fiber diameter, diameter distribution, mean pore size, wetting property, air permeability,
and bursting strength.
The surface morphology of the nanofiber webs before and after lamination was imaged using
a scanning electron microscope as shown in Figure 7. The average fiber diameter of the PAN and
PVDF nanofibers before lamination was determined to be 171 nm and 221 nm, respectively. The
diameter of the PVDF nanofibers was greater than that of the PAN nanofibers. The main reason was
the difference in viscosity. In previous work [36], it was determined that a 14 wt. %. PVDF solution
has a viscosity of 969 mPa.s, while 8 wt. %. PAN has 191 mPa.s. Based on the viscosity results, one
can expect that a polymeric solution with a lower viscosity will have a lower fiber diameter. After
the lamination process, neither the PVDF nor the PAN nanofiber diameters significantly changed at
a pressure of 50 kN (Figure 8). However, significant changes were observed at laminating
pressures of 75 kN and 100 kN. When the highest laminating pressure was applied (i.e., 100 kN), the
diameter of the PAN and PVDF nanofibers increased by 14% and 25%, respectively. The fibers were
flattened under heat and pressure, and the fiber diameter increased gradually. The highest fiber
diameter changes were observed in the case of the PVDF nanofiber layer due to its lower glass
transition and melting temperature compared to PAN [37,38].

68
Figure 7. SEM images and fiber diameter distribution of (A) PAN nanofiber web before lamination;
(B) PAN50; (C) PAN75; (D) PAN100; (E) PVDF nanofiber web before lamination; (F) PVDF50;
(G) PVDF75; and (H) PVDF100.
360
300
240
180
120
60
0
Figure 8. Fiber diameter of various multilayer nanofibrous membranes under different laminating pressures.
Dia
me
ter
(nm
)

69
It was verified that there is a strong correlation between the electrospun fiber diameters and the
polymer concentration, which has been well documented in the literature [39–41]. From the SEM images, the
PAN and PVDF multilayer nanofibrous membranes exhibited bead-free surface morphology.
The average pore size of the membranes is given in Figure 9. Electrospun materials readily deform at low
pressures. Since the tensile strength of PVDF and PAN nanofibers before lamination is quite low to
withstand air pressure, their pore size was not measured.
0.6
0.5
0.4
0.3
0.2
0.1
0.0
PAN50 PAN75 PAN100
0.9
0.8
0.7
0.6
0.5
0.4
0.3
0.2
0.1
0.0
PVDF50 PVDF75 PVDF100
Figure 9. The relationship between the mean pore size and the laminating pressure of (A) PAN and
(B) PVDF multilayer nanofibrous membranes.
In general, there is a correlation between the fiber diameter and the average pore size of the
nanofibers. Reducing the fiber diameter increases the surface area and compact web structure, which
results in a small pore size [42]. Bagherzadeh et al. [43] demonstrated a theoretical analysis to predict the
pore size of electrospun nanofibers. According to their theory, at a given web porosity, increasing the fiber
diameter and thickness of the web reduces the dimensions of the pores. This theory was validated
experimentally, and the results were compared with the existing theory to predict the pore size distribution
of nanofiber mats. Their results showed that the pore size significantly increased with an increase in fiber
diameter, web porosity and density of the layers. In this work, the correlation between the diameter of the
PVDF nanofibers and the mean pore size was compatible with the literature, while PAN showed an
opposite correlation. The laminating pressure effect must be taken into consideration. The nanofiber layer
did not change; only the fibers flattened after lamination due to the pressure. It was expected that a higher
pressure would cause a lower pore size since the fibers flattened and melting adhesive filled more of the
pores and covered the surface of the nanofibers as shown in Figure 10. The PAN multilayer nanofibrous
membranes fulfilled this expectation while the PVDF did not. Figure 9B shows that the average pore size
and the standard deviation of the pore size measurements increased with pressure, which could be due to
possible damage of the PVDF nanofibers under high pressure. Gockeln et al. [44] investigated the influence
of laminating pressures on the microstructure and electrochemical performance of the lithium-ion battery
electrodes. The results indicated that all the laminated samples showed highly porous and homogeneous
networks, while the pore size slightly decreased with an increase in laminating pressure. At higher
pressures, the intrinsic electrical conductivity was improved due to more compression.
The water and ethylene glycol wettability of the PAN and PVDF multilayer nanofibrous
membranes were examined by a contact angle measurement as shown in Figure 11. The surface energy
and surface roughness are the dominant factors for the wettability. As can be seen from Figure 11, an
increase in laminating pressure decreased the water and ethylene glycol contact angle of both PAN and
PVDF multilayer nanofibrous membranes. Hence, ethylene glycol has a lower surface energy compared to
water, with the differences in contact angle value being 20◦ for PAN and 30◦ for PVDF. Similar behavior
was observed in the literature [45,46]. It is well known that when the surface
(B) (A)
Po
re s
ize
(µ
m)
Po
re s
ize
(µ
m)

70
energy is lowered, and surface roughness is raised, the hydrophobicity is enhanced [47–49]. With
the help of heat, the higher laminating pressure on the surface may cause changes to the surface
shape and make the surface flatter, which results in an increase in the surface wettability (Figure
11). The PVDF membranes showed hydrophobic characteristics at the lowest laminating pressure
(i.e., 50 kN), while at higher laminating pressures they showed hydrophilic properties. By setting
the lamination process parameters, one can prepare hydrophilic PVDF multilayer nanofibrous
membranes without any surface modification.
Figure 10. An illustration of adhesive melting over the surface of a nanofiber web, forming a non-
porous film.
100
90
80
70
60
50
40
30
50 60 70 80 90 100
Pressure (kN)
110
100
90
80
70
60
50
40
30
50 60 70 80 90 100
Pressure (kN)
Figure 11. Contact angle vs. laminating pressure of (A) PAN; (B) PVDF multilayer
nanofibrous membranes.
The morphology of the nanofiber webs, including their pore size, shape, size distribution and
porosity, has a significant influence on the air permeability of the multilayer membrane. To
investigate the effect of laminating pressure on the air permeability of the multilayer nanofibrous
membranes, the samples were placed on a circular sample holder, and the air flow rates through the
samples were measured (Figure 12A). Like the air flows, the areas of the sample and pressure drop
remained constant
water
glycol ethylene (B)
water
glycol ethylene (A)
Co
nta
ct
an
gle
(°)
Co
nta
ct
an
gle
(°)

71
PAN
PVDF (A)
Bu
rsti
ng
str
en
gth
(k
N)
during the measurement. Due to the weakness of neat nanofiber layers, the air permeability test was not
performed. In a previous study [31], the tensile strength of the nanofiber layers was found to be between 3
and 4.33 (N/25 mm), which is extremely low to withstand any external force.
12 220
10
200
8
6
4
2
0
40 50 60 70 80 90 100
180
160
140
120
50 60 70
80 90 100
Pressure (kN) Pressure (kN)
PAN
PVDF (B)
Air
pe
rme
ab
ilit
y (
Lm
-2s
-1)
Figure 12. Influence of laminating pressure on (A) air permeability; and (B) bursting strength of multilayer
nanofibrous membranes.
Abuzade et al. [50] studied the effects of the process parameters (e.g., concentration of solution,
applied voltage) on the porosity and air permeability of an electrospun nanoweb. The results showed that
the nanofiber diameter and size distribution are dominant parameters in controlling the pore sizes formed by
the nanofiber intersections and air permeability of the electrospun web. Figure 12A showed that increasing
the laminating pressure lowered the air permeability of the multilayer membranes. Compression of the
melting adhesive, filling the pores of the nanofiber and nonwoven web, covered the surface of the thin
nanofiber layer and created a non-porous film (Figure 10). As a result, the breathability of the membranes
was decreased. Similarly, Kanafchian et al. [32] claimed that during the lamination, the melt adhesive
penetrates through the nanofiber/fabric structure, which leads to filling of the pores of nanofibers and a
decrease in air permeability. The PAN multilayer nanofibrous membrane has a lower air permeability than
PVDF, mainly due to the lower fiber diameter of the PAN nanofibers compared to the PVDF nanofibers.
Rajak et al. [51] prepared PAN nanofiber webs from various concentrations. The results indicated that
changes in concentration affect the fiber diameter. At a higher concentration and fiber diameter, the air
permeability has a higher value.
A bursting test was performed to determine the mechanical strength of the laminated layers, and the
results are shown in Figure 12B. The test method has been developed in our laboratory. The maximum
delamination point of the multilayer nanofibrous membranes was measured using hydrostatic pressure.
The results showed that PAN nanofibers have a better adhesion to the supporting layer and a better bursting
strength compared to PVDF. The adhesion between the layers is related to the material surface chemistry
and its influence on adhesion, together with the properties of adhesive materials and interactions at the
adhesive-substrate surface interface. Materials that can wet each other tend to have a better adhesion, and
the wettability of the material is related to its surface energy. For instance, low surface energy materials
such as poly(tetrafluoroethylene), ceramics, and silicon, are resistant to wetting and adhesive bonding
[52]. Lee et al. [53] found that the surface energy of PAN is around 44 mJ/m2, while this value was
calculated as 54.1 mJ/m2 by Pritykin et al. [54]. On the other hand, PVDF has a very low surface energy
value of around 26 mJ/m2 [55]. Due to the lower surface energy of PVDF compared to PAN, the adhesion
between the layers is weaker, which results in low lamination strength. The results show that laminating
pressure plays an important role in the bursting strength. By increasing the laminating pressure under heat,
the melted adhesive fills the pores of the nanofibers and nonwovens and penetrates through the layers. A
better mechanical strength is

72
achieved due to the entanglement of the adhesive web and the layers. The results showed that the bursting
strength of a material can be improved by adjusting the lamination conditions.
1.1. Evaluation of Liquid Filtration by Cross-Flow Filtration
Taking their practical applications into consideration, laminated multilayer nanofibrous membranes
were used to further investigate their water permeability performance due to their hydrophilic, porous,
small pore size and predominant mechanical properties for liquid filtration. A cross-flow filtration unit
was prepared in our laboratory. Using Equation (5), the water permeability of the PAN and PVDF
multilayer nanofibrous membranes was calculated (Figures 13 and 14).
Figure 13. Permeability of PAN multilayer nanofibrous membranes at various laminating pressures over
time.
Figure 14. Permeability of PVDF multilayer nanofibrous membranes at various laminating pressures over
time.

73
A decrease in permeability was observed for both the PAN and PVDF multilayer nanofibrous membranes
depending on the operation time as shown in Figures 13 and 14. There are a few possible reasons for the decrease
in permeability during liquid filtration. The first reason is concentration polarization, which is a consequence of
the selectivity of the membrane. When the liquid passes through the membrane, the solute is retained by the
membrane surface with a relatively high concentration. Moreover, the hydrophilicity of the membrane decreases
over time during filtration due to membrane fouling and concentration polarization. Since tap water is not pure,
dissolved molecules, suspended solids, and organics may be contained in the water, which can cause a decrease
in the water flux due to fouling. The second reason is that close to the membrane surface, the effective
transmembrane pressure (TMP) driving force reduces due to an osmotic pressure difference between the filtrate
and the feed solution. TPM is generally observed in the case of ultra-filtration (UF) membranes. Another reason
may be related to the compression/collapse of membrane pores, thereby causing a reduction in water
permeability. The operating conditions (feed pressure, temperature, pH, flow rate, etc.) are also effective factors in
membrane permeability. In general, the flux decline is caused by a decreased driving force and/or an increased
resistance of the membrane, raw water characteristics, and particulate matter levels [56–58].
At the beginning, all the PAN membranes had the highest permeability (Figure 13). After a 4-h filtration
test, the flux declined to 824, 909, and 375 Lm−2h−1bar−1 in the case of PAN50, PAN75, and PAN100,
respectively. The results indicated that laminating pressure has a huge impact on the water permeability of the
multilayer membranes. The laminating pressure and the permeability of the membranes showed a non-linear
relationship in the case of the PAN membranes. PAN50 and PAN75 multilayer nanofibrous membranes showed
the best water permeability. On the other hand, all the PVDF membranes showed very low initial permeability
at the beginning due to the hydrophobic nature of the PVDF nanofibers, and the melted adhesive web partially
occupied the membrane
pores, increasing the hydraulic resistance to filtration (Figure 14). The results of 4 h of filtration of PVDF
membranes showed that the highest permeability (1444 Lm−2h−1bar−1) was only achieved at the lowest
laminating pressure (50 kN). PVDF75 and PVDF100 had almost the same permeability value (650 and 681
Lm−2h−1bar−1, respectively) after the 4-h filtration test. Li et al. [59] reported a simple strategy to improve the
waterproof/breathable performance and mechanical properties of electrospun PVDF fibrous membranes using
a thermo-pressing system. It was found that the effect of temperature and pressure on PVDF has a synergistic
effect on the fiber morphology and crystal structure. By properly adjusting the temperature and pressure, robust
mechanical properties and excellent waterproof/breathable performance of PVDF membranes were achieved.
In terms of water permeability, PAN75 has the best results from the PAN membranes. PVDF50 showed the
best permeability results after the 4-h filtration test from all the PAN and PVDF membranes. The results showed
that after proper lamination multilayer nanofibrous membranes are suitable for future application in liquid
filtration.
1. Conclusions
There is a huge demand for the filtration application of nanofiber layers due to their specific surface, low
pore size and high porosity. In this study, the effect of laminating pressure on PAN and PVDF multilayer
nanofibrous membranes was investigated to prepare suitable microfilters for liquid filtration. The surface
morphology, average pore size, air permeability, water permeability, bursting strength, and the contact angle of
the membranes were compared. Different performance levels were achieved by varying the laminating pressure
of the multilayer nanofibrous membranes. The pressure effect had a considerable influence on air permeability,
average pore size, contact angle, bursting strength, and water permeability. The surface morphology results
showed that the fiber diameter slightly increased with an increase in laminating pressure, while the water and
ethylene glycol contact angles decreased. The main effect of laminating pressure was observed on the average
pore size, air permeability, bursting strength and water permeability of the membranes. PVDF50 showed the

74
best water filtration of all the membranes. However, the bursting strength of PVDF50 is the lowest, which
may cause possible damage and delamination of the layers under pressure over time. PAN nanofibers have
a better adhesion to the surface of the multilayer. PAN75 was selected as the best candidate for liquid
filtration due to its high water permeability and mechanical strength. PVDF multilayer nanofibrous
membranes showed better air permeability than PAN, which may be better for the possible application of
air filtration. These findings imply that to achieve the best permeable membrane results, the lamination
process should be carefully optimized.
Author Contributions: Fatma Yalcinkaya conceived and designed the experiments; Fatma Yalcinkaya performed the experiments; Fatma Yalcinkaya analyzed the data; Jakub Hruza contributed reagents/materials/analysis tools and preparation of tools; Fatma Yalcinkaya wrote the paper.
Acknowledgments: This work was supported by project LO1201 obtained through the financial support of the Ministry of Education, Youth and Sports in the framework of the targeted support of the “National Program for Sustainability I” and the OPR&DI project CZ.1.05/2.1.00/19.0386.
Conflicts of Interest: The authors declare that there is no conflict of interest.
References
1. Gao, J.; Zhu, J.; Luo, J.; Xiong, J. Investigation of microporous composite scaffolds fabricated by embedding
sacrificial polyethylene glycol microspheres in nanofibrous membrane. Compos. Part A Appl. Sci. Manuf. 2016, 91,
20–29. [CrossRef]
2. Tang, Y.; Chen, L.; Zhao, K.; Wu, Z.; Wang, Y.; Tan, Q. Fabrication of PLGA/HA (core)-collagen/amoxicillin (shell)
nanofiber membranes through coaxial electrospinning for guided tissue regeneration. Compos. Sci. Technol. 2016,
125, 100–107. [CrossRef]
3. Zhang, W.; Ronca, S.; Mele, E. Electrospun nanofibres containing antimicrobial plant extracts. Nanomaterials
2017, 7, 42. [CrossRef] [PubMed]
4. Sill, T.J.; von Recum, H.A. Electrospinning: Applications in drug delivery and tissue engineering. Biomaterials
2008, 29, 1989–2006. [CrossRef] [PubMed]
5. Tan, L.; Gan, L.; Hu, J.; Zhu, Y.; Han, J. Functional shape memory composite nanofibers with graphene oxide filler.
Compos. Part A Appl. Sci. Manuf. 2015, 76, 115–123. [CrossRef]
6. Zhao, X.G.; Jin, E.M.; Park, J.Y.; Gu, H.B. Hybrid polymer electrolyte composite with SiO2 nanofiber filler for solid-
state dye-sensitized solar cells. Compos. Sci. Technol. 2014, 103, 100–105. [CrossRef]
7. Yoon, B.; Lee, S. Designing waterproof breathable materials based on electrospun nanofibers and assessing the
performance characteristics. Fibers Polym. 2011, 12, 57–64. [CrossRef]
8. Fehse, M.; Cavaliere, S.; Lippens, P.E.; Savych, I.; Iadecola, A.; Monconduit, L.; Jones, D.J.; Rozière, J.; Fischer,
F.; Tessier, C.; et al. Nb-doped TiO2 nanofibers for lithium ion batteries. J. Phys. Chem. C 2013, 117, 13827–13835.
[CrossRef]
9. Aydın, H.; Çelik, S.Ü.; Bozkurt, A. Electrolyte loaded hexagonal boron nitride/polyacrylonitrile nanofibers for
lithium ion battery application. Solid State Ionics 2017, 309, 71–76. [CrossRef]
10. Wang, X.; Drew, C.; Lee, S.H.; Senecal, K.J.; Kumar, J.; Samuelson, L.A. Electrospun nanofibrous membranes for
highly sensitive optical sensors. Nano Lett. 2002, 2, 1273–1275. [CrossRef]
11. Liu, P.; Wu, S.; Zhang, Y.; Zhang, H.; Qin, X. A fast response ammonia sensor based on coaxial PPy–PAN
nanofiber yarn. Nanomaterials 2016, 6, 121. [CrossRef] [PubMed]
12. Macagnano, A.; Perri, V.; Zampetti, E.; Bearzotti, A.; De Cesare, F.; Sprovieri, F.; Pirrone, N. A smart nanofibrous
material for adsorbing and detecting elemental mercury in air. Atmos. Chem. Phys. 2017, 17, 6883–6893.
[CrossRef]
13. Zhang, X.F.; Feng, Y.; Huang, C.; Pan, Y.; Yao, J. Temperature-induced formation of cellulose nanofiber film with
remarkably high gas separation performance. Cellulose 2017, 24, 5649–5656. [CrossRef]

75
14. Zampetti, E.; Pantalei, S.; Bearzotti, A.; Bongiorno, C.; De Cesare, F.; Spinella, C.; Macagnano, A. TiO2 nanofibrous chemoresistors coated with PEDOT and PANi blends for high performance gas sensors. In
Procedia Engineering; Elsevier: Amsterdam, The Netherlands, 2012; Volume 47, pp. 937–940.
15. Ge, J.; Choi, N. Fabrication of functional polyurethane/rare earth nanocomposite membranes by electrospinning
and its VOCs absorption capacity from air. Nanomaterials 2017, 7, 60. [CrossRef] [PubMed]
16. Desai, K.; Kit, K.; Li, J.; Michael Davidson, P.; Zivanovic, S.; Meyer, H. Nanofibrous chitosan non-wovens for
filtration applications. Polymer 2009, 50, 3661–3669. [CrossRef]
17. Liao, Y.; Tian, M.; Wang, R. A high-performance and robust membrane with switchable super-wettability for
oil/water separation under ultralow pressure. J. Memb. Sci. 2017, 543, 123–132. [CrossRef]
18. Li, Z.; Kang, W.; Zhao, H.; Hu, M.; Wei, N.; Qiu, J.; Cheng, B. A novel polyvinylidene fluoride tree-like nanofiber
membrane for microfiltration. Nanomaterials 2016, 6, 152. [CrossRef] [PubMed]
19. Sood, R.; Cavaliere, S.; Jones, D.J.; Rozière, J. Electrospun nanofibre composite polymer electrolyte fuel cell and
electrolysis membranes. Nano Energy 2016, 26, 729–745. [CrossRef]
20. Yalcinkaya, F. Preparation of various nanofiber layers using wire electrospinning system. Arab. J. Chem. 2016.
[CrossRef]
21. Ding, Y.; Zhang, P.; Long, Z.; Jiang, Y.; Xu, F.; Di, W. The ionic conductivity and mechanical property of
electrospun P(VdF-HFP)/PMMA membranes for lithium ion batteries. J. Memb. Sci. 2009, 329, 56–59. [CrossRef]
22. Jahanbaani, A.R.; Behzad, T.; Borhani, S.; Darvanjooghi, M.H.K. Electrospinning of cellulose nanofibers mat for
laminated epoxy composite production. Fibers Polym. 2016, 17, 1438–1448. [CrossRef]
23. Charles, L.E.; Kramer, E.R.; Shaw, M.T.; Olson, J.R.; Wei, M. Self-reinforced composites of hydroxyapatite-coated
PLLA fibers: Fabrication and mechanical characterization. J. Mech. Behav. Biomed. Mater. 2012, 17, 269–277.
[CrossRef] [PubMed]
24. Iqbal, Q.; Bernstein, P.; Zhu, Y.; Rahamim, J.; Cebe, P.; Staii, C. Quantitative analysis of mechanical and
electrostatic properties of poly(lactic) acid fibers and poly(lactic) acid-carbon nanotube composites using atomic
force microscopy. Nanotechnology 2015, 26, 105702. [CrossRef] [PubMed]
25. Charles, L.F.; Shaw, M.T.; Olson, J.R.; Wei, M. Fabrication and mechanical properties of PLLA/PCL/HA
composites via a biomimetic, dip coating, and hot compression procedure. J. Mater. Sci. Mater. Med. 2010, 21, 1845–
1854. [CrossRef] [PubMed]
26. Xu, Y.; Zhang, X.; Wang, X.; Wang, X.; Li, X.; Shen, C.; Li, Q. Simultaneous enhancements in the strength,
modulus and toughness of electrospun polymeric membranes. RSC Adv. 2017, 7. [CrossRef]
27. Jirícek, T.; Komárek, M.; Chaloupek, J.; Lederer, T. Maximising flux in direct contact membrane distillation using
nanofibre membranes. Desalin. Water Treat. 2017, 73, 249–255. [CrossRef]
28. Jirícek, T.; Komárek, M.; Chaloupek, J.; Lederer, T. Flux enhancement in membrane distillation using
nanofiber membranes. J. Nanomater. 2016, 2016, 1–7. [CrossRef]
29. Yalcinkaya, B.; Yalcinkaya, F.; Chaloupek, J. Thin film nanofibrous composite membrane for dead-end seawater
desalination. J. Nanomater. 2016, 2016, 1–12. [CrossRef]
30. Yalcinkaya, B.; Yalcinkaya, F.; Chaloupek, J. Optimisation of thin film composite nanofiltration membranes based
on laminated nanofibrous and nonwoven supporting material. Desalin. Water Treat. 2017, 59, 19–30. [CrossRef]
31. Yalcinkaya, F.; Yalcinkaya, B.; Hruza, J.; Hrabak, P. Effect of nanofibrous membrane structures on the treatment of
wastewater microfiltration. Sci. Adv. Mater. 2016, 9, 747–757. [CrossRef]
32. Kanafchian, M.; Valizadeh, M.; Haghi, A.K. A study on the effects of laminating temperature on the polymeric
nanofiber web. Korean J. Chem. Eng. 2011, 28, 445–448. [CrossRef]
33. Yao, M.; Woo, Y.C.; Tijing, L.D.; Shim, W.-G.; Choi, J.-S.; Kim, S.-H.; Shon, H.K. Effect of heat-press conditions on
electrospun membranes for desalination by direct contact membrane distillation. Desalination 2016, 378, 80–91.
[CrossRef]
34. Mohammadian, M.; Haghi, A.K. Study on the production of a new generation of electrospun nanofiber webs.
Bulg. Chem. Commun. 2014, 46, 530–534.
35. Yalcinkaya, F.; Siekierka, A.; Bryjak, M. Preparation of fouling-resistant nanofibrous composite membranes for
separation of oily wastewater. Polymers 2017, 9, 679. [CrossRef]
36. Yalcinkaya, F.; Yalcinkaya, B.; Pazourek, A.; Mullerova, J.; Stuchlik, M.; Maryska, J. Surface modification of
electrospun PVDF/PAN nanofibrous layers by low vacuum plasma treatment. Int. J. Polym. Sci. 2016, 2016, 1–9.
[CrossRef]
37. Gopalan, A.I.; Santhosh, P.; Manesh, K.M.; Nho, J.H.; Kim, S.H.; Hwang, C.G.; Lee, K.P. Development of
electrospun PVdF-PAN membrane-based polymer electrolytes for lithium batteries. J. Memb. Sci. 2008, 325, 683–
690. [CrossRef]

76
38. Liu, T.-Y.; Lin, W.-C.; Huang, L.-Y.; Chen, S.-Y.; Yang, M.-C. Surface characteristics and hemocompatibility of
PAN/PVDF blend membranes. Polym. Adv. Technol. 2005, 16, 413–419. [CrossRef]
39. Hammami, M.A.; Krifa, M.; Harzallah, O. Centrifugal force spinning of PA6 nanofibers—Processability and
morphology of solution-spun fibers. J. Text. Inst. 2014, 105, 637–647. [CrossRef]
40. Essalhi, M.; Khayet, M. Self-sustained webs of polyvinylidene fluoride electrospun nano-fibers: Effects of polymer
concentration and desalination by direct contact membrane distillation. J. Memb. Sci. 2014, 454, 133–143.
[CrossRef]
41. Beachley, V.; Wen, X. Effect of electrospinning parameters on the nanofiber diameter and length. Mater. Sci. Eng. C
Mater. Biol. Appl. 2009, 29, 663–668. [CrossRef] [PubMed]
42. Lowery, J.L.; Datta, N.; Rutledge, G.C. Effect of fiber diameter, pore size and seeding method on growth of human
dermal fibroblasts in electrospun poly(ε-caprolactone) fibrous mats. Biomaterials 2010, 31, 491–504. [CrossRef]
[PubMed]
43. Bagherzadeh, R.; Najar, S.S.; Latifi, M.; Tehran, M.A.; Kong, L. A theoretical analysis and prediction of pore size
and pore size distribution in electrospun multilayer nanofibrous materials. J. Biomed. Mater. Res. Part A 2013, 101,
2107–2117. [CrossRef] [PubMed]
44. Gockeln, M.; Pokhrel, S.; Meierhofer, F.; Glenneberg, J.; Schowalter, M.; Rosenauer, A.; Fritsching, U.; Busse, M.;
Mädler, L.; Kun, R. Fabrication and performance of Li4Ti5O12/C Li-ion battery electrodes using combined double
flame spray pyrolysis and pressure-based lamination technique. J. Power Sources 2018, 374, 97–106. [CrossRef]
45. Stiubianu, G.; Nicolescu, A.; Nistor, A.; Cazacu, M.; Varganici, C.; Simionescu, B.C. Chemical modification of
cellulose acetate by allylation and crosslinking with siloxane derivatives. Polym. Int. 2012, 61, 1115–1126.
[CrossRef]
46. Law, K.-Y.; Zhao, H. Wetting on rough surfaces. In Surface Wetting; Springer International Publishing: Cham,
Switwerland, 2016; pp. 55–98.
47. Youngblood, J.P.; McCarthy, T.J. Ultrahydrophobic polymer surfaces prepared by simultaneous ablation of
polypropylene and sputtering of poly(tetrafluoroethylene) using radio frequency plasma. Am. Chem. Soc. Polym.
Prepr. Div. Polym. Chem. 1999, 40, 563–564. [CrossRef]
48. Chen, W.; Fadeev, A.Y.; Hsieh, M.C.; Öner, D.; Youngblood, J.; McCarthy, T.J. Ultrahydrophobic and
ultralyophobic surfaces: Some comments and examples. Langmuir 1999, 15, 3395–3399. [CrossRef]
49. Wenzel, R.N. Surface roughness and contact angle. J. Phys. Colloid Chem. 1949, 53, 1466–1467. [CrossRef]
50. Abuzade, R.A.; Zadhoush, A.; Gharehaghaji, A.A. Air permeability of electrospun polyacrylonitrile nanoweb.
J. Appl. Polym. Sci. 2012, 126, 232–243. [CrossRef]
51. Rajak, A. Synthesis of electrospun nanofibers membrane and its optimization for aerosol filter application.
KnE Eng. 2016, 1. [CrossRef]
52. Von Fraunhofer, J.A. Adhesion and cohesion. Int. J. Dent. 2012, 2012, 1–8. [CrossRef] [PubMed]
53. Lee, L.-H. Relationships between surface wettability and glass temperatures of high polymers. J. Appl. Polym. Sci.
1968, 12, 719–730. [CrossRef]
54. Pritykin, L.M. Calculation of the surface energy of homo- and copolymers from the cohesion parameters and
refractometric characterisics of the respective monomers. J. Colloid Interface Sci. 1986, 112, 539–543. [CrossRef]
55. Chen, N.; Hong, L. Surface phase morphology and composition of the casting films of PVDF-PVP blend.
Polymer 2001, 43, 1429–1436. [CrossRef]
56. Kim, K.-M.; Woo, S.; Lee, J.; Park, H.; Park, J.; Min, B. Improved permeate flux of PVDF ultrafiltration
membrane containing PVDF-g-PHEA synthesized via ATRP. Appl. Sci. 2015, 5, 1992–2008. [CrossRef]
57. Van den Berg, G.B.; Smolders, C.A. Flux decline in ultrafiltration processes. Desalination 1990, 77, 101–133.
[CrossRef]
58. Meier-Haack, J.; Booker, N.A.; Carroll, T. A permeability-controlled microfiltration membrane for reduced fouling
in drinking water treatment. Water Res. 2003, 37, 585–588. [CrossRef]
59. Li, X.; Lin, J.; Bian, F.; Zeng, Y. Improving waterproof/breathable performance of electrospun poly(vinylidene
fluoride) fibrous membranes by thermo-Pressing. J. Polym. Sci. Part B Polym. Phys. 2017, 56, 1–10. [CrossRef]
© 2018 by the authors. Licensee MDPI, Basel, Switzerland. This article is an open access article
distributed under the terms and conditions of the Creative Commons Attribution (CC BY)
license (http://creativecommons.org/licenses/by/4.0/).

77
1
2
3
4
5
6
7
8
9
10
11
12
13
14
15
16
17
18
19
20
21
22
23
24
25
26
27
28
29
30
31
32
33
34
35
36
37
38
39
40
41
42
43
44
45
46
47
48
49
50
51
52
53
54
55
56
57
DOI: 10.1002/open.201800267 Full Papers
Novel electrospun polyacrylonitrile (PAN) nanofibrous mem- dust filter results indicated that electrospun PAN nanofibrous
branes were prepared by using heat-press lamination under membranes showed very high air-dust filtration efficiency of
various conditions. The air permeability and the burst-pressure more than 99.99 % in between PM0.3 and PM2.5, whereas cross-
tests were run to select the membranes for point-of-use air and flow filtration test showed very high water permeability over
water cleaning. Membrane characterization was performed by 600 L/(m2hbar) after 6 h of operation. Combining their excellent
using scanning electron microscopy, contact angle, and average efficiency and water permeability, these membranes offer an
pore size measurements. Selected membranes were used for ideal solution to filter both air and water pollutants.
both air dust filtration and cross-flow water filtration tests. Air
Electrospun Polyacrylonitrile Nanofibrous Membranes for Point-of-Use Water and Air Cleaning
Remi Roche[b] and Fatma Yalcinkaya*[a]
1. Introduction
Water and air pollution are increasing concern all over the world as a
risk of human health.[1–3]
Air pollution can cause asthma, skin irritation,
nausea, cancer, brain damage, birth defects, respiratory and heart
problems due to gaseous pollutants and particulate matter (PM).[4–8]
Based on inhalable particle size, PM is classified into coarse (2.5–10
μm), fine (0.1–
2.5 μm) and ultrafine (< 0.1 μm).[9]
Exposure to elevated PM levels
over the long term can reduce life expectancy by a few years while
short-term exposure contributes to acute cardiovas- cular morbidity
and mortality.[8]
Under this condition, an efficient air filter is demanded
to capture of air pollutants in different sizes. Textile based high-
efficiency particulate air (HEPA) and ultra-low particulate air (ULPA)
filters can capture very small PM with a filtration efficiency over than
99.90 %.[9]
Fibrous materials that have fiber diameter about a few
micro- meters with porosity around 80–90 % can easily remove sub-
micrometer and micrometer particles from air and water with a high
efficiency. Beside the air pollution, water pollution is another issue that
needs an emergency solution for the current and future life. The
availability of freshwater resources has been reduced due to a growing
population. As a result of population growth, the amount of water
consumption and the number of manufacturing and industrial
production have been increased.
[a] Dr. F. Yalcinkaya Department of Nanotechnology and Informatics
Institute of Nanomaterials, Advanced Technologies and Innovation
Technical University of Liberec
Studentska 1402/2, 46117, Liberec, Czech Republic
E-mail: [email protected]
[b] R. Roche National Polytechnic Institute of Chemical Engineering and Technology (INP-
ENSIACET)
4, allée Emile Monso – CS 44362, 31030 Toulouse Cedex 4, France
© 2019 The Authors. Published by Wiley-VCH Verlag GmbH & Co. KGaA.
This is an open access article under the terms of the Creative Commons Attribution Non-Commercial NoDerivs License, which permits use and dis-
tribution in any medium, provided the original work is properly cited, the
use is non-commercial and no modifications or adaptations are made.
The industries, such as chemical, paper, beverage, automotive, food,
agriculture, power generation, textiles, and garments consume tons of
water daily. By 2030, it is expected that the demand for water supply will
exceed about 40 % of current supply.[10]
Before reuse or releasing the used
water directly to nature, it is necessary to clean the water from
contaminations. Membrane technology is one of the effective and
successful methods to compete with conventional separation process for
the treatment of wastewater due to their low cost, energy- efficiency,
compactness, high permeability, and high selectivity and easy-to-operate
properties. In principle, the membrane acts as a semi-permeable barrier
that separates two distinct phases usually under a driving force. For an
effective separation and high throughput, the membrane should have a
proper pore size with a highly porous structure.
Nanofibrous webs have a large surface area to volume, high porosity,
tight pore size and high permeability that make them an appropriate
candidate for filtration applications. Therefore, nanofibers have received
increased attention in water and air domain applications. The first
commercialized application of electrospun nanofibers was in air filters.[11]
Despite the high permeability and tight pore size, the application of
nanofiber webs in the water domain area is limited. The main reason is
the mechanical weakness of single layer nanofiber web. In the application
of membranes, the nanofiber webs require addi- tional supporting layer or
additives to provide strength. Several methods have been reported to
develop mechanical strength of the nanofiber webs. Blending of
polymers,[12]
dip-coating,[13]
or polymer and an additive such as epoxy[14]
or
inorganics[15,16]
were suggested as solutions for the improvement of the
strength. However, these methods require time and chemicals which is
costly. Recently, Wirth et al.[17]
reported ultrasonic welding of
polyacrylonitrile (PAN) nanofiber mats without destruction of the mat
morphology. Various welding patterns were used and their effects on
adhesion forces between both joined nanofiber mats and different failure
mechanisms have been investigated. The results indicated that some
welding patterns enabled bonding stronger than the mats themselves.
ChemistryOpen 2019, 8, 97–103 97 © 2019 The Authors. Published by Wiley-VCH Verlag GmbH & Co. KGaA

78
1
2
3
4
5
6
7
8
9
10
11
12
13
14
15
16
17
18
19
20
21
22
23
24
25
26
27
28
29
30
31
32
33
34
35
36
37
38
39
40
41
42
43
44
45
46
47
48
49
50
51
52
53
54
55
56
57
However, this method still needs to optimize based on
materials and the pattern of welding equipment. Other
attempts to prevent damage of nanofiber webs have been
done as nanofiber-coated yarn.[18–21]
A macroscopic size random
yarn has been used as core and nanofiber layer was covered
around. To form a textile structure, it is necessary to use knitting
or weaving technology. An external yarn is necessary to cover
for the protection of the open surface of the nanofiber layer
before knitting or weaving which makes the process costly. In
the various study, the nanofibers webs are combined to a
support either like layer to layer or sandwiched structure
between different layers.[22–30]
Jiricek[31,32]
and Yalcinkaya et
al.[24,33]
used a bi-component polyethylene (PE) /polypropy-
lene (PP) spun bond as a supporting layer for nanofiber layers.
Heat-press technique was applied using a fusing machine for
the lamination process. The polyvinylidene fluoride (PVDF) and
polyamide-6 (PA-6) nanofiber layers were adhered on the outer
surface of the bi-component due to the low melting point of
PE. The resultant multilayer nanofibrous membranes were used
for water distillation and desalination. In the previous work,[26,30]
the PVDF nanofibrous membranes have been prepared using
heat-press technique under various conditions. Results indi-
cated that PVDF nanofibers are suitable as water and air filters.
In this work, polyacrylonitrile (PAN) nanofiber web was
prepared using needle-free wire electrospinning industrial
production method. PAN is easy to electrospun into nanofiber
and has thermal stability, tolerance to most solvents, and
commercial availability.[34,35] The mechanical strength of the
prepared electrospun web was improved by lamination with a
supporting layer and adhesive web. The lamination conditions,
such as temperature, duration of heat-press and force of the
press have been investigated. The air permeability and burst
pressure tests were run to determine membranes for air and
water filtration test. The ultimate goal of this work is to
introduce electrospun PAN nanofibrous membranes that pre-
pared by industrial production method as air and water filter.
So far, there has been no deep work reported for the lamination
of PAN nanofibers using heat press under various lamination
condition and then apply for both air and water filtration.
1. Results and Discussion
1.1. Selection of the Membranes
PAN nanofiber layer was laminated under various conditions
and 18 types of membranes were prepared. The selection of the
filter membranes has been done based on their air permeability
and bursting pressure as shown in Figure 1. Figure 1 is divided
into 6 pieces according to the temperature and duration of
lamination. In each piece, there are three values which show
the lamination force in the order of 40, 50, and 100 kN,
respectively. Membranes were selected according to high
bursting pressure and the air permeability. Hence, there is no
previous work dealing with optimum air permeability and the
bursting pressure of membranes, we decided to select the
membranes which had higher air permeability and bursting
Figure 1. Effect of lamination conditions on air permeability and the delamination strength of various PAN membranes.
pressure. In this case, a line was drawn in Figure 1, on 4 Lm
-2s
-1 air
permeability and 195 kN bursting pressure. The selective
membranes were marked with a green square.
Based on the Figure 1, (a) the air permeability of the
membranes decreased with increased temperature, applied
lamination force, and lamination duration, (b) since, bursting
pressure depends on both adhesion properties of the hybrid
materials and the conditions of lamination, it is difficult to
explain the relationship between bursting pressure and the
lamination condition.
It is possible to say that, lamination force had an effect on
bursting pressure, such as when the applied pressure increased
the bursting pressure was increased. However, under high heat
(130 °C) and long lamination period (5 min), the adhesive web and
nanofiber layer lost its strength and resulted in low resistance to
delamination. Results also suggested that the air permeability of
the membrane was in direct proportion to the applied force of the
lamination process. Higher applied force means, melted adhesive
can penetrate through the pores of the nanofiber layer and reduce
the porosity of the membrane. The melted adhesive covered the
surface of the nanofiber layer. As a result, a non-fibrous, film
structure can form on the surface as shown in Figure 2. The region
of film adhesive on the surface of the membrane blocked the
pores. Even though these regions
Figure 2. The surface of the PAN nanofibrous membrane after the lamination process.

79
1
2
3
4
5
6
7
8
9
10
11
12
13
14
15
16
17
18
19
20
21
22
23
24
25
26
27
28
29
30
31
32
33
34
35
36
37
38
39
40
41
42
43
44
45
46
47
48
49
50
51
52
53
54
55
56
57
are not demanded, these regions provide better adhesion
between the support and nanofiber layer. To prepare an
optimal material, it should be considered both permeability and
the bursting resistance of the membranes.
The air permeability is an important criterion for the
membrane permittivity, especially for the air filters. On the other
hand, bursting pressure shows the necessary minimum pressure to
destroy or to separate nanofiber layer from the supporting
materials. In this case, selection high air permeability and the
bursting pressure are demanded. Based on the results in Figure 1,
only 5 membranes showed higher air permeability and at the same
time higher bursting pressure. These membranes are;
PAN_110_50_3, PAN_110_50_5, PAN_110_ 100_5,
PAN_120_100_3, PAN_130_50_3, PAN_130_40_5.
1.1. Surface Characterization
The SEM images of the samples are taken and shown as in
Figure 3. Comparing the diameter of the fiber, SEM images
showed that after the lamination process, the fiber diameter
increased almost 75 % more due to the structural change of
PAN under heat and pressure. Unlike the literature finding,[36]
hot press process affected the fiber diameter of PAN nanofibers.
Sabantina et al.[37]
observed that the diameter of the PAN
nanofiber on the polypropylene substrate increased while the
PAN nanofiber diameter stayed constant on aluminum foil after
stabilization under 280 °C.
Under the force and applied temperature of the lamination,
the fibers were getting flattened. Increasing applied temper-
ature and the force caused fusion and bending. As a result, fiber
diameter increased. Figure 3 (g) was taken to observe the fiber
diameter under the highest force (100 kN), temperature (130 °C)
and duration (5 min) of the lamination. Apparently, PAN_130_
100_5 had the highest fiber diameter among the others. In the
literature, it was found that applying heat treatment increased
the fusion at interfiber contact points which increased the
mechanical strength of the electrospun membranes.[38,39] The
mechanical strength of the PAN nanofiber increased 760 times
after hot-press process.[36] However, excessive lamination tem-
perature, force, and duration may cause low mechanical
strength and deterioration of the mechanical property.
Water contact angle of the membranes was measured and
shown in Figure 4. The contact angle results indicate that
membranes are hydrophobic which is not an advantage for liquid
separation. Membranes which has a water contact angle greater
than or equal to 90° is counted as hydrophobic membranes.[22] It
was found that the hydrophobic PVDF became hydrophilic after
the lamination process.[30] Unlike the PVDF membranes, the
lamination conditions at given range did not change the
wettability of the membranes. The previous work showed that
neat PAN nanofiber has a contact angle around 70° under the
lamination condition at a temperature of 135 °C and 50 kN
pressure for 3 min.[40] That might be the melted effect of adhesive
web and the changing of the PAN structure under high
temperature. In general, it is known that hydrophobic membranes
tend to foul easier than hydrophilic ones. For this
Figure 3. SEM images of a) PAN_110_50_3, b) PAN_110_50_5, c) PAN_110_ 100_5, d) PAN_120_100_3, e) PAN_130_50_3, f) PAN_130_40_5, g) PAN_ 130_100_5, and h) PAN nanofiber before lamination process.
Figure 4. Water contact angle of the electrospun PAN membranes.

80
1
2
3
4
5
6
7
8
9
10
11
12
13
14
15
16
17
18
19
20
21
22
23
24
25
26
27
28
29
30
31
32
33
34
35
36
37
38
39
40
41
42
43
44
45
46
47
48
49
50
51
52
53
54
55
56
57
Figure 5. Pore size vs. fiber diameter of the electrospun PAN membranes.
reason, a surface modification is required for the increase of the
electrospun PAN membrane wettability. Previous works showed
that the hydrophilic surface modification of electrospun PAN
membrane with plasma treatment was not long lasting while
additional chemical modification provided permeant wettabil-
ity.[40,41]
Membrane pore size is an important criterion for the
selectivity and the permeability of the membrane. Pore size,
size distribution, and porosity are parameters that directly
influence the air permeability of the nanofiber web. Fiber
diameter plays a major role in the pore size of the nanofiber
layers.[42–44]
The average pore size according to the fiber
diameter of the membranes is shown in Figure 5. The pore size
and the fiber diameter of the membranes showed almost the
same behavior. Pore size increased with fiber diameter. Li et al.
showed that the pore size and pore size distribution of the
polylactic acid (PLA) nanofiber membranes directly related to
fiber diameter and area weight of the membrane.[45]
Herein, the
area weight of the membranes was kept the same while fiber
diameter slightly changed depends on the lamination con-
dition. In that case, it can be assumed that only fiber diameter
and the lamination conditions are strongly associated with the
pore size of the membranes. The adhesive during lamination
process is melting and can fill pores of the membranes which
might cause a reduction in pore size and porosity of the
membranes. A proper lamination condition has to be deter-
mined without losing the performance of the membranes.
1.1. Filtration Results
Air filtration test was run and the removal of the particles in
between PM0.1 and PM2.5 has been measured. Non-slip flow is
the dominant mechanism for the high-efficiency particulate air
(HEPA) and ultra-low particulate air (ULPA) filters. The problem
of commercial HEPA and ULPA filters are that they can clog
very easily due to the limited specific surface area.[9,46] Since the
fiber size of the nanofibers is small in the nm range, the slip-
flow mechanism becomes more important to disturb the
airflow.[47]
As a result, the dust particles are collected to the
surface not inside of the nanofiber layer which could improve
the cleaning of the membranes.
The efficiency of the particle removal of the nanofibrous
membranes is given in Figure 6. In all experiments, the super-
ficial air velocity was 5 cm/s with a filter area 100 cm2.
Figure 6. Filtration efficiency of the membranes against to various particle sizes and the schematic diagram of the filtration unit: a) dust particles, b) nanofibrous membrane, and c) filtered air.
Air filtration results indicated that all the membranes have
superior filtration efficiency over than 99.97 % at various particle
sizes. Among all membranes, PAN_130_40_5 showed highest
filter efficiency (> 99.999 %) for the PM0.1.
Zhao et al.[48]
prepared PAN nanofibers in various fiber
diameters using lithium chloride salt (LiCl) at various concen-
trations. The air transmission resistance of the PAN membranes
was measured to verify slip flow of air molecules from the
surface of the nanofibers. The slip-effect could be controlled by
the fiber diameter at standard atmospheric condition. They
found that the slip-effect was gradually weakening with the
reduction of fiber diameter. Their results indicated that PAN
fibrous membranes with the optimized parameters showed
very high PM2.5 purification efficiency of 99.09 %, low air
resistance of 29.5 Pa, and long service life. In this work, since
the fiber diameter of the membranes are almost equal after the
lamination process, the lamination condition was the only
effective parameter on the permeability of the membranes. To
characterize the filter performance, quality factor (QF) was
calculated. The QF of the membranes was calculated using the
Eq. 1:[48,49]
QF = ln(1-n)/ΔP (1)
where P is the pressure drop, and n is the filtration efficiency.
The quality factor has been calculated for the PM0.1. The QF of
PAN membranes are given in Figure 7. QF is directly propor-
tional to filtration efficiency while was negatively proportional
to the pressure drop. The higher the QF means the better the
filter performance. Herein, both PAN 110_50_3 and PAN_130_
40_5 showed the highest QF among the other membranes. The

81
1
2
3
4
5
6
7
8
9
10
11
12
13
14
15
16
17
18
19
20
21
22
23
24
25
26
27
28
29
30
31
32
33
34
35
36
37
38
39
40
41
42
43
44
45
46
47
48
49
50
51
52
53
54
55
56
57
5 2
Figure 7. QF of various PAN nanofibrous membranes.
PAN 130_40_5 showed not only the better dust filtration
efficiency, but also QF compared to other PAN membranes.
The results indicated that PAN nanofibrous membranes had
high particle separation efficiency for coarse and fine particles.
However, the air permeability of the PAN membranes was
extremely low (lower than 6 Lm-2 s-1) which increase the pressure
drop and low energy saving for long-term use. In general,
nanofiber webs itself have a very low-pressure drop. After the
lamination process, most probably the melted adhesive web filled
to pores of nanofiber web and decreased the porosity of the
membranes. As a result, the air permeability decreased. However,
PAN membranes can be potentially employed as HEPA filter with
high efficiency in clean air applications such as in airplanes,
hospitals, and clean rooms.
The water permeability test was run using tap water. The tap
water is not pure; it contains several minerals, inorganics,
hormones, fluorine compounds, etc. that can cause membrane
fouling. The water permeability test was run to proof whether the
membranes were suitable for water treatment or not. The results
are given in Figure 8. The results indicated that the
Figure 8. Water permeability of the various PAN nanofibrous membranes during 6 h.
permeability of the membranes was over than 4000 L/(m2 hbar).
However, the permeability reduced gradually through the
membrane in time due to several possible reasons such as
concentration polarization and membrane fouling.[26,50,51]
After
3 h of operation, the membrane permeability reached to steady-
state. Among the all membranes, PAN_110_50_3, PAN_ 110_50_5
and PAN_120_100_3 showed the highest permeabil- ity (> 1200
L/(m2 h bar)) after 6 h of operation. On the other hand,
membranes that laminated at the highest temperature (130 °C)
showed the lowest permeability which is almost half of other
membranes (> 600 L/(m2 h bar)). The results indicated lamination
temperature had an influence on the water perme- ability of PAN
nanofibrous membranes. It was found that heated PAN
nanofibers over their glass temperature, the segmental mobility of
the molecular chains and dipole-dipole interaction of the nitrile
groups increased. The nitrile groups started to release from their
bound state. As a result, crystallization of the fiber improved.[52–54]
Herein, the temper- ature most probably affects the crystalline
structure and pore size (Figure 5) of the PAN membranes which
may reduce the water permeability. It was found that water
absorption rate decreased with an increased crystallinity of the
polymer.[55–57]
It can be generalized that PAN nanofibrous membranes that
laminated using heat-press showed extremely high permeabil-
ity compared to that literature[58,59] which showed less than
400 L/(m2 hbar) for pure water permeation.
Hwang et al.[60] compared three types of commercial
membranes for crossflow microfiltration. The membranes were
MF-Millipore® (made of mixed cellulose esters), Durapore®
(made of modified polyvinylidene difluoride) and Isopore®
(made of bisphenol polycarbonate) membrane with the same
mean pore size of 0.1 μm. The results indicated that Isopore
membrane showed the highest flux rate (≈ 5× 10⁵ L/(m
2s))
compared to MF-Millipore ( ≈ 4× 10⁵ L/(m2s)) and Durapore (
≈ 2×10 L/(m s)) membranes after 3000 second of operation
time. The flux rates of the membranes in this work were
changed in between 1× 10⁵ L/(m
2 s) (PAN_110_100_5) and 2×
105 L/(m2 s) (PAN_130_50_3) after 3600 seconds of operation
time. The filtration test results indicated that PAN membranes
are comparable with the commercial membranes without any
post-treatment.
The results indicate, PAN nanofibrous membranes that
laminated under various condition showed enormous water
permeability. Electrospun PAN nanofibrous membrane seems a
good candidate for the treatment of wastewater. Comparable
results were obtained in the literature using PVDF nanofibrous
membranes.[30] The PVDF nanofibrous membranes that were
laminated under different condition using the same heat-press
system showed very high water permeability. It can be concluded
that the heat-press lamination system is suitable for the
preparation of nanofibrous membranes for water treatment.
1. Conclusions
PAN nanofibers were laminated under various conditions and
tested as air and liquid filtration in order to assay whether these

82
1
2
3
4
5
6
7
8
9
10
11
12
13
14
15
16
17
18
19
20
21
22
23
24
25
26
27
28
29
30
31
32
33
34
35
36
37
38
39
40
41
42
43
44
45
46
47
48
49
50
51
52
53
54
55
56
57
laminated membranes are suitable for end use or not. The air
permeability and the burst pressure tests determined the
selective membranes according to their permeable structure
and resistance to delamination. Selected membranes used for
air and water filtration. The air filtration results showed the
membranes had very high filtration efficiency (≥ 99.97) for
PM0.1. However, the membranes showed very low air perme-
ability due to adhesion method. The adhesive between the
membrane and support melted and reduced the porosity of the
membrane. The low air permeable membranes require more
energy and which is costly. The air permeability problem can be
overcome using different lamination technique. Conversely,
PAN membranes showed very high water permeability (>
600 L/(m2 h bar)) after 6 h of operation. Results indicate that
electrospun PAN nanofibrous membranes laminated by heat-
press are more suitable for water domain application compared
to air filtration. Hence, the aim of this work is the investigation
of the lamination process and effect on air and water filtration,
the self-cleaning property and the surface modification of PAN
membranes will be studied as future work.
Experimental Section
Preparation of Membranes
8% wt. of PAN (150 kDa H-polymer, Elmarco, Liberec, Czech Republic) was prepared in N, N-dimethylacetamide (DMAc) and mixed over the night. The solvent was purchased from Penta s.r.o. (Prague, Czech Republic). The prepared solution was electrospun using needle-free electrospinning equipment (Nanospider NS 8S1600U, Elmarco, Liberec, Czech Republic). The spinning con-
ditions were determined as; + 55kV/-15 kV voltage with a distance between the electrodes was 188 mm. The humidity and the temperature were set as unchanged by using an air controlling unit as 20 % RH and 23 °C. A backing paper was used as collecting material for the nanofiber with a speed of 15 mm/min. The final
Table 1. Preparation of nanofibrous membranes under various lamination conditions.
Nanofiber Temperature [°C]
Applied force [kN]
Time [min]
Abbreviation
PAN 110 40 3 PAN_110_40_3 50 PAN_110_50_3 100 PAN_110_100_3 40 5 PAN_110_40_5 50 PAN_110_50_5 100 PAN_110_100_5 120 40 3 PAN_120_40_3 50 PAN_120_50_3 100 PAN_120_100_3 40 5 PAN_120_40_5 50 PAN_120_50_5 100 PAN_120_100_5 130 40 3 PAN_130_40_3 50 PAN_130_50_3 100 PAN_130_100_3 40 5 PAN_130_40_5 50 PAN_130_50_5
100 PAN_130_100_5
done. The pore size of the samples was measured according to capillary flow porosimetry theory using a custom-made device in our laboratory.
Burst-pressure of the nanofiber layer from the supporting layer was measured by the device built in our laboratory.[26] Using burst- pressure, the minimum strength to burst nanofibrous membranes was measured.
Filtration tests
The air permeability of all multilayer nanofibrous membranes was tested using an SDL ATLAS Air Permeability Tester (@200 Pa and 20 cm2, South Carolina, US). At least three measurements were taken for each sample.
For air filtration, the particle filtration test for the selected membranes done was by MPF 1000 HEPA filtration device (PALAS
density of the nanofiber web was 3 g/m2. The details of the electrospinning system and the spinning conditions were given in
GmbH, Karlsruhe, Germany) in between PM0.1 and PM2.5.
somewhere else.[26]
Prepared nanofiber webs were undergone to a lamination process to combine nanofibers onto a suitable substrate for filtration application. A co-polyamide adhesive web (Protechnic, Cernay, France) was used between 100 g/m2 polyethylene terephthalate spun bond nonwoven supporting layer (Mogul Co. Ltd., Gaziantep, Turkey) and the PAN nanofiber to adhere layers. For this aim, heat- press (hot-press) equipment is used (Pracovni Stroje, Teplice, Czech Republic). Lamination condition was optimized by changing of applied heat, force and the duration of lamination time. Table 1 shows the lamination condition and the abbreviation of each sample. 18 samples were prepared and tested. The abbreviation of the samples was given according to the name of nanofiber_ lamination temperature_lamination force_duration of lamination.
Characterization of the Membranes
Scanning electron microscope (SEM, Vega 3SB, Brno, Czech Republic) and Krüss Drop Shape Analyzer DS4 (Krüss GmbH, Hamburg, Germany) were used to determine both surface shape and contact angle of the samples. At least 50 measurements for fiber diameter and 5 measurements for the contact angle were
A cross-flow filtration unit was built in our laboratory for the water filtration test as shown in Figure 9. The flux (F) and the permeability
Figure 9. A cross-flow unit: A) membrane cells, B) permeate, C) feed, D) pump, E) surface bubble cleaning, F) pressure controller, G) feed flow speed controller.

83
1
2
3
4
5
6
7
8
9
10
11
12
13
14
15
16
17
18
19
20
21
22
23
24
25
26
27
28
29
30
31
32
33
34
35
36
37
38
39
40
41
42
43
44
45
46
47
48
49
50
51
52
53
54
55
56
57
(k) of the selected membranes were calculated according to Eq. (2) and (3):
F = (1/A) (dV/dt) (2)
k =(F/p) (3)
where A is the effective membrane area (m2), V is the total volume of the permeate (L), p is the transmembrane pressure (bar), and t is the filtration time (h).
Acknowledgements
This work was supported by the Ministry of Education, Youth and
Sports of the Czech Republic and the European Union – European
Structural and Investment Funds in the frames of Operational
Programme Research, Development and Education – project
Hybrid Materials for Hierarchical Structures (HyHi, Reg.
No. CZ.02.1.01/0.0/0.0/16_019/0000843).
Conflict of Interest
The authors declare no conflict of interest.
[1] M. J. H. Worthington, R. L. Kucera, I. S. Albuquerque, C. T. Gibson, A. Sibley, A. D. Slattery, J. A. Campbell, S. F. K. Alboaiji, K. A. Muller, J. Young, Chem. Eur. J. 2017, 23, 16219–16230.
[2] A. Nomura, C. W. Jones, Chem. Eur. J. 2014, 20, 6381–6390. [3] R. Zhang, Z. Yu, L. Wang, Q. Shen, X. Hou, X. Guo, J. Wang, X. Zhu, Y.
Yao, Chem. Eur. J. 2017, 23, 13696–13703. [4] A. F. W. Ho, W. Wah, A. Earnest, Y. Y. Ng, Z. Xie, N. Shahidah, S. Yap, P. P.
Pek, N. Liu, S. S. W. Lam, Int. J. Cardiol. 2018, 271, 352–358. [5] W. H. Organization, “Ambient (outdoor) air quality and health,” can be
found under http://www.who.int/en/news-room/fact-sheets/detail/am- bient-(outdoor)-air-quality-and-health, n.d.
[6] R. D. Brook, S. Rajagopalan, C. A. Pope, J. R. Brook, A. Bhatnagar, A. V. Diez-Roux, F. Holguin, Y. Hong, R. V. Luepker, M. A. Mittleman, Circulation
2010, 121, 2331–2378. [7] C. A. Pope, R. T. Burnett, G. D. Thurston, M. J. Thun, E. E. Calle, D.
Krewski, J. J. Godleski, Circulation 2004, 109, 71–77. [8] I. Markevych, F. Tesch, T. Datzmann, M. Romanos, J. Schmitt, J. Heinrich,
Sci. Total Environ. 2018, 642, 1362–1368. [9] V. V Kadam, L. Wang, R. Padhye, J. Ind. Text. 2018, 47, 2253–2280.
[10] M. Mahdi, A. Shirazi, A. Kargari, S. Ramakrishna, J. Doyle, M. Rajendrian, P. Ramesh Babu, J. Membr. Sci. Res. 2017, 3, 209–227.
[11] D. Groitzsch, E. Fahrbach, Microporous Multilayer Nonwoven Material for
Medical Applications, 1985, US4618524A. [12] F. Yalcinkaya, Arab. J. Chem. 2016, DOI 10.1016/j.arabjc.2016.12.012. [13] L. F. Charles, M. T. Shaw, J. R. Olson, M. Wei, J. Mater. Sci. Mater. Med.
2010, 21, 1845–1854. [14] A. R. Jahanbaani, T. Behzad, S. Borhani, M. H. K. Darvanjooghi, Fibers
Polym. 2016, 17, 1438–1448. [15] L. E. Charles, E. R. Kramer, M. T. Shaw, J. R. Olson, M. Wei, J. Mech. Behav.
Biomed. Mater. 2012, 17, 269–277. [16] R. Liu, L. Ma, J. Mei, S. Huang, S. Yang, E. Li, G. Yuan, Chem. Eur. J. 2017,
23, 2610–2618. [17] E. Wirth, L. Sabantina, M. Weber, K. Finsterbusch, A. Ehrmann, Nano-
materials 2018, 8, 746. [18] F. Yalcinkaya, M. Komarek, D. Lubasova, F. Sanetrnik, J. Maryska,
Nanocon 2014, 6th Int. Conf. 2015.
[19] J. Malašauskienė, R. Milašius, J. Nanomater. 2013, 2013, 1–6. [20] F. Yalcinkaya, M. Komarek, D. Lubasova, F. Sanetrnik, J. Maryska, J.
Nanomater. 2016, 2016, 1–7. [21] C. K. Liu, H. J. He, R. J. Sun, Y. Feng, Q. shi Wang, Mater. Des. 2016, 112,
456–461. [22] F. Yalcinkaya, B. Yalcinkaya, J. Hruza, P. Hrabak, Sci. Adv. Mater. 2016, 9,
747–757. [23] M. Kanafchian, M. Valizadeh, A. K. Haghi, Korean J. Chem. Eng. 2011, 28,
445–448. [24] B. Yalcinkaya, F. Yalcinkaya, J. Chaloupek, J. Nanomater. 2016, 2016, 1–
12. [25] B. Yoon, S. Lee, Fibers Polym. 2011, 12, 57–64. [26] F. Yalcinkaya, J. Hruza, Nanomaterials 2018, 8, 272. [27] W. Liu, S. Wang, M. Xiao, D. Han, Y. Meng, Chem. Commun. 2012, 48, 3415–
3417. [28] F. Yalcinkaya, B. Yalcinkaya, J. Hruza, P. Hrabak, J. Maryska, in NANOCON
2016 - Conf. Proceedings, 8th Int. Conf. Nanomater. - Res. Appl., TANGER, Brno, 2016.
[29] P. Valipour, V. Babaahmadi, K. Nasouri, Adv. Polym. Technol. 2014, 33, DOI 10.1002/adv.21440.
[30] R. Roche, F. Yalcinkaya, Nanomaterials 2018, 8, 771. [31] T. Jiříček, M. Komárek, J. Chaloupek, T. Lederer, Desalin. Water Treat.
2017, 73, 249–255. [32] T. Jiříček, M. Komárek, J. Chaloupek, T. Lederer, Komá, M. Rek, J.
Chaloupek, T. Lederer, J. Nanomater. 2016, 2016, 1–7. [33] B. Yalcinkaya, F. Yalcinkaya, J. Chaloupek, Desalin. Water Treat. 2017, 59,
19–30. [34] Y. Mei, C. Yao, K. Fan, X. Li, J. Membr. Sci. 2012, 417–418, 20–27. [35] F. Yalcinkaya, A. Siekierka, M. Bryjak, Polymers (Basel). 2017, 9, 679. [36] A. A. Ali, G. C. Rutledge, J. Mater. Process. Technol. 2009, 209, 4617–4620. [37] L. Sabantina, M. Á. Rodríguez-Cano, M. Klöcker, F. J. García-Mateos, J. J.
Ternero-Hidalgo, Al Mamun, F. Beermann, M. Schwakenberg, A. L. Voigt, J. Rodríguez-Mirasol, Polymers (Basel). 2018, 10, 735.
[38] Z. Ma, M. Kotaki, S. Ramakrishna, J. Membr. Sci. 2005, 265, 115–123. [39] L. Zhang, L.-G. Liu, F.-L. Pan, D.-F. Wang, Z.-J. Pan, J. Eng. Fibers Fabr.
2012, 7, 7–16. [40] F. Yalcinkaya, J. Appl. Polym. Sci. 2018, 135, 46751. [41] F. Yalcinkaya, A. Siekierka, M. Bryjak, RSC Adv. 2017, 7, 56704–56712. [42] R. A. Abuzade, A. Zadhoush, A. A. Gharehaghaji, J. Appl. Polym. Sci. 2012,
126, 232–243. [43] S. J. Eichhorn, W. W. Sampson, J. R. Soc. Interface 2010, 7, 641–649. [44] M. Krifa, W. Yuan, Text. Res. J. 2016, 86, 1294–1306. [45] D. Li, M. W. Frey, Y. L. Joo, J. Membr. Sci. 2006, 286, 104–114. [46] A. Podgórski, A. Bałazy, L. Gradoń, Chem. Eng. Sci. 2006, 61, 6804–6815. [47] S. Sundarrajan, K. Luck Tan, S. Huat Lim, S. Ramakrishna, Procedia Eng.
2014, 75, 159–163. [48] X. Zhao, S. Wang, X. Yin, J. Yu, B. Ding, Sci. Rep. 2016, 6, 35472. [49] Z. Jiang, H. Zhang, M. Zhu, D. Lv, J. Yao, R. Xiong, C. Huang, J. Appl.
Polym. Sci. 2018, 135, 45766. [50] P. Aimar, M. Meireles, P. Bacchin, V. Sanchez, in Membr. Process. Sep.
Purif., Springer Netherlands, Dordrecht, 1994, pp. 27–57. [51] H. Rezaei, F. Z. Ashtiani, A. Fouladitajar, Braz. J. Chem. Eng. 2014, 31, 503–
518. [52] M. Sadrjahani, S. A. Hosseini Ravandi, Fibers Polym. 2013, 14, 1276–1282. [53] J. C. Masson, Acrylic Fiber Technology and Applications, M. Dekker, 1995. [54] A. K. Gupta, A. K. Maiti, J. Appl. Polym. Sci. 1982, 27, 2409–2416. [55] Y. Lin, W. Zhong, L. Shen, P. Xu, Q. Du, J. Macromol. Sci. Phys. 2005, 44 B,
161–175. [56] T. Negoro, W. Thodsaratpreeyakul, Y. Takada, S. Thumsorn, H. Inoya, H.
Hamada, in Energy Procedia, Elsevier, 2016, pp. 323–327. [57] D. W. Auckland, R. Cooper, in Conf. Electr. Insul. Dielectr. Phenom. - Annu.
Rep. 1974, IEEE, 1974, pp. 71–79. [58] N. Scharnagl, H. Buschatz, Desalination 2001, 139, 191–198. [59] Y. Xu, Q. Wei, Functional Nanofibers and Their Applications, Woodhead
Publishing, 2012. [60] K. J. Hwang, T. T. Lin, J. Membr. Sci. 2002, 199, 41–52.
Manuscript received: November 26, 2018 Revised manuscript received: December 28, 2018
Version of record online: ■■■, ■■■■
Keywords: air filtration · lamination · nanofiber ·
polyacrylonitrile · water filtration

84
4.3. Surface Modification and Application of Nanofiber Membranes in Water
Treatment
The application of nanofibers in membrane technology is quite problematic due to various technical
obstacles mentioned in “Chapter 1-Main problems”. During our research, we tried to focus on
introducing nanofiber webs into liquid separation applications and tried to solve problems one by one
in the frame of our limits and efforts. Besides the preparation of nanofiber membranes, we focused on
the possible applications. Moreover, to improve nanofiber permeability, selectivity, rejection, and
fouling resistance property, surface modification has been introduced to nanofiber membranes. In the
following reprints, we represent results for the how-to modify nanofiber membrane surfaces,
application of nanofiber layers for the separation of oily wastewater from a different source,
application of nanofiber membrane as thin film support layer for the separation of seawater and chiral
component. The main results of the reprints include;
Application of polyamide nanofiber membrane (prepared by different adhesion method) for the
separation of pitch and tar oils, engine oil/water mixture, and kitchen oil/water mixture: Based on the
results, it can be suggested that polyamide nanofiber membrane is suitable for the separation of
wastewater from industry and engine oil/water mixture but not for the kitchen oil (first reprint)
Surface modified nanofiber membranes for separation of kitchen oil: Two different approaches are
followed. In the first, the membrane surface is activated by plasma, and then chemical modification is
followed. In the second approach, nanoparticles (NPs) have been incorporated on the nanofiber
surface. In both cases, the membrane showed too high flux and selectivity for the water in the
oil/water mixture. Incorporation of NPs improved membrane fouling resistance. In all research, the
mixture of oil/water prepared half to half and in emulsion form, which caused membranes to foul
easily. However, modified nanofiber membranes showed outstanding performance with fouling
resistance properties promising for the domestic wastewater separation process (reprints 2-5).
Thin film composite nanofiltration membranes (TFCN) based on laminated nanofibrous and
nonwoven supporting material: Nanofiber membranes as support layer offer advantages on classical
nonwoven material for the thin film composite (TFC) membranes. The nanofibers provide an
increased surface area, intrinsically high porosity with an interconnected pore structure and high
surface porosity, which increases the effective membrane area by reducing the amount of thin film
layer masked by the support layer. In the last two reprints, the nanofiber membrane has been used as a
supporting layer for the thin film composite nanofiltration (reprints 6-7). In the one attempt, seawater
desalination has been done, and our membranes had high flux and ion rejection for real seawater with
a high amount of salt ions. In the second attempt, it is the first time a unique combination of
nonporous composite membranes with the microfibrous structures together with the chiral active
substance used at the same time for the separation of chiral drugs. The separation has been done from
liquid phases by pertraction that uses an adsorption-enantioselective membrane.
All the work submitted in this habilitation thesis suggests that nanofibers are a good candidate for
membrane technology.

85
Reprint:
1. Yalcinkaya F, Yalcinkaya B, Hruza J. Electrospun Polyamide-6 Nanofiber Hybrid
Membranes for Wastewater Treatment. Fibers and Polymers. 2019 Jan;20(1):93-9.
2. Yalcinkaya F, Siekierka A, Bryjak M. Surface modification of electrospun
nanofibrous membranes for oily wastewater separation. RSC advances.
2017;7(89):56704-12.
3. Yalcinkaya F, Siekierka A, Bryjak M. Preparation of fouling-resistant nanofibrous
composite membranes for separation of oily wastewater. Polymers. 2017
Dec;9(12):679.
4. Boyraz E, Yalcinkaya F, Hruza J, Maryska J. Surface-modified nanofibrous PVDF
membranes for liquid separation technology. Materials. 2019 Jan;12(17):2702.
5. Torres-Mendieta R, Yalcinkaya F, Boyraz E, Havelka O, Wacławek S, Maryška J,
Černik M, Bryjak M. PVDF nanofibrous membranes modified via laser-synthesized
Ag nanoparticles for a cleaner oily water separation. Applied Surface Science. 2020
May 15:146575.
6. Yalcinkaya B, Yalcinkaya F, Chaloupek J. Thin film nanofibrous composite
membrane for dead-end seawater desalination. Journal of Nanomaterials. 2016 Aug
1;2016.
7. Gaálová J, Yalcinkaya F, Cuřínová P, Kohout M, Yalcinkaya B, Koštejn M, Jirsák J,
Stibor I, Bara JE, Van der Bruggen B, Izák P. Separation of racemic compound by
nanofibrous composite membranes with chiral selector. Journal of Membrane
Science. 2020 Feb 15;596:117728.

86
Fatma Yalcinkaya *
Fibers and Polymers 2019, Vol.20, No.1, 93-99
DOI 10.1007/s12221-019-8820-4
ISSN 1229-9197 (print version)
ISSN 1875-0052 (electronic version)
Electrospun Polyamide-6 Nanofiber Hybrid Membranes for Wastewater Treatment
1,2 1 1,2 , Baturalp Yalcinkaya , and Jakub Hruza
1Department of Nanotechnology and Informatics, Institute of Nanomaterials, Advanced Technologies and
Innovation, Technical University of Liberec, Studentska 1402/2, Liberec 46117, Czech Republic 2Institute for New Technologies and Applied Informatics, Faculty of Mechatronics, Technical University of
Liberec,
Studentska 1402/2, Liberec 46117, Czech Republic
(Received September 5, 2018; Revised September 25, 2018; Accepted October 10,
2018)
Abstract: Electrospun nanofiber hybrid membranes have superior membrane performance due to their high specific
surface area, narrow pore size, high porosity, and uniform pore size. Recently, increasing attention has been given to hydrophilic membranes such as polyamide 6 (PA6) in applications microfiltration and reverse osmosis. Electrospun
PA6 nanofiber hybrid membranes have not found any real application due to their poor mechanical strength under high pressure. In this study, PA6 nanofiber layer was prepared using wire electrospinning method. Three supporting material with different adhesion method has been used to improve the mechanical properties of the membranes. Membranes
were characterized with Scanning Electron Microscope images, pore size, and contact angle measurements. Tensile strength and the delamination tests were run to measure the mechanical properties of the membranes. Three types of wastewater were carried out during filtration; using real wastewater supplied from a company which consists of pitch
and tar oils, engine oil/water mixture and kitchen oil/water mixture. Results indicated that the adhesion method and the supporting layer played a big role in the permeability of the membranes. The PA6 nanofiber hybrid membranes exhibited high water fluxes in even at low pressures which indicate that electrospun nanofiber membranes might be highly promising for microfiltration applications.
Keywords: Wastewater, Nanofiber, Membrane selectivity, Microfilter, Polyamide
Introduction
Membrane technology as an easy, efficient, versatile,
chemical-free and low-cost method has been extensively
used in many separation processes, such as water purification,
desalination, distillation, and oily wastewater treatment.
Despite these advantages of the membranes, the widespread
application of the membranes for oily wastewater remains
limited due to membrane fouling. The surfactant adsorption
and/or pore sealing by oil droplets cause a severe decline of
the flux and rejection rate. Several attempts have been done
to improve the flux and rejection rate of the membranes. For
instance, the mixing of inorganic nanoparticles has been
found to be helpful for membrane permeability and fouling
resistance by increasing the hydrophilicity or changing the
pore structure of the membranes [1-6]. Genne et al. found
that membrane permeability increased for growing amounts
of inorganic zirconium oxide (ZrO2) grains added to the
casting solution which resulted in the formation of a highly
porous surface layer [7]. Yan et al. prepared organic-
inorganic composite membranes that were formed by nano-
sized alumina particles in the poly(vinylidene fluoride)
solution. The additional nano-sized Al2O3 particles improved
the surface hydrophilicity of the membrane which increased
the flux and antifouling performance of the membrane [2].
Ebert et al. investigated the influence of titanium dioxide
(TiO2) in poly (vinylidene fluoride) (PVDF) and polyamide-
*Corresponding author: [email protected]
imide (PAI) membranes. The membranes with the TiO2 support showed significantly better permeate quality even at
high-temperature range [5].
The demand for high performance and the efficient
membrane has led to increasing attention in advanced
functional nanofiber materials. Electrospun nanofiber hybrid
membranes have superior membrane performance due to
their high specific surface area, narrow pore size, high
porosity, and uniform pore size while maintaining a very
good permeation flux. These advantages can directly contribute
to both high permeation flux and solute rejection ratio for
microfiltration (MF) applications [8,9]. Moreover, the
production cost of nanofiber hybrid membranes is estimated
almost half compared to commercial membranes [10].
In this study, we demonstrate a novel microfiltration
polyamide 6 (PA6) nanofibrous hybrid membrane, having an
average fiber diameter of about 90 nm, laminated on various
support with the various adhesive method. The aim of the
lamination process is to enhance the mechanical strength of
the membranes which can withstand external forces during
liquid separation. The vast majority of all reported nanofibrous
membrane research involves permeability and the selectivity
of the membranes while there is not enough research has
been done to improve the mechanical strength of the
membranes. In our previous work, we focus on to improve
the mechanical strength of the poly(vinylidene fluoride) and
polyacrylonitrile nanofiber web [11]. Herein, PA6 nanofibers
are used for liquid separation. The PA6 polymer has excellent
mechanical properties including high tensile strength, high

87
94 Fibers and Polymers 2019, Vol.20, No.1 Fatma Yalcinkaya et al.
2
2
2
2
flexibility, low creep, good resilience, and high impact
strength (toughness). Moreover, it is very simple to produce
PA6 nanofibers using electrospinning system. Although
significant scientific activity has occurred with regards the
use of polyamides as nanofibrous membranes, there is no
previous work dealing with the improvement of mechanical
strength of the PA6 nanofibrous hybrid membranes. The
primary objective of this study is to prepare highly permeable
and mechanically strong PA6 nanofibrous hybrid membrane
prepared for the various wastewater treatments. For this aim,
three types of feed solution were carried out for wastewater
filtration; using real wastewater supplied from a company
which consists of pitch and tar oils, engine oil/water mixture,
and kitchen oil/water mixture and membrane performance
has been evaluated.
Experimental
Preparation of Electrospun Membrane 12 % wt. of PA6 (BASF-Ultramid B24, Germany) solution
were prepared by dissolving the polymer pellets in acetic
acid/formic acid (2/1 % wt.) solvent mixture over the night.
Figure 2. Schematic diagram of the lamination process.
place between the two electrodes, the polymeric nanofiber
web is collected on baking paper. No solution dipping was
observed. An air conditioning unit is used to control the o
relative humidity (31 %) and temperature (22 C) of the spinning in a closed chamber. The area weight of the PA6
nanofiber was set around 2 g/m .
The prepared nanofiber layers adhered onto various
surfaces to enhance their mechanical properties. 17 g/m
polyethylene terephthalate (PET) woven web (plain weave
All the solvents were purchased from Penta s.r.o. (Prague, 2
structure), 20 g/m 2
bicomponent spunbond and 100 g/m Czech Republic). The PA6 nanofiber layers were prepared
using a lab-scale wire electrospinning system (Figure 1).
The principle of wire electrospinning system has been
introduced to literature several times [11-13]. In brief, the
solution is placed in a solution tank, which is a closed
system and connected to a solution bath. The positively
charged wire electrode (60 kV) passes along a metal orifice
in the middle of the solution bath. There is a solution bath
with a speed of 240 mm/s which is moved back and forward
to feed the surface of the wire electrode with a polymeric
solution. Behind a mobile supporting backing paper
(PET) spunbond nonwoven webs were used as supporting
material. Since it was not possible to get the same density of
supporting layer from different suppliers, different density of
supporting materials was used. Each supporting layer had a
different adhesion method. For instance, 17 g/m supporting
layer had its own adhesive on the surface while it was
purchased. The co-polyamide dot adhesive glue was used to
adhere 17 g/m woven web and PA6 nanofibers. The bi-
component spunbond material was composed of polypropylene
(inner) and polyethylene (outer) surface which showed an
adhesion role for the PA6 nanofiber layers under heat and 2
(55 mm/min), a second wire electrode, which is connected to pressure. Since 100 g/m nonwoven did not have any 2
a negatively charged voltage supplier (-40 kV). The distance adhesive on the surface, a 3 g/m co-polyamide net was used
between the electrodes is 180 mm. While the spinning takes between the nonwoven and PA6 nanofiber layer. A mini
fusing machine (Meyer, Germany) was used for the
lamination process as shown in Figure 2 [14]. For lamination,
the conditions are arranged as; speed of belt was 1.7 m/min,
the temperature was 130 o 2 C and the pressure was 15 N/cm .
The nanofiber layer was placed to the top of
the adhesive surface which was connected
to the supporting layer. Due to heat, pressure
and the contact time of lamination, the
adhesives were melted and adhered the
nanofibers to the surface of the supporting
layers. Abbreviations for the samples are
given according to the density of the
supporting material, such as PA6-17, PA6-
20, and PA6-100.
Figure 1. Schematic diagram of wire electrospinning unit.
Characterization of the Membrane The surface characterizations of the membranes were done
using a scanning electron microscope (SEM, Vega 3SB,
Brno, Czech Republic). From each sample, at least 50 fibers
were measured. The fiber diameter was analyzed and the

88
p
p
diameter distribution was evaluated. The surface contact
angle of the samples was measured using a Krüss Drop
Shape Analyzer DS4 (Krüss GmbH, Hamburg, Germany), at five different points, using distilled water (surface tension
-1 72.0 mN m ) on the clean and dry samples at room temperature. A device was built in our laboratory to determine the
maximum, average and minimum pore sizes. The bubble
point test allowed the size of the pores of the porous material
to be measured. The principle of the measurement was
explained in previous work [11].
Mechanical Properties of the Membrane The tensile strength of the membranes was measured
using the universal testing machine (Labor-Tech s.r.o., CR)
with the extension rate of 10 mm/min at room temperature.
The samples were 100 mm long, 25 mm wide, and the
distance between the two clamps was 50 mm. Both machine
direction (MD), and the other the cross direction (CD) was
measured. Another device was built in our laboratory for the
measurement of the maximum resistance of the nanofiber
layers for delaminating from the supporting layer [11]. The
samples were placed between two rings. The sample size
was 47 mm in diameter. Pressurized water was applied to the
membrane, and the hydrostatic pressure was measured using
a pressure controller. The hydrostatic pressure was increased
gradually, and as soon as the nanofiber layer delaminated,
the pressure value on the screen decreased sharply. The
maximum pressure value was recorded as the bursting
strength of the membrane. At least 3 measurements were
done for each sample.
Filtration Test Filtration test was done using a cross-flow filtration unit
which was developed in our laboratory. Three types of feed
solutions were prepared and tested during filtration. In the
first test, a wastewater was supplied from an industrial
company which has pitch and tar oil in the feed. In the
second and the third tests, engine and kitchen (sunflower)
oils in water were used as feed solutions. The amount of
engine oil and the kitchen oil in 1 liter of water was 200 ml.
The fraction of oil in feed solution was 20 % v/v. The
velocity of the feed solution was 20 l/min.
The permeability (k) of the membranes was calculated
using equation (1):
[k]= F/T (l/(m2hbar)) (1)
where F is the flux of membranes in l/(m2h) and T is the
transmembrane pressure in bar.
Results and Discussion
Characterization of the Membrane The SEM images of the membranes were taken after the
lamination process to observe any possible damages (Figure
3). Fiber diameter distribution was evaluated. The results
indicated that there was no visible damage observed on the
surface of the nanofibers. The diameter of the nanofiber web
is around 90 nm after the lamination process.
Despite no damage, it was observed that in some points
the adhesive web was over the surface of the nanofibers and
created blind points with zero pores as shown in Figure 4. It
was not possible to get rid of these blind points for a proper
lamination. From these blind points, fibers adhered to the
substrate very strongly in a mechanical way.
Surface wettability of the membranes was investigated by
using contact angle measurement. The results are shown in
Figure 5.
Figure 3. SEM images of the (a) PA6-17, (b) PA6-20, and (c) PA6-100 nanofibrous membranes.

89
characteristics of polyolefin is their
hydrophobicity.
In the case of PA6-100, a co-polyamide net was used as
2
adhesive. The density of the web was 3 g/m and with a very
Figure 4. Adhesives cover the surface of the nanofiber layer.
Figure 5. The contact angle of the various PA6 nanofibrous hybrid
membranes.
The results of contact angle showed that even though the
surface has the same polymeric nanofiber, each substrate
showed different hydrophilicity. The main reason is due to
adhesive glues. Since the adhesives covered the surface of
nanofibers place to place, the material showed the charac-
teristics of the adhesive web. For instance, the PA6-17 has
co-polyamide dot glues which were distributed to the surface
of the supporting material evenly. It seems that the co-
polyamide used in PA6-17 had the hydrophilic characteristic.
Aiba et al. found that N-methylated aromatic random co-
polyamides of the amide linkages increased the chain mobility
at the membrane surfaces and consequently enhanced the
water-induced surface reorganization [15]. Konagaya et al. prepared flat asymmetric membranes of the co-polyamides
open structure which means, the contact area of the co-
polyamide adhesive net with nanofibers are lower than that
contact area of co-polyamide dots with nanofiber. Even
though the hydrophilicity of the PA6-17 is superior compared
to other membranes due to more adhesive glue on the
nanofiber surface, we can expect that more pores of the
nanofibers were filled with adhesive glue. As a result, the
permeability of PA6-17 could be lower than other membranes.
The information for the dot co-polyamide glue and the co-
polyamide adhesive net has not been given by the supplier.
There is also a possibility that both co-polyamide had
different characteristics which would result in differences in
wettability. Compared to contact angle results, we can say
that the lamination method has a very huge effect on the
hydrophilicity of the nanofibrous membranes. The hy-
drophilicity of the membranes can be change with adhesion
method. The mean pore size, tensile strength and the delamination
strength of the membranes are given in Table 1.
The pore size of the membranes was determined by the
PA6 nanofiber layer on the top. Since the same nanofiber
layer was used, any change in the mean pore size has been
observed. On the other hand, there was a huge difference in
the mechanical properties of the membranes. The supporting
layers under the nanofiber webs were determined the
mechanical properties of the membranes. Since PA6-100 has
the highest density, the tensile strength on both MD and CD
was the highest compared to other membranes.
The PA6-100 showed the highest delamination resistance
compared to other membranes. The reason could be due to
the interaction between adhesive with nanofiber and
adhesive with supporting layer. The adhesion between the
layers was physically due to the van der Waals forces. The
surface tension of each material plays a key role for
intermolecular forces which determine the attraction of the
materials. The strength of adhesion between the layers
depends not only on the intermolecular interactions at the
interface but also on the mechanical response of each
material. There have been several proposed theory to explain
the mechanism of the adhesion such as adhesion based on
the surface properties (adsorption and wetting) [18], on
Table 1. Mechanical properties of the PA6 nanofibrous membranes
Mean pore Tensile strength (25 mm/N) Max. Sample delamination
which were hydrophilic characteristics [16]. In another size (µm) MD CD strength (kPa)
work, the hydrophilicity of the polyolefin membranes was
improved by preparing polyolefin-polyamide mixture [17].
The membrane PA6-20 showed the highest hydrophobicity
due to polyolefin adhesive. One of the most known
PA6-17 0.755±0.09 20.34±10.56 16.34±4.12 55±5.73
PA6-20 0.753±0.14 36.35±1.71 37.88±2.33 47±17.90
PA6-100 0.710±0.08 91.99±12.50 81.40±5.00 84±8.65

90
chemical interactions [19], on fracture mechanics, on
diffusion [20] or on electrostatic interaction [21,22]. The
adsorption theory has the widest applicability while the other
theories may be appropriate in certain circumstances. In
literature, it is proposed that one of the most important
factors influencing adhesive strength is the ability of the
adhesive to spread spontaneously on the substrate when the
joint is initially formed [23]. Herein, the adhesion strength
between the PA6-100 layers had the highest value.
Filtration Tests In the first test, a wastewater from the industrial company
has been used. The exact source of the water was not given
by the company. The feed solution included pitch and tar oil.
The permeability of the PA6 nanofibrous hybrid membranes
has been evaluated and shown in Figure 6.
The permeability measurement was done during 15 hours.
Obviously, the permeate flux rate is initially high and falls
off rapidly with a time of filtration and flux attenuation
becomes more and more rapid in time. There are some
reasons for the decrease in permeability. The first reason is
that membrane fouling. Membrane fouling is to increase the
resistance to the flow of liquid through the membrane due to
blocking the pores and deposition of a cake layer on the
surface. The second reason is concentration polymerization.
Moreover, the hydrophilicity of the membrane decreased
over time during filtration due to membrane fouling and
concentration polarization. After 6 hours of filtration, steady-
state permeability has been observed for all the membranes.
The main reason is that the cake layer reached the
equilibrium thickness.
After 15 h of filtration test, the PA6-100 membrane
showed much higher permeability than compared to others 2
(over 400 l/m hbar). There could be a few reasons. In general, hydrophilic membranes could improve the membrane
Figure 6. Wastewater separation: Permeability of PA6 nanofibrous
membranes after wastewater treatment.
permeability. However, in some cases, hydrophilicity plays a
disadvantage for membrane permeability. The microvoids
could be generated as defects in the hydrophilic membranes,
which may cause negative effects on membrane permeability
and even causes the collapse of membranes under trans-
membrane pressure [24]. Even though the PA617 had the
highest hydrophilicity, the membrane performance was
lower compared to PA6-100. Another reason could be the
adhesive material filling the pores of the nanofibers. Since
PA6-100 has less contact with adhesive web compared to
PA6-17, the porosity is higher. Higher porosity results in
higher permeability. Moreover, co-polyamide adhesive net
was used for adhesion of PA6-100 while hydrophobic
polyolefin surface was used for PA6-20. Since there was no
way to get rid of adhesives from the top of the nanofiber
layer, the hydrophobic structure of PA6-20 decreased the
permeability and increased the membrane fouling. It was
observed in the literature that hydrophobic membranes tend
to foul easily due to the hydrophobic interaction between
solutes, the membrane surface and pores [25,26]. The feed and the permeate solutions are given in Figure 7.
In the second step of the filtration test, the PA6-100
membrane was selected as an optimum membrane for engine
oil/water separation due to high membrane permeability and
mechanical strength. The results of permeability are given in
Figure 8. Because of the high porosity of the PA6-100
nanofibrous membrane, the membrane exhibited outstanding performance including high permeability (around 524 l/
2 (m hbar)) and selectivity.
It was found that the engine oil separation test results were
showing the same permeability decline as in the case of
wastewater treatment. The membrane fouling is the main
reason. PA6 is highly polar and has an affinity to water
molecules which selectively allows the water molecules to
pass through the membrane while restricting the passing for
oil molecules. Apparently, PA6-100 is a hydrophilic/oleophobic
membrane. The wetting behavior of the PA6-100 membrane
Figure 7. Feed and permeate solution for the PA6-100 nanofibrous
membrane for wastewater separation.

91
Figure 8. Engine oil/water separation: permeability of the PA6-
100 nanofibrous membrane.
Figure 9. Feed and permeate solution for the PA6-100 nanofibrous
membrane for engine oil/water separation.
allowed only water molecules to penetrate through the
membrane and rejected oil molecules. The wetting behavior
may be due to the small water molecules can penetration the
polymer coating immediately while the large oil molecules
cannot penetrate or penetrate much more slowly. There is
another mechanism to explain the wetting behavior of the
membranes. This mechanism proposed that the polymer
coatings may take different conformations on top of the
surface when faced with water and oil: more hydrophilic
segments will be attracted with water, resulting in a
hydrophilic property.
The feed and the permeate solutions are given in Figure 9.
In the third filtration test, kitchen oil/water mixture was
used as feed solution. The water was colored to green with
food colorant to better determination of selectivity. The
permeability result of PA6-100 membrane is given in Figure
10.
The Figure 10 shows that unlike the wastewater or engine
oil/water treatment, the permeability results of kitchen oil/
water separation is quite low. The reasons could be the size
of different oils or the organic compounds of different oils.
Oil droplets blocked the membrane surface by pore sealing.
Moreover, the colorant effect should be considered. It is well
known that PA membranes have an affinity for colorants.
The food colorant could block the PA6 membrane pores and
Figure 10. Kitchen oil/water separation: permeability of the PA6-
100 nanofibrous membrane.
Figure 11. Feed and permeate solution for the PA6-100 nanofibrous
membrane for kitchen oil/water separation.
cause to fouling. The feed and the permeate solutions are
given in Figure 11.
Oil droplets were clearly visible in the feed, whereas no
droplets were observed in the permeate solution. Even
though selectivity of the PA6-100 nanofibrous membrane for
kitchen oil/water separation was very good, the permeability
result was not sufficient. The results showed us that for oil
separation; only selected oils can be successfully separated
using a PA6 nanofibrous membrane. All the membranes
suffered from the fouling. A post surface treatment is
necessary to improve resistant to fouling.
Conclusion
In this work, a novel PA6 nanofiber hybrid membrane
been successfully prepared for liquid filtration. To improve
the mechanical strength of the nanofiber layers, various
supporting layers with different adhesion method has been
applied. The tensile strength and the delamination tests

92
showed that only PA6-100 membrane has the best perfor-
mance. The permeability performance of PA6-100 membrane
was superior in the separation of wastewater from industry
and the oil from the engine oil/water mixture. The
performance of PA6-100 membrane was extremely low for
the separation of kitchen oil/water mixture. The PA6-100
nanofiber hybrid membrane seems promising for the
wastewater treatment and only selected oily water separation.
But prior to industrial operation, it seemed necessary to
adjust an antifouling property of the membrane. In summary,
this work could assist in obtaining a better understanding of
the nanofiber hybrid membranes for liquid separation.
Acknowledgments
This work was supported by the Ministry of Education,
Youth and Sports of the Czech Republic and the European
Union - European Structural and Investment Funds in the
frames of Operational Programme Research, Development
and Education - project Hybrid Materials for Hierarchical
Structures (HyHi, Reg. No. CZ.02.1.01/0.0/0.0/16_019/
0000843).
References
1. W. C. Chong, E. Mahmoudi, Y. T. Chung, M. M.
BaAbbad, C. H. Koo, and A. W. Mohammad, Desalin.
Water Treat., 96, 12 (2017).
2. L. Yan, Y. S. Li, and C. B. Xiang, Polymer (Guildf), 46,
7701 (2005).
3. A. Bottino, G. Capannelli, V. D’Asti, and P. Piaggio, Sep.
Purif. Technol., 22-23, 269 (2001).
4. W. Chen, Y. Su, L. Zhang, Q. Shi, J. Peng, and Z. J. Jiang,
Memb. Sci., 348, 75 (2010).
5. K. Ebert, D. Fritsch, J. Koll, and C. J. Tjahjawiguna,
Memb. Sci., 233, 71 (2004).
6. G. Arthanareeswaran, T. Sriyamunadevi, and M. Raajenthiren,
Sep. Purif. Technol., 64, 38 (2008).
7. Genné, S. Kuypers, and R. Leysen, J. Membr. Sci., 113,
343 (1996).
8. Y. Ko, Y. Choi, Y. Jang, J. Choi, and S. Lee, Desalin. Water
Treat., 97, 87 (2017).
9. M. J. A. Shirazi, S. Bazgir, M. M. A. Shirazi, and S.
Ramakrishna, Desalin. Water Treat., 51, 5974 (2013).
10. D. Bjorge, N. Daels, S. De Vrieze, P. Dejans, T. Van Camp,
W. Audenaert, J. Hogie, P. Westbroek, K. De Clerck, and
S. W. H. Van Hulle, Desalination, 249, 942 (2009).
11. F. Yalcinkaya and J. Hruza, J. Nanomaterials, 8, 272
(2018).
12. B. Yalcinkaya, F. Yalcinkaya, and J. Chaloupek, J.
Nanomater., Article No. 2694373, 2016 (2016).
13. F. Yalcinkaya, Arab. J. Chem., doi:10.1016/j.arabjc.2016.12.
012 (2016).
14. B. Yalcinkaya, F. Yalcinkaya, and J. Chaloupek, Desalin.
Water Treat., 59, 19 (2017).
15. M. Aiba, K. Ito, T. Tokuyama, H. Tomioka, T. Higashihara,
M. Ueda, and H. Matsumoto, Macromol. Chem. Phys.,
219, 1 (2018).
16. S. Konagaya and M. Tokai, J. Appl. Polym. Sci., 76, 913
(2000).
17. J. Meier-Haack, M. Valko, K. Lunkwitz, and M. Bleha,
Desalination, 163, 215 (2004).
18. S. Wu, J. Adhes., 5, 39 (1973).
19. A. Ahagon and A. N. Gent, J. Polym. Sci. Polym. Phys.
Ed., 7, 1285 (1975).
20. E. Helfand and Y. J. Tagami, Chem. Phys., 56, 3592
(1971).
21. B. V. Derjaguin, N. A. Krotova, V. V. Karassev, Y. M.
Kirillova, and I. N. Aleinikova, Prog. Surf. Sci., 45, 95
(1994).
22. H. W. Kammer, Acta Polym., 34, 112 (1983).
23. A. Kinloch, “Adhesion and Adhesives: Science and
Technology”, p.18, Springer Netherlands: Dordrecht,
1987.
24. Y. Zhu, D. Wang, L. Jiang, and J. Jin, NPG Asia Mater.,
Article No. e101, 6 (2014).
25. K.-H. Choo and C.-H. Lee, J. Colloid Interface Sci., 226,
367 (2000).
26. F. Y. Guo, P. C. Sun, and J. F. Wei, Environ. Technol.
(United Kingdom), 39, 3159 (2018).

93
56704 | RSC Adv., 2017, 7, 56704–56712 This journal is © The Royal Society of Chemistry 2017
PA PER
RSC Advances
Cite this: RSC Adv., 2017, 7, 56704
Received 29th October 2017
Accepted 8th December
2017
DOI: 10.1039/c7ra11904f
rsc.li/rsc-advances
Surface modification of electrospun nanofibrous membranes for oily wastewater separation
Fatma Yalcinkaya, *a Anna Siekierkab and Marek Bryjakb
This paper presents a method for producing nanofibrous composite membranes for the
separation of a vegetable oil–water mixture. Neat polyvinylidene fluoride (PVDF),
polyacrylonitrile (PAN) nanofibres and PVDF/PAN mixtures were used to prepare the
membranes. Argon plasma treatment, followed by a chemical surface modification, was
applied to alter the hydrophilicity and oleophobicity of the membranes. The obtained results
showed that the membranes change their surface character (hydrophilicity and oleophilicity)
in relation to the mixing ratio of the PVDF/PAN nanofibres and the surface modification
parameters. These results can extend the application of PVDF, PAN and PVDF/PAN
nanofibrous membranes to the treatment of oily water.
1. Introduction
Oil–water emulsions emitted into the soil or water from
domestic and industrial wastewater are one of the most severe
issues that threaten human life and ecological systems, with
a significant amount of oily wastewater generated every day.
Thus, there is a growing demand to produce an oil–water
separation system that has high selectivity, high efficiency,
low fouling properties and is easy to apply and manage.
Microfiltration membranes are applied for oil–water sepa-
ration treatment, along with other methods, such as bioreme-
diation and chemical methods.1–3 The production of
high- performance membranes with anti-fouling
properties still remains challenging. Surface absorption,
surface grafting and blending are some of the methods used
for the surface modi-
fication of membranes4–10 to improve their anti-fouling prop-
erties. A hydrophilic membrane surface helps to reduce bio-
fouling and protein adhesion in microfiltration. Blending
materials is considered the simplest and most inexpensive
approach for surface modification. Recently, the plasma
modification method has attracted interest due to its extremely
short modification time and non-destructive action. However,
the modification is usually not permanent on most polymer
surfaces, often disappearing within hours or days of treat-
ment.11–13 To counteract this phenomenon, a post-
treatment method should be applied to provide a
permanent surface modification.
Polyvinylidene fluoride (PVDF) is one of the most
frequently used polymers in membrane technology due to its
outstanding chemical, thermal and oxidation resistance
properties,14–16 while polyacrylonitrile (PAN) is a
common polymer that is characterised by its thermal
stability, toler- ance to most solvents, strong
antioxidant capacity and commercial availability.17,18
PVDF has better mechanical properties than PAN.19 PAN is
a hydrophilic polymer, whereas PVDF is a hydrophobic
polymer. The versatility of both polymers thus makes
them suitable for manufacturing membranes for
liquid/liquid and liquid/solid separations.
The objective of this paper is to evaluate the properties of
modified nanofibrous composite membranes obtained from
PVDF, PAN and PVDF/PAN mixtures. Mixing the polymers
should increase the hydrophilicity of the nanofibre web while
also increasing the strength of the web by binding its fibres
together. However, the main disadvantage regarding the use of
nanofibres in filtration is their lack of mechanical integrity.
Two of the novelties of this paper are that the nanofibre layers
were produced with the Nanospider industrial equipment,20
and that the layers strongly adhered to a nonwoven supporting
layer without any damage, using hot-press lamination tech-
nology to improve their performance in liquid filtration
applications. The microwave plasma technique, followed by
a chemical post-treatment, was used to hydrophilise the
membrane surfaces. While similar papers dealing with the
plasma modification of polymer membranes have been pub-
lished,21–26 none have considered the use of a nanofibre
web surface modification with both plasma and chemical
treat- ments for liquid/liquid and liquid/solid
separations. This
study may thus provide a better understanding of the effects of
aTechnical University of Liberec, Institute for Nanomaterials, Advanced
Technology and Innovation, Studentska 1402/2, 46117 Liberec, Czech
Republic. E-mail: [email protected]
bWroclaw University of Science and Technology, Faculty of Chemistry, 27
Wybrzeze Stanislawa, Wyspianskiego, 50-370 Wroclaw, Poland
surface modifications on the permeability and liquid selec-
tivity of the membranes as a function of chemical modifica-
tion time.

94
RSC Advances Paper
1. Materials and methods
PAN (Elmarco s.r.o., Czech Republic) was dissolved in dime-
thylformamide (DMF) to produce an 8% wt. PAN solution, and
PVDF (Solef 1015, Belgium) was dissolved in dimethylacetamide
(DMAc) to produce a 13% wt. PVDF solution. The DMF and
DMAc solvents were purchased from Penta s.r.o., Czech
Republic. The solutions were stirred overnight. Five different
samples were prepared, defined by their PVDF/PAN nanofibre
blend ratios (Table 1). A Nanospider electrospinning device
(Elmarco s.r.o., Czech Republic) was used to produce the
nanofibres under controlled and stable processing conditions,
following previous studies (Fig. 1).27 A solution carriage
feeds the polymer solution on a 0.2 mm moving stainless
steel wire. The speed of the carriage is 245 mm s 1. High voltage
suppliers are connected to the wire electrode (60 kV) and
the collector electrode ( 15 kV). When the applied voltage
exceeds a critical value, the polymer solution jets move
towards the collector, the solvent evaporates, and the
nanofibre web is collected on baking paper moving in front
of the collector electrode. The speed of the movement of the
baking paper is 10 cm min 1. The distance between the
electrodes is 18 cm. The temperature and humidity of input
air are set to 23 C and 20% by the air- conditioning
system. The intake and outlet airflows are 100 and 115 m3
h 1, respectively.
The zero-shear viscosity of the polymer solutions was
measured using a Fungilab Expert viscometer at 23 C.
Pressure-driven liquid filtration applications require that the
membranes possess sufficient mechanical strength to with-
stand the operational conditions. The nanofibres were thus
Fig. 1 Schematic illustration of the electrospinning device, with
key components labelled. (A) Solution tank (feeds the solution
towards the wire); (B) wire electrode; (C) spinning area; (D)
collecting electrode, connected to a silicon paper as supporting
material; (E) high voltage supply; (F) air intake; and (G) air
outlet.
was used to modify the surface for 5 min. The scheme of the
plasma reactor is shown in Fig. 2. After the plasma treatment,
the samples were exposed to the atmosphere for 20 min and
then immersed in 1 M sodium hydroxide (NaOH) aqueous
solution. The times of sample immersion were 0, 2, 4, 6 and
24 h. The samples were then rinsed and kept in distilled water.
A Millipore Amicon 50 mL stirred filtration cell (Millipore
Corporation Billerica, Massachusetts, USA), with an active
filtration area of 13.4 cm2, was used to evaluate membrane
laminated onto a nonwoven spunbond supporting material to
improve the mechanical strength of the membranes. The
surface of the membranes was characterised by Scanning
Electron Microscope (SEM, Vega 3SB) and the fibre diameters were
analysed using the Image-J image processing software. The surface
contact angle of the samples was measured at room temperature
using a Kruss Drop Shape Analyzer DS4 with distilled water on
the clean and dry samples. The PVDF/PAN mixture of polymeric
nanofibres was evaluated using Fourier transform infrared
spectroscopy (FTIR, Nicolet iZ10 by Thermo Scientific). A 1200-AEL
capillary flow porometer (Porous Media Inc., Ithaca, NY) was used in this
study to measure the pore size of the samples.
The prepared nanofibrous composite membranes were cut
into 5 cm 5 cm squares and subjected to the standard plasma
treatment.10 Microwave-induced low vacuum argon (Ar) plasma
Fig. 2 Remote microwave plasma device, with key components
labelled. (A) Low vacuum microwave plasma head; (B) reaction
chamber; (C) MW generator; (D) Ar gas flowmeter; and (E) Ar gas
tank.
Table 1 Key physical parameters of the PVDF/FAN samples analysed in this study
S2 0/1 190.9 1.29 0.5 710 344
S3 2/1 718.0 1.99 0.5 790 516
S4 1/1 499.3 4.35 0.5 910 245
S5 1/2 348.5 0.72 0.5 820 324
Sample code PVDF/PAN wt ratio Viscosity (mPa) Area weight (g m 2) Pore size (nm)
S1 1/0 969.3 3.52 0.5 2030 562

95
56706 | RSC Adv., 2017, 7, 56704–56712 This journal is © The Royal Society of Chemistry 2017
S
P
Fig. 3 Schematic diagram of dead-end filtration.
performance (Fig. 3). The feed solution was prepared by mixing
blue-coloured distilled water with vegetable (kitchen) oil in
a 1 : 1 volume ratio. Water was coloured using methylene blue
to properly observe the separation process. The feed solution
was mixed with a hand mixer for a few minutes until a uniform
mixture was obtained. The tested dry membrane was placed in
the filtration cell, which was then filled with 20 mL of filtrated
distilled water. The separation conditions were created under
0.02 bar pressure. A 50 mL oil–water mixture was used for each
test. The oil–water mixture did not separate into two phases
during filtration. A magnetic stirrer was used to mix the feed
solution during filtration. After the separation test, the
permeate solution was collected in a glass graduated cylinder
tube and sealed tightly to avoid evaporation. The permeate was
kept for 24 h to separate into two phases and then determine
the resultant water and oil percentages in volume ratio. The oil
and water contents were calculated according to eqn (1):
Fig. 4 SEM images of the unmodified samples after lamination.
V CS =
V 100%; (1)
where CS is the content of selected liquid (oil or water), VS is
the volume of selected liquid and VP is the total volume of
the permeate.
The permeate flux (F) and permeability (k) of the membrane
were calculated according to eqn (2) and (3), respectively:
dV
It should be noted that the PVDF nanofibres possess a fibre
diameter that is 2.5 times larger than that of the PAN nano-
fibres. Mixing the PVDF polymer with PAN yields a fibre diam-
eter that is 1.6 times smaller than that of the neat PVDF
sample nanofibres. It was observed that the neat PAN nano-
fibres have a beaded structure, which could be due to the low
viscosity of the PAN solution (Table 1). Bead-free nanofibres
were obtained after mixing PAN with PVDF. There were no
F = A
k =
; (2) dt
F
; (3) p
visible changes in the observed fibre diameter after lamination.
Water contact angle measurements are one of the simplest
and easiest methods for determining the hydrophilic or
hydrophobic nature of chemical groups attached to the surface
where A is the effective membrane area (m2), V is the
total volume of F, p is transmembrane pressure (bar) and t
is the
filtration time.
1. Results and discussion 1.1. Surface analysis and characterisation of the
unmodified membranes
The SEM images in Fig. 4 show that there is no damage to the
fibres on the top surface of the substrate, which suggests that
the lamination was done successfully.
of the layers. Based on the water contact angle observations
(Fig. 5), it was evident that the addition of PAN increased the
hydrophilicity of the resultant PVDF/PAN membranes. The
results showed that a neat PAN (S2) web, with a contact angle of
less than 90 , could be considered as a hydrophilic material.28
Sample S5 had a contact angle close to 90 , while samples S1, S3
and S4 each had angles larger than 90 and exhibited hydro-
phobic characteristics. The contact angles changed after surface
modification. The plasma and chemical modifications resulted
in fully wettable surfaces with a contact angle of 0 . Only two
modified images are shown in Fig. 5. Tran et al.29 found
that using non-polymer-forming plasma gas treatments, such
as Ar,

96
Fig. 5 Water contact angles of unmodified and modified
nanofibrous membranes.
He and O2 plasma treatments, increase the membrane surface
hydrophilicity and membrane permeability. Similarly, super-
hydrophilic PVDF electrospun membranes have been obtained
by oxygen plasma treatment. Moreover, the plasma treatment
did not significantly influence the average size and morphology
of the nanofibres.30 Another study showed that both the surface
modifications of PVDF and the surface wettability improved
under plasma exposure.31 The most significant result is the
hydrophilic modification of the PVDF membrane.
The FTIR spectra were collected to investigate the chemical
structure of the PVDF/PAN nanofibrous webs, shown in Fig. 6.
The spectra confirmed the presence of both polymers in the
blends, the absorption bands at 2240 cm 1 and 1664 cm 1 for
the PAN nitrile groups and the stretching bands at 1173 cm 1
Fig. 6 FTIR spectra of the five PVDF/PAN samples.
chemical operation with NaOH were used to modify the
membrane surfaces. The Ar plasma treatment should crosslink
the polymers on the surface fibres and introduce polar groups
there, while the chemical operation with NaOH should turn the
nitrile groups into more polar carboxylic functionalities. The
exploitation of both methods of surface modification should
provide more stable and highly hydrophilic properties for the
long-lasting service of the membranes.
FTIR spectra were used to verify the effect of the plasma and
chemical modifications on the composite membrane surfaces
of S1, S2 and S4 (Fig. 8–10). Fig. 8–10 show that the modification
caused a marked change in the surface functionality for the
PVDF membranes, while only slight changes were observed for
the PAN and PVDF/PAN (1/1) membranes. Tables 2 and 3
describe the key absorbance peaks of the evaluated membranes
in greater detail.
Compared to unmodified PAN membranes, the peak at
1737 cm 1 shifted to 1733 cm 1 after surface modification
(Fig. 8). A sharp increase in the peak at 1733 cm 1 was observed
after the plasma treatment and NaOH surface modification,
likely due to the presence of an extra carboxylic group on the
modified surface.
Significant differences were observed after surface modifi-
cation of the PVDF membranes (Fig. 9). The very broad and less
intense peak between 2500 and 3500 cm 1 was due to O–H
functionalities that improve the hydrophilicity of the
membranes. The change in peak shape was due to of the extent
of hydrogen bond stretching among the alcohol or carboxylic
acid groups. These peaks change significantly with the surface
and 876 cm 1 for the –CF2 and C–F groups of PVDF, respec-
tively. The characteristic peaks for PVDF and PAN were modified
according to the composition of the PVDF/PAN mixture.
1.1. Characterisation of the modified membranes
The mechanism of plasma deposition and chemical surface
modification is shown in Fig. 7. Ar plasma treatment and
Fig. 7 Schematic diagram of membrane surface modification
using a plasma and NaOH solution.

97
Fig. 8 FTIR spectra of PAN membranes before and after
surface treatment (only Ar plasma, Ar plasma + 2 h NaOH, Ar
plasma + 24 h NaOH).
modification and length of NaOH treatment. The peak at
2928 cm 1 indicated the C–H stretching frequency due to the
parent hydrocarbon chain of the compound.
There were no significant changes in the PVDF/PAN 1/1
mixture after surface modification (Fig. 10). The FTIR results
indicate that the surface of the PVDF membrane was success-
fully modified, following the modification mechanism shown in
Fig. 7. Given the presence of carboxylic groups on the
membrane surface, one can expect the highly permeable and
anti-fouling reaction of such materials.
1.1. Oil–water separation
Surface treatment allows for the creation of specific surface
chemistries that increase membrane permeability and reduce
membrane fouling. However, separation of the oil–water
mixture is always difficult, so several microfilters are used for
this purpose.
The filtration results for the unmodified membranes, as well
as the membranes modified by the Ar plasma and NaOH
treatments, are shown in Fig. 11. The permeability of the
membranes was compared before and after surface modifica-
tion. The time “0” refers to the membranes without any treat-
ment. The distilled water permeability values increased
tremendously for the modified membranes.
The permeability of all of the composite membranes
depends on both the surface modification and modification
time. It was found that the immersion of the samples in NaOH
for 6 h resulted in the highest permeability result for each
membrane type (Fig. 11). The highest permeability was achieved
for the S5 sample, which was 20 times higher than the perme-
ability of the untreated S5 sample.
It was observed that the permeabilities of S2, S4 and S5
decreased after increasing the NaOH immersion to 24 h
(Fig. 11). A commercially available ultrafiltration membrane of
PAN was pre-treated in NaOH solution.47 The NaOH-
induced hydrolysis of nitrile groups on the membrane
surface led to a decrease in both the pore diameter and
permeability of the membrane. The average pore diameter
underwent a 4.3-fold decrease during the hydrolysis. The
results showed that modi-
fication of the membrane surface by anchoring carboxylic
groups made the surface less prone to protein deposition. The
hydrolysis of PAN and PAN/PVDF membranes resulted in the
Fig. 9 FTIR spectra of PVDF membranes before and after surface treatment (only Ar plasma, Ar plasma + 2 h NaOH,
Ar plasma + 24 h NaOH).

98
Fig. 10 FTIR spectra of PVDF/PAN (1/1) membranes before and after surface treatment (only Ar plasma, Ar plasma +
2 h NaOH, Ar plasma + 24 h NaOH).
swelling of the PAN polymers and a decrease in pore diameter.
The pore sizes of the membranes were not measured after
surface modification. The swollen pores apparently reduced the
permeability of the membranes. A 6 h NaOH treatment seems
optimum for all membranes.
An example filtration procedure for an oil–water mixture
through the prepared membranes is shown in Fig. 12, with the
results of the separation included in Table 4.
The results in Table 4 show that the modification of the
nanofibrous membranes had a great effect on the selectivity of
the membranes. The membranes in the first row, with a zero
immersion time, had no surface treatment. Opposite to
unmodified PAN, the unmodified PVDF shows hydrophobic/
oleophilic properties. Similar results were recorded in the
literature, where the neat PVDF membranes showed
hydrophobic/oleophilic characteristics either in surfactant-free
Table 2 FTIR spectroscopy absorption bands for modified
and unmodified PAN
Wavelength (cm 1) Explanation
water-in-oil emulsion or a surfactant-stabilised water-in-oil
emulsion.48–50 The hydrophilicity and oleophilicity of the
unmodified membranes change based on the ratio of PVDF/
PAN. In the sample of PAN composite membranes, the
hydrophilic/oleophobic characteristics of the PAN did not
change after surface modification. However, the water perme-
ability of the PAN composite membranes underwent a 4-fold
improvement after 6 h of immersion in the NaOH solution. It
was observed that surface modification of neat PVDF allowed
the material to exhibit hydrophilic properties. The literature
showed that treated PVDF membranes can convert the
membrane from being highly hydrophobic to being super-
hydrophilic when wetted with water and with a high perme-
ability.51,52 When the porous hydrophobic material is
immersed in water, the water cannot penetrate the pores.
However, the reduction of the surface tension of the solution
(by the addition of salt or NaOH) made the membranes
‘permeable’ for water. The effects of both the surface
modification and the increase in pore permeability improve the
membrane hydrophilicity. Zhang et al.53 prepared a
superhydrophilic/superoleophobic PAN ultrafiltration
membrane by an alkaline-induced phase inver- sion process
by the addition of NaOH into coagulation bath. 1240, 1369, 1453,
2938
Vibration of aliphatic CH groups
(CH, CH2, CH3)32 This induced the in situ hydrolysis of –CN groups in the PAN chain to –COOH groups, which resulted in the superwetting of
1733, 1737 Stretching vibration of the C=O bond.
The presence of this C=O peak could be due
to residual DMF in the PAN fibers.32 Moreover,
additional surface treatment changes the
intensity of the peak due to the carboxylic
group on the surface
2240, 2242 Stretching vibration of the nitrile groups
(CN) in acrylonitrile structure33
the PAN membranes. The membrane showed ultralow oil
adhesion, thus endowing the membrane with superior oil–
water separation properties and a high water permeability.
The mixture of polymers showed that it was possible to
control the oil or water uptake by altering the time of modifi-
cation. In general, it is possible to conclude that the surface
modification of the membranes improves their hydrophilicity

99
Table 3 FTIR spectroscopy absorption bands for modified
and unmodified PVDF
Wavelength (cm 1) Explanation
725 Methylene swing in-plane vibration
due to C–C rocking vibrations in –(CH2)n.
The absorbance is originating from
exposure of the polymer + plasma bond
to air for 20 min34,35
841 C–F stretching vibration of PVDF36
881 C–C–C asymmetrical stretching vibration
of PVDF36
1175 Band for –CF2 symmetrical stretching and
a phase of PVDF37–39
1242 Enhanced carbonyl absorption peak –C–O–
stretching band40,41
1401 –C–F– stretching39
1546 Carboxylate peak asymmetric –O–C–O–42
1638–1718 Carbonyl (C=O) stretching vibrations.
Primarily centred around 1710–1720 cm 1
(ref. 43)
2853 Symmetric stretching of CH2
2925 Asymmetric stretching of C–H44
3020 Asymmetric starching vibration of the
CH2 groups45
2500–3300 O–H stretching absorption46
while decreasing their oleophilicity. PVDF nanofibres had
a better mechanical and abrasion resistance compared to the
PAN nanofibres. Surface-modified PVDF nanofibres seem to be
suitable for the separation of water from water–oil mixtures.
Moreover, it was found that a mixture of PVDF with PAN can be
hydrophilic/oleophobic and gain a higher permeability
compared to neat PVDF and neat PAN membranes.
The study presents the first industrial nanofibre production
method to fabricate nanofibres for the separation of oily
wastewater. Moreover, easy spinnable polymers and an inex-
pensive surface modification method were used to change
surface hydrophilicity and oleophobicity. Compared to similar
Fig. 12 Permeates after oil–water filtration. Sample S1 (left) and
S2 (right) after 4 h in NaOH solution.
studies in the literature, the membranes tested here showed
very high permeability after separation.54–58
Based on the permeability and selectivity results, S5 was
selected as the best candidate for the filtration of oily waste-
water. The surface morphology of S5 was investigated by SEM
image after surface modification and separation test, as shown
in Fig. 13.
The SEM results showed that the diameter of the nanofibres
increased with increasing immersion time, while the size
distribution of the nanofibres improved. This is due to the
swelling of PAN nanofibres in the NaOH aqueous solution.
Similar results were obtained in the literature.47 Yang et
al.59 found that after immersing the PAN membranes in
NaOH, the hydraulic permeability decreased, and an
increase in the rejection of dextran was observed due to
the swelling of the hydrolysed layer. Kim et al.60 found
that the annealed PAN membrane underwent a decrease in
pore size after it was treated with 2 M NaOH or CH3ONa for
over 2 h. The reason for this is that NaOH-induced
hydrolysis of the nitrile groups on the membrane surface
results in membranes with decreasing pore diameters. The
pore diameters of the samples were not measured after
modification, because the pore size measure- ments were done
on dry membranes. Drying the wet nanofibre web would
cause cracking on the surface of the nanofibres, which
highlights that it is better to keep the membrane in a wet
condition once it has been wetted. After surface modification,
the membranes were kept in distilled water until the separation
test was run. The SEM results indicate that fibres grew and
became flattened, likely due to the decrease in pore size. After
separation, the membranes were dried in the oven without
any cleaning, and the SEM images were taken. The images
showed that after oil separation, all membrane surfaces were
contami- nated with oil (Fig. 13). The fibres are barely visible
under a cake
Table 4 The water and oil contents in the permeates
Water content (%) Oil content (%) Time in NaOH
(h)
S1
S2
S3
S4
S5
S1
S2
S3
S4
S5
0 0 100 0 50 73 100 0 100 50 27
2 10 100 26 100 81 90 0 74 0 19
4 18 100 50 100 86 82 0 50 0 14
Fig. 11 The permeability of the samples after various modification 6 74 100 100 100 100 26 0 0 0 0
times in the NaOH solution. 24 78 100 100 100 100 22 0 0 0 0

100
Fig. 13 SEM images of sample S5 after: (a) 4 h, (b) 6 h and (c)
24 h surface modification and their SEM images after the
separation test, (d) unmodified membrane after the separation
test.
layer. The permeability results of the 24 h modification were
quite low compared to the 2, 4 and 6 h separation tests. It is
visible from the SEM image that the total surface of the 24 h
modified membrane was totally covered with an oil film, which
led to a marked decrease in its permeability.
1. Conclusions
Functional PVDF, PAN and PVDF/PAN nanofibrous composite
membranes were successfully fabricated for the separation of
an oily wastewater. It was found that both the polymer
blending method and modification of the membranes can
change the surface hydrophilicity and oleophilicity. These
changes can be attributed to structural changes in the
membranes to decrease surface energy and increase in pore
permeability.
The membrane permeability can also be altered based on the
chemical treatment parameters. In the case of membranes with
modified PAN, water permeability increases dramatically.
Depending on modification parameter, a permeability of
25 000 L m 2 h bar 1 was achieved with Ar plasma exposure
followed by NaOH modification. The FTIR results confirm the
polymer mixture and surface modification. Contact angle
measurements showed that after surface treatment,
membranes become highly hydrophilic, with the water drop
immediately disappearing. SEM studies revealed no physical
damage to the polymer surface lamination.
The distilled water flux for the modified membranes
increased dramatically because of its high hydrophilicity. The
oily wastewater fouling was considerably reduced by the
membrane flux for modified membranes.
Improved strength and, in the instance of PVDF, the
improved wettability of the membranes, make them more
suitable for aqueous filtration. These prepared membranes
could thus be used for the practical microfiltration of oily
wastewater.
Conflicts of interest
There are no conflicts to declare.
Acknowledgements
This work was supported by the Ministry of Education, Youth
and Sports of the Czech Republic in the framework of the tar-
geted support of the “National Programme for Sustainability I”
(project LO1201) and the Czech Republic Operational Pro-
gramme Research and Development for Innovation (OPR & DI;
project CZ.1.05/2.1.00/19.0386). The authors would also like to
thank Mrs Jana Mullerova for her help in the FTIR
measurements.
Notes and references
1 M. A. Zahed, H. A. Aziz, M. H. Isa, L. Mohajeri and
S. Mohajeri, Bioresour. Technol., 2010, 101, 9455–9460.
2 A. Vidyasagar, K. Handore and K. M. Sureshan,
Angew. Chem., Int. Ed., 2011, 50, 8021–8024.
3 R. R. Fouad, H. A. Aljohani and K. R. Shoueir, Mar.
Pollut. Bull., 2016, 112, 46–52.
4 J. Kim and B. Van der Bruggen, Environ. Pollut., 2010,
158, 2335–2349.
5 X. Zhao, Y. Su, W. Chen, J. Peng and Z. Jiang, J. Memb.
Sci., 2012, 415–416, 824–834.
6 S. Kang, A. Asatekin, A. M. Mayes and M. Elimelech, J. Memb.
Sci., 2007, 296, 42–50.
7 X. X. Xu, C. L. Zhou, B. R. Zeng, H. P. Xia, W. G. Lan and
X. M. He, Sep. Purif. Technol., 2012, 96, 229–236.
8 S.-H. Oh, J.-W. Ma, J. M. Bae, Y. Kang, J.-P. Ahn, H.-K. Kang,
J. Chae, D. Suh, W. Song, S. Kim and M.-H. Cho, Appl.
Surf. Sci., 2017, 419, 1–8.
9 Z. Xu, K. Miyazaki and T. Hori, Appl. Surf. Sci., 2016,
370, 243–251.

101
10 I. Gancarz, M. Bryjak, J. Wolska, A. Siekierka
and W. Kujawski, Chem. Pap., 2016, 70, 350–355.
11 M. Tsuchida and Z. Osawa, Colloid Polym. Sci., 1994,
272, 770–776.
12 I. Punga and G. Borcia, J. Adv. Res. Phys., 2013, 4, 1–5.
13 J. G. A. Terlingen, H. F. C. Gerritsen, A. S. Hoff man
and J. Feijen, J. Appl. Polym. Sci., 1995, 57, 969–
982.
14 K. Y. Wang, S. W. Foo and T. S. Chung, Ind. Eng.
Chem. Res., 2009, 48, 4474–4483.
15 W. Chen, Y. Su, J. Peng, X. Zhao, Z. Jiang, Y.
Dong, Y. Zhang, Y. Liang and J. Liu, Environ. Sci.
Technol., 2011, 45, 6545– 6552.
16 A. K. Manna, M. Sen, A. R. Martin and P. Pal, Environ. Pollut., 2010, 158, 805–811.
17 M. Amirilargani, A. Sabetghadam and T. Mohammadi, Polym. Adv. Technol., 2012, 23, 398–
407.
18 B. P. Tripathi, N. C. Dubey, R. Subair, S. Choudhury,
M. Stamm, K. T. Gause, J. J. Richardson, F. Caruso
and V. Abetz, RSC Adv., 2016, 6, 4448–4457.
19 R. M. Elkhaldi, S. Guclu and I. Koyuncu, Desalin.
Water Treat., 2016, 57, 26003–26013.
20 O. Jirsak, F. Sanetrnik, D. Lukas, V. Kotek, L.
Martinova and J. Chaloupek, WO Pat.,
WO/2005/024101, 2005.
21 K. Smolinska, M. Bryjak, J. Wolska and W. Kujawski,
Mater. Chem. Phys., 2014, 148, 548–553.
22 K. Smolinska and M. Bryjak, Desalination, 2012, 300, 64–69.
23 M. Ulbricht and G. Belfort, J. Memb. Sci., 1996,
111, 193–215. 24 D. S. Wavhal and E. R. Fisher, J.
Memb. Sci., 2002, 209, 255–269.
25 M. Suzuki, A. Kishida, H. Iwata and Y. Ikada,
Macromolecules, 1986, 19, 1804–1808.
26 M. Gorjanc, M. Mozetiˇc, G. Primc, A. Vesel, K.
Spasi´c, N. Puaˇc, Z. L. Petrovi´c and M. Kert, Appl. Surf. Sci., 2017, 419, 224–234.
27 Y. Fatma, A. Siekierka, M. Bryjak and J. Maryska, IOP Conf. Ser.: Mater. Sci. Eng., 2017, 254, 102011.
28 F. Yalcinkaya, B. Yalcinkaya, J. Hruza and P.
Hrabak, Sci. Adv. Mater., 2017, 9, 747–757.
29 T. D. Tran, S. Mori and M. Suzuki, Thin Solid Films, 2007, 515, 4148–4152.
30 D. M. Correia, C. Ribeiro, V. Sencadas, G. Botelho,
S. A. C. Carabineiro, J. L. G. Ribelles and S.
Lanceros- M´endez, Prog. Org. Coatings, 2015, 85,
151–158.
31 M. D. Duca, C. L. Plosceanu and T. Pop, Polym. Degrad. Stab., 1998, 61, 65–72.
32 J. Li, S. Su, L. Zhou, V. Kundr´at, A. M. Abbot, F.
Mushtaq, D. Ouyang, D. James, D. Roberts and H.
Ye, J. Appl. Phys., 2013, 113, 24313.
33 S. N. M. Salleh, M. Z. Abdullah and A. A. Wahab, MATEC Web Conf., 2014, 13, 4014.
34 E.-G. Schlosser, Angew. Chemie, 1987, 99, 284.
35 N. Naresh Kumar, S. Yap, F. bt Samsudin, M. Khan
and R. Pattela Srinivasa, Polymers, 2016, 8, 295.
36 H. Bai, X. Wang, Y. Zhou and L. Zhang, Prog. Nat. Sci.: Mater. Int., 2012, 22, 250–257.
37 R. Li, C. Chen, J. Li, L. Xu, G. Xiao, D. Yan, B. Liu,
G. M. Veith, S. Dai, Q. H. Yang, H. M. Ning, J. H. Li,
Y. Li and Y. H. Zhao, J. Mater. Chem. A, 2014, 2,
3057.
38 D. Mandal, K. Henkel and D. Schmeisser, J. Phys.
Chem. B, 2011, 115, 10567–10569.
39 F. Yalcinkaya, B. Yalcinkaya, A. Pazourek, J.
Mullerova, M. Stuchlik and J. Maryska, Int. J. Polym.
Sci., 2016, 2016, 4671658.
40 B. Yan and B. Zhang, Analytical methods in
combinatorial chemistry, CRC Press, 2011.
41 R. Bodˆırl˘au, R. Bodˆırl˘au and C. A. Teac˘a, Rom.
J. Phys., 2008, 93–104.
42 G. E. Dunn and R. S. McDonald, Can. J. Chem.,
1969, 47, 4577–4588.
43 V. N. Rai, C. Mukherjee and B. Jain, Indian J. Pure
Appl. Math., 2017, 55, 775–785.
44 G. C. Nille, V. K. Singh and K. R. C. Reddy, J. Ayurveda Holist. Med., 2016, 4, 1–11.
45 A. Bashir, S. K. Raghuvanshi, S. Hartha, N. P.
Sharma, J. B. M. Krishna and M. A. Wahab, Prog.
Nanotechnol. Nanomater., 2013, 2, 42–46.
46 B. S. Gupta, B. P. Jelle, T. Gao and T. Gao, Int. J.
Spectrosc., 2015, 2015, 1–7.
47 M. Bryjak, H. Hodge and B. Dach, Appl. Macromol. Chem. Phys., 1998, 260, 25–29.
48 W. Zhang, Z. Shi, F. Zhang, X. Liu, J. Jin and L.
Jiang, Adv. Mater., 2013, 25, 2071–2076.
49 J. Kong and K. Li, Sep. Purif. Technol., 1999, 16, 83–93.
50 Z. Zhou and X.-F. Wu, Mater. Lett., 2015, 160, 423–427.
51 M. Obaid, H. O. Mohamed, A. S. Yasin, M. A. Yassin,
O. A. Fadali, H. Kim and N. A. M. Barakat, Water Res.,
2017, 123, 524–535.
52 W. Zhang, Y. Zhu, X. Liu, D. Wang, J. Li, L. Jiang and J. Jin, Angew. Chem., Int. Ed., 2014, 53, 856–860.
53 F. Zhang, S. Gao, Y. Zhu and J. Jin, J. Memb. Sci.,
2016, 513, 67–73.
54 C. Yang, G. Zhang, N. Xu and J. Shi, J. Memb. Sci.,
1998, 142, 235–243.
55 X. Hu, Y. Yu, J. Zhou, Y. Wang, J. Liang, X. Zhang,
Q. Chang and L. Song, J. Memb. Sci., 2015, 476,
200–204.
56 M. H. Tai, P. Gao, B. Y. L. Tan, D. D. Sun and J. O. Leckie, ACS Appl. Mater. Interfaces, 2014, 6, 9393–9401.
57 C.-T. Hsieh, J.-P. Hsu, H.-H. Hsu, W.-H. Lin and R.-S.
Juang, Surf. Coat. Technol., 2016, 286, 148–154.
58 C. Li, C. Song, P. Tao, M. Sun, Z. Pan, T. Wang and M. Shao, Sep. Purif. Technol., 2016, 168, 47–56.
59 M.-C. Yang and J.-H. Tong, J. Memb. Sci., 1997, 132, 63–71.
60 I.-C. Kim, H.-G. Yun and K.-H. Lee, J. Memb. Sci., 2002, 199, 75–84.

102
polymers
Article
Preparation of Fouling-Resistant Nanofibrous Composite Membranes for Separation of Oily Wastewater
Fatma Yalcinkaya 1,*, Anna Siekierka 2 and Marek Bryjak 2
1 Department of Nanotechnology and Informatics, Technical University of Liberec, Institute for Nanomaterials, Advanced
Technologies and Innovation, Studentska 1402/2, 46117 Liberec, Czech Republic 2 Faculty of Chemistry, Wroclaw University of Science and Technology, 27 Wybrzeze Stanislawa
Wyspianskiego, 50-370 Wroclaw, Poland; [email protected] (A.S.); [email protected] (M.B.)
* Correspondence: [email protected]; Tel.: +420-485-353-389
Received: 13 November 2017; Accepted: 4 December 2017; Published: 6 December 2017
Abstract: A facile and low-cost method has been developed for separation of oily wastewater. Polyvinylidene
fluoride/polyacrylonitrile (PVDF/PAN) nanofibers laminated on a supporting layer were tested. In order to create
highly permeable and fouling-resistant membranes, surface modifications of both fibers were conducted. The
results of oily wastewater separation showed that, after low vacuum microwave plasma treatment with Argon
(Ar) and chemical modification with sodium hydroxide (NaOH), the membranes had excellent hydrophilicity,
due to the formation of active carboxylic groups. However, the membrane performance failed during the
cleaning procedures. Titanium dioxide (TiO2) was grafted onto the surface of membranes to give them highly
permeable and fouling-resistance properties. The results of the self-cleaning experiment indicated that grafting
of TiO2 on the surface of the membranes after their pre-treatment with Ar plasma and NaOH increased the
permeability and the anti-fouling properties. A new surface modification method using a combination of plasma
and chemical treatment was introduced.
Keywords: nanofiber; modified nanofiber; nanocomposite
1. Introduction
The increasing amount of industrial and domestic oily wastewater has become one of the most important
problematic issues for the environment and human health. Oil–water emulsion separation has gained more
importance in recent decades. A few methods have been developed for oil–water separation, such as oil
containment booms [1], coagulation method [2], oil sorption materials [3–5], oil skimmers [1], air flotation [6],
and combustion [7]. However, these methods have disadvantages, like secondary pollution, expensive
operation, low efficiency, complicated operation, and they are time-consuming. Microfiltration is one of the
simplest and widely used methods for separation of oily wastewater. Many researchers have developed various
types of microfilters. Membranes are the most important part of the microfiltration process [8]. For instance, it
was found that superhydrophilic in situ-crosslinked zwitterionic polyelectrolyte/polyvinylidene fluoride-
blend membranes exhibit high water permeation flux and good antifouling properties for separating oil-in-
water emulsions with high separation efficiency [9]. Cao et al. prepared hyperbranched polyethyleneimine
(HPEI) glass fiber membranes for oil–water separation. The modified membrane showed high permeation and
quantitative oil rejection with excellent thermal and chemical stability, compared with polymer-based
membranes [10]. Cumming et al. [11] developed a method for characterizing the rejection efficiency, by using
an asymmetric metal microfilter to separate oil in a water dispersion. Results showed that the rejection of oil
drops depended on the size distribution of the emulsion, and the use of a surface
Polymers 2017, 9, 679; doi:10.3390/polym9120679 www.mdpi.com/journal/polymers

103
Polymers 2017, 9, 679 2 of 15
filter without any internal tortuosity excluded the possibility of internal fouling. However, fouling is a common problem
that has to be faced during microfiltration. In fouling, the membrane is contaminated by a solution or particle, which
results in a decrease in membrane performance. In general, fouling forms on hydrophobic surfaces as a result of
aggregation, protein adsorption, and denaturation at the membrane–solution interface [12].
Fouling causes a decrease in the performance of the filters, and generates extra costs for repetitive cleaning
procedures. For effective oily water treatment, antifouling membranes with very high selectivity are required. More
often, the selectivity and the fouling resistant properties of the membranes are strongly dependent on their surface
wettability. With this aim in mind, many researchers have employed various modifications to change the surface
properties of the polymeric membranes, such as surface grafting, blending, surface coating, and surface absorption [13–
19]. Zhang et al. [20] fabricated a Graphene oxide modified polyacrylonitrile hierarchical-structured membrane. It was
found that this hierarchical-structured membrane exhibited a very high flux, feasible rejection ratio, and superior
antifouling performance in separating an oil–water emulsion, due to its surface hydrophilicity. In another work [21],
pancreatic enzyme was immobilized on polyethersulfone membranes by electron beam modification. The anti-fouling
property of the membrane was obtained after switching on the catalytic activity of the enzyme by adjusting the pH and
temperature. As a result, the membrane surface actively degraded a fouling layer, and regained its initial permeability. Yang
et al. [22] fabricated a superhydrophilic and superoleophobic nanocomposite coating by spray casting nanoparticle–polymer
suspensions on various substrates. They synthesized the polymer with hydrophilic and oleophobic properties by using
the reaction of poly (diallyldimethylammonium chloride) (PDDA) with sodium perfluorooctanoate (PFO) in aqueous
solution, in which PFO anions can coordinate to quaternary ammonium groups of PDDA. As a result of the high surface
concentration of fluorinated groups, together with carboxyl and quaternary ammonium groups, oleophobic and
hydrophilic material were fabricated. Water molecules are able to penetrate the surfaces, while oils cannot. An air plasma
treatment was applied to enhance the hydrophilicity of the coating material and increase the water permeability, while
there was no change in superoleophobic properties. Wei et al. [23] used maleic anhydride to graft onto a
polyacrylonitrile (PAN) membrane surface via ultraviolet irradiation. Hyperbranched polyester grafting onto the PAN
membrane surface, by the reaction of hydroxyl groups with anhydride groups of maleic anhydride, followed the grafting
process. The filtration showed that modified membranes had a 4–6 times higher water flux and better antifouling
properties than pristine PAN membranes, and their hydrophilicity was significantly improved. Zhang et al. [14] fabricated
an ultralow oil-fouling amphiphilic copolymer incorporated poly(ether sulfone) (PES) heterogeneous membrane. First, the
amphiphilic copolymer was prepared by semibatch reversible addition—where the fragmentation chain was transferred by
poly (ethylene glycol) methyl ether methacrylate (PEGMA) and 3,3,4,4,5,5,6,6,7,7,8,8,8-tridecafluorooctyl acrylate (TFOA).
The resultant amphiphilic fluorinated gradient copolymers were then incorporated into the PES. The resultant membrane
showed effective oil–water emulsion separation due to the hydrophilicity of PEG and low surface energy of PTFOA. Wang
et al. [24] prepared titanium dioxide (TiO2) doped polyvinylidene fluoride (PVDF) nanofibers to prevent fouling of
membranes in oil–water separation. TiO2 gel was prepared and mixed with the PVDF solution before the spinning
process. The membranes showed reversible separation of the oily water by UV (or sunlight) irradiation and heating
treatment. Among various materials, TiO2 has been widely used, due to its self-cleaning and photocatalytic properties
[25,26].
In this work, nanofibers were produced as an active layer for microfiltration. The properties
of the nanofibers, such as their ability to be embedded within other media, high surface-to-volume ratio, large porosity,
narrow pore size, easiness to operate, and adjustable functionality, are much more effective than conventional polymeric
membranes used in liquid filtration. Nanofibers have a porosity of over 80% in the structure, which improves the
filtration efficiency of the membranes. The low mechanical strength of the nanofibers restricts their application in
liquid filtration [27].

104
To overcome this problem, a special lamination technique was applied, and nanofibrous composite
membranes were formed as microfilters. The principle of the lamination technique has been
explained in our previous work [28–30]. The use of this lamination technique did not change the
properties of the nanofibers on the surface of the membrane. A polyester nonwoven layer was
selected as a supporting layer for the nanofibers. The lamination technology provides excellent
adhesion of the nanofibers to the substrate, as well as durable structural stability, which provides
a longer lifespan and greater effectiveness in the cleaning process. In this work, a mixture of PVDF
and polyacrylonitrile (PAN) nanofibers were fabricated. PVDF has a high hydrophobicity and
thermal stability, good chemical resistance and oleophilicity. Its good electrical properties result
from the polarity of alternating groups on the polymer chain, and easiness to fabricate the nanofiber
web [31,32]. PAN has good characteristics, including thermal stability, tolerance to most solvents,
and commercial availability [33]. PAN nanofibers are more hydrophilic and better at plasma
etching compared to PVDF [34,35]. However, PAN nanofibers have lower mechanical and abrasion
resistance than PVDF. The aim of mixing both polymers is to improve the mechanical properties of
the nanofiber web, while providing an effective plasma treatment. In addition, both of the polymers
were selected due to their relative low cost and widespread commercial use.
The selectivity and permeability are two key factors in the membrane process. The selectivity
of membranes is largely determined by the surface porosity and pore size of the substructure, and
the chemical and physical properties of the membrane, while the permeability mainly depends on
the hydrophilicity, porosity, and pore size of the membrane. Due to the lack of functional groups
on the PVDF/PAN nanofibrous membrane surface, it is necessary to introduce some functional
groups by surface modification. In this study, the nanofibrous composite membranes were
covered by TiO2 nanoparticles, due to their high stability, high photocatalytic activity, non-toxicity,
low cost, chemical resistance, and antibacterial activity to certain microorganisms. TiO2
nanoparticles can be used to successfully overcome the fouling problem. The nanoparticles were
grafted on the surface of nanofibrous membranes using plasma and chemical pre-treatments.
According to our knowledge, this method has not been reported so far. The ultimate goal of this
work was to introduce a new surface modification method that could offer highly permeable and
fouling resistant membranes.
1. Materials and Methods
1.1. Preparation of the Nanofiber Web
A total of 8 wt % polyacrylonitrile (PAN) (MW = 150 kDa, purchased from Elmarcos.r.o.,
Liberec, Czech Republic) was dissolved in dimethylformamide (DMF), while 13 wt %
polyvinylidene fluoride (PVDF) (form from Solef 1015, Bruxelles, Belgium) was dissolved in
dimethylacetamide (DMAc). Solvents were purchased from Penta, s.r.o., Prague, Czech Republic.
The solutions were stirred overnight. A nanofiber web blend was prepared. The blend ratio of
PVDF/PAN nanofibers in the composite was 1/2 in wt %. This ratio was determined based on our
previous experience [34,36]. A lab-scale Nanospider (Elmarco s.r.o., Liberec, Czech Republic)
electrospinning device was used for the production of nanofibers under stable conditions (Figure
1). A solution tank fed the solution toward the wire electrode. If the electrical fields between the wire
electrode and the collector overcome the surface tension, Taylor’s cones were formed, and jets moved
towards a take-up cylinder connected to a supporting material. The spinning conditions were kept
stable by controlling the humidity, temperature and air input–output speed.

105
Figure 1. Schematic diagram of the Nanospider device.
1.1. Formation of a Nanofibrous Composite Membrane
The nanofiber web was gently laminated on a supporting layer using a Meyer RPS-L Mini
lamination machine (Maschinenfabrik Herbert Meyer GmbH, Roetz, Germany) at room
temperature (Figure 2).
Figure 2. Lamination method and equipment [37].
The nanofiber web was collected on silicon paper. A 100 g/m2 polyethylene terephthalate
spunbond nonwoven fabric was used as supporting layer, and 3 g/m2 of co-polyamide adhesive
web were used to adhere the nanofibers and the nonwoven web. The lamination machine had a
conveyer belt resistant to heat and damage. The maximum width of the samples was set as 400
mm, while there was no limitation on the length. The configuration of the substrate mainly
depended on the application, and could be varied to reach the desired structural properties,
including strength, stiffness, and durability, pliability and flexibility, and temperature resistance.
The zero-shear viscosity of the polymer solutions was obtained using a Fungilab Expert
viscometer (Fungilab Leading Viscosity Technology, Barcelona, Spain) at 23 ◦C. The surface of the
membranes was characterized using a Scanning Electron Microscope (SEM, Vega 3SB, Brno, Czech
Republic) and fiber diameter, diameter distribution, and porosity were analyzed using the Image-J
program (free online program). The surface contact angle of the samples was measured at room
temperature using a Kruss Drop Shape Analyzer DS4 (Kruss GmbH, Hamburg, Germany), using
distilled water on the clean and dry sample. An 1200-AEL capillary flow porometer (Porous Media
Inc., Ithaca, NY, USA) was used in this study to measure the pore size. FTIR spectra were used to
verify the effect of the plasma and chemical modifications on the composite membrane surface.
The polymeric nanofiber membranes were evaluated using Fourier transform infrared
spectroscopy (FTIR, Nicolet iZ10 by Thermo Fisher Scientific, Waltham, MA, USA).
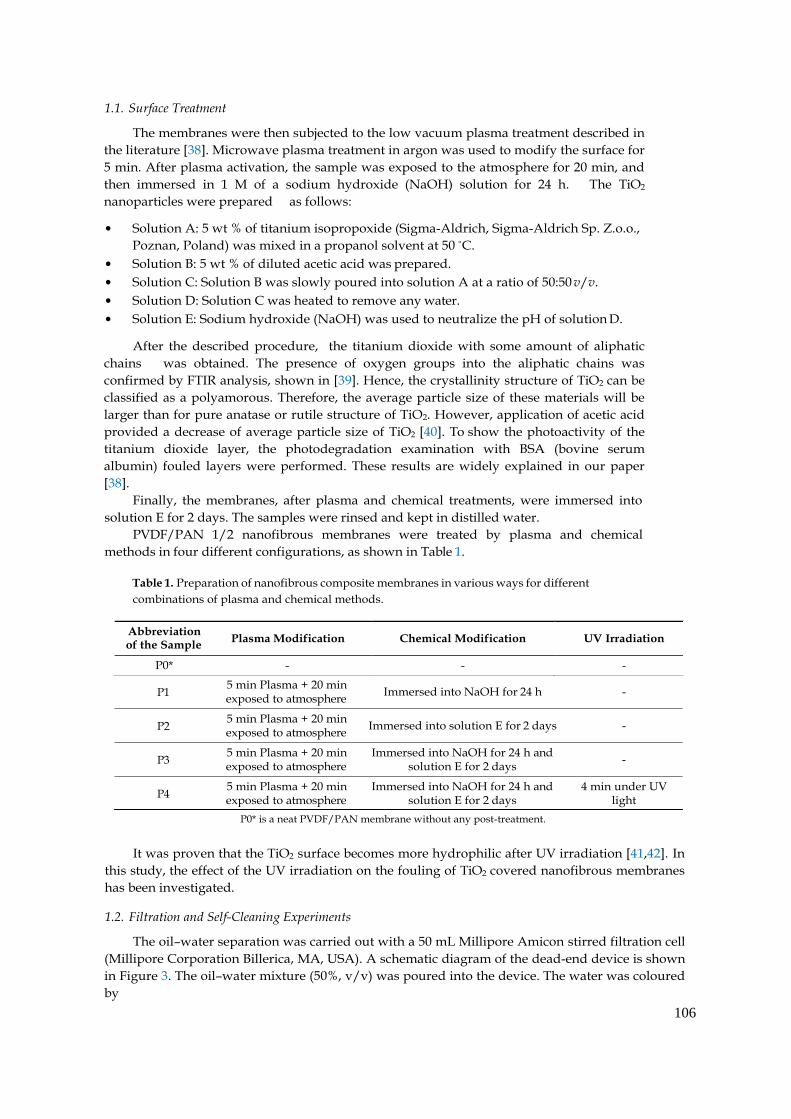
106
1.1. Surface Treatment
The membranes were then subjected to the low vacuum plasma treatment described in
the literature [38]. Microwave plasma treatment in argon was used to modify the surface for
5 min. After plasma activation, the sample was exposed to the atmosphere for 20 min, and
then immersed in 1 M of a sodium hydroxide (NaOH) solution for 24 h. The TiO2
nanoparticles were prepared as follows:
• Solution A: 5 wt % of titanium isopropoxide (Sigma-Aldrich, Sigma-Aldrich Sp. Z.o.o.,
Poznan, Poland) was mixed in a propanol solvent at 50 ◦C.
• Solution B: 5 wt % of diluted acetic acid was prepared.
• Solution C: Solution B was slowly poured into solution A at a ratio of 50:50 v/v.
• Solution D: Solution C was heated to remove any water.
• Solution E: Sodium hydroxide (NaOH) was used to neutralize the pH of solution D.
After the described procedure, the titanium dioxide with some amount of aliphatic
chains was obtained. The presence of oxygen groups into the aliphatic chains was
confirmed by FTIR analysis, shown in [39]. Hence, the crystallinity structure of TiO2 can be
classified as a polyamorous. Therefore, the average particle size of these materials will be
larger than for pure anatase or rutile structure of TiO2. However, application of acetic acid
provided a decrease of average particle size of TiO2 [40]. To show the photoactivity of the
titanium dioxide layer, the photodegradation examination with BSA (bovine serum
albumin) fouled layers were performed. These results are widely explained in our paper
[38].
Finally, the membranes, after plasma and chemical treatments, were immersed into
solution E for 2 days. The samples were rinsed and kept in distilled water.
PVDF/PAN 1/2 nanofibrous membranes were treated by plasma and chemical
methods in four different configurations, as shown in Table 1.
Table 1. Preparation of nanofibrous composite membranes in various ways for different
combinations of plasma and chemical methods.
of the Sample
5 min Plasma + 20 min exposed to atmosphere
5 min Plasma + 20 min exposed to atmosphere
Immersed into NaOH for 24 h -
Immersed into solution E for 2 days -
5 min Plasma + 20 min exposed to atmosphere
5 min Plasma + 20 min exposed to atmosphere
Immersed into NaOH for 24 h and solution E for 2 days
Immersed into NaOH for 24 h and solution E for 2 days
-
4 min under UV light
P0* is a neat PVDF/PAN membrane without any post-treatment.
It was proven that the TiO2 surface becomes more hydrophilic after UV irradiation [41,42]. In
this study, the effect of the UV irradiation on the fouling of TiO2 covered nanofibrous membranes
has been investigated.
1.2. Filtration and Self-Cleaning Experiments
The oil–water separation was carried out with a 50 mL Millipore Amicon stirred filtration cell
(Millipore Corporation Billerica, MA, USA). A schematic diagram of the dead-end device is shown
in Figure 3. The oil–water mixture (50%, v/v) was poured into the device. The water was coloured
by
P1
P2
P3
P4
Abbreviation Plasma Modification Chemical Modification UV Irradiation
P0* - - -

107
methylene blue to properly observe the separation process. The feed solution was mixed with a
hand mixer for a few minutes, until a uniform mixture was obtained. Subsequently, 90 mL of
distilled water was filtrated, followed by 45 mL of the oil–water mixture. This procedure was
repeated a few times to determine the anti-fouling properties of the membrane. The membrane was
not changed or replaced during each repeating step. The separation process was performed under
a 0.02 bar pressure.
Figure 3. Schematic diagram of dead-end filtration.
The permeate flux (F) and the permeability (k) of the membrane were calculated
(Equations (1) and (2)):
F = 1 dV
A dt
k = F
p
(1)
(2)
where A is the effective membrane area (m2), V is the total volume of the permeate (F), p is the
transmembrane pressure (bar), and t is the filtration time [43].
1. Results
1.1. Membrane Characterization
The SEM images are given in Figure 4. The SEM images demonstrated that the lamination
process did not damage the surface of the nanofiber layer. However, there were some blind spots,
where the adhesive web covered the surface of the nanofibers and totally blocked the pores. In the
resultant web, blind spots were rarely observed. It was not possible to remove these blind spots
without delaminating the membranes, but it was possible to keep their number as low as possible.
The fiber diameter of the nanofiber was around 110 nm, which was good for the filtration process,
due to the small pore size. The pore size of the nanofiber was related to the diameter of the fiber. A
lower fiber diameter yielded a lower mean pore size.
Table 2 shows the characterization of the nanofiber layer. The basis weight of the nanofiber
web was less than 1 g/m2, which was advantageous at high production speeds, and led to low
production costs. The porosity of the membrane was quite important for the permeability of the
membranes. In this study, the nanofiber layer had a porosity of more than 85% of its bulk volume. In
theory, the low water contact angle indicates higher hydrophilicity and better wettability that
increases the water permeability through the membrane. It is well know that hydrophilic
membranes decrease the fouling due to the high affinity of the membrane to water molecules [44].
The pristine PVDF/PAN membrane without any surface treatment can be considered as being
“hydrophobic” by definition [43].
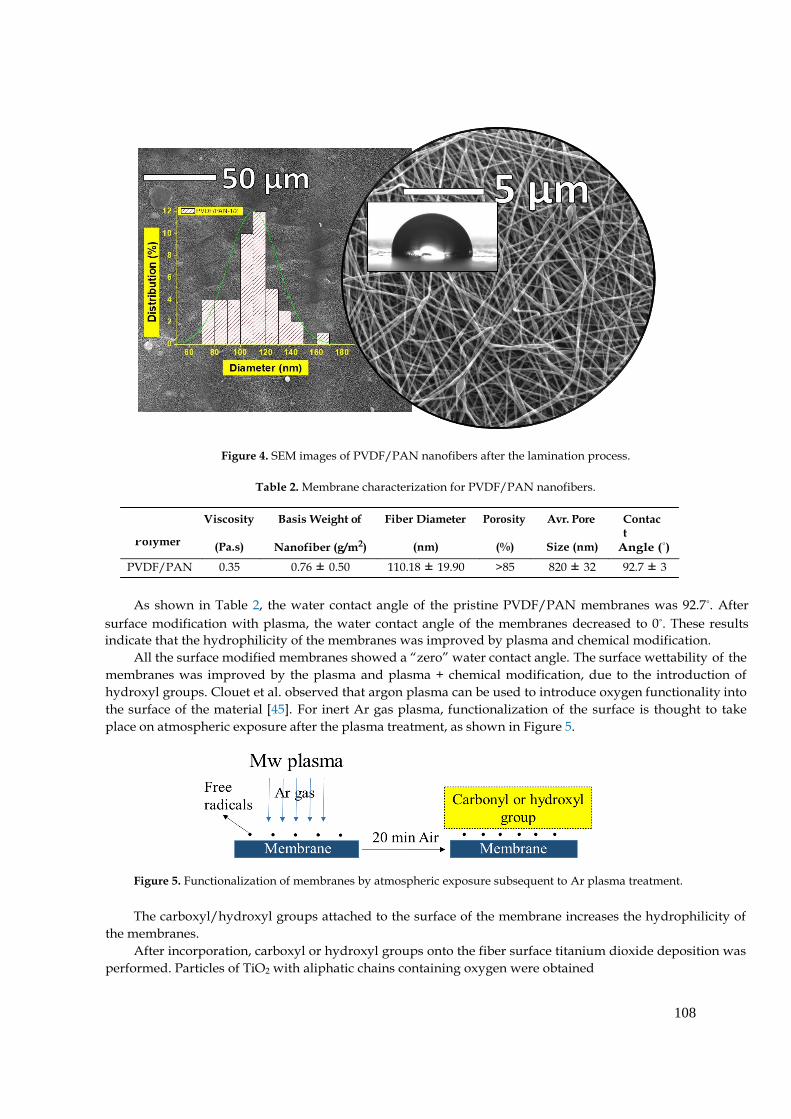
108
Figure 4. SEM images of PVDF/PAN nanofibers after the lamination process.
Table 2. Membrane characterization for PVDF/PAN nanofibers.
Viscosity Basis Weight of Fiber Diameter Porosity Avr. Pore Contact
Polymer (Pa.s) Nanofiber (g/m2) (nm) (%) Size (nm) Angle (◦)
PVDF/PAN 0.35 0.76 ± 0.50 110.18 ± 19.90 >85 820 ± 32 92.7 ± 3
As shown in Table 2, the water contact angle of the pristine PVDF/PAN membranes was 92.7◦. After
surface modification with plasma, the water contact angle of the membranes decreased to 0◦. These results
indicate that the hydrophilicity of the membranes was improved by plasma and chemical modification.
All the surface modified membranes showed a “zero” water contact angle. The surface wettability of the
membranes was improved by the plasma and plasma + chemical modification, due to the introduction of
hydroxyl groups. Clouet et al. observed that argon plasma can be used to introduce oxygen functionality into
the surface of the material [45]. For inert Ar gas plasma, functionalization of the surface is thought to take
place on atmospheric exposure after the plasma treatment, as shown in Figure 5.
Figure 5. Functionalization of membranes by atmospheric exposure subsequent to Ar plasma treatment.
The carboxyl/hydroxyl groups attached to the surface of the membrane increases the hydrophilicity of
the membranes.
After incorporation, carboxyl or hydroxyl groups onto the fiber surface titanium dioxide deposition was
performed. Particles of TiO2 with aliphatic chains containing oxygen were obtained

109
via sol-gel method. The mechanism of self-assembly of TiO2 on the polymer surface is described in
Figure 6.
Figure 6. Mechanisms of self-assembly of TiO2 with a polymer surface. Reproduction from [46].
In the first case, the titanium particles are connected to the surface by the ether coordination
bonds, while in the second, the Ti is bonded by hydroxyl groups to the alkyl moieties. To verify the
photoactivity of TiO2 on the polymer surface, the photodegradation process was conducted. The
results showed that the fouled layer of BSA could be removed from the membrane surface with 95%
efficiency after UV irradiation in the presence of TiO2 particles [38]. Unfortunately, the TiO2
particles on the surface were not visible by means of our SEM instrument. We were only able to
determine that they did not aggregate.
It was found that NaOH-induced hydrolysis of nitrile groups on the PAN surface resulted in
increasing of membranes swelling with the time of treatment [47]. Yang et al. [48] hydrolyzed PAN
hollow fiber in different concentrations of NaOH solution (0.5, 1 and 2 N). By increasing the
concentration of NaOH, the concentration of carboxylic groups greatly increased. However, the
highest concentration caused severe degradation of PAN fibers. In another paper dealing with
chemical modification with NaOH, the decrease of water flux during the progress of hydrolysis with
the increase of solute rejection was observed [49].
1.1. Filtration and Self-Cleaning Experiments
In this study, oil/water separation experiments were conducted by using a dead-end filtration
device. The permeability of the each membrane was calculated according to Equation (2). Figure 7
shows the permeability of membranes for alternated filtration of water and the oily water. The
process was repeated in each cycle. Between each cycle, the membranes were washed gently.
The performance of the membranes without post treatment is shown in Figure 7A. In each
cycle, the filtration efficiency and the permeability of the membranes decreased drastically due to the
fouling phenomenon. The permeability of the membranes with pure water decreased over 3000 times
from the first to the fourth cycle. The same filtration protocol was repeated for the treated
membranes.
1.2x10⁵
1.0x10⁵
8.0x10⁴
6.0x10⁴
2.0x10⁵
1.6x10⁵
1.2x10⁵
4.0x10⁴
2.0x10⁴
8.0x10
4
4.0x10⁴
0.0
1
2 3 4
0.0
1 2 3 4 5
P0-number of cycle P1-number of cycle
Figure 7. Cont.
(A) Oil-water
Distilled water (B) Oil-water
Distilled water
Perm
ea
bil
ity
(L/h
m2b
ar)
Per
mea
bili
ty (
L/h
m2 b
ar)

110
Figure 7. Repeated fouling and self-cleaning experiments of samples (A) P0, (B) P1, (C) P2, (D) P3, and (E)
P4.
Membrane P1 showed better permeability than P0, due to the increase of hydrophilicity after
treatment. However, fouling was inevitable. At the end of the fifth cycle, the pure water permeability of the
membranes decreased 6 times. A similar trend was observed for membrane P2. Immersing the membrane
into the TiO2 solution after plasma treatment did not improve the membrane performance. On the other
hand, membrane P3 showed excellent permeability with antifouling properties, even after the tenth cycle. A
mid-treatment between plasma and TiO2 modification was necessary. Immersion in NaOH solution is an
effective method for grafting TiO2 to the surface of the membrane, due to the creation of carboxylic groups.
Once the sufficient surface grafting of TiO2 had been obtained, the membrane fouling-resistance and
membrane permeability improved. A schematic diagram of the chemical modification process is shown in
Figure 8.
In the first stage, membranes treated with Ar microwave plasma were exposed to air for 20 min.
Carbonyl/hydroxyl groups were formed on the surface of the membranes. Formation of carboxylic groups
on the surface occurred after NaOH treatment. Eventually, TiO2 particles were grafted to the activated
surface.
It is well known that UV radiation activates TiO2 located on the surface. For this aim, membrane P4
was prepared and tested on a filtration unit. The results show that there is no high permeability difference
between membranes P3 and P4. As UV treatment generates an extra cost, it can be concluded that such
operation is not needed to improve membrane permeability.
1 2 3 4 5
0.0
4.0x10⁴
8.0x10⁴
1.2x10⁵
1.6x10⁵
2.0x10⁵
Perm
eab
ilit
y (
L/h
m2b
ar)
P2-number of cycle
Emulsion
Distilled water(C)
1 2 3 4 5 6 7 8 9 10
0.0
4.0x10⁴
8.0x10⁴
1.2x10⁵
1.6x10⁵
2.0x10⁵
Perm
eab
ilit
y (
L/h
m2b
ar)
P3-number of cycle
Emulsion Distilled water (D)
1 2 3
0.0
4.0x10⁴
8.0x10⁴
1.2x10⁵
1.6x10⁵
2.0x10⁵
2.4x10⁵
2.8x10⁵
Perm
eab
ilit
y (
L/h
m2b
ar)
P4-number of cycle
Emulsion Distilled water(E)

111
Figure 8. Schematic diagram of the surface modification of PVDF/PAN membranes.
The FTIR spectra were collected in order to investigate the chemical structure of the pristine
membrane, and the membrane after plasma and chemical modification. Figure 9 confirms the presence of both
polymers in the blend of PVDF/PAN. Stretching bands at 1175 cm−1, 1412 cm−1, and 876 cm−1 for the –CF2
and C–F groups of PVDF, and absorption bands at 2239 cm−1 for the PAN nitrile groups, were observed. The
TiO2 sample had transmittance peaks in the range of 500–1000 cm−1, which was assigned to the vibrations
of Ti–O and Ti–O–Ti framework bonds. The bands around 1619 cm−1 corresponded to the bending modes of water Ti–OH [50–53].
P3
P0
400 800 1200 1600 2000 2400
Wavenumber (cm-1
)
Figure 9. FTIR spectra of the neat sample and the sample after modification.
Figure 10 showed the permeability comparison of all of the membranes. The oily water and the pure
water permeability was compared separately. All of the surface modified membranes exhibited higher pure
water permeability than the pristine membrane. Moreover, membrane P3 has higher permeability and
better anti-fouling properties compared to P0, P1, and P2, and its
Ab
so
rban
ce
(%
)

112
(A)
P0
P1
P2
P3
P4
fouling resistance property were remarkably improved. It can be concluded that the TiO2 grafted to the
hydrophilic membrane surface prevented direct adhesion of the oil droplets. Chen et al. [54] prepared a porous
PVDF–MWCNT (multiwalled carbon nanotube) foam, which was characterized as a reusable and compressible
superhydrophobic–superoleophilic separator with good elasticity and low surface energy. The porous PVDF–
MWCNT foam exhibited high adsorption capacity to a variety of oils/organic solvents that made it a promising
candidate for large-scale industrial applications. Unlike our membranes, their foams worked on the adsorption
principle with a capacity 300–1200% of its own weight. Our membranes P0–P4 worked in the permeability
principle, and did not need any additional treatment.
3.6x10⁴
2.5x10⁵
3.0x10⁴
2.0x10⁵
2.4x10
4
1.8x10⁴
1.2x10⁴
3
1.5x10
5
1.0x10
5
5.0x10
4
6.0x10
0.0
0 1 2 3 4 5 6 7 8 9 10
Number of cycle for emulsion
0.0
0 1 2 3 4 5 6 7 8 9 10
Number of cycle for distilled water
(B)
P0
P1
P2
P3
P4
Perm
eab
ilit
y (
L/h
m2b
ar)
Perm
eab
ilit
y (
L/h
m2b
ar)
× ( )
Figure 10. Permeability vs the number of cycles for (A) oil–water, and (B) distilled water.
The selectivity of the membranes is shown in Figure 11. The feed solution after separation was collected,
and the volume ratio of the oil and water was measured. The percentage of the selected liquid was calculated as
follows:
amount o f selected liquid = Vselected liquid
100 % (3) Vtotal f eed
V is the volume in liters.
100
80
60
40
20
0
P0 P1 P2 P3 P4
Figure 11. Selectivity of the membranes P0–P4.
Figure 11 shows that the neat PVDF/PAN membrane is both hydrophilic and oleophilic, while the surface
treated membranes are more hydrophilic. The water selectivity of the pristine PVDF/PAN membrane improves
from 73 to 100% as soon as the surface modification took place. The oleophobic
Water
Oil
Am
ou
nt
of
perm
ea
te i
n v
olu
me
(%
)

113
characteristics of the membranes made them attractive for the filtration of oily wastewater. Even though the
membranes showed good hydrophilicity and oleophobicity, they were not sufficient enough to be applied
to the separation process. The sought membranes should be easily cleanable, and should not lose their
performance over time. Only two of the investigated membranes, P3 and P4, fulfill the properties of ideal
membranes for oil–water separation. On the other hand, the permeability of membranes P3 and P4 was
almost the same for the separation of oily wastewater. We determined that membrane P3 was the best
membrane for separation, and that there was no need to expose it to UV light in order to activate the TiO2
particles on the membrane surface. The method used for the surface modification proved that highly
permeable and highly selective membranes can be obtained for the separation of oily wastewater.
4. Conclusions
In summary, a PVDF/PAN nanofiber web was successfully fabricated and laminated. The resultant
membranes showed both hydrophilic and oleophilic characteristics. A series of surface modifications were
applied to the PVDF/PAN membranes to enhance the hydrophilicity and permeability of the
membranes.
It was found that Ar-plasma surface treatment was not multifunctional; therefore, more than one
chemical modification was required to accommodate the grafting of a functional TiO2 group onto the
membrane surface. Since the surface of the TiO2-grafted membranes was able to build a highly
hydrophilic and low surface energy barrier against the adhesion of oil droplets, the permeability and the
antifouling properties were significantly enhanced. Undoubtedly, the most important part of the surface
modification technique was grafting of TiO2 onto the surface of the membrane.
In conclusion, we have reported a facile and low-cost method for the preparation of
hydrophilic/oleophobic membranes by using a new surface modification approach with a plasma and
chemical method. Needless to say, surface treated polymeric PVDF/PAN membranes are a good candidate
for use in separation technologies for water/oil emulsions.
Acknowledgments: The results of this work was supported by project LO1201 obtained through the financial support of the Ministry of Education, Youth and Sports in the framework of the targeted support of the “National Program for Sustainability I” and the OPR&DI project CZ.1.05/2.1.00/19.0386”. The authors would also like to thank Jana Mullerova for her help in the FTIR measurements.
Author Contributions: Marek Bryjak, Fatma Yalcinkaya and Anna Siekierka conceived and designed the experiments; Fatma Yalcinkaya and Anna Siekierka performed the experiments; Fatma Yalcinkaya analyzed the data; Marek Bryjak, Fatma Yalcinkaya and Anna Siekierka contributed reagents/materials/analysis tools; Fatma Yalcinkaya wrote the paper.
Conflicts of Interest: The authors declare no conflict of interest. The founding sponsors had no role in the design of the study; in the collection, analyses, or interpretation of data; in the writing of the manuscript, and in the decision to publish the results.
References
1. Cheng, M.; Gao, Y.; Guo, X.; Shi, Z.; Chen, J.; Shi, F. A functionally integrated device for effective and facile oil spill cleanup. Langmuir 2011, 27, 7371–7375. [CrossRef] [PubMed]
2. Ahmad, A.L.; Sumathi, S.; Hameed, B.H. Coagulation of residue oil and suspended solid in palm oil mill effluent by chitosan, alum and PAC. Chem. Eng. J. 2006, 118, 99–105. [CrossRef]
3. Paul, U.C.; Fragouli, D.; Bayer, I.S.; Athanassiou, A. Functionalized cellulose networks for efficient oil removal from oil–water emulsions. Polymers 2016, 8, 52. [CrossRef]
4. Liu, T.; Chen, S.; Liu, H. Oil adsorption and reuse performance of multi-walled carbon nanotubes.
Procedia Eng. 2015, 102, 1896–1902. [CrossRef]
5. Okiel, K.; El-Sayed, M.; El-Kady, M.Y. Treatment of oil–water emulsions by adsorption onto activated carbon, bentonite and deposited carbon. Egypt. J. Pet. 2011, 20, 9–15. [CrossRef]
6. Al-Shamrani, A.A.; James, A.; Xiao, H. Destabilisation of oil–water emulsions and separation by dissolved air flotation. Water Res. 2002, 36, 1503–1512. [CrossRef]

114
7. Felizardo, P.; Joana Neiva Correia, M.; Raposo, I.; Mendes, J.F.; Berkemeier, R.; Bordado, J.M. Production
of biodiesel from waste frying oils. Waste Manag. 2006, 26, 487–494. [CrossRef] [PubMed] 8. Mi, Y.; Li, J.; Zhou, W.; Zhang, R.; Ma, G.; Su, Z. Improved stability of emulsions in preparation of
uniform small-sized konjac glucomanna (KGM) microspheres with epoxy-based polymer membrane by premix membrane emulsification. Polymers 2016, 8, 53. [CrossRef]
9. Zhu, Y.; Xie, W.; Zhang, F.; Xing, T.; Jin, J. Superhydrophilic in-situ-cross-linked zwitterionic polyelectrolyte/PVDF-blend membrane for highly efficient oil/water emulsion separation. ACS Appl. Mater. Interfaces 2017, 9, 9603–9613. [CrossRef] [PubMed]
10. Cao, Z.; Hao, T.; Wang, P.; Zhang, Y.; Cheng, B.; Yuan, T.; Meng, J. Surface modified glass fiber membranes with superior chemical and thermal resistance for O/W separation. Chem. Eng. J. 2017, 309, 30–40. [CrossRef]
11. Cumming, I.W.; Holdich, R.G.; Smith, I.D. The rejection of oil using an asymmetric metal microfilter to separate an oil in water dispersion. Water Res. 1999, 33, 3587–3594. [CrossRef]
12. Koehler, J.A.; Ulbricht, M.; Belfort, G. Intermolecular forces between proteins and polymer films with relevance to filtration. Langmuir 1997, 13, 4162–4171. [CrossRef]
13. Jiang, J.; Zhu, L.; Zhu, L.; Zhang, H.; Zhu, B.; Xu, Y. Antifouling and antimicrobial polymer membranes based on bioinspired polydopamine and strong hydrogen-bonded poly(N-vinyl pyrrolidone). ACS Appl. Mater. Interfaces 2013, 5, 12895–12904. [CrossRef] [PubMed]
14. Zhang, G.; Jiang, J.; Zhang, Q.; Gao, F.; Zhan, X.; Chen, F. Ultralow oil-Fouling heterogeneous poly(ether sulfone) ultrafiltration membrane via blending with novel amphiphilic fluorinated gradient copolymers. Langmuir 2016, 32, 1380–1388. [CrossRef] [PubMed]
15. Zhou, S.; Xue, A.; Zhao, Y.; Li, M.; Wang, H.; Xing, W. Grafting polyacrylic acid brushes onto zirconia membranes: Fouling reduction and easy-cleaning properties. Sep. Purif. Technol. 2013, 114, 53–63. [CrossRef]
16. Zhao, X.; Su, Y.; Chen, W.; Peng, J.; Jiang, Z. Grafting perfluoroalkyl groups onto polyacrylonitrile membrane surface for improved fouling release property. J. Membr. Sci. 2012, 415–416, 824–834. [CrossRef]
17. Ju, H.; McCloskey, B.D.; Sagle, A.C.; Wu, Y.H.; Kusuma, V.A.; Freeman, B.D. Crosslinked poly(ethylene oxide) fouling resistant coating materials for oil/water separation. J. Membr. Sci. 2008, 307, 260–267. [CrossRef]
18. Jing, B.; Wang, H.; Lin, K.Y.; McGinn, P.; Na, C.; Zhu, Y. A facile method to functionalize engineering solid membrane supports for rapid and efficient oil–water separation. Polymer 2013, 54, 5771–5778. [CrossRef]
19. Zhou, T.; Yang, J.; Zhu, D.; Zheng, J.; Handschuh-Wang, S.; Zhou, X.; Zhang, J.; Liu, Y.; Liu, Z.; He, C.; et al. Hydrophilic sponges for leaf-inspired continuous pumping of liquids. Adv. Sci. 2017, 4, 1700028. [CrossRef] [PubMed]
20. Zhang, J.; Xue, Q.; Pan, X.; Jin, Y.; Lu, W.; Ding, D.; Guo, Q. Graphene oxide/polyacrylonitrile fiber hierarchical-structured membrane for ultra-fast microfiltration of oil-water emulsion. Chem. Eng. J. 2017, 307, 643–649. [CrossRef]
21. Schulze, A.; Breite, D.; Kim, Y.; Schmidt, M.; Thomas, I.; Went, M.; Fischer, K.; Prager, A. bio-inspired polymer membrane surface cleaning. Polymers 2017, 9, 97. [CrossRef]
22. Yang, J.; Zhang, Z.; Xu, X.; Zhu, X.; Men, X.; Zhou, X. Superhydrophilic–superoleophobic coatings.
J. Mater. Chem. 2012, 22, 2834–2837. [CrossRef]
23. Wei, X.; Fei, Y.; Shi, Y.; Chen, J.; Lv, B.; Chen, Y.; Xiang, H. Hemocompatibility and ultrafiltration performance of PAN membranes surface-modified by hyperbranched polyesters. Polym. Adv. Technol. 2016, 27, 1569–1576. [CrossRef]
24. Wang, Y.; Lai, C.; Wang, X.; Liu, Y.; Hu, H.; Guo, Y.; Ma, K.; Fei, B.; Xin, J. Beads-on-string structured nanofibers for smart and reversible oil/water separation with outstanding antifouling property. ACS Appl. Mater. Interfaces 2016, 8, 25612–25620. [CrossRef] [PubMed]
25. Daoud, W.A.; Leung, S.K.; Tung, W.S.; Xin, J.H.; Cheuk, K.; Qi, K. Self-cleaning keratins. Chem. Mater. 2008,
20, 1242–1244. [CrossRef]
26. Kaihong, Q.; Wang, X.; Xin, J.H. Photocatalytic self-cleaning textiles based on nanocrystalline titanium dioxide. Text. Res. J. 2011, 81, 101–110. [CrossRef]
27. Homaeigohar, S.; Elbahri, M. Nanocomposite electrospun nanofiber membranes for environmental remediation. Materials 2014, 7, 1017–1045. [CrossRef] [PubMed]
28. Yalcinkaya, F. Mechanically enhanced electrospun nanofibers for wastewater treatment. In Proceedings of the International Conference on Advances in Energy Systems and Environmental Engineering, Wroclaw, Poland, 2–5 July 2017; Volume 7

115
29. Yalcinkaya, F. Preparation of various nanofiber layers using wire electrospinning system. Arab. J. Chem. 2016,
12. [CrossRef]
30. Jirícek, T.; Komárek, M.; Chaloupek, J.; Lederer, T. Flux enhancement in membrane distillation sing nanofiber membranes. J. Nanomater. 2016, 2016, 9327431. [CrossRef]
31. Wang, Z.; Hou, D.; Lin, S. Composite membrane with underwater-oleophobic surface for anti-oil-fouling membrane distillation. Environ. Sci. Technol. 2016, 50, 3866–3874. [CrossRef] [PubMed]
32. Liao, Y.; Wang, R.; Tian, M.; Qiu, C.; Fane, A.G. Fabrication of polyvinylidene fluoride (PVDF) nanofiber membranes by electro-spinning for direct contact membrane distillation. J. Membr. Sci. 2013, 425–426, 30–39. [CrossRef]
33. Mei, Y.; Yao, C.; Fan, K.; Li, X. Surface modification of polyacrylonitrile nanofibrous membranes with superior antibacterial and easy-cleaning properties through hydrophilic flexible spacers. J. Membr. Sci. 2012, 417–418, 20–27. [CrossRef]
34. Yalcinkaya, F.; Yalcinkaya, B.; Pazourek, A.; Mullerova, J.; Stuchlik, M.; Maryska, J. Surface modification of electrospun PVDF/PAN nanofibrous layers by low vacuum plasma treatment. Int. J. Polym. Sci. 2016, 2016. [CrossRef]
35. Kang, Y.H.; Ahn, K.; Jeong, S.Y.; Bae, J.S.; Jin, J.S.; Kim, H.G.; Hong, S.W.; Cho, C.R. Effect of plasma treatment on surface chemical-bonding states and electrical properties of polyacrylonitrile nanofibers. Thin Solid Films 2011, 519, 7090–7094. [CrossRef]
36. Yalcinkaya, F.; Siekierka, A.; Bryjak, M.; Maryska, J. Preparation of various nanofibrous composite membranes using wire electrospinning for oil-water separation. In IOP Conference Series: Materials Science and Engineering; IOP Publishing Ltd.: Bristol, UK, 2017; Volume 254, p. 102011.
37. Yalcinkaya, B.; Yalcinkaya, F.; Chaloupek, J. Thin film nanofibrous composite membrane for dead-end seawater desalination. J. Nanomater. 2016, 2016, 2694373. [CrossRef]
38. Gancarz, I.; Bryjak, M.; Wolska, J.; Siekierka, A.; Kujawski, W. Membranes with a plasma deposited titanium isopropoxide layer. Chem. Pap. 2016, 70. [CrossRef]
39. Siekierka, A.; Kujawa, J.; Kujawski, W.; Bryjak, M. Lithium dedicated adsorbent for the preparation of electrodes useful in the ion pumping method. Sep. Purif. Technol. 2018, 194, 231–238. [CrossRef]
40. Bessekhouad, Y.; Robert, D.; Weber, J.V. Preparation of TiO2 nanoparticles by Sol-Gel route. Int. J. Photoenergy
2003, 5, 153–158. [CrossRef]
41. Uosaki, K.; Yano, T.; Nihonyanagi, S. Interfacial water structure at as-prepared and UV-induced
hydrophilic TiO2 surfaces studied by sum frequency generation spectroscopy and quartz crystal
microbalance. J. Phys. Chem. B 2004, 108, 19086–19088. [CrossRef]
42. Wang, R.; Hashimoto, K.; Fujishima, A.; Chikuni, M.; Kojima, E.; Kitamura, A.; Shimohigoshi, M.; Watanabe, T. Light-induced amphiphilic surfaces. Nature 1997, 388, 431–432. [CrossRef]
43. Yalcinkaya, F.; Yalcinkaya, B.; Hruza, J.; Hrabak, P. Effect of nanofibrous membrane structures on the treatment of wastewater microfiltration. Sci. Adv. Mater. 2017, 9, 747–757. [CrossRef]
44. Na, L.; Liu, Z.; Xu, S. Dynamically formed poly(vinyl alcohol) ultrafiltration membranes with good anti-fouling characteristics. J. Membr. Sci. 2000, 169, 17–28. [CrossRef]
45. Clouet, F.; Shi, M.K. Interactions of polymer model surfaces with cold plasmas: Hexatriacontane as a model molecule of high-density polyethylene and octadecyl octadecanoate as a model of polyester. I. Degradation rate versus time and power. J. Appl. Polym. Sci. 1992, 46, 1955–1966. [CrossRef]
46. Li, J.H.; Xu, Y.Y.; Zhu, L.P.; Wang, J.H.; Du, C.H. Fabrication and characterization of a novel TiO2
nanoparticle self-assembly membrane with improved fouling resistance. J. Membr. Sci. 2009, 326, 659–
666. [CrossRef]
47. Bryjak, M.; Hodge, H.; Dach, B. Modification of porous polyacrylonitrile membrane. Die Angew. Makromol. Chem.
1998, 260, 25–29. [CrossRef]
48. Yang, M.C.; Tong, J.H. Loose ultrafiltration of proteins using hydrolyzed polyacrylonitrile hollow fiber.
J. Membr. Sci. 1997, 132, 63–71. [CrossRef]
49. Abedi, M.; Sadeghi, M.; Pourafshari Chenar, M. Improving antifouling performance of PAN hollow fiber membrane using surface modification method. J. Taiwan Inst. Chem. Eng. 2015, 55, 42–48. [CrossRef]
50. Grujic-Brojcin, M.; Scepanovic, M.; Dohcevic-Mitrovic, Z.; Popovic, Z.V. Infrared study of nonstoichiometric anatase TiO2 nanopowders. Sci. Sinter. 2006, 38, 183–189. [CrossRef]
51. León, A.; Reuquen, P.; Garín, C.; Segura, R.; Vargas, P.; Zapata, P.; Orihuela, P.A. FTIR and Raman
Characterization of TiO2 Nanoparticles Coated with Polyethylene Glycol as Carrier for 2-
Methoxyestradiol. Appl. Sci. 2017, 7, 49. [CrossRef]
52. Kumar, P.M.; Badrinarayanan, S.; Sastry, M. Nanocrystalline TiO2 studied by optical, FTIR and X-ray
photoelectron spectroscopy: Correlation to presence of surface states. Thin Solid Films 2000, 358, 122–130.
[CrossRef] 53. Pan, H.; Wang, X.; Xiao, S.; Yu, L.; Zhang, Z. Preparation and characterization of TiO2 nanoparticles

116
surface-modified by octadecyltrimethoxysilane. Indian J. Eng. Mater. Sci. 2013, 20, 561–567.
54. Chen, F.; Lu, Y.; Liu, X.; Song, J.; He, G.; Tiwari, M.K.; Carmalt, C.J.; Parkin, I.P. Table salt as a template to prepare reusable porous PVDF–MWCNT foam for separation of immiscible oils/organic solvents and corrosive aqueous solutions. Adv. Funct. Mater. 2017, 27, 1702926. [CrossRef]
© 2017 by the authors. Licensee MDPI, Basel, Switzerland. This article is an open access article distributed
under the terms and conditions of the Creative Commons Attribution (CC BY) license
(http://creativecommons.org/licenses/by/4.0/).

117
materials
Article
Surface-Modified Nanofibrous PVDF Membranes for Liquid Separation Technology
Evren Boyraz 1, Fatma Yalcinkaya 1,2,* , Jakub Hruza 1,2 and Jiri Maryska 1,2
1 Center for nanomaterials, Advanced Technology and Innovation, Department of Nanomaterials and Informatics, Technical University of Liberec, Studentska 1402/2, 46117, Czech Republic
2 Faculty of Mechatronics, Institute for New Technologies and Applied Informatics, Technical University of
Liberec, Studentska 1402/2, 46117 Liberec, Czech Republic
* Correspondence: [email protected]; Tel.: +420-485-353-389
Received: 1 August 2019; Accepted: 22 August 2019; Published: 23 August 2019
Abstract: Preparing easily scaled up, cost-effective, and recyclable membranes for separation technology is challenging.
In the present study, a unique and new type of modified polyvinylidene fluoride (PVDF) nanofibrous membrane was
prepared for the separation of oil–water emulsions. Surface modification was done in two steps. In the first step,
dehydrofluorination of PVDF membranes was done using an alkaline solution. After the first step, oil removal and
permeability of the membranes were dramatically improved. In the second step, TiO2 nanoparticles were grafted onto
the surface of the membranes. After adding TiO2 nanoparticles, membranes exhibited outstanding anti-fouling and
self-cleaning performance. The as-prepared membranes can be of great use in new green separation technology and
have great potential to deal with the separation of oil–water emulsions in the near future.
Keywords: PVDF; membrane; surface modification; filtration; nanofiber; electrospinning
1. Introduction
Burgeoning industrial development unavoidably generates large volumes of wastewater that contain emulsified
oil/water mixtures. Cost-effective and efficient separation processes for such mixtures are in high demand yet still
challenging. Current separation techniques include centrifuges, magnetic separation, oil skimming, floating, and
depth filters, which are more suitable for immiscible oil/water mixtures but not for emulsified ones [1]. Emulsified
oil/water mixtures can contain droplet sizes less than a few microns, which require specific separation techniques.
Polymer-based microfiltration (MF) membranes were successfully used for the separation of oil/water
emulsions. However, the permeability and flux of the membrane decline rapidly due to membrane fouling that
reduces their performance over a short operation time. The main reason for the membrane fouling is that oil droplets
plug the pore size of the membrane and/or adsorption of the surfactant. To address the membrane fouling problem,
several attempts were made to improve the hydrophilicity of the membrane through blending of hydrophilic
polymers, surface grafting, or surface modification. Zhang et al. [2] prepared an alkaline-induced phase inversion
polyacrylonitrile (PAN) membrane, which showed superhydrophilic/underwater superoleophobic characteristics.
During the phase inversion process, sodium hydroxide (NaOH) was added to the coagulation bath. In the NaOH
coagulation bath, the –CN groups of PAN hydrolyzed to –COOH groups, which introduced hydrophilic components to
the PAN. Moreover, adding NaOH led to the formation of a rough structure on the membrane surface. The resultant
membrane showed very high flux with oil rejection of the oil residual. On the other hand, Fan et al. [3] prepared
hydrophilic/oleophilic polystyrene (PS)/polyacrylonitrile (PAN) bicomponent membranes that exhibited extremely
high oil flux. The bicomponent PS/PAN membrane was prepared using the electro-blowing method. Results
indicated that the flux of the
Materials 2019, 12, 2702; doi:10.3390/ma12172702 www.mdpi.com/journal/materials

118
Materials 2019, 12, 2702 2 of 12
membrane achieved up to 1800 L·m−2·h−1 (efficiency > 99.6%) with a flux recovery ratio of 94.09% after 10 cycles. Moreover,
the tensile strength of the membrane improved by increasing the ratio of PAN in the mixture. In another work [4], titanium
dioxide (TiO2) nanoparticles were grafted onto the surface of polyvinylidene fluoride (PVDF)/polyacrylonitrile (PAN)
membranes using a two-step modification system. In the first step, hydroxyl and carbonyl groups were introduced onto the
membrane surface using low-vacuum argon plasma treatment and a NaOH aqueous solution. In the second step, TiO2
nanoparticles were grafted onto the surface of the membrane. Results indicated that the TiO2 grafted membrane showed
extremely high water permeability with a self-cleaning property. Nanofiber webs are a good candidate for use in filtration
applications due to their high surface area, tight pore size, and highly porous structure. Even though there is an air
filtration application on an industrial scale, water domain applications are still in progress. Mechanical strength of the
nanofibers is not enough to withstand any pressure under water. There were a number of works submitted on improving
mechanical properties of nanofibers such as dip coating, addition of epoxy,
polymer or inorganics blending, tailoring, ultrasonic welding, heat pressing, etc. [5–14].
Herein, the mechanical problem of the nanofiber layer was solved using the heat-press lamination process. Using this method, nanofiber webs were transported and adhered to a different surface without any damage [15]. A PVDF nanofibrous membrane was used for the separation of oil/water emulsions. PVDF is commonly used in membrane technology due to its outstanding mechanical, chemical, thermal, and oxidation resistance properties [16]. PVDF is an oleophilic/hydrophobic
membrane due to its low surface energy (25 dynes·cm−1) [16,17]. The aim of this work was to prepare self-cleaning PVDF nanofibrous hybrid membranes for the separation of oily wastewater.
For this reason, various nanofiber layers were used for the separation of oil–water emulsions. Firstly, performance of
the membranes was measured and compared. Secondly, selected membranes were carried to the surface modification
process. Finally, the self-cleaning membrane was prepared for the separation of oil–water emulsions.
1. Materials and Methods
1.1. Membrane Preparation
PVDF nanofibers were obtained from Nanocenter (Laboratory of nanomaterial application, Technical University of
Liberec, Liberec, Czech Republic). Nanofiber layers had densities of 1, 2, and 3 g/m2. To increase mechanical strength, a
100-g/m2 polyethylene terephthalate nonwoven (Mogul Nonwovens, Gaziantep, Turkey) was used as a supporter. A co-
polyester adhesive was used to bind nanofibers to the nonwoven surface. The heat-press method was applied as explained
previously [8,13,15]. The highest-density nanofiber web was taken for further surface modification. Sample abbreviations are
given in Table 1.
Table 1. Abbreviations of the samples. PVDF—polyvinylidene fluoride.
PVDF
1.2. Surface Modification
148.5 ± 45.6 3 - PVDF 3 134.2
± 37.2 3 NaOH PVDF_N 164.9 ± 40.3 1 NaOH + TiO2 PVDF_NT 248.2 ± 47.8 3 KOH PVDF_K 174.9 ± 57.6
3 KOH + TiO2 PVDF_KT 197.0 ± 54.7
Polymer Density (g/m2) Modification Abbreviation Fiber Diameter (nm)
1 2
- -
PVDF 1 PVDF 2
148.9 ± 23.1
The first step in the surface modification was done by dehydrofluorination of the PVDF membrane using alkaline
solutions. Two types of dehydrofluorinated PVDF were prepared with sodium hydroxide

119
(NaOH, Penta s.r.o., Prague, Czech Republic) and potassium hydroxide (KOH, Penta s.r.o., Prague,
Czech Republic).
The reaction of the alkaline solution with PVDF is given as follows [18]:
-(CH2-CF2)- + xOH → -(CH=CF)- + xF + H2O,
where x is Na or K.
After the lamination process, one of the membranes was immersed into 72 g of NaOH
solution in 30 mL of distilled water (DI) for 48 h, while the other membrane was immersed into 2 g
of KOH solution in 20 mL of isopropyl alcohol (IPA, Penta s.r.o., Prague, Czech Republic) for 1 h.
Subsequently, the membranes were taken from the alkaline solutions, washed several times
with DI, and immersed into 0.5 g of titanium dioxide (TiO2, 20 nm, Sigma-Aldrich spol. s.r.o,
Prague, Czech Republic)/40 mL of DI mixture and kept for 24 h.
Immediately after TiO2 treatment, the membranes were taken and washed several times using
DI water via the immersion method and one-minute cleaning with the ultrasonic cleaner to
remove excessive TiO2 on the surface of the membrane.
Hydroxyl groups play an important role in the reaction chemistry of metal-oxide surfaces
such as TiO2. The reaction of the alkaline solution with PVDF and the interaction between the
dehydrofluorinated PVDF and TiO2 are shown in Figure 1.
Figure 1. Surface modification of the polyvinylidene fluoride (PVDF) membrane.
The interaction between dehydrofluorinated PVDF and TiO2 was studied in the literature [4,19,20].
1.1. Characterization
Surface morphology of the membranes was characterized using scanning electron microscopy
(SEM, Vega 3SB, Brno, Czech Republic). The samples were mounted on a stub of metal with
adhesive (double-sided adhesive), coated with 7 nm of gold, and then observed in the microscope
under various magnifications at various places (accelerating voltage = 30 kV; beam intensity = 7).
Fiber diameter was analyzed using the free online Image-J program. From each sample, at least 50
fibers were measured. Average, maximum, and minimum pore sizes of the membranes were
measured using a custom-made porometer and the principle of bubble point measurement, as
explained in the literature [15]. The bubble point test is used to determine the size of the pores of
the porous material. In the bubble point test, sufficient gas pressure is applied to overcome the
capillary forces of the wetted membrane pores to determine largest pore size. In this method, it is
necessary to control the pressure needed to pass a liquid through the tested porous material and
for wetting the sample. The size of the average and minimum pores can also be determined by
increasing the air pressure and measuring its flow through the sample. In these circumstances, it is
necessary to compare the pressure curve of the wet sample with the pressure curve of the dry
sample. The flow rate increases when the pressure increases in the dry sample. On the other hand,
in the wet sample, at the beginning, there is no flow because all the pores are filled with the liquid.
At a certain pressure, the gas empties the largest pore, and gas begins to flow through the wet sample.
The intersection between the calculated half-dry and the wet sample gives the mean flow pore size.
When all the pores are emptied, an intersection between the wet and dry curve will be observed.
This means that the relationship between the applied pressure and the detected flow becomes linear,
and the intersection of the wet and dry curve represents

120
the detected minimum pore size. In this work, ethylene glycol (surface tension 47.3 mN·m−1) was
used to wet the samples. Both wet and dry measurement were taken to determine maximum,
minimum, and mean pore size. At least three measurements were taken.
Air permeability of the membranes was tested using an SDL ATLAS Air Permeability Tester
(Rock Hill ATLAS Air Permeability Tester (at 200 Pa and 20 cm2, Rock Hill, SC, USA). The air
permeability test was used for determination of the air permeability of the flat membrane. A
specimen was clamped over the test head opening by pressing down the clamping arm, which
started the vacuum pump. Measurements were performed by application of 200 Pa of air pressure
per 20 cm2 of fabric surface. At least three measurements were taken at various places on the
membrane. Results were expressed as
L·m−2·s−1.
Bursting pressure of the membranes was tested, and the maximum delamination pressure
was recorded using a custom-made device. The membrane (47 mm in diameter) was placed
between two rings, and pressurized water was applied from one side until the nanofiber layer
delaminated from the supporting layer. The hydrostatic pressure was measured using a pressure
controller, which was placed in front of the membrane and connected to a computer. The hydrostatic
pressure was increased gradually, and, as soon as the nanofiber layer burst, the pressure value on
the screen decreased sharply. The maximum pressure value was recorded as the
bursting/delamination strength of the membrane [15].
A Krüss Drop Shape Analyzer DS4 (Krüss GmbH, Hamburg, Germany) was used for
the measurement of water contact angle using distilled water (surface tension 72.0 mN·m−1). Five measurements from each membrane were taken.
The hydroxyl groups on the PVDF nanofiber were observed using Fourier-transform infrared
spectroscopy (FTIR, Nicolet iZ10 by Thermo Scientific, Prague, Czech Republic).
1.1. Emulsion Preparation
A 50 vol.%/50 vol.% oil/water emulsion was prepared. Water-soluble/oil-insoluble food
colorant was used to detect permeate after separation. Nonionic Triton X-100 (Sigma-Aldrich spol.
s.r.o, Prague, Czech Republic) was used as a surfactant for preparation of the emulsion. Generally,
oil–water emulsions are prepared using nonionic surfactants [21]. The preparation method was as
follows:
−→ A few drops of pink color food colorant were mixed with 100 g of distilled water.
−→ Then, 2 g of surfactant was added to the water and mixed with a magnetic stirrer for 10 min.
−→ Next, 100 g of sunflower oil was added to the water/surfactant mixture.
−→ Finally, the solution was mixed with a magnetic stirrer at 500 rpm for 24 h.
A digital microscope (Levenhuk Digital Microscope, Prague, Czech Republic) was used for the
determination of oil droplet size (Figure 2). The emulsion was kept for one week without any
stirring. Droplet size was then measured. There was no change in the size of the droplets. Average
drop size was found to be 1.05 ± 0.34 µm.
Figure 2. Droplets of oil under a microscope.

121
1.1. Filtration Test
An Amicon (50 mL stirred cell, Millipore Corporation, Billerica, MA, USA) dead-end filtration
unit was used for the separation test. The flux and the permeability of the samples were calculated
according to Equations (1) and (2).
F=G/At (1)
P= F/T (2)
where F is the flux (L·m−2·h−1), A is the area of the membrane (m2), G is the amount of permeate (L), t is the time of the filtration process, T is the transmembrane pressure, and P is the permeability
of the membrane (L·m−2·h−1·bar−1).
Selectivity of the membranes was observed according to permeate color, and the microscope
was used to detect any oil droplets in the permeate. The separation test for one membrane was
done a number of times. In the first step, only 15 mL of distilled water was used as feed; in the
second step, 15 mL of emulsion was used. This process was repeated at least three times to observe
membrane fouling or self-cleaning.
2. Results and Discussion
2.1. Characterization of the Membranes
SEM images of the samples were taken after lamination and the surface modification process
(Figures 3 and 4).
Figure 3. SEM images of (a) PVDF 1, (b) PVDF 2, and (c) PVDF 3 after lamination.
It was observed that the fiber diameter did not change with increasing nanofiber web density
(Figure 3, Table 1). Since spinning conditions remained the same, only the backing paper speed was
changed to get various nanofiber web densities, which did not influence fiber diameter. On the
other hand, treatment of the PVDF nanofiber with an alkaline solution yielded a slight increase in
fiber diameter because of swelling of the fibers (Figure 4a,c). Figure 4b,d show that TiO2
nanoparticles distributed very well on the surface of the nanofiber without any aggregation,
showing that a regular dehydrofluorination took place. Hydrophilic OH groups on the membrane
attached to the TiO2 nanoparticles. The fibers became thicker after the TiO2 nanoparticle
attachment on the surface.
The FTIR spectra were collected in order to investigate the chemical structure of the PVDF
nanofibrous webs. These are shown in Figure 5. The stretching bands at 1173 cm−1 and 876 cm−1
were attributed to the –CF2 and C–F groups of PVDF. The spectra confirmed the presence of –OH groups
after surface modification, with absorption bands at 1600 cm−1 representing –OH group deformation vibrations. The very broad and less intense peak between 2500 cm−1 and 3500
cm−1 was due to O–H functionalities. It may be concluded that the bonded –OH groups played a major role in the hydrophilicity of the membranes.

122
Figure 4. SEM images of (a) PVDF_N, (b) PVDF_NT, (c) PVDF_K, and (d) PVDF_KT.
stretching vibration C-F bond
500 1000 1500 2000 2500 3000 3500
Wavenumbers (cm-1)
Figure 5. Fourier-transform infrared (FTIR) image of the PVDF membranes.
Pore size of the samples before modification was measured and is shown in Table 2.
Membrane pore size for the modified samples was not measured. Once the samples were
modified, they were kept wet in distilled water as recommended. It was found that drying of the
modified and wetted
symmetrical stretching of -CF 2
stretching vibration -OH
deformation vibration -OH
PVDF_K
PVDF_N
PVDF
Ab
sorb
an
ce

123
membrane could cause possible membrane cracks and damage. Unfortunately, pore size measurement was done
only for the dry samples. Increased nanofiber web density caused a decrease in the average pore size due to the
compact structure. The role of pore size in the separation process was significant. Tight pore size increased the
selectivity of the membranes.
Table 2. Maximum and average pore size of the membranes.
Sample Maximum Pore Size (µm) Average Pore Size (µm)
PVDF 1 4.54 ± 0.14 2.50 ± 0.29 PVDF 2 4.20 ± 0.00 1.15 ± 0.08
PVDF 3 4.23 ± 0.05 0.72 ± 0.04
Air permeability of the membranes was measured after the lamination process. The main aim of this step
was to observe whether the adhesive blocked the pore size of the nanofibers during lamination. The bursting
pressure test is another method of determining the quality of the lamination process. Using this test, the
strength of the lamination was measured. Figure 6 shows the relationship among density of the nanofiber
layer, air permeability, and bursting pressure.
PVDF 1 PVDF 2 PVDF 3
120
140
160
180
200
220
240
260
Bursting strength Air permeability
Bu
rsti
ng
str
en
gth
(kP
a)
3
4
5
6
7
8
9
10
11
12
Air p
erm
ea
bility
(Lm
-2s-1)
Figure 6. Bursting pressure and air permeability of the membrane according to nanofiber web density.
There was an inverse proportional relationship between the density of the nanofiber web and air
permeability. Lower density meant fewer fiber bundles on the web, which resulted in a more open structure.
On the contrary, higher density meant more fiber bundles, which resulted in a compact structure. Bursting
pressure results indicated that, at the lowest density (1 g/m2), adhesion of the nanofibers to the support was
not as strong as that at the higher nanofiber web density. The reason could have been the low mechanical
strength and high abrasion resistance of the low-density nanofiber fiber web. As soon as the fiber density
increased from 1 to 2 g/m2, bursting pressure improved by 80%. Further improvements did not change fiber
density significantly. Based on previous work [8,13], the minimum required bursting pressures for the PVDF
and polyacrylonitrile (PAN) nanofiber membranes were determined to be 175 kPa and 195 kPa, respectively.
When density exceeded 1 g/m2, nanofibers showed a bursting pressure >175 kPa. It can be suggested that the
minimum required nanofiber web density is 2 g/m2 for the preparation of membranes. Since the membrane
with 3 g/m2 showed excellent bursting pressure, and the possibility of modification of more fibers on the
surface, this membrane was selected as the candidate for surface modification.

124
Water contact angle (CA) of the membranes was measured. Membrane behavior under
emulsion changed due to additives such as surfactant. The CA of the membranes was measured
after oil separation. Results are given in Table 3.
Table 3. Water contact angle (CA) of the membranes before and after separation.
Sample CA before Separation (◦) CA after Separation (◦) Image (Before Separation)
PVDF 1 71.23 ± 1.31 62.40 ± 2.17
PVDF 2 80.83 ± 1.53 47.46 ± 1.93
PVDF 3 89.40 ± 4.67 35.32 ± 8.71
PVDF_N 0 0 -
PVDF_NT 39.43 ± 3.01 0
PVDF_K 0 0 -
PVDF_KT 0 0 -
The CA of the neat membranes without any modification had a contact angle <90◦, which can
be considered “hydrophilic”. Typically, PVDF nanofibers have a hydrophobic nature. After
lamination, the surface structure of the PVDF membranes most likely changed. Moreover, the
adhesive web between the nanofiber and the supporting layer played a significant role. The
adhesive web partly covered the surface of the nanofibers, which may have exhibited hydrophilic
characteristics.
Results of the CA showed that increasing the density of the nanofiber web decreased the
wettability of the samples. There was a proportional relationship between nanofiber web density
and CA.
Research results indicated that increasing the hydrophilicity of the membrane prevented
membrane fouling and improved membrane permeability [4,16,22].
1.1. Separation Test
A separation test was run using dead-end cell separation, and the permeability of the
unmodified membranes was calculated according to Equation (2). Results are given in Figure 7,
which compares unmodified membranes at various densities. Each membrane was used and
circulated three times to measure fouling. Between each circulation, distilled water was filtrated.
Results indicated that, at the beginning, PVDF 2 showed enormous permeability compared to the
others. The lowest permeability was achieved using PVDF 3 at the first circulation. However,
membranes PVDF 1 and PVDF 2 showed a sharp decrease in permeability with the second
circulation; the reason for this was membrane fouling. The membrane with the highest nanofiber
density (PVDF 3) showed a stable permeability after three circulations; this could have been due to
the high specific surface area of PVDF 3. A higher density meant more nanofiber web was on the
structure, resulting in a bigger surface area in total. On the contrary, Hobbs et al. [23] found that
there is a proportional relationship between flux decline ratio and membrane surface area. A higher
surface area showed a higher flux decline ratio.

125
18
15
12
9
6
3
0 1 2 3
Circulation
Figure 7. Permeability of the unmodified membranes.
Figure 8 shows the results of the modified membranes. Surface modification helped improve membrane
surface cleaning. For long-term application, surface-modified membranes should be an excellent candidate for
use in the separation process. Life span and performance of the membranes were improved using surface
modification. Moreover, the added TiO2 acted as an antibacterial on the membranes. The TiO2 nanoparticles
were activated under ultraviolet (UV) light during separation, which might have enhanced the performance,
self-cleaning, and antibacterial properties of the membranes [24]. Montazer et al. [25] modified the surface of
polyester/wool fabric using TiO2 nanoparticles. Water adsorption increased, while the time of water droplet
adsorption decreased.
30
24
18
12
6
0
1 2 3
Number of circulation
Figure 8. Permeability of the modified membranes.
Moreover, the antibacterial efficacy of the material against Escherichia coli was found to be 100%. In
another study, it was reported that a polydimethylsiloxane (PDMS)/TiO2 composite provided excellent
photocatalytic properties and developed self-cleaning properties [26]. Xu et al. [27] prepared TiO2–high-density
polyethylene (HDPE) nanocomposite surfaces that exhibited superhydrophobicity. Exposure to UV light caused
the surface of the composite to become hydrophilic. As a result, wettability and self-cleaning properties of the
nanocomposite increased. More examples appeared in the literature. The effectiveness of TiO2 nanoparticles
on wettability and self-cleaning properties is indisputable.
PVDF 1 PVDF 2 PVDF 3
PVDF 3
PVDF_KT
PVDF_N PVDF_NT PVDF_K
Perm
eab
ilit
y (
Lm
-2h
-1b
ar-1
)
Perm
eab
ilit
y (
Lm
-2h
-1b
ar-1
)

126
The surface of the membranes after oil separation was detected using SEM images, as shown in Figure 9. We could
understand from the SEM images that membranes with high permeability and surface cleaning attracted less oil. For instance, the
permeability of the PVDF 3 decreased consistently in each circulation. PVDF_N was blocked after the first circulation. These two
membranes showed, in the SEM images (Figure 9a,b), that an oily film covered the surface of the membranes. For the membranes
PVDF_N and PVDF_NT, there was less oil contamination on the membrane surface. Based on this result, it can be concluded that
surface modification improved membrane permeability and self-cleaning performance.
Figure 9. SEM images of the samples after oil separation: (a) PVDF 3, (b) PVDF_N, (c) PVDF_NT,
(d) PVDF_K, (e) PVDF_KT.
Permeate solution was collected and checked under the microscope to detect any oil droplets. Moreover, coloring the water
helped to detect oil content in the mixture. Unmodified membranes showed hydrophobic/oleophilic characteristics, while modified
membranes were hydrophilic/oleophobic.
1. Conclusions
PVDF is one of the most frequently used polymers in the membrane filtration market due to its outstanding properties, such
as chemical resistance, thermal stability, and high mechanical strength. Despite the superior properties of PVDF membranes, there
is still plenty of room for improvement in membrane performance and life span. In this work, PVDF nanofibrous hybrid
membranes were prepared for the separation of the oil–water emulsions. A two-step surface modification took place using
alkaline solution and TiO2 nanoparticle grafting. Water permeability of the membranes increased due to –OH groups and
hydrophilic TiO2 nanoparticles (NPs) on the membrane surface.
Moreover, membranes showed self-cleaning properties after the modification process. Photocatalytic activity can be
improved through UV induction on the TiO2-modified membranes. We believe that this method can be used in the separation of
emulsified oil/water. Based on the result, it can be concluded that nanofiber webs are good candidates for water domain filtration
applications.

127
Author Contributions: Conceptualization, E.B. and F.Y.; methodology, F.Y.; software, E.B.; validation, E.B., F.Y., and J.H.; formal analysis, E.B.; investigation, F.Y.; resources, F.Y. and J.H.; data curation, E.B. and F.Y.; writing—original draft preparation, F.Y.; writing—review and editing, F.Y.; visualization, E.B. and F.Y.; supervision, F.Y.; project administration, J.M., F.Y., and J.H.; funding acquisition, F.Y., J.M., and J.H.
Funding: This research was funded by “The Ministry of Industry and Trade in the framework of the Program Trio; project Reg. No. FV10409 and the Ministry of Education, Youth, and Sports of the Czech Republic and the European Union, European Structural and Investment Funds in the frames of Operational Program Research, Development, and Education HyHi, Reg. No. CZ.02.1.01/0.0/0.0/16_019/0000843” and “The APC was funded by the Ministry of Industry and Trade in the framework of the Program Trio; project Reg. No. FV10409 and the Ministry of Education, Youth, and Sports of the Czech Republic and the European Union, European Structural and Investment Funds in the frames of Operational Program Research, Development, and Education HyHi, Reg. No. CZ.02.1.01/0.0/0.0/16_019/0000843”.
Conflicts of Interest: The authors declare no conflicts of interest.
References
1. Zhang, W.; Shi, Z.; Zhang, F.; Liu, X.; Jin, J.; Jiang, L. Superhydrophobic and superoleophilic PVDF membranes
for effective separation of water-in-oil emulsions with high flux. Adv. Mater. 2013, 25, 2071–2076. [CrossRef]
2. Zhang, F.; Gao, S.; Zhu, Y.; Jin, J. Alkaline-induced superhydrophilic/underwater superoleophobic
polyacrylonitrile membranes with ultralow oil-adhesion for high-efficient oil/water separation. J. Memb. Sci.
2016, 513, 67–73. [CrossRef]
3. Fan, L.; Yan, J.; He, H.; Deng, N.; Zhao, Y.; Kang, W.; Cheng, B. Electro-blown spun PS/PAN fibrous membrane
for highly efficient oil/water separation. Fibers Polym. 2017, 18, 1988–1994. [CrossRef]
4. Yalcinkaya, F.; Siekierka, A.; Bryjak, M. Preparation of fouling-resistant nanofibrous composite membranes for separation of oily wastewater. Polymers 2017, 9, 679. [CrossRef]
5. Yalcinkaya, F. Preparation of various nanofiber layers using wire electrospinning system. Arab. J. Chem. 2016. [CrossRef]
6. Grimmelsmann, N.; Grothe, T.; Homburg, S.V.; Ehrmann, A. Electrospinning and stabilization of chitosan nanofiber mats. In Proceedings of the IOP Conference Series: Materials Science and Engineering, Beijing, China, 24–27 October 2017; Volume 254, p. 102006.
7. Charles, L.F.; Shaw, M.T.; Olson, J.R.; Wei, M. Fabrication and mechanical properties of PLLA/PCL/HA
composites via a biomimetic, dip coating, and hot compression procedure. J. Mater. Sci. Mater. Med. 2010, 21,
1845–1854. [CrossRef]
8. Roche, R.; Yalcinkaya, F. Incorporation of PVDF nanofibre multilayers into functional structure for filtration applications. Nanomaterials 2018, 8, 771. [CrossRef]
9. Jahanbaani, A.R.; Behzad, T.; Borhani, S.; Darvanjooghi, M.H.K. Electrospinning of cellulose nanofibers mat for laminated epoxy composite production. Fibers Polym. 2016, 17, 1438–1448. [CrossRef]
10. Liu, R.; Ma, L.; Mei, J.; Huang, S.; Yang, S.; Li, E.; Yuan, G. Large areal mass, mechanically tough and freestanding electrode based on heteroatom-doped carbon nanofibers for flexible supercapacitors. Chem. A Eur. J. 2017, 23, 2610–2618. [CrossRef]
11. Wirth, E.; Sabantina, L.; Weber, M.; Finsterbusch, K.; Ehrmann, A. Preliminary study of ultrasonic welding as a joining process for electrospun nanofiber mats. Nanomaterials 2018, 8, 746. [CrossRef]
12. Sabantina, L.; Hes, L.; Mirasol, J.R.; Cordero, T.; Ehrmann, A. Water vapor permeability through PAN nanofiber mat with varying membrane-like areas. Fibres Text. East. Eur. 2019, 27, 12–15. [CrossRef]
13. Roche, R.; Yalcinkaya, F. Electrospun polyacrylonitrile nanofibrous membranes for point-of-use water and air cleaning. ChemistryOpen 2019, 8, 97–103. [CrossRef] [PubMed]
14. Sabantina, L.; Kinzel, F.; Hauser, T.; Többer, A.; Klöcker, M.; Döpke, C.; Böttjer, R.; Wehlage, D.; Rattenholl, A.; Ehrmann, A. Comparative Study of Pleurotus ostreatus Mushroom Grown on Modified PAN Nanofiber Mats. Nanomaterials 2019, 9, 475. [CrossRef] [PubMed]
15. Yalcinkaya, F.; Hruza, J. Effect of laminating pressure on polymeric multilayer nanofibrous membranes for
liquid filtration. Nanomaterials 2018, 8, 272. [CrossRef] [PubMed]
16. Yalcinkaya, F.; Siekierka, A.; Bryjak, M. Surface modification of electrospun nanofibrous membranes for oily wastewater separation. RSC Adv. 2017, 7, 56704–56712. [CrossRef]
17. Zhou, Z.; Wu, X.F. Electrospinning superhydrophobic-superoleophilic fibrous PVDF membranes for high-
efficiency water-oil separation. Mater. Lett. 2015, 160, 423–427. [CrossRef]

128
18. Xiao, L.; Davenport, D.M.; Ormsbee, L.; Bhattacharyya, D. Polymerization and functionalization of
membrane pores for water related applications. Ind. Eng. Chem. Res. 2015, 54, 4174–4182. [CrossRef] 19. Martakov, I.S.; Torlopov, M.A.; Mikhaylov, V.I.; Krivoshapkina, E.F.; Silant’ev, V.E.; Krivoshapkin, P.V.
Interaction of cellulose nanocrystals with titanium dioxide and peculiarities of hybrid structures formation. J. Sol-Gel Sci. Technol. 2018, 88, 13–21. [CrossRef]
20. Dong, L.; Liu, X.; Xiong, Z.; Sheng, D.; Lin, C.; Zhou, Y.; Yang, Y. Preparation of UV-blocking poly(vinylidene fluoride) films through SI-AGET ATRP using a colorless polydopamine initiator layer. Ind. Eng. Chem. Res. 2018, 57, 12662–12669. [CrossRef]
21. Shi, F.; Wu, J.; Zhao, B. Preparation and investigation of intelligent polymeric nanocapsule for enhanced oil recovery. Materials 2019, 12, 1093. [CrossRef]
22. Naseeb, N.; Mohammed, A.A.; Laoui, T.; Khan, Z. A novel PAN-GO-SiO2 hybrid membrane for
separating oil and water from emulsified mixture. Materials 2019, 12, 212. [CrossRef] [PubMed]
23. Hobbs, C.; Hong, S.; Taylor, J. Effect of surface roughness on fouling of RO and NF membranes during
filtration of a high organic surficial groundwater. J. Water Supply Res. Technol. AQUA 2006, 55, 559–570.
[CrossRef]
24. Martins, P.M.; Ribeiro, J.M.; Teixeira, S.; Petrovykh, D.Y.; Cuniberti, G.; Pereira, L.; Lanceros-Méndez, S. Photocatalytic microporous membrane against the increasing problem of water emerging pollutants. Materials 2019, 12, 1649. [CrossRef] [PubMed]
25. Montazer, M.; Seifollahzadeh, S. Enhanced self-cleaning, antibacterial and UV protection properties of
nano TiO2 treated textile through enzymatic pretreatment. Photochem. Photobiol. 2011, 87, 877–883.
[CrossRef] [PubMed]
26. Tavares, M.T.S.; Santos, A.S.F.; Santos, I.M.G.; Silva, M.R.S.; Bomio, M.R.D.; Longo, E.; Paskocimas, C.A.;
Motta, F.V. TiO2/PDMS nanocomposites for use on self-cleaning surfaces. Surf. Coatings Technol. 2014,
239, 16–19. [CrossRef]
27. Xu, Q.F.; Liu, Y.; Lin, F.J.; Mondal, B.; Lyons, A.M. Superhydrophobic TiO2-polymer nanocomposite
surface with UV-induced reversible wettability and self-cleaning properties. ACS Appl. Mater. Interfaces
2013, 5, 8915–8924. [CrossRef] [PubMed]
© 2019 by the authors. Licensee MDPI, Basel, Switzerland. This article is an open access article distributed under
the terms and conditions of the Creative Commons

129
AppliedSurfaceScience526(2020)146575
PVDF nanofibrous membranes modified via laser-
synthesized Ag nanoparticles for a cleaner oily
water separation
R. Torres-Mendietaa,⁎, F. Yalcinkayaa, E. Boyraza, O. Havelkaa, S.
Wacławeka, J. Maryškaa,
M. Černíka, M. Bryjakb
a Institute for Nanomaterials, Advanced Technologies and Innovation, Technical University of Liberec, Studentská 1402/2, 461 17
Liberec, Czech Republic b
Department of Polymer and Carbon Materials, Wrocław University of Science and Technology, Wyb. St. Wyspianskiego 27, 50-370
Wrocław, Poland
A R T I C L E I N F O
Keywords:
Laser-synthesis of nanomaterials
Oil/water separation
PVDF membrane
Ag nanoparticle
Nanofiber
A B S T R A C T
The relatively new exploitation of nanoassemblies used for the recovery of clean water from oily emulsions has
received a great deal of attention recently. Among the different innovations, nanofibrous membranes decorated
with nanoparticles seem to be the most promising option due to their versatility, recyclability, and high oil/
water separation performance. In the current study, we introduce a laser-mediated strategy to produce poly-
vinylidene fluoride nanofibrous membranes decorated with a low loading of Ag nanoparticles. The pristine
membranes were firstly modified by an alkaline treatment to obtain hydroxyl groups on their surface, which
then facilitated the nanoparticle decoration. The synthesis and decoration of the nanoparticles were achieved by
the laser-mediated reduction of silver nitrate dissolved in water, while no hazardous reducing or stabilizing
agents were employed in the process. In comparison with the unmodified membrane, the modified one displayed
an outstanding hydrophilic behavior and a remarkable 3.9-fold improvement in the separation of water from oily
emulsions with a nearly negligible permeability decline through the time. In sum, the introduced methodology
not only enables the improvement over the oil/water separation performance in polymer-based membranes but
also promises to reduce the environmental impact related to the design of nanotechnology-based solutions used
in the sector.
1. Introduction
Over the last two centuries, the improper management of water has
led to severe environmental issues. One of the most frequent is the oil
wastewater contamination, which can be associated with health pro-
blems resulting from exposure to its toxic compounds [1]. The greatest
challenge behind the treatment of oily polluted water lies in the com-
plexity of removing tight emulsions or hydrate formations. The various
solutions that the scientific community is currently exploring en-
compass the following alternatives: flotation, gravity separation, ad-
sorption, electrocoagulation, flocculation, coagulation, and membrane
filtration [2]. Among the different options, a combination of membrane
filtration and contemporary nanotechnology advances appears to be
one of the most promising. In addition to the inherent benefits of the
membranes, such as their easiness of operation and smaller carbon
footprint compared to other systems, the incorporation of nanomater-
ials like nanofibers provides a low flow resistance, bio-compatibility,
and high porosity; properties that significantly improve the oil/water
separation efficiency [3].
However, the technology still faces a major challenge; during the
separation process, foulants such as colloids, microorganisms, organic
matter, suspended solids, emulsified oils or macromolecules, accumu-
late on the membrane surface and block the membrane pores, resulting
in an increase in the membrane mass transfer resistance and decrease in
permeate flux [4]. To alleviate such drawbacks, chemical/mechanical
cleaning, adjustment of operating conditions, pre-treatment of the feed
water, and membrane surface modification have been tested [5], the
latter being a solution with virtually unlimited alternatives. In this
context, one of the most exciting forms of surface modification is the
incorporation of metal and semiconductor nanoparticles (NPs) on the
surface of nanofibrous membranes, which largely improves the long-
term membrane permeability and antifouling properties [6], or provide
them with additional purification features like the photocatalytic de-
gradation of dissolved pollutants in the water [7]. In particular, the use
of Ag NPs has been intensively explored due to its antibacterial per-
formance, which prevents the biofouling of the membranes caused by
settlement and growth of microorganisms, and its ability to turn hy-
drophobic surfaces into hydrophilic, which results in the increment of
⁎ Corresponding author.
E-mail address: [email protected] (R. Torres-Mendieta).
https://doi.org/10.1016/j.apsusc.2020.146575
Received 7 February 2020; Received in revised form 14 April 2020; Accepted 3 May 2020
Contents lists available at ScienceDirect
Applied Surface Science
journal homepage: www.elsevier.com/locate/apsusc

130
R. Torres-Mendieta, et al. AppliedSurfaceScience526(2020)146575
2
Fig. 1. Schematic diagram of the dehydrofluorination process.
the water flux, rejection of hydrophobic foulants like oil pollutants, and
overall antifouling performance [8]. However, similar to the buildup
case of most of the nanometric systems, their most common synthetic
routes are associated with the use of hazardous reducing and stabilizing
agents, which inevitably contributes to environmental pollution [9].
In the current work, we addressed this issue by exploring for the
first time the employment of a laser-mediated synthesis strategy to
generate ligand-free Ag NPs and decorate the surface of Polyvinylidene
fluoride (PVDF) nanofibrous membranes in a single stage to improve
their oil/water separation properties, while the usage of reducing or
stabilizing agents was suppressed during the process.
The NPs synthesis strategy known as pulsed laser photoreduction/
oxidation in liquids (LPL) is a technique driven by an extreme light-
matter interaction; a pulsed laser source is used to promote the optical
breakdown of a liquid that contains precursor metal salts. The extreme
peak intensities required to reach the optical breakdown in various li-
quids (>1010 W/cm2) [10], usually lead to the photolysis of the solvent
molecules and the formation of radicals, which prompt the reduction of
the precursor metal salts. Subsequently, the reduced salts form the final
NPs [11], which, if are in the vicinity of a nanofibrous material, can be
physically adsorbed to its surface. As the process does not require the
use of any stabilization agent, the surface of the decorating NPs remains
free from any ligand; a highly desirable situation since the covering of
NPs by ligands may result in the suppression of their physical and
chemical properties or to crossed chemical effects [12].
Overall, the goal of the current work was to introduce in the oil/
water separation literature, the use of a NPs laser-mediated synthesis
strategy to improve the separation performance of nanofibrous mem-
branes. Although the versatility of the proposed synthesis strategy has
brought plenty of benefits to the eco-friendly design of complex nano-
metric systems, to our knowledge, it has never been applied in the
fabrication of potent oil/water separation materials, where the pre-
ferred use of light over the commonly employed reducing chemical
agents, may have not only a positive impact on the reduction of che-
mical waste generation but also the ligand-free surface of the laser-
synthesized NPs may be of more significant benefit in terms of atom
economy. Thus, the recovery of clean water from oily polluted sources
is not overshadowed by the commonly employed polluting synthetic
strategies behind the development of the materials used in the sector.
1. Experimental
1.1. Membrane preparation
PVDF nanofibers were prepared on a needleless electrospinning
system (Nanospider NS 8S1600U, Elmarco, Liberec, Czech Republic).
The nanofiber webs (density of 3.5 g/m2) were collected on a silicon
paper, and further laminated to improve their mechanical strength by a
heat-press equipment (Pracovni Stroje, Teplice, Czech Republic). For
the hybrid membrane, a copolyester adhesive was used to adhere the
nanofiber web to a polyethylene terephthalate spunbond nonwoven
(100 g/m2, Mogul Co. Ltd., Gaziantep, Turkey) under a thermal treat-
ment of 130 C and a pressing force of 50 kN [13].
1.2. Surface modification
Even though PVDF is one of the most popular polymers used for
building nanofibrous membranes, it is still a non-reactive material that
may not allow the adsorption of NPs over its surface. To permit the NPs
decoration, it was necessary to add hydroxyl groups over the surface of
the nanofibers. For this, a 1.4 M solution of potassium hydroxide (KOH,
Fluka, Czech Republic) in isopropanol (IPA, Fluka, Czech Republic) was
prepared by magnetically stirring for 1 h at a temperature of 50 C.
After the KOH was fully dissolved in the IPA, the solution was cooled at
room temperature and stored for further use.
The dehydrofluorination of the PVDF membrane was performed by
immersing the membrane in the alkaline solution and leaving it to react
for 30 min at room temperature. Subsequently, the membrane’s color
changed from white to brown as it is graphically depicted in Fig. 1.
Finally, the membrane was washed several times with deionized water
(18.2 M cm) and further stored in clean deionized water.
1.3. Laser-mediated synthesis and decoration of Ag NPs
The Ag NPs synthesis and decoration of the membrane’s surface
took place at the same time. The synthesis setup was based on the one
previously reported by our research team for the formation of Fe-Cu
oxide nanocrystals [14]. In short, as it is graphically represented in
Fig. 2, a laser beam was focused by a plano-convex lens in a glass vessel
containing 5 mM liquid solution of silver nitrate (AgNO3, Sigma–Al-
drich, USA) in deionized water, and continuously mixed by a magnetic
stirrer, where the concentration was selected according to previous
reports [15]. During the process, a PVDF dehydrofluorinated membrane
(PVDF-OH) was situated on the walls of the glass vessel, so the newly
synthesized Ag NPs could be physically adsorbed onto the membrane’s
surface.
The laser source used for the experiments was a Nd:YLF (Litron
Lasers; LDY300 PIV Series diode-pumped, dual cavity), delivering
pulses with a duration of 150 nm full width at half maximum (FWHM)
at a central wavelength of 527 nm, a repetition rate of 1 kHz each
cavity, and a beam diameter of 5 mm at a width of 1/e2. The average
power used was 11 W, and the lens focal length was 35 mm. Therefore,
the peak intensity used to irradiate the liquid solution was 71010 W/
cm2, which according to the relevant literature, is enough to prompt the

131
Fig. 2. Setup used for the laser-mediated synthesis and decoration of Ag NPs.
optical breakdown in water that consequently leads to the creation of
radicals that allow the reduction of the metal ions [10]. Once the NPs
are synthesized, the magnetic stirrer permits their movement through
the liquid medium taking them away from the laser focal point and
approaching them to the membrane, where they are physically ad-
sorbed through the OH- groups [16]. Note that the synthesis process
was optimized to irradiate for 5 min every mL of the corresponding
liquid solution; therefore, it may take a longer time the usage of larger
liquid volumes. Besides, it is worth mentioning that the employment of
a ns pulsed laser source with the laser parameters used in the current
experiment, but with a shorter pulse duration than 150 nm, should lead
to a more efficient reduction of metal ions since the peak intensity can
be incremented.
Once the synthesis process finished, the magnetic stirrer kept
working for another 2 h to increment the chances of fully decorating the
whole of the membrane’s surface. Afterward, the membrane decorated
with the Ag NPs (Ag/PVDF-OH) was rinsed several times with deio-
nized water to remove the Ag NPs that were not properly attached to
the membrane. After, the used water was appropriately laid-off.
1.1. Membrane characterization
The OH- functionalization of the PVDF nanofibers was verified by
Fourier transform infrared spectroscopy (FT-IR, NICOLET IZ10, Thermo
Scientific, USA) performed in the dried samples. The corresponding
spectra were taken at a wavenumber range of 4000–500 cm−1 with a
resolution of 2 cm−1. The surface roughness of the samples before and
after the dehydrofluorination process was measured employing Atomic
Force Microscopy (AFM, JPK nanowizard III, Bruker Corporation, USA).
The scannings were always performed on a surface area of 10 × 10 µm
using contact mode with a cantilever NANOSENSORSTM PPP-
CONTSCR.
The membrane’s morphology was examined by field emission
scanning electron microscopy (FE-SEM, UHR Carl Zeiss Ultra Plus,
Jena, Germany). The instrument was operated at various accelerating
voltages (EHT; 2–10 kV) and working distances (WD; 7.4–7.9 mm). The
topography examination was performed by analyzing the secondary
electrons (SEs), and the observation of the Ag NPs was assessed by
analyzing the backscattered electrons (BSEs). Also, the elemental
composition was verified with an energy-dispersive X-ray detector
(EDX, Oxford X-Max 20, UK), which was attached to the FE-SEM and
the corresponding quantification was performed using the software
AZtec 2.4. The amount of Ag mass loading in the membrane’s surface
was roughly calculated by inspecting the FE-SEM micrographs, and
their stability was assessed by the measurement of the Ag content in the
resulting water after the separation tests through an inductively cou-
pled plasma - mass spectrometer (ICP-MS; Perkin Elmer, NexION
Fig. 3. Scheme of the dead-end filtration device.
3000D, USA), which has a detection limit of 0.5 ng/L.
The pore size of the membranes was determined by the bubble point
method using a Porometer 3G through a pore size analyzer
(Quantachrome Instruments, Anton Paar GmbH, Germany). The tests
were performed according to the ASTM F316-03(2011) standard.
Finally, the water contact angle in air and underwater oil contact angle
of the samples was determined using a Krüss Drop Shape Analyser DS4
(Krüss GmbH, Hamburg, Germany). For the water contact angle in air,
the droplets consisted of deionized water (surface tension 72.0 mN/m,
deionized by Aqual 27, Czech Republic), and the measurements were
taken at six different points on the clean and dry samples at room
temperature. For the underwater oil contact angle measurements, the
droplets consisted of vegetable oil (Lukana sunflower oil, Czech
Republic), and the measurements were taken by fixing the membranes
at an altitude of 1 cm from the bottom of a water reservoir, which was
covered with deionized water to a maximum height of 4 cm. The oil
droplets were released from the bottom of the water reservoir so they
could float and interact with the membrane’s surface.
1.2. Separation test
A 50 mL Amicon dead-end filtration device (Millipore Corporation
Billerica, MA, USA) was used for the filtration tests (Fig. 3). The feed
solution for the filtration test was prepared by mixing a green-colored
(Kovandvi, Czech Republic) distilled water with vegetable oil (Lukana
sunflower oil, Czech Republic) in a 1:1 weight ratio and 0.1% wt. of the
non-ionic Triton X100 surfactant (Sigma–Aldrich, USA) for making the
emulsion. The feed was mixed by a magnetic stirrer (500 rpm) at room
temperature for 5 h until a uniform emulsion was obtained. The sta-
bility of the emulsion was assessed by measuring the diameter of the oil
droplets with an optical microscope (Levenhuk Digital Microscope,
Czech Republic), just after the emulsion preparation and after two
weeks while the emulsion kept stored at room temperature (Fig. S1 in
the Supporting Material). The average diameter of the oil droplets in
the recently prepared emulsion was (0.8 ± 0.2) µm, and the average size after two weeks was (1.1 ± 0.3) µm, which means that the ag-
glomeration of oil droplets in the emulsion was minimal, and therefore
the emulsion kept stable for two weeks, making it suitable for its usage
in the separation tests.
The filtration tests consisted of 10 runs. For this, each membrane
filtered a volume of 15 mL of distilled water before the runs. Later, the
protocol for the runs was the following: filtration of 30 mL of the oil/
water emulsion under a pressure condition of 0.02 bar, and in between
each run the membrane was roughly cleaned by the filtration of 15 mL
of distilled water. After the separation tests, the permeate solution was
collected into a closed glass tube and kept for 24 h to analyze the re-
sidual water and oil under the optical microscope. Moreover, the
amount of oil in the feed and permeate was determined by the Non-
Purgeable Organic Carbon (NPOC) measurements by means of a total
carbon analyzer (Jena MULTI N/C 2100S, Germany).

132
The permeate flux (F) and the permeability (k) of the membrane
were calculated as follows:
L) the carbon concentration in the final permeate liquid after completing
the separation cycles. After the 5th run for PVDF and after the 10th run
for PVDF-OH and Ag/PVDF-OH. Note that the NPOC analytical metho-
𝐹 =𝑉/(𝐴. 𝑡)
(1) dology measures the amount of carbon in the samples, therefore, as the
feed was an emulsion composed by green-colored distilled water, vege-
table oil, and the non-ionic Triton X100 surfactant, the Ci and Cf values
𝑘 = 𝐹/𝑝 (2)
where A is the effective membrane area (m2), V is the total volume of
permeate (L), p is the trans-membrane pressure (bar), and t is the fil-
tration time (h). The decline of the membrane’s permeability was de-
termined from the differences between the permeability before (ki) and
after fouling (kf ) [17]:
ki kf
not only reflect the amount of oil in the feed and permeate, respectively,
but also the carbon coming from the colorant and the surfactant.
1. Results and discussion
1.1. Membrane characterization
PVDF is a dielectric polymer that displays a high thermal and che-
mical stability, conventionally attributed to the strong bonding CeF
Decline in permeability (%) = ki
× 100% (3)
(485 kJ mol−1) and an electronic shielding on the CeC bonds [18],
which makes the polymer chemically inert and in general unable to be
The flux recovery ratio (FRR (%)) was calculated according to: functionalized. However, as it has been extensively reported, when the
polymer is exposed to a highly alkaline environment, as in the case of
FRR (%) = (Jf/Ji)×100 the current study (KOH/IPA), it is possible to promote its dehydro-
(4)
where Ji represents the pure water flux that can be filtrated by the clean
fluorination via the following process:
[ CH2 CF2 ]n + KOH [ CH = CF
]n + KF + H2 O
(6)
membranes, and Jf represents the pure water flux that can be filtrated
by the membranes after undergoing the final oil/water separation run.
For PVDF, the measurement was taken after the 5th run because the
membrane got fouled entirely after the 5th run. For PVDF-OH and Ag/
PVDF-OH, the measurements were taken after the 10th run.
Finally, the rejection ratio (R (%)) was calculated according to:
As proposed by Ross et al. [19], an elimination reaction occurs,
where the elements H and F remove from the polymer chain and a
eC]Ce double bond is generated. Moreover, when the modified
polymer chain is in contact with a hydroxide rich solution, it can ex-
perience the incorporation of hydroxyl groups through the following set
of reactions:
(7)
R (%) = 1
Cf × 100%
Ci
(5)
In short, in the highly alkaline environment, the PVDF can undergo
oxidative degradation, which leads to the presence of the hydroxyl
groups on the material’s surface [20].
where Ci (g/L) represents the carbon concentration in the feed and Cf (g/ As seen in Fig. 4 a), the FTIR spectra of both nanofibrous mem-
branes, before and after being subject to the alkaline treatment, exhibit

133
Fig. 4. FTIR spectra of pristine PVDF and PVDF-OH membranes, a) in the wavenumber range 500–4000 cm−1, where the vertical dashed
lines highlight the general differences between both spectra, b) in the wavenumber range 500–1300 cm−1, where the vertical black dashed
lines belong to peaks of the phase of PVDF, and the vertical red dashed lines belong to peaks of the phase of PVDF. (For interpretation of the
references to colour in this figure legend, the reader is referred to the web version of this article.)
the typical band at 1170 cm−1 associated to the stretching vibrations of
CF2 in the PVDF [20], and only the non-treated membrane clearly
shows the peaks located at 2923, 2853 cm−1 usually associated to the
stretching vibrations of CH2. Besides, in both spectra displayed in Fig. 4
b), it is possible to identify the peaks located at 1279 and 840 cm−1,
that belong to the phase of PVDF, but those belonging to the phase
of PVDF (976, 795, 766, and 614 cm−1) are only observed in the non-
treated membrane [21]. Moreover, the spectrum that belongs to the
material after the alkaline treatment (PVDF-OH) exhibits two new
peaks, a broad one centered at 3350 cm−1 that seems to overshadow
the peaks corresponding to the CH2 stretching vibrations and the other
at 1640 cm−1.
When the PVDF undergoes the current dehydrofluorination process,
the peak located at 1640 cm−1 is usually associated to the conjugated
Fig. 5. FE-SEM micrographs of a) the neat PVDF membrane (micrograph taken
at EHT = 2.00 kV and WD = 7.8 mm), b) the PVDF-OH membrane before the
laser synthesis of Ag NPs (EHT = 2.00 kV and WD = 7.7 mm), c) the mem-
brane after the Ag NPs synthesis (EHT = 2.50 kV and WD = 7.9 mm) and d)
the size histogram of the fiber diameter of the neat PVDF membrane, which also
coincides with the PVDF-OH and Ag/PVDF-OH samples.
C=C the 3400 to 3200 cm−1 band is usually associated with the
formation of a hydroxyl group in the material’s surface [22]. Yet, it
should be noted that even a minimal amount of H2O from the air can
get adsorbed in the material’s surface resulting in the enhancement
of the peak’s intensity. In summary, the FTIR results suggest that the
PVDF nanofi- brous membranes were successfully functionalized
with OH- groups according to the relevant literature [23].
Besides, the alkaline treatment seems to suppress the peaks related
to the phase of the polymer and emphasize those belonging to its
phase. Since the phase of the PVDF is more chemically active than the
one [24], its presence may contribute to the physisorption of the Ag
NPs over the membrane’s surface, and as Ribeiro et al. [25] suggest, it
could be worth the optimization in the phase generation towards a
more efficient Ag NPs attachment.
The average surface roughness of the membranes was obtained from
the AFM measurements (Fig. S2 in the Supporting Material), where the
pristine PVDF and PVDF-OH membranes display a roughness Ra of
(240.9 ± 45.9) nm and (165.3 ± 1.3) nm, respectively. These results are
in agreement with the common observation of the surface roughness
decrease of PVDF-based membranes after being exposed to a KOH so-
lution [26].
The FE-SEM micrographs in Fig. 5 show that there is no clear
morphological change in the nanofibers before or after the alkaline
treatment or even after the in situ synthesis of the Ag NPs. The only
visible change is observed in the Fig. 5 c), exhibiting the appearance of
small particles anchored to the surface of the nanofibers. In any case,
the mean size of the nanofibers is (120 ± 25) nm.
Also, it is worth mentioning that the accelerating voltages and
working distances were selected in order to observe the material
without the necessity to use any further metal coating that may hide the
presence of the Ag NPs when performing the chemical composition
analysis.
In this context, Fig. 6 shows the comparison between the back-
scattered electron (BSE) and secondary electron (SE) micrographs
(Fig. 6 a) and b), respectively). Both pictures exhibit the presence of the
NPs, but as the SE signal is rather surface-sensitive, the NPs are more
visible in the BSE micrograph (Fig. 6 a)), which also confirms that the
chemical composition of the NPs is of an Ag nature.

134
Fig. 6. a) BSE and b) SE micrographs of Ag/PVDF-OH, c) EDX spectrum of the specimen, and d) the size histogram of the Ag NPs considering 700 counts.
Conventionally, BSEs that re-emerge after interacting with the
specimen under study are more strongly back-scattered when inter-
acting with heavy elements than when interacting with the lighter
elements. In our situation, this was verified by the EDX spectrum (Fig. 6
c)), whereby the only elements found in the sample were C, F, Ag and
Table 1
Water contact angle measurements in air and underwater oil contact angle
measurements. Note that since the oil droplet was not sticking to the surface of
Ag/PVDF-OH by itself, it was necessary to rub the oil droplet to the membrane,
so it could stay few seconds to take the picture.
O, where Ag is the heaviest of them. Therefore, it is possible to infer
that the NPs were made of Ag. Moreover, their distribution over the
membrane and nanofibers surface is uniform (Fig. S3 in the Supporting
Material), whereas the average size of the Ag NPs is (35 ± 10) nm.
Considering that the atomic radius of Ag is 144 pm, and its atomic
weight is 107.87 g/mol, the approximate Ag weight loading over a
circular filter with a diameter of (4.45 ± 0.05) cm (dimensions used for the filtration tests) should be (8.58 ± 0.43)µg.
Sample Contact
angle in
air (°)
PVDF 86.8 ±
8.4
PVDF-OH 94.5 ± 5.8
Contact
angle
underwater
(°)
70.4 ± 4.5
101.6 ± 3.0
Image in air Image underwater
The current topographical distribution and size of the NPs is a
highly desired situation because, as previously reported by different
sources, the metal NPs improve the hydrophilicity and surface charge of
the nanofibers resulting in the minimization of the fouling phenomenon
[27].
The stability of Ag/PVDF-OH determined by the ICP-MS measure-
ment of the water filtrated after various oil/water separation runs
showed that after the first run the amount of Ag content in the filtrated
water was only 0.013 mg/L, or ideally 0.19 µg in 15 mL of the filtrated
water, after the second separation run, the Ag content decreased by one
order of magnitude, and the subsequent runs kept presenting a de-
creasing Ag concentration (Table S1 in the Supporting Material). These
results indicate that the most considerable Ag weight detached out of
the nanofibers surface, which occurs at the first oil/water separation
run, was a 2.2%. Therefore, it can be considered that the robustness of
Ag/PVDF-OH permits the utilization of the material for the oil/water
separation process without undergoing a significant loss of the Ag
content. Moreover, according to the World Health Organization [28],
and the United States Environmental Protection Agency [29], the
maximum contamination level of silver in drinking water is set to
0.1 mg/L, which indicates that the low release of Ag from Ag/PVDF-
OH, does not represent a risk for the human health.
Besides, the pore size measurements show that the untreated PVDF
membrane has an average pore size of 0.34 µm. After the treatment
Ag/PVDF-OH 0.0 119.4 ± 2.5
with the KOH solution (PVDF-OH), the average pore size slightly de-
creases to 0.27 µm, as previously reported [26], the pore size reduction
might occur due to the microstructural shrinkage of the membrane by
the surface treatment. After the NPs decoration process (Ag/PVDF-OH),
the average pore size increased to 0.80 µm. The possible reason for this
phenomenon is that when the laser mediated synthesis of the Ag NPs
takes place, the optical breakdown of water is promoted, in which a
resulting plasma is confined in the laser focal point that elevates the
temperature in the solution [30]. While the process takes place, the
thermal energy can be transmitted to the membranes and activate the
movement of the fibers that are not densely packed. To clarify this fact,
the PVDF-OH membrane was exposed to various temperatures in order
to monitor the pore size change. The pore size of the membrane
changed from 0.30, 0.31, 0.34, and 0.68 µm for the temperatures of 20,
36, 58, and 88 °C, respectively. Therefore, we consider that the com-
bination of the heat transmitted from the optical breakdown spot while
synthesizing the Ag NPs and the continuous stirring of the liquid re-
sulted in the opening of the membrane’s pores. That fact is visible in
Fig. 5 where the Ag/PVDF-OH membrane has a more open structure

135
compared to the neat PVDF.
Finally, the water contact angle tests shown in Table 1 reveal that
the addition of the hydroxyl groups (PVDF vs. PVDF-OH) does not lead
to any significant effect on the wettability of the dry samples, when the
tests are performed in air, which is in accordance with the relevant
literature. Conventionally, the number of hydroxyl groups on the sur-
face of the membranes is not the only factor that may lead to a change
in wettability, e.g., differences in the surface structure may be more
dominant [31]. Conversely, the Ag/PVDF-OH samples displayed out-
standing hydrophilicity, which according to the literature, is due to the
interaction between the Ag NPs and the liquid that gets in contact with
the membrane (water in this case) [32]. Ideally, if no other oxidant is
present, the O2 dissolved in the water can promote the oxidation and
consequent ion release of the Ag NPs through the following reaction.
These results suggest that the simple addition of the OH- groups to
the PVDF membrane does not lead to a long-lasting hydrophilic beha-
vior, whereas the addition of Ag NPs do regardless the membranes are
stored in a wet or dry form.
1.1. Membrane filtration properties
1.1.1. Emulsion permeability measurements
The results of the oil/water separation tests (Fig. 7 a)) show that the
pristine PVDF membrane became fouled after the fifth run, while the
PVDF-OH and Ag/PVDF-OH membranes did not become fouled even
after 10 runs. The water permeability of the neat PVDF membrane in-
creased 1.8-fold after the dehydrofluorination treatment and 3.9-fold
after the addition of the Ag NPs; a substantial improvement in the oil/
2Ag + 1
O2(aq) + 2H+ 2Ag+
+ H2 O(1) (8) water separation performance when comparing with the latest mem-
(s) 2 (aq) (aq) brane modification strategies for similar systems, which go from 2- to 4- fold [34,36–38].
where Ag(s) refer to the solid Ag [33]. Further, the hydrated Ag+ can
get adsorbed onto the surface of the Ag NPs and the nanofibers, im-
proving the adhesion and spread of the liquid by capillarity. Besides, it
should be noted that despite the small amount of Ag weight loading, the
larger hydrophilicity in Ag/PVDF-OH in comparison with the latest
works in the field [34], can be attributed to the ligand-free nature of the
Ag NPs produced in the current study. The lack of ligands covering the
Ag NPs surface maximizes the number of possible elements able to
undergo the oxidation and, consequently, Ag+ release.
In addition, before the water contact angle tests, all of the samples
were kept in a wet form. During this stage, the PVDF-OH and Ag/PVDF-
OH specimens were immersed into deionized water, while the neat
PVDF floated on the solvent. Once all of the membranes were dried and
underwent the water contact angle test, the behaviour of the neat PVDF
and Ag/PVDF-OH specimens remained hydrophobic and hydrophilic,
respectively. In contrast, the behaviour of the PVDF-OH sample tran-
sitioned from hydrophilic to hydrophobic. In order to ratify this, spare
portions of the samples that kept stored in the wet form (no contact
with air) were used for underwater oil contact angle measurements, and
the corresponding results confirmed the consistent behavior of pristine
PVDF and Ag/PVDF-OH, and the transition for PVDF-OH depending on
the storing conditions.
The PVDF-OH change from hydrophilic to hydrophobic might be
explained by the flip-flop mechanism, which is commonly observed in
surface functionalities attached to polymer-membranes [35]. After the
eOH functionalization, the membrane exhibits hydrophilic behavior
due to the affinity between the eOH groups on the surface of the fibers
and the water molecules, but in the case of contact with air, the eOH
groups may turn from the outside to the inside of the polymer surface
because the air is hydrophobic. In the case of Ag/PVDF-OH, such a
process is not viable since the NPs cannot be drawn under the polymer
surface due to their big size compared to the eOH groups.
The decline in permeability, which indicates the membrane’s
fouling, increased continuously for the PVDF membrane, while it re-
mained constant and almost negligible for the treated membranes
(Fig. 7 b)). In line with these results, the flux recovery ratio FRR (%)
after the last oil/water separation run of the samples was 22.4% for
PVDF, 43.5% for PVDF-OH, and 38.1% for Ag/PVDF-OH. These results
indicate that the surface modification of PVDF clearly leads to an in-
crement in its antifouling properties, even when the modified mem-
branes underwent twice the number of oil/water separation runs than
the unmodified one. Moreover, the water that was recovered after the
5th and 10th runs through PVDF, PVDF-OH and Ag/PVDF-OH mem-
branes, respectively, was free of oil droplets (Fig. S4 in the Supporting
Material), and the corresponding NPOC measurements revealed that
the rejection rate R (%) of the membranes was 96.3% for PVDF, 96.1%
for PVDF-OH, and 96.2% for Ag/PVDF-OH, which allows concluding
that all the membranes greatly suppress the passage of oil droplets.
Besides, beyond the scope of the current work, which explores the re-
duction of chemical-waste production by enforcing the usage of light
sources to modify membranes, it is essential to keep in mind that the
water flux and permeability of the membranes depend on the applied
pressure [39]. Therefore, an increment in the applied pressure (0.02 bar
in the current work) towards the industrial usage of the material should
also reflect an increase in the water flux and permeability values.
As it is extensively reported, the roughness and hydrophobicity of
the PVDF membrane are two significant factors that lead to its fouling
and poor recyclability [40]. On the one hand, its rough surface allows
the allocation of foulants. On the other hand, its hydrophobicity pro-
motes the adhesion of hydrophobic organics to the membrane’s surface
resulting in its fouling. In the case of PVDF-OH, when the dehydro-
fluorination process takes place, the roughness in the surface of the
nanofibers gets reduced as it is noticed from the AFM results, and the
membrane becomes hydrophilic when stored in a wet form as the
Fig. 7. Graphs showing the a) emulsion permeability and b) decline in permeability of the samples.

136
Fig. 8. Micrographs of the membranes after completing the emulsion run cy-
cles.
underwater oil contact angle measurements exhibit it. These features
make the membrane’s surface, less favorable for the attachment of
foulants leading to the observed increment in FRR (%), and even when
its pore size is smaller than the untreated membrane, its hydrophilicity
when stored in the wet form seems to have a dominant impact on the
water permeability. However, as the water contact angle tests demon-
strated, both the PVDF-OH and Ag/PVDF-OH membranes show a hy-
drophilic behavior when they are kept in a wet form, but when the
membranes are dried, the PVDF-OH membrane becomes hydrophobic,
which may consequently result in a negative impact on its permeability
performance.
Differently, the superior permeability and recyclable performance of
the Ag/PVDF-OH membrane can be mainly attributed to its larger pore
size, Ag-induced hydrophilic behavior and resistance to the adhesion of
oil droplets. On the one hand, larger pore sizes can be translated as
empty spaces where a liquid can pass through; ergo the water perme-
ability gets incremented. On the other hand, as it is exhibited in Fig. 8,
which shows how the membranes look after completing the separation
tests, the low load of (0.55 ± 0.03) µg/cm2 Ag NPs seem to not only
increment the water permeability in the membrane but also reduce the
adhesion of the oil droplets over its surface. As discussed above, when
Ag NPs get in contact with a liquid medium that contains oxidant ele-
ments like dissolved O2, the Ag NPs undergo an oxidation process that
results in the release of Ag+. As the liquid used in the oil/water se-
paration tests is an emulsion composed of non-ionic oil droplets dis-
persed in water, it is possible to infer that despite other oxidants could
be present, at least the O2 dissolved in the emulsion could render the
oxidation of the Ag NPs, and consequently, the Ag+ release and ad-
sorption over the membrane surface, which subsequently should lead to
the preferential adhesion and spread of water rather than the non-ionic
oil droplets due to a stronger electrostatic attraction of water (a polar
solvent) to the membrane’s surface covered by the Ag+ [41], resulting
in the possibility to re-use the material multiple times without experi-
encing a great blocking of the membrane pores, i.e., a reduction of the
water permeability, as it is suggested by the increment in its FRR (%).
Therefore, the implementation of the current laser-based membrane
modification methodology, not only contributes to reducing the use of
chemicals and their consequent leftovers but in the framework of the
latest advances in the field, also leads to a competitive improvement
over the membrane’s oil/water separation performance.
1. Conclusions
The main reason to conduct the current work was to explore the
benefits of using light instead of hazardous reducing agents to generate
NPs that decorate the surface of membranes used for the recovery of
clean water from oily emulsions. For this, the LPL strategy was em-
ployed for the first time to synthesize Ag NPs in a medium free from
reducing or stabilizing agents and decorate the surface of dehydro-
fluorinated PVDF nanofibrous membranes in a single-stage. The process
incremented the membrane’s pore size from 0.34 µm to 0.80 µm and
allowed the uniform and stable incorporation of ligand-free Ag NPs
with diameter of (35 ± 10) nm over the nanofibers, which rendered an
outstanding hydrophilicity in the membranes while using an extremely
low NPs load of (0.55 ± 0.03) µg/cm2. These membrane modifications
resulted in a 3.9-fold improvement of the oil/water separation perfor-
mance over the unmodified PVDF membrane, the decline in perme-
ability remained almost negligible after ten separation runs, and an
increment in the flux recovery ratio, due to a minimization in the oil
adherence over the membrane surface. Moreover, the pass of oil dro-
plets through the membrane stayed suppressed despite the change in
pore size, and the rejection rate kept > 96 %.
Overall, the current study revealed that the adoption of the laser-
mediated membrane surface modification strategy leads to a compar-
able improvement over the oil/water separation performance to the one
achieved by the latest polluting-linked and NPs-costly strategies.
However, the replacement of chemicals by the light could be of para-
mount interest in the eco-friendly generation of efficient and recyclable
materials for the oil/water separation sector.
Credit authorship contribution statement
R. Torres-Mendieta: Conceptualization, Methodology, Validation,
Investigation, Writing - original draft, Resources, Writing - review &
editing, Visualization, Supervision, Project administration. F.
Yalcinkaya: Conceptualization, Methodology, Validation,
Investigation, Writing - original draft, Resources, Writing - review &
editing, Visualization, Supervision, Project administration. E. Boyraz:
Methodology, Investigation. O. Havelka: Methodology, Investigation,
Writing - review & editing. S. Wacławek: Investigation, Writing - re-
view & editing. J. Maryška: Validation, Writing - review & editing,
Supervision, Project administration. M. Černik: Validation, Writing -
review & editing, Supervision, Project administration. M. Bryjak:
Validation, Writing - review & editing, Supervision.
Declaration of Competing Interest
The authors declare that they have no known competing financial
interests or personal relationships that could have appeared to influ-
ence the work reported in this paper.
Acknowledgement
The research presented in this article was supported by the Ministry
of Education, Youth and Sports of the Czech Republic and the European
Union - European Structural and Investment Funds in the framework of
the Operational Programme Research, Development and Education -
project entitled Hybrid Materials for Hierarchical Structures (HyHi,
Reg. No. CZ.02.1.01/0.0/0.0/16_019/0000843).
Appendix A. Supplementary material
Supplementary data associated with this article can be found, in the
online version, at https://doi.org/10.1016/j.apsusc.2020.146575.
References
[1] T. Birkhead, Stormy outlook for long-term ecology studies, Nature 514 (2014) 405,
https://doi.org/10.1038/514405a.
[2] H.J. Tanudjaja, C.A. Hejase, V.V. Tarabara, A.G. Fane, J.W. Chew, Membrane-based
separation for oily wastewater: A practical perspective, Water Res. 156 (2019)
347–365, https://doi.org/10.1016/j.watres.2019.03.021.
[3] F. Yalcinkaya, B. Yalcinkaya, J. Hruza, P. Hrabak, Effect of nanofibrous membrane
structures on the treatment of wastewater microfiltration, Sci. Adv. Mater. 9 (2017)
747–757, https://doi.org/10.1166/sam.2017.3027.
[4] M.R. Esfahani, S.A. Aktij, Z. Dabaghian, M.D. Firouzjaei, A. Rahimpour, J. Eke,
I.C. Escobar, M. Abolhassani, L.F. Greenlee, A.R. Esfahani, et al., Nanocomposite
membranes for water separation and purification: Fabrication, modification, and
applications, Sep. Purif. Technol. 213 (2019) 465–499, https://doi.org/10.1016/j.
seppur.2018.12.050.
[5] S. Huang, R.H. Ras, X. Tian, Antifouling membranes for oily wastewater treatment:
Interplay between wetting and membrane fouling, Curr. Opin. Colloid Interf. Sci. 36
(2018) 90–109, https://doi.org/10.1016/j.cocis.2018.02.002.

137
[6] N. Ismail, W. Salleh, A. Ismail, H. Hasbullah, N. Yusof, F. Aziz, J. Jaafar,
Hydrophilic polymer-based membrane for oily wastewater treatment: A review,
Sep. Purif. Technol. 233 (2019) 116007, https://doi.org/10.1016/j.seppur.2019.
116007.
[7] D. Zioui, H. Salazar, L. Aoudjit, P.M. Martins, S. Lanceros-Méndez, Polymer-based
membranes for oily wastewater remediation, Polymers 12 (1) (2020) 42, https://
doi.org/10.3390/polym12010042.
[8] J.H. Jhaveri, Z. Murthy, A comprehensive review on anti-fouling nanocomposite
membranes for pressure driven membrane separation processes, Desalination 379
(2016) 137–154, https://doi.org/10.1016/j.desal.2015.11.009.
[9] S.C. Abeyweera, K.D. Rasamani, Y. Sun, Ternary silver halide nanocrystals, Acc.
Chem. Res. 50 (2017) 1754–1761, https://doi.org/10.1021/acs.accounts.7b00194.
[10] J. Noack, A. Vogel, Laser-induced plasma formation in water at nanosecond to
femtosecond time scales: calculation of thresholds, absorption coefficients, and
energy density, IEEE J. Quantum Electron. 35 (1999) 1156–1167, https://doi.org/
10.1109/3.777215.
[11] M. Sakamoto, M. Fujistuka, T. Majima, Light as a construction tool of metal na-
noparticles: synthesis and mechanism, J. Photochem. Photobiol., C 10 (2009)
33–56, https://doi.org/10.1016/j.jphotochemrev.2008.11.002.
[12] L. Kőrösi, M. Rodio, D. Dömötör, T. Kovács, S. Papp, A. Diaspro, R. Intartaglia,
S. Beke, Ultrasmall, ligand-free ag nanoparticles with high antibacterial activity
prepared by pulsed laser ablation in liquid, J. Chem. 2016 (4143560) (2016) 8,
https://doi.org/10.1155/2016/4143560.
[13] R. Roche, F. Yalcinkaya, Incorporation of pvdf nanofibre multilayers into functional
structure for filtration applications, Nanomaterials 8 (2018) 771, https://doi.org/
10.3390/nano8100771.
[14] R. Torres-Mendieta, O. Havelka, M. Urbánek, M. Cvek, S. Wacławek, V.V.T. Padil,
D. Jašíková, M. Kotek, M. Černík, Laser-assisted synthesis of fe-cu oxide nano-
crystals, Appl. Surf. Sci. 469 (2019) 1007–1015, https://doi.org/10.1016/j.apsusc.
2018.11.058.
[15] J.-P. Abid, A. Wark, P.-F. Brevet, H. Girault, Preparation of silver nanoparticles in
solution from a silver salt by laser irradiation, Chem. Commun. (7) (2002) 792–793,
https://doi.org/10.1039/B200272H.
[16] H. Chou, C. Wu, F. Lin, J. Rick, Interactions between silver nanoparticles and
polyvinyl alcohol nanofibers, AIP Adv. 4 (2014) 087111, https://doi.org/10.1063/
1.4890290.
[17] P. Kaner, D.J. Johnson, E. Seker, N. Hilal, S.A. Altinkaya, Layer-by-layer surface
modification of polyethersulfone membranes using polyelectrolytes and agcl/tio2
xerogels, J. Membr. Sci. 493 (2015) 807–819, https://doi.org/10.1016/j.memsci.
2015.05.048.
[18] B. Ameduri, B. Boutevin, G. Kostov, Fluoroelastomers: synthesis, properties and
applications, Prog. Polym. Sci. 26 (2001) 105–187, https://doi.org/10.1016/
S0079-6700(00)00044-7.
[19] G. Ross, J. Watts, M. Hill, P. Morrissey, Surface modification of poly (vinylidene
fluoride) by alkaline treatment1. the degradation mechanism, Polymer 41 (2000)
1685–1696, https://doi.org/10.1016/S0032-3861(99)00343-2.
[20] D. Li, M. Liao, Study on the dehydrofluorination of vinylidene fluoride (vdf) and
hexafluoropropylene (hfp) copolymer, Polym. Degrad. Stab. 152 (2018) 116–125,
https://doi.org/10.1016/j.polymdegradstab.2018.04.008.
[21] P. Martins, A. Lopes, S. Lanceros-Mendez, Electroactive phases of poly (vinylidene
fluoride): Determination, processing and applications, Progress Polym. Sci. 39 (4)
(2014) 683–706, https://doi.org/10.1016/j.progpolymsci.2013.07.006.
[22] H. Wang, Z. Liu, E. Wang, R. Yuan, D. Gao, X. Zhang, Y. Zhu, A robust super-
hydrophobic pvdf composite coating with wear/corrosion-resistance properties,
Appl. Surf. Sci. 332 (2015) 518–524, https://doi.org/10.1016/j.apsusc.2015.01.
213.
[23] D. Li, M. Liao, Dehydrofluorination mechanism, structure and thermal stability of
pure fluoroelastomer (poly (vdf-ter-hfp-ter-tfe) terpolymer) in alkaline environ-
ment, J. Fluorine Chem. 201 (2017) 55–67, https://doi.org/10.1016/j.jfluchem.
2017.08.002.
[24] H. Pan, B. Na, R. Lv, C. Li, J. Zhu, Z. Yu, Polar phase formation in poly (vinylidene
fluoride) induced by melt annealing, J. Polym. Sci., Part B: Polym. Phys. 50 (20)
(2012) 1433–1437, https://doi.org/10.1002/polb.23146.
[25] C. Ribeiro, C.M. Costa, D.M. Correia, J. Nunes-Pereira, J. Oliveira, P. Martins,
R. Goncalves, V.F. Cardoso, S. Lanceros-Mendez, Electroactive poly (vinylidene
fluoride)-based structures for advanced applications, Nature Protocols 13 (4)
(2018) 681, https://doi.org/10.1038/nprot.2017.157.
[26] N.A. Samsure, N.A. Hashim, N.M.N. Sulaiman, C.Y. Chee, Alkaline etching treat-
ment of pvdf membrane for water filtration, RSC Adv. 6 (2016) 22153–22160,
https://doi.org/10.1039/c6ra00124f.
[27] E. Mahmoudi, L.Y. Ng, W.L. Ang, Y.T. Chung, R. Rohani, A.W. Mohammad,
Enhancing morphology and separation performance of polyamide 6, 6 membranes
by minimal incorporation of silver decorated graphene oxide nanoparticles, Sci.
Rep. 9 (2019) 1216, https://doi.org/10.1038/s41598-018-38060-x.
[28] W.H.O. (WHO), W.H.O. Staff, Guidelines for drinking-water quality, vol. 1, World
Health Organization, 2004.
[29] 2018 drinking water standards and advisory tables, https://www.epa.gov/sites/
production/files/2018-03/documents/dwtable2018.pdf, accessed: 2020-02-03.
[30] P.K. Kennedy, A first-order model for computation of laser-induced breakdown
thresholds in ocular and aqueous media. I. theory, IEEE J. Quantum Electron. 31
(1995) 2241–2249, https://doi.org/10.1109/3.477753.
[31] M. Fuji, M. Araki, T. Takei, T. Watanabe, M. Chikazawa, Structure and wettability
of various silica surfaces: Evaluation on the nano and macro levels [translated],
KONA Powder Particle J. 18 (2000) 236–241, https://doi.org/10.14356/kona.
2000031.
[32] J.-H. Li, X.-S. Shao, Q. Zhou, M.-Z. Li, Q.-Q. Zhang, The double effects of silver
nanoparticles on the pvdf membrane: Surface hydrophilicity and antifouling per-
formance, Appl. Surf. Sci. 265 (2013) 663–670, https://doi.org/10.1016/j.apsusc.
2012.11.072.
[33] J. Liu, R.H. Hurt, Ion release kinetics and particle persistence in aqueous nano-silver
colloids, Environ. Sci. Technol. 44 (6) (2010) 2169–2175, https://doi.org/10.1021/
es9035557.
[34] W. Xu, H. Zhuang, Z. Xu, M. Huang, S. Gao, Q. Li, G. Zhang, Design and con-
struction of ag@ mofs immobilized pvdf ultrafiltration membranes with anti-bac-
terial and antifouling properties, Adv. Polym. Technol. (2020), https://doi.org/10.
1155/2020/5456707.
[35] Y. Wang, X. Gong, Special oleophobic and hydrophilic surfaces: approaches, me-
chanisms, and applications, J. Mater. Chem. A 5 (8) (2017) 3759–3773, https://doi.
org/10.1039/C6TA10474F.
[36] D. Sun, D. Yue, B. Li, Z. Zheng, X. Meng, Preparation and performance of the novel
pvdf ultrafiltration membranes blending with pva modified sio2 hydrophilic na-
noparticles, Polym. Eng. Sci. 59 (S1) (2019) E412–E421, https://doi.org/10.1002/
pen.25002.
[37] Z. Xu, T. Wu, J. Shi, K. Teng, W. Wang, M. Ma, J. Li, X. Qian, C. Li, J. Fan,
Photocatalytic antifouling pvdf ultrafiltration membranes based on synergy of
graphene oxide and tio2 for water treatment, J. Membr. Sci. 520 (2016) 281–293,
https://doi.org/10.1016/j.memsci.2016.07.060.
[38] X. Zhao, N. Jia, L. Cheng, R. Wang, C. Gao, Constructing antifouling hybrid mem-
branes with hierarchical hybrid nanoparticles for oil-in-water emulsion separation,
ACS Omega 4 (1) (2019) 2320–2330, https://doi.org/10.1021/acsomega.8b03408.
[39] X. Yi, S. Yu, W. Shi, N. Sun, L. Jin, S. Wang, B. Zhang, C. Ma, L. Sun, The influence
of important factors on ultrafiltration of oil/water emulsion using pvdf membrane
modified by nano-sized tio2/al2o3, Desalination 281 (2011) 179–184, https://doi.
org/10.1016/j.desal.2011.07.056.
[40] M. Li, L. Wu, C. Zhang, W. Chen, C. Liu, Hydrophilic and antifouling modification of
pvdf membranes by one-step assembly of tannic acid and polyvinylpyrrolidone,
Appl. Surf. Sci. 483 (2019) 967–978, https://doi.org/10.1016/j.apsusc.2019.04.
057.
[41] L. Huang, C. Maltesh, P. Somasundaran, Adsorption behavior of cationic and non-
ionic surfactant mixtures at the alumina–water interface, J. Colloid Interface Sci.
177 (1) (1996) 222–228, https://doi.org/10.1006/jcis.1996.0024.

138

139

140

141
Hindawi Publishing Corporation Journal
of Nanomaterials
Volume 2016, Article ID 2694373, 12 pages
http://dx.doi.org/10.1155/2016/2694373
Research Article
Thin Film Nanofibrous Composite Membrane for Dead-End Seawater Desalination
Baturalp Yalcinkaya,1 Fatma Yalcinkaya,1 and Jiri Chaloupek2
1Institute for Nanomaterials, Advanced Technologies and Innovation, Technical University of Liberec, Studentska 1402/2, 461 17 Liberec, Czech Republic
2Department of Nonwoven and Nanofibrous Material, Faculty of Textile, Technical University of Liberec, Studentska 1402/2, 461 17 Liberec, Czech Republic
Correspondence should be addressed to Baturalp Yalcinkaya; [email protected]
Received 28 May 2016; Revised 24 July 2016; Accepted 31 July 2016
Academic Editor: Zeeshan Khatri
Copyright © 2016 Baturalp Yalcinkaya et al. This is an open access article distributed under the Creative Commons Attribution License, which permits unrestricted use, distribution, and reproduction in any medium, provided the original work is properly cited.
The aim of the study was to prepare a thin film nanofibrous composite membrane utilized for nanofiltration technologies. The composite membrane consists of a three-layer system including a nonwoven part as the supporting material, a nanofibrous scaffold as the porous surface, and an active layer. The nonwoven part and the nanofibrous scaffold were laminated together to improve the mechanical properties of the complete membrane. Active layer formations were done successfully via interfacial polymerization. A filtration test was carried out using solutions of MgSO4, NaCl, Na2SO4, CaCl2, and real seawater using the dead-end filtration method. The results indicated that the piperazine-based membrane exhibited higher rejection of divalent salt ions (>98%) with high flux. In addition, the m-phenylenediamine-based membrane exhibited higher rejection of divalent and monovalent salt ions (>98% divalent and >96% monovalent) with reasonable flux. The desalination of real seawater results showed that thin film nanofibrous composite membranes were able to retain 98% of salt ions from highly saline seawater without showing any fouling. The electrospun nanofibrous materials proved to be an alternative functional supporting material instead of the polymeric phase-inverted support layer in liquid filtration.
1. Introduction
Demand for fresh water sources is increasing due to a popu- lation explosion in the world. Humans need drinkable water, and groundwater resources are decreasing more than ever before. Many countries are facing serious problems regarding this. Several technological methods such as desalination [1, 2] or distillation of seawater [3, 4] have given hope to people in areas of water scarcity. Membrane desalination is an effective technology that produces fresh water from brackish water or seawater using nanofiltration (NF) [5] and reverse osmosis (RO) [6] membrane processes.
Conventional NF and RO membranes consist of a con- siderably thick phase-inverted polymeric support layer and a relatively thin polyamide (PA) active layer by in situ polymerization of an aqueous solution containing di- or polyfunctional amine and organic solutions containing di- or
trifunctional carboxylic acid chloride at their interface [7–12]. Recently, an electrospun nanofibrous layer has been prepared as an alternative supporting layer to form a thin PA active layer using electrospinning methods. In this method, the polymer solutions are spun directly onto nonwoven fabrics to prepare the nanofibres [13, 14] and a PA active layer is formed over the nanofibrous layer. The final structure is called a thin film nanofibrous composite (TFNC) membrane. One of the greatest advantages of the TFNC membrane is its extremely high permeate flux due to its high surface area and direct channel structure [15–18]. Besides the high flux performance, TFNC membranes have shown excellent rejection in both mono- and divalent salt ions, indiscriminately [19].
Despite the high salt rejection and permeate flux perfor- mance of TFNC membranes, the weak mechanical properties of the nanofibrous layer and insufficient adhesion between the nonwoven layer and the nanofibres have become the main

142
limitations of the nanofiltration process. In the literature there are various attempts to overcome the mechanical prob- lem of nanofibres [20–22]. Some of the studies have focused on increasing interfibre adhesion to improve the mechanical properties of the entire membrane [23, 24]. For instance, a mixed solvent system (dimethylformamide (DMF) and N- methyl-pyrrolidinone (NMP)) was used to prepare a solution of polyethersulfone (PES) by Yoon et al. [25].A PES polymer solution has been electrospun using needle electrospinning. A different solvent mixed system contained solvents with various vapour pressures. Therefore, the nanoweb on the supporting material was still partly wetted because of the high vapour pressure of NMP, and this could lead to adhesion between the fibres. However, the average fibre diameter increased directly proportional to the mechanical strength [16]. In other studies, to increase the strength and integrity of the nonwoven and nanofibrous composite supporting layer, heat and pressure were applied [26]. These above-mentioned methods influenced the morphology of the nanofibrous layer in a negative way (e.g., there is an increase in the fibre diameter or nonfibrous area). Moreover, the needle electrospinning method, which is a small-scale nanofibres production system, used the studies mentioned above. Hence, the commercialization of those nanofilters is improbable.
The primary purpose of the researcher is to prepare a membrane with the best rejection and flux performance in the area of desalination. In the literature, there are many attempts to increase membrane performance by using var- ious kinds of additives in an aqueous or organic phase to obtain a better IP process [27–29]. Petersen reported that, to obtain higher rejection performance in piperazine-based (PIP) membranes, the presence of an acid acceptor was necessary in an aqueous solution. However, this was not the case for m-phenylenediamine-based (MPD) membranes [10]. The reaction rate of a PIP solution into the trimesoyl chloride (TMC) solution was rather low and requires a higher concentration of acyl halide along with an acid acceptor to promote the PA active barrier layer. In the case of MPD- based membranes, the high portion of tertiary amine content acts as a built-in acid acceptor. Hermans proved that the use of a tertiary amine base was necessary to obtain a high rejection rate together with surfactants. However, adding each of them separately did not improve the performance [30]. Mansourpanah indicated that adding different kinds of surfactants (anionic, cationic, and nonionic) affects the filtration performance and morphology of the active barrier layer. They reported that an increase in surfactant concentra- tions in aqueous PIP solutions usually decreases rejection and increases permeate flux with some exceptions [31, 32].
When it comes to desalination technology, the dead- end filtration method is usually applied as a pretreatment for reverse osmosis in seawater desalination using a low- pressure membrane such as microfiltration or ultrafiltration [33, 34]. The polymeric phase-inverted micro- and ultrafil- tration membranes have proved themselves to be able to take on this task. However, polymeric phase-inverted membranes tend to show fouling due to their hydrophobic structure. Moreover, most of the common phase-inverted membranes are produced from expensive polymers such as PVDF, PES, or
PSf using highly concentrated polymer solutions via a solvent and nonsolvent exchange system.
Taking into consideration the above information, the objectives of the present work are the following:
(1) To prepare alternative supporting material, which is relatively cheap and applicable to upscale production of liquid filtration or desalination.
(2) To overcome the main issues of nanofibrous mem- branes (weak mechanical properties) in liquid nano- filtration and prepare the finest possible nanofibrous surface without negatively affecting the morphology of the nanofibres for PA thin active surface.
(3) To desalinate real seawater provided from the Med- iterranean Sea using thin film nanofibrous com- posite membranes under low pressure via dead-end filtration.
In this study, three-layered thin film nanofibrous com- posite membranes were prepared. The nonwoven and nanofi- brous supporting layers were combined using the lamination method by applying heat and pressure. The top PA thin active layer was formed by interfacial polymerization. The characterizations of laminated support layer and prepared thin film nanofibrous composite membrane were done. The long-term filtration performance was evaluated via a dead- end filtration cell using mono- and divalent salt solutions. Finally, real seawater filtration was carried out using the dead- end filtration cell.
2. Experimental
2.1. Materials. The TFNC bottom substrate was a polypropy- lene/polyethylene (80/20, 18 g/m2) bicomponent spunbond nonwoven fabric (Pegatex S BICO) from Pegas Nonwo- vens s.r.o. (Czech Republic). The solution used to pro- duce the porous nanofibre layer by electrospinning con- sisted of polyamide 6 (PA6) (BASF B24) dissolved in acetic acid/formic acid. The selective layer of the TFNC membrane was prepared by interfacial polymerization of two immiscible phases on the porous nanofibre layer. Piperazine (PIP) and m-phenylenediamine (MPD) were purchased from Sigma- Aldrich and prepared in deionised water as aqueous phases, while the organic phase was prepared by dissolving trimesoyl chloride (TMC) (Sigma-Aldrich) in hexane at 40∘C. The filtration performance of TFNC membranes was tested using salt solutions containing magnesium sulphate (MgSO4), sodium chloride (NaCl), and calcium chloride (CaCl2) pur- chased from Penta s.r.o. (Czech Republic) and sodium sul- phate (Na2SO4) purchased from Lachema, Brno (Chemapol). Triethylamine (TEA) was purchased from Sigma-Aldrich. Sodium hydroxides (NaOH) were chosen as acid acceptor materials and Synferol AH 1241 was used as an anionic surfactant.
2.2. Preparation of the Electrospun PA6 Porous Nanofibrous Layer. A solution of polyamide 6 (8% wt.) was dissolved in acetic acid/formic acid at a ratio of 2/1 at 80∘C for

143
(−)
Collector electrode
Take-up
cylinder
Nanofiber fabric
Backing material (paper)
Polymer solution feeding tank
Wire feeding apparatus
and electrode
(+)
Wire
Slit
Nanofiber jets
Polymer solution carriage movement
Figure 1: Electrospinning of PA6 nanofibres using the Nanospider Production Line NS 1WS500U.
4 hours to produce a nanofibre layer using wire electrode electrospinning equipment (NS 1WS500U, Elmarco s.r.o., Czech Republic). Wire electrospinning is a new technique that uses an electrical force to spin nanofibres from a free surface liquid towards a collector electrode [35] (Figure 1).A solution carriage feeds the polymer solution arounda moving stainless steel wire. The speed of the carriage is 245 mm/s and the rotation speed of the wire is 40.5 cm/h. High voltage suppliers are connected to the wire electrode (55 kV) and the collector electrode (−10 kV). When the applied voltage exceeds a critical value, many Taylor cones are created on the surface of the wire. Polymer solution jets move towards the collector, the solvent evaporates, and the PA6 nanofibrous layer is collected on baking paper moving in front of the collector electrode. The speed of the movement of the baking paper is 9 cm/min.
The distance between the electrodes is 18 cm. The temper- ature and humidity of input air are set to 23∘C and 30% by the air-conditioning system. The volumes of air input and output are 98 and 110 m3/h, respectively.
2.1. Lamination of Nonwoven and Nanofibrous Materials. Bicomponent spunbond nonwoven and PA6 nanofibrous fabrics were laminated using RPS-Mini fusing lamination equipment (Meyer-Germany). This process was carried out tenuously to avoid damaging the structure of the nanofibres such as the fibre diameter and pore size.
The PA6 nanofibrous layer was put onto PP/PE bicompo- nent nonwoven fabric and inserted between two Teflon belts moving at 2 m/min in the lamination equipment.
The temperature was set at 135∘C considering the melting point of PE (120–130∘C). The nanofibrous layer adhered to
Figure 2: Lamination method and equipment.
the nonwoven fabric under a pressure of 15 N/cm while the PE fibres partly melted. The resulting product is called the nonwoven-nanofibrous composite (NNC) scaffold (Figure 2).
2.2. Preparation of the Active Barrier Layer. The laminated PP/PE bicomponent spunbond nonwoven fabric and the PA6 nanofibrous web were used as supporting material to prepare the TFNC membranes. To form an active barrier layer, interfacial polymerization was carried out using MPD and PIP monomers for an aqueous solution while TMC was used for organic solutions.
To prepare the PIP-based TFNC membranes, TEA [4.0% (w/v)] and NaOH [1.0% (w/v)] were added to a certain amount of PIP [2.0% (w/v)] aqueous solution while the concentration of the TMC was [0.2% (w/v)]. The reaction times selected for the aqueous and organic solutions were 1 min and 45 sec, respectively. The drying time between the solutions was set at 5 min. The temperature and time of curing
in the incubator were 110∘C and 10 min, respectively.
Backing paper Teflon belt
Heated pressure rollers
Nonwoven fabric Nanofibrous fabric
Direction of lamination

144
MPD-based membranes were prepared using an acid Table 1: Properties of the NNC scaffold.
acceptor [TEA, 2.0% (w/v)] and surfactants [anionic liquid, 0.2% (w/v)]. The selected concentrations of MPD and TMC were [2.0% (w/v)] and [0.2% (w/v)] in aqueous and organic
Smallest pore size (�m)
Bubble point pore size
(�m)
Mean flow pore size
(�m)
Fibre diameter
(nm) solutions. The IP reaction for the MPD-based membranes was carried out under the same conditions as the drying, curing time, and curing temperature mentioned above for the PIP-based membranes except that the reaction times were different. The selected reaction time for the MPD aqueous solution was 1 min, whereas the reaction time for the organic solution was 30 sec.
2.1. Characterization of Enhanced TFNC Membranes. The surface morphologies of enhanced MPD- and PIP-based TFNC membranes were investigated using scanning elec- tron microscopy (Tescan-Vega3 SEM). Attenuated total reflectance Fourier transforms infrared spectroscopy (ATR-
0.469 1.064 0.739 126 ± 29.1
of enhanced MPD- and PIP-based TFNC membranes. All of the filtration experiments were performed to observe the long-term and fouling performance of the TFNC membranes. The experiments were performed using pure water and salt solutions, for example, 2,000 ppm MgSO4, NaCl, CaCl2, and Na2SO4 solutions, were used as feed water. The rejection performance was calculated by (1), using a conductivity meter:
Cf − Cp FTIR) characterization of the MPD- and PIP-based TFNC membrane surfaces was performed with the ATR accessory,
Rejection (%) = Cf
× 100, (1)
using a Nicolet IZ10 (Thermo Fisher Scientific Inc., Waltham, MA). Analysis of samples was carried out by applying the reflection technique using a Germanium crystal. The surface hydrophilicity of the NNC scaffold and MPD- and PIP-based TFNC membranes was evaluated using an optical angle meter (Kruss Drop Shape Analyzer DS4).
2.2. Molecular Weight Cut-Off (MWCO) Test Using Aqueous PEG Solutions. Molecular weight cut-off refers to the lowest molecular weight solute (in daltons) in which 90% of the solute is retained by the membrane. The MWCO of MPD- and PIP-based membranes was evaluated with polyethylene glycol aqueous feed solutions, containing 1000 ppm PEG with different molecular weights (Sigma-Aldrich; Mn: 200, 400, and 600). The permeants and feed solutions were analyzed using a total organic carbon analyzer (direct measurement method, Analytik Jena Multi N/C 2100S, Germany). The filtration performance of PEG solutions was tested using a dead-end filtration cell.
2.3. Liquid Chromatography Analysis. The prepared MPD- and PIP-based membranes were used to determine whether residual compounds such as MPD, PIP, TMC, TEA, or surfac- tants were released from the membranes to the permeation side. Therefore, the membranes were set into a dead-end filtration cell and only pure water was used as a feed solution. The permeate water samples were stored in a vial specifically for liquid analysis. The existence of residual chemicals that could be released from the membrane itself during the pure water filtration experiments was investigated using ABSciex 3200 QTRAP mass spectrometer and Dionex UltiMate 3000 liquid chromatography.
The amount of salt ions (Na+, Ca+2, K+, Mg+2, Cl−, SO−4,
NO−2, and NO−3) in the original feed seawater and filtered seawater was determined through ion chromatography anal- ysis using ICS-90 Dionex.
2.4. Evaluation of Filtration Performance. The dead-end fil- tration cell was used to investigate the filtration performance
where Cf and Cp are the conductivity of the feed and permeant concentrations.
1. Results and Discussion
3.1. Characteristic of TFNC Membranes. In this study, pro- duction of PA6 nanofibres was carried out onto a backing paper substrate using a Nanospider electrospinning device. Subsequently, the PA6 nanofibrous layer was transferred onto a PP/PE spunbond nonwoven fabric by the lamina- tion method. Figure 3 illustrates the top-viewed and cross- sectioned SEM image of the TFNC membranes. The average fibre diameter of the top layer of the NNC scaffold was 126 ± 29.1 nm and the mean flow pore size was 0.739 �m. Further features of the NNC scaffold are listed in Table 1.
The tensile strength tests of the nonwoven fabric, nanofi- brous scaffold, and NNC scaffold were measured individually. The nanofibrous layer showed weak mechanical properties of 4.33 N/25 mm (machine direction) and 4.12 N/25 mm (counter-direction), while the tensile strength of the spun- bond bicomponent nonwoven fabric was 14.95 N/25 mm (machine direction) and 6.14 N/25 mm (counter-direction). When the lamination method was applied, the tensile strength of the NNC scaffold was increased to 29.17 N/25 mm (machine direction) and 14.42 N/25 mm (counter-direction). The thicknesses of the nanofibrous scaffold and the spunbond bicomponent nonwoven fabric were 38 ± 0.5 �m and 75 ± 1 �m, respectively. After lamination of the fabrics, the total scaffold thickness was 105 ± 5 �m.
The PIP- and MPD-based TFNC membranes were pre- pared by adding various additives to the aqueous solutions. The addition of an acid acceptor, a strong base, and anionic surfactants to the aqueous solution had a significant effect on the surface morphology of the PIP- and MPD-based TFNC membranes (Figure 4).
It is evident from the SEM images in Figure 4 that the fibrous pattern of the nanofibrous layer disappeared and formed a typical ridge and valley PA structure on the NNC scaffold. The surface structures of the MPD-based

145
50 �m
5 �m 50 �m 5 �m
(a) (b)
Figure 3: SEM images of (a) top view (nanofibres) and (b) cross-sectioned TFNC membranes.
(a) (b)
Figure 4: Surface images of (a) PIP-based membranes which were prepared TEA+NaOH and (b) MPD-based membranes which were prepared TEA+Synferol AH.
membranes prepared with the anionic liquid were smooth and homogenous according to the PIP-based membranes. The morphological difference of the MPD- and PIP-based membranes is mainly due to the difference in the chemical structure of the monomers.
The FTIR spectra of the obtained PIP-based PA active layers on the NNC scaffold are shown in Figure 5. The strong and broad signals around the wavelength of 3,405 cm−1 were observed with the addition of NaOH, which was assigned to the carboxylic acid group or the hydroxyl group on the sur- face of the active layer. However, for the membranes coated with MPD-based active layers, the same bond seems weaker. A strong band at 1,620 cm−1 is an indicator of the C=O bond of an amide functional group for both membranes.
The FTIR spectra of the prepared MPD-based PA active layers on the NNC scaffold are also given in Figure 5. The characteristic properties of the MPD-based membranes were seen at 1,650 cm−1 and 1,550 cm−1, which are repre- sented by the C=C bond of the phenyl ring and amide II, respectively. The C-H stretching region for the anionic
liquid (Synferol AH) can be observed from the medium peaks at 2,956 cm−1 (asymmetric CH3), 2,923 cm−1 (asymmetric
CH2), and 2,854 cm−1 (symmetric CH3). The other peaks
observed after 1,000 cm−1 indicate C-H bonds in aromatics groups.
The reaction of both MPD (Figure 6) and PIP (Figure 7) monomers with TMC led to the successful formation of a dense layer on the NNC scaffold.
The surface hydrophilicity of the prepared PIP- and MPD-based TFNC membranes is given in Table 2.
The NNC scaffold showed slightly hydrophilic behaviour, while the membranes with the active barrier layer showed more hydrophilic behaviour than the NNC scaffold. The measurement of contact angles of the PIP-based membranes showed superhydrophilic behaviour with the existence of acid acceptors (TEA, NaOH). The measurement of the contact angle of the MPD-based membranes demonstrated that the addition of an acid acceptor and an ionic liquid to the aqueous solution hasa significant effect on the surface hydrophilicity of the active layer.
PA active layer
Nanofibre layer
Nonwoven layer
20 �m
5 �m 2 �m

146
Table 3: The rejection values of the TFNC membranes using PEG feed solutions.
Membranes PEG-200 PEG-400 PEG-600
PIP+TEA+NaOH 61.5% 91.1% 98.9
MPD+TEA+Sy-AH 97.3% 98.9% 99.6
Table 4: Properties of the salt used for the feed solutions.
Type of salt Conductivity
pH Parts per million (ppm) (mS/cm)
4000 3500 3000 2500 2000 1500 1000
Wavenumbers (cm−1)
MPD+TEA+Synferol AH-based layer (3) PIP+TEA+NaOH-based layer (2) PA nanofibers layer (1)
Figure 5: ATR-FTIR of the NNC scaffold (1) and PIP-based (2) and MPD-based (3) membranes.
Table 2: Contact angle properties of NNC and TFNC membranes (specified with reaction time).
Contact
2
was 1.3 nm (200 Da), which means that the effective pore size of the MPD+TEA+Sy-AH-based membrane was less than 1.3 nm [36]. The TOC analysis showed that the PIP+TEA+NaOH-based membrane was able to retain com- pounds with a maximum average molecular weight of 400 g/mol. On the other hand, the MPD+TEA+Sy-AH-based membrane was able to retain a compound with a molecular
Membranes angle Images of water droplet weight of less than 200 g/mol.
3.3. Filtration Performance of TFNC Membranes. The filtra- tion processes in the extended period were carried out using a PIP+TEA+NaOH-based membrane. First, the filtration process was carried out using distilled water to determine the pure water permeate flux and level of compaction of the membrane (Figure 8).
In the early filtration stage of all of the membranes, determination of the pure water flux is necessary in order for the membranes to reach a steady state. In this study, transmembrane pressure was applied to all of the prepared membranes for compaction. Once the membranes reach a steady state using pure water, the filtration process was car- ried out for the feed solutions. Figure 8 shows the pure water flux of PIP+TEA+NaOH-based membranes for 24 hours. The
3.2. Determination of the Molecular Weight Cut-Off of the TFNC Membranes. The filtration of an aqueous PEG solution with different molecular weights was carried out using dead- end filtration to determine the MWCO of the TFNC mem- brane. Table 3 gives the PEG rejection values of the PIP-based TFNC membrane prepared using TEA + NaOH as an additive and the MPD-based TFNC membrane prepared using TEA + Synferol AH as an additive. 1000 ppm PEG 200, 400, and 600 solutions were used as the test samples during the MWCO tests.
It was found that the MWCO of the PIP+TEA+NaOH- based membrane was 400 Da (the rejection rate was 91.1%). The average solution diameter of PEG-400 was 1.8 nm, which means that the effective pore size of the PIP+TEA+NaOH- based membrane was around 1.8 nm. The MPD+TEA+Sy- AH-based membrane showed a high PEG-200 rejection rate (97.3%). The average solution diameter of PEG-200
filtration of the pure water flux began with 78.5 L m−2 h−1
and was then decreased to 75.9 and 74.7 L m−2 h−1. Stable
flux averaging 73.5 L m−2 h−1 was obtained after 6 hours. The differences between the steady state and the third-hour flux were not so significant (1.2 L m−2 h−1). It is also seen from Figure 8 that the amount of compaction on the PIP-based membranes was almost negligible.
After the steady state of the PIP+TEA+NaOH-based membrane was determined and attained using pure water, feed solution experiments were carried out for an extended period. Four kinds of salts, that is, MgSO4, NaCl, CaCl2, and Na2SO4, were chosen for the feed solution. The properties of the salt solutions are given in Table 4 and the filtration performances of the four kinds of solution are illustrated in Figure 9.
The flux and rejection performance are shown for the filtration of feed solutions in all of the graphs in Figure 9.
1550
2956 2923
(3) 2854
3405
1650
1734
1620
(2)
(1)
NNC scaffolds 62.7 ± 2.74
PIP+TEA+NaOH+TMC (1 min + 45 sec)
0
MPD+TEA+Synf+TMC (1 min + 30 sec)
21 ± 1.64
Ab
sorb
ance
(%
)
MgSO4 2.21 5.59 2,000
Na2SO4 5.74 6.87 2,000
NaCl 3.52 6.15 2,000
CaCl 3.62 5.75 2,000

147
O O
O
O
Cl
O Cl
O O
Cl Cl
+
NH2
NH2 N N H H
H H N N
TMC MPD Crosslinked structure Linear structure
Figure 6: An aromatic polyamide formed with trimesoyl chloride and m-phenylenediamine.
O O
Cl Cl
+ NH
N
NH
TMC PIP Crosslinked structure Linear structure
Figure 7: Reaction of trimesoyl chloride and piperazine to aliphatic PA.
80
78
76
74
72
70
0 2 4 6 8 10 12 14 16 18 20 22 24
Running time (hour)
Pure water flux
Figure 8: Observation of the filtration process for an extended period of PIP+TEA+NaOH membrane using pure water at 4.8 bar.
In Figure 9(b), the flux performance showed a decreas- ing trend, which means that the PIP+TEA+NaOH-based membrane showed slightly fouling behaviour during the filtration of the Na2SO4 feed solution. Eventually, the
PIP+TEA+NaOH-based membrane showed a high rejection performance for divalent salts. Inherently, the retained monovalent salt ratios were low.
The MPD+TEA+Sy-AH-based membrane used for the pure water filtration over an extended period is shown in Figure 10.
The MPD+TEA+Sy-AH-based membrane began with considerably high pure water flux; after a while the pure water flux becomes stable and reaches a steady state. The pure
water flux began around 31.2 L m−2 h−1 and then reached a steady state at 22.3 L m−2 h−1 after 6 hours. The membrane compaction is crucial for the NF and RO membranes and depends on the applied pressure and type of membrane [37, 38]. Flux performance can drop significantly, especially in reverse osmosis membranes [39]. Figures 8 and 10 show that the compaction rate of the TFNC membranes is substantially low due to the advantages of the fibrous structure of the supporting layer.
The filtration experiments of different salt-based feed solutions for the MPD+TEA+Sy-AH-based membrane are given in Figure 11. The rejection rates of divalent salts were higher than 98% and were around 96-97% for monovalent salts. The flux performance of the MPD+TEA+Sy-AH-based membrane showed a slightly decreasing trend. This may be explained by the concentration polarization due to the use of a dead-end filtration cell.
O O
O OH
O O
N
O
N N
O O
O OH
Pu
re w
ater
flu
x (L
/m2 h
)

148
Rej
ecti
on
on
CaC
l 2 (%
)
Flu
x (
L/m
2h
)
46
44
42
40
38
36
34
0 1 2 3
4 5 6
7 8 9 10
99.5
99.0
98.5
98.0
97.5
97.0
96.5
96.0
25.0
24.5
24.0
23.5
23.0
22.5
22.0
0 1
2 3 4 5
6 7 8 9 10
98.0
97.5
97.0
96.5
96.0
95.5
95.0
Rejection
Flux
56
54
52
50
48
Running time (hour)
(a)
36 60
33 58
30 56
27
54
24
21 52
Rejection
Flux
Running time (hour)
(b)
27
24
21
18
15
0 1 2 3 4 5 6 7 8 9 10 0 1 2 3 4 5 6 7 8 9 10
Rejection
Flux
Running time (hour)
(c)
Rejection
Flux
Running time (hour)
(d)
Figure 9: Extended filtration of (a) MgSO4, (b) Na2SO4, (c) CaCl2, and (d) NaCl feed solutions at 2,000 ppm and 4.8 bar using a dead-end cell.
A specific amount of feed water was used in each
experiment, and the circulation of feed water was impossible in the dead-end filtration system. As the water molecules diffuse through the TFNC membrane, the salt ion is retained and the concentration of feed water continuously increases. Due to the fact that the ratio of salt ions increased rapidly, concentrated feed solutions accumulate on the surface of the membrane and lead to salt leakage or fouling. Moreover, the osmotic pressure of the feed water increases proportionally to the concentration of the feed solution. For this reason, the flux of feed water tended to decrease during filtration using the MPD-based membranes.
3.4. Analysis of Real Seawater Filtration. The desalination of seawater using membrane technology is a promising technique, which essentially requires more than one step to produce drinkable water such as prefiltration, microfiltration, and softening. The results of ion-exchange chromatogra- phy analysis and conductivity measurements show that the
amount of the main dissolved salt ions and the conductivity of the seawater were extremely high for the NF membrane filtration process (Table 5).
The primarily filtration experiment was carried out using PIP+TEA+NaOH- and MPD+TEA+Sy-AH-based mem- branes by measuring the conductivity of the permeate water only (Figure 12).
The results in Figure 12 show that the conductivity value of permeate water dropped from 53.2 mS/cm to 47 mS/cm and 38 mS/cm, respectively, while the flux performance was
24.6 L m−2 h−1 and 0.65 L m−2 h−1, respectively. It is clear that the PIP- and MPD-based membranes remained incapable of retaining an excessive amount of salt ions in the seawater all at once. For this reason, the same feed seawater was circulated and was used more than once while the same membrane was fixed on the dead-end cell.
The filtration experiment of circulated seawater started with the PIP-based membranes and was repeated six times. Subsequently, the same permeate water was used
Flu
x (L
/m2h
) F
lux
(L/m
2 h)
Rej
ecti
on
on
Mg
SO
4 (%
)
Flu
x (
L/m
2h
)
Rej
ecti
on
on
NaC
l (%
) R
ejec
tio
n o
n N
a2S
O4 (%
)

149
4
2
3
4
2
3
40
35
30
25
20
15
10
0 2 4 6 8 10 12 14 16 18 20 22 24
Running time (hour)
Pure water flux
Table 6: Amount of ions in the filtered seawater sample [permeant (4.) in Figure 13(b)].
Cations mg/L
Na+ 219
Mg+2 1.8
Ca+2 9.4
K+ 8.6
Anions mg/L
Cl− 341
SO −2 4.2
NO − <10
NO − <10
Conductivity of seawater 585.1 �S/cm
Figure 10: Observation of the filtration process of MPD+TEA+Sy- AH membrane for an extended period using pure water at 4.8 bar.
Table 5: The main dissolved ions in a Mediterranean seawater sample.
10.5 mS/cm while the flux performance was more or less the same (0.965 L m−2 h−1).
After the fourth attempt at MPD-based filtration, the conductivity of the obtained permeate water was 585.1 �S/cm with increased flux (1.12 L m−2 h−1), which means that approximately 98.9% of the salt ions were retained from the
seawater using TFNC membranes by dead-end filtration. The Cations mg/L
Na+ 11,741
Mg+2 1,447
Ca+2 433
K+ 411
Anions mg/L
Cl− 21,384
SO −2 2,357
NO − <100
NO − <100
Conductivity of seawater 53.2 ms/cm
as feed water using the MPD-based membranes and was repeated four times (Figure 13). The flux performance of the PIP+TEA+NaOH-based membranes in the filtration of seawater was higher compared to the MPD+TEA+Sy-AH- based membranes. Moreover, the flux performance of PIP- based membranes increased after each filtration process, while the conductivity of the feed seawater decreased. The conductivity of the feed seawater remained stable after the fifth (32.5 mS/cm) and sixth (32.0 mS/cm) filtration (Fig- ure 13(a)). It was understood that after four filtration cycles using the PIP-based membranes there was none or only trace amounts of divalent salt ions in the feed seawater. The rate of recovery was more than 95% at the end of the filtration processes of seawater using the PIP-based membrane.
Further filtration was continued with MPD+TEA+Sy- AH-based membrane using prefiltered feed seawater, which had a conductivity of 32.0 mS/cm (Figure 13(b)). In the first attempt of filtration, the conductivity dropped to 20 mS/cm
while the flux performance was 0.935 L m−2 h−1, which was slightly higher than shown in Figure 12. During the second filtration of the feed seawater, the conductivity decreased to
final recovery rate was around 75% at the end of the seawater filtration process using the MPD-based membrane.
The analysis of ion-exchange chromatography was car- ried out again, and the amounts of salt ions in the filtered water are given in Table 6.
It is clear from Figure 13 that the rejection ratio of salt ions from seawater was dependent on the number of repetitions of the circulated feed seawater using the dead-end filtration method. We firmly believe that there was a chance to retain the rest of the salt ions from the obtained seawater permeants by increasing the circulation time. However, the flux performance of the MPD-based membranes dropped extremely. It was not reasonable to proceed with the filtration of seawater experiment using a dead-end filtration cell and so we limited the circulation times of the feed seawater to four using the MPD-based membrane.
Another advantage of TFNC membranes was revealed by liquid chromatography analysis of permeate water. The results of the analysis showed that the amount of the residual chemical, which was maybe released from the membrane itself, was not observed except for a trace amount of TEA (0.1 mg/L after 5 hours of pure water filtration).
1. Conclusion
In this study, not only the flux performances but also the rejection performances of MPD- and PIP-based mem- branes were significantly high using an acid acceptor and surfactants. The addition of TEA as an acid acceptor is necessary for the formation of poly(piperazine amide). The presence of TEA increased the reaction rate of the PIP monomer to the TMC monomers. A strong base (NaOH) was added as a second additive to the aqueous solution and a poly(piperazine amide) active layer formed onto the NNC scaffold. The highest divalent rejection performance
Pu
re w
ater
flu
x (L
/m2 h
)

150
16 98
15 97
14 96
95 13
94 12
93
11 92
10 91
9 90 0 2 4 6 8 10 12 14 16 18 20 22
Running time (hour)
Rejection
16
15
14
13
12
11
0 2 4 6 8 10 12 14 16 18 20 22
Running time (hour)
Rejection
100
99
98
97
96
95
94
93
92
91
Flux
16
15
14
13
12
11
(a)
100
99
98
97
96
95
94
93
92
91
Flux
14
13
12
11
10
9
(b)
99
98
97
96
95
94
93
0 2 4 6 8 10 12 14 16 18 20
Running time (hour)
Rejection
0 2 4 6 8 10 12 14 16 18 20 22
Running time (hour)
Rejection
Flux (c)
Flux (d)
Figure 11: Extended filtration of (a) NaCl, (b) CaCl2, (c) MgSO4, and (d) Na2SO4 feed solutions at 2,000 ppm and 4.8 bar using a dead-end cell.
27 60
24 55
21
18 50
15 45
12 40
9
6 35
3 30
0 PIP+TEA+NaOH MPD+TEA+Sy-AH
Type of membrane
Flux
Conductivity
Figure 12: Filtration experiment of seawater using different mem- branes and a dead-end cell at 4.8 bar.
was obtained using the PIP+TEA+NaOH-based membrane,
which was on average 98.8% MgSO4 and 97.4% Na2SO4. Even though the effect of the dead-end filtration method proved to be a disadvantage, the pure water flux and permeate flux of PIP+TEA+NaOH-based membranes were high, that is,
73.5 L m−2 h−1 and 40.5L m−2 h−1, respectively. The MPD- based membrane showed high flux and rejection perfor- mance with the addition of an anionic liquid and TEA. The highest monovalent rejection performance was recorded with the MPD+TEA+Sy-AH-based membrane, which had an average of 97.4% CaCl2 and 96.3% NaCl. The pure water flux and permeate flux of the MPD+TEA+Sy-AH- based membrane were high, that is, 22.5 L m−2 h−1 and 12.5
L m−2 h−1, respectively. The filtration experiments of the real seawater indicated
that the TFNC membranes were not able to retain a sufficient amount of salt ions at the first attempt. For this reason, the combination of circulated feed seawater was used to retain
Flu
x (L
/m2h
)
Flu
x (L
/m2h
) F
lux
(L/m
2h
)
Co
nd
uct
ivit
y (
mS/
�m
) R
ejec
tio
n o
n N
aCl
(%)
Flu
x (
L/m
2h
)
Rej
ecti
on
on
Mg
SO
4 (%
)
Flu
x (
L/m
2h
)
Rej
ecti
on
on
Na
2S
O4 (%
) R
ejec
tio
n o
n C
aC
l 2 (%
)
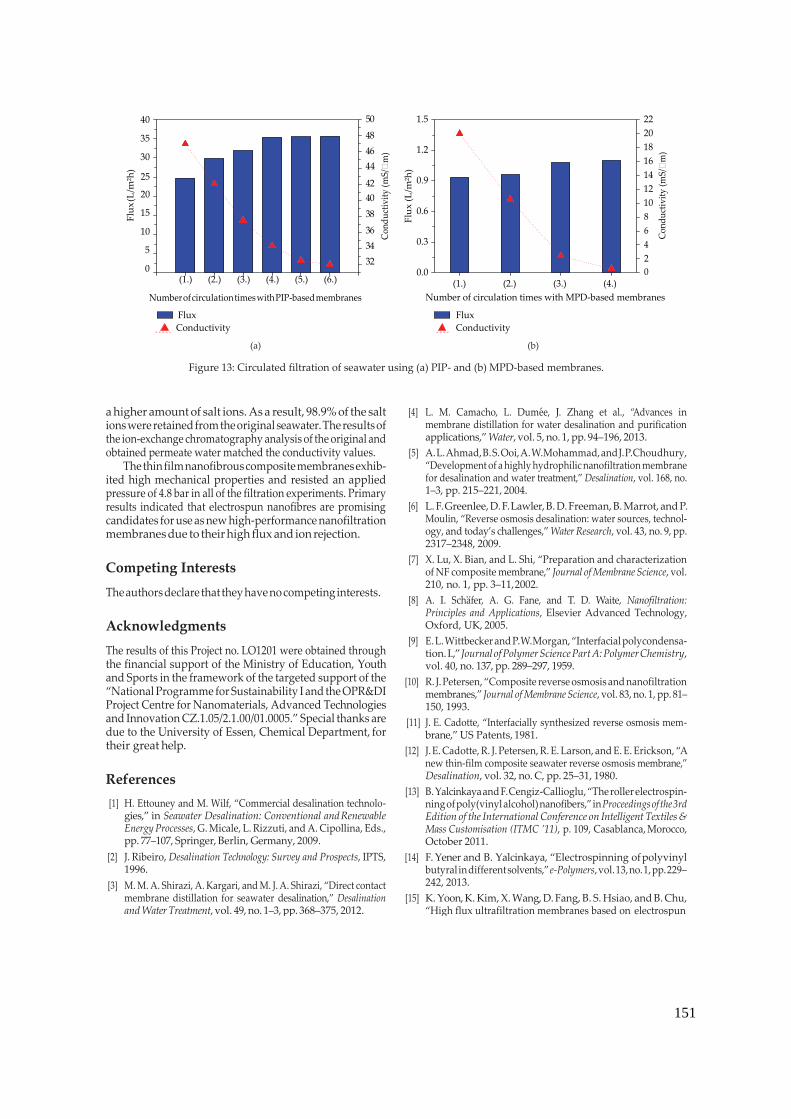
151
40 50
35 48
30 46
44 25
42
20 40
15 38
10 36
5 34
0 32
(1.) (2.) (3.) (4.) (5.) (6.)
1.5
1.2
0.9
0.6
0.3
0.0
22
20
18
16
14
12
10
8
6
4
2
0 (1.) (2.) (3.) (4.)
Number of circulation times with PIP-based membranes
Flux
Conductivity
(a)
Number of circulation times with MPD-based membranes
Flux
Conductivity
(b)
Figure 13: Circulated filtration of seawater using (a) PIP- and (b) MPD-based membranes.
a higher amount of salt ions. As a result, 98.9% of the salt ions were retained from the original seawater. The results of the ion-exchange chromatography analysis of the original and obtained permeate water matched the conductivity values.
The thin film nanofibrous composite membranes exhib- ited high mechanical properties and resisted an applied pressure of 4.8 bar in all of the filtration experiments. Primary results indicated that electrospun nanofibres are promising candidates for use as new high-performance nanofiltration membranes due to their high flux and ion rejection.
Competing Interests
The authors declare that they have no competing interests.
Acknowledgments
The results of this Project no. LO1201 were obtained through the financial support of the Ministry of Education, Youth and Sports in the framework of the targeted support of the “National Programme for Sustainability I and the OPR&DI Project Centre for Nanomaterials, Advanced Technologies and Innovation CZ.1.05/2.1.00/01.0005.” Special thanks are due to the University of Essen, Chemical Department, for their great help.
References
[1] H. Ettouney and M. Wilf, “Commercial desalination technolo- gies,” in Seawater Desalination: Conventional and Renewable Energy Processes, G. Micale, L. Rizzuti, and A. Cipollina, Eds., pp. 77–107, Springer, Berlin, Germany, 2009.
[2] J. Ribeiro, Desalination Technology: Survey and Prospects, IPTS, 1996.
[3] M. M. A. Shirazi, A. Kargari, and M. J. A. Shirazi, “Direct contact membrane distillation for seawater desalination,” Desalination and Water Treatment, vol. 49, no. 1–3, pp. 368–375, 2012.
[4] L. M. Camacho, L. Dumee, J. Zhang et al., “Advances in membrane distillation for water desalination and purification applications,” Water, vol. 5, no. 1, pp. 94–196, 2013.
[5] A. L. Ahmad, B. S. Ooi, A. W. Mohammad, and J. P. Choudhury, “Development of a highly hydrophilic nanofiltration membrane for desalination and water treatment,” Desalination, vol. 168, no. 1–3, pp. 215–221, 2004.
[6] L. F. Greenlee, D. F. Lawler, B. D. Freeman, B. Marrot, and P. Moulin, “Reverse osmosis desalination: water sources, technol- ogy, and today’s challenges,” Water Research, vol. 43, no. 9, pp. 2317–2348, 2009.
[7] X. Lu, X. Bian, and L. Shi, “Preparation and characterization of NF composite membrane,” Journal of Membrane Science, vol. 210, no. 1, pp. 3–11, 2002.
[8] A. I. Schafer, A. G. Fane, and T. D. Waite, Nanofiltration: Principles and Applications, Elsevier Advanced Technology, Oxford, UK, 2005.
[9] E. L. Wittbecker and P. W. Morgan, “Interfacial polycondensa- tion. I.,” Journal of Polymer Science Part A: Polymer Chemistry, vol. 40, no. 137, pp. 289–297, 1959.
[10] R. J. Petersen, “Composite reverse osmosis and nanofiltration membranes,” Journal of Membrane Science, vol. 83, no. 1, pp. 81– 150, 1993.
[11] J. E. Cadotte, “Interfacially synthesized reverse osmosis mem- brane,” US Patents, 1981.
[12] J. E. Cadotte, R. J. Petersen, R. E. Larson, and E. E. Erickson, “A new thin-film composite seawater reverse osmosis membrane,” Desalination, vol. 32, no. C, pp. 25–31, 1980.
[13] B. Yalcinkaya and F. Cengiz-Callioglu, “The roller electrospin- ning of poly(vinyl alcohol) nanofibers,” in Proceedings of the 3rd Edition of the International Conference on Intelligent Textiles & Mass Customisation (ITMC ’11), p. 109, Casablanca, Morocco, October 2011.
[14] F. Yener and B. Yalcinkaya, “Electrospinning of polyvinyl butyral in different solvents,” e-Polymers, vol. 13, no. 1, pp. 229– 242, 2013.
[15] K. Yoon, K. Kim, X. Wang, D. Fang, B. S. Hsiao, and B. Chu, “High flux ultrafiltration membranes based on electrospun
Flu
x (L
/m2h
)
Co
nd
uct
ivit
y (
mS/
�m
)
Flu
x (
L/m
2h
)
Co
nd
uct
ivit
y (
mS/
�m
)

152
nanofibrous PAN scaffolds and chitosan coating,” Polymer, vol. 47, no. 7, pp. 2434–2441, 2006.
[16] L. Yung, H. Ma, X. Wang et al., “Fabrication of thin-film nanofibrous composite membranes by interfacial polymeriza-
tion using ionic liquids as additives,” Journal of Membrane Science, vol. 365, no. 1-2, pp. 52–58, 2010.
[17] N.-N. Bui, M. L. Lind, E. M. V. Hoek, and J. R. McCutcheon, “Electrospun nanofiber supported thin film composite mem- branes for engineered osmosis,” Journal of Membrane Science, vol. 385-386, no. 1, pp. 10–19, 2011.
[18] Z. Fan, Z. Wang, M. Duan, J. Wang, and S. Wang, “Preparation and characterization of polyaniline/polysulfone nanocomposite ultrafiltration membrane,” Journal of Membrane Science, vol. 310, no. 1-2, pp. 402–408, 2008.
[19] X. Wang, T.-M. Yeh, Z. Wang et al., “Nanofiltration membranes prepared by interfacial polymerization on thin-film nanofi- brous composite scaffold,” Polymer, vol. 55, no. 6, pp. 1358–1366, 2014.
[20] S.-S. Choi, Y. S. Lee, C. W. Joo, S. G. Lee, J. K. Park, and K.-S. Han, “Electrospun PVDF nanofiber web as polymer electrolyte or separator,” Electrochimica Acta, vol. 50, no. 2-3, pp. 339–343, 2004.
[21] R. Sen, B. Zhao, D. Perea et al., “Preparation of single-walled carbon nanotube reinforced polystyrene and polyurethane nanofibers and membranes by electrospinning,” Nano Letters, vol. 4, no. 3, pp. 459–464, 2004.
[22] X. Wang, K. Zhang, M. Zhu, B. S. Hsiao, and B. Chu, “Enhanced mechanical performance of self-bundled electrospun fiber yarns via post-treatments,” Macromolecular Rapid Communica- tions, vol. 29, no. 10, pp. 826–831, 2008.
[23] L. Huang, J. T. Arena, S. S. Manickam, X. Jiang, B. G. Willis, and J. R. McCutcheon, “Improved mechanical properties and hydrophilicity of electrospun nanofiber membranes for filtration applications by dopamine modification,” Journal of Membrane Science, vol. 460, pp. 241–249, 2014.
[24] L. Huang, S. S. Manickam, and J. R. McCutcheon, “Increasing strength of electrospun nanofiber membranes for water filtra- tion using solvent vapor,” Journal of Membrane Science, vol. 436, pp. 213–220, 2013.
[25] K. Yoon, B. S. Hsiao, and B. Chu, “Formation of functional polyethersulfone electrospun membrane for water purification by mixed solvent and oxidation processes,” Polymer, vol. 50, no. 13, pp. 2893–2899, 2009.
[26] S. Kaur, R. Barhate, S. Sundarrajan, T. Matsuura, and S. Ramakr- ishna, “Hot pressing of electrospun membrane composite and its influence on separation performance on thin film composite nanofiltration membrane,” Desalination, vol. 279, no. 1–3, pp. 201–209, 2011.
[27] X. Wang, D. Fang, K. Yoon, B. S. Hsiao, and B. Chu, “High performance ultrafiltration composite membranes based on poly(vinyl alcohol) hydrogel coating on crosslinked nanofi- brous poly(vinyl alcohol) scaffold,” Journal of Membrane Sci- ence, vol. 278, no. 1-2, pp. 261–268, 2006.
[28] S. Kaur, Z. Ma, R. Gopal, G. Singh, S. Ramakrishna, and T. Matsuura, “Plasma-induced graft copolymerization of poly(methacrylic acid) on electrospun poly(vinylidene flu- oride) nanofiber membrane,” Langmuir, vol. 23, no. 26, pp. 13085–13092, 2007.
[29] S. Kaur, D. Rana, T. Matsuura, S. Sundarrajan, and S. Ramakr- ishna, “Preparation and characterization of surface modified electrospun membranes for higher filtration flux,” Journal of Membrane Science, vol. 390-391, pp. 235–242, 2012.
[30] S. Hermans, R. Bernstein, A. Volodin, and I. F. J. Vankelecom, “Study of synthesis parameters and active layer morphology of interfacially polymerized polyamide-polysulfone membranes,” Reactive and Functional Polymers, vol. 86, pp. 199–208, 2015.
[31] Y. Mansourpanah, K. Alizadeh, S. S. Madaeni, A. Rahimpour, and H. Soltani Afarani, “Using different surfactants for chang- ing the properties of poly(piperazineamide) TFC nanofiltration membranes,” Desalination, vol. 271, no. 1–3, pp. 169–177, 2011.
[32] Y. Mansourpanah, S. S. Madaeni, and A. Rahimpour, “Fabri- cation and development of interfacial polymerized thin-film composite nanofiltration membrane using different surfactants in organic phase; study of morphology and performance,” Journal of Membrane Science, vol. 343, no. 1-2, pp. 219–228, 2009.
[33] J. Guilbaud, A. Masse, F.-C. Wolff, and P. Jaouen, “Seawater pretreatment by dead-end micro and ultrafiltration in pressure- driven inside feed,” Desalination and Water Treatment, vol. 51, no. 1–3, pp. 416–422, 2013.
[34] S. C. J. M. van Hoof, J. G. Minnery, and B. Mack, “Dead-end ultrafiltration as alternative pre-treatment to reverse osmosis in seawater desalination: a case study,” Desalination, vol. 139, no. 1–3, pp. 161–168, 2001.
[35] O. Jirsak, F. Sanetrnik, D. Lukas, V. Kotek, L. Martinova, and J. Chaloupek, “Method of nanofibres production from a polymer solution using electrostatic spinning and a device for carrying out the method,” US Patents, 2005.
[36] J. K. Lin, M. R. Ladisch, J. A. Patterson, and C. H. Noller, “Deter- mining pore size distribution in wet cellulose by measuring solute exclusion using a differential refractometer,” Biotechnol- ogy and Bioengineering, vol. 29, no. 8, pp. 976–981, 1987.
[37] A. A. Manito Pereira, J. M. Timmer, and J. J. Keurentjes, “Swelling and compaction of nanofiltration membranes in a non-aqueous environment,” Desalination, vol. 200, no. 1–3, pp. 381–382, 2006.
[38] K. M. Persson, V. Gekas, and G. Tragardh, “Study of membrane compaction and its influence on ultrafiltration water permeabil- ity,” Journal of Membrane Science, vol. 100, no. 2, pp. 155–162, 1995.
[39] R. K. McGovern, D. McConnon, and J. H. Lienhard V, “The effect of very high hydraulic pressure on the permeability and salt rejection of reverse osmosis membranes,” in Proceedings of the IDA World Congress on Desalination and Water Reuse, International Desalination Association, San Diego, Calif, USA, 2015.

153
Journal of Membrane Science 596 (2020) 117728
Separation of racemic compound by nanofibrous composite membranes
with chiral selector
Jana Gaaalovaa a, Fatma Yalcinkaya b, Petra Cu�rínova�
a, Michal Kohout c, Baturalp Yalcinkaya b,
Martin Ko�stejn a, Jan Jirs�ak d, Ivan Stibor b, Jason E. Bara e, Bart Van der Bruggen f, g,
Pavel Izaak a, c,*
a Institute of Chemical Process Fundamentals of the CAS, v.v.i, Rozvojova 135, 165 00, Prague, Czech Republic
b Technical University of Liberec, Studentska� 1402/2, 461 17, Liberec 1, Czech Republic
c UCT Prague, Technicka� 5, 166 28, Prague 6, Dejvice, Czech Republic
d Jan Evangelista Purkyn�e University in Ústí nad Labem, Pasteurova 1, 400 96, Ústí nad Labem, Czech Republic
e Department of Chemical & Biological Engineering, University of Alabama, Tuscaloosa, AL, USA, 35487-0203
f Department of Chemical Engineering, KU Leuven, Celestijnenlaan 200F, B-3001, Leuven, Belgium
g Faculty of Engineering and the Built Environment, Tshwane University of Technology, Private Bag X680, Pretoria, 0001, South Africa
A R T I C L E I N F O
Keywords:
Chiral resolution
Composite membrane
Pertraction
Preferential sorption
Separation of enantiomers
A B S T R A C T
A series of unique composite membranes formed from a nanoµ fibrous material with different amounts of a
chiral selector was used for separation of chiral drugs. The membrane performances were demonstrated through
sorption tests, wherein they were soaked in an aqueous solution of racemic D, L-tryptophan (a model chiral
drug). The changes in concentration of both enantiomers over time were monitored by HPLC analysis. During
100 days, a blank membrane (without the chiral selector) exhibited no sorption activity. The membranes con-
taining the selector had no influence on the amount of D-enantiomer, while the L-enantiomer was preferentially
adsorbed on each membrane. The intensity of the sorption was found to be a direct function of the amount of the
selector contained in a particular membrane. The separation of the same model chiral compound was further
studied in diffusion cells by pertraction. The preferential sorption of L-tryptophan in the feed underlined the
crucial importance of the selector in an active layer in view of chiral recognition of enantiomers. Due to the
exclusive membrane material, the retention of L-tryptophan in the membrane materials did not block the passage
of D-enantiomer into the permeate at any point during the experiment. Moreover, the nanomaterial in the active
layer assured the distribution of the selector to the point that only 50% of (S, S)-1,2-diaminocyclohexane in one
part of the active layer was sufficient to achieve 99% of enantioselectivity. The membranes – fresh and used –
were analysed by Fourier-transform infrared (FTIR) spectroscopy and characterized by scanning electron mi-
croscopy (SEM) confirming the stability of the tested membranes. To complete the study, the role of the poly-
amide active layer in chiral recognition of tryptophan enantiomers was proposed.
1. Introduction
Currently, nearly 50% of pharmaceuticals on the market are chiral
drugs, the majority of which are racemates, i.e., an equimolar mixture of
two enantiomers. The enantiomers may cause significantly different
physiological effects of the same medicament; e.g., anti-arthritic/
mutagenic penicillamine, bitter/sweet asparagine, tuberculostatic/
blindness-causing ethambutol or sedative/teratogenic thalidomide [1].
In such drugs, the pharmacologically active enantiomer (eutomer)
metabolizes differently to its diastereomer, which is at best is bio-inert
or worse, has undesired (in the case of high dosage of teratogen even
fatal) bioactivity. Another “chiral alert” comes from toxicology. Chiral pharmaceuticals are essential in clinical medicine, and demand from
widespread applications inevitably results in an increased production.
However, overuse also results in the drugs (and their metabolites)
becoming environmental pollutants [2]. Bioaccumulation, persistence
or toxicity also depends on the enantiomeric composition. There is an
ascendant pressure to characterize the effects of both enantiomers or to
* Corresponding author. Institute of Chemical Process Fundamentals of the CAS, v.v.i, Rozvojova 135, 165 00, Prague, Czech Republic.
E-mail address: [email protected] (P. Iza�k).
https://doi.org/10.1016/j.memsci.2019.117728
Received 23 August 2019; Received in revised form 4 December 2019; Accepted 6 December 2019
Available online 6 December 2019 0376-7388/© 2019 Elsevier B.V. All rights reserved.
Contents lists available at ScienceDirect
Journal of Membrane Science
journal homepage: http://www.elsevier.com/locate/memsci

154
J. Gaa�lova� et al. Journal of Membrane Science 596 (2020) 117728
2
replace racemic mixtures by enantiomerically enriched or enantiopure
medicinal products. The separation of enantiomers is therefore vital to
assure general drug safety.
One approach leading to optically pure enantiomers is the asym- metric synthesis of enantiopure drugs [3–5], while another approach relies on the separation of the enantiomeric mixtures by asymmetric
biotransformation, sensors, liquid-liquid extraction (LLEx), chromatog-
raphy, capillary electrophoresis, or membranes [6,7]. One of the most
important technologies applied for high-resolution purification of
products is chromatographic enantioseparation [8–10]. However, from an economic point of view, membrane separation processes represent a
particularly advantageous option. The benefits of membranes include
better mass transfer efficiency, increased flow rates, ease of operation,
and the ability to deal with large molecules.
There are multiple methods in which membrane processes can be
employed [11]. Membrane-assisted processes and
adsorption-enantioselective (liquid and solid) membranes for chiral
resolution were summarized in a comprehensive review by Xie et al.
[12] The former is based on non-enantioselective membranes which
have no enantioselectivity themselves. However, they can assist in an
enantioselective process, such as enzyme enhanced ultrafiltration or
polymer enhanced ultrafiltration [13]. In an adsorption-type enantio-
selective membrane, the binding affinity between enantiomers and
chiral recognition sites is stronger than that of a diffusion-
enantioselective membrane. This interaction force always ex-
ists between one enantiomer and one chiral site [14–18]. The separation of racemic mixtures from liquid phases by pertraction, using
adsorption-enantioselective membranes is discussed in the paper. Its
principle of pertraction is similar to that of LLEx: the feed mixture and
extraction agent are in direct contact, and the separation process is
based on the solubility/affinity of the substance in both phases. In per-
traction, both media are separated by a non-porous polymeric or liquid
membrane, which mediates the transport of the individual components
between the phases. The separation of mixtures through permeation is
controlled by the rates of membrane transport processes. The most
common types of membranes for permeation are liquid and composite
membranes. The latter exhibit an outstanding proton conductivity, fuel
cell durability and performance, when compared to other types of hy-
drocarbon membranes and the industrial standard Nafion® 212 [19].
In previous works [20,21], a composite three-layer membrane was
prepared, with the layers comprising (1) a nonwoven part, functioning
as supporting material, (2) a nanofibrous scaffold, forming the porous
layer, and (3) an active barrier layer. The selective layer of the thin film
membrane was prepared by interfacial polymerization of two immis-
cible phases on the porous nanofiber layer. In this process either
piperazine or m-phenylene diamine (MPD) was dissolved in deionized
water to form the aqueous phase, while the organic phase was prepared
by dissolving 1,3,5-trimesoyl chloride (TMC) in n-hexane. The active
film was obtained by remittent immersion of the fibrous composite in
both phases and subsequent thermal treatment. Such membranes are
suitable for desalination and ion separation due to the narrow pore size
of the membrane.
The innovation of the present work is to use MPD and TMC for the
creation of a thin film on the nanofibrous layer substituting variable
portions of MPD with a chiral active substance, (S,S)-1,2-dia-
minocyclohexane (DACH), thus obtaining a membrane suitable for
enantiomer separation [22]. To the best of our knowledge, this is the
first successful exploration of nonporous composite membranes with the
unique combination of nanofibrous and microfibrous structures plus
chiral composition at the same time.
This study highlights the membrane-based separation of the enan-
tiomers of D, L-tryptophan (D, L-Trp), a molecule that catabolizes
numerous physiological processes and contributes to intestinal and
systemic homeostasis in health and disease [23]. There is preliminary
evidence that an altered Trp metabolism is related to white matter
integrity in schizophrenia [24]. Furthermore, an increased catabolic
turnover of Trp along the kynurenine pathway in patients with major
depressive disorder was detected [25]. In 1989, the Japanese company
Showa Denko genetically modified bacteria in an attempt to market
large quantities of L-Trp [26]. However, this resulted in the death of 37
people and another 1500 disabled by disease causing muscle pain [27]
due to the presence of D-Trp. Enantioselective membranes should safely,
without produced impurities, separate the two enantiomers of the drug.
Tobis et al. reported the facile synthesis of nanophase separated
amphiphilic polymer conetworks, which allows the preparation of chiral
membranes with precise mesh size and morphology. They demonstrated
that variation of composition and phase swelling allows controlling of
the selectivity and the permeability by varying the nanostructure. When
using tryptophan as substrate in water with a chiral amphiphilic poly-
mer conetworks membrane with 29 wt% of poly((R), (S)–N-(1-hydrox- y-butan-2-yl)acrylamide) the L-enantiomer can be completely separated
from the D-enantiomer [28].
1. Experimental
1.1. Materials
Polyethylene/polypropylene (PE/PP = 80/20, 18 g/m2) bicompo-
nent spunbond nonwoven fabric (Pegatex S BICO) was furnished by
Pegas Nonwovens s.r.o., Czech Republic. Together with polyamide 6
(PA6) (BASF B24), it was described in previous work [21]. TMC, MPD,
DACH and D, L-Trp of purity 99% were purchased from Sigma-
Aldrich. Deionized water was produced by an ultrapure water
system (Simpli Lab, Millipore S. A., Molsheim, France).
1.2. Membrane preparation
As shown in Fig. 1, the membrane components are:
- Supporting layer: PE/PP bicomponent nonwoven
fabric/material
- Nanofiber: PA6 nanofiber. The laminated spunbond nonwoven
fabric and the PA6 nanofibrous web were used as a supporting ma-
terial to prepare the thin film nanocomposite (TFNC) membranes.
- Thin film: MPD/DACH in aqueous phase, TMC in organic
phase. To form an active barrier layer, interfacial polymerization
was car- ried out to form a polyamide layer on the PA6 nanofiber
using 2% (w/v) MPD with addition of various amount of chiral
active sub- stance in aqueous solution while 0.2% (w/v) TMC
was used for preparation of organic solutions (hexane). The
interfacial polymer- ization reaction for the membranes was
carried out under the same conditions as drying (5 min), curing
time (10 min) and temperature (100 °C). The reaction time for the
MPD/DACH aqueous solution was 60 s, while 30 s for the reaction
time of TMC organic solution.
- Chiral active substance: DACH. As the active substance playing the
role of the chiral selector for chiral drugs, DACH, in variable amounts
was used.
Fig. 1. Membrane components.

155
The commercially available film (PE/PP), used as the support,
was covered by micromaterial prepared by electrospinning. The
large spe- cific surface area has been stabilized by lamination and the
stable tissue thus obtained used as the polymeric support material for
the interfacial polymerization process. The active layer was
prepared by interfacial
polymerization using a solution of MPD in water with addition of 10–50% of chiral selector (cs) - DACH (calculated on total diamine). The organic phase was prepared by dissolving TMC in hexane. The sup-
porting membrane was immersed in the aqueous and then in the organic
phase, and the preparation process was finalized by subsequent thermal
treatment, resulting in the chiral membrane [20].
The quality of the membrane depends on a number of factors: pri-
marily the concentration of solutions, the contact time of the fabric with
both solutions and the conversion of the reaction at the interface.
Finally, membranes with excellent material properties (mechanical
stability and flexibility) were prepared. The membranes were denoted
on the basis of cs content: 10%cs, 20%cs, 30%cs, 40%cs and 50%cs.
1.1. Experimental set-up, mode and evaluation terminology
2.3.1. Preferential sorption
The preferential sorption of D, L-Trp is depicted in Fig. 2. The ex-
periments were performed in dark glass bottles. 50 mL of D, L-Trp (the
racemic mixture) in water (cTrp = 0.01 M) were put in contact with a
membrane (time = 0) and were agitated at 25 °C on a GLF 3005 rotator
at 130 rpm. The active area of the chiral membrane was 9 cm2 with
average thickness 0.4 mm. The solution - 1 mL - was sampled at regular
time intervals and analysed by high-performance liquid chromatog-
raphy (HPLC). UltiMate3000 spectrometer (Thermo Scientific) was
used, equipped with a Chiralpak ZWIX(+) (250x 3 mm, ID, 3 μm)
column (Diacel). The mobile phase composed of 98% MeOH and 2%
H2O, containing 50 mM of formic acid (HCOOH) and 25 mM of dieth-
ylamine (Et2NH) as a buffer. The flow was isocratic at the rate of 0.5 mL
min-1, total run time of analysis was 25 min. The peaks of both enan-
tiomers were detected by a UV diode-array detector at 254 nm. Using the
calibration curve, the concetrantions of each enantiomers were deter-
mined. The complete series of membranes, with different percentages of
incorporated CS, was tested.
2.3.2. Pertraction
Pertraction experiments were carried out in a closed, circular stain-
less steel cell of 5.8 cm diameter and 6 cm length. In the middle, the cell
was divided into two chambers by a membrane, anchored in a stainless
Fig. 2. Preferential sorption of tryptophan racemic mixture(D-enantiomer in
blue, L-enantiomer in red). (For interpretation of the references to colour in this
figure legend, the reader is referred to the Web version of this article.)
steel disc. The layout of the cell is shown within the scheme of the
pertraction set-up in Fig. 3. Experiments were performed at a
constant temperature of 25 0C, maintained by recirculating
cooler/chiller pumping EtOH through the double wall of the cell.
The membrane was cut to the desired size immediately preceding the
experiment, using a round punch of 3 cm diameter, then fixed
between two parts of the disc with screws. The cell was then closed
from both sides and the chambers were filled with a stripping solution
(deionized water) and feed solution (2M aqueous D, L-Trp)
simultaneously, so that the pressure was kept equal on both sides
of the membrane. Both chambers were equipped with a PTFE-
coated magnetic stirrer and constantly stirred using external
rotating magnets. The samples for analysis of the composition were
extracted through septa from the feed (1 mL) and permeate side of the
pertraction cell (1 mL) at regular time intervals by disposable sanitary
syringes; with higher frequency at the beginning of the experiment (0,
5, 15, 30, 60 min), then at longer time intervals, depending on the
rate of separation. The sampling was first performed from the
stripping solution, then from the feed. While the sample was taken,
another needle was stuck through the septum to prevent a pressure
change in the chamber. Samples were then analysed by HPLC as
described above.
The amounts of D- and L-Trp transported through the membrane
were determined according to Eqn. (1), where flux, J (mol⋅cm-2⋅h-1), is defined as
J = Q/At (1)
where Q (mol) represents the amount of transported Trp, A (cm2) stands
for the active membrane area, and t (h) is the time. The permselectivity
(α) is defined as the flux ratio (JD/JL) and in case that feed solution was Trp racemate the permselectivity is defined in Eqn. (2).
α = JD /JL (2)
1.2. Analysis and characterization of the membrane materials
The membranes, fresh and used, were analysed by Fourier-transform
infrared spectroscopy (FTIR) and characterized by scanning electron
microscopy (SEM). An FTIR spectrometer Avatar 360 (Nicolet) was used
to measure IR spectra of samples in the range of 508 and 4000 cm-1
(resolution 1.93 cm-1, 200 scans, 1 s per scan). FTIR in ATR mode was
used to obtain spectra from the membrane pressed against the ZnSe
crystal. An SEM (Tescan Indusem) was used to image the surface
morphology (top view) of the membranes and their cross-section. Im-
aging was carried out with an accelerating voltage of 15 kV. A thin layer
of gold was sputtered on the membranes to impart better conductivity to
the samples. Samples for cross-section imaging were prepared by
immersing the partially cut membrane into LN2 followed by fracturing
into two pieces. The necessary drying of samples prior the measurement
resulted in cracks on the superficial layer. SEM images were manually
processed by a measuring tool, which is standard part of Tescan soft-
ware, in order to determine a diameter of nanofibers. Fifty nanofibers
were measured and the average was evaluated statistically.
2. Results and discussion
2.1. Scanning electron microscopy observations
As-prepared membranes were characterized by SEM. Fig. 4 A shows
the cross section and Fig. 4 B shows the detailed top view SEM micro-
photograph of the membrane with 20%cs. The carrier fabric of the
membrane is about 430 μm thick (Fig. 4 A). The fabric has a micro-
fibrous structure with fibers of ~15 μm diameter and this support is
responsible for the good mechanical properties of the membrane. On top
of the carrier fabric, there is an observable nanofibrous layer with

156
Fig. 3. Pertraction set up.
Fig. 4. (A) SEM cross section microphotograph
of the as-prepared membrane with 20%cs,
composed of PE/PP bicomponent nonwoven fabric with diameter around 15 μm. The mem- brane thickness varies between 400 and 450 μm. PA6 nanofibers, where MPD/TMC + chiral
selector (DACH) was introduced in different %,
form the top layer with thickness around 3.5 μm. (B) SEM top view micrograph of as-prepared
membrane with 20%cs. On top of PA6 nano-
fibers, a thin submicron layer is formed,
comprised of MPD/TMC + chiral selector
(DACH). (C) SEM top view micrograph of orig-
inal membrane.
thickness of about 3.5 μm. These values are practically the same for all
tested membranes. The top view of the membrane (Fig. 4 B) shows the
nanofibrous structure of PA6 with fibers of ~250 nm diameter. These
nanofibers impart the material with a superior dispersion. The top view
revealed a complete coverage of nanofibers by a thin layer. It is
composed of compact material, MPD/TMC + chiral selector
DACH playing the main role in the separation process. The thickness
of this
superficial layer is > 1 μm. The crack in the layer enabling observation of
Fig. 5. HPLC spectra: racemic mixture of D, L-Trp, time zero, (left), mixture of D, L-Trp after a preferential sorption of L-Trp, 110 days, membrane with 50% of chiral
selector, peak ratio approximately 70:30 D:L form (right).

157
nanofibers originates from the drying process of the membrane, which is
inevitable for placing the membrane into the SEM.
A top view of the original membrane without any chemical treatment
(Fig. 4C) shows detailed image of PA6 fibers with diameter from 100 to
250 nm. The average diameter of nanofibers is 150 nm.
1.1. Preferential sorption experiments
The preferential sorption experiments of D, L-Trp by membranes
with various amounts of cs were monitored by HPLC analysis. Fig. 5
shows two exemplary spectra of a Trp solution. Both images reveal the
peak at retention time 15.5 min, attributed to D-Trp, as well as the peak
at 18 min linked to L-Trp. The left spectra of Fig. 5 gives similar peak
areas of two Trp enantiomers, with area ratio close to 50:50 D:L form,
illustrating the composition of the racemic mixture which is present at
the start of the preferential sorption experiments (i.e., t = 0). During the
course of the sorption experiments, for the membranes containing the
chiral selector, the peak attributed to the L-enantiomer decreased, while
the peak of the D-enantiomer remained constant. Simply put, L-Trp was
preferentially adsorbed in the membrane, while D-Trp was not. An
example of the spectra with nearly depleted L-Trp is shown on the right
side of Fig. 5.
The evolution of the peak ratio matching the two Trp enantiomers
relative to the experimental time is shown in Fig. 6.
The increasing amount of chiral selector in membranes (from 0 to
50%) is illustrated by an increasing intensity of the appropriate colour
(L-Trp = red, D-Trp = blue). The peak areas correspond to the amount of
enantiomer in the solution and it can be seen that the proportion of each
enantiomer is changing and the gap between their percentages is
growing. The membrane with 50%cs causes the largest gap between the
area ratio of the enantiomers, and the membrane without cs the lowest
one. That proves the highest selectivity in the preferential sorption ex-
periments for the membrane with 50%cs, the lowest selectivity for the
membrane without cs, and for the entire series: 0%cs < 10%cs < 20%cs
< 30%cs < 40%cs < 50%cs.
The diverging values of peak area ratio during the sorption experi-
ments and the broadening of the gap between D- and L-Trp gave the base
for enantiomeric excess values, presented in Fig. 7. This figure shows an
increase of enantiomeric excess in time of preferential sorption with the
amount of cs. In fact, L-Trp is preferentially adsorbed into all membranes
where cs is present, while D-Trp remains in the solution during the entire
experiment. This effect increases with an increasing percentage of chiral
selector in the membrane: 0%cs < 10%cs < 20%cs < 30%cs < 40%cs <
Fig. 6. Area ratio of HPLC peaks corresponding to D-Trp enantiomer (noted as “_D” and marked as blue rounds for each membrane) and L-Trp enantiomer (noted as “_L” and marked as red squares for each membrane) in a function of the time of the sorption process. (For interpretation of the references to colour
in this figure legend, the reader is referred to the Web version of this article.)
Fig. 7. Dependence of enantiomeric excess on time of preferential sorption and
of the amount of cs.
50%cs. Therefore, for the chosen interval of %cs, the amount of adsor-
bed L-Trp is proportional to the fraction of chiral selector in the mem-
brane. Fig. 8 traces the peak area loss at the end of the preferential
sorption experiments comparing to the ones at t = 0 as a function of %cs
in the membrane’s top layer. The sorption activity of all membranes was negligible towards the D-enantiomer, although the sorption of L-Trp
correlated to an essentially linear trend with increasing fraction of cs in
membrane.
1.2. Pertraction experiments
3.3.1. Pertraction of tryptophan
An enantiomeric separation of the model chiral drug D, L-Trp was
performed during 1 month in diffusion cells in the pertraction mem-
brane process (see Table 1). Fig. 9 describes the ratio D-Trp and L-Trp
concentrations at the permeate side, for whole series of membranes at
4th day, again the series of membranes at 6th day etc., for the duration
of the pertraction experiment. The values for D-Trp are in blue, those for
Fig. 8. Preferential sorption activity of membranes towards D-Trp (blue
rounds) and L-Trp (red squares) in a function of the amount of cs in the membrane’s top layer (in % versus one part of the top layer, described in the part of membrane preparation above). (For interpretation of the references to
colour in this figure legend, the reader is referred to the Web version of
this article.)

158
the L-Trp are in red, and deeper shades symbolize an increasing fraction
of chiral selector (a lighter color for a lower amount of cs, a darker color
for a higher amount of cs in the membrane etc.). The permeation of each
membrane remains stable within the error of 2% during whole
experiment. The separation ability of the membrane was increasing
(similarly to the sorption process) as follows: 0%cs < 10%cs < 20%cs <
30%cs < 40%cs < 50%cs. Corresponding final enantiomeric ratios were
50:50, 59:41, 70:30, 82:18, 91:9 and 99:1.
During pertraction experiments, Trp flowed through the membrane
at a rate of 3.25 mmol m-2 h-1 during the first hour, and the flux de-
clines to ~0.07 mmol m-2 h-1 during the last hours due to the decrease
of the concentration gradient, which is the driving force of the separa-
tion. In accordance with the preferential sorption, L-Trp was adsorbed
proportionally to the fraction of the chiral selector in the active layer of
corresponding membranes. However, a decreased amount of D-Trp in
the feed was also observed. Here, the diverse behavior of the membranes
towards each enantiomer during permeation underlines the crucial
importance of the selector in the active layer17. The chiral recognition of
enantiomers causes the retention of L-Trp in the membranes, while D-
Trp passed through the separating material. The result of such perme-
ation is an excess of D-Trp in the permeate, visible in Fig. 9. The excess
was again proportional to the amount of the chiral selector in the
membranes: 0%cs < 10%cs < 20%cs < 30%cs < 40%cs < 50%cs. Due to
the exclusive membrane material, the retention of L-Trp in the mem-
brane materials did not block the transport of D-Trp into the permeate
during the entire experimental time. Moreover, only 50% of DACH in
the active layer is required to achieve 99% enantioselectivity.
1.1. Analysis of membranes by fourier-transform infrared spectroscopy
Two membranes – one unused membrane, in “as-prepared” state and the “used” membrane after the 3 month sorption experiment - were analysed from both sides using FTIR. The spectrum of the top side
covered by nanofibres corresponds to PA6 with pronounced amidic vi-
brations at 1640 and 1540 cm-1. At 1715 cm-1, a weak valence vibra-
tion of a carbonyl group (C=O) was observed. The shape of the
spectra at 3300 cm-1 (not shown) indicates the presence of mainly 2°
amides as
there is only one band present. IR data thus indicate that this side of the
membrane did not change during use, revealing a good stability of the
material (Fig. 10).
The spectrum of the bottom side of the as-prepared membrane
(Fig. 11) shows amidic vibrations at 1640 and 1540 cm-1 with very low
intensity. On the other hand, C=O group vibrations were well
pro- nounced (1715 and 1240 cm-1). After the usage, the C=O signal
significantly decreases and the intensity of amidic vibrations remain the
same. The shape of the spectra at 3300 cm-1 shows only the presence of
2° amides; however, the intensity is much lower than for the top side of
the membrane. The presence of halides was not observed (1780-1820
cm-1).
Figs. 10 and 11 indicate that the spectrum of the nanofibrous side of
membrane can be clearly assigned to PA6. The polymerization of the
chiral selector in the top layer is almost quantitative, leaving only a very
small amount of residual free carboxylic acid units. This layer forms only
a thin film on the nanofibers, and this side of the membrane remains
Table 1
The composition of D: L enantiomers in feed side and permeate side of per-
traction cell after 29 days of the experiment. The composition at time 0 was 2.00
mml/ml in feed side (60 ml) and 0 mmol/ml in permeate side (60 ml) of per-
traction cell.
Amount of Chiral
selector (%)
0 10 20 30 40 50
Feed D: L (mmol/ 1.92 : 1.78 : 1.65 : 1.62 : 1.58 : 1.51 :
ml) 1.84 1.64 1.40 1.38 1.29 1.22
Permeate D: L 0.01 : 0.10 : 0.25 : 0.27 : 0.25 : 0.34 :
(mmol/ml) 0.01 0.07 0.11 0.05 0:03 0.01
Fig. 9. Ratio of D-Trp (in blue) and L-Trp (in red) concentration as a function of
time in permeate side for all membranes. An increasing fraction of chiral
selector in membranes is illustrated by growing intensity of colours. (For
interpretation of the references to colour in this figure legend, the reader is
referred to the Web version of this article.)
unchanged during the sorption process.
At the bottom layer of the fresh membrane, well pronounced signals
of a C=O group are clearly visible, indicating that the polymerization
reaction at this surface takes place with rather low conversion, forming a
defective resin. Nevertheless, residual halide signals can be observed,
indicating that all the starting acid chloride was converted into amide or
hydrolyzed to the corresponding carboxylic acid. After the membrane
was used, the signals of carboxylic acid are diminished, probably due to
gradual dissolution of these non-polymerized species into the permeate.
Indeed, minor impurities were observed in the obtained chromatograms
(see Fig. 5 (right) the unassigned peak). The spectrum of the layer, after
the sorption process, corresponds to a compact polyamide layer.
1.2. Mechanism of chiral recognition
To complete the study, the role of the polyamide active layer in chiral
recognition of Trp enantiomers was elucidated. The mechanism of chiral
recognition has been conventionally described in terms of the three-
point interaction model [29]. Although often challenged as too
simplistic and not sufficiently general [30], the three-point model usu-
ally provides a useful insight into the enantioselective binding geometry
without the need of detailed computational modelling, and it has been
frequently applied in an intuitive way to explain chiral separation in
various systems [30].
In an attempt to explain the role of TMC + MPD/DACH PA6 active
layer in chiral recognition of Trp enantiomers, a binding mechanism
between (presumably zwitterionic) Trp molecules and the
TM–DACH–TM moiety is proposed (Fig. 12). The three interactions required by the three-point model are
assumed to be the following: (i) a π–π stacking between the aromatic rings of the indole and trimesoyl moieties possibly aided by N–H (Trp) … C=O antiparallel dipole–dipole interaction, (ii) the (Trp)–NH+
3 … O–C interaction, and (iii) the (Trp)–CO–
2 … H–N interaction. Interactions (ii) and (iii) between ionic and polar groups possess a variable degree of H-
bonding character depending on particular bonding geometry; none- theless, in any case they involve a strong electrostatic ion–dipole component. In addition, the steric fit into the assumed binding pockets
created within the polymeric structure of the selector has to be taken
into account.
For the (S,S) configuration of DACH, the spatial arrangement of
interaction sites conforms to L-Trp, whereas D-Trp cannot simulta-
neously engage in all bonds (i), (ii), and (iii), see Fig. 12.
In order to provide the proposed intuitive model with stronger
theoretical support, MOPAC2016 package [31] was used to optimize the

159
Fig. 10. FTIR spectra of membranes as-prepared and used, top side.
Fig. 11. FTIR spectra of membranes as-prepared and used, bottom side.
structures of the respective complexes of tryptophan and the selector
fragment. The semiempirical PM6 method was used in the PM6-D3H4
difference of ca 10 kJ/mol accounts for the marked preference of the
selector to L-enantiomer.
variant of Rezac and Hobza [32] designed specifically to treat
non-covalent complexes.
Fig. 13 Shows the structures resulting from the PM6-D3H4 optimi-
zation. One can see that the binding of L-tryptophan is in accordance
with the proposed mechanism and involves all four interactions sug-
gested, whereas D-tryptophan is only able to maintain two hydrogen
bonds losing the alignment needed for a π–π stacked configuration. PM6-D3H4 in MOPAC2016 was also employed to calculate gas-phase
heats of formation of the optimized complexes of L- and D-Trp with the
selector fragment, yielding-531.00 and -520.97 kJ/mol, respectively,
corroborating the assumed stronger binding in the case of L-Trp. The
1. Conclusion
A series of membranes was prepared and successfully applied in both
sorption and pertraction experiments. The unique composition nano-
µ fibrous composition of the membrane material assures stability
and superior dispersion of the active surface layer. The crucial part of the
barrier is formed by the chiral selector, which was added in different
proportions into the top layer. New membranes underwent sorption
tests, soaked in an aqueous solution of the model chiral drug D, L-Trp.
The evolution of enantiomeric concentration over time was monitored

160
Fig. 12. The proposed chiral recognition mech- anism of Trp by TM–DACH–TM selector moiety in the TMC + MPD/DACH polyamide active
layer. Trimesoyl amide groups depicted with
thinner bonds are farther from the observer,
behind Trp molecule in its binding position. Left
— binding of L-Trp to the selector; right —
binding of D-Trp to the selector. Arrows indicate
interactions assumed within the three-point
model: red (HB/qμ) — strong H-bonding and/or ion–dipole interactions; green (ππ) — a π–π stacking interaction; magenta (μμ) – an “auxil- iary” dipole–dipole interaction in antiparallel alignment. (For interpretation of the references
to colour in this figure legend, the reader is
referred to the Web version of this article.)
Fig. 13. Final geometries of the (L/D)-Trp–selector complexes resulting from PM6-D3H4 optimization. Left — L-Trp; right — D-Trp. Hydrogen bonds are drawn in magenta. Visualization was made by Visual Molecular Dynamics [33].
by HPLC analysis and revealed no sorption activity for a blank mem- brane – i.e., one lacking a chiral selector. On the contrary, the mem- branes containing the selector demonstrated preferential sorption
activity towards one enantiomer. The sorption of L-Trp was found to be
proportional to the fraction of the chiral selector in the active layer of
the membrane, while an unchanged concentration of D-Trp was detec-
ted in the solution during the entire testing time interval. In addition, an
enantiomeric separation of the same model chiral drug was performed in
by pertraction in diffusion cells. The preferential sorption of L-Trp from
the feed underlined the crucial importance of the selector in the active
layer to achieve chiral recognition of enantiomers. Due to the exclusive
membrane material, the retention of L-Trp in the membrane materials
did not block the transport of D-Trp into the permeate during the entire
experimental time. Moreover, only 50% of DACH in one part of the
active layer was sufficient to achieve an enantioselectivity of 99%. Fresh
and used membranes were analysed by FTIR spectroscopy and charac-
terized by SEM. The role of the PA active layer in chiral recognition of
Trp enantiomers was elucidated. This study demonstrates that such
membranes can be an effective tool for the separation of enantiomers.
Declaration of competing interest
There is no conflict of Interest.
Acknowledgements
The authors gratefully acknowledge Czech Science Foundation grant
N° 17-00089S for financial support. Computational resources were pro-
vided by the CESNET LM2015042 and the CERIT Scientific Cloud LM2015085, provided under the programme “Projects of Large Research, Development, and Innovations Infrastructures”.
Symbols used
cs chiral selector
DACH (S,S)-1,2-diaminocyclohexane
Exp. experiment
FTIR Fourier-transform infrared spectroscopy
HPLC high-performance liquid chromatography
J pervaporate flow
m mass
MPD m-phenylene diamine
PA6 polyamide 6
rpm rotation per minute
SEM scanning electron microscopy
TMC 1,3,5-trimesoyl chloride
Trp tryptophan
w mass fraction Δt time change
Appendix A. Supplementary data
Supplementary data to this article can be found online at https://doi.
org/10.1016/j.memsci.2019.117728.
References
[1] I.K. Reddy, R. Mehvar, Chirality in Drug Design and Development, CRC Press,
2004.
[2] Y. Zhou, S. Wu, H. Zhou, H. Huang, J. Zhao, Y. Deng, H. Wang, Y. Yang, J. Yang,
L. Luo, Chiral pharmaceuticals: environment sources, potential human health
impacts, remediation technologies and future perspective, Environ. Int. 121 (2018)
523–537. [3] A. Nag, Asymmetric Synthesis of Drugs and Natural Products, CRC Press, 2018.
[4] Y.-P. Xue, C.-H. Cao, Y.-G. Zheng, Enzymatic asymmetric synthesis of chiral amino acids, Chem. Soc. Rev. 47 (4) (2018) 1516–1561.
[5] A. Ho€lzl-Hobmeier, A. Bauer, A.V. Silva, S.M. Huber, C. Bannwarth, T. Bach,
Catalytic deracemization of chiral allenes by sensitized excitation with visible light, Nature 564 (7735) (2018) 240–243.
[6] I. Agranat, H. Caner, J. Caldwell, Putting chirality to work: the strategy of chiral
switches, Nat. Rev. Drug Discov. 1 (2002) 753.
[7] H. Lorenz, A. Seidel-Morgenstern, Processes to separate enantiomers, Angew. Chem. Int. Ed. 53 (5) (2014) 1218–1250.
[8] J. Shen, Y. Okamoto, Efficient separation of enantiomers using stereoregular chiral
polymers, Chem. Rev. 116 (3) (2016) 1094–1138.

161
[9] X.-Y. Huang, D. Pei, J.-F. Liu, D.-L. Di, A review on chiral separation by counter-
current chromatography: Development, applications and future outlook,
J. Chromatogr. A 1531 (2018) 1–12. [10] L. Candelaria, L.V. Frolova, B.M. Kowalski, K. Artyushkova, A. Serov, N.G. Kalugin,
Surface-modified three-dimensional graphene nanosheets as a stationary phase for
chromatographic separation of chiral drugs, Sci. Rep. 8 (1) (2018) 14747.
[11] C. Fernandes, M.E. Tiritan, M.M.M. Pinto, Chiral separation in preparative scale: a
brief overview of membranes as tools for enantiomeric separation, Symmetry 9
(10) (2017) 206.
[12] R. Xie, L.-Y. Chu, J.-G. Deng, Membranes and membrane processes for chiral resolution, Chem. Soc. Rev. 37 (6) (2008) 1243–1263.
[13] A.H. O€ lçerog�lu, P. Çalık, L. Yilmaz, Development of enhanced ultrafiltration
methodologies for the resolution of racemic benzoin, J. Membr. Sci. 322 (2) (2008) 446–452.
[14] K. Singh, P.G. Ingole, J. udhari, H. Bhrambhatt, A. Bhattacharya, H.C. Bajaj,
Resolution of racemic mixture of alpha-amino acid derivative through composite membrane, J. Membr. Sci. 378 (1-2) (2011) 531–540.
[15] P.G. Ingole, H.C. Bajaj, D.N. Srivastava, B. Rebary, Preparation of thin film polymer
composite membranes for optical resolution of racemic mixture of α-amino acids, Separ. Sci. Technol. 48 (12) (2013) 1777–1787.
[16] P.G. Ingole, H.C. Bajaj, K. Singh, Membrane separation processes: optical resolution of lysine and asparagine amino acids, Desalination 343 (2014) 75–81.
[17] K. Singh, S. Devi, H.C. Bajaj, P. Ingole, J. Choudhari, H. Bhrambhatt, Optical
resolution of racemic mixtures of amino acids through nanofiltration membrane process, Separ. Sci. Technol. 49 (17) (2014) 2630–2641.
[18] L.M. Yuan, Y.Q. Su, A.H. Duan, Y. Zheng, P. Ai, X.X. Chen, Optical resolution of D,
L-Phenylglycine and chiral separation mechanism using an enantioselective membrane of vancomycin, Chem. J. Chin. Univ. 37 (11) (2016) 1960–1965.
[19] X. Liu, Y. Li, J. Xue, W. Zhu, J. Zhang, Y. Yin, Y. Qin, K. Jiao, Q. Du, B. Cheng,
X. Zhuang, J. Li, M.D. Guiver, Magnetic field alignment of stable proton-
conducting channels in an electrolyte membrane, Nat. Commun. 10 (1) (2019)
842.
[20] B. Yalcinkaya, F. Yalcinkaya, J. Chaloupek, Optimisation of thin film composite
nanofiltration membranes based on laminated nanofibrous and nonwoven
supporting, Mater. Desalin. Water Treat. 59 (2017) 19–30.
[21] B. Yalcinkaya, F. Yalcinkaya, J. Chaloupek, Thin film nanofibrous composite
membrane for dead-end seawater desalination, J. Nanomater. 2016 (2016) 12.
[22] K. Singh, P.G. Ingole, H.C. Bajaj, H. Gupta, Preparation, characterization and
application of β-cyclodextrin-glutaraldehyde crosslinked membrane for the enantiomeric separation of amino acids, Desalination 298 (2012) 13–21.
[23] H.M. Roager, T.R. Licht, Microbial tryptophan catabolites in health and disease,
Nat. Commun. 9 (1) (2018) 3294.
[24] J. Chiappelli, T.T. Postolache, P. Kochunov, L.M. Rowland, S.A. Wijtenburg, D.
K. Shukla, M. Tagamets, X. Du, A. Savransky, C.A. Lowry, A. Can, D. Fuchs, L.
E. Hong, Tryptophan metabolism and white matter integrity in schizophrenia,
Neuropsychopharmacology 41 (2016) 2587.
[25] T. Teraishi, H. Hori, D. Sasayama, J. Matsuo, S. Ogawa, M. Ota, K. Hattori,
M. Kajiwara, T. Higuchi, H. Kunugi, 13C-tryptophan breath test detects increased
catabolic turnover of tryptophan along the kynurenine pathway in patients with
major depressive disorder, Sci. Rep. 5 (2015) 15994.
[26] E.A. Belongia, C.W. Hedberg, G.J. Gleich, K.E. White, A.N. Mayeno, D.
A. Loegering, S.L. Dunnette, P.L. Pirie, K.L. MacDonald, M.T. Osterholm, An investigation of the cause of the eosinophilia–myalgia syndrome associated with tryptophan use, N. Engl. J. Med. 323 (6) (1990) 357–365.
[27] L.J. Crofford, J.I. Rader, M.C. Dalakas, R.H. Hill, S.W. Page, L.L. Needham, L.
S. Brady, M.P. Heyes, R.L. Wilder, P.W. Gold, L-tryptophan implicated in human
eosinophilia-myalgia syndrome causes fasciitis and perimyositis in the Lewis rat,
J. Clin. Investig. 86 (5) (1990) 1757–1763. [28] J. Tobis, L. Boch, Y. Thomann, J.C. Tiller, Amphiphilic polymer conetworks as
chiral separation membranes, J. Membr. Sci. 372 (2011) 219–227.
[29] A. Berthod, Chiral recognition mechanisms, Anal. Chem. 78 (7) (2006) 2093–2099; (a) K. Jozwiak, R. Moaddel, S. Ravichandran, A. Plazinska, J. Kozak, S. Patel, R. Yamaguchi, I.W. Wainer, Exploring enantiospecific ligand–protein interactions using cellular membrane affinity chromatography: chiral recognition as a dynamic process, J. Chromatogr. B 875 (1) (2008) 200–207.
[30] M. La€mmerhofer, Chiral recognition by enantioselective liquid chromatography:
mechanisms and modern chiral stationary phases, J. Chromatogr. A 1217 (6) (2010) 814–856.
[31] J.P. Stewart, Stewart Computational Chemistry, Colorado Springs, CO, USA, 2016.
[32] J. R�ez�a�c, P. Hobza, J. Chem. Theory Comput. 8 (1) (2012) 141–151 ([RHref]).
[33] W. Humphrey, A. Dalke, K. Schulten, J. Mol. Graph. 14 (1996) 33–38 ([VMDref]).

162
5. CONCLUSION The “nanotechnology” has been introduced to literature by the Nobel Prize scientist Richard Feynman
with his speech “There's Plenty of Room at the Bottom” in the meeting of the American Physical
Society at Caltech, in December of 1959 [80]. He predicted that one day scientists would make things
at the atomic level, and since then, nanotechnology builds upwards, and we are able to make them
more precisely and controllable as we want.
Nanofiber has been widely used in various applications due to its unique structure, surface properties,
and functionality. There is significantly grown in both pilot and industrial-scale nanofiber production
devices. Considering the high technical developments and advantages, nanofibers are expected to take
part in a wide variety of markets. One application area that will receive countless benefits from these
developments and will continue to profit in the future is nanofiber membranes in water treatment.
Nanofibers have great potential in different water purification processes such as microfilters, UF, NF,
desalination, distillation, and removal of microbial, heavy metals, dyes, and other toxic substances.
Some of the technical obstacles of nanofibers, given in “Chapter 1-Main problems”, limit their
application in the water domain area.
In this thesis, first, we tried to determine the main obstacles and problem of nanofibers to apply to
membrane technology, and then demonstrate some achievements to justify and improve existing
research in the literature. This thesis suggests various approaches that have the potential to solve
many of the problems introduced in “Chapter 1-Main problems”.
This thesis discusses the role of nanofiber membranes that are suitable for use in water treatment in
the different water purification process.

163
REFERENCES
1. Hutten, I.M. CHAPTER 1 - Introduction to Nonwoven Filter Media. In Handbook of Nonwoven
Filter Media; Hutten, I.M., Ed.; Butterworth-Heinemann: Oxford, 2007; pp. 1–28 ISBN 978-1-
85617-441-1.
2. Nanofiber Technology in Filtration – The American Filtration and Separations Society (AFS)
Available online: https://www.afssociety.org/nanofiber-technology-in-filtration/ (accessed on
Sep 9, 2020).
3. Gilbert, W. De Magnete; Courier Corporation, 1958; ISBN 978-0-486-26761-6.
4. Cooley, J.F. Improved methods of and apparatus for electrically separating the relatively volatile
liquid component from the component of relatively fixed substances of composite fluids. United
Kingdom Patent 1900, 6385, 19.
5. Yener, F. New Methods in the Study of Roller Electrospinning Mechanism. Ph.D. thesis,
Technical University of Liberec: Liberec, 2014.
6. Jirsak, O.; Sanetrnik, F.; Lukas, D.; Kotek, V.; Martinova, L.; Chaloupek, J. A Method of
Nanofibres Production from a Polymer Solution Using Electrostatic Spinning and a Device for
Carrying Out the Method 2005.
7. Yalcinkaya, F.; Yalcinkaya, B.; Jirsak, O. Dependent and Independent Parameters of Needleless
Electrospinning. In Electrospinning; Haider, S., Haider, A., Eds.; IntechOpen: Rijeka, 2016.
8. Shenoy, S.L.; Bates, W.D.; Frisch, H.L.; Wnek, G.E. Role of chain entanglements on fiber
formation during electrospinning of polymer solutions: good solvent, non-specific polymer–
polymer interaction limit. Polymer 2005, 46, 3372–3384, doi:10.1016/j.polymer.2005.03.011.
9. Barnes, H.A. A Handbook of Elementary Rheology; University of Wales, Institute of Non-
Newtonian Fluid Mechanics, 2000; ISBN 978-0-9538032-0-0.
10. Filatov, V.; Budyka, A.; Kirichenk, V. Electrospinning of Micro-and-Nanofibers: Fundementals
and Applications in Seperation and Filtration Process. 2007. Bgell House Inc. Danbury,
Connecticut, United states.
11. Fallahi, D.; Rafizadeh, M.; Mohammadi, N.; Vahidi, B. Effects of feed rate and solution
conductivity on jet current and fiber diameter in electrospinning of polyacrylonitrile solutions.
e-Polymers 2009, 9, doi:10.1515/epoly.2009.9.1.1250.
12. Bhattacharjee, P.K.; Schneider, T.M.; Brenner, M.P.; McKinley, G.H.; Rutledge, G.C. On the
measured current in electrospinning. Journal of Applied Physics 2010, 107, 044306,
doi:10.1063/1.3277018.
13. Theron, S.A.; Zussman, E.; Yarin, A.L. Experimental investigation of the governing parameters
in the electrospinning of polymer solutions. Polymer 2004, 45, 2017–2030,
doi:10.1016/j.polymer.2004.01.024.
14. Demir, M.M.; Yilgor, I.; Yilgor, E.; Erman, B. Electrospinning of polyurethane fibers. Polymer
2002, 43, 3303–3309, doi:10.1016/S0032-3861(02)00136-2.
15. Yalcinkaya, F. Preparation of various nanofiber layers using wire electrospinning system.
Arabian Journal of Chemistry 2019, 12, 5162–5172, doi:10.1016/j.arabjc.2016.12.012.
16. Anton, F. Process and apparatus for preparing artificial threads 1934.
17. Kny, E.; Ghosal, K.; Thomas, S. Electrospinning: From Basic Research to Commercialization;
Royal Society of Chemistry, 2018; ISBN 978-1-78801-100-6.
18. Bechold, H. Investigations on colloids by filtration methods. Biochem. Z 1907, 6, 379.
19. Loeb, S.; Sourirajan, S. Sea water demineralization by means of an osmotic membrane. In; ACS
Publications, 1962.
20. Muralidhara, H.S. Chapter 2 - Challenges of Membrane Technology in the XXI Century. In
Membrane Technology; Cui, Z.F., Muralidhara, H.S., Eds.; Butterworth-Heinemann: Oxford,
2010; pp. 19–32 ISBN 978-1-85617-632-3.
21. Overview of Membrane Science and Technology. In Membrane Technology and Applications;
John Wiley & Sons, Ltd, 2012; pp. 1–14 ISBN 978-1-118-35968-6.
164
22. Abdullah, N.; Rahman, M.A.; Dzarfan Othman, M.H.; Jaafar, J.; Ismail, A.F. Chapter 2 -
Membranes and Membrane Processes: Fundamentals. In Current Trends and Future
Developments on (Bio-) Membranes; Basile, A., Mozia, S., Molinari, R., Eds.; Elsevier, 2018;
pp. 45–70 ISBN 978-0-12-813549-5.
23. Purkait, M.K.; Sinha, M.K.; Mondal, P.; Singh, R. Chapter 1 - Introduction to Membranes. In
Interface Science and Technology; Purkait, M.K., Sinha, M.K., Mondal, P., Singh, R., Eds.;
Stimuli Responsive Polymeric Membranes; Elsevier, 2018; Vol. 25, pp. 1–37.
24. Yalcinkaya, F. A review on advanced nanofiber technology for membrane distillation. Journal
of Engineered Fibers and Fabrics 2019, 14, 1558925018824901,
doi:10.1177/1558925018824901.
25. Hwang, K.-J.; Lin, T.-T. Effect of morphology of polymeric membrane on the performance of
cross-flow microfiltration. Journal of Membrane Science 2002, 199, 41–52, doi:10.1016/S0376-
7388(01)00675-5.
26. Koenhen, D.M.; Mulder, M.H.V.; Smolders, C.A. Phase separation phenomena during the
formation of asymmetric membranes. Journal of Applied Polymer Science 1977, 21, 199–215,
doi:10.1002/app.1977.070210118.
27. Cadotte, J.E.; Petersen, R.J.; Larson, R.E.; Erickson, E.E. A new thin-film composite seawater
reverse osmosis membrane. Desalination 1980, 32, 25–31, doi:10.1016/S0011-9164(00)86003-
8.
28. Gohil, J.M.; Choudhury, R.R. Chapter 2 - Introduction to Nanostructured and Nano-enhanced
Polymeric Membranes: Preparation, Function, and Application for Water Purification. In
Nanoscale Materials in Water Purification; Thomas, S., Pasquini, D., Leu, S.-Y., Gopakumar,
D.A., Eds.; Micro and Nano Technologies; Elsevier, 2019; pp. 25–57 ISBN 978-0-12-813926-4.
29. Fleischer, R.L.; Price, P.B.; Walker, R.M.; Walker, R.M. Nuclear tracks in solids: principles
and applications; Univ of California Press, 1975; ISBN 0-520-02665-9.
30. Tasselli, F. Membrane Preparation Techniques. In Encyclopedia of Membranes; Drioli, E.,
Giorno, L., Eds.; Springer: Berlin, Heidelberg, 2015; pp. 1–3 ISBN 978-3-642-40872-4.
31. Tiyek, I.; Gunduz, A.; Yalcinkaya, F.; Chaloupek, J. Influence of Electrospinning Parameters on
the Hydrophilicity of Electrospun Polycaprolactone Nanofibres. J Nanosci Nanotechnol 2019,
19, 7251–7260, doi:10.1166/jnn.2019.16605.
32. Membrane Transport Theory. In Membrane Technology and Applications; John Wiley & Sons,
Ltd, 2004; pp. 15–87 ISBN 978-0-470-02039-5.
33. Yalcinkaya, B.; Yalcinkaya, F. 12. Nanofibers in liquid filtration; De Gruyter, 2019; ISBN 978-
3-11-058139-3.
34. Ferry, J.D. Ultrafilter Membranes and Ultrafiltration. Chemical reviews 1936, 18, 373–455.
35. Renkin, E.M. Filtration, diffusion, and molecular sieving through porous cellulose membranes.
The Journal of general physiology 1954, 38, 225.
36. Luis, P. Chapter 1 - Introduction. In Fundamental Modelling of Membrane Systems; Luis, P.,
Ed.; Elsevier, 2018; pp. 1–23 ISBN 978-0-12-813483-2.
37. Khulbe, K.C.; Feng, C.Y.; Matsuura, T. Surface modification of synthetic polymeric membranes
for filtration and gas separation. Recent Patents on Chemical Engineering 2010, 3, 1–16.
38. Morgan, P.W. Condensation polymers: by interfacial and solution methods; Interscience
Publishers, 1965; Vol. 10;.
39. Lau, W.-J.; Ong, C.-S.; Nordin, N.; Sani, N.A.A.; Mokhtar, N.M.; Gohari, R.J.; Emadzadeh, D.;
Ismail, A.F. Surface Modification of Polymeric Membranes for Various Separation Processes.
Surf. Treat. Biol. Chem. Phys. Appl 2016, 115–180.
40. Al-Jumaili, A.; Alancherry, S.; Grant, D.; Kumar, A.; Bazaka, K.; Jacob, M.V. Chapter 8 -
Plasma Treatment of Polymeric Membranes. In Non-Thermal Plasma Technology for Polymeric
Materials; Thomas, S., Mozetič, M., Cvelbar, U., Špatenka, P., K.m., P., Eds.; Elsevier, 2019;
pp. 211–240 ISBN 978-0-12-813152-7.
41. Abd El-Ghaffar, M.; Tieama, H.A. A review of membranes classifications, configurations,
surface modifications, characteristics and Its applications in water purification. Chemical and
Biomolecular Engineering 2017, 2, 57.
165
42. Salmani, L.; Nouri, M. Electrospun Silk Fibroin Nanofibers with Improved Surface Texture.
Journal of Textiles and Polymers 2016, 4, 75–81.
43. Chen, L.; Cheng, H.-H.; Xiong, J.; Zhu, Y.-T.; Zhang, H.-P.; Xiong, X.; Liu, Y.-M.; Yu, J.;
Guo, Z.-X. Improved Mechanical Properties of Poly(butylene succinate) Membrane by Co-
electrospinning with Gelatin. Chin J Polym Sci 2018, 36, 1063–1069, doi:10.1007/s10118-018-
2112-0.
44. Sen, R.; Zhao, B.; Perea, D.; Itkis, M.E.; Hu, H.; Love, J.; Bekyarova, E.; Haddon, R.C.
Preparation of Single-Walled Carbon Nanotube Reinforced Polystyrene and Polyurethane
Nanofibers and Membranes by Electrospinning. Nano Lett. 2004, 4, 459–464,
doi:10.1021/nl035135s.
45. Bilge, K.; Yorulmaz, Y.; Javanshour, F.; Ürkmez, A.; Yılmaz, B.; Şimşek, E.; Papila, M.
Synergistic role of in-situ crosslinkable electrospun nanofiber/epoxy nanocomposite interlayers
for superior laminated composites. Composites Science and Technology 2017, 151, 310–316,
doi:10.1016/j.compscitech.2017.08.029.
46. Nissilä, T.; Hietala, M.; Oksman, K. A method for preparing epoxy-cellulose nanofiber
composites with an oriented structure. Composites Part A: Applied Science and Manufacturing
2019, 125, 105515, doi:10.1016/j.compositesa.2019.105515.
47. Wang, X.; Zhang, W.-J.; Yu, D.-G.; Li, X.-Y.; Yang, H. Epoxy Resin Nanofibers Prepared
Using Electrospun Core/Sheath Nanofibers as Templates. Macromolecular Materials and
Engineering 2013, 298, 664–669, doi:10.1002/mame.201200174.
48. Jahanbaani, A.R.; Behzad, T.; Borhani, S.; Darvanjooghi, M.H.K. Electrospinning of cellulose
nanofibers mat for laminated epoxy composite production. Fibers Polym 2016, 17, 1438–1448,
doi:10.1007/s12221-016-6424-9.
49. Tang, X.; Yan, X. Dip-coating for fibrous materials: mechanism, methods and applications. J
Sol-Gel Sci Technol 2017, 81, 378–404, doi:10.1007/s10971-016-4197-7.
50. Cai, J.; Zhang, Q.; Lei, M.; He, J.; Liu, G. The use of solvent-soaking treatment to enhance the
anisotropic mechanical properties of electrospun nanofiber membranes for water filtration. RSC
Adv. 2016, 6, 66807–66813, doi:10.1039/C6RA11020G.
51. Choi, S.-S.; Lee, Y.S.; Joo, C.W.; Lee, S.G.; Park, J.K.; Han, K.-S. Electrospun PVDF nanofiber
web as polymer electrolyte or separator. Electrochimica Acta 2004, 50, 339–343,
doi:10.1016/j.electacta.2004.03.057.
52. Huang, L.; Manickam, S.S.; McCutcheon, J.R. Increasing strength of electrospun nanofiber
membranes for water filtration using solvent vapor. Journal of Membrane Science 2013, 436,
213–220, doi:10.1016/j.memsci.2012.12.037.
53. Yoon, K.; Hsiao, B.S.; Chu, B. Formation of functional polyethersulfone electrospun membrane
for water purification by mixed solvent and oxidation processes. Polymer 2009, 50, 2893–2899,
doi:10.1016/j.polymer.2009.04.047.
54. Byron, J.J.; Nicholas, M. Method and apparatus for ultrasonic welding 1965.
55. Trejo, N.K.; Reyes, C.G.; Sanchez, V.; Zhang, D.; Frey, M.W. Developing composite nanofibre
fabrics using electrospinning, ultrasonic sewing, and laser cutting technologies. International
Journal of Fashion Design, Technology and Education 2016, 9, 192–200,
doi:10.1080/17543266.2016.1154111.
56. Wirth, E.; Sabantina, L.; Weber, M.O.; Finsterbusch, K.; Ehrmann, A. Preliminary Study of
Ultrasonic Welding as a Joining Process for Electrospun Nanofiber Mats. Nanomaterials 2018,
8, 746, doi:10.3390/nano8100746.
57. Bernstein, R.; Kaufman, Y.; Freger, V. Membrane Characterization. In Encyclopedia of
Membrane Science and Technology; American Cancer Society, 2013; pp. 1–41 ISBN 978-1-
118-52231-8.
58. Li, M.; Li, J.; Zhou, M.; Xian, Y.; Shui, Y.; Wu, M.; Yao, Y. Super-hydrophilic electrospun
PVDF/PVA-blended nanofiber membrane for microfiltration with ultrahigh water flux. Journal
of Applied Polymer Science 2020, 137, 48416, doi:10.1002/app.48416.
59. Gopal, R.; Zuwei, M.; Kaur, S.; Ramakrishna, S. Surface Modification and Application of
Functionalized Polymer Nanofibers. In Molecular Building Blocks for Nanotechnology: From
Diamondoids to Nanoscale Materials and Applications; Mansoori, G.A., George, T.F.,

166
Assoufid, L., Zhang, G., Eds.; Topics in Applied Physics; Springer: New York, NY, 2007; pp.
72–91 ISBN 978-0-387-39938-6.
60. Yalcinkaya, F. Effect of argon plasma treatment on hydrophilic stability of nanofiber webs.
Journal of Applied Polymer Science 2018, 135, 46751, doi:10.1002/app.46751.
61. Yusof, M.R.; Shamsudin, R.; Zakaria, S.; Azmi Abdul Hamid, M.; Yalcinkaya, F.; Abdullah,
Y.; Yacob, N. Electron-Beam Irradiation of the PLLA/CMS/β-TCP Composite Nanofibers
Obtained by Electrospinning. Polymers 2020, 12, 1593, doi:10.3390/polym12071593.
62. Boyraz, E.; Yalcinkaya, F.; Hruza, J.; Maryska, J. Surface-Modified Nanofibrous PVDF
Membranes for Liquid Separation Technology. Materials 2019, 12, 2702,
doi:10.3390/ma12172702.
63. Torres-Mendieta, R.; Yalcinkaya, F.; Boyraz, E.; Havelka, O.; Wacławek, S.; Maryška, J.;
Černík, M.; Bryjak, M. PVDF nanofibrous membranes modified via laser-synthesized Ag
nanoparticles for a cleaner oily water separation. Applied Surface Science 2020, 526, 146575,
doi:10.1016/j.apsusc.2020.146575.
64. Bryjak, M.; Hodge, H.; Dach, B. Modification of porous polyacrylonitrile membrane. Angew.
Makromol. Chem. 1998, 260, 25–29.
65. Cécile, C.; Hsieh, Y.-L. Hydrophilic polystyrene/maleic anhydride ultrafine fibrous membranes.
Journal of Applied Polymer Science 2010, 115, 723–730, doi:10.1002/app.31003.
66. Yalcinkaya, F.; Siekierka, A.; Bryjak, M. Surface modification of electrospun nanofibrous
membranes for oily wastewater separation. RSC Advances 2017, 7, 56704–56712,
doi:10.1039/C7RA11904F.
67. Yalcinkaya, F.; Siekierka, A.; Bryjak, M. Preparation of Fouling-Resistant Nanofibrous
Composite Membranes for Separation of Oily Wastewater. Polymers (Basel) 2017, 9,
doi:10.3390/polym9120679.
68. Guarino, V.; Varesano, A. Electrospinning Technology for Filtering Membranes Fabrication. In
Filtering Media by Electrospinning: Next Generation Membranes for Separation Applications;
Focarete, M.L., Gualandi, C., Ramakrishna, S., Eds.; Springer International Publishing: Cham,
2018; pp. 1–24 ISBN 978-3-319-78163-1.
69. Jiao, L.; Yan, K.; Wang, J.; Lin, S.; Li, G.; Bi, F.; Zhang, L. Low surface energy nanofibrous
membrane for enhanced wetting resistance in membrane distillation process. Desalination 2020,
476, 114210, doi:10.1016/j.desal.2019.114210.
70. Jiříček, T.; Komárek, M.; Lederer, T. Polyurethane Nanofiber Membranes for Waste Water
Treatment by Membrane Distillation Available online:
https://www.hindawi.com/journals/jnt/2017/7143035/ (accessed on Apr 8, 2020).
71. Li, M.; Wang, D.; Xiao, R.; Sun, G.; Zhao, Q.; Li, H. A novel high flux poly(trimethylene
terephthalate) nanofiber membrane for microfiltration media. Separation and Purification
Technology 2013, 116, 199–205, doi:10.1016/j.seppur.2013.05.046.
72. Ding, Y.; Wu, J.; Wang, J.; Wang, J.; Ye, J.; Liu, F. Superhydrophilic carbonaceous-silver
nanofibrous membrane for complex oil/water separation and removal of heavy metal ions,
organic dyes and bacteria. Journal of Membrane Science 2020, 614, 118491,
doi:10.1016/j.memsci.2020.118491.
73. Huang, X.; Zhang, S.; Xiao, W.; Luo, J.; Li, B.; Wang, L.; Xue, H.; Gao, J. Flexible
PDA@ACNTs decorated polymer nanofiber composite with superhydrophilicity and
underwater superoleophobicity for efficient separation of oil-in-water emulsion. Journal of
Membrane Science 2020, 614, 118500, doi:10.1016/j.memsci.2020.118500.
74. Wang, Y.; Zhang, X.; He, X.; Zhang, W.; Zhang, X.; Lu, C. In situ synthesis of MnO2 coated
cellulose nanofibers hybrid for effective removal of methylene blue. Carbohydrate Polymers
2014, 110, 302–308, doi:10.1016/j.carbpol.2014.04.008.
75. Rahaman, S.; Chen, T.; Islam, M.S.; Ma, W. Membranes for Forward Osmosis and Membrane
Distillation and Process of Treating Fracking Wastewater 2020.
76. Bahmani, P.; Maleki, A.; Daraei, H.; Khamforoush, M.; Rezaee, R.; Gharibi, F.; Tkachev, A.G.;
Burakov, A.E.; Agarwal, S.; Gupta, V.K. High-flux ultrafiltration membrane based on
electrospun polyacrylonitrile nanofibrous scaffolds for arsenate removal from aqueous solutions.
Journal of Colloid and Interface Science 2017, 506, 564–571, doi:10.1016/j.jcis.2017.07.086.

167
77. Li, R.; Li, M.; Li, Z.; Zhu, Q.; Zhong, W.; Liu, K.; Wang, D. A thin film composite membrane
supported by a hydrophilic poly(vinyl alcohol-co-ethylene) nanofiber membrane: Preparation,
characterization, and application in nanofiltration. Journal of Applied Polymer Science 2018,
135, 46261, doi:10.1002/app.46261.
78. Schinwald, A.; Murphy, F.A.; Prina-Mello, A.; Poland, C.A.; Byrne, F.; Movia, D.; Glass, J.R.;
Dickerson, J.C.; Schultz, D.A.; Jeffree, C.E.; et al. The threshold length for fiber-induced acute
pleural inflammation: shedding light on the early events in asbestos-induced mesothelioma.
Toxicol. Sci. 2012, 128, 461–470, doi:10.1093/toxsci/kfs171.
79. 14:00-17:00 ISO/TR 13121:2011 Available online:
https://www.iso.org/cms/render/live/en/sites/isoorg/contents/data/standard/05/29/52976.html
(accessed on Sep 24, 2020).
80. Feynman, R.P. Plenty of Room at the Bottom.; 1959.

168
APPENDIX-LIST OF PUBLICATIONS
A.1. Publications in WoS -impacted journals
1. F. Yener, O. Jirsak, ‘Comparison between the Needle and Roller Electrospinning of
Polyvinylbutyral’, Journal of Nanomaterials, Vol. 2012, Article ID 839317, 6 pages
DOI:10.1155/2012/839317, 2012.
2. F. Yener, O. Jirsak, R. Gemci, Using a Range of PVB Spinning Solution to Acquire
Diverse Morphology for Electrospun Nanofibres, IJCCE, Vol.31, No:4, pages:49-58,
2012.
3. F. Yener, B.Yalcinkaya, ‘Electrospinning of Polyvinyl Butyral in Different Solvents’,
e-Polymers, Vol. 13, Issue 1, pp. 229–242, 2013.
4. F. Yener, B.Yalcinkaya, O. Jirsak, ‘On the Measured Current in the Needle- and
Needleless Electrospinning’, Journal of Nanoscience and Nanotechnology, Vol. 13,
Issue 7, pp. 4672-4679, DOI: 10.1166/jnn.2013.7189, 2013.
5. B. Yalcinkaya, F. Yener, O. Jirsak, F. Cengiz-Callioglu, ‘On the Nature of Electric
Current in the Electrospinning Process’, Journal of Nanomaterials, Vol. 2013, Article
ID 538179, 10 pages, DOI: 10.1155/2013/538179, 2013.
6. B. Yalcinkaya, F. Cengiz-Callioglu, F. Yener, Measurement and Analysis of Jet
Current and Jet Life in Roller Electrospinning of Polyurethane, Textile Research
Journal, March, Vol. 84, no 16, pages: 1720-1728, DOI: 0040517514528563, 2014.
7. F. Yalcinkaya, B. Yalcinkaya, O. Jirsak, Influence of Salts on Electrospinning of
Aqueous and Nonaqueous Polymer Solutions, Journal of Nanomaterials, vol. 2015,
Article ID 134251, 12 pages, DOI:10.1155/2015/134251, 2015.
8. F.Yalcinkaya, Effect of Current on Polymer Jet in Electrospinning Process, Tekstil ve
Konfeksiyon, Vol. 25, Issue 3, pages: 201-206, 2015.
9. F. Yalcinkaya, Experimental Study on Electrospun Polyvinyl Butyral Nanofibers
Using a Non-solvent System, Fibers and Polymers, Vol. 16, Issue 12, pp. 2544-2551,
DOI: 10.1007/s12221-015-5525-1, 2015.
10. F. Yalcinkaya, M. Komarek, D. Lubasova, F. Sanetrnik, J. Maryska, Preparation of
Antibacterial Nanofibre/Nanoparticle Covered Composite Yarns, Journal of
Nanomaterials, Volume 2016 (2016), Article ID 7565972, 7 pages, DOI:
10.1155/2016/7565972, 2016.
11. F. Yalcinkaya, B. Yalcinkaya, A. Pazourek, J. Mullerova, M. Stuchlik, J. Maryska,
Surface Modification of Electrospun PVDF/PAN Nanofibrous Layers by Low
Vacuum Plasma Treatment, International Journal of Polymer Science, Volume 2016,
Article ID 4671658, 9 pages, DOI: 10.1155/2016/4671658, 2016.
12. B. Yalcinkaya, F. Yalcinkaya, J. Chaloupek, Thin Film Nanofibrous Composite
Membrane for Dead-End Seawater Desalination, Journal of Nanomaterials, Volume
2016, Article ID 2694373, 12 pages, DOI: 10.1155/2016/2694373, 2016.
13. F. Yalcinkaya, B. Yalcinkaya, O. Jirsak, Analysis of the Effects of the Rotating Roller
Speed on a Roller Electrospinning System, Textile Research Journal, DOI:
10.1177/0040517516641362, Vol 87, Issue 8, pages 913-928, 2017.

169
14. F. Yalcinkaya, D. Lubasova, Quantitative Evaluation of Antibacterial Activities of
Nanoparticles (ZnO, TiO2, ZnO/ TiO2, SnO2, CuO, ZrO2, AgNO3) Incorporated into
Polyvinyl Butyral Nanofibres, Polymers for Advanced Technologies, Vol. 28, Issue 1,
pp. 137-140, DOI: 10.1002/pat.3883, 2017.
15. F.Yalcinkaya, B. Yalcinkaya, J. Hruza, P. Hrabak, Effect of Nanofibrous Membrane
Structures on the Treatment of Wastewater Microfiltration, Science of Advanced
Materials, Volume 9, issue 5, pp.747-757, DOI:10.1166/sam.2017.3027, 2017.
16. B. Yalcinkaya, F. Yalcinkaya, J. Chaloupek, Optimisation of Thin Film Composite
Nanofiltration Membranes Based on Laminated Nanofibrous and Nonwoven
Supporting Material, Desalination and Water Treatment, Volume 59, pages 19-30,
DOI: 10.1155/2016/2694373, 2017.
17. F. Yalcinkaya, A. Siekierka, M. Bryjak, Preparation of Fouling-Resistant Nanofibrous
Composite Membranes for Separation of Oily Wastewater, Polymers, Volume 9,
Issue 12, Article number 679, DOI: 10.3390/polym9120679, 2017.
18. F. Yalcinkaya, A. Siekierka, M. Bryjak, Surface Modification of Electrospun
Nanofibrous Membranes for Oily Wastewater Separation, RSC Advances, Volume 7,
Issue 89, pp. 56704-56712, DOI: 10.1039/C7RA11904F, 2017.
19. M. R. Yusof, R. Shamsudin, Y. Abdullah, F. Yalcinkaya, N. Yaacob, Electrospinning
of Carboxymethyl Starch/Poly (L-Lactide) Acid Composite Nanofibers, Polymers for
Advanced Technologies, Volume 29, Issue 6, pp. 1843-1851, DOI:10.1002/pat.4292,
2018. IF=2.137.
20. F. Yalcinkaya, J. Hruza, Effect of Laminating Pressure on Polymeric Nanofibre
Composite
21. Membranes for Liquid Filtration, Nanomaterials, Volume 8, Issue 5, Article number
272, DOI: 10.3390/nano8050272, 2018. IF=3.504.
22. F. Yalcinkaya, The Effect of Argon Plasma Treatment on Hydrophilic Stability of
Nanofibre Webs, Journal of Applied Polymer Science, Volume 135, Issue 38, DOI:
10.1002/app.46751, 2018. IF=1.901.
23. R. Roche, F. Yalcinkaya, Incorporation of PVDF Nanofiber Multilayers into
Functional Structure for Filtration Applications, Nanomaterials, Volume 8, Issue 10,
771, DOI: 10.3390/nano8100771, 2018. IF=3.504.
24. I. Tiyek, A. Gunduz, F. Yalcinkaya, J. Chaloupek, Influence of Electrospinning
Parameters on the Hydrophilicity of Electrospun Polycaprolactone Nanofibers,
Journal of Nanoscince and Nanotechnology, Volume 19, pp. 1-10, 2019, DOI:
10.1166/jnn.2019.16605. IF=1.354.
25. F. Yalcinkaya, B. Yalcinkaya, J. Hruza, Electrospun Polyamide-6 Nanofiber Hybrid
Membranes for Wastewater Treatment, Fibers and Polymers, Volume 20, Issue 1, pp
93-99, 2019. IF=1.353.
26. F.Yalcinkaya, A Review on Advanced Nanofiber Technology for Membrane
Distillation, Journal of Engineered Fibers and Fabrics, 2019, DOI:
10.1177/1558925018824901. IF=0.678.

170
27. R. Roche, F. Yalcinkaya, Electrospun Polyacrylonitrile Nanofibrous Membranes for
Point-of-Use Water and Air Cleaning, ChemistryOpen, Volume 8, Issue 1, pp. 97-
103, 2019, DOI: 10.1002/open.201800267. IF=2.801.
28. E. Boyraz, F. Yalcinkaya, J. Hruza, J. Maryska, Surface-Modified Nanofibrous PVDF
Membranes for Liquid Separation Technology, Materials, Volume 12, Issue 17, pp.
2702, 2019, DOI: 10.3390/ma12172702. IF= 2.972.
29. Mohd Reusmaazran Yusof, Roslinda Shamsudin, Sarani Zakaria, Muhammad Azmi
Abdul Hamid, Fatma Yalcinkaya, Yusof Abdullah, Norzita Yacob, Fabrication and
Characterization of Carboxymethyl Starch/Poly (L-Lactide) Acid/β-Tricalcium
Phosphate Composite Nanofibers via Electrospinning, Polymers, Volume 11, Issue 9,
pp. 1468, 2019, 10.3390/polym11091468. IF= 3.164.
30. F. Yalcinkaya, M. Komarek, Polyvinyl Butyral (PVB) Nanofiber/Nanoparticle
Covered Yarns for Antibacterial Textile Surfaces, International Journal of Molecular
Sciences, 2019, Volume 20, Issue 17, pp. 4317, DOI: 10.3390/ijms20174317.
IF=4.183.
31. F. Yalcinkaya, Preparation of Various Nanofiber Layers Using Wire Electrospinning
System, Arabian Journal of Chemistry, Volume 12, Issue 8, Pages 5162-5172, DOI:
10.1016/j.arabjc.2016.12.012, 2019. IF=3.298.
32. Jana Gaalova, Fatma Yalcinkaya, Petra Curinova, Michal Kohout, Baturalp
Yalcinkaya, Martin Kostejn, Jan Jirsak, Ivan Stibor, Jason E. Bara, Bart Van der
Bruggen, Pavel Izak, Separation of racemic compound by nanofibrous composite
membranes with chiral selector, Journal of Membrane Science, 2020, Volume 596,
IDOI: 10.1016/j.memsci.2019.117728. IF=7.015.
33. F. Yalcinkaya, E. Boyraz, J. Maryska, K. Kucerova, A Review on Membrane
Technology and Chemical Surface Modification for the Oily Wastewater Treatment,
Materials, 2020, Volume 13, Issue 2, pp 493, DOI: 10.3390/ma13020493. IF= 2.972 .
34. R. Torres-Mendieta, F. Yalcinkaya, E. Boyraz, O. Havelka, S. Wacławeka, J.
Maryška, M.Černik, M.Bryjak, PVDF nanofibrous membranes modified via laser-
synthesized Ag nanoparticles for a cleaner oily water separation, Applied Surface
Science, Volume 256, 2020, DOI: 10.1016/j.apsusc.2020.146575. IF= 5.155.
35. Mohd Reusmaazran Yusof, Roslinda Shamsudin, Sarani Zakaria, Muhammad Azmi
Abdulhamid, Fatma Yalcinkaya, Yusof Abdullah, Norzita Yacob, Electron Beam
Irradiation of the PLLA/CMS/β-TCP Composite Nanofibers Obtained by
Electrospinning, Polymers, 12 (7), 2020, DOI: 10.3390/polym12071593. IF= 3.426.
A.2. Published in refereed journals, technical notes, letters to the editor, discussion, case
reports and a summary of publications other than the type of article
1. F. Yener, O. Jirsak, B. Yalçinkaya, ‘Effects of Material Parameters on Electrospun
Polyvinyl Butyral Nanofiber Web’, Electronic Journal of Textile Technologies, Issue:
5, Volume: 2, Pages: 26-34, 2011.
2. R. Gemci, F. Yener, H. Solak, ‘The Relationship between Applied Voltage and
Diameter of PVB Nanofibers’, KSU. Journal of Engineering Sciences, 14(1), 2011.

171
3. F. Yalcinkaya, B. Yalcinkaya, O. Jirsak, Dependent and Independent Parameters of
Needleless Electrospinning, Fibers and Textiles, ISSN 1335-0617, 1, pages: 75-79,
2015.
4. F. Yalcinkaya, B. Yalcinkaya, J. Maryska, Preparation and Characterization of
Polyvinyl Butyral Nanofibers Containing Silver Nanoparticles, Journal of Materials
Science and Chemical Engineering, Vol.4, no 1, pp. 8-12.
doi:10.4236/msce.2016.41002, 2016.
5. F. Yalcinkaya, A. Siekierka, M. Byjak, J. Maryska, Preparation of various
nanofibrous composite membranes using wire electrospinning for oil-water
separation, IOP Conf. Ser.: Mater. Sci. Eng., Volume 254, Article no 102011, 17th
World Textile Conference AUTEX, DOI: 10.1088/1757-899X/254/10/102011, 2017.
6. F. Yalcinkaya, Mechanically enhanced electrospun nanofibers for wastewater
treatment, E3S Web of Conferences, International Conference on Advances in Energy
Systems and Environmental Engineering (ASEE17), Volume 22, Article no 00193, 7
pages, DOI: 10.1051/e3sconf/20172200193, 2017.
A.3. International conference by presenting papers published in full text
1. F.Yener, O.Jirsak, ‘Improving Performance of Polyvinyl Butyral Electrospinning’,
3th Nanocon, ISBN978-80-87294-23-9, Brno, Czech Republic, 2011.
2. F.Yener, O.Jirsak, B.Yalçinkaya, “The Determination of Anionic and Non-Ionic
Surfactant Effect on Electrospun Nanofibers”, 18th Strutex, Liberec-Czech Republic,
2011.
3. F.Yener, O.Jirsak, B.Yalçinkaya,” Effect of Additives on Needle Electrospinning
system, 18th Strutex, Liberec-Czech Republic, 2011.
4. B.Yalçinkaya, F.Yener, O.Jirsak, F. CengizÇallioğlu, 'Influence of NaCl
Concentration on the Taylor Cone Number and Spinning Performance', 18th Strutex
Liberec-Czech Republic, 2011.
5. B.Yalçinkaya, O.Jirsak, F.Cengiz Çallioğlu, F.Yener, ' The Effect of Concentration
on Spinning Performance Using Roller Electrospinning ', 18th Strutex, Liberec-Czech
Republic, 2011.
6. N.Duyar, B.Yalçinkaya, F.Yener, “Preparation of Electrospun fibers PVB/CNT
Composite Fibers”, 18th Strutex, Liberec-Czech Republic, 2011.
7. H.G. Sevgisunar, F.Yener, B.Yalçinkaya, “Comparision of Needle and Rod
Electrospinning System”, 18th Strutex, Liberec-Czech Republic, 2011.
8. F. Yener, O. Jirsak, ‘Optimization and Characterization of Polyvinyl Butyral
Nanofibers in Different Acetalisation Degree’, 12th Autex, ISBN 978-953-7105-47-
1,pp. 251-256, Croatia, Zadar 2012.
9. F. Yener, O. Jirsak, “Effect of Nonsolvent on Electrospinning Performance and
Nanofiber Properties”, 4th Nanocon, ISBN 978-80-87294-35-2, Brno, pp 471-475,
Czech Republic, 2012.
10. B. Yalçinkaya, F. Yener, F. CengizCallioglu, O. Jirsak, “Effect of Solution
Concentration and Additive on taylor cone Structure”, 4th Nanocon, ISBN 978-80-
87294-35-2, 1st edition, pp 200-203, Brno, Czech Republic, 2012.

172
11. O. Jirsak, K. Farana, F. Yener, ‘Electrospinning Studies: Jet Forming Force’, 19th
Strutex, Liberec-Czech Republic, 2012.
12. F. Yener, O. Jirsak, “Development of New Methods for Study of Mechanism of
Electrospinning”, 19th Strutex, Liberec-Czech Republic, 2012.
13. F. Yener, B. Yalcınkaya, O. Jirsak, ‘Roller Electrospinning System: A Novel Method
to Producing Nanofibers’, The International Istanbul Textile Congress, ISBN: 978-
605-4057-37-5, pp. 917-922, Istanbul, Turkey, 2013.
14. B. Yalçinkaya, F. Yener, F. Cengiz-Callioglu, O. Jirsak, ‘Relation between number of
Taylor Cone and life of jet on the roller electrospinning', The International Istanbul
Textile Congress, ISBN: 978-605-4057-37-5, pp. 213-218, Istanbul, Turkey, 2013.
15. F. Yener, B. Yalcınkaya, O. Jirsak, ‘New Measurement Methods for Studying of
Mechanism of Roller Electrospinning System’, 5th Nanocon, Brno, ISBN 978–80–
87294–47–5, pp808-812, Czech Republic, 2013.
16. F. Yalcinkaya, B. Yalcinkaya, O. Jirsak, Experimental Investigation of Salt Effect on
Electrospinning Parameters and Nanofiber Morphology, 6th Nanocon, Brno, Czech
Republic, ISBN 978-80-87294-53-6, 1st edition, pp 785-790, 2014.
17. F. Yalcinkaya, M. Komarek, D. Lubasova, F. Sanatrnik, J. Maryska, Producing
Antibacterial Textile Material by Weaving PVB/CuO Nanocomposite Fiber Covered
Yarn, 6th Nanocon, Brno, Czech Republic,ISBN 978-80-87294-53-6, 1st edition, pp
421-426, 2014.
18. F. Yalcinkaya, B. Yalcinkaya, O. Jirsak, Dependent and Independent Parameters of
Needleless Electrospinning, 20th Strutex, Liberec-Czech Republic, 2014.
19. F. Yalcinkaya, B. Yalcinkaya, J. Maryska, Preparation and Characterization of
Polyvinyl butyral Nanofibers Containing Silver Nanoparticles, (abstract) The 5th
Conference on Nanomaterials (CN 2016), 14-16 January, Bangkok, page 59, 2016.
20. F. Yalcinkaya, B. Yalcinkaya, J. Hruza, P. Hrabak, J. Maryska, Nanofibrous
Composite Membranes for Microfiltration, 8th Nanocon-International conference on
Nanomaterials, Brno, Czech Republic, October 17 2016.
21. E. Boyraz, F. Yalcinkaya, Polymeric Nanofibers Produced by Needleless
Electrospinning, 22th Strutex, Liberec-Czech Republic, 2018.
22. F. Yalcinkaya, Ondrej Hofman, Jiri Maryska, Surface Propertıes of Lowvacuum
Plasma Modıfıed Polyvınylıdene Fluorıde (PVDF) Nanofıber Membranes, 18th
World Textile Conference AUTEX, 20-22 June 2018, Istanbul, Turkey.
23. E. Boyraz, F. Yalcinkaya, Oily Wastewater Separation by Using Nanofibrous
Membrane, 47th Textile Research Symposium, June 17-19, Liberec, Czech Republic,
ISBN 978-80-7494-473-4, 2019.
A.4. International conference by presenting papers published in abstract
1. F. Yalcinkaya, B. Yalcinkaya, J. Hruza, P. Hrabak, Mechanically Enhanced
Electrospun Polyamide-6 Nanofiber Composite Membranes for Liquid Filtration,
MELPRO-Membrane and Electrosmembrane Process, 13-16 May 2018, Prague,
Czech Republic.

173
2. F. Yalcinkaya, A. Siekierka, Modified PVDF Nanofibrous Membranes for the
Separation of Oil-Water Emulsion, NART-Nanofiber, Applications and Related
Technologies, 18-20 Sept 2019, Liberec, Czech Republic.
3. F. Yalcinkaya, J. Hruza, J. Maryska, Functional Electrospun Nanofiber Webs for the
Separation of Oily Wastewater, Nanocon 2019- 11th International Conference on
Nanomaterials - Research & Application, 16-18th October 2019, Brno, Czech
Republic.
A.5. Patents
1. Method for Application of a Cosmetic Composition Containing at least One Active
Substrate to Skin and a Means for Carrying out this Method for Application of the
Cosmetic Composition. Nafigate Cosmetic a.s.; Ladislav Mares, Jana Svobodova,
Fatma Yalcinkaya. International Patent No: PCT/CZ2015/000111, WO/2016/050227,
07.04.2016.
2. J. Gaálová, Fatma Yalcinkaya, P. Cuřínová, M. Kohout, I. Stibor, P. Izák: Separation
of Chiral Drugs by Composite Chiral Membrane Based on 1,2- diaminocyclohexane
and 1,3-diaminobenzene, CZ 308513 (2020).
A.6. Book Chapters
1. F. Yalcinkaya, B. Yalcinkaya, O. Jirsak, Dependent and Independent Parameters of
Roller Electrospinning System, Electrospinning, Material, Techniques, and
Biomedical Applications, book edited by Sajjad Haider and Adnan Haider, ISBN 978-
953-51-2822-9, Print ISBN 978-953-51-2821-2, http://dx.doi.org/10.5772/65838,
DOI: 10.5772/62860, IntechOpen publisher, Published: December 21, 2016.
2. B. Yalcinkaya, F. Yalcinkaya, Nanofibers in Liquid Filtration, Green electrospinning,
book edited by Nesrin Horzum, Mustafa M. Demir, Rafael Munoz-Espi, Danieal
Crespy, ISBN 978-3-11-058139-3, De Gruyter publisher, July 2019.
3. F. Yalcinkaya, A. Gul, E. Boyraz, M. Bryjak, Nanofibers for oil-water separation and
coalescing filtration, "Electrospun and Nanofibrous Membranes: Principles and
Applications" to be published by Elsevier (submitted), 2020.