
Oncogenic fusion protein EWS-FLI1 is a network hub that regulates alternative splicing
10
Oncogenic fusion protein EWS-FLI1 is a network hub that regulates alternative splicing Saravana P. Selvanathan a , Garrett T. Graham a , Hayriye V. Erkizan a , Uta Dirksen b , Thanemozhi G. Natarajan c , Aleksandra Dakic d , Songtao Yu d , Xuefeng Liu d , Michelle T. Paulsen e , Mats E. Ljungman e , Cathy H. Wu c , Elizabeth R. Lawlor f , Aykut Üren a , and Jeffrey A. Toretsky a,1 a Department of Oncology and Pediatrics, Georgetown University, Washington, DC 20057; b Department of Pediatric Hematology and Oncology, University Hospital Münster, Westfalian Wilhelms University Münster, 48149 Münster, Germany; c Protein Information Resource, Georgetown University and University of Delaware, Washington, DC 20057; d Department of Pathology, Center for Cell Reprogramming, Georgetown University, Washington, DC 20057; and e Department of Radiation Oncology and Translational Oncology Program and f Departments of Pediatrics and Pathology, University of Michigan, Ann Arbor, Michigan, MI 48109 Edited by James L. Manley, Columbia University, New York, NY, and approved February 11, 2015 (received for review January 12, 2015) The synthesis and processing of mRNA, from transcription to trans- lation initiation, often requires splicing of intragenic material. The final mRNA composition varies based on proteins that modulate splice site selection. EWS-FLI1 is an Ewing sarcoma (ES) oncoprotein with an interactome that we demonstrate to have multiple partners in spliceosomal complexes. We evaluate the effect of EWS-FLI1 on posttranscriptional gene regulation using both exon array and RNA- seq. Genes that potentially regulate oncogenesis, including CLK1, CASP3, PPFIBP1, and TERT, validate as alternatively spliced by EWS- FLI1. In a CLIP-seq experiment, we find that EWS-FLI1 RNA-binding motifs most frequently occur adjacent to intron–exon boundaries. EWS-FLI1 also alters splicing by directly binding to known splicing factors including DDX5, hnRNP K, and PRPF6. Reduction of EWS-FLI1 produces an isoform of γ-TERT that has increased telomerase activity compared with wild-type (WT) TERT. The small molecule YK-4–279 is an inhibitor of EWS-FLI1 oncogenic function that disrupts specific pro- tein interactions, including helicases DDX5 and RNA helicase A (RHA) that alters RNA-splicing ratios. As such, YK-4–279 validates the splic- ing mechanism of EWS-FLI1, showing alternatively spliced gene pat- terns that significantly overlap with EWS-FLI1 reduction and WT human mesenchymal stem cells (hMSC). Exon array analysis of 75 ES patient samples shows similar isoform expression patterns to cell line models expressing EWS-FLI1, supporting the clinical relevance of our findings. These experiments establish systemic alternative splic- ing as an oncogenic process modulated by EWS-FLI1. EWS-FLI1 mod- ulation of mRNA splicing may provide insight into the contribution of splicing toward oncogenesis, and, reciprocally, EWS-FLI1 interactions with splicing proteins may inform the splicing code. alternative splicing | EWS-FLI1 | TERT | Ewing sarcoma | CLK1 T he alternative splicing of mRNA expands the diversity of the human proteome through evolution and ontogeny (1, 2). Spliceosomal network interactions, including proteins that rec- ognize splice enhancer and silencer regions, are critical for the regulation of alternative splicing leading to protein isoforms with disparate functionality (3). Alternative splicing provides both a method by which to categorize subsets of cancers and an ave- nue for more effective targeted treatments (4). However, the spliceosomal protein interaction networks that are specific to cancer have not been systematically defined; alternative splicing can also change protein–protein interactions within networks (5). A systems biology approach can be used to study the relationship between splicing and oncogenesis by using tumor models with chromosomal translocations whose expressed fusion proteins have putative roles in splicing (6, 7). Fusion proteins produced by chromosomal translocations in sarcomas often contain the amino-terminal portion of EWS and are classified as transcription factors due to the presence of a canonical carboxyl-terminal DNA-binding domain (6). EWS- FLI1 is a well-established ES oncoprotein and is recognized as a DNA-binding transcriptional regulator (8, 9). The EWS-FLI1 fusion protein of Ewing sarcoma (ES) is an example of a fusion protein whose DNA gene targets have been comprehensively investigated, yet dysregulation of these target genes induced or repressed by EWS-FLI1 does not fully explain the disease phe- notype (10). In addition, some data suggest that DNA binding is not required for transformation by EWS-FLI1 (11, 12). We recently showed that EWS-FLI1 directly binds RNA and interferes with the activity of RNA helicase A (RHA) (13). In addition, previous protein interaction studies identified the SF1 and U1C splicing factors as partners of EWS-FLI1 and discov- ered that EWS-FLI1 alters the splicing of an adenoviral tran- script (14, 15). Also, EWS-FLI1 has been shown to modify the IGFBP3 mRNA half-life (16) as well as directly slow the rate of RNA polymerase activity during cyclin D transcription, leading to a more oncogenic isoform, cyclin D1b (17). In total, these studies suggest functionally significant EWS-FLI1 activity in ad- dition to transcriptional regulation driven by DNA binding (16). Thus, further resolution of EWS-FLI1 biology through protein partners is necessary to clarify its full complement of activity as an oncoprotein. The study of complete protein networks remains challenging because it is difficult to modify single interactions while pre- serving overall network architecture (18). Fusion proteins are ideal as both models of oncogene function as well as targets for anticancer therapy. However, creating small-molecule inhibitors Significance Alternative splicing of RNA allows a limited number of coding regions in the human genome to produce proteins with diverse functionality. Alternative splicing has also been implicated as an oncogenic process. Identifying aspects of cancer cells that differentiate them from noncancer cells remains an ongoing challenge, and our research suggests that alternatively spliced mRNA and subsequent protein isoforms will provide new an- ticancer targets. We determined that the key oncoprotein of Ewing sarcoma (ES), EWS-FLI1, regulates alternative splicing in multiple cell line models. These experiments establish onco- genic aspects of splicing that are specific to cancer cells and thereby illuminate potentially oncogenic splicing shifts as well as provide a useful stratification mechanism for ES patients. Author contributions: S.P.S., A.Ü., and J.A.T. designed research; S.P.S., G.T.G., and H.V.E. performed research; U.D., T.G.N., A.D., S.Y., X.L., M.T.P., M.E.L., C.H.W., and E.R.L. con- tributed new reagents/analytic tools; S.P.S. and G.T.G. analyzed data; and A.Ü. and J.A.T. wrote the paper. Conflict of interest statement: United States Patent and Trademark Office awarded pat- ent for YK-4–279 to Georgetown University; inventors include A.Ü. and J.A.T. A license agreement has been executed between Georgetown University and Tokalas, Inc. for these patents, in which J.A.T. is a founding shareholder. This article is a PNAS Direct Submission. 1 To whom correspondence should be addressed. Email: [email protected]. This article contains supporting information online at www.pnas.org/lookup/suppl/doi:10. 1073/pnas.1500536112/-/DCSupplemental. www.pnas.org/cgi/doi/10.1073/pnas.1500536112 PNAS | Published online March 3, 2015 | E1307–E1316 MEDICAL SCIENCES PNAS PLUS
-
Upload
independent -
Category
Documents
-
view
4 -
download
0
Transcript of Oncogenic fusion protein EWS-FLI1 is a network hub that regulates alternative splicing

Oncogenic fusion protein EWS-FLI1 is a network hubthat regulates alternative splicingSaravana P. Selvanathana, Garrett T. Grahama, Hayriye V. Erkizana, Uta Dirksenb, Thanemozhi G. Natarajanc,Aleksandra Dakicd, Songtao Yud, Xuefeng Liud, Michelle T. Paulsene, Mats E. Ljungmane, Cathy H. Wuc,Elizabeth R. Lawlorf, Aykut Ürena, and Jeffrey A. Toretskya,1
aDepartment of Oncology and Pediatrics, Georgetown University, Washington, DC 20057; bDepartment of Pediatric Hematology and Oncology, UniversityHospital Münster, Westfalian Wilhelms University Münster, 48149 Münster, Germany; cProtein Information Resource, Georgetown University and Universityof Delaware, Washington, DC 20057; dDepartment of Pathology, Center for Cell Reprogramming, Georgetown University, Washington, DC 20057; andeDepartment of Radiation Oncology and Translational Oncology Program and fDepartments of Pediatrics and Pathology, University of Michigan, AnnArbor, Michigan, MI 48109
Edited by James L. Manley, Columbia University, New York, NY, and approved February 11, 2015 (received for review January 12, 2015)
The synthesis and processing of mRNA, from transcription to trans-lation initiation, often requires splicing of intragenic material. Thefinal mRNA composition varies based on proteins that modulatesplice site selection. EWS-FLI1 is an Ewing sarcoma (ES) oncoproteinwith an interactome that we demonstrate to have multiple partnersin spliceosomal complexes. We evaluate the effect of EWS-FLI1 onposttranscriptional gene regulation using both exon array and RNA-seq. Genes that potentially regulate oncogenesis, including CLK1,CASP3, PPFIBP1, and TERT, validate as alternatively spliced by EWS-FLI1. In a CLIP-seq experiment, we find that EWS-FLI1 RNA-bindingmotifs most frequently occur adjacent to intron–exon boundaries.EWS-FLI1 also alters splicing by directly binding to known splicingfactors including DDX5, hnRNP K, and PRPF6. Reduction of EWS-FLI1produces an isoform of γ-TERT that has increased telomerase activitycompared with wild-type (WT) TERT. The small molecule YK-4–279 isan inhibitor of EWS-FLI1 oncogenic function that disrupts specific pro-tein interactions, including helicases DDX5 and RNA helicase A (RHA)that alters RNA-splicing ratios. As such, YK-4–279 validates the splic-ing mechanism of EWS-FLI1, showing alternatively spliced gene pat-terns that significantly overlap with EWS-FLI1 reduction and WThuman mesenchymal stem cells (hMSC). Exon array analysis of 75ES patient samples shows similar isoform expression patterns to cellline models expressing EWS-FLI1, supporting the clinical relevance ofour findings. These experiments establish systemic alternative splic-ing as an oncogenic process modulated by EWS-FLI1. EWS-FLI1 mod-ulation of mRNA splicing may provide insight into the contribution ofsplicing toward oncogenesis, and, reciprocally, EWS-FLI1 interactionswith splicing proteins may inform the splicing code.
alternative splicing | EWS-FLI1 | TERT | Ewing sarcoma | CLK1
The alternative splicing of mRNA expands the diversity of thehuman proteome through evolution and ontogeny (1, 2).
Spliceosomal network interactions, including proteins that rec-ognize splice enhancer and silencer regions, are critical for theregulation of alternative splicing leading to protein isoforms withdisparate functionality (3). Alternative splicing provides botha method by which to categorize subsets of cancers and an ave-nue for more effective targeted treatments (4). However, thespliceosomal protein interaction networks that are specific tocancer have not been systematically defined; alternative splicingcan also change protein–protein interactions within networks (5).A systems biology approach can be used to study the relationshipbetween splicing and oncogenesis by using tumor models withchromosomal translocations whose expressed fusion proteinshave putative roles in splicing (6, 7).Fusion proteins produced by chromosomal translocations in
sarcomas often contain the amino-terminal portion of EWS andare classified as transcription factors due to the presence ofa canonical carboxyl-terminal DNA-binding domain (6). EWS-FLI1 is a well-established ES oncoprotein and is recognized asa DNA-binding transcriptional regulator (8, 9). The EWS-FLI1
fusion protein of Ewing sarcoma (ES) is an example of a fusionprotein whose DNA gene targets have been comprehensivelyinvestigated, yet dysregulation of these target genes induced orrepressed by EWS-FLI1 does not fully explain the disease phe-notype (10). In addition, some data suggest that DNA binding isnot required for transformation by EWS-FLI1 (11, 12).We recently showed that EWS-FLI1 directly binds RNA and
interferes with the activity of RNA helicase A (RHA) (13). Inaddition, previous protein interaction studies identified the SF1and U1C splicing factors as partners of EWS-FLI1 and discov-ered that EWS-FLI1 alters the splicing of an adenoviral tran-script (14, 15). Also, EWS-FLI1 has been shown to modify theIGFBP3 mRNA half-life (16) as well as directly slow the rate ofRNA polymerase activity during cyclin D transcription, leadingto a more oncogenic isoform, cyclin D1b (17). In total, thesestudies suggest functionally significant EWS-FLI1 activity in ad-dition to transcriptional regulation driven by DNA binding (16).Thus, further resolution of EWS-FLI1 biology through proteinpartners is necessary to clarify its full complement of activity asan oncoprotein.The study of complete protein networks remains challenging
because it is difficult to modify single interactions while pre-serving overall network architecture (18). Fusion proteins areideal as both models of oncogene function as well as targets foranticancer therapy. However, creating small-molecule inhibitors
Significance
Alternative splicing of RNA allows a limited number of codingregions in the human genome to produce proteins with diversefunctionality. Alternative splicing has also been implicated asan oncogenic process. Identifying aspects of cancer cells thatdifferentiate them from noncancer cells remains an ongoingchallenge, and our research suggests that alternatively splicedmRNA and subsequent protein isoforms will provide new an-ticancer targets. We determined that the key oncoprotein ofEwing sarcoma (ES), EWS-FLI1, regulates alternative splicing inmultiple cell line models. These experiments establish onco-genic aspects of splicing that are specific to cancer cells andthereby illuminate potentially oncogenic splicing shifts as wellas provide a useful stratification mechanism for ES patients.
Author contributions: S.P.S., A.Ü., and J.A.T. designed research; S.P.S., G.T.G., and H.V.E.performed research; U.D., T.G.N., A.D., S.Y., X.L., M.T.P., M.E.L., C.H.W., and E.R.L. con-tributed new reagents/analytic tools; S.P.S. and G.T.G. analyzed data; and A.Ü. and J.A.T.wrote the paper.
Conflict of interest statement: United States Patent and Trademark Office awarded pat-ent for YK-4–279 to Georgetown University; inventors include A.Ü. and J.A.T. A licenseagreement has been executed between Georgetown University and Tokalas, Inc. for thesepatents, in which J.A.T. is a founding shareholder.
This article is a PNAS Direct Submission.1To whom correspondence should be addressed. Email: [email protected].
This article contains supporting information online at www.pnas.org/lookup/suppl/doi:10.1073/pnas.1500536112/-/DCSupplemental.
www.pnas.org/cgi/doi/10.1073/pnas.1500536112 PNAS | Published online March 3, 2015 | E1307–E1316
MED
ICALSC
IENCE
SPN
ASPL
US
that disrupt a specific protein–protein interaction remains a sig-nificant challenge (19, 20). We have validated a small moleculeprobe, YK-4–279, an enantio-specific inhibitor that both disruptsRHA interaction from EWS-FLI1 and restores RHA helicaseactivity (13, 21, 22). Reagents that specifically disrupt spliceo-somal protein interactions are useful for the characterization ofspliceosomal networks as well as understanding oncogenic aspectsof posttranscriptional modifications.Here we describe an unbiased, in-depth, proteomic analysis of
EWS-FLI1 protein partners that focuses on alternative splicing.Our analysis includes protein partner identification, functionalclassification, experimental validation, and placement of theseidentified proteins into the splicing network. We report that EWS-FLI1 not only has multiple direct connections within the spliceo-some but also drives aberrant splicing in cell line models that havestrong correlations with ES patient tumor samples. YK-4–279 isa critical probe in these experiments as it disrupts EWS-FLI1protein interactions, subsequently altering mRNA splicing. Themechanism and effect of aberrant splicing driven by EWS-FLI1provide insights into the oncogenic nature of protein isoforms ofCLK1, Caspase-3, Liprin-β-1, and TERT. In addition, our resolu-tion of the EWS-FLI1 protein network that links alternative splicingwith transcription provides perspective into a systems biology modelinvolving an oncogenic fusion protein, as well as additional op-portunities for targeted therapeutics.
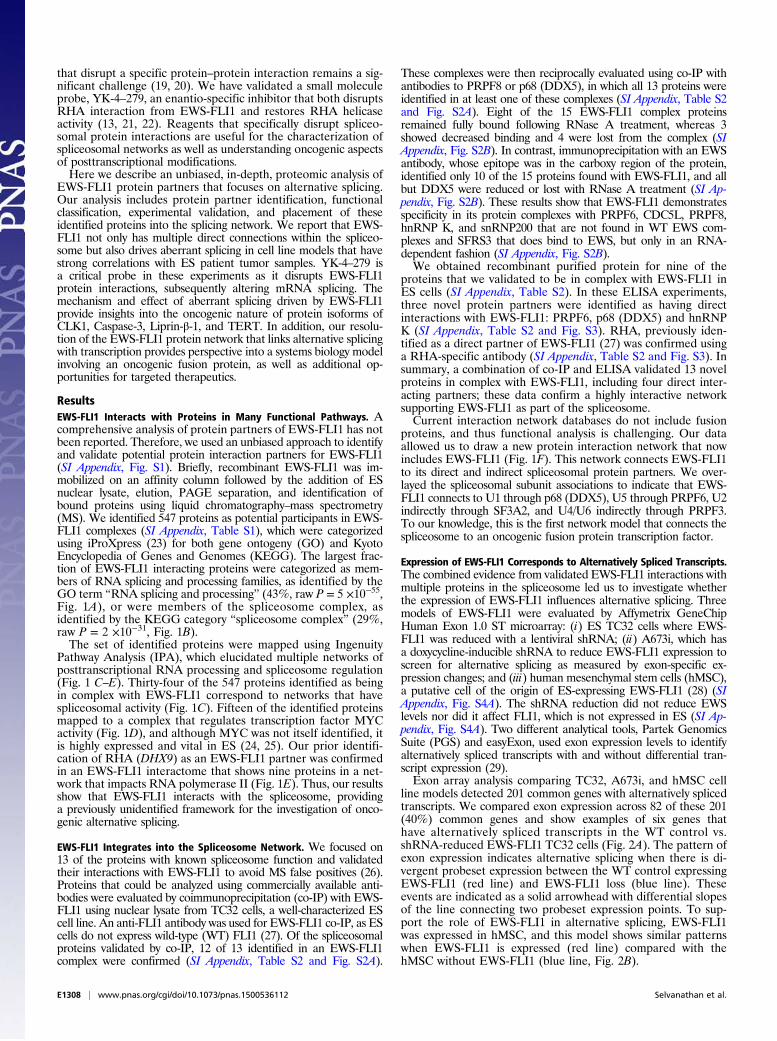
ResultsEWS-FLI1 Interacts with Proteins in Many Functional Pathways. Acomprehensive analysis of protein partners of EWS-FLI1 has notbeen reported. Therefore, we used an unbiased approach to identifyand validate potential protein interaction partners for EWS-FLI1(SI Appendix, Fig. S1). Briefly, recombinant EWS-FLI1 was im-mobilized on an affinity column followed by the addition of ESnuclear lysate, elution, PAGE separation, and identification ofbound proteins using liquid chromatography–mass spectrometry(MS). We identified 547 proteins as potential participants in EWS-FLI1 complexes (SI Appendix, Table S1), which were categorizedusing iProXpress (23) for both gene ontogeny (GO) and KyotoEncyclopedia of Genes and Genomes (KEGG). The largest frac-tion of EWS-FLI1 interacting proteins were categorized as mem-bers of RNA splicing and processing families, as identified by theGO term “RNA splicing and processing” (43%, raw P = 5 ×10−55,Fig. 1A), or were members of the spliceosome complex, asidentified by the KEGG category “spliceosome complex” (29%,raw P = 2 ×10⁻³¹, Fig. 1B).The set of identified proteins were mapped using Ingenuity
Pathway Analysis (IPA), which elucidated multiple networks ofposttranscriptional RNA processing and spliceosome regulation(Fig. 1 C–E). Thirty-four of the 547 proteins identified as beingin complex with EWS-FLI1 correspond to networks that havespliceosomal activity (Fig. 1C). Fifteen of the identified proteinsmapped to a complex that regulates transcription factor MYCactivity (Fig. 1D), and although MYC was not itself identified, itis highly expressed and vital in ES (24, 25). Our prior identifi-cation of RHA (DHX9) as an EWS-FLI1 partner was confirmedin an EWS-FLI1 interactome that shows nine proteins in a net-work that impacts RNA polymerase II (Fig. 1E). Thus, our resultsshow that EWS-FLI1 interacts with the spliceosome, providinga previously unidentified framework for the investigation of onco-genic alternative splicing.
EWS-FLI1 Integrates into the Spliceosome Network. We focused on13 of the proteins with known spliceosome function and validatedtheir interactions with EWS-FLI1 to avoid MS false positives (26).Proteins that could be analyzed using commercially available anti-bodies were evaluated by coimmunoprecipitation (co-IP) with EWS-FLI1 using nuclear lysate from TC32 cells, a well-characterized EScell line. An anti-FLI1 antibody was used for EWS-FLI1 co-IP, as EScells do not express wild-type (WT) FLI1 (27). Of the spliceosomalproteins validated by co-IP, 12 of 13 identified in an EWS-FLI1complex were confirmed (SI Appendix, Table S2 and Fig. S2A).
These complexes were then reciprocally evaluated using co-IP withantibodies to PRPF8 or p68 (DDX5), in which all 13 proteins wereidentified in at least one of these complexes (SI Appendix, Table S2and Fig. S2A). Eight of the 15 EWS-FLI1 complex proteinsremained fully bound following RNase A treatment, whereas 3showed decreased binding and 4 were lost from the complex (SIAppendix, Fig. S2B). In contrast, immunoprecipitation with an EWSantibody, whose epitope was in the carboxy region of the protein,identified only 10 of the 15 proteins found with EWS-FLI1, and allbut DDX5 were reduced or lost with RNase A treatment (SI Ap-pendix, Fig. S2B). These results show that EWS-FLI1 demonstratesspecificity in its protein complexes with PRPF6, CDC5L, PRPF8,hnRNP K, and snRNP200 that are not found in WT EWS com-plexes and SFRS3 that does bind to EWS, but only in an RNA-dependent fashion (SI Appendix, Fig. S2B).We obtained recombinant purified protein for nine of the
proteins that we validated to be in complex with EWS-FLI1 inES cells (SI Appendix, Table S2). In these ELISA experiments,three novel protein partners were identified as having directinteractions with EWS-FLI1: PRPF6, p68 (DDX5) and hnRNPK (SI Appendix, Table S2 and Fig. S3). RHA, previously iden-tified as a direct partner of EWS-FLI1 (27) was confirmed usinga RHA-specific antibody (SI Appendix, Table S2 and Fig. S3). Insummary, a combination of co-IP and ELISA validated 13 novelproteins in complex with EWS-FLI1, including four direct inter-acting partners; these data confirm a highly interactive networksupporting EWS-FLI1 as part of the spliceosome.Current interaction network databases do not include fusion
proteins, and thus functional analysis is challenging. Our dataallowed us to draw a new protein interaction network that nowincludes EWS-FLI1 (Fig. 1F). This network connects EWS-FLI1to its direct and indirect spliceosomal protein partners. We over-layed the spliceosomal subunit associations to indicate that EWS-FLI1 connects to U1 through p68 (DDX5), U5 through PRPF6, U2indirectly through SF3A2, and U4/U6 indirectly through PRPF3.To our knowledge, this is the first network model that connects thespliceosome to an oncogenic fusion protein transcription factor.
Expression of EWS-FLI1 Corresponds to Alternatively Spliced Transcripts.The combined evidence from validated EWS-FLI1 interactions withmultiple proteins in the spliceosome led us to investigate whetherthe expression of EWS-FLI1 influences alternative splicing. Threemodels of EWS-FLI1 were evaluated by Affymetrix GeneChipHuman Exon 1.0 ST microarray: (i) ES TC32 cells where EWS-FLI1 was reduced with a lentiviral shRNA; (ii) A673i, which hasa doxycycline-inducible shRNA to reduce EWS-FLI1 expression toscreen for alternative splicing as measured by exon-specific ex-pression changes; and (iii) human mesenchymal stem cells (hMSC),a putative cell of the origin of ES-expressing EWS-FLI1 (28) (SIAppendix, Fig. S4A). The shRNA reduction did not reduce EWSlevels nor did it affect FLI1, which is not expressed in ES (SI Ap-pendix, Fig. S4A). Two different analytical tools, Partek GenomicsSuite (PGS) and easyExon, used exon expression levels to identifyalternatively spliced transcripts with and without differential tran-script expression (29).Exon array analysis comparing TC32, A673i, and hMSC cell
line models detected 201 common genes with alternatively splicedtranscripts. We compared exon expression across 82 of these 201(40%) common genes and show examples of six genes thathave alternatively spliced transcripts in the WT control vs.shRNA-reduced EWS-FLI1 TC32 cells (Fig. 2A). The pattern ofexon expression indicates alternative splicing when there is di-vergent probeset expression between the WT control expressingEWS-FLI1 (red line) and EWS-FLI1 loss (blue line). Theseevents are indicated as a solid arrowhead with differential slopesof the line connecting two probeset expression points. To sup-port the role of EWS-FLI1 in alternative splicing, EWS-FLI1was expressed in hMSC, and this model shows similar patternswhen EWS-FLI1 is expressed (red line) compared with thehMSC without EWS-FLI1 (blue line, Fig. 2B).
E1308 | www.pnas.org/cgi/doi/10.1073/pnas.1500536112 Selvanathan et al.
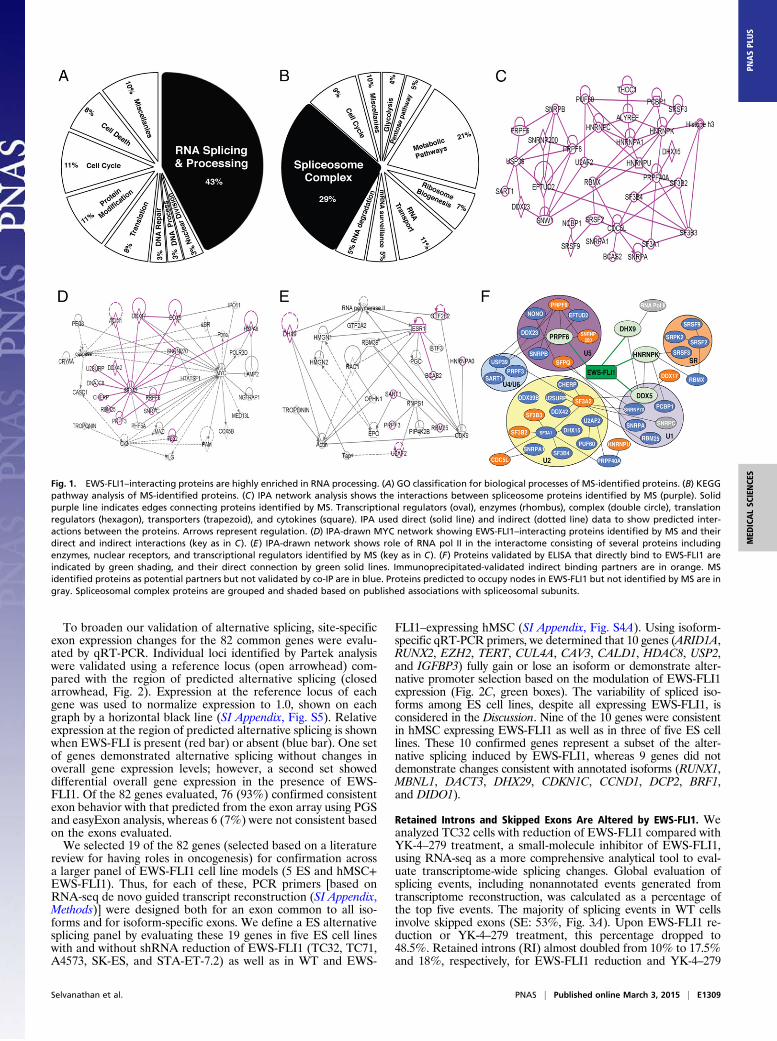
To broaden our validation of alternative splicing, site-specificexon expression changes for the 82 common genes were evalu-ated by qRT-PCR. Individual loci identified by Partek analysiswere validated using a reference locus (open arrowhead) com-pared with the region of predicted alternative splicing (closedarrowhead, Fig. 2). Expression at the reference locus of eachgene was used to normalize expression to 1.0, shown on eachgraph by a horizontal black line (SI Appendix, Fig. S5). Relativeexpression at the region of predicted alternative splicing is shownwhen EWS-FLI is present (red bar) or absent (blue bar). One setof genes demonstrated alternative splicing without changes inoverall gene expression levels; however, a second set showeddifferential overall gene expression in the presence of EWS-FLI1. Of the 82 genes evaluated, 76 (93%) confirmed consistentexon behavior with that predicted from the exon array using PGSand easyExon analysis, whereas 6 (7%) were not consistent basedon the exons evaluated.We selected 19 of the 82 genes (selected based on a literature
review for having roles in oncogenesis) for confirmation acrossa larger panel of EWS-FLI1 cell line models (5 ES and hMSC+EWS-FLI1). Thus, for each of these, PCR primers [based onRNA-seq de novo guided transcript reconstruction (SI Appendix,Methods)] were designed both for an exon common to all iso-forms and for isoform-specific exons. We define a ES alternativesplicing panel by evaluating these 19 genes in five ES cell lineswith and without shRNA reduction of EWS-FLI1 (TC32, TC71,A4573, SK-ES, and STA-ET-7.2) as well as in WT and EWS-
FLI1–expressing hMSC (SI Appendix, Fig. S4A). Using isoform-specific qRT-PCR primers, we determined that 10 genes (ARID1A,RUNX2, EZH2, TERT, CUL4A, CAV3, CALD1, HDAC8, USP2,and IGFBP3) fully gain or lose an isoform or demonstrate alter-native promoter selection based on the modulation of EWS-FLI1expression (Fig. 2C, green boxes). The variability of spliced iso-forms among ES cell lines, despite all expressing EWS-FLI1, isconsidered in the Discussion. Nine of the 10 genes were consistentin hMSC expressing EWS-FLI1 as well as in three of five ES celllines. These 10 confirmed genes represent a subset of the alter-native splicing induced by EWS-FLI1, whereas 9 genes did notdemonstrate changes consistent with annotated isoforms (RUNX1,MBNL1, DACT3, DHX29, CDKN1C, CCND1, DCP2, BRF1,and DIDO1).
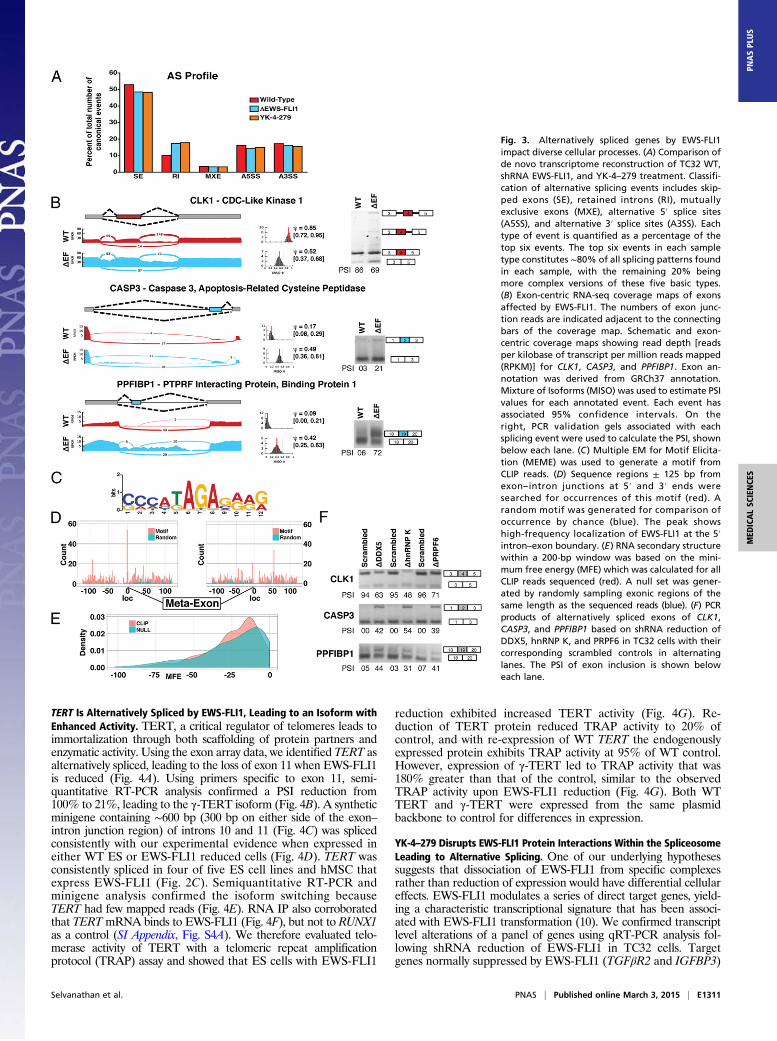
Retained Introns and Skipped Exons Are Altered by EWS-FLI1. Weanalyzed TC32 cells with reduction of EWS-FLI1 compared withYK-4–279 treatment, a small-molecule inhibitor of EWS-FLI1,using RNA-seq as a more comprehensive analytical tool to eval-uate transcriptome-wide splicing changes. Global evaluation ofsplicing events, including nonannotated events generated fromtranscriptome reconstruction, was calculated as a percentage ofthe top five events. The majority of splicing events in WT cellsinvolve skipped exons (SE: 53%, Fig. 3A). Upon EWS-FLI1 re-duction or YK-4–279 treatment, this percentage dropped to48.5%. Retained introns (RI) almost doubled from 10% to 17.5%and 18%, respectively, for EWS-FLI1 reduction and YK-4–279
Fig. 1. EWS-FLI1–interacting proteins are highly enriched in RNA processing. (A) GO classification for biological processes of MS-identified proteins. (B) KEGGpathway analysis of MS-identified proteins. (C) IPA network analysis shows the interactions between spliceosome proteins identified by MS (purple). Solidpurple line indicates edges connecting proteins identified by MS. Transcriptional regulators (oval), enzymes (rhombus), complex (double circle), translationregulators (hexagon), transporters (trapezoid), and cytokines (square). IPA used direct (solid line) and indirect (dotted line) data to show predicted inter-actions between the proteins. Arrows represent regulation. (D) IPA-drawn MYC network showing EWS-FLI1–interacting proteins identified by MS and theirdirect and indirect interactions (key as in C). (E) IPA-drawn network shows role of RNA pol II in the interactome consisting of several proteins includingenzymes, nuclear receptors, and transcriptional regulators identified by MS (key as in C). (F) Proteins validated by ELISA that directly bind to EWS-FLI1 areindicated by green shading, and their direct connection by green solid lines. Immunoprecipitated-validated indirect binding partners are in orange. MSidentified proteins as potential partners but not validated by co-IP are in blue. Proteins predicted to occupy nodes in EWS-FLI1 but not identified by MS are ingray. Spliceosomal complex proteins are grouped and shaded based on published associations with spliceosomal subunits.
Selvanathan et al. PNAS | Published online March 3, 2015 | E1309
MED
ICALSC
IENCE
SPN
ASPL
US

treatment. Other splicing events—mutually exclusive exons (MXE),alternative 5′ splice site (A5SS), and alternative 3′ splice site(A3SS)—did not demonstrate consistent changes between con-ditions nor did they have the same magnitude as the increase inretained introns (Fig. 3A).The above analysis is based on the de novo transcriptome from
RNA-seq; therefore, we also determined splice events correspondingonly to annotated events in the Ensembl, UCSC, and RefSeq ref-erences for GRCh37, for both EWS-FLI1 reduction and YK-4–279treatment, with common genes shaded in blue (SI Appendix, TableS3 A and B). The significance of overlap between the shEWS-FLI1and YK-4–279 groups based on annotated splice events was signif-icant for SE (P = 3.7 × 10⁻²³), RI (P = 2.5 × 10⁻⁸), MXE (P = 4.8 ×10⁻⁵), A5SS (P = 1.9 × 10⁻⁵), and A3SS (P = 2.6 × 10⁻⁴).We show three examples of alternative splicing based on re-
duction of EWS-FLI1 expression as well as the calculated per-cent spliced-in (PSI) from RNA-seq in the graph, with 95%confidence limits, and the corresponding semiquantitative RT-PCR densitometry PSI determination below each gel image (Fig.3B). CLK1 shows both a retained intron on both ends of exon 4and a skipped exon 4 (PSI reduced from RNA-seq 85 to 52% andsemiquantitative RT-PCR 86 to 69%). CASP3 shows a skippedexon 2 (PSI reduced from RNA-seq 49 to 17% and semi-quantitative RT-PCR 21 to 3%), and PPFIBP1 shows a skippedexon 19 (PSI reduced from RNA-seq 42 to 9% and semiquantitativeRT-PCR 72 to 6%) when EWS-FLI1 is expressed. Two othergenes, EZH2 and CALD1, were evaluated by semiquantitativeRT-PCR based on primers designed for isoform-specific detectionand RNA immunoprecipitation. Both demonstrated multipleisoform changes and likely alternative promoter use based on thereduction of EWS-FLI1 (SI Appendix, Fig. S4C). None of these
splicing changes were observed with shRNA reduction of WT EWSprotein in TC32 cells (SI Appendix, Fig. S4B).Cross-linking immunoprecipitation (CLIP) of EWS-FLI1 was
used to determine a motif associated with EWS-FLI1 binding toRNA. This motif (Fig. 3C) occurred more frequently within 3 ntof the 5′ exon–intron boundary than any other place ± 500 nt ateither the 5′ and 3′ ends of exon–intron boundaries (Fig. 3D). Toevaluate a second method by which EWS-FLI1 may interact withRNA, we determined the potential RNA secondary structurepreference of EWS-FLI1 using local secondary structure pre-diction (30, 31). Using sequenced CLIP reads greater than 20 nt,we calculated the minimum free energy (MFE) structures thatwere possible and compared them to those generated from a ran-dom set of exonic reads of the same length (Fig. 3E).We evaluated the effect on spliced isoforms of reducing EWS-
FLI1 splicing partners p68 (DDX5), hnRNP K, and PRPF6 (SIAppendix, Fig. S4B). Alternative splicing for each of CLK1,CASP3, and PPFIBP1 occurred secondary to each of the proteinreductions with almost similar PSI to that of EWS-FLI1 re-duction (Fig. 3F). Additional isoform switching occurred withreduction of p68 in 5 of 10 targets, of hnRNP K in 4 of 10, and ofPRPF6 in 3 of 10 (SI Appendix, Fig. S4B). None of the spliceo-somal protein reductions significantly changed the EWS-FLI1expression levels in TC32 cells (SI Appendix, Fig. S4B). Ascontrols for specificity, SF3A2, an indirect partner of EWS-FLI1(Fig. 1F) was reduced and did not demonstrate any of the iso-form switching observed after reduction of direct partners (SIAppendix, Fig. S4B). Using a further specificity control, reductionof PRPF6 in MDA-MB-231 breast cancer cells did not result inisoform switching (SI Appendix, Fig. S4B).
Fig. 2. Exon expression patterns and overall gene expression are altered by EWS-FLI1. (A) Partek genome analysis of the exon array probe set shows relativeexon-level expression across genes. Each point is the expression at a single probeset (nodes). The y axis indicates relative intensity of exon expression, and thex axis indicates each probeset in 5′ to 3′ direction. TC32 WT control, express EWS-FLI1 (red) is compared with shRNA EWS-FLI1 reduction (blue). To validatealternative splicing, qRT-PCR primers were prepared based on probesets showing AS (closed arrows). Open arrows indicate a region of the transcript of equalexon expression used for primer design to normalize intensity across each gene. (B) Partek analysis of exon expression in hMSC with EWS-FLI1 expression (red)and absence, control WT hMSC (blue) similar to A. (C) Cellular models of ES were evaluated for a gene set using qRT-PCR with primer identification based onexamples in A. Across the top are five ES cell lines and hMSC ± EF. The gene list is shown in the first column. Those genes with alternative splicing similar toEWS-FLI1 are shown in green, no isoform switch in red, and inconclusive qRT-PCR in light orange.
E1310 | www.pnas.org/cgi/doi/10.1073/pnas.1500536112 Selvanathan et al.
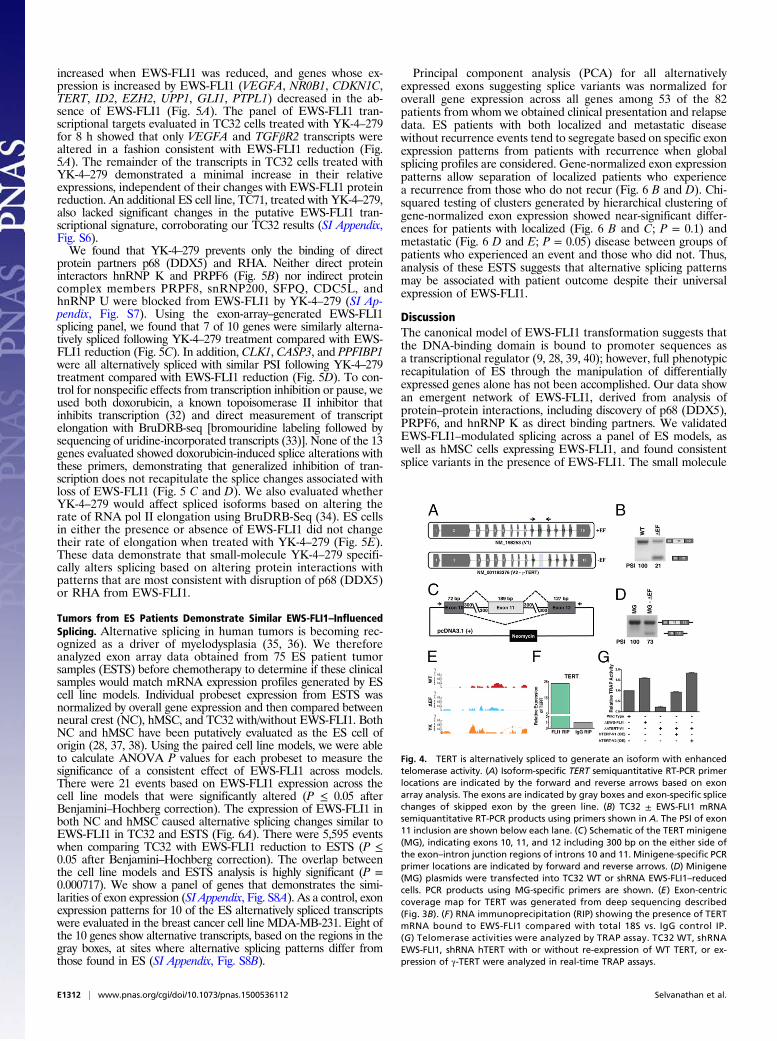
TERT Is Alternatively Spliced by EWS-FLI1, Leading to an Isoform withEnhanced Activity. TERT, a critical regulator of telomeres leads toimmortalization through both scaffolding of protein partners andenzymatic activity. Using the exon array data, we identified TERT asalternatively spliced, leading to the loss of exon 11 when EWS-FLI1is reduced (Fig. 4A). Using primers specific to exon 11, semi-quantitative RT-PCR analysis confirmed a PSI reduction from100% to 21%, leading to the γ-TERT isoform (Fig. 4B). A syntheticminigene containing ∼600 bp (300 bp on either side of the exon–intron junction region) of introns 10 and 11 (Fig. 4C) was splicedconsistently with our experimental evidence when expressed ineither WT ES or EWS-FLI1 reduced cells (Fig. 4D). TERT wasconsistently spliced in four of five ES cell lines and hMSC thatexpress EWS-FLI1 (Fig. 2C). Semiquantitative RT-PCR andminigene analysis confirmed the isoform switching becauseTERT had few mapped reads (Fig. 4E). RNA IP also corroboratedthat TERTmRNA binds to EWS-FLI1 (Fig. 4F), but not to RUNX1as a control (SI Appendix, Fig. S4A). We therefore evaluated telo-merase activity of TERT with a telomeric repeat amplificationprotocol (TRAP) assay and showed that ES cells with EWS-FLI1
reduction exhibited increased TERT activity (Fig. 4G). Re-duction of TERT protein reduced TRAP activity to 20% ofcontrol, and with re-expression of WT TERT the endogenouslyexpressed protein exhibits TRAP activity at 95% of WT control.However, expression of γ-TERT led to TRAP activity that was180% greater than that of the control, similar to the observedTRAP activity upon EWS-FLI1 reduction (Fig. 4G). Both WTTERT and γ-TERT were expressed from the same plasmidbackbone to control for differences in expression.
YK-4–279 Disrupts EWS-FLI1 Protein Interactions Within the SpliceosomeLeading to Alternative Splicing. One of our underlying hypothesessuggests that dissociation of EWS-FLI1 from specific complexesrather than reduction of expression would have differential cellulareffects. EWS-FLI1 modulates a series of direct target genes, yield-ing a characteristic transcriptional signature that has been associ-ated with EWS-FLI1 transformation (10). We confirmed transcriptlevel alterations of a panel of genes using qRT-PCR analysis fol-lowing shRNA reduction of EWS-FLI1 in TC32 cells. Targetgenes normally suppressed by EWS-FLI1 (TGFβR2 and IGFBP3)
Fig. 3. Alternatively spliced genes by EWS-FLI1impact diverse cellular processes. (A) Comparison ofde novo transcriptome reconstruction of TC32 WT,shRNA EWS-FLI1, and YK-4–279 treatment. Classifi-cation of alternative splicing events includes skip-ped exons (SE), retained introns (RI), mutuallyexclusive exons (MXE), alternative 5′ splice sites(A5SS), and alternative 3′ splice sites (A3SS). Eachtype of event is quantified as a percentage of thetop six events. The top six events in each sampletype constitutes ∼80% of all splicing patterns foundin each sample, with the remaining 20% beingmore complex versions of these five basic types.(B) Exon-centric RNA-seq coverage maps of exonsaffected by EWS-FLI1. The numbers of exon junc-tion reads are indicated adjacent to the connectingbars of the coverage map. Schematic and exon-centric coverage maps showing read depth [readsper kilobase of transcript per million reads mapped(RPKM)] for CLK1, CASP3, and PPFIBP1. Exon an-notation was derived from GRCh37 annotation.Mixture of Isoforms (MISO) was used to estimate PSIvalues for each annotated event. Each event hasassociated 95% confidence intervals. On theright, PCR validation gels associated with eachsplicing event were used to calculate the PSI, shownbelow each lane. (C) Multiple EM for Motif Elicita-tion (MEME) was used to generate a motif fromCLIP reads. (D) Sequence regions ± 125 bp fromexon– intron junctions at 5′ and 3′ ends weresearched for occurrences of this motif (red). Arandom motif was generated for comparison ofoccurrence by chance (blue). The peak showshigh-frequency localization of EWS-FLI1 at the 5′intron–exon boundary. (E) RNA secondary structurewithin a 200-bp window was based on the mini-mum free energy (MFE) which was calculated for allCLIP reads sequenced (red). A null set was gener-ated by randomly sampling exonic regions of thesame length as the sequenced reads (blue). (F) PCRproducts of alternatively spliced exons of CLK1,CASP3, and PPFIBP1 based on shRNA reduction ofDDX5, hnRNP K, and PRPF6 in TC32 cells with theircorresponding scrambled controls in alternatinglanes. The PSI of exon inclusion is shown beloweach lane.
Selvanathan et al. PNAS | Published online March 3, 2015 | E1311
MED
ICALSC
IENCE
SPN
ASPL
US
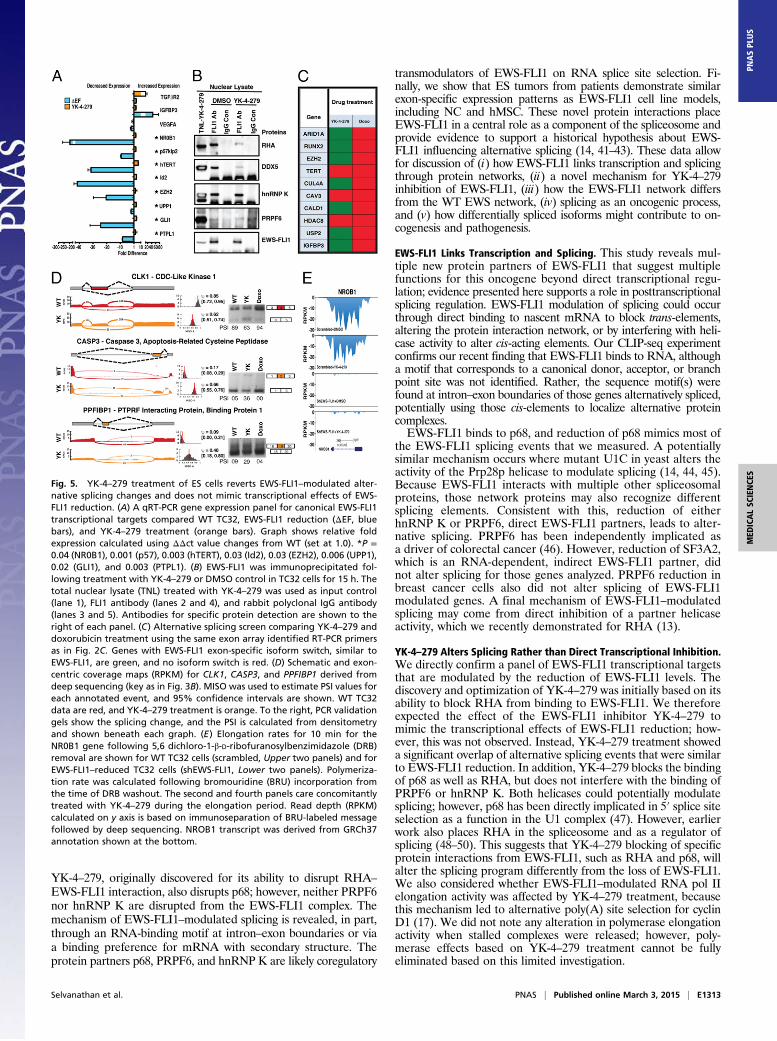
increased when EWS-FLI1 was reduced, and genes whose ex-pression is increased by EWS-FLI1 (VEGFA, NR0B1, CDKN1C,TERT, ID2, EZH2, UPP1, GLI1, PTPL1) decreased in the ab-sence of EWS-FLI1 (Fig. 5A). The panel of EWS-FLI1 tran-scriptional targets evaluated in TC32 cells treated with YK-4–279for 8 h showed that only VEGFA and TGFβR2 transcripts werealtered in a fashion consistent with EWS-FLI1 reduction (Fig.5A). The remainder of the transcripts in TC32 cells treated withYK-4–279 demonstrated a minimal increase in their relativeexpressions, independent of their changes with EWS-FLI1 proteinreduction. An additional ES cell line, TC71, treated with YK-4–279,also lacked significant changes in the putative EWS-FLI1 tran-scriptional signature, corroborating our TC32 results (SI Appendix,Fig. S6).We found that YK-4–279 prevents only the binding of direct
protein partners p68 (DDX5) and RHA. Neither direct proteininteractors hnRNP K and PRPF6 (Fig. 5B) nor indirect proteincomplex members PRPF8, snRNP200, SFPQ, CDC5L, andhnRNP U were blocked from EWS-FLI1 by YK-4–279 (SI Ap-pendix, Fig. S7). Using the exon-array–generated EWS-FLI1splicing panel, we found that 7 of 10 genes were similarly alterna-tively spliced following YK-4–279 treatment compared with EWS-FLI1 reduction (Fig. 5C). In addition, CLK1, CASP3, and PPFIBP1were all alternatively spliced with similar PSI following YK-4–279treatment compared with EWS-FLI1 reduction (Fig. 5D). To con-trol for nonspecific effects from transcription inhibition or pause, weused both doxorubicin, a known topoisomerase II inhibitor thatinhibits transcription (32) and direct measurement of transcriptelongation with BruDRB-seq [bromouridine labeling followed bysequencing of uridine-incorporated transcripts (33)]. None of the 13genes evaluated showed doxorubicin-induced splice alterations withthese primers, demonstrating that generalized inhibition of tran-scription does not recapitulate the splice changes associated withloss of EWS-FLI1 (Fig. 5 C and D). We also evaluated whetherYK-4–279 would affect spliced isoforms based on altering therate of RNA pol II elongation using BruDRB-Seq (34). ES cellsin either the presence or absence of EWS-FLI1 did not changetheir rate of elongation when treated with YK-4–279 (Fig. 5E).These data demonstrate that small-molecule YK-4–279 specifi-cally alters splicing based on altering protein interactions withpatterns that are most consistent with disruption of p68 (DDX5)or RHA from EWS-FLI1.
Tumors from ES Patients Demonstrate Similar EWS-FLI1–InfluencedSplicing. Alternative splicing in human tumors is becoming rec-ognized as a driver of myelodysplasia (35, 36). We thereforeanalyzed exon array data obtained from 75 ES patient tumorsamples (ESTS) before chemotherapy to determine if these clinicalsamples would match mRNA expression profiles generated by EScell line models. Individual probeset expression from ESTS wasnormalized by overall gene expression and then compared betweenneural crest (NC), hMSC, and TC32 with/without EWS-FLI1. BothNC and hMSC have been putatively evaluated as the ES cell oforigin (28, 37, 38). Using the paired cell line models, we were ableto calculate ANOVA P values for each probeset to measure thesignificance of a consistent effect of EWS-FLI1 across models.There were 21 events based on EWS-FLI1 expression across thecell line models that were significantly altered (P ≤ 0.05 afterBenjamini–Hochberg correction). The expression of EWS-FLI1 inboth NC and hMSC caused alternative splicing changes similar toEWS-FLI1 in TC32 and ESTS (Fig. 6A). There were 5,595 eventswhen comparing TC32 with EWS-FLI1 reduction to ESTS (P ≤0.05 after Benjamini–Hochberg correction). The overlap betweenthe cell line models and ESTS analysis is highly significant (P =0.000717). We show a panel of genes that demonstrates the simi-larities of exon expression (SI Appendix, Fig. S8A). As a control, exonexpression patterns for 10 of the ES alternatively spliced transcriptswere evaluated in the breast cancer cell line MDA-MB-231. Eight ofthe 10 genes show alternative transcripts, based on the regions in thegray boxes, at sites where alternative splicing patterns differ fromthose found in ES (SI Appendix, Fig. S8B).
Principal component analysis (PCA) for all alternativelyexpressed exons suggesting splice variants was normalized foroverall gene expression across all genes among 53 of the 82patients from whom we obtained clinical presentation and relapsedata. ES patients with both localized and metastatic diseasewithout recurrence events tend to segregate based on specific exonexpression patterns from patients with recurrence when globalsplicing profiles are considered. Gene-normalized exon expressionpatterns allow separation of localized patients who experiencea recurrence from those who do not recur (Fig. 6 B and D). Chi-squared testing of clusters generated by hierarchical clustering ofgene-normalized exon expression showed near-significant differ-ences for patients with localized (Fig. 6 B and C; P = 0.1) andmetastatic (Fig. 6 D and E; P = 0.05) disease between groups ofpatients who experienced an event and those who did not. Thus,analysis of these ESTS suggests that alternative splicing patternsmay be associated with patient outcome despite their universalexpression of EWS-FLI1.
DiscussionThe canonical model of EWS-FLI1 transformation suggests thatthe DNA-binding domain is bound to promoter sequences asa transcriptional regulator (9, 28, 39, 40); however, full phenotypicrecapitulation of ES through the manipulation of differentiallyexpressed genes alone has not been accomplished. Our data showan emergent network of EWS-FLI1, derived from analysis ofprotein–protein interactions, including discovery of p68 (DDX5),PRPF6, and hnRNP K as direct binding partners. We validatedEWS-FLI1–modulated splicing across a panel of ES models, aswell as hMSC cells expressing EWS-FLI1, and found consistentsplice variants in the presence of EWS-FLI1. The small molecule
Fig. 4. TERT is alternatively spliced to generate an isoform with enhancedtelomerase activity. (A) Isoform-specific TERT semiquantitative RT-PCR primerlocations are indicated by the forward and reverse arrows based on exonarray analysis. The exons are indicated by gray boxes and exon-specific splicechanges of skipped exon by the green line. (B) TC32 ± EWS-FLI1 mRNAsemiquantitative RT-PCR products using primers shown in A. The PSI of exon11 inclusion are shown below each lane. (C) Schematic of the TERT minigene(MG), indicating exons 10, 11, and 12 including 300 bp on the either side ofthe exon–intron junction regions of introns 10 and 11. Minigene-specific PCRprimer locations are indicated by forward and reverse arrows. (D) Minigene(MG) plasmids were transfected into TC32 WT or shRNA EWS-FLI1–reducedcells. PCR products using MG-specific primers are shown. (E) Exon-centriccoverage map for TERT was generated from deep sequencing described(Fig. 3B). (F ) RNA immunoprecipitation (RIP) showing the presence of TERTmRNA bound to EWS-FLI1 compared with total 18S vs. IgG control IP.(G) Telomerase activities were analyzed by TRAP assay. TC32 WT, shRNAEWS-FLI1, shRNA hTERT with or without re-expression of WT TERT, or ex-pression of γ-TERT were analyzed in real-time TRAP assays.
E1312 | www.pnas.org/cgi/doi/10.1073/pnas.1500536112 Selvanathan et al.
YK-4–279, originally discovered for its ability to disrupt RHA–EWS-FLI1 interaction, also disrupts p68; however, neither PRPF6nor hnRNP K are disrupted from the EWS-FLI1 complex. Themechanism of EWS-FLI1–modulated splicing is revealed, in part,through an RNA-binding motif at intron–exon boundaries or viaa binding preference for mRNA with secondary structure. Theprotein partners p68, PRPF6, and hnRNP K are likely coregulatory
transmodulators of EWS-FLI1 on RNA splice site selection. Fi-nally, we show that ES tumors from patients demonstrate similarexon-specific expression patterns as EWS-FLI1 cell line models,including NC and hMSC. These novel protein interactions placeEWS-FLI1 in a central role as a component of the spliceosome andprovide evidence to support a historical hypothesis about EWS-FLI1 influencing alternative splicing (14, 41–43). These data allowfor discussion of (i) how EWS-FLI1 links transcription and splicingthrough protein networks, (ii) a novel mechanism for YK-4–279inhibition of EWS-FLI1, (iii) how the EWS-FLI1 network differsfrom the WT EWS network, (iv) splicing as an oncogenic process,and (v) how differentially spliced isoforms might contribute to on-cogenesis and pathogenesis.
EWS-FLI1 Links Transcription and Splicing. This study reveals mul-tiple new protein partners of EWS-FLI1 that suggest multiplefunctions for this oncogene beyond direct transcriptional regu-lation; evidence presented here supports a role in posttranscriptionalsplicing regulation. EWS-FLI1 modulation of splicing could occurthrough direct binding to nascent mRNA to block trans-elements,altering the protein interaction network, or by interfering with heli-case activity to alter cis-acting elements. Our CLIP-seq experimentconfirms our recent finding that EWS-FLI1 binds to RNA, althougha motif that corresponds to a canonical donor, acceptor, or branchpoint site was not identified. Rather, the sequence motif(s) werefound at intron–exon boundaries of those genes alternatively spliced,potentially using those cis-elements to localize alternative proteincomplexes.EWS-FLI1 binds to p68, and reduction of p68 mimics most of
the EWS-FLI1 splicing events that we measured. A potentiallysimilar mechanism occurs where mutant U1C in yeast alters theactivity of the Prp28p helicase to modulate splicing (14, 44, 45).Because EWS-FLI1 interacts with multiple other spliceosomalproteins, those network proteins may also recognize differentsplicing elements. Consistent with this, reduction of eitherhnRNP K or PRPF6, direct EWS-FLI1 partners, leads to alter-native splicing. PRPF6 has been independently implicated asa driver of colorectal cancer (46). However, reduction of SF3A2,which is an RNA-dependent, indirect EWS-FLI1 partner, didnot alter splicing for those genes analyzed. PRPF6 reduction inbreast cancer cells also did not alter splicing of EWS-FLI1modulated genes. A final mechanism of EWS-FLI1–modulatedsplicing may come from direct inhibition of a partner helicaseactivity, which we recently demonstrated for RHA (13).
YK-4–279 Alters Splicing Rather than Direct Transcriptional Inhibition.We directly confirm a panel of EWS-FLI1 transcriptional targetsthat are modulated by the reduction of EWS-FLI1 levels. Thediscovery and optimization of YK-4–279 was initially based on itsability to block RHA from binding to EWS-FLI1. We thereforeexpected the effect of the EWS-FLI1 inhibitor YK-4–279 tomimic the transcriptional effects of EWS-FLI1 reduction; how-ever, this was not observed. Instead, YK-4–279 treatment showeda significant overlap of alternative splicing events that were similarto EWS-FLI1 reduction. In addition, YK-4–279 blocks the bindingof p68 as well as RHA, but does not interfere with the binding ofPRPF6 or hnRNP K. Both helicases could potentially modulatesplicing; however, p68 has been directly implicated in 5′ splice siteselection as a function in the U1 complex (47). However, earlierwork also places RHA in the spliceosome and as a regulator ofsplicing (48–50). This suggests that YK-4–279 blocking of specificprotein interactions from EWS-FLI1, such as RHA and p68, willalter the splicing program differently from the loss of EWS-FLI1.We also considered whether EWS-FLI1–modulated RNA pol IIelongation activity was affected by YK-4–279 treatment, becausethis mechanism led to alternative poly(A) site selection for cyclinD1 (17). We did not note any alteration in polymerase elongationactivity when stalled complexes were released; however, poly-merase effects based on YK-4–279 treatment cannot be fullyeliminated based on this limited investigation.
Fig. 5. YK-4–279 treatment of ES cells reverts EWS-FLI1–modulated alter-native splicing changes and does not mimic transcriptional effects of EWS-FLI1 reduction. (A) A qRT-PCR gene expression panel for canonical EWS-FLI1transcriptional targets compared WT TC32, EWS-FLI1 reduction (ΔEF, bluebars), and YK-4–279 treatment (orange bars). Graph shows relative foldexpression calculated using ΔΔct value changes from WT (set at 1.0). *P =0.04 (NR0B1), 0.001 (p57), 0.003 (hTERT), 0.03 (Id2), 0.03 (EZH2), 0.006 (UPP1),0.02 (GLI1), and 0.003 (PTPL1). (B) EWS-FLI1 was immunoprecipitated fol-lowing treatment with YK-4–279 or DMSO control in TC32 cells for 15 h. Thetotal nuclear lysate (TNL) treated with YK-4–279 was used as input control(lane 1), FLI1 antibody (lanes 2 and 4), and rabbit polyclonal IgG antibody(lanes 3 and 5). Antibodies for specific protein detection are shown to theright of each panel. (C) Alternative splicing screen comparing YK-4–279 anddoxorubicin treatment using the same exon array identified RT-PCR primersas in Fig. 2C. Genes with EWS-FLI1 exon-specific isoform switch, similar toEWS-FLI1, are green, and no isoform switch is red. (D) Schematic and exon-centric coverage maps (RPKM) for CLK1, CASP3, and PPFIBP1 derived fromdeep sequencing (key as in Fig. 3B). MISO was used to estimate PSI values foreach annotated event, and 95% confidence intervals are shown. WT TC32data are red, and YK-4–279 treatment is orange. To the right, PCR validationgels show the splicing change, and the PSI is calculated from densitometryand shown beneath each graph. (E) Elongation rates for 10 min for theNR0B1 gene following 5,6 dichloro-1-β-D-ribofuranosylbenzimidazole (DRB)removal are shown for WT TC32 cells (scrambled, Upper two panels) and forEWS-FLI1–reduced TC32 cells (shEWS-FLI1, Lower two panels). Polymeriza-tion rate was calculated following bromouridine (BRU) incorporation fromthe time of DRB washout. The second and fourth panels care concomitantlytreated with YK-4–279 during the elongation period. Read depth (RPKM)calculated on y axis is based on immunoseparation of BRU-labeled messagefollowed by deep sequencing. NROB1 transcript was derived from GRCh37annotation shown at the bottom.
Selvanathan et al. PNAS | Published online March 3, 2015 | E1313
MED
ICALSC
IENCE
SPN
ASPL
US

We did observe changes in splicing when YK-4–279 disrupted p68and RHA, but it did not disrupt PRPF6 or hnRNP K. However,when PRPF6 or hnRNP K expression was reduced, the alternativesplicing changes showed similarity with YK-4–279 for a subset ofgenes (SI Appendix, Fig. S4B, compared with Fig. 5C). This supportsour findings that these splice site modulators are part of EWS-FLI1–directed modulation of splicing, yet have different effects than that ofp68 or RHA. Although larger data sets would be informative, thesedata suggest that a small molecule, such as YK-4–279, can be used todissect properties of protein interactions that would otherwise remainobscured when RNAi approaches are used for functional analysis, aselimination of a protein can lead to confounding downstream
effects. Treatment with doxorubicin to control for general tran-scriptional inhibition demonstrates that splicing alterations inducedby YK-4–279 are not a secondary effect of cells dying. Thus, small-molecule inhibitors of specific protein–protein interactions will be-come increasingly useful in understanding the functionality andpotentially oncogenic properties of the spliceosome.
Spliceosomal Network of EWS Differs from EWS-FLI1. These experi-ments highlight the importance of building protein interactionnetworks that include fusion oncoproteins. There appear to becritical differences between the canonical EWS network and ourexperimentally validated EWS-FLI1 network, both in theirqualitative protein interactions and the dependence of RNAbridging for these complexes to form (SI Appendix, Fig. S2B).Our experiments show that reduction of EWS did not create thesame splice variants as EWS-FLI1 reduction among the ninevariants tested (SI Appendix, Fig. S4B). WT EWS interacts withmany proteins and has a role in many cellular processes as anRNA-binding protein (51). Full-length EWS is recognized asa regulator of alternative splicing in regions of DNA damage,which involves a network of proteins different from EWS-FLI1(52). The EWS network interactions are substantially differentfrom EWS-FLI1 and can be visualized in silico using STRING 9.1(53) that includes YB-1 (SI Appendix, Fig. S9). YB-1 was identifiedas a splicing protein partner of EWS that did not complex withEWS-FLI1, which was consistent with our data (41, 54). EWS alsointeracts with RHA (DHX9); however, PRPF6 and hnRNP K donot complex with EWS (SI Appendix, Fig. S9). PRPF6 and hnRNPK, however, do connect to RHA and YB-1 without intercedingnetwork nodes. Our data show that EWS-FLI1 directly interacts,independent of RNA, with PRPF6 and hnRNP K as well as RHA.EWS, previously reported to alter splicing (6), also alters FAS al-ternative splicing (AS); although EWS-FLI1 also leads to the samesplice alteration, the PSI appears much lower (55). This supportsdata reporting that different complexes of proteins differentiallyrecognize splice enhancers or suppressors; this paper provides toolsto further probe this theory using alternative splicing as a model.The extent to which EWS-FLI1 perturbs the EWS network couldbe elucidated in future work by (i) further dissection of YB-1 orother protein interactions or (ii) evaluation of EWS inhibitionon oncogenesis.
Spliceosome as Oncogenic Modulator. Before the data presented inthis paper, TERT, CLK1, CASP3, and PPFIBP1 were not recog-nized as isoforms modulated by EWS-FLI1. One prior reportidentified EWS-FLI1 increasing TERT activity independently ofDNA binding; however, no isoform analysis was performed (56).These four genes were recognized as putative contributors tooncogenesis based on the published literature (57–65). None ofthese genes were alternatively spliced by WT EWS reduction.TERT functions through a combination of direct enzymatic
activity and as a protein scaffold to affect transcription as well astelomere maintenance (66, 67). We identified an EWS-FLI1–modulated splice variant of TERT using exon array analysis, de-spite very low levels of TERT transcription in our RNA-seq data.Native TERT splicing analysis in ES, TERTminigene splicing, andRNA IP data support a direct involvement of EWS-FLI1 in thisalternative splicing. The canonical isoform of TERT includes 62amino acids translated from exon 11 and is the predominant splicevariant identified in WT ES cells expressing EWS-FLI1. However,in the EWS-FLI1–reduced cells, exon 11 is skipped and the largeisoform is significantly reduced. This TERT variant has beenclassified as the γ-isoform, where the distal reverse transcriptasedomain is shortened (68). The only functional data for γ-TERTshow that cell lines Huh7 and HLE expressing very small quan-tities of γ-TERT have 50% greater telomerase activity than cellslacking γ-TERT (68). When EWS-FLI1 was reduced in ES cells,expression of the γ-TERT isoform was increased and telomeraseactivity also increased above baseline. To determine if this in-crease was due to the γ-TERT isoform, WT TERT was reducedwith shRNA followed by expression of both WT and γ-TERT.
Fig. 6. Alternative splicing patterns in ESTS and TC32 have similar exon-specific expression. (A) Gene-normalized probeset intensity plots for NC andhMSC WT (−EF) with expression of EF (+EF) as well as TC32 cells as WT (+EF)and shRNA reduction of EWS-FLI1 (−EF), and ESTS. Each probeset has beennormalized by gene expression to provide a relative measure of exon in-clusion. (B) PCA plots based on the differential exon expression leading toalternative splicing profiles for patients with localized ES. Patients who didnot experience recurrence (open triangle, black) and patients who experi-enced recurrence (closed circle, red) are plotted in the first three principalcomponent dimensions. Variance in each principal component is listed alongthe axes. (C) Dendrogram clustering of first three principal componentsevaluating patients with localized disease illustrating weak grouping effectseparating patients with (red) and without (black) recurrence (P = 0.1).(D) PCA plots based on the differential exon expression leading to alterna-tive splicing profiles for patients with metastatic ES. Patients who did notexperience recurrence (open triangle, black) and patients who experiencedrecurrence (closed circle, red) are plotted in the first three principal com-ponent dimensions. Variance in each principal component is listed along theaxes. (E) Dendrogram clustering of the first three principal componentsevaluating patients with metastatic disease illustrating strong grouping ef-fect separating patients with (red) and without (black) recurrence (P = 0.05).
E1314 | www.pnas.org/cgi/doi/10.1073/pnas.1500536112 Selvanathan et al.

Although exogenous expression of WT TERT replaced telomeraseactivity to baseline, exogenous expression of γ-TERT increasedactivity by ∼50% over baseline. We conclude from this that EWS-FLI1 influences splicing with potential biologic consequences,and future work will be dedicated to resolving the contribution ofthese alternative isoforms.Three other genes—CLK1, CASP3, and PPFIBP1—were
consistently alternatively spliced by EWS-FLI1 and also dem-onstrated similar alternative splicing following reduction of EWS-FLI1 direct splicing partners. CLK1 demonstrated both intronretention and exon skipping. The skipped exon 4 and intron re-tention variants are either both inactive or rapidly cleared bynonsense-mediated decay (63, 69). The loss of CLK1 activity maydisrupt a feedback loop because its kinase activity is critical for thephosphorylation of multiple SR proteins that regulate splicing (63,70, 71). The inclusion of CASP3 exon 2 with EWS-FLI1 reductionplaces an internal ribosome entry site into the 5′-UTR of themRNA (72). This 5′-UTRmay enhance the translation of caspase-3,thus increasing its protein levels and in part explaining the in-creased apoptosis seen with YK-4–279 treatment (21). CASP3exon 2 has also been recognized as containing a polymorphismthat increases the likelihood of head and neck cancer (61).PPFIBP1 is a scaffolding protein where the reduction of EWS-FLI1 leads to the inclusion of exon 19, which is translated toa region between the first and second sterile alpha motif (SAM)protein interaction domain, which is critical for CASK binding(73). PPFIBP1 has been implicated in both brain and pancreaticcancer; however, the relationship between oncogenesis andspecific isoforms is not well characterized (60, 64).
Alternative Splicing in Patient Tumors Validates Modeling, May Inform onES Oncogenesis, and Has Potential for Patient Stratification. One of thesignificant challenges for physicians treating patients with ES istherapeutic stratification at the time of diagnosis, beyond metastaticdisease (74, 75). With many new therapeutic options in development,knowledge of those patients who will experience a tumor recurrencewould allow for augmented or personalized therapy at the time ofdiagnosis, rather than after relapse. We were able to show, usingPCA analysis of all splicing events, that there was a separation be-tween patients with either localized or metastatic disease who do notexperience a relapse and those likely to relapse. All these patientsexpressed EWS-ets fusions, and prior prospective investigations didnot demonstrate survival differences based on the EWS-ets fusiontype (76, 77). Therefore, heterogeneity in survival, based on EWS-FLI1–regulated splicing, seems counterintuitive. Our evaluation ofES cell lines, which all expressed EWS-ets (two type 1, two type 2,and one type 3), also showed some variability in spliced isoforms.This suggests that EWS-ets splicing factor partner proteins, whichparticipate in splice site selection, could lead to alternative isoformexpression that is reflected in our patient samples.These alternative protein isoforms, generated based on tumor
differences in splicing-factor levels beyond EWS-FLI1, could beresponsible for differences in ES outcome. Thus, we hypothesizethat patients who have recurrent disease, although all express EWS-ets, may ultimately have different oncogenesis-related protein iso-forms in their tumors. The clinical data analyzed here lead toa testable hypothesis that could solve a vexing clinical challenge; thisrequires prospective validation with an approach sensitive to splicedisoforms, such as RNA-seq or single-molecule real-time sequencing.These deep-sequencing technologies were neither cost effective norwidely available 10 y ago when the samples analyzed for this paperwere collected.
A number of studies laid important groundwork by probingthe potential role of EWS-FLI1 in alternative splicing (14, 16, 41,44). The data in this paper indicate that EWS-FLI1 impacts ESbiology beyond transcriptional modulation and has a significantrole in posttranscriptional regulation. This additional function-ality of EWS-FLI1 is critical to consider when designing small-molecule inhibitors or other perturbants. The tools that we usedto create EWS-FLI1 networks are likely exportable to otherfusion protein transcription factors (7). Reducing protein levelsof critical splicing partners in the EWS-FLI1 complexes andobserving changes in expressed gene isoforms could be in-formative toward a comprehensive map of functional splicingeffects. In addition, we show the effectiveness of small-moleculeperturbation of protein complexes in dissecting splicing patterns.This relatively specific targeting in a model where a single protein,EWS-FLI1, connects transcription and splicing could uncovervaluable components of the elusive splicing code. This work addsa level of complexity to our understanding of the role of chimerictranscription factors and provides for the possibility of novel ther-apeutic targets that would be both specific and highly effective.
Materials and MethodsAdditional materials and methods text can be found in SI Appendix.
Cell Lines and Reagents. ES cell lines TC32, TC71, A4573, SKES, STA-ET-7.2, andA673i (Olivier Delattre, Institute Curie, Paris) were grown in 10% (vol/vol) FBSin RPMI at 37 °C in 5% CO2 and passaged every 3–4 d. hMSC were obtainedfrom Lonza. Eukaryotic EWS-FLI1 was expressed using pCIneo.EWS-FLI1.EWS-FLI1 shRNA was a generous gift from Christopher T. Denny (University ofCalifornia, Los Angeles). Lentiviral stocks were made by transiently trans-fecting 2.7 μg of expression vector, 675 ng of VSV-G–expressing plasmid pCMV,and 2.0 μg of packaging plasmid pCMVHR8.2 deltaR. Viral stocks were col-lected 2 d after transfection, filtered, and frozen.
Ewing Sarcoma Tumor Samples. Patient’s samples and informed consent wereobtained from 43 German patients treated within the Euro-E.W.I.N.G.-99(EE99) trial and from 14 German patients treated within the European In-tergroup Cooperative Ewing Sarcoma Studies (EICESS)-92 trial (74, 78). Anadditional 29 samples were from patients who participated in the referencedclinical trials and signed informed consent for inclusion of their tumor in bi-ology investigations (79). All data and informatics for this publication wereobtained with coded ESTS that had all identifying information removed.
ACKNOWLEDGMENTS. We thank Anton Wellstein for careful reading andcomments; Stephen Lessnick and Christopher T. Denny for plasmids; OlivierDelattre for cell line A673i; and Ryan Commins, Sarah Jaffe, Kamal Saj-wan, and Lauren Scher for technical assistance. Technical support was pro-vided by the Genome Core, Children’s Hospital Los Angeles. Financialsupport for this research was provided by the Children’s Cancer Foundation(Baltimore); St. Baldrick’s Foundation; Go4theGoal Foundation; BurroughsWellcome Clinical Scientist Award in Translational Research (to J.A.T.); andNIH Grants RC4CA156509 (to J.A.T.), R01CA133662 (to J.A.T.), R01CA138212(to J.A.T.), R01CA134604 (to E.R.L.), and R21CA180524 (to X.L.). Support wasalso provided by Biostatistics and Bioinformatics, Genetics and Epigenetics,Proteomics and Metabolomics, Tissue Culture, Shared Resources, Mid-Atlan-tic Shared Resources Consortium by Lombardi Comprehensive Cancer CenterCancer Center Support Grant P30 CA051008-16 (Lou Weiner, PI); DKH-108128 and by Federal Ministry of Education and Research Germany (toU.D.); Bundesministerium für Bildung und Forschung (TranSaRNet), DeutschesZentrum für Luft- und Raumfahrt e.V. 01GM0869, European Ewing Consor-tium (602856-2), PanCareLife (602030-2); PROVABES ERA-Net-TRANSCAN(01KT1310); and National Cancer Institute (NCI) Grant 1U01CA114757, Children’sOncology Group (NCI CA98543, CA98413).
1. Barbosa-Morais NL, et al. (2012) The evolutionary landscape of alternative splicing invertebrate species. Science 338(6114):1587–1593.
2. Merkin J, Russell C, Chen P, Burge CB (2012) Evolutionary dynamics of gene andisoform regulation in mammalian tissues. Science 338(6114):1593–1599.
3. Kornblihtt AR, et al. (2013) Alternative splicing: A pivotal step between eukaryotictranscription and translation. Nat Rev Mol Cell Biol 14(3):153–165.
4. Garraway LA, Lander ES (2013) Lessons from the cancer genome. Cell 153(1):17–37.5. Ellis JD, et al. (2012) Tissue-specific alternative splicing remodels protein-protein in-
teraction networks. Mol Cell 46(6):884–892.
6. Kovar H (2011) Dr. Jekyll and Mr. Hyde: The Two Faces of the FUS/EWS/TAF15 ProteinFamily. Sarcoma 2011:837474.
7. Mitelman F, Johansson B, Mertens F (2007) The impact of translocations and genefusions on cancer causation. Nat Rev Cancer 7(4):233–245.
8. Braun BS, Frieden R, Lessnick SL, May WA, Denny CT (1995) Identification of targetgenes for the Ewing’s sarcoma EWS/FLI fusion protein by representational differenceanalysis. Mol Cell Biol 15(8):4623–4630.
9. Smith R, et al. (2006) Expression profiling of EWS/FLI identifies NKX2.2 as a criticaltarget gene in Ewing’s sarcoma. Cancer Cell 9(5):405–416.
Selvanathan et al. PNAS | Published online March 3, 2015 | E1315
MED
ICALSC
IENCE
SPN
ASPL
US
10. Erkizan HV, Uversky VN, Toretsky JA (2010) Oncogenic partnerships: EWS-FLI1 protein in-teractions initiate key pathways of Ewing’s sarcoma. Clin Cancer Res 16(16):4077–4083.
11. Jaishankar S, Zhang J, Roussel MF, Baker SJ (1999) Transforming activity of EWS/FLI isnot strictly dependent upon DNA-binding activity. Oncogene 18(40):5592–5597.
12. Welford SM, Hebert SP, Deneen B, Arvand A, Denny CT (2001) DNA binding domain-independent pathways are involved in EWS/FLI1-mediated oncogenesis. J Biol Chem276(45):41977–41984.
13. Erkizan HV, et al. (2015) RNA helicase A activity is inhibited by oncogenic transcriptionfactor EWS-FLI1. Nucleic Acids Res 43(2):1069–1080.
14. Knoop LL, Baker SJ (2001) EWS/FLI alters 5′-splice site selection. J Biol Chem 276(25):22317–22322.
15. Yang L, Chansky HA, Hickstein DD (2000) EWS.Fli-1 fusion protein interacts with hy-perphosphorylated RNA polymerase II and interferes with serine-arginine protein-mediated RNA splicing. J Biol Chem 275(48):37612–37618.
16. France KA, Anderson JL, Park A, Denny CT (2011) Oncogenic fusion protein EWS/FLI1down-regulates gene expression by both transcriptional and posttranscriptionalmechanisms. J Biol Chem 286(26):22750–22757.
17. Sanchez G, et al. (2008) Alteration of cyclin D1 transcript elongation by a mutatedtranscription factor up-regulates the oncogenic D1b splice isoform in cancer. Proc NatlAcad Sci USA 105(16):6004–6009.
18. Csermely P, Korcsmáros T, Kiss HJ, London G, Nussinov R (2013) Structure and dy-namics of molecular networks: A novel paradigm of drug discovery: A comprehensivereview. Pharmacol Ther 138(3):333–408.
19. Koehler AN (2010) A complex task? Direct modulation of transcription factors withsmall molecules. Curr Opin Chem Biol 14(3):331–340.
20. Uren A, Toretsky JA (2005) Ewing’s sarcoma oncoprotein EWS-FLI1: The perfect targetwithout a therapeutic agent. Future Oncol 1(4):521–528.
21. Erkizan HV, et al. (2009) A small molecule blocking oncogenic protein EWS-FLI1 interactionwith RNA helicase A inhibits growth of Ewing’s sarcoma. Nat Med 15(7):750–756.
22. Barber-Rotenberg JS, et al. (2012) Single enantiomer of YK-4-279 demonstratesspecificity in targeting the oncogene EWS-FLI1. Oncotarget 3(2):172–182.
23. Mittag T, Kay LE, Forman-Kay JD (2010) Protein dynamics and conformational dis-order in molecular recognition. J Mol Recognit 23(2):105–116.
24. Bailly RA, et al. (1994) DNA-binding and transcriptional activation properties of theEWS-FLI-1 fusion protein resulting from the t(11;22) translocation in Ewing sarcoma.Mol Cell Biol 14(5):3230–3241.
25. Rosolen A, Toretsky J, Neckers L (1994) Antisense inhibition of CHP100 C-myc ex-pression results in reduced in vitro growth kinetics and loss of in vivo tumorigenesis.Prog Clin Biol Res 385:95–101.
26. Mellacheruvu D, et al. (2013) The CRAPome: A contaminant repository for affinitypurification-mass spectrometry data. Nat Methods 10(8):730–736.
27. Toretsky JA, et al. (2006) Oncoprotein EWS-FLI1 activity is enhanced by RNA helicaseA. Cancer Res 66(11):5574–5581.
28. Tirode F, et al. (2007) Mesenchymal stem cell features of Ewing tumors. Cancer Cell11(5):421–429.
29. Chang TY, et al. (2008) easyExon: A Java-based GUI tool for processing and visuali-zation of Affymetrix exon array data. BMC Bioinformatics 9:432.
30. Hofacker IL, Priwitzer B, Stadler PF (2004) Prediction of locally stable RNA secondarystructures for genome-wide surveys. Bioinformatics 20(2):186–190.
31. Mathews DH, et al. (2004) Incorporating chemical modification constraints into a dy-namic programming algorithm for prediction of RNA secondary structure. Proc NatlAcad Sci USA 101(19):7287–7292.
32. Collins I, Weber A, Levens D (2001) Transcriptional consequences of topoisomeraseinhibition. Mol Cell Biol 21(24):8437–8451.
33. Paulsen MT, et al. (2014) Use of Bru-Seq and BruChase-Seq for genome-wide assess-ment of the synthesis and stability of RNA. Methods 67(1):45–54.
34. Veloso A, et al. (2014) Rate of elongation by RNA polymerase II is associated withspecific gene features and epigenetic modifications. Genome Res 24(6):896–905.
35. Yoshida K, et al. (2011) Frequent pathway mutations of splicing machinery inmyelodysplasia. Nature 478(7367):64–69.
36. Papaemmanuil E, et al.; Chronic Myeloid Disorders Working Group of the In-ternational Cancer Genome Consortium (2011) Somatic SF3B1 mutation in myelo-dysplasia with ring sideroblasts. N Engl J Med 365(15):1384–1395.
37. von Levetzow C, et al. (2011) Modeling initiation of Ewing sarcoma in human neuralcrest cells. PLoS ONE 6(4):e19305.
38. Riggi N, et al. (2008) EWS-FLI-1 expression triggers a Ewing’s sarcoma initiation pro-gram in primary human mesenchymal stem cells. Cancer Res 68(7):2176–2185.
39. Lessnick SL, Dacwag CS, Golub TR (2002) The Ewing’s sarcoma oncoprotein EWS/FLIinduces a p53-dependent growth arrest in primary human fibroblasts. Cancer Cell1(4):393–401.
40. Prieur A, Tirode F, Cohen P, Delattre O (2004) EWS/FLI-1 silencing and gene profiling ofEwing cells reveal downstream oncogenic pathways and a crucial role for repression ofinsulin-like growth factor binding protein 3. Mol Cell Biol 24(16):7275–7283.
41. Chansky HA, Hu M, Hickstein DD, Yang L (2001) Oncogenic TLS/ERG and EWS/Fli-1fusion proteins inhibit RNA splicing mediated by YB-1 protein. Cancer Res 61(9):3586–3590.
42. Petermann R, et al. (1998) Oncogenic EWS-Fli1 interacts with hsRPB7, a subunit ofhuman RNA polymerase II. Oncogene 17(5):603–610.
43. Kovar H, et al. (2001) The EWS protein is dispensable for Ewing tumor growth. CancerRes 61(16):5992–5997.
44. Knoop LL, Baker SJ (2000) The splicing factor U1C represses EWS/FLI-mediatedtransactivation. J Biol Chem 275(32):24865–24871.
45. Du H, Tardiff DF, Moore MJ, Rosbash M (2004) Effects of the U1C L13 mutation andtemperature regulation of yeast commitment complex formation. Proc Natl Acad SciUSA 101(41):14841–14846.
46. Adler AS, et al. (2014) An integrative analysis of colon cancer identifies an essentialfunction for PRPF6 in tumor growth. Genes Dev 28(10):1068–1084.
47. Liu ZR (2002) p68 RNA helicase is an essential human splicing factor that acts at the U1snRNA-5′ splice site duplex. Mol Cell Biol 22(15):5443–5450.
48. Li J, et al. (1999) A role for RNA helicase A in post-transcriptional regulation of HIVtype 1. Proc Natl Acad Sci USA 96(2):709–714.
49. Fujii R, et al. (2001) A role of RNA helicase A in cis-acting transactivation responseelement-mediated transcriptional regulation of human immunodeficiency virus type1. J Biol Chem 276(8):5445–5451.
50. Hartmuth K, et al. (2002) Protein composition of human prespliceosomes isolated bya tobramycin affinity-selection method. Proc Natl Acad Sci USA 99(26):16719–16724.
51. Pahlich S, Quero L, Roschitzki B, Leemann-Zakaryan RP, Gehring H (2009) Analysis ofEwing sarcoma (EWS)-binding proteins: Interaction with hnRNP M, U, and RNA-heli-cases p68/72 within protein-RNA complexes. J Proteome Res 8(10):4455–4465.
52. Paronetto MP, Miñana B, Valcárcel J (2011) The Ewing sarcoma protein regulates DNAdamage-induced alternative splicing. Mol Cell 43(3):353–368.
53. Franceschini A, et al. (2013) STRING v9.1: Protein-protein interaction networks, withincreased coverage and integration. Nucleic Acids Res 41(Database issue):D808–D815.
54. Park JH, et al. (2013) A multifunctional protein, EWS, is essential for early brown fatlineage determination. Dev Cell 26(4):393–404.
55. Paronetto MP, et al. (2014) Regulation of FAS exon definition and apoptosis by theEwing sarcoma protein. Cell Reports 7(4):1211–1226.
56. Takahashi A, et al. (2003) EWS/ETS fusions activate telomerase in Ewing’s tumors.Cancer Res 63(23):8338–8344.
57. Chai W, Ford LP, Lenertz L, Wright WE, Shay JW (2002) Human Ku70/80 associatesphysically with telomerase through interaction with hTERT. J Biol Chem 277(49):47242–47247.
58. Wu XQ, et al. (2013) Feedback regulation of telomerase reverse transcriptase: Newinsight into the evolving field of telomerase in cancer. Cell Signal 25(12):2462–2468.
59. Wong MS, et al. (2013) Regulation of telomerase alternative splicing: A target forchemotherapy. Cell Reports 3(4):1028–1035.
60. Johansson FK, Göransson H, Westermark B (2005) Expression analysis of genes in-volved in brain tumor progression driven by retroviral insertional mutagenesis inmice. Oncogene 24(24):3896–3905.
61. Chen K, et al. (2008) CASP3 polymorphisms and risk of squamous cell carcinoma of thehead and neck. Clin Cancer Res 14(19):6343–6349.
62. Aubol BE, et al. (2014) N-terminus of the protein kinase CLK1 induces SR proteinhyperphosphorylation. Biochem J 462(1):143–152.
63. Ninomiya K, Kataoka N, Hagiwara M (2011) Stress-responsive maturation of Clk1/4pre-mRNAs promotes phosphorylation of SR splicing factor. J Cell Biol 195(1):27–40.
64. Heidenblad M, et al. (2002) Detailed genomic mapping and expression analyses of12p amplifications in pancreatic carcinomas reveal a 3.5-Mb target region for am-plification. Genes Chromosomes Cancer 34(2):211–223.
65. Rozeman LB, et al. (2006) Array-comparative genomic hybridization of centralchondrosarcoma: Identification of ribosomal protein S6 and cyclin-dependent kinase4 as candidate target genes for genomic aberrations. Cancer 107(2):380–388.
66. Ye J, Renault VM, Jamet K, Gilson E (2014) Transcriptional outcome of telomeresignalling. Nat Rev Genet 15(7):491–503.
67. Cao X, et al. (2014) The use of transformed IMR90 cell model to identify the potentialextra-telomeric effects of hTERT in cell migration and DNA damage response. BMCBiochem 15:17.
68. Hisatomi H, et al. (2003) Expression profile of a gamma-deletion variant of the humantelomerase reverse transcriptase gene. Neoplasia 5(3):193–197.
69. Duncan PI, Stojdl DF, Marius RM, Bell JC (1997) In vivo regulation of alternative pre-mRNA splicing by the Clk1 protein kinase. Mol Cell Biol 17(10):5996–6001.
70. Aubol BE, et al. (2013) Partitioning RS domain phosphorylation in an SR proteinthrough the CLK and SRPK protein kinases. J Mol Biol 425(16):2894–2909.
71. Shi Y, Manley JL (2007) A complex signaling pathway regulates SRp38 phosphoryla-tion and pre-mRNA splicing in response to heat shock. Mol Cell 28(1):79–90.
72. Zhang J, Bahi N, Llovera M, Comella JX, Sanchis D (2009) Polypyrimidine tract binding pro-teins (PTB) regulate the expression of apoptotic genes and susceptibility to caspase-dependent apoptosis in differentiating cardiomyocytes. Cell Death Differ 16(11):1460–1468.
73. Wei Z, et al. (2011) Liprin-mediated large signaling complex organization revealed bythe liprin-α/CASK and liprin-α/liprin-β complex structures. Mol Cell 43(4):586–598.
74. Ladenstein R, et al. (2010) Primary disseminated multifocal Ewing sarcoma: Results ofthe Euro-EWING 99 trial. J Clin Oncol 28(20):3284–3291.
75. Gorlick R, Janeway K, Lessnick S, Randall RL, Marina N; COG Bone Tumor Committee(2013) Children’s Oncology Group’s 2013 blueprint for research: Bone tumors. PediatrBlood Cancer 60(6):1009–1015.
76. Le Deley MC, et al. (2010) Impact of EWS-ETS fusion type on disease progression inEwing’s sarcoma/peripheral primitive neuroectodermal tumor: Prospective resultsfrom the cooperative Euro-E.W.I.N.G. 99 trial. J Clin Oncol 28(12):1982–1988.
77. van Doorninck JA, et al. (2010) Current treatment protocols have eliminated theprognostic advantage of type 1 fusions in Ewing sarcoma: A report from the Child-ren’s Oncology Group. J Clin Oncol 28(12):1989–1994.
78. Schuck A, et al. (2003) Local therapy in localized Ewing tumors: Results of 1058 pa-tients treated in the CESS 81, CESS 86, and EICESS 92 trials. Int J Radiat Oncol Biol Phys55(1):168–177.
79. Womer RB, et al. (2012) Randomized controlled trial of interval-compressed chemo-therapy for the treatment of localized Ewing sarcoma: A report from the Children’sOncology Group. J Clin Oncol 30(33):4148–4154.
E1316 | www.pnas.org/cgi/doi/10.1073/pnas.1500536112 Selvanathan et al.