Geometrical Calibration of a 2.5D Periapical Radiography ...

On site evaluation of three flat panel detectors for digital radiographyGiovanni Borasi, Andrea Nitrosi, Paolo Ferrari, and Davide TassoniServizio di Fisica Sanitaria, Azienda Ospedaliera Santa Maria Nuova, V. le Risorgimento 80,42100 Reggio Emilia (RE), Italy
~Received 21 May 2002; accepted for publication 8 January 2003; published 25 June 2003!
During a tender we evaluated the image performance of three commercially available active matrixflat panel imagers~AMFPI! for general radiography, one based on direct detection method~Sephotoconductor! the other two on indirect detection method~CsI phosphor!. Basic image qualityparameters~MTF, NNPS, DQE! were evaluated with particular attention to dose and energy de-pendence. As it is known, presampling modulation transfer function~MTF! of selenium baseddetector is very high~at 70 kV, 2 cycles/mm, 2.5mGy, about 0.80!. Indirect detection panels exhibita comparable~lower! resolution~at 70 kV, 2 cycles/mm, 2.5mGy, MTF is about 0.34 for both thesystems analyzed! and a more pronounced energy and dose dependence could also be noted in oneof them. As a consequence of the very high resolution, the normalized noise power spectrum~NNPS! of the direct system is substantially flat, very similar to a white noise. Considering that thesensitive layer of all detectors is the same~0.5 mm!, the relatively higher NNPS values are relatedto selenium absorption properties~lower Z respect to CsI:Tl! and detector inherent noise. NNPSs ofthe other systems, at low frequencies, are comparable but the frequency dependence is significantlydifferent. At 70 kV, 2.5mGy, 0.5 cycles/mm detective quantum efficiency~DQE! is about 0.35 forthe direct detection system, and about the same~0.6! for the indirect ones. The combined effect ofadditive and multiplicative noise components makes DQE dependence on dose not monotonic.DQE present a maximum for an intermediate exposure. This complex behavior may be useful tocharacterize the systems in terms of the monodimensional integral over the frequency of DQE~IDQE!. Both visual contrast-detail experiment and the direct evaluation of the signal-to-noise ratioconfirmed, at least in a qualitative way, the system performances predicted by IDQE. ©2003American Association of Physicists in Medicine.@DOI: 10.1118/1.1569273#
tim
lu
de
es
aintr
sF
ecrre
tgco
he
con-helityiva-uld
ateac-
m
theon
r
nelAn-
ub-
theing
ized,t,
m-
I. INTRODUCTION
Since more than a decade, detectors based on photoslated luminescence~Computed Radiography!, photoconduc-tion ~Thoravision! or charge coupled devices~CCD!, havemade digital images available in general radiography.1,2 Nev-ertheless it is easy to foresee that the real ‘‘digital revotion’’ will become a reality with the large diffusion of theactive matrix flat panel imagers~AMFPI!.
AMFPIs systems are constituted by a detection layerposited over an active matrix array~AMA ! of thin film tran-sistor ~TFT!.3 They are classified as direct or indirect typdepending on the characteristics of the detection layer.
In the direct conversion detector radiation quanta aresorbed into a layer of amorphous selenium, producelectron–hole pairs. Under the influence of a strong elecfield created between the external surfaces, the chargeseparated, drift towards the collecting electrodes of the Tand are locally stored. The read out circuit allows to seltively discharge each single TFT assuring its correct cospondence to an image element~pixel!. In the indirect con-version, a layer of scintillation material~CsI! absorbs theimpinging x-ray photons. The light produced is channeleda photodiode where it is converted into an electric charThe subsequent steps of the process are similar to directversion systems.
Except for their different structural characteristics, t
1719 Med. Phys. 30 „7…, July 2003 0094-2405 Õ2003Õ30„7…
u-
-
-
b-gicareT--
oe.n-
main aspect of these new devices is a higher quantumversion efficiency, allowing to produce, with respect to ttraditional screen-film systems, images of a higher quawithout increasing the patient dose or images of an equlent quality at a reduced exposure level. This aspect costrongly influence traditional clinical procedures.
For that reason, during a tender, we decided to evaluthe image performance of three commercially availabletive matrix flat panel Imagers~AMFPI! for general radiogra-phy: the system A~Hologic! uses direct detection, the systeB ~GE–Revolution! and the system C~Philips–TrixellPixium 4600! use the indirect detection method.
Measurements were taken in different hospitals, withsame evaluation protocol. Modulation transfer functi~MTF!, normalized noise power spectrum~NNPS!, detectivequantum efficiency~DQE! were evaluated with a particulaattention to the dose and energy dependence.
First theoretical and empirical investigations on flat pawere done in the past years, particularly by Siewerdsen,tonuk. and Cunningham group,4–6 aiming to estimate theirphysical performances and a benchmark was recently plished, on exactly the same AMFPIs, by Samei.7
The present work points out some specific aspects:energy and exposure dependence of the different imagparameters is analyzed and the image noise is characterindividuating an additive and a multiplicative componenwhose weight is different for the different systems. The co
1719Õ1719Õ13Õ$20.00 © 2003 Am. Assoc. Phys. Med.
st
1720 Borasi et al. : On site evaluation of three flat panel detectors 1720
Medical Physics, Vo
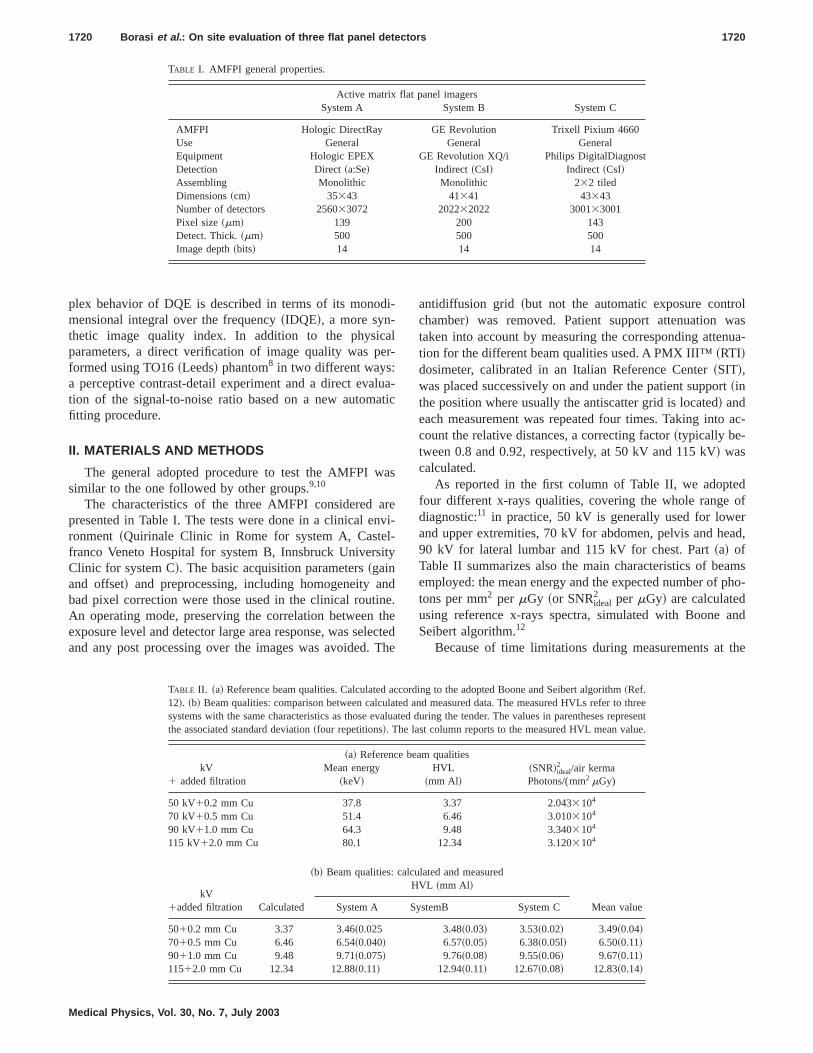
TABLE I. AMFPI general properties.
Active matrix flat panel imagersSystem A System B System C
AMFPI Hologic DirectRay GE Revolution Trixell Pixium 4660Use General General GeneralEquipment Hologic EPEX GE Revolution XQ/i Philips DigitalDiagnoDetection Direct~a:Se! Indirect ~CsI! Indirect ~CsI!Assembling Monolithic Monolithic 232 tiledDimensions~cm! 35343 41341 43343Number of detectors 256033072 202232022 300133001Pixel size~mm! 139 200 143Detect. Thick.~mm! 500 500 500Image depth~bits! 14 14 14
di
ale
luat
a
arv
l-ity
nnethecT
olasua-
rt
ac-
dofrad,
mspho-
and
the
plex behavior of DQE is described in terms of its monomensional integral over the frequency~IDQE!, a more syn-thetic image quality index. In addition to the physicparameters, a direct verification of image quality was pformed using TO16~Leeds! phantom8 in two different ways:a perceptive contrast-detail experiment and a direct evation of the signal-to-noise ratio based on a new automfitting procedure.
II. MATERIALS AND METHODS
The general adopted procedure to test the AMFPI wsimilar to the one followed by other groups.9,10
The characteristics of the three AMFPI consideredpresented in Table I. The tests were done in a clinical enronment ~Quirinale Clinic in Rome for system A, Castefranco Veneto Hospital for system B, Innsbruck UniversClinic for system C!. The basic acquisition parameters~gainand offset! and preprocessing, including homogeneity abad pixel correction were those used in the clinical routiAn operating mode, preserving the correlation betweenexposure level and detector large area response, was seland any post processing over the images was avoided.
l. 30, No. 7, July 2003
-
r-
a-ic
s
ei-
d.etedhe
antidiffusion grid ~but not the automatic exposure contrchamber! was removed. Patient support attenuation wtaken into account by measuring the corresponding attention for the different beam qualities used. A PMX III™~RTI!dosimeter, calibrated in an Italian Reference Center~SIT!,was placed successively on and under the patient suppo~inthe position where usually the antiscatter grid is located! andeach measurement was repeated four times. Taking intocount the relative distances, a correcting factor~typically be-tween 0.8 and 0.92, respectively, at 50 kV and 115 kV! wascalculated.
As reported in the first column of Table II, we adoptefour different x-rays qualities, covering the whole rangediagnostic:11 in practice, 50 kV is generally used for loweand upper extremities, 70 kV for abdomen, pelvis and he90 kV for lateral lumbar and 115 kV for chest. Part~a! ofTable II summarizes also the main characteristics of beaemployed: the mean energy and the expected number oftons per mm2 per mGy ~or SNRideal
2 per mGy! are calculatedusing reference x-rays spectra, simulated with BooneSeibert algorithm.12
Because of time limitations during measurements at
to threerepresent
ue.
TABLE II. ~a! Reference beam qualities. Calculated according to the adopted Boone and Seibert algorithm~Ref.12!. ~b! Beam qualities: comparison between calculated and measured data. The measured HVLs refersystems with the same characteristics as those evaluated during the tender. The values in parenthesesthe associated standard deviation~four repetitions!. The last column reports to the measured HVL mean val
~a! Reference beam qualitieskV
1 added filtrationMean energy
~keV!HVL
~mm Al!~SNR!ideal
2 /air kermaPhotons/(mm2 mGy)
50 kV10.2 mm Cu 37.8 3.37 2.0433104
70 kV10.5 mm Cu 51.4 6.46 3.0103104
90 kV11.0 mm Cu 64.3 9.48 3.3403104
115 kV12.0 mm Cu 80.1 12.34 3.1203104
~b! Beam qualities: calculated and measured
kV1added filtration Calculated
HVL ~mm Al!
Mean valueSystem A SystemB System C
5010.2 mm Cu 3.37 3.46~0.025 3.48~0.03! 3.53~0.02! 3.49~0.04!7010.5 mm Cu 6.46 6.54~0.040! 6.57~0.05! 6.38~0.05l! 6.50~0.11!9011.0 mm Cu 9.48 9.71~0.075! 9.76~0.08! 9.55~0.06! 9.67~0.11!11512.0 mm Cu 12.34 12.88~0.11! 12.94~0.11! 12.67~0.08! 12.83~0.14!

mmtinlc
ered
cu
acm
Mhee
nip
etens
er
seare
ioP
16dif-
alu-arda-
asnu-
ehe
he
eaneden-and
sed
1721 Borasi et al. : On site evaluation of three flat panel detectors 1721
three Hospitals, we did not directly measure x-ray beaHVLs. The manufacturers properly calibrated the systeand we recorded all technical data, in particular: generaand x-ray tube model, inherent and added filtrations. Usthese data with the Boone and Seibert algorithm, we calated the number of photons per mm2 per mGy required forDQE calculation. After the completion of the tender, wmeasured the HVLs for all the x-ray beams qualities on thsystems with the same characteristics as those evaluateding the tender. The measured HVLs differed from the callated ones by a maximum of 5%~at 115 kV! and the meandifference was 3%. These data are reported in~b! of Table II.Using the same algorithm we estimated that this inaccurwould influence the estimated number of photons per m2
per mGy value by a maximum of 4%~in average 2%!. Thesame inaccuracy would affect the DQE values.
For each energy several exposures~at least 6! were taken,in a range between 0.6 and 100mGy ~air kerma on the AM-FPI!. Air kerma measurements were done, using the PIII, with the same x-rays qualities reported in Table II. In tfollowing analysis when we speak generically of ‘‘dose’’ wrefer to the air kerma physical quantity.
The experimental setup is illustrated in Fig. 1. The mimum distance between the tube focus and the patient supwas 1.5 m. To avoid backscattered radiation, the dosimwas positioned at a distance of 40 cm in front of the patisupport. This expedient proved to be unnecessary: the porior wall of PMX III, including different metallic layers,makes the dosimeter nearly insensitive to the backscattradiation.
Using the system diaphragms, the radiation field wasto cover an area of 25325 cm2 on the support plane. Thlimited amount of time available for tests led us to derivemuch information as possible from each single shot. Figu2 ~TO16 phantom! and 3~MTF square wave pattern! showthe test object employed; Fig. 3 also shows the central regof a sample test image, where air kerma, MTF and NN
FIG. 1. Experimental setup.
Medical Physics, Vol. 30, No. 7, July 2003
ss
orgu-
eur--
y
X
-ortertte-
ed
et
ss
nS
were evaluated at the same time, is shown. For the TOphantom exposures, the geometrical setup was slightlyferent: the selected field was 32332 cm2 and the dosimeterwas positioned near the phantom in the support plane.
For each exposure level, all image parameters were evated on just a single image, so that MTF, relative standdeviation ~RSD! and NNPS correspond to a single realiztion. Only 70 kV exposures were repeated four times~andaveraged!. For all the tests the smallest focus available wselected and the exposure levels were obtained with maally selecting the tube load~mAs! at the system console. Thimages were transferred in DICOM to our Center for tsubsequent evaluation.
A. System response evaluation
At a fixed energy, from an image obtained irradiating tFPD at a certain dose, three sufficiently large area~;1 cm2 !were selected, the closest to the dosimeter. The three mregion of interest~ROI! signals were calculated and averagto obtain a unique signal value for the image. For eachergy, the procedure was repeated for the different doses
FIG. 2. TO16 Leeds test phantom used for contrast detail analysis.
FIG. 3. MTF and Wiener spectrum acquiring mode on an uniformly expoimage.

nafo
waan
nti
pr
th
ues
r
esntm
eeroth
ulfoafo
avr
untrtie
too
his
lat-Fies,
eiesas
theFor
.RSDc-
ents
or-ed
ies
he
ean
1722 Borasi et al. : On site evaluation of three flat panel detectors 1722
the obtained image mean values were fitted to find a sigto-dose response curve at that energy. Employing thecurves~at 50, 70, 90, and 115 kVp!, the image pixel valueswere converted from signal to air kerma, i.e., each imagemapped in dose, for the subsequent evaluation of MTFNNPS.
B. Relative sensitivity
The sensitivity is related to the quantity of radiationeeded to produce a certain value of the signal. The relasensitivity could be determined as the ratio between adefined air kerma value~in our case 2.5mGy! at 70 kV andthe air kerma needed, at a different energy, to obtainsame signal.
If a simple exponential law describes the beam attention in the detection layer, the following relation describthe relative sensitivity:
Si5*E•f i~E!•~12exp~2m~E!•t !•dE/Di
*E•f70 kV~E!•~12exp~2m~E!•t !•dE/D70 kV, ~1!
whereE is the energy,m the linear attenuation coefficient fothe detector material,t the detector thickness,D the airkerma value, andf the photon fluence at the detector.
C. Presampling MTF
For presampling MTF evaluation, an image of a lead tobject ~Fig. 3!, producing square wave patterns of differefrequencies, is acquired with an angle of about 2° respecthe detector lines or columns. The test object is 0.05 mthick and includes 14 inserts in a frequency range betw0.10 and 10 cycles/mm. The corresponding image is pcessed using a specific program, developed, as all the oprogram used to analyze and produce this article’s reswith Mathcad™. The procedure can be summarized aslows. First, by selecting two corners of the test object,accurate estimate of the tilting angle is derived. Second,each insert, several profiles~at least 20! along image lines/columns are extracted and merged together, taking intocount the relative phases. The resulting point cloud is an osampled profile,13 with a pixel pitch about 30 times smallethan the original one. To evaluate the amplitude of the fdamental frequency, these data are fitted with a trigonomeseries of odd harmonic frequencies, as is described by Sstorfer and Spahn.14 Finally the amplitudes correspondingthe different frequencies are fitted with an inverse polynmial function. The zero frequency extrapolated value of tfunction is used to normalize the different amplitudes,
Medical Physics, Vol. 30, No. 7, July 2003
l-ur
sd
vee-
e
a-
ttto
n-er
ts,l-nr
c-er
-icr-
-so
representing the MTF values. The use of an MTF interpoing function is important for DQE calculation where MTand NNPS values, in connection with the same frequencare required.
MTF calculation in a direction perpendicular to thanode–cathode axis was carried out for different energand different doses. To test the system isotropy, MTF wevaluated also in the anode–cathode direction~at 70 kV, forjust one exposure level!.
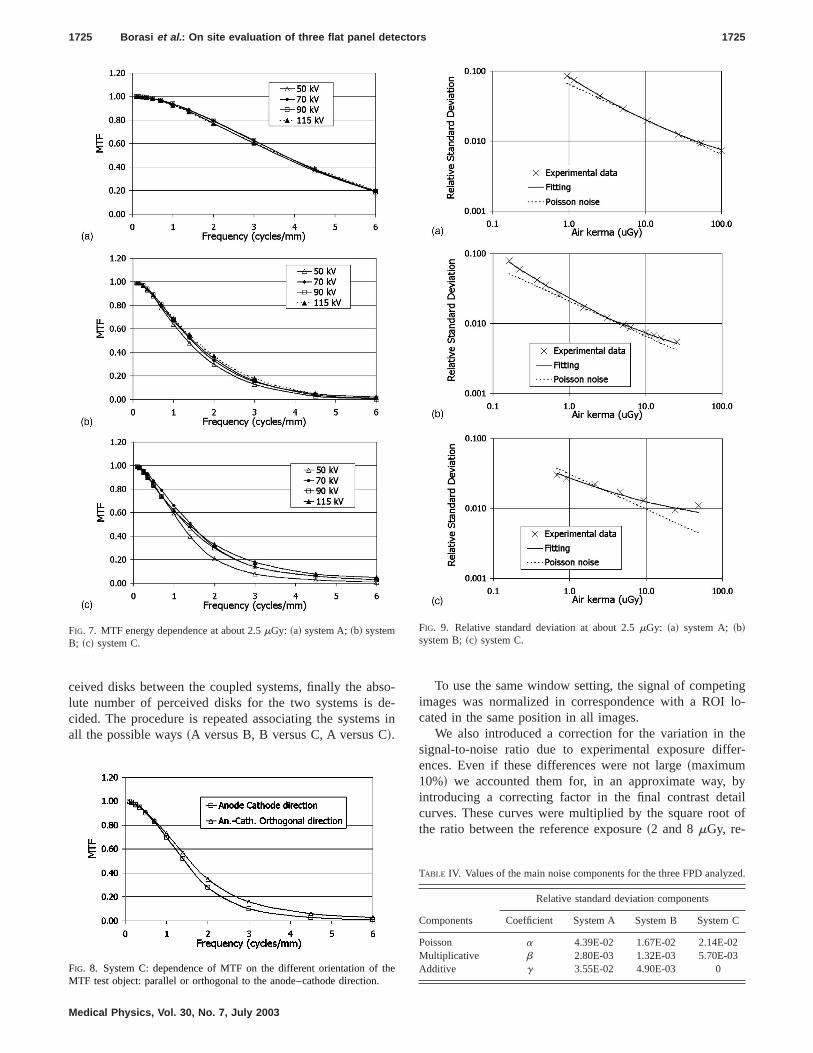
D. Relative standard deviation analysis
The trend of the relative standard deviation versusexposure can give a useful insight into noise properties.that purpose, the noise evaluation area~5123512 pixel! ofFig. 3 is subdivided into 64 ROIs~64364 pixel! and therelative standard deviation, RSD, which is~standarddeviation!/~average signal value!, of each ROI is calculatedThe 64 samples are averaged and the trend of meanversus the exposure level is fitted using the following funtion:
s rel~x!51
x•~aAx1bx1g!. ~2!
As analyzed by other authors,15,16 the noise could be dividedin its main components. The term in parentheses represthe absolute standard deviation anda, b, andg represent thecontributions, respectively, of the quantum-statistical~Pois-son! noise source, of a dose related~multiplicative! noisesource and of a dose independent~additive! noise source. Asdiscussed in a paper by Moy and Bosset,17 the multiplicativecontribution can be attributed to a nonperfect spatial unifmity correction, while the additive term can be correlatwith the internal electronic noise of the detector.
E. NNPS, DQE, and IDQE calculation
The digital normalized noise power spectrum NNPSdig iscalculated in correspondence with discrete frequenc(ui ,v j ) using the formula18
NNPSdig~ui ,v j !5x0y0
NxNy•EH uDFT2D$Ddnxny
%u2
d̄2 J ~3!
whose meaning is the following: in each ROI we take ttwo-dimensional discrete Fourier transform (DFT2D) of thesignal fluctuation with the mean signal value (Ddnxny
), thesquared modulus of the result is divided by the squared mvalue of the signal in the ROI (d̄). The calculation is re-
erred to an
021.954
TABLE III. TO16 Phantom~Ref. 8! includes 12 series of inserts: each series contains 12 discs of decreasing contrast. The reported contrasts are refx-ray beam quality of 70 kV and 1 mm Cu added filtration.
Series
TO16 Phantom characteristics
A B C D E F G H I J K L
Diameter~mm! 11.1 7.90 5.60 4.00 2.80 2.00 1.40 1.00 0.70 0.50 0.35 0.25Min. contrast 0.001 0.001 0.001 0.002 0.002 0.002 0.003 0.003 0.003 0.013 0.017 0.Max. contrast 0.067 0.067 0.067 0.088 0.088 0.088 0.128 0.128 0.128 0.573 0.726 0
e
egne
e
io
or-e
nare
th
ar
:
nrg
r
t
o
s
rality
l.ofnofe awas
u-
1723 Borasi et al. : On site evaluation of three flat panel detectors 1723
peated for the different ROIs and the corresponding exptation value (E) of the data is considered.x0y0 are the pixeldimensions andNxNy are the numbers of pixels, along thtwo dimensions, contained in the ROIs~supposed as havinall the same dimension!. If the system is linear, or has beelinearized~as in our case!, the previous expression gives thNNPS in an absolute scale (mm2), as is discussed in thpaper of Flynn and Samei.7
As for RSD, NNPS was calculated taking the expectatvalue over 64 ROIs~64364 pixels each! in the noise evalu-ation area~5123512! of each image, shown in Fig. 3. Nfiltering or windowing was applied in the calculation. In paticular no ‘‘detrending’’ to remove low frequency trend in thdata was performed.
For an easier comparison of the systems, a odimensional representation of the NNPS is calculated byeraging the 2D NNPS spectrum samples over circulargions of the same width and increasing radius infrequency space,
NNPSdig~n i !51
Ni(h,k
NNPSdig~uh ,vk!, ~4!
where Ni is the number of samples falling in the circulregion numberi, whose frequencies (uh ,vk) verify the rela-tionship
n i2Dn/2<Auh21vk
2<n i1Dn/2, ~5!
whereDn is the single region width~in our case 1/20 of theNyquist frequency!. Using the previous definition of theNNPS, the detective quantum efficiency is expressed as
DQE~n!5MTF~n!2
NNPS~n!•q•D, ~6!
where MTF is the modulation transfer function,D the airkerma~mGy! on detector plane,q (mm22 mGy21! the ‘‘idealSNR2.’’ This latter quantity has a different definition whewe consider the detector as a photon counting or an eneintegrating device. In the first case the definition ofq is
q5E0
kVp
f~E!dE ~7!
where f(E) (mm22 keV21 mGy! represents the x-ray aikerma spectral distribution andkVp represents the maximumenergy in the spectrum. In this caseq is interpreted as thenumber of photons~per unit area and unit dose! of the pri-mary beam reaching the detector plane.
If one assumes that the detector behaves as a perfecergy integrator,q is defined as
q5~*0
kVpf~E!E dE!2
*0kVpf~E!E2 dE
. ~8!
In the present paper the detector is considered as a phcounting device. As reported by Samei7 the difference in theq values for the two cases is at the most 5%.
In DQE calculation MTF and NNPS at the same dolevel are combined.
Medical Physics, Vol. 30, No. 7, July 2003
c-
n
e-v--
e
y-
en-
ton
e
As synthetic image quality index we adopted the integvalue of DQE over the frequency range. This quant~IDQE! is calculated as
IDQE5E0
ncutoffDQE~n!dn. ~9!
The unit of IDQE is (mm21). An analogous quantity wasproposed by Fetterlyet al.19 as a two-dimensional integraWe tried to use the two-dimensional Fetterly definitionIDQE, but with this definition we found no the correlatiowith detail perceptibility. The one-dimensional versionIDQE, although lacking a theoretical basis, seems to breasonable way to synthesize the whole DQE curve andfound well correlated with detail perceptibility.
F. Phantom analysis
Image quality derived from physical parameters~MTF,NNPS, and DQE! was compared with direct phantom evalation. For that we used the Leeds TO16 phantom8 repro-duced in Fig. 2. The circular test object~radius 16 cm! is
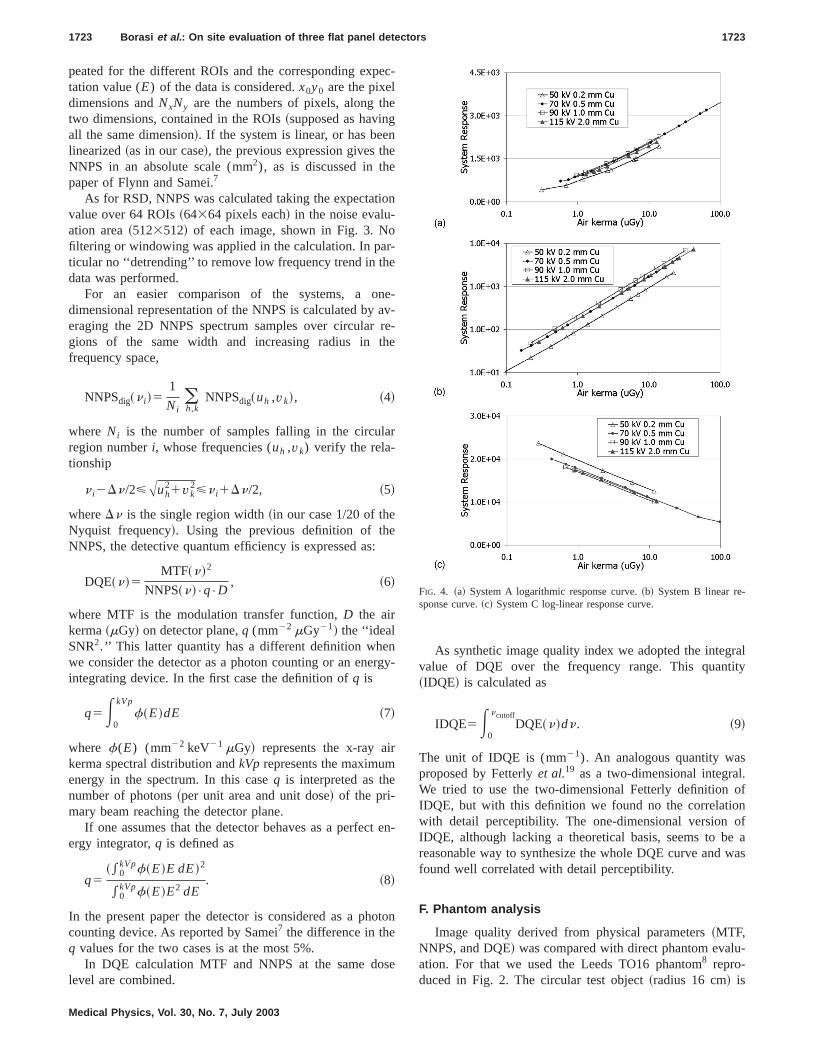
FIG. 4. ~a! System A logarithmic response curve.~b! System B linear re-sponse curve.~c! System C log-linear response curve.

hed0m
st
dlyis
ppetin
o
theerefor
ol
toroksect,rgy
withingoftose.rstsys-rer-
1724 Borasi et al. : On site evaluation of three flat panel detectors 1724
made of Lucite and includes 12 series of disks of higdensity: in each series there are 12 disks with the same raand a variable contrast~spanning from 0.0016 to 0.954 at 7kV11 mm Cu!. Disk diameter spans from 10 to 0.25 m~see Table III!.
The phantom was exposed at the beam quality suggeby the Manufacturer~70 kV with 1 mm of Cu added! at twodifferent exposure levels~about 2 and 8mGy!.
The phantom has been provided with a mathematicalscription and software programs were developed to anaphantom images. At first each image is geometrically regtered and, using the signal to dose response curve, mainto dose. Two procedures were performed, a contrast dstudy and a direct signal to noise evaluation by a disk fitttechnique.
1. Contrast-detail study
The TO16 is widely used for contrast-detail analysisradiographic imagers. In these kinds of studies,20–23 for each
FIG. 5. Relative sensitivity at 2.5mGy: ~a! system A; ~b! system B;~c!system C.
Medical Physics, Vol. 30, No. 7, July 2003
rius
ed
e-ze-ed
ailg
f
disk series, the operator judges the contrast for whichdisk perceptibility is vanishing. In our case the images wpresented on a diagnostic quality Workstation Monitorsoft copy reporting~B/W Barco™ MGD521 204832560resolution! calibrated according to a quality control protocbased on the IEC 61223-2-5 document.24
One of the problems of this technique is that the operashould maintain the same evaluation criteria when he loat the different images. To help the operator in this resptwo images of the same disk produced with the same eneand dose level by two competing systems are presented,the same window setting, in two adjacent panels. A scrollbar allows to move back and forth along the seriescoupled images. In this way it is easier for the operatorformulate a reproducible opinion, at least in a relative senThe judgment procedure follows three different steps: fithe operator scrolls through the series and decides whattem is better~or if they are identical!, second the operatoevaluates what the difference is in terms of number of p
FIG. 6. MTF dose dependence at 70 kV1 0.5 Cu:~a! system A;~b! systemB; ~c! system C.
bsdes
inglo-
heer-
byailt of
ed.
th.
1725 Borasi et al. : On site evaluation of three flat panel detectors 1725
ceived disks between the coupled systems, finally the alute number of perceived disks for the two systems iscided. The procedure is repeated associating the systemall the possible ways~A versus B, B versus C, A versus C!.
FIG. 7. MTF energy dependence at about 2.5mGy: ~a! system A;~b! systemB; ~c! system C.
FIG. 8. System C: dependence of MTF on the different orientation ofMTF test object: parallel or orthogonal to the anode–cathode direction
Medical Physics, Vol. 30, No. 7, July 2003
o--in
To use the same window setting, the signal of competimages was normalized in correspondence with a ROIcated in the same position in all images.
We also introduced a correction for the variation in tsignal-to-noise ratio due to experimental exposure diffences. Even if these differences were not large~maximum10%! we accounted them for, in an approximate way,introducing a correcting factor in the final contrast detcurves. These curves were multiplied by the square roothe ratio between the reference exposure~2 and 8mGy, re-
TABLE IV. Values of the main noise components for the three FPD analyz
Components
Relative standard deviation components
Coefficient System A System B System C
Poisson a 4.39E-02 1.67E-02 2.14E-02Multiplicative b 2.80E-03 1.32E-03 5.70E-03Additive g 3.55E-02 4.90E-03 0e
FIG. 9. Relative standard deviation at about 2.5mGy: ~a! system A; ~b!system B;~c! system C.
der
reisogedea
bect
mtth
thentern abe
ngisbya
radi-en-errac-n.
lur-um
ck-ourTherage
as
nsea
ke
ure,
,
sth-
1726 Borasi et al. : On site evaluation of three flat panel detectors 1726
spectively! and the measured one. This corrective factorrives from the theoretical dependence of contrast-to-noisetio on the square root of the exposure level.25
Also the pixel size differences are accounted for by psenting images on an absolute geometrical scale. In the valization program the operator can change with a single ctrol the window setting on both images and he is encourato do it. The same holds for the zoom factor. To proviresults with a statistical basis, the same images were evated by a group of seven trained observers
To test the statistical significance of the differencestween contrast detail curves of the three system, a two faANOVA test ~with repetitions!26 was performed. The maineffects considered were detector type and disk size.
The test was initially done considering the three systeand including all phantom details. To have a closer insighwas repeated considering all possible combinations ofsystems~A vs B, B vs C, and C vs A! and grouping details
FIG. 10. Normalized noise power spectrum at 70 kV1 0.5 mm Cu:~a!system A;~b! system B;~c! system C.
Medical Physics, Vol. 30, No. 7, July 2003
-a-
-u-n-d
lu-
-or
site
into two subsets: large1medium (>0.7 mm! and small~,0.7 mm!
2. Contrast-to-noise ratio evaluation by a diskfitting procedure
Taking advantage of the mathematical description ofphantom, for each disk a square region centered on its ceis selected, its side is at least twice the disk diameter. I‘‘perfect’’ imager the signal corresponding to a disk wouldrepresented by the functionH(u r̄ 2r 0̄u), defined as
H~ u r̄ 2 r̄ 0u!5H h if u r̄ 2 r̄ 0u<R0 ,
0 if u r̄ 2 r̄ 0u.R0 ,~10!
wherer̄ is the 2D coordinates vector,r 0̄ is the vector point-ing to the disk center,R0 is the disk radius,h is the signalvalue. A digital version of this function is generated, takiinto account the partial volume effect. This latter functionfitted to the 2D experimental data of the selected regionminimizing thex2 function. The searching is done usingnon-linear least square routine based on the conjugate gent algorithm. The starting point for the searching is the ctral pixel of the region where, in principle, the disk centshould be located. Registration inaccuracies move, in ptice, the disk center a few pixels away from this positioWhen the minimum is reached, the fittedh value representsthe disk average signal level. In the real systems, where bring occurs, this value is somewhat lower than the maximvalue. The fit accuracy is controlled by thex2 value and bythe residual analysis. The standard deviation of the baground signal is evaluated in correspondence with the fcorners of the region and the four results are averaged.ratio between the disk average signal value and the avestandard deviation of the surrounding region is assumedthe contrast-to-noise ratio.
III. RESULTS AND DISCUSSION
A. General features: System response and relativeSensitivity
The three systems show different signal to dose respocurves. System A@Fig. 4~a!# curve, at high exposures, isstraight line~in a log-linear scale! with an upward concavityat low exposure: it is well represented by a function lia ln(x1b). System B response is linear@Fig. 4~b!#. System Cexhibits log-linear response@Fig. 4~c!#. Differently from thetwo previous systems, in this case, increasing the exposthe signal decreases.
Figures 5~a!, 5~b!, and 5~c! show the relative sensitivitycalculated at 2.5mGy, compared with theory~1!. As can beseen all systems peak at 90 kV11 mm Cu: System A pre-sents a less prominent peak than the other systems.
B. System spatial resolution: MTF dose and energydependence
In the following, we report the comparison of MTF curveof different systems. The curves are the result of a ma
c-e of.re-
ennt
of
4-n
pl
1727 Borasi et al. : On site evaluation of three flat panel detectors 1727
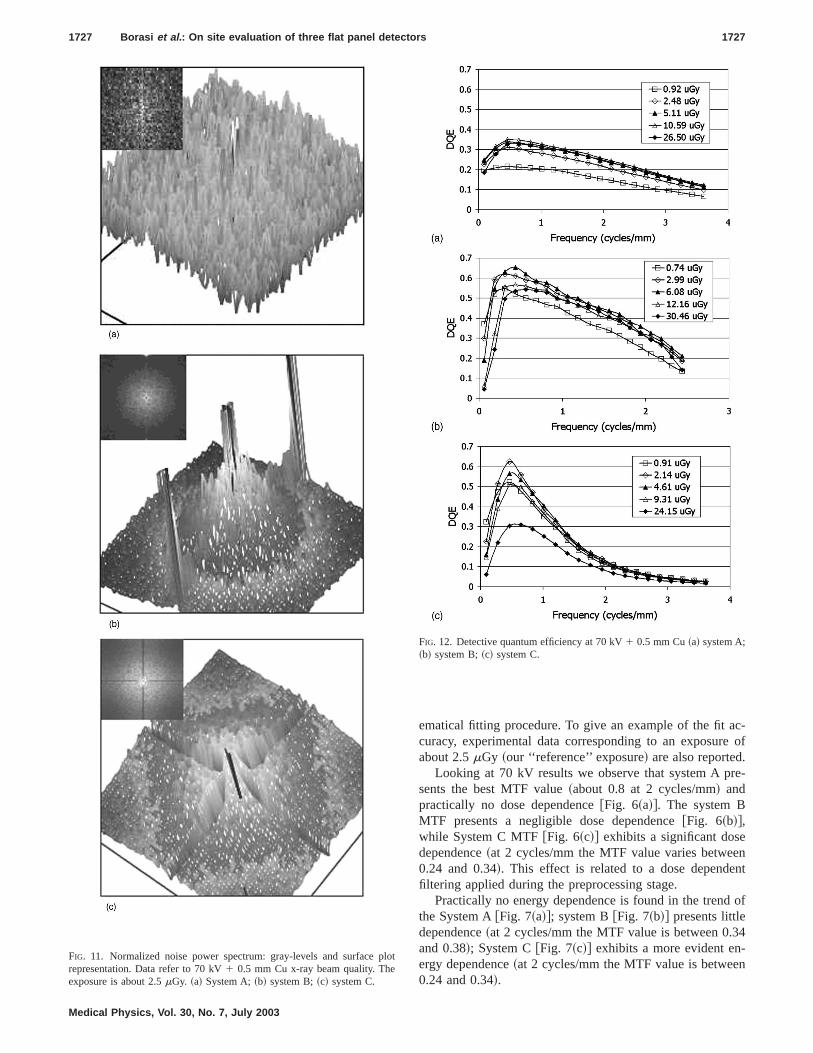
FIG. 11. Normalized noise power spectrum: gray-levels and surfacerepresentation. Data refer to 70 kV1 0.5 mm Cu x-ray beam quality. Theexposure is about 2.5mGy. ~a! System A;~b! system B;~c! system C.
Medical Physics, Vol. 30, No. 7, July 2003
ematical fitting procedure. To give an example of the fit acuracy, experimental data corresponding to an exposurabout 2.5mGy ~our ‘‘reference’’ exposure! are also reported
Looking at 70 kV results we observe that system A psents the best MTF value~about 0.8 at 2 cycles/mm! andpractically no dose dependence@Fig. 6~a!#. The system BMTF presents a negligible dose dependence@Fig. 6~b!#,while System C MTF@Fig. 6~c!# exhibits a significant dosedependence~at 2 cycles/mm the MTF value varies betwe0.24 and 0.34!. This effect is related to a dose dependefiltering applied during the preprocessing stage.
Practically no energy dependence is found in the trendthe System A@Fig. 7~a!#; system B@Fig. 7~b!# presents littledependence~at 2 cycles/mm the MTF value is between 0.3and 0.38!; System C@Fig. 7~c!# exhibits a more evident energy dependence~at 2 cycles/mm the MTF value is betwee0.24 and 0.34!.
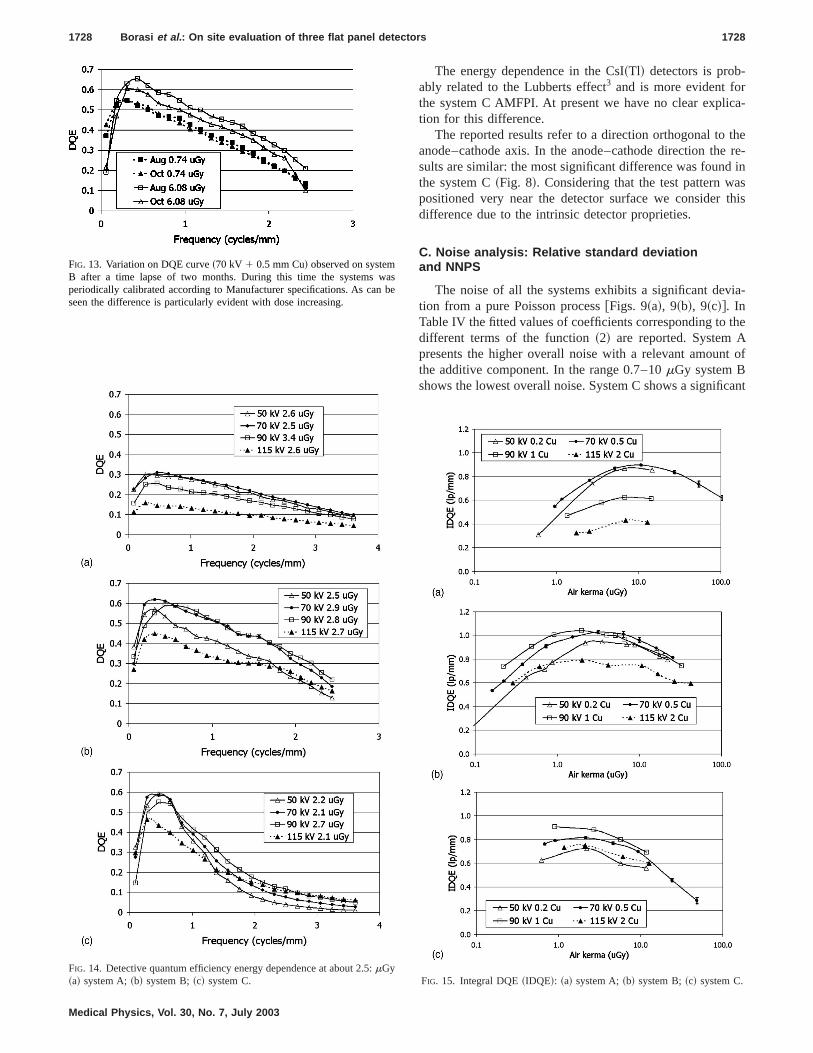
ot
FIG. 12. Detective quantum efficiency at 70 kV1 0.5 mm Cu~a! system A;~b! system B;~c! system C.
ca-
there-ins
this
ia-
the
t of
ant
ab
1728 Borasi et al. : On site evaluation of three flat panel detectors 1728
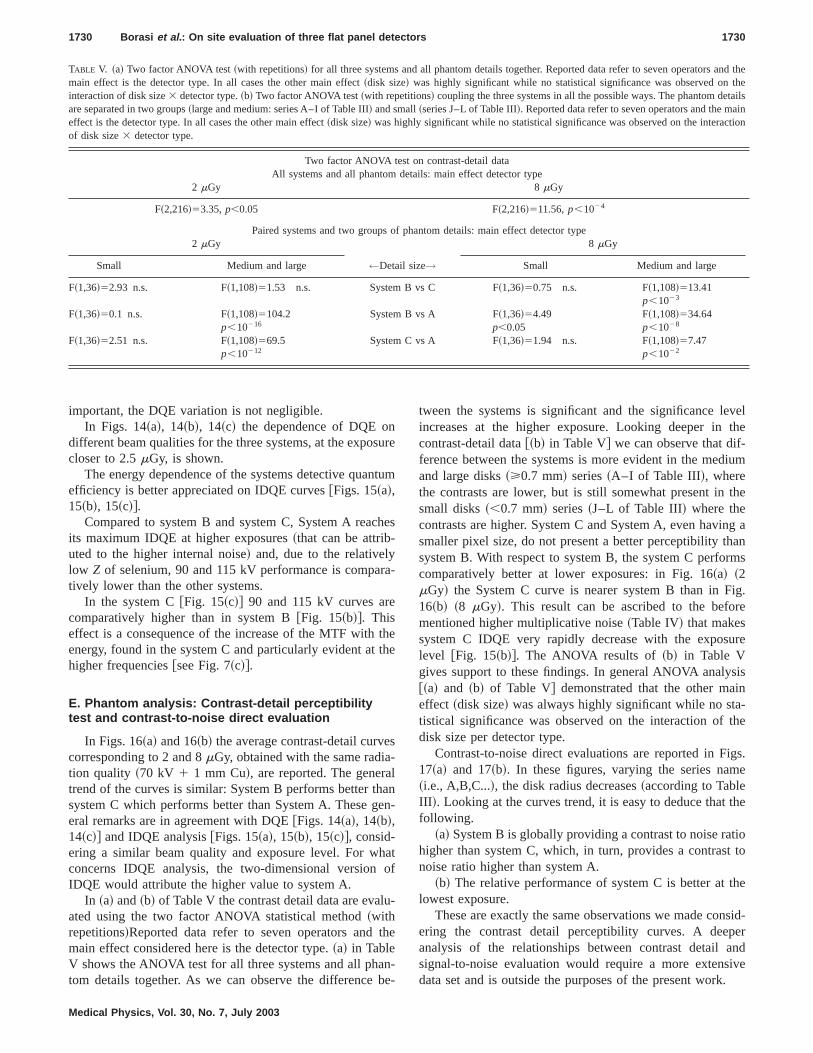
FIG. 13. Variation on DQE curve~70 kV 1 0.5 mm Cu! observed on systemB after a time lapse of two months. During this time the systems wperiodically calibrated according to Manufacturer specifications. As canseen the difference is particularly evident with dose increasing.
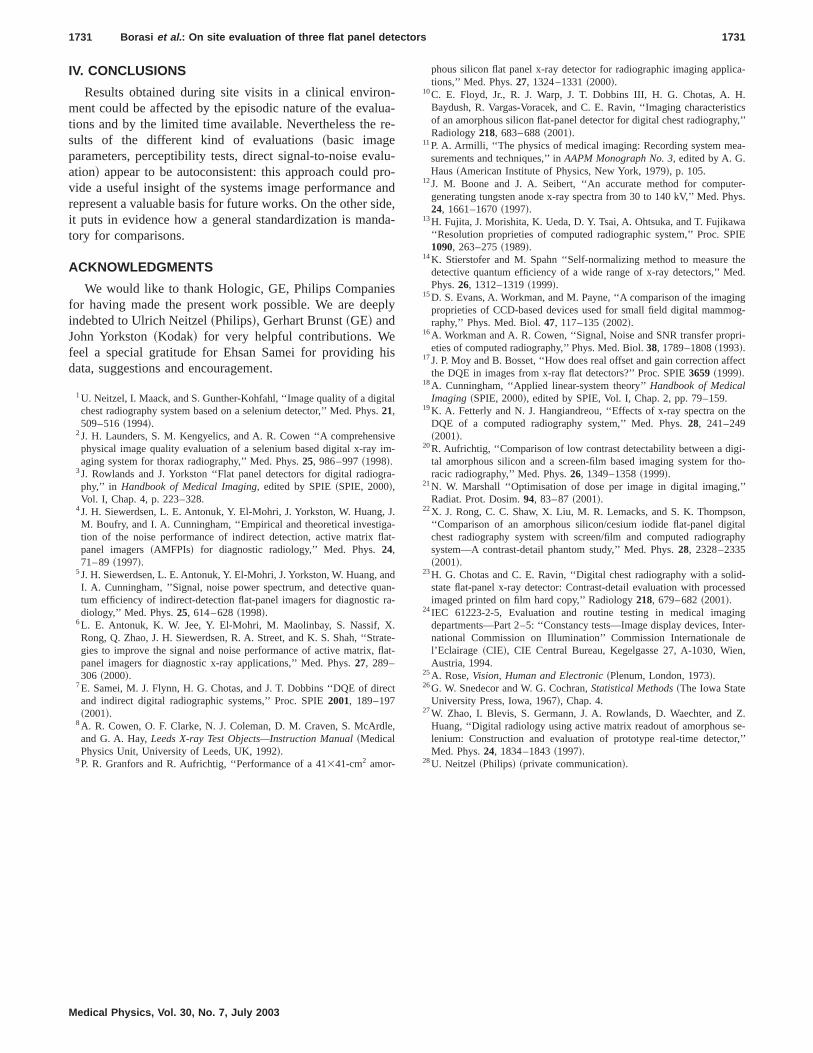
FIG. 14. Detective quantum efficiency energy dependence at about 2.5:mGy~a! system A;~b! system B;~c! system C.
Medical Physics, Vol. 30, No. 7, July 2003
The energy dependence in the CsI~Tl! detectors is prob-ably related to the Lubberts effect3 and is more evident forthe system C AMFPI. At present we have no clear explition for this difference.
The reported results refer to a direction orthogonal toanode–cathode axis. In the anode–cathode direction thesults are similar: the most significant difference was foundthe system C~Fig. 8!. Considering that the test pattern wapositioned very near the detector surface we considerdifference due to the intrinsic detector proprieties.
C. Noise analysis: Relative standard deviationand NNPS
The noise of all the systems exhibits a significant devtion from a pure Poisson process@Figs. 9~a!, 9~b!, 9~c!#. InTable IV the fitted values of coefficients corresponding todifferent terms of the function~2! are reported. System Apresents the higher overall noise with a relevant amounthe additive component. In the range 0.7–10mGy system Bshows the lowest overall noise. System C shows a signific
se
FIG. 15. Integral DQE~IDQE!: ~a! system A;~b! system B;~c! system C.

iaurdd
e
gprdp
feA
reth
lin-
. Ie-lts
E
vel
urere.
a
n-
nd
nceorepo-cificem.r-ere
eto
ob-At
ore
me
1729 Borasi et al. : On site evaluation of three flat panel detectors 1729
amount of multiplicative noise and relative standard devtion ~RSD! decreases less rapidly on increasing the exposAt lower exposures, as a consequence of a negligible ative noise, system C could present a lower RSD value.
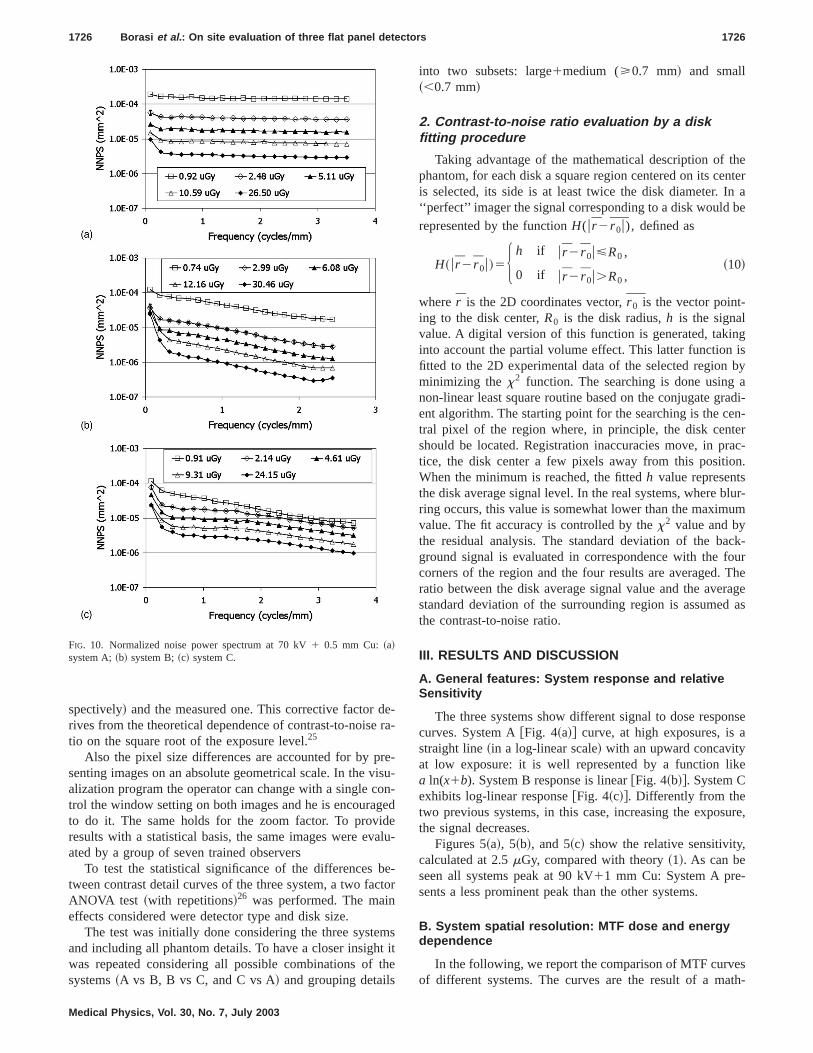
The NNPS of all systems presents a significant increaslow frequency. In Figs. 10~a!, 10~b! and 10~c! this effect isreported at 70 kV1 0.5 mm Cu added filtration. Increasinthe dose level, the effect is more prominent and extendsgressively toward higher frequencies. This can be ascribethe increase of the multiplicative noise component as exsure increases.
NNPS of the System A AMFPI@Fig. 10~a!# is practicallyflat ~in agreement with the theoretical previsions27! and itsvalue is higher than that of the other systems. At the reence exposure~2.5 mGy! the NNPS values are: System@Fig. 10~a!# 4.0931025 at 0.5 cycles/mm and 3.8331025 at2.0 cycles/mm; System B@Fig. 10~b!#; 1.4731025 at 0.5cycles/mm and 3.4631026 at 2.0 cycles/mm; System [email protected]~c!#; 2.0831025 at 0.5 cycles/mm and 1.0231025 at 2.0cycles/mm. System B and System C noise presents diffetrends: System B NNPS decreases more rapidly withfrequency and also with the exposure level.
Figures 11~a!, 11~b!, 11~c! report 2D gray-level and thecorresponding surface plot representation of NNPSs: thecorrelated noise~white vertical line in gray-level representation ! appears more evident in system A than in system Bthe system C the noise related to rows and columns corrtion is removed by a ‘‘destripping’’ filter, applied in the preprocessing stage:28 the removal of these frequencies resuin the black cross.
FIG. 16. Contrast detail curves for the three systems at 70 kV1 1 mm Cu:~a! at 2 mGy; ~b! at 8 mGy.
Medical Physics, Vol. 30, No. 7, July 2003
-e.i-
at
o-too-
r-
nte
e
nla-
D. Detective quantum efficiency: DQE and IDQE
As a consequence of the low frequency noise, all DQfrequency spectra@at 70 kV 1 0.5 mm Cu added filtration;Figs. 12~a!, 12~b!, 12~c!# exhibit a maximum whose positionshifts toward the higher frequencies as the exposure leincreases.
Due to the presence of the additive noise, at low exposlevels, the maximum of DQE increases with the exposuThe multiplicative noise component makes DQE, abovecertain exposure level, decrease with the exposure.
Indirect detection systems exhibit a maximum DQE cosiderably higher than the direct one~about 0.6 for system Band system C to respect 0.35 for system A!.
At the reference exposure~2.5 mGy!, system A @Fig.12~a!# presents a DQE value of 0.31 at 0.5 cycles/mm a0.22 at 2.0 cycles/mm; system B@Fig. 12~b!# 0.61 at0.5cycles/mm and 0.29 at 2.0; system C@Fig. 12~c!# 0.63 at0.5 cycles/mm and 0.14 at 2.0 cycles/mm. As a consequeof the NNPS trend System C DQE decreases much mrapidly than system B both respect to frequency and exsure. These data could have been influenced by the speimage processing algorithm implemented in the test syst
The importance of a proper calibration for better perfomances can be appreciated when looking at Fig. 13, whtwo DQE evaluations of the same system~B! carried out in atime interval of 2 months, are compared. During this timperiod the system was periodically calibrated, accordingthe Manufacturer’s specification: the differences are prably caused by small variation in the system calibration.the higher exposure level, where multiplicative noise is m
FIG. 17. Disk fitting curves for the three systems at 70 kV1 1 mm Cu:~a!at 2mGy; ~b! at 8mGy. On the abscissa axis is reported the disk series na~see Table III!.
and thethetailsain
ction
1730 Borasi et al. : On site evaluation of three flat panel detectors 1730
TABLE V. ~a! Two factor ANOVA test~with repetitions! for all three systems and all phantom details together. Reported data refer to seven operatorsmain effect is the detector type. In all cases the other main effect~disk size! was highly significant while no statistical significance was observed oninteraction of disk size3 detector type.~b! Two factor ANOVA test~with repetitions! coupling the three systems in all the possible ways. The phantom deare separated in two groups~large and medium: series A–I of Table III! and small~series J–L of Table III!. Reported data refer to seven operators and the meffect is the detector type. In all cases the other main effect~disk size! was highly significant while no statistical significance was observed on the interaof disk size3 detector type.
Two factor ANOVA test on contrast-detail dataAll systems and all phantom details: main effect detector type
2 mGy 8 mGy
F~2,216!53.35,p,0.05 F~2,216!511.56,p,1024
Paired systems and two groups of phantom details: main effect detector type2 mGy 8 mGy
Small Medium and large ←Detail size→ Small Medium and large
F~1,36!52.93 n.s. F~1,108!51.53 n.s. System B vs C F~1,36!50.75 n.s. F~1,108!513.41p,1023
F~1,36!50.1 n.s. F~1,108!5104.2p,10216
System B vs A F~1,36!54.49p,0.05
F~1,108!534.64p,1028
F~1,36!52.51 n.s. F~1,108!569.5p,10212
System C vs A F~1,36!51.94 n.s. F~1,108!57.47p,1022
nsu
nt
h
ra
thth
es-lae
hao
lu-
th
nb
velthe
-ium
the
ng aan
rms
ig.re
ure
sisin-the
igs.e
the
tiot to
the
nsid-er
andive.
important, the DQE variation is not negligible.In Figs. 14~a!, 14~b!, 14~c! the dependence of DQE o
different beam qualities for the three systems, at the expocloser to 2.5mGy, is shown.
The energy dependence of the systems detective quaefficiency is better appreciated on IDQE curves@Figs. 15~a!,15~b!, 15~c!#.
Compared to system B and system C, System A reacits maximum IDQE at higher exposures~that can be attrib-uted to the higher internal noise! and, due to the relativelylow Z of selenium, 90 and 115 kV performance is compatively lower than the other systems.
In the system C@Fig. 15~c!# 90 and 115 kV curves arecomparatively higher than in system B@Fig. 15~b!#. Thiseffect is a consequence of the increase of the MTF withenergy, found in the system C and particularly evident athigher frequencies@see Fig. 7~c!#.
E. Phantom analysis: Contrast-detail perceptibilitytest and contrast-to-noise direct evaluation
In Figs. 16~a! and 16~b! the average contrast-detail curvcorresponding to 2 and 8mGy, obtained with the same radiation quality ~70 kV 1 1 mm Cu!, are reported. The generatrend of the curves is similar: System B performs better thsystem C which performs better than System A. These geral remarks are in agreement with DQE@Figs. 14~a!, 14~b!,14~c!# and IDQE analysis@Figs. 15~a!, 15~b!, 15~c!#, consid-ering a similar beam quality and exposure level. For wconcerns IDQE analysis, the two-dimensional versionIDQE would attribute the higher value to system A.
In ~a! and~b! of Table V the contrast detail data are evaated using the two factor ANOVA statistical method~withrepetitions!Reported data refer to seven operators andmain effect considered here is the detector type.~a! in TableV shows the ANOVA test for all three systems and all phatom details together. As we can observe the difference
Medical Physics, Vol. 30, No. 7, July 2003
re
um
es
-
ee
nn-
tf
e
-e-
tween the systems is significant and the significance leincreases at the higher exposure. Looking deeper incontrast-detail data@~b! in Table V# we can observe that difference between the systems is more evident in the medand large disks~>0.7 mm! series~A–I of Table III!, wherethe contrasts are lower, but is still somewhat present insmall disks~,0.7 mm! series~J–L of Table III! where thecontrasts are higher. System C and System A, even havismaller pixel size, do not present a better perceptibility thsystem B. With respect to system B, the system C perfocomparatively better at lower exposures: in Fig. 16~a! ~2mGy! the System C curve is nearer system B than in F16~b! ~8 mGy!. This result can be ascribed to the befomentioned higher multiplicative noise~Table IV! that makessystem C IDQE very rapidly decrease with the exposlevel @Fig. 15~b!#. The ANOVA results of~b! in Table Vgives support to these findings. In general ANOVA analy@~a! and ~b! of Table V# demonstrated that the other maeffect ~disk size! was always highly significant while no statistical significance was observed on the interaction ofdisk size per detector type.
Contrast-to-noise direct evaluations are reported in F17~a! and 17~b!. In these figures, varying the series nam~i.e., A,B,C...!, the disk radius decreases~according to TableIII !. Looking at the curves trend, it is easy to deduce thatfollowing.
~a! System B is globally providing a contrast to noise rahigher than system C, which, in turn, provides a contrasnoise ratio higher than system A.
~b! The relative performance of system C is better atlowest exposure.
These are exactly the same observations we made coering the contrast detail perceptibility curves. A deepanalysis of the relationships between contrast detailsignal-to-noise evaluation would require a more extensdata set and is outside the purposes of the present work
n-lure
alpranidd
sp
hi
al.
iveim
ra
Ja-at
ndanra
.atfla
ec
le
ca-
H.ticsy,’’
a-
er-ys.
aIE
theed.
ingog-
ri-
fect
he
i-tho-
’’
n,italphy
id-sed
ingter-
den,
Z.e-r,’’
1731 Borasi et al. : On site evaluation of three flat panel detectors 1731
IV. CONCLUSIONS
Results obtained during site visits in a clinical enviroment could be affected by the episodic nature of the evations and by the limited time available. Nevertheless thesults of the different kind of evaluations~basic imageparameters, perceptibility tests, direct signal-to-noise evation! appear to be autoconsistent: this approach couldvide a useful insight of the systems image performancerepresent a valuable basis for future works. On the other sit puts in evidence how a general standardization is mantory for comparisons.
ACKNOWLEDGMENTS
We would like to thank Hologic, GE, Philips Companiefor having made the present work possible. We are deeindebted to Ulrich Neitzel~Philips!, Gerhart Brunst~GE! andJohn Yorkston~Kodak! for very helpful contributions. Wefeel a special gratitude for Ehsan Samei for providingdata, suggestions and encouragement.
1U. Neitzel, I. Maack, and S. Gunther-Kohfahl, ‘‘Image quality of a digitchest radiography system based on a selenium detector,’’ Med. Phys21,509–516~1994!.
2J. H. Launders, S. M. Kengyelics, and A. R. Cowen ‘‘A comprehensphysical image quality evaluation of a selenium based digital x-rayaging system for thorax radiography,’’ Med. Phys.25, 986–997~1998!.
3J. Rowlands and J. Yorkston ‘‘Flat panel detectors for digital radiogphy,’’ in Handbook of Medical Imaging, edited by SPIE~SPIE, 2000!,Vol. I, Chap. 4, p. 223–328.
4J. H. Siewerdsen, L. E. Antonuk, Y. El-Mohri, J. Yorkston, W. Huang,M. Boufry, and I. A. Cunningham, ‘‘Empirical and theoretical investigtion of the noise performance of indirect detection, active matrix flpanel imagers~AMFPIs! for diagnostic radiology,’’ Med. Phys.24,71–89~1997!.
5J. H. Siewerdsen, L. E. Antonuk, Y. El-Mohri, J. Yorkston, W. Huang, aI. A. Cunningham, ’’Signal, noise power spectrum, and detective qutum efficiency of indirect-detection flat-panel imagers for diagnosticdiology,’’ Med. Phys.25, 614–628~1998!.
6L. E. Antonuk, K. W. Jee, Y. El-Mohri, M. Maolinbay, S. Nassif, XRong, Q. Zhao, J. H. Siewerdsen, R. A. Street, and K. S. Shah, ‘‘Strgies to improve the signal and noise performance of active matrix,panel imagers for diagnostic x-ray applications,’’ Med. Phys.27, 289–306 ~2000!.
7E. Samei, M. J. Flynn, H. G. Chotas, and J. T. Dobbins ‘‘DQE of dirand indirect digital radiographic systems,’’ Proc. SPIE2001, 189–197~2001!.
8A. R. Cowen, O. F. Clarke, N. J. Coleman, D. M. Craven, S. McArdand G. A. Hay,Leeds X-ray Test Objects—Instruction Manual~MedicalPhysics Unit, University of Leeds, UK, 1992!.
9P. R. Granfors and R. Aufrichtig, ‘‘Performance of a 41341-cm2 amor-
Medical Physics, Vol. 30, No. 7, July 2003
a--
u-o-de,a-
ly
s
-
-
.
-
--
e-t-
t
,
phous silicon flat panel x-ray detector for radiographic imaging applitions,’’ Med. Phys.27, 1324–1331~2000!.
10C. E. Floyd, Jr., R. J. Warp, J. T. Dobbins III, H. G. Chotas, A.Baydush, R. Vargas-Voracek, and C. E. Ravin, ‘‘Imaging characterisof an amorphous silicon flat-panel detector for digital chest radiographRadiology218, 683–688~2001!.
11P. A. Armilli, ‘‘The physics of medical imaging: Recording system mesurements and techniques,’’ inAAPM Monograph No. 3, edited by A. G.Haus~American Institute of Physics, New York, 1979!, p. 105.
12J. M. Boone and J. A. Seibert, ‘‘An accurate method for computgenerating tungsten anode x-ray spectra from 30 to 140 kV,’’ Med. Ph24, 1661–1670~1997!.
13H. Fujita, J. Morishita, K. Ueda, D. Y. Tsai, A. Ohtsuka, and T. Fujikaw‘‘Resolution proprieties of computed radiographic system,’’ Proc. SP1090, 263–275~1989!.
14K. Stierstofer and M. Spahn ‘‘Self-normalizing method to measuredetective quantum efficiency of a wide range of x-ray detectors,’’ MPhys.26, 1312–1319~1999!.
15D. S. Evans, A. Workman, and M. Payne, ‘‘A comparison of the imagproprieties of CCD-based devices used for small field digital mammraphy,’’ Phys. Med. Biol.47, 117–135~2002!.
16A. Workman and A. R. Cowen, ‘‘Signal, Noise and SNR transfer propeties of computed radiography,’’ Phys. Med. Biol.38, 1789–1808~1993!.
17J. P. Moy and B. Bosset, ‘‘How does real offset and gain correction afthe DQE in images from x-ray flat detectors?’’ Proc. SPIE3659 ~1999!.
18A. Cunningham, ‘‘Applied linear-system theory’’Handbook of MedicalImaging ~SPIE, 2000!, edited by SPIE, Vol. I, Chap. 2, pp. 79–159.
19K. A. Fetterly and N. J. Hangiandreou, ‘‘Effects of x-ray spectra on tDQE of a computed radiography system,’’ Med. Phys.28, 241–249~2001!.
20R. Aufrichtig, ‘‘Comparison of low contrast detectability between a digtal amorphous silicon and a screen-film based imaging system forracic radiography,’’ Med. Phys.26, 1349–1358~1999!.
21N. W. Marshall ‘‘Optimisation of dose per image in digital imaging,Radiat. Prot. Dosim.94, 83–87~2001!.
22X. J. Rong, C. C. Shaw, X. Liu, M. R. Lemacks, and S. K. Thompso‘‘Comparison of an amorphous silicon/cesium iodide flat-panel digchest radiography system with screen/film and computed radiograsystem—A contrast-detail phantom study,’’ Med. Phys.28, 2328–2335~2001!.
23H. G. Chotas and C. E. Ravin, ‘‘Digital chest radiography with a solstate flat-panel x-ray detector: Contrast-detail evaluation with procesimaged printed on film hard copy,’’ Radiology218, 679–682~2001!.
24IEC 61223-2-5, Evaluation and routine testing in medical imagdepartments—Part 2–5: ‘‘Constancy tests—Image display devices, Innational Commission on Illumination’’ Commission Internationalel’Eclairage ~CIE!, CIE Central Bureau, Kegelgasse 27, A-1030, WieAustria, 1994.
25A. Rose,Vision, Human and Electronic~Plenum, London, 1973!.26G. W. Snedecor and W. G. Cochran,Statistical Methods~The Iowa State
University Press, Iowa, 1967!, Chap. 4.27W. Zhao, I. Blevis, S. Germann, J. A. Rowlands, D. Waechter, and
Huang, ‘‘Digital radiology using active matrix readout of amorphous slenium: Construction and evaluation of prototype real-time detectoMed. Phys.24, 1834–1843~1997!.
28U. Neitzel ~Philips! ~private communication!.
Copyright © 2022 FDOKUMEN