on-farm phenotypic characterization and performance - CORE
147
i ON-FARM PHENOTYPIC CHARACTERIZATION AND PERFORMANCE EVALUATION OF ABERGELLE AND CENTRAL HIGHLAND GOAT BREEDS AS AN INPUT FOR DESIGNING COMMUNITY-BASED BREEDING PROGRAM MSc Thesis ALUBEL ALEMU January, 2015 Haramaya University
-
Upload
khangminh22 -
Category
Documents
-
view
0 -
download
0
Transcript of on-farm phenotypic characterization and performance - CORE

i
ON-FARM PHENOTYPIC CHARACTERIZATION AND PERFORMANCE
EVALUATION OF ABERGELLE AND CENTRAL HIGHLAND GOAT
BREEDS AS AN INPUT FOR DESIGNING COMMUNITY-BASED
BREEDING PROGRAM
MSc Thesis
ALUBEL ALEMU
January, 2015
Haramaya University

ii
ON-FARM PHENOTYPIC CHARACTERIZATION AND PERFORMANCE
EVALUATION OF ABERGELLE AND CENTRAL HIGHLAND GOAT
BREEDS AS AN INPUT FOR DESIGNING COMMUNITY-BASED
BREEDING PROGRAM
A Thesis Submitted to the
School of Animal and Range Sciences, School of Graduate Studies
HARAMAYA UNIVERSITY
In Partial Fulfillment of the Requirements for the Degree of MASTER
OF SCIENCE IN AGRICULTURE (ANIMAL GENETICS AND
BREEDING)
By
Alubel Alemu
January, 2015
HaramayaUniversity

iii
SCHOOL OF GRADUATE STUDIES
HARAMAYA UNIVERSITY
As Thesis Research advisors, we hereby certify that we have read and evaluated this thesis
prepared under our guidance by Alubele Alemu entitled On-Farm Phenotypic
Characterization and Performance Evaluation of Abergelle and Central Highland Goat
Breeds as an Input for Designing Community-Based Breeding Program. We recommend
that it be submitted as fulfilling the Thesis requirement.
Dr. TADELLE DESSIE ________________ _____________
Major Advisor Signature Date
Dr. YOSEPH MEKASHA _________________ ___________
Co-advisor Signature Date
As member of the Board of Examiners of the M.Sc. Thesis Open Defense Examination, We
certify that we have read, evaluated the Thesis prepared by Alubel Alemu, and examined the
candidate. We recommend that the Thesis be accepted as fulfilling the Thesis requirement for the
Degree of Master of Science in Agriculture (Animal Genetics and Breeding).
Tesema Zewdu (PhD) __ 16th January 2015
Chairperson Signature Date
Prof. A.K. Banerjee _________________ 16th January 2015
Internal Examiner Signature Date
Solomon Abegaz (PhD) _________________ 16th January 2015
External Examiner Signature Date

iv
DEDICATION
I dedicate this Thesis manuscript to all of my family members especially to my grandmother
Emahoy YALGANESH TAFETE (R.I.P.), my elder sister W/ro MISANESH ALEMU, my
elder brother Ato MESAFINT ALEMU and my lovely wife W/ro ELSA AMARE (Elsi).

v
STATEMENT OF AUTHOR
First, I declare that this thesis is my bonafide work and that all sources of materials used for this
thesis have been duly acknowledged. This thesis has been submitted in partial fulfillment of the
requirements for MSc. degree at Haramaya University and is deposited at the University Library
to be made available to borrowers under rules of the Library. I solemnly declare that this thesis is
not submitted to any other institution anywhere for the award of any academic degree, diploma,
or certificate.
Brief quotations from this thesis are allowable without special permission provided that accurate
acknowledgement of source is made. Requests for permission for extended quotation from or
reproduction of this manuscript in whole or in part may be granted by the Head of the School of
Animal and Range Science or the Dean of School of Graduate Studies when in his or her
judgment the proposed use of the material is in the interests of scholarship. In all other instances,
however, permission must be obtained from the author.
Name: Alubel Alemu Signature:
Place: Haramaya University, Haramaya
Date of Submission January, 2015

vi
BIOGRAPHICAL SKETCH
The author of this thesis, Mr. Alubel Alemu, was born on September 22, 1986 at Libo Kemkem
District, South Gondar Zone, Amhara Regional State, Ethiopia from his father Ato Alemu
Habesha and his mother W/ro Wubalem Kassie.
He attended his primary education at Ambo Meda Elementary School; and his secondary
education at Addis Zemen Senior Secondary School. He then joined Jimma University, College
of Agriculture and Veterinary Medicine (JUCAVM) in the department of Animal Production and
health in 2002 and awarded a B.Sc. degree in Agriculture (Animal Production and health) in
June 2007.
Soon after graduation, the author was recruited by Amhara Regional Agricultural Research
Institute (ARARI), and served as Junior Researcher I, Junior Researcher II and Assistant
Researcher I for three and half years. Then in October 2011, he joined the School of Graduate
Studies (SGS) of Haramaya University to pursue his MSc. study in Animal Genetics and
Breeding in the School of Animal and Range Sciences.

vii
ACKNOWLEDGEMENTS
In the first place and above all I would like to thank the Almighty GOD with his mother St.
Virgin MARY for his absolute protection and mercifulness.
I would like to express my deepest and sincere gratitude to my major advisor Dr. Tadelle Dessie
for his guidance, constructive criticism and all round support from the initial proposal
development stage up to the completion of this thesis work. In addition to his professional
support, I always admire his positive thinking and democratic way of leadership quality while I
was in ILRI-Addis (more than a year) working together with his research team members
(drivers, office administrative and secretary, PhD students, consultants, research assistances and
MSc students). I have learnt a lot from you. Thank you very much for everything you did. I am
also grateful to my co-advisor Dr. Yoseph Mekasha for his excellent guidance and comments. I
am very much impressed by your kind approach, treatment and genuine behavior. Thank you.
I would like to thank Amhara Regional Agricultural Research Institute (ARARI) for providing
me study leave and salary during the study period. I am grateful to Biosciences eastern and
central Africa-International Livestock Research Institute (BecA-ILRI) for sponsoring this study
by providing research costs, sideline capacity building trainings, office, library and stipend. I am
thankful to Ziquala, Tanqua Abergelle and Lay Armachiho districts goat keepers and respective
agricultural and rural development offices staffs for their nice co-operation and participation. I
am also thankful to all of the staffs of Sekota Dry Land Agricultural Research Center (SDARC),
Gondar Agricultural Research Center (GARC) and Abergelle Agricultural Research Centre
(AARC) for their unreserved co-operation. I would like to appreciate the Department Graduate
Committee (DGC) of Animal Sciences and the School of Graduate Studies of Haramaya
University for their comments and provision of various services.
I would like to thank Eshetu Zerihun, Michael Temesgen (from ILRI), Adane Eshetu, Dr. Abebe
Tesfaye, Tesfey G/Mariam (from SDARC), Melese Tigabu (from Ziquala agricultural and rural
development office), Shumye Belay, Dr. Mulalem Zenebe, Minister Birhanie, Hailay agos, Desta
Tekle (from AARC), Israel Adane, Teshome Wondie, Belete Shimelash (from GARC) and

viii
Moges Genet, Yenus Mohammed, Alemyirga Nigus, (from Lay Armachiho agricultural and rural
development office) for their unreserved help and participation during data collection.
My appreciation and heartfelt thanks goes to the focal persons of the respective agricultural
research center animal breeding and genetics researchers for their unreserved and perfect
supervision of enumerators for the on-farm performance evaluation and monitoring work. I
thank you Bewuketu Amare, Minister Birhanie, Dr. Guesh Abay, Alayu Kidanie and Dr.
Solomon Abegaz. I am also thankful to enumerators Maru, Tamto, Beyene, Kassay and
Gizachew for your commitment and understanding the value of research data. Thank you.
I would like to express my heartfelt thanks to Rahel Misganew, Tigist Endeshaw, Yetinayet
Mamo, Wondimeneh Esatu, Tatek Woldu, Temesgen Jenberie, Getinet Mekuriaw, Grum
Gebreyesus, Hulunim Gatew, Netsanet Zergaw for your academic and social experiences
sharing, supports, comments, the funs we had during my stay in ILRI Addis. Thank you.
Last but not least, I thank you Selamawit Demeke, Adino Worku, Birhanu Tereda, Dr. Fikirte
Gebrie, Tigab Mamo, Ayda Tegenu, G/Hana Girmay, Aemro Bezabih and Tikunesh Zelalem for
your contribution and help.
Finally, to complete this paper so many people were involved directly or indirectly which is
impossible to list out all. So I want to extend my thanks and cordial appreciations to all.

ix
ACRONYMS AND ABBERVIATIONS
AARC Abergelle Agricultural Research Centre
ADWG Average Daily Weight Gain
AIC Akaike Information Criteria
AnGR Animal Genetic Resources
ANRS Amhara National Regional State
ARARI Amhara Regional Agricultural Research Institute
BIC Bayesian Information Criteria
BL Body Length
BW Body Weight
CG Chest Girth
CSA Central Statistical Authority
DNA Deoxyribonucleic Acid
EL Ear Length
FAnGR Farm Animal Genetic Resource
FAO Food and Agriculture Organization of the United Nation
FMD Foot and Mouth Disease
GARC Gondar Agricultural Research Center
GLM General Linear Model
GPS Global Positioning System
HL Horn Length
HW Height at Withers
IBC Institute of Biodiversity Conservation
ILCA International Livestock Center for Africa
ILRI International Livestock Research Institute
Lk Livestock
masl meter above sea level
NA Not available
NGO Non Governmental organization
NRC National Research Council

x
ACRONYMS AND ABBERVIATIONS (Continued)
PA Peasant Association
PPI Pair of Permanent Incisor
PPR Pest des Petit, Ruminants
PW Pelvic Width
R2 Coefficient of Determination
RL Rump Length
RMSE Root Mean Square Error
SAS Statistical Analysis System
SC Scrotum Circumference
SDARC Sekota Dry Land Agricultural Research Center
SE Standard Error
SERA Strengthening Emergency Response Abilities
SNNPR Southern Nations Nationalities and Peoples Region
SPSS Statistical Package for Social Science
X2 Chi Square

xi
TABLE OF CONTENTES
STATEMENT OF AUTHOR V
BIOGRAPHICAL SKETCH VI
ACKNOWLEDGEMENTS VII
ACRONYMS AND ABBERVIATIONS IX
TABLE OF CONTENTES XI
LIST OF TABLES XIV
LIST OF FIGURES XVI
TABLES IN APPENDIX XVII
ABSTRACT XVIII
1. INTRODUCTION 1
2. LITERATURE REVIEW 4
2.1. Origin and Domestication of Goats 4
2.2. Goat Breeds in Ethiopia 52.2.1. Indigenous goat breeds (populations) 52.2.2. Exotic goat breeds in Ethiopia 6
2.3. Goat Flock Demography 6
2.4. Goat Production Systems 7
2.5. Socio-Economic Importance of Goat Production 8
2.6. Characterization of Farm Animal Genetic Resources (AnGR) 92.6.1. Phenotypic characterization 92.6.2. Genetic characterization 10
2.7. Productivity of Indigenous Goat Breeds 10

xii
TABLE OF CONTENTES (continued)
2.7.1. Reproductive performance 102.7.2. Productive performance 11
2.8. Community-Based Goat Genetic Improvement Strategy in Ethiopia 13
2.9. Research Gap in the Study Area 14
3. MATERIALS AND METHODS 15
3.1. Study Areas 15
3.2. Study Site Selection 18
3.3. Data Types and Methods of Data Collection 193.3.1. Stakeholders meeting 203.3.2. Questionnaire and group discussion 203.3.3. Body measurements and observations 213.3.4. On-farm performance evaluation and monitoring 21
3.4 Data Management and Analysis 223.4.1. Questionnaire and group discussion 223.4.2. Body measurement and observation 233.4.3. On-farm performance evaluation and monitoring 25
4. RESULTS AND DISCUSSIONS 26
4.1. General Household Information 264.1.1. General socioeconomic characteristics 264.1.2. Family size, land and livestock holding 274.1.3. Crop and livestock farming system 30
4.2. Goat Flock Structure and Management 31
4.3. Goat Production Objective 35
4.4. Milk Production 36
4.5. Labor division for the routine goat Husbandry activities by the household 38
4.6. Feed and Feeding Management 434.6.1. Major goat feed sources and browsing/grazing management 434.6.2. Major crop residues 444.6.3. Major forage plant species 45

xiii
TABLE OF CONTENTES (continued)
4.7. Herding and Herd Management 474.7.1. Herding 474.7.2. Water sources and watering 484.7.3. Types of houses and Housing system 50
4.8. Major Goat Diseases 52
4.9. Indigenous Knowledge of Goat Breeding and Management Practices 554.9.1. Breeding male 554.9.2. Breeding female 58
4.10. Goat Marketing 60
4.11. Goat production constraints 61
4.12. Characterization of Abergelle and Central Highland Goats 624.12.1. Qualitative characters 624.12.2. Live body weight and linear body measurements 694.12.3. Correlation between body weight and other linear body measurements 724.12.4. Prediction of body weight from different linear body measurements 73
4.13. On-Farm Performance Evaluation and Monitoring 764.13.1. Base (initial) flock profile 764.13.2. Flock dynamics 774.13.3. Birth weight and growth performance of Abergelle and Central Highland goats 82
4.13.3.1. Average weight of birth, three, six and nine months 824.13.3.2. Average daily weight gain (g) 86
4.13.4. Milk production performance of Abergelle goats 90
5. SUMMARY, CONCLUSIONS AND RECOMMENDATIONS 93
5.1. Summary 93
5.2. Conclusions and Recommendations 96
6. REFERENCES 98
7. APPENDICES 107

xiv
LIST OF TABLES
Table 1. Distribution of documented indigenous goat breeds/types in Ethiopia ............................5Table 2. Classification of small ruminant production types and systems in tropical Africa...........7Table 3. Linear body measurements in adult females of indigenous goat breeds .........................12Table 4. Average milk off-take (liters per day) of goat by agro-ecological zones, livestock
densities and production systems...........................................................................................13Table 5. Total number of livestock populations in each district ...................................................18Table 6. Total number of PAs, households and human populations in each district ....................18Table7. Number (N) and percentage (%) of households per Sex, position in the household,
educational background, age and marital status of the respondents in the study districts .....26Table 8. Mean ±SD family size (n), land holding (ha) and livestock holding (n) per household by
districts ...................................................................................................................................29Table 9. Food, cash income sources and livestock contribution for food and cash income .........31Table 10. Number and Mean (±SD) of each of goat classes by district ........................................33Table 11. Ranking of goat production objectives by districts .......................................................36Table 12. Mean ±SD of milk yield (liter), lactation length (months) and weaning age (months)
by district ...............................................................................................................................37Table 13. Labor division for the routine goat husbandry activities by the household in Ziquala
district ....................................................................................................................................40Table 14. Labor division for the routine goat husbandry activities by the household in Tanqua
Abergelle district....................................................................................................................41Table 15. Labor Labor division for the routine goat husbandry activities by the household in
Lay-Armachiho district ..........................................................................................................42Table 16. Ranking of goat feed sources by district in wet and dry seasons..................................44Table 17. Major crop residues used for goat feed supplementation in Ziquala and Tanqua
Abergelle districts ..................................................................................................................45Table 18. Major forage plant species for goats in Ziquala district ................................................46Table 19. Major forage plant species for goats in Tanqua Abergelle district ..............................46Table 20. Major forage plant species for goats in Lay Armachiho district ...................................46Table 21. Goat herding Practices in Ziquala, Tanqua Abergelle and Lay Armachiho districts (by
% of respondents within districts)..........................................................................................48Table 22. Source of water, distance to the nearest watering point and frequency of watering for
adult goat in dry and wet seasons by district (by % of respondents within districts) ............49Table 23. Types of goat houses and Housing materials in Ziquala, Tanqua Abergelle and Lay
Armachiho districts ................................................................................................................51Table 24. Major goat diseases in Ziquala district..........................................................................53Table 25. Major goat diseases in Tanqua Abergelle district .........................................................53Table 26. Major goat diseases in Lay Armachiho district.............................................................54Table 27. Selection criteria for breeding buck in the study districts .............................................56

xv
LIST OF TABLES (continued)
Table 28. Selection criteria for breeding doe in the study districts ...............................................58Table 29. Index values of occurrences of births across twelve months ........................................59Table 30. Ranking of classes of goats to be sold when cash is needed.........................................61Table 31. Ranking of the main constraints for goat production in the study districts ..................62Table 32. Number (N) and percentages (%) of qualitative traits in Abergelle and Central
Highland goats .......................................................................................................................65Table 33. Number (N), Least square mean (LSM)± Standard error (SE) of body weight (kg) and
body measurements (cm) by breed, sex, and their interactions .............................................70Table 34. Correlations between body weight and other linear body measurements .....................72Table 35. Models for prediction of live weight from different linear body measurement for
Abergelle and Central Highland goats ...................................................................................75Table 36. Base flock structure by district......................................................................................77Table 37. Entries and exits of goats in the monitored villages by districts ...................................78Table 38. Least square means (±SE) birth, three, six and nine month weights (kg) for Abergelle
and Central Highland .............................................................................................................84Table 39. Least square means (±SE) of daily weight gain (g) for Abergelle and Central Highland
goat breeds by sex, parity and birth type ...............................................................................89Table 40. Least square means (±SE) of milk yield (ml) across parity, season, district and season
by district interactions for Abergelle goats ............................................................................92

xvi
LIST OF FIGURES
Figure 1. Map of the study areas ...................................................................................................15Figure 2. Major food crops in the study districts by percent of respondents involved in the
production ..............................................................................................................................30Figure 3. Traditional suckling control methods in Ziquala (a) and Tanqua Abergelle (b) districts
................................................................................................................................................38Figure 4. Goat houses in Ziquala (a) and Tanqua Abergelle (b) ...................................................50Figure 5. Buck castration in Ziquala(a) and Lay Armachiho(b) districts .....................................57Figure 6. Sample flock, female and male goat in the study areas .................................................63Figure 7. Different ‘liybia’ goats in Abergelle goat breed ............................................................64Figure 8. Associations (relations) among different categories of qualitative traits using multiple
correspondence analysis technique ........................................................................................68Figure 9. Inflow pattern across a year by sex and age in the study districts (a, b and c) ..............81Figure 10. Outflow pattern across a year by sex and age in the study districts (a, b and c) .........81Figure 11. Growth trends (birth to nine months) of male, female and the averages of both sexes
for Abergelle goats (at Ziquala and Tanqua Abergelle districts) and Central Highland goats(at Lay Armachiho district)....................................................................................................87
Figure 12 Least square means of daily weight gain trends (birth to nine months) of male, femaleand the averages of both sexes for Abergelle goats (at Ziquala and Tanqua Abergelledistricts) and Central Highland goats (at Lay Armachiho district)........................................87
Figure 13. Milk yield trends across lactation weeks (1st week lactation up to 12th week lactation)in Ziquala and Tanqua Abergelle districts .............................................................................91

xvii
TABLES IN APPENDIX
Appendix Table 1. Goat outflow pattern across a year by sex and age in Ziquala .....................123Appendix Table 2. Goat outflow pattern across a year by sex and age in Tanqua Abergelle ....123Appendix Table 3. Goat outflow pattern across a year by sex and age in Lay Armachiho .......124Appendix Table 4. Goat inflow pattern across a year by sex and age in Ziquala ......................124Appendix Table 5. Goat inflow pattern across a year by sex and age in Tanqua Abergelle .....124Appendix Table 6. Goat inflow pattern across a year by sex and age in Lay Armachiho .........125Appendix Table 7. Analysis output of GLM ANOVA for different linear body measurements of
Abergelle and Central Highland goat breeds for the effect of breed, sex and breed by sexinteractions ...........................................................................................................................125
Appendix Table 8. Analysis output of GLM ANOVA for growth traits of Abergelle goat inZiquala district monitoring site for the effect of sex, parity and birth type .........................127
Appendix Table 9. Analysis output of GLM ANOVA for growth traits of Abergelle goat inTanqua Abergelle district monitoring site for the effect of sex, parity and birth type ........127
Appendix Table 10. Analysis output of GLM ANOVA for growth traits of Central Highland goatin Lay Armachiho district monitoring site for the effect of sex, parity and birth type ........128

xviii
ON-FARM PHENOTYPIC CHARACTERIZATION AND PERFORMANCE
EVALUATION OF ABERGELLE AND CENTRAL HIGHLAND GOAT
BREEDS AS AN INPUT FOR DESIGNING COMMUNITY-BASED
BREEDING PROGRAM
ByAlubel Alemu: BSc in Animal Production and health, Jimma University
Major Advisor: Tadelle Dessie (PhD)
Co-Advisors: Yoseph Mekasha (PhD)
ABSTRACT
The objectives of this study were to describe the production environment and productionsystems, characterize (phenotypic) and evaluate on-farm performances of Abergelle and CentralHighland goat breeds. A total of 256 farmers in Ziquala (68), Tanqua Abergelle (70) and Lay-Armachiho (118) districts were interviewed for the household survey. Data for qualitative andquantitative characters were collected from a total of 640 4PPI age category goats (143 fromZiquala and 183 from Tanqua Abergelle districts on Abergelle goat breed and 314 from LayArmachiho district on Central Highland goat breed). Base flock, flock dynamics, birth andgrowth weight, milk yield data recordings were taken from mid July 2013 up to mid August 2014for on-farm performance evaluation. Data collected through questionnaire (survey) weredescribed by descriptive statistics using SPSS. Observations on qualitative traits were analyzedfor male and female goats separately using frequency procedure of SAS. Whereas, quantitativetraits were analyzed using the GLM procedures of SAS. Individual interviews and groupdiscussions made in all of the three districts indicated that all of the farmers practiced both cropand livestock production. The first objective of keeping goat in all districts was to get cashincome. Unlike Lay Armachiho district, all goat keepers in Ziquala and Tanqua Abergelledistricts reported that they milk their goats. From the current survey result milk yield(mean±SD)/doe/day (liter) in the rainy and in the dry seasons in Ziquala district were 0.43±0.24and 0.15±0.14 respectively. The corresponding values for Tanqua Abergelle district were0.48±0.24 and 0.19±0.29 respectively. The actual on-farm milk yield (mean±SE) monitoringresult in Ziquala district in wet and dry seasons were 285.42±5.64 and 243.12±9.92milliliter/doe/day respectively. The corresponding values for Tanqua Abergelle district were452.68±6.15 and 362.03±9.19 milliliter/doe/day respectively. Communal natural pasture andriver water were the major sources of goat feeding and watering respectively both in dry and wetseasons in each of the three districts. Among the interviewed goat keepers in the study districts97.1% in Ziquala, 98.7% in Tanqua Abergelle and 66.8% in Lay Armachiho had their ownindigenous breeding male goat. Coat color, body conformation and growth rate were the first,

xix
second and third selection criteria for breeding buck respectively in Ziquala and TanquaAbergelle districts. The corresponding values for Lay Armachiho district were bodyconformation, growth rate and coat color. The first preferred trait for does was milk yield inZiquala and Tanqua Abergelle districts and body conformation in Lay Armachiho district.Drought, disease and feed shortage were the first, second and third major constraintsrespectively for goat production in Ziquala and Tanqua Abergelle districts. The correspondingvalues for Lay Armachiho district were disease, theft and predator. Majority of Abergelle goatcoat color was brown/red (30.40%) and its combination with other coat colors (50.61%),whereas relatively high proportion of Central Highland goat had white coat color (21.66) andits combination with other coat colors (55.09 %). There were very high significant differences(at least P<0.01) across breeds in all body measurements except (p>0.05) rump length andpelvic width. From all the measurements compared, Central Highland goat had higher valuesexcept rump length, pelvic width and horn length. In general, males showed highermeasurements than females and the interaction between sex and breed significantly (at leastp<0.05) affected all the parameters measured. Least square means (±SE) of body weight (kg) forAbergelle males and females at 4PPI were 30.75±0.60 and 24.30±0.32 respectively. Thecorresponding values for Central Highland goats were 34.79±0.73 and 33.11±0.31 respectively.The average flock size per monitored households in Ziquala, Tanqua Abergelle and LayArmachiho districts were 27.33±1.88, 19.18±1.32 and 13.79± 9.41 goats respectively. Theoverall least square means (±SE) for birth, three, six and nine month weights (kg) of Abergellegoat kids at Ziquala district monitoring site were 1.98± 0.06, 7.30± 0.21, 9.25±0.31 and11.21±0.53 respectively. For the same breed at Tanqua Abergelle district monitoring site for theabove age categories (in kg) were 1.97± 0.06, 7.43± 0.23, 11.08±0.33 and 13.24±0.55respectively. The corresponding values for Central Highland goats in Lay Armachiho districtmonitoring site were 2.31±0.04, 10.67± 0.17, 17.53±0.24 and 22.66±0.44 respectively. Asrecommendation, further cluster studies should be conducted on Central Highland goat breedfor the uniformity or dissimilarity of goats for the areas delineated by FARM Africa (1996).Abergelle goat keepers traditionally believe that ‘liybia’ goat is prolific and productive due toespecial gene it has. This traditional knowledge should be scientifically proved or disprovedwhether this goat genetic makeup is significantly different or similar with other ordinary goatsin the same goat breed.
Key words: Phenotypic characterization, Production environment, goat production, On-farm
goat performance evaluation, Abergelle and Central Highland goat breeds

1
1. INTRODUCTION
Ethiopia is endowed with abundant livestock resources of varied and diversified genetic pools
with specific adaptations to a wide range of agro-ecologies. Farm animals as a whole are an
integral part of the country’s agricultural system and are raised both in the Highland and lowland
areas. Similarly, the habitats of the indigenous goat breeds extend from the arid lowlands (the
pastoral and agro-pastoral production system) to the humid Highlands (mixed farming systems)
covering even the extreme tsetse-infested areas of the country (Workneh, 1992).
The country is home for diverse indigenous goat populations, numbering 24.06 million heads
(CSA, 2013) parallel to its diverse ecology, production systems and ethnic communities. Goat in
Ethiopia is a among neglected farm animals in agricultural research and development programs.
Apart from limited experiences of FARM Africa (1996) in crossbreeding of local goats with
exotic dairy goats for improved milk production in the Hararghe Highlands and the SNNPR,
there has been no organized goat improvement program in the country (Azage et al, 2010).
These goat populations are phenotypically classified into 13 distinct major breed types or
populations (DAGRIS, 2007). However, genetic/molecular characterization revealed only the
presence of eight distinctively different breed types or populations in the country (Tesfaye,
2004). According to this author, the eight distinct genetic entities include Arsi-Bale, Gumez,
Keffa, Woyto-Guji, Abergelle, Afar, Highland goats (previously separated as Central and North-
West Highland) and the goats from the previously known as Hararghe Highland, Short-eared
Somali and Long-eared Somali.
In developing regions, populations of livestock of the same species, especially if they are
geographically isolated and recognized by ethnic owners as being distinct from others around
them, are traditionally recognized/considered as distinct eco-types or breeds (Solomon et al,
2011). Abergelle goat types are widely distributed along the Tekeze River in Southern Tigray
(Tembien and Inderta), Waghimra, Raya Azebo, and North Gondar (Simien). These goats are
kept by the Agew and Tigray ethnic groups. Central Highland goats are mainly found in the
Central Highlands, west of the Rift Valley, Wollo, Gondar and Shoa (FARM Africa, 1996).

2
Breed characterization has a paramount importance for efficient utilization and conservation of
farm animal genetic resources. Absence of adequate information on the characteristics of breeds
potentially leads to miss decision and genetic erosion through cross breeding, replacement and
dilution (Zewdu, 2008).
Characterization of Farm Animal Genetic Resources (FAGR) encompasses all activities
associated with the identification, quantitative and qualitative description, and documentation of
breed populations and the natural habitats and production systems to which they are or are not
adapted. The aim is to obtain better knowledge of FAGR, of their present and potential future
uses for food and agriculture in defined environments, and their current state as distinct breed
populations (FAO, 1984; Rege, 1992)
There are two types of breed characterization: phenotypic and genotypic characterization. The
genetic relationship between breeds can be quantified by estimating allelic frequencies from
biochemical or DNA analysis (NRC, 1993). The classical description of breeds (coat color,
horns, tail type, etc.) is based upon phenotype. Phenotypic characterization can be
complementary to the powerful biotechnological tools for measuring genetic diversity at the
level of the genome. Characterization tools range from simple descriptions of traditional
livestock populations to a highly sophisticated molecular genetics tools (Solomon et al, 2011).
Characterization activities should contribute to objective and reliable prediction of animal
performance in defined environments, so as to allow a comparison of potential performance
within the various major production systems found in a country or region. It is, therefore, more
than the mere accumulation of existing reports (FAO, 2007).
Performance recording is an important tool to suggest the breeding policy for a given area.
However, recording in general is hardly practiced in any livestock species in the country, to
identify the performance and management gaps (Awigichew, 2000; Tibbo, 2006). Thorough
monitoring of the productive, reproductive and economic performance of small ruminants and
their existing level of integration with crop production and other livestock keeping is required to
capture a full picture of their contribution and thereby verifying possible intervention areas
(Getahun, 2008).

3
Very often, the results obtained from on-station research are of little relevance to traditional
production systems and may not contribute much towards understanding of the specific
adaptation of animals to farmer’s conditions (Rey et al., 1992). One further attraction of on-farm
performance study is that it provides information in location specific production conditions that
could lead to breed improvement options that are appropriate to the system (ILCA, 1987; Rey et
al., 1992). However, unlike on-station experiments, on-farm study is influenced by many factors
which could not be controlled.
Despite its significance in terms of milk, meat, cash income and skin production, research on
Abergelle goat breed has been scant (Belay, 2008). Moreover information on the central
Highland goat is very limited. Thus characterizing these goat genetic resource and evaluation of
their performance in their existing production environment is very useful to plan different
developmental strategies like community-based genetic improvement program and others.
Therefore, the objectives of this study were:
1. To characterize (phenotypic) Abergelle and Central Highland goat breeds in their
existing production environments.
2. To describe the production environment and their production systems as an input for
designing community-based goat genetic improvement program.
3. To evaluate and document on-farm performances of Abergelle and Central Highland goat
breeds to plan appropriate breeding strategy and other developmental issues in the future.

4
2. LITERATURE REVIEW
2.1. Origin and Domestication of Goats
Taxonomically the domestic goats (Capra hircus) belong to the order Artiodactyla, suborder
Ruminantia, family Bovidae and tribe Caprini. Goats are divided into two genera: Capra and
Hemitragus. As cited by Tesfaye (2004), the genus Capra is divided into eight species (Ansell in
Meester and Setzer, 1977; Corbet, 1978; Alados, 1985b): C. aegagrus, C. hircus, C. ibex, C.
walie, C. caucasica, C. cylindricornis, C. pyrenaica, C. falconeri. (http: //www. press. jhu. edu
/books/walkers mammals_of_the_world/artiodactyla/artiodactyla.bovidae.capra.html)
Domestication of goats is considered to have occurred in the mountainous area of western Asia
between the 7th and 9th millennium B.C. (Epstein, 1971; Devendra and Burns, 1983). The origin
of domestic goats remain uncertain and controversial, however, archaeological evidence suggests
that were probably first domesticated in the Fertile Crescent region of the Near East possibly
first in the Zagros Mountains area 10,000 years ago (Zeder and Hesse, 2000). The Bezoar (Capra
aegagrus) is thought to be the progenitor of the domestic goat.
It is believed that by the 5th millennium B.C. goats had reached Egypt and by about 3500 BC
goats with spiral or corkscrew horns entered Egypt from the Middle East. From Egypt the goats
moved to the South and West part of the African continent.
Goats in Africa have traditionally been divided into three main families the Dwarf goats of West
and Central Africa, the Savannah goats of sub-Saharan Africa and the Nubian type goat of
Northern Africa (Epstein, 1971; Wilson, 1991). Generally, goats of sub-Saharan Africa are
divided into three major types following their morphology; the long lop-eared type in north east
and southern Africa, the small short-eared type dominant in eastern Africa and the dwarf short-
eared type of West Africa. Most tropical goats were not well characterized both by genotype and
phenotype and can be called nondescript. However, there have been several attempts to assign
goats to breed/types based on such variables as origin, utility, body size, ear shape and ear length
(FARM Africa, 1996).

5
It is assumed that the first wave of goats entered Ethiopia from the north between 2000 and 3000
B.C. The ancestors of Ethiopian goats are closely associated with goat types which migrated
from the Middle East and North Africa.
2.2. Goat Breeds in Ethiopia
2.2.1. Indigenous goat breeds (populations)
Table 1. Distribution of documented indigenous goat breeds/types in Ethiopia
Breedgroupname
Breedname Synonym Distribution
Longearedgoats
Barka Bellenay, BeniAmer
Northern and northwestern Ethiopia near the border withEritrea and the Sudan
ShortearedSmall-horned
LongearedSomali
Digodi, Melebo,Boran Somali,Benadir, Gigwain
Rangeland of the southern Ogaden,Bale,Borana andSouthern Sidamo with the Somali and Borana Pastoralists
ShortearedSomali
Ogaden, Mudugh,Dighier,Abgal,Issa-Somali, Bimal
Northern and Eastern Ogaden and around Dire Dawa
WesternHighland Agew Highlands of Western Ethiopia (Gondar, Gojjam, Wollega
and Shoa)WesternLow land Gumuz Lowlands of Western Ethiopia (Metekel, Assosa, and
Gambella)Woyto-Guji
Woyto, Guji,Konso
North Omo, South Omo, Sidamo, Borana
Abergelle NA Southern Tigray, North Wollo, and North Gondar
ShortearedSmall-horned
Afar Adal, Assaorta,Denakil
Afar region and parts of Eritrea and Djibouti with the AfarPastoralists
Arsi-BaleArsi, Gishe,Sidama, Manta,Awarch
Arsi, Bale, Sidamo and western Hararghe Zones
CentralHighland Brown Goat, Kaye
Highland of Central Ethiopia from Tigray through Wollo,Gondar to Shoa
HarargheHighland Kotu-Oromo Highlands of eastern and western Hararghe
Keffa NA Keffa and adjoining parts of Kembata and Hadiya
Source: Asfaw and Tamrat, (2004), NA=not available

6
Information compiled on physical description and management system revealed that there are 14
goat types in Ethiopia and Eritrea (Farm-Africa, 1996). Almost all indigenous goat types in
Ethiopia (Table 1) fall under the general group of Short eared Small-horned goats found
throughout eastern, central and southern Africa. They inhabit all agro-climatic zones and
production systems in the areas. There is only one breed (the Barka) from a different breed
group, and it comes mainly from Eritrea (Asfaw and Tamrat, 2004). However, a recent genetic
characterization of Ethiopian goats by Tesfaye (2004) was inconsistent with this classification of
FARM Africa. Following the analysis of 15 microsatellite loci, the results indicate eight separate
genetic entities: the Arsi-Bale, Gumez, Keffa, Woyto-Guji, Abergalle, Afar, Highland Goats
(previously separated as Central and North West Highland) and the goats from the previously
known Hararghe, Southeastern Bale and Southern Sidamo provinces (Hararghe Highland, Short-
eared Somali and Long-eared Somali goats).
2.2.2. Exotic goat breeds in Ethiopia
Most of the goat breeds introduced to date have been dairy goats with the main purpose of
crossing with local goats to improve milk production in areas where goat milk is known to be
consumed (Alemu and Merkel, 2008). However, Very recently, Boer goat semen has been
imported from the United States of America for crossbreeding studies at the two Universities
(Haramaya and Hawassa) to improve meat production of local goats (IBC, 2004). Anglo-Nubian,
Boer, Saanen and Toggenburg goats are some of the important breeds that have been introduced
to Ethiopia (Alemu and Merkel, 2008).
2.3. Goat Flock Demography
Flock structure is the proportion in the flock of the different age and sex classes of goats. The
number of males and females in flocks and their ages are often used as an indicator of a
particular traditional management system in Africa (Wilson, 1986). Flock structure is also a
basis for calculating or forecasting flock productivity (ILCA, 1990). For instance, a relatively
low proportion of young stock in a flock would suggest that adult mortality is low or pre
weaning mortality is high, or the kidding percentage is low. Alternatively, it may mean that more
kids were sold during the year (Ibrahim, 1998). When the primary objective is to produce milk,

7
the proportion of females retained is usually higher than when the objective is to produce meat
(FARM Africa, 1996). A high proportion of castrates suggest that the system is likely to be
related to meat production objectives. For example, in low land goats of Ethiopia, the primary
objective is to produce milk and castrates with four pairs of incisors account for 0.5% of the total
flock, whereas for the Central Highland goats whose primary purpose is meat production and
sale in times of need the proportion of castrated male with four pairs of incisors is 2.2% (Nigatu,
1994).
2.4. Goat Production Systems
In Africa, it is possible to distinguish two major types of production systems. These are the
traditional systems and the modern ones. The two groups differ essentially in their use of the
main factors of production, with traditional systems using mainly land and labour while modern
systems also have large capital requirements and generally a lesser requirement for one or other
of the remaining factors (FAO, 1991).According to FAO (1991) Two principal criteria serve to
define traditional systems. The first is the degree of dependence of the household or the
production unit on livestock or livestock products either for household income or for food
supply. The second is the type of agriculture practiced in association with livestock production.
Table 2. Classification of small ruminant production types and systems in tropical Africa
Type System Macro-management Main productionfactors
Nutrient source
Traditional Pastoral Nomadic/Semisedentary Land RangeAgro-pastoral
Transhumant/Sedentary Land/Labour Range/Cropbyproducts
Agricultural Sedentary Labour/Land Crop byproducts/Householdwaste/Forage
Urban Sedentary Labour Householdwaste/Feed
Modern Ranching Sedentary Land/Capital Range/ForageFeedlot Sedentary Capital/Labour Feed/ForageDairy farm Sedentary Capital/Labour/Land Feed/ForageStation Sedentary Land/Labour/Capital Range/Forage/Feed
Source: FAO, 1991

8
Sheep and goats are distributed in all agro-ecological zones of the country although the majority
of the sheep population is concentrated in the Highlands. The majority of the goat population is
found in large flocks in the arid and semi-arid lowlands. In pastoral and agro–pastoral production
systems, found in arid and semi-arid agro–ecological zones, goats are kept by nearly all
pastoralists, often in mixed flocks with sheep, freely grazing or browsing in the rangelands
(Yoseph, 2007).
2.5. Socio-Economic Importance of Goat Production
Goats are important for diversifying production, creating employment, increasing income,
building capital, contributing to human nutrition and reducing risk, in addition to their
quantifiable outputs of several products (Banerjee et al., 2000). The short generation interval of
sheep and goats coupled with high frequency of multiple births allow for rapid increases in
animal numbers. This builds financial capital and allows the sale of surplus animals for cash that
can be used for other agricultural enterprises, school fees, medical bills, etc (Alemu and Merkel,
2008). In the context of smallholder subsistence agriculture, the objectives of keeping goats go
beyond the products of meat, milk, fiber, manure and offspring, and include benefits in resource
use, socio-economic and socio-cultural functions (Jahnke, 1982).
Very often, there are no banking facilities in rural areas and an easy way to store cash for future
needs is through the purchase of sheep and goats. In fact, in some areas, small ruminants have
been described as the ‘village bank’. It has to be noted that this is beyond the cash value of the
animal (Alemu and Merkel, 2008).
Unlike market-oriented commercial farmers, subsistence livestock producers follow broad
production objectives that are driven more by their immediate subsistence needs rather than
demands of a market (Workneh et al., 2003). As subsistence goats are a low-cost and inflation-
proof alternative of saving, their value provides asset (financing) and security (insurance)
benefits at times of difficulty. Being small animal, compared to the big animals as cows its value
is not very high (Winrock International, 1992). This means keeping goats is not too risky and
restoration of the herd size is also quickly done. Little capital investment in buildings or other

9
materials is required for their upkeep, and space and maintenance requirements are low (Jahnke,
1982).
Sheep and goats contribute a quarter of the domestic meat consumption; about half of the
domestic wool requirements; about 40% of fresh skins and 92% of the value of semi-processed
skin and hide export trade. At optimum off take rates, Ethiopia can export 700,000 sheep and 2
million goats annually, and at the same time supply 1,078,000 sheep and 1,128,000 goats for the
domestic market. The current annual off take rate of sheep and goats is, however, only 33 and
35%, respectively (Alemu and Merkel, 2008).
2.6. Characterization of Farm Animal Genetic Resources (AnGR)
Characterization of indigenous breeds is a base for any breed or productivity improvement
programs. Characterization should include physical description, reproduction and adaptations,
uses, prevalent breeding system, population trends, predominant production system, description
of environments in which it is predominantly found and an indication of performance levels
(Workneh et al., 2004). There are two types of breed characterization: phenotypic and genotypic
characterization.
2.6.1. Phenotypic characterization
Phenotypic characterization of animal genetic resources for food and agriculture (AnGR) is the
practice of systematically documenting the observed characteristics, geographical distribution,
production environments and uses of these resources. The information provided by
characterization studies is essential for planning the management of AnGR at local, national,
regional and global levels (FAO, 2011).
In the developed world, livestock recording schemes provide a continuous source of data for
monitoring trends in the industry, including improved understanding of breeds and the
production system. Unfortunately, such structures are not available in most developing countries.
Here, designed, rapid, on-farm surveys can be useful for collecting basic (macro level)
information on production systems, population statistics of breeds, physical (or descriptive)

10
characteristics and performance levels-milk production, fertility, mortality, longevity, growth,
meat production etc.(Philipsson et al, 2011)
FAO (1986) published a comprehensive list of variables for describing the phenotypic and
genetic characteristics (descriptor lists) of FAnGRs as the basis for systematic phenotypic
characterization and to facilitate global valid comparison and classification of breeds within a
species. However, the organization had come to recognize that these descriptors were far too
complex for universal application (FAO, 2007).
2.6.2. Genetic characterization
Outcomes of morphological characterization need to be complemented by genetic
characterization (FAO 2007). Genetic characterization involves the description of breeds in
terms of the relative allelic frequencies, degree of polymorphism using a set of neutral reference
markers and classifying livestock breeds using genetic distances between populations/breeds
(Cavalli-Sforza and Edwards 1967; Nei 1972; Nei et al. 1983).
Genetic characterization tools included biochemical (protein) polymorphisms and molecular
polymorphisms. However, biochemical markers lack the power to resolve differences between
closely related populations because of low polymorphism (Meghen et al. 1994)
2.7. Productivity of Indigenous Goat Breeds
In sub-Saharan Africa the majority of sheep and goats are raised by smallholder farmers on a
small scale; profitability is low due to low market weight, overall low reproductive efficiency
and high mortality (Ibrahim, 1998).
2.7.1. Reproductive performance
Reproduction is a series of events (gamete production, fertilization, gestation, reproductive
behavior, kidding, etc.) that terminates when a young is born. Reproductive performance is a
prerequisite for any successful livestock production programme. Where farm resources are

11
severely limited as it is often the case in sub-Saharan Africa, reproduction failure is the first sign
of decreased productivity (Mukasa-Mugerwa et al., 2002).
Measures of reproduction commonly used in sheep and goats include age at puberty, age at first
lambing/kidding, post-partum interval, parturition interval and fertility indices (Alemu and
Merkel, 2008). On the other hand Ibrahim (1998) added some other reproductive efficiency
measuring parameters: fertility, prolificacy (litter size), fecundity (fertility x prolificacy) and
survival.
According to Alemu and Merkel (2008) the cause of reproductive failures in sheep and goat is
varied and often poorly understood. This depression of reproductive performance can be broadly
classified into:
Failure to mate;
Failure of fertilization in mated animals;
Loss during any stage of gestation (embryonic, fetal losses);
Neonatal mortality and subsequent loss occurring until the time of weaning
Flock reproductive rate also affects selection intensity and consequently the rate of genetic
improvement in all traits under selection. Poor reproductive performances of Ethiopian sheep
and goats can be associated with genetic factors, poor management, seasonal fluctuations in feed
resources and diseases (Mukasa-Mugerwa et al., 2002).
2.7.2. Productive performance
Growth performance
Growth is a very important characteristic of animals for meat production and it depends on
factors such as breed, sex, nutrition and other environmental conditions. Most of Ethiopian
goats’ adult body weight range from 25-40 kg (Peacock, 1996). Mukassa-Mugerwa et al. (1989)
stated that growth rate of goats in Ethiopia declined from 104 g/day at 3 months to 87 g/day, 65
g/day and 44 g/day at 6 , 12 and 24 months, respectively. The results of preliminary
classification by FARM Africa (1996) have shown that variation exits between indigenous goat
breeds for body weight traits. Table 3 shows some linear body measurements in matured adult
females of the indigenous goat breeds in Ethiopia.

12
Several studies in the tropics have shown that body weight in goats could be estimated from
chest girth measurement with fair accuracy (Badi et al., 2002; Slippers et al., 2000). These
findings are in line with the study conducted on the morphological characteristics of indigenous
goats in representative zones and districts of Amhara Region (Halima et al., 2012) that
correlation coefficients (r) between live weight and other body measurement traits were found
positive with the presence of highly significant (P<0.01) associations of body weight with heart
girth (r= 0.899) and body weight with body length (r=0.729) for west Amhara Region goat
populations’ (Gumuz, Begia-Medir and Agew goat ecotypes). The same author showed that
correlation coefficients (r) between live weight with heart girth (r= 0.823) and live weight with
body length (r=0.538) for the east Amhara Region goat populations (Bati, Abergelle and Central
Abregelle goats).
Table 3. Linear body measurements in adult females of indigenous goat breeds
BW = Body weight; WH = Wither height; CG = Chest girth; SD = Standard Deviation
Source: FARM Africa (1996)
Milk yield performance
Compared to cow milk, goat milk is richer in vitamins and minerals, so particularly appropriate
for the diet of the elderly, the sick and children (Devendra and Burns, 1983; Getahun, 2008). In
central rift valley, in eastern, south-eastern and north-eastern part of Ethiopia, goat milk is
Breed Parameters (Mean + SD)WH (cm) BW (kg) CG (cm)
Nubian 70.1 ± 3.4 34.1 + 5.4 74.3 + 3.8Barka (Begayit) 67.9 + 4.3 33.8 + 5.3 73.9 + 4.8Afar 60.9 + 3.3 23.7 + 3.4 67.4 + 3.8Abergelle 65.0 + 2.8 28.4 + 3.5 71.2 + 3.8Arsi-Bale 66.1 ± 3.5 30.4 ± 4.5 74.9 ± 4.0Woyto-Guji 66.4 ± 3.5 28.8 ± 5.0 72.5 ± 4.2Hararghe Highland 62.5 ± 3.5 29.1 ± 4.5 72.8 ± 4.5Short-eared Somali 61.8 ± 4.1 27.8 ± 6.0 70.4 ± 4.7Long-eared Somali 69.4 ± 3.3 31.8 ± 5.4 74.4 ± 4.0Central Highland 67.9 ± 3.2 30.1 ± 5.4 74.1 ± 4.4Western Highland 70.8 ± 4.7 33.0 ± 6.0 75.8 ± 4.5Western Lowland 63.5 ± 3.8 33.9 ± 6.9 75.9 ± 5.2Keffa 66.7 ± 4.0 28.2 ± 5.2 72.2 ± 4.5

13
consumed by farming community (Abule, 1998; Workneh et al., 2004). According to Workneh
Ayalew and Rowlands (2004), goats are more frequently milked in the kolla agro-ecological
zones, low livestock density areas and in the pastoral production systems (Table 4). The reported
average daily milk off-take is 0.5 liter per doe for an average lactation length of about 3.4
months.
Table 4. Average milk off-take (liters per day) of goat by agro-ecological zones, livestock
densities and production systems
Categories No. ofhouseh
olds
Average milk yield (litres)Mean sd Min Max Range
AEZDega 103 0.6 0.4 0.2 2 1.8Weinadega 211 0.5 0.3 0.13 2 1.88Kolla 351 0.5 0.3 0.1 1.5 1.4Overall 665 0.5 0.3 0.1 2 1.9Livestock densitiesLow 139 0.6 0.3 0.2 1.5 1.3Medium 152 0.5 0.3 0.1 2 1.9High 190 0.5 0.3 0.12 2 1.88Very High 184 0.5 0.3 0.2 2 1.8Overall 665 0.5 0.3 0.1 2 1.9Production systemsCrop–livestock 470 0.5 0.3 0.1 2 1.9Agro-pastoral 135 0.5 0.3 0.13 1.5 1.38Pastoral 60 0.5 0.3 0.25 1 0.75Overall 665 0.5 0.3 0.1 2 1.9
Source: Workneh Ayalew and Rowlands (2004), AEZ =Agro-ecological zones
2.8. Community-Based Goat Genetic Improvement Strategy in Ethiopia
Apart from limited experiences of FARM Africa in crossbreeding of local goats with exotic
dairy goats for improved milk production in the Hararghe Highlands and the SNNPR, there has
been no organized goat improvement program in the country (Azage et al, 2010). However there
are on-going works on village (community) based goat genetic resource improvement projects
by Amhara Regional Agricultural Research Institute (ARARI) at Sekota Dry Land Agricultural
Research Center (SDARC), Gondar Agricultural Research Center (GARC) and Debre Birhan

14
Agricultral Ressearch Center (DBARC) on Abergelle, western low land and central Highland
goats respectively.
2.9. Research Gap in the Study Area
Characterization of AnGR aims to obtain better knowledge of AnGR, of their present and
potential future uses for food and agriculture in defined environments, and their current state as
distinct breed populations (FAO, 1984; Rege, 1992). According to FAO (2007) changes in
population size and structure need to be documented regularly for all breeds. Monitoring should
be conducted at least once per generation of the species, particularly for breeds classified as at
risk or potentially at risk. This requires surveys at intervals of about eight years for horses and
donkeys, five years for cattle, buffalo, sheep and goats, three years for pigs and two years for
poultry species.
Abergelle and central Highland goat breeds were phenotipically characterized more than 18
years back by FARM Africa (1996) during Ethiopian and Eritrean goat types characterization.
Even though FARM Africa (1996) was able to provide information on physical description and
other related issues of Ethiopian goat breeds, this work was not aimed to characterize these goat
breeds to the direction of village or community based genetic improvement strategy. Goat on-
farm performance evaluation and monitoring work in Ethiopia is scant. Furthermore, updating of
the previous results is vital since genetic resources and production systems are not static, routine
inventories and on-going monitoring is needed (Sölkner et al., 1998).
15
3. MATERIALS AND METHODS
3.1. Study Areas
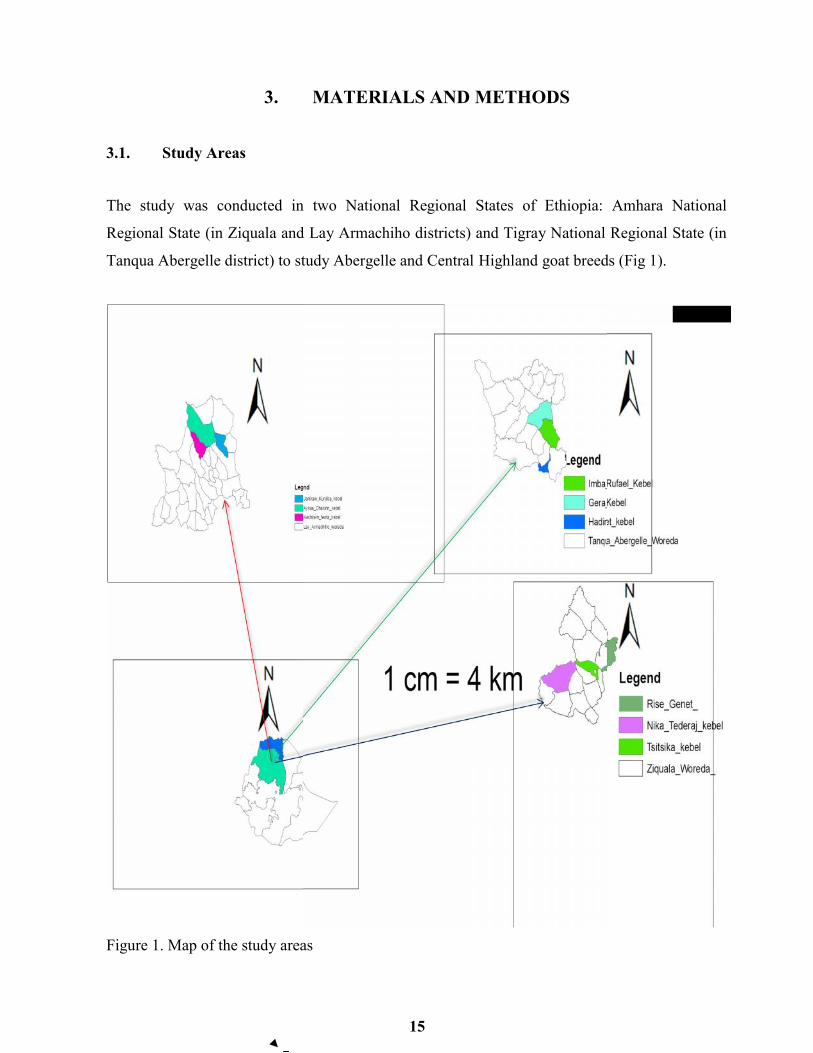
The study was conducted in two National Regional States of Ethiopia: Amhara National
Regional State (in Ziquala and Lay Armachiho districts) and Tigray National Regional State (in
Tanqua Abergelle district) to study Abergelle and Central Highland goat breeds (Fig 1).
Figure 1. Map of the study areas
15
3. MATERIALS AND METHODS
3.1. Study Areas
The study was conducted in two National Regional States of Ethiopia: Amhara National
Regional State (in Ziquala and Lay Armachiho districts) and Tigray National Regional State (in
Tanqua Abergelle district) to study Abergelle and Central Highland goat breeds (Fig 1).
Figure 1. Map of the study areas

16
Ziquala district
Ziquala district is one of the seven districts in Wag Hmira zone, Amhara National Regional State
(ANRS). It is located 65 km from the Zone town (Sekota) and 784 km from Addis Ababa,
Ethiopia. Its latitude, longitude and altitude at the district town (Tsitsika) are 12o 48’N, 38o 47’ E
and 1462 masl respectively. The sampled PAs in Ziquala district extended from 12o 76’ to 12o
81’N by latitude and 38o 66’ E to 38o 89’ E by longitude (from Nika Tederaj to Rise Genet) in
the range of 1237 to 1684 masl altitudes (actual GPS records during data collection with ± 3.5
meter tolerable error). In Ziquala district the rainfall is unimodal, short and erratic that extends
not more than two months per year, usually from end of June to the end of August. The annual
average rainfall and temperature in Ziquala district was 255mm and 22oc respectively (Dereje,
2004). The erratic seasonal rainfall coupled with the steep slopes topography with low vegetation
cover have led to low retention of ground water and high run-off, which in turn led to extensive
soil erosion in the district. Crop production usually fails due to low soil fertility and high
moisture stress, almost every year. As result majority the population is dependent on food aided
organizations (NGOs and Governmental organizations).
Services (e.g. health services both for human and livestock, school, hotel) and infrastructures
(e.g. road) are generally very poor in Ziquala district. Abergelle goat breed in Wag Hmira zone
is mainly found in three districts (Sihala, Ziquala and Abergelle) which are neighboring to
central Tigray zone in the North. This goat breed is also found in some parts of Sekota and
Dihana districts of the zone in the Northern part.
.Tanqua Abergelle district
Tanqua Abergelle district is found in Central Tigray Zone which is located 110 km from Mekelle
(the capital city of Tigray National Regional State) and 893 km from Addis Ababa. The latitude,
longitude and altitude at the district town (Yechila) are 13o 22 N, 38o 99 E and 1574 masl
respectively. The PAs sampled in Tanqua Abergelle district located from 13o 21’ to 13o 44’N by
latitude (from Hadinet to Gera) and 38o 95’ E to 39o 00’ E by longitude in the range of 1432 to
1825 masl altitudes (actual GPS records). The mean annual rainfall of Tanqua Abergelle district
was 539 mm and the temperature ranges from 20-280c (SERA, 2000). Higher value of average

17
annual temperature of Tanqua Abergelle district was recently reported by Gebremedhin et al
(2013) that range between 27 and 30°C.
Relatively, infrastructures (e.g. all weather road) and services (e.g. health services for human,
school, and hotel) in Tanqua Abergelle district is better than Ziquala district but less than Lay
Armachiho district. Abergelle goat breed is found mainly in Tanqua Abergelle and Tenbien
districts in the zone (FARM Africa, 1996) which are nearby for Sihala, Ziquala and Abergelle
districts in the South.
Lay Armachiho district
Lay Armachiho district is one of the twenty three districts found in North Gondar Zone which is
located 20 km in North of the Zone town (Gondar) and 758 km from the capital city of Ethiopia
(Addis Ababa). At the district town (Tikil Dingai) latitude, longitude and altitudes are 12o 58’N,
37o 04’ E and 2052 masl respectively. Sampled PAs in Lay Armachiho district situated from
12o 80’ to 12o 93’N by latitude and 37o 34’ E to 37o 53’ E by longitude (from Camfenta to
Janikaw) in the range of 1178 to 1281 masl altitudes (actual GPS records). Lay Armachiho
district gets flatter and lowland as one travels from the South to the North where goat population
is relatively high in number and economically important. In Lay Armachiho district annual
temperature and annual rainfall ranges between 17-24C0 and 840-1200 mm per year
respectively. However, the northern lowland areas of Lay Armachiho have the highest annual
temperature of between 22-24Co.Generally the district’s altitude ranges from 1000 to 3000 masl.
More specifically, fifty percent of the land mass in the northern part of lies between 1000 and
2300 masl, while the remaining lies between 2000 and 3000 masl (Kahsay, 2013). In Lay
Armachiho district the rain fall is unimodal and usually starts from May to September.
Relatively, the amount and duration of rain per year is better than Ziqual and Tanqua Abergelle
districts. As result the vegetation cover in Lay Armachiho district is relatively better.
Relatively, infrastructures (e.g. all weather road) and services (e.g. health services for human,
school, and hotel) in Lay Armachiho district is better than both Ziquala and Tanqua Abergelle
districts.

18
Total number of livestock populations, PAs, households and human populations in each district are
presented in Table 5 and 6.
Table 5. Total number of livestock populations in each district
District Cattle Goat Sheep Donkey Mule Horse chickin BeehivesZ. (2014) 64629 101122 25872 7340 349 1 26272 16151T A(2014) 75728 247540 100027 19541 349 42 104390 12560L.A(2012) 198755 74636 39135 21762 379 334 164650 19819Z =Ziquala,T.A=Tanaqua Abergelle, L.A=Lay ArmachihoSource: Respective district agricultural and rural development offices
Table 6. Total number of PAs, households and human populations in each district
DistrictTotalPA MHH FHH THH Male Female Total
Ziquala† 15 9061 2822 11865 24093 24937 48515Ziquala* - - - - 22464 21500 43964T.Abergelle† 21 18540 5105 23645 54021 51935 105956T.Abergelle* - - - - 47126 45718 92844L. rmachiho† 34 29733 5907 35640 92537 94567 187101L.Armachiho* - - 79513 78284 157797†=2014 respective district agricultural and rural development offices (Unpublished),MHH =Male Household, FHH= Female Household, THH=Total Household *= CSA2007census,
3.2. Study Site Selection
The study areas were selected purposively based on the populations of two goat breeds:
Abergelle goat breed in Waghimra and Central Tigray zones and Central Highland goat breed in
North Gondar zone. Before selection of districts and peasant associations (PAs), a series of steps
were followed. First, discussions were made with the zonal livestock experts and researchers to
select one district at each of the three zones. Thus Ziquala district in Waghimra zone, Tanqua
Abergelle district in Central Tigray zone and Lay Armachiho district in North Gondar zone were
selected. Within the selected districts a rapid field survey and discussions were made with a team
of researchers and the respective district animal science experts to locate appropriate PAs for the
baseline data collection (characterization) and for on-farm performance monitoring purpose.

19
Three PAs in each district (Rise Genet, Tsitsika and Nika Tederaj, from Ziquala district, Hadinet,
Imbarufael and Gera from Tanqua Abergelle district and Kechkemfenta, Aykuwachakirin and
Janikaw kunjiba from Lay Armachiho district) were selected. Within the selected nine PAs,
survey (individual household interviews and group discussions) and goat linear body
measurements were made. From these nine selected PAs one PA was selected from each district
(Tsitsika, Hadinet and Kechkemfenta) for on-farm performance monitoring purpose. Within the
selected PAs for on-farm performance monitoring purpose one village in each of Ziquala (Bilaku
village with 33 selected participant households) and Tanqua Abergelle (Dingur village with 44
selected participant households) districts and three villages in Lay Armachiho district (Wikaw,
Mizaw and Zentay villages with 38 selected participant households) were selected and on-farm
performance data were collected. Due to low number of goat population per household and
scattered settlement of farmers in Lay Armachiho district, three villages were included to
increase the population size of monitored animals and goat keepers.
Throughout all the steps (from the zone to PA) the criteria used to select study sites were goat
population, economic importance of goat in the area and willingness of farmers to participate in
this study program.
3.3. Data Types and Methods of Data Collection
Data were collected from secondary data sources, stakeholders meeting including farmers,
pretested semi- structured questionnaire, employing field measurements (on qualitative and
quantitative traits), organizing group discussions (farmers and Development agents) and on-farm
performance recorded data.
Enumerators for data collection both for survey and linear body measurements were from the
staffs of the respective research centers: four researchers from Sekota Dry Land Agricultural
Research Center for Ziquala district, four researchers from Abergelle Agricultural Research
Center for Tanqua Abergelle district and three researchers from Gondar Agricultural Research
Center for Lay Armachiho district and one district animal expert in each district except in
Tanqua Abergelle district.

20
3.3.1. Stakeholders meeting
Different stakeholders (including farmers) meeting was organized at each district before the
commencement of the actual field work. The research team was accompanied by the respective
district animal production experts and DAs (PA development agents) to conduct the meeting.
The meeting was focusing on clarifying and sensitizing farmers and different stakeholders on the
objectives of the research, gathering information about challenges and opportunities of goat
production in the respective study districts. Moreover, the meeting was helpful to avoid
unrealistic expectations by the communities and different stakeholders.
Different stakeholders invited for the meeting were a minimum of 15 farmers, one livestock
development agent (DA) working in the selected peasant association, one animal production
expert at district level, one animal breeding researcher and two livestock traders (excluding Lay-
Armachiho district) working in the area at each selected districts.
The different stakeholder’s participation was helpful to understand the challenges and
opportunities in the areas and to map out possible intervention issues along the value chain.
3.3.2. Questionnaire and group discussion
Modified questionnaire was prepared by adopting a questionnaire prepared by ILRI
(International Livestock Research Institute)-OADB (Oromiya Agricultural Development
Bureau) for survey of livestock breeds in Oromiya region (Workneh and Rowlands, 2004) and
standard description list developed by FAO (1986). The questionnaire was pre-tested before
administration and some re-arrangements were made based on the study objectives (appendix1).
A total of 256 farmers in Ziquala (68), Tanqua Abergelle (70) and Lay-Armachiho (118) districts
were interviewed for the household survey.
Climatic data on temperature and rainfall, geographical location, human and livestock
demography data were collected from the Zone administrative office, the district office of
Agriculture and Rural Development and other written documents.

21
3.3.3. Body measurements and observations
It is customary to describe breeds in terms of mature females if the researcher has no special
intention to see the size of flock owned and flock structure (FARM Africa, 1996). This is
because they usually exist in larger numbers and it is easier to determine their stage of maturity
than for males. Data for qualitative and quantitative characters were collected from a total of 640
4PPI (4 pair of permanent incisors) age category of goats (143 from ziquala and 183 from
Tanqua Abergelle districts on Abergelle goat breed and 314 from Lay Armachiho district on
Central Highland goat breed). Data were recorded on the prepared format adopted from the
standard description list developed by FAO (1986) and ILRI-OADB breed descriptor list
(Workneh and Rowlands, 2004). Data for quantitative characters were collected using 100cm
long textile measuring tape and suspending balance having 50 kg capacity with 0.2 kg precision.
Data were collected early in the morning to avoid the effect of feeding and watering on the
animal’s body size (FAO, 2012). Pregnant does and sick goats were excluded from sampling.
Each experimental animal was identified by sex, site (location), breed and flock number (farmer)
(Appendix Table 2).
3.3.4. On-farm performance evaluation and monitoring
After farmer’s trait preferences data were collected and analyzed using ranking index method
and group discussions were made, on-farm data recording formats were developed based on the
preferred traits in the respective districts (Appendix 3). Enumerators in each district were
recruited and trained how to record the on farm performance data. Enumerator’s educational
level was from grade eight to diploma level. Animals were identified by ear tags. Close
supervision and guidance for enumerators’ were given by the respective agricultural research
centers (Sekota Dry Land Agricultural Research Center for Ziquala district, Abergelle
Agricultural Research Center for Tanqua Abergelle district and Gondar Agricultural Research
Center for Lay Armachiho district by nominating one animal breeding researcher as a focal
person). On-farm data recording formats were developed on different sheets. Accordingly,
number and types of goats owned by farmers at the beginning of flock inventory (base flock),
flock dynamics (in-flows and out-flows), milk yield data per week (excluding Lay Armachiho

22
district), birth data within 24 hours (birth type, birth weight and birth date i.e. season of birth),
and body weight data (for three, six and nine months) were recorded.
3.4 Data Management and Analysis
After data were coded and entered into the computer for analysis, preliminary data analysis like
homogeneity test, normality test and screening of outliers were employed before conducting the
main data analysis. Household survey (questionnaire) data was analyzed using districts as fixed
factor.
After significance test was made between sampled goat types in Ziquala and Tanqua Abergelle
districts both for qualitative and quantitative data, these sampled goat populations were merged
as one breed (Abergelle goat breed) because of they are homogenous in all the parameters except
for toggles presence and absence. Therefore, based on the analysis made between these districts
(Ziquala and Tanqua Abergelle) and the earlier work report (FARM Africa, 1996) throughout
this paper Abergelle goat breed stands for goats sampled in Ziquala and Tanqua Abergelle
districts. Using FARM Africa’s (1996) report goats sampled in Lay Armachiho district is named
as Central Highland goat.
3.4.1. Questionnaire and group discussion
Data collected through questionnaire (survey) were described by descriptive statistics using
Statistical Package for Social Sciences (SPSS 14.0 for windows, release 14.0, 2005). Chi-square
was employed when required to test (p≤0.05) the independence of categories. F-test was applied
when required to test the statistical significance (p≤0.05). Indices were calculated for ranked data
to provide ranking of the reasons of keeping goat, goat breeding objective, buck and doe
selection criteria, contribution of different farming activities to the family food and income and
major goat production constraints etc. Index (e.g. having five rank level) was calculated as Index
= Sum of (5 X number of household ranked first + 4 X number of household ranked second + 3
X number of household ranked third + 2 X number of household ranked forth + 1 X number of
household ranked fifth) given for an individual reason, criteria or preference divided by the sum
of (5 X number of household ranked first + 4 X number of household ranked second + 3 X

23
number of household ranked third + 2 X number of household ranked forth+ 1 X number of
household ranked fifth) for overall reasons, criteria or preferences.
3.4.2. Body measurement and observation
Observations on qualitative traits were analyzed separately for male and female goats using
frequency procedure of Statistical Analysis System (SAS, release 9.1, 2003) within breed. Chi-
square was employed when required to test the independence of categories or to assess the
statistical significance (p≤0.05) within breed. Chi-square was also calculated across/between
breeds to test the existence of significance differences between breeds.
Multiple Correspondence analyses were employed to see the associations of the qualitative traits
by breed. Quantitative traits (Body weight and other body measurements: Body Length (BL),
Wither Height (WH), Chest Girth (CG), Chest width (CW), Rump length (RL), Pelvic Width
(PW), Horn Length (HL), Ear Length (EL) and Scrotum Circumference (SC)) were analyzed
using the General Linear Model (GLM) procedures of the Statistical Analysis System (SAS,
release 9.1, 2003). Sex (excluding scrotal circumference) and breed of the experimental goat
were fitted as fixed independent variables while body weight and other linear body
measurements were fitted as dependent variables. When analysis of variance declares
significance, least square means were separated using adjusted Tukey-Kramer test.
Model used to analyze body weight and other linear body measurements was:
Yijk = + Si +Bj + (SB)ij+ eijk
Where: Yijk = the observed k (body weight or other linear body measurements) in the ith sex and
jth breed of the experimental goats
=overall mean
Si= the effect of ith sex (male and female)
Bj = the effect of jth breed group (Abergelle goat and Central Highland goat)
(SB)ij = the effect of interaction of ith of sex group with jth of breed group
eijk = random residual error

24
The relationship (using Pearson’s correlation coefficient) between body weight and other linear
body measurements was calculated for each breed and sex separately. The stepwise multiple
linear regression analysis was done to obtain models for estimation of live body weight from
other linear body measurements for each breed and sex separately. Initially, selection of
variables at p≤0.05 was employed by incorporating all variables at the same time to see the order
of selected variables, and then stepwise regression analysis was made. The smaller values of
Conceptual predictive (Cp), Akaike Information Criteria (AIC), Schwarz Bayesian Criteria
(SBC) and RMSE and the higher value of R2 were used to determine those traits that contribute
much to the response variable (Kaps and Lamberson, 2004). Best fitted model was selected
based on (R2), R2 change, RMSE and simplicity of measurement under field conditions. The
following models were used for the analysis of multiple linear regressions.
For male:
Υ j = a + β 1X 1 + β 2X 2 + β 3X 3 + β 4X 4 + β 5X 5 +ej
Where:
Yj = the response variable; body weight
a = the intercept
X1, X2, X3, X4 and X5 are the explanatory variables of body length; height at wither, chest girth,
pelvic width and scrotum circumference respectively.
β1, β2... β5 is regression coefficient of the variables X1, X2,..X5
ej = the residual random error
For female:
Υj =a + β1X1 + β2X2 + β3X3 + β4X4 + β 5X 5 + β 6X 6 + ej
Where:
Yj = the response variable; body weight
a = the intercept
X1, X2, X3, X4, X5, X6 are the explanatory variables of body length, wither height, chest girth,
chest width, rump length and pelvic width respectively.
β1, β2... β6 is regression coefficient of the variables X1, X2... X 6
ej = the residual random error

25
3.4.3. On-farm performance evaluation and monitoring
Basic statistics (mean, least square mean, standard deviation, standard error, range, maximum,
minimum, frequency and percentage) were used for base flock, final flock, flock dynamics, flock
structure, milk yield, birth data and growth performance studies. Model used to analyze growth
performance of monitored goat (birth to nine months) was:
Yijbf= μ + Si + Pj +Tb+ eijbf
Where: Yijbf = Observed live body weight (birth, three, six and nine months) and weight gain
per day (from birth to three months , from three to six months and from six to nine months) at i th
sex, jth parity and bth type of birth
μ = Overall mean
Si= the effect of ith sex (i = male and female)
Pj = the effect of jth parity (j = 1, 2, 3, 4, ≥5)
Tb= the effect of bth type of birth (b = single, twin, triple)
eijbf = random residual error
Based on Dereje’s study result (Dereje, 2004) in Ziquala district, natural grasses and shrubs can
only support the animals during the wet season from July to December. The survey part of this
study result also confirmed that feed situation in Ziquala and Tanqua Abergelle districts where
critical from December up to June and conversely feed is relatively better from July to
December. Therefore based on the above mentioned evidences, model used to analyze milk
yield for Abergelle goat breed in Tanqua Abergelle and Ziquala districts was:
Yijltf= μ + Si + Pj + Dl + Mt+ (SB)il+ eijltf
Where: Yijltf = Observed milk yield at ith season, jth parity, lth location and tth milking time
μ = Overall mean
Si= the effect of ith season (i = relatively feed available season (July up to December), relatively
feed scarce season (January up to June))
Pj = the effect of jth parity (j = 1, 2, 3, 4, 5≥6)
Dl= the effect of lth loction or site (l=Ziquala and Tanqua Abergelle districts)
Mt= the effect of tth milking time (Evening and morning)
(SB)il = the effect of interaction of ith season with lth loction or monitoring site
eijltf = random residual error

26
4. RESULTS AND DISCUSSIONS
4.1. General Household Information
General Socioeconomic characteristics, family size, land and livestock holding, crop and
livestock farming system in the Ziquala, Tanqua Abergelle and Lay-Armachiho districts is
presented bellow.
4.1.1. General socioeconomic characteristics
A total of two hundred fifty six farmers were interviewed for the household survey. Sex, position
in the household, educational background, age and marital status of the respondents is presented
in Table 7.
Table7. Number (N) and percentage (%) of households per Sex, position in the household,
educational background, age and marital status of the respondents in the study districts
Descriptors Ziquala TanquaAbergelle
LayArmachiho
Overall Test
N % N % N % N % X2 –value
p-value
Sex of therespondents na
male 62 91.2 67 95.7 114 96.6 243 94.9female 6 8.8 3 4.3 4 3.4 13 5.1Respondentsposition inthe HH
na
owner 68 100 70 100 112 94.9 250 97.7shepherd 0 0 0 0 1 0.8 1 0.4relative 0 0 0 0 5 4.2 5 2Ability toread andwrite
11.3 0.003
yes 14 20.6 30 57.1 52 55.9 96 62.5no 54 79.4 40 42.9 66 44.1 160 37.5Educationalbackground 19.3 0.013
Read and 2 2.9 10 14.3 27 22.9 39 15.2

27
write*primary 10 14.7 17 24.3 22 18.6 49 19.1secondary 1 1.5 2 2.9 3 2.5 6 2.3high school 1 1.5 1 1.4 - - 2 0.8Age 11 0.354<20 - - - - 3 2.5 3 1.221-30 16 23.5 14 20 19 16.1 49 19.131-40 27 39.7 21 30 34 28.8 82 3241-50 12 17.6 20 28.6 35 29.7 67 26.251-60 10 14.7 8 11.4 16 13.6 34 13.3>60 3 4.4 7 10 11 9.3 21 8.2Marital status nasingle 1 1.5 - - 9 7.6 10 3.9
married 63 92.6 70 100 104 88.1 237 92.6divorced 2 2.9 - - 2 1.7 4 1.6widow 2 2.9 - - 3 2.5 5 2
na = not applicable for X2-square test i.e some of the observation(s) within the category are less than 5
counts *=informal learning to read and write like adult school or religious school HH = household
In this particular study male respondents accounted the largest proportion in all the study areas:
91.2%, 95.7% and 96.6% in Ziquala, Tanqua Abergelle and Lay Armachiho districts
respectively. The remaining lower proportion of women respondents in Ziquala, Tanqua
Abergelle and Lay Armachiho districts respectively were 8.8%, 4.3% and 3.4%. The occurrence
of less percentage of women respondents in the study areas may be due to work load inside the
house and as a result the probability of getting them outside of the house is less. Moreover, when
someone knocks the door of somebody’s house, male usually comes out first and respond
specially if the household head is male. The comparisons of male to female ratio in the above
sentences do not necessarily mean household head but sex of the respondent’s proportion.
4.1.2. Family size, land and livestock holding
Family size in terms of total and both sexes were not significantly (P<0.05) different across all
the three districts. Average family size in Ziquala, Tanqua Abergelle and Lay Armachiho
districts were 6.4, 6.5 and 7.1 respectively. The National, Tigray Regional State and Amhara
Regional State rural average family size in 2007 census were 4.9, 4.6 and 4.5 respectively (CSA,
2007). The current study results regarding on family size in all the three districts were higher

28
than both the national and their respective regional states rural average household size. In
agreement with the current study result, Zewdu (2008) reported higher family size than the
national family size in Horro (7.3) and in Adiyo Kaka (8.6). Higher figure than the national
average family size were also reported by Grum (2010) around Dire Dawa, Ahmed (2013) in
Horro Guduru Wollega Zone and Biruh (2013) in low land areas of South Omo Zone.
Average total land holding including own grazing land in hectare in Ziquala, Tanqua Abergelle
and Lay Armachiho districts were 2.5, 2.5 and 3.3 respectively. There is highly significant
(p<0.005) differences between Abergelle goat keepers (Ziquala and Tanqua Abergelle districts)
and Central Highland goat keepers (Lay Armachiho district) in terms of total land holding and
land with a title deed.
Almost all respondents (100% in Ziquala, 99.8% in Tanqua Abergelle and 95.7 % in Lay
Armachiho districts) indicated that the trend of land holding per household is decreasing over
time. Human population growth rate, expansion of the existing town and newly established town,
delineation of huge land for forestry (area closure), establishment of governmental institutes
(school, clinic, farmer training center), land degradation and soil erosion are some of the
mentioned factors for declining of landholding per house hold across all the districts.
In all the study districts same livestock species are kept with different average numbers per
household; which may indicate the importance of those particular animals in these particular
areas. Average number of cattle, goat and sheep holding per household in the study districts were
significantly (p<0.0001) different. In Ziquala and Tanqua Abergelle districts average number of
all livestock species per household did not show significant (p>0.05) differences (Table 8.).
Relatively, higher average number of cattle (9.6) per household was observed in Lay Armachiho
district than in Ziquala (5.1) and Tanqua Abergelle (5.0) districts. In contrast higher average
number of goat and sheep per household were observed in Ziquala and Tanqua Abergelle
districts than Lay Armachiho district (Table 8.). Goat population per household (mean ± SD) in
Ziquala, Tanqua Abergelle and Lay Armachiho districts were 36.1±61.9, 38.2±63.9 and
10.5±7.5 respectively. The current study result on Abergelle goat population per household was
higher than the report of FARM Africa (1996), which was 20, and lower than Solomon (2013)
report (48.5) on the same goat breed. The disagreement may be due to goat population

29
differences across districts (since study districts are different) or random sampling error i.e by
chance farmers having higher number of goat population were interviewed in the previous study
and the reverse is true in the current study.
Table 8. Mean ±SD family size (n), land holding (ha) and livestock holding (n) per household by
districts
a, b, c: different superscripts denote significant differences at P<0.05 between means within
rows, SD= standard devation, N=number of sampled household,Land with a title deed*
=excluding rented land, †=including own grazing land
Descriptors Ziquala(N=68)
TanquaAbergelle
(N=70)
LayArmachiho
(N=118)
Overall(N=256)
Test
Mean±SD Mean±SD Mean±SD Mean±SD F-value p-alueFamily sizeMale 3.3(1.5) a 3.4(1.2) a 3.8(1.8) a 3.5(1.6) 2.152 0.118female 3.1(1.6) a 3.1(1.5) a 3.3(1.8) a 3.2(1.7) 0.443 0.643Total 6.4(2.1) a 6.5(1.9) a 7.1(2.9) a 6.8(2.4) 2.079 0.127
LandTotal land† 2.5(1.2)a 2.5(1.4) a 3.3(2.5)b 2.9(2.0) 5.42 0.005Total land witha title deed*
1.8(0.9) a 1.5(0.9) a 2.9(2.4) b 2.2(1.8) 14.94 0.000
Total land usedin rainy season
2.3(1.1) a 2.1(1.1) a 3.0(7.2) a 2.6(5.0) 0.892 0.411
Total land usedin dry season
0.2(0.3) a 0.2(0.3) a 0.3(0.8) a 0.2(0.5) 0.034 0.967
LivestockCattle 5.1(4.0) a 5.0(3.8) a 9.6(7.2) b 7.1 (6.1) 20.45 0.000Goats 36.1(61.9) a 38.2(63.9) a 10.5(7.5) b 24.9(48.1) 10.52 0.000Sheep 8.2(10.0) a 7.1(9.5) a 1.3(2.5) b 4.7 (8.0) 24.56 0.000
Donkey 1.1(0.9) a 1.3(1.0) a 1.0(0.9 ) a 1.1(1.0) 2.17 0.117
Chicken (indigenous) 7.7(6.2) a 7.9(6.4) a 9.5(8.8) a 8.6(7.6) 1.56 0.211
Chicken (Exotic) 0.2 (0.7) a 0.8(4.9) a 0.62(2.3) a 0.5 (3.0) 0.69 0.505Bee colony (hive) 3.0(5.7) a 2.0(5.0) a 1.6(3.8) a 2.1(4.7) 2.01 0.136

30
4.1.3. Crop and livestock farming system
Individual interviews and group discussions made in all of the three districts indicated that all of
the farmers practiced both crop and livestock productions with a varied degree of attention
(interest of intensification/maximization).
Major food crops produced in 2012 production year in each of the study districts as recalled by
respondents is presented in fig. 2. Almost all (95.59, 97.14 and 97.46 percent in Ziqual, Tanqua
Abergelle and Lay Armachiho districts respectively) respondents in all of the study districts
produced sorghum for household food consumption. Relatively equivalent percents of
respondents were observed in Ziquala and Tanqua Abergelle districts in each of the given food
crops (Fig. 2.) production activity. Higher respondent’s percentages in Lay Armachiho district
were observed in maize, millet and noug production. Since lowland peasant associations of Lay
Armachiho district were sampled (where goat population was relatively higher) this food crop
types do not necessarily represent Highland parts of the district.
Figure 2. Major food crops in the study districts by percent of respondents involved in the
production
0
20
40
60
80
100
120
% o
f res
pond
ents
invo
lved
Major food crops in the study districts
30
4.1.3. Crop and livestock farming system
Individual interviews and group discussions made in all of the three districts indicated that all of
the farmers practiced both crop and livestock productions with a varied degree of attention
(interest of intensification/maximization).
Major food crops produced in 2012 production year in each of the study districts as recalled by
respondents is presented in fig. 2. Almost all (95.59, 97.14 and 97.46 percent in Ziqual, Tanqua
Abergelle and Lay Armachiho districts respectively) respondents in all of the study districts
produced sorghum for household food consumption. Relatively equivalent percents of
respondents were observed in Ziquala and Tanqua Abergelle districts in each of the given food
crops (Fig. 2.) production activity. Higher respondent’s percentages in Lay Armachiho district
were observed in maize, millet and noug production. Since lowland peasant associations of Lay
Armachiho district were sampled (where goat population was relatively higher) this food crop
types do not necessarily represent Highland parts of the district.
Figure 2. Major food crops in the study districts by percent of respondents involved in the
production
Ziquala (N=68)
Tanqua (N=70)
Arma(N=118)

31
Based on the calculated indices (Table 9.) regarding for household food source for ziquala and
Tanqua Abergelle were livestock, crop, daily labor and trading in order of ranks. As household
food source crop, livestock, trading and daily labor in Lay Armachiho district has an index value
of 0.56, 0.41, 0.02 and 0.01 respectively and in ranking order.
Table 9. Food, cash income sources and livestock contribution for food and cash income
4.2. Goat Flock Structure and Management
Goat flock structure by age and sex in Ziquala, Tanqua Abergelle and Lay Armachiho districts is
presented in Table 10. There were significant (p<0.05) differences on the average goat
populations in each of all age and sex categories across districts. Using mean separation
techniques we can clearly see that goat flock structure in Ziquala and Tanqua Abergelle districts
in all age and sex categories were not significantly (p>0.05) different.
Descriptors
Ziquala Tanqua Abergelle Lay Armachiho
1st
rank2nd
rank3rd
rankInde
x1st
rank2nd
rank3rd
rank Index 1st
rank2nd
rank3rd
rankInde
x
FSLivestock 49 49 2 0.71 59 10 2 0.55 9 109 0 0.41Crop 15 17 5 0.24 9 59 5 0.42 109 1 1 0.56Trading 1 0 1 0.01 0 1 1 0.01 0 6 0 0.02Daily labor 3 2 1 0.04 2 0 1 0.02 0 2 1 0.01CISLivestock 53 13 1 0.53 60 10 0 0.54 74 27 3 0.49Crop 6 46 14 0.35 8 55 7 0.38 31 72 1 0.42Trading 1 1 2 0.02 1 3 8 0.05 8 1 5 0.05Daily labor 7 6 0 0.09 1 1 1 0.02 2 1 1 0.02Handicraft 1 0 0 0.01 0 1 1 0.01 2 2 2 0.02LKCFcattle 18 39 10 0.35 21 33 13 0.34 92 20 1 0.46goat 46 16 4 0.43 43 20 5 0.42 24 78 15 0.35sheep 2 8 26 0.12 4 10 24 0.13 0 5 7 0.02donkey 0 3 18 0.06 0 4 22 0.07 1 10 56 0.11chicken 0 0 5 0.01 0 2 4 0.02 1 2 21 0.04beehives 2 2 2 0.03 2 1 1 0.02 0 0 7 0.01FS=for food source, CIS=for cash income source, LKCF=livestock for cash income and food source

32
From Table 10 we can learn that within a given household goat flock in Ziquala district one can
find 16.02% male kids less than six months, 16.57% female kids less than six months, 11.31%
males between six month to one year, 14.73% females between six month to one year, 7.92%
males greater than one year (intact), 30.92% females greater than one year and 2.53% castrated.
The corresponding values for Tanqua Abergelle district were 14.48%, 15.80%, 9.60%, 14.97%,
7.71%, 35.05% and 2.38% respectively. In the same way, 17.80%, 16.64%, 7.78%, 12.67%,
9.60%, 33.44% and 2.07% respectively were the observed corresponding values for Lay
Armachiho district.
The ratio of male to female in all of the three districts at the age of less than six months was
proportional. However, above six months female proportions were high especially at age of
greater than one year. This is because of male goat greater than one year is frequently sold
whenever cash is needed in the household (group discussion and see Table 29). Here
intervention is needed to control negative selection to improve the reproductive and productivity
of goats particularly for males because of farmers usually sell good body condition (which may
have good genetic makeup) to get high price. The ratio between males (intact) greater than one
year of age and their female counterparts in Ziquala, Tanqua Abergelle and Lay Armachiho
districts were 1:4, 1:5 and 1:4 respectively. These particular study results were in agreement
with that of Wilson (1988) who reported ratios of between1:4 and 1:6 for small ruminants in
traditional livestock production systems of Africa.
Within a given flock in the study areas the first and second highest proportions were females
greater than one year and kids (both sex) less than six months respectively, which is in
agreement of the report made by Biruh (2013) on Woyto Guji goats in low land areas of south
Omo zone. High proportion of kids within a flock might be an opportunity to increase the
selection intensity which in turn increases production and productivity within a short period of
time.

33
Table 10. Number and Mean (±SD) of each of goat classes by district
Goat classes by ageand sexes
Ziquala (n=68) Tanqua Abergelle(n=70)
Lay Armachiho(n=118) Overall (n=256) Test
N Mean ± SD N Mean ±SD N Mean ±SD N Mean ±SD F-value
p-value
Male kids < 6months 374 5.50± 8.74 a 383 5.47±8.87 a 215 1.87±1.91 b 972 3.84±6.84 9.36 0.000
Female kids < 6months 387 5.69 ± 8.44 a 418 5.97±9.19 a 201 1.75±1.70 b 1006 3.98±6.89 12.01 0.000
Male 6 months to 1year 264 3.88± 9.32 a 254 3.63±9.47 a 94 0.81±1.29 b 612 2.41±7.10 5.64 0.004
Female 6 months to1 year 344 5.06± 10.06 a 396 5.66±11.09 a 153 1.32±1.66 b 893 3.52±8.11 8.40 0.000
Male > 1 year(Intact) 185 2.72± 4.90 a 204 2.91±5.30 a 116 1.01±1.51 b 505 2.00±3.99 6.79 0.001
Female > 1 year 722 10.62±12.89 a 927 13.24±16.00a 404 3.58±3.22 b 2053 8.18±11.75 19.03 0.000Castrate 59 0.87.±2.46 a 63 0.90±2.62 a 25 0.22±0.59 b 147 0.58±1.93 3.87 0.022Total 2335 34.34±49.99 2645 37.79±53.83 1208 10.24±7.27 6188 24.17±40.40 - -

34
The average goat farming experiences (in years) of the respondents in Ziquala, Tanqua Abergelle
and Lay Armachiho districts were 14.10±9.35, 15.70±10.97 and 11.08±11.63 respectively. The
average numbers of goats used to start goat farming (as recalled by the owners) were
13.72±11.68, 13.11±12.60 and 3.34±6.25 in Ziquala, Tanqua Abergelle and Lay Armachiho
districts respectively. More than 79% of source of this first goat to start goat farming in the study
areas were as a gift from the family (from mother or father or both) and purchased from
neighboring farms or markets. The remaining percents of source of the first goat were from
development projects as gift, development project as loan and as a gift from relatives or friends.
Even though farmers in the study areas do not keep any kind of record for their goat farming
activities they can trace back and remember some of the major activities they did. The overall
goat flock dynamics (out flow and in flow) for one year (April 1, 2012-March 30, 2013)
considering respondents percentage who said “yes” for selling and buying were 60.5 % and
42.6 % respectively. Most of the respondents bought female goat greater or equal to one year old
for production purpose and they sold all goat classes with different priority (see Table 29)
whenever cash is needed. Percentages of respondents who said “yes” for buying of goat for the
last twelve months in Ziquala, Tanqua Abergelle and Lay Armachiho districts were 32.4%,
32.9% and 54.2% respectively. In the same way Percentages of respondents who said “yes” for
selling of their goat for the last twelve months in Ziquala, Tanqua Abergelle and Lay Armachiho
districts were 70.6%, 60.0% and 55.1% respectively.
Individual goat identification by the owner (household) using different techniques like using coat
color, specific name, ear tag, parentage (pedigree) or using any other techniques has an
advantage even after the animal died, lost or sold. For instance, if veterinary technician gets
shortage of vaccine while he/she was giving vaccine for the household flock, he /she can register
the specific name of goat(s) that do not have been given vaccine so that he/she can give them
vaccine for the other day accordingly. The other advantage of individual goat identification by
the owner (household) for the breeders is to trace back the pedigree of the animal at least by the
dam side. In general, majority of farmers in all of the three districts identify their goat by coat
color (98.4%), name (58.2%), and parentage (100%). Here parentage identification generally
stands for dam side but it is not to mean that farmers do not know the sire of the kid. Individual
goat identification (respondent percentage) by coat color, name and parentage in Ziquala district

35
were 100%, 76.5% and 77.9% respectively. The corresponding values for Tanqua Abergelle
district were 97.1%, 87.1% and 70.0% respectively. Similarly, farmers in Lay Armachiho district
identified their goat by coat color (98.3%), name (30.5%) and parentage (40.7%).
Farmers in Ziquala district reported that goat mobility around the Tekezie basin in peak dry
season is common to search areas where feed and water is easily available. Even though the
degree of mobility (which class of goat to move, duration of stay far from permanent house and
the distance to move) is less than Ziquala district, goat keepers in Tanqua Abergelle district also
exercised goat movement from place to place in search of feed and water. In contrast farmers in
Lay Armachiho districts do not move their goat anywhere because of feed and water is not a
problem especially in dry season. Goat keepers (42.5% of the respondents) in Ziquala district
move their whole goat flock around the Tekezie basin at peak dry season (usually from February
to June). Similarly, Goat keepers (22.8% of the respondents) in Tanqua Abergelle district move
their goat flock (usually very young kids, very old and sick goats are left in and around the
permanent residence of the household) from April to June for a few days or for a few weeks.
4.3. Goat Production Objective
The purpose of keeping goat in the study areas is presented in Table 11. According to Jaitner et
al. (2001) knowledge of reasons for keeping animals is a prerequisite for deriving operational
breeding goals. Rank of purposes of keeping goat in Ziquala and Tanqua Abergelle districts was
the same even though the index value for each of the objectives are different. In contrast goat
production objectives in Lay Armachiho district was different from Ziquala and Tanqua
Abergelle districts except goat rearing was the means of cash income in the first rank for all of
the three districts.
Different studies in Ethiopia concerning goat production objectives indicated that cash income
is the primary goat production objective by the respective goat keepers. For instance Mahilet
(2012) on Hararghe Highland goat, Ahmed (2013) on Ethiopian indigenous goats in Horro
Guduru Wollega zone and Solomon (2013) on Abergelle and Western Lowland goat breeds,
reported that cash income was the first rank among different goat production objectives.

36
Table 11. Ranking of goat production objectives by districts
ProductionObjectives
Ziquala Tanqua Abergelle Lay Armachiho1st
Rank2nd
RankIndex 1st
Rank2nd
RankIndex 1st
Rank2nd
RankIndex
Sale/CashIncome 58 6 0.60 43 14 0.48 108 10 0.64
Manure 6 37 0.24 21 19 0.29 0 0 0.00Meat 2 11 0.07 0 12 0.06 8 88 0.29Milk 2 14 0.09 6 25 0.18 0 0 0.00Saving 0 0 0.00 0 0 0.00 2 20 0.07
The current study result index values of goat production objectives as source of cash income,
manure, meat, milk and as means of saving were 0.60, 0.24, 0.07, 0.09 and 0.00 respectively in
Ziquala district. The corresponding values for Tanqua Abergelle district were 0.48, 0.29, 0.06,
0.18 and 0.00 respectively. In Lay Armachiho district goat production objectives as source of
cash income, manure, meat, milk and as means of saving were 0.64, 0.00, 0.29, 0.00 and 0.07
respectively. Goat keepers in Ziquala and Tanqua Abergelle districts use goat milk in their daily
diet as row milk or products of milk (cheese, butter, and yogurt). However, goat milk
consumption in Lay Armachiho district is strictly a cultural taboo.
4.4. Milk Production
Unlike Lay Armachiho district goat keepers, all goat keepers (100%) in Ziquala and Tanqua
Abergelle districts reported that they milk their goats. Frequency of milking and milk yield per
day per doe were different in the rainy and in the dry seasons due to feed and water scarcity in the
dry season for both districts. Percent of respondents who said “yes” for goat milking twice per day
(morning and evening) in the rainy and in the dry season in Ziquala district were 96.8% and
36.8% respectively. The corresponding values for Tanqua Abergelle district were 87.7% and
39.1% respectively. The remaining percentage for each season was goat milking once per day.
Majority of the respondents (>82%) in each district use goat milk after processing it traditionally
(making butter out of milk by agitating it in hand). The remaining percentage of the respondents
reported that they use goat milk as raw milk and by boiling. It is cultural taboo that ladies
(mostly > 15 years old) are not allowed to use raw milk but processed i.e. products of milk

37
(cheese, butter, and yogurt). This is because of mainly for two reasons. The first reason was if
she is adapted to use raw milk, other members of the household will not get milk and milk
products specially butter for selling. The second reason was, they believe that it is too difficult
for her husband to make the first sexual intercourse (disvirgining process) when she gets
married. Traditionally, goat keepers in both districts believe that goat milk has some medicinal
values and improves the health status of human being than cow milk as goat eats so many plant
species. Fortunately, in agreement with the farmer’s indigenous knowledge about goat milk
verses cow milk, it is scientifically proved that goat milk is better than cow milk in many ways.
(http://www.mtcapra.com/benefits-of-goat-milk-vs-cow-milk/) (Accessed on November. 6
2014). All respondents in both districts (100%) reported that milk and milk products are
consumed in their household, whereas 29.4% in Ziquala district and 39.7% in Tanqua Abergelle
district marketed milk products (butter) to generate cash income.
Milk yield, lactation length and weaning age of kids across Ziquala and Tanqua Abergelle
districts were not significantly (p>0.05) different in both seasons. From the current survey result
milk yield per doe per day (in liter) in the rainy season and in the dry season in Ziquala district
were 0.43±0.24 and 0.15±0.14 respectively. The corresponding values for Tanqua Abergelle
district were 0.48±0.24 and 0.19±0.29 respectively. Biruh (2013) reported average volume of
milk yield per day per doe (liter) in Benatsemay, Hamer and Dasenech districts without
classifying the season were 0.176, 0.184 and 0.208 respectively. This is lower than the current
survey results in the rainy season and higher than in the dry season in Ziquala district.
Table 12. Mean ±SD of milk yield (liter), lactation length (months) and weaning age (months)
by district
Milk yield, lactation length andWeaning age
Ziquala(N=68)
Tanqua(N=70)
Overall(N=138)
TestF-value P-value
Milk /doe/day in the rainy season 0.43±0.24 a 0.48±0.24 a 0.46±0.24 1.96 0.164Milk /doe/day in the dry season 0.15±0.14 a 0.19±0.29 a 0.17±0.23 1.21 0.273Lactation length in the rainy season 4.21±2.02 a 3.59±2.11 a 3.90±2.09 3.10 0.081Lactation length in the dry season 4.32±1.40 a 4.46±2.00 a 4.39± 1.73 0.23 0.634Weaning age of kids 4.85±1.81 a 4.84±1.73 a 4.85± 1.77 0.00 0.973SD=Standard deviation N=number of respondents, means were compared within rows

38
Generally, lactation length in the rainy season is shorter than dry season because of the feed and
water availability that will in turn create conducive environment for doe to conceive and kids to
wean shortly. Average lactation lengths (in months) in Ziquala district in the rainy and dry seasons
were 4.21±2.02 and 4.32±1.40 respectively. Similarly, the corresponding values for Tanqua
Abergelle district were 3.59±2.11 and 4.46±2.00 respectively. Average weaning age of kids (in
months) in Ziquala, Tanqua Abergelle and Lay Armachiho districts were 4.85±1.81, 4.84±1.73
and 4.5 respectively. As indicated in Fig 3 some farmers in Ziquala and Tanqua Abergelle
districts use artificial weaning techniques by prohibiting suckling of kids to its dam by putting
liquid cow-dung on teat and udder and by tying the teat using a thread like substance. However,
this practice was also used if kids were kept together with does during the day time so that goat
keepers can get milk at night.
a) b)
Figure 3. Traditional suckling control methods in Ziquala (a) and Tanqua Abergelle (b) districts
4.5. Labor division for the routine goat Husbandry activities by the household
Although all the family members involved in the routine goat Husbandry activities, the extent
(the size of percentage) and coverage (number of activities shared by a given household
members) were different because of age and gender categories in the household. Detail profiles
of each of the housed members in the routine goat Husbandry activities in Ziquala, Tanqua
Abergelle and Lay Armachiho districts are presented in Table 13, 14 and 15 respectively.

39
In all the study districts purchasing and selling activities were left for males greater than fifteen
years old specially for the household head. This is because he is believed to be knowledgeable to
select the best breeding doe and buck when he purchase and he can sell animals at best price by
negotiation. Even though the percentage of females (greater than fifteen years old) activities in
purchasing and selling were low relatively higher percentages were observed in Selling. As a
summary, males greater than fifteen years old in the family involved in purchasing and selling
activities greater than 94.1% and 89.7 % respectively in all the districts. Whereas females greater
than fifteen years old involved in purchasing and selling activities less than 14.4 % and 39.1 %
respectively in all the districts. These data clearly shows us that males, specially household head,
were exclusively decision maker in economical issues in the family.
Relatively higher percentage of involvements by males less than fifteen years old and males
greater than fifteen years old in the family and in hired labourers were observed in herding,
breeding, caring sick animals, feeding and milking activities in all the districts. In contrast
making and selling dairy products were almost exclusively done by females specially females
greater than fifteen years old in Ziquala and Tanqua Abergelle districts. In all the study areas all
age categories of females do not allowed slaughtering animals including chicken because of
religious and culture of the communities. Slaughtering activity was done by males greater than
fifteen years old in the family (>97.01 %) and to some extent (<22.0%) by males greater than
fifteen years old in hired labourers in all the study districts.

40
Table 13. Labor division for the routine goat husbandry activities by the household in Ziquala district
NB A given activity is possible to be performed by more than one household member and a given household member is responsible for
different husbandry activies
Activities
Family member Hired labourfemale male female male
≤15yearsN (%)
>15yearsN (%)
≤15yearsN (%)
>15yearsN (%)
≤15yearsN (%)
>15yearsN (%)
≤15yearsN (%)
>15yearsN (%)
Purchasing - 7(10.3) - 64(94.1) - - - -Selling - 25(39.1) - 61(89.7) - - - -Herding 10(14.7) 4(5.9) 34(50.0) 9(13.2) 4(5.9) 0(0.0) 5(7.4) 2(2.9)Breeding 2(2.9) 4(5.9) 29(42.6) 33(48.5) 4(5.9) 4(5.9) 14(20.6) 2(2.9)Caring sick animals 6(8.8) 17(25.0) 40(58.8) 43(63.2) 2(2.9) - 12(17.6) -Feeding 6(8.8) 3(4.4) 26(38.2) 35(51.5) 7(10.3) - 8(11.8) 14(20.6)Milking 3(4.4) 8(11.8) 28(41.2) 38(55.9) 6(8.8) 1(1.5) 3(4.4) 2(2.9)Making dairy products 9(13.2) 66(97.1) - - - - - -Selling dairy products 8(11.8 63(92.6) 2(2.9) 2(2.9) - - - -Barn cleaning 27(39.7) 32(47.1) 28(41.2) 45(66.2) 4(5.9) 1(1.5) 2(2.9) -Slaughtering - - - 68(100) 1(1.5)

41
Table 14. Labor division for the routine goat husbandry activities by the household in Tanqua Abergelle district
NB A
given
activity
is
possible to be performed by more than one household member and a given household member is responsible for different husbandry
activities
Activities
Family Hired labourfemale male female male
≤15yearsN (%)
>15yearsN (%)
≤15yearsN (%)
>15yearsN (%)
≤15yearsN (%)
>15yearsN (%)
≤15yearsN (%)
>15yearsN (%)
Purchasing - 2(2.9) - 68(97.1) - - - -Selling - 4(5.7) - 67(98.5) - - - 2(2.9)Herding 4(5.7) 7(10.0) 46(65.7) 3(4.3) - - 1(1.4) 2(2.9)Breeding 2(2.9) 2(2.9) 31(44.3) 27(38.6) 4(5.7) - 5(7.1) -Caring sick animals 1(1.4) 9(12.9) 10(14.3) 55(78.6) - 2(2.9) 3(4.3) -Feeding 1(1.4) 2(2.9) 40(57.1) 32(45.7) 2(2.9) - 4(5.7) 3(4.3)Milking 3(4.3) 15(21.4) 40(57.1) 29(41.4) 2(2.9) 1(1.4) 4(5.7) 1(1.4)Making dairy products 8(11.4) 62(88.6) - - - - - -Selling dairy products 4(5.7) 59(84.3) 4(5.7) 1(1.4) - - - -Barn cleaning 19(27.1) 22(31.4) 41(58.6) 33(47.1) - 1(1.4) 5(7.1) -Slaughtering - - - 68(97.1) - - - (3(4.3)

42
Table 15. Labor Labor division for the routine goat husbandry activities by the household in Lay-Armachiho district
NB A given activity is possible to be performed by more than one household member and a given household member is responsible for
different husbandry activities.
Activities
Family Hired labourfemale male female male≤15yearsN (%)
>15yearsN (%)
≤15yearsN (%)
>15yearsN (%)
≤15yearsN (%)
>15yearsN (%)
≤15yearsN (%)
>15yearsN (%)
Purchasing - 17(14.4) - 111(94.1) - - - 7(5.9)Selling - 37(31.6) - 113(95.8) - - - 19(16.1)Herding 16(13.6) 13(11.0) 79(66.9) 38(32.2) - 1(0.8) 9(7.6) 1(0.8)Breeding 5(4.2) 12(10.2) 23(19.5) 63(53.4) 15(12.7) - 21(17.8) 6(5.1)Caring sick animals 9(7.6) 51(43.2) 31(26.3) 58(49.2) - - 7(5.9) 1(0.8)Feeding 31(31.6) 38(32.2) 62(52.5) 47(39.8) - 6(5.1) 9(7.6) 1(0.8)Barn cleaning 60(50.8) 71(60.2) 67(56.8) - - 3(2.5) 5(4.2) -Slaughtering - - - 117(99.2) - - - 26(22.0)

43
4.6. Feed and Feeding Management
4.6.1. Major goat feed sources and browsing/grazing management
Index values of major goat feed sources in Ziquala, Tanqua Abergelle and Lay Armachiho
districts during dry and wet season is presented in Table 16. Communal natural pasture was the
major source of goat feed both in dry and wet seasons in each of the three districts. The current
survey result is in agreement with Tesfaye (2009), Grum (2010), Amelmal (2011) and Biruh
(2013) reported in Metema district, around Dire Dawa, Dawuro Zone and Konta Special Woreda
of SNNPR and Low Land areas of South Omo Zone respectively.
The index value of communal natural pasture in wet (rainy) season in Ziquala, Tanqua Abergelle
and Lay Armachiho districts were 0.68, 0.69 and 0.58 respectively. The corresponding values of
fallow land in wet season were 0.32, 0.31 and 0.42 respectively. In dry season crop residues
(0.21), Crop aftermath (0.08) and Hay (0.05) were ranked second, third and fourth next to
communal natural pasture (0.66) for goat feed in Ziquala district. The same ranking order was
observed in Tanqua Abergelle district with corresponding values of 0.30, 0.12 and 0.08
respectively next to communal natural pasture (0.50). In Lay Armachiho district goat feed
supplementation was not common. This might be because of goat feed in the area is not critical
specially in dry season after food crop is harvested and relatively good vegetation cover. Natural
pasture (0.83) and crop aftermath (0.17) were the major goat feed sources in Lay Armachiho
district.
Here, it is not to mean that the above mentioned goat feed sources were the only goat feed
sources in the study areas. There were other feed sources like locally made beverage byproducts
from ‘tela’ and ‘areki’, food left over from household, backyard forages, private browsing and
grazing land which is locally called ‘hidarya’ in Tigrigna ‘kilkil’ in Amharic and mineral soil.
Since index values were calculated up to third rank and the above mentioned feed sources were
not appeared up to third rank, consequently index value for each of feed sources were zero.

44
Table 16. Ranking of goat feed sources by district in wet and dry seasons
4.6.2. Major crop residues
Goat feed supplementation was not practiced in Lay Armachiho district both in dry and rainy
seasons. According to the respondents in Ziquala and Tanqua Abergelle districts, feed
supplementation for goats was prioritized based on the reproductive status, body condition,
health condition, age, candidate goat to be slaughtered or sold in the near future and season of
the year. Accordingly, newly kidding does (to initiate milk production for the kids and household
consumption), emaciated goats, sick goats, kids and goat to be slaughtered or sold in the near
future were given highest priority to be supplemented, mostly from February to early June.
Cowpea and sorghum residues (locally called ‘goyla’ and ‘mawa’ respectively) were most
common goat feed supplements in both Ziquala and Tanqua Abergelle districts in dry season,
mostly from February to early June. Concerning the number of varieties (types of supplement
feed sources) used for goat feed supplementation in dry season, Tanqua Abergelle district had
more alternatives (around six supplement feed sources) than Ziquala district (having three
supplement feed sources). The ranking order (based on the calculated index value) of goat feed
supplements in dry season in Ziquala district were Sorghum (0.43), Cowpea (0.40) and Sesame
(0.17).
feed sourceand season
Ziquala Tanqua Abergelle Lay Armachiho1st
rank2nd
rank3rd
rankIndex 1st
rank
2nd
rank
3rd
rankIndex 1st
rank2nd
rank3rd
rankIndex
Wet seasonNaturalpasture 64 1 1 0.68 63 4 1 0.69 113 7 2 0.58
Fallow land 4 24 33 0.32 7 35 0 0.31 5 73 97 0.42Dry seasonNaturalpasture 63 12 36 0.66 53 12 22 0.50 107 93 31 0.83
Hay 0 3 13 0.05 3 6 13 0.08 0 0 0 0.00Cropresidues 5 29 7 0.21 14 41 1 0.30 0 0 0 0.00
Cropaftermath 0 12 6 0.08 0 15 20 0.12 11 15 47 0.17

45
Table 17. Major crop residues used for goat feed supplementation in Ziquala and Tanqua
Abergelle districts
Whereas in Tanqua Abergelle district Cowpea, Sorghum, Maize, Ground nut, Barley and Sesame
residues were used for goat supplements in dry season in order of importance with index value
of 0.33, 0.32, 0.12, 0.11, 0.07 and 0.05 respectively.
4.6.3. Major forage plant species
Major forage plant species in Ziquala, Tanqua Abergelle and Lay Armachiho districts are
presented in Table 18, 19 and 20 respectively. Data for major forage plant species index values
calculation were collected based on not the palatability or the special important nature of the
plant (e.g. medicinal value or milk quality and quantity effects etc.) but based on availability and
duration (i.e. by the concept of intake proportion throughout the year). For instance ‘mata’,
Grewia kakothamnos was reported in Ziquala and Tanqua Abergelle districts as the most
palatable goat feed but currently it is too hard to find a single tree in the areas. For scientific
name of each plant species Azene (2007) and Dagnachew (2011) reference materials were used.
Cropresidues
Ziquala Tanqua Abergelle
1st
rank2nd
rank3rd
rank4th
rankIndex 1st
rank2nd
rank3rd
rank4th
ranIndex
Cowpea 42 13 3 1 0.40 43 4 2 2 0.33Sorghum 21 39 11 3 0.43 22 27 7 0 0.32Maize 0 0 0 0 0.00 5 15 0 4 0.12Barley 0 0 0 0 0.00 0 6 0 21 0.07Sesame 5 13 6 18 0.17 0 6 2 8 0.05Groundnut 0 0 0 0 0.00 0 12 4 17 0.11

46
Table 18. Major forage plant species for goats in Ziquala district
plant name 1st 2nd 3rd 4th 5th
Index MostlyavailableLocal Scientific rank rank rank rank rank
Goza Balanites aegyptica 15 21 19 9 6 0.26 year roundAbika Acacia tortilis 8 15 15 13 7 0.19 Jun.-Mar.Tsalwa Acacia asak 16 7 10 9 1 0.17 Jun-Mar.Ekima Terminalia glaucescens 13 8 9 8 10 0.16 Jun-Mar.Giba Ziziphus spinachristi 6 6 3 3 3 0.08 Sep.-JunMata Grewia kakothamnos 2 6 6 5 6 0.07 year roundArina Na 6 2 0 4 4 0.05 year roundLoza Na 0 0 0 4 5 0.01 year roundna = scientific name not available on the above reference materials
Table 19. Major forage plant species for goats in Tanqua Abergelle district
Plant name1st 2nd 3rd 4th 5th
Index
Mostlyavailable
Local Scientific rank rank rank rank rankguawaza Balanites aegyptica 17 12 7 5 5 0.21 year round
giba Ziziphus spinachristi 20 13 9 8 6 0.25 Sep.-Jun
woyba Terminalia glaucescens 16 8 9 7 4 0.19 Jun-Mar
siraw Acacia spp 8 11 9 9 6 0.16 Jun-Mar
tsalwa Acacia asak 0 3 8 15 18 0.1 Jun-Mar.
arena na 6 2 0 1 2 0.05 year round
kebkeb na 1 1 6 1 3 0.04 Oct.-Junna =scientific name not available on the above reference materials
Table 20. Major forage plant species for goats in Lay Armachiho district
Plant name 1st 2nd 3rd 4th 5th MostlyavailableLocal Scientific rank rank rank rank rank Index
kirkira Na 26 33 22 10 3 0.22 Year roundshola Ficus sur 25 22 24 19 8 0.20 Year roundatat Maytenus arbutifolia 25 13 13 11 12 0.15 Year roundgirar Acacia spp 23 8 11 11 10 0.13 June -Februaryagam Carissa edulis 9 18 10 10 10 0.11 Year roundgumero Capparis tomentosa 7 10 16 19 16 0.11 Year roundwarka Ficus vasta 2 6 9 3 9 0.05 Year roundBamba Ficus sycomorus 1 7 2 1 5 0.03 Year roundna = scientific name not available on the above reference materials

47
4.7. Herding and Herd Management
4.7.1. Herding
As stated by Sölkner-Rollefson (2003), a good understanding of the community’s herding
practices is crucial to bring sustainable improvement in the smallholders flock through
community-based strategies. All (100%) goat keepers in Ziquala and Tanqua Abergelle districts
herded their goat both in dry and rainy seasons. But in Lay Armachio district 92.7 % and 7.3 %
of the respondents herded and tethered respectively during rainy (cropping) season and 25.8%
and 18.3% of the respondents herded and tethered their goat respectively during dry season. The
remaining 55.9% of the respondents’ goat were roaming during dry season. Here it should be
noticed that goat keepers in Lay Armachio district were keeping their goat mainly to protect crop
damage (during cropping season) even though goat theft in the area was reported as one of the
biggest problem in goat production. After all crops harvested in Lay Armachio district from
cropping areas, goat keepers usually visited (checked) their goat during watering time (11:30
am-1:30 pm) and when goats are coming back to around the homestead (around 4:30pm-
6:30pm).
Goats in all of the study areas spend by grazing and or browsing all the day time (from 6:30am-
7:00pm). In the study areas goat keeping practice is presented in Table 21. Majority (>92.6%) of
goat keepers in Ziquala and Tanqua Abergelle districts herded their goats separately from kids.
This is because of goat keepers need to milk their goats two times per day and newly born kids
need close attention. In the above mentioned two districts most of goat keepers herded their
goats together with sheep. According to the respondents, goats in Lay Armachiho district were
herded separately with kids (49.2 %) and all classes of goats together (50.8%). In all the study
areas all the respondents reported that communal grazing land is decreasing over time due to the
same reasons mentioned above for the reasons of decreasing landholding size per household in
the study areas. Some farmers in Ziquala (17.2%) and Tanqua Abergelle (14.3%) districts and
majority of the farmers in Lay Armachiho (72.7%) district use their own (private) grazing and
browsing land in addition to the communal grazing and browsing land. All of (100%) the
respondents in the study areas use communal grazing and browsing land for their goat
production.

48
Table 21. Goat herding Practices in Ziquala, Tanqua Abergelle and Lay Armachiho districts (by
% of respondents within districts)
Herding Ziquala Tanqua Armachihon % n % n %
Within goat flockkids are separately herded 63 92.6 69 98.6 58 49.2all classes of goats herded together 5 7.4 1 1.4 60 50.8Goat flock is herdedtogether with cattle 3 4.4 4 5.7 40 33.9together with sheep 49 72.1 42 60 2 1.7separately 16 23.5 24 34.3 76 64.4
Way of herdinggoat of a household run as a flock 56 82.4 61 87.1 65 55.1goats of more than one household run as aflock
12 17.6 9 12.9 53 44.9
All (100%) respondents in each of the study districts stated that goat feed availability fluctuate
seasonally. Respondents in Ziquala (82.6%) and Tanqua Abergelle (78.9%) districts reported
that goat feed shortage usually happens from late December to early June. Even though goat feed
shortage is not a serious problem in Lay Armachiho district two opposite seasons (rainy and dry
seasons) were mentioned by the respondents. Majority (61.4%) of respondents mentioned that
their goats usually face feed shortage during rainy (cropping) season, August and September.
The reason was not feed unavailability in the area but majority of the land is covered by food
crops and goats are confined in small plot of land for higher proportion of day time. On the other
hand 32.7% of respondents agreed that goat feed shortage mostly happen during peak dry season
from March up to May due to some of the trees shade their leaves. Roughage goat feed
supplementation during peak dry season, as mentioned above, in Ziquala and Tanqua Abergelle
districts were reported, but not common in Lay Armachiho district. Goat fattening practice and
concentrate feeds for goats were not used in all the study areas.
4.7.2. Water sources and watering
In all the study districts and all seasons (dry and rainy seasons) river water was the main source
of goat watering, especially in dry season (Table 22.). The current study is in agreement with
Workneh and Rownalds (2004) that stated rivers are generally the most important sources of

49
water during dry and wet seasons in crop livestock system households in Oromia region. Like
feed availability status (as mentioned above), relatively water availability both in dry and rainy
seasons in Lay Armachiho district was not mentioned as a problem. On the contrary, during
group discussions, respondents in Ziquala and Tanqua Abergelle districts reported that during
dry season water shortage was one of the main constraints for goat production especially for kids
and sick goats.
Majority (>67.1%) of respondents in Ziquala and Tanqua Abergelle districts watered their goat
between one and five kilometers distance during dry and rainy seasons. Whereas relatively less
proportion (<66.1%) of respondents in Lay Armachiho district watered their goat between one
and five kilometers distance during dry and rainy seasons.
Table 22. Source of water, distance to the nearest watering point and frequency of watering for
adult goat in dry and wet seasons by district (by % of respondents within districts)
Since water is freely available everywhere during rainy season, majority (>71.4%) of
respondents indicated that their goat can freely access water all the day time during rainy season.
On the other hand less proportion of respondents in Ziquala (2.9%), Tanqua Abergelle (11.4 %)
and Lay Armachiho (34.7 %) districts reported that their goat can freely access water during dry
season. During dry season most (>65.3 %) of goat keepers watered their goat once per day. Goat
keepers in Ziquala (85.3 %), Tanqua Abergelle (90 %) and Lay Armachiho (68.6 %) districts
Source, distanceand frequencyof watering
Ziquala Tanqua Abergelle Lay ArmachihoRainyseason
Dryseason
Rainyseason
Dryseason
Rainyseason
Dryseason
Sourceriver 47.0 92.6 44.3 82.9 58.5 95.8spring 32.4 7.4 34.3 17.1 16.1 4.2rain water 20.6 - 21.4 - 25.4 -Distancewatered at home 4.4 0.0 15.7 17.1 22.0 6.8Less than one Kilometer 8.8 20.6 4.3 15.7 45.8 27.1One –five kilometer 86.8 79.4 80.0 67.1 32.2 66.1Frequencyfreely available 91.2 2.9 71.4 11.4 85.6 34.7once a day 8.8 97.1 28.6 88.6 14.4 65.3

50
watered kids a home. This is because of very young kids (less than one month old) are not able
to move together with adult goats in a distance area and goat keepers in Ziquala and Tanqua
Abergelle districts need to milk their goat twice per day. Moreover kids are more vulnerable for
predators than adults, kids need more attention.
4.7.3. Types of houses and Housing system
Housing is one of the major goat husbandry activities which protect from extreme temperature,
rain, wind, predators and theft. In the study areas different types of houses, Housing materials
and Housing systems were identified (Table 23).
From Table 23 readers may misunderstand that in Lay Armachiho district 61 respondents use
iron sheet for goat house roof construction but the reality was goat keepers share their house
either inside or outside (extend of building) for their goat during night time. In the same way
readers may be confused that how stone is used as goat house roof construction in Ziquala and
Tanqua Abergelle districts, but it is common to construct houses roof from flat stones in Wag
and Tigray ethnic communities that they locally call it ‘hidimo’.
a) Cave b) hidimo
Figure 4. Goat houses in Ziquala (a) and Tanqua Abergelle (b)
Kid’s house

51
Table 23. Types of goat houses and Housing materials in Ziquala, Tanqua Abergelle and Lay
Armachiho districts
Types of houses andHousing materials
Ziquala(N=68)
TanquaAbergelle
(N=70)
LayArmachiho
(N=118)n % n % n %
House with roof 11 16.18 41 58.57 106 89.83In family house 2 18.18 5 12.20 72 67.92Separate house 5 45.45 17 41.46 21 19.81Veranda (extend of building) 4 36.36 19 46.34 13 12.26House without roof 57 83.82 29 41.43 12 10.17Yard (enclosed land) 48 84.21 25 86.21 12 100.00natural cave 9 15.79 4 13.79 0 0.00Housing materials for roof 11 16.18 41 58.57 106 89.83Iron sheet 0 0.00 4 9.76 61 57.55Grass 8 72.73 16 39.02 45 42.45Stone 3 27.27 21 51.22 0 0.00Housing materials for wall 37 54.41 61 87.14 103 87.29Wood 21 56.76 18 29.51 95 92.23Stone 16 43.24 43 70.49 8 7.77Housing materials for floor 68 100.00 70 100.00 118 100.00Wood 3 4.41 13 18.57 24 20.34Stone 18 26.47 27 38.57 45 38.14Earth/soil 47 69.12 30 42.86 49 41.53Kids housed withadult goats
yes 7 10.29 12 17.14 41 34.75no 61 89.71 58 82.86 77 65.25Goats housed togetherwith other animalsyes 9 13.24 21 30.00 72 61.02no 59 86.76 49 70.00 46 38.98NB % for main (bold) heads was calculated from a total sample for each district, N=number of
respondents
From group discussions made in all the study districts, all goat keepers sheltered their goat
during the rainy season at night. Since the length of rainy season in Ziquala and Tanqua
Abergelle districts is very short (usually 60 to 70 days, at the end of June up to very early

52
September), goat keepers in these districts design temporary goat house to shelter their goat from
heavy wind, rain and cold weather. Therefore, the table above did not represent the main rainy
season for the above mentioned two districts. Goat houses with roof in Ziquala, Tanqua
Abergelle and Lay Armachiho districts were 16.18%, 58.57% and 89.83% respectively and the
remaining (without roof) percentages in the same order were 83.82%, 41.43% and 10.17%.
In all the study districts majority of (>65.25%), especially in Ziquala and Tanqua Abergelle
districts (>82.86%), respondents housed their kids separately from adult goats. As mentioned
above this was mainly because of to protect newly born kids and to milk does for the next day
(milking was reported only in Ziquala and Tanqua Abergelle districts).
Majority of (>70.00%) respondents in Ziquala and Tanqua Abergelle districts reported that they
did not housed their goat together with other animals. Traditionally, farmers in Ziquala and
Tanqua Abergelle districts mixed their sheep and goat together both in day and night time,
because they considered goat and sheep as if they are the same species. So in the table below
‘other animals’ did not include sheep in Ziquala and Tanqua Abergelle districts. On the contrary
61.02% of respondents in Lay Armachiho district housed their goat together with other animals.
The main reasons in all districts why farmers housed different animals of species together in one
house were for the ease of management and not to construct houses for each species of animal.
4.8. Major Goat Diseases
Diseases have numerous negative impacts on productivity of herds i.e. death of animals, loss of
weight, slow down growth, poor fertility performance, decrease in physical power and the likes
(CSA, 2012). Gatenby (1986) also stated that maximum productivity in a given system of
production is obtained when disease control is optimal.
Major goat diseases (based on index values) and it’s most frequently occurring months in a year
as mentioned by respondents in each of Ziquala, Tanqua Abergelle and Lay Armachiho districts
are presented in Table 24, 25, 26 respectively in ranking order. Even though the quality of
service was very poor (as explained by respondents), access to veterinary services in Ziquala,

53
Tanqua Abergelle and Lay Armachiho districts were 91.18%, 100.00 % and 95.80%
respectively.
Table 24. Major goat diseases in Ziquala district
Disease name 1st 2nd 3rd Index Mostlyoccurred
Local English rank rank rankGurba Sheep and goat
pox19 17 13
0.26not seasonal
Entit Anthrax 14 10 11 0.18 Mar-Jun
Shilimie PPR 13 12 12 0.18 mar-JunTinan Coenurosis 6 10 15 0.13 not seasonalInt. parasites na 9 2 16 0.12 not seasonalExt. parasites na 6 6 16 0.11 not seasonalHagaza na 0 1 0 0.00 Aug-SepMich na 2 0 0 0.01 Apr-JunPPR = Pest des Petit Ruminants, na=not available
Table 25. Major goat diseases in Tanqua Abergelle district
Disease name 1st 2nd 3rd
Index Mostly occurredLocal English rank rank rank
Nifat PPR 13 11 8 0.17 mar-JunEnfrir Sheep and goat
pox11 12 6 0.16 not seasonal
Tigtigta pasteurellosis 11 9 5 0.14 Aug-Dec & Apr-Jun
Megirem Anthrax 9 8 10 0.13 Mar-JunEx.Parasite
na 5 6 15 0.10 not seasonal
Int.parasite
na 6 7 12 0.11 not seasonal
kinen Coenurosis 5 7 9 0.09 not seasonalEchilam FMD 7 3 0 0.07 Aug-DecWoki Black Leg 1 3 0 0.02 Jul.-DecePPR = Pest des Petit Ruminants, FMD = Foot and Mouth Disease, na =not available

54
From group discussions made in all districts with farmers and peasant association development
agents (DAs) the quality (most of the drugs were broad spectrum and near to expiry date) and the
quantity (amount of each drug and number of types of drugs) of drugs were not satisfactory.
Table 26. Major goat diseases in Lay Armachiho district
Disease name 1st 2nd 3rd 4th 5th Index MostlyLocal name English rank rank rank rank rank occurred
Afemeyaz FMD 17 19 18 9 4 0.17 Jun-OctInt. parasite na 6 7 3 3 2 0.05 May-OctAdeba/kurba/abrehe Anthrax 8 17 18 6 2 0.12 mar-Oct
Enkirkirit Coenurosis 51 24 10 1 2 0.27not
seasonalExt. parasites na 22 20 16 4 2 0.17 Jan-May
yenefas beshita na 4 15 22 7 2 0.11not
seasonal
diro/sal na 2 2 3 0 2 0.02not
seasonalenkit pasteurellosis 6 9 6 2 1 0.06 Jun-OctChakuwat foot root 2 2 2 3 4 0.02 Jun-Sep
FMD = Foot and Mouth Disease, na =not available
During linear body measurement and qualitative data observation, occurrence of tick and mange
data were recorded from 630 sampled goats. The occurrences of tick in Ziquala, Tanqua
Abergelle and Lay Armachiho were 23.1, 17.3 and 4.3 percent respectively. The corresponding
values for mange were 53.8, 26.9 and 19.2 percent respectively. Here it is clearly seen that both
tick and mange had high prevalence’s in Ziquala district which needs immediate intervention.
All respondents in each of the study areas reported that the only veterinary service provider was
governmental. Distance to nearest veterinary services in Ziquala district (based on respondents
percentages) were 1-5km (47.1%), 6-10km (14.7%) and >10Km (38.2%). The corresponding
values for Tanqua Abergelle and Lay Armachiho districts were 8.6%, 54.3%, 37.1% and 32.4%,
26.4%, 41.2% respectively. Because of unsatisfactory veterinary services were delivered in the
study areas, majority of goat keepers in Ziquala (61.4%), Tanqua Abergelle (51.1%) and Lay
Armachiho (57.9) districts did not sent their sick goats to the nearby animal clinic regularly, but
the remaining percentages did. Instead, 48.5%, 57.1% and 28.8% of respondents in Ziquala,

55
Tanqua Abergelle and Lay Armachiho districts respectively used traditional treatments for their
sick goats.
4.9. Indigenous Knowledge of Goat Breeding and Management Practices
4.9.1. Breeding male
As stated by Galal et al. (1996) availability of ram in the system considerably affects all
biological and financial performances of the flock. Among the interviewed goat keepers in the
study districts 97.1% in Ziquala, 98.7% in Tanqua Abergelle and 66.8% in Lay Armachiho had
their own indigenous breeding male goat. Birhu (2013) reported the proportion of respondents
who had their own breeding buck in Benatsemay 93.33%, Hamer 96.67% and Dasenech 90%
districts which were less than in Ziquala and Tanqua Abergelle districts and higher than in Lay
Armachiho district when compared with the current study results. From individual interview and
group discussions made in all of the study districts there was no cross or pure exotic goat breeds
that means all goat populations were pure indigenous goat breeds (Abergelle and Central
Highland goat breeds). Average number (± standard deviation) of breeding male goat per
household (per farmer) was 1.65(±1.32), 1.26(±1.33) and 0.88(± .45) in Ziquala, Tanqua
Abergelle and Lay Armachiho districts respectively. As indicated above goat keepers in Ziquala
and Tanqua Abergelle districts keep more than one breeding male goat mainly because of their
breeding female goats were high and to have reserve incase one of them may die. Average
number (± standard deviation) of years that breeding male goat could give mating service in
Ziquala, Tanqua Abergelle and Lay Armachiho districts were 2.61(± 0.90), 2.26(±0.63) and
2.08(± 0.15) respectively.
There was no any special management for breeding buck in all of the study districts. Majority of
respondents (>98.89%), those who had their own breeding buck, in Ziquala, Tanqua Abergelle
and Lay Armachiho districts reported that source of their own breeding buck was from their own
goat flock. The primary purpose of keeping buck in all of the study areas was mainly for mating
specially for intentionally selected breeding bucks. But in addition to mating prestige was an
added value of keeping breeding male goats particularly if the numbers of bucks are higher than
two. Selection of male for breeding purpose was common in all the study areas. The average (±

56
standard deviation) age of breeding male goat selection in months in Ziquala, Tanqua Abergelle
and Lay Armachiho districts were 10.01(± 4.39), 10.21(±4.46) and 6.54(± 4.06) respectively.
Coat color, body conformation and growth rate were the first, second and third selection criteria
for breeding buck respectively in Ziquala and Tanqua Abergelle districts. The corresponding
values for Lay Armachiho district were body conformation, growth rate and coat color.
Table 27. Selection criteria for breeding buck in the study districts
Traits Ziquala Tanqua Abergelle Lay ArmachihoR1 R2 R3 I R1 R2 R3 I R1 R2 R3 I
Coat color 30 21 12 0.37 28 22 13 0.35 4 20 31 0.13Body conformation 19 24 9 0.29 30 19 6 0.33 77 12 13 0.43Growth rate 4 13 13 0.13 6 5 20 0.12 18 35 15 0.22IBFHMY 9 1 12 0.11 2 18 1 0.11 0 0 0 0.00Libido 1 1 4 0.02 2 2 4 0.03 2 8 5 0.04Kid bodysizewhen born 1 3 2 0.03 1 0 4 0.02 1 5 5 0.03Goodbrowser/grazer 2 1 2 0.03 0 1 2 0.01 0 0 0 0.00Resistanceto disease 1 1 3 0.02 0 1 13 0.04 0 2 7 0.02
If born astwin 0 0 0 0.00 0 0 0 0.00 10 16 11 0.12R1=first rank, R2= second rank, R3= third rank, I=Index and IBFHMY =If born from high milk yielder
Majority of goat keepers, 89.33% in Ziquala, 87.01% in Tanqua Abergelle and 61.06% in Lay
Armachiho districts, could be able to identify the sire of kids. Since household goat flock in
Ziquala and Tanqua Abergelle districts were kept without mixing with other household goat
flocks and the number of breeding male goat in the flock was not more than four, goat keepers in
Ziquala and Tanqua Abergelle districts were able to identify the sire of the kids very easily.
Whereas in Lay Armachiho district the number of breeding male goat within the close relatives
were few in number and goats of close relatives were kept together, goat keepers in this study
area were able to identify the sire of the kids to some extent. In all the study areas goat keepers
used phenotypic characteristics (coat color, head profile, ear length and orientation, body
conformation, height etc) of the kids to trace back the sire of the kids. The current result

57
(identification of the sire of the kids) is in disagreement with Mahilet (2012) report which was
less than 26.8% (i.e 26.8% in Meta, 12% in Babbile and 23.8% in Gurawa districts)
Majority (>93.57%) of respondents in Ziquala and Tanqua Abergelle districts did not allow their
buck to serve does other than their own does because they afraid disease transmission, theft and
the buck will get tired as a result their does will not get service on time. But they allowed a buck
to mate his mother, daughter and sister due to 100% lack of the inbreeding concept. Even some
goat keepers were very happy if their selected buck will mate with his mother, daughter and
sister; because they believe that the performance (growth and milk yield) of the new born will be
good due to cumulative effect (since both buck and doe come from the same pedigree as best
animals). The above statements holds true in Lay Armachiho district except the first sentence,
because more than one household goat flock were browse together the whole day as a result
bucks in this area were not restricted to mate with does other than own flock.
All respondents in all the study districts castrate their buck by their own method (traditionally)
using ‘gejemo’, made from metal and ‘alelo’, a ball shape stone (Fig. 5). The major reasons why
respondents castrate their buck were to control breeding (29.92% in Ziquala, 37.45% in Tanqua
Abergelle, 13.65% in Lay Armachiho districts) and to improve fattening which will ultimately
fetch high price (70.08% in Ziquala, 62.55% in Tanqua Abergelle, 86.35% in Lay Armachiho
districts). Average (±SD) age of bucks (in years) to be castrated in Ziquala, Tanqua Abergelle
and Lay Amachiho districts were 4.46 (± 0.98), 3.94(±1.13) and 3.47(± 2.07) respectively.
a) b)
Figure 5. Buck castration in Ziquala(a) and Lay Armachiho(b) districts

58
4.9.2. Breeding female
The proportion of respondents who practiced selection for breeding female in Ziquala, Tanqua
Abergelle and Lay Armachiho districts were 96.66%, 93.45% and 83.97% respectively. Girum
(2010) reported that the proportion of goat keepers who practiced selection of does was 38.7%,
which was much less than the current result. Selection criteria for breeding does in the study
districts are summarized in Table 28. Based on index value, the first preferred trait for does in
Ziquala, Tanqua Abergelle and Lay Armachiho districts were milk yield (0.24), milk yield (0.20)
and body Conformation (0.34) respectively. Age (mean ±SD) of selection (months) for breeding
does in Ziquala, Tanqua Abergelle and Lay Armachiho districts were 12.35 (± 5.25),
11.90(±5.35) and 8.58(± 6.44) respectively.
Table 28. Selection criteria for breeding doe in the study districts
Traits Ziquala Tanqua Abergelle Lay ArmachihoR1 R2 R3 I R1 R2 R3 I R1 R2 R3 I
Milk production 11 19 17 0.24 14 11 5 0.20 0 0 0 0.00Twining ability 16 12 9 0.22 7 3 8 0.10 30 28 13 0.29Body Conformation 12 8 9 0.12 13 5 3 0.15 41 25 16 0.34Frequent kidding 11 4 3 0.12 9 6 7 0.13 17 17 19 0.19Coat color 5 6 6 0.09 10 14 9 0.19 2 9 15 0.07Growth rate 4 5 2 0.07 4 7 8 0.10 6 11 20 0.11Good browser 2 5 5 0.06 4 6 3 0.08 0 0 0 0.00Hardship tolerance 2 1 5 0.04 2 3 8 0.06 0 0 0 0.00R1=first rank, R2= second rank, R3= third rank, I=Index
Single and twin birth occurrences (%) in Ziquala district were 95.46 and 4.54 respectively.
Almost the same percentages (with Ziquala district) were reported in Tanqua Abergelle district;
single (94.89%) and twin (5.11%). In contrast with Ziquala and Tanqua Abergelle districts,
higher proportions of does in Lay Armachiho district give twin birth type and triple birth type
was very common. Single, twin and triple birth type occurrences (%) reported in Lay Armachiho
district were 21.44%, 72.18% and 6.38% respectively. From personal observation and individual
interviews single birth is not expected from does above parity one in Lay Armachiho district,
even some times twin birth type is common for parity one. Regarding litter size (birth type) on
Abergelle goat breed, Belay (2008) and FARM Africa (1996) reported in agreement with the

59
current study result conducted on Abergelle goat breed. Belay (2008) reported on single and twin
birth types were 96.6% and 3.4% respectively and the corresponding values of FARM Africa
(1996) report were 98.7% and 1.3% respectively. FARM Africa (1996) reported 83.00% single,
twin 17.00% and triple 0.00% birth types on central Highland goat breed, in disagreement with
the current study result on Lay Armachiho district.
Based on index values most of does in Ziquala (0.84) and Tanqua Abergelle (0.84) districts give
birth from October to January. Out of twelve months most peak birth occurred in November both
in Ziquala (0.46) and Tanqua Abergelle (0.32) districts. So we can conclude that Abergelle goat
breed is almost seasonal breeder. This information is vital for breeders specially for community
based genetic improvement program to exchange bucks during the peak mating seasons from
May to August more specifically June to avoid inbreeding problem and unwanted bucks to mate
with does. Comparatively, does in Lay Armachiho district can give birth almost evenly
throughout the year. This difference between the study districts may be due to feed unavailability
in Ziquala and Tanqua Abergelle districts during dry season almost from December to June.
Table 29. Index values of occurrences of births across twelve months
Months Ziquala Tanqua Abergelle ArmachihoR1 R2 R3 I R1 R2 R3 I R1 R2 R3 I
Jan 0 6 19 0.08 2 14 16 0.12 6 5 8 0.05Feb 0 5 6 0.04 1 2 3 0.02 5 6 9 0.05Mar 0 1 1 0.01 0 2 0 0.01 11 11 7 0.09Apr 0 1 2 0.01 0 5 3 0.03 10 13 4 0.08May 0 1 1 0.01 0 2 1 0.01 13 6 14 0.09Jun 0 4 11 0.05 0 1 4 0.01 17 6 9 0.10Jul 0 3 4 0.02 0 1 4 0.01 2 1 3 0.02Aug 0 5 3 0.03 0 1 16 0.04 7 6 4 0.05Sept 0 0 1 0.00 0 1 6 0.02 17 16 13 0.14Oct 3 7 13 0.09 10 17 7 0.17 15 16 18 0.13Nov 60 4 0 0.46 40 6 1 0.32 12 17 11 0.11Dec 5 31 7 0.21 17 18 9 0.23 3 15 18 0.08
R1 = first ranked, R2= second ranked, R3 =third ranked and I= Index
Kidding interval is one of the key components of reproductive performances of a given farm
animal production which affects the overall economic return. Kidding interval (mean ±SD in

60
moths) of does in Ziquala, Tanqua Abergelle and Lay Armachiho districts were 10.89± 1.22,
11.09±1.13 and 8.58±2.02 respectively. Almost similar results were reported by Belay (2008) on
Abergelle goat breed (339.3±21.21 days, which is 11.31 months) and somewhat different result
on Central Highland goats breeds (307.9±14.20 days which is 10.26 months). As estimated by
the respondents, number of kidding per doe life time (mean ±SD) in Ziquala, Tanqua Abergelle
and Lay Armachiho districts were 8.65±3.00, 8.10±2.56 and 7.85±5.50 respectively. This shows
that goat keepers in Ziquala and Tanqua Abergelle districts can harvest a minimum of eight kids
per doe life time. This is in disagreement with the report of FARM Africa (1996) that stated the
average number of kids born per breeding female is 2.8 by Abergelle goat breed.
4.10. Goat Marketing
As indicated above the first objective of goat keepers across all the study districts was to
generate cash income to cover different expenses (school fee for their children, closing, medical,
food grain when drought happen etc.). In all the study districts goat marketing was traditional i.e.
they did not use weighing balance and they did not have market information and the price was
fixed by negotiation between the buyers and sellers. All respondents reported that they did not
have market information except their traditional knowledge as price usually higher during
holidays (Easter, New Year, x-mas etc.). The main goat market shade for Ziquala and Tanqua
Abergelle goat keepers was Mekelle specially Mekelle International Abattoir and for Lay
Armachiho goat keepers Gondar town was the main goat market shade.
Goat keepers (respondents) in all the study areas reported that they usually sell their goat classes
by making priority unless they are forced to sell due to urgent money demand in the household.
As indicted below (Table.30), across all the study areas goat keepers sell male kid between six
months and one year, old doe and old buck in the first, second and third priority respectively.
Unlike goat keepers in Ziquala and Tanqua Abergelle districts, goat keepers in Lay Armachiho
district sell male and female kids at the age of less than six months because of some kids can
attain market weight before six months.

61
Table 30. Ranking of classes of goats to be sold when cash is needed
Classesof
goats
Ziquala Tanqua Abergelle Lay Armachiho1st
R2nd
R3rd
RIndex 1st
R2nd
R3rd
RIndex 1st
R2nd
R3rd
RIndex
MK <6 m 0 0 0 0.00 0 0 0 0.00 3 5 2 0.03FK<6 m 0 0 0 0.00 0 0 0 0.00 2 4 5 0.03BK 6m-1yr 34 3 11 0.30 16 30 12 0.29 54 22 13 0.32Dk 6m-1yr 1 20 5 0.12 0 9 5 0.06 9 23 17 0.13BD 0 5 4 0.04 2 1 2 0.02 6 2 4 0.04BB 2 1 3 0.03 3 4 2 0.05 4 3 9 0.04Castrated 5 6 14 0.10 12 9 10 0.15 14 6 12 0.10Old doe 15 15 13 0.22 27 7 14 0.26 11 31 17 0.17Old buck 11 16 13 0.20 10 9 21 0.17 15 14 21 0.14
MK=male kid, FK=female kid, BK=buck kid,DK=doe kid,BD=breeding doe,BB=breeding buck,
m=month
The average market age (mean±SD in months) for male goat in Ziquala, Tanqua Abergelle and
Lay Armachiho districts were 8.98±2.01, 9.03±2.16 and 6.25±1.88 respectively. The
corresponding values for female counter part were 10.16±2.61, 9.97±2.44 and 7.06± 2.07
respectively. Even though goat keepers in all the study areas did not allow male goats to reach
maximum old age, average (mean±SD in years) culling age due to old age for male goat in
Ziquala, Tanqua Abergelle and Lay Armachiho districts were 5.17±1.28, 5.23±1.19 and
4.63±1.08) respectively. The corresponding values for female counter part were 8.12±1.28,
7.94±1.11 and 10.63±1.08 respectively.
4.11. Goat production constraints
Identification of major constraints for a given farm animal production in a given area is a
prerequisite to plan appropriate intervention strategies. Based on the current study result (Table
31) drought, disease and feed shortage were the first, second and third major constraints
respectively for goat production in Ziquala and Tanqua Abergelle districts with varied index
values. On the other hand, disease, theft and predator were the first, second and third major
constraints respectively in Lay Armachiho district. As indicated below in Table 31, respondents
in Ziquala and Tanqua Abergelle districts did not report lack of superior genotypes as a problem.

62
The reason was they believe that goat breeds (types) other than Abergelle goat breed cannot
survive in the area especially during severe dry season (mostly from March to June).
Table 31. Ranking of the main constraints for goat production in the study districts
Constraints Ziquala Tanqua Abergelle Lay Armachiho1st
rank2nd
rank3rdrank
Index 1st
rank2nd
rank3rdrank
Index 1st
rank2nd
rank3rdrank
Index
Drought 35 16 7 0.36 28 22 11 0.34 2 1 5 0.02FS 5 15 19 0.16 7 15 20 0.17 1 4 8 0.03WS 3 1 2 0.03 3 17 12 0.13 2 3 3 0.02Disease 20 24 19 0.32 27 7 11 0.26 44 50 29 0.38Predator 2 6 9 0.07 1 2 6 0.03 11 16 23 0.13Market 0 1 1 0.01 2 2 1 0.03 0 0 4 0.01
LS 3 3 7 0.06 2 2 1 0.03 6 16 15 0.09LSG 0 0 0 0.00 0 0 2 0.00 0 4 7 0.02theft, 0 0 0 0.00 0 0 0 0.00 52 22 7 0.30FS=feed shortage, WS=water shortage, LS=labor shortage, LSG=lack of superior genotype
4.12. Characterization of Abergelle and Central Highland Goats
4.12.1. Qualitative characters
As indicated in Table 32 majority of Abergelle goat coat color was brown/red (30.40%) and its
combination with other coat colors (50.61%), whereas relatively high proportion of Central
Highland goat had white coat color (21.66) and its combination with other coat colors (55.09 %).
The above mentioned coat colors (red/brown for Abergelle goat and white for Central Highland
goat) were fairly proportional between male and female goats within breed. Red/brown coat
color dominancy, in line with the current study result on Abergelle goat, were reported by
FARM Africa (1996), Biruh (2013) and Sollomon (2013) on Abergelle, Woyto Guji and
Abergelle goats respectively. Goat populations with white coat color dominant, in line with the
current study result on Central Highland goat, were reported by Grum (2010) and Solomon
(2013) on Short Eared Somali goats and Western lowland goats respectively. In contrary to the
current study result on Central Highland goat, FARM Africa (1996) described this goat breed as
reddish-brown coat color type. The possible reason may be FARM Africa (1996) delineated very

63
wide areas for Central Highland goat which may not be true; there may be heterogeneity within
this breed.
a) Abergelle goat b) Central Highland goat
Figure 6. Sample flock, female and male goat in the study areas
From individual interviews and group discussions we clearly understand that all goat keepers
dislike black coat color in both sexes specially in Plain type. It is extremely uncommon to find a
goat keeper who is voluntary to slaughter plain black coat color goat in all the study districts.
Their justifications regarding black coat color in all the districts were mainly because of three
major reasons. 1) Farmers associate black color with devil or Satan. 2) In addition to the
conventional uses of farm animals specially on chicken, sheep and goat, farmers use their farm
animals for their cultural belief (“kolie” or “wukabi”) practices with specific color type either by
slaughtering or as live animal excluding black color. 3) Black color goat usually sold with less
price than other colors most probably due to the cumulative effect of the above two reasons.
Unlike Central Highland goat keepers, Abergelle goat keepers do not prefer white coat color
goats in both sexes due to three main reasons: 1) They believe that small number of white color
goats on grazing land seems many in number than brown color goats for other farmers because
of white color is easily visualized by people. Since stone and soil in Ziquala and Taqnqua
Abergelle goatflock
Abergelle goat female andmale
Central Highland goatflock
Central Highland female and malegoats

64
Abergelle areas has reddish brown color, brown goats don not easily visualized. Therefore if
other farmer specially whom believed to have evil eyes or “eyne buda” or “mikegna” perceives
as farmer x has many goats, farmer x’s goat will die. 2) Unfortunately, If farmer x’s goat flock
having white color damage or destroy some body’s food crop, everyone can simply identify the
owner of the goat flock. Then the owner will be accused and charged money as compensation
which is locally called ‘afelama’ in Ziquala and ‘kahasa’ in Tanqua Abergelle ”. 3) White Coat
color goats have high chance to be preyed than brown color goats. Abergelle goat keepers also
prefer mixed (white, black and red/brown) coat color goats. Moreover, goat keepers in Ziquala
and Taqnqua Abergelle districts most prefer a kind of red brown coat color goat which they
locally call it ‘liybia’ (Fig 6.) even though the proportion of this kind of goat is very low. The
reason was goat keepers traditionally believe that this kind of goat is prolific and productive due
to especial gene it has. As indicated below (Fig 7) different ‘liybia’ goats were observed.
Figure 7. Different ‘liybia’ goats in Abergelle goat breed

65
Table 32. Number (N) and percentages (%) of qualitative traits in Abergelle and Central Highland goats
qualitativetraits
Levels Abergelle Central Highland
Female Male Total Female Male TotalN (%) N (%) N (%) N (%) N (%) N (%)
Coat color black 19 7.60 2 2.63 21 6.44 5 1.91 5 9.62 10 3.18
type white 3 1.20 0 0.00 3 0.92 51 19.47 17 32.69 68 21.66
Red/brown 76 30.40 25 32.89 101 30.98 37 14.12 5 9.62 42 13.38
Black and white 28 11.20 8 10.53 36 11.04 30 11.45 6 11.54 36 11.46
Black and red 30 12.00 9 11.84 39 11.96 20 7.63 1 1.92 21 6.69White and red 73 29.20 25 32.89 98 30.06 93 35.50 16 30.77 109 34.71Black, white and red 21 8.4 7 9.21 28 8.59 26 9.92 2 3.85 28 8.92
X2-test within breed 3.6ns 16.4**X2-test between breed 93.5**Coat color Plain 98 39.20 27 35.53 125 38.34 93 35.50 27 51.92 120 38.22pattern Patchy 93 37.20 37 48.68 130 39.88 106 40.46 19 36.54 125 39.81
Spotted 59 23.60 12 15.79 71 21.78 63 24.05 6 11.54 69 21.97X2-test within breed 3.8 ns 6.3*X2-test between breed 0.0 ns
Head profile Straight 246 98.40 76 100.00 322 98.77 218 83.21 47 90.38 265 84.39Concave 4 1.60 0 0.00 4 1.23 44 16.79 5 9.62 49 15.61
X2-test within breed 1.2 ns 1.7 ns
X2-test between breed 43.5**Horn presence Absent 3 1.20 1 1.32 4 1.23 17 6.49 5 9.62 22 7.01
Present 247 98.80 75 98.68 322 98.77 245 93.51 47 90.38 292 92.99X2-test within breed 0.0 ns 0.7 ns
X2-test between breed 13.7**Horn shape straight 19 7.69 8 10.67 27 8.39 44 17.96 9 19.15 53 18.15

66
Ns=not significant at p<0.05, *= significant at p<0.05 up to <0.01, and **= significant at p<0.01
curved 195 78.95 31 41.33 226 70.19 186 75.92 31 65.96 217 74.32spiral 33 13.36 36 48.00 69 21.43 15 6.12 7 14.89 22 7.53
X2-test within breed 44.4** 4.6 ns
X2-test between breed 31.5**Hornorientation
Upward 21 8.50 9 12.00 30 9.32 34 13.88 3 6.38 37 12.67
Backward 226 91.50 66 88.00 292 90.68 211 86.12 44 93.62 255 87.33X2-test within breed 0.8ns 2.0 ns
X2-test between breed 1.8 ns
Ear orientation erect 5 2.00 0 0.00 5 1.53 7 2.67 0 0.00 7 2.23semi-pendulous 1 0.40 0 0.00 1 0.31 103 39.37 34 65.38 137 43.63carried horizontally 244 97.60 76 100.00 320 98.16 152 58.02 18 34.62 107 54.14
X2-test within breed 1.9 ns 12.5**X2-test between breed 180.1**Back profile straight 230 92.00 70 92.11 300 92.02 158 60.31 26 50.00 184 58.60
slopes up towards therump
20 8.00 6 7.89 26 7.98 82 31.30 11 21.15 93 29.62
curved (dipped) - - - - - - 8.40 15 28.85 37 11.78X2-test within breed 0.0 ns 17.7**X2-test between breed 102.3**Toggle Absent 234 93.60 67 88.16 301 92.33 225 85.88 41 78.85 266 84.71
Present 16 6.40 9 11.84 25 7.67 37 14.12 11 21.15 48 15.29X2-test within breed 2.4 ns 1.7 ns
X2-test between breed 9.2**Ruff Absent 249 99.60 0 0.00 249 76.38 250 95.42 16 30.77 266 84.71
Present 1 0.40 76 100.00 77 23.62 12 4.58 36 69.23 48 15.29X2-test within breed 320.5** 140.0**X2-test between breed 7.1**Beard Absent 238 95.20 11 14.47 249 76.38 192 73.28 23 44.23 215 68.47
Present 12 4.82 65 85.53 77 23.62 70 26.72 29 55.77 99 31.53X2-test within breed 210.5** 17.0**X2-test between breed 5.0*

67
Unlike Central Highland goat, there is no significant difference (α>0.05) with in Abergelle goats
in coat color type. Very high significant difference (α<0.0001) was observed between Abergelle
and Central Highland goats in coat color type. This uniformity coat color within Abergelle goats
indicated that Abergelle goat keepers have coat color preferences and selection practices.
Coat color pattern difference within and between Abergelle and Central Highland goats was not
significant (α>0.05). Coat color pattern observed in Abergelle goat was plain (38.34%), patchy
(39.88%) and spotted (21.78%). Almost the same proportion of coat color pattern was also
observed in Central Highland goats, plain (38.22%), patchy (39.81%) and spotted (21.97%).
Majority of Abergelle (98.77%) and Central Highland (84.39) goats had straight head profile and
the remaining percentage for both breeds was concave.
Majority (>90.38 %) of Abergelle and Central Highland goats were horned. The occurrences of
polled goats in the study areas, specially in Abergelle goats, were very rare which is in line with
the previous studies by FARM Africa (1996), Halima et al (2012), Ahmed (2013), Biruh (2013
Sollomon (2013) on Abergelle, Ethiopian indigenous goats, Goats in Horro Guduru Wollega
zone, Woyto Guji, and Abergelle goats respectively. Straight (8.39 %), curved (70.19 %) and
spiral (21.43 %) Horn shape with Upward (9.32 %) and Backward (90.68) Horn orientation were
observed in Abergelle goats. The corresponding value for Central Highland goats were (18.15
%), (74.32 %), (7.53 %), and (12.67 %), (87.33 %). Unlike horn orientation, horn shape and horn
presence between Abergelle and Central Highland goats were highly significant (α<0.001)
Ear orientation in Central Highland goats were Almost fifty-fifty, semi-pendulous (43.63%) and
carried horizontally (54.14) but in Abergelle goats Ear orientation was largely (98.16%)
horizontally carried. Back profile in Abergelle goats were almost all (92.02%) straight and the
remaining percentage was slopes up towards the rump. Straight (58.60 %), slopes up towards the
rump (29.62%) and curved or dipped (11.78%) back profile were observed in Central Highland
goats.
Toggle in Abergelle goats were not common in both sexes, female (6.40%) and male (11.84 %),
whereas relatively higher frequency were observed in Central Highland goats, female (14.12%)
and male (21.15 %). All (100%) Abergelle male and majority of Central Highland male (69.23

68
%) goats had ruff. The corresponding ruff observations on females were almost none 0.40 % and
4.58% respectively. Beard was more frequent in Abergelle male (85.53%) and Central Highland
male (55.77 %) goats than in Abergelle female (4.82%) and Central Highland female (26.72%)
goats.
Figure 8. Associations (relations) among different categories of qualitative traits using multiple
correspondence analysis technique
Keys for abbreviations of the above figure
Breeds Horn presence Coat color patternAbergelle=A Absent=P Plain=P1Central Highland=C Present=H Patchy=P2Coat color type Horn shape Spotted=P3Black=C1 Straight=S1 Back profileWhite=C2 Curved=S2 Straight=B1Red/brown=C3 Spiral=S3 slopes up towards the rump=B2Black and white=C4 Ear orientation curved (dipped)=B3Black and red=C5 Erect=E1 RuffWhite and red=C6 semi-pendulous=E2 Absent=R1Black, white and red=C7 carried horizontally=E3 Present=R2

69
4.12.2. Live body weight and linear body measurements
Least square mean ±SE of body weight and other linear body measurements of Central Highland
and Abergelle goats are presented in (Table 33) using breed, sex and breed * sex interactions as
fixed factors. Intact males were used in both breeds; castrated males were not used for this
specific analysis.
There were very high significant differences (at least P<0.01) across breeds in all body
measurements except (p>0.05) RL and PW. From all the measurements compared, Central
Highland goat had higher values except RL, PW and HL. Although there was no significant
difference (P>0.05) between Abergelle and Central Highland goats, Abergelle goat had
numerically higher value on RL and PW, which was not expected relative to other
measurements. This may be either of the following two reasons: body conformation difference
between these goat populations or these measurements (RL and PW) were not good enough
informative (not sensitive) to differentiate population. Horn length on Abergelle goat had higher
value (p<0.0001) than Central Highland goat, which was expected from field observation and
FARM Africa (1996) report.
In general, in all the parameters considered, males showed significantly (at least P<0.01) higher
measurements than females except RL, PW and EL. This condition was expected since there is
hormonal difference between males and females. Moreover, Isaac et al. (2005) indicated that
sexual dimorphism in body size is clearly widespread among many mammalian taxa, with male-
biased dimorphism being the more common, but certainly not the exclusive pattern. The
interaction between sex and breed significantly (at least p<0.05) affected all the parameters
measured. Horn length (HL) in Abergelle male goat was significantly (p<0.01) higher than both
sexes of Central Highland goats and Abergelle female goat. As a summary, both male and
female Central Highland goats had higher (at least p<0.05) values in BW, BL, HW, CG, CW and
EL measurements than both male and female Abergelle goats.

70
Table 33. Number (N), Least square mean (LSM)± Standard error (SE) of body weight (kg) and body measurements (cm) by breed,
sex, and their interactions
Effects and level BW BL HW CG CWN LSM±SE N LSM±SE N LSM±SE N LSM±SE N LSM±SE
Over all 630 29.48 630 59.27 630 67.02 630 71.48 630 14.74CV% 630 17.10 630 6.51 630 5.74 630 6.09 630 11.51R2 630 0.42 630 0.21 630 0.46 630 0.37 630 0.28Breed ** ** ** ** **Abergelle 320 27.52±0.34b 320 58.32±0.26b 320 65.31±0.26b 320 70.21±0.29b 320 14.24±0.11b
CHL 310 33.95±0.40a 310 61.44±0.30a 310 71.02±0.30a 310 74.90±0.34a 310 15.80±0.13a
Sex ** ** ** ** **Female 512 28.70±0.22b 512 58.90±0.17b 512 66.36±0.17b 512 70.80±0.19b 512 14.57±0.08b
Male 118 32.77±0.47a 118 60.86±0.36a 118 69.98±0.36a 118 74.31±0.41a 118 15.48±0.16a
Breed X Sex ** * ** ** **CHL male 48 34.79±0.73a 48 62.00±0.56a 48 72.17±0.56a 48 75.65±0.63a 48 15.96±0.24a
Abergelle male 70 30.75±0.60c 70 59.71±0.46b 70 67.79±0.46c 70 72.97±0.52c 70 15.00±0.20b
CHL female 262 33.11±0.31b 262 60.88±0.24a 262 69.87±0.24b 262 74.14±0.27b 262 15.64±0.10a
Abergelle female 250 24.30±0.32d 250 56.92±0.24c 250 62.84±0.24d 250 67.45±0.28d 250 13.49±0.11c
BW=Body weight, BL= Body Length, HW= Height at Withers, CG= Chest Girth, CW= Chest width, Kg=kilogram, cm=centimeter )
*= significant at p<0.05 up to <0.01 and **= significant at p<0.01. Means on the same column with different superscripts (a,b,c ,d) are
significantly different (P<0.05).

71
Continued from Table 33
Effects and level RL PW HL EL SCN LSM±SE N LSM±SE N LSM±SE N LSM±SE N LSM±SE
Over all 630 12.98 630 12.24 604 17.53 628 13.96 118 23.40CV% 630 9.99 630 9.69 604 22.34 628 9.61 118 8.60R2 630 0.04 630 0.02 604 0.57 628 0.39 118 0.18Breed ns ns ** ** **Abergelle 320 13.05±0.09a 320 12.34±0.08a 316 23.30±0.27a 319 12.81±0.09b 70 22.63±0.24b
CHL 310 12.92±0.10a 310 12.20±0.09a 288 15.74±0.32b 309 15.04±0.11a 48 24.52±0.29a
Sex ns ns ** ns naFemale 512 12.95±0.06a 512 12.21±0.05a 291 15.91±0.18b 510 14.01±0.06a - -Male 118 13.03±0.12a 118 12.32±0.11a 113 23.14±0.38a 118 13.84±0.13a 118 23.57±0.19Breed X Sex ** ** ** * naCHL male 48 12.67±0.19b 48 12.06±0.17bc 44 16.69±0.59b 48 15.02±0.19a 48 -Abergelle male 70 13.39±0.15a 70 12.59±0.14a 69 29.59±0.47a 70 12.66±0.16b 70 -CHL female 262 13.18±0.08a 262 12.34±0.07ab 244 14.80±.0.25c 261 15.06±0.08a - -Abergelle female 250 12.71±0.08b 250 12.09±0.08c 247 17.01±0.25b 249 12.97±0.09b - -
RL= Rump Length, PW= Pelvic Width, HL= Horn Length, EL= Ear Length and SC= Scrotum Circumference, ns=not significant
(P>0.05) *= significant at p<0.05 up to <0.01, **= significant at p<0.01 and na=not applicable. Means on the same column with
different superscripts (a,b,c ,d) are significantly different (P<0.05).

72
4.12.3. Correlation between body weight and other linear body measurements
Correlation coefficients of live body weight with other quantitative variables for male and
female Abergelle and Central Highland goat breeds is presented in Table 34. Except chest width,
ear length and scrotum circumference, all linear body measurements showed very high
significant (p<0.01) associations with body weight positively.
Among measured linear quantitative variables chest girth (r=0.769 up to 0.928) was the highest
positively associated variable with body weight both for male and female Abergelle and Central
Highland goat breeds. This suggests that either this variable alone or by combining with other
linear quantitative variables (which will be determined later using multiple linear regression
analysis in the next chapter) could provide a good estimate for predicting live body weight of
Abergelle and Central Highland goat breeds. In agreement with the current result, chest girth as
the most correlated linear quantitative variables with body weight was reported by many
researchers Grum (2010), (Mahilet (2012), Ahmed (2013) and Biruh (2013)).
Table 34. Correlations between body weight and other linear body measurements
Linear bodymeasurements
Goat breedAbergelle Central Highland
Female Male Female MaleN r N r N r N r
Body Length 250 0.494** 70 0.749** 262 0.645** 48 0.796**
Height atWithers
250 0.471** 70 0.660** 262 0.556** 48 0.856**
Chest Girth 250 0.769** 70 0.842** 262 0.782** 48 0.928**
Chest width 250 0.073ns 70 0.299* 262 0.387** 48 0.678**
Rump Length 250 0.376** 70 0.437** 262 0.376** 48 0.475**
Pelvic Width 250 0.236** 70 0.382** 262 0.436** 48 0.672**
Horn Length 247 0.400** 69 0.634** 244 0.430** 44 0.571**
Ear Length 249 0.130** 70 0.160ns 261 0.228** 48 0.053ns
ScrotumCircumference
- - 70 0.710** - - 48 0.247ns
* = p<0.05, **= p<0.01, ns=p>0.05, N= Number of observations and - =not applicable

73
Next to chest girth body length (r=0.494 up to 0.796) and height at withers (r=0.471 up to 0.856)
were the second and the third most correlated variables with body weight respectively for male
and female Abergelle and Central Highland goat breeds except body length showed lower
association with body weight in Abergelle male goats.
In contrast, chest width, rump length, pelvic width, horn length, ear length and scrotum
circumference did not show consistency across breeds and sexes in addition to the lower
correlation coefficient values. From this we can understand that these variables do not have the
potential to predict live body weight.
4.12.4. Prediction of body weight from different linear body measurements
Stepwise multiple linear regression analysis was carried out on Abergelle and Central Highland
goat breeds to generate models (equations) for prediction of live body weight of matured (4PPI)
male and female goats separately (Table 35). For this particular study, five (CG, BL, HW, RL
and PW) and four (CG, BL, SC and PW) predictors (quantitative traits) were selected in order to
develop the prediction equation for Abergelle female and male goats respectively, based on the
values of R2, R2 change, root mean square error (RMSE), the nature of trait (e.g. horn) and
simplicity of measurement under field condition. Thus best fitted prediction models were
selected with smaller C (P), AIC, SBC, RMSE and higher R2 values. In the same manner, four
(CG, BL, CW and HW) and two (CG and HW) predictors were selected for matured female and
male Central Highland goats respectively.
In the current study chest girth (CG) was the best predictor variable, which explains more
variation than any other linear body measurements in both breeds and sexes. This is in agreement
with the results of Tesfaye (2008), Grum (2010), Halima et al. (2012), Mahilet (2012),Ahmed
(2013), Belete (2013), Biruh (2013) and Hulunim (2014) as chest girth was selected first for
prediction of live body weight of animals. The better association of body weight with chest girth
was possibly due to relatively larger contribution to body weight of chest girth which consists of
bones, muscles and viscera (Thiruvenkadan, 2005). Body length (BL) was the second selected
predictor except for male Central Highland goat (which was Height at wither).

74
Even if the addition of new variables in each steps in the model increases R2 value (even this is
not always true) there may be an increment of the values of C (P), AIC, SBC, RMSE which
will ultimately decreases the efficiency of the model. This is because of the addition of
unnecessary variable(s) which has weak association with body weight. On the contrary, precision
of the model becomes less when we use few variables. So optimization is the only solution to
generate best fitted models.

75
Table 35. Models for prediction of live weight from different linear body measurement for Abergelle and Central Highland goats
Breed Sex N/o Models R2 R2 change RMSEAbergelle F (4PPI) 250 -23.82 + 0.71CG 0.59 0.06 1.95
-32.92 + 0.26BL + 0.63CG 0.65 0.01 1.81-36.12 + 0.23BL + 0.11HW + 0.60CG 0.65 0.01 1.80-37.03 + 0.21BL + 0.11HW + 0.58CG + 0.26RL 0.66 0.00 1.78-36.37 + 0.23BL + 0.11HW + 0.59CG + 0.28RL - 0.19PW 0.66 0.00 1.78
M(4PPI)* 70 -43.89 + 1.02CG 0.73 0.07 2.87-53.93 + 0.48BL + 0.76CG 0.8 0.03 2.50-57.01 + 0.49BL + 0.59CG + 0.68SC 0.83 0.01 2.35-55.96 + 0.54BL + 0.66CG - 0.70PW + 0.68SC 0.84 0.00 2.26
CHL F (4PPI) 262 -42.2 + 1.02CG 0.63 0.03 3.42-47.43 + 0.36BL + 0.79CG 0.66 0.03 3.30-49.36 + 0.36BL + 0.75CG + 0.32CW 0.69 0.00 3.16-52.44 + 0.34BL + 0.11HW + 0.70CG + 0.32CW 0.69 0.00 3.14
M(4PPI)* 48 -40.62 + 1.08CG 0.87 0.02 3.16-45.91 + 0.32HW + 0.76CG 0.89 0.00 2.98
*=intact male, N/o=number of observations, CHL=Central Highland BL=Body Length, HW=Height at Wither, CG=Chest Girth,
CW=Chest Width, RL= Rump Length; PW=Pelvic Width, SC=Scrotum Circumference

76
4.13. On-Farm Performance Evaluation and Monitoring
As presented below in Table 36, a total of 115 goat keeper households having a total of 2270
goats was registered for the on-farm goat performance evaluation and monitoring purpose in
Ziquala, Tanqua Abergelle and Lay Armachiho districts from mid July 2013 up to mid August
2014 (13 months) with special emphasis of flock dynamics (in-flow and out-flow), birth weight
and growth performances evaluation in each districts. Milk yield performance was monitored in
Ziquala and Tanqua Abergelle districts but not in Lay Armachiho district, as goat milk is not
consumed in this area by goat keepers.
4.13.1. Base (initial) flock profile
The average of each class of goats kept by the households and composition by age and sex in
each of the study districts is presented in Table 36. From all goat classes in the monitored
households, the highest proportion was does and weaned females respectively in all the study
areas. The first reason was goat keepers need to produce high number of kids to get cash income
by selling, since goat keepers’ first objective of keeping goat in all the study areas was to get
cash income (Table 11). The second reason for Ziquala and Tanqua Abergelle districts was to
have high number of does for milk production.
The average flock size per monitored households with standard deviation in Ziquala, Tanqua
Abergelle and Lay Armachiho districts were 27.33±1.88, 19.18±1.32 and 13.79± 9.41 goats
respectively. The result of survey part (Table 10) and monitoring part (Table .36) regarding flock
size per households in the current study is in disagreement, especially for Tanqua Abergelle
district. The reason may be most probably due to sample size and area coverage for on-farm
performance evaluation and monitoring part was very small as compared with survey part. The
standard deviations in the monitored households’ goat flock were very much lower than the
survey part (Table 10) in Ziquala and Tanqua Abergelle districts that indicated higher variability
of flock size per household across sampled households for survey part and the reverse is true for
monitoring part.

77
Table 36. Base flock structure by district
Classes ofgoats
Ziquala(nhh=33
Tanqua Abergelle(nhh=44)
Lay Armachiho(nhh=38)
N % Mean±Sd N % Mean±Sd N % Mean±SdMale kid 10 1.1 0.30±0.53 76 9.0 1.73±1.83 85 16.2 2.32±1.74
Female kid 9 1.0 0.27±0.67 108 12.8 2.45±2.34 84 16.0 2.24±1.92
Weaned male 90 10.0 2.73±2.90 82 9.7 1.86±1.98 25 4.8 0.66±1.15
Weaned female275 30.5 8.33±5.27 14
6 17.3 3.32±3.01 87 16.6 2.18±2.58
Doe465 51.6 14.09±1.0
5387 45.9 8.80±6.23 22
5 42.9 5.92±4.36
Buck 47 5.2 1.42±2.29 40 4.7 0.91±1.12 17 3.2 0.45±0.60Castrated 6 0.7 0.18±0.39 5 0.6 0.11±0.32 1 0.2 0.03±0.16
Total902
100.0
27.33±1.88
844
100.0
19.18±1.32
524
100.0
13.79±9.41
Grand total goats=2270nhh=number of households monitored, N=sum of each goat category
The average number of goat holding per household in the current study districts were much more
higher than the reports of Endeshaw (2007), Tsedeke (2007), Deribe (2009) and Fikre (2009),
which were 4.5, 4.1, 6.5 and 5.98 goats per household respectively while comparable with the
reports of Tesfaye (2009), Girum (2010) and Feki (2013) which were 20.0, 32.8 and 36.9 goats
per household respectively. The current study result was also much higher than the reports made
in different countries in Africa; Francis (1988, 5.0 by Ndamukong et al. (1989) in Cameroon, 4.5
Ibrahim (1998) and 4.0 by Ahuya et al. (2005) in Kenya, 7.5 by) in Nigeria, 8.0 by Turkson
(1992) in Ghana and 9.9 by Jaitner et al. (2001) goats in Gambia.
4.13.2. Flock dynamics
At the commencement of (July 2013) the village goat monitoring work a total of 2270 goats
(902, 844 and 524 goats in Ziquala, Tanqua Abergelle and Lay Armachiho districts respectively)
were found from a total of 115 households (33, 44 and 38 households in Ziquala, Tanqua
Abergelle and Lay Armachiho districts respectively). Goat entry sources (Table. 37) to the
monitored household goat flock were through purchasing, birth, gift (given for the family
members, usually when daughter or son in the family married and ready to live separately from

78
their family), exchanging by other livestock species and received as wage, locally known as
‘gwasa’ in Tanqua Abergelle and ‘meka’ in Ziquala. Gwasa and meka’ in this localities context
was defined as when poor people (usually male from 12 to 25 years old) recruited as goat keeper
for the whole goat classes (a minimum of one year contract agreement) by goat owner to be paid
one fourth of the new born kids instead of giving money in cash form as salary. On the other
hand goat exit routs from the monitored household goat flock were via selling, gift, theft, home
slaughtering, death due to different causes and payment for goat keepers as wage (‘gwasa’ in
Tanqua Abergelle and ‘meka’ in Ziquala). In one year round village goat monitoring period a
total of 1197 (540, 363 and 294 goats in Ziquala, Tanqua Abergelle and Lay Armachiho districts
respectively) and 719 goats (342, 128 and 249 goats in Ziquala, Tanqua Abergelle and Lay
Armachiho districts respectively) were recorded as inflow and outflow respectively i.e 1916
goats movement was recorded both for inflow and outflow of goats.
In all monitored villages, birth (>79 %) as goat entry sources took the lions share. However, the
proportion of the current results of goat entry sources in the study districts via birth (79.63%,
89.81% and 91.84% in Ziquala, Tanqua Abergelle and Lay Armachiho districts respectively)
were lower than the report (94.4%) of Deribe (2009) in southern Ethiopia and higher than the
report (63%) made by Tsedeke (2007) in the same district (Alaba district, southern Ethiopia).
‘Meka’ in Ziquala district contributed (10.00 %) in second rank as source of goat entry in to the
households goat flock. In Tanqua Abergelle (7.71%) and Lay Armachiho (6.80%) districts
Purchasing took the second rank as source of goat entry to the households goat flock.
Table 37. Entries and exits of goats in the monitored villages by districts
DescriptorsZiquala(nhh=33)
Tanqua Abergelle(nhh=44)
Lay Armachiho(nhh=38)
Overall(nhh=115)
N % N % N % N %Initial (July 2013) 902 - 844 - 524 - 2270 -InflowPurchased 38 7.04 28 7.71 20 6.80 86 7.18Birth 430 79.63 326 89.81 270 91.84 1026 85.71Gift 13 2.41 9 2.48 0 0.00 22 1.84Exchange 5 0.93 0 0.00 4 1.36 9 0.75

79
‘Meka’ 54 10.00 0 0.00 0 0.00 54 4.51Total 540 100.00 363 100.00 294 100.00 1197 100.00OutflowSold 115 33.63 35 27.34 106 42.57 256 35.61Gift 15 4.39 14 10.94 0 0.00 29 4.03Theft 1 0.29 2 1.56 4 1.61 7 0.97Slaughtered 34 9.94 19 14.84 40 16.06 93 12.93Exchanged 8 2.34 1 0.78 3 1.20 12 1.67
Died 85 24.85 57 44.53 92 36.95 234 32.55‘Meka’ 72 21.05 0 0.00 0 0.00 72 10.01Others 12 3.51 0 0.00 4 1.61 16 2.23Total 342 100.00 128 100.00 249 100.00 719 100.00Final (Aug. 2014) 1100 18.00* 1079 21.78* 569 7.91* 2748 17.39*nhh=number of households monitored, N=sum of each goat category, *= % of increment
The highest proportions recorded for the outflow of goats in monitored villages in Ziquala,
Tanqua Abergelle and Lay Armachiho districts were through selling (33.63%), death (44.53%)
and selling (42.57%) respectively. Even though exit rout via death were high(>24%) in all the
study villages, we can say that nearly fifty percent of the exit routs of goat in Tanqua Abergelle
district was due to death by different causes, which needs critical intervention strategy to
alleviate the problem. Deribe (2009) reported lower proportion (when compared with the current
study result) of exit percentages of goat (17.8%) and sheep (13.8%) in Alaba district, southern
Ethiopia, due to death by different causes.
At the end of one year monitoring period, the net increment (inflow-outflow divided by final
population) of goat population in monitored villages in Ziquala, Tanqua Abergelle and Lay
Armachiho districts were 18.00%, 21.78% and 7.91% respectively. This indicted that farmers in
the study areas give attention for goat production specially in Tanqua Abergelle and Ziquala
districts which will ultimately contribute for food security in the areas.
Goat inflow and outflow patterns in the study districts across a year by sex and age are presented
in Figure 9 and 10. As indicated above in Table 9 the main source of goat entry in to the
monitored household goat flock in all study villages was through birth (>79 %) with a very clear
cut across a year in Ziquala and Tanqua Abergelle districts. From a total of births recorded
during one year monitoring period in Ziquala (430) and Tanqua Abergelle (326) districts 74.65

80
%(171 male and 150 female, 321) and 54.91% (84 male and 95 female 326) respectively were
observed in November. So as speculated above in section 4.9.2 in Table 29 from the survey data,
the actual monitoring data confirms that majority of Abergelle goat breed is giving birth in
November most probably because of feed availability during the onset of rainy season (May up
to June). On the other hand birth pattern in Lay Armachiho district did not show seasonality i.e.
does in this study area give birth throughout the year.
From the total inflow goats through purchasing in Ziquala (38), Tanqua Abergelle (28) and Lay
Armachiho (86) districts 71.05 % (27), 57.14% (16) and 20.93% (18) respectively were weaned
females and does. This indicates that farmers in the study areas need to expand goat production.
The outflow pattern of goats in all the study areas across the year (considering months as the
smallest unit of measurement) did not show clear difference which is in disagreement with the
report of Deribe (2009), more than 40% of the exits of goats were in months of February, May
and August in Alaba district. However, unlike the inflow pattern of goats, all goat classes were
observed to exit the monitored household flock due to different routs of exits. From the total
outflow of goats because of death in Ziquala (85), Tanqua Abergelle (57) and Lay Armachiho
(92) districts 45.88 % (39), 59.65% (34) and 23.91% (22) respectively were weaned females and
does. From this observation we can understand that productive classes of goats were died
specially in Tanqua Abergelle and Ziquala districts.

81
Figure 9. Inflow pattern across a year by sex and age in the study districts (a, b and c)
Figure 10. Outflow pattern across a year by sex and age in the study districts (a, b and c)
81
Figure 9. Inflow pattern across a year by sex and age in the study districts (a, b and c)
Figure 10. Outflow pattern across a year by sex and age in the study districts (a, b and c)
81
Figure 9. Inflow pattern across a year by sex and age in the study districts (a, b and c)
Figure 10. Outflow pattern across a year by sex and age in the study districts (a, b and c)

82
4.13.3. Birth weight and growth performance of Abergelle and Central Highland goats
Growth is the most important trait in small ruminant production affecting the contribution of the
sector to the farm household through live animal sale and meat production (Belay and Mengistie,
2013). Growth performance of Abergelle and Central Highland kids’ were studied from birth to
at different ages (three, six and nine months) in Ziquala and Tanqua Abergelle districts for
Abergelle goat breed and in Lay Armachiho district for Central Hiland goat breed by considering
sex of kids, parity of dams and type of births as fixed independent non genetic factors (Table 38
and 39).
4.13.3.1. Average weight of birth, three, six and nine months
In general, Central Highland goat breed in Lay Armachiho district monitoring site significantly
(p<0.001) outsmarted in all the parameters (in birth weight, three, six and nine months weight)
compared with Abergelle goats (in both monitoring sites, Ziquala and Tanqua Abergelle
districts) (see Table 38 and Fig. 11). Belay Deribe (2008) concluded that Central Highland goats
were higher in most of growth (ADG, average daily gain) and Carcass parameters than Abergelle
goats. From the current and previous studies result we can suspect that either the environment or
unique gene(s) or both contribute for Central Highland goats to be best performer compared to
Abergelle goat breed, which needs to be investigated in the future. Whereas, within Abergelle
goat breed at Ziquala and Tanqua Abergelle monitoring sites, birth weight, three and six month
weight did not show significant(p>0.05) differences. But at nine month within Abergelle goat
breed, goats at Tanqua Abergelle district monitoring site showed better performance than goats
in Ziquala district monitoring site. This may be most probably due to relatively better
environment (feed and water) and health services effect in Tanqua Abergelle district monitoring
site (personal observation).
The overall least square means (±SE) for birth, three, six and nine month weights (kg) of
Abergelle goat kids at Ziquala district monitoring site were 1.98± 0.06, 7.30± 0.21, 9.25±0.31
and 11.21±0.53 respectively. For the same breed at Tanqua Abergelle district monitoring site for
the above age categories (kg) were 1.97± 0.06, 7.43± 0.23, 11.08±0.33 and 13.24±0.55

83
respectively. The corresponding values for Central Highland goats in Lay Armachiho district
monitoring site were 2.31±0.04, 10.67± 0.17, 17.53±0.24 and 22.66±0.44 respectively.
The current study result of overall least square mean birth weight of Abergelle goat breed at
Ziquala monitoring site had lower value (1.98± 0.06 kg) than the report (2.29 kg) of Zeryhun
(2006) and somewhat higher than the report (1.91±0.04 kg) of Belay and Mengistie (2013) for
the same breed. Higher birth weight values (2.70±0.05 kg for Bati goats, 2.42±0.05kg for Borena
and 2.19±0.08kg for Short-eared Somali goats) were reported by Hulunim (2014). On the
contrary, lower birth weight (1.5 kg) was reported by Tucho et al. (2000) for Mid Rift Valley
goat kids. Sex, parity and type of birth had effect on birth weight of Abergelle goat breed at
Ziquala monitoring site at p<0.05, p<0.001 and p<0.05 significant levels respectively.
Accordingly, male, parity ≥ 4 and single birth type showed heavier birth weights. Similar reports
(by Ahuya et al., 2009 and Belay and Mengistie, 2013) were observed for the significant effects
of sex, parity and type of birth on birth weight by suggesting their own expectations and
speculations. On the other hand sex, parity and type of birth had no significant (p>0.05) effect on
three, six and nine months of kids body weight consistently for Abergelle goat breed at Ziquala
monitoring site. Except sex effect (p<0.05) only at nine month of kids body weight (Table 38),
sex, parity and type of birth had no significant (p>0.05) effect on birth weight, three, six and nine
months of kids body weight for Abergelle goat breed at Tanqua Abergelle monitoring site. Male
kid’s heavier weight both at birth and somewhere in its age (in our case at nine month) may be
associated with hormonal differences (Nkungu et al., 1995) between male and female kids,
probably androgen play role for male kid’s heavier weight.
The observed overall least square mean birth weight (2.31±0.04kg) of Central Highland goat
breed at Lay Armachiho district monitoring site was more or less comparable for many of the
reports made on different Ethiopian indigenous goat breeds birth weight. For instance
2.42±0.05kg for Borena and 2.19±0.08kg for Short-eared Somali goats reported by Hulunim

84
Table 38. Least square means (±SE) birth, three, six and nine month weights (kg) for Abergelle and Central Highland
goat breeds by sex, parity and birth type
Monitoring Factors BW 3MW 6MW 9MWSite N LSM±SE N LSM±SE N LSM±SE N LSM±SE
over all 1308 *** 852 *** 654 *** 375 ***Ziquala 473 1.98± 0.06b 380 7.30± 0.21b 315 9.25±0.31c 176 11.21±0.53c
Tanqua 376 1.97± 0.06b 232 7.43± 0.23b 185 11.08±0.33b 142 13.24±0.55b
Arma 459 2.31±0.04a 240 10.67± 0.17a 154 17.53±0.24c 57 22.66±0.44a
AZ sex 473 * 380 ns 315 ns 176 nsmale 241 2.09±0.04a 197 7.80±0.25 168 10.11±0.33 90 11.37±0.48
female 232 2.02±0.04b 183 7.79±0.24 147 9.94±0.35 86 11.20±0.44
parity 473 *** 380 ns 315 ns 176 ns1 88 1.98±0.05b 68 7.96±0.31 51 10.19±0.42 29 11.25±0.57
2 67 2.08±0.05ab 55 7.86±0.32 47 9.83±0.43 26 11.17±0.58
3 108 2.00±0.05b 72 7.74±0.28 61 10.05±0.37 32 11.23±0.52
4 90 2.10±0.05a 78 7.78±0.29 69 9.91±0.38 39 11.08±0.54
≥5 120 2.013±0.04a 107 7.65±0.25 87 10.13±0.36 50 11.67±0.46
BT 473 * 380 ns 315 ns 176 nssingle 452 2.14±0.02a 365 7.91±0.45 305 10.56±0.63 170 11.514±0.16
twin 21 1.97±0.07b 15 7.69±0.09 10 9.49±0.11 6 11.05±0.85
ATA sex 376 ns 232 ns 185 ns 142 *male 200 2.17±0.16 120 7.78±0.27 93 11.28±0.36 67 13.76±0.47a
female 176 2.00±0.17 112 7.75±0.26 92 11.01±0.36 75 13.17±0.48b
parity 376 ns 232 ns 185 ns 142 ns

85
Continued from Table 381 90 2.26±0.18 50 7.85±0.31 41 11.10±0.42 35 13.43±0.502 50 2.03±0.21 31 7.77±0.36 26 11.59±0.46 20 13.94±0.573 69 2.06±0.20 45 7.98±0.32 40 11.16±0.41 28 13.34±0.524 66 2.02±0.20 39 7.73±0.34 30 11.14±0.44 21 13.55±0.53
≥5 10 2.06±0.17 67 7.57±0.28 48 10.75±0.40 38 13.05±0.52BT 376 ns 232 ns 185 ns 142 ns
single 362 2.12±0.06 220 7.82±0.11 178 11.40±0.13 139 13.67±0.14twin 14 2.05±0.30 12 7.73±0.47 7 10.89±0.66 3 13.26±0.90
CHLA sex 459 *** 240 * 154 * 57 nsmale 222 2.34±0.03a 117 11.13±0.31a 74 18.47±0.51a 20 22.83±1.58
female 237 2.25±0.03b 123 10.38±0.30b 80 16.87±0.49b 37 22.51±1.01
parity 459 * 240 ns 154 ns 57 ns1 89 2.20±0.04b 51 10.74±0.41 36 17.29±0.65 14 23.34±1.63
2 120 2.25±0.04b 77 10.74±0.34 47 17.82±0.57 14 23.98±1.54
3 99 2.35±0.04a 50 10.42±0.42 27 16.96±0.75 12 21.07±1.71
4 52 2.30±0.05ab 22 11.40±0.61 16 18.06±0.97 6 21.34±2.32
≥5 99 2.36±0.04a 40 10.48±0.49 28 18.20±0.80 11 23.63±1.91
BT 459 *** 240 ns 154 ns 57 nssingle 152 2.47±0.03a 82 11.23±0.32 52 18.25±0.53 12 23.28±1.73
twin 266 2.24±0.02b 133 10.94±0.25 84 17.63±0.91 38 21.77±0.91
triple 41 2.18±0.05b 25 10.09±0.57 18 17.11±0.42 7 22.96±2.20
AZ=Abergelle goat breed in Ziquala district, ATA= Abergelle goat breed in Tanqua Abergelle district, CHLA=Central Highland goat breed in Lay
Armachiho district, Arma= Armachiho, N= number of monitored kids, BT=birth type, BW=birth weight, 3MW=3 month weight, 6MW= 6 month
weight, 9MW=9 month weight, Means in the same column with different superscripts are significantly different at indicated significant level; *
p<0.05, ** p<0.01, *** p<0.001 ns =not significantly different

86
(2014), 2.34 kg for Boran Somali goats reported by Tucho et al. (2000) and 2.28±0.04 kg
Tesfaye Tsegaye (2009) in Metema district are some of the reports. Sex, parity and type of birth
showed effect on birth weight of Central Highland goat breed at p<0.001, p<0.05 and p<0.001
significant levels respectively.
As discussed above for Abergelle goat breed, male Central Highland goats had significantly
(p<0.001) heavier birth weight (2.34±0.03kg) than their female counter parts (2.25±0.03kg). But
sex effect decreased (p<0.05) after birth and did not exert its effect (p>0.05) on nine month old
kids. On the other hand parity and type of birth effects (p>0.05) were not happened after birth.
Hulunim (2014) reported that parity on Borena and for Short-eared Somali goats had no effect
after birth but on Bati goat kids until three months of age. In general, Central Highland does
parity ≥ 3 had heavier birth weight kids. Regarding on birth type effect on birth weight of kids
for Central Highland goat breed, single born kids showed highest birth weight followed by twin
born kids than triple born kids.
As conclusion, Central Highland goat breed had significantly (p<0.001) heavier birth weight and
body weight up to nine month than Abergelle goat in both sexes. Similarly male goats were
heavier (at least numerically) than female goats across all monitoring sites and breeds (Table 38
and Fig. 11).
4.13.3.2. Average daily weight gain (g)
Observed least square means of daily weight gain at three months of interval from birth up to
nine months of age for Abergelle and Central Highland goat kids is summarized in Table 39.The
overall least square means of daily weight gain between monitoring sites (districts) from birth to
three, from three to six and from six to nine months were highly significant (p<0.001). Using
mean separation techniques, it was possible to conclude that this strong significant difference
was mainly because of Central Highland goats are fast growing goats (Fig. 11). Whereas within
Abergelle goats daily weight gain was significantly (p<0.001) different only from three month to
six month age of kids.

87
Zmf=Ziquala male and female, Zm=Ziquala male, Zf=Ziquala female,Tmf=Tanqua Abergelle male and
female, Tm =Tanqua Abergelle male, Tf= Tanqua Abergelle female, Amf=Lay Armachiho male and
female, Am= Lay Armachiho male, Af= Lay Armachiho female
Figure 11. Growth trends (birth to nine months) of male, female and the averages of both sexes
for Abergelle goats (at Ziquala and Tanqua Abergelle districts) and Central Highland goats (at
Lay Armachiho district)
Zmf=Ziquala male and female, Zm=Ziquala male, Zf=Ziquala female,Tmf=Tanqua Abergelle male and
female, Tm =Tanqua Abergelle male, Tf= Tanqua Abergelle female, Amf=Lay Armachiho male and
female, Am= Lay Armachiho male, Af= Lay Armachiho female
Figure 12 Least square means of daily weight gain trends (birth to nine months) of male, female
and the averages of both sexes for Abergelle goats (at Ziquala and Tanqua Abergelle districts)
and Central Highland goats (at Lay Armachiho district)
0
20
40
60
80
100
120
Birth to 3month 3 to 6 month 6 to 9 month
LSm
ens o
f dai
ly w
eigt
gain
(g)
Age (birth to nine month)
Zmf
Zm
Zf
Tmf
Tm
Tf
Amf
Am
Af

88
Abergelle goat at Tanqua Abergelle monitoring site (39.81±2.57 g) showed higher daily weight
gain than Ziquala monitoring site (39.81±2.57). From the calculated all daily weight gains (birth
to three, three to six and six to nine months) the highest daily weight gain was observed from
birth to three month in all the parameters (sex, parity and type of birth) and in all the study areas
(Fig. 12).
Even though not significant (p>0.05), least square means of daily weight gain of males were
heavier than their female counter parts for all age categories in the present study at all the
monitoring sites. Male body weight dominancy as compared with their female counter parts were
also reported by different authors (Naik et al., 1985; Belay and Mengistie, 2013; Hulunim, 2014;
Shumuye et al., 2014)
Like sex effect on daily weight gain, Parity did not show significant (p>0.05) effect on daily
weight gain of all age categories and in all the monitoring sites. Moreover, in this study parity
did not indicate any consistency (increasing or decreasing order across parity number) on daily
weight gain at least numerically. However, different authors reported that pre- weaning daily
weight gain is affected by parity (Belay and Mengistie, 2013; Hulunim, 2014; Shumuye et al.,
2014).
Type of birth (single, twin and triple) like sex of kids did not significantly (p>0.05) affected
growth performance of all age category studied kids in all the study areas. Even though not
significant (p>0.05), type of birth effect for Abergelle goat kids indicated clear trends
(numerically) that single born kids showed higher daily weight gain than twins from birth to nine
month but for Central Highland goat single birth was higher than twins and twins were higher
than triples only at birth. Most literatures supported that single born kids are heavier than twin
and twins are heavier than triple (Belay and Mengistie, 2013; Bushara et al., 2013; Hulunim,
2014; Shumuye et al., 2014).

89
Table 39. Least square means (±SE) of daily weight gain (g) for Abergelle and Central Highland
goat breeds by sex, parity and birth type
MonitoringSite
Factors ADWG g/day(BW TO 3MW)
ADWG g/day(3MW TO 6MW)
ADWG g/day(6MW to 9MW)
N LSM±SE N LSM±SE N LSM±SEover all 852 *** 654 *** 375 ***Ziqual 380 56.50±2.33b 315 20.19±2.42c 176 23.20±3.40b
Tanqua 232 57.82±2.49b 185 39.81±2.57b 142 24.20±3.48b
Arma 240 92.62±1.84a 154 75.47±1.93a 57 61.65±2.78a
Ziquala sex 380 ns 315 ns 176 nsmale 197 62.75±2.67 168 17.74±1.84 90 22.21±2.32
female 183 62.73±2.79 147 17.33±1.97 86 21.26±2.48parity 380 ns 315 ns 176 ns
1 68 63.80±3.40 51 17.68±2.35 29 22.11±2.972 55 63.85±3.57 47 16.53±2.39 26 18.30±3.043 72 62.03±3.15 61 18.48±2.09 32 22.96±2.714 78 62.77±3.20 69 18.08±2.14 39 22.30±2.80
≥5 107 61.23±2.78 87 16.91±2.01 50 22.99±2.40BT 380 ns 315 ns 176 ns
single 365 64.08±4.97 305 18.99±0.64 170 22.44±0.82twin 15 61.39±1.01 10 16.08±3.53 6 21.03±4.43
Tanqua sex 232 ns 185 ns 142 nsAbergelle male 120 62.70±3.00 93 39.66±3.68 67 23.22±2.20
female 112 61.22±2.90 92 36.23±3.75 75 22.12±2.24parity 232 ns 185 ns 142 ns
1 50 62.74±3.51 41 37.68±4.31 35 23.71±2.352 31 61.99±4.06 26 42.72±4.75 20 20.86±2.683 45 63.62±3.61 40 34.73±4.23 28 24.33±2.434 39 61.84±3.81 30 37.40±4.59 21 22.17±2.49
≥5 67 59.61±3.08 48 37.20±4.09 38 22.29±2.43BT 232 ns 185 ns 142 ns
single 220 63.07±1.23 178 39.07±1.37 139 24.04±0.64twin 12 60.85±5.21 7 36.83±6.78 3 21.30±4.22
Lay sex 240 ns 154 ns 57 nsArmachiho male 117 96.94±3.34 74 78.14±4.30 20 62.79±10.99
female 123 90.06±3.23 80 73.04±4.09 37 59.71±7.03parity 240 ns 154 ns 57 ns
1 51 92.83±4.39 36 81.17±5.46 14 81.80±11.362 77 93.82±3.72 47 70.24±4.79 14 61.96±10.753 50 89.99±4.52 27 77.84±6.29 12 53.38±11.954 22 99.99±6.60 16 68.32±8.11 6 48.93±16.16
≥5 40 89.87±5.33 28 80.37±6.69 11 60.17±13.30

90
Continued from Table 39BT 240 ns 154 ns 57 ns
single 82 99.57±3.45 52 73.13±4.46 12 62.65±12.05twin 133 95.60±2.74 84 74.07±3.55 38 52.56±6.33triple 25 85.34±6.17 18 79.57±7.63 7 68.54±15.32
N= number of monitored kids, BT=birth type, BW=birth weight, 3MW=3 month weight, 6MW= 6 monthweight, 9MW=9 month weight, ADWG g/day =average daily weight gain in gram per day, Means in thesame column with different superscripts are significantly different at indicated significant level; *p<0.05, ** p<0.01, *** p<0.001, ns =not significantly different
4.13.4. Milk production performance of Abergelle goats
Least square means (±SE) of milk yield for Abergelle goats recorded from 850 does for a year
(from mid July 2013 to mid August 2014) in Ziquala and Tanqua Abergelle districts is presented
in Table 40 by considering parity, season, district, milking time and season by district
interactions as fixed independent non genetic factors. The overall least square means (±SE) of
milk yield per day per doe for Abergelle goats was 346.36±10.08 ml, which is lower than milk
yield (500 ml per day per doe) of most Ethiopian indigenous breeds of goats in their natural
habitat (MOA, 1999) but almost comparable with the results (380±0.06) of Kidus Nigussie
(2010), in Eastern and Southern Ethiopia.
Majority of goats (72.20% in Ziquala and 61.14% in Tanqua Abergelle districts) had complete
milk yield records up to twelve weeks even though milk yield trend was in decreasing manner
specially after nine weeks in both districts (Fig. 13). From the remaining percentages (27.80% in
Ziquala and 38.86% in Tanqua Abergelle districts) some proportions of does ceased giving milk
before twelve weeks, which indicated that twelve weeks were the maximum lactation length for
Abergelle goats. Almost similar result (3.07±0.13 months) for lactation length was reported by
Kidus Nigussie (2010) for indigenous goats in Eastern and Southern Ethiopia. The overall milk
production of 850 goats was within the range of 146 ml to 496 ml. Regarding milk yield trends
across lactation weeks, milk production was increased from birth to the first two weeks and
decline thereafter in both monitoring sites (Fig. 12). Highest average daily milk yield was
recorded at fourth week lactation and then declined after fourth week in Black Bengal goats in
West Bengal (Dhara et al., 2012) This immediate decline milk yield of Abergelle goat may be

91
due to environmental stresses (feed and water), because of majority of Abergelle goats give birth
on the onset of dry season (mainly November).
Figure 13. Milk yield trends across lactation weeks (1st week lactation up to 12th week lactation)
in Ziquala and Tanqua Abergelle districts
In this study, daily milk yield was affected (p<0.05) by parity (Table 40) where maximum daily
milk yield was observed at middle parity number i.e. parity three. It was observed from this
investigation that milk production was higher from parity three to parity five than parity number
greater than or equal to six and parity number less than or equal to two. Similar results were
reported by Hossain et al. (2004) and Dhara et al. (2012) as parity number increased daily milk
yield also increased, specially peak daily milk yield was observed at parity three.
Within Abergelle goats, Tanqua Abergelle monitoring site (407.35±5.56 ml) had significantly
(p<0.001) higher daily milk yield than Ziquala monitoring site (264.27±5.72 ml). This may be,
as mentioned above, attributed due to relatively better environment (feed, water, management)
and health conditions in Tanqua Abergelle district. In the same way season strongly affected
(p<0.001) daily milk yield of Abergelle goats. This is noticeably; both districts had animal feed
shortage usually from early January to June. Thus the current study result of daily milk yield as
affected by season in general (for both districts i.e. Considering Abergelle goat by season) and
season by district interactions effect in particular are logically acceptable from the reality (feed
availability of the study areas in wet and dry season).
050
100150200250300350400
w1
w2
w3
w4
w5
w6
w7
w8
w9
w10
w11
w12
Milk
yie
ld
Lactation weeks
Ziquala
0
100
200
300
400
500
600
W1
w2
w3
w4
w5
w6
w7
w8
w9
w10
w11
w12
Milk
yie
ld
Lactation weeks
Tanqua Abergelle

92
Milking time (Morning and evening) also significantly (p<0.001) influenced daily milk yield of
Abergelle goats. Daily milk yield at evening (179.83±2.91 ml) was higher than daily milk yield
at morning (165.39±2.91 ml). In agreement with the current study result, Morning milk yields
were 6% lower than evening milk yields in the study of Ouweltjes (1998). In the same study,
differences became smaller as lactation advanced, and were smaller for heifers than for older
cows. However, to the contrary of the current study result, Islam (2001) reported that higher milk
collection occurred at morning (52.77%) than evening (47.24%).
Table 40. Least square means (±SE) of milk yield (ml) across parity, season, district and season
by district interactions for Abergelle goats
Factors N LSM±SE Factors N LSM±SEOverall 850 346.36±10.08 Season 850 ***Parity 850 * wet 619 369.05±4.21a
1 187 318.12±7.57c dry 231 302.57±6.79b
2 121 330.18±9.35bc District*season 850 ***3 164 355.31±8.14a Ziquala wet 339 285.42±5.64c
4 159 344.58±8.43ab Ziquala dry 107 243.12±9.92d
5 137 334.57±11.37abc Tanqua Abergelle wet 280 452.68±6.15a
>6 82 332.11±8.95abc Tanqua Abergelle dry 124 362.03±9.19b
District 850 *** Milking time 1138† ***Ziquala 446 264.27±5.72b Evening (6:00pm) 569 179.83±2.91a
Tanqua Abergelle 404 407.35±5.56a Morning(6:00 am) 569 165.39±2.91b
N= number of monitored does, Means in the same column with different superscripts aresignificantly different at indicated significant level; * =p<0.05, ***= p<0.001, ns =notsignificantly different, †=complete lactation milk yield was recorded from 569 does but due todouble count (morning and night) the number of does seams 1138 but actually 569 does.

93
5. SUMMARY, CONCLUSIONS AND RECOMMENDATIONS
5.1.Summary
Ethiopia is home for diverse indigenous goat populations parallel to its diverse ecology,
production systems and ethnic communities. However goat in Ethiopia is among neglected farm
animals in agricultural research and development programs. Apart from limited experiences of
FARM Africa in crossbreeding of local goats with exotic dairy goats for improved milk
production in the Hararghe Highlands and the SNNPR there has been no organized goat
improvement program in the country.
Performance recording is an important tool to suggest the breeding policy for a given area.
However, recording in general is hardly practiced in any livestock species in Ethiopia, to identify
the performance and management gaps. Very often, the results obtained from on-station research
are of little relevance to traditional production systems and may not contribute much towards
understanding of the specific adaptation of animals to farmer’s conditions. One further attraction
of on-farm performance study is that it provides information in location specific production
conditions that could lead to breed improvement options that are appropriate to the system. Thus
characterizing these goat genetic resources and evaluation of their performance in their existing
production environment is very useful to plan different developmental strategies like
community-based genetic improvement program and others. Therefore, the objectives of this
study were to characterize (phenotypic), describe the production environment and their
production system, evaluate and document on-farm performances of Abergelle and Central
Highland goat breeds in their existing production environments as an input for designing
community-based goat genetic improvement program and other developmental issues in the
future.
Data were collected from secondary data sources, stakeholders meeting, pretested semi-
structured questionnaire, employing field measurements, organizing group discussions and on-
farm performance recorded data. Data collected through questionnaire (survey) were described
by descriptive statistics using SPSS. Observations on qualitative traits were analyzed separately
for male and female goats using frequency procedure of Statistical Analysis System. Multiple

94
Correspondence analyses were employed to see the associations of the qualitative traits by breed.
Quantitative data (Body weight and other body measurements, growth performances of kids,
milk yield) were analyzed using the General Linear Model (GLM) procedures of the Statistical
Analysis System. The stepwise multiple linear regression analysis was done to obtain models for
estimation of live body weight from other linear body measurements for each breed and sex
separately.
Goat population per household (mean ± SD) in Ziquala, Tanqua Abergelle and Lay Armachiho
districts were 36.1±61.9, 38.2±63.9 and 10.5±7.5 respectively. Within a given household goat
flock in Ziquala district one can find 16.02% male kids less than six months, 16.57% female kids
less than six months, 11.31% males between six month to one year, 14.73% females between six
month to one year, 7.92% males greater than one year (intact), 30.92% females greater than one
year and 2.53% castrated. The corresponding values for Tanqua Abergelle district were 14.48%,
15.80%, 9.60%, 14.97%, 7.71%, 35.05% and 2.38% respectively. In the same way, 17.80%,
16.64%, 7.78%, 12.67%, 9.60%, 33.44% and 2.07% respectively were the observed
corresponding values for Lay Armachiho district. The ratio between males (intact) greater than
one year of age and their female counterparts in Ziquala, Tanqua Abergelle and Lay Armachiho
districts were 1:4, 1:5 and 1:4 respectively. These particular study results were in agreement
with that of Wilson (1988) who reported ratios of between1:4 and 1:6 for small ruminants in
traditional livestock production systems of Africa.
In all the study districts cash income was the primary goat production objective. Milk production
in Ziquala and Tanqua Abergelle districts was the 3rd objective of goat rearing next to manure.
Whereas, goat milk consumption in Lay Armachiho district is strictly a cultural taboo. From the
current survey result milk yield per doe per day (in liter) in the rainy season and in the dry season
in Ziquala district were 0.43±0.24 and 0.15±0.14 respectively. The corresponding values for
Tanqua Abergelle district were 0.48±0.24 and 0.19±0.29 respectively. However, the actual on-
farm milk yield record was lower than the survey result for both districts. Thus the actual on-
farm milk yield records per doe per day (in milliliter) for Abergelle goats at Ziquala monitoring
site in wet and dry season were 285.42±5.64 and 243.12±9.92 respectively. The corresponding
values for Tanqua Abergelle monitoring site were 452.68±6.15 and 362.03±9.19 respectively.
Generally, lactation length in the rainy season is shorter than dry season because of the feed and

95
water availability that will in turn create conducive environment for does to conceive and kids to
wean shortly. Average lactation lengths (in months) in Ziquala district in the rainy and dry seasons
were 4.21±2.02 and 4.32±1.40 respectively. Similarly, the corresponding values for Tanqua
Abergelle district were 3.59±2.11 and 4.46±2.00 respectively. Average weaning age of kids (in
months) in Ziquala, Tanqua Abergelle and Lay Armachiho districts were 4.85±1.81, 4.84±1.73
and 4.5 respectively.
Communal natural pasture was the major source of goat feed both in dry and wet seasons in each
of the three districts. Goat feed supplementation was not practiced in Lay Armachiho district
both in dry and rainy seasons. According to the respondents in Ziquala and Tanqua Abergelle
districts, feed supplementation for goats was prioritized based on the reproductive status, body
condition, health condition, age, candidate goat to be slaughtered or sold in the near future and
season of the year.
Selection of male and female for breeding purpose was common in all the study areas specially
for males. Coat color, body conformation and growth rate were the first, second and third
selection criteria for breeding buck respectively in Ziquala and Tanqua Abergelle districts. The
corresponding values for Lay Armachiho district were body conformation, growth rate and coat
color. Based on index value, the first preferred trait for does in Ziquala, Tanqua Abergelle and
Lay Armachiho districts were milk yield (0.24), milk yield (0.20) and body Conformation (0.34)
respectively. Majority of Abergelle goat coat color was red/brown (30.40%) and its combination
with other coat colors (50.61%), whereas relatively high proportion of Central Highland goat had
white coat color (21.66) and its combination with other coat colors (55.09 %). Goat keepers in
Ziquala and Taqnqua Abergelle districts most prefer ‘liybia’ goat. The reason was goat keepers
traditionally believe that this kind of goat is prolific and productive due to especial gene it has.
Drought, disease and feed shortage were the first, second and third major constraints respectively
for goat production in Ziquala and Tanqua Abergelle districts. The corresponding values for Lay
Armachiho district were disease, theft and predator.
In one year round village goat monitoring period a total of 1197 and 719 were recorded as inflow
and outflow respectively i.e. 1916 goats movement was recorded both for inflow and outflow of

96
goats. In all monitored villages, birth (>79 %) as goat entry sources took the lions share.
Whereas the highest proportions recorded for the outflow of goats in monitored villages in
Ziquala, Tanqua Abergelle and Lay Armachiho districts were through selling (33.63%), death
(44.53%) and selling (42.57%) respectively. At the end of one year monitoring period, the net
increment (inflow-outflow divided by final population times by 100) of goat population in
monitored villages in Ziquala, Tanqua Abergelle and Lay Armachiho districts were 18.00%,
21.78% and 7.91% respectively. This indicted that farmers in the study areas give attention for
goat production specially in Tanqua Abergelle and Ziquala districts which will ultimately
contribute for food security in the areas.
The overall least square means (±SE) for birth, three, six and nine month weights (kg) of
Abergelle goat kids at Ziquala district monitoring site were 1.98± 0.06, 7.30± 0.21, 9.25±0.31
and 11.21±0.53 respectively. For the same breed at Tanqua Abergelle district monitoring site for
the above age categories (kg) were 1.97± 0.06, 7.43± 0.23, 11.08±0.33 and 13.24±0.55
respectively. The corresponding values for Central Highland goats in Lay Armachiho district
monitoring site were 2.31±0.04, 10.67± 0.17, 17.53±0.24 and 22.66±0.44 respectively.
5.2. Conclusions and Recommendations
The ratio of male to female in all of the three districts at the age of less than six months was
proportional. However, above six months female proportions were high especially at age of
greater than one year. This is because of male goat greater than one year is frequently sold
whenever cash is needed in the household. Here intervention is needed to control negative
selection to improve the reproductive and productivity of goats particularly for males because of
farmers usually sell good body condition males (which may have good genetic makeup) to get
high price.
Health condition of goats and health services delivered in all the study districts was poor,
especially in Ziquala district. To improve reproductive and productivity of goats, disease
prevention and treatment strategies should be designed in all the study districts. Moreover
research on economical important diseases and ethno veterinary (traditional treatments of
diseases by farmers) practices of farmers should be conducted.

97
Goat keepers in Ziquala and Taqnqua Abergelle districts most prefer ‘liybia’ goat.The reason
was goat keepers traditionally believe that this kind of goat is prolific and productive due to
especial gene it has. This traditional knowledge should be scientifically prove/disprove whether
this goat genetic makeup is different or similar with other ordinary goats.
Abergelle goat breed is almost seasonal breeder. This information is vital for breeders specially
for community based genetic improvement program to exchange bucks during the peak mating
seasons from May to August more specifically June to avoid inbreeding problem and unwanted
bucks to mate with does.
In all the study districts goat marketing was traditional i.e. they did not use weighing balance and
they did not have market information and the price was fixed by negotiation between the buyers
and sellers. Farmers should use weighing balance and should get current market (price per kg)
information in their locality.
From different literature reviews, majority of Central Highland goat’s physical (both qualitative
and quantitative traits) description as studied by different researchers including FARM Africa’s
(1996) report did not fit (agree) with the current study results in Lay Armachiho district.
Therefore, further cluster studies should be conducted for the uniformity (if so as one breed) or
dissimilarity (if not as more than one breeds/ecotypes) for the areas delineated by FARM Africa
(1996) for Central Highland goat.

98
6. REFERENCES
Abule E., 1998. Role and decision making power of women in livestock production aroundAdami Tulu. In: Proceedings of 6th annual conference of the Ethiopian Society of AnimalProduction (ESAP) held in Addis Ababa, Ethiopia, August 14-15 May 1998. pp 95-102.
Ahmed Seid, 2013. On-farm phenotypic and production system characterization of indigenousgoats in Horro Guduru Wollega Zone, Western Ethiopia. An msc thesis presented to the schoolof Graduate Studies of Haramaya University of Agriculture. 94PP.
Ahuya, C.O., Okeyo, A.M and Murithi, F.M., 2005. Productivity of cross-bred goats undersmallholder production systems in the Eastern Highlands of Kenya. ILCA (International Centrefor Africa), Nairobi, Kenya.
Ahuya CO, Ojango JMK, Mosi RO, Peacock CP, Okeyo AM, 2009. Performance of Toggenburgdairy goats in smallholder production systems of the eastern Highlands of Kenya, SmallRuminant Res., 83: 7-13.
Alados, C. L., 1985b. Distribution and status of the Spanish ibex (Capra pyrenaica Schinz). InLovari (1985), pp. 204-11.
Alemayehu Reda, 1993. Characterization (phenotypic) of indigenous goats and goat husbandrypractices in East and South-eastern Ethiopia. An MSc Thesis Presented to the School ofGraduate Studies of Alemaya University of Agriculture. 135p.
Alemu Yami and R.c. Merkel, 2008. Ethiopian Sheep and Goat productivity ImprovementProgram. Addis Ababa, Ethiopia. pp348
Amelmal Alemayehu, 2011. Phenotypic characteriization of indigenous sheep types of DawuroZone and Konta special woreda. An MSc Thesis Presented to School of Graduate Studies,Haramaya University, Ethiopia. 118pp.
Awgichew K., 2000. Comparative performance evaluation of Horro and Menz sheep of Ethiopiaunder grazing and intensive feeding conditions. PhD dissertation, Humboldt University, Berlin,Germany.
Azage Tegegne, Berhanu Gebremedhin and Hoekstra D., 2010. Livestock input supply andservice provision in Ethiopia: Challenges and opportunities for marketoriented development.IPMS (Improving Productivity and Market Success) of Ethiopian Farmers Project WorkingPaper 20. ILRI (International Livestock Research Institute), Nairobi, Kenya. 48 pp.
Azage T. and Alemu G., 1997. Prospects for peri-urban dairy development in Ethiopia. In:Proceedings of the Fifth National Conference of the Ethiopian Society of Animal Production. 15-17 May, 1997, Addis Ababa, Ethiopia. pp. 28-39.

99
Azene Bekele, 2007. Useful trees and shrubs for Ethiopia, Identification, propagation andmanagement for agricultural and pastoral communities. Swedish International DevelopmentAuthority, Nairobi, Kenya. pp550.
Badi A.M.I., Fissehaye N. and Rattan P.J.S., 2002. Estimation of live body weight in Eritreangoat from heart girth and height at withers. Indian J. Anim. Sci. 72, 893-895.
Banerjee, A.K., G. Animut and E. Ermias, 2000. Selection and breeding strategies for increasedproductivity of goats in Ethiopia. In: R.C. Merkel, G. Abebe and A.L. Goetsch (eds.). TheOpportunities and Challenges of Enhancing Goat Production in East Africa. Proceedings of aconference held at Debub University, Awassa, Ethiopia from November 10 to 12, 2000. E (Kika)de la Garza Institute for Goat Research, Langston University, Langston, OK pp. 70-79
Belay Deribe and Mengistie Taye, 2013. Evaluation of growth performance of Abergelle goatsunder traditional management systems in Sekota District, Ethiopia. Pak. J. of Biol. Sci.16(14):692-696.
Belay Deribe, 2008. Growth, reproductive performance and carcass characteristics of abergelleand central Highland goat types under traditional management in sekota woreda. MSc thesispresented at Haramaya University.
Belete Asefa, 2013. On farm phenotypic characterization of indigenous goat types and theirproduction system in Bale Zone of Oromia Region, Ethiopia. MSc thesis presented at HaramayaUniversity.
Biruh Tesfahun, 2013. Phenotypic and production system characterization of Woyto Guji Goatsin Lowland areas of South Omo Zone. An MSc thesis submitted to School of Animal and RangeScience, School of Graduate Studies Haramaya University. 89pp.
Bushara, I., D. M., Mekki, A. O., Idris, M. B., Elemam, O. M. A., Abdelhadi, M. M, MunaAhmed, A. M., Abu Nikhiala, and A. R. Alimon, 2013. Productivity of Taggar goats as affectedby sex of kids and litter size. Basic Research J. of Agri. Sci. and Review 2(5):116-121.
Cavalli-Sforza, L.L. and Edwards, A.W., 1967. Phylogenetic analysis. Models and estimationprocedures. American Journal of Human Genetics 19: 233–240.
Corbet, G. B., 1978. The mammals of the Palaearctic Region: a taxonomic review.BritishMuseum. (National History), London, 314 pp.
CSA (Central Statistical Authority), 2013. Ethiopian agricultural sample survey. Vol II. Reporton livestock and livestock characteristics. Statistical Bulletin 570. CSA, Addis Ababa, Ethiopia.
CSA (Central Statistical Authority), 2012. Ethiopian agricultural sample survey. Vol II. Reporton livestock and livestock characteristics. Statistical Bulletin 532. CSA, Addis Ababa, Ethiopia.
CSA (Central Statistical Agency)., 2007. Summary and statistical report of the 2007 populationand housing census result. Addis Ababa, Ethiopia, CSA.

100
Dagnachew Gebeyehu, 2011. A Quick Reference on Trees/Shrubs Commonly Produced inNurseries of the Slmp Amhara Woredas
DAGRIS, 2007. Domestic Animal Genetic Resources Information System (DAGRIS). (eds. S.Kemp, Y. Mamo, B. Asrat and T. Dessie). International Livestock Research Institute, AddisAbaba, Ethiopia.http://dagris.ilri.cgiar.org
Dereje Andualem, 2004. Preliminary Survey of Livestock Production Systems in ZiqualaWoreda, Waghimira Zone of Amhara Regional State. M.Sc thesis, Alemaya university ofAgriculture, Alemaya, Ethiopia. 72pp.
Deribe Gemiyu, 2009. On-Farm Performance Evaluation of Indigenous Sheep and Goats inAlaba, Southern Ethiopia. MSc thesis, Submitted to the School of Graduate Studies of HaramayaUniversity, Ethiopia. 163p.
Devendra, C., and Burns, M., 1983. Goat production in the tropics. Commonwealth AgriculturalBeauro. Farnham house, Farnham royal, Slough SL2 3BN UK. pp, 183.
Dhara K. C, Ray N., Taraphder S.* and Guha S., 2011. Milk production performance of BlackBengal goats in West Bengal. International Journal of Livestock Production Vol. 3(2), pp. 17-20
Endeshaw Assefa., 2007. Assessment on production system and marketing of goats at Daledistrict (Sidama Zone). MSc Thesis ,Hawassa University, Awassa, Ethiopia.
Epstein, H., 1971. The origion of the domestic animals of Africa. Vol. II. African publishingcorporation. New York, London, Munich. pp 719.
ESAP (Ethiopian Society of Animal Production). 2004. Farm animal biodiversity in Ethiopia:Status and Prospects. Asfaw Yimegnuhal and Tamrat Degefa (eds). Proceeding of the 11th
Annual conference of the Ethiopian Society of Animal Production (ESAP) held in Addis Ababa,Ethiopia, August 28-30, 2003. ESAP, Addis Ababa.441pp.
Falconer, D.S. and T.F.C. Mackay, 1996. Introduction to Quantitative Genetics. 4th ed. Harlow,England, Longman. 438P.
FAO (Food and Agricultural Organization of the United Nations), 2012. Phenotypiccharacterization of animal genetic resources. FAO Animal Production and Health GuidelinesNo.11. Rome, Italy.
FAO (Food and Agricultural Organization of the United Nations), 2011. Draft Guidelines onPhenotypic Characterization of Animal Genetic Resources. Rome, 18 – 22 July.
FAO (Food and Agricultural Organization of the United Nations), 2007. The State of theWorld’s Animal Genetic Resources for Food and Agriculture, edited by Barbara Rischkowsky &Dafydd Pilling, Rome.

101
FAO (Food and Agricultural Organization of the United Nations), 1991. Small ruminantproduction and the small ruminant genetic resource in tropical Africa pp181.
FAO (Food and Agriculture Organization of United Nation), 1986. Animal Genetic ResourceData Banks. 2. Descriptor Lists for Cattle, Buffalo, Sheep and Goats. Animal Production andHealth paper N.50/2. FAO, Rome, Italy.
FAO (Food and Agricultural Organization of the United Nations). 1984. Animal genetic resourceconservation by management, databanks and training. Animal Production and Health Paper No.44/1. Rome.
FARM Africa, 1996. Goat types of Ethiopia and Eritrea: physical description and managementsystems. International Livestock Research Institute, Ethiopia, pp55.
Feki Misbah, 2013. Community-Based Characterization of Afar Goats Breeds in Aysaita Districtof Afar Region. An MSc thesis submitted to School of Animal and Range Science, School ofGraduate Studies Haramaya University. 129pp.
Fikre Keba. 2009. Sheep production system in Damot Gale Woreda and supplementary value ofpigeon pea (Cajanus cajan) and sweet potato (Ipomoea batatas) in sheep fattening diets. Msc.Thesis. Submitted to Hawassa University, November, 2009, Awassa, Ethiopia.
Francis, P.A., 1988. Livestock and farming systems in Southeast Nigeria. In: Proc. Int.Workshop on Goat Production in the Humid Tropics. University of Ife. July, 20-24, 1987. Smith,O.B. and Bosman, H.G. (Eds)., Wageningen. pp. 125-137.
Galal, E.S.E, Metawi H.R.M., Aboul-Naga A.M., and Abdel-Aziz, 1996. Performance of andfactors affecting the smallholder sheep production system in Egypt. Small Rumin. Res. 19:97-102.
Gatenby, R., 1986. Sheep production in the tropics and subtropics. Tropical Agricultural Series.Longman. London and New York.
Gebremedhin Gebrezgabiher, Shewit Kalayou and Samson Sahle,2013. An ethno-veterinarysurvey of medicinal plants in woredas of Tigray region, Northern Ethiopia. International Journalof Biodiversity and Conservation Vol. 5(2), pp. 89-97
Getahun, L., 2008. Productive and Economic performance of Small Ruminant production inproduction system of the Highlands of Ethiopia. Ph.D. dissertation. University of Hohenheim,Stuttgart-Hoheinheim, Germany.
Getinet Ameha, 2001. On-farm characterization of types and evaluation of productivity of goatsin northwestern part of Ethiopia. MSc thesis presented at Alemaya University. 105p.

102
Grum Gebreyesus, 2010. Community-Based Participatory Characterization of the short EaredSomali Goat Population around Dire Dawa. An MSc thesis submitted to School of Animal andRange Science, School of Graduate Studies Haramaya University. 129pp.
Halima Hassen, Samer Lababidi, Barbara Rischkowsky, Michael Baum and Markos Tibbo,2012. Phenotypic characterization of Ethiopian indigenous goat populations. Afr. J. of Biotech.11(73), 13838-13846.
Hossain SMJ, Alam MR, Sultana N, Amin MR, 2004. Milk Production from Indigenous BlackBengal Goat in Bangladesh. J. Biol. Sci., 4(3): 262-265.
Hulunim Gatew, 2014. On-Farm Phenotypic Characterization and Performance Evaluation ofBati, Borena and Short Eared Somali Goat Populations of Ethiopia. MSc thesis, Submitted to theSchool of Graduate Studies of Haramaya University, Ethiopia. 140p.
Ibrahim, H., 1998. Small Ruminant Productions Techniques. ILRI training manual. ILRI(International Livestock Research Institute), Nairobi, Kenya. 3:192p.
ILCA, 1990. (International livestock centre for Africa). Livestock research Manual systemmanual. ILCA, Addis Ababa, Ethiopia. Part I. 287p.
ILCA (International Livestock Centre for Africa). 1987. Annual Report, ILCA, Addis Ababa,Ethiopia. pp 17-21
Institute of Biodiversity Conservation (IBC), 2004. The State of Ethiopia's Farm Animal GeneticResources: Country Report. A Contribution to the First Report on the State of the World'sAnimal Genetic Resources. IBC. Addis Ababa, Ethiopia.
Isaac J.L., 2005. Potential causes and life-history consequences of sexual size dimorphism inmammals. Mammal Review, 35: 101–115
ISLAM, K. M. S., 2001. Quality and amount of morning and evening milk of the BangladeshBaghabarighat Milk Shed Area throughout the year. Asian-Australasian Journal of AnimalSciences, 14, 92-95.
Jahnke H.E, 1982. Livestock Production Systems and Livestock Development in TropicalAfrica. Kieler Wissenschaftsverlag Vauk, Kiel, Germany. 273 pp.
Jaitner, J., J. Sowe, E. Secka-Njie and L. Dempfle, 2001. Ownership pattern and managementpractices of small ruminants in Gambia-Implication for a breeding programme. RuminantResources. 40: 101-108.
Kahsay Berhe, 2013. Diagnosis and intervention plans for North Gonder zone, Amhara Region.The Livestock and Irrigation Value chains for Ethiopian Smallholders (LIVES) project.
Kaps, M. and W. R. Lamberson, 2004. Biostatistics for Animal Science. CABI Publishing,Cambridge.

103
K. C. Dhara, N. Ray, S.Taraphder and S. Guha, 2012. Milk production performance of BlackBengal goats in West Bengal. International Journal of Livestock Production Vol. 3(2), pp. 17-20.
Kemp S.J., 1992. The potential contribution of biotechnology in breed characterization.Proceedings of the Research Planning Workshop held at ILCA, 19-21 February 1992, AddisAbaba, Ethiopia. pp.23-27.
Kidus Nigussie, 2010. Goat Breeds Utilization and Productivity of Crossbred Goats in Easternand Southern Ethiopia and Biophysical Model. A Thesis Submitted to Graduate School of AddisAbaba University, Addis Ababa, Ethiopia. p123.
Mahilet Dawit, 2012. Characterization of hararghe Highland goat and their production system ineastern hararghe. MSc. Thesis Haramaya University.pp89.
Markos Tibbo, 2006. Productivity and health of indigenous sheep breeds and crossbreds in thecentral Ethiopian Highlands. Doctoral Thesis, Swedish University of Agricultural Sciences.Uppsala, Sweden.
Meester, J., and Setzer., H. W. (1977). The mammals of Africa: an dentification manual.Smithson. Inst. Press, Washington, D.C.
Meghen, C., MacHugh, D. E., and Bradley, D. G., 1994. Genetic characterization and WestAfrica cattle. World Animal Review 78(1): 59-66.
MOA (Ministry of Agriculture), 1999. National livestock research and development workshop(Amharic translation). March 29-April 1, Addis Ababa, Ethiopia.
Mohammad A. Jabbar, B.M. Swallow and J.E.O. Rege, 2006. Incorporation of farmerknowledge and preferences in designing breeding policy and conservation strategy for domesticanimals In: Animal Genetics Training Resource, version 2, 2006. International LivestockResearch Institute, Nairobi, Kenya, and Swedish University of Agricultural Sciences, Uppsala,Sweden.
Mukasa-Mugerwa, E., Anindo, D., Sovani, S., Lahlou-Kassi, A., Tebely, S., Rege, J.E.O. andBaker, R.L. 2002. Reproductive performance and productivity of Menz and Horro sheep lambingin the wet and dry seasons in the Highlands of Ethiopia. Small Ruminant Research 45 : 261-271.
Mukasa-Mugerwa E., 1989. A review of a productive performance of female Bos indicus (zebu)cattle. ILCA Monograph 6. ILCA, Addis Ababa, Ethiopia.
Naik, P.K., B.N. Patro and P.K. Mishra, 1985. Some factors affecting the body weight at ifferentages in Ganjam goats. Indian J. Anim. Sci., 55: 213-14.
Ndamukong, K.J.N., Sewell, M.M.H. and Asanji, M.F., 1989. Management and productivity ofsmall ruminants in the North west province of Cameroon. Trop. Anim. Health Prod. 21:109-119.
Nei, M, 1972. Genetic distance between populations. American Naturalist 106: 283–292.

104
Nei, M., Tajima, F. and Tateno, Y, 1983. Accuracy of estimated phylogenetic trees frommolecular data. II. Gene frequency data. Journal of Molecular Evolution 19: 153–70.
Nigatu Alemayehu, 1994. Characterization of Indigenous Goat Types & husbandry Practices inSouthern Ethiopia. An MSc. Thesis, Alemaya University of Agriculture. Alemaya, Ethiopia.
Nkungu D. R, G. C. Kifaro and L. A. Mtenga, 1995. Performance of dairy goats, inMgeta,Morogoro, Tanzania. Srnet Newsletter. 28: 3-8.
NRC, 1993. (National Research Council). Managing global genetic resources: LivestockCommittee. Agricultural imperatives. National Academic Press, Washington, D.C.
Ouweltjes, W., 1998. The relationship between milk yield and milking interval in dairy cows.Livestock Production Science, 56, 193-201
Peacock C. 1996. Improving goat production in the tropics. A Manual for Development workers.Published jointly by FARM-Africa and Oxfam (UK and Ireland), Oxfam, UK. 87pp.
Philipsson J., Zonabend E., Bett, R.C. and Okeyo A.M. 2011. Global perspectives on animalgenetic resources for sustainable agriculture and food production in the tropics In: AnimalGenetics Training Resource, version 3, 2011. Ojango, J.M., Malmfors, B. and Okeyo, A.M.(Eds). International Livestock Research Institute, Nairobi, Kenya, and Swedish University ofAgricultural Sciences, Uppsala, Sweden.
Rege, J.E.O. 1992. Background to ILCA’s animal genetic resources characterization project,objectives and agenda for the research planning workshop. In J.E.O. Rege & M.E. Lipner, eds.Animal genetic resources: their characterization, conservation and utilization. Research planningworkshop, ILCA, Addis Ababa, Ethiopia, 19-21 February, 1992, pp. 55–59. Addis Ababa.International Livestock Centre for Africa.
Rey B., Lebbi S H B and Reynolds (eds). 1992. Small ruminant research and Development inAfrica. Proceedings of the 1st Binnial Conference of the African Small ruminant Research.ILCA (international Livestock Centre for Africa), Nairobi, Kenya, pp 425-437.
SERA (Strengthening Emergency Response Abilities), 2000. Vulnerability Profile in AbergeleWoreda Central Zone of Tigray Region.
Shumuye Belay, Gebreslassie Gebru, Guesh Godifey, Minister Brhane, Mulalem Zenebe, HailayHagos and Tsegay Teame, 2014. Reproductive performance of Abergelle goats and growth rateof their crosses with Boer goats. Livestock Research for Rural Development, Volume 26.
Slippers S.C., Letty B.A. and De Villiers J.F., 2000. Predicting the body weight of Nguni goats.S. Afr. J. Anim. Sci. 30 (Suppl. 1), 127-128.
Sölkner J., H. Nakimbigwe and A. Valle-Zarate, 1998. Analysis of determinants for success andfailure of village breeding programmes. Proc. 6th World Congr. Genet. Appl. Livestock Prod.25: 273 – 280.

105
Sölkner-Rollefson, J., 2003. Community-based management of animal genetic resources withspecial references to pastoralists. pp. 14-26. In: Proceedings of the Workshop on Community-based Management of Animal Genetic Resources, 7-11 May, 2001, Mbabane, Swaziland.
Solomon Abegaz, 2013. Design of Community Based Breeding programs for two indigenousgoat breeds of Ethiopia. PhD desertation. BOKU-University of Natural Resources and Lifesciences, Department of Sustainable Agricultural Systems, Division of Livestock Sciences ,Vienna, Austria. 100pp.
Solomon Gizaw, Komen, H., Hanote, O., van Arendonk, J.A.M., Kemp, S., Aynalem Haile,Mwai, O. and Tadelle Dessie. 2011. Characterization and conservation of indigenous sheepgenetic resources: A practical framework for developing countries. ILRI Research Report No.27. Nairobi, Kenya, ILRI.
Tesfaye Alemu, 2004. Genetic characterization of indigenous gota populations of Ethiopia usingmicrosatellite DNA markers. PhD desertation. National Dairy Research Institute (DeeemedUniversity) Karnal (Haryna), India. 259p.
Tesfaye Getachew, 2008. Characterization of Menz and Afar indigenous sheep breeds ofsmallholders and pastoralists for designing community-based breeding strategies in Ethiopia. AnMsc Thesis Presented to School of Graduate Studies, Haramaya university Ethiopia. 75p.
Tesfaye Tsegaye, 2009. Characterization of goat production systems and on- farm evaluation ofthe growth performance of grazing goats supplemented with different protein sources in metemaworeda, Amhara region, Ethiopia. Msc Thesis Haramaya university.pp108.
Thiruvenkadan, A. K, 2005. Determination of best-fitted regression model for estimation of bodyweight in Kanni Adu Kids under farmer’s management system. Livestock research for RuralDevelopment.17: 1- 11.
Tibbo, M. 2006. Productivity and health of indigenous sheep breeds and crossbreds in the centralEthiopian Highlands. Faculty of Medicine and Animal Science Department of Animal Breedingand Genetics. Ph.D. dissertation. Swedish University of Agricultural Sciences, Uppsala, Sweden.pp 11-63.
Tsedeke K. 2007. Production and marketing of sheep and goats in Alaba, SNNPR. Msc thesis,Hawassa University. Hawassa, Ethiopia.
Tucho TA, A. Regassa and L. Fita, 2000. Preliminary production and reproduction ofperformance evaluation of Mid Rift Valley borana Somali goats. in the opportunities andchallenges of enhancing goat production in East Africa, Merkel, R.C., G. Abebe andA.L.Goetsch (eds.) Debub University, Hawasa, Ethiopia.
Turkson, P.K., 1992. The Practices ad Problems fo Rural Women Involved in Small RuminantProduction. In: Proc. West African Commonwealth Veterinary Association / Ghana VeterinaryMedical Association Conference. 7-12 September. Eds. Amanfu, W. And Koney, E.B.M.,Ghana. Pp. 135-140.

106
Wilson R T., 1991. Small Ruminant Production and Small Ruminant Genetic Resources inTropical Africa. FAO. J. Animal Production and Health. No.88. FAO, Rome
Wilson, R.T. and A. Traore, 1988. Livestock production in Central Mali: Reproductiveperformance and reproductive wastage in ruminants in the agro-pastoral system.Theriogenology, 29(4):931-944.
Wilson, R.T., 1986. Livestock Production in Central Mali: Long-term studies on cattle and smallruminants in the agro-pastoral system. Research report No 14, International Livestock Centre forAfrica: Addis Ababa, Ethiopia.
Wilson, R. T. and J. W. Durkin, 1984. Age at permanent incisor eruption in indigenous goats andsheep in semi-arid Africa. Livestock Prod. Sci. 11(4):451-455.
Winrock International.1992. Assessment of animal agriculture in sub-Saharan Africa. WinrockInternational, Morrilton. Ark., USA. Pp.125.
Workneh Ayalew, 1992. Preliminary survey of indigenous goat types and husbandry practices inSouthern Ethiopia. An MSc Thesis Presented to the School of Graduate Studies of AlemayaUniversity of Agriculture.191p.
Workneh Ayalew, Ephrem Getahun, Markos Tibbo, Yetnayet Mamo and J. E. O Rege, 2004.Current states of knowledge on characterization of farm Animal Genetic Resource inEthiopia.pp. 1-21. In: Proceeding of the 11th Annual conference of Ethiopian Society of AnimalProduction (ESAP). August 28-30, 2004. Addis Ababa, Ethiopia.
Workneh Ayalew and Rowlands J. (eds). 2004. Design, execution and analysis of the livestockbreed survey in Oromiya Regional State, Ethiopia. OADB (Oromiya Agricultural DevelopmentBureau), Addis Ababa, Ethiopia, and ILRI (International Livestock Research Institute), Nairobi,Kenya. 260 pp.
Workneh Ayalew, King J., Bruns E. and Rischkowsky B., 2003. Economic evaluation ofsmallholder subsistence livestock production: lessons from an Ethiopian goat developmentprogram. J. Ecological Economics 45(3):473-485.
Yoseph Mekasha, 2007. Reproductive traits in Ethiopian male goats, with special reference tobreed and nutrition. PhD dissertation. Department of Clinical Sciences, Faculty of VeterinaryMedicine and Animal Sciences, Swedish University of Agricultural Science (SLU), Uppsala,Sweden. 56p
Zeder, M.A., Hesse, B., 2000. The initial domestication of goats (Capra hircus) in the Zagrosmountains 10,000 years ago. Science 287, 2254–2257.
Zeryhun M., 2006. Goat husbandry practices and productive performances in Sekota district ofAmahara rigion. Msc Thesis Haramaya university.pp108
Zewdu Edea. 2008. Characterization of Horro and Bonga Indigenous Sheep Breeds ofSmallholders for Designing Community Based-breeding Strategies. pp107

107
7. APPENDICES

108
Appendix 1. Semi-structured questionnaire for the Survey partPart 1. General information on householdsQuestionnaire number: _______ Name of enumerator________________Date: ___________________ Kebele/Village____________________Zone:____________________ Woreda__________________1.1 Respondent and Owner detailsRESPONDANT [1. Owner; 2. Shepherd;3.Relative]GENDER OWNER [1 = Male, 2 = Female]Age (years)Can read and write. 1 = Yes, 0 = NoInstruction (level)Type of schooling (1=General; 2=Vocational)Farming experience (years)Experience in goat farming (years)Marital status (code)Religion groupAge group codes 1=<20 2=[20-<30[ 3= [30-
<40[4=[40-<50[ 5= [50-<60]6=>60Instruction codes 1= None 3= Secondary 5= Higher education2= Primary 4= Higher school
Marital status codes 1= Single 2=Married 3= Divorced 4= WidowReligion codes 1 =
Orthodox4 = Seventh Day Adventist 6 = Traditional African
Religion2=Catholic
3 = Muslim 5= Protestant (all except forSDA)
= Hindu
1.2 Owner’s position in the household (HH): [….] 1. Male head, 2. Female head, 3.Relative, 4. Son, 5. Daughter, 6. Others (specify) _______Household family size (number): Male ______ Female______ Total ______1.4 What is your major farming activity? [….] 1. Livestock production 2. Crop production3. Crop - livestock production 4. Other (Specify)_________________Non-farm activities [……] 1. Hand craft 2. Trading 3. Daily labor4. Others (specify) _______________
Rank your farming and non-farm activities according to the respective criteriaRank Major HH food source Major HH Cash income1st
2nd
3rd
4th
5th
6th
Activities codes 1=Livestock
3= Handcraft 5= Daily labor2= Crop 4= Trading 6= Other
1.7 Please provide the following information for the area of land used (in ha)Land area owned (including own* grazing for fodderarea)
Area [__ _ _]
How much of your owned land has a title deed?All [__](1 = YesNo=0)
Part (specify area) [ _ __]
Area: __________
GPS waypoints:East:North:Elevation :

109
How much of the land area is rented in? Area[___] Rent paid per year [_____.__]
How much of your land do you rent out? Area [__] Rent earned per year[__.__]
*Excluding public or community land1.8 Trend in land holding 1. Decreasing, 2. Increasing, 3. StableIf decreasing why? ___________________________________________If increasing why? ___________________________________________1.9 Please give the following details for each plot you cultivate, including the homestead.
Plot no Rainy (cropping) season Dry (non-cropping) seasonCrops (code) Area (same unit
as 1.7) **Crops (code) Area (same unit as
1.7) **1 [__] x [__] x [__] [__] x [__] x [__]2 [__] x [__] x [__] [__] x [__] x [__]3 [__] x [__] x [__] [__] x [__] x [__]4 [__] x [__] x [__] [__] x [__] x [__]5 [__] x [__] x [__] [__] x [__] x [__]6 [__] x [__] x [__] [__] x [__] x [__]Food crops codes Cash crop codes00=Garden/Homestead 10 = Cabbages 30 =
Cowpeas/pigeon pea41 = Rice
01= Maize 11 = Onions 31 = Othervegetables for sale
42=Eucalyptus/Podocarpus
02 = Sorghum 12 = Yams/taro 32 = Coffee 43= Sugarcane03 = Cassava 13 = Carrots 33= Tea 44= Sesame04 = Haricot bean 14 = Bananas 34 = Cocoa 45= Groundnuts05 = Irish potatoes 15 = Arrow roots 35 = Palm tree 46= Planted pastures
(grass or forbs)06 = Sweet potatoes 16 = Cucumber 36 = Fruit/tree crop 47= Fallow/unimproved
pasture07 = Okra 17 = Green pepper 37 = Hibiscus 48= Elephant
grass/Napier grass08 = Tomatoes 18 = Pawpaw 38 = Raphia 49= Chat09 = Amaranthus 19 = Soybean 39 = Moringa 50 = Others20. Tef 25. Rice 40. Cotton21. Barley 26. Oat22. Horse bean 27. Ensete23. Noug 28. Wheat24. Millet 29. Others**Ensure that the sum of the different plot areas is the same as the sum of area indicated in 1.7
Part 2. Production and management systems2.1. GeneralPlease indicate the number of animals for the different species that are currently owned by yourhousehold.Livestock Total
numberowned
Numberownedspecifica
Numberownedspecifica
Numberowned
Numberowned
Mostimportant

110
2.1.1. Please indicate the type of goats you keep on your farm, their breed types, number kept onthe farm and number owned by your household.Goat type Breed Grade Breed name Number on farm Number owned
Codes: For any question dealing with goat type, breed grade and breed names, please use thefollowing codes.
Goat type codes1 = Male kids < 6months
5 = Male > 1 year (Intact)2 = Female kids < 6months
6 = Female > 1 year3 = Male 6 months to 1year
7 = Castrate4 = Female 6 months to1 yearBreed grade codes1 = Pure 2 = High grade 3 = Low grade 4 = IndigenousBreed name codesExotic breeds Indigenous breeds1 = 4 = 6= 9= Unknown2 = 5= 7= 10= Others (specify)3 = 8=
by thehousehold
llyby men
lly bywomen
bymalechildren
byfemalechildren
(Rank)
Cattle IndigenousExotic/crosscrcrosscrossindigenouoticGoatIndigenousExotic/cross
SheepIndigenousExotic/cross
Donkey
IndigenousExotic
Horse IndigenousExotic
Camel IndigenousExotic
Chicken
IndigenousExotic
Pig IndigenousExotic
Other poultry, specifyRabbitBees (# bee hives)Aquaculture (# fish ponds)Other (specify)____________

111
2.1.2. When did you start keeping goats? Year [__ __ __ __]2.1.3. With how many goats did you start your goat farming with? [___] (Number)2.1.4. Where did you get your first goats from? [__] (Code)1= Inherited (from mother or father?)2= Purchased from neighboring farm/market3 = Purchased from a distant farm/market4 = Purchased from a friend5 = Obtained from a development project asgift
6= Obtained from a development project as loan7= As a gift from relatives/friends8= As a loan from relative/friend/ neighborpayment9 = Purchased from a neighbor10 = Other (specify) ___________________
2.1.5. If you have cross breed and/ non-local goats, when did you acquire your first cross breedand/or grade goat? (Whichever is first – acquisition of pure or cross breeds) [__ )2.1.6. If you have cross breed and/or pure breed (grade) goats, how did you first acquire thegoat? [__] (code)Source of pure/cross breed goat1= Inherited (from mother or father?)2= Purchased from neighboring farm/market3 = Purchased from a distant farm/market4 = Purchased from a friend5 = Obtained from a development project asgift
6= Obtained from a development project as loan7= As a gift from relatives/friends8= As a loan from relative/friend/ neighborpayment9 = Purchased from a neighbor= Other (specify) ___________________
2.1.7. For the year 2012, did you purchase/acquire any goat? [___] (code) 1 = Yes 0 = NoIf yes for question 2.1.7. why?2.1.8. For the year 2012, did you sale/reduce any goat? [___] (Code) 1 = Yes 0 = NoIf yes for question 2.1.8. why?2.1.9. Do you keep any kind of records for your goat enterprise? [__] (code) 1 = Yes 0 = No2.1.10. If yes, what types of records do you keep? [__] [__] [__] [__] [__] [__]1 = Breeding records 4 = Sales and purchases 7 = Extension visitors book2 = Production records 5 = Births 8 = Feeding records
9 = Other(specify)____________________
3 = Veterinary (treatment)records
= Deaths
2.1.11 how do you usually identify your goat? (code) [__] [__] [__] [__] [__]0 = Noidentification
2 = Ear tag 4 = Parentage
1 = Name 3 = Color 5 = Others(specify)
2.1.12. Mobility pattern [___] (code) 1. Sedentary, 2. Seasonal, 3. Pastoral2.1.13. Reason for mobility 2 & 3 of 2.1.12 [___] (code) 1. In search of feed, 2. In search offood, 3. Security issues, 4. Disease outbreak, 5. Others _____2.1.14. Flock movement [___] (code) 1. Whole flock, 2. Adults only, 3. Others ____2.1.15 which is the main (first) purpose that you keep goats for? [ ] [code]
2.1.16. Which is the second most important purpose that you keep goats for? [___] (Code)

112
1 = Sale (cash income) 2 =Consumption
3 = Manure
4 = Meat 5= Milk 6= Blood7= Skin 8= Saving 9= Ceremonies (gift/wedding, sacrifices)10. Others (specify)______
2.1.17. If you use goats for milk production
Criteria Rainy (cropping) season Dry (non-cropping) season
Milk/doe/day(litres)Lactation lengthFrequency ofmilkingMilk feeding toweaningUses made of milk(can be more thanone)Milk/day (Litres): 1 = < 1l, 2 = 1l-2l 3 = 2l-3l 4=>3lMilkingcodes(freq)
1 = Once a day 2 = Twice a day 3 = Thrice
Milk feeding toweaning codes
1= Unrestrictedsuckling
2= Restrictedsuckling
3=Bucket feeding
Uses made of milkcodes
1 = Market 2 = Household =Others_________________
2.1.18. If the family is making use of it, the way of preparation and utilization is [___] (code)Raw milk, 2. Boiling, 3. Pasteurization, 4. Skimming/making butter out of it, 5. others2.1.19. The type of mechanism you use to wean kids [___] (code) 1. Natural, 2. Assisted2.1.20. Average weaning age of kids is [___] months ___________2.1.21. Members of household and hired labour responsibilities for goat production activities[___] (tick the appropriate answer)
Family Hired labourActivities female male female male
≤15years
>15years
≤15years
>15years
≤15years
>15years
≤15years
>15years
PurchasingSellingHerdingBreedingCaringsickanimalsFeedingMilkingMakingdairy

113
2.2. Feeding and grazing management2.2.1. Feed source ( tick the appropriate answer) and rank them
Type of feed source Wet season Rank Dry season RankNatural pastureEstablished pastureHayCrop residuesFallow landConcentratesOthers/specify ____
2.2.2. The five major crop residues used for goats’ feed (Rank according to priority)Cash/food crop (Code) Rank
Food crops codes Cash crop codes00 =Garden/Homestead
10 = Cabbages 30 = Cowpeas/pigeonpea
41 = Rice
01= Maize 11 = Onions 31 = Other vegetablesfor sale
42=Eucalyptus/Podocarpus
02 =Sorghum
12 = Yams/taro 32 = Coffee 43= Sugarcane
03 =Cassava
13 = Carrots 33= Tea 44= Sesame
04 = Haricotbean
14 = Bananas 34 = Cocoa 45=Groundnuts
05 = Irishpotatoes
15 = Arrow roots 35 = Palm tree 46= Plantedpastures (grassor forbs)
06 = Sweetpotatoes
16 = Cucumber 36 = Fruit/tree crop 47=Fallow/unimproved pasture
07 = Okra 17 = Green pepper 37 = Hibiscus 48= Elephantgrass/Napiergrass
08 =Tomatoes
18 = Pawpaw 38 = Raphia 49= Chat
09 = 19 = Soybean 39 = Moringa 50 = Others
productsSellingdairyproductsBarncleaningSlaughtering

114
Amaranthus20. Tef 25. Rice 40. Cotton21. Barley 26. Oat22. Horsebean
27. Ensete
23. Noug 28. Wheat24. Millet 29. Others
2.2.3. Major five forage plant species for goats, ranking order and seasonalityLocalname
Commonname
Rank Seasonality Picture numberannual Perennial
2.2.4. Grazing land ownership [ ] Code 1. Private ; 2. Communal ; 3. Both2.2.5. Grazing/browsing method during dry season [ ] Code 1.Roaming ,2. Tethered, 3.Herding, 4. Paddock, 5. Zero, 6. Others/specify ____2.2.6. Grazing/browsing method during wet season [ ] Code 1.roaming ,2. tethered, 3.Herding, 4. Paddock, 5. Zero, 6. Others/specify ____2.2.7. Length of grazing and/ or browsing time during dry season [ ] Code 1. Morning, 2.Afternoon, 3. Whole day2.2.8.Length of grazing and/ or browsing time during wet season: [ ] Code 1. Morning, 2.Afternoon, 3. Whole day2.2.9.Trend in communal grazing areas? [….] 1. Decreasing 2. Increasing 3. StableWhat do you think the reason? ____________________________________________2.2.10 how is goat flock herded during the day time? [.....] Code 1. Male and female areseparated, 2. kids are separated; 3. Male and female goats are herded together; 4. All classesgoats herded together2.2.11. Goat flock is herded [.....] Code 1. Together with cattle, 2. Goats herded separately, 3.Together with sheep, 4. Together with camel, 5. Together with calves, 6. Together with equines,7. All herded together2.2.12. Way of herding [.....] Code 1. Goats of a household run as a flock, 2. Goats of more thanone household run as a flock, 3. Others/Specify _____
2.2.13.Is there seasonal fluctuation in feed supply? [.....] Code 1= Yes, 2= No2.2.14. At which month(s) of the year do you experience most feed shortage?
2.2.15. Do you supplement your goats? [.....] Code 1= Yes 2= No2.2.16. If your answer is yes for question 2.2.15 what is your supplementation (Rank
according to importance)
2.2.17. Concentrates used for goats feeds( rank the most frequent used 1 and so on)Type RankHomemade grain
Supplement type Wet season Rank Dry season RankRoughageMinerals (salts)/vitaminsConcentratesOthers (specify)

115
Oil seed cakesLocal brewery by-productsFlour by-products
Others (Specify______________________________________________2.2.18. Do you practice goat fattening [.....] 1= Yes 2=No2.2.19. If your answer is yes for question no. 2.2.18, which categories of animals do youfatten?(you can tick more than 2) [.....] Older malesOlder femaleCastratesYoung malesYoung femaleCulled young maleCulled Young femaleNB Name 3 categories of animals you use for fattening in order of importance
1.__________ 2. ______________ 3._______________________2.2.20. At which periods of the year do you commonly fatten goat? ___________
Season Fattening duration (in months) Reason____________ _______________________________
2.2.21. What type of feed resources you use to fatten goats? [.....] Naturel PastureCrop residuesConcentrateOthers(specify) __________2.3. WateringSource of water( tick the appropriate answer)
Source Wet season Dry seasonWater wellDam/pondRiverSpringRain waterPipe water
Others (specify) _stance to nearest watering pointDistance Wet season Dry seasonWatered at home<1km1–5 km6–10 km>10 km
Are kids watered with the adults? [.....] 1= Yes 2= NoIf no, describe watering distance and frequency of kids:Distance(meter) =____, Frequency =Frequency of watering( tick the appropriate answer)
Frequency Wet season Dry seasonFreely availableOnce a dayOnce in 2 daysOnce in 3 days

116
OthersHousing
Housing/enclosure for adult goat (Tick one or more boxes)
With roofIn family house
Separate houseVeranda (extend of building)
Without roofKraal (enclosed village)
Yard (enclosed land)None
Others (specify)
Housing materials( tick the appropriate answer)Type Roof Wall FloorIron sheetsGrass/BushesWoodStone/bricksconcreteEarth/mudothers
Are kids housed with adult goat? [.....] 1= Yes 2=NoIf no, reason_____________________________________
Are goats housed together with other animals? [.....] 1= Yes 2= No.If yes, what are the advantages and disadvantages you noticed? ___________________Health
What are the major goats diseases occur frequently in your area? List in order of importance.___________________________________Clinical signs___________________________________________________________Clinical signs________________________Do you have access to veterinary services [.....] 1. Yes 2. NoIf yes, which type of veterinary service you accessed? [.....] Government veterinarian/nursesPrivate veterinarian NGOsCommunity association health workersDistance to nearest veterinary services [.....]1-5km 6-10km >10kmOther (specify)________Most animals are provided with veterinary treatment when they are sick[.....]Never, why? __________________________________________occasionally regularlyMost animals are subject to traditional treatments [.....]never, why ? __________________________________________occasionally regularlyAdaptability traits of goats
Adaptability good moderate lessDiseaseInternal parasiteExternal parasiteHeat

117
FrostDroughtFeed shortageWater shortage
Breeding practices2.6.1. Do you have breeding buck? [.....] 1= Yes 2= NoIf yes, Number of crossbred breeding buck? ____________
Number of exotic breeding buck? ____________Number of local breeding buck? __________________2.6.2. If you have exotic and/or crossbred buck, how do you have it? [.....]1= Inherited (from mother or father?)2= Purchased from neighboring farm/market3 = Purchased from a distant farm/market4 = Purchased from a friend5 = Obtained from a development project asgift
6= Obtained from a development project as loan)7= As a gift from relatives/friends8= As a loan from relative/friend/ neighborpayment9 = Purchased from a neighbor= Other (specify) ___________________
2.6.3. If you have more than one breeding buck, why do you need to keep more than one? [.....]2.6.4. For how many years on the average is the one buck serving in your flock? [.....]2.6.5. Is there any special management for breeding buck? [.....] 1= Yes 2= No2.6.6 If yes, specify type of management________________________________2.6.7. Source of breeding buck [.....]1= Inherited (from mother or father?)2= Purchased from neighboring farm/market3 = Purchased from a distant farm/market4 = Purchased from a friend5 = Obtained from a development project asgift
6= Obtained from a development project as loan)7= As a gift from relatives/friends8= As a loan from relative/friend/ neighborpayment9 = Purchased from a neighbor= Other (specify) ___________________
2.6.8. Purpose of keeping buck [.....] 1. Mating; 2. Socio-cultural; 3. Fattening; 4.ther(specify)_____________2.6.9. Do you practice selection for breeding male [.....] 1. Yes, 2. No2.6.10 Do you practice selection for breeding female [.....] 1. Yes, 2. No2.6.11. Which attributes or traits do you consider in selecting breeding buck and doe? Rank thetraits in order of importance for selection.For buck (with their respective rank)5max.
rank For doe (with their respective rank)5max.
rank
Associated attributes/Traits code1 = Growth rate 8 = Coat color (please record the names!)2 = Fertility (kidding interval) 9 = Resistance to disease3 = Fertility (litter size) 10 = Temperament/behavior4 = Kid weights 11 = Hardship tolerance5 = Meat production 12 = Body size6 = Meat quality 13= Feed intake

118
7 = Market value = Other (specify) _____________________2.6.12. Age of selection (months); Breeding male _________, Breeding female __________
2.6.13 Type of mating used [.....] 1. Controlled; 2. Uncontrolled/Random2.6.14. Ifuncontrolled, what is the reason? [.....] 1. Goats grazed &/or browse together, 2. Lack ofawareness, 3. Insufficient number of bucks, 4. Others/specify ____2.6.15. Could you be able to identify the sire of a kid? [.....] 1= Yes2= No
If yes, specify the criteria used to identify ___________________________2.6.16.Do you allow a buck to mate his
1. Yes 2. No Reason ___
a. Mother _________________________
b. Daughter _________________________
c. Sister _________________________
2.6.17. Do you allow your buck to serve does other than yours?Reason
1. Yes ______________________________________________________
2. No ______________________________________________________
2.6.18. Do you allow your doe to be served by anyone else buck?Reason
1. Yes ______________________________________________________
2 . No ______________________________________________________2.6.19. Occurrences of birth type per 100 doe in your goat flock?1) Single 2) twin 3) triple 4) not constant2.6.20. On average, what is the kidding interval of your doe (in month)?2.6.21. Average number of kidding per doe life time ___________2.6.22. Kidding pattern, occurrence of most births(Tick one or more boxes then rank top three )
2.6.23. Doyou
castrate your buck? [.....] 1= Yes 2= No2.6.24. If you castrate your buck, what are your reasons for castration? [.....] Control breedingImprove fatteningBetter price
Others(Specify)_____________2.6.25. Specify Castration method you used [.....]By your own (traditional) ; 2) Veterinarians(modern)
January July Top 3 months most birthsoccur
February August ____________________March September ____________________April October ____________________May NovemberJune December

119
2.6.26. If you castrate traditionally, what type of materials you used for castration?_____________________________________________________________________2.6.27. At what age do you castrate bucks? ____________________2.7. MarketingWhich class of goat do you sell first in case of cash needed?
Average market age in month male_________ female__________Average culling age in years due to old age male_________ female__________
Goat production constraints2.8.1. What are the main constraints for goat production? (Rank with significance)
Thank you very much!!!Appendix 2. Linear body measurements and physical descriptions recording format withkeys for abbreviations and pictorial explanationsPart 4. Field observation and measurement recording formatsSheet No. ___________ Date: ______________________ Location:________________Name of enumerator_______________________ Owner HH Code_____________
Zone/Location: ______________________________________________________A. Qualitative observations recording sheetNo.
sex
Coatcolor
Coatcolorpattern
Head(facial)profile
Hornpresence
Hornshape
Hornorientation
Earorientation
Backprofile
Toggles
Ruff
Beard
Photo#
TicksY/N
MangeY/N
123B. Quantitative measurements recording sheet (continued from A)
No. BW BL HW CG CW RL PW HL (*) EL(*)
SC
123
Class Rankmale kids less than 6 monthsFemale kids less than 6 monthsBuck kids between 6 months and one yearDoe kids between 6 months and one yearBreeding doesBreeding bucksCastratedOld doesOld bucks

120
BW=Body weight, BL= Body Length, HW= Height at Withers, CG= Chest Girth, CW= Chestwidth, RL= Rump Length, PW= Pelvic Width, HL= Horn Length, EL= Ear Length and SC=Scrotum Circumference(*): Only one side or both?
Indications for field observation in domestic goatsSex 1= Male 2= Female 3=CastrateCoat color 1=Black 2= White 3=Brown/RedCoat colorpattern
1=Plain 2=Patchy 3=Spotted
Head profile 1 = Straight 2 = Concave 3= Convex 4= Ultraconvex
Horn shape (*) 1= straight 2= curved 3= spiral 4= corkscrewHornorientation
1= Lateral 2= Upward 3= Backward 4=Not clear
Ear orientation 1= erect 2= pendulous 3= semi-pendulous
4= carriedhorizontally
Back profile 1= straight 2= slopes uptowards the rump
3= slopes downfrom withers
4=curved(dipped)
Horn – Ruff –Beard - Toggles
1= Absent 2= Present
(*): Mention if horns are broken with asterisk and look some pictorial descriptions below
Straight Curved Spiral Corkscrew
Body Length (BL) Height at withers (HW) Rump length (RL)

121
Chest girth (CG) Horn length (HL) Ear length (EL)
Pelvic width (PW) Chest width (CW) Scrotal Circumference (SC)
Appendix 3. On-Farm performance evaluation and monitoring data recording format
Goats owned by a Farmer at the beginning of flock inventory (Base Flock)
Date first surveyed__________Farmer’s Name ________________ Village:
____________Enumerator________________
NO. ID Age(Dentations)
Goat category1. Malekid2. Femalekid3. Weanedmale4. WeanedFemale5. Doe6. Bucks
Color1. brown2. white3. black4. mixed5. Others
Parity Reproductivestatus1. Open2. Pregnant
Remark
Flock profile of the household
Goat category Malekid
Femalekid
Weanedmale
WeanedFemale
Doe Bucks Fattened Castrate

122
Amount innumberMonitoring of Flock Dynamics (In-Flow and Out-Flow)
Exit EntryNO ID Date
ofExit
Goat category1. Malekid2. Femalekid3. Weanedmale4. WeanedFemale5. Doe6. Bucks
Reasons forexit1. Sold(includeprice inbirr)2. Gift3. Theft4.Slaughtered5.Exchanged6. Death(Specifycause ofdeath)7. Others
Date ofaddition
Goat category1. Malekid2. Femalekid3. Weanedmale4. WeanedFemale5. Doe6. Bucks
Reasons foraddition1. purchased(includeprice in birr)2. birth3. gift4. Exchange5. others
Milk Recording Format
DoeID
DoeAge
Parity
Milk YieldWeek1_____
Week______
Week______
Week______
Week______
Week______
Date
AM
PM
Date
AM
PM
Date
AM
PM
Date
AM
PM
Date
AM
PM
Date
AM
PM
Birth Recording Format
No. Dateof
birth
DoeID
KidsID
Kids sex1. Male2. Female
Buck ID(Only
after theselectionprogram)
Birth Type (1. Single,2. Twine,3. Triple)
BirthWeight
(Kg)
Doesweight
Remark
Body Weight Recording Format
Body weight

123
ID 3monthweight
Datetaken
6monthweight
Date taken9
monthweight
Date taken12
monthweight
Datetaken
Appendix Table 1. Goat outflow pattern across a year by sex and age in Ziquala
ExitMonths
Malekid
Femalekid
Weanedmale
WeanedFemale
Doe Buck Total
Jan 2 1 7 6 10 1 27Feb 5 6 1 3 4 2 21Mar 6 2 4 5 3 2 22Apr 10 5 6 5 14 1 41May 7 9 5 10 27 1 59Jun 3 3 0 1 8 2 17Jul 0 0 0 1 2 0 3Aug 2 0 3 4 8 0 17Sep 0 0 7 3 8 0 18Oct 5 1 2 3 9 1 21Nov 8 4 10 16 11 3 52Dec 2 4 18 7 10 3 44Total 50 35 63 64 114 16 342
Appendix Table 2. Goat outflow pattern across a year by sex and age in Tanqua Abergelle
ExitMonths
Malekid
Female kid
Weanedmale
WeanedFemale
Doe Buck Total
Jan 1 0 0 0 1 0 2Feb 2 1 2 2 8 1 16Mar 2 0 0 1 2 2 7Apr 1 1 3 1 7 4 17May 2 0 4 0 1 0 7Jun 0 1 1 0 4 0 6Jul 0 0 3 4 8 0 15Aug 0 0 2 0 3 2 7Sep 1 0 6 0 5 1 13Oct 0 0 0 0 4 0 4Nov 1 0 7 0 4 0 12Dec 1 0 10 8 3 0 22Total 11 3 38 16 50 10 128

124
Appendix Table 3. Goat outflow pattern across a year by sex and age in Lay Armachiho
Exit Months Malekid
Femalekid
Weanedmale
WeanedFemale
Doe
Buck Total
Jan 4 2 2 3 3 1 15Feb 1 1 7 2 0 0 11Mar 0 2 0 0 1 0 3Apr 6 3 9 7 1 0 26May 3 4 10 3 11 1 32Jun 0 0 0 0 0 0 0Jul 0 0 0 0 0 0 0Aug 0 2 2 1 4 0 9Sep 9 2 3 5 1 0 20Oct 16 7 3 3 4 2 35Nov 9 9 7 4 8 2 39Dec 18 11 0 3 26 1 59Total 66 43 43 31 59 7 249
Appendix Table 4. Goat inflow pattern across a year by sex and age in Ziquala
EntryMonths
Malekid
Female kid
Weanedmale
WeanedFemale
Doe Buck Total
Jan 10 6 0 0 3 0 19Feb 6 11 1 1 2 0 21Mar 9 11 12 0 0 0 32Apr 0 1 0 0 1 0 2May 5 3 10 21 8 0 47Jun 1 3 0 0 0 0 4Jul 0 0 0 0 0 0 0Aug 0 2 0 0 0 0 2Sep 12 18 0 1 0 0 31Oct 7 2 1 12 3 0 25Nov 171 150 0 2 7 0 330Dec 11 13 0 0 3 0 27Total 232 220 24 37 27 0 540
Appendix Table 5. Goat inflow pattern across a year by sex and age in Tanqua Abergelle
EntryMonths
Male kid Female kid Weaned male Weaned Female Doe Buck Total
Jan 3 2 0 0 0 0 5Feb 32 21 0 0 0 0 53

125
Appendix Table 6. Goat inflow pattern across a year by sex and age in Lay Armachiho
EntryMonths
Malekid
Femalekid
Weanedmale
WeanedFemale
Doe Buck Total
Jan 12 13 0 0 0 0 25Feb 15 12 0 0 0 27Mar 6 5 0 0 0 0 11Apr 18 10 0 0 0 0 28May 21 30 0 1 5 1 58Jun 1 1 0 0 0 0 2Jul 0 0 0 0 0 0 0Aug 6 7 1 0 3 0 17Sep 18 16 0 6 1 0 41Oct 23 20 0 0 1 0 44Nov 15 16 0 0 0 0 31Dec 4 5 0 0 1 0 10Total 139 135 1 7 11 1 294
Appendix Table 7. Analysis output of GLM ANOVA for different linear body measurements ofAbergelle and Central Highland goat breeds for the effect of breed, sex and breed by sex interactions
Dependent
Variable
Source
variationDF Type III SS Mean Square F Value Pr > F
BW
breed 1 3850.832389 3850.832389 151.50 <.0001
Sex 1 1539.935012 1539.935012 60.58 <.0001
Sex*breed 1 529.786413 529.786413 20.84 <.0001
BLbreed 1 908.4471337 908.4471337 61.08 <.0001
Sex 1 356.1789240 356.1789240 23.95 <.0001
Mar 0 0 0 2 0 1 3Apr 12 11 0 0 0 1 24May 9 9 0 0 0 0 18Jun 8 5 0 1 0 0 14Jul 1 0 5 0 4 4 14Aug 16 24 0 0 0 0 40Sep 0 0 0 0 0 0 0Oct 1 0 0 0 0 0 1Nov 84 95 0 7 0 0 186Dec 1 1 1 0 2 0 5Total 167 168 6 10 6 6 363

126
Sex*breed 1 65.2638698 65.2638698 4.39 0.0366
HW
breed 1 3033.140551 3033.140551 204.52 <.0001
Sex 1 1224.034036 1224.034036 82.53 <.0001
Sex*breed 1 165.320038 165.320038 11.15 0.0009
CG
breed 1 2041.186124 2041.186124 107.81 <.0001
Sex 1 1148.435700 1148.435700 60.66 <.0001
Sex*breed 1 375.040912 375.040912 19.81 <.0001
CW
breed 1 226.6017220 226.6017220 78.67 <.0001
Sex 1 77.2730507 77.2730507 26.83 <.0001
Sex*breed 1 33.6795138 33.679513 11.69 0.0007
RL
breed 1 1.47610981 1.47610981 0.88 0.3492
Sex 1 0.57469807 0.57469807 0.34 0.5590
Sex*breed 1 32.77949587 32.77949587 19.49 <.0001
PW
breed 1 1.79140524 1.79140524 1.27 0.2596
Sex 1 1.15133379 1.15133379 0.82 0.3661
Sex*breed 1 13.77643274 13.77643274 9.79 0.0018
HL
breed 1 5036.566962 5036.566962 328.25 <.0001
Sex 1 4617.845766 4617.845766 300.96 <.0001
Sex*breed 1 2517.057374 2517.057374 164.05 <.0001
EL
breed 1 460.5095144 460.5095144 255.89 <.0001
Sex 1 2.8561063 2.8561063 1.59 0.2082
Sex*breed 1 1.8139986 1.8139986 1.01 0.3158
SC
breed 1 101.957637 101.9576372 25.17 <.0001
Sex 0 0.0000000 - - -
Sex*breed 0 0.0000000 - - -

127
Appendix Table 8. Analysis output of GLM ANOVA for growth traits of Abergelle goat in Ziqualadistrict monitoring site for the effect of sex, parity and birth type
Dependent
Variable
Source
variationDF Type III SS Mean Square F Value Pr > F
Birthweight
parity 4 1.63009535 0.40752384 3.83 0.0045
Sex 1 0.49896434 0.49896434 4.68 0.0309
Birth type 1 0.58873846 0.58873846 5.53 0.0191
3month
weight
parity 4 4.21784585 1.05446146 0.37 0.8324
Sex 1 0.00908664 0.00908664 0.00 0.9552
Birth type 1 0.64965938 0.64965938 0.23 0.634
6month
weight
parity 4 4.87885090 1.21971272 0.32 0.8668
Sex 1 2.27814571 2.27814571 0.59 0.4425
Birth type 1 10.69541637 10.69541637 2.78 0.0967
9month
weight
parity 4 9.04391351 2.26097838 0.56 0.6934
Sex 1 1.25359715 1.2535971 0.31 0.5788
Birth type 1 1.19369569 1.19369569 0.29 0.5880
Appendix Table 9. Analysis output of GLM ANOVA for growth traits of Abergelle goat in TanquaAbergelle district monitoring site for the effect of sex, parity and birth type
Dependent
Variable
Source
variationDF Type III SS Mean Square F Value Pr > F
Birthweight
parity 4 3.26777434 0.81694359 0.66 0.6223
Sex 1 2.73892779 2.73892779 2.20 0.1386
Birth type 1 0.0649285 0.06492851 0.05 0.8194
3month
weight
parity 4 5.07628004 1.26907001 0.50 0.7391
Sex 1 0.25117362 0.25117362 0.10 0.7545

128
Birth type 1 0.07727151 0.07727151 0.03 0.8623
6month
weight
parity 4 8.46690306 2.11672577 1.00 0.4068
Sex 1 0.07871155 0.07871155 0.04 0.8470
Birth type 1 0.63298824 0.63298824 0.30 0.5844
9month
weight
parity 4 11.05885508 2.76471377 1.15 0.3344
Sex 1 11.73767951 11.73767951 4.90 0.0286
Birth type 1 0.49536147 0.49536147 0.21 0.6502
Appendix Table 10. Analysis output of GLM ANOVA for growth traits of Central Highland goat in LayArmachiho district monitoring site for the effect of sex, parity and birth type
Dependent
Variable
Source
variationDF Type III SS Mean Square F Value Pr > F
Birthweight
parity 4 1.63010215 0.40752554 3.05 0.0169
Sex 1 0.92255062 0.92255062 6.91 0.0089
Birth type 2 6.68308252 3.34154126 25.01 <.0001
3month
weight
parity 4 16.19160104 4.04790026 0.52 0.7215
Sex 1 31.45630858 31.45630858 4.04 0.0457
Birth type 2 24.6047998 12.30239993 1.58 0.2085
6month
weight
parity 4 85.01110028 21.25277507 3.18 0.0155
Sex 1 46.01378719 46.01378719 6.88 0.009
Birth type 2 50.15958556 25.07979278 3.75 0.0259
9month
weight
parity 4 79.21095796 19.80273949 0.68 0.6112
Sex 1 1.16938813 1.16938813 0.04 0.8424
Birth type 2 21.25007412 10.62503706 0.36 0.6973