Olig1 and Olig2 triplication causes developmental brain defects in Down syndrome
21
Olig1 and Olig2 triplication causes developmental brain defects in Down syndrome Lina Chakrabarti 1 , Tyler K. Best 2 , Nathan P. Cramer 2 , Rosalind S.E. Carney 1 , John T.R. Isaac 3 , Zygmunt Galdzicki 2 , and Tarik F. Haydar 1,€ 1 Center for Neuroscience Research, Children’s National Medical Center, Washington DC, 20010 2 Department of Anatomy, Physiology and Genetics, School of Medicine, Uniformed Services University of the Health Sciences, Bethesda, Maryland 20814 3 Developmental Synaptic Plasticity Section, NINDS, Bethesda, MD 20892 Summary Over-inhibition is thought to be one of the underlying causes of the cognitive deficits in Ts65Dn mice, the most widely used model of Down syndrome (DS). Here we demonstrate a direct link between gene triplication and defects in neuron production during embryonic development. These neurogenesis defects lead to an imbalance between excitatory and inhibitory neurons and to increased inhibitory drive in the Ts65Dn forebrain. We discovered that Olig1 and Olig2, two genes triplicated in DS and Ts65Dn, are over-expressed in the Ts65Dn forebrain. To test the hypothesis that Olig triplication is causative for the neurological phenotype, we used a genetic approach to normalize the dosage of these two genes and thereby rescued the inhibitory neuron phenotype in the Ts65Dn brain. These data identify seminal alterations during brain development and demonstrate a mechanistic relationship between triplicated genes and these brain abnormalities in the Ts65Dn mouse. Keywords cell density; Down syndrome; excitatory neurons; inhibitory neurons; Olig1; Olig2; Ts65Dn Introduction Down syndrome (DS), caused by triplication of chromosome 21, is the most frequent genetic cause of intellectual disability 1,2 . Although the etiology of the cognitive deficit remains unclear, cellular and anatomical abnormalities in the prenatal and perinatal forebrain and cerebellum suggest that early brain development is altered in DS 3–5 . Similar central nervous system (CNS) abnormalities have been described in mouse models of DS. In particular, the Ts65Dn mouse, the most widely used model of DS, has abnormal forebrain Users may view, print, copy, download and text and data- mine the content in such documents, for the purposes of academic research, subject always to the full Conditions of use: http://www.nature.com/authors/editorial_policies/license.html#terms Corresponding author: Tarik F. Haydar, Ph.D., Center for Neuroscience Research, Children’s National Medical Center, 111 Michigan Avenue NW, Washington DC 20010, T: 202-476-2383, F: 202-476-4988, [email protected]. € Current address: Department of Anatomy and Neurobiology, Boston University School of Medicine, Boston Massachusetts 02118. Author Contributions L.C. performed the experiments, analyzed the data, wrote the manuscript and generated the figures. T.K.B., N.P.C. (both contributed equally), J.T.R.I. and Z.G. performed the electrophysiology experiments, analyzed data and revealed the physiological phenotype. R.S.E.C. generated the RNA probes. T.H. generated the hypothesis, designed experiments, analyzed data and wrote the manuscript. NIH Public Access Author Manuscript Nat Neurosci. Author manuscript; available in PMC 2012 January 3. Published in final edited form as: Nat Neurosci. 2010 August ; 13(8): 927–934. doi:10.1038/nn.2600. NIH-PA Author Manuscript NIH-PA Author Manuscript NIH-PA Author Manuscript
Transcript of Olig1 and Olig2 triplication causes developmental brain defects in Down syndrome

Olig1 and Olig2 triplication causes developmental brain defectsin Down syndrome
Lina Chakrabarti1, Tyler K. Best2, Nathan P. Cramer2, Rosalind S.E. Carney1, John T.R.Isaac3, Zygmunt Galdzicki2, and Tarik F. Haydar1,€
1 Center for Neuroscience Research, Children’s National Medical Center, Washington DC, 200102 Department of Anatomy, Physiology and Genetics, School of Medicine, Uniformed ServicesUniversity of the Health Sciences, Bethesda, Maryland 208143 Developmental Synaptic Plasticity Section, NINDS, Bethesda, MD 20892
SummaryOver-inhibition is thought to be one of the underlying causes of the cognitive deficits in Ts65Dnmice, the most widely used model of Down syndrome (DS). Here we demonstrate a direct linkbetween gene triplication and defects in neuron production during embryonic development. Theseneurogenesis defects lead to an imbalance between excitatory and inhibitory neurons and toincreased inhibitory drive in the Ts65Dn forebrain. We discovered that Olig1 and Olig2, twogenes triplicated in DS and Ts65Dn, are over-expressed in the Ts65Dn forebrain. To test thehypothesis that Olig triplication is causative for the neurological phenotype, we used a geneticapproach to normalize the dosage of these two genes and thereby rescued the inhibitory neuronphenotype in the Ts65Dn brain. These data identify seminal alterations during brain developmentand demonstrate a mechanistic relationship between triplicated genes and these brainabnormalities in the Ts65Dn mouse.
Keywordscell density; Down syndrome; excitatory neurons; inhibitory neurons; Olig1; Olig2; Ts65Dn
IntroductionDown syndrome (DS), caused by triplication of chromosome 21, is the most frequentgenetic cause of intellectual disability1,2. Although the etiology of the cognitive deficitremains unclear, cellular and anatomical abnormalities in the prenatal and perinatalforebrain and cerebellum suggest that early brain development is altered in DS3–5. Similarcentral nervous system (CNS) abnormalities have been described in mouse models of DS. Inparticular, the Ts65Dn mouse, the most widely used model of DS, has abnormal forebrain
Users may view, print, copy, download and text and data- mine the content in such documents, for the purposes of academic research,subject always to the full Conditions of use: http://www.nature.com/authors/editorial_policies/license.html#terms
Corresponding author: Tarik F. Haydar, Ph.D., Center for Neuroscience Research, Children’s National Medical Center, 111 MichiganAvenue NW, Washington DC 20010, T: 202-476-2383, F: 202-476-4988, [email protected].€Current address: Department of Anatomy and Neurobiology, Boston University School of Medicine, Boston Massachusetts 02118.Author ContributionsL.C. performed the experiments, analyzed the data, wrote the manuscript and generated the figures. T.K.B., N.P.C. (both contributedequally), J.T.R.I. and Z.G. performed the electrophysiology experiments, analyzed data and revealed the physiological phenotype.R.S.E.C. generated the RNA probes. T.H. generated the hypothesis, designed experiments, analyzed data and wrote the manuscript.
NIH Public AccessAuthor ManuscriptNat Neurosci. Author manuscript; available in PMC 2012 January 3.
Published in final edited form as:Nat Neurosci. 2010 August ; 13(8): 927–934. doi:10.1038/nn.2600.
NIH
-PA Author Manuscript
NIH
-PA Author Manuscript
NIH
-PA Author Manuscript

and cerebellar development6–8, defects in synapse formation and neurophysiology9–12 andbehavioral deficits13–15.
Recent studies have suggested that the major functional defect in the postnatal Ts65Dn brainmay be an imbalance between excitation and inhibition. In addition to decreased numbers ofexcitatory synapses10,16 and relative increase in inhibitory synaptic markers in the cortexand hippocampus9,17, several groups have found that excessive GABA-mediated inhibitionimpairs the induction of long-term potentiation (LTP) in Ts65Dn hippocampus10–12,18. Arecent study also pointed to increased inhibition by showing that chronic treatment ofTs65Dn animals with GABA receptor antagonists could rescue defects in explicit learning,memory and LTP19. Altogether, these functional studies suggest that increased inhibitorysynaptic drive may be a general physiological phenotype in the Ts65Dn forebrain. In thisstudy, we sought to determine the molecular and cellular basis for this over-inhibitionphenotype and therefore conducted a multidisciplinary series of experiments to assayneurophysiology, neurogenesis and the genetic mechanisms of altered growth of the Ts65Dnbrain.
The mammalian forebrain is composed of two main classes of neurons, excitatoryglutamatergic projection neurons and inhibitory GABAergic interneurons, both of whichconverge on the cortex through a diverse but precisely ordered sequence of developmentalsteps. Although they are generated from precursors in different telencephalic compartments,coordination in migration patterns, differentiation programs and network connectivity mustoccur between the projection neurons and interneurons for proper formation and function ofthe mature brain20–22. It is therefore possible that abnormalities in neuronal generation,migration or allocation may underlie the cognitive phenotype in DS. We recently discoveredthat embryonic neurogenesis in the dorsal neocortical ventricular zone (VZ) is transientlydelayed in Ts65Dn mice7, but how this delay affects postnatal cortical maturation, andwhether the embryonic production of interneurons from their ventral telencephalicprecursors was also affected were unknown.
Here, we demonstrate that a complex set of neurogenesis defects in multiple brain regionslead to an excitation/inhibition imbalance in the Ts65Dn forebrain. Furthermore, our studiesimplicate two genes triplicated in DS and Ts65Dn, Olig1 and Olig2, in the defective ventralneurogenesis. Using an in vivo genetic normalization approach, we uncover a causalrelationship between the extra gene dosage of Olig1 and Olig2 and the excitation/inhibitionphenotype in the Ts65Dn forebrain.
ResultsNeuronal allocation is impaired in Ts65Dn forebrain
First, to determine if the reduced embryonic neurogenesis in the dorsal neocortex wepreviously described7 leads to a persistent paucity of excitatory neurons in Ts65Dn, wemeasured the density of T-brain1 (Tbr1+) neurons in the pre- and postnatal Ts65Dn cortex.We found, beginning in the first postnatal week (P8), that there were fewer Tbr1+ neurons inthe Ts65Dn dorsal neocortex and that this paucity of excitatory neurons persisted at P15 andP30 (Supplementary Fig. 1 and Supplementary Table 1). Thus, the prenatal abnormalities indorsal neocortical neurogenesis7 result in long-lasting deficits in excitatory neuronal densityin Ts65Dn neocortex.
To determine whether defects were also present in the inhibitory neuron lineage, wecharacterized the three major non-overlapping subclasses of forebrain interneurons (e.g.calretinin-, parvalbumin- and somatostatin- expressing groups). In contrast to the decreasesin excitatory neurons, these studies revealed a profound increase in the number of
Chakrabarti et al. Page 2
Nat Neurosci. Author manuscript; available in PMC 2012 January 3.
NIH
-PA Author Manuscript
NIH
-PA Author Manuscript
NIH
-PA Author Manuscript

parvalbumin+ and somatostatin+ neurons in the Ts65Dn neocortex at P8, P15 and P30 (Fig.1a,b, Supplementary Fig. 2 and Supplementary Table 1). Moreover, the number of cellsexpressing calbindin, a calcium-binding protein present in an overlapping population ofinterneurons23–25 was also markedly increased in the Ts65Dn cortex (Fig. 1a,b,Supplementary Fig. 2 and Supplementary Table 1). Interestingly, though, no significantchange was observed in the number of calretinin+ cells in Ts65Dn cortex at any of the agesstudied. Supernumerary parvalbumin+ and somatostatin+ cells were also found in the CA1region of Ts65Dn hippocampus at P15 (+54% and +30% respectively) (Fig. 2)demonstrating a widespread over-abundance of interneurons throughout the Ts65Dnforebrain. These changes were confirmed by measurements of total calbindin protein contentin the cortex (+43%) and hippocampus (+24%) of P15 Ts65Dn forebrain (SupplementaryFig. 2). Taken together, these results demonstrate a novel and significant overproduction oftwo specific classes of forebrain inhibitory neurons in Ts65Dn.
Increased inhibition in Ts65Dn forebrainAlthough several reports have suggested that the defects in synaptic plasticity in Ts65Dn aredue to over-inhibition9–12, no data have directly demonstrated an inhibitory phenotype inTs65Dn brain at the single cell level. We used patch-clamp recordings to measure theintrinsic membrane properties of forebrain neurons. We found that the rate of spontaneousinhibitory post-synaptic currents (sIPSC) is significantly higher (+300%) in CA1 pyramidalneurons from Ts65Dn compared to euploid mice (Supplementary Fig. 3a,c). This increasedsIPSC frequency is consistent with larger number of interneurons since spontaneous actionpotential-mediated GABA release would naturally increase with more interneurons. Todetermine whether the increased sIPSC frequency was due to an increased number ofinterneurons or to a change in number of inhibitory terminals, we evaluated miniature IPSC(mIPSC). We found no significant difference in the frequency of mIPSC between euploidand Ts65Dn (Supplementary Fig. 3d. The increase in sIPSC frequency with no change inmIPSC indicates that although there are more interneurons, the number of inhibitorysynapses per pyramidal neuron remains similar between euploid and Ts65Dn. Integration ofthese results therefore suggests that the interneurons are more active in the basal state inTs65Dn hippocampus. To evaluate this possibility, we measured sIPSC under depolarizingconditions (9mM as opposed to 3 mM K+ ACSF) and found that the sIPSC frequencyincreased ~6 fold in euploid and only ~2 fold in Ts65Dn (Supplementary Fig. 3c) indicatingthat Ts65Dn interneurons are already shifted toward the upper range of excitability underbasal conditions. Altogether, these studies indicate that the developmental overproduction ofTs65Dn interneurons alters hippocampal circuitry such that interneurons spontaneously firemore frequently.
Effect of trisomy on gene triplication and neurogenesisNext, we sought to understand the molecular reasons for the supernumerary interneurons inthe Ts65Dn forebrain. It is now well-established that the vast majority of mouse forebraininterneurons are generated from precursors in the medial and caudal ganglionic eminences(MGE, CGE) of the ventral telencephalon26. These progenitor zones express a wide range oftranscription factors including Dlx 1/2/5/6, Nkx2-1 and Lhx6, all of which have critical rolesin cell fate decisions and neuronal subtype specification27–29. Inhibitory neurons expressingparvalbumin and somatostatin primarily arise from the Nkx2-1 and Lhx6 expressing domainof the MGE while the calretinin-expressing interneurons are generated in the dorsal regionof the CGE. Investigation of the neural precursor pools in the ganglionic eminences by insitu hybridization of Dlx2, Dlx5, Nkx2-1 and Lhx630–33 demonstrate that Lhx6, which ispreferentially expressed in postmitotic MGE cells, may be slightly expanded in Ts65Dn atE13.5 and E14.5 (Fig. 3a,b and Supplementary Fig. 4). Since Lhx6 is required forinterneuron specification, tangential migration and proper distribution in the cortical
Chakrabarti et al. Page 3
Nat Neurosci. Author manuscript; available in PMC 2012 January 3.
NIH
-PA Author Manuscript
NIH
-PA Author Manuscript
NIH
-PA Author Manuscript

layers28,34, the increased numbers of interneurons in Ts65Dn cortex may be derived from anexpanded population of Lhx6-expressing neuroblasts in the MGE.
Following on these gene expression studies, to determine whether the proliferation of theMGE progenitors are specifically affected in Ts65Dn, we assayed the rate of neuronproduction in vivo. Using a combination of pulse BrdU labeling and neuronal immuno-labeling by β-tubulin III (TUJ1) antibody (Fig. 3c), we measured the numbers of neuronsproduced from the ventral telencephalon within a 24 hr period. We found that the Ts65DnMGE at E14.5 had 36% more BrdU+/TUJ1+ cells compared to euploid (Fig. 3d), indicatinghigher rates of neurogenesis in the Ts65Dn MGE. In contrast, consistent with the normalnumbers of LGE- and CGE-derived neurons in the Ts65Dn telencephalon, the rates ofneurogenesis in the LGE and CGE were statistically unchanged from controls (althoughLGE values demonstrated a possible trend). The increased production of TUJ1+ cells inTs65Dn MGE suggests higher output and potential depletion of MGE progenitors. Sincepremature depletion would be inconsistent with the findings of over-abundance ofinterneurons in the postnatal Ts65Dn neocortex, we measured the cell cycle duration ofMGE cells at E13.5 and E14.5 to see whether cell division kinetics are different in theTs65Dn MGE. We found that the labeling index (LI) slope and the time at which maximumLI is reached did not differ between euploid and Ts65Dn mice (Fig. 3e,f and SupplementaryTable 2) suggesting that the length of the cell cycle is the same in both groups. However,these studies did indicate a larger proliferative cell population in the MGE of Ts65Dn brainat E13.5 and E14.5 (evident as a larger Y-intercept value). Moreover, the number ofphosphohistone-3 (PH3) labeled M-phase cells was significantly increased in the SVZ ofTs65Dn MGE at both E14.5 and E15.5 (Fig. 3g,h). Taken together, these results suggest thata larger progenitor population in the VZ and SVZ of the Ts65Dn MGE undergoes divisionsat a normal rate but with a higher neuronal output to generate supernumerary interneuronsduring the ventral neurogenesis period. These striking results uncover novel and highlyspecific regional defects in the neurogenesis pattern along the Ts65Dn dorsal-ventral axisand elucidate the spatial and temporal underpinnings of the over-abundant interneuronpopulation in the postnatal Ts65Dn cortex.
There are several transcription factor genes triplicated in DS and Ts65Dn which are knownto be essential for specification of various cell types. For example, the basic helix-loop-helix(bHLH) transcription factors Olig1 and Olig2 are implicated in oligodendrogenesis andneurogenesis35–37. In particular, the expression pattern of Olig2 in the MGE indicates a rolein the generation of interneurons38–40. Because Olig1 and Olig2 are triplicated in DS andTs65Dn, we reasoned that mis-expression of these genes may play a role in the Ts65Dninhibition phenotype. Indeed, we detected a 1.7 and 1.5 fold increase in Olig1 and Olig2expression, respectively, in the MGE of Ts65Dn brain at E14.5 using semiquantitative realtime RT-PCR (Fig. 4e and Supplementary Table 3). In addition, more Olig2+ cells werefound in the Ts65Dn MGE compared to euploid littermates at E13.5 and E14.5 (Fig. 4a–d,f).Previous studies which have shown that distinct cohorts of cortical interneurons arise fromtelencephalic Olig2-expressing precursors suggest that Olig2 expression may be necessaryfor expression of several homeodomain containing genes in MGE, particularly Lhx640.Therefore, these results suggest that Olig1/Olig2 over-expression may be the genetic basis ofthe interneuron over-production in the Ts65Dn brain.
Olig normalization and rescue of the Ts65Dn phenotypesTo test the hypothesis that the extra Olig1/Olig2 gene dosage is causally related to the MGEneurogenesis phenotype, we removed one allele of each gene within the Ts65Dn backgroundby breeding Ts65Dn females with Olig1/2+/− double heterozygous males37 (Fig. 4g).Quantification of Olig2 expressing cells in the VZ and SVZ of the MGE ofTs65DnOlig1/2+/+/− rescue animals at E14.5 revealed similar numbers of Olig2 positive
Chakrabarti et al. Page 4
Nat Neurosci. Author manuscript; available in PMC 2012 January 3.
NIH
-PA Author Manuscript
NIH
-PA Author Manuscript
NIH
-PA Author Manuscript

cells when compared to euploid animals (Supplementary Fig. 5). Furthermore, using theBrdU/TuJ1 method for measuring the rate of neurogenesis in the MGE of E14.5Ts65DnOlig1/2+/+/−, full Ts65Dn, euploid and euploidOlig1/2+/− littermate pups, we foundthat returning Ts65Dn animals to disomy for just Olig1 and Olig2 was sufficient to reduceMGE neurogenesis to euploid levels (Fig. 4h). Furthermore, we used a BrdU and Ki67double labeling paradigm to measure the fraction of cells leaving the cell cycle (the exitingfraction) in the MGE within a 24 hr period. As expected, we found that from E13.5 to E14.5the exiting fraction was increased in the VZ (+36%) and SVZ (+31%) of Ts65Dn MGE,confirming the higher rates of neurogenesis in the Ts65Dn MGE. Importantly, the Olig1/Olig2 gene dosage normalization rescued the exiting fraction in Ts65DnOlig1/2+/+/− MGEto euploid control levels (Fig. 4 i,j). This Olig1/Olig2 dosage reduction had a specific andmajor impact on MGE-derived cells during the prenatal period since Lhx6 and somatostatinexpressing cells were returned to normal numbers in the E15.5 ventral telencephalon inTs65DnOlig1/2+/+/− mice (Fig. 5a–h). Finally, to determine if this genetic rescue wassufficient to reverse the increased interneuron phenotype in the postnatal Ts65Dn brain, wemeasured the density of calbindin, parvalbumin and somatostatin expressing neurons in theTs65DnOlig1/2+/+/− cortical layers at P15. We found that the numbers of these interneuronsubtypes in the Olig1/Olig2 rescued mice were comparable to the euploid littermates (Fig. 6and Supplementary Fig. 6 and Table 4). Altogether, these cellular, molecular and anatomicalstudies establish the gene dosage imbalance for Olig1 and Olig2 as the underlying cause ofthe ventral neurogenesis and inhibitory neuron phenotype in Ts65Dn mice.
Lastly, to confirm that Olig1/2 over-expression directly leads to the over-inhibition ofpyramidal neurons in Ts65Dn forebrain, we assayed the electrophysiological characteristicsof CA1 pyramidal neurons in Ts65DnOlig1/2+/+/− rescue mutants. We found that the rate ofsIPSC was significantly higher in Ts65Dn CA1 pyramidal neurons compared to euploid orTs65DnOlig1/2+/+/− littermates (Fig. 7a). Group data comparisons (n = 34, 27, and 33 cellsfor Ts65Dn, Ts65DnOlig1/2+/+/−, and euploid mice respectively) reveal a significantrightward shift in the frequency probability distribution function for Ts65Dn CA1 pyramidalcells (p < 0.001 vs. Ts65DnOlig1/2+/+/− and euploid, one-way ANOVA with Tukey post-hoc comparison, Fig. 7b). Importantly, the sIPSC frequency distributions forTs65DnOlig1/2+/+/− and euploid littermates were not significantly different (p = 0.75),indicating that Olig1/2 triplication leads to a higher activity of inhibitory inputs in Ts65Dn.Similar to our previous analysis (Supplementary Fig. 3), we found that the frequency ofmIPSC were similar between euploid, Ts65Dn and Ts65DnOlig1/2+/+/− neurons (Fig. 7c,d),indicating that while the Ts65Dn interneurons are more active, the number of synapses perpyramidal neuron is unchanged by trisomy. Taken together, these results demonstrate thatreducing the Olig1/2 gene dosage not only corrected the interneuron over-productionphenotype in Ts65Dn but also rescued the excessive sIPSC frequency and over-inhibition ofCA1 pyramidal cells in trisomic hippocampus.
DiscussionOur studies establish a link between prenatal neurogenesis defects and altered brain functionin the postnatal Ts65Dn mouse, the most widely studied model of DS. To elucidate themolecular causes of this phenotype, we used a genetic rescue approach to show thatincreased gene dosage for Olig1 and Olig2 is responsible for the interneuron over-production. Deleting an allele of each of these genes prevented the interneuron over-production in the trisomic mouse brain. These data present the surprising result thatincreased gene dosage of just 2 of the 128 triplicated genes in Ts65Dn41 are largely, if notsolely, responsible for the interneuron phenotype in this mouse model.
Chakrabarti et al. Page 5
Nat Neurosci. Author manuscript; available in PMC 2012 January 3.
NIH
-PA Author Manuscript
NIH
-PA Author Manuscript
NIH
-PA Author Manuscript

For the first time, these results demonstrate that gene triplication can have quite oppositeeffects on cell proliferation in different regions of the developing brain. While onlydecreases in cell proliferation have thus far been found in DS fetal neocortex andfibroblasts42,43 as well as in dorsal neocortical, cerebellar, and hippocampal precursor cellsin Ts65Dn7,42–44, the increased number of forebrain interneurons in Ts65Dn indicates thatreduced proliferation is not a general hallmark of DS brain development. Rather, our resultson transcription factor gene expression and precursor cell proliferation demonstrate thatthere is an increase in the number of Ts65Dn interneuron precursors which results inenhanced amplification of founder cells and greater neuronal output compared to theeuploid. Thus, a diverse set of abnormalities, all of which are established during prenatalbrain development, may combine to result in cognitive dysfunction in Ts65Dn mice.
The discovery of altered numbers of excitatory and inhibitory neurons may explain theelectrophysiological abnormalities previously seen in adult Ts65Dn mice. A wide range ofstudies have explored the role of hippocampal function as the neurobiological basis forcognitive failure in Ts65Dn10–12,19. One important hypothesis from these studies is that thesuppression of LTP and augmentation of LTD in the Ts65Dn hippocampus is primarily dueto enhanced inhibitory synaptic transmission. While others have found an increase ininhibitory synapse markers in the dentate gyrus of the Ts65Dn mouse9, whether or not thenumber of inhibitory and excitatory neurons is changed during Ts65Dn development wasunknown.
Here we find that an altered excitation/inhibition neuron ratio in Ts65Dn leads to over-inhibition of individual forebrain pyramidal neurons. In particular, not only is the number ofinhibitory interneurons increased in Ts65Dn mice, but this change is accompanied by anincrease in the rate and magnitude of IPSC inputs to CA1 pyramidal cells. The ability toreverse both phenotypes by decreasing the dosage of Olig1/2 in trisomic mice supports acausal link between aberrant production of inhibitory interneurons and excessive inhibitionin the hippocampus. The changes in frequency distribution of sIPSC without changes inmIPSC can be explained by an increase in action potential-dependent activity ofinterneurons. This could occur if intrinsic properties of interneurons are abnormal (loweraction potential threshold) or by changes in the excitatory afferents activating the inhibitorynetwork in the Ts65Dn hippocampus. For instance, since GABAergic interneurons directlyreceive all descending and intrahippocampal excitatory inputs45, if excitatory input to thehippocampal feed-forward inhibitory network is diminished (e.g. due to the reductions innumbers of Ts65Dn forebrain excitatory neurons reported here) this could result indisinhibition of the inhibitory network in the Ts65Dn hippocampus.
In examining the intrinsic properties of CA1 pyramidal cells, we did not find any significantchanges in resting membrane potential or membrane resistance between the groups. We did,however, find that the membrane capacitance was reduced in Ts65Dn andTs65DnOlig1/2+/+/− mice compared to euploid mice (Supplementary Figure 7 andSupplementary Table 5). This suggests that CA1 pyramidal cells in trisomic mice aresmaller in size and possibly reflects reduced dendritic branching associated with trisomy46.Smaller dendritic trees presumably have less computational capacity which would beexpected to exacerbate the aberrant processing of information resulting from over-inhibition.
These cellular and physiological data in the Ts65Dn telencephalon indicate that the balancebetween excitation and inhibition may be altered in DS and that this may underlie some orall of the cognitive deficits found in this prevalent disorder. Excitation-inhibition imbalanceis now thought to be a major component of several other neurodevelopmental disordersincluding epilepsy, autism and Fragile X syndrome47, 48. It is also tempting to speculate thatover-inhibition may be the basis of other abnormalities found in DS. For example, gene-
Chakrabarti et al. Page 6
Nat Neurosci. Author manuscript; available in PMC 2012 January 3.
NIH
-PA Author Manuscript
NIH
-PA Author Manuscript
NIH
-PA Author Manuscript

dosage imbalance and over-inhibition may play a key role in the epileptic spasms in Ts65Dnmice, now considered a robust animal model of the infantile spasms occurring in DS49. Infact, gene triplication and increased expression of the G-protein coupled potassium channel(Girk2) is thought to underlie an increased GABAB receptor agonist contribution tohippocampal neuronal network activity as well as a potential role in induced epilepticspasms in Ts65Dn mice49,50. Therefore, inhibitory abnormalities may contribute to theprevalence of debilitating neurological disorders in DS children.
Our genetic rescue study has also potentially revealed a broader determinative role of Olig1and Olig2 genes on ventral telencephalic neurogenesis. For example, we found that MGEneurogenesis in the ventral telencephalon and interneuron allocation to the postnatalneocortex was reduced in euploidOlig1/2+/− animals (Figs. 4h and 6, Supplementary Fig. 6and Table 4). Thus, although it is well established that Olig1 and Olig2 regulate multiplesteps of neuron and glia formation in the CNS37, here we provide new evidence that thesetranscription factors also play critical role on the rate of neuron production from the MGEunder normal conditions and are therefore necessary factors for generating the proper ratioof excitatory and inhibitory neurons in the neocortex.
The present analyses of Ts65Dn forebrain development provide a novel explanation of howseveral prenatally-specified abnormalities combine to fundamentally alter the formation andmaintenance of proper cortical circuits. A complex set of prenatal defects thereby lead to thelearning and memory deficits seen in Ts65Dn mice and in DS children. The results stronglysuggest that widespread effects of Olig1 and Olig2 over-expression from earlydevelopmental stages are a main component of Ts65Dn/DS phenotypes. Thus, developmentof molecular tools for modulation of Olig1 and Olig2 transcription may be useful forameliorating the cognitive deficits in DS. The results presented in this study can be used asbiomarkers for the rational development of early interventional therapies of the cognitiveimpairments in DS.
METHODSAnimals
Ts65Dn and euploid B6EiC3 animals were generated by backcrossing Ts65Dn females toC57BL/6JEi X C3H/HeSnJ F1 hybrid (B6EiC3) males. The parental generation wasobtained from the Jackson Laboratory (Bar Harbor, ME). Quantitative PCR (qPCR)genotyping was performed on genomic DNA extracted from tail tips7. Olig1/2+/− doubleheterozygote animals in C57BL/6J background37 were obtained from David Anderson’slaboratory and bred in our animal facility. All experiments involving animals wereperformed in accordance with institutional and federal guidelines. Mutant mice weregenotyped using RT-PCR as described previously37. Ts65Dn females were crossed withOlig1/2+/− heterozygote males to generate Ts65DnOlig1/2+/+/− animals and the mutantswere genotyped using both qPCR and PCR.
Tissue processingTs65Dn and euploid littermates at postnatal day (P) 8, P15 and P30 were anesthetized byForane (1-chloro-2,2,2-trifluoroethyl difluoromethyl ether) and perfused intracardially with1M phosphate buffered saline (PBS, pH 7.4) followed by 4% paraformaldehyde (PFA). Theperfused brains of the postnatal animals as well as the fresh embryonic brains were removedand fixed in PFA overnight at 4°C followed by 30% sucrose. All samples were embedded inTissue-Tek OCT compound (Sakura Finetek Inc., Torrance, CA), frozen on dry ice andsectioned (20 μm) by Microm HE505E cryostat (ThermoFisher Scientific, Kalamazoo, MI).All measurements and analyses were done at the level of sensorimotor cortex.
Chakrabarti et al. Page 7
Nat Neurosci. Author manuscript; available in PMC 2012 January 3.
NIH
-PA Author Manuscript
NIH
-PA Author Manuscript
NIH
-PA Author Manuscript

ImmunohistochemistryAll immunohistochemical reactions were performed on 20μm frozen brain sections from P8,P15 and P30 pups unless otherwise stated. The antibodies used were rabbit anti-calretinin,calbindin, parvalbumin (1:1000, Chemicon, Temecula, CA), Olig2 (1:500, Abcam,Cambridge, MA), Ki67 (1:500, Vector Laboratories, Burlingame, CA), Phospho-histone3(PH3, 1:250, Upstate, Lake Placid, NY) and Tbr1 (1:2000, a gift from Dr. Robert Hevner,University of Washington, Seattle, WA), rat anti- somatostatin (1:250, Chemicon) and BrdU(1:100, Abcam) and mouse anti- β-tubulin III (TUJ1, 1:500, Covance, Berkeley, CA) andparvalbumin (!:500, Sigma). The secondary antibodies used were AlexaFluor 488,AlexaFluor 546 conjugated or biotinylated goat anti-rabbit, donkey anti-rat, or goat anti-mouse (1:200, Invitrogen, Carlsbad, CA). All frozen sections were mounted withVectashield (Vector Laboratories) and paraffin sections were mounted with permount(Fisher Scientific).
Dioxygenin-labeled RNA in situ hybridizationRNA in situ hybridization was performed on E13.5 and E14.5 paraffin sections and E15.5frozen sections for Dlx2, Dlx5, Nkx2-1, Lhx6 and somatostatin probes. Sections werepostfixed in 4% PFA for 10 min followed by 2 × 5 min rinses in PBS. Proteinase K(Invitrogen) digestion (20 μg/mL in PBS) was carried out for 6 min followed by 1 × 5 minrinse in PBS, refixing for 5 min in 4% PFA and another PBS rinse. The sections wereacetylated for 10 min (2.2 g triethanolamine hydrochloride, 540 μL of 10 N NaOH, 300 μLof acetic anhydride in 60 mL of molecular grade water) prior to 3 × 5 min rinses in PBS.RNA probes, prepared at a dilution of 2 μL/mL of hybridization solution (50% formamide,10% dextran sulfate, 1% 100× Denhart’s, 250 μg/mL yeast tRNA, 0.3 M NaCl, 20 mMTris–HCl, pH8, 5 mM ethylene diaminetetraacetic acid [EDTA], 10 mM NaPO4, 1%sarcosyl in diethylpyrocarbonate-treated H2O, were incubated at 80 °C for 2 min.Thereafter, 250 μL of the probe mix was applied to each slide, coverslipped with Hybri-slips(Sigma) and placed in a sealed box humidified with 50% formamide and H2O and incubatedat 55 °C overnight. The next day, the Hybri-slips were floated off by placing the slides in 5×saline-sodium citrate buffer, prior to a 30-min high stringency wash in prewarmed 50%formamide, 2× SSC at 65 °C. Next, the sections were rinsed in 3 × 10 min rinses in RNasebuffer (0.5 M NaCl, 10 mM Tris–HCl, pH 7.5, 5 mM EDTA), followed by RNaseA (Roche,Indianapolis, IN) treatment (20 μg/mL in RNase buffer) for 30 min and one 15 min rinse inRNase buffer, all at 37 °C. The high stringency washes were repeated twice for 20 min eachat 65 °C, followed by a 15 min rinse in 2× SSC, then 0.1× SSC, both at 37 °C and a PBT(PBS + 0.1% Tween 20; Sigma) rinse for 15 min at room temperature. The sections wereblocked with 10% goat serum in PBT for 1 h at room temperature, prior to a 3-h incubationwith an alkaline phosphatase-coupled anti-DIG antibody (1:5000 in 1% goat serum in PBT;Roche) in a humidified chamber at room temperature. Then, the sections were rinsedextensively in PBT at room temperature (4 × 15 min rinses) and then underwent 2 × 10 minrinses in freshly prepared NTMT buffer (100 mM NaCl, 100 mM Tris–HCl, pH 9.5, 50 mMMgCl2, 0.1% Tween 20). The sections were then placed in a light-protected humidifiedchamber with approximately 400 μL of BM-purple AP substrate (Roche) containing ~0.25mg/mL levamisol (Sigma) until satisfactory staining was achieved, typically overnight.Finally, the sections were rinsed twice in PBS, coverslipped using Crystal mount aqueousmounting media (Sigma) and photographed immediately.
In vivo neurogenesis assayPregnant Ts65Dn females at E13.5 were injected once with BrdU (50 μg per gm bodyweight, i.p.) and killed 24 hrs (n=3) after injection. Twenty micron coronal sections of thefrozen heads were stained for either BrdU and TUJ1 or BrdU and Ki67. Images with Z-stacks (1 μm steps) were collected on a confocal microscope (Zeiss LSM 510 Meta). In the
Chakrabarti et al. Page 8
Nat Neurosci. Author manuscript; available in PMC 2012 January 3.
NIH
-PA Author Manuscript
NIH
-PA Author Manuscript
NIH
-PA Author Manuscript

images with BrdU/TUJ1 double staining, BrdU+ and BrdU+/TUJ1+ cells were counted in theSVZ of ganglionic eminences in the ventral forebrain. We considered the BrdU+/TUJ1+
labeling to represent the neurons which had exited the cell cycle just after the BrdUinjection. Similarly, in the images with BrdU/Ki67 double staining, BrdU+ and BrdU+/Ki67− cells were counted in the VZ and SVZ of the medial ganglionic eminence. TheBrdU+/Ki67− cells represent the cells exiting the cell cycle just after the BrdU injection.
Cell cycle analysisA cumulative BrdU labeling protocol was followed to determine (i) the growth fraction (i.e.the proportion of cells that comprise the proliferating population), (ii) Tc, the length of thecell cycle and (iii) the time to reach the growth fraction (Tc-Ts)7. Pregnant Ts65Dn femalesat E13.5 or E14.5 were injected with BrdU (50μg per gm body weight, i.p.) every 2 hrs withsurvival times of 2, 6, 10, 14, 18 and 24 hrs (n=3–6 for each time point per genotype). Thelast injection was given 2 hrs before sacrifice. The labeling index (LI), or fraction of cellslabeled with BrdU, was determined at each time point using immunohistochemistry. Alllabeling experiments were started at 7 AM.
Western blot analysisFor Western blot analysis, calbindin protein from the cortex of P15 pups was obtained bytissue homogenization in RIPA buffer (50mM Tris-HCl pH 7.4, 0.9% NaCl, 1% NP-40, and0.25% sodium deoxycholate). Protein concentration was determined according tomanufacturer’s instruction using BCA Protein Assay Kit (Pierce, Rockford, IL). Twentymicrograms of protein homogenate were loaded per well for electrophoresis after which theproteins were transferred to polyvinylidene difluoride membranes and blocked with 5% milkfor 1 hour at room temperature. The blots were incubated overnight at 4°C with rabbit anti-calbindin (1:5000, Chemicon) and mouse anti-β-actin (1:20,000, Chemicon). After washing,blots were incubated for one hour with HRP-conjugated secondary antibodies (1:10,000,Chemicon). Blots were developed by chemiluminescence using SuperSignal Kit (Pierce).Quantification of band densitometry was performed using Scion Image software.
Semi quantitative RT-PCRTotal RNAs were prepared using Trizol (Invitrogen) from the medial ganglionic eminenceof euploid and Ts65Dn brain at E14.5. cDNA was synthesized from 2 μg of total RNA usingThermoScript RT-PCR system (Invitrogen). Twenty nanograms of the cDNA were usedwith primers for Olig1 and Olig2 (target gene) and β-actin (control gene) for PCR by SYBR-Green method. The reaction was carried out at 95°C for 5 min, followed by 30 cycles of95°C for 15 sec, 58°C for 15 sec and 72°C for 15 sec and finally 72°C for 10 min on aniCycler (BioRad, Hercules, CA) with a 96 well format. Relative quantification wascalculated by Gene Expression Analysis for iCycler (BioRad).
ElectrophysiologyMice, 2–3 weeks old, were anesthetized, decapitated and the brain was rapidly removed andplaced in ice cold (~4°C) cutting artificial cerebrospinal fluid (ACSF) containing (in mM):NaCl 124, KCl 3, CaCl2 2, NaH2PO4 1.25, MgSO4 5, NaHCO3 26, d-glucose 10, bubbledwith a mixture of 95% O2/5% CO2. Parasagittal slices, 400-μm thick, were cut on a LancerVibratome (Vibratome series 1000; Vibratome, St. Louis, Missouri USA) and transferred toa warmed (~37°C) solution of 50% slicing ACSF and 50% recording ACSF (the samecomposition as cutting ACSF, but MgSO4 at 1 instead of 5 mM) bubbled with a mixture of95% O2/5% CO2. After 20 minutes they were transferred to room temperature (~21°C) O2/CO2 bubbled recording ACSF where they were maintained for at least 1 hour beforerecording. Slices were placed in a recording chamber containing bubbled recording ACSF
Chakrabarti et al. Page 9
Nat Neurosci. Author manuscript; available in PMC 2012 January 3.
NIH
-PA Author Manuscript
NIH
-PA Author Manuscript
NIH
-PA Author Manuscript

on the stage of an upright Zeiss FS-1 microscope (Carl Zeiss Microimaging Inc.,Thornwood, NY). Using a Photonics IR camera, CA1 pyramidal neurons were identified anda whole-cell patch-clamp configuration was obtained with a borosilicate patch pipette ofresistance 3–5 M containing (in mM): K-gluconate 130, KCl 15, HEPES 5, EGTA 1, Mg-ATP 4, Na-GTP 0.3 with pH adjusted to ~7.3 with KOH. Recordings were performed involtage-clamp configuration and data acquired by way of an Axopatch 200A or 200Bamplifier (Molecular Devices, Sunnyvale, CA), filtered at 5 kHz (8-pole Bessel filter, NPI,ALA Scientific Instruments, Inc., Westbury, NY, USA), and recorded on a personalcomputer using Clampex acquisition software (Molecular Devices). After perfusion of 20μM CNQX and 50 μM D-APV (to block AMPA/Kainate and NMDA receptor mediatedcurrents) sIPSC were recorded from neurons held at −70 mV under a gap free protocol andlater visually inspected and detected offline using MiniAnalysis 6.0 (Synaptosoft, DecaturGA.). sIPSC were eliminated by 20 μM bicuculline (specific GABAA receptor antagonist) inboth diploid (n=4) and Ts65Dn (n=5) slices indicating that events were GABAA mediated.IPSC frequency probability distributions were generated from instantaneous eventfrequencies pooled from all cells for each condition (euploid, n=32; Ts65DnOlig1/2+/+/−,n=27; Ts65Dn, n=34). mIPSC were also recorded at −70 mV in perfusate of 1 μM TTX (toblock action potentials and thus sIPSCs), 20 μM CNQX and 50 μM D-APV and analyzed asdescribed above for sIPSCs.
Image analysisAll fluorescent images were taken on a LSM510 Meta confocal microscope (Carl Zeiss Inc.,Germany). Immunolabeled cells in each cortical layer (viz. layers II–III, IV, V and VI) werecounted every tenth sections of 20 μm each (every 200 μm) in a 500μm width x 150μmheight frame in 15 μm thick z-stack images (1μm steps) using Volocity (Improvision,Lexington, MA) and LSM 510 softwares packages. The layers of the neocortex werediscriminated using the layer markers, Brn1 (layer I–III), RORβ (layer IV), ER81 (layer V)and Foxp2 (layer VI). The VZ and SVZ abventricular boundary in the MGE was estimatedat 100 μm. The bright field images were taken on a BX40 Olympus microscope (OlympusAmerica Inc., Center Valley, PA) and immunolabeled cells were counted using NIH ImageJsoftware.
Statistical analysisData are presented as mean ± S.D. unless otherwise stated. Comparisons of meandifferences between groups were made by unpaired two-tailed Student’s t-test unlessotherwise stated. A probability level of p<0.05 was considered to be statistically significant.
Supplementary MaterialRefer to Web version on PubMed Central for supplementary material.
AcknowledgmentsSupported by Dana Foundation Neuro-Immuno Imaging grant (T.H.), RO1 HD05780 (T.H./Z.G.), the NationalDown Syndrome Society (L.C.), the Jerome Lejeune Foundation (Z.G.), and a gift from Robin and Rob Wilder.Imaging supported by the Intellectual Retardation and Developmental Disabilities Research Center (P30HD40677). We wish to thank Vittorio Gallo, Josh Corbin and members of Corbin and Haydar labs for discussionsand critical reading of the manuscript.
References1. Epstein CJ. Developmental genetics. Experientia. 1986; 42:1117–1128. [PubMed: 3021509]
Chakrabarti et al. Page 10
Nat Neurosci. Author manuscript; available in PMC 2012 January 3.
NIH
-PA Author Manuscript
NIH
-PA Author Manuscript
NIH
-PA Author Manuscript

2. Korenberg JR, et al. Down syndrome: toward a molecular definition of the phenotype. Am J MedGenet Suppl. 1990; 7:91–97. [PubMed: 2149983]
3. Golden J, Hyman B. Development of the superior temporal neocortex is anomalous in trisomy 21. JNeuropathol Exp Neurol. 1994; 53:513–520. [PubMed: 8083693]
4. Schmidt-Sidor B, Wisniewski KE, Shepard TH, Sersen EA. Brain growth in Down syndromesubjects 15 to 22 weeks of gestational age and birth to 60 months. Clin Neuropathol. 1990; 9:181–190. [PubMed: 2146054]
5. Weitzdoerfer R, Dierssen M, Fountoulakis M, Lubec G. Fetal life in Down syndrome starts withnormal neuronal density but impaired dendritic spines and synaptosomal structure. J Neural TransmSuppl. 2001:59–70. [PubMed: 11771761]
6. Baxter LL, Moran TH, Richtsmeier JT, Troncoso J, Reeves RH. Discovery and genetic localizationof Down syndrome cerebellar phenotypes using the Ts65Dn mouse. Hum Mol Genet. 2000; 9:195–202. [PubMed: 10607830]
7. Chakrabarti L, Galdzicki Z, Haydar TF. Defects in embryonic neurogenesis and initial synapseformation in the forebrain of the Ts65Dn mouse model of Down syndrome. J Neurosci. 2007;27:11483–11495. [PubMed: 17959791]
8. Lorenzi HA, Reeves RH. Hippocampal hypocellularity in the Ts65Dn mouse originates early indevelopment. Brain Res. 2006; 1104:153–159. [PubMed: 16828061]
9. Belichenko PV, et al. Excitatory-inhibitory relationship in the fascia dentata in the Ts65Dn mousemodel of Down syndrome. J Comp Neurol. 2009; 512:453–466. [PubMed: 19034952]
10. Belichenko PV, et al. Synaptic structural abnormalities in the Ts65Dn mouse model of downsyndrome. J Comp Neurol. 2004; 480:281–298. [PubMed: 15515178]
11. Kleschevnikov AM, et al. Hippocampal long-term potentiation suppressed by increased inhibitionin the Ts65Dn mouse, a genetic model of Down syndrome. J Neurosci. 2004; 24:8153–8160.[PubMed: 15371516]
12. Siarey RJ, Stoll J, Rapoport SI, Galdzicki Z. Altered long-term potentiation in the young and oldTs65Dn mouse, a model for Down Syndrome. Neuropharmacology. 1997; 36:1549–1554.[PubMed: 9517425]
13. Costa AC, Walsh K, Davisson MT. Motor dysfunction in a mouse model for Down syndrome.Physiol Behav. 1999; 68:211–220. [PubMed: 10627083]
14. Hyde LA, Frisone DF, Crnic LS. Ts65Dn mice, a model for Down syndrome, have deficits incontext discrimination learning suggesting impaired hippocampal function. Behav Brain Res.2001; 118:53–60. [PubMed: 11163633]
15. Reeves RH, et al. A mouse model for Down syndrome exhibits learning and behaviour deficits.Nat Genet. 1995; 11:177–184. [PubMed: 7550346]
16. Kurt MA, Davies DC, Kidd M, Dierssen M, Florez J. Synaptic deficit in the temporal cortex ofpartial trisomy 16 (Ts65Dn) mice. Brain Res. 2000; 858:191–197. [PubMed: 10700614]
17. Perez-Cremades D, et al. Alteration of inhibitory circuits in the somatosensory cortex of Ts65Dnmice, a model for Down’s syndrome. J Neural Transm.
18. Costa AC, Grybko MJ. Deficits in hippocampal CA1 LTP induced by TBS but not HFS in theTs65Dn mouse: a model of Down syndrome. Neurosci Lett. 2005; 382:317–322. [PubMed:15925111]
19. Fernandez F, et al. Pharmacotherapy for cognitive impairment in a mouse model of Downsyndrome. Nat Neurosci. 2007; 10:411–413. [PubMed: 17322876]
20. Haydar TF. Advanced microscopic imaging methods to investigate cortical development and theetiology of mental retardation. Ment Retard Dev Disabil Res Rev. 2005; 11:303–316. [PubMed:16240412]
21. Miller MW. Cogeneration of retrogradely labeled corticocortical projection and GABA-immunoreactive local circuit neurons in cerebral cortex. Brain Res. 1985; 355:187–192. [PubMed:3910166]
22. Valcanis H, Tan SS. Layer specification of transplanted interneurons in developing mouseneocortex. J Neurosci. 2003; 23:5113–5122. [PubMed: 12832535]
Chakrabarti et al. Page 11
Nat Neurosci. Author manuscript; available in PMC 2012 January 3.
NIH
-PA Author Manuscript
NIH
-PA Author Manuscript
NIH
-PA Author Manuscript

23. DeFelipe J. Neocortical neuronal diversity: chemical heterogeneity revealed by colocalizationstudies of classic neurotransmitters, neuropeptides, calcium-binding proteins, and cell surfacemolecules. Cereb Cortex. 1993; 3:273–289. [PubMed: 8104567]
24. Kawaguchi Y, Kubota Y. GABAergic cell subtypes and their synaptic connections in rat frontalcortex. Cereb Cortex. 1997; 7:476–486. [PubMed: 9276173]
25. Markram H, et al. Interneurons of the neocortical inhibitory system. Nat Rev Neurosci. 2004;5:793–807. [PubMed: 15378039]
26. Wonders CP, Anderson SA. The origin and specification of cortical interneurons. Nat RevNeurosci. 2006; 7:687–696. [PubMed: 16883309]
27. Hobert O, Westphal H. Functions of LIM-homeobox genes. Trends Genet. 2000; 16:75–83.[PubMed: 10652534]
28. Liodis P, et al. Lhx6 activity is required for the normal migration and specification of corticalinterneuron subtypes. J Neurosci. 2007; 27:3078–3089. [PubMed: 17376969]
29. Shirasaki R, Pfaff SL. Transcriptional codes and the control of neuronal identity. Annu RevNeurosci. 2002; 25:251–281. [PubMed: 12052910]
30. Eisenstat DD, et al. DLX-1, DLX-2, and DLX-5 expression define distinct stages of basal forebraindifferentiation. J Comp Neurol. 1999; 414:217–237. [PubMed: 10516593]
31. Grigoriou M, Tucker AS, Sharpe PT, Pachnis V. Expression and regulation of Lhx6 and Lhx7, anovel subfamily of LIM homeodomain encoding genes, suggests a role in mammalian headdevelopment. Development. 1998; 125:2063–2074. [PubMed: 9570771]
32. Porteus MH, Bulfone A, Ciaranello RD, Rubenstein JL. Isolation and characterization of a novelcDNA clone encoding a homeodomain that is developmentally regulated in the ventral forebrain.Neuron. 1991; 7:221–229. [PubMed: 1678612]
33. Sussel L, Marin O, Kimura S, Rubenstein JL. Loss of Nkx2.1 homeobox gene function results in aventral to dorsal molecular respecification within the basal telencephalon: evidence for atransformation of the pallidum into the striatum. Development. 1999; 126:3359–3370. [PubMed:10393115]
34. Alifragis P, Liapi A, Parnavelas JG. Lhx6 regulates the migration of cortical interneurons from theventral telencephalon but does not specify their GABA phenotype. J Neurosci. 2004; 24:5643–5648. [PubMed: 15201337]
35. Lu QR, et al. Common developmental requirement for Olig function indicates a motor neuron/oligodendrocyte connection. Cell. 2002; 109:75–86. [PubMed: 11955448]
36. Takebayashi H, et al. Dynamic expression of basic helix-loop-helix Olig family members:implication of Olig2 in neuron and oligodendrocyte differentiation and identification of a newmember, Olig3. Mech Dev. 2000; 99:143–148. [PubMed: 11091082]
37. Zhou Q, Anderson DJ. The bHLH transcription factors OLIG2 and OLIG1 couple neuronal andglial subtype specification. Cell. 2002; 109:61–73. [PubMed: 11955447]
38. Bertrand N, Castro DS, Guillemot F. Proneural genes and the specification of neural cell types. NatRev Neurosci. 2002; 3:517–530. [PubMed: 12094208]
39. Ma Q. Transcriptional regulation of neuronal phenotype in mammals. J Physiol. 2006; 575:379–387. [PubMed: 16825304]
40. Miyoshi G, Butt SJ, Takebayashi H, Fishell G. Physiologically distinct temporal cohorts of corticalinterneurons arise from telencephalic Olig2-expressing precursors. J Neurosci. 2007; 27:7786–7798. [PubMed: 17634372]
41. Kahlem P, et al. Transcript level alterations reflect gene dosage effects across multiple tissues in amouse model of down syndrome. Genome Res. 2004; 14:1258–1267. [PubMed: 15231742]
42. Contestabile A, et al. Cell cycle alteration and decreased cell proliferation in the hippocampaldentate gyrus and in the neocortical germinal matrix of fetuses with down syndrome and inTs65Dn mice. Hippocampus. 2007
43. Segal DJ, McCoy EE. Studies on Down’s syndrome in tissue culture. I. Growth rates and proteincontents of fibroblast cultures. J Cell Physiol. 1974; 83:85–90. [PubMed: 4273197]
44. Clark S, Schwalbe J, Stasko MR, Yarowsky PJ, Costa AC. Fluoxetine rescues deficientneurogenesis in hippocampus of the Ts65Dn mouse model for Down syndrome. Exp Neurol.2006; 200:256–261. [PubMed: 16624293]
Chakrabarti et al. Page 12
Nat Neurosci. Author manuscript; available in PMC 2012 January 3.
NIH
-PA Author Manuscript
NIH
-PA Author Manuscript
NIH
-PA Author Manuscript

45. Freund TF, Buzsaki G. Interneurons of the hippocampus. Hippocampus. 1996; 6:347–470.[PubMed: 8915675]
46. Dierssen M, et al. Alterations of neocortical pyramidal cell phenotype in the Ts65Dn mouse modelof Down syndrome: effects of environmental enrichment. Cereb Cortex. 2003; 13:758–764.[PubMed: 12816891]
47. Gibson JR, Bartley AF, Hays SA, Huber KM. Imbalance of neocortical excitation and inhibitionand altered UP states reflect network hyperexcitability in the mouse model of fragile X syndrome.J Neurophysiol. 2008; 100:2615–2626. [PubMed: 18784272]
48. Polleux F, Lauder JM. Toward a developmental neurobiology of autism. Ment Retard Dev DisabilRes Rev. 2004; 10:303–317. [PubMed: 15666334]
49. Cortez MA, et al. Infantile Spasms and Down syndrome: A New Animal Model. Pediatr Res. 200950. Harashima C, et al. Abnormal expression of the G-protein-activated inwardly rectifying potassium
channel 2 (GIRK2) in hippocampus, frontal cortex, and substantia nigra of Ts65Dn mouse: amodel of Down syndrome. J Comp Neurol. 2006; 494:815–833. [PubMed: 16374808]
Chakrabarti et al. Page 13
Nat Neurosci. Author manuscript; available in PMC 2012 January 3.
NIH
-PA Author Manuscript
NIH
-PA Author Manuscript
NIH
-PA Author Manuscript
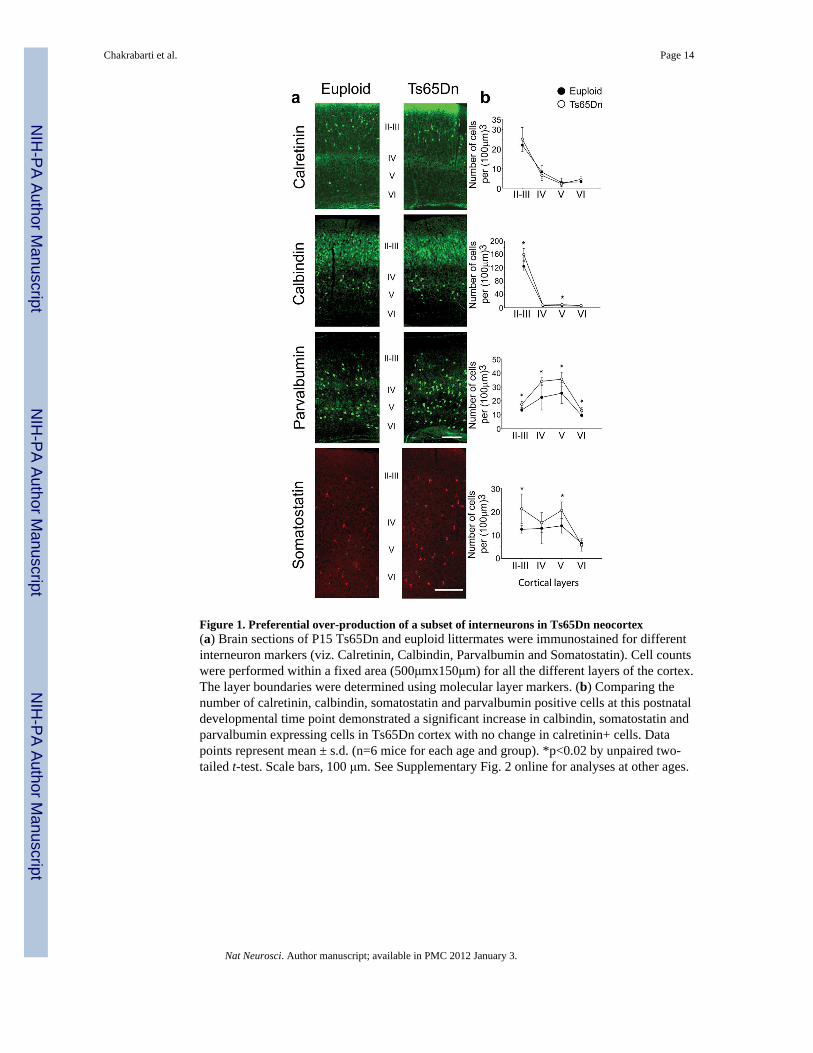
Figure 1. Preferential over-production of a subset of interneurons in Ts65Dn neocortex(a) Brain sections of P15 Ts65Dn and euploid littermates were immunostained for differentinterneuron markers (viz. Calretinin, Calbindin, Parvalbumin and Somatostatin). Cell countswere performed within a fixed area (500μmx150μm) for all the different layers of the cortex.The layer boundaries were determined using molecular layer markers. (b) Comparing thenumber of calretinin, calbindin, somatostatin and parvalbumin positive cells at this postnataldevelopmental time point demonstrated a significant increase in calbindin, somatostatin andparvalbumin expressing cells in Ts65Dn cortex with no change in calretinin+ cells. Datapoints represent mean ± s.d. (n=6 mice for each age and group). *p<0.02 by unpaired two-tailed t-test. Scale bars, 100 μm. See Supplementary Fig. 2 online for analyses at other ages.
Chakrabarti et al. Page 14
Nat Neurosci. Author manuscript; available in PMC 2012 January 3.
NIH
-PA Author Manuscript
NIH
-PA Author Manuscript
NIH
-PA Author Manuscript

Figure 2. Over-production of a subset of interneurons in Ts65Dn hippocampus(a, b) Confocal images of parvalbumin expressing cells in the Ts65Dn and euploidhippocampus at P15. (e, f) Higher magnification of parvalbumin+ cells in the CA1 region ofthe Ts65Dn and euploid hippocampus. (c, d) Confocal images of somatostatin expressingcells in the Ts65Dn and euploid hippocampus at P15. (g) Analysis of cell countinguncovered an overabundance of parvalbumin and somatostatin-expressing inhibitoryinterneurons in the Ts65Dn brain. This is a phenocopy of the results in the Ts65Dnneocortical wall (Figure 1) and implicates changes in production of these specificinterneuron subtypes. Data points represent mean ± s.d. (n=4 mice for each age and group).*p<0.05 by unpaired two-tailed t-test. Scale bars, 200 μm.
Chakrabarti et al. Page 15
Nat Neurosci. Author manuscript; available in PMC 2012 January 3.
NIH
-PA Author Manuscript
NIH
-PA Author Manuscript
NIH
-PA Author Manuscript

Figure 3. Increased gene expression and proliferation in the MGE of the Ts65Dn ventraltelencephalon(a, b) Lhx6 expression was increased in the MGE of Ts65Dn brain at E13.5 and E14.5.Scale bar, 200 μm. See Supplementary figure 5 for additional markers. (c, d) E13.5 timedpregnant Ts65Dn females were injected (intraperitoneally) with BrdU to label a cohort ofneural progenitors in S-phase and embryos were harvested 24 h later. (c) A representativesection stained with antibodies to BrdU (green) and TUJ1 (red). Scale bar, 200 μm. (d) Thefraction of cells labeled with both BrdU and TUJ1 (BrdU+/TUJ1+; newly generated neurons)24 h after pulse label is 36% higher in the MGE of Ts65Dn. No significant change in LGEor CGE neurogenesis was observed in Ts65Dn brains, suggesting that increasedneurogenesis was specific to the Ts65Dn MGE during this period of time. (e, f) Thecumulative labeling plots for MGE progenitors at E13.5 and E14.5 demonstrate that thelabeling index (percentage of BrdU+ cells) rises precipitously until reaching saturation at theGF value, which represents the proportion of the precursor cells that are participating in thecell cycle. The time to reach saturation defines the Tc-Ts value, which was normal inTs65Dn (see also Supplementary Table 2). (g, h) Distribution of PH3-labeled M-phase cellsin the MGE at E14.5 and E15.5. Starting from the ventricular border, the MGE was dividedinto 15 bins each 20 μm in thickness. Scale bar, 100 μm. The number of mitotic cells in theSVZ of Ts65Dn MGE was increased compared to euploid indicating an increase inabventricular mitoses in Ts65Dn. Data points represent mean ± s.d. (n=3–6 mice for eachage and group). *p<0.05; by unpaired two-tailed t-test.
Chakrabarti et al. Page 16
Nat Neurosci. Author manuscript; available in PMC 2012 January 3.
NIH
-PA Author Manuscript
NIH
-PA Author Manuscript
NIH
-PA Author Manuscript

Figure 4. Normalization of Olig genes rescues the neurogenesis phenotype in Ts65DnOlig1/2+/+/−
(TsOlig1/2+/+/−) MGE(a, b) Olig2 expression was increased in the MGE of Ts65Dn brain at E13.5 and E14.5.Higher magnification shows an increased number of Olig2 expressing cells in the MGE ofTs65Dn mice at E13.5 (c) and E14.5 (d). Scale bar, 200 μm. (e) Semi quantitative RT-PCRindicates higher expression of Olig1 and Olig2 genes in the MGE of Ts65Dn at E14.5. (f)Quantification of Olig2 expressing cells demonstrates an increase in the number of Olig2+
cells in the VZ and SVZ of Ts65Dn MGE compared to euploid littermates at E13.5 andE14.5. (g) Substitution of C57BL/6J Olig1/2+/− females for the C57BL/6JEi females yieldsB6C3Olig1/2+/− males for crossing with Ts65Dn females. Thus, the resultingTs65DnOlig1/2+/+/− (TsOlig1/2+/+/−), Ts65DnOlig1/2+/+/+ (Ts65Dn) and euploid pups haveidentical background strain potential compared to the normal Ts65Dn productiontechniques. We compared TsOlig1/2+/+/, Ts65Dn and euploidOlig1/2+/+ littermate pups toremove any strain and construct-dependent effects on neuronal population anddifferentiation. (h) The increase in MGE neurogenesis found in Ts65Dn is prevented inTsOlig1/2+/+/− animals at E14.5. Moreover, reduced neurogenesis was found in the MGE ofeuploid heterozygotes (euploidOlig1/2+/−), suggesting that normal ventral telencephalicneurogenesis is dependent on Olig1 and Olig2 gene copy number and expression. (i, j) Todetermine the q-fraction 24 h after BrdU injection, sections from euploid, Ts65Dn andTsOlig1/2+/+/− brains were stained with antibodies to Ki67 (red) and BrdU (green). Scalebar, 50 μm. The fraction of cells labeled only with BrdU (BrdU+/Ki67−; no longer dividing)after 24 h period (q-fraction) is higher in Ts65Dn MGE compared to euploid. However, theq-fraction increase found in Ts65Dn MGE is corrected in TsOlig1/2+/+/− animals. Data
Chakrabarti et al. Page 17
Nat Neurosci. Author manuscript; available in PMC 2012 January 3.
NIH
-PA Author Manuscript
NIH
-PA Author Manuscript
NIH
-PA Author Manuscript

points represent mean ± s.d. (n=3–4 mice for each age and group). *p<0.05; **p<0.005 bytwo-tailed t-test.
Chakrabarti et al. Page 18
Nat Neurosci. Author manuscript; available in PMC 2012 January 3.
NIH
-PA Author Manuscript
NIH
-PA Author Manuscript
NIH
-PA Author Manuscript

Figure 5. Gene dosage reduction rescues inhibitory neuron phenotype in embryonicTsOlig1/2+/+/− telencephalon(a–f) Postmitotic interneuron markers Lhx6 and somatostatin were analyzed in brain sectionsof E15.5 euploid, Ts65Dn and TsOlig1/2+/+/− embryos by in situ hybridization. (a–c) TheLhx6 expression pattern in TsOlig1/2+/+/− MGE is similar to euploid. (d–f) Somatostatinexpression in TsOlig1/2+/+/− telencephalon is comparable to euploid. The boxed areas g andh represent the cell counting areas for dorsal and ventral telencephalon respectively. (g, h)Comparing the number of somatostatin-expressing cells demonstrates an increase in Ts65Dntelencephalon while the TsOlig1/2+/+/− rescued animals exhibited a normal number ofsomatostatin-expressing cells in dorsal telencephalon and no significant difference in theventral telencephalon. Data points represent mean ± s.d. (n=3 mice for each age and group).*p<0.05; **p<0.005 by unpaired two-tailed t-test. Scale bar: 200 μm.
Chakrabarti et al. Page 19
Nat Neurosci. Author manuscript; available in PMC 2012 January 3.
NIH
-PA Author Manuscript
NIH
-PA Author Manuscript
NIH
-PA Author Manuscript

Figure 6. Normal number of inhibitory neurons in postnatal TsOlig1/2+/+/− neocortex(a–d) Confocal images of somatostatin expressing cells in the neocortex of Ts65Dn,euploid, euploidOlig1/2+/− and TsOlig1/2+/+/− littermates at P15. (e–h) Confocal images ofparvalbumin expressing cells in the neocortex of the same animals. Immunoreactive cellswere counted within a fixed area (500μmx150μm) for all the different layers of the cortex.The layer boundaries were determined using molecular layer markers. (i–j) Comparing thenumber of somatostatin and parvalbumin positive cells demonstrates that the increasedinterneuron phenotype in Ts65Dn neocortex is prevented in TsOlig1/2+/+/− animals.Moreover, significantly reduced numbers of somatostatin and parvalbumin expressing cellswere observed in the cortical layer II–III of euploidOlig1/2+/− heterozygotes. Data pointsrepresent mean ± s.e.m. (n=4–6 mice for each age and group). *p<0.05; **p<0.01 by two-tailed t-test. Scale bar: 100 μm.
Chakrabarti et al. Page 20
Nat Neurosci. Author manuscript; available in PMC 2012 January 3.
NIH
-PA Author Manuscript
NIH
-PA Author Manuscript
NIH
-PA Author Manuscript
Figure 7. Reduction in Olig1 and Olig2 gene-dosage rescues the electrophysiological phenotype inTs65Dn CA1 pyramidal cells(a) Representative voltage clamp recordings showing increased sIPSC rates in Ts65Dn CA1pyramidal neurons (bottom) compared to those from both euploid (top) and TsOlig1/2+/+/−
(middle). (b) The cumulative probability distribution function for the intervals betweensIPSC is shifted rightward for Ts65Dn CA1 pyramidal cells. In contrast, the curves forTsOlig1/2+/+/− and euploid mice are similar. (c) In the presence of TTX, IPSC rates aresimilar in CA1 pyramidal neurons from all mice. (d) The cumulative probability distributionfunctions for each genotype in the presence of TTX are similar.
Chakrabarti et al. Page 21
Nat Neurosci. Author manuscript; available in PMC 2012 January 3.
NIH
-PA Author Manuscript
NIH
-PA Author Manuscript
NIH
-PA Author Manuscript