Oil Price Shocks and Macroeconomic Performance in Nigeria
60
565 Simeon Oludiran Akinleye and Stephen Ekpo* Fecha de recepción: 9 de mayo de 2012; fecha de aceptación: 5 de septiembre de 2013. Abstract: This paper examines the macroeconomic implications of symmetric and asymmetric oil price and oil revenue shocks in Nigeria, using the vector autore- gressive (VAR) estimation technique. The paper finds that both positive and nega- tive oil price shocks influence real government expenditure only in the long run rather than in the short run, while examining positive and negative shocks to ex- ternal reserves revealed stronger implications for expenditure in the long run, with positive rather than negative oil price shocks having stronger short and long run effects on real GDP, and therefore triggering inflationary pressure and domes- tic currency depreciation as importation rises. This implies that the country ex- hibits the Dutch disease syndrome in the short and long run. However, results obtained show that oil revenue shocks are capable of impeding economic growth only in the long run while raising general price levels marginally in the short run after the initial shocks, with evidence of serious threat to interest rate and the domestic currency in the short and medium term, as the volume of imports in- creases significantly along with the external reserves. Findings on the asymmet- ric effects of oil revenue shocks revealed that positive shocks to oil revenue stimu- late expansionary fiscal posture in the Nigerian economy in the short run in line with theory, thereby creating inflationary pressure and domestic currency depre- ciation. The combined implications of these discoveries suggest the need for prop- er coordination of fiscal and monetary policy for sustainable macroeconomic sta- bility to be achieved. Keywords: oil price shocks, oil revenue, macroeconomic performance, VAR. Shock de precios del petróleo y el desempeño macroeconómico de Nigeria Resumen: Este trabajo examina las implicaciones macroeconómicas de los cho- ques simétricos y asimétricos de precios e ingresos petroleros en Nigeria mediante la técnica de estimación autorregresiva vectorial (VAR, por sus siglas en inglés). El Oil Price Shocks and Macroeconomic Performance in Nigeria *Simeon Oludiran Akinleye, [email protected], Senior Lecturer; Stephen Ekpo, [email protected], Graduate Research Student, Department of Economics, Faculty of So- cial Sciences, University of Lagos. Lagos, Nigeria. economía mexicana NUEVA éPOCA, vol. Cierre de Época (II) 2013 . PP. 565-624
-
Upload
khangminh22 -
Category
Documents
-
view
0 -
download
0
Transcript of Oil Price Shocks and Macroeconomic Performance in Nigeria
565
Simeon Oludiran Akinleye and Stephen Ekpo*Fecha de recepción: 9 de mayo de 2012; fecha de aceptación: 5 de septiembre de 2013.
Abstract: This paper examines the macroeconomic implications of symmetric and asymmetric oil price and oil revenue shocks in Nigeria, using the vector autore-gressive (var) estimation technique. The paper finds that both positive and nega-tive oil price shocks influence real government expenditure only in the long run rather than in the short run, while examining positive and negative shocks to ex-ternal reserves revealed stronger implications for expenditure in the long run, with positive rather than negative oil price shocks having stronger short and long run effects on real gdp, and therefore triggering inflationary pressure and domes-tic currency depreciation as importation rises. This implies that the country ex-hibits the Dutch disease syndrome in the short and long run. However, results obtained show that oil revenue shocks are capable of impeding economic growth only in the long run while raising general price levels marginally in the short run after the initial shocks, with evidence of serious threat to interest rate and the domestic currency in the short and medium term, as the volume of imports in-creases significantly along with the external reserves. Findings on the asymmet-ric effects of oil revenue shocks revealed that positive shocks to oil revenue stimu-late expansionary fiscal posture in the Nigerian economy in the short run in line with theory, thereby creating inflationary pressure and domestic currency depre-ciation. The combined implications of these discoveries suggest the need for prop-er coordination of fiscal and monetary policy for sustainable macroeconomic sta-bility to be achieved.
Keywords: oil price shocks, oil revenue, macroeconomic performance, var.
Shock de precios del petróleo y el desempeño macroeconómico de Nigeria
Resumen: Este trabajo examina las implicaciones macroeconómicas de los cho-ques simétricos y asimétricos de precios e ingresos petroleros en Nigeria mediante la técnica de estimación autorregresiva vectorial (var, por sus siglas en inglés). El
Oil Price Shocks and Macroeconomic Performance in Nigeria
*Simeon Oludiran Akinleye, [email protected], Senior Lecturer; Stephen Ekpo, [email protected], Graduate Research Student, Department of Economics, Faculty of So-cial Sciences, University of Lagos. Lagos, Nigeria.
economía mexicana nueva época, vol. Cierre de Época (II) 2013 . pp. 565-624
566 S. O. Akinleye and S. Ekpo: Oil Price Shocks and Macroeconomic Performance in Nigeria
documento encuentra que los shocks de los precios del petróleo, tanto positivos como negativos, tienen influencia sobre el gasto gubernamental real sólo en el largo (más que en el corto) plazo, mientras que al examinar los shocks, positivos y negativos, de las reservas externas se encontró que existen implicaciones más fuertes para el gasto en el largo plazo, y que los shocks de los precios petroleros positivos (más que los negativos) tienen efectos de corto y largo plazo sobre el pib, lo que consecuentemente desata presión inflacionaria y depreciación de la mone-da nacional conforme aumenta la importación. Esto implica que el país exhibe el síndrome de la enfermedad holandesa en el corto y largo plazo. Sin embargo, los resultados muestran que los shocks de los ingresos petroleros tienen capacidad para impedir el crecimiento económico sólo en el largo plazo, mientras que elevan marginalmente el nivel general de precios en el corto plazo luego de los shocks iniciales; con evidencia de una amenaza seria a la tasa de interés y a la moneda nacional en el corto y mediano plazo conforme el volumen de importaciones se in-crementa considerablemente junto con las reservas externas. Los resultados sobre los efectos asimétricos de los shocks del ingreso petrolero revelaron que los shocks positivos de los ingresos del petróleo estimulan la postura fiscal expansionista en la economía nigeriana en el corto plazo (de acuerdo con la teoría), creando en esa forma presión inflacionaria y depreciación monetaria. Las implicaciones combina-das de estos hallazgos sugieren la necesidad de una coordinación apropiada de las políticas monetaria y fiscal si se quiere alcanzar la estabilidad macroeconómica sostenida.
Palabras clave: shocks de los precios del petróleo, ingresos petroleros, desem-peño macroeconómico, var.
jel classification: C13, C22, E39, F42, 055.
Introduction
Nigeria is highly vulnerable to fluctuations in the international oil market, given the fragile nature of the economy and the heavy de-
pendence on crude oil proceeds, despite being the sixth largest producer of oil in the world (Akpan, 2009). The provision of plausible explanations for the relationship between oil price movements and macroeconomic perfor-mance has occupied the attention of economists over the last four decades. The steep upward trend in the price of crude oil in recent years, reaching a record nominal high of US $147 in mid-2008 and a sharp drop to US $46 a barrel a year later, has led to increasing concern about its macroeco-nomic implications, both abroad and in Nigeria.
The Nigerian economy has consistently relied on export of crude oil for foreign exchange earnings and revenues, particularly as it accounts for over 95 per cent of export earnings and about 85 per cent of government revenues. Its contribution to gdp, however, stood at 17.85 per cent in 2008 (Aliyu, 2009). Nigeria’s oil statistics show that the country has an esti-mated 36.2 billion barrels of oil reserves which places the country as the
567economía mexicana nueva época, vol. Cierre de Época (II) 2013
second largest in terms of oil reserve on the African continent. The Energy Information Administration (2009) estimates Nigeria’s effective oil pro-duction capacity to be around 2.7 million barrels per day. Serious drop in oil production levels, which affected exports and the plummeting of world oil prices in late 2008 resulted in huge revenue gaps for the country. Equally, the country is exposed to oil price shocks through massive impor-tation of refined petroleum products since the collapse of local refineries in the late 1980s. Currently, the country imports almost 85 per cent of re-fined products for local consumption. The near collapse of the power gen-eration and distribution industry in the country further accentuates the acute shortage of energy. The burden on the government to provide energy resources at subsidised rate became very unwieldy, and between 1999 and 2008, the Federal Government of Nigeria reduced its subsidy approxi-mately nine times. This adversely affected production, consumption and investment decisions and hence the rate of economic growth (Aliyu, 2009).
Theoretically, a transmission channel mechanism has been devised to explaining the media through which oil prices affect real economic activi-ty. Notably, two channels; supply and demand, have been prominent in the literature, while other postulated channels such as economic policy reac-tion, valuation and asymmetric response channels have been viewed to be ambiguous with the latter channels technically oriented. The supply side effects relate to the fact that crude oil is a basic input to production and commerce, and hence an increase in oil price leads to a rise in production and distribution costs that induce firms to lower output. Changes in oil price also entail demand-side effects on consumption and investment. Oil price changes also influence foreign exchange markets and generate stock exchange panics, higher interest rate, produce inflation and eventually lead to monetary and financial instability (Jiménez-Rodríguez and Sán-chez, 2005).
Furthermore, an oil-price increase leads to a transfer of income from importing to exporting countries through a shift in the terms of trade. The magnitude of the direct effect of a given price increase depends on the share of the cost of oil in the national income, the degree of dependence on imported oil and the ability of end-users to reduce their consumption and switch away from oil. In net oil-importing countries, higher oil prices lead to inflation, increased input costs, reduced non-oil demand and lower in-vestment. Tax revenues fall and the budget deficit increases, due to rigidi-ties in government expenditure, which drives interest rates up. Given the resistance to real declines in wages, an oil price increase typically leads to
568 S. O. Akinleye and S. Ekpo: Oil Price Shocks and Macroeconomic Performance in Nigeria
upward pressure on nominal wage levels, thereby stimulating wage pres-sures with far reaching implications which manifests, possibly in all the postulated channels: supply, demand, economic policy reaction, valuation and asymmetric response (Wakeford, 2006).
A large body of research has examined the impact of oil price shocks on output and summarily suggests that oil price volatility tends to exert a positive effect on the gdp growth for a net oil exporting country and a negative effect on net oil importing countries. Early empirical studies found a linear negative relationship between oil prices and real activity in oil importing countries, while results from studies done in the mid-1980s suggest reversal of initial outcomes in light of the declines in oil prices that occurred over the second half of the 1980s. Thus, Mork (1989), Lee et al. (1995) and Hamilton (1996) introduced non-linear transformations of oil prices to re-establish the negative relationship between increases in oil prices and economic downturns. Recently, Hamilton (2003) and Jiménez-Rodríguez and Sánchez (2005) also found evidence of a non-linear rela-tionship between the two variables for the US economy. The issue of asym-metry in non-linear relationship between gdp and oil prices in the literature has thus proposed two other non-linear transformations, name-ly: scaled specification (Lee et al., 1995), taking the volatility of oil prices into account; and net specification (Hamilton, 1996), which considers the amount by which oil prices have gone up over the last year. However, asymmetries in the response of real activity to oil prices have been rela-tively ambiguous.
More concretely, this explanation relates to adjustment costs resulting from the implied sectoral reallocation of resources. According to this argu-ment, an increase (decrease) in oil prices would lead to a contraction (ex-pansion) in sectors that make use of oil in the production process. The contractions and expansions that occur in energy-efficient and energy in-tensive sectors as a result of changes in oil prices thus stimulate adjust-ments and readjustments that could give rise to the asymmetric effect (Akpan, 2009).
This paper adopts a unique quarterly data on crude oil price by using the Bonny light crude oil price obtained from the Central Bank of Nigeria (cbn) online statistics database for its analysis, since the Bonny light crude accounts for more than 55 per cent of the Nigerian crude oil export over the years as against the UK Brent crude oil price and the Nigerian-Forcados crude oil price employed by other authors (Olomola and Adeju-mo, 2006; Akpan, 2009; Aliyu, 2009 and Chuku et al., 2011). This thus en-
569economía mexicana nueva época, vol. Cierre de Época (II) 2013
sures that the macroeconomic consequence of shocks to oil price in Nigeria is captured using more reliable crude oil price data. The study also exam-ined the effects of shocks to oil revenue on key macroeconomic variables and was able to show the differences between symmetry and asymmetry shocks to oil price and oil revenue as well as their impact on the Nigerian economy using separate models, a novel approach. Furthermore, aside from the plausible discoveries made, the study was able to provide empiri-cal evidence that shows that both positive and negative shocks to oil rev-enue relatively increase the level of external reserve in the mid to long run. This outcome could be traceable to the steady resort to external bor-rowings among different political regimes in the period covered, with sal-utary implication on importation of capital goods for infrastructural proj-ects as contained in series of national development plans. Similarly, available data revealed less demand pressure on external reserves in pe-riods of sharp decline in oil revenue. This thus neutralized the downside effects that expectedly would have emanated from negative shocks to rev-enue from oil export.
The rest of the paper is structured as follows. Section I presents the literature review, while section II explains the theoretical framework and methodology, including sources of data and analytical techniques. The em-pirical result is discussed in section III, with conclusion provided in the final section.
I. Literature Review
A number of empirical works on the relationship between oil prices fluc-tuations and economic activity has been carried out using different esti-mation approaches. By looking at the channel of transmission of oil price shocks to the larger economy, many researchers have argued that fluctua-tions in oil prices are linked to macroeconomic performance.
I.1. Developed Countries
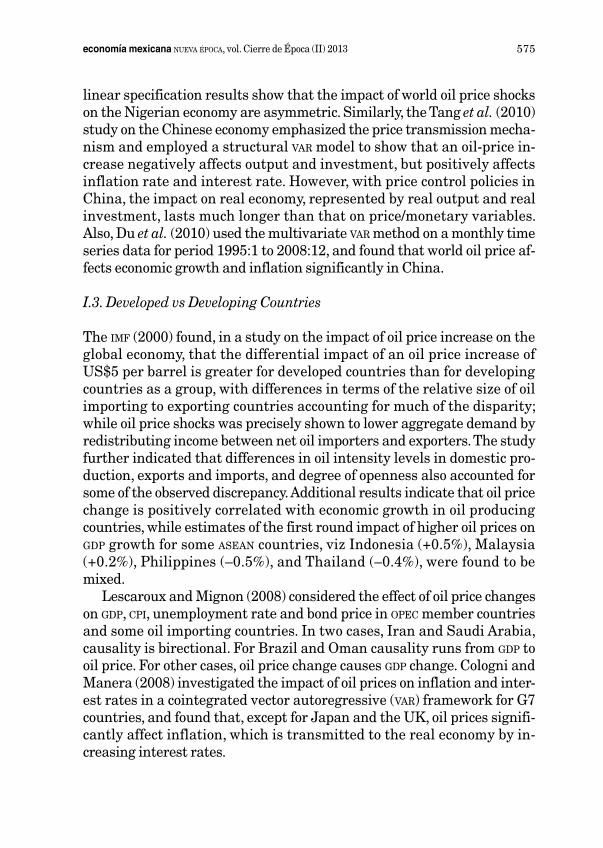
Bernanke et al. (1997) studied the role of monetary policy as the central issue rather than a factor contributing to discontinuity in the oil price-gdp relationship. Evidences from their impulse response functions show that had the Federal Reserve maintained the funds rate at the pre-shock level, most of the gdp response to oil price over the 1973, 1979-1980, and 1990 episodes would have been avoided. This suggests that most, if not all, of
570 S. O. Akinleye and S. Ekpo: Oil Price Shocks and Macroeconomic Performance in Nigeria
the reduction in gdp during the recessions following those episodes was at-tributable to monetary policy rather than the oil price shocks themselves.
Hamilton and Herrera (2001) reexamined the Bernanke et al. (1997) study, and arrived at a diametrically opposite conclusion about the rela-tive contributions of monetary policy and oil price shocks to the recessions following the 1973, 1979-1980, and 1990 oil price shocks. From their anal-ysis of the impulse response functions, they discovered that the potential of monetary policy to avert the contractionary consequences of an oil price shock is not as great as suggested by the analysis of Bernanke et al. Rath-er, oil shocks appear to have a bigger effect on the economy than suggested by their var, and they were unpersuaded of the feasibility of implementing the monetary policy needed to offset even small shocks.
It is believed that monetary policy’s response to oil price shocks can cause aggregate economic fluctuations. Brown and Yücel (1999) tested such hypothesis using a seven-variable var model in the US economy and found that a constant federal funds rate during an oil shock is an accom-modative monetary policy stance; on the other hand, holding nominal gdp constant corresponds to a neutral monetary policy. Similar study by El-tony and Al-Alwadi (2001) employed the unrestricted var, the Vector Error Correction Model and the structured var, and found all three versions es-timates indicating high degree of interrelation among the major ma-croeconomic variables.
Backus and Crucini (2000) study on the terms of trade and the volatil-ity of oil price in the US economy indicates that heightened terms of trade volatility are significantly related to increased oil price volatility, as op-posed to fluctuations in nominal or real exchange rates that are both in-significant with respect to the terms of trade volatility.
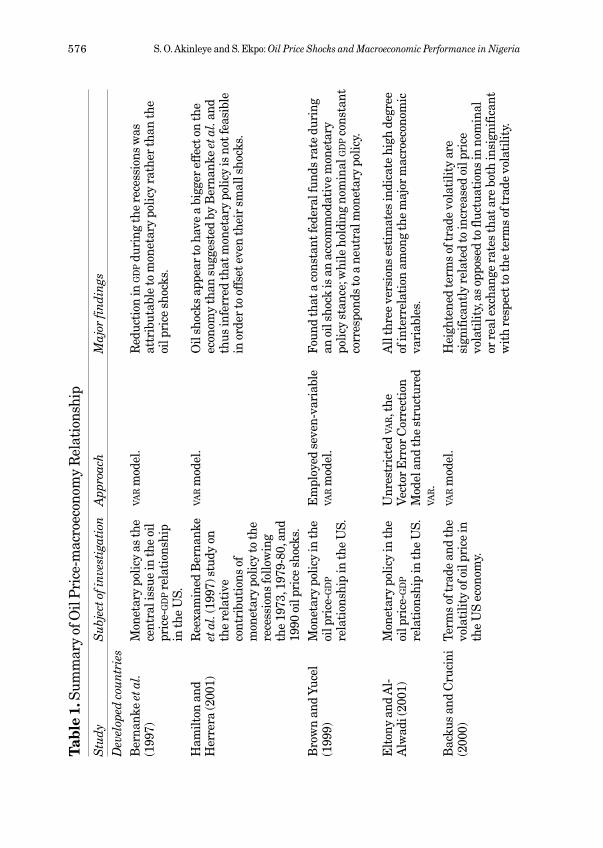
Focusing on the inflationary effects of oil price shocks, Hooker (2002) assessed the contribution of oil price changes on US inflation in a phillips curve framework, taking into account the asymmetries, non-linearities and structural break effects. His results on structural break indicate that changes in the price of oil had significant effects on core inflation before 1980 but weakened after that period.
Contrary to previous research outcomes, the Cuñado and pérez de Gra-cia (2003) study on 15 European countries revealed mixed results, as cointegrating long-run relationship between oil prices and economic activ-ity was found only in two countries (the United Kingdom and Ireland). Therefore, they suggest that the impact of oil shocks on economic activity is limited to the short run. They conclude that the use of either world oil
571economía mexicana nueva época, vol. Cierre de Época (II) 2013
price index or a national real price index is part of the explanation to the difference.
Jiménez-Rodríguez and Sánchez (2005) using multivariate var analy-sis in a study involving major industrialised oecd countries found that the response of real gdp to oil price shocks differ between net oil importers and exporters with the exception of United Kingdom (net exporter) and Japan (net importer). Also, their asymmetric (non-linear) specification showed that oil price declines are significant only in few countries, while shocks to oil price, together with monetary shocks, are found to be the largest source of volatility in real output aside itself. The authors re-specified earlier models and employed standard vector autoregression methods for linear and non-linear specified models. Their results indicate that non-linear im-pact of oil prices on real gdp is positively significant, especially as oil price increases influence gdp growth substantially than that of oil price de-clines, with the latter being statistically insignificant in most cases.
Guo and Kliesen (2005) used a measure of realized volatility construct-ed from daily crude oil future prices traded on the Nymex, and find that, over the period 1984-2004, oil price volatility has a significant effect on various key US macroeconomic indicators, such as fixed investment, con-sumption, employment and the unemployment rate.
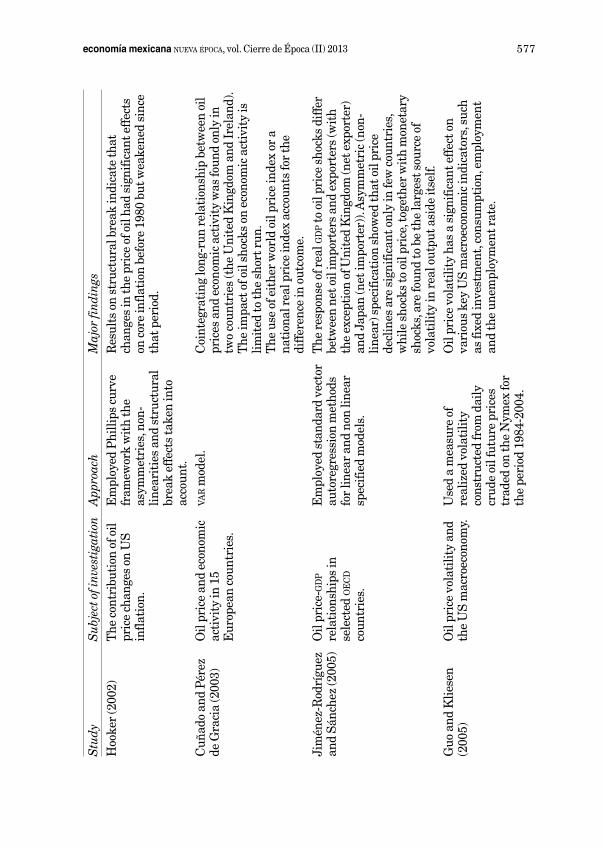
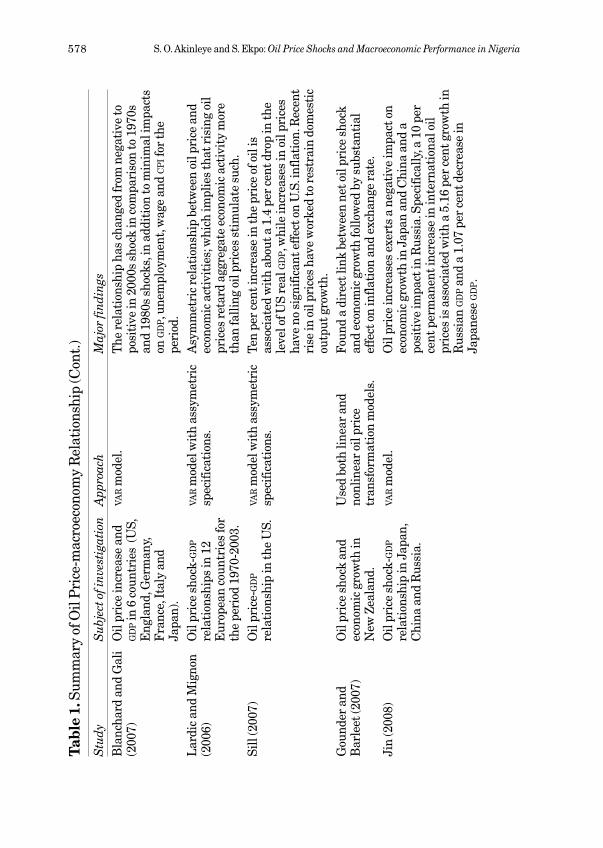
The var model analysis by Blanchard and Gali (2007) found that the relationship between oil price increase and gdp in 6 countries (US, Eng-land, Germany, France, Italy and Japan) changed from negative to posi-tive from the 2000s shock in comparison to shocks in the 1970s and 1980s, in addition to minimal impacts on gdp, unemployment, wage and cpi for the period. Lardic and Mignon (2006) studied 12 European countries for the period 1970 to 2003 and found asymmetric relationship between oil price and economic activities; implying that rising oil prices retard aggregate economic activity more than falling oil prices stimulate same.
Sill (2007) in a study on the US economy found that a 10 per cent in-crease in the price of oil is associated with about 1.4 per cent drop in the level of US real gdp, while increases in oil prices have no significant effect on US. inflation. Nevertheless, the evidence suggests that the recent rise in oil prices has worked to restrain domestic output growth. Gounder and Bartleet (2007) used both linear and nonlinear oil price transformation models to discover a direct link between net oil price shock and economic growth in New Zealand, followed by substantial effect on inflation and exchange rate. Also, Chen and Chen (2007) found a co-integrating rela-tionship between real oil prices and real exchange rates.
572 S. O. Akinleye and S. Ekpo: Oil Price Shocks and Macroeconomic Performance in Nigeria
Jin (2008), in a comparative analysis, discovered that oil price increas-es exert a negative effect on economic growth in Japan and China and a positive effect on Russia. Specifically, a 10 per cent permanent increase in international oil prices is associated with a 5.16 per cent growth in Rus-sian gdp and a 1.07 per cent decrease in Japanese gdp.
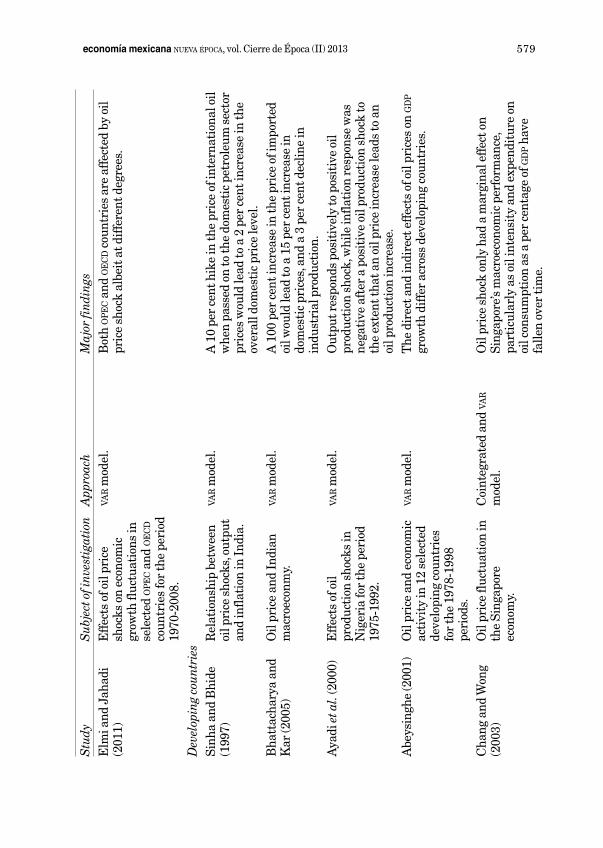
In a recent study, Elmi and Jahadi (2011) used var approach to analyze the effect of oil price shocks on economic growth fluctuations in selected opec and oecd countries for the period 1970-2008, and found that both opec and oecd countries are affected by oil price shock albeit at different degrees.
I.2. Developing Countries
Sinha and Bhide (1997) examined the relationship between oil price shocks, output and inflation in India, and show that a 10 per cent hike in the price of international oil when passed on to the domestic petroleum sector prices would lead to a 2 per cent increase in the overall domestic price level. A similar study by Bhattacharya and Kar (2005) found that a 100 per cent increase in the price of imported oil would lead to a 15 per cent increase in the domestic prices, and a 3 per cent decline in industrial production.
Also, Ayadi et al. (2000) studied the effects of oil production shocks for Nigeria, as a net exporter of oil for the period 1975-1992 using the var ap-proach, and found that output responds positively to positive oil produc-tion shock, while inflation response was negative after a positive oil pro-duction shock to the extent that an oil price increase leads to an oil production increase. The authors’ results thus suggest that output in-creases; inflation decreases and the national currency depreciate follow-ing a positive oil-price shock in Nigeria.
Abeysinghe (2001) studied the impact of oil price changes by focusing on only 12 economies, which include Indonesia, Malaysia, Singapore, philippines, and Thailand using data over the 1978-1998 period. This study evaluates the direct and indirect effects of oil prices on gdp growth of these economies. Chang and Wong (2003) examined the impact of oil price fluctuation on the Singapore economy, using cointegrated vecm tech-nique, impulse response analysis and vdc. The results obtained suggest that oil price shock only had a marginal effect on Singapore’s macroeco-nomic performance, particularly as descriptive analysis showed that Sin-gapore’s oil intensity and expenditure on oil consumption as a percentage of gdp have fallen over time. Cuñado and pérez de Gracia (2005) found
573economía mexicana nueva época, vol. Cierre de Época (II) 2013
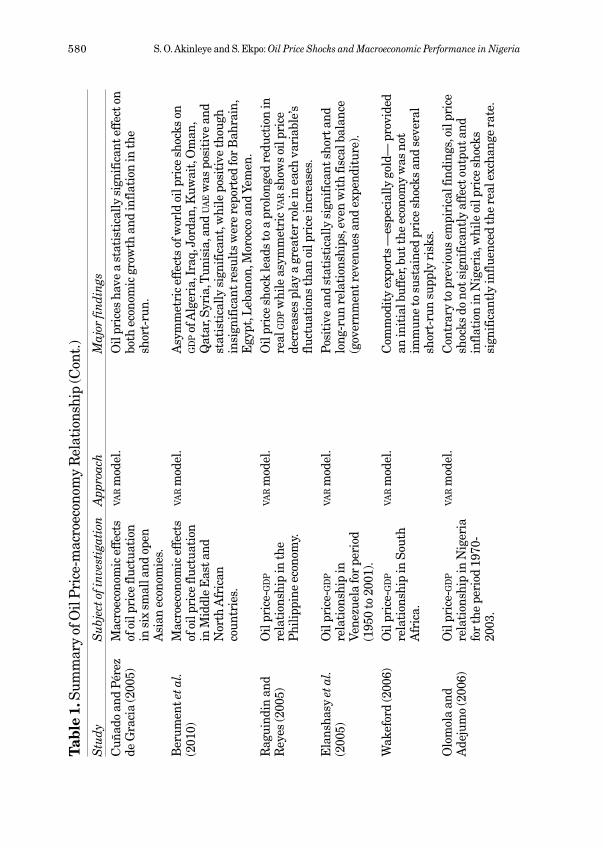
that oil prices have a statistically significant effect on both economic growth and inflation in the short-run in six small and open Asian econo-mies, including Malaysia, Singapore, philippines, Thailand and some oecd countries.
Berument et al. (2010) in a study on Middle East and North African countries found the asymmetric effects of world oil price shocks on the gdp of Algeria, Iraq, Jordan, Kuwait, Oman, Qatar, Syria, Tunisia, and UAE to be positive and statistically significant, while positive but insignificant results were reported for Bahrain, Egypt, Lebanon, Morocco and Yemen. Raguindin and Reyes (2005) impulse response functions results showed that oil price shock leads to a prolonged reduction in the real gdp of the philippine economy, while asymmetric var model analysis suggest that oil price decreases play a greater role in each variable’s fluctuations than oil price increases. In a related study, Elanshasy et al. (2005) examine the subject matter on Venezuela for period (1950 to 2001) using similar esti-mation approach, and reported positive and statistically significant short and long-run relationships, even with fiscal balance (government reve-nues and expenditure).
Wakeford (2006) study on the South African economy revealed that while commodity exports —especially gold— provided an initial buffer, the economy was not immune to sustained price shocks and several short-run supply risks. However, using var methodology for the period 1970-2003, Olomola and Adejumo (2006) found that contrary to previous em-pirical findings, oil price shocks do not significantly affect output and inflation in Nigeria, while oil price shocks was found to significantly influ-ence the real exchange rate. This result is slightly different from that ob-tained by Ayadi (2005), which suggests that oil price changes significantly influence economic development in Nigeria via industrial production. The results further suggest that oil price changes affect industrial production indirectly through its effect on exchange rate albeit insignificantly.
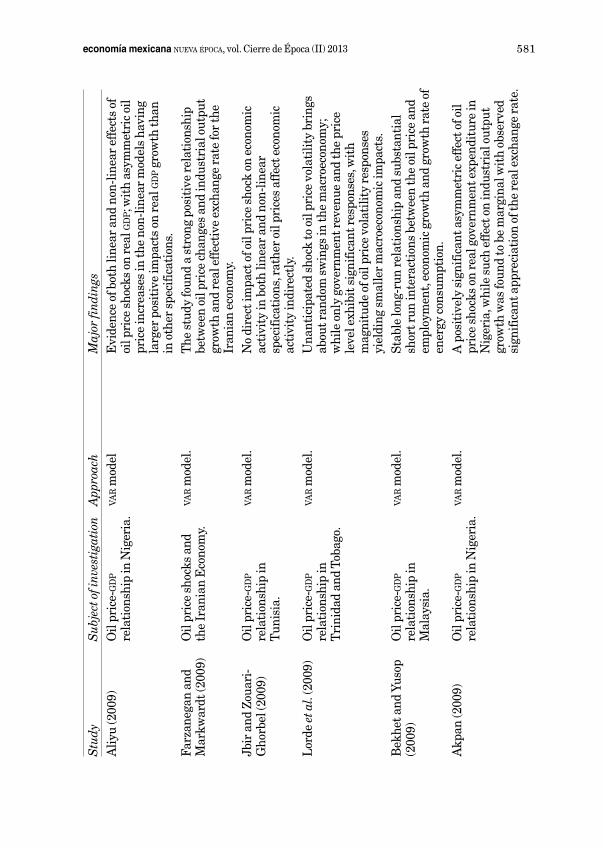
Farzanegan and Markwardt (2009) found a strong positive relation-ship between oil price changes and industrial output growth and real ef-fective exchange rate for the Iranian economy. However, results obtained by Jbir and Zouari-Ghorbel (2009) indicate that there is no direct impact of oil price shock on the economic activity in both linear and non-linear specifications in Tunisia, rather oil prices affect economic activity indi-rectly and also oil price shock was discovered to be mostly transmitted via government’s spending. Using vector autoregressive (var) methodology, Lorde et al. (2009) found that unanticipated shock to oil price volatility
574 S. O. Akinleye and S. Ekpo: Oil Price Shocks and Macroeconomic Performance in Nigeria
brings about random swings in the macroeconomy of Trinidad and Toba-go. However, only government revenue and the price level exhibit signifi-cant responses, while magnitude of oil price volatility responses tend to yield smaller macroeconomic impacts. Also, Granger-causality tests indi-cate causality from oil prices to output and oil prices to government reve-nue. Similarly, Bekhet and Yusop (2009) reveal evidence of a stable long-run relationship and substantial short run interactions between the oil price and employment, economic growth and growth rate of energy con-sumption in Malaysia.
Akpan (2009) using var model analysis found a positively significant asymmetric effect of oil price shocks on real government expenditure in Nigeria, while such effect on industrial output growth was found to be marginal with observed significant appreciation of the real exchange rate. These findings reinforce results obtained in earlier studies by Olomola and Adejumo (2006) and Ayadi (2005) on Nigeria. Similarly, Aliyu (2009) used a non-linear approach and found evidence of both linear and non-linear effects of oil price shocks on real gdp in Nigeria; precisely, the study found that asymmetric oil price increases in the non-linear models have larger positive impacts on real gdp growth than in other specifications. The study, which focused on the effects of oil price shock and real exchange rate volatility on real economic growth in Nigeria, found a unidirectional causality running from oil prices to real gdp and bidirectional causality from real exchange rate to real gdp and vice versa, while further results indicate that oil price shock and appreciation in the level of exchange rate exert positive impact on real economic growth in Nigeria.
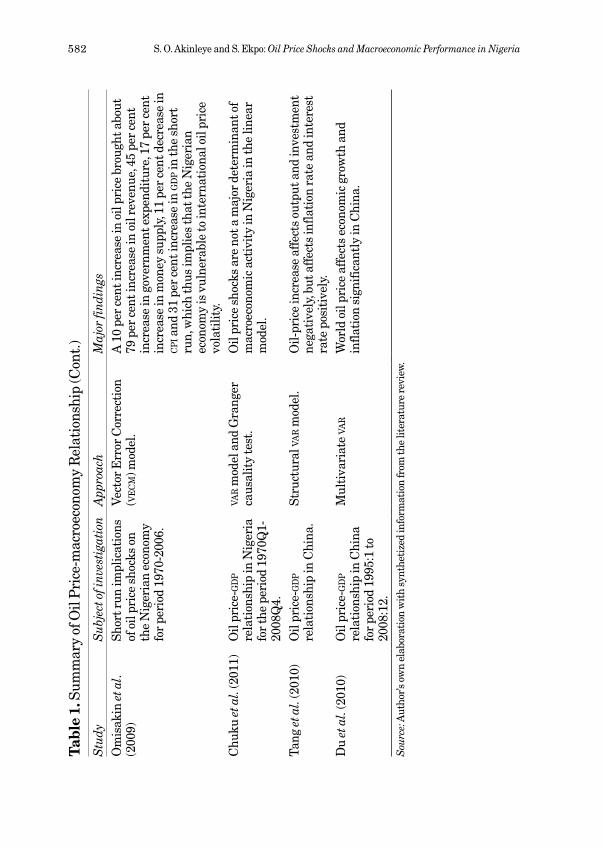
Omisakin et al. (2009) examined the short run implications of oil price shocks on the Nigerian economy using Vector Error Correction (vecm) model on data for the period 1970-2006 and found that a 10 per cent in-crease in oil price brought about 79 per cent increase in oil revenue, 45 per cent increase in government expenditure, 17 per cent increase in money supply, 11 per cent decrease in cpi and 31 per cent increase in gdp in the short run, which thus implies that the Nigerian economy is vulnerable to international oil price volatility.
Chuku et al. (2011) studied the linear and asymmetric impacts of oil price shocks on the Nigerian economy for the period 1970Q1-2008Q4 us-ing var model and Granger causality test approach; and found that oil price shocks are not a major determinant of macroeconomic activity in Nigeria in the linear model; while Granger causality results indicate that world oil prices do not influence macroeconomic activity and that non-
575economía mexicana nueva época, vol. Cierre de Época (II) 2013
linear specification results show that the impact of world oil price shocks on the Nigerian economy are asymmetric. Similarly, the Tang et al. (2010) study on the Chinese economy emphasized the price transmission mecha-nism and employed a structural var model to show that an oil-price in-crease negatively affects output and investment, but positively affects inflation rate and interest rate. However, with price control policies in China, the impact on real economy, represented by real output and real investment, lasts much longer than that on price/monetary variables. Also, Du et al. (2010) used the multivariate var method on a monthly time series data for period 1995:1 to 2008:12, and found that world oil price af-fects economic growth and inflation significantly in China.
I.3. Developed vs Developing Countries
The imf (2000) found, in a study on the impact of oil price increase on the global economy, that the differential impact of an oil price increase of US$5 per barrel is greater for developed countries than for developing countries as a group, with differences in terms of the relative size of oil importing to exporting countries accounting for much of the disparity; while oil price shocks was precisely shown to lower aggregate demand by redistributing income between net oil importers and exporters. The study further indicated that differences in oil intensity levels in domestic pro-duction, exports and imports, and degree of openness also accounted for some of the observed discrepancy. Additional results indicate that oil price change is positively correlated with economic growth in oil producing countries, while estimates of the first round impact of higher oil prices on gdp growth for some asean countries, viz Indonesia (+0.5%), Malaysia (+0.2%), philippines (–0.5%), and Thailand (–0.4%), were found to be mixed.
Lescaroux and Mignon (2008) considered the effect of oil price changes on gdp, cpi, unemployment rate and bond price in opec member countries and some oil importing countries. In two cases, Iran and Saudi Arabia, causality is birectional. For Brazil and Oman causality runs from gdp to oil price. For other cases, oil price change causes gdp change. Cologni and Manera (2008) investigated the impact of oil prices on inflation and inter-est rates in a cointegrated vector autoregressive (var) framework for G7 countries, and found that, except for Japan and the UK, oil prices signifi-cantly affect inflation, which is transmitted to the real economy by in-creasing interest rates.
576 S. O. Akinleye and S. Ekpo: Oil Price Shocks and Macroeconomic Performance in Nigeria
Tabl
e 1.
Sum
mar
y of
Oil
pri
ce-m
acro
econ
omy
Rel
atio
nshi
p
Stu
dyS
ubje
ct o
f inv
esti
gati
onA
ppro
ach
Maj
or fi
ndin
gsD
evel
oped
cou
ntri
esB
erna
nke
et a
l. (1
997)
Mon
etar
y po
licy
as th
e ce
ntra
l iss
ue in
the
oil
pric
e-g
dp r
elat
ions
hip
in th
e U
S.
var m
odel
.R
educ
tion
in g
dp d
urin
g th
e re
cess
ions
was
at
trib
utab
le to
mon
etar
y po
licy
rath
er th
an th
e oi
l pri
ce s
hock
s.
Ham
ilton
and
H
erre
ra (2
001)
Ree
xam
ined
Ber
nank
e et
al.
(199
7) s
tudy
on
the
rela
tive
co
ntri
buti
ons
of
mon
etar
y po
licy
to th
e re
cess
ions
follo
win
g th
e 19
73, 1
979-
80, a
nd
1990
oil
pric
e sh
ocks
.
var m
odel
.O
il sh
ocks
app
ear
to h
ave
a bi
gger
eff
ect o
n th
e ec
onom
y th
an s
ugge
sted
by
Ber
nank
e et
al.
and
thus
infe
rred
that
mon
etar
y po
licy
is n
ot fe
asib
le
in o
rder
to o
ffse
t eve
n th
eir
smal
l sho
cks.
Bro
wn
and
Yuce
l (1
999)
Mon
etar
y po
licy
in th
e oi
l pri
ce-g
dp
rela
tion
ship
in th
e U
S.
Em
ploy
ed s
even
-var
iabl
e va
r m
odel
.Fo
und
that
a c
onst
ant f
eder
al fu
nds
rate
dur
ing
an o
il sh
ock
is a
n ac
com
mod
ativ
e m
onet
ary
polic
y st
ance
; whi
le h
oldi
ng n
omin
al g
dp c
onst
ant
corr
espo
nds
to a
neu
tral
mon
etar
y po
licy.
Elt
ony
and
Al-
Alw
adi (
2001
)M
onet
ary
polic
y in
the
oil p
rice
- gd
p
rela
tion
ship
in th
e U
S.
Unr
estr
icte
d va
r, t
he
Vect
or E
rror
Cor
rect
ion
Mod
el a
nd th
e st
ruct
ured
va
r.
All
thre
e ve
rsio
ns e
stim
ates
indi
cate
hig
h de
gree
of
inte
rrel
atio
n am
ong
the
maj
or m
acro
econ
omic
va
riab
les.
Bac
kus
and
Cru
cini
(2
000)
Term
s of
trad
e an
d th
e vo
lati
lity
of o
il pr
ice
in
the
US
econ
omy.
var m
odel
.H
eigh
tene
d te
rms
of tr
ade
vola
tilit
y ar
e si
gnifi
cant
ly r
elat
ed to
incr
ease
d oi
l pri
ce
vola
tilit
y, as
opp
osed
to fl
uctu
atio
ns in
nom
inal
or
rea
l exc
hang
e ra
tes
that
are
bot
h in
sign
ifica
nt
wit
h re
spec
t to
the
term
s of
trad
e vo
lati
lity.
577economía mexicana nueva época, vol. Cierre de Época (II) 2013
Stu
dyS
ubje
ct o
f inv
esti
gati
onA
ppro
ach
Maj
or fi
ndin
gsH
ooke
r (2
002)
The
con
trib
utio
n of
oil
pric
e ch
ange
s on
US
infla
tion
.
Em
ploy
ed p
hilli
ps c
urve
fr
amew
ork
wit
h th
e as
ymm
etri
es, n
on-
linea
riti
es a
nd s
truc
tura
l br
eak
effe
cts
take
n in
to
acco
unt.
Res
ults
on
stru
ctur
al b
reak
indi
cate
that
ch
ange
s in
the
pric
e of
oil
had
sign
ifica
nt e
ffec
ts
on c
ore
infla
tion
bef
ore
1980
but
wea
kene
d si
nce
that
per
iod.
Cuñ
ado
and
pére
z de
Gra
cia
(200
3)O
il pr
ice
and
econ
omic
ac
tivi
ty in
15
Eur
opea
n co
untr
ies.
var m
odel
.C
oint
egra
ting
long
-run
rel
atio
nshi
p be
twee
n oi
l pr
ices
and
eco
nom
ic a
ctiv
ity
was
foun
d on
ly in
tw
o co
untr
ies
(the
Uni
ted
Kin
gdom
and
Irel
and)
. T
he im
pact
of o
il sh
ocks
on
econ
omic
act
ivit
y is
lim
ited
to th
e sh
ort r
un.
The
use
of e
ithe
r w
orld
oil
pric
e in
dex
or a
na
tion
al r
eal p
rice
inde
x ac
coun
ts fo
r th
e di
ffer
ence
in o
utco
me.
Ji
mén
ez-R
odrí
guez
an
d Sá
nche
z (2
005)
Oil
pric
e-g
dp
rela
tion
ship
s in
se
lect
ed o
ec
d
coun
trie
s.
Em
ploy
ed s
tand
ard
vect
or
auto
regr
essi
on m
etho
ds
for
linea
r an
d no
n lin
ear
spec
ified
mod
els.
The
res
pons
e of
rea
l gd
p to
oil
pric
e sh
ocks
diff
er
betw
een
net o
il im
port
ers
and
expo
rter
s (w
ith
the
exce
ptio
n of
Uni
ted
Kin
gdom
(net
exp
orte
r)
and
Japa
n (n
et im
port
er))
. Asy
mm
etri
c (n
on-
linea
r) s
peci
ficat
ion
show
ed th
at o
il pr
ice
decl
ines
are
sig
nific
ant o
nly
in fe
w c
ount
ries
, w
hile
sho
cks
to o
il pr
ice,
toge
ther
wit
h m
onet
ary
shoc
ks, a
re fo
und
to b
e th
e la
rges
t sou
rce
of
vola
tilit
y in
rea
l out
put a
side
itse
lf.G
uo a
nd K
liese
n (2
005)
Oil
pric
e vo
lati
lity
and
the
US
mac
roec
onom
y.U
sed
a m
easu
re o
f re
aliz
ed v
olat
ility
co
nstr
ucte
d fr
om d
aily
cr
ude
oil f
utur
e pr
ices
tr
aded
on
the
Nym
ex fo
r th
e pe
riod
198
4-20
04.
Oil
pric
e vo
lati
lity
has
a si
gnifi
cant
eff
ect o
n va
riou
s ke
y U
S m
acro
econ
omic
indi
cato
rs, s
uch
as fi
xed
inve
stm
ent,
cons
umpt
ion,
em
ploy
men
t an
d th
e un
empl
oym
ent r
ate.
578 S. O. Akinleye and S. Ekpo: Oil Price Shocks and Macroeconomic Performance in Nigeria
Tabl
e 1.
Sum
mar
y of
Oil
pri
ce-m
acro
econ
omy
Rel
atio
nshi
p (C
ont.
)
Stu
dyS
ubje
ct o
f inv
esti
gati
onA
ppro
ach
Maj
or fi
ndin
gsB
lanc
hard
and
Gal
i (2
007)
Oil
pric
e in
crea
se a
nd
gd
p in
6 c
ount
ries
(U
S,
Eng
land
, Ger
man
y,
Fra
nce,
Ital
y an
d Ja
pan)
.
var m
odel
.T
he r
elat
ions
hip
has
chan
ged
from
neg
ativ
e to
po
siti
ve in
200
0s s
hock
in c
ompa
riso
n to
197
0s
and
1980
s sh
ocks
, in
addi
tion
to m
inim
al im
pact
s on
gd
p, u
nem
ploy
men
t, w
age
and
cp
i for
the
peri
od.
Lar
dic
and
Mig
non
(200
6)O
il pr
ice
shoc
k-g
dp
rela
tion
ship
s in
12
Eur
opea
n co
untr
ies
for
the
peri
od 1
970-
2003
.
var m
odel
wit
h as
sym
etri
c sp
ecifi
cati
ons.
Asy
mm
etri
c re
lati
onsh
ip b
etw
een
oil p
rice
and
ec
onom
ic a
ctiv
itie
s; w
hich
impl
ies
that
ris
ing
oil
pric
es r
etar
d ag
greg
ate
econ
omic
act
ivit
y m
ore
than
falli
ng o
il pr
ices
sti
mul
ate
such
.Si
ll (2
007)
Oil
pric
e-g
dp
rela
tion
ship
in th
e U
S.va
r m
odel
wit
h as
sym
etri
c sp
ecifi
cati
ons.
Ten
per
cent
incr
ease
in th
e pr
ice
of o
il is
as
soci
ated
wit
h ab
out a
1.4
per
cen
t dro
p in
the
leve
l of U
S re
al g
dp, w
hile
incr
ease
s in
oil
pric
es
have
no
sign
ifica
nt e
ffec
t on
U.S
. inf
lati
on. R
ecen
t ri
se in
oil
pric
es h
ave
wor
ked
to r
estr
ain
dom
esti
c ou
tput
gro
wth
.G
ound
er a
nd
Bar
leet
(200
7)O
il pr
ice
shoc
k an
d ec
onom
ic g
row
th in
N
ew Z
eala
nd.
Use
d bo
th li
near
and
no
nlin
ear
oil p
rice
tr
ansf
orm
atio
n m
odel
s.
Foun
d a
dire
ct li
nk b
etw
een
net o
il pr
ice
shoc
k an
d ec
onom
ic g
row
th fo
llow
ed b
y su
bsta
ntia
l ef
fect
on
infla
tion
and
exc
hang
e ra
te.
Jin
(200
8)O
il pr
ice
shoc
k-g
dp
rela
tion
ship
in J
apan
, C
hina
and
Rus
sia.
var m
odel
.O
il pr
ice
incr
ease
s ex
erts
a n
egat
ive
impa
ct o
n ec
onom
ic g
row
th in
Jap
an a
nd C
hina
and
a
posi
tive
impa
ct in
Rus
sia.
Spe
cific
ally
, a 1
0 pe
r ce
nt p
erm
anen
t inc
reas
e in
inte
rnat
iona
l oil
pric
es is
ass
ocia
ted
wit
h a
5.16
per
cen
t gro
wth
in
Rus
sian
gd
p a
nd a
1.0
7 pe
r ce
nt d
ecre
ase
in
Japa
nese
gd
p.
579economía mexicana nueva época, vol. Cierre de Época (II) 2013
Stu
dyS
ubje
ct o
f inv
esti
gati
onA
ppro
ach
Maj
or fi
ndin
gsE
lmi a
nd J
ahad
i (2
011)
Eff
ects
of o
il pr
ice
shoc
ks o
n ec
onom
ic
grow
th fl
uctu
atio
ns in
se
lect
ed o
pe
c a
nd o
ec
d
coun
trie
s fo
r th
e pe
riod
19
70-2
008.
var m
odel
.B
oth
op
ec a
nd o
ec
d c
ount
ries
are
aff
ecte
d by
oil
pric
e sh
ock
albe
it a
t diff
eren
t deg
rees
.
Dev
elop
ing
coun
trie
sSi
nha
and
Bhi
de
(199
7)R
elat
ions
hip
betw
een
oil p
rice
sho
cks,
out
put
and
infla
tion
in In
dia.
var m
odel
.A
10
per
cent
hik
e in
the
pric
e of
inte
rnat
iona
l oil
whe
n pa
ssed
on
to th
e do
mes
tic
petr
oleu
m s
ecto
r pr
ices
wou
ld le
ad to
a 2
per
cen
t inc
reas
e in
the
over
all d
omes
tic
pric
e le
vel.
Bha
ttac
hary
a an
d K
ar (2
005)
Oil
pric
e an
d In
dian
m
acro
econ
my.
var m
odel
.A
100
per
cen
t inc
reas
e in
the
pric
e of
impo
rted
oi
l wou
ld le
ad to
a 1
5 pe
r ce
nt in
crea
se in
do
mes
tic
pric
es, a
nd a
3 p
er c
ent d
eclin
e in
in
dust
rial
pro
duct
ion.
Aya
di e
t al.
(200
0)E
ffec
ts o
f oil
prod
ucti
on s
hock
s in
N
iger
ia fo
r th
e pe
riod
19
75-1
992.
var m
odel
.O
utpu
t res
pond
s po
siti
vely
to p
osit
ive
oil
prod
ucti
on s
hock
, whi
le in
flati
on r
espo
nse
was
ne
gati
ve a
fter
a p
osit
ive
oil p
rodu
ctio
n sh
ock
to
the
exte
nt th
at a
n oi
l pri
ce in
crea
se le
ads
to a
n oi
l pro
duct
ion
incr
ease
.A
beys
ingh
e (2
001)
Oil
pric
e an
d ec
onom
ic
acti
vity
in 1
2 se
lect
ed
deve
lopi
ng c
ount
ries
fo
r th
e 19
78-1
998
peri
ods.
var m
odel
.T
he d
irec
t and
indi
rect
eff
ects
of o
il pr
ices
on
gd
p
grow
th d
iffer
acr
oss
deve
lopi
ng c
ount
ries
.
Cha
ng a
nd W
ong
(200
3)O
il pr
ice
fluct
uati
on in
th
e Si
ngap
ore
econ
omy.
Coi
nteg
rate
d an
d va
r
mod
el.
Oil
pric
e sh
ock
only
had
a m
argi
nal e
ffec
t on
Sing
apor
e’s
mac
roec
onom
ic p
erfo
rman
ce,
part
icul
arly
as
oil i
nten
sity
and
exp
endi
ture
on
oil c
onsu
mpt
ion
as a
per
cen
tage
of g
dp h
ave
falle
n ov
er ti
me.
580 S. O. Akinleye and S. Ekpo: Oil Price Shocks and Macroeconomic Performance in Nigeria
Tabl
e 1.
Sum
mar
y of
Oil
pri
ce-m
acro
econ
omy
Rel
atio
nshi
p (C
ont.
)S
tudy
Sub
ject
of i
nves
tiga
tion
App
roac
hM
ajor
find
ings
Cuñ
ado
and
pére
z de
Gra
cia
(200
5)M
acro
econ
omic
eff
ects
of
oil
pric
e flu
ctua
tion
in
six
sm
all a
nd o
pen
Asi
an e
cono
mie
s.
var m
odel
.O
il pr
ices
hav
e a
stat
isti
cally
sig
nific
ant e
ffec
t on
both
eco
nom
ic g
row
th a
nd in
flati
on in
the
shor
t-ru
n.
Ber
umen
t et a
l. (2
010)
Mac
roec
onom
ic e
ffec
ts
of o
il pr
ice
fluct
uati
on
in M
iddl
e E
ast a
nd
Nor
th A
fric
an
coun
trie
s.
var m
odel
.A
sym
met
ric
effe
cts
of w
orld
oil
pric
e sh
ocks
on
gd
p o
f Alg
eria
, Ira
q, J
orda
n, K
uwai
t, O
man
, Q
atar
, Syr
ia, T
unis
ia, a
nd u
ae w
as p
osit
ive
and
stat
isti
cally
sig
nific
ant,
whi
le p
osit
ive
thou
gh
insi
gnifi
cant
res
ults
wer
e re
port
ed fo
r B
ahra
in,
Egy
pt, L
eban
on, M
oroc
co a
nd Y
emen
.R
agui
ndin
and
R
eyes
(200
5)O
il pr
ice-
gd
p
rela
tion
ship
in th
e p
hilip
pine
eco
nom
y.
var m
odel
.O
il pr
ice
shoc
k le
ads
to a
pro
long
ed r
educ
tion
in
real
gd
p w
hile
asy
mm
etri
c va
r s
how
s oi
l pri
ce
decr
ease
s pl
ay a
gre
ater
rol
e in
eac
h va
riab
le’s
fluct
uati
ons
than
oil
pric
e in
crea
ses.
E
lans
hasy
et a
l. (2
005)
Oil
pric
e-g
dp
rela
tion
ship
in
Vene
zuel
a fo
r pe
riod
(1
950
to 2
001)
.
var m
odel
.po
siti
ve a
nd s
tati
stic
ally
sig
nific
ant s
hort
and
lo
ng-r
un r
elat
ions
hips
, eve
n w
ith
fisca
l bal
ance
(g
over
nmen
t rev
enue
s an
d ex
pend
itur
e).
Wak
efor
d (2
006)
Oil
pric
e-g
dp
rela
tion
ship
in S
outh
A
fric
a.
var m
odel
.C
omm
odit
y ex
port
s —
espe
cial
ly g
old—
pro
vide
d an
init
ial b
uffe
r, bu
t the
eco
nom
y w
as n
ot
imm
une
to s
usta
ined
pri
ce s
hock
s an
d se
vera
l sh
ort-
run
supp
ly r
isks
.O
lom
ola
and
Ade
jum
o (2
006)
Oil
pric
e-g
dp
rela
tion
ship
in N
iger
ia
for
the
peri
od 1
970-
2003
.
var m
odel
.C
ontr
ary
to p
revi
ous
empi
rica
l fin
ding
s, o
il pr
ice
shoc
ks d
o no
t sig
nific
antl
y af
fect
out
put a
nd
infla
tion
in N
iger
ia, w
hile
oil
pric
e sh
ocks
si
gnifi
cant
ly in
fluen
ced
the
real
exc
hang
e ra
te.
581economía mexicana nueva época, vol. Cierre de Época (II) 2013
Stu
dyS
ubje
ct o
f inv
esti
gati
onA
ppro
ach
Maj
or fi
ndin
gsA
liyu
(200
9)O
il pr
ice-
gd
p
rela
tion
ship
in N
iger
ia.
var m
odel
Evi
denc
e of
bot
h lin
ear
and
non-
linea
r ef
fect
s of
oi
l pri
ce s
hock
s on
rea
l gd
p; w
ith
asym
met
ric
oil
pric
e in
crea
ses
in th
e no
n-lin
ear
mod
els
havi
ng
larg
er p
osit
ive
impa
cts
on r
eal g
dp g
row
th th
an
in o
ther
spe
cific
atio
ns.
Farz
aneg
an a
nd
Mar
kwar
dt (2
009)
Oil
pric
e sh
ocks
and
th
e Ir
ania
n E
cono
my.
var m
odel
.T
he s
tudy
foun
d a
stro
ng p
osit
ive
rela
tion
ship
be
twee
n oi
l pri
ce c
hang
es a
nd in
dust
rial
out
put
grow
th a
nd r
eal e
ffec
tive
exc
hang
e ra
te fo
r th
e Ir
ania
n ec
onom
y.Jb
ir a
nd Z
ouar
i-G
horb
el (2
009)
Oil
pric
e-g
dp
rela
tion
ship
in
Tun
isia
.
var m
odel
.N
o di
rect
impa
ct o
f oil
pric
e sh
ock
on e
cono
mic
ac
tivi
ty in
bot
h lin
ear
and
non-
linea
r sp
ecifi
cati
ons,
rat
her
oil p
rice
s af
fect
eco
nom
ic
acti
vity
indi
rect
ly.
Lor
de e
t al.
(200
9)O
il pr
ice-
gd
p
rela
tion
ship
in
Tri
nida
d an
d To
bago
.
var m
odel
.U
nant
icip
ated
sho
ck to
oil
pric
e vo
lati
lity
brin
gs
abou
t ran
dom
sw
ings
in th
e m
acro
econ
omy;
w
hile
onl
y go
vern
men
t rev
enue
and
the
pric
e le
vel e
xhib
it s
igni
fican
t res
pons
es, w
ith
mag
nitu
de o
f oil
pric
e vo
lati
lity
resp
onse
s yi
eldi
ng s
mal
ler
mac
roec
onom
ic im
pact
s.B
ekhe
t and
Yus
op
(200
9)O
il pr
ice-
gd
p
rela
tion
ship
in
Mal
aysi
a.
var m
odel
.St
able
long
-run
rel
atio
nshi
p an
d su
bsta
ntia
l sh
ort r
un in
tera
ctio
ns b
etw
een
the
oil p
rice
and
em
ploy
men
t, ec
onom
ic g
row
th a
nd g
row
th r
ate
of
ener
gy c
onsu
mpt
ion.
Akp
an (2
009)
Oil
pric
e-g
dp
rela
tion
ship
in N
iger
ia.
var m
odel
.A
pos
itiv
ely
sign
ifica
nt a
sym
met
ric
effe
ct o
f oil
pric
e sh
ocks
on
real
gov
ernm
ent e
xpen
ditu
re in
N
iger
ia, w
hile
suc
h ef
fect
on
indu
stri
al o
utpu
t gr
owth
was
foun
d to
be
mar
gina
l wit
h ob
serv
ed
sign
ifica
nt a
ppre
ciat
ion
of th
e re
al e
xcha
nge
rate
.
582 S. O. Akinleye and S. Ekpo: Oil Price Shocks and Macroeconomic Performance in Nigeria
Stu
dyS
ubje
ct o
f inv
esti
gati
onA
ppro
ach
Maj
or fi
ndin
gsO
mis
akin
et a
l. (2
009)
Shor
t run
impl
icat
ions
of
oil
pric
e sh
ocks
on
the
Nig
eria
n ec
onom
y fo
r pe
riod
197
0-20
06.
Vect
or E
rror
Cor
rect
ion
(ve
cm
) mod
el.
A 1
0 pe
r ce
nt in
crea
se in
oil
pric
e br
ough
t abo
ut
79 p
er c
ent i
ncre
ase
in o
il re
venu
e, 4
5 pe
r ce
nt
incr
ease
in g
over
nmen
t exp
endi
ture
, 17
per
cent
in
crea
se in
mon
ey s
uppl
y, 11
per
cen
t dec
reas
e in
c
pi a
nd 3
1 pe
r ce
nt in
crea
se in
gd
p in
the
shor
t ru
n, w
hich
thus
impl
ies
that
the
Nig
eria
n ec
onom
y is
vul
nera
ble
to in
tern
atio
nal o
il pr
ice
vola
tilit
y.C
huku
et a
l. (2
011)
Oil
pric
e-g
dp
rela
tion
ship
in N
iger
ia
for
the
peri
od 1
970Q
1-20
08Q
4.
var m
odel
and
Gra
nger
ca
usal
ity
test
.O
il pr
ice
shoc
ks a
re n
ot a
maj
or d
eter
min
ant o
f m
acro
econ
omic
act
ivit
y in
Nig
eria
in th
e lin
ear
mod
el.
Tang
et a
l. (2
010)
Oil
pric
e-g
dp
rela
tion
ship
in C
hina
.St
ruct
ural
va
r m
odel
.O
il-pr
ice
incr
ease
aff
ects
out
put a
nd in
vest
men
t ne
gati
vely
, but
aff
ects
infla
tion
rat
e an
d in
tere
st
rate
pos
itiv
ely.
Du
et a
l. (2
010)
Oil
pric
e-g
dp
rela
tion
ship
in C
hina
fo
r pe
riod
199
5:1
to
2008
:12.
Mul
tiva
riat
e va
rW
orld
oil
pric
e af
fect
s ec
onom
ic g
row
th a
nd
infla
tion
sig
nific
antl
y in
Chi
na.
Sou
rce:
Aut
hor’s
ow
n el
abor
atio
n w
ith
synt
heti
zed
info
rmat
ion
from
the
liter
atur
e re
view
.
Tabl
e 1.
Sum
mar
y of
Oil
pri
ce-m
acro
econ
omy
Rel
atio
nshi
p (C
ont.
)
583economía mexicana nueva época, vol. Cierre de Época (II) 2013
II. Theoretical Framework and Methodology
II.1. Theoretical Overview
There has been extensive theoretical work on the macroeconomic conse-quences of oil price shocks. Most of these studies argued that since the mid-1970s, oil price movements have been a major source of business cy-cle fluctuations, but rather failed to reach consensus on the validity of a peculiar transmission channel that helps to explain the processes by which fluctuations in oil prices influence the macro economy.
According to Hunt et al. (2002), an increase in oil prices can influence the economy through many channels. The first mechanism reflects the transfer of income from oil-importing to oil-exporting countries, which leads to a decrease in global demand in the oil-importing nations. The de-crease in demand in the oil-importing countries outweighs the increase in the oil-exporting countries because of an assumed low propensity to con-sume in the latter. Secondly, given the level of capital stock and assuming that wages are relatively inflexible in the short run, an increase in input costs of production will result in non-oil output being affected. Also, since crude oil is a basic input in production, an increase in oil prices leads to an increase in production costs. The third channel is when workers and pro-ducers resist a decrease in their real wages and profit margins. This re-sults in upward pressure on labour costs and prices. The fourth channel is through the definition of core inflation. An increase in energy prices raises the consumer price index, leading to calls for action from the central bank. A tight monetary policy has dire consequences on economic output. Fi-nally, the extent to which monetary authorities’ reactions are inconsistent with announced policy objectives could erode their credibility.
Tang et al. (2010) in a study of the short and long-term effects of oil shocks on the Chinese economy identified six transmission channels. Namely: Supply-side shock effect, focusing on the direct impact on output due to the change in marginal producing costs caused by oil-price shock; wealth transfer effect, emphasizing on the different marginal consump-tion rate of petrodollar and that of ordinary trade surplus; inflation effect, analyzing the relationship between domestic inflation and oil prices; real balance effect, investigating the change in money demand and monetary policy; sector adjustment effect, estimating the adjustment cost of indus-trial structure, which is mainly used to explain the asymmetry in oil-price shock impact; and unexpected effect, focusing on the uncertainty over oil
584 S. O. Akinleye and S. Ekpo: Oil Price Shocks and Macroeconomic Performance in Nigeria
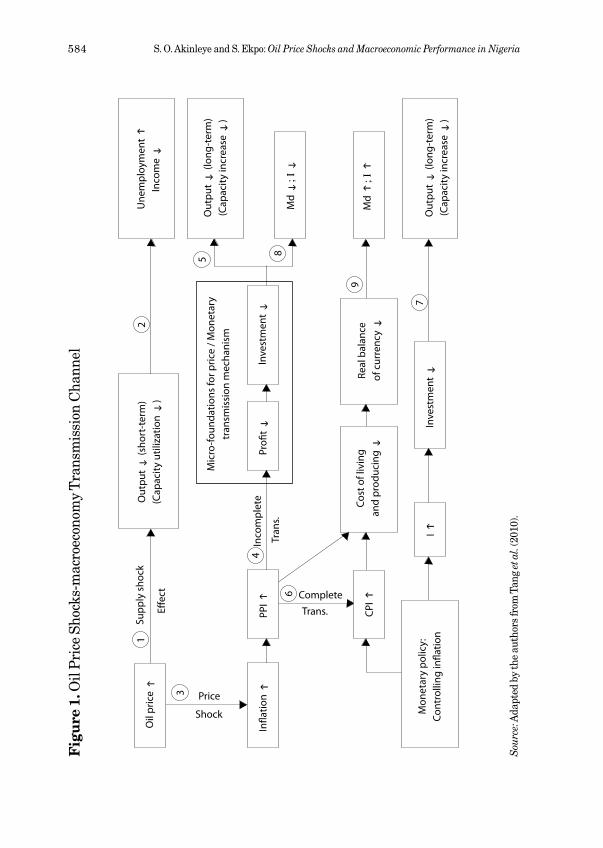
Fig
ure
1. O
il p
rice
Sho
cks-
mac
roec
onom
y T
rans
mis
sion
Cha
nnel
Oil
pric
e ↑
In�a
tion ↑
PPI ↑
CPI ↑
Mon
etar
y po
licy:
Cont
rolli
ng in
�atio
nI ↑
Inve
stm
ent ↓
Out
put ↓
(lon
g-te
rm)
(Cap
acity
incr
ease
↓)
Md ↑
; Ι ↑
Real
bal
ance
of
cur
renc
y ↓
Cost
of l
ivin
g an
d pr
oduc
ing ↓
Pro�
t ↓In
vest
men
t ↓
Mic
ro-fo
unda
tions
for p
rice
/ Mon
etar
ytr
ansm
issi
on m
echa
nism
Out
put ↓
(sho
rt-t
erm
)(C
apac
ity u
tiliz
atio
n ↓
)E�
ect
Price
Shock
Inco
mpl
ete
Supp
ly s
hock
Complete
Tran
s.
Trans.
Une
mpl
oym
ent ↑
Inco
me ↓
Out
put ↓
(lon
g-te
rm)
(Cap
acity
incr
ease
↓)
Md ↓
; Ι ↓
5
6
7
8
9
21
3
4
Sou
rce:
Ada
pted
by
the
auth
ors
from
Tan
g et
al.
(201
0).
585economía mexicana nueva época, vol. Cierre de Época (II) 2013
price and its impact. These channels have been proven to be valid in in-dustrialised countries.
According to the authors, crude oil is one of the most fundamental and crucial raw materials for industrial production and the change in its price can affect the output directly. As Arrow (1) in figure 1 indicates, oil-price shocks can increase the marginal cost of production in many industries, and thus reduce the production. This is referred to as the supply-side shock effect. The reduction of output due to the cut in capacity utilization can recover quickly within the range of capacity. However, oil-price shocks also have long-term effect on output which is carried out through price/monetary transmission mechanism (Arrow (3)).
Cost shocks in the upstream industry can be transmitted from produc-ers and sectors to end-users. A well developed industrial chain can trans-mit inflationary shock from upstream to down-stream, leaving the pro-ducers’ profit rate slightly affected. That can raise the overall cost for consumers and producers, thus reducing the consumers’ real balance. This transmission ends up with the reduction of consumption and the real output as well. This is the story witnessed in most developed countries. But in China, hackneyed price controls, surplus production due to limited domestic demand and tough price competition in exporting sectors make the output prices very sticky (Arrow (3)) (Tang et al., 2010).
Due to limited space for mark-up, down-stream producers could only reduce their profit to assimilate the cost increase, which would doubtless-ly cause the decrease in their investment. Since investment determines the increase of production capacity, i.e. the potential output ability, which cannot recover in a short period of time even when the cost shock disap-pears, a decrease in investment would abate output in the long run. In the authors’ view, this channel is more important and dominant in China. Real balance decrease can enlarge money demand in the market while invest-ment decrease can lessen it, so the net impact of an oil price shock on in-terest rate is unclear and neither the corresponding monetary policy needed (Tang et al., 2010). Similar theoretical analysis was asserted to be valid by Jin (2008), West African Monetary Agency, wama (2008) and Les-caroux and Mignon (2008), who also added that the macroeconomic effects of oil shocks are transmitted via supply and demand side channels and are substantially minimized by economic policy reactions.
Altogether, two major channels (demand and supply) have been put for-ward, in addition to three other recent ones (economic policy reactions, valu-ation and asymmetric response). precisely, the supply side channel focuses
586 S. O. Akinleye and S. Ekpo: Oil Price Shocks and Macroeconomic Performance in Nigeria
on oil as an input in the industrial and production processes, with its atten-dant effects on firm’s productivity and supply, non-oil potential supplies, workers’ and producers’ real wages and profit margins (Jiménez-Rodríguez and Sánchez 2005; Hunt et al., 2002). Other identified manifestations of supply side channel consequences include, the tendency of shrinking cur-rent investment in the oil and gas sector as well as aggravating future po-tentials (Hamilton, 1996), just as possible structural shift occasioned by changes in resource (capital and labour) requirements in both energy-in-tensive and non-energy-intensive industries due to oil price volatility.
The demand side channel consequences of increase in oil prices reflects through lower demands due to high production cost induced higher sell-ing price; transfer of income and resources from oil-importing to oil-ex-porting economies which affects aggregate demand and consumption globally as demand in the former is likely to decline more than it will rise in the latter (Hunt et al., 2002) and heightened economic uncertainty (wama, 2008).
Other identified channels such as economic policy reactions, valuation, and asymmetric response are considered as follows: Economic policy reac-tions occur through monetary authorities’ actions toward curtailing ad-verse effects of increase in oil price such as inflation and lower aggregate demand, through interest rate and money supply. Money supply plays a role in the negative correlation between oil prices and economic activity, as the real money balances channel presupposes that increases in oil pric-es cause inflation which, in turn, reduces the quantity of real balances in the economy (Ferderer, 1996). Besides, counter-inflationary monetary pol-icy responses to oil price shocks are considered responsible for the real output losses associated with these shocks.
Asymmetric response channel relates to identifying the responses be-tween oil prices and macroeconomic variables, such as gdp responses and employment. One of these include sectoral shifts hypothesis, similar in nature to the demand side effects, as oil price shocks lead to many costs in the form of job losses in one sector or region and net changes in aggregate employment. Second is the demand decomposition mechanism which op-erates eventually through employment but begins as a disturbance to sector-specific demand. Last is the investment pause effect in which re-ductions in orders and purchases remain uncertain. To deal with cases where oil price decreases, unlike increases, have positive real income (terms-of-trade) effects that offset identified negative impacts, many time-series modellers include nonlinear, asymmetric oil-price specifications
587economía mexicana nueva época, vol. Cierre de Época (II) 2013
(Mork, 1989). Mork hypothesized that oil price decreases had little effects on economic activity compared to oil price increases. His results confirmed this hypothesis by incorporating both an oil price increase variable and an oil price decrease variable in the model.
The valuation channel of adjustment relies on changes in asset prices in response to oil demand and oil supply shocks. The magnitude and the na-ture of these capital gains and losses depend on the size of the initial gross foreign asset holdings and liabilities of oil importers and exporters, as well as their precise composition by financial instrument and currency. Stan-dard diversification arguments suggest that oil-exporters should hold some of their wealth in the form of assets in oil importing economies (and vice versa). This diversification of asset holdings plays an important role. Under the additional assumption that an increase in the price of oil, ceteris paribus, will cause profits and asset prices to increase in the oil-exporting economy (and to fall in the oil-importing economy), some of the increased wealth associated with higher oil prices will be transferred from oil export-ers to oil importers. Thus, positive oil-specific demand shocks and negative oil supply shocks should be associated with a temporary capital loss in oil exporting countries (and a corresponding capital gain in the rest of the world). In the long-run, asset prices return to their steady state level and the valuation channel vanishes. However, it is suggested that the valuation effect should be larger for oil exporters than for oil importers, ceteris pari-bus. Although this prediction ignores the important role of relative ex-change rate adjustments triggered by oil demand and oil supply shock, in general, one would not expect the stylized bilateral and symmetric model to generate accurate predictions for specific oil-importing economies.
II.2. Methodology
II.2.1 Dataset and DescriptionThis paper employs quarterly data for the period 1970:I-2010:IV to exam-ine the effects of oil price shocks and oil revenue shocks on different sec-tors of the Nigerian economy, i.e.: the supply-side of the economy, real bal-ances, inflation and the sector adjustment effects. However, certain events that shaped the global economy and crude oil price in particular within the period covered were identified and categorized as periods that exerted exogenous shocks to both oil price and the domestic economy and the world at large. In this regard, the Iranian revolution (1979), the Iraq-Iran war (1980-1988), the Iraq-Kuwait war (1990), the financial crisis of South
588 S. O. Akinleye and S. Ekpo: Oil Price Shocks and Macroeconomic Performance in Nigeria
East Asia (1998), the terrorist attacks on the USA (2001) and the Iraq war (2003) as well as the global economic and financial crisis (2007-2010) were considered pertinent, hence we incorporated six dummy variables to cap-ture these shocks. Seasonal dummies are used in all specifications of vars to control for probable seasonalities in selected variables with more em-phasis on capturing the cost of oil price changes and not seasonal patterns mostly in the positive and negative values of oil price and oil revenue. Seven endogenous variables are selected along with the crude oil price which is categorized as an exogenous variable based on the fact that it is largely influenced by external factors. The endogenous variables include: real government expenditure, (Rgovexp), real gross domestic product (rgdp), inflation rate (inf) proxy by the Consumer price Index, interest rate (int), real effective exchange rate (rexr), real volume of import (rimp) and external reserves (Extrevs).
II.2.2. Data SourcesFor real oil price (Roilprice), the Nigerian-Bonny light spot crude oil price was used as it accounts for a larger proportion of the country’s crude oil export over the years, with data obtained from the Central Bank of Nige-ria. The dollar prices were transformed to its equivalent Naira value us-ing the corresponding real effective exchange rate published by the Cen-tral Bank of Nigeria (2011).
Real oil revenue (Roilrev) data was obtained from both the Central Bank of Nigeria (cbn) Statistical Bulletin (2011) and the Nigerian Na-tional petroleum Corporation (nnpc) Annual Statistical Bulletin. Data for real government expenditure (Rgovexp) were obtained from the Central Bank of Nigeria (cbn) Statistical Bulletin in annual forms but transformed to quarterly form using the cubic spline approach, while quarterly data for real gross domestic product (rgdp), inflation rate (inf) proxied by the Con-sumer price Index and interest rate (int) (cbn’s benchmark rate) were sourced from the cbn Statistical Bulletin (2011). Similarly, data for real volume of import (rimp) and external reserves (Extrevs) were obtained from the bulletin in annual form but transformed into quarterly form us-ing the cubic spline approach, while data for real effective exchange rate (rexr) were sourced from the International Financial Statistics, ifs (2011).
II.2.3. Model SpecificationFollowing Sims’ (1980) seminal paper, the vector autoregression (var) model has become one of the leading approaches employed in the analysis
589economía mexicana nueva época, vol. Cierre de Época (II) 2013
of dynamic economic interactions (Adrangi and Allender, 1998, and palm, 1983), especially in investigations of the oil price shocks-macroeconomy relationship. This study follows suit by employing the var model to exam-ine the short and long-run impacts of oil price distortions on leading mac-roeconomic indicators in Nigeria. The var approach is founded on Grang-er’s (1969) specification of causality. Causality in Granger’s sense is inferred when values of a variable, say Xt has explanatory power in a re-gression of Yt on lagged values of Yt and Xt .
Following, we consider a var model of order k, thus:
(1)
Where: Yt = (Roilprice, Rgovexp, rgdp, inf, int, rexr, rimp, Extrevs)is an n x 1 vector of seven endogenous variables, and, Roilprice is real oil price, Rgovexp is real government expenditure, rgdp is Real gdp, inf is infla-tion rate; int is interest rate; rexr is Real Exchange Rate, rimp is real volume of import , while Yt – 1 is the corresponding lag term for order i. Φi , is the n x n matrix of auto regressive coefficient vector Yt – 1, for i = 1, 2, …k. C0 = (C1, C2,…,Cn) is the C intercept vector of the var model. εt = (ε1 t , ε2 t ,…, ε nt) is the n x 1 vector of white noise process. K is the number of lagged terms. var esti-mations are very sensitive to lag structure of variables.
A similar model is built for oil revenue shock and thus specified as equation two as follows:
Yt = (Roilrev, Rgovexp, rgdp, inf, int, rexr, rimp, Extrevs) (2)
With other variables defined as above while Roilrev is real oil revenue.The var system can be transformed into its moving average representa-
tion in order to analyze the system’s response to real oil price shock on one hand and its response to oil revenue shock on the other hand, as follows:
Where γ 0 is the identity matrix, μ is the mean of the process. The ma repre-sentation is used to obtain forecast error variance decomposition and the impulse-response function.
The vector of exogenous variables mentioned above is specified as equation 3 as follows:
k
i = 1Yt = C0 + ∑ Φi Yt – 1 + εt
∞
i = 0Yt = μ + ∑ γiεt – 1

590 S. O. Akinleye and S. Ekpo: Oil Price Shocks and Macroeconomic Performance in Nigeria
X = {Constant, Q1, Q2, Q3, D1, D2, D3, D4, D5, D6} (3)
Where Q1 – Q3 refers to seasonal dummies and D1 – D6 refers to all other important exogenous events mentioned above for the period 1970-2010.
Using a sufficient lag length may help to reflect the long-term impact of variables on others. However, including longer lag lengths will lead to multicollinerarity problems and will increase the degrees of freedom (dof) (Tang et al., 2010). Empirical simulations show that for any K ≥ 11, the model will become divergent with at least one auto regressive root that is greater than one. According to sequential modified Likelihood Ratio test statistic (lr), lag orders between 1 and 3 are recommended for models of this nature (Chuku et al., 2011). Accordingly, to determine the optimal lag length to use for our model, we employ five different lag order selection criteria (lr, fpe, aic, sic, hq) to guide our decision. The essence of the bat-tery of tests is for confirmatory analysis.
II.2.3.1. Asymmetric SpecificationBased on the postulation that the effects of oil price shocks on macroeco-nomic variables are usually asymmetric in nature (see Hamilton, 2009 and Du et al., 2010), the authors examine the asymmetric impacts of oil price and oil revenue shocks by adopting the kind of oil price transforma-tion put forward by Mork (1989) and Hamilton (1996). According to Mork’s definition, oil price change is segmented into increase and decrease, with a specific rate of change in the world oil prices divided into positive and negative version; while the Hamilton specification considers net oil in-crease and decrease as follows:
roilpt+ = max (0,(roilpt − roilpt − 1 )) (1)roilpt− = min (0,(roilpt − roilpt − 1 )) (2)
If the value for the current quarter exceeds the previous year’s maximum, the percentage change over the year’s maximum is calculated. If the price of oil at time t is lower than it had been at some point during the previous four quarters, the series is defined to be zero for date t. Although, the two specifications were taken into cognizance for models developed, we how-ever choose only the Mork’s asymmetric specification for the var analysis in order to report findings based on a specific approach and thus avoid ambiguous findings.
591economía mexicana nueva época, vol. Cierre de Época (II) 2013
II.2.4. Estimation proceduresAugmented Dickey-Fuller (adf) and phillips-perron (pp) techniques are used to test for unit roots in the variables included in the model so as to avoid spurious regression; while Johansen cointegration test is employed to determine the existence of long run relationships in the specified mod-el. Vector Autogressive (var) technique is employed for estimation purpose through the Impulse Response Function and Variance Decomposition analysis.
The var technique was adopted because it captures the effect of varia-tion in one variable on the others. In adopting the var methodology, we ig-nore the argument put forward by Hamilton (1994) which suggests that one could ignore the non-stationarity of included variables altogether and simply estimate the var in levels, relying on standard t- and F- distribu-tion for testing any hypotheses as the true process is a var in differences while preliminary estimation of var in levels rendered the var model in-valid. Besides, we relied on a body of literature which argued that, in the short term, unrestricted var performs better than even a cointegrated var or vecm if var in differences is adopted, particularly as demonstrated by Hoffman and Rasche (1996) and Naka and Tufte (1997). Also, this study follows the example of the citations in the literature reviewed where most adopt the var estimation method. We conduct the var lag length selection test, ar root stability test and residual tests to examine the validity and appropriateness of the specified model. Also, we consider different alter-native orderings for the estimated var models as a robustness check as well as examine the possibility of inconsistency in the results obtained.
Using the var technique, the symmetric and asymmetric effects of oil price and oil revenue shocks on the Nigerian economy were analyzed. In estimating the asymmetric effects of oil price shocks, Mork (1989) and Hamilton (1996) oil price change specifications were adopted while oil rev-enue shocks were analyzed using the oil price change methodology put forward by Mork (1989).
III. Empirical Results
III.1. Unit Root Test Results
The results of the Augmented Dickey-Fuller (adf) and phillips-perron (pp) unit root test conducted to determine the stationarity properties of se-lected variables and the appropriate specification for var estimation are
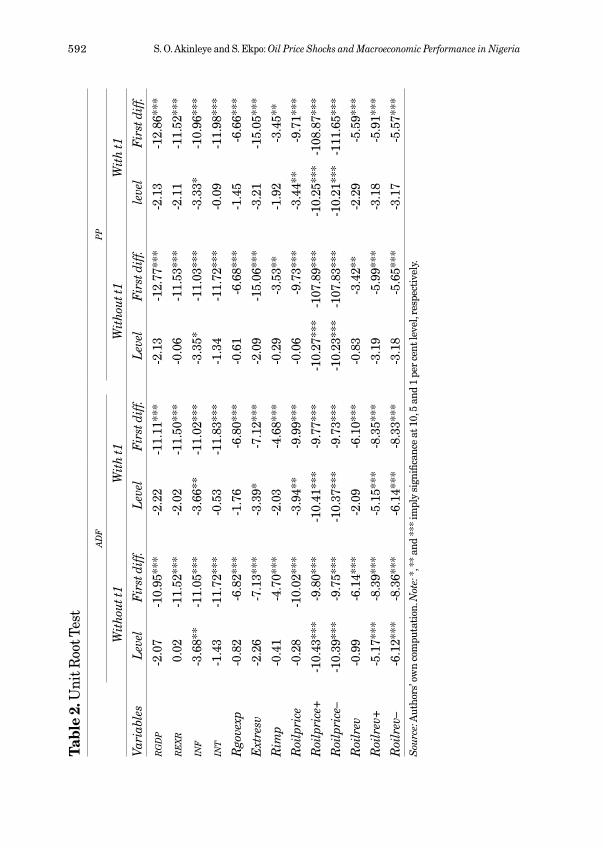
592 S. O. Akinleye and S. Ekpo: Oil Price Shocks and Macroeconomic Performance in Nigeria
ad
fp
p
Wit
hout
t1W
ith
t1W
itho
ut t1
Wit
h t1
Vari
able
sL
evel
Fir
st d
iff.
Lev
elF
irst
dif
f.L
evel
Fir
st d
iff.
leve
lF
irst
dif
f.
rg
dp
-2.0
7-1
0.95
***
-2.2
2-1
1.11
***
-2.1
3-1
2.77
***
-2.1
3-1
2.86
***
re
xr
0.02
-11.
52**
*-2
.02
-11.
50**
*-0
.06
-11.
53**
*-2
.11
-11.
52**
*
inf
-3.6
8**
-11.
05**
*-3
.66*
*-1
1.02
***
-3.3
5*-1
1.03
***
-3.3
3*-1
0.96
***
int
-1.4
3-1
1.72
***
-0.5
3-1
1.83
***
-1.3
4-1
1.72
***
-0.0
9-1
1.98
***
Rgo
vexp
-0.8
2-6
.82*
**-1
.76
-6.8
0***
-0.6
1-6
.68*
**-1
.45
-6.6
6***
Ext
resv
-2.2
6-7
.13*
**-3
.39*
-7.1
2***
-2.0
9-1
5.06
***
-3.2
1-1
5.05
***
Rim
p-0
.41
-4.7
0***
-2.0
3-4
.68*
**-0
.29
-3.5
3**
-1.9
2-3
.45*
*
Roi
lpri
ce-0
.28
-10.
02**
*-3
.94*
*-9
.99*
**-0
.06
-9.7
3***
-3.4
4**
-9.7
1***
Roi
lpri
ce+
-10.
43**
*-9
.80*
**-1
0.41
***
-9.7
7***
-10.
27**
*-1
07.8
9***
-10.
25**
*-1
08.8
7***
Roi
lpri
ce–
-10.
39**
*-9
.75*
**-1
0.37
***
-9.7
3***
-10.
23**
*-1
07.8
3***
-10.
21**
*-1
11.6
5***
Roi
lrev
-0.9
9-6
.14*
**-2
.09
-6.1
0***
-0.8
3-3
.42*
*-2
.29
-5.5
9***
Roi
lrev
+-5
.17*
**-8
.39*
**-5
.15*
**-8
.35*
**-3
.19
-5.9
9***
-3.1
8-5
.91*
**
Roi
lrev
–-6
.12*
**-8
.36*
**-6
.14*
**-8
.33*
**-3
.18
-5.6
5***
-3.1
7-5
.57*
**S
ourc
e: A
utho
rs’ o
wn
com
puta
tion
. Not
e: *
, **
and
***
impl
y si
gnifi
canc
e at
10,
5 a
nd 1
per
cent
leve
l, re
spec
tive
ly.
Tabl
e 2.
Uni
t Roo
t Tes
t
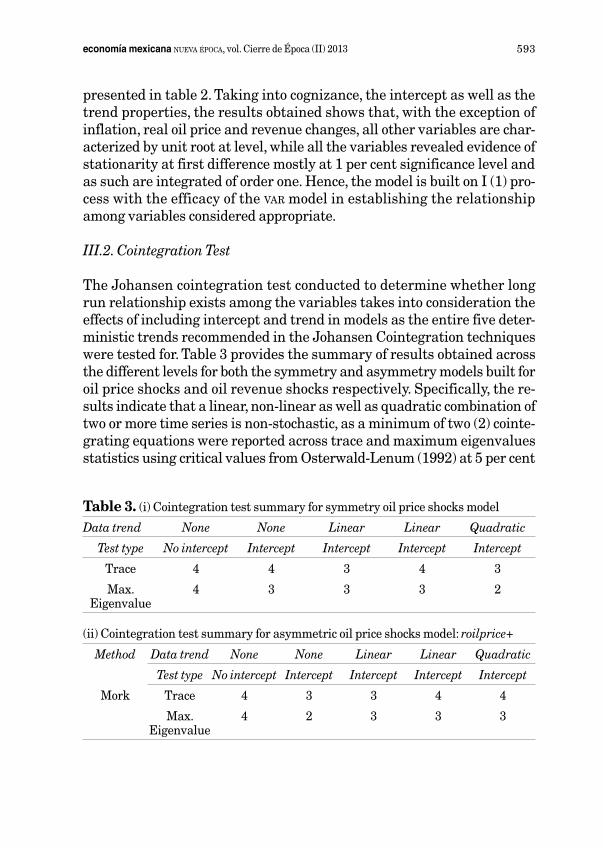
593economía mexicana nueva época, vol. Cierre de Época (II) 2013
presented in table 2. Taking into cognizance, the intercept as well as the trend properties, the results obtained shows that, with the exception of inflation, real oil price and revenue changes, all other variables are char-acterized by unit root at level, while all the variables revealed evidence of stationarity at first difference mostly at 1 per cent significance level and as such are integrated of order one. Hence, the model is built on I (1) pro-cess with the efficacy of the var model in establishing the relationship among variables considered appropriate.
III.2. Cointegration Test
The Johansen cointegration test conducted to determine whether long run relationship exists among the variables takes into consideration the effects of including intercept and trend in models as the entire five deter-ministic trends recommended in the Johansen Cointegration techniques were tested for. Table 3 provides the summary of results obtained across the different levels for both the symmetry and asymmetry models built for oil price shocks and oil revenue shocks respectively. Specifically, the re-sults indicate that a linear, non-linear as well as quadratic combination of two or more time series is non-stochastic, as a minimum of two (2) cointe-grating equations were reported across trace and maximum eigenvalues statistics using critical values from Osterwald-Lenum (1992) at 5 per cent
Table 3. (i) Cointegration test summary for symmetry oil price shocks model
Data trend None None Linear Linear Quadratic
Test type No intercept Intercept Intercept Intercept Intercept
Trace 4 4 3 4 3
Max. Eigenvalue
4 3 3 3 2
(ii) Cointegration test summary for asymmetric oil price shocks model: roilprice+
Method Data trend None None Linear Linear Quadratic
Test type No intercept Intercept Intercept Intercept Intercept
Mork Trace 4 3 3 4 4
Max. Eigenvalue
4 2 3 3 3
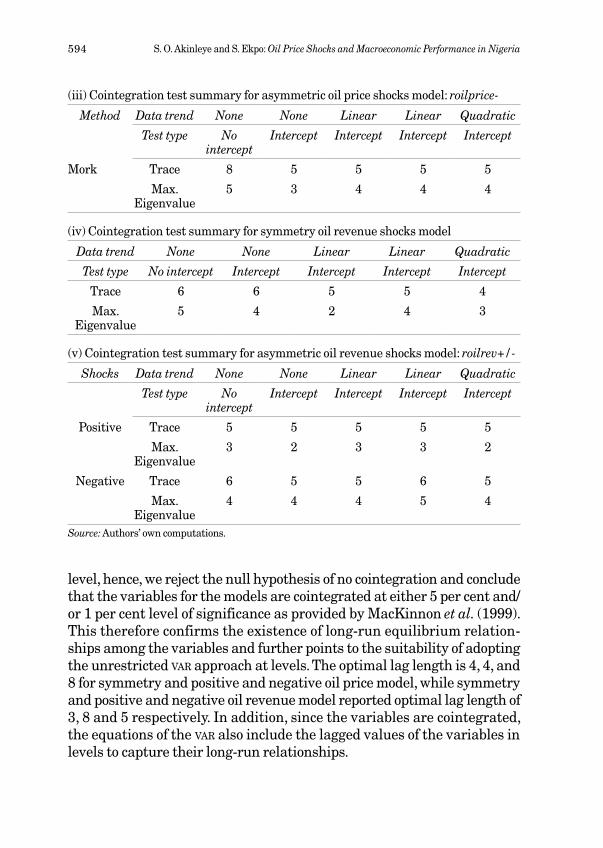
594 S. O. Akinleye and S. Ekpo: Oil Price Shocks and Macroeconomic Performance in Nigeria
(iii) Cointegration test summary for asymmetric oil price shocks model: roilprice-
Method Data trend None None Linear Linear Quadratic
Test type Nointercept
Intercept Intercept Intercept Intercept
Mork Trace 8 5 5 5 5
Max. Eigenvalue
5 3 4 4 4
(iv) Cointegration test summary for symmetry oil revenue shocks model
Data trend None None Linear Linear Quadratic
Test type No intercept Intercept Intercept Intercept Intercept
Trace 6 6 5 5 4
Max. Eigenvalue
5 4 2 4 3
(v) Cointegration test summary for asymmetric oil revenue shocks model: roilrev+/-
Shocks Data trend None None Linear Linear Quadratic
Test type Nointercept
Intercept Intercept Intercept Intercept
positive Trace 5 5 5 5 5
Max. Eigenvalue
3 2 3 3 2
Negative Trace 6 5 5 6 5
Max. Eigenvalue
4 4 4 5 4
Source: Authors’ own computations.
level, hence, we reject the null hypothesis of no cointegration and conclude that the variables for the models are cointegrated at either 5 per cent and/or 1 per cent level of significance as provided by MacKinnon et al. (1999). This therefore confirms the existence of long-run equilibrium relation-ships among the variables and further points to the suitability of adopting the unrestricted var approach at levels. The optimal lag length is 4, 4, and 8 for symmetry and positive and negative oil price model, while symmetry and positive and negative oil revenue model reported optimal lag length of 3, 8 and 5 respectively. In addition, since the variables are cointegrated, the equations of the var also include the lagged values of the variables in levels to capture their long-run relationships.
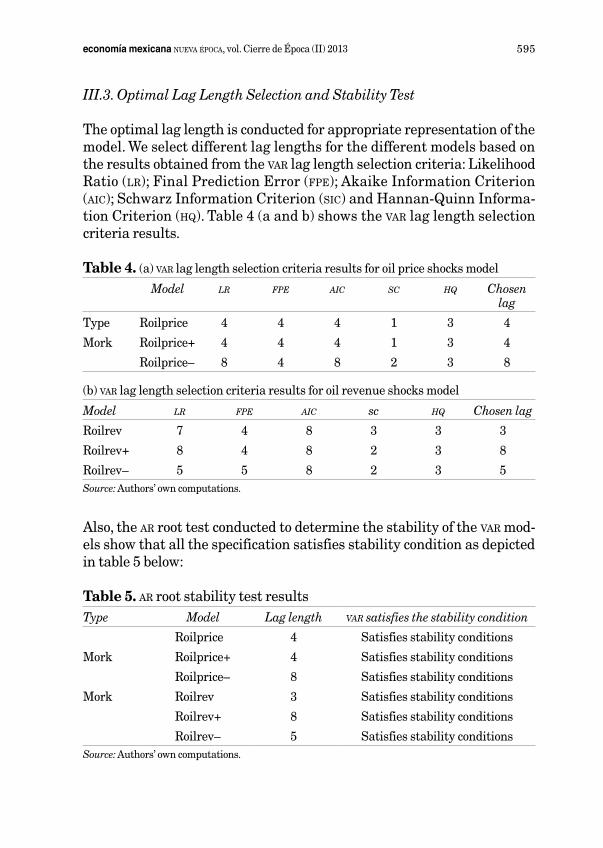
595economía mexicana nueva época, vol. Cierre de Época (II) 2013
III.3. Optimal Lag Length Selection and Stability Test
The optimal lag length is conducted for appropriate representation of the model. We select different lag lengths for the different models based on the results obtained from the var lag length selection criteria: Likelihood Ratio (lr); Final prediction Error (fpe); Akaike Information Criterion (aic); Schwarz Information Criterion (sic) and Hannan-Quinn Informa-tion Criterion (hq). Table 4 (a and b) shows the var lag length selection criteria results.
Table 4. (a) var lag length selection criteria results for oil price shocks model
Model lr fpe aic sc hq Chosen lag
Type Roilprice 4 4 4 1 3 4
Mork Roilprice+ 4 4 4 1 3 4
Roilprice– 8 4 8 2 3 8
(b) var lag length selection criteria results for oil revenue shocks model
Model lr fpe aic sc hq Chosen lag
Roilrev 7 4 8 3 3 3
Roilrev+ 8 4 8 2 3 8
Roilrev– 5 5 8 2 3 5Source: Authors’ own computations.
Also, the ar root test conducted to determine the stability of the var mod-els show that all the specification satisfies stability condition as depicted in table 5 below:
Table 5. ar root stability test resultsType Model Lag length var satisfies the stability condition
Roilprice 4 Satisfies stability conditions
Mork Roilprice+ 4 Satisfies stability conditions
Roilprice– 8 Satisfies stability conditions
Mork Roilrev 3 Satisfies stability conditions
Roilrev+ 8 Satisfies stability conditions
Roilrev– 5 Satisfies stability conditionsSource: Authors’ own computations.
596 S. O. Akinleye and S. Ekpo: Oil Price Shocks and Macroeconomic Performance in Nigeria
III.4. var Analysis for Oil Price Shocks
Based on the Johansen cointegration results and the results from the lag selection criterion, a var Model with cointegrating vector(s) is estimated. Tests conducted to prevent spurious regression indicate that the residuals of the estimated var are appropriately uncorrelated, indicating that the estimated var is correctly specified and the parameter estimates are con-sistent. The coefficients from the estimated var are not of primary interest in this empirical work. Rather, we focus on the impulse response functions (irfs) and variance decomposition (vdc) generated from the var.
III.4.1. Impulse Response FunctionThe variance-covariance matrix of the var was factorized using Cholesky decomposition method suggested by Doan (1992) in order to identify or-thogonalised innovations in each of the variables and the dynamic re-sponses to such innovations. The generalized impulse response functions capture the responsiveness of the dependent variable in the var estimates to shocks to each of the variables. For each equation, a unit shock is ap-plied to the error, and the effects upon the var system over twelve quarters are noted. As the var system contains eight variables, a total of 64 im-pulses are expected to be generated. The impulse response functions are estimated at 68 per cent confidence interval, obtained from 1 000 Monte Carlo simulations to reflect the level of significance. Furthermore, we in-clude dummy variables to capture series of exogenous shocks that ema-nated in the period covered by the study.
However, since our main objective is to examine the effect of oil price shocks on the seven macroeconomic variables, the response of the dependent macroeconomic variables are solely identified. Also, since it has been ob-served that irfs are sometimes subject to the ordering of the variables in the system, we try 56 different permutations of the variables. We observe no sig-nificant differences in the shapes of the irfs for the different permutations and altering orderings conducted. Since it is known in the literature that oil price shocks usually have an immediate and direct impact on government expenditure, gdp, inflation, exchange rate, volume of import and external re-serves, we choose the ordering Rgovexp, rgdp, inf, int, rexr, rimp, and Extrevs.
(a) Symmetric EffectsFigure 2 shows the irfs for generalized one standard innovation for the pe-riod of 1974:I-2010:IV. The shocks in real oil price slightly reduced real gov-
597economía mexicana nueva época, vol. Cierre de Época (II) 2013
ernment expenditure for the first eight quarters but became marginally positive in the last three quarters. The slight but steady falls in real govern-ment expenditure therefore reduced the general price level significantly for the first four quarters. However, shocks in real oil price significantly in-creased real gdp, interest rate and real effective exchange rate for the first three quarters after initial shock; although these variables fell slightly be-fore rising mildly for real gdp from the fifth to the twelfth quarter, positive but insignificant for interest rate from sixth to twelfth quarter, and posi-tively insignificant for real effective exchange rate from fourth to twelfth quarter. Real import responds in positively insignificant manner after ini-tial shocks in oil price, thereafter volume of import rises moderately in the medium and long term. External reserves responded in a positively insig-nificant fashion to shocks in oil price in the first four quarters but became flat in same insignificant manner from the fifth to twelfth quarter. The re-verse reaction to shocks in oil price by real government expenditure and real gdp suggests that growth motivating forces lies outside government expen-diture, such forces seems likely to have neutral effect on general price levels.
Taking into cognizance the frequent adjustments in Nigerian fiscal framework in response to prevailing economic situation in the period cov-ered, budgetary operations thus, became a function of different factors, and are designed to achieve specific objectives across different political regimes. Reduction in real government expenditures and the corresponding ease in inflation, therefore reflect the effect of reflationary budget usually imple-mented by the Executive arm of government through the Federal Ministry of Finance and the Budget Office, in periods of oil price growth as witnessed during the Gulf war. Conversely, short run rise in real gdp, interest rate and real effective exchange rate, would be traced to the corresponding effects of contractionary monetary policy designed by the Central Bank of Nigeria (cbn) to achieve macroeconomic stabilization objectives, through upward re-view of benchmark interest rate, liquidity ratio and devaluation of local cur-rency, so as to reduce the adverse effect of oil price growth. Medium-and long-run reactions also reflect appropriate adjustments in policy mix (fiscal and monetary) in accordance to prevailing political and economic conditions. This became more apparent during and after the introduction of the Struc-tural Adjustment programme (sap). The insignificant rise in the volume of imports is due to fall in demand for capital goods as a result of reduction in government expenditure. Results for external reserves would naturally be traced to the debilitating effects of external debt servicing on huge external debt profile prior to the debt relief and restructuring exercise of 2005.
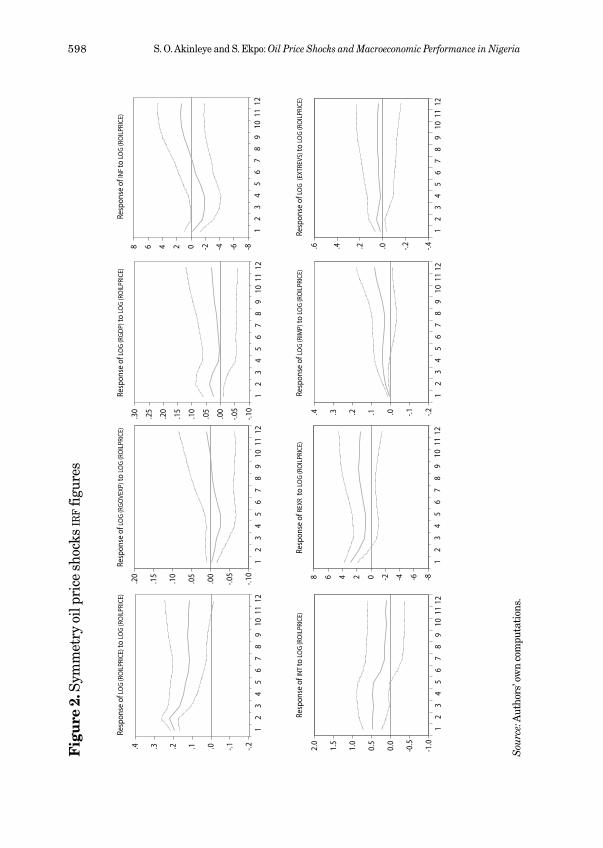
598 S. O. Akinleye and S. Ekpo: Oil Price Shocks and Macroeconomic Performance in Nigeria
Fig
ure
2. S
ymm
etry
oil
pric
e sh
ocks
irf fi
gure
s
-.2-.1.0.1.2.3.4 -1.0
-0.50.0
0.5
1.0
1.5
2.0
12
34
56
78
910
1112
12
34
56
78
910
1112
-8-6-4-202468 -.4-.2.0.2.4.6
-.10
-.05
.00
.05
.10
.15
.20
.25
.30 -.2-.1.0.1.2.3.4
12
34
56
78
910
1112
12
34
56
78
910
1112
12
34
56
78
910
1112
12
34
56
78
910
1112
12
34
56
78
910
1112
12
34
56
78
910
1112
-.10
-.05
.00
.05
.10
.15
.20 -8-6-4-202468
Resp
onse
of L
OG
(RO
ILPR
ICE)
to LO
G (R
OIL
PRIC
E)Re
spon
se o
f LO
G (R
GOVE
XP) t
o LO
G (R
OIL
PRIC
E)Re
spon
se o
f LO
G (R
GDP)
to LO
G (R
OIL
PRIC
E)Re
spon
se o
f INF
to LO
G (R
OIL
PRIC
E)
Resp
onse
of I
NT to
LOG
(RO
ILPR
ICE)
Resp
onse
of R
EXR
to LO
G (R
OIL
PRIC
E)Re
spon
se o
f LO
G (R
IMP)
to LO
G (R
OIL
PRIC
E)Re
spon
se o
f LO
G (E
XTRE
VS) t
o LO
G (R
OIL
PRIC
E)
Sou
rce:
Aut
hors
’ ow
n co
mpu
tati
ons.
599economía mexicana nueva época, vol. Cierre de Época (II) 2013
(b) Asymmetric EffectsFigure 3 displays the irfs for generalized one standard deviation shock to positive changes in oil price for the period of 1974:I-2010:IV. Real gov-ernment expenditure responded negatively but insignificantly to posi-tive changes in oil price more in the first four quarters than in the medi-um and long term. Real gdp responds to such positive changes in a statistically insignificant way especially in the last six quarters. The re-sults obtained with respect to real government expenditure and gdp thus reflect the dominant influence of public sector spending in overall eco-nomic activities, as efforts to ensure macroeconomic stability through effective coordination of fiscal and monetary policy prevent immediate monetization of oil proceeds through increase public spending, which therefore kept growth at modest levels. The general price level falls sig-nificantly from the third to seventh quarters to show that the Nigerian economy does not suffer from the usual inflationary pressures associated with positive changes in oil prices in the short run. This was made pos-sible by policy response in the form of monetary tightening stance which effectively tamed growth in broad money supply in the medium-and long-run.
Interest rate grows steadily for the first six quarters to peak in the fifth quarter after initial positive changes in oil price but slows down gradually in the medium to long term all in a less significant manner. This conveys the reaction of interest rate to effective liquidity tightening measures by the monetary authority mostly through increase in bench-mark interest rate. Real effective exchange rate jumped sharply in the first three quarters in response to positive changes in oil price, slows down in the medium to long term but was consistently significant throughout the periods to suggest the downside risk to the country’s cur-rency on increase oil price, particularly following the liberalization of the Nigerian foreign exchange market as part of the broad financial sector reforms programme of sap. However, volume of real import rose slightly from the second to the seventh quarters from such changes shocks and act as a built-in stabilizer, which helped to mitigate the downside risk of possible inflationary pressures from increased money supply after posi-tive oil price shocks. The statistically significant drop in long-run trend of cpi, could further be attributed to slight increase in import volumes cou-pled with the monetary tightening policy effects. External reserves fell slightly and consistently for the first nine quarters in response to positive oil price changes possibly due to modest monetization of oil proceeds.
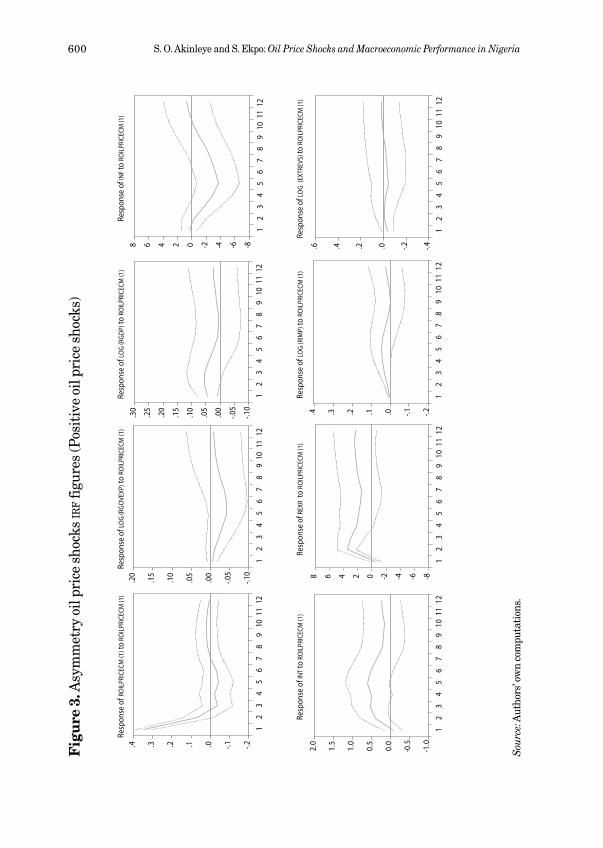
600 S. O. Akinleye and S. Ekpo: Oil Price Shocks and Macroeconomic Performance in Nigeria
Fig
ure
3. A
sym
met
ry o
il pr
ice
shoc
ks ir
f fi
gure
s (p
osit
ive
oil p
rice
sho
cks)
Sou
rce:
Aut
hors
’ ow
n co
mpu
tati
ons.
-.2-.1.0.1.2.3.4
12
34
56
78
910
1112
-.10
-.05
.00
.05
.10
.15
.20
12
34
56
78
910
1112
-.10
-.05
.00
.05
.10
.15
.20
.25
.30
12
34
56
78
910
1112
-8-6-4-202468
12
34
56
78
910
1112
-1.0
-0.50.0
0.5
1.0
1.5
2.0
12
34
56
78
910
1112
-8-6-4-202468
12
34
56
78
910
1112
-.2-.1.0.1.2.3.4
12
34
56
78
910
1112
-.4-.2.0.2.4.6
12
34
56
78
910
1112
Resp
onse
of R
OIL
PRIC
ECM
(1) t
o RO
ILPR
ICEC
M (1
)Re
spon
se o
f LO
G (R
GOVE
XP) t
o RO
ILPR
ICEC
M (1
)Re
spon
se o
f LO
G (R
GDP)
to R
OIL
PRIC
ECM
(1)
Resp
onse
of I
NF to
RO
ILPR
ICEC
M (1
)
Resp
onse
of I
NT to
RO
ILPR
ICEC
M (1
)Re
spon
se o
f REX
R to
RO
ILPR
ICEC
M (1
)Re
spon
se o
f LO
G (R
IMP)
to R
OIL
PRIC
ECM
(1)
Resp
onse
of L
OG
(EXT
REVS
) to
ROIL
PRIC
ECM
(1)
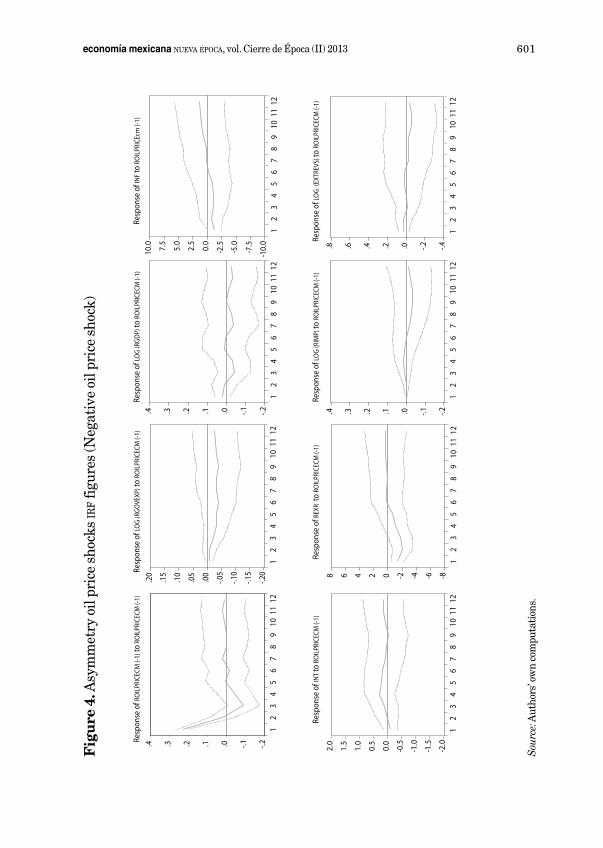
601economía mexicana nueva época, vol. Cierre de Época (II) 2013
Fig
ure
4. A
sym
met
ry o
il pr
ice
shoc
ks ir
f fi
gure
s (N
egat
ive
oil p
rice
sho
ck)
Resp
onse
of R
OIL
PRIC
ECM
(-1)
to R
OIL
PRIC
ECM
(-1)
Resp
onse
of L
OG
(RGO
VEXP
) to
ROIL
PRIC
ECM
(-1)
Resp
onse
of L
OG
(RGD
P) to
RO
ILPR
ICEC
M (-
1)Re
spon
se o
f INF
to R
OIL
PRIC
Ecm
(-1)
Resp
onse
of I
NT to
RO
ILPR
ICEC
M (-
1)Re
spon
se o
f REX
R to
RO
ILPR
ICEC
M (-
1)Re
spon
se o
f LO
G (R
IMP)
to R
OIL
PRIC
ECM
(-1)
Resp
onse
of L
OG
(EXT
REVS
) to
ROIL
PRIC
ECM
(-1)
12
34
56
78
910
1112
12
34
56
78
910
1112
12
34
56
78
910
1112
12
34
56
78
910
1112
12
34
56
78
910
1112
12
34
56
78
910
1112
12
34
56
78
910
1112
12
34
56
78
910
1112
-10.
0
-7.5
-5.0
-2.50.0
2.5
5.0
7.5
10.0 -.4-.2.0.2.4.6.8
-.2-.1.0.1.2.3.4 -.2-.1.0.1.2.3.4
-.20
-.15
-.10
-.05
.00
.05
.10
.15
.20 -8-6-4-202468
-.2-.1.0.1.2.3.4
-2.0
-1.5
-1.0
-0.50.0
0.5
1.0
1.5
2.0
Sou
rce:
Aut
hors
’ ow
n co
mpu
tati
ons.
602 S. O. Akinleye and S. Ekpo: Oil Price Shocks and Macroeconomic Performance in Nigeria
Figure 4 demonstrates the responses of variables to generalized one stan-dard deviation shock to negative changes in oil price for the period of 1979:I-2010:IV. The response of real government expenditure to decreas-ing real oil price is slightly but consistently negative throughout the peri-ods though in a less significant manner. The slight but steady decrease in government expenditure slowed down aggregate demand and thus reduced real gdp in same manner from the third to twelfth quarters. Inflation fell marginally in the short to medium term and rose mildly in the long term as captured by the last four quarters. However, interest rate rises gradually but insignificantly in the short to medium term but slowed in the long run in response to decreasing oil price, which apparently reflects the expansion-ary monetary policy stance of the Central bank, which prevailed in such period in order to achieve moderate gdp growth in a less inflationary envi-ronment. Significant depreciation in the real effective exchange rate was short-lived in the short term, specifically in the first two quarters and moved out of the region in the medium to flatten out in a positively insig-nificantly manner in the last six quarters in its response to decrease in oil price. Volume of real import responded gradually to negative shocks in oil price, reducing slightly but steadily toward the medium to long term, which possibly captured the reaction to shortfall in liquidity and financing sources for import and reduced demand for both capital and consumer goods. Simi-larly, external reserves seems relatively resilient to decreasing oil price in the short to long term as it gradually declined insignificantly from the me-dium to long term as reflected in the last six quarters. This could be attrib-uted to the effect of deficit financing with much reliance on foreign creditors in conjunction with domestic sources. periodic foreign currency denominat-ed debt interest payment therefore accounted for the slight but consistent reduction in short-medium-and long term external reserves level.
III.4.2. Variance Decomposition AnalysisWe further examine the forecasting error variance decomposition to deter-mine the proportion of the movements in the time series that are due to shocks in their own series as opposed to shocks in other variables, including oil prices, as the impulse response functions basically analyze the qualita-tive response of the variables in the system to shocks in real oil prices.
(a) Symmetric EffectsTable 6 demonstrates the variance decompositions of the var model in symmetry definition of oil price shock. Oil price growth stimulates the
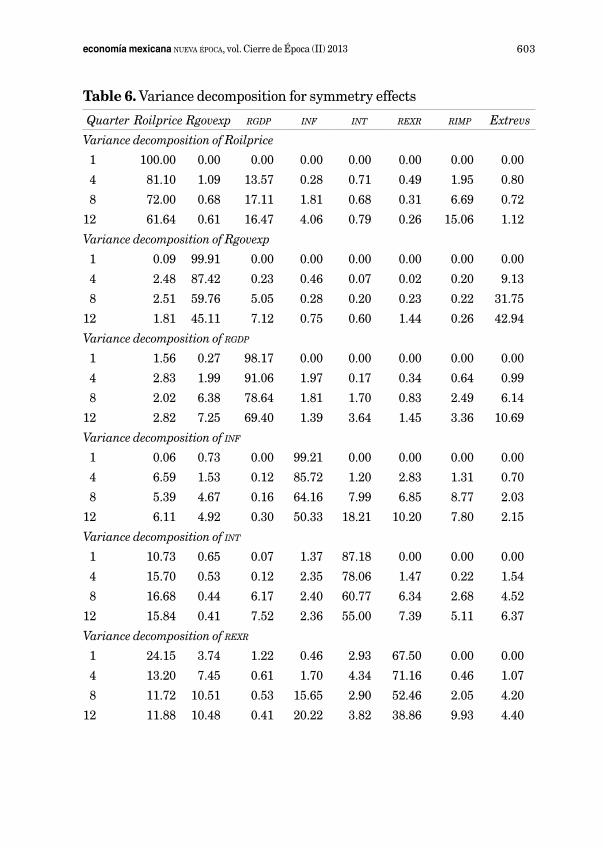
603economía mexicana nueva época, vol. Cierre de Época (II) 2013
Table 6. Variance decomposition for symmetry effects
Quarter Roilprice Rgovexp rgdp inf int rexr rimp Extrevs
Variance decomposition of Roilprice
1 100.00 0.00 0.00 0.00 0.00 0.00 0.00 0.00
4 81.10 1.09 13.57 0.28 0.71 0.49 1.95 0.80
8 72.00 0.68 17.11 1.81 0.68 0.31 6.69 0.72
12 61.64 0.61 16.47 4.06 0.79 0.26 15.06 1.12
Variance decomposition of Rgovexp
1 0.09 99.91 0.00 0.00 0.00 0.00 0.00 0.00
4 2.48 87.42 0.23 0.46 0.07 0.02 0.20 9.13
8 2.51 59.76 5.05 0.28 0.20 0.23 0.22 31.75
12 1.81 45.11 7.12 0.75 0.60 1.44 0.26 42.94
Variance decomposition of rgdp
1 1.56 0.27 98.17 0.00 0.00 0.00 0.00 0.00
4 2.83 1.99 91.06 1.97 0.17 0.34 0.64 0.99
8 2.02 6.38 78.64 1.81 1.70 0.83 2.49 6.14
12 2.82 7.25 69.40 1.39 3.64 1.45 3.36 10.69
Variance decomposition of inf
1 0.06 0.73 0.00 99.21 0.00 0.00 0.00 0.00
4 6.59 1.53 0.12 85.72 1.20 2.83 1.31 0.70
8 5.39 4.67 0.16 64.16 7.99 6.85 8.77 2.03
12 6.11 4.92 0.30 50.33 18.21 10.20 7.80 2.15
Variance decomposition of int
1 10.73 0.65 0.07 1.37 87.18 0.00 0.00 0.00
4 15.70 0.53 0.12 2.35 78.06 1.47 0.22 1.54
8 16.68 0.44 6.17 2.40 60.77 6.34 2.68 4.52
12 15.84 0.41 7.52 2.36 55.00 7.39 5.11 6.37
Variance decomposition of rexr
1 24.15 3.74 1.22 0.46 2.93 67.50 0.00 0.00
4 13.20 7.45 0.61 1.70 4.34 71.16 0.46 1.07
8 11.72 10.51 0.53 15.65 2.90 52.46 2.05 4.20
12 11.88 10.48 0.41 20.22 3.82 38.86 9.93 4.40
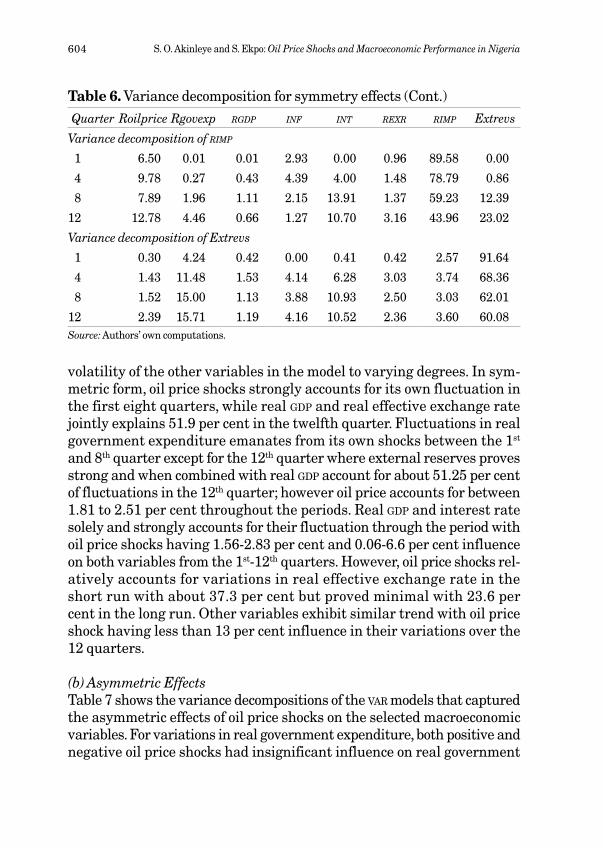
604 S. O. Akinleye and S. Ekpo: Oil Price Shocks and Macroeconomic Performance in Nigeria
Quarter Roilprice Rgovexp rgdp inf int rexr rimp Extrevs
Variance decomposition of rimp
1 6.50 0.01 0.01 2.93 0.00 0.96 89.58 0.00
4 9.78 0.27 0.43 4.39 4.00 1.48 78.79 0.86
8 7.89 1.96 1.11 2.15 13.91 1.37 59.23 12.39
12 12.78 4.46 0.66 1.27 10.70 3.16 43.96 23.02
Variance decomposition of Extrevs
1 0.30 4.24 0.42 0.00 0.41 0.42 2.57 91.64
4 1.43 11.48 1.53 4.14 6.28 3.03 3.74 68.36
8 1.52 15.00 1.13 3.88 10.93 2.50 3.03 62.01
12 2.39 15.71 1.19 4.16 10.52 2.36 3.60 60.08Source: Authors’ own computations.
volatility of the other variables in the model to varying degrees. In sym-metric form, oil price shocks strongly accounts for its own fluctuation in the first eight quarters, while real gdp and real effective exchange rate jointly explains 51.9 per cent in the twelfth quarter. Fluctuations in real government expenditure emanates from its own shocks between the 1st
and 8th quarter except for the 12th quarter where external reserves proves strong and when combined with real gdp account for about 51.25 per cent of fluctuations in the 12th quarter; however oil price accounts for between 1.81 to 2.51 per cent throughout the periods. Real gdp and interest rate solely and strongly accounts for their fluctuation through the period with oil price shocks having 1.56-2.83 per cent and 0.06-6.6 per cent influence on both variables from the 1st-12th quarters. However, oil price shocks rel-atively accounts for variations in real effective exchange rate in the short run with about 37.3 per cent but proved minimal with 23.6 per cent in the long run. Other variables exhibit similar trend with oil price shock having less than 13 per cent influence in their variations over the 12 quarters.
(b) Asymmetric EffectsTable 7 shows the variance decompositions of the var models that captured the asymmetric effects of oil price shocks on the selected macroeconomic variables. For variations in real government expenditure, both positive and negative oil price shocks had insignificant influence on real government
Table 6. Variance decomposition for symmetry effects (Cont.)

605economía mexicana nueva época, vol. Cierre de Época (II) 2013
Quarter
Roilprice+
Roilpric–
Rgovexp+
Rgovexp–
rgdp+
rgdp–
inf+
inf–
int+
int–
rexr+
rexr–
rimp+
rimp–
Extrevs+
Extrevs–
Vari
ance
dec
ompo
sitio
n of
Rgo
vexp
10.
421.
8299
.58
98.1
80.
000.
000.
000.
000.
000.
000.
000.
000.
000.
000.
000.
00
44.
434.
0685
.48
76.5
30.
630.
010.
464.
980.
020.
200.
030.
170.
150.
488.
8011
.97
88.
274.
6752
.39
45.0
57.
982.
000.
312.
960.
071.
330.
095.
631.
031.
8029
.85
36.5
6
126.
264.
1539
.60
28.3
210
.19
2.36
0.74
1.97
0.25
4.70
1.92
9.56
1.74
4.57
39.2
844
.38
Vari
ance
dec
ompo
sitio
n of
rg
dp
14.
940.
640.
080.
5294
.98
98.8
40.
000.
000.
000.
000.
000.
000.
000.
000.
000.
00
49.
842.
242.
391.
3083
.90
90.4
11.
654.
240.
320.
200.
460.
220.
310.
951.
110.
44
86.
641.
506.
752.
8372
.27
80.5
51.
714.
122.
901.
580.
540.
542.
355.
066.
843.
81
125.
711.
347.
632.
6963
.73
76.4
01.
293.
756.
062.
580.
710.
623.
646.
8311
.23
5.79
Vari
ance
dec
ompo
sitio
n of
inf
10.
355.
380.
680.
180.
030.
0998
.94
94.3
50.
000.
000.
000.
000.
000.
000.
000.
00
47.
714.
210.
790.
880.
770.
2285
.29
85.7
01.
242.
512.
512.
380.
632.
421.
051.
28
819
.44
3.10
2.34
6.15
1.31
1.70
57.4
368
.45
5.86
6.02
8.21
1.71
3.35
9.78
2.07
3.09
1216
.25
3.00
2.62
5.51
1.50
1.51
47.6
553
.79
14.4
620
.21
11.9
61.
983.
2610
.99
2.31
3.00
Vari
ance
dec
ompo
sitio
n of
int
10.
370.
040.
560.
510.
000.
262.
391.
7996
.67
97.4
00.
000.
001.
980.
000.
000.
00
411
.37
1.93
1.01
1.05
0.67
0.54
2.49
0.97
82.6
383
.09
0.43
5.66
0.16
4.92
1.23
1.85
819
.30
2.07
0.91
1.85
2.84
4.59
3.01
1.48
66.6
159
.60
1.71
6.66
0.59
11.6
05.
0310
.99
Tabl
e 7.
Var
ianc
e de
com
posi
tion
for
asym
met
ry e
ffec
ts u
sing
mor
k sp
ecifi
cati
on
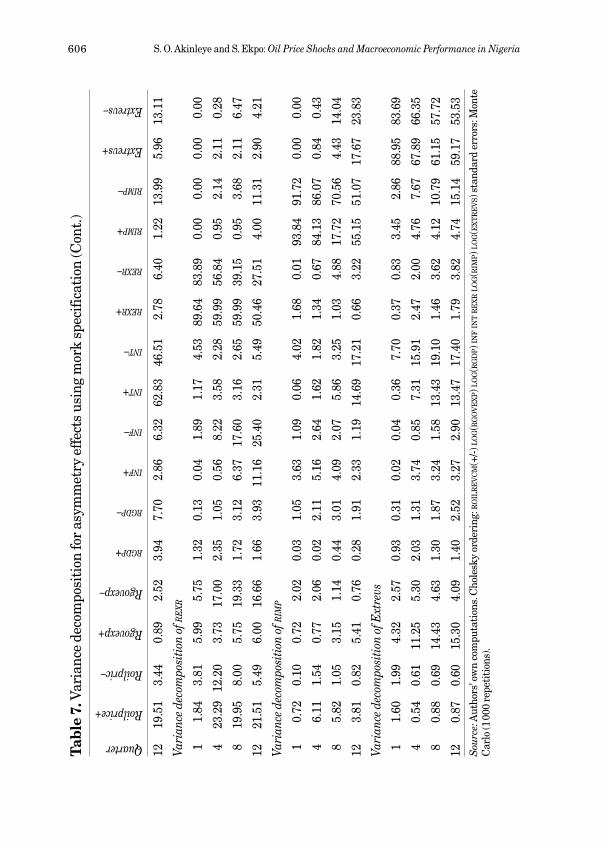
606 S. O. Akinleye and S. Ekpo: Oil Price Shocks and Macroeconomic Performance in Nigeria
Quarter
Roilprice+
Roilpric–
Rgovexp+
Rgovexp–
rgdp+
rgdp–
inf+
inf–
int+
int–
rexr+
rexr–
rimp+
rimp–
Extrevs+
Extrevs–
1219
.51
3.44
0.89
2.52
3.94
7.70
2.86
6.32
62.8
346
.51
2.78
6.40
1.22
13.9
95.
9613
.11
Vari
ance
dec
ompo
sitio
n of
re
xr
11.
843.
815.
995.
751.
320.
130.
041.
891.
174.
5389
.64
83.8
90.
000.
000.
000.
00
423
.29
12.2
03.
7317
.00
2.35
1.05
0.56
8.22
3.58
2.28
59.9
956
.84
0.95
2.14
2.11
0.28
819
.95
8.00
5.75
19.3
31.
723.
126.
3717
.60
3.16
2.65
59.9
939
.15
0.95
3.68
2.11
6.47
1221
.51
5.49
6.00
16.6
61.
663.
9311
.16
25.4
02.
315.
4950
.46
27.5
14.
0011
.31
2.90
4.21
Vari
ance
dec
ompo
sitio
n of
rim
p
10.
720.
100.
722.
020.
031.
053.
631.
090.
064.
021.
680.
0193
.84
91.7
20.
000.
00
46.
111.
540.
772.
060.
022.
115.
162.
641.
621.
821.
340.
6784
.13
86.0
70.
840.
43
85.
821.
053.
151.
140.
443.
014.
092.
075.
863.
251.
034.
8817
.72
70.5
64.
4314
.04
123.
810.
825.
410.
760.
281.
912.
331.
1914
.69
17.2
10.
663.
2255
.15
51.0
717
.67
23.8
3
Vari
ance
dec
ompo
sitio
n of
Ext
revs
11.
601.
994.
322.
570.
930.
310.
020.
040.
367.
700.
370.
833.
452.
8688
.95
83.6
9
40.
540.
6111
.25
5.30
2.03
1.31
3.74
0.85
7.31
15.9
12.
472.
004.
767.
6767
.89
66.3
5
80.
880.
6914
.43
4.63
1.30
1.87
3.24
1.58
13.4
319
.10
1.46
3.62
4.12
10.7
961
.15
57.7
2
120.
870.
6015
.30
4.09
1.40
2.52
3.27
2.90
13.4
717
.40
1.79
3.82
4.74
15.1
459
.17
53.5
3S
ourc
e: A
utho
rs’ o
wn
com
puta
tion
s. C
hole
sky
orde
ring
: ro
ilr
ev
cm
(+/-)
lo
g(r
go
ve
xp) l
og(r
gd
p) i
nf in
t r
ex
r l
og(r
imp) l
og(e
xt
re
vs)
sta
ndar
d er
rors
: Mon
te
Car
lo (1
000
repe
titi
ons)
.
Tabl
e 7.
Var
ianc
e de
com
posi
tion
for
asym
met
ry e
ffec
ts u
sing
mor
k sp
ecifi
cati
on (C
ont.
)
607economía mexicana nueva época, vol. Cierre de Época (II) 2013
expenditure in the short and long run; however, both positive and negative shocks to external reserves had stronger implications for expenditure in the long run among other variables (excluding real government expendi-ture itself). For fluctuations in real gdp, positive oil price shocks had a com-paratively moderate short and long run role compared to negative oil price shocks. While positive oil price shocks account for 15.5 per cent and 13.3 per cent of variances in real gdp in the short and long run respectively, negative oil price shocks explain just 2.8 and 24.4 per cent of fluctuations for the same period. However, the past innovations in real gdp explain more than 80 per cent of the variance in real gdp in the short-run (one to four quarters after shock) and more than 60 per cent in the long run (eight to twelve quarters after shock) in both positive and negative oil price shocks while only real government expenditure and external reserves seems rela-tively influential on real gdp in the long run (twelfth quarter after shock) in both positive and negative oil price shocks. For variations in inflation, both positive and negative oil price shocks had inconsequential effect on infla-tion one quarter after shock; however only positive oil price shock accounts for more than 16 per cent of variances in inflation in the long run (eighth to twelfth quarter after shock). positive rather than negative shocks to oil price explain more about variations in interest rate in the long run.
For variations in real effective exchange rate, both positive and nega-tive oil price shocks explain more about changes in real effective exchange rate four quarters after shock, while the influence of positive shocks proves stronger than that of negative oil price shock in the long run (eighth to twelfth quarter after shock); in the same vein, inflation also accounts for more than 17 per cent of variations in real effective exchange rate in the long run (eighth to twelfth quarter after shock). Both positive and nega-tive shocks to oil price do not stimulate fluctuation in the volume of im-ports immediately after initial shock; however, positive oil price shock ex-plains little in the fourth to eighth quarter after shock in this regard. In addition, negative shock to inflation stimulates inflation throughout the period after shock, while both positive and negative shocks to external reserves accounted more for variations in the volume of imports in the long run (more than 14% in the twelfth quarter after shock). For fluctua-tions in external reserves, neither positive nor negative oil price shocks changed external reserves, rather both positive and negative shocks to real government expenditure proved influential in this regard throughout the period (after its own innovations) while both positive and negative shocks to interest rate and volume of imports also account for more of the
608 S. O. Akinleye and S. Ekpo: Oil Price Shocks and Macroeconomic Performance in Nigeria
variations in external reserves (after the fourth to twelfth quarter from initial shocks). This demonstrates the close connection between govern-ment expenditure, volume of imports and foreign exchange.
III.5. var Analysis on Oil Revenue Shocks
III.5.1. Impulse Response Function(a) Symmetric EffectsFigure 5 shows the irfs for generalized one standard innovation for the period of 1973:I-2010:IV. The shocks in real oil revenue reduced real gov-ernment expenditure marginally for the first four quarters but increased slightly and consistently in the medium term (fifth to seventh quarter) to long term (the last three quarters) as it reached its peak at the eighth quarter. However, real gdp rose steadily but insignificantly consequent upon oil real revenue shock from the third quarter to the last quarter to show the salutary but weak growth-inducing effect of shocks in real oil revenue to economic growth in line with similar reaction by real govern-ment expenditure which thus reflects the widely held empirical view of the positive association between government expenditure and economic growth, prominent in less developed countries such as Nigeria. Inflation response to oil revenue shock was weak throughout the period, as it oscil-lated slightly within the short and medium only to stabilize following gradual up-tick in the last five quarters. In contrast, interest rate increase significantly in response to oil revenue shock only in the third to fifth quar-ters but declined and became flattened in the long term to suggest that monetary policy induced-increase in interest rate in response to perceived improvement in the volume of money-in-circulation occasioned by oil rev-enue inflows seems potent shortly after initial shocks in oil revenue with moderation in the use of the instrument by the monetary authority in the long term as macroeconomic variables reaction to such shock becomes ap-parent empirically. The response of real effective exchange rate to shocks in oil revenue exhibit resilient posture as it consistently flattens out positively throughout the period insignificantly. Shocks to oil revenue growth in-crease the volume of imports in an oscillated fashion from the second to the last quarter, recording its peak at the fourth quarter. A similar trend was reported for external reverse which rose steadily throughout the period, albeit insignificantly. Altogether, this shows that while oil revenue shocks in symmetric definition increases real government expenditure, real gdp, volume of import and external reserves mostly in the long run at different

609economía mexicana nueva época, vol. Cierre de Época (II) 2013
Resp
onse
of L
OG
(RO
ILRE
V) to
LOG
(RO
ILRE
V)Re
spon
se o
f LO
G (R
GOVE
XP) t
o LO
G (R
OIL
REV)
Resp
onse
of L
OG
(RGD
P) to
LOG
(RO
ILRE
V)Re
spon
se o
f INF
to LO
G (R
OIL
REV)
Resp
onse
of I
NT to
LOG
(RO
ILRE
V)Re
spon
se o
f REX
R to
LOG
(RO
ILRE
V)Re
spon
se o
f LO
G (R
IMP)
to LO
G (R
OIL
REV)
Resp
onse
of L
OG
(EXT
REVS
) to
LOG
(RO
ILRE
V)
-.2-.1.0.1.2.3.4 -1.0
-0.50.0
0.5
1.0
1.5
2.0
-.10
-.05
.00
.05
.10
.15
.20 -8-6-4-202468
-.10
-.05
.00
.05
.10
.15
.20
.25
.30
-.10
-.05
.00
.05
.10
.15
.20
-4-210 -.4-.3-.2-.1.0.1.2.3.4
12
34
56
78
910
1112
12
34
56
78
910
1112
12
34
56
78
910
1112
12
34
56
78
910
1112
12
34
56
78
910
1112
12
34
56
78
910
1112
12
34
56
78
910
1112
12
34
56
78
910
1112
02468
Fig
ure
5. S
ymm
etry
oil
reve
nue
shoc
ks ir
f fi
gure
s
Sou
rce:
Aut
hors
’ ow
n co
mpu
tati
ons.
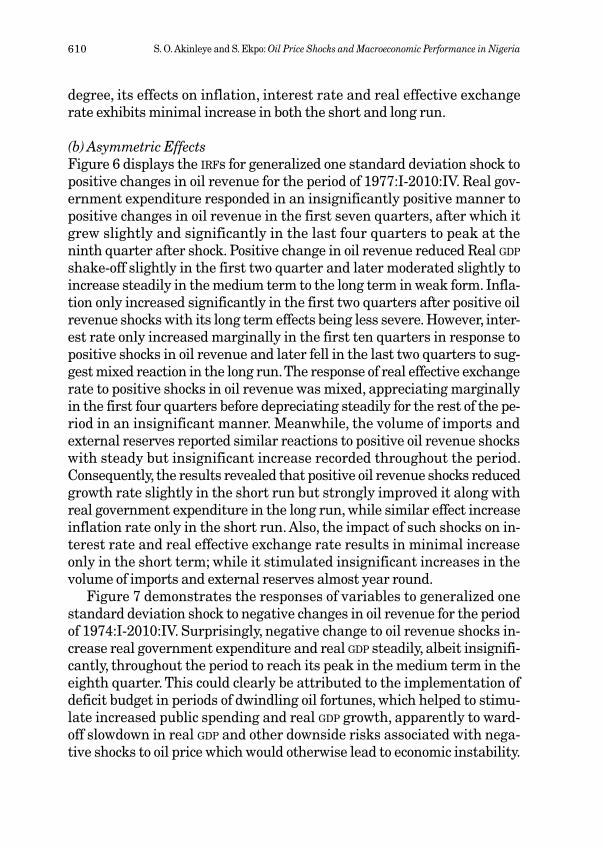
610 S. O. Akinleye and S. Ekpo: Oil Price Shocks and Macroeconomic Performance in Nigeria
degree, its effects on inflation, interest rate and real effective exchange rate exhibits minimal increase in both the short and long run.
(b) Asymmetric EffectsFigure 6 displays the irfs for generalized one standard deviation shock to positive changes in oil revenue for the period of 1977:I-2010:IV. Real gov-ernment expenditure responded in an insignificantly positive manner to positive changes in oil revenue in the first seven quarters, after which it grew slightly and significantly in the last four quarters to peak at the ninth quarter after shock. positive change in oil revenue reduced Real gdp shake-off slightly in the first two quarter and later moderated slightly to increase steadily in the medium term to the long term in weak form. Infla-tion only increased significantly in the first two quarters after positive oil revenue shocks with its long term effects being less severe. However, inter-est rate only increased marginally in the first ten quarters in response to positive shocks in oil revenue and later fell in the last two quarters to sug-gest mixed reaction in the long run. The response of real effective exchange rate to positive shocks in oil revenue was mixed, appreciating marginally in the first four quarters before depreciating steadily for the rest of the pe-riod in an insignificant manner. Meanwhile, the volume of imports and external reserves reported similar reactions to positive oil revenue shocks with steady but insignificant increase recorded throughout the period. Consequently, the results revealed that positive oil revenue shocks reduced growth rate slightly in the short run but strongly improved it along with real government expenditure in the long run, while similar effect increase inflation rate only in the short run. Also, the impact of such shocks on in-terest rate and real effective exchange rate results in minimal increase only in the short term; while it stimulated insignificant increases in the volume of imports and external reserves almost year round.
Figure 7 demonstrates the responses of variables to generalized one standard deviation shock to negative changes in oil revenue for the period of 1974:I-2010:IV. Surprisingly, negative change to oil revenue shocks in-crease real government expenditure and real gdp steadily, albeit insignifi-cantly, throughout the period to reach its peak in the medium term in the eighth quarter. This could clearly be attributed to the implementation of deficit budget in periods of dwindling oil fortunes, which helped to stimu-late increased public spending and real gdp growth, apparently to ward-off slowdown in real gdp and other downside risks associated with nega-tive shocks to oil price which would otherwise lead to economic instability.
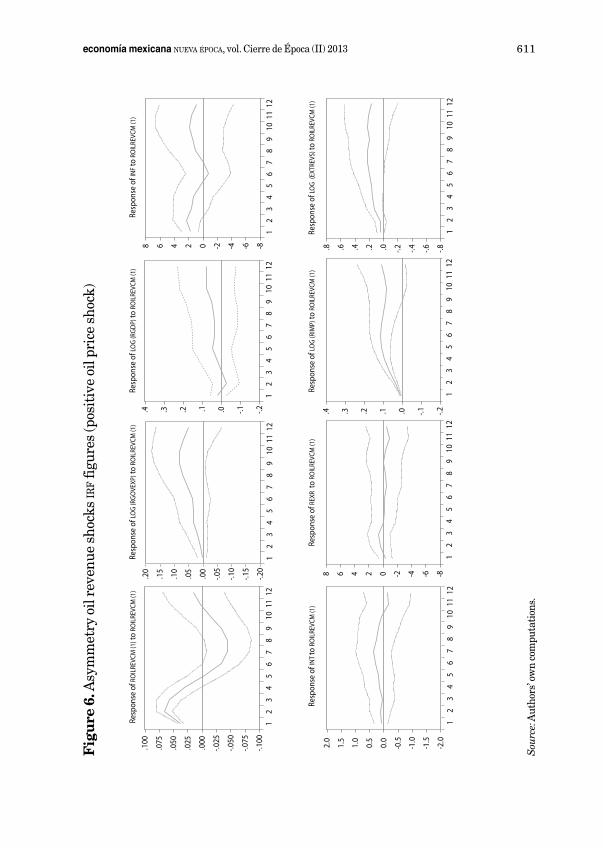
611economía mexicana nueva época, vol. Cierre de Época (II) 2013
Fig
ure
6. A
sym
met
ry o
il re
venu
e sh
ocks
irf fi
gure
s (p
osit
ive
oil p
rice
sho
ck)
Resp
onse
of R
OIL
REVC
M (1
) to
ROIL
REVC
M (1
)Re
spon
se o
f LO
G (R
GOVE
XP) t
o RO
ILRE
VCM
(1)
Resp
onse
of L
OG
(RGD
P) to
RO
ILRE
VCM
(1)
Resp
onse
of I
NF to
RO
ILRE
VCM
(1)
Resp
onse
of I
NT to
RO
ILRE
VCM
(1)
Resp
onse
of R
EXR
to R
OIL
REVC
M (1
)Re
spon
se o
f LO
G (R
IMP)
to R
OIL
REVC
M (1
)Re
spon
se o
f LO
G (E
XTRE
VS) t
o RO
ILRE
VCM
(1)
-.100
-.075
-.050
-.025
.000
.025
.050
.075
.100
-2.0
-1.5
-1.0
-0.50.0
0.5
1.0
1.5
2.0
12
34
56
78
910
1112
12
34
56
78
910
1112
12
34
56
78
910
1112
12
34
56
78
910
1112
12
34
56
78
910
1112
12
34
56
78
910
1112
12
34
56
78
910
1112
12
34
56
78
910
1112
-8-6-4-2 -.8-.6-.4-.2.0.2.4.6.8
-.2-.1.1 .0.2.3.4 -.2-.1.0.1.2.3.4
-.20
-.15
-.10
-.05
.00
.05
.10
.15
.20 -8-6-4-202468
02468
Sou
rce:
Aut
hors
’ ow
n co
mpu
tati
ons.
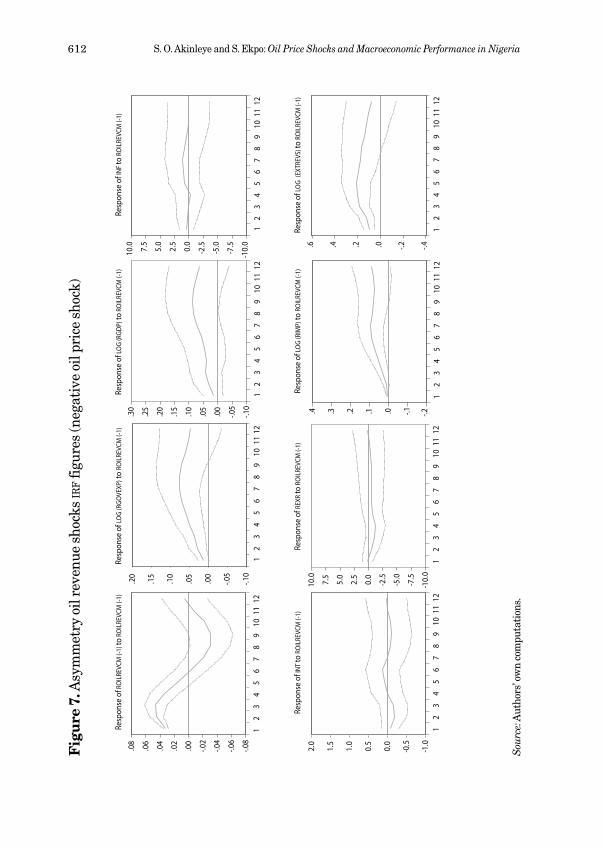
612 S. O. Akinleye and S. Ekpo: Oil Price Shocks and Macroeconomic Performance in Nigeria
Fig
ure
7. A
sym
met
ry o
il re
venu
e sh
ocks
irf fi
gure
s (n
egat
ive
oil p
rice
sho
ck)
Sou
rce:
Aut
hors
’ ow
n co
mpu
tati
ons.
Resp
onse
of R
OIL
REVC
M (-
1) to
RO
ILRE
VCM
(-1)
Resp
onse
of L
OG
(RGO
VEXP
) to
ROIL
REVC
M (-
1)Re
spon
se o
f LO
G (R
GDP)
to R
OIL
REVC
M (-
1)Re
spon
se o
f INF
to R
OIL
REVC
M (-
1)
Resp
onse
of I
NT to
RO
ILRE
VCM
(-1)
Resp
onse
of R
EXR
to R
OIL
REVC
M (-
1)Re
spon
se o
f LO
G (R
IMP)
to R
OIL
REVC
M (-
1)Re
spon
se o
f LO
G (E
XTRE
VS) t
o RO
ILRE
VCM
(-1)
-.08
-.06
-.04
-.02
.00
.02
.04
.06
.08
-1.0
-0.50.0
0.5
1.0
1.5
2.0
-.10
-.05
.00
.05
.10
.15
.20
-10.
0
-7.5
-5.0
-2.50.0
2.5
5.0
7.5
10.0
-.10
-.05
.00
.05
.10
.15
.20
.25
.30
-.2-.1.0.1.2.3.4
-10.
0
-7.5
-5.0
-2.50.0
2.5
5.0
7.5
10.0 -.4-.2.0.2.4.6
12
34
56
78
910
1112
12
34
56
78
910
1112
12
34
56
78
910
1112
12
34
56
78
910
1112
12
34
56
78
910
1112
12
34
56
78
910
1112
12
34
56
78
910
1112
12
34
56
78
910
1112
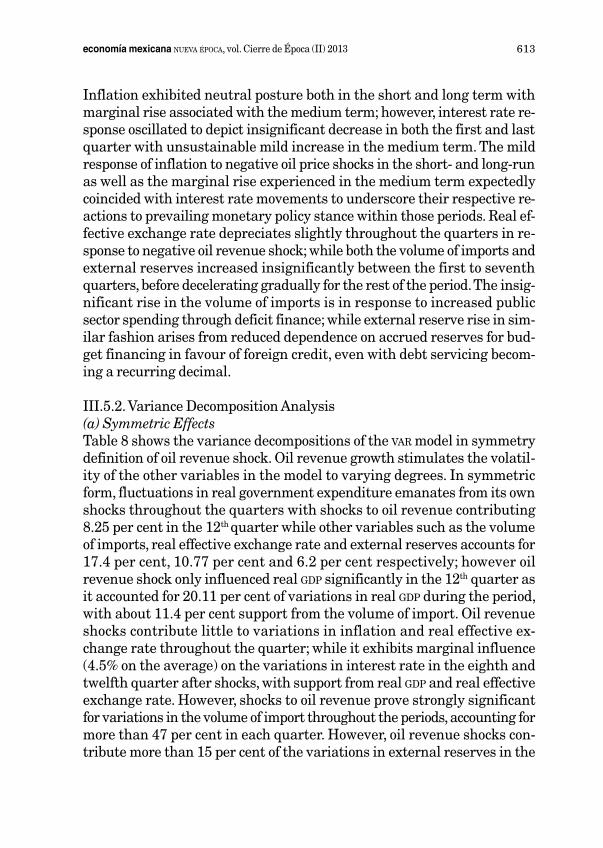
613economía mexicana nueva época, vol. Cierre de Época (II) 2013
Inflation exhibited neutral posture both in the short and long term with marginal rise associated with the medium term; however, interest rate re-sponse oscillated to depict insignificant decrease in both the first and last quarter with unsustainable mild increase in the medium term. The mild response of inflation to negative oil price shocks in the short- and long-run as well as the marginal rise experienced in the medium term expectedly coincided with interest rate movements to underscore their respective re-actions to prevailing monetary policy stance within those periods. Real ef-fective exchange rate depreciates slightly throughout the quarters in re-sponse to negative oil revenue shock; while both the volume of imports and external reserves increased insignificantly between the first to seventh quarters, before decelerating gradually for the rest of the period. The insig-nificant rise in the volume of imports is in response to increased public sector spending through deficit finance; while external reserve rise in sim-ilar fashion arises from reduced dependence on accrued reserves for bud-get financing in favour of foreign credit, even with debt servicing becom-ing a recurring decimal.
III.5.2. Variance Decomposition Analysis(a) Symmetric EffectsTable 8 shows the variance decompositions of the var model in symmetry definition of oil revenue shock. Oil revenue growth stimulates the volatil-ity of the other variables in the model to varying degrees. In symmetric form, fluctuations in real government expenditure emanates from its own shocks throughout the quarters with shocks to oil revenue contributing 8.25 per cent in the 12th quarter while other variables such as the volume of imports, real effective exchange rate and external reserves accounts for 17.4 per cent, 10.77 per cent and 6.2 per cent respectively; however oil revenue shock only influenced real gdp significantly in the 12th quarter as it accounted for 20.11 per cent of variations in real gdp during the period, with about 11.4 per cent support from the volume of import. Oil revenue shocks contribute little to variations in inflation and real effective ex-change rate throughout the quarter; while it exhibits marginal influence (4.5% on the average) on the variations in interest rate in the eighth and twelfth quarter after shocks, with support from real gdp and real effective exchange rate. However, shocks to oil revenue prove strongly significant for variations in the volume of import throughout the periods, accounting for more than 47 per cent in each quarter. However, oil revenue shocks con-tribute more than 15 per cent of the variations in external reserves in the
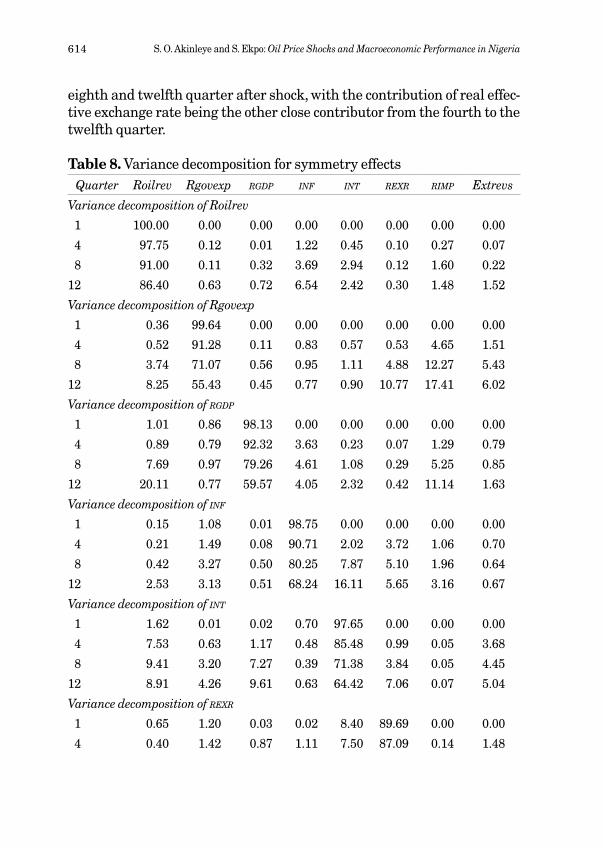
614 S. O. Akinleye and S. Ekpo: Oil Price Shocks and Macroeconomic Performance in Nigeria
eighth and twelfth quarter after shock, with the contribution of real effec-tive exchange rate being the other close contributor from the fourth to the twelfth quarter.
Table 8. Variance decomposition for symmetry effectsQuarter Roilrev Rgovexp rgdp inf int rexr rimp Extrevs
Variance decomposition of Roilrev
1 100.00 0.00 0.00 0.00 0.00 0.00 0.00 0.00
4 97.75 0.12 0.01 1.22 0.45 0.10 0.27 0.07
8 91.00 0.11 0.32 3.69 2.94 0.12 1.60 0.22
12 86.40 0.63 0.72 6.54 2.42 0.30 1.48 1.52
Variance decomposition of Rgovexp
1 0.36 99.64 0.00 0.00 0.00 0.00 0.00 0.00
4 0.52 91.28 0.11 0.83 0.57 0.53 4.65 1.51
8 3.74 71.07 0.56 0.95 1.11 4.88 12.27 5.43
12 8.25 55.43 0.45 0.77 0.90 10.77 17.41 6.02
Variance decomposition of rgdp
1 1.01 0.86 98.13 0.00 0.00 0.00 0.00 0.00
4 0.89 0.79 92.32 3.63 0.23 0.07 1.29 0.79
8 7.69 0.97 79.26 4.61 1.08 0.29 5.25 0.85
12 20.11 0.77 59.57 4.05 2.32 0.42 11.14 1.63
Variance decomposition of inf
1 0.15 1.08 0.01 98.75 0.00 0.00 0.00 0.00
4 0.21 1.49 0.08 90.71 2.02 3.72 1.06 0.70
8 0.42 3.27 0.50 80.25 7.87 5.10 1.96 0.64
12 2.53 3.13 0.51 68.24 16.11 5.65 3.16 0.67
Variance decomposition of int
1 1.62 0.01 0.02 0.70 97.65 0.00 0.00 0.00
4 7.53 0.63 1.17 0.48 85.48 0.99 0.05 3.68
8 9.41 3.20 7.27 0.39 71.38 3.84 0.05 4.45
12 8.91 4.26 9.61 0.63 64.42 7.06 0.07 5.04
Variance decomposition of rexr
1 0.65 1.20 0.03 0.02 8.40 89.69 0.00 0.00
4 0.40 1.42 0.87 1.11 7.50 87.09 0.14 1.48
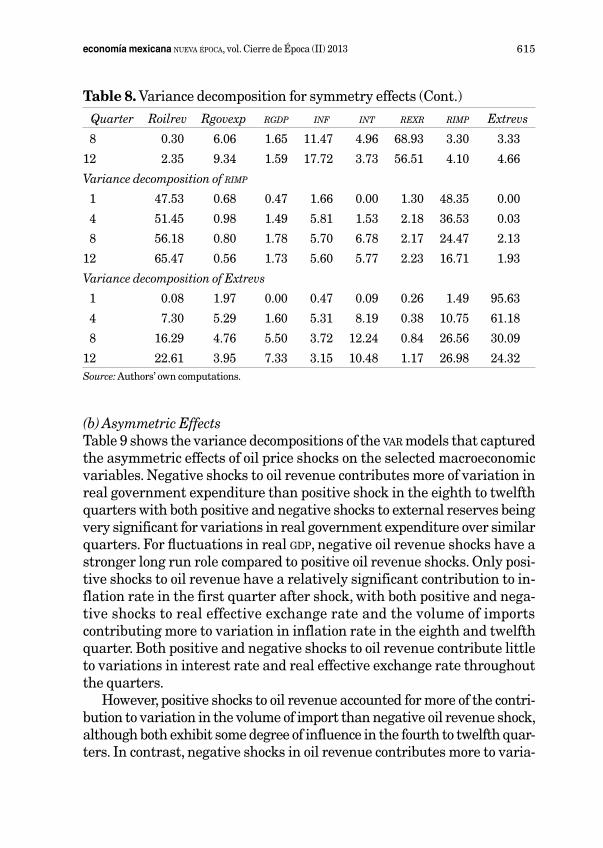
615economía mexicana nueva época, vol. Cierre de Época (II) 2013
Quarter Roilrev Rgovexp rgdp inf int rexr rimp Extrevs
8 0.30 6.06 1.65 11.47 4.96 68.93 3.30 3.33
12 2.35 9.34 1.59 17.72 3.73 56.51 4.10 4.66
Variance decomposition of rimp
1 47.53 0.68 0.47 1.66 0.00 1.30 48.35 0.00
4 51.45 0.98 1.49 5.81 1.53 2.18 36.53 0.03
8 56.18 0.80 1.78 5.70 6.78 2.17 24.47 2.13
12 65.47 0.56 1.73 5.60 5.77 2.23 16.71 1.93
Variance decomposition of Extrevs
1 0.08 1.97 0.00 0.47 0.09 0.26 1.49 95.63
4 7.30 5.29 1.60 5.31 8.19 0.38 10.75 61.18
8 16.29 4.76 5.50 3.72 12.24 0.84 26.56 30.09
12 22.61 3.95 7.33 3.15 10.48 1.17 26.98 24.32Source: Authors’ own computations.
(b) Asymmetric EffectsTable 9 shows the variance decompositions of the var models that captured the asymmetric effects of oil price shocks on the selected macroeconomic variables. Negative shocks to oil revenue contributes more of variation in real government expenditure than positive shock in the eighth to twelfth quarters with both positive and negative shocks to external reserves being very significant for variations in real government expenditure over similar quarters. For fluctuations in real gdp, negative oil revenue shocks have a stronger long run role compared to positive oil revenue shocks. Only posi-tive shocks to oil revenue have a relatively significant contribution to in-flation rate in the first quarter after shock, with both positive and nega-tive shocks to real effective exchange rate and the volume of imports contributing more to variation in inflation rate in the eighth and twelfth quarter. Both positive and negative shocks to oil revenue contribute little to variations in interest rate and real effective exchange rate throughout the quarters.
However, positive shocks to oil revenue accounted for more of the contri-bution to variation in the volume of import than negative oil revenue shock, although both exhibit some degree of influence in the fourth to twelfth quar-ters. In contrast, negative shocks in oil revenue contributes more to varia-
Table 8. Variance decomposition for symmetry effects (Cont.)
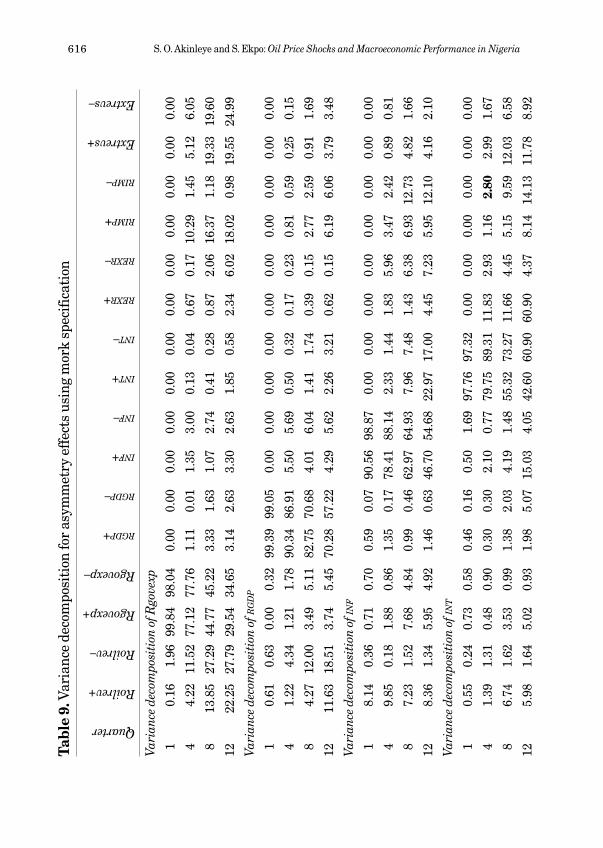
616 S. O. Akinleye and S. Ekpo: Oil Price Shocks and Macroeconomic Performance in Nigeria
Quarter
Roilrev+
Roilrev–
Rgovexp+
Rgovexp–
rgdp+
rgdp–
inf+
inf–
int+
int–
rexr+
rexr–
rimp+
rimp–
Extrevs+
Extrevs–
Vari
ance
dec
ompo
siti
on o
f Rgo
vexp
10.
161.
9699
.84
98.0
40.
000.
000.
000.
000.
000.
000.
000.
000.
000.
000.
000.
00
44.
2211
.52
77.1
277
.76
1.11
0.01
1.35
3.00
0.13
0.04
0.67
0.17
10.2
91.
455.
126.
05
813
.85
27.2
944
.77
45.2
23.
331.
631.
072.
740.
410.
280.
872.
0616
.37
1.18
19.3
319
.60
1222
.25
27.7
929
.54
34.6
53.
142.
633.
302.
631.
850.
582.
346.
0218
.02
0.98
19.5
524
.99
Vari
ance
dec
ompo
siti
on o
f rg
dp
10.
610.
630.
000.
3299
.39
99.0
50.
000.
000.
000.
000.
000.
000.
000.
000.
000.
00
41.
224.
341.
211.
7890
.34
86.9
15.
505.
690.
500.
320.
170.
230.
810.
590.
250.
15
84.
2712
.00
3.49
5.11
82.7
570
.68
4.01
6.04
1.41
1.74
0.39
0.15
2.77
2.59
0.91
1.69
1211
.63
18.5
13.
745.
4570
.28
57.2
24.
295.
622.
263.
210.
620.
156.
196.
063.
793.
48
Vari
ance
dec
ompo
siti
on o
f in
f
18.
140.
360.
710.
700.
590.
0790
.56
98.8
70.
000.
000.
000.
000.
000.
000.
000.
00
49.
850.
181.
880.
861.
350.
1778
.41
88.1
42.
331.
441.
835.
963.
472.
420.
890.
81
87.
231.
527.
684.
840.
990.
4662
.97
64.9
37.
967.
481.
436.
386.
9312
.73
4.82
1.66
128.
361.
345.
954.
921.
460.
6346
.70
54.6
822
.97
17.0
04.
457.
235.
9512
.10
4.16
2.10
Vari
ance
dec
ompo
siti
on o
f in
t
10.
550.
240.
730.
580.
460.
160.
501.
6997
.76
97.3
20.
000.
000.
000.
000.
000.
00
41.
391.
310.
480.
900.
300.
302.
100.
7779
.75
89.3
111
.83
2.93
1.16
2.80
2.99
1.67
86.
741.
623.
530.
991.
382.
034.
191.
4855
.32
73.2
711
.66
4.45
5.15
9.59
12.0
36.
58
125.
981.
645.
020.
931.
985.
0715
.03
4.05
42.6
060
.90
60.9
04.
378.
1414
.13
11.7
88.
92
Tabl
e 9.
Var
ianc
e de
com
posi
tion
for
asym
met
ry e
ffec
ts u
sing
mor
k sp
ecifi
cati
on
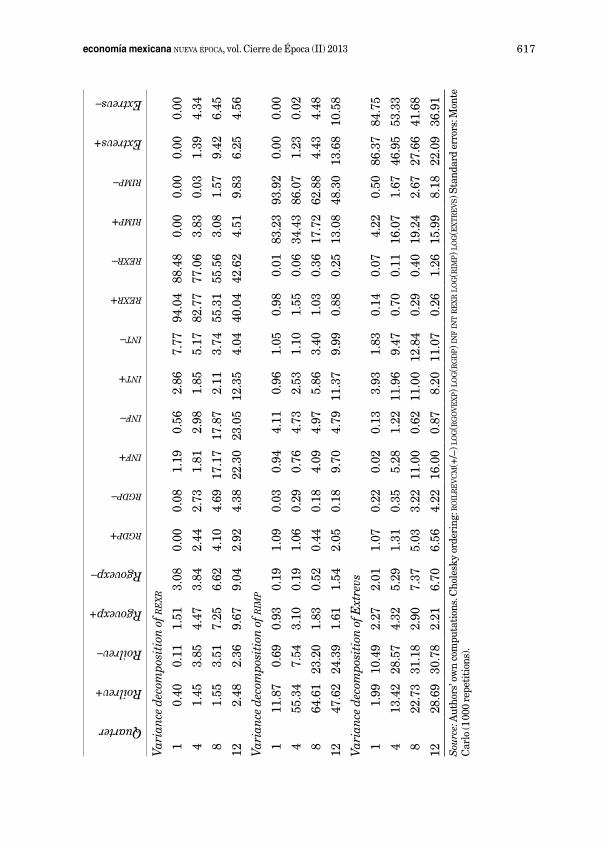
617economía mexicana nueva época, vol. Cierre de Época (II) 2013
Quarter
Roilrev+
Roilrev–
Rgovexp+
Rgovexp–
rgdp+
rgdp–
inf+
inf–
int+
int–
rexr+
rexr–
rimp+
rimp–
Extrevs+
Extrevs–
Vari
ance
dec
ompo
siti
on o
f re
xr
10.
400.
111.
513.
080.
000.
081.
190.
562.
867.
7794
.04
88.4
80.
000.
000.
000.
00
41.
453.
854.
473.
842.
442.
731.
812.
981.
855.
1782
.77
77.0
63.
830.
031.
394.
34
81.
553.
517.
256.
624.
104.
6917
.17
17.8
72.
113.
7455
.31
55.5
63.
081.
579.
426.
45
122.
482.
369.
679.
042.
924.
3822
.30
23.0
512
.35
4.04
40.0
442
.62
4.51
9.83
6.25
4.56
Vari
ance
dec
ompo
siti
on o
f rim
p
111
.87
0.69
0.93
0.19
1.09
0.03
0.94
4.11
0.96
1.05
0.98
0.01
83.2
393
.92
0.00
0.00
455
.34
7.54
3.10
0.19
1.06
0.29
0.76
4.73
2.53
1.10
1.55
0.06
34.4
386
.07
1.23
0.02
864
.61
23.2
01.
830.
520.
440.
184.
094.
975.
863.
401.
030.
3617
.72
62.8
84.
434.
48
1247
.62
24.3
91.
611.
542.
050.
189.
704.
7911
.37
9.99
0.88
0.25
13.0
848
.30
13.6
810
.58
Vari
ance
dec
ompo
siti
on o
f Ext
revs
11.
9910
.49
2.27
2.01
1.07
0.22
0.02
0.13
3.93
1.83
0.14
0.07
4.22
0.50
86.3
784
.75
413
.42
28.5
74.
325.
291.
310.
355.
281.
2211
.96
9.47
0.70
0.11
16.0
71.
6746
.95
53.3
3
822
.73
31.1
82.
907.
375.
033.
2211
.00
0.62
11.0
012
.84
0.29
0.40
19.2
42.
6727
.66
41.6
8
1228
.69
30.7
82.
216.
706.
564.
2216
.00
0.87
8.20
11.0
70.
261.
2615
.99
8.18
22.0
936
.91
Sou
rce:
Aut
hors
’ ow
n co
mpu
tati
ons.
Cho
lesk
y or
deri
ng: r
oil
re
vc
m(+
/–) l
og(r
go
ve
xp)
lo
g(r
gd
p) in
f in
t r
ex
r l
og(r
imp)
lo
g(e
xtr
ev
s) S
tand
ard
erro
rs: M
onte
C
arlo
(1 00
0 re
peti
tion
s).
618 S. O. Akinleye and S. Ekpo: Oil Price Shocks and Macroeconomic Performance in Nigeria
tions in external reserves than positive shock to oil revenue, as it accounts for about 10.5 per cent of such variations in the first quarter and more than 28 per cent in the fourth down to the twelfth quarter after shocks.
IV. Conclusion and Policy Implications
Based on the empirical findings, it can be concluded that symmetry shocks to oil price do not pose significant inflationary threat to the Nige-rian economy in the short run; rather, it improves the level of real gdp dur-ing this period, while concerns for macroeconomic stability can only be traced to the relatively significant increase in interest rate, real effective exchange rate and real volume of import it would have engendered after the initial shock, along with significant fall in external reserves. As re-gards the asymmetric effects of oil price shocks, both positive and negative oil price shocks only influence real government expenditure in the long run, rather than in the short run, while both positive and negative shocks to external reserves revealed stronger implications for expenditure in the long run, among other variables (excluding real government expenditure itself). However, for fluctuations in real gdp positive oil price shocks have a stronger short and long run role compared to negative oil price shocks, and thus suggest that positive oil price shocks could guarantee growth in the short run when aligned with the qualitative outcome of the irf. Fur-thermore, as only positive oil price shock accounts for more than 16 per cent of variances in inflation in the medium to long run (eighth to twelfth quarter after shock), it is concluded that positive shocks to oil price could trigger inflationary pressure during such period. Also, positive rather than negative shocks to oil price explain more about variations in interest rate in the long run, while both positive and negative oil price shocks ex-plain more about changes in real effective exchange rate four quarters after shock. Furthermore, only positive oil price shock explains stimulated fluctuation in the volume of imports in the fourth to eighth quarter after shock, while neither positive nor negative oil price shocks move external reserves; rather, both positive and negative shocks to real government expenditure proved influential in this regard in the short and long run. These findings are therefore relatively in line with the demand side trans-mission channel postulated by Tang et al. (2010), as positive shocks to oil price motivates variations in government spending, stimulate growth, in-flationary pressures, increase interest and real effective exchange rate and real volume of import. Hence, this implies that proper coordination of

619economía mexicana nueva época, vol. Cierre de Época (II) 2013
fiscal and monetary policy is needed to ensure that while growth potential is embedded in positive shocks to oil price, the downside risks from infla-tion rate, interest rate, exchange rate and drastic fall in external reserves deserve immense attention. More importantly, the country exhibits the Dutch disease syndrome, since positive oil price shocks increase the real effective exchange rate and appreciate domestic currency in the short and long run, thereby reducing the price of imports while increasing the price of exports in the process. Similarly, the vulnerability of the economy is further underscored by a significant fall in the real effective exchange rate in the short run, which consequently depreciates the local currency.
The empirical findings on oil revenue shocks show that real gdp growth is impeded only in the long run, with inflation rate rising marginally in the short run after initial shocks, and pose serious threat to interest rate in the medium term, depreciating real effective exchange rate slightly in the short and long run, while increasing the volume of imports and the level of external reserves significantly in the medium to long term. However, asymmetric effects of oil revenue shocks revealed that positive oil revenue shocks increased real government expenditure slightly in the short and medium term after shocks, and reduced real gdp slightly in the short run, but increase it in the long run, while negative oil revenue shocks sig-nificantly increase real government expenditure and real gdp in the long run. Hence, positive oil revenue shocks increase inflation rate, interest rate and real effective exchange rate slightly only in the short run, with negative shocks having mild effects on the variables; meanwhile, both pos-itive and negative shocks significantly increase the volume of imports and external reserves in the medium and long term respectively. This implies that positive shocks to oil revenue stimulate expansionary fiscal stance in the Nigerian economy in the short run, in line with the envisaged effects of positive oil price shocks by Tang et al. (2010), and thereby create infla-tionary pressure and domestic currency depreciation. In this regard, mon-etary tightening policy is envisaged for sustainable macroeconomic stabil-ity to be achieved.
References
Abeysinghe, T. (2001), “Estimated of Direct and Indirect Impact of Oil price on Growth”, Economics Letters, 73, pp. 147-153.
Adrangi, B. and M. Allender (1998), “Budget Deficits and Stock prices: International Evidence”, Journal of Economics, 22 (2-3), pp. 57-66.
620 S. O. Akinleye and S. Ekpo: Oil Price Shocks and Macroeconomic Performance in Nigeria
Akpan, E. O. (2009), Oil Price Shocks and Nigeria’s Macroeconomy, paper presented at the Annual Conference of csae Conference, Economic De-velopment in Africa, 22nd-24th March, Oxford.
Aliyu, S. U. R. (2009), “Impact of Oil price Shock and Exchange Rate Vola-tility on Economic Growth in Nigeria: An Empirical Investigation”, Re-search Journal of International Studies, 11, pp. 4-15.
Ayadi, O. F. (2005), “Oil price Fluctuations and the Nigerian Economy”, opec Review, Sept., pp. 199-217.
Ayadi, O. F., A. Chatterjee and C. p. Obi (2000), “A Vector Autoregressive (var) Analysis of an Oil-Dependent Emerging Economy-Nigeria”, opec Review, December, pp. 329-349.
Backus, D. K. and M. J. Crucini (2000), “Oil prices and the Terms of Trade”, Journal of International Economics, 50, pp. 185-213.
Bekhet, H. A. and N. Y. M. Yusop (2009), “Assessing the Relationship be-tween Oil prices, Energy Consumption and Macroeconomic perfor-mance in Malaysia: Co-integration and Vector Error Correction Model (vecm) Approach”, International Business Research, 2, (3).
Bernanke, B., M. Gertler and M. Watson (1997), “Systematic Monetary policy and the Effect of Oil price Shocks”, Brookings Papers on Eco-nomic Activity, 1, pp. 91-142.
Berument, M. H., N. B. Ceylan and N. Dogan (2010): “The Impact of Oil price Shocks on the Economic Growth of Selected mena Countries”, En-ergy Journal, 31, pp. 149-176.
Bhattacharya, B. B. and S. Kar (2005), Shocks, Economic Growth and the Indian Economy, Institute of Economic Growth Working paper.
Blanchard, O. and J. Gali (2007), “The Macroeconomic Effects of Oil price Shocks: Why are the 2000s so different from the 1970s?, NBER Chap-ters”, in International Dimensions of Monetary Policy, National Bureau of Economic Research, pp. 373-421.
Brown, S. p. A. and M. K. Yücel (1999), “Oil prices and US Aggregate Eco-nomic Activity: A Question of Neutrality”, Economic and Financial Re-view, Federal Reserve Bank of Dallas, Second Quarter, pp. 16-23.
Central Bank of Nigeria (2011), http://www.statistics.cbn.gov.ng/stats-online [retrieved November 16th, 2011].
Chang, Y. and J. F. Wong (2003), “Oil price Fluctuations and Singapore Economy”, Energy Policy, 31, pp. 1151-1165.
Chen, S. S. and H. C. Chen (2007), “Oil prices and Real Exchange Rates”, Energy Economics, 29 (3), pp. 390-404.
Chuku, C. A., F. A. Usenobong, R. S. Ndifreke and L. E. Ekpeno (2011), “Oil
621economía mexicana nueva época, vol. Cierre de Época (II) 2013
price Shocks and the Dynamics of Current Account Balances in Nige-ria”, opec Energy Review, 35 (2), pp. 119-139.
Cologni, A. and M. Manera (2008), “Oil prices, Inflation and Interest Rates in a Structural Cointegrated var Model for G7 Countries”, Energy Poli-cy, 30, pp. 856-888.
Cuñado, J. and F. pérez de Gracia (2003), “Do Oil price Shocks Matter? Evidence from some European Countries”, Energy Economics, 25, pp. 137-154.
______ (2005), “Oil prices, Economic Activity and Inflation: Evidence for Some Asian Countries”, The Quarterly Review of Economics and Fi-nance, 45, pp. 65-83.
Doan, T. A. (1992), rats User’s Manual, Estima.Du, L., Y. He and C. Wei (2010), “The Relationship Between Oil price
Shocks and China’s Macro-Economy: An Empirical Analysis”, Energy Policy, 38, pp. 4142-4151.
Elanshasy, A., M. Bradley and F. Joutz (2005), “Evidence on the Role of Oil prices in Venezuela’s Economic performance”, Proceedings of the 25th Annual North American Conference, International Association of En-ergy Economics, Denver, September, pp. 18-21.
Elmi, Z. M. and M. Jahadi (2011), “Oil price Shocks and Economic Growth: Evidence from opec and oecd”, Australian Journal of Basic and Ap-plied Sciences, 5 (6), pp. 627-635.
Eltony, M. N. and M. Al-Awadi (2001), “Oil price Fluctuations and their Im-pact on the Macroeconomic Variables of Kuwait: A Case Study Using a var Model”, International Journal of Energy Research, 25 (11), pp. 939-959.
Energy Information Administration (2009), Country Analysis Briefs on Nigeria, Official Energy Statistics from the United States Government at: http://www.eia.doe.gov/emeu/cabs/OpEC_Revenues/Factsheet.html.
Farzanegan, M. R. and G. Markwardt (2009), “The Effects of Oil price Shocks on the Iranian Economy”, Energy Economics, 31 (1), pp. 134-151.
Ferderer, p. (1996), “Oil price Volatility and the Macroeconomy”, Journal of Macroeconomics, 18, pp. 1-26.
Gounder, R. and M. Bartleet (2007), “Oil price Shocks and Economic Growth: Evidence for New Zealand, 1989-2006”, paper presented at the New Zealand Association of Economists Annual Conference, Christchurch, 27-29th June.
Granger, C. W. J. (1969), “Investigating Causal Relations by Econometric Models and Cross-Spectral Methods”, Econometrica, 37, pp. 424-438.
622 S. O. Akinleye and S. Ekpo: Oil Price Shocks and Macroeconomic Performance in Nigeria
Guo, H. and K. L. Kliesen (2005), “Oil price Volatility and US Macroeco-nomic Activity”, Review-Federal Reserve Bank of St.Louis, 57 (6), pp. 669-683.
Hamilton, J. (1996), “This is What Happened to the Oil price-Macroecono-my Relationship”, Journal of Monetary Economics, 38, pp. 215-220.
______ (2003), “What is an Oil Shock?”, Journal of Econometrics, 113, pp. 363-398.
Hamilton, J. D. (2009), “Causes and Consequences of the Oil Shock of 2007-08”, Brookings Papers on Economic Activity, Economic Studies program, The Brookings Institution, 40 (1), Spring, pp. 215-283.
Hamilton, J. D. and A. M. Herrera (2001), “Oil Shocks and Aggregate Ma-croeconomic Behavior: The Role of Monetary policy”, mimeo, Dept. of Economics, University of California, San Diego.
Hamilton, J. D. (1994), Time Series Analysis, princeton, New Jersey, prince-ton University press.
Hoffman, D. L. and R. H. Rasche (1996), “Assessing Forecast performance in a Cointegrated System”, Journal of Applied Econometrics, 11, pp. 495-517.
Hooker, M. A. (2002), “Are Oil Shocks Inflationary? Asymmetric and Non-linear Specifications Versus Changes in Regime”, Journal of Money, Credit and Banking, 34, pp. 540-561.
Hunt, B., p. Isard and D. Laxton (2002), “The Macroeconomic Effects of Higher Oil prices”, National Institute of Economic Review, 179 (1), pp. 87-103.
International Financial Statistics (2011), ifs cd-rom dataset.International Monetary Fund (2000), “The Impact of Higher Oil prices on
the Global Economy”, paper prepared by the imf Research Department, December 8th, Washington, D. C.
Jbir, R. and S. Zouari-Ghorbel (2009), “Recent Oil price Shocks and Tuni-sian Economy”, Energy Policy, 37, pp. 1041-1051.
Jiménez-Rodríguez, R. and M. Sánchez (2005), “Oil price Shocks and Real gdp Growth: Empirical Evidence for Some oecd Countries”, Applied Economics, 37, pp. 201-228.
Jin, G. (2008), “The Impact of Oil price Shock and Exchange Rate Volatil-ity on Economic Growth: A Comparative Analysis for Russia, Japan and China”, Research Journal of International Studies, 8, pp. 98-111.
Lardic, S. and V. Mignon (2006), “The Impact of Oil prices on gdp in Euro-pean Countries: An Empirical Investigation Based on Asymmetric Cointegration”, Energy Policy, 34 (18), pp. 3910-3915.
623economía mexicana nueva época, vol. Cierre de Época (II) 2013
Lee K., N. Shawn and R. Ratti (1995), “Oil Shocks and the Macroeconomy: The Role of price Variability”, Energy Journal, 16 (4), pp. 39-56.
Lescaroux, F. and V. Mignon (2008), “On the Influence of Oil prices on Eco-nomic Activity and Other Macroeconomic and Financial Variables”, opec Energy Review, 32 (4), pp. 343-380.
Lorde, T., M. Jackman and C. Thomas (2009), “The Macroeconomic Effects of Oil price Fluctuations on a Small Open Oil-producing Country: The case of Trinidad and Tobago”, Energy Policy, 37, pp. 2708-2716.
MacKinnon, J. G., A.A. Haug and L. Michelis (1999), “Numerical Distribu-tion Functions of Likelihood Ratio Tests For Cointegration”, Journal of Applied Econometrics, 14, pp. 563-577.
Mork, K. A. (1989), “Oil and the Macroeconomy when prices go up and down: An Extension of Hamilton’s Results”, Journal of Political Econo-my, 97, pp. 740-744.
Naka, A. and D. Tufte (1997), “Examining Impulse Response Functions in Cointegrated Systems”, Applied Economics, 29 (12), pp. 1593-1603.
Nigerian National petroleum Corporation (various editions) Annual Sta-tistical Bulletin.
Olomola, p. A. and A.V. Adejumo (2006), “Oil price Shock and Macroeco-nomic Activity in Nigeria”, International Research Journal of Finance and Economics, 3, pp. 28-34.
Omisakin, O, O. Adeniyi and A. Omojolaibi (2009), “A Vector Error Correc-tion Modeling of Energy price Volatility of an Oil Dependent Economy: The Case of Nigeria”, Pakistan Journal of Social Sciences, 6 (4), pp. 207-213.
Osterwald-Lenum, M. (1992), “A Note with Quantiles of the Asymptotic Distribution of the Maximum Likelihood Cointegration Rank Test Sta-tistic”, Oxford Bulletin of Economics and Statistics, 54, pp. 461-472.
palm, F. (1983), Structural Econometric Modelling and Time Series Analy-sis”, in Anold Zellner, Applied Time Series Analysis of Economic Data, Economic Research Report ER-5, US Department of Commerce, Wash-ington, D. C., pp. 199-233.
Raguindin, C. E. and R. G. Reyes (2005), The Effects of Oil Price Shocks on the Philippine Economy: A var Approach, University of the philippines School of Economics Working paper.
Sill, K. (2007), “The Macroeconomics of Oil Shocks”, Federal Reserve Bank of Philadelphia Business Review (First Quarter), pp. 21-31.
Sims, C.A. (1980), “Macroeconomics and Reality”, Econometrica, 48, pp. 1-48.Sinha, A. and S. Bhide (1997), “An Assessment of the Macroeconomic Im-
624 S. O. Akinleye and S. Ekpo: Oil Price Shocks and Macroeconomic Performance in Nigeria
pact of Domestic price of petroleum products”, Margin, 29 (3&4), pp. 229-247, as cited in: Study of Macroeconomic Impact of High Oil Prices by National Council of Applied Economic Research, 2006.
Tang, W., L. Wu and Z. Zhang (2010), “Oil price Shocks and Their Short-and Long-Term Effects on the Chinese Economy”, Energy Economics Journal, 32 (1), pp. S3-S14.
Wakeford, J. (2006), “The Impact of Oil price Shocks on the South African Macroeconomy: History and prospects”, in Accelerated and Shared Growth in South Africa: Determinants, Constraints and Opportunities, pp. 18-20, October.
West African Monetary Agency (2008), Impact of Petroleum Price Fluctua-tions on Key Convergence Criteria in Ecowas Member States.