ogie - USF Digital Collections
181
AC'\1>1 11 JH) l A lmtitutul dl' 'pt· ogie 1 'I 1 1 • t ., ·.m1 \!I ·m 1 1
-
Upload
khangminh22 -
Category
Documents
-
view
3 -
download
0
Transcript of ogie - USF Digital Collections

AC'\1>1 11 JH) l A lmtitutul dl' 'pt· ogie
1 'I 11 • t ~" ., ·.m1 \!I ·m 1 1

THEORETICAL-AND APPLIED
HARSTOLOGY
Volume 8

THEORETICAL AND APPLIED KA.BSTOLOGY
vol. S 1996
Director: dr. Costin Rltdulescu
EDITORIAL BOARD:
+ Edito~~ilz~Chief . I~an POVA~ : . ·. .. ~: Moe~bers: ~~(>~:f~~~~~z•: ·· • Associated Ediiar: crtstlan GORAN ' ·· ·•· .... : .: ·· · • · .. .•"1-Ioiia Mlt:RO:FAN
. . . ... . . .. .. ..... · · ···· ·· ··· ······ · : F;.rt.i• sll.Y¢S1tlttl. : : : . ; . : : : .. : : : : : . : : : : : : : . : : : :: : .. : .. : ... ~ : ~ ~ : ~ : : . .: . : . . . : . : . : . : . : . : : :- : . .
· ·.: + ': Edit~ri~i :secreta .; stt-rltl CONS'I'AN.TIN ....
ADVISORS BOARD:
: ~~;~~:tftJI~l~J~;~r:::~~~e::;:~~!~~i1::~Wff?vi~!t~tyJJ::tt1t>) •·· • ·· .. :·. . . . . . . • ·. Gabriel DIACONu' (geologi~·t, li~?Uf <iJth~ ''G~ospel~6td.gy'; Sectii:/n; !'Emit&icovitl1''Spe!eological ·
Institu.t~13zui1rare#; Riim4niaJ: :·> ···· · ·· ·· ··· · · ·· · · ··· · · · · ·· · · ·· · ·· · • Claude i>RoGvE(prdfe;~6ro}Hydrogdo!dgy, Univetsiiyoflftontp(!llier, France) : . . . • Emlll~n GA$PAI.l(se11¥r sclen!~#.in#iiut~fqr fhy~ics ~~(il'{ucl~dr '»;ngill(!e'rj~g; • JJ'ucharest, .· .. RoT/lCl'!il:lJ .. ::.· .... ::· ... · .. : : ...•... :. . •• ••• •• · .·.··· ·:· . . . : ••····.···. ·.... , . ..: :. :.•:.······ .· , : .·.·· .. : . ·
• · f:rlstl~ f!()JlA,N)$e.o.8~aph,e.rUzeap of tiFt ''R.,~gio1~llfa.rsfolpgy lrn.d Q.av~ Cf#ll#lfe'~ $estia.rz. . .· .. • . ;;;;Jj~tif:~~i:;~~bjj~tfnh'~t®Jtffi6:Jd~:i~~4rb$J~~~1~./~r&s;ecfi4i-s.~. " • .. · .
· Compa.riy; B~cfia.rest; Ri:imiinia}< . .. . ... ... .. . .. .. .. .. . ' : : :::: · . .. · ·· • · · G rigore :POSE A (professor: ofOeO.rniifpholbgy;. Bii.C.h4fest (Jn'i\!efslty, 1?.9martia) · •. Gheotghel{Ac()vttl • (s~rlibt stieilkst, {Emil RatdViJd'' Sp~i~6iogiciitlnstiiut'e~ .
ctui-'-}lapgc(j ~rr:s;~c~, ~omani(l) •., . ••·•. • . • · .•.·•·•••• •.·• .•· ••· · ··• ··•• •· ..•...•. · .• ·. · ·•· · • • · • Costln ·.MDULES.Cl.J (s-eniOr sc~ntjSt; d~tectbr of the ·"Emil R.acoviJi'i~' Spele()logic.:al Institute
Romania, co'rf:e$pofuilng membeiojifze Romanian.Ac(@emy) .·· . .. · .. · : ·· ...... ·.. ..· ... . • Florian.ZAMFIRESCP:{professpf: oJHy'd.rrig(3ology, •l3~c.harest . CJriiveitiiy, Rolnim~a) · .· .
ISSN 1 012 - 9308
Orders from abroad for issue or subscription may be also sent to: RODIPET S.A. or to ORION PRESS. Orders from Romania may be also sent to ROD I PET S.A., ORION PRESS or AMCO PRESS.
RODIPET S.A., Pia!a Presei Libera 1, sect. 1, P.O. Box 33-57, lax: +40-1-2226407, tei..:+4D-1·6185103;+4D-1·2224126, Bucureljti, Romania.
ORION PRESS INTERNATIONAL S.R.L, ~OS. Oltenitei 35-37, sect. 4, P.O.Box 61-170, lax:+-40·1·3122425; +4D-1-0347145, tei:+4D-1-6346345, Bucure~ti, Romania. .
AMCO PRESS S.R.L, Bd. Nicoiae Grigorescu 29A, ap.66, sect. 3, P.O. Box 57-88, lax: +4D-1·3125100, te1:+4Q-1-6439300; +4D-1·3125109, Bucure~ti, Romania.
EDITURA ACADEMIEI ROMANE
Galea 13 Septembrie 13, R-76117 Bucure~ti, Romania,P.O.Box 5-42 V: +40-1-410.32.00

ACADEMIA ROMAN A
INSTITUTUL DE SPEOLOGIE ,EMIL RACOVI'fA"
THEORETICAL and
APPLIED
KABSTOLOGY
Volume 8/1995
ED I T U R A A .C A D E, M I E I R 0 M A N E
Bucure§ti

Cover photographs: Front : "The Labyrinth". Phreatic karst-network with eUiptical cross-sectiOns. Coiba Mare Cave, Bihar Mountains, Romania.
Back : "The horologe of caves". Growing rings in the stalactite represent the sequences suitable for radiodating. Sample .from·Piatra Cave, Central Dobrogea, Romania. (top). Varved draperies formed along steep limestone layers. Bulba Cave, Romania (bottom). (all photographs by Cristian LASCU)
·:'•
{ ~ .... ,-
.-:·.
THEORETICAL AND APPUED KARSTOLOGY is an annual bulletin of karst science edited by the "Emil RacovifCi" Speleological Institute and published by the Romanian Academy's Publishing House. The bulletin is concerned with the publication of original scientific papers which cover the whole spectrum of karstological research viz: karst geology and mineralogy, karstochemistry, karst geomorphology, karst hydrology and hydrogeology, speleochronology, climate and subterranean environment, speleo-paleontology, environmental problems in karst a.s.o. The Editors welcome the submission of contributions in these fields from all over the world.
The .first 4 volumes were published as a series by the ,Emil Racovifil" Speleological Institute and are available by the Editorial Board. For the foreign readers, TAK volumes may be obtained by exchange with specialized publications. All the correspondence concerning the exchange proposals or the submission of contributions should be addressed to:
T.A.K. EDITORIAL BOARD INSTITUTUL DE SPEOLOGIE "Emil Racovita"
str. Frumoasl111, R-78114 BUCURE~TI 12 ROMANIA
ir: +40-1-650.34.65; fax: 40-1-2113874
Printed by: TIPOGRAFIA TIMS, Calea Plevnei 136, Bucure~ti
DTP Editor: Silviu Constantin

.·.1. ,. . . Theoretical and Applied Karstology, vol. 811995
~ . . EDITORIAL ........ · ............ .. ...................... : ... : .......... .................. ~................. 7
TAKREVIEWS
Augustin TENU & Florin DAVIDESCU- Environmental isotopic studies in karstic calcareous areas of Romania . . . . . . .. . . .. . . . . . . .. . .. .. . .. . ... .. . ... . . . .. . 9
TAK ARTICLES . : . :.i
Stein-Erik LAURITZEN & Bogdan-Petronio ONAC - Uranium series dating of some speleothems from Romania . . .. . . . . . . . . .. . . . ... .. .. .. .. ... .. . .. . 25
Helena HERCMAN, Stein-Erik LAURITZEN & Jerzy GLAZEK -Uranium-series dating of speleothems from Niediwiedzia and Radochowska caves, Sudetes (Poland)...... ....... .. ............ ........ ........ .. 37
Philippe MARTIN - Les travertins sont-ils les dep()ts correlatifs d'hydrosystemes karstiques ? Le cas des bassins versants provenpux (France)........................ ................................................................... 49
Bogdan-Petronio ONAC, Lucretia GHERGARI & Agnes GAL -Crystallographical studies on gypsum crystals in Ponora§ Cave (Pli.durea Craiului Mountains,Romania). ............. ............................. 63
Dumitru ISTVAN, Sanda MANESCU & Maria .JURCA - Study on moon.milk from Pe§tera Mare, Piatra Molo§naia (Repedea, Maramure§ Mountains, Romania).... ................................................ 69
Bogdan-Petronio ONAC, Monica BENGEANU, Mihai BOTEZ & J6zef ZIH - Preliminary report on the mineralogy of Pe§tera din Valea Rea... ............................. .. ................................................................ 75
Emil SIL VESTRU, Tudor T ~ & Gheorghe FRA TILA -Preliminary data on the hydrogeology of karst terrains around the springs of Some§ul Cald river (Bihor-Vlli.deasa Montains, Romania) 81
Traian CONSTANTINESCU - Le karst de type Movile (Mangalia, Dobrogea de Sud, Roumanie) .......................................................... 91
I
Dorel MOGO~ANU - Cretaceous paleokarst in the Moesian Platform (Romania) ........ ............................................................................... 97
Philippe MARTIN - Les formes fluviatiles du massif karstique de la Sainte Baume (Bouches du Rhone, Var, France) ............................. 103

6
Andras BALOGH - Hydrodynamical test preparation of karstic reservoirs for Chinese request .................. : ................................. .
Mehmet EKMEKc;I- Effects of Quaternary tectonic activities on karstification pattern in Ceyhan-Berke dam-site, SE Turkey ..... . .
Horta MITROFAN, Mihal MAFTEIU, loan POVARA & Mariana MITRUTRJ - Electrometric investigations on the supply channels of Hercules spring (Romania) ...................................... .
Zoran STEVANOVIC & Veselln DRAGISIC - Some cases of accidental karst water pollution in the Serbian Carpathians ........
Aurel ROT ARU, Atexandru BULGAR & loan POVARA -L'etude hydrodynamique du systeme karstique de Motru Sec-Baia de Aramli. (Roumanie) ...................................................... ..
Emanoll ~TRJCA & Horta ILINCA - Pleistocene mammals (Rodentia) from Movile Cave (Romania) ..... .......................... : .. ..
Costin RADULESCU & Petre-Mihal SAMSON - On some Middle and Late Pleistocene rare small mammal elements from the karst deposits of central Dobrogea (Romania) ........................... ..
SHORT NOTES
117
123
129
137
145
157
163
Cristian LASCU - Split stalactites ... .. .. .... .. ............ .... .... .............. .... . 175
Alexandra-Crlstina · PAUNESCU - Precisions sur les Arvicola terrestris (Linnreus) (Rodentia, Mammalia) du dernier cycle glaciaire de Roumanie .... ........................................................... :. · 179
.·;.
r ·
Contents

EDIT0RIAL
W hen the First Symposium on Theoretical and Applied Karstology was held in Bucharest, in 1983, under the auspices of the "Emil RacoviJi:l" Speleological Institute
and the Enterprise for Geological and Geophysical Prospecting, the late Professor Traian Orghidan, director of the Speleological Institute (having at that time the status of a laboratory in the framework of the Institute for Biological Sciences), in a Foreword to the Proceedings volume of this inaugural session, expressed "the organizers' and participants' desire to make this symposium pennanent, in fonn of an annual meeting, where all those interested in karstological problems may be brought into the knowledge of today scientifical ideas" (Theoretical and Applied Karstology, volume 1, page 11 ).
In 1995, we celebrated the 75th anniversary of the foundation at Cluj of the Speleological Institute by the well-known polar explorer and most outstanding Romanian biologist Emil RacoviJi:l.
The festivities dedicated to this solemn occasion were organized under the auspices of the Romanian Academy and included two commemorative sessions, one in Bucharest (on May 24) and one in Cluj (on May 26). We were honored to co'unt among the participants in these sessions personalities of the scientific community from Romania and from abroad. The speakers paid homage to Emil RacoviJli, the legendary scientist who created the Biospeleology and who, for establishing the Speleological Institute, acted in a new and very modem spirit, conceiving the young science of Speleology as a new branch of knowledge involving by nature pluridisciplinary aspects and devoted to the elucidation of the secrets kept in the subterranean world.
Last year we have been proud to have the opportunity to organize in the framework of this celebration the 13th Symposium on Karstology bearing in mind the prophetical words expressed by Professor Traian Orghidan. The Symposium was held deliberately at Cluj, in which city Emil RacoviJi:l, as already mentioned, founded the first Speleological Institute in the world. Scientists from many European countries (France, Gennany, Norway, Poland, the Republic of Moldova and Yugoslavia) and from the United States participated in the program of this symposium.
This eighth volume of Theoretical and Applied Karstology comes to the public of specialists and various readers with a diverse content and includes a selection of the oral communications presented at Cluj. Additional papers related to the Symposium's topics were also accepted.

8 Editorial
At present, when we iive in a united Europe, the cyclic economic prosperity and recession could create alternatively favoraJ?le or hard times for science. We are now confronted to both collaboration and competition in science. We have to bridge not only the component discipU,nes of Speleology and Karstology, but also the interests and aspirations of East and West. The present challenges, after the dissolving of ba"iers between western and eastern countries of Europe, pose new problems for science and researchers. We have to respond to these challenges infonnulating symposium's agendafor the next few years which separate us from the XX/st Century.
I am sure that we will succeed in translating the common scientifical aspirations and values of Speleology and Karstology into a common plan to work together with more efficiency than in the past, combining our efforts in pluridisciplinary researches in order to demonstrate the benefits resulting from both fundamental and applied aspects of sciences.
Costin RADULESCU

TAK REVIEWS
Enviro·nmentalls:otopic Studies in J ~ : • • ,.~ •
Karstic Calcareous .:Areas of Romania
Augustin TENU & Florin DAVIDESCU1
ABSTRACT The application of the environmental isotope techniques in the study of karstic areas might offer significant contributions concerning the origin and genesis of the groundwater&, underground hydrodynamic parameters and vulnerability to pollution. After a brief theoretical approach the results obtained by these techniques for Oradea-Felix hydrogeothennal system, Wallachian Platform, Domogled hydrostructure and South Dobrogea, are synthetically presented.
Key words: environmental isotope techniques, groundwater flow, karst, Romania.
ETUDES PAR LA METHODE DES ISOTOPES DU MILIEU DANS LES ZONES KARSTIQUES CALCAIRES
RESUME L'erude des zones karstiques basee sur les techniques des isotopes du milieu peut conduire a des resultats significatifs concernant l'origine et Ia genese des eaux souterraines, les parametres hydrodynamiques et La vulnerabilite a Ia pollution. Apres une breve approche theorique on presente les resultats obtenus par l'application des techniques mentionnees dans le cas du systeme hydro-geothennal de Oradea-Felix, de la Plate-fonne de Valachie, de I' hydrostructure de Domogled et de Ia Dobrogea de Sud.
Mots cles: techniques des isotopes du milieu, ecoulement souterrain, karst, Roumanie.
INTRODUCTION
The application of environmental isotopes techniques in hydrogeology started in Romania in 1969.
• Used isotopes
The initial investigations made use of tritium (3H), later on the stable isotopes in the water moleculadeliterium (2H) and oxygen-18 (180) were measured as well. After 1976, carbon-13 (13C) and radiocarbon (14C) measurements were performed on the carbonates and bicarbonates in the water, and lately, 15N and 180 from the dissolved nitrates were added~ ..
• Studied areas Due to their strong impact on economical activities, the karstic areas played an important part in the research based on these methodologies. We can thus mention the fact that studies of isotopic hydrogeology were carried out on thermal and thermornineral water accumulations (area of Oradea-Felix, Geoagiu-Spa, the central pmt of the Wallachian Platfonn, Herculane-Spa), as well as on hydrostructures with fresh waters (South Dobrogea, Valcan Mountains, Cerna Basin).
• The topics approached The main hydrogeological problems where environmental isotopes studies had . a significant

10
contribution, cover the following dornail;ts:
1. origin and genesis of the groundwater including aspects related to recharge areas, water mixing and interrelations with other aquifers;
2. underground hydrodynamic parameters such as: flpw directions and., actual velocities, transit times, effective porosity and through these, the delineation of the flow pattern of the hydrostruc-ture; · ··
3. vulnerability to pollution of the aquifers and ~dentification of the origin and sources of nitrogen, m case of underground pollution with its compounds.
In the following examples, a few representative cases are presented for the above mentioned studied areas.
1. ORADEA-FELIX HYDROGEOTHERMALSYSTEM
Oradea-Felix area is located in the western part of Romania, at the western border of Padurea Craiului Mountains.
HYDROGEOLOGICAL BACKGROUND
The Mesozoic deposits, mostiy calcareous .and dolomitic, partially karstified, create a single hydrogeological system, although in the Oradea subzone the thermal aquifer is located in Triassic deposits at about 2400 m depth, while in the Felix
NW
A. fenu & F. Davidescu
sub-zone it is related to the Lower Cretaceous (K1)
at 50-100m depth only (Fig. 1).
Obviously, there are certain differences between the two sub-zones in what concerns the piezometric head, the water temperature and the hydrochemical composition. While in the Felix sub-zone the thermal waters have a balneologic utilization, in the Oradea sub-zone they are important from the
. energetic point of view. '
It must be emphasized that the values of the surveyed hydraulic, physical, hydro- and geochemical parameters displayed no systematic or significant modifications over a century.
In acquiring the current hydrogeological image and finally the concept of a single hydrogeothermal system, the environmental isotopes studies performed over the interval 1968-1986 have had a significant contribution (TENU, 1975; 1981; 1987; TENU et al., 1981). During this interval of two -decades, the exploitation of thermal water in both sub-zones has gradually developed.
The last stage of the isotopic study started in 1987. ·
The main target of this isotopic study <TENU et . al., in press c) was to determine the intensity of the hydrodynamic connections between the two sub-zones.
RESULTS AND INTERPRETATION
Three representative years, distributed across about two decades, were chosen and the available
SE Km ORADEA AREA----------- FELIX
\ - ~ ·' ,. l ' -I ,.
'. ' I .-
0 1 2 3Km

Environmental isotopic studies in luustic calcareous areas
isotopic data were synthesized into the table below (Table 1).
............. ··.·· ·.· ·.··.·.·.·.·.·.·.·.·.·-: .. ·.· .·.·.··· "1.-:/-{:: · . ·.;:: 1 .(::-.·:t~/·: · . .":::: ··=>: >·~.:-:::
: f¢U~~~WW.Ii#((, ·· / ::: t : >J . • ••••. ,:···· • : •.. = ••• · <:: 19±3 <5 <5
8 D %o vs. SMOW -64.3 -69.0 -72.8
8 180 %o vs. SMOW -9.8 -11.0
8 13C %o vs. PDB. -3.8 -11.3 14C (pmc) 5.4 6.8 12.7
<5 <5
8 D %o vs. SMOW -72.3 -72.2
8 180 %o vs. SMOW -10.6 -10.4
8 13C %o vs. PDB. -3.8 -16.7 14C (pmc) 4.7 10.4
It must be noticed that, as already indicated, no systematic parameters modifications occured in
pmc
74
11
time; the only exceptions are the carbon isotopes and,in the Felix sub-zone the deuteriUm and the oxygen-18. It must be also noticed that the carbon-13 became more negative in 1987 than . in 1977 in both sub-zones, more unexpectedly in the deepest aquifer (the calcareous matrix have the same oi3C = 0.0 ... +0.5%o for both aquifers).
As for radiocarbon (Fig. 2), on a superimposed background of generally low contents, there has been first recorded a gentle increase, of less than 0.2 pmc/year, while after 1977 the annual mean increase for both aquifers reached values of about 0.6 pmc/year.
Since 1977 can be considered to mark an enhancement of the withdrawal from the system, we may suspect that during the last decade desequilibria occur into the natural inflow-outflow balance that, for the present, have been revealed only by the carbon isotopes.
What was the exact cause of this desequilibria ?
Out of the various correlations, the one in Figure 3 is significant. By making use of radiocarbon determinations, of measured maximum artesian discharge in the Felix sub-zone and of the· cumulated discharges of both sub-zones measured only during the last 10 years, this correlation reveals the direct de endence between the contents in me and
~ // .A 2
/ /
c.\'\,./ J1 10 r\~ / I
s~Y/ I \). // I
/ c.'" 8 I / ~
I / '\ ~ I// \)~
Subzone: Q.'\S ?_!101.---~ 6 . I _ _. I
FeliX ~--- Subzone : {aquifer K1 l 1 Ora de a 9
4 1 I
{cquifer Tl 1 I
2
t, years 19 70 1975 7980 1985

12
a c \1/s)
pmc
250
i2
iC 2CO
9
8
150
7 :y, 1971
6 I 1 I
I I
5 / i969
100 ' 150 .100
I I
I I
I I
I I
I I
I I
I 14
o A
' B
C p Ills)
cwnulative discharge. This relationships can be expressed by the equation:
pmc = 0.047 Qe + 0,35
There still remain certain elements relat~ to· the Oradea sub-zone such as the very marked decrease
A. Tenu 41!. ~cu
of the 13C content and the preservation of the D and ISQ values which are correlated neither between them nor with ·the increase of the radiocarbon content.
CONCLUSIONS
The presented case is considered important for the illustration of the way in which the environmental isotopes can reveal, before other classical survey parameters, the occurrence of modifications ·in the
·natural regime of some highly exploited hydrostructures.
More than that, this investigation method can cmitribute · to the identification of the cases and . .
mechanisms leading to the observed qualitative modifications.
· Exceeding the proposed topic framework, . it must be mentioned that this last stage of the study has also been obtained by isotopic study, such as:
• the system open structure character
• the permant(nt recharge by the mountain karstic aiea
• very long apparent transit time
• the meteoric origin of the thermal waters . •>
• the presence of auxiliary supply in the system
• the ascending provenance of the thermal water in the Felix sub-zone aquifer.
2. WALLACHIAN PLATFORM
The area under study is located in the southern part of Romania. It covers a length of about 100 km, extending from the Danube to the latitude of Snagov village.
OBJECTIVES
The main goals of the study have been:
a. to identify the regional flow pattern in a Late Jurassic-Early Cretaceous reservoir and, at the same time, to verify expecirnentitly the geological hypothesis that a south-to-north flow exists. This hypothesis is, at first glance, a strange one, since a S-N direction would be opposite both to the morphologic slope and to the flow -direction observed in "Stratele de Frlte§ti" (Frlte§ti Layers), a medium-depth aquifer having the same dip as the Mesozoic.

Environmental isotopic studies in luustic calcareous areas
-72.0** 960 -66.3 725** -69.8** 635 -65.8 640** -71.6**
1520* -73.0* 1505** -73.5** 2060 -86.9 1935** -87.1**
2540
2920
b. to determine the origin of the thennal water and to mvestigate, whenever possible, some aspects linked to the hydrothennalism of the area.
HYDROGEOLOGICAL ASPECTS
In this area, there is a Mesozoic carbonate aquifer about 1000 m thick that stores a great volume of water. In its southern part, these waters are cold, whereas northwards from the latitude of Bucharest they are thermal.
The general structure of the sedimentary deposits is monoclinal, · with general dip from the south to the north. Tills structure can easily be seen in the case of the carbonate complex which outcrops on the bank of the Danube in the area of Giurgiu city, but it can also be found at the depth of about 1900 mat Bucharest and 2750 mat Snagov (Fig. 4).
The Late JurctSsic and Early Cretaceous are of particular hydrogeological importance, due to their favorable lithology, areal continuity and significant thickness. The Late Jurassic, mainly made up of carbonate rocks, limestones and dolomites, has a high permeability, due to fissures, faults and · karstic cavities.
The specific flow rate of this aquifer can be considered good and very good (about 5-10 l/s/m), sometimes (such as in the Uzunu area), with values up to 40 Ils/m. In the latter area, other hydrogeological parameters have the following values: transmissivity T = 9000 m2/day; hydraulic conductivity, K = 12.5 rnlday; radius of influence, R = 1500 m.
13
-11.20 -10.02** -10.15 62.2 ± 1.8 -10.00** 12±2
-9.93 49.0 ± 1.6 -10.00** 6±2
-10.02* <5* 21.4± 0.7*
-10.38** -11.80
<5 4.2 ± 1.0 -11.85**
<5 10.7 ±0.7
<5 3.0±0.7
RESULTS AND INTERPRETATION
The experimental data available consist of hydrochemical analyses and environmental isotope measurements (D, 180, 3H, 14C). It is important to note that until now · the environmental isotope measurements have been carried out only in the southern and central part of the study area, representing about 70 km of the entire · cross-section. The results of these analyses are shown in Table 3. The data from Table 3 and the location of the wells (Fig. 4) have to be taken into consideration in order to interpret the results of the isotopic analyses.
Tritium has been found only in the first two wells in the neighbourhood of the Danube during a study period that extends over the spring-summer of 1988, when the Danube had an average of 25 TU. From Uzunu to Otopeni, because of the deepening of the aquifer, the tritium content drops, as expected, below the significant level for the liquid scintillation method (5 TU).
These results demonstrate the presence of a direct hydrodinamic link, more exactly a recharge of the Mesozoic aquifer by the Danube.
Although this is a qualitative information, it has a particular importance for the boundary condition of the conceptual hydrOgeological model.
Radiocarbon analyses, carried out for the section Giurgiu-Otopeni, confirm the infonnation provided by tritium on the recharge from the Danube.
Furthermore, except for well 2664 Otopeni, which has been sampled by air lift pumping, all the other values constantly decrease as one moves away from the Danube. Titis pattern indicates an

-}. 0 r.o
N 0
1000
2000-
4000
5000
6000
-60
70~ ~ I -801 I
-90
r. la/omica I
-12 ·11
BUCURE!;lTI
2641
Danube, May 7 986 'Y
Giurgiu az Giurgiu N Danube
ZHS Uzunu
-10 5180 o/oo
.g
r. Argef I
CALUGARENI-UZUNU 6
53 s
0 10
km
.... ~
?-~ I All ~
i f -a
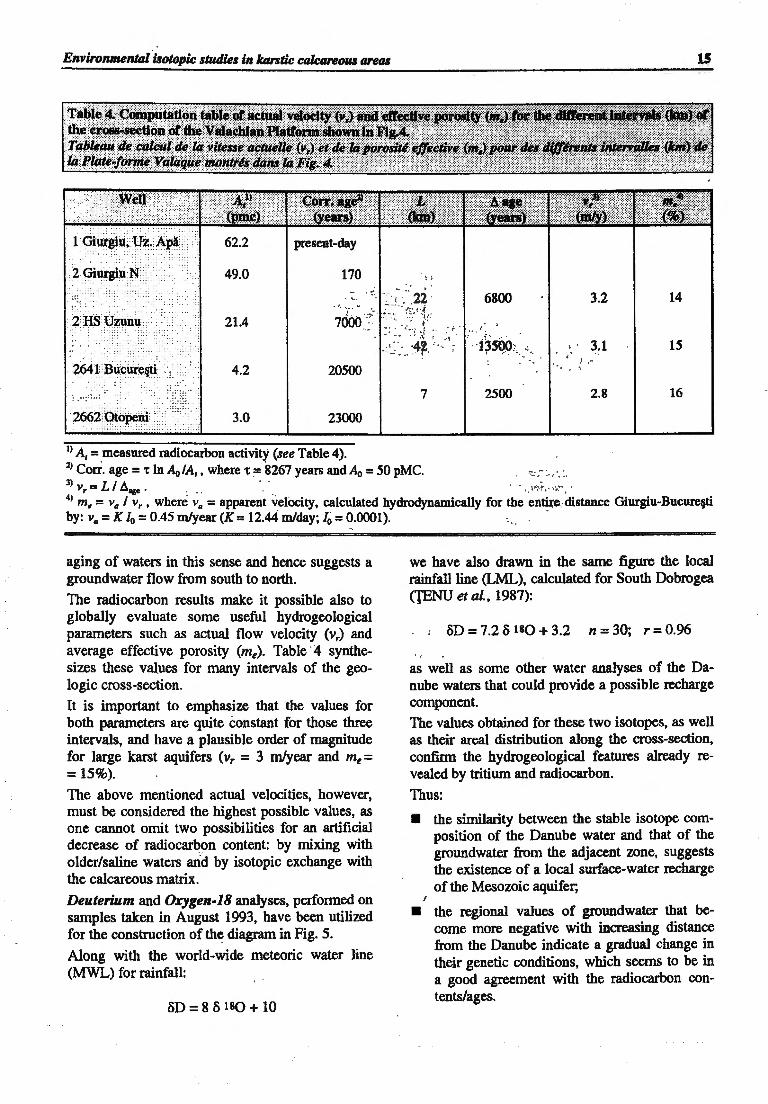
Environmental isotopic studies in karstic calcareous areas 15
present-day
49.0 170 '::
... . . ~ . .. . -.. , ._ .22 · 6800 3.2 14
21.4 ,. ;
i~sQo:-, ·- : 3.1 15 -. .. 4.2 20500
7 2500 2.8 16 ' . .. . . . . . : . : . . . : . : ~ . : .
• 26~2 q~JP.¢#.i • ' .. :. • . : 3.0 23000
1> A, = measured radiocarbon activity (see Table 4).
2> Con. age = 't In Ao lA, • where 't = S267 years and Ao = 50 pMC. . ____ , ...
3) Ll A . . .. v, = Uage . . . . . · ,_1•'':':~.- .·.~··. 4) m. = VQ I v,. where VQ =apparent velocity, calculated hydrodynamically for the enti(e.distance Giurgiu-Bucure~ti
by: va = K 10 = 0.45 mlyear (K = 12.44 mlday; /0 = 0.0001). ··
aging of waters in this sense and hence suggests a groundwater flow from south to north.
The radiocarbon results make it possible also to globally evaluate some useful hydrogeological parameters such as actual flow velocity (v,) and average effective porosity (me). Table · 4 synthesizes these val.ues for many intervals of the geologic cross-section.
It is important to emphasize that the values for both parameters are quite constant for those three intervals, and have a plausible order of magnitude for large karst aquifers ( Vr = 3 rnlyear and me= = 15%).
The above mentioned actual velocities, however, must be considered the highest possible values, as one cannot omit two possibilities for an artificial decrease of radiocarbon content: by mixing with older/saline waters arid by isotopic exchange with the calcareous matrix.
Deuterium and Oxygen-18 analyses, performed on samples taken in August 1993, have been utilized for the construction of the diagram in Fig. 5.
Along with the world-wide meteoric water line (MWL) for rainfall:
oD =so 1so + 10
we have also drawn in the same figure the local rainfall line (LML), calculated for South Dobrogea (fENU et al., 1987):
oD = 1.2 o uo + 3.2 n = 30; r= 0.96
as well as some other water analyses of the Danube waters that could provide a possible recharge component.
The values obtained for these two isotopes, as well as their areal distribution along the cross-section, confirm the hydrogeological features already revealed by tritium and radiocarbon.
Thus:
• the similarity between the stable isotope composition of the Danube water and that of the groundwater from the adjacent zone, suggests the existence of a local surface-water recharge of the Mesozoic aquifer;
• the regional values of groundwater that become more negative with increasing distance from the Danube indicate a gradual change in their genetic conditions, which seems to be in a good agreement with the radiocarbon contents/ages.

16
NNW SSE/W
000
750 Domogled spring
I
500 Cerna river
250
+ + + +
+ + 1- + . + +
CONCLUSIONS
The most important conclusions of the geochemical and isotopic study can be thus summarized:
• in the Mesozoic aquifer there is an important groundwater flow; the flow direction is from south to north.
• undoubtedly the Danube recharges the aquifer in the area of Giurgiu city.
• along the Giurgiu-Otopeni section, the aquifer has a max. 3 rnlyear average actual velocity and a min. 15% effective porosity.
• the origin of the water in this aquifer, both warm and cold, is almost exclusively meteoric, although the entire aquifer, and especially the
. area Otopeni-Balote§ti, receives saline, prevalently chloride waters, presumably as upward inputs through the system of fractures.
·' 3. DOMOGLED
HYDROSTRUCTURE
It mainly corresponds to the calcareous massif bearing the same name, that is, the south end of the Mehedinti Mountains, in the south-western part of the country.
E DOMOGLED -------:;•
+ ... 0 500 100Cm
HYDROGEOLOGICAL BACKGROUND
From a morphological point of view Dornogled is a plateau with numerous karstic landforms, bordered to the W by an impressive tectonic escarpment (Cerna Valley). All around it numerous springs occur, most of them in the area of the western escarpment and to the south.
From the geological-structural point of view the situation is rather complicated (Fig. 6). The J3 and K1 series include partly karstified rocks and are predominant.
One of the springs emerging from the massif, the Domogled spring, located in the Herculane Spa area, has high quality water. As a result it required a complex hydrogeological study, conceriring especially quality and discharge stability .
GOALS OF THE STUDY
• to detennine the groundwater transit time and the mixing degree of the various seq~ences of the annual recharge;
• to establish the relationships between. ~e subterranean and the surface waters in the•area.

Environmental isotopic studies in karstic calcareous areas 17
THE RESULTS
Although a larger range of analyses has been carried out, the problem has been finally solved only based on tritium.
The study was extended to the 1987-1989 period · and it mainly consisted of prospection sampling of all karstic springs, of the surface and underground waters in the area and of a monthly systematic sampling of the Domogled spring.
The first determinations showed that there is a clear and constant difference between the values obtained for the Domogled spring (almost constant above 32 TIJ) and the values of 23-25 TIJ mea~ured in the other karstic springs (Table 5).
15-20 .'/
*Seasonal mean values 1987-1989.
1987 July-Sept. 42 Oct.-Dec. 42
1988 Jan.-March 26 April-June 34 34 July- Sept. 36 Oct.-Dec. 38
1989 Jan.-March 35
This characteristic reveals the fact that Domogled spring is draining its own hydrogeological subsystem which is different from the zonal system, common to other springs. ·
As against the el~ents previously known, this situation occurred as entirely original: it emphasizes the fact that the water of this sub-system has a higher tw;n~ver time than the whole system.
On the baSis of the 3H input curve (weighted an-. nual average values) for the Oradea station ('fEt:ID et al., 1989) and the experimental curve obtained for the Domogled spring (Table 6) the main known mathematical models have been applied: completely mixed reservoir model (YURTSEVER, 1983) and dispersive reservoir model with the use of binomial age distribution function (DINCER & DAVIS, 1967),
As it can be seen on Figure 7, the completely mixed reservoir model led to the estimation of a
.; seven-year turnover time while the ·seroii:d)nodel . . h): .. .
to a nine~year one. An "t0 = 8 yearS· .. seeffis }c;i esti-mate the real situation in a satisfactory manner. It
\ ·must be noticed that for the entire karstic system ·· -··the turnover time is about 1-2 years showing a
_significant difference in_ the ground water dynam--ics and the recharge pattern.
Another interesting aspect must be emphasized. On April 1988 an In-EDT A tracing was carried out in a swallet of the plateau, the tracer being detected after 24 h in the Domogled spring. After a flowing period of 5 days, a sudden and unexpected interruption of the tracer occurred.
·.The results obtained by means of the two methods were, at least at first sight, contradictory for those not familiar with karst problems. Besides, the literature in the field does not offer either many examples of investigations carried out by simultaneously using both natural and artificial tracers.
The explanation of the indicated situation is the following:
Artificial tracers are usually injected into large sinkholes which are connected to large channels. In this case, as the labeling was performed during a flood (snow melt) period, the transit time of the fresh-water component was established. The results obtained by means of artificial tracers, con-
t cern therefore only a small part of the karstic system as a whole. The true turnover time for the whole catchment basin of the karst under study can be determined when environmental isotopes are used.

18
1982 7983 1984 1985
.. Besides, we can note the fact that the strong inflow :~ from the plateau which occur in the spring of , 1988, when the artificial labelling has been per
formed was also identified by low tritium contents (Fig.7).
· .. CONCLUSIONS
·As a general conclusion it must be kept in mind that nothing is totally predictable with the karst and that each separate case shows its own peeuliarities and unknowns and that only a study by means of combined methods can discover and clarify them.
; In the case of the Domogled spring a hydrogeological subsystem with a longer · turnover/average residence time was revealed, fact with positive implications in the exploitation of the water of this spring as still water.
The necessity of extending the hydrogeological protection area outside the calcareous plateau was also revealed. ·
4. SOUTHERN DOBROGEA
Southern Dobrogea became an objective of environmenta.J. isotopes studies starting from 1971. The study objectives included on the one hand the regional framework with the complexity of the
A. fenu & F. Davidescu
1986 1987 1988 1989
100 .90 80 70
60
50
40
30
20
associated hydrodynamic problems and, on the other hand, some local aspects, especially in areas of a stringent economical interest.
We shall illustrate below the two categories ·of research objectives;
4.1 . REGIONAL FRAMEWORK
Southern Dobrogea is located in the south..:eastern part of Romania covering an area of over 5000 km2. ,.
Hydrogeological background . ,
In Southern Dobrogea, two major aquifers occur, the economic interest of which derives from the areal extension of the reservoir and the potential flow rates.
Lower aquifer - in the Jurassic and Barremian limestone formations, and
Upper aquifer- in the Sarmatian limestones. ;
Water accumulations with a local character and therefore with less significance have been also identified in the . Pliocene, Eocene and Senonian deposits.
T/1.e lower aquifer. is related to the limestone and dolomitic deposits, sometimes fractured and karstified, and in most parts of Southern Dobrogea, it represents a unitary complex.

Environmentol isotopic studies in karstic calcareous areas 19
The thickness of the whole Jurassic-Barremian complex gradually decreases from the SW to theE and NE from over 1000 m to 400 m.
The piezometric surface outlines a groundwater flow from the Pre-Balkan Platform, with SW-NE general directions.
The hydraulic gradients have low values ranging between 0.0002 and 0.0016.
The piezometric head of the waters in this aquifer is ascensional except for the area around Tatlageac Lake where it becomes artesian.
We can quote as main hydrogeological parameters: transmissivities (T) generally within the range of 1,000-100,000 m2/day and well flow rates (Q) ranging most often from 5 to 150 lis at a drawndown of a few meters.
The upper aquifer is significant from the hydrogeological standpoint in the south-eastern part of the region where the thickness of the Sannatian deposits exceeds 10 m.
The piezometric contours generally suggest a flow directed from the Pre-Balkan Platform to the North and from the .Cobadin Plateau to the East. The hydraulic gradients vary between 0.004 and 0.01.
In the eastern part of Dobrogea, the Sarmatian aquifer levels are under pressure.
As to the hydrogeological parameters we can quote: transmissivities (T) currently ranging between 50 and 1500 m2/day and well flow rates (Q) from 0.02 to 10 lis for drawndowns of0.5-10 m.
Barr. 54.8 Petreni Barr. 33.5 C. Basarabi, 2 Sen. 63.5 C. Basarabi, 1 Sen. 70.2
Objectives
The above mentioned hydrogeological image stands at the 1994 level· of knowledge. In 1971, when the isotopic studies started, many of the aspects related to the regional flow pattern were unknown, and others were in a hypothesis stage.
The main purpose of the isotopic research carried out at the regional level in South Dobrogea was the elaboration of a conceptual hydrogeological model in order to outline the main elements of regional hydrodynamics.
Results of isotoplcal research
In South Dobrogea, between 1971 and 1994 measurements of all significant isotopes, that is: 3H, I4C, BC, D, IRQ and lSN have been carried out.
The sampling was performed over a fixed network of sampling points which includes not only the major aquifers but also all water types existing in the region. Three moments of this interval are considered significant and will be further discussed.
1975
Within a cooperation with the University of PisaITALY, the following isotopes could be simultaneously measured in a limited number of points of the Lower aquifer: T, D, ISO, 13C and I4C ('fENU et al., 1975). The results of these analyses, the first of this type in Romania at that time, are given in Table 7.
4831 ± 104 -7.7 -11.2 - 70.3
8785 ± 136 -7.9 -11.3 - 73.2
3648 ± 192 -8.2 -1 1.2
2842 ± 48 -8.1 - 10.9 -64.5 C. Ci§mea II, 1 0 8.2 20090 ± 376 -6.7 -12.5 - 77.2 Mam.aia, IMH 10.4 18181 ± 216 -7.7 - 12.5 - 78.8 Man galla 4.1 25658 ±512 -7.3 - 12.8 -78.2
-11.6 -68.3 -10.8 -59.8 -5.9 -43.3 -5.4 -31 .8 -4.1 - 21.6
1) Samples 1-9 refer to groundwater; samples 10-13 are surface waters. 2) The ages of the aquifers are Barremian, Senonian and Jurassic. 3) Calculated using a half-time of 5568 years.
-20
F
0 F
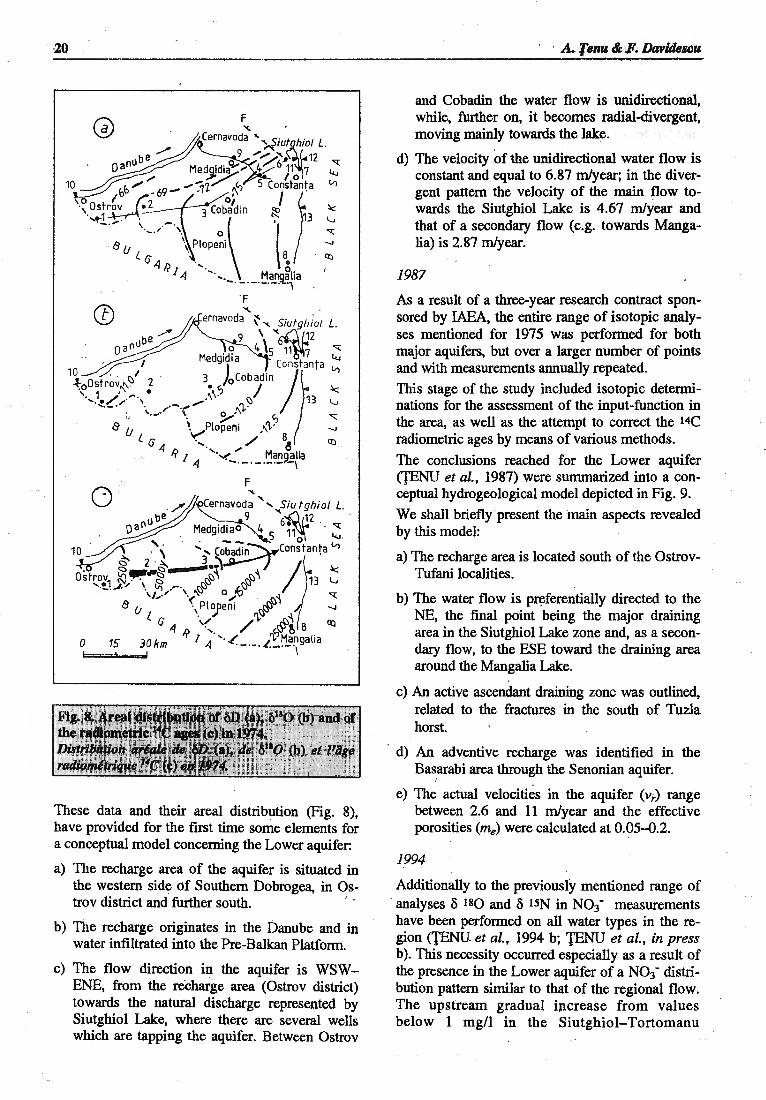
These data and their areal distribution (Fig. 8), have provided for the first time some elements for a conceptual model concerning the Lower aquifer:
a) Tite recharge area of the aquifer is situated in the western side of Southern Dobrogea, in Os-trov district and further south. '
b) The recharge originates in the Danube and in water infiltrated into the Pre-Balkan Platform.
c) The flow direction in the aquifer is WSWENE, from the reehaige area (Ostrov district) towards the natural discharge represented by Siutghiol Lake, where there are several wells which are tapping the aquifer. Between Ostrov
' · A. fenu & F.DaPideacu
and Cobadin the water flow is unidirectional, while, further on, it becomes radial-divergent, moving mainly towards the lake.
d) The velocity of the unidirectional water flow is constant and equal to 6.87 rnlyear; in the divergent pattern the velocity of the main flow towards the Siutghiol Lake is 4.67 rnlyear and that of a secondary flow (e.g. towards Mangalia) is 2.87 rnlyear.
1987
As a result of a three-year research contract sponsored by IAEA, the entire range of isotopic analyses mentioned for 1975 was performed for both major aquifers, but over a larger number of points and with measurements annually repeated.
This stage of the study included isotopic determinations for the assessment of the input-function in the area, as well as the attempt to correct the I4C radiometric ages by means of various methods.
The conclusions reached for the Lower aquifer ('fENU et al., 1987) were summarized into a conceptual hydrogeological model depicted in Fig. 9.
We shall briefly present the Inain aspects revealed by this model:
a) The recharge area is located south of the OstrovTufani localities.
b) The water flow is p~ferentially directed to the NE, the final point being the major draining area in the Siutghiol Lake zone and, as a secondary flow, to the ESE toward the draining area around the Mangalia Lake.
c) An active ascendant draining zone was outlined, related to the fractures in the south of Tuzla horst.
· d) An adventive recharge was identified in the Ba~arabi area through the Senonian aquifer.
e) The actual velocities in the aquifer (v,) range between 2.6 and 11 rnlyear and the effective porosities (me) were calculated at 0.05-0.2.
1994
Additionally to the previously mentioned range of ·analyses o ISO and o ISN in No3- measurements have been performed on all water types in the region ('fENU et al., 1994 b; 'fENU et al., in press b). This necessity occurred especially as a result of the presence in the Lower aquifer of a No3- distribution pattern similar to that of the regional flow. The upstream gradual increase from values below 1 mg/1 in the Siutghiol-Tortomanu

Environmental isotopic studies in karstic calcareous areas
8 0 5 10 km l-,-- ·- ··' . I
u
areas to over 45 mg/1 in the border area, in the South (zone also representing the recharge area of the aquifer), suggested the possibility of a diffuse pollution phenomenon that could gradually be extended to the entire aquifer.
The main objectives of this research moment were the following:
• the determination of the pollutant source and implicitly of its nature;
• the definition of the causes controlling the regional pattern of N03- distribution in the Lower aquifer.
Table 8 synthetically presents some isotopic mean contents, for water types in South Dobrogea.
The individual isotopic and chemical values referring to the N03- content were used in constructing the diagrams in Figure 10 a and b.
21
The study led to the following conclusions:
a) Nature of nitrate: mixed, organic and inorganic, for both aquifers.
b) Sources: mainly animal waste; soil N and _ industrial fertilizers have been identified locally, in separdte points (Upper aquifer) and near recharge area points (Lower aquifer).
c) The gradual downstream reduction in content 1 of nitrate in the Lower aquifer may be attrib
uted to a denitrification process, this phenomenon being locally indicated by isotopic measurements even in the southern part of South Dobrogea.
4.2. SIUTGHIOL LAKE AREA
Among the local objectives of high economical interest, we shall briefly expose the example of the

22
-10.2 -34.0 18.7 15.2 10.1
-10.6 -53.6 8.6 11.6 13.3
-11.6 -67.3 3.5 10.9 12.2 .. ~.
Soils Fertiliz.
100
:z ~ .,l r:n ou, E I
;-;:::. 0 z
,L .\
. !
I
I . I
Aryimal Wa~tes
IJ.
I
+20
. :
t.,:
·25
Siutghiol zone (see . also DA VIDESCU et at., -t: l983; DAVIDESCU et al., 1991; TENU & DAVI
DESCU, 1993).
Hydrogeological background
·. The Lower aquifer (J3+K1 calcareous deposits) has a WSW~ENE flowing direction and discharges into the Siutghiol Lake and partially into the Black
. Sea continental shelf. In the area adjacent to the Siutghiol Lake this formation is overlain by Senonian chalk, Sannatian limestone and Quater- nary deposits.
At . the western side of the Siutghiol Lake three major groundwater intakes (C1, C2, and C3) have
•25
+20-
_ ·1Sr I"' . (..)
:z 0
"' .::;, •10
been created by exploiting the excellent , quality ground water of the Lower aquifer (Fig. 11 ). ,
There is obviously a reciprocal relationship . between the ground water flows, the total discharge of the intakes and the natural discharge into the lake and the Sea. The hydrologists interpreted the decline of the lake level from +246 em in 1957 to +95 em in 1972 as being due to the progressive increase,· by. more than three times, of the water volume extracted by the three intakes and thus, to the decrease of the ground water input into the lake from 1300 lis to 800 1/s. This point of vie~ had been accepted until the isotopic study baS been performed. ·

Environmental isotopic studies in karstic calcareous areas
/ /
<!!' /
d 4('
The target of the Isotopic research
The main target of this study was to reveal the relationships between the various water types in the area in order to identify the mechanism leading to the decline of the lake level.
The results of the Isotopic study
A sytematic sampling wa8 carried out in carefully chosen points over an interval of more than one hydrological year, including all water types. The research was mainly based on tritium measurements (Table 9).
The first results clearly indicated that the Water in the Lower aquifer was totally lacking in deprived of tritium a regional level and that only in the areas of the intakes, the water displayed a low and variable content of this isotope.
23
........ ...... . .. .. .. . ...•...... . ..•. . . . ..... . . · · ··· .. ···· ·· ·-····· · ··
:J.i~n£ :· :~~~l~it~~: :: :: .- , ::; ,i :' · i,#jl:~~teri~:(ttJf 1 Siutgbiol Lake 80-97
2 Black Sea 82-84
3 C1 catcbement 7-21
4 ~catchment Bgd-8
5 ~catchment Bgd-6
6 Lower aquifer Bgd (water flow)
Considering the high values recorded in the lake and the areal dispersion of the wells with 3H contents within the intakes, it has become obvious that there is a penetration of the lake water into the underground due to the high withdrawal rates (Fig. 10). It was even possible to reveal the extension of this influence area for various moments of time, the study being continued over an eight-year period (DAVIDESCU, 1983).
A seasonal modification of the extension of the penetration area was noticed, related to the exploitation intensity which varied from 1.6 m3/s in winter to 2.6 m3/s in summer.
Based on these isotopic data and knowing the withdrawal rates of the wells, an assessment of the water quantity extracted from the lake during various time periods has been attempted.
Thus, only for July 1973 a volume of min. 0.5 mil m3 was revealed.
The calculation was carried out on the basis of the following relationship:
(Aex -Ag) ~ = Va { )
\A1 - Ag
where V stands for the water volume, A for tritium activities and l, ex, and g refer to the lake water, the water extracted by through intakes and the groundwater respectively. In the above relationship A~=O.
Conclusions
This case-study offered two important conclusions, that is:
a) The decline of the Siutghiol lake level was not associated to the decrease in the ground water supply toward the lake, but to the extraction from the lake, via the underground, of significant water amounts. This new conclusion has changed the

24
conceptual model prc<viously accepted for the relationships eXisting between aquifers . and surface water in the area.
b) The existence of a process by which water penetrates from the lake into the underground proves the potential vulnerability of the intakes
REFERENCES CONSTANTINEsCU, T. & TENU. A., (1973) Exem
ples d'application des isotopes du milieu dans lbydrogeologie roumaine. Meteorology and Hydrology, 2 pp. 21-31.
CONSTANTINESCU, T. & TENU, A., (1977) Solutions quantitatives en hydrologie a l'aide du tritium naturel. (in Romanian). Hidrotehnica 22, pp. 39-43.
DAVIDESCU, F., D. (1981) New aspects regarding the relationships between the different water types in the Siutghiol zone, supplied by tritium. (in Romanian). Hidrotehnica, 26. 9, PP.· 261-264.
DAVIDESCU, F., D., TENU, A. & SLA VESCU, A., (1983) Considerations regarding the main recharging components of Eocen-Sarmatian aquifer in the Techirghiol zone. (in. Romanian). St. Cercet. IMH, Hidrogeologie, L, pp. 205-216.
DA VIDESCU, F., D., TENU, A. & SIA VESCU, A. (1991) Environmental isotopes in karst hydrology. A lay-out of problems with exemplifications in Romania. Theor. & Appl. Karstology, 4, pp. 77-86.
DINCER, T. & DAVIS, G., H. (1977) Some considerations on tritium dating and the estimates · of tritium input function. Mem. Congress Istanbul, JAH, pp. 276-286.
TENU, A. (1975) Hydrogeological complex studies on thermal waters, from Felix-1 Mai Spa. (in Romanian). Studii de Hidrogeol., IMH, pp. 75-132.
TENU, A. (1981) The hyperthermal waters of northwest of Romania. (in Romanian). Ed. Acad., 208 p. .
TENU, A. (1987) Tracer investigations in geothermal systems. in Modem trends in tracer hydrology, ll, (GASPAR, E., Ed.), CRC-Press Inc., Boca Raton, Florida, pp.95-131.
TENU, A. & DAVIDESCU, F. (1993) Relations entre le lac Techirghiol (Dobroudja de Sud, Romania) et les aquiferes adjacents. The or. Appl. Karst., 6, pp. 163-174.
TENU, A., NOTO, P., CORTECCI, G. & NUTI, S. (1975) Environmental isotopic study of the Barremian-Jurassic . aquifer in South Dobrogea (Romania) Journal of Hydrology 26, pp. 185-198.
TENU, A., CONSTANTINESCU. T., DAVIDESCU, F., D., NUTI, S., NOTO, P. & SQUARCI, P. (1981) Research on the thermal waters of the Western Plain of Romania. Geothennics, 10, pp. 1-28.
~ . .. A. fenu & F. J)apidelcu
areas, especially under the ·hydrodynamic conditions created by the swnmer intense exploitation. This very important conclusion has practically imposed severe measures for zonal protection in view of a proper water preservation.
TENU. A., DAVIDESCU, F. & SLAVESCU, A. (1983) Quelques conclusions d'hydrogeologie isotopique de la Dobrogea du Sud. An. lnst. Geol. Geophys., 63, pp. 257-264.
TENU, A., DAVIDESCU, F., & CUNESCU, M. (1992) Determination of the turnover time in a karstic hydrostructure by means of tritium. Bull. A.H.R., 1, pp.43-48.
TENlJ, A., SLAVESCU, A. & DAVIDESCU, F., D. (1989) Level and evolution of the tritium concentrations in the natural waters of Romania. Meteorology and Hydrology, Special Report, pp. 41-48.
TENU, A., SLAVESCU, A. & DAVIDESCU, F., (1991) Application of · environmental isotope methods to the study of Domogled hydrostructure (Romania). Use of Isotope Techniques in Water Resources Development, I.A.E.A., Vienna,pp. 701-703.
TENlJ, A., DAVIDESCU, F., MUSSI, M., SQUARCI, P. & VAMVU, V. (1994a) Hydrodynamic and genetic aspects from central part of V alachian Platform. Proc. Intern. Hydrogeol. Symp., Constantzt;J-Romania, pp. 536-556.
TENU. A., DA VIDESCU, F., SIMIONA~. S., EICHINGER; L., BERTLEFF, B., MICHEL, W., SECARA, E., CARADIMA, Z. & PITU, N., (1994b) Assessment of the pollution impact on the groundwaters quality in . South Dobrogea. Proc. Intern. Hydrogeol. Symp., Constantz!JRomania, pp. 557-571.
TENU, A., DAVIDESCU, F., MUSSI, M., SQUARCI, P. & VAMVU, V. (in press, a) A low enthalpy geothermal system in the Moesian Platform. Proc. of World Geothermal Congress, Firenze, Italy, May, 1995.
TENU, A., DAVIDESCU, F., SIMIONA~. S., EICHINGER, L., VOERKELIUS, S., MICHAEL, W. & BER'iLEFF, B., (in press, b) Isotopic investigations of a possible groundwater pollution in the karstic system from South Dobrogea. Proc. l.A.E.A. Symp. "Isotopes in Water Resources Management", Vienna, March. 1995.
TENU, A., DA VIDESCU, F., D., SLAVESCU, A. & COHUT, I. (in press, c) Some considerations on isotopic basis regarding the evolution of hydrogeothermal system Oradea-Brule Felix. (in romanian), Studii Tehn. Econ., E, 16.
YURTSEVER, Y. (i983) Models for tracer data analysis. In Guidebook on N_uclear Techniques in Hydrology, Technical Reports, Series 91, IAEA, pp. 381-402.

TAK ARTICLES
Uranium Series Dating of.some Speleothems from Romania
' ..
Stein-Erik LAURITZEN1 & Bogdan-Petronlu ONAC2
ABSTRACT
In order to test the potential for Uranium-series disequilibrium dating of speleothems in Romania, nine dating . analyses were perfonned on eight samples from various caves in Apuseni Mountains and Dobrogea. Low to moderate uranium concentrations, good chemical yields, and few samples with significant 23'Th contamination, provided reliable data in most cases. The dates range between 22 kyr up to 188 kyr, which is in general accordance with speleotheme chronozones known from other areas, and with known periods of ameliorated climates during the upper Pleistocene. These preliminary dates also provide erosion rate estimates for fluvial valley incision of 0.5 to 0.6 mlkyr in the Crisul Repede basin. Attempts to date a hominid footprint from Virtop Glacier cave, suggest so far a maximum age of about 22 kyr.
: Key words: Uffh dating, speleothems, Romania.
DATATION AU MOYEN DU DESEQUILIBRE DES SERIES D'URANIUM DE QUELQUES SPELEOTHEMES DE ROUMANIE
RESUME
Afin de tester le potentiel de datation au moyen du desequilibre des series d'uranium des speleothemes de Roumanie, neuf dates ont ere obtenues sur huit echantillons provenant de differentes grottes des Monts Apuseni et de Dobrogea. Etant donne les concentrations faibles jusqu'a moderees de /'uranium et le peu d'echantillons contamines significativement avec 232Th, les resultats sont consideres comme dignes de confiance dans Ia plupart des cas. Les datations se situent entre 22 lea et 188 lea, intervalle de temps qui est concordant avec les chronozones des speleothemes d'autres regions et avec les periodes connues d'ameliorations climatiques durant le Pleistocene superieur. Ces datations pre/imina ires foumissent aussi des estimations pour le taux d'erosion des vallees fluviLltiles de l'ordre de 0,5-0,6 m/ka dans le bassin de Criful Repede. Les essais de dater une empreinte de pied humain de Ia Grotte du Glacier de Vllrtop (VTP) ont indique pour /'instant un llge maximum d'environ 22 lea.
Mots cles: datation U/Ih, speleothemes, Roumanie.
INTRODUCTION
About 2% of the land surface in Romania consist of karst (Fig. 1), containing more than 12,000 known caves (ONAC & COCEAN, 1994). Most Romanian caves are well-decorated with speleothems, which, apart from having great aesthetic value, are in many cases situated within important stratigraphic and geomorphological contexts. Several caves contain paleolithic remains, that so far
only have been dated by means of 14C dating methods (CAACIUMARU, 1980; PAUNESCU, 1989). This method has also been applied to speleothems, but due to ambiguous correction factors for dead carbon, such results are not easily interpreted (fENU & DAVIDESCU, 1991; HOLMGREN et al., 1994). Caves and cave deposits are also important tools for the study of past environmental changes (LAURTIZEN, 1993b). The geographical position

26
0 SOkm
of Romania, which is located far south of the maximum limits of the Pleistocene ice sheets, make speleotheme dating especially interesting from a paleoclimatological view. We may expect speleotheme growth to become more continuous in time through glacial cycles than in the northern latitudes, where the close proximity of glaciers interrupted speleotheme deposition (LAURTIZEN 1993, 1995).
Uranium-series dating of speleothems proved to be a powerful tool for the earth sciences and for archaeology (IV ANOVICH & HARMON, 1992). The method has a practical time-resolution up to 350 kyr. Using a -particle counting techniques, ages of 100 kyr may be detennined with 5% error or less. The recently developed Thermal Ionization
S.-E. Lauritzen & B.-P. Onac
~ 0 ('
0
Mass Spectrometry (TIMS) technique may determine isotopic ratios with much higher accuracy, in practice extending the resolution of U-series dates to 500 kyr with a precision that is an order of magnitude better than a-particle counting (CHEN et al., 1992). The purpose of this paper is to present a first survey of uraniwn-series dating of speleothems from Romania, using a-particle counting. Our aim was to assess various geographic and geomorphological settings, with respect to Uranium content and dating suitability.

Uranium series dating of some speleothems from Romania 27
1 I '?
0 20m -Ocm
X }(X X X X X X XX X XX X X X X X X X
X=guano 1 XX XX -10
2 ~-r-7.,..___ -20 3 ~-- -30
4a -40
-50 4b . ·o 5
...... 6a -60
-70 .,
(lJ
-80 6b 0 ()
0 c -90
~---------------·----------------------·-----------------------~
GEOLOGICAL AND GEOMORPHOLOGICAL SEITING
In Central Dobrogea, a syncline-incased karst is well developed on Jurassic limestones especially along the Casimcea valley (BLEAHU, 1982). The Pe§tera Liliecilor (Bats cave) de Ia Gura Dobrogei (GD, a in Fig. 1), is a fossil cave with two galleries (Fig. 2); both galleries contain important guano deposits (Galeria cu Fosile), fossils and ceramics ( Galeria cu Ceramic([).
GheJarul (Glacier) Vdrtop (VTP, bin Fig. 1), is a 340 m long, fossil cave situated in the OcoaleScarisoara high karst plateau at 1170 m asl.
(BLEAHU & VIE~. 1963). Due to ventilation effects (RACOVff A, 1975), (WIGLEY & BROWN, 1976), perennial ice formations (icicle speleothems) occur in the entrance series, which is situated 170m above the valley floor. In 1974, a new chamber, which previously had been closed behind a massive stalagmite barrier, was opened and found to contain some plant litter (leaves) and 3 human footprints which were stamped into a now hardened flowstone mass (VIEHMANN, 1987) (Fig. 3). One of them is complete, and was removed together with the flowstone floor into which it was impressed, being now kept in the "Emil Racovita" Speological Institute in Cluj. The plant litter suggests that at the time the chamber

28 S.-E. Lauritzen & B.-P. OIUIC
0 1020 30m
Sola Minunilor
---Steps Room VTP 1+2
Entrance Bteahu, M., Viehmann,l.,1963
was entered by man another, now closed, entrance existed in close proximity.
Pe~tera U71ilor (Bears Cave) (URS, gin Fig. I) is the most important show cave in Romania. It is well decorated with various speleothems and contain a huge deposit of cave bear (Ursus spelaeus) remains. 'The cave is situated in the westernmost part of the Apuseni Mountains, at an altitude of 489 m asl. It was accidentally discovered in a marble quany.
Pe~tera Lithophagus (LFG, c in Fig. 1), is situated in the slopes of the Iada valley (545 m asl.). The cave has no natural ent.raitce, being opened as a
result of bauxite mining. The cave display impressive quantities of clay fills and various types of aragonitic and calcitic speleothems.
Pe~tera Vt2ntului (Wind Cave) (SCS, din Fig. 1) is located in the northern part of Pldurea Craiului Mountains, and it is the largest cave system in Romania (>45 km total length). The cave, situated only about 20 m above the river, is developed along four distinct floors; the lower one carries a stream (SZILAGYI et al., 1979). Pe§tera de Ia Vadu Crllului (VC, e in Fig. 1), is a tourist cave situated close to Vantului cave, having its entrance at 305 m a.s.l. and 20 m

Uranium series dating of some speleothems from Romania 29
0 10cm l:::::==::!::::=:::;t

30
above the streambed of the nearby Cri§ul Repede river. The cave is one km long having a lower stream passage and a dry upper floor (VIEHMANN et al., 1964 ).
Pe§tera Gal~eni (GLS, fin Fig. 1), situated close to the previous two, is about 3,500 m long and is well decorated with speleothems. The cave has a large deposit of bat guano.
The last four caves are located in Plldurea Craiului Mountains, which is one of the most important karstic areas of Romania. The karst rocks consist of middle Triassic thin-bedded limestones, and of Jurassic-Cretaceous massive limestones (RUSU, 1988).
SAMPLE DESCRIPTION
· GD. During a stratigraphic excavation into the cave (RADULESCO & SAMSON, 1976), a broken stalactite (36 em· long and 10 em thick) was collected in layer 4b within a total stratigraphy of 95 em, covering 6 different layers (Fig. 2).
Apart from the uppermost level (layer 1), which is a Holocene guano deposit, all the others are a siltlike sediment having yellowish-red to brown color (RADULESCO & SAMSON, 1976). The color differences are due to a variable content of clastic material (limestone).
Layer 4b (with the stalactite) has a high clastic content, and unconformably lies over the layers 5 and 6. The hatched zones from layers 3 and 6a are rich in manganese oxides.
The micromammal association in layer 4b is very similar to the Mosbach-2 fauna (KOENIGSW ALD & TOBIEN, 1987), which had been dated by K/Ar method to about 600 kyr (FORSTEN, 1991). On the other hand, ZAGWUN (1992) assigns the same fauna elements to 350-400 kyr.
VTP. A 20 mm thick slice was cut from the side of the 12 em thick footprint slab. This subsample was divided into an · upper and lower fraction A and B (see Fig. 4). The samples were taken from a tlowstone or hardened moonmilk deposit, 12 em thick. into which the human footprint was impressed while the surface of the mass was still soft (Fig. 4).
URS. The lower part of a transparent crystalline stalagmite ( 43 em high) which was removed from its place when the cave was adapted for tourism. has been analyzed.
LFG. The sample, an almost transparent macrocrystalline stalagmite (about 35 em high), grew on a large breakdown block, located in the median
S.-E. lAuritzen & B.-P. Onae
part of the cave. The lowest 2 em (bottom) . was selected for dating (Fig. 3a). · ·
·~~ '·.
SCS. The sample, a brown macrocrystalline stalagmite (47 em high), was collected in the socalled "1st of May" gallery from the 2nd floor of V~tului cave. The basal 2 em layer was selected for dating (Fig. 3b ). The sampling site is a well decorated gallery which receives a considerable amount ·i>f seepage water, as it is situated quite close to the surface . • Microclimatic investigations have shown that the temperature of this gallery is fairly constant at 10.6°C (ONAC & RACOVffA, 1992).
VC. Two pieces of flowstone (5 respectively 9 em thick) were collected respectively from the lower and upper floors of the cave, at about 200 m and
·· · 50 m from the cave entrance. The samples covered the passage wall, 1.5 m and about 35 em above the floor level. Both samples cqnsist of layered flowstone with alternating compact and porous zones. The color varies from white to yellowish-brown. The two samples were collected about 200 m from the cave entrance, in a place where there is insignificant ventilation (RACOVITA & CRACIUN, 1970).
GLS sample, a 3.5 em thick flowstone, was collected in the "Bats Room" (Fig. 3c ), close to a place with abundant water seepage. The sample is of light color, and is quite porous, with two compact calcite intercalations.
ANALYTICAL PROCEDURE
Subsamples (26-112 g) were cut out of stratigraphically distinct levels in each speleotheme, cleaned by short immersion in dilute hydrochloric acid and dried. The samples (lumps) were covered with distilled water, added spike, and dissolved by successive addition of cone. HN03•
Organic contaminants (i.e . . humic matter) were oxidized by repetitive treatments with H20 2 in strong, boiling HN03• U and Th nuclides were preconcentrated by scavenger precipitation on Fe(OH)3• The scavenger was removed by ether extraction in 9M HCl, and finally, U and Th were separated by means of ion exchange chromatography (Dowex lx8 in 9M HCL, then 0.1 M HCI). The Th fraction was separated from Ca, Ra, etc., by another ion exchange step (Dowex lx8 in 8M HN03, then 0.1 M HCl). After further purification steps, U and Th were electroplated onto stainless steel disks and counted for alpha particle activity in vacuo. A commercial 22BrJn/232U spike was used as an internal standard to correct for chemical yields.

Uranium series dating of some speleothems from Romania
DATA PROCESSING
Raw counts were corrected for background and delay time between separation of U and Th nuclides, and the · age finally calculated from 23'1:bf34U and 234U/23SU activity ratios, using the algorithms of IV ANOVICH & HARMON (1982; 1992), implemented in Turbo Pascal code (LAURITZEN, 1993). Since the time in this radiogenic system is a function of two motherdaughter equilibrium (i.e. 234UP8U and 230Th/ 234U), the age can only be expressed implicitly, and
. solved by iteration, see eqn (1). Errors in the re
. suiting radiometric ages are given as 1cr and are based on counting statistics only (see eqn. (1)).
23oTh 238u
(1) ~ ... 234[1- exp(-A.23ot )1+ u u 'J
· In the case of detrital 23~ contamination, sufficient initial 23~ is present to corrupt the requirements for initial conditions of (230Th/234U)0 = = 0.0. The contamination can be monitored through the indeJ:., 230Th/232Th, because the allogenic, detrital 23~ contamination is always accompanied by the "common" Th isotope 232Th. The contamination can be tolerated if the index is ~ 20. Otherwise, the age becomes too high, and must be corrected for by various means. Here, correction was performed by using the equation suggested by (SCHW ARCZ, 1980), where the lefthand side of eqn (1) is replaced with:
(2) 230Th 232Th
234 -~ 80 exp(-A.230 t) u u
The input correction factor (B0) is the initial 230Th/23~ ratio. B0 is often assumed equal to 1.5, which is based on numerous analyses of soils and detritus (IV ANOVICH & HARMON, 1992). However, since B0 will vary from site to site, a better approach would be to analyze the local cave detritus, or the insoluble residue from dirty speleothems, and from them derive a local B0. As there is no such data yet available for the Romanian karst, we stuck to the value of 1.5. See also IV ANOVICH & HARMON (1992) for further discussion of contaminated calcite.
31
DISCUSSION
Tree preparations (Lab no. 497, 498 and 500, Table 1) suffered from low U yields ( < 30% ), probably due to the presence of humics which were insufficiently oxidized. Because low chemical yields result in lower radiometric yields, these analyses have larger error intervals (la) than the other dates. For the remaining samples, chemical yields were moderate to high, and all spectra were well resolved, yielding reliable dates. The results are listed in Table I. Other three samples displayed significant detrital Th contamination, where correction reduced the corresponding ages by 11 to 37% (fable 1).
A) INDIVIDUAL SAMPLES
GD. 'This sample, which is a stalactite, is dense and macrocrystalline, although it contains several thin, brown growth layers due to periodical deposition of clay. 'This may be the reason why the sample suffered from detrital ~ contamination, which yielded a corrected age of 67 k:yr. The result is very surprising and controversial, considering the previous biostratigraphic correlation to 350-400 k:yr. Although we have no reason to doubt the provenance of the sample, the high quality of the speleotheme contrasts the strongly corroded limestone clasts found in the same layer.
VTP 1 (Footprint Flowstone). In total, four dates have been performed on various subsamples of this specimen (Fig. 4). The first subsample is the top layer of a stalagmite which grew together with the soft flowstone mass. The growth layers representing this subsample can be traced laterally into the flowstone mass only one centimeter below the top surface into which the footprint was made (VTP 1, Lab no. 490). The second sample (VTP 2 - Lab no. 503) covered the remaining base of the slab. Yet another two more subsamples were taken from the hardened moonmilk surface (VTP 3, Lab. No. 809), and from the base of the slab, at the side of the stalagmitic structure (VTP 4, Lab. No. 810). These two samples, representing top and base of the porous, hardened moonrnilk mass, were highly cont.aminated with 230Th, and no meaningful age could be calculated by using B0 = 1.5. The only way to tackle this problem, is to collect more data and perform an isochron plot (IV ANOVICH & HARMON, 1992) to correct for the 230Th contamination.
3 C. RADUI...ESCU,pers. comm., 1995

32 '·· S.-E. lAuritzen & B.-P. OIUIC
:: ~ . :=:·· '/]] · 'mm "'""""''-~', . ·.··· .. ·:: l ':::<::(:i•
. ''·::•:::::;• ,, ~;:: : ::; .:::: 1 :::!~1'ii·F . :: ·> 10~ . . . :lJl billi:]j jj¢. ~:=;: ,: ::: ::::T:ffi:.,:: .. ~tAJ,.,.t;tA .h> +2.41 +2.64
GD ~
489 0.22 1.35 0.516 9.4 75.9 67.12 stratigraphy .
Footprint in VTP flowstone, (1)
490' 0.12 1.49 0.188 ..
top layer
VTP Ditto, (2)
503 0.02 2.32 0.927 base layer
scs Stalagmite on 491 0.09 1.71 0.273
bedrock
vc Flowstone- 1 497 0.14 1.59 0.281
V't Flowstone- 2 811 0.13 .: 1.87 0.293
GLS Flowstone 498 0.11 ·1.85 0.379
LFG Stalagmite on
500 2.5 1.07 0.740 block
"'· -· URS ~ 812 0.05 1.35 0.324 base
The 3 subsamples (VTP 2-4) display rather low U concentrations (0.02-{).03 ppm), which is quite similar to other moonmilk deposits, like those in Norway (LAURITZEN, unpublished); This is almost at the detection limit of the a-counting technique, which in tum result in ,verj large analytical errors (Table 1). · ·
In contrast, the upper sample of the stalagmite (490) is purer and more massive than the surrounding, hardened moonmilk: mass. It contains six times more U, and negligible 23o.rb contamination. This produced an age that is well within the limits of reliable detennination. The age (22.4 ± 4.2 kyr) may, according to the stratigraphic position of the stalagmite, be taken as slightly older or equal to the footprint itself.
The four subsarnples are quite different, both with respect to age, U-content, 234Uf231U, and Th contamination. The lower (corrected) age of 118 kyr, may represent the last interglacial thermomer, and suggests that most of the depoSit might have gro'wn during that period. The local environment ·
-2.37 -2.59
+4.21 >1000 22.4
-4.06
2.3 187.7 +29.4
118.7 +41.0
-24.2 -37.5
4.8 33.8 +3.24 24.6
+4.07
-3.16 -4.00
>1000 35.2 +12.5
-11.4
>1000 36.67 +2.50
-2.45
>1000 . 49.7 +13.9
-12.6
>1000 142.5 +14.4
:
-12.6
: +3.36 >1000 41.79
-3.27
had a detrital content high enough to contaminate the precipitated calcite.
However, it must be borne in mind that the porous nature of the material makes itsfar from ideal for dating. Even· if most of the carbonate was in place at the time of impact, the mass was still saturated
. with water and soft. It is quite unlikely that it · might have acted as an isotopically closed system before it dried up and hardened, so the dates. are in part related to the final hardening of the flowstonelmoonmilk mass. The more massive fabric of the stalagmite top (VTP 1) would be somewhat less sensitive to this effect.
In conclusion, the footprint is definitely younger than the higher age of 118 ± 41/37 kyr. Please note that the lower 10' error limit includes 77 kyr. Also, the footprintis probably contemporaneous with the stalagmite age of 22.4 ± 4,2 kyr. However, the two other, highly contaminated samples are disturbing, and further dates should be done before any final conclusions are drawn on the age of the deposit.

,~ .
Uranium series dating of some speleothems from Romania
1--•----l 1--•___, 1- • -l
33
a) 1- • -l ~ · -~ r----------·----------~
3 Cl)
Ill ..... ~
"'0 2 4-< 0 1-< Ill
.D E :::I z
0 10
8
;>., u 6 c Ill :::I 0"
4 v ..... t.L..
2
0
-
-
-
-
I I I
20
,. , l • l
I I I
40
r--
I I I
60 I I I
80
It is interesting to note that, if the lower age is reasonably correct, the footprint may be within the range of the 14C method, and comparison with other, radiocarbon dated cultural remains within or in the vicinity of the cave would be worthwhile. Although 14C dating of speleotheme calcite is problematic, due to an unknown dead-carbon dilution factor and residence time of the 14C prior to deposition, a radiocarbon date would at least provide a minimum age. For comparison with other archaeological deposits, the recent intercalibration between 14C-years and calendar years, which is very close to 230Th years (BARD et al., 1990),
,---
I I I
100
Age, kyr
I I I
120
~----·~
-
I I I
140 I I I
160 I I I
180
'b)
c)
I I· 200
implies that the U-series age quoted here, should correspond to a 14C age of 26.3 ± 4.2 kyr.
URS. In spite of a relatively low content (0.05 ppm), gave a reliable date of 42± 3.3 kyr.
LFG. This was an almost transparent, macrocrystalline stalagmite, possessing a high U content. The date suggests that the sample grew during the
.last Interglaciation. The age of this sample overlaps with the lower, corrected date of the footprint flowstone (VTP 2).

34
900
.5. UJ 0 ::::> I-
5 <X:
500
500
E . w 0 ::::> f-
5 <X:
300
NE
0
w
0
sw
400 800 OISTANCE(m)
1 2 3 DlSTANCE(I<m)
SCS. The sample suffered from detrital 230Th contamination, and yielded a corrected age of 25 kyr.
VC. The sample gave a reliable age, but with a relatively high error.
GLS. The sample gave an analytically reliable date of 50 kyr, but with a large error.
COLLECTIVE PROPERTIES OF THE DATES .
Although the data set so far is quite small {9), it may be worthwhile discussing the distribution of the ages in time and with respect to Pleistocene climate. This can be done by plotting the dates in a histogram, or by using a Gaussian probability approach. As radiometric ages are based on exponential relationships (i.e. first-order processes), the error intervals are unsymmetrical and increase (exponentially) with age. Plotting age distributions in histograms with constant class size would therefore be misleading, high ages will appear with too high precision, and younger (precise) ages may . become grouped into intervals that are too large to ' · pay justice to the resolution. Therefore, ages
S.-E. Lauritzen & B ... P. Onoc
should be transformed into continuous PDF functions and plotted as such (GORDON et al., 1989), yielding a much more realistic picture of significance levels. This is done in Fig. 6, where all data (n = 9) are shown.
Maxima in the speleotheme growth occur at -23 kyr (two samples), -40 kyr (three samples), -68 kyr (one sample) and -140 kyr (one sample). The large error of the VTP sample {Lab No. 503, at 118 kyr) suppresses its significance in the diagram. As discussed above, the oldest growth interval of 140-90 kyr is compatible with the last interglacial (sensu lato) or oxygen isotope stage 5 as it is expressed in the speleotheme record (GORDON et al., 1989). The higher age of 142 kyr is in good · agreement with high latitude data from Norway (LAURITZEN, 1990), NE Europe (BAKER et al., 1993), and also with the controversial Devil's Hole vein calcite in USA (WINOGRAD et al., 1988). The remaining ages are also acceptable within the known framework of speleotheme growth intervals, although the two samples of 22 and 24 kyr grew at a time when, for instance, the Scandinavian ice sheets were thought to expand. However, recent studies of Greenland Ice cores (DANSGAARD et al., 1993); (BOND et al., 1993), suggests that the climate during the last 250
. kyr has been quite unstable, with numerous interstadials, also around 22 and 24 kyr. These preliminary results indicate the potential for compari-
1
sons with the local glacial chronology within Ro- ·. mania, in particular if evidence of local Carpathiati·· glaciations exists from this time-range.
EROSION RATES IN THE CRI$UL REPEDE BASIN
Because speleothems of normal shape (stalactites and stalagmites) only form in air-filled cave galleries within the vadose zone, the occurrence of a speleotheme in time and space also indicate the position of the local erosional base-level. In the cases where the water-table in caves are dictated by stream-levels in adjacent valleys, the oldest speleotheme found at a given altitude provide a · ininimum age for the corresponding position of the · adjacent base-level of erosion, i.e. the valley floor. The minimum age can then be converted into maximum valley erosion rates (FORD et al., 1981); (ATKINSON & ROWE, 1992), eqn (3).
(3)

Uranium series dating of some speleothems from Romania
1bis is done for two caves, where the position of the speleothems could be associated with a corresponding water-table controlled by the adjacent valley floor. The elevation (&!) was 66 and 21 m for Lithophagus and Vadu-Crisului cave, respectively (Fig. 7). Eqn (3) yields minimum average erosion rates through the last 40- 140 kyr of 56 to 46 mlkyr (Table 2). These minima are of the same order of magnitude, or slightly larger than glacial/interglacial erosion rates deduced in a similar way in glacial landscapes.
Lithophagus ·
(LFG)
Vadu Cri§ului
(VC)
REFERENCES
66
21
142.5 0.46
37.67 0.56
ATKINSON, T., C. & ROWE, P., J . (1992) Application of dating to denudation chronology and landscape evolution. In IV ANOVICH, M. & HARMON, R., S. (Eds.): Uraniwn-series Disequilibrium: Applications to Earth, marine and Environmental Sciences, Clarendon Press, Oxford pp. 669-703.
BAKER, A., SMART, P., L. & FORD, D., C. (1993) Northwest European paleoclimate as indicated by growth frequency variations of secondary calcite deposits. Palaeogeography, Palaeoclimatology, Palaeoecology, 100, pp. 291-301.
BLEAHU, M., D. (1972) Karst of Rumania. In HERAK, M. & STRINGFIELD, V., T. (Eds.): Karst: Important Karst Regions of the Northern Hemisphere. Elsevier, Amsterdam, pp. 341-353
BLEAHU, M. (1982) Relieful carstic. Albatros, Bucure§ti, 287 p.
BLEAHU, M. & VIEHMANN,I. (1%3) Ghetarul de Ia Virtop. Ocrotirea Naturii, 7, pp.147-152.
BOND,.G., BROECKER, W., S., JOHNSEN, S.,J., McMANUS, J., LABEYRE, J., JOUZEL, J. & BONANI, G. (1993) Correlations between climate recbrds from North Atlantic sediments and Greenland ice. Nature, 365, pp. 143-147.
CONCLUSIONS
Nine successful U-series dates were performed on Romanian speleothems, yielding Uranilim contents in the range of 0.02 to 2.5 ppm. The relatively high U-content and general low detrital Th contamination found in some areas demonstrate that very precise geochronological work is possible here. The dates cluster into mid-Weichselian interstadials, demonstrating that interesting correlations with local and regional (European) glacial history can be made when more data become available. Uranium-series dating of speleothems is also valuable for archaeology and paleobiology, as absolute dates can be provided for events like the Vartop footprint. A more systematic dating program ·on Romanian speleothems is in progress.
ACKNOWLEDGEMENTS
The authors wish to thank Dr. Costin Radulescu, Dr. Cornel Ple§a, Dr. Iosif Viehmann and Matei Vremir for providing dating samples from Liliecilor, Vadu Cri§ului, Vartop and Lithophagus caves. Grateful acknowledgments are extended to Marius MAcicl§aD who made part of the drawings. The Uranium Series dating were done at the U-series dating Laboratory at the Department of Geology, Bergen University.
CARCIUMARU, M. (1980) Mediul geografic tn Pleistocenul superior §i culturile paleolitice din Romdnia. Ed. Acad. RSR, Bucure~ti, 268 p.
CHEN, J., H., EDWARDS, R., L. & WASSERBURG, G., J. (1992) Mass spectrometry and application to uranium-series disequilibrium. In IV ANOVICH, M. & HARMON, R., S. (Eds.) Uraniwn-series Disequilibriwn: Applications to Earth, marine and Environmental Sciences, Clarendon Press, Oxford, pp. 174-206.
DANSGAARD, W., JOHNSEN, S., J., CLAUSEN, H., B., DAHL-JENSEN, D., GUNDESTRUP, N., S. HAMMER, C., U., HVIDBERG, C., S., STEFFENSEN, J., P., SVEINBORNSDOTTIR, A., E., JOUZEL, J. & BOND, G. (1993) Evidence for general instability of past climate from a 250-kyr ice-core record. Nature, 364, pp. 218- 220.
FORD, D., C., SCHWARCZ, H., P., DRAKE, J., J., HARMON, R., S. & LATHAM, A., G. (1981) Estimates of the age of the existing relief within the southern rocky mountains of Canada. Arctic and Alpine Research, 13, pp. 1-10.
FORSTEN, A. (1991) Size decrease in PleistoceneHolocene true or caballoid horses of Europe. Mammalia, SS, p. 3.
36
GORDON, D., SMART, P., L., FORD, D., C., ANDREWS, J., N., ATKINSON, · T., C., ROWE, P .• J. .& CHRISTOPHER. N., S., J. (1989) Dating of late Pleistocene interglacial and interstadial periods in the United Kingdom from speleothem growth frequency. Quatimwry Research, 31, pp. 14-26.
HOLMGREN, K., LAURITZEN, S.-E. & POSSNERT, G. (1994) ~U and 14C dating of a late Pleistocene stalagmite in Lobatse II Cave, Botswana. Quaternary Geochronology, 13, pp. 111-119.
IVANOVICH, M. & HARMON, R., S. (1982) Uraniwn Series Disequilibrium. Applications to environmental problems. Clarendon Press, 571 p.
IVANOVICH, M. & HARMON, R., S. (1992) Uraniwn-series Disequilibrium.· Applications to Earth, marine and Environmental Sciences. Clarendon Press, Oxford, 910 p.
KOENIGSW ALD, W. & TOBIEN, H. (1987) Be-. merlrungen zur Altersstellung der pleistociinen
Mosbach-Sande bei Weisbaden. Geologische Jahrbuch, 115.
LAURITZEN, S.-E. (1991) Uranium Series Dating of Speleothems: A Glacial Chronology for Nordland, Norway, for the last 600 ka. Striae, 34, pp. 127-132.
LAURITZEN, S.-E. (1993a) .. Age 4U2U". Program . for reading ADCAM energy spectra, integration peak-correction and calculation of 23'Th0riumi34Uranium ages. Departement of Geology, Bergen, 5000 lines (unpublished).
LAURITZEN, S.-E. (1993b) Natural Environmental Change in Karst: The QuatemlliY Record.
·'. Catena Supplement, 25, pp. 21-40. LAURITZEN, S.-E. (1995) High-resolution proxy
. ·1 . record during the last interglacial in Norway : .· from speleothems. Quaternary Research, 43, pp.
. 133-146. ONAC, B. & P., COCEAN, P. (1994) Une vue globale
sur le karst roumain. Kras I Speleologia, 8 (XVII), (in press).
ONAC, B., P. & RACOVffA, G. (1992) Recherches climatologiques dans la Pestem Vintului (Monts Pldurea Craiului). Theoretical and Applied Karstology, 5, pp. 167-192.
S.-E. Lauritzen & B.-P. OIUIC
PAUNESCU, A. (1989) ~ Paloolitique et le M~olitique de Roumanie. L~Anthropologie, 93, pp. 123-158.
RACOYrfA, G. (1975) La classification topoclimatique des cavit6& souterraines. Trav. Inst. S~ol. "E. Racovitza", XIV, pp. 197-216. ·
RACOVffA, G. & CRACIDN. V. (1970) Note sur le topoclimat de 1a grotte de Vadu Crisului. Trav. Inst. S~ol. "E. Racovitza", IX, pp. 61-80.
RADULESCO, C. & SAMSON, P. (1976) Sur quelques Rongeurs (Rodentia, Mammalia) du Pleistoc~ne moyen et superieur de Dobrogea (Roumanie ). Trav. Inst. Sp~ol. "E. Racovitza ", ~.pp. 171-189.
RUSU, T. (1988) Carstul din MunJii PIJdurea Craiului. Dacia, Cluj-Napoca, 254 p.
SCHW ARCZ, H., P. (1980) Absolute age determination of archaeological sites by ur&niuni dating of travertines. Archaeometry, 22, pp. 3-24.
SZILAGY, A., KOMIVES, E., NAGY, I., VARGA, A. & KEREKES, K. (1979) Pe§tera Vintului. Trav. Inst. Sp~ol. "E. Racovi11.tl", XVIII, pp. 259-266. .
'fENU, A. & DAVIDESCU, F., D. (1991) La datation par radiocarbone dans Ia recherche speloologique. Theor. Appl: Karst., 4, pp. 7-16.
VIEHMANN, I. (1987) Prehistoric human footprints in Romania's caves.Theor. Appl. Karst., 3, pp . 229-234.
VIEHMANN, I., P~A. C. & RUSU, T. (1964) Pe~era de Ia Vadu Cri§ului. Trav. Inst. S~ol. "E. Racovitza", ill, pp. 49-81.
WIGLEY, T., M., L. & BROWN, M., C. (1976) The physics of caves. In FORD, T. D. & CULLINGFORD, C., H., D. (Eds.): The Science of Speleology, Academic Press, London, pp.329-358 .
WINOGRAD, 1., J., SZABO, B .• J. & COPLEN, A. (1988) A 250,000-year Climatic Record from Great basin Vein Calcite: Implications for Mi
. lankovitch Theory. Science, 242, pp. 1275-1280.
ZAGWIJN, W., H. (1992) The beginning of the ice age in Europa and its major subdivisions. Quaternary Science Reviews 11.

uranium-Serie·s Dating of Speleothem- from Niedzwiedzia and Radochowska Caves,
Sudetes ·[Poland]
Helena HERCMAN1, Stein-Erik LAURITZEN2 & Jerzy GUZE:K1
ABSTRACT
14 new uranium series dates were performed on speleothem samples from NiedZwiedzia (Bear Cave) and Radochowska caves in the Polish Sudetes, and are presented together with other two previous dates. All samples were low in uranium concentration, inducing relatively large errors in the dates. The oldest date from
NiedZwiedzia cave (180 :t 21 ka) provides strong evidence for the antiquitY ·of the cave and for the fact that the . n . . cave was drained above the watertable as early as oxygen isotope stage 7. Dating of flowstone above the bonebearing deposits in Niedzwiedzia cave has so far been unsuccessful, and the deposits still provide an interesting geochronological challenge.
Key words: Ufl'h dating, speleothems, Poland.
DATATIONS DES SPELEOTHEMES DES GROTTES NIEDi.WIEDZIA ET RADOCHOWSKA (SUDETES, POLOGNE) A L'AIDE DES SERIES
D'URANIUM RESUME
Sont presentees, en s'ajoutant a deux datations anterieures, 14 nouvelles datations a !'aide des series de !'uranium executees sur des echantillons de speleothemes des grottes de Niediwiedzia (Grotte des Ours) et de Radochowska des Sudetes polonaises. Tous les echantillons ayant une faible concentration de l'uranium, les erreurs sont relativement grandes dans ces datations. La avaleur Ia plus elevee obtenue pour Ia grotte de Nie-
diwiedzia (180 :t u ka) est une preuve certaine de l'anciennete de cette cavite qui a ere draine au-dessus de la
nappe phreatique meme lors du stade isotopique 7. La datation du plancher stalagmitique qui recouvre les deptJts d'ossements de Niediwiedzia n'a pas donne de resultats concluants et l'dge de ces depots restent encore un deft gh)chronologique interessant.
Mots-cles: datations Ulfh; speleothe'mes, Pologne.
INTRODUCTION
Being the most resistant landfonns of an area, karst caves may contain important clues to the evolution of the surrounding landscape and to environmental changes on the surface. Radio- . metric dating of deposits in the Sudetes caves are
interest:i.Dg and important for at least the following reasons:
(a) Both1 Niedzwiedza and Radochowska caves display interesting relationships to the surface landfonns, being relict karst conduits that are now perched with respect to the present-day ··· erosional base level.

38
~,/./~ 1 • ~2 8 :...L...t.. 3
4
e 5 0
Q 6
(b) These two Sudetian caves are situated south of the limits of the continental Pleistocene gla~ ciations as they are revealed on the Polish lowland (Fig. I). Speleothem precipitation is controlled by climatic factors, the growth rate is enhanced under warm and humid condi~ tions, and inhibited under cold and dry condi~ tions. For instance, speleothem deposition is strongly inhibited in periods with permafrost, and during periods of glacial cover, the cave may become a part of the en-glacial aquifer and flooded, which will totally stop growth or even redissolve speleothems (LAURITZEN, 1993b, 1995). Therefore, the dating of speleo~ thems in this geographic position is interesting for testing previous results from Norway and
H. HerciiUln et al.
······································· ..... ...
t··~ ... fl\\ .. R .. ~.. ~l ..... r.... H ~·a·· ····· ·· ........ A ~ ·······: N S
the British Isles, where the N-S directed paleoclimatic gradient caused speleothem growth to occur in narrower time windows at higher than lower latitudes (LAURITZEN, 1993b).
(c) Both caves have both yielded a highly interesting stratigraphy with paleontological and archeological evidence (FRENZEL, 1936; BOSAK & HORACEK, 1982; WISZNIOWSKA, 1989); archeological deposits were also described by Z01Z (1937; 1939) for Radochowska ·cave. The fossil association (Ursus spelaeus, Crocuta spelaea, Myotis mystacinus, Myotis bechsteini) indicates an upper Pleistocene age, but no reliable dates have so far been assigned to the fauna remains. Therefore,

_u._ra_n_i_u_~_s_e_~_·_s_da_h_n~g~o_n~sp_e_k_o_the~~~------------------------------·------------------_:39
U-series dating of speleothems in stratigraphically relevant positions may also provide indirect dates of the bone deposits.
GEOLOGICAL AND GEOMORPHOLOGICAL
BACKGROUND
GLACIAL HISTORY
The territory of Poland has been covered by continental ice sheets several times since the beginning of the Brunhes epoch. The maximum extent of erratic boulders and till deposits reaches the Carpathian and Sudetic mountain slopes (Fig. 1). The maximum glaciation is called the Sanian glaciation and correlates with the Elsterian 2 to the West (BOWEN, 1992). No le~s than three younger and less extensive glaciations (Odranian, Warthanian and Vistulian) are preserved on the surface. The highest mountains on the southern border were also glaciated. There were at least three alpine glaciations in the Tatras (the highest mountain group in the central Carpathians) and
0 Bm ~
one prominent glaciation in the Karkonosze (the highest mountain group of the Sudetes), probably the youngest one.
GEOLOGICAL SETTING
The Sudetes represent an uplifted block of the Variscan orogen at the north-eastern slope of the Bohemian Massif in which the complicated structure of the Late Precambrian and Paleozoic metamorphic sequences outcrops. Between these metamorphic rocks, steep and fractured marble lenses occur, which have been strongly karstified. This karstification is mainly of Cainozoic age, because metamorphic rocks were submerged and covered several times· with fresh-water and marine sediments since the Late Carboniferous till the Late Cretaceous. ~e final karstification began with the Upper Cretaceous uplift and persisted to modem times. This long period of karstification encompasses many phases that are more or less clearly separated by deposits derived from marine transgresions or from Pleistocene glaciations (GLAZEK, 1989).
0
0,8 m
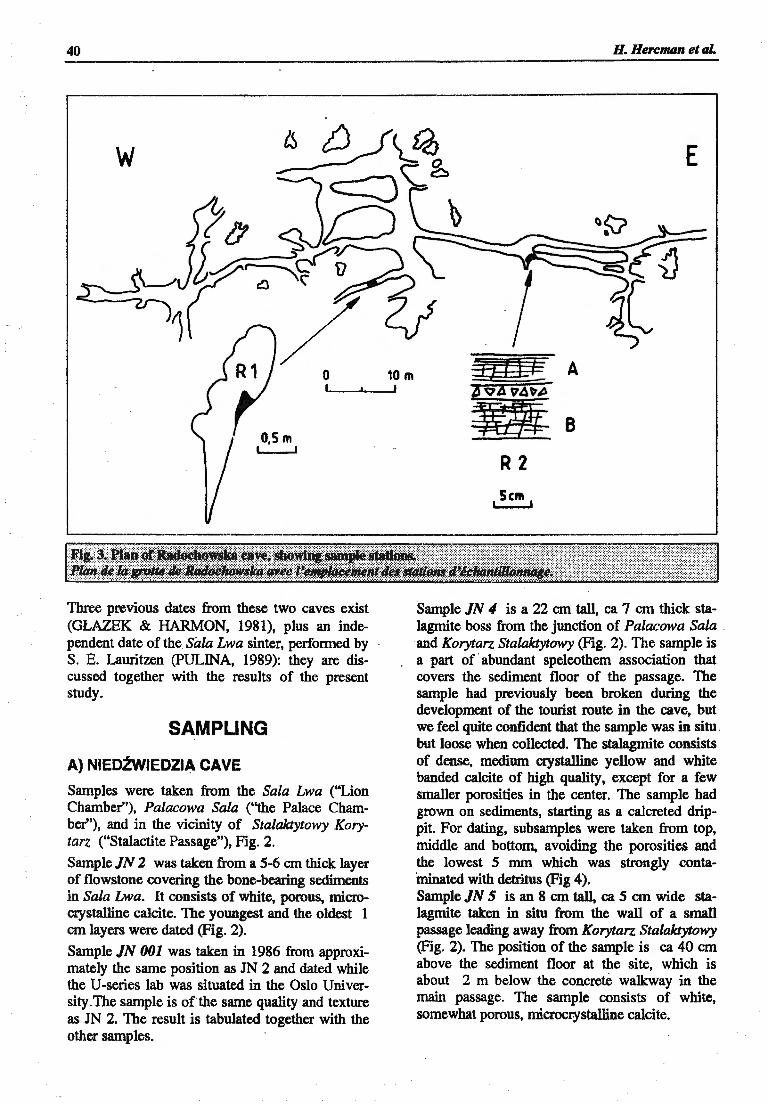
40 H. Herc11UUI et al. ---------------------------------------------------------------
0
0,5 m L--.....J
Three previous dates from these two caves exist (GLAZEK & HARMON, 1981), plus an independent date of the Sala Lwa sinter, performed by S. E. Lauritzen (PULINA, 1989): they are discussed together with the results of the present study.
SAMPLING
A) NIEDZWIEDZIA CAVE
Samples were taken from the Sala Lwa (''Lion Chamber''), Palacowa Sala ("the Palace Chamber''), and in the vicinity of Stalaktytowy Korytarz ("Stalactite Passage"), Fig. 2.
Sample JN 2 was taken from a 5-6 em thick layer of flowstone covering the bone-bearing sediments in Sala Lwa. It consists of white, porous, microcrystalline calcite. The youngest and the oldest 1 em layers were dated (Fig. 2).
Sample JN 001 was taken in 1986 from approximately the same position as JN 2 and dated while the U-series lab was situated in the Oslo University.The sample is ofthe same quality and texture as JN 2. The result is tabulated together with the other samples.
10 m m, t t A
• B
R2
1 5 em
1
Sample JN 4 is a 22 em tall, ca 7 em thick stalagmite boss from the junction of Palacowa Sala . and Korytarz Stalaktytowy (Fig. 2). The sample is a part of · abundant speleothem association that covers the sediment floor of the passage. The sample had previously been broken during the development of the tourist route in the cave, but we feel quite confident that the sample was in situ . but loose when collected. The stalagmite consists of dense, medium crystalline yellow and white banded calcite of high quality, except for a few smaller porosities in the center. The sample had grown on sediments, starting as a calcreted drippit. For dating, subsamples were taken from top, middle and bottom, avoiding the porosities and the lowest 5 mm which was strongly contalninated with detritus (Fig 4 ). Sample JN 5 is an 8 em tall, ca 5 em wide stalagmite taken in situ from the wall of a small passage leading away from Korytarz Stalaktytowy (Fig. 2). The position of the sample is ca 40 em above the sediment floor at the site, which is about 2 m below the concrete walkway in the main passage. The sample consists of white, somewhat porous, microcrystalline calcite.

Uranium-series dating on speleothems
· :< 1cm 1--------l
The youngest and oldest ca. 1 em layers were dated (Fig. 5).
B) RADOCHOWSKA CAVE
Two samples were taken in two different locations in the cave, Figure 3.
Sample Rl is a 6 em tall, 5 cui wide stalagmite, which was taken in situ on the wall of a rift-type passage (Fig. 3). It consists of: dense, microcrystalline calcite with white and yellow laminae.
· 1cm 1------1
41
+
Within the sample, there is a prominent growth band, 0.2-2.0 mm thick. The yo\ingest and oldest 1 em layers were date<i (Fig. 6). ·;,
Sampie iU .is a sequence of two flowstone layers separated by clayey .sedinients and fonns a resi-
. . _dual ledge on the passage wall, about 1.5 m ·above. the floor (Fig. 3). The two flowstone layers were sep~ted by a '1-2 em thick layer of clay containing flowstone clasts. The lowest of the two flowstones (R2b), is 5 em thick. and consists of microcrystalline, white and brown laminated
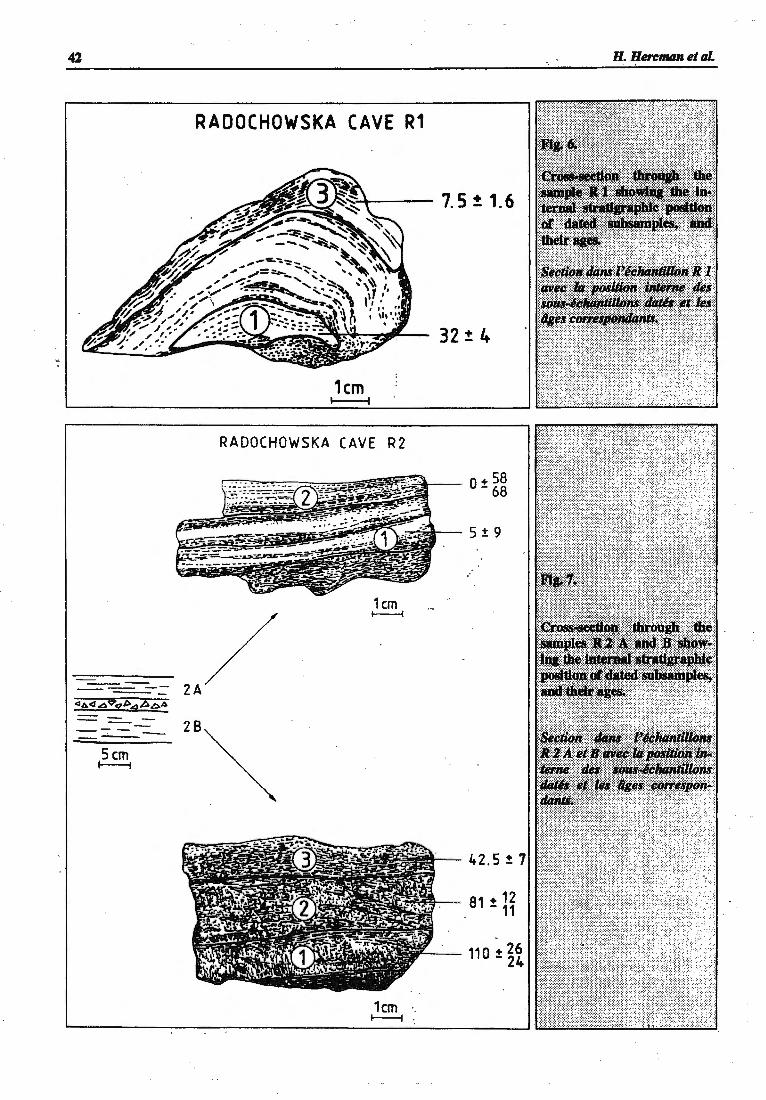
42
-------- ----- -
--Scm 1---;
RADOCHOWSKA CAVE R1
1cm ~
RADOCHOWSKA CAVE R2
28~
1cm f-----1
H. Hercman et al.
7. 5 :!: 1. 6
32 ± 4

Uranium-series dating on speleothems
flowstone calcite. Two prominent, somewhat disconform growth bands occur in the sample, and it has been divided along these horizons into three subsamples (upper, middle and lower) that were dated separately. The upper flowstone (R2a) is 3-4 em thick, consisting of laminated, white and brown calcite intercalated. with several detrital horizons (Fig. 7). For dating, the sample was split in two subsamples that included upper and lower 1 em respectively, avoiding the lowest detrital horizon.
METHODS
Uranium series disequilibrium dating of cave calcite (speleothems) is based on the fact that the part of the various daughter nuclides in the radioactive decay series of 238U are chemical elements that behave differently in the meteoric weathering system. During oxidative weathering of old, uranium-containing deposits, U isotopes are easily mobilized as (U02)
2+ (often as a carbonate com
plex), whilst Th is highly insoluble under these conditions and additionaly it is adsorbed onto clay minerals. In consequence, the percolation water which deposits calcite speleothems, will contain 238U and 234U that are essentially deprived of their daughter nuclide, 230Th. After deposition, the ingrowth of 23~ is described by the equation (1):
23o 111 23su
234 = m- (1- exp(-A.not ))+ u u
+ >...230 (1- 23
23
4
8u) 11- exp(-(>...230 - A.234 ))r) A.no - A.n4 U ~
where 230Th/234U, 238U P34U are the measured activity ratios of the nuclides in the sample, Ano and A234 are the decay constants of 23~ and 234U respectively, and t is the elapsed time in years. In this way, the 230Th/234U disequilibrium method measures the time since the mineral phase (calcite) was precipitated. However, application of the method is generally based on three assumptions:
a) The initial.conditions must be known (i.e. the sample must have been free of 230Th at the time of deposition).
b) The sample had to behave as a geochemical closed system since deposition.
c) The sample must contain sufficient U for analysis.
43
Condition a) is only satisfied if the sample is free from detrital matter. Detrital particles contain both 23~ and 2»fh, and contamination can therefore be detected by ihe appearance of the 23~ peak in the spectra. With the analytical precision that is available by means of a.-:-particle spectrometry, (which is the method used here), a contamination of up to 5% cno1'hfl~;;:: 20) has no significant effect on the resulting age of the sample and can therefore be tolerated. However, if the 2301'hf3~ index is significantly smaller than 20, the age must be corrected for the amount of 230Th that existed into the sample at t = 0. This can be done in several ways (SCHW ARCZ, 1980; IV ANOVICH & HARMON, 1982; SCHW ARCZ & LATHAM, 1989; PRZBYLOWICZ et al., 1991). In the present work, corrected ages are calculated by replacing the left-hand side of equation (1) by:
230Th 232Th (2) 234 234 Bo exp(-A.23ot)
u u where B0 represents the 2301'hf3~ ratio in the detritus at t = 0 (SCHW ARCZ 1980). Although B0 should be detennined from local detritus, an empirically based value of 1.5 is generally used for this purpose, and was also adopted here (IV ANOVICH & HARMON, 1982).
Condition b) is satisfied for non-porous, macrocrystalline speleothems, which are among the best-suited materials for dating. Condition c) is more critical, because the U-content of a speleothem is dependent on the host rock, and the percolation system above the cave. This factor can vary both between and within regions and caves. Generally, a U concentration greater than about 0.05 ppm is required for a.-particle spectrometry, but by increasing the sample mass and using longer counting times, samples with as little as 0.01 ppm U can be dated. The error that is quoted in the resulting dates is based solely on counting statistics and on the accuracy of spike calibration, and is therefore a direct function on the sample size, its U-content and the chemical yield in the analysis.
SAMPLE PREPARATION
Subsamples of 30-100 g were cleaned mechanically and by short immersion in 6M HCI. After addition of a 228TIII232U spike and a Fe carrier, the sample was dissolved in ca. 1M HN03 and filtered. After isotopic equilibration through prolonged boiling, U and Th were concentrated by scavenging on Fe(OH)3, and then separated by means of ion exchange chromatography

44
U content, Niediwiedzia Cave
1.6 1- . . ; . . . . .: . . . . . : . . • . . :. • . . . ; . . . -
.. "' 1.2 a. E 0 ..
.. .: . . . -: .... .. . · . ' .. ~ ... -:-
1- :
0.4 · .. . : ;.y .>.<-
J, ....
. I I . I I · .. ; · o~~~=uuy~~~~~~~~~~ 0 0.05 0.1 0.15 0.2 0.25 t . ...
U fnnml
(Dowex 1, 9M HCl and 8M HN03 for U and Th respectively). After further purification, the U and Th fractions were electroplated on stainless steel disks and counted for a-particle activity in vacuo on silicon barrier detectors in an Ortec Octete system for 2-4 days. The spectra were further processed by conventional algorithms (IV ANO,.. VICH & HARMON, 1982), Appendix c, implemented in the program "Age4U2U" (LAU-· RITZEN, 1993a). Errors are quoted as 1a of the mean.
RESULTS AND DISCUSSION
The results of the 14 dates performed are shown in Table 1. All samples are quite low in uranium content (Fig. 8, 9), which was in part compensated for by · using sample . of larger mass and prolonged counting times. In spite of these precautions, some of the analyses gave very large analytical errors. In addition, only four of the samples (J.No. 667; 733, 727 and 561) display acceptable levels of detrital ~ contamination (2301bf32Tb ~ 20), the remaining dates were cor
rected by eqn(2), using B0 = 1.5. The correction procedure increases the error, therefore three dates (J.No. 757 and 543, and also J.No. 727 which had low chemical yield), gave la errors larger than the age itself and are therefore meaningless.
" ..
H. Hercman et al.
U content, RadochowskG CGve
3~~~~~~~~~TITITITITjiiiiiiii"Tj llllllllljlllilll1-l ~ . .
2. 5 ._ ... ~ . . 1- . : ... .. ; .... ~· ..... : .... -
1- .
2._ ..... . • •.••• : • •• • : .••. ·:· 0. · -- : ... .
1- . 1- :
; 1. 5 - . . . . . . 1- . :· . . . . : . . . . -: . . . . . :- . . . ~ " . -0
~ .. D E
" c
1- .
1- · ·· · · I'"' · .., . F .... · • ~~- 1- 1- . 1-~~- 1- 1- . 1-
0.5- ... . ·.· ... ·.· .. · -
0 I I ' I 0 0.05 0.1 0.15 0.2 0.25
U (ooml
NIEDZWIEDZIA CAVE
The large stalagmite (JN-4) gave .. reliable ~d reasonably precise dates for the top (3) and IDlddle (2) layers. Significant detrital Th con~ation was present in the basal (1) sample, which by correction changed from 31 to 26 ka. The choice of B0 is somewhat arbitrary, but, due to the principle of stratigraphic superimposition, the basal age is in any case greater than the age of the middle layer (19±3 ka), which suggests that the choice of B0 is reasonable. The age/stratigraphy plot of Fig. 10 suggests an average growth rate of 12±1 mmlka. Extrapolation of the regression line to stratigraphic top and bottom, indicate that the stalagmite started to grow a:t 30.5±3 ka, and continued until 10±2 ka. Except for the dense white and brownish lamination, the stalagmite does not reveal any major hiatus along its entire· growth axis. It therefore appears that the speleothem grew without interruption during this interval. The stalagmite (JN5), which was a quite porous, low uranium specimen. which also displayed significant detrital Th contamination, yielded low precision dates. Growth commenced prior to 26±8 ka and was halted after 16±5.5 ka. · The result is in general agreement with the larger stalagmite (JN4).

Uranium-series dating on speleothems 45
sample •. IJ:tB • Ocone. . · · 234tJi238tF 2301'bl~)1' 2.3.i)Tll/liJ4tF i\$e:tk8> .. .:•: :·corrected
N()' • .JN()i • (ppfu) •••... ::-·: .:; :.:::::::: :; :: ;: •• • • •••••
·· ·~~3@ij . ·--- · ... . ... . •:::
JN413 667 0.13 1.27 ± 0.04 29.5 0.11 ± 0.02 12.0 ± 2.0
JN412 733 0.07 1.45 ± 0.07 21.0 0.16 ± 0.02 19.0 ± 3.<1
JN 4/1 702 0.06 1.84 ± 0.09 8.1 0.25 ± 0.03 31.0 ± 3.5 26.0 ±4.0
JN 5/2 713 0.02 4.75 ± 0.52 7.0 0.17 ± 0.04 20.0 ± 4.5 16.0 ± 5.5
+6.5 +8.0 JN 5/1 682 0.01 2.17 ± 0.20 5.0 0.28 ± 0.05 35.0 26.0
-6.0 -7.5 +41.5 +43
JH001 162 0.40 1.40 ±0.26 11.1 0.78 ± 0.1 47.3 139.0 -30.9 -32
m +171 +229 JN2/1 0.04 1.20 ± 0.09 1.8 0.72 ± 0.27 32 30
-67 -800 ~ +168
JN2/2 727 0.02 1.64 ± 0.13 100.0 0.22± 0.69 27 ~
-69 R 588 0.13 1.22± 0.04 4.5 0.10± 0.01 11.1 ± 1.2 7.5 ± 1.6
1/3 R
561 0.18 1.72 ± 0.05 100.0 0.26 ± 0.03 32.0± 4.0 1/1
R +19 +26
545 0.08 1.50 ± 0.07 2.4 0.87 ± 0.04 80 110 2B/1 -17 -24
R +10 +12
560 0.09 1.33 ± 0.05 5.1 0.62± 0.04 01 81 2B/2 -9 -11
R 593 0.07 1.44 ± 0.06 2.8 0.51 ± 0.03 75.0 ± 5 42.5 ± 7.0
2B/3 R
579 0.10 1.52 ± 0.06 1.6 0.50± 0.03 71.0 ± 4.5 5.0±9.0 2A/1
R +27 +58
2Al2 543 0.08 1.15 ± O.Dl 1.5 0.85 ± 0.05 88 0
-22 -68
1 N-Niedzwiedzia Cave; R-Radochowska Cave 2 ULB-Uranium Series Dating Laboratory, Bergen. 3 Corrected by using eqn(2) and B0 = 1.5 · (SCHW ARCZ, 1980).
B!~~~~~~1ilff¥-~~~~¥~1ri1Jfi•ani~~·Y•··•••••••·••··•····•······ ··· ............ ·.····.···· ·············· .······· .. <I .... · ......... ····· .... ··.·.··· •..•.•...... Cave Location . · .. ·.; .Material . Age(ka) Reference ,
Kalcytowy Patak Internal part stalactite
of 180 +21
GLAZEK, 1986 Niedzwiedzia · -17
Radochowska Stalagmite 63 ATKINSON 19851
-90
1 Personal communication to J. Glazek 1985.

46
.. 0 .0
E 0
~ 100 ;-
~ f-
~ so ~ . .
~
Growth rate diagram of sample JH 4~93
Niedivicdzio Cave
. . . · .. ... : . . ..
10 20 30 40 Age lkal
The fossiliferous sediment sections in Sala Lwa is perhaps the most interesting targets for chronometry in the cave. According to Murphy's law, the speleothems from this site are of the worst possible quality, they are porous, have very low uranium content and display large detrital contamination. Neither of the two dating attempts . performed on sample JN2 gave meaningful results (fable 1).
Yet another date was performed by (GLAZEK & HARMON, 1981; GLAZEK, 1986) on a stalactite from the lower levels of the cave (fable 2). This was a stalactite that displayed two distinct phases of growth. The inner, older zone was dated, avoiding the young central channel of the stalactite. The date (180± ka) is interesting, since so far the only date that testifies to the great antiquity of the cave. ·
RADOCHOWSKA CAVE
The small stalagmite (R1) gave an uncontaminated date at the base of 32.0±4.0 ka, whilst the top subsample dated, after correction, to 11.1±1.2 ka. This is a long growth interval, which is continuous.
The lower part of the composite flowstone sequence (R2b) dated at the base (1) to
. 21 110.0 ± 17 ka. the middle to 81 ± 11, and the top
layer to 42.5±7 ka. The detrital contamination
.. .. " E 0
E E
H. Hercman et al.
Gra..,th rate diagram of sample 2/93
Radochowska Cave
100~-----.------.------.------,
CD
. . . ... •' . ..... ·.· . . ... . ·.· . . . . .
0
was relatively high. Between each of these dated zones, there is a physical hiatus (Fig. 11). None of the dates from the top flowstone, above the clay hiatus, gave results with the standard deviation less than the age itself, however both suggest for a Holocene age for the deposit. In spite of the problematic low U -content and detrital contamination in most samples, some general trends may be iferred from the data:
1) The high age of 180 ka from the lower levels of Niediwiedzia cave support other geomorphological evidence for an old age of the . cave.
. . 2) The well-dated stalagmites JN4 and Rl demon-
strate an apparently continuous speleothem growth during isotope stage 2, a period when, in northern localities, such growth stopped (GORDON et al., 1989; LAURITZEN, 1993b).
This provide strong evidence that the area above Niediwiedzia cave was neither covered with glacier ice, nor experienced severe enough permafrost conditions to inhibit speleothem growth. The other, contaminated but corrected dates from Niediwiedzia and Radochowska caves support this conclusion. The result also confirms the hypothesis presented earlier by LAURITZEN (1993b) that the latitudinal distribution of speleothem growth in · time reveals paleoclimatic gradients.

Uranium-series dating on speleothems
All data are compiled in Fig. 12, where the inferred growth intervals and hiatuses are compared with the standard oxygen isotope stages. Speleothem deposition may be correlated with stage 7 and 5.
T [ka]
0
50
100
An intrastage hiatus in stage 5 15 0 is suggested by the Rado
chowska samples, which may correlate with the stadial stages 5d or 5b. Stage 4 seems to be accommodated by a hiatus in sample R2b, whilst the hiatus that is indi-cated by the clay horizon between the two parts of sample R2 may be placed at 2 0 0 either the stage 3/2 or stage 2/1 boundaries. It must how-ever be strongly emphasized that the uncertainty in the corrected dates makes these two correlations quite uncer-
Niedzwiedzia Cave
'JN4'JNS
Radochowska Cave
2 1 R2A
R1
HIATUS --.-t---R2B 2
-HIATUS-- ----
R2B 1
STRATIGRAPHY I 8 o w e n 19921
N W E1Jrope
Ho locen
late
We ich se l ian
Early
We ichselian
Eem ian
Sao le Ill
6 (Warthe l
Ba nt ega /
4'J
tain. The JN4 stalagmite is j f I the best and · strongest evi- '1 2 13 denceofthemall. ~--~~~~~------------------------------------~ The fossiliferous sections in Sala Lwa are still a geochronological challenge. Further attempts must be done to get speleothem samples of a better quality. U-series dating experiments on bone
and teeth, as well as amino acid racemization analysis and ESR dating of tooth enamel samples is possible on material from these sections.

48
CONCLUSIONS
In spite of low uraniwn content and high detrital contamination, several successful uraniwn series dates have been performed on speleothems in the two caves. The most prominent result is the evidence for continuous speleothem growth through isotope stage 2, a period when the Scandinavian glaciers advanced almost 200 km to the Sudetic mountain slopes (cj. Fig. 1). Tiris result provides strong evidence that the area was neither covered with glacier ice, nor experienced severe enough pennafrost conditions to inhibit speleothem growth. The other, contaminated but corrected dates from Niedzwiedzia and Radochowska caves also support this conclusion. Dating of the bone-bearing sediments was unsuccessful, and the deposits still provide a great geochronological challenge.
REFERENCES BOSAK, P. & HORACEK, I. (1982) Kvartemi sedi
menty Jaskyne Niedzwiedza v Kletne (Polsko). Ceskoslovensky Kras, 33, pp. 79-89.
BOWEN, D., Q. (1992) The Pleistocene of North West Europe. Scientific Progress, 76, pp. 209-233.
FRENZEL, J. (1936) Knochenfunde in der Reiersdorfer TropftteinshOhle Breslau, Breslau.
GLAZEK, J. (1986) Wyniki datowan naciekow jaskiniowych z terenu Polski metoda Th-230/U-234. Zesz.. Nauk. Pol. Sl., seria. Mat:Fiz.,Geochronometria, 2, pp. 55-65.
GLAZEK, J. (1989) Paleokarst of Poland. In BOSAK, P., FORi:>, D., C., GLAZEK, i. & HORACEK, I. (Eds.): Paleokarst a systematic and regional review, pp. 77-10.5. Akademia/Elsevier, Prague
GLAZEK, J. & HARMON, R., S. (1981) Radiometric Dating of Polish Cave Speleothems- current results. Proc., 8th. International Speleological Congress. Bowling Green, l, pp. 424-427.
GORDON, D., SMART, P.. L., FORD, D., C., ANDREWS, J., N., ATKINSON, T., C., ROWE, P., J. & CHRISTOPHER, N., S., J. (1989) Dating of late Pleistocene interglacial and interstadial periods in the United Kingdom from speleothem growth frequency. Quaternary Research, 31, pp. 14-26.
IVANOVICH, M. & HARMON, R., S. (1982) Uranium Series Disequilibrium. Applications to environmental problems. Clarendon, Oxford, 571 p.
LAURITZEN, S.-E. 1993a: "Age4U2U". Program for reading ADCAM energy spectra, integration peak-co"ection' and calculation of 23orhoriuml 234Uranium ages. Computer Program Turbo Pascal Code, 5,000 lines, Department of Geology, Bergen (unpublished).
H. Hercman et al.
ACKNOWLEDGEMENTS
Financial support for :field~ork: was provided by the Bergen and Poznan Universities as well as by KBN grant no. 0888/P2/94/06. Logistic support was indirectly supplied during the Xth . Speleological School in February 1993 by the Silesian University. The radiometric dating was financed through the KLIMBRE program by grants ~m The National Norwegian Research Foundation (NFR) to S.E. Lauritzen, and through a NFR stipendium to H. Hercman. We thank Prof. M. Pulina and the administrators of Niediwiedzia cave for enthusiastic support and sampling permission, respectively.
LAURITZEN, S.-E. (1993b) Natural Environmental Change in Karst: The Quaternary Record. Catena Supplement, 25, pp. 21-40.
LAURITZEN, S.-E. (1995) High-resolution paleotemperature proxy record during the last interglaciation in Norway from speleothems. Quaternary Research, 43, pp. 133-146.
PRZBYLOWICZ, W., SCHWARCZ, H., P. & LATHAM, A., G. (1991) Dirty calcites; 2, Uranium-series dating of artificial calcite-detritus mixtures. Chemical Geology, 86, pp. 161-178.
PULINA, M. (1989) Srodowisko Geograficzne (Geographic Environment). In JAHN, A., KOZLOWSKIEGO, S. & WISZNIOWSKA, T. (Eds.): Jaskina Niediwiedzia w Kletnie (The bear cave at Kletno), Polish Acad. of Science, Wroclaw, pp. 21-57.
SCHWARCZ, H., P. (1980) Absolute age determinations of archaeological sites by uranium dating of travertines. Archaeometry, 22, pp. 3-24.
SCHWARCZ, H., P. & LATHAM, A., G. (1989) Dirty calcites I: Uranium series dating of contaminated calcite using leachates alone. Isotope Geoscience, 80, pp. 35-43.
WISZNIOWSKA, T. (1989) Kopalne szczatld zwierzece (Fossil animal Remains). In JAHN, A., KOZLOWSKIEGO, ·s. & WISZNIOWSKA, T. (Eds.): Jaskina Niediwiedzia w Kletnie (The bear cave at Kletno), Polish Acad. of Science, Wroclaw, pp. 255-279.
ZOTZ, L., F:(1937) Altsteinzeitlicher Biirenkult in den Sudeten. Altschlesicher Blliner, 12 (1/2),.
ZOTZ, L., F. (1939) Die Altsteinzeit in Niederschlesien Kabitzsch, K, Leipzig, 146 p.

Les travertins sont-ils les depots corr~latifs d'hydrosystemes karstiques ? Le cas de
bassins versants proven~aux .(france]
Philippe MARTIN1
RESUME
Des etudes recentes faites en Provence sur des edifices travertineux nous ont conduit a envisager ces construc-tions com.me des syst~mes eta proposer I' idee de syst~me travertineux. . Ces syst~mes travertineux ~oivcnt en particulier des flux modules par des reseaui de drainage (reseaux souterrains, reseaux fluviatiles) exportateurs de matiere et perturbent Ia realisation d'un profillongitudinal d'equilibre dynamique. En consequence i1 semble que l'evolution d'un aquifere d'un etat non-karstifie a un etat karstifie puisse conduire au recoupement puis a Ia disparition du syst~me travertineux qui lui est assode. La description de ces relations entre syst~mes exportateurs d'amont et systemes accumulateurs d'aval nous conduit a qualifier cette association de geosysteme karstique. Le syst~me travertineux est regule par les interactions existant entre ses sous-syst~mes (barrage-vasque; flux-biocenose) et par le fonctionnement et I' evolution des reseaux de drainage exportateurs de matiere. Le geosysteme karstique est regule a un niveau superieur par le syst~me morphoclimatique, par Ia geodynamique interne et par Ia societe.
Mots cles: travertins, systeme karstique, bassin versant, fonctionnement, evolution, regulation, systeme travertineux, geosysteme karstique, karst, SE de Ia France.
ARE THE TRAVERTINES THE CORRELATIVE DEPOSITS OF THE KARSTIC HYDROSYSTEMS ? THE CASE OF RIVER BASINS IN PROVENCE
(FRANCE) ABSTRACT
Recent studies undertaken in Provence on travertine constructions induced us to regard tlu!se constructions as systems and to propose the concept of travertine systems. These travertine systems receive flow from drainage networks exporting matter ( subterraneous and fluvial) and disturb tlu! establishment of a longitudinal dynamic equilibrium profile. It tlu!reby seems that aquiferous change from a non karst to a karst state may lead to tlu! creation followed by disapearance of an associated travertine system. Tlu! description of these relations between upstream exporting systems and downstream accumulating systems allows us to name this association a karst geosystem. Tlu! travertine system is regularized by interactions of its components and by tlu! working and evolution of its· drainage networks which export matter. On a superior level karst geosystems are regularized by climate, internal geodynamics and by society.
Key words: travertines, karst system, river basin, working, evolution, regularizing, travertine system, karst geosystem, karst, soutlu!astem France.

50
I. INTRODUCTION
Des etudes dejl anciennes en Provence (de SAPORTA, 1867) ont montre que les formations travertineuses conservent remarquablement des temoins ,. ae 1' evoiution locale de Ia ·vegetation (macro-restes vegetaux). Toutefois, Ia lithostratigraphie de ces accumulations se revela fort complexe car Ies principes de continuite et de superposition n'y sont pas toujours respectes. A cette situation !l~ peut trouver plusieurs raisons parmi lesquelles nous pouvons citer: le volume reduit des dep6ts, }'opposition fondamentale entre barrage et vasque, Ia geometrie propre des edifices ou apparaissent differentes formes specifiques ( d6me, voile, bordure deversante festonnee en "lobes" et en "selles" (LAMBERT, 1955), couche etc . . . ), Ia variete des faci~. la multiplicite des dispositions stratigraphiques integrarit souvent des lacunes importantes ainsi que de tres rapides variations longitudinales et laterales de facies etc . . .
Ces dep6ts resultent aussi de Ia redistribution, dans Ie paysage, des carbonates dissous. En cela ils sont comparables aux concretions (stalagmite, stalactite etc ... ) qui jalonnent les axes souterrains de migration des solutions carbonatees (CAB~.OL, 1978).
Ces fC!rmations, qu'elles soient int~mes ou externes, ne peuvent donc-t-elles pas etre considerees comme des dep6ts correlatifs de 1a karstification des massifs situes en amont, comme des indicateurs synthetiques de l'histoire locale du karst (V AUDOUR, 1984, 1986a) 1 Pour ce faire il faudrait preciser Ies logiciels qui president A leur realisation, c'est-A-dire les envisager sous l'angle de leur fonctionnement et de leur integration dans I' ensemble dynamique que constitue Ie karst.
II. LES TRAVERTINS ET LE KARST: DES RELATIONS
COMPLEXES
Le lien fonctionnel existant entre Ie karst et Ies travertins a ete depuis Iongtemps reconnu. II a conduit A distinguer d'amont en aval (CASANOVA, 1981):.
• un paysage intensement karstifie (calcaires et/ou dolomies);
• des formations de sources, grossi~rement stratiflees, de pendage conforme l celui de la pente topographique et qui s'etendent depuis 1a resurgence jusqu' l une confluence majeure;
Ph. Mlll'lin
• des formations de barrage, fonctionnant en retenne ou en cascade, limitees au cours amont des reseaux hydrographiques;.
• et des formations alluviales, dans le cours,aval et sub-horizontal· du fleuve, qui presenteiit en altemance des couches travertineuses et des passees detritiques.
., Cette typologie qui allie A Ia fois des considerations sur 1a topographic, sur 1a morphologie et sur le fonctionnement peut etre ramenee l deux grands types d'organisations (MARTIN, 1988, 1991):
• le binome: aquifere carbonate - travertins de source. L'aquifere pouvant avoir un fonctionnement karstique ou non, et drainer en sus des terrains non carbonates (systeme karstique unaire ou binaire de MANGIN (1975));
• /'association: bassin versant fluviatile - travertins alluviaux. Le bassin versant fluviatile (ou systeme fluviatile) est une unite plus vaste pouvant associer A Ia fois un drainage aerien et un ou des drainage(s) souterrain(s).
La genese de ces formations· etant encore sujette l discussions, nous rappellerons que deux sortes d'interpretation sont aujourd'hui proposees: l'une voit dans revolution physico-chimique d'\me eau bicarbonate (precipitation de carbonates consecutive a l'evasion d'une partie du C00, le facteur responsable de ces accumulations (BAKALOWICZ, 1988); l'autre recherche dans l'activite d'organismes vivants l'origine principale de ces memes travertins (CASANOVA, 1981; ADOLPHE, 1986; CASTANIER, 1987). M8me dans !'hypothese ou, comme dans le domain marin (recifS), Ie facteur biologique aurait un caractae dominant ou initiateur (realisation de noyaux de germination), les caracteristiques . physiques et chimiques des flux qui traversent ces formations ne peuvent pas etre tenues pour marginates (SRDOC et aL, 1985) car:
• les travertins construits s'etablissent a partir d'un flux d'eau et de carbonates dissous;
• i~ serait tees etonnant que le tapis algo-bacte. nen, que Ia biocenose si souvent d6crite ne ne-. ' cess1tent pas un biotope particulier, dans Ia de-
termination duquel les caracteristiques ·des flux qui le traversent, prennent une part essentielle; . .
• les formations travertineuses sont loin de ne comprendre que des facies construits;
• et surtout, car parmi toutes Ies sources situees dans un contexte bioclimatique semblable et drainant des aquiferes carbonates, certaines ne
. ~ ' . .

Les travertins sont-ils les depots correlatifs d'hydrosys~mes kantiques ? 51
presentent pas de depot (cas du Causse du Larzac) (AMBERT, 1986), cas du massif de la Sainte Baume en Basse Provence (MARTIN, 1988, 1991), sans qu'il soit possible d'imputer cette absence a une erosion apres dep6t. De meme, 1' etude litho-stratigraphique et paleogeographique de uavertins proven~aux (MANGIN et al., 1991) montre que l'on ne peut pas imputer automatiquement I' absence ou la presence de travertins aux seules variations climatiques (pejoration ou optimisation).
Ne pouvant actuellement etablir une ou des causalite(s) lineaire(s) simple(s) entre ces depots et divers facteurs; je propose de concevoir ces formations travertineuses d'une part, comme des productions de ces unites de drainage genertes par exportation de matiere, mais aussi et surtout, d'une autre part, comme des objets coherents, en interrelation avec leur environnement, evoluant selon leur dynamique propre et aboutissant a une structure particuliere qui a pu etre decrite au travers d'une analyse lithostratigraphique.
Ill. LES TRAVERTINS: DES UNITES MORPH0-810-SEDIMENTAIRES
ORGANISEES EN SYSTEME
L' analyse lithostratigraphique a permis de faire apparai"tre, la ou le site n' oriente pas trop la geometrie de la formation - c'est-a-dire dans des vallees assez larges et peu pentues - 1' organisation autour de laquelle se structurent les dep6ts travertineux. Cette organisation s' articule autour (MANGIN et al., 1991):
• d'une sequence sedimentaire verticale ou chronosequence qui traduit des transformations de 1' environnement de la formation;
• et d'une unite morpho-bio-sedimentaire qui constitue un ensemble structure comprenant un barrage construit et un domain lacustre ou palustre a 1' arriere.

52 Ph. Martin
Pont routi er des Tompines
Grande prai ri e
I
1. DESCRIPTION DE FORMES EXISTANT DANS LES TRAVERTINS
Vinterclction .existant entre la forme receptrice (vall~) et la dynamique de depot aboutit toujours, m8me dans les cas ou la forme receptrice conditionne fortement la geometrie du depot, l !'apparition d'une organisation propre aux travertins. Celle-ci s'articule autour d'un barrage construit et d'une vasque qui peut etre plus ou moins importante et plus ou moins combl~ par des sediments detritiques.
Le barrage doit Stre entendu ici comme un objet qui, par sa construction, s'oppose A la dynamique fluviatile; c' est-a-dire a la recherche du profil longitudinal d'equilibre dynamique qui permet !'evacuation de la charge (eau et sediments) avec une depense d'energie minimale et constante par unite de longueur. II peut prendre plusieurs formes plus ou moins spectaculaires. _ Ce type d'organisation est tres visible, bien que le site soit en voie de demantelement, dans le vallon de Saint Pons (Bouches du Rhone, Fig. 1) ou la source du meme nom a fortement contribue l la formation d'un depot tres important (Fig. 2). Dans
' For~ge 154
r.:"l l:..:..j 6
la partie mediane du vallon, nous trouvons d'une part un banage qui est aujourd'hui leg~rement recoupe, sur lequel a ete construite la chapelle Saint Martin, et d'autre part, plus en amont, un espace plat, nomme la Grande Prairie, qui correspond a la limite supeneure du remplissage comblant le domaine lacustre ou palustre arri~re. Dans les deux cas, 1a stratigraphie a ete reconnue par ~es forages qui ont atteint le substratum calcane (BRGM, 1983). Le forage no 270 qui a traverse le banage sur 50 m montre que I' essen tiel du remplissage est constitue par des faci~ construits surmontant une oouche d'argile ocre rouge emballant, en particulier, des blocs cal~ et des elements travertineux. Le forage no 154 qui a traverse sur 24 m des fonnations situ~s plus en amont, montre qu'elles sont constitutes d'elements detritiques fins (sables, petits graviers, matrice argileuse ai.nsi que de depots vegetaux dans le niveau le plus profond) (MARTIN, 1986, 1991).
Toutefois, nous n'avons decnt lA qu'un site en voie de demantelement et non un exemple fonctionnel, c' est-i\-dire un barrage en croissance delimitant un lac. Comme il n'en existe pas dans Ia vall~ de l'Huveaune, ni en Provence, d'ailleurs,

Les travertins sont-& les dlpots comlatifs d'hydrosysames kantlques ? 53
nous devons toumer nos yeux vers celui de Plitvice en Y ougoslavie qui est certainement l'un des plus remarquables d'Europe. Les descriptions qui en sont faites (ROGLIC, 1977, 1981; SRDOC et al., 1985) montrent que l'on y retrouve 1a meme organisation geometrique et morpho-sedimentaire. Ce site est forme. de 14 lacs successifs delimites par des barrages de travertins. Certains de ces lacs atteignant des profondeurs importantes (lac Prosce: 37,4 m, lac Kozjak:46,4 m) (ROGLIC, 1981).
De telles associations de formes existent aussi dans d'autres milieux. Dans les galeries de l'endokarst, les explorateurs ont depuis longtemps dc5crit des organisations semblables appelees gours (MARTEL, 1890).
Cette relative ubiquite de formes laisse pressentir qu'elles sont engendrees par des dynamiques comparables dans lesquelles les carbonates jouent un role fondamental. L'etude des travertins semble ainsi etre un cadre favorable pour conduire une reflexion sur les logiques qui sous-tendent ces morphologies. ·
2. CHAQUE FORME EST L'EXPRESSJON DE LA DY AMIQU; SOUS-JACENTE QUI L'ENGENDRE
Certains barrages du site de Plitvice sont aujourd'hui immerges et done morts, victimes de la rapidite de croissance de celui qui est situe en a val. La dynamique essentielle organisant ces paysages s'exprime done au travers d'une construction mais a une vitesse qui est propre a chaque barrage. Ceci implique 1' existence de pbenom~nes autocatalytiques plus ou moins prononces, dans la realisation desquels entrent des. mc5canismes physicochimiques.
Les cascades augmentent !'evasion du C02
(ROQUES, 1969) facilitant ainsi la sursaturation des eaux et done la precipitation des carbonates, la ou la tranche d'eau est la plus faible, c'est-a-dire sur le barrage suivant. Ce type d'interaction se
retrouve aussi entre le lac, veritable trappe a sCdiments et le barrage dont la croissance necessite des eaux peu capables d'une erosion mCcanique et done peu chargees en sediments. La faible turbidite qui en resulte est aussi un facteur favorable a la vie des algues et la croissance des cristaux. Ainsi les premiers lacs ont-ils, en stockant des sediments, une action favorable sur la croissance de barrages situes en aval. Jusqu'a leur comblement i1s amortissent les changements intervenus dans le debit soli de.
Ces interactions qui s'exercent a plusieurs niveaux con:terent a cet ensemble travertineux coherence, permanence et autonomie, ce qui nous pennet de definir comme un systbne (W ALLISER, 1977). En consequence, barrage et vasque peuvent etre analyses comme les sous-systemes d'un systeme travertineux elementaire. L'association de plusieurs de ces systemes elementaires constitue un syst~me travertineux (Fig. 3) qui, comme tout syst~e, autorise 1' emergence de proprietes n'existant pas au niveau de chaque element. Si no us reprenons 1' exemple du vallon de Saint Pons (MARTIN, 1986, 1991) nous constatons que son occupation a ete precoce (poteries de 1' Age du fer et du Haut Empire romain) et importante (abbaye cistercienne 1205-1407, moulins, foulons, martinets etc ... ) ce qui rev~le bien la richesse du site (espaces plats irrigables et energie hydroelectrique facilement accessible) comparee aux garrigues environnants.
Lors de la description des formes et des formations, ainsi que lors de !'evocation des relations existant entre ces elements, nous avons admis que des flux d'eaux bicarbonatees et de sediments traversaient les systemes travertineux. Ces flux qui assurent la coherence de !'ensemble, ont deux origines.
SYSTEME TRAVERTINEUX
SYSTEME TRAVERTINEUX ,--I
Ll.l SYSTEME TRAVERTINEUX 1:)
--.. < ~ ~ VASQUE at:
Ill: < ELEMENT A IRE Cl
I ELEMENT A IRE i I J[
I )

54
IV. PRODUCTION DE FLUX ET RELATIONS ENTRE LES HYDROSYSTEMES AMONT EXPORTA
TEURS .DE MATIERE
Les syst~mes travertineux sont situes pres a l'aval des zones d' erosion dont ils dependent. Celles-ci peuvent etre soit:
• un aqui~re carbonate,
• soit un bassin versant superficiel.
Ces deux entites qui ont aussi etre apprehendees au travers de l'analyse systemique (systeme karstique (MANGIN, 1975), syst~me fluviatile (AMOROCHO & HART, 1964)) modulent, en fonction de leur cStat propre, les entrees auxquelles elles sont soumises. Les flux qui en resultent presentent des caracteristiques qui peuvent etre plus ou moins favorables aux constructions travertineuses que cela soit sur un plan qualitatif ou quantitatif (bilan). Ils pennettent d'etablir que les syst~mes travertineux ne sont pas isoles et qu'ils soot en rapport reciproque avec leur environnement. Le systeme karstique, generalement plus petit, pennet d'aborder plus faci1ement certaines interactions fondamentales.
46 13.10 0.80
36 13.80 1.26
40 14.95 1.41
• d'4pres COULIER, 1985.
1.88
1.
Ph. Martin .
1. LE POTENTIEL DE TRAVERTINISATION DES FLUX PRODUITS ·
Le systeme karstique (MANGIN, 1975, 1984) est une unite de drainage qui s'·organise a partir d'un aquifere carbonate (systeme karstique unaire) qui peut etre karstifie ( capacite de concentrer des precipitations et d'ecouler un flux plus ou moins rapidement; ces capacites soot liees a Ia morphologic du reseau souterrain), le devenir ou I' a voir ete. Une bonne representation de la reSponse du syst~e peut etre obtenue par un correlogramme eroise pluies/debits, qui, lorsque Ia variable d'entree (pluies) presente un caract~re aleatoire, constitue une bonne representation de l'hydrogramme unitaire (MANGIN, 1984). Cet aquifere peut aussi recevoir des flux draines par des impluviwns non karstifiables syst~me karstique binaire ).
Le fonctionnement d'un tel syst~me s'articule autour de trois types de variables:
• les variables litho-structurales (composition chimique des roches: teneur en Ca++, Mg++, SO/ ... etc.; proprietes physiques: porosite, etat de Ia fracturation etc ... );
• les variables morphologiques (etat de la surface, fonne du reseau de drainage souterrain etc.);
• et les variables d'entree (de matiere: pluie, cl-, S04 2- etc., et d' energie: SQit Solaire, soit liee a la gravite eta I' altitude).
4.61 0.40 280 0.0198
4.88 1.06 275
5.12 1.12

Les travertins sont-ils les dlpots con-llatifs d'hydro:rystemes kantique1 ? 55
et produit a Ia sortie des flux qui ont ~t~ modul~s par les interactions existant a l'int~rieur du systeme. Ces caract~ristiques acquises contribuent a detenniner le potentiel de travertinisation (ORDONEZ et al., 1986) de ces flux. Ce potentiel, qui a ~t~ d~fini comme Ia diff~rence entre Ia concentration maXimale thoorique possible en carbonate de calcium sous Ia pC02 de 1' atmosphere libre et Ia concentration mesuree au griffon qui depend elle de Ia pC02 interne 6quilibrante (ROQUES, 1967), doit aussi int~grer:
• des facte\lrs physico-chimiques comme les concentrations en ions Mg2+ et S042- (effet d'ion commun) (GAMS, 1967; MUXART, 1981; NICOD, 1986; BAKALOWICZ, 1988), ou comme la concentration en carbone organique dissous (dissolved organic carbon) (SRDOC et al., 1985),
• et des facteurs hydrodynamiques comme Ia capacit~ d'~rosion m~anique, Ia turbidit~. l'importance des d&its d'~tiage etc. Facteurs qui jouent aussi un certain rOle dans Ia d~termination des potentiels de d~pots puisqu'ils interviennent au niveau des quantit~s mises en jeu et qu'ls influent grandement sur le signe du bilan.
2. LE CONFINEMENT DES ATMOSPHERES DE L'ENDOKARST FACILITE LA CONSER· VATION DE FORTES PC02 EQUILIBRANTES
Toutes les analyses physico-chimiques effectu~s sur Ia Saint Baume (Tab. 1) montrent d'une part
que Ia min~ralisation carbonatoo des eaux issues d'un drainage souterrain est en moyenne 25 a 100 fois sup~rieure a celle qu'elle aurait pu etre sous atmosphere libre (pC02 ~ 3 ·HI' atm) et que d'autre part, Ia concentration moyenne en HC03-
est lioo, par une correlation linea.ire excellente, a Ia pC02 moyenne (Fig. 4). Cet .. excts" de carbonates par rapport a 1a pC02 de 1' atmosphere libre mat~rialise en fait une sur-dissolution lioo au fonctionnement du systeme karstique. Celle-ci ne peut se concevoir que si l'aquitere karstique ~tablit des ~hanges de C02 (gazeux ou dissous) limites avec l'atmosphere libre; c'est-a-dire que si cet aquifere est un milieu suffisamment confin~. Le C02 est essentiellement produit dans les sols (BAKALOWICZ, 1979). Les venues de C02
d'origine profonde ainsi que l'attaque acide des carbonates ne changent rien au principe (n~si~ du confinement), ils augmentent seulement les ~entre Ia pC02 de l'endokarst et Ia pC02 atmospberique. Ce C02 migre vers l'int~rieur de l'aquitere soit par les ~seaux karstiques sous forme diphasique, alimentant ainsi soit par ~vasion soit par diffusion, 1' atmosphere interne. Mais celle-ci ne peut rester enrichie en C02 (ROQUES, 1967) que si les echanges de gaz carbonique avec }'atmosphere libre sont limit~s (communication difficile entre les vides karstiques et 1' ext~rieur, role des couvertures pedologique etc.).
~ ~ 7~--------------------------------------------, E = ~
~
= = ~ s 6 5 = .9 ..... ~ 1.. ..... c: (1,1 5 u = 0 u I
r"l 0 u
HCQ3- = 4,19 + 0,65 pC02 r = 0,90 ; n = 14
Ph.M.95 = 4+---~---,.---~---.--~.---.---~--~ 0 1 2 3 4
pC02 moyenne en %

56 Ph. Martin
15 T = ,10,57 + 3,65 Mg · m
,1, • . r = 0,86 ; n = 14
14 13 Ill
13 1!1
11
PhM.95 10+---~--~--~--~--~--~--~--~--~~
0,2 0,4 0,6 0,8 1,0 1,2
Mg++ concentration minimale en meq/1
• ' . • .· s 500~----------------~-----------------,
= A = 471,45 • 192,11 Mg QJ Cll QJ u l.r :I 0 Cll
Cll QJ
"C QJ
"C :I ....... ·-.:: <
r = 0,79; n :d4
400
300
Ph.M.95 200+---~--,---·~---r--~---r---~---r--~--~
0,2 0,4 0,6 0,8 1,0 1,2
Mg++ concentration minimale en ineq/1
3~ LES INTERACTIONS EXISTANT ENTRE LES SYSTEMES KARSTIQUES ET LES SYSTEMES FLUVIATILES CONDITIONNENT LES CONCENTRATIONS EN MG2
•,
LES DEBITS D'ETIAGE . ET LEUR TEMPERATURE
Les analyses effectu6es permettent d'etablir deux correlations:
• entre Ia temperature maximale mesuree a chaque exutoire du massif de Ia Sainte Baume et Ia concentration minimale en Mg2
+ (Fig. 5), : ; ,
• et entre 1' altitude de ces sources et cette meme valeur minimale de Mg2+ (Fig. 6).
Ces regressions montrent que Ia quantite minimale de Mg2
+ expuls6e de l'aquitere est li6e tres fortement d'une part ala vitesse de circulation des eaux qui lorsqu'elle est lente permet une augmentation de temperature (gradient geothermique)et d'autre part a l'altitude des sources,· c'est-a-dire essentiellement a !'existence ou non d'un karst noye important vidangeable par ces exutoires.· Ceci est d'ailleurs confirme par les correlations 'existant entre:
• le coefficient moyen de tarissement (moyenne des coefficients de tarissement obtenus par ajustement du modele de Maillet aux phases

Les travertim sont-ils les depots co"ellltifs d'hydrosystemes kllntiques ?
..... u s:: Cl.l ...... 0
E ..... s:: Cl.l
5 Cll Cll
"i: ~ ..... Cl.l "0 ..... s:: Cl.l ·r; E
Cl.l 0 u
0,08
0,06
0,04
0,02
Ph.M.95 0,00
0,2
lil
~See de Peyruis exclue
Ct = 0,038 - 0,031 Mg lil
1:1 r = 0,89 ; n = 13
0,4 0,6 0,8 1,0 1,2
Mg++ concentration minimale en meq/1
15~~------------------------------~ T = 14,97- 111,6 Ct
14 r = 0,93 ; n = 13
13
12 See de Peyruis exclue
~ 1:1
11
Ph.M.95 1oL---~--~----~--~~~----,---~--~
0,00
de tarissement) de chaque source et la valeur rninirnale de Mg2+ (Fig. 7),
• entre le coefficient moyen de tarissement de chaque source et la temperature rnaxirnale mesuree a chaque exutoire (Fig. 8).
Ces regressions qui ont ete reaJ.isees en excluant la source de Peyruis car celle-d n'est qu'un exutoire de trop plein, montrent que les modalites hydrodynarniques de fonctionnement detenninent en partie les caracteristiques physico-chirniques de ces eaux.
De meme, lors des etiages, le fonctionnement hydrodynarnique est a mettre en rapport avec la position des exutoires cornrne le montre la correlation existant entre le coefficient moyen de tarissement et }'altitude des sources (Fig. 9). Cette correlation
0,02 0,04 0,06 0,08
Coefficient de tarissement moyen : Ct
est en outre bien meilleure si I' on ne prend pas en compte les sources de Saucette, de la Brise et des Encanaux superieurs (n = 9, r = = 0,970, part de la variance expliquee: ~ 94%).
Cornrne la position des emergences est liee aux grandes unites morpho-structurales (exutoire en relatioa avec une faille delirnitant deux blocs a la lithologie differente par ex.), au fonctionnement et a I' evolution morpho-dynarnique du reseau de drainage aerien (creusement de gorges, de vallees) on doit admettre que les caracteristiques d' etiage des flux sont dependants des rapports reciproques qu'entretiennent ces deux niveaux d'organisation specifiques que sont les systemes fluviatiles et karstiques.

Ph. Martin '
e 500~----------------~~----------~
t:: QJ
en QJ u 1-::s
/m ~ 400 en QJ
See de Peyruis exclue "'0 QJ ·
"'0 :I ..... ·..... ~ 300
A = 243,5 + 5494,5 Ct
r = 0, 79 ; n = 13
Ph.M.95 e zoo+---~----~--~--~----~--~--~~--~
0,00 0,02 0,04 0,06 0,08
Coefficient de tarissement moyen : Ct
Dans le cas de flux produits par des systemes fluviatiles (ou bassins versants) d'autres types d'interactions existent entre les differentes variables dont la diversite peut etre plus grande. Un bassin versant peut integrer dans son impluvium des affleurements particuliers ainsi que des sous-syst~mes tres differents qui vont produire des flux specifiques (syst~me karstique, aquifere alluvial, fonnations . colluviales, exploitations agricoles, communautes humaines etc .. . ). Les probl~ mes essentielles soot alors ceux du melange d'eaux et de la dilution de solutes dont la concentration ne doit pas depasser certains seuils (DOC inferieure a 10 mg/1 (SRDOC et al., 1985); ortophosphates inferieurs a 0,05 mg/1 (CASANOVA, 1986)). La realisation de melange des eaux est tres liee a 1' etat morphologique du bassin, a sa forme (HORTON, 1945; CHORLEY, 1969) etat qui retentit aussi sur son fonctionnement hydrodynamique et en particulier sur la modulation des crues (Fig. 10, Haute Huveaune ). Le probl~me de la dilution est, par contre, plus dependant des quantites d'eau disponibles en penode d'etiage et done de la capacite de retention et de regulation des aquiferes.
4. CONSEQUENCES DES VITESSES D'EVOLUTION SPECIFIQUES DE CHAQUE HYDROSYSTEME.
Lorsque la dynamique fluviatile abaisse suf:fisamment l'exutoire et/ou lorsque celui-ci est surun accident majeur et lorsque le potentiel de karstification n • a pas encore entraine une karstification fonctionnelle importante (drains fonctionnels bien d6veloppes),· l'emergcmce peut soutirer des niveaux constituant d'importantes reserves mal draines
(systemes annexes- MANGIN, 1975) des eaux plus anciennes qui ont eu le temps de dissoudre de la dolomite, tout en disposant de volumes importants au debut du tarissement (cas de la source de Saint Pons, Fig. 10). Cet etat conjoncturel est une disposition tres favorable aux depots travertineux car elle associe a un comportement hydrodynamique pondere, une mineralisation favorable qui se trouvera tres desequilibree lorsque l'atmosph~re libre deviendra la phase gazeuse de reference.
Inversement lorsque la karstification peut se developper et etablir tres rapidement un reseau karstique complexe (10 a 15.000 ans environ dans le cas du Bagel, Ari~ge (MANGIN, 1982, 1985) duree qui doit etre plus longue en Provence), les caracteristiques hydrodynamiques (Fig. 10) et hydrochimiques (cas de la source des Encanaux superieurs) des flux qui soot alors produits sont beaucoup moins favorables aux constructions travertineuses (crues importantes, etiages sev~res). Toutefois, comme les rapports reciproques de chaque systeme karstique avec son environnement sont specifiques, 1' etat d' evolution dans laquel chaque unite de drainage se trouve est particulier. Leurs histoires n • etant pas semblables, leurs fonctionnements ne peuvent etre que differents. Les flux les plus favorables ne sont done pas seulement lies aux variables lithologiques (calcaire, dolomie, gypse etc.) (NICOD, 1986), et aux variables climatiques (pluies et production de COJ, ils soot aussi determines par le niveau de karstification (capacite de concentrer plus ou moins rapidement des precipitations et d. ecouler un flux, ces capacites sont liees a la morphologic du reseau) et par revolution reciproque des
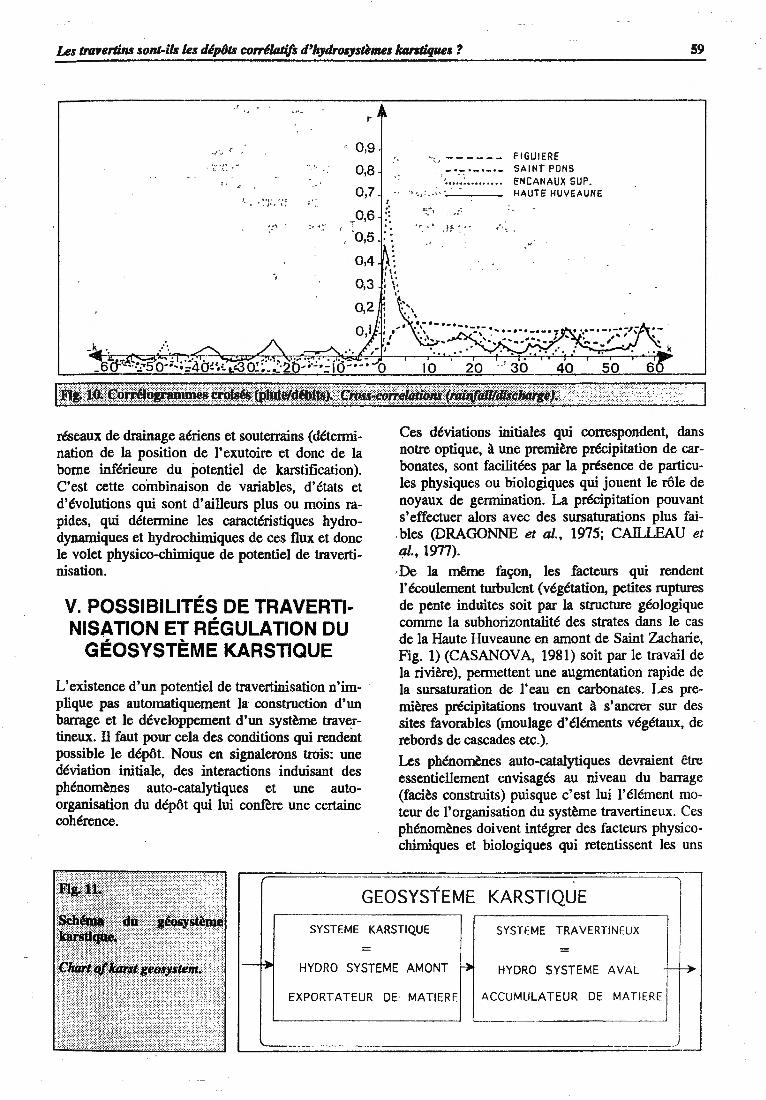
Les travertim sont-ils les depots co"e'Ultifs d'hydrosystemes kllntiques ? 59
r
..• ·· .. 0,9
0,8
0,7
~: ·. . :, .. ~-
-,
0,6 :· '0,5
reseaux de drainage aeriens et souterrains (detennination de la position de 1' exutoire et done de la borne inferieure du potentiel de karstification). C'est cette combinaison de variables, d'etats et d'evolutions qui sont d'ailleurs plus ou mains rapides, qui detennine les catacteristiques hydrodynamiques et hydrochimiques de ces flux et done le valet physico-chimique de potentiel de travertinisation.
V. POSSIBILITES DE TRAVERTINISATION ET REGULATION DU
GEOSYSTEME KARSTIQUE
L'existence d'un potentiel de travertinisation n'implique pas automatiquement la construction d'un barrage et le developpement d'un syst~me travertineux. D faut pour cela des conditions qui rendent possible le dep6t. Nous en signalerons trois: une deviation initiale, des interactions induisant des pbenom~nes auto-catalytiques et une autoorganisation du dep6t qui lui contere une certaine coherence.
.·
~-i .• ------
,, . . ·.··---~:.-·I • •'
. ~ ... .H·· ..
FIGUIER£ SAINT PONS ENCANAUX SUP. HAUl E HUVEAUNE
Ces deviations initiales qui correspondent, dans notre optique, a une premiere precipitation de carbonates, soot facilitees par la presence de particules physiques ou biologiques qui jouent le role de noyaux de gennination. La precipitation pouvant s'effectuer alors avec des sursaturations plus fai
.bles (DRAGONNE et al., 1975; CA.ll.LEAU et al., 1977).
·De la meme fa~n. les facteurs qui rendent 1' ecoulement turbulent (vegetation, petites ruptures de pente induites soit par la structure geologique comme la subhorizontalite des strates dans le cas de la Haute Huveaune en amant de Saint Zacharie, Fig. 1) (CASANOVA, 1981) soit par le travail de la riviere), permettent une augmentation rapide de Ia sursaturation de 1' eau en carbonates. Les premieres precipitations trouvant a s'ancrer sur des sites favorables (moulage d' elements vegetaux, de rebords de cascades etc.).
Les phenomenes auto-catalytiques devraient etre essentiellement envisages au niveau du barrage (facies construits) puisque c'est lui !'element moteur de I' organisation du systeme travertineux. Ces phenom~nes doivent integrer des facteurs physicochimiques et biologiques qui retentissent les uns
-. -
GEOSYSIEME KARSTIQUE
SYSTEME KARSTIQUE SYSTEME TRAVERTINEUX
= = :-~ HYDRO SYSTEME AMONT ~ HYDRO SYSTEME AVAL f-~
EXPORTATEUR DE MATIERE ACCUMULATEUR DE MATIERE
I J __

60
sur les autres, comme la consonunation du C02 dissous par Ia vegetation aquatique induit une elevatic'n du pH favorisant la precipitation de carbonates. L'opposition que nous evoquions en introduction entre les auteurs qui accordent la pr6-po:trferance aux phenomenes physico-chimiques et ceux qui voient dans le travail d'organismes vivan~!> 1' origine de la precipitation devrait trouver une solution satisfaisante dans 1' etude des interaction:-.: existant entre ces deux categories de processus.
Lorsque Ia deviation initiale est amplifiee par les phenom~nes auto-catalytiques, nous voyons e~erger une organisation qui entrave la dynanuque fluviatile et qui ne peut done etre qu'epbemere et . d' etcndue restreinte, mais dont la duree est en partie liee aux interrelations existant a l'interieur du sy:)teme (role de trappe a sediments des lacs, par ex .).
La. regulation de ces syst~mes travertineux s' effectue done:
• par des interrelations entre sous-syst~mes qui lui conterent une certaine stabilite,
• par le fonctionnement des hydro-syst~mes amont exportateurs de mati~re qui determine des flux presentant en particulier une variabilite cyclique sur differentes echelles de temps
BiBLIOGRAPHIE
ADLOPHE, J., P. (1986) Biocristallogenese et ecomorphologie des tufs, travertins. Enseignements tires d'exemples naturels et experimentaux. Travertins l.s. et ~volution des paysages holocenes dans le domaine mediterran~en, Mediterranee, 51,1-2, pp. 11-17. .
AMBERT, P. (1986) Les tufs holocenes du plateau du Larzac: donnus actuelles. Travertins l.s. et evolution des paysages holocenes dans le domaine medite"aneen, Medite"anee, 57, 1-2, pp. 61-65.
AMOROCH, J. & HART, W., E. (1964) A critique of current methods in hydrologic system investigation. Transactions of American Geophysical Union, 45, p. 307.
BAKALOWICZ, M. (1979) Contribution de Ia geochimie des eaux a Ia connaisance de I' aquifere karstique et de Ia lcarstification. These d'Etat en Sciences Naturelles, Univ. P. et M. Curie, Paris 6, Lab. Sout. du CNRS, Moulis, 269 p.
BAKALOWICZ, M. (1988) La formation des travertins: aspects g~himiques; essai de synth~se et discussion. Travaux 1988, U.A. 903 du CNRS, XVll, ATP-PIREN: les edifices travertineux et
Ph. Martin
(annee, periodes humides/periodes s~hes etc ... ),
• et par 1' evolution de ces hydro-systemes amont (organisation/desorganisation du res.eau de drainage souterrain, capture de bassms versants superficiels etc ... ).
La description de ces relations fondamentales existant entre ces syst~es iunont exportateurs de matiere et ces systemes a val qui 1' accumulent nous conduit a definir cet ensemble plus vaste. comme un geosyst~me karstique (Fig. 11). Ce geosyst~me karstique est regul~ par le ~onctionnement de syst~mes situes a un ruveau d'organisation superieur dont:
• le syst~me morpho-climatique qui det~ne les entrees des hydro-syst~mes amont, certains facteurs du systeme travertineux et le niveau des mers dont depend le potentiel d'erosion lineaire (glyptogen~se),
• la geodynamique interne (altitude liee a l'orogen~se, flux de C02 d'origine profonde),
• et 1' action anthropique qui peut influencer et perturber tres rapidement les equili?res acq~s (deforestation, derivation, du moms depws 1' occupation romaine, des eaux des sources etc ... ) (V AUOOUR, 1986b).
l'bistoire de l'environnement dans le Midi de la France, Aix en Provence, pp. 261-268.
CABROL, P. (1978) Contribution A l'etude du concretionnement carbonate des grottes du sud de Ia France, morphologic, genese, diagenese. -These 3tme cycle. Memoire du centre d' etude et de recherche geologiques et hydrogeologiques. Univ. de Montpellier, XII, 275 p.
CAILLEAU, P., DRAGONNE, D., GIROU, A., HUMBERT, L., JACQUIN, C. & ROQUES, H. (1977) Etude experimentale de Ia precipitation des carbonates de calcium en presence de l'ion magnesium. Bull. Soc. Fr. Mineral. Cristallogr., 100, pp. 81-88.
CASANOVA, J. (1981) Morphologie et biolithogenese des barrages de travertins. Colloque de /'Association des Geographes Fran~ais: "Fonnations carbonatees extemes, tuft et travertirrs", Ass. Fr. Karstologie, memoire n° 3, pp. 45-54.
CASANOVA, J. (1986) Perte. du pouvoir encro6tant des cyanophycUs constructrices de travertins liees A Ia pollution: exemple de l'Huveaune. Travertins l.s. et evolution des paysages holocenes dans le domaine medite"aneen, Mediterranee,S7,1-2, p. 179.

Les traYertim sont-il& les depots correlatifs d'hydrosysames kantiques ? 61
CASfANIER, S. (1987) Microbiogeologie: processus et mot:lillites de Ia carbonatogen~se bacterienne. These de doctoral d'Etat, Univ. de Nantes, 541 p.
CHORLEY, R., J. (1969) Introduction to physical hydrology. Methen & Co. Ltd., 205 p.
COULIER, C. (1985) Hydrogeologie karstique de Ia Sainte Baume occidentale, Bouches du RMne, Var. These de 3m.e cycle, Univ. de Provence, Aix, Marseille I, 400 p.
DRAGONNE, D., DUVAL, F., GARREAU, J., GIROU, A., HUMBERT, L., JACQUlN, C. & ROQUES, H. (1975) Genese experimentale et naturelle des carbonates de calcium - Etude bibliographique. Institute Fran~ais du Petrole, INSA Toulouse, Institut de GOOdynamique Bordeaux, 300 p.
GAMS, I. (1967) Sur Ia nature des eaux qui conduisent a Ia formation de tufs calcaires dans NW du karst Dinarique. Spelaion Carso, 5, pp. 9-14.
HORTON, R., E. (1945) Erosional development of streams and their drainage basins: hydrophysical approach to quantitative morphology. Bulletin of the Geological Society of America. S6, pp. 275-370.
LAMBERT, A. (1955) Remarques sur les depats de travertins par les cours d'eau et leurs consequences geomorphologiques. Bull. Soc. Geol. France, 6, V, p.577.
MANGIN, A., GUENDON, J., L., V AUDOUR, J. & MARTIN, P. (1991) Les travertins: accumulations carbonatees associees aux systemes karstiques, sequences sedimentaire& et paieoenvironnements quaternaires. Bull. Soc. Geol. France 162, 3, pp. 585-594.
MANGIN, A. (1975) Contribution A l'etude hydrodynamique des aquiferes karstiques. -These science. - Ann. Speleologie 1974, 29, 3, pp. 283-332; 1974,29,4,pp.495-601; 1975,30, 1, pp. 21-124. .
MANGIN, A. (1982) L'approche systemique du karst, consequences conceptuelles et methodologiques. Reunion monografica sobre el karst, Larra, pp. 141-157.
MANGIN, A. (1984) Pour une meilleure connaissance des systemes hydrologiques a partir des analyses correlatoire et spectrale. Journal of Hydrology, 67, pp. 25-43.
MANGIN, A. (1985) Progres recents dans I'etude hydrogeologique des karsts. Stygologia, 1, (3), E.J. Brill, Leiden, pp. 239-257.
MARTEL, E., A. (1890) Note sur quelques questions relatives a Ia geologie des grottes et des eaux souterraines. Bull. Soc. Geol. France, 3e serie, XIX. pp. 142-165.
MARTIN, P. (1986) Les travertins du vallon de Saint Pons (Gemenos, B. du Rh.) Travertins l.s. et evolution des paysages holocenes dans le domaine mediterraneen, Medite"anee, 57, 1-2, p. 92.
MARTIN, P. (1988) Consequences du fonctionnement et de I' evolution des aquiferes carbonates sur les
· constructions travertineuses; le cas des sources de Saint Pons, des Encanaux su¢rieurs (basin de l'Huveaune) de Ia Font Alaman eJ de Ia Figuiere (bassin de 1' Argens). Travaux 1988, U.A. 903 du CNRS, XVll, ATP-PIREN: les edifices travertineux et l'histoire de l'environnement dans le Midi de Ia France, Aix en Provence, pp. 193-200.
MARTIN, P. (1991) Hydrogeomorphologie des geo-. systemes karstiques des versants nord et ouest de Ia Sainte Baume (B. du Rh., Var, France). Etude hydrologique, hydrochimique et de vulnerabilite a Ia pollution. These, Univ. d' AixMarseille ll, 326 p.
MUXART, T. (1981) Rappel des principaux facteurs conditionnant Ia precipitation des carbonates en milieu continental. Colloque de /'Association des Geographes Franrais: "Formations carbonaMes extemes, tufs et travertins", Ass. Fr. Karstologie, memoire n° 3, pp. 119-128.
NICOD, J. (1986) Facteurs physico-cbimiques de !'accumulation des formations travertineuses. Travertins l.s. et evolution des paysages holocenes dans le domaine mediterraneen, Medite"anee,51, 1-2,pp. 161-167.
ORDONEZ, S., GONZALES, J., A. & GARCIA DEL CURA, M., A. (1986) Petrographie et morphologie des edifices tuffeux quaternaires du centre de l'Espagne. Travertins l.s. et evolution des paysages holocenes dans le domaine mediterraneen, Medite"anee, 57, 1-2, pp. 52-60.
PETRIK, M. (1958) Contribution to the hydrology of the lakes of Plitvice. Plitvicka jezera - nacionalni park., Zagreb, pp. 49-171.
ROGLIC, J. (1977) Les lacs de Plitvice. Norois special karstologie, 95 his, pp. 305-318.
ROGLIC, J. (1981) Les barrages de tuf calcaire aux lacs de Plitvice. Colloque de l'Associction des Geographes Franrais: "Formations carbonatees extemes, tufs et travertins", Ass. Fr. Karstologie, memoire n° 3, pp. 137-144.
ROQUES, H. (1967) Chimie des carbonates et hydrogeologie karstique. Phenomenes karstiques, memoires et docwnents, nouv. serie, 4, Ed. CNRS, pp. 113-141.
ROQUES, H. (1969) Probl~mes de transferts de masse poses par l'evolution des eaux souterraines. Ann. Spe/eo., 24, 3, pp. 455-494.
SAPORT A, G. de (1867) La flore des tufs quaternaires de Provence. C.R. 33° Congres Sc. Fr., Aix Remondet-Aubin, 32 p.
I SRDOC, D., HORVATINCIC, N., OBELIC, B., KRA-
JCAR, I. & SLIPCEVIC, A. (1985) Calcite deposition processes in karst waters with special emphasis on the Plitvice lakes, Yugoslavia. Carsus Yugoslavia!, 11,4-6, pp. 101-204.
V AUDOUR, J. (1984) Les travertins de piemont: contribution a l'etude des geosystemes karstiques mediterraneens. Colloque "Montagne et piemonts" en hommage a F. Taillefer (Toulouse, mai 1982), Revue de Geographie des Pyrenees et du Sud-Ouest, I, pp. 349-362.

62
VAUDOUR. J. (1986a) Introduction a !'etude des gOOsyst!mes karstiques. Trav. U.A. 903 du CNRS, XV, Aix en Provence, pp. 1-8.
VAUOOUR, J. (1986b) Travertins holocenes et pression anthropique. Travertins l.s. et evolution des
Ph. Martin
paysages holocenes dans le domaine mediterraneen, Mediterranee, 57, 1-2, pp. 168-173.
W ALLISER, B. (1977) Systemes et 1710deles. Introduction critique a /'analyse de systemes. Ed. du Seuil, Paris, 248 p.

Crystallog·raphical Studies on Gypsum , Crystals in Ponoraf Cave
[Pidurea Craiului Mountains, Romania]
Bogdan-Petroniu ONAC1, Lucretia GHERGARI2 & Agnes GA.L 3
ABSTRACT
About 200 gypsum crystals formed within a black clay deposit in Ponora§ cave were analyzed with respect to their crystallographical features. The most developed faces are those of pinacoid and prism. Plotting the number of crystallographical_ forms per crystal against the frequency of combinations we found a hi-model curve characterizing two gener~tions of gypsum crystals that have been grown in different conditions.
Key ~ords: crystallography, gypsum, Ponora§ cave, Romania.
ETUDES CRISTALLOGRAPHIQUES SURLES CRISTAUX DE GYPSE DE LA GROTTE DE PONORA$ (MONTS PADUREA CRAIULUI, ROUMANIE)
RESUME .
Quelques 200 cristau.x de gypse fonnes dans un depot d'argile noire de Ia grotte de Panora§ ont ete analyses du point de vue cristallographique. Les plus developpees faces sont celles de pinaco'fde et de primze. En rapport ant le nombre de fonnes cristallographiques par cristau.xen fonction des frequences des combinaisons, on a trouve une courbe hi-modale qui caracterise deux generations de cristau.x de gypse qui se sont developpes dans des conditions differentes.
Mots-cles: cristallographie, gypse, Grotte de Panora§, Roumanie.
INTRODUCTION
Ponora~ cave lies in the north-eastern part of Padurea Craiului Mountains (Fig. Ia), in the so-called Dami~-Ponor~ catchment depression (RUSU, 1988). The cave entrance occurs in Stramberg -type limestone. It is known from 1979 and it has been surveyed by members of CSA Club in Cluj. The total length of its galleries is over 4.5 km. 1 Ponora~ cave developed close to a fault · line striking E-W,' which brought . the Upper Jurassic limestones (Stramberg facies) in contact with:
1 I. GYOROG, pers. conun.
• quartzite sandstones and clays of Hettangian-lower Sinemurian age; ·
• upper Sinemurian-Carixian spatic limestones (± chert), and
• oolitic limestones (Bajocian-lower Callovian).
We just mention here that the presence of all these four lithological units within the cave played an importartt role on its morphology.
The paper has two main objectives:
I) to characterize the gypsum speleothems that occur in the Ponora~ cave and
2) to specify their genesis.

64
Q = .... -- = = = .... -- =
an
100 s: =
a
=== .... --= = = .... -- = 100 ~ 100 ~
lOl
B.P. Onac et aJ.
041
120
l '~~:·~::''llll~il&i'i~~l:f.III.W.J,J.II~:-:::,::==:;,:i::;:.:.::,;·:·::::::;:::;::, .::.=: :;::=::,:::.:::::::·i=.::::i;:=ii:;=;:;i;:·:: ,;=:1,:;:;::=,:::::::il':i:,;:,:.;,=.:==:=:: ::t.::::;:;:;:::.:]
LOCATION OF THE GYPSUM SPELEOTHEMS
Between the Waterfall and ''Pools Room" (Sala Bazinelor) (Fig. 1 b) the Hettangian clay occurs in two different facieses. The main one is represented by a layer of black clay (0.25 up to 1.1 m thick) which can be followed along the northern wall of the gallery, while the other one is a fine grained
· black clay that has been washed away by the stream and re-deposited on the cave floor.
Gypsum speleothems (crystals) were identified in both types of clay, but each of the two occunences displays different morphologies.
The gypsum crystals that grew within the black clay along the wall are chaotically disposed and have prismatic habit (Fig. 2). The length of these crystals never exceeds 6 em (usually 4-5 em). During the growing process fine particles of clay have been trapped in the gypswn lattice producing a high degree of impurification. Very few crystals are clean and transparent. · ·

Cristallographical studies on gipsum crystals
101
~ 010 -
The other types of gypsum crystals are formed under a thin layer (2-4 mm) of fine black clay on the cave floor. They have acicular habit (Fig. 3), never exceed 1.2 em in length and the way they are growing is perpendicular to the clay surface, pointing down with the crystal tip. All these crystals are perfectly transparent. We also remarked that the surface of the clay layer under which acicular gypsum crystals grow has always some yellow spots (thin films) composed of goethite/limonite.
CRYSTALLOGRAPHICAL DATA
Over 200 gypsum crystals were analyzed by means of one-circle reflecting goniometer in order to determine their main crystallographical forms. In addition we established the persistence and frequency of all these forms as well as the number of crystallographical forms per crystal.
We found 24 forms of pinacoid and prism, the most frequent of which were: (1 00), (0 I 0), (00 1), (1 0 I\ (f 02), (I 0 3), (f 0 1), respectively (0 11), (021), (081), 01 O), (120), < T 22).
Our statistical studies rely on two different groups of crystals; the first one included 120 crystals that had grown within the black clay located along the
120
122 011 122
c -=
65
northern wall, and the other one 91 crystals formed on the clay which had accumulated on the cave floor.
Plotting the form types against frequency (Fig. 4a, Sa and 6a) the persistence of the pinacoid forms became very evident.
In the diagrams 4b and Sb we plotted the number of crystallographical forms . per crystal against the frequency of combinations. It can be seen that the most frequent combination for the prismatic gypsum crystals is the one made up of 5-6 forms (less frequent are the combinations of 3-4 forms) (Fig. 2). Alternatively, 68% of the acicular crystals are build up of three forms, few crystals include four forms and even less five or six) (Fig. 3).
In order to characterize both types of gypsum crystals hosted by the black clay, we have represented them in the diagram from Figure 6b. The bi-model curve we obtained suggests two generations of crystals that grew in different conditions.
DISCUSSION AND CONCLUSIONS
Computer simulations of crystal growth based on kinetic theory (GILMER, 1980) have demonstrated

66
.-.. ~ 0 ._,
"' = .~ -CIS
= :E E Q u ~ u = ~ = C"
f:! ""'
45
~ 40 35 I 30 !
I 25 20 IS -
10 5
0 --- ---
50 ~ I
40 -1-
i 30 I
20 .,-!
10 I-I
0
e ... e
Form types
3 4 5 6
Number of crystallographical forms per crystal
0 0 ;; N
Form types
2 4 6
.... -.... .... IN
7
~--~~
---·---1
Number of crystallographical forms per crystal
B.P. Onac et al.

Cristallographical studies on gipsum crystals
.-.. ~ Q -"' = 0 .. ~
= :c e 0 <:.1
..... <:.1
= ~ :I
[ ... r-.
40
35
30
25
20
c:> ... c:>
67
Form types
2 3 4 5 6 7 8
Number of crystallographical forms per crystal
that crystal species and their distributions are controlled primarily by the structure. The growth of any single crystal is an interaction of the structure-detennined forces with the environment. The growth of a crystal is a long lasting process during which the conditions of growth and, therefore, the changes in habit are subjected to variations.
The prismatic gypsum crystals having a higher number of crystallographical forms indicate a very slow growth rate under relative constant solution supply. Equal values for the pressure (in all directions) inside the sediment could be an explanation for the chaotically distribution of the gypsum crystals within the clay strata.
Some of these gypsum crystals did not have sufficient crystal energy to push aside the clay and
REFERENCES
GILMER, G., H. (1980) Computer models of crystal growth. Science, 208 (4442), pp. 355-363.
HILL, C., A. & FORTI, P. (1986) Cave minerals of the world. NSS, Huntsville, Alabama, 238 p.
so-called "eroded crystals" formed (HILL & FORTI, 1986).
In turn, the low number of crystallographical forms that characterize the acicular "floor gypsum crystals" is an evidence of a much faster evolution of the crystals. The pressure (inside the clay layer) oriented perpendicularly to the cave floor seems to be higher than in any other direction, so the growing of the crystals followed it.
The crystal energy was sufficiently high to raise up the thin clay layer under which these crystals developed.
Oxidation of pyrite from the clay formation to sulfuric acid and the reaction of the latter with the calcium ions existing in the seeping water are, in our opinion, the processes which generated the gypsum crystals in Ponofa§ cave.
oRA~EANU. I. (1991) Hydrogeological map of the Plldurea Craiului Mountains (Romania). Theor. Appl. Karst., 4, pp. 97-127.
RUSU, T. (1988) Carstul din MunJii Padurea Craiului. Ed. Dacia, Cluj-Napoca, 254 p.


·study on Moonmilk from Peftera _Mare, Piatra· Molofnaia [Repedea, Maramuref
Mountains, Romania]
Dumitru I~TVAN, Sanda MANESCU & Maria JURCA1
ABSTRACT
The moonmilk was investigated by using a complex study, including complete chemical analysis, spectral analysis, X-ray diffraction, thermal analysis and other chemical analyses. The purpose was to analyze the water content, the way it is eliminated and to identify the factors which favor this unusual capacity to retain the water. · The analyzed moonmilk has a calcite character (about 80% is crystallized calcite) with a significant presence of aluminium silicate gel (clay gel). The water retaining capacity is due to both the porous network of anhydrous calcite in the moonmilk, and the retaining capacity of the clay gel. The clay gel is probably an exokarstic waste product originating in the levigalion of the soil that covers the limestones. The analyzed moon.milk is a recent product deposited quasi-synchronously with its sampling.
Key words: calcitic moonmilk, clay gel, water content.
L'ETUDE DU MONTM/LCH DE PE$TERA MARE, PIATRA MOLO$NAIA (REPEDEA, MONTS DE MARAMURE$)
RESUME
On a effectue une etude complete (des analyses chimiques completes, des analyses spectrales quantitatives, diffraction des rayons X, analyses thenniques et plusieurs detenninations chimiques) du montmilch, au but de preciser le contenu en eau, le mode d'elimination de l'eau et Ia cause de /'haute capacite de retenir l'eau. Le montmilch analyse a un caractere calcitique (/e calcite crista/lise represente environ 80%) ayant une fraction importante (15- 20%) constitue d'un gel Al-siliceux. Le gel argileux est probablement un produit exokarstique residue/, provenant de Ia Ievigation des sols d'au-dessus. Le monrmilch analyse est un produit actuel, f onne quasiment en meme temps que le prelevement.
Mots-c/es: montmilch calcitique, gel argileux, contenu en eau.
The cave Pe§tera Mare din Stanca Molo§naia was discovered and surveyed in 1994 by Montana Baia Mare Speleological Club. During the explorations one sample of moonmilk was collected for finding its calcitic or magnesian character.
After keeping this sample for 4 months in an open plastic bag at room's temperature, we have been
surprised by the wet-plastic-clay aspect, almost unchanged from the moment of sampling; this is showing a very good water retaining capacity. Due to this observation we initiated a study that had the aim to determine the water content, the retention mechanism and the conditions of water elimination.

70
1. GENERAL DATA
1.1. GEOLOGICAL STRUCTURE
The Cave Pe§tera Mare din Sta.nca Molo§naia is excavated in the western edge of a Triassic limestone and dolo~te occurrence from the Subbucovinic Nappe (Fig. 1). This is the largest occurrence of such rocks in Maramure§ Mts (4 km E-W length, 0.7-1.5 km width). It is a dry, mountain slope type cave, yet obviously subject to water seepage, developed on tectonic fissures.
1.2. THE MOONMILK DEPOSIT LOCALISA· TION
The maximal abundance is occurring in a subhorizontal 1 m long gallery with small height (0.3-0.8 m) and rounded profile. The gallery with moonmilk is a secondary lateral gallery of the Ascendant Gallery, at the + 17 m level. The cave has a total length of 190m, elevation range -7.5; 22.2 m and a horizontal extension of 45 m. The moonmilk forms a quasicontinuous layer on the walls, while on the floor it is partially washed-out, transported and accumulated in the existent holes by the infiltration water, that forms a temporary streamlet. The moonmilk has a white colour with yellow spots, a high humidity, that is giving his plastic features and an aspect that is suggesting its very recent deposition from the solutions that penetrate into the gallery through the fissures in the ceiling of the cave.
2. ANALYTICAL DATA
2.1. CHEMICAL ANALYSIS
The complete chemical analysis for the moonmilk and the Triassic limestone was performed. Though the water content is not real (due to the fact that the water content methodology involves the heating of the sample for drying it before analysis), for the other oxides the chemical composition accurately mirrors the chemical composition of the anhydrous ''frameworlc" of moonmilk (Table 1). One can notice the chemical anhydrous similitude between the moonmilk and the limestone. The rational analysis shows that the two samples have in their composition mainly calcite: 82.96% the limestone, 84.24% the moonmilk.
D. /swan et aL
--Umestone Moonmllk
Si01 3.35 3.51
F~03 0.28 0.63
Fe01 3.16 0.11 AI10 3 0 2.29
CaO 50.14 49.13 MgO 1.30 0.96 Ti01 0.05 0.06 MnO 0.02 0.02 N~O 0.4 0.46 K10 0.03 0.015 PlOs 0.02 0.12 col 37.51 39.45
Notable differences can be observed for the aluminum oxyde, that is present as main oxyde in moonmilk - 2.29% and absent in the limestone. For the phosphorous oxyde the presence is six times higher in moonmilk (0.12%) that in limestone (0.02%). The mineralogical composition indicated by X-ray diffraction (calcite, quartz) is in concordance with the chemical analysis.

Study on moonmilk from Peflera Mare
co 1,8826 co
1,9919 1,934
co 2,103
co 2,2961 co
2,5014
2.2. X-RAY DIFFRACTION ANALYSIS
It indicates the. calcitic character of the moonmilk, the crystallized calcite representing about 80% of the anhydrous part of the analyzed material (the determination was made on the 2.2961 A peak) (Fig. 2). Quartz occurs as traces. Some peaks are suggesting that basic phosphates, with or without crystallization . water might be included. Though the phosphatic minerals determination was uncertain, their presence is confirmed by the complete chemical analysis.
2.3. THE QUANTITATIVE SPECTRAL ANALYSIS
The main minor elements identified (Ba and Sr) are related to calcium carbonate. It is worth mentioning the high content in Ti (650 ppm) and the presence of Mn (Table 2).
co 3,0639
7l
2.4. THE DIFFERENTIAL THERMAL ANALYSIS
The investigation involves heating of the sample (for drying) at 50°C. The thermogravimetric curve reflects a continuous mass reduction until the temperature of calcite decomposition and carbon dioxide (COJ elimination was reached (Fig. 3). the decrease of mass between 140° and 450° was about 4%. The mass diminution until the beginning of calcite decomposition reflects a cumulative effect, due to a dehydration of limestone, phosphatic minerai and of clay gels, the latter being in a incipient crystallization phase. The water loss is the same in calcite and in molecular sieves (zeolites). The analysis confirms the presence of about 80% crystallized calcite.
2.5. THE WATER CONTENT DETERMINATION
Increasing the temperature at 105°C for two hours, we could establish the water loss (Fig. 4 ). The mass difference (1.0224 g the initial sample and 0.1442 g the final sample) certifies that the loss of mass is 85.9% (water).

72 D. Istvan et al.
TG 2oomg
DTA
T
100 % H20
90
80
70
60
50
40
30
20
10
Time (minute}
20 40 ~0 80 100 120 140
2.6. ELIMINATION OF WATER iN TIME
The ampulla with 10 grams moonmilk was introduced into a drying stove at 1 05°C and after ten minutes it was removed; then the sample was cooled in the exicator then it was weighted again. The ampulla was subsequently introduced again into the drying stove and the operations repeated after 20, 30, 40, ... minutes (Fig. 4, Table 3). The results show that the sample lost weight at an increased rate after 10-20 minutes and respectively
after 40-50 minutes of heating the samples. After 50 minutes at 105°C, 70.6% of the water content was eliminated. Further, the. rate of water loss decreases, so 'that during the interval 50-90 minutes the water contents reduced by only 14.6%, then, ~etween 90-140 minutes, no more mass reduction IS recorded. This investigation confirms that at nonnal temperature the moonmilk has a good ca-pacity of retaining the water. .

Study on moonmilkfrom PeJlera Mare
Time (min.) %H10 10 9.19
20 20.84
30 33.59
40 42.88
50 70.60 60 75.02
70 78.93 80 82.64
90 85.20
100 85.72
110 85.67
120 85.71
130 85.74
Temperature oc %H10 30 97.86
40 95.16
50 90.29 60 78.17 70 75 .20 90 70.14 100 62.94 110 52.89
120 47.85
130 45.76 140 42.60
150 38.46
160 30.69
170 25.95 180 22.09 190 21.91 200 21.88
2.7. THE LOSS OF WATER AS A FUNCTION OF TEMPERATURE
The samples were repeatedly weighted during a test performed by increasing the temperature from 20°C to 230°C in the drying stove. The results indicate three domains where the loss of water is more significant (Fig. 5, Tabel 4 ):
73
• 50-60°C - 12.12% of entire content, to be compared with an average gradient of 5.5% H20/10°C, recorded between 30-180°C. It probably corresponds to the elimination of water from the spongious network of the crystallized calcite;
• 90-120°C, 22.29% loss of water, probably from the calcium carbonate and clay gels;
• 150-180°C, 16.34% loss of water, probably from incipiently crystallized clay minerals (That have the higher capacity to retain the water).
2.8. EVALUATION OF THE WATER QUANTITY NECESSARY FOR REHYDRATION
The dried sample was wetted with distilled water and was kept at the room temperature until the water evaporated. The water retained in the sample as a result was 1.25%, showing that dehydration phenomena for moonmilk are practically irreversible under normal condition.
3. RESULTS INTERPRETATION
The analyzed mooiunilk has a high water content and a remarkable capability of retaining this water, even four months after collecting the sample from the original environment and keeping it in normal conditions. The water retaining capacity of the analyzed calcitic moonmilk is favored by the network of calcite crystals, which form a porous structure, but mostly because of the existence of a non-crystallized gel (the X-ray diffraction results indicate a gel weight content of 15-20%). The chemical analysis suggests that most of it is an alumino-silicic gel of smectites type, and only a small part of it ( <5%) might be calcium carbonate gel. It can be thus inferred that the large water retaining capacity of the analyzed moonmilk is due to the intense adsorption on the active surfaces of the clay type gel. The thermal analysis and the derivatogrames show that the crystallized clay minerals are missing, which suggests a recent genesis (SEDLETSKY, 1937 quoted in ZAMFIRESCU et at., 19S5) shows that the clay minerals crystallize from aluminum silicate gels after about four years).

74
100
9
80
70
20
10
D. Istvan et al.
%~0
20 40 60 80 100 120 140 160 180 200 220 240
The oriiin of the alumino-silicic gels is in this case exokarstic. Most soils have in their composition, as an essential component, an amorphous component of alumino-silicic gels type (DEER et al., 1963, quoted in ZAMFIRESCU et al., 1985). The cave where the moonmilk . continues to ·be deposited is strongly ascending, situated on a mountain slope, hence the seepage water can easily incorporate and then redeposit the clay gels originating in the soil, together with the main carbonate component which originates in the dissolution of limestones.
4. CONCLUSIONS
The complex study of moonmilk from Pe§tera Mare din Piatra Molo§naia (Maramure§ Mts.) shows the_ following:
REFERENCES DIACONU, G. (1990) Clo~ani cave. Mineralogical and
genetic study of carbonates and clays. Misc. Speol. Rom., 2, 135 p.
GHERGARI, L., ONAC, B., P. & sANTAMAR!AN A. (1993) Mineralogy 6fmoonmilk: formation in .· Romania and Norwegian caves. Theor. Appl. Karst., 6, pp. 107- 120. · · _:
I~TV AN, D., TAMA~; I. & RIST, t (1995) Conside-. ratu asupra carstului din Valea Repedea ......,
• the moonmilk 'is present in ascending gallery · developed in Triassic limestones;
• it bas a calcitic character, with a composition close to that of the parent-rock;
• a large part (15-20%) of the moonmilk has a gel character of clay, and subordinately of carbonate type;
• the important water retaining capacity (the water content is still 85.9% about 4 months after collecting and keeping the sample at room's temperature) is related to this gel;
• the studied moonmilk is a recent product, deposited quasisyncbronously with the period when it was collected.
- Vart'ul Pietriceaua (Muntli Maramure§lflui). Cere. speol., 3, (in press). ·
ONAC, B.,P. & GHERGARI, L. (1993) Moonmilk mineralogy in some Romanian and Norwegian caves. Cave Sciences, 20, 3, Transaction of the BCRA, pp. 107-111. .
ZAMFIRESCU, F., COM~A. R., MATE!, L. (1985) Rocile argiloase In practica inginereasca. Ed. Tehnid, Bucure§ti, 399 p.

Preliminary Report on the ·M.ineralo·gy of Peftera din Valea Rea
[Bihar Mountains, Romanial
Bogdan-Petroniu ONAC1, Monica BENGEANU2
, Mihai BOTEZ3 & Jozsef ZIH''
ABSTRACT From a mineralogical point of view, P~tera din Valea Rea presents a great interest. Gypsum is unique in what concerns its type of occurrence and abundance. Gypsum speleothems (flower, crystal, rope, snow, hair, cotton, crust and stalagmite) from Pe~tera din Valea Rea exhibit features never described before in a Romanian cave. The most typical speleothems are those consisting of gypsum, anhydrite and celestite, yet some may include carbonate minerals (calcite, aragonite, magnesite, hydromagnesite, dolomite, rhodochrosite, malachite) and phosphates (brushite, barrandite, bobierrite, vivianite, wavellite). Quartz, periclase, kaolinite, dickite, nacrite and illite have also been identified in various speleothems. ·
Key words: speleothems, mineralogy, Bihar Mts., Romania
RESUME
NOTE PRELIMINAIRE SUR LA MINERALOGIE DE LA GROTTE DE VALEA REA (MONTS BIHOR, ROUMANIE)
La grotte "Pe~tera din Valea Rea" presente un grand interet mineralogique. u gypse est unique par son mode d'occurrence et par son abandonee. Les speleothemes de gypse (efflorescences, cristaux, . "cordes", "neige", "cheveux", "eaton", croates et stalagmites) de la Pe~tera din Valea Rea sont inedites pour les grottes roumaines. Les sp~Leothemes les plus rypiques sont celles de gypse, anhydrite et c~lestine mais on rencontre aussi des types incluant des mineraux carbonatiques (calcite, aragonite, magnesite, hydromagnesite, dolomite, rhodocrosite, malachite) et phosphatiques (brushite, ba"andite, bobierrite, vivianite, wavellite). Dans quelques speleothemes, on a aussi identifie quartz , periclase, kaolinite, dickite, nacrite et illite.
Mots cl.es: speleothemes, mineralogie, Monts de Bihar, Roumanie.
GENERAL DATA
The cave is situated in the upper part of the Valea Rea catchment area (Fig. 1) (1450 m a.s.l.), on the southern slope of Carligati-Flintlina Rece-Comu Muntilor Ridge (Bihor Mountains). It has been discovered by Adrian VlUen~ in 1986; since then several expeditions were carried-out by members of the speleological associations: "Z" and "Cristal"
Oradea, "Ursus Spelaeus" Targu Mure~ and Societatea Ardeleanii de Speologie (DAMM, 1991). The Valea Rea karstic system has now a length of over 15 km of which 11.7 km are surveyed (P. Damm, pers. comm.). The deepest point is 265m below the entrance.
The cave develops in a region that can be characterized as a petrographic mosaic, located at the contact between the quartzite andesites

B. P. Onac et al. 76
1. Padt 2.BIIileasa 3. Baraa 4. v. t:etllior &. Baril& Cctlanw.i 6. LL.me4 Plerdl.d. 1. Poiana Poncr 8. Paragina
760 0 11500m
(Banatititic Series) and the dolomites/black limestones of Anisian age of the Ferice Fonnation (Codro Nappe) (IANOVICI et al., 1976). The structure of the area is highly complicated by several faults, few of them playing an important role on the cave speleogenesis.
Most of the ground water originates in noncarbonate rocks, hence it transports different ions that certainly influence the crystallogenetic processes. In order to avoid any kind of damages against the cave environment, we shall not give any details concerning the locations of specific speleothems within the cave.
METHODOLOGY
The results discussed in this paper are based on the examination of 23 samples collected from the whole cave system. Most of the sampled
speleothems were small chips and fragments found loose on the cave floor. All samples have been examined under the binocular microscope. The minerals in the constitution of the specimens have been identified by X -ray diffraction. The expected minerals, calcite, dolomite, aragonite, hydromagnesite, malachite, gypsum, celestite, brushite and quartz were easily identified by comparison of the diffraction patterns with those of a reference chart. Thennal, chemical and emission spectroscopy analysis as well as scanning electron microscope have been additionally used in order to characterize the other minerals identified through the X-ray diffraction. It is not the purpose of this paper to discuss all aspects of the mineralogy of the speleothems we found in this cave; those aspects and some crystallographic remarks will make the subject of another report (ONAC et al., in prep.).
Table h C&mow.te Djl~ril~ tdendfl~.lli .vh"~Ou$ sji!eothemdl'om ~@ftera"iJm .VilealUL .· · < t •·' · Especes de ininerailx: ciif!J~itdliquei." lile1fi!JJees 4iim· fd Pef.leta 'i1iiJ iVidea 'Reti ,. , . : . . . . . .. . :· :.·· ; ..
·Miner81 < ...
· C.omoosUhbi ·.·.;. :. / ' .. : o~urfen~~> .\ .:· : ~ {: ······ · .: ·:. << ... ··:·•· .... ::::·::.
Aragonite CaC03 Wall crusts, helictite.
Calcite CaC03 Dripstone, flowstone, belictite, wall crusts, coralloids
Dolomite MgCa(C03) 2 Spar crystals crusts, clusters.
Hydromagnesite 4MgC03Mg(OH)z4Hp Moonmillc, spot crusts
Malachite CuC03Cu(OH)2 Nodular speleothems, wall crusts
Rhodochrosite MnC01 Wall crusts

Preliminary report on the mineralogy of Peflera din Valea Rea 77
CARBONATE SPELEOTHEMS
Light-colored and not necessarily spectacular calcite coatings and crusts occur along the cave walls, ceilings and floors directly on the bare dolomite or limestone bedrock. However, in many regions of the cave these speleothems-are interesting because they are composed of aragonite and periclase. The latter appears as light-yellow spots, mainly on dolomitic bed.J.:ock or covering small surfaces of magnesium-rich calcitic crusts. It is formed in contact-altered magnesian limestone as a result of decarbonation of dolomite.
We also observed millimetric dolomite crystals that appear to grow outward directly from calcite coating. Although growth from films of downward-flowing water cannot be excluded, it seems
· more likely, considering the distribution of the coatings over the walls, that the solutions which deposit these crystals ooze directly from magnesium-rich rock behind the coating.
Green earthy nodules were found in a weathered material that covers a millimetric layer of quartz . The X -ray diffraction patterns of these nodules are sharp and well resolved, indicating a wellcrystallized malachite. Sometimes this weathered material is itself covered by a black crust that is composed as the X-ray analysis indicated by quartz and rhodochrosite.
Malachite crusts have been earlier reported from · Szemlohegyi · cave-Romania (see HILL & FORTI, 1986, p. 143), but it has been impossible for us to localize this cave.
White, blue
Tufts of aciculate needles radiating outward from the cave wall or stalagmites, shaped rather like helictities appear in several places; all these speleothems contain aragonite as an essential constituent.
Moonmilk occurs as a dry powder dusted over the surfaces of stalactites and some bedrock, in many parts of the cave. It also occurs as sticky pure white blobs associated with aciculate calcite. All specimens of moomiri.lk examined yielded the X-ray diffraction patterns of hydromagnesite.
Similar soft, wet, daubs of hydromagnesite moonmilk were found in many other locations in the cave.
Spots of pure-white hydromagnesite crusts were also observed in few places of the cave.
Speleothems that consist essentially of calcite offer an overwhelming variety of morphologies.
SULFATE SPELEOTHEMS The cave hosts the most interesting collection of sulfate speleothems from Romania. Table 2 lists sulfate speleothems of different types and subtypes (according to the classification presented by Hll.L & FORTI, 1986), that we have found in Pe§tera din V alea Rea.
White to light blue anhydrite crystals appear intermixed with celesdte crystals over or within gypsum wall crusts. The largest crystals do not exceed 5 millimeters. They have been observed first under the binocular microscope being subsequently certified by the X-ray analysis.
Crystals and wall crusts Anhydrite
Celestite
Gypsum
CaS04
SrS04
CaS042H20
Blue-gray tint Crystals and wall crusts
Selenite (coarsely crystalline, transparent variety of _gypslllil)
White; tinted yellow gray Gypsum flowers
• anthodite and oulopholite
Euhedral crystals
Wall crusts
• snowballs and blisters
• starburst
Fibrous gypsum
• hair, cotton, rope, snow
Needles

78
Blue-gray crystals of celestite having various sizes, shapes and a high degree of perfection have been observed to be spread over the gypsum crusts.
Gypsum flowers are the most common speleothems in this cave. Both anthodites and oulopholites have been observed. They are composed of branching and curving bundles of aggregates and twinned gypsum crystals (GHERGARI & ONAC, in press); the longest "petal" bundle that we saw was 33.5 em long.
Euhedral crystals of gypsum, up to 28.5 em in length and 5 to 6 mm in diameter have been found chaotically spread on the surface of a sand "beach" just one meter above the underground stream. In between these large and thick crystals, delicate selenite needles up to 10 em in length and few millimeters wide have been also observed. The origin of these crystals is related to the upflow of sulfate solutions through the sandy soil of that cave passage.
Both granular and fibrous varieties of gypsum crusts (WHITE, 1968) have been found. Their thickness usually exceeds 4 em. As a subtype of the gypsum crusts, we identified in few locations of the cave starbursi gypsum crusts consisting of crystals that radiate from a common center. The crystals are growing parallel to the wall and not perpendicular to it.
Blisters and snowballs often protrude from gypsum crusts.
Four different morphological subtypes of fibrous sulfates can be described (Hll.L & FORTI, 1986):
• Hair. Single gypsum fiber, up to 10 em or more in length have been observed hanging from the walls. When they rich a certain length or because of air movement these delicate and flexible crystals will slowly be drifted down from the wall.
• Rope. 1hls speleOthem hangs down from cave ceilings or any other overhanging ledges and consists of fibrous strands matted together into parallel bundles. The gypsum ropes we have seen are up to 15 em in length and 1 em in diameter, being well spiraled.
• Cotton and Snow. Both speleothems appear as floor material derived from detached ropes and hairs. Cave cotton consists of masses of fibrous or needle-like intergrown crystals while cave snow fonns a white powder composed of fine grains of fibrous gypsum.
In one region of the cave we noticed that calcite stalactites are covered by a thick layer of gypsum
B. P. Onac et al.
(probably selenite) crystals. It is perhaps a place where the chemistry of the percolating water changed radically in time. Most of the stalactites within this region are intensely corroded at the calcite/gypsum contact. So far we did not elucidate the origin this phenomenon.
PHOSPHATE SPELEOTHEMS
We collected some white-yellowish, earthy mass floor material in a place where thin guano deposits covered the gypsum floor crust. The X-ray diffraction indicated the presence of gypsum and brushite - Ca[HP04] 2H:P· Spectral analysis identified more than 1% phosphorus (as P20 5).
Brushite derives its phosphate from decaying bat guano in an acid-rich (below pH 6) environment. Other 4 phosphate minerals (barrandite [(Fe, Al)P042H20], bobierrite Mg3[P04h8H20, vivianite F~[P04h8H20 and wave/lite Ah[(P04) 2/(0H)3]5H20) were identified by means of X -ray analysis in nodules and small lenses from a light-brown clay collected in the lower part of a profile that has in its upper part a centimetric layer of white clay. The lower part of the profile is partly covered by bat guano. 1bis unusual paragenesis is due to the reaction between magnesium and iron (the latter represented by goethite) present into the doloinitic bedrock or/and in the cave soil, aluminium, which has been supplied by the caoliniticlillitic white clay and phosphorus leached from bat guano.
SILICATE SPELEOTHEMS
So far, in a few places of the cave, there have been found small euhedral crystals of quartz up to 6 mm long and 2-3 mm wide at the base. Some of the quartz crystals are coated with a thin layer of clay, while others are covered by a brown calcite crust. The quartz crystals directly overlie either the limestone bedrock or some detrital material cemented in ceiling pockets.
Fluid inclusion studies on some quartz crystals collected in this cave have indicated that the quartz grew subaqueously at 270°C.
Carbonate crusts usually have a silt or clay content of one percent or less (Hll.L & FORTI, 1986) and sometimes they may contain a large amount of detritus deposited within or between individual carbonate layers. Detrital microcrystalline quartz and kaolinite are the most common minerals that appear as residuum in carbonate speleothems being brought in by the percolating water.

PreUmlnary report on the mineralogy of Peflera din Valea Rea 79
We inferred that the interbedded quartz layers into the calcitic crusts were a product of opal recrystallization. The source of silica for Pettera din Valea Rea is apparently the igneous rocks as well as some sandstones and conglomerates that outcrop in the proximity of the cave.
Illite has been found in association with kaolinite in centimetric, white-plastic veins at the limestone/residual clay boundary.
Lenses of white plastic material found in alluvial deposits, were sampled in order to define their mineralogical composition. The X-ray and especially the thermal analysis indicated tlult they were composed of dickite and nacrite, which are isochemical [AitSi40 10(0H)8] but not isostructural. Both minerals contain no exchangeable cations. In our opinion, they were formed by chemical weathering of alkali feldspars under acidic conditions.
Until now, dickite has been reported only from Iza cave (VIEHMANN et al., 1981 ), while nacrite bas never been mentioned before in a cave environ- · ment. Both occurrences need further investigations in order to determine how these minerals formed at the cave temperature.
REFERENCES DAMM, P. (1991) Avenu1 Adrian de sub Comu
Munp1or. Speleotelex 7 (19), pp: 14-17. GHERGARI, L. & ONAC, B.,P. (in press) The crysta1-
logenesis of gypsum flowers. Cave Science. HILL, C., A. & FORTI, P. (1986) Cave Minerals of the
World. NSS, Huntsville, Alabama, 238 p. IANOVICI, V., BORCO~. M., BLEAHU, M.,
PATRUIUS, D., LUPU, M., DIMITRESCU, R.
CONCLUSIONS
The purely factual mineral identi:fi~ons reported here aimed to point out the mineralogical interest that this cave presents. So far, 21 minerals assigned to four chemical groups were found to form speleothems in Pe,tera din V alea Rea; 10 of these minerals are for tlle very first time mentioned in our caves, three (barrandite, periclase and nacrite) being new in the international literature as well. Due to presence of the dolomitic rocks, magnesite, hydromagnesite, periclase and dolomite were found to fonn speleothems.
Gypsum offers the greatest variety of speleothems we ever found in a Romanian cave, while the association of phosphate (except for the brushite) is entirely new. .
Among the silicate speleothems, the presence of quartz crystals formed at 270°C indicates a hydrothennal activity in the vicinity of the cave while dickite and nacrite were deposited in an unusual environment, that needs additional observations and analyses in order to be accurately understood.
& SA VU, H. (1976) Geologia Munfilor Apuseni, Ed. Did. Pedag., Buc~ti.
VIEHMANN, 1., DEMETER, I., LUNGU, V. & SARADY, P. (1981) Note preliminaire sur !'argile blanche de Ia Grone d'lza (Monts de Rodna, Roumanie). Trav. /nst. Speol. "E. Racovitza", XX, pp. 213-215.
WHITE, W ., B. (1968) Sulfate mineralogy in some caves in the United States. Act. IV Int. Cong. Speleol., Ljublijana, 3, pp. 253-259.


Preliminary Data an the Hydrogeology of Karst Terrains Around the
Springs of Some,ul Cald River [Bihor-VIideasa Mountains, Romania]
Emil SILVESTRU\ Tudor TAMA~ & Gheorghe FRATILA2
ABSTRACT
Six karst drainages have been investigated in the western section of the Some§Ul Cald Graben. Both fluoresceine tracings and pH, temperature and conductivity measurements have been performed. The resulting data provided the grounds for delimiting of subterranean hydrographic basins and for several considerations concerning karstogenesis in the area.
Key words: karst hydrogeology, water tracing, Some§nl Cald, Romania.
DONNEES PRELIMINAIRES SUR L'HYDROGEOLOGIE DES TERRAINS CALCAIRES AUTOUR DES SOURCES DU SOME$UL CALD
RESUME (MONTS BIHOR-VLADEASA, ROUMANIE)
Six drainages karstiques localises dans le ouest du Graben de Some~ul Cald ont ete recherche par des trarages a jluoresceine et ajoute aux mesurages du pH, de la temperature et de Ia conductivite. Les resultats ont ere utilise pour Ia delimitation des bassins hydrographiques soute"aines ainsi que pour quelques considerations concernant Ia karstogenese dans Ia region.
Mots ells: hydrogeologie karstique, trarage, Somejul Cald, Roumanie.
1. GENERAL DATA
The Some~ul Cald Springs area represents the western part of Some§ul Cald Graben, located in . the northern Bihar Mountains. The area is bordered by Some§ul Cald River to the south, Alunul Mic Valley to the east, the Cuciulata-Piatra Gditoare ridge to the west and the Onceasa Plateau to the north.
2.GEOLOGICAL SETTING
The Some§ul Cald Graben is a tectonic conidor with a quasi-continuous sedimentary series known as the Bihor Autochthonous, consisting of alternating detrital and carbonate sequences of ages ranging from Upper Permian to Upper Cretaceous, intruded by the Laramian ignimbrites of Mount Vlll.deasa to the north and north-east. To the west, the autochthonous is overthrusted by the Skythian

82
detrital fonnation of the Codru Nappe System (MANTEA, 1985) (Fig. 1, 2).
3. THE KARSTIFIABLE DEPOSITS
Two carbonate series, of Upper Jurassic and Lower Cretaceous ages, host. all karst features in the area: The Upper Jurassic series, with an average thickness of 150-350 m, consists of two types of limestones :
E. Sillle&tru et al.
• the Farcu white limestone, 50 to 200m thick, of Oxfordian-Lower.Tithonian age
• the Albioara black limestone, 100 to 150 m thick, of Upper Tithonian age. ·
The Lower Cretaceous series, up to 150m thick, contain three microfacial types: limestones with fenestral lamination, limestones with milliolids and limestones with orbitolines. The age of this series is Barremian-Lower Aptian (MANTEA, 1985).

The hydrogeology of lumt terraim around the JourcttJ of Some1rd Cald 83
ssw NNE_,--sw Onceasa
NE
Pestera Cerbului Avenul cuVaca
1400 V. Alunul Mare
1000
w Pdrfwl Ars
I I I I
' I I I I I I
E~NW Cudulatn
Avenul din Cuciulata I
\
..
L1
II. Somesului Cald ' I
lzbucul cu I I
Cascada I I I
I I I I
J; I I .
+
L1 J1 I Lt+3-J3)2
SE §Jl?J3 htir~ap114
I++}/ Is· w Is
1~17 I,, je
1~19 I ~ 110
[-... 111 ... ,12
Draw by : Oidicescu ~-=-

·': 84
4. THE HYDROGRAPHIC NETWORK
The surface streams in the area belong to the upper reaches of the Some§ul Cald River. This surface drainage, organized on the impervious igneous formations of Vlldeasa and on the Werfenian and Senonian deposits from the northern part of the graben, supplies a well-developed karstic network
· which discharges through outlets with important flow rates. The hydrographic network is represented by the Some§Ul Cald River and its left-side tributaries: V alea Vacii and Alunul Mare.
Valea Vacii, the first left-side affluent of the Some§ul Cald River downstream of Some§Ul Cald Gorges, is a dry karstic valley with a disorganized hydrographic network, all the active flows entering underground via swallets located near the boundary between quartzites and limestones (V ALENA~. 1978). Alunul Mare is cut in the south-eastern part of the Onceasa plateau. Its water sinks through a series of swallets in its bed after a surface flow of 500 m. Downstream, the valley is dry nearly all year long. Some 700 m upstream of the confluence with Some§ul Cald River, the Alunul Mare Valley is supplied by two karstic springs, one coming from the left and the other from the right side of the valley. The average discharge of Alunul Mare at the confluence is 50-55 lis under nonnal flow conditions.
5. THE ENDOKARST OF THE SOME$UL CALD SPRINGS ZONE
5.1.CUCIULATA- VALEA VACII AREA
Ponorul din Cuclulata Cave3 (1400 m a.s.l.) is located 150 m north-west of Cuciulata summit (1475 m a.s.l.). It is a swallet cave, with a surveyed length of 3,140 m extending over an elevation range of 75 m. The stream passage is developed along descending canyons interrupted by small pits. Some 40 m below the entrance, the overall slope decreases and the cave stream, with an average flow rate of 1 lis, follows a meandered canyon down to the final sump (-75 m)~
Avenul din Cuclulata4 (1400 m a.s.l.) is situated 300 m north-east of Cuciulata summit (1475 m a.s.l.). The entrance of the pothole (Fig. 3a) consists of a 40 m shaft; an underground stream, with
. an average flowrate of 4 lis, is intercepted at the bottom of the shaft. The bed of the stream
3 National Caves Inventory No., 3410/6 (GORAN 1982) 4 •
National Caves Inventory No., 3140/29, (GORAN, 1982)
E. Silvestru et al.
passage consists of Hettangian-Sinemurian quartzite sandstones, which are followed down to -174 m. From -63.3 m to the first duck ( -141.5 m), the stream follows a large steeply descending passage, with its ceiling developed along bedding planes. At -174 m there is an important right-side tributary, with a flow rate comparable to that of the main stream. This affluent is supposed to be the stream intercepted in Ponorul din Cuciulata, at a distance of 300 m and a depth of 90 m (VALENA~. 1978). After a secQnd duck (-183.6 m), the final sump is reached at -186.6 m.
The pothole is located in an area in which Barremian-Lower Aptian limestones outcrop. Down to its bottom, the entrance shaft crosses these limestones, as well as the Upper Jurassic ones, reaching the layers of Lower Liassic quartzite sandstones. The Middle and Upper Liassic deposits, especially the Toarcian Marls Formation, are lacking from the intercepted succession.
Ftsura Neagrli Cave (fig. 3b, 1371 m length, -117m in depth) is situated on the Valea Vacii valley, 200 m upstream of the second left-side affluent. A dry swallet of the valley provides the entrance into the cave. Nowadays the water sinks into another swallet, 20 m upstream, and reaches the cave 8 m below the entrance. The cave generally follows an intricate system of descending canyons, interrupted by pits. Upstream the 6th sump, the cave stream has an average flow rate of 6-7 1/s.
5.2. ALUNUL MARE VALLEY AREA
Pqtera Cerbului-A venul cu Vacli System (Fig. 3c)
Cerbulul Cave (5,094 m) is located on ·the left side of Alunul Mare Valley, at 38 m relative altitude and 2 km upstream the confluence with Some~ul Cald River. Right after the entrance, consisting of an 8 m shaft, the cave is divided in two independent sections. The first one, after a 15 m pit and a system of large fossil passages (lOxlO m), continues with a younger sector, following a system of canyons that lead to a sump pool. The pool forms the lowest point of this section.
The other section, much longer, begins with a system of dry passages developed on several floors, that lead to the main dry floor.
The stream passage is intercepted by a pit at the final part of the dry level and consists of two sec~ons with different morphologies. The fU'St section Is a large, not very high passage, with important clay deposits, and ends downstream in a sump. The other section is a meandering canyon.
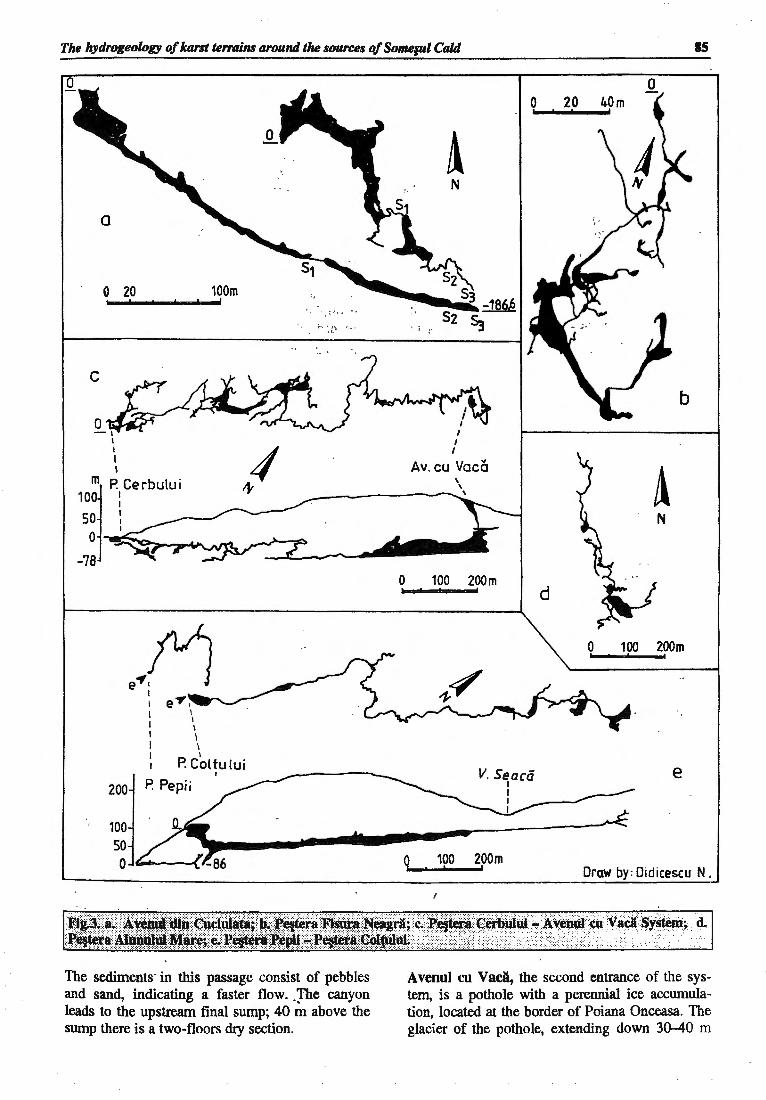
The hydrogeology of kant terrains around the sources of Some1ul Cald 15
a
0 20
c
0 - I
I I I I
100m
m P. Ce rbulu i 100 I
I
so : 0
-78
I
200
100 so 0
.~M I
e'P' , I I \
I \ \
I I I \ I I
I P. Coltului I
P. Pepii
.... ''\
The sediments· in this passage consist of pebbles and sand, indicating a faster flow. }'he canyon leads to the upstream final sump; 40 m above the sump there is a two-floors dry section.
0
I I
I I
I I
Av. cu Vaca
100 200m
N
d
0 100 200m
e
Q 100 200m I I
Draw by: Oidicescu N.
d..
A venul cu Vaca, the second entrance of the system, is a pothole with a perennial ice accumulation, located at the border of Poiana Onceasa. The glacier of the pothole, extending down 30-40 m

86
elevation range, is reached via a large entrance into a collapse sinkhole and a 3 m pit.
The junction with Pe§tera Cerbului cave was discovered in September 1994, via a squeeze fol- . lowed by a 38 m pit that intercepts the final dry section of the cave. There is no stream flowing down the pothole; the stream passage of the system, with an average flow rate of 5-10 lis, is situated at -125m below the entrance.
lzbucul Alunulul Mare Cave (1265 m surveyed length) is an outflow cave, located on the right side of Alunul Mare Valley, 700 m upstream the confluence with Some§ul Cald River (Fig. 3d). The cave has three entrances: the first one, along the stream, is right in the valley floor; the other two are in small sinkholes, 50 m away from the previous one.
The cave begins with a conduit (1 x 2 m), that ends with a squeeze giving access to the main passage. This passage continues upstream via a series of breakdown chambers, then by two sumps bypassed via dry passages, which lead to the final, upstream sump. The average discharge of the cave stream at the outlet is 15-20 lis, but it can exceed 500 lis in flood conditions.
5.3. PE~TERA PEPII - PE~TERA COLTU· LUI SYSTEM
ColttJiul Cave (3526 m) (Fig. 3e) is situated 650 m downstream the confluence of Alunul Mare Valley with Some§Ul Cald River, at the foot of Piatra (Cliff) Coltului. The cave stream, with an average flow rate of 15-20 lis, was intercepted at -86m.
The downstream section of the cave has a series of 5 waterfalls totaling 22 m that lead to the downstream final sump. Upstream, over a length of 1000 m, the passage follows a 25-40 m high canyon; further upstream, the morphology is totally changed, the canyon becoming a low passage, with horizontal ceiling, that leads to the upstream sump.
Pqtera PepU3 (845 m) is located on the left side of the Some§ul Cald River, at 5 m· relative elevation. This cave fonns the outflow of the stream in Coltului Cave; only some 90 m of unknown passage separate the upstream end of Pe§tera Pepii from the downstream end of Coltului Cave.
The main stream passage in P. Pepii is 417 m long and mainly develops along a northwestern direc-
. tion ending upstream with a sump.
s National Caves Inventory No., 3410/53, (GORAN, 1982)
E. Silvestru et al.
6. TRACER TESTS IN CUCIULATA:-VALEA VACII AREA
The first tracer test was performed on November 22, 1994 at 18:30, in Ponorul din Cuciulata Cave, at -65 m (1335 a.s.l.); the tracer reappeared in Izbucul Moloh outlet (1210 m a.s.l., 15 lis average flow) after 35 hours (average travel time 48 h). At that date, the flow rate of the cave stream was less than 1 lis. 400 grams of fluoresceine were used. The water samples were taken for three days, four times a day during the first two and twice during the third day, when the tracer concentration visibly declined (Fig. 4 ). The tracer followed the subterranean path with a theoretical flow velocity of 20 mlh (average velocity 14.5 mlh), over 700 m straight line distance and 125 m elevation range. Another tracing experiment was performed on march 21, 1995 in Fisura Neagra Cave, with 250 g of fluoresceine, at a flow rate of the cave stream of 5-7 lis. The tracer was injected in the 6th sump (1210 a.s.l.) at 19:10, and it reappeared at the Izbucul cu Cascada outlet (1200 m a.s.l., average flow rate 10-15 lis) after 12 hours. Five water samples were collected from the outlet over 24 hours time span. The straight line distance between the point of injection and the outlet is 450 m, over only 10 m elevation range. The theoretical flow velocity was 37.5 mlh (Fig. 5).
We injected the same quantity of fluoresceine in the first sump ( -141.5 m) in A venul din Cuciulata pothole, on April 28, 1995, 14:19 h. At that time, the average flow rate of the cave stream was 10 lis, double than normal, because of the snow-melting. We noticed the tracer appearing at the Izbucul cu Cascada outlet (580 m away and 58.5 m below) only 2 h 15' later (flow velocity of 256.6 mlh). Five water samples have been collected every two hours (Fig. 6).
7. TRACER TESTS IN ONCEASA AREA
We suspected a communication between the swallets 01 and 0 2 and the stream in the Pe§tera Cerbului (see Fig. 1 and Table 1). The presumed outlets of the stream in Pe§tera Cerbului are the springs VIIb and VIle from Alunul Mare Valley (situated some 500 m away, 10 m below), They have an average discharge of 14.5 to 17 lis in normal flow conditions.

The hydrogeology of kant ten-ains around the sources of Some1ul Cald
T0/o
100
80
60
40
20
2 4 .X I. 25 .XI.
22. Ill.
87
26.XI.1994
2 3 . Ill. 1995

88
100
80
60
40
20
19:05 20:02
29. IV 22:02 0:05 2:05
30.1V.1995
location altitude (m) flow rate (1/s) distance (m) elevation range m
01 1325 <0.1 180 125 02 1350 . <0.1 250 100 5 1225 5-10
index water temp. air temp. pH Q (1/s) conducdvlty ( S/cm) (OC) eq
I. 5.0 2.9 8.47 15 114 II. 3.40 2.8 8.64 3 92.15 III. 3.31 3.1 8.65 2 85.5 IV. 5.45 2.9 8.43 10-15 159.6 v. 5.4 3.2 7.40 1.2 184.3 VI. 5.9 2.4 7.67 1.0 209 VIla. 5.6 2.4 6.30 10-12 140.6 Vllb. 6.0 2.4 6.25 2.5 125.4 Vile. 6.0 2.4 6.19 12-15 138.7 VIII 5.7 2.1 8.46 15-20 214.7
E. Silvestro et al.
quantity (g)
400 400
T.D.S. (mecMxlO")
7.31
5.90
5.48
10.23
11.81
13.39
9.01
8.03
8.89
13.76

The hydrogeology of lumt temlins around the sources of Some1ul Cald 89
When the tracing test was performed the swallet flowrates were visibly reduced. The tracers were not detected either at VIIb and VIle, or in Cerbului Cave. We repeated the tracing test on April 28, 1995, injecting 400 grams of fluoresceine in 0 2,
now at an average flow rate of 4-5 Vs (snowmelting occurred meanwhile). However, the same result as in the previous test was obtained. That makes us suppose that the water that sinks in 0 1
and 0 2 reappears at the springs of Onceasa Valley, situated 200m to the west (see Fig. 1).
8. OTHER MEASUREMENTS
The temperatures of the karst springs indicated a dependence of most of the waters to the zone of annual heterothermy (RUSU, 1988). The outlets II
REFERENCES GORAN, C. (1982) Catalogul sistematic al pesterilor
din Romania, Ed. CNEFS, Bucuresti, 496 p. MANTEA, G. (1985) Geological Studies in the Upper
Basin of the Some~ul Cald Valley and Valea Seacl Region (Bihor-VlAdeasa Mountains). An. JGG, Bucure§ti, 66, pp 1-91
..
and m were exceptions, the measured values of their parameters (pH, C, T ) being almost similar to those of the Sometul Cald River in their vicinity. The data concerning conductivity are shown in Table 2
9. HYDROGEOLOGICAL KARST SYSTEMS
The main flow directions and the approximate boundaries of the karst hydrogeological systems associated to the most important karst sources in the area are indicated ·on the map. They were delimited according to the tracing experiments and the other measurements performed.
V ALENA~, L. (1978) Morfologia A venului din Cuciulata (Muntii Bihor). Nymphaea, VI. pp 363-368, Oradea.
RUSU, T. (1988) MunJii Plidurea Craiului, Ed. Dacia. Cluj-Napoca, 256 p.


Le karst de type Movile [Mangalia, Dobrogea de Sud, Roumaniel
Traian CONSTANTINESCU1
RESUME
L'interaction de 4 facteurs geosystemiques principaux (Ia circulation des eaux souterraines thermominerales, la presence des calcaires lumachelliques et oolithiques sarmatiens, le climat aride et la morphologie de plateau ... bas situe au voisinage de Ia Mer Noire), a determine le developpement d'un karst a part. Afin de souligner son originalite, I' auteur considere que la denomination "karst de type Movile" est Ia plus opportune.
Mots des: karst de type movile, Grotte de Movile, movile, oban, obane, exokarst, complexe exokarstique, Mangalia, Dobrogea de Sud, Roumanie.
THE MOVJLE-TYPE KARST (MANGALIA, SOUTH DOBROGEA, ROMANIA)
ABSTRACT
The interaction of the four main geosystemical factors (the circulation of the subterranean thennomineral waters, the presence of the Sannatian lumachellic and oolithic limestones, the dry climate and the morphology of the neighbourhood of the Black Sea) has detennined the development of a special karst. In order to point out the originality of this particular karst, the author considers that the denomination ''Movile-type karst" is the most suitable.
Key words: movile-type karst, Movile Cave, movile, obane, exokarst, exokarstic complex, Mangalia, South Dobrudja (Dobrogea de Sud), Romania.
La grotte de Movile (Pe~tera de La Movile) (CONSTANTINESCU, 1987) est a present la plus renommee caverne de Ia Roumanie, son ecosysteme etant considere comme unique au monde (SARBU & POPA, 1992). Selon nous, cet ecosysteme represente seulement un des effets genetique-evolutifs du karst d'ici.
Nous presenterons le secteur etudit\ c'esHl-dire une surface d'environ 20 km2
, situe immediatement il. l'ouest de la Mer Noire (Fig. 1). La zone a des altitudes absolues de 0-35 m. Au point de vue morphologique, elle represente deux larges vallees (Valea Mangaliei et Valea Obanelor) separees par un interfluve. Les vallees ont des altitudes moins
2 movila (sing.); movile (pl.) = monticule; on.p1aintien Je mot roumain ainsi: movile (pl.).
de 25 m et dans leur cadre affleurent des calcaires lumachelliques et oolithiques d'age sarmatien. Sur l'interfluve sont predominants les depots loessoi·des recouverts par des sols.
La geologie de la region est bien connue. Nous mentionnons seulement qu'au-dessous des calcaires sarmatiens, apres un depot d'argiles, epais d'environ 25 m, il y a aussi des depots carbonates, respectivement, des calcaires d'age eocene, jurassique et cretace, qui depassent 400 m d'epaisseur (FERU & CAPOTA, 1991).
Le karst de Movite, qui fait le sujet de ce travail, est developpe exclusivement dans 1es calcaires sannatiens. Nous avons anticipe que dans le cadre des vallees, les calcaires affleurent, fait ''trahit" aussi par Ia presence d'un exokarst specifique,

materialise, essentiellement, par des depressions karstiques (grandes dolines) denommees dans Ia region "obane"'3 .II est question de trois secteurs a vee des obam!, pour lesquels nous proposons la denomination de "complexes exokarstiques" (Fig. lA, B, C.).
Lc complexe "La Movi/e'" presente un groupe de 3 obane (Fig.1A): Obanul Mare, Obanul Mic, Obanul Blebea. Toutes les trois representent des depressions generees par des collapsus karstiques. Aujourd'hui elles se trouvent a differents stades de rcmplissage (CONSTANTINESCU, 1989).
Obanul Mic (250/200m; profondeur 7-10m) se trouve en phase de marecage-lac, trait determine aussi par la presence d'une petite source d'eau douce.
Obanul Blebea (600/450m; profondeur 12-16 m) sc trouve en phase de lac-marecage, alimente par des sources sulfureuses, mais il y a aussi et un drainage karstique. L'un des points d'infiltration est situc a cote de la bordure sud.
Obanul Mare(400/300m;profondeur 10-14 m) est totalcmcnt sec. Les depots de remplissage peuvent depasser l'epaisseur de 40 m, fait precise par les forages (ISPIF,1986).
La bordure des obane presente une morphologic a part. Celle-ci se caracterise par une altemance des movite calcaires (ayant l'hauteur de 3-8m, dian1etre de I 0-40 m) et des do lines a dimensions plus petites que les obane (diametre de 5-30 m; profondcur 3-10 m; Photo 1). Cet ensemble de movi!edolines est semblable a un karst tropical a l'echelle ·reduite, qui est en totale contradiction avec le eli-
·' oban(sing.); obane(pl.) =grande doline; on maintiennent le mot roumaine ainsi : oba111!(pl.)
GROTTE
T. Constantinescu
·ii /,
OE j.l I
MOVILE
mat sec de la zone. Ce fait suggere !'existence des facteurs specifiques impliques dans la genese et !'evolution de ces formes exokarstiques (CONSTANTINESCU, 1993).
Le complexe "Mla§tina Mangaliei" (mla~tina =marecage; Fig. IB) est la depression karstique avec la plus grande extension de la zone(diametre 1.200/l.OOOm). Elle se trouve aussi dans une phase de colmatage. Sur les calcaires sarmatiens reposent des depots argileux et une strate tourbeuse.
La morphologic de Ia depression a ete moins etudiee, mais on connait deja qu'ici existe des dolines et meme des petites avens a des puissantes sources sulfureuses.
La denomination de "marecage" est partiellement justifiee parce que le caractere lacustre est predominant, trait determine par Ia presence des sources mentionnees et de !'apport du Paraul Sulfuros
-·~:~--t~~~~te:·JJj····· ·•······. ·····~;f~~~~~ITij~~r~~·~o~~:re::
Gr(}tt~-.: -.i~i;~~~!~~tr•~);~~~:;•:~ re;: ?~ J,tt\li'eJ;~i:'p~' ne~te; 10.
Ilrtte : q,pqt~.~ .- ~~-]·#.lii¢~g~:.. ~ ;. Limh~ . li· ::~f:~f~~~~ ·· , · :::~eP,o~ J~oi'd~s; 14. Cali!ah:es
_, .: ... , , ...
··•· · re~~;imt:ftic; :/J,qp~ ... .l •. l(~r~ti~. t]epression
( ·;: i:- ;-

Le karst de type Movile 93
,,
:I 1:::>
:I I
', I II ,< ,I .
I I
... 1
.... ·r .. ··]
l I
_ _ r,... __ .....,. __ _
-, - -,
0 0.5 10 1,5Km
1 I C) I 2l G I 3 ( 0 I 41 .1. l sl t:~-7 I sl ~ I 71 ~ af---,,-1 gE;J 10f3J~ 11E<Q;J ,zr·· .............. ··l 13111111111111 141

94
(Ruisseau Sulfureux; Q =50 lJsec) qui a ses sources dans le complexe ''Kara-Oban" (Fig. 1). Ces caracteristiques representent des arguments qui soutiennent que !'age du complexe est plus jeune que celui du Movile.
Le complexe "Kara-Oban" (Fig. I C) se remarque par ses traits morpho-hydrokarstiques. Du point de vue morphologique, le complexe represente une large vallee, faiblement mise en evidence, delimitee par Ia courbe de niveau de 15 m. If y a un groupe de dolines plus grandes (diamelre plus de 40 m; profondeur de 8-10 m) et d'autres plus petites (profondeur 3-4 m). On remarque Ia doline circulaire "Kara-Oban" (diametre 100 m; profondeur 10m), dans laquelle existent des sources sulfureuses qui maintiennent un lac permanent. Le lac a aussi un drainage karstique.
Outre des dolines, on remarque des marecages situes a l'E et au S du Kara-Oban, qui sont aussi des aires depressionnaires de petite profondeur (3-4m), mais d'une extension plus grande (env. 2 km2
). Dans ces marecages se dechargent des puissantes sources sulfureuses qui forment le Paraul Sulfuros. Parmi des dolines et des marecages il y a quelques movile qui n'ont ni les dimensions, ni la densite de celles developpees dans le complexe "La Movite".
En conclusion, Ia presence de 3 complexes exokarstiques prefigurent un karst a part-effet de !'interaction des certains facteurs specifiques. En bref nous presenterons ces facteurs.
1.CIRCULATION DES EAUX SULFUREUSES-MESOTHERMALES
Selon nous, l'action de ces eaux represente le facteur principal de Ia genese et revolution de ce karst, qui se delimite seulement a l'espace affecte par des eaux en discussion. Nous precisons aussi qu'elles ont un caractere ascensionnel et que leur origine n'est pas enc<;>re elucidee, bien qu'il existe des etudes hydrogeologiques (LASCU et al., 1993; FERU & CAPOTA, 1991; MARIN & NICOLESCU, 1993 etc). Au fond, pour la caracterisation du geosysteme karstique, l'origine des eaux ne represente pas une question essentielle. Nous considerons conune tres importants 3 traits de ces eaux:
• le caractere ascensionnel, favorise, aussi, par Ia presence des certaines fai11es;
• le drainage radiaire des eaux a cote de certains points, au niveau des calcaires sarmatiens; un exemple edifiant est represente par le complexe "Kara-Oban", ou le pbenomene a ete
T. Constaf!-tinescu
demontre par des tra~ages (GA;;PAR & ORA;;EANU, 1987);
• l'aquirere karstique de la zone "Mangalia" est considere comme une sousunite hydrogeologique a part de Ia Dobrogea de Sud (P ASCU, 1983).
La mineralisation (specialement Ja presence du soufre) et le therrqalisme sont seulement des elements favorables, mais ils n'ont pas un role determinant pour le processus de karstification.
L'association des traits mentionnes, met en evidence l'une des particularites essentielles du karst d'ici: les rivieres souterraines sont engendrees, essentiellement, par les eaux sulfureusesascensionnelles venues des autres systemes. Le schema d'ensemble du fonctionnement d'un systeme karstique (MANGIN, 1975) est respecte seulement en partie. Ce karst represente done un cas particulier en Dobrogea de Sud et meme en Roumanie.
Le fait qu'a present les eaux sulfureuses se melangent avec des eaux d'irrigation ne modifie pas le fond du probleme. La periode d'irrigation est plus courte (20-25 ans) et, normalement, I' action de ces eaux n'a pas influence le modelage du cavemement actuel.
2. LA PRESENCE DES CALC~RESLUMACHELUQUES
ET OOLITHIQUES
Les etudes geologiques precisent que dans Ia zone "Mangalia" il y a un depot des roches carbonatiques avec une epaisseur de 4~00m de calcaires jurassiques, cretaces, eocenes et sarmatiens, les demiers ayant l'epaisseur de 100m (LASCU, 1989; FERU & CAPOTA, 1991).
Rappelons que, selon nous, le karst de Movile se developpe seulement dans les calcaires sarmatiens. On connai't qu'a cause de leurs proprietes, les calcaires sarmatiens (lumachelliques et oolithiques) sont plus karstifiables que les autres types de calcaire. En consequence, ils ont represente un milieu favorable pour Ia circulation des eaux souterraines sulfureuses. Cette propriete est refletee par une particularite karstique essentielle: le modelage d'un cavernement pendant une periode de temps plus courte, mais aussi son effondrement plus rapide.
Cette particularite . represente un argument pour soutenir "Ia jeunesse" du karst de Movile, qui. selon nous, est d'age Quaternaire superieur. Sans detailler Ia question, nous considerons qu'au Pliocene Ia karstification de Ia region a eu d'ampleur plus prononcee qu'aujourd'hui. Par consequent, le
Le karst de type MoviU
cavemement a. ete totalement detroit. Le cavemement actuel a seulement un ige quaternaire, meme quaternaire superieur. Jusqu'l ce moment i1 n'existe pas des arguments sOrs, mais on conna1"'t une serie d'aspects qui conduisent l l'hypothese mentionnee. ·
3. LE CLIMAT SEC
Panni les facteurs ayant un role detenninant pour Ia genese et revolution du karst, est aussi le climat sec, caracteristique de la zone meme au Pleistocene superieur (Wiinn).
Aujourd'hui Ia moyenne annuelle des precipitations est de 350 mm, tandis que !'evapotranspiration est de 700 min. Pendant le Pleistocene superieur le climat n'a pas ete plus humide que celui actuel (CONEA, 1970). En ces conditions, la quantite des eaux de surface infiltrees dans les calcaires a ete tres reduite, de sorte que leur role dans le modelage du cavemement peut etre ignore. Le phenomene a ete accentue et par la presence des depots loessoi"des qui recouvrent les calcaires sarmatiens. L' existence des calcaires non karstifies jusqu'l 15-20 m de profondeur, represente un argument en ce sens. Cette affirmation a comme preuve, les puits geologiques, les forages et les fontaines des indigenes. Nous precisons que dans l'espace du complexe exokarstique "Movile" ont ete depistes (par des forages) encore quatre vides souterrains situes approximativement au niveau de la grotte de Movite. Ce fait suggere que la grotte mentionnee represente le niveau superieur de karstification de Ia zone. Done, }'affirmation que le reseau souterrain et implicitement le cavemement ont ete generes, essentiellement, par des eaux sulfureuse-ascensionnelles, a comme argument aussi le climat sec.
4. LA MORPHOLOGIE DU PLATEAU BAS SITUE TRES
PRES DE LA MER NOIRE
On conna1"'t que pendant le Quaternaire, outre l'eustatisme positif ou negatif de la Mer Noire, la zone de Mangalia a ete sownise aussi aux mouvements epirogeniques positifs et negatifs (BRA TESCU, 1942). Specialement ces mouvements epirogeniques, ont influence les oscillations du niveau gene-
95
. . ra1 des eaux sulfureuses. Les oscillalions, l leur tour, ont favorise les effondrements karstiques sous deux aspects:
• le modelage des niveaux de karstification, respectivement un cavemement etage, qui a ete soumis plus facilement aux effondrements;
• Ia reactivite des vides souterrains, phenomene qui a favorise aussi leur effondrement.
. CONCLUSIONS
Dans les classifications des specialistes roumains le karst de la Dobrogea de Sud est defini comme un type a part en Rownanie, respectivement "karst de plateau bas" (BLEAHU et al., 1976; BLEAHU, 1982; GORAN, 1983).
Selon nous, }'interaction des facteurs presentes a determine le developpement d' un karst a part dans la zone de Movile. Afin de souligner son originalite, nous considerons que la denomination "karst de type Movile" est la plus convenable.
Synthetiquement, le karst de type Movile peut etre caracterise comme il suit:
• l'exokarst est represente essentiellement par des obane; si les effondrements ont eu de l'ampleur, la bordure des obane a ete tres affectee, pbenomene reflete a present par ['en semble movile-dolines (Photo 1 );
• l'endokarst: un reseau des cours souterrains et un cavemement ayant des dimensions reduites, en majorite des cas inaccessibles a l'homme; le developpement des vides souterrains volumineux n'est pas possible, parce qu'ils s'effondrent a de certaines dimensions, le phenomene etant determine par les proprietes des calcaires lumachelliques et oolithiques.
• le fonctlonnement de ce systeme karstique presente des aspects specifiques; il respecte seulement en partie le schema general connu (MANGIN, 1975).
En conclusion, nous soulignons que l'unicite de l'ecosysteme de la grotte de Movile, represente l'un des effets genetique-evolutifs du karst de type Moyile.
96
BIBLIOGRAPHIE
BLEAHU, M., DECU, V., NEGREA, S., PL~A, C, POVARA, I. & ' VIEHMANN, I. (1976) Pefteri din Rom4nia. Ed. ~t. Encicl., Bucure§ti, 416 p.
BLEAHU, M. (1982) Relieful carstic. Ed. Albatros, · Bucure§ti, 295 p.
BRATESCU, C. (1942) Oscilapile de nivel ale apelor §i bazinului Milrii Negre in Cuatemar., BSRRG, LXII, pp. 193-~78.
CONEA, A. (1970) FomzaJiuni cuatemare fn Dobrogea (loessuri fi paleosoluri ). Ed. Acad. RSR, Bucure§ti, 234 p.
CONSTANTINESCU, T. (1986) Pefterile Terrei. Ed. Albatros, Bucure§ti, 243 p.
CONSTANTINESCU, T. (1989) Considerations sur Ia zone karstique de "La Movile " . Misc. Speol. Rom., 1, pp. 7-12.
CONSTANTINESCU, T. (1993) Pe§tera de Ia Movile. Prezentare geospeologicll Academica, 6, pp. 28-29.
PERU, M., U. & CAPOTA, A. (1991) Les eaux thermominerales karstiques de Ia zone Mangalia (Roumanie). Theor. Appl. Karst., 4, pp. 113-147.
GA~PAR, E. & oRA~EANU, I. (1987) Natural and artifical traces in the study of hydrodynamics of karst. Theor. Appl. Karst., 3, pp. 31-107.
T. Constantinescu
GORAN C. (1983) Les types de relief karstique de R~umanie. Trav. Inst. Speol. "Emile Racovitza", xxn. PP· 91-101. ·
LASCU, C. (1989) Paleogeographical ~d. hydrogeological hypothesis regarding the ongm ?f a peculiair cave fauna. Miscelanea Speologtca Romanica, 1, pp. 13-18.A
LASCU, C., POPA, R., SARBU, ~ .• VLASCEANU, L & PRODAN, S. (1993) La grotte de Ia Movile: une faune hors du temps. lA Recherche, 24, pp 1091-1098.
MARIN, C. & NICOLESCU, T (1993) The geoc::he- . mistry from southeastern Dobrogea. Trav. lnst. Speol. "Emile Racovitza", XXXII, pp. 229-247.
MANGIN A. (1975) Contribution A I' etude hydrodyn~que des aquiferes karstiques. Troisie~e Partie. Constitution et fonctionnement des aqwteres karstiques. Ann. Speleol. 30, 1, pp 21-124.
PASCU, M., R. (1983) Apele subterane din Rom4nia. Ed. Tehnicli, Bucure§ti, 440 p.
sARBu, S. & POPA, R. (1992) A unique chemoautotrophically based cave ecosystem. In The Natural Hystory of Biospeleology, CAMACHO, A. (Ed.) Madrid, pp. 637-666.

Cretaceous Paleokarst in the Moesian Platform [Romania]
Corel MOGO~ANU1
ABSTRACT
The sedimentary cover of the Moesian Platform is divided into four major cycles of sedimentation, separated by three major unconformities. These unconformities correspond to emersion periods of the Moesian domain, during which the exogene factors altered the earth crust, which resulted in a topography specific to each geological period. As the Early Cretaceous deposits of the platform are mostly carbonate, the resulting topography is of karstic type. This assertion is supported by information provided by drillholes.
Key-words: paleokarst, Moesian Platform, core-samples
SUR LE PALEOKARST CRETACE DE LA PLATE-FORME MOESIENNE
RESUME
La couverture sedimentaire tk Ia Plate-forme Moesienne est divisee en quatre cycles sedimentaires majeurs, . separes par trois discordances majeures. Ces discordances correspontknt a tks periodes d'emersion du ckJmaine Moesien, pendant lesquelles les facteurs exogenes ont altere Ia crofite terrestre, en resultant un relief specifique a chaque periode geologique. Du fait que dans Ia plate-forme les dep~ls du Cretace inferieur sont surtout carbonates, le relief qui en est resulte est de type karstique. Cette affirmation est argwnente par tks informations provenant tks forages.
Mots cles: paleokarst, Plate-forme Moesienne, carottes.
The investigated area is located in the Teleorman district, about 60 km SW of Bucharest (Fig. 1). Blejesti oil field, in the central part of the Moesian Platform, provides the broad geological framework.
The sedimentary cover of the Moesian Platform is divided into four cycles of sedimentation, separated by three major hiatuses (P ARASCHIV, 1979):
· • the first cycle (Cambrian (?) - Silesian);
• the second cycle (Permian- Triassic);
• the third cycle (Late Liassic - Senonian);
. • the fourth cycle (Neogene).
As a function of the depositional environment, the sedimentary formations can be separated into seven broad lithofacial units (PARASCHIV, 1979):
• the lower detritic group (Cambrian (?) - Eifelian);
• the lower carbonate group (Givetian -Dinantian);
• the intermediate detritic group (Silesian -Early Triassic);
• the Triassic carbonate series;
. • the upper detritic group (Late Triassic - Middl~ Jurassic);
• the upper carbonate group (Late Jurassic -Cretaceous);
• the Neogene detri~c series .
. ·. The synthetic stratigraphic column of the Moesian Platform is shown in Fig. 2.

.. , ..
. ~, \ ~ .- · )··}::'/
/ Cluj I o
.... l~} i~ ;
.~
\ · ..... I \
The Cretaceous is included in the third cycle of sedimentation, namely in the upper carbonate group. The carbonate series which had started in the Late Jurassic continued also in the Early Cretaceous (Neocomian - Barremian). In the considered area, this carbonate series includes rocks belonging to the reef facies (biostroma limestomes, pseudooolitic limestones, microcrystalline limestones subjected to recrystallizations and do1omitizations, dolomite limestones of the algal or coralligenous type biostroma, sandy limestones, interbeddings of marls, sandstones and sands). Isolate occurrences of carbonate rocks have been identified up to the Late Albian. The carbonate rocks are overlain by detritic deposits consisting of glauconitic sandstones and sands, shales, marls and marly limestones. During the Turonian - Senonian, carbonate deposits occur again, as limestones and marly chalk limestones. During the Paleogene and the Early Miocene (about 55 My), the Moesian Platform underwent a continental evolution. A large variety of landforms could develop as a result, according to the nature of the pre-existing rocks (P ARASCHIV, 1979).
From the analysis of the data available within ICPT Chnpina, it can be stated that a karstic topography is associated to the Cretaceous formations which belong to Blejesti oil field. The limestone body which will be further considered forms roughly a triangular prism, with its upper surface of about 5 km2 and a thickness of 800-1000 m.
The first information on the existence of voids (cracks, fractures, vacuoles, caverns) within a specific formation are provided by drilling mud losses (CARCOANA, 1966). About 30% of the wells drilled in the considered area experienced major drilling mud losses while traversing the Early Cretaceous formations. Figure 3 shows the contour map at the top of the Early Cretaceous deposits,
D. MogOfiUIU
with the position of the above mentioned wells, while Figure 4 provides a 3D representation of that surface. The amount of drilling mud which has been lost is of the order of thousands of m3
, with a well average of about 150m3
•
Another indication on voids occurrences in a specific formation is provided by drilling incidents (falling of the casing). In one of the wens drilled in the indicated area, a 12 m fall of a casing .section has been recorded.
At microscopic scale, descriptions of core-samples can also provide information on the existence, as well as on the origin of voids. Next are reproduced (according to ICPT Campina) a few descriptions of core-samples from Blejesti oil field:
1. Cored interval (1.5 m), recovered (1.5 m): greyyellowish vacuolar limestone, with fine cracks filled with oil.
2. Cored interval (1.0 m), recovered (0.2 m): limestone subjected to diagenesis, with sparse and fine sutures, sparse and small caverns filled with oil.
3. Cored interval (1.0 m), recovered (0.15 m): microcristalline limestone, with small caverns and small cracks.
4. Cored interval (1.0 m), recovered (0.15 m): limestone with marl films; fine, hard sandstone.
5. Cored interval (4.0 m), recovered (1.0 m): microcristalline limestone with oil filled caverns, with calcite ooated vugs and fine cracks filled with <>n . . ,
6. Cored interval (4.0 m), recovered (1.0 m): microcristalline limestone, with frequent, oil saturated · microfissures and microcaverns filled with oil.

Cretaceous pale_okllrst in the Moesian Platform · 99
~ ~~::an _;;y~;h.\,i¥;~ ~! :i~= clays
0 Pontian ~~:f.-;:· _·.:·= .: .::::~;9. Marla 1111d clay with 11111da
~ Meotian ';;:,7j;.:;;i..'::1:;;J.;11[.:4/!!T- S1111da, marla, clays 1 ~ Sarmatian ~-~::.:_·,:;:;:::::-~4:~ S1111dy marla 1111d limestones, limestones with Serpulo,
0 ~ ....... -.,· •. -.~ .. ,._~ ,·'-.·.~ .. :~--·.·'~t·~-:~ sandstones and sands ;: tJ r.B::-a-:d:-eru-:.:-an---:(T;;::o-rt_o_ru-:.-an-:)----1"::-.:: ~t::: t:o. .. .,:. .... ,~'\"""fr; ~-.. _"0..,.....±,.,_'-!'~ ... -=. t-~c::m::··'ti· ~Mada;:;::;:;::.::::c:;la::y:..:s:lllll:::..:da:=llll:...d':"'"tnmf(--nm-. con-gl':"'"om-cra~tes------1 flll!.t • • ... • ... •._•..._• • •.• .. • .. •. • • o~r--..
PAl
~ UPPER
J.OWRR
MALM
DOGGER
KEUPER
MUSCHELKALK
BUNfSANDSTEIN
PERMIAN
~ z
WESTPHALIAN NAMlTRTAN DINANTIAN
UPPER
~ MIDDLE
~ LOWER Sll..URIAN
ORDOVICIAN
CAMBRIAN
~ I Limestoncs·. marlv limestones sn ....... ....... · Marla and chalky limcstones
tu Limestones and chalky limestones
em ~ ~ -::: Marla and marly limestones ........ _~ ..........
llln ·. ~.:~:•:~ Micrites br Marly limestones ne - Wealdian facies th " ~').. A "~ a. Pourbek.ia.o Facies 1--w v ... ~ km ~ c b. Reef limestones ox _d . . . . . . . . . c . Chertv T.im.,.tnnes d. Limestones
:.::::.:: · .. :.::::.: _ : ... ;: :.:.: ::.:-~. Limy s~dstones -=------:.....------ DolOIDltes
~~~:._-~:.·::: :~·.:::.:·~·.;·;·:::·:·::·::: ~~tones with gypsum
Anhydrites, basalt flows, marls, marly limestones, sandstones
.L_ 1
-"' > > . Marly limestones · Anhydrites 1111d clays
n, · l.i~-•~·- ~ntl mnlv ·
~ .. ~ .. ~,. ~ ... ~,: Clays with anhydrites · A .. A--A --11• · A ··A"A " A' · A · Quartzitic Sandstones ~ _ ~:.!~. Clays,llllhydrites,limestones, rhyolites (p), conglomerates b-_- -~>-...e~;
~....:...... . .....:..._ . ....:...... . - Sandstones, .. : ~ ~ . . . . . . · ... .ArVlaceous schists tufa · • Calcarenites, dolomites,
Micrites and calcarenites . r r r r r Limestones and dolomites
> Anhydrites
.. ,. · ,. .... -,.. .. ,. .. ,. .. h-.,.. Quartzitic sandstones and conglomerates - --------·-·-..... ·-· -..- ---·-· ·-·---r-_-_- - -----:.Argilites ~ _ _ _ _ Clays with graptolites -----
- - - Clays, marls, sandstones _._ ......... .......... __._ ~
· ~ ·~ -~ - ~-- ~-~-- ~-- ~ · · · r- _ _ _ __ Clays
~ · ~ ·; ·•· ~- ·.; ·; ·; ~ · ~ · ~ S1111dstones and conglomerates
PRECAMBRIAN ~1 j !t~ ~ ~· a. Palazu-type methamorphites; b. retromorphites with .___ _____________ 4lt..,...!.J..l-,~ I tm111ites: c. "Green schists"
~F~f,,rig·>'::•:~l=·:•••; ~~.·~··· ~· ·~;~··-·,··~· .. ······}: ··~}-. -~ ·;···-'- ~l]:~~~····:·•••·l.=. m ·1 .. ·· : I;;~IMIJ ..• I .. I .. I-.. ~-~~·-r.IJ-1 . ~. :~;,t~MP"""~;=,\:g)r..,....§ :-:~-.:=~:r .. /: • """"""··.~ .. :""""': .• :.: ":"": . .. ,,..., ... r .•. -.• ""7"" ...... ......,.. •. · ~ 7. Cored interval (4.0 m), recovered (1.0 m):
highly fissured microcristalline limestone, with numerous caverns and microcaverns filled with oil.
8. Cored interval (4.0 m), recovered (1.0 m): microcristalline white-yellowish limestone, with oil saturated vugs and caverns ..
9. Cored interval (13 .. 0 m), recovere<t. (0.75 m): microcristalline limestone, with frequent caverns connected by cracks (on the cracks and on
the walls of the caverns calcite crystals can be noticed) ..
10. Cored interval (18.0 m), recovered (3.0 m): microcristalline, solid limestone.
11. Cored interval (12.0 m), recovered (3.0 m): sugar-like limestone (subjected to strong diagenesis), with frequent caverns and open cracks.

100
4{)00
sc.-L.E ..-1, c m I • f)Q d Q19 un?-
12. Cored interval (1.0 m), recovered (1.0 m): white-yellowish limestone, with vacuoles filled with oil.
13. Cored interval (17.0 m), recovered (1.87 m): white-grayish limestone, · with caverns filled with oil; fine grained, green glauconitic sand-stone. I
14. Cored interval (13.0 m), recovered (6.5 m): white-grayish limestone with chalky appearance; sandy limestone with small caverns with oil; conglomerate subjected to diagenesis. · ~
D. MogOfanu
~000
15. Cored interval (15.0 m), recovered (1.5 m): white-yellowish limestone with small caverns with calcite; gray marl; gray-greenish carbonate sandstone.
· 16. Cored interval (8.0 m)., recovered (1.8 m): hard, white-yellowish limestone, with small caverns and diaclases filled with calcite.
17. Cored interval (1.0 m), recovered (l.O.m): hard limestone, with vugs and small cracks With oil.
18. Cored interval (1.4 m), recovered (1.4 m): fissured sandy limestone, with numerous .· cav
. ems and organic remains.

Cretaceous paleokarst in the Moesian Platform
19. Cored interval (1.0 m), recovered (1.0 m): carbonate sandstone, with numerous caverns and alveola filled with oil.
20. Cored interval (1.0 m), recovered (1.0 m): carbonate conglomerate with frequent dissolution zones (caverns).
21. Cored interval (1.55 m), ·recovered (1.55 m): sugar like limestone with sparse dissolution zones, with calcite deposits.
22. Cored interval (7.0 m), recovered (1.9 m): microcrystalline limestone, with numerous caverns.
REFERENCES CARCOANA, A. (1966) Exploatarea ziidimintelor
carbonatate subJiri, putin tnclinate ~i de permeabilitate midi, cu aplicaJie la ziicamfntul Albian
101
23. Cored interval (6.0 m), recovered (1.6 m): microcrystalline limestone, with numerous empty alveola and cracks.
As a conclusion, it can be stated that a paleokarst of considerable extension exists within the Cretaceous deposits of the Moesian Platform. Its development occurs probably both on the horizontal and on the vertical, especially in the western part of the investigated area (Fig. 3, 4). Considering the descriptions of the core-samples and the behavior of the wells during exploitation, it can be concluded that part of the passages are clogged with more recent formations, of Cenomanian - Turonian age, while anothe.r part still exist as empty underground voids.
de la Htrle~ti, Ph. D. Thesis, Campina (unpublished).
PARASCIDV, D. (1979) Platfonna Moesicii ~i ziiciimintele ei de hidrocarburi. Ed. Academiei R. S. Romania, Bucure~ti.

104
INTRODUCTION .
La Sainte Baume est un chainon carbonate du sudestde Ia France oriente·dW en E, presentant une longue crete avoisinant les 1100 m et draine par 2 petits fleuves cOtiers; l'Huveaune A l'ouest et l'Argens A l'est. Ce massif est aussi un karst draine par de nombreux reseaux souterrains aboutissant A une douzaine de . sources importantes (MARTIN, 1991). 185 cavites yon ete inventorites. Les elements les plus remarquables sont: l'aven du Petit Saint Cassien (321 m de profondeur et 9,3 km de reseau) et le reseau Sabre (4,3 km).
Ce double drainage fonctionnel pose un probleme car on lit souvent dans la litterature que la karstification "desorganise le drainage superficiel". Cela signifie que lorsque le drainage souterrain se realise, il perturbe les tcoulements de surface et gtSnere des formes superficielles qui facilitent la pen.etration de l'eau sous terre (doline, poljes, depres-SiOn fermte). . Ce schema classique malgre une longue phase de karstification (NICOD, 1967) ne semble pas s'appliquer sur ce massif bien que I' on note !'existence de plusieurs depressions fermtes dont le polje du Plan d'Aups a 800 m, au pied de la Haute Chaine. Ce polje qui s'inonde parfois pendant plusieurs semaines possMe un ponor qui n'a pu ctre mis en relation directe avec aucune des sources situees plus bas, a plusieurs centaines de metres, au pied du massif. ·
Les consequences de la karstification devraient se lire sur les profils des talwegs; ceux-ci devraient presenter des contres -pentes. Une modelisation de ces profits par une double exponentielle permettra, ou non, de le verifier. Elle permettra en outre de quantifier Ia variete de ces profits. La "sinuosite" de ces talwegs sera aussi quantifiee en recherchant par la methode deL. F. Richardson (MANDELBROT, 1995) leur dimension fractale.
II est par ailleurs bien etabli qu'il existe des relations entre la longueur des talwegs, la surface drainee et la longueur de Ia ligne de partage des eaux des bassins versants. La validation de ces relations pour des terrains karstiques, nous permettra d'un~ part de determiner Ia dimension fractale de ces objets et d'autre part de montrer que la geometric de ces bassins suit les memes regles que celles de nombreux autres objets.
n. est. aussi logi~ue de deduire de l'idte de desorgarusation le dramage par Ia karstification que Ia hierarchisation des talwegs telle qu'elle a pu etre avancte par HORTON (1945) puis de nombreuses fois demontree est detruite correlativement A l'etablissement de drainages souterrains. En particulier
Ph. Martin
les relations amont-aval et Ia hitrarchisation des drains devraient disparaitre. Ceci nous conduira A mettre en evidence et a quantifier certains 6lements de I' organisation du drainage superficiel. . Nous montrerons en outre que dans certains cas les differentes approches utilisees (relations de Horton et gtometrie fractale) aboutissent a un meme resultat. Cette convergence dans les resultats pennet d'effectuer des verifications et laisse supposer que les
·. structures revelees ne sont pas des artefacts. En consequence il est interessant d'essayer de voir si les reseaux de drainages superficiels fonctionnant sur ce massif ne presentent pas dans leur morphologic quelques particularitts qui les differencieraient d'autres reseaux developpes sur roches karstifiables ou non. Cette problematique s'inscrit dans une perspective plus large, dans une reflexion plus generale et tres actuelle sur les formes (BOUTOT, 1993; FRANKHAUSER, 1994).
1. MODELISATION PAR UNE DOUBLE EXPONENTIELLE DES
PROFILS DES TALWEGS.
Les talwegs sont les elements les plus simples que nous pouvons utiliser pour essayer de rendre compte de }'organisation du drainage.
Classiquement on considere que le profil longitudinal d'un talweg est une fonction (JAUZEIN, 1971) du debit, de la charge, du calibre des alluvions, de la rugosite, de la vitesse, de Ia profondeur, de la largeur et la pente d'un cours d'eau. Ce pro:fil integre, entre outre, de par son evolution, le temps.
Nous avons determine a partir de cartes a 1125 .~me les profils des talwegs de Ia Sainte Baume (Tableau 1 ).
4 modeles (lineaire, logarithmique, exponentiel et bilogarithmique) ont pu etre utilises pour modeliser de tels profils (SHEPHERD, 1985). Nous pro~osons ~'utiliser une double· exponentielle qui fait mterverur 3 parametres et qui est de Ia forme (MARTIN, 1991, p.257):
avec: H0
Hd d -
a b e
Hd ... H0
·e(-ar)
I' altitude en m du point initial, l'altitude en m du profil au point d, la distance en plan depuis le point initial exprimee en centaines de metres, une constante pour un talweg donne, une constante pour un talweg donne, Ia base des logarithmes neperiens.

Les fo~s ~;iatiles du mtliSsi/ karstique de Ia Sainte Baume 105
· ¢~~I,#f#Y: : ~~B:f i~?r~:: ##i~~~ .: '." :::::::::: : .. : ~~Q~bJ~ ~j\~ ~ 1\~\H~~:; ~~ ......... . . : : ; : ~ . ' .. : . : : : : . : : : ~ : i ~ ~ : : : : : : : : : . . . . . . . . "
Guillilridiere .. , ..... ··············· ················
cJt•¢i R¢4b.~· : . . .... :·:.: .. ::::::::::::.:::::::.: ::::.::::.::::
Qqll~t~¢i4?~i i#i. .. :: .. p~.ij.bj .~h,l~l ····· . H~t~Wib :tk~L · ·•H :: Wt~~ aht~Wi~ • :::: ..................... . . . . . . . . . . . . . . . . . . . . . . . . . . . .
· qiy'*~·~~~~#·:·::::·:.: qly.#,P¢:~~~~~~ :: H:. ...............................................
peyttij~ : o~: ·a~ud~>:
. ::~: =::~: =~:;;: ;~;:: ::::.:: ~:~: :_:~ ;: : :mf.~tti.¢(~ :•.::::: :··.
..
~~~~~ tm~b : . ······-······-········ ......................
_ $~S#Rr~f:t~ :·:: ___ ............. . ········· ··· ······
GflJ~I:~f · :::::::: :::::::.:: :::::::::::::::::: :::::::::::::;·:::: ·····
·Fau···e•::" .. ... ··················· ···· ···· ...... :·:·:::::::::::::::·: ..
... ..... ............
28,25 700 364
58,25 900 350
33,25 520 364
55,00 710 410
49,50 750 490
66,25 600 360
75,75 680 338
488,25 690 0
26,75 690 400
45,75 800 420
78,25 800 270
77,50 560 245
55,50 700 225
42,75 750 240
34,75 850 620
35,75 640 200
38,25 690 150
97,25 860 100
•coerootl'hlmti .~;i::t#~iW,~::
..... .. . ...
: .:.·:.:::::::;: :· . ........
0,306 0,229 0,998 9 0,908 16
0,434 0,188 0,999 17 0,903 25
0,045 0,622 0,964 13 0,988 17
0,029 0,721 0,989 28 0,998 35
0,023 0,745 0,990 12 0,999 19
0,147 0,292 0,997 12 0,997 18
0,147 0,374 0,995 18 0,985 29
0,100 0,511 0,996 33 0,990 56
0,246 0,251 0,998 11 0,952 15
0,174 0,333 0,996 9 0,967 16
0,061 0,656 0,985 5 0,991 30
0,068 0,529 0,993 16 0,994 32
0,054 0,756 0,985 43 0,998 48
0,067 0,760 0,997 9 0,992 19
0,044 0,579 0,980 18 0,989 23
0,051 0,869 0,946 15 0,996 29
0,135 0,506 0,995 14 0,965 39
0,135 0,609 0,981 20 0,987 .35
• Ces talwegs au fonctionnement aujourd'bui tres episodique, debouchent dans la plaine d'Aubagne ou l'ensemble du drainage a ete anthropise. Nous avons done prefere les limiter aux parties inscrites dans les calcaires et dans les dolomies des collines de Bassan.
Les parametre >a< et >m< peuvent etre calcules gdice a la relation lineaire existant entre le logarithme neperien de B(lnB) et le logarithme neperien de d(lnd) avec:
Lorsque la relation 1nB en fonction de lnd est lineaire nous pouvons ecrire:
1nB = lna - p · lnd
p etant la pente de la droite avec:
m= 1-p
Bien qu'introduisant 1 parametre de plus que les 4 modeles classiquement utilises, cette double expo-
nentielle presente l'avantage de s'ajuster de fa~on satisfaisante a un tres grand nombre de profils de talwegs. Le Tableau. 1 montre que les coefficients de correlation soot tres bons entre les valeurs calculees et mesurees. L'utilisation de ce modele permet des comparaisons plus faciles et plus larges. Les valeurs prises par les differents parametres restent dans une fourchette assez etroite. >a< est compris entre 0,023 et 0,434 ce qui correspond a une variation d'un facteur 20. >m< lui evolue entre 0,188 et 0,869 ce qui correspond a une variation d'un facteur 5.
>a< et >m< soot lies par une relation qui se linearise lorsque l'on porte >a< en fonction de lim (Fig.1). Lorsque >m< tend vers 1, >a< tend vers une valeur minimale qui semble etre 0,03. Lorsque >m< tend vers 1. >a< tend vers l'infini.

106
U,5 . a .
0,4
0,3
0,2
0,1
a = - 0,07 -r 0,085 lim
r = 0,95 ; n = 18
• •
Ph. Martin
•
Ph.M.95 0,0 ~--~--~--~----.---~--.---~---.--~~~
1 2 3
Le param~tre >a< et le param~tre >m< ont des ·significations precises. >a< rend compte de la partie initiate du profit. I1 exprime une decroissance en fonction d'une distance. Son influence dans le mod~le est determinante dans les parties initiates de la courbe. >m< rend compte de !'orientation sub-horizontale et finale de la courbe. Une forte valeur de >a< correspond a une decroissance tres rapide de !'elevation du talweg en fonction de la distance. Une forte valeur de >m< correspond a decroissance quasiment exponentielle tout au long du profit du talweg et done a une pente relativement forte dans la partie aval.
Les relations existant entre ces differents facteurs laissent penser que les causes qui ont genere ces objets sont relativement semblables et/ou qu'elles sont limitees par des interactions, des mecamsmes regulateurs qui n'autorisent que la realisation de formes homologues.· En cela ces formes peuvent etre considerees comme significatives, comme nous informant d'une succession de processus de fonctionnement au :til du temps (qui peut etre tres long) dont elles sont la resultante. Elles correspondent done a une expression qualitative des proprietes du systeme qui leur a donne naissance. L'approche morphometrique vise a exprimer cette dimension qualitative par des valeurs quantifiees de fa~n a pouvoir, par des mises en relation successives, determiner Jes principes organisationnels
. de ces formes et done remonter aux processus les ayant mis en forme.
4 5 6
Par rapport a notre objectif initial, i1 apparat"t tres clairement que les talwegs du massif de la Sainte Baume ne presentent pas les stigmates d'une desorganisation liee au developpement de la lcarstification.
La geometric de ces formes derive d'un fonctionnement, d'un ecoulement des eaux qui est lui meme proportionnel a la surface du bassin versant drain e.
2. TALWEGS, SURFACE DRAINEES ET LIGNES SUPERFICIEL
LES DE PARTAGE DES EAUX
Comme nous l'avons rappele ci-dessus la Sainte Baume est drainee par deux fleuves: l'Argens et son affluent le Caramy a l'E et l'Huveaune a l'W. Celui-ci est fractionne en plusieurs sous-bassins importants et bien individualises (bassins de: Peyruis, de la Gastaude, de 1a Vede, des Seignors, de Ia Gal~re et du Fauge; unites auxquelles nous avons ajoute un bassin drainant le revers meridional duMont Olympe).
2.1. RELATIONS ENTRE LA SURFACE DRAINEE ET LA LONGUEUR DU TALWEG PRINCIPAL
Ces differents bassins ont ete identifies sur la carte au 1125oooeme puis individualises· par decoupage pour etre enfin planim6tres par pesee. Les longueurs ont ete mesurees en se tenant au plus pres

Les formes flurialiles du IIUUsi/ lean tUple de Ia Sainte Baume 107
du trace du talweg. Rappelons que cette mesure doit etre consideree ll'echelle ou elle a ete rea.J.isee puisque nous allons montrer ci-dessous que les talwegs soot des objets fractals et done que leur longueur est variable en fonction de l'echelle d'observation.
On doit aussi signaler, dans cette operation de mesures,. une. difficulte liee a l'anthropisation de la plaine d'Aubagne. Ce secteur de Ia vallee de l'Huveaune, l Ia difference de la partie meridionale du bassin de. Saint Zacharie, a subi de prof on des modifications. Son drainage prC-historique, en partie tributaire de ponors, a ete remodele pour assurer un assainissement suffisant (zone des Paluds) et
.. .........• ... .. ... ..•... '.... . ..........•......
·a.~~~@¢·::::::,:::::::::·::.:::,:.': =.·::::::=::: •:=:: ........ ·····::•:••:•::,:::::==:;,:;::,,:: .•.• ::.:, •••• :. ·. ·:::.·::::::::::::: ...................... :: ::::::::::::::::=::::::·:· ..... ...... . .............. ·············
?•t.~~:: ·i . ii'J:!' : :: i'li::::: :_::,,:·: .=::·:·! ::: . •. . :: : .:• :: .. :· : ........ :-
~ey~~:.:· .m . ':.··m·.::·:m: =:::: ::,=· . •·· ..... · ·: .. ·: _: . ••: • : · •.•..• :· •• Gas:taWi~n=::=::::::::un:: :::: : ::::::: .... •· ····· .... ·······::::::::::::::::::·:::::;:::::::::::::::::::······· •···· ····· .. ...
~~:~t!~~>:-~.: :::,::::.: :.; ...... ::. ·:. . ·: .. :. : ·,.:,::=<: ....
une production agricole indisperiSable: ·ees travaux ont eu pour consequences d'effacer compl~tement les limites naturelles de cette partie finale du bassin versant du Fauge. Ce probl~me q~ se pc)se aussi pour les bassins versants de Ia Gal~re et des Seignors, nous a conduits l arreter nos mesures au contact massif-plaine. ll resulte de ce choix une incertitude sur Ia surface totale de ces bassins versants. ·· . A partir des donnees qui sont resumees dans le Tableau 2 nous avons pu etablir une correlation satisfaisante entre Ia surface et Ia longueur de ces bassins versants (Fig. 2).
505,00 53,65
13,91 7,82
13,83 10,30
6,75 5,55
18,73 10,30
1f##•~ :~:::=:: :::~::::::=:::;: :: :,::::_: .·.H_:: : ,• • .· ·:···: : .... :::::.: :: ....•.. 19,33 9,97
-·~~·~),~1~:~-~~~~~*-~r~~~h·:•_:'.:•••·••: , .....•...... : :d~~~~:Jusqti••:t~t:~hl~:~ffirribi~H:.=·=::: ::::,.::=••·•:::::: . : •••••.•
2,81
2,96
3,77
3,82
* Extrapolation en fonction de Ia longueur pr~sumee du talweg jusqu'a sa confluence avec l'Huveaune, tres en a val de Gemenos. ·
La relation est une fonction puissance:
S- 0,22 · L1'922
De la meme fa~on on peut obtenir une excellente correlation entre la longueur et Ia surface de ces bassins:
L - 2,2 . SJ·SIS
Cette equation peut 8tre comparee a celle fournic par HACK (1957):
ou la constante a varie entre 1 et 2,3 (moyenne a 1,3) et ou l'exposant b varie lui entre--0,6 et 0,7 (moyenne a 0,64).
Ces travaux ont depuis ete completes par ceux de MANDELBROT (1977; 1982) lequel considerant que Ia longueur du talweg ou de la riviere variait en fonction de l'echelle a laquelle on la calculait a emis I 'hypothese que l'exposant - b- de cette equation etait egal l D/2; D etant Ia dimension fractale du talweg de la rivi~e principale.
2.2 DIMENSION FRACTALE ET LONGUEUR DES TALWEGS ET DES LIGNES SUPERFICIELLES DE PARTAGE DES EAUX
Pour chaque trace en plan de talweg et pour chaque ligne de partage des ~ux Iimitant chaque bassin versant (perimetre), nous pouvons calculer Ia dimension fractale de ces courbes non differentiables par la methode de RICHARDSON (1961).
Les longueurs approchees ayant ete estimees a partir de differents pas, on porte en ordonnees le

108
100
1 1
L = 2,2 * S"0,515
r = 0,994 ; n = 8
10
Ph. Martin
100 1000
Surface en km2 = S
12oo~-----------------------------~
"Q
II
d = 1134 * D"-6,1
8 = Q)
= 0 ·--~ --Q)
> ·-= 'Q)
~
1000
800
600
400
r = 0,95; n = 5
•
•
Ph.M.96 200+-------~-------~------~----~
1,0 1,1 1,2 Dimension fractale des talwegs = D
logarithme decimal de chacune de ces longueurs en fonction du logarithme decimal de Ia mesure du pas correspondant. Lorsque, sur ce diagramme bilogarithmique, Ia longueur approchee augmente sans limite mais de telle sorte que les points experimentaux s'alignent sur une droite, alors "Ia pente de cette droite denotee par 1D, constitue Ia methode Ia plus directe d'estimation de Ia dimension fractale D" (MANDELBROT, 1995). Notons que dans certains cas Ia distribution des points montre que Ia longueur approchee tend vers une valeur
limite lorsque le pas tend lui vers 0. Nous avons retranscrit dans le Tableau 3 les principaux resultats obtenus.
Les valeurs des dimensions fractales obtenues soot tres proches de celles determinees dans d'autres circonstances (ROBERT & ROY, 1989; SNOW, 1989; BREYER & SNOW, 1992; BEAUVAIS et al., 1994) et sont conformes a Ia fourchette (de 1 a 1,5) donnee par MANDELBROT (1995) pour les objets constituant le relief. terrestre.

Les formes fluviatiles du massif karstique de la ~inte Baume 109
545 ;! -;;,: ',.1.··
1,070 1,198 16,25 10,30 13,83 395
1,068 [a] 10,50 5,55 6,75 475
1,091 1,076 21,00 10,30 18,73 820 ·r•
[b) 15,25 7,10 12,42 895
53,65 1020
[a] la longueur approch~e tend vers une limite lorsque le pas tend vers 0. (b] La relation entre la longueur approch~ et la longueur du pas est quadratique. [c] Le bassinet le talweg du Fauge sont ceux qui se d~veloppent en amont de G~menos. (d) En raison de l'anthropisation tr~s forte de ce bassin (ville de Marseille) les d~terminations ont et~ limitees aux parties non anthropis~s. Pour la determination des dimensions fractales (talweg et perim~tre) cette limitation ne devrait pas introduire de biais puisque ces courbes possMent une homotbetie mais la longueur totale du perimetre. n'est pas mesurable.
Les dimensions fractales calculees pour les talwegs s'eclairent si on les relie Ala denivellation totale du profil. Cette relation (Fig. 3) montre bien que la rectitude des cheminements s'accroit avec !'importance de la denivellation. En d'autres termes nous retrouvons la une idee bien connue: lorsque la pente est forte, l'ecoulement se fait de fa~on rectiligne; lorsque la pente est faible l'ecoulement est sinueux voir meandriforme. La decroissance des pentes des talwegs etant liee A la croissance des surfaces drainees (MARTIN, 1991) c'est en fait !'ensemble des capacites d'erosion qui determinent Ia dimension fractale des talwegs.
La moyenne des dimensions fractales des talwegs des 4 sous bruisins de l'Huveaune s'etablit done a 1,1. En retenant le raisonnement de Mandelbroi on calcule done pour l'Huveaune:
· b = D/2 = 1,03/2 = 0,515 ,,
soit une valeur identique de celle de l'exposant b.
et pour la valeur moyenne de la dimension fractale des talwegs:
1,1/2 = 0,55
Cette valeur est proche de celle a laquelle on doit s'attendre en fonction de la theorie fractale: D/2 = 0,543.
Ces resultats montrent que sur la Sainte Baume la constante a prend une valeur tres forte, voisine de la branche superieure de la fourchette donnee par HACK (1957), et que l'exposant best tres faible, en d~A de la limite inferieure donnee. Ceci revient
a dire que les surfaces drainees par unite de longueur seraient dans !'ensemble plus importantes sur la Sainte Baume que dans le cas moyen. Cela semble en accord avec les pertes auxquelles doivent faire face ce type de bassins versants. Mais cette difference est extremement faible au regard des resultats obtenus pour la dimension fractale. II semble done bien que ce soit plutot les valeurs de HACK qui soient exceptionnelles. De nouvelles investigations sur de tels bassins versants de massifs karstiques permettraient de preciser cette question. Peut-etre peut on emettre !'hypothese que c'est sur des terrains karstifies que se realisent au mieux les formes definies par !'approche theorique.
2.3 SURFACE DRAINEE ET PERIMETRE DU BASSIN VERSANT
Nous avons vu que la ligne de partage des eaux ou perimetre du bassin versant est une courbe non differentiable dont on peut calculer la dimension fractale. Nous nous trouvons des lors devant un objet dont la surface est limitee mais qui, est enser- · re par une courbe . dont la longueur est infinie comme c'est par exemple aussi le cas pour le "flocon de von Koch" (MANDELBROT, 1995). 11 devient done interessant de verifier si l'on retrouve dans ce cas une relation entre la surface et le perimetre comme cela a dejA ete demontre pour differents objets fractals (MANDELBROT, 1982) comme les nuages (LOVFJOY, 1982). Cette relation qui s'exprime par une fonction puissance de Ia forme (GOUYET, 1992, p.61):

no
100 Ph.M.96
r.I'J S = 0,2:* P"1,5 II
N avec: 5 ~ 10 r = 0,99; n = 5 c Q)
Q) et comme: Cj
~ "" S =a P"2/D = r.I'J
Dim. Frac. = D = 2/1,5 = 1,33
1T-------~~--~--~--~~~~~
10 Perimetre en km = P
100
1000
Nb = 915,16 * 10"(-0,59 R) ,.Q
z .. r = 1,00; n = 5
~ 100 ~ "; ..... ~
"0
~ 10 ,.Q
s 0 z
Ph.M.95 1+-~-.--~.-~-.~--~~~~~
0 1 2 3
permet de calculer, comme l'a montre MANDELBROT (1982) Ia dimension fractale du bassin ver-sant. ·
En appliquant cette approche aux 5 bassins bersants pour lesquels nous disposons ~ la fois d~ Ia surface du bassi~ versant et de la longueur appro- ·
· chee de son penmetre, nous retrouvons bien une relation de la meme . forme que celle donnee cidessus qui nous permet de calculer une dimension fractale proche de 1,3 (Fig. 4). Ce premier resultat
4 5
Rang: R 6
qui reste ~ confirmer n'est pas en desaccord avec 1~ valeurs obtenues par ailleurs sur de grands bassms versants. La dimension fractale du bassin de l'Amazone est par exemple de 1,8 et celle du Nil de 1,4 (DAUPHINE, 1991 a; b; 1995). I1 semble en outre que Ia dimension fractale crolt. avec !'augmentation de la pluviosite et done de 1'6coulement. Dans ces conditions i1 n'est pas illogique que la dimension fractale de bassins versants su-
' perficiels en domaine karstique soit assez faible puisqu'une partie de 1'6coulement se r6alise a tra-vers l'endokarst. ·

Dans tous les cas on retrouve une homogen6i'te dans la forme des bassins versants. n n'est done pas necessaire de se situer dans une region de geologie unifonne pour voir apparaitre les structures sous-jacente de ces bassins versants. Ceci souligne la predominance des facteurs dynamiques sur les resistances des structures geologiques. Cette dynamique integrant de nombreux facteurs et une part de hasard. A partir de ces investigations nous ne pouvons done mettre en evidence aucune desorganisation du ~nage.
3. RELATIONS DE HORTON ET DIMENSION FRACTALE DU RESEAU SUPERFICIEL DE DRAI
NAGEDUHAUTCARAMY
Le Caramy etant le sous-bassin le plus important du versant nord du massif nous l'avons choisi pour effectuer un denombrement · selon la methode de HORTON (1945) ainsi qu'une mesure de la dimension fractale par la methode des boites ( LE MEHAU1E, 1990; GOUYET, 1992).
3.1. LES RELATIONS DE HORTON
La codification utilisee est celle etablie par STRAHLER (1964) et SCHUMM (SCHUMM et
111
Cette codification pennet une transcription mathematique de 1a diminl!tion progressive d'amont en aval, du nombre de drains en fonction de leur importance. exprimee ici par un rang.
HORTON (1945) a etabli principalement 4 relations. Nous n'en retiendrons que 2. Celie entre le nombre de talweg et l'ordre de ces talwegs et celle entre 1a longueur moyenne des talwegs d'un ordre et cet ordre (HIRSCH. 1962). Comme le montrent les Figures 5 et 6 nous avons abouti dans les 2 cas A un bon ajustement dont !'equation est pour la relation entre le nombre de talwegs et l'ordre:
Nb = 915,16 . 10'-<1,!19 R)
avec: r=1,00etn=5
et: L est le nombre de talwegs d'un rang donne, R est le rang ou ordre des talwegs.
et pour celle entre Ia longueur moyenne de chaque niveau et le rang des talwegs:
L = 0, 085 . 10(0.39 R)
avec:
r = 0,99 et n = 4 et:
al., 1986): L est la moyenne des longueurs mesurees au - est de 1 er ordre tout cours d'eau qui n'a pas curvimetre,
encore ~u d'affluent, R est Ie rang ou ordre des talwegs.
- est d'ordre 2 tout cours d'eau ayant ~u au ll appara1"t done, A travers ees 2 exemples que l'or-moins un affluent d'ordre 1, ganisation classique des reseaux de drainage se
.-----------~~------~--------~--~~ - est d'ordre 3 tout cours 10 ~-----------------"'7"--.....,
d'eau ayant ~u au moins un affluent d'ordre 2,
- etc.
,1 1 2 3
L = 0,085 * 10A(0,39 R)
r = 0,99; n = 4
Pb.M.95
4 5 6
Rang: R
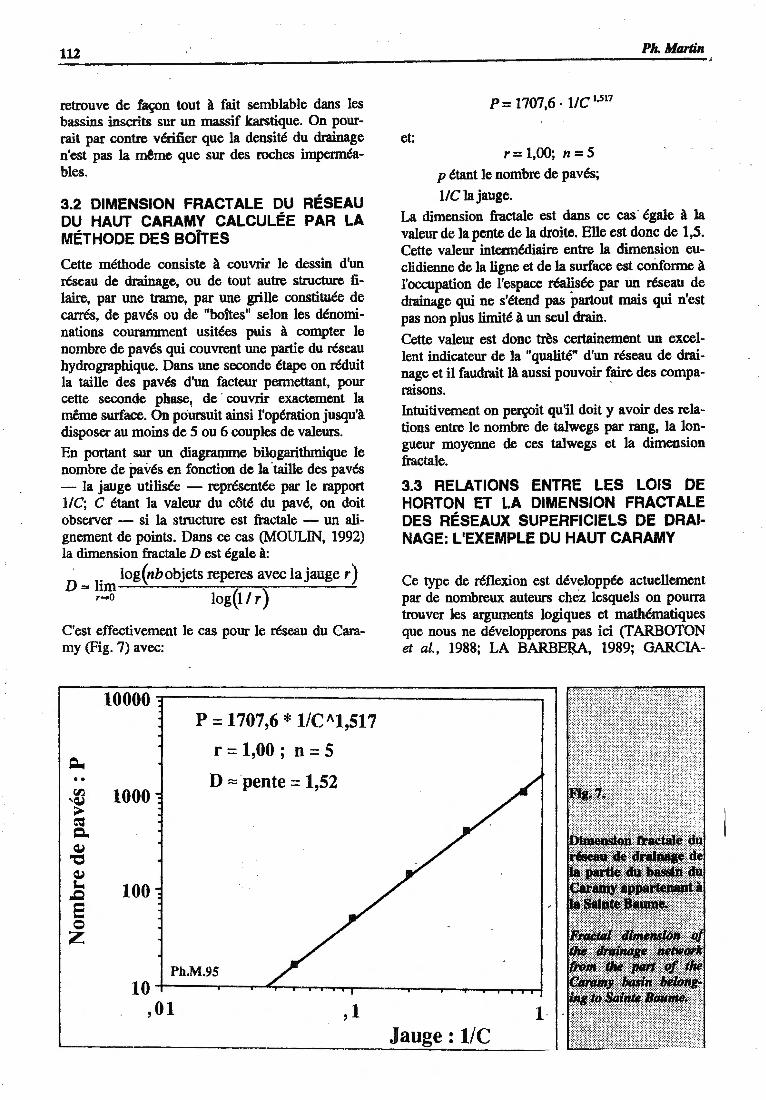
1U
retrouve de fa~n tout a fait semblable dans les bassins inscrits sur un massif karstique. On pourrail par contre verifier que la densite du drainage n'est pas la meme que sur des roches impermeables.
3.2 DIMENSION FRACTALE DU RESEAU DU HAUT CARAMY CALCULEE PAR LA METHODE DES BOiTES
Cette methode consiste a couvrir le dessin d'un reseau de drainage, ou de tout autre structure filaire, par une trame, par une grille constitu6e de carres, de paves ou de "boites" selon les denominations couramment usitees puis a compter le nombre de paves qui couvrent une partie du reseau hydrographique. Dans une seconde etape on reduit la taille des paves d'un facteur pennettant, pour cette seconde phase, de · couvrir exactement la meme surface. On poursuit ainsi I' operation jusqu'a disposer au moins de 5 ou 6 couples de valeurs.
En portant sur un diagramme bilogarithmique le nombre de paves en fonction de la taille des paves - la jauge utilis6e - represent6e par le rapport 1/C; C etant Ia valeur du rote du pave, on doit observer - si la structure est fractale - un alignement de points. Dans ce cas (MOULIN, 1992) la dimension fractale D est egale a:
· . log(nbobjets reperes avec lajauge r) D = lim---!..------;---.------..!..
r-o log(l/ r)
C'est effectivement le cas pour le reseau du Caramy (Fig. 7) avec:
et:
P = 1707,6 · 1/C 1.517
r= 1,00; n = 5
p etant le nombre de paves;
1/C la jauge.
Ph. Marlin
La dimension fractale est dans ce cas. egale a la valeur de la pente de la droite. Elle est done de 1,5. Cette valeur intennediaire entre la dimension euclidienne de la ligne et de Ia surface est cotlfonne a !'occupation de l'espace r6alis6e par lin reseau de drainage qui ne s'etend pas partout mais qui n'est pas non plus limite a un seul drain.
Cette valeur est done tres certainement un excellent indicateur de la "qualite" d'un reseau de drainage et i1 faudrait la aussi pouvoir faire des comparaisons.
Intuitivement on pe~it qu'il doit y avoir des relations entre le nombre de talwegs par rang, la longueur moyenne de ces talwegs et la dimension fractale.
3.3 RELATIONS ENTRE LES LOIS DE HORTON ET LA DIMENSION FRACT ALE DES RESEAUX SUPERFICIELS DE DRAINAGE: L1EXEMPLE DU HAUT CARAMY
Ce type de reflexion est developp6e actuellement par de nombreux auteurs chez lesquels on pourra trouver les arguments logiques et mathematiques que nous ne developperons pas ici (T ARBOTON et al., 1988; LA BARBERA, 1989; GARCIA-
10000~--------------------------~
1000
P = 1707,6 * 1/C"l,517
r = 1,00; n = 5
D :::::: pente = 1,52
Pb.M.9S 10+---~~4-~~.----~~~~~
,01 ,1 1 Jauge: 1/C

Les formes fluvialiles du I'IUUri/ luustique de Ia Sainte Baume 113
RUIZ & OTALORA, 1992; Llli, 1992; RODRIGUEZ-ITURBE et al., 1992; SNOW & MAYER, 1992; TARBOTON et al., 1992).
Ainsi si l'on calcule la longueur moyenne d'ordre 1 (NLJ) puis celui d'ordre 2 (NL2) et que l'on effectue le rapport NL2/NLJ on obtient:
NLJ = 0,2086; NL2 = 0,5122
0,5122/0,2086 = 2,45 = = Ratio de longueur th6orique = RLth.
Si l'on effectue Ia meme operation pour les nombres de talwegs par ordre (NI'l et NT2 par ex.) on obtient:
NT 1 = 235,23; NT2 = 60,46
60,46 /235,23 = 0,257 = =Ratio de bifurcation th6orique = RBth.
Si I' on effectue 'ensuite le rapport entre:
log RBth /log RLth
on obtient:
log 0,257/log 2,45 = -0,5910,39::-1,513
Cette valeur apparai't comme etant identique, au signe pres, a la valeur de la pente de la relation bilogarithmique entre le nombre de paves et la jauge et done tout a fait l'homologue de Ia dimension fractale calculee. En fait pour obtenir une valeur positive il suffit de prendre comme rapport:
RBth = NI'll NF2 = 3,89
nous avons done:
log 3,89/log 2,45 = 0,39 0,59/0,39 = 1,513
Cette solution est en fait une application, par analogie, de Ia methode de calcul de la dimension fractale par la methode de l'agregation limitee par diffusion ou DLA (LE MEHAUTE, 1990, p.l41). Cet auteur note; "en appuyant le raisonnement sur /'analyse de l'autosimilarite, on observe que la dimension fractale peut etre reliee aux differents ratios qui determinent la digitation a savoir:
/!,. = ln(rn)/ln(1/r 1 )
ou m represente le ratio relatif au nombre de digitations entre l'etape n et n-1 et r1 est le ratio portant sur les longueurs de digitations·· entre les memes etapes d'iteration". Et cet auteur de conclure: "il peut etre montre, dans les cas des digita-
tions visqueuses, que La dimension fractale A trouvee en 2 dimensions, est proche de 1 ,5". On peut tnmscrire tout ceci de Ia fa~n suivante:
ll = lnRBth lln(1/RLth)
et done:
8:::ln0,2571ln(1/2,45) = -1,3586/-0,8961 = 1,516
La encore un resultat identique a Ia dimension fractale trouvee par Ia methode des boites.
Cette dimension fractale apparait done comme une caracterisation fondamentale rendant compte d'une structure majeure; caracterisation que l'on peut verifier en empruntant differentes voies mais nulle part au travers de ces resultats nous n'avons mis en evidence une quelconque II desorganisation du drainage" sous l'effet de Ia karstification.
EN CONCLUSION
Les formes modelisees, les valeurs des parametres, des modeles entrent dans les fourchettes des valeurs obtenues par ailleurs. Meme si certaines valeurs s'expliquent par Ia specificitC du substrat, il apparait que l'organisation generale des reseaux de drainages de ce massif est conforme a celle rencontree dans d'autres domaines, sur d'autres substeats. De ce point de vue Ia specificite du karst est extremement mince. La presence de reseaux souterrains, d'un drainage important et fonctionnel par l'endokarst ne se traduit pas en surface dans l'organisation des reseaux fluviatiles. n n'y a done pas de "desorganisation" mais il y a par contre coexistence de ces 2 systemes de drainage. Toute la question est de savoir priurquoi.
A partir de l'analyse hydrologique du fonctionnement de l'endokarst et des reseaux superficiels j'ai suggere (MARTIN, 1991) que cette co-existence constituait une reponse a un moindre "coOt" (coOt en travail) pour ecouler l'eau tombant sur ce massif. Cela nous renvoie au principe de Maupertuis dit Loi de moindre action: "Si un changement se produit dans Ia Nature, Ia quantite d'action necessaire pour l'accomplir doit etre Ia plus petite possible" 1ce qui peut s'exprimer aussi par: "En toutes circonstances la Nature minimise !'action" (HILDBRANDT & TROMBA, 1986).
En d'autres termes l'eau tombant sur le massif de Ia Sainte Baume doit etre acheminee vers Ia Mediterranee ou toute l'energie disponible qui est en fonction de }'elevation du massif et des precipitations se sera dissipee. Pour cela !'analyse th6orique des formes montre (STEVENS, 1978) que l'organisa-
114
tion Ia plus economique est une structure arboresccnte collectant des precipitations spatialement dispersees. ~T .
La Nature tend done en fonction du principe de moindre action a developper un reseau de drainage qui puisse acheminer les gros comme les petits debits.
Par ailleurs si l'on envisage que dans le Genie civil on considere qu'a partir d'une certaine epaisseur de materiel a d6blayer pour faire circuler un flux, il est preferable de realiser un tunnel - car le travail a effectuer est globalernent moindre pour un re~ sultat semblable - et si l'on transpose cette approche au travail de glyptogenese realise par Ia Nature, on s'aper~it qu'.elle fait de rnfme et que pour acheminer les debits elle etablit des shunts karstiques, des reseaux de drainages souterrains. Notons qu'il faut en fait renverser Ia proposition; ce sont les Hommes qui imitent la Nature.
Mais ces shunts karstiques, tout comme les aqueducs souterrains d'ailleurs, presentent un inconvenient majeur. Les debits qui y transitent ne peuvent etre accrus qu'en augmentant Ia vitesse de circulation de l'eau lorsque Ia totalite de Ia section de Ia galerie est mouillee. L'exploration speleologique montre bien a ce titre soit par !'observation directe des retrecissements dans les galeries, soit par les mises en charges qui sont observees, que certaines
BIBLIOGRAPHIE
BEAUVAIS, A., DUBOIS, J. & BADRI, A. (1994) Application d'une analyse fractale a l'etude morphometrique du trace des cours d'eau: methode de Richardson. C. R. Acad. Sci., Pans, 318, II, pp. 219-225.
BOl.ITOT, A., (1993) L'invention desfonnes. Ed. Odile Jacob, Paris, 376 p.
BREYER,_ S., P_- & SNOW, R., S. (1992) Drainage basm penmeters: a fractal significance. Geomorphology S, · 1/2, special issue: Fractal in geomorphology (SNOW, R., S. & L. MAYER Eds.), pp.143-157.
DAUP~, A. (1991a) Chaos, fractales et geographie. Revue d'analyse spatiale quantitative et appliquee, 30, Nice, pp 9-21;
DAUPHINE, A. (1991b) De l'ordre au chaos. L'espace geographique, 4, pp. 289"-301.
DAUPHINE, A. "(1995) Chaos; fractales et dynami. ques en geographie. Coli. Espace modes d'em
. · ploi, Ed. GIP Reclus, Montpellier, 136 p. . FRANKHAUSER, P. (1994) La fractalite des structu
res urbaines. Anthropos Economica Ed , Paris, · 291 p. .
·; . i·Ph. Martin
sections forment des goulets d'etranglernent qui. vont limiter les possibilites d'accroissement de Ia , vitesse et done les possibilites d'augmentation des· debits. En d'autres termes les reseaux de drainage souterrains sont des solutions optirnales pour ecouler de faibles ou de moyens debits pas pour ecouler de forts debits, des debits de pointes de crues. A contrario on peut considerer dans un domaine karstique comme le massif de Ia Sainte Baurne que le reseau de drainage de surface permet un accroissement quasiment illimite de la surface mouillee et done une augmentation presque'illimitee des debits ecoulables. Cela est particulierement vrai dans les vallees ou les gorges. Ces phases de crues ttant morphologiquement tres actives on peut comprendre que le reseau de drainage superficiel persiste malgre le developpeement d'un reseau de drainage souterrain, mfme si par exemple Ia densite du drainage est plus faible.
Tout ceci me porte a penser que l'association de deux types de drainage l'un superficiel, l'autre souterrain est une forme stable d'organisation morphologique qui presente toute une serie "d'avantages". Dans cette perspective la karstifica-·· tion ne desorganise pas le drainage, elle le rend plus complexe afin de limiter le travail necessaire a l'ecoulement des eaux.
GARCIA-RUIZ, J., M. & OTALORA, F. (1992) Fractal trees and Horton's laws. Mathematical geology, 24,1, pp. 61-71.
GOUYET, J., F. (1992) Physique et struturesfractales. Ed. Masson., Paris, 234 p.
HACK, J., T. (1957) Studies of longitudinal stream profiles in Virginia and Maryland. U.S. Ge~l. ' Surv. Prof Pap., 294-B, pp. 45-94. ,
lllLDEBRANDT, S. & TROMBA A. (1986) Mathematiques et fonnes optimales. L'explication des structures naturelles. Ed. Pour Ia Science, Paris, 180 p.
HIRSCH, F. (1962) Methode de prevision des debits des cours d'eau par l'analyse morphometrique · des reseaux fluviati1es. Revue de geomorphologie dynamique, xm. 7-IJ-9, pp. 97-106.
HORTON, R., E. (1945) Erosional development of streams and their drainage basif!.s: hydrophysical approach to quantitative morphology. Bulletin of"the Geological Society of America, 56, pp. 275-370. . ,·
JAUZEIN, A. (1971) Les agents de la morphogen~se, 1 - les eaux courantes. Travaux du laboratoire de geologie, cours et documents S, Ecole Normale Superieure, Paris, 171 p.

Lesformesflut~iallles du IIUIS:rifkllrstique de Ia Sainte Baume 115
LA BARBERA; P. (1989) On the fractal dimension of stream networks. Water Ressources Research, 25, 4, pp. 735-741.
LE MEHAUTE, A. (1990) Les geometries fractales. Ed. Hermes, Paris, 198 p.
LIU, T., (1992) Fractal structure and propertie of stream networks. Water Ressources Research, 28,ll,pp. 2981-2988.
LOVEJOY, S. (1982) Area-perimeter relation for rain and cloud areas. Science, 216, p.185.
MANDELBROT, B. (1977) Fractals: Fonn, chance and dimension. W. H. Freeman, New York.
MANDELBROT, B. (1982) The fractal geometry of nature. W. H. Freeman, New York.
MANDELBROT, B. (1995) Les objets fractals, 4hl<: ed. Ed. Flammarion, Coli. Champ 301,208 p.
MARTIN, P. (1991) Hydrogeomorphologie des geosystemes lcarstiques des versants nord et ouest de la Sainte Bowne (B. du Rh., Var; France). TMse Universite d'Aix- Marseille II, 326 p.
MOULIN, T. (1992) Les outils mathematiques: fractales, relateurs aritbm6tiques. in Systemique theorique et applications (F. LE GALLOU & B. BOUCHON-MEUNIER coord., G.E.S.T.A.Ed. TecDoc Lavoisier, pp.140-158.
NICOD, J. (1967) Recherches morphologiques en Basse-Provence calcaire. Th~se d'etat, Universite d'Aix-Marseille II, Ed. Louis Jean, Gap, 557 p.
RICHARDSON, L., F. (1961) The problem of continuity: An appendix of sttistics of deadly quarrels. Gen. Syst~ Yearb., 6, pp.l39-187.
ROBERT, A. & ROY, A., G. (1990) On the fractal interpretation of the mainstream length-drainage area relationship. Water Ressources Research, 26, 5, pp. 83!hCl42.
RODRIGUEZ-ITURBE, I., RINALDO, A., RIGON, R., BRAS, R., L., MARANI, A. & UJASZVASQUEZ, E. (1992) Energy dissipation, ·mnoff production and the three-dimensional structure of river basins. Water Ressources Research, 28, 4, pp.1095-1103.
SCHUMM. S., A., MOSLEY, M., P. & WEAVER. W., E. (1986) Experimental fluvial geomorphology. Ed. A Willey & Sons, New-York, 403 p.
SHEPHERD, R., G. (1985) Regression analysis of river profiles. Journal of Geology, 93, pp.377-384.
SNOW, R., S. (1989) Fractal sinuosity of stream channels. Pageoph., 131, 112, pp.99-109.
SNOW, R., S. & MAYER. L. (1992) Fractals in geomorphology. Geomorphology, special issue, 5, 1-2, 194 p.
STRAHLER, A., N. (1964) Quantitativr morphology of drainage basins and channel networks. in Handbook of applied hydrology (CHOW, V., T., Ed.), McGraw-Hill, New-York, section 4-II.
T ARBOTON, D., G., BRAS, R., L., RODRIGUEZITURBE, I. (1988) The fractal nature of river networks. Water Ressources Research, 24, 8, pp. 1317-1322.
T ARBOTON, D., G., BRAS, R., L. & RODRIGUEZITURBE, I. (1992) A physical basis for drainage density. Geomorphology 5, 112, special issue: Fractal in geomorphology, (R.S. SNOW & L. MAYER Eds), pp.59-67.


. .-.. ·.
.~.
Hydrodynamical Test Preparation of Karstic. Reservoirs for Chinese Request· ,
Andras BALOGH1
ABSTRACT In Hungarian petrol industrial practice several methods were developed for testing hydrodynamical properties of fluid reservoirs. ·In present article we briefly describe two types of testing methods, which are remarkable for karstology experts. One of them is Pulse Interference Test and the other is Cavern Volume Test, both of them developed in our company. Pulse test is hydrodynam.ical examination method of fluid reservoirs surrounded by wells. With help of pulse test and analysis the existence of flow connection between test wells and the value of flow parameters can be determined. We run several pulse tests to understand karstic water supply system of Heviz-lake in Hungary, where water production of bauxite mining may influence the rate of inflow and temperature of that thermal water. This testing method is also useful in water inrush preventing, because unknown caverns can be suspected between the wells, from the deviation of value of flow parameters. It is very important to estimate the volume of a cavern filled up by water in underground mining area, because water inrush preventive operations can be designed on the basis of known cavern volume determined by Cavern Volume Test.
Key words: well testing, pulse test, Hungary.
PREPARATION DES ESSAIS DE POMP AGE DANS DES AQUIFERES KARSTIQUES PRENANT EN CONSIDERATION LA DEMAN DE CHINOISE
RESUME Dans Ia pratique hongroise de .l'industrie petroliere on a developpe plusieurs methodes pour tester les proprieres hydrodynamiques des formations emmagasinant des fluides. L'article present decrit brievement deux types de pompages d'essai, qui pourraient interesse les experts en karstologie. II s'agit de l'Essai Pulsatoire d'lnteifhence et de l'Essai de Volume de Caveme, qui ont ere developpes dans notre compagnie. L'Essai Pulsatoire d'Inteiference est une methode d'investigation hydrodynamique des formations satures en fluides, qui sont entourees par plusieurs puits. Par l'intermidiaire de l'Essai Pulsatoire d'lnterference et de son interpretation on peut identifier /'existence des connexions hydrauliques entre les puits et etablir les valeurs des parametres d'ecoulement du reservoir. Nous avons realise plusieurs essais pulsatoires de pompage, a.fin de comprendre le mecanisme d'alimentation du Lac Heviz. en Hongrie, ou /'extraction de l'eau des mines de bauxite peut influencer l'intensite de Ia recharge et Ia temperature de cette eau thermale. Cette methode d'essai est utile aussi en prevention des venues d'eau, car /'existence des cavernes inconnues peut etre deduite en prenant en compte les deviations dans les valeurs des parametres d' ecoulement. Il est tres important d'evaluer le volume d'une caveme remplie d'eau dans une region de travaux miniers soute"ains, puisque des operations preventives contre les venues d'eatl peuvent etre preparees a partir du volume connu d'une cave me, deduit par l'intermidiairf! de l'Essai de Volume de Caveme.
Mots-cles: essai de pompage, essai pulsatoire, Hongrie.

118
INTRODUCTION Measurement is important part of understanding process of physical systems. A proper test indicates newer and newer theOry and gives evidence if a theoretical model is acceptable or not. lbis principle is strongly true in case of understanding karstic reservoirs where the subject of our study is hidden from our eyes and we can get any infonnation only with testing.
In present paper we introduce two test methods of karstic reservoirs. We do not intend to describe them in details, only briefly describe them and our practice. Both of them are well testing methods, consequently we record pressure response of flow rate stimulation. One of the introduced tests is Pulse Interference Test. It is for characterizing flow connection between two or more wells. The other one is Cavern Volume Test to determine volume of underground closed caverns. It is very useful for example in· water inrush preventing.
PULSE INTERFERENCE TEST
Pulse Interference Test is a flow communication test. It means, that we stimulate the reservoir with flow rate change in ihe active well and record the pressure response of stimulation in one (or more) farther observation well (Fig. 1). If pressure response can be detected than we know, that there is flow connection between the two wells. That infonnation helps to investigate integrity of reservoirs.
We are speaking about Pulse Interference Test, when flow rate in active well is regularly alternating. It can be pulsing production or injection. Fig. 2 shows a real test result (Nagylengyel field, Hungary), where flow rate was alternating among 0
Active well
A. Balogh
and 90 m3/day with 10 hours cycle period. Pressure response in observing well also pulses with the same circle period but with significant delay-
. ing. We have to use high sensitivity pressure gauges for observation, b~use us~y pressure amplitude is very small. It IS v~ry 1mportan~ to properly design required cycle penod and required sensitivity of applied pressure gauges.
EVALUATION OF PULSE INTERFERENCE TEST
The amplitude and delaying time of pulsing pressure response is the function of reservoir flow parameters. Supposing homogenous reservoir model, transmissibility (T) and storage capacity (S) can be calculated from amplitude and delaying time (BRIGHAM, 1970). These parameters can be calculated also from other reseryoir parameters on the basis of following equations:
T = k · hlf.L and S = cj> • c, · h
However in most of the cases (80%) unexpected pressure noises disturb the test. Fig. 3 shows a typical test example for a pressure noise di_sturbed Pulse Interference Test. The pressure n01se can origin for example from tide effect, temperature effect, production from other wells and many unexpected sources. Pressure can be so badly distorted, that it seems to be impossible to evaluate its amplitude and delaying time.
For this reason we developed a software (T6TH, 1978; T6TH & MEGYERY, 1992; T6TH et al., 1995) to analyze and design pulse tests. We apply a special noise filtration method in it, that takes advantages of pulsing feature of pressure response. We think that Pulse Interference Test- together
Observation well

Hydroditu~mical test preJHITtllion of kant reservoirs
M~NAU~ed T .P ..A dela
-0.05
l I! ·0.1
CD !5 fi -0.15 li':
-0.2
. -0.25 0 10 30 40 50 so
Measwed T .P ..A data
90
80 .. · - ·· · . .
70 ., sol'
.. ... - .. ::a 50f .ro;
. . ..... w
70
:Jli 20-
10
0 9)
119
• Prenure
• Flow Rote
0.01
0
90
~~~~r-+-+-~4-~~~~-+-+-4 eo ·0.01 "
';f-0.02
!. ·0.03 Q)
! ·0.04 n 0: ·0.05
..().06
·0.07
..().00 0 10 20 30 40 50
Elapsed Time (hn1)
with that filtration method and proper test design -is a very effective interference test method because we can analyze 90% of tests with analysis software.
OUR PRACTICE OF PULSE INTERFERENCE TESTING
We performed about 500 Pulse Interference Tests in Hungary. The distance of active well. to observation well was 500 m on the average and it varied from 8 m up to 3080 m. We make test services
60 70 80
70 :!1
60 i :%1
50~ II
401 w
30Ci: -= 20-
10
0
-••-Pressl..l'e
-••- Flow Rate
mainly for petrol industry (MEGYERY, 1990; MEGYERY, 1992), but there were 84 at bauxite mining area and 21 at coal mining area.
It was an interesting application when we run sev-' eral tests for bauxite mining industry. There is a
huge lcarstic reservoir system in western Hungary and there was bauxite mining activity under the static lcarstic water level For this reason they bad to pump out water with high flow rate. After a while temperature began to decrease in Hevfz thermal lake, because flow rate of karstic sources of the lake began to decrease. That lake is a famous tourist nlace with thermal water in the same

120
Cavern
V.Cf
p
q dt
dt
A. Balogh
karstic system, about 50 Ian farther from bauxite mines. Pulse Interference Tests was applied to get correct flow parameters regarding to the critical reservoir part.
CAVERN VOLUME TEST
When we speak about cavern, we are thinking an underground hole, that is opened to the surface only with a well. Cavern is filled up by water or gas, and there is limited inflow through the natural fractures at the inner surface (GYENESE et al., 1989) as it is shown in Fig. 4.
We suddenly change the volume of the water (or gas) content of the cavern. For this sudden perturbation the cavern responses with sudden pressure drop or increase. Knowing volume change (~ V), pressure change (!J.p) and total compressibility (c, ), the volume of the cavern (Y) can be calculated on the basis of following equation:
1 ~v V=-·-
ct ~p
If there is overpressure at the wellhead, then we change the volume of fluid content of the cavern with short (1-2 sec) blow out. Flow rate history and theoretical pressure response are shown in Fig. 5.
If there is negative water level, then we compress nitrogen into the well and perform a sudden blow out of the nitrogen.
If there is a gas cavern with atmospheric pressure, we bum well-defined amoun~ of gun powder in the cavern.
VERIFYING OF CAVERN VOLUME TEST
We performed several experiments on known volume objects, as gas tanks, concrete pipe, water tower, salt dome. We had tested the volume and it served the real volume of them.
Furthermore Cavern Volume Tests are applied for water inrush prevention at mining areas. Before stuffing of explored caverns we determine its volume, and. on the basis of that information, the needed amount of stuffing material can be calculated.

Hydrodinamical test preparation of karst reservoirs
THE CHINESE IDEA REGARDING TO CAVERN DETECTING
Chinese coal mining experts are inquiring about the two above described methods. Their idea is that Pulse Interference Test could be used for cavern detecting. There is one active well and some observation well around that. We suppose that the reservoir more or less homogeneous, but there is a cavern somewhere in this area, as it is shown in Fig. 6. The cavern has such effect, that value of transmissibility and storage capacity between observation well 1 and active well will be smaller, than in other directions. The difference in case of transmissibility is not too much, but in case of storage capacity it is significant.
Suspicious area can be drilled to find cavern. When drill hits the cavern, its volume can be tested by Cavern Volume Test and it can be stuffed. In this way Pulse Interference Test combined with Cavern Volume Test could be an effective testing method of water inrush prevention. This method is not yet verified in the practice.
CONCLUSIONS
I. Pulse Interference Test combining with noise filtering is an effective interference testing method. It infonns about flow connection between two wells.
121
2. Cavern Volume Test can be used for any caverns, where inflow rate into the cavern is limited.
3. Pulse Interference Test and Cavern Volume Test together could be effective tool of water inrush prevention.
NOMENCLATURE
!Qescnj!__tion .. Basic SI unit . .
. .
A . Ptllsatiori •. pressure respense (Pa·sec/m3)
. amplitude . . . . c, . ·· Totalcompressil>ility · (11 Pa) D, . Delaying time of pressure re- (sec)
spon~e . h . Layerthickness (m) k ...•. Periiteability (m2
)
p .· Pressure response (Pa) .q Pulsil)g.fl(>w r:ate · (m3/sec) S > Storage capacity (m /Pa) t TranslDissibility (m2·m /Pa·sec) V •. Ca:Vetn .volunie (m3
)
J.l ··• Viscosity : (Pa·sec) · ·~ •··• Porosity • (dimensionless) .ll V Volllllle cluutge of cavern con-
tent . •t;p · Pressure change response to
•• volume change

122
REFERENCES BRIGHAM, W., E. (1970) Planning and Analysing of
Pulse-Tests. J. Pet. Tech., 5, pp. 618-624. GYENESE, 1., KOSA, M. & MEGYERY, M. (1989) A
kavernameretmeghatdrUZJis hidrodinamikai mOdszerenek tecluwlOgidja. ertekel~e. Koolaj es FlUdgubanyliszati Vlillalat
MEGYERY, M . (1990) A tarol6ter szerkezetenek lefrasa interferencia meresek alapjan, B.K.L. K6olaj es Foldgdz, 8, pp. 234-237.
MEGYERY, M. (1992) Research of Pore Structure in Oil Reservoirs of Complex Porosity by Pulse Tests. 1992 SPE Forwn Series in Europe Frontiers ofTechnology (Advances in Well Test De-
· A, Balogh
sign and Interpretation), Seefeld, Austria, 13-18 Sept.
TOTH, B. (1978) Zavarsztlresi m6dszerek alkalmazasa a pulzacios bidrodinamikai interferencia vizsgalatok ertelmezeseben. B.K.L. K!Jolaj Is Foldgdz. s. pp. 147-151.
TOTH, B. & MEGYERY, M. (1992) Evaluation of Pulse Test with Noise Suppressing. paper SPE 24531, 1992 Abu Dhabi 5th Petroleum Conference and Exhibition, Abu Dhabi, 18-20 May.
TOTH, B., MEGYERY, M., BALOGH, A. & GYENESE, I. (1995) PulsEx Pulse Interference Test Analysis and Design Software. Geoinform Ltd, Nagylcanizsa, Hungary.

Effects of .Quaternary Tectonic Activitie~ on Ka·rstification PaHern in Ceyhan-Berke
Dam-Site, SE Tur-ey Mehmet EKMEKCI1
-··:
ABSTRACT
The Berke Project consists of construction of a dam and a hydropower plant on Ceyhan river running at · the . Eastern Mediterranean region of Turkey. There has been considerable debate on the intensity of karstification and its subsurface distribution at the damsite, a knowledge which is of great importance for grouting curtain
·. design. Two different types of karstification were identified in the area: normal karst and thermal karst. Nor- · mal karst, progressing from the surface downward along the major faults has not been well developed. The karstification base related to normal karst is higher than the mechanical erosion base of the main river valley. Tectonic activities that had been efective during Late Pliocene until Late Quaternary had two fold effect on the
:;·' groundwater system in the region. Firstly, in some places it caused fracture emption of basalt during PlioQuaternary. This, consequently, had been a trigger for thermal spring occurrence. Thermal karst has ~erefore progressed upward from great depths, . enlarging fractures to form thermal karst conduits. Secondly, the tectonic activity has · continued until Late Quaternary and formerly developed karst conduits have been dissected due to dislocations. The resulted karst pattern is observed as randomly scattered, usually air or water filled cavities. This type of karst encourages construction of the dam with regard to karst problems. However, tectonic activity should be regarded as a more serious, potential risk rather than karstic leakages.
Key words: tectonic activity, normal karst, thermal karst, karst pattern, Berke dam, Turkey.
LES CONSEQUENCES DE LA TECTONIQUE QUATERNAIRE SUR LE RESEAU KARST/QUE DU SITE DU BARRAGE DE BERKE
RESUME (SUD-EST DE LA TURQUIE)
Le projet Berke prboitla construction d'un barrage et d'une centrale hydroelectrique sur Ia riviere Ceyhan dans Ia region est-mediterraneenne de Ia Turquie. L'intensire de Ia karstification et sa distribution souterraine sont tres bien discutees a /'emplacement du barrage; c'est un sujet essentiel pour Ia conception du rideau impermeable. Dans Ia region, deux types de karstification ont ere identifies, une karstification nonnale et une karstification d'origine hydrothennale. La karstification liee a Ia karstification nonnale est plus elevee que le niveau d'erosion mecanique de Ia valUe de Ia riviere principale. L'activite tectonique du Pliocene au Quaternaire a eu un double effet sur /'evolution du reseau souterrain dans Ia region. En premier, elle a provoque dans certains endroits /'eruption fissurale de basalte au Plioqitatemaire. Cene situation afavorise en consequence l'arrivee d'eaux thennales. La karstification thennale a ensuite progresse des profondeurs vers Ia surface en elargissant des fractures devenues ainsi des conduites. Deuxiemement, l 'activire tectonique a continue jusqu 'a Ia fin du Quaternaire conduisant a Ia dislocation de Ia karstification primaire. Le reseau karstique resultant est tres disperse avec des cavires remplies d'eau ou d'air. Ce type de karstification est favorable a Ia construction d'un barrage. Cependantl'activite tectonique doit etre
: '_consideree comme un risque potentiel plus serieux que les fuites karstiques.
:.Mots cle: activite tectonique, karstification nonnale, karstification thennale, reseau karstique, barrage de ,;··Berke, Turquie.

124
INTRODUCTION
Ceyhan river, running in the Eastern Mediterranean region of Turkey (Fig. 1) is one of the major rivers in the Turkey that are fed mainly by karstic springs. The mean discharge of the river at the damsite section is 156 m3/s. The drop in elevation together with the valley morphology favors the hydropower production at the site selected for dam construction. However, this section is covered mainly by carbonate rocks which have been subjected to intensive tectonic movements during different phases. Karstic features are rare at the surface. 'This couraged many engineering geologists in selecting this site for dam construction. However, exploratory drilings, later shown that some karstic cavities existed underground and that they were scattered randomly. Existence of the thermal springs, at a distance of only 1 km downstream and karst springs of high-content of sulphate and C02, close to the reservoir area has drawn attentions to the role of karstification which might cause serious problems of watertightness at both the reservoir area and damsite.
Identification of karst types, definition of karstification processes and determination of karst pattern have been the primary aim of this study.
GEOHYDROLOGY
The damsite and its reservoir area are covered by the autochtonous Jurassic-Cretaceous carbonate rock units as part of the Arabic Platform. The closure of the Southern Tethys during Campanian formed a very complex geological structure with two phases of overthrusting in the study area (KOZLU, 1987). The simplified hydrogeological map of the study area is given in Fig. 2.
The Paleozoic quartz-:fillite schist sequence that cropped out in the northern and northeastern part of the study area, represents the basement of -the impervious units. This unit is covered by a sequence of interbeds of shale and dolomies, where the lower part of this sequence is also considered as an impervious unit. Therefore, the northwestern part of reservoir area is bordered by these impervious units (Fig. 2).
The Somakli complex (Ks) that is considered to be one of the widespread allochtonous units, includes several units of different geohydrological characteristics. The impervious unit in this complex is represented by mainly serpentines with limestone blocks. The allochtonous Kizildag ophiolites (Kof) are also considered as impervious units. Field observations have shown that these ophiolites sometimes overlay some pervious autochthonous units. Therefore, the ophiolites should not always be . considered as a pervious units. The Miocene is composed of impervious siltstone, shale, sandstone and carbonate cemented gravel, which are of less importance regarding the aim of this study.
The autochthonous Jurassic-Cretaceous carbonate · rocks (Jkb) covering most of the study area, are composed of massive dolomitic limestone and recrystallized limestone, and karstification is developed in this unit.
KARSTIFICATION PROCESSES AND DISTRIBUTION OF KARST
A significant part of the reservoir will be in contact with Jkb carbonate rocks. Besides, the dam itself will be placed over a deep gorge developed in the same carbonate units. Although impervious units cover the downstream section, presence of the downstream thermal springs emerging from the calcschists, required a detailed hydrogeological
1 o 100 :ioo .. . . ....__.__.___.___,

Effects of q_uaternary tectonic activity on karstification pattern 125
' :~ . 'i.:~t t·!~I · ... ''':tiffl·l'·
Ill~ t-r--r. : 'l-T~.,...~··.'
Qu~~etil.Jlcy f*lij\iJum~ !:-:::: .. · . ....
Cai-#·········~yc{fftg~~~k;qu.~.········ #,frptiJfAJ~···
·j~- ~~~~~i~;JG
MwcM~•·•·· · ····• (ilftP.erittJaiJ~sJ; .••••:•• xnmr
. ?l';· :f? •. ••·•···• •• : .
whether a hydrologic relation exists or will exist after impoudement. The upper levels of the Jkb carbonate rocks were found to extend underneath the ophiolithic complex (Ks) and reexposure in the deep valley of Saydere stream (Fig. 3). Numerous cavities suggesting outflow during wet periods were located at the contact of this unit with the valley bottom.
The outcrops of the Jkb unit does not exhibit typical features like karrens, dolines etc. However, it is
not uncommon to encounter some cavities along the major faults. Lack of surficial karst may be due to the unfavorable climatic conditions. The major uplift have been in Pliocene when also the fast excavation of Ceyhan river has begun. Karstic springs that are located at elevations quite higher than the river valley indicate the fact that after Pliocene, karstification has progressed much slower than the mechanical erosion in the river

U6
sw
Say Stream
·~ : 1) LL_j
4) •
l
2) ~
5),
valley. However~ during tunnel excavations and in the exploration boreholes drilled at the reservoir area and damsite, a nwnber of solution cavities have been encountered underground scattered at different levels and depths (Fig. 4 ). These cavities would be. indicators of paleokarst in case they all were filled with insoluble material. They are filled with water. However, they are not active in the sense of fast Conduit flow.
Based on primarily careful and detailed analyses of borehole data, together with the knowledge of geological history of the region. and observations during hydrogeological mapping, two types of karstification processes were identified in the area: 1) nonnal karst developed along faults and from the surface downward, and 2) thermal karst developed again along faults carrying col-rich thermal waters from great depths. In the latter case, karsti-
. fication has developed from deep underground upward.
M.EiuM!cfi
NORMAL KARST
Normal karst has not well developed due to the unfavorable geologic and climatic conditions in the area. Folding is much more common than faulting, indicating the fact that compressional tectonics had been effective rather than the tension tectonics. This have inhibited, or at least slowed down karstification processes. Therefore, immature features of normal karst can be observed only along some major faults. Springs that are located at high elevations indicate that the karstification base is higher than the regional erosion base which is mark~ by the Ceyhan River valley. Small springs emerging near the bottom of the iiver valley at the downstream section are located along a fault zone (see Fig. 2). The carbonate rocks bear water within their cracks and interstices. 1bis aquifer is of diffuse flow character and exterids even below the river bottopt as the water

Effects of f/llale17Ulry tectonic activity on kmsti,ficatlon paltem 127
CD £1:\'-/rt\ ~
table is penetrated by observation wells. Dyetracing tests carried out between boreholes located upstream (injection points) and small springs located downstream (observation points) have revealed that the groundwater · flow is very slow unless it is diverted to a major fault (DSI, 1990).
THERMAL KARST
Thermal karst, on the other hand seems to have been affected by dislocation due to recent tectonic activities which had also caused fracture erruptions of basalts. These activities had two fold effect on the karstification pattern. Fractures played important role in carrying thermal waters whose C02
content is very high. High content of C02 has enhanced the dissolution of the carbonate rocks. Consequently, the fractures are enlarged and their capacity of carying water has increased. There have developed more than one main conduit carrying thennal waters, after the Plio-Quaternary basaltic fracture erruption. Evidences ··of recent tectonic activities can be traced from the Late Quaternary alluvial terace relicts located at high
stands today. Thermal waters are ascended and mixed with the meteoric waters at shallow sections, as chemical and isotopic data have revealed. The mixed waters today, form the meso thermal springs located at the downstream of the damsite (EKMEK<;I, 1992). The second effect of the Late Quaternary tectonic activity has caused a dissection of most of the thermal karst conduits due to dislocating the formerly developed karst paths. The thermal waters then have been diverted to the largest conduit which had not been affc--cted as the others. And the cavities scattered randomly underground are the relicts of former conduits that had been dislocated by recent faulting. These cavities are not completely isolated from the hydrologic cycle. They are filled with mainly fresh water supplied by the shallow aquifer, through fractures and cracks. However, replenishment of this water is very slow compared to the flow within the conduit of the thermal springs presently discharging at the downstream section (EKMEKCI, 1992).

128
CONCLUSIONS
Karstification processes are affected by various factors. In Berke damsite case, two types of karst were recognized. The nonnal karstification which means karstification processes driven by atmospheric waters is irrunature. Karstification base related to this type of karst does not form a problem with regard to dam construction, since it is much higher than the erosion base of the Ceyhan river, the main drainage element in the region. However, the second type karst which has been recognized is the thennal karst, developed from the deep underground upward, along fractures, after the basaltic fracture erruption during PlioQuaternary. fractures have been enlarged with
REFERENCES DSI (1990). Report on Groundwater Tracing Experi
ment in Ceyhan-Berlce Damsite. Ankara (wzpublished- in Turkish).
EKMEK<;I, M. (1992). Karst Hydrogeological Investigation of Ceyhan-Berlce Dam and its vicinity.
dissolution by C02 rich thennal waters. This conduits are then connected to the shalow fresh water aquifer near the surface. Tiris type of formation would cause serious problems of watertightness in damsite and reservoir area. But, tectonic activities · during Late Quaternary, have caused dislocation of karst paths. The resulted karst pattern as now observed in the exploration boreholes, is a randomly scattered inactive solution cavities. These cavities are the relicts of the dissected thennal solution conduits whose waters have been diverted to the major enlarged fracture supplying water to the major thermal springs located at about I km downstream of the damsite. Regarding the feasibility of the dam, it was concluded that the dam may under more serious risk of tectonic activity than watertightness problem.
Ph.D. Thesis, Hacettepe University, Ankara (unpublished- in Turkish).
KOZLU, H. (1987). Report on Petrolewn Geology of M313 -Andirin-Adana-Iskenderun Region. Turkish Petroleum Company Report No.2403, Ankara (~mpublished- in Turkish).

Electrometric Investigations on the Supply Channels of Hercules Spring (Romania]
Horia MITROFAN\ Mihai MAFTEIU2, loan POVARA3 & Mariana MITRUTIU
ABSTRACT The thermal spring Hercules at Baile Herculane is fed by a karstic conduit, inaccessible to direct exploration. The "mise a la masse" resistivity method has been used in order to trace the path of the karstic conduit, presumably a carrier of rainfall originating, cooling water. A self potential (SP) survey has been additionally performed, in an attempt to identify hot water upflows.
Key words: "mise a Ia masse", self potential, thermal spring, Baile Herculane, Romania.
INVESTIGATIONS ELECTROMETRIQUES SUR LES CONDUITS D'ALIMENTA TION DE LA SOURCE HERCULES (ROUMANIE)
RESUME I...n source thermale Hercules de Baile Herculane est alimentee par un conduit karstique, inaccessible a /'exploration directe. Afin de tracer le trajet du conduit karstique, qu'on presume de canaliser des precipitations refroidissant l'eau therma/e, on a utilise Ia methode electrombrique de la "mise a ·Ia masse". En plus on a effectue une p~ospection par Ia methode des potentiels electriques naturels, afin d'identifier des voies ou se produisait /'ascension de l'eau them1ale.
Mots-cles: "mise a Ia masse", potentiel electrique nature/, source thennale, Baile Herculane.
INTRODUCTION
Known since the Antiquity, Hercules is the major thermal spring in the Brule Herculane geothermal area. Its minimum flow rate is 10.2 lls, with a maximum temperature of 53.5° C. However, during rainy periods cold seepage mixes with the thermal water, which makes the temperature to decline down to 17° C, while the discharge increases up to I OS lls.
Such a behaviour is certainly liable to prevent a uniform exploitation regime, if the spring was to be used for balneological purposes. In order to mitigate the adverse effects of the mixing between the hot inflow and the cold seepage (the latter being presumably carried through the karstic channels), schemes for tapping the hot, and separately
the cold water components have been devised. All such schemes require a reasonably accurate information on the location of the flow paths into the ground. In oroer to achieve this goal, besides direct methods (mining and drilling works) and indirect thermometric methods (POV ARA, 1992, MITROFAN & POVARA, 1992), electrometric investigations have been performed as well. The results of the latter will be discussed in the following.
GEOLOGICAL AND HYDROGEOLOGICAL SETIING
Hercules spring comes out from a 200 m stack of Late Jurassic-Early Cretaceous limestones, underlain by less permeable, 10-25 m thick, EarlyMedium Jurassic arkose and carbonate sandstones

130 H. Milrofan et aL
!;;~~:{~~ .. ;:! 2 I I 3
4 t 5 t 6 ~ 7 CA..
6 ~
9 (!)
10 f\.
11 'V 12 - _..
0 0,2 0,4 Km

Electrometric investigations on the supply clumnel.r of Hercule Spring 131
(NASTASEANU, 1980). The latter are deposited directly on a basement consisting of fractured granites, which have been proven to carry thermal water flows (V ASILESCU & LITEANU, 1973; POV ARA, 1992). The Late Jurassic-Early Cretaceous limestones are covered by 200 m thick, Barremian-Aptian marly limestones, known as the "Iuta Layers", whichafter the sedimentary stack ends with the Turonian-Senonian wildflisch formation. Both formations overlying the Late Jurassic-Early Cretaceous limestones are virtually impervious.
In the area of Hercules spring the deposits are folded, to form an overturned syncline dissected by longitudinal and transverse fractures (Fig. I), which belong tp several stages of deformation, of both pre-Alpme and Alpine ages (DIACONU, 1987).
Tracer tests have indicated that the water from swallets in the next three · valleys to the north (V alea Seacl, V alea cu Cascadli and V alea Slatina), located 800-3.020 m away and 365-580 m above Hercules spring (Fig. I), reaches the outlet in 1.5-7 days.
Based on all the above discussed information, the following conceptual model has been used as a framework for devising the electrometric investigation program:
There is a rather direct flow-connection, which runs NW -SE, roughly parallel to the syncline axis, between the sinking valleys situated to the north and Hercules spring, the closest swallet being the one in V alea Seadl. Since this is the path of the cold water flow, hot water inflows should reach this conduit via transverse fractures, which have been proven to provide the discharge paths for all the other thermal springs in the area. The trans-
verse fractures probably act as flow paths for the ascending plume of a thermal convection cell, that occupies the granite body underlying the · sedimentary stack.
ELECTROMETRIC INVESTIGATIONS APPROACH
Given the above indi~ted conceptual model, two electrometric methods have been assumed appropriate for providing relevant information:
1. The resistivity "mise a Ia masse" method (KRULC, 1967; ARANDJELOVIC & MILOSEVIC, 1967). A DC is injected into the ground via two current electrodes, one of which is introduced into the water of the spring, while the other one is located at virtually infinity (Fig. 2). A separate array of potential electrodes is used for measuring the resulting distribution of electric potentials at the ground surface, in the proximity of the current electrode sunk into the spring. Since the water has a better electrical conductivity than the surrounding rock, the underground stream favours a smaller potential drop, and as a result its path appears as a "ridge" of electrical potential.
The measured potential values are subsequently used for calculating an "appearent resistivity" of the subsurface medium. If the ground consisted of a homogeneous medium, the appearent resistivity should display everywhere the same value. On the contrary, underground inhomogeneities, such as water bearing karstic channels, would result in "anomalies" in the distribution of the appearent resistivity, which would trace the projection on earth surface of the underground stream.
In our specific case, the potential was measured on
4---

132
traverses approximately perpendicular· to the straight line connecting the current electrodes (Fig. 2). At one extremity of the traverse there was a potential electrode kept in a fixed position, while the other electrode was moved in succesive positions along the traverse, with the potential drop between the two eleetrodes being recorded for each position. Such a measurement scheme, of "potential" type, is able to secure a better signal/noise ratio, especially in the anomalous areas, than the more conventional "gradient" type scheme (in which the two potential electrodes are simultaneously moved, with the distance between them being kept fixed, at each measurement step). However, it has to be pointed out that the adopted scheme provides a rather unconventional apparent resistivity image, i.e. the inhomogeneity (in our case the conductive -water body) into which the current electrode is introduced, always appears as a ''maximum''.
Two distinct sets of measurements have been performed on the same site (yet using different traverse lines for each set):
• the first one, without any external enhancement of the electrical conductivity of the water in the karstic conduit;
• the second one, 12 hours after injecting 50 kg ofNaCl in the swallet in Valea Seadt
2. The spontaneuos potential (SP) method (BOGOSLOVSKY & OGIL VY, 1973). When groundwater flows through a porous or fractured medium, cations are preferentially retained by the walls of the flow channels as compared to anions. As a result, a groundwater outflow will usually display a positive electrical potential, while an inflow will display a negative one. When considering the process from a specific point of observation, such as the ground surface, upflow (for instance the ascending plume of a convection cell) is associated to positive potentials, and downflow (vertical seepage for instance) is associated to negative ones.
The described phenomenon allows a straightforward identification of such electrical indicators of flow directions, by simply measuring the "self potential" (SP) drop between two electrodes posi-tioned on the ground. ·
In the given situation, measurements have been performed on traverses approximately perpendicular to the fractures which had been inferred to carry the hot inflows to the main spring conduit. At one extremity of the traverse there was a potential electrode kept in a fixed position, while the other electrode was moved in successive positions
H. Mitrofan et al.
along the traverse, with the potential drop between the two electrodes being recorded for each position.
INVESTIGATION RESULTS
A lineament of maximum apparent resistivity has been outlined by the "mise a la masse" method (Fig. 3, 4 ). Its axis runs for more than 400 m, roughly in a SE-NW direction, and fonns the prolongation of a streamcourse which had been previously intercepted by mining and drilling works (POV ARA, 1992), and which had been further "traced" through the interpretation of thermometric measurements (MITROFAN & POVARA, 1992). The lineament follows the syncline axis, paralleling the scarp of Cerna gorge, situated about 200 m to the east. It is reasonable to assume that this major resistivity feature is associated to the main conduit that supplies Hercules thermal spring.
In the proximity of the swallet in V alea Seadt, the main lineament breaks into several parallel maxima. Only the easternmost of these maxima is associated to the actual swallet in V alea Seadi, while the other ones, located north-westward, suggest that the main conduit extends beyond the streambed of V alea Seacl, toward additional supply areas. Another, less important "branching" of the main lineament occurs some 200 m NW of Grota cu Aburi, in the proximity of a strike-slip fault.
Both measurements sets (performed respectively without, and with injection of electrolite into the swallet in Valea Seaca), display virtually the same distribution of the maximum "anomalies". However, the apparent resistivity maxima definitely "sharpen up" after injecting NaCl into the swallet.
Four areas with positive SP values of more than +50 mV have been identified (Fig. 5). They occur as WNW-ESE lineaments, which cross the NWSE path of the inferred main flow conduit. The setting of the SP ·maxima is consistent with the hypothesis of thermal upflows that reach the main streamcourse via transverse fractures.
It is interesting to point out that one of the areas displaying negative SP values in excess of -25 mV corresponds to the apparent resistivity maximum "branching" situated NW of Grota cu Aburi. This coincidence, also associated to the presence of a strike-slip fault, suggests the existence of a tributary inlet into the main stream way, supplied by vertical seepage. Moreover, a tracing experiment indicated that the usually dry gully located in this place can also provide, during heavy rainfall, a concentrated supply to the spring conduit.

Electrometric investigations on the supply channels of Hercule Spring 133
PN9 I \ I I I I I
PN8 \ I \ I I \ I
\ I
2 3
4
5
6
7
8
\ \ \ \ \ \
\ \
{ I I I I I
-5/J-
t
====:::,..
9 -.--.--;
10
11
12
+ +
---....-.......)
202,5
13~
\ I \ \ I I
\
\ I
i I \ I I I I I
PN6
.
\ ·' . j: ...... . . . ',. . --
0 50 100m

134 H. Mitrofan et al.
~ No CL injection point
::),
---~' ·'
PN 9 PN 8
\ I I I I I I I \ I
\
' \ \ I \
\ I
\ \
\ I I I \ I
\ \ I ( I I I I I
-700D-
2 ' 3 ................ ..
4 ~
5 ====:::~ 6
7
8 ~ + +
10
11 ----.......)
12 202,5
13~
\ I I I I
I
JSJ)•,,,, ,_
... .. .. _21,_._ ' ·, 325,5
" .. ..... '-, . ' ....
' -, ' .............. llat~0 -------,.so ..
--~ C' <t -, ', ....... _______ _
.~z0/,5 . . ,.. .
·..-: + • ,..i- • •
..... • ..., • + • ',. . -
50 100m

Electrometric investigations on the supply channels of Hercule Spring
R_~------- """ ~ ..... ',,, - ..... -- .. ,.~· ......
1 -0-
2 -------
3 COllifilllll[
4 E..=2s.?:.•:.:
5
6 ======::; 7
8
9~
11
12 -----0 13 202,5
14 u.J.dd.!..W
--.!~~·" 351,9'•,,
------ 54 .. ·A ''·, 315.5
.. ··· :-., ..
F
PESTERA DESPIC.ATURA
135
. -: ZOI.S
. .,. ~ ·..-: . . . . a
... :: • • 170,
', . .. -- r:::
50 100m

136 H. Mitrofan et al. ----------------------------------------------·----------
CONCLUSIONS
In order to obtain more infonnation on the location of the separate undergroUnd flow paths that provide hot, and respec;:tively cold water supply to Hercules thermal spring, two electrometric investigation methods have been used.
The resistivity "mise ala masse" method outlined a lineament that runs for more than 400 m, roughly SE - NW, in the prolongation of a streamcourse which had been previously intercepted by mining and drilling works, and further traced by the interpretation of thermometric measurements. This lineament probably follows the path of the main karstic conduit that leads to the spring. The pattern of the appearent resistivity lineament in the proximity of the swallet in Valea Seaca seems to indi-
REFERENCES ARANDJELOVIC, D. & MILOSEVIC, L. (1967)
Hydrogeological investigation in Yugoslav karst areas by the application of geophysical methods., Mem. AI.H., 7.
BOGOSLOVSY, V. V. & OGILVY, A. A. (1973) Deformations of natural electric fields near drainage structures., Geoph. Prosp., 21, 4, pp. 716-723. .
DIACONU, G. (1987) La goologie et Ia tectonique du perimetre d'influence de Ia source thermominerale "Hercule", BAile Herculane. Theor. Appl. Karstol., 3; pp. 109-116.
KRULK, Z. (1967) Geophysikalische Untersuchungen unterirdis~her Wasserwege in Jugoslavischen Karst., Steir. Beitr. Hydrogeol.,19, pp 111-120.
cate that the main conduit extends also beyond the streambed of V alea Seaca, toward additional supply areas.
The self potential (SP) measurements delineated four positive "anomalies" of more than +50 mV, that may correspond to transverse fractures feeding hot inflows into the main streamcourse. The four areas can be considered as targets for subsequent mining and drilling works, aiming at the tapping of the hot component of the spring supply.
Both resistivity and SP data also delineated a secondary feature of the main drainage system. It is located some 200 m NW of Grota cu Aburi, in the proximity of a strike-slip fault, and probably consists of a tributary inlet that collects some concentrated vertical seepage.
MITROFAN, H. & POV ARA, I. (1992) Delineation of a thermal water carrying karstic conduit by means of thermometric measurements in the Blile Herculane area @.omania). Tlu!or. Appl. Karstol., 5, pp. 139-144.
NASTASEANU, S. (1980) Geologie des Monts Cema., · Ann. Inst. Geol. Geoph., LIV, pp. 153-280.
POV ARA, I. (1992) New data on the Hercule thermal aquifer obtained by tempemture measurements (Blile Herculane, Romania). Tlu!or. Appl. Karstol., 5, pp. 127-138.
VASILESCU, G. & LITEANU, E. (1973) Noi surse de ape termominerale din zona Bil.ile Herculane., St. teh-econ., E 11.

Some Cases of Accidental Karst Water Pollution in the Serbian Carpathians
Zoran STEVANOVIC & Veselin DRAGISIC1
ABSTRACT Karst aquifers in Serbia are one of the main sources for water supply. The quality of karst water is generally very good (1st and 2nd class for drinldng). A good natural predisposition for the protection of karst is the predominantly mountainous relief and uninhabited catchment areas. The results of "tracing" experiments with ground waters indicate that under convenient conditions the pollution may migrate. as far as 10 1an of rectilinear distance as early as 24 hours. Few cases of accidental chemical and bacteriological pollution of karstic aquifer was registred during the last 15 years: e.g. influence of copper mining activity in the zone of Bor and Majdanpek, radioactive contamination of aquifer in Golubacke Mts., and hydric epidemics happened in several small towns in Serbia ( Boljevac, Sjenica, Dimitrovgrad). The complexity of conditions of protection in karst area (especially cavern and channel dimensions and high filtration rapidity) often requires an introduction of several zones and belts of sanitary protection.
Key words: karst aquifer, pollution, radioactive pollution, mining activity, protection zones.
QUELQUES CAS DE POLLUTION ACCIDENTELLE DE L'EAU KARST/QUE DANS LES CARPATES DE LA SERBIE
RESUME Les aquiflres karstiques sont une des sources principales pour /'alimentation en eau. La qua/ire de l'eau karstique est generalement tres bonne (classes 1 et 2 de potabilite). Une circonstancefavorable pour Ia protection de ces eaux est representee par Ia predominance du relief de montagne avec des basins de reception peu habites. Les experiences de tr(lfage ont indiqui que, dans des conditions favorables, Ia pollution peut migrer avec w1e vitesse de 10 km distance rectiligne dans 24 heures seulement. Quelques cas de pollution accidentelle, chimique ou bacteriologique, de l'aquiflre karstique ont ere enregistres pendant les demieres 15 annees: par ex. /'influence de l'activite miniere dans la zone de Bor et de Majdanpelc, la contamination radioactive de l'aquiflre de Monts Golubacke et des epidimies hydriques dans quelques petites localites en Serbie (Boljevac, Sjenica, Dimitrovgrad). La complexite des conditions de protection dans les zones karstiques (et specialement les dimensions des cavernes et conduits et le grand coefficient de filtration) exige souvent ['introduction de plusieurs zones et ceintures de protection sanitaire.
Mots-cles: aquiflre karstique, pollution, pollution radioactive, activite miniere, zones de protection.
INTRODUCTION
Karst ground water, discharging at many springs in Serbia, is used for regional · and local water supplies. Large reserves and good quality of water,
often beyond the reach of polluting industries, open p~ospects of its increased use.
Under the presently prevailing conditions, the production is not paralleled with adequate protection against contamination of water resources. In respect of their importance for future use, entirely

138
new regulations should be enacted, preventive and control measures defined for an economical management of the available resource. The quality of karst .water in most of 14~ exploited sources is very good (drinking water classes I and II). Occasional bacterial contamination are repaired by c:rl~tary chJprination,, . the only treatment of; potable water ili ·majority of water distribution systems. The largest part of karst areas is uninhabited, rendering it easy for sanitary control and protection against contamination. However, a karst aquifer has hydraulic characteristics very unsuitable for protection: large karst channels, caverns, fractures, preferential ways of circulation and dominantly turbulent flow. 1bis makes complicated the definition of a sanitary zone and works in a karst area compared with other water-bearing rocks, and requires in each case specific consideration of the natural environment and the influences of local and artificial factors.
QUALITY OF KARST WATER AND SOURCES OF POLLUTION
Karst ground water has the largest distribution in the Carpatho-Balkan mountain arc of eastern Serbia. It is produced to supply water to major towns (Nis, Bor, Zajecar, Pirot, Paracin, Cuprija, etc.).
Water is regularly controlled at intakes for its po- . tability by local sanitary-health agencies (health protection institutes) · in the volumes and at the frequencies regulated by law. There is not still a central agency for interpretation of the analytical data and coordination of the sanitary control activities.
More than three hundred chemical analyses of water from a hundred of karst springs were made from 1980 to 1995 at the Hydrochemical Laboratory of the School of Mining and Geology.
The mean annual value of the temperature measurements of "cold" karst springs, 11,2°C, is a little higher than the mean perennial air temperature of the region. Karst ground waters are always colorless, odorless and tasteless. Occasional, shortlasting (rarely lasting longer than 2-3 days) turbidities · of gravity springs waters make one of the major problems in regard of their usage. The average content of ion HC03 is 87% mval and of ion Ca it is 75% mval, wherefore ions Mg, Na, K, S04, Cl, N03, etc.; usually occur inferiorly. Ions ~. Fe, Mn, as well as rnicroelements, are usually absent, and if they do occur, it is always within the limits of the valid quality standards (STEVANOVIC, 1988b).
Z. StertllUIPiC & V. DrrlgUIC
The pH values imply a generally alkaline, rarely a neutral character (mean value 7.6). With regard of the hardness value, these w~ters cover all transitions from soft to very hard waters. The total hardness is from 7.8-16.1°dH (German degrees). All analyzed waters show a low IDS content pf 0.2-0.4 gil (only 10% samples below, and 6% above these estimates), the average value being 0.28 gil.
Within open karst structures ground water has low IDS content due to intensive water exchange and the rapid filtration. The developed channels and caverns provide short contact between water and rock. In deeper parts of the aquifer, slower filtration results in the increase of mineralization, so that different "layers" of karst ground waters frequently occur (STEVANOVIC, 1988a).
For the conventional classification into gravity and ascending springs, depending on the water table in the actual discharge area, it should be mentioned that the latter have better properties than the former, because they drain "lower'' zones, though some exceptions are not excluded. A specific type of "combined" springs, with the drainage system of gravity' channels and as~nding siphons in the outflow area, indicates that quality of water from various channels should be monitored. Thus, our analyses have shown that, irrespective . of the ''unity" of a drained karst aquifer, there are variations in quality. Upper channels, which often may be intennittent, are generally characterized by lower mineralization, higher percentage of Ca and HC03_ ions, higher general hardness, etc. The differences are frequently minimal, but nevertheless indicate certain differentiation that may be important under some other conditions (e.g. where pollution is involved).
The sources are classified according to the type of pollution: natural or artificial, and on the effects on ground water: physical and chemical or biological;
Natural sources of pollution include organic matters, produced by decomposition of plant or animal remnants, and erosion, a producer of particles which floating penetrate underground and cause turbidity of karst springs after heavy rains.
Artificial polluters are agriculture, with its waste of animal origin from large farms or individual farmstead~ and fertilizers (natural or artificial) and pesticides, and urban communities (HANZEL et. al., 1989). The latter is the largest and certainly most dangerous group of polluter which includes:
• rainfalls (acid rains);
• industrial wastewater;
• municipal sewage;

Some ·cases of accidental water pollution in the Serbian Carpathkuu 139
• disposals of toxic materials - chemical, radioactive, etc.;
• dispos~s of garbage (solid and liquid);
• petroleum derivatives, exhaust gases, etc.
SOME EXAMPLES OF CHE~ICAL POLLUTION OF KARST WATER
Excessive exploitation of ground·water, expansion of depression cones · and change in the drainage area outline may lead to significant variations- in the physical and chemical properties of water. Under similar conditions, even chemically undesirable components may be "dragged in" from adjacent, overlying or lateral aquifers (e.g. frequent cases of nitrate or pesticide seepage from the overlying aquifers under the fields of intensive farming).
Examples of excessive, even pennanent, contamination of ground water in the Carpathian region of Serbia are known near the large mining centers. Mining works and copper ore processing plants in eastern Serbia are an illustrative example.
Copper mining works at Bor, Veliki Krivelj and Majdanpek have large volumes of waste rocks and flotation tailings where water acquires specific physical and chemical properties affected by minerals and reagents used in flotation (DRAGISIC, 1992). Majdanpek and Veliki Krivelj copper mines are directly bordering on the limestone ridge of Veliki Krs, which is extending from Rgotina in the south to Majdanpek in the north. Waste rocks and tailings from both mines are disposed in catchment areas of karst springs or on limestone, which provide a direct hydraulic communication of waste mine and tailings waters with karst ground water
and consequent complete contamination of parts of the Veliki Krs karst area; it is also · a hazard to some speleological sites and the life in them.
Rock wastes in Majdanpek consist of fragments and blocks of mineralized, hydrothennally altered · volcanic rocks and crystalline schists. Degradation of sulphide minerals in waste rocks give the ground water specific physical and chemical properties. In parts of waste dumps, this water directly percolates into karstified limestones and contaminates ground water. Besides, disposed tailings cover some of karst springs.
Tailing from the Majdanpek flotation plant, which processes low-copper ore, is disposed off in the catchment area of the Valja Fundata blind Jairst valley (Fig. I). The tailings contain sulphate water of pH 11. Its chemical composition is expressed by Kurlov's formula which reads:
SO~HC0~0 H Mo.62 C N K p JJ
a1s a+ 21
Advanced karstification of limestones and activation of Valja Fundata ponor allowed the flow of the buJk of tailings, and resulted in contamination of karst ground water and speleological sites in the right bank of the Veliki Pek river in the canyon near Debell Lug. After a rapid outflow of waste water from the tailings in the early seventies, the entire flora and fauna were killed in the river to its confluence into the Danube.
Copper mining works at Veliki Krivelj and Majdanpek, and new works at the foot of Veliki Krs (Cerovo, Cementation, Kraku Bugarescu), threaten to contaminate karst water in other parts of Veliki Krs, particularly the Ostrelj spring and Beli Izvor spring cave near Rudna Glava.
y v y
y "
.,. ~. ;.:; 1 f7\j"';l rv-vl :··:·..:. I. ~2. ~).

140
Flotation of chalcopyrite ore from Veliki Krivelj mine has produced a large volume of tailings which is disposed 4tto the Krivelj River. Mine water from the Kri velj copper workings is also disposed into this river. At the present rates of copper ore production and processing in Veliki Krivelj, the projected waste deposit in the Krivelj River valley will rise, in several years, to the
z. Stnt~~UniC & V. Dragi&it!
alititude of 350 m and will partly flood the limestones in the Ostrelj spring drainage area including the spring. The conse~uen~s ~ not diffic~t to guess, particularly beanng m mmd the cheffilcal composition of waste water:
so~4 H Mz.o96 C N K M P 7.33
a67 a+ 26 g7
Radioactive contamination of karst aquifers in Serbia was not considered, because it was believed nonexistent. However, in the late eighties, hydrogeological, hydrochemical and radioc~emical investigations near Golubac detected radioactive contamination of ground water in the karst of Golubac mountains along the border with Romania (Fig. 2).
First tested samples were collected in the spring of 1987 from the alluvial aquifer and from the Danube on the location Vinci (directly opposite to the Romanian island Moldova Veche). As the first analyses showed . radioactive pollution, further urgent and more extensive analyses were undertaken in the broader karst area. All samples of karst water analyzed for radioactive contamination (VUJASINOVIC et al.,1994) were positive, as they contained excessive Ra and Rn concentrations (Table 1.).
1 3,00
2 0,28 0,7
3 0,19 0,6
4 2,52 0,14
5 0,16 0,2
6 0,25 0,3
· 7 0,18 0,4
Note: Pennissible total alpha activity including Ra and Rn is 0.11 Bq/1.
The largest karst springs in Golubacke Mts. are at the air rectilinear distance of some 10 lan from Danube river (and hypsometrically about 100m above). In the neighborhood of the springs, and in the whole catchment area there is no geological formation (i.e. Permian sandstones) or human activities, possible causes of radioactive contami-

Some C(lles of accidental waJer pollution in the Serbian Carpathia"' 141
nation. One of the hypothesis of possible source of pollutants was mining activity and .waste dumps on the Romanian side of Danube (in area of Moldova Veche). There is also possible that this is a result of air pollution and of particle deposition transported by northwardly winds that can be extremely strong at the entra.rice into the Danube gorg~ Djerdap-Portes de Fer (wind squalls may reach 100 krnlh). Unfortunately, that was not checked and confirmed by detailed investigations.
SOME EXAMPLES OF BACTERIAL POLLUTION OF
KARST WATER
Bacteriological. analyses of water have indicated frequent pollution, particularly by microorganisms, which in some cases caused water-borne infections. The number of individual or local contamination is very high. The results of "tracing" experiments with ground waters indicate that under favorable conditions the pollution may migrate as far as 10 km of rectilinear distance as early as 24 hours. Active hydraulic connections between the ground and surface waters, by means of which the harmful components may be carried from great distances including non-karst terrains, and infiltrated into the narrowest spring zone, have a particular significance in this regard (S1EV ANOVIC & DRAGISIC, 1992).
The large amount of bacterial contamination occurrences raises the question of the genesis of pollutants . and differentiation in relation · to ''normal" bacterial flora, taking into consideration concrete hydrogeological characteristics and the urbanization level (and unpopulated areas at bjgb altitudes). On the other band. dominantly faecal character indicates "fresh" pollution (the presence of E. Coli, inhabitants of intestine tract of animals and humans, then Proteus species, sulphitereducing Clostridium, Pseudomonas, etc.). 'This is also supported by Certain laboratory tests that indicated relatively short life of microorganisms under the simulated limestone-water conditions. The knowledge of these relations is very important in planning the protection steps and zones.
GAVIC (1985) gives an infonnation on the life cycle of E. Coli. Depending on the conditions, the shortest life is 70 to 210 days, which proves how old is a pollution of this type. Experimental detenirlnations of the life cycle for different microorganisms in limestones by the same author are very important. At low temperatures (4-8°C) life cycles vary from 40 days for Salmonella
\
·. \
~ f\""\\1 r-::-1. r-;-1. ~ r;::;-10 ~ E.t.:±!J I. l..D...iJZ. ~3. ~4. ~~. ~6. ~7.
..
r--·J e.

142
(at contamination rates of lOS microbesll ·of water) to 120 days for enterococci (at the contamination rates of lOS microbes/1 of water).
The consequences of ignoring the hydrogeological situation and the sanitary protection area in the drainage area are explained for the case of Mirovo Spring, one of the strongest karst springs in central Carpatho-Balkanides of eastern Serbia, tapped for water supply to Boljevac and nearby villages.
The outflowing stream from Mirovo Spring and the R.asinac Stream from the Mirovo River which flows into the Cmi Timok. The area drained by Mirovo Spring is mountainous with the. highest Rtanj peak, 1566 m high. Near the spring, in the Rtanj scarp area, the resort Rtanj is the only community in the area.
1be spring is situated on a mountain slope facing northeast (Fig. 3), at the contact of Upper Jurassic limestone and irnpenneable Devonian rocks. It is fed ·from a gravity flow over a regional fault of northwest-southeast trend, and discharges at the altitude of 390 m.
Repeated analyses of karst water . indicated its favorable physical and chemical properties: Unlike these properties, bacterial picture is quite different. Bacteriological analyses indicated more than once the septicity of drinking water, because it contained colifonn organisms, Aerobacter and Pseudomonas aerug., of fecal derivation.
The septiclty of Mirovo Spring water was indicated in August 1982 by intestinal infections caused by water-borne bacteria and virus Echo 11 among over thousand inhabitants of Boljevac and surrounding communities. The bacterial contamination of water supplied to Boljevac and nearby communities bas been repaired by elementary chlorination, which has only a mitigating effect without eliminating the source of contamination.
For identification of the source of pollution, hydrology was investigated in the general area of Mirovo Spring. The resort center Rtanj was identified as a constant source of pollution, some 3.5 Ion southeast of the Mirovo Spring in the R.aSinac · Stream drainage area. This community is built on noncarbonate rocks - a thick series of sandstones, shales and conglomerates. Without a sewerage system, domestic waste water is discharged directly into the R.asinac Stream which flows toward the Mirovo Spring. Downstream of the community, the stream runs over heavily karstified Lower Cretaceous and Upper Jurassic lime~ stones, partly percolating through fractures and poilors in the bed. Downstream of the ponor to the Mirovo Spring, most of the year there is no surface stream because it sinks carrying all the
z. Stevanovic & V. Dragisic
pollutants and flows underground to the Mirovo Spring (DRAGISIC & Mll..ADINOVIC, 1992).
The characteristic example of the pollution transport from a remote part of the catchment area has been recorded in the waters of Nernanja spring near Cuprija. In these waters, a virtually pennanent bacteriological contamination bas been recorded, most often of fecal character. The number of coliform germs in some analyses was up to 38.000 and that of total living bacteria was up to 6.500 per 1 mi. Surface waters in the upper part of catchment area resulted to be even more contaminated (colifonn genns numbered 2.400.000, living bacteria 102.000, with E. coli and Citrobacter being isolated as well). Surface streams flow through several villages without any sewage system being installed. In the limestone section of the profile beyond the spring, the greatest part of these waters gravitating towards the zone of discharge, disappear. The Nemanja seepage spring bas several levels of discharge.
The gravity springs on higher peaks, are characterized by the rapid transport of pollution of a higher rate, while the bypsometrically lower rising springs have more favorable characteristics and a much lower rate of bacteriological impurity.
Zubrava I I
~--------------·----------------~
To meet the increased water demand, the earlier used intake at Dimitrovgrad Spring (Strosena
· Cesrna) was connected to the existing regional water supply system arid the Protopopinac Spring on August 7, 1989, without a preliminary sanitary control of the water. The result was a burst of the enterocolitis infection which continued to midSeptember reaching the climax on August 15, when 2282 infection cases were registered. Water from this spring is a rare example also of partial

Some cases of accidental water pollution in the Serbian Carpathians 143
chemical contamination resulting from the densely populated spring area.
PROTECTION ZONES AND LAW REGULATIONS
Ground water protection is not adequately regulated, although many documents concerning it ha~e b~n .adopted .. Serbia is not the only country of Impractical .and mconclusive legislation in this domain. In the operating practice, the inapplicability of legal provisions and the need for more specific regulations are generally felt (individual designers introduce even four different zones of various limitations and protections in specific projects).
Differentiation should be made, according to PARRIAUX et al. (1990) between: 1. "Transmissive" karst, of highly karstified limestones, where protection zones should be large (a few km2
) and .2. ''Dispersed" karst, of relatively low karstified rocks and small protection zones (to about 5 km2
).
A VDAGIC & COROVIC (1990) propose three zones: Zone I includes a spring or water intake ~d all concentric ponors with the propagation time t < 10 days; Zone II with 10 days < t < 20 days; and Zone III, the rest of the drainage area.
Concerning the sanitary protection zones to be regulated by low in this country, we think that two general situations should be distinguished: (1) Zone of direct protection to cover the karst water discharge area and its hinterland. It is a zone of strict protection, where construction of only water intakes should be allowed. Its surface area will depend on local hydrogeology, but should not be smaller than 1-5 km2
, and will include the belt of direct physical protection. (2) Zone of limited regime will always cover, in view of the specific character of karst aquifer, the entire drainage area, i.e. the water-bearing formation and even a larger terrain for possible redistribution of ground water between adjoining basins.
Otherwise stated, the entire surface area of a karst aquifer ·should be declared the zone of limited protection. However, it should not be a completely limiting factor for developing amenities, hunting, fishing, forest economy and the like, but certain preventive measures are mandatory. Thus, for example, construction may be pennitted for works which discharge only highly decomposing pollutants through a central, impervious drainage system, and any storage of harmful 'inaterials should be prohibited. The location of most karst aquifers in eastern Serbia and the unpopulated
CATt:H,.ENT IIOUNOAIIY
I'AUL TS AN() ,.AIN
CDNQUITS ZQ,_ • • •UZONE
area above them provide sufficient conditions for legal protection of such areas by introducing the category of national parks or areas of particUlar public interest. This would contribute to the conservation of healthy ground water resources and prevention of possible contamination. It also would be important for many prospective water reservoirs, as the water demand will soon grow and new source will have to be exploited.
The first step of an investigation. process must be the delineation of the drainage area. Without adequate background information the necessary measures and works cannot be properly designed to protect a karst area. The mentioned examples suggest how fast can be the propagation of pollutants from the remotest parts of a drainage area, which niakes the accurate delineation of the drainage basin essential for adequate prevention of water contamination (STEVANOVIC & FILIPOVIC, 1994) . .
Watersheds in karst regions cannot be taken to be well defined lines. Where ground water flow is dynamic, watershed zones are varying as a function of the hydrologic cycle and the ground surface water levels. Zonal watersheds are established based on the field hydrogeological mapping data and using methods of direct field and desk analyses. These methods include: remote detection, geophysical surveys (particularly mise a Ia masse, geo-bomb), speleological methods, hydmchemical methods. One of the basic and exact methods is the tracing of ground water flows, which should be repeated under different hydrological conditions, because the variations in a drainage area may be significant over the year. One indirect method is the analysis of water balance elements, which inversely gives the approximate size of a karst cachment area. Karstic rocks essentially differ from homogeneous

144
unkarstified rocks which can be simulated on physical models or at least at the "gray box" level. The best approach to karst seems to be a consistent analysis based on monitoring inflows and outflows in a karst medium and their character, and the observation of the behavior of water flow through the karst medium as a "black box".
For the definition of a drainage area and the design of protective works, it is important to define the type of the karst hydrogeologic structure. For (1) open structures (exposed recharge and drainage areas), the contamination hazard is the highest and protection feasibility the smallest. For (2) semiopen structures (open discharge areas, completely or partly covered recharge areas), the contamination hazard is the highest in the source area. and the protection work are relatively simple. For (3) semicovered structures (open recharges areas, and partly covered discharge areas of active underground runoff), the protection from contamination is also complex. The most favorable situation is (4) covered or partly covered structures.
With respect to the variability of watershed zones in karst regions, for preventive protection one must know ''the maximum basin", or the theoreti-
REFERENCES AVDAGIC, I & COROVIC, A. (1990) Defining of
protective zones of karst mountainous springs. Memoires lntem.Congr. lAH Lausanne, XXII, 2, pp.l122-1129.
DRAGISIC, V. (1992) Hidrogeologija lezista bakra istocne Srbije, Monography, Publ. IHG- RGF, Belsmde.
DRAGISIC, V. & MILADINOVIC, B. (1992) Bakteriolosko zagadjenje i uslovi zastite Mirovskog vrela u istocnoj Srbiji. Zbomik I simpozijwna o zastiti karsta, Belgrade.
GAVICH. I., K. et al. (1985) Metody ohrany podzemny vod od zagrjaznenij(J i istoscenija. Nedra, Moscow.
HANZEL, V., KUllMAN, E. & VRANA, K. (1989) Contamination and protection of fissure-karst water in Slovaki!l. 'Mpadn~ K.arpaty, ser. Hidrogeol. a Inz. geal., 8, Geol. ustav "D. Sllira". Bratislava, pp. 127-144.
PARRIAUX, A. et al. (1990) The concept of protection zones in karstic mountains, Memoires Intern. Congr. IAH, XXH, 2, Lausanne, pp. 1136-1143.
Z. SleviiiUWiC & V. Dragln~
cally defined largest drainage area of surface and ground water runoffs for flood flow conditions. Specific sanitary measures for elimination. and repair of excessive pollution will be determined in each concrete situation depending of the nature and the type of the pollution. For preventive protection of water resources in karst areas, the behavior in drainage areas should be fonilulated in regulatory acts. Some of the proposed measures are given below:
• Prohibition of industries which produce or handle hannful materials in the basin;
• Prohibition of disposal of untreated waste water;
• Prohibition of storage or disposal of toxic or radioactive wastes;
• Prohibition of working mineral deposits, · deposition of gangue and tailings;
• Prohibition of transpOrt of toxic materials; • Prohibition of uncontrolled use of pesti
cides and herbicides in agriculture; • Mandatory acquirement of a water iight for
construction of buildings which must be provided with plumbing or impervious septic pits.
STEVANOVIC, Z. (1988a) Regime of the quality of karst ground waters in Eastem Serbia, Karst Hydrogeol. and KLirst Envir. Protection, XXI, 2, Geol. Publ. House, Beijing.
STEVANOVIC, Z. (1988b) Kvalitet karstnih izdanskih voda istocne Srbije, Zbornik rad. Odbora za kras i spel. SANU knj. 3, Belgrade, pp. 66-86
STEVANOVIC, Z. & DRAGISIC, V. (1992) The Directions of Circulation of Karst Ground Waters in the Carpatho-Balkanides, Serbia. in Tracer Hydrology, HOTZL, H., WERNER, A. & BALKEMA, A. (Eds.), Roterdam, pp. 291-295.
STEVANOVIC, Z. & FILIPOVIC, B. (Eds.) (1994) Ground Waters in Carbonate Rocks of the Carpathian - Balkan Mountain Range". Spec.ed. of CBGA, Allston Hold. Co, Jersey, 237p.
VUJASINOVIC, S., STEVANOVIC, Z., MATIC,' I. & GORDANIC, V. (1994) An example of groundwater contamination by radionuclides. Coli. of pape. I Mediterr. Congr. on Radiation Proiect., Athenes.
~ ·-· ·

L •etude hydrodinamique du systeme karstique de Motru Sec-Baia de Arami
[Roumanie1
Aurel ROTARU1, Alexandru BULGAR2 & loan POVARA3
Le systeme karstique de Ia zone de Motru Sec-Baia de AramA est un systeme complexe, avec une alimentation Ala fois diffuse par precipitation et organisee par les pertes situees dans le lit de la riviere de Motru Sec. La decharge du· systeme se produit par Ia ligne de sources de Ia zone de Baia de AramA. Les tra~ages ont prouve Ia continuite des depots calcaires de I 'Autochtone Danubien de meme que du systeme karstique au dessous de Ia Nappe Getique. L'etude du systeme karstique a ete realisee par Ia methodologie de I 'analyse systemique mise au point et developpee dans le cadre du Laboratoire Souterrain de Moulis (France). Les resultats obtenus en utilisant cette methode sur les hydrogrammes de sources apportent des renseignements sur Ia complexite du systeme. Cette complexite se traduit par un "effet memoire" important et une faible correlation avec les precipitations. Cependant, I 'analyse a revele !'importance de Ia contribution des pertes de Motru Sec dans I 'alimentation du systeme karstique.
Mots cles : karst, analyse systemique, Monts Mehedinp. zone Motru Sec-Baia de AramA.
A HYDRODYNAMIC STUDY OF THE MOTRU SEG-BAIA DE ARAMA KARST SYSTEM ( MEHEDINfl MOUNTAINS, ROMANIA)
ABSTRACT
The Motru Sec-Baia de Aramii karst system is a complex system with a recharge both diffuse by precipitations and organized from Motru Sec river swallet. The outlet is a line of sources in the Baia de Aramii zone. Labeling have proved both the Danubian Autohtone carbonatic deposits and karst system continuity under the Getic Nappe. The karst system study was realized by systemic analysis developed in the subterranean laboratory from Moulis (France). The analyses perfonned for the registered hydro graphs of four most important sources have provided the system complexity. The hydrodynamic behavior is characterized by strength "memory effect", regulation time, and a poor correlation with rainfall history. Also, the analyses indicate the major importance of the Motru Sec river losses to the karst system recharge.
Key words: karst, system analysis, MehedinJi MoWitains, Motru Sec-Baia de Aramii zone.

146
INTRODUCTION
Le syst~me karstique Motru Sec-Baht, de Arama se trouve dans l'extremite de nord-ouest des Monts Mehedinp. Le reseau hydrographique de Ia zone comporte Ia rivi~re de Motru et ses affluents dont sur Ia rive droite les petites rivieres de Motru Sec, -de Motru§or et de Brebina qui reyoit elle meme les eaux du ruisseau de Bulba.
Du point de vue geologique Ia zone est situ6e dans Ia partie meridionale de 1' Autochtone Danubien qui compreild des formations metamorphiques (le
A. Rotaru et al.
socle cristallin) couvert par des depOts sedimentaires secondaires et tertiaires (Fig. I).
Les formations secondaires se sont depos6es pen-. dant le Jurassique ttt le Cretace. Le debut du Jurassique est represente par un ensemble detritique en faci~s de Gresten (Jurassique inferieur), suivi par les depOts du Dogger et du Maim, qui sont calcaires. Deposes en concordance de sedimentation, les depOts du Cretace inferieur sont aussi calcaires et I' ensemble carbonate mespzoi'que atteint 500 m d'epaisseur. Les calcaires affleurent dans Ia partie septentrionale de. Ia zone dans l'interfluve de

L'etude hydrodynamique du systeme karstique de Motru Sec-Baia de Aram4 147
Motru-Motru Sec et sur Ia rive droite de Ia rivi~re de Motru Sec. On peut trouver les calcaires meme vers le sud, dans Ia proximite de Ia ville de Baia de Aram~ ou sont situees les sources karstiques analysees.
Les depots du Cretace superieur et du Temaire, enti~rement marno-argileux sont disposes sur Ies formations du Cretace inferieur. Ils sont recouverts par les formations qui apparuennent a la Nappe Getique et a la Nappe de Severin, essentiellement impermeables. La karstification a favorise le develcippement de nombreux phenom~nes karstiques souterrains et de surface. Parmi ces phenom~nes i1 faut mentionner les grottes de Martel et de Lazului pour le role qu'elles jouent (trop-plein) dans le fonctionnement du syst~me karstique (DECOU et al. 1967).
Les tra~ges ont prouve les liaisons hydrogeologiques entre les pertes du Motru Sec et de ses affluents Gorganul et Izvorele et les sources de Baia de AratM (SLA VOACA et al., 1985; DIACONU, 1989). De meme, ces tra~ages ont prouve le continuum du paquet calcaire au dessous de Ia Nappe Getique et de Ia Nappe de Severin.
METHODES
L'analyse systemique utilise comme methodologie de travail dans notre etude, mise au point au Laboratoire Souterrain du CNRS a Moulis (France) (IURKIEWICZ & MANGIN 1995), ne necessite que des donn¢es d'entree ou de some sans en changer l'etat du systeme (comme par exemple les pompages). Par rapport aux donnees dont on dispose les ·methodes utilisees seront:
• L'analyse des courbes de debits classes
Cette analyse conduit a reconnai"tre les phenomenes qui perturbent le regime des emergences karstiques: les apports suppiementaires vers le
. systeme ou les ecoulements vers l'exterieur.
• L'analyse correlatoire et spectrale
lei le systeme karstique est assimile a un filtre qui laisse plus ou moins passer !'information contenue dans le signal. La structure des chroniques d'entree et de some est traitee soit separement (analyses simples), soit l'une par rapport a !'autre (analyses croises). L'analyse correlatoire se deroule dans le domaine tempore! tandis que 1' analyse spectrale dans le domaine frequentiel.
Pour notre etude nous avons utilise des debits mesures dans des periodes differentes a quatre sources qui sortent du systeme de Motru Sec-Baia de Aranm:
• pour les sources de Munce/, de Ovid et de Abator Ies chroniques comportent Ies periodes du 20.08.1977 a 31.12.1983 et du 1.01.1985 a 31.12.1987,
• pour Ia source de Pllstravarie on dispose de donnees dans Ia periode du 15.08.1992 a 30.04.1994.
Dans le cas des premieres deux periodes, le signal d'entree a ete Ia pluviometrie .de Clo§ani tandis que pour Ia troisi"~me Ia pluviometrie de Apa Neagrn.
A cause de !'importance des pertes dans le thalweg calcaire de Ia rivi~re de Motru Sec (Ia plus grande difference enregistree entre les debits amont et aval de Ia bande calcaire a ete de 2,45m3/s) on a aussi considere comme signal d'entree le debit de cette riviere enregistre a Valea Pietrei (situee en amont de Ia zone calcaire) dans les annees de 1977-1983 et de 1985-1987.
CARACTERISTIQUES MOYENNES DES PERIODES ETUDIEES
Avant d'exposer les resultats obtenus, il convient de preciser les caracteristiques moyennes hydrologiques et pluviometriques des periodes etudiees, en raison d'avoir des termes de comparaison (Tableau 1). Dans ce tableau la pluie a ete caracterisee par Ia moyenne de la hauteur totale annuelle, puisque les durees de periodes sont fort differentes. Le debit a ete caracterise par 1' interm6diaire de la moyenne (lis).
D'abord on observe que la periode de 1985-1987 est plus seche que la periode de 1977-1983, mais Ia periode la plus seche est celle du 15.08.1992 a 30.04.1994. La moyenne, ainsi que Ia variance pour les sources de Munce! et de Ovid diminuent dans la periode plus seche. En revanche, pour la chronique de debits du Motru Sec le comportement est a !'inverse. Cela signifie que la moyenne est fortement influencee par les valeurs exceptionnelles des periodes de crue. La forte augmentation du debit en crue n'est pas manifeste aux sources a cause d'un phenomene de sursaturation rencontre dans les pertes du Motru Sec en periodes pluvieuses. La situation est confirmee en crue, par le comportement des grottes de Lazului et de Martel qui n'en restent insurgeantes mais emergeantes.

148
31.12.1983
01.01.1983-
31.12.1987
15.08.1992-
30.04.1994
ANALYSE DES COURSES DES DEBITS CLASSES
L'utilisation de cette analyse permet quelques constatations: ·
a) Le comportement des sources de Ovid, de Munce! et de Abator est le m8me, done on ne presente que les courbes les plus representatives, obtenues pour la source de Ovid.
b) Pendant la peri ode de basses eaux le comportement des trois sources mentionnees n'est pas forcement caracteristiqU:e pour un etiage. ll s'agit ici de periodes pour lesquelles les debits sont a peu pres constants (150-250 1/s) et passent rarement au-dessous de ces valeurs (Fig. 2). Sur la courbe de distribution des classes de debits ce fait se traduit par une augmentation de la pente dans la zone qui correspond a des debits moyens. Ce comportement panu"t traduire la reponse d'une composante profonde de 1' aquifere.
En revanche, · le comportement de Ia source de Pastravll.rie est typique pour la periode de basses eaux (Fig. 3). Les valeurs enregistrees jusqu'au debit de 60 lis representent 80%. Dans le point qui correspond au debit de 60 1/s il y a une rupture de la pente de la droite representative suivie par I'abaissement de la pente au dessus de cette valeur. L' explication peut 8tre liee a 1' evolution decroissante d'une composante rapide du systeme.
b) En periode des hautes eaux toutes les sources ont le m8me comportement. Ce comportement se traduit par une rupture de la pente de la droite re-
A. Rotaru et al.
presentative avec !'augmentation de la pente pour des forts debits et e' est probablement 1' effet des trop-pleins situes dans la confluence de la vallees de Bulba avec le ruisseau Paraul lui Berilll, qui commencent a fonctionner.
L1ANALYSE CORRELATOIRE ET SPECTRALE
LE SIGNAL o•ENTREE
LA PLUIE
Pour les deux periodes, !'analyse de la pluviorrietrie de Clo§ani a revele la pluie comme un processus aleatoire (Fig. 4 ). La decroissance observee est tres rapide et les valeurs du coefficient de correlation r~c inferieures a 0,1 sont atteintes dans un intervalle de deux jours pour la periode 1977-1983 et de trois jours pour la periode 1985-1987. Une situation similaire (forte decroissance apres deux jours) caractense le m8me type d'analyse sur la pluviometrie de Apa Neagm (1992-1994).
Les spectres de densite de variance montrent des pies de faible amplitude pour differentes periodicites peu significatives. Sur le spectre obtenu pour la chronique de 1985-1987 apparemment il y a une periodicite a 50 jours (Fig. 5). L'analyse a long terme (k = 6 et m = 750) pour Ia chronique de 1977-1983 (filtre avec un filtre de moyenne mobile equipondere dont !'amplitude est de 80 jours) montre sur le spectre de Ia. pluie une certaine periodieite a six mois (Fig. 6).

L'ltude hydrodynamique du systeme luustique de Motru Sec-Baia de AramJJ 149
~/o
99
95
90
80
70
60
50
40
30
20 10
99
95
80
70
60
lO
40
30
20
10
Ovid 1977-1983
·.·.
+
8D 100 120 16D 200 240 300 360 44ll s2o Ollis]
Pastravarie 1992-1994
+ +
+ + +
2l 6l 1Dl 145 185 225 265 305 345 385Q[l/s]
.·e~~~~~~~~~~~;~•::J~··~:~~·~··'~~~::·~!:· CumuliiiiilpereeliieS:Jfiilie ·disc1iil!ie: (i}Pitrtitw.6rie Spring • . : · : .... · · . . . .· · · .. ·• · · : .::.
LE DEBIT DE MOTRU SEC (AMONT CAL CAIRE)
Comme nous avons deja dit, des qu'il arrive dans Ia zone calcaire le debit de la riviere de Motru Sec s'engouffre, partiellement ou en totalite. En raison de ce fait, nous avons considere les valeurs de ce debit Gauge a Valea Pietrei) toujours comme un signal d'entree. dans le . systeme. On dispose de
l .WIJU
CIOfiBn/1985-1987 0.8800
o. 7600
0 .6400
0.5200
0.4000
0 .2800
0.1600
I I I I I I I I I I 0.0 12.l 25 .0 37.5 50.0 62.5 75.0 87.5 100.0 112.5 12l .O
lU
C/ofiani 1985-1987
0 I
0 .00 0.05 0 .10 0.15 0 .20 0.25 0 .30 0.35 0.40 0.4l 0.50
donnees pour les periodes de 1977-1983 et de 1985-1987.
L'analyse a court terme montre un comportement identique pour les deux periodes (Fig. 7). La valeur rl = 0,2 est atteinte apres 54 jours. <;a veut dire que le systeme hydrologique de surface possMe un tres grand "effet memoire". La periodicite a 50 jours, observee sur ie spectre de Ia pluie, est

150 .
- 357 j C/o~an/1977-1983
- 179 j 20
15
10
o.oo o.o~ o.1o 0 . 1~ o.zo o.25 o.ao o .J~ o. 40 o.4~ o.~o
l.UUUU
0,8800
I
0. ?600 I I I
0.6400
0.~200
0.4000
0.2800
0.1600
0.0400
\- {2) I
\ I I I I I \
\
' (1) ~
\ - -..........
Va/ea P/etrei 1977-1983 (1) 1985·1987 (2)
cachee ici par les fortes valeurs de spectre au debut qui sont l'effet d'une tendance (Fig. 8). L'analyse a long terme (k = 10, m = 1250) effec- . tuee sur la chronique de la penode de 1977-1983 montre de tres fortes periodicites annuelles auxquelles s'ajoute une periodicite saisonniere (six muis) mieux mise en evidence sur Ie spectre (Fig. 9).
10
10
.-357}
179 }
A. Rotaru et al.
Vales Pietrel 1977-1983 (1) 1985-1987 (2)
Va/ea Pietre/1977-1983
LE CORRELOGRAMME CROISE PLUIE-DEBIT .
Pour chercher 1a liaison entre les deux signaux on a effectue !'analyse croisee. Si la fonction d'entree peut etre consideree comme aleatoire, le correlogramme croise correspond a Ia reponse impulsionneUe du systeme, ce qui est le but cherch6.

L'etude hydrodynamique du systeme luustique de Motru Sec-Baia de Aranul 151
1 .0000-
0.8800 -
o. 7600 -
0 .6400 -
0 .szoo -
0.4000 -
0.2800 -
Vales Pletrei
1977-1983 (1) 1985-1987 (2)
Valea Pletrei 1977-1983 (1) 1985-1987 (2)
L'hydrogramme unitaire du syst~me hydrologique de surface Motru Sec atteint le maximum apres deux jours (Fig. 10). La forme du correlogramme croise montre une relation causale avec un pic a proximite de l'origine. Le correlogramme de la chronique de 1977-1983 devient nul apr~s une periode de 53 jours, periode qui correspond a ''l'effet memoire" revete par les correlogrammes simples. Pour la chronique de 1985-1987 la forme du correlogramme . est fortement perturbee par la
1.00111
0.8800
o. 7600
0 .6400
0.5200
0.4000
0 .2800
0.1600
0 .0400
10
4
I
\ \
\ \ \
Ovid 1977-1983 (1) 1985-1987 (2)
' --
\, _____ ~ ', , '~
~ (2) '
I
' I 1:
I
fa= 0.108 \ ~ f,, = 0.056
(1) ~ -
\\ -~ \
Ovid 1977-1983 (1) 1985-1987 (2)
0.00 0 .05 0 .10 0 .15 0.20 O.ZS 0 .30 O.JS 0.40 0 .45 O.SO
perio9icite de la pluie a 50 jours, periodicite revelee aussi par la forme de la fonction d'amplitude.
LE SIGNAL DE SORTIE
ANALYSE SIMPLE
L'analyse correlatoire et spectrale simple, faite sur les debits des sources de Ovid, de Muncel et de Abator a revele, en ce qui conceme I' etat du

152
1.0000
Pastravarle 1992·1994 0.8800
o. ?600
0.6400
0 .5200
0 .4000
0 .2800
0.1600
0 .0400
Pastriiviirie 1992-1994
4
(01 = 0.1
systeme une situation en quelque sorte differente pour la periode 1977-1983 par rapport a celle de 1985-1987. Ainsi, dans la premiere periode le corelograrrune montre une decroissance extremement lente (Fig. 12) avec une tendance, puisque I' effet memoire d6passe pour chacune des sources Ia fen8tre d'observation (125 jours). En revanche pour Ia seconde periode (1985-1987), ''l'effet me·moire" diminue A 60-70 jours. La cause de cette difference c' est peut Btre 1' etat de charge du systeme car l'effet memoire en termes d'infonna-
10
4
0 .8800 -
0.?600 -
0 .6400 -
0 .4000 -
0.3800 -
0.1600 -
357j
,.;(2)
A. Rotllru et al.
Ovid 1977-1983
Ovid 1977-1983 (1) 1985-1987 (2)
tion est !'equivalent de la notion de reserves en termes d'hydraulique (JURKIEWICZ & MANGIN, 1994). Au debut du corr61ograme 1a decroissance est assez faib1e pour 1a chronique de 1977-1983 mais elle devient plus rapide pour la deuxieme periode (effet pepite). Ce pbenomene traduit I.:existence d'un ecoulement rapide pour une certaine partie du debit. Sur le spectre de densite de variance }'existence de deux .composantes se traduit par deux zones (Fig. 13). La premiere est la zone de decroissance monotone du spectre et correspond

L'etude hydrodynamique du systeme karstique de Motru Sec-Baia de Arama . 153
1.0000 -
0.8800 -
0.7600-
0.6400 -
0.5ZOO -
0.4000 -
o.zsoo -
0.1600 -
0.0400 -
-O.OBOB-,
(1 )
l ;, · : (2) I I
I
I I
\ I
I
I
(2) '•
I ' I
Ovid 1977-1983 (1) 1985-1987 {2)
I I
I I
'
(1)
' ' ' '
Ovid 1977-1983 (1) 1985-1987 (2)
a I' ecoulement lent. La deuxieme zone est la zone de petits pies qui sui vent et correspondent a la composante rapide de 1' ecoulement. L'importance de cette composante est tres faible (frequences de coupure et temps de regulation dans le Tableau 2).
Une situation particuliere a ete visualise par !'application de I' analyse sur les debits de la source de Plistdivarie (Fig. 14). Cette source possede un "effet memoire" faible (25 jours). De meme, Ia
1.0000 -
Pastravarie 1992-1994 0.8800 -
0.7600 -
0.6400 -
0.5ZOO -
0.4000-
0.2800 -
Pastravarie 1992-1994
decroissance au debut du correlograrnme est tres rapide. Ce comportement conduit vers Ia meme hypothese, a savoir que la source de Pastravlirie est essentiellement I' exutoire de Ia composante rapide de l'ecoulement du systeme. Le spectre de densite de variance revele de nouveau }'existence de deux composantes de l'ecoulement (Fig. 15).

154
L'analyse a long terine confirme !'existence d'un cycle annuel mais aussi d'une tendance qui se manifeste sur le correlogramrne par une abaissement cyclique de r~: et par les fortes ~aleurs du spectre a l'origine (Fig. 16).
L 'ANALYSE CROISEE
L'analyse croisee pour les sources de Ovid, de Muncel et de Abator, premierement avec Ia pluie de Clo§ani, montre une correlation faible particulierement pour Ia periode de 1977-1983 (r~: < 1, Fig. 17). Pour Ia periode suivante (1985-1987), Ia correlation avec Ia pluie est un peu amelioree, mais le maximum du correlogramme ne depasse que tres peu Ia valeur de 0, 1.
Par contre, Ia correlation entre les debits de Motru Sec et les trois sources montre assez clairement Ia relation qui existe entre eux (Fig. 18). Le correlogramme atteint le maximum apres 2-3 jours, avec des valeurs de 0,23 pour Ia source de Abator et de
· 0,455 pour Ia source de Ovid. A cause "u fait que !'entree n'est pas aleatoire, Ia forme du correlogramme croise ne represente pas Ia reponse impulsionelle du systeme. Les valeurs du r.~: sont positives dans Ia partie des k negatifs, probablement a cause de !'influence de l'effet memoire du signal d'entree. Pour Ia periode d~ 1985-1987, puisque Ie systeme est peu charge i1 en resulte des changements dans la forme de la relation. Ainsi, pour la source de Ovid le maximum du coirelogramme arigmente jusqu'a 0.545, et, il faut remarquer Ie deplacement de celui-ci vers l'origine (Fig. 18). Pour cette periode la situation est l'effet de Ia decroissance des reserves. du systeme, ce qui permet
A. Rotaru et aL
de mettre en evidence une relation plus importante avec Ia pluie. Le correlogramme devient symetrique pour les premiers jours comme pour deux phenomenes soumis a I' influence de Ia meme . cause.
Les deux composantes qui participent au debit de cette source sont traduites sur Ia fonction d'amplitude par deux zones bien delimitees (Fig. 19).
Pour Ia source de P~travliri.e nous avons effectue seulement !'analyse croisee avec les precipitations de Apa Neagra). Encore une fois, Ia source P~trnvllrie se comporte differemment (Fig. 20). Le correlogramme ne depasse pas la valeur de 0.16, atteinte apres cinq jours mais la forme de la reponse montre Ia liaison directe pluie-debit.
La fonction d'amplitude permet de retrouver !'existence de deux composantes de l'ecoulement (Fig.21).
CONCLUSIONS
Le systeme karstique de Motru . Sec-Baia de Araml est un systeme karstique coniplexe dont 1' alimentation est representee par deux . signaux differents.
Le premier signal, aleatoire, est represente par la pluie. La correlation entre ce signal d'entree et le signal de sortie est tres faible. Le deuxieme signal est represente par les pertes de la riviere de Motru Sec. ll s'agit d'un signal structure avec un grand effet memoire et deux periodicites, dont Ia periodicite annuelle est Ia plus forte. Ce signal ne permet pas de trouver Ia forme de la reponse impulsionneUe du systeme, bien que Ia correlation avec le debit signal de sortie soit tres bonne. · ·

L'etude hydrodyiUlmique du systeme karstique de Motru Sec-Baia de Aramd 155
Le systeme Motru Sec-Baia de Araml presente deux composarttes de I' 6coulement. La premiere, rapide, est prouvee par les experiences de tra~age et confirmee par l'analyse systemique. Cette composante se decharge en principal par Ia source Pilstmvme et !'importance de cette composante
BIBLIOGRAPHIE
DECOU, A., DECOU, V. & BLEAIID, M., D. (1967) Grottes d'Oltenie explorees de 1959 a 1962, Recherches sur les grottes du Banat et d'Oltenie, Ed CNRS, Paris, pp. 342-344.
DIACONU, G. (1989) Studiu carstologic in perimetrul cuprins intre Cerna ~i BistriJa (jud. Gorj), fn vederea evidenJierii direcJiilor curgerilor subterane ~i a conturarii principalelor bazine hidrocarstice., Arh. ISER, Bucure~ti. (non-publie)
parait faible. La deuxiane, lente, est prouvee par Ia forme de Ia courbe des debits classes, le grand effet memoire, Ia forme du spectre de _densite de variance, les temps de regulation et Ia forme de Ia fonction d'amplitude.
IURK.IEWICZ, A. & MANGIN, A. (1994) Utilisation de l'analyse systemique dans l'etude des aquiferes karstiques des monts Valcan (Roumanie)., Theor. Appl. Karst.,1, pp. 9-96.
SIAVOACA, D., ORA~EANU, I., GASPAR. E. & BULGAR A. (1985) Hydrogeological contributions for the existence of the Getic Nappe in the Motru Sec-Baia de Aramli. region., Theor. Appl. Karst., 2, pp. 175-181.


Pleistocene mammals [Rodentia] from Movile Cave (Romania]
Emanoll $TIUCA & Horla ILINCA1
ABSTRACT The excavations undertaken in the Movile Cave (Mangalia. Southern Dobrogea) yielded a vertebrate fauna containing several species of rodents characteristic of a dry open environment (Sicista subtilis, Lagurus lo.gurus throcicus, Eolagurus luteus axshaenicus) in association with species indicative of grassland with shrubs (Apodemus sylvaticus, Microtus cf. epiroticus). A marshy facies was also present as shown by fish and amphibian remains. The vertebrate species recognised so far are small enough to have fallen prey to predatOI}' birds. The occurrence of fossil remains in the sediments accumulated in the Main Gallery is a strong evidence that the cave, isolated at present, was in communication with the outside environment during certain time intervals. Judging from the evolutionary stage of the rodent species present, the faunal assemblage can be correlated with a late phase of the last glacial cycle (WiirmianNistulian) which should be situated within the isotopic stage 2 of deep sea cores (24 to 12 kyr BP).
Key words: vertebrate fauna, micromammals (rodents), last glacial cycle (Wfum.ianNistulian), Movile Cave, Southern Dobrogea. Romania.
MAMMIFERES PLEISTOCENES (RODENTIA) DE LA GROTTE DE MOVILE
RESUME (ROUMANIE)
Les fouilles entreprises dans Ia Grotte de Movile situee pres de Mangalia en Dobrogea meridionale, ont foumi une faune de vertebres renfennant plusieurs especes de rongeurs carocteristiques d'un mlieu sec et ouvert (Sicista subtilis, Lagurus lagurus throcicus, Eolagurus luteus axshaenicus) associees a desfonnes indiquant Ia presence de zones herbeuses parsemees de vegetation arbustive (Apodemus sylvaticus, Microtus cf. epiroticus). L'existence d'un facies marecageux est indiquee par des restes de poissons et d'amphibiens. Les especes de vertebes sont de taille suffisamment reduite pour etre considerees comme reprhentant Ia capture des oiseaux de proie. La decouverte de restes fossiles dans les sediments accumules dans la Galerie Principale demontre sans conteste que Ia grotte, isolee tl present, a ete en communication avec l'environnement e:rterieur pendant certains laps de temps. Enjugeant par le degre evolutif des especes de rongeurs, /'ensemble faunistique peut etre mis en co"elo.tion avec une phase tardive du demier cycle glaciaire (Wunnien/Vistulien), qui devroit trouver sa place dans le Stade isotopique 2 des carottes oceaniques profondes (24 a 12 lea BP).
Mots cles: faune de vertebres, micromammifores (rongeurs), demier cycle glo.ciaire (Wiirmien/Vistulien), Grotte de Movile, Dobrogea meridionale, Roumanie.
INTRODUCTION The Movile Cave is located about 3 km east of the Black Sea shore, near the town of Mangalia (Southern Dobrogea). The ]andscape is distinguished by the presence of two depressions (sinkholes) called Obanul Mare and Obanul Mic.
Dug in limestones of Sannatian age, the cave consists of two superposed systems of galleries corresponding to a dry upper level (Main Gallery) and a submerged lower level. The cave is well known in connection with the phenomenon of chemoautotrophy (SAR.BU & POPA, 1992). A great number of terrestrial and aquatic invertebrates species, for

158
the most part endemic to the subterranean system, represent also a peculiarity of this cave (DECU & JUBERTIIIE, 1994 ). It is worth remembering that the Movile Cave was discovered in . 1986 by C. Lascu at a depth of about 18 m, during the digging of a well at the edge of the Obanu Mare sinkhole (CONSTANTINESCU, J989; LASCU, 1989). At present the cave appears to be completely isolated, without a natural entrance.
The presence of some sparse remains of rodents on the floor of the Main Gallery collected by our colleagues Dr. T. Constantinescu and C. Lascu indicated that deposits accumulated in the cave might contain micromammalian fossils. In order to investigate the paleontological records, three test trenches were executed in the upper dry passage. The first trench (code PMv-S1) was located in a small niche of the Main Gallery; the second (code PMv-S2) was placed· near the lake conducting to the submerged gallery and the third one at the eastern extremity of the Main Gallery, where the floor is covered with numerous limestone blocks. The first test trench was excavated till a depth of 38cm (excavation conducted in microstratigraphy), while the second and the third test trenches reached only lOcm in depth. Washing and sieving of sediments showed that PMv-S1 was the more interesting, producing vertebrate remains on the whole depth excavated. PMv-S2 was practically devoid of fossils, whereas PMv-S3yielded only a few rodent molars in a fragmentary state.
It should be remembered that the material found by Dr. T. Constantinescu in the so-called Spiders Chamber consists of a mandible retaining the second and third molars, attributable to the steppe lemming Lagurus lagurus (Pallas). · In the vicinity of the lake, C. Lascu collected skeletal remains including a fragmentary skull, two lover jaws and some limb bones identified as Microtus cf. epiroticus Ondrias (SAMSON, 1993).
STRATIGRAPHY
PMV-S1
In the first test trench the deposits corresponding to the levels 1 to 4 (from top to bottom) seem to be very homogeneous consisting of a siltic clay: the color varies from brown (10 YR 5/3 moist) to light yellowish brown (10 YR 6/4 dry). Layer 4 contains at its base collapsed limestone blocks 20-30 em in diameter. Beneath these blocks the lithology is changed. On a depth of 10 em the clayey sands become dominant. The color of the
E. ~tiuc4 & H. llinca
sediment varies from very pale brown (1 0 YR 7/4 moist) to nearly white (10 YR 8/3 dry).
The fossil remains are distributed a,.s follows:
Ievell
level2
level3
level4
level5
PMV-S3
Eolagurus luteus axshaenicus Rldulescu &Samson Microtus cf. epiroticus Mustelidae indet (cf. Mustela sp) Reptilia (Anguidae gen et sp. indet)
Apodemus sylvaticus (Linnaeus) Lagurus lagurus thracicus Rldulescu & Samson Microtus cf. epiroticus Amphibia indet. Pisces indet.
Chiroptera gen et sp. indet. Rana sp. Lacerta sp.
Rana sp. Lacerta sp.
Eolagurus luteus axhaenicus Sicista subtilis Rana sp.l Rana sp.2 Pisces gen et sp. indet.
, ..
Although situated at a short distance from PMv-Sh the sediment of this sounding consists of a clay, somewhat darker (strong brown 7.5 YR 5/6 moist) .. and more reddish (reddish yellow 7.5 YR 6/6 dry) · as compared with the PMv-S1 sequence of deposits. Washing and screening produced some fragments of rodents molars which were not identified.
THE FAUNA
The fauna can be divided into two groups the most · important of which is represented by the micrornamrnalian taxa. Indeed, these have been identified at specific and subspecific level. The other group consisting of skeletal remains of fish, amphibians (relatively numerous) and reptiles has not yet been studied in · detail. As shown in the faunal list, the rodents include predominantly dry steppe elements such as steppe lemming (Lagurus and Eolagurus) and Sicista subtilis in association with grassland (Microtus cf. epiroticus) and sy lvo-steppe Apodemus sylvaticus) taxa.
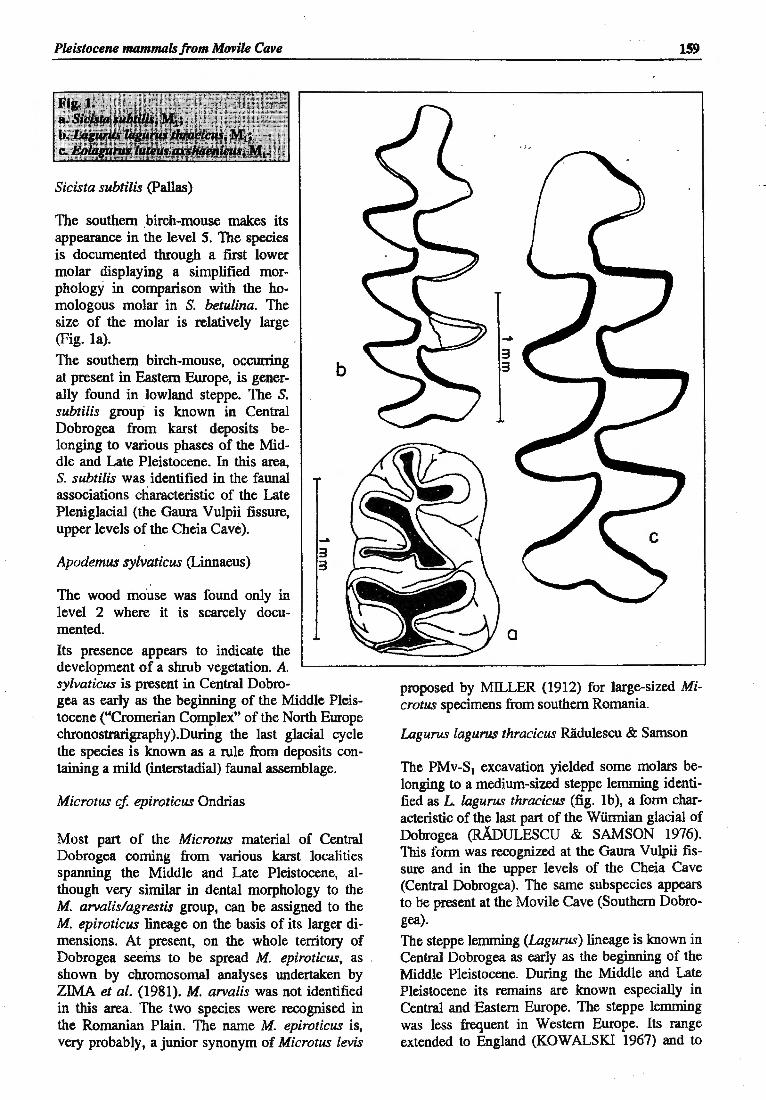
Pleistocene mammals from Movile Cave
Sicista subtilis (Pallas)
The southern .birch-mouse makes its appearance in the level 5. The species is docwnented through a first lower molar displaying a simplified morphology in comparison with the homologous molar in S. betulina. The size of the molar is relatively large (Fig. la).
The southern birch-mouse, occurring at present in Eastern Europe, is generally found in lowland steppe. The S. subtilis group is known in Central Dobrogea from karst deposits belonging to various phases of the Middle and Late Pleistocene. In this area, S. subtilis was identified in the faunal associations characteristic of the Late Pleniglacial (the Gaura Vulpii fissure, upper levels of the Cheia Cave).
Apodemus sylvaticus (Linnaeus)
The wood mouse was found only in level 2 where it is scarcely documented.
Its presence appears to indicate the development of a shrub vegetation. A. sylvaticus is present in Central Dobro-
3 3
b
gea as early as the beginning of the Middle Pleistocene ("Cromerian Complex" of the North Europe chronostrarigraphy).During the last glacial cycle the species is known as a rule from deposits containing a mild (interstadial) faunal assemblage.
Microtus cf epiroticus Ondrias
Most part of the Microtus material of Central Dobrogea coming from various karst localities spanning the Middle and Late Pleistocene, although very similar in dental morphology to the M. arvalislagrestis group, can be assigned to the M. epiroticus lineage on the basis of its larger dimensions. At present, on the whole territory of Dobrogea seeins to be spread M. epiroticus, as shown by chromosomal analyses undertaken by ZIMA et al. (1981 ). M. arvalis was not identified in this area. The two species were recognised in the Romanian Plain. The name M. epiroticus is, very probably, a junior synonym of Microtus levis
159
a
proposed by MILLER (1912) for large-sized Microtus specimens from southern Romania.
Lagurus lagurus thracicus R.adulescu & Samson
The PMv-S1 excavation yielded some molars belonging to a mediwn-sized steppe lemming identified as L. lagurus thracicus (fig. 1b), a form characteristic of the last part of the Wtinnian glacial of Dobrogea (RADULESCU & SAMSON 1976). This form was recognized at the Gaura Vulpii fissure and in the upper levels of the Cheia Cave (Central Dobrogea). The same subspecies appears to be present at the Movile Cave (Southern Dobrogea). The steppe lemming (Lagurus) lineage is known in Central Dobrogea as early as the beginning of the Middle Pleistocene. During the Middle and Late Pleistocene its remains are known especially in Central and Eastern Europe. The steppe lemming was less frequent in Western Europe. Its range extended to England (KOWALSKI 1967) and to

160
France (CHALINE, · 1972) in connection with changes in vegetation (Artemisia steppe) associated with a dry continental climate during the glacial cycles. The steppe lemming is now distributed from the River Dnieper to Mongolia and northwestern China. The species is. a dweller of steppe and semidesert zones of Eastern Europe and Central Asia.
Eolagurus luteus axshaenicus (Fig. lc)
The yellow lemming is represented by a largesized form which appears to be characteristic of the Late Pleniglacial of Southeastern and Eastern Europe. During the Middle and Late Pleistocene, various forms of the genus Eolagurus are known from karst deposits . in Central bobrogea. In the Cheia Cave (upper levels), a large form of yellow lemming is present in association with Late Paleolithic implements. Large specimens were also discovered at the Gaura Vulpii fissure which yielded a micromammalian assemblage belonging to the last part of the Wiinnian.
Judging from the whole evidence concerning the stratigraphic distribution of Eolagurus forms during the last glacial cycle, the presence of very large specimens (named E. luteus axshaenicus on the basis of the material coming from the upp~~ levels of the Cheia Cave) (R.ADULESCU & SAMSON 1976) is coincident for the most part with the isotopic stage 2 (24 to 12 kyr).
At present E. luteus is distributed in Mongolia. northwestern China and adjacent part of the former Soviet Union (Zaisan). On the Romanian territory Eolagurus is known only from Dobrogea. Its first appearance is registered at the beginning of the Middle Pleistocene (lower level in the rock-shelter of Gura Dobrogei- 4 (RADULESCU & SAMSON, 1986). Towards the end of the last glacial cycle, the species becomes rare and disappears
. very probably during the last phases of the Wiirmian, being absent in Holocene deposits.
A subspecies similar in size was described from Novgorod-Severski and other localities in the
. Ukraine (REKOVETS, 1985) belonging iuso to the ··. last ~art of the W~an (V aldaian) glacial cycle.
Judgmg by the matenal described by Rekovets (1. c.) this. ~arge-sized subspecies from NovgorodSeverski IS very similar if not identical with Eolagurus luteus axshaenicus from southeastern Romania (Dobrogea).
ECOLOGY
Th~ r~ent as~emblage includes five species, the arvicolids bemg the more frequent species.
E. ~tiucll & H. IUnca
Although the faUnal data are preliminary, the occurrence of representatives of the genera Lagurus and Eolagurus in association with Sicista ! subtilis is indicative of a (dry) steppe biotope. Out of these three elements, only S. subtilis survived up till now in Dobrogea. The presence of fish and amphibians offers evidence for the existence of residual marshy zones in connection with the sinkholes ("obane") located in the very proximity of the cave.
A tentative interpretation of the biostratigraphy (faunal content in the PMv-S1) might indicate a slight oscillation of the climate. On the basis of the mammalian fossils the top (level 1) and bottom (level 5) sediments could be contemporary with a more continental climate, whereas the intercalated level 2 (presence of the wood mouse) would reflect a somewhat more humid phase. In addition, the small manuna1 fauna seems to be deprived of cold elements. . · .
During the time period of ~ccumulation ~f ~~ertebrate fossils the Movile Cave was in commulrication with the outside world, the entrance being dug in the eastern wall of the sinkhole of Obanul Mare at a depth of about 18m. The time interval when the cave entrance was not blocked could be tied to the Novoeuxinian stage of the Black Sea history characterized by a regression attaining minus 80-90m (FEDOROV, 1982).
It is worth noting . that the Novoeuxinian palynoassemblage are of temperate-cool aspects with predominance of the grass pollen (abundance of Artemisia and somewhat less of various species of Chenopodiaceae, as indicated by studies from three holes drilled in the central and western parts of the Black Sea (Glomar Challenger 1975) (KORENOVA & KARTASHOVA, 1978)~ These palynological date throw light also on the landscape of Central and Southern Dobrogea taking into account that lagurines are dwellers . of arid steppes and semi-desert zones developed under a climate distinguished by a strong increase of continentality.
AGE OF THE FAUNA
The succession of small mammal assemblages of karst deposits of Central Dobrogea is fairly wellknown on the basis of excavations undertaken between 1956 and 1981 by the Paleontological Section of the Sp~leological Institute. The dental morphology of the steppe lemmings (Lagurus,
. Eolagurus) suggests a Late Pleistocene age for the paleontological content from the Movile Cave.

Pleistocene mammals from Movile Cave
As shown by the evolutioxiary stage of the species present, the deposits of the test trench PMv-S1 are considered to date from the last part (corresponding to the isotopic stage 2 of deep-sea cores) of the Wiinnian glacial cycle. This time interval is distinguished in area under consideration (Central and Southern Dobrogea) by the association of a medium-sized form of the steppe lemming (Laguru:S lagurus thracicus) with a largesized fonn of the yellow steppe lemming (Eolagurus luteus axshaenicus).
REFERENCES
CHALINE, J. (1972) Les rongeurs du Pleistocene moyen et superieur de France. Cahiers de Paleontologie, Ed. CNRS, Paris.
CONSTANTINESCU, T. (1989) Consideration sur Ia zone karstiquue de "La Movile" (Mangalia, Dobrogea de Sud, Roumanie). Misc. Speol. Rom .. 1, pp. 7-12.
DECU, V. & JUBERTHIE, C. (1994) Un monde retrouve: Ia grotte de Movile. In: Encyclopaedia Universalis, pp. 224-228.
FEDOROV, P., V. (1982) The main problems of the Black Sea Pleistocene. XI INQUA Congres, Abstracts, 1, Moscow, p. 88.
KORENOVA, E., V. & KARTASHOVA, G., G. ( 1978) Palynological study of samples from hole 379A, 380A, LEG 24B . Initial Report of deep Sea Drilling Project, 42 (2), pp. 951-957.
KOWALSKI, K. (1967) l.agurus lagurus (Pallas, 1773) and Cricetus cricetus (Linnaeus, 1758) (Rodentia, Mammalia) in the Pleistocene of England. Acta Cracoviensia XII, 6, pp. 111-122.
LASCU, C. (1989) Paleogeographycal and hydrogeological hypothesis regarding the origin of peculiar cave fauna. Misc. Speol. Rom. 1 pp. 13-18.
161
ACKNOWLEDGMENTS
Our sincere gratitude is due to Dr. P-M Samson, for his comments and criticism, and for the main outline of this paper
For much additional help and information, especially for his patience, ·we would like to thank to Dr. C. Rldulescu, who substantially improved the quality of this paper.
We wish to express our sincere gratitude to ~Siirbu and his field party for the fruitful collaboration.
MILLER, G., S. (1912) Catalogue of the Mammals of Western Europe. Collection of the British Museum, Clowes & son.
RADULESCU, C & SAMSON, P.-M. (1976) Quelques Rongeurs (Rodentia , Mammalia)du Pleistocene moyen et superieur de Dobrogea (Roumanie). Trav. Inst. Speol. "Emile Racovitza", XXV, pp. 67-83.
RADULESCU, C. & SAMSON, P.-M. (1986) Les micromammiteres du Pleistocene moyen de Gura Dobrogei-4 (Dept. de Constanta. Roumanie) Trav. Inst. Speol. "Emile Racovitza", XXV, pp. 67-83.
REKOVETS, L., I. (1985) Microtheriofauna of the Desna and Dnieper - Late Paleolithic (in Russian), Naukova Dumka, Kiev, 166 p.
SAMSON, P.-M. (1 993) Resturile fosile de rozatoare. Academica, ill, 6 (30) p. 31 .
SAR.BU, ~-. M. & POPA, R. (1992) A unique chemoautotrophically based cave ecosystem. In: The natural history of biospeology (CAMACHO, A. Ed.). Monografias Museo Na·· cional de Ciencias Naturales, Madrid, pp. 637-666. .
ZIMA, J., CERVENY, J., HRABE, V., KRAL, B. & SEBELA, M. (1981) On the occurrence of Microtus epiroticus in Rumania (Arvicolidae, Rodentia), Folia Zoologica, 30, 2.


On some Middle and Late -Pleistocene ·Rare Small Mammal Elements from the Karst Deposits of Central Dobrogea [Romania]
Costin RADULESCU & Petre-Mihal SAMSON1
. ABSTRACT
Fossiliferous karst deposits located in the Jurassic limestones of Central Dobrogea yielded micromammalian assemblages belonging to the Middle and Late Pleistocene. Pleistocene climatic fluctuations registered for this area influenced the peculiar aspects of the fauna containing various amounts of elements with eastern European and central Asiatic affinities. Some rare species such as Vistemomys cortezi (beginning of the Middle Pleistocene, "Cromerian complex"), Alactagulus cf. acontion, Ellobius cf. talpinus (penultimate glacial cycle, Rissian/Saalian) and Scirtopoda telum (end of the last glacial cycle, WfinnianNistulian) are presented and discussed. In addition, other elements showing Aegean and Anatolian relationships are also commented (Allactaga orghidani, Rattus casimcensis, Microtus guentheri group characteristic of the Gura Dobrogei-2 phase, late Cromerian or post-Cromerian in age). Three new taxa are described: Alticola (s.l.) remaxi n. sp. froin the Gura Dobrogei-5 rock-shelter (uncertain phase within the first half of the Middle Pleistocene), Ellobius calabaei n. sp. from Pe§tera Liliecilor (Bats Cave) at Gura Dobrogei (Gura Dobrogei-2 phase) and Microtus guentheri vistierensis n. ssp. from the upper layers of the Gura Dobrogei-4 rock-shelter (penultimate glacial cycle).
Key words: rodents (Mammalia), dental morphology, new taxa, karst deposits, Middle and Late Pleistocene, Central Dobrogea, Romania.
SUR QUELQUES MICROMAMMIFERES RARES DU PLEISTOCENE MOYEN ET SUPERIEUR DES DEPOTS KARSTIQUES DE LA DOBROGEA
CENTRALE (ROUMANIE) RESUME
Les deptJts fossilifores karstiques, situes dans les calcaires jurassiques de Dobrogea centrale ont foumi des ensembles de micromammifores appartenant au Pleistocene moyen et superieur. Les fluctuations climatiques pleistoc~nes, enregistrees dans cette region ont influence les aspects particuliers qu'avait pris Ia faune qui contient des taux variables d'elements montrant des affinites est-europeennes et centre-asiatiques. Quelques rares especes, telles que Vistemomys cortezi (debut du Pleistocene moyen ou du "Complexe Cromerien"), Alactagulus cf. acontion, Ellobius cf. talpinus (phase de l'avant-demier cycle glaciaire) et Scirtopoda telum (fin du demier cycle glaciaire ou du WUnnien/Vistulien), sont presentees et discutees. On ajoute des commentaires sur d'autres elements ayant des affinites egeennes ou anatoliennes (Allactaga orghidani, Rattus casimcensis et Microtus groupe guentheri caracteristiques de Ia phase de Gura Dobrogei-2 d'age cromerien tardif ou post-cromerien). On decrit trois nouveaux taxa: Alticola (s.l.) remaxi n. sp. de l'abri-sous-roche de Gura Dobrogei-5 (phase encore non-difinie de Ia premiere moitie du Pleistocene moyen), Ellobius calabaei n. sp. de Peltera li.liecilor (Grotte des Chauves-Souris) de Gura Dobrogei (phase de Gura Dobrogei-2) et Microtus guentheri vistierensis n. ssp. des couches superieures de l'abri-sous-roche de Gura Dobrogei-4 (phase de l'avant-demier cycle glaciaire).
Mots-des: rongeurs (Mammalia), morphologie dentaire, taxons nouveaux, depots karstiques, Pleistocene moyen et superieur, Dobrogea centrale, Roumanie.

164
INTRODUCTION
Located between the Danube River and the Black Sea, the territory of Dobrogea is distinguished by many climatic and faunal peculiarities when compared with other regions of southern Romania. For instance, Dobrogea is characterized by more marked continental influences; among rodents, Mesocricetus newtoni Nehring is known only from this part of the country being absent froin the adjacent Romanian regions.
Paleontological investigations, carried out since 1956 in the karst deposits located in the Jurassic limestones of central Dobrogea, supplied rich small mammal associations containing many species occurring outside their present areas of distribution. During certain phases of the Middle and Late Pleistocene, central Dobrogea was distinguished by strong increases of continentality reflected in the peculiar rodent species which invaded this area. It is worth remembering that the yellow steppe lemming (Eolagurus) is known in fossil state only from central and southern parts of Dobrogea. Its remains were never mentioned from other regions of Romania.
The peculiar geographic!U situation of Dobrogea represented an important factor which favored alternatively during the climatic fluctuations of the Quaternary immigrations from the vast steppe area of eastern Europe and central Asia (Turanian zone) on the one hand and from the Aegean and Ana-tolian regions on the other. ·
In what follows some small marnrnal elements will be discussed in connection with their rarity in this area or their particular biostratigraphic . significance.
All material studied is stored in the paleontological collection of the ''Emil Racovitl" Speleological Institute, Bucharest. Measurements are in mm.
BIOSTRATIGRAPHY
The fossil micromammalian assemblages of central Dobrogea can be divided into the following units:
MIDDLE PLEISTOCENE
Ji,auna with larger Mimomys fonns (M. intermedius group)
TI:tis type of association is known from the lower level of Gura Dobrogei-4 rock-shelter (code GD-4/i) located on the the right bank of the Visterna brook, a tributary of the Casimcea River. The as-
C. Rtldulescu & P.-M. Samson
sociation includes a peculiar rodent form named Vistemomys cortezi Rldulescu & Samson; the steppe lemmings, identified as Lagurus posterius Zazhigin, represent the dominant species. The GD-4/i fauna was assigned to a cold and very dry time interval (RADULESCU & SAMSON, 1986) which might be correlated to Glacial A of the "Cromerian complex" in the chronostratigraphic scheme of the Netherlands (northern Europe) and to the beginning of the Tiraspolian faunal complex (Shamin fauna) of Eastern Europe.
Faunas with Mimomys/Arvicolo. transitional ronns TI:tis type of fauna is based on the successive evolutionary stages known from the Casian Cave (located in the Casimcea valley) (RJ\DULESCU & SAMSON, 1994). These faunas appear to correspond to various phases of the "Cromerian complex". We assigned provisionally to an early phase of the Middle Pleistocene the basal layer at the Gura Dobrogei-5 rock-shelter (code GD-5), placed near the GD-4 site 0.2 km downstream on the same bank of the Visterna brook. The basal layer at GD-5 yielded a few dental material including Alticola (s.l.) remaxi n. sp. We point out that this whitish loessic layer is similar to the lower levels at GD-4/i. Their correlation demands, however, further investigation.
Faunas with Arvicolo. cantianus
These associations are known from the . Pe§tera Liliecilor Cave (Bats' Cave) at Gura Dobrogei, from superimposed sediments corresponding to two accumulation zones called Gura Dobrogei-1 (code GD-1) (the lower sequence of layers) and Gura Dobrogei-2 (code GD-2) (the upper sequence of deposits containing also prehistoric artifacts). The infilling in the GD-2 zone can be further subdivided into three main accumulations of sediments, as follows:
• lower accumulation (code GD-2/i) consisting in an alternation of guano layers and gravelly levels laid down prior to the GD-2 phase (Rldulescu & Samson, 1977);
• middle accumulation (code GD-2/m) represented by siltic and clayey layers containing small limestone fragments (beginning of the GD-2 phase); presence of Allactaga orghidani Rldulescu & Samson; ·
• upper accumulation (code GD-2/s) consisting in thermoelastic limestone fragments ("eboulis"); this accumulation is interrupted by a siltic level at the base and a fossil soil greyish brown in color at the top (Rldulescu &

On some Middle Pleistocene rare small mammals
Samson, 1977). The upper accumulation yielded some faunal elements showing Aegean and Anatolian affinities such as Rattus casimcensis !Udulescu & Samson and Microtus guentheri group. An eastern immigrant appears to be represented by Ellobius calabaei n. sp.
Fauna with Arvicola cantianus/terrestris
A peculiar small mammal association was collected in the upper sequence of sediments at Gura Dobrogei-4 rock-shelter (code GD-4/s) (RADULESCU & SAMSON, 1986). The rich rodent fauna includes a variety of species among which we mention Alactagulus cf. acontion (Pallas), recorded here for the first time in Romania, Ellobius cf. talpinus (Pallas) and Microtus guentheri vistierensis n. ssp. The faunal assemblage is distinguished by the presence of Citellus cf.citelloides Kormos, Allactaga jaculus (Pallas), Spa/ax leucodon Nordmann, Cricetulus migratorius (Pallas), Mesocricetus newtoni Nehring, Allocricetulus eversmanni (Brandt), Clethrionomys glareolus (Schreber), Lagurus lagurus (Pallas), Eolagurus luteus (Eversmann), Arvicola cantianus Hinton I terrestris (Linnreus ), Chionomys nivalis (Martins), Stenocranius gregalis (Pallas), Microtus epiroticus group and other forms.
The faunal assemblage, judging from the evolutionary stage of component elements is attributable to a phase belonging to the penultimate glacial cycle (Rissian!Saalian).
LATE PLEISTOCENE
Faunas with Arvicola terrestris
This type of fa11nas encompasses various phases of the last glacial cycle (WiirmianNistulian). The excavations carried out at the "La Adam" Cave (Vistema valley) (DUMITRESCU et al., 1963) supplied both big and small mammal remains in association with levels containing middle and late Paleolithic implements (SAMSON, 1970; 1976). The sequence of strata includes the last part of the penultimate glaciation and a long series of consecutive layers belonging to the last glacial cycle. The latest interval of the last glaciation in Dobrogea is characterized by dry climatic conditions. In a stratigraphic level containing a steppe faunal association (Citellus, Mesocricetus newtoni, Lagurus lagurus, Microtus epiroticus and other elements) Scirtopoda telum Lichtenstein makes its appearance for· the first time in this area. The species is recorded here for the first time in Romania. The layer which yielded this . very rare faunal element was laid down at the very end of the Pleistocene sequence of deposits.
165
COMMENTSONSOMEPECUUAR FAUNAL ELEMENTS
Vistemomys cortezi
V.cortezi appears to have an isolated position within the European system of voles possessing rooted molars (RADULESCU & SAMSON, 1986). A related form, named Clethrionomys mirus Savinov &Tutkova, is known from central .· Asia (eastern Kazakhstan) at Aktogai (Alma-Ata region) and Novaya Shulba (Semipalatinsk) (TIJTKOV A, 1988).
The first lower molar (M/1) in V. cortez.i is very similar to homologous specimens described as C. mirus. Their close morphological relationship suggests that C. mirus may be assigned to the genus Vistemomys. A difference between V. cortezi and V. mirus consists in the morphology of the last upper molar (M3/). In the latter species the posterointernal salient angle (LSA4) is very slightly developed (TIJTKOVA, 1988, Figs. 4-5), whereas V. cortezi possesses LSA4 relatively well marked (RADULESCU & SAMSON, 1986, Fig. 2, 6-7).
The more primitive structure of M3/ in V. mirus is in agreement with its earlier geological age, the associated fauna including at Novaya Shulba a mixture of archaic (Villanyia petenyi (Mehely), Mimomys cf hintoni Fejfar ) and more advanced species (Allophaiomys pliocaenicus Kormos, Eolagurus simplicidens (Young)) (TIJTKOV A, 1988).
Summarizing, V. cortezi appears to have its closest affinities with V. mirus of eastern and southeastern Kazakhstan. It is worth emphasizing that the morphology of M/1 is very similar in the two species under consideration. Judging from the morphology of M3/, V. cortezi is characterized by somewhat more advanced features. The presence in central Dobrogea of a species resembling a taxon of Kazakhstan can be explained only by a migration during a time interval of extreme dryness (Turanian influences on eastern and southeastern Europe) at the beginning of the Middle Pleistocene equated tentatively to Glacial A of the chronostr<~.tigraphic scheme of the Netherlands (ZAGWIJN, 1992).
I
Allactaga orghidani
This species makes its first appearance in central Dobrogea at the beginning of the GD-2 phase. Judging by the morphology of M3/, A. orghidani displays relationships with the recent eastern Mediterranean Allactaga euphratica Thomas. Compared with A. jaculus lineage of eastern

166
/o
99.9 99.8
99.5 99
95
90 84 80
70
50
30
20 16 10
5
1 0.5 0.2
~
r-
- '---
-
I
/ •
~
I L
I 'I
I -
j( /
I v· )~
Jr ) I(
Jl(
Europe, M3/ in A. orghidani is characterized by the presence of an incomplete mesoloph and a more developed first . synclinal (RADULESCU & SAMSON, 1976, Fig. 3, 1-5).
The ancestry of A. orghidani is still unknown. Morphological evidence suggests affinities with eastern Mediterranean forms of Allactaga and, very probably, an immigration to Dobrogea from the Aegean and Anatolian regions.
Rattus casimcensis
This taxon is fairly well represented at GD-2/s having a maximal frequency in the greyish brown soil fonnation. The species was created on the basis of a lower jaw with M/1-3 (RADULESCU & SAMSON, 1973). In the meantime additional material was collected including several lower and upper jaws.
The origin and relationships of R. casimcensis are so far unknown. It is worth, however, remembering that the Middle Pleistocene marrimalian fauna
C. RiJdulescu & P.-M. Samson
'X 99.9 99.8
99.5 I"" 99
~ ~
95 V" 90 ~~
84 - II"' 80 ~ 70
'J
so f- ) v 30
j'f
20 l/ 16 >- L 10
/ 5
!f
1 )
o.s l/ 14
0.2 2.45 2.52 2 .66 z.ao l-94 3.06 3.22 3.36
:
from Latomi-1, Chios (STORCH, 1975) contains, among the murid taxa, a form cf. Rattus sp. represented by a M2/. A comparison with M21 in R. casimcensis indicated some similarity between cf. Rattus sp. and the species of Dobrogea in both size and morphology.
Microtus guentheri group
As already mentioned, the GD-2 fauna is distinguished by the presence of a species of Microtus differing in size from the autochtonous M. epiroticus group. As shown by measurements of M/1 (occlusal length) the GD-2/m sediments yielded a homogeneous population attributable to M. epiroticus gfQUp (Fig. 1).
A sample collected in the GD-2/s portion of the deposits indicated that the arvicolids include, very probably, two taxa of field ·voles on the basis of measurements of M/1 s. These were identified as M. guentheri group Oarge:-sized form) and M. epiroticus group (medium-sized form) (Fig. 2,

On some Middle Pleistocene rare small mammals
cumulative probability distribution of lengths of M/1 showing slight asymmetry).
MIDDLE PLEISTOCENE
Penultimate Glacial Cycle Alactagulus cf.acontion
This species, known only from GD-4/s, is represented by a first left upper molar (M1/) (Fig. 3). The specimen is distinguished by its high crown and the strong convexity of the lingual wall; the mesocone is strongly reduced; the anteroextemal root is nearly completely regressed; the anterointernal root is well developed; the two posterior roots show practically an equal development. The reduction of the anteroextemal root is a feature encountered in extant A. acontion. In addition, the recent species is distinguished by a reduction of the posteroexternal root in comparison with the posterointernal one (TOPACHEVSKI, 1965). As mentioned above, the equal development of the posterior roots indicates a somewhat more primitive condition for the specimen from GD-4/s.
Measurements Length of the crown
anterior width
posterior width
Discussion
1.95
1.30
1.50
Remains of Alactagulus are known only from eastern Europe, coming from various localities Early
167
and Middle Pleistocene in age, such as Nogaisk (Alactagulus sp. Late Tamanian faunal complex) (TOPACHEVSKY, 1965) and Shamin (A.ex gr. acontion, Early Tiraspolian faunal complex) (MARKOV A, 1990). The westernmost Quaternary site with Alactagulus is located on the middle Dnieper, near Kremenchug (TOPACHEVSKY, 1965).
The discovery of Alactagulus cf. acontion at GD-4/s indicated that the species was more widely distributed during certain phases of the penulti-
. mate glacial cycle. The GD-4/s represents the westernmost site with A.cf.acontion of eastern and southeastern Europe. It must be remembered that A. acontion inhabits desert zones. Its sporadic appearance in central Dobrogea was undoubtedly linked to prevailing dry climatic conditions. At present, the species is distributed from the southem portion of the Volga-Ural interfluve and westem Turkmenia to Zaisan (Russia) and northwestem China (GROMOV, 1963).
Ellobius cf. talpinus
Ellobius is represented at GD-4/s by a unique specimen, a left second upper molar (Fig. 5.2). The two-rooted tooth is relatively high crowned; the crown-cementum is lacking. In occlusal view, the specimen is characterized by the strong confluence of the dentine fields and the presence on the lingual side of only two reentrant angles.

168
Measurements
Length of the crown
Width of the crown
2.45
1.50
Width anterior lobe 1.35
Height (anterior) 3:30
Discussion:
The fossil molar, distinguished by a height crown, displays many similarities to homologous tooth of extant E. talpinus (for direct comparative purposes we had at our disposal only recent material of E. fuscocapillus Blyth from Turkmenia).
The GD-4 specimen and E. tschemojaricus Alexandrova (Late Middle Pleistocene on lower Volga River) (ALEXANDROVA, 1976) could possibly be conspecific, but the lack of description precludes any close morphological analysis.
During the various climatic phases of the Pleistocene, Ellobius extended or retracted its area of distribution in eastern and southeastern Europe. GD-4/s represents so far the westernmost fossil locality including Eilobius within the antepenultimate glacial cycle. It must be noted that the pres-
, ence of specimens (M/1) attributable to the genus Ellobius (cf. Ellobius in the Villanyian small manunal fauna from Rivoli Veronese, northeastern Italy) (SALA et al., 1994) needs further investigation.
C. Rlfdulescu & P.-M. Samson
Ellobius talpinus is now widely distributed in steppe and semi-desert biotopes from southern Ukraine to Mongolia and northern China (OGNEV, 1950).
LATE PLEISTOCENE
Scirtopoda telum
This element is represented by one left first lower molar (M/1) which possesses the typical morphology of the extant species (Fig. 4 ). In occlusal view the molar displays a relatively simplified structure consisting in an anterior lobe (metaconid) followed on the buccal side by proto- and hypoconid; the lobe on the opposite side (entoconid) is rather well developed. A lateral internal view shows that the crown has a distal synclinid which is markedly shorter as compared with the anterior one, a feature also present in extant species.
The molar has two roots. The anterior root is slender and almost circular in section; the distal root is larger showing a slight furrow on its anterior side.
Measurements
occlusal length of the crown
occlusal width of the crown
Discussion ··:
1.85
1.70
S. telum appears to be an Asiatic immigrant which made its first appearance in eastern J?:tirope during

On some Middle' Pleistocene rare snudl mammals
the first half of the Middle Pleistocene. The species is relatively frequent in the Late Pleistocene and Early Holocene faunas along the northern portion of the Black Sea extending westwards to the Dnieper.
The main biotopes of S. telum are represented by desert zones and desert steppes of various types. In the western portion of its distribution area. the species is also spread in sandy steppes of interfluves and in sandy valleys with poor shrub vegetation (GROMOV, 1963). S. telum is now distributed from the Don River in the east to the River Irtysh (Semipalatinsk), northern Mongolia and northwestern China. A relict population (S. telum falz.{eini Brauner) is known from the lower course of the Dnieper (GROMOV, 1963, TOPACHEVSKY, 1973).
I
c
DESCRIPTION OF THE NEW TAXA
Alticola (s.l.) rema.xi n. sp.
169
Type: a lower left molar (Mil) (coli. ISER, GD-5/001) (Fig. 5.3).
Horizon and locality: basal layer, Gura Dobrogei-5 rock-shelter, Visterna valley, Central Dobrogea.
Distribution: known only from type locality.
Age: phase of uncertain situation within the first part of the Middle Pleistocene.
Etymology: from Remaxos(us), a king whose authority extended over territories to west and north of the Danube River, protector of Greek cities on the Black· Sea (mentioned about 200 years B.C.).

170
~· lUst Joaw molar 1lrida broad .oonnc:ctions between the dentine fields, except the posterior loop; enamel thick, undifferentiated; apices of re-entrants rounded not curved forward; anteroconid complex with an anterolingual salient angle (LSA4); cement abundant, present in the upper part of the crown; the molar is rootless.
Dltrerendal diagnosis: the primitive morphology of M/1 distinguishes sharply the new taxon from all Middle Pleistocene arvicoline taxa known from Europe. Some resemblance may be noted between the new taxon of central Dobrogea and certain forms belonging to the vast group of taxa assigned to the genus Alticola (s.l.).
Measurements:
length (occlusal)
width (occlusal)
anteroconid length
2.75
0.97
1.17
confluence T4-T5 (c according to van der MEULEN, 1975) 0·
55
confluence T5-anteroconid (b according 0. 75 to van der MEULEN, 1975)
width posterior loop
posterior height
0.85
3.60
Discussion: Alticola (s.l.) remaxi n. sp. possesses some features suggesting a relationship to the living representatives of the Asiatic genus Alticola and its allied forms (Anteliomys, Hyperacrius) (OGNEV, 1950; GROMOV, 1977).
The species form GD-4/s shows some resemblance to the extant A. vinogradovi Rasorenova (OGNEV 1950, Fig. 237, 2) in wich M/1 has broad communications between dentine fields, (except the posterior loop which is isodated) and re-entrants angles with rounded apices (lingual re-entrants are not curved forward and the external ones are only slightly bent anteriorly). The morphological variation seems to be rather marked in A. vinogradovi, the isolated dentine fields oscillating from 2 to 6 (OGNEV, 1950).
It must be emphasized that there are also similarities between A. remaxi n. sp. and the species of the genus Anteliomys. A. wardii Thomas possesses M/1 with rather abundant crowncementum and relatively broad confluences between the three dentine fields (GROMOV, 1977, Fig. 18).
Taking into account the peculiar morphology of the GD-5 material, we assign so far the enigmatical species from this site to· the genus Alticola (s.l.). At present, the species of Alticola are distributed in mountainous areas of central and northeastern Asia (OGNEV, 1950).
C. Rildulescu & P.-M. Samson
a a
Ellobius calabaei n. sp.
Type: a lower left molar {M/1) (coli. ISER, GD-2/s/0001) (Fig. 5.1).
Horizon and locality: middle part of upper ther·moclastic accumulation (GD-2/s.), Pe§tera Liliecilor (Bats Cave) at Gura Dobrogei, Vistema Valley, Central Dobrogea.
Dlstrlbudon: known only from type locality.
Age: part of the GD-2 phase belonging to the Late Cromerian and/or post-Cromerian times.
Etymology: from Calaba:us, a Latin name of Thracian origin for a river in the vicinity of the Greek city of Histria, identified hypothetically with the Casimcea River. ·

On some Middle Pleistocene rare small mammals
Diagnosis: the size of E. talpinus, but first molar possessing a broad communication between dentine fields and relatively short dentine tracts; anteroconid complex moderately developed, without prism-fold; LRA4 and BRA3 shallow.
Differential diagnosis: Although close morphologically to E. paleotalpinus Shevchenko from Kryjanovka. southwestern Ukraine (Odessan faunal complex, Early Pleistocene), the new species is· characterized by larger dimensions. In comparison with E. melitopoliensis Topachevsky, known from Tikhonova in association with primitive Arvicola fonns, Ellobius from GD-2 differs in having more symmetrical and less massive anteroconid complex; in addition, E. melitopoliensis is characterized by a very reduced anterobuccal re-entrant, a well-developed anterobuccal salient angle and the presence of a prism-fold (TOPACHEVSKY, 1973, Fig. 26, 12-13).
Compared with E. tschemojaricus Alexandrova from Nizhneye Zaimische on lower Volga River (ALEXANDROVA, 1976, Fig. 16) (found in association with Arvicola chosaricus Alexandrova distiguished by undifferentiated enamel thickness characteristic of the penultimate glacial cycle), E. calabaei n. sp. appears to be more primitive, possesing broader communications between the dentine fields; the shallow re-entrant angles of the paraconid complex in GD-2 specimen mark another distinction between the two species.
Measurements:
length (occlusal) 3.25
maximum length of the crown 3.40
width (occlusal) 1.20
anteroconid length 1.35
anteroconid width 1.10
width anteroconid neck 0.75
confluence between posterior lobe and T1 0.13
confluence between Tl-T2 0.34
confluence between T2-T3 0.30
confluence between T3 and anteroconid 0.21 complex
width posterior lobe 1.40
distal heigth of the crown 3.00
height posteroexternal dentine track 1. 70
height anteroexternal dentine track 2.50
heigth posterointernal dentine track 2.15
Descrlpdon and discussion: the occlusal face shows a broad confluence between Tl, T2 and T3; the communication is less marked between the posterior loop and Tl on the one hand and
171
between anteroconid complex and T3. The enamel is thick and uniform. The re-entrant angles of the anteroconid complex are shallow representing a diagnostic feature. The posteroexternal salient angle (BSA3) is practically deprived of prism-fold. The anteroconid complex is moderately developed in length. Judging from its morphology, the specimen under consideration is intermediate between E. paleotalpinus (of the Early Pleistocene) and extant E. talpinus. The new species is considered as representing a link (contemporary with Arvicola cantianus faunas of the Middle Pleistocene) in the true E. talpinus lineage. -
Microtus guentheri vistierensis n. ssp.
Type: a lower right molar (M/1) (coli. ISER, GD-4/s/0001) (Fig. 6.la).
Para type: a left upper molar (M3/) (coil. ISER, GD-4/s/0002) (Fig. 6.lb).
Horizon and locality: upper layers, Gura Dobrogei-4/s rock-shelter, Vistema valley, Central Dobrogea.
Distribution: known only from type locality.
Age: Middle Pleistocene phase within the penultimate glacial cycle (Rissian/Saalian).
Etymology: from Vistier, the name of a town (XVIth Century) in Central Dobrogea located in the vicinity of the fossiliferous sites.
Diagnosis: large-sized relict (?) population of M. guentheri (Danford & Alston) registering maximal values for the M/1 lengths. Anterior loop developed transversally displaying lingual (LSA6) and buccal · (BSA5) salient angles; T6 and T7 tending to become isolated; anteroconid complex with LRA5 and BRA4 well developed. M3/ with complex morphology presenting four buccal salient angles.
Dltrerentlal diagnosis: compared with Middle Pleistocene dental material known from Latomi-1, Chios (STORCH, 1975) and from Arnissa, Macedonia (MAYHEW, 1978) (Late Middle Pleistocene), the specimens of central Dobrogea are distinguished by their larger dimensions. On the basis of the material from GD-2/~ (Fig. x) and GD-4/s (Fig. x), M. guentheri appears to be characterized by a continuous increase of size. The species is unknown later than GD-4/s.
Measurements:
length (occlusal) (type)
length (occlusal) (paratype)
3.50
2.37

172 C. Rildulescu & P.-M. Samson
-·---% . ·.
99.9 ~9.8
99.5 99
95
84 80
70
so
1~--4-~~-+-+~--~+-1--r~-+~~r-r-+-~
as~+-4-~~-+~~--~-+-1--r-+-+~~r-r-+-~
a2~~~-L~~--L-~~-L~~~~~~-L~~--~ 2.52 2.66 2.80 2.94 3.08 3.22 . 3.36 ... 3~50 ) .64
·,·
Discussion: The aluilysed sample consists in 300 M/1 of fields voles belonging to M. cf. epiroticus (medium-sized form) (Fig. 6.2) on the one hand and to M. guentheri vistierensis n. ssp. on the other. (see Fig. 7 showing cumulative probability distribution of Mil lengths; it must be noted that the asymmetrical aspect is indicative of two distinct populations).
The range of variation of M. guentheri vistierensis n. ssp. is comprised, very probably, between 2.90 (probable lowest value) and 3.72 (highest observed value). The mean is placed around the value of 3.30. The fossil samples of M. guentheri from Latomi-'-1 and Arnissa show highest length
REFERENCES ALEXANDROVA, L., P. (1976) Rodents of Antbro
pogene of the European part of the USSR. (in Russian), Tr. GIN, 291, Moscow, pp. 1-HX>.
DUMITRESCU, M., SAMSON, P., TERZEA, E., RADULESCU, C. & GIDCA,.M. (1963) Pe~tera "La Adam", stapune pleistocenll. Lucr. lnst. Speol. "E. Racovi¢", 1-U, pp. 229-284.
_ GROMOV, 1., M. (1963) Mammals in the fauna of the SSSR (in Russian) in GROMOV, 1., M., GUREIEV, A., A., NOVIKOV, G., A., SOK-
3
values equaling 3.50 and 3~51 respectively. A sample (N=10) of extant subspecies M. guentheri hartingi Barrett-Hamilton shows a rather limited observed range (3.10-3.25) (ONDRIAS, 1965).
At present M. guentheri is distributed in Greece, southern Yugoslavia, southern Bulgaria, Anatolia and Israel reaching North Africa (Libya). Central Dobrogea represented the northernmost extension of fossil M. guentheri during its history. The evolutionary stage of the species present suggests that this dispersal was coincident with a phase of the penultimate glacial cycle. ·
OLOV, 1., L., SI'RELKOV, P., P. · & CHAPSKY, K., K., 1, Publ. House Acad. Sc. USSR, Moscow-~ningrad, pp. 244-638.
GROMOV, . I., . M. (1977) Mammals, Voles (Microtiliaef(m Russian) in GROMOV, 1., M. & POLYAKOV, I., I., Fauno of the SSSR, lll, 8, Publ. House "Nauka .. , Leningrad, pp. 1-399.
MARKOV A, A., K. (1990) The sequence . of Early · · · Pleistocene small-mammal fauna ··from the
. ' South Russian Plain. QuartlJrpallJontologie, 8, pp. 131-151. ..

On some Middle Pleistocene rare small mammals
MAYHEW, D., F. (1978) Late Pleistocene small mammals from Arnissa (Macedonia, Greece). Proc. Kon. Ned. Alcad. Wetensch. Amsterr:lam, B, 81, 3, pp. 302-321.
MEULEN, A., J., van der (1975) Middle Pleistocene smaller mammals from the Monte Peglia (Orvieto, Italy) with special reference to the phylogeny of Microtus (Arvicolida:, Rodentia). Quatemaria, 17, pp. 1-144.
OGNEV, S., I. (1950) Mammals of the USSR and adjacent countries (in Russian). 7. Publ. House Acad. Sc. USSR, Moscow-Leningrad, 706 p.
RADULESCO, C. & SAMSON, P. (1973) Sur ladecouverte d'une es~e nouvelle de Murlde {Rodentia, Mammalia) dans le Pleistocene moyen de Roumanie. Rev. Roum. Biol.zoologie, 18, 3, pp. 185-187.
RADULESCO, · C. & SAMSON, P. (1976) Sur quelques rongeurs (Rodentia, Mammalia) du Pleistocene moyen et superieur de Dobrogea (Roumanie). Trav. lnst. Speol. "E. Racovitza", XV, pp. 171-189.
RADULESCO, C. & SAMSON, P. (1977) Arvicola (Rodentia, Mammalia) dans le Pleistocene moyen de Roumanie. Trav. lnst. Speol. "E. Racovitza", XVI, pp. 151-162.
RADULESCO, C. & SAMSON, P. (1986) Les micromammiferes du Pleistocene moyen de Gura Dobrogei-4 (dep. de Constanta, Roumanie). Trav. Inst. Speol. "E. Racovitza", pp. 67-83.
RADULESCU, C. & SAMSON, P.-M. (1994) Dental morphology of the Mimomys/Arvicola transition forms. Theor. Appl. Karstol., 7, pp. 199-206.
173
SALA. B., MASINI, F. & TORRE, D. (1994) Villanyian arvicolids from Rivoli Veronese, a karst fissure in the Agide Valley, Northeastern Italy. Bol. Soc. Paleontologica Italiano,_ 33, (1), pp. 3-11. .
SAMSON, P. (1971) La stratigraphie du Quaternaire superieur en Roumanie. VIlle Cangr~s INQUA, Paris 1969. Etudes sur le Quaternaire dans le Monde.
SAMSON, P. (1976) Les Equides fossiles de Roumanie (Pliocene moyen - Pleistocene superieur). Geologica Romano, 14, pp. xx-xx.
STORCH, G. (1975) Eine mittelpleistozine Nager-Fauna von der Inset Chios, Agais (Mamma1ia: Rodentia). Sencunbergiana bioi., 56, 416, pp. 165-189.
TOPACHEVSKY, V., A. (1965) Insectivores and rodents of the Late Pleistocene fauna at Nogaisk (in Russian). Publ. Honse "Naukova Dumb", Kiev, pp. 1-163.
TOPACHEVSKY, V., A. (1973) Rodents of the Tamanian faunal complex of Crimeea. (in Russian). Publ. House "Naukova Dumka", Kiev, pp. 1-235.
TUTKOV A, L., A. (1988) Clethrionomys mirus Sa vinov et Tutkova, 1987 in the rodent fauna of eastern Kazakhstan. (in Russian). Materials on the History of Fauna and Flora of Kazakhstan, 10, Publ. House "Nauka" of Kaza.kh SSR, pp. 94-98.
ZAGWUN, W., H. (1992) The beginning of the Ice Age in Europe and its major subdivisions. Quat. Sci. Rev., 11, pp. 583-591.


SHORT NOTES
Stalactites displaying a specific split along the longitudinal axis occurred quite often. The tension forces induced by a volume contraction is responsible for the axial splitting. Such effect due to the recrystallization and contraction of speleothems determines their final morphology.
The stalactites can be mechanically affected by earthquakes (SCHILLA T, 1969), gravitational collapses, (PRINZ, 1908) frost shattering (POV AHA & DIACONU, 1974 ).
We found "in situ" stalactites and broken fragments displaying a specific fissure along the longitudinally axis, which certainly can not be satisfactorily explained by above mentioned factors.
15 natural split stalactites from nine caves were considered. The caves are very different concerning geology, geomorphology and local climate. One is now entirely underwater and two are geodetype caves, so no correlation between the fractured stalactites and special speleothems occurrence or the local envifonment could be used in order to explain them. 14 samples of broken fragment were cut and polished. The following observations were made:
1. All stalactites are split parallel with the long axis.
The open splits dimensions are: 9 mm wide in one case, 0,5-1 mm wide for five samples, less than
Split stalactites.,
Cristian LASCU1
0,1 mm wide for the other six stalactites. Except one situation, all the stalactite radial thickness is split from the peripheral surface till the central growing origin (Fig. 1).
2. The crack has a radial position or has a diametric cross section (Fig. 2a).
In all situations the crack is located near the reduced thickness section were the broken force was minimal. In most cases, the growing rings have an asymmetrical geometry as referred to the growth axis.
3. Most crack walls have a crude aspect, like a broken glass, without a transition between the void and the neighbor area. In one case, a close examination indicates a secondary corrosion of the internal crystal caps exposed by the fracture space. A thin film of clay is present in some of the fissures.
4. Two cracks were welded by a late callous-like deposition which can be easy recognized because of the calcite veins, pop-com buttons, or small helictites positioned along the old cracks on the stalactite surface.
5 . 12 samples are calcite stalactites and two are aragonitic stalactites (Fig. 3).
6. Normally the cracks are linear, from basis to peak. In one case we can see a migration of the radial position of the crack along the growth axis.
- ·~ I:-· ' I -'•
. ;.·,·
. ~,='

Split stalactites 176
QG) THE ORIGIN OF THE SPLIT ·
The split stalactites are rare features but their occurrence is high enough to make us reflect about the common cause which produced them. ;,.~- .
Discussing the stalactites fonnation, WHITE (1976) mentions as a common fact,· the wedge shaped grains oriented with C axes · perpendicular to growth axes. Many other authors refer to the prismatic radial crystals as a ubiquitous stalactite component, but they .are considering the prismatic radial crystals slowly generated · simultaneously · with the stalactite growing process. HILL & FORTI (1986) admit 6 possible stages in the evolution of mono-crystalline and macrocrystalline stalactite in conjunction with different changes which occurred during stalactite formation. In the final stage of stalactite formation, "both the cave and the stalactite become drier, growth bands become closer together and uneven, and the tree-ring-like cross section of nonnal stalactite is producecf'. (By an obvious editing mistake, the term "stalagmite" is misused instead of "stalactite" twice in the original text). Admitting such late transformations in certain different conditions, we must analyze a given speleotheme structure both as a result of initial growing factors and the late post-genetic processes.
·~ .•.
In three cross-sections in the stalactites we studied, we could see that the crack affects the crystallized areas only. These areas have a typical prismatic structure and are translucent for light. As opposed to this prismatic structure areas, the non split areas represent a crypto-crystalline, porous mass, opaque for the light.
In fact, in the stalactite history there were periods of time with a rapid feeding inflow and fast growing. Less crystallized calcite,_ even porous material, was deposited in an anarchic, less compact structure.-· The late changes in the cave environment favored the carbonate grains recrystallization in a more compact spatial network. In some cases the water loss could also have played a role in stalactite volume condensing (Fig. 3).
The tension forces induced by a volume contraction is, in our opinion, responsible for the axial splitting of the stalactites. (Such forces can exceed 1000 kgf/cm2 or s"veral tones for the all splitting area, being similar and comparable in value with the forces induced by dehydration or dilatation. (-, 1950). Recrystallization mostly affects homogeneously and simultaneously the entire volume of the stalactite. This result in even distribution of the tensions in the stalactites and splitting does not occur.
177
Non homogeneous recrystallization occurring simultaneously in the entire volwne may explain most common, linear splitting while non homogeneous recrystallization evolving in time along the growth axis may explain a helycoidal splitting pattern as observed in a singular case. (Fig. 2b)
Studying the morphological features of some phreatic speleothems in Majorca, GINES et al. (1981) were very close to this explanation when they considered the "autofracturing" of many of the · concretions as a consequence of aragonitecalcite inversions which occurred during the cave evolution.
SIGNIFICANCE OF THE SPLIT STALACTITES
I. The mechanical effect of the contractions due to the recrystallization and volume contraction of the
BIBLIOGRAPHY GINES, J., GINES, A. & POPAR L. (1981) Morpho
logical and mineralogical features of phreatic speleothems occurring in coastal caves of Majorca (Spain). Proceedings of the 8th Int. Congr. Spleology, 530 p.
HILL, C . & FORTI, P. (1986) Cave minerals of the world. NSS Inc. Bookstore, Huntsville, 172 p.
KENDALL, A., C. & BROUGHTON, P., L. (1978) Origin of fabrics in speleothems composed of columnar calcite crystals. J. Soc. Petrol, 48, p. 519.
LATHAM, A., G. & SCHWARCZ, H., P. (1989) Dating of contaminated travertines. Proc. Int. Congr. Speleo., Budapest, p. 80.
C. Liueu
speleothems may have a more important role ~ weasswned. Some cracked stalagmites too and sinte.r or flowstones exfoliation can be associated ·with this effect. 2. While in some cases the aligned deposition of pop-com fonnations and helictites show welded cracks, in many other cases the cracks are opened to seeping water (MOORE, 1958) and are coated with fine clay. This i~ an indication that the geochemical system of the stalactite internal core was opened for some period of time. In order to avoid the juvenation of the age, Uffh dating sampling should be done with appropriate caution (LATHAM & SCHWARZ, 1989).
ACKNOWLEDGEMENTS We thank Dr. S.-E. Lauritzen and Dr. G. Diaconu for suggestions, M. Gligan for providing samples, M. Baciu for drawings and F. Baciu for English version.
MOORE, G., W. (1958) Role of earth tide in the formation of disc-shaped cave deposits. Atti II Int. Congress Speleo., Bari-Lecce, p . 505.
POV ARA, I. & DIACONU, G. (1974) Deroulement du processus de gelifraction dans le milieu souterrain. Trav. Inst. Speol. "E. Racovitza", XIIL pp. 139-146.
PRINZ, W. (1908) Les· cristallisations des grottes de Belgique. Nouv. Mem. Soc. Beige. Geol. , ll, p. 65.
SCHILLAT, B. (1969) Erscheinungsformen von gebrochenen Sinter. Abh. V Int. Kong. Spelaeo/. , Stuttgart, p. 14. (1950) Formular matematic si tehnic. Ed. Tehnic!, Bucure§ti.


Precisions sur les Arvicola terrestris [Linnceusl [Rodentia~ Mammalia] du dernier
cycle glaciaire de Roumanie
Le materiel d' Arvicola examine par nous provient de la grotte "Pe~tera. Muierilor" de Baia de Fier (dep. de Gorj) en Oltenie et de Dealul Burzau (commune de Tinea, dep. de Bihor) dans le secteur nord-ouest de la Roumanie.
"Pe~tera Muierilor" de Baia de Fier est une grotte amenagee, introduite dans le circuit touristique. Son importance au point de vue scientifique reside dans les industries du type paleolithique moyen (Mousterien) et superieur (attribuee i\ un facies de 1' Aurignacien moyen) (NICOLAESCU-PLOPSOR, 1957), ainsi que dans les ossements de gros mammiferes, carnivores en particulier, dont la majorite ecrasante se rapportent a 1' ours des cavernes (BOMBITA. 1956). Outre cela, le niveau mousterien a fourni des restes humains panni lesquels un crane et une mandibule (NICOLAESCUPLOPSOR, 1957), attribues a Homo sapiens jossilis. II convient de rappeler que cette decouverte a ete accueillie avec beaucoup de reserve (NECRASOV, 1971).
Les micromammiteres de "Pe~tera Muierilor" sont encore peu connus. Quelques mandibules du campagnol des neiges, Chionomys nivalis (Martins), ont ete etudiees par TERZEA ( 1972). Ces vestiges, associes a Cricetus cricetus (Linnreus), Microtus agrestis (Linreus) et Ochotona pusilla (Pallas), proviennent de la couche loessique a eboulis massif qui recouvre les niveaux a industrie du Paleolithique superieur, mis en evidence a !'entree de Ia grotte.
Les collections de 1' Institut de Speologie "Emil Racovit~" contiennent des restes d' Arvicola terrestris provenant du meme secteur de fouilles. Le materiel consiste en neuf premieres molaires inferieures (M/1). La couche mousterienne qui apparait dans la tranchee transversale a l'interieur de la grotte (NICOLABSCU-PLOPSOR et al., 1957) a
Alexandra-Cristina PAUNESCU1
fourni quelques restes de rongeurs refermant C. cricetus, A.terrestris (trois mandibules) et M. arvalis (Pallas) (RADULESCU & SAMSON, 1993). A des fins comparatives, nous avons utilise une vingtaine de. mandibules d' A. terrestris en provenance de Dealul Burzau, gisement fossilitere situe au point de vue chronologique soit a Ia charniere Wiirm IIIIII, soit dans une phase clemente du debut du Wiirm III. Precisons que ces subdivisions du dernier cycle glaciaire correspondent a la chronologie des auteurs fran~ais (JURCS.AK et al., 1982).
Etant donne les discussions concernant la signification chronologique des representants du genre Arvicola (HEINRICH, 1990) qui soot consideres comme un veritable "chronometre" depuis son apparition vers la fin du "Complexe Cromcricn" (Pleistocene moyen), il nous a paru interessant d'etablir les rapports probables entre les echantillons fossiles de Roumanie et les populations d'Arvicola de Ia derniere glaciation d'Europe centrale, etudiees par HEINRICH ( 1990).
Nous rappelons que les molaires d' Arvicola soot caracterisees pendant Je Wiirm par I' accentuation de l'epaisseur de Ia bande d' email anterieure des triangles qui composent le dent. L'evaluation de l'epaisseur de !'email a ete effectuee d'apres les methodes de HEINRICH (1990) qui impliquent treize mesures pour chaque M/1. Les quotients SDQ ("Schmelzband-Differenzierungs-Quotient")
1 ont ete calcules sur chaque Mil (SDQ)et pour l'ensemble de l'echantillon (SDQP). Mentionnons que SDQP chez A. terrestris est inferieur a 100. Une mise en parallcle de nos echantillons (SDQP) et des stations a A. terrestris d'Europe centrale qui nous ont servi de termes de reference (HEINRICH, 1990) est presentee dans le Tableau I .
1. Institutul de Speolog(e ~'ElnilRacovitl1', str. Frunibasa II, R ~78 114 Bu~\Ire§ti, Romania.

180
Tableau 1.
Euerwanger Biihl H (Allemagne) Dealul Buwu (R.oumanie) Baia deFier (Wiirm superieur) (Roumanie) Kemathenhohle (Allemagne) Istall6sko (Hongrie) . Baia deFier (Wiirm inf~rieur) (R.oumanie) Subalyuk (Hongrie) Tata (Hongrie)
L'examen des valeurs de SDQP nous permet de formuler quelques conclusions. La premiere conclusion fait ressortir un rapprochement entre Ie materiel du Wfi.rm inferieur (Mousterien) de Baia de Fier et la grotte de Subalyuk en Hongrie. La seconde conclusion montre que les pieces dentaires du Wtinn superieur de Baia de Fier et de Dealul Burzau se situent entre les stations allemandes de Kemathenhohle (-31.459 B.P.) et de Euerwanger
BIBLIOGRAPHIE
BOMBffA, G. (1956) Mammiferes des couches glaciaires des cavernes de Baia de Fier. Resultats pal~ontologiques des fouilles de 1951. Rev. Bioi., l, 1, pp. 229-250.
HEINRICH, W.-D. (1990) Some aspects of the evolution and biostratigraphy of Arvicola (Mammalia, Rodentia) in the Central European
. Pleistocene. Int: Symp. Evol. Phyl. Biostr. Arvicolids (FEJFAR & HEINRICH Eds.), Geol. Survey, Pra~e, pp. 165-182.
JURCSAK, T., RADULESCO, C. & SAMSON, P. · (1982) Les mammiferes du Wfum de Dealul Burz!u. I. Rodentia. Nymphaea, 10, pp. 151-170.
NECRASOV, 0. (1971) Originea ji evoluJia omului. Ed. Acad. Rom., Bucure§ti, 276 p.
-31.459 -36.417
-99.400 .
83,03 84,65 88,50 89,23 89,54 94,60 96,43 99,22
A.-C. Pdunescu
Biihl H (-26.500 B.P.) respectivement. La population de Dealul Burzau serait, semble-t-il, en jugeant par la morphologie de_ M/1, un peu plus recente que celle du Paleolithique superieur de Baia deFier, constatation en accord avec la situation de Dealul Burzau dans une phase de la premiere partie du Wtinn III des auteurs fra.n~ais (JURCSAx et al., 1982).
NICOLAESCU-PLOP~OR, C., S. (1957) Le Paieolithique dans Ia R~publique Populaire Roumaine a Ia lumiere des dernieres recherches. Dacia, 1, pp. 41-60.
NICOLAESCU-PLOP~OR, C., S. et al. (1957) ~antierul arheologic Baia de Pier. Mat. Cercet. Ark,3, pp. 13-27. ·
RADULESCU, C. & SAMSON, P.-M. (1993) Small mammals of the penultimate glacial cycle (Saale/Riss) discovered in two caves from NW Oltenia, Romania. Theor. Appl. Karst., 5, pp. 203-211.
TERZEA, E. (1972) Remarques sur Ia morphologic dentaire et Ia repartition de Microtus nivalis Martins dans le Pleistocene de Roumanie. Trav. Inst. Speol. "Emile Racovitza ", 11, pp. 271-298. .

INFORMATION FOR CONTRIBUTORS
Papers may be submitted for publication as Articles (up to 15 pages) or as . Short Notes (up to 5 pages). Larger articles, i.e. Synthesis or Reviews may also be published but the subject and contents of these should be discussed first with the Editorial Board. In any case, priority will be given to the papers presented at the previous annual Symposium of Theoretical and Applied Karstology.
Manusc:rlpts must be submitted in English or French, if possible on a floppy-disk (IBM-compatible foonat) accompanied by two paper-copies. Typed manuscripts will be double-space typed on one side of the paper, with no more than 2000 characters/page (31 lines/page; 67 charac:tersJline). Papers should be headed by the title and the author(s) full name(s). The complete address of the author(s) will be listed on a separate sheet. If more than one author, please underline the name and address of the person to whom the correspondence and proof should be sent.
An abstract in papets language should be placed directly after the title and author(s)' name(s), followed by the key-words. These will be followed by the translation of the title, abstract and key-words in the other language of the volume (English if the paper's language is French and French if the papets language is English).
Acknowledgements should be placed at the end of the text, after the heading ·Acknowledgements, before the references.
Mathematical equations should be numbered in consecutive order throughout the text, using Arabic numbers.
The footnotes are to be consecutively numbered with exponential numbers and double-space typed on a separate sheet
References cited in the text (and only these) should be listed. in alphabetical order, on (a) separate sheet(s), after the heading REFERENCES/BIDLIOGRA-
. PillE, taking for example this issue of TAK References should be cited in the text in parentheses, in capital letters, by the name(s) of author(s) followed by the year of publication, e.g. "(AHRENS, 1962)" except when the authots name is part of the sentence, e.g. "AHRENS (1962) has shown that ... ". When reference is made more than once to same author and year a, b, c, etc. should be added to date in the text and reference list. If there are more than two authors it is in order to put "et al." behind the frrst name, e.g. "(KLEIN et al., 1988)".
Tables are to be numbered in Arabic numerals in order of their appearance within the text, e.g. "Table 1". Each table must be submitted on a separate sheet(s). If the table has a title and/or a legend these must be translated in both volume's languages.
Figures (maps or line drawings in black Indian ink on transparent paper) · should be prepared in anticipation of reduction; small symbols or fine details may
reproduce poorly. The authors are requested to limit the size of their illustrations as much as possible. The original figures must not exceed 31 x 20 em. The number of folded figures being limited, only ONE figure exceeding this size will be, as an exception, accepted.
Plates and text-figures should be numbered consecutively, with Arabic numerals, in order of appearance. The top of the figure should be indicated whenever exists any possibility of ambiguity. Please indicate in the manuscript where the caption-figure or group of figures is to be inserted.
The captions and explanations of the figures will be doubled-spaced typed on a separate sheet, in both volume's languages.
Authors bear sole responsibility for the content of their contribution. The Editorial Board reserves the right to refuse any manuscript submitted if
the subject is out of the volume's topics and to m,ake suggestions and modifications before publication. The authors are requested to pay special attention to the accuracy of the figures or photographs. The manuscripts of the refused papers will NOT be returned.
Papers accepted by the Editorial Board will become the property of the Publisher. No article or any part thereof may be reproduced in whatever form without the written permission of the Publisher.