Office of Utility Regulation - Guernsey Competition ...
45
Office of Utility Regulation Audit of Emissions from Radio Masts __________________________________ Information Notice Document No: OUR 08/13 July 2008 Office of Utility Regulation Suites B1 & B2, Hirzel Court, St Peter Port, Guernsey, GY1 2NH Tel: (0)1481 711120, Fax: (0)1481 711140, Web: www.regutil.gg
-
Upload
khangminh22 -
Category
Documents
-
view
0 -
download
0
Transcript of Office of Utility Regulation - Guernsey Competition ...

Office of Utility Regulation
Audit of Emissions from Radio Masts
__________________________________
Information Notice Document No: OUR 08/13 July 2008
Office of Utility Regulation Suites B1 & B2, Hirzel Court, St Peter Port, Guernsey, GY1 2NH Tel: (0)1481 711120, Fax: (0)1481 711140, Web: www.regutil.gg

Contents
1. Introduction......................................................................................................................4
2. Structure of this Report ..................................................................................................6 2.1 The Auditors .............................................................................................................6
3. Background.......................................................................................................................7 3.1 Radio Emissions from Radio Masts ......................................................................7 3.2 Publication of the Results .......................................................................................8
4. Guidelines for Emission Levels......................................................................................9 4.1 Relevant Bodies........................................................................................................9
4.1.1 The International Commission on Non-ionizing Radiation Protection (ICNIRP) ..................................................................................................................9 4.1.2 The UK’s Health Protection Agency .......................................................10 4.1.3 The European Committee for Electrotechnical Standardisation (CENELEC) ............................................................................................................ 11 4.1.4 The World Health Organisation (WHO) ................................................ 11
4.2 Approach to Setting Limits...................................................................................12 4.2.1 The concept of precautionary limits ....................................................... 12 4.2.2 Science-based limits................................................................................ 13 4.2.3 Differences in the science-based approaches ......................................... 13 4.2.4 Short-term versus long-term effects....................................................... 15 4.2.5 Enforcement of limits ............................................................................. 15 4.2.6 The Guernsey audits ............................................................................... 15
4.3 Recommended Benchmark Levels ......................................................................16 4.3.1 Reference Electric Field Strength Levels................................................ 16 4.3.2 Basic Restriction Levels .......................................................................... 16 4.3.3 Minimum clearance distance from antennas ......................................... 17 4.3.4 Cumulative exposure quotient................................................................ 19
4.4 Conclusions.............................................................................................................20
5. Sites in the Bailiwick of Guernsey ...............................................................................21 5.1 Cellular Operators’ sites........................................................................................21 5.2 Fixed links sites ......................................................................................................23 5.3 Other sites ...............................................................................................................24
6. Operators Processes and Procedures ..........................................................................26
7. Results of the Site Audits ..............................................................................................27 7.1 Survey Methodology ..............................................................................................27
© Office of Utility Regulation, July 2008 2

7.2 Field strength Levels .............................................................................................27 7.2.1 Cellular Operators’ sites..........................................................................27 7.2.2 Fixed link operator (Newtel)................................................................... 31
7.3 Antenna Accessibility and Site Signage ..............................................................32 7.3.1 Antennas that are disguised....................................................................32 7.3.2 Antennas with easy access ..................................................................... 34 7.3.3 High power antennas that have low height ............................................35 7.3.4 Site signage............................................................................................. 36
8. Summary of Recommendations and Conclusions ....................................................39
© Office of Utility Regulation, July 2008 3

1. Introduction In February 2005, the OUR published its first full audit of all mast sites operated by licensed operators and the details of that audit were made public in a document entitled “Audit of Emissions from Radio Masts in Guernsey: Report and Information Notice; OUR 05/05R”). This full audit was followed later in 2005 by a smaller sample audit of 14 sites undertaken for the OUR by Ofcom, the UK regulator. In both audits all sites complied fully with the guidelines applied, the International Commission for Non-Ionising Radiation Protection’s (“ICNIRP”) guidelines. Since then there has been a number of developments in the wireless market but most particularly in the mobile market. The arrival of Airtel-Vodafone (“Airtel”) along with the continued development of the mobile networks of C&W Guernsey (“C&WG”) and Wave Telecom (“Wave) has resulted in both more mast locations compared to 2005 but also a higher concentration of equipment in almost half the sites as mast sharing has increased. All operators in the telecoms markets, whether providing fixed or mobile services, are required to comply with certain obligations laid out in the form of their duties under the various applicable laws, such as the Regulation of Utilities (Bailiwick of Guernsey) Law 2001 (“Regulation Law”) and the Telecommunications (Bailiwick of Guernsey) Law 2001 (“Telecoms Law”). Further, the licence conditions that operators are required to comply with also include conditions designed to protect consumers and the environment. Of particular relevance in the context of this audit is the condition which covers the requirement of all operators to ensure that emissions from any radio sites operated or controlled by a licensee complies with the highest internationally accepted standard with respect to the levels of emissions. This condition states that:
“The Licensee shall ensure that non-ionising radiation emissions from its Licensed Telecommunications Network are within the limits specified by the guidelines published by the International Commission for Non-Ionising Radiation Protection (ICNIRP) and that it complies with any radiation emission standards adopted and published from time to time by ETSI, the European Committee for Electrotechnical Standardisation and any other standards specified by the DG.”
The OUR believes it is important that the operators’ compliance with their obligations be assessed and the results of that assessment made public. In the DG’s opinion it is the publication of the results of the individual site audits which will help provide as much reassurance as possible to the public on the degree to which radio equipment operated by the telecoms operators comply with standards designed to ensure the safety and wellbeing of those living close to such sites.
Therefore this audit has involved a number of separate tasks. These included:
• An audit of emission levels for each operator at each site utilised by that operator;
• An assessment of the cumulative emission levels at sites that are shared by more than one operator;
• A review of the operator’s processes and procedures for ensuring on-going compliance;
© Office of Utility Regulation, July 2008 4

• An assessment of the appropriate safety guidelines against which compliance should be assessed; and
• The publication of the results of the individual site audits so that the fullest information possible can be made available to the general public.
The main conclusions from this audit are that:
• The ICNIRP guidelines remain the most appropriate standard against which to assess emission levels in Guernsey;
• Emission levels from all sites comply with the ICNIRP guidelines;
• The effect of site sharing has led to higher emission levels at individual sites but the cumulative emission levels are still below the ICNIRP reference levels;
• Operators have appropriate processes and procedures in place to ensure on-going compliance, although some sites at the time of the audit did not have appropriate signage in place to alert the general public to the fact that RF equipment was in operation (although this has since been addressed by the operators concerned);
• Two sites are at heights that allow for easier access by the general public to the antennae equipment than considered appropriate. The OUR will be asking the operators concerned to consider, in consultation with the relevant planning authorities, how this might be addressed.
The OUR is aware there is likely to be further developments in the use of wireless technology in the Bailiwick, both in the fixed and mobile markets. The DG will therefore undertake further sample audits of approximately 15 sites in Summer of 2009 and 2010 to monitor on-going compliance. Given the very low level readings from the non-mobile operators’ sites, the DG intends that the audits in 2009 and 2010 will focus solely on the mobile operators. The individual site reports are available on the OUR’s website – www.regutil.gg – and an overview of the location and summary information on each site can be found on Digimap – http://maps.digimap.gg/masts/. The Digimap information contains site location information, a picture of the mast structure and summary emission level information.
© Office of Utility Regulation, July 2008 5

2. Structure of this Report The rest of this paper is structured as follows:
Section 3: Describes the background to the audit and details how members of the public may access further information on the detailed results of the audit;
Section 4: Sets out the DG’s assessment of the appropriate standard against which emissions should be assessed;
Section 5: Sets out the summary result of the audit of each mast site including the cumulative result;
Section 6: Details the results of the audit of the individual operators’ processes and procedures for ensuring compliance with their licence obligations;
Section 7: Summarises the issues identified by the audit and the recommendations arising from the review; and
Section 8: Sets out the conclusions and further work in relation to future on-going compliance
The DG would like to thank all operators for their co-operation and assistance to both the OUR and to Red-M, the consultants engaged by the OUR to undertake this audit.
2.1 The Auditors The audit has been undertaken on behalf of the OUR by Red-M. Red-M is independent of operators and equipment vendors and provides a range of services connected with the provision of telecommunications services, with particular emphasis on mobile cellular systems. It has provided services to a range of clients including cellular operators, cellular equipment manufacturers, local councils and private individuals.
© Office of Utility Regulation, July 2008 6

3. Background The OUR was established in October 2001 to regulate the telecommunications, post and electricity sectors in Guernsey independently from the companies and from the States of Guernsey. Among the objectives of the OUR is the requirement set out in the Regulation Law to
“ensure that utility activities are carried out in such a way as to best serve and contribute to the economic and social development and well-being of the Bailiwick” and to “lessen where practicable, any adverse impact of utility activities on the environment”.
These general duties are further reflected in the licence conditions under which all telecoms operators provide services. In particular, a specific licence condition has been included to cover the management of radio based networks, of which the most common are mobile networks and point-to-point links. These are the most prevalent radio based networks in the Bailiwick. This licence condition states that:
“The Licensee shall ensure that non-ionising radiation emissions from its Licensed Telecommunications Network are within the limits specified by the guidelines published by the International Commission for Non-Ionising Radiation Protection (ICNIRP) and that it complies with any radiation emission standards adopted and published from time to time by ETSI, the European Committee for Electrotechnical Standardisation and any other standards specified by the DG.”
To ensure that operators are in compliance with their licence obligations, the DG has undertaken an audit of operators using radio spectrum in the Bailiwick and assess emission levels from infrastructure in place and operational during April 2008. Sections 4, 5 and 6 set out the DG’s conclusions on the appropriate guidelines to be following in assessing emission levels, the findings of the audit of mast sites and reports on the processes and procedures in place by the telecoms operators.
3.1 Radio Emissions from Radio Masts All radio waves are electromagnetic (“EM”) waves which are composed of electric and magnetic fields. These waves are described as ‘non-ionising radiation’ as distinct from the ionising radiation produced by radioactive sources.
Exposure to EM waves is measured in terms of the electric and magnetic field strengths which are produced by a transmitter at locations which could be accessed by the public. The electric field strength, E, is measured in volts per meter [V.m-1]. The power which could be absorbed by an object at a given location is proportional to the area of the object multiplied by the square of the electric field strength.
We are all regularly exposed to EM radiation from a variety of sources. Besides mobile phone systems, common sources of radio waves include television broadcasts which in the Bailiwick
© Office of Utility Regulation, July 2008 7

(and the UK) operate at frequencies between 400 MHz and 860 MHz and microwave communication links (dishes) which usually operate at frequencies above 1000 MHz.
The potential health impact of EM fields has been studied for many years. The increase in the usage of mobile phones has caused an increased public concern in this area, with the result that a number of bodies have been set up and tasked with overseeing research into such effects. The conclusions from these investigations are used to set regulatory limits on field exposure which reflect a precautionary principle based on the current state of knowledge. This is discussed further in section 4.
3.2 Publication of the Results It is important to the DG that the public has confidence in the ability of the licensed telecoms operators within the Bailiwick, and in particular those using radio spectrum as part of their networks, to manage those networks for the good of all and that their networks are in compliance with the highest possible standards. In order to help promote confidence and to reassure the general public, the DG is publishing full details of this audit. The summary details of the individual site audits are set out in section 5. The actual individual site reports are available from the OUR free of charge either by following the link on the OUR website – www.regutil.gg – or by contacting our Office. In addition summary details on each site, which shows the location, description and summary results of the emission levels can be found on the Digimap website –http://maps.digimap.gg/masts/. You may contact the OUR either by:
• phone – 711120 • email – [email protected]
specifying the site report you are interested in and the name and address to which you would like the report sent. Alternatively we will be happy to email you a copy should you prefer.
© Office of Utility Regulation, July 2008 8

4. Guidelines for Emission Levels
Part of this audit also consisted of reviewing latest progress on guidelines with respect to maximum exposure levels to electromagnetic radiation and to recommend benchmarking levels against which the site audit will be compared. The DG is aware that, in the context of public concern on the erection of new base stations over the past year, concern has been raised about what are the appropriate guidelines for exposure levels against which to require the telecoms operators to comply.
Currently, the OUR requires operators, under the terms of their licences, to comply with the ICNIRP guidelines. The OUR has asked its advisors to assess the various standards that are utilised in a number of countries and assess the rationale for those standards and comment on whether Guernsey should consider amending the guidelines to operators on exposure levels from base stations.
This report contains the results of that review together with Red-M’s recommendation for benchmark levels.
4.1 Relevant Bodies
All radio waves are electromagnetic waves, which are composed of electric and magnetic fields. These waves are referred to as ‘non-ionising radiation’ as distinct from the ionising radiation produced by radioactive sources.
The potential health impact of EM fields has been studied for many years by both civil and military bodies. The increase in the usage of mobile phones has caused an increased public concern in this area, with the result that a number of bodies have been set up and tasked with overseeing research into such effects.
The conclusions from these investigations are used to set regulatory limits on field exposure which reflect a precautionary principle based on the current state of knowledge.
The following are a list of the relevant bodies involved in the set-up of guidelines with respect to EM exposure which we believe are most relevant to any consideration by the OUR of this matter.
4.1.1 The International Commission on Non-ionizing Radiation Protection (ICNIRP) ICNIRP is an independent non-governmental scientific organization, for the World Health Organization and the International Labour Office, responsible for providing guidance and advice on the health hazards of non-ionizing radiation exposure1. After examining available research, ICNIRP issued guidelines for limiting potential hazard from EM exposure in 19982. These guidelines are reviewed on an ongoing basis as part of the assessment of the state-of-the-art research into exposure to EM radiation, but no update of the guidelines has been proposed since that date. 1http://www.icnirp.de/ 2 International Commission on Non-Ionizing Radiation Protection, “Guidelines for limiting exposure to time-varying electric, magnetic, and electromagnetic fields (up to 300GHz), Health Physics, vol. 75, no. 4, pp. 494-522, April, 1998.
© Office of Utility Regulation, July 2008 9

Figure 1 shows the reference levels for public and occupational exposures in the range 100kHz to 10GHz.
ICNIRP Reference Levels [V/m]
10
100
1000
0.1 1 10 100 1000 10000Frequency [MHz]
Elec
tric
fiel
d st
reng
th [V
/m]
General public [V/m]
Field workers [V/m]
Figure 1 ICNIRP Reference Field Strength Levels versus frequency for public (blue line) and occupational (red line) exposures
4.1.2 The UK’s Health Protection Agency
The HPA3 is an independent UK statutory body, with areas of interest in the health protection of UK citizens.
The HPA’s limits on human exposure to EM fields were first published4 by the ex-National Radiological Protection Board (NRPB) in 2004, and following a thorough review of the scientific evidence5 available to that date and an extensive consultation exercise6, the HPA revised its guidelines on the exposure limits to coincide with those of ICNIRP. This was made clear in their latest report, published in the same year, in which they concluded that:
“The review of current scientific knowledge, the adoption of a cautious approach to the interpretation of these data, and a recognition of the benefits of international
3 http://www.hpa.org.uk/radiation 4 National Radiological Protection Board, “Restrictions on Human Exposure to Static and Time Varying Electromagnetic Fields and Radiation: Scientific basis and recommendations for the implementation of the Board’s Statement”, Documents of the NRPB, Volume 4 no. 5, 1993. 0-859-513661 5Review of the Scientific Evidence for Limiting Exposure to Electromagnetic Fields (0-300GHz), Documents of the NRPB, vol. 15 No. 3 (2004). 6 Proposals for Limiting Exposure to EM Fields (0-300GHz): Summary of comments received on the May 2003 consultation document and responses from NRPB, NRPB-W59, July 2004 (ISBN: 0 85951 540 0).
© Office of Utility Regulation, July 2008 10

harmonisation, combine in a recommendation to adopt the ICNIRP exposure guidelines for occupational and general public exposure to electromagnetic fields between 0 and 300GHz.” [NRPB 2004]
4.1.3 The European Committee for Electrotechnical Standardisation (CENELEC)
In 1999, the European Council in its recommendation (1999/519/EC) has endorsed the guidelines set by ICNIRP on reference exposure levels, and recommended that these should form the basis of the European standard7. These recommendations still apply.
In its recommendation, the Council of Europe states that:
“It is imperative to protect members of the general public within the Community against established adverse health effects that may result as a consequence of exposure electromagnetic fields” [European Council]
It is important to note here the emphasis on “established adverse health effects”. Established effects are effects that can be measured and repeated and have a recognised medical definition as opposed to other more subjective effects associated with human perception. These will be discussed in further detail in section 4.1.4 hereafter.
The Council’s recommendation then goes on to say:
“…..; recalling that only established effects have been used as the basis for the recommended limitations of exposure; advice on this matter has been International Commission on Non-Ionising Radiation Protection (ICNIRP) and has been endorsed by the Commissions’ Scientific Steering Committee;” [European Council 1999]
In 2002 and as a result of these recommendations, CENELEC, the European Committee for Electrotechnical Standardisation, has set the European Standard EN50385:2002 relating to “Product standard to demonstrate the compliance of radio base stations and fixed terminal stations for wireless telecommunication systems with the basic restrictions or the reference levels related to human exposure to radio frequency electromagnetic fields (110 MHz - 40 GHz) - General public”.
Standard EN50385:2002, and its associated standards, is in line with ICNIRP’s and provides a basis for measuring and calculating field strength levels around base stations.
This standard also sets the maximum transmit power below which a radiating element (antenna) can be considered as safe.
4.1.4 The World Health Organisation (WHO)
The WHO is an organisation within the United Nations whose main role is to direct, advise and coordinate all actions relating to health matters at the UN. According to its website, the WHO is “responsible for providing leadership on global health matters, shaping the health
7 European Council recommendation on the limitation of exposure of the general public to electromagnetic fields (0 Hz-300 GHz), in Official Journal of European Communities L 199/59 of 30 July 1999
© Office of Utility Regulation, July 2008 11

research agenda, setting norms and standards, articulating evidence-based policy options, providing technical support to countries and monitoring and assessing health trends.” The six key tasks of the WHO are to promote development, foster health security, strengthen health systems, harness research, information and evidence, enhance partnerships and improve the performance of health agencies. The WHO is also pursuing an active role in attempting to bring together the research and guidelines set around the world.
Ongoing international research into the health hazards of EM fields is coordinated by the WHO’s EMF Project8. The Project has established priorities and guidelines for conducting such research.
In recent publications and conferences (see footnote 10), the WHO’s EMF Project acknowledges the existence of differences between the guideline levels set by different countries and has set its goal on achieving a harmonisation of these levels. Harmonisation, in the views of the WHO, is essential as it addresses the organisation’s need to provide a consistent message with regard to protection levels around the world, and would minimise the problems linked with the implementation of a policy for health protection from RF fields.
To understand the arguments put forward by the WHO, we discuss in this section the findings of a report published on behalf of the organisation9 on the issue of guideline level discrepancies across the globe. The author of the report is a specialist on the issues of health-related exposure to EM fields10.
The report identifies two “competing” principles for the establishment of these guidelines: a science-based approach and a precautionary approach.
The science-based limits are based on expert evaluation of the scientific literature which is itself based on research into studies of the adverse effect of exposure to EM radiation. The limits are then set with a view to prevent hazards by radiation with an appropriate margin. The precautionary-based limits are on the other hand “specifically intended to minimise the yet unknown risks” of EM fields by the country of adoption.
4.2 Approach to Setting Limits
4.2.1 The concept of precautionary limits A few countries, such as Switzerland and Italy, have recently instituted exposure limits that are based on the precautionary measure. The Swiss exposure guidelines (contained in an ordinance, or letter of law) for instance were set at the lowest levels that were felt to be technically and economically feasible.
It should also be noted that the Swiss ordinance has a list of exceptions where the guidelines do not apply, such as old installations for instance, and applies differently according to what type of technology/system it refers to (cellular, broadcasting, power lines…). The guidelines were more specifically intended to apply to “sensitive areas”. These areas include places where people can stay for a prolonged time, and would therefore suggest that streets/rooftops/radio site would be excluded, but places such as schools, hospitals, workplaces would be included.
8 http://www.who.int/emf 9 http://www.who.int/peh-emf/meetings/day2Varna_Foster.pdf 10Foster KR. Radiofrequency exposure from wireless LANs. Hlth Phys 92:280-289; 2007
© Office of Utility Regulation, July 2008 12
The Swiss introduced the notion of installation limit values (ILV) as an equivalent to the limits set by ICNIRP and have set these to levels that are about 10 times lower than the ICNIRP levels (see Table 1). The Swiss Guidelines states that:
“contrary to the exposure limit values, [ILVs] are not based on health effects but on the technical and economic practicability. The experience shows that long term exposure from a single source at places of sensitive use can in the great majority of cases be kept far below the exposure limit values without unduly impeding the construction and operation of installations. The ILV are therefore not new, lower safety limit values. They simply reflect today’s state of technology to reduce long term exposure.”
4.2.2 Science-based limits In the science-based approach, we find for example the ICNIRP guidelines which are adopted in Western Europe and numerous countries worldwide. We also find the guidelines adopted by the US Federal Communications Commission (FCC), as well as those adopted by Russia and China. It will become clearer however in the following sections that the science used to establish those guidelines are different between the West European (ICNIRP) and US approach on one hand and the Russian/Chinese approaches on the other hand.
Red-M has noted that translations of the Russian or Chinese documents are very difficult to get hold of and most of the analysis below is based on the publications cited in this section.
Despite these 2 groups’ science-based approach, there are differences between the maximum exposure levels in the standards set by these countries as illustrated in Table 1. The limits presented in the table are the maximum limits [in V/m] at the typical frequency of 2GHz used for cellular communications worldwide.
4.2.3 Differences in the science-based approaches The WHO report goes on by reviewing the guidelines and the possible reasons for the discrepancies in the science-based maximum levels.
Setting aside the limits adopted by countries on a precautionary basis, the differences between the ICNIRP field strength reference levels for example and the Chinese or Russian maximum levels vary by a factor of 10.
Guideline/ref Countries of adoption Max limits at 2GHz
[V/m] Applied basis
ICNIRP Western Europe and numerous countries worldwide
61 Science-based
IEEE C9511 FCC in the US 61 Science-based
11 IEEE Standards Coordinating Committee 28 on Non-Ionizing Radiation Hazards: Standard for Safe Levels
© Office of Utility Regulation, July 2008 13

Sanitary norms and regulations 2.2.4/2.1.8.055-96
Russia and most countries from the former Warsaw Pact
6.1 Science-based
UDC 614.898.5 GB 9175-88 China 6.1 Science-based
Swiss ordinance12 Italy, Switzerland 6 Precautionary limits
Table 1- Difference between EM exposure standards around the world
In the view of the WHO, the difference between the scientific approaches adopted by the Russian/Chinese scientists and the Western European science community (including the US), rests on the following 3 key points:
1. A lack of clarity in the descriptions of the studies, methodology followed and standard of reporting in many of the Russian/Chinese studies.
2. Absence of controlled experiments in many of the Russian/Chinese reports.
3. And finally, use of little known or subjective “symptoms” in the reporting of the effects of the Russian/Chinese EM exposure experiments that are difficult to analyse or replicate in other studies.
Point 1 regarding the lack of clarity ranks the highest in the WHO’s review of the Russian and the Chinese standard. The organisation notes that the reports often lacked crucial information such as the frequency of the tests and the intensity of the exposure. In Western Europe, the WHO highlights the fact that such studies would need to be thoroughly reviewed by peers before it can be taken into account in the setting of the standard.
On the second point, the WHO notes that many of the Russian/Chinese papers are merely case studies as opposed to clinically controlled experiments with an emphasis on the repeatability of the methodology, the control of the experiment’s parameters and the measurability of the results. As a result, these reports would bear little weight in the Western health agencies’ view as to the validity of their outcome.
The final key difference between the Western guidelines (ICNIRP and the US’s IEEE C95) and those of the Russian or Chinese guidelines is in the way exposure is assessed: in the West, observations are principally measured as thermal effects (heating of the biological tissues) with exposure limited to a few minutes to a few hours and can thus be quantified by conventional measuring techniques. In Russia and China, the effects that have been observed are behavioural and cognitive rather than thermal and rely on infinitesimal levels of radiation levels administered over longer periods of time to detect effects that are often very subjective in nature and difficult to replicate or measure with sufficient accuracy. A number of symptoms and conditions reported in the Russian and the Chinese studies would be difficult to analyse or quantify by any Western health organisation, and the criteria used to diagnose those conditions are non-specific with no clear medical significance. This stems mainly from differences about health and medicine in general between the Russian and Eastern European literature and that of the West.
with Respect to Human Exposure to Radio Frequency Electromagnetic Fields, 3kHz to 300KHz (ANSI/IEEE, 1999), The Institute of Electrical and Electronic Engineers, New York, 1992 12 Regulation for the protection of the general population in Switzerland, J. Baumann and G Goldberg, 1999
© Office of Utility Regulation, July 2008 14
4.2.4 Short-term versus long-term effects From the review of the literature available on the subject, Red-M believes that the two science-based approaches are not contradictory but rather complementary: in the case of the ICNIRP guidelines, the emphasis is on the short-term exposure (few minutes to few hours) and is concerned with established effects such as the heating of the tissues. It would therefore apply mainly to instances where the public would only be exposed momentarily to EM radiation such as for example passing near a transmitter, or stopping close to a source for a short period of time.
In the case of the Russian/Chinese guidelines, the emphasis is on low level, continuous radiation and the fact that the impact might only materialise over periods of decades. As a result, the studies tend to focus on low doses of radiation and on the reaction of participants exposed to those doses. These standards would therefore apply to everyday situations and would concern places where people live, work or spend prolonged periods of time.
4.2.5 Enforcement of limits Clearly these two approaches have led to the differences we have today in the maximum exposure limits, and the WHO’s aim to reach harmonisation of the levels will certainly lead to a convergence of the methods and a realisation that the levels should be consistent across the world.
One final point that Red-M wishes to highlight is with respect to implementation and enforcement of those guidelines. Whereas in western Europe, the Directive 2004/40/EC13 sets out an agenda for enforcing the ICNIRP limits to protect the health and safety of people in the workplace, no evidence was found in the open literature about enforcement, auditing or monitoring of the levels in countries such as Russia or China which have tighter levels. This potentially reduces the scope of the guidelines.
If, in addition, the tighter guidelines only apply to sensitive areas such as the Swiss implementation, then most areas in the immediate vicinity of radio masts would be excluded from having to satisfy these tighter levels.
During the course of the surveys in Guernsey, Red-M found that only on rare occasions did the levels measured approach even the tighter guidelines set by Russia and China and these measurements were only evident in close proximity to the sites. As expected, the electrical field strength was found to decrease very rapidly as distance from the site increases suggesting that, on the basis of the results of the audit, all but one site would meet the tighter guidelines.
4.2.6 The Guernsey audits The audit conducted by Red-M is concerned primarily with radiation at or very near the sites. These cannot be regarded as “sensitive areas” as defined by the Swiss standards for example which adopted the precautionary guidelines, or areas where people gather as the masts would
13 Directive 2004/04/EC of the European Parliament and the Council on the minimum health and safety requirements regarding the exposure of workers to the risks arising from physical agents (electromagnetic fields), 29th April 2004
© Office of Utility Regulation, July 2008 15

be usually secluded, protected within a compound and generally isolated from residential places.
4.3 Recommended Benchmark Levels
In view of the arguments put forward in the previous section, Red-M believes that, from the arguments put forward by the WHO, it appears that the standard of the work gone into the assessment of the safety limits for RF exposure by the Russian community for example, is not as high and thorough as the one ICNIRP employed before publishing their guidelines. The WHO holds regular forums and conferences into the harmonisation of guidelines and no definitive outcome has yet been published with respect to adopting new standards or a unified standard. Red-M believes that adopting the Russian limits would be more of a precautionary measure than based on a peer-reviewed, controlled scientific approach.
Furthermore, the Guernsey audit is concerned with EM levels at or very near sites and would not constitute in the majority of cases what is regarded, in the tighter guidelines, as “sensitive areas”.
As a result, and until the WHO achieves its goal of harmonising the standards across the world by use of further research and consultations, Red-M has recommended using the public reference field strengths set by ICNIRP for comparing the results of the audit from the Guernsey sites and benchmarking the surveyed emissions against these levels.
4.3.1 Reference Electric Field Strength Levels
Reference field strength limits derived from the plot in Figure 1 for typical cellular frequencies are shown in Table 2 below:
ICNIRP Reference Field Strengths, [V.m-1]
900 MHz 1.8 GHz 2.2GHz
Field Workers 90 127.3 137
General Public 41.25 58.3 61
Table 2 ICNIRP Reference field strengths for typical cellular bands
4.3.2 Basic Restriction Levels
For antennas that are within touching distance of people, ICNIRP have defined Basic Restriction levels of transmit power above which SAR (Specific Absorption Rate), or E-field measurements are required before an antenna can be considered as compliant with the guidelines. The SAR is a measure of the amount of radio frequency energy absorbed by the body when using a RF device such as a mobile phone or an antenna and is generally used only when the device comes into contact with the human body. The Basic Restriction levels are provided in the table below:
© Office of Utility Regulation, July 2008 16

Average SAR, [W/kg] Whole body Localised (head and trunk)
Localised (limbs)
Field Workers 0.40 10 20
General Public 0.08 2 4
Table 3-ICNIRP Basic Restriction levels between 10MHz and 10GHz
The unit body area (or weight) over which the Basic Restriction levels should be applied is 10 grams and corresponds approximately to the weight of the end of a finger.
In particular, and in its clause on Evaluation of Results and Determination of Compliance, the Standard states that:
“If the average power emitted by the base station is less than or equal to 20mW then the base station is deemed to comply without testing.
If the average power emitted by the base station is more than 20mW, then E, H, or SAR calculations and/or measurements shall be performed according to clause 4. The results of calculations and/or measurements shall be compared directly to the limits.
The product is deemed to fulfill the requirements of this standard if the calculated and/or measured values are less than or equal to the limits.” [CENELEC 2002]
The 20mW (or 13dBm) threshold level applies to the general public and is derived from the Basic Restriction levels of 2 W.kg-1 for the head, neck and trunk as defined by ICNIRP, considering an element of 10g of human flesh. The levels for occupational exposure should be multiplied by 5.
It should be noted that these threshold levels determine the antenna “touch-safe” criteria below which an antenna needs not be tested for compliance. These levels would therefore not apply to antennas which are not accessible by the general public.
4.3.3 Minimum clearance distance from antennas
The predicted peak-to-peak levels of electric field strength EPP for the antennas are estimated using the following expression
22377
rPE T
PP π= [V.m-1] [1]
where PT is the maximum transmit EIRP [in Watts] and r is the distance from the centre of radiation of the antenna [in meters]. This formula assumes free-space propagation between the transmitter and the probe. While this might be a reasonable assumption in the case of the rooftop level and the street level calculations, this might be over-optimistic and would therefore represent a worst-case scenario in most situations where there is no direct line of sight to the antenna. The minimum clearance distance from an antenna for ICNIRP compliance can be estimated from this expression and is given by
© Office of Utility Regulation, July 2008 17
22377
ICNIRP
T
EP
rπ
= [m] [2]
where EICNIRP are the maximum peak-to-peak levels as recommended by ICNIRP for public exposure. The clearance distance defines the extent of the exclusion zone around a site: all areas outside this exclusion zone will have levels that are safely below the ICNIRP guidelines.
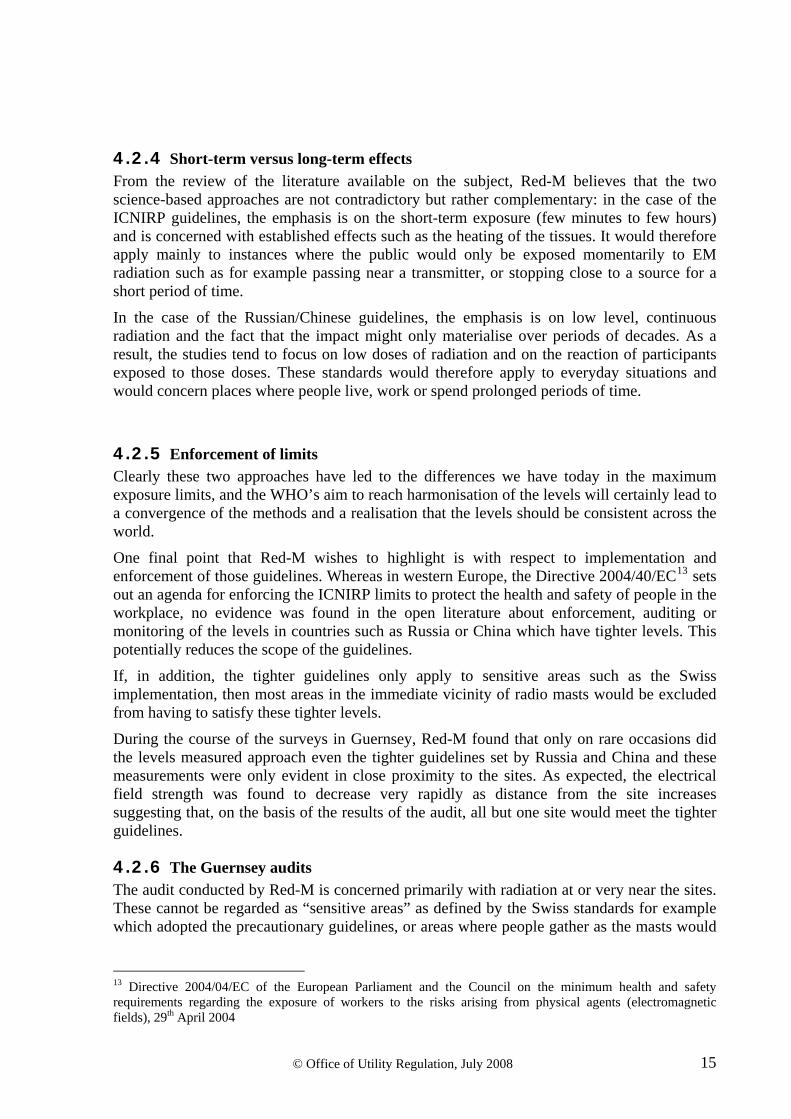
Exclusion zone for outdoor antennas In order to estimate typical exclusion zone distances, we have used the scenario depicted in Figure 2 whereby the site would be at about 10m height, and the public would be allowed to get to within touching distance of the mast supporting the antenna. In the region immediately below the antenna, the transmit power is much lower than along the boresight because the radiation pattern of the antenna would generally focus the RF power towards the horizon as illustrated in the figure. Assuming the most common antenna types used by Guernsey’s cellular operators, Red-M found that the gain at or near the supporting mast, would be 20 to 30dB lower than in the antenna’s main direction. The antennas used in the fixed-links operated by Newtel would have even more loss immediately below the antenna.
10m
1m
Clearancedistance
Figure 2- A typical antenna height is about 10m from the ground
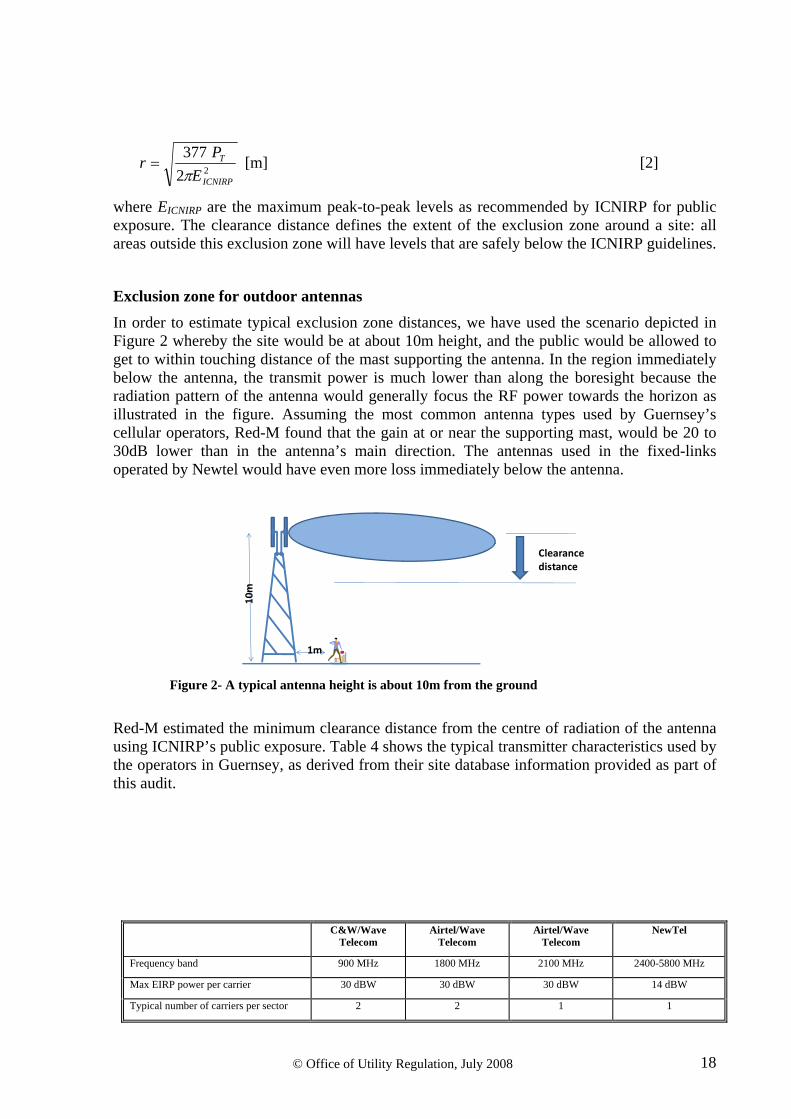
Red-M estimated the minimum clearance distance from the centre of radiation of the antenna using ICNIRP’s public exposure. Table 4 shows the typical transmitter characteristics used by the operators in Guernsey, as derived from their site database information provided as part of this audit.
C&W/Wave Telecom
Airtel/Wave Telecom
Airtel/Wave Telecom
NewTel
Frequency band 900 MHz 1800 MHz 2100 MHz 2400-5800 MHz
Max EIRP power per carrier 30 dBW 30 dBW 30 dBW 14 dBW
Typical number of carriers per sector 2 2 1 1
© Office of Utility Regulation, July 2008 18

EICNIRP 41.3 V/m 58.3 V/m 61 V/m 61 V/m Field strength below the antenna – at street level 2.4 V/m 2.4 V/m 1.7 V/m 0.3 V/m
Clearance distance (peak ICNIRP) 84 cm 59 cm 57 cm 6 cm
Table 4 Typical minimum clearance distance for general public exposure around sites for Guernsey operators
Red-M also assumed a nominal 2 degrees downtilt for the antenna beam to reflect general practice.
The results suggest that, provided the base of antennas mounted on masts or structures are at least 4 metres above the ground (average height of a person fully stretched up + the clearance distances given in Table 4), and that these masts or structures are not accessible to the public or that the public is prevented from standing in front of the antennas, it would be unlikely that the public would be exposed to field strength above the ICNIRP recommended Reference levels. So a simple message would be that as long as members of the general public or workers are kept away from the front of the antenna, then the field strength levels should be below ICNIRP’s Reference levels.
For sites that are lower that the clearance distance, these figures would need to be estimated or measured on a case by case basis, hence the surveys being carried out by Red-M as part of this audit.
Indoor sites For indoor sites that are within touching distance, the Basic Restriction levels in section 4.3.2 of this report apply, whereby an antenna would only be considered safe if its transmit power is less than 20mW (or 13dBm).
The exclusion zone distances estimated above apply to general public protection. For occupational purposes, workers accessing a site might get closer as the levels of exposure are higher than those for the general public (see Table 2).
For occupational purposes, the auditors have concentrated their investigations on the policies set by the operators for dealing with instances where antennas require access for maintenance, installation, adjustment or other purposes involving the actual handling of radiating elements.
4.3.4 Cumulative exposure quotient
In situations where exposure to EM field can occur at different frequencies, it is important that the aggregate effect of the fields is taken into account. As a result, Red-M uses the Exposure Quotient (EQ) to calculate the cumulative effects from the different frequencies present on a site and compare it to the ICNIRP Reference level. The EQ is calculated as the sum of the ratios of the measured field strength to the ICNIRP Reference level at each frequency band as defined in the expression below:
1222
≤⎟⎟⎠
⎞⎜⎜⎝
⎛+⎟⎟
⎠
⎞⎜⎜⎝
⎛+⎟⎟
⎠
⎞⎜⎜⎝
⎛= UMTS
ICNIRP
UMTSMEAS
DCSICNIRP
DCSMEAS
GSMICNIRP
GSMMEAS
EE
EE
EE
EQ
© Office of Utility Regulation, July 2008 19

where for example is the ICNIRP Reference level for the GSM900 band reported in GSM
ICNIRPEETable 2, and is the field strength measured on the day of the survey in that band. Note
that we take into account all the measured field strengths across any given band in this calculation and not just the highest measured peak.
GSMMEAS
A band EQ of 1 (unity) means that the cumulative radiation levels at the surveyed frequency bands has reached or exceeded the ICNIRP Reference level.
4.4 Conclusions The DG is aware that concerns do exist with regard to the possible health effects of exposure to emissions from RF equipment utilised by the telecoms operators in the Bailiwick. The DG has considered whether the current guidelines, requiring compliance with the ICNIRP limits, remains appropriate and provides adequate safeguards on public health. On the basis of the assessment carried out by Red-M, the DG remains of the view that the ICNIRP Guidelines remain the appropriate guidelines against which to assess compliance. The DG notes that, while there are lower standards in place in other countries, he is not convinced that these afford any greater level of protection to Islanders than that currently offered by the ICNIRP guidelines. Emission levels measured at all sites in Guernsey during this audit were found to be at levels that, even if assessed against the lower guidelines applied in countries such as Russia or Switzerland, all but one site would still meet this lower standard. Given that the WHO is seeking to standardise the guidelines that all countries assess emission levels against, the DG does not believe that it is logical for Guernsey to adopt standards that goes against this aim at this time. However he will keep this matter under review as further research is carried out at an international level into the further development of the appropriate guidelines in this area.
© Office of Utility Regulation, July 2008 20
5. Sites in the Bailiwick of Guernsey
5.1 Cellular Operators’ sites
At the time of the audit, there were 66 sites used by Guernsey’s cellular operators for supporting their services. This number has seen an increase since the last audit carried out by CDS in 2004 where 48 sites were deployed. This increase in the number of sites is primarily a result of an additional operator launching since that audit (Airtel-Vodafone) and an increase in the portfolio of sites of the existing operators to sustain the demand partly for 3rd generation services and also as extra demand for voice and data services on the GSM networks.
The table overleaf lists the sites identified during the audit, with additional information such as the address, type of site and date/time of the survey. A more comprehensive set of information relating to these sites is provided in a separate spreadsheet in Appendix A. There is an individual detailed report available for each site providing significantly more detailed information on the audit at each site.
These sites were all surveyed by Red-M between April 8th and May 1st 2008. The surveys were conducted by a qualified RF engineer and consisted of:
• A visual inspection of the site to determine its type, the type of antennas deployed and their height.
• An inspection of the signs put by the operators around the site to warn of the existence of RF emissions
• A GPS reading of the site location
• A measure of the RF field strength levels in all the frequency bands transmitted at the site using a frequency-selective probe
• A photograph of the site, and of the measurement location.
A list of the sites audited and the results of the highest reading recorded at each site is listed in Table 5 below.
© Office of Utility Regulation, July 2008 21

Site Name Base Station Site Address ParishPost Code Site type
Suvey date
Survey time
Airport Generator Shed La Villiaze Forest GY8 0DS Rooftop 15-Apr-08 14:39Airport Radar Tower La Villiaze St Andrews GY6 8YE Mast 24-Apr-08 08:41Airport terminal La Villiaze Forest GY8 0DS Indoor 15-Apr-08 15:33Alderney Exchange Longis Road Alderney - Mast 22-Apr-08 09:00Alderney Water Tower Les Mouriaux, St Anne Alderney - Rooftop 22-Apr-08 09:52Arcade - Balloonees 9, Commercial Arcade St Peter Port - Indoor 18-Apr-08 12:44Arqiva TV Transmitter Les Rochers, St Anne Alderney - Tower 21-Apr-08 13:18BBC Tower, Pleinmont La Rue de Chemin Le Roi Toreteval GY8 0LB Tower 23-Apr-08 14:18Beau Sejour Leisure Centre, Amherst Road St Peter Port GY1 2DL Rooftop 16-Apr-08 12:05Best's Quarry Mauxmarquis Road St Andrews - Mast 15-Apr-08 10:30Castel Hospital La Neuve Rue Castel GY5 7NJ Rooftop 27-Apr-08 11:51Centenary house La Vrangue, St Peter Port St Peters GY1 2EY Pole 18-Apr-08 11:25Court House (car park) St James Street St Peter Port - Indoor 17-Apr-08 08:51Dairy Baliffs Cross, St Andrews St Andrews GY6 8RJ Rooftop 15-Apr-08 11:30DoR Cambridge Park St Peter Port GY1 1UY Rooftop 28-Apr-08 09:22Falcon Vinery, Rue du Pre Bourdon St Saviour GY7 9JS Monopole 01-May-08 10:57Fermain Valley Hotel. Fermain Road St Peter Port - Rooftop 25-Apr-08 16:23Fish Co-op Castel Emplacement St Peter Port - Rooftop 24-Apr-08 11:36Fort Doyle Platte saline Alderney - Pole 21-Apr-08 11:48Fort George Rue De La Douzaine St Peter Port GY1 1ZW Mast 09-Apr-08 12:48Fort Richmond Perrelle Bay - Rooftop 23-Apr-08 12:28Fort Sausmarez La Rue Canteraine St Peters - Rooftop 10-Apr-08 11:05Gervaise Farm Route des Houguets St Saviour GY7 9UJ Monopole 27-Apr-08 10:32Gouffre Oriana, La Rue Du Gouffre Forest - Indoor 25-Apr-08 12:58Guernsey College Pitronnerie Road St Peter Port GY1 2RL MonopoleHerm Herm Herm - Rooftop 13-Apr-08 11:51High St Waterloo House, High Street St Peter Port - Indoor 18-Apr-08 14:22Homefield La Collette, La rue de L’Epinelle Forest GY8 0HL Monopole 10-Apr-08 16:13Hubits Les Hubits Farm, Les Traudes St Martins GY4 6NE Monopole 08-Apr-08 09:38Jamblin Jamblin Quarry, Jamblin Road Vale GY3 5EU Monopole 29-Apr-08 10:23Jerbourg (Bunker) La Route De Jerbourg St Martins - Pole 08-Apr-08 11:26Kingsmill Water Guernsey Water, Kings Mills Castel - Rooftop 23-Apr-08 11:13La Fregate Hotel La Fregate Hotel, Beauregard Lane St Peter Port GY1 1UT Rooftop 24-Apr-08 12:44La Moinierie Sark - Rooftop 26-Apr-08 08:19Les Adams Rue de Felconte St Pierre Du Bo GY7 9LJ Pole 25-Apr-08 12:03Les Caches Business Park,Les Caches Road St Martins GY4 6PH Mast 09-Apr-08 11:10Les Touillets Arqiva transmitter, Rue D'Eglise Castel GY5 7NB Tower 10-Apr-08 13:30Little Sark Clos de La Pointe, Little Sark Sark - Pole 14-Apr-08 11:16Marais vinery Rue de Marais Vale GY6 8AZ Monopole 27-Apr-08 12:56Maraive Vinery, La rue de la Maraive Vale GY3 5BE Monopole 29-Apr-08 11:58Maseline Harbour - Sark Maseline Harbour Sark - Pole 15-Apr-08 13:49Mignot plateau - St Barnabas church Rosemary Lane, Cornet Street St Peter Port N/A Indoor - wall m 17-Apr-08 11:44Nelson House Pitronnerie Road, St Peter Port St Peters GY1 2RL MonopoleOakfield Vinery, Les Osmonds Lane, La Route Des CaSt Sampsons GY2 4GF Monopole 28-Apr-08 10:21Odeon Bunker Alderney Alderney - Rooftop 21-Apr-08 12:37Petit Bot Las Tapitas restaurant Forest GY4 6UJ Rooftop 22-Apr-08 16:03Police HQ Hospital Lane St Peter Port GY1 2QN Rooftop 24-Apr-08 13:42PoP St Georges Complex St Peter Port GY1 2BH Rooftop 24-Apr-08 10:42Princess Elizabeth Hospital (OutdoorRue Mignot, La Rue De La Corbinerie St Andrews GY4 6UU Rooftop 17-Apr-08 10:18Regency Marette Road, L'Islet St Sampsons GY2 4FR Monopole 29-Apr-08 09:21Reservoir Rue a l'Or St Saviour - Rooftop 24-Apr-08 10:45Rohais BBC, Les Rohais St Peter Port - Pole 23-Apr-08 10:23Ronez Quarry Les Vardes Quarry St Sampsons GY2 4TF Mast/rooftop 27-Apr-08 15:46Sark Harbour - crane sheds Sark Harbour Office, Sark GY9 0SB Rooftop 15-Apr-08 13:49Sark Harbour - old harbour Sark Harbour Office, Sark GY9 0SB Wall mount 15-Apr-08 13:49Sark Telephone Exchange Rue Lucas Sark GY9 0SG Mast 14-Apr-08 12:03SEB SEB Chimney, North Side Vale GY1 3AD Rooftop 28-Apr-08 12:06Sir Charles Frossard House Le Charroterie St Peter Port GY1 1FH Rooftop 16-Apr-08 10:24St Peter Port Harbour Cambridge Berth St Peter Port Pole 11-Apr-08 12:11St Peters Exchange La Route du Longfrie St Peters GY7 9RX Mast 11-Apr-08 10:00St Pierre Park Rohais St Peter Port GY1 1FD Rooftop 20-Apr-08 11:35TRS Huberts Lane St Peter Port GY1 1RG Mast 19-Apr-08 14:04Vale Garage Vale Garage complex Braye Road Vale GY3 5PA Wall mountVictoria Tower Victoria Tower, The Arsenal St Peter Port GY1 1UW Rooftop 19-Apr-08 14:44Watchtower Rue De La Masse Castel GY5 7PT Rooftop 10-Apr-08 14:46Water tower Forest Road St Martins GY4 6UB Rooftop 09-Apr-08 15:17Wave Shop 24 High Street St Peter Port GY1 2JU Indoor 18-Apr-08 14:54Westwood Vinery, Rue des Grons St Martins GY4 6JR Monopole 08-Apr-08 16:44
Table 5 List of existing Guernsey sites including PMR and WiFi sites in the grey shaded cells
The detailed results of these surveys were delivered to the OUR in 66 separate audit reports.
© Office of Utility Regulation, July 2008 22

5.2 Fixed links sites
Newtel operates dedicated fixed-links and has 18 sites. The full list of these sites is provided in the table below.
Site name Site Address Postcode Frequency [GHz]
GY1 2DL 2.42.45.85.82.42.4
Digimap Guernsey Tobacco Factory, La Ramee,St Peter Port GY1 2ET 2.45.85.8
Sir Charles Frossard House
La Charroterie, St Peter Port GY1 1FH 5.8
Royal Court St James Chambers, St Peter Port GY1 2PA 5.8Cadastre Building Nelson Place, Smith Street, St Peter Port GY1 2JG 5.8Airport Tower La Villiaze, Forest GY8 0DS 5.8Sigma-Aztec Braye Road, Vale GY1 3SD 5.8Bulwer Avenue St Sampson GY2 4ET 5.8
GY1 3ET 5.82.4
Project & Hire Bulwer Avenue, St Sampson GY2 4LQ 2.4XKO Communications
Pitronnerie Road, St Peter Port GY1 2RF 5.8
5.85.8
La Tonnelle House Safferys 5.8Mont Cuet Landfill Site
Choute,Vale 2.4
Arkavist Braye Road, Vale 5.8Intergrated Skills Fort Complex, Tracheries, St Sampsons GY2 4SN 2.4BBC Radio Guernsey Bulwer avenue, St Sampsons GY2 4LA 5.8
100Kv substation compound, Barkers Quarry
Cour de Parc
Beau Sejour Leisure Centre
Quay side
JEC telecom hut
Amherst, St Peter Port
La Rue des Pres
PO Box 109, St Sampson Harbour
Table 6 - List of Newtel sites
Surveying the fixed link sites was outside the scope of this work as it was considered that the field strength measured at street level would be extremely small given the highly directional nature of the antennas. A theoretical calculation of the expected radiation levels was estimated based on the information provided by the operator, backed by the ETSI specification and the corresponding Ofcom Interface Requirement documents14,15 for the type of equipment used by Newtel. The levels were found to be extremely small as expected and the results presented in the relevant section of this report (section 7.2).
14 UK Radio Interface Requirement 2007, Fixed Broadband Services Operating in the Frequency Range 5725-5850MHz (version 1.0), Dec. 2003 15 UK Interface Requirement for Wideband Transmission Systems Operating in the 2.4GHz ISM band and Using Wide Band Modulation Techniques, Nov. 2006
© Office of Utility Regulation, July 2008 23

5.3 Other sites
Guernsey also has a small number of operators of other types of wireless systems: a Wireless LAN operator in the WiFi band (MicroTech), a Personal Mobile Radio operator (Links two-way radio) and a satellite link operator (Hughes Networks). The processes and procedures put in place by these operators with respect to EM exposure were also reviewed as part of this audit. The low emissions levels, or high directivity of their antennas meant that these operators’ emission levels were not measured during the surveys, but were assessed from the information supplied by the operators.
MicroTech The list of sites operated by MicroTech, the WLAN operator, is given below:
Site name
Nelson House Guernsey College of Further Education
Site Location
Pitronnerie Road, St. Peter Port, GY1 2RL
Pitronnerie Road, St. Peter Port, GY1 2RL
Services
Data Data
Frequency band 2.4GHz 2.4GHz Height
12 meters above ground at local site
40 meters above ground at local site
Radiated power
30mW - 100mW max from antenna port
30mW - 100mW max from antenna port
Carriers
11 11
Antenna beamwidth
11º 11º
Tilt
+5 degrees approx -1 degrees approx
Table 7 - MicroTech sites
The sites are very low power (30 -100mW) and operate in the unlicenced band (2.4GHz), similar to the band used for WiFi home systems. The sites are also very high above ground. For these reasons, Red-M does not believe MicroTech sites should cause any concern with respect to EM radiation.
Links 2-way radio
The list of sites operated by Links 2-way radio, the PMR operator, is given below:
Site
name
Address Site
type
Frequency
band
Height EIRP Nb of
carriers
Azimuth
21 41W 1 220 DoR Cambridge
Park, St
Rooftop 164-
167MHz 22 41W 1 360
© Office of Utility Regulation, July 2008 24

22 41W 1 360 Peter Port
20 41W 1 360
Beau
Sejour
Amherst, St
Peter Port
Rooftop 165MHz 20 41W 1 220
Table 8 - Sites operated by Links 2-way radio Links operates two sites: one in Beau Sejour and the other in the Duke of Richmond Hotel (DoR). The sites are omni-directional and only operate in an intermittent fashion. Furthermore, these sites are single-carrier and have lower power than cellular sites (40dBm compared to ~60dBm for maximum output power at GSM or UMTS). These sites are also at a height that ensures the immediate vicinity of the transmitters at street level would be outside the exclusion zone. A good illustration of the expected low levels is shown in Table 9 where Red-M reported the cumulative EQ measured at one of the sites (Duke of Richmond). The EQ for that site was found to be 1/6119175 of ICNIRP. Hughes Networks Hughes Networks is a broadband satellite network operator that provides professional managed services to Camelot, the Lottery operator, for a secure backhaul of their new payment terminals. The network also supports broadband media services that allow the new terminals to advertise Camelot’s products and local information.
The sites are typically located in customer premises (usually shops) and consist of a satellite dish either on a roof or wall-mounted. At the time of the audit, Hughes Networks had one rooftop site in Vale.
© Office of Utility Regulation, July 2008 25

6. Operators Processes and Procedures During the course of this audit, Red-M had the opportunity to meet a number of Guernsey wireless operators (Cable & Wireless, Wave Telecom, Airtel-Vodafone, Links and Newtel) in order to discuss the processes and procedures put in place in order to comply with their licence requirements. The documents requested by Red-M included:
• Health & Safety procedures
• Statement of work (new installs or maintenance work)
• Site share procedure (notification of site maintenance/new install to co-hosts)
• Guidelines to contractors on site install
• Guidelines on how to set-up exclusion zones and site signage policy
• Code of practice
• Procedures and guidelines on RF surveys prior to commissioning sites
Most of these documents are concerned with occupational exposure and the safeguards put in place the operators to deal with aspects of workers handling radiating elements during site visits. Guidelines on setting-up exclusion zones and signage on the other hand are generally intended for the protection of the general public from RF hazards.
Part of the surveys was also focusing on the accessibility of the sites. The engineer was tasked with evaluating how easy a site could be accessed by the general public and how any exclusion was implemented and physically delimited by the operators to ensure that radiating elements of the antennas are kept out of reach of the public.
Overall, Red-M believes that all the operators have sufficient processes or mechanisms for limiting exposure to RF radiation, to the general public and to workers (employees, sub-contractors…), and that the limits used to define acceptable levels of radiation are those recommended by ICNIRP.
Red-M has come across some instances where practices on the ground did not reflect the procedures in place, and where applicable, these have been highlighted in this report.
© Office of Utility Regulation, July 2008 26

7. Results of the Site Audits 7.1 Survey Methodology
EM field levels have been measured in these surveys using a carefully designed and controlled methodology. Elements of this methodology include:
• A peak search around the site performed in order to determine with accuracy the location where the maximum radiation levels were received. To achieve this, the survey engineer walked in the area surrounding the site along a pre-defined template path, using the hand-held probe and notes the location of maximum reading.
• Subject to accessibility, walks were limited to a nominal 100m from the site. Generally, stretching up to the point (and slightly beyond) where the peak values were measured.
• A note of the position of the peak reading was made by the engineer. • The probe was then positioned on a tripod at the exact location of the maximum
radiation level readings and the measurement taken. The height of the probe was approximately 1.5m above the ground.
• The exact measurement position was recorded using a GPS receiver and photos of the site were taken.
The measurements were performed using:
• An isotropic field probe, which reacts to all polarisations (directions) of the electric
field, in a similar way to biological tissue. • A carefully calibrated exposure level meter for all cellular frequencies to ensure that
that the measurements are meaningful and accurate. The probe and meter’s serial number are reported in the individual reports. 7.2 Field strength Levels
7.2.1 Cellular Operators’ sites The surveys were conducted during working days (Monday-Friday) between the 8th of April and the 1st of May 2008, generally within working hours (8:00 and 17:00). This would generally be regarded as peak-times in operators’ pricing structure as traffic would generally be higher during this period than in the evening or at night.
Summary results of the EM emissions from all the Guernsey cellular sites (GSM, DCS and UMTS) are shown in Table 9 in order of decreasing cumulative EQ measured at the site (full results showing per operator contribution to the cumulative EQ are shown in Appendix A).
© Office of Utility Regulation, July 2008 27

Site NameCumulative
EQCumulative EQ ratio
Centenary house 4.46E-02 1/ 22Little Sark 4.32E-02 1/ 23La Moinierie 3.23E-02 1/ 31High St 2.60E-02 1/ 39Airport Generator Shed 2.17E-02 1/ 46Airport Radar Tower 2.13E-02 1/ 47Court House (car park) 1.53E-02 1/ 65Maseline Harbour - Sark 1.35E-02 1/ 74Les Adams 8.64E-03 1/ 116Jerbourg (Bunker) 7.31E-03 1/ 137Airport terminal 5.99E-03 1/ 167BBC Tower, Pleinmont 5.49E-03 1// 182St Peters Exchange 5.43E-03 1/ 184Water tower 5.06E-03 1/ 198Hubits 5.06E-03 1/ 198Fish Co-op 4.98E-03 1/ 201Dairy 4.58E-03 1/ 218Oakfield 4.58E-03 1/ 218Fermain Valley Hotel. 3.88E-03 1/ 258Maraive 3.41E-03 1/ 293Ronez Quarry 2.90E-03 1/ 345Regency 2.82E-03 1/ 354Homefield 2.81E-03 1/ 356Sark Harbour - old harbour 2.64E-03 1/ 379Sir Charles Frossard House 2.59E-03 1/ 387St Peter Port Harbour 2.56E-03 1/ 390Alderney Water Tower 2.52E-03 1/ 396Westwood 2.42E-03 1/ 413Sark Harbour - crane sheds 2.36E-03 1/ 424Falcon 2.31E-03 1/ 432Rohais 2.28E-03 1/ 439Fort Doyle 2.23E-03 1/ 448Odeon Bunker 2.20E-03 1/ 454Best's Quarry 2.20E-03 1/ 455Petit Bot 2.17E-03 1/ 461La Fregate Hotel 1.97E-03 1/ 507Mignot plateau - St Barnabas church 1.64E-03 1/ 610Beau Sejour 1.62E-03 1/ 617Jamblin 1.35E-03 1/ 739Arqiva TV Transmitter 1.26E-03 1/ 795Sark Telephone Exchange 1.19E-03 1/ 842Les Touillets 1.17E-03 1/ 852Watchtower 1.17E-03 1/ 853Alderney Exchange 1.06E-03 1/ 945Gervaise Farm 1.03E-03 1/ 967SEB 9.80E-04 1/ 1021Marais vinery 9.61E-04 1/ 1041Reservoir 8.73E-04 1/ 1146PoP 8.54E-04 1/ 1171Les Caches 7.76E-04 1/ 1288St Pierre Park 5.48E-04 1/ 1824Arcade - Balloonees 4.55E-04 1/ 2199Police HQ 4.50E-04 1/ 2223TRS 4.48E-04 1/ 2230Princess Elizabeth Hospital (Indoors) 3.55E-04 1/ 2814Wave Shop 2.90E-04 1/ 3449Gouffre 2.04E-04 1/ 4909Kingsmill Water 1.65E-04 1/ 6045Victoria Tower 8.95E-05 1/ 11176Princess Elizabeth Hospital (Outdoor 8.56E-05 1/ 11686Fort Sausmarez 5.01E-05 1/ 19965Fort Richmond 3.77E-05 1/ 26522Herm 3.06E-05 1/ 32676Fort George 2.07E-05 1/ 48397Castel Hospital 2.81E-07 1/ 3558719DoR 1.63E-07 1/ 6119175
Table 9 - Cumulative EQ from the cellular sites These results show that the cumulative exposure quotient, which expresses the aggregate exposure as a ratio of the ICNIRP Reference level, of all the cellular transmissions (GSM,
© Office of Utility Regulation, July 2008 28
DCS and UMTS) measured at any given site were below the ICNIRP Reference levels for public exposure, and varied between 1/22 and 1/3558719. For comparison, we also added in the table the results of the survey for the PMR-only site (two-way radio) at the Duke of Richmond Hotel, which showed very small levels (EQ of 1/6119175). A band Exposure Quotient of unity (one) would mean that the ICNIRP Reference level was reached across the frequency band of the operator, either as a single peak within that band, or as a cumulative effect.
Compared to the levels recorded during the 2004-05 site audit, a number of factors may contribute to the increase in levels observed in the band EQ. The most likely factors are:
1. Increase in the transmit power. The cellular operators networks are getting more mature and their share of the total traffic would be closely dependent on the quality of service they offer. As a result, operators would tend to increase their levels (but would be within the maximum levels permitted by their licence conditions and the GSM specifications).
2. At the time the 2004 audit was carried out, mobile phone penetration rates were in the region of 70% whereas now it is over 100% and the volume of calls has increased significantly since.
3. With the arrival of a new operator, the competition for new or existing customers becomes more acute. The net result is that operators will use higher power to increase their coverage footprint. The background “noise” generated by the increase in transmit powers will also contribute to the observed increase in EM exposure.
4. Operators will tend to have additional sites to target specific areas with high traffic requirements (such as around town centres, venues, tourist attractions, ports of entry…). New sites will also be built, resulting in an adjustment of the transmit parameters of neighbouring sites in order to reduce interference. One parameter that operators will generally adjust in the downtilt of the antennas, resulting in higher power being received near the site, even if the total power from the site has not been increased.
5. The number of channels transmitted at the site. The greater the number of channels, the larger the band Exposure Quotient as this is calculated as the sum of contributions from all channels within the band. As a result, sites with multiple channels such as at Beau Sejour or Harbour will generate higher band EQ than sites with single channels.
It is worth noting that, as described in the more comprehensive set of results presented in Appendix A that 7 out of 8 of the sites with a cumulative EQ greater than 1/100 belong to the same operator (C&W).
Further investigation of the sites recorded with the 8 highest cumulative EQ during the audit was carried out in order to determine how close these sites were to equal or exceed the ICNIRP Reference levels. In this investigation, we used the site parameters provided by the operators at the start of the audit.
© Office of Utility Regulation, July 2008 29

Site Name
Measured Field
strength [V/m] Band EQ
Max antenna EIRP [dBm]
Nb of Channels in sector
Minimum distance for rms FS to be below ICNIRP [m]
Minimum distance for rms FS to be below ICNIRP with double the Nb of carriers [m]
Centenary house 5.90 4.46E-02 1/ 22 52 2 2.3 3.4Little Sark 3.91 4.25E-02 1/ 24 52 2 2.3 3.4La Moinierie 3.96 3.23E-02 1/ 31 0 2 0.006 0.008High St 4.15 2.55E-02 1/ 39 35 2 0.3 0.5Airport Generator Shed 3.83 2.17E-02 1/ 46 57.3 2 4.4 6.2Airport Radar Tower 3.10 1.74E-02 1/ 58 52 2 2.3 3.4Court House (car park) 3.58 1.53E-02 1/ 65 35 2 0.3 0.5Maseline Harbour - Sark 3.33 1.35E-02 1/ 74 35 2 0.3 0.5
Band EQ Rel to ICNIRP
Table 10 - Sites measured with a cumulative EQ of more than 1/100th of ICNIRP – All data refers to GSM900 transmission.
In the above table, columns 2-4 show the results of the measurements for the operator with the strongest field strength at the site, columns 5-6 show the maximum transmit power from the listed sites (for a single sector/antenna) and the number of carriers on that sector. Column 7 shows the distance from the site, along the antenna’s pointing direction, beyond which the field strength drops below the ICNIRP Reference level. Column 8 shows the results of Red-M’s sensitivity analysis which consists of doubling the number of carriers at that site, also equivalent to doubling the maximum transmit power for the same number of carriers.
The results show that a doubling of the number of carriers (or transmit power) would only result in a 50% increase in the exclusion zone radius. Since the distances are typically of the order of 5m or less, the absolute impact of doubling the power at a site on the exclusion zone distance remains small.
In Table 11, we used the same approach as above but reported in columns 2-4 the approximate distance at which Red-M made the measurements from the site, the field strength [V/m] evaluated at that position using the theoretical approach, and the field strength expected at that position using a hypothetical doubling of the number of carriers (or of the transmit power). Columns 5-6 show the estimated EQ at that distance, and columns 7-8 show the EQ ratio for the current situation and the hypothetical situation.
With the exception of La Moinierie and Maseline Harbour which show measured levels exceeding the theoretical levels estimated from the operator’s data, the levels measured at the other sites appear to be of the same order of magnitude as those predicted. Exceptions for La Moinerie and Maseline might be due to erroneous information provided by the operators as the theoretical estimations are based on a worst-case scenario and should therefore exceed measured levels.
This is the case for example of the Airport Generator Sheds, which is predicted at 11.5 V/m and measured at only 3.8V/m. The activity at this site will almost certainly be linked with the airport activity (airplanes landing and taking off and plane capacity) and a difference is therefore to be expected depending on the day/time of the survey.
© Office of Utility Regulation, July 2008 30

Site NameDistance from site [m]
Predicted field strength [V/m]
Predicted FS after doubling the nb of carriers [V/m] EQ
EQ after doubling the site power
Centenary house 20 6.3 8.9 1.40E-02 2.80E-02 1/ 71 1/ 36Little Sark 20 6.3 8.9 1.40E-02 2.80E-02 1/ 71 1/ 36La Moinierie 5 0.05 0.07 1.40E-06 2.80E-06 1/ 714286 1/ 357143High St 5 3.5 5 4.40E-03 8.90E-03 1/ 227 1/ 112Airport Generator Shed 20 11.5 16.3 4.70E-02 9.40E-02 1/ 21 1/ 11Airport Radar Tower 20 6.3 8.9 1.40E-02 2.80E-02 1/ 71 1/ 36Court House (car park) 5 3.5 5 4.40E-03 8.90E-03 1/ 227 1/ 112Maseline Harbour - Sark 8 2.2 3.13 1.10E-03 2.10E-03 1/ 909 1/ 476
EQ ratio from predicted FS
EQ ratio after doubling the TX power
Table 11 - Impact of doubling the number of carrier on the EQ
For the rest of the sites, the theoretical calculation indicates that the sites were operating close to their maximum levels at the time of the surveys.
The results of this sensitivity analysis show that a doubling of the power (either through a doubling of the number of channels or as the transmit power on the same channels) would result in a doubling of the EQ.
One important thing to bear in mind in that, for the measured EQ to double, the entire transmission power will need to double. So if two carriers are used on that site, then both carriers’ power would need to double in order to translate into the above results. Most operators would have either a limited number of channels at their disposal, and would need careful planning not to cause interference to their existing services by using adjacent channels for example. Doubling of existing power would also be constrained by the equipment used on the site, by the specification of the technology used and by their licence conditions. So it is not always a simple task to double the power at a given site.
As an illustration to the above sensitivity analysis, for the site with the highest measured EQ (Centenary House, EQ ratio of 1/22), for the ratio to get to levels above 1/10th of ICNIRP for example, the power would need to be multiplied by a factor of 2.2. For the ratio to come close to one (i.e. the site would be at the ICNIRP Reference level), the total power at the site would need to be multiplied by 22.
7.2.2 Fixed link operator (Newtel) In the table below, Red-M estimated the levels that would be emitted from Newtel’s sites using worst-case scenario for the radio propagation loss in the bands and the information provided by the operator for these sites. The calculations assumed propagation in free space, which would translate in minimal loss between the antenna and the position at which we predicted the field strength.
The field strengths were estimated at street level assuming a 30˚ incidence angle (from the vertical).
© Office of Utility Regulation, July 2008 31

Site name
Cumulative EQ
Estimated field strength [V/m]
ICNIRP Ref. Level Relative to estimated field strength
Exposure Quotient
5.98E-07 1/ 1673637 0.0156 3898 6.58E-08 1/ 15192909
0.0221 2805 1.27E-07 1/ 7866194
0.0278 2264 1.95E-07 1/ 5124628
0.0248 2580 1.50E-07 1/ 6657960
0.0078 8287 1.46E-08 1/ 68676472
0.0139 4732 4.47E-08 1/ 22390775
Digimap 1.70E-07 1/ 5882418 0.0276 2425 1.70E-07 1/ 58824183.45E-08 1/ 29015691 0.0095 7169 1.95E-08 1/ 51400457
0.0085 8163 1.50E-08 1/ 66626551
Sir Charles Frossard House 4.12E-08 1/ 24276912 0.0142 4927 4.12E-08 1/ 24276912
Royal Court 1.20E-07 1/ 8316163 0.0246 2884 1.20E-07 1/ 8316163
Cadastre Building 1.18E-07 1/ 8506800 0.0247 2917 1.18E-07 1/ 8506800
Airport Tower 9.08E-08 1/ 11008977 0.0220 3318 9.08E-08 1/ 11008977
Sigma-Aztec 1.25E-07 1/ 8011009 0.0261 2830 1.25E-07 1/ 8011009
Bulwer Avenue 1.71E-08 1/ 58550259 0.0098 7652 1.71E-08 1/ 585502592.11E-08 1/ 47471045 0.0098 7733 1.67E-08 1/ 59803752
0.0051 15172 4.34E-09 1/ 230196546
Project & Hire 7.86E-10 1/ 1272055789 0.0022 35666 7.86E-10 1/ 1272055789
XKO Communications 1.22E-09 1/ 817825173 0.0028 28598 1.22E-09 1/ 817825173
7.60E-09 1/ 131618173 0.0055 14514 4.75E-09 1/ 210662030
0.0044 18729 2.85E-09 1/ 350779332
La Tonnelle House 2.31E-07 1/ 4337840 0.0399 2083 2.31E-07 1/ 4337840
Mont Cuet Landfill Site 1.36E-09 1/ 734005193 0.0031 27093 1.36E-09 1/ 734005193
Arkavist 1.46E-07 1/ 6826855 0.0329 2613 1.46E-07 1/ 6826855
Intergrated Skills 6.78E-10 1/ 1474637103 0.0023 38401 6.78E-10 1/ 1474637103
BBC Radio Guernsey 1.19E-09 1/ 838906057 0.0030 28964 1.19E-09 1/ 838906057
Cour de Parc
Beau Sejour
Quay side
JEC telecom hut
Exposure Quotient Relative to ICNIRP
Cumulative EQ ratio
Table 12 - Estimated Field strength and cumulative EQ for the Newtel sites based on the operator site information
The above results show that the field strength expected at street level would be well below the ICNIRP Reference levels and would therefore not expose the public to potentially harmful RF radiation levels.
7.3 Antenna Accessibility and Site Signage
The sites in Guernsey, Sark and Alderney consist of a mixture of rooftops, poles, wall-mounts and masts as indicated in the list in Table 5. Most sites were found to be either difficult or impossible to access without specialist climbing equipment. Most sites were found to be fenced off with a locked gate for security reasons. A minority of sites were however found to be neither protected nor sign-posted. In this section, we report on the few sites that will require further attention to bring them to a level where the operators would further reduce public exposure to the radiation emanating from them.
7.3.1 Antennas that are disguised
Red-M commented on the extent to which operators have attempted to minimise the visual impact of some transmit antennas by disguising them to blend in with the local clutter. Red-M is aware that, in order to preserve the aesthetics of the environment and reduce the visual
© Office of Utility Regulation, July 2008 32

impact of antennas, radiating elements can be disguised and blended with their supporting structure.
However, the reverse side of “trying too hard to disguise them” is that these antennas become less noticeable by the non-expert eye and would therefore become less likely to have dissuasive effect on the general public. Service staff (cleaners, painters…) would be particularly at risk of coming in close contact with the devices.
Red-M has identified during the survey a small number of sites that fall into this category.
Figure 3 - Antennas at C&WG’s High Street store
In the example above, the antennas are disguised as the sides of the flower pot by blending them into a real flower pot and painting them in the same colour. The size and shape of the antenna can hardly be distinguished from the pot’s side panels.
Figure 4 – Antenna at Petit Bot site is disguised as a PVC pipe
© Office of Utility Regulation, July 2008 33

Figure 5 - Antenna at PoP is disguised as a gutter downpipe
In the other two examples shown above, the antennas are disguised inside white tubes resembling gutter downpipe. The size, shape and colour of the antenna tube are identical to the real gutter pipes one can notice at the end of the roof.
Although Red-M noted the rationale for this approach is to minimise visual impact, it believes that the antennas should be well sign-posted if there is a risk that the general public, and that includes non-RF contractors, can come into contact with the elements. Furthermore, these antennas are outdoor antennas and can therefore transmit at the maximum allowed power for macrocells. The antenna in Figure 4 for example transmits at 38.9dBm and has 2 radio channels, taking the possible total radiated power to 41.9dBm.
Red-M notes however that for the cases of the antennas on Figure 4 and Figure 5, signs were posted either on the downpipe (as illustrated in Figure 5) or on the rooftop. There was no evidence however of any sign warning of the RF radiation hazard in the case of the antennas on Figure 3 (the C&WG shop on the High Street). The DG notes that C&WG has confirmed that it has already taken steps to address this issue.
7.3.2 Antennas with easy access Red-M has also come across antennas with relatively “easy” access, where “easy” is used to refer to the fact that no specialist access equipment would be required to get within touching distance of the antenna, either because the building roof is accessible through a door or a pre-installed ladder, or that the antenna is at ground level.
A complete description of the sites described in this section, including photographs taken on the day of the survey, can be found in the individual site reports.
Mignot Plateau
The antennas at Mignot Plateau are wall-mounted but are within touching distance (see Figure 6 below), with the base of the antennas at about 2.5m from the ground.
© Office of Utility Regulation, July 2008 34

Figure 6 - Antenna at Mignot Plateau
Access to the antenna is through a gate as shown in the picture, and the gate has a sign showing the extent of the exclusion zone. Red-M however believes that the antenna is too close to the ground to offer sufficient protection to the public.
7.3.3 High power antennas that have low height As part of the site audit, Red-M found that some antennas were transmitting high power whilst not having sufficient height to provide an adequate exclusion zone. Little Sark
Figure 7- Antennas at Little Sark are high power and are only ~4m high
The cumulative EQ measured on the Little Sark site was found to be 1/23 of ICNIRP. Although below the ICNIRP Reference level, it is felt that, should the transmitters be on high activity level, and given the low height of the antenna, the cumulative level could potentially get closer to the ICNIRP Reference level. Technical solutions, such as raising the antenna, or
© Office of Utility Regulation, July 2008 35

up-tilting the panel, should be considered by the operators in order to minimise the risks of high level exposure from the site. Court House
Figure 8 - Antennas at the Court House's main hall One of the antennas in the Court House is located inside the main hall, at touching distance from the ground. The antenna, although indoors, is not deemed touch-safe by CENELEC16 as it receives 28dBm into its port (or 35dBm overall EIRP power including the antenna gain).
Although having its immediate surroundings protected by what appears to be a body walk-through scanner, Red-M believes further measures should be taken to offer greater protection. Furthermore, the antenna is not signed.
The DG will request the operators concerned to consider the options for addressing the concerns identified by Red-M with regard to Little Sark and Mignot Plateau. The DG accepts that operators will need to discuss possible solutions with the relevant planning authorities on Guernsey and Sark in relation to both these sites. With regard to the Court House, the DG has been informed by C&WG that it has already taken steps to address the issues identified by Red-M.
7.3.4 Site signage
The vast majority of sites were found to have appropriate signs (such as those shown in Figure 9 and Figure 10) generally posted at the foot of the mast, in the vicinity of the antenna or by the access gate. One example from each cellular operator is shown in the figures below.
16 CENELEC, the European body for electro-technical standardisation, puts the “touch-safe” limit at 13dBm (20mW).
© Office of Utility Regulation, July 2008 36
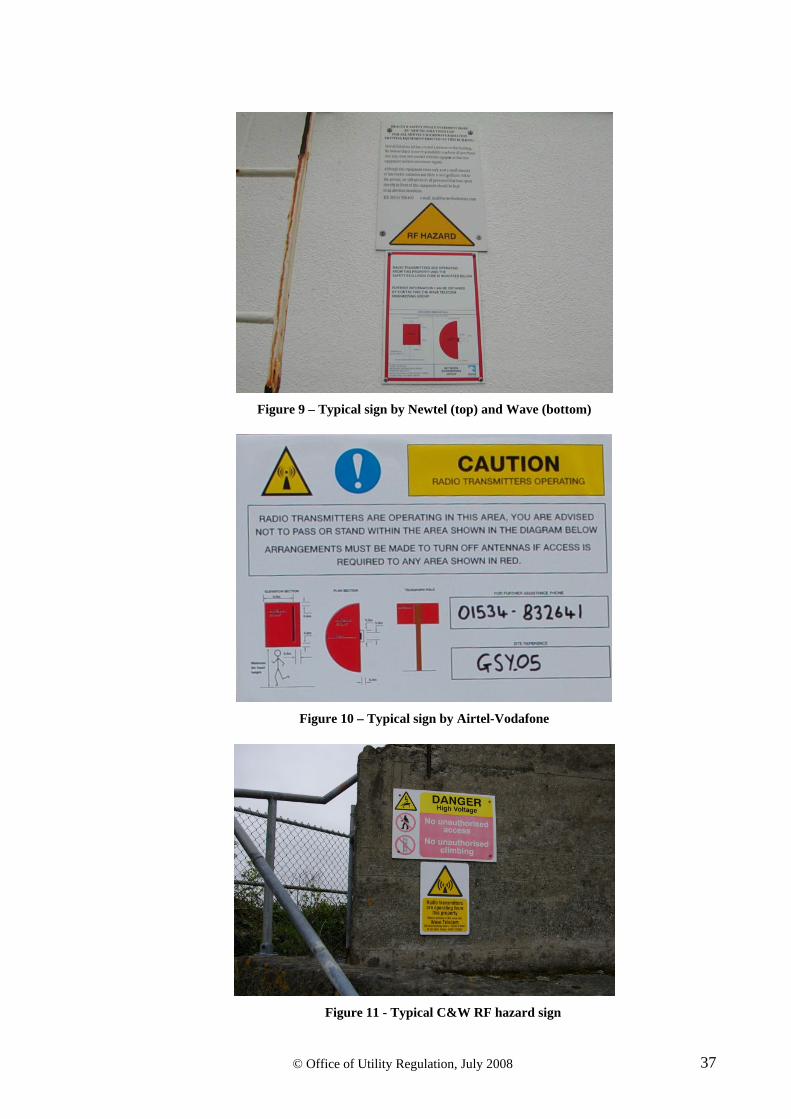
Figure 9 – Typical sign by Newtel (top) and Wave (bottom)
Figure 10 – Typical sign by Airtel-Vodafone
Figure 11 - Typical C&W RF hazard sign
© Office of Utility Regulation, July 2008 37

A small number of sites were however found not to display any RF hazard sign (e.g. High Street, Court House). The antennas failing to display signs were generally those fixed to walls, disguised or indoors. Even though some were found to be difficult to get access to by passers-by and could as a result be assumed to be at the required safety distance, Red-M believes that these antennas should be clearly signed. Signs could be posted very close to the antenna or on the antenna itself so that general maintenance workers are warned of the existence of such devices and their potential hazard.
The DG has already raised the issue of appropriate signage with the companies concerned and both C&WG and Newtel have confirmed that all sites now have appropriate signage in place. The DG will however review this issue further in the near future.
© Office of Utility Regulation, July 2008 38

8. Summary of Recommendations and Conclusions As can bee seen from the foregoing information, a comprehensive audit of all operational mast sites has been completed and a full review of the processes and procedures of the operators has also been carried out.
The following points are a summary of the audit’s outcome:
• The benchmark levels against which EM radiation should be assessed are those recommended by ICNIRP. These levels remain the industry standard across the world and have been adopted by the European Council and the HPA in their recommendations. Red-M investigated alternative guidelines and found no evidence to suggest that those alternative guidelines offer a scientifically more robust definition of the protection levels, or that the methods employed to arrive at those levels are scientifically proven or that the countries that adopted them have put in place the necessary tools or processes to enforce or implement those guidelines.
• On the operators’ processes and procedures, Red-M believes that the large majority of operators in Guernsey have in place the necessary processes to protect the public and their workforce. This is done by setting up a centralised system for allowing employees and sub-contractors to work safely in the vicinity of their radiating equipment, having thorough risk assessment procedures for identifying sources of RF hazard, by limiting their transmissions to the levels permitted by their licence conditions and the relevant equipment standards, by setting-up exclusion zones around their sites to prevent the public from getting close to any potentially harmful area, and by displaying sign of the presence of radio equipment.
• Some sites were found not to display any sign that RF equipment is live. For these sites Red-M recommends that the operators pay special attention in ensuring this is complied with. The DG notes that the operators concerned (Newtel and C&WG) have confirmed that they have taken steps to address this issue.
• 8 out of the 65 sites surveyed were found to have cumulative Exposure Quotients higher than 1/100. For comparison, none of the sites surveyed in 2004 had a cumulative EQ higher than 1/100. Possible reasons for this increase are given in section 7.2.1 of this report.
• Even though these sites have seen increases in their EQ, they still comply with the ICNIRP guidelines and are therefore not causing unnecessary exposure.
• Red-M also carried out a sensitivity analysis on the highest 8 sites in order to investigate under what circumstances these sites would fail the ICNIRP levels. The analysis showed that, for the highest measured site (Centenary House), the power at the site would need to be multiplied by 22 in order to reach an EQ of 1. Red-M however believes that getting the extra power to achieve that would be a challenge and does not therefore see a high likelihood of this materialising.
• Red-M would however recommend that those sites with the highest EQ be monitored by the operators themselves to ensure that the levels remain below ICNIRP, and by OUR as part of their on-going audit process.
• One indoor site was found to transmit at higher power than the “touch-safety” limit even though it was found to be within touching distance (Court House). For this site (and others in the same category), Red-M recommends that the operators comply with
© Office of Utility Regulation, July 2008 39

© Office of Utility Regulation, July 2008 40
the touch-safe limit of 20mW (or 13dBm) into the antenna port, unless those antennas have been SAR17 tested. C&WG, the operator of this site, has already confirmed that it has taken steps to address this issue.
• Two sites (Maseline Harbour and La Moinierie) were measured at much higher levels than what the worst-case levels predicted using the data supplied by the operator of these 2 sites appear to indicate. We recommend that the operator of these 2 sites look at the measured levels and the calculations and provide an explanation as to why there is such a large discrepancy between the two.
The OUR will be writing to each operator audited to follow-up with them the findings of this audit and to ensure that the actions need to further protect the general public are taken. The OUR is aware that the majority of the issues identified by RED-M (such as lack of signage at some sites and power levels at the Courthouse site) have already been addressed by the operators concerned. There are also some issues with regard to access to a small number of sites which may need to be considered in discussions between the operators and the relevant planning authorities in the various Islands.
The reviews planned for 2009 and 2010 will concentrate on the mobile operators as the DG believes these sites give rise to most public concern and the level of emissions from the equipment operated by the smaller operators are extremely low. This exercise was conducted in the interests of the community and their safety is a key consideration in this exercise. The process going forward is intended to ensure that Islanders have good quality information in this sensitive area and are kept fully informed. In planning the future audits in 2009 and 2010, the DG will look to consult with the public representatives in Alderney and Sark and with parish constables in Guernsey to consider where resources are focussed for ongoing monitoring programmes.
17 SAR tests (Specification Absorption Ratio) are conducted in labs to accurately measure the power flux density (in mW/cm2) over the surface of the antenna and can determine whether the antenna satisfies the ICNIRP limit. The touch-safe limit is a precautionary limit that ensures the ICNIRP limit is always satisfied given the conductive properties of a typical antenna.
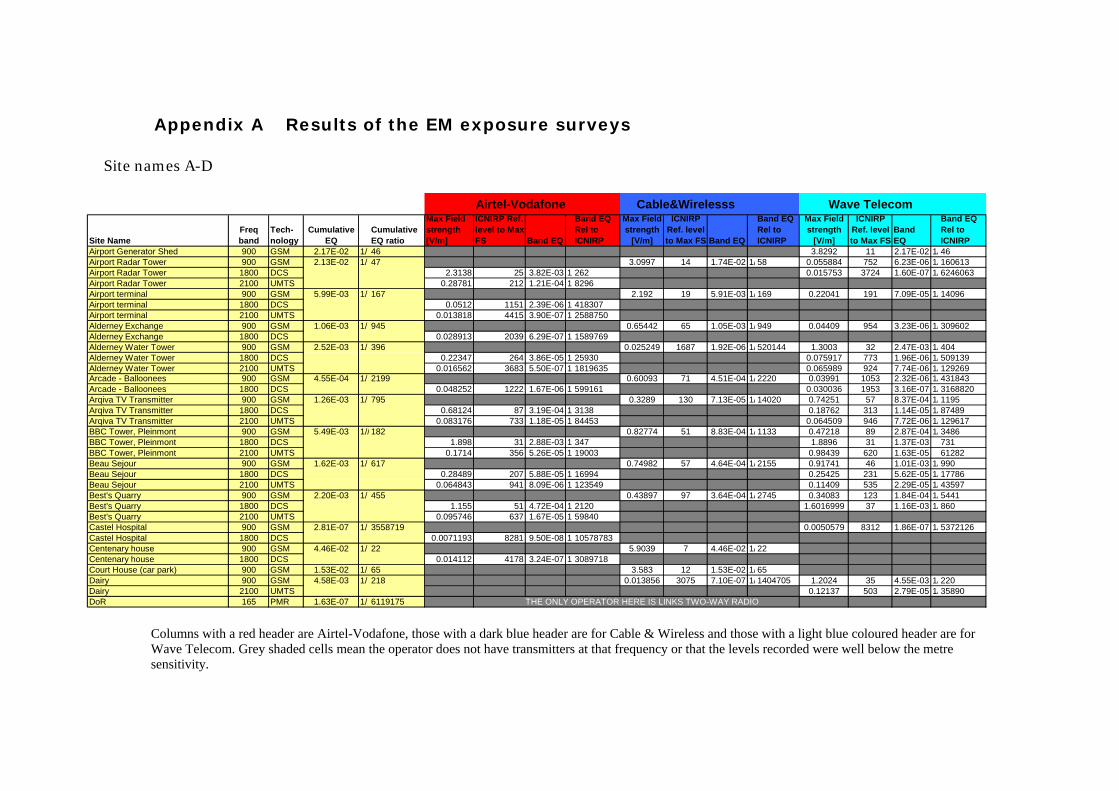
Appendix A Results of the EM exposure surveys
Site names A-D
Airtel-Vodafone Cable&Wirelesss Wave Telecom
Site NameFreq band
Tech-nology
Cumulative EQ
Cumulative EQ ratio
Max Field strength [V/m]
ICNIRP Ref. level to Max FS Band EQ
Band EQ Rel to ICNIRP
Max Field strength
[V/m]
ICNIRP Ref. level to Max FS Band EQ
Band EQ Rel to ICNIRP
Max Field strength
[V/m]
ICNIRP Ref. level to Max FS
Band EQ
Band EQ Rel to ICNIRP
Airport Generator Shed 900 GSM 2.17E-02 1/ 46 3.8292 11 2.17E-02 1/46Airport Radar Tower 900 GSM 2.13E-02 1/ 47 3.0997 14 1.74E-02 1/58 0.055884 752 6.23E-06 1/160613Airport Radar Tower 1800 DCS 2.3138 25 3.82E-03 1/262 0.015753 3724 1.60E-07 1/6246063Airport Radar Tower 2100 UMTS 0.28781 212 1.21E-04 1/8296Airport terminal 900 GSM 5.99E-03 1/ 167 2.192 19 5.91E-03 1/169 0.22041 191 7.09E-05 1/14096Airport terminal 1800 DCS 0.0512 1151 2.39E-06 1/418307Airport terminal 2100 UMTS 0.013818 4415 3.90E-07 1/2588750Alderney Exchange 900 GSM 1.06E-03 1/ 945 0.65442 65 1.05E-03 1/949 0.04409 954 3.23E-06 1/309602Alderney Exchange 1800 DCS 0.028913 2039 6.29E-07 1/1589769Alderney Water Tower 900 GSM 2.52E-03 1/ 396 0.025249 1687 1.92E-06 1/520144 1.3003 32 2.47E-03 1/404Alderney Water Tower 1800 DCS 0.22347 264 3.86E-05 1/25930 0.075917 773 1.96E-06 1/509139Alderney Water Tower 2100 UMTS 0.016562 3683 5.50E-07 1/1819635 0.065989 924 7.74E-06 1/129269Arcade - Balloonees 900 GSM 4.55E-04 1/ 2199 0.60093 71 4.51E-04 1/2220 0.03991 1053 2.32E-06 1/431843Arcade - Balloonees 1800 DCS 0.048252 1222 1.67E-06 1/599161 0.030036 1953 3.16E-07 1/3168820Arqiva TV Transmitter 900 GSM 1.26E-03 1/ 795 0.3289 130 7.13E-05 1/14020 0.74251 57 8.37E-04 1/1195Arqiva TV Transmitter 1800 DCS 0.68124 87 3.19E-04 1/3138 0.18762 313 1.14E-05 1/87489Arqiva TV Transmitter 2100 UMTS 0.083176 733 1.18E-05 1/84453 0.064509 946 7.72E-06 1/129617BBC Tower, Pleinmont 900 GSM 5.49E-03 1// 182 0.82774 51 8.83E-04 1/1133 0.47218 89 2.87E-04 1/3486BBC Tower, Pleinmont 1800 DCS 1.898 31 2.88E-03 1/347 1.8896 31 1.37E-03 731BBC Tower, Pleinmont 2100 UMTS 0.1714 356 5.26E-05 1/19003 0.98439 620 1.63E-05 61282Beau Sejour 900 GSM 1.62E-03 1/ 617 0.74982 57 4.64E-04 1/2155 0.91741 46 1.01E-03 1/990Beau Sejour 1800 DCS 0.28489 207 5.88E-05 1/16994 0.25425 231 5.62E-05 1/17786Beau Sejour 2100 UMTS 0.064843 941 8.09E-06 1/123549 0.11409 535 2.29E-05 1/43597Best's Quarry 900 GSM 2.20E-03 1/ 455 0.43897 97 3.64E-04 1/2745 0.34083 123 1.84E-04 1/5441Best's Quarry 1800 DCS 1.155 51 4.72E-04 1/2120 1.6016999 37 1.16E-03 1/860Best's Quarry 2100 UMTS 0.095746 637 1.67E-05 1/59840Castel Hospital 900 GSM 2.81E-07 1/ 3558719 0.0050579 8312 1.86E-07 1/5372126Castel Hospital 1800 DCS 0.0071193 8281 9.50E-08 1/10578783Centenary house 900 GSM 4.46E-02 1/ 22 5.9039 7 4.46E-02 1/22Centenary house 1800 DCS 0.014112 4178 3.24E-07 1/3089718Court House (car park) 900 GSM 1.53E-02 1/ 65 3.583 12 1.53E-02 1/65Dairy 900 GSM 4.58E-03 1/ 218 0.013856 3075 7.10E-07 1/1404705 1.2024 35 4.55E-03 1/220Dairy 2100 UMTS 0.12137 503 2.79E-05 1/35890DoR 165 PMR 1.63E-07 1/ 6119175 THE ONLY OPERATOR HERE IS LINKS TWO-WAY RADIO
Columns with a red header are Airtel-Vodafone, those with a dark blue header are for Cable & Wireless and those with a light blue coloured header are for Wave Telecom. Grey shaded cells mean the operator does not have transmitters at that frequency or that the levels recorded were well below the metre sensitivity.

Site names F-L
Site NameFreq band
Tech-nology
Cumulative EQ
Cumulative EQ ratio
Max Field strength [V/m]
ICNIRP Ref. level to Max FS Band EQ
Band EQ Rel to ICNIRP
Max Field strength
[V/m]
ICNIRP Ref. level to Max FS Band EQ
Band EQ Rel to ICNIRP
Max Field strength
[V/m]
ICNIRP Ref. level to Max FS
Band EQ
Band EQ Rel to ICNIRP
Falcon 900 GSM 2.31E-03 1/ 432 0.011752 3625 4.70E-07 1/2111762 0.94325 45 1.79E-03 1/559Falcon 1800 DCS 0.65824 90 4.50E-04 1/2221 0.028436 2036 8.08E-07 1/1238212Falcon 2100 UMTS 0.14542 419 7.18E-05 1/13927Fermain Valley Hotel. 900 GSM 3.88E-03 1/ 258 1.3535 31 3.88E-03 1/258Fish Co-op 900 GSM 4.98E-03 1/ 201 0.19376 220 1.34E-04 1/7477 1.7967 23 4.69E-03 1/213Fish Co-op 1800 DCS 0.1086 543 1.54E-05 1/64760 0.064254 913 7.49E-06 1/133461Fish Co-op 2100 UMTS 0.032126 1899 1.76E-06 1/569558 0.28288 216 1.33E-04 1/7534Fort Doyle 900 GSM 2.23E-03 1/ 448 1.3332 32 2.23E-03 1/449 0.079564 528 3.97E-06 1/252038Fort George 900 GSM 2.07E-05 1/ 48397 0.053315 799 7.14E-06 1/139966Fort George 1800 DCS 0.010602 5533 6.94E-08 1/14399817Fort George 2100 UMTS 0.089471 682 1.34E-05 1/74358Fort Richmond 900 GSM 3.77E-05 1/ 26522 0.10884 391 2.57E-05 1/38846 0.073777 570 1.00E-05 1/99561Fort Richmond 1800 DCS 0.048399 1218 1.76E-06 1/569101 0.017967 3265 1.61E-07 1/6212128Fort Sausmarez 900 GSM 5.01E-05 1/ 19965 0.18976 225 4.94E-05 1/20232 0.02083 2018 6.61E-07 1/1512355Gervaise Farm 900 GSM 1.03E-03 1/ 967 0.50603 83 1.00E-03 1/995Gervaise Farm 2100 UMTS 0.091365 668 2.90E-05 1/34499Gouffre 900 GSM 2.04E-04 1/ 4909 0.31653 135 2.03E-04 1/4920 0.013083 3214 4.43E-07 1/2258695Guernsey College 2400 WiFi SITE OPERATED BY MICROTECH AT 2.4GHz ONLYHerm 900 GSM 3.06E-05 1/ 32676 0.14913 282 3.06E-05 1/32676High St 900 GSM 2.60E-02 1/ 39 4.152 10 2.55E-02 1/39 0.70593 60 4.08E-04 1/2454High St 1800 DCS 0.028959 2036 7.94E-07 1/1259805 0.018908 3102 2.78E-07 1/3591352High St 2100 UMTS 0.015083 4044 6.36E-07 1/1572717 0.028013 2178 1.42E-06 1/702813Homefield 900 GSM 2.81E-03 1/ 356 1.1587 36 2.75E-03 1/363Homefield 2100 UMTS 0.18193 335 5.74E-05 1/17432Hubits 900 GSM 5.06E-03 1/ 198 1.0144 41 2.08E-03 1/482Hubits 1800 DCS 1.3151 45 8.56E-04 1/1169 1.7466 34 1.91E-03 1/524Hubits 2100 UMTS 0.28979 210 1.65E-04 1/6047 161829993 377 5.24E-05 1/19082Jamblin 900 GSM 1.35E-03 1/ 739 0.6936 61 1.26E-03 1/794Jamblin 2100 UMTS 0.16583 368 9.25E-05 1/10809Jerbourg (Bunker) 900 GSM 7.31E-03 1/ 137 1.1037 39 3.28E-03 1/305 1.6232 26 4.03E-03 1/248Kingsmill Water 900 GSM 1.65E-04 1/ 6045 0.34698 123 1.65E-04 1/6045La Fregate Hotel 900 GSM 1.97E-03 1/ 507 0.072391 589 3.33E-05 1/30058 0.09333 450 2.25E-05 1/44460La Fregate Hotel 1800 DCS 1.2516 47 1.16E-03 1/861 1.0994 53 7.28E-04 1374La Fregate Hotel 2100 UMTS 0.0925 659 1.53E-05 1/65310 0.076421 798 9.93E-06 100717La Moinierie 900 GSM 3.23E-02 1/ 31 3.9626 11 3.23E-02 1/31Les Adams 900 GSM 8.64E-03 1/ 116 0.042588 1000 5.30E-06 1/188639 1.8727 22 7.59E-03 1/132Les Adams 1800 DCS 0.012821 4598 2.78E-07 1/3591699Les Adams 2100 UMTS 0.56093 109 1.05E-03 1/956Les Caches 1800 DCS 7.76E-04 1/ 1288 1.1014 54 7.76E-04 1/1288Les Touillets 900 GSM 1.17E-03 1/ 852 0.11795 361 5.50E-05 1/18186 0.732 57 8.15E-04 1/1226Les Touillets 1800 DCS 0.48412 122 1.86E-04 1/5389 0.39415 149 5.25E-05 1/19054Les Touillets 2100 UMTS 0.18532 329 6.48E-05 1/15431Little Sark 900 GSM 4.32E-02 1/ 23 3.907201 11 4.25E-02 1/24 0.74192 57 6.70E-04 1/1492
© Office of Utility Regulation, July 2008 42

Site names M-Sa
Site NameFreq band
Tech-nology
Cumulative EQ
Cumulative EQ ratio
Max Field strength [V/m]
ICNIRP Ref. level to Max FS Band EQ
Band EQ Rel to ICNIRP
Max Field strength
[V/m]
ICNIRP Ref. level to Max FS Band EQ
Band EQ Rel to ICNIRP
Max Field strength
[V/m]
ICNIRP Ref. level to Max FS
Band EQ
Band EQ Rel to ICNIRP
Marais vinery 900 GSM 9.61E-04 1/ 1041 0.59938 70 9.22E-04 1/1085Marais vinery 2100 UMTS 0.10169 600 3.93E-05 1/25449Maraive 900 GSM 3.41E-03 1/ 293 1.0403 40 3.37E-03 1/296Maraive 2100 UMTS 0.10441 584 3.92E-05 1/25533Maseline Harbour - Sark 900 GSM 1.35E-02 1/ 74 3.3307 13 1.35E-02 1/74Maseline Harbour - Sark 1800 DCS 0.04353 1354 1.27E-06 1/786829 0.0719 816 3.57E-06 1/280132Mignot plateau - St Barnabas church 900 GSM 1.64E-03 1/ 610 0.21001 203 9.79E-05 1/10220 0.93601 45 1.41E-03 1/711Mignot plateau - St Barnabas church 1800 DCS 0.19992 295 4.68E-05 1/21361 0.11845 495 9.58E-06 1/104379Mignot plateau - St Barnabas church 2100 UMTS 0.08438 723 1.01E-05 1/98956 0.1908 320 6.88E-05 1/14536Nelson House 2400 WiFi SITE OPERATED BY MICROTECH ONLY AT 2.4GHzOakfield 900 GSM 4.58E-03 1/ 218 0.020596 2079 1.60E-06 1/626390 0.72561 58 1.79E-03 1/560Oakfield 1800 DCS 1.4773 40 2.60E-03 1/385 0.0639 918 4.80E-06 1/208436Oakfield 2100 UMTS 0.17844 342 9.69E-05 1/10324 0.1866 327 9.64E-05 1/10374Odeon Bunker 900 GSM 2.20E-03 1/ 454 1.0596 40 2.19E-03 1/456 0.027646 1521 2.22E-06 1/449844Odeon Bunker 1800 DCS 0.0646 913 1.49E-06 1/670926 0.089628 654 3.74E-06 1/267366Petit Bot 900 GSM 2.17E-03 1/ 461 0.96223 44 6.06E-04 1/1650 1.1377 37 1.55E-03 1/646Petit Bot 2100 UMTS 0.095615 638 1.74E-05 1/57625Police HQ 900 GSM 4.50E-04 1/ 2223 0.012083 3526 5.69E-07 1/1757788 0.57315 73 4.47E-04 1/2238Police HQ 1800 DCS 0.040911 1441 1.20E-06 1/833784 0.010768 5448 3.01E-07 1/3320715Police HQ 2100 UMTS 0.022366 2727 8.64E-07 1/1157263PoP 900 GSM 8.54E-04 1/ 1171 0.022862 1863 1.84E-06 1/544810 0.034711 1211 1.90E-06 1/526183PoP 1800 DCS 0.028479 2070 6.48E-07 1/1542464 1.083 54 8.50E-04 1/1177Princess Elizabeth Hospital (Indoors) 900 GSM 3.55E-04 1/ 2814 0.011804 3562 2.69E-07 1/3712707Princess Elizabeth Hospital (Indoors) 1800 DCS 0.70323 84 3.25E-04 1/3073 0.012919 4541 8.20E-08 1/12132816Princess Elizabeth Hospital (Indoors) 2100 UMTS 0.12835 475 2.96E-05 1/33832Princess Elizabeth Hospital (Outdoor 900 GSM 8.56E-05 1/ 11686 0.058029 725 4.85E-06 1/206383Princess Elizabeth Hospital (Outdoor 1800 DCS 0.32596 181 6.64E-05 1/15059 0.20025 293 1.26E-05 1/79592Princess Elizabeth Hospital (Outdoor 2100 UMTS 0.029614 2060 1.75E-06 1/570200Regency 900 GSM 2.82E-03 1/ 354 0.96122 44 2.11E-03 1/474Regency 1800 DCS 0.59271 99 4.02E-04 1/2487 0.056163 1044 1.10E-06 1/906652Regency 2100 UMTS 0.18425 331 1.27E-04 1/7876 0.23709 257 1.84E-04 1/5446Reservoir 900 GSM 8.73E-04 1/ 1146 0.64109 66 8.73E-04 1/1146Rohais 900 GSM 2.28E-03 1/ 439 1.043 41 2.27E-03 1/440 0.0481 873 7.02E-06 1/142434Ronez Quarry 900 GSM 2.90E-03 1/ 345 0.83277 51 2.90E-03 1/345Sark Harbour - crane sheds 900 GSM 2.36E-03 1/ 424 0.85357 50 9.90E-04 1/1010Sark Harbour - crane sheds 1800 DCS 0.57345 103 2.05E-04 1/4879 1.319 44 1.16E-03 1/858Sark Harbour - old harbour 900 GSM 2.64E-03 1/ 379 1.1534 37 1.69E-03 1/591Sark Harbour - old harbour 1800 DCS 1.2081 49 9.36E-04 1/1068 0.10319 568 7.49E-06 1/133513Sark Telephone Exchange 900 GSM 1.19E-03 1/ 842 0.40115 106 4.64E-04 1/2154 0.5567399 76 6.34E-04 1/1576Sark Telephone Exchange 2100 UMTS 0.19491 313 7.46E-05 1/13403 0.08497 718 1.38E-05 1/72492
© Office of Utility Regulation, July 2008 43
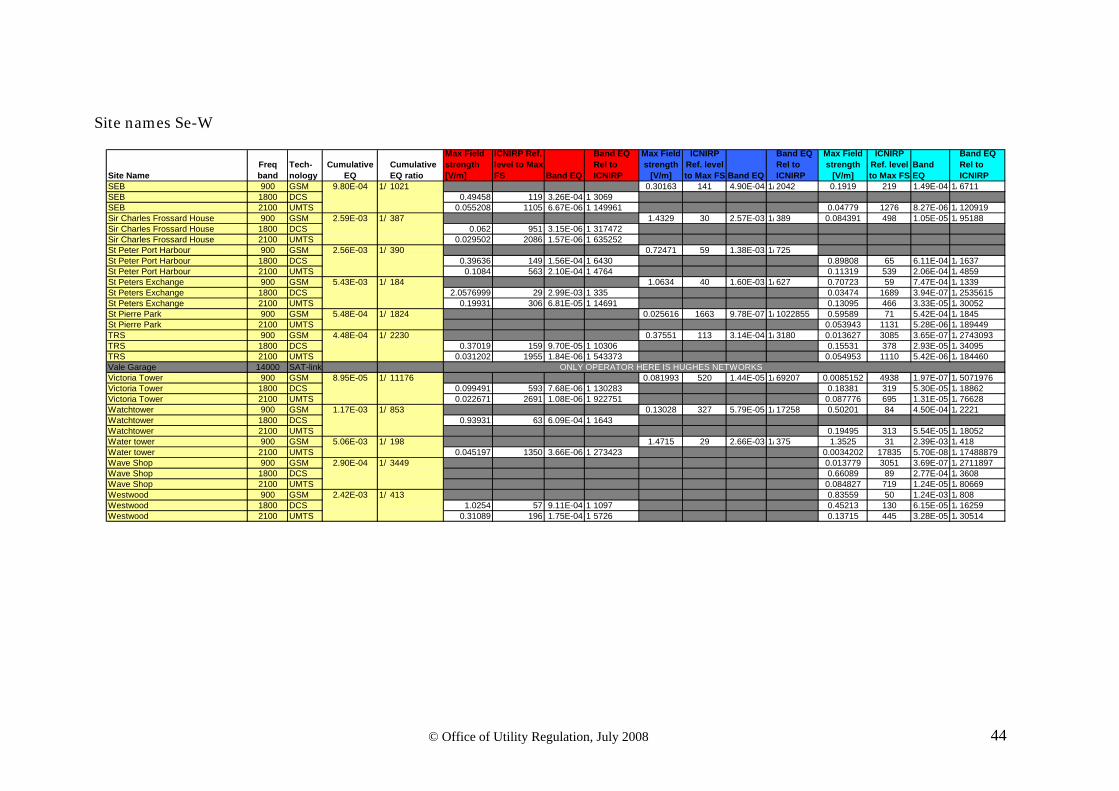
© Office of Utility Regulation, July 2008 44
Site names Se-W
Site NameFreq band
Tech-nology
Cumulative EQ
Cumulative EQ ratio
Max Field strength [V/m]
ICNIRP Ref. level to Max FS Band EQ
Band EQ Rel to ICNIRP
Max Field strength
[V/m]
ICNIRP Ref. level to Max FS Band EQ
Band EQ Rel to ICNIRP
Max Field strength
[V/m]
ICNIRP Ref. level to Max FS
Band EQ
Band EQ Rel to ICNIRP
SEB 900 GSM 9.80E-04 1/ 1021 0.30163 141 4.90E-04 1/2042 0.1919 219 1.49E-04 1/6711SEB 1800 DCS 0.49458 119 3.26E-04 1/3069SEB 2100 UMTS 0.055208 1105 6.67E-06 1/149961 0.04779 1276 8.27E-06 1/120919Sir Charles Frossard House 900 GSM 2.59E-03 1/ 387 1.4329 30 2.57E-03 1/389 0.084391 498 1.05E-05 1/95188Sir Charles Frossard House 1800 DCS 0.062 951 3.15E-06 1/317472Sir Charles Frossard House 2100 UMTS 0.029502 2086 1.57E-06 1/635252St Peter Port Harbour 900 GSM 2.56E-03 1/ 390 0.72471 59 1.38E-03 1/725St Peter Port Harbour 1800 DCS 0.39636 149 1.56E-04 1/6430 0.89808 65 6.11E-04 1/1637St Peter Port Harbour 2100 UMTS 0.1084 563 2.10E-04 1/4764 0.11319 539 2.06E-04 1/4859St Peters Exchange 900 GSM 5.43E-03 1/ 184 1.0634 40 1.60E-03 1/627 0.70723 59 7.47E-04 1/1339St Peters Exchange 1800 DCS 2.0576999 29 2.99E-03 1/335 0.03474 1689 3.94E-07 1/2535615St Peters Exchange 2100 UMTS 0.19931 306 6.81E-05 1/14691 0.13095 466 3.33E-05 1/30052St Pierre Park 900 GSM 5.48E-04 1/ 1824 0.025616 1663 9.78E-07 1/1022855 0.59589 71 5.42E-04 1/1845St Pierre Park 2100 UMTS 0.053943 1131 5.28E-06 1/189449TRS 900 GSM 4.48E-04 1/ 2230 0.37551 113 3.14E-04 1/3180 0.013627 3085 3.65E-07 1/2743093TRS 1800 DCS 0.37019 159 9.70E-05 1/10306 0.15531 378 2.93E-05 1/34095TRS 2100 UMTS 0.031202 1955 1.84E-06 1/543373 0.054953 1110 5.42E-06 1/184460Vale Garage 14000 SAT-link ONLY OPERATOR HERE IS HUGHES NETWORKSVictoria Tower 900 GSM 8.95E-05 1/ 11176 0.081993 520 1.44E-05 1/69207 0.0085152 4938 1.97E-07 1/5071976Victoria Tower 1800 DCS 0.099491 593 7.68E-06 1/130283 0.18381 319 5.30E-05 1/18862Victoria Tower 2100 UMTS 0.022671 2691 1.08E-06 1/922751 0.087776 695 1.31E-05 1/76628Watchtower 900 GSM 1.17E-03 1/ 853 0.13028 327 5.79E-05 1/17258 0.50201 84 4.50E-04 1/2221Watchtower 1800 DCS 0.93931 63 6.09E-04 1/1643Watchtower 2100 UMTS 0.19495 313 5.54E-05 1/18052Water tower 900 GSM 5.06E-03 1/ 198 1.4715 29 2.66E-03 1/375 1.3525 31 2.39E-03 1/418Water tower 2100 UMTS 0.045197 1350 3.66E-06 1/273423 0.0034202 17835 5.70E-08 1/17488879Wave Shop 900 GSM 2.90E-04 1/ 3449 0.013779 3051 3.69E-07 1/2711897Wave Shop 1800 DCS 0.66089 89 2.77E-04 1/3608Wave Shop 2100 UMTS 0.084827 719 1.24E-05 1/80669Westwood 900 GSM 2.42E-03 1/ 413 0.83559 50 1.24E-03 1/808Westwood 1800 DCS 1.0254 57 9.11E-04 1/1097 0.45213 130 6.15E-05 1/16259Westwood 2100 UMTS 0.31089 196 1.75E-04 1/5726 0.13715 445 3.28E-05 1/30514