Ocean Drilling Program Initial Reports Volume 111
217
3. SITE 504: COSTA RICA RIFT 1 Shipboard Scientific Party 2 HOLE 504B Date occupied: 29 August 1986; 5 October 1986 Date departed: 30 September 1986; 16 October 1986 Time on hole: 42 days, 22 hr (total; two visits) Position: 1 0 13.6H'N, 83°43.818'W Water depth (sea level; corrected m, echo-sounding): 3460 Water depth (rig floor; corrected m, echo-sounding): 3471.1 Bottom felt (m, drill pipe): 3474 Total depth (mbsf)): 1562.3 Penetration (m): 212.3 (during Leg 111) Number of cores: 28 Total length of cored section (m): 209.1 Total core recovered (m): 26.42 Core recovery (%): 12.64 Basement rocks Depth sub-bottom: 1350; 1562.3 Nature: basalts: massive flows and sheeted dikes Age: 5.9 m.y. Measured velocity (km/s): 6.0-6.4 Principal results: Leg 111 spent 42.9 days at Hole 504B, including nearly 29 days for coring operations and slightly more than 14 days for log- ging and experiments. Leg 111 deepened Hole 504B by 212.3 m, to a 1 Becker, K., Sakai, H., et al., 1988. Proc. ODP, Init. Repts. (Pt. A), 111: College Station, TX (Ocean Drilling Program). 2 Keir Becker (Co-Chief Scientist), Rosenstiel School of Marine and Atmo- spheric Sciences, University of Miami, Miami, FL 33149; Hitoshi Sakai (Co-Chief Scientist), Ocean Research Institute, University of Tokyo, Tokyo 164, Japan; Rus- sell B. Merrill, Staff Scientist, Ocean Drilling Program, Texas A&M University, College Station, TX 77843; Andrew C. Adamson, Ocean Drilling Program, Texas A&M University, College Station, TX 77843; Joanne Alexandrovich, Lamont- Doherty Geological Observatory, Palisades, NY 10964; Jeffrey C. Alt, Depart- ment of Earth and Planetary Sciences, Washington University, St. Louis, MO 63130; Roger N. Anderson, Lamont-Doherty Geological Observatory, Palisades, NY 10964: Daniel Bideau, IFREMER/Centre de Brest, BP 337, 29273 Brest Ce- dex, France; Robert Gable, Bureau Recherche de Geologique et Minieres, BP 6009, 45060 Orleans Cedex-2, France; Peter M. Herzig, Institute of Mining and Economic Geology, Aachen University of Technology, D-5100 Aachen 1, Federal Republic of Germany; Simon Houghton, Department of Earth Sciences, Open University, Milton Keynes, Buckinghamshire MK7 6AA, United Kingdom; Hideo Ishizuka, Department of Geology, Kochi University, 2-5-1 Akebonocho, Kochi 780, Japan; Hodaka Kawahata, Department of Geology, University of Toronto, Toronto, Ontario M5S 1A1, Canada; Hajimu Kinoshita, Department of Earth Sciences, Chiba University, 1-33 Yayoi-cho, Chiba 260, Japan; Michael A. Lovell, Department of Geology, University of Nottingham, University Park, Nottingham NG7 2RD, United Kingdom; John Malpas, Earth Sciences Department, Memo- rial University, St. John's, Newfoundland A1B 3X5, Canada; Harue Masuda, Ocean Research Institute, University of Tokyo, Tokyo 164, Japan; Roger H. Morin, U.S. Geological Survey, Denver Federal Center, Denver, CO 80225; Michael J. Mottl, Hawaii Institute of Geophysics, University of Hawaii, Honolulu, HI 96822; Janet E. Pariso, School of Oceanography, University of Washington, Seattle, WA 98195; Philippe Pezard, Lamont-Doherty Geological Observatory, Palisades, NY 10964; Joseph Phillips, Institute for Geophysics, University of Texas at Austin, Austin, TX 78751; Joel Sparks, Department of Geology and Geography, Univer- sity of Massachusetts, Amherst, MA 01003; Stefan Uhlig, Institut fur Geowissen- schaften und Lithosphaerenforschung, Universitat Giessen, D-6300 Giessen, Fed- eral Republic of Germany. total depth of 1562.3 m below seafloor (mbsf) or 1287.8 m into base- ment. Coring was very difficult in the sheeted dikes that were en- countered, and a total of 26.42 m of core was recovered, for an over- all recovery of 12.6%. Hole 504B claimed parts of three coring as- semblies, and much of the leg was spent in attempts to fish and mill junk from the bottom of the hole. The rocks recovered from Hole 504B during Leg 111 are aphyric or sparsely- to highly-phyric, fine- to medium-grained, olivine tho- leiitic basalts, similar in chemical composition to the basalts recov- ered during previous legs. Phenocrysts of olivine, clinopyroxene, plagioclase, and rare chromian spinel occur in various combinations, including olivine + clinopyroxene and plagioclase + clinopyroxene. The basalts were cored from massive units, and five intrusive dike contacts were sampled, with dips between 70° and vertical. Most of the recovered basalt is slightly altered, with olivine re- placed by ± chlorite, ± pyrite, ± talc, ± mixed-layer clay miner- als, ± magnetite, or by chlorite + actinolite. Thin, subhorizontal or subvertical cracks are common in the upper part of the core, but are rare in the deeper part. Some of these cracks are filled by ± chlorite, ± actinolite, ± sulfides, ± quartz, ± prehnite, ± laumontite, or ± anhydrite. Actinolite becomes more abundant deeper in the re- covered core. Although coring was difficult, the logging and experiments were quite successful. Before Leg 111 began coring, undisturbed borehole temperatures were continuously logged, and borehole waters were sampled. The highest measured temperature was 148.9°C at 1280 mbsf, suggesting an equilibrium temperature of about 165°C at the present total depth of the hole. Deep in the hole, the temperature gradient is basically linear, but it decreases from 116°C/km in the pillow lavas to 61 °C/km in the dikes; this change in the gradient sug- gests a puzzling reduction in heat flow with depth. Slightly de- pressed temperatures in the upper 400 m indicate that ocean bottom water still flows down the casing into the upper 100-200 m of base- ment, at a rate of about 80 L/hr, about 1% of the rate when the hole was first drilled. Four samples of borehole waters were collected from 466, 631, 766, and 1236 mbsf, at temperatures of 81°, 101°, 115°, and 146°C, respectively; these were free of the bentonite mud contamination that affected Leg 92 samples. These samples show a strong vertical gradient in major chemical composition: Mg 2 + , SO 2 . - , and (Na + +K + ) decrease with depth, while Ca 2+ increases with depth. These samples fall on mixing lines between ocean bottom water and the borehole end-member. This suggests that the chemical composi- tion of the borehole water is controlled by sluggish vertical convec- tion within the borehole and exchange of borehole water with the ocean bottom water that flows downhole and into the upper 100-200 m of basement. Permeabilities measured in the dike section indicate that the kilo- meter of basement deeper than 500 mbsf is uniformly impermeable (5-20 x 10" 18 m 2 ), so that the only permeable section of basement is the uppermost 100-200 m of pillow lavas, into which the down- hole flow is directed. During Leg 111, Hole 504B was logged with an exceptional suite of tools: Schlumberger neutron-activation/gamma-spectroscopy tool (ACT/GST), Schlumberger electrical resistivity tool (DLL), Schlum- berger density/magnetometer tool (LDT/GPIT), LDGO multichan- nel sonic tool (MCS), and USGS borehole televiewer (BHTV). When calibrated against the properties of the recovered basalts, the logs yield a nearly continuous geophysical, geochemical, and lithological characterization of the basement, despite the relatively poor core re- covery. The ACT and LDT tools resolved the relative abundances of the major elements Al, Ca, Fe, K, Mg, S, Si, U, and Th, and allowed the 35
-
Upload
khangminh22 -
Category
Documents
-
view
0 -
download
0
Transcript of Ocean Drilling Program Initial Reports Volume 111
3. SITE 504: COSTA RICA RIFT1
Shipboard Scientific Party2
HOLE 504B
Date occupied: 29 August 1986; 5 October 1986 Date departed: 30 September 1986; 16 October 1986 Time on hole: 42 days, 22 hr (total; two visits) Position: 1013.6H'N, 83°43.818'W Water depth (sea level; corrected m, echo-sounding): 3460 Water depth (rig floor; corrected m, echo-sounding): 3471.1 Bottom felt (m, drill pipe): 3474 Total depth (mbsf)): 1562.3 Penetration (m): 212.3 (during Leg 111) Number of cores: 28 Total length of cored section (m): 209.1 Total core recovered (m): 26.42 Core recovery (%): 12.64 Basement rocks
Depth sub-bottom: 1350; 1562.3 Nature: basalts: massive flows and sheeted dikes Age: 5.9 m.y. Measured velocity (km/s): 6.0-6.4
Principal results: Leg 111 spent 42.9 days at Hole 504B, including nearly 29 days for coring operations and slightly more than 14 days for logging and experiments. Leg 111 deepened Hole 504B by 212.3 m, to a
1 Becker, K., Sakai, H., et al., 1988. Proc. ODP, Init. Repts. (Pt. A), 111: College Station, TX (Ocean Drilling Program).
2 Keir Becker (Co-Chief Scientist), Rosenstiel School of Marine and Atmospheric Sciences, University of Miami, Miami, FL 33149; Hitoshi Sakai (Co-Chief Scientist), Ocean Research Institute, University of Tokyo, Tokyo 164, Japan; Russell B. Merrill, Staff Scientist, Ocean Drilling Program, Texas A&M University, College Station, TX 77843; Andrew C. Adamson, Ocean Drilling Program, Texas A&M University, College Station, TX 77843; Joanne Alexandrovich, Lamont-Doherty Geological Observatory, Palisades, NY 10964; Jeffrey C. Alt, Department of Earth and Planetary Sciences, Washington University, St. Louis, MO 63130; Roger N. Anderson, Lamont-Doherty Geological Observatory, Palisades, NY 10964: Daniel Bideau, IFREMER/Centre de Brest, BP 337, 29273 Brest Ce-dex, France; Robert Gable, Bureau Recherche de Geologique et Minieres, BP 6009, 45060 Orleans Cedex-2, France; Peter M. Herzig, Institute of Mining and Economic Geology, Aachen University of Technology, D-5100 Aachen 1, Federal Republic of Germany; Simon Houghton, Department of Earth Sciences, Open University, Milton Keynes, Buckinghamshire MK7 6AA, United Kingdom; Hideo Ishizuka, Department of Geology, Kochi University, 2-5-1 Akebonocho, Kochi 780, Japan; Hodaka Kawahata, Department of Geology, University of Toronto, Toronto, Ontario M5S 1A1, Canada; Hajimu Kinoshita, Department of Earth Sciences, Chiba University, 1-33 Yayoi-cho, Chiba 260, Japan; Michael A. Lovell, Department of Geology, University of Nottingham, University Park, Nottingham NG7 2RD, United Kingdom; John Malpas, Earth Sciences Department, Memorial University, St. John's, Newfoundland A1B 3X5, Canada; Harue Masuda, Ocean Research Institute, University of Tokyo, Tokyo 164, Japan; Roger H. Morin, U.S. Geological Survey, Denver Federal Center, Denver, CO 80225; Michael J. Mottl, Hawaii Institute of Geophysics, University of Hawaii, Honolulu, HI 96822; Janet E. Pariso, School of Oceanography, University of Washington, Seattle, WA 98195; Philippe Pezard, Lamont-Doherty Geological Observatory, Palisades, NY 10964; Joseph Phillips, Institute for Geophysics, University of Texas at Austin, Austin, TX 78751; Joel Sparks, Department of Geology and Geography, University of Massachusetts, Amherst, MA 01003; Stefan Uhlig, Institut fur Geowissen-schaften und Lithosphaerenforschung, Universitat Giessen, D-6300 Giessen, Federal Republic of Germany.
total depth of 1562.3 m below seafloor (mbsf) or 1287.8 m into basement. Coring was very difficult in the sheeted dikes that were encountered, and a total of 26.42 m of core was recovered, for an overall recovery of 12.6%. Hole 504B claimed parts of three coring assemblies, and much of the leg was spent in attempts to fish and mill junk from the bottom of the hole.
The rocks recovered from Hole 504B during Leg 111 are aphyric or sparsely- to highly-phyric, fine- to medium-grained, olivine tho-leiitic basalts, similar in chemical composition to the basalts recovered during previous legs. Phenocrysts of olivine, clinopyroxene, plagioclase, and rare chromian spinel occur in various combinations, including olivine + clinopyroxene and plagioclase + clinopyroxene. The basalts were cored from massive units, and five intrusive dike contacts were sampled, with dips between 70° and vertical.
Most of the recovered basalt is slightly altered, with olivine replaced by ± chlorite, ± pyrite, ± talc, ± mixed-layer clay minerals, ± magnetite, or by chlorite + actinolite. Thin, subhorizontal or subvertical cracks are common in the upper part of the core, but are rare in the deeper part. Some of these cracks are filled by ± chlorite, ± actinolite, ± sulfides, ± quartz, ± prehnite, ± laumontite, or ± anhydrite. Actinolite becomes more abundant deeper in the recovered core.
Although coring was difficult, the logging and experiments were quite successful. Before Leg 111 began coring, undisturbed borehole temperatures were continuously logged, and borehole waters were sampled. The highest measured temperature was 148.9°C at 1280 mbsf, suggesting an equilibrium temperature of about 165°C at the present total depth of the hole. Deep in the hole, the temperature gradient is basically linear, but it decreases from 116°C/km in the pillow lavas to 61 °C/km in the dikes; this change in the gradient suggests a puzzling reduction in heat flow with depth. Slightly depressed temperatures in the upper 400 m indicate that ocean bottom water still flows down the casing into the upper 100-200 m of basement, at a rate of about 80 L/hr, about 1% of the rate when the hole was first drilled.
Four samples of borehole waters were collected from 466, 631, 766, and 1236 mbsf, at temperatures of 81°, 101°, 115°, and 146°C, respectively; these were free of the bentonite mud contamination that affected Leg 92 samples. These samples show a strong vertical gradient in major chemical composition: Mg2 + , SO2 . - , and (Na+ +K + ) decrease with depth, while Ca2 + increases with depth. These samples fall on mixing lines between ocean bottom water and the borehole end-member. This suggests that the chemical composition of the borehole water is controlled by sluggish vertical convection within the borehole and exchange of borehole water with the ocean bottom water that flows downhole and into the upper 100-200 m of basement.
Permeabilities measured in the dike section indicate that the kilometer of basement deeper than 500 mbsf is uniformly impermeable (5-20 x 10"18 m2), so that the only permeable section of basement is the uppermost 100-200 m of pillow lavas, into which the down-hole flow is directed.
During Leg 111, Hole 504B was logged with an exceptional suite of tools: Schlumberger neutron-activation/gamma-spectroscopy tool (ACT/GST), Schlumberger electrical resistivity tool (DLL), Schlumberger density/magnetometer tool (LDT/GPIT), LDGO multichannel sonic tool (MCS), and USGS borehole televiewer (BHTV). When calibrated against the properties of the recovered basalts, the logs yield a nearly continuous geophysical, geochemical, and lithological characterization of the basement, despite the relatively poor core recovery.
The ACT and LDT tools resolved the relative abundances of the major elements Al, Ca, Fe, K, Mg, S, Si, U, and Th, and allowed the
35
SITE 504
construction of a normative mineralogy log. The variation in log-determined geochemistry and mineralogy is a response to both the original chemistry of the phyric vs. aphyric units and the presence of alteration products such as chlorite, actinolite, and clays. The logs show that the alteration products are tightly confined to fractures along boundaries between individual extrusive or intrusive events. In particular, the basalts beneath the stockwork sampled during Leg 83 at 910-930 mbsf are more phyric and contain more Al than the basalts above the stockwork.
Both the MCS and the DLL clearly distinguish individual litho-logic units. Deep in the dikes, compressional and shear velocities logged with the MCS reach 6.4 and 3.7 km/s, respectively, and electrical resistivity increases to over 1000 li-m. The BHTV revealed major breakouts in this otherwise massive section, which suggested that some of the drilling problems might have resulted from spalling of wall rocks as stresses were relieved around the newly drilled hole.
The DLL allows determination of both fracture and total apparent porosity; the latter ranges from about 15% in the upper pillow lavas to less than 1% deep in the dikes. The variation in the logged abundances of alteration products correlates with the apparent porosities calculated from resistivities, suggesting that some of the apparent porosity calculated from electrical resistivity may represent original porosity that has been filled by conductive alteration products.
The logged abundances of alteration minerals also correlate with changes in logged magnetic intensities. The logged magnetic inclination clearly changes at about 800 mbsf, from 15° in the pillow lavas above to 8° in the pillows, flows, and dikes below. This observation suggests that Hole 504B may intersect a tectonic feature—the relict trace of early listric faulting within the rift valley—about 100-200 m shallower than the lithologic transition between pillow lavas and sheeted dikes. Such a fault trace may have been the permeable conduit for circulating hydrothermal fluids that produced the heavily mineralized stockwork at the base of the pillow lavas.
A highly successful vertical seismic profile (VSP) was conducted, shooting to a geophone clamped nearly every 10 m up the hole from 1535 mbsf. The seismograms show several important reflectors that may be associated with Layer 3: (1) about 100 m deeper than the present depth of the hole, a reflector that may mark the contact between the dikes of layer 2C and the underlying gabbros of Layer 3, and (2) about 900 m deeper than the present depth of the hole, dipping reflectors that probably lie well within Layer 3. Thus, Layer 3 gabbros may well be within reach of the next full drilling leg to Hole 504B.
Unfortunately, Leg 111 left part of its last coring bottom-hole assembly (BHA) in the bottom of Hole 504B. A diamond core bit, float valve, lower support bearing, and inner core barrel were lost when the connection between the bit and the stabilized bit sub above parted. Leg 111 spent its last 5 days trying to fish this junk from the hole, and successfully recovered the inner core barrel and part of the lower support bearing. However, Leg 111 had neither the proper tools nor enough time to complete the hole-cleaning operation, and had to depart with junk left in the deepest hole into oceanic basement.
BACKGROUND A N D OBJECTIVES
Introduction During Leg 111 of the Ocean Drilling Program (ODP),
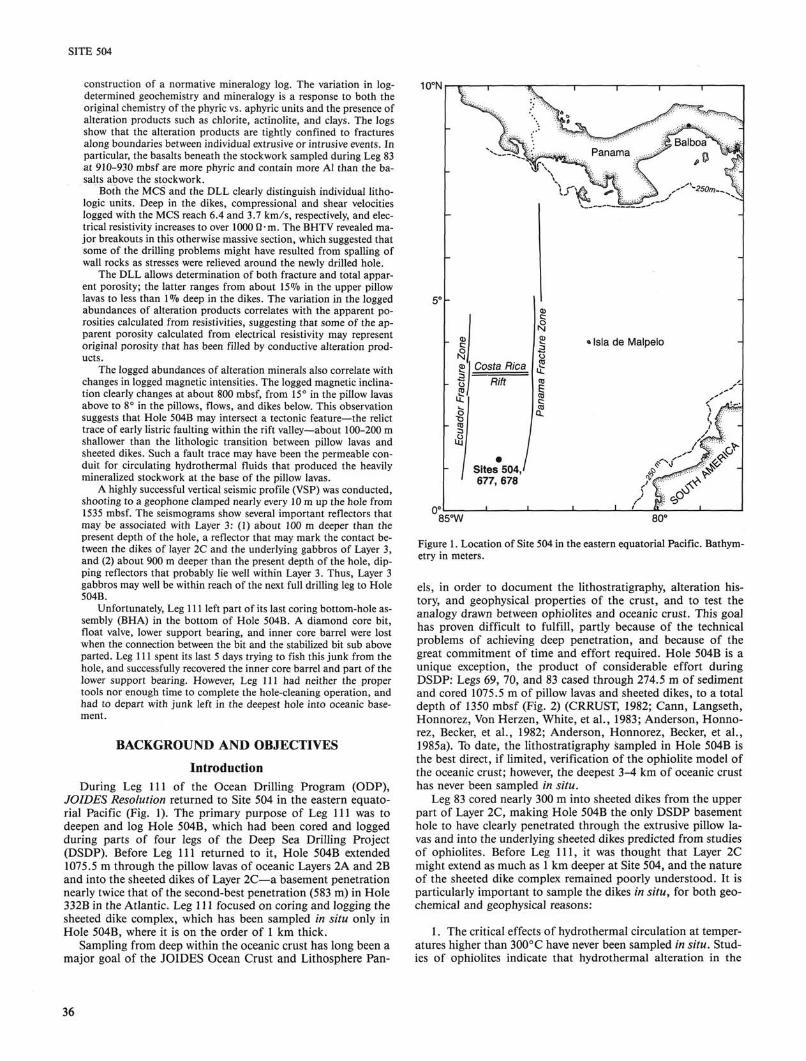
JOIDES Resolution returned to Site 504 in the eastern equatorial Pacific (Fig. 1). The primary purpose of Leg 111 was to deepen and log Hole 504B, which had been cored and logged during parts of four legs of the Deep Sea Drilling Project (DSDP). Before Leg 111 returned to it, Hole 504B extended 1075.5 m through the pillow lavas of oceanic Layers 2A and 2B and into the sheeted dikes of Layer 2C—a basement penetration nearly twice that of the second-best penetration (583 m) in Hole 332B in the Atlantic. Leg 111 focused on coring and logging the sheeted dike complex, which has been sampled in situ only in Hole 504B, where it is on the order of 1 km thick.
Sampling from deep within the oceanic crust has long been a major goal of the JOIDES Ocean Crust and Lithosphere Pan-
10°N
en c o N | £
actu
ifc* o c> i CO .1 C M UJ
Costa Rica
Rift
/ / /
Sites 504,' 677, 678
n N 2 .3 o
£ CD
CC
c en Q
«Isla de Malpelo
j i-85°W
Figure 1. Location of Site 504 in the eastern equatorial Pacific. Bathymetry in meters.
els, in order to document the lithostratigraphy, alteration history, and geophysical properties of the crust, and to test the analogy drawn between ophiolites and oceanic crust. This goal has proven difficult to fulfill, partly because of the technical problems of achieving deep penetration, and because of the great commitment of time and effort required. Hole 504B is a unique exception, the product of considerable effort during DSDP: Legs 69, 70, and 83 cased through 274.5 m of sediment and cored 1075.5 m of pillow lavas and sheeted dikes, to a total depth of 1350 mbsf (Fig. 2) (CRRUST, 1982; Cann, Langseth, Honnorez, Von Herzen, White, et al., 1983; Anderson, Honno-rez, Becker, et al., 1982; Anderson, Honnorez, Becker, et al., 1985a). To date, the lithostratigraphy sampled in Hole 504B is the best direct, if limited, verification of the ophiolite model of the oceanic crust; however, the deepest 3-4 km of oceanic crust has never been sampled in situ.
Leg 83 cored nearly 300 m into sheeted dikes from the upper part of Layer 2C, making Hole 504B the only DSDP basement hole to have clearly penetrated through the extrusive pillow lavas and into the underlying sheeted dikes predicted from studies of ophiolites. Before Leg 111, it was thought that Layer 2C might extend as much as 1 km deeper at Site 504, and the nature of the sheeted dike complex remained poorly understood. It is particularly important to sample the dikes in situ, for both geochemical and geophysical reasons:
1. The critical effects of hydrothermal circulation at temperatures higher than 300°C have never been sampled in situ. Studies of ophiolites indicate that hydrothermal alteration in the
36
SITE 504
Dri l l ing h i s t o r y L i thos t ra t ig raphy
400
800
1200
Cas inq*-11 3 / 4 " I .D.
Leg 69 (10 /79)
Uncased —► _ 9 7 /8 " b i t
489
-Leg 70 (12 /79)
~836
Leg 83 (1 1/81 - 1 / 8 2 )
1287.5
1350 Experiments
Sediment
274.5
Pillow lavas and
minor f lows
—
846 571 .5
Trans i t ion
1055 780 .5 —
Sheeted dikes and
massive uni ts
1075.5
e <L>
w 4 0 0 a
— 800
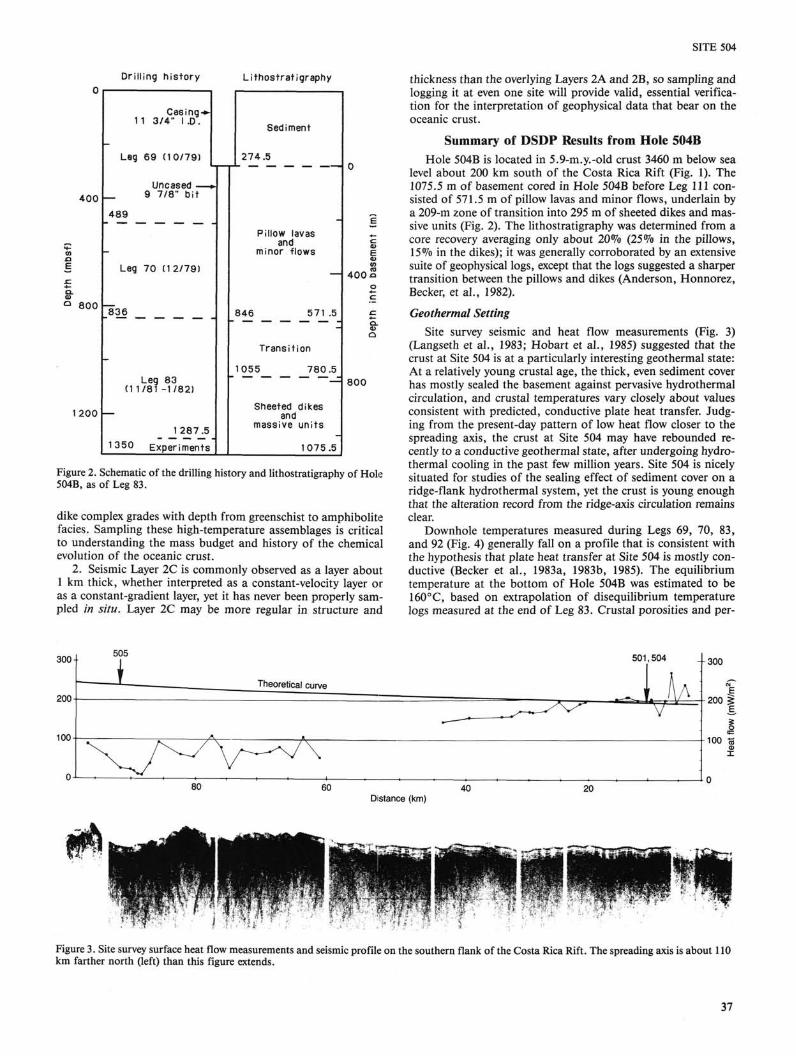
Figure 2. Schematic of the drilling history and lithostratigraphy of Hole 504B, as of Leg 83.
dike complex grades with depth from greenschist to amphibolite fades. Sampling these high-temperature assemblages is critical to understanding the mass budget and history of the chemical evolution of the oceanic crust.
2. Seismic Layer 2C is commonly observed as a layer about 1 km thick, whether interpreted as a constant-velocity layer or as a constant-gradient layer, yet it has never been properly sampled in situ. Layer 2C may be more regular in structure and
thickness than the overlying Layers 2A and 2B, so sampling and logging it at even one site will provide valid, essential verification for the interpretation of geophysical data that bear on the oceanic crust.
Summary of DSDP Results from Hole 504B Hole 504B is located in 5.9-m.y.-old crust 3460 m below sea
level about 200 km south of the Costa Rica Rift (Fig. 1). The 1075.5 m of basement cored in Hole 504B before Leg 111 consisted of 571.5 m of pillow lavas and minor flows, underlain by a 209-m zone of transition into 295 m of sheeted dikes and massive units (Fig. 2). The lithostratigraphy was determined from a core recovery averaging only about 20% (25% in the pillows, 15% in the dikes); it was generally corroborated by an extensive suite of geophysical logs, except that the logs suggested a sharper transition between the pillows and dikes (Anderson, Honnorez, Becker, et al., 1982).
Geothermal Setting Site survey seismic and heat flow measurements (Fig. 3)
(Langseth et al., 1983; Hobart et al., 1985) suggested that the crust at Site 504 is at a particularly interesting geothermal state: At a relatively young crustal age, the thick, even sediment cover has mostly sealed the basement against pervasive hydrothermal circulation, and crustal temperatures vary closely about values consistent with predicted, conductive plate heat transfer. Judging from the present-day pattern of low heat flow closer to the spreading axis, the crust at Site 504 may have rebounded recently to a conductive geothermal state, after undergoing hydro-thermal cooling in the past few million years. Site 504 is nicely situated for studies of the sealing effect of sediment cover on a ridge-flank hydrothermal system, yet the crust is young enough that the alteration record from the ridge-axis circulation remains clear.
Downhole temperatures measured during Legs 69, 70, 83, and 92 (Fig. 4) generally fall on a profile that is consistent with the hypothesis that plate heat transfer at Site 504 is mostly conductive (Becker et al., 1983a, 1983b, 1985). The equilibrium temperature at the bottom of Hole 504B was estimated to be 160°C, based on extrapolation of disequilibrium temperature logs measured at the end of Leg 83. Crustal porosities and per-
505
Distance (km)
Figure 3. Site survey surface heat flow measurements and seismic profile on the southern flank of the Costa Rica Rift. The spreading axis is about 110 km farther north (left) than this figure extends.
37

SITE 504
100
200
300
400
500 -
600
r 700
800
900
1000
1100
1200
1300
i — i — ■ — r
■ Hole 504C sediment temperatures, Leg 69
Equilibrium reentry temperatures * Measured 3 Dec. 1979, Leg 70 * Measured 23 Nov. 1981, Leg 83 * Measured 8 Apr. 1983, Leg 92
Leg 70 Leg 83 - . . »* Temperature logs
o A extrapolations to equilibrium
1350 m Leg 83 depth
20 40 60 80 100 Temperature (°C)
120 140 160
Figure 4. Temperatures measured in Hole 504B during Legs 69, 70, 83, and 92. The equilibrium geothermal gradient follows the conductive profile indicated by dashed and solid lines, with an estimated bottom-hole temperature of about 160°C at 1350 mbsf. The depressed temperatures in the upper 400 m reflect the downhole flow of cold ocean bottom water through the casing and into the upper 100-150 m of basement.
meabilities decrease sharply with depth (Fig. 5), to values that probably do not allow pervasive hydrothermal convection (Anderson and Zoback, 1982; Becker et al., 1982; Anderson, Hon-norez, Becker, et al., 1985a; Becker, 1985). However, the upper 100-200 m of basement (Layer 2A) is a relatively permeable, porous section, in which the pore fluids were observed to be under-pressured by about 10 bars relative to hydrostatic when the hole first penetrated this section (Anderson and Zoback, 1982). As a result, ocean bottom water has been drawn down the casing into the upper levels of basement at a rate that has noticeably decayed since the hole was first drilled (Fig. 6) (Becker et al., 1983a, 1983b, 1985).
200
400 —
600 —
a. 800 —
1000 —
1200 —
Apparent bulk poros i t y (%) 4 8 12
L o g 1 Q b u l k permeabil ity (
Figure 5. Apparent bulk porosities (circles) of basement in Hole 504B, determined by applying Archie's Law to large-scale electrical resistivities. Also plotted are bulk permeabilities measured over the intervals spanned by the vertical bars.
Thus the uppermost basement in Hole 504B is still permeable enough to allow convection of the pore fluids. Indeed, recent detailed heat flow work (Fig. 4 of Langseth et al., this volume) and numerical simulations (Williams et al., 1986) have confirmed that subdued convection still occurs in the permeable, upper levels of basement beneath the impermeable sediment cover, partly controlled by the presence of isolated basement topographic highs. A major purpose of the sediment coring done at Sites 677 and 678 during Leg 111 was to investigate the extent and nature of this presently-active convection.
Petrology of Recovered Basalts The basement rocks recovered from Hole 504B before Leg
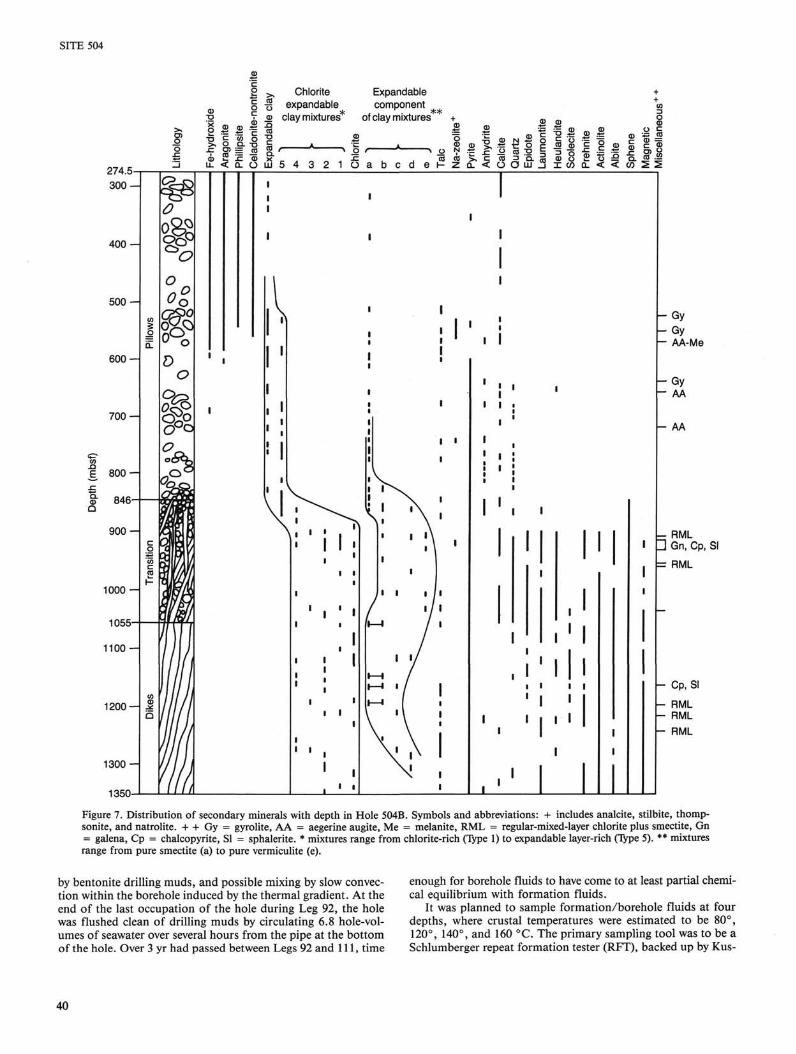
111 were fine- to medium-grained, plagioclase-olivine ± clino-pyroxene ± chrome spinel, phyric basalts, with aphyric types more abundant with depth (Kempton et al., 1985). All of the recovered basalts were mineralogically and chemically altered to some extent. Detailed studies of the downhole variation of secondary minerals and mineral assemblages (Fig. 7) documented the existence of three major alteration zones (Alt et al., 1985):
1. An upper alteration zone in the pillow lavas (374.5-584.5 mbsf) that displays typical effects of mostly oxidative "seafloor weathering" commonly observed in DSDP holes.
2. A lower alteration zone in the pillows (584.5-836 mbsf) that was presumably produced by reactions with low-temperature suboxic to anoxic solutions at low water/rock ratios.
3. A high-temperature alteration zone (898-1350 mbsf) from which the first samples of ocean floor basalt containing green-schist-facies alteration minerals were recovered in situ.
38

SITE 504
0 20 40 60 80 Borehole temperature C O
Figure 6. Equilibrium temperatures measured in the upper part of Hole 504B and temperatures predicted using a constant downhole flow model. Note the decay of the downhole flow rate with time since the hole was first drilled.
The pronounced changes in alteration mineralogy observed from 836 to 898 mbsf were interpreted to have resulted from a steep temperature gradient between low-temperature (< 100°C) alteration solutions circulating in the pillow lavas and very high-temperature fluids (>300°C) that affected the lower portion of basement at the site (Alt et al., 1985; Honnorez et al., 1985). The transition between pillow lavas and underlying dikes corresponds closely to the transition from low- to high-temperature alteration, because the bulk permeability and porosity of the dikes are orders of magnitude lower than in the pillows (Fig. 5).
Despite the effects of alteration, the primary composition and variation of the recovered basalts could be reliably established. The pillow lavas and dikes sampled from Hole 504B during DSDP were remarkably uniform in composition (Emmer-mann, 1985). The olivine tholeiites from the hole have high MgO contents (as high as 10.5 wt%) and very low abundances of K (<300 ppm). Judging from their high mg-values (0.60-0.75), the basalts appear to have undergone only limited high-level crystal fractionation. Glass analyses from Hole 504B and nearby Holes 501 and 504A provide strong evidence for the existence of a magma chamber of nearly steady-state composition along this portion of the Costa Rica Rift (Natland et al., 1983).
Logging and Geophysical Experiments During Legs 69, 70, 83, and 92, Hole 504B was logged with
an extensive suite of in-situ geochemical and geophysical experiments (Table 1). The geophysical data indicate that the in-situ physical properties of the crust change dramatically across the transition from pillow lavas to sheeted dikes (Anderson, Honnorez, Becker, et al., 1982): sonic and seismic velocities and electrical resistivity increase sharply, while bulk porosity and
permeability drop by orders of magnitude. These measurements demonstrate that the velocity structure of Layer 2 at the site is controlled not by petrology, but by variations in porosity with depth (Salisbury et al., 1985). The sonic and seismic data are generally consistent with a sharp Layer 2B/2C boundary at the top of the sheeted dikes (Stephen and Harding, 1983; Little and Stephen, 1985). The sonic data, but not the much-longer-wavelength seismic data, indicate a thin Layer 2A, consisting of the upper 100-200 m of highly porous pillow lavas (Newmark et al., 1985). This layer corresponds to the highly permeable, under-pressured zone into which ocean bottom water has been drawn since the hole was drilled. Layer 2B comprises the lowermost 500 m of pillows, in which the original porosity has been partially sealed by alteration products.
Leg 111 Coring and Logging Plan for Hole 504B Leg 83 cored through the major lithologic transition between
pillow lavas and sheeted dikes in Hole 504B, which closely corresponds to both the Layer 2B/2C boundary and the transition between zeolite- and greenschist-facies alteration. The next major structural boundary is that between Layers 2 and 3, corresponding to the transition between dikes and underlying gab-bros. Based on studies of ophiolites, the transition between green-schist- and amphibolite-facies alteration should occur within the dike complex, and probably will not correspond to a major seismic or structural boundary. Seismic data from sonobuoys and the oblique seismic experiment suggest that the Layer 2C/3 transition is 2-2.5 km into basement at Site 504, as much as 1 km deeper than Hole 504B extended before Leg 111. Based on past drilling experience, Leg 111 expected to core a few hundred meters deeper, predominantly within the dike complex.
In accordance with recommendations from JOIDES PCOM, Leg 111 was planned such that 43-44 of its 48-49 operational days were to be spent in Hole 504B. These 43-44 days were divided into three phases, like the successful Leg 83 program:
1. Immediately after reentry, measurements of equilibrium borehole temperatures and sampling of borehole fluids, followed by limited logging and packer permeability measurements crucial to the existing section (5 days).
2. Coring deeper into the sheeted dikes (29-30 days). 3. Logging and geophysical measurements in the dike sec
tion (8-9 days). The plans for these segments are described in detail below, along with pertinent operational considerations. Table 2 summarizes the plans for both phases of logging.
Measurements Before Drilling (5 Days) When Leg 111 returned to Hole 504B, over 3 yr had passed
since the hole was last disturbed by Leg 92 operations. This was sufficient time for any thermal disturbances to have dissipated, and for borehole temperatures to have reached equilibrium with crustal temperatures. It was planned to log temperatures from casing to the bottom of the hole immediately after the first Leg 111 reentry of Hole 504B, before any disturbance by the drill pipe to the thermal state of the borehole fluids. Temperatures in the cooler upper part of the hole were expected to allow an estimate of the rate of flow of ocean bottom water down the hole into the uppermost basement. This flow was predicted to have decayed by Leg 111 to less than 1 °7o of its original rate. Temperatures in the deeper, hot (100°-160°C) section of the hole had never been accurately measured and required the use of the French (BRGM) temperature probe which had been endorsed by Downhole Measurements Panel for Leg 111.
It was then planned to sample formation and/or borehole fluids from deep within basement. Chemical analyses of past water samples from Hole 504B have produced equivocal results, because of contamination by sampling devices, contamination
39
SITE 504
2 >, Chlorite § ■§ expandable
P 9 « clay mixtures*
HIP Expandable component
of clay mixtures * *
If la-I L < D L O I U 5 4 3 2 1 o a b e d e i -
a a E Jo 0)
= "5 <D O
X CO
<1>
c .c o Q.
<D
O
X) <
m ~ £ <
Q. CO
400
5 0 0 -
6 0 0 -
700
E 8 0 0 -
846-
9 0 0 -
1 0 0 0 -
1055-
1100 —
1200 —
P 0
is
D i
i i • ■ i '
i
- AA
I I
I I I I
I
Gy Gy AA-Me
Gy AA
- RML 3 Gn, Cp, SI
= RML
- Cp, SI - RML - RML - RML
Figure 7. Distribution of secondary minerals with depth in Hole 504B. Symbols and abbreviations: + includes analcite, stilbite, thomp-sonite, and natrolite. + + Gy = gyrolite, AA = aegerine augite, Me = melanite, RML = regular-mixed-layer chlorite plus smectite, Gn = galena, Cp = chalcopyrite, SI = sphalerite. * mixtures range from chlorite-rich (Type 1) to expandable layer-rich (Type 5). ** mixtures range from pure smectite (a) to pure vermiculite (e).
by bentonite drilling muds, and possible mixing by slow convection within the borehole induced by the thermal gradient. At the end of the last occupation of the hole during Leg 92, the hole was flushed clean of drilling muds by circulating 6.8 hole-volumes of seawater over several hours from the pipe at the bottom of the hole. Over 3 yr had passed between Legs 92 and 111, time
enough for borehole fluids to have come to at least partial chemical equilibrium with formation fluids.
It was planned to sample formation/borehole fluids at four depths, where crustal temperatures were estimated to be 80°, 120°, 140°, and 160 °C. The primary sampling tool was to be a Schlumberger repeat formation tester (RFT), backed up by Kus-
40

SITE 504
Table 1. Logs and experiments run before Leg 111 in Hole 504B.
Log/Experiment Interval successfully logged (mbsf)
Caliper log Neutron log Density log Sonic logs:
P, S, full waveform Multichannel sonic
Borehole televiewer Oblique seismic experiment Resistivity logs:
Spherically focused laterolog Large-scale experiments:
Temperature (11 data sets) Borehole fluid samples Packer: permeability intervals Magnetometer (USSR)
274.5-1287.5 274.5-1287.5 274.5-1287.5
274.5-1287.5 274.5-426 274.5-1287.5 316.5, 546.5, 726.5, 941.5 (geophone)
274.5-1287.5 274.5-836 (45-, 91-, 182-m spacing) 274.5-1287.5 (10-, 20-, 40-, 80-m
spacing) 0.0-1287.5 451-1204 (four samples) 316.5-489, 473.5-489, 536.5-1287.5 274.5-489
Table 2. Logs and experiments planned to be run in Hole 504B during Leg 111.
Measurement Tool and/or operator
Depth interval (mbsf)
Before drilling—listed in order of deployment
Temperature3
Water sampling15
Neutron activation3
Multichannel sonic3
Magnetometer3
Permeability3
France (BRGM) Schlumberger RFT/Kuster ACT/GST/NGT LDGO Japan Univ. Miami packer
0-1350 400-1350 275-1350 ) 275-1350 > 275-1350 ) 500-1350
After drilling—not listed in order of deployment
Temperature3
Sonic/electrical Density/porosity3
Neutron activation3
Electrical resistivity3
Borehole televiewer3
Multichannel sonic3
Magnetometer Large-scale resistivity Permeability3
VSP3
France (BRGM) LSS/DIL/SFL Schlumberger LDT/NGT/CNT Schlumberger ACT/GST/NGT Schlumberger DLL Schlumberger USGS LDGO Japan Univ. Miami Univ. Miami packer Univ. Texas/Austin
900-bottom 900-bottom \ 275-bottom ! 900-bottom f 275-bottom ) 900-bottom 900-bottom \ 900-bottom / 900-bottom 900-bottom 275-bottom
Time estimate
12 hr 36 hr
2 days
1 day
18 hr
3 days
18 hr 12 hr
18 hr 1-2 days 2 days
3 = actually run. = only borehole waters were actually sampled.
ter borehole water samplers; special gas-tight transfer apparatus was prepared for extracting these samples. The RFT is designed to draw a 9-L sample of formation fluid through a seal pressed against the borehole wall. (Note that the RFT never satisfactorily sampled formation fluids during Leg 111, but instead sampled borehole water.) The sampled fluids were to be analyzed for (1) major and minor element contents, (2) dissolved volatile components (C02 , H2S, methane, and rare gases), (3) isotopic compositions of HzO, C0 2 , H2S, and rare gases, ai1^ (4) 3H. These measurements were intended to constrain the chemical and isotopic compositions of the pore fluids in equilibrium with the basalts, and to allow estimates of the transport rates and budget of these components in the crust/seawater system at Site 504.
Before Leg 111 cored any deeper, it was planned to run three important logs that had not yet been run in the existing section:
1. Schlumberger ACT/GST/NGT, a neutron activation/spectral gamma tool capable of resolving abundances of several important elements, including Al, Ca, Fe, K, Mg, S, Si, Th, and U.
2. LDGO multichannel sonic tool (MCS). 3. Japanese three-component magnetometer.
As the magnetometer is completely self-contained, it was to be combined with the MCS during a single logging run. These three logs were to be run before Leg 111 coring to complete the logging of Layers 2A and 2B. This would allow the option of running the drill pipe to the top of the dikes to cool the hole during the post-drilling logging program, if necessary.
Finally, the permeability of the dikes was to be measured, using a drill-string packer equipped with inflation elements made of special, high-temperature rubber. It was necessary to make these measurements before drilling any deeper into Hole 504B, because (1) the permeability of the upper dikes had not yet been measured in sufficient detail, and (2) in measuring permeability with the packer, the bottom of the hole is utilized as the bottom of the tested interval.
Coring the Sheeted Dikes in Hole 504B (29-30 Days) It was important to recover a reasonable proportion of the
interval cored during Leg 111, as the dikes probably contain the crucial geochemical and alteration signals of high-temperature, axial hydrothermal circulation. Leg 83 penetrated 514 m of transition zone and dikes during a drilling program of about 1 month duration, including coring, pipe trips, bit changes, and contingency time. However, Leg 83 recovery and penetration rates in the dikes were marginal using standard steel rotary bits; the deepest 184 m of the hole required five bits that lasted an average of 20 hr rotating time each, with an overall recovery of 15.3%.
Leg 111 expected better performance using steel rotary bits, simply because the superior heave compensation on JOIDES Resolution allows the proper weight to be maintained on the bit during drilling. In addition, three diamond bits were purchased for Leg 111, in the hopes that they would improve recovery, if not penetration. Based on their own experience and the advice of bit manufacturers, ODP engineers considered a penetration rate of 1 m/hr to be quite good in dense crystalline rocks like the sheeted dikes.
Logging and Experiments (8-9 Days) The uppermost kilometer of basement in Hole 504B was suc
cessfully logged with an extensive suite of Schlumberger logs and special experiments during Legs 83 and 92 (Table 1). Most of these logs and experiments showed sharp changes in the in-situ physical properties across the transition into the dikes (e.g., Fig. 5). After Leg 111 drilled deeper into the hole, it was planned to log the full dike section with the standard suite of tools (Table 2). In addition, two special experiments were planned: VSP throughout the hole, and packer permeability measurements in the dikes. Although an oblique seismic experiment was run during Leg 92 (Little and Stephen, 1985), the geophone was never clamped in the dike section; a VSP would provide valuable data regarding the depth to the Layer 2/3, basalt/gabbro transition that is a long-term objective of drilling in Hole 504B.
The major operational constraint on these logs and experiments was expected to be temperature: the equilibrium bottom-hole temperature before Leg 111 coring was estimated to be 160°C, and the gradient is about 6°C/100 m in the dikes. Given 300-500 m of additional Leg 111 coring, equilibrium bottom-hole temperatures were expected to approach 200°C. This temperature is well above the 150°-rating of the standard logging cable, and is near the upper operational limits of many of the logging tools. Even if the hole could be cooled by circulation during Leg 111 drilling and before logging, temperatures deep in the hole would rebound very quickly, probably exceeding
41

SITE 504
150°C within several hours of cooling. Thus Leg 111 required the use of a 1-km-long section of high-temperature logging cable attached to the end of the standard logging cable. This cable extension would allow us to minimize circulation and the thermal disturbance to the formation, and log the dikes at conditions as close as possible to equilibrium. The order in which tools were to be deployed after drilling was left to be determined based on the priorities of the scientific party, the time available for logging, and the requirements of the tools for special cooling of the hole.
Modifications to Leg 111 Plans Made during the Course of the Leg
As is always the case, actual operations did not proceed as smoothly as planned, and several important modifications to this plan were made as Leg 111 developed:
1. During the initial phase of measurements, the Schlum-berger RFT failed to return through the bit and lost a clamping arm in the hole, necessitating a pipe trip before the scheduled packer experiments could be attempted. The packer work was then postponed for several days, after running a mill bit and a rotary coring bit.
2. As extra time was then required to complete the initial phase of logging, insufficient time was left for full completion of the post-drilling logging program. Only the higher-priority logs were run after Leg 111 drilling; these are identified in Table 2.
3. During the second and third weeks of coring, two consecutive steel rotary coring bits failed catastrophically, each time leaving all four roller cones in the hole. After the first of these
bit failures, 4 days were spent in fishing and milling operations before the resumption of coring. After the second bit failure, Leg 111 immediately proceeded with the post-drilling phase of measurements and a 5-day program of coring sediments at Sites 677 and 678, before attempting to clean the hole and resume coring at the end of the leg.
Leg 111 held fairly closely to the PCOM recommendation to spend 44 days at Hole 504B, roughly 30 for coring and 14 for downhole measurements and logging. Unfortunately, coring the sheeted dikes proved very difficult, and Leg 111 deepened the hole only 212.3 m. On the other hand, the logging program was extremely successful, despite the loss of some time due to the RFT failure, and despite misgivings about the abilities of logging tools to withstand high temperatures in the hole.
OPERATIONS As the primary purpose of Leg 111 of the Ocean Drilling
Program was to deepen and log Hole 504B, 43 of the leg's 48 operational days were scheduled at the hole. Of these 43 days, slightly more than 14 days were spent in logging operations (including milling part of a logging tool lost in the hole), and about 29 days were spent in coring operations (including fishing and milling parts of several bits lost in the hole). Figure 8 gives an overview of Leg 111 operations.
Leg 111 cored 212.3 m in Hole 504B, advancing the hole to a depth of 1562.3 mbsf. Initially recovery was fairly good, about 20%, but it steadily decreased, for an overall recovery percentage of 12.6%. During 90.7 actual rotating hours, 5 bits averaged a penetration rate of 2.3 m/hr. Leg 111 coring in Hole 504B is summarized in Table 3. The logging program was quite
1300
1400
1500
Junk lost in the hole and/or t ime lost
I I I I 1 1 1
1600 31 10 20
September 30 10
October 20
August
Figure 8. Summary of Leg 111 operations with respect to depth in Hole 504B and time during the leg.
42
SITE 504
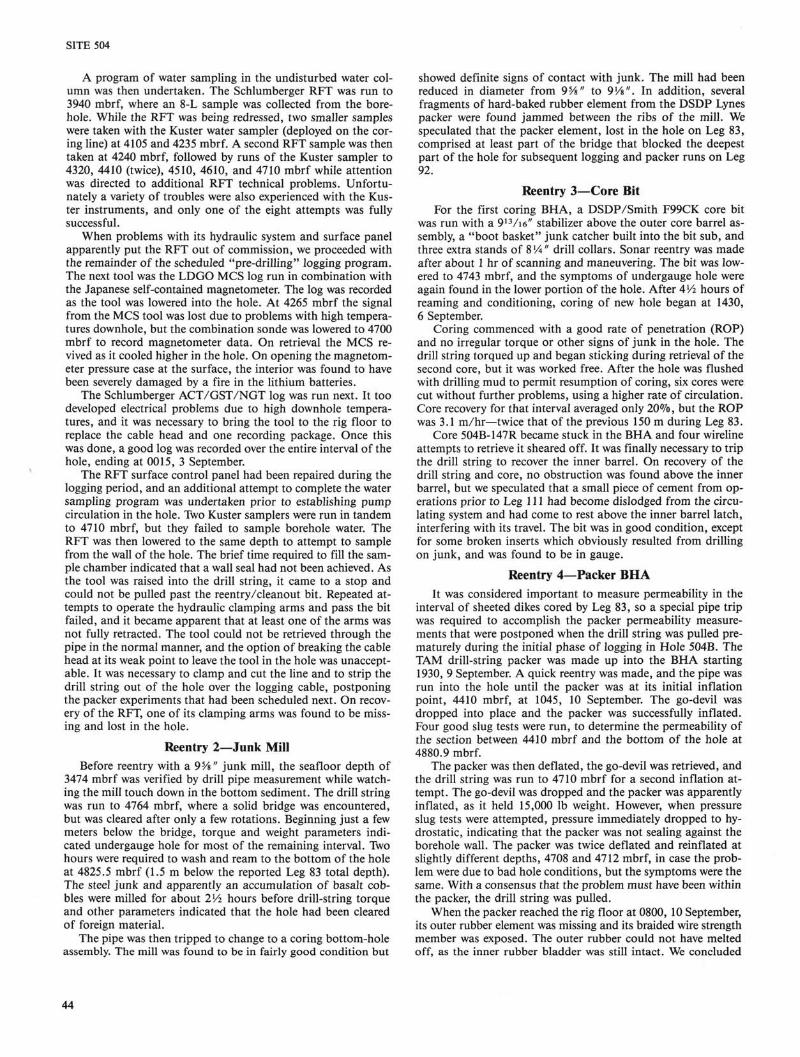
Table 3. Coring summary Hole 504B.
Core no. 142R 143R 144R 145R 146R 147R 148R 149R 150R 151R 152R 153R 154R 155R 156R 157R 158R 159R 160R 161R 162M 163R 164R 165R 166R 167R 168M 169R 170R
Date (1986)
Sep. 6 7 7 7 7 8 11 11 11 11 12 12 12 12 13 13 13 16 16 17 19 22 22 23 23 23
Oct. 6 8 9
Time
1845 0330 1000 1630 2130 1815 0830 1500 1945 2315 0515 1000 1730 2245 0515 1130 1845 1645 2345 1200 0500 1545 2130 0700 0945 2015 1415 1415 0530
Depth top bottom
(mbsf)
1352.8-1359.3 1359.3-1368.7 1368.7-1378.3 1378.3-1388.0 1388.0-1397.4 1397.4-1406.8 1406.8-1416.9 1416.9-1426.4 1426.4-1430.5 1430.8-1435.9 1435.9-1445.3 1445.3-1454.3 1454.3-1459.0 1459.0-1463.8 1463.8-1473.1 1473.1-1482.5 1482.5-1488.1 1488.1-1494.7 1494.7-1504.1 1504.1-1511.5 1511.5-1511.6 1511.6-1515.1 1515.1-1529.5 1529.5-1543.5 1543.5-1545.9 1545.9-1547.5 1547.5-1547.6 1547.6-1553.6 1553.6-1562.1
Length cored (m) 6.5 9.4 9.6 9.7 9.4 9.4 10.1 9.5 4.1 5.1 9.4 9.0 4.7 4.8 9.3 9.4 5.6 6.6 9.4 7.4 0.1 3.5 14.4 14.0 2.4 1.6 0.1 6.0 8.5
recovered (m) 1.85 1.77 0.84 4.03 0.21 2.25 2.23 1.77 1.53 0.25 0.70 1.50 1.29 0.55 0.20 0.50 0.40 0.40 0.20 0.42 0.10 1.78 0.43 0.46 0.08 0.00 0.10 1.22 0.30
Recovery (%) 28.4 18.8 8.8
41.5 2.2
23.9 22.1 18.6 37.3 4.9 7.4 16.6 27.4 11.4 2.2 5.3 7.1 6.1 2.1 5.7
100.0 50.8 3.0 3.3 3.3 0.0
100.0 20.3 3.5
successful, although not all of the scheduled experiments could be run. Table 2 summarizes the logging plan and actual experiments run during Leg 111.
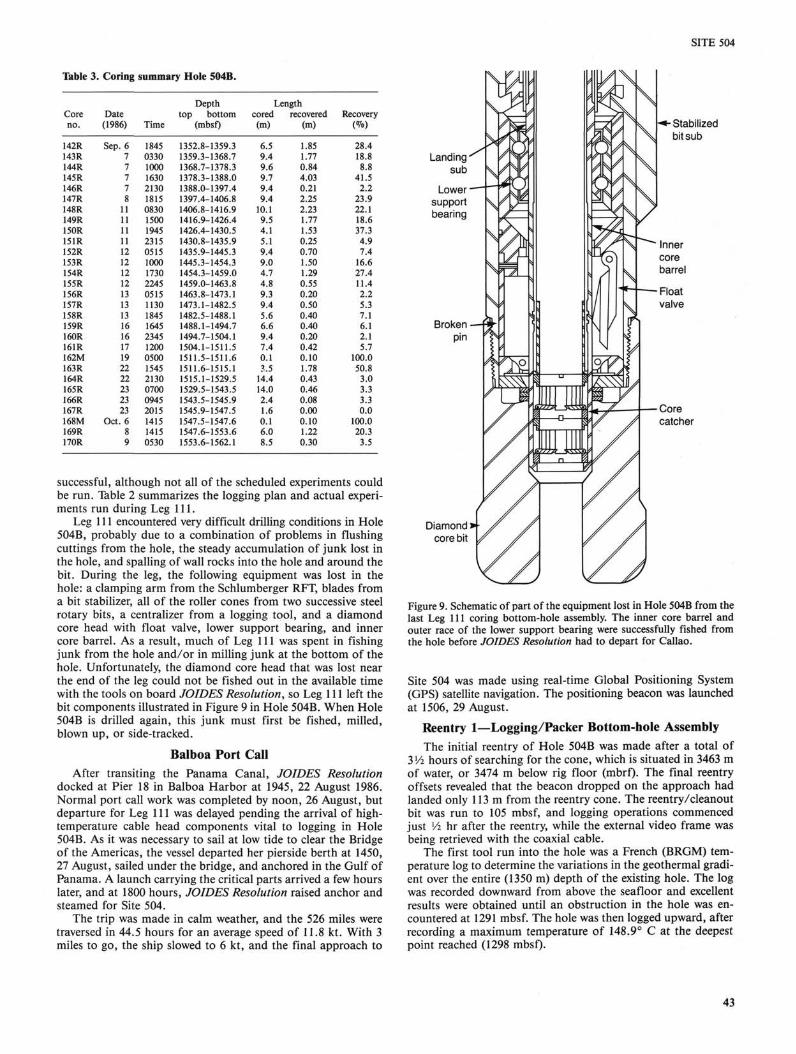
Leg 111 encountered very difficult drilling conditions in Hole 504B, probably due to a combination of problems in flushing cuttings from the hole, the steady accumulation of junk lost in the hole, and spalling of wall rocks into the hole and around the bit. During the leg, the following equipment was lost in the hole: a clamping arm from the Schlumberger RFT, blades from a bit stabilizer, all of the roller cones from two successive steel rotary bits, a centralizer from a logging tool, and a diamond core head with float valve, lower support bearing, and inner core barrel. As a result, much of Leg 111 was spent in fishing junk from the hole and/or in milling junk at the bottom of the hole. Unfortunately, the diamond core head that was lost near the end of the leg could not be fished out in the available time with the tools on board JOIDES Resolution, so Leg 111 left the bit components illustrated in Figure 9 in Hole 504B. When Hole 504B is drilled again, this junk must first be fished, milled, blown up, or side-tracked.
Balboa Port Call After transiting the Panama Canal, JOIDES Resolution
docked at Pier 18 in Balboa Harbor at 1945, 22 August 1986. Normal port call work was completed by noon, 26 August, but departure for Leg 111 was delayed pending the arrival of high-temperature cable head components vital to logging in Hole 504B. As it was necessary to sail at low tide to clear the Bridge of the Americas, the vessel departed her pierside berth at 1450, 27 August, sailed under the bridge, and anchored in the Gulf of Panama. A launch carrying the critical parts arrived a few hours later, and at 1800 hours, JOIDES Resolution raised anchor and steamed for Site 504.
The trip was made in calm weather, and the 526 miles were traversed in 44.5 hours for an average speed of 11.8 kt. With 3 miles to go, the ship slowed to 6 kt, and the final approach to
Landing sub
Lower support bearing
Stabilized bit sub
Core catcher
Diamond core bit
Figure 9. Schematic of part of the equipment lost in Hole 504B from the last Leg 111 coring bottom-hole assembly. The inner core barrel and outer race of the lower support bearing were successfully fished from the hole before JOIDES Resolution had to depart for Callao.
Site 504 was made using real-time Global Positioning System (GPS) satellite navigation. The positioning beacon was launched at 1506, 29 August.
Reentry 1—Logging/Packer Bottom-hole Assembly The initial reentry of Hole 504B was made after a total of
3V2 hours of searching for the cone, which is situated in 3463 m of water, or 3474 m below rig floor (mbrf)- The final reentry offsets revealed that the beacon dropped on the approach had landed only 113 m from the reentry cone. The reentry/cleanout bit was run to 105 mbsf, and logging operations commenced just Vi hr after the reentry, while the external video frame was being retrieved with the coaxial cable.
The first tool run into the hole was a French (BRGM) temperature log to determine the variations in the geothermal gradient over the entire (1350 m) depth of the existing hole. The log was recorded downward from above the seafloor and excellent results were obtained until an obstruction in the hole was encountered at 1291 mbsf. The hole was then logged upward, after recording a maximum temperature of 148.9° C at the deepest point reached (1298 mbsf)-
SITE 504
A program of water sampling in the undisturbed water column was then undertaken. The Schlumberger RFT was run to 3940 mbrf, where an 8-L sample was collected from the borehole. While the RFT was being redressed, two smaller samples were taken with the Kuster water sampler (deployed on the coring line) at 4105 and 4235 mbrf. A second RFT sample was then taken at 4240 mbrf, followed by runs of the Kuster sampler to 4320, 4410 (twice), 4510, 4610, and 4710 mbrf while attention was directed to additional RFT technical problems. Unfortunately a variety of troubles were also experienced with the Kuster instruments, and only one of the eight attempts was fully successful.
When problems with its hydraulic system and surface panel apparently put the RFT out of commission, we proceeded with the remainder of the scheduled "pre-drilling" logging program. The next tool was the LDGO MCS log run in combination with the Japanese self-contained magnetometer. The log was recorded as the tool was lowered into the hole. At 4265 mbrf the signal from the MCS tool was lost due to problems with high temperatures downhole, but the combination sonde was lowered to 4700 mbrf to record magnetometer data. On retrieval the MCS revived as it cooled higher in the hole. On opening the magnetometer pressure case at the surface, the interior was found to have been severely damaged by a fire in the lithium batteries.
The Schlumberger ACT/GST/NGT log was run next. It too developed electrical problems due to high downhole temperatures, and it was necessary to bring the tool to the rig floor to replace the cable head and one recording package. Once this was done, a good log was recorded over the entire interval of the hole, ending at 0015, 3 September.
The RFT surface control panel had been repaired during the logging period, and an additional attempt to complete the water sampling program was undertaken prior to establishing pump circulation in the hole. Two Kuster samplers were run in tandem to 4710 mbrf, but they failed to sample borehole water. The RFT was then lowered to the same depth to attempt to sample from the wall of the hole. The brief time required to fill the sample chamber indicated that a wall seal had not been achieved. As the tool was raised into the drill string, it came to a stop and could not be pulled past the reentry/cleanout bit. Repeated attempts to operate the hydraulic clamping arms and pass the bit failed, and it became apparent that at least one of the arms was not fully retracted. The tool could not be retrieved through the pipe in the normal manner, and the option of breaking the cable head at its weak point to leave the tool in the hole was unacceptable. It was necessary to clamp and cut the line and to strip the drill string out of the hole over the logging cable, postponing the packer experiments that had been scheduled next. On recovery of the RFT, one of its clamping arms was found to be missing and lost in the hole.
Reentry 2—Junk Mill Before reentry with a 9Vs" junk mill, the seafloor depth of
3474 mbrf was verified by drill pipe measurement while watching the mill touch down in the bottom sediment. The drill string was run to 4764 mbrf, where a solid bridge was encountered, but was cleared after only a few rotations. Beginning just a few meters below the bridge, torque and weight parameters indicated undergauge hole for most of the remaining interval. Two hours were required to wash and ream to the bottom of the hole at 4825.5 mbrf (1.5 m below the reported Leg 83 total depth). The steel junk and apparently an accumulation of basalt cobbles were milled for about 2V% hours before drill-string torque and other parameters indicated that the hole had been cleared of foreign material.
The pipe was then tripped to change to a coring bottom-hole assembly. The mill was found to be in fairly good condition but
showed definite signs of contact with junk. The mill had been reduced in diameter from 9Ys" to 91/s". In addition, several fragments of hard-baked rubber element from the DSDP Lynes packer were found jammed between the ribs of the mill. We speculated that the packer element, lost in the hole on Leg 83, comprised at least part of the bridge that blocked the deepest part of the hole for subsequent logging and packer runs on Leg 92.
Reentry 3—Core Bit For the first coring BHA, a DSDP/Smith F99CK core bit
was run with a 913/i6" stabilizer above the outer core barrel assembly, a "boot basket" junk catcher built into the bit sub, and three extra stands of 814" drill collars. Sonar reentry was made after about 1 hr of scanning and maneuvering. The bit was lowered to 4743 mbrf, and the symptoms of undergauge hole were again found in the lower portion of the hole. After AVi hours of reaming and conditioning, coring of new hole began at 1430, 6 September.
Coring commenced with a good rate of penetration (ROP) and no irregular torque or other signs of junk in the hole. The drill string torqued up and began sticking during retrieval of the second core, but it was worked free. After the hole was flushed with drilling mud to permit resumption of coring, six cores were cut without further problems, using a higher rate of circulation. Core recovery for that interval averaged only 20%, but the ROP was 3.1 m/hr—twice that of the previous 150 m during Leg 83.
Core 504B-147R became stuck in the BHA and four wireline attempts to retrieve it sheared off. It was finally necessary to trip the drill string to recover the inner barrel. On recovery of the drill string and core, no obstruction was found above the inner barrel, but we speculated that a small piece of cement from operations prior to Leg 111 had become dislodged from the circulating system and had come to rest above the inner barrel latch, interfering with its travel. The bit was in good condition, except for some broken inserts which obviously resulted from drilling on junk, and was found to be in gauge.
Reentry 4—Packer BHA It was considered important to measure permeability in the
interval of sheeted dikes cored by Leg 83, so a special pipe trip was required to accomplish the packer permeability measurements that were postponed when the drill string was pulled prematurely during the initial phase of logging in Hole 504B. The TAM drill-string packer was made up into the BHA starting 1930, 9 September. A quick reentry was made, and the pipe was run into the hole until the packer was at its initial inflation point, 4410 mbrf, at 1045, 10 September. The go-devil was dropped into place and the packer was successfully inflated. Four good slug tests were run, to determine the permeability of the section between 4410 mbrf and the bottom of the hole at 4880.9 mbrf.
The packer was then deflated, the go-devil was retrieved, and the drill string was run to 4710 mbrf for a second inflation attempt. The go-devil was dropped and the packer was apparently inflated, as it held 15,000 lb weight. However, when pressure slug tests were attempted, pressure immediately dropped to hydrostatic, indicating that the packer was not sealing against the borehole wall. The packer was twice deflated and reinflated at slightly different depths, 4708 and 4712 mbrf, in case the problem were due to bad hole conditions, but the symptoms were the same. With a consensus that the problem must have been within the packer, the drill string was pulled.
When the packer reached the rig floor at 0800, 10 September, its outer rubber element was missing and its braided wire strength member was exposed. The outer rubber could not have melted off, as the inner rubber bladder was still intact. We concluded
44
SITE 504
that the element had not completely retracted after the first packer inflation at 4410 mbrf, and it had been rubbed off as the pipe was moved down the hole to 4710 mbrf. The inner bladder would then have held inflation pressure and the steel wire braid would have gripped the borehole wall enough to hold weight, but without the outer rubber a proper hydraulic seal could not have been maintained.
Reentry 5—Core Bit For the second core bit, an RBI type C-7 was chosen. The
cutting structure featured conical inserts that were only slightly longer than those of the preceding F99CK bit. It was hoped that the longer inserts would produce an even better rate of penetration. The "boot basket" was again used because of the presence of junk in the hole, and the same BHA was deployed as on the previous coring trip. After sonar reentry, coring commenced at 0300, 11 September.
As coring progressed, core recovery decreased and hole problems increased. The pipe tended to stick when circulation was reduced or stopped for wireline core retrieval trips, despite precautionary mud flushes. Conditions were generally good during the actual coring operation, but only so long as abnormally high circulation rates were maintained. Over an interval of 81.3 m, a very good ROP of 2.3 m/hr was achieved, but the average core recovery was only 10.1%. When no full-round core had been recovered on three consecutive cores, bit failure was suspected and the drill string was tripped.
The cutting structure and bearings of the bit were found to be in exceptionally good condition for having drilled for 35 hr on basalt and junk. All four blades of the welded-blade stabilizer were gone—either worn flush with the body or broken loose at the weld. Another large load of junk in the boot basket and some extra large pieces indicated that the latter was the case. The reason for the inability to produce satisfactory core was not apparent, but the presence of junk in the hole and the abnormally high circulation rate were suspected factors.
Reentries 6 and 7—Core Bits Another C-7 core bit was installed and the BHA was run to
reentry depth. As the bit was brought low over the rim of the cone, both mud pumps were used to flush a substantial accumulation of drill cuttings off the rim and sonar reflectors, to improve visibility during video reentries. When the "dust" had cleared, the cone was reentered and the interior of the cone was also thoroughly washed. A closeup (videotaped) inspection confirmed that the visibility of the reentry cone had been significantly improved.
The bit was then run to 1444 mbsf and the top drive was picked up for coring. It was discovered at that time that the bit or pipe was plugged and that fluid circulation was not possible. After several attempts to attain circulation, a wireline run was made to retrieve the inner core barrel and open a passage for circulation. That attempt and a subsequent one were unsuccessful when the overshot failed to engage the pulling neck on the inner barrel. All signs indicated that suspended cuttings from the hole had flowed back into the BHA during the pipe trip and had filled it to a point above the inner barrel. A pipe trip was then the only apparent solution to the problem.
When the BHA was recovered, the outer core barrel was found to be clean, without a trace of cuttings, but the first drill collar above it was plugged with about 4 m of sand-sized cuttings. Inspection of the core bit revealed that, although it had never been rotated or run to total depth, it had apparently been pinched about Vie" by undergauge hole.
In view of the durability of the cutting structure of the second core bit, a type C-57 bit was deployed—again to gain penetration rate by using slightly longer tungsten carbide inserts.
The bit was run to 1413 mbsf and a total of 63/4hours was then required to wash and ream the final 75 m to total depth. Torqu-ing and sticking were experienced over most of the interval, but were eventually overcome by mud flushes and working of the pipe.
Two cores were then cut with fairly normal conditions, but the pipe had to be freed after sticking during the retrieval of the first core. The average ROP had been 2.4 m/hr, but only a few rounded basalt pebbles had been recovered on each core. Hole problems had disappeared when the third core was started. After 1 or 2 m, ROP began to decrease and torque to increase gradually, apparently due to inadequate hole cleaning. After 7.7 m had been cut, progress was so slow and torquing/sticking so serious that coring was stopped to retrieve the core barrel and stabilize the hole. The core contained 42 cm and some full-round pieces—the best with the third bit. It appeared that recovery had been limited by a collapsed core liner.
Rotation and vertical motion of the drill string had again become free and a new inner barrel had been pumped into place in anticipation of improved core recovery. As soon as the bit touched the bottom of the hole, however, the torque returned and completely locked rotation as soon as more weight was applied. With the hole-cleaning problems in abeyance, the symptoms of bit failure were recognized. A high-viscosity mud slug was pumped to clean the hole and the drill string was recovered.
On recovery the bit, which had accrued only 16 Vi rotating hours, was found to be completely destroyed. All four roller cones and much of the steel core guide remained in the hole. The boot basket was emptied of a third collection of junk— RFT, stabilizer, and bit parts.
Reentries 8, 9, and 10—Junk Baskets and Mill Between 0100, 18 September, and 1645, 21 September, three
pipe trips were made to clean out the four roller cones left in the hole. During the first two of these trips, attempts were made to fish the roller cones with junk baskets in the BHA. The first junk basket returned ten big rocks and one roller cone; the second junk basket returned another roller cone.
A 95A" junk mill was then used to grind up the remaining cones and debris. The mill was run for 23A hours, until it rotated smoothly with low torque for a half-hour. When it was recovered it was about 75"Vo worn and scarred by junk, but in good condition, and coring was resumed.
Reentry 11—Core Bit The next core bit was a DSDP/Smith F99CK bit—the same
kind of bit as had been run with good results in the first coring BHA. When this bit reached the bottom of the hole, there was some torque and indication of junk left, but coring proceeded with a high ROP for nearly a day. Recovery was good in the first core cut with this bit, but was low from then on, apparently limited by collapsed core liners and jammed core catchers. The ROP decreased and serious torque and sticking problems occurred during the fourth and fifth cores. During the fifth core an advance of only 1.6 m was made, and the core could not be retrieved, so the pipe was tripped.
When the bit reached the rig floor at 0830, 24 September, it was in worse shape than the previous bit, and it too had lost all four roller cones in the hole. The hole was even more seriously junked than before, and prospects appeared bad for further coring after time-consuming fishing and milling. It was decided to proceed immediately with the logging program originally scheduled to follow Leg 111 coring, and then to complete the 5-day program of sediment coring at Sites 677 and 678, in order to leave the rest of Leg 111 open for whatever remedial work was necessary before resuming coring in Hole 504B. During the time spent logging Hole 504B and coring Sites 677 and 678, ODP
45
SITE 504
procured some special fishing and milling tools to complement the depleted shipboard stock. These were air-freighted to Ecuador and brought out by the tuna vessel Sirius.
Reentry 12—Logging/Packer BHA Experiments planned after Leg 111 coring in Hole 504B in
cluded logging, vertical seismic profile, and permeability measurements, so the BHA included the TAM packer just above the logging bit. After a quick BHTV reentry, the pipe was run into the hole to 3620 mbrf.
The first log run was the Schlumberger ACT/GST/NGT/ CNT/LDT. Shortly after the log was started down the pipe, the bearing in the lower logging sheave failed, so it was necessary to pull the tool back and replace the sheave. The tool was run into the hole and set down on bottom at 5002 mbrf. At this point it was found that the logging cable was much shorter than expected—barely long enough to keep one wrap on the logging winch. A good log was recorded, giving a maximum bottom-hole temperature of 116°C.
The second log run was the Schlumberger Dual Laterolog (DLL). As the DLL was rigged, the cable slipped off the lower sheave wheel, damaging the armor of the high-temperature cable extension 95 m from the bottom. It was decided not to amputate the damaged section because the damage appeared marginal, and if the 95 m had been removed there would not have been sufficient cable to reach the total depth of the hole. An excellent, quick log was recorded from the entire open hole section.
After the DLL was rigged down, it was found that two of the seven conductors in the cable were of low isolation, apparently due to water in the high-temperature cable. Ninety-nine meters were cut from the high-temperature cable, which was reheaded to run the USGS borehole televiewer. An additional 490-m section of standard temperature cable was attached by torpedo between the standard logging line and high-temperature extension, to have sufficient cable to reach total depth. An excellent borehole televiewer log was recorded from 5005 to 4650 mbrf—complementing the BHTV log recorded during Leg 83.
The next tool run was the LDGO multichannel sonic tool, which had been modified during the leg for high-temperature operation. However, the tool failed at total depth because of high temperature, and it was twice pulled to a shallower depth to cool it and restore its function. An excellent log was recorded by logging down at twice normal logging speed. The maximum temperature recorded was 138°C.
After the MCS log, the logging cable was retrieved to the top of the high-temperature section. The torpedo was opened and the standard cable on the winch was checked for isolation between conductors. It was found that the low isolation was in the line on the winch, not in the high-temperature section. Nevertheless, the cable isolation met the Schlumberger minimum standard, and the VSP was successfully run with the cable in its current condition.
The VSP experiment was run for nearly 2 days (0230, 27 September to 2315, 28 September), using the Schlumberger Well Seismic Tool (WST). To minimize noise at the clamped seismometer, the casing landing tool (CLT) was used to immobilize the drill string in the casing. Air- and water-guns were suspended from the crane for use as sound sources for the experiment. Unfortunately, at the beginning of the VSP, a seal in the large water gun failed and the replacement part in the repair kit proved not to be the proper size. A smaller water gun was substituted for the duration of the experiment. A very successful VSP was obtained with the WST clamped nearly every 10 m from 5008 to 3635 mbrf.
At the conclusion of the VSP, the rotary shifting tool was run on the sand line to release the CLT. The drill string was then run down the hole to 4710 mbrf for permeability measurements with the packer. The go-devil was dropped, the packer was inflated and set, and two excellent slug tests were run. A third slug test was attempted at the same seat, but when the test pressure reached 1600 psi, pressure suddenly dropped to hydrostatic and the weight on the packer was lost. Attempts to reset and pressure the packer were unsuccessful, and the go-devil was retrieved so one more log could be run.
The bit was pulled back up to 3620 mbrf and the Schlumberger Lithodensity tool (LDT/NP/NGT/GPIT) was run. No operational problems were encountered, and an excellent log was recorded throughout the entire open hole section. The maximum bottom-hole temperature recorded was 145°C.
The drill string was started out of the hole and the packer reached the drill floor at 0600, 30 September 30. The packer was in tatters, with a shredded outer rubber element and a few broken inner wires. All of the internal seals were intact, but the inflation bladder had burst. The cause of the failure could not be pinpointed.
JOIDES Resolution left Hole 504B at 0645, 30 September, for a 5-day program of coring the sediments at Sites 677 and 678, both within 3 km of Site 504. After this program, the vessel returned to Hole 504B at 0500, 5 October.
Reentries 13 and 14—Junk Basket and Junk Mill As the ship returned to Hole 504B, the Homco junk basket
and ODP boot basket were made up in the BHA. When it was run to the bottom of the hole, the BHA encountered about 15 m of fill, which was washed and reamed out. When the total depth of the hole was reached, a core barrel with an attached magnet was run down the pipe, to seat such that the magnet would be a few inches above the fingers in the junk basket. Drilling mud was circulated down the pipe and up the hole, and then allowed to flow back, hopefully to allow the junk to be washed back into the drill pipe and boot basket. When the fishing BHA was pulled out of the hole, the contents of the junk basket were disappointing—just three rocks and no roller cones. The boot basket contained some fragments of bit cones and inserts, and the magnet recovered only rust.
The redressed 95A" junk mill was then run into the hole. In the process, reentry was made with no scan time, immediately after turning on the video—an unbeatable record. The mill was run for 23A hours on the bottom, with torque becoming very smooth for the last 3A hours. After the hole was flushed with high-viscosity mud, the junk mill was pulled to the surface. It was recovered in very worn condition, but evenly worn and with little damage from junk, and it was decided to run a steel rotary coring bit.
Reentry 15—Core Bit Another DSDP/Smith F99CK roller cone bit was run into
the hole, and rotated for 9 hr, cutting two cores (169R and 170R). At first, drilling was smooth and the hole appeared clean; during the second core, the ROP decreased and the bit began to torque on bottom. The bit was pulled early and appeared on deck in very worn condition, with much damage from junk, but in one piece.
Reentry 16—Junk Mill The Ecuadorian tuna vessel Sirius arrived with a shipment of
new fishing and milling equipment just after the last bit was pulled to the rig floor. A new 9 7A" flat-bottom junk mill was made up into the next BHA with two boot baskets in tandem.
46
SITE 504
As the mill was run to hole bottom, about 2lA hours of reaming the hole were required. After this reaming, the mill was rotated for 214 hours on bottom and then was pulled back to the rig floor. It was recovered moderately worn, but VA " out of gauge, and the boot baskets contained many small fragments of junk.
Reentry 17—Diamond Core Bit The hole finally appeared to be clean enough to run the dia
mond core bit that all hoped would improve core recovery if not penetration rates. A 927/32" Nor Geoset diamond core bit was installed immediately below a stabilized bit sub in the BHA. The bit was run down the hole with no problems, except in the deepest 2 m, which appeared to be slightly undergauge. When the bit touched bottom at the start of attempted coring, the rig floor gauges registered instantaneous pressure pulses of 2000 psi or more that sent hammer shocks through the drill string. After the bit was picked up and set back down a few times, the pressure steadied at approximately the specified value. However, after about 25 min of rotation, the pressure decreased and torque increased, and there was no penetration. The core barrel was pulled, in case it was jammed, but it contained nothing. Forty barrels of high-viscosity mud were then circulated, before sending another core barrel down.
When coring was attempted again, drilling torque was much too high and the drilling fluid pressure was too low. The bit was torquing and dragging when it was picked up off bottom. Rocks appeared to be keeping the bit off bottom and to be fouling the outside of the BHA, so the pipe was pulled up six joints in an attempt to loosen the rocks. An overpull of 100,000 pounds was required before the pipe was freed. When the pipe was worked and rotated back down, it could get no deeper than 15 m above the bottom of the hole, and it was decided to trip the pipe out of the hole.
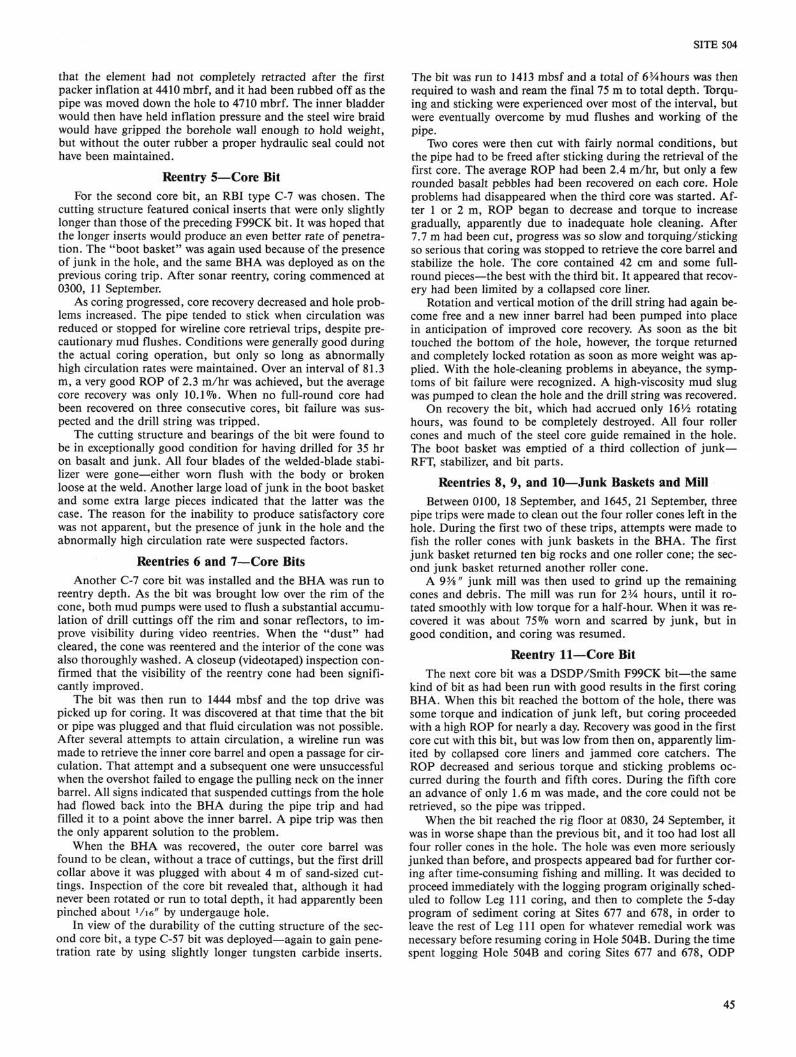
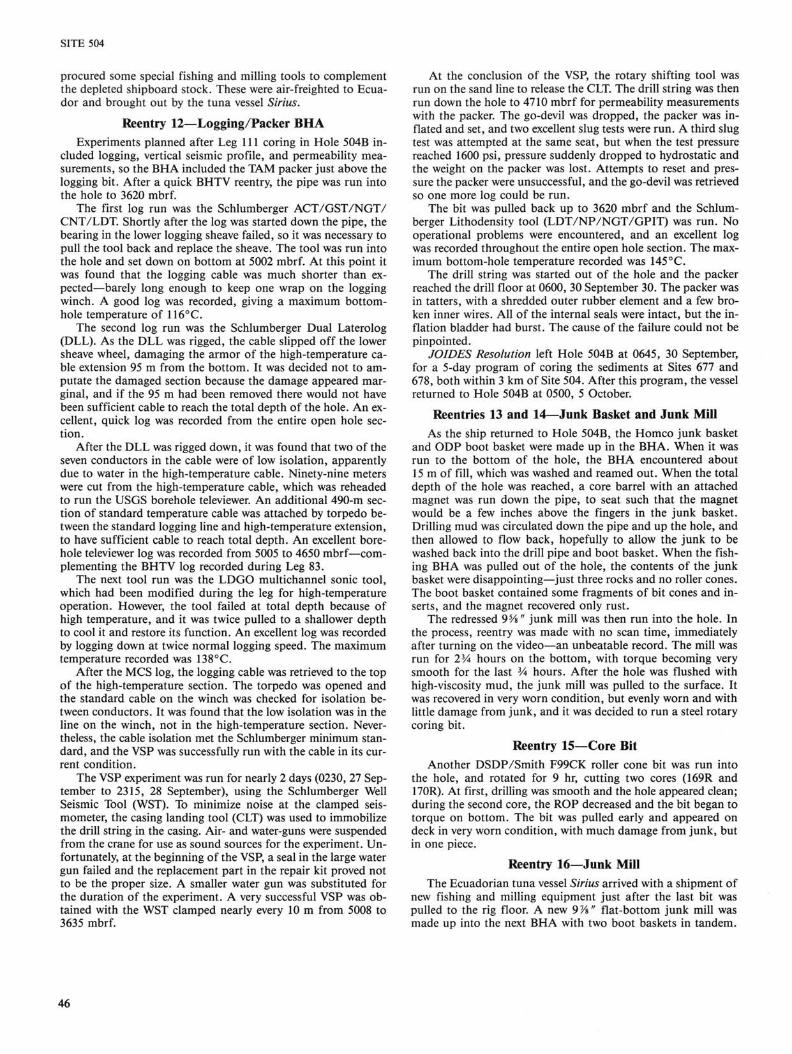
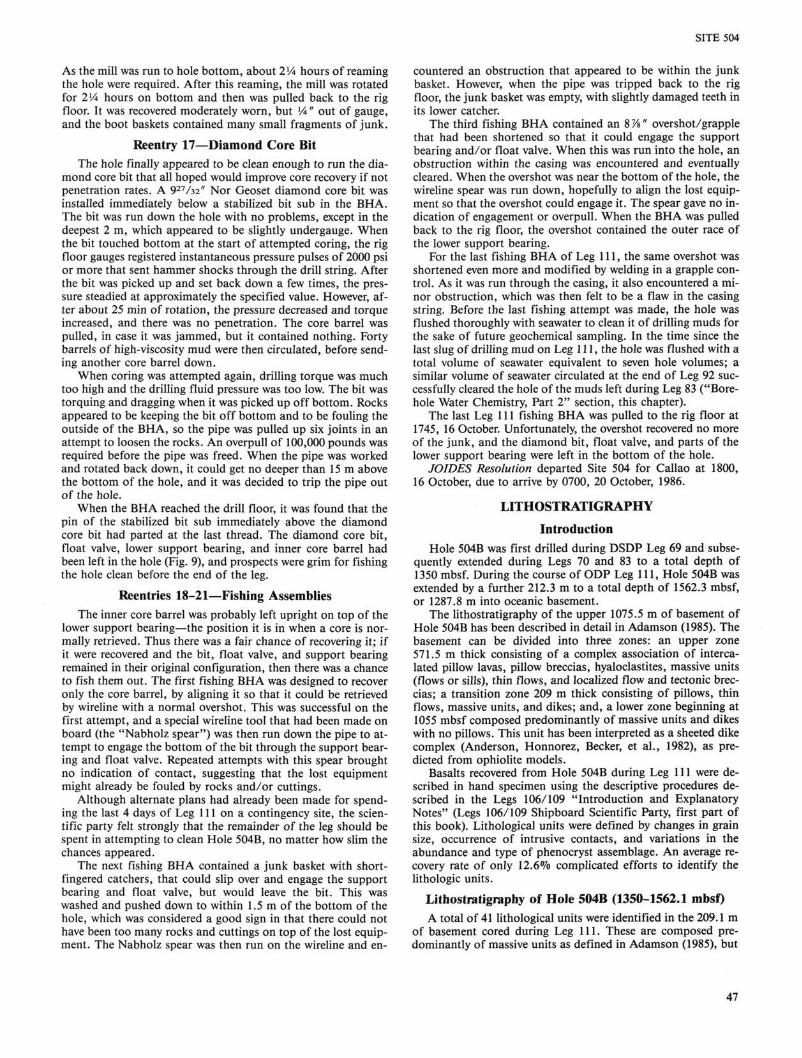
When the BHA reached the drill floor, it was found that the pin of the stabilized bit sub immediately above the diamond core bit had parted at the last thread. The diamond core bit, float valve, lower support bearing, and inner core barrel had been left in the hole (Fig. 9), and prospects were grim for fishing the hole clean before the end of the leg.
Reentries 18-21—Fishing Assemblies The inner core barrel was probably left upright on top of the
lower support bearing—the position it is in when a core is normally retrieved. Thus there was a fair chance of recovering it; if it were recovered and the bit, float valve, and support bearing remained in their original configuration, then there was a chance to fish them out. The first fishing BHA was designed to recover only the core barrel, by aligning it so that it could be retrieved by wireline with a normal overshot. This was successful on the first attempt, and a special wireline tool that had been made on board (the "Nabholz spear") was then run down the pipe to attempt to engage the bottom of the bit through the support bearing and float valve. Repeated attempts with this spear brought no indication of contact, suggesting that the lost equipment might already be fouled by rocks and/or cuttings.
Although alternate plans had already been made for spending the last 4 days of Leg 111 on a contingency site, the scientific party felt strongly that the remainder of the leg should be spent in attempting to clean Hole 504B, no matter how slim the chances appeared.
The next fishing BHA contained a junk basket with short-fingered catchers, that could slip over and engage the support bearing and float valve, but would leave the bit. This was washed and pushed down to within 1.5 m of the bottom of the hole, which was considered a good sign in that there could not have been too many rocks and cuttings on top of the lost equipment. The Nabholz spear was then run on the wireline and en
countered an obstruction that appeared to be within the junk basket. However, when the pipe was tripped back to the rig floor, the junk basket was empty, with slightly damaged teeth in its lower catcher.
The third fishing BHA contained an 8 7A" overshot/grapple that had been shortened so that it could engage the support bearing and/or float valve. When this was run into the hole, an obstruction within the casing was encountered and eventually cleared. When the overshot was near the bottom of the hole, the wireline spear was run down, hopefully to align the lost equipment so that the overshot could engage it. The spear gave no indication of engagement or overpull. When the BHA was pulled back to the rig floor, the overshot contained the outer race of the lower support bearing.
For the last fishing BHA of Leg 111, the same overshot was shortened even more and modified by welding in a grapple control. As it was run through the casing, it also encountered a minor obstruction, which was then felt to be a flaw in the casing string. Before the last fishing attempt was made, the hole was flushed thoroughly with seawater to clean it of drilling muds for the sake of future geochemical sampling. In the time since the last slug of drilling mud on Leg 111, the hole was flushed with a total volume of seawater equivalent to seven hole volumes; a similar volume of seawater circulated at the end of Leg 92 successfully cleared the hole of the muds left during Leg 83 ("Borehole Water Chemistry, Part 2" section, this chapter).
The last Leg 111 fishing BHA was pulled to the rig floor at 1745, 16 October. Unfortunately, the overshot recovered no more of the junk, and the diamond bit, float valve, and parts of the lower support bearing were left in the bottom of the hole.
JOIDES Resolution departed Site 504 for Callao at 1800, 16 October, due to arrive by 0700, 20 October, 1986.
LITHOSTRATIGRAPHY
Introduction Hole 504B was first drilled during DSDP Leg 69 and subse
quently extended during Legs 70 and 83 to a total depth of 1350 mbsf. During the course of ODP Leg 111, Hole 504B was extended by a further 212.3 m to a total depth of 1562.3 mbsf, or 1287.8 m into oceanic basement.
The lithostratigraphy of the upper 1075.5 m of basement of Hole 504B has been described in detail in Adamson (1985). The basement can be divided into three zones: an upper zone 571.5 m thick consisting of a complex association of intercalated pillow lavas, pillow breccias, hyaloclastites, massive units (flows or sills), thin flows, and localized flow and tectonic breccias; a transition zone 209 m thick consisting of pillows, thin flows, massive units, and dikes; and, a lower zone beginning at 1055 mbsf composed predominantly of massive units and dikes with no pillows. This unit has been interpreted as a sheeted dike complex (Anderson, Honnorez, Becker, et ah, 1982), as predicted from ophiolite models.
Basalts recovered from Hole 504B during Leg 111 were described in hand specimen using the descriptive procedures described in the Legs 106/109 "Introduction and Explanatory Notes" (Legs 106/109 Shipboard Scientific Party, first part of this book). Lithological units were defined by changes in grain size, occurrence of intrusive contacts, and variations in the abundance and type of phenocryst assemblage. An average recovery rate of only 12.6% complicated efforts to identify the lithologic units.
Lithostratigraphy of Hole 504B (1350-1562.1 mbsf) A total of 41 lithological units were identified in the 209.1 m
of basement cored during Leg 111. These are composed predominantly of massive units as defined in Adamson (1985), but
47

SITE 504
five dikes were also identified by the presence of chilled intrusive contacts (Fig. 10). Small centimeter-sized chilled intrusive fingers were also seen in Units 153 and 185. The chilled intrusive margins defining the dikes dip between 70° and almost vertical (Fig. 11). A breccia zone approximately 1 m long was recovered in Unit 153 which may represent a continuation of the
chilled intrusive contact separating Units 151 and 152. Similar brecciated contacts were observed in the Leg 83 section of this lower zone as described by Anderson, Honnorez, Becker, et al. (1982). Generally, however, the basalts recovered from this lower section of the hole are relatively unfractured. Large veins are rare, and most fractures are extremely narrow and inclined from
CD S i ! !
1400-
1450-
1500-
Cor
e
142
143
144
145
146
Rec
■
Lith
e
Lith
.
No recovery
; : ; ^ q
: : 147
148
149
150
151
152
153
154
155
156
157
158
159
160
*-=— 153 .154.
155
157 158 .159.
160
162
163
164
•165' 167
168
I r i i i i i i i i i [ i t i i i | i i
: 561
175
176
177
"178"
181
182
183 .184. 185
Il86
Phe
1 15 3^
- 1 0 -7 13 7
9
12
Bas
PC
OPC
A 5" 15
5
12
OPC
OPC
fi
3
4
2
OP
OPC
A , 2 - 4 u i -2 4 3
5 10l
7
5
OPC
OC
OPC
oc
H
5 OPC
A
2 •^b-J
2
<1
OPC A
OPC
A
5
2 _
OPC
PC"
A
156-6
161-A
1550-
166-A
169-A 170 171 173-5 174-10
Lithological type
Massive units
1 Dikes
Chilled intrusive contacts
Grain size I Very fine grained
I Fine grained
I Medium grained
Basalt type
OPC
OP
Olivine-plagioclase-clinopyroxene phyric Olivine-plagioclase phyric
Olivine-clinopyroxene phyric
PC Plagioclase-clinopyroxene phyric
A Aphyric
Figure 10. Basement lithostratigraphy of Hole 504B from 1350 to 1562.1 mbsf. Cores 162 and 168 are 0.1 m long. Basalt type classification is that described in "Petrography" section, this chapter. Unit 174 intrudes into Unit 173. Chilled intrusive fingers of basalt occur in Units 153 and 185.
48
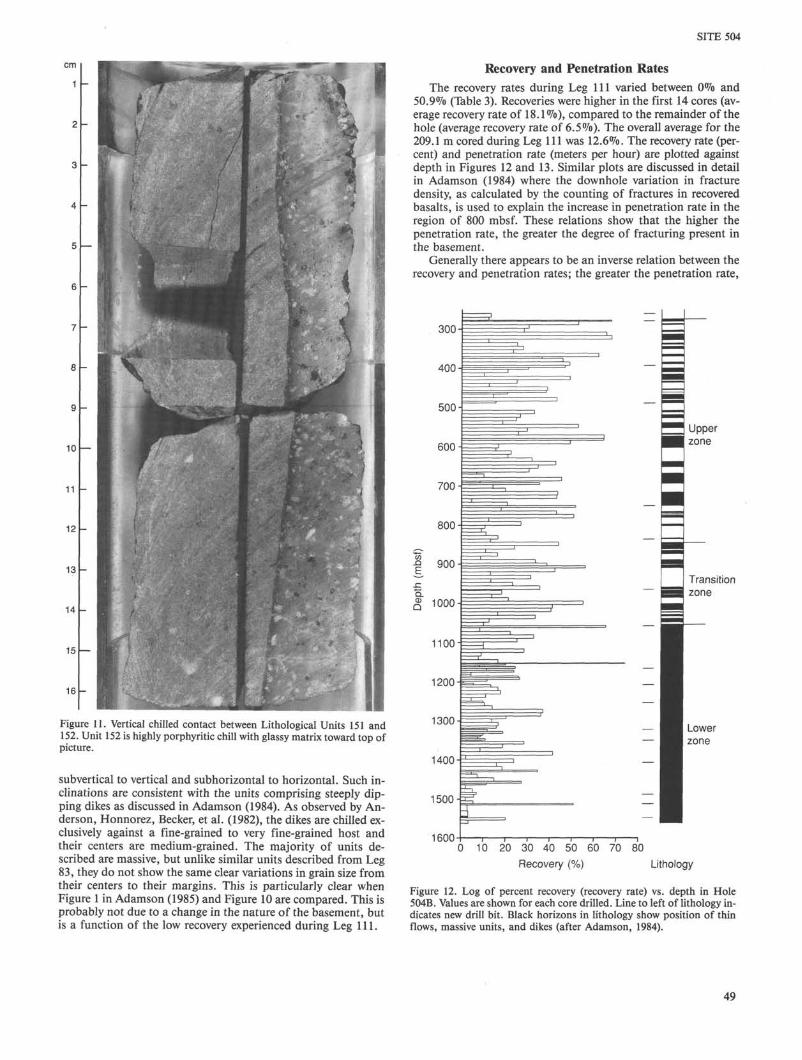
SITE 504
Figure 11. Vertical chilled contact between Lithological Units 151 and 152. Unit 152 is highly porphyritic chill with glassy matrix toward top of picture.
subvertical to vertical and subhorizontal to horizontal. Such inclinations are consistent with the units comprising steeply dipping dikes as discussed in Adamson (1984). As observed by Anderson, Honnorez, Becker, et al. (1982), the dikes are chilled exclusively against a fine-grained to very fine-grained host and their centers are medium-grained. The majority of units described are massive, but unlike similar units described from Leg 83, they do not show the same clear variations in grain size from their centers to their margins. This is particularly clear when Figure 1 in Adamson (1985) and Figure 10 are compared. This is probably not due to a change in the nature of the basement, but is a function of the low recovery experienced during Leg 111.
Recovery and Penetration Rates The recovery rates during Leg 111 varied between 0% and
50.9% (Table 3). Recoveries were higher in the first 14 cores (average recovery rate of 18.1 %), compared to the remainder of the hole (average recovery rate of 6.5%). The overall average for the 209.1 m cored during Leg 111 was 12.6%. The recovery rate (percent) and penetration rate (meters per hour) are plotted against depth in Figures 12 and 13. Similar plots are discussed in detail in Adamson (1984) where the downhole variation in fracture density, as calculated by the counting of fractures in recovered basalts, is used to explain the increase in penetration rate in the region of 800 mbsf. These relations show that the higher the penetration rate, the greater the degree of fracturing present in the basement.
Generally there appears to be an inverse relation between the recovery and penetration rates; the greater the penetration rate,
Figure 12. Log of percent recovery (recovery rate) vs. depth in Hole 504B. Values are shown for each core drilled. Line to left of lithology indicates new drill bit. Black horizons in lithology show position of thin flows, massive units, and dikes (after Adamson, 1984).
49
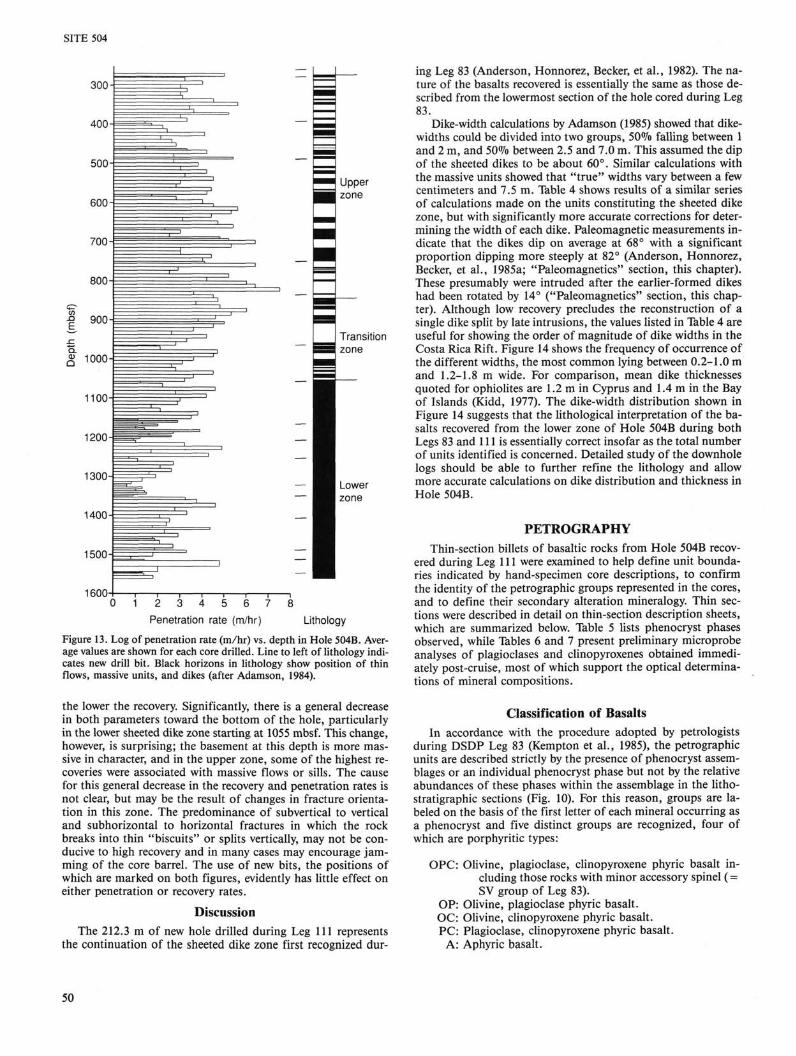
SITE 504
— I ■ Lower
1 2 3 4 5 6 7 Penetration rate (m/hr) Lithology
Figure 13. Log of penetration rate (m/hr) vs. depth in Hole 504B. Average values are shown for each core drilled. Line to left of lithology indicates new drill bit. Black horizons in lithology show position of thin flows, massive units, and dikes (after Adamson, 1984).
ing Leg 83 (Anderson, Honnorez, Becker, et al., 1982). The nature of the basalts recovered is essentially the same as those described from the lowermost section of the hole cored during Leg 83.
Dike-width calculations by Adamson (1985) showed that dike-widths could be divided into two groups, 50% falling between 1 and 2 m, and 50% between 2.5 and 7.0 m. This assumed the dip of the sheeted dikes to be about 60°. Similar calculations with the massive units showed that "true" widths vary between a few centimeters and 7.5 m. Table 4 shows results of a similar series of calculations made on the units constituting the sheeted dike zone, but with significantly more accurate corrections for determining the width of each dike. Paleomagnetic measurements indicate that the dikes dip on average at 68° with a significant proportion dipping more steeply at 82° (Anderson, Honnorez, Becker, et al., 1985a; "Paleomagnetics" section, this chapter). These presumably were intruded after the earlier-formed dikes had been rotated by 14° ("Paleomagnetics" section, this chapter). Although low recovery precludes the reconstruction of a single dike split by late intrusions, the values listed in Table 4 are useful for showing the order of magnitude of dike widths in the Costa Rica Rift. Figure 14 shows the frequency of occurrence of the different widths, the most common lying between 0.2-1.0 m and 1.2-1.8 m wide. For comparison, mean dike thicknesses quoted for ophiolites are 1.2 m in Cyprus and 1.4 m in the Bay of Islands (Kidd, 1977). The dike-width distribution shown in Figure 14 suggests that the lithological interpretation of the basalts recovered from the lower zone of Hole 504B during both Legs 83 and 111 is essentially correct insofar as the total number of units identified is concerned. Detailed study of the downhole logs should be able to further refine the lithology and allow more accurate calculations on dike distribution and thickness in Hole 504B.
PETROGRAPHY Thin-section billets of basaltic rocks from Hole 504B recov
ered during Leg 111 were examined to help define unit boundaries indicated by hand-specimen core descriptions, to confirm the identity of the petrographic groups represented in the cores, and to define their secondary alteration mineralogy. Thin sections were described in detail on thin-section description sheets, which are summarized below. Table 5 lists phenocryst phases observed, while Tables 6 and 7 present preliminary microprobe analyses of plagioclases and clinopyroxenes obtained immediately post-cruise, most of which support the optical determinations of mineral compositions.
the lower the recovery. Significantly, there is a general decrease in both parameters toward the bottom of the hole, particularly in the lower sheeted dike zone starting at 1055 mbsf. This change, however, is surprising; the basement at this depth is more massive in character, and in the upper zone, some of the highest recoveries were associated with massive flows or sills. The cause for this general decrease in the recovery and penetration rates is not clear, but may be the result of changes in fracture orientation in this zone. The predominance of subvertical to vertical and subhorizontal to horizontal fractures in which the rock breaks into thin "biscuits" or splits vertically, may not be conducive to high recovery and in many cases may encourage jamming of the core barrel. The use of new bits, the positions of which are marked on both figures, evidently has little effect on either penetration or recovery rates.
Discussion The 212.3 m of new hole drilled during Leg 111 represents
the continuation of the sheeted dike zone first recognized dur-
Classification of Basalts In accordance with the procedure adopted by petrologists
during DSDP Leg 83 (Kempton et al., 1985), the petrographic units are described strictly by the presence of phenocryst assemblages or an individual phenocryst phase but not by the relative abundances of these phases within the assemblage in the litho-stratigraphic sections (Fig. 10). For this reason, groups are labeled on the basis of the first letter of each mineral occurring as a phenocryst and five distinct groups are recognized, four of which are porphyritic types:
OPC: Olivine, plagioclase, clinopyroxene phyric basalt including those rocks with minor accessory spinel (= SV group of Leg 83).
OP: Olivine, plagioclase phyric basalt. OC: Olivine, clinopyroxene phyric basalt. PC: Plagioclase, clinopyroxene phyric basalt.
A: Aphyric basalt.
50
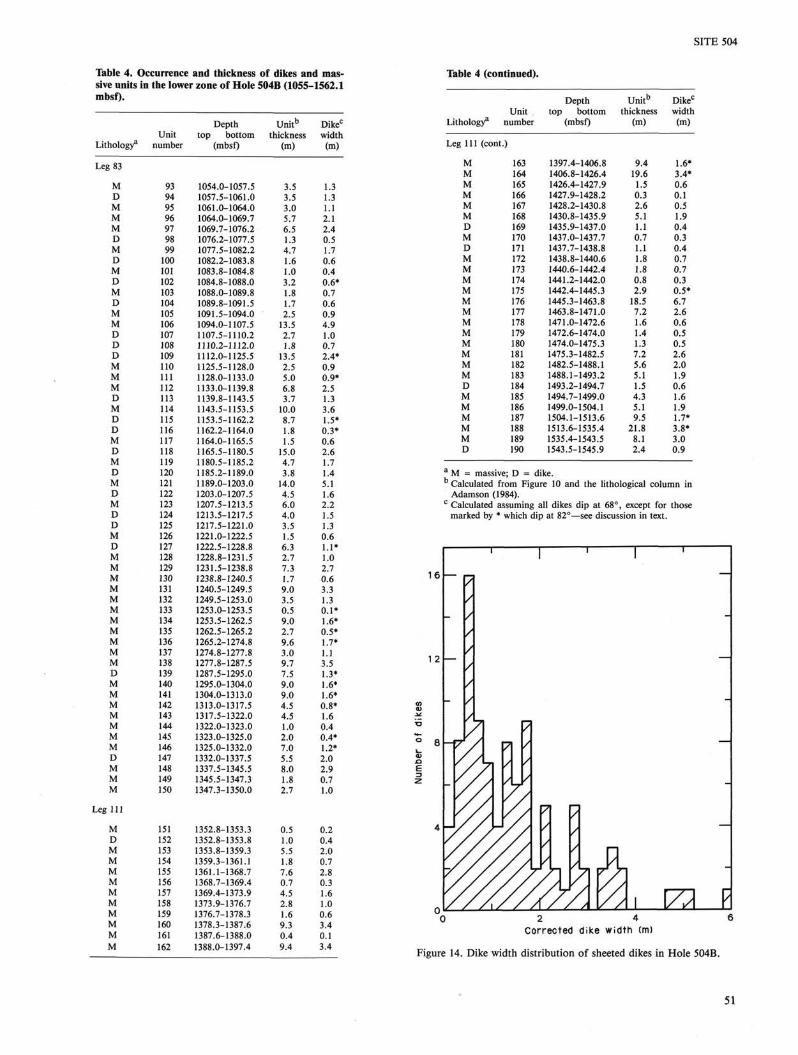
SITE 504
Table 4. Occurrence and thickness of dikes and massive units in the lower zone of Hole 504B (1055-1562.1 ntbsf).
Table 4 (continued).
Lithology*
Leg 83
M D M M M D M D M D M D M M D D D M M M D M D D M D M D M D M D D M D M M M M M M M M M M M D M M M M M M M D M M M
Leg 111
M D M M M M M M M M M M
Unit number
93 94 95 96 97 98 99
100 101 102 103 104 105 106 107 108 109 110 111 112 113 114 115 116 117 118 119 120 121 122 123 124 125 126 127 128 129 130 131 132 133 134 135 136 137 138 139 140 141 142 143 144 145 146 147 148 149 150
151 152 153 154 155 156 157 158 159 160 161 162
Depth top bottom
(mbsf)
1054.0-1057.5 1057.5-1061.0 1061.0-1064.0 1064.0-1069.7 1069.7-1076.2 1076.2-1077.5 1077.5-1082.2 1082.2-1083.8 1083.8-1084.8 1084.8-1088.0 1088.0-1089.8 1089.8-1091.5 1091.5-1094.0 1094.0-1107.5 1107.5-1110.2 1110.2-1112.0 1112.0-1125.5 1125.5-1128.0 1128.0-1133.0 1133.0-1139.8 1139.8-1143.5 1143.5-1153.5 1153.5-1162.2 1162.2-1164.0 1164.0-1165.5 1165.5-1180.5 1180.5-1185.2 1185.2-1189.0 1189.0-1203.0 1203.0-1207.5 1207.5-1213.5 1213.5-1217.5 1217.5-1221.0 1221.0-1222.5 1222.5-1228.8 1228.8-1231.5 1231.5-1238.8 1238.8-1240.5 1240.5-1249.5 1249.5-1253.0 1253.0-1253.5 1253.5-1262.5 1262.5-1265.2 1265.2-1274.8 1274.8-1277.8 1277.8-1287.5 1287.5-1295.0 1295.0-1304.0 1304.0-1313.0 1313.0-1317.5 1317.5-1322.0 1322.0-1323.0 1323.0-1325.0 1325.0-1332.0 1332.0-1337.5 1337.5-1345.5 1345.5-1347.3 1347.3-1350.0
1352.8-1353.3 1352.8-1353.8 1353.8-1359.3 1359.3-1361.1 1361.1-1368.7 1368.7-1369.4 1369.4-1373.9 1373.9-1376.7 1376.7-1378.3 1378.3-1387.6 1387.6-1388.0 1388.0-1397.4
Unitb
thickness (m)
3.5 3.5 3.0 5.7 6.5 1.3 4.7 1.6 1.0 3.2 1.8 1.7 2.5
13.5 2.7 1.8
13.5 2.5 5.0 6.8 3.7
10.0 8.7 1.8 1.5
15.0 4.7 3.8
14.0 4.5 6.0 4.0 3.5 1.5 6.3 2.7 7.3 1.7 9.0 3.5 0.5 9.0 2.7 9.6 3.0 9.7 7.5 9.0 9.0 4.5 4.5 1.0 2.0 7.0 5.5 8.0 1.8 2.7
0.5 1.0 5.5 1.8 7.6 0.7 4.5 2.8 1.6 9.3 0.4 9.4
Dikec
width (m)
1.3 1.3 1.1 2.1 2.4 0.5 1.7 0.6 0.4 0.6* 0.7 0.6 0.9 4.9 1.0 0.7 2.4* 0.9 0.9* 2.5 1.3 3.6 1.5* 0.3* 0.6 2.6 1.7 1.4 5.1 1.6 2.2 1.5 1.3 0.6 1.1* 1.0 2.7 0.6 3.3 1.3 0.1* 1.6* 0.5* 1.7* 1.1 3.5 1.3* 1.6* 1.6* 0.8* 1.6 0.4 0.4* 1.2* 2.0 2.9 0.7 1.0
0.2 0.4 2.0 0.7 2.8 0.3 1.6 1.0 0.6 3.4 0.1 3.4
Lithology3 Unit
number
Leg 111 (cont.)
M M M M M M D M D M M M M M M M M M M M M D M M M M M D
163 164 165 166 167 168 169 170 171 172 173 174 175 176 177 178 179 180 181 182 183 184 185 186 187 188 189 190
Depth top bottom
(mbsf)
1397.4-1406.8 1406.8-1426.4 1426.4-1427.9 1427.9-1428.2 1428.2-1430.8 1430.8-1435.9 1435.9-1437.0 1437.0-1437.7 1437.7-1438.8 1438.8-1440.6 1440.6-1442.4 1441.2-1442.0 1442.4-1445.3 1445.3-1463.8 1463.8-1471.0 1471.0-1472.6 1472.6-1474.0 1474.0-1475.3 1475.3-1482.5 1482.5-1488.1 1488.1-1493.2 1493.2-1494.7 1494.7-1499.0 1499.0-1504.1 1504.1-1513.6 1513.6-1535.4 1535.4-1543.5 1543.5-1545.9
Unitb
thickness (m)
9.4 19.6 1.5 0.3 2.6 5.1 1.1 0.7 1.1 1.8 1.8 0.8 2.9
18.5 7.2 1.6 1.4 1.3 7.2 5.6 5.1 1.5 4.3 5.1 9.5
21.8 8.1 2.4
Dikec
width (m)
1.6* 3.4* 0.6 0.1 0.5 1.9 0.4 0.3 0.4 0.7 0.7 0.3 0.5* 6.7 2.6 0.6 0.5 0.5 2.6 2.0 1.9 0.6 1.6 1.9 1.7* 3.8* 3.0 0.9
a M = massive; D = dike. Calculated from Figure 10 and the lithological column in Adamson (1984).
c Calculated assuming all dikes dip at 68°, except for those marked by * which dip at 82°—see discussion in text.
0 2 4 Corrected dike width (m)
Figure 14. Dike width distribution of sheeted dikes in Hole 504B.
51

SITE 504
Table 5. Phenocryst phases observed in Hole 504B basalts.
Rock group Phenocrysts
Leg 83 (from Kempton et al., 1985)
OPC
OP
sv
OC/PC
Leg 111
OPC (including spinel-bearing rocks)
OP
PC
OC
Olivine Plagioclase Clinopyroxene Olivine Plagioclase Olivine Plagioclase Clinopyroxene Spinel
Olivine Plagioclase Clinopyroxene Spinel Olivine Plagioclase Plagioclase Clinopyroxene Olivine Clinopyroxene
Percent
0.5-2.0 1.0-5.0 1.0-5.0 0.5-3.0 0.5-5.0 0.0-5.0 1.0-10.0 0.0-1.0 « 1 . 0
Size (mm)
0.3-3.5 0.5-3.0 0.4-4.8 1.0-2.5 1.2-2.0 0.5-4.0 1.0-2.5 0.8-1.5
0.01-0.2 Not recorded.
0.5-9.0 1.0-20.0 0.5-10.0
« 1 . 0 2.0-3.0 0.5-7.0 1.0-8.0 0.5-3.0
2.0 0.5
0.3-4.0 0.1-3.0 0.3-5.0 0.1-0.5 0.2-3.0 0.3-3.0 0.2-2.0 0.5-2.5 1.0-2.5 <3.0
Morphology
Euhedral Subhedral Anhedral Euhedral Subhedral Euhedral Subhedral Anhedral Euhedral
Euhedral-subhedral Euhedral-subhedral Subhedral Euhedral Euhedral Euhedral Euhedral Euhedral Euhedral Subhedral
Note: Groundmass modal abundances are reported in text. Acronyms are defined in text.
On the core barrel sheets and thin-section description sheets, the names of porphyritic rocks are constructed in order of decreasing abundance of phenocrysts.
The term basalt refers to a characteristic mineral assemblage and does not imply a particularly fine-grained texture. The term phyric is used to describe a texture in which larger crystals (phenocrysts) are set in a finer groundmass that may be crystalline or glassy or both. Aphyric rocks are essentially those with no phenocrysts; for practical purposes this means that if one or two phenocrysts amounting to clearly less than 1 °Io of the total rock are present and elsewhere the unit appears to lack phenocrysts, then the rock is described as aphyric. The minor occurrence of phenocrysts in such a case is, however, described in the detailed accounts of thin sections. Sparsely phyric rocks are those that contain less than 2% phenocrysts; moderately phyric, those that contain 2%-10% phenocrysts; highly phyric, more than 10% phenocrysts.
Porphyritic Rocks Approximately two thirds of the 45 rocks examined in thin
section can be classified as porphyritic and contain a phenocryst assemblage represented by either olivine and/or clinopyroxene and/or plagioclase (Table 5). Whereas rock groups containing the assemblages olivine and clinopyroxene (OC) and plagioclase and clinopyroxene (PC) were not reported on DSDP Leg 83,
Table 6. Plagioclase compositions from Hole S04B, Leg 111 basalts.
Sample Character Position SiQ2 A1203 TiQ2 C r 2 0 3 FeO MnO MgO CaO Na 2 0 K 2 0 NiO Total
142R-l,6-8cm Phenocryst
142R-1, 9-12 cm Phenocryst
142R-2, 57-59 cm Phenocryst
143R-1, 2-4 cm Phenocryst
144R-1, 0-2 cm Phenocryst
145F-3, 44-46 cm Phenocryst
142R-2, 57-59 cm Groundmass
core rim core rim core rim core rim core rim core rim
48.12 55.70 46.15 47.92 47.98 50.78 47.05 47.88 49.02 51.82 47.40 54.16 47.42 50.52
31.80 26.57 32.94 32.58 33.14 30.41 32.23 32.53 32.02 28.85 32.68 28.32 31.76 30.31
0.03 0.10 0.01 0.01 0.01 0.03 0.00 0.00 0.04 0.05 0.02 0.05 0.03 0.03
0.00 0.00 0.03 0.00 0.02 0.00 0.01 0.00 0.05 0.00 0.00 0.01 0.01 0.00
0.45 1.11 0.33 0.31 0.42 0.55 0.39 0.41 0.50 0.82 0.34 0.86 0.40 0.64
0.01 0.04 0.00 0.01 0.00 0.00 0.01 0.01 0.03 0.00 0.00 0.01 0.00 0.00
0.23 0.16 0.24 0.21 0.20 0.29 0.26 0.21 0.20 0.21 0.24 0.17 0.20 0.32
16.76 11.38 17.50 17.39 17.07 14.95 17.32 17.66 15.92 13.84 17.80 12.59 16.01 14.00
2.35 4.94 1.48 1.57 1.78 3.11 1.72 1.62 2.16 3.77 1.58 4.16 1.99 3.32
0.01 0.00 0.00 0.00 0.01 0.01 0.00 0.01 0.01 0.01 0.01 0.02 0.01 0.01
0.00 0.03 0.01 0.01 0.05 0.01 0.03 0.01 0.05 0.03 0.03 0.01 0.03 0.04
99.76 100.03 98.69
100.01 100.68 100.14 99.02
100.34 100.00 99.40
100.10 100.36 99.86 99.19
Table 7. Clinopyroxene and olivine compositions from Hole 504B, Leg 111 basalts.
Sample
Clinopyroxene
142R-1, 6-8 cm
142R-1, 9-12 cm
142R-2, 57-59 cm
143R-1, 2-4 cm
144R-1, 0-2 cm
145R-3, 44-46
143R-1
144R-1, 0-2 cm
Olivine
142R-1, 9-12 cm
Character
Phenocryst
Phenocryst
Phenocryst
Phenocryst
Phenocryst
Phenocryst
Groundmass
Groundmass
Phenocryst
Position
core rim core rim core rim core rim core rim core rim
Si0 2
51.90 52.78 51.98 51.84 51.84 52.20 53.45 53.19 53.30 52.62 52.23 52.92 52.63 50.31 53.18
40.31 40.69
A1203
2.48 1.75 3.41 3.14 2.76 2.64 2.41 2.58 3.30 3.09 2.10 2.49 3.11 3.32 2.75
0.04 0.05
T i 0 2
0.30 0.22 0.34 0.30 0.31 0.28 0.26 0.22 0.28 0.29 0.22 0.23 0.53 0.72 0.66
0.00 0.00
C r 2 0 3
0.48 0.31 1.33 0.91 0.39 0.29 0.68 0.77 1.09 1.00 0.82 0.91 0.05 0.11 0.14
0.05 0.05
FeO
5.41 5.44 4.61 4.84 5.77 5.50 5.08 4.86 4.66 4.68 4.13 4.79 9.07 9.03 8.41
13.74 13.41
MnO
0.15 0.16 0.12 0.14 0.14 0.18 0.10 0.17 0.13 0.08 0.11 0.06 0.20 0.23 0.15
0.17 0.20
MgO
18.46 19.07 17.67 18.00 18.33 18.86 18.27 17.64 17.55 17.71 19.45 18.69 16.35 16.80 16.88
45.07 45.05
CaO
18.37 18.85 20.11 19.72 19.09 18.51 19.40 19.31 20.26 20.71 18.80 18.75 18.14 18.59 18.89
0.32 0.30
Na 2 0
0.18 0.15 0.24 0.17 0.22 0.16 0.18 0.23 0.21 0.19 0.15 0.21 0.11 0.21 0.09
nda
nd
K 2 0
0.02 0.00 0.00 0.01 0.01 0.01 0.01 0.02 0.01 0.00 0.00 0.02 0.00 0.00 0.01
nd nd
NiO
0.04 0.01 0.03 0.06 0.04 0.13 0.04 0.05 0.04 0.05 0.04 0.02 0.02 0.02 0.00
0.16 0.17
Total
97.79 98.74 99.84 99.13 98.90 98.76 99.88 99.04
100.83 100.42 99.05 99.09
100.21 99.14
101.16
99.86 99.92
nd = not determined.
52
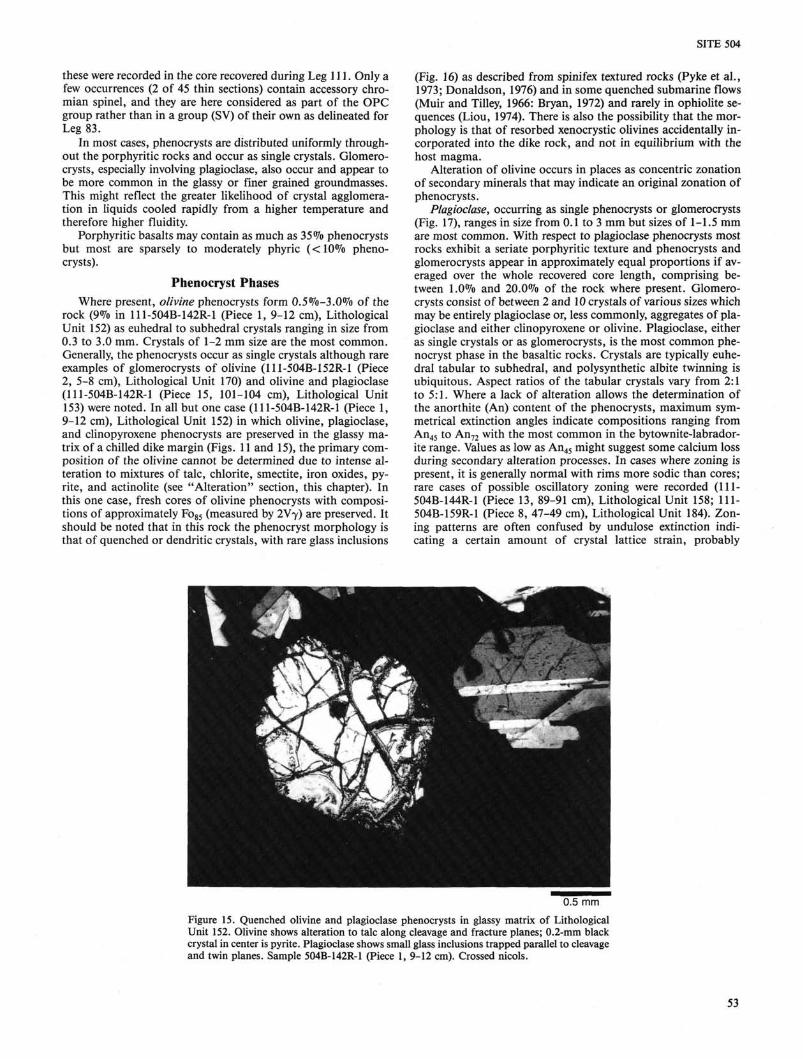
SITE 504
these were recorded in the core recovered during Leg 111. Only a few occurrences (2 of 45 thin sections) contain accessory chro-mian spinel, and they are here considered as part of the OPC group rather than in a group (SV) of their own as delineated for Leg 83.
In most cases, phenocrysts are distributed uniformly throughout the porphyritic rocks and occur as single crystals. Glomero-crysts, especially involving plagioclase, also occur and appear to be more common in the glassy or finer grained groundmasses. This might reflect the greater likelihood of crystal agglomeration in liquids cooled rapidly from a higher temperature and therefore higher fluidity.
Porphyritic basalts may contain as much as 35% phenocrysts but most are sparsely to moderately phyric (<10% phenocrysts).
Phenocryst Phases Where present, olivine phenocrysts form 0.5%-3.0% of the
rock (9% in 111-504B-142R-1 (Piece 1, 9-12 cm), Lithological Unit 152) as euhedral to subhedral crystals ranging in size from 0.3 to 3.0 mm. Crystals of 1-2 mm size are the most common. Generally, the phenocrysts occur as single crystals although rare examples of glomerocrysts of olivine (111-504B-152R-1 (Piece 2, 5-8 cm), Lithological Unit 170) and olivine and plagioclase (111-504B-142R-1 (Piece 15, 101-104 cm), Lithological Unit 153) were noted. In all but one case (111-504B-142R-1 (Piece 1, 9-12 cm), Lithological Unit 152) in which olivine, plagioclase, and clinopyroxene phenocrysts are preserved in the glassy matrix of a chilled dike margin (Figs. 11 and 15), the primary composition of the olivine cannot be determined due to intense alteration to mixtures of talc, chlorite, smectite, iron oxides, py-rite, and actinolite (see "Alteration" section, this chapter). In this one case, fresh cores of olivine phenocrysts with compositions of approximately Fo85 (measured by 2VY) are preserved. It should be noted that in this rock the phenocryst morphology is that of quenched or dendritic crystals, with rare glass inclusions
(Fig. 16) as described from spinifex textured rocks (Pyke et al., 1973; Donaldson, 1976) and in some quenched submarine flows (Muir and Tilley, 1966: Bryan, 1972) and rarely in ophiolite sequences (Liou, 1974). There is also the possibility that the morphology is that of resorbed xenocrystic olivines accidentally incorporated into the dike rock, and not in equilibrium with the host magma.
Alteration of olivine occurs in places as concentric zonation of secondary minerals that may indicate an original zonation of phenocrysts.
Plagioclase, occurring as single phenocrysts or glomerocrysts (Fig. 17), ranges in size from 0.1 to 3 mm but sizes of 1-1.5 mm are most common. With respect to plagioclase phenocrysts most rocks exhibit a seriate porphyritic texture and phenocrysts and glomerocrysts appear in approximately equal proportions if averaged over the whole recovered core length, comprising between 1.0% and 20.0% of the rock where present. Glomerocrysts consist of between 2 and 10 crystals of various sizes which may be entirely plagioclase or, less commonly, aggregates of plagioclase and either clinopyroxene or olivine. Plagioclase, either as single crystals or as glomerocrysts, is the most common phenocryst phase in the basaltic rocks. Crystals are typically euhedral tabular to subhedral, and polysynthetic albite twinning is ubiquitous. Aspect ratios of the tabular crystals vary from 2:1 to 5:1. Where a lack of alteration allows the determination of the anorthite (An) content of the phenocrysts, maximum symmetrical extinction angles indicate compositions ranging from An45 to An72 with the most common in the bytownite-labrador-ite range. Values as low as An45 might suggest some calcium loss during secondary alteration processes. In cases where zoning is present, it is generally normal with rims more sodic than cores; rare cases of possible oscillatory zoning were recorded (111-504B-144R-1 (Piece 13, 89-91 cm), Lithological Unit 158; 111-504B-159R-1 (Piece 8, 47-49 cm), Lithological Unit 184). Zoning patterns are often confused by undulose extinction indicating a certain amount of crystal lattice strain, probably
0.5 mm Figure 15. Quenched olivine and plagioclase phenocrysts in glassy matrix of Lithological Unit 152. Olivine shows alteration to talc along cleavage and fracture planes; 0.2-mm black crystal in center is pyrite. Plagioclase shows small glass inclusions trapped parallel to cleavage and twin planes. Sample 504B-142R-1 (Piece 1, 9-12 cm). Crossed nicols.
53
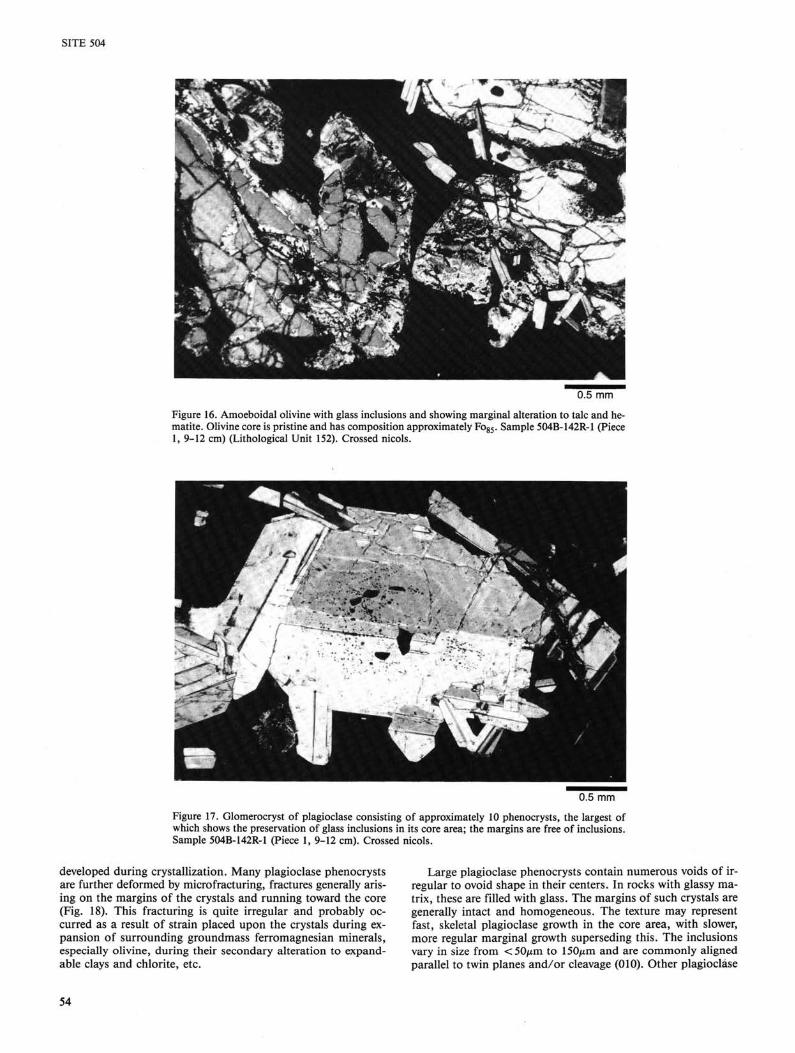
SITE 504
0.5 mm
Figure 16. Amoeboidal olivine with glass inclusions and showing marginal alteration to talc and hematite. Olivine core is pristine and has composition approximately Fog5. Sample 504B-142R-1 (Piece 1, 9-12 cm) (Lithological Unit 152). Crossed nicols.
0.5 mm Figure 17. Glomerocryst of plagioclase consisting of approximately 10 phenocrysts, the largest of which shows the preservation of glass inclusions in its core area; the margins are free of inclusions. Sample 504B-142R-1 (Piece 1, 9-12 cm). Crossed nicols.
developed during crystallization. Many plagioclase phenocrysts are further deformed by microfracturing, fractures generally arising on the margins of the crystals and running toward the core (Fig. 18). This fracturing is quite irregular and probably occurred as a result of strain placed upon the crystals during expansion of surrounding groundmass ferromagnesian minerals, especially olivine, during their secondary alteration to expandable clays and chlorite, etc.
Large plagioclase phenocrysts contain numerous voids of irregular to ovoid shape in their centers. In rocks with glassy matrix, these are filled with glass. The margins of such crystals are generally intact and homogeneous. The texture may represent fast, skeletal plagioclase growth in the core area, with slower, more regular marginal growth superseding this. The inclusions vary in size from <50fxm to 150/mi and are commonly aligned parallel to twin planes and/or cleavage (010). Other plagioclase
54

SITE 504
0.5 mm
Figure 18. Phenocryst of plagioclase with marginal olivine highly altered to mixed-layer clays and oxides. The plagioclase is fractured as a result of groundmass olivine expansion during alteration. Sample 504B-146R-1 (Piece 4, 21-23 cm). Crossed nicols.
phenocrysts have numerous secondary fluid inclusions developed on cleavage planes and probably associated with alteration which takes the form of chlorite ± clays ± zeolites on cleavage traces and crystal margins. Rarely, plagioclase phenocrysts are partially recrystallized to low An plagioclase or albite and generally show incipient subgrain growth in these cases.
Clinopyroxene occurs as a phenocryst phase in all but one of the porphyritic rocks examined in thin section. These phenocrysts form between 0.5% and 10% of the mode as crystals which range in size from less than 0.5 mm to approximately 5 mm for the long axis. The larger crystals are generally bladed with aspect ratios of approximately 1:5. The most common crystal size is 1-2 mm long axis. Phenocrysts have three distinct morphologies; the most common are typically euhedral to subhedral and appear in hand specimen as grass-green-colored crystals. In samples where groundmass texture is coarse, large anhedral poiki-litic crystals of pyroxene contain numerous stubby plagioclase crystals (Fig. 19). The pyroxenes in this case exceed the average dimensions of the groundmass pyroxenes but have crystal surfaces controlled by the growth of surrounding groundmass. Thus they probably reflect the combined effect of nucleation and growth of groundmass plagioclase on the surface of pyroxene phenocrysts, whilst the latter clearly continued to grow past the intratelluric stage. The resultant texture is not clearly porphyritic. Such clinopyroxene "oikocrysts" have, however, been included as a phenocryst phase in modal analyses. Lastly, amoeboid varieties occur in glassy chilled margins (Fig. 20) (111-504B-142R-1 (Piece 1, 9-12 cm), Lithological Unit 152). The possibility that these represent resorbed megacrysts of endiop-sidic composition is considered below. Some clinopyroxene phenocrysts show the same fracturing as associated plagioclases, resulting from groundmass expansion during alteration.
Clinopyroxene phenocrysts also occur together with plagioclase as glomerocrysts. In such cases it is not unusual for the pyroxene to partly or completely enclose euhedral feldspar laths in subophitic or ophitic relationship. In these glomerocrysts, the pyroxenes maintain a characteristically euhedral morphology in comparison to the "oikocrystic" variety.
Clinopyroxene phenocrysts are often twinned by simple basal planes and may be subtly zoned (sector zoning). Optical properties do not allow for accurate determination of compositions, but crystal color in hand specimen and birefringence and dispersion in thin section would suggest diopsidic augites. In Sample 111-504B-142R-1 (Piece 1, 9-12 cm), Lithological Unit 152, clinopyroxene phenocrysts exhibit a quenched habit, and the largest contain glass inclusions not unlike the associated plagioclase phenocrysts.
Groundmass Groundmass grain sizes in the porphyritic basalts vary from
glassy to medium grained. The glassy groundmasses are invariably associated with dike chilled margins and are discussed below. Crystalline groundmasses of the nonglassy rocks are typically diabasic but show some variation from subophitic to inter-granular; one sample (111-504B-152R-1 (Piece 20, 123-126 cm), Lithological Unit 175) clearly shows the development of plumose texture. The groundmass mineralogies comprise combinations of plagioclase, clinopyroxene, olivine, spinel, iron oxide, and secondary minerals. In addition, accessory phases such as apatite and zircon have been tentatively recorded in minor amounts.
Plagioclase forms between 27% and 55% of the groundmass as crystals that are typically elongate with aspect ratios of as much as 10:1. Grain size varies between 0.02 and 2 mm but crystals of approximately 0.2 mm long axis are most common. The larger groundmass crystals appear in rocks that display a seriate porphyritic texture where plagioclase varies in continuous grain sizes from the smallest groundmass crystal to the largest phenocryst. Crystals are generally euhedral to subhedral and occur in random orientation or have a tendency to aggregate as radiating crystals imparting a palmate texture to the groundmass. Groundmass plagioclase crystals are little altered (see "Alteration" section, this chapter) and where compositions are measurable appear to cluster between An45 and An50, although compositions as high as An60 (111-504B-159R-1 (Piece 8, 47-49 cm), Lithological Unit 183) are recorded.
55
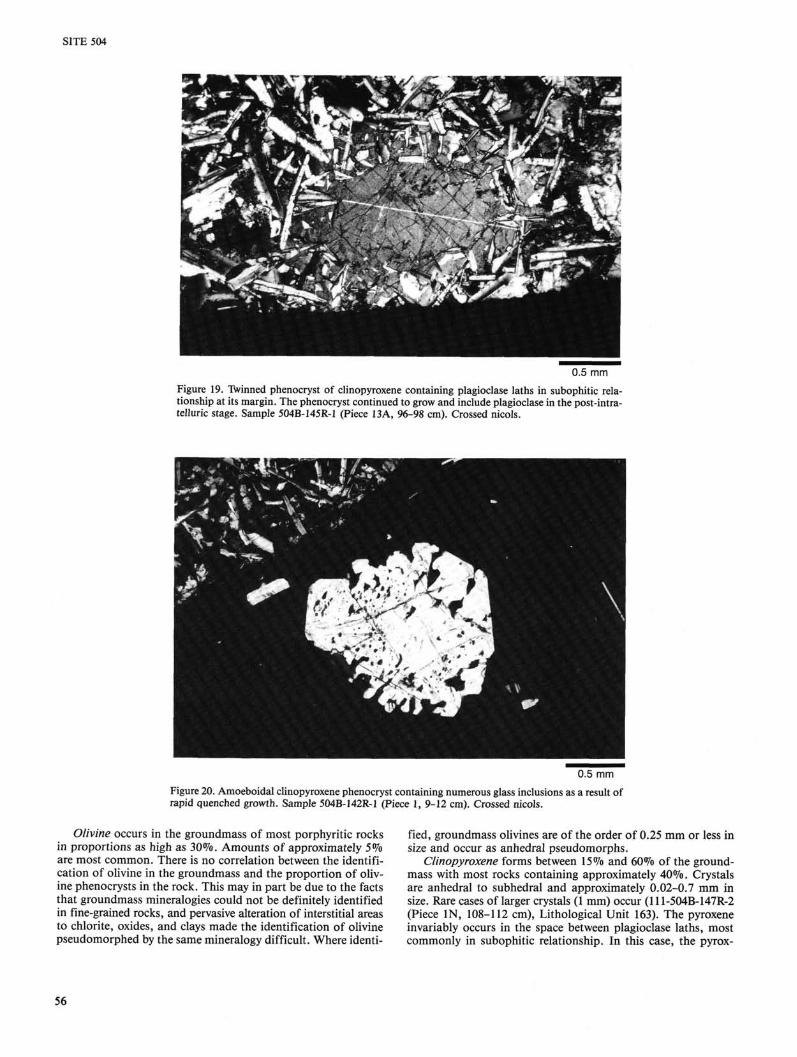
SITE 504
0.5 mm Figure 19. Twinned phenocryst of clinopyroxene containing plagioclase laths in subophitic relationship at its margin. The phenocryst continued to grow and include plagioclase in the post-intra-telluric stage. Sample 504B-145R-1 (Piece 13A, 96-98 cm). Crossed nicols.
0.5 mm Figure 20. Amoeboidal clinopyroxene phenocryst containing numerous glass inclusions as a result of rapid quenched growth. Sample 504B-142R-1 (Piece 1, 9-12 cm). Crossed nicols.
Olivine occurs in the groundmass of most porphyritic rocks in proportions as high as 30%. Amounts of approximately 5% are most common. There is no correlation between the identification of olivine in the groundmass and the proportion of olivine phenocrysts in the rock. This may in part be due to the facts that groundmass mineralogies could not be definitely identified in fine-grained rocks, and pervasive alteration of interstitial areas to chlorite, oxides, and clays made the identification of olivine pseudomorphed by the same mineralogy difficult. Where identi
fied, groundmass olivines are of the order of 0.25 mm or less in size and occur as anhedral pseudomorphs.
Clinopyroxene forms between 15% and 60% of the ground-mass with most rocks containing approximately 40%. Crystals are anhedral to subhedral and approximately 0.02-0.7 mm in size. Rare cases of larger crystals (1 mm) occur (111-504B-147R-2 (Piece IN, 108-112 cm), Lithological Unit 163). The pyroxene invariably occurs in the space between plagioclase laths, most commonly in subophitic relationship. In this case, the pyrox-
56

SITE 504
enes are generally equant, and undulose extinction suggests some structural deformation during crystallization. However, plumose morphologies occur in some samples (111-504B-152R-1 (Piece 20, 123-126 cm), Lithological Unit 175), and other pyroxene morphologies are somewhat controlled by the orientation of the plagioclases in cases where palmate texture is developed (Fig. 21). Pyroxenes show varying degrees of alteration to actinolite, chlorite, and magnetite. This is especially clear in Sample 111-504B-159R-1 (Piece 8, 47-49 cm), Lithological Unit 183, as shown in Figure 22.
Fe-Ti oxides, replaced in part by sphene pseudomorphs, form approximately 5% of most rocks. Amounts as high as 11% occur in some cases. Grains are equant, euhedral, and generally 0.02-0.07 mm in size and are located on clinopyroxene margins or in the interstices between plagioclase and clinopyroxene.
Chromian spinel is reported in two cases among the rocks investigated. In accordance with Leg 83 DSDP policy these rocks could have been assigned to their own petrographic group (the SV group). However, here they are considered as an integral part of the OPC group. Spinel occurs in such minor amounts
0.5 mm Figure 21. Palmate texture developed by plagioclase laths subophitically enclosed in clinopyroxene in groundmass of Sample 504B-147R-2 (Piece 1, 44-46 cm). Crossed nicols.
0.5 mm Figure 22. Sheaflike growth of clinopyroxenes in groundmass of Sample 504B-159R-1 (Piece 8, 47-49 cm).
57
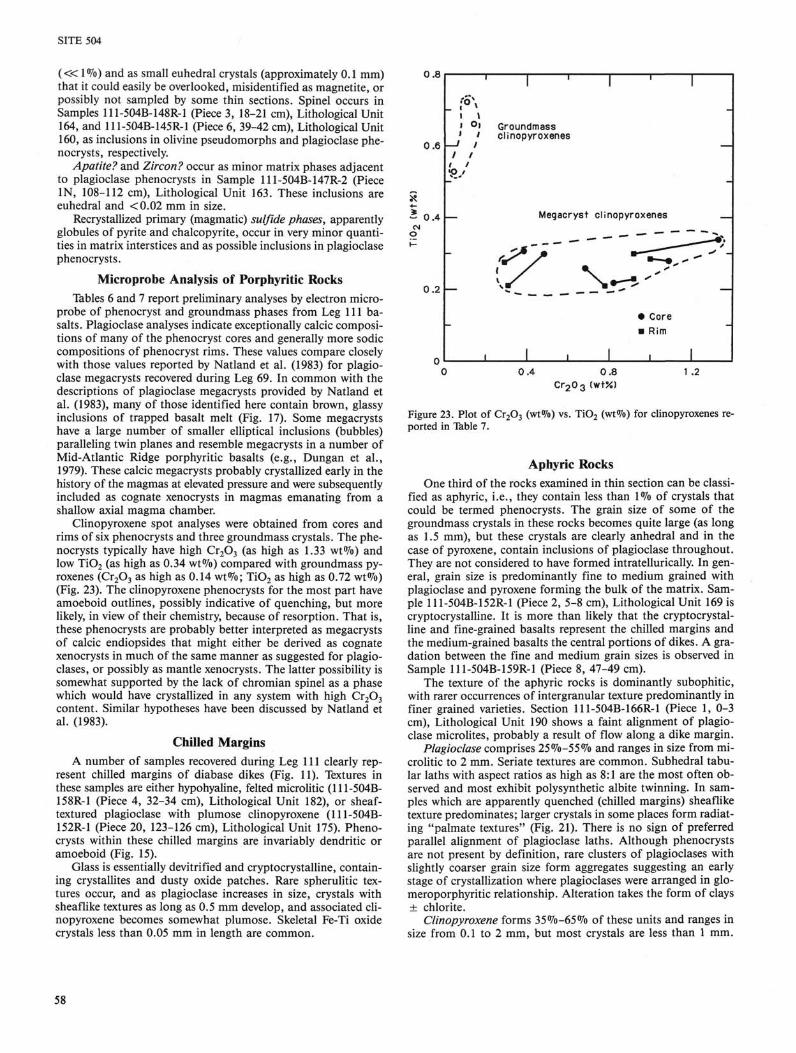
SITE 504
( « 1 % ) and as small euhedral crystals (approximately 0.1 mm) that it could easily be overlooked, misidentified as magnetite, or possibly not sampled by some thin sections. Spinel occurs in Samples 111-504B-148R-1 (Piece 3, 18-21 cm), Lithological Unit 164, and 111-504B-145R-1 (Piece 6, 39-42 cm), Lithological Unit 160, as inclusions in olivine pseudomorphs and plagioclase phe-nocrysts, respectively.
Apatite? and Zircon? occur as minor matrix phases adjacent to plagioclase phenocrysts in Sample 111-504B-147R-2 (Piece IN, 108-112 cm), Lithological Unit 163. These inclusions are euhedral and <0.02 mm in size.
Recrystallized primary (magmatic) sulfide phases, apparently globules of pyrite and chalcopyrite, occur in very minor quantities in matrix interstices and as possible inclusions in plagioclase phenocrysts.
Microprobe Analysis of Porphyritic Rocks Tables 6 and 7 report preliminary analyses by electron micro-
probe of phenocryst and groundmass phases from Leg 111 basalts. Plagioclase analyses indicate exceptionally calcic compositions of many of the phenocryst cores and generally more sodic compositions of phenocryst rims. These values compare closely with those values reported by Natland et al. (1983) for plagioclase megacrysts recovered during Leg 69. In common with the descriptions of plagioclase megacrysts provided by Natland et al. (1983), many of those identified here contain brown, glassy inclusions of trapped basalt melt (Fig. 17). Some megacrysts have a large number of smaller elliptical inclusions (bubbles) paralleling twin planes and resemble megacrysts in a number of Mid-Atlantic Ridge porphyritic basalts (e.g., Dungan et al., 1979). These calcic megacrysts probably crystallized early in the history of the magmas at elevated pressure and were subsequently included as cognate xenocrysts in magmas emanating from a shallow axial magma chamber.
Clinopyroxene spot analyses were obtained from cores and rims of six phenocrysts and three groundmass crystals. The phenocrysts typically have high Cr203 (as high as 1.33 wt%) and low Ti02 (as high as 0.34 wt%) compared with groundmass pyroxenes (Cr203 as high as 0.14 wt%; Ti02 as high as 0.72 wt%) (Fig. 23). The clinopyroxene phenocrysts for the most part have amoeboid outlines, possibly indicative of quenching, but more likely, in view of their chemistry, because of resorption. That is, these phenocrysts are probably better interpreted as megacrysts of calcic endiopsides that might either be derived as cognate xenocrysts in much of the same manner as suggested for plagio-clases, or possibly as mantle xenocrysts. The latter possibility is somewhat supported by the lack of chromian spinel as a phase which would have crystallized in any system with high Cr203 content. Similar hypotheses have been discussed by Natland et al. (1983).
Chilled Margins A number of samples recovered during Leg 111 clearly rep
resent chilled margins of diabase dikes (Fig. 11). Textures in these samples are either hypohyaline, felted microlitic (111-504B-158R-1 (Piece 4, 32-34 cm), Lithological Unit 182), or sheaf-textured plagioclase with plumose clinopyroxene (111-504B-152R-1 (Piece 20, 123-126 cm), Lithological Unit 175). Phenocrysts within these chilled margins are invariably dendritic or amoeboid (Fig. 15).
Glass is essentially devitrified and cryptocrystalline, containing crystallites and dusty oxide patches. Rare spherulitic textures occur, and as plagioclase increases in size, crystals with sheaflike textures as long as 0.5 mm develop, and associated clinopyroxene becomes somewhat plumose. Skeletal Fe-Ti oxide crystals less than 0.05 mm in length are common.
r
i i 1 Oi
—1 1 1 1
1 1
—
'
1
Groundmass clinopyroxenes
1 ' 1
-
Megacryst clinopyroxenes
f/" 1
• Core ■ Rim
1 , 1 0 0.4 0.8 1 .:
C r 2 0 3 (wt%)
Figure 23. Plot of Cr203 (wt%) vs. Ti02 (wt%) for clinopyroxenes reported in Table 7.
Aphyric Rocks One third of the rocks examined in thin section can be classi
fied as aphyric, i.e., they contain less than 1% of crystals that could be termed phenocrysts. The grain size of some of the groundmass crystals in these rocks becomes quite large (as long as 1.5 mm), but these crystals are clearly anhedral and in the case of pyroxene, contain inclusions of plagioclase throughout. They are not considered to have formed intratellurically. In general, grain size is predominantly fine to medium grained with plagioclase and pyroxene forming the bulk of the matrix. Sample 111-504B-152R-1 (Piece 2, 5-8 cm), Lithological Unit 169 is cryptocrystalline. It is more than likely that the cryptocrystalline and fine-grained basalts represent the chilled margins and the medium-grained basalts the central portions of dikes. A gradation between the fine and medium grain sizes is observed in Sample 111-504B-159R-1 (Piece 8, 47-49 cm).
The texture of the aphyric rocks is dominantly subophitic, with rarer occurrences of intergranular texture predominantly in finer grained varieties. Section 111-504B-166R-1 (Piece 1, 0-3 cm), Lithological Unit 190 shows a faint alignment of plagioclase microlites, probably a result of flow along a dike margin.
Plagioclase comprises 25%-5 5% and ranges in size from microlitic to 2 mm. Seriate textures are common. Subhedral tabular laths with aspect ratios as high as 8:1 are the most often observed and most exhibit polysynthetic albite twinning. In samples which are apparently quenched (chilled margins) sheaflike texture predominates; larger crystals in some places form radiating "palmate textures" (Fig. 21). There is no sign of preferred parallel alignment of plagioclase laths. Although phenocrysts are not present by definition, rare clusters of plagioclases with slightly coarser grain size form aggregates suggesting an early stage of crystallization where plagioclases were arranged in glo-meroporphyritic relationship. Alteration takes the form of clays ± chlorite.
Clinopyroxene forms 35%-65% of these units and ranges in size from 0.1 to 2 mm, but most crystals are less than 1 mm.
58
SITE 504
Crystal morphologies are generally anhedral, although euhedral prisms and sheaflike bundles occur (Fig. 22). Clinopyroxenes partly enclose plagioclase crystals and the latter clearly control the overall morphology. Alteration can be quite intense and pyroxenes may be almost entirely replaced by actinolite ± chlorite.
Olivine occurs as pseudomorphed subhedral crystals entirely replaced by talc, chlorite ± mixed-layer clays. Crystals are generally from 0.1 to 0.5 mm in size and comprise as much as 10% of the rock where present.
Fe-Ti oxides are an integral part of the aphyric rocks although quite often replaced by sphene. They form as much as 10% of the mode, averaging approximately 5%. Crystal morphology is generally equant, although masked somewhat by replacement, and crystals average 0.15 mm in size. Skeletal crystals occur in chilled margins.
Crystallization Sequence Petrographic relationships do not allow elucidation of an un
ambiguous crystallization history. However, the following features are pertinent:
1. Clearly, Fe-Ti oxides were the last phases to crystallize, occurring in interstices between clinopyroxene and plagioclase.
2. The subophitic to ophitic relationship between clinopyroxene and plagioclase clearly identifies the clinopyroxene as the later phase.
3. The relative crystallization order of plagioclase and olivine is equivocal. Both occur as phenocryst phases, and plagioclase is by far the more abundant. This dominance of plagioclase may suggest crystallization initially in the plagioclase primary phase field (Kempton et al., 1985). However, plagioclase could have been concentrated prior to eruption by physical processes (flotation?) in a magma chamber. Relative phenocryst abundance is therefore a misleading indicator, especially in view of the possible origin of many as xenocrysts. Relationship between olivine and plagioclase in the groundmass suggests cotec-tic crystallization. Preliminary 1-atmosphere experiments carried out on basalts recovered on DSDP Leg 83 (Autio, 1984) suggest that olivine appears on the liquidus approximately 20°C higher than plagioclase, confirming that olivine preceded plagioclase in the crystallization sequence.
4. Spinel occurs as inclusions in olivine phenocrysts and was probably the first mineral to crystallize. The lack of chromian spinel as a groundmass phase may be explained by the fact that, with decreasing temperature, liquidus chromian spinel reacts to produce Cr-rich pyroxene.
The postulated sequence of crystallization is therefore:
Spinel — olivine — olivine + plagioclase — olivine + plagioclase + clinopyroxene — olivine + plagioclase + clinopyroxene + Fe-Ti oxide.
ALTERATION
Introduction Interaction of seawater with the oceanic crust significantly
affects the compositions of seawater and the crust and influences the seismic and magnetic properties of the oceanic litho-sphere. Besides aiding in the evaluation of these effects, examination of altered rocks from the seafloor can provide constraints on temperatures of subsurface reactions and compositions of hydrothermal fluids. Hole 504B, previously drilled on Legs 69, 70, and 83, is the deepest hole in the oceanic crust and extended 1075.5 m into the basement before Leg 111. The additional drilling in Hole 504B completed during Leg 111 provided the opportunity to document alteration effects at greater depths in
the dike section and to determine any variability in alteration type or grade.
Previous Results Previous drilling in Hole 504B penetrated to 1350 mbsf. A
schematic of the basement lithostratigraphy and distribution of secondary minerals with depth beneath 274.5 m of sediments is shown in Figure 24. Alteration effects can be divided into three basic zones: the upper 310 m of the pillow section, the lower pillow section, and the combined transition zone and dike sections (Honnorez et al., 1983; Alt et al., 1985).
The upper 310 m of the pillow section are characterized by centimeter-sized oxidation halos around fractures. Goethite and celadonite replace olivine and fill pore space in these halos, while saponite replaces olivine and fills pores and fractures throughout the rocks. Other accessory alteration minerals also occur (Fig. 24). The lower pillow section is characterized mainly by the presence of saponite (sometimes with minor chlorite in-terlayering) replacing olivine and filling pore spaces and fractures. Secondary pyrite is also characteristic, and occurs disseminated in the rock and in fractures with saponite. Other minerals are present in lesser amounts, mostly in fractures (Fig. 24).
Greenschist facies minerals appear abruptly at 898 mbsf in the upper part of the lithologic transition zone and characterize alteration in the transition zone and dike sections. Chlorite, mixed-layer clays, actinolite, pyrite, and sphene occur in veins and, along with albite, replace primary phases in host basalts and dikes. A stockworklike sulfide mineralization occurs from 910 to 928 mbsf in the transition zone; pyrite is disseminated in the rock and occurs with quartz and lesser sphalerite and chalco-pyrite in veins cutting across the earlier chlorite-actinolite veins. Breccias and quartz-epidote veins are common, and the rocks are generally more extensively altered in the transition zone and upper 100 m of the dikes than deeper in the dike section.
The dikes are generally dark grey in color, sometimes with millimeter- to centimeter-sized light greenish-grey alteration halos around fractures. These zones are more extensively altered than the host rock. Similar irregular light grey patches occur around millimeter-sized vugs. From 1189 to 1319 mbsf in the dike section the rocks contain few fractures and are generally only slightly altered. Olivine in these rocks is replaced by smectite-rich mixed-layer clay minerals, talc, magnetite, and pyrite, whereas plagioclase, clinopyroxene, and magnetite are only very slightly altered. From 1336 to 1350 mbsf, the bottom of the pre-Leg 111 section, the recovered rocks are extensively fractured and altered, and were among the most extensively recrystallized rocks yet recovered. Some of these samples contained veins as thick as 1 cm of anhydrite, laumontite, and prehnite.
Based on vein relationships and various chemical and iso-topic data, the following model for alteration of the crust at Site 504 has been proposed (Alt et al., 1986). At the spreading axis, the dikes and lithologic transition zone were altered at 200°-350°C as hydrothermal fluids welled up through the dikes into the transition zone. These fluids mixed with cooler seawater circulating in the overlying more permeable pillow section, resulting in a steep temperature gradient (2.5°C/m) across the top of the transition zone. The lower pillow section was altered by the resultant "mixed" fluids under reducing conditions at temperatures less than 100°C, while the upper 310 m of pillows reacted with oxidizing seawater at low temperatures (0°-50°C). Based on vein relationships a second stage of upwelling of highly reacted axial hydrothermal fluids resulted in formation of the stockworklike sulfide mineralization in the upper transition zone at 250°-350°C. As the crust moved off-axis, recharge of cold seawater to depths of at least 1076 m within the basement resulted in local deposition of anhydrite in veins and fractures. Later, calcic zeolites, calcite, and prehnite formed in crosscut-
59
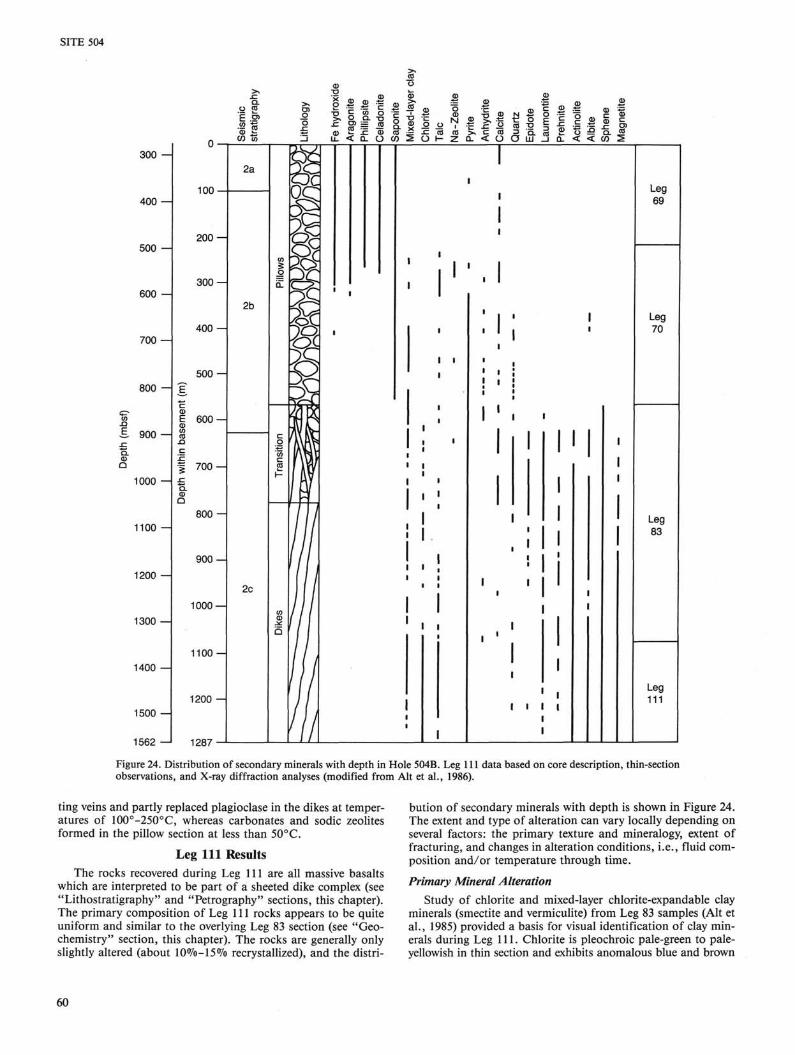
SITE 504
CO »
300
400 -
500
600
7 0 0 -
800 -
to -Q £ 900 sz Q . (D
Q
1000
1100 -
1200 —
1300 —
1400 -
1500
1562
100
200 —
300
400 —
S O D
'S 700 —
8 0 0 -
900 —
1000
1100 —
1200
1287
2a
2b
2c
ill B so
a. V " v 0 N © t - l H £ § I
CD CO ~ £ ^ « 5 -6 * i IL < Q. O (O O
co co >. c « = '5. « " H Z C L < O O U J _ J Q .
| 8 1 c S «5 c = •■£ x: c» o £ a. « < < ( 0 5
I I ' i i I
i i
I I 1 . ,
! i
Leg 69
I I
I I M
i i i i
i
Leg 70
Leg 83
Leg 111
Figure 24. Distribution of secondary minerals with depth in Hole 504B. Leg 111 data based on core description, thin-section observations, and X-ray diffraction analyses (modified from Alt et al., 1986).
ting veins and partly replaced plagioclase in the dikes at temperatures of 100°-250°C, whereas carbonates and sodic zeolites formed in the pillow section at less than 50°C.
Leg 111 Results The rocks recovered during Leg 111 are all massive basalts
which are interpreted to be part of a sheeted dike complex (see "Lithostratigraphy" and "Petrography" sections, this chapter). The primary composition of Leg 111 rocks appears to be quite uniform and similar to the overlying Leg 83 section (see "Geochemistry" section, this chapter). The rocks are generally only slightly altered (about KWo-lSVo recrystallized), and the distri
bution of secondary minerals with depth is shown in Figure 24. The extent and type of alteration can vary locally depending on several factors: the primary texture and mineralogy, extent of fracturing, and changes in alteration conditions, i.e., fluid composition and/or temperature through time.
Primary Mineral Alteration Study of chlorite and mixed-layer chlorite-expandable clay
minerals (smectite and vermiculite) from Leg 83 samples (Alt et al., 1985) provided a basis for visual identification of clay minerals during Leg 111. Chlorite is pleochroic pale-green to pale-yellowish in thin section and exhibits anomalous blue and brown
60
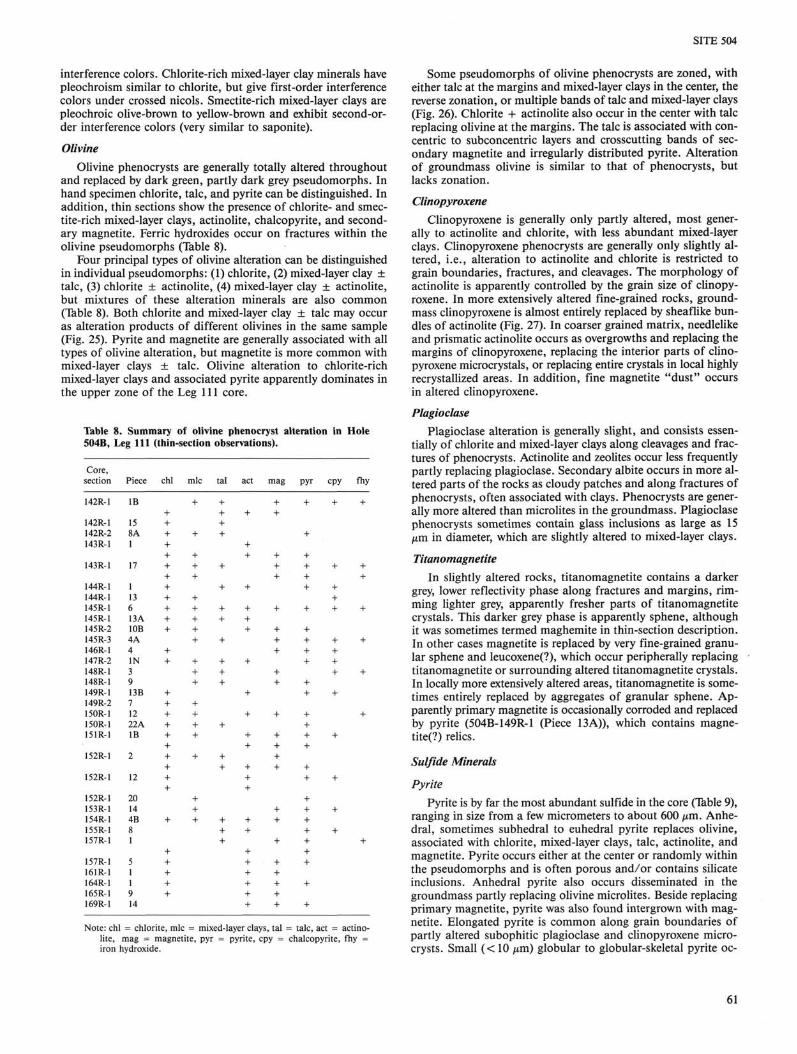
SITE 504
interference colors. Chlorite-rich mixed-layer clay minerals have pleochroism similar to chlorite, but give first-order interference colors under crossed nicols. Smectite-rich mixed-layer clays are pleochroic olive-brown to yellow-brown and exhibit second-order interference colors (very similar to saponite).
Olivine Olivine phenocrysts are generally totally altered throughout
and replaced by dark green, partly dark grey pseudomorphs. In hand specimen chlorite, talc, and pyrite can be distinguished. In addition, thin sections show the presence of chlorite- and smectite-rich mixed-layer clays, actinolite, chalcopyrite, and secondary magnetite. Ferric hydroxides occur on fractures within the olivine pseudomorphs (Table 8).
Four principal types of olivine alteration can be distinguished in individual pseudomorphs: (1) chlorite, (2) mixed-layer clay ± talc, (3) chlorite ± actinolite, (4) mixed-layer clay ± actinolite, but mixtures of these alteration minerals are also common (Table 8). Both chlorite and mixed-layer clay ± talc may occur as alteration products of different olivines in the same sample (Fig. 25). Pyrite and magnetite are generally associated with all types of olivine alteration, but magnetite is more common with mixed-layer clays ± talc. Olivine alteration to chlorite-rich mixed-layer clays and associated pyrite apparently dominates in the upper zone of the Leg 111 core.
Table 8. Summary of olivine phenocryst alteration in Hole 504B, Leg 111 (thin-section observations).
Core, section Piece chl mlc tal mag pyr cpy fhy
142R-1 IB
142R-1 142R-2 143R-1
143R-1
144R-1 144R-1 145R-1 145R-1 145R-2 145R-3 146R-1 147R-2 148R-1 148R-1 149R-1 149R-2 150R-1 150R-1 151R-1
152R-1
152R-1
152R-1 153R-1 154R-1 155R-1 157R-1
157R-1 161R-1 164R-1 165R-1 169R-1
15 8A 1
17
1 13 6 13A 10B 4A 4 IN 3 9 13B 7 12 22A IB
2
12
20 14 4B 8 1
5 1 1 9 14
+ + + + + + + + + + + +
+ +
+ + + + + + + + + +
+
+ + + + +
+
+ + +
+ + + + +
+ + +
+ + + +
+
+ + +
+ + +
+
+
+ +
+
+ + +
+
+ +
+ + +
+
+ +
+
+ + +
+
+
+
+ +
+ + +
+ +
+ + + + + +
+
+ + +
+
+ + +
+ +
+
+ + + +
+ +
+
+ + + + +
+
+ + + +
+
+ + + +
+ +
+ + + +
+ +
+ + + + + + +
+
+
Note: chl = chlorite, mlc = mixed-layer clays, tal = talc, act = actinolite, mag = magnetite, pyr = pyrite, cpy = chalcopyrite, fhy = iron hydroxide.
Some pseudomorphs of olivine phenocrysts are zoned, with either talc at the margins and mixed-layer clays in the center, the reverse zonation, or multiple bands of talc and mixed-layer clays (Fig. 26). Chlorite + actinolite also occur in the center with talc replacing olivine at the margins. The talc is associated with concentric to subconcentric layers and crosscutting bands of secondary magnetite and irregularly distributed pyrite. Alteration of groundmass olivine is similar to that of phenocrysts, but lacks zonation.
Clinopyroxene Clinopyroxene is generally only partly altered, most gener
ally to actinolite and chlorite, with less abundant mixed-layer clays. Clinopyroxene phenocrysts are generally only slightly altered, i.e., alteration to actinolite and chlorite is restricted to grain boundaries, fractures, and cleavages. The morphology of actinolite is apparently controlled by the grain size of clinopyroxene. In more extensively altered fine-grained rocks, ground-mass clinopyroxene is almost entirely replaced by sheaflike bundles of actinolite (Fig. 27). In coarser grained matrix, needlelike and prismatic actinolite occurs as overgrowths and replacing the margins of clinopyroxene, replacing the interior parts of clinopyroxene microcrystals, or replacing entire crystals in local highly recrystallized areas. In addition, fine magnetite "dust" occurs in altered clinopyroxene.
Plagioclase Plagioclase alteration is generally slight, and consists essen
tially of chlorite and mixed-layer clays along cleavages and fractures of phenocrysts. Actinolite and zeolites occur less frequently partly replacing plagioclase. Secondary albite occurs in more altered parts of the rocks as cloudy patches and along fractures of phenocrysts, often associated with clays. Phenocrysts are generally more altered than microlites in the groundmass. Plagioclase phenocrysts sometimes contain glass inclusions as large as 15 /xm in diameter, which are slightly altered to mixed-layer clays.
Titanomagnetite In slightly altered rocks, titanomagnetite contains a darker
grey, lower reflectivity phase along fractures and margins, rimming lighter grey, apparently fresher parts of titanomagnetite crystals. This darker grey phase is apparently sphene, although it was sometimes termed maghemite in thin-section description. In other cases magnetite is replaced by very fine-grained granular sphene and leucoxene(?), which occur peripherally replacing titanomagnetite or surrounding altered titanomagnetite crystals. In locally more extensively altered areas, titanomagnetite is sometimes entirely replaced by aggregates of granular sphene. Apparently primary magnetite is occasionally corroded and replaced by pyrite (504B-149R-1 (Piece 13A)), which contains magnetite^) relics.
Sulfide Minerals
Pyrite Pyrite is by far the most abundant sulfide in the core (Table 9),
ranging in size from a few micrometers to about 600 /xm. Anhe-dral, sometimes subhedral to euhedral pyrite replaces olivine, associated with chlorite, mixed-layer clays, talc, actinolite, and magnetite. Pyrite occurs either at the center or randomly within the pseudomorphs and is often porous and/or contains silicate inclusions. Anhedral pyrite also occurs disseminated in the groundmass partly replacing olivine microlites. Beside replacing primary magnetite, pyrite was also found intergrown with magnetite. Elongated pyrite is common along grain boundaries of partly altered subophitic plagioclase and clinopyroxene micro-crysts. Small (< 10 /xm) globular to globular-skeletal pyrite oc-
61

SITE 504
0.5 mm
Figure 25. Photomicrograph of olivine phenocryst alteration to chlorite (chl), mixed-layer clays (mlc, in the center), magnetite (mag, on fractures), and pyrite (py). Sample 111-504B-150R-1, 54-56 cm. Crossed polars.
0.5 mm
Figure 26. Photomicrograph of zonal alteration of groundmass olivine to talc (tc) in the center and multiple subconcentric bands of mixed-layer clays (mlc), talc, and magnetite (mag) at the margin. Sample 111-504B-147R-1, 39-41 cm. Crossed polars.
curs in Samples 111-504B-149R-2 (Piece 7) and 111-504B-158R-1 (Piece 3A), and may represent recrystallized igneous sulfides. Pyrite pseudomorphs of magmatic sulfides may also be present in Cores 111-504B-163R to 111-504B-166R, where only very small traces of pyrite ( < 5 /xm) occur in the groundmass (Table 9). However, no magmatic pyrrhotite grains were observed in these samples. Chilled margins (Sample 111-504B-152R-1 (Piece 2)) often contain only very few minute pyrite grains. The abun
dance of pyrite clearly decreases with depth from Sections 111-504B-163R-1 to 111-504B-166R-1. Sample 111-504B-163R-1, 124-126 cm, is essentially free of sulfide in thin section. In contrast, the largest amount of pyrite was found in Section 111-504B-3B-1, which was recovered from a boot basket run with the drill bit. High concentrations of disseminated subhedral to anhedral, porous pyrite grains occur in this sample. The pores (filled by silicate inclusions?) occur in subconcentric layers and
62

SITE 504
0.1 mm
Figure 27. Photomicrograph showing replacement of groundmass clinopyroxene by needlelike ac-tinolite (act). Sample 111-504B-147R-2, 108-112 cm. Plane light.
are most abundant in the interior of the grains, whereas the margins are almost free of pores. This sample most likely represents rubble which has fallen down the hole from the stockwork zone above the sheeted dike complex.
Chalcopyrite Chalcopyrite occurs only in small amounts and is generally
associated with pyrite, either as small anhedral inclusions (< 10-30 ^m) or as grains as large as about 100 /xm intergrown with pyrite. Small individual anhedral to subhedral chalcopyrite grains also occur disseminated in the groundmass and are possibly partly of magmatic origin. Chalcopyrite is by far most abundant in Core 111-504B-145R, where it occurs within and adjacent to veins consisting of chlorite at the margins and quartz + sulfides in the center (e.g., Sample 111-504B-145R-1 (Piece 6)). Within this vein, chalcopyrite grains are surrounded by sphalerite. In Samples 111-504B-144R-1 (Piece 1), 111-504B-146R-1, 21-23 cm, 111-504B-148R-1 (Piece 3), and 111-504B-153R-1 (Piece 14), chalcopyrite inclusions in pyrite (as large as 50 /xm in diameter) and in the groundmass are slightly more abundant than usual. Cubanite(?) was tentatively identified in Sample 111-504B-144R-1, 2-4 cm, associated with pyrite and chalcopyrite.
Sphalerite and Pyrrhotite Sphalerite and pyrrhotite occur in various samples (Table 9)
almost exclusively as minute inclusions in pyrite. Due to the small grain size (less than about 10 fim) the occurrence of sphalerite could not be confirmed in all cases and must await electron microprobe analyses. However, sphalerite was identified in Sample 111-504B-145R-1 (Piece 6) within and adjacent to a chalco-pyrite-bearing vein.
An unidentified bluish gray low-reflectivity mineral was observed on board ship associated with primary globular sulfides in several samples, but has not been detected in subsequent study.
Veins, Fractures, and Vugs The following description of veins is based on both core de
scriptions and thin-section observations. However, mineral identi
fications from the core descriptions are necessarily tentative and are indicated by (?) following the mineral name.
Veins, fractures, and micro fractures occur in varying abundance throughout the cored section. Micro fractures (<0.2 mm) and thin veins (<0.5 mm), mostly filled by light grey minerals (mixed-layer clays/zeolites?), are common throughout and generally lack alteration halos. Monomineralic chlorite veins are also abundant. More prominent veins, varying in width between 0.5 and 4 mm but averaging about 1 mm, were most frequently recovered in Cores 111-504B-142R to 111-504B-145R and in Cores 111-504B-152R to 111-504B-166R. These veins are generally associated with various types of alteration halos as wide as 5 mm. As revealed by X-ray diffraction analyses and thin-section study, the most common veins are composed of chlorite and/or actinolite ± sphene ± pyrite ± mixed-layer clays. Where actinolite is present, it generally occurs lining the walls of the vein and may be intergrown with chlorite or mixed-layer clays at the center. Sphene also tends to be concentrated near the margins, whereas pyrite can occur throughout the veins. Zeolites (apparently mostly laumontite, Table 10) are less abundant in veins, but sometimes fill reopened actinolite ± chlorite veins (e.g., Samples 111-504B-152R-1 (Piece 2A) and 111-504B-158R-1 (Piece 3A)). Quartz and prehnite are less common, while epidote is rare.
Prehnite occurs in Sample 111-504B-158R-1 (Piece 4) where a chlorite + actinolite vein in a breccia was reopened and filled with quartz and needlelike actinolite. The quartz in turn was partly replaced by prehnite, which also filled open space in the fracture (Fig. 28). Trace amounts of epidote also occur in this sample: a 0.5-mm quartz vein contains radial aggregates of 15-60-fj.m epidote needles and prisms. This vein was subsequently reopened and filled with prehnite, which also partly replaces the quartz. Epidote was also observed as rare 25-75-ptm grains associated with prehnite in spaces within a 0.2-mm actinolite + chlorite + sphene vein in Sample 111-504B-158R-1 (Piece 3A).
Several quartz-sulfide veins, about 1 mm wide, occur in Core 111-504B-145R, and are surrounded by 1-2 mm-wide dark grey to black alteration halos. In a thin section of Sample 111-504B-
63
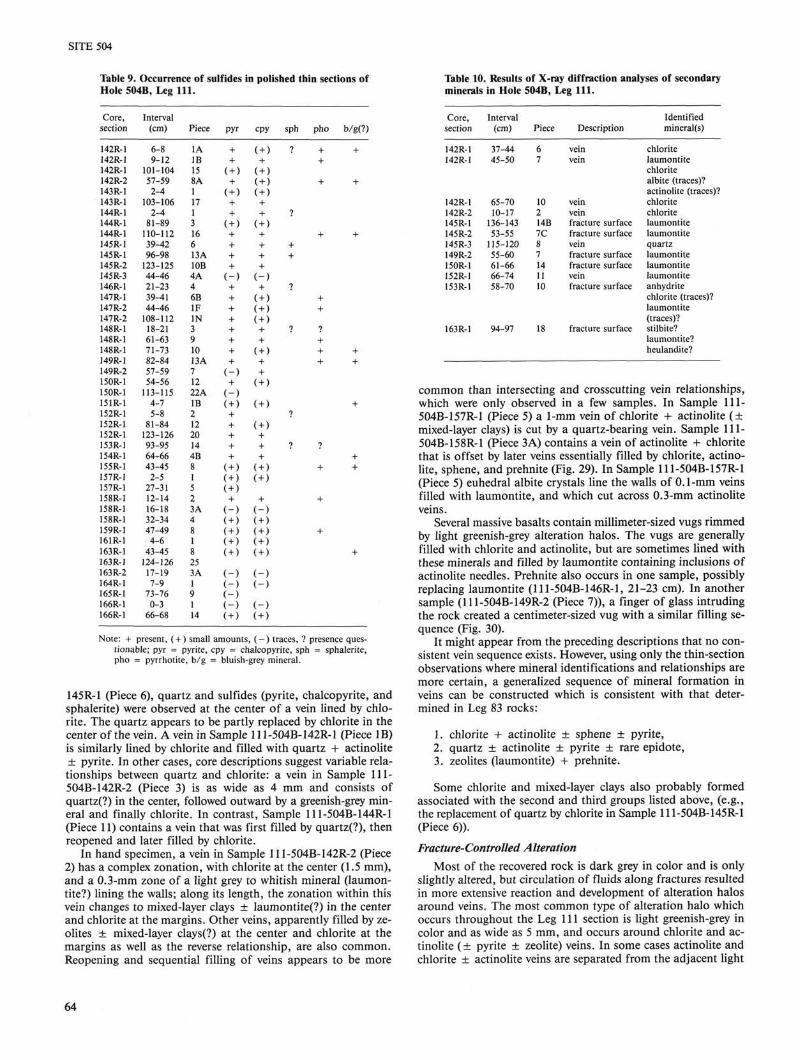
SITE 504
Table 9. , Occurrence of sulfides in polished thin sections of Hole 504B, Leg
Core, section
142R-1 142R-1 142R-1 142R-2 143R-1 143R-1 144R-1 144R-1 144R-1 145R-1 145R-1 145R-2 145R-3 146R-1 147R-1 147R-2 147R-2 148R-1 148R-1 148R-1 149R-1 149R-2 150R-1 150R-1 151R-1 152R-1 152R-1 152R-1 153R-1 154R-1 155R-1 157R-1 157R-1 158R-1 158R-1 158R-1 159R-1 161R-1 163R-1 163R-1 163R-2 164R-1 165R-1 166R-1 166R-1
Note: +
Interval (cm)
6-8 9-12
101-104 57-59 2-4
103-106 2-4
81-89 110-112 39-42 96-98
123-125 44-46 21-23 39-41 44-46
108-112 18-21 61-63 71-73 82-84 57-59 54-56
113-115 4-7 5-8
81-84 123-126 93-95 64-66 43-45 2-5
27-31 12-14 16-18 32-34 47-49 4-6
43-45 124-126 17-19 7-9
73-76 0-3
66-68
111.
Piece
1A IB 15 8A 1 17 1 3 16 6 13A 10B 4A 4 6B IF IN 3 9 10 13A 7 12 22A IB 2 12 20 14 4B 8 1 5 2 3A 4 8 1 8 25 3A 1 9 1 14
pyr
+ +
( + ) +
( + ) + +
( + ) + + + +
(-) + + + + + + + +
(-) +
(-) ( + ) + + + + +
( + ) ( + ) ( + ) +
(-) ( + ) ( + ) ( + ) ( + )
(-) (-) (-) (-) ( + )
present, ( + ) small amounts
cpy
( + ) +
( + ) ( + ) ( + )
+ +
( + ) + + + +
(-) +
( + ) ( + ) ( + ) + +
( + ) + +
( + )
( + )
( + ) + + +
( + ) ( + )
+ (-) ( + ) ( + ) ( + ) ( + )
(-) (-) (-) ( + )
sph
?
?
+ +
?
?
?
?
, ( - ) traces, ?
pho b/g(?)
+ + +
+ +
+ +
+ +
? + + + + +
+
9
+ + +
+
+
+
presence ques-tionable; pyr = pyrite, cpy = chalcopyrite, sph = sphalerite, pho = pyrrhotite, b/g = bluish-grey mineral.
145R-1 (Piece 6), quartz and sulfides (pyrite, chalcopyrite, and sphalerite) were observed at the center of a vein lined by chlorite. The quartz appears to be partly replaced by chlorite in the center of the vein. A vein in Sample 111-504B-142R-1 (Piece IB) is similarly lined by chlorite and filled with quartz + actinolite ± pyrite. In other cases, core descriptions suggest variable relationships between quartz and chlorite: a vein in Sample 111-504B-142R-2 (Piece 3) is as wide as 4 mm and consists of quartz(?) in the center, followed outward by a greenish-grey mineral and finally chlorite. In contrast, Sample 111-504B-144R-1 (Piece 11) contains a vein that was first filled by quartz(?), then reopened and later filled by chlorite.
In hand specimen, a vein in Sample 111-504B-142R-2 (Piece 2) has a complex zonation, with chlorite at the center (1.5 mm), and a 0.3-mm zone of a light grey to whitish mineral (laumon-tite?) lining the walls; along its length, the zonation within this vein changes to mixed-layer clays ± laumontite(?) in the center and chlorite at the margins. Other veins, apparently filled by zeolites ± mixed-layer clays(?) at the center and chlorite at the margins as well as the reverse relationship, are also common. Reopening and sequential filling of veins appears to be more
Table 10. Results of X-ray diffraction analyses of secondary minerals in Hole 504B, Leg 111.
Core, Interval Identified section (cm) Piece Description mineral(s)
142R-1 142R-1
142R-1 142R-2 145R-1 145R-2 145R-3 149R-2 150R-1 152R-1 153R-1
163R-1
37-44 45-50
65-70 10-17
136-143 53-55
115-120 55-60 61-66 66-74 58-70
94-97
6 7
10 2 14B 7C 8 7 14 11 10
18
vein vein
vein vein fracture surface fracture surface vein fracture surface fracture surface vein fracture surface
fracture surface
chlorite laumontite chlorite albite (traces)? actinolite (traces)? chlorite chlorite laumontite laumontite quartz laumontite laumontite laumontite anhydrite chlorite (traces)? laumontite (traces)? stilbite? laumontite? heulandite?
common than intersecting and crosscutting vein relationships, which were only observed in a few samples. In Sample 111-504B-157R-1 (Piece 5) a 1-mm vein of chlorite + actinolite (± mixed-layer clays) is cut by a quartz-bearing vein. Sample 111-504B-158R-1 (Piece 3A) contains a vein of actinolite + chlorite that is offset by later veins essentially filled by chlorite, actinolite, sphene, and prehnite (Fig. 29). In Sample 111-504B-157R-1 (Piece 5) euhedral albite crystals line the walls of 0.1-mm veins filled with laumontite, and which cut across 0.3-mm actinolite veins.
Several massive basalts contain millimeter-sized vugs rimmed by light greenish-grey alteration halos. The vugs are generally filled with chlorite and actinolite, but are sometimes lined with these minerals and filled by laumontite containing inclusions of actinolite needles. Prehnite also occurs in one sample, possibly replacing laumontite (111-504B-146R-1, 21-23 cm). In another sample (111-504B-149R-2 (Piece 7)), a finger of glass intruding the rock created a centimeter-sized vug with a similar filling sequence (Fig. 30).
It might appear from the preceding descriptions that no consistent vein sequence exists. However, using only the thin-section observations where mineral identifications and relationships are more certain, a generalized sequence of mineral formation in veins can be constructed which is consistent with that determined in Leg 83 rocks:
1. chlorite + actinolite ± sphene ± pyrite, 2. quartz ± actinolite ± pyrite ± rare epidote, 3. zeolites (laumontite) + prehnite.
Some chlorite and mixed-layer clays also probably formed associated with the second and third groups listed above, (e.g., the replacement of quartz by chlorite in Sample 111-504B-145R-1 (Piece 6)).
Fracture-Controlled Alteration Most of the recovered rock is dark grey in color and is only
slightly altered, but circulation of fluids along fractures resulted in more extensive reaction and development of alteration halos around veins. The most common type of alteration halo which occurs throughout the Leg 111 section is light greenish-grey in color and as wide as 5 mm, and occurs around chlorite and actinolite (± pyrite ± zeolite) veins. In some cases actinolite and chlorite ± actinolite veins are separated from the adjacent light
64
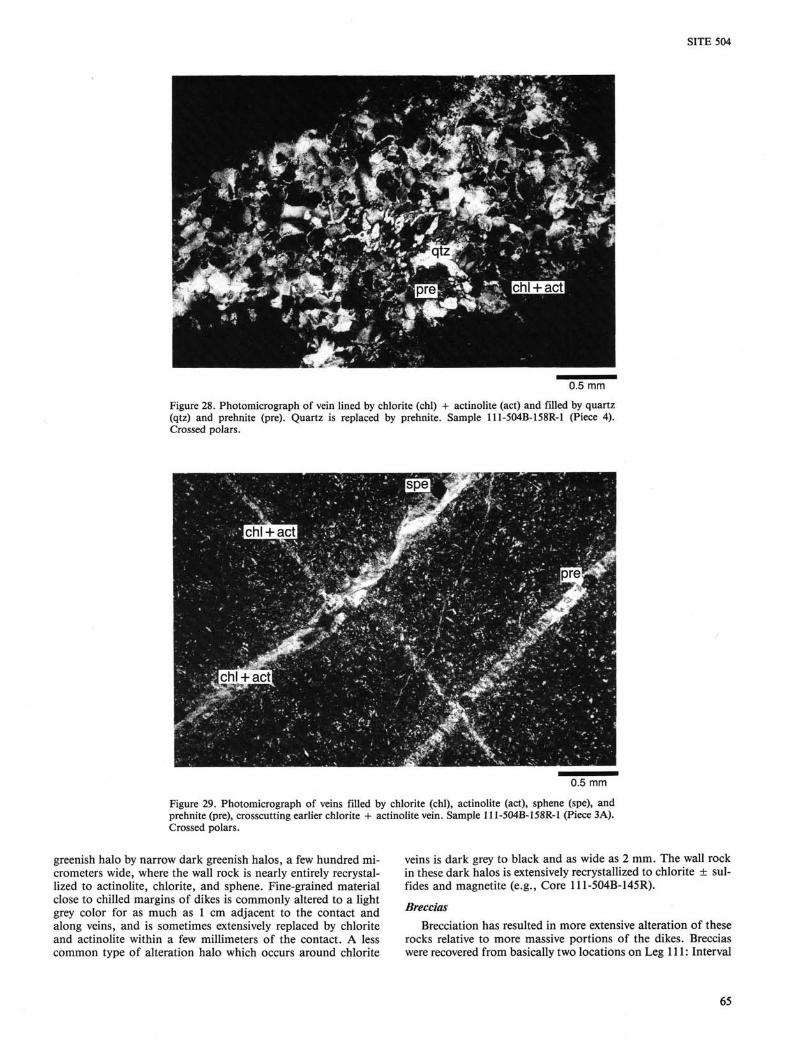
SITE 504
0.5 mm
Figure 28. Photomicrograph of vein lined by chlorite (chl) + actinolite (act) and filled by quartz (qtz) and prehnite (pre). Quartz is replaced by prehnite. Sample 111-504B-158R-1 (Piece 4). Crossed polars.
0.5 mm
Figure 29. Photomicrograph of veins filled by chlorite (chl), actinolite (act), sphene (spe), and prehnite (pre), crosscutting earlier chlorite + actinolite vein. Sample 111-504B-158R-1 (Piece 3A). Crossed polars.
greenish halo by narrow dark greenish halos, a few hundred micrometers wide, where the wall rock is nearly entirely recrystal-lized to actinolite, chlorite, and sphene. Fine-grained material close to chilled margins of dikes is commonly altered to a light grey color for as much as 1 cm adjacent to the contact and along veins, and is sometimes extensively replaced by chlorite and actinolite within a few millimeters of the contact. A less common type of alteration halo which occurs around chlorite
veins is dark grey to black and as wide as 2 mm. The wall rock in these dark halos is extensively recrystallized to chlorite ± sul-fides and magnetite (e.g., Core 111-504B-145R).
Breccias Brecciation has resulted in more extensive alteration of these
rocks relative to more massive portions of the dikes. Breccias were recovered from basically two locations on Leg 111: Interval
65
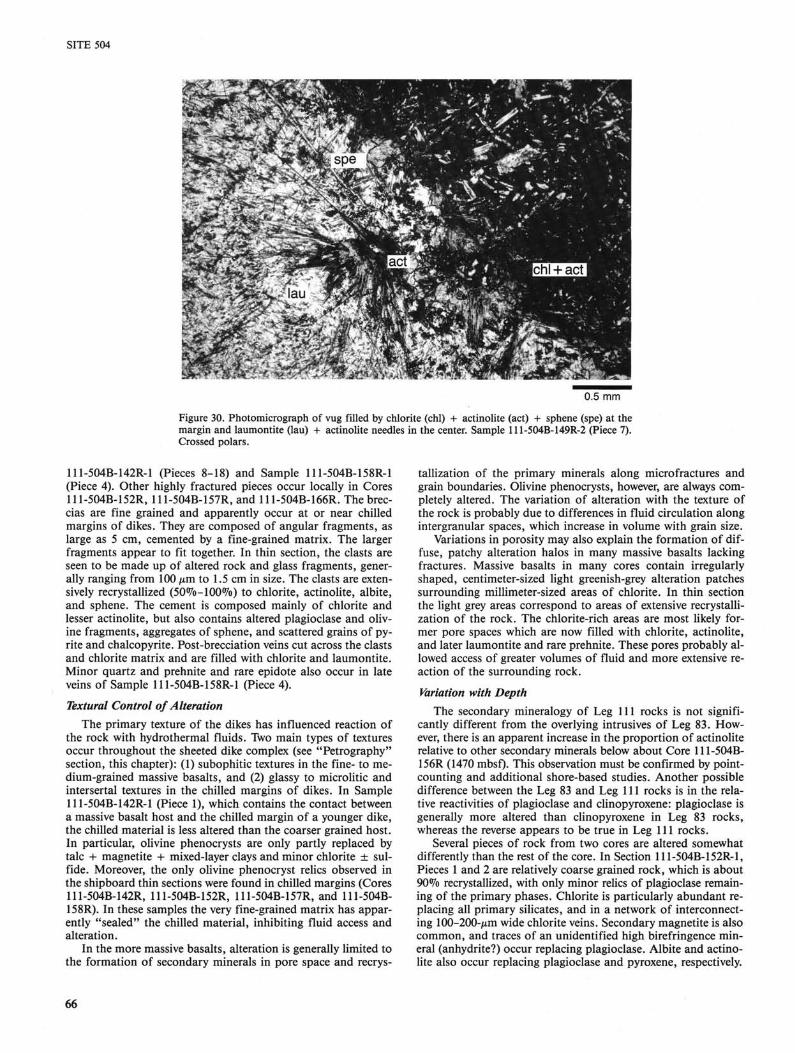
SITE 504
0.5 mm
Figure 30. Photomicrograph of vug filled by chlorite (chl) + actinolite (act) + sphene (spe) at the margin and laumontite (lau) + actinolite needles in the center. Sample 111-504B-149R-2 (Piece 7). Crossed polars.
tallization of the primary minerals along microfractures and grain boundaries. Olivine phenocrysts, however, are always completely altered. The variation of alteration with the texture of the rock is probably due to differences in fluid circulation along intergranular spaces, which increase in volume with grain size.
Variations in porosity may also explain the formation of diffuse, patchy alteration halos in many massive basalts lacking fractures. Massive basalts in many cores contain irregularly shaped, centimeter-sized light greenish-grey alteration patches surrounding millimeter-sized areas of chlorite. In thin section the light grey areas correspond to areas of extensive recrystalli-zation of the rock. The chlorite-rich areas are most likely former pore spaces which are now filled with chlorite, actinolite, and later laumontite and rare prehnite. These pores probably allowed access of greater volumes of fluid and more extensive reaction of the surrounding rock.
Variation with Depth The secondary mineralogy of Leg 111 rocks is not signifi
cantly different from the overlying intrusives of Leg 83. However, there is an apparent increase in the proportion of actinolite relative to other secondary minerals below about Core 111-504B-156R (1470 mbsf). This observation must be confirmed by point-counting and additional shore-based studies. Another possible difference between the Leg 83 and Leg 111 rocks is in the relative reactivities of plagioclase and clinopyroxene: plagioclase is generally more altered than clinopyroxene in Leg 83 rocks, whereas the reverse appears to be true in Leg 111 rocks.
Several pieces of rock from two cores are altered somewhat differently than the rest of the core. In Section 111-504B-152R-1, Pieces 1 and 2 are relatively coarse grained rock, which is about 90% recrystallized, with only minor relics of plagioclase remaining of the primary phases. Chlorite is particularly abundant replacing all primary silicates, and in a network of interconnecting 100-200-/im wide chlorite veins. Secondary magnetite is also common, and traces of an unidentified high birefringence mineral (anhydrite?) occur replacing plagioclase. Albite and actinolite also occur replacing plagioclase and pyroxene, respectively.
111-504B-142R-1 (Pieces 8-18) and Sample 111-504B-158R-1 (Piece 4). Other highly fractured pieces occur locally in Cores 111-504B-152R, 111-504B-157R, and 111-504B-166R. The breccias are fine grained and apparently occur at or near chilled margins of dikes. They are composed of angular fragments, as large as 5 cm, cemented by a fine-grained matrix. The larger fragments appear to fit together. In thin section, the clasts are seen to be made up of altered rock and glass fragments, generally ranging from 100 jxm. to 1.5 cm in size. The clasts are extensively recrystallized (50%-100%) to chlorite, actinolite, albite, and sphene. The cement is composed mainly of chlorite and lesser actinolite, but also contains altered plagioclase and olivine fragments, aggregates of sphene, and scattered grains of py-rite and chalcopyrite. Post-brecciation veins cut across the clasts and chlorite matrix and are filled with chlorite and laumontite. Minor quartz and prehnite and rare epidote also occur in late veins of Sample 111-504B-158R-1 (Piece 4).
Textural Control of Alteration The primary texture of the dikes has influenced reaction of
the rock with hydrothermal fluids. Two main types of textures occur throughout the sheeted dike complex (see "Petrography" section, this chapter): (1) subophitic textures in the fine- to medium-grained massive basalts, and (2) glassy to microlitic and intersertal textures in the chilled margins of dikes. In Sample 111-504B-142R-1 (Piece 1), which contains the contact between a massive basalt host and the chilled margin of a younger dike, the chilled material is less altered than the coarser grained host. In particular, olivine phenocrysts are only partly replaced by talc + magnetite + mixed-layer clays and minor chlorite ± sul-fide. Moreover, the only olivine phenocryst relics observed in the shipboard thin sections were found in chilled margins (Cores 111-504B-142R, 111-504B-152R, 111-504B-157R, and 111-504B-158R). In these samples the very fine-grained matrix has apparently "sealed" the chilled material, inhibiting fluid access and alteration.
In the more massive basalts, alteration is generally limited to the formation of secondary minerals in pore space and recrys-
66
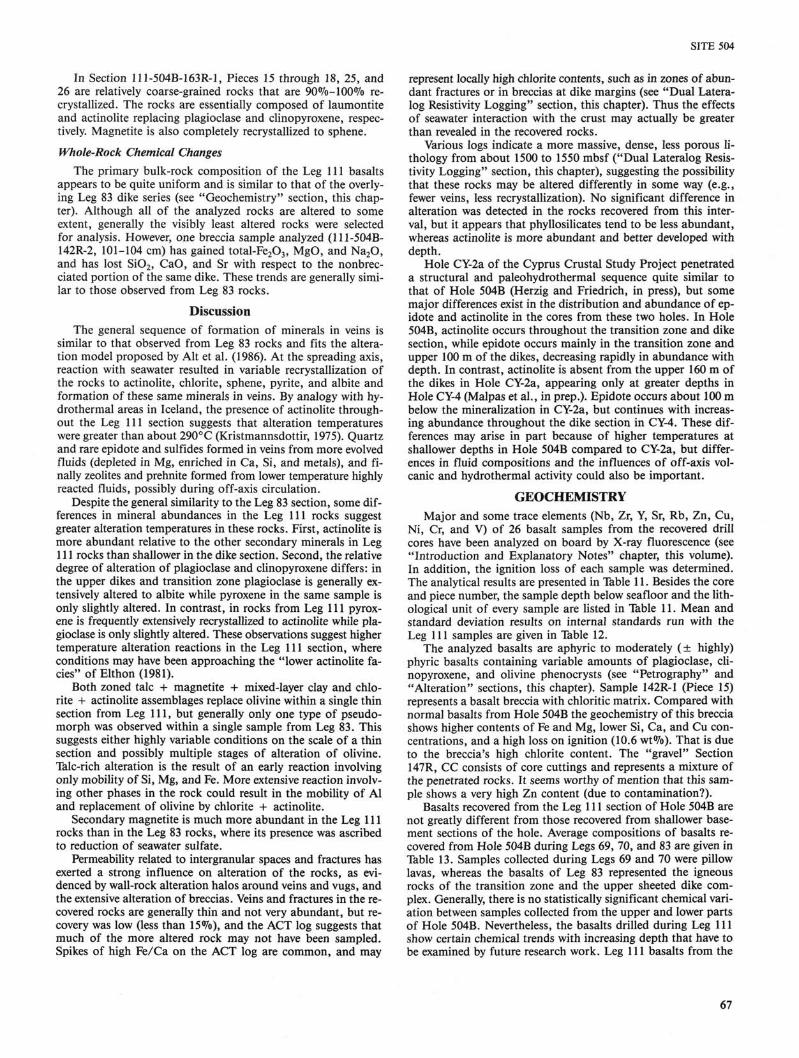
SITE 504
In Section 111-504B-163R-1, Pieces 15 through 18, 25, and 26 are relatively coarse-grained rocks that are 90<%-100% re-crystallized. The rocks are essentially composed of laumontite and actinolite replacing plagioclase and clinopyroxene, respectively. Magnetite is also completely recrystallized to sphene.
Whole-Rock Chemical Changes The primary bulk-rock composition of the Leg 111 basalts
appears to be quite uniform and is similar to that of the overlying Leg 83 dike series (see "Geochemistry" section, this chapter). Although all of the analyzed rocks are altered to some extent, generally the visibly least altered rocks were selected for analysis. However, one breccia sample analyzed (111-504B-142R-2, 101-104 cm) has gained total-Fe203, MgO, and Na20, and has lost Si02, CaO, and Sr with respect to the nonbrec-ciated portion of the same dike. These trends are generally similar to those observed from Leg 83 rocks.
Discussion The general sequence of formation of minerals in veins is
similar to that observed from Leg 83 rocks and fits the alteration model proposed by Alt et al. (1986). At the spreading axis, reaction with seawater resulted in variable recrystallization of the rocks to actinolite, chlorite, sphene, pyrite, and albite and formation of these same minerals in veins. By analogy with hy-drothermal areas in Iceland, the presence of actinolite throughout the Leg 111 section suggests that alteration temperatures were greater than about 290°C (Kristmannsdottir, 1975). Quartz and rare epidote and sulfides formed in veins from more evolved fluids (depleted in Mg, enriched in Ca, Si, and metals), and finally zeolites and prehnite formed from lower temperature highly reacted fluids, possibly during off-axis circulation.
Despite the general similarity to the Leg 83 section, some differences in mineral abundances in the Leg 111 rocks suggest greater alteration temperatures in these rocks. First, actinolite is more abundant relative to the other secondary minerals in Leg 111 rocks than shallower in the dike section. Second, the relative degree of alteration of plagioclase and clinopyroxene differs: in the upper dikes and transition zone plagioclase is generally extensively altered to albite while pyroxene in the same sample is only slightly altered. In contrast, in rocks from Leg 111 pyroxene is frequently extensively recrystallized to actinolite while plagioclase is only slightly altered. These observations suggest higher temperature alteration reactions in the Leg 111 section, where conditions may have been approaching the "lower actinolite fades" ofElthon(1981).
Both zoned talc + magnetite + mixed-layer clay and chlorite + actinolite assemblages replace olivine within a single thin section from Leg 111, but generally only one type of pseudo-morph was observed within a single sample from Leg 83. This suggests either highly variable conditions on the scale of a thin section and possibly multiple stages of alteration of olivine. Talc-rich alteration is the result of an early reaction involving only mobility of Si, Mg, and Fe. More extensive reaction involving other phases in the rock could result in the mobility of Al and replacement of olivine by chlorite + actinolite.
Secondary magnetite is much more abundant in the Leg 111 rocks than in the Leg 83 rocks, where its presence was ascribed to reduction of seawater sulfate.
Permeability related to intergranular spaces and fractures has exerted a strong influence on alteration of the rocks, as evidenced by wall-rock alteration halos around veins and vugs, and the extensive alteration of breccias. Veins and fractures in the recovered rocks are generally thin and not very abundant, but recovery was low (less than 15%), and the ACT log suggests that much of the more altered rock may not have been sampled. Spikes of high Fe/Ca on the ACT log are common, and may
represent locally high chlorite contents, such as in zones of abundant fractures or in breccias at dike margins (see "Dual Latera-log Resistivity Logging" section, this chapter). Thus the effects of seawater interaction with the crust may actually be greater than revealed in the recovered rocks.
Various logs indicate a more massive, dense, less porous li-thology from about 1500 to 1550 mbsf ("Dual Lateralog Resistivity Logging" section, this chapter), suggesting the possibility that these rocks may be altered differently in some way (e.g., fewer veins, less recrystallization). No significant difference in alteration was detected in the rocks recovered from this interval, but it appears that phyllosilicates tend to be less abundant, whereas actinolite is more abundant and better developed with depth.
Hole CY-2a of the Cyprus Crustal Study Project penetrated a structural and paleohydrothermal sequence quite similar to that of Hole 504B (Herzig and Friedrich, in press), but some major differences exist in the distribution and abundance of epidote and actinolite in the cores from these two holes. In Hole 504B, actinolite occurs throughout the transition zone and dike section, while epidote occurs mainly in the transition zone and upper 100 m of the dikes, decreasing rapidly in abundance with depth. In contrast, actinolite is absent from the upper 160 m of the dikes in Hole CY-2a, appearing only at greater depths in Hole CY-4 (Malpas et al., in prep.). Epidote occurs about 100 m below the mineralization in CY-2a, but continues with increasing abundance throughout the dike section in CY-4. These differences may arise in part because of higher temperatures at shallower depths in Hole 504B compared to CY-2a, but differences in fluid compositions and the influences of off-axis volcanic and hydrothermal activity could also be important.
GEOCHEMISTRY Major and some trace elements (Nb, Zr, Y, Sr, Rb, Zn, Cu,
Ni, Cr, and V) of 26 basalt samples from the recovered drill cores have been analyzed on board by X-ray fluorescence (see "Introduction and Explanatory Notes" chapter, this volume). In addition, the ignition loss of each sample was determined. The analytical results are presented in Table 11. Besides the core and piece number, the sample depth below seafloor and the lith-ological unit of every sample are listed in Table 11. Mean and standard deviation results on internal standards run with the Leg 111 samples are given in Table 12.
The analyzed basalts are aphyric to moderately (± highly) phyric basalts containing variable amounts of plagioclase, clinopyroxene, and olivine phenocrysts (see "Petrography" and "Alteration" sections, this chapter). Sample 142R-1 (Piece 15) represents a basalt breccia with chloritic matrix. Compared with normal basalts from Hole 504B the geochemistry of this breccia shows higher contents of Fe and Mg, lower Si, Ca, and Cu concentrations, and a high loss on ignition (10.6 wt%). That is due to the breccia's high chlorite content. The "gravel" Section 147R, CC consists of core cuttings and represents a mixture of the penetrated rocks. It seems worthy of mention that this sample shows a very high Zn content (due to contamination?).
Basalts recovered from the Leg 111 section of Hole 504B are not greatly different from those recovered from shallower basement sections of the hole. Average compositions of basalts recovered from Hole 504B during Legs 69, 70, and 83 are given in Table 13. Samples collected during Legs 69 and 70 were pillow lavas, whereas the basalts of Leg 83 represented the igneous rocks of the transition zone and the upper sheeted dike complex. Generally, there is no statistically significant chemical variation between samples collected from the upper and lower parts of Hole 504B. Nevertheless, the basalts drilled during Leg 111 show certain chemical trends with increasing depth that have to be examined by future research work. Leg 111 basalts from the
67

SITE 504
Table 11. Basalt major and trace element chemistry, Hole 504B, Leg 111.
Core, Section Interval (cm) Piece # Lithological unit Depth (mbsf)
wt%:
Si0 2 Ti0 2 A1203 F e 2°3 tot MnO MgO CaO N a 2 0 K 2 0 P2O5 Total
Ignition loss
ppm:
Nb Zr Y Sr Rb Zn Cu Ni Cr V FMa
142R-1 6-8 1A
151 1352.9
50.01 1.01
15.13 10.73 0.18 7.73
12.63 2.00 0.01 0.06
99.49
0.54
1 50 26 58
<1 72 70 77
226 300
55.5
142R-1 98-101
15
153 1353.8
48.50 1.04
14.68 14.38 0.20 9.69 9.29 2.14 0.02 0.07
100.01
10.6
1 49 25 31
<1 90 12 98
201 327
57.2
142R-2 57-5 8A
153 1354.9
49.90 1.01
14.78 10.93 0.19 8.26
12.96 1.89 0.01 0.06
99.99
2.19
2 50 27 52
<1 74 85 87
242 307
54.4
143R-1 105-107
17
155 1360.4
48.74 0.78
16.43 9.33 0.16 8.94
13.27 2.28 0.05 0.05
100.03
1.00
1 41 22 60
< i 74 95
134 343 232
48.4
144R-1 89-92
13
158 1369.6
49.63 0.88
16.14 9.50 0.16 8.39
13.54 1.78 0.01 0.06
100.09
0.72
2 45 23 55
<1 69
101 110 392 274
50.5
145R-1 95-97 13A
160 1379.3
49.91 0.88
15.63 9.88 0.16 8.80
13.32 1.79 0.01 0.06
100.44
0.29
2 44 24 57
1 57 91
113 408 258
50.3
145R-2 123-125
10B
160 1381.1
50.16 0.81
15.73 9.49 0.15 8.92
13.14 1.96 0.01 0.05
100.41
2.5
1 38 22 55
<1 56
137 109 388 257
48.9
145R-3 44-46
4A
160 1381.8
49.66 0.84
15.56 9.54 0.16 9.02
13.02 1.95 0.01 0.05
99.81
0.60
2 41 22 57
< 1 59
109 121 413 261 48.8
147R-1 39-41
6B
163 1397.8
49.61 0.83
15.92 9.36 0.16 8.67
13.23 2.00 0.01 0.05
99.84
0.40
1 43 22 64
<1 64 87
113 409 241 49.3
147R-2 44-46
IF
163 1399.0
49.44 0.92
15.42 9.78 0.17 8.51
13.14 2.01 0.01 0.05
99.45
2.10
1 47 23 62
<1 70 88
103 398 272 50.8
147R.CC mixture mixture
163 mixture
49.55 1.03
14.43 11.15 0.20 8.81
12.22 2.45 0.05 0.06
99.95
0.81
2 52 27 63
1 265
91 98
293 311 53.2
148R-1 61-63
9
164 1407.4
50.63 1.09
14.28 11.49 0.19 8.18
12.35 1.95 0.01 0.06
100.23
0.17
1 56 28 60
< 1 81 82 71
124 319 55.8
Note: Fe203 t0t: total Fe as Fe203. a FM = fractionation grade. See text.
sheeted dike complex are classified as olivine tholeiites and have the same high MgO (>7.5 wt%) and low K20 (<0.02 wt%) contents as recognized by Emmermann (1985) for Leg 69 basalts. Davies et al. (1979) elaborated a geochemical discrimination diagram for (1) magnesia-rich, (2) tholeiitic, and (3) calc-alkaline Archean metabasalts that is applicable to these younger basalts (Fig. 31). The samples analyzed lie along the tholeiitic and magnesian trends, suggesting a derivation from a fairly magnesia-rich source. Some of this variation may be due to accumulation of Cr-rich diopside phenocrysts.
The fractionation grade FM (100 x FeOtot/(FeOtot + MgO)) of the basalts sampled during Leg 111 varies between 48 and 58. Within this range certain fractionation trends can be observed. Figures 32 and 33 show the variation of major and trace element concentration in dependence of the fractionation grade. The basaltic breccia (FM = 57.2) has not been taken into account in this discussion. According to the evolution of basaltic magmas by fractional crystallization, the concentration of Si02, Ti02, Fe203tot, MnO, and P205 increases with the fractionation grade while MgO and CaO decrease as shown in Figure 32. As expected, analogous chemical variations are observed within the trace elements (Fig. 33). Zr, Y, Zn, and V show an evident increase and Ni and Cr a noticeable depletion during fractionation. It is important to keep in mind that intensive allochemical alteration processes may be superimposed on the primary trends of magmatic differentiation. However, by using relatively alteration-resistant elements such as Nb, Zr, Y, Ti, and Cr, the primary magmatic fractionation trend(s) and source characteristics of these samples can be identified, despite moderate degrees of alteration (Figs. 32 and 33). For example, plotting Zr vs. Ti02 (Fig. 34) or Zr vs. Nb (Fig. 35), a common parental melt can be postulated for the samples analyzed.
The trace element characteristics of the Leg 111 basalts place them in the Group D basalt type as defined by Autio and Rhodes (1983). Group D basalts are similar to normal Type I mid-ocean ridge basalt (Bryan et al., 1976), except they exhibit extreme depletion of highly and moderately incompatible elements (Nb: 0.5-1.9 ppm, Zr: 38-58 ppm, Zr/Nb: 40-50). Autio and Rhodes (1983) postulate that this extreme depletion is due to the remelt-ing of a residual mantle source depleted by previous melting event(s).
Continuous downhole changes in concentrations of specific elements in the basalts recovered during Legs 69 to 111 are only recognized in the case of K20, Y, and Sr. Their mean values seem to decrease slightly with increasing depth (Table 12). Due to the great variation in major and trace element concentrations, no significant correlation between basalt chemistry and increasing depth in the Leg 111 section can be observed (Figs. 36 and 37). Over the 170-m interval that was sampled, there appears to be a very rough correlation between fractionation grade and depth that does not seem to be associated with accumulation of phenocrysts (Fig. 38). However, local departures from this trend confuse this relationship. A close succession of basalt dike intrusions of different fractionation grades from the same magma source can explain this.
BOREHOLE WATER CHEMISTRY, PART 1
CHEMISTRY OF WATERS FROM BASEMENT IN HOLE 504B
Introduction Hydrogeologic processes in oceanic crust along the mid-ocean
ridge system are important for heat transport within the crust,
68

Table 11 (continued).
SITE 504
148R-1 68-70
10
164 1407.5
50.12 1.07
14.15 11.32 0.19 8.33
12.35 2.12 0.02 0.06
99.73
149R-1 82-84 13B
164 1417.8
50.54 1.07
14.32 11.30 0.20 8.29
12.49 2.12 0.02 0.07
100.42
150R-1 113-115
22A
167 1427.6
49.85 0.84
15.36 9.73 0.17 9.18
12.75 2.25 0.02 0.05
100.19
152R-1 123-126
20
175 1437.2
49.14 0.87
15.86 10.08 0.17 8.12
13.57 1.90 0.01 0.05
99.77
153R-1 93-95
14
176 1446.3
49.59 0.95
15.35 10.20 0.17 8.96
13.10 2.08 0.02 0.06
100.45
154R-1 64-66
4B
176 1455.0
50.02 1.00
14.68 10.60 0.18 8.31
12.73 2.04 0.01 0.06
99.63
155R-1 43-45
8
176 1459.5
50.29 0.99
14.86 10.60 0.18 8.51
12.85 2.01 0.01 0.06
100.36
158R-1 12-14
2
182 1482.7
49.86 1.11
14.05 11.60 0.20 8.11
12.35 2.07 0.02 0.07
99.44
161R-1 4-6
1
187 1504.2
50.26 0.91
15.31 10.54 0.17 8.03
13.06 1.73 0.01 0.05
100.07
163R-1 43-45
8
187 1512.1
49.62 1.04
15.62 10.58 0.16 7.75
12.77 1.85 0.01 0.06
99.46
163R-2 17-19
3A
188 1513.3
49.61 1.03
15.74 10.62 0.17 7.95
13.03 1.82 0.01 0.06
100.04
164R-1 7-9
1
188 1515.2
49.97 1.00
15.42 10.45 0.17 7.98
12.71 1.82 0.01 0.06
99.59
169R-1 62-65
14
191 1548.3
49.60 0.91
14.96 10.42 0.17 8.61
13.26 1.81 0.01 0.05
99.80
169R-1 66-68
14
191 1548.3
49.55 0.90
15.00 10.34 0.18 8.51
13.19 1.72 0.01 0.05
99.45
0.15 0.49 1.16 6.70 1.00 2.00 1.90 0.19 0.60 0.78 0.76 0.36 0.76 0.75
2 56 28 60 <1
1 55 28 62
<1
1 40 20 61
<1
1 45 24 57
<1
1 46 23 66
<1
2 53 26 62
<1
2 50 26 61
<1
2 58 29 59
< 1
1 43 25 46
< 1
2 54 28 60
<1
2 52 26 61
< 1
2 51 27 59
< 1
1 44 25 48
<1
1 44 24 48
< 1 80 77 64 81 60 77 72 80 58 63 64 61 74 72 87 80 86 94 71 88 89 86 116 86 80 80 102 98 75 74 120 107 114 87 92 69 90 86 87 90 106 105
155 145 376 324 389 268 284 104 254 252 284 256 324 294 323 313 251 290 247 289 290 338 303 302 304 291 304 295
55.0 55.1 48.8 52.8 50.6 53.4 52.8 56.3 54.2 55.1 54.6 54.1 52.1 52.2
Table 12. Leg 111 XRF precision data.
BHVO-1 (anhydrous) Standard n = 7 Hawaiian tholeiite
1 standard Relative Determination Oxide Mean (wt%) deviation deviation (%) limit (wt%)
Si02 Ti0 2 A1203 F e 2°3 tot MnO MgO CaO Na 2 0 K 2 0 P 2 O 5
49.40 2.73
13.53 12.25 0.17 7.24
11.52 2.39 0.54 0.26
0.12 0.01 0.04 0.02
<0.01 0.04 0.03 0.09
<0.01 <0.01
0.24 0.37 0.30 0.16
0.55 0.26 3.8
0.03 0.01 0.01 0.01 0.005 0.01 0.003 0.02 0.005 0.004
AH 92-29 1A BVHO-1 n = 9 Mid-Atlantic
Standard n = 9 Hawaiian tholeiite Ridge Basin
1 standard Relative 1 standard Relative Determination Mean deviation deviation Mean deviation deviation limit
Element (ppm) ( ± ppm) (± %) (ppm) (± ppm) (± %) (ppm)
Nb Zr Y Sr Rb Zn Cu Ni Cr V
18.8 179. 25.9
389. 9.2
107. 141. 118. 298. 319.
0.1 0.9 0.2 0.7 0.3 1.0 2.0 0.7 3.6 5.1
0.2 0.5 1.0 0.2 3.6 0.9 1.4 0.6 1.2 1.6
3.5 128. 39.2
129. 1.3
89. 66.
101. 249. 299.
0.1 0.4 0.4 0.4 0.4 0.6 1.0 1.3 1.5 3.5
3.4 0.4 0.9 0,3
63. 0.7 1.6 1.3 0.6 1.2
0.4 0.6 0.6 0.6 0.6 1.0 1.2 I.G 2. 3.
Note: Fe203 t 0 t = total Fe as Fe 20 3 . BHVO-1 = U.S. Geological Survey Basalt Standard. All 92-29 1A = M.O.R.B. Standard supplied by W. B. Bryan. Relative deviation = 1 standard deviation/mean.
69

SITE 504
Table 13. Average compositions of basalts from Hole 504B, Legs 69, 70, 83, and 111.
Leg
Depth (mbsf)
69
275-489
Standard Average deviation
70
489-836
Standard Average deviation
83
836-1350
Standard Average deviation
111
1350-1516
Standard Average deviation
wt%:
Si0 2 Ti0 2 A1203 F e 2°3 tot MnO MgO CaO N a 2 0 K 2 0 P 2 O 5
49.79 0.95
15.78 9.71 0.17 8.12
12.83 2.25 0.17 0.07
0.46 0.09 0.60 0.61 0.02 0.49 0.41 0.14 0.11 0.03
49.61 0.97
15.28 10.21 0.17 8.35
12.82 2.24 0.04 0.07
0.44 0.14 0.59 0.63 0.02 0.36 0.46 0.17 0.04 0.01
49.01 0.89
15.58 9.89 0.19 8.62
12.55 1.95 0.02 0.07
0.93 0.14 0.83 0.74 0.05 0.97 0.64 0.23 0.01 0.02
49.78 0.96
15.20 10.38 0.18 8.42
12.89 2.00 0.02 0.06
0.50 0.10 0.66 0.72 0.02 0.42 0.38 0.17 0.01 0.01
ppm:
Nb Zr Y Sr R Zn Cu Ni Cr V
55 29 88
75 —
110 356
—
16 3
29
6 —
26 89 —
50 28 70
60 —
92 294
—
18 6
16
7 —
20 88 —
59 24 62
75 102 120 326
—
— 15 4
10
21 76 35 70 —
1.4 48 25 59
<1 70 90 97
289 288
0.4 6 2 4
9 15 18 97 30
Leg 70: data from Hubberten et al. (1983), n = 68. I l l : n = 24.
the directions and relative rates of chemical exchange for various species between seawater and the basaltic crust, at moderately elevated temperatures that are nonetheless too low to confidently evaluate their effects in laboratory experiments; and (3) to use the chemistry of the waters to assess the hydrologic processes that are occurring in the hole and in the crust near Site 504.
Leg 111 has provided the fifth opportunity to sample waters from the basement section of Hole 504B, and the fourth which has occurred an extended period of time after the last disturbance by drilling. After being thoroughly flushed by surface seawater at the end of Leg 92, Hole 504B sat undisturbed for 1233 days prior to our sampling on Leg 111. This compares with periods of 39, 711, and 470 days prior to sampling on DSDP Legs 70, 83, and 92, following the initial drilling of the hole on Leg 69.
In 13 attempts this time we recovered only four good samples from basement, compared with six on Leg 92, three on Leg 83, and two on Leg 70. These four samples were nonetheless adequate to permit a reasonably confident interpretation of what has happened in the hole since Leg 92. All of these samples were collected passively from the open borehole. Although one of the tools we used is capable of actively drawing water from the interstices of the wall rocks, we were unable to find a place in the hole where we could do this. Unlike Leg 92, we obtained samples that were almost totally free of drilling mud or other sediment, as was also the case for Leg 83. For this we owe a debt of gratitude to the Leg 92 scientists and drilling crew for so thoroughly flushing the hole, with 6.8 times its volume of surface seawater. Clearly the approximately 1.5 hole-volumes used at the end of Leg 83 were grossly inadequate. As for nearly all the previous samples, we again encountered trivial to moderate contamination from seawater which either leaked into the samplers during descent or was pushed downhole during the logging and sampling operations. Nitrate analyses, however, have again al-
Note: Leg 69: data from Hubberten et al. (1983), n = 40. Leg 83: data from Emmermann (1983), n = 89. Leg
T i0 2
100
0 20 40 60 80 100
Figure 31. Discrimination diagram after Davies et al. (1979) showing the magnesia-rich character of the basalts from Hole 504B drilled during Leg 111.
for chemical exchange with the overlying oceans, and for aging and alteration of the crust. Hole 504B has provided a unique opportunity to study these processes on a mid-ocean ridge flank. An important part of these studies has been the sampling of waters from the basement section of the hole. Three major objectives have been sought through this sampling: (1) to sample and characterize true basement formation water, including its variation with temperature and depth in the crust; (2) to determine
70
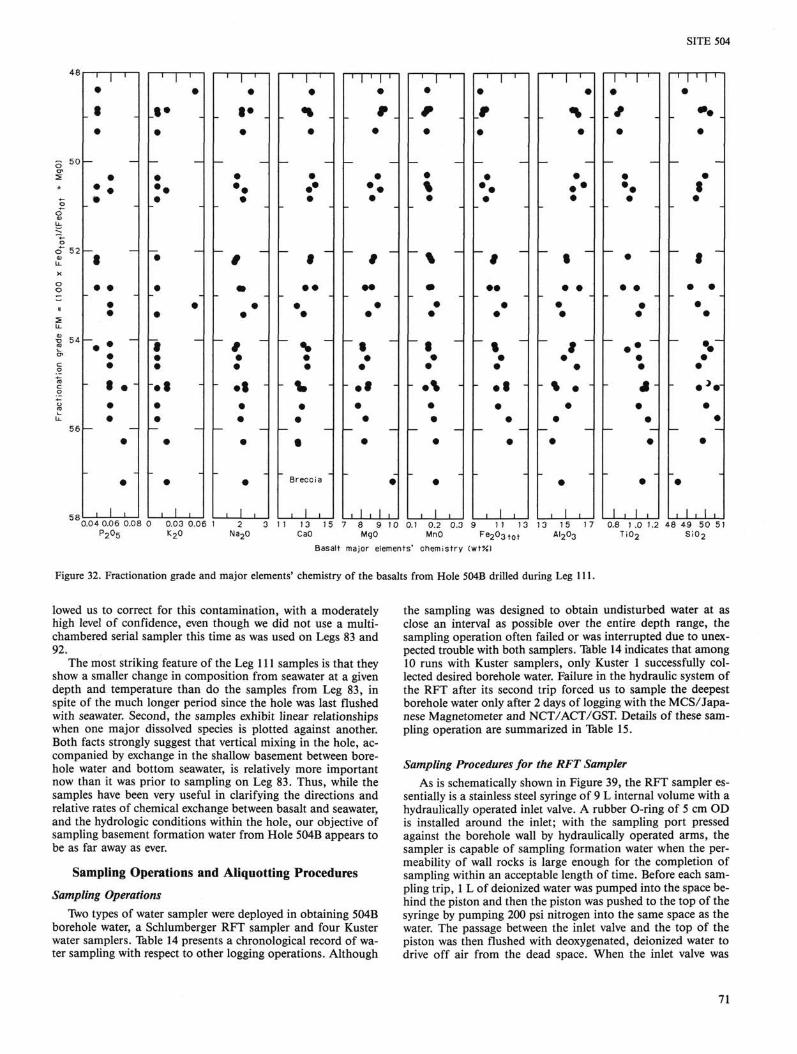
SITE 504
48
3 5 0
2 + o
o~ 01 u. o
o " 52 CJ U. X
o o
ii
2 L L
5 54 00
a> c o 1o c o o BJ
L L
56
58
1 1 ' • • •
• • • •
• • • •
• • • • t • • •
•
•
, 1 ,
' 1 ' •
•
• • • •
•
• • •
t • • • t • •
•
•
, 1 ,
' 1 ' •
•
• • • •
9
m • •
9 • •
• • •
•
, 1 i
—'—1—'— •
•
• •• •
t • •
• •
• • - v -
• •
t
Breccia
, 1 ,
' I ' M •
•
• • • •
9
— • •
t • •
• • •
•
. 1 , 1 .
1 1 ' •
•
• % •
• • •
• • •
• • •
•
, l .
' 1 ' • _9 •
• • • •
9
•• • •
t • •
• •
•
i I .
' 1 ' •
•
• • • •
•
• • • •
9 •
•
- % • •
•
•
•
. I .
I ' M •
•
• • • •
•
• • • •
• • • •
• • •
•
i i i i
' I ' M •
•
• t •
t
• • • •
•• • •
• •
•
•
. 1 , 1 , 0.04 0.06 0.08 0 0.03 0.06 1
P-,0 2U5 K90 Na20 3 11 13 15 7 8 9 10 0.1 0.2 0.3 9 11 13 13 15 17 0.8 1 .0 1.2 48 49 50 51
CaO MgO MnO F e 2 ° 3 t o t Basalt major elements' chemis t ry (wt%)
A l 2 0 3 TiO- SiO-
Figure 32. Fractionation grade and major elements' chemistry of the basalts from Hole 504B drilled during Leg 111.
lowed us to correct for this contamination, with a moderately high level of confidence, even though we did not use a multi-chambered serial sampler this time as was used on Legs 83 and 92.
The most striking feature of the Leg 111 samples is that they show a smaller change in composition from seawater at a given depth and temperature than do the samples from Leg 83, in spite of the much longer period since the hole was last flushed with seawater. Second, the samples exhibit linear relationships when one major dissolved species is plotted against another. Both facts strongly suggest that vertical mixing in the hole, accompanied by exchange in the shallow basement between borehole water and bottom seawater, is relatively more important now than it was prior to sampling on Leg 83. Thus, while the samples have been very useful in clarifying the directions and relative rates of chemical exchange between basalt and seawater, and the hydrologic conditions within the hole, our objective of sampling basement formation water from Hole 504B appears to be as far away as ever.
Sampling Operations and Aliquotting Procedures
Sampling Operations Two types of water sampler were deployed in obtaining 504B
borehole water, a Schlumberger RFT sampler and four Kuster water samplers. Table 14 presents a chronological record of water sampling with respect to other logging operations. Although
the sampling was designed to obtain undisturbed water at as close an interval as possible over the entire depth range, the sampling operation often failed or was interrupted due to unexpected trouble with both samplers. Table 14 indicates that among 10 runs with Kuster samplers, only Kuster 1 successfully collected desired borehole water. Failure in the hydraulic system of the RFT after its second trip forced us to sample the deepest borehole water only after 2 days of logging with the MCS/Japa-nese Magnetometer and NCT/ACT/GST. Details of these sampling operation are summarized in Table 15.
Sampling Procedures for the RFT Sampler As is schematically shown in Figure 39, the RFT sampler es
sentially is a stainless steel syringe of 9 L internal volume with a hydraulically operated inlet valve. A rubber O-ring of 5 cm OD is installed around the inlet; with the sampling port pressed against the borehole wall by hydraulically operated arms, the sampler is capable of sampling formation water when the permeability of wall rocks is large enough for the completion of sampling within an acceptable length of time. Before each sampling trip, 1 L of deionized water was pumped into the space behind the piston and then the piston was pushed to the top of the syringe by pumping 200 psi nitrogen into the same space as the water. The passage between the inlet valve and the top of the piston was then flushed with deoxygenated, deionized water to drive off air from the dead space. When the inlet valve was
71

SITE 504
+ 50 —
o 5 2 -
54
56 —
58
1 1 1 1 1
•
•
• • •
• ••
• • •
• • • •
• •
•
• , 1 , 1 ,
1 1 ' • V _
•
• t •
•• •• • •
t • • * •
• • 1
•
' 1 ' •
• • •
• •
t • • • •
1 • •
• • •
•
, 1 ,
' 1 ' •
_ • • • _ •
• • •
•
m • •
• • •
•
• •
•
Breccia
, 1 ,
' 1 ' •
•
• • #
•
• •
•
•• • •
• • •
•
, 1 ,
i | i | i •
•
• • •
•
f
• • • •
• • • •
• •
•
, 1 , 1 ,
• I ' M •
•
• t •
••
• • • •
• • • •
• • •
•
, 1 i 1 ,
•
•
•
•
•
• • • •
• • • •
• •
•
•
, 1 , 1 , 200 250 300 100 300 500 50
V Cr 100 150 50 Ni
100 150 50 75 100 40 50 60 70 15 20 25 30 30 40 50 60 Cu Zn Sr Y Zr
Basalt trace elements' chemistry (ppm) Figure 33. Fractionation grade and trace elements' chemistry of the basalts from Hole 504B drilled during Leg 111.
120
B- 60 —
0 .5 1 .0 T i 0 2 ( w t % )
1 .5
Figure 34. Zr vs. Ti02 for 24 Leg 111 samples and for sample averages from Legs 69, 70, and 83. m = slope.
opened at a desired depth in Hole 504B, the piston was pushed down by incoming borehole water until the back-up pressure behind the piston equaled the hydrostatic pressure at that depth. With 1 L of water in the back-up space of the RFT, about 8 L of borehole water were sampled each time. In the three sampling attempts with the RFT, the strain gauge installed inside the syringe indicated that the syringe was filled with water within 7-8 s after opening the inlet valve, implying that the waters sampled were borehole water and not formation water. We failed to obtain a good seal between the O-ring and the borehole wall because the RFT arms were too short to push the ring against the wall.
1. Gas samples. The recovered RFT was placed upright on deck and the release valve (RV, Fig. 39) at the bottom of the RFT was opened to bring the internal pressure of the syringe down to atmospheric. The liter of water in the back-up space behind the piston was then drained to allow any dissolved gases in the sample to exsolve and expand. The gas and liquid sampling manifold was then connected to the RFT. Fig. 39 shows the manifold used for RFT 2 and 3. The manifold used for RFT 1 had a 1000-psi pressure gauge in place of P2 and P3 and therefore was not capable of measuring the low pressure encountered in the sampling procedures (see below). The stainless steel sample bottles for helium (top) and other gases (bottom) had been evacuated to better than 0.8 Torr with a mechanical pump. Other spaces were flushed with nitrogen prior to connection to the RFT and, after being connected to it, were evacuated with the mechanical pump through V7. All the valves were shut off before opening VO.
72
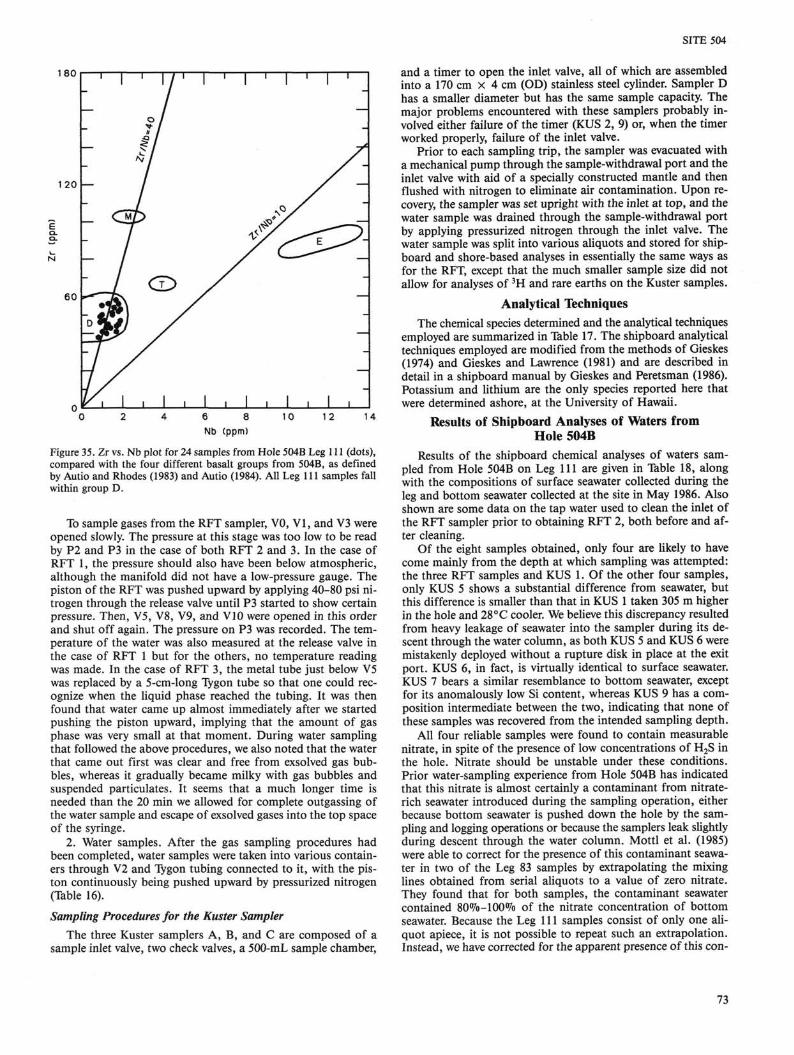
SITE 504
0 2 4 6 8 10 12 14 Nb (ppm)
Figure 35. Zr vs. Nb plot for 24 samples from Hole 504B Leg 111 (dots), compared with the four different basalt groups from 504B, as defined by Autio and Rhodes (1983) and Autio (1984). All Leg 111 samples fall within group D.
To sample gases from the RFT sampler, VO, VI, and V3 were opened slowly. The pressure at this stage was too low to be read by P2 and P3 in the case of both RFT 2 and 3. In the case of RFT 1, the pressure should also have been below atmospheric, although the manifold did not have a low-pressure gauge. The piston of the RFT was pushed upward by applying 40-80 psi nitrogen through the release valve until P3 started to show certain pressure. Then, V5, V8, V9, and V10 were opened in this order and shut off again. The pressure on P3 was recorded. The temperature of the water was also measured at the release valve in the case of RFT 1 but for the others, no temperature reading was made. In the case of RFT 3, the metal tube just below V5 was replaced by a 5-cm-long Tygon tube so that one could recognize when the liquid phase reached the tubing. It was then found that water came up almost immediately after we started pushing the piston upward, implying that the amount of gas phase was very small at that moment. During water sampling that followed the above procedures, we also noted that the water that came out first was clear and free from exsolved gas bubbles, whereas it gradually became milky with gas bubbles and suspended particulates. It seems that a much longer time is needed than the 20 min we allowed for complete outgassing of the water sample and escape of exsolved gases into the top space of the syringe.
2. Water samples. After the gas sampling procedures had been completed, water samples were taken into various containers through V2 and Tygon tubing connected to it, with the piston continuously being pushed upward by pressurized nitrogen (Table 16).
Sampling Procedures for the Kuster Sampler The three Kuster samplers A, B, and C are composed of a
sample inlet valve, two check valves, a 500-mL sample chamber,
and a timer to open the inlet valve, all of which are assembled into a 170 cm X 4 cm (OD) stainless steel cylinder. Sampler D has a smaller diameter but has the same sample capacity. The major problems encountered with these samplers probably involved either failure of the timer (KUS 2, 9) or, when the timer worked properly, failure of the inlet valve.
Prior to each sampling trip, the sampler was evacuated with a mechanical pump through the sample-withdrawal port and the inlet valve with aid of a specially constructed mantle and then flushed with nitrogen to eliminate air contamination. Upon recovery, the sampler was set upright with the inlet at top, and the water sample was drained through the sample-withdrawal port by applying pressurized nitrogen through the inlet valve. The water sample was split into various aliquots and stored for shipboard and shore-based analyses in essentially the same ways as for the RFT, except that the much smaller sample size did not allow for analyses of 3H and rare earths on the Kuster samples.
Analytical Techniques The chemical species determined and the analytical techniques
employed are summarized in Table 17. The shipboard analytical techniques employed are modified from the methods of Gieskes (1974) and Gieskes and Lawrence (1981) and are described in detail in a shipboard manual by Gieskes and Peretsman (1986). Potassium and lithium are the only species reported here that were determined ashore, at the University of Hawaii.
Results of Shipboard Analyses of Waters from Hole 504B
Results of the shipboard chemical analyses of waters sampled from Hole 504B on Leg 111 are given in Table 18, along with the compositions of surface seawater collected during the leg and bottom seawater collected at the site in May 1986. Also shown are some data on the tap water used to clean the inlet of the RFT sampler prior to obtaining RFT 2, both before and after cleaning.
Of the eight samples obtained, only four are likely to have come mainly from the depth at which sampling was attempted: the three RFT samples and KUS 1. Of the other four samples, only KUS 5 shows a substantial difference from seawater, but this difference is smaller than that in KUS 1 taken 305 m higher in the hole and 28 °C cooler. We believe this discrepancy resulted from heavy leakage of seawater into the sampler during its descent through the water column, as both KUS 5 and KUS 6 were mistakenly deployed without a rupture disk in place at the exit port. KUS 6, in fact, is virtually identical to surface seawater. KUS 7 bears a similar resemblance to bottom seawater, except for its anomalously low Si content, whereas KUS 9 has a composition intermediate between the two, indicating that none of these samples was recovered from the intended sampling depth.
All four reliable samples were found to contain measurable nitrate, in spite of the presence of low concentrations of H2S in the hole. Nitrate should be unstable under these conditions. Prior water-sampling experience from Hole 504B has indicated that this nitrate is almost certainly a contaminant from nitrate-rich seawater introduced during the sampling operation, either because bottom seawater is pushed down the hole by the sampling and logging operations or because the samplers leak slightly during descent through the water column. Mottl et al. (1985) were able to correct for the presence of this contaminant seawater in two of the Leg 83 samples by extrapolating the mixing lines obtained from serial aliquots to a value of zero nitrate. They found that for both samples, the contaminant seawater contained 80%-100% of the nitrate concentration of bottom seawater. Because the Leg 111 samples consist of only one aliquot apiece, it is not possible to repeat such an extrapolation. Instead, we have corrected for the apparent presence of this con-
73
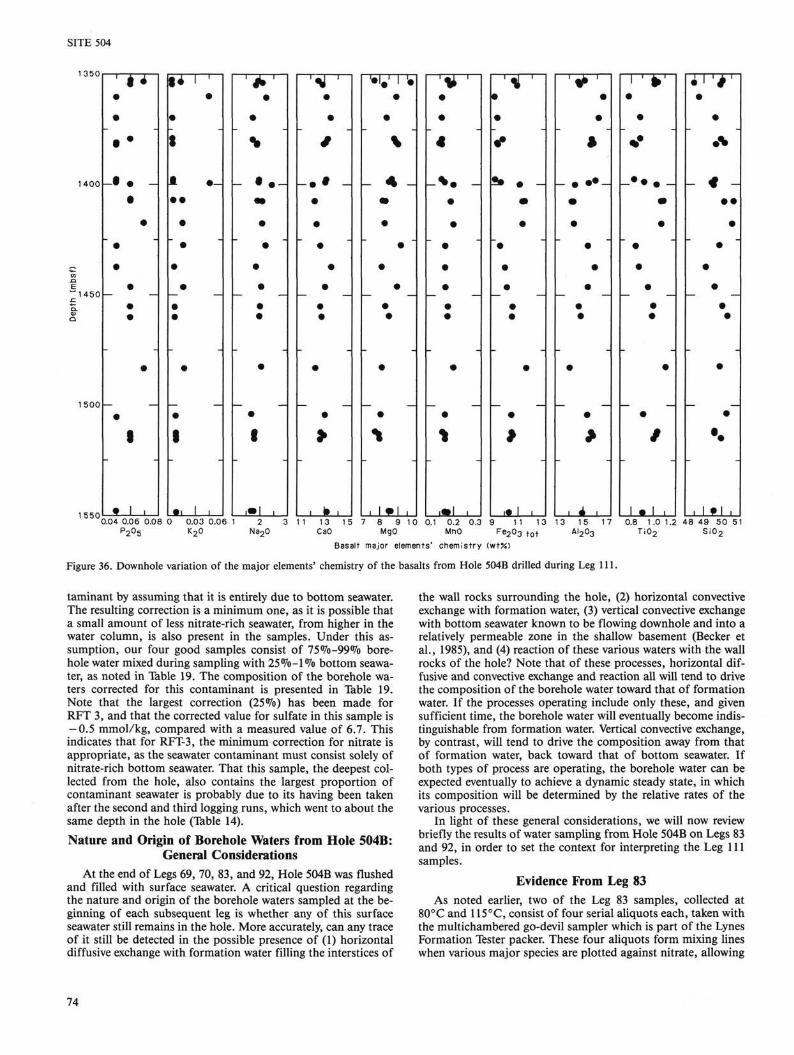
SITE 504
1350
1400
1450 —
1500 —
1550
• •
• •
• • -•
•
• • • •
•
•
1
t 1 1
• •
f
* • -• •
• •
• •
• •
•
•
1
• I 1 1
• •
- • • -
• •
• • • •
•
•
I
. • 1 ■
• •
/
• • •
• •
• •
•
• >
■ b ■
• •
\
- 4 -• •
• •
• • •
•
•
, l « l ,
• •
4
•
•
•
•
•
• •
•
•
. • I ,
'i ' • •
• •
• • • •
•
•
*
• •
ft
- • • • -
•
•
•
• •
• •
•
•
>
, 4 ,
1 <t' •
•
•
•
•
• • • •
•
•
/
I . I ,
• •
A
- 4 -• •
• •
• •
• •
•
•
• •
, 1 9 1 , 0.04 0.06 0.08 0
PoOs 0.03 0.06 1 K20
2 Na20
3 1 1 13 15 7 CaO
9 10 0.1 0.2 0.3 9 MgO MnO ^ 2 0 3 t o t
Basalt major elements' chemist ry twt%)
13 13 15 17 A l 2 0 3
0.8 1 .0 1.2 48 49 50 51 TiOo SiOo
Figure 36. Downhole variation of the major elements' chemistry of the basalts from Hole 504B drilled during Leg 111.
taminant by assuming that it is entirely due to bottom seawater. The resulting correction is a minimum one, as it is possible that a small amount of less nitrate-rich seawater, from higher in the water column, is also present in the samples. Under this assumption, our four good samples consist of 759b-99% borehole water mixed during sampling with 25%- l% bottom seawater, as noted in Table 19. The composition of the borehole waters corrected for this contaminant is presented in Table 19. Note that the largest correction (25%) has been made for RFT 3, and that the corrected value for sulfate in this sample is - 0 . 5 mmol/kg, compared with a measured value of 6.7. This indicates that for RFT-3, the minimum correction for nitrate is appropriate, as the seawater contaminant must consist solely of nitrate-rich bottom seawater. That this sample, the deepest collected from the hole, also contains the largest proportion of contaminant seawater is probably due to its having been taken after the second and third logging runs, which went to about the same depth in the hole (Table 14).
Nature and Origin of Borehole Waters from Hole 504B: General Considerations
At the end of Legs 69, 70, 83, and 92, Hole 504B was flushed and filled with surface seawater. A critical question regarding the nature and origin of the borehole waters sampled at the beginning of each subsequent leg is whether any of this surface seawater still remains in the hole. More accurately, can any trace of it still be detected in the possible presence of (1) horizontal diffusive exchange with formation water filling the interstices of
the wall rocks surrounding the hole, (2) horizontal convective exchange with formation water, (3) vertical convective exchange with bottom seawater known to be flowing downhole and into a relatively permeable zone in the shallow basement (Becker et al., 1985), and (4) reaction of these various waters with the wall rocks of the hole? Note that of these processes, horizontal diffusive and convective exchange and reaction all will tend to drive the composition of the borehole water toward that of formation water. If the processes operating include only these, and given sufficient time, the borehole water will eventually become indistinguishable from formation water. Vertical convective exchange, by contrast, will tend to drive the composition away from that of formation water, back toward that of bottom seawater. If both types of process are operating, the borehole water can be expected eventually to achieve a dynamic steady state, in which its composition will be determined by the relative rates of the various processes.
In light of these general considerations, we will now review briefly the results of water sampling from Hole 504B on Legs 83 and 92, in order to set the context for interpreting the Leg 111 samples.
Evidence From Leg 83 As noted earlier, two of the Leg 83 samples, collected at
80°C and 115°C, consist of four serial aliquots each, taken with the multichambered go-devil sampler which is part of the Lynes Formation Tester packer. These four aliquots form mixing lines when various major species are plotted against nitrate, allowing
74

SITE 504
1350
1 400 —
1450 —
1 500 —
1550
1 ii. •
•
•
•
•
•
•
• •
<
•
• •
<
•
•
4
- • *
•
•
•
•
•
>
•
•
r # • -•
•
•
•
•
• •
•
•
X
1 1 * >
•
•
• • •
% -
•
•
•
• •
•
•
r
•
•
4
•
•
•
•
• •
•
•
•
i 4 i
•
•
<
•
•
•
•
•
• •
•
•
*
'
1 K •
•
• #
•
•
•
•
• •
•
•
>«4 i
•
•
• • •
•
•
•
•
• •
•
i
•
t
i ! • 1 i 220 280 340 100 250 400 50 100 150 70 115 160 50
V Cr Ni Cu 75 100 40 50 60 70 20 Zn Sr
25 Y
30 30 40 50 60 Zr
Basalt trace elements' chemistry (ppm)
Figure 37. Downhole variation of the trace elements' chemistry of the basalts from Hole 504B drilled during Leg 111.
the end-member borehole water compositions to be determined by extrapolation to zero nitrate in the presence of H2S (Mottl et al., 1985). The extrapolations indicate that the last aliquots to enter the sampler consist of 70%-80% borehole water mixed with 30%-20% seawater contaminant, which can be modeled in turn as 80%-100°7o bottom seawater mixed with 20%-0% nitrate-free (surface?) seawater.
Mottl et al. (1985) discussed at length the usefulness of tritium (3H) as a tag for surface seawater remaining in the hole from the previous leg. Tritium is present in the surface waters at Site 504 at a concentration of about 2.5 T.U. (tritium units), entirely as a result of atmospheric nuclear weapons testing in the late 1950's and early 1960's. Tritium is radioactive with a half-life of 12.2 years. It is virtually absent from seawater in this area below a depth of several hundred meters. Its concentration therefore is zero in the bottom waters and it is certainly absent from the basement formation waters. It is essentially nonreactive with the wall rocks, because it is present in surface seawater left in the hole as an integral component of the water itself. Tritium
concentrations in the four aliquots each of the two Leg 83 samples have now been determined by W. J. Jenkins of Woods Hole Oceanographic Institution. These data were not available for the Leg 83 Initial Reports volume, and they are only now being prepared for publication.
The tritium data confirm the estimates given above based on the extrapolations to zero nitrate. For the 80°C sample, taken from 204 m into basement (479 mbsf), tritium and nitrate both go to zero together, indicating that the borehole water sampled from this depth on Leg 83 was completely free of tritium, and therefore of any trace of the surface seawater left in the hole 711 days earlier at the end of Leg 70. For the 115°C sample, by contrast, tritium was still present in the borehole water end-member at approximately one-third of its original concentration in surface seawater. This sample was taken from 518 m into basement (793 mbsf), which at the time was 43 m above the bottom of the hole.
Mottl et al. (1985) calculated that during the 711 days between Legs 70 and 83, horizontal diffusion alone would have re-
75
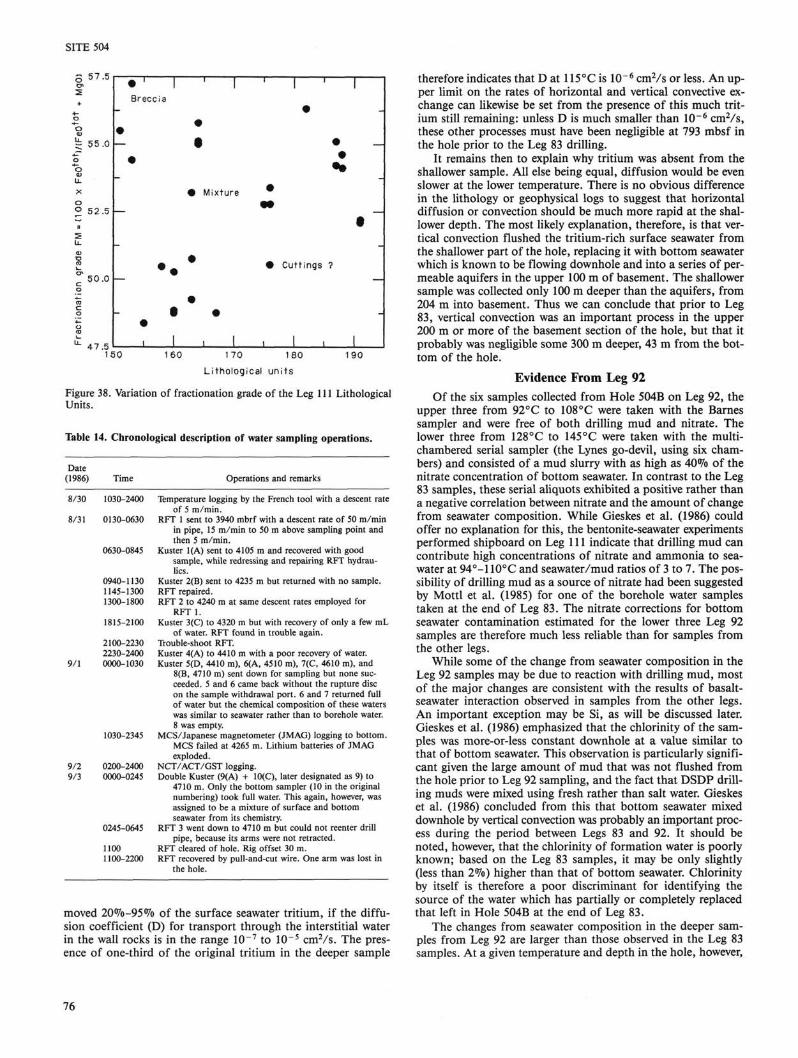
SITE 504
2
+
t 55.0 3
U-
X
0
2 52.5 11
2
0
o< c 50.0 0
TO c 0
0 <U
^ i T R
• B
•
• -
—
-
1
recc
• 1
ia
•
1
•
•
|
1
•
i
• M
#
•
I
1
ixture
•
1
1
• 9 9
•
1
1
•
Cuttings
1 1
1
• •
•
?
1
-
—
-
—
-
—
_
150 160 170 180
Li thological un i ts 190
Figure 38. Variation of fractionation grade of the Leg 111 Lithological Units.
Table 14. Chronological description of water sampling operations.
Date (1986) Time Operations and remarks
8/30
8/31
9/1
1030-2400
0130-0630
0630-0845
0940-1130 1145-1300 1300-1800
1815-2100
2100-2230 2230-2400 0000-1030
Temperature logging by the French tool with a descent rate of 5 m/min.
RFT 1 sent to 3940 mbrf with a descent rate of 50 m/min in pipe, 15 m/min to 50 m above sampling point and then 5 m/min.
Kuster 1(A) sent to 4105 m and recovered with good sample, while redressing and repairing RFT hydraulics.
Kuster 2(B) sent to 4235 m but returned with no sample. RFT repaired. RFT 2 to 4240 m at same descent rates employed for
RFT 1. Kuster 3(C) to 4320 m but with recovery of only a few mL
of water. RFT found in trouble again. Trouble-shoot RFT. Kuster 4(A) to 4410 m with a poor recovery of water. Kuster 5(D, 4410 m), 6(A, 4510 m), 7(C, 4610 m), and
8(B, 4710 m) sent down for sampling but none succeeded. 5 and 6 came back without the rupture disc on the sample withdrawal port. 6 and 7 returned full of water but the chemical composition of these waters was similar to seawater rather than to borehole water. 8 was empty.
MCS/Japanese magnetometer (JMAG) logging to bottom. MCS failed at 4265 m. Lithium batteries of JMAG exploded.
NCT/ACT/GST logging. Double Kuster (9(A) + 10(C), later designated as 9) to
4710 m. Only the bottom sampler (10 in the original numbering) took full water. This again, however, was assigned to be a mixture of surface and bottom seawater from its chemistry.
RFT 3 went down to 4710 m but could not reenter drill pipe, because its arms were not retracted.
RFT cleared of hole. Rig offset 30 m. RFT recovered by pull-and-cut wire. One arm was lost in
the hole.
9/2 9/3
1030-2345
0200-2400 0000-0245
0245-0645
1100 1100-2200
moved 20%-95% of the surface seawater tritium, if the diffusion coefficient (D) for transport through the interstitial water in the wall rocks is in the range 10~7 to 10 ~5 cm2/s. The presence of one-third of the original tritium in the deeper sample
therefore indicates that D a t l l 5 ° C i s l 0 - 6 cmVs or less. An upper limit on the rates of horizontal and vertical convective exchange can likewise be set from the presence of this much tritium still remaining: unless D is much smaller than 10 - 6 cmVs, these other processes must have been negligible at 793 mbsf in the hole prior to the Leg 83 drilling.
It remains then to explain why tritium was absent from the shallower sample. All else being equal, diffusion would be even slower at the lower temperature. There is no obvious difference in the lithology or geophysical logs to suggest that horizontal diffusion or convection should be much more rapid at the shallower depth. The most likely explanation, therefore, is that vertical convection flushed the tritium-rich surface seawater from the shallower part of the hole, replacing it with bottom seawater which is known to be flowing downhole and into a series of permeable aquifers in the upper 100 m of basement. The shallower sample was collected only 100 m deeper than the aquifers, from 204 m into basement. Thus we can conclude that prior to Leg 83, vertical convection was an important process in the upper 200 m or more of the basement section of the hole, but that it probably was negligible some 300 m deeper, 43 m from the bottom of the hole.
Evidence From Leg 92 Of the six samples collected from Hole 504B on Leg 92, the
upper three from 92 °C to 108°C were taken with the Barnes sampler and were free of both drilling mud and nitrate. The lower three from 128°C to 145°C were taken with the multi-chambered serial sampler (the Lynes go-devil, using six chambers) and consisted of a mud slurry with as high as 40% of the nitrate concentration of bottom seawater. In contrast to the Leg 83 samples, these serial aliquots exhibited a positive rather than a negative correlation between nitrate and the amount of change from seawater composition. While Gieskes et al. (1986) could offer no explanation for this, the bentonite-seawater experiments performed shipboard on Leg 111 indicate that drilling mud can contribute high concentrations of nitrate and ammonia to seawater at 94°-110°C and seawater/mud ratios of 3 to 7. The possibility of drilling mud as a source of nitrate had been suggested by Mottl et al. (1985) for one of the borehole water samples taken at the end of Leg 83. The nitrate corrections for bottom seawater contamination estimated for the lower three Leg 92 samples are therefore much less reliable than for samples from the other legs.
While some of the change from seawater composition in the Leg 92 samples may be due to reaction with drilling mud, most of the major changes are consistent with the results of basalt-seawater interaction observed in samples from the other legs. An important exception may be Si, as will be discussed later. Gieskes et al. (1986) emphasized that the chlorinity of the samples was more-or-less constant downhole at a value similar to that of bottom seawater. This observation is particularly significant given the large amount of mud that was not flushed from the hole prior to Leg 92 sampling, and the fact that DSDP drilling muds were mixed using fresh rather than salt water. Gieskes et al. (1986) concluded from this that bottom seawater mixed downhole by vertical convection was probably an important process during the period between Legs 83 and 92. It should be noted, however, that the chlorinity of formation water is poorly known; based on the Leg 83 samples, it may be only slightly (less than 2%) higher than that of bottom seawater. Chlorinity by itself is therefore a poor discriminant for identifying the source of the water which has partially or completely replaced that left in Hole 504B at the end of Leg 83.
The changes from seawater composition in the deeper samples from Leg 92 are larger than those observed in the Leg 83 samples. At a given temperature and depth in the hole, however,
76
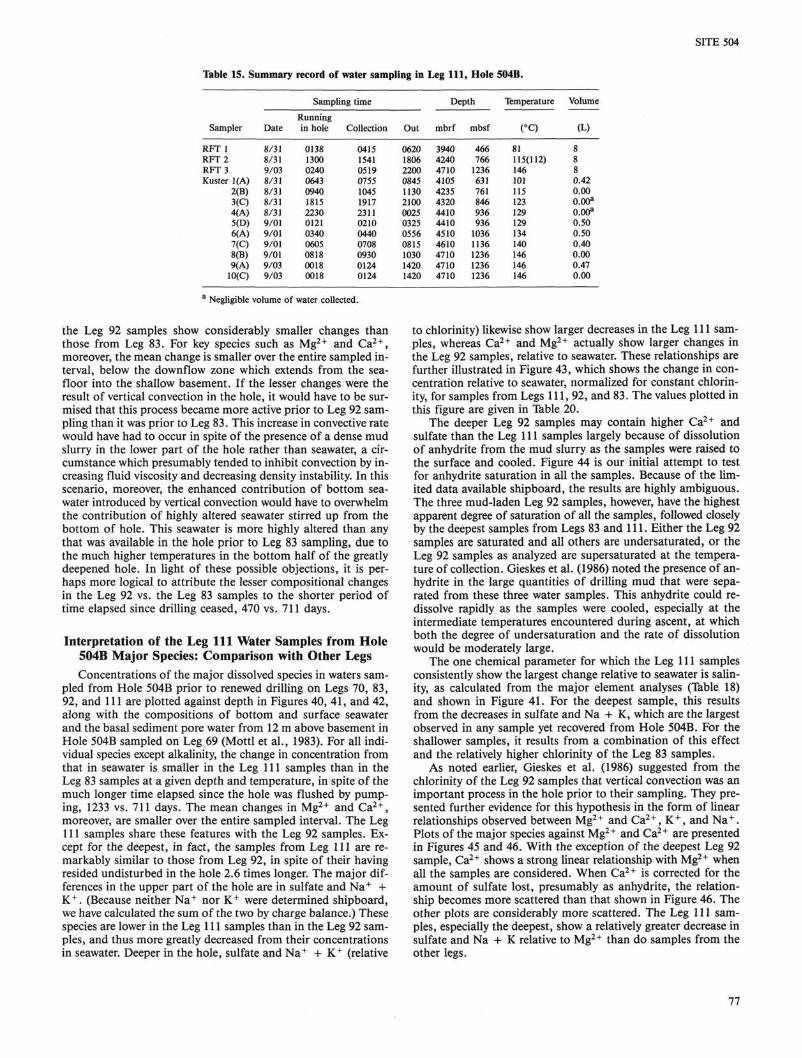
SITE 504
Table 15. Summary record of water sampling in Leg 111, Hole 504B.
Sampling time Depth Temperature Volume
Sampler
RFT 1 RFT2 RFT 3 Kuster 1(A)
2(B) 3(C) 4(A) 5(D) 6(A) 7(C) 8(B) 9(A) 10(C)
Date
8/31 8/31 9/03 8/31 8/31 8/31 8/31 9/01 9/01 9/01 9/01 9/03 9/03
Running in hole
0138 1300 0240 0643 0940 1815 2230 0121 0340 0605 0818 0018 0018
Collection
0415 1541 0519 0755 1045 1917 2311 0210 0440 0708 0930 0124 0124
Out 0620 1806 2200 0845 1130 2100 0025 0325 0556 0815 1030 1420 1420
mbrf
3940 4240 4710 4105 4235 4320 4410 4410 4510 4610 4710 4710 4710
mbsf
466 766 1236 631 761 846 936 936 1036 1136 1236 1236 1236
(°Q 81 115(112) 146 101 115 123 129 129 134 140 146 146 146
(L) 8 8 8 0.42 0.00 0.00a 0.00a 0.50 0.50 0.40 0.00 0.47 0.00
a Negligible volume of water collected.
the Leg 92 samples show considerably smaller changes than those from Leg 83. For key species such as Mg2+ and Ca2 + , moreover, the mean change is smaller over the entire sampled interval, below the downflow zone which extends from the sea-floor into the shallow basement. If the lesser changes were the result of vertical convection in the hole, it would have to be surmised that this process became more active prior to Leg 92 sampling than it was prior to Leg 83. This increase in convective rate would have had to occur in spite of the presence of a dense mud slurry in the lower part of the hole rather than seawater, a circumstance which presumably tended to inhibit convection by increasing fluid viscosity and decreasing density instability. In this scenario, moreover, the enhanced contribution of bottom sea-water introduced by vertical convection would have to overwhelm the contribution of highly altered seawater stirred up from the bottom of hole. This seawater is more highly altered than any that was available in the hole prior to Leg 83 sampling, due to the much higher temperatures in the bottom half of the greatly deepened hole. In light of these possible objections, it is perhaps more logical to attribute the lesser compositional changes in the Leg 92 vs. the Leg 83 samples to the shorter period of time elapsed since drilling ceased, 470 vs. 711 days.
Interpretation of the Leg 111 Water Samples from Hole 504B Major Species: Comparison with Other Legs Concentrations of the major dissolved species in waters sam
pled from Hole 504B prior to renewed drilling on Legs 70, 83, 92, and 111 are plotted against depth in Figures 40, 41, and 42, along with the compositions of bottom and surface seawater and the basal sediment pore water from 12 m above basement in Hole 504B sampled on Leg 69 (Mottl et al., 1983). For all individual species except alkalinity, the change in concentration from that in seawater is smaller in the Leg 111 samples than in the Leg 83 samples at a given depth and temperature, in spite of the much longer time elapsed since the hole was flushed by pumping, 1233 vs. 711 days. The mean changes in Mg2+ and Ca2 + , moreover, are smaller over the entire sampled interval. The Leg 111 samples share these features with the Leg 92 samples. Except for the deepest, in fact, the samples from Leg 111 are remarkably similar to those from Leg 92, in spite of their having resided undisturbed in the hole 2.6 times longer. The major differences in the upper part of the hole are in sulfate and Na+ + K+ . (Because neither Na+ nor K+ were determined shipboard, we have calculated the sum of the two by charge balance.) These species are lower in the Leg 111 samples than in the Leg 92 samples, and thus more greatly decreased from their concentrations in seawater. Deeper in the hole, sulfate and Na+ + K+ (relative
to chlorinity) likewise show larger decreases in the Leg 111 samples, whereas Ca2+ and Mg2+ actually show larger changes in the Leg 92 samples, relative to seawater. These relationships are further illustrated in Figure 43, which shows the change in concentration relative to seawater, normalized for constant chlorinity, for samples from Legs 111, 92, and 83. The values plotted in this figure are given in Table 20.
The deeper Leg 92 samples may contain higher Ca2+ and sulfate than the Leg 111 samples largely because of dissolution of anhydrite from the mud slurry as the samples were raised to the surface and cooled. Figure 44 is our initial attempt to test for anhydrite saturation in all the samples. Because of the limited data available shipboard, the results are highly ambiguous. The three mud-laden Leg 92 samples, however, have the highest apparent degree of saturation of all the samples, followed closely by the deepest samples from Legs 83 and 111. Either the Leg 92 samples are saturated and all others are undersaturated, or the Leg 92 samples as analyzed are supersaturated at the temperature of collection. Gieskes et al. (1986) noted the presence of anhydrite in the large quantities of drilling mud that were separated from these three water samples. This anhydrite could re-dissolve rapidly as the samples were cooled, especially at the intermediate temperatures encountered during ascent, at which both the degree of undersaturation and the rate of dissolution would be moderately large.
The one chemical parameter for which the Leg 111 samples consistently show the largest change relative to seawater is salinity, as calculated from the major element analyses (Table 18) and shown in Figure 41. For the deepest sample, this results from the decreases in sulfate and Na + K, which are the largest observed in any sample yet recovered from Hole 504B. For the shallower samples, it results from a combination of this effect and the relatively higher chlorinity of the Leg 83 samples.
As noted earlier, Gieskes et al. (1986) suggested from the chlorinity of the Leg 92 samples that vertical convection was an important process in the hole prior to their sampling. They presented further evidence for this hypothesis in the form of linear relationships observed between Mg2+ and Ca2 + , K + , and Na + . Plots of the major species against Mg2+ and Ca2+ are presented in Figures 45 and 46. With the exception of the deepest Leg 92 sample, Ca2+ shows a strong linear relationship with Mg2+ when all the samples are considered. When Ca2+ is corrected for the amount of sulfate lost, presumably as anhydrite, the relationship becomes more scattered than that shown in Figure 46. The other plots are considerably more scattered. The Leg 111 samples, especially the deepest, show a relatively greater decrease in sulfate and Na + K relative to Mg2+ than do samples from the other legs.
77
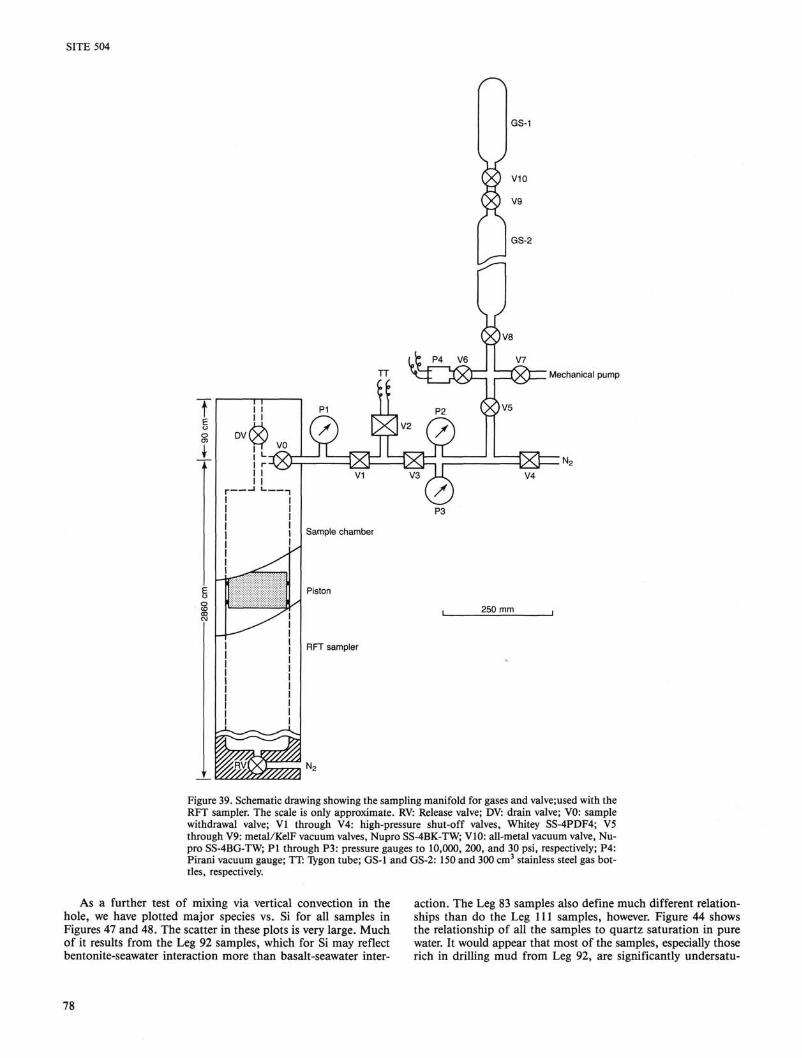
SITE 504
r^
Mechanical pump
Figure 39. Schematic drawing showing the sampling manifold for gases and valve;used with the RFT sampler. The scale is only approximate. RV: Release valve; DV: drain valve; V0: sample withdrawal valve; VI through V4: high-pressure shut-off valves, Whitey SS-4PDF4; V5 through V9: metal/KelF vacuum valves, Nupro SS-4BK-TW; V10: all-metal vacuum valve, Nu-pro SS-4BG-TW; PI through P3: pressure gauges to 10,000, 200, and 30 psi, respectively; P4: Pirani vacuum gauge; TT: Tygon tube; GS-1 and GS-2: 150 and 300 cm3 stainless steel gas bottles, respectively.
As a further test of mixing via vertical convection in the hole, we have plotted major species vs. Si for all samples in Figures 47 and 48. The scatter in these plots is very large. Much of it results from the Leg 92 samples, which for Si may reflect bentonite-seawater interaction more than basalt-seawater inter
action. The Leg 83 samples also define much different relationships than do the Leg 111 samples, however. Figure 44 shows the relationship of all the samples to quartz saturation in pure water. It would appear that most of the samples, especially those rich in drilling mud from Leg 92, are significantly undersatu-
78
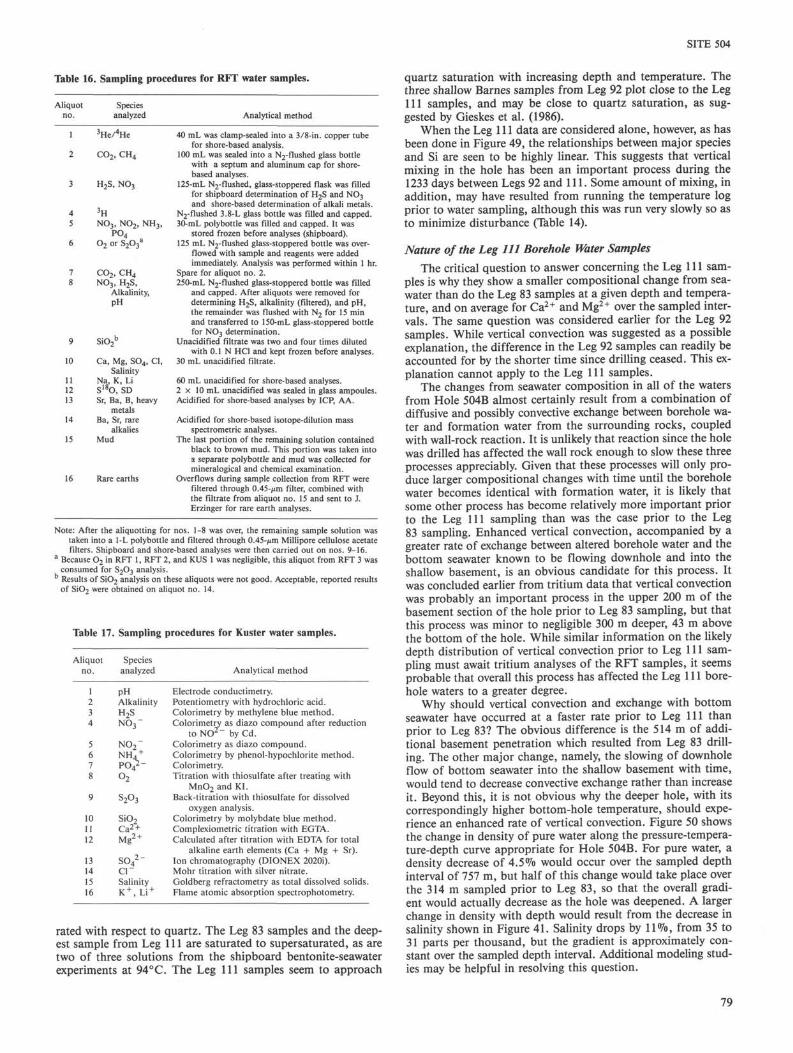
SITE 504
Table 16. Sampling procedures for RFT water samples.
Aliquot Species no. analyzed Analytical method
3He/4He
C02 , CH4
H2S, N0 3
3U N03 , N02 , NH3,
P0 4 0 2 or S203
a
7 C02> CH4 8 N03> H2S,
Alkalinity, pH
SiO?
10
11 12 13
14
15
16
Ca, Mg, S04 , Cl, Salinity
Na, K, Li S180, SD Sr, Ba, B, heavy
metals Ba, Sr, rare
alkalies Mud
Rare earths
40 mL was clamp-sealed into a 3/8-in. copper tube for shore-based analysis.
100 mL was sealed into a N2-flushed glass bottle with a septum and aluminum cap for shore-based analyses.
125-mL N2-flushed, glass-stoppered flask was filled for shipboard determination of H2S and N0 3 and shore-based determination of alkali metals.
N2-flushed 3.8-L glass bottle was filled and capped. 30-mL polybottle was filled and capped. It was
stored frozen before analyses (shipboard). 125 mL N2-flushed glass-stoppered bottle was over
flowed with sample and reagents were added immediately. Analysis was performed within 1 hr.
Spare for aliquot no. 2. 250-mL N2-flushed glass-stoppered bottle was filled
and capped. After aliquots were removed for determining H2S, alkalinity (filtered), and pH, the remainder was flushed with N2 for 15 min and transferred to 150-mL glass-stoppered bottle for N0 3 determination.
Unacidified filtrate was two and four times diluted with 0.1 N HC1 and kept frozen before analyses.
30 mL unacidified filtrate.
60 mL unacidified for shore-based analyses. 2 x 10 mL unacidified was sealed in glass ampoules. Acidified for shore-based analyses by ICP, AA.
Acidified for shore-based isotope-dilution mass spectrometric analyses.
The last portion of the remaining solution contained black to brown mud. This portion was taken into a separate polybottle and mud was collected for mineralogical and chemical examination.
Overflows during sample collection from RFT were filtered through 0.45-^m filter, combined with the filtrate from aliquot no. 15 and sent to J. Erzinger for rare earth analyses.
Note: After the aliquotting for nos. 1-8 was over, the remaining sample solution was taken into a 1-L polybottle and filtered through 0.45-^m Millipore cellulose acetate filters. Shipboard and shore-based analyses were then carried out on nos. 9-16.
a Because 0 2 in RFT 1, RFT 2, and KUS 1 was negligible, this aliquot from RFT 3 was consumed for S203 analysis. Results of Si02 analysis on these aliquots were not good. Acceptable, reported results of Si02 were obtained on aliquot no. 14.
Table 17. Sampling procedures for Kuster water samples.
Aliquot no.
Species analyzed Analytical method
Electrode conductimetry. Potentiometry with hydrochloric acid. Colorimetry by methylene blue method. Colorimetry as diazo compound after reduction
to N O 2 " by Cd. Colorimetry as diazo compound. Colorimetry by phenol-hypochlorite method. Colorimetry. Titration with thiosulfate after treating with
M n 0 2 and KI. Back-titration with thiosulfate for dissolved
oxygen analysis. Colorimetry by molybdate blue method. Complexiometric titration with EGTA. Calculated after titration with EDTA for total
alkaline earth elements (Ca + Mg + Sr). Ion chromatography (DIONEX 2020i). Mohr titration with silver nitrate. Goldberg refractometry as total dissolved solids. Flame atomic absorption spectrophotometry.
rated with respect to quartz. The Leg 83 samples and the deepest sample from Leg 111 are saturated to supersaturated, as are two of three solutions from the shipboard bentonite-seawater experiments at 94°C. The Leg 111 samples seem to approach
1 2 3 4
5 6 7 8
9
10 11 12
13 14 15 16
pH Alkalinity H2S N 0 3 ~
N 0 2 ~ NH4
+
PO 42 -
o2
s2o3
Si02 Ca2 + Mg2 +
so42~
cr Salinity K + , L i +
quartz saturation with increasing depth and temperature. The three shallow Barnes samples from Leg 92 plot close to the Leg 111 samples, and may be close to quartz saturation, as suggested by Gieskes et al. (1986).
When the Leg 111 data are considered alone, however, as has been done in Figure 49, the relationships between major species and Si are seen to be highly linear. This suggests that vertical mixing in the hole has been an important process during the 1233 days between Legs 92 and 111. Some amount of mixing, in addition, may have resulted from running the temperature log prior to water sampling, although this was run very slowly so as to minimize disturbance (Table 14).
Nature of the Leg 111 Borehole Water Samples The critical question to answer concerning the Leg 111 sam
ples is why they show a smaller compositional change from sea-water than do the Leg 83 samples at a given depth and temperature, and on average for Ca2+ and Mg2+ over the sampled intervals. The same question was considered earlier for the Leg 92 samples. While vertical convection was suggested as a possible explanation, the difference in the Leg 92 samples can readily be accounted for by the shorter time since drilling ceased. This explanation cannot apply to the Leg 111 samples.
The changes from seawater composition in all of the waters from Hole 504B almost certainly result from a combination of diffusive and possibly convective exchange between borehole water and formation water from the surrounding rocks, coupled with wall-rock reaction. It is unlikely that reaction since the hole was drilled has affected the wall rock enough to slow these three processes appreciably. Given that these processes will only produce larger compositional changes with time until the borehole water becomes identical with formation water, it is likely that some other process has become relatively more important prior to the Leg 111 sampling than was the case prior to the Leg 83 sampling. Enhanced vertical convection, accompanied by a greater rate of exchange between altered borehole water and the bottom seawater known to be flowing downhole and into the shallow basement, is an obvious candidate for this process. It was concluded earlier from tritium data that vertical convection was probably an important process in the upper 200 m of the basement section of the hole prior to Leg 83 sampling, but that this process was minor to negligible 300 m deeper, 43 m above the bottom of the hole. While similar information on the likely depth distribution of vertical convection prior to Leg 111 sampling must await tritium analyses of the RFT samples, it seems probable that overall this process has affected the Leg 111 borehole waters to a greater degree.
Why should vertical convection and exchange with bottom seawater have occurred at a faster rate prior to Leg 111 than prior to Leg 83? The obvious difference is the 514 m of additional basement penetration which resulted from Leg 83 drilling. The other major change, namely, the slowing of downhole flow of bottom seawater into the shallow basement with time, would tend to decrease convective exchange rather than increase it. Beyond this, it is not obvious why the deeper hole, with its correspondingly higher bottom-hole temperature, should experience an enhanced rate of vertical convection. Figure 50 shows the change in density of pure water along the pressure-temperature-depth curve appropriate for Hole 504B. For pure water, a density decrease of 4.5% would occur over the sampled depth interval of 757 m, but half of this change would take place over the 314 m sampled prior to Leg 83, so that the overall gradient would actually decrease as the hole was deepened. A larger change in density with depth would result from the decrease in salinity shown in Figure 41. Salinity drops by 11%, from 35 to 31 parts per thousand, but the gradient is approximately constant over the sampled depth interval. Additional modeling studies may be helpful in resolving this question.
79

SITE 504
pH Salinity Salinity Chlorinity Alkalinity SO2 C a 2 + Mg2 +
a t 2 5 ° C %o %o mmol/kg meq/kg mmol/kg mmol/kg mmol/kg refractive calculated titration titration ion titration titration
index chromatography corrected corrected
7.68 6.94 6.95 6.64
7.62 7.81 7.91
8.17
33.8 33.9 33.5 32.0 34.0
34.1 33.9 33.8 32.5
33.95 34.07 33.54 31.80
34.53 34.44 34.31
33.53
532.7 540.7 537.0 540.8 540.6 540.9 540.3 538.5 526.6 526.6
<2.82 <2.82
2.11 1.58 1.56 1.34
2.44 2.45 2.13
2.27
26.98 24.73 21.65 6.72
22.71 (27.95) 27.64 27.64 26.22 26.68
13.42 18.98 24.32 36.73 18.36 10.20 10.45 10.31 10.26 9.58
0.21 0.19
48.53 45.88 40.03 29.31 46.58 52.11 52.05 51.72 50.39 50.76
0.01 0.01
Table 18. Composition of waters collected from Hole 504B, Leg 111.
Species: Units: Method:
Depth Depth Temp. Sample (mbrf) (mbsf) (°C)
RFT 1 3940 466 81 KUS 1 4105 631 101 RFT 2 4240 766 115 RFT 3 4710 1236 146 KUS 5 (4410) (936) (129) Bottom seawater3 2 KUS 7 (4610) (1136) (140) KUS 9 (4710) (1236) (146) KUS 6 (4510) (1036) (134) Surface seawater RFT 2:
Control Cleaning water
a Bottom seawater collected in May 1986, on cruise TT198. Surface seawater collected on site, 5 September, 1986.
Minor Species and Redox Conditions
Oxygen could not be detected in any of the Leg 111 high-temperature samples, in spite of the admixture during sampling of as much as 25% bottom seawater. This had been the case as well for Leg 83 samples containing as much as 40% seawater contaminant. The introduced oxygen presumably was reduced either by Fe2+ or by H2S. While Fe2+ has not yet been determined, the Leg 111 samples precipitated small quantities of rust-colored material after exposure to the atmosphere for several hours. A faint odor of H2S was barely detectable in some of the samples under controlled conditions. This corresponded to measured concentrations of about 1 jtmol/kg, similar to those reported for the Leg 92 samples but much lower than those for the Leg 83 samples. Thiosulfate was sought in the deepest RFT sample, but was not detectable at a limit of 8 /xmol/kg. This contrasts greatly with the Leg 92 results, in which thiosulfate concentrations as high as 400 ^mol/kg were reported. It must be questioned whether these high levels resulted from reaction with the sampler, with various greases, or perhaps with benton-ite. Ammonium concentrations in the Leg 111 samples are more-or-less consistent with those from Legs 92 and 83, although the individual sample sets exhibit wide ranges. Phosphate was measured to be 0.5-0.8 jimol/kg in the Leg 111 samples, in aliquots that had not precipitated Fe-oxyhydroxides.
Summary and Conclusions Four reliable water samples were obtained from the basement
section of Hole 504B prior to renewed drilling on Leg 111, 1233 days after the hole had been flushed with surface seawater at the end of Leg 92. The samples range in temperature from 81° to 146°C. They show large compositional changes from seawater, having gained Ca2+ and Si and lost Na + K, Mg2 + , and sulfate. These compositional changes, like those observed in samples from this hole taken on previous legs, almost certainly result from a combination of diffusive and possibly convective exchange with formation water from the interstices of the rocks surrounding the hole, coupled with reaction with the wall rocks. At a given temperature and depth in the hole, however, and on average for Ca2+ and Mg2+ over the sampled intervals, the changes seen in the Leg 111 samples are smaller than those in the Leg 83 samples, in spite of a much longer time (1233 vs. 711 days) available for exchange and reaction. The smaller changes may result from vertical convection in the hole and accompanying exchange of borehole water with bottom seawater which is
known to be flowing downhole and into shallow basement. This process would effectively dilute the altered borehole water, changing its composition back toward that of seawater. It also apparently has mixed the waters of varying composition vertically in the hole, so that samples from different depths form mixing lines when major species are plotted against one another. The resulting borehole water compositions are a function of the relative rates of the various processes.
If this explanation is correct, it implies that the rate of vertical convection in the hole must have been faster prior to Leg 111 than prior to Leg 83. The reasons for this change are not obvious, but may be related to the deepening of the hole by 514 m during Leg 83.
BOREHOLE WATER CHEMISTRY, PART 2
IRON-BACTERIA-BEARING MUDS FROM HOLE 504B
Introduction The last few tens of milliliters of water from the RFT sam
plers always contained black mud. These muddy waters from RFT 2 and 3 were kept in separate polybottles, later washed with deionized water by centrifuge and decantation, and dried for further examination. The muddy water sample from RFT 1 was not retained. However, a small quantity of suspended mud in other aliquots was filtered and examined.
Water chemistry on Leg 92 suffered much from bentonite mud used for drilling on Leg 83 and left in the hole afterward. At the end of Leg 92, surface seawater 6.8 times the borehole volume was pumped into the hole in order to wash out the drilling mud from Leg 83. As noted above, very small amounts of mud were found in the waters sampled on Leg 111. It is nonetheless interesting to know the nature and origin of these muds and whether they contain bentonite used on Leg 83. For this purpose shipboard X-ray diffraction (XRD) and scanning electronic microscopy (SEM), in addition to some chemical analyses, were used to identify minerals and their morphology and to compare them with drilling mud obtained from the ship.
Muds The muds are black to reddish brown in color. The total
weight of dry mud recovered from RFT 2 and RFT 3 is 420 and 750 mg, respectively. Because about lA of the original mud from RFT 3 had been consumed for detection of sulfide prior to dry-
81 101 115 146
(129) 2
(140) (146) (134)
80
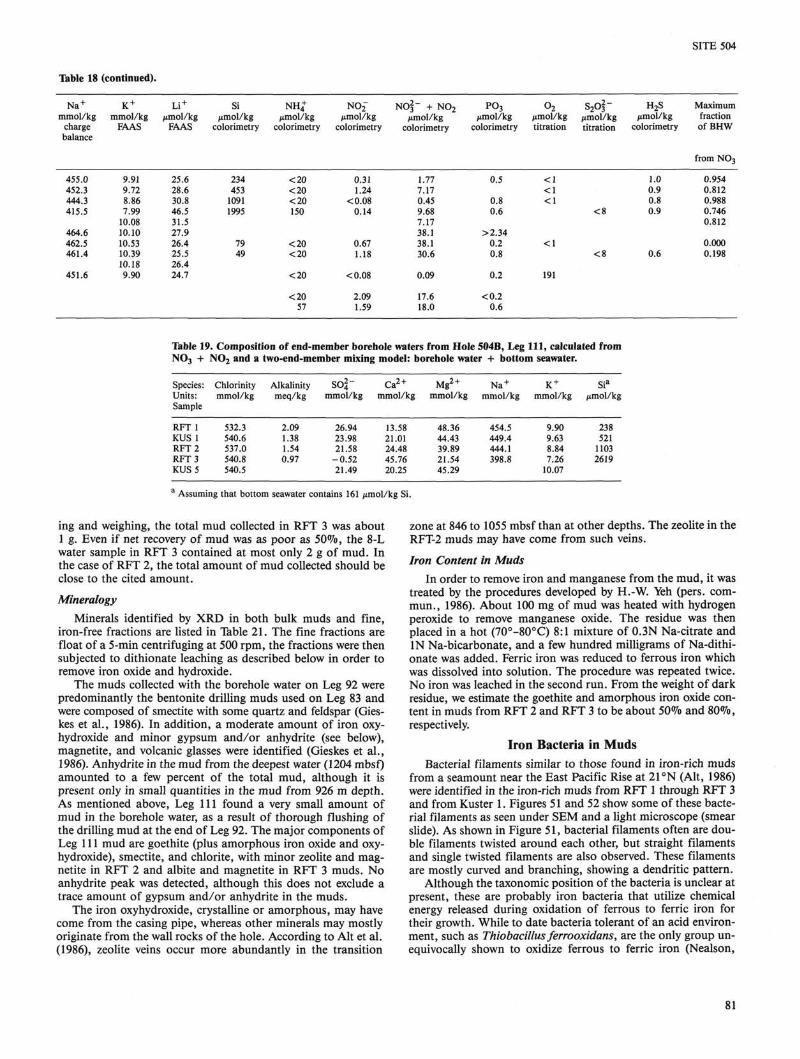
Table 18 (continued).
SITE 504
N a +
mmol/kg charge balance
455.0 452.3 444.3 415.5
464.6 462.5 461.4
451.6
K +
mmol/kg FAAS
9.91 9.72 8.86 7.99
10.08 10.10 10.53 10.39 10.18 9.90
L i +
/*mol/kg FAAS
25.6 28.6 30.8 46.5 31.5 27.9 26.4 25.5 26.4 24.7
Si /xmol/kg
colorimetry
234 453
1091 1995
79 49
NH4+
/miol/kg colorimetry
<20 <20 <20 150
<20 <20
<20
<20 57
N0 2 -/iinol/kg
colorimetry
0.31 1.24
<0.08 0.14
0.67 1.18
<0.08
2.09 1.59
NOf" + N 0 2 /*mol/kg
colorimetry
1.77 7.17 0.45 9.68 7.17 38.1 38.1 30.6
0.09
17.6 18.0
PO3 /imol/kg
colorimetry
0.5
0.8 0.6
>2.34 0.2 0.8
0.2
<0.2 0.6
o2 ^mol/kg titration
< 1 <1 <1
<1
191
s 2 o 2 -^mol/kg titration
< 8
< 8
H2S /miol/kg
colorimetry
1.0 0.9 0.8 0.9
0.6
Maximum fraction of BHW
from NO3
0.954 0.812 0.988 0.746 0.812
0.000 0.198
Table 19. Composition of end-member borehole waters from Hole 504B, Leg 111, calculated from N03 + N02 and a two-end-member mixing model: borehole water + bottom seawater.
Species: Units: Sample
RFT 1 KUS 1 RFT 2 RFT 3 KUS 5
Chlorinity mmol/kg
532.3 540.6 537.0 540.8 540.5
Alkalinity meq/kg
2.09 1.38 1.54 0.97
SO2 . -
mmol/kg
26.94 23.98 21.58
-0 .52 21.49
Ca2 +
mmol/kg
13.58 21.01 24.48 45.76 20.25
Mg2 +
mmol/kg
48.36 44.43 39.89 21.54 45.29
Na +
mmol/kg
454.5 449.4 444.1 398.8
K +
mmol/kg
9.90 9.63 8.84 7.26
10.07
Sia
fimol/kg
238 521
1103 2619
Assuming that bottom seawater contains 161 mol/kg Si.
ing and weighing, the total mud collected in RFT 3 was about 1 g. Even if net recovery of mud was as poor as 50%, the 8-L water sample in RFT 3 contained at most only 2 g of mud. In the case of RFT 2, the total amount of mud collected should be close to the cited amount. Mineralogy
Minerals identified by XRD in both bulk muds and fine, iron-free fractions are listed in Table 21. The fine fractions are float of a 5-min centrifuging at 500 rpm, the fractions were then subjected to dithionate leaching as described below in order to remove iron oxide and hydroxide.
The muds collected with the borehole water on Leg 92 were predominantly the bentonite drilling muds used on Leg 83 and were composed of smectite with some quartz and feldspar (Gies-kes et al., 1986). In addition, a moderate amount of iron oxy-hydroxide and minor gypsum and/or anhydrite (see below), magnetite, and volcanic glasses were identified (Gieskes et al., 1986). Anhydrite in the mud from the deepest water (1204 mbsf) amounted to a few percent of the total mud, although it is present only in small quantities in the mud from 926 m depth. As mentioned above, Leg 111 found a very small amount of mud in the borehole water, as a result of thorough flushing of the drilling mud at the end of Leg 92. The major components of Leg 111 mud are goethite (plus amorphous iron oxide and oxy-hydroxide), smectite, and chlorite, with minor zeolite and magnetite in RFT 2 and albite and magnetite in RFT 3 muds. No anhydrite peak was detected, although this does not exclude a trace amount of gypsum and/or anhydrite in the muds.
The iron oxyhydroxide, crystalline or amorphous, may have come from the casing pipe, whereas other minerals may mostly originate from the wall rocks of the hole. According to Alt et al. (1986), zeolite veins occur more abundantly in the transition
zone at 846 to 1055 mbsf than at other depths. The zeolite in the RFT-2 muds may have come from such veins. Iron Content in Muds
In order to remove iron and manganese from the mud, it was treated by the procedures developed by H.-W. Yeh (pers. com-mun., 1986). About 100 mg of mud was heated with hydrogen peroxide to remove manganese oxide. The residue was then placed in a hot (70°-80°C) 8:1 mixture of 0.3N Na-citrate and IN Na-bicarbonate, and a few hundred milligrams of Na-dithi-onate was added. Ferric iron was reduced to ferrous iron which was dissolved into solution. The procedure was repeated twice. No iron was leached in the second run. From the weight of dark residue, we estimate the goethite and amorphous iron oxide content in muds from RFT 2 and RFT 3 to be about 50% and 80%, respectively.
Iron Bacteria in Muds Bacterial filaments similar to those found in iron-rich muds
from a seamount near the East Pacific Rise at 21 °N (Alt, 1986) were identified in the iron-rich muds from RFT 1 through RFT 3 and from Kuster 1. Figures 51 and 52 show some of these bacterial filaments as seen under SEM and a light microscope (smear slide). As shown in Figure 51, bacterial filaments often are double filaments twisted around each other, but straight filaments and single twisted filaments are also observed. These filaments are mostly curved and branching, showing a dendritic pattern.
Although the taxonomic position of the bacteria is unclear at present, these are probably iron bacteria that utilize chemical energy released during oxidation of ferrous to ferric iron for their growth. While to date bacteria tolerant of an acid environment, such as Thiobacillus ferrooxidans, are the only group unequivocally shown to oxidize ferrous to ferric iron (Nealson,
81
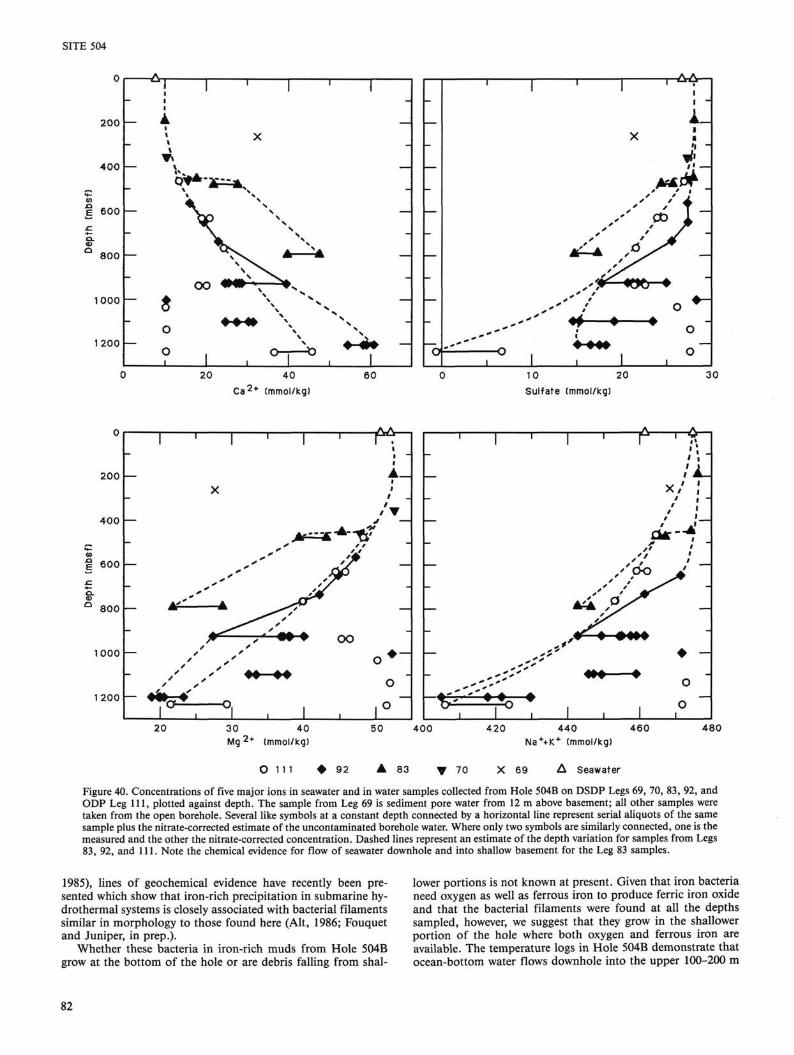
SITE 504
200 —
400 —
E 600
800 —
1000 —
1200 —
20 40 Ca 2 + (mmol/kg)
10 20 Sulfate (mmol/kg)
0
200
400
600
8 0 0
1000
1200
—
—
—
—
I
if-
• /
I 0
' 1 '
X
*' * * * '- A ^ <
•
r J~\
, °l .
1
if—a
1
- i j ^ - i
i
A _ • J
/ ▼ J —
-A- **t'"
'
—
OO
o
1
—
—
A*" "
1
1
.-r--**>'
- T °
i
i
1 '
•
A *
1
—f-X /
d *
' ' & 0
1
# i / i
* i -
i #
/
—
♦ -O
0 _
1 20 30 40
Mg 2 + (mmol/kg)
0 111
50 400 420 440 460 Na*+K + (mmol/kg)
480
♦ 92 A 83 V 70 X 69 A Seawater
Figure 40. Concentrations of five major ions in seawater and in water samples collected from Hole 504B on DSDP Legs 69, 70, 83, 92, and ODP Leg 111, plotted against depth. The sample from Leg 69 is sediment pore water from 12 m above basement; all other samples were taken from the open borehole. Several like symbols at a constant depth connected by a horizontal line represent serial aliquots of the same sample plus the nitrate-corrected estimate of the uncontaminated borehole water. Where only two symbols are similarly connected, one is the measured and the other the nitrate-corrected concentration. Dashed lines represent an estimate of the depth variation for samples from Legs 83, 92, and 111. Note the chemical evidence for flow of seawater downhole and into shallow basement for the Leg 83 samples.
1985), lines of geochemical evidence have recently been presented which show that iron-rich precipitation in submarine hy-drothermal systems is closely associated with bacterial filaments similar in morphology to those found here (Alt, 1986; Fouquet and Juniper, in prep.).
Whether these bacteria in iron-rich muds from Hole 504B grow at the bottom of the hole or are debris falling from shal
lower portions is not known at present. Given that iron bacteria need oxygen as well as ferrous iron to produce ferric iron oxide and that the bacterial filaments were found at all the depths sampled, however, we suggest that they grow in the shallower portion of the hole where both oxygen and ferrous iron are available. The temperature logs in Hole 504B demonstrate that ocean-bottom water flows downhole into the upper 100-200 m
82

SITE 504
2 0 0
400
E 600
800
1000 —
1200
4 -x
»»» »♦
♦♦—*
6^ 7 r i i i i i i i
1
1 1
1 1
—
—
— ♦ 1
1 rA~~
o
1 1
1
Q (
1
1 r ' i > vX \ -
▼ \ \ —
N
l!u~ \ —
, °f> : *• 0.76 0.78 0.80 0.82 0.84 0.86 0.88 510
Na + + K+/chlorinity (mol/mol) 520 530 540
Chlorinity (mmol/kg) 550
0
200
400
OT
E 600
Q .
° 800
1000
1200
; ' 1 ' 1 ' 1 « 1 ' - i
i •A
!*\ X - i * * » * V T \ X —\ v N
v> ♦
V
: \ - - , ^ w * v v i
.♦♦ ■ — ♦♦—# 44 1 , 1 , 1 , 1 > ? ,
1 '
—
— .
~ -
— ■*■
— _
> V
T\
1 1 '
—
-
x •>
— ««
T n * ^ , <t ,
.. r , A
* , « &
# #
4 A A ^W V V
1 1 1
\ A
X J II
CO/ A • , > ^ ^pr
♦
1 1
-
—
-
—
-
500 1000 1500 2000 2500 31 Si (/imol/kg)
O 1 1 1 4 92 A 83 V 70 X 69 A Seawater
32 33 34 Salinity (calculated %.)
35
Figure 41. Concentrations of major species in seawater and in water samples collected from Hole 504B on DSDP Legs 69, 70, 83, 92, and ODP Leg 111, plotted against depth. Symbols are the same as in Figure 40.
of basement (see "Background and Objectives" section, this chapter). The depth variation in the chemical composition of the borehole water obtained in Leg 111 strongly suggests that this ocean-bottom water mixes with the borehole water at the top of a vertical convective cell in the borehole. Such a mixing zone between the 02-rich ocean-bottom water and Fe2+-rich borehole water would provide a favorable environment for the growth of iron-oxidizing bacteria. Bacterial oxidation and precipitation of iron could have been important in the iron budget of the hydrothermal system in the crust that now resides at Site
504B, before mud sealed off the penetration of oxygenated seawater into basement. In this context, it is worth noting that fossil filaments replaced by iron oxide and cemented by silica have been reported in ferruginous cherts associated with the Troodos ophiolite on Cyprus and the Zambales ophiolite in the Philippines (Fouquet and Juniper, in prep.).
The following materials were also examined for bacterial filaments with SEM, but with no success: (1) rust taken from a drill pipe which was used on Leg 110 but not on Leg 111, (2) rust from a steel arm of the RFT sampler that was lost in the
83
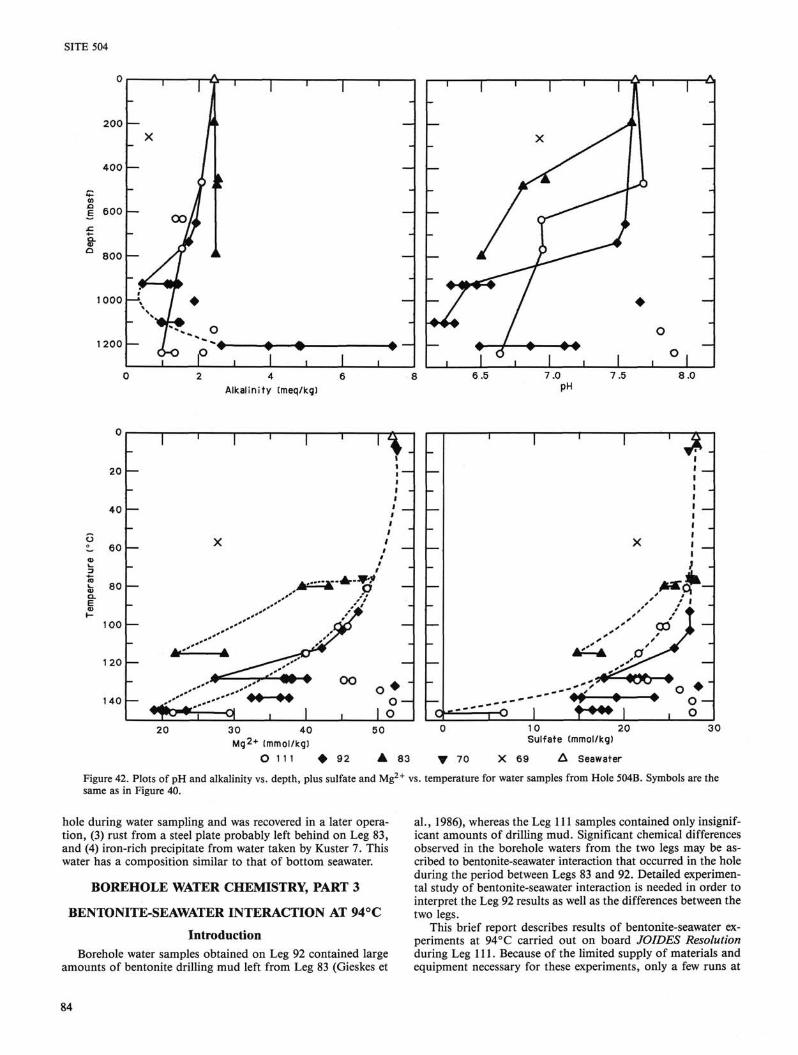
SITE 504
200
400
E 600
800 —
1 000 —V
1200
6.5 7.0 7.5 8.0 Alkalinity (meq/kg) PH
O ^ T - O
30 40 Mq2 + (mmol/kg)
O 1 1 1 ♦ 92
50
A 83
10 20 Sulfate (mmol/kg)
30
▼ 70 X 69 A Seawater
Figure 42. Plots of pH and alkalinity vs. depth, plus sulfate and Mg2+ vs. temperature for water samples from Hole 504B. Symbols are the same as in Figure 40.
hole during water sampling and was recovered in a later operation, (3) rust from a steel plate probably left behind on Leg 83, and (4) iron-rich precipitate from water taken by Kuster 7. This water has a composition similar to that of bottom seawater.
BOREHOLE WATER CHEMISTRY, PART 3
BENTONITE-SEAWATER INTERACTION AT 94°C
Introduction Borehole water samples obtained on Leg 92 contained large
amounts of bentonite drilling mud left from Leg 83 (Gieskes et
al., 1986), whereas the Leg 111 samples contained only insignificant amounts of drilling mud. Significant chemical differences observed in the borehole waters from the two legs may be ascribed to bentonite-seawater interaction that occurred in the hole during the period between Legs 83 and 92. Detailed experimental study of bentonite-seawater interaction is needed in order to interpret the Leg 92 results as well as the differences between the two legs.
This brief report describes results of bentonite-seawater experiments at 94 °C carried out on board JOIDES Resolution during Leg 111. Because of the limited supply of materials and equipment necessary for these experiments, only a few runs at
84

Leg 1 1 1 : RFT 1, KUS 1, RFT 2, RFT 3
50
-50
101 115 Temperature C O
DSDP Leg 83 : PA 1, PA 2
50
-5 0
80 1 15
Temperature (°C)
1 46
7^//A w m
SITE 504
Ca2 +
SO 2 -4
Mg 2 +
Na++ K+
Leg 92 : BAW 2, 3. 4; GDW 1. 2. 3
100 —
Temperature (°C)
Figure 43. Change in concentration of major species in waters from Hole 504B collected on Legs 111, 92, and 83, relative to seawater and normalized to the chlorinity of each individual sample. The samples are arranged in order of increasing temperature. Horizontal lines within each bar mark the change as calculated from the actual measured concentrations, whereas the total height of each bar represents the nitrate-corrected values for the borehole water uncontaminated by seawater during sampling. As noted in the text, the 128°C sample from Leg 92 probably has an excessively large nitrate-correction. See Table 20.
94°C were completed. Nonetheless, the results contain some interesting information relevant to our present interpretations.
Materials
Bentonite Drilling Mud The bentonite drilling mud used for these experiments was
obtained from a bulk tank on board JOIDES Resolution. X-ray diffraction (XRD) and microscopic observation of smear slides indicate that the drilling mud contains a substantial amount of barite. Both bentonite and barite used for drilling are of API (American Petroleum Institute) grade. In addition to other types of clays, silica, or other minerals existing as natural contaminants, the muds may contain as additives soda ash (Na2C03), caustic soda (NaOH), KC1, and some organic chemicals. The drilling mud was used as it was given to us, without any further cleaning.
Seawater
Surface seawater obtained at this site was filtered through a 0.45-/xm Millipore cellulose acetate filter and was used for the experiments.
Experimental Methods Two series of experiments were carried out. In the first, mix
tures each containing 3 g bentonite mud and 10 mL seawater were sealed into 0.5-in. ID X 15-cm long Nalgene CPE tubes and kept in an oven at a temperature range of 90°-l 10°C. In the second series, the volume of seawater was increased to 20 mL and the tubes were kept at 94°C. At desired time intervals, the tubes were taken out of the oven and the solution was separated from the mud by centrifuge. The solution was then analyzed for major cations and anions, and for pH, alkalinity, Si, NH3, and N0 3 by the same techniques as for the borehole waters.
o5
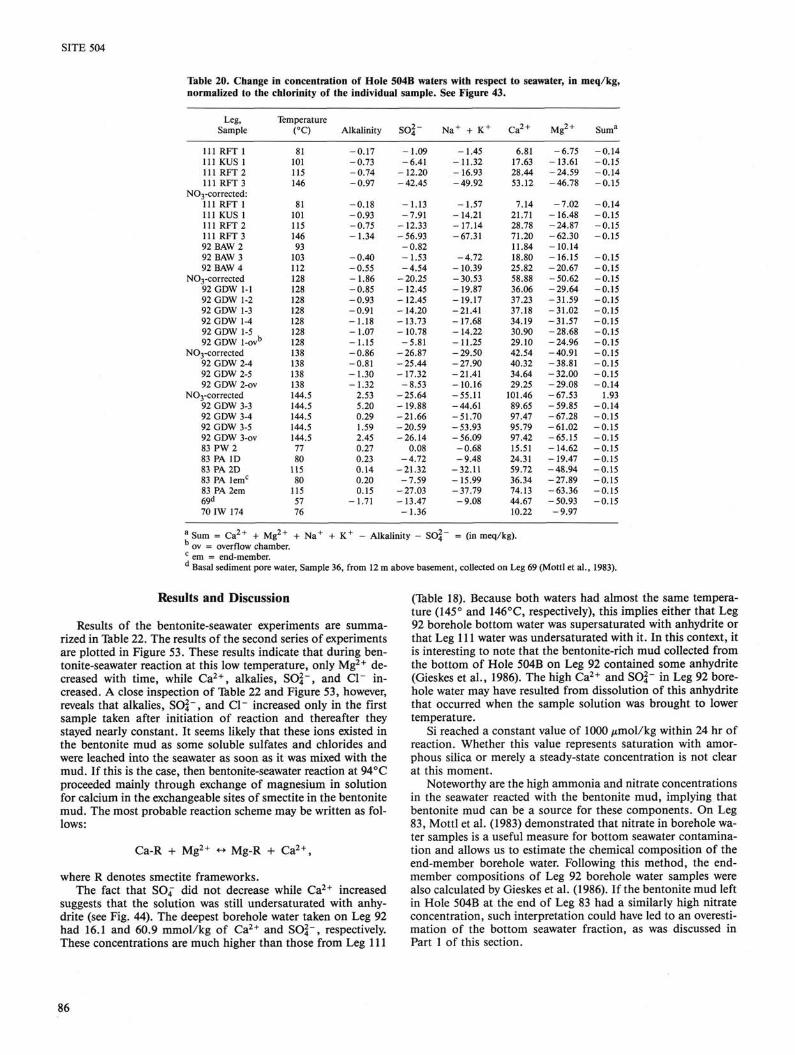
SITE 504
Table 20. Change in concentration of Hole 504B waters with respect to seawater, in meq/kg, normalized to the chlorinity of the individual sample. See Figure 43.
Leg, Sample
111 RFT 1 111 KUS 1 111 RFT 2 111 RFT 3
N03-corrected: 111 RFT 1 111 KUS 1 111 RFT 2 111 RFT 3 92 BAW 2 92 BAW 3 92 BAW 4
N03-corrected 92 GDW 1-1 92 GDW 1-2 92 GDW 1-3 92 GDW 1-4 92 GDW 1-5 92 GDW l-ovb
N03-corrected 92 GDW 2-4 92 GDW 2-5 92 GDW 2-ov
N03-corrected 92 GDW 3-3 92 GDW 3-4 92 GDW 3-5 92 GDW 3-ov 83 P W 2 83 PA ID 83 PA 2D 83 PA lemc
83 PA 2em 69d
70 IW 174
Temperature ( ° Q
81 101 115 146
81 101 115 146 93
103 112 128 128 128 128 128 128 128 138 138 138 138 144.5 144.5 144.5 144.5 144.5 77 80
115 80
115 57 76
Alkalinity
-0 .17 -0 .73 -0 .74 -0 .97
-0 .18 -0 .93 -0 .75 -1 .34
-0 .40 -0 .55 -1 .86 -0 .85 -0 .93 -0 .91 -1 .18 -1 .07 -1 .15 -0 .86 -0 .81 -1 .30 -1 .32
2.53 5.20 0.29 1.59 2.45 0.27 0.23 0.14 0.20 0.15
-1 .71
so|--1 .09 -6 .41
-12.20 - 42.45
-1 .13 -7 .91
-12.33 -56.93
-0 .82 -1 .53 -4 .54
- 20.25 -12.45 -12.45 - 14.20 -13.73 -10.78 -5 .81
-26.87 -25.44 -17.32
-8 .53 -25.64 -19.88 -21.66 -20.59 -26.14
0.08 -4 .72
-21.32 -7 .59
-27.03 -13.47 -1 .36
N a + + K +
-1 .45 -11.32 - 16.93 -49.92
-1 .57 -14.21 -17.14 -67.31
-4 .72 - 10.39 -30.53 -19.87 -19.17 -21.41 -17.68 -14.22 -11.25 -29.50 -27.90 -21.41 -10.16 -55.11 -44.61 -51.70 -53.93 - 56.09 -0 .68 -9 .48
-32.11 - 15.99 -37.79 -9 .08
Ca2 +
6.81 17.63 28.44 53.12
7.14 21.71 28.78 71.20 11.84 18.80 25.82 58.88 36.06 37.23 37.18 34.19 30.90 29.10 42.54 40.32 34.64 29.25
101.46 89.65 97.47 95.79 97.42 15.51 24.31 59.72 36.34 74.13 44.67 10.22
Mg2 +
-6 .75 -13.61 -24.59 -46.78
-7 .02 -16.48 -24.87 -62.30 -10.14 -16.15 - 20.67 - 50.62 -29.64 -31.59 -31.02 -31.57 -28.68 -24.96 -40.91 -38.81 -32.00 -29.08 -67.53 -59.85 -67.28 -61.02 -65.15 -14.62 -19.47 -48.94 -27.89 -63.36 -50.93 -9 .97
Sum3
-0 .14 -0 .15 -0 .14 -0 .15
-0 .14 -0 .15 -0 .15 -0 .15
-0 .15 -0 .15 -0 .15 -0 .15 -0 .15 -0 .15 -0 .15 -0 .15 -0 .15 -0 .15 -0 .15 -0 .15 -0 .14
1.93 -0 .14 -0 .15 -0 .15 -0 .15 -0 .15 -0 .15 -0 .15 -0 .15 -0 .15 -0 .15
a Sum = Ca2+ + Mg2* + Na+ + K+ - Alkalinity - SO^" = (in meq/kg). ov = overflow chamber.
c em = end-member. Basal sediment pore water, Sample 36, from 12 m above basement, collected on Leg 69 (Mottl et al., 1983).
Results and Discussion
Results of the bentonite-seawater experiments are summarized in Table 22. The results of the second series of experiments are plotted in Figure 53. These results indicate that during bentonite-seawater reaction at this low temperature, only Mg2+ decreased with time, while Ca2 + , alkalies, SO2.-, and C l - increased. A close inspection of Table 22 and Figure 53, however, reveals that alkalies, SO 2 - , and Cl" increased only in the first sample taken after initiation of reaction and thereafter they stayed nearly constant. It seems likely that these ions existed in the bentonite mud as some soluble sulfates and chlorides and were leached into the seawater as soon as it was mixed with the mud. If this is the case, then bentonite-seawater reaction at 94°C proceeded mainly through exchange of magnesium in solution for calcium in the exchangeable sites of smectite in the bentonite mud. The most probable reaction scheme may be written as follows:
Ca-R + Mg2+ «. Mg-R + Ca2 + ,
where R denotes smectite frameworks. The fact that SO,j~ did not decrease while Ca2+ increased
suggests that the solution was still undersaturated with anhydrite (see Fig. 44). The deepest borehole water taken on Leg 92 had 16.1 and 60.9 mmol/kg of Ca2+ and SO2.-, respectively. These concentrations are much higher than those from Leg 111
(Table 18). Because both waters had almost the same temperature (145° and 146°C, respectively), this implies either that Leg 92 borehole bottom water was supersaturated with anhydrite or that Leg 111 water was undersaturated with it. In this context, it is interesting to note that the bentonite-rich mud collected from the bottom of Hole 504B on Leg 92 contained some anhydrite (Gieskes et al., 1986). The high Ca2+ and SO2.- in Leg 92 borehole water may have resulted from dissolution of this anhydrite that occurred when the sample solution was brought to lower temperature.
Si reached a constant value of 1000 /imol/kg within 24 hr of reaction. Whether this value represents saturation with amorphous silica or merely a steady-state concentration is not clear at this moment.
Noteworthy are the high ammonia and nitrate concentrations in the seawater reacted with the bentonite mud, implying that bentonite mud can be a source for these components. On Leg 83, Mottl et al. (1983) demonstrated that nitrate in borehole water samples is a useful measure for bottom seawater contamination and allows us to estimate the chemical composition of the end-member borehole water. Following this method, the end-member compositions of Leg 92 borehole water samples were also calculated by Gieskes et al. (1986). If the bentonite mud left in Hole 504B at the end of Leg 83 had a similarly high nitrate concentration, such interpretation could have led to an overesti-mation of the bottom seawater fraction, as was discussed in Part 1 of this section.
86

SITE 504
-3.0
-3.5
O CO
-4.0
-4.5
-5.0 1
Supersaturated 200°
Seawater *5~
Undersaturated
W O m(S04~) = 1 mmol/kq
(Bischoff and Dickson. 1 975)
3000
2000 —
1000 —
2.0 2 .5 3 .0 3 .5 1000/T(°K)
0 111 + 92 A 83 ▼ 70 X 69
50 100
Temperature (°C)
A Seawater
150
Figure 44. Tests for saturation with anhydrite (left diagram) and quartz (right diagram), for water samples from Hole 504B collected on Legs 69 (basal sediment pore water), 70, 83, 92, and 111 (borehole waters). Also shown as unconnected plusses are seawater and the four bentonite-seawater experimental solutions discussed in "Borehole Water Chemistry, Part 3" section, this chapter. Three dashed lines defining anhydrite saturation are „hown in the left diagram, from left to right: (1) a line connecting the 200°C basalt experiment of Bischoff and Dickson (1975) with the 150°-200°C range within which seawater is known to become saturated with anhydrite on heating at 500 bars pressure (Bischoff and Seyfried, 1978), (2) a line (circled plusses) based on the experimental data of Marshall et al. (1964) for anhydrite saturation in NaCl solutions with the same ionic strength as our samples, and (3) a line (four X's) based on experimental data for anhydrite saturation in seawater-derived solutions, compiled by Gieskes et al. (1986) for Leg 92. In the right diagram, the data for quartz saturation (connected plusses) are from Helgeson et al. (1979) below 100°C, and from the compilation of Holland and Malinin (1978) above 100°C.
PALEOMAGNETICS
Introduction Hole 504B is located on the southern flank of the Costa Rica
Rift within the negative magnetic anomaly 3'. At this site, drilling during DSDP Legs 69, 70, and 83 previously penetrated to a total depth of 1350 mbsf, and three major lithologic zones were identified within the basaltic crust: (1) the upper zone that consists primarily of altered extrusive basalt, (2) the transition zone that is hydrothermally altered and consists of both extrusives and dikes, and (3) the lowest zone that is less altered and consists entirely of basaltic dikes. Leg 111 continued coring within the sheeted dike complex to a total depth of 1562.3 mbsf, the deepest penetration of oceanic basement to date.
The shipboard paleomagnetic study was conducted in order to characterize the variation in remanent magnetic properties with depth in the crustal section. Shore-based studies will be carried out in order to define the composition of magnetic source minerals, define the amount and type of alteration present, and elucidate the effect of alteration on the magnetic properties.
Experimental Methods Paleomagnetic samples were chosen from the recovered core
on the basis of lithologic homogeneity and the ability to orient the sample vertically. Although we attempted to take one sample per core section (1.5 m), the presence of unoriented core pieces did not always allow this. All measurements were made on mini-cores which were 2.5 cm in diameter and approximately 2.0 cm in length.
Remanent magnetic properties (intensity, inclination, and declination) were measured with a MOLSPIN Portable Rock Magnetometer. This magnetometer was connected to a DEC PRO-350 microcomputer using software written by Y. Hamano on Leg 109 and modified by J. Tauxe on Leg 110. Since ODP hard-rock cores are not oriented azimuthally, inclination is the only directional component that can be validly measured. Alternating field demagnetization was performed in 25-Oe steps using a single-axis Schonstedt Geophysical Specimen Demagnetizer. In all cases, demagnetization was continued until the sample intensity fell below one half of J0 (natural remanent magnetization) value and until stable components were identified on a Zijder-veld plot. The MDF (mean destructive field) is the peak value of the demagnetizing field that caused the sample intensity to reach one half J0 and was determined from demagnetization curves.
Initial susceptibility (X0) was measured with a Bartington Magnetic Susceptibility Meter. The Koenisberger ratio (Q) was calculated from observed XQ and J0 values using a field value of 0.5 Oe such that Q = J0/(X0 x 0.5). See Table 23 for numerical values of paleomagnetic measurements.
Results
Intensity of Remanent Magnetization (J0) J0 values are displayed in Figure 54A. With the exception of
values for the top three samples and a sample at 1515 mbsf, which are scattered, the value of J0 clusters tightly about 1800 /xemu/cm3. This value is slightly higher than those observed by Kinoshita et al. (1985) on Leg 83. The low scatter is not surpris-
87

SITE 504
480
35 2 +
Mg (mmol/kg)
O 1 1 1 ♦ 92 A 83 V 70 X 69
35 Mg* (mmol/kg)
A Seawater
Figure 45. Concentrations of major species in seawater and in water samples collected from Hole 504B on DSDP Legs 69, 70, 83, 92, and ODP Leg 111, plotted against Mg2+. The sample from Leg 69 is basal sediment pore water; all other samples were taken from the open borehole. Symbols are the same as in Figure 40.
ing considering the small variation in lithology throughout the recovered section. It is very likely that these values simply represent lithologies which are easily recovered, so units with higher degrees of fracturing and more pervasive alteration are less likely to be recovered and thus these results may be biased toward high intensities. Hopefully, areas of low recovery can be characterized from geophysical logs and this problem can be further resolved.
Initial Susceptibility (X0) Magnetic susceptibility is primarily a function of concentra
tion and grain size of magnetic minerals. The X0 values for the recovered core are displayed in Figure 54B and show an increase
with depth from about 1500 fiG/Ot to 3500 ^G/Oe. The mean value of X0 from the upper part of the sheeted complex was observed to be 1000 /xG/Oe (Kinoshita et al., 1985; Smith and Banerjee, 1986). If the dikes were initially of the same composition, as implied by the petrology, then the increase in susceptibility could be easily explained by changes in either grain size or concentration of magnetite. Studies of ophiolite complexes and the upper portion of the sheeted dike complex at this site indicate that primary titanomagnetites are strongly affected by hy-drothermal alteration (Swift and Johnson, 1984; G. M. Smith and S. K. Banerjee, pers. comm., 1987) The observed increase of X0 with depth thus may be caused by an change in the style or degree of alteration.
88

SITE 504
S- 540
c 530 —
520 —
510
6 —
- sc
0 30
- i S:
550 —
20
10
I
20 Ca 2 +
40 (mmol/kq)
60
+ 92 V 70 X 69 A Seawater
Figure 46. Plots of alkalinity and chlorinity vs. Mg2+, plus alkalinity and sulfate vs. Ca2+, for water samples from Hole 504B. Symbols are the same as in Figure 40.
Koenisberger Ratio (Q)
The Koenisberger ratio is commonly used to determine the source of in-situ magnetization and is important in identifying the source of the magnetic anomalies observed at sea level. Values less than 1 imply a magnetization dominated by an induced magnetization parallel to the current field, and values greater than 1 imply a magnetization dominated by remanent magnetization. The mean values for Q decrease from 3.5 at 1350 mbsf to 1 at 1550 mbsf (see Fig. 55A). Leg 83 results from the dike complex also gave a mean Q value of 3.5 (Kinoshita et al., 1985). This indicates that in-situ magnetization is dominated by remanent magnetization in the upper part of the hole, and that components of magnetization parallel to the earth's current field
become more important with depth. Additionally, this suggests that the upper dikes may indeed contribute to the magnetic anomaly observed at sea level.
Mean Destructive Field (MDF) MDF values are plotted vs. depth in Figure 55B and have a
mean value which decreases from 175 Oe at 1350 mbsf to 75 Oe at 1550 m. This is lower than the average MDF of 225 Oe which was observed by Kinoshita et al. (1985) from the upper part of the sheeted dike complex. MDF is used to judge the ease with which remanent magnetization is removed and to infer the grain size of magnetic minerals. These data suggest that the effective magnetic grain size is increasing with depth in the sheeted complex. Further, since only a weak field is required to remove
89
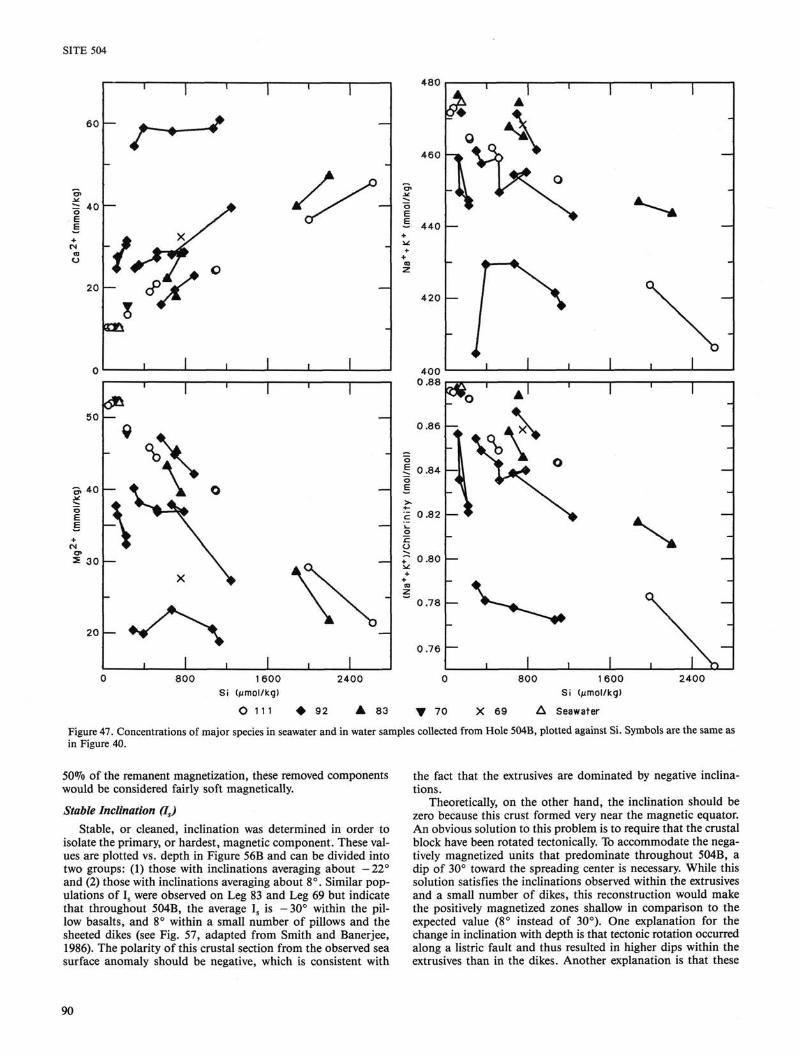
SITE 504
480
50
S. 40 u o e E
+ N
2 30
20
1
I 1 1
1 ' 1
1 1 1
0.86
c 0.82
r o.8o -
0.78
0.76
^
800 1600 Si (Mmol/kg)
O 1 1 1
2400 800
♦ 92 ▲ 83 ▼ 70 X 69
1600 Si (Mmol/kg)
A Seawater
2400
Figure 47. Concentrations of major species in seawater and in water samples collected from Hole 504B, plotted against Si. Symbols are the same as in Figure 40.
50% of the remanent magnetization, these removed components would be considered fairly soft magnetically.
Stable Inclination (Is) Stable, or cleaned, inclination was determined in order to
isolate the primary, or hardest, magnetic component. These values are plotted vs. depth in Figure 56B and can be divided into two groups: (1) those with inclinations averaging about - 2 2 ° and (2) those with inclinations averaging about 8°. Similar populations of Is were observed on Leg 83 and Leg 69 but indicate that throughout 504B, the average Is is - 3 0 ° within the pillow basalts, and 8° within a small number of pillows and the sheeted dikes (see Fig. 57, adapted from Smith and Banerjee, 1986). The polarity of this crustal section from the observed sea surface anomaly should be negative, which is consistent with
the fact that the extrusives are dominated by negative inclinations.
Theoretically, on the other hand, the inclination should be zero because this crust formed very near the magnetic equator. An obvious solution to this problem is to require that the crustal block have been rotated tectonically. To accommodate the negatively magnetized units that predominate throughout 504B, a dip of 30° toward the spreading center is necessary. While this solution satisfies the inclinations observed within the extrusives and a small number of dikes, this reconstruction would make the positively magnetized zones shallow in comparison to the expected value (8° instead of 30°). One explanation for the change in inclination with depth is that tectonic rotation occurred along a listric fault and thus resulted in higher dips within the extrusives than in the dikes. Another explanation is that these
90
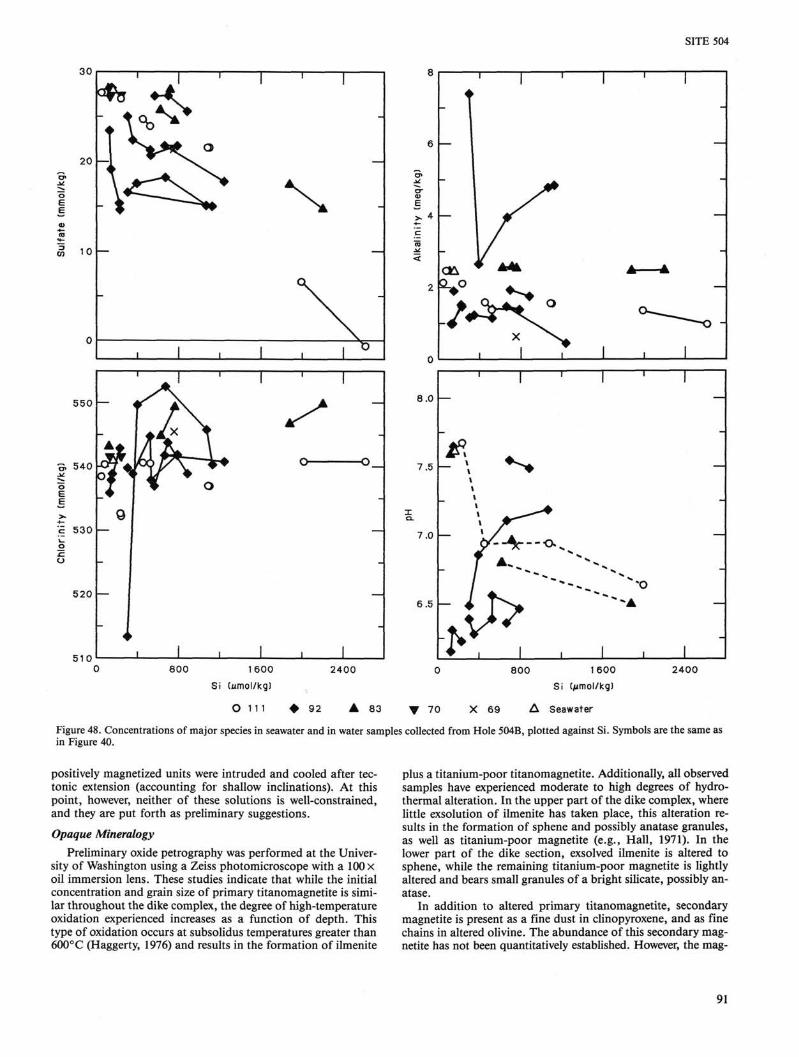
SITE 504
30
* • * »
20
10
550
"5. 540
530
520 —
510
S
800 1600 Si (umol/kg)
2400
O 1 1 1 ♦ 92 A 83 V 70 X 69
800 1600 Si (/umol/kg)
A Seawater
2400
Figure 48. Concentrations of major species in seawater and in water samples collected from Hole 504B, plotted against Si. Symbols are the same as in Figure 40.
positively magnetized units were intruded and cooled after tectonic extension (accounting for shallow inclinations). At this point, however, neither of these solutions is well-constrained, and they are put forth as preliminary suggestions.
Opaque Mineralogy Preliminary oxide petrography was performed at the Univer
sity of Washington using a Zeiss photomicroscope with a 100 x oil immersion lens. These studies indicate that while the initial concentration and grain size of primary titanomagnetite is similar throughout the dike complex, the degree of high-temperature oxidation experienced increases as a function of depth. This type of oxidation occurs at subsolidus temperatures greater than 600° C (Haggerty, 1976) and results in the formation of ilmenite
plus a titanium-poor titanomagnetite. Additionally, all observed samples have experienced moderate to high degrees of hydro-thermal alteration. In the upper part of the dike complex, where little exsolution of ilmenite has taken place, this alteration results in the formation of sphene and possibly anatase granules, as well as titanium-poor magnetite (e.g., Hall, 1971). In the lower part of the dike section, exsolved ilmenite is altered to sphene, while the remaining titanium-poor magnetite is lightly altered and bears small granules of a bright silicate, possibly anatase.
In addition to altered primary titanomagnetite, secondary magnetite is present as a fine dust in clinopyroxene, and as fine chains in altered olivine. The abundance of this secondary magnetite has not been quantitatively established. However, the mag-
91

SITE 504
5 5 0
| 500 E
t 450 —
1 1
+ -
* ■ «s _
■ v .
1
, ■
1
1 ' 1
■ Na+ + K +
+ Chlorinity
N
1 , 1
+ _
u .oo
0.86
3 £ 0.84
e
£ 0.82 i _
o c o r o.8o V +
+ z
0.78
0.76
♦+ N "
\ — _
-
1
x x V* V
1
1 ' 1 ' 1 ■ RFT ♦ <US
4- Seawater
■ \ V.
V
X X
X X
X X
X X
X
X
! , 1 , l N
— -
—
— _
—
-
2.5
2.0
£ 1 .5 —
1 .0 —
800 1600 Si (/jmol/kqJ
2400 800 1600 Si (MTiOl/kq!
2400
Figure 49. Concentrations of major species in seawater and in water samples collected from Hole 504B on ODP Leg 111, plotted against Si.
netic properties measurements of MDF and X0 suggest that the primary contributor to the magnetic signal has a large effective grain size.
Conclusions While the mean value of J0 for the section of sheeted dikes
cored during Leg 111 agrees fairly well with that of the upper sheeted dike complex, susceptibility is observed to increase down-hole, and MDF and Q are observed to decrease downhole. These data indicate that the effective grain size of magnetic minerals is increasing as a function of depth. Oxide petrography shows that high-temperature oxidation of primary titanomagne-tite increases with depth. This appears to result in a change in the style of alteration caused by the interaction of hydrothermal fluid with titanomagnetite.
Is values do not agree with the theoretical value, and this may be a result of tectonic rotation toward the spreading center. Further, a change in mean inclination is observed between the pillow basalts and dikes.
PHYSICAL PROPERTIES The measurements of physical properties of basalts recov
ered from Hole 504B during Leg 111 are described, together
with the techniques used, in the "Introduction and Explanatory Notes" chapter, this volume. The results of the calibrations used in computing the results are given here.
Index Properties Index properties measurements of wet and dry weights and
volumes were made at a frequency approximating one per core-section, though occasionally, where core recovery was especially poor and there appeared to be no major lithological change, no determinations were made at that specific depth. The measurements were then used to determine the parameters of wet bulk density, porosity, water content, and grain density (Table 24 and Fig. 58).
The average wet bulk density of the samples measured was 2.91 g/cm3 ± 0 . 0 6 g/cm3, whilst the grain density determinations gave a mean value of 2.94 g/cm3 ± 0.06 g/cm3. These values are much in line with previous results and are not considered to be exceptional. Porosity values center on a mean value of 1.33% ± 0.73%, while corresponding water content determinations give a mean of 0.10% ± 0.12%. Again these values are not significantly different from those reported previously. It should perhaps be noted, however, that at exceptionally low porosities (water contents) such as those exhibited by basement at
92
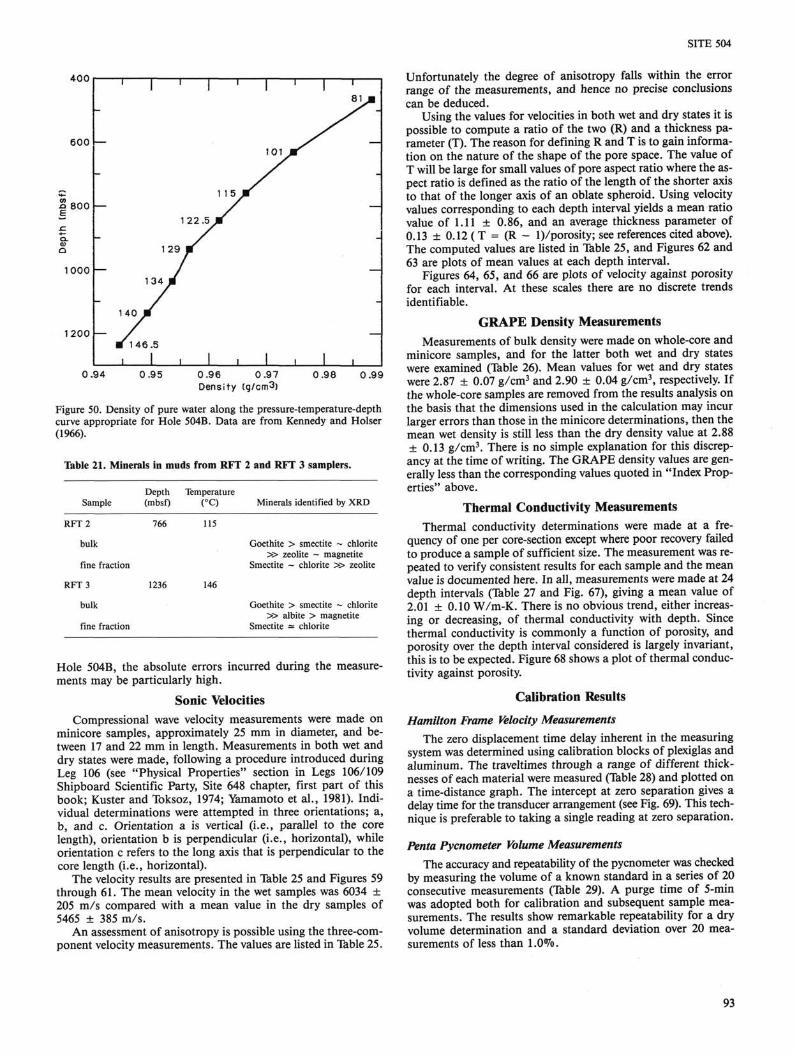
SITE 504
400
500
£> 800 —
1000 —
1200 —
0.94
_
""
-
' l
129
134 m
140 m
■ 146.5
1 1
122
I
.51
1
1
1 1 5 M
1
1 '
101 wT
I I
8 1 *
—
-
—
-
1 1 0.95 0.96 0.97
Density (g/cm3) 0.98 0.99
Figure 50. Density of pure water along the pressure-temperature-depth curve appropriate for Hole 504B. Data are from Kennedy and Holser (1966).
Table 21. Minerals in muds from RFT 2 and RFT 3 samplers.
Sample Depth Temperature (mbsf) (°C) Minerals identified by XRD
RFT 2
bulk
fine fraction
RFT 3
bulk
fine fraction
766
1236
115
146
Goethite > smectite ~ chlorite » zeolite ~ magnetite
Smectite ~ chlorite » zeolite
Goethite > smectite ~ chlorite » albite > magnetite
Smectite * chlorite
Hole 504B, the absolute errors incurred during the measurements may be particularly high.
Sonic Velocities Compressional wave velocity measurements were made on
minicore samples, approximately 25 mm in diameter, and between 17 and 22 mm in length. Measurements in both wet and dry states were made, following a procedure introduced during Leg 106 (see "Physical Properties" section in Legs 106/109 Shipboard Scientific Party, Site 648 chapter, first part of this book; Kuster and Toksoz, 1974; Yamamoto et al., 1981). Individual determinations were attempted in three orientations; a, b, and c. Orientation a is vertical (i.e., parallel to the core length), orientation b is perpendicular (i.e., horizontal), while orientation c refers to the long axis that is perpendicular to the core length (i.e., horizontal).
The velocity results are presented in Table 25 and Figures 59 through 61. The mean velocity in the wet samples was 6034 ± 205 m/s compared with a mean value in the dry samples of 5465 ± 385 m/s.
An assessment of anisotropy is possible using the three-component velocity measurements. The values are listed in Table 25.
Unfortunately the degree of anisotropy falls within the error range of the measurements, and hence no precise conclusions can be deduced.
Using the values for velocities in both wet and dry states it is possible to compute a ratio of the two (R) and a thickness parameter (T). The reason for defining R and T is to gain information on the nature of the shape of the pore space. The value of T will be large for small values of pore aspect ratio where the aspect ratio is defined as the ratio of the length of the shorter axis to that of the longer axis of an oblate spheroid. Using velocity values corresponding to each depth interval yields a mean ratio value of 1.11 ± 0.86, and an average thickness parameter of 0.13 ± 0.12 ( T = (R - l)/porosity; see references cited above). The computed values are listed in Table 25, and Figures 62 and 63 are plots of mean values at each depth interval.
Figures 64, 65, and 66 are plots of velocity against porosity for each interval. At these scales there are no discrete trends identifiable.
GRAPE Density Measurements Measurements of bulk density were made on whole-core and
minicore samples, and for the latter both wet and dry states were examined (Table 26). Mean values for wet and dry states were 2.87 ± 0.07 g/cm3 and 2.90 ± 0.04 g/cm3, respectively. If the whole-core samples are removed from the results analysis on the basis that the dimensions used in the calculation may incur larger errors than those in the minicore determinations, then the mean wet density is still less than the dry density value at 2.88 ± 0 . 1 3 g/cm3. There is no simple explanation for this discrepancy at the time of writing. The GRAPE density values are generally less than the corresponding values quoted in "Index Properties" above.
Thermal Conductivity Measurements Thermal conductivity determinations were made at a fre
quency of one per core-section except where poor recovery failed to produce a sample of sufficient size. The measurement was repeated to verify consistent results for each sample and the mean value is documented here. In all, measurements were made at 24 depth intervals (Table 27 and Fig. 67), giving a mean value of 2.01 ± 0.10 W/m-K. There is no obvious trend, either increasing or decreasing, of thermal conductivity with depth. Since thermal conductivity is commonly a function of porosity, and porosity over the depth interval considered is largely invariant, this is to be expected. Figure 68 shows a plot of thermal conductivity against porosity.
Calibration Results
Hamilton Frame Velocity Measurements The zero displacement time delay inherent in the measuring
system was determined using calibration blocks of plexiglas and aluminum. The traveltimes through a range of different thicknesses of each material were measured (Table 28) and plotted on a time-distance graph. The intercept at zero separation gives a delay time for the transducer arrangement (see Fig. 69). This technique is preferable to taking a single reading at zero separation.
Penta Pycnometer Volume Measurements The accuracy and repeatability of the pycnometer was checked
by measuring the volume of a known standard in a series of 20 consecutive measurements (Table 29). A purge time of 5-min was adopted both for calibration and subsequent sample measurements. The results show remarkable repeatability for a dry volume determination and a standard deviation over 20 measurements of less than 1.0%.
93

SITE 504
9.8fjim
Figure 51. SEM views of bacterial filaments in iron-rich sediments from Hole 504B. A. Bacterial filament from RFT-2 (4240 mbsf, 118°C).
HIGH-TEMPERATURE MEASUREMENTS AFTER RETURN TO THERMAL EQUILIBRIUM
Introduction After the first reentry of Hole 504B during Leg 111, the pipe
was held within the top of casing and temperatures throughout the hole were immediately logged before any thermal disturbance could be imparted to the fluids in the borehole. The last disturbance to the hole had occurred over 3 yr earlier during Leg 92; this period of time was sufficiently long for borehole temperatures to have fully equilibrated with the crustal geother-mal gradient.
During the four previous legs to Hole 504B, 11 temperature profiles had been recorded; of these, the most valuable were the 3 profiles taken under equilibrium conditions as Legs 70, 83, and 92 began operations in the hole (Becker et al., 1983a, 1983b, 1985). After the initial reentries during these legs, the drill pipe and bit were slowly run down the hole to clean out any bridges or obstructions and to allow temperature measurements and water sampling with tools that either landed in the bit or were built into the BHA. Thus, the Legs 70, 83, and 92 profiles of equilibrium temperatures were measured during pauses in these sampling/hole-cleaning pipe runs at widely-spaced discrete points using recorders that extended less than 1 m ahead of the bit.
94

SITE 504
'. « s
Figure 52. Bacterial filaments from the bottom of Hole 504B (4710 mbsf, 146°C) viewed by an optical microscope. Magnification X277.
There had never been any safety problems resulting from bridges or abnormal hole conditions in Hole 504B, and, during Leg 111, the borehole waters were to be sampled using tools on the logging cable or the coring line. Therefore, after Leg 111 reen-tered Hole 504B, the temperature logging tool was allowed to be the first equipment run down into the hole. As a result, of all temperatures ever measured in DSDP/ODP holes, the profile measured during Leg 111 (Plate 4, back pocket) is probably the closest to equilibrium and the best in quality.
Previous temperature logs in Hole 504B had shown that crustal temperatures generally followed a profile consistent with conductive cooling of 5.9-m.y.-old crust (Fig. 4), with temperatures approaching 160°C at the bottom of the hole (1350 mbsf)-However, temperatures in the upper 400 m were depressed relative to the conductive profile, indicating that ocean bottom water was flowing down the hole at a rate that significantly decayed over the 4 yr between Legs 69 and 92 (Fig. 6). The high temperatures deep in the hole had never been measured accurately, as they were beyond the operating and resolution ranges of the DSDP tools used. The primary purpose of the Leg 111 temperature log was to accurately measure the geothermal gradient deep in the hole. A second purpose was to measure temperatures in the upper 400 m and to subsequently estimate the
present rate and overall decay of downhole flow of ocean bottom water over the 7 yr since this flow started during Leg 69.
Technical Description of Temperature-Logging Equipment
The equipment used to log temperatures in Hole 504B during Leg 111 was a high-temperature tool developed and built at the Bureau de Recherches Geologiques et Minieres (BRGM), France, and used throughout Europe for the past 7 yr for studies of continental heat flow. In order to measure the high temperatures expected in Hole 504B, the probe was modified to operate at elevated temperatures while maintaining its high-resolution capabilities.
The Probe The downhole probe is a cylinder made of stainless steel,
60 mm in diameter and about 3 m in length, weighing 50 kg. The temperature sensors are accurately calibrated thermistors housed in a 5-mm-diameter tube at the lower end of the probe. Temperatures are determined from the resistances of two thermistors that can be monitored separately or in combination for maximum sensitivity over the logged interval.
Measuring and Recording Equipment The control unit acquires data through the 7-conductor log
ging cable, and records and displays thermistor resistance values. It includes a DC current calibrator, a digital voltmeter (6Vi digit), and a microcomputer. The validity of the DC thermistor resistance measurement can be checked by replacing the cable and probe with a 10-kC precision resistor.
Calibration The entire system—thermistor probe, cable resistance, and
measuring and recording equipment—was calibrated at the La-boratoire National de Mesures in Paris, which issued a calibration certificate. Calibrated resistance data for the entire system are given in Table 30. The temperature-resistance calibration data were fit to the standard function for thermistor resistance (R),
1/T(°K) = A + Bln(R) + C[ln(R)]3
and the appropriate calibration coefficients were used to convert measured resistances to temperatures. Figure 70 shows this calibration function for the combination of the two thermistors used in the probe. Table 31 presents typical resistance values
Table 22. Time variation of solution chemistry during bentonite-seawater interaction at 90°C-110°C (bentonite-1) and 94°C (bentonite-2).
Sample
Bentonite 1-0 -1
Bentonite 2-0 -1 -2 -3
Sample
Bentonite 1-0 -2
Bentonite 2-0 -1 -2 -3
Time (hr)
0 5.0 0 6.3
23.7 51.2
pH at
23 °C
8.17 7.75 8.17 8.15 7.63 7.63
Alkalinity (meq/kg)
2.271 3.338 2.271 2.987 2.494 1.88
Salinity (%o)
calculated
32.5
32.5 36.13 36.34 36.58
SO2 , -
26.68 39.40 26.68 32.49 33.01 33.15
Ca2 + Mg2 +
(mmol/kg)
9.58 15.25 9.58
13.96 19.00 22.31
Chlorinity (%o)
50.76 29.22 50.76 37.41 33.25 30.10
(mmol/kg) titration
18.669
18.669 19.409 19.478 19.613
526.58
526.58 547.46 549.40 553.21
N a + + K +
461.54
461.54 512.68 513.41 516.59
Si
570 996
1010
N H ^ NOJ- + N02 (ftmol/kg)
<20
<20
87
0.09 164
0.0
94.3 103
95

SITE 504
1000 —
800 —
=: 600 —
400
200
1
/ /
/ / /
_ / m _ / /
_ / /
-/ J. i
4 1
II 1
1 '
i 1 1
1 '
i
—
—
-
_
-
60
50
- , - * ■
rv 40
«> 3 0
20
10
Chlorinity — X /10 .
(Na++ K+l/10
■ # - ^ -+ so|" Mg 2x-
_ - ♦ Ca2+
S
20 40 Duration (hr)
60 20 40 Duration (hr)
60
T = 94°C, P = vapor pressure, w/r = 6.7 (g/g)
Figure 53. Time excursion of Si, Ca, Mg, Na + K, Cl, and S04 in solution during bentonite-seawater interaction at 94°C.
Table 23. Numerical values for paleomagnetic measurements.
Core-section interval (cm)
142R-1, 6 142R-2, 57 143R-1, 105 144R-1, 89 145-1, 95 145-2, 123 145-3, 44 147-1, 39 147-2, 44 148-1, 61 148-1, 68 149-1, 82 150-1, 113 152-1, 123 155-1, 43 158-1, 12 161-1,4 163-1, 43 163-2, 17 164-1, 7 169R-1, 66
Depth (mbsf)
1352.86 1354.87 1360.35 1369.59 1379.25 1381.03 1381.74 1397.79 1398.94 1407.41 1407.48 1417.72 1427.53 1437.13 1459.43 1482.62 1504.14 1512.03 1513.27 1515.17 1548.26
Xo (jiG/Oe)
3064.0 1921.0 467.0 1641.0 1629.0 1152.0 1588.0 1605.0 1849.0 1773.0 1865.0 1691.0 1349.0 1893.0 2705.0 2121.0 2109.0 3559.4 3123.9 2834.1 2262.5
Jo , (/^emu/cm )
6000.57 3416.72 258.37 1338.63 2352.77 2079.53 1935.28 2179.79 2143.82 2191.40 1742.21 1650.92 1515.90 1783.48 1499.73 1084.03 1729.85 1834.86 2441.82 4483.44 1539.30
Io 35.7
-20.3 -36.8 6.8 14.4 0.3
-2.5 35.1 38.9 23.5 31.9 3.4 28.9 54.3 3.4
-21.9 63.1 41.5 30.9 43.2 45.6
Is -36.8 -25.4 -17.1 -14.9 -21.6 -22.5 -23.8
8.2 7.4 7.0 12.0 4.9 0.0 8.1
-1.3 -18.9 7.7 7.8 2.2
20.6 4.0
MDF (Oe)
97 75 222 149 130 121 143 132 131 152 161 171 104 75 161 138 102 140 160 83 106
that correspond to temperature variations of 0.1 °C and illustrates the temperature sensitivity of the measurement system, given that the digital voltmeter resolves resistance to 0.1 0.
Data Acquisition The tool is run downward at a logging speed equal to or less
than 5 m/min. Depth and temperature values are generally recorded every 10-35 cm; a finer sampling interval is possible but not very useful because of slight oscillations in cable length and position. At cooler temperatures, the resistance of one thermistor is initially monitored; as logging progresses deeper and temperatures increase, two thermistors are monitored to optimize
1350
1 400 —
1450 —
500
1550
I ' • '
I l*_J 5000 0 2000 4000
Figure 54. A. J0 (/^emu/cm3) plotted vs. depth for Leg 111 samples. B. X0 (/xG/Oe) plotted vs. depth for Leg 111 samples.
96

SITE 504
1350
1400
1450
1500
1 c;^n
A
—
• •
• • •
• • -• • • •
•
•
•
• • • •
4 50 250
Figure 55. A. Q ratio plotted vs. depth for Leg 111 samples. B. MDF plotted vs. depth for Leg 111 samples.
1300
1400
1500
• •
• %
-40 0 40 l 0 (degrees)
-40 0 40 I s (degrees)
Figure 56. A. I0 (initial inclination) plotted vs. depth for Leg 111 samples. B. Is (stable inclination) plotted vs. depth for Leg 111 samples.
resolution. Profiles of temperature and geothermal gradient are displayed simultaneously.
Results The temperature log was run from 1200 to 2300 on 30 August
1986. The tool was run downward from seafloor to the bottom of the hole at 5 m/min and a sampling interval of 35 cm. A single thermistor was used down to 300 mbsf and the combination of two thermistors was used below this depth. The tool reached an obstruction at 1291 mbsf, after which it was held stationary at 1298 mbsf to check the stability of the recorded bottom-hole temperature. The temperature log was repeated when pulling the tool up out of the hole, and the probe was held stationary at 4 m above seafloor to check the probe reading against the well-known bottom water temperature of 2.01 °C.
Temperature Profile and Geothermal Gradient The recorded profiles of temperature and gradient are dis
played together in Figure 71. Near the seafloor, the temperature increases slowly with depth from the bottom water value (Fig. 72). Near the bottom of the hole, measured temperatures reach a stable maximum of 148.55 °C at 1298 mbsf (Table 32 and Fig. 73).
In the shallow part of the hole, the measured gradient increases rapidly with depth. High gradient values are recorded down to about 270 mbsf, accompanied by large observed variations which are related to the thermal disturbance caused by the downhole flow of bottom water. Deeper than 270 mbsf, the observed gradient decreases rapidly down to 900 mbsf. Below 900 mbsf, the gradient fluctuates closely about an average value of 6°C/100 m.
Discussion
Comparison to Previous Measurements Deeper than 350 mbsf, the temperatures measured during
Leg 111 are close to temperatures measured in Hole 504B during previous legs (Fig. 4). Differences in the shallowest 350 m are due to the transient decay of the downhole flow of cold ocean bottom water. In the dikes, the gradient stabilizes at a value of 6°C/100 m, slightly lower than the value of 7°C/100 m determined with less accurate measurements during Leg 92. The lower gradient value implies a correspondingly lower interval heat flow value of about 120 mW/m2 in the dikes.
Determination of Rate of Downhole Flow Temperatures measured during Leg 111 in the cased section
of the hole (where the rate of downhole flow must remain uniform with depth) were matched to profiles predicted for various constant downhole flow rates using the transient model of Becker et al. (1983a). A comparison of the measured temperatures with those predicted using the model (Fig. 74) indicates that the rate of downhole flow is about 1.1 m/hr, or about 80 L/hr. This flow rate has considerably decayed over 7 yr, from rates of 90, 25, and 2.4 m/hr (6400, 1800, and 170 L/hr) determined during Legs 70, 83, and 92, respectively (Becker et al., 1983a, 1983b, 1985). The Leg 111 rate of 80 L/hr confirms the prediction of Williams et al. (1986).
Variations in the Temperature and Gradient Profiles In addition to the effect of the downhole flow, the profiles of
both temperature and gradient show large thermal disturbances in the depth interval 60-120 mbsf (Fig. 75). These disturbances
97

1400
Figure 57. Is plotted vs. depth for previously drilled portions of 504B (after Smith and Banerjee, 1986).
Table 24. Index properties of basalts from Hole 504B, Leg 111.
Core-section
142R-2 142R-2 143R-2 144R-1 145R-1 145R-2 145R-3 147R-1 147R-2 148R-1 149R-1 150R-1 152R-1 153R-1 154R-1 155R-1 157R-1 161R-1 163R-1 163R-2 164R-1 169R-1
Interval (cm)
6-8 65-67 14-15 83-84
104-105 127-128 47-48 43-44 48-49
138-139 82-84
113-115 121-122 130-131 64-66 43-45 21-22
4-6 43-45 17-19 7-9
66-68
Depth (mbsf)
1352.9 1355.0 1360.9 1369.5 1379.3 1381.1 1381.8 1397.8 1399.4 1408.2 1417.7 1427.5 1437.1 1446.6 1455.0 1459.4 1473.3 1504.2 1512.0 1513.3 1515.2 1548.3
Bulk density (g/cm3)
2.93 2.91 2.88 2.68 2.90 2.90 2.89 2.93 2.94 2.94 2.98 2.89 2.94 2.90 2.98 2.98 2.86 2.94 2.93 2.90 2.93 2.96
Porosity (%) 1.18 0.97 2.20 1.47 1.07 1.77 1.83 1.09 2.31 0.93 0.42 0.97 0.65 1.73 0.65 1.07 3.65 0.85 0.99 0.99 1.03 0.63
Water content
(%) 0.13 0.05 0.06 0.04 0.03 0.10 0.07 0.03 0.06 0.01 0.05 0.10 0.07 0.05 0.07 0.11 0.06 0.09 0.10 0.09 0.11 0.06
Grain density (g/cm3)
2.95 2.93 2.92 2.71 2.92 2.93 2.93 2.95 2.98 2.95 2.99 2.91 2.95 2.93 2.99 3.00 2.93 2.96 2.95 2.92 2.96 2.97
might be related to circulation of water within the sedimentary layer or between casing and sediment.
The gradient profile clearly delineates the permeable, under-pressured zone in the upper basement into which the water that flows down the casing enters radially (Fig. 76) (Anderson and Zoback, 1982). In this zone, the gradient profile correlates closely with the profile of bulk porosity calculated by Becker (1985) from a large-scale resistivity log (Fig. 77).
Variations in Geothermal Gradient Related to Lithology On a fine scale, the variation of thermal gradient correlates
closely with lithology (Fig. 78). With detailed shore-based study, this correlation will allow the determination of interval heat flow at various depths and the construction of a log of apparent thermal conductivity. Such fine-scale modeling of conductive processes will then be expanded into a thermal model which considers variations in porosity and thermal conductivity, and the effect of water circulation.
NEUTRON ACTIVATION LOGGING
Nuclear Logging at Hole 504B Hole 504B is the deepest penetration yet into the oceanic
crust. As such, it provides the best reference section of ocean lithosphere for comparison to geophysical and geochemical models based upon remote sensing and ophiolite models from land. However, the core recovery in Hole 504B has been less than 20% of the drilled section. Consequently, great emphasis has already been placed during DSDP Legs 69, 70, 83, and 92 upon geophysical logs to locate the recovered basalts within their proper geological framework in order to interpret the structure, lithology, and alteration history of the oceanic crust at Hole 504B. A suite of standard Schlumberger logs was completed during Leg 83, through the pillow lavas of layers 2A and 2B and the section of layer 2C dikes that was penetrated during Leg 83. Below we report the results of two sophisticated new Schlumberger geochemical logging suites which greatly enhance not only the interpretations from the geophysical logs, but the core analyses as well.
The first new nuclear logging tool used during Leg 111, the "neutron activation log" is in fact four different nuclear logs combined into one lowering into the well bore (Fig. 79). A Natural Gamma Spectroscopy tool (NGT) measures the abundances of naturally occurring radionuclides potassium (in weight percent), and uranium and thorium (in parts per million). Below this tool, a californium (Cf) chemical source is carried within an otherwise standard Compensated Neutron tool (CNT-G; an am-ericium-beryllium source is usually used). This higher neutron flux of lower energy neutrons of Cf activates aluminum specifically. Another NGT is then passed across the Cf-activated borehole wall to measure the spectral windows of this aluminum activation. Then, a Gamma Spectroscopy Tool (GST-A) is passed across the formation. This tool does not have a chemical source, but a "minitron" tube of tritium emits a controlled burst of neutrons at energies higher than the Cf in order to activate Fe, Ca, Si, H, Cl, and S. A 256-channel spectral analyzer then reads the energy levels from emitted gamma rays which impact a Nal crystal from a photomultiplier and transmits the spectrum to the surface.
The second new nuclear log is, in fact, a new interpretation technique applied to the Lithodensity Tool (LDT), which bombards the formation with gamma rays from a cesium source. Not only is bulk density recorded, but a photoelectric factor (PEF) is measured which is used to calculate a residual major elemental abundance (above those measured by the gamma spectroscopy tools) which at Hole 504B is related to the weight percent of magnesium in the rock.

SITE 504
1350
1400 —
1450 —
1500
1 550 2 .8 3 .0 3 .2 0
Wet-bulk density {g/cm3)
2.5 Porosity
(%)
0.15 0 .30 2 Water content
3 .0 3 .2 Grain density
(q/cm3)
Figure 58. Variation of index properties with depth.
The resulting nuclear logs (Plate 1, back pocket), when combined with the geophysical logs at Hole 504B, allow us to quantitatively measure the major element chemical variation, at 15-cm intervals, continuously over the entire hole (including the 80% not recovered by coring). The activation volume of about 1 m surrounding the tool allows the recording of bulk-rock chemical changes from both altered and unaltered parts of the oceanic crust.
Neutron Activation Logging The traditional logs of sonic, electrical, and nuclear sources
are enhanced in their geological interpretive capabilities by the use of multiple receivers and sonic/ultrasonic combinations. The nuclear logging techniques, however, are even more highly sophisticated. Not only are active chemical sources of americium, beryllium, cesium, and californium used to bombard the rock in situ, but a "minitron" tube of tritium is pulsed by 65,000-100,000 V once every 100 [is. The resulting burst of 108 neutrons produces a wide spectrum of emitted gamma ray energies which identify the concentration of specific chemical elements in the formation (Fig. 80).
Hydrogen, chlorine, silicon, calcium, iron, and sulfur contents of the rock are then extracted by comparing the measured spectra to standards for each of these elements (Fig. 80). When combined with aluminum content determined from Cf activation, magnesium calculated from the LDT, and potassium, uranium, and thorium measured by the NGT, a log of elemental chemical changes encountered downhole is generated. Thirteen chemical elements in the formation are measured by the neutron activation tool (H, Cl, Si, Ca, Fe, S, Gd, Ti, Al, K, U, Th, Mg). The volumetric chemical analysis contains evidence of bulk-rock, alteration products, and pore fluid geochemical variations recorded throughout the logged interval. Recovered core serves to calibrate the conversion of the counts per second to weight
percent to the limited extent within which it can be placed within the stratigraphic sequence of the well. Even more interesting, specific elemental variations downhole can be distributed into a mineralogical matrix to produce not only a lithology log, but a normative mineralogy log, which in turn can be compared with X-ray diffraction and thin-section analysis results from core analyses to give a more complete picture of the geochemical changes encountered within the well.
As part of their field testing during development of the geochemical logging tools, Schlumberger tested the logging results against sidewall core analyses in several sedimentary basin wells around the world. Fe, Si, Ca, Al, K, U, and Th variations between core and log data are shown in Figure 81. Absolute weight percent accuracies have been determined from these case studies (Chapman, et. al., 1987) to be as follows: Al, relative deviation at 1 sigma averages 20% so that if aluminum abundance is 20 wt%, the analysis is accurate to ±4 ; Ca, 5% relative deviation; Fe, 20%; Si, 5%; U, 50%, and Th, 20%. Further, the gadolinium spectral concentration is contaminated by about 20% Sm. The Mg accuracy is difficult to estimate because it is calculated by difference, and as such, it will change from well to well as the major elemental components change. For example, if Hole 504B were a granitic well, the difference would have more Na than Mg in it. In any event, it is the least accurate of the elemental abundance curves. Below, the Hole 504B logging results will be shown to agree rather well with core analysis results. Also, these are absolute weight percentage accuracies. Relative accuracies are considerably better, of course.
In the near future, an even more sophisticated tool will be introduced; a cryogenic germanium crystal is being tested down-hole which gives an order-of-magnitude-better spectral resolution. Such elements as Ni, Co, V, and Cr will eventually be loggable. Ni/Al ratios, for example, are thought to be exceedingly high at major meteor impact times. Also, the resolution
99

SITE 504
Table 25. P-wave velocities measured in basalts from Hole 504B, Leg 111.
Core- Interval Depth section (cm) (mbsf) Orientation
142R-1 6-8 1352.9 a
142R-2 65-67 1354.S
143R-1 105-107 1360.4
144R-1 89-91 1369.6
145R-1 95-97 1379.3
145R-2 123-125 1381.0
145R-3 44-46 1381.6
147R-1 39-41 1397.S
147R-2 44-46 1399.4
148R-1 68-70 1407.5
149R-1 82- 1417.7
150R-1 113-115 1427.5
152R-1 123-126 1437.1
154R-1 64-66 1454.9
155R-1 43-45 1459.4
161R-1 12-19 1504.2 4-6 1504.2
163R-1 43-45 1512.0
163R-2 17-19 1513.3
164R-1 7-9 1515.2
169R-1 66- 1548.3
Velocity (m/s, wet)
5813.3 5501.9 5813.3 5751.7 5738.6 6405.7 5818.0 6011.9 6229.0 5941.5 5731.4 6288.3 6028.6 5958.8 6153.6 6004.8 6033.4 6275.3 5903.5 5918.0 6113.5 5678.7 5950.6 6167.6 6002.4 6060.0 6358.1 6263.0 6126.2 6046.9 6038.3 6333.3 6409.6 5758.5 6138.4 6008.8 5771.7 5684.8 6375.0 6111.4 6148.4 6064.3 6118.6 6089.2 6143.7 6175.7 5806.9 5833.7 5977.3 5955.2 5997.6 6107.8 6116.2 6074.5 6327.5 6203.4 5953.4 6335.3 5904.0 5825.2 6006.1
Velocity (m/s, dry)
5586.3 5465.4 5102.8 5600.9 5911.0 6259.5 5406.0 5347.5 5339.8 6014.3 —
5329.8 5262.5 5592.9 5077.1 5506.5 5416.7 5180.6 5676.4 5605.3 5137.0 4945.3 5098.8 5245.2 5316.6 5328.4 5082.3 5368.1 5130.1 5058.8 5195.5 5169.7 5391.5 5417.6 5595.1 5612.6 5922.7 —
5877.0 4889.8 4931.8 5339.1 4869.0 5072.2 4906.1 —
5115.4 5136.2 5422.7 5764.8 5929.9 6041.2 5760.8 5719.5 5698.1 5746.6 5803.7 5888.0 5413.1 5356.4 5627.2
Velocity ratio (R) 1.04 1.01 1.14 1.03 0.97 1.02 1.08 1.12 1.17 0.99 — 1.18 1.15 1.07 1.21 1.09 1.11 1.21 1.04 1.06 1.19 1.15 1.17 1.18 1.13 1.14 1.25 1.17 1.19 1.20 1.16 1.23 1.19 1.06 1.10 1.07 0.98 — 1.09 1.25 1.25 1.14 1.26 1.20 1.25 — 1.14 1.14 1.10 1.03 1.01 1.01 1.06 1.06 1.11 1.08 1.03 1.08 1.09 1.09 1.07
Thickness parameter
(T) 0.03 0.01 0.12 0.03 — 0.02 0.04 0.06 0.08 — — 0.12 0.14 0.06 0.20 0.05 0.06 0.12 0.02 0.03 0.10 0.14 0.15 0.16 0.06 0.06 0.11 0.18 0.21 0.21 0.39 0.54 0.45 0.07 0.10 0.07 — — 0.13 0.38 0.38 0.21 0.24 0.19 0.24 — 0.16 0.16 0.12 0.03 0.01 0.01 0.06 0.06 0.11 0.08 0.03 0.07 0.14 0.14 0.11
Note: Velocities corrected to 24°C.
in measurement of the presently determined elements will be greatly improved.
The Lithodensity Tool (LDT) The LDT carries a cesium source in a pad pressed against the
well bore. Gamma rays emitted by the source are either Comp-ton-scattered by electrons or photoelectrically absorbed by electrons. The former results in lowered energy states for the gamma rays. The electron density which is measured is a direct function of the bulk density of the formation. This is the traditional den
sity tool measurement technique. The PEF, however, is a lower energy, higher count-per-second measure of the capture cross section of an element. By windowing low energy (PEF) and higher energy (density) gamma ray regions of the total gamma ray spectrum, the PEF can be separated from the density measurement. The photoelectric absorption index of elements and minerals can be measured in the laboratory, and the total PEF of a formation is the sum of the components. If we determine the major elemental concentrations of the rock-fluid system by neutron activation for all elements except one, the PEF can then
100
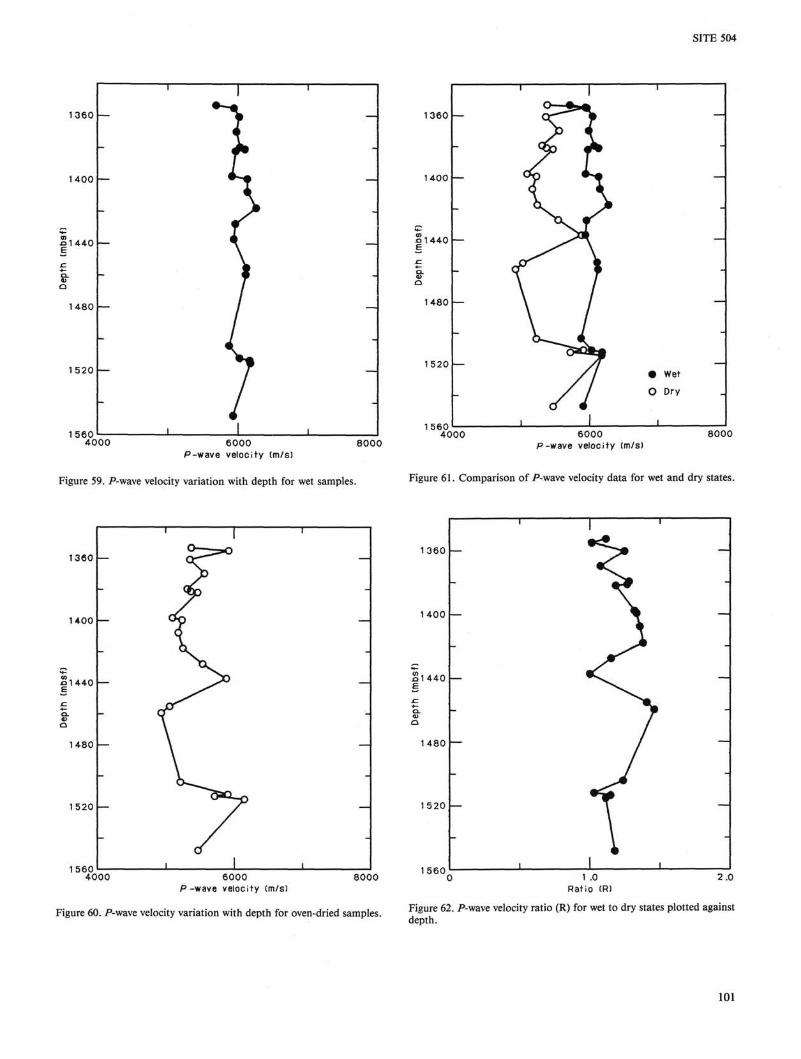
SITE 504
1360 —
1400
.01440 E
s-Q 1480
1520 —
1560 4000 6000 P-wave velocity (m/s)
8000
1360 —
1560 4000 6000
P-wave velocity (m/s) 8000
Figure 59. P-wave velocity variation with depth for wet samples. Figure 61. Comparison of P-wave velocity data for wet and dry states.
1360
1400
£>1440 e
Dept
h
1480
1520
1 SAC!
I
— Ck)
— ^s"^
ST — \
i
'
—
—
-
—
r —
■ 4000 6000
P-wave velocity Cm/s) 8000
1360 —
1400 —
o1440
1480
1520 —
1560 2.0
Figure 60. P-wave velocity variation with depth for oven-dried samples. Figure 62. P-wave velocity ratio (R) for wet to dry states plotted against depth.
101

SITE 504
1 360 —
1400
a 1440
1480 —
6500
1520
1560_ 0 .2 0 .4
Thickness parameter (T) Figure 63. Variation of the thickness parameter (T) with depth.
6500
6000
5500
Porosity (%)
Figure 64. P-wave velocity plotted against porosity for wet samples.
be used to calculate the abundance of that missing element. Si, Al, Fe, Ca, and Cl are measured by the neutron activation tool. Of the major elements in basalt, only Mg and Na are not measured. Much of the Na encountered in the borehole is associated with Cl in the fluid (both borehole and formation fluid). The difference between PEF and the sum of the abundances of the other major elements times the photoelectric absorption index of each, results in a measure of the weight percent of magnesium in the rock. In fact, Mg plus Na are measured. The addition of Mg to the neutron activation tool's elemental determinations provides, for the first time, a virtually complete major element chemical determination of the well-bore rock. This in turn, allows for the characterization of not only the structural and lithological units encountered in Hole 504B, but the normative mineralogical constituents of the formation.
5 5500 —
4500
—
1
o
t
o
o
o
1 o
0 o 0° o o
1
o
1
1
o o
1
— o
o
Porosity (%)
Figure 65. P-wave velocity plotted against porosity for dry samples.
DOUU
6000
5500
5000
—
-
T
•
o
1
•
«
o
o
1
• \ • •
•
o
o o
°o o
o
1
T -
•
o
1
1
• •
o 0
# Wet
O Dry
1
• • _
— O
o -
—
0 1 2 Porosi ty (%)
Figure 66. Comparison of wet and dry states using P-wave velocity plotted vs. porosity.
In a particularly rugose hole such as Hole 504B, the density error curve (DRHO) will often give unacceptably high readings (>0.10) where the bow-spring centralizers on the LDT tool are not strong enough to produce a solid pad against the well bore. DRHO is the difference in density readings between a near and a far crystal gamma ray counter. When this occurs, the density and PEF values must be corrected for bad hole conditions. This is accomplished by calculating a pseudodensity curve from the longest spacing electrical resistivity curve (LLd) from the latero-log pass of the hole. Porosity-corrected density calculated from this LLd allows for bad hole correction of the data where DRHO is unacceptably large.
One practical use of this combination of nuclear sources is that they allow logging through drill pipe and casing so that difficult hole conditions can be overcome, even when severe enough
102

SITE 504
Table 26. GRAPE bulk densities of basalts from Hole 504B, Leg 111.
Core-section
142R-1
142R-2 143R-1
144R-1 144R-1 145R-1
145R-2
145R-3
147R-1 147R-1
147R-2 147R-2
148R-1 148R-1 148R-1 148R-1
149R-1 149R-1 149R-1
149R-2 150R-1 150R-1 150R-1
152R-1
153R-1 154R-1
155R-1 155R-1
159R-1 161R-1 161R-1
163R-1 163R-1
163R-1 163R-2 163R-2
164R-1 164R-1
169R-1
Interval (cm)
6-8
65-67 105-107
82-95 89-91 95-97
123-125
44-46
11-17 39-41
36-43 44-46
50-53 75-76
109-111 68-70
10-20 80-94 82-84
12-22 25-32
120-125 113-115
123-126
59-70 64-66
39-47 43-45
43-50 12-19 4-6
40-42 43-45
135-137 4-6
17-19
4-6 7-9
66-68
Depth (mbsf)
1352.9
1354.9 1360.4 1360.4 1369.6 1369.6 1379.3 1379.3 1381.0 1381.0 1381.8 1381.8 1397.6 1397.8 1397.8 1399.3 1399.4 1399.4 1407.3 1407.6 1407.9 1407.5 1407.5 1417.1 1417.8 1417.7 1417.7 1418.6 1426.7 1427.6 1427.5 1427.5 1437.1 1437.1 1445.9 1454.9 1454.9 1459.4 1459.4 1459.4 1488.5 1504.3 1504.2 1504.2 1512.0 1512.0 1512.0 1513.0 1513.2 1513.3 1513.3 1515.2 1515.2 1515.2 1548.3
Whole-core sample
Parallel Perpendicular
2.987
2.671
2.724
2.638
2.650
2.672
2.931 2.950 3.002
2.942 2.951
2.969 2.737 2.889
2.927
2.858 2.930
2.914
2.9482 2.826
2.870
2.855 2.876
2.867
(g/cm3)
2.987
2.710
2.672
2.723
2.706
2.721
2.909 2.960
2.976 2.861 2.955
2.879
2.908 2.919
2.859
— 2.8502
2.889
2.683 2.871
2.888
Minicore sample
a
2.950 2.828 2.941 2.899 2.863 2.885 2.851 2.839 2.835 2.753 2.875 2.790 2.691
2.930 2.876
2.636 2.871
2.945 2.964
2.926 2.967
2.915 2.744 2.841 2.861
3.013 2.903
2.832 2.883
2.855 2.830
2.589 2.920
3.019 2.910
2.916 2.836 2.944
b (g/cm3)
2.860 2.950 2.820 2.860 2.938 2.826 2.835 2.802 2.792
2.941 2.909
2.946 2.936
2.973 2.915
2.843 2.910
2.898 2.882 2.865 —
2.969 2.999
2.943 2.942
2.936 2.900
2.879 2.938
2.920 2.918
2.909 2.859 2.967
c
2.612 2.932 2.634 2.582 2.910 2.950 2.978 3.010 2.915 2.945 2.879 2.945 3.007
2.977 2.967
3.012 2.960
2.984 2.947
2.967 3.001
2.957 2.924 2.996 2.919
3.024 3.032
3.027 3.032
2.994 2.977
2.931 2.940
2.931 2.949
2.993 2.869 2.973
Wet, dry
W D W W D W D W D W D W D W W D W w D W w w w D w w w D w w w w D w D w w D W w D W w w D w w D W W w D W w D W
to prevent open-hole logging. At Hole 504B, the nuclear logs allowed us to "see" behind casing in order to document the distribution of chert beds and clay-rich layers.
Below, we will illustrate these scientific well-logging techniques using Hole 504B as a case study. We will discuss in detail the remarkable results obtained from these nuclear tools, including their implications for interpretation of the chemical and physical measurements made in the hole. We will end with a discussion of the geochemical changes seen from the log results compared to core analyses, and discuss the integration of the two data sets.
Logs from DSDP Leg 83 at Hole 504B The Schlumberger logging suite run during DSDP Leg 83 re
veals three distinct layers within the upper kilometer of base
ment: the upper 150-m section of very low seismic velocity and resistivity, the middle layer of increasing velocity and slightly higher resistivity, and the deep zone of high velocity and resistivity (Fig. 82) (Anderson, Honnorez, Becker, et al., 1985a).
An interesting section of Hole 504B is found at the pillow-dike transition between layers 2B and 2C. Within this boundary zone, a sulfide mineralization stockwork was cored during Leg 83. The stockwork appears as the largest hydroxyl mineral content zone in the hole (Anderson, Honnorez, Becker, et al., 1985a). Permeability measurements spanning this zone show a large decrease from the pillows above to the dikes below (Anderson, Honnorez, Becker, et al., 1985b). Porosities measured with long-spaced electrical resistivities show a more abrupt decrease across this zone (Becker, 1985). Hot, upwelling, mineralized hy-drothermal fluids probably mixed with cold sea water at this
103

SITE 504
Table 27. Thermal conductivities of basalts from Hole 504B, Leg 111. 2.5
Core-section
Interval (cm)
Calibration checks
Depth (mbsf)
Silica standard k = 1.38 W/m°K
142R-1 142R-2 143 R-1 144R-1 145R-1 145R-2
145R-3
147R-1 147R-2 148R-1 149R-1 149R-2 150R-1 152R-1 153R-1
154R-1 155R-1 158R-1 159R-1 161R-1 163R-1 163R-2 164R-1 169R-1
0-8 53-64 99-105 83-93 94-106
120-130
38-48
29-35 35-50 46-57 91-96 11-23
117-125 121-127 59-70
61-83 39-47 26-36 42-50 11-22 36-48 15-22 0-13
62-69
1352.9 1354.8 1360.3 1369.5 1379.3 1381.0
1381.7
1397.7 1399.3 1407.3 1417.8 1418.6 1427.6 1437.0 1445.9
1455.0 1459.4 1482.8 1488.5 1504.2 1512.0 1513.3 1515.1 1548.3
Reading 1
1.43 1.43 1.41 1.39
2.21 2.16 1.97 1.91 1.82 1.95 2.16 1.81 2.07 2.03 2.06 2.03 2.00 1.93 1.95 1.88 2.11 1.87 1.97 2.33 1.89 2.00 2.09 1.93 1.85 1.93 1.78
Reading 2
Reading 3
(W/m°K)
1.39 1.39 1.39 1.38
2.18 2.19 1.92 1.92 1,80 2.10
1.98
2.08 2.07 1.97 2.17 2.10 2.09 1.97 1.91
2.00 1.89 1.97 2.03 2.04 2.02 1.93 1.97 1.80
1.42 1.44 1.39 1.40
2.21 2.28 1.83 1.89 1.83 2.17
2.04
1.93
1.93 2.21 2.04 2.13 1.83 2.05
2.04 1.92
2.06 2.06 1.95 1.97 1.79
Reading 4
2.24
2.23
2.09 2.00
2.09 2.18 1.93 2.05
1.93
1.98
Mean value
2.20 2.22 1.91 1.91 1.82
2.12
2.01 2.07 2.01 2.14 2.00 2.06 1.89
1.97 1.99 2.06 1.93 2.02 2.07 2.00 1.91 1.96 1.79
1360 —
1560 1 .5 2.0
Thermal conductivity (W/m-K)
Figure 67. Thermal conductivity variation with depth.
2.5
o 2.0 — • • • •
• • • / • • • •
1 .5 0 1
Poros i ty (%)
Figure 68. Thermal conductivity plotted vs. porosity.
Table 28. Calibration measure-ments for Hamilton Frame velo-cimeter.
Thickness (mm)
Plexiglas 12.68 25.52 50.92 63.66
t = 1.74 + 0.367x
for x = 0, t = 1.74 fis
Aluminum
12.65 25.36 38.04 50.70 63.48
t = 1.79 + 0.157x
for x = 0, t = 1.79 us.
Traveltime (flS)
6.33 11.16 20.63 24.96
3.68 5.88 7.82 9.71
11.74
Note: Average delay time = 1.77 ps.
30
20 —
10 —
I
Plexiglas
* y
y y •
— y y .
• ^*^~ y ^ ^ - — " ™
y £—
y y
I
s' -y
* '
-
Aluminum
I 20 40
Distance (mm) 60
Figure 69. Calibration plot for Hamilton Frame velocimeter.
104

SITE 504
Table 29. Calibration measurements for Penta pycno-meter.
Run no. 1 2 3 4 5 6 7
Volume (cm3)
4.4117 4.3750 4.4567 4.4314 4.3836 4.3822 4.3792
Run no. 8 9 10 11 12 13 14
Volume (cm3)
4.3891 4.4004 4.3878 4.4216 4.4089 4.3963 4.3836
Run no. 15 16 17 18 19 20
Volume (cm3)
4.3792 4.3552 4.4018 4.3525 4.3878 4.4807
Note: Standard known volume = 4.3900 cm3. Mean value = 4.3982; standard deviation = 0.031; error = 0.031/ 4.3982 = ± 0.7%.
15.000
100 150 200 Temperature (°C)
250 300
Figure 70. Resistance-temperature function for thermistors Thl + Th2.
Table 30. Temperature-resistance calibration of probe thermistors.
Thermistors
Th 1 Th2 Th 1 + Th 2
Temperature (°Q 247.75 247.80 247.83
Resistance (0)
313.75 326.78 639.95
Temperature (°Q 206.22 206.28 206.27
Resistance (Q)
659.55 685.21 1344.42
Temperature (°C) 151.92 151.93 151.94
Resistance (Q)
2136.70 2212.40 4350.43
Temperature (°C) 102.56 102.57 102.58
Resistance (Jl)
8151.10 8408.48 16552.65
Table 31. Resistance-temperature table, extracted for temperatures of 128c
Thermistor 2. Resistances measured in ohms. -157°C at 0.1-C° intervals, for Thermistor 1 +
°c 128 129 130 131 132 133 134 135 136 137 138 139 140 141 142 143 144 145 146 147 148 149 150 151 152 153 154 155 145 157
0.0 8009.9847 7797.9297 7592.4135 7393.2083 7200.0954 7012.8641 6831.3121 6655.2447 6484.4745 6318.8214 6158.1118 6002.1789 5850.8620 5704.0065 5561.4634 5423.0894 5288.7463 5158.3010 5031.6254 4908.5961 4789.0940 4673.0044 4560.2169 4450.6248 4344.1254 4240.6197 4140.0121 4042.2104 3947.1257 3854.6724
0.1 7988.4783 7777.0877 7572.2127 7373.6264 7181.1110 6994.4566 6813.4617 6637.9323 6467.6818 6302.5307 6142.3062 5986.8421 5835.9782 5689.5606 5547.4408 5409.4759 5275.5285 5145.4659 5019.1604 4896.4891 4777.3333 4661.5789 4549.1156 4439.8374 4333.6417 4230.4301 4130.1071 4032.5811 3937.7634 3845.5686
0.2 7967.0394 7756.3108 7552.0747 7354.1052 7162.1852 6976.1057 6795.6660 6620.6727 6450.9402 6286.2894 6126.5483 5971.5513 5821.1389 5675.1576 5533.4596 5395.9026 5262.3495 5132.6683 5006.7317 4884.4172 4765.6067 4650.1862 4538.0462 4429.0807 4323.1879 4220.2693 4120.2301 4022.9789 3928.4273 3836.4901
0.3 7945.6677 7735.5988 7531.9994 7334.6445 7143.3178 6957.8112 6777.9247 6603.4658 6434.2493 6270.0971 6110.8379 5956.3063 5806.3438 5660.7974 5519.5199 5382.3693 5249.2093 5119.9082 4994.3393 4872.3804 4753.9139 4638.8264 4527.0085 4418.3548 4312.7638 4210.1374 4110.3810 4013.4037 3919.1173 3827.4370
0.4 7924.3631 7714.9515 7511.9866 7315.2441 7124.5086 6939.5729 6760.2377 6586.3112 6417.6091 6253.9538 6095.1746 5941.1070 5791.5929 5646.4799 5505.6214 5368.8760 5236.1077 5107.1854 4981.9829 4860.3785 4742.2549 4627.4992 4516.0024 4407.6596 4302.3693 4200.0341 4100.5597 4003.8553 3909.8334 3818.4092
0.5 7903.1253 7694.3687 7492.0359 7295.9037 7105.7574 6921.3906 6742.6047 6569.2089 6401.0193 6237.8592 6079.5585 5925.9533 5776.8861 5632.2050 5491.7640 5355.4224 5223.0445 5094.4998 4969.6625 4848.4114 4730.6296 4616.2047 4505.0279 4396.9948 4292.0044 4189.9595 4090.7661 3994.3339 3900.5754 3809.4065
0.6 7881.9540 7673.8501 7472.1473 7276.6232 7087.0640 6903.2640 6725.0257 6552.1586 6384.4798 6221.8132 6063.9893 5910.8449 5762.2230 5617.9725 5477.9477 5342.0084 5210.0197 5081.8513 4957.3780 4836.4790 4719.0379 4604.9426 4494.0848 4386.3605 4281.6689 4179.9133 4081.0001 3984.8391 3891.3433 3800.4289
0.7 7860.8491 7653.3955 7452.3204 7257.4023 7068.4281 6885.1931 6707.5003 6535.1602 6367.9905 6205.8156 6048.4669 5895.7817 5747.6037 5603.7822 5464.1722 5328.6340 5197.0330 5069.2397 4945.1292 4824.5812 4707.4796 4593.7129 4483.1731 4375.7565 4271.3628 4169.8956 4071.2616 3975.3710 3882.1371 3791.4762
0.8 7839.8102 7633.0047 7432.5551 7238.2408 7049.8497 6867.1777 6690.0285 6518.2135 6351.5510 6189.8663 6032.9911 5880.7636 5733.0280 5589.6340 5450.4374 5315.2989 5184.0844 5056.6649 4932.9160 4812.7178 4695.9547 4582.5154 4472.2926 4365.1827 4261.0860 4159.9062 4061.5505 3965.9295 3872.9566 3782.5485
0.9 7818.8372 7612.6774 7412.8512 7219.1386 7031.3284 6849.2174 6672.6100 6501.3183 6335.1614 6173.9651 6017.5619 5865.7904 5718.4956 5575.5278 5436.7432 5302.0030 5171.1738 5044.1269 4920.7384 4800.8888 4684.4630 4571.3501 4461.4432 4354.6390 4250.8383 4149.9451 4051.8668 3956.5144 3863.8017 3773.6457
105
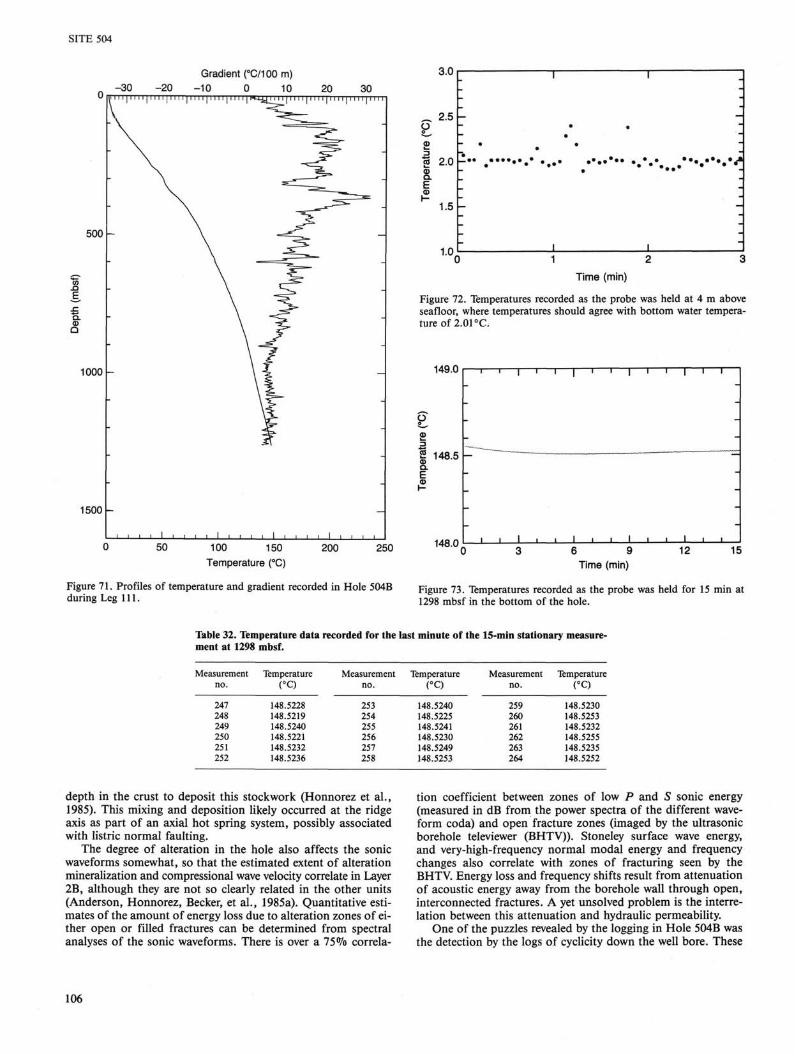
SITE 504
Gradient ("C/100 m) -30 -20 -10 0 10 20 30
500 -
CD Q
1000
3.0
2.5 O
£ 2.0
l -1.5
1.0
'•*. •. '.'••....•••••••••<
1 2 3 Time (min)
Figure 72. Temperatures recorded as the probe was held at 4 m above seafloor, where temperatures should agree with bottom water temperature of 2.01 °C.
1500 -
50 100 150 200 250 Temperature (°C)
Figure 71. Profiles of temperature and gradient recorded in Hole 504B during Leg 111.
148.0 6 9 Time (min)
Figure 73. Temperatures recorded as the probe was held for 15 min at 1298 mbsf in the bottom of the hole.
Table 32. Temperature data recorded for the last minute of the 15-min stationary measurement at 1298 mbsf.
Measurement no.
247 248 249 250 251 252
Temperature (°C)
148.5228 148.5219 148.5240 148.5221 148.5232 148.5236
Measurement no.
253 254 255 256 257 258
Temperature (°C)
148.5240 148.5225 148.5241 148.5230 148.5249 148.5253
Measurement no.
259 260 261 262 263 264
Temperature CO
148.5230 148.5253 148.5232 148.5255 148.5235 148.5252
depth in the crust to deposit this stockwork (Honnorez et al., 1985). This mixing and deposition likely occurred at the ridge axis as part of an axial hot spring system, possibly associated with listric normal faulting.
The degree of alteration in the hole also affects the sonic waveforms somewhat, so that the estimated extent of alteration mineralization and compressional wave velocity correlate in Layer 2B, although they are not so clearly related in the other units (Anderson, Honnorez, Becker, et al., 1985a). Quantitative estimates of the amount of energy loss due to alteration zones of either open or filled fractures can be determined from spectral analyses of the sonic waveforms. There is over a 75% correla
tion coefficient between zones of low P and S sonic energy (measured in dB from the power spectra of the different waveform coda) and open fracture zones (imaged by the ultrasonic borehole televiewer (BHTV)). Stoneley surface wave energy, and very-high-frequency normal modal energy and frequency changes also correlate with zones of fracturing seen by the BHTV. Energy loss and frequency shifts result from attenuation of acoustic energy away from the borehole wall through open, interconnected fractures. A yet unsolved problem is the interrelation between this attenuation and hydraulic permeability.
One of the puzzles revealed by the logging in Hole 504B was the detection by the logs of cyclicity down the well bore. These
106
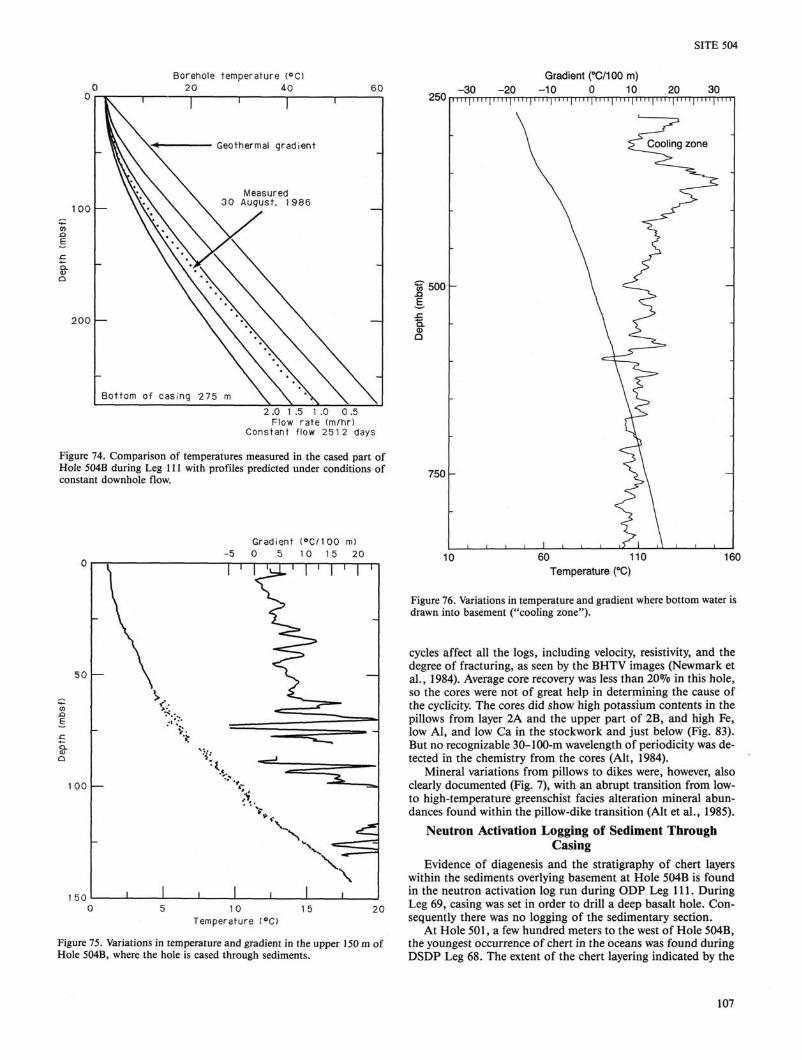
SITE 504
Borehole temperature (°C) 20 40
100
Geothermal gradient
Measured 30 August, 1986
200
SO
Bottom of casing
2.0 1 .5 1 .0 0 .5 Flow rate (m/hr)
Constant flow 2512 days
Figure 74. Comparison of temperatures measured in the cased part of Hole 504B during Leg 111 with profiles predicted under conditions of constant downhole flow.
Gradient ( °C/100 m) 0 5 10 15 20
r
100 —
1 50 10
Temperature (°C>
Gradient (°C/100 m) o c n - 3 0 - 2 0 - 1 0 0 10 20 30 2 5 0 ii 11111 I I ii 1111111111111111 n 1111111 I I n 11 I I ii I I I I 111111 I I 11 ii i n 11111
| 500
750
1 1 1 1 ] 1 1 1 1 1 1 1 1 1 1
10 60 110 Temperature (°C)
160
Figure 75. Variations in temperature and gradient in the upper 150 m of Hole 504B, where the hole is cased through sediments.
Figure 76. Variations in temperature and gradient where bottom water is drawn into basement ("cooling zone").
cycles affect all the logs, including velocity, resistivity, and the degree of fracturing, as seen by the BHTV images (Newmark et al., 1984). Average core recovery was less than 20% in this hole, so the cores were not of great help in determining the cause of the cyclicity. The cores did show high potassium contents in the pillows from layer 2A and the upper part of 2B, and high Fe, low Al, and low Ca in the stockwork and just below (Fig. 83). But no recognizable 30-100-m wavelength of periodicity was detected in the chemistry from the cores (Alt, 1984).
Mineral variations from pillows to dikes were, however, also clearly documented (Fig. 7), with an abrupt transition from low-to high-temperature greenschist facies alteration mineral abundances found within the pillow-dike transition (Alt et al., 1985).
Neutron Activation Logging of Sediment Through Casing
Evidence of diagenesis and the stratigraphy of chert layers within the sediments overlying basement at Hole 504B is found in the neutron activation log run during ODP Leg 111. During Leg 69, casing was set in order to drill a deep basalt hole. Consequently there was no logging of the sedimentary section.
At Hole 501, a few hundred meters to the west of Hole 504B, the youngest occurrence of chert in the oceans was found during DSDP Leg 68. The extent of the chert layering indicated by the
107
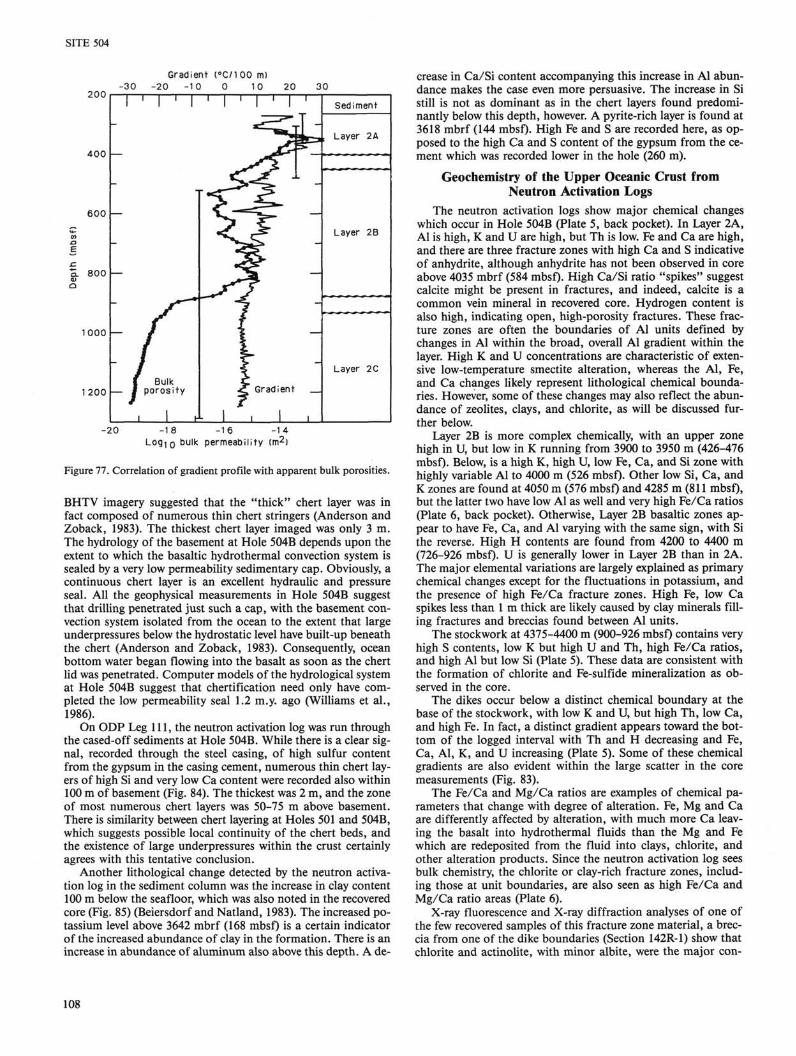
SITE 504
-30
400
600
800
1000
1200
I
—
I
Gradient -20 -10
1 | I | I
Bulk porosi ty
1 r
CC/100 m) 0 10 20
1 ' 1 ' 1 30
1
^!L\-jf -*-
^ Gradient
1 ■ 1 l
Sediment
. Layer 2A
» ~ > — ^ — - . * - > - > < - * - - * * - * ■ *
Layer 2B
Layer 2C
-20 -18 -16 -14 Log^o oulk permeability (m2)
Figure 77. Correlation of gradient profile with apparent bulk porosities.
BHTV imagery suggested that the "thick" chert layer was in fact composed of numerous thin chert stringers (Anderson and Zoback, 1983). The thickest chert layer imaged was only 3 m. The hydrology of the basement at Hole 504B depends upon the extent to which the basaltic hydrothermal convection system is sealed by a very low permeability sedimentary cap. Obviously, a continuous chert layer is an excellent hydraulic and pressure seal. All the geophysical measurements in Hole 504B suggest that drilling penetrated just such a cap, with the basement convection system isolated from the ocean to the extent that large underpressures below the hydrostatic level have built-up beneath the chert (Anderson and Zoback, 1983). Consequently, ocean bottom water began flowing into the basalt as soon as the chert lid was penetrated. Computer models of the hydrological system at Hole 504B suggest that chertification need only have completed the low permeability seal 1.2 m.y. ago (Williams et al., 1986).
On ODP Leg 111, the neutron activation log was run through the cased-off sediments at Hole 504B. While there is a clear signal, recorded through the steel casing, of high sulfur content from the gypsum in the casing cement, numerous thin chert layers of high Si and very low Ca content were recorded also within 100 m of basement (Fig. 84). The thickest was 2 m, and the zone of most numerous chert layers was 50-75 m above basement. There is similarity between chert layering at Holes 501 and 504B, which suggests possible local continuity of the chert beds, and the existence of large underpressures within the crust certainly agrees with this tentative conclusion.
Another lithological change detected by the neutron activation log in the sediment column was the increase in clay content 100 m below the seafloor, which was also noted in the recovered core (Fig. 85) (Beiersdorf and Natland, 1983). The increased potassium level above 3642 mbrf (168 mbsf) is a certain indicator of the increased abundance of clay in the formation. There is an increase in abundance of aluminum also above this depth. A de
crease in Ca/Si content accompanying this increase in Al abundance makes the case even more persuasive. The increase in Si still is not as dominant as in the chert layers found predominantly below this depth, however. A pyrite-rich layer is found at 3618 mbrf (144 mbsf). High Fe and S are recorded here, as opposed to the high Ca and S content of the gypsum from the cement which was recorded lower in the hole (260 m).
Geochemistry of the Upper Oceanic Crust from Neutron Activation Logs
The neutron activation logs show major chemical changes which occur in Hole 504B (Plate 5, back pocket). In Layer 2A, Al is high, K and U are high, but Th is low. Fe and Ca are high, and there are three fracture zones with high Ca and S indicative of anhydrite, although anhydrite has not been observed in core above 4035 mbrf (584 mbsf). High Ca/Si ratio "spikes" suggest calcite might be present in fractures, and indeed, calcite is a common vein mineral in recovered core. Hydrogen content is also high, indicating open, high-porosity fractures. These fracture zones are often the boundaries of Al units defined by changes in Al within the broad, overall Al gradient within the layer. High K and U concentrations are characteristic of extensive low-temperature smectite alteration, whereas the Al, Fe, and Ca changes likely represent lithological chemical boundaries. However, some of these changes may also reflect the abundance of zeolites, clays, and chlorite, as will be discussed further below.
Layer 2B is more complex chemically, with an upper zone high in U, but low in K running from 3900 to 3950 m (426-476 mbsf). Below, is a high K, high U, low Fe, Ca, and Si zone with highly variable Al to 4000 m (526 mbsf). Other low Si, Ca, and K zones are found at 4050 m (576 mbsf) and 4285 m (811 mbsf), but the latter two have low Al as well and very high Fe/Ca ratios (Plate 6, back pocket). Otherwise, Layer 2B basaltic zones appear to have Fe, Ca, and Al varying with the same sign, with Si the reverse. High H contents are found from 4200 to 4400 m (726-926 mbsf). U is generally lower in Layer 2B than in 2A. The major elemental variations are largely explained as primary chemical changes except for the fluctuations in potassium, and the presence of high Fe/Ca fracture zones. High Fe, low Ca spikes less than 1 m thick are likely caused by clay minerals filling fractures and breccias found between Al units.
The stockwork at 4375-4400 m (900-926 mbsf) contains very high S contents, low K but high U and Th, high Fe/Ca ratios, and high Al but low Si (Plate 5). These data are consistent with the formation of chlorite and Fe-sulfide mineralization as observed in the core.
The dikes occur below a distinct chemical boundary at the base of the stockwork, with low K and U, but high Th, low Ca, and high Fe. In fact, a distinct gradient appears toward the bottom of the logged interval with Th and H decreasing and Fe, Ca, Al, K, and U increasing (Plate 5). Some of these chemical gradients are also evident within the large scatter in the core measurements (Fig. 83).
The Fe/Ca and Mg/Ca ratios are examples of chemical parameters that change with degree of alteration. Fe, Mg and Ca are differently affected by alteration, with much more Ca leaving the basalt into hydrothermal fluids than the Mg and Fe which are redeposited from the fluid into clays, chlorite, and other alteration products. Since the neutron activation log sees bulk chemistry, the chlorite or clay-rich fracture zones, including those at unit boundaries, are also seen as high Fe/Ca and Mg/Ca ratio areas (Plate 6).
X-ray fluorescence and X-ray diffraction analyses of one of the few recovered samples of this fracture zone material, a breccia from one of the dike boundaries (Section 142R-1) show that chlorite and actinolite, with minor albite, were the major con-
108

I I I I [ I I I I I I I I I I I I I I I I I I I I I- T T
I ' ' ' I ' ' '
TgT~g~TT H it 1 . I 3
mmm TOO
I I | I I I I | I I I I | I I I I
I I I I I
Lithological type H Pillow basalts
Thin flows
Y'-^'ii Massive units
[;'■;] Dikes
b | H | Chilled intrusive contact
Grain size | 1 Very fine grained (no chilled contact)
Fine grained
Medium grained
I Coarse grained
Basalt type Plagiocla essential chrome spinel
agioclase-oliv ugite) phyric agioclase-oliv
(emerald green) phyric
4 Olivine-plagioclase phyric
[ f j ] Aphyric
Phenocrysts [7 -9] Percent of phenocrysts present
I s I Sparsely phyric
m Moderately phyric
H PIagioclase-olivine phyric with essential chrome spinel
HPIagioclase-ol iv ine-c l inopyroxene (augite) phyric
I , I Plagioclase-olivine-clinopyroxene
' I I I I I I I I I I I I I I I -25 -20 -15 -10 -5 0 5
Gradient (°C/100 m) 10 15 20 25
Figure 78. Correlation of variations in geothermal gradient with lithology (from Adamson, 1985).
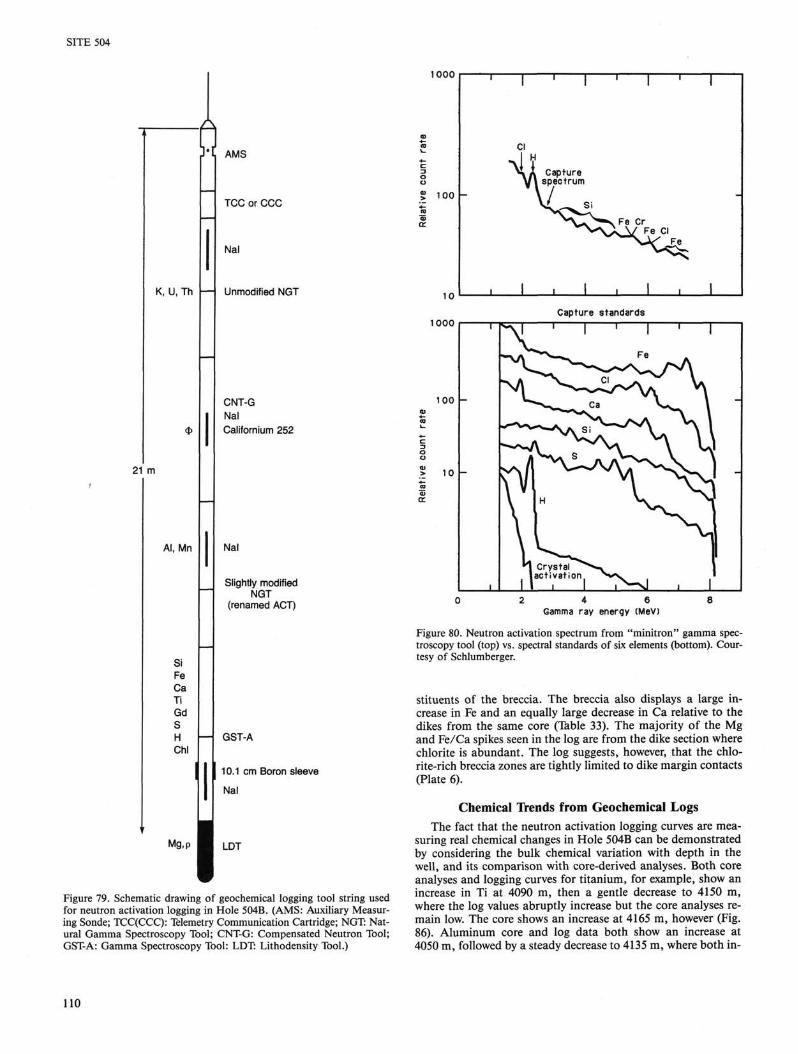
SITE 504
1000
tl
K, U, Th
21 m
Al, Mn
Si Fe Ca Ti Gd S H Chi
AMS
TCC or CCC
Nal
Unmodified NGT
CNT-G Nal Californium 252
Nai
Slightly modified NGT
(renamed ACT)
Mg,p
GST-A
10.1 cm Boron sleeve
Nal
LDT
Figure 79. Schematic drawing of geochemical logging tool string used for neutron activation logging in Hole 504B. (AMS: Auxiliary Measuring Sonde; TCC(CCC): Telemetry Communication Cartridge; NGT: Natural Gamma Spectroscopy Tool; CNT-G: Compensated Neutron Tool; GST-A: Gamma Spectroscopy Tool: LDT: Lithodensity Tool.)
4 6 Gamma ray energy (MeV)
Figure 80. Neutron activation spectrum from "minitron" gamma spectroscopy tool (top) vs. spectral standards of six elements (bottom). Courtesy of Schlumberger.
stituents of the breccia. The breccia also displays a large increase in Fe and an equally large decrease in Ca relative to the dikes from the same core (Table 33). The majority of the Mg and Fe/Ca spikes seen in the log are from the dike section where chlorite is abundant. The log suggests, however, that the chlo-rite-rich breccia zones are tightly limited to dike margin contacts (Plate 6).
Chemical Trends from Geochemical Logs The fact that the neutron activation logging curves are mea
suring real chemical changes in Hole 504B can be demonstrated by considering the bulk chemical variation with depth in the well, and its comparison with core-derived analyses. Both core analyses and logging curves for titanium, for example, show an increase in Ti at 4090 m, then a gentle decrease to 4150 m, where the log values abruptly increase but the core analyses remain low. The core shows an increase at 4165 m, however (Fig. 86). Aluminum core and log data both show an increase at 4050 m, followed by a steady decrease to 4135 m, where both in-
110
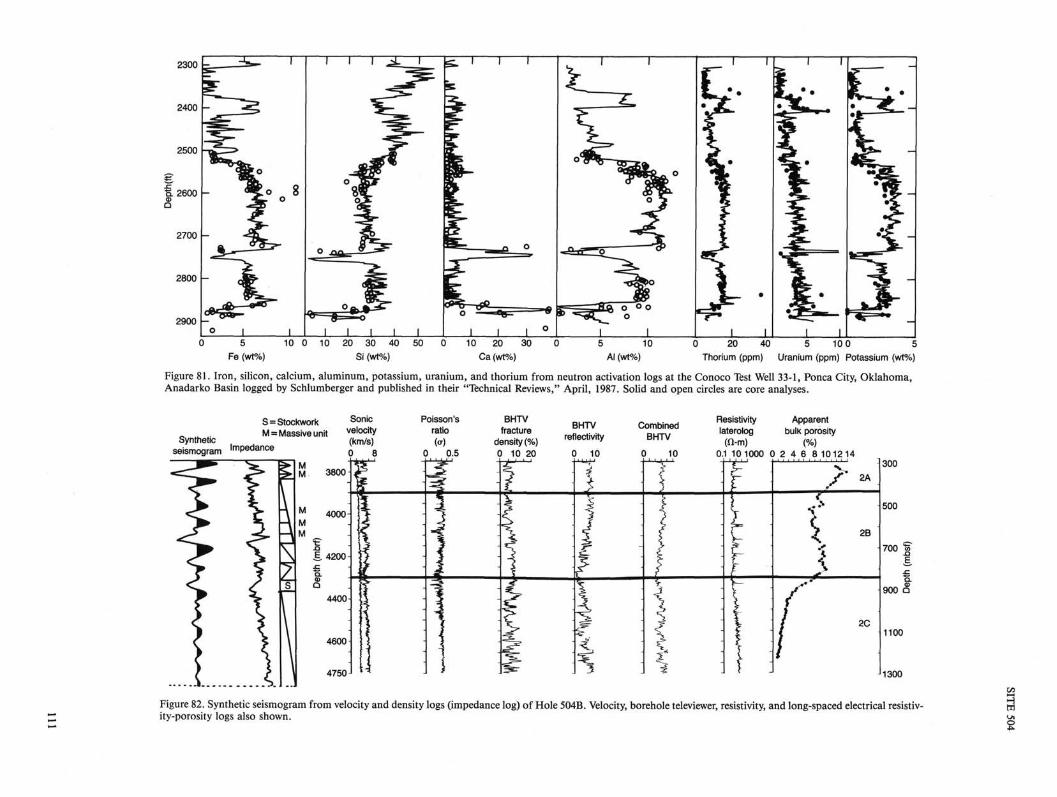
2300 u 3 C — n ~ - i — i — i ^ " fcs-"1—i—'—rr~—i " rzr~i—n~—i—nr——:
L 2 I l_J I I L__J I I I I I ° I i I I I l 1 I I 1 0 5 10 0 10 20 30 40 50 0 10 20 30 0 5 10 0 20 40 5 10 0 5
Fe (wt%) Si (wt%) Ca (wt%) Al (wt%) Thorium (ppm) Uranium (ppm) Potassium (wt%)
Figure 81. Iron, silicon, calcium, aluminum, potassium, uranium, and thorium from neutron activation logs at the Conoco Test Well 33-1, Ponca City, Oklahoma, Anadarko Basin logged by Schlumberger and published in their "Technical Reviews," April, 1987. Solid and open circles are core analyses.
S = Stockwork S o n i c Poisson's BHTV Combined Resistivity Apparent M = Massive unit v e l o c i ty r a t i° * ■ * * " » reflectivitv BHTV l a t e r o l o g bulk porosity
S y n t h 6 t l C Imoedance ( k m / s ) ( a ) density(%) r e f l e c t , v l ty B H T V (O-m) (%) seismogram ^ _ _ _ _ 9, , ,? 9, , , ?;5 9 ,™ ,2? 0 10 0 10 0.1 101000 0 2 4 6 8 101214
/ / \ 4750-1 *"* J * J ^ r J ^ J * J r J ^1300
Figure 82. Synthetic seismogram from velocity and density logs (impedance log) of Hole 504B. Velocity, borehole televiewer, resistivity, and long-spaced electrical resistivity-porosity logs also shown.
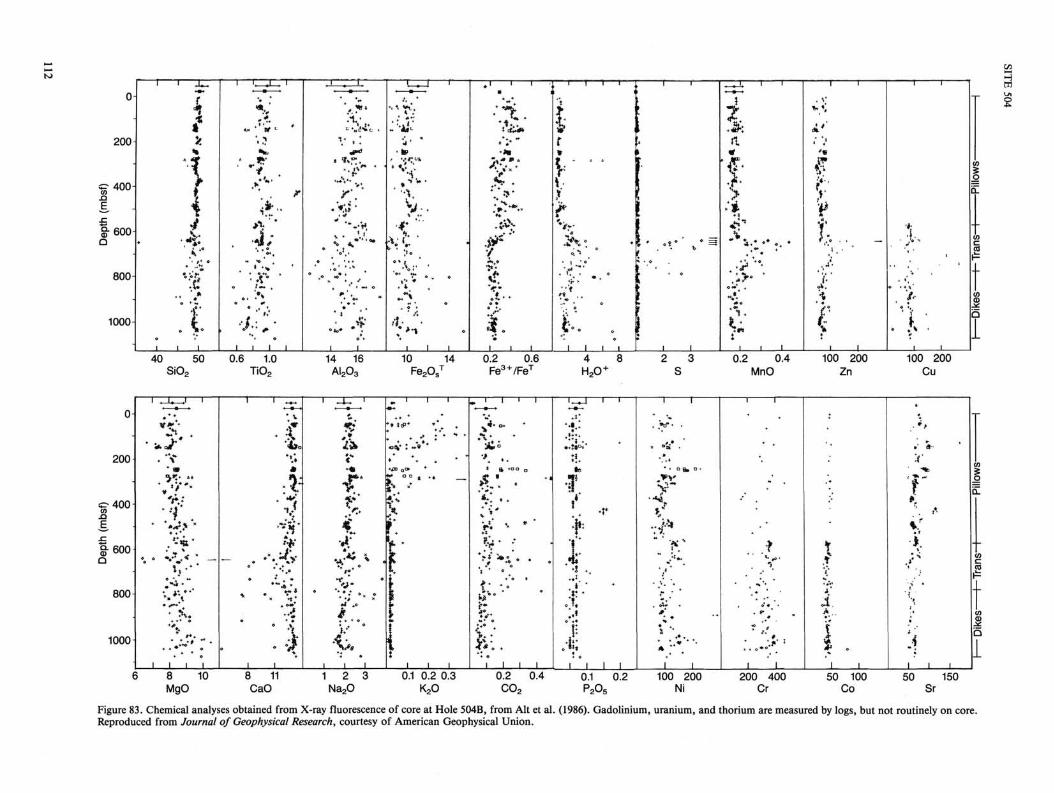
1 1—XT~1—I—r~T ,~i—I '.'i—;--r, 1 r y - f 1 1—71 1 1 n—1—1—1—1—T 1 r rzzz—1 1 1 1 ' 1 1 ' _ ♦»♦ ■ > — • — ► « — • — ► « — » — ■ ■ n 11 ' ■ 1 0- f % ♦ \ v t. • v - . 1 ,v
200- ^ ♦ ? v ♦ : *;• * .>* f t n
8 ! ♦. ' >*\ ?• +->+ X I > >' °-£ - 4 4**- **J4 V . >>♦' \r I ; * i*
800- *:♦*; : v*« * • >• ~** , **«. t • > • *f * > ' . , • : * • ♦ >. * '/< ♦ t * * * S * * » » * % # ♦ ♦ « . , f «* 4 A »
o + * * « # ^ ♦ ♦ + « ■ * « « * , ^ ^ o f # • * ♦ • ♦ 25
. 1 , '/:,' ... -f t'V • I - jf- • ! \i *> ■ h ' I I I I I I 1 I I I I I I I I I I I I i I I I I 1 I I I I I I 1 1 1 1 1 1
40 50 0.6 1.0 14 16 10 14 0.2 0.6 4 8 2 3 0.2 0.4 100 200 100 200 Si02 Ti02 Al203 Fe2Os
T Fe3+/FeT H 2 0 + S MnO Zn Cu
—i , it ,i—i—i 1 1 ~ i—i—zc—i—\ir~i—i—i—c-1—i—'—i—i—fin—i—i—I 1 1 1 1 1 1 1 ; 0- 7~^ T I ' *♦ * ♦ ~ T • ♦, * T
*+* *\ T V , ♦ + ♦ * * * *** *, * ' '
J*.ar* 'wo ZZk c y ; .V* & ° .4»^* « » i * , * .* «-• 200- . *V *»Jl <" » * * ♦ ♦ ♦ * A »♦ SI «*« *. : :*'
^400- 'C< 1 t t ?:** I ' S ** • :* *<
9-600 .* % .iT V* L *♦? I J* .T I <
H * * * ♦*%. **^e iv ' i % . ; *J ^ v * ' - * ? f •= I •"** . *^*% . v * r t * ♦. ,» * *♦* * . ' * - : \ * v *
800 *, * v * * • *l * v» •» • I t?» * * ' & + " ; ♦* , * i {
1000 • v--- ••! I-.' I I:-- 4 •*?-"•' •'%' I • :1 1 I I I I I I I I 1 I I I I I I I I I — I I 1 I I I I I I I 1 I I I I I 1 1 1 I
6 8 10 8 11 1 2 3 0.1 0.2 0.3 0.2 0.4 0.1 0.2 100 200 200 400 50 100 50 150 MgO CaO Na20 K20 C0 2 P205 Ni Cr Co Sr
Figure 83. Chemical analyses obtained from X-ray fluorescence of core at Hole 504B, from Alt et al. (1986). Gadolinium, uranium, and thorium are measured by logs, but not routinely on core. Reproduced from Journal of Geophysical Research, courtesy of American Geophysical Union.
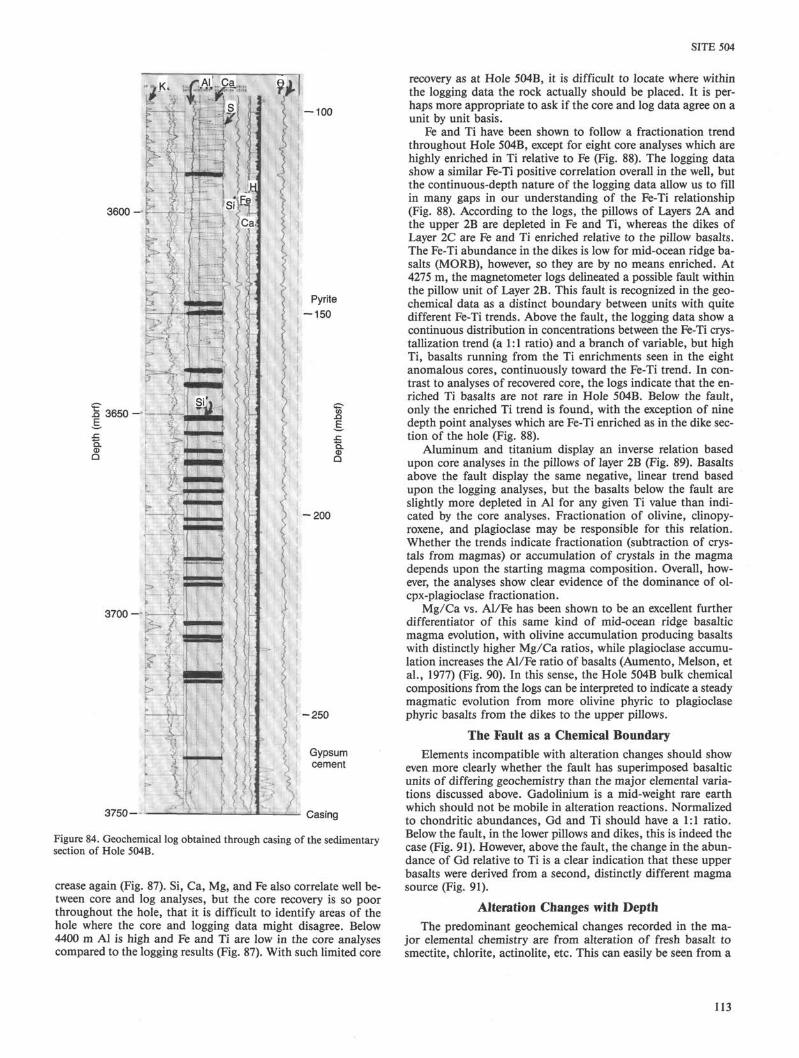
SITE 504
k
3600-i
\. : •: . : ■
i •■-;:
' *,Fe 1 Si r® ] ,
' J 1 . : 1
3700 -
X
<:;:< a —
i } ■ = :
t:
3750-
- 1 0 0
Pyrite -150
I
- 2 0 0
-250
Gypsum cement
Casing
Figure 84. Geochemical log obtained through casing of the sedimentary section of Hole 504B.
crease again (Fig. 87). Si, Ca, Mg, and Fe also correlate well between core and log analyses, but the core recovery is so poor throughout the hole, that it is difficult to identify areas of the hole where the core and logging data might disagree. Below 4400 m Al is high and Fe and Ti are low in the core analyses compared to the logging results (Fig. 87). With such limited core
recovery as at Hole 504B, it is difficult to locate where within the logging data the rock actually should be placed. It is perhaps more appropriate to ask if the core and log data agree on a unit by unit basis.
Fe and Ti have been shown to follow a fractionation trend throughout Hole 504B, except for eight core analyses which are highly enriched in Ti relative to Fe (Fig. 88). The logging data show a similar Fe-Ti positive correlation overall in the well, but the continuous-depth nature of the logging data allow us to fill in many gaps in our understanding of the Fe-Ti relationship (Fig. 88). According to the logs, the pillows of Layers 2A and the upper 2B are depleted in Fe and Ti, whereas the dikes of Layer 2C are Fe and Ti enriched relative to the pillow basalts. The Fe-Ti abundance in the dikes is low for mid-ocean ridge basalts (MORB), however, so they are by no means enriched. At 4275 m, the magnetometer logs delineated a possible fault within the pillow unit of Layer 2B. This fault is recognized in the geochemical data as a distinct boundary between units with quite different Fe-Ti trends. Above the fault, the logging data show a continuous distribution in concentrations between the Fe-Ti crystallization trend (a 1:1 ratio) and a branch of variable, but high Ti, basalts running from the Ti enrichments seen in the eight anomalous cores, continuously toward the Fe-Ti trend. In contrast to analyses of recovered core, the logs indicate that the enriched Ti basalts are not rare in Hole 504B. Below the fault, only the enriched Ti trend is found, with the exception of nine depth point analyses which are Fe-Ti enriched as in the dike section of the hole (Fig. 88).
Aluminum and titanium display an inverse relation based upon core analyses in the pillows of layer 2B (Fig. 89). Basalts above the fault display the same negative, linear trend based upon the logging analyses, but the basalts below the fault are slightly more depleted in Al for any given Ti value than indicated by the core analyses. Fractionation of olivine, clinopy-roxene, and plagioclase may be responsible for this relation. Whether the trends indicate fractionation (subtraction of crystals from magmas) or accumulation of crystals in the magma depends upon the starting magma composition. Overall, however, the analyses show clear evidence of the dominance of ol-cpx-plagioclase fractionation.
Mg/Ca vs. Al/Fe has been shown to be an excellent further differentiator of this same kind of mid-ocean ridge basaltic magma evolution, with olivine accumulation producing basalts with distinctly higher Mg/Ca ratios, while plagioclase accumulation increases the Al/Fe ratio of basalts (Aumento, Melson, et al., 1977) (Fig. 90). In this sense, the Hole 504B bulk chemical compositions from the logs can be interpreted to indicate a steady magmatic evolution from more olivine phyric to plagioclase phyric basalts from the dikes to the upper pillows.
The Fault as a Chemical Boundary Elements incompatible with alteration changes should show
even more clearly whether the fault has superimposed basaltic units of differing geochemistry than the major elemental variations discussed above. Gadolinium is a mid-weight rare earth which should not be mobile in alteration reactions. Normalized to chondritic abundances, Gd and Ti should have a 1:1 ratio. Below the fault, in the lower pillows and dikes, this is indeed the case (Fig. 91). However, above the fault, the change in the abundance of Gd relative to Ti is a clear indication that these upper basalts were derived from a second, distinctly different magma source (Fig. 91).
Alteration Changes with Depth The predominant geochemical changes recorded in the ma
jor elemental chemistry are from alteration of fresh basalt to smectite, chlorite, actinolite, etc. This can easily be seen from a
113
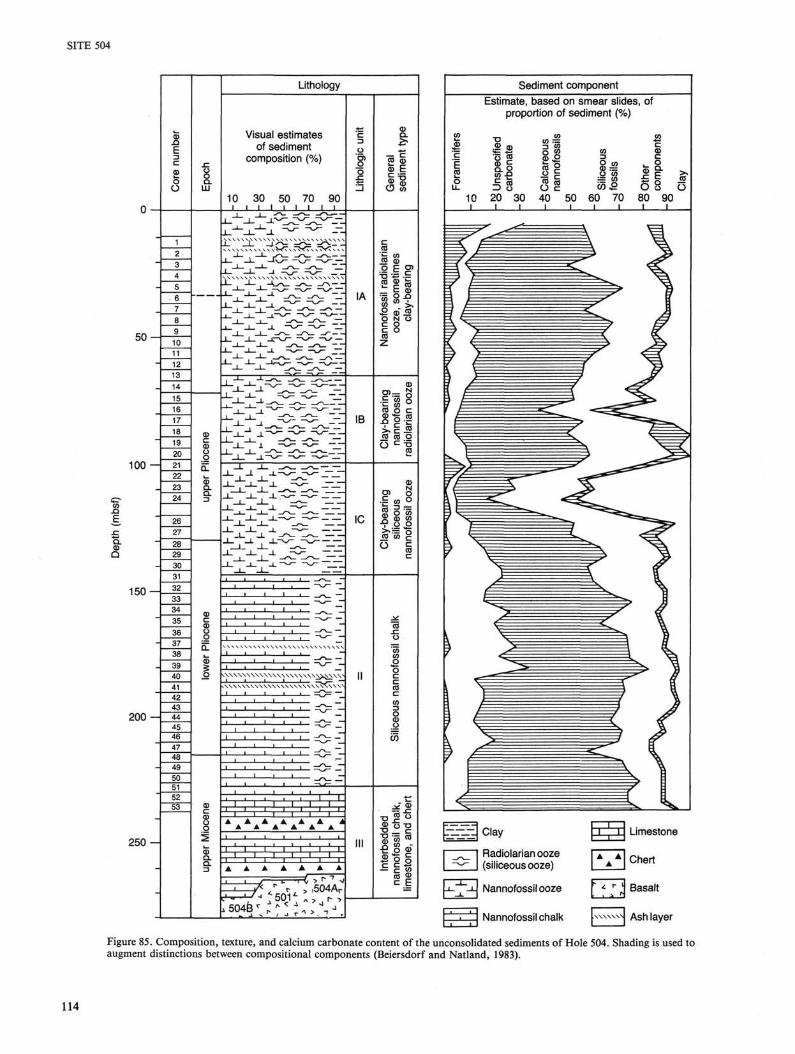
Sediment component Estimate, based on smear slides, of
proportion of sediment (%)
100
f Q
150 —
2 0 0 -
q Limestone 2 5 0 -
AA
A | Chert
f '< r J Basalt
kxwxxj Ash layer Figure 85. Composition, texture, and calcium carbonate content of the unconsolidated sediments of Hole 504. Shading is used to augment distinctions between compositional components (Beiersdorf and Natland, 1983).
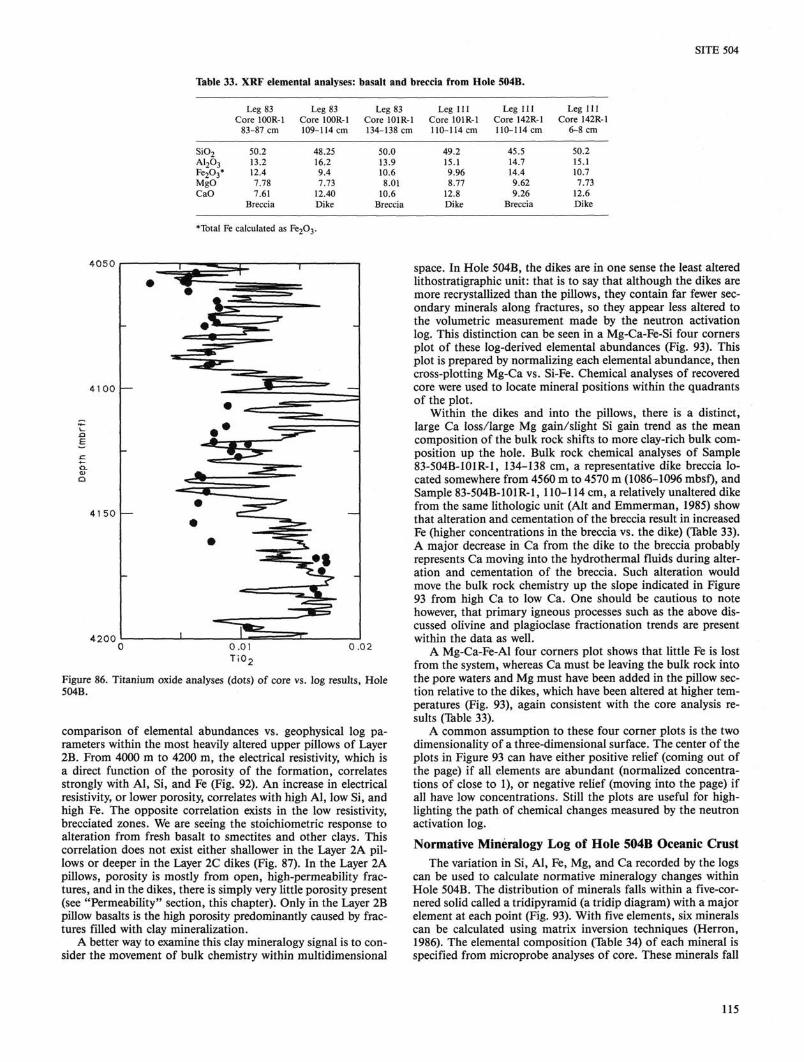
SITE 504
Table 33. XRF elemental analyses: basalt and breccia from Hole 504B.
Leg 83 Leg 83 Leg 83 Leg 111 Core 100R-1 Core 100R-1 Core 101R-1 Core 101R-1
83-87 cm 109-114 cm 134-138 cm 110-114 cm
Leg 111 Leg 111 Core 142R-1 Core 142R-1 110-114 cm 6-8 cm
Si02 A1203 Fe203* MgO CaO
50.2 13.2 12.4 7.78 7.61
Breccia
48.25 16.2 9.4 7.73
12.40 Dike
50.0 13.9 10.6 8.01
10.6 Breccia
49.2 15.1 9.96 8.77
12.8 Dike
45.5 14.7 14.4 9.62 9.26
Breccia
50.2 15.1 10.7 7.73
12.6 Dike
*Total Fe calculated as Fe203.
4050
4100 —
41 50 —
4200 0.02
Figure 86. Titanium oxide analyses (dots) of core vs. log results, Hole 504B.
comparison of elemental abundances vs. geophysical log parameters within the most heavily altered upper pillows of Layer 2B. From 4000 m to 4200 m, the electrical resistivity, which is a direct function of the porosity of the formation, correlates strongly with Al, Si, and Fe (Fig. 92). An increase in electrical resistivity, or lower porosity, correlates with high Al, low Si, and high Fe. The opposite correlation exists in the low resistivity, brecciated zones. We are seeing the stoichiometric response to alteration from fresh basalt to smectites and other clays. This correlation does not exist either shallower in the Layer 2A pillows or deeper in the Layer 2C dikes (Fig. 87). In the Layer 2A pillows, porosity is mostly from open, high-permeability fractures, and in the dikes, there is simply very little porosity present (see "Permeability" section, this chapter). Only in the Layer 2B pillow basalts is the high porosity predominantly caused by fractures filled with clay mineralization.
A better way to examine this clay mineralogy signal is to consider the movement of bulk chemistry within multidimensional
space. In Hole 504B, the dikes are in one sense the least altered lithostratigraphic unit: that is to say that although the dikes are more recrystallized than the pillows, they contain far fewer secondary minerals along fractures, so they appear less altered to the volumetric measurement made by the neutron activation log. This distinction can be seen in a Mg-Ca-Fe-Si four corners plot of these log-derived elemental abundances (Fig. 93). This plot is prepared by normalizing each elemental abundance, then cross-plotting Mg-Ca vs. Si-Fe. Chemical analyses of recovered core were used to locate mineral positions within the quadrants of the plot.
Within the dikes and into the pillows, there is a distinct, large Ca loss/large Mg gain/slight Si gain trend as the mean composition of the bulk rock shifts to more clay-rich bulk composition up the hole. Bulk rock chemical analyses of Sample 83-504B-101R-1, 134-138 cm, a representative dike breccia located somewhere from 4560 m to 4570 m (1086-1096 mbsf), and Sample 83-504B-101R-1, 110-114 cm, a relatively unaltered dike from the same lithologic unit (Alt and Emmerman, 1985) show that alteration and cementation of the breccia result in increased Fe (higher concentrations in the breccia vs. the dike) (Table 33). A major decrease in Ca from the dike to the breccia probably represents Ca moving into the hydrothermal fluids during alteration and cementation of the breccia. Such alteration would move the bulk rock chemistry up the slope indicated in Figure 93 from high Ca to low Ca. One should be cautious to note however, that primary igneous processes such as the above discussed olivine and plagioclase fractionation trends are present within the data as well.
A Mg-Ca-Fe-Al four corners plot shows that little Fe is lost from the system, whereas Ca must be leaving the bulk rock into the pore waters and Mg must have been added in the pillow section relative to the dikes, which have been altered at higher temperatures (Fig. 93), again consistent with the core analysis results (Table 33).
A common assumption to these four corner plots is the two dimensionality of a three-dimensional surface. The center of the plots in Figure 93 can have either positive relief (coming out of the page) if all elements are abundant (normalized concentrations of close to 1), or negative relief (moving into the page) if all have low concentrations. Still the plots are useful for highlighting the path of chemical changes measured by the neutron activation log.
Normative Mineralogy Log of Hole 504B Oceanic Crust The variation in Si, Al, Fe, Mg, and Ca recorded by the logs
can be used to calculate normative mineralogy changes within Hole 504B. The distribution of minerals falls within a five-cornered solid called a tridipyramid (a tridip diagram) with a major element at each point (Fig. 93). With five elements, six minerals can be calculated using matrix inversion techniques (Herron, 1986). The elemental composition (Table 34) of each mineral is specified from microprobe analyses of core. These minerals fall
115

3750
3800
3850 —F&z-J.
3900 -
3950 -
4000
4050
4100
4150
4200
Figure 87. Aluminum, silicon, iron, calcium, and magnesium weight percentage abundances, core analyses (dots) vs. log results, Hole 504B. Also plotted is porosity determined from the electrical resistivity laterolog. Speckled, porosity to left of elemental abundance; shaded, porosity to right of elemental abundance. Note scales—Al, Fe, Ca increase to right; porosity, Si, Mg increase to left.
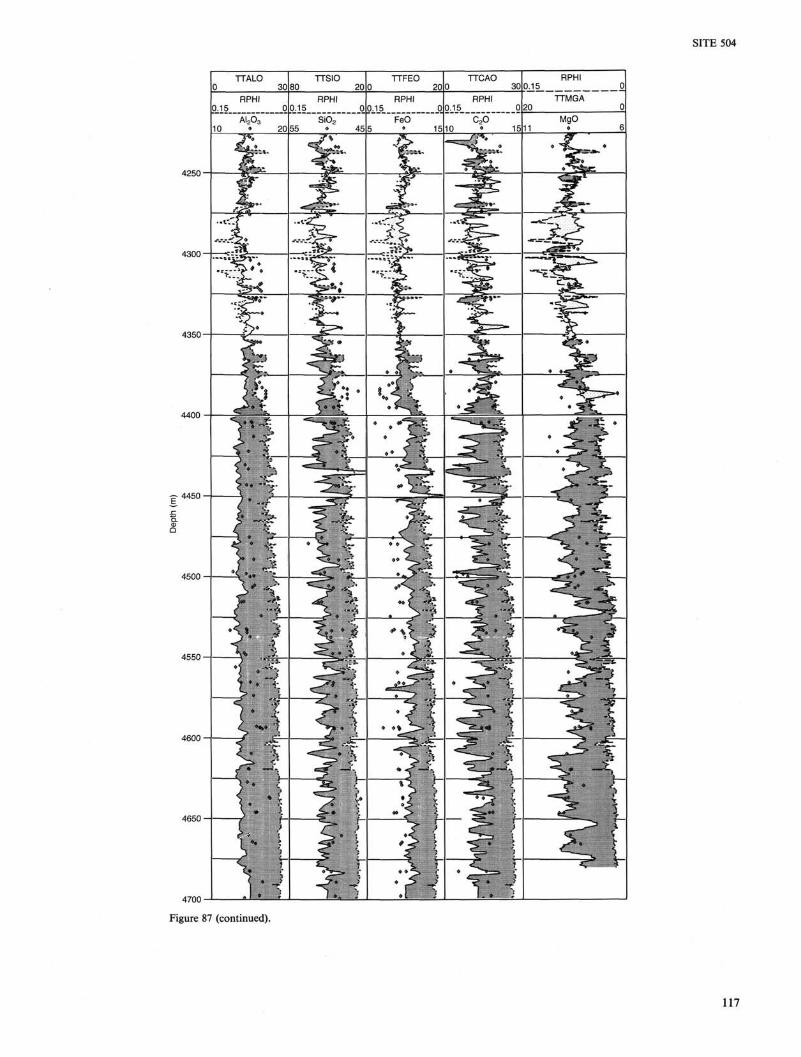
SITE 504
4700
Figure 87 (continued).
117

SITE 504
13
9
K
B
-
•
I I 10
8
.
1 1 A
— .
i i
0.8
i S I i
1
'"'b/i
1
1.0
I
| 1.2
I
I
-
J I
' I
1.4
—
I D
__
-
I
I I
.>-M / i i
I
x°
/\0'
i
-
TiO, TiO,
Figure 88. Core in Layer 2B (A), then geochemical log data for Layer 2A (B), Layer 2B above (C), then below fault (D), and Layer 2C elemental abundance cross-plot (E) of FeO vs. Ti02. Solid line is iron-titanium fractionation trend. (Copy each figure separately onto transparencies, then overlay to see trends clearly.)
within specific clusters of four-corner plots of projected compositions of each face of the solid (Fig. 93). The chemical composition represented by the clinopyroxene of Table 34 is a sub-Ca augite, and the olivine is Fo7g. The An content of the plagio-clase cannot be calculated without known Na content, but the analyses of Kempton et al. (1985) are consistent with the composition chosen (Table 34).
As noted above, the bulk chemical changes of the hole follow specific trends on each of the four-corner plots (Fig. 93), with movement from high Ca to high Mg within each plot as the data are considered in zones from the dikes to the pillows. These three plots fully describe the distribution within the tridip solid of the log-determined elemental compositions. Proximity to the normative mineral compositions can be calculated if those compositions are specified as in Table 34.
The log of mineral abundances shows two major mineralogi-cal suites within the hole (Plate 6): plagioclase + clinopyroxene + olivine forms the bulk of the formation (this is the fresh basalt itself). A second component divides the basalt into specific units, and appears as large spikes of Mg-, Ca-, and Si-rich am-phibole (actinolite in the dike section) + A1-, Fe-, and Mg-rich chlorite (in the dikes) or Fe-, Mg-, and Si-rich smectite (in the pillows) or other clays (Plate 6).
This normative mineralogy log of the hole describes the formation as predominantly composed of these two units with rel
atively fresh basalt with minor smectite separated by breccia zones containing hydroxyl minerals (Plate 6). In Hole 504B, there is strong positive correlation between the abundances of plagioclase, olivine, and clinopyroxene. Positive correlation is also seen between actinolite (or its clay equivalent), smectite, and chlorite (or its clay equivalent). The plagioclase-clinopyrox-ene-olivine group shows strong negative correlation with the ac-tinolite-chlorite-smectite group.
Alteration Synthesis in the Upper Oceanic Crust of Hole 504B
The mineralogical variations in Hole 504B allow us to fully describe the geochemistry of the section through which we drilled, in spite of only 20% core recovery. Further, it is clear that the neutron activation log is sensitive to the chemical evolution of this young oceanic crust. A reasonable scenario for the evolutionary history of that crust might be as follows: dikes and lavas of varying primary composition were intruded and erupted during original formation of the 504B crust at the Costa Rica Rift ridge axis. A fault subsequently superimposed the upper pillow units onto the lower pillow basalts of Layer 2B and the dikes of Layer 2C. Interaction with seawater occurred and continued as the crust spread and aged away from the ridge crest. The stockwork mineralization zone was deposited as hot hydro-thermal waters traveling up the fault zone came in contact with
118
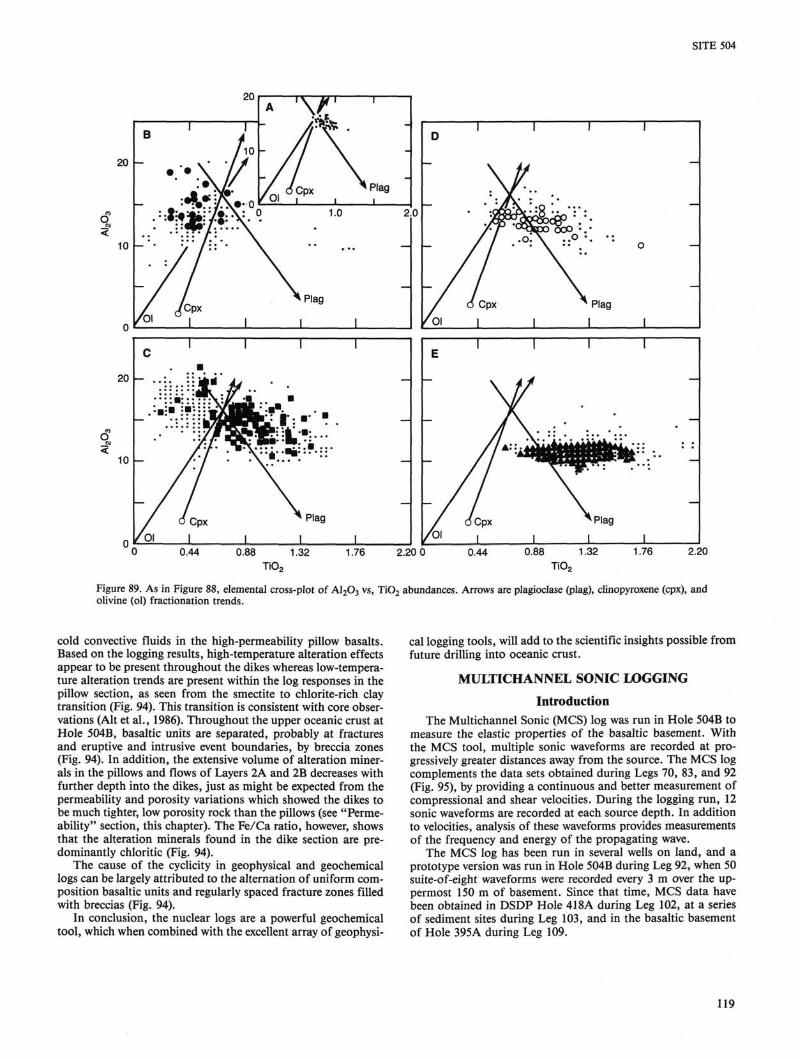
SITE 504
*i-*.5i^ _ _ _ ^ — _ — — .
0 0.44 0.88 1.32 1.76 2.20 0 0.44 0.88 1.32 1.76 2.20 TiOz TiOa
Figure 89. As in Figure 88, elemental cross-plot of A1203 vs, Ti02 abundances. Arrows are plagioclase (plag), clinopyroxene (cpx), and olivine (ol) fractionation trends.
cal logging tools, will add to the scientific insights possible from future drilling into oceanic crust.
MULTICHANNEL SONIC LOGGING
Introduction The Multichannel Sonic (MCS) log was run in Hole 504B to
measure the elastic properties of the basaltic basement. With the MCS tool, multiple sonic waveforms are recorded at progressively greater distances away from the source. The MCS log complements the data sets obtained during Legs 70, 83, and 92 (Fig. 95), by providing a continuous and better measurement of compressional and shear velocities. During the logging run, 12 sonic waveforms are recorded at each source depth. In addition to velocities, analysis of these waveforms provides measurements of the frequency and energy of the propagating wave.
The MCS log has been run in several wells on land, and a prototype version was run in Hole 504B during Leg 92, when 50 suite-of-eight waveforms were recorded every 3 m over the uppermost 150 m of basement. Since that time, MCS data have been obtained in DSDP Hole 418A during Leg 102, at a series of sediment sites during Leg 103, and in the basaltic basement of Hole 395A during Leg 109.
119
cold convective fluids in the high-permeability pillow basalts. Based on the logging results, high-temperature alteration effects appear to be present throughout the dikes whereas low-temperature alteration trends are present within the log responses in the pillow section, as seen from the smectite to chlorite-rich clay transition (Fig. 94). This transition is consistent with core observations (Alt et al., 1986). Throughout the upper oceanic crust at Hole 504B, basaltic units are separated, probably at fractures and eruptive and intrusive event boundaries, by breccia zones (Fig. 94). In addition, the extensive volume of alteration minerals in the pillows and flows of Layers 2A and 2B decreases with further depth into the dikes, just as might be expected from the permeability and porosity variations which showed the dikes to be much tighter, low porosity rock than the pillows (see "Permeability" section, this chapter). The Fe/Ca ratio, however, shows that the alteration minerals found in the dike section are predominantly chloritic (Fig. 94).
The cause of the cyclicity in geophysical and geochemical logs can be largely attributed to the alternation of uniform composition basaltic units and regularly spaced fracture zones filled with breccias (Fig. 94).
In conclusion, the nuclear logs are a powerful geochemical tool, which when combined with the excellent array of geophysi-

SITE 504
Al/Fe Al/Fe
Figure 90. As in Figure 88, elemental abundances of Mg/Ca vs. Al/Fe from logs. Plagioclase (plag) phyric and olivine (ol) phyric frac-tionation trends shown as well.
Description and Operation of the MCS Log
A schematic of the MCS sonde is shown in Figure 96. This tool brings the powerful seismic processing techniques developed for surface surveying to the logged well bore. Each firing of the source becomes a minirefraction experiment because the sound energy moves radially outward from the tool centralized in the well to the rock. There it enters and travels down the wall rock, before propagating through the drilling fluid back to the tool. The sound energy is then received by as many as 12 transducers spaced every 15 cm starting 1-3 m below the source.
These waveforms resemble small microearthquake seismo-grams (Fig. 97), and can be analysed as such. The compres-sional, shear, and surface wave codas separate into individual energy packets as the energy moves out across the receiver array. The velocities of the coda packets are precisely measured by a seismic technique called semblance. With semblance analysis, a series of increasing velocity increments is applied to assess the maximum statistical coherence of the multiple receivers, giving a precise determination not only of velocities, but also of the degree of energy loss across the array. The traditional full waveform display of a single receiver also allows for the qualitative identification of such energy loss, but the semblance statistics quantify this energy loss for each separate coda.
For operations at Hole 504B, a 2-m source-to-first-receiver spacing was used. During recording, the tool is raised or lowered
in the hole at a constant rate. A suite of 12 waveforms (generated from 12 successive firings of the source producing the 12-receiver suite) is recorded at fixed depth intervals. The amplifier gain for each receiver is controlled from the surface.
The MCS log recorded during Leg 111, from basement top down to a depth of 5000 mbrf, was acquired with two separate logging runs: the first at the beginning of the leg from 3751 mbrf to 4250 mbrf (277-776 mbsf), and the second in the deeper part of the hole after it had been drilled to a depth of 5021 mbrf (1547 mbsf).
The first MCS log was recorded shortly after the temperature log, which indicated that the upper temperature limit of the MCS tool would be exceeded during this run. It was consequently decided to log going down the hole. Full waveforms recorded in casing showed that the cement bond was good from 3662 mbrf to 3705 mbrf (188-231 mbsf) and fair to poor elsewhere. The waveforms were recorded from the bottom of the casing (3751 mbrf or 277 mbsf) to a depth of 4250 mbrf (776 mbsf), where the tool stopped firing the sonic source due to a component failure in the sonde. The rate of descent was kept at 4 m/min. Approximately 2400 sets of waveforms were acquired over that section of the hole, which averages a data point every 18 cm.
The second MCS log was recorded after Hole 504B had been drilled to 1547.5 mbsf, with a tool that had been upgraded to extend its temperature rating. However, the first attempt to re-
120
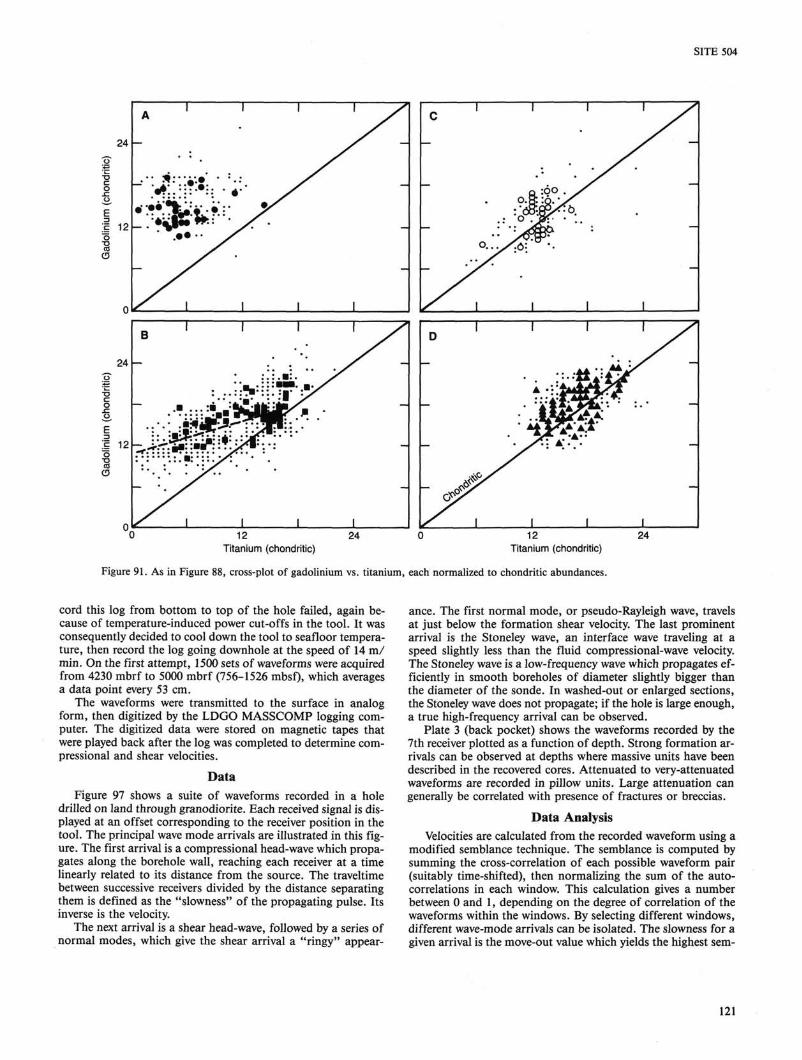
SITE 504
Titanium (chondritic) Titanium (chondritic) Figure 91. As in Figure 88, cross-plot of gadolinium vs. titanium, each normalized to chondritic abundances.
cord this log from bottom to top of the hole failed, again because of temperature-induced power cut-offs in the tool. It was consequently decided to cool down the tool to seafloor temperature, then record the log going downhole at the speed of 14 m/ min. On the first attempt, 1500 sets of waveforms were acquired from 4230 mbrf to 5000 mbrf (756-1526 mbsf), which averages a data point every 53 cm.
The waveforms were transmitted to the surface in analog form, then digitized by the LDGO MASSCOMP logging computer. The digitized data were stored on magnetic tapes that were played back after the log was completed to determine com-pressional and shear velocities.
Data Figure 97 shows a suite of waveforms recorded in a hole
drilled on land through granodiorite. Each received signal is displayed at an offset corresponding to the receiver position in the tool. The principal wave mode arrivals are illustrated in this figure. The first arrival is a compressional head-wave which propagates along the borehole wall, reaching each receiver at a time linearly related to its distance from the source. The traveltime between successive receivers divided by the distance separating them is defined as the "slowness" of the propagating pulse. Its inverse is the velocity.
The next arrival is a shear head-wave, followed by a series of normal modes, which give the shear arrival a "ringy" appear
ance. The first normal mode, or pseudo-Rayleigh wave, travels at just below the formation shear velocity. The last prominent arrival is the Stoneley wave, an interface wave traveling at a speed slightly less than the fluid compressional-wave velocity. The Stoneley wave is a low-frequency wave which propagates efficiently in smooth boreholes of diameter slightly bigger than the diameter of the sonde. In washed-out or enlarged sections, the Stoneley wave does not propagate; if the hole is large enough, a true high-frequency arrival can be observed.
Plate 3 (back pocket) shows the waveforms recorded by the 7th receiver plotted as a function of depth. Strong formation arrivals can be observed at depths where massive units have been described in the recovered cores. Attenuated to very-attenuated waveforms are recorded in pillow units. Large attenuation can generally be correlated with presence of fractures or breccias.
Data Analysis Velocities are calculated from the recorded waveform using a
modified semblance technique. The semblance is computed by summing the cross-correlation of each possible waveform pair (suitably time-shifted), then normalizing the sum of the autocorrelations in each window. This calculation gives a number between 0 and 1, depending on the degree of correlation of the waveforms within the windows. By selecting different windows, different wave-mode arrivals can be isolated. The slowness for a given arrival is the move-out value which yields the highest sem-
121
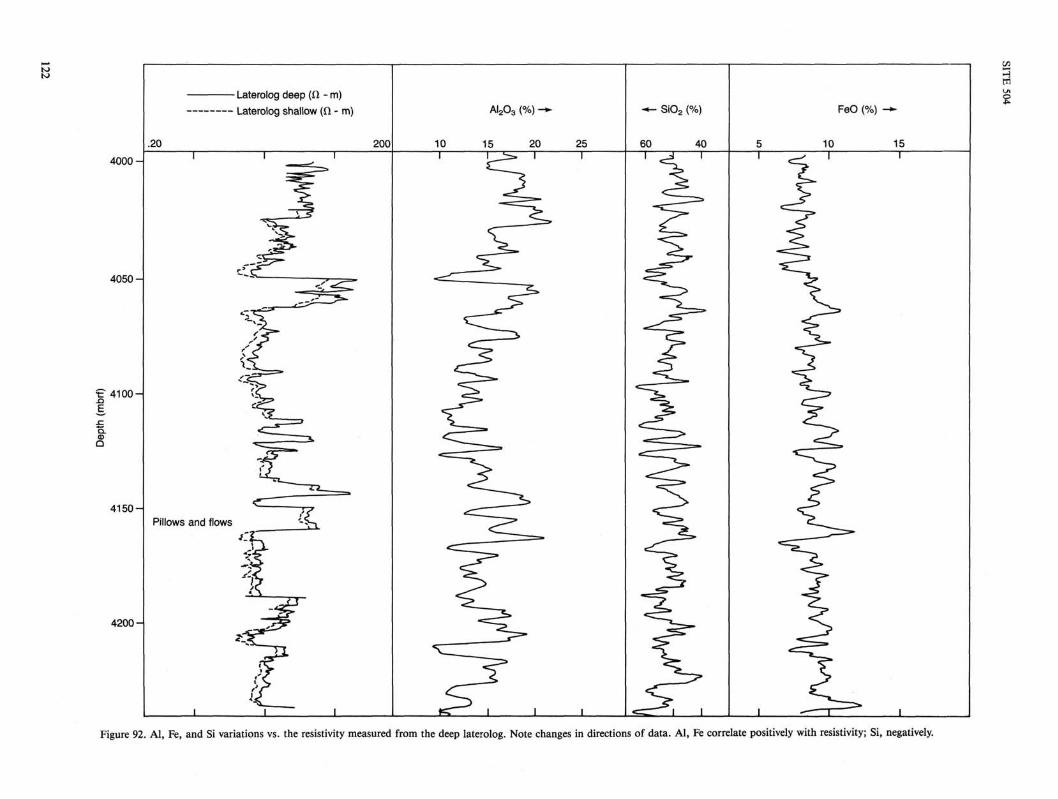
Laterolog deep (Cl - m) Laterolog shallow (n - m) Al203 (%) -*- -« - Si02 (%) FeO (%) -+-
.20 200 10 15 20 25 60 40 5 10 15 4000- ' r ~ ^ ' ^ ^ ' ' < J ' ' ^ ~ " '
Pillows and flows ' - ^ ~^=" ^ = ^ C _ ^ _ ^
I I I I F T I I I I < = Z ^ \ I I I -— I : > i Figure 92. Al, Fe, and Si variations vs. the resistivity measured from the deep laterolog. Note changes in directions of data. Al, Fe correlate positively with resistivity; Si, negatively.
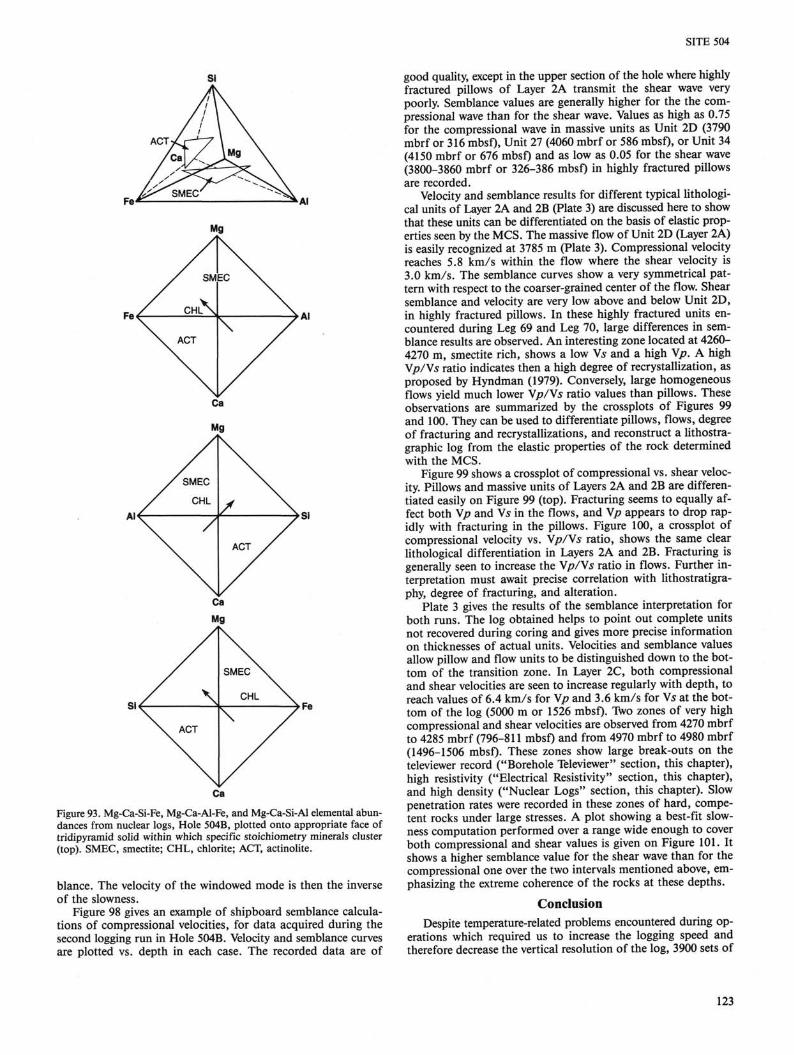
SITE 504
Figure 93. Mg-Ca-Si-Fe, Mg-Ca-Al-Fe, and Mg-Ca-Si-Al elemental abundances from nuclear logs, Hole 504B, plotted onto appropriate face of tridipyramid solid within which specific stoichiometry minerals cluster (top). SMEC, smectite; CHL, chlorite; ACT, actinolite.
blance. The velocity of the windowed mode is then the inverse of the slowness.
Figure 98 gives an example of shipboard semblance calculations of compressional velocities, for data acquired during the second logging run in Hole 504B. Velocity and semblance curves are plotted vs. depth in each case. The recorded data are of
good quality, except in the upper section of the hole where highly fractured pillows of Layer 2A transmit the shear wave very poorly. Semblance values are generally higher for the the compressional wave than for the shear wave. Values as high as 0.75 for the compressional wave in massive units as Unit 2D (3790 mbrf or 316 mbsf), Unit 27 (4060 mbrf or 586 mbsf), or Unit 34 (4150 mbrf or 676 mbsf) and as low as 0.05 for the shear wave (3800-3860 mbrf or 326-386 mbsf) in highly fractured pillows are recorded.
Velocity and semblance results for different typical lithologi-cal units of Layer 2A and 2B (Plate 3) are discussed here to show that these units can be differentiated on the basis of elastic properties seen by the MCS. The massive flow of Unit 2D (Layer 2A) is easily recognized at 3785 m (Plate 3). Compressional velocity reaches 5.8 km/s within the flow where the shear velocity is 3.0 km/s. The semblance curves show a very symmetrical pattern with respect to the coarser-grained center of the flow. Shear semblance and velocity are very low above and below Unit 2D, in highly fractured pillows. In these highly fractured units encountered during Leg 69 and Leg 70, large differences in semblance results are observed. An interesting zone located at 4260-4270 m, smectite rich, shows a low Vs and a high Vp. A high Vp/Vs ratio indicates then a high degree of recrystallization, as proposed by Hyndman (1979). Conversely, large homogeneous flows yield much lower Vp/Vs ratio values than pillows. These observations are summarized by the crossplots of Figures 99 and 100. They can be used to differentiate pillows, flows, degree of fracturing and recrystallizations, and reconstruct a lithostra-graphic log from the elastic properties of the rock determined with the MCS.
Figure 99 shows a crossplot of compressional vs. shear velocity. Pillows and massive units of Layers 2A and 2B are differentiated easily on Figure 99 (top). Fracturing seems to equally affect both Vp and Vs in the flows, and Vp appears to drop rapidly with fracturing in the pillows. Figure 100, a crossplot of compressional velocity vs. Vp/Vs ratio, shows the same clear lithological differentiation in Layers 2A and 2B. Fracturing is generally seen to increase the Vp/Vs ratio in flows. Further interpretation must await precise correlation with lithostratigra-phy, degree of fracturing, and alteration.
Plate 3 gives the results of the semblance interpretation for both runs. The log obtained helps to point out complete units not recovered during coring and gives more precise information on thicknesses of actual units. Velocities and semblance values allow pillow and flow units to be distinguished down to the bottom of the transition zone. In Layer 2C, both compressional and shear velocities are seen to increase regularly with depth, to reach values of 6.4 km/s for Vp and 3.6 km/s for Vs at the bottom of the log (5000 m or 1526 mbsf). Two zones of very high compressional and shear velocities are observed from 4270 mbrf to 4285 mbrf (796-811 mbsf) and from 4970 mbrf to 4980 mbrf (1496-1506 mbsf). These zones show large break-outs on the televiewer record ("Borehole Televiewer" section, this chapter), high resistivity ("Electrical Resistivity" section, this chapter), and high density ("Nuclear Logs" section, this chapter). Slow penetration rates were recorded in these zones of hard, competent rocks under large stresses. A plot showing a best-fit slowness computation performed over a range wide enough to cover both compressional and shear values is given on Figure 101. It shows a higher semblance value for the shear wave than for the compressional one over the two intervals mentioned above, emphasizing the extreme coherence of the rocks at these depths.
Conclusion Despite temperature-related problems encountered during op
erations which required us to increase the logging speed and therefore decrease the vertical resolution of the log, 3900 sets of
123
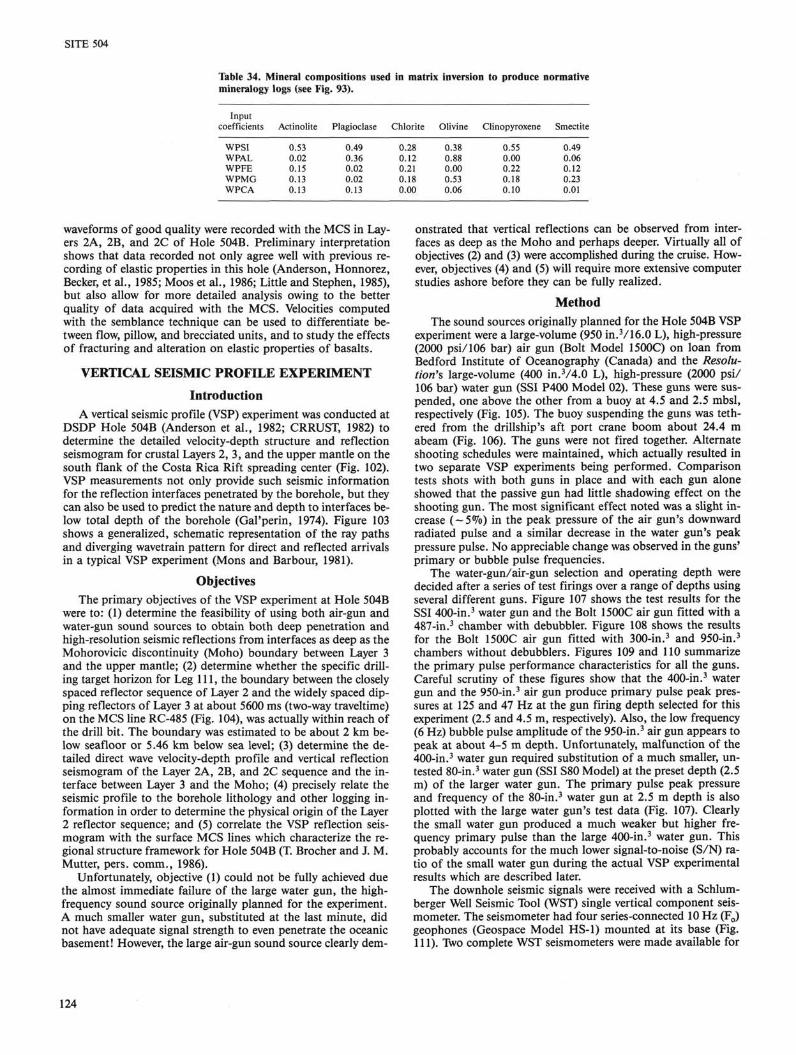
SITE 504
Table 34. Mineral compositions used mineralogy logs (see Fig. 93).
Input coefficients Actinolite Plagioclase
WPSI WEAL WPFE WPMG WPCA
0.53 0.02 0.15 0.13 0.13
0.49 0.36 0.02 0.02 0.13
waveforms of good quality were recorded with the MCS in Layers 2A, 2B, and 2C of Hole 504B. Preliminary interpretation shows that data recorded not only agree well with previous recording of elastic properties in this hole (Anderson, Honnorez, Becker, et al., 1985; Moos et al., 1986; Little and Stephen, 1985), but also allow for more detailed analysis owing to the better quality of data acquired with the MCS. Velocities computed with the semblance technique can be used to differentiate between flow, pillow, and brecciated units, and to study the effects of fracturing and alteration on elastic properties of basalts.
VERTICAL SEISMIC PROFILE EXPERIMENT
Introduction A vertical seismic profile (VSP) experiment was conducted at
DSDP Hole 504B (Anderson et al., 1982; CRRUST, 1982) to determine the detailed velocity-depth structure and reflection seismogram for crustal Layers 2, 3, and the upper mantle on the south flank of the Costa Rica Rift spreading center (Fig. 102). VSP measurements not only provide such seismic information for the reflection interfaces penetrated by the borehole, but they can also be used to predict the nature and depth to interfaces below total depth of the borehole (Gal'perin, 1974). Figure 103 shows a generalized, schematic representation of the ray paths and diverging wavetrain pattern for direct and reflected arrivals in a typical VSP experiment (Mons and Barbour, 1981).
Objectives The primary objectives of the VSP experiment at Hole 504B
were to: (1) determine the feasibility of using both air-gun and water-gun sound sources to obtain both deep penetration and high-resolution seismic reflections from interfaces as deep as the Mohorovicic discontinuity (Moho) boundary between Layer 3 and the upper mantle; (2) determine whether the specific drilling target horizon for Leg 111, the boundary between the closely spaced reflector sequence of Layer 2 and the widely spaced dipping reflectors of Layer 3 at about 5600 ms (two-way traveltime) on the MCS line RC-485 (Fig. 104), was actually within reach of the drill bit. The boundary was estimated to be about 2 km below seafloor or 5.46 km below sea level; (3) determine the detailed direct wave velocity-depth profile and vertical reflection seismogram of the Layer 2A, 2B, and 2C sequence and the interface between Layer 3 and the Moho; (4) precisely relate the seismic profile to the borehole lithology and other logging information in order to determine the physical origin of the Layer 2 reflector sequence; and (5) correlate the VSP reflection seismogram with the surface MCS lines which characterize the regional structure framework for Hole 504B (T. Brocher and J. M. Mutter, pers. comm., 1986).
Unfortunately, objective (1) could not be fully achieved due the almost immediate failure of the large water gun, the high-frequency sound source originally planned for the experiment. A much smaller water gun, substituted at the last minute, did not have adequate signal strength to even penetrate the oceanic basement! However, the large air-gun sound source clearly dem-
124
in matrix inversion to produce normative
Chlorite Olivine Clinopyroxene Smectite 0.28 0.12 0.21 0.18 0.00
0.38 0.88 0.00 0.53 0.06
0.55 0.00 0.22 0.18 0.10
0.49 0.06 0.12 0.23 0.01
onstrated that vertical reflections can be observed from interfaces as deep as the Moho and perhaps deeper. Virtually all of objectives (2) and (3) were accomplished during the cruise. However, objectives (4) and (5) will require more extensive computer studies ashore before they can be fully realized.
Method The sound sources originally planned for the Hole 504B VSP
experiment were a large-volume (950 in.3/16.0 L), high-pressure (2000 psi/106 bar) air gun (Bolt Model 1500C) on loan from Bedford Institute of Oceanography (Canada) and the Resolution's large-volume (400 in.3/4.0 L), high-pressure (2000 psi/ 106 bar) water gun (SSI P400 Model 02). These guns were suspended, one above the other from a buoy at 4.5 and 2.5 mbsl, respectively (Fig. 105). The buoy suspending the guns was tethered from the drillship's aft port crane boom about 24.4 m abeam (Fig. 106). The guns were not fired together. Alternate shooting schedules were maintained, which actually resulted in two separate VSP experiments being performed. Comparison tests shots with both guns in place and with each gun alone showed that the passive gun had little shadowing effect on the shooting gun. The most significant effect noted was a slight increase (~5%) in the peak pressure of the air gun's downward radiated pulse and a similar decrease in the water gun's peak pressure pulse. No appreciable change was observed in the guns' primary or bubble pulse frequencies.
The water-gun/air-gun selection and operating depth were decided after a series of test firings over a range of depths using several different guns. Figure 107 shows the test results for the SSI 400-in.3 water gun and the Bolt 1500C air gun fitted with a 487-in.3 chamber with debubbler. Figure 108 shows the results for the Bolt 1500C air gun fitted with 300-in.3 and 950-in.3
chambers without debubblers. Figures 109 and 110 summarize the primary pulse performance characteristics for all the guns. Careful scrutiny of these figures show that the 400-in.3 water gun and the 950-in.3 air gun produce primary pulse peak pressures at 125 and 47 Hz at the gun firing depth selected for this experiment (2.5 and 4.5 m, respectively). Also, the low frequency (6 Hz) bubble pulse amplitude of the 950-in.3 air gun appears to peak at about 4-5 m depth. Unfortunately, malfunction of the 400-in.3 water gun required substitution of a much smaller, untested 80-in.3 water gun (SSI S80 Model) at the preset depth (2.5 m) of the larger water gun. The primary pulse peak pressure and frequency of the 80-in.3 water gun at 2.5 m depth is also plotted with the large water gun's test data (Fig. 107). Clearly the small water gun produced a much weaker but higher frequency primary pulse than the large 400-in.3 water gun. This probably accounts for the much lower signal-to-noise (S/N) ratio of the small water gun during the actual VSP experimental results which are described later.
The downhole seismic signals were received with a Schlum-berger Well Seismic Tool (WST) single vertical component seismometer. The seismometer had four series-connected 10 Hz (F0) geophones (Geospace Model HS-1) mounted at its base (Fig. 111). Two complete WST seismometers were made available for
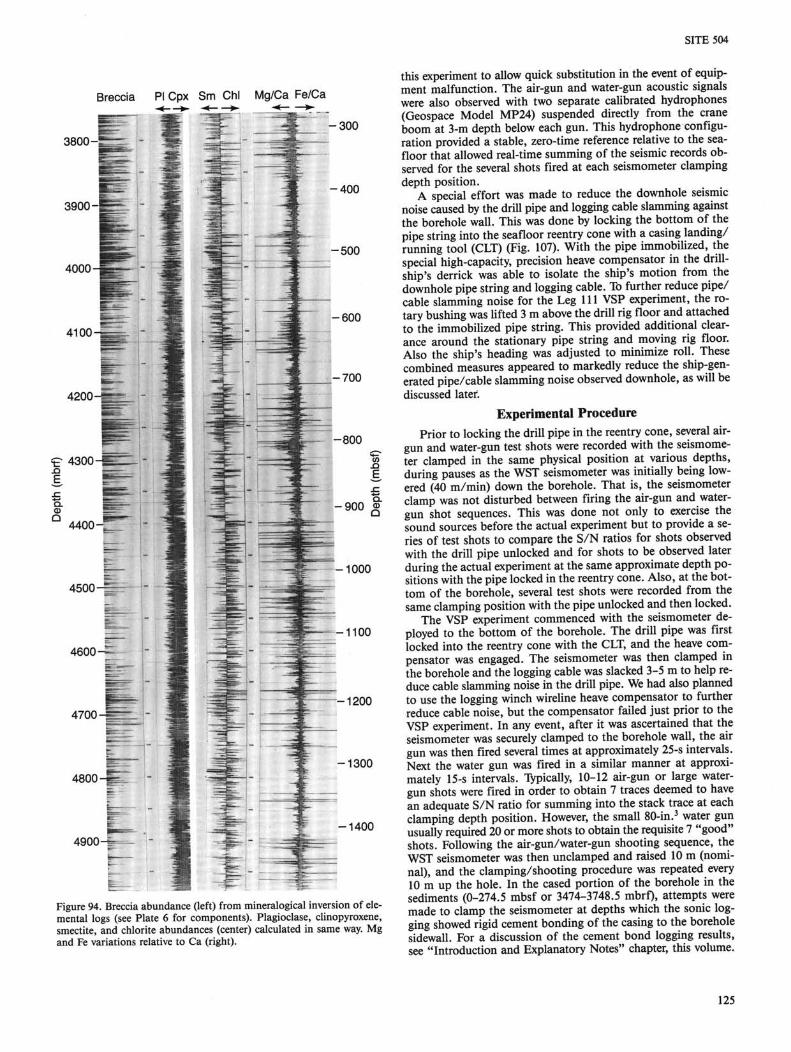
Breccia PI Cpx Sm Chi Mg/Ca Fe/Ca
Figure 94. Breccia abundance (left) from mineralogical inversion of elemental logs (see Plate 6 for components). Plagioclase, clinopyroxene, smectite, and chlorite abundances (center) calculated in same way. Mg and Fe variations relative to Ca (right).
SITE 504
this experiment to allow quick substitution in the event of equipment malfunction. The air-gun and water-gun acoustic signals were also observed with two separate calibrated hydrophones (Geospace Model MP24) suspended directly from the crane boom at 3-m depth below each gun. This hydrophone configuration provided a stable, zero-time reference relative to the sea-floor that allowed real-time summing of the seismic records observed for the several shots fired at each seismometer clamping depth position.
A special effort was made to reduce the downhole seismic noise caused by the drill pipe and logging cable slamming against the borehole wall. This was done by locking the bottom of the pipe string into the seafloor reentry cone with a casing landing/ running tool (CLT) (Fig. 107). With the pipe immobilized, the special high-capacity, precision heave compensator in the drill-ship's derrick was able to isolate the ship's motion from the downhole pipe string and logging cable. To further reduce pipe/ cable slamming noise for the Leg 111 VSP experiment, the rotary bushing was lifted 3 m above the drill rig floor and attached to the immobilized pipe string. This provided additional clearance around the stationary pipe string and moving rig floor. Also the ship's heading was adjusted to minimize roll. These combined measures appeared to markedly reduce the ship-generated pipe/cable slamming noise observed downhole, as will be discussed later.
Experimental Procedure Prior to locking the drill pipe in the reentry cone, several air-
gun and water-gun test shots were recorded with the seismometer clamped in the same physical position at various depths, during pauses as the WST seismometer was initially being lowered (40 m/min) down the borehole. That is, the seismometer clamp was not disturbed between firing the air-gun and water-gun shot sequences. This was done not only to exercise the sound sources before the actual experiment but to provide a series of test shots to compare the S/N ratios for shots observed with the drill pipe unlocked and for shots to be observed later during the actual experiment at the same approximate depth positions with the pipe locked in the reentry cone. Also, at the bottom of the borehole, several test shots were recorded from the same clamping position with the pipe unlocked and then locked.
The VSP experiment commenced with the seismometer deployed to the bottom of the borehole. The drill pipe was first locked into the reentry cone with the CLT, and the heave compensator was engaged. The seismometer was then clamped in the borehole and the logging cable was slacked 3-5 m to help reduce cable slamming noise in the drill pipe. We had also planned to use the logging winch wireline heave compensator to further reduce cable noise, but the compensator failed just prior to the VSP experiment. In any event, after it was ascertained that the seismometer was securely clamped to the borehole wall, the air gun was then fired several times at approximately 25-s intervals. Next the water gun was fired in a similar manner at approximately 15-s intervals. Typically, 10-12 air-gun or large water-gun shots were fired in order to obtain 7 traces deemed to have an adequate S/N ratio for summing into the stack trace at each clamping depth position. However, the small 80-in.3 water gun usually required 20 or more shots to obtain the requisite 7 "good" shots. Following the air-gun/water-gun shooting sequence, the WST seismometer was then undamped and raised 10 m (nominal), and the clamping/shooting procedure was repeated every 10 m up the hole. In the cased portion of the borehole in the sediments (0-274.5 mbsf or 3474-3748.5 mbrf), attempts were made to clamp the seismometer at depths which the sonic logging showed rigid cement bonding of the casing to the borehole sidewall. For a discussion of the cement bond logging results, see "Introduction and Explanatory Notes" chapter, this volume.
125
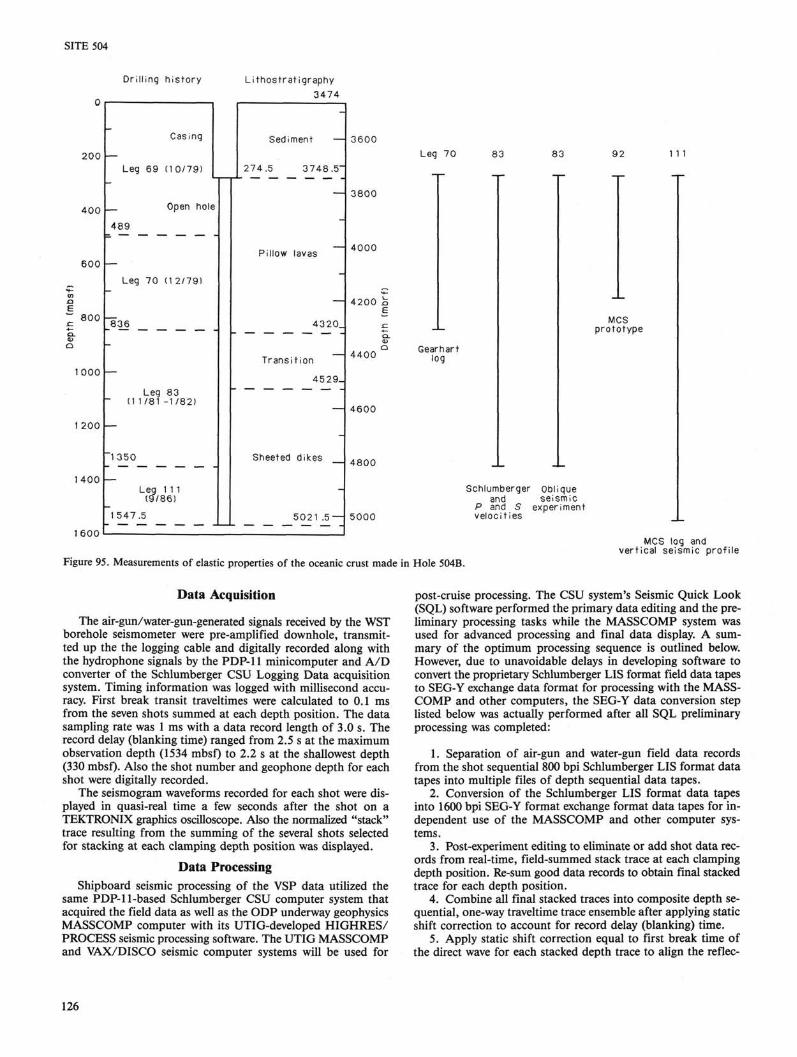
SITE 504
Dri l l ing h is to ry L i thos t ra t ig raphy 3474
200 —
400
600 —
800 —
1000 —
1200 —
1400 —
1600
Casing
Leg 69 (1 0/79)
Open hole
489
Leg 70 (12/79)
~836
Leg 83 (1 1/81 -1 /82 )
" 1 3 5 0
Leg 111 (9/86)
1 547.5
Sedi
274.5
Pillow
Trans
Sheeted
— -
-
ment —
3 7 4 8 . 5 "
lavas
~
4320_
t ion
4 5 2 9 -
—
dikes
-
5021 .5 —
3600
— 3800
— 4000
— 4200 a
4400
— 4600
— 4800
5000
Leg 70 83 83 92 1 1 1
Gearhart log
MCS prototype
Schlumberger Oblique and seismic
P and S experiment veloci t ies
Figure 95. Measurements of elastic properties of the oceanic crust made in Hole 504B.
MCS log and ver t ica l seismic prof i le
Data Acquisition
The air-gun/water-gun-generated signals received by the WST borehole seismometer were pre-amplified downhole, transmitted up the the logging cable and digitally recorded along with the hydrophone signals by the PDP-11 minicomputer and A/D converter of the Schlumberger CSU Logging Data acquisition system. Timing information was logged with millisecond accuracy. First break transit traveltimes were calculated to 0.1 ms from the seven shots summed at each depth position. The data sampling rate was 1 ms with a data record length of 3.0 s. The record delay (blanking time) ranged from 2.5 s at the maximum observation depth (1534 mbsf) to 2.2 s at the shallowest depth (330 mbsf)- Also the shot number and geophone depth for each shot were digitally recorded.
The seismogram waveforms recorded for each shot were displayed in quasi-real time a few seconds after the shot on a TEKTRONIX graphics oscilloscope. Also the normalized "stack" trace resulting from the summing of the several shots selected for stacking at each clamping depth position was displayed.
Data Processing Shipboard seismic processing of the VSP data utilized the
same PDP-11-based Schlumberger CSU computer system that acquired the field data as well as the ODP underway geophysics MASSCOMP computer with its UTIG-developed HIGHRES/ PROCESS seismic processing software. The UTIG MASSCOMP and VAX/DISCO seismic computer systems will be used for
post-cruise processing. The CSU system's Seismic Quick Look (SQL) software performed the primary data editing and the preliminary processing tasks while the MASSCOMP system was used for advanced processing and final data display. A summary of the optimum processing sequence is outlined below. However, due to unavoidable delays in developing software to convert the proprietary Schlumberger LIS format field data tapes to SEG-Y exchange data format for processing with the MASSCOMP and other computers, the SEG-Y data conversion step listed below was actually performed after all SQL preliminary processing was completed:
1. Separation of air-gun and water-gun field data records from the shot sequential 800 bpi Schlumberger LIS format data tapes into multiple files of depth sequential data tapes.
2. Conversion of the Schlumberger LIS format data tapes into 1600 bpi SEG-Y format exchange format data tapes for independent use of the MASSCOMP and other computer systems.
3. Post-experiment editing to eliminate or add shot data records from real-time, field-summed stack trace at each clamping depth position. Re-sum good data records to obtain final stacked trace for each depth position.
4. Combine all final stacked traces into composite depth sequential, one-way traveltime trace ensemble after applying static shift correction to account for record delay (blanking) time.
5. Apply static shift correction equal to first break time of the direct wave for each stacked depth trace to align the reflec-
126
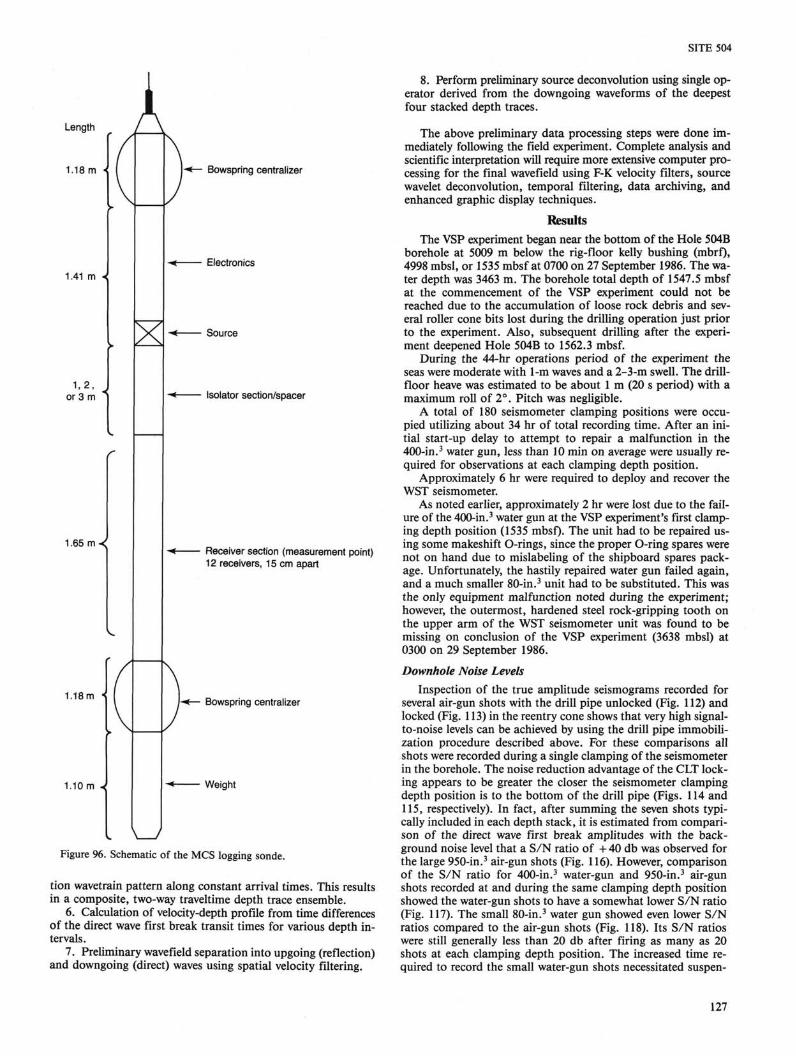
SITE 504
Length
1.18m <
1.41 m «<
1,2, or 3 m
Bowspring centralizer
r
1.65 m -<
1.18m <
1.10m +
■< Electronics
-< Source
Isolator section/spacer
Receiver section (measurement point) 12 receivers, 15 cm apart
Bowspring centralizer
Weight
W Figure 96. Schematic of the MCS logging sonde.
tion wavetrain pattern along constant arrival times. This results in a composite, two-way traveltime depth trace ensemble.
6. Calculation of velocity-depth profile from time differences of the direct wave first break transit times for various depth intervals.
7. Preliminary wavefield separation into upgoing (reflection) and downgoing (direct) waves using spatial velocity filtering.
8. Perform preliminary source deconvolution using single operator derived from the downgoing waveforms of the deepest four stacked depth traces.
The above preliminary data processing steps were done immediately following the field experiment. Complete analysis and scientific interpretation will require more extensive computer processing for the final wavefield using F-K velocity filters, source wavelet deconvolution, temporal filtering, data archiving, and enhanced graphic display techniques.
Results The VSP experiment began near the bottom of the Hole 504B
borehole at 5009 m below the rig-floor kelly bushing (mbrf), 4998 mbsl, or 1535 mbsf at 0700 on 27 September 1986. The water depth was 3463 m. The borehole total depth of 1547.5 mbsf at the commencement of the VSP experiment could not be reached due to the accumulation of loose rock debris and several roller cone bits lost during the drilling operation just prior to the experiment. Also, subsequent drilling after the experiment deepened Hole 504B to 1562.3 mbsf.
During the 44-hr operations period of the experiment the seas were moderate with 1-m waves and a 2-3-m swell. The drill-floor heave was estimated to be about 1 m (20 s period) with a maximum roll of 2°. Pitch was negligible.
A total of 180 seismometer clamping positions were occupied utilizing about 34 hr of total recording time. After an initial start-up delay to attempt to repair a malfunction in the 400-in.3 water gun, less than 10 min on average were usually required for observations at each clamping depth position.
Approximately 6 hr were required to deploy and recover the WST seismometer.
As noted earlier, approximately 2 hr were lost due to the failure of the 400-in.3 water gun at the VSP experiment's first clamping depth position (1535 mbsf). The unit had to be repaired using some makeshift O-rings, since the proper O-ring spares were not on hand due to mislabeling of the shipboard spares package. Unfortunately, the hastily repaired water gun failed again, and a much smaller 80-in.3 unit had to be substituted. This was the only equipment malfunction noted during the experiment; however, the outermost, hardened steel rock-gripping tooth on the upper arm of the WST seismometer unit was found to be missing on conclusion of the VSP experiment (3638 mbsl) at 0300 on 29 September 1986.
Downhole Noise Levels Inspection of the true amplitude seismograms recorded for
several air-gun shots with the drill pipe unlocked (Fig. 112) and locked (Fig. 113) in the reentry cone shows that very high signal-to-noise levels can be achieved by using the drill pipe immobilization procedure described above. For these comparisons all shots were recorded during a single clamping of the seismometer in the borehole. The noise reduction advantage of the CLT locking appears to be greater the closer the seismometer clamping depth position is to the bottom of the drill pipe (Figs. 114 and 115, respectively). In fact, after summing the seven shots typically included in each depth stack, it is estimated from comparison of the direct wave first break amplitudes with the background noise level that a S/N ratio of + 40 db was observed for the large 950-in.3 air-gun shots (Fig. 116). However, comparison of the S/N ratio for 400-in.3 water-gun and 950-in.3 air-gun shots recorded at and during the same clamping depth position showed the water-gun shots to have a somewhat lower S/N ratio (Fig. 117). The small 80-in.3 water gun showed even lower S/N ratios compared to the air-gun shots (Fig. 118). Its S/N ratios were still generally less than 20 db after firing as many as 20 shots at each clamping depth position. The increased time required to record the small water-gun shots necessitated suspen-
127
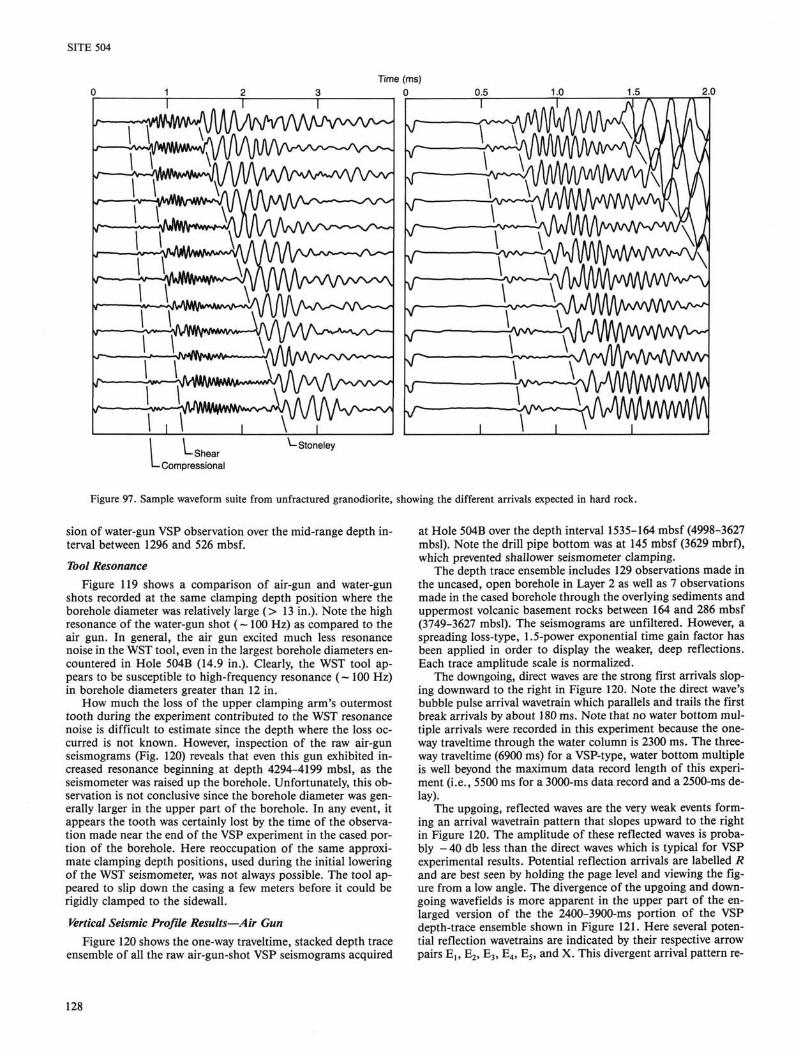
SITE 504
Time (ms)
^ H i W ^ ^ — ' V x ^
<r~ i \
V />——
I V
-w—J^VV%WW\A—V\/W\/ \ /Vyv^w^/ \ / -—
•Shear ■Compressional
Stoneley
\T v~
L. \ V7^^—VA^A/\AA/w\AA/vv^^A>
iv ^Anl\l\M\^
\ ^ - ^ A ^ W W w v w ^
Figure 97. Sample waveform suite from unfractured granodiorite, showing the different arrivals expected in hard rock.
sion of water-gun VSP observation over the mid-range depth interval between 1296 and 526 mbsf.
Tool Resonance Figure 119 shows a comparison of air-gun and water-gun
shots recorded at the same clamping depth position where the borehole diameter was relatively large (> 13 in.). Note the high resonance of the water-gun shot ( -100 Hz) as compared to the air gun. In general, the air gun excited much less resonance noise in the WST tool, even in the largest borehole diameters encountered in Hole 504B (14.9 in.). Clearly, the WST tool appears to be susceptible to high-frequency resonance ( -100 Hz) in borehole diameters greater than 12 in.
How much the loss of the upper clamping arm's outermost tooth during the experiment contributed to the WST resonance noise is difficult to estimate since the depth where the loss occurred is not known. However, inspection of the raw air-gun seismograms (Fig. 120) reveals that even this gun exhibited increased resonance beginning at depth 4294-4199 mbsl, as the seismometer was raised up the borehole. Unfortunately, this observation is not conclusive since the borehole diameter was generally larger in the upper part of the borehole. In any event, it appears the tooth was certainly lost by the time of the observation made near the end of the VSP experiment in the cased portion of the borehole. Here reoccupation of the same approximate clamping depth positions, used during the initial lowering of the WST seismometer, was not always possible. The tool appeared to slip down the casing a few meters before it could be rigidly clamped to the sidewall.
Vertical Seismic Profile Results—Air Gun Figure 120 shows the one-way traveltime, stacked depth trace
ensemble of all the raw air-gun-shot VSP seismograms acquired
at Hole 504B over the depth interval 1535-164 mbsf (4998-3627 mbsl). Note the drill pipe bottom was at 145 mbsf (3629 mbrf), which prevented shallower seismometer clamping.
The depth trace ensemble includes 129 observations made in the uncased, open borehole in Layer 2 as well as 7 observations made in the cased borehole through the overlying sediments and uppermost volcanic basement rocks between 164 and 286 mbsf (3749-3627 mbsl). The seismograms are unfiltered. However, a spreading loss-type, 1.5-power exponential time gain factor has been applied in order to display the weaker, deep reflections. Each trace amplitude scale is normalized.
The downgoing, direct waves are the strong first arrivals sloping downward to the right in Figure 120. Note the direct wave's bubble pulse arrival wavetrain which parallels and trails the first break arrivals by about 180 ms. Note that no water bottom multiple arrivals were recorded in this experiment because the oneway traveltime through the water column is 2300 ms. The three-way traveltime (6900 ms) for a VSP-type, water bottom multiple is well beyond the maximum data record length of this experiment (i.e., 5500 ms for a 3000-ms data record and a 2500-ms delay).
The upgoing, reflected waves are the very weak events forming an arrival wavetrain pattern that slopes upward to the right in Figure 120. The amplitude of these reflected waves is probably - 40 db less than the direct waves which is typical for VSP experimental results. Potential reflection arrivals are labelled R and are best seen by holding the page level and viewing the figure from a low angle. The divergence of the upgoing and down-going wavefields is more apparent in the upper part of the enlarged version of the the 2400-3900-ms portion of the VSP depth-trace ensemble shown in Figure 121. Here several potential reflection wavetrains are indicated by their respective arrow pairs E l s E2, E3, E4, E5, and X. This divergent arrival pattern re-
128
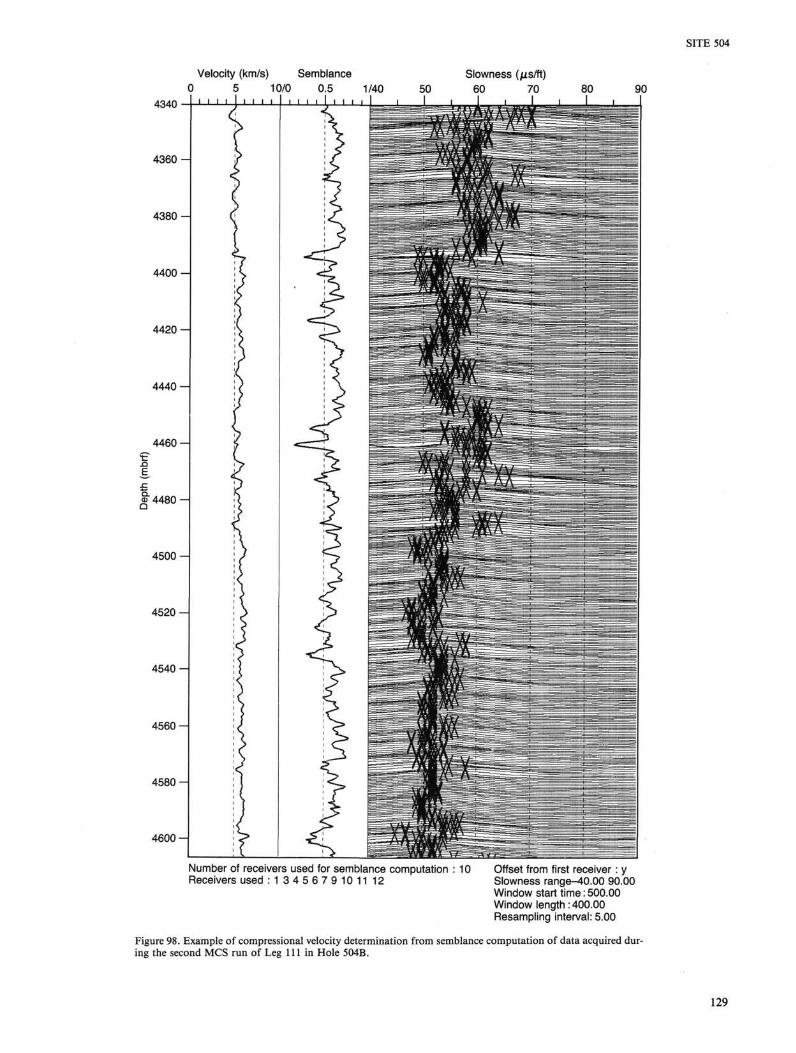
SITE 504
Velocity (km/s) Semblance Slowness (/us/ft) 0 5 10/0 0.5 1/40 50 60 70 80 90
4340 I ' ' ' ' J ' ' ' ' I ' ' ' ' I ' ' I ' I J I i I i I i
4 3 6 0 -
4 5 8 0 -
4 6 0 0 -
Number of receivers used for semblance computation : 10 Offset from first receiver: y Receivers used :1 3 4 5 6 7 9 1 0 1 1 12 Slowness range-40.00 90.00
Window start time: 500.00 Window length:400.00 Resampling interval: 5.00
Figure 98. Example of compressional velocity determination from semblance computation of data acquired during the second MCS run of Leg 111 in Hole 504B.
129
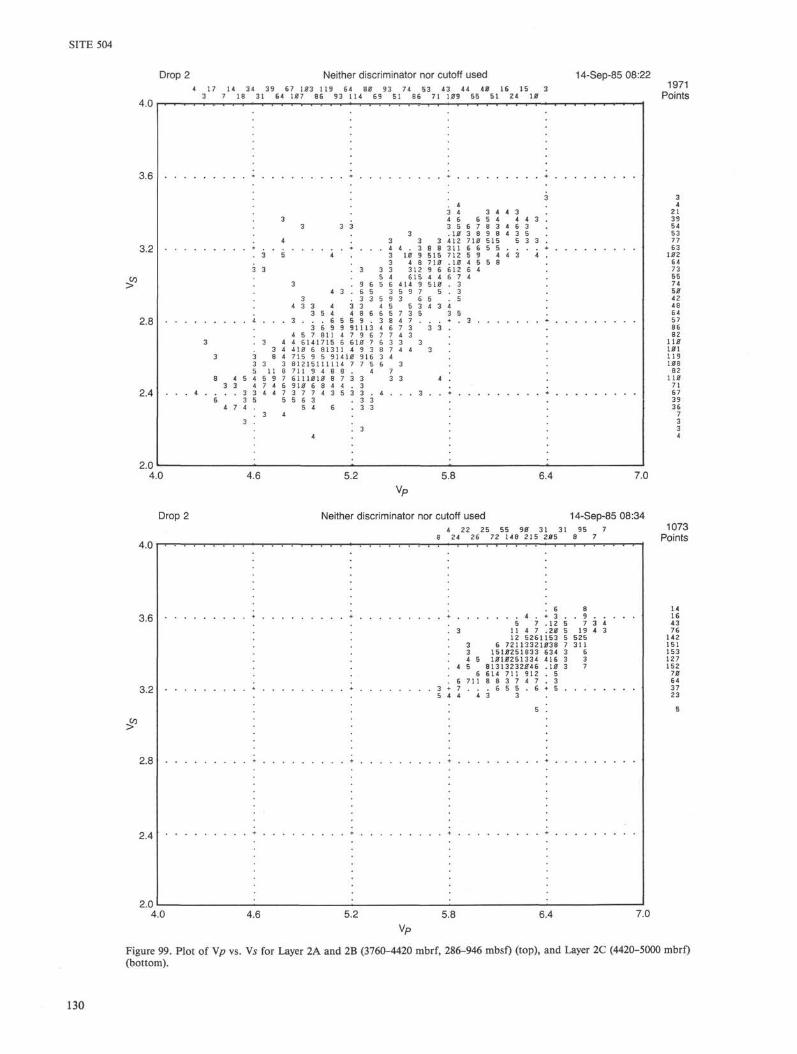
SITE 504
Drop 2 Neither discriminator nor cutoff used 14-Sep-85 08:22
4.0 4 17 14 34 39 67 103 119 64 80 93 74 53 43 44 40 16 15
3 7 18 31 64 107 86 93 114 69 51 86 71 109 55 51 24 U
3.6
2.4
2.0
3
3
8 4 5 3 3
. . . 4 . . . . 3 6 3
4 7 4
3
3 . 4 3 4 3 4 4 3
3 . 4 6 6 5 4 4 4 3 . 3 3 3 3 5 6 7 8 3 4 6 3 .
3 . 1 0 3 8 9 8 4 3 5 4 . 3 3 3 4 1 2 7 1 0 5 1 5 5 3 3 .
3 5 4
i 3
3 4 3
3 4 3 3 4
3 5 4
3 6 9 9 4 5 7 8 1 1 4
3 4 4 6 1 4 1 7 1 5 6 3 4 4 1 0 6 8 1 3 1 1
3 8 4 7 1 5 9 5 9 1 4 1 3 3 3 8 1 2 1 5 1 1 1 1 1 4 5 1 1 8 7 1 1 9 4 8 8 ( 5 9 7 6 1 1 1 0 1 0 8 7 ( 7 4 6 9 1 0 6 8 4 4 3 4 4 7 3 7 7 4 3 5 3 5 5 6 3
5 4 6 3 4
4
3 1 0 9 5 1 5 7 1 2 5 9 4 4 3 4 . 3 4 8 7 1 0 . 1 0 4 5 5 8
3 3 3 3 1 2 9 6 6 1 2 6 4 5 4 6 1 5 4 4 6 7 4
9 6 5 6 4 1 4 9 5 1 0 . 3 6 5 3 5 9 7 5 . 3 3 3 5 9 3 6 5 . 5
3 3 4 5 5 3 4 3 4 ( 8 6 6 5 7 3 5 3 5
3 1 1 1 3 4 6 7 3 3 3 7 9 6 7 7 4 3 5 1 0 7 6 3 3 3 4 9 3 8 7 4 4 3 J 9 1 6 3 4 7 7 5 6 3
4 7 3 3 3 3 4 . 3
. 3 3
. 3 3
. 3
1971 Points
55 74 50 42 48 64 57 86 82 110 101 119 108 82 1 10 71 67 39 " 6
4.0 4.6 5.2 5.8 6.4 7.0
Drop 2 Neither discriminator nor cutoff used 14-Sep-85 08:34
4.0 22 25 55 90 31 31 S
( 26 72 148 215 205 8
3.6
3.2
¥
2.8
2.4
2.0
5 -
'. 6 8 4 . + 3 . . 9
5 7 . 1 2 5 7 3 4 3 1 1 4 7 . 2 0 5 1 9 4 3
12 5 2 6 1 1 5 3 5 5 2 5 3 6 7 2 1 1 3 3 2 1 0 3 8 7 3 1 1 3 1 5 1 0 2 5 1 8 3 3 6 3 4 3 6 4 5 1 0 1 0 2 5 1 3 3 4 4 1 6 3 3
4 5 8 1 3 1 3 2 3 2 0 4 6 . 1 0 3 7 6 6 1 4 7 1 1 9 1 2 . 5
6 7 1 1 8 8 3 7 4 7 . 3
1 4 4 3 3
5 '.
4.0 4.6 5.2 5.8 6,4 7.0 Vp
1073 Points
14 16 43 76
142 151 153 127 152
70 64 37 23
Figure 99. Plot of \p vs. Vs for Layer 2A and 2B (3760-4420 mbrf, 286-946 mbsf) (top), and Layer 2C (4420-5000 mbrf) (bottom).
130
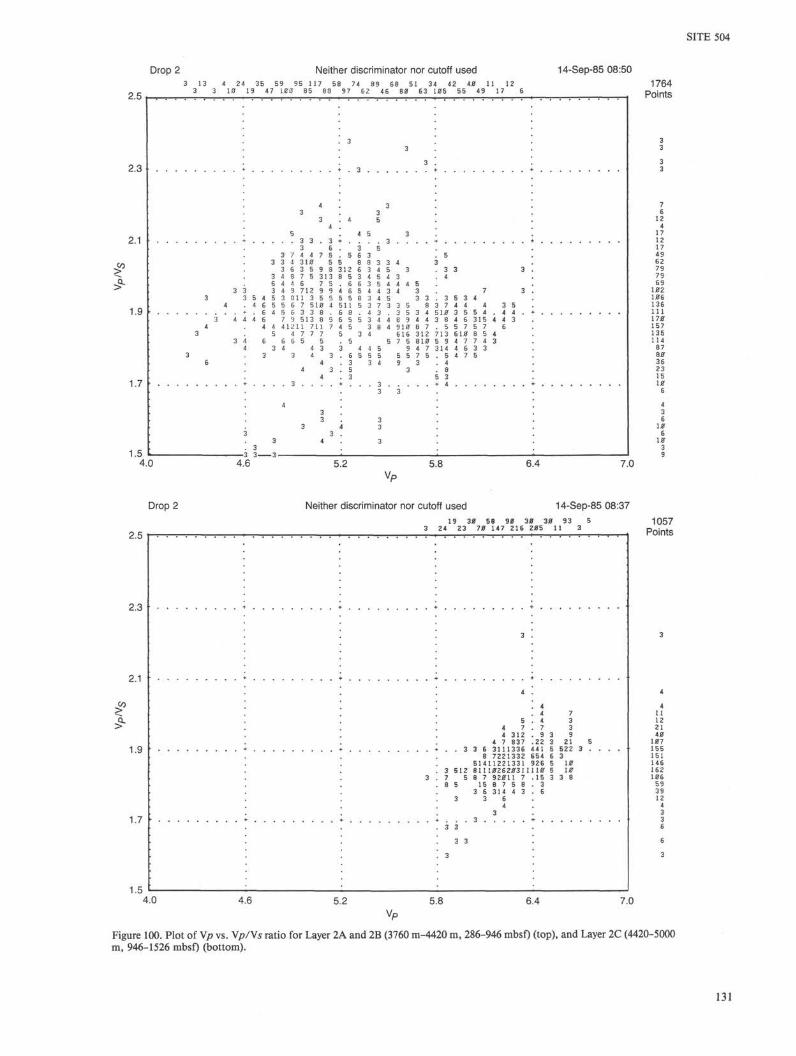
Drop 2 Neither discriminator nor cutoff used 14-Sep-85 08:50
2.5
2.3
2.1
l 24 35 59 95 117 58 74 89 68 51 34 42 40 11 12 10 19 47 100 85 88 97 62 46 80 63 105 55 49 17
?
1.9
1.7
1.5 4.0
3 3
4
3 4 4
3 3
3 6
4 3
3 4
5
3 6 3 7 4 4 7 5
3 3 4 310 5 ! 3 6 3 5 9 8 :
3 4 8 7 5 313 i 6 4 4 6 7 5
! 3 4 3 712 9 9 S 5 4 5 3 811 3 5 5
4 6 5 5 6 7 510 4 ► . 6 4 5 6 3 3 8 . 1 4 6 7 3 5 1 3 8 5
4 4 41211 711 7 5 4 7 7 7
\ 6 6 6 5 5 1 3 4 4 3
3 3 4 3 4
4 3 4
► . . . . 3 . . . .
'. 4 3 3
3 3 3
3 4 . 3
3 '. '. 3
3 ! '.
3 3
4 5 .
4 5 3 !
3 5 . 5 6 3 . 5
> 8 8 3 3 4 3 1 1 2 6 3 4 5 3 . 3 3 3 . 1 5 3 4 5 4 3 . 4
6 6 3 5 4 4 4 5 . 1 6 5 4 4 3 4 3 . 7 3 . ) 5 8 3 4 5 3 3 . 3 5 3 4 i l l 5 3 7 3 3 5 8 3 7 4 4 4 3 5
> 5 5 3 4 4 8 9 4 4 3 8 4 6 315 4 4 3 1 5 3 8 4 910 8 7 . 5 5 7 5 7 6 : 3 4 616 312 713 610 B 5 4
5 5 7 5 810 5 9 4 7 7 4 3 3 4 4 5 9 4 7 3 1 4 4 6 3 3
6 5 5 5 5 5 7 5 . 5 4 7 5 3 3 4 9 3 . 4 5 3 . 8 3 5 3
3 3 .
3 4 3 .
3
4.6 5.2 5.8 6.4 7.0
Drop 2 Neither discriminator nor cutoff used 14-Sep-85 08:37
2.5 19 30 58 90 30 30 93 5
24 23 70 147 216 205 11 3
2.3
2.1
¥
1.9
1.7
1.5
:
3
3
4
5 4 7 4 312
4 7 837
8 7221332 51411221331
3 512 811102620311 7 5 8 7 92011 7 8 5 15 8 7 5 8
3 6 314 4 3 3 3 6
4 3
3 3
3 3
3
4 4 7 4 3 7 3 9 3 9
22 3 21 5 141 5 522 3 . . . . 554 6 3 326 5 10 10 5 10 15 3 3 8
3 6
•
4.0 4.6 5.2 5.8 6.4 7.0
Figure 100. Plot of Vp vs. Vp/Vs ratio for Layer 2A and 2B (3760 m-4420 m, 286-946 mbsf) (top), and Layer 2C (4420-5000 m, 946-1526 mbsf) (bottom).
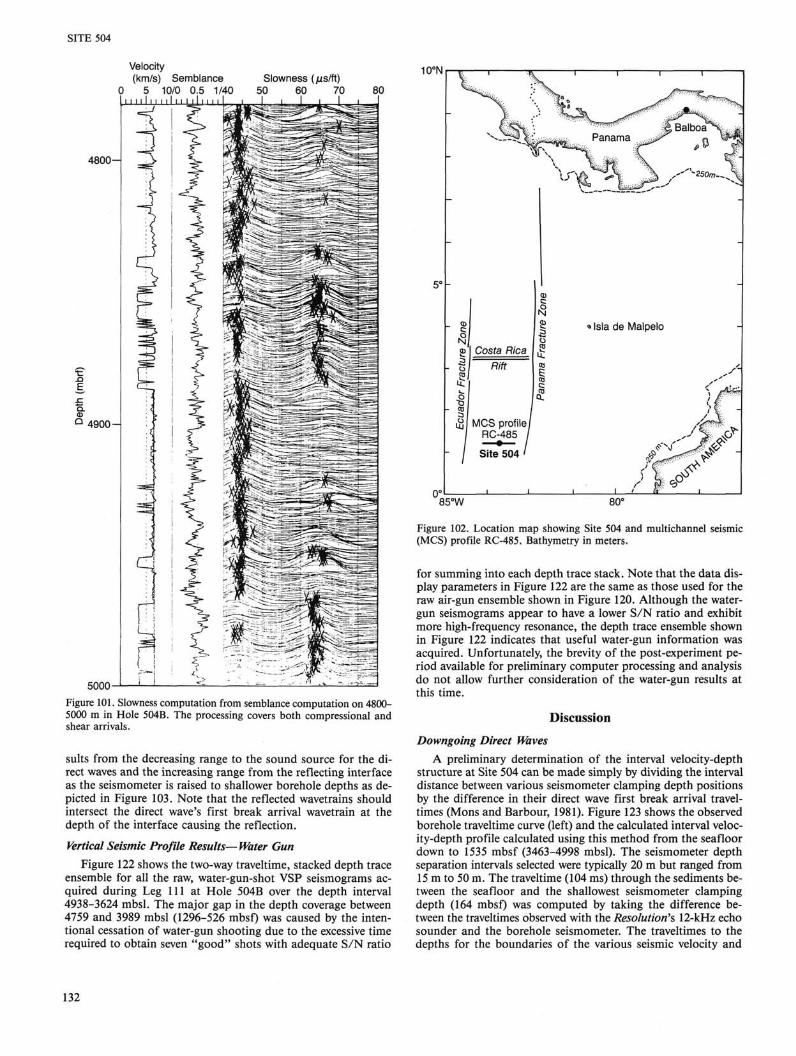
SITE 504
Velocity (km/s) Semblance Slowness (jus/ft)
0 5 10/0 0.5 1/40 50 60 70 80 I I 111 l n 11 I I Li j l i l l L JareJgggAgg4aw4iE Ueda
10°N
4800-
4900-
5000 Figure 101. Slowness computation from semblance computation on 4800-5000 m in Hole 504B. The processing covers both compressional and shear arrivals.
suits from the decreasing range to the sound source for the direct waves and the increasing range from the reflecting interface as the seismometer is raised to shallower borehole depths as depicted in Figure 103. Note that the reflected wavetrains should intersect the direct wave's first break arrival wavetrain at the depth of the interface causing the reflection.
Vertical Seismic Profile Results— Water Gun Figure 122 shows the two-way traveltime, stacked depth trace
ensemble for all the raw, water-gun-shot VSP seismograms acquired during Leg 111 at Hole 504B over the depth interval 4938-3624 mbsl. The major gap in the depth coverage between 4759 and 3989 mbsl (1296-526 mbsf) was caused by the intentional cessation of water-gun shooting due to the excessive time required to obtain seven "good" shots with adequate S/N ratio
P I Costa Rica
* Isla de Malpelo
Rift
£ MCS profile RCL485 /
Site 504 '
85°W 80°
Figure 102. Location map showing Site 504 and multichannel seismic (MCS) profile RC-485. Bathymetry in meters.
for summing into each depth trace stack. Note that the data display parameters in Figure 122 are the same as those used for the raw air-gun ensemble shown in Figure 120. Although the water-gun seismograms appear to have a lower S/N ratio and exhibit more high-frequency resonance, the depth trace ensemble shown in Figure 122 indicates that useful water-gun information was acquired. Unfortunately, the brevity of the post-experiment period available for preliminary computer processing and analysis do not allow further consideration of the water-gun results at this time.
Discussion
Downgoing Direct Waves A preliminary determination of the interval velocity-depth
structure at Site 504 can be made simply by dividing the interval distance between various seismometer clamping depth positions by the difference in their direct wave first break arrival travel-times (Mons and Barbour, 1981). Figure 123 shows the observed borehole traveltime curve (left) and the calculated interval velocity-depth profile calculated using this method from the seafloor down to 1535 mbsf (3463-4998 mbsl). The seismometer depth separation intervals selected were typically 20 m but ranged from 15 m to 50 m. The traveltime (104 ms) through the sediments between the seafloor and the shallowest seismometer clamping depth (164 mbsf) was computed by taking the difference between the traveltimes observed with the Resolution's 12-kHz echo sounder and the borehole seismometer. The traveltimes to the depths for the boundaries of the various seismic velocity and
132

SITE 504
Figure 103. Schematic representation of ray paths and wavetrain arrival pattern for a marine vertical seismic profile (VSP) experiment (modified after Mons and Barbour, 1983).
lithologic units recognized in Hole 504B (Salisbury et al., 1985; Becker, 1985) have been interpolated from the observed borehole traveltime curve and are shown at the right in Figure 122. Table 35 presents a summary of the VSP-derived interval velocities for each seismolithologic unit.
Sonic logging velocity profiles have previously been reported for Hole 504B from DSDP Legs 83 and 92 logging data by Salisbury et al. (1985), Mutter and Newmark (1986), and Moos et al. (1986). Comparison of the VSP interval velocity-depth profile with the DSDP Leg 83 sonic profile shows good general agreement. However, the wide excursions seen in the DSDP Leg 92 sonic velocity profiles, especially those ranging from 2000 to 7000 m/s described by Moos et al. (1986) for thin units within the uppermost part of Layer 2A, cannot be verified. This might be expected due to the much wider spacing of the VSP observations compared to the sonic velocity logging measurement interval (i.e., 10 m vs. 0.15 m, respectively). Further VSP data comparisons with the new sonic velocity logging results obtained on ODP Leg 111 (see "Multichannel Sonic Log" section, this chapter) as well as the oblique reflection/refraction results recently reported by Little and Stephen (1985) and Stephen and Harding (1983) for Hole 504B will be an important part of future shore-based studies.
Upgoing Reflected Waves Full interpretation of the reflected wavefield observed in VSP
experiments requires careful separation of the the upgoing and downgoing waves using velocity filtering (Seeman and Horo-wicz, 1983). Deconvolution of the upgoing reflected waves is done using the downgoing, direct wave of each seismogram to derive a source wavelet operator (Lee and Balch, 1983). Iterative modeling techniques are commonly employed to match synthetic seismograms computed from borehole logging/physical properties information with the observed VSP reflected wavefield (Gri-velet, 1985). The VSP reflection seismogram can also be com
pared with the surface ship MCS reflection profile which crosses the borehole site (Poster, 1983). This allows extrapolation of the borehole coring and logging information over the region surrounding the drill site.
Although such detailed analysis of the reflected wavefield is clearly beyond the scope of this field data report, certain qualitative inferences can be made about the reflected waves from the preliminary wavefield separation procedure initiated during the Leg 111 cruise:
1. First, each seismogram of the partial one-way traveltime, stacked depth trace ensemble (Fig. 121) was static-shifted by the time of the direct wave's first break arrival. The time shifting results in the 4900-6400-ms two-way traveltime seismogram ensemble shown in Figure 124. This time-shift serves to align all wavetrain arrivals reflected from simple, single horizon planar interfaces along the vertical, two-way traveltime axis of the figure. Note also that the visual alignment of the reflection wave-trains is markedly enhanced by this simple time-shifting and is again best seen by holding the figure level and viewing it from a low angle. In fact, many of the weak reflections (Ej-Es, X) only tentatively identified in the one-way traveltime plot of Figure 121 can now be confidently traced in Figure 124.
2. Next, a spatial velocity filter was applied to the partial two-way traveltime seismogram ensemble shown in Figure 124 to reject all dipping wavetrains and thus enhance the reflected arrival wavetrains along the vertical time axis. The result of this preliminary attempt to separate the upgoing reflected wavetrains arriving during the initial 1000 ms of the two-way traveltime seismogram ensemble is shown in Figure 125. Ideally, the upgoing arrivals would present a pattern of nearly vertical isochronous wavetrains if the reflecting interfaces are simple horizontal planes. In fact, careful examination of Figure 125 reveals that while most of the weak, high-frequency wavetrain arrivals are indeed aligned along vertical isochron lines, especially at the top
133
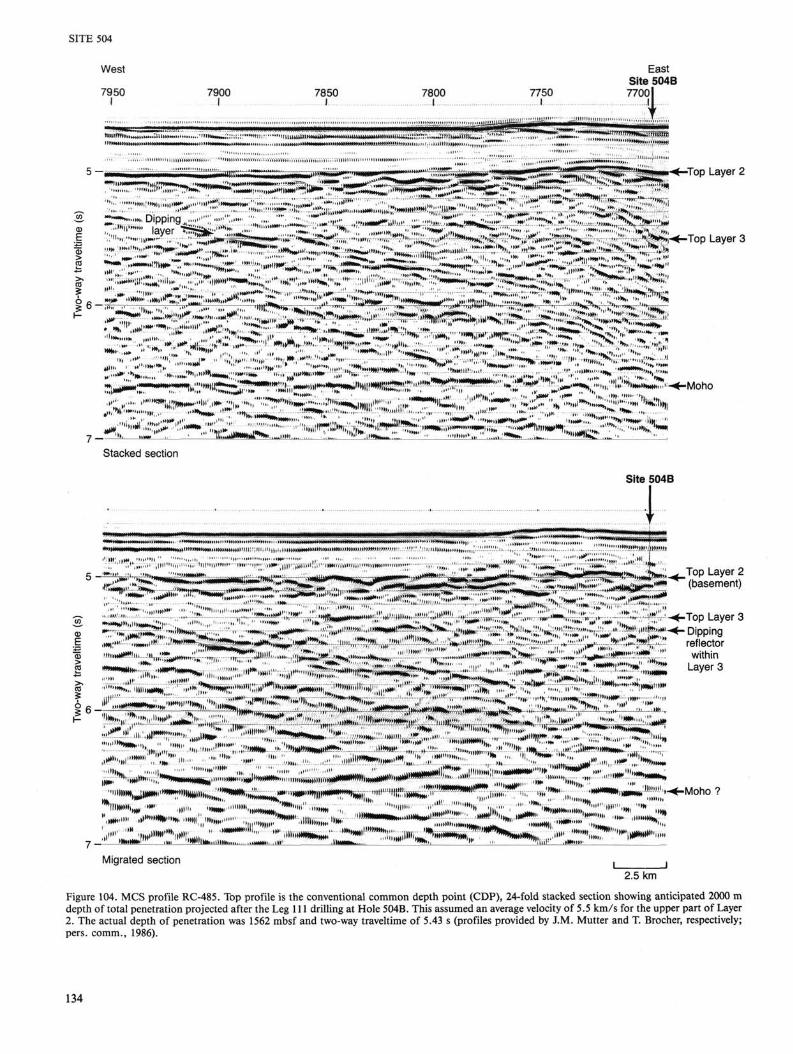
SITE 504
West
7950 7850 I
7800 I
7750 I
East Site 504B 77001
■Top Layer 2
Moho
Site 504B
_Top Layer 2 " (basement)
■Top Layer 3 ■ Dipping reflector within
Layer 3
* * * ■ " > a i??""";,,;; *6mm0**
'Hil l -Sl»^*>»iwnilMBi)-,pl»»ljl
__1 ili
Hi "1 - - - 4*W*«llIt„...".f- -
It), ! ' I " '
»C "'%■ ,,, iH„ -mm <mm. ,. — l>: m. " i H l i kMtl ''"1 " " ^ i (, ^ " '
!Mi«i«!l*i *» T"%w 'liuiimML ^!_ l" jsrr^ ^ " p r ii,, >»> " w ^ l h ' " " " "WIHWIIW *"
"* ' (l, I I I I . I " " „ „ iii'mum, '»>»»,
lte: ■■^sfe^;^%,t::> ; ; ; ;»"">.ic r^r^ii;;^^^ •»» ^ ^ ' ' n ^
I h a i l " ' Fw>»ii ')>' iii ™ m i ' ,►»»»»'
■Moho ?
Migrated section 2.5 km
Figure 104. MCS profile RC-485. Top profile is the conventional common depth point (CDP), 24-fold stacked section showing anticipated 2000 m depth of total penetration projected after the Leg 111 drilling at Hole 504B. This assumed an average velocity of 5.5 km/s for the upper part of Layer 2. The actual depth of penetration was 1562 mbsf and two-way traveltime of 5.43 s (profiles provided by J.M. Mutter and T. Brocher, respectively; pers. comm., 1986).
134
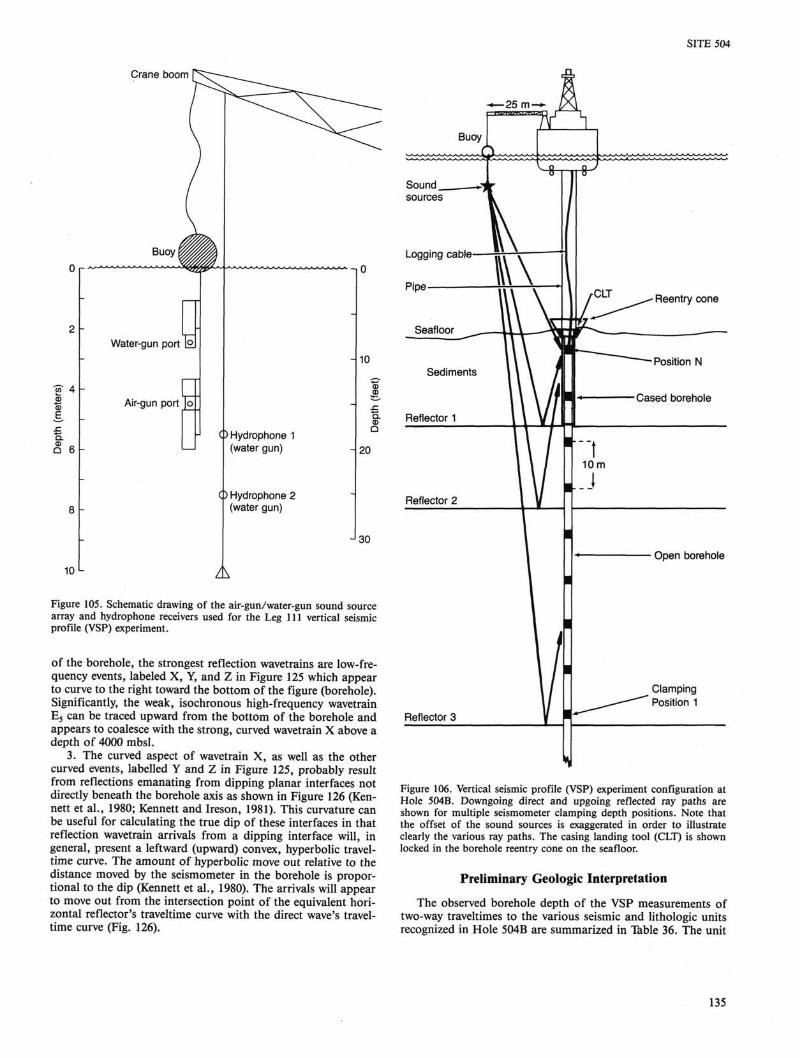
SITE 504
Crane boom
O r
w 4 .2 cE £
Q 6
10 L
Water-gun port |£
Air-gun port Jo
Cp Hydrophone 1 (water gun)
Cp Hydrophone 2 (water gun)
10
I 20
J 3 0
A Figure 105. Schematic drawing of the air-gun/water-gun sound source array and hydrophone receivers used for the Leg 111 vertical seismic profile (VSP) experiment.
of the borehole, the strongest reflection wavetrains are low-frequency events, labeled X, Y, and Z in Figure 125 which appear to curve to the right toward the bottom of the figure (borehole). Significantly, the weak, isochronous high-frequency wavetrain E5 can be traced upward from the bottom of the borehole and appears to coalesce with the strong, curved wavetrain X above a depth of 4000 mbsl.
3. The curved aspect of wavetrain X, as well as the other curved events, labelled Y and Z in Figure 125, probably result from reflections emanating from dipping planar interfaces not directly beneath the borehole axis as shown in Figure 126 (Ken-nett et al., 1980; Kennett and Ireson, 1981). This curvature can be useful for calculating the true dip of these interfaces in that reflection wavetrain arrivals from a dipping interface will, in general, present a leftward (upward) convex, hyperbolic travel-time curve. The amount of hyperbolic move out relative to the distance moved by the seismometer in the borehole is proportional to the dip (Kennett et al., 1980). The arrivals will appear to move out from the intersection point of the equivalent horizontal reflector's traveltime curve with the direct wave's travel-time curve (Fig. 126).
Figure 106. Vertical seismic profile (VSP) experiment configuration at Hole 504B. Downgoing direct and upgoing reflected ray paths are shown for multiple seismometer clamping depth positions. Note that the offset of the sound sources is exaggerated in order to illustrate clearly the various ray paths. The casing landing tool (CLT) is shown locked in the borehole reentry cone on the seafloor.
Preliminary Geologic Interpretation
The observed borehole depth of the VSP measurements of two-way traveltimes to the various seismic and lithologic units recognized in Hole 504B are summarized in Table 36. The unit
135
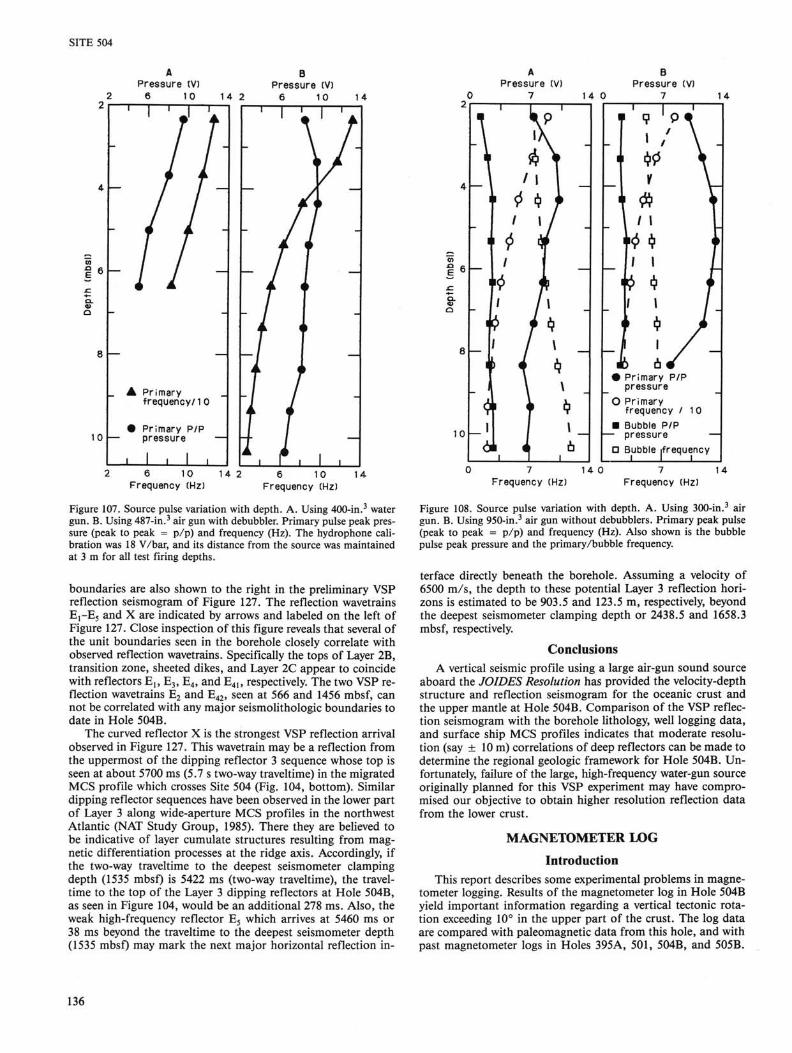
SITE 504
10 —
Pressure (V) 6 10
A Primary frequency/10
• Primary P/P pressure
B Pressure (V)
6 10 T "
6 10 Frequency (Hz)
Pressure (V) 7 14 0
Pressure (V) 7 14
4 —
10 —
1 1 1
" * \ ' - " 1 1
1
1
' <> * f i \ I
' 0 • / j
tf * 1 / * 'C> +*
1 / »
\ • *■ f * _ i 1 \ _
i i i
8 —
1
1
\
1 1 ]
9 ' P * L/V 1 V * 1 4$ f ' ' 1
•e * f / I / _
•i * i 1 1 / -1 : / -
• Primary P/P pressure
O Primary frequency / 10
■ Bubble P/P — pressure —
D Bubble (frequency
6 10 Frequency (Hz)
14 0 14 Frequency (Hz) Frequency (Hz)
Figure 107. Source pulse variation with depth. A. Using 400-in.3 water Figure 108. Source pulse variation with depth. A. Using 300-in.3 air gun. B. Using 487-in.3 air gun with debubbler. Primary pulse peak pressure (peak to peak = p/p) and frequency (Hz). The hydrophone calibration was 18 V/bar, and its distance from the source was maintained at 3 m for all test firing depths.
boundaries are also shown to the right in the preliminary VSP reflection seismogram of Figure 127. The reflection wavetrains E J - E J and X are indicated by arrows and labeled on the left of Figure 127. Close inspection of this figure reveals that several of the unit boundaries seen in the borehole closely correlate with observed reflection wavetrains. Specifically the tops of Layer 2B, transition zone, sheeted dikes, and Layer 2C appear to coincide with reflectors Eu E3, E4, and E41, respectively. The two VSP reflection wavetrains E2 and E42, seen at 566 and 1456 mbsf, can not be correlated with any major seismolithologic boundaries to date in Hole 504B.
The curved reflector X is the strongest VSP reflection arrival observed in Figure 127. This wavetrain may be a reflection from the uppermost of the dipping reflector 3 sequence whose top is seen at about 5700 ms (5.7 s two-way traveltime) in the migrated MCS profile which crosses Site 504 (Fig. 104, bottom). Similar dipping reflector sequences have been observed in the lower part of Layer 3 along wide-aperture MCS profiles in the northwest Atlantic (NAT Study Group, 1985). There they are believed to be indicative of layer cumulate structures resulting from magnetic differentiation processes at the ridge axis. Accordingly, if the two-way traveltime to the deepest seismometer clamping depth (1535 mbsf) is 5422 ms (two-way traveltime), the travel-time to the top of the Layer 3 dipping reflectors at Hole 504B, as seen in Figure 104, would be an additional 278 ms. Also, the weak high-frequency reflector E5 which arrives at 5460 ms or 38 ms beyond the traveltime to the deepest seismometer depth (1535 mbsf) may mark the next major horizontal reflection in-
gun. B. Using 950-in.3 air gun without debubblers. Primary peak pulse (peak to peak = p/p) and frequency (Hz). Also shown is the bubble pulse peak pressure and the primary/bubble frequency.
terface directly beneath the borehole. Assuming a velocity of 6500 m/s, the depth to these potential Layer 3 reflection horizons is estimated to be 903.5 and 123.5 m, respectively, beyond the deepest seismometer clamping depth or 2438.5 and 1658.3 mbsf, respectively.
Conclusions A vertical seismic profile using a large air-gun sound source
aboard the JOIDES Resolution has provided the velocity-depth structure and reflection seismogram for the oceanic crust and the upper mantle at Hole 504B. Comparison of the VSP reflection seismogram with the borehole lithology, well logging data, and surface ship MCS profiles indicates that moderate resolution (say ± 10 m) correlations of deep reflectors can be made to determine the regional geologic framework for Hole 504B. Unfortunately, failure of the large, high-frequency water-gun source originally planned for this VSP experiment may have compromised our objective to obtain higher resolution reflection data from the lower crust.
MAGNETOMETER LOG
Introduction This report describes some experimental problems in magne
tometer logging. Results of the magnetometer log in Hole 504B yield important information regarding a vertical tectonic rotation exceeding 10° in the upper part of the crust. The log data are compared with paleomagnetic data from this hole, and with past magnetometer logs in Holes 395A, 501, 504B, and 505B.
136

SITE 504
2 8 14 Peak pressure (V)
• 300 - in . 3 air gun
O 487- in . 3 air gun
A 950-in .3 air gun
■ 400- in . 3 water gun
a 8 0 - i n . 3 water gun
Figure 109. Comparison of primary pulse peak pressure for 400-in.3 water gun, and 300-, 487-, and 950-in.3 air guns. The 80-in.3 water-gun frequency at 2.4-m depth is also shown by an open square.
60 100 140 Primary frequency (Hz)
180
Figure 110. Comparison of primary pulse frequency for 400-in.3 water gun and 300-, 487-, and 950-in.3 air guns. The 80-in.3 water-gun frequency at 2.4-m depth is also shown by an open square.
Logging cable
r a
High-pressure j hydraulic » section
Maximum temperature Maximum pressure
Total length Total weight
Clamping j device "^ j
Rock-gripping teeth
\ ■t V.
Geophones and 4
amplifiers
U
175°C(350°F) 1400 bar (20,000 psi)
204 in. (5.2 m) 273 lb (123.9 kg)
Standard arms—hole diameter 131/2 in. (maximum) 51/2 in. (minimum)
?Large arms (optional)-hole diameter 19V2 in. (maximum) 8 in. (minimum)
Velocity geophones Geospace HSMOHz Bandwidth
Downhole amplifier Gain Bandwidth
four used in series 10-200 Hz at 3 db
60 db 0Hz-2Hzat3db
Figure 111. Schematic drawing of the Schlumberger Well Seismic Tool (WST) used for the vertical seismic profile (VSP) experiment at Hole 504B. Note location of hardened steel rock-gripping teeth on the borehole sidewall clamping arms.
The stability of the natural remanent magnetization (NRM) of rock formations is discussed.
It is concluded from the discussion that the chemical constituents of oceanic basalts, particularly Ti, Fe, and other transient metals, should be measured downhole to eliminate ambiguities in the interpretation of the magnetometer data. The downhole magnetometer should be run to continuously log the magnetization of rock formations and fill the gaps of discontinuous pa-leomagnetic data from recovered cores.
It is well known that the magnetic layer within the oceanic crust is a pile of inhomogeneous magnetic units which carry various magnetic characters. The main factors which influence the character of NRM of rock formations are:
1. Low-temperature oxidation of primary titanomagnetite and bleaching of components, especially titanium.
137
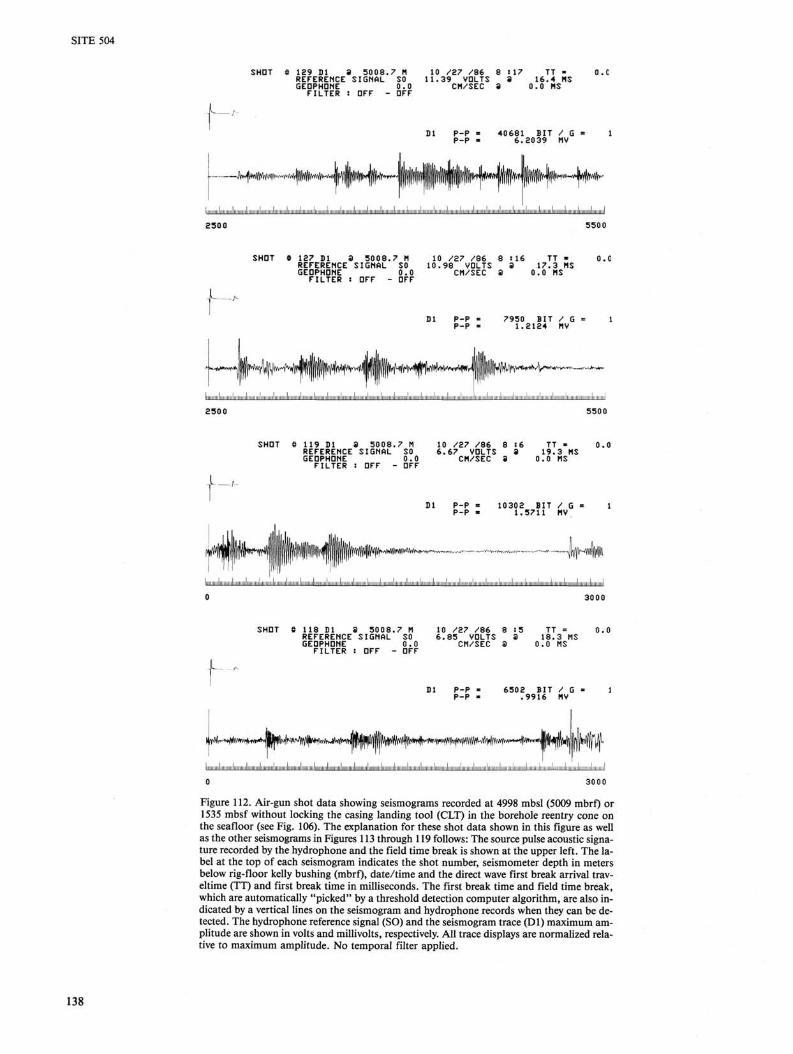
SITE 504
SHOT * 129 Dl S 5008.7 M REFERENCE SIGNAL SO GEDPHDNE 0.0 FILTER : DFF - OFF
10 /27 /86 8 «17 TT « 11.39 VOLTS 8 16.4 MS CM/SEC 3 0.0 MS
Dl l-l 40681 BIT / G = 6.2039 MV
ii i i.l.ii.; -j ,i i ; mil :iliiMiii,iii ; il .IIIIII .mi Ii- \\ In I iiiiliiiiiiiiiluiiiiniliiMiiml
2500
SHOT * 127 Dl 8 5008.7 M REFERENCE SIGNAL SO GEDPHDNE 0.0 FILTER : DFF - DFF
10 /27 /86 8 :16 TT « 10.98 VDLTS 3 17.3 MS CM/SEC 3 0.0 MS
119 Dl 3 5008.7 M REFERENCE SIGNAL SO GEDPHDNE 0.0 FILTER : DFF - DFF
10 /27 /86 8 16 TT « 6.67 VDLTS 3 19.3 MS CM/SEC 3 0.0 MS
D1 V-l
^l¥V^>|V¥MWv*-vV*Y~ v-
10302 BIT / G 1.5711 MV
WHIN iiiiliiiiiiiinmiiiiiiliiiiiiiiiliHiiiiiiliiiiiniiliiiiiiiiiliiimiiiliiiiiiiiiliiiii. inJimii.iiliii hum i
-^H^W
SHDT « 118 Dl 3 5008.7 M REFERENCE SIGNAL SO GEDPHDNE 0.0 FILTER : DFF - DFF
10 /27 /86 8 :5 TT = 0.0 6.85 VDLTS 3 18.3 MS CM/SEC 3 0.0 MS
W 6502 BIT / G .9916 MV
\it4r^tmt< *<**f l ( f+H^ ffftyi%fivfl^%^
Inn Iiiiuiiiil iiiiliiiiiiiiiliiiiiiiiil ;11Li:■ 11i,1111.111;i 11-111:111 :111!,i!!i.11.1111-111ii iiMliiimiiilimiiiiiiiiiiiiiiiliiiiiiiiiliiiiiiiiiliiiiiiiiiliiiiiiiiiliMiiiiiilui iiiiiinnl mil miliini
0 3000
Figure 112. Air-gun shot data showing seismograms recorded at 4998 mbsl (5009 mbrf) or 1535 mbsf without locking the casing landing tool (CLT) in the borehole reentry cone on the seafloor (see Fig. 106). The explanation for these shot data shown in this figure as well as the other seismograms in Figures 113 through 119 follows: The source pulse acoustic signature recorded by the hydrophone and the field time break is shown at the upper left. The label at the top of each seismogram indicates the shot number, seismometer depth in meters below rig-floor kelly bushing (mbrf), date/time and the direct wave first break arrival trav-eltime (TT) and first break time in milliseconds. The first break time and field time break, which are automatically "picked" by a threshold detection computer algorithm, are also indicated by a vertical lines on the seismogram and hydrophone records when they can be detected. The hydrophone reference signal (SO) and the seismogram trace (Dl) maximum amplitude are shown in volts and millivolts, respectively. All trace displays are normalized relative to maximum amplitude. No temporal filter applied.
138
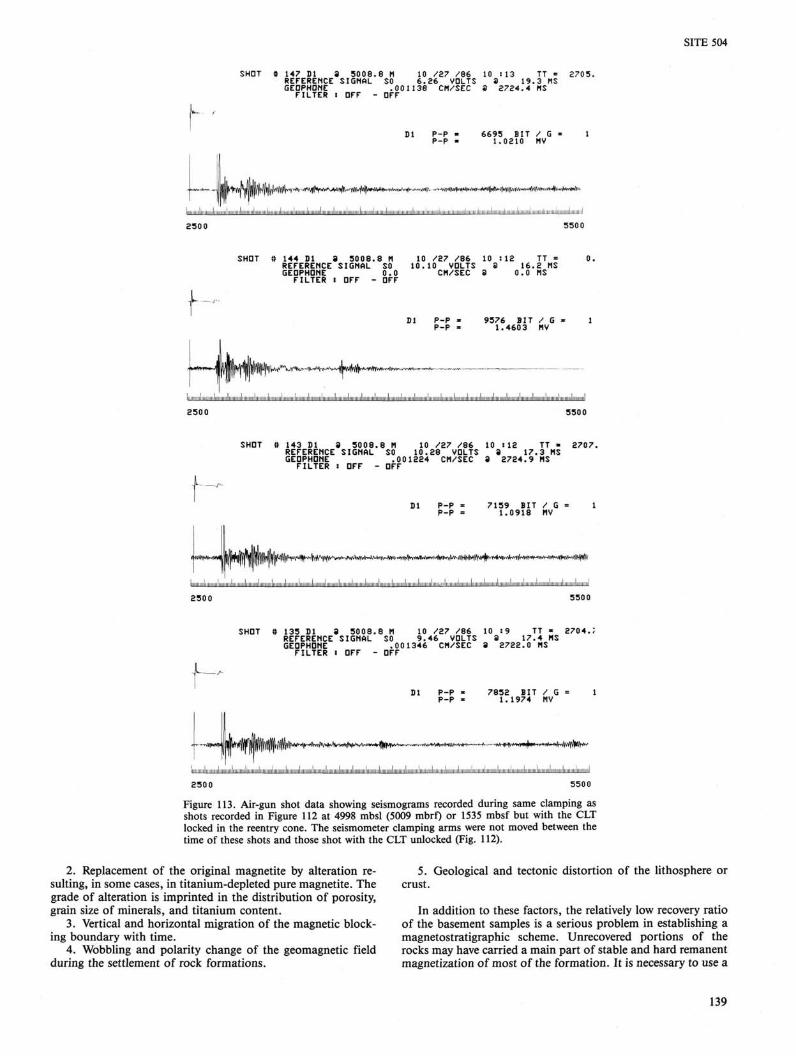
SITE 504
SHOT « 147 Dl S 5008.8 M 10 /27 /86 10 :13 TT = 2705. REFERENCE SIGNAL SO 6.26 VOLTS 3 19.3 MS GEDPHDNE .001138 CM/SEC 3 2724.4 MS FILTER : DFF - OFF
P-P » 6693 BIT / G « 1 P-P ■ 1.0210 MV
I lllllllllllllllllllllllUllllllllllllllllllllllllllllllHlllllllimillllll Il lull Illl I' h il II li II ..I i l l , I I, n I. I.i I I l.; I. I illlllllllllll |[|1U I IlllihlllllllHllllllllllliil!
5500
SHOT « 144 Dl 3 5008.8 M 10 /Z7 /86 10 :12 TT = 0. REFERENCE SIGNAL SO 10.10 VDLTS 3 16.2 MS GEDPHDNE 0.0 CM/SEC 3 0.0 MS FILTER I DFF - DFF
Dl P-P « 9576 BIT / G « 1 P-P » 1.4603 MV
fftyJ'\/f%r-^*<^i-^^limj^^
iiiiniiiiiiiiiiiiiii iiiiliiiiiiiiiliiiiiinil iiiiiiiiiiliiiuiiiiiiiiuiiiiliiiiiniilmi IIIIIIIIIIIII li i i 11 i L 111 -i 11 : iiiiliiiiiiiiiLiiiiiilimiiiiil I mil iiliiiniiiil Iiiiiiimliiiiiiiiiliinmiilmiuiiil mil
2 5 0 0 5 5 0 0
SHDT « 143 Dl 3 5008.8 M 10 /27 /86 10 s12 TT » 2707. REFERENCE SIGNAL SO 10.28 VDLTS 3 17.3 MS GEDPHDNE .001224 CM/SEC 3 2724.9 MS FILTER : DFF - DFF
Dl P-P = 7159 BIT / G = 1 P-P = 1.0918 MV
Imiiii'ii' iiiliiiiiiiiiiiiiiiiniliiiiiiiiilimiimliiiiiiiiil iiliiiimiiliiiiiiiiiliiiniiii
2500
« - ^ W W < * - * M < l v ^ W - - r t y ^ r v M ^ ^
u
SHDT « 135 Dl 3 5008.8 M 10 /27 86 10 :9 TT * 2704. REFERENCE SIGNAL SO 9.46 VDLTS 3 17.4 MS GEDPHDNE .001346 CM/SEC 3 2722.0 MS FILTER : DFF - DFF
Dl P-P - 7852 BIT / G = 1 P-P * 1. 1974 MV
rvv^^w,*^ftWMf^A*K-^-*^wv/^-Mfl^^^vv'vv*^i—■<™~t—-j*-^friiiJft+*H*jf*< > en*' ''ijyw wyifiWfvw'
i
2500
Figure 113. Air-gun shot data showing seismograms recorded during same clamping as shots recorded in Figure 112 at 4998 mbsl (5009 mbrf) or 1535 mbsf but with the CLT locked in the reentry cone. The seismometer clamping arms were not moved between the time of these shots and those shot with the CLT unlocked (Fig. 112).
2. Replacement of the original magnetite by alteration resulting, in some cases, in titanium-depleted pure magnetite. The grade of alteration is imprinted in the distribution of porosity, grain size of minerals, and titanium content.
3. Vertical and horizontal migration of the magnetic blocking boundary with time.
4. Wobbling and polarity change of the geomagnetic field during the settlement of rock formations.
5. Geological and tectonic distortion of the lithosphere or crust.
In addition to these factors, the relatively low recovery ratio of the basement samples is a serious problem in establishing a magnetostratigraphic scheme. Unrecovered portions of the rocks may have carried a main part of stable and hard remanent magnetization of most of the formation. It is necessary to use a
139
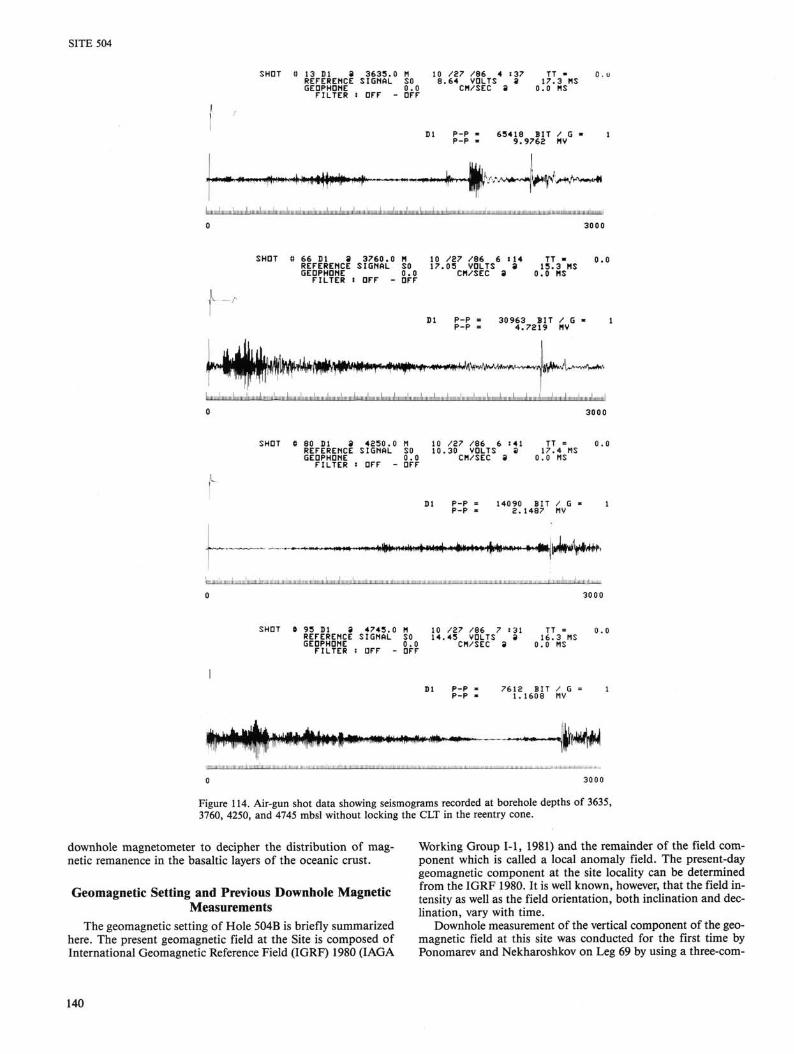
SITE 504
SHOT « 13 Dl 9 3633.0 M 10 /Z? /86 4 :37 TT » O.u REFERENCE SIGNAL SO 8.64 VDLTS 9 17.3 US GEDPHGNE 0.0 CM/SEC 8 0.0 MS FILTER : DFF - OFF
III P-P * 65418 BIT / G P-P « 9.9762 MV
*iw»ilfl>uiri^fW^M4MHf>'11 f \^'^>^^M
IIIIIIIIIII IIIMIIIIIIIIIIIIIHIIIJHIIIII Mill niimiii) m i ; J i n :l iinliiiiiMiilii In Liiiiiilmimnl 1m I MIHIIIIIIII mil iiiimiiMiiiiii il I illliiiiiiiilniii Iiiiiiim:
0 3000
SHOT 0 66 Dl 8 3760.0 M 10 /Z7 /86 6 :14 TT « 0.0 REFERENCE SIGNAL SO 17.05 VDLTS 8 15.3 MS GEDPHDNE 0.0 CM/SEC 8 0.0 MS FILTER i DFF - DFF
Dl P-P = 30963 BIT / G P-P = 4.7219 MV
l*IYMiVyWvV*«yw-vv*cvi» U*A / r > " W ^ » * ( A
I Illuilllllllllllllllll Ill l l l l l l lMII I IL. l l l l l ln l l i l l i l l l II I' hi:; II i I I Jill I Illlilllllllllllll Illllllllljll Ill Illl Illlllllllll ll Hill I
SHDT « 80 Dl 8 4250.0 M 10 /27 /86 6 :41 TT = REFERENCE SIGNAL SO 10.30 VDLTS 8 17.4 MS GEDPHDNE 0.0 CM/SEC 8 0.0 MS FILTER : DFF - DFF
Dl P-P = 14090 BIT / G « 1 P-P « 2. 1487 MV
»||»UIIIK»IH..4'«*H IwHNUi fofamw **4Hbmfyl^
ill mill. ill i In
SHDT S 95 Dl 8 4745.0 M 10 /27 /86 7 :31 TT = REFERENCE SIGNAL SO 14.45 VDLTS 8 16.3 MS GEDPHDNE 0.0 CM/SEC 8 0.0 MS FILTER : DFF - DFF
Dl P-P » 7612 BIT / G = 1 P-P « 1. 1608 MV
Figure 114. Air-gun shot data showing seismograms recorded at borehole depths of 3635, 3760, 4250, and 4745 mbsl without locking the CLT in the reentry cone.
downhole magnetometer to decipher the distribution of magnetic remanence in the basaltic layers of the oceanic crust.
Geomagnetic Setting and Previous Downhole Magnetic Measurements
The geomagnetic setting of Hole 504B is briefly summarized here. The present geomagnetic field at the Site is composed of International Geomagnetic Reference Field (IGRF) 1980 (IAGA
Working Group 1-1, 1981) and the remainder of the field component which is called a local anomaly field. The present-day geomagnetic component at the site locality can be determined from the IGRF 1980. It is well known, however, that the field intensity as well as the field orientation, both inclination and declination, vary with time.
Downhole measurement of the vertical component of the geomagnetic field at this site was conducted for the first time by Ponomarev and Nekharoshkov on Leg 69 by using a three-com-
140

SITE 504
— ^
SHDT tt 1977 Dl 9 3638.0 M 10 /28 /86 20 :17 TT = 2417 REFERENCE SIGNAL SO 12.88 VDLTS 9 16.4 MS GEDPHDNE .010647 CM/SEC 9 2434.2 MS FILTER i DFF - OFF
« 6 3 8 2 1 BIT / G 9 . 7 3 2 7 MV
—-+
IlLllHll lIlllllllllllllllllUlllllillllllHIIIIIlh Illl 1 ' I l l l l l .iliiiiiiiiiliiiiMiiiliiiiiMiiliiiMiiiilimiiiimiiiiiiiiLiimiLiimil
2000 5000
J1-
SHDT « 1783 Dl 9 3760.0 M 10 /28 /86 15 :3 TT - 2481, REFERENCE SIGNAL SO 12.24 VDLTS 9 17.3 MS GEDPHDNE .006109 CM/SEC 9 2499.1 MS FILTER » DFF - DFF
Dl P-P - 33872 BIT / G - 1 P-P - 5.1655 MV
in Iiiiimiiliiiiiiiiiliiniiiiiliiiiiiiiiliiiiiiiiiliiiiiniil IIIIIIIIIIIIIII Ii Iiiiiiiiiilimiiiiiliiiimiiiiimmilii il
2 4 0 0
l l l l l l l l l l l l l l l i l l l l l l l
5400
UwV
SHDT « 1198 Dl 9 4235.0 M 10 /28 /86 5 :12 TT « 2575. REFERENCE SIGNAL SO 12.40 VDLTS 9 17.3 MS GEDPHDNE .002219 CM/SEC 9 2593.1 MS FILTER i DFF - DFF
Dl V-% 13392 BIT / G 2.0423 MV
IIWIIIIIIIII Im Iiiiiiiiiiiiimiml ml I II n i n i'n: n ; n i Ii I .11 .: I M I ,II 1 ulminiiiliiiiiiiiilimiiinliii Imimiiliiiiiiiiiliiiiiimliiiimiil
5 4 0 0
SHDT « 754 Dl 9 4750.0 M 10 /27 /86 21 :2 TT » 2665.7 REFERENCE SIGNAL SO 12.30 VDLTS 9 17.3 MS GEDPHDNE .001038 CM/SEC 9 2683.0 MS FILTER s DFF - DFF
Dl P-P = 6226 BIT / G P-P - .4747 MV
i i i
2 5 0 0
W W I I I
5 5 0 0
Figure 115. Air-gun shot data showing seismograms recorded at depths of 3638, 3760, 4235, and 4750 mbsl, which are near the same borehole clamping depth position as the shots in Figure 114, but here the CLT was locked in the reentry cone.
ponent downhole magnetometer in Hole 501 as well as in the upper part of Hole 504B. Their results showed sharp jumps in the vertical component of the magnetic field and gave fairly good agreement with the paleomagnetic results of rock samples of these holes (Ponomarev and Nekharoshkov, 1983; Johnson, 1979; Hamano and Kinoshita, in press). Detailed geological interpretations of these findings, however, were very limited.
Measurements of Downhole Magnetic Field
The magnetic field in the drilled hole, Hres, is given as a function of the formation magnetization of rocks, Jres, added to the local magnetic field in a form of vector summation:
Hres = H(IGRF) + Hloc = H(Jres)
141
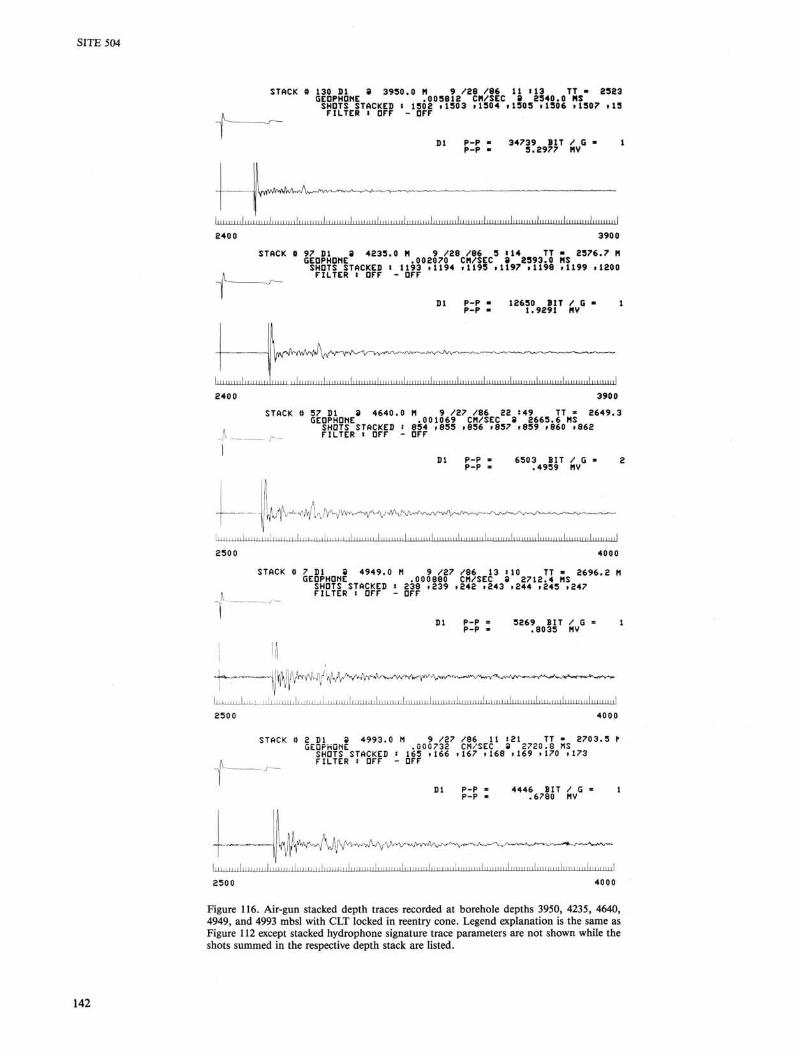
STACK 0 130 Dl 9 3 9 5 0 . 0 M 9 / 2 8 / 8 6 11 H 3 TT ■ 8983 GEDPHDME . 0 0 9 8 1 2 CM/SEC 3 2 9 4 0 . 0 MS
SHOTS STACKED i 1902 i 1 9 0 3 . 1 9 0 4 »1909 i l 5 0 6 >1907 i 1 5 FILTER i OFF - OFF
Dl P-P - 34739 BIT / G P-P - 9 . 2 9 7 7 MV
I n i i i i i i i l i i i i i i i i i l i i i i i i i i i l i i i i i i i i i l i i i i i i i i i l i i i i i i i i i l i i i i i i i i i l m i l i i l i i i i i i i i i l i i i i i i i i i l i m i i i i i l m i i i i i i l i i m i i i i l u i i i i i n l
2400 3900
STACK ft 97 Dl 3 4235.0 M 9 /28 /86 5 i14 TT ■ 2576.7 M GEDPHOMC .002070 CM/SEC 8 2993.0 MS SHOTS STACKED i 1193 .1194 .1199 .1197 .1198 ,1199 .1200 FILTER I OFF - OFF
D1 ?:? 12690 BIT / G 1.9291 MV
li I i i i i i i i i i l n i l n i l i i i n i M i l i i i i i i i i i l i n i In nl n i ii I I n i l i m i n i l in I l l I l l i il i i i i i n i il i n i i i i i i l
2400 3900 STACK ft 57 Dl 3 4640.0 M 9 /27 /86 22 :49 TT = 2649.3 GEOPHDNE .001069 CM/SEC 3 2665.6 MS SHOTS STACKED ' 854 .855 .856 .857 .859 .860 .862 ,1 r._ FILTER « OFF - OFF
I D l P - P - 6 5 0 3 B I T / G * 2
P - P = . 4 9 5 9 MV
I M M M I I I I M MM M i l i i i i hM. l i ,n. i MI I M.I 1 I M I M I I I I I . i l l m 11 MM I I n i l I I M I M I I n i l nu l l n I I m i l l I I ii I I i l l
2 5 0 0 4 0 0 0
STACK 8 7 Dl 3 4949.0 M 9 /Z? /86 13 s10 TT ■ 2696.2 M GEOPHDNE .000880 CM/SEC 3 2712.4 MS SHOTS STACKED ' 238 .239 .242 .243 .244 .245 .247 « FILTER : OFF - OFF
Dl P-P = 5269 BIT / G P-P * .8035 MV
*!•*».
2500
~4' Wl/ V^M/ '^^^^rr^'^^^<r^^^\M^^ i l i M H M . i l i l i i i M i i i i l i ' i i i i i i i l i i i i i i i i i l i i i i i i i i l l l i i i i i i l l l l l l i l l l l l l l l l l l l l l l l l l l h l l l l l l l l l l l i l l l l l l l l l l i l l
4000
STACK ft 2 Dl 3 4993.0 M 9 /27 /86 11 :21 TT - 2703.5 f GEDPHDME .000732 CR/SEC 3 £720.8 MS SHOTS STACKED : 165 .166 .167 .168 .169 .170 .173 FILTER : DFF - OFF
Dl P-P = 4446 BIT / G = 1 P-P « .6780 MV
2500
U jJ ' /W'^ ' ■^\f^^^^J^\f\^\^^r^M^^^~--^^--^4^J
i M 11.11 M i ■ 11 M 11 1111 i 111111111111 i i 11.11 i i i i 1111 11 n i l 111111111111111111111111111111111111 n 1111
4000
Figure 116. Air-gun stacked depth traces recorded at borehole depths 3950, 4235, 4640, 4949, and 4993 mbsl with CLT locked in reentry cone. Legend explanation is the same as Figure 112 except stacked hydrophone signature trace parameters are not shown while the shots summed in the respective depth stack are listed.
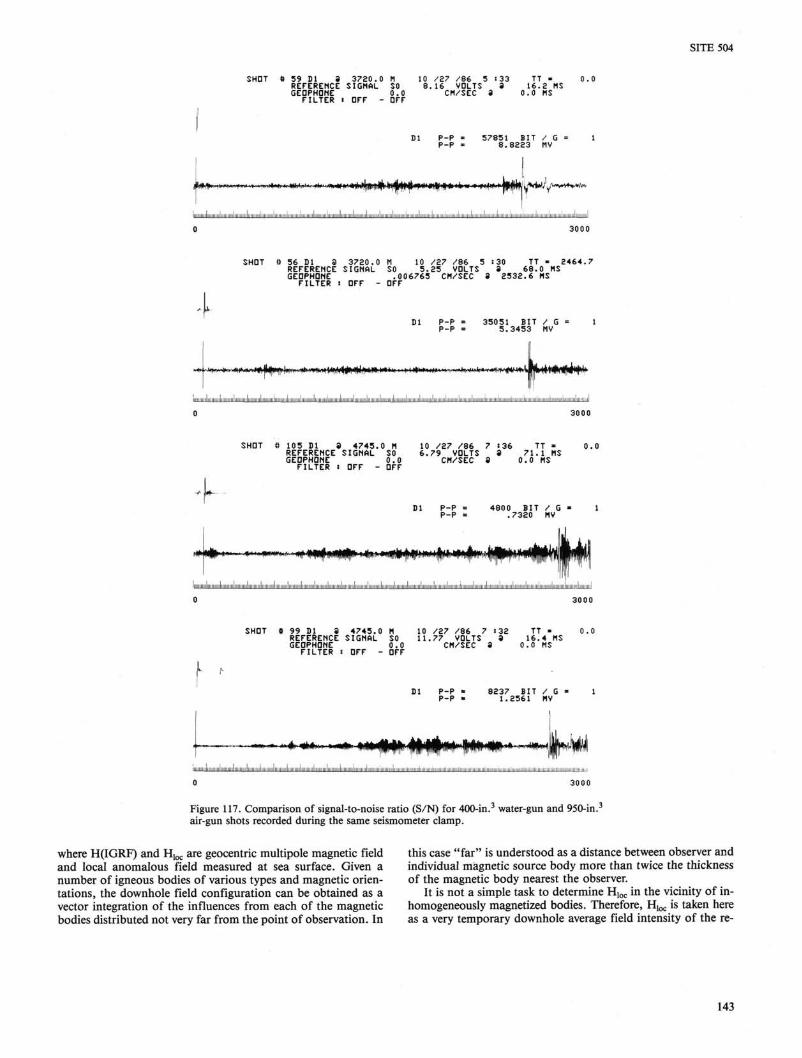
SITE 504
SHOT * 39 Dl 8 3720.0 M 10 /Z7 /86 5 : 33 TT « 0.0 REFERENCE SIGNAL SO 8.16 VDLTS 3 16.2 MS GEDPHDNE 0.0 CM/SEC 9 0.0 MS
FILTER i DFF - OFF
Dl P-P - 57851 BIT / G P-P = 8.8223 MV
Mlifof&mwfm te'^w> I I 1:11 iiiiiiliiiiiiini JIIIIIIHI . 1 1 iiiliiiiiiiiiln. Liiinllil iiliiNiiiiilmiiinil in uliilhiiiilh I. i ; l , i . , i . , i i, , i :
/wtMt*t*»«M*
3000
SHOT « 56 Dl 3 3720.0 M 10 /27 /86 5 :30 TT ■ 2464.7 REFERENCE SIGNAL SO 5.25 VDLTS 3 68.0 MS GEDPHDNE .006765 CM/SEC 3 2532.6 MS
FILTER s DFF - DFF
Dl P-P = 35051 BIT / G - 1 P-P = 5.3453 MV
> KMT > * .<»i Wii|«iH»-.'rtiiw'».iU fy> '' t*'1*1'"**'*'"»I H>W»»>M>I<'^*^K^»M'«'WIH^-W|I
.. Ill mi iiiLilu II I.IIIIIII.IIIII ml ill || II nui II il inn liniiii.iL II j li iL IlLlllllLllllllll
SHDT « 105 Dl 3 4745.0 M REFERENCE SIGNAL SO GEDPHDNE 0.0
FILTER : DFF - DFF
10 /27 /86 7 :36 TT * 6.79 VDLTS 3 71.1 MS
CM/SEC 3 0.0 MS
Dl P-P = 4800 BIT / G * 1 P-P = .7320 MV
i#iWp i IflMNI i|wV'f*if'f
' I I I I I I I I I I I I I I H I I I I I I I I I I I I I I I I I I I I I I l l N l l l l l l l l l l l l l l l l l l l l l l l l l l l l l l l l l l l l l l l M l l l t l l L l l l l l l l l l l l l l l l l l l l l l l l l l l l l l l l I I l l l i l l l l l l l l l l l l l l l l l l l l l l l i H i l l I l l l l l l l l l l I l l l l l l l l l l l l l l l l l l l l l l l l l l l l l l l l l l I l l l l l l l l Il l , M , l i l l l l l l l l l l ;
0 3000
SHDT S 99 Dl 3 4745.0 M 10 /27 /86 7 :32 TT » 0.0 REFERENCE SIGNAL SO 11.77 VDLTS 3 16.4 MS GEDPHDNE 0.0 CM/SEC 3 0.0 MS
FILTER : DFF - DFF
8237 BIT / G » 1 1.2561 MV
— — « — ' ■ «*w »~*Hp < m
i i i i n . II I i i i i i i i i i l i in i i i i L i i i i i i l i i i i i i i i i l i i i i liiiMinil
Figure 117. Comparison of signal-to-noise ratio (S/N) for 400-in.3 water-gun and 950-in.3
air-gun shots recorded during the same seismometer clamp.
where H(IGRF) and Hioc are geocentric multipole magnetic field and local anomalous field measured at sea surface. Given a number of igneous bodies of various types and magnetic orientations, the downhole field configuration can be obtained as a vector integration of the influences from each of the magnetic bodies distributed not very far from the point of observation. In
this case "far" is understood as a distance between observer and individual magnetic source body more than twice the thickness of the magnetic body nearest the observer.
It is not a simple task to determine Hloc in the vicinity of in-homogeneously magnetized bodies. Therefore, Hloc is taken here as a very temporary downhole average field intensity of the re-
143

SITE 504
L_U_L 2300
STACK * 172 Dl 8 3633.1 M 10 /28 /86 19 :15 TT = 2416. GEDPHDNE .004743 CM/SEC 3 2466.8 MS SHDTS STACKED : 1925 .1926 .1927 .1928 ,1929 »1930 »1931 FILTER 8 DFF - DFF
Dl P-P - 29023 BIT / G P-P - 2.2130 MV
jWwvyvM (AWVyw—'VWVA, ~
i ; i i i I I ! I l l l i i l I i i i l i i i i I l l l l l l l l l I l l ; i i
3050
2400
STACK « 163 Dl 8 3862.0 H 10 /28 /86 17 :46 TT - 2505. GEDPHDME .002338 CM/SEC 8 2533.2 MS SHDTS STACKED i 1851 >1852 .1853 ,1854 , 1833 ,1856 ,1857 FILTER i DFF - DFF
« « 13813 BIT / G 1.0532 MV
/>v-'j WH \ tw^W^" i N^Y^^^ J ^ i ^^~^^—A^-—A~-JKA»WJ
i l l I I I I : I I I I I l l I I I I I l I l I I I I l I I
3150
STACK « 45 Dl 8 4770.0 M 10 /Z? ^86 20 127 TT - 2657.3 GEDPHDME .000069 CM/SEC 8 2704.4 MS SHOTS STACKED : 683 ,692 ,695 ,696 ,698 ,699 ,706 FILTER : DFF - DFF
»« ;-.; 1525 BIT / G .1163 MV
-WV^-'A''^'r"fth\Ut:~-" ' ^ , ™ | L / | | ^
1 1 1 1 1 1 1 1 1 1 1 1 1 1 1 1 1 1 1 1 1
2300 3250
STACK ft 28 Dl 8 4850.0 M 10 /27 /86 17 «5 TT - 2672.3 GEDPHDME .000079 CM/SEC 8 2715.3 MS SHDTS STACKED i 474 ,476 ,479 ,481 ,482 ,483 ,484 FILTER : DFF - DFF
Dl %--% 1318 BIT / G .1005 MV
l^w*(tr-'
' ii i l l L l l i l . . : : . . . : : : . : ; ; ; : i i i l I i i l l l l l l l i I I I I I l I L L J : : L J I ; _ L ^ J
2500 3250
i
STACK ft 8 Dl 8 4949.0 M 10 /27 /86 13 :20 TT = 2712.4 GEDPHDME .000069 CM/SEC 8 2761.5 MS SHDTS STACKED : 254 ,255 ,256 ,257 ,260 FILTER : DFF - DFF
Dl P-P = 1427 BIT / G = 2 P-P « .1088 MV
A'fjH-- .-wJW<vvyvvAA! l ip | . pv"V | ,1 JS i[n fj'WiV^^ A/Wf^4w»Mw^
2500
Figure 118. Water-gun (80-in.3) stacked depth traces recorded at borehole depths 3635, 3862, 4770, 4850, and 4949 mbsl with CLT locked in reentry cone.
144
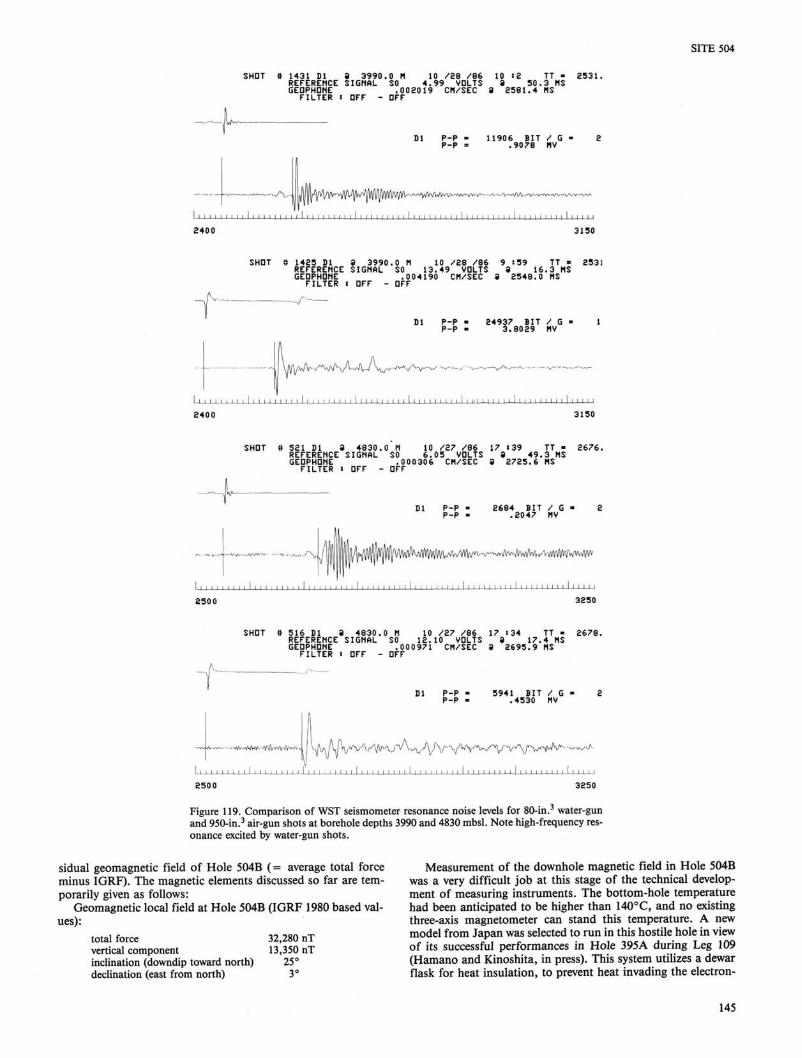
SITE 504
SHDT « 1431 Dl 9 3990.0 M 10 /Z9 /86 10 s2 TT - 2531, REFERENCE SIGNAL SO 4.99 VOLTS a 50.3 MS GEDPHQNE .002019 CM/SEC 9 2581.4 MS FILTER : OFF - OFF
~ W -
D1 ?:?
^v^v^/VvVA'vV''^
11906 BIT / G .90 78 MV
i i i i i i i i i i i i i i i i i i i i i i i i i i i i i i i i i i
£400 3150
SHDT « 1425 Dl 3 3990.0 M 10 /28 /86 9 :59 TT = 2531 REFERENCE SIGNAL SO 13.49 VDLTS 9 16.3 MS GEDPHQNE .004190 CM/SEC 9 2548.0 MS FILTER i DFF - DFF
Dl P-P - 24937 BIT / G P-P - 3.8029 MV
/ v f \ A A i v
i i n m i l i i i i i n H i i i i i I I I m i i i i l l m i I i i i
2400 3150
SHDT « 521 Dl 9 4 8 3 0 . 0 M 10 / 2 7 ^86 17 i 3 9 TT « 2 6 7 6 . REFERENCE SIGNAL SO 6 . 0 5 VDLTS 9 4 9 . 3 MS GEDPHQNE . 0 0 0 3 0 6 CM/SEC 9 2 7 2 5 . 6 MS
FILTER : DFF - DFF
2684 BIT / G .2047 MV
- ^ W V W V w M vA"-,'\/W\WWvv\/v\A'
I l I I : l l I l I I I I : I l l I l l I I I I I I : i I I I I I I I I I I I I I I I I I 1 I I I I I I I I I I I I J
250 0 3250
SHDT « 516 Dl 9 4 8 3 0 . 0 M 10 / 2 7 / 8 6 17 :34 TT - 2 6 7 8 . REFERENCE SIGNAL SO 12 .10 VDLTS 9 1 7 . 4 MS GEDPHQNE . 0 0 0 9 7 1 CM/SEC 9 2 6 9 5 . 9 MS
FILTER : DFF - DFF
Dl P-P - 5941 BIT / G P-P ■ .4530 MV
—v^vWWvv-jy^vvvVVv
i l l i
■ SfA /UV^VVvnjVY^/^
I I I I I _l I I I 1 I I I I I I I
2500 3250
Figure 119. Comparison of WST seismometer resonance noise levels for 80-in.3 water-gun and 950-in.3 air-gun shots at borehole depths 3990 and 4830 mbsl. Note high-frequency resonance excited by water-gun shots.
sidual geomagnetic field of Hole 504B (= average total force minus IGRF). The magnetic elements discussed so far are temporarily given as follows:
Geomagnetic local field at Hole 504B (IGRF 1980 based values):
total force 32,280 nT vertical component 13,350 nT inclination (downdip toward north) 25° declination (east from north) 3°
Measurement of the downhole magnetic field in Hole 504B was a very difficult job at this stage of the technical development of measuring instruments. The bottom-hole temperature had been anticipated to be higher than 140°C, and no existing three-axis magnetometer can stand this temperature. A new model from Japan was selected to run in this hostile hole in view of its successful performances in Hole 395A during Leg 109 (Hamano and Kinoshita, in press). This system utilizes a dewar flask for heat insulation, to prevent heat invading the electron-
145
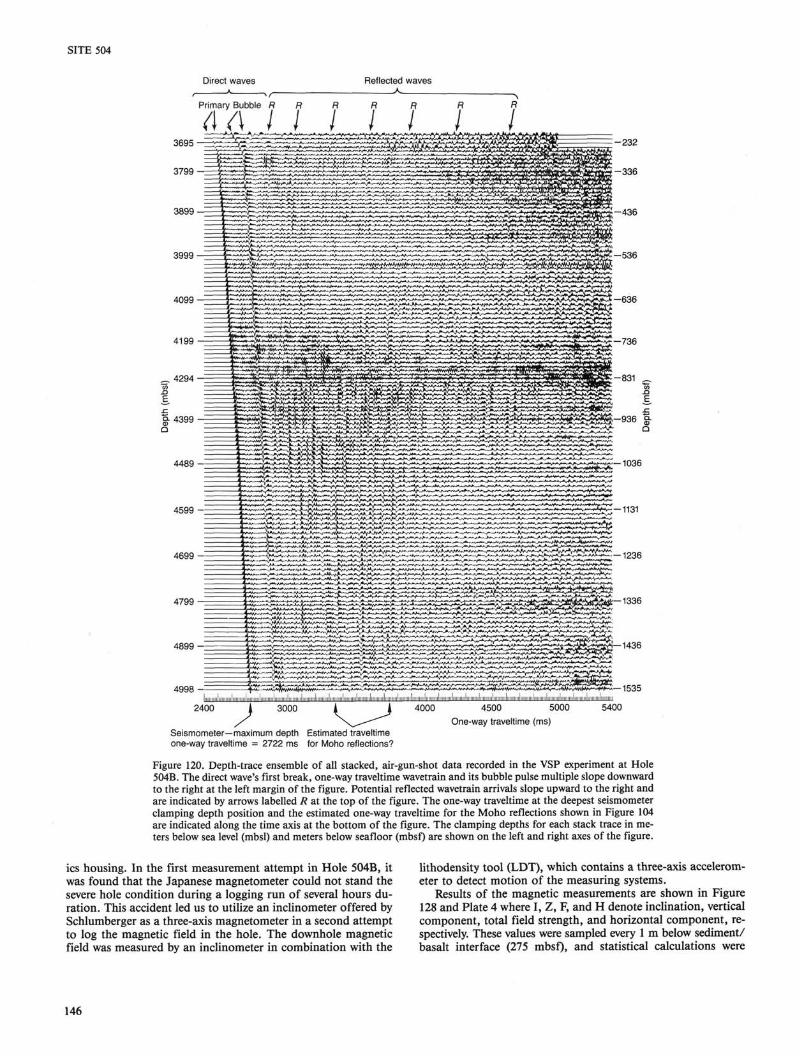
SITE 504
Direct waves Reflected waves A
Primary Bubble R R R R R R
A A I / / / / / -232
-336
3899
4899 - — 1436
4998 - ^Er^S3f ts^S£S*^^^^ I iiiliiintmi iiiiliiiiimili ilim I I il iiiliininiilii I I IIIIIIII Imi li IIIIIIIIIIIIIIM I l l Iiiiiiiiiiliiiiiiiiiliiiiiiiiiliiiiiiiiiliiiiiiiiiliiiiiiiiiliiiiiiiiiliiiiiiiiiliiniiiiiliiiiiillilllilllill
2400 3000 4000 4500 5000 One-way traveltime (ms)
5400
Seismometer—maximum depth Estimated traveltime one-way traveltime = 2722 ms for Moho reflections?
Figure 120. Depth-trace ensemble of all stacked, air-gun-shot data recorded in the VSP experiment at Hole 504B. The direct wave's first break, one-way traveltime wavetrain and its bubble pulse multiple slope downward to the right at the left margin of the figure. Potential reflected wavetrain arrivals slope upward to the right and are indicated by arrows labelled R at the top of the figure. The one-way traveltime at the deepest seismometer clamping depth position and the estimated one-way traveltime for the Moho reflections shown in Figure 104 are indicated along the time axis at the bottom of the figure. The clamping depths for each stack trace in meters below sea level (mbsl) and meters below seafloor (mbsf) are shown on the left and right axes of the figure.
ics housing. In the first measurement attempt in Hole 504B, it was found that the Japanese magnetometer could not stand the severe hole condition during a logging run of several hours duration. This accident led us to utilize an inclinometer offered by Schlumberger as a three-axis magnetometer in a second attempt to log the magnetic field in the hole. The downhole magnetic field was measured by an inclinometer in combination with the
lithodensity tool (LDT), which contains a three-axis accelerom-eter to detect motion of the measuring systems.
Results of the magnetic measurements are shown in Figure 128 and Plate 4 where I, Z, F, and H denote inclination, vertical component, total field strength, and horizontal component, respectively. These values were sampled every 1 m below sediment/ basalt interface (275 mbsf), and statistical calculations were
146

SITE 504
Oceanic basement reflection Layer 2 reflections
1 A Direct waves .E, E2 E EH X Moho ?
3695
3799
3899
3999
4099
4199
4294
4399-
4499-
4599-
4699
4799 —
4899 —
4998 —
— 232
•336
—436
•536
-636
— 736
—831
i i l i i i i m i i h i n i i i i i l i i i
2400
-936
-1036
— 1131
—1236
-1336
—1436
- 1 5 3 5
Moho ? 3900 Two-way traveltime (ms)
Figure 121. Depth-trace ensemble of the VSP-stacked shot data shown in Figure 116 for the record interval 2400-3900 ms. Potential reflection wavetrains from interfaces E rE 5 and X within Layer 2 and the Moho are tentatively identified by arrow pairs.
made to give the following values of the magnetic field parameters.
Average Standard deviation
Intensity of magnetic field (nT) 37,600 1,490 Horizontal component (nT) 28,500 1,195 Inclination (degree) 42.0 1.9
Some important findings in this hole are:
1. Inclination measured in the hole lies between 34° and 48° in contrast to the inclination of the present local field measured on the sea surface (about 25°).
2. There are more than ten sets of coincidental changes in the field strength and the inclination. Some of them show a clear indication of the existence of strongly magnetized layers with reversed orientation.
147

SITE 504
3624 — — 161
^.^../w^*»^v-t*v-v^'*-^i"-^y*fv>^ — 5 2 6 t
1296 £
4938 —
^ ^ ^ ^ S i f f i '■'•^•^f'-"*-'»'^*^VV^"'~>'-^"Vw"»~"/'^'j,^'+,C''',t
i l l l l ! ! ! i l l l l l l l l l l l l l l i m i l l i l l l l l l l l l i l l l l l l l l l i l l l l l i l l l i l l l l l l l l l l l l l l l l l l l l l l l l l l l l l l l l l l l l l l l l l l l l l l l l l l
1475 iiiiiiiiiliiiiiiiiiliiiiiiiiiliiiiiiitiiiiiitiiiiliiNiiiiiliiiiiiiiiliiiiiiiiiliiimmliii
4800 7800 Two-way traveltime (ms)
Figure 122. Depth-trace ensemble of all stacked, 80-in.3 water-gun-shot data recorded in the VSP experiment at Hole 504B. Note each trace has been static shifted for the one-way traveltime of the direct wave's first break arrival. This results in a two-way traveltime plot. The offset in the direct wave first break arrival wavetrain between 4759 and 3989 mbsl (1296-526 mbsf) was due to the cessation of water-gun shooting over this depth interval (see text).
3. The variation of the magnetic field can be divided into three zones from top to bottom of the hole. They are characterized by:
Top: variable intensity with maximum amplitude 2,500 nT, Middle: highly variable intensity with maximum amplitude
5,000 nT; Bottom: quiet change in the field intensity with only a couple
of spikes of amplitude about 2,000 nT. 4. Cross plots between F and I show also a certain correla
tion with this zoned structure (Fig. 129): Top: negative correlation factor indicates that the majority
of the basaltic formations are negatively magnetized; Middle: no correlation indicates some influence of alteration
on magnetic minerals; Bottom: weak negative correlation implies again a negative
magnetization over the lower part of this hole.
This zoned pattern seems to correlate with the structure of rock facies, alteration minerals, density of fractures on the hole wall, and other physical parameters such as density, porosity, resistivity, and permeability.
Interpretation of the Results The field strength in the hole is a composite value of the gen
eral geomagnetic field combined with the field induced by the surrounding rock formation of the measuring systems. We define the downhole magnetic anomaly to be the difference of the measured field between the hole and the sea surface. In a very simplified case where the sensor of the measuring system is hanging right in the center of the vertical hole of circular cross section, and the magnetic layers are oriented in horizontal planes with infinite extent in the horizontal scale, a magnetic field around the sensor from a single layer can be given in analytical form.
Fh = PI x Mh (sin(atan(Z2)) - sin(atan(Zj))) Fz = - 2 x PI x Mz(sin(atan(Z2)) - sin(atan(Zj)))
Symbols and subscripts denote:
PI: 3.1416, h, z: subscripts h and z stand for horizontal and vertical ori
entations, formation field induced by single Mx layer, magnetization of an xth magnetic layer,
depth of top of the same layer, depth of bottom of the same layer.
Other influences on the measured field values will be induced by off-centering of the sensor as well as the irregular shape of the cross section of the drilled hole. These effects cannot be estimated due to the lack of detailed parameters for these unknowns. Therefore, we simply apply concentric models to the present interpretation.
First, we must verify that the measured values are reliable. Regarding the inclination value, it is clear that the average measured inclination value is much greater than that calculated from IGRF 1980 of this site. This difference can be attributed to some additional permanent and/or induction field from the logging tools combined with the Schlumberger inclinometer system. The added weights and other tools produce some anisotropic external field due to their elongated shapes, which will significantly distort the vertical component of the geomagnetic field. This consideration can be verified when we look at the magnetic data of Hole 395A of Hamano and Kinoshita (in press). They have conducted a comparison logging of the downhole magnetic field using Japanese and German magnetometers and the Schlumberger combination tools. It was found that the inclination derived from the Schlumberger tool was larger than the IGRF by about 14°, whereas the Japanese magnetometer (by a stand-alone measurement) gave an average inclination very close to the IGRF inclination value (Schlumberger inclination = 51.84; Japanese inclination = 42.14; both with standard deviation smaller than 2.5° for 20 samples; IGRF inclination = 42.0; Hamano and Kinoshita, in press). Therefore, we assume that
148
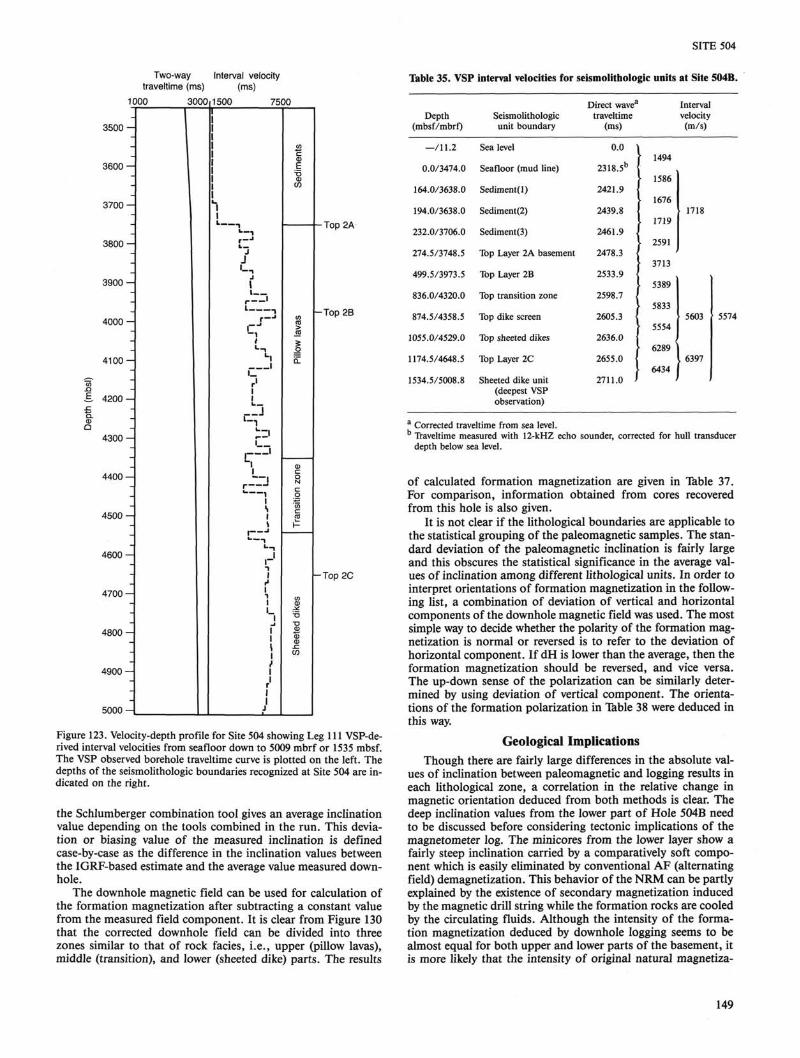
SITE 504
Two-way Interval velocity traveltime (ms) (ms)
1000 3000 1500 7500
Table 35. VSP interval velocities for seismolithologic units at Site 504B.
3500-
3600-
3700-
3800-
3900
4000
4100-
£ 4200-
4300-
4400 —
4500
4600-
4700-
4800-
4900-
5000-
I I t
^3
j 1
i_
-Top 2B
■ Top 2A
-Top 2C
Figure 123. Velocity-depth profile for Site 504 showing Leg 111 VSP-de-rived interval velocities from seafloor down to 5009 mbrf or 1535 mbsf. The VSP observed borehole traveltime curve is plotted on the left. The depths of the seismolithologic boundaries recognized at Site 504 are indicated on the right.
the Schlumberger combination tool gives an average inclination value depending on the tools combined in the run. This deviation or biasing value of the measured inclination is defined case-by-case as the difference in the inclination values between the IGRF-based estimate and the average value measured down-hole.
The downhole magnetic field can be used for calculation of the formation magnetization after subtracting a constant value from the measured field component. It is clear from Figure 130 that the corrected downhole field can be divided into three zones similar to that of rock facies, i.e., upper (pillow lavas), middle (transition), and lower (sheeted dike) parts. The results
Depth (mbsf/mbrf)
—/11.2
0.0/3474.0
164.0/3638.0
194.0/3638.0
232.0/3706.0
274.5/3748.5
499.5/3973.5
836.0/4320.0
874.5/4358.5
1055.0/4529.0
1174.5/4648.5
1534.5/5008.8
Seismolithologic unit boundary
Sea level
Seafloor (mud line)
Sediment(l)
Sediment(2)
Sediment(3)
Top Layer 2A basement
Top Layer 2B
Top transition zone
Top dike screen
Top sheeted dikes
Top Layer 2C
Sheeted dike unit (deepest VSP observation)
Direct wave3
traveltime (ms)
0.0 *
2318.5b I
2421.9 I
2439.8 1
2461.9 I
2478.3 [
2533.9 1 I
2598.7 1
2605.3 (
2636.0 I
2655.0 I
2711.0 '
1494
1586
1676
1719
2591
3713
5389
5833
5554
6289 '
6434 ■
Interval velocity
(m/s)
1718
5603
. 6397
■
5574
a Corrected traveltime from sea level. Traveltime measured with 12-kHZ echo sounder, corrected for hull transducer depth below sea level.
of calculated formation magnetization are given in Table 37. For comparison, information obtained from cores recovered from this hole is also given.
It is not clear if the lithological boundaries are applicable to the statistical grouping of the paleomagnetic samples. The standard deviation of the paleomagnetic inclination is fairly large and this obscures the statistical significance in the average values of inclination among different lithological units. In order to interpret orientations of formation magnetization in the following list, a combination of deviation of vertical and horizontal components of the downhole magnetic field was used. The most simple way to decide whether the polarity of the formation magnetization is normal or reversed is to refer to the deviation of horizontal component. If dH is lower than the average, then the formation magnetization should be reversed, and vice versa. The up-down sense of the polarization can be similarly determined by using deviation of vertical component. The orientations of the formation polarization in Table 38 were deduced in this way.
Geological Implications Though there are fairly large differences in the absolute val
ues of inclination between paleomagnetic and logging results in each lithological zone, a correlation in the relative change in magnetic orientation deduced from both methods is clear. The deep inclination values from the lower part of Hole 504B need to be discussed before considering tectonic implications of the magnetometer log. The minicores from the lower layer show a fairly steep inclination carried by a comparatively soft component which is easily eliminated by conventional AF (alternating field) demagnetization. This behavior of the NRM can be partly explained by the existence of secondary magnetization induced by the magnetic drill string while the formation rocks are cooled by the circulating fluids. Although the intensity of the formation magnetization deduced by downhole logging seems to be almost equal for both upper and lower parts of the basement, it is more likely that the intensity of original natural magnetiza-
149
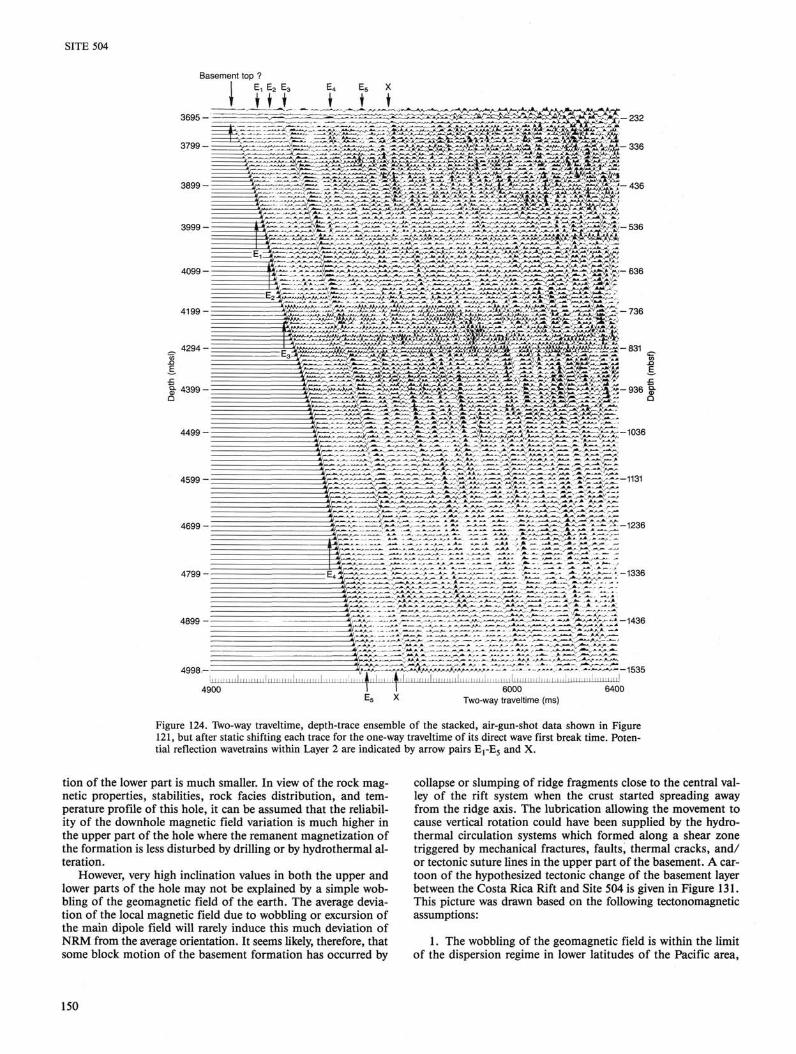
SITE 504
Basement top ? E, E2 E3 E4
If ♦ * 3695-
3799
— ^ - -- - ■ ^ ^ j ^ ^ V " - ^ ' ^ ' ' ^ ^ ^ ^ ^ T V ^ - - ^ ^ . j ^ y T t ^ " X j T " "■'■■■■-'• :■' ' , '7. ' .<. ." ■■■■ ■ . . ■ ; ■ ■
•232
336
- 4 3 6
-536
-636
736
- 8 3 1
- 9 3 6
-1036
-—1131
-1236
- « A A A
-1336
-1436
4998--l l l l l l i l l l l l L L I I I i l l l
4900
A ^ A * ^ y M ^ A # ^ A ^ > ^ *
LLLLLLLLLLLLL M l l l n n t l l l l h l l l I l l 1535
6000 Two-way traveltime (ms)
6400
Figure 124. Two-way traveltime, depth-trace ensemble of the stacked, air-gun-shot data shown in Figure 121, but after static shifting each trace for the one-way traveltime of its direct wave first break time. Potential reflection wavetrains within Layer 2 are indicated by arrow pairs E rE 5 and X.
tion of the lower part is much smaller. In view of the rock magnetic properties, stabilities, rock fades distribution, and temperature profile of this hole, it can be assumed that the reliability of the downhole magnetic field variation is much higher in the upper part of the hole where the remanent magnetization of the formation is less disturbed by drilling or by hydrothermal alteration.
However, very high inclination values in both the upper and lower parts of the hole may not be explained by a simple wobbling of the geomagnetic field of the earth. The average deviation of the local magnetic field due to wobbling or excursion of the main dipole field will rarely induce this much deviation of NRM from the average orientation. It seems likely, therefore, that some block motion of the basement formation has occurred by
collapse or slumping of ridge fragments close to the central valley of the rift system when the crust started spreading away from the ridge axis. The lubrication allowing the movement to cause vertical rotation could have been supplied by the hydro-thermal circulation systems which formed along a shear zone triggered by mechanical fractures, faults, thermal cracks, and/ or tectonic suture lines in the upper part of the basement. A cartoon of the hypothesized tectonic change of the basement layer between the Costa Rica Rift and Site 504 is given in Figure 131. This picture was drawn based on the following tectonomagnetic assumptions:
1. The wobbling of the geomagnetic field is within the limit of the dispersion regime in lower latitudes of the Pacific area,
150

SITE 504
3749
3799-
3899
Basement Ei E2 E3 E4 E41E42 E5 X
• II I l l l l I : - 3 3 6
3999 - ■
4099-
4199-
TK 4294 J D
Q 4399
j^Sjj^**i>~^fl*y 1 0jfa^*& .JK^/*A^
F3 ' j - , > -;'--^ — - r -~ y * y *
:^ri~S|: *^4^----^s^
4499
4599 -
4699 -
4 7 9 9 -
4 8 9 9 -
4949-
-436
4800 Two-way traveltime (ms)
i Inn In In in i in I in in i n I nun i I I I ini l i i in i i i i l ini frni l nl i iAi iml I Ill
Seismometer max. depth/traveltime
Figure 125. Upgoing reflected waves for the 4400-5900 ms portion of the two-way traveltime, VSP depth trace ensemble. A zero-dip spatial velocity filter has been used to separate the upgoing, vertical reflected wavefield from the downgoing, direct wavefield which dips downward to the right in Figure 124. Note strong vertical wavetrains E rE 5 and X, tentatively identified in Figure 124 can now be clearly seen. Two addition vertical wavetrains E41 and E42 are also apparent. The wavetrain identified as X in Figure 124, as well as the deeper wavetrains Y and Z at the right in this figure, appear to be curved. They may be reflections from dipping interfaces within Layer 3 (see text).
i.e., within 12°. The dispersion of remanent magnetization of a thick layer of volcanic formation can be averaged out during acquisition process of the NRM.
2. Tb (blocking temperature of NRM) is restricted in a narrow band, and the top surface is below the present total depth of Hole 504B. The formation magnetization is fixed above the Tb surface, but zero below it.
3. Hydrothermal circulation had quickly cooled down the rock formation between the layer and the seafloor to settle NRM near the central part of rift system. Hence, the isotherm of Tb is simply assumed to have been seated always below the hydrothermal layer.
4. The rate of spreading of the ocean floor of this area has been intermittent, triggered by intrusions in the rift zone. The
north-south component of the lithospheric movement has been smaller than the velocity of the Nazca plate (assume 10 cm/yr relative to South America), so the latitude of Site 504 has remained within 5° of the equator. Therefore, the maximum probable change in the average inclination values due to horizontal lithospheric movement should be within 10°.
5. Cooling of the lithosphere has occurred in a quasi-diffusive manner. For example, the 560° isotherm (Curie temperature of magnetite) migrates down 100 m in 10,000 yr, 1,000 m in 1 m.y., and 2,000 m in 4 m.y. The depth of iso-Tb surface is shallower than these depths, and as a result the formation magnetization deep in the hole is still metastable and weak. However, detailed chemical compositions and associated magnetic properties of rock formations are not yet studied sufficiently. In
151

SITE 504
Horizontal reflector
Figure 126. VSP ray paths (left) and schematic representation of hyperbolic depth trace ensemble traveltime curves for observed one-way reflections (center) from a dipping interface intersecting the borehole and the two-way reflection curves (right) after static shifting for the first break time of the direct wave arrival of each depth trace (modified after Kennett and Ireson, 1981). Gj-G4 represent geophone locations.
Table 36. Correlation of VSP reflections with seismolithologic units.
Seismolithologic interval velocity (m/s)
Depth (mbsf/mbrf)
—/3474.0
274.5/3748.5 286.0/3760.0
476.0/3950.0 499.5/3973.5
556.0/4030.0
831.0/4305.0 846.0/4320.0 874.5/4358.5
1055.0/4529.0 1136.0/4610.0
1174.5/4648.5 1246.0/4720.0
1416.0/4870.0
1534.8/5008.8
1562.3/5036.3
1658.3/5132.33
2038.3/5522.33
Seismolithologic unit boundary
Seafloor
Top Layer 2A
Top Layer 2B
?
Top transition zone Top dike screen
Top sheeted dikes
Top Layer 2C
?
» Borehole total depth
» Borehole total depth
VSP reflection wavetrain
Basement
E,
E2
E,
?
E4
E41
E42
Deepest VSP observation
Borehole total
E5
X
depth
Two-way reflection traveltime
(ms)
4637.0
4956.6 J 4950.0
5050.0 J 5067.8
5090.0
5190.0 J 5197.4 ' 5210.6
5272.0 5290.0 '
5310.0 5330.0
5380.0
5422.0
5430.5a
5460.0
5700.0b
VSP interval velocity (m/s)
1827
3800
■ 4000
• 5000
1 \ 6100 !
5500
' 6000
> 6600
4500
5500
6278
1718
3713
5389
5574
5603
6289
6434
a Estimated values assuming rock velocity of 6500 m/s below deepest VSP observation at 1534.8 mbsf (5008.8 mbrf). Top of dipping reflector sequence within Layer 3 estimated from migrated MCS profile, Figure 104.
particular, titanium contents of ferromagnetic minerals (mostly titanomagnetites in tholeiitic basalts) are critical to this kind of estimation and discussion. Lithochemical logging tools will be invaluable in this kind of program.
We infer that the remanent magnetization of rock formations in the upper part of Hole 504B has been significantly rotated around an east-west axis, possibly along a listric normal fault that extends through the basement.
PERMEABILITY MEASUREMENTS IN THE SHEETED DIKES
Introduction The circulation of seawater through fresh basalt plays a criti
cal role in the development of the physical and chemical nature of the oceanic crust. The modes and effects of circulation are partly controlled by the variable permeability and porosity of
152

SITE 504
4899
4949
5000 E4 Deepest seismometer-
clamping depth
4 X 6000 Dipping layer 3
event? top layer 3 = E5 ?
Two-way traveltime (ms)
Figure 127. Correlation of VSP reflected wavefield at Site 504 with recognized seismolithologic boundaries in the borehole.
the basaltic layer. As crustal permeability and porosity probably vary with irregular fractures and voids of unknown scale, they cannot be reliably determined from dredged or cored samples. Instead, bulk permeability and porosity must be measured in situ, at averaging scales large enough to include the effects of irregular fracture porosity and to escape the disturbance of drilling on the formation.
There are several downhole logs and experiments from which porosity can be determined (e.g., Becker, 1985; "Dual Lateralog Resistivity Logging" section, this chapter). However, while it is intuitive that there must be some relationship between permeability and porosity, the permeability of the oceanic crust cannot be reliably determined from its porosity. There are many scales of porosity—intergranular or pore porosity, cracks, and large
fractures—not all of which contribute to permeability. The permeability of the oceanic crust is probably dominated by large-scale, interconnected porosity, which cannot be distinguished from other forms of porosity by logging. To date, the only reliable means of assessing permeability is by actively testing the formation in situ, which is best done using a packer to isolate a section of a borehole that penetrates the formation.
During Leg 111, a drill-string packer was deployed twice to measure the bulk permeability of two sections of Hole 504B:
1. 936-1406.8 mbsf in the uppermost dikes, with the packer set at 936 m when the total hole depth was 1406.8 m, and
2. 1236-1547.5 mbsf in the dikes, with the packer set at 1236 m when the total hole depth was 1547.5 m.
153

SITE 504
30
Relative field strength (nt) and angle (degrees)
40 50 60 70
3800
4000
4200 -
4400
4600 -
4800 -
5000 T r k 30 25
Absolute values
Figure 128. Results of magnetic field log plotted vs. subsurface depth for Hole 504B. I, Z, H, and F denote inclination, vertical force, horizontal force, and total force, respectively. Amplitude of I (and Z, H, and F) is given by vertical thick bars on the left, and absolute values of these parameters are given on the right in units of degrees for I and nanoTesla for field strengths.
The permeability of the pillow lavas and shallow dikes in Hole 504B was measured during Legs 69, 70, and 83 by Anderson and Zoback (1982), Becker et al. (1983a), and Anderson et al. (1985), respectively (Fig. 5). The permeability of the oceanic crust has been sampled in only one other hole, 395A, during Leg 78B by Hickman et al. (1984) and during Leg 109 by Becker (in prep). The results form an important comparison, as the two holes are located in young crust of similar ages, but different geothermal regimes: Hole 395A is located in an isolated sediment pond in rough, unsealed crust that is open to active hydro-thermal circulation, whereas Hole 504B is located in thickly-sedi-mented, partially-sealed crust that is much less open to circulation.
In this section we will first review the measurement of permeability using a packer, then describe the procedures and results of the measurements made during Leg 111, and then briefly compare the preliminary permeability values measured during Leg 111 with previous measurements in Holes 504B and 395A.
0.42
0.40
0.38
F
3750-4260 mbsl
• • •
• • • • • • • • • . . . . • • # • » • • •
• # • • • • • • • • ■ • • • • • • # • * • * ■
• • • • • • • • . . . . . . . . . . . . . . . . . . . . . . . . . . .
1 , I
. -
■
• •
"
0.42 -
6 0.40 -
0 . 3 8 -
F
-
-
-
1 '
; ; * • • • ■
i
i ■ i
4260-4550 mbsl
-
-
1 i , i
0.42 -
$0.40
0.38
4550-4950 mbsl
'4
• • • • • • • • •
1-9
10-19
20-29
30-39
40-49
50-59
60-69
70-79
80-89
90-99
38 42 Inclination (degrees)
46
Figure 129. Cross plots of total force vs. inclination values for three zones: top, middle, and bottom of hole as defined by magnetic units. A. Subsurface depth, 3750-4260 mbsl. B. Subsurface depth, 4260-4550 mbsl. C. Subsurface depth, 4550-4950 mbsl. Radii of plots are assigned to frequency of occurrences and are proportional to the frequency by 10 steps as seen in the figure.
154
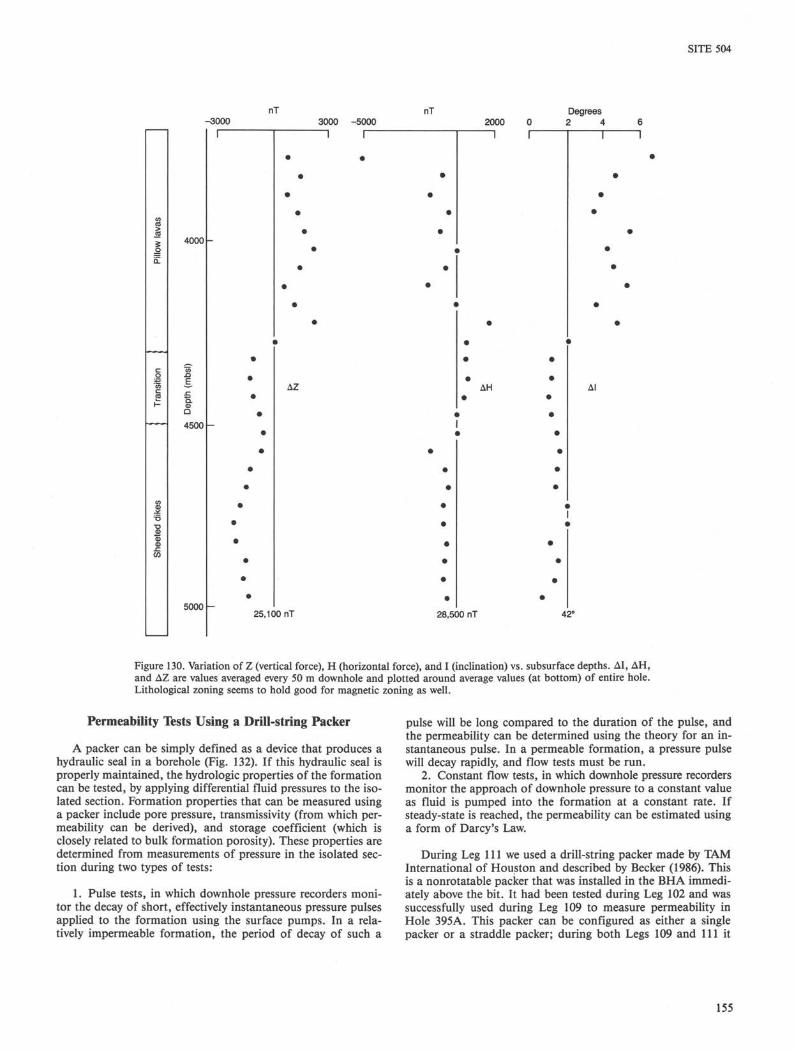
SITE 504
nT nT -3000 3000 -5000 2000 0
co to > « %
ilo<
[ Pi
l
c o iti
CO c 2 K
co <D - it T3 •o S a> CD .c CO
4000
"55 -O E, ^ Q. 5 Q
4500
5000
Degrees 2 " 4 6
1 1
AZ AH Al
25,100 nT 28,500 nT 42°
Figure 130. Variation of Z (vertical force), H (horizontal force), and I (inclination) vs. subsurface depths. AI, AH, and AZ are values averaged every 50 m downhole and plotted around average values (at bottom) of entire hole. Lithological zoning seems to hold good for magnetic zoning as well.
Permeability Tests Using a Drill-string Packer
A packer can be simply defined as a device that produces a hydraulic seal in a borehole (Fig. 132). If this hydraulic seal is properly maintained, the hydrologic properties of the formation can be tested, by applying differential fluid pressures to the isolated section. Formation properties that can be measured using a packer include pore pressure, transmissivity (from which permeability can be derived), and storage coefficient (which is closely related to bulk formation porosity). These properties are determined from measurements of pressure in the isolated section during two types of tests:
1. Pulse tests, in which downhole pressure recorders monitor the decay of short, effectively instantaneous pressure pulses applied to the formation using the surface pumps. In a relatively impermeable formation, the period of decay of such a
pulse will be long compared to the duration of the pulse, and the permeability can be determined using the theory for an instantaneous pulse. In a permeable formation, a pressure pulse will decay rapidly, and flow tests must be run.
2. Constant flow tests, in which downhole pressure recorders monitor the approach of downhole pressure to a constant value as fluid is pumped into the formation at a constant rate. If steady-state is reached, the permeability can be estimated using a form of Darcy's Law.
During Leg 111 we used a drill-string packer made by TAM International of Houston and described by Becker (1986). This is a nonrotatable packer that was installed in the BHA immediately above the bit. It had been tested during Leg 102 and was successfully used during Leg 109 to measure permeability in Hole 395A. This packer can be configured as either a single packer or a straddle packer; during both Legs 109 and 111 it
155
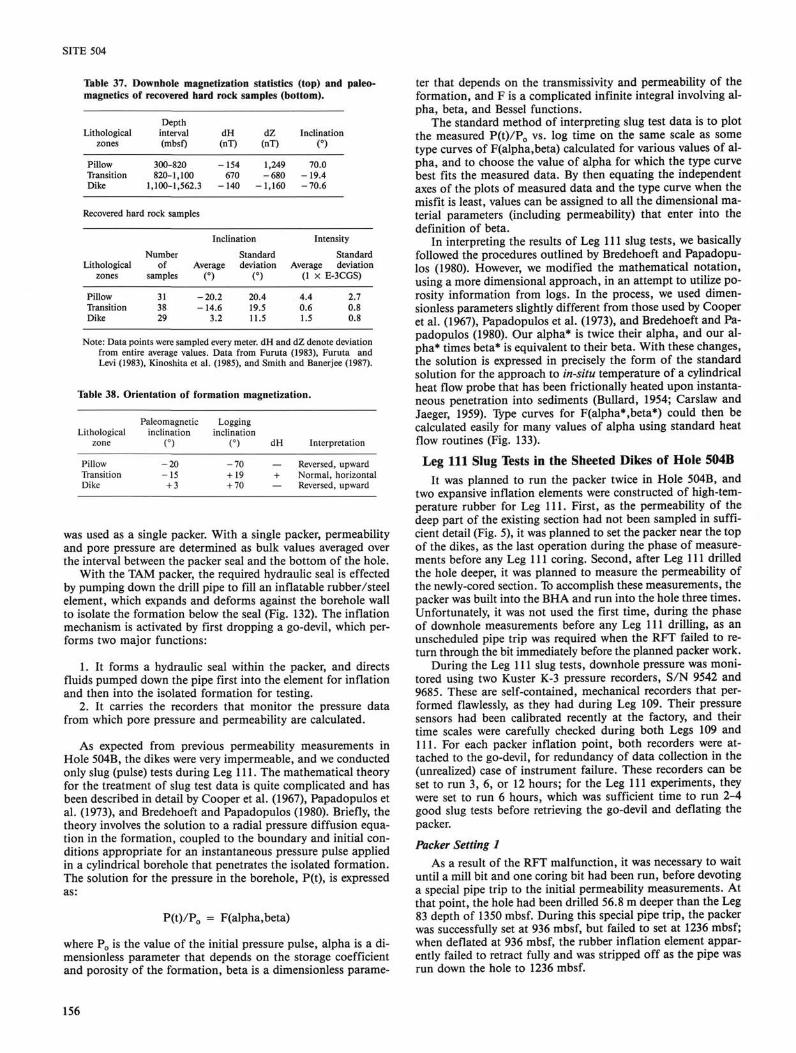
SITE 504
Table 37. Downhole magnetization statistics (top) and paleo-magnetics of recovered hard rock samples (bottom).
Lithological zones
Pillow Transition Dike
Depth interval (mbsf)
300-820 820-1,100
1,100-1,562.3
dH (nT)
-154 670
- 1 4 0
dZ (nT)
1,249 -680
-1,160
Inclination (°)
70.0 -19 .4 -70 .6
Recovered hard rock samples
Inclination Intensity Number Standard Standard
Lithological of Average deviation Average deviation zones samples (°) (°) (1 x E-3CGS)
Pillow 31 -20.2 20.4 4.4 2.7 Transition 38 -14.6 19.5 0.6 0.8 Dike 29 3.2 11.5 1.5 0.8
Note: Data points were sampled every meter. dH and dZ denote deviation from entire average values. Data from Furuta (1983), Furuta and Levi (1983), Kinoshita et al. (1985), and Smith and Banerjee (1987).
Table 38. Orientation of formation magnetization.
Lithological zone
Pillow Transition Dike
Paleomagnetic inclination
O - 2 0 - 1 5
+ 3
Logging inclination
n - 7 0 + 19 + 70
dH
+
Interpretation
Reversed, upward Normal, horizontal Reversed, upward
was used as a single packer. With a single packer, permeability and pore pressure are determined as bulk values averaged over the interval between the packer seal and the bottom of the hole.
With the TAM packer, the required hydraulic seal is effected by pumping down the drill pipe to fill an inflatable rubber/steel element, which expands and deforms against the borehole wall to isolate the formation below the seal (Fig. 132). The inflation mechanism is activated by first dropping a go-devil, which performs two major functions:
1. It forms a hydraulic seal within the packer, and directs fluids pumped down the pipe first into the element for inflation and then into the isolated formation for testing.
2. It carries the recorders that monitor the pressure data from which pore pressure and permeability are calculated.
As expected from previous permeability measurements in Hole 504B, the dikes were very impermeable, and we conducted only slug (pulse) tests during Leg 111. The mathematical theory for the treatment of slug test data is quite complicated and has been described in detail by Cooper et al. (1967), Papadopulos et al. (1973), and Bredehoeft and Papadopulos (1980). Briefly, the theory involves the solution to a radial pressure diffusion equation in the formation, coupled to the boundary and initial conditions appropriate for an instantaneous pressure pulse applied in a cylindrical borehole that penetrates the isolated formation. The solution for the pressure in the borehole, P(t), is expressed as:
P(t)/P0 = F(alpha,beta)
where P0 is the value of the initial pressure pulse, alpha is a di-mensionless parameter that depends on the storage coefficient and porosity of the formation, beta is a dimensionless parame
ter that depends on the transmissivity and permeability of the formation, and F is a complicated infinite integral involving alpha, beta, and Bessel functions.
The standard method of interpreting slug test data is to plot the measured P(t)/P0 vs. log time on the same scale as some type curves of F(alpha,beta) calculated for various values of alpha, and to choose the value of alpha for which the type curve best fits the measured data. By then equating the independent axes of the plots of measured data and the type curve when the misfit is least, values can be assigned to all the dimensional material parameters (including permeability) that enter into the definition of beta.
In interpreting the results of Leg 111 slug tests, we basically followed the procedures outlined by Bredehoeft and Papadopulos (1980). However, we modified the mathematical notation, using a more dimensional approach, in an attempt to utilize porosity information from logs. In the process, we used dimensionless parameters slightly different from those used by Cooper et al. (1967), Papadopulos et al. (1973), and Bredehoeft and Papadopulos (1980). Our alpha* is twice their alpha, and our alpha* times beta* is equivalent to their beta. With these changes, the solution is expressed in precisely the form of the standard solution for the approach to in-situ temperature of a cylindrical heat flow probe that has been frictionally heated upon instantaneous penetration into sediments (Bullard, 1954; Carslaw and Jaeger, 1959). Type curves for F(alpha*,beta*) could then be calculated easily for many values of alpha using standard heat flow routines (Fig. 133).
Leg 111 Slug Tests in the Sheeted Dikes of Hole 504B It was planned to run the packer twice in Hole 504B, and
two expansive inflation elements were constructed of high-temperature rubber for Leg 111. First, as the permeability of the deep part of the existing section had not been sampled in sufficient detail (Fig. 5), it was planned to set the packer near the top of the dikes, as the last operation during the phase of measurements before any Leg 111 coring. Second, after Leg 111 drilled the hole deeper, it was planned to measure the permeability of the newly-cored section. To accomplish these measurements, the packer was built into the BHA and run into the hole three times. Unfortunately, it was not used the first time, during the phase of downhole measurements before any Leg 111 drilling, as an unscheduled pipe trip was required when the RFT failed to return through the bit immediately before the planned packer work.
During the Leg 111 slug tests, downhole pressure was monitored using two Kuster K-3 pressure recorders, S/N 9542 and 9685. These are self-contained, mechanical recorders that performed flawlessly, as they had during Leg 109. Their pressure sensors had been calibrated recently at the factory, and their time scales were carefully checked during both Legs 109 and 111. For each packer inflation point, both recorders were attached to the go-devil, for redundancy of data collection in the (unrealized) case of instrument failure. These recorders can be set to run 3, 6, or 12 hours; for the Leg 111 experiments, they were set to run 6 hours, which was sufficient time to run 2-4 good slug tests before retrieving the go-devil and deflating the packer.
Packer Setting 1 As a result of the RFT malfunction, it was necessary to wait
until a mill bit and one coring bit had been run, before devoting a special pipe trip to the initial permeability measurements. At that point, the hole had been drilled 56.8 m deeper than the Leg 83 depth of 1350 mbsf. During this special pipe trip, the packer was successfully set at 936 mbsf, but failed to set at 1236 mbsf; when deflated at 936 mbsf, the rubber inflation element apparently failed to retract fully and was stripped off as the pipe was run down the hole to 1236 mbsf.
156

u
SITE 504
Figure 131. Cross section of the lithosphere showing the topographic features of the ocean floor along a line projected to the 88° meridian in the inset locality map. From left (south) to right (north) of the top sketch, NZB: Nazca Basin; CAR: Carnegie Ridge; CRR: Costa Rica Rift; COR: Cocos Ridge; and PAB: Pacific Basin. Tb band shows distribution of the magnetic blocking temperature of the formation. The lower three sketches show a sequence of an upheaval and subsequent subsidence, with small solid arrows indicating motions of the topmost part of the crust in the rift zone. A pair of thin lines (almost vertical, crossing from the top to the bottom) connect identical spots of the crust under spreading motion. The thick arrows show direction of relative spreading of the lithosphere. Changes in the magnetic inclination of the formations at depths marked with small solid circles (in the crust) are projected in a vertical plane normal to the east-west direction. The magnitudes of the outer radii of the black fans are roughly proportional to the average remanent magnetization intensity of the formations. Angular spreads of the black fans correspond to dispersions of logged magnetic data obtained from individual lithological zones (pillow, transition, and dike sections, respectively).
157

SITE 504
&
H I
0
Figure 132. Sketches of inflatable drill-string packers. A. A single-element packer, shown here run through casing, which isolates the formation between the element and the bottom of the hole. B. A straddle packer, shown here in open hole, which separately isolates the zone between the elements and the zone between the lower element and the bottom of the hole.
P/P0 = F (alpha*, beta*)
0.001 0.01 0,100 1 .000 alpha* beta*
10.000 100.000
Figure 133. Values of P/P0 = F(alpha*,beta*) calculated by numerical integration for values of alpha* appropriate for the basaltic crust. Note that alpha* is here redefined as twice the value used by Cooper et al. (1967), Papadopulos et al. (1973), and Bredehoeft and Papadopulos (1980), and alpha* times beta* here is equivalent to their beta, so there is no direct correspondence between their type curves and these.
The packer inflation point at 936 mbsf was chosen to exclude the section at 911-929 mbsf, where a mineralized stockwork was sampled during Leg 83, indicating that this zone had been very permeable 5.9 m.y. ago at the ridge axis. Below 936 mbsf, porosity decreases sharply (Fig. 5), and it was expected that the dikes would be correspondingly less permeable. The packer inflated and set smoothly at this depth, and four successive slug tests were run. As the original recorder data show (Figs. 134 and 135A), each of these slugs took in excess of 30 min to decay to less than half the original P0, indicating that the formation was indeed very impermeable.
Packer Setting 2 When Leg 111 suspended coring and proceeded early with
the scheduled post-drilling experiments plan, Hole 504B had been drilled only 140.7 m deeper than it had been when the packer was set at 936 mbsf. Anticipating that the packer element would last for only one setting again, we decided to split the interval between 936 m and the total depth of 1547.5, and returned to 1236 mbsf, where an attempt to set the packer had failed before. The packer inflated and set smoothly, and two excellent slug tests were run, before we attempted a higher magnitude slug test which burst the packer element and aborted the otherwise successful experiment (Figs. 134 and 135B).
Operational Note: Performance of Packer Inflation Elements Although both of the special inflation elements procured for
Hole 504B were destroyed during Leg 111, the packer experiments were an unqualified success. The inflation elements were factory prototypes, rated to withstand the 150°C temperatures in the hole. At this temperature, even special high-temperature rubber compounds lose most of their elastic memory and strength, so the elements were not expected to last as long as normal nitrile elements. In fact, they were purchased only for use in Hole 504B, and were considered expendable in the Leg 111 effort. The quality of the downhole pressure records (Figs. 134 and 135) attests to the good hydraulic seals obtained using
Kuster "time"
Figure 134. Original records from Kuster K-3 S/N 9542 from both packer setting depths, before conversion of readings to time and pressure.
158

SITE 504
50
48
46 —
44 55
53 —
A 1
ker
pac
Infla
te
I
i
-4 _
<n d) "•" O1
Z3 CO
{ —1
1
1 CN 4 -
cn m *-cr ■D
CO
\ VJ 1
1 o -l_
en 0) *-CT> 3 O)
M
i
•tf +_ w <D *" o> D CO
1
1
o
7 Def
late
pa
1
—
_
1 ' 1 B
-
<D
O TO O .
<0
c
r
m
w
^ CO
1 1
1
(O
«0 <i>
t r 3
CO
1 1 1
1
M
TO
0)
TO
0)
s CD
1
-
—
-
51
49
47 1 2 3 4
Time (hr)
Figure 135. Annotated records of pressure vs. time for Leg 111 packer settings. A. 936 mbsf. B. 1236 mbsf.
the prototype elements, even if they only lasted for one packer setting each.
Preliminary Calculation of the Permeability of the Sheeted Dikes
For this report, we calculated permeability values only from the second slug test of the packer set at 936 mbsf (identified as slug test 2) and from the first slug test of the packer set at 1236 mbsf (identified as slug test 5). The first slug test during the packer set at 936 mbsf was somewhat disturbed by an irregular packer inflation and setting process. In the interpretation of the later slug tests at each packer depth, the measured pressures must be carefully corrected for the superposed effects of the previous slugs. Thus, it is important to interpret the earlier slug tests as fully and accurately as possible before considering subsequent slug tests. It is clear from the unprocessed pressure data (Figs. 134 and 135) that the decay curves of the later pulses are similar in form to those of the initial pulses, so all the slug tests should yield consistent results.
For the initial pulses of each packer setting, measured pressures were referred to a hydrostatic baseline. The values of P0 were obtained from the first stable pressure readings at the con
clusion of pumping the pulses, not from the higher peak values during the last few seconds of pumping, which are interpreted to be transient values as pressure stabilized in the long, narrow drill string and borehole. For example, for slug test 5, P0 was taken as 51.5 MPa less hydrostatic, not 52.3 MPa less hydrostatic (Fig. 135B). P(t)/Po was then plotted vs. time (Fig. 136) and vs. log10 of time (Fig. 137) to fit to the type curves of Fig. 133. After the best fit was determined, the product (alpha x beta) could be equated to the time tj at which the independent axis of the P /P 0 plots overlay the point at which (alpha x beta) = 1 on the independent axis of the type curve.
Permeability could then be calculated from tlt the dimensions of the borehole and drill pipe, the viscosity and compressibility of the fluid in the isolated formation, and the compressibility in the pressurized system. The viscosity is strongly dependent on temperature, and we used the formula of Gartling (1977) and Anderson et al. (1985):
viscosity (N - s/m2) = 0.01668 T"0-8987,
1 .0
Figure 136. Plots of P/P0 vs. time for the two slug tests treated in this report. A. Slug test 2 at 936 mbsf. B. Slug test 5 at 1236 mbsf.
159
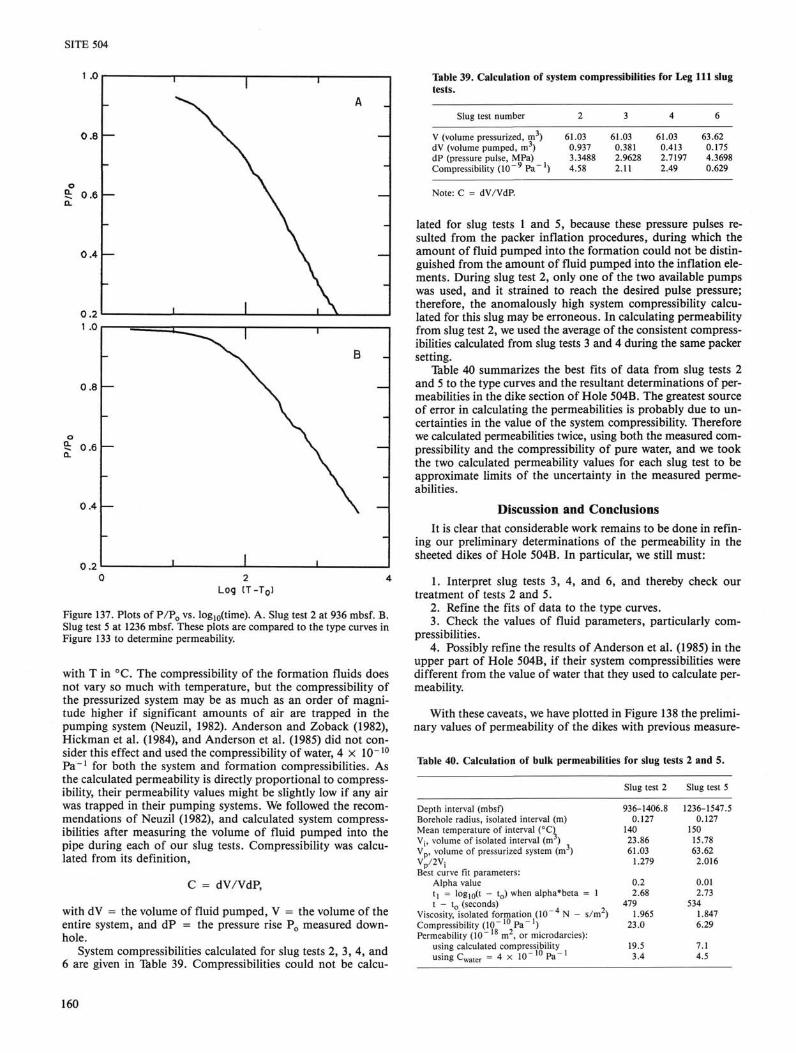
SITE 504
1 ,\J
0.8
© 9: 0.6 a
0.4
n ■?
1
— \ ^
—
—
_ j
1 ' A
1 , \
-
—
-
—
H -
0.2
Log [T-T 0J
Figure 137. Plots of P/P0 vs. log10(time). A. Slug test 2 at 936 mbsf. B. Slug test 5 at 1236 mbsf. These plots are compared to the type curves in Figure 133 to determine permeability.
with T in °C. The compressibility of the formation fluids does not vary so much with temperature, but the compressibility of the pressurized system may be as much as an order of magnitude higher if significant amounts of air are trapped in the pumping system (Neuzil, 1982). Anderson and Zoback (1982), Hickman et al. (1984), and Anderson et al. (1985) did not consider this effect and used the compressibility of water, 4 x 10~10
P a - 1 for both the system and formation compressibilities. As the calculated permeability is directly proportional to compressibility, their permeability values might be slightly low if any air was trapped in their pumping systems. We followed the recommendations of Neuzil (1982), and calculated system compressibilities after measuring the volume of fluid pumped into the pipe during each of our slug tests. Compressibility was calculated from its definition,
C = dV/VdP,
with dV = the volume of fluid pumped, V = the volume of the entire system, and dP = the pressure rise P0 measured down-hole.
System compressibilities calculated for slug tests 2, 3, 4, and 6 are given in Table 39. Compressibilities could not be calcu-
1.03 0.937 3.3488 4.58
61.03 0.381 2.9628 2.11
61.03 0.413 2.7197 2.49
63.62 0.175 4.3698 0.629
Table 39. Calculation of system compressibilities for Leg 111 slug tests.
Slug test number 2 3 4 6
V (volume pressurized, m ) dV (volume pumped, m ) dP (pressure pulse, MPa) Compressibility ( 1 0 - 9 P a - *)
Note: C = dV/VdP.
lated for slug tests 1 and 5, because these pressure pulses resulted from the packer inflation procedures, during which the amount of fluid pumped into the formation could not be distinguished from the amount of fluid pumped into the inflation elements. During slug test 2, only one of the two available pumps was used, and it strained to reach the desired pulse pressure; therefore, the anomalously high system compressibility calculated for this slug may be erroneous. In calculating permeability from slug test 2, we used the average of the consistent compressibilities calculated from slug tests 3 and 4 during the same packer setting.
Table 40 summarizes the best fits of data from slug tests 2 and 5 to the type curves and the resultant determinations of permeabilities in the dike section of Hole 504B. The greatest source of error in calculating the permeabilities is probably due to uncertainties in the value of the system compressibility. Therefore we calculated permeabilities twice, using both the measured compressibility and the compressibility of pure water, and we took the two calculated permeability values for each slug test to be approximate limits of the uncertainty in the measured permeabilities.
Discussion and Conclusions It is clear that considerable work remains to be done in refin
ing our preliminary determinations of the permeability in the sheeted dikes of Hole 504B. In particular, we still must:
1. Interpret slug tests 3, 4, and 6, and thereby check our treatment of tests 2 and 5.
2. Refine the fits of data to the type curves. 3. Check the values of fluid parameters, particularly com
pressibilities. 4. Possibly refine the results of Anderson et al. (1985) in the
upper part of Hole 504B, if their system compressibilities were different from the value of water that they used to calculate permeability.
With these caveats, we have plotted in Figure 138 the prelimi
nary values of permeability of the dikes with previous measure-
Table 40. Calculation of bulk permeabilities for slug tests 2 and 5.
Slug test 2 Slug test 5
Depth interval (mbsf) Borehole radius, isolated interval (m) Mean temperature of interval (°C) V:, volume of isolated interval (m )
p i Vp, volume of pressurized system (m ) Vp/2V ; Best curve fit parameters:
Alpha value t] = log10(t - t0) when alpha*beta = 1 t - t0 (seconds)
Viscosity, isolated formation (10 ~ N - s/m ) Compressibility (10" 10 Pa" ') Permeability (10~ m , or microdarcies):
using calculated compressibility using Cw a t e r = 4 x 1 0 " 1 0 P a _ 1
936-1406.8 0.127
140 23.86 61.03
1.279
0.2 2.68
479 1.965
23.0
19.5 3.4
1236-1547.5 0.127
150 15.78 63.62
2.016
0.01 2.73
534 1.847 6.29
7.1 4.5
160

SITE 504
ments in Hole 504B. We draw several important conclusions from this plot:
The sheeted dikes in Hole 504B appear to be uniformly impermeable. In fact, the permeability of the dikes appears to be virtually the same as the deeper pillow lavas of Layer 2B, which apparently have been sealed by the precipitation of alteration products. Thus, the lowermost kilometer of dikes and pillow lavas penetrated by Hole 504B appear to be impermeable. Only the upper 100-200 m of pillow lavas appear to be open to circulation of pore fluids. We infer that the subdued hydrothermal circulation that has been invoked to explain the moderate-amplitude variation in surface heat flow around Site 504 may be confined to the shallow levels of basement.
The permeability within the lower pillow lavas and dikes does not appear to vary with porosity as determined from resistivity measurements or from other logs, despite the fact that apparent bulk porosities strongly decrease with depth from the pillow lavas into the dikes (Fig. 138). This observation apparently refutes speculation by Becker et al. (1983b) and Anderson et al. (1985) that it might be possible to estimate permeability using resistivity logging. This speculation was based primarily on the empirical relationship between permeabilities and porosities determined from resistivities in the part of Hole 504B to 1300 mbsf (Fig. 138); this relationship no longer appears to be valid.
Detailed interpretation of the Leg 111 Schlumberger logs ("Neutron Activation Logging" section, this chapter) sug-
Apparent bulk poros i ty (%) 0 4 8 12
I .
I ,
I
' I ' I
1 1 1
Sediment
Layer 2B
Layer 2C
1 0 - 2 0 1 0 - 1 8 1 0 - 1 6 1 0 - 1 4 Bulk permeabil i ty tm^)
Figure 138. Permeabilities (elongate vertical rectangles) and apparent bulk porosities vs. depth in Hole 504B, measured during Legs 69, 70, 83, and 111. The vertical extent of the rectangles represents the depth interval over which the average permeabilities were measured. The horizontal extent of the rectangles represents the range of estimated errors in the permeability determinations.
gests that there is a significant amount of relatively conductive alteration products in the breccias that partially seal the lower pillow lavas of layer 2B. If this is the case, then the real porosities in the lower pillow lavas would be lower than the apparent bulk porosities calculated directly from measured resistivities (Fig. 138), and the measured permeabilities would be more consistent with the real porosities.
The distribution of permeability with depth in Hole 504B contrasts significantly with permeabilities in Hole 395A, which is located in a sediment pond in unsealed 7-m.y.-old Atlantic crust. Hole 395A was drilled in 1975 and now extends to a depth of 606 mbsf, 494 m into basement. During Leg 78B, Hickman et al. (1984) measured an extremely low permeability in a massive unit in the deepest 25 m of the hole. In contrast, during Leg 109 Becker (in prep.) measured high permeabilities throughout the rest of the open hole section in Hole 395A. The impermeable unit of Hickman et al. (1984) is less permeable than the dikes in Hole 504B; the rest of the formation in Hole 395A is as permeable as the shallowest 100 m of basement in Hole 504B. Thus, most of the lava pile in Hole 3 95A appears to be quite permeable and open to extensive hydrothermal circulation, whereas most of the pillow lavas in Hole 504B are sealed and as impermeable to circulation as the underlying sheeted dikes.
DUAL LATEROLOG RESISTIVITY LOGGING
Introduction The Schlumberger dual laterolog tool (DLL) was run in Hole
504B in order to measure with optimum vertical definition the shallow and deep electrical resistivities of the rock surrounding the borehole. Total porosity and fracture porosity were evaluated from the measured resistivities using Archie's law (Archie, 1942).
The DLL log was recorded from the top of the basement to 1529 mbsf (Fig. 139). A Gearhart deep resistivity laterolog was recorded during Leg 70 down to 836 mbsf (Fig. 139) but did not allow fracture porosity evaluation from its single scale of measurement (Cann and Von Herzen, 1983). During Leg 83, a large-scale resistivity experiment yielded excellent resistivity data from which total porosity was extracted (Becker et al., 1982, Becker, 1985). Dual induction and shallow spherically-focused logs (DIL-SFL) were recorded as well and provided a shallow measurement of correct magnitude though poor accuracy at bed boundaries and high resistivity values.
Tool Description and Operations A schematic of the DLL sonde is given in Figure 140A, with
a sketch of the current flow within the formation. The principle of the tool is to measure the intensity of a variable current i0 flowing from a current electrode \ between the monitoring electrodes (Mu etc.) to a remote return. This intensity is proportional to the formation conductivity. Two symmetrical guard electrodes, A t and A ' lt emit focusing currents constraining the A0 current beam to flow perpendicularly out into the formation by establishing equipotential surfaces coaxial with the tool.
The deep current (LLd) is focused in a path about 0.6 m wide. It flows back to a surface electrode with its related focusing currents, which reduces the borehole effect (Fig. 140C). This also guarantees deep penetration of the current into the rock, like that achieved with the LSR tool. For the shallow measurement (LLs), the same current electrode A<, is used at a different frequency, with a similar vertical resolution of 0.6 m. Both measuring and focusing currents for the LLs return to electrodes located within the tool, which restricts the measurement to a shallower region. A comparison of different laterolog measurements in terms of the depths of investigation (Fig. HOB) shows that
161

SITE 504
Dri l l ing h i s to ry L i thos t ra t ig raphy 3474
200
400
600
8 0 0
1000
1 200
1400
1600
Casing
Leg 69 (10/79)
Open hole
489
Leg 70 (1 2/79)
836
Leg 83 (1 1/81 -1 /82 )
1350
Leg 111 (9/86)
1547.5
Sediment — 3600
274.5 3748 .5
Pillow lavas
— 3800
— 4000
— 4200 5
4320 -
Trans i t ion
4529 H
Sheeted dikes
5021 . 5 — 5000
Leg 70
83 83 1 1 1
— 4400 Focused
r e s i s t i v i t y
— 4600
— 4800
D IL -SFL LSR
Figure 139. Resistivity logs recorded in Hole 504B.
DLL
90% of the LLs measurement comes radially from the first 40 in. of the formation while this region contributes up to only 40% for the deep measurement (LLd), if conductive fluid is present in the borehole.
The main characteristics of this resistivity tool can be summarized as follows: measurement accuracy at high resistivities; differential measurement obtained from two different depths of investigation; and limited borehole effect, accounted for by correction charts (Fig. 140C).
On Leg 111, the DLL log was the second log to be recorded in Hole 504B during the second suite of downhole experiments. The tool calibrated perfectly just below the casing shoe, and a log was recorded while going down to the bottom of the hole from 3800 mbrf (326 mbsf). The lowermost measurement was obtained at 5003 mbrf (1529 mbsf)- An upgoing log was recorded up to 10 m below the casing shoe at a speed of 1600 m/ hr.
The log presented here covers depths from 5003 mbrf to 3758 mbrf (1529-284 mbsf) with a data point taken every 15 cm. The measurement in the uppermost few meters of basaltic basement was disregarded due to the focusing of the current lines into the casing when approaching it and the consequent shifting of the reference potential electrode. Due to the large water depth at Site 504, the current return electrode was clamped to the drill pipe on the rig floor instead of being laid down on the seafloor. The location of this electrode can therefore be considered as the bottom of the drill pipe instead of the seafloor.
Data Analysis Technique
The data analysis was performed in three steps. First, total and fracture porosities were evaluated. Second, the lithological units were differentiated based on porosity values and patterns of resistivity curves. Third, different zones in the first 1230 m of basaltic basement were described with possible implications regarding formation of the oceanic crust.
Total porosity evaluation Becker et al. (1982) showed that total porosity could be esti
mated in basaltic ocean crust using the empirical Archie's law (with a = 1 and m = 2) although this formula was developed for sedimentary rocks (Fig. 141). The same assumption was therefore made, as a first approximation, for this analysis, and total porosity (PHI(t)) was calculated as:
PHI(t)2 - R w / RLLd
where RLLd is the measured deep resistivity of the rock and Rw represents both borehole and pore fluid resistivity.
Since the salinity of the pore fluid can be considered constant with depth ("Borehole Water Chemistry" sections, this chapter), the simple law of conductivity variations with temperature defined by Von Herzen et al. (1983) was used:
Cw = 1 / Rw = 3 + (T / 10)
162
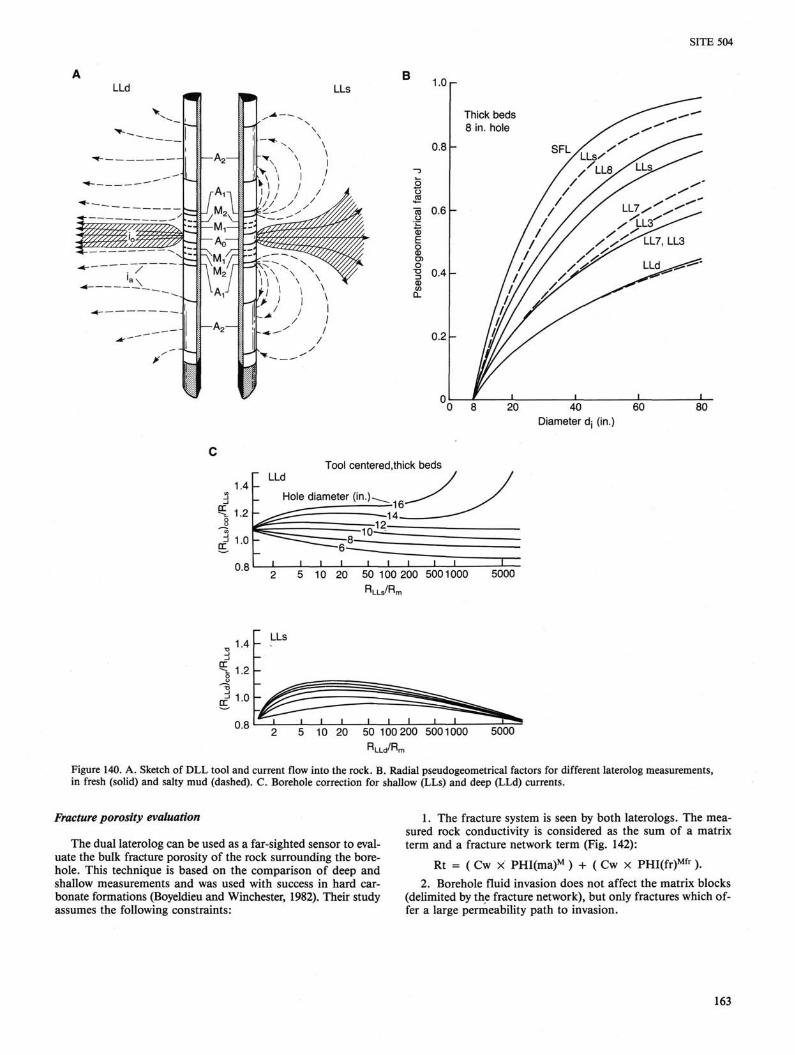
SITE 504
B LLd LLs 1.0 r
0.8 -
15 0.6 -
E o CD O) o "§ 0.4 CD CO
0.2
Thick beds 8 in. hole
SFL
/ / / / / / / / /
/ / / , / / / /
/ / / / / / / /
/ / / / /
v/s i / s s t// / / a// x
f i
^ " ■ " " " ' ^ - ^ • ~ " "
y ^ «*■* / y ^ -—■ '
s -"" ^"^ / s ^^ ^ LLs^ >^ ^ ^ /\l&/u?^
x X^ **' / / "^
'S L L 7 / < - ^ ; / / < L 3 ^ > ^
/ C ^ t L 7 , LL3 / t ' / JS , , , i j r LLd^ss**^
i i 20 40 60
Diameter dj (in.) 80
Tool centered,thick beds
2 5 10 20 50 100 200 5001000 5000 R|-Ls/Rm
1.4 -
V'2 o
£ 1.0 0,8
LLs
5 10 20 50 100 200 5001000 Rl_Lc/Rm
5000
Figure 140. A. Sketch of DLL tool and current flow into the rock. B. Radial pseudogeometrical factors for different laterolog measurements, in fresh (solid) and salty mud (dashed). C. Borehole correction for shallow (LLs) and deep (LLd) currents.
Fracture porosity evaluation
The dual laterolog can be used as a far-sighted sensor to evaluate the bulk fracture porosity of the rock surrounding the borehole. This technique is based on the comparison of deep and shallow measurements and was used with success in hard carbonate formations (Boyeldieu and Winchester, 1982). Their study assumes the following constraints:
1. The fracture system is seen by both laterologs. The measured rock conductivity is considered as the sum of a matrix term and a fracture network term (Fig. 142):
Rt = ( Cw x PHI(ma)M ) + ( Cw x PHI(fr)Mfr). 2. Borehole fluid invasion does not affect the matrix blocks
(delimited by the fracture network), but only fractures which offer a large permeability path to invasion.
163

SITE 504
200
4 0 0 —
6 0 0 —
Apparent bulk poros i ty (%)
4 8 12
CL 8 0 0 —
1000 —
1200 —
- 2 0
I 1 1
1
—
1
1
1
%m*
1 1 ' 1 ~r-T _
* L i •
J t \
" 1 ,-
i«<r—
-
• i i i i
Sediment
Layer 2A
—-"----—
Layer 2B
Layer 2C
- 1 8 - 1 6 - 1 4 L o g i o D U l l < : permeabil i ty (m2)
Figure 141. Variations of permeability (from packer measurements) and bulk porosity (from long-spacing resistivity data) recorded during Leg 83.
3. The invasion of the fracture network is restricted to LLs depth of investigation which ensures that LLd reaches the virgin zone.
4. The water saturation of the fracture network is assumed to be zero in the virgin zone but 100% close to the borehole.
These constraints allowed them to estimate a lower limit for fracture porosity expressed by:
PHI(fr) > ((CLLs - CLLd) / (Cmf - Cw)) 1/Mfr
where: CLLs and CLLd are laterolog-derived conductivities; Cmf and Cw are respectively mud filtrate and formation pore fluid conductivities; and Mfr is the apparent cementation factor (sometimes called tortuosity factor) of the fractured formation.
In the case of basaltic crust drilled with seawater, the salinities of the pore fluid and the borehole fluid are comparable enough so that any invasion effect can be ignored. The comparison of LLd and LLs data therefore informs us of:
1. The influence of an anisotropic distribution of the pore space in the rock as seen by the two measurements due to different depths of investigation.
2. The existence of fractures in the vicinity of the borehole due to stress relief caused by drilling.
3. The existence of a zone invaded with cold drilling fluid (sea water), minimized here since the drilling was underbalanced.
A vertical distribution of fractures would have a larger impact on the shallow measurement than on the deep (Serra, 1984). Fractures seen by LLd in series with matrix blocks affect the measurement very slightly; such fractures offer a preferential path for LLs current flow and substantially decrease the values
of the formation resistivity of the shallow measurement (Fig. 142). The Boyeldieu and Winchester equation can be rewritten in this case:
PHI(fr. vert.) > ((CLLs-CLLd) / Cw ) 1/Mfr
where Mfr is the "cementation factor" of the vertical fracture network. This computation defines only a lower limit for the vertical fracture porosity evaluation since the deep measurement is slightly affected by the vertical fracture network which increases CLLd and therefore decreases the value of the fracture porosity estimate.
Similarly, a horizontal distribution of fractures (Fig. 142) would influence the deep measurement more than the shallow one, although in this case both of them are affected significantly, which results again in an underestimation of horizontal fracture porosity with:
PHI(fr. horiz.) > ((CLLd-CLLs) / Cw ) 1/Mfr
Boyeldieu and Winchester (1982) and Serra (1984) mention values of Mfr ranging from 1.3 to 1.6 for fractured carbonate rocks. An average value of 1.45 was used here as a first approximation for Mfr, since no previous application of this method in fractured basaltic rock is known to exist. A better definition of Archie's law parameters vs. depth can be obtained from the comparison with core data and computation of formation factors for various types of fracturing, alteration, and porosity of basalts.
Lithostratigraphic Description from Resistivity Data The two borehole-corrected resistivity curves are presented
on a logarithmic scale (0.2-2000 fi • m) in the right-hand track of Plate 2 (back pocket). The total and fracture porosity curves are drawn on a linear scale (0<%-20% from right to left) in the left-hand track.
These four curves permit the differentiation of: (1) pillows and massive units; (2) small and large flows, and dikes; (3) fractured and competent zones; (4) large-scale layers of the basement; and (5) description of certain features such as glassy margins, or changes of parameters within the units themselves, such as grain size.
Typical examples of log signatures for well-defined lithologic units with good core recovery are studied here.
Figure 143 gives the example of three massive units all with chilled margins at the top (sharp resistivity decrease for both curves), and decreasing resistivities toward the center of each unit associated with increasing grain size centerward.
Figure 143A represents Unit 2D described as two "sparsely to moderately phyric basalt flows" (Cann, Langseth, Honnorez, Von Herzen, White, et al., 1983). Differences in laterolog resistivity readings suggest the presence of vertical fractures (shaded black) associated with cooling joints on both sides of the unit and horizontal ones in the middle. The maximum value of horizontal fracture porosity is found at the boundary between the two flows, located at 3790 m (316 mbsf). The grain size coarsens, then thins below that depth, which gives the flow at the base of the unit a fairly symmetrical aspect. A gradual return to typical pillow lava resistivity values indicates the presence of a rubbly surface at its base. It should be noted that the lowest resistivity data within the bottom flow (supposedly representing larger grain size) is slightly shifted from the center toward its top. This is due to the presence of a second flow on top of the first one, which has cooled more rapidly at its base than at its top, therefore shifting upward the depth where coarser grain size can be found (the second flow can be viewed as a thermal blanket on top of the first one). Highly fractured and brecciated
164

SITE 504
Rma A V W W
C — Cmatriv + C matrix T "-"fracture Rfr
Figure 142. A. Resistivity model for matrix and fractures seen by a laterolog. C = conductivity; Rma = matrix resistivity; Rfr = fracture resistivity. B. Vertical fracture network. C. Horizontal fracture network.
rocks described at the top of Unit 3A have a high fracture porosity with a maximum value of 5% at 3799 m (325 mbsf).
Figure 143B represents Unit 27, described as a "massive flow with grain size changes from fine (at the top and bottom) to medium and coarse toward the center". According to this description, only the top of the unit (4048-4054 m or 574-580 mbsf) may have been recovered during drilling. Intense fracturing above it indicates this is a sill, emplaced on top of a short layer of pillows at 4055 m (581 mbsf)- The massive flow located below is characterized by a very rubbly transition to the underlying highly fractured Unit 28. This flow and the short pillow sequence appear then to be missing in the lithostratigraphic sequence obtained from cores. Massive flow breccias on each side of Unit 27 show a fracture porosity as high as 3% and a matrix porosity of about 8%. A glassy margin is observed at the top of Unit 27.
Figure 143C represents Unit 34, described as "massive, coarsegrained, ophitic basalt with a glassy margin at the top". It gives a very symmetrical, resistivity pattern 10 m thick, with increasing grain size toward the middle of the unit, and very sharp, similar edges probably reflecting comparable physical conditions on each side of the unit at the time of cooling. The slight shift to the bottom of the unit of the point of lower resistivity may reflect a thermal conductivity contrast between upper and lower surfaces of the unit, in this case probably of a lava pond, at the time of its cooling.
Figure 144 gives examples of resistivity patterns in the pillows, flows, and dikes of Layer 2B. Figure 144A shows a sequence of thin alternating phyric and aphyric units, starting with Unit 10. The resistivity decreases in this sequence with in
creasing content of phenocrysts. The vertical, very symmetrical sequence observed from 3900 m to 3908 m (426-434 mbsf) reflects a succession of horizontal features, possibly three small sills of different phenocryst content, each intruded in the center of the previous one. A positive correlation is therefore observed between matrix porosity (total minus fracture porosity) and content of phenocrysts (Adamson, 1985) (i.e. the more phenocrysts, the higher the matrix porosity), as opposed to an inverse correlation between fracture porosity and resistivity data.
Figure 144B shows thin flows and pillows of Layer 2B. The three flows, described as Units 41, 43, and 44 on the lithostratigraphic record, have average resistivity values of 40 Q-m, whereas surrounding pillows average about 10 Q-m. The thin flows of Units 41, 43, and 44 show as well a grain size increase centerward. Unit 45 shows a typical resistivity profile across a pillow unit, often more variable than those observed in massive ones, with sudden decreases of both curves generally correctable with the presence of glassy margins. Fracture porosity is here generally high in the pillows and low in the flows or dikes.
Figure 144C shows a sequence of dikes located at the bottom of the transition zone. As beds become smaller than about 1 m, the dual laterolog tool tends to smooth out their edges. This effect gives a wavy pattern for rapid, successive changes, as observed in the middle of Unit 112.
Figure 145 shows a sequence of dikes from Layer 2C of very constant thicknesses (about 3.5 m). The dikes can be differentiated due to resistivity baseline shifts from one unit to another. The large differences between deep and shallow resistivities can be explained by the existence of a subvertical preferential path
165
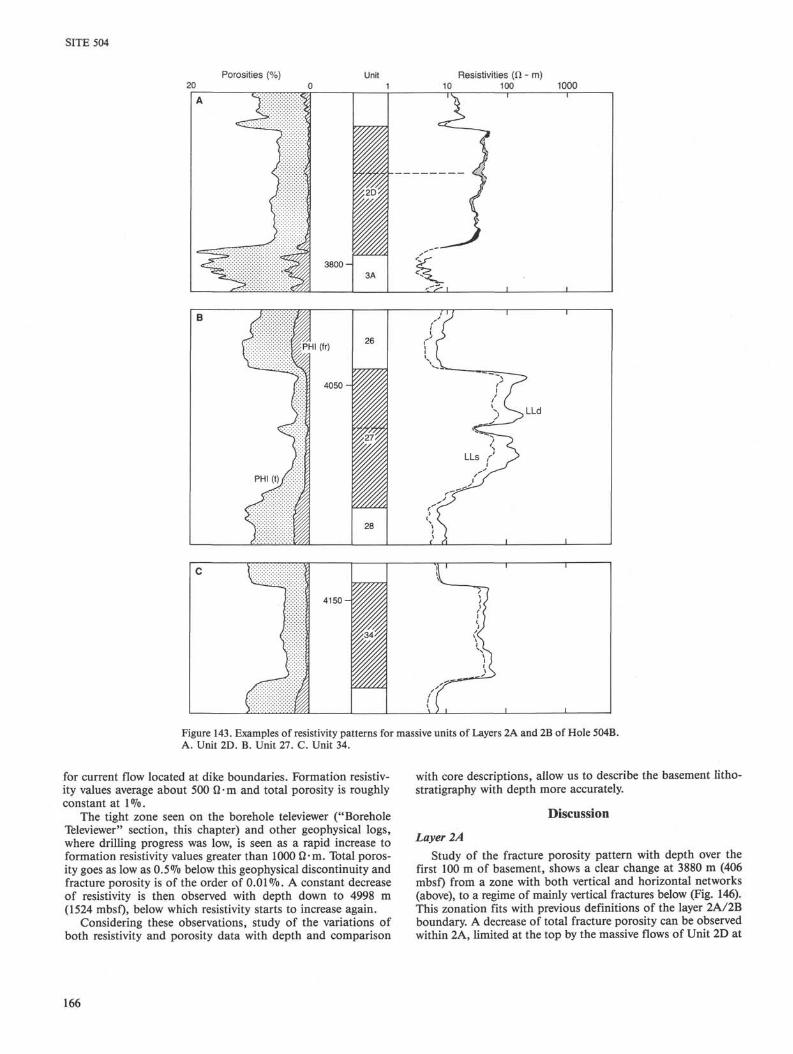
SITE 504
20 Porosities (%) Unit Resistivities (11 - m)
10 100 1000 — i —
3800-
PHI (fr)
4050
26
28
LLd
4 1 5 0 -
Figure 143. Examples of resistivity patterns for massive units of Layers 2A and 2B of Hole 504B. A. Unit 2D. B. Unit 27. C. Unit 34.
for current flow located at dike boundaries. Formation resistivity values average about 500 fi-m and total porosity is roughly constant at 1%.
The tight zone seen on the borehole televiewer ("Borehole Televiewer" section, this chapter) and other geophysical logs, where drilling progress was low, is seen as a rapid increase to formation resistivity values greater than 1000 0-m. Total porosity goes as low as 0.5% below this geophysical discontinuity and fracture porosity is of the order of 0.01%. A constant decrease of resistivity is then observed with depth down to 4998 m (1524 rnbsf). below which resistivity starts to increase again.
Considering these observations, study of the variations of both resistivity and porosity data with depth and comparison
with core descriptions, allow us to describe the basement litho-stratigraphy with depth more accurately.
Discussion
Layer 2A Study of the fracture porosity pattern with depth over the
first 100 m of basement, shows a clear change at 3880 m (406 mbsf) from a zone with both vertical and horizontal networks (above), to a regime of mainly vertical fractures below (Fig. 146). This zonation fits with previous definitions of the layer 2A/2B boundary. A decrease of total fracture porosity can be observed within 2A, limited at the top by the massive flows of Unit 2D at
166
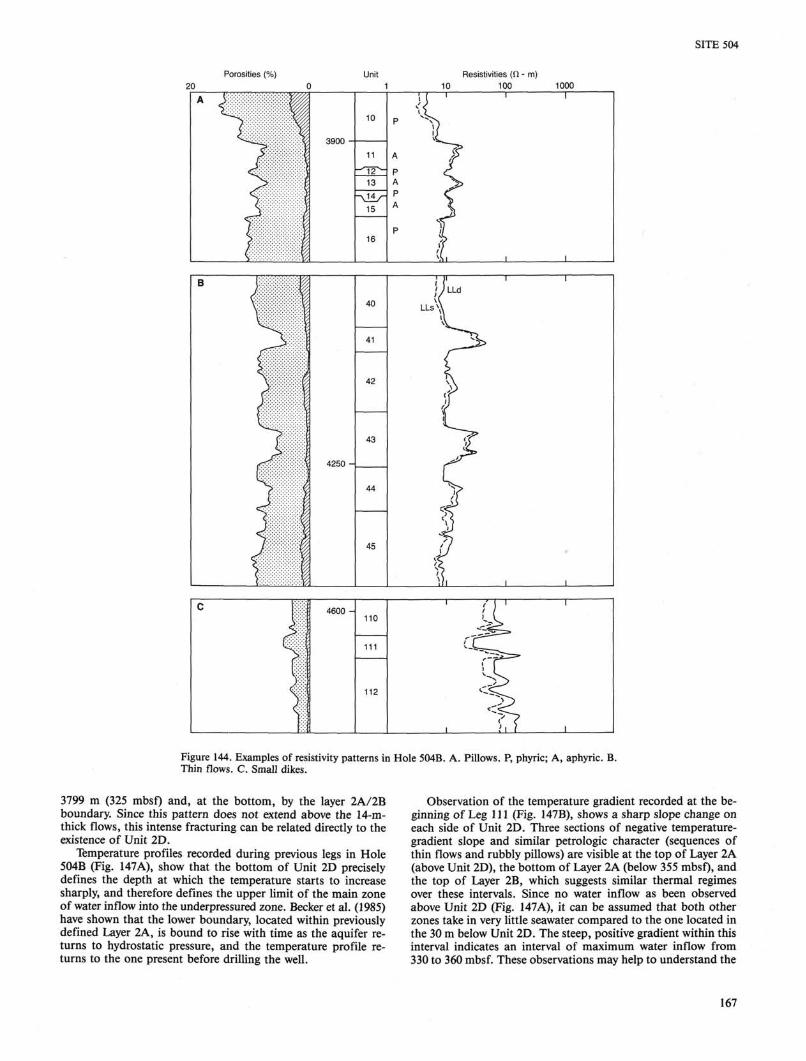
SITE 504
Porosities (%) Unit 20
Resistivities (ft - m) 100 1000
3900
10
13
16
4250
40
41
42
43
45
! JLLd
LLsM
1 . . . . c r;
t^::::
1 4600 -
110
111
112
I / I I I
r~ I )\1 I
Figure 144. Examples of resistivity patterns in Hole 504B. A. Pillows. P, phyric; A, aphyric. B. Thin flows. C. Small dikes.
3799 m (325 mbsf) and, at the bottom, by the layer 2A/2B boundary. Since this pattern does not extend above the 14-m-thick flows, this intense fracturing can be related directly to the existence of Unit 2D.
Temperature profiles recorded during previous legs in Hole 504B (Fig. 147A), show that the bottom of Unit 2D precisely defines the depth at which the temperature starts to increase sharply, and therefore defines the upper limit of the main zone of water inflow into the underpressured zone. Becker et al. (1985) have shown that the lower boundary, located within previously defined Layer 2A, is bound to rise with time as the aquifer returns to hydrostatic pressure, and the temperature profile returns to the one present before drilling the well.
Observation of the temperature gradient recorded at the beginning of Leg 111 (Fig. 147B), shows a sharp slope change on each side of Unit 2D. Three sections of negative temperature-gradient slope and similar petrologic character (sequences of thin flows and rubbly pillows) are visible at the top of Layer 2A (above Unit 2D), the bottom of Layer 2A (below 355 mbsf), and the top of Layer 2B, which suggests similar thermal regimes over these intervals. Since no water inflow as been observed above Unit 2D (Fig. 147A), it can be assumed that both other zones take in very little seawater compared to the one located in the 30 m below Unit 2D. The steep, positive gradient within this interval indicates an interval of maximum water inflow from 330 to 360 mbsf. These observations may help to understand the
167

SITE 504
Porosities (%) 20 0
Unit 10
Resistivities (fi 100 1000
<
:
>
<
:
:
4950 -
!
:
5000-
176
177
178
179
180
181
182
183
184
185
186
187
,
I V I )
•> > i 1 ) ) f ( ) ) \ 1 \ V
\ \ i f
) \ ! {
I > > < r ( \ I I
) ) I K \
\ \ \ X > \ f - < —
\ \ ) S
I , \ >
Figure 145. Examples of resistivity patterns for dikes of Layer 2C in Hole 504B.
mismatch of the Leg 83 temperatures to a flow-rate estimate predicted by a 100-m-thick, laterally infinite reservoir model. These remarks agree with the interpretation by Becker et al. (1983) who modeled the inflow into a thin reservoir located at the same depth, although they did not relate it to Unit 2D.
This suggests that the underpressured aquifer, or the conditions allowing it to develop, were initially emplaced at the ridge axis and are not related to the appearance of chert, about a million years ago. Different models can be thought of to develop the underpressure below the massive unit such as:
1. A static one where the increasing water depth, as the crust cools and subsides with age, increases the overburden pressure,
locally poorly transmitted downward through the massive unit due to its very low permeability; or
2. A dynamic one where hydrothermal circulation already present is capped by the low-permeability extrusion, and acts as a pump with time to create the aquifer.
However, nothing at this stage allows us to determine whether the cause is static, dynamic, or a combination of both processes.
Similar borehole inflow situations have been encountered in other holes, although never studied as extensively as Hole 504B. About a kilometer from Hole 504B, Hole 501 penetrated 73 m into basaltic basement during Leg 68 (Figure 147C), going
168
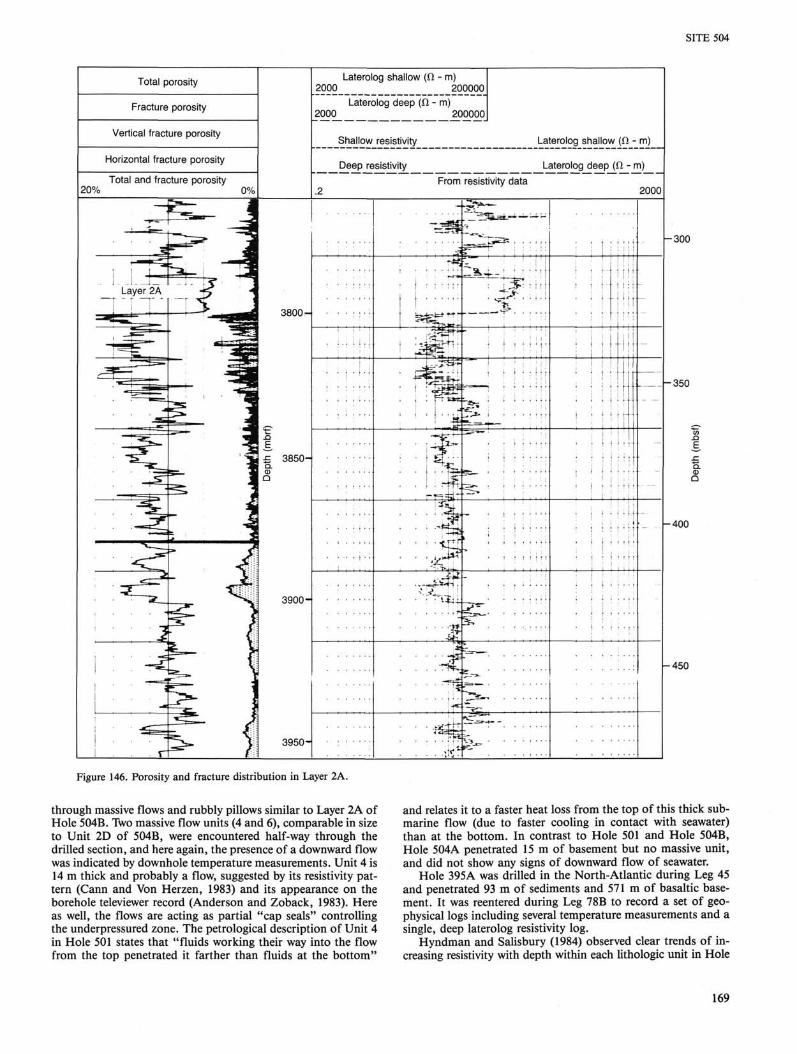
SITE 504
■300
- 3 5 0
- 4 0 0
- 4 5 0
Figure 146. Porosity and fracture distribution in Layer 2A.
through massive flows and rubbly pillows similar to Layer 2A of Hole 504B. Two massive flow units (4 and 6), comparable in size to Unit 2D of 504B, were encountered half-way through the drilled section, and here again, the presence of a downward flow was indicated by downhole temperature measurements. Unit 4 is 14 m thick and probably a flow, suggested by its resistivity pattern (Cann and Von Herzen, 1983) and its appearance on the borehole televiewer record (Anderson and Zoback, 1983). Here as well, the flows are acting as partial "cap seals" controlling the underpressured zone. The petrological description of Unit 4 in Hole 501 states that "fluids working their way into the flow from the top penetrated it farther than fluids at the bottom"
and relates it to a faster heat loss from the top of this thick submarine flow (due to faster cooling in contact with seawater) than at the bottom. In contrast to Hole 501 and Hole 504B, Hole 504A penetrated 15 m of basement but no massive unit, and did not show any signs of downward flow of seawater.
Hole 395A was drilled in the North-Atlantic during Leg 45 and penetrated 93 m of sediments and 571 m of basaltic basement. It was reentered during Leg 78B to record a set of geophysical logs including several temperature measurements and a single, deep laterolog resistivity log.
Hyndman and Salisbury (1984) observed clear trends of increasing resistivity with depth within each lithologic unit in Hole
169
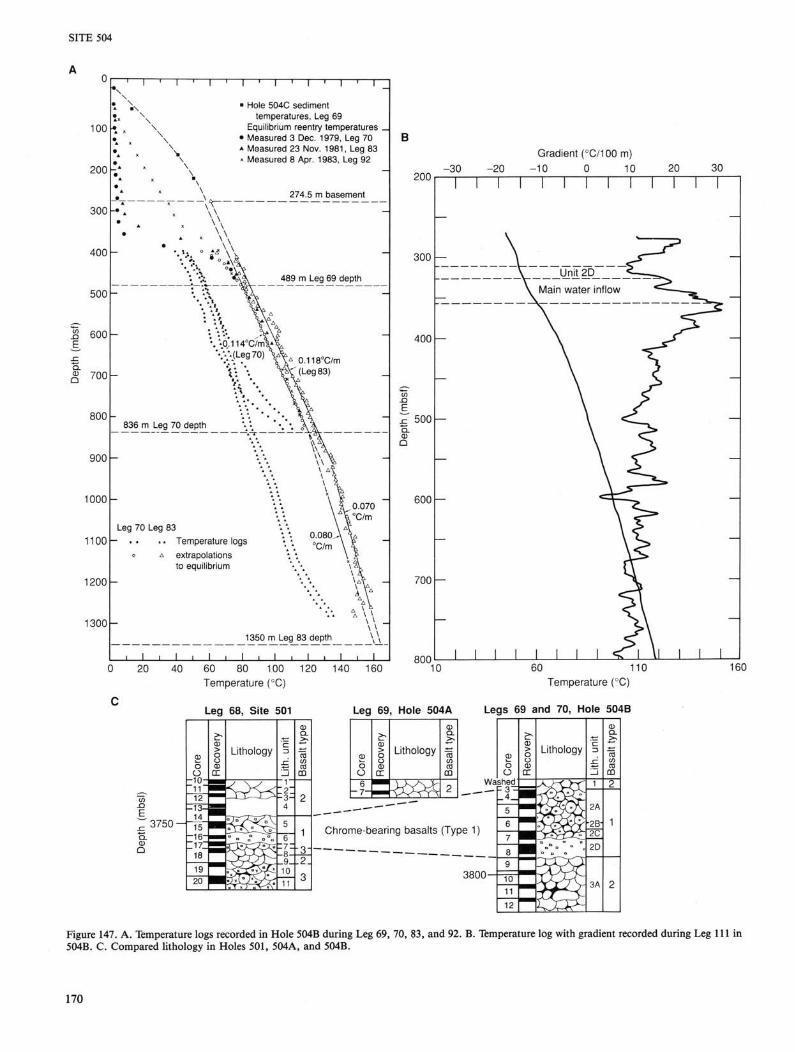
SITE 504
100 *
200 -
300 -
400-
500-
600
% 700-
800-
900-
1000-
1100-
1200-
1300-
■ Hole 504C sediment temperatures, Leg 69
Equilibrium reentry temperatures * Measured 3 Dec. 1979, Leg 70 * Measured 23 Nov. 1981, Leg 83 * Measured 8 Apr. 1983, Leg 92 Gradient (°C/100 m)
-10 0 10 20 30
0 20 40 60 80 100 120 140 160 Temperature (°C)
10 60 111 Temperature (°C)
160
Leg 68, Site 501 Leg 69, Hole 504A Legs 69 and 70, Hole 504B
3750 —
CD O CJ 6
- 7 -
>* > o O <» DC
Lithology
W^
Cl)
typ
alt
CO m
CD
2
Chrome-bearing basalts (Type 1)
3800
Figure 147. A. Temperature logs recorded in Hole 504B during Leg 69, 70, 83, and 92. B. Temperature log with gradient recorded during Leg 111 in 504B. C. Compared lithology in Holes 501, 504A, and 504B.
170

SITE 504
395A, reflecting decreasing porosity and interpreted as magma cycles. In this model, each unit represents an eruptive cycle, commencing at the bottom with massive, high-resistivity flows and pillows then gradually trending to more flow breccia toward the top, with low resistivity and high porosity, representing the last phase of an eruptive cycle.
Each of these units is truncated at its top by an abrupt change in physical properties. On Figure 148, successive decreasing trends have been emphasized by dashed lines on the resistivity record, and every resistivity value in excess of 30 Q-m, located at the base of these sequences, has been shaded black and plotted on the temperature log. It is interesting to notice that the downward flow observed on the different temperature logs recorded during Leg 78B appears to be injected below the base of resistive, massive units referred as to 3A and 4A on Figure 148. This could indicate the presence of several aquifers in Hole 395A, located at the top of each sequence of decreasing resistivity. The perturbation caused by drilling through them would thus create a water inflow from the bottom of the ocean tending to bring all these underpressured zones back to hydro
static pressure in sequence, starting with the shallower one and working down with time. Since the temperature logs of Figure 148 were recorded 5 yr after the well was drilled, an aquifer may have been present at the top of the zone referred as to 2A and brought back to hydrostatic pressure by seawater inflow during this time.
The example of Hole 395A confirms the observations made in Hole 504B, where, to date, a single thick zone of inflow has been observed. It is possible to relate the existence of underpressured zones to massive, resistive units that act as caprocks.
The total porosity is always lower than 16% in Layer 2A of Hole 504B. The variations can be related to the nearby presence of thin flows and to associated increases in fracture porosity. The matrix porosity averages about 11% in the pillows, down to 3880 m (406 mbsf).
Layer 2B As mentioned in the previous discussion, the technique used
here distinguishes mainly vertical fracturing from the top of Layer 2B (3880 m) to the bottom of the hole. Sharp decreases of
4 7 0 0 -
4 8 0 0 -
4900-
5000 —
5100-
5140
mTTT] 1 I I Mi l l
I i i m i l l I i i i n n
0
100
200
Seafloor
1A
2A
\ \ \ \ \ \ \ \ \ \
\ , \ \ \ \ 1 \ 1 \ | \
1B \ | \ \ \ \ ■■2B I 3A K \ |
BUB 300 ■ ■ i \ t i
NX V \ i 4A T j T \ \ '
K^4B 400 ■ ■PTv
500
600
5A \ \
5B
Sediment Basement
-
i i i i i i i i i i i i i i i
100 1000 Resistivity (£>m)
1
4600
- 4700
4800 ■="
4900
- 5000
5100
10 15 Temperature (°C)
20 Lithology
Figure 148. Lithology from core description, resistivity, and temperature logs recorded in Hole 395A during Leg 78A.
171
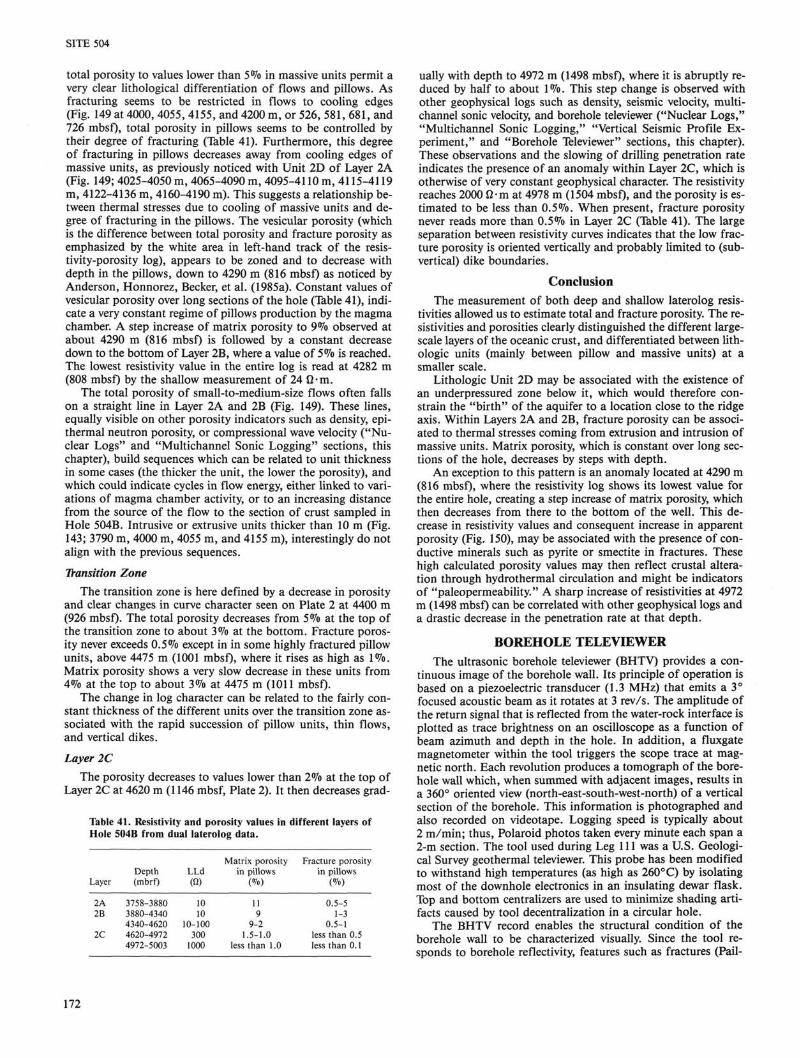
SITE 504
total porosity to values lower than 5% in massive units permit a very clear lithological differentiation of flows and pillows. As fracturing seems to be restricted in flows to cooling edges (Fig. 149 at 4000, 4055, 4155, and 4200 m, or 526, 581, 681, and 726 mbsf), total porosity in pillows seems to be controlled by their degree of fracturing (Table 41). Furthermore, this degree of fracturing in pillows decreases away from cooling edges of massive units, as previously noticed with Unit 2D of Layer 2A (Fig. 149; 4025-4050 m, 4065-4090 m, 4095-4110 m, 4115-4119 m, 4122-4136 m, 4160-4190 m). This suggests a relationship between thermal stresses due to cooling of massive units and degree of fracturing in the pillows. The vesicular porosity (which is the difference between total porosity and fracture porosity as emphasized by the white area in left-hand track of the resistivity-porosity log), appears to be zoned and to decrease with depth in the pillows, down to 4290 m (816 mbsf) as noticed by Anderson, Honnorez, Becker, et al. (1985a). Constant values of vesicular porosity over long sections of the hole (Table 41), indicate a very constant regime of pillows production by the magma chamber. A step increase of matrix porosity to 9% observed at about 4290 m (816 mbsf) is followed by a constant decrease down to the bottom of Layer 2B, where a value of 5% is reached. The lowest resistivity value in the entire log is read at 4282 m (808 mbsf) by the shallow measurement of 24 Q-m.
The total porosity of small-to-medium-size flows often falls on a straight line in Layer 2A and 2B (Fig. 149). These lines, equally visible on other porosity indicators such as density, epi-thermal neutron porosity, or compressional wave velocity ("Nuclear Logs" and "Multichannel Sonic Logging" sections, this chapter), build sequences which can be related to unit thickness in some cases (the thicker the unit, the lower the porosity), and which could indicate cycles in flow energy, either linked to variations of magma chamber activity, or to an increasing distance from the source of the flow to the section of crust sampled in Hole 504B. Intrusive or extrusive units thicker than 10 m (Fig. 143; 3790 m, 4000 m, 4055 m, and 4155 m), interestingly do not align with the previous sequences.
Transition Zone The transition zone is here defined by a decrease in porosity
and clear changes in curve character seen on Plate 2 at 4400 m (926 mbsf)- The total porosity decreases from 5% at the top of the transition zone to about 3% at the bottom. Fracture porosity never exceeds 0.5% except in in some highly fractured pillow units, above 4475 m (1001 mbsf), where it rises as high as 1%. Matrix porosity shows a very slow decrease in these units from 4"/o at the top to about 3% at 4475 m (1011 mbsf).
The change in log character can be related to the fairly constant thickness of the different units over the transition zone associated with the rapid succession of pillow units, thin flows, and vertical dikes.
Layer 2C The porosity decreases to values lower than 2% at the top of
Layer 2C at 4620 m (1146 mbsf, Plate 2). It then decreases grad-
Table 41. Resistivity and porosity values in different layers of Hole 504B from dual laterolog data.
Layer
2A 2B
2C
Depth (mbrf)
3758-3880 3880-4340 4340-4620 4620-4972 4972-5003
LLd (0)
10 10
10-100 300
1000
Matrix porosity in pillows
(%) 11 9
9-2 1.5-1.0
less than 1.0
Fracture porosity in pillows
(%) 0.5-5
1-3 0.5-1
less than 0.5 less than 0.1
ually with depth to 4972 m (1498 mbsf), where it is abruptly reduced by half to about 1 %. This step change is observed with other geophysical logs such as density, seismic velocity, multichannel sonic velocity, and borehole televiewer ("Nuclear Logs," "Multichannel Sonic Logging," "Vertical Seismic Profile Experiment," and "Borehole Televiewer" sections, this chapter). These observations and the slowing of drilling penetration rate indicates the presence of an anomaly within Layer 2C, which is otherwise of very constant geophysical character. The resistivity reaches 2000 Q-m at 4978 m (1504 mbsf). and the porosity is estimated to be less than 0.5%. When present, fracture porosity never reads more than 0.5% in Layer 2C (Table 41). The large separation between resistivity curves indicates that the low fracture porosity is oriented vertically and probably limited to (sub-vertical) dike boundaries.
Conclusion The measurement of both deep and shallow laterolog resis
tivities allowed us to estimate total and fracture porosity. The resistivities and porosities clearly distinguished the different large-scale layers of the oceanic crust, and differentiated between lith-ologic units (mainly between pillow and massive units) at a smaller scale.
Lithologic Unit 2D may be associated with the existence of an underpressured zone below it, which would therefore constrain the "birth" of the aquifer to a location close to the ridge axis. Within Layers 2A and 2B, fracture porosity can be associated to thermal stresses coming from extrusion and intrusion of massive units. Matrix porosity, which is constant over long sections of the hole, decreases by steps with depth.
An exception to this pattern is an anomaly located at 4290 m (816 mbsf), where the resistivity log shows its lowest value for the entire hole, creating a step increase of matrix porosity, which then decreases from there to the bottom of the well. This decrease in resistivity values and consequent increase in apparent porosity (Fig. 150), may be associated with the presence of conductive minerals such as pyrite or smectite in fractures. These high calculated porosity values may then reflect crustal alteration through hydrothermal circulation and might be indicators of "paleopermeability." A sharp increase of resistivities at 4972 m (1498 mbsf) can be correlated with other geophysical logs and a drastic decrease in the penetration rate at that depth.
BOREHOLE TELEVIEWER The ultrasonic borehole televiewer (BHTV) provides a con
tinuous image of the borehole wall. Its principle of operation is based on a piezoelectric transducer (1.3 MHz) that emits a 3° focused acoustic beam as it rotates at 3 rev/s. The amplitude of the return signal that is reflected from the water-rock interface is plotted as trace brightness on an oscilloscope as a function of beam azimuth and depth in the hole. In addition, a fluxgate magnetometer within the tool triggers the scope trace at magnetic north. Each revolution produces a tomograph of the borehole wall which, when summed with adjacent images, results in a 360° oriented view (north-east-south-west-north) of a vertical section of the borehole. This information is photographed and also recorded on videotape. Logging speed is typically about 2 m/min; thus, Polaroid photos taken every minute each span a 2-m section. The tool used during Leg 111 was a U.S. Geological Survey geothermal televiewer. This probe has been modified to withstand high temperatures (as high as 260 °C) by isolating most of the downhole electronics in an insulating dewar flask. Top and bottom centralizers are used to minimize shading artifacts caused by tool decentralization in a circular hole.
The BHTV record enables the structural condition of the borehole wall to be characterized visually. Since the tool responds to borehole reflectivity, features such as fractures (Pail-
172
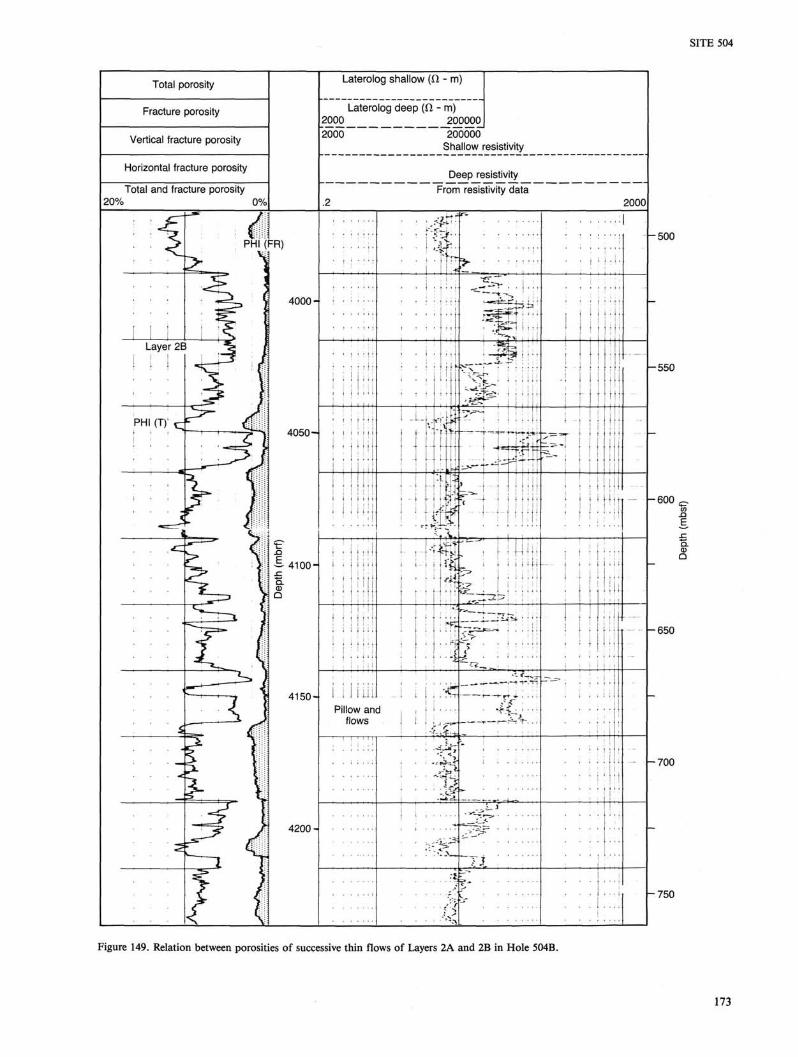
SITE 504
Total porosity
Fracture porosity
Vertical fracture porosity
Horizontal fracture porosity
Total and fracture porosity 20% 0%
Laterolog shallow (ft - m)
Laterolog deep (O - m)
2000 200000 Shallow resistivity
Deep resistivity From resistivity data
2000
4
PHI (FR)
4000-
- i—i i i I ' i
4050-! ! I ! '' i i i I i t i ; l i i ;
tttt if
I M t I M I i i \\l\
4100-
l i .
4150-Pillow and
flows
4200-
■B'I u
t f f f h
\ f
I t V f t *
''Mr-
I \
lilt
^
If
I S * . —
II
i^k
■ * &
Win
—-4—^ M . + J + _ . ( . _ ^ ^ . | i , , | l (
fHSte ±^t ^+*-rt-r
44+14 -t- i i t h t 4 i t U 4 i
t !- I H i I i 1 i i i i-l-l
•XT 3T 1 i-r+ +
I T "
^
I I
-500
■550
* • : ; i i I i i t i
j ! I t
-600
-650
-700
750
Figure 149. Relation between porosities of successive thin flows of Layers 2A and 2B in Hole 504B.
173
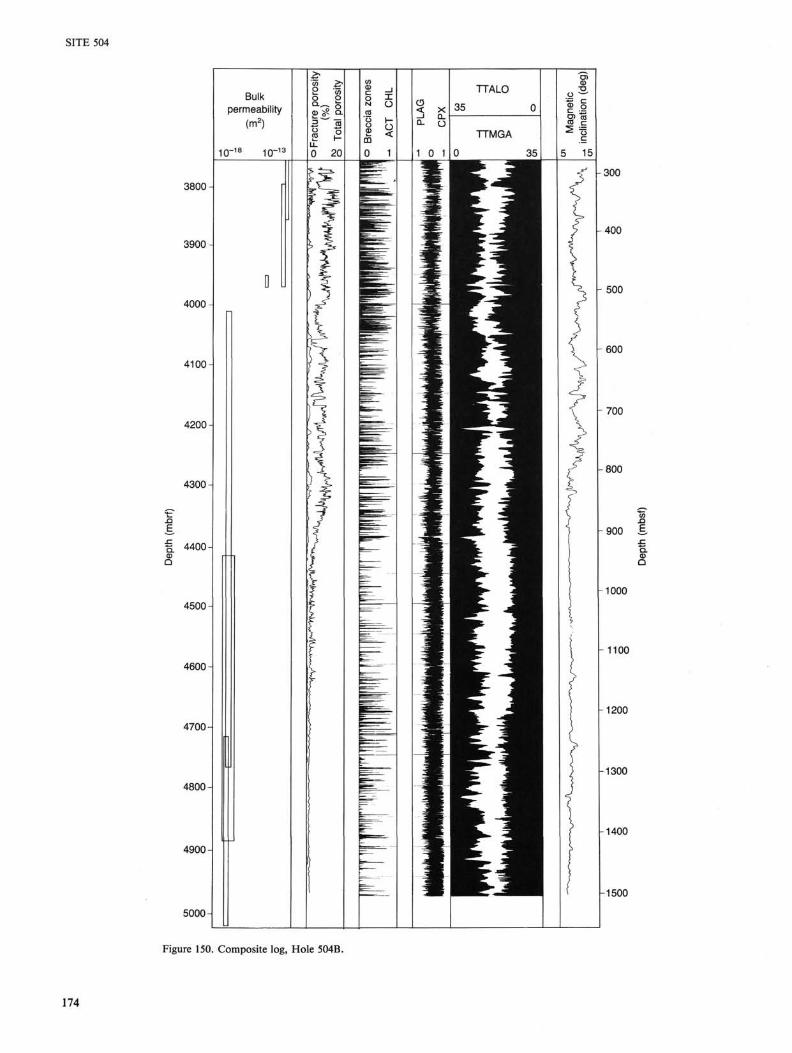
SITE 504
3800-
3900
4000
4100
4200
4300
K 4400-
4500
4600
4700
4800
4900-
5000
300
400
500
600
-700
800
900
1000
1100
1200
1300
1400
1500
t
174
Figure 150. Composite log, Hole 504B.

SITE 504
let, 1985), lithologic sequences (Paillet et al., 1985), bedding planes, breakouts (Zoback et al., 1985), and localized spalling can be identified. Examination of the BHTV log in the context of other standard geophysical logs (see "Dual Lateralog Resistivity Logging" and "Multichannel Sonic Log" sections, this chapter) can also yield information regarding possible correlations among borehole reflectivity and such properties as bulk density, total porosity, fracture porosity, acoustic velocity and attenuation, and natural gamma activity. The photographic record of the BHTV log obtained during Leg 111 at Hole 504B is presented in Figure 151. The log spans the interval from 5005 to 4650 m below the rig floor (1531-1176 mbsf), extending upward from the newly drilled section to a 100-m overlap (4750-4650 m) with the televiewer log previously obtained during DSDP Leg 83 (Newmark et al., 1984) to what was then approaching total depth.
The lower section of this hole encompasses a sheeted dike layer which exhibits very low porosities and a fairly competent, dense rock matrix. Much of the descriptive signature in the BHTV log is related to structural characteristics such as spalling and breakouts, rather than lithologic variations and contacts. Thus, information regarding the deep regional stress field at Hole 504B is obtainable through a systematic analysis of the BHTV data stored on videotape. Georgi (1985) and Lysne (1986) have presented algorithms whereby these data can be processed in terms of radial acoustic traveltimes to yield a continuous, 360° caliper log of the borehole. The geometric shape in cross section can be evaluated to determine the orientation of the horizontal principal stresses in situ as a function of depth (Plumb and Hickman, 1985).
SUMMARY A N D CONCLUSIONS: CORING A N D LOGGING THE SHEETED DIKES IN HOLE 504B
Leg 111 spent 42.9 days at Hole 504B, including nearly 29 days for coring operations and slightly more than 14 days for logging and experiments. Leg 111 deepened Hole 504B by 212.3 m, to a total depth of 1562.3 mbsf or 1287.8 m into basement (Fig. 152). Coring was very difficult in the sheeted dikes that were encountered, and a total of 26.42 m of core was recovered, for an overall recovery of 12.6% (Table 3). Hole 504B claimed parts of three coring assemblies and two logging tools, and much of the leg was spent in attempts to fish and mill junk from the bottom of the hole.
Although the coring results were disappointing, the logging and experiments were quite successful, and provided much of the continuous detail necessary to interpret the little core that was recovered. Logging had been scheduled in two phases, the first at the beginning of the leg before any coring, and the second at the end of the leg, after the hole had been cored as deep as possible. However, coring operations were suspended earlier than scheduled, when the second of two consecutive steel rotary bits disintegrated. The second set of logs and experiments was run when the hole had been advanced only 197.5 m beyond its depth at the beginning of the leg.
The scientific results of Leg 111 operations in Hole 504B are summarized below, in nearly chronological order, with these three exceptions:
1. The permeability measurements made during pauses in coring are discussed with the temperatures measured at the beginning of the leg.
2. The logs run at the beginning of the leg are discussed with the logs run toward the end.
3. The results of the two cores recovered after the second phase of logging are discussed with the major part of the coring.
Temperature and Permeability Measurements
Before Leg 111 began coring, undisturbed borehole temperatures were continuously logged from seafloor to 1298 mbsf and back up to seafloor. The highest measured temperature was 148.6°C at 1298 mbsf, indicating a temperature of about 152°C at 1350 mbsf, then the total depth of the hole. This was about 10°C less than had been predicted from temperatures measured on earlier legs (Fig. 4; Becker et al., 1983a). The measured gradient extrapolates to an estimated crustal temperature of 165° C at the total depth of 1562.3 mbsf reached by subsequent Leg 111 coring.
Deep in the hole, the temperature gradient is basically linear, but it decreases from 116°C/km in the pillow lavas to 61°C/km in the dikes (Fig. 153). Short-wavelength variations in the thermal gradient correlate with the lithology, indicating that conductive heat transfer predominates. The change in gradient between pillow lavas and dikes suggests a puzzling reduction in heat flow, which is discussed below.
Slightly depressed temperatures in the upper 400 m indicate that ocean bottom water still flows down the casing into the upper 100-200 m of basement. The rate of downhole flow was estimated to be 1.1 m/hr or about 80 L/hr, about 1% of the rate when the hole was first drilled, almost 7 yr earlier during Leg 69 (Fig. 154).
The bulk permeability of the sheeted dikes was measured twice after setting a drill-string packer, once at 936 mbsf when the hole was 1406.8 m deep, and a second time at 1236 mbsf when the hole was 1547.5 m deep. The permeability of the dikes was uniformly low, about 5-20 x 10"18 m2. Somewhat unexpectedly, the dikes proved to be as permeable as the relatively impermeable, partially-sealed pillow lavas of Layer 2B. Thus the lower kilometer of the hole, comprising sealed pillow lavas and sheeted dikes, is uniformly impermeable. The only permeable section of basement in Hole 504B is the upper 100-200 m, which is about three orders of magnitude more permeable than the lower kilometer, and is the zone into which the downhole flow of ocean bottom water is directed (Fig. 155).
Discussion: the Apparent Reduction in Heat Flow with Depth The large decrease in the temperature gradient from pillow
lavas to sheeted dikes suggests that the vertical heat flow is less in the dikes than in the pillow lavas. As the surface heat flow in the area varies about an average that is consistent with the value predicted for conductive cooling of 5.9-m.y.-old crust, the crustal gradient would be expected to approach the predicted gradient more closely with depth. Thermal conductivities in the dikes are about 20% higher than in the pillow lavas, which would account for only part of the reduction in gradient in the dikes. It is difficult to explain a reduction in heat flow with depth without invoking circulation of pore fluids, yet the measured permeabilities indicate that only the upper 100-200 m of basement is permeable enough to allow such circulation in the vicinity of the hole. The chemistry summarized below indicates that the borehole fluids convect within the hole, yet the temperature gradient shows only signs of conductive processes. More study is required to determine whether slow convection within the borehole could produce the observed chemistry and reduce the overall temperature gradient without affecting the otherwise conductive character of the temperature profile.
Borehole Water Chemistry Prior to renewed drilling in Hole 504B, Leg 111 obtained
four reliable samples of borehole waters, from depths of 466, 631, 766, and 1236 mbsf, at temperatures of 81 °C, 101 °C, 115°C, and 146°C, respectively. These samples were collected
175
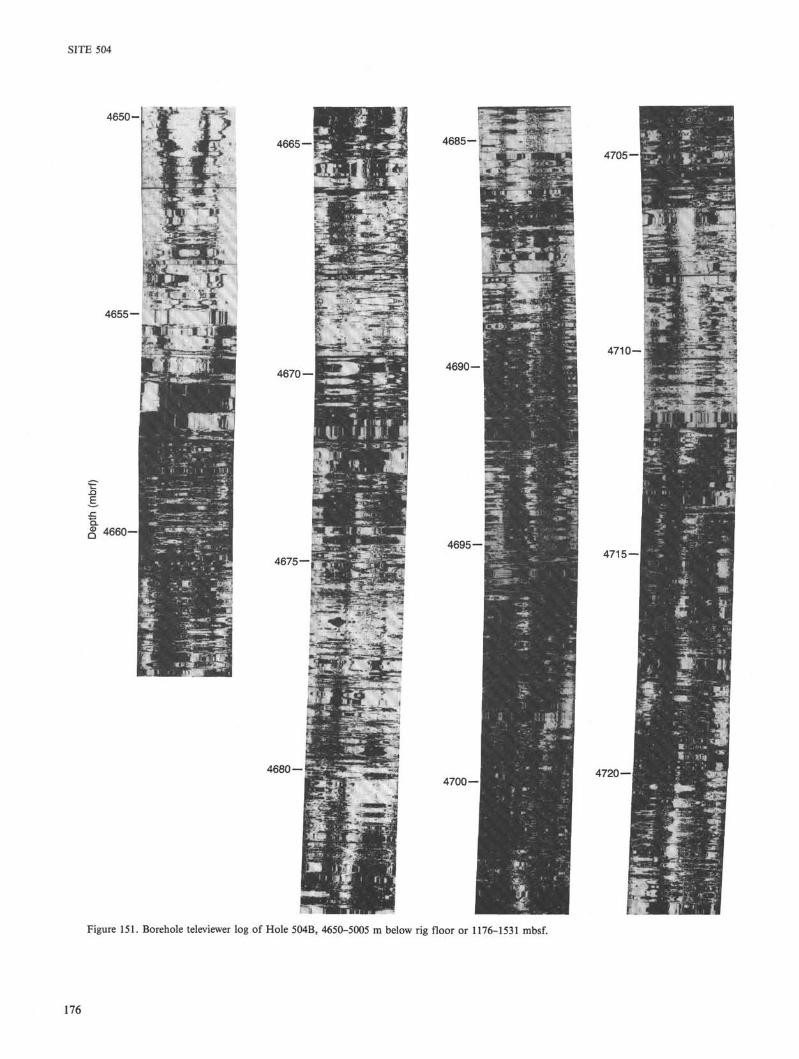
SITE 504
4650-
4655—
.Q E
g 4660—
4665 —
i**L
C"
4670 —
4675—
3 * - ■ ; % - -
4685-
•'" ^ , f ^iPHtc* 4705 — ,!!■■■■ l S & S ; l i C , , : ■ ■ ■ ■ ■ ■ . . : ; ■ ■ ■ ■ ■ . ■■■
4 6 9 0 - I
^ • * : ■ ■'■■ *
4710--
4715—i
4680 — 1 4700—1
4720—1
Figure 151. Borehole televiewer log of Hole 504B, 4650-5005 m below rig floor or 1176-1531 mbsf.
176
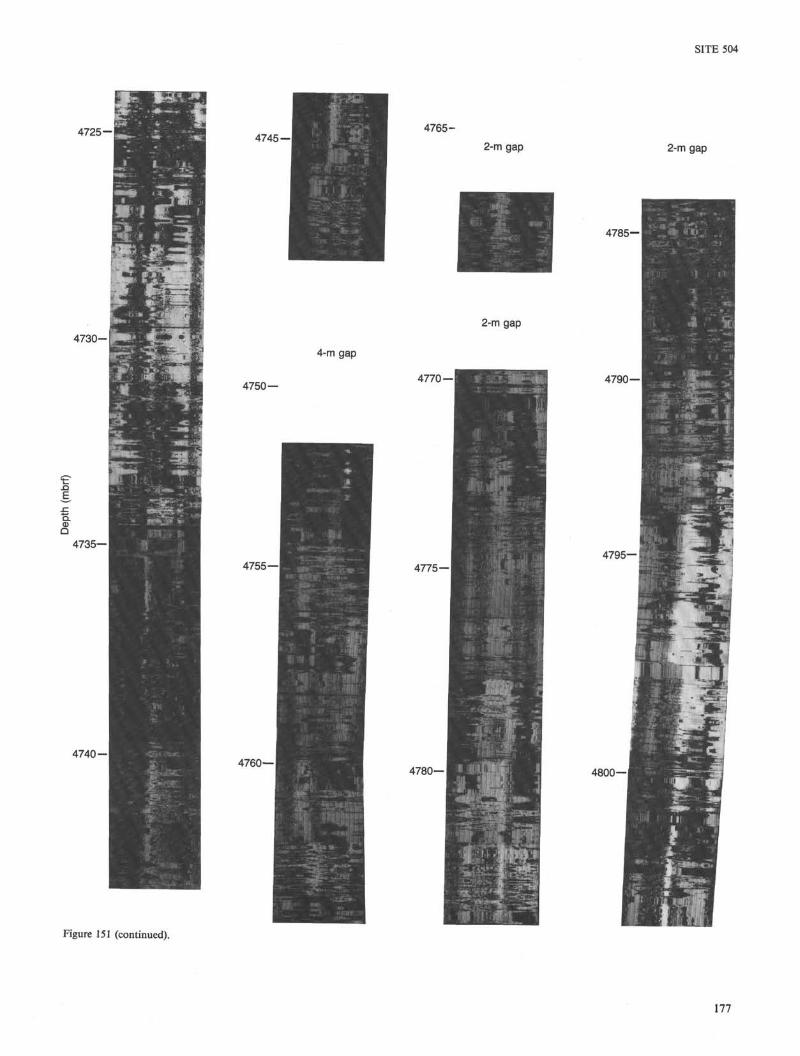
SITE 504
4725-
•».. I,
4730-
t:
Q. (D D 4735—
4740 —
«! : i * * .:
4745 —
4750—
4755—I
4760—
4-m gap
4765-
4770 —
4775—
4780—
2-m gap
2-m gap
yr'fc*
2-m gap
4795—
! TO
4800—
Figure 151 (continued).
177
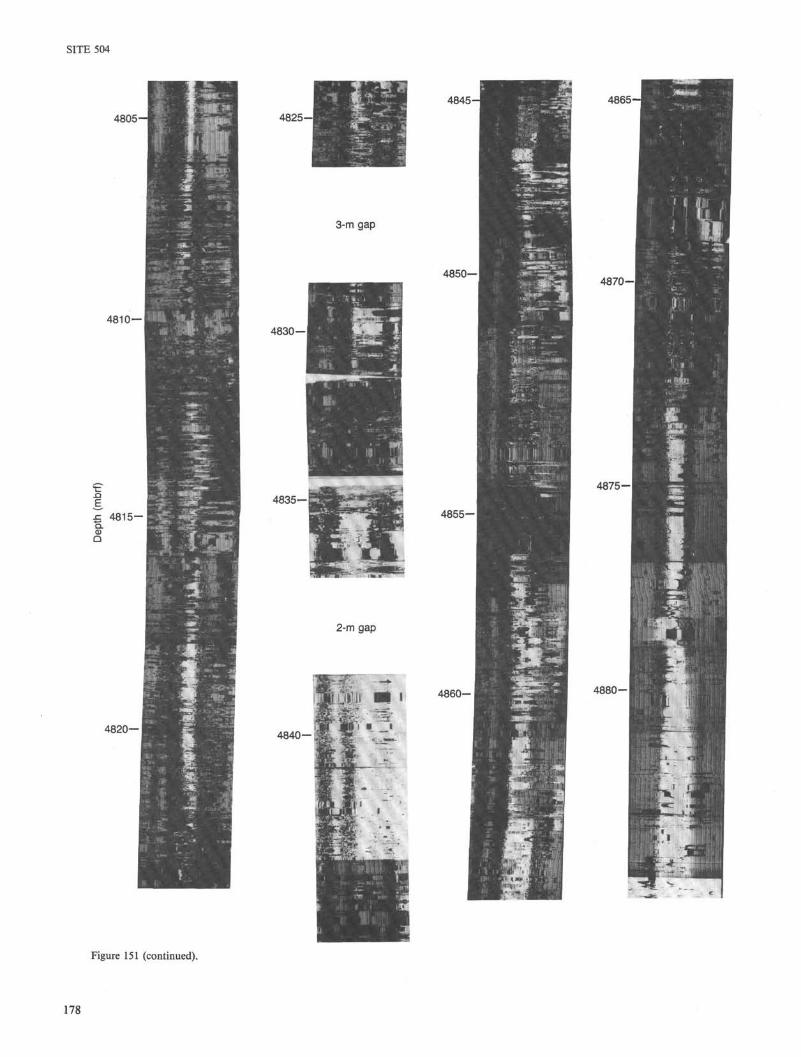
SITE 504
4805-
4810—
£ 4815-■» Q. a> D
■3\ \
4 8 2 0 —
4825
3-m gap
4 8 3 0 —
4 8 3 5 —
2-m gap
4 8 4 0 —
4845-
4850—
K • raw**** 1
B^E^^^S
Sfi X'1?
4 8 5 5 -
■t.
4865-
4 8 7 0 -
4 8 7 5 -
4 8 8 0 -
«P*v
Figure 151 (continued).
178

SITE 504
4885- ,
' ■■ " " > *
L I.
4895—1
m>**
M 9 „ -^
m 1
4900— # ^
i " i « * ■
4905-
4910-
4920-
■ = = > -
I
4945-
4915-
iif3*
4950- V • *§§
4955-
4960-
Figure 151 (continued).
179
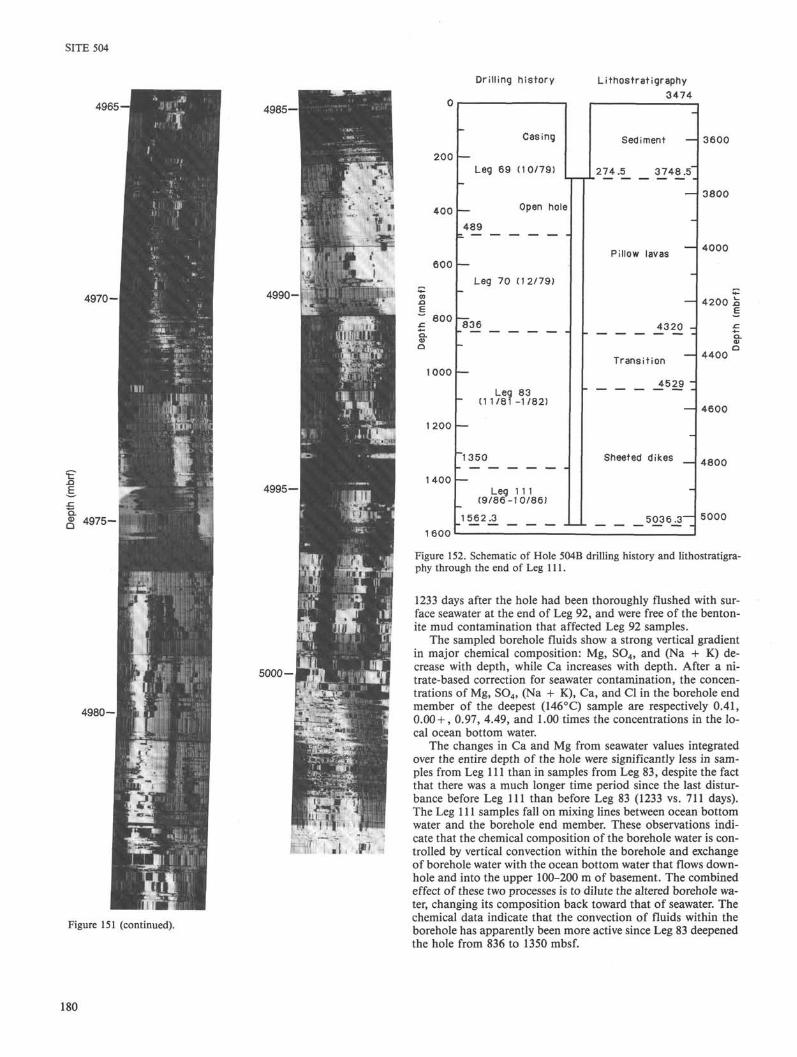
0
200
400
600
800
1000
1200
1400
Drilling history
Casing
Leg 69 (10/79)
Open hole
489
Leg 70 (12/79)
J536
Leg 83 - (11/81-1/82)
~1350
Leg 111 (9/86-10/86)
1562.3
Lithostratigraphy 3474
-
Sediment —
274.5 3748.5"
Pillow lavas
_4320 -
Transition
4529 "
_
Sheeted dikes
-
5036 . 3 —
— 3800
4000
4200
4400
4600
4800
5000
Figure 152. Schematic of Hole 504B drilling history and lithostratigraphy through the end of Leg 111.
1233 days after the hole had been thoroughly flushed with surface seawater at the end of Leg 92, and were free of the benton-ite mud contamination that affected Leg 92 samples.
The sampled borehole fluids show a strong vertical gradient in major chemical composition: Mg, S04, and (Na + K) decrease with depth, while Ca increases with depth. After a nitrate-based correction for seawater contamination, the concentrations of Mg, S04, (Na + K), Ca, and Cl in the borehole end member of the deepest (146°C) sample are respectively 0.41, 0.00+, 0.97, 4.49, and 1.00 times the concentrations in the local ocean bottom water.
The changes in Ca and Mg from seawater values integrated over the entire depth of the hole were significantly less in samples from Leg 111 than in samples from Leg 83, despite the fact that there was a much longer time period since the last disturbance before Leg 111 than before Leg 83 (1233 vs. 711 days). The Leg 111 samples fall on mixing lines between ocean bottom water and the borehole end member. These observations indicate that the chemical composition of the borehole water is controlled by vertical convection within the borehole and exchange of borehole water with the ocean bottom water that flows down-hole and into the upper 100-200 m of basement. The combined effect of these two processes is to dilute the altered borehole water, changing its composition back toward that of seawater. The chemical data indicate that the convection of fluids within the borehole has apparently been more active since Leg 83 deepened the hole from 836 to 1350 mbsf.
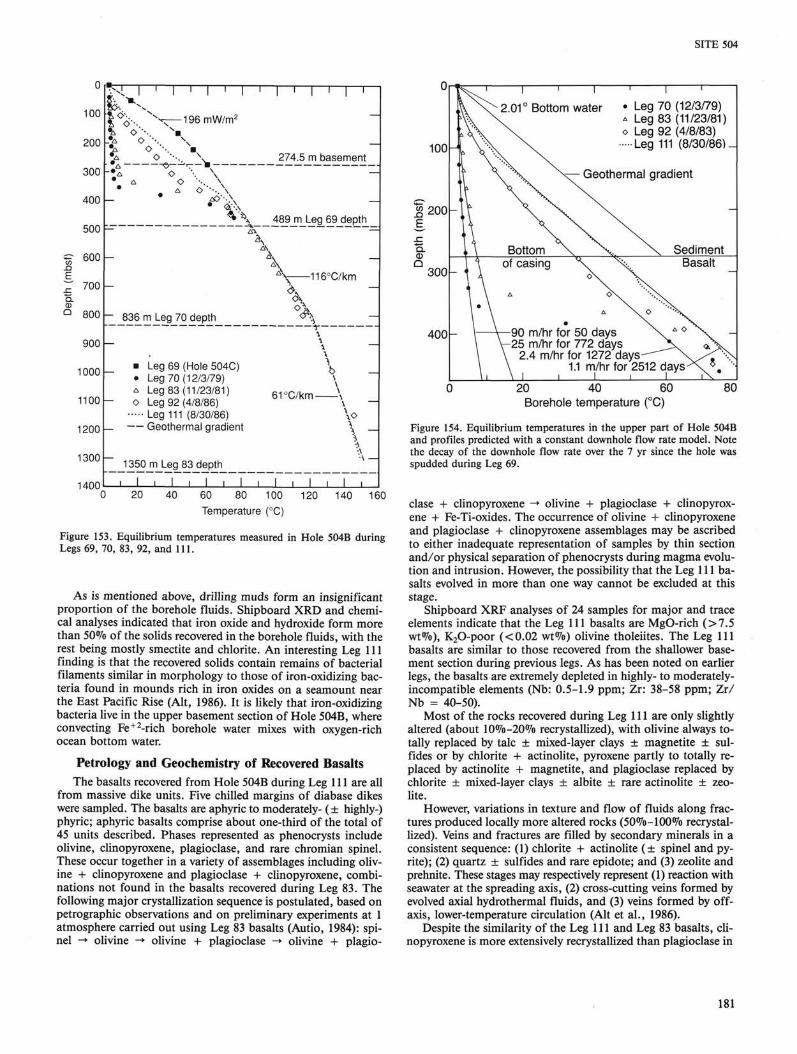
SITE 504
0
100
200
300
400
500
£ 600 _o E ~ 700
Q 800
3>i i ' fe.. X % o •-.
o '• k o
1200
13001—
1400
I I ' I I I I
196mW/m2
274.5 m basement
^ _ \ ^ i8?jm_lze9.6_9_c|ept!l A-*
\ ii6°C/km
OK
836 m Leg 70 depth o <&
900
1 nnn L " L e g 6 9 (H o l e 5 0 4 C ) • Leg 70 (12/3/79) A Leg 83 (11/23/81;
1100 j — o Leg 92 (4/8/86) Leg 111 (8/30/86)
— Geothermal gradient
61°C/km-
J25^_m_Leg 83 depth
i I ■ I i I T ~ l i I ~ ~ " T 0 20 40 60 80 100 120 140 160
Temperature (°C)
Figure 153. Equilibrium temperatures measured in Hole 504B during Legs 69, 70, 83, 92, and 111.
As is mentioned above, drilling muds form an insignificant proportion of the borehole fluids. Shipboard XRD and chemical analyses indicated that iron oxide and hydroxide form more than 50% of the solids recovered in the borehole fluids, with the rest being mostly smectite and chlorite. An interesting Leg 111 finding is that the recovered solids contain remains of bacterial filaments similar in morphology to those of iron-oxidizing bacteria found in mounds rich in iron oxides on a seamount near the East Pacific Rise (Alt, 1986). It is likely that iron-oxidizing bacteria live in the upper basement section of Hole 504B, where convecting Fe+2-rich borehole water mixes with oxygen-rich ocean bottom water.
Petrology and Geochemistry of Recovered Basalts The basalts recovered from Hole 504B during Leg 111 are all
from massive dike units. Five chilled margins of diabase dikes were sampled. The basalts are aphyric to moderately- (± highly-) phyric; aphyric basalts comprise about one-third of the total of 45 units described. Phases represented as phenocrysts include olivine, clinopyroxene, plagioclase, and rare chromian spinel. These occur together in a variety of assemblages including olivine + clinopyroxene and plagioclase + clinopyroxene, combinations not found in the basalts recovered during Leg 83. The following major crystallization sequence is postulated, based on petrographic observations and on preliminary experiments at 1 atmosphere carried out using Leg 83 basalts (Autio, 1984): spinel -» olivine -*■ olivine + plagioclase -» olivine + plagio-
100
200
3 0 0 -
4 0 0 -
20 40 60 Borehole temperature (°C)
Figure 154. Equilibrium temperatures in the upper part of Hole 504B and profiles predicted with a constant downhole flow rate model. Note the decay of the downhole flow rate over the 7 yr since the hole was spudded during Leg 69.
clase + clinopyroxene -*■ olivine + plagioclase + clinopyroxene + Fe-Ti-oxides. The occurrence of olivine + clinopyroxene and plagioclase + clinopyroxene assemblages may be ascribed to either inadequate representation of samples by thin section and/or physical separation of phenocrysts during magma evolution and intrusion. However, the possibility that the Leg 111 basalts evolved in more than one way cannot be excluded at this stage.
Shipboard XRF analyses of 24 samples for major and trace elements indicate that the Leg 111 basalts are MgO-rich (>7.5 wt%), K20-poor (<0.02 wt%) olivine tholeiites. The Leg 111 basalts are similar to those recovered from the shallower basement section during previous legs. As has been noted on earlier legs, the basalts are extremely depleted in highly- to moderately-incompatible elements (Nb: 0.5-1.9 ppm; Zr: 38-58 ppm; Zr/ Nb = 40-50).
Most of the rocks recovered during Leg 111 are only slightly altered (about 10%-20% recrystallized), with olivine always totally replaced by talc ± mixed-layer clays ± magnetite ± sul-fides or by chlorite + actinolite, pyroxene partly to totally replaced by actinolite + magnetite, and plagioclase replaced by chlorite ± mixed-layer clays ± albite ± rare actinolite ± zeolite.
However, variations in texture and flow of fluids along fractures produced locally more altered rocks (50%-100% recrystallized). Veins and fractures are filled by secondary minerals in a consistent sequence: (1) chlorite + actinolite (± spinel and py-rite); (2) quartz ± sulfides and rare epidote; and (3) zeolite and prehnite. These stages may respectively represent (1) reaction with seawater at the spreading axis, (2) cross-cutting veins formed by evolved axial hydro thermal fluids, and (3) veins formed by off-axis, lower-temperature circulation (Alt et al., 1986).
Despite the similarity of the Leg 111 and Leg 83 basalts, clinopyroxene is more extensively recrystallized than plagioclase in
181
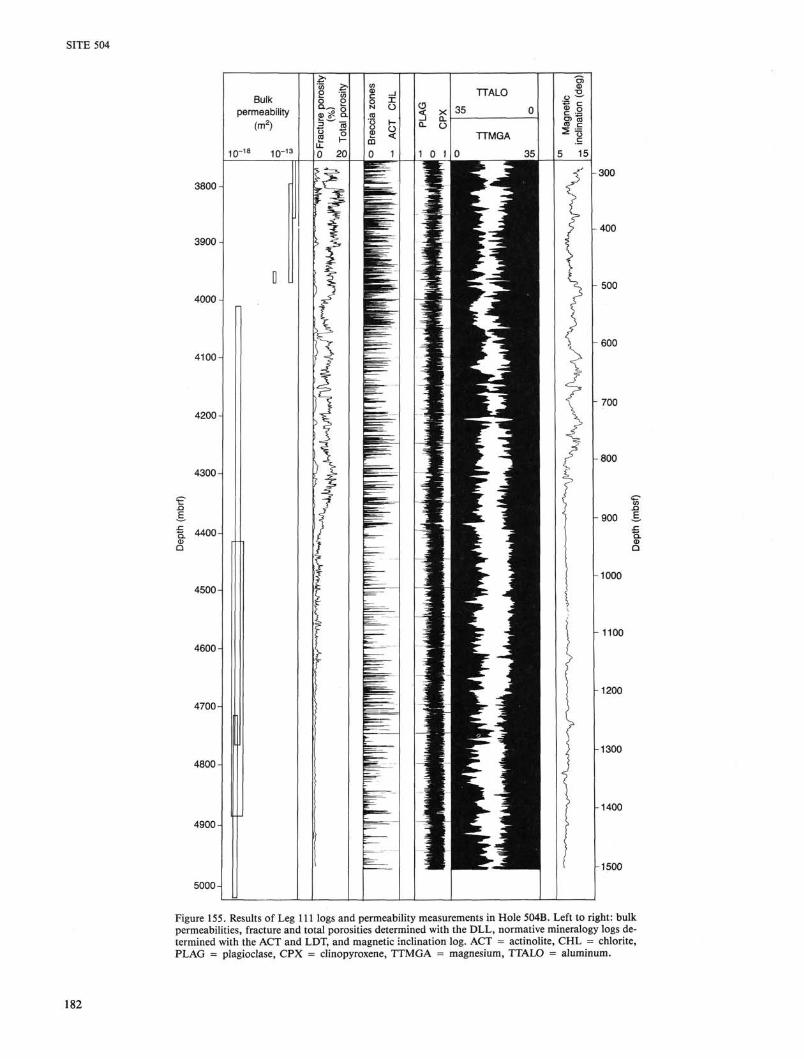
SITE 504
3800-
5000-
300
-400
500
600
- 7 0 0
800
900 B
1000
1100
1200
1300
1400
1500
Figure 155. Results of Leg 111 logs and permeability measurements in Hole 504B. Left to right: bulk permeabilities, fracture and total porosities determined with the DLL, normative mineralogy logs determined with the ACT and LDT, and magnetic inclination log. ACT = actinolite, CHL = chlorite, PLAG = plagioclase, CPX = clinopyroxene, TTMGA = magnesium, TTALO = aluminum.
182
SITE 504
the Leg 111 samples, whereas the opposite is true in the Leg 83 dike samples. Moreover, in the Leg 111 section actinolite apparently increases with depth in proportion to the other secondary minerals. These observations suggest a possible increase in alteration temperature with depth, approaching the "lower actinolite fades" of Elthon (1981). However, the Leg 111 basalts are characterized by disequilibrium, reaching equilibrium only on a scale of a millimeter or less, so the use of a metamorphic facies concept must be further defined by chemical and isotopic studies.
Logging Measurements and Vertical Seismic Profile During Leg 111, Hole 504B was logged with an exceptional
suite of tools: Schlumberger ACT/GST neutron-activation/ gamma-spectroscopy tool, Schlumberger DLL electrical resistivity tool, Schlumberger LDT/GPIT density/magnetometer tool, LDGO multichannel sonic tool (MCS), and USGS borehole televiewer (BHTV). When calibrated against the properties of the recovered basalts, the logs yield a nearly continuous geophysical, geochemical, and lithological characterization of the basement, despite the relatively poor core recovery.
The ACT and LDT tools resolved the relative downhole abundances of the major elements Al, Ca, Fe, K, Mg, S, Si, U, and Th, and allowed the construction of a normative mineralogy log (Fig. 155). The variation in log-determined geochemistry and mineralogy is a response to both the original chemistry of the phyric vs. aphyric units and the presence of alteration products such as chlorite, actinolite, and clays. These logs show that the alteration products are tightly confined to fractures along boundaries between relatively unaltered extrusive or intrusive units of fairly homogeneous geochemistry. In particular, the basalts beneath the stockwork sampled at 910-930 mbsf during Leg 83 are more phyric and contain more Al than the basalts above the stockwork.
Both the MCS and the DLL clearly distinguished individual lithologic units. Deep in the dikes, compressional and shear velocities logged with the MCS reach 6.4 and 3.7 km/s, respectively, and electrical resistivity increases to over 1000 Q-m. The BHTV revealed major breakouts in this otherwise massive section, and suggested that some of the drilling problems experienced here might have resulted from spalling of wall rocks as stresses were relieved around the newly drilled hole.
The DLL measures resistivities at two scales of penetration into the formation; comparison of the two measurements allows determination of both fracture and total apparent porosity. Total apparent porosity ranges from about 15% in the upper pillow lavas to less than 1% deep in the dikes, and apparent fracture porosity ranges from as much as 5% in the pillow lavas to less than 0.5% in the dikes. The variation in the logged abundances of alteration products correlates with the apparent porosities calculated from resistivities, suggesting that some of the apparent porosity may represent original porosity that has been filled by alteration products. If this is the case, then the logged apparent porosities in the sealed pillow lavas of Layer 2B are probably too high, and there is probably a better correlation between permeability and true porosity than between permeability and apparent porosity (Fig. 155).
The logged abundances of alteration minerals also correlate with changes in logged magnetic intensities. The logged magnetic inclination clearly changes at about 800 mbsf, from 15° in the pillow lavas above, to 8° in the pillows, flows, and dikes below. This observation suggests that Hole 504B may intersect a tectonic feature—the relict trace of early listric faulting within the rift valley—about 100-200 m shallower than the lithologic transition between pillow lavas and sheeted dikes. Such a fault trace may have been the permeable conduit for circulating hy-drothermal fluids that produced the heavily mineralized stock-work at the base of the pillow lavas.
A highly successful vertical seismic profile (VSP) was conducted, shooting to a geophone clamped nearly every 10 m up the hole from 1535 mbsf. The seismograms show several important reflectors that may be associated with Layer 3: (1) about 100 m deeper than the present depth of the hole, a reflector that may mark the contact between the dikes of layer 2C and the underlying gabbros of Layer 3, and (2) about 900 m deeper than the present depth of the hole, dipping reflectors that probably lie well within Layer 3. Thus, Layer 3 gabbros may well be within reach of the next full drilling leg to Hole 504B.
Prospects for Future Drilling in Hole 504B Leg 111 encountered very difficult drilling conditions in Hole
504B, probably because of a combination of several factors:
1. An inability to completely flush cuttings from the very deep hole.
2. The steady accumulation of steel junk in the hole. 3. Spalling of wall rocks into the hole and around the coring
assemblies. 4. The dense, crystalline nature of the dikes cored deeper
than 1500 mbsf.
During Leg 111 drilling in Hole 504B, two steel rotary bits disintegrated after only 16-17 rotating hours each. Each of the these bits left all four of its roller cones in the hole, and a considerable amount of time and effort was devoted to fishing and milling this junk (and lost parts of two logging tools) from the hole. It was hoped that coring with a diamond bit would improve recovery, but a diamond bit could not be run until the hole was cleaned of all steel junk.
Unfortunately, when hole conditions finally allowed a diamond bit to be run near the end of Leg 111, part of this last coring BHA was lost in the bottom of Hole 504B. A diamond core bit, float valve, lower support bearing, and inner core barrel were lost when the connection broke between the bit and the stabilized bit sub above. Leg 111 spent its last 5 days trying to fish this junk from the hole, and successfully recovered the inner core barrel and part of the lower support bearing. However, Leg 111 had neither the proper tools nor enough time to complete the hole-cleaning operation, and had to leave the deepest hole into oceanic basement to be cleaned on a later leg.
REFERENCES Adamson, A. C , 1984. Hydrothermal petrology in the Costa Rica Rift
[Ph.D. Thesis]. Univ. Newcastle upon Tyne, U.K. , 1985. Basement lithostratigraphy, Deep Sea Drilling Project
Hole 504B. In Anderson, R. N., Honnorez, J., Becker, K., et al., Init. Repts. DSDP, 83: Washington (U.S. Govt. Printing Office), 121-127.
Alt, J. C , 1984. Alteration in the upper oceanic crust [Ph.D. Dissert.]. Univ. Miami.
, 1986. Hydrothermal/bacterial iron deposit from a seamount near 21 °N, East Pacific Rise. Geol. Soc. Am. Abstr. Progr., 95618 (Abstract).
Alt, J. C , and Emmerman, R., 1985. Geochemistry of hydrothermally altered basalts: Deep Sea Drilling Project Hole 504B, Leg 83. In Anderson, R. N., Honnorez, J., Becker, K., et al., Init. Repts. DSDP, 83: Washington (U.S. Govt. Printing Office) 249-262.
Alt, J. C , Laverne, C , and Muehlenbachs, K., 1985. Alteration of the upper oceanic crust: Mineralogy and processes in Deep Sea Drilling Project Hole 504B, Leg 83. In Anderson, R. N., Honnorez, J., Becker, K., et al., Init. Repts. DSDP, 83: Washington (U.S. Govt. Printing Office), 217-247.
Alt, J. C , Honnorez, J., Laverne, C , and Emmermann, R., 1986. Alteration of a 1 km section through the upper oceanic crust, DSDP Hole 504B: The mineralogy, chemistry and evolution of basalt—sea-water interactions. J. Geophys. Res., 91:10,309-10,335.
Anderson, R. N., and Zoback, M. D., 1982. Permeability, underpressures, and convection in the oceanic crust near the Costa Rica Rift, eastern equatorial Pacific. J. Geophys. Res., 87:2860-2868.
183

SITE 504
, 1983. The implications of fracture and void distribution from bore-hole televiewer imagery for the seismic velocity of the upper oceanic crust at Deep Sea Drilling Project Holes 501 and 504B. In Cann, J. R., Langseth, M. G., Honnorez, J., Von Herzen, R. P., and White, S. M., et al., Init. Repts. DSDP, 69: Washington (U.S. Govt. Printing Office), 255-270.
Anderson, R. N., Honnorez, J., Becker, K., et al., 1982. DSDP Hole 504B, the first reference section over 1 km through Layer 2 of the oceanic crust. Nature, 300:589-594.
, 1985a. Init. Repts. DSDP, 83: Washington (U.S. Govt. Printing Office).
, 1985b. Hole 504B, Leg 83. In Anderson, R. N., Honnorez, J., Becker, K., et al., Init. Repts. DSDP, 83: Washington (U.S. Govt. Printing Office), 13-118.
Anderson, R. N., Zoback, M. D., Hickman, S. H., and Newmark, R. L., 1985a. Permeability versus depth in the upper oceanic crust: in situ measurements in DSDP Hole 504B, eastern equatorial Pacific. J. Geophys. Res., 90:3659-3669.
, 1985b. Permeability versus depth in the upper oceanic crust: In situ measurements in Deep Sea Drilling Project Hole 504B, eastern equatorial Pacific. In Anderson, R. N., Honnorez, J., Becker, K., et al., Init. Repts. DSDP, 83: Washington (U.S. Govt Printing Office), 429-442.
Archie, G. E., 1942. The electrical resistivity log as an aid in determining some reservoir characteristics. J. Pet. Technol., 5:1-8.
Aumento, R, Melson, W. G., et al., 1977. Init. Repts. DSDP, 37: Washington (U.S. Govt. Printing Office).
Autio, L. K., 1984. Compositional diversity of mid-ocean ridge basalts: an experimental and geochemical study with emphasis on the depleted Costa Rica Rift Zone basalts [Ph.D. dissert.]. Univ. Massachusetts.
Autio, L. K., and Rhodes, J. M., 1983. Costa Rica Rift Zone basalts: Geochemical and experimental data from a possible example of multistage melting. In Cann, J. R., Langseth, M. G., Honnorez, J., Von Herzen, R. P., and White, S. M., et al., Init. Repts. DSDP, 69: Washington (U.S. Govt. Printing Office), 729-746.
Becker, K., 1985. Large-scale electrical resistivity and bulk porosity of the oceanic crust, Deep Sea Drilling Project Hole 504B, Costa Rica Rift. In Anderson, R. N., Honnorez, J., Becker, K., et al., Init. Repts. DSDP, 83: Washington (U.S. Govt. Printing Office), 419-427.
, 1986. Drillstring packers in the Ocean Drilling Program. JOIDES Journal, 12:51-57.
, in preparation. Permeability and hydrogeology of the upper oceanic crust at Site 395. In Detrick, R. S., Honnorez, J., Bryan, W. B., Juteau, T , et al., Proc. ODP, Init. Repts. (Pt. B), 106/109: College Station, TX (Ocean Drilling Program).
Becker, K., Von Herzen, R. P., Francis, T.J.G., Anderson, R. N., Honnorez, J., Adamson, A. C , Alt, J. C , Emmermann, R., Kempton, P. D., Kinoshita, H., Laverne, C , Mottl, M., and Newmark, R. L., 1982. In situ electrical resistivity and bulk porosity of the oceanic crust, Costa Rica Rift. Nature, 300:594-598.
Becker, K., Langseth, M. G., and Von Herzen, R. P., 1983a. Deep crustal geothermal measurements, Hole 504B, Deep Sea Drilling Project Legs 69 and 70. In Cann, J. R., Langseth, M. G., Honnorez, J., Von Herzen, R. P., and White, S. M., et al., Init. Repts. DSDP, 69: Washington (U.S. Govt. Printing Office), 223-236.
Becker, K., Langseth, M. G., Von Herzen, R. P., and Anderson, R. N., 1983b. Deep crustal geothermal measurements, Hole 504B, Costa Rica Rift. J. Geophys. Res., 88:3447-3457.
Becker, K., Langseth, M. G., Von Herzen, R. P., Anderson, R. N., and Hobart, M. A., 1985. Deep crustal geothermal measurements, Hole 504B, Deep Sea Drilling Project Legs 69, 70, 83, and 92. In Anderson, R. N., Honnorez, J., et al., Init. Repts. DSDP, 83: Washington (U.S. Govt. Printing Office), 405-418.
Beiersdorf, H., and Natland, J. H., 1983. Sedimentary and diagenetic processes in the central Panama basin since the late Miocene: the li-thology and composition of sediments from Deep Sea Drilling Project Sites 504 and 505. In Cann, J. R., Langseth, M. G., Honnorez, J., Von Herzen, R. P., White, S. M., et al., Init. Repts. DSDP, 69: Washington (U.S. Govt. Printing Office), 343-383.
Bischoff, J. L., and Dickson, F. W., 1975. Seawater-basalt interaction at 200 °C and 500 bars: Implication for the origin of sea-floor heavy metal deposits and regulation of seawater chemistry. Earth Planet. Sci. Lett., 25:385-397.
Bischoff, J. L., and Seyfried, W. E., 1978. Hydrothermal chemistry of seawater from 25° to 250°C. Am. J. Sci., 278:838-860.
Boyeldieu, C , and Winchester, A., 1982. Use of the dual laterolog for the evaluation of the fracture porosity in hard carbonate formation. Offshore South-East Asia 1982 Conjf., Singapore.
Bredehoeft, J. D., and Papadopulos, S. S., 1980. A method for determining the hydraulic properties of tight formations. Water Resour. Res., 16:223-238.
Bryan, W. B., 1972. Morphology of quench crystals in submarine basalts. /. Geophys. Res., 77:5812-5819.
Bryan, W. B., Thompson, G., and Frey, F. A., 1976. Inferred geologic settings and differentiation in basalts from the Deep-Sea Drilling Project. J. Geophys. Res., 81:4285-4304.
Bullard, E. C , 1954. The flow of heat through the floor of the Atlantic Ocean. Proc. R. Astron. Soc, Ser. A, 222:408-429.
Cann, J. R., Langseth, M. G., Honnorez, J., Von Herzen, R. P., White, S. M., et al., 1983. Init. Repts. DSDP, 69: Washington (U.S. Govt. Printing Office).
Cann, J. R., and Von Herzen, R. P., 1983. Downhole logs at DSDP Sites 501, 504, and 505, near the Costa Rica Rift. In Cann, J. R., Langseth, M. G., Honnorez, J., Von Herzen, R. P., White, S. M., et al., Init. Repts. DSDP, 69: Washington (U.S. Govt. Printing Office), 281-300.
Carslaw, H. S., and Jaeger, J. C , 1959. The Conduction of Heat in Solids: London (Oxford Univ. Press).
Chapman, S., Colson, L., Flaum, C , et. al., 1987. The emergence of geochemical well logging. Tech. Rev.
Cooper, H. H., Bredehoeft, J. D., and Papadopulos, S. S., 1967. Response of a finite-diameter well to an instantaneous charge of water. Water Resour. Res., 3:263-269.
Cox, A., 1969. Confidence limits for the precision parameter k. J. Geophys., 18:545-549.
, 1970. Latitude dependence of the angular dispersion of the geomagnetic field. J. Geophys., 20:253-269.
Cox, A., Doell, R. R., and Dalrymple, G. B., 1964. Reversals of the Earth's magnetic field. Science, 144:1537-1543.
CRRUST, 1982. Geothermal regimes of the Costa Rica Rift, east Pacific, investigated by drilling, DSDP-IPOD Legs 68, 69, and 70. Bull. Geol. Soc. Am., 93:862-875.
Dalrymple, G. B, Clague, D. A., and Lanphere, M. A., 1977. Revised age for Midway Volcano, Hawaiian volcanic chain. Earth Planet. Sci. Lett., 37:107-116.
Davies, J. F , Grant, W E., and Whitehead, R.E.S., 1979. Immobile trace elements and Archean volcanic stratigraphy in the Timmins mining area, Ontario. Can. J. Earth Sci., 16:305-311.
Doell, R. R., and Cox, A., 1971. Pacific geomagnetic secular variation. Science, 171:248-254.
, 1972. The Pacific geomagnetic secular variation anomaly and the question of lateral uniformity in the lower mantle. In Robertson, E. C. (Ed.), The Nature of the Solid Earth: New York (McGraw-Hill), 245-284.
Donaldson, C. H., 1976. An experimental investigation of olivine morphology. Contrib. Min and Pet., 57:187-213.
Dungan, M. A., Long, P. E., and Rhodes, J. M., 1979. The petrology, mineral chemistry and one-atmosphere phase relations of basalts from Site 395. In Melson, W G., Rabinowitz, P. D., et al., Init. Repts. DSDP, 45: Washington (U.S. Govt. Printing Office), 461-477.
Elthon, D., 1981. Metamorphism in oceanic spreading centers. In Emi-liani, C. (Ed.), The Sea (Vol. 7): New York (Wiley), 285-303.
Emmermann, R., 1985. Basement geochemistry, Hole 504B. In Anderson, R. N., Honnorez, J., Becker, K., et al., Init. Repts. DSDP, 83: Washington (U.S. Govt. Printing Office), 183-199.
Fouquet, Y, and Juniper, S. K., in prep. Formation of hydrothermal iron-silica deposits within microbial mats.
Furuta, T , 1983. Magnetic properties of basalt samples from Holes 504B and 505B on the Costa Rica Rift, Deep Sea Drilling Project legs 69 and 70. In Cann, J. R., Langseth, M. G., Honnorez, J., Von Herzen, R. P., White, S. M., et al., Init. Repts. DSDP, 69: Washington (U.S. Govt. Printing Office), 711-720.
Furuta, T , and Levi, S., 1983. Basement paleomagnetism of Hole 504B. Deep Sea Drilling Project Legs 69 and 70. In Cann, J. R., Langseth, M. G., Honnorez, J., Von Herzen, R. P., Whilte, S, M., et al., Init. Repts. DSDP, 69: Washington (U.S. Govt. Printing Office), 697-703.
184
SITE 504
Furuta, T., and Fujimoto, H., 1986. Does ocean crust over 1 km become to references of marine magnetic anomaly? (Submitted to Nature.)
Gal'perin, E. I., 1974. Vertical seismic profiling. Soc. Explor. Geophys. Spec. Publ., 12.
Gartling, D. K., 1977. Convective heat transfer analysis by the finite element method. Comput. Methods Appl. Mech. Eng., 12:365-382.
Georgi, D. T., 1985. Geometrical aspects of borehole televiewer images, SPWLA Annu. Logging Symp. (26th).
Gieskes, J. M., 1974. Interstitial water studies, Leg 25. In Simpson, E.S.W., Schlich, R., et al., Init. Repts. DSDP, 25: Washington (U.S. Govt. Printing Office), 361-394.
Gieskes, J. M., Kastner, M., Erzinger, J., Boulegue, J., and Hart, S. R., 1986. Geochemical studies in Hole 504B, Leg 92. In Leinen, M., Rea, D. K., et al., Init. Repts. DSDP, 92: Washington (U.S. Govt. Printing Office), 547-562.
Gieskes, J. M., and Lawrence, J. R., 1981. Alteration of volcanic matter in deep sea sediments: Evidence from the chemical composition of interstitial waters from deep sea drilling cores. Geochim. Cosmo-chim. Acta, 45:1687-1703.
Gieskes, J. M., and Peretsman, G., 1986. Water Chemistry Procedures Aboard JOIDES Resolution—Some Comments. ODP Tech. Note 5.
Grivelet, P., 1985. Inversion of vertical seismic profiles by interactive modelling. Geophysics, 50(6): 924-930.
Haggerty, S. E., 1976. Opaque mineral oxides in terrestrial igneous rocks, Oxide Minerals. Mineral. Soc. Am. Short Course Notes, 3:101-140.
Hall, J. M., 1985. The Iceland Research Drilling Project crustal section: variation of magnetic properties with depth in Icelandic type oceanic crust. Can. J. Earth Sci., 22:85-101.
Hamano, Y., and Kinoshita, H., in press. Measurement of three components of magnetic field in Hole 395A. In Detrick, R. S., Honno-rez, J., Bryan, W B., Juteau, T , Adamson, A. C , et al., Proc, Init. Repts., ODP, 106/109 (Ocean Drilling Program).
Helgeson, H. C , Delaney, J. M., Nesbitt, H. W , and Bird, D. K., 1978. Summary and critique of the thermodynamic properties of rock-forming minerals. Am. J. Sci., 278A: 1-229.
Herron, M. J., 1986, Mineralogy from geochemical well logging. Clays and Clay Minerals, 34:204-213.
Herzig, P. M., and Friedrich, G. H., in press. Sulphide mineralization, hydrothermal alteration and chemistry in the drill hole CY-2a, Agro-kipia, Cyprus. In Robinson, P. T , Gibson, I. L., and Panayiotou, A. (Eds.), Cyprus Crustal Study Project Init. Repts. Hole CY-2/2a: Paper Can. Geol. Sur., 85-29.
Hickman, S. H., Langseth, M. G., and Svitek, J. F , 1984. In situ permeability and pore-pressure measurements near the mid-Atlantic Ridge, Deep Sea Drilling Project Hole 395A. In Hyndman, R. D., Salisbury, M. H., et al., Init. Repts. DSDP, 78B: Washington (U.S. Govt. Printing Office), 699-708.
Hobart, M. A., Langseth, M. G., and Anderson, R. N., 1985. A geo-thermal and geophysical survey on the south flank of the Costa Rica Rift: Sites 504 and 505. In Anderson, R. N., Honnorez, J., Becker, K., et al., Init. Repts. DSDP, 83: Washington (U.S. Govt. Printing Office), 379-404.
Holland, H. D., and Malinin, S. D., 1979. The solubility and occurrence of non-ore minerals. In Barnes, H. C. (Ed.), Geochemistry of Hydrothermal Ore Deposits (2nd ed.): New York (Wiley), 461-508.
Honnorez, J., Laverne, C , Hubberten, H. W , Emmermann, R., and Muehlenbachs, K., 1983. Alteration processes in Layer 2 basalts from DSDP Hole 504B, Costa Rica Rift. In Cann, J. R., Langseth, M. G., Honnorez, J., Von Herzen, R. P., White, S. M., et al., Init. Repts. DSDP, 69: Washington (U.S. Govt. Printing Office), 509-546.
Honnorez, J., Alt, J. C , Honnorez-Guerstein, B.-M., Laverne, C , Muehlenbachs, K., Ruiz, J., and Saltzman, E., 1985. Stockwork-like sulfide mineralization in young oceanic crust: Deep Sea Drilling Project Hole 504B. In Anderson, R. N., Honnorez, J., Becker, K., et al., Init. Repts. DSDP, 83: Washington (U.S. Govt. Printing Office), 263-282.
Hubberten, H.-W, Emmermann, R., andPuchelt, H., 1983. Geochemistry of basalts from Costa Rica Rift Sites 504 and 505 (Deep Sea Drilling Project Legs 69 and 70). In Cann, J. R., Langseth, M. G., Honnorez, J., Von Herzen, R. P., White, S. M., et al., Init. Repts. DSDP, 70: Washington (U.S. Govt. Printing Office), 791-803.
Hyndman, R. D., 1979. Poisson's ratio in the oceanic crust—A review. Tectonophysics, 59:321-333.
Hyndman, R. D., and Salisbury, M. H., 1984. The physical nature of young upper oceanic crust on the Mid-Atlantic Ridge, Deep Sea Drilling Project Hole 395A. In Hyndman, R. D., and Salisbury, M. H., et al., Init. Repts. DSDP, 78B: Washington (U.S. Govt. Printing Office), 839-848.
IAGA Working Group 1-1, 1981. Analysis of the main field and secular variations (International Geomagnetic Reference Field 1980). IAGA News, 200:100-102.
Johnson, H. P., 1979. Magnetization of the oceanic crust. Rev. Geophys. Space Phys., 17:215-226.
Kempton, P. D., Autio, L. K., Rhodes, J. M., Holdaway, M. J., Dun-gan, M. A., and Johnson, P., 1985. Petrology of basalts from Hole 504B, Deep Sea Drilling Project, Leg 83. In Anderson, R. N., Honnorez, J., Becker, K., et al., Init. Repts. DSDP, 83: Washington (U.S. Govt. Printing Office), 129-164.
Kennedy, G. C , and Holser, W. T , 1966. Pressure-volume-temperature and phase relations of water and carbon dioxide. In Clark, S. P., Jr. (Ed.), Handbook of Physical Constants: Geol. Soc. Am. Memoir, 97: 371-383.
Kennett, P., and Ireson, R. L., 1981. The VSP as an interpretation tool for structural and stratigraphic analysis, European Assoc. Explor. Geophys. (43rd Annual Meeting), Venice {Seismograph Service Companies Tech. Paper, DT80101B10.
Kennett, P., Ireson, R. L., and Conn, P. J., 1980. Vertical seismic profiles: Their application in exploration geophysics, Geophys. Prospecting, 28:676-699.
Kinoshita, H., Furuta, T , and Kawahata, H., 1985. Magnetic properties and alteration in basalt, Hole 504B, Deep Sea Drilling Project Leg 83. In Anderson, R. N., Honnorez, J., Becker K., et al., Init. Repts. DSDP, 83: Washington (U.S. Govt. Printing Office), 331-338.
Kidd, R.G.W, 1977. A model for the process of formation of the upper oceanic crust. Geophys. J. R. Astron. Soc, 50:149-183.
Kristmannsdottir, H., 1975. Hydrothermal alteration of basaltic rocks in Icelandic geothermal areas. Second U.N. symposium on the development and utilization of geothermal resources, San Francisco, 441-445.
Kuster, G. T , and Toksoz, M. N., 1974. Velocity and attenuation of seismic waves in two-phase media: Part I. Theoretical formulations. Geophysics, 39:587-606.
Langseth, M. G , Cann, J. R., Natland, J. H., and Hobart, M. A., 1983. Geothermal phenomena at the Costa Rica Rift: background and objectives for drilling at Deep Sea Drilling Project Sites 501, 504, and 505. In Cann, J. R., Langseth, M. G , Honnorez, J., Von Herzen, R. P., White, S. M., et al., Init. Repts. DSDP, 69: Washington (U.S. Govt. Printing Office), 5-30.
Lee, M. W., and Balch, A. H., 1983. Computer processing of vertical seismic profile data. Geophysics, 48(3):272-287.
Legs 106/109 Shipboard Scientific Party, 1988. Introduction and explanatory notes. In Detrick, R. S., Honnorez, J., Bryan, W. B., Juteau, T., et al., Proc. ODP, Init. Repts. (PL A), 106/109: College Station, TX (Ocean Drilling Program).
Liou, J. G., 1974. Mineralogy and chemistry of glassy basalts, Coastal Ranges ophiolites, Taiwan. Bull. Geol. Soc. Am., 85:1-10.
Little, S. A., and Stephen, R. A., 1985. Costa Rica Rift borehole seismic experiment, Deep Sea Drilling Project Hole 504B, Leg 92. In Anderson, R. N., Honnorez, J., Becker, K., et al., Init. Repts. DSDP, 83: Washington (U.S. Govt. Printing Office), 517-528.
Lysne, P., 1986. Determination of borehole shape by inversion of televiewer data. Log Analyst, May-June, 64-71.
Malpas, J., Moore, P., and Case, G., in press. Regional geology of the area around the CY-4 bore hole, Cyprus Crustal Study Project. In Malpas, J., Gibson, I. L., and Xenophontos, C. (Eds.), Cyprus Crustal Study Project Init. Repts. Hole CY-4: Geol. Survey Canada.
Marshall, W L., Slusher, R., and Jones, E. V, 1964. Aqueous systems at high temperature. XIV Solubility and thermodynamic relationships for CaS04 in NaCl-H20 solutions from 40° to 200°C, 0 to 4 molal NaCl. J. Chem. Eng. Data, 9:187-191.
Mason, F. J., and Raff, A. D., 1961. Magnetic survey off the west coast of North America, 32°N-42°N. Bull. Geol. Soc. Am., 72:1259-1266.
185
SITE 504
Merrill, R. T., and McElhiny, M. W., 1983. The Earth's Magnetic Field: London (Academic Press).
Mons, R., and Barbour, K., 1981. Vertical seismic profiling. Schlum-berger Wireline Atlantic-Marketing Geophysics, SMP-1108.
Moos, D., Goldberg, D., Hobart, M., and Anderson R. N., 1986. Elastic waves velocities in Layer 2A from full waveform-sonic logs at Hole 504B. In Leinen, M., and Rea, D. K., et al., Init. Repts. DSDP, 92: Washington (U.S. Govt. Printing Office). 563-570.
Mottl, M. J., Lawrence, J. R., and Keigwin, L. D., 1983. Elemental and stable-isotope composition of pore waters and carbonate sediments from Deep Sea Drilling Project Sites 501/504 and 505. In Cann, J. R., Langseth, M. G., Von Herzen, R. P., White, S. M., et al., Init. Repts. DSDP, 69: Washington (U.S. Govt. Printing Office), 461-473.
Mottl, M. J., Druffel, E.R.M., Hart, S. R., Lawrence, J. R., and Saltz-man, E. S., 1985. Chemistry of hot waters sampled from basaltic basement in Hole 504B, Deep Sea Drilling Project Leg 83, Costa Rica Rift. In Anderson, R. N., Honnorez, J., Becker, K., et al., Init. Repts. DSDP, 83: Washington (U.S. Govt. Printing Office), 315-328.
Muir, I. D., and Tilley, C. E., 1966. Basalts from the northern part of the Mid-Atlantic Ridge, II; the Atlantis collection near 30°N. J. Pet., 7:193-201.
Mutter, J. M., and Newmark, R. L., 1986. Seismic response of detailed structure in Deep Sea Drilling Project Hole 504B: Synthetic seismo-grams in the domain of intercept time and ray parameter. In Leinen, M., and Rea, D. K., et al., Init. Repts. DSDP, 92: Washington (U.S. Govt. Printing Office), 571-582.
Natland, J. H., Adamson, A. C , Laverne, C , Melson, W. G., and O'Hearn, T., 1983. A compositionally nearly steady state magma chamber at the Costa Rica Rift: evidence from basalt glass and mineral data, Deep Sea Drilling Project Sites 501, 504, and 505. In Cann, J. R., Langseth, M. G., Honnorez, J., Von Herzen, R. P., White, S. M., et al., Init. Repts. DSDP, 69: Washington (U.S. Govt. Printing Office), 811-858.
NAT Study Group, 1985. North Atlantic Transect: A wide aperture, two-ship multichannel seismic study of the oceanic crust, J. Geo-phys. Res., 90:10321-10341.
Nealsen, K. H., 1985. The microbial iron cycle. In Krumbein, W. E. (Ed.), Microbial Geochemistry: Oxford (Blackwell), 159-190.
Neuzil, C. E., 1982. On conducting the modified "slug" test in tight formations. Water Resour. Res., 18:439-441.
Newmark, R. L., Anderson, R. N., Moos, D., and Zoback, M. D., 1984. Sonic and ultrasonic logging of Hole 504B and its implications for the structure, porosity, and stress regime of the upper 1 km of the oceanic crust. In Anderson, R. N., Honnorez, J., et al., Init. Repts. DSDP, 83: Washington (U.S. Govt. Printing Office), 479-510.
Paillet, F. L., 1985. Acoustic-televiewer and acoustic-waveform logs used to characterize deeply buried basalt flows, Hanford Site, Benton County, Washington, U.S. Geol. Survey Open-File Rept. 85-419.
Paillet, F. L., Keys, W. S., and Hess, A. E., 1985. Effects of lithology on televiewer-log quality and fracture interpretation, SPWLA Annual Logging Symp. (26th).
Papadopulos, S. S., Bredehoeft, J. D., and Cooper, H. H., 1973. On the analysis of 'slug test' data. Water Resour. Res., 9:1087-1089.
Plumb, R. A., and Hickman, S. J., 1985. Stress-induced borehole elongation; a comparison between the four-arm dipmeter and the borehole televiewer in the Auburn geothermal well. J. Geophys. Res., 90: 5513-5523.
Ponomarev, V. N., and Nekhoroshkov, V. L., 1983. First measurements of the magnetic field within the ocean crust: Deep Sea Drilling Project Legs 68 and 69. In Cann, J. R., Langseth, M. G., Honnorez, J., Von Herzen, R. P., White, S. M., et al., Init. Repts. DSDP, 69: Washington (U.S. Govt. Printing Office), 271-279.
Poster, D. K., 1983. Interpretation aspects of offshore VSP data. Offshore Technol. Conf. (15th), 4540:237-240.
Pyke, D. R., Naldrett, A. J., and Eckstrand, O. R., 1973. Archean ul-tramafic flows in Munro Township, Ontario. Bull. Geol. Soc. Am., 84:955-978.
Salisbury, M. H., Christensen, N. I., Becker, K., and Moos, D., 1985. The velocity structure of layer 2 at Deep Sea Drilling Project Site 504 from logging and laboratory experiments. In Anderson, R. N., Honnorez, J., Becker, K., et al., Init. Repts. DSDP, 83: Washington (U.S. Govt. Printing Office), 529-539.
Schlumberger Ltd (1974). Log Interpretation. Volume 1. Seeman, B., and Horowicz, L., 1983. Vertical seismic profiling: Separa
tion of upgoing and downgoing acoustic waves in a stratified medium. Geophysics, 48(5): 555-568.
Serra, O., 1984. Fundamentals of Well Log Interpretation: Amsterdam (Elsevier).
Smith, G. M., and Banerjee, S. K., 1986. The magnetic structure of the upper kilometer of the marine crust. J. Geophys. Res., 91:10,337-10,354.
Stephen, R. A., and Harding, A. J., 1983. Travel time analysis of borehole seismic data. J. Geophys. Res., 88:8289-8298.
Swift, B. A., and Johnson, H. P., 1984. Magnetic properties of the Bay of Islands ophiolite suite and implications for the magnetization of the ocean crust. J. Geophys. Res., 89:3291-3308.
Talwani, M., Windisch, C. C , and Langthes, M. G., 1971. Reykjanes Ridge crest: A detailed geophysical study. J. Geophys. Res., 76:473-517.
Vine, F. J., and Matthews, D. H., 1963. Magnetic anomalies over oceanic ridges. Nature, 199:947-949.
Von Herzen, R. P., Francis, T.J.G, and Becker, K., 1983. In situ large-scale electrical resistivity of ocean crust, Hole 504B. In Cann, J. R., Langseth, M. G., Honnorez, J., Von Herzen, R. P., White, S. M., et al., Init. Reports DSDP, 69: Washington (U.S. Govt. Printing Office), 237-244.
Williams, C. F , Narasimhan, T. N., Anderson, R. N., Zoback, M. D., and Becker, K., 1986. Convection in the oceanic crust: numerical simulation of observations from DSDP Hole 504B, Costa Rica Rift. J. Geophys. Res., 91:4877-4889.
Yamamoto, K., Kosuga, M., and Hirasawa, T , 1981. A theoretical method for determination of effective elastic constants of isotropic composites. Sci. Rep. Tohoku Univ., Ser.5, Geophys., 28:47-67.
Zoback, M. D., and Anderson, R. N., 1983. Permeability, underpressures, and convection in the oceanic crust at Deep Sea Drilling Project Hole 504B. In Cann, J. R., Langseth, M. G., Honnorez, J., Von Herzen, R. P., White, S. M., et al., Init. Repts. DSDP, 69: Washington (U.S. Govt. Printing Office), 245-254.
Zoback, M. D., Moos, D., and Mastin, L., 1985. Well bore breakouts and in-situ stress, /. Geophys. Res., 90:5523-5530.
186
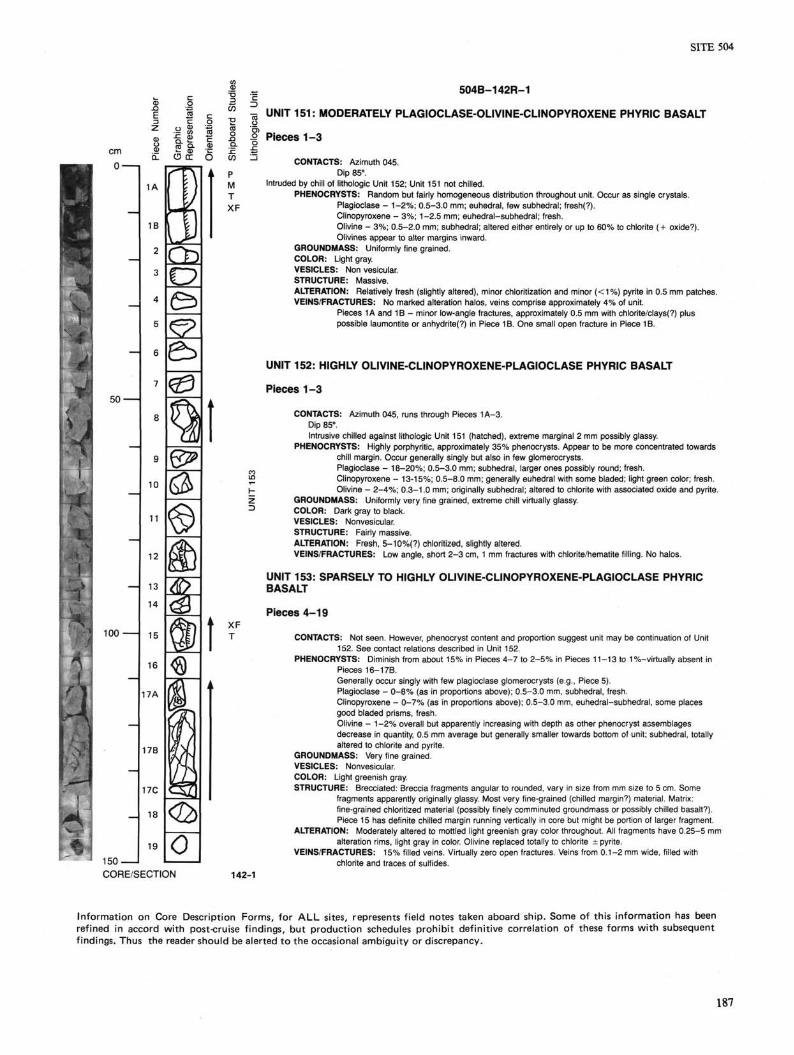
SITE 504
cm 0-
50
? > f 100
1B
10
11
12
17B
19
o 5 2 TO Q- .5
0. O I O
& >
S e>
p M T XF
0 150-CORE/SECTION
t- 504B-142R-1 c
■g UNIT 151: MODERATELY PLAGIOCLASE-OLIVINE-CLINOPYROXENE PHYRIC BASALT
I Pieces 1-3 - 1 CONTACTS: Azimuth 045.
Dip 85°. Intruded by chill of lithologic Unit 152; Unit 151 not chilled.
PHENOCRYSTS: Random but fairly homogeneous distribution throughout unit. Occur as single crystals. Plagioclase - 1-2%; 0.5-3.0 mm; euhedral, few subhedral; fresh(?). Clinopyroxene - 3%; 1-2.5 mm; euhedral-subhedral; fresh. Olivine - 3%; 0.5-2.0 mm; subhedral; altered either entirely or up to 60% to chlorite (+ oxide?). Olivines appear to alter margins inward.
GROUNDMASS: Uniformly fine grained. COLOR: Light gray. VESICLES: Non vesicular. STRUCTURE: Massive. ALTERATION: Relatively fresh (slightly altered), minor chloritization and minor (<1%) pyrite in 0.5 mm patches. VEINS/FRACTURES: No marked alteration halos, veins comprise approximately 4% of unit.
Pieces 1A and 1B - minor low-angle fractures, approximately 0.5 mm with chlorite/clays(?) plus possible laumontite or anhydrite(?) in Piece 1B. One small open fracture in Piece 1B.
UNIT 152: HIGHLY OLIVINE-CLINOPYROXENE-PLAGIOCLASE PHYRIC BASALT
Pieces 1 - 3
CONTACTS: Azimuth 045, runs through Pieces 1A-3. Dip 85°. Intrusive chilled against lithologic Unit 151 (hatched), extreme marginal 2 mm possibly glassy.
PHENOCRYSTS: Highly porphyritic, approximately 35% phenocrysts. Appear to be more concentrated towards chill margin. Occur generally singly but also in few glomerocrysts. Plagioclase - 18-20%; 0.5-3.0 mm; subhedral, larger ones possibly round; fresh. Clinopyroxene - 13-15%; 0.5-8.0 mm; generally euhedral with some bladed; light green color; fresh. Olivine - 2-4%; 0.3-1.0 mm; originally subhedral; altered to chlorite with associated oxide and pyrite.
GROUNDMASS: Uniformly very fine grained, extreme chill virtually glassy. COLOR: Dark gray to black. VESICLES: Nonvesicular. STRUCTURE: Fairly massive. ALTERATION: Fresh, 5-10%(?) chloritized, slightly altered. VEINS/FRACTURES: Low angle, short 2 -3 cm, 1 mm fractures with chlorite/hematite filling. No halos.
XF T
UNIT 153: SPARSELY TO HIGHLY OLIVINE-CLINOPYROXENE-PLAGIOCLASE PHYRIC BASALT
Pieces 4-19
CONTACTS: Not seen. However, phenocryst content and proportion suggest unit may be continuation of Unit 152. See contact relations described in Unit 152.
PHENOCRYSTS: Diminish from about 15% in Pieces 4 -7 to 2 -5% in Pieces 11-13 to 1 %-virtually absent in Pieces 16-17B. Generally occur singly with few plagioclase glomerocrysts (e.g., Piece 5). Plagioclase - 0 -8% (as in proportions above); 0.5-3.0 mm, subhedral, fresh. Clinopyroxene - 0 -7% (as in proportions above); 0.5-3.0 mm, euhedral-subhedral, some places good bladed prisms, fresh. Olivine - 1-2% overall but apparently increasing with depth as other phenocryst assemblages decrease in quantity, 0.5 mm average but generally smaller towards bottom of unit; subhedral, totally altered to chlorite and pyrite.
GROUNDMASS: Very fine grained. VESICLES: Nonvesicular. COLOR: Light greenish gray. STRUCTURE: Brecciated: Breccia fragments angular to rounded, vary in size from mm size to 5 cm. Some
fragments apparently originally glassy. Most very fine-grained (chilled margin?) material. Matrix: fine-grained chloritized material (possibly finely comminuted groundmass or possibly chilled basalt?). Piece 15 has definite chilled margin running vertically in core but might be portion of larger fragment.
ALTERATION: Moderately altered to mottled light greenish gray color throughout. All fragments have 0.25-5 mm alteration rims, light gray in color. Olivine replaced totally to chlorite ± pyrite.
VEINS/FRACTURES: 15% filled veins. Virtually zero open fractures. Veins from 0.1-2 mm wide, filled with chlorite and traces of sulfides.
142-1
I n f o r m a t i o n o n Core D e s c r i p t i o n F o r m s , f o r A L L s i tes, represents f i e l d notes t a k e n a b o a r d sh ip . S o m e o f t h i s i n f o r m a t i o n has been r e f i n e d in a c c o r d w i t h post -c ru ise f i n d i n g s , b u t p r o d u c t i o n schedules p r o h i b i t d e f i n i t i v e c o r r e l a t i o n o f these f o r m s w i t h subsequen t f i n d i n g s . Thus t h e reader s h o u l d be a le r ted t o t h e occas iona l a m b i g u i t y o r d i sc repancy .
187

SITE 504
504B-142R-2
2 o
cm
0-
it a 5 5 -c S
50'
100
8A
8B
a 0 o B o Q
UNIT 153, Continued: MODERATELY CLINOPYROXENE-OLIVINE-PLAGIOCLASE PHYRIC BASALT
PHENOCRYSTS: Clinopyroxene - 504B-145R-3, Piece 13, and 504B-145R-4, Piece 1: decreasing size of clinopyroxene (1-5 mm), less elongated.
Pieces 1-8
CONTACTS: Not seen clearly. However, Pieces 1-2 (see Piece 2) have small portions of chill versus Unit 153. (Unit 153 is intruded by small portions of chilled margin.) Not clear to which unit these margins belong.
PHENOCRYSTS: Vary from approximately 3% at top of unit to 10% at bottom of unit. Occur as single crystals. Plagioclase - 2 -5% (correlating with the proportions above), 1-5 mm, euhedral (tabular), fresh. Olivine - 1-2% (increasing towards bottom of unit, 0.3-3 mm, subhedral, 100% altered to chlorite and pyrite. Clinopyroxene - 1%, light green, 1-2.5 mm, euhedral, fresh.
GROUNDMASS: Varies from top to bottom, very fine grained to fine grained. Also in Pieces 1-3 patchy grain size varies from very fine to fine grained.
COLOR: Medium to dark gray. Light gray alteration patches throughout the unit. VESICLES: Nonvesicular. STRUCTURE: Massive (see grain size variation). ALTERATION: Dark and light gray alteration halos (2-4 mm, varies according to fracture size) around fractures
in Pieces 1-3. Rest of unit relatively fresh (slightly altered). VEINS/FRACTURES: In Pieces 1-3, fractures vertical and horizontal form about 5 -7% with width < 1 - 1 mm.
Filled with chlorite/ sulfides/ prehnite/ quartz ±zeolite(?). Have zoned alteration around them with dark (chlorite/ actinolite) mm-wide zone immediately adjacent to vein and light reaction zone outside this. Veins in Pieces 8A-8B, forming 2% of rock, white vein-filling mineral in minor veins <<0.5 mm (possibly laumontite).
XF
150-CORE/SECTION 142-2
188

SITE 504
cm 0 -
II S o
50-
100
150 — CORE/SECTION
2
3
4
5
6
7
8
9
10
11A
11 B
11C
12A 12B 12C
13
14
15
16
17
18
19
20
21
22
r\ c3 (7 0 Co Z=7 o o V Q n 1 i y 03 r? CD 22 ^7
0 a 0 0 p s
t -
t . ' in
1-
t t t S
H
i
t
11 XF P M T
t
t t
504B-143R-1
UNIT 154: MODERATELY PLAGIOCLASE-OLIVINE-CLINOPYROXENE PHYRIC BASALT
Pieces 1-7
CONTACTS: None. PHENOCRYSTS: Homogeneous distribution throughout of single crystals.
Plagioclase - 5%, 0.25-3 mm, euhedral, fresh. Olivine - 4%, 0.25-2 mm, euhedral, totally altered to talc + chlorite + pyrite + rare ferric oxide. Clinopyroxene - 1%, 1-2 mm, subhedral, fresh.
GROUNDMASS: Uniformly fine grained. COLOR: Dark gray. VESICLES: Nonvesicular. STRUCTURE: Massive. ALTERATION: Olivine replaced by talc + chlorite + pyrite + rare ferric oxide. Overall: slightly altered.
Piece 1, prismatic, white mineral on fractures. Light gray alteration halos (2 mm wide) around veins in Piece 1.
VEINS/FRACTURES: < 1 %, <0.5 mm, filled with chlorite.
UNIT 155: MODERATELY TO HIGHLY OLIVINE-PLAGIOCLASE PHYRIC BASALT
143R-1, Piece 8, to the end of Core 143R
CONTACTS: None. PHENOCRYSTS: Olivine as glomerocrysts, plagioclase and clinopyroxene as single crystals. Most abundant in
Pieces 17 and 18. Plagioclase - =0-3%, maximum in Piece 17, 0.5-3 mm, euhedral, tabular, fresh. Olivine - 7-10%, 0.5-3 mm, euhedral to subhedral, totally altered by zoned chlorite + talc + pyrite (+ oxides?). Clinopyroxene - absent(?).
GROUNDMASS: Generally fine grained with patches of coarser grained material in Pieces 17-21 with interstitial chlorite (+ talc?).
COLOR: Dark gray. VESICLES: Nonvesicular. STRUCTURE: Massive. ALTERATION: Generally slightly (Pieces 8-16) to moderately (Pieces 17-22 and 143R-2, Pieces 1-10) altered
143R-1, Pieces 17-21, and 143R-2, Pieces 1, 3, and 5, contain 1-3 cm, strongly altered patches of chlorite with light greenish gray alteration halos. Olivine replaced by zoned chlorite + talc + pyrite (+ oxides?).
VEINS/FRACTURES: 1 %, <0.5 mm, filled with chlorite (50%) and unidentified white mineral (50%) + traces of pyrite; no apparent relationship.
143-1
189
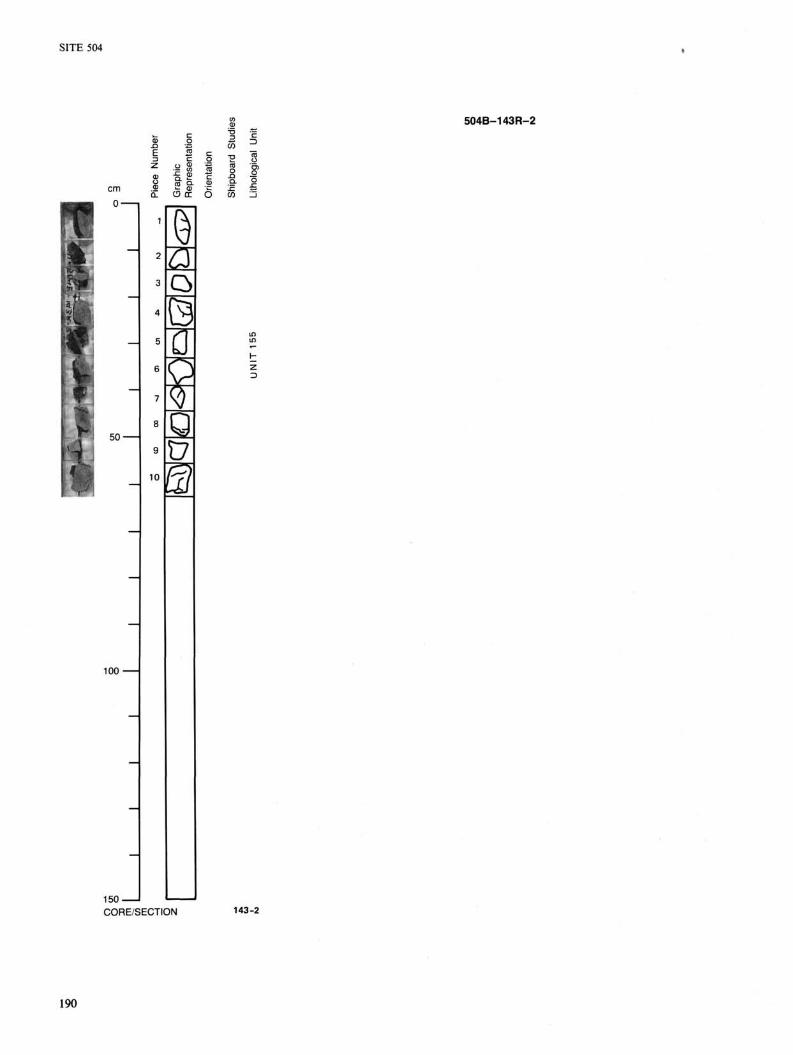
SITE 504
504B-143R-2
cm 0-
10 a o
50'
100
Q-
1
2
3
4
5
6
7
8
9
10
O CC
o Q Q
g
150-CORE/SECTION 143-2
190
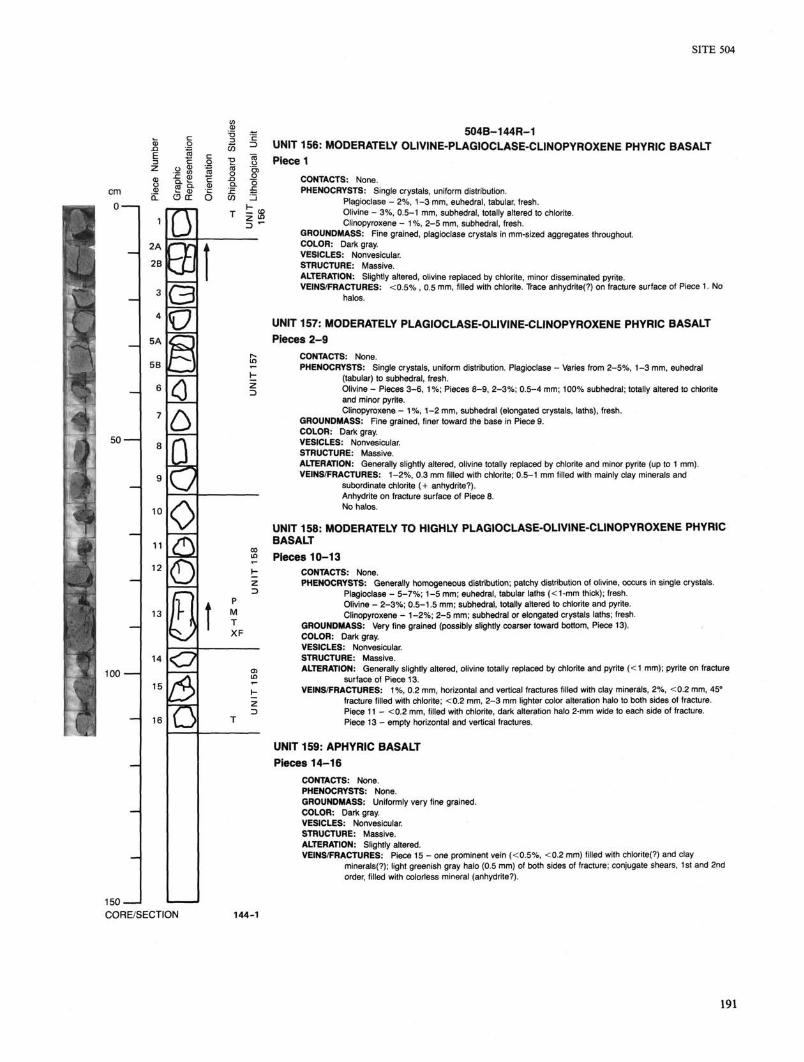
SITE 504
cm
0-
50-
100
2A
2B
5A
5B
10
11
12
13
14
15
16
2 o
O tr O
D
o
o 6 0
0 la
<? # O
150-CORE/SECTION
I
— CD Z ">
P M T XF
504B-144R-1 UNIT 156: MODERATELY OLIVINE-PLAGIOCLASE-CLINOPYROXENE PHYRIC BASALT Piece 1
CONTACTS: None. PHENOCRYSTS: Single crystals, uniform distribution.
Plagioclase - 2%, 1-3 mm, euhedral, tabular, fresh. Olivine - 3%, 0.5-1 mm, subhedral, totally altered to chlorite. Clinopyroxene - 1 %, 2-5 mm, subhedral, fresh.
GROUNDMASS: Fine grained, plagioclase crystals in mm-sized aggregates throughout. COLOR: Dark gray. VESICLES: Nonvesicular. STRUCTURE: Massive. ALTERATION: Slightly altered, ofivine replaced by chlorite, minor disseminated pyrite. VEINS/FRACTURES: <0.5% , 0.5 mm, filled with chlorite. Trace anhydrite(?) on fracture surface of Piece 1. No
halos.
UNIT 157: MODERATELY PLAGIOCLASE-OLIVINE-CLINOPYROXENE PHYRIC BASALT Pieces 2-9
CONTACTS: None. PHENOCRYSTS: Single crystals, uniform distribution. Plagioclase - Varies from 2-5%, 1 -3 mm, euhedral
(tabular) to subhedral, fresh. Olivine - Pieces 3-6, 1%; Pieces 8-9, 2-3%; 0.5-4 mm; 100% subhedral; totally altered to chlorite and minor pyrite. Clinopyroxene - 1%, 1-2 mm, subhedral (elongated crystals, laths), fresh.
GROUNDMASS: Fine grained, finer toward the base in Piece 9. COLOR: Dark gray. VESICLES: Nonvesicular. STRUCTURE: Massive. ALTERATION: Generally slightly altered, olivine totally replaced by chlorite and minor pyrite (up to 1 mm). VEINS/FRACTURES: 1-2%, 0.3 mm filled with chlorite; 0.5-1 mm filled with mainly clay minerals and
subordinate chlorite (+ anhydrite?). Anhydrite on fracture surface of Piece 8. No halos.
UNIT 158: MODERATELY TO HIGHLY PLAGIOCLASE-OLIVINE-CLINOPYROXENE PHYRIC BASALT Pieces 10-13
CONTACTS: None. PHENOCRYSTS: Generally homogeneous distribution; patchy distribution of olivine, occurs in single crystals.
Plagioclase - 5-7%; 1-5 mm; euhedral, tabular laths (<1-mm thick); fresh. Olivine - 2-3%; 0.5-1.5 mm; subhedral, totally altered to chlorite and pyrite. Clinopyroxene - 1-2%; 2-5 mm; subhedral or elongated crystals laths; fresh.
GROUNDMASS: Very fine grained (possibly slightly coarser toward bottom, Piece 13). COLOR: Dark gray. VESICLES: Nonvesicular. STRUCTURE: Massive. ALTERATION: Generally slightly altered, olivine totally replaced by chlorite and pyrite (<1 mm); pyrite on fracture
surface of Piece 13. VEINS/FRACTURES: 1%, 0.2 mm, horizontal and vertical fractures filled with clay minerals, 2%, <0.2 mm, 45°
fracture filled with chlorite; <0.2 mm, 2-3 mm lighter color alteration halo to both sides of fracture. Piece 11 - <0.2 mm, filled with chlorite, dark alteration halo 2-mm wide to each side of fracture. Piece 13 - empty horizontal and vertical fractures.
UNIT 159: APHYRIC BASALT Pieces 14-16
CONTACTS: None. PHENOCRYSTS: None. GROUNDMASS: Uniformly very fine grained. COLOR: Dark gray. VESICLES: Nonvesicular. STRUCTURE: Massive. ALTERATION: Slightly altered. VEINS/FRACTURES: Piece 15 - one prominent vein (<0.5%, <0.2 mm) filled with chloritef?) and clay
minerals(?); light greenish gray halo (0.5 mm) of both sides of fracture; conjugate shears, 1st and 2nd order, filled with colorless mineral (anhydrite?).
144-1
191

504B-145R-1
UNIT 160: MODERATELY CLINOPYROXENE-PLAGIOCLASE-OLIVINE PHYRIC BASALT
Pieces 1-15
CONTACTS: None. PHENOCRYSTS: Varying distribution throughout the unit, increasing phenocryst content 5-15% between Pieces
6-13B, all other pieces 5% uniform distribution, zonation in some crystals. Plagioclase - 1-3%, 0.5-3 mm, subhedral to euhedral, fresh. Olivine - 1-2%, 0.5-3 mm, subhedral, totally altered, altered to chlorite, pyrite, talc(?), mixed layer silicates, hematite in five fractures in Pieces 9B and 13A, layered relationship with chlorite forming center, talc and mixed layer/ silicates forming rim. Oinopyroxene - 2-5%; 1-10 mm; prismatic crystals, subhedral to euhedral; fresh.
GROUNDMASS: Uniformly medium grained. COLOR: Dark gray. VESICLES: None. STRUCTURE: Massive. ALTERATION: Slightly altered. Light green alteration halos, Pieces 1, 14A, and 14B up to 4 cm wide; olivine
altered as described above. VEINS/FRACTURES: Pieces 3 and 14B, zeolites(?) on outer fracture surface.
Piece 6: one prominant fracture 2 mm wide, layered, filled first with zeolite (rim) followed by chlorite and chalcopyrite (center); dark green alteration halo 3-4 mm with light green alteration halo =0.8-1 cm. Piece 15: fracture 2-mm wide, layered, filled with zeolite first (rim) followed by chalcopyrite; 4 mm dark green alteration halo, horizontal to subhorizontal fracture, minor vertical to subvertical, partly filled with clay minerals(?).
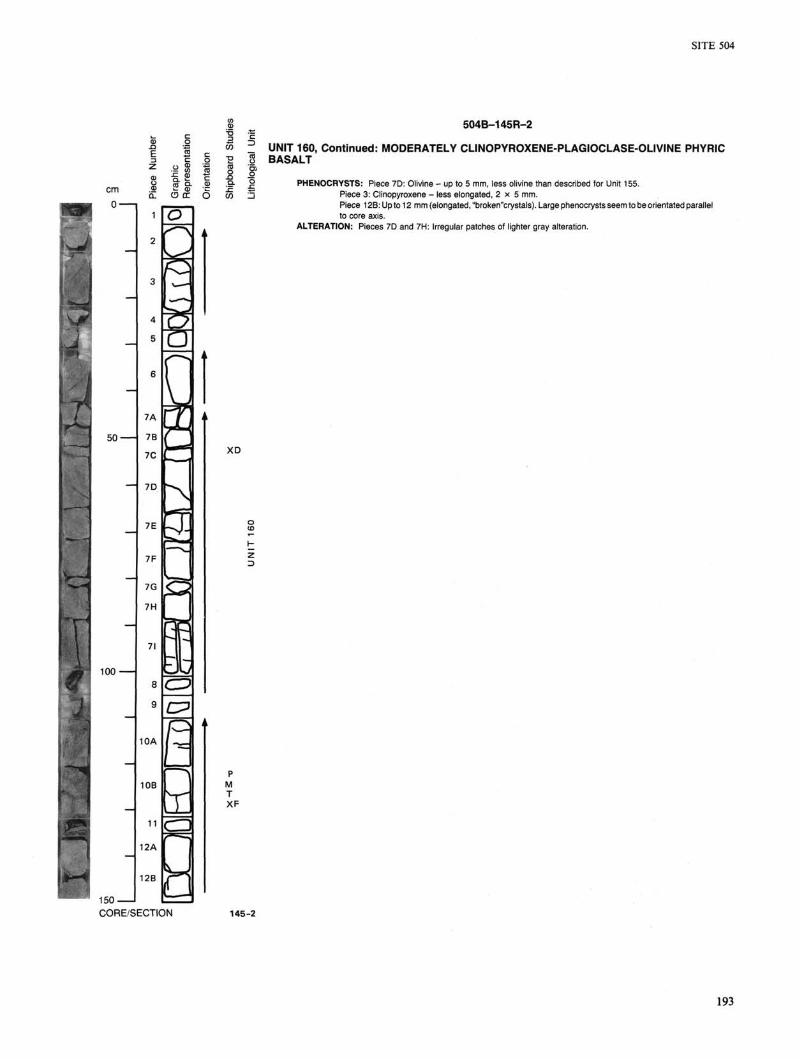
SITE 504
504B-145R-2
II cm ■ 0-
O 0C O
—
50
■:: 3 ■'■:
100
lr~•*
7F
R
10A
10B
C 3
CD
12B T"""1*
150 CORE/SECTION
UNIT 160, Continued: MODERATELY CLINOPYROXENE-PLAGIOCLASE-OLIVINE PHYRIC BASALT
PHENOCRYSTS: Piece 7D: Olivine - up to 5 mm, less olivine than described for Unit 155. Piece 3: Clinopyroxene - less elongated, 2 x 5 mm. Piece 12B: Up to 12 mm (elongated, "broken"crystals). Large phenocrysts seem to be orientated parallel to core axis.
ALTERATION: Pieces 7D and 7H: Irregular patches of lighter gray alteration.
XD
P M T XF
145-2
193
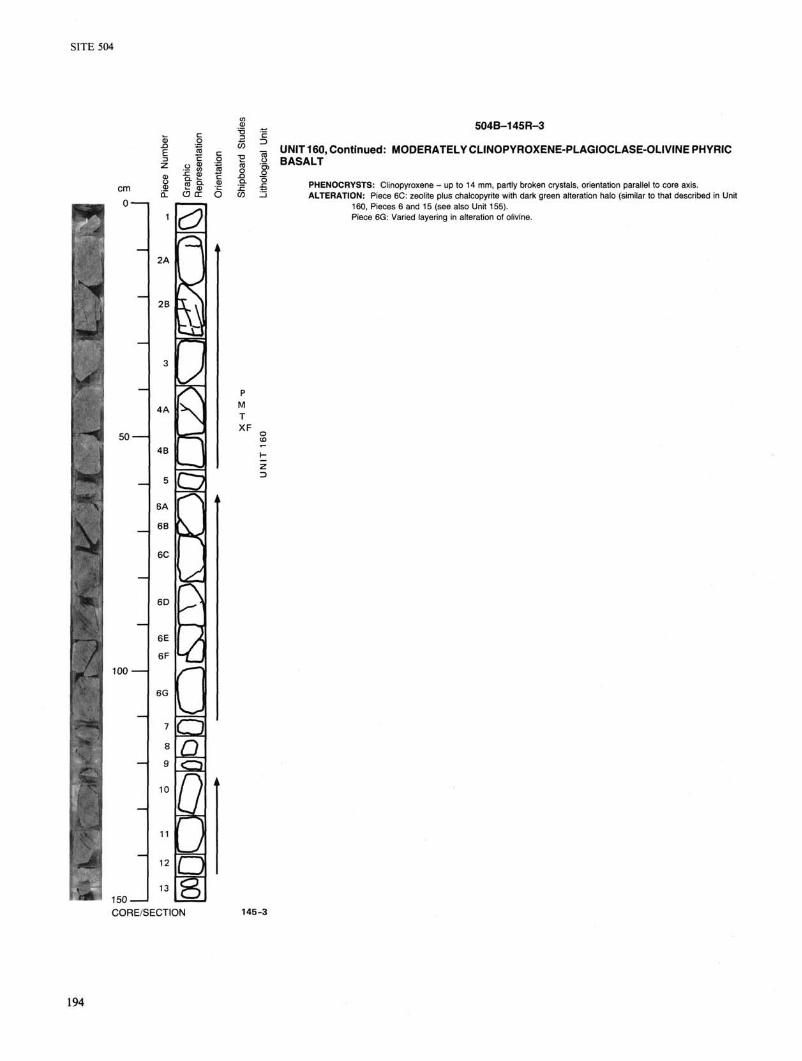
SITE 504
504B-145R-3
cm 0 -
£ o
£ -c £
50
100
2B
4A
6C
6D
10
11
12
13
<3
150-CORE/SECTION
- UNIT 160, Continued: MODERATELYCLINOPYROXENE-PLAGIOCLASE-OLIVINEPHYRIC 2 BASALT p r-i
PHENOCRYSTS: Clinopyroxene - up to 14 mm, partly broken crystals, orientation parallel to core axis. ALTERATION: Piece 6C: zeolite plus chalcopyrite with dark green alteration halo (similar to that described in Unit
160, Pieces 6 and 15 (see also Unit 155). Piece 6G: Varied layering in alteration of olivine.
P M T XF
145-3
194
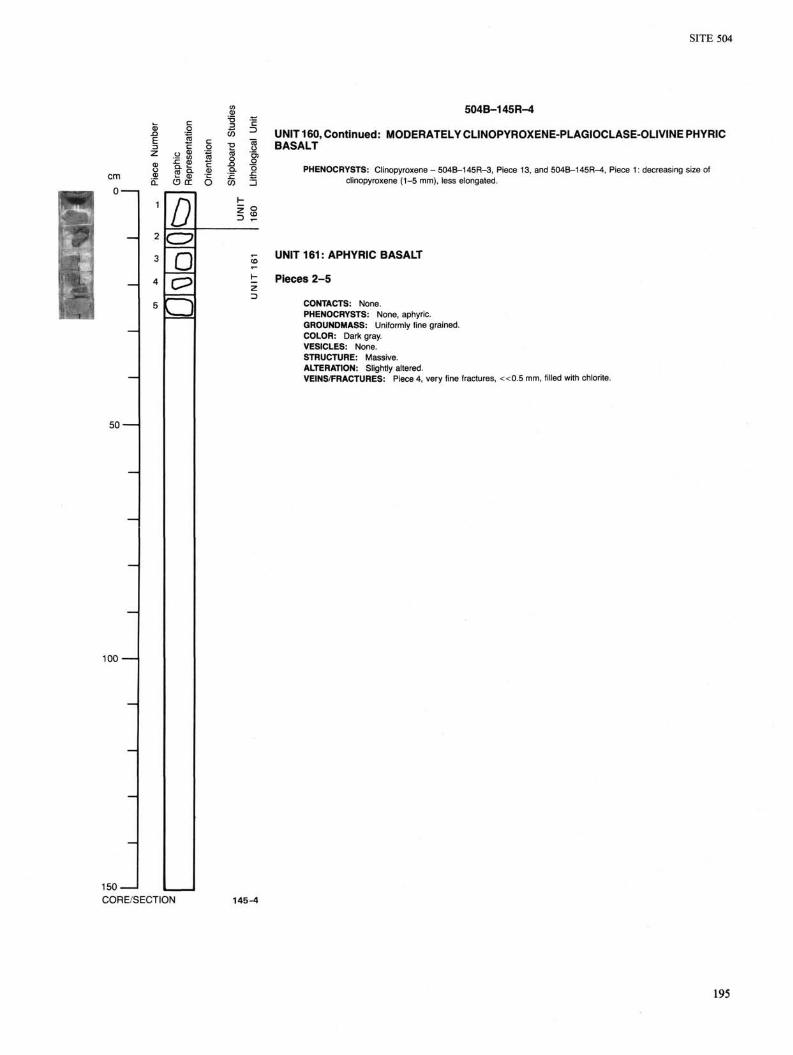
SITE 504
504B-145R-4
cm 0 -
2 g-o cc
1
:-i-;.. . , S
50-
100
_
D C O D
150-CORE/SECTION
6 w 5
i IS
UNIT 160, Continued: MODERATELY CLINOPYROXENE-PLAGIOCLASE-OLIVINE PHYRIC BASALT
PHENOCRYSTS: Clinopyroxene - 504B-145R-3, Piece 13, and 504B-145R-4, Piece 1: decreasing size of clinopyroxene (1-5 mm), less elongated.
UNIT 161: APHYRIC BASALT
Pieces 2-5
CONTACTS: None. PHENOCRYSTS: None, aphyric. GROUNDMASS: Uniformly fine grained. COLOR: Dark gray. VESICLES: None. STRUCTURE: Massive. ALTERATION: Slightly altered. VEINS/FRACTURES: Piece 4, very fine fractures, « 0 . 5 mm, filled with chlorite.
145-4
195
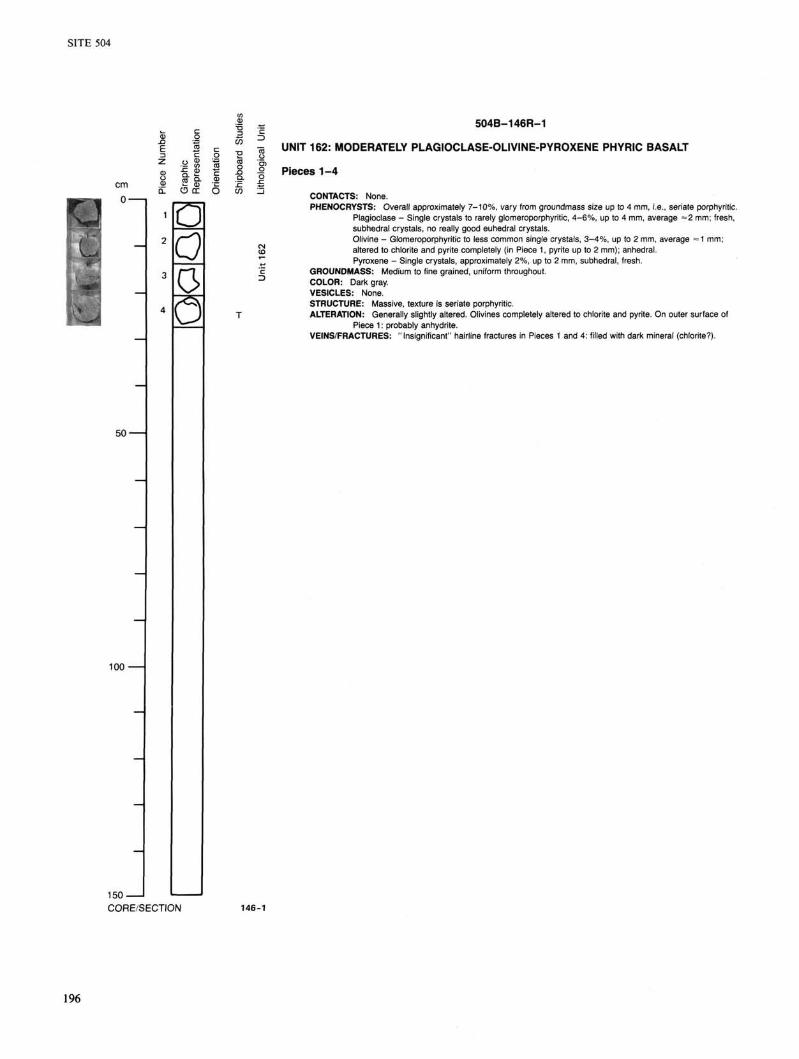
504B-146R-1
UNIT 162: MODERATELY PLAGIOCLASE-OLIVINE-PYROXENE PHYRIC BASALT
Pieces 1-4
CONTACTS: None. PHENOCRYSTS: Overall approximately 7-10%, vary from groundmass size up to 4 mm, i.e., seriate porphyritic.
Plagioclase - Single crystals to rarely glomeroporphyritic, 4 -6%, up to 4 mm, average ~2 mm; fresh, subhedral crystals, no really good euhedral crystals. Olivine - Glomeroporphyritic to less common single crystals, 3-4%, up to 2 mm, average =1 mm; altered to chlorite and pyrite completely (in Piece 1, pyrite up to 2 mm); anhedral. Pyroxene - Single crystals, approximately 2%, up to 2 mm, subhedral, fresh.
GROUNDMASS: Medium to fine grained, uniform throughout. COLOR: Dark gray. VESICLES: None. STRUCTURE: Massive, texture is seriate porphyritic. ALTERATION: Generally slightly altered. Olivines completely altered to chlorite and pyrite. On outer surface of
Piece 1: probably anhydrite. VEINS/FRACTURES: "Insignificant" hairline fractures in Pieces 1 and 4: filled with dark mineral (chlorite?).
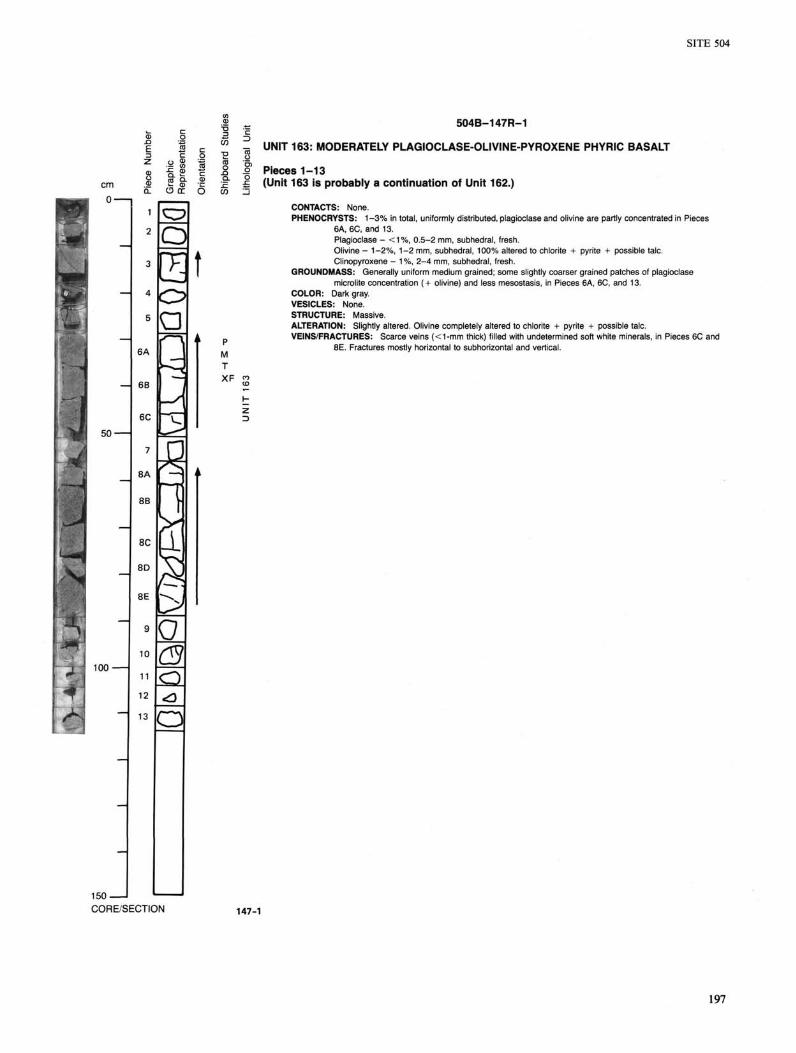
SITE 504
_ 504B-147R-1 c
Z UNIT 163: MODERATELY PLAGIOCLASE-OLIVINE-PYROXENE PHYRIC BASALT
£ sz e
Pieces 1-13 (Unit 163 is probably a continuation of Unit 162.)
6A
— 6B
50-
4 100
8C
8D
8E
10
13
cr?
a
6C V^
a
o SD.
O
150-CORE/SECTION
P M T
CONTACTS: None. PHENOCRYSTS: 1-3% in total, uniformly distributed, plagioclase and olivine are partly concentrated in Pieces
6A, 6C, and 13. Plagioclase - < 1 % , 0.5-2 mm, subhedral, fresh. Olivine - 1-2%, 1-2 mm, subhedral, 100% altered to chlorite + pyrite + possible talc. Clinopyroxene - 1 %, 2-4 mm, subhedral, fresh.
GROUNDMASS: Generally uniform medium grained; some slightly coarser grained patches of plagioclase microlite concentration (+ olivine) and less mesostasis, in Pieces 6A, 6C, and 13.
COLOR: Dark gray. VESICLES: None. STRUCTURE: Massive. ALTERATION: Slightly altered. Olivine completely altered to chlorite + pyrite + possible talc. VEINS/FRACTURES: Scarce veins (<1-mm thick) filled with undetermined soft white minerals, in Pieces 6C and
8E. Fractures mostly horizontal to subhorizontal and vertical.
147-1
197
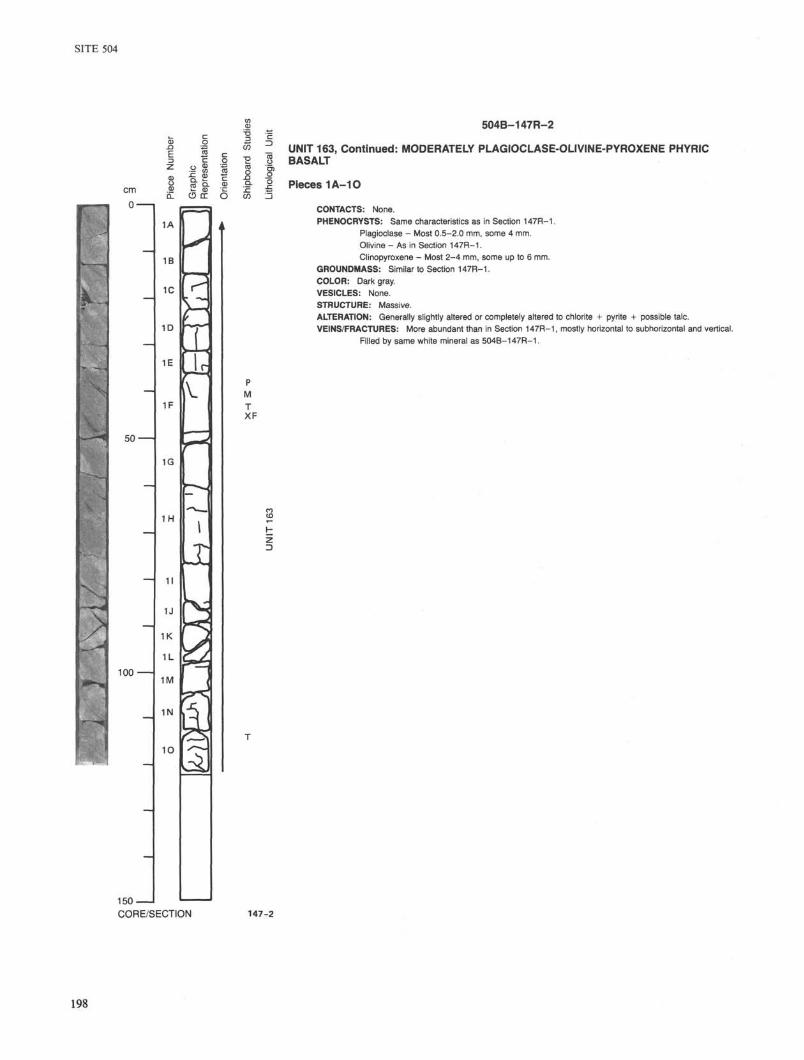
SITE 504
504B-147R-2
■y. '%■ '"■•• i 1
■'V:V.
■r;;v
cm 0-
c is c 3 C O » -g.fi C 8 5& -g Q. O CC O
50'
100
1E
1F
1G
1 H
V
r —
1J
1L
1M
10
1 5 0 -CORE/SECTION
UNIT 163, Continued: MODERATELY PLAGIOCLASE-OLIVINE-PYROXENE PHYRIC BASALT
Pieces 1A-10
CONTACTS: None. PHENOCRYSTS: Same characteristics as in Section 147R-1.
Plagioclase - Most 0.5-2.0 mm, some 4 mm. Olivine - As in Section 147R-1. Clinopyroxene - Most 2-4 mm, some up to 6 mm.
GROUNDMASS: Similar to Section 147R-1. COLOR: Dark gray. VESICLES: None. STRUCTURE: Massive. ALTERATION: Generally slightly altered or completely altered to chlorite + pyrite + possible talc. VEINS/FRACTURES: More abundant than in Section 147R-1, mostly horizontal to subhorizontal and vertical.
Filled by same white mineral as 504B-147R-1.
P M T XF
147-2
198
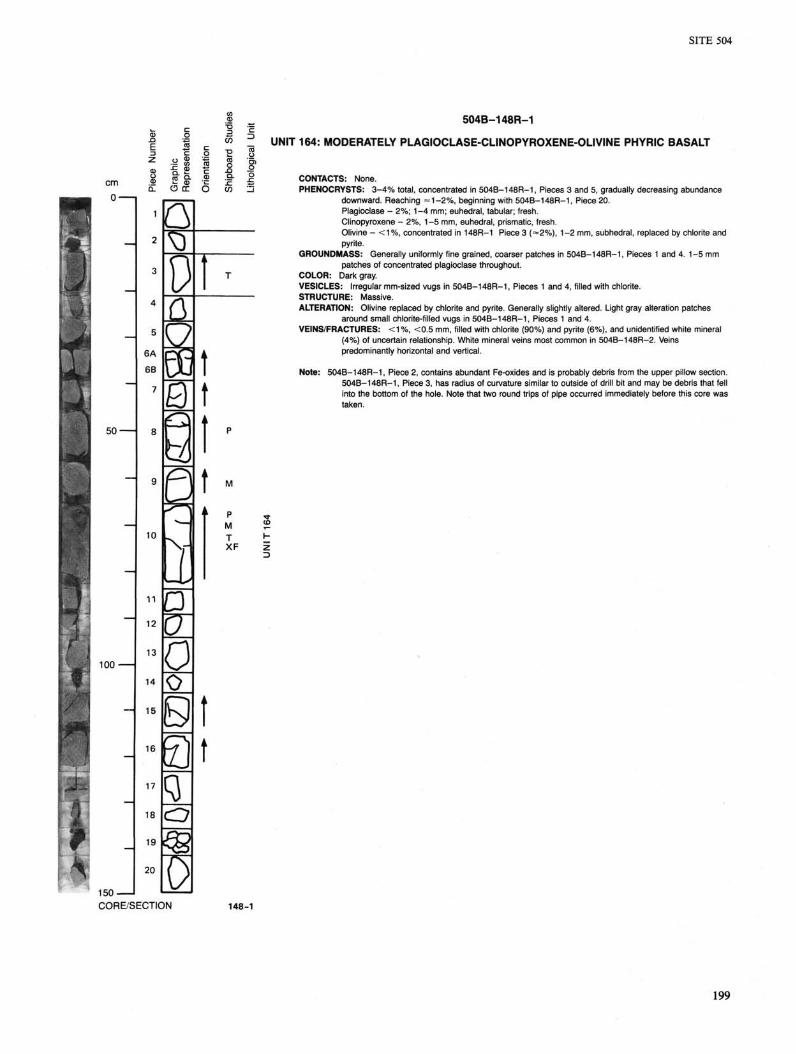
SITE 504
504B-148R-1
UNIT 164: MODERATELY PLAGIOCLASE-CLINOPYROXENE-OLIVINE PHYRIC BASALT
cm 0 -
50'
100
V
\ 150-CORE/SECTION
CL
1
2
3
4
5
6A
6B
7
8
9
.
11
12
13
14
15
O DC
^
0 a 2 03 0 0
3 0 0 O 0 s
"0 17
18
19
20
q o «
0
O CO Z3
T
t t t '
M
a P
M
X F
!
t
CONTACTS: None. PHENOCRYSTS: 3-4% total, concentrated in 504B-148R-1, Pieces 3 and 5, gradually decreasing abundance
downward. Reaching =1-2%, beginning with 504B-148R-1, Piece 20. Plagioclase - 2%; 1-4 mm; euhedral, tabular; fresh. Clinopyroxene - 2%, 1-5 mm, euhedral, prismatic, fresh. Olivine - <1%, concentrated in 148R-1 Piece 3 (=2%), 1-2 mm, subhedral, replaced by chlorite and pyrite.
GROUNDMASS: Generally uniformly fine grained, coarser patches in 504B-148R-1, Pieces 1 and 4. 1-5 mm patches of concentrated plagioclase throughout.
COLOR: Dark gray. VESICLES: Irregular mm-sized vugs in 504B-148R-1, Pieces 1 and 4, filled with chlorite. STRUCTURE: Massive. ALTERATION: Olivine replaced by chlorite and pyrite. Generally slightly altered. Light gray alteration patches
around small chlorite-filled vugs in 504B-148R-1, Pieces 1 and 4. VEINS/FRACTURES: <1 %, <0.5 mm, filled with chlorite (90%) and pyrite (6%), and unidentified white mineral
(4%) of uncertain relationship. White mineral veins most common in 504B-148R-2. Veins predominantly horizontal and vertical.
Note: 504B-148R-1, Piece 2, contains abundant Fe-oxides and is probably debris from the upper pillow section. 504B-148R-1, Piece 3, has radius of curvature similar to outside of drill bit and may be debris that fell into the bottom of the hole. Note that two round trips of pipe occurred immediately before this core was taken.
148-1
199
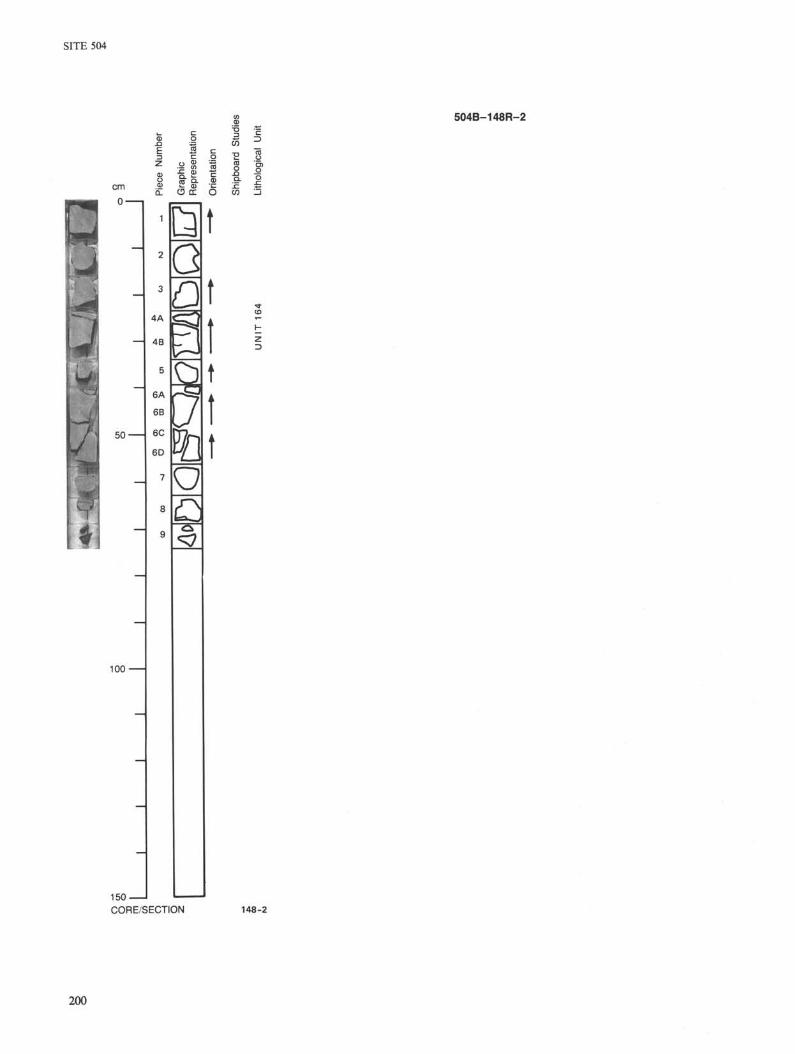
SITE 504
504B-148R-2
CO O
ii C3
50'
100
4A
4B
6A
6B
6C
6D
G
St *3
o a
t
t
150-CORE/SECTION 148-2
200

SITE 504
504B-149R-1
S 0 'rh
UNIT 164, Continued: SPARSELY PLAGIOCLASE-CLINOPYROXENE-OLIVINE PHYRIC BASALT
50
100
cc: O
11
13A
13B
_ 15 OO
16B
16C
^P
& x> QD X
150-CORE/SECTION
§ £ 504B-148R-1, Piece 4, to 504B-149R-2, Piece 7 CO H
CONTACTS: None. PHENOCRYSTS: =1 -2% total, homogeneous distribution. < 1 % to aphyric in 504B-149R-2, Pieces 6 and 7.
Plagioclase - < 1 % , 1-4 mm, euhedral, tabular, fresh. Clinopyroxene - = 1 % , 1-6 mm, euhedral, prismatic, fresh. Olivine - <0.5%, 0.5-2 mm, subhedral, replaced by chlorite and pyrite.
GROUNDMASS: Uniformly fine grained, becoming very fine grained in 504B-149R-2, Pieces 6 and 7. COLOR: Dark gray. VESICLES: Absent. STRUCTURE: Massive. ALTERATION: Generally slightly altered; olivine altered to chlorite and pyrite. Alteration halos in 504B-149R-2,
Pieces 6 and 7 (see below). VEINS/FRACTURES: < 1 %, <0.5 mm (except 504B-149R-2, Pieces 6 and 7). Numerous subhorizontal to horizontal
and subvertical to vertical fractures. Open fractures mainly filled with white mineral. Mineralized with chlorite and pyrite. 504B-149R-1, Piece 7: White (anhydrite?) mineral in vein plus chlorite. 504B-149R-2, Piece 2B: Sulfides on broken surface. Light greenish gray. 504B-149R-2, Pieces 6 and 7: < 1 mm wide, = 1 % of rock, alteration in halos. 1.5-mm-wide veins filled by chlorite (rim) with whitish anhydrite mineral (center)/ zeolites. Piece 6: Late phase 1 -mm-wide chlorite-filled vein plus pyrite (no halo) crosscuts with other veins and halos.
P M T XF
149-1
201
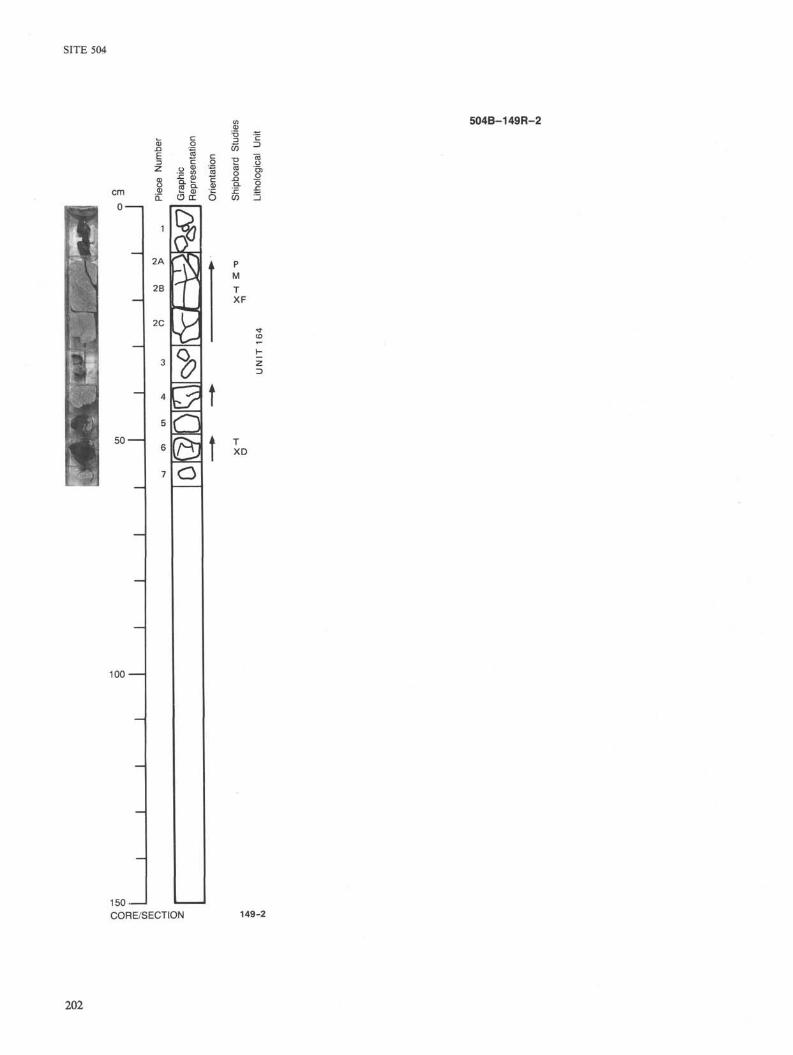
SITE 504
504B-149R-2
CO O
y a »
100
CD
h.
1
2A
2B
2C
3
4
5
6
7
E 0) O CC
n O
p M T XF
T XD
150 CORE/SECTION 149-2
202
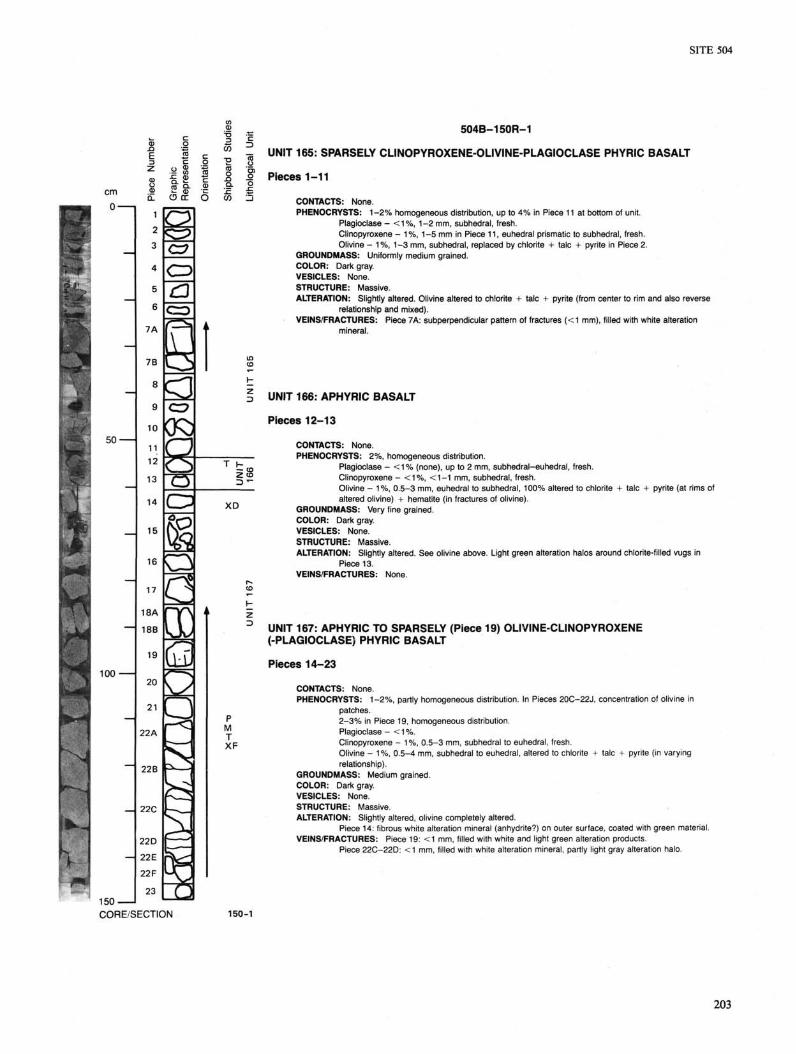
SITE 504
is o cm
0 -ii s
50
1
2
3
4
5
6
7A
7B
8
9
10
11 12
13
14
15
16
17
18A
18B
19
20
21
22A
22B
22C
22D
22E
22 F
23 150 CORE/SECTION
o ^
0 £2
8
100
<r? CD a
^5 o <§ o £2 DC S3 Q o
X D
P M T XF
504B-150R-1
UNIT 165: SPARSELY CLINOPYROXENE-OLIVINE-PLAGIOCLASE PHYRIC BASALT
Pieces 1-11
CONTACTS: None. PHENOCRYSTS: 1 - 2 % homogeneous distribution, up to 4% in Piece 11 at bottom of unit.
Plagioclase - < 1 % , 1-2 mm, subhedral, fresh. Clinopyroxene - 1%, 1-5 mm in Piece 11, euhedral prismatic to subhedral, fresh. Olivine - 1%, 1-3 mm, subhedral, replaced by chlorite + talc + pyrite in Piece 2.
GROUNDMASS: Uniformly medium grained. COLOR: Dark gray. VESICLES: None. STRUCTURE: Massive. ALTERATION: Slightly altered. Olivine altered to chlorite + talc + pyrite (from center to rim and also reverse
relationship and mixed). VEINS/FRACTURES: Piece 7A: subperpendicular pattern of fractures (<1 mm), filled with white alteration
mineral.
UNIT 166: APHYRIC BASALT
Pieces 12-13
CONTACTS: None. PHENOCRYSTS: 2%, homogeneous distribution.
Plagioclase - < 1 % (none), up to 2 mm, subhedral-euhedral, fresh. Clinopyroxene - < 1 % , < 1 - 1 mm, subhedral, fresh. Olivine - 1%, 0.5-3 mm, euhedral to subhedral, 100% altered to chlorite + talc + pyrite (at rims of altered olivine) + hematite (in fractures of olivine).
GROUNDMASS: Very fine grained. COLOR: Dark gray. VESICLES: None. STRUCTURE: Massive. ALTERATION: Slightly altered. See olivine above. Light green alteration halos around chlorite-filled vugs in
Piece 13. VEINS/FRACTURES: None
UNIT 167: APHYRIC TO SPARSELY (Piece 19) OLIVINE-CLINOPYROXENE (-PLAGIOCLASE) PHYRIC BASALT
Pieces 14-23
CONTACTS: None. PHENOCRYSTS: 1-2%, partly homogeneous distribution. In Pieces 20C-22J, concentration of olivine in
patches. 2 -3% in Piece 19, homogeneous distribution. Plagioclase - < 1 %. Clinopyroxene - 1%, 0.5-3 mm, subhedral to euhedral, fresh. Olivine - 1%, 0.5-4 mm, subhedral to euhedral, altered to chlorite + talc + pyrite (in varying relationship).
GROUNDMASS: Medium grained. COLOR: Dark gray. VESICLES: None. STRUCTURE: Massive. ALTERATION: Slightly altered, olivine completely altered.
Piece 14: fibrous white alteration mineral (anhydrite?) on outer surface, coated with green material. VEINS/FRACTURES: Piece 19: < 1 mm, filled with white and light green alteration products.
Piece 22C-22D: <1 mm, filled with white alteration mineral, partly light gray alteration halo.
150-1
203

504B-151R-1
UNIT 168: SPARSELY CLINOPYROXENE-OLIVINE PHYRIC BASALT
Pieces 1-8
CONTACTS: None observed. PHENOCRYSTS: =3%, fairly uniformly distributed, but apparently more in Pieces 1-3.
Plagioclase - None. Olivine - 1.5%, 0.2-1 mm, euhedral single crystals replaced by chlorite ± pyrite. Clinopyroxene - 1.5%, 1-4 mm, euhedral prismatic crystals (single), fresh.
GROUNDMASS: Uniformly fine grained with mm-sized patches of feldspar (more clearly in Piece 8). COLOR: Uniformly dark gray. VESICLES: None. STRUCTURE: Massive. ALTERATION: Slightly altered; olivine totally replaced by chlorite/pyrite. VEINS/FRACTURES: In Pieces 1 and 8 only: rare in Piece 1: horizontal hairline vein filled with unidentified white
mineral (quartz?). In Piece 8, hairline open fracture and hairline veins (quartz?). No alteration halos.

SITE 504
% %?
50'
/ %> 100
« ?. .33
1 5 0 -CORE/SECTION
CD Q_
1
2
3
4
5
6
7
8
9
10
11
12
13
14
15
16
17
18
19
20
2 a> O DC
9
0 0 o Q 0 c? c 8* 6
V c^ o a o CD O ft
Ori
t
I
Shi
" 17
0 Li
th
z D
T en
h z D
r~
I-Z
h-Z D
H Z
H Z
CUTTING 0 174
t in
H
3 P XF
504B-152R-1
UNIT 169: SPARSELY PLAGIOCLASE-OLIVINE PHYRIC BASALT
Pieces 1-2
CONTACTS: Chilled against Unit 170. Dip = 70°. Azimuth = 045°.
PHENOCRYSTS: < 1 % total, concentrated at contact; mm-sized xenoliths of Unit 170 included in Piece 2 (working half only). Plagioclase - < 1 % , 0.2-0.5 mm, euhedral, fresh. Olivine - < 1 % , 0.2-0.4 mm, euhedral, replaced by chlorite.
GROUND-MASS: Very fine grained throughout. COLOR: Dark gray grading to light gray within 5 mm of contact. VESICLES: None. STRUCTURE: Massive. ALTERATION: Slightly altered. Olivine replaced by chlorite. 0.5 mm light gray alteration halos around veinlets.
White -» light gray alteration within 5 mm of contact, grades -» dark gray. VEINS/FRACTURES: < 1 % of unit, =0.2-mm wide, filled with chlorite (90%) plus white mineral (10%). No
relationship observed.
UNIT 170: MODERATELY PLAGIOCLASE-OLIVINE PHYRIC BASALT
Pieces 2-3
CONTACTS: Unit 169 chilled against Unit 170. Therefore, relationships as above. PHENOCRYSTS: 5% total, uniform distribution.
Plagioclase - 2-3%, 2-3 mm, rounded-subhedral. Olivine - 2-3%, 0.8-3 mm, euhedral, replaced by chlorite. No apparent pyroxene.
GROUNDMASS: Fine to medium grained, patchy grain size. Variation picked out by alteration. COLOR: Dark greenish gray. VESICLES: None. STRUCTURE: Massive. ALTERATION: Moderately to strongly altered. Olivine replaced by chlorite. Common disseminated pyrite. Patchy
chloritization results in "graphic" appearance, giving each a more coarse-grained look than it actually has.
VEINS/FRACTURES: 1 % vertical chlorite veins in Piece 2, 0.5-1-mm wide. 1 % white prismatic mineral (laumontite) on fracture surfaces.
UNIT 171: MODERATELY PLAGIOCLASE-CLINOPYROXENE-OLIVINE PHYRIC BASALT
Pieces 4-6
CONTACTS: None visible, but Piece 6 grades to very fine grained, probably chilled zone. PHENOCRYSTS: 3% to 5%, uniformly distributed, single crystals.
Plagioclase - 2%, 0.5-1 mm, subhedral, fresh. Olivine - 1-2%, 0.5-1 mm, subhedral, replaced by chlorite and trace pyrite. Clinopyroxene - 2%, 1-5 mm, euhedral prismatic, fresh.
GROUNDMASS: Very fine grained throughout, finer at edge of Piece 6. COLOR: Uniformly dark gray, except for chilled zone of Piece 6. VESICLES: None. STRUCTURE: Massive. ALTERATION: Slightly altered throughout, olivine replaced by chlorite. VEINS/FRACTURES: One hairline fracture filled with unidentified white mineral in Piece 6.
Piece 5 has =0.5 mm chlorite vein with 1-2-mm-wide lighter gray alteration halo.
152-1
205
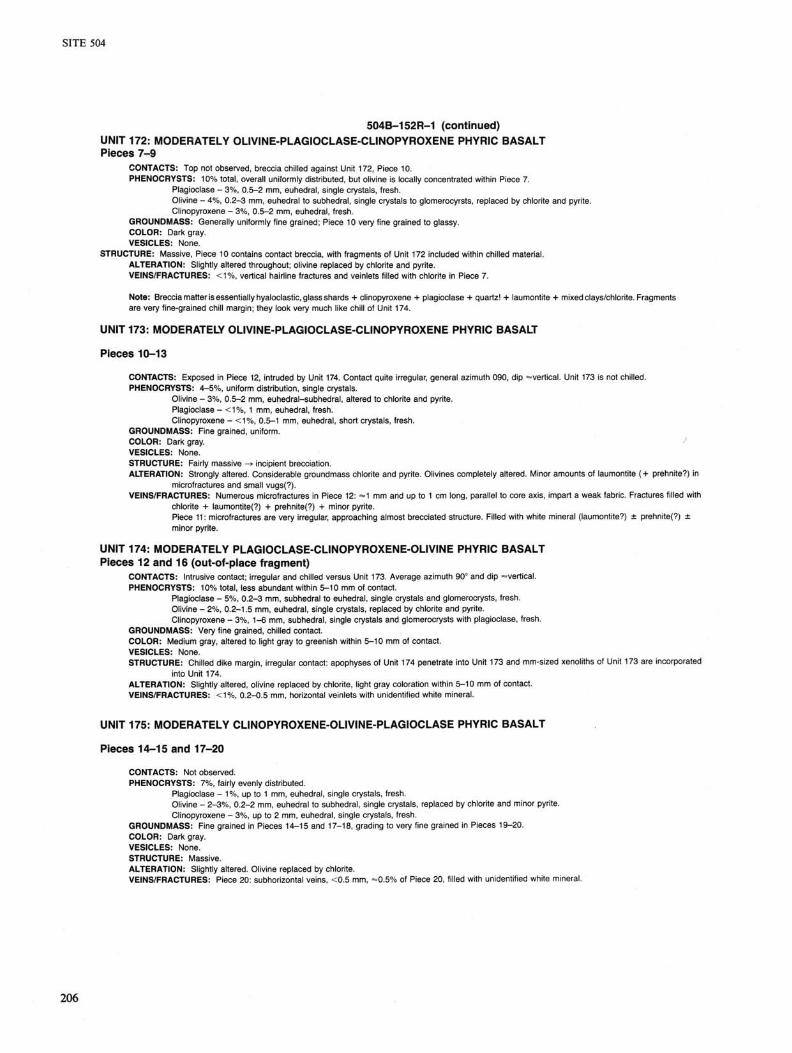
504B-152R-1 (continued) UNIT 172: MODERATELY OLIVINE-PLAGIOCLASE-CLINOPYROXENE PHYRIC BASALT Pieces 7-9
CONTACTS: Top not observed, breccia chilled against Unit 172, Piece 10. PHENOCRYSTS: 10% total, overall uniformly distributed, but olivine is locally concentrated within Piece 7.
Plagioclase - 3%, 0.5-2 mm, euhedral, single crystals, fresh. Olivine - 4%, 0.2-3 mm, euhedral to subhedral, single crystals to glomerocyrsts, replaced by chlorite and pyrite. Clinopyroxene - 3%, 0.5-2 mm, euhedral, fresh.
GROUNDMASS: Generally uniformly fine grained; Piece 10 very fine grained to glassy. COLOR: Dark gray. VESICLES: None.
STRUCTURE: Massive, Piece 10 contains contact breccia, with fragments of Unit 172 included within chilled material. ALTERATION: Slightly altered throughout; olivine replaced by chlorite and pyrite. VEINS/FRACTURES: < 1 % , vertical hairline fractures and veinlets filled with chlorite in Piece 7.
Note: Breccia matter is essentially hyaloclastic, glass shards + clinopyroxene + plagioclase + quartz! + laumontite + mixed clays/chlorite. Fragments are very fine-grained chill margin; they look very much like chill of Unit 174.
UNIT 173: MODERATELY OLIVINE-PLAGIOCLASE-CLINOPYROXENE PHYRIC BASALT
Pieces 10-13
CONTACTS: Exposed in Piece 12, intruded by Unit 174. Contact quite irregular, general azimuth 090, dip ^vertical. Unit 173 is not chilled. PHENOCRYSTS: 4-5%, uniform distribution, single crystals.
Olivine - 3%, 0.5-2 mm, euhedral-subhedral, altered to chlorite and pyrite. Plagioclase - < 1 % , 1 mm, euhedral, fresh. Clinopyroxene - < 1 % , 0.5-1 mm, euhedral, short crystals, fresh.
GROUNDMASS: Fine grained, uniform. COLOR: Dark gray. VESICLES: None. STRUCTURE: Fairly massive —> incipient brecciation. ALTERATION: Strongly altered. Considerable groundmass chlorite and pyrite. Olivines completely altered. Minor amounts of laumontite (+ prehnite?) in
microfractures and small vugs(?). VEINS/FRACTURES: Numerous microfractures in Piece 12: -»1 mm and up to 1 cm long, parallel to core axis, impart a weak fabric. Fractures filled with
chlorite + laumontite(?) + prehnite(?) + minor pyrite. Piece 11: microfractures are very irregular, approaching almost brecciated structure. Filled with white mineral (laumontite?) ± prehnite(?) ± minor pyrite.
UNIT 174: MODERATELY PLAGIOCLASE-CLINOPYROXENE-OLIVINE PHYRIC BASALT Pieces 12 and 16 (out-of-place fragment)
CONTACTS: Intrusive contact; irregular and chilled versus Unit 173. Average azimuth 90° and dip ^vertical. PHENOCRYSTS: 10% total, less abundant within 5-10 mm of contact.
Plagioclase - 5%, 0.2-3 mm, subhedral to euhedral, single crystals and glomerocrysts, fresh. Olivine - 2%, 0.2-1.5 mm, euhedral, single crystals, replaced by chlorite and pyrite. Clinopyroxene - 3%, 1-6 mm, subhedral, single crystals and glomerocrysts with plagioclase, fresh.
GROUNDMASS: Very fine grained, chilled contact. COLOR: Medium gray, altered to light gray to greenish within 5-10 mm of contact. VESICLES: None. STRUCTURE: Chilled dike margin, irregular contact: apophyses of Unit 174 penetrate into Unit 173 and mm-sized xenoliths of Unit 173 are incorporated
into Unit 174. ALTERATION: Slightly altered, olivine replaced by chlorite, light gray coloration within 5-10 mm of contact. VEINS/FRACTURES: < 1 % , 0.2-0.5 mm, horizontal veinlets with unidentified white mineral.
UNIT 175: MODERATELY CLINOPYROXENE-OLIVINE-PLAGIOCLASE PHYRIC BASALT
Pieces 14-15 and 17-20
CONTACTS: Not observed. PHENOCRYSTS: 7%, fairly evenly distributed.
Plagioclase - 1%, up to 1 mm, euhedral, single crystals, fresh. Olivine - 2-3%, 0.2-2 mm, euhedral to subhedral, single crystals, replaced by chlorite and minor pyrite. Clinopyroxene - 3%, up to 2 mm, euhedral, single crystals, fresh.
GROUNDMASS: Fine grained in Pieces 14-15 and 17-18, grading to very fine grained in Pieces 19-20. COLOR: Dark gray. VESICLES: None. STRUCTURE: Massive. ALTERATION: Slightly altered. Olivine replaced by chlorite. VEINS/FRACTURES: Piece 20: subhorizontal veins, <0.5 mm, =0.5% of Piece 20, filled with unidentified white mineral.

SITE 504
cm 0-
ff
50
100
1
2
3
4
5A
5B
6A 6B
7
8
9A 9B
10
11A 11B
12A 12B
13
14
15
16
17
18
19
20A 20B
21
22
0 0 0 0 (ft 0fc Q o 00
Q a <3 0 0 O &
O 0 0 00 < %
0
504B-153R-1
UNIT 176: SPARSELY OLIVINE-CLINOPYROXENE-PLAGIOCLASE PHYRIC BASALT
153R-1, Pieces 1-22, and 153R-2, Pieces 1 to 15
CONTACTS: None. PHENOCRYSTS: 3% in 153R-2, Piece 14 and 6% in 153R-1, Piece 14; generally homogeneous, olivine shows
a less uniform distribution. Plagioclase - 1%, 0.5-1.5 mm, subhedral, fresh(?). Clinopyroxene - 1-2%, 1-8 mm, euhedral-subhedral (prismatic), fresh. Olivine - 1-3%, 0.5-2.5 mm, subhedral to euhedral, 100% altered to chlorite + mixed-layer clays + talc + pyrite.
GROUNDMASS: Throughout uniformly fine grained, becoming slightly finer grained toward bottom of core (153R-2, Pieces 13-15).
COLOR: Dark gray. VESICLES: Absent. STRUCTURE: Massive. ALTERATION: Slightly altered throughout. Olivine is totally altered by chlorite + mixed-layer clays + talc + pyrite
in varying abundance (but dominantly chlorite) and related patches (2-4 cm diameter <\>) of lighter greenish gray alteration color, e.g., 153R-1, Pieces 10 and 14, and 153R-2, Piece 1.
VEINS/FRACTURES: Mainly subvertical fractures, <0.2 mm, filled with chlorite + pyrite + laumontite, subhorizontal fractures are mainly filled with white mineral (laumontite?). Laumontite on fracture surfaces of 153R-1, Pieces 9A, 10, 13, and 17; and 153R-2, Piece 7.
XF T
150 CORE/SECTION 153-1
207
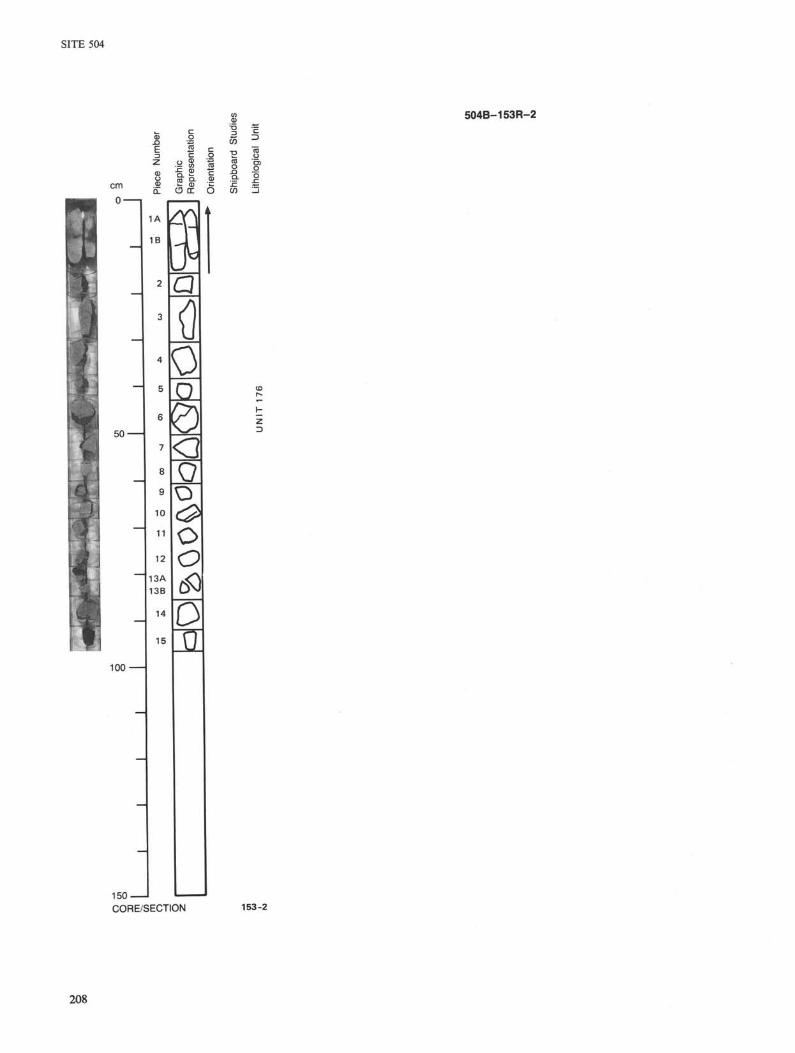
SITE 504
504B-153R-2
JS O
cm
0 -
£ -C S
1B
50'
i " i ^
100
10
11
12
14
15
150-CORE/SECTION 153-2
208
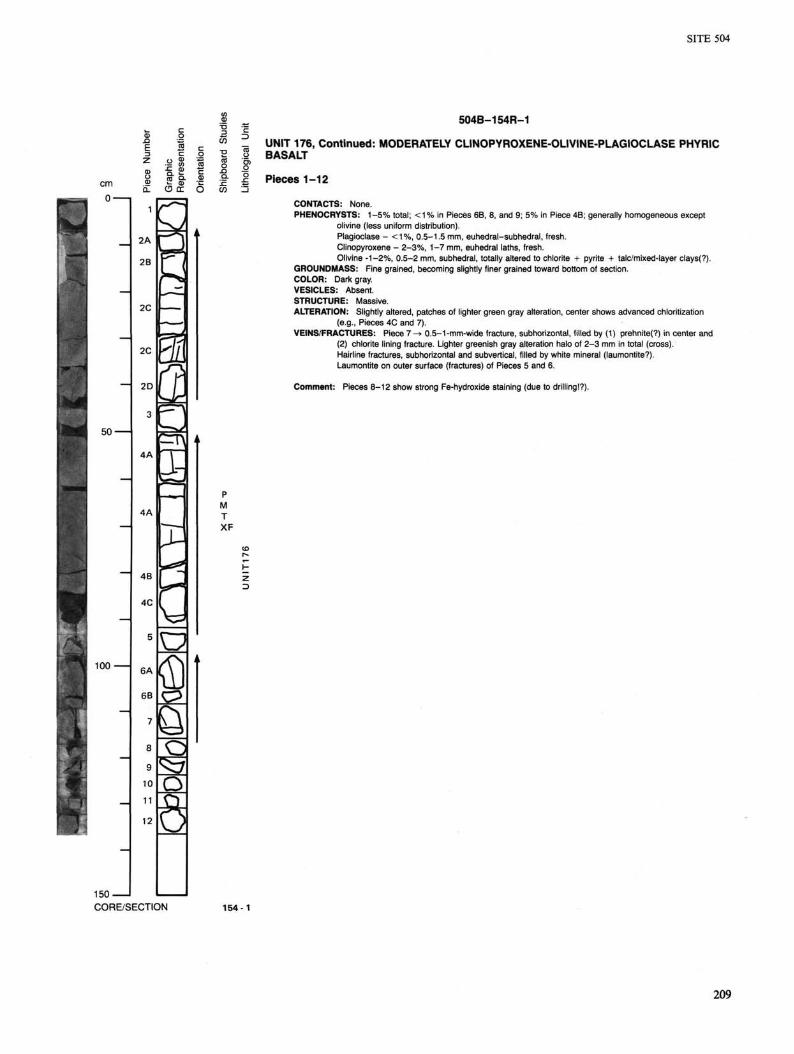
SITE 504
504B-154R-1
cm 0-
50-
100
iS o
If
2A
2B
2C
2C
2D
4A
4A
4B
4C
6A
6B
o El S2 6
■° Q
1 5 0 -CORE/SECTION
UNIT 176, Continued: MODERATELY CLINOPYROXENE-OLIVINE-PLAGIOCLASE PHYRIC BASALT
Pieces 1-12
CONTACTS: None. PHENOCRYSTS: 1-5% total; <1 % in Pieces 6B, 8, and 9; 5% in Piece 4B; generally homogeneous except
olivine (less uniform distribution). Plagioclase - <1%, 0.5-1.5 mm, euhedral-subhedral, fresh. Clinopyroxene - 2-3%, 1-7 mm, euhedral laths, fresh. Olivine -1-2%, 0.5-2 mm, subhedral, totally altered to chlorite + pyrite + talc/mixed-layer clays(?).
GROUNDMASS: Fine grained, becoming slightly finer grained toward bottom of section. COLOR: Dark gray. VESICLES: Absent. STRUCTURE: Massive. ALTERATION: Slightly altered, patches of lighter green gray alteration, center shows advanced chloritization
(e.g., Pieces 4C and 7). VEINS/FRACTURES: Piece 7 -> 0.5-1-mm-wide fracture, subhorizontal, filled by (1) prehnite(?) in center and
(2) chlorite lining fracture. Lighter greenish gray alteration halo of 2-3 mm in total (cross). Hairline fractures, subhorizontal and subvertical, filled by white mineral (laumontite?). Laumontite on outer surface (fractures) of Pieces 5 and 6.
Comment: Pieces 8-12 show strong Fe-hydroxide staining (due to drilling!?).
P M T XF
154-1
209

SITE 504
504B-155R-1
cm 0 -
-
50-
100
a>
D-
1
2
3
4
5 6
7A
7B
7C
7D
8
9
10
11
12
13
14
£ (D O DC
Q <^
a o Q Q
5 o « S- .8 £ J^ S
UNIT 176, Continued: MODERATELY CLINOPYROXENE-OLIVINE-PLAGIOCLASE PHYRIC BASALT
Pieces 1-14
CONTACTS: None observed. PHENOCRYSTS: 5% total, single crystals, uniformly distributed.
Plagioclase - 1%, 1-2 mm, subhedral, fresh. Olivine - 2%, 0.5-1 mm, subhedral, replaced by chlorite and pyrite. Clinopyroxene - 2%, 1-4 mm, euhedral, fresh.
GROUNDMASS: Uniformly fine grained. COLOR: Dark gray. VESICLES: Irregular mm-sized vugs filled with chlorite in Pieces 2 and 8. STRUCTURE: Massive. ALTERATION: Slightly altered. Olivine replaced by chlorite and pyrite; cm-sized light gray alteration halos around
chlorite-filled vugs in Pieces 2 and 8. VEINS/FRACTURES: Open horizontal hairline cracks, < 1 %, in Pieces 7B and 8. Similar vertical crack in
Piece 12. < 1 % fine veinlets (<0.5 mm) filled with chlorite and unidentified white mineral in Pieces 2, 7, 8, and 14. No relationship observed.
P T XF
1 5 0 -CORE/SECTION 155-1
210

SITE 504
cm 0 -
M
,
l\ F \
'-■'I
, :
M
50
100
(J Q. .5
C?
10
11
12
13
14
5 o o Q
IS £5 o
a
150 -CORE/SECTION
UNIT 178
Z3 < -
504B-156R-1
UNIT 177: APHYRIC TO SPARSELY PLAGIOCLASE-OLIVINE PHYRIC BASALT
Pieces 1-8 and 10-12
CONTACTS: Not observed. PHENOCRYSTS: 1 %, single crystals. Generally uniformly distributed, but plagioclase more abundant in
Piece 12. Plagioclase - 1 % , 0.2-1 mm, subhedral, fresh. Olivine - < 1 %, 0.2-0.5 mm, subhedral, replaced by chlorite. Clinopyroxene - None.
GROUNDMASS: Grading from very fine grained in Piece 1 to fine grained in Piece 12. COLOR: Gray to greenish gray. VESICLES: None. STRUCTURE: Massive. Close to chilled margin at top of section, small amount of another unit chilled against
Unit 177 in Pieces 1 and 2. ALTERATION: Slightly to moderately altered, olivine replaced by chlorite; very fine grained; Pieces 1 and 2
altered to light gray color. Diffuse 5 mm greenish gray alteration halos around chlorite vein in Piece 12.
VEINS/FRACTURES: Unoriented veins, 1 %, 0.2-1 mm, filled with chlorite (80%), pyrite (1 %), epidote(?) (1 %) and white mineral (quartz?) (18%). White mineral appears to have formed later than chlorite.
UNIT 178: SPARSELY PLAGIOCLASE-CLINOPYROXENE-OLIVINE PHYRIC BASALT
Pieces 9 and 13
CONTACTS: Not observed. PHENOCRYSTS: Total =2%, clinopyroxene concentrated in Piece 13, single crystals.
Plagioclase - 1%, 1-2 mm, subhedral, fresh. Olivine - < 1 %, 0.5-2 mm, subhedral, replaced by chlorite. Clinopyroxene - 1 %, 1 - 3 mm, euhedral, fresh.
GROUNDMASS: Fine grained. COLOR: Dark gray. VESICLES: None. STRUCTURE: Massive. ALTERATION: Generally slightly altered, olivine replaced by chlorite. Greenish gray alteration patches and
1-2-mm-wide halos around fine chlorite veinlets (<0.5 mm) in Piece 13. VEINS/FRACTURES: 1%, <0.5 mm, filled with chlorite, all in Piece 13 (unoriented).
UNIT 179: MODERATELY PYROXENE-OLIVINE-PLAGIOCLASE PHYRIC BASALT
156R-1, Piece 14, to 157R-1, Piece 1
CONTACTS: None visible. PHENOCRYSTS: « 6 % , uniformly distributed.
Olivine - 2%, 0.5-2 mm, euhedral-subhedral, altered to chlorite plus hm (in fractures of olivine). Clinopyroxene - 3%, 0.5-1.5 mm, euhedral-subhedral, fresh. Plagioclase - < 1 % , ~1 mm, subhedral, fresh.
GROUNDMASS: Uniformly fine grained. COLOR: Dark greenish gray. VESICLES: No vesicles. STRUCTURE: Massive. ALTERATION: Slightly altered. Olivine completely altered to chlorite plus Fe-oxide (hm). Thin ( = 1 mm) light gray
alteration halos around altered olivine. VEINS/FRACTURES: None visible.
156-1
211
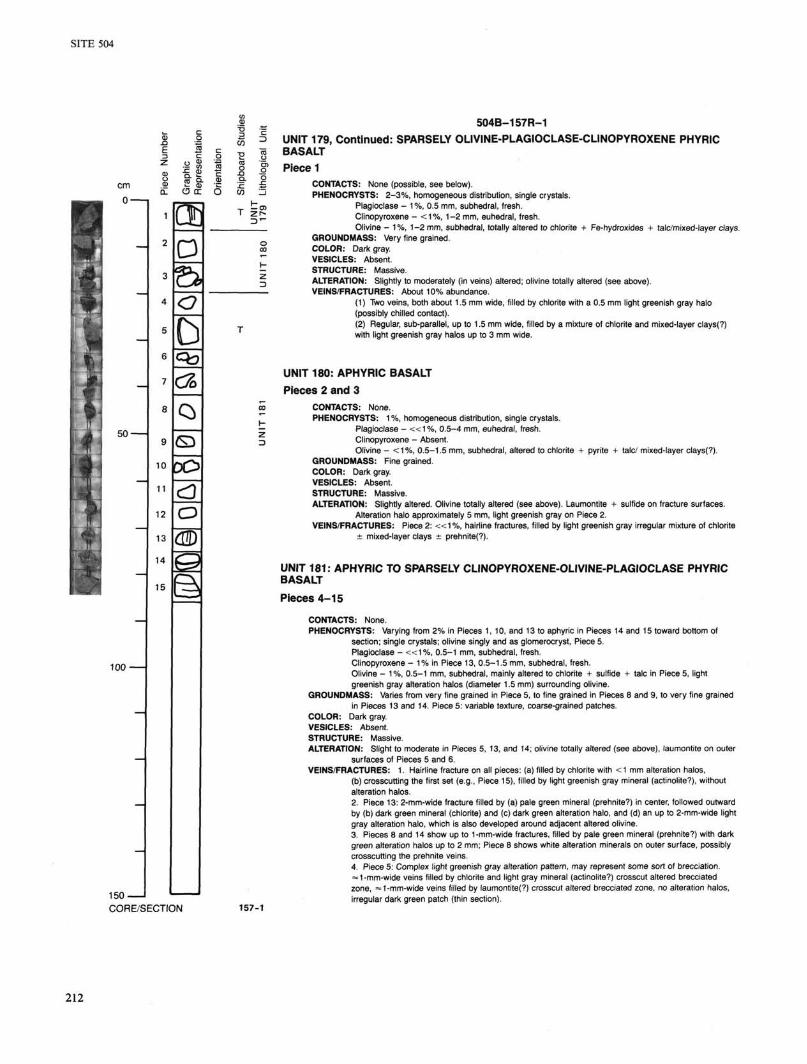
SITE 504
cm
0 -
k • * -
5 0 '
100
Us 2 CD
< a_
6 Qo_
8 Q> 9 Q 0 CO
2 O
3 d©
T z r *
150-CORE/SECTION 157-1
504B-157R-1 UNIT 179, Continued: SPARSELY OLIVINE-PLAGIOCLASE-CLINOPYROXENE PHYRIC BASALT Piece 1
CONTACTS: None (possible, see below). PHENOCRYSTS: 2-3%, homogeneous distribution, single crystals.
Plagioclase - 1%, 0.5 mm, subhedral, fresh. Clinopyroxene - < 1 % , 1-2 mm, euhedral, fresh. Olivine - 1%, 1-2 mm, subhedral, totally altered to chlorite + Fe-hydroxides + talc/mixed-layer clays.
GROUNDMASS: Very fine grained. COLOR: Dark gray. VESICLES: Absent. STRUCTURE: Massive. ALTERATION: Slightly to moderately (in veins) altered; olivine totally altered (see above). VEINS/FRACTURES: About 10% abundance.
(1) Two veins, both about 1.5 mm wide, filled by chlorite with a 0.5 mm light greenish gray halo (possibly chilled contact). (2) Regular, sub-parallel, up to 1.5 mm wide, filled by a mixture of chlorite and mixed-layer clays(?) with light greenish gray halos up to 3 mm wide.
UNIT 180: APHYRIC BASALT Pieces 2 and 3
CONTACTS: None. PHENOCRYSTS: 1 %, homogeneous distribution, single crystals.
Plagioclase - < < 1 % , 0.5-4 mm, euhedral, fresh. Clinopyroxene - Absent. Olivine - < 1 % , 0.5-1.5 mm, subhedral, altered to chlorite + pyrite + talc/ mixed-layer clays(?).
GROUNDMASS: Fine grained. COLOR: Dark gray. VESICLES: Absent. STRUCTURE: Massive. ALTERATION: Slightly altered. Olivine totally altered (see above). Laumontite + sulfide on fracture surfaces.
Alteration halo approximately 5 mm, light greenish gray on Piece 2. VEINS/FRACTURES: Piece 2: « 1 % , hairline fractures, filled by light greenish gray irregular mixture of chlorite
± mixed-layer clays ± prehnite(?).
UNIT 181: APHYRIC TO SPARSELY CLINOPYROXENE-OLIVINE-PLAGIOCLASE PHYRIC BASALT Pieces 4-15
CONTACTS: None. PHENOCRYSTS: Varying from 2% in Pieces 1,10, and 13 to aphyric in Pieces 14 and 15 toward bottom of
section; single crystals; olivine singly and as glomerocryst, Piece 5. Plagioclase - « 1 % , 0.5-1 mm, subhedral, fresh. Clinopyroxene - 1 % in Piece 13, 0.5-1.5 mm, subhedral, fresh. Olivine - 1%, 0.5-1 mm, subhedral, mainly altered to chlorite + sulfide + talc in Piece 5, light greenish gray alteration halos (diameter 1.5 mm) surrounding olivine.
GROUNDMASS: Varies from very fine grained in Piece 5, to fine grained in Pieces 8 and 9, to very fine grained in Pieces 13 and 14. Piece 5: variable texture, coarse-grained patches.
COLOR: Dark gray. VESICLES: Absent. STRUCTURE: Massive. ALTERATION: Slight to moderate in Pieces 5, 13, and 14; olivine totally altered (see above), laumontite on outer
surfaces of Pieces 5 and 6. VEINS/FRACTURES: 1. Hairline fracture on all pieces: (a) filled by chlorite with <1 mm alteration halos,
(b) crosscutting the first set (e.g., Piece 15), filled by light greenish gray mineral (actinolite?), without alteration halos. 2. Piece 13: 2-mm-wide fracture filled by (a) pale green mineral (prehnite?) in center, followed outward by (b) dark green mineral (chlorite) and (c) dark green alteration halo, and (d) an up to 2-mm-wide light gray alteration halo, which is also developed around adjacent altered olivine. 3. Pieces 8 and 14 show up to 1 -mm-wide fractures, filled by pale green mineral (prehnite?) with dark green alteration halos up to 2 mm; Piece 8 shows white alteration minerals on outer surface, possibly crosscutting the prehnite veins. 4. Piece 5: Complex light greenish gray alteration pattern, may represent some sort of brecciation. « 1 -mm-wide veins filled by chlorite and light gray mineral (actinolite?) crosscut altered brecciated zone, =1-mm-wide veins filled by laumontite(?) crosscut altered brecciated zone, no alteration halos, irregular dark green patch (thin section).
212

SITE 504
504B-158R-1
UNIT 182: APHYRIC BASALT
cm 0-
O cc
50-
3A
3B <0
<ffl
XF T
E) 9
Pieces 1-7, Piece 2 probably not in order, coming from different level(?)
CONTACTS: None. PHENOCRYSTS: Aphyric, except Pieces 6 and 7 < 1 %. Homogeneous distribution.
For Pieces 6 and 7: Plagioclase - < 1 %, up to 3 mm, euhedral, fresh. Clinopyroxene - < 1 % , up to 2 mm, euhedral (prismatic), fresh. Olivine - < 1 % , 1 mm, anhedral, altered to chlorite + pyrite + talc/mixed-layer clays(?).
GROUNDMASS: Uniformly very fine grained, except Piece 2, which is fine grained. COLOR: Dark gray. VESICLES: None. STRUCTURE: Massive. ALTERATION: Piece 4: slightly to moderately altered.
Piece 2: disseminated pyrite, <0.3 mm, < < 1 % , no fractures present here. VEINS/FRACTURES: 1. Subvertical fractures, up to 0.5 mm, filled by white mineral (laumontite?) and chlorite
(Pieces 3A and 7), or only by chlorite (Piece 6). Chlorite-filled fractures show light gray halos up to 2 mm. 2. Horizontal to subhorizontal fractures crosscutting type 1. Piece 3A - <1-mm-wide fracture, filled by (a) white mineral (=0.2 mm) in the center, followed by (b) chlorite, lining the fracture. Weak, very light gray alteration halo of about 2 mm each side, conjugated sheers from this vein =45°, filled by chlorite and/or white mineral (about 0.5 mm thick); crosscutting the fractures type 1. Piece 3B - contains a series of parallel fractures, <1 mm, filled with chlorite (type 1), about 10% abundance; crosscutting veins: type 2 (filled with white mineral). Piece 4 - shows complex fracturing, probably some sort of brecciation. Mainly chlorite-filled veins up to 4 mm. About 4-mm light greenish gray alteration halos, also dark gray alteration halo of chlorite-filled vein, sulfides and chlorite on outer fracture surface.
100
1 5 0 -CORE/SECTION 158-1
213
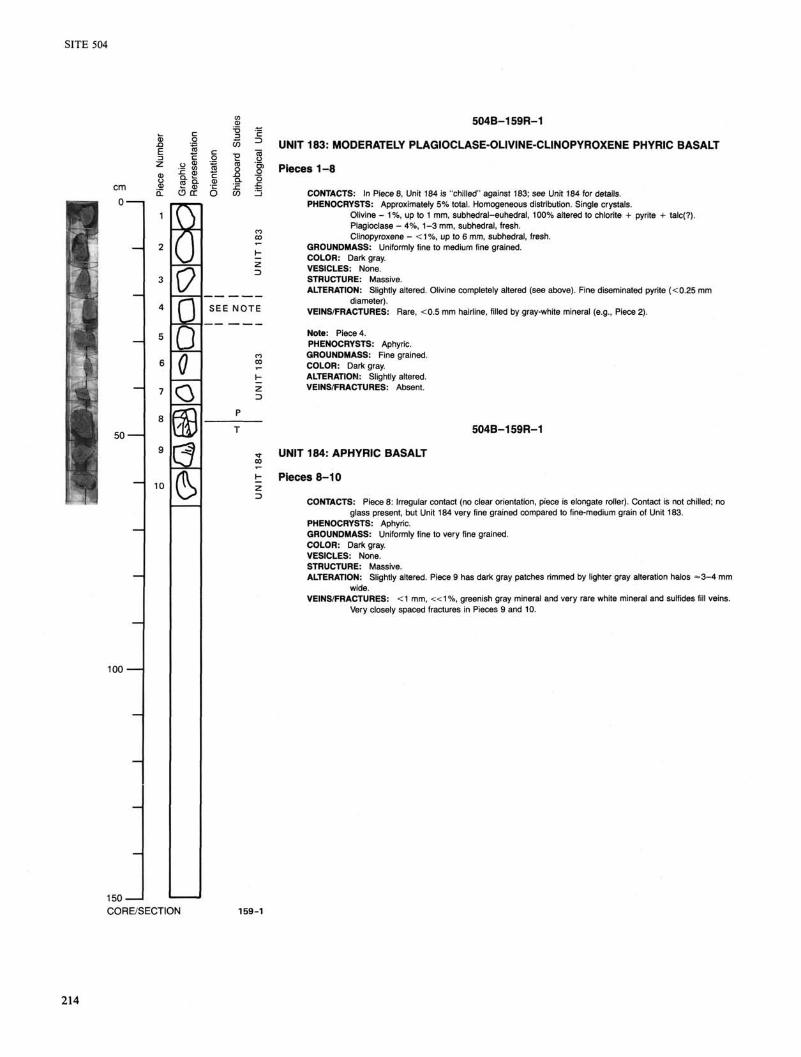
SITE 504
cm 0 -
50
100
*S o
I t s
9 0 0 d o
a e>
150 -CORE/SECTION
SEE NOTE
504B-159R-1
UNIT 183: MODERATELY PLAGIOCLASE-OLIVINE-CLINOPYROXENE PHYRIC BASALT
Pieces 1-8
CONTACTS: In Piece 8, Unit 184 is "chilled" against 183; see Unit 184 for details. PHENOCRYSTS: Approximately 5% total. Homogeneous distribution. Single crystals.
Olivine - 1%, up to 1 mm, subhedral-euhedral, 100% altered to chlorite + pyrite + talc(?). Plagioclase - 4%, 1-3 mm, subhedral, fresh. Clinopyroxene - <1%, up to 6 mm, subhedral, fresh.
GROUNDMASS: Uniformly fine to medium fine grained. COLOR: Dark gray. VESICLES: None. STRUCTURE: Massive. ALTERATION: Slightly altered. Olivine completely altered (see above). Fine diseminated pyrite (<0.25 mm
diameter). VEINS/FRACTURES: Rare, <0.5 mm hairline, filled by gray-white mineral (e.g., Piece 2).
Note: Piece 4. PHENOCRYSTS: Aphyric. GROUNDMASS: Fine grained. COLOR: Dark gray. ALTERATION: Slightly altered. VEINS/FRACTURES: Absent.
504B-159R-1
UNIT 184: APHYRIC BASALT
Pieces 8-10
CONTACTS: Piece 8: Irregular contact (no clear orientation, piece is elongate roller). Contact is not chilled; no glass present, but Unit 184 very fine grained compared to fine-medium grain of Unit 183.
PHENOCRYSTS: Aphyric. GROUNDMASS: Uniformly fine to very fine grained. COLOR: Dark gray. VESICLES: None. STRUCTURE: Massive. ALTERATION: Slightly altered. Piece 9 has dark gray patches rimmed by lighter gray alteration halos =3-4 mm
wide. VEINS/FRACTURES: < 1 mm, « 1 %, greenish gray mineral and very rare white mineral and sulfides fill veins.
Very closely spaced fractures in Pieces 9 and 10.
159-1
214

SITE 504
504B-160R-1
cm 0 -
' '?.
50
100
10
« 9- .2
101 75 £> <3 Q
D 0 o H)
150-CORE/SECTION
D
CUTTING
in
UNIT 185: APHYRIC BASALT
Pieces 1-2 and 4-6
CONTACTS: None observed. PHENOCRYSTS: Essentially aphyric: < 1 % total. Phenocrysts evenly distributed.
Clinopyroxene - < 1 % , 1-3 mm, subhedral, fresh. GROUNDMASS: Fine grained (uniform). COLOR: Dark gray. VESICLES: None. STRUCTURE: Massive. Small chilled dykelet cutting 185 in Piece 6, = 5 mm wide. ALTERATION: Light gray alteration halos =3-mm wide around veins and around dykelet in Piece 6. VEINS/FRACTURES: Less than % 1 , 2-mm-wide, quartz-filled vein in Piece 2; 1-mm chlorite vein in Piece 1.
Sparse pyrite and chlorite on margins of dykelet. Quartz vein running parallel to margin of dykelet.
UNiT 186: APHYRIC BASALT
Pieces 7-10
CONTACTS: None observed. PHENOCRYSTS: Less than 1 % overall, evenly distributed.
Plagioclase - < 1 % , 0.5-3 mm, euhedral, partially altered to ? in centers. GROUNDMASS: Very fine grained (more than Unit 185). COLOR: Dark gray. VESICLES: None. STRUCTURE: Massive. ALTERATION: 2 mm light gray alteration halos around veins in Pieces 9 and 10. Sparse pyrite in Piece 3. VEINS/FRACTURES: < 1 % , 0.5-mm-wide chlorite-filled veins in Pieces 9 and 10. Plagioclase phenocrysts partly
altered to chlorite(?) in cores.
160-1
215

504B-161R-1
UNIT 187: MODERATELY PLAGIOCLASE-CLINOPYROXENE-OLIVINE PHYRIC BASALT
Pieces 1-11
CONTACTS: None. PHENOCRYSTS: 3% in total, homogeneous distribution, except olivine is more common at the top (Piece 1).
Single crystals. Olivine - < 1 % , up to 2 mm, subhedral, completely altered to chlorite + pyrite + talc + mixed-layer clays. Clinopyroxene - < 1 % , up to 6 mm, euhedral (prismatic), fresh. Plagioclase - 3%, 1-5 mm, euhedral (laths), fresh.
GROUNDMASS: Uniformly medium grained but patches of coarser material in Piece 1. COLOR: Dark gray. VESICLES: None. STRUCTURE: Massive. ALTERATION: Slightly altered. Olivine 100% altered (see above). VEINS/FRACTURES: < 1 % .
Pieces 2, 3, 7, and 8: <0.5 mm, filled by chlorite in Piece 2 and pale green mineral actinolite(?) in Pieces 2, 7, and 8; irregular dark gray 2 mm halo followed outward by 3 mm irregular light gray halo. Piece 11: 0.5 mm vein, filled by greenish gray mineral.

SITE 504
Core 162M consists of miscellaneous material sampled from the bottom of the borehole while trying to recover cones that fell off a rotary bit.
jS o
cm 0 -
Si
50-
100
Q
0
tf7
0 Q
150-CORE/SECTION
504B-162M-1
Pieces 2, 3, 5, 6, and 7: Moderately to highly olivine-plagioclase basalt
clinopyroxene phyric
CONTACTS: None. PHENOCRYSTS: 10-20% total.
Plagioclase - 1-8%, 0.5-1 mm, subhedral, glomerocrysts and single crystals, fresh. Olivine - 3-15%, 0.2-3 mm, subhedral, single crystals and glomerocrysts, replaced by smectite, Fe-oxide, calcite. Clinopyroxene - < 1 % , mostly in Piece 6, 0.5-1 mm, subhedral, fresh.
GROUNDMASS: Fresh, fine grained. COLOR: Gray. VESICLES: <5%, mostly in Piece 7, 0.5-2 mm, rounded, filled with smectite and calcite. STRUCTURE: Massive. ALTERATION: Slightly altered. Olivine replaced by smectite and calcite. 1-20-mm-wide reddish oxidation halos
around some fractures (1 cm wide). Dark gray (black) alteration halo around outer surfaces of Piece 5. VEINS/FRACTURES: None observed.
Piece 1: Aphyric basalt, most likely from below 900 mbsf
CONTACTS: None. PHENOCRYSTS: None, Aphyric. GROUNDMASS: Fine grained. COLOR: Greenish gray. VESICLES: None. STRUCTURE: Massive. ALTERATION: Uniformly slightly altered to greenish gray color. VEINS/FRACTURES: None.
Pieces 4, 8, and 9: Moderately plagiclase-olivine + clinopyroxene phyric basalt
CONTACTS: None. PHENOCRYSTS: 5-10% total.
Plagioclase - 1-5%, 0.5-3 mm, subhedral single crystals, fresh. Olivine - 1-4%, 0.5-2 mm, single crystals and glomerocrysts, replaced by clays and pyrite. Clinopyroxene - 1-2%, 1-2 mm, subhedral, single crystals, fresh.
GROUNDMASS: Fine grained. COLOR: Dark gray. VESICLES: None. STRUCTURE: Massive. ALTERATION: Slightly altered. Olivine replaced by clays and pyrite. VEINS/FRACTURES: <1 %, hairline crack filled with white stuff in Piece 4B, hairline crack filled with clay and
pyrite in Piece 9A.
162-1
217
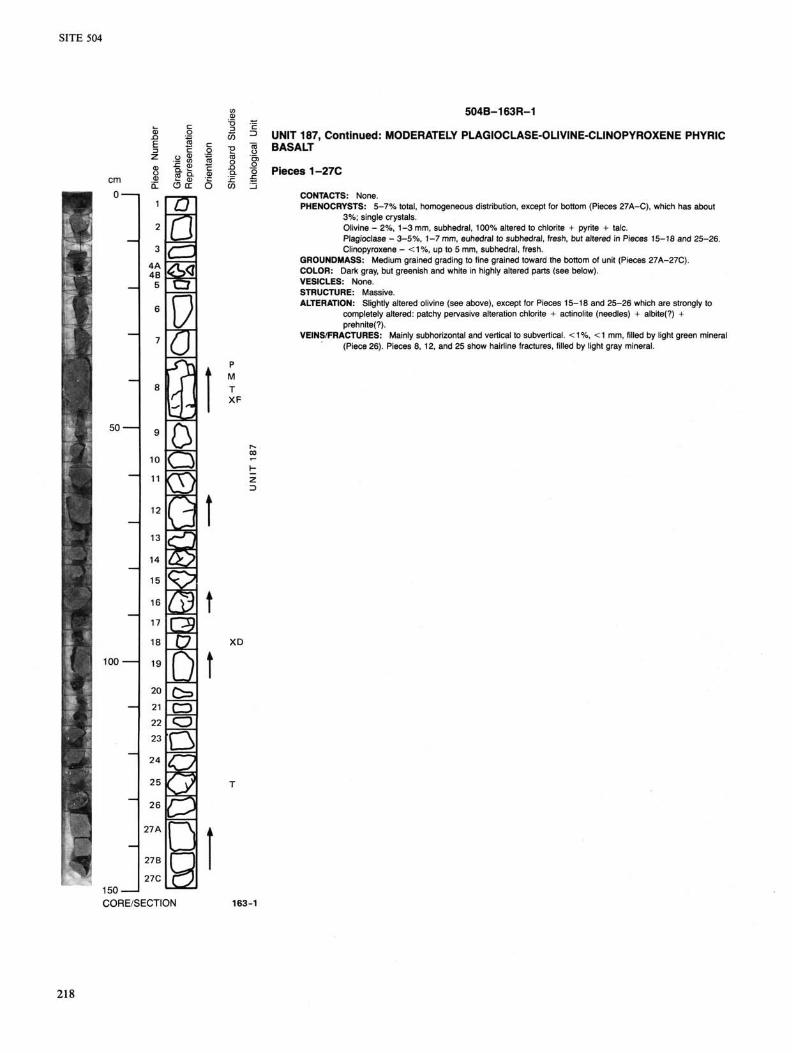
SITE 504
504B-163R-1
UNIT 187, Continued: MODERATELY PLAGIOCLASE-OLIVINE-CLINOPYROXENE PHYRIC BASALT
Pieces 1-27C cm
0 -
50'
100
"© 12
13
14
15
16
17
18
19
24
25
26
27A
CD O
1 5 0 -CORE/SECTION
CONTACTS: None. PHENOCRYSTS: 5-7% total, homogeneous distribution, except for bottom (Pieces 27A-C), which has about
3%; single crystals. Olivine - 2%, 1-3 mm, subhedral, 100% altered to chlorite + pyrite + talc. Plagioclase - 3-5%, 1-7 mm, euhedral to subhedral, fresh, but altered in Pieces 15-18 and 25-26. Clinopyroxene - < 1 %, up to 5 mm, subhedral, fresh.
GROUNDMASS: Medium grained grading to fine grained toward the bottom of unit (Pieces 27A-27C). COLOR: Dark gray, but greenish and white in highly altered parts (see below). VESICLES: None. STRUCTURE: Massive. ALTERATION: Slightly altered olivine (see above), except for Pieces 15-18 and 25-26 which are strongly to
completely altered: patchy pervasive alteration chlorite + actinolite (needles) + albite(?) + prehnite(?).
VEINS/FRACTURES: Mainly subhorizontal and vertical to subvertical. <1%, <1 mm, filled by light green mineral (Piece 26). Pieces 8, 12, and 25 show hairline fractures, filled by light gray mineral.
P M T XF
XD
163-1
218

SITE 504
cm 0-
II I O DC O
I —
50
_ 10B
100
3B
O
^ 5
°o &
150-CORE/SECTION
504B-163R-2
UNIT 188: MODERATELY PLAGIOCLASE-OLIVINE-CLINOPYROXENE PHYRIC BASALT
163R-2, Piece 1, and 164R-1, Piece 10
CONTACTS: None. PHENOCRYSTS: Varying between 7% (163R-3, Piece 19, and 164R-2, Piece 1) and 2% (164R-2, Piece 10);
single crystals and glomerocrysts (164R-1, Pieces 1-2). Olivine - 2-3%, 1-4 mm, euhedral to subhedral. 504B-164R-1, Piece 3: olivine concentrated up to 5%, altered to chlorite and pyrite. Clinopyroxene - 2%, up to 9 mm, euhedral to subhedral, clinopyroxene with inclusions of plagioclase in 163R-2, Piece 3C. Plagioclase - 3%, 1-4 mm, subhedral to euhedral, fresh.
GROUNDMASS: Medium grained, getting finer grained toward bottom of section (164R-1, Pieces 9 and 10). COLOR: Dark gray. VESICLES: None. STRUCTURE: Massive. ALTERATION: Slightly altered, olivine completely altered (see above), light color alteration patches 164R-1,
Pieces 9 and 10. VEINS/FRACTURES: 1. Hairline fractures mainly subhorizontal to horizontal and vertical to subvertical, filled by
light gray mineral. 2. 1 mm fracture, filled by dark and light green mineral and lined by light gray halo up to 3 mm.
163-2
219
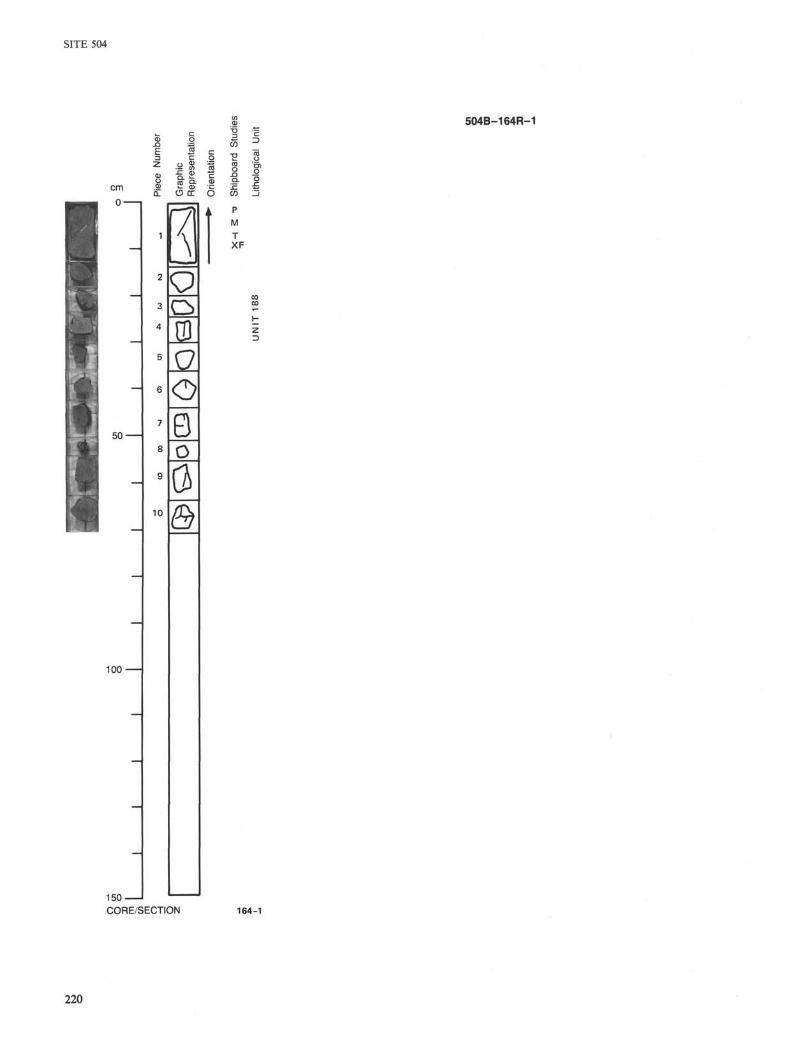
SITE 504
504B-164R-1
2 o cm 0 -
« S- .9>
50'
100
Q_
1
2
3
4
5
6
7
8
9
10
O CZ
8 a o B O (3
CO
p M T XF
150-CORE/SECTION 164-1
220

SITE 504
504B-165R-1
UNIT 188, Continued: MODERATELY PLAGIOCLASE-CLINOPYROXENE-OLIVINE PHYRIC BASALT
a ° Pieces 1-3B
M0I
50'
100
150-CORE/SECTION
1
2
3A
3B
4
5
6
7
8
9
0 9 0
UN
IT 1
88
UN
IT 1
89
CONTACTS: None observed. PHENOCRYSTS: Total approximately 3%, uniformly distributed.
Plagioclase - 1.5%, <3 mm, euhedral, single crystals, fresh. Clinopyroxene - <1%, <4 mm, euhedral, single crystals, fresh. Olivine - < 1 %, 0.5-3 mm, subhedral -* anhedral, single crystals, replaced by clay + Fe-oxides (including hematite) and chlorite.
GROUNDMASS: Uniformly fine grained. COLOR: Dark gray. VESICLES: No vesicles. STRUCTURE: Massive. ALTERATION: Slightly altered, olivine replaced by clays/ chlorite/ oxides. Alteration less than in 504B-164R-1. VEINS/FRACTURES: < 1 % filled veins, up to 1 mm. < 1 % open fracture (Pieces 3A and 3B). Veins have chlorite
and zeolite(?).
UNIT 189: MODERATELY CLINOPYROXENE-OLIVINE-PLAGIOCLASE PHYRIC BASALT
Pieces 4-9
CONTACTS: None observed. PHENOCRYSTS: Total =3-4%, uniformly distributed.
Plagioclase - <1%, up to 2 mm, euhedral, single crystals, fresh. Pyroxene - 1.5-2%, up to 4 mm, euhedral, single crystals, fresh. Olivine - 1-1.5%, « 1 mm, subhedral-anhedral, replaced by chlorite + clays + oxides + pyrite.
GROUNDMASS: Uniformly fine grained (but coarser than Unit 188). COLOR: Dark gray. VESICLES: No vesicles. STRUCTURE: Massive. ALTERATION: Slightly altered olivines replaced by chlorite/clays/pyrite/Fe-oxide. VEINS/FRACTURES: « 1 %, hairline veins filled with chlorite and clays.
165-1
221
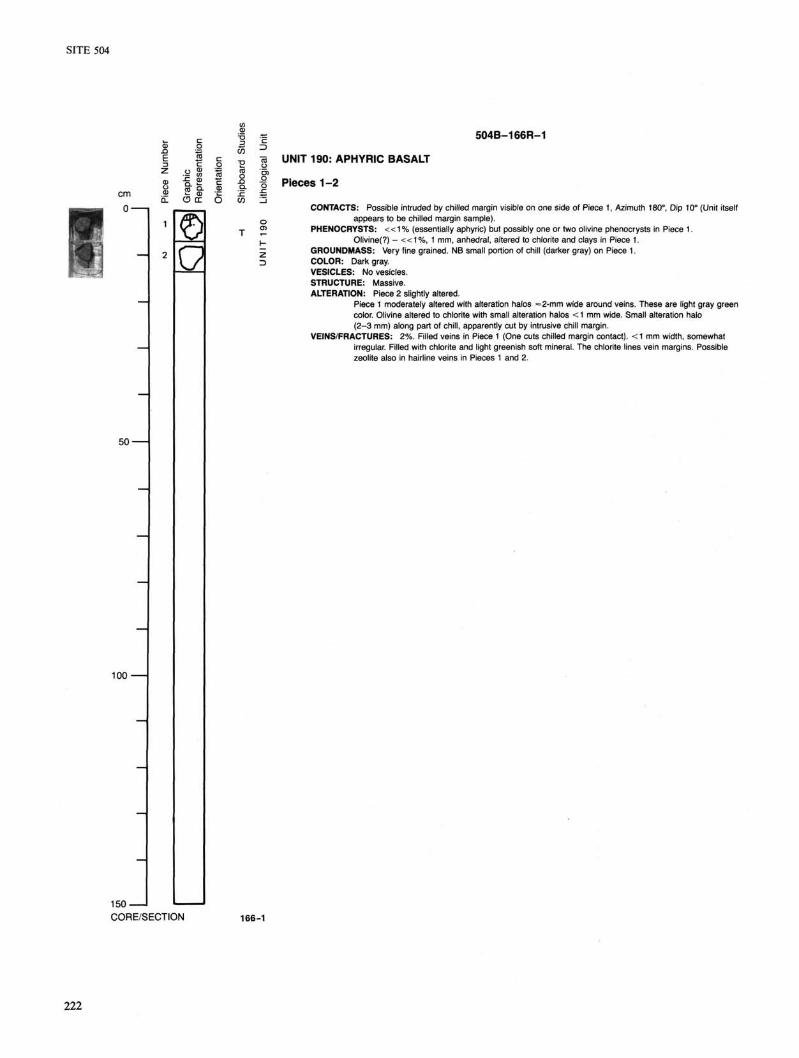
SITE 504
504B-166R-1
S o
cm 0-
I I I
50'
100
150-CORE/SECTION
T X-
Z D
UNIT 190: APHYRIC BASALT
Pieces 1 - 2
CONTACTS: Possible intruded by chilled margin visible on one side of Piece 1, Azimuth 180°, Dip 10° (Unit itself appears to be chilled margin sample).
PHENOCRYSTS: « 1 % (essentially aphyric) but possibly one or two olivine phenocrysts in Piece 1. Olivine(?) - <<1%, 1 mm, anhedral, altered to chlorite and clays in Piece 1.
GROUNDMASS: Very fine grained. NB small portion of chill (darker gray) on Piece 1. COLOR: Dark gray. VESICLES: No vesicles. STRUCTURE: Massive. ALTERATION: Piece 2 slightly altered.
Piece 1 moderately altered with alteration halos =2-mm wide around veins. These are light gray green color. Olivine altered to chlorite with small alteration halos < 1 mm wide. Small alteration halo (2-3 mm) along part of chill, apparently cut by intrusive chill margin.
VEINS/FRACTURES: 2%. Filled veins in Piece 1 (One cuts chilled margin contact). <1 mm width, somewhat irregular. Filled with chlorite and light greenish soft mineral. The chlorite lines vein margins. Possible zeolite also in hairline veins in Pieces 1 and 2.
166-1
222

SITE 504
cm 0 -
50
13 go,
100
a.
CD a
14
15
16
17
21
22
23
Q
150-CORE/SECTION
504B-169R-1
UNIT 191: MODERATELY CLINOPYROXENE-OLIVINE-PLAGIOCLASE PHYRIC BASALT
f | Pieces 1,7, 11A, 11B, 12, 14, and 21-23 £ JC 5
CONTACTS: None. PHENOCRYSTS: 3-4%, homogeneous distribution. Plagioclase - 1%, 1-5 mm (Piece 14), euhedral prismatic to subhedral, fresh.
Olivine - 1-2%, 0.5-3 mm, subhedral, replaced by chlorite and pyrite. Clinopyroxene - 2%, 1-7 mm, euhedral prismatic to subhedral, fresh.
GROUNDMASS: Uniformly fine grained. Piece 7: patches of coarser-grained groundmass. COLOR: Dark gray. VESICLES: None. STRUCTURE: Massive. ALTERATION: Slightly altered. Olivine completely altered (see above). Patchy alteration in Piece 23 (greenish
gray), associated with dark vein described below. VEINS/FRACTURES: Horizontal to subhorizontal, vertical to subvertical.
Piece 1 - Surface coated by chalcopyrite and pyrite, most pieces contain hairline fractures, filled by light gray material(?), crosscut by fractures described below. Pieces 11 A, 1 tb, 12, 21, and 22 - contain inclined fractures (about 60°), up to 1 mm wide, filled and lined by chlorite + pyrite (Piece 22) + pale green to gray mineral (Pieces 11A and 11B). Alteration halos (light greenish gray) up to 2 mm wide in Pieces 11A and 11B, dark gray (1 mm) halo with lighter outer halo (2 mm) on Piece 22. Piece 23: Irregular dark vein, 2 mm wide; light greenish gray irregular halo up to 3 mm wide, also forming patches in the groundmass.
0)
XF =>
169-1
223
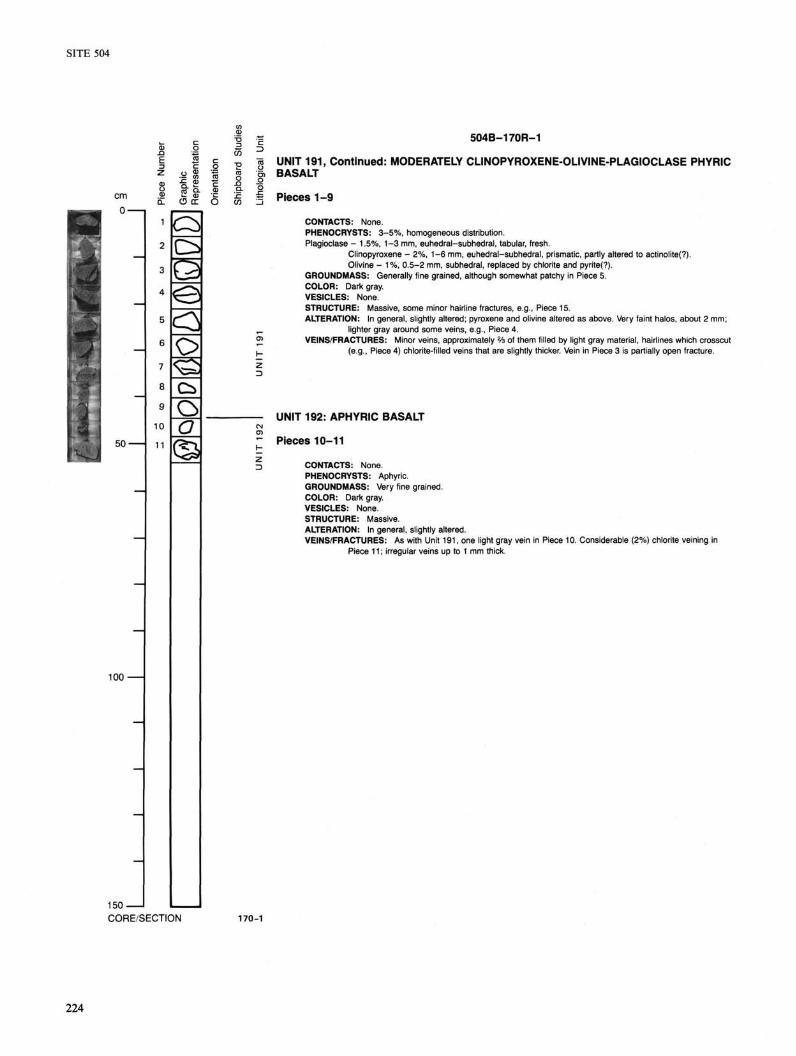
504B-170R-1
10
n
o tr
Q
o IS Ca O O
2 o 76 UNIT 191, Continued: MODERATELY CLINOPYROXENE-OLIVINE-PLAGIOCLASE PHYRIC ■a BASALT
m 9- .5 * £ ^ Pieces 1-9
CONTACTS: None. PHENOCRYSTS: 3-5%, homogeneous distribution. Plagioclase - 1.5%, 1-3 mm, euhedral-subhedral, tabular, fresh.
Clinopyroxene - 2%, 1-6 mm, euhedral-subhedral, prismatic, partly altered to actinolite(?). Olivine - 1 %, 0.5-2 mm, subhedral, replaced by chlorite and pyrite(?).
GROUNDMASS: Generally fine grained, although somewhat patchy in Piece 5. COLOR: Dark gray. VESICLES: None. STRUCTURE: Massive, some minor hairline fractures, e.g., Piece 15. ALTERATION: In general, slightly altered; pyroxene and olivine altered as above. Very faint halos, about 2 mm;
lighter gray around some veins, e.g., Piece 4. VEINS/FRACTURES: Minor veins, approximately % of them filled by light gray material, hairlines which crosscut
(e.g., Piece 4) chlorite-filled veins that are slightly thicker. Vein in Piece 3 is partially open fracture.
UNIT 192: APHYRIC BASALT
Pieces 10-11
CONTACTS: None. PHENOCRYSTS: Aphyric. GROUNDMASS: Very fine grained. COLOR: Dark gray. VESICLES: None. STRUCTURE: Massive. ALTERATION: In general, slightly altered. VEINS/FRACTURES: As with Unit 191, one light gray vein in Piece 10. Considerable (2%) chlorite veining in
Piece 11; irregular veins up to 1 mm thick.

SITE 504
THIN SECTION DESCRIPTION
ROCK NAME: Moderately plagioclase clinopyroxene phyric basalt WHERE SAMPLED: Unit 151 TEXTURE: Intergranular, subophitic GRAIN SIZE: Fine
111-504B-142R-1 (Piece 1A, 6-8 cm)
OBSERVER: Malpas
PRIMARY MINERALOGY
PHENOCRYSTS Plagioclase
Clinopyroxene
GROUNDMASS Plagioclase
Clinopyroxene Olivine Magnetite
SECONDARY MINERALOGY Clays Chlorite Actinolite Sphene Magnetite
Pyrite(?) Talc Chlorite,
actinolite
PERCENT PRESENT
35
30
1
PERCENT 9 4 3
0.2 0.8 Tr
PERCENT ORIGINAL
SIZE RANGE (mm)
0.2-2.0
APPROX. COMPOSITION
An 54
36 3 1
REPLACING/ FILLING
Plag, Olivine, plag Cpx Magnetite(?) Olivine, cpx Olivine Olivine, cpx Veins
1-2 Diopside/ augite
150^
75|< 75/x 35^
An 45
MORPHOLOGY
Euhedral, tabular Subhedral
Euhedral, bladed Subhedral Subhedral Subhedral
COMMENTS
Occur as glomerocrysts and single crystals. Sometimes together with cpx. Strained (wavy extinction). Minor alteration to actinolite along cleavage traces. Occurs as glomerocrysts with plag.
Replaced in part by chlorite(?), clays.
Replaced in part by clays(?), actinolite(?). Replaced by chlorite, talc, clays(?).
COMMENTS Plag replaced, especially in vugs.
Especially in vugs.
Especially in vugs.
Minor veins, 50/i wide, of chlorite, actinolite, and possibly quartz, occur in the section.
COMMENTS: Although the rock is generally fine-grained, it has a patchy appearance with patches or "vugs" up to 2 mm in which alteration minerals, chlorite, magnetite, and clays, are concentrated. Magnetite concentration in the matrix occurs around radiating plag laths and may represent devitrification of original glassy mesostasis.
THIN SECTION DESCRIPTION
ROCK NAME: Moderately plagioclase clinopyroxene phyric basalt WHERE SAMPLED: Contact unit 151 TEXTURE: Subophitic (diabasic) GRAIN SIZE: Fine to aphanitic
111-504B-142R-1 (Piece 1B, 9-12 cm)
OBSERVER: Malpas
PRIMARY MINERALOGY
PHENOCRYSTS Plagioclase
Clinopyroxene
GROUNDMASS Plagioclase
Clinopyroxene
Oxides
SECONDARY MINERALOGY Clays Chlorite Actinolite Sphene Oxides
PERCENT PRESENT
6
<1
45
25
2
PERCENT 6 6
<2 <1
7
PERCENT ORIGINAL
6
<1
50
42
2
REPLACING/ FILLING
Cpx, Cpx Cpx (?) Cpx
plag
SIZE APPROX. RANGE COMPO-(mm) SITION MORPHOLOGY COMMENTS
0.3-1.0 An 45
0.5
< 0.1 -0.5 An 40
0.1 Augite
< 0.1-0.2 Magnetite(?)
Euhedral-subhedral
Euhedral
Zoned Marginal 1/10 of crystals. Glomerocrysts.
Only one phenocryst represented. Appears fresh.
Acicular, bladed Stubby, subhedral Anhedral
Altered in part to clays ( + talc?).
Altered to oxides/chlorite/clays.
COMMENTS Alteration predominantly of groundmass cpx, and some plag. Alteration of groundmass cpx. Cpx in groundmass replaced in part. Somewhat patchy distribution. Small, euhedral, high relief crystals, possibly sphene in groundmass. Patchy. Occurs with chlorite in some aggregates =20-30% altered. These patches =1 mm. Slightly finer grain size. Generally due to alteration of cpx.
COMMENTS: Unit 151. This thin section is probally not representative of the unit. There is no record of ol phenocrysts which are described in the lithological description. Likewise for cpx. Plag phenocrysts probably underestimated in lithological description. In so far as plag concerned, almost almost seriate porphyritic since maximum groundmass plag is larger than minimum phenocryst. See 111-504B-142R-1 (Piece 1A, 6-8 cm). Note: patchy clots of oxides + chlorite + clays ± actinolite may represent altered areas of finer groundmass.
225

THIN SECTION DESCRIPTION 111-504B-142R-1 (Piece 1R, 9-12 cm) ROCK NAME: Highly plagioclase clinopyroxene olivine phyric basalt WHERE SAMPLED: Chilled margin, unit 152 TEXTURE: Chilled margin, hypohyaline GRAIN SIZE: Glass + phenocrysts. Hyaline. OBSERVER: Malpas
PRIMARY MINERALOGY
PHENOCRYSTS Olivine
Plagioclase
Clinopyroxene
GROUNDMASS Glass Plagioclase
SECONDARY MINERALOGY Clays Chlorite Actinolite Shpene Quartz Oxides Talc Chlorite
PERCENT PRESENT
5
20
7
2
PERCENT 25 19.1 0.2 (?) (?)
21.5 0.2 Tr
PERCENT ORIGINAL
9
20
7
53 12
SIZE APPROX. RANGE COMPO-(mm) SITION
< 0.5-2.5 Fo85
< 0.1 -2.8 An 65[??]
< 0.5-2.5 Augite/ diopside
Salitic
20/c
REPLACING/ FILLING
Ol, matrix Ol, matrix Ol
Ol, matrix Ol
Veins
MORPHOLOGY
Euhedral-subhedral Euhedral
Euhedral, resorbed
Euhedral
= 2% replacing ol. = 1 % replacing ol. Replaces olivine together with chlorite.
Mainly magnetite and hematite. Replat Replaces olivine. Chlorite filled fracture (0.5 mm) with qi
COMMENTS
Altered to 1) Mixed layered clays + talc + magnetite; 2) Chlorite + talc + magnetite + actinolite. Single crystals or glomerocrysts. Glass inclusions in centers. Glomerocrysts with plag, and single crystals. Reaction with glass; 0.05 mm rims. Glass inclusions up to 5Qjt. Basal twins common.
Now smectite + chlorite + oxides. Microlites.
COMMENTS
COMMENTS: Phenocrysts of plag, plag + cpx, and plag + ol commonly occur imglomerocrysts. Cpx + ol are resorbed in places. Plag + cpx commonly have glass inclusions, 40-80/1. Ol alteration occured first along crystal margins and then along fractures. Phenocrysts are often broken. Chilled margin: Pyrite intergrown with chalcopyrite, chalcopyrite inclusions in pyrite, pyrite intergrown with magnetite, small pyrrhotite inclusions in pyrite. Thin section is taken at contact between two basaltic dike units. Unit 152 is clearly chilled compared to unit 151. Unit 152 shows altered glassy contact, 2 mm wide, grading into altered glassy mesostasis with microlites of plag. Oxide + smectite + chlorite alteration. Intrusion permissive since no rip-ups of older unit in chill. Cpx in reaction relationship with glass; resorbed margins and numerous glass inclusions. Plag phenocrysts (core An 65) show normal zoning towards outside third of crystals. Also have glass inclusions in centers.
THIN SECTION DESCRIPTION
ROCK NAME: Moderately plagioclase clinopyroxene olivine phyric basalt basaltic WHERE SAMPLED: Contact between dike and breccia unit 153 TEXTURE: Cataclastic (30-40% clasts) GRAIN SIZE: Very fine to fine OBSERVER: Bideau
111-504B-142R-1 (Piece 15, 101-104 cm)
PRIMARY MINERALOGY
PHENOCRYSTS Olivine Plagioclase Clinopyroxene
GROUNDMASS Clinopyroxene Plagioclase
SECONDARY MINERALOGY Clays Zeolites Zeolites Chlorite
Albite Actinolite Sphene
Opaques
PERCENT PRESENT
<1 4
<1
70 20
PERCENT
PERCENT ORIGINAL
SIZE RANGE (mm)
<1 51 6 150/1-1 mm
<1 1.5
APPROX. COMPOSITION MORPHOLOGY
Subhedral Euhedral Subhedral
70 20
REPLACING/ FILLING
Olivine, matrix Plag, veins Veins Olivine, talc veins Plag Veins, matrix Opaques
Opaques, olivine
<0.1 <0.5
COMMENTS
Single crystals. Glomerocrysts with plag. Tabular. Glomerocrysts. Recrystallized. Fresh.
Fresh.
COMMENTS Some mixed-layer clays associated with talc in altered olivine and dispersed in the groundmass. Some broken plag in the chlorite cement seem replaced by zeolites. Post-brecciation veins contain zeolite(?). Also occurs in the cement. Probable mixed-layer chlorite/ clays and chlorite.
Partial replacement of plag. Occurs in the matrix of coarse-grained clasts. Often found replacing oxides. Probably occurs with chlorite in a V-wide vein.
Scarce pyrite. Rare chalcopyrite. Magnetite
COMMENTS: Greenish clasts of basaltic breccia, at the contact with a dike, are cemented by chlorite. The chilled margin of the dike is brecciated, The size of the clasts is <1 mm -1.5 cm. Olivine can be fresh as well as completely replaced by chlorite and/or talc; talc crystallized first. Plag is partially replaced by chlorite and actinolite along cleavage traces and cracks. Plag is also replaced by patches of albite . The groundmass is cryptocrystalline, partially replaced by mixed-layer clays.
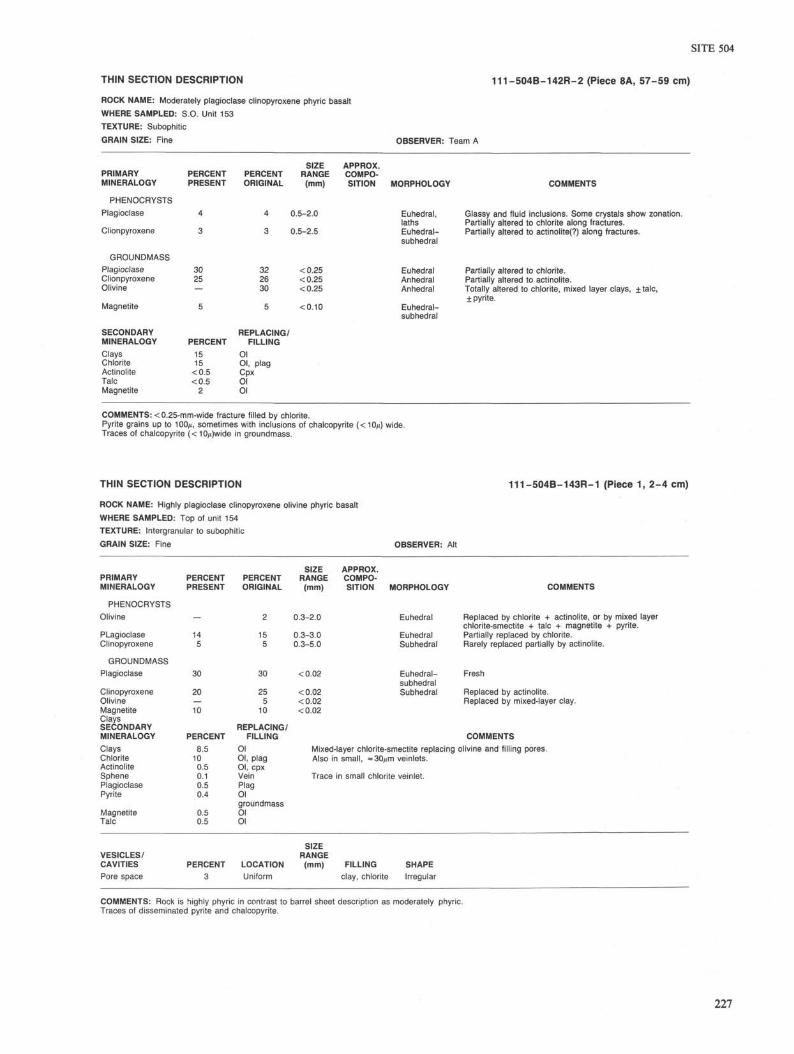
SITE 504
THIN SECTION DESCRIPTION 111-504B-142R-2 (Piece 8A, 57-59 cm)
ROCK NAME: Moderately plagioclase clinopyroxene phyric basalt WHERE SAMPLED: SO . Unit 153 TEXTURE: Subophitic GRAIN SIZE: Fine OBSERVER: Team A
PRIMARY MINERALOGY
PHENOCRYSTS Plagioclase
Clionpyroxene
GROUNDMASS Plagioclase Clionpyroxene Olivine
Magnetite
PERCENT PRESENT
4
3
30 25
5
PERCENT ORIGINAL
4
3
32 26 30
5
SIZE RANGE (mm)
0.5-2.0
0.5-2.5
<0.25 <0.25 <0.25
<0.10
APPROX. COMPOSITION MORPHOLOGY
Euhedral, laths Euhedral-subhedral
Euhedral Anhedral Anhedral
Euhedral-subhedral
COMMENTS
Glassy and fluid inclusions. Some crystals show zonation. Partially altered to chlorite along fractures. Partially altered to actinolite(?) along fractures.
Partially altered to chlorite. Partially altered to actinolite. Totally altered to chlorite, mixed layer clays, + talc, ± pyrite.
SECONDARY MINERALOGY Clays Chlorite Actinolite Talc Magnetite
PERCENT 15 15
<0.5 <0.5
2
REPLACING/ FILLING
Ol Ol, plag Cpx Ol Ol
COMMENTS: <0.25-mm-wide fracture filled by chlorite. Pyrite grains up to 100 t, sometimes with inclusions of chalcopyrite (<10*t) wide. Traces of chalcopyrite (< 10/t)wide in groundmass.
THIN SECTION DESCRIPTION
ROCK NAME: Highly plagioclase clinopyroxene olivine phyric basalt WHERE SAMPLED: Top of unit 154 TEXTURE: Intergranular to subophitic GRAIN SIZE: Fine
111-504B-143R-1 (Piece 1, 2-4 cm)
OBSERVER: Alt
PRIMARY MINERALOGY
PHENOCRYSTS Olivine
PLagioclase Clinopyroxene
GROUNDMASS Plagioclase
Clinopyroxene Olivine Magnetite Clays SECONDARY MINERALOGY Clays Chlorite Actinolite Sphene Plagioclase Pyrite
Magnetite Talc
PERCENT PRESENT
20
10
PERCENT 8.5
10 0.5 0.1 0.5 0.4
0.5 0.5
PERCENT ORIGINAL
25 5
10
REPLACING/ FILLING
Ol Ol, plag Ol, cpx Vein Plag Ol groundmass Ol Ol
SIZE RANGE
(mm)
0.3-2.0
0.3-3.0 0.3-5.0
<0.02
<0.02 <0.02 <0.02
APPROX. COMPOSITION MORPHOLOGY
Euhedral
Euhedral Subhedral
Euhedral-subhedral Subhedral
COMMENTS
Replaced by chlorite + actinolite, or by mixed layer chlorite-smectite + talc + magnetite + pyrite. Partially replaced by chlorite. Rarely replaced partially by actinolite.
Fresh
Replaced by actinolite. Replaced by mixed-layer clay.
COMMENTS Mixed-layer chlorite-smectite replacing olivine and filling pores. Also in small, =30^m veinlets.
Trace in small chlorite veinlet.
VESICLES/ CAVITIES Pore space
PERCENT 3
LOCATION Uniform
SIZE RANGE (mm) FILLING SHAPE
clay, chlorite Irregular
COMMENTS: Rock is highly phyric in contrast to barrel sheet description as moderately phyric. Traces of disseminated pyrite and chalcopyrite.
227
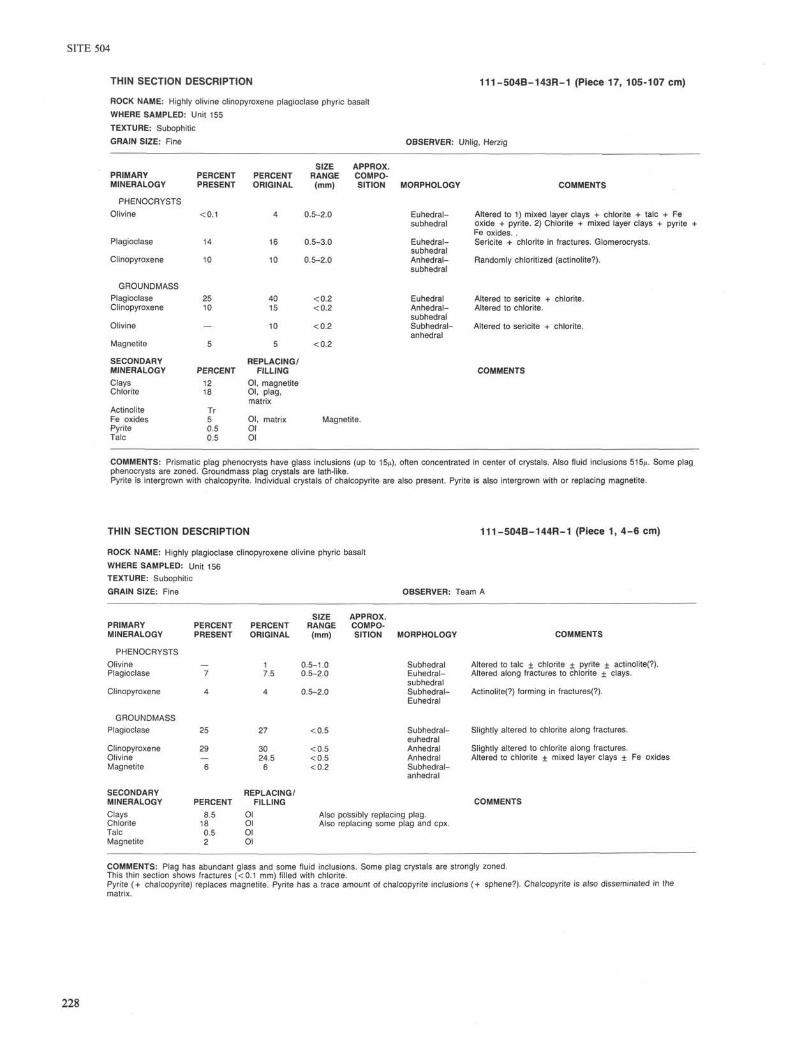
THIN SECTION DESCRIPTION 111-504B-143R-1 (Piece 17, 105-107 cm) ROCK NAME: Highly olivine clinopyroxene plagioclase phyric basalt WHERE SAMPLED: Unit 155 TEXTURE: Subophitic GRAIN SIZE: Fine OBSERVER: Uhlig, Herzig
PRIMARY MINERALOGY
PHENOCRYSTS Olivine
Plagioclase
Clinopyroxene
GROUIMDMASS Plagioclase Clinopyroxene
Olivine
Magnetite
SECONDARY MINERALOGY Clays Chlorite
Actinolite Fe oxides Pyrite Talc
PERCENT PRESENT
25 10
PERCENT 12 18 Tr 5 0.5 0.5
PERCENT ORIGINAL
SIZE RANGE (mm)
0.5-2.0
0.5-3.0
0.5-2.0
APPROX. COMPOSITION
40 15
10
5
REPLACING/ FILLING
Ol, magnetite Ol, plag, matrix
Ol, matrix Ol Ol
<0.2 <0.2
<0.2
<0.2
MORPHOLOGY
Euhedral-subhedral
Euhedral-subhedral Anhedral-subhedral
Euhedral Anhedral-subhedral Subhedral-anhedral
COMMENTS
Altered to 1) mixed layer clays + chlorite + talc oxide + pyrite. 2) Chlorite + mixed layer clays + Fe oxides. . Sericite + chlorite in fractures. Glomerocrysts.
Randomly chloritized (actinolite?).
Altered to sericite + chlorite. Altered to chlorite.
Altered to sericite + chlorite.
COMMENTS
h Fe pyrite
Magnetite.
COMMENTS: Prismatic plag phenocrysts have glass inclusions (up to 15/i), often concentrated in center of crystals. Also fluid inclusions 515/t. Some plag phenocrysts are zoned. Groundmass plag crystals are lath-like. Pyrite is intergrown with chalcopyrite. Individual crystals of chalcopyrite are also present. Pyrite is also intergrown with or replacing magnetite.
THIN SECTION DESCRIPTION
ROCK NAME: Highly plagioclase clinopyroxene olivine phyric basalt WHERE SAMPLED: Unit 156 TEXTURE: Subophitic GRAIN SIZE: Fine
111-504B-144R-1 (Piece 1, 4-6 cm)
OBSERVER: Team A
PRIMARY MINERALOGY
PHENOCRYSTS Olivine Plagioclase
Clinopyroxene
GROUNDMASS Plagioclase
Clinopyroxene Olivine Magnetite
SECONDARY MINERALOGY Clays Chlorite Talc Magnetite
PERCENT PRESENT
PERCENT 8.5
0.5 2
PERCENT ORIGINAL
1 7.5
27
30 24.5
6
SIZE RANGE (mm)
0.5-1.0 0.5-2.0
<0.5
<0 .5 <0 .5 <0 .2
REPLACING/ FILLING
Ol Ol Ol Ol
APPROX. COMPOSITION MORPHOLOGY
Subhedral Euhedral-subhedral Subhedral-Euhedral
Subhedral-euhedral Anhedral Anhedral Subhedral-anhedral
Also possibly replacing plag. Also replacing some plag and cpx.
COMMENTS
Altered to talc + chlorite + pyrite + actinolite(?) Altered along fractures to chlorite + clays.
Actinolite(?) forming in fractures(?).
Slightly altered to chlorite along fractures.
Slightly altered to chlorite along fractures. Altered to chlorite + mixed layer clays + Fe oxides
COMMENTS
COMMENTS: Plag has abundant glass and some fluid inclusions. Some plag crystals are strongly zoned. This thin section shows fractures (<0.1 mm) filled with chlorite. Pyrite (+ chalcopyrite) replaces magnetite. Pyrite has a trace amount of chalcopyrite inclusions (+ sphene?). Chalcopyrite is also disseminated in the matrix.
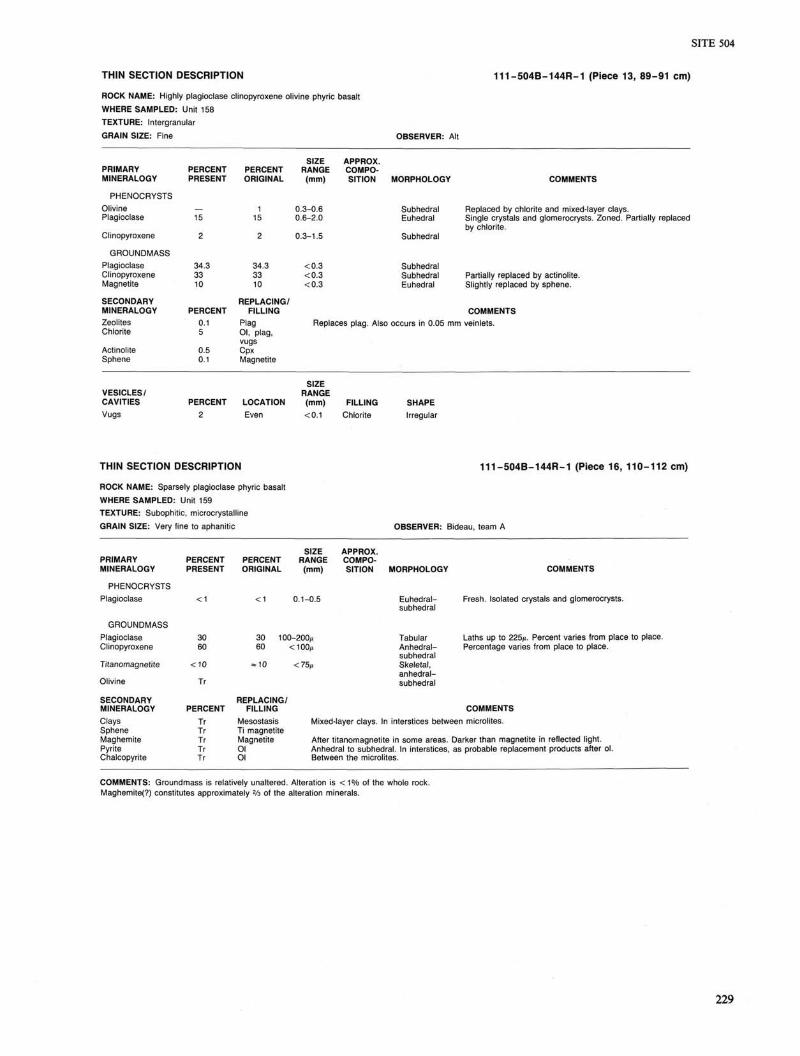
SITE 504
THIN SECTION DESCRIPTION 111-504B-144R-1 (Piece 13, 89-91 cm)
ROCK NAME: Highly plagioclase clinopyroxene olivine phyric basalt WHERE SAMPLED: Unit 158 TEXTURE: Intergranular GRAIN SIZE: Fine OBSERVER: Alt
PRIMARY MINERALOGY
PHENOCRYSTS Olivine Plagioclase
Clinopyroxene
GROUNDMASS Plagioclase Clinopyroxene Magnetite
SECONDARY MINERALOGY Zeolites Chlorite
Actinolite Sphene
PERCENT PRESENT
34.3 33 10
PERCENT 0.1 5
PERCENT ORIGINAL
SIZE RANGE (mm)
0.3-0.6 0.6-2.0
0.3-1.5
0.5 0.1
34.3 33 10
REPLACING/ FILLING
Plag Ol, plag, vugs Cpx Magnetite
<0.3 <0.3 <0.3
APPROX. COMPOSITION MORPHOLOGY
Subhedral Euhedral
Subhedral
Subhedral Subhedral Euhedral
COMMENTS
Replaced by chlorite and mixed-layer clays. Single crystals and glomerocrysts. Zoned. Partially replaced by chlorite.
Partially replaced by actinolite. Slightly replaced by sphene.
COMMENTS Replaces plag. Also occurs in 0.05 mm veinlets.
VESICLES/ CAVITIES Vugs
PERCENT 2
LOCATION Even
SIZE RANGE (mm) <0.1
FILLING Chlorite
SHAPE Irregular
THIN SECTION DESCRIPTION
ROCK NAME: Sparsely plagioclase phyric basalt WHERE SAMPLED: Unit 159 TEXTURE: Subophitic, microcrystalline GRAIN SIZE: Very fine to aphanitic
111-504B-144R-1 (Piece 16, 110-112 cm)
OBSERVER: Bideau, team A
PRIMARY MINERALOGY
PHENOCRYSTS Plagioclase
GROUNDMASS Plagioclase Clinopyroxene
Titanomagnetite
Olivine
SECONDARY MINERALOGY Clays Sphene Maghemite Pyrite Chalcopyrite
PERCENT PRESENT
30 60
< 1 0
Tr
PERCENT Tr Tr Tr Tr Tr
PERCENT ORIGINAL
SIZE RANGE (mm)
0.1-0.5
30 100-200,1 60 < 100,1
= 10 < 7 5 / J
REPLACING/ FILLING
Mesostasis Ti magnetite Magnetite Ol Ol
APPROX. COMPOSITION MORPHOLOGY
Euhedral-subhedral
Tabular Anhedral-subhedral Skeletal, anhedral-subhedral
COMMENTS
Fresh. Isolated crystals and glomerocrysts.
Laths up to 225,;. Percent varies from place to place. Percentage varies from place to place.
COMMENTS Mixed-layer clays. In interstices between microlites.
After titanomagnetite in some areas. Darker than magnetite in reflected light. Anhedral to subhedral. In interstices, as probable replacement products after ol. Between the microlites.
COMMENTS: Groundmass is relatively unaltered. Alteration is < 1 % of the whole rock. Maghemite(?) constitutes approximately % of the alteration minerals.
229
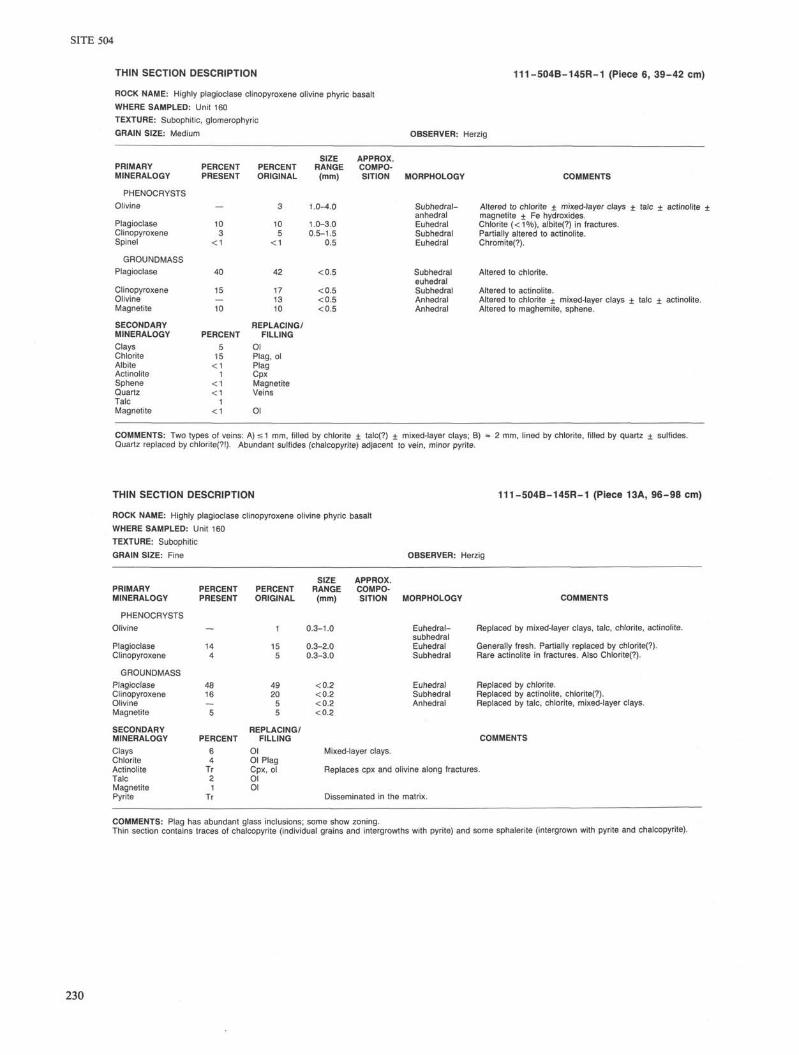
THIN SECTION DESCRIPTION 111-504B-145R-1 (Piece 6, 39-42 cm) ROCK NAME: Highly plagioclase clinopyroxene olivine phyric basalt WHERE SAMPLED: Unit 160 TEXTURE: Subophitic, glomerophyric GRAIN SIZE: Medium OBSERVER: Herzig
PRIMARY MINERALOGY
PHENOCRYSTS Olivine
Plagioclase Clinopyroxene Spinel
GROUNDMASS Plagioclase
Clinopyroxene Olivine Magnetite
SECONDARY MINERALOGY Clays Chlorite Albite Actinolite Sphene Quartz Talc Magnetite
PERCENT PRESENT
10 3
<1
15
10
PERCENT 5
15 <1
1 <1 <1
1 <1
PERCENT ORIGINAL
10 5
<1
SIZE RANGE (mm)
1.0-4.0
1.0-3.0 0.5-1.5
0.5
42
17 13 10
REPLACING/ FILLING
Ol Plag, ol Plag Cpx Magnetite Veins
Ol
<0.5
<0.5 <0.5 <0.5
APPROX. COMPOSITION MORPHOLOGY
Subhedral-anhedral Euhedral Subhedral Euhedral
Subhedral euhedral Subhedral Anhedral Anhedral
COMMENTS
Altered to chlorite ± mixed-layer clays ± talc ± actinolite ± magnetite + Fe hydroxides. Chlorite (<1°/o), albite(?) in fractures. Partially altered to actinolite. Chromite(?).
Altered to chlorite.
Altered to actinolite. Altered to chlorite ± mixed-layer clays ± talc + actinolite. Altered to maghemite, sphene.
COMMENTS: Two types of veins: A) < 1 mm, filled by chlorite + talc(?) + mixed-layer clays; B) ■» 2 mm, lined by chlorite, filled by quartz + sulfides. Quartz replaced by chlorite(?l). Abundant sulfides (chalcopyrite) adjacent to vein, minor pyrite.
THIN SECTION DESCRIPTION 111-504B-145R-1 (Piece 13A, 96-98 cm)
ROCK NAME: Highly plagioclase clinopyroxene olivine phyric basalt WHERE SAMPLED: Unit 160 TEXTURE: Subophitic GRAIN SIZE: Fine OBSERVER: Herzig
PRIMARY MINERALOGY
PHENOCRYSTS Olivine
Plagioclase Clinopyroxene
GROUNDMASS Plagioclase Clinopyroxene Olivine Magnetite
SECONDARY MINERALOGY Clays Chlorite Actinolite Talc Magnetite Pyrite
PERCENT PRESENT
PERCENT 6 4
Tr 2 1
Tr
PERCENT ORIGINAL
SIZE RANGE (mm)
0.3-1.0
0.3-2.0 0.3-3.0
49 20
5 5
REPLACING/ FILLING
Ol Ol Plag Cpx, ol Ol Oi
<0.2 <0.2 <0.2 <0.2
APPROX. COMPOSITION MORPHOLOGY
Euhedral-subhedral Euhedral Subhedral
Euhedral Subhedral Anhedral
COMMENTS
Replaced by mixed-layer clays, talc, chlorite, actinolite.
Generally fresh. Partially replaced by chlorite(?). Rare actinolite in fractures. Also Chlorite(?).
Replaced by chlorite. Replaced by actinolite, chlorite(?). Replaced by talc, chlorite, mixed-layer clays.
COMMENTS Mixed-layer clays.
Replaces cpx and olivine along fractures.
Disseminated in the matrix.
COMMENTS: Plag has abundant glass inclusions; some show zoning. Thin section contains traces of chalcopyrite (individual grains and intergrowths with pyrite) and some sphalerite (intergrown with pyrite and chalcopyrite).
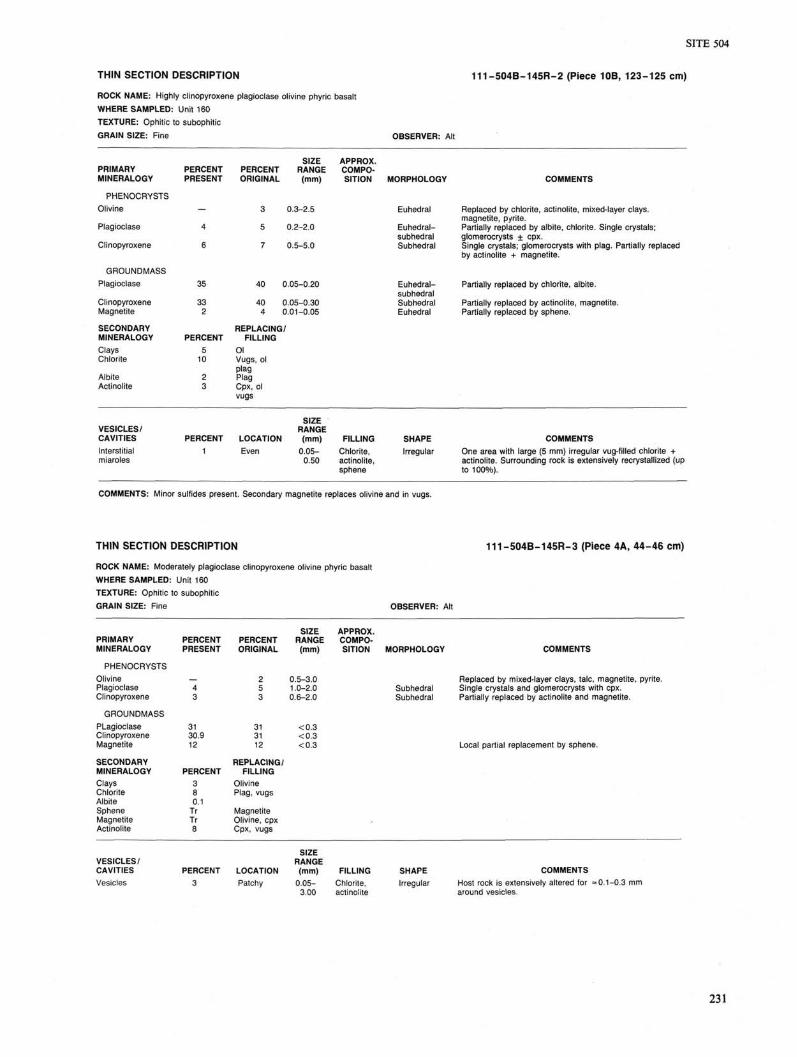
SITE 504
THIN SECTION DESCRIPTION 111-504B-145R-2 (Piece 10B, 123-125 cm)
ROCK NAME: Highly clinopyroxene plagioclase olivine phyric basalt WHERE SAMPLED: Unit 160 TEXTURE: Ophitic to subophitic GRAIN SIZE: Fine OBSERVER: Alt
PRIMARY MINERALOGY
PHENOCRYSTS Olivine
Plagioclase
Clinopyroxene
GROUNDMASS Plagioclase
Clinopyroxene Magnetite
SECONDARY MINERALOGY Clays Chlorite
Albite Actinolite
PERCENT PRESENT
35
PERCENT 5
10
PERCENT ORIGINAL
SIZE RANGE (mm)
3 0.3-2.5
5 0.2-2.0
7 0.5-5.0
40
40 4
0.05-0.20
0.05-0.30 0.01-0.05
REPLACING/ FILLING
Ol Vugs, ol plag Plag Cpx, ol vugs
APPROX. COMPOSITION MORPHOLOGY COMMENTS
Euhedral Replaced by chlorite, actinolite, mixed-layer clays. magnetite, pyrite.
Euhedral- Partially replaced by albite, chlorite. Single crystals; subhedral glomerocrysts + cpx. Subhedral Single crystals; glomerocrysts with plag. Partially replaced
by actinolite + magnetite.
Euhedral- Partially replaced by chlorite, albite. subhedral Subhedral Partially replaced by actinolite, magnetite. Euhedral Partially replaced by sphene.
VESICLES/ CAVITIES Interstitial miaroles
PERCENT 1
LOCATION Even
SIZE RANGE (mm)
0.05-0.50
FILLING SHAPE COMMENTS Chlorite, Irregular One area with large (5 mm) irregular vug-filled chlorite + actinolite, actinolite. Surrounding rock is extensively recrystallized (up sphene to 100%).
COMMENTS: Minor sulfides present. Secondary magnetite replaces olivine and in vugs.
THIN SECTION DESCRIPTION
ROCK NAME: Moderately plagioclase clinopyroxene olivine phyric basalt WHERE SAMPLED: Unit 160 TEXTURE: Ophitic to subophitic GRAIN SIZE: Fine OBSERVER: Alt
111-504B-145R-3 (Piece 4A, 44-46 cm)
PRIMARY MINERALOGY
PHENOCRYSTS Olivine Plagioclase Clinopyroxene
GROUNDMASS PLagioclase Clinopyroxene Magnetite
SECONDARY MINERALOGY Clays Chlorite Albite Sphene Magnetite Actinolite
PERCENT PRESENT
31 30.9 12
PERCENT 3 8 0.1
Tr Tr
PERCENT ORIGINAL
SIZE RANGE (mm)
0.5-3.0 1.0-2.0 0.6-2.0
31 31 12
REPLACING/ FILLING
Olivine Plag, vugs
Magnetite Olivine, cpx Cpx, vugs
<0.3 <0,3 <0.3
APPROX. COMPOSITION MORPHOLOGY
Subhedral Subhedral
COMMENTS
Replaced by mixed-layer clays, talc, magnetite, pyrite. Single crystals and glomerocrysts with cpx. Partially replaced by actinolite and magnetite.
Local partial replacement by sphene.
VESICLES/ CAVITIES Vesicles
SIZE RANGE
PERCENT LOCATION (mm) FILLING 3 Patchy 0.05- Chlorite,
3.00 actinolite
SHAPE COMMENTS Irregular Host rock is extensively altered for
around vesicles. = 0.1-0.3 mm
231
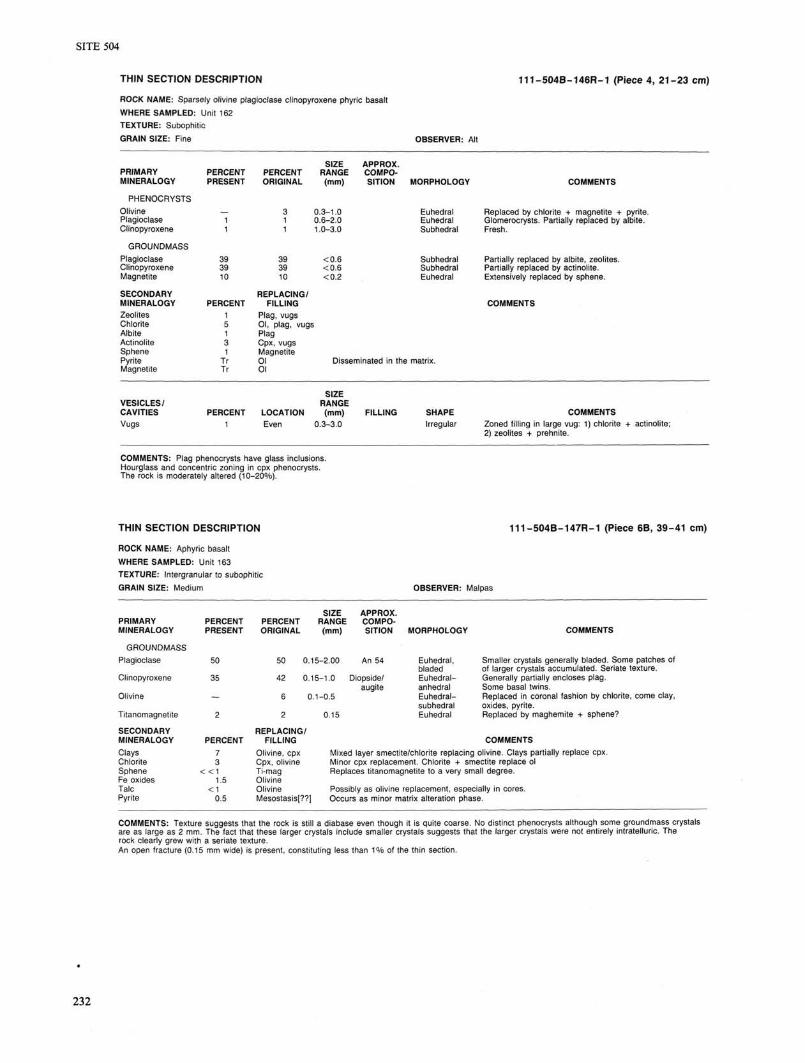
THIN SECTION DESCRIPTION 111-504B-146R-1 (Piece 4, 21-23 cm)
ROCK NAME: Sparsely olivine plagioclase clinopyroxene phyric basalt WHERE SAMPLED: Unit 162 TEXTURE: Subophitic GRAIN SIZE: Fine OBSERVER: Alt
PRIMARY MINERALOGY
PHENOCRYSTS Olivine Plagioclase Clinopyroxene
GROUNDMASS Plagioclase Clinopyroxene Magnetite
SECONDARY MINERALOGY Zeolites Chlorite Albite Actinolite Sphene Pyrite Magnetite
PERCENT PRESENT
38 39 10
PERCENT 1 5 1 3 1
Tr Tr
PERCENT ORIGINAL
SIZE RANGE (mm)
0.3-1.0 0.6-2.0 1.0-3.0
39 39 10
REPLACING/ FILLING
Plag, vugs Ol, plag, vugs Plag Cpx, vugs Magnetite Ol Ol
<0.6 <0.6 <0.2
APPROX. COMPOSITION MORPHOLOGY
Euhedral Euhedral Subhedral
Subhedral Subhedral Euhedral
COMMENTS
Replaced by chlorite + magnetite + pyrite. Glomerocrysts. Partially replaced by albite. Fresh.
Partially replaced by albite, zeolites. Partially replaced by actinolite. Extensively replaced by sphene.
COMMENTS
Disseminated in the matrix.
VESICLES/ CAVITIES Vugs
PERCENT LOCATION Even
SIZE RANGE (mm)
0.3-3.0 FILLING SHAPE COMMENTS
Irregular Zoned filling in large vug: 1) chlorite + actinolite; 2) zeolites + prehnite.
COMMENTS: Plag phenocrysts have glass inclusions. Hourglass and concentric zoning in cpx phenocrysts. The rock is moderately altered (10-20%).
THIN SECTION DESCRIPTION 111-504B-147R-1 (Piece 6B, 39-41 cm)
ROCK NAME: Aphyric basalt WHERE SAMPLED: Unit 163 TEXTURE: Intergranular to subophitic GRAIN SIZE: Medium OBSERVER: Malpas
PRIMARY MINERALOGY
GROUNDMASS Plagioclase
Clinopyroxene
Olivine
Titanomagnetite
SECONDARY MINERALOGY Clays Chlorite Sphene Fe oxides Talc Pyrite
PERCENT PRESENT
PERCENT 7 3
< < 1 1.5
< 1 0.5
SIZE APPROX. PERCENT RANGE COMPO-ORIGINAL (mm) SITION MORPHOLOGY
50 0.15-2.00
42
6
2 0.15
An 54
0.15-1.0 Diopside/ augite
0.1-0.5
Euhedral, bladed Euhedral-anhedral Euhedral-subhedral Euhedral
COMMENTS
Smaller crystals generally bladed. Some patches of of larger crystals accumulated. Seriate texture. Generally partially encloses plag. Some basal twins. Replaced in coronal fashion by chlorite, come clay, oxides, pyrite. Replaced by maghemite + sphene?
REPLACING/ FILLING
Olivine, cpx Cpx, olivine Ti-mag Olivine Olivine
COMMENTS Mixed layer smectite/chlorite replacing olivine. Clays partially replace cpx. Minor cpx replacement. Chlorite + smectite replace ol Replaces titanomagnetite to a very small degree.
Possibly as olivine replacement, especially in cores. Mesostasis[??] Occurs as minor matrix alteration phase.
COMMENTS: Texture suggests that the rock is still a diabase even though it is quite coarse. No distinct phenocrysts although some groundmass crystals are as large as 2 mm. The fact that these larger crystals include smaller crystals suggests that the larger crystals were not entirely intratelluric. The rock clearly grew with a seriate texture. An open fracture (0.15 mm wide) is present, constituting less than 1 % of the thin section.
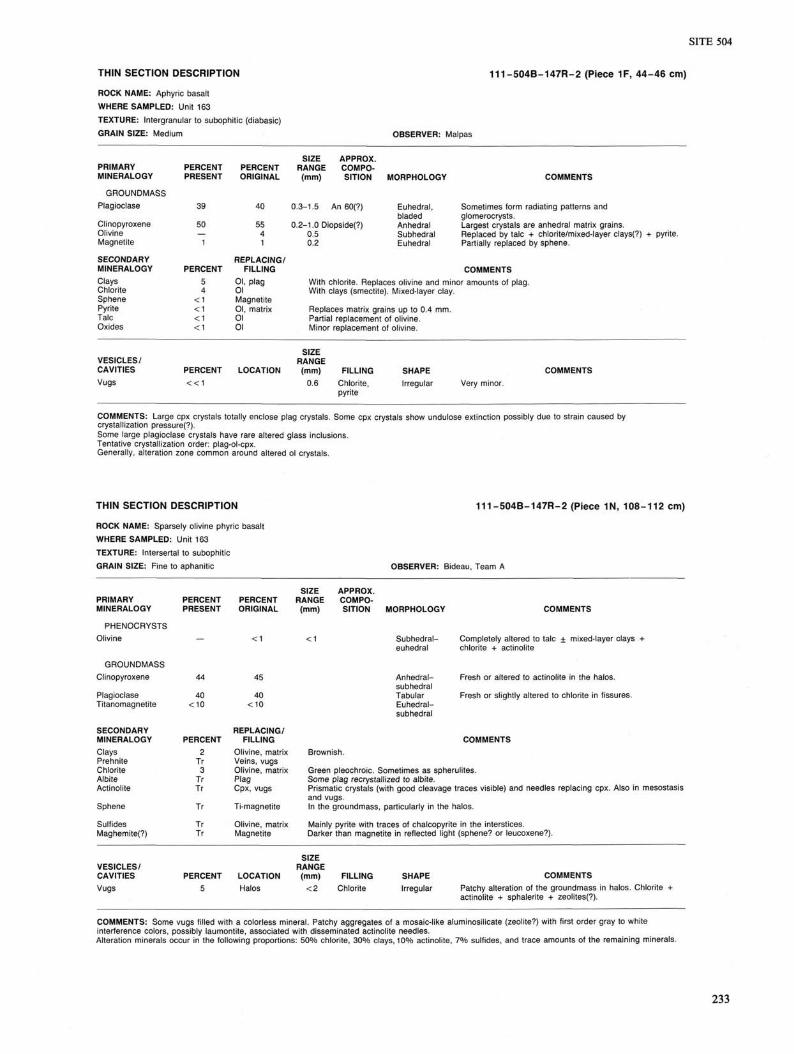
THIN SECTION DESCRIPTION 111-504B-147R-2 (Piece 1F, 44-46 cm)
ROCK NAME: Aphyric basalt
WHERE SAMPLED: Unit 163
TEXTURE: Intergranular to subophitic (diabasic) GRAIN SIZE: Medium OBSERVER: Malpas
PRIMARY MINERALOGY
GROUNDMASS Plagioclase
Clinopyroxene Olivine Magnetite
SECONDARY MINERALOGY Clays Chlorite Sphene Pyrite Talc Oxides
PERCENT PRESENT
39 50 1
PERCENT 5 4
<1 <1 <1 <1
PERCENT ORIGINAL
40
SIZE APPROX. RANGE COMPO-(mm) SITION MORPHOLOGY
0.3-1.5 An 60(?)
55 0.2-1.0 Diopside(?) 4 0.5 1 0.2
REPLACING/ FILLING
Ol, plag Ol Magnetite Ol, matrix Ol Ol
Euhedral, bladed Anhedral Subhedral Euhedral
COMMENTS
Sometimes form radiating patterns and glomerocrysts. Largest crystals are anhedral matrix grains. Replaced by talc + chlorite/mixed-layer clays(?) + pyrite. Partially replaced by sphene.
COMMENTS With chlorite. Replaces olivine and minor amounts of With clays (smectite). Mixed-layer clay.
Replaces matrix grains up to 0.4 mm. Partial replacement of olivine. Minor replacement of olivine.
VESICLES/ CAVITIES Vugs
SIZE RANGE
PERCENT LOCATION (mm) FILLING < < 1 0.6 Chlorite,
pyrite
SHAPE Irregular
COMMENTS Very minor.
COMMENTS: Large cpx crystals totally enclose plag crystals. Some cpx crystals show undulose extinction possibly due to strain caused by crystallization pressuref?). Some large plagioclase crystals have rare altered glass inclusions. Tentative crystallization order: plag-ol-cpx. Generally, alteration zone common around altered ol crystals.
THIN SECTION DESCRIPTION
ROCK NAME: Sparsely olivine phyric basalt WHERE SAMPLED: Unit 163 TEXTURE: Intersertal to subophitic GRAIN SIZE: Fine to aphanitic
111-504B-147R-2 (Piece 1N, 108-112 cm)
OBSERVER: Bideau, Team A
PRIMARY MINERALOGY
PHENOCRYSTS Olivine
GROUNDMASS Clinopyroxene
Plagioclase Titanomagnetite
SECONDARY MINERALOGY Clays Prehnite Chlorite Albite Actinolite
Sphene
Sulfides Maghemite(?)
VESICLES/ CAVITIES Vugs
PERCENT PRESENT
—
44
40 <10
PERCENT 2
Tr 3
Tr Tr
Tr
Tr Tr
PERCENT 5
PERCENT ORIGINAL
<1
45
40 <10
REPLACING/ FILLING
Olivine, matrix Veins, vugs Olivine, matrix Plag Cpx, vugs
Ti-magnetite
Olivine, matrix Magnetite
LOCATION Halos
SIZE RANGE (mm)
<1
APPROX. COMPOSITION
Brownish.
Green pleochroic. !
MORPHOLOGY
Subhedral-euhedral
Anhedral-subhedral Tabular Euhedral-subhedral
COMMENTS
Completely altered to talc + mixed-layer clays + chlorite + actinolite
Fresh or altered to actinolite in the halos.
Fresh or slightly altered to chlorite in fissures.
COMMENTS
Sometimes as spherulites. Some plag recrystallized to albite. Prismatic crystals (with good cleavage and vugs. In the groundmass
traces visible) and needles replacing cpx. Also in mesostasis
particularly in the halos.
Mainly pyrite with traces of chalcopyrite in the interstices. Darker than magnetite in reflected light (sphene? or leucoxene?).
SIZE RANGE
(mm) <2
FILLING Chlorite
SHAPE Irregular
COMMENTS Patchy alteration of the groundmass in halos. Chlorite + actinolite + sphalerite + zeolites(?).
COMMENTS: Some vugs filled with a colorless mineral. Patchy aggregates of a mosaic-like aluminosilicate (zeolite?) with first order gray to white interference colors, possibly laumontite, associated with disseminated actinolite needles. Alteration minerals occur in the following proportions: 50% chlorite, 30% clays, 10% actinolite, 7% sulfides, and trace amounts of the remaining minerals.
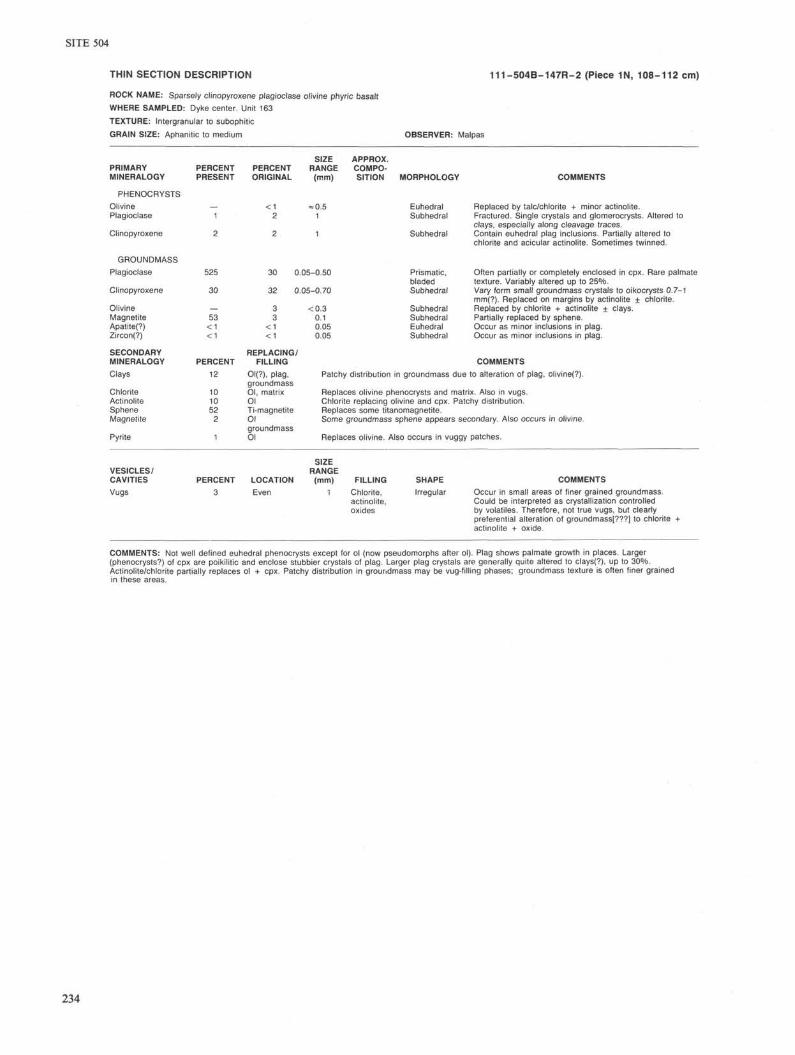
THIN SECTION DESCRIPTION 111-504B-147R-2 (Piece 1N, 108-112 cm)
ROCK NAME: Sparsely clinopyroxene plagioclase olivine phyric basalt WHERE SAMPLED: Dyke center. Unit 163 TEXTURE: Intergranular to subophitic GRAIN SIZE: Aphanitic to medium OBSERVER: Malpas
PRIMARY MINERALOGY
PHENOCRYSTS Olivine Plagioclase
Clinopyroxene
PERCENT PRESENT
SIZE PERCENT RANGE ORIGINAL (mm)
<1 2
= 0.5 1
APPROX. COMPOSITION MORPHOLOGY COMMENTS
Euhedral Replaced by talc/chlorite + minor actinolite. Subhedral Fractured. Single crystals and glomerocrysts. Altered to
clays, especially along cleavage traces. Subhedral Contain euhedral plag inclusions. Partially altered to
chlorite and acicular actinolite. Sometimes twinned.
GROUNDMASS Plagioclase
Clinopyroxene
Olivine Magnetite Apatitef?) Zircon(?)
SECONDARY MINERALOGY Clays
Chlorite Actinolite Sphene Magnetite
Pyrite
525
30
53 <1 <1
PERCENT 12
10 10 52
2
30 0.05-0.50
32 0.05-0.70
:;: 3
<1 <1
REPLACING/ FILLING
OI(?), plag, groundmass Ol, matrix Ol Ti-magnetite Ol groundmass Ol
<0.3 0.1 0.05 0.05
Prismatic, Often partially or completely enclosed in cpx. Rare palmate bladed texture. Variably altered up to 25%. Subhedral Vary form small groundmass crystals to oikocrysts 0.7-1
mm(?). Replaced on margins by actinolite + chlorite. Subhedral Replaced by chlorite + actinolite + clays. Subhedral Partially replaced by sphene. Euhedral Occur as minor inclusions in plag. Subhedral Occur as minor inclusions in plag.
COMMENTS Patchy distribution in groundmass due to alteration of plag, olivine(?).
Replaces olivine phenocrysts and matrix. Also in vugs. Chlorite replacing olivine and cpx. Patchy distribution. Replaces some titanomagnetite. Some groundmass sphene appears secondary. Also occurs in olivine.
Replaces olivine. Also occurs in vuggy patches.
VESICLES/ CAVITIES Vugs
SIZE RANGE
PERCENT LOCATION (mm) FILLING 3 Even 1 Chlorite,
actinolite, oxides
SHAPE COMMENTS Irregular Occur in small areas of finer grained groundmass.
Could be interpreted as crystallization controlled by volatiles. Therefore, not true vugs, but clearly preferential alteration of groundmass[???] to chlorite actinolite + oxide.
COMMENTS: Not well defined euhedral phenocrysts except for ol (now pseudomorphs after ol). Plag shows palmate growth in places. Larger (phenocrysts?) of cpx are poikilitic and enclose stubbier crystals of plag. Larger plag crystals are generally quite altered to clays(?), up to 30%. Actinolite/chlorite partially replaces ol + cpx. Patchy distribution in groundmass may be vug-filling phases; groundmass texture is often finer grained In these areas.

SITE 504
THIN SECTION DESCRIPTION 111-504B-148R-1 (Piece 3, 18-21 cm)
ROCK NAME: Sparsely plagioclase olivine phyric basalt WHERE SAMPLED: Unit 164 TEXTURE: Ophitic GRAIN SIZE: Fine OBSERVER: Alt
PRIMARY MINERALOGY
PHENOCRYSTS Olivine
Plagioclase
GROUNDMASS Plagioclase Clinopyroxene Olivine Magnetite Spinel
SECONDARY MINERALOGY Clays Albite Actinolite Sphene Pyrite
PERCENT PRESENT
-7
36.9 37
— 7 <0.1
PERCENT 12 Tr Tr Tr 0.1
PERCENT ORIGINAL
2
7
36.9 37 10 7
<0.1
SIZE RANGE (mm)
0.4-3.0
0.1-3.0
<0.3 <0.3 <0.3 <0.3
0.15
REPLACING/ FILLING
Ol Plag Cpx Magnetite Ol
APPROX. COMPOSITION MORPHOLOGY
Euhedral
Euhedral
Subhedral Subhedral Subhedral Euhedral Subhedral
COMMENTS
Replaced by mixed-layer clays + talc + magnetite + pyrite. Single crystals and glomerocrysts. Partially replaced by clays and albite.
Partially replaced by clays. Slightly replaced by actinolite. Replaced by mixed-layer clays. Slightly replaced by sphene. Single crystal in ol pseudomorph.
COMMENTS: Ol pseudomorphs are sometimes zoned: mixed-layer clays in the center, rimmed by talc.
THIN SECTION DESCRIPTION
ROCK NAME: Moderately plagioclase clinopyroxene olivine phyric basalt WHERE SAMPLED: Unit 164 TEXTURE: Subophitic GRAIN SIZE: Fine
111-504B-148R-1 (Piece 9, 61-63 cm)
OBSERVER: Alt
PRIMARY MINERALOGY
PHENOCRYSTS Olivine
Plagioclase Clinopyroxene
GROUNDMASS Plagioclase Clinopyroxene Olivine Magnetite
SECONDARY MINERALOGY Clays Albite Actinolite Sphene
PERCENT PRESENT
PERCENT
PERCENT ORIGINAL
SIZE RANGE (mm)
0.4-0.6
0.6-1.0 0.9-.3.0
41 41
1 7
REPLACING/ FILLING
Ol, plag, vugs Plag Cpx Magnetite
<0.6 <0 .6 <0 .4 <0 .6
APPROX. COMPOSITION MORPHOLOGY
Subhedral
Subhedral Subhedral
COMMENTS
Replaced by mixed-layer clays + talc + magnetite + pyrite. Glomerocrysts. Partially replaced by clays, albite.
Partially replaced by clays, albite. Partially replaced by actinolite. Replaced by mixed-layer clay, talc, magnetite.
VESICLES/ CAVITIES Vugs
PERCENT < 1
LOCATION
SIZE RANGE (mm) <0.3
FILLING Clays
SHAPE Irregular
235
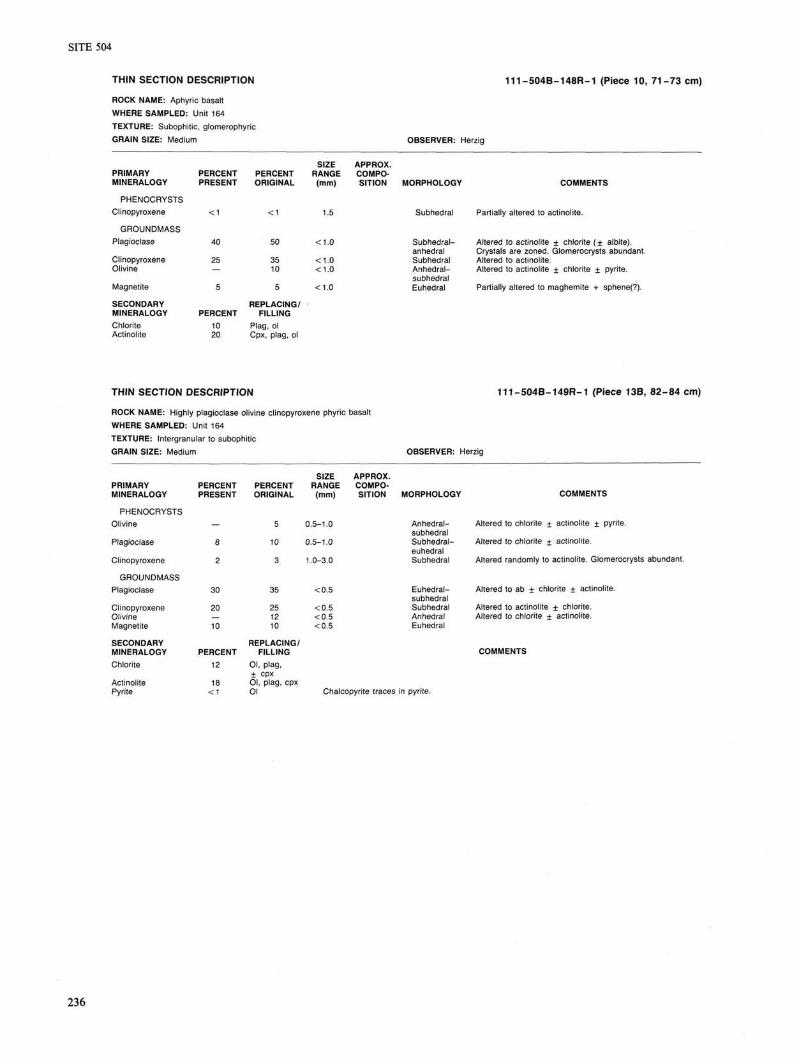
THIN SECTION DESCRIPTION 111-504B-148R-1 (Piece 10, 71-73 cm)
ROCK NAME: Aphyric basalt WHERE SAMPLED: Unit 164 TEXTURE: Subophitic, glomerophyric GRAIN SIZE: Medium OBSERVER: Herzig
PRIMARY MINERALOGY
PHENOCRYSTS Clinopyroxene
GROUNDMASS Plagioclase
Clinopyroxene Olivine
Magnetite
SECONDARY MINERALOGY Chlorite Actinolite
PERCENT PRESENT
<1
40
25
5
PERCENT 10 20
PERCENT ORIGINAL
<1
50
35 10
5
REPLACING/ FILLING
Plag, ol Cpx, plag, ol
SIZE RANGE (mm)
1.5
<1.0
<1.0 <1.0
<1.0
APPROX. COMPOSITION MORPHOLOGY
Subhedral
Subhedral-anhedral Subhedral Anhedral-subhedral Euhedral
COMMENTS
Partially altered to actinolite.
Altered to actinolite ± chlorite (+ albite). Crystals are zoned. Glomerocrysts abundant. Altered to actinolite. Altered to actinolite + chlorite ± pyrite.
Partially altered to maghemite + sphene(?).
THIN SECTION DESCRIPTION
ROCK NAME: Highly plagioclase olivine clinopyroxene phyric basalt WHERE SAMPLED: Unit 164 TEXTURE: Intergranular to subophitic GRAIN SIZE: Medium
1 1 1 - 5 0 4 B - 1 4 9 R - 1 (Piece 13B, 8 2 - 8 4 cm)
OBSERVER: Herzig
PRIMARY MINERALOGY
PHENOCRYSTS Olivine
Plagioclase
Clinopyroxene
GROUNDMASS Plagioclase
Clinopyroxene Olivine Magnetite
SECONDARY MINERALOGY Chlorite
Actinolite Pyrite
PERCENT PRESENT
— 8
2
30
20 — 10
PERCENT 12
18 < 1
PERCENT ORIGINAL
5
10
3
35
25 12 10
REPLACING/ FILLING
Ol, plag, ± cpx Ol, plag, cpx Ol
SIZE RANGE
(mm)
0.5-1.0
0.5-1.0
1.0-3.0
<0.5
<0.5 <0.5 <0.5
APPROX. COMPOSITION
Chalcopyrite traces
MORPHOLOGY
Anhedral-subhedral Subhedral-euhedral Subhedral
Euhedral-subhedral Subhedral Anhedral Euhedral
in pyrite.
COMMENTS
Altered to chlorite + actinolite + pyrite.
Altered to chlorite + actinolite.
Altered randomly to actinolite. Glomerocrysts abundant.
Altered to ab + chlorite + actinolite.
Altered to actinolite + chlorite. Altered to chlorite + actinolite.
COMMENTS
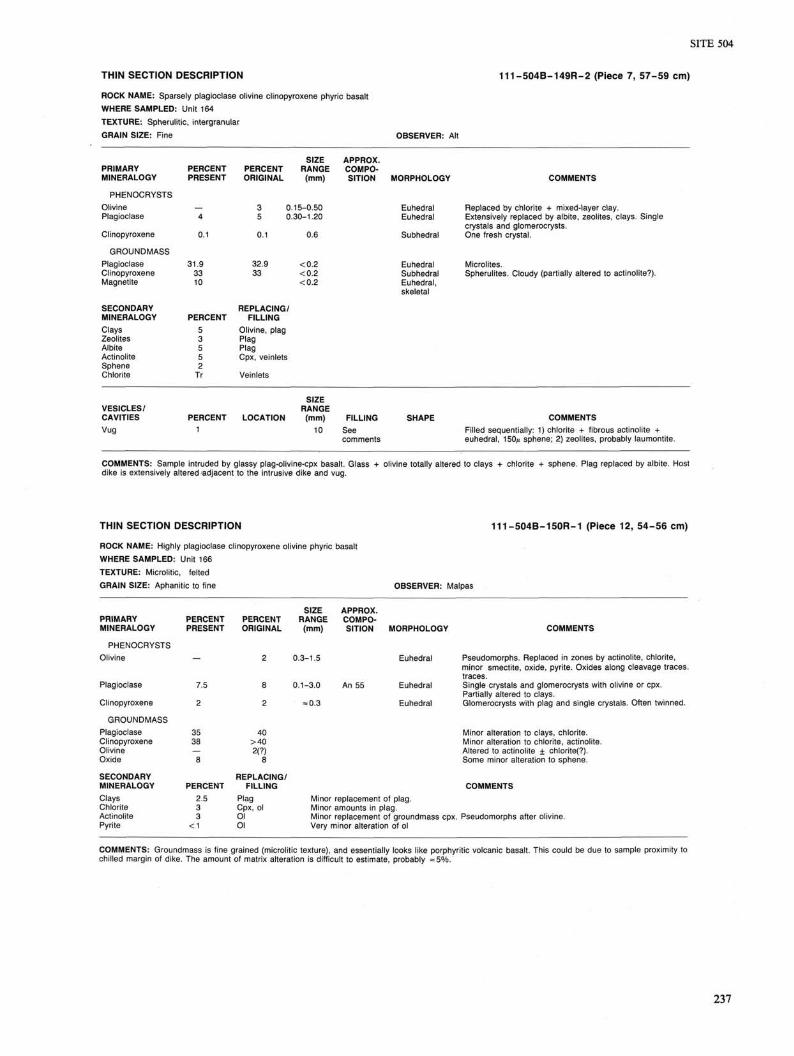
SITE 504
THIN SECTION DESCRIPTION 111-504B-149R-2 (Piece 7, 57-59 cm)
ROCK NAME: Sparsely plagioclase olivine clinopyroxene phyric basalt WHERE SAMPLED: Unit 164 TEXTURE: Spherulitic, intergranular GRAIN SIZE: Fine OBSERVER: Alt
PRIMARY MINERALOGY
Clinopyroxene
GROUNDMASS Plagioclase Clinopyroxene Magnetite
SECONDARY MINERALOGY Clays Zeolites Albite Actinolite Sphene Chlorite
PERCENT PRESENT
PHENOCRYSTS Olivine — Plagioclase 4
0.1
31.9 33 10
PERCENT 5 3 5 5 2
Tr
PERCENT ORIGINAL
SIZE RANGE (mm)
32.9 33
0.15-0.50 0.30-1.20
<0.2 <0.2 <0.2
REPLACING/ FILLING
Olivine, plag Plag Plag Cpx, veinlets
Veinlets
APPROX. COMPOSITION MORPHOLOGY
Euhedral Euhedral
Subhedral
Euhedral Subhedral Euhedral, skeletal
COMMENTS
Replaced by chlorite + mixed-layer clay. Extensively replaced by albite, zeolites, clays. Single crystals and glomerocrysts. One fresh crystal.
Microlites. Spherulites. Cloudy (partially altered to actinolite?).
VESICLES/ CAVITIES Vug
PERCENT 1
LOCATION
SIZE RANGE (mm)
10 FILLING SHAPE COMMENTS
See Filled sequentially: 1) chlorite + fibrous actinolite + comments euhedral, 150/x sphene; 2) zeolites, probably laumontite.
COMMENTS: Sample intruded by glassy plag-olivine-cpx basalt. Glass + olivine totally altered to clays + chlorite + sphene. Plag replaced by albite. Host dike is extensively altered adjacent to the intrusive dike and vug.
THIN SECTION DESCRIPTION
ROCK NAME: Highly plagioclase clinopyroxene olivine phyric basalt WHERE SAMPLED: Unit 166 TEXTURE: Microlitic, felted GRAIN SIZE: Aphanitic to fine
111-504B-150R-1 (Piece 12, 54-56 cm)
OBSERVER: Malpas
PRIMARY MINERALOGY
PHENOCRYSTS Olivine
Plagioclase
Clinopyroxene
GROUNDMASS Plagioclase Clinopyroxene Olivine Oxide
SECONDARY MINERALOGY Clays Chlorite Actinolite Pyrite
PERCENT PRESENT
—
7.5
2
35 38
8
PERCENT 2.5 3 3
<1
PERCENT ORIGINAL
2
8
2
40 >40 2(?)
8
REPLACING/ FILLING
Plag Cpx, ol Ol Ol
SIZE RANGE
(mm)
0.3-1.5
0.1-3.0
= 0.3
APPROX. COMPOSITION
An 55
MORPHOLOGY
Euhedral
Euhedral
Euhedral
Minor replacement of plag. Minor amounts in plag. Minor replacement of groundmass cc Very minor alteration of ol
COMMENTS
Pseudomorphs. Replaced in zones by actinolite, chlorite, minor smectite, oxide, pyrite. Oxides along cleavage traces. traces. Single crystals and glomerocrysts with olivine or cpx. Partially altered to clays. Glomerocrysts with plag and single crystals. Often twinned.
Minor alteration to clays, chlorite. Minor alteration to chlorite, actinolite. Altered to actinolite ± chlorite(?). Some minor alteration to sphene.
COMMENTS
COMMENTS: Groundmass is fine grained (microlitic texture), and essentially looks like porphyritic volcanic basalt. This could be due to sample proximity to chilled margin of dike. The amount of matrix alteration is difficult to estimate, probably =5%.
237

THIN SECTION DESCRIPTION 111-504B-150R-1 (Piece 22A, 113-115 cm)
ROCK NAME: Sparsely plagioclase olivine phyric basalt WHERE SAMPLED: Unit 167 TEXTURE: Subophitic GRAIN SIZE: Fine to medium OBSERVER: Bideau
PRIMARY MINERALOGY
PHENOCRYSTS Olivine Plagioclase
GROUNDMASS Plagioclase Clinopyroxene Opaques
SECONDARY MINERALOGY Clays Chlorite Actinolite Opaques Sphene
PERCENT PRESENT
36 50
< 5
PERCENT 1.0 6.0 0.5 0.5 Tr
PERCENT ORIGINAL
< 2 3
35 5G
5
R E P L A C I N G / F ILLING
Ol, matrix Ol, veinlets Ol, matrix Ol Magnetite
SIZE APPROX. RANGE COMPO-(mm) SITION MORPHOLOGY
Tabular
51 5 1 0.2
COMMENTS
Altered to mixed-layer clays + talc + pyrite + actinolite. Patchy extinction.
Fresh. Euhedral tabular to acicular.
Ti-mag
Tabular Anhedral Skeletal Maghemite(?) also present.
COMMENTS Expandable chlorite/clay mixture. Alteration of ol, and in mesostasis. Also in interstices. Forms along cracks in plag. Chlorite + expandable clays from after olivine. Also in interstices. Pyrite replaces ol and fills interstices. One crystal of chalcopyrite. In matrix and in chlorite veins.
COMMENTS: Open fracture (horizontal strike) with no surrounding alteration halo.
THIN SECTION DESCRIPTION
ROCK NAME: Aphyric basalt WHERE SAMPLED: Unit 168 TEXTURE: Subophitic, glomerophyric GRAIN SIZE: Medium
111-504B-151R-1 (Piece 1B, 4 - 7 cm)
OBSERVER: Herzig
PRIMARY MINERALOGY
PHENOCRYSTS Olivine
PERCENT PRESENT
SIZE PERCENT RANGE ORIGINAL (mm)
Clinopyroxene
GROUNDMASS Plagioclase
Clinopyroxene Olivine Magnetite
SECONDARY MINERALOGY Chlorite Actinolite
<1
40
25
5
PERCENT 10 20
<1
50
35 10 5
REPLACING/ FILLING
Plag Cpx,
, ol plag, ol
1.0-2.5
<1.0
<1.0 <1.0 <1.0
APPROX. COMPOSITION MORPHOLOGY
Subhedral
Subhedral-euhedral
Euhedral-subhedral Subhedral Subhedral Anhedral
COMMENTS
Altered to 1) mixed-layer clays + chlorite + actinolite pyrite ± magnetite; 2) Actinolite + chlorite + pyrite + magnetite. Alteration is zonal in places: cores altered predominately to actinolite; margins altered to chlorite mixed-layer clays + actinolite. Partially altered to actinolite.
Altered to chlorite + actinolite.
Altered to actinolite. Altered to actinolite + chlorite + mixed-layer clays. Partially altered to maghemite + sphene(?).
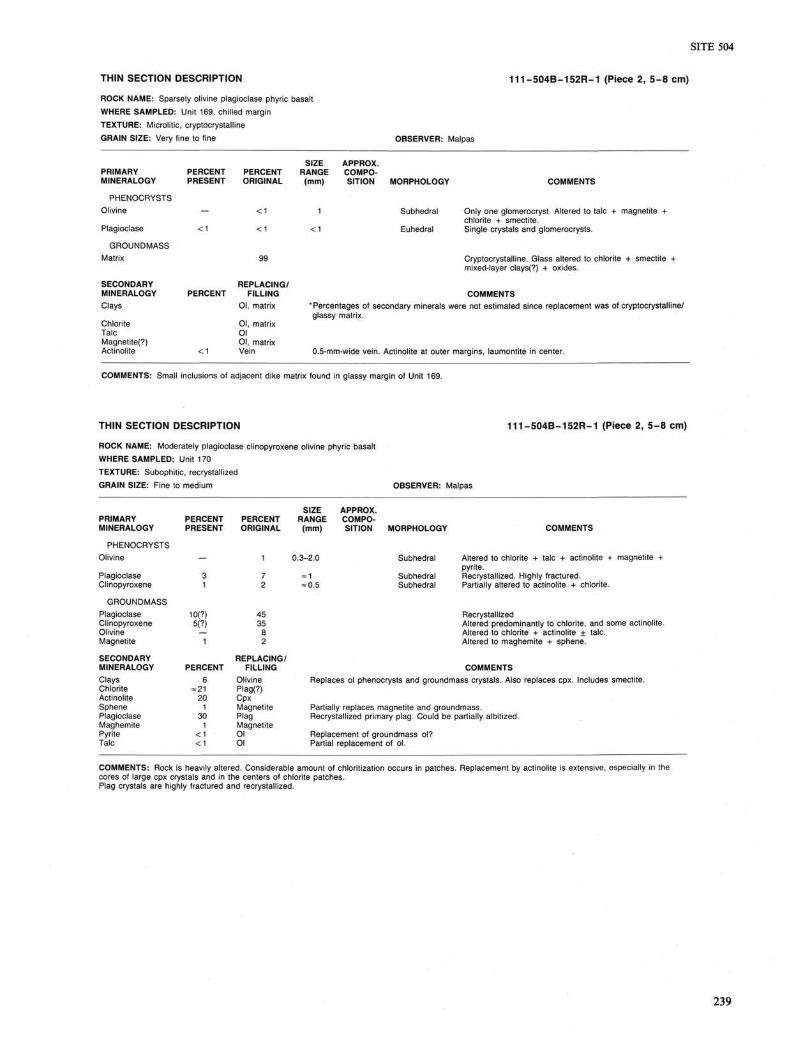
THIN SECTION DESCRIPTION 111-504B-152R-1 (Piece 2, 5 - 8 cm)
ROCK NAME: Sparsely olivine plagioclase phyric basalt WHERE SAMPLED: Unit 169, chilled margin TEXTURE: Microlitic, cryptocrystalline GRAIN SIZE: Very fine to fine OBSERVER: Malpas
PRIMARY MINERALOGY
PHENOCRYSTS Olivine
Plagioclase
GROUNDMASS Matrix
SECONDARY MINERALOGY Clays
Chlorite Talc Magnetite(?) Actinolite
PERCENT PRESENT
-<1
PERCENT
<1
PERCENT ORIGINAL
<1
<1
99
REPLACING FILLING
Ol, matrix
Ol, matrix Ol Ol, matrix Vein
SIZE APPROX. RANGE COMPO-(mm) SITION MORPHOLOGY
1
<1
Subhedral
Euhedral
COMMENTS
Only one glomerocryst. Altered to talc + magnetite + chlorite + smectite. Single crystals and glomerocrysts.
Cryptocrystalline. Glass altered to chlorite + smectite + mixed-layer clays(?) + oxides.
COMMENTS 'Percentages of secondary minerals were not estimated since replacement was of cryptocrystalline/ glassy matrix.
0.5-mm-wide vein. Actinolite at outer margins, laumontite in center.
COMMENTS: Small inclusions of adjacent dike matrix found in glassy margin of Unit 169.
THIN SECTION DESCRIPTION
ROCK NAME: Moderately plagioclase clinopyroxene olivine phyric basalt WHERE SAMPLED: Unit 170 TEXTURE: Subophitic, recrystallized GRAIN SIZE: Fine to medium OBSERVER: Malpas
1 1 1 - 5 0 4 B - 1 5 2 R - 1 (Piece 2 , 5 - 8 cm)
PRIMARY MINERALOGY
PHENOCRYSTS Olivine
Plagioclase Clinopyroxene
GROUNDMASS Plagioclase Clinopyroxene Olivine Magnetite
SECONDARY MINERALOGY Clays Chlorite Actinolite Sphene Plagioclase Maghemite Pyrite Talc
PERCENT PRESENT
10(7) 5(?)
PERCENT 6
= 21 20
1 30 1
<1 <1
PERCENT ORIGINAL
SIZE RANGE (mm)
0.3-2.0
= 1 = 0.5
45 35
REPLACING/ FILLING
Olivine Plag(?) Cpx Magnetite Plag Magnetite Ol Ol
APPROX. COMPOSITION MORPHOLOGY
Subhedral
Subhedral Subhedral
COMMENTS
Altered to chlorite + talc + actinolite + magnetite + pyrite. Recrystallized. Highly fractured. Partially altered to actinolite + chlorite.
Recrystallized Altered predominantly to chlorite, and some actinolite. Altered to chlorite + actinolite + talc. Altered to maghemite + sphene.
COMMENTS Replaces ol phenocrysts and groundmass crystals. Also replaces cpx. Includes smectite.
Partially replaces magnetite and groundmass. Recrystallized primary plag. Could be partially albitized.
Replacement of groundmass ol? Partial replacement of ol.
COMMENTS: Rock is heavily altered. Considerable amount of chloritization occurs in patches. Replacement by actinolite is extensive, especially in the cores of large cpx crystals and in the centers o< chlorite patches. Plag crystals are highly fractured and recrystallized.
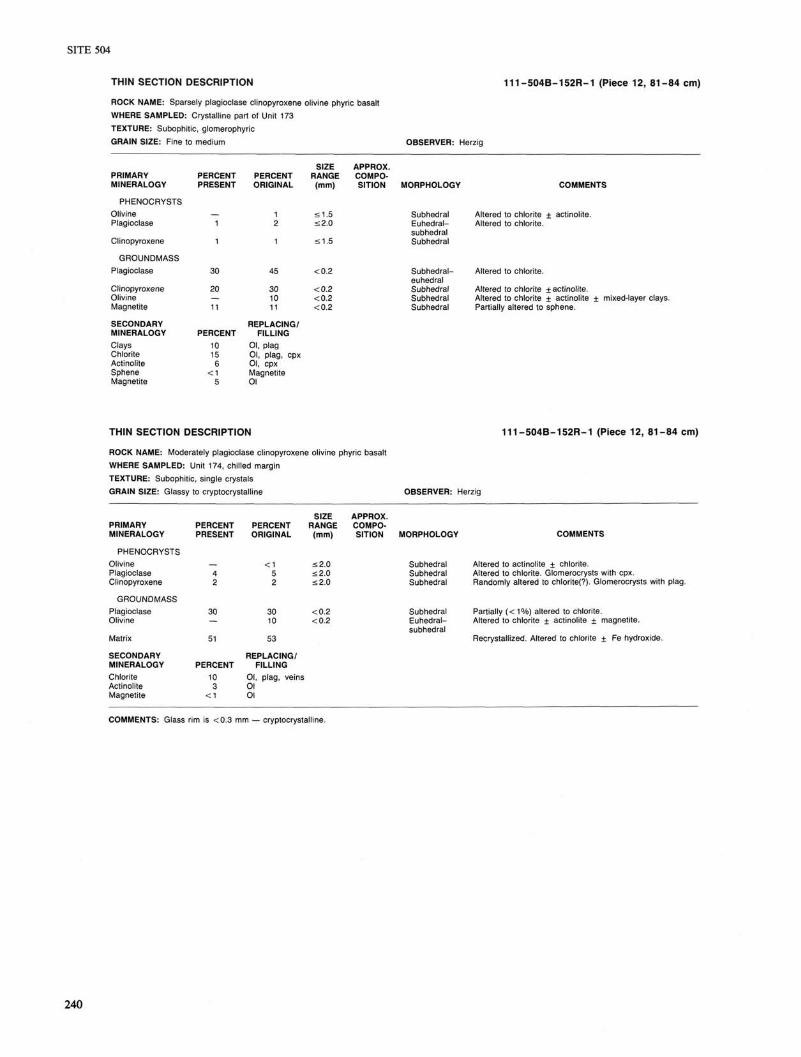
THIN SECTION DESCRIPTION 111-504B-152R-1 (Piece 12, 81-84 cm) ROCK NAME: Sparsely plagioclase clinopyroxene olivine phyric basalt WHERE SAMPLED: Crystalline part of Unit 173 TEXTURE: Subophitic, glomerophyric GRAIN SIZE: Fine to medium OBSERVER: Herzig
PRIMARY MINERALOGY
PHENOCRYSTS Olivine Plagioclase
Clinopyroxene
GROUNDMASS Plagioclase
Clinopyroxene Olivine Magnetite
SECONDARY MINERALOGY Clays Chlorite Actinoiite Sphene Magnetite
PERCENT PRESENT
1
1
30
20
11
PERCENT 10 15 6
<1 5
PERCENT ORIGINAL
1 2
1
45
30 10 11
REPLACING/ FILLING
Ol, plag Ol, plag, cpx Ol, cpx Magnetite Ol
SIZE RANGE
(mm)
£1.5
<2.0
<1.5
<0.2
<0.2 <0.2 <0.2
APPROX. COMPOSITION MORPHOLOGY
Subhedral Euhedral-subhedral Subhedral
Subhedral-euhedral Subhedral Subhedral Subhedral
COMME
Altered to chlorite ± actinoiite. Altered to chlorite.
Altered to chlorite.
Altered to chlorite + actinoiite. Altered to chlorite ± actinoiite Partially altered to sphene.
THIN SECTION DESCRIPTION
ROCK NAME: Moderately plagioclase clinopyroxene olivine phyric basalt WHERE SAMPLED: Unit 174, chilled margin TEXTURE: Subophitic, single crystals GRAIN SIZE: Glassy to cryptocrystalline
1 1 1 - 5 0 4 B - 1 5 2 R - 1 (Piece 12, 8 1 - 8 4 cm)
OBSERVER: Herzig
PRIMARY MINERALOGY
PHENOCRYSTS Olivine Plagioclase Clinopyroxene
GROUNDMASS Plagioclase Olivine
Matrix
SECONDARY MINERALOGY Chlorite Actinoiite Magnetite
PERCENT PRESENT
4 2
30
51
PERCENT 10 3
<1
PERCENT ORIGINAL
<1 5 2
30 10
53
REPLACING/ FILLING
Ol, plag, veins Ol Ol
SIZE RANGE
(mm)
<2.0 <2.0 <2.0
<0.2 <0.2
APPROX. COMPOSITION MORPHOLOGY
Subhedral Subhedral Subhedral
Subhedral Euhedral-subhedral
COMMENTS
Altered to actinoiite ± chlorite. Altered to chlorite. Glomerocrysts with cpx. Randomly altered to chlorite(?). Glomerocrysts with plag.
Partially (<1%) altered to chlorite. Altered to chlorite + actinoiite ± magnetite.
Recrystallized. Altered to chlorite ± Fe hydroxide.
COMMENTS: Glass rim is <0.3 mm — cryptocrystalline.
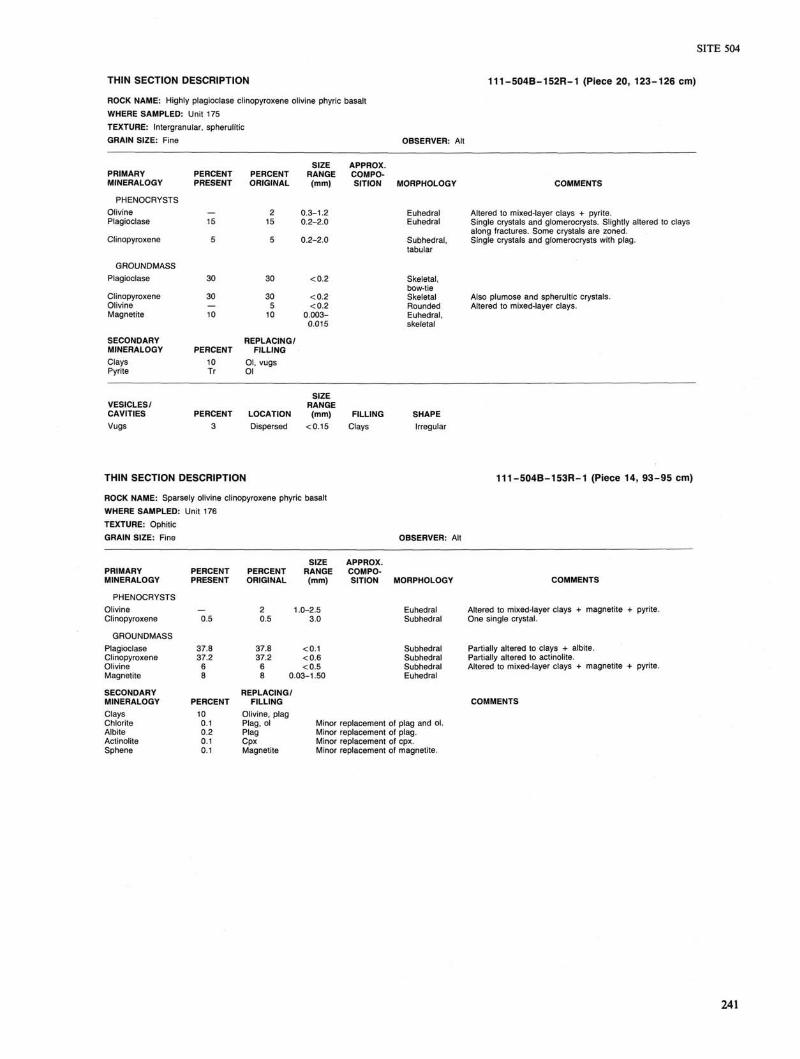
SITE 504
THIN SECTION DESCRIPTION 111-504B-152R-1 (Piece 20, 123-126 cm)
ROCK NAME: Highly plagioclase clinopyroxene olivine phyric basalt WHERE SAMPLED: Unit 175 TEXTURE: Intergranular, spherulitic GRAIN SIZE: Fine OBSERVER: Alt
PRIMARY MINERALOGY
PHENOCRYSTS Olivine Plagioclase
Clinopyroxene
GROUNDMASS Plagioclase
Clinopyroxene Olivine Magnetite
SECONDARY MINERALOGY
PERCENT PRESENT
15
5
30
30
10
PERCENT ORIGINAL
30 5
10
SIZE RANGE (mm)
0.3-1.2 0.2-2.0
<0.2
<0 .2 <0 .2
0.003-0.015
Clays Pyrite
REPLACING/ PERCENT FILLING
10 Ol, vugs Tr Ol
APPROX. COMPOSITION MORPHOLOGY
Euhedral Euhedral
Subhedral, tabular
Skeletal, bow-tie Skeletal Rounded Euhedral, skeletal
COMMENTS
Altered to mixed-layer clays + pyrite. Single crystals and glomerocrysts. Slightly altered to clays along fractures. Some crystals are zoned. Single crystals and glomerocrysts with plag.
Also plumose and spherultic crystals. Altered to mixed-layer clays.
VESICLES/ CAVITIES Vugs
SIZE RANGE
PERCENT LOCATION (mm) FILLING SHAPE 3 Dispersed <0.15 Clays Irregular
THIN SECTION DESCRIPTION
ROCK NAME: Sparsely olivine clinopyroxene phyric basalt WHERE SAMPLED: Unit 176 TEXTURE: Ophitic GRAIN SIZE: Fine
111-504B-153R-1 (Piece 14, 93-95 cm)
OBSERVER: Alt
PRIMARY MINERALOGY
PHENOCRYSTS Olivine Clinopyroxene
GROUNDMASS Plagioclase Clinopyroxene Olivine Magnetite
SECONDARY MINERALOGY Clays Chlorite Albite Actinolite Sphene
PERCENT PRESENT
0.5
37.8 37.2
6 8
PERCENT 10 0.1 0.2 0.1 0.1
PERCENT ORIGINAL
2 0.5
37.8 37.2
6
SIZE RANGE (mm)
1.0-2.5 3.0
<0.1 <0.6 <0.5
0.03-1.50
REPLACING/ FILLING
Olivine, plag Plag, ol Plag Cpx Magnetite
APPROX. COMPOSITION MORPHOLOGY
Euhedral Subhedral
Subhedral Subhedral Subhedral Euhedral
COMMENTS
Altered to mixed-layer clays + magnetite + pyrite. One single crystal.
Partially altered to clays + albite. Partially altered to actinolite. Altered to mixed-layer clays + magnetite + pyrite.
COMMENTS
Minor replacement of plag and ol. Minor replacement of plag. Minor replacement of cpx. Minor replacement of magnetite.
241

THIN SECTION DESCRIPTION 111-504B-154R-1 (Piece 4B, 64-66 cm)
ROCK NAME: Aphyric basalt WHERE SAMPLED: Unit 176 TEXTURE: Subophitic, glomerophyric GRAIN SIZE: Medium OBSERVER: Herzig
PRIMARY MINERALOGY
PHENOCRYSTS Olivine
Plagioclase Clinopyroxene
GROUNDMASS Plagioclase
Clinopyroxene
Olivine
Magnetite
SECONDARY MINERALOGY Chlorite Actinolite
PERCENT PRESENT
—
<1 <1
40
25
5
PERCENT 10 20
PERCENT ORIGINAL
<1
<1 <1
50
35
10
5
REPLACING/ FILLING
Plag, ol Cpx, plag, ol
SIZE RANGE (mm)
1.0-1.5
1.0-1.5 1.0-1.5
<1.0
<1.0
<1.0
<1.0
APPROX. COMPOSITION MORPHOLOGY
Subhedral
Euhedral Subhedral
Euhedral-subhedral Subhedral-anhedral Anhedral
Euhedral
COMMENTS
Altered to actinolite ± mixed-layer clays + chlorite ± talc(?) + pyrite ± magnetite. Zonal alteration pattern: core altered to actinolite ± mixed-layer clays + pyrite; rim altered to actinolite + magnetite. Altered to actinolite + chlorite. Partially altered to actinolite.
Altered to actinolite + chlorite.
Altered to actinolite.
Altered to actinolite ± chlorite ± mixed-layer clays talc(?) + pyrite ± magnetite. Partially altered to maghemite (sphene?).
COMMENTS: Disseminated pyrite.
THIN SECTION DESCRIPTION
ROCK NAME: Sparsely plagioclase clinopyroxene olivine phyric basalt WHERE SAMPLED: Unit 176 TEXTURE: Subophitic (diabasic) GRAIN SIZE: Fine to medium
111-504B-155R-1 (Piece 8, 43-45 cm)
OBSERVER: Malpas
PRIMARY MINERALOGY
PHENOCRYSTS Olivine
Plagioclase Clinopyroxene
GROUNDMASS Plagioclase
Clinopyroxene
Olivine Magnetite
SECONDARY MINERALOGY Clays Chlorite Actinolite Pyrite Maghemite Talc
PERCENT PRESENT
< 1 <1
50
37
PERCENT <1
6 <1 <1
<2(?) <1
PERCENT ORIGINAL
<1 < 1
SIZE RANGE (mm)
APPROX. COMPOSITION MORPHOLOGY
Euhedral
1.5 2
55 <0 .1-1 .0
43
Augite/ diopside
An 52
0.15-0.50 Diopside/ augite
5 0.15 5 <0.15
REPLACING/ FILLING
Plag Ol, cpx Ol Ol: Magnetite Ol
Subhedra Euhedral
Euhedral, bladed Anhedral-subhedral Anhedral Anhedral
COMMENTS
Zonally replaced: margins altered to talc; core altered to actinolite + pyrite. Expansion cracks. Poikilitically enclose stubby plag.
Minor alteration to clays.
Subophitic with plag.
Completely altered to chlorite ± pyrite + magnetite. Partially altered to maghemite.
COMMENTS Partial replacement of plag. Replacement of groundmass ol. minor replacement of cpx. Replacement of ol phenocryst cores. Partial replacement of groundmass ol Replacement of magnetite? Replacement of ol phenocryst margins.
COMMENTS: Open fracture, 1 mm wide, 0.5 mm from top of piece. Rock is fairly fresh with the exception of ol crystals. Ol is altered to talc which results in fractured plag, etc.
chlorite + actinolite + pyrite + magnetite. This alteration produces expansion
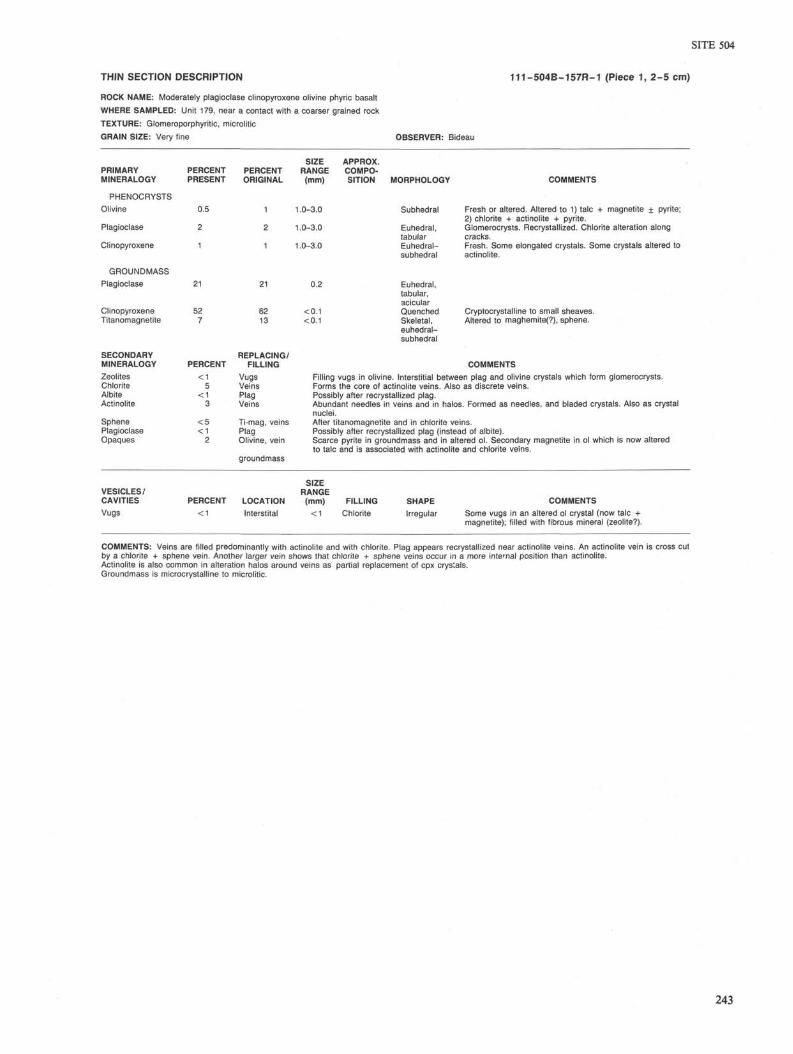
THIN SECTION DESCRIPTION 111-504B-157R-1 (Piece 1, 2 - 5 cm)
ROCK NAME: Moderately plagioclase clinopyroxene olivine phyric basalt WHERE SAMPLED: Unit 179, near a contact with a coarser grained rock TEXTURE: Glomeroporphyritic, microlitic GRAIN SIZE: Very fine OBSERVER: Bideau
PRIMARY MINERALOGY
PHENOCRYSTS Olivine
Plagioclase
Clinopyroxene
GROUNDMASS Plagioclase
Clinopyroxene Titanomagnetite
SECONDARY MINERALOGY Zeolites Chlorite Albite Actinolite
Sphene Plagioclase Opaques
PERCENT PRESENT
0.5
2
1
PERCENT ORIGINAL
SIZE RANGE (mm)
1 1.0-3.0
2 1.0-3.0
1 1.0-3.0
82 13
REPLACING/ PERCENT FILLING
APPROX. COMPOSITION
<1 5
<1 3
<5 <1
2
Vugs Veins Plag Veins
Ti-mag, veins Plag Olivine, vein
groundmass
MORPHOLOGY
Subhedral
Euhedral, tabular Euhedral-subhedral
Euhedral, tabular, acicular Quenched Skeletal, euhedral-subhedral
COMMENTS
Fresh or altered. Altered to 1) talc + magnetite + pyrite; 2) chlorite + actinolite + pyrite. Glomerocrysts. Recrystallized. Chlorite alteration along cracks. Fresh. Some elongated crystals. Some crystals altered to actinolite.
<0.1 Quenched Cryptocrystalline to small sheaves. <0.1 Skeletal, Altered to maghemite(?), sphene.
COMMENTS Filling vugs in olivine. Interstitial between plag and olivine crystals which form glomerocrysts. Forms the core of actinolite veins. Also as discrete veins. Possibly after recrystallized plag. Abundant needles in veins and in halos. Formed as needles, and bladed crystals. Also as crystal nuclei. After titanomagnetite and in chlorite veins. Possibly after recrystallized plag (instead of albite). Scarce pyrite in groundmass and in altered ol. Secondary magnetite in ol which is now altered to talc and is associated with actinolite and chlorite veins.
VESICLES/ CAVITIES Vugs
SIZE RANGE
PERCENT LOCATION (mm) FILLING SHAPE < 1 Interstital < 1 Chlorite Irregular
COMMENTS Some vugs in an altered ol crystal (now talc + magnetite); filled with fibrous mineral (zeolite?).
COMMENTS: Veins are filled predominantly with actinolite and with chlorite. Plag appears recrystallized near actinolite veins. An actinolite vein is cross cut by a chlorite + sphene vein. Another larger vein shows that chlorite + sphene veins occur in a more internal position than actinolite. Actinolite is also common in alteration halos around veins as partial replacement of cpx crystals. Groundmass is microcrystalline to microlitic.

T H I N S E C T I O N D E S C R I P T I O N 1 1 1 - 5 0 4 B - 1 5 7 R - 1 (Piece 5, 2 7 - 3 1 cm)
ROCK NAME: Moderately plagioclase clinopyroxene olivine phyric basalt WHERE SAMPLED: Unit 181, at the contact with coarser grained rock TEXTURE: Glomeroporphyritic, microlitic GRAIN SIZE: Very fine OBSERVER: Bideau
PRIMARY MINERALOGY
PHENOCRYSTS Olivine Plagioclase
Clinopyroxene
GROUNDMASS Plagioclase
Clinopyroxene Titanomagnetite
SECONDARY MINERALOGY Zeolites Chlorite Albite Actinolite
Sphene
Opaques
PERCENT PRESENT
0.5
50 2
PERCENT Tr 4 1
10
Tr
1
PERCENT ORIGINAL
60 5
SIZE RANGE (mm)
1.0-2.0 1.0-2.0
<0.5 <0.2
REPLACING/ FILLING
Vein Ol, veins Plag, veinlets Ol, cpx, veins Opaques
APPROX. COMPOSITION MORPHOLOGY COMMENTS
Subhedral Completely altered to chlorite + actinolite + opaques. Tabular Partially recrystallized. Altered to chlorite + actinolite along
cracks. Subhedral Partially altered to actinolite.
Tabular, acicular Anhedral Skeletal
Microlites.
Altered to actinolite(?) Altered to maghemite(?) and sphene in the coarser grained portion.
COMMENTS Possibly laumontite.
Alteration of primary plag phenocrysts.:
The most abundant phase in veins and halos.
After oxides, both primary and secondary.
Mainly magnetite maghemite(?). Some elongated pyrite crystals along a tiny veinlet.
COMMENTS: Two generations of veins: 1) actinolite + chlorite + opaques, which is cut bv 2) white mineral (ab) + chlorite. Second vein is chlorite at the contact with the first vein. Two veins consist of an ab core surrounded by a colorless to pale brown mineral with anomalous brown birefringence and good cleavage. Groundmass is cryptocrystalline to microlitic.
THIN SECTION DESCRIPTION
ROCK NAME: Aphyric basalt WHERE SAMPLED: Unit 182 TEXTURE: Massive, subophitic GRAIN SIZE: Fine
1 1 1 - 5 0 4 B - 1 5 8 R - 1 (Piece 2 , 1 2 - 1 4 cm)
OBSERVER: Uhlig
PRIMARY MINERALOGY
PHENOCRYSTS Plagioclase
GROUNDMASS Clinopyroxene
Plagioclase
Magnetite
Olivine Zircon Apatite Pyrite
SECONDARY MINERALOGY Clays Chlorite Actinolite Sphene
PERCENT PRESENT
<0.5
39
35
10
— < < 0 . 5 < < 0 . 5
1.5
PERCENT 2 3 2 7
PERCENT ORIGINAL
<0.5
41
36
17
4 <0.5 <0.5
1.5
REPLACING/ FILLING
Ol Ol, plag Cpx Magnetite
SIZE RANGE (mm)
0.5
<0.2
<0.3
<0.2
<0.2 < 0.005 < 0.005 <0.2
APPROX. COMPOSITION MORPHOLOGY
Euhedral-subhedral
Subhedral-anhedral Laths, euhedral Subhedral-euhedral Subhedral Euhedral Euhedral Euhedral
COMMENTS
Chloritization beginning along fractures.
Slightly altered to actinolite.
Chloritization beginning. Fluid inclusions.
Replaced by sphene.
Altered to chlorite and mixed-layer clays.
Slightly disseminated in groundmass.
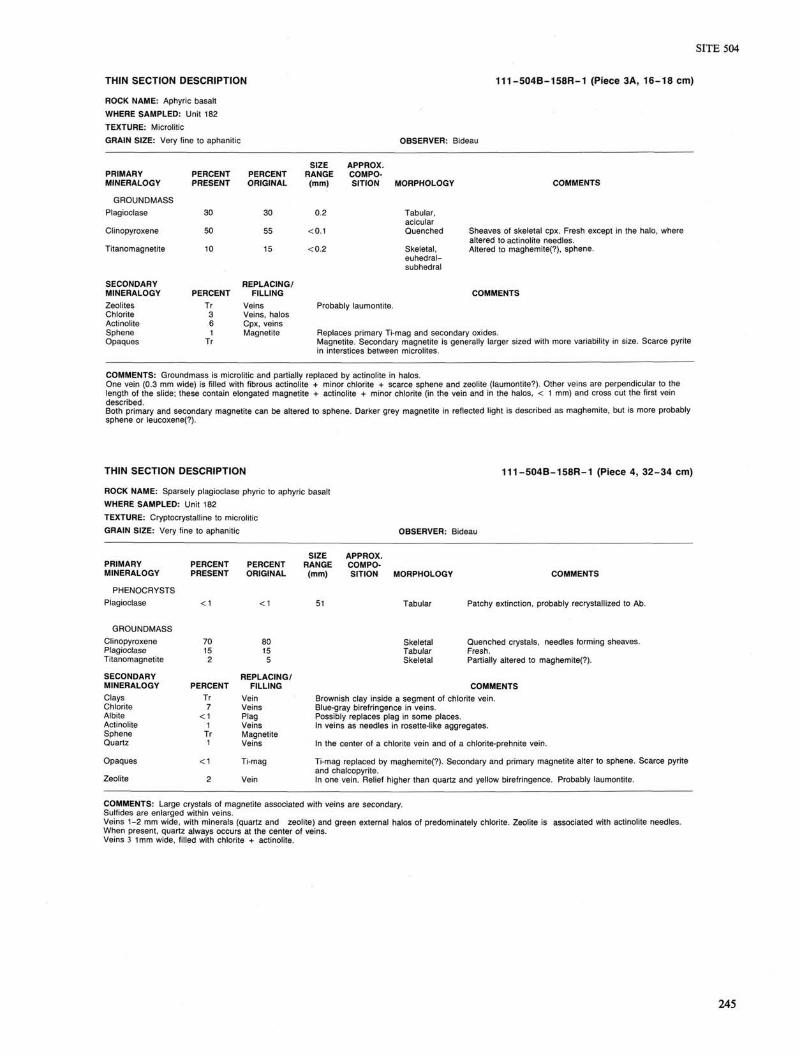
SITE 504
THIN SECTION DESCRIPTION 111-504B-158R-1 (Piece 3A, 16-18 cm)
ROCK NAME: Aphyric basalt WHERE SAMPLED: Unit 182 TEXTURE: Microlitic GRAIN SIZE: Very fine to aphanitic OBSERVER: Bideau
PRIMARY MINERALOGY
GROUNDMASS Plagioclase
Clinopyroxene
Titanomagnetite
SECONDARY MINERALOGY Zeolites Chlorite Actinolite Sphene Opaques
PERCENT PRESENT
30
50
10
PERCENT Tr 3 6 1
Tr
PERCENT ORIGINAL
30
55
15
REPLACING/ FILLING
Veins Veins, halos Cpx, veins Magnetite
SIZE RANGE (mm)
0.2
<0.1
<0.2
APPROX. COMPOSITION MORPHOLOGY
Tabular, acicular Quenched
Skeletal, euhedral-subhedral
Probably laumontite.
COMMENTS
Sheaves of skeletal cpx. Fresh except in the halo, where altered to actinolite needles. Altered to maghemite(?), sphene.
COMMENTS
Replaces primary Ti-mag and secondary oxides. Magnetite. Secondary magnetite is generally larger sized with more variability in size. Scarce pyrite in interstices between microlites.
COMMENTS: Groundmass is microlitic and partially replaced by actinolite in halos. One vein (0.3 mm wide) is filled with fibrous actinolite + minor chlorite + scarce sphene and zeolite (laumontite?). Other veins are perpendicular to the length of the slide; these contain elongated magnetite + actinolite + minor chlorite (in the vein and in the halos, < 1 mm) and cross cut the first vein described. Both primary and secondary magnetite can be altered to sphene. Darker grey magnetite in reflected light is described as maghemite, but is more probably sphene or leucoxene(?).
THIN SECTION DESCRIPTION
ROCK NAME: Sparsely plagioclase phyric to aphyric basalt WHERE SAMPLED: Unit 182 TEXTURE: Cryptocrystalline to microlitic GRAIN SIZE: Very fine to aphanitic
1 1 1 - 5 0 4 B - 1 5 8 R - 1 (Piece 4, 3 2 - 3 4 cm)
OBSERVER: Bideau
PRIMARY MINERALOGY
PERCENT PRESENT
PERCENT ORIGINAL
SIZE RANGE (mm)
APPROX. COMPOSITION MORPHOLOGY
PHENOCRYSTS Plagioclase < 1 Tabular
COMMENTS
Patchy extinction, probably recrystallized to Ab.
GROUNDMASS Clinopyroxene Plagioclase Titanomagnetite
SECONDARY MINERALOGY Clays Chlorite Albite Actinolite Sphene Quartz
Opaques
Zeolite
70 15
2
PERCENT Tr 7
<1 1
Tr 1
<1
2
80 15
5
REPLACING/ FILLING
Vein Veins Plag Veins Magnetite Veins
Ti-mag
Vein
Skeletal Quenched crystals, needles forming sheaves. Tabular Fresh. Skeletal Partially altered to maghemite(?).
COMMENTS Brownish clay inside a segment of chlorite vein. Blue-gray birefringence in veins. Possibly replaces plag in some places. In veins as needles in rosette-like aggregates.
In the center of a chlorite vein and of a chlorite-prehnite vein.
Ti-mag replaced by maghemite(?). Secondary and primary magnetite alter to sphene. Scarce pyrite and chalcopyrite. In one vein. Relief higher than quartz and yellow birefringence. Probably laumontite.
COMMENTS: Large crystals of magnetite associated with veins are secondary. Sulfides are enlarged within veins. Veins 1-2 mm wide, with minerals (quartz and zeolite) and green external halos of predominately chlorite. Zeolite is associated with actinolite needles. When present, quartz always occurs at the center of veins. Veins 3 1mm wide, filled with chlorite + actinolite.
245
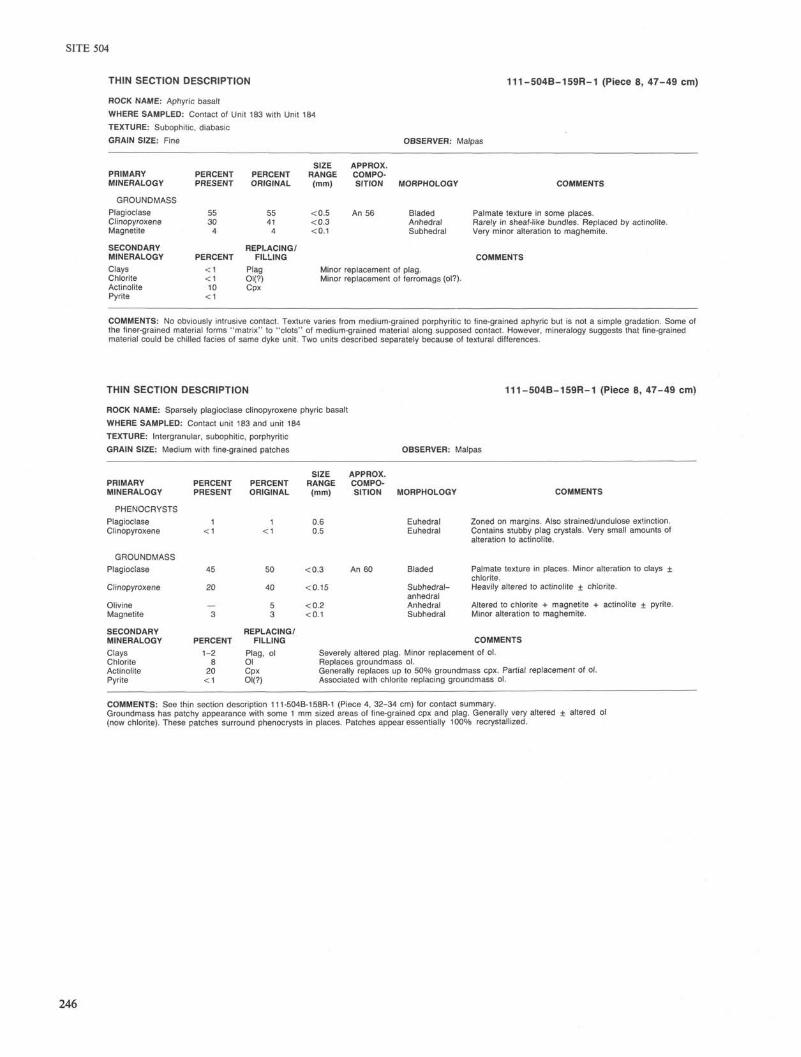
THIN SECTION DESCRIPTION 111-504B-159R-1 (Piece 8, 47-49 cm)
ROCK NAME: Aphyric basalt
WHERE SAMPLED: Contact of Unit 183 with Unit 184 TEXTURE: Subophitic, diabasic GRAIN SIZE: Fine OBSERVER: Malpas
PRIMARY MINERALOGY
GROUNDMASS Plagioclase Clinopyroxene Magnetite
SECONDARY MINERALOGY Clays Chlorite Actinolite Pyrite
PERCENT PRESENT
<1 <1 10
<1
PERCENT ORIGINAL
55 41
4
REPLACING/ FILLING
OI(?) Cpx
SIZE RANGE (mm)
<0.5 <0.3 <0.1
APPROX. COMPOSITION MORPHOLOGY
Bladed Anhedral Subhedral
Minor replacement of plag. Minor replacement of ferromags (ol?).
COMMENTS
Palmate texture in some places. Rarely in sheaf-like bundles. Replaced by actinolite. Very minor alteration to maghemite.
COMMENTS
COMMENTS: No obviously intrusive contact. Texture varies from medium-grained porphyritic to fine-grained aphyric but is not a simple gradation. Some of the finer-grained material forms "matrix" to "clots" of medium-grained material along supposed contact. However, mineralogy suggests that fine-grained material could be chilled facies of same dyke unit. Two units described separately because of textural differences.
THIN SECTION DESCRIPTION
ROCK NAME: Sparsely plagioclase clinopyroxene phyric basalt WHERE SAMPLED: Contact unit 183 and unit 184 TEXTURE: Intergranular, subophitic, porphyritic GRAIN SIZE: Medium with fine-grained patches
111-504B-159R-1 (Piece 8, 47-49 cm)
OBSERVER: Malpas
PRIMARY MINERALOGY
PHENOCRYSTS Plagioclase Clinopyroxene
PERCENT PRESENT
1 <1
PERCENT ORIGINAL
1 <1
SIZE RANGE (mm)
0.6 0.5
APPROX. COMPOSITION MORPHOLOGY
Euhedral Euhedral
COMMENTS
Zoned on margins. Also strained/undulose extinction. Contains stubby plag crystals. Very small amounts of alteration to actinolite.
GROUNDMASS Plagioclase
Clinopyroxene
Olivine Magnetite
SECONDARY MINERALOGY Clays Chlorite Actinolite Pyrite
45
20
PERCENT 1-2
20 < 1
50
40
5 3
REPLACING/ FILLING
Plag, ol Ol Cpx OI(?)
<0.3
<0.15
<0.2 <0.1
An 60 Bladed
Subhedral-anhedral Anhedral Subhedral
Palmate texture in places. Minor alteration to clays ± chlorite. Heavily altered to actinolite ± chlorite.
Altered to chlorite + magnetite + actinolite ± pyrite. Minor alteration to maghemite.
COMMENTS Severely altered plag. Minor replacement of ol. Replaces groundmass ol. Generally replaces up to 50% groundmass cpx. Partial replacement of ol. Associated with chlorite replacing groundmass ol.
COMMENTS: See thin section description 111-504B-158R-1 (Piece 4, 32-34 cm) for contact summary. Groundmass has patchy appearance with some 1 mm sized areas of fine-grained cpx and plag. Generally very altered (now chlorite). These patches surround phenocrysts in places. Patches appear essentially 100% recrystallized.
+ altered ol
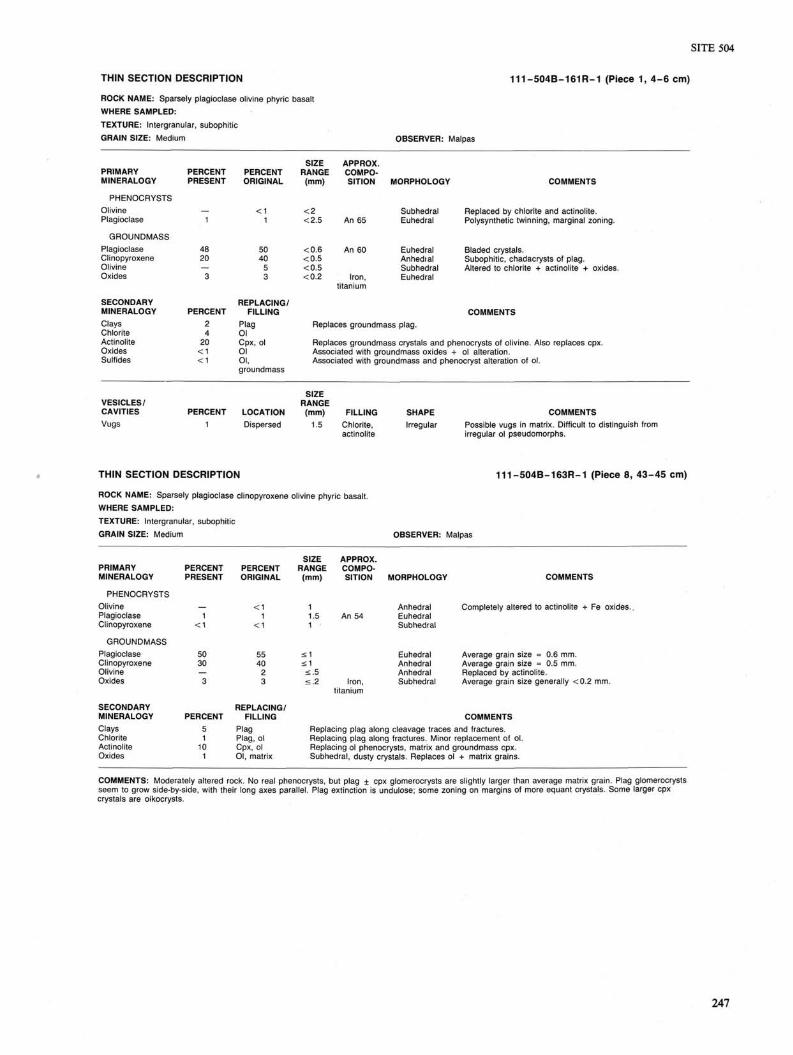
THIN SECTION DESCRIPTION 111-504B-161R-1 (Piece 1, 4 - 6 cm)
ROCK NAME: Sparsely plagioclase olivine phyric basalt WHERE SAMPLED: TEXTURE: Intergranular, subophitic GRAIN SIZE: Medium OBSERVER: Malpas
PRIMARY MINERALOGY
PHENOCRYSTS Olivine Plagioclase
GROUNDMASS Plagioclase Clinopyroxene Olivine Oxides
SECONDARY MINERALOGY Clays Chlorite Actinolite Oxides Sulfides
PERCENT PRESENT
48 20
PERCENT 2 4
20 <1 <1
PERCENT ORIGINAL
50 40
5 3
REPLACING/ FILLING
Plag Ol Cpx, ol Ol Ol, groundmass
SIZE APPROX. RANGE COMPO-
(mm) SITION MORPHOLOGY
< 2 <2.5
<0.6 <0.5 <0.5 <0.2
An 65
Iron, titanium
Subhedral Euhedral
Euhedral Anhedial Subhedral Euhedral
Replaces groundmass plag.
COMMENTS
Replaced by chlorite and actinolite. Polysynthetic twinning, marginal zoning.
Bladed crystals. Subophitic, chadacrysts of plag. Altered to chlorite + actinolite H
COMMENTS
Replaces groundmass crystals and phenocrysts of olivine. Also replaces cpx. Associated with groundmass oxides + ol alteration. Associated with groundmass and phenocryst alteration of ol.
VESICLES/ CAVITIES Vugs
SIZE RANGE
PERCENT LOCATION (mm) FILLING 1 Dispersed 1.5 Chlorite,
actinolite
SHAPE COMMENTS Irregular Possible vugs in matrix. Difficult to distinguish from
irregular ol pseudomorphs.
THIN SECTION DESCRIPTION 111-504B-163R-1 (Piece 8, 43-45 cm)
ROCK NAME: Sparsely plagioclase clinopyroxene olivine phyric basalt. WHERE SAMPLED: TEXTURE: Intergranular, subophitic GRAIN SIZE: Medium OBSERVER: Malpas
PRIMARY MINERALOGY
PHENOCRYSTS Olivine Plagioclase Clinopyroxene
GROUNDMASS Plagioclase Clinopyroxene Olivine Oxides
PERCENT PRESENT
1 <1
50 30
SIZE APPROX. PERCENT RANGE COMPO-ORIGINAL (mm) SITION MORPHOLOGY
< 1 1 Anhedral 1 1.5 An 54 Euhedral
< 1 1 Subhedral
55 < 1 Euhedral 40 <1 Anhedral
2 <.5 Anhedral 3 <.2 Iron, Subhedral
titanium
COMMENTS
Completely altered to actinolite + Fe oxides.
Average grain size = 0.6 mm. Average grain size = 0.5 mm. Replaced by actinolite. Average grain size generally <0.2 mm.
SECONDARY MINERALOGY Clays Chlorite Actinolite Oxides
PERCENT 5 1
10 1
REPLACING/ FILLING
Plag Plag, ol Cpx, ol Ol, matrix
COMMENTS Replacing plag along cleavage traces and fractures. Replacing plag along fractures. Minor replacement of ol. Replacing ol phenocrysts, matrix and groundmass cpx. Subhedral, dusty crystals. Replaces ol + matrix grains.
COMMENTS: Moderately altered rock. No real phenocrysts, but plag + cpx glomerocrysts are slightly larger than average matrix grain. Plag glomerocrysts seem to grow side-by-side, with their long axes parallel. Plag extinction is undulose; some zoning on margins of more equant crystals. Some larger cpx crystals are oikocrysts.
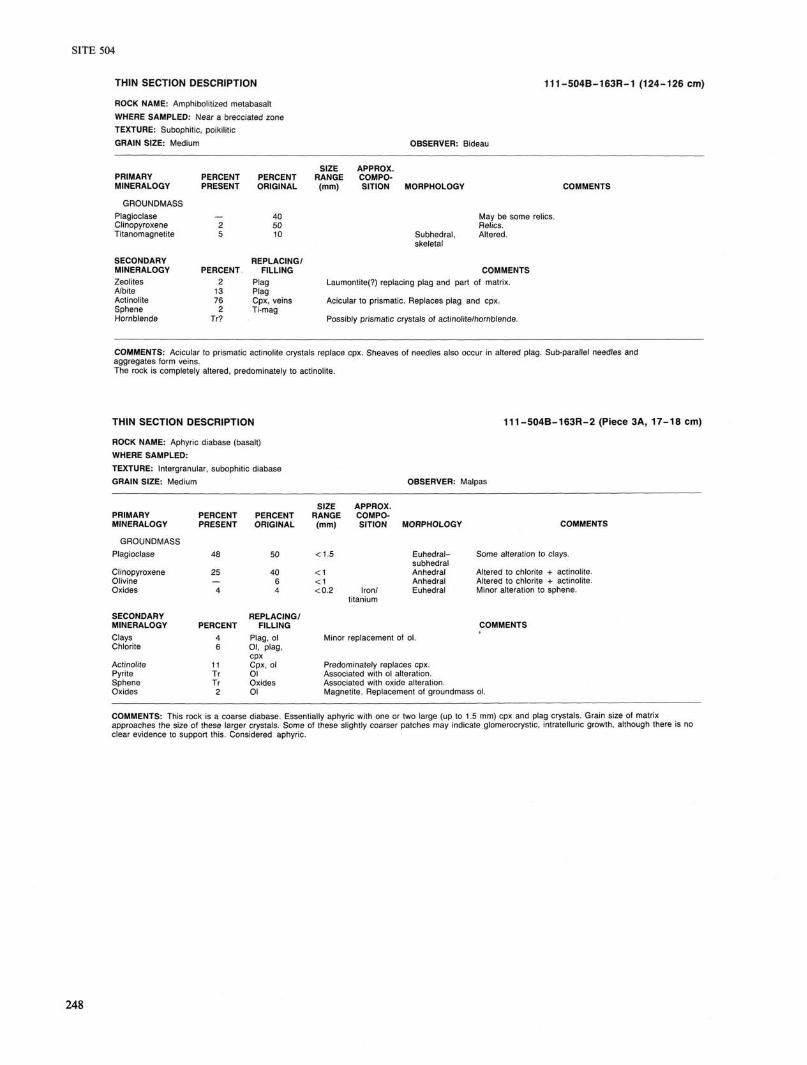
THIN SECTION DESCRIPTION 111-504B-163R-1 (124-126 cm)
ROCK NAME: Amphibolitized metabasalt WHERE SAMPLED: Near a brecciated zone TEXTURE: Subophitic, poikilitic GRAIN SIZE: Medium OBSERVER: Bideau
PRIMARY MINERALOGY
GROUNDMASS Plagioclase Clinopyroxene Titanomagnetite
SECONDARY MINERALOGY Zeolites Albite Actinolite Sphene Hornblende
PERCENT PRESENT
PERCENT 2
13 76
2 Tr?
PERCENT ORIGINAL
40 50 10
REPLACING/ FILLING
Plag Plag Cpx, veins Ti-mag
SIZE APPROX. RANGE COMPO-
(mm) SITION MORPHOLOGY
Subhedral, skeletal
COMMENTS
May be some relics. Relics. Altered.
COMMENTS
Laumontite(?) replacing plag and part of matrix.
Acicular to prismatic. Replaces plag and cpx.
Possibly prismatic crystals of actinolite/hornblende.
COMMENTS: Acicular to prismatic actinolite crystals replace cpx. Sheaves of needles also occur in altered plag. Sub-parallel needles and aggregates form veins. The rock is completely altered, predominately to actinolite.
THIN SECTION DESCRIPTION
ROCK NAME: Aphyric diabase (basalt) WHERE SAMPLED: TEXTURE: Intergranular, subophitic diabase GRAIN SIZE: Medium
111-504B-163R-2 (Piece 3A, 17-18 cm)
OBSERVER: Malpas
PRIMARY MINERALOGY
GROUNDMASS Plagioclase
Clinopyroxene Olivine Oxides
SECONDARY MINERALOGY Clays Chlorite
Actinolite Pyrite Sphene Oxides
PERCENT PRESENT
48
25
4
PERCENT 4 6
11 Tr Tr 2
PERCENT ORIGINAL
40 6 4
REPLACING/ FILLING
Plag, ol Ol, plag, cpx Cpx, ol Ol Oxides Ol
SIZE RANGE (mm)
< 1 <1 <0.2
APPROX. COMPOSITION MORPHOLOGY
Euhedral-subhedral Anhedral Anhedral Euhedral Iron/
titanium
Minor replacement of ol.
COMMENTS
Some alteration to clays.
Altered to chlorite + actinolite. Altered to chlorite + actinolite. Minor alteration to sphene.
COMMENTS
Predominately replaces cpx. Associated with ol alteration. Associated with oxide alteration. Magnetite. Replacement of groundmass ol.
COMMENTS: This rock is a coarse diabase. Essentially aphyric with one or two large (up to 1.5 mm) cpx and plag crystals. Grain size of matrix approaches the size of these larger crystals. Some of these slightly coarser patches may indicate glomerocrystic, intratelluric growth, although there is no clear evidence to support this. Considered aphyric.
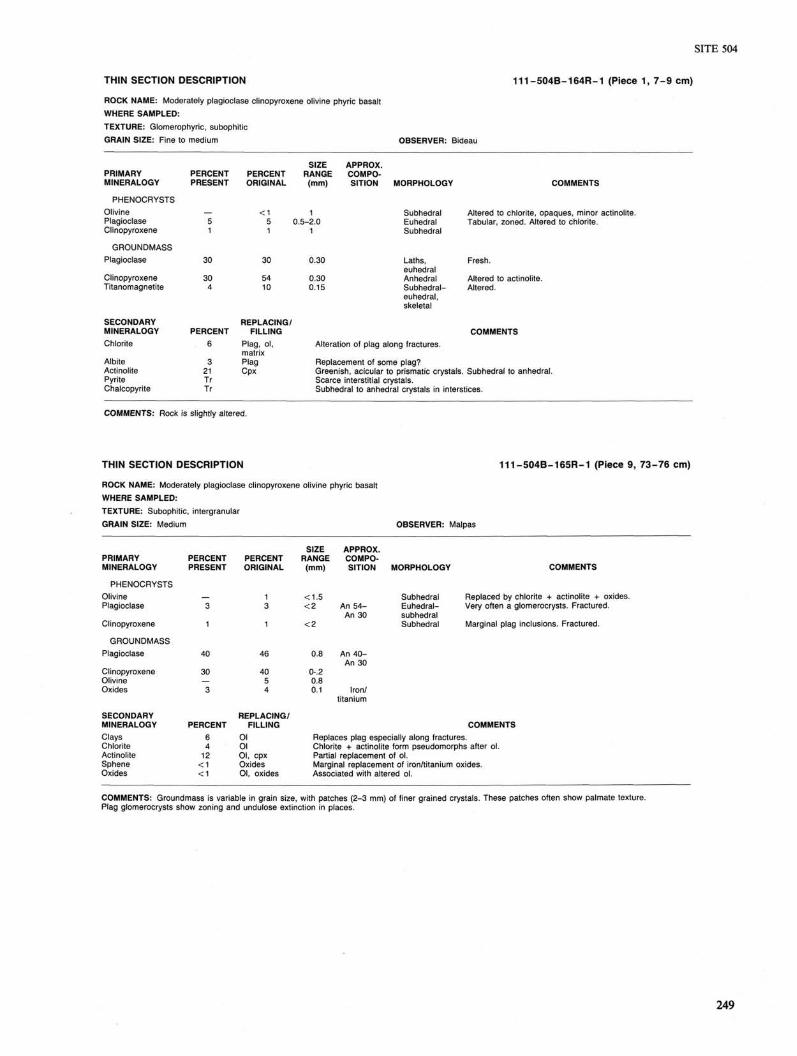
SITE 504
THIN SECTION DESCRIPTION 111-504B-164R-1 (Piece 1, 7 -9 cm)
ROCK NAME: Moderately plagioclase clinopyroxene olivine phyric basalt WHERE SAMPLED: TEXTURE: Glomerophyric, subophitic GRAIN SIZE: Fine to medium OBSERVER: Bideau
PRIMARY MINERALOGY
PHENOCRYSTS Olivine Plagioclase Clinopyroxene
GROUNDMASS Plagioclase
Clinopyroxene Titanomagnetite
SECONDARY MINERALOGY Chlorite
Albite Actinolite Pyrite Chalcopyrite
PERCENT PRESENT
30
30 4
PERCENT 6
3 21 Tr Tr
PERCENT ORIGINAL
<1 5 1
SIZE RANGE (mm)
0.5-2.0 1
30
54 10
REPLACING/ FILLING
Plag, ol, matrix Plag Cpx
0.30 0.15
APPROX. COMPOSITION MORPHOLOGY
Subhedral Euhedral Subhedral
Laths, euhedral Anhedral Subhedral-euhedral, skeletal
Alteration of plag along fractures.
COMMENTS
Altered to chlorite, opaques, minor actinolite. Tabular, zoned. Altered to chlorite.
Fresh.
Altered to actinolite. Altered.
COMMENTS
Replacement of some plag? Greenish, acicular to prismatic crystals. Subhedral to anhedral. Scarce interstitial crystals. Subhedral to anhedral crystals in interstices.
COMMENTS: Rock is slightly altered.
THIN SECTION DESCRIPTION
ROCK NAME: Moderately plagioclase clinopyroxene olivine phyric basalt WHERE SAMPLED: TEXTURE: Subophitic, intergranular GRAIN SIZE: Medium
111-504B-165R-1 (Piece 9, 73-76 cm)
OBSERVER: Malpas
PRIMARY MINERALOGY
PHENOCRYSTS Olivine Plagioclase
Clinopyroxene
GROUNDMASS Plagioclase
Clinopyroxene Olivine Oxides
SECONDARY MINERALOGY Clays Chlorite Actinolite Sphene Oxides
PERCENT PRESENT
3
1
40
30
3
PERCENT 6 4
12 <1 <1
PERCENT ORIGINAL
46
40 5 4
REPLACING/ FILLING
Ol Ol Ol, cpx Oxides Ol, oxides
SIZE RANGE (mm)
<1.5 <2
0.8
0-.2 0.8 0.1
APPROX. COMPOSITION
An 54-An 30
An 40-An 30
Iron/ titanium
MORPHOLOGY
Subhedral Euhedral-subhedral Subhedral
COMMENTS
Replaced by chlorite + actinolite + oxides. Very often a glomerocrysts. Fractured.
Marginal plag inclusions. Fractured.
COMMENTS Replaces plag especially along fractures. Chlorite + actinolite form pseudomorphs after ol. Partial replacement of ol. Marginal replacement of iron/titanium oxides. Associated with altered ol.
COMMENTS: Groundmass is variable in grain size, with patches (2-3 mm) of finer grained crystals. These patches often show palmate texture. Plag glomerocrysts show zoning and undulose extinction in places.
249

SITE 504
THIN SECTION DESCRIPTION 111-504B-166R-1 (Piece 1, 0 - 3 cm)
ROCK NAME: Sparsely plagioclase clinopyroxene phyric basalt WHERE SAMPLED: Near brecciated area TEXTURE: Glomerophyric, microlitic GRAIN SIZE: Very fine to fine OBSERVER: Bideau
PRIMARY MINERALOGY
PHENOCRYSTS Plagioclase
Clinopyroxene
GROUNDMASS Plagioclase
Clinopyroxene
Titanomagnetite
SECONDARY MINERALOGY Chlorite Albite Actinolite Sphene Pyrite Magnetite
PERCENT PRESENT
< 5
<1
10
5
3
59
PERCENT 4 2
10 2
Tr Tr
PERCENT ORIGINAL
SIZE RANGE (mm)
< 5 0.1-0.6
< 1 0.1-0.5
0.30-0.75
0.30
0.03
67 REPLACING/
FILLING Veins Plag, mesostasis Cpx, veins, mesostasis Magnetite
Veins
APPROX. COMPOSITION MORPHOLOGY
Tabular, euhedral Euhedral
Laths, euhedral Skeletal, subhedral Anhedral
COMMENTS
Not homogeneously distributed.
Altered in the pale halos.
Fresh. Needles and laths.
Dusty. Altered to sphene.
COMMENTS Localized in a corner and enriched in opaques. Probably replacing plag. In monomineralic veins or replacing groundmass ol. Replacing matrix titanomagnetite. Also borders actinolite veins. Anhedral. Rare Secondary magnetite occurs in chlorite vein.
COMMENTS: One open fracture was probably filled with chlorite which was mechanically removed in thin section manufacture. Some chlorite + sphene remaining on the borders and in the halo. The chlorite vein contains about 30% magnetite. Groundmass is altered in 1-5 mm halos around veins.
THIN SECTION DESCRIPTION
ROCK NAME: Moderately plagioclase clinopyroxene olivine phyric basalt WHERE SAMPLED: Unit 169 TEXTURE: Massive, subophitic GRAIN SIZE: Medium
111-504B-169R-1 (Piece 14, 66-68 cm)
OBSERVER: Herzig
PRIMARY MINERALOGY
PHENOCRYSTS Olivine
Plagioclase Clinopyroxene
GROUNDMASS Olivine Plagioclase Clinopyroxene Magnetite
SECONDARY MINERALOGY Clays Zeolites Chlorite Actinolite Sphene Pyrite
PERCENT PRESENT
3 1
35 20 5
PERCENT 1 2 2
28 2 1
PERCENT ORIGINAL
< 1
3 1
10 40 40
6
REPLACING/ FILLING
Ol Plag Plag Ol, cpx cpx Magnetite Ol
SIZE RANGE (mm)
1.5
0.5-2.0 0.5-4.0
<0.5 <0.5 <0.5 <0.5
APPROX. COMPOSITION MORPHOLOGY
Anhedral-subhedral Euhedral Subhedral
Anhedral Subhedral Anhedral Anhedral
Replaces groundmass olivine.
COMMENTS
Replaced by actinolite, pyrite.
Glomerocrysts.
Replaced by actinolite. Replaced by chlorite, actinolite, zeolite. Replaced by actinolite. Replaced by sphene.
COMMENTS
250
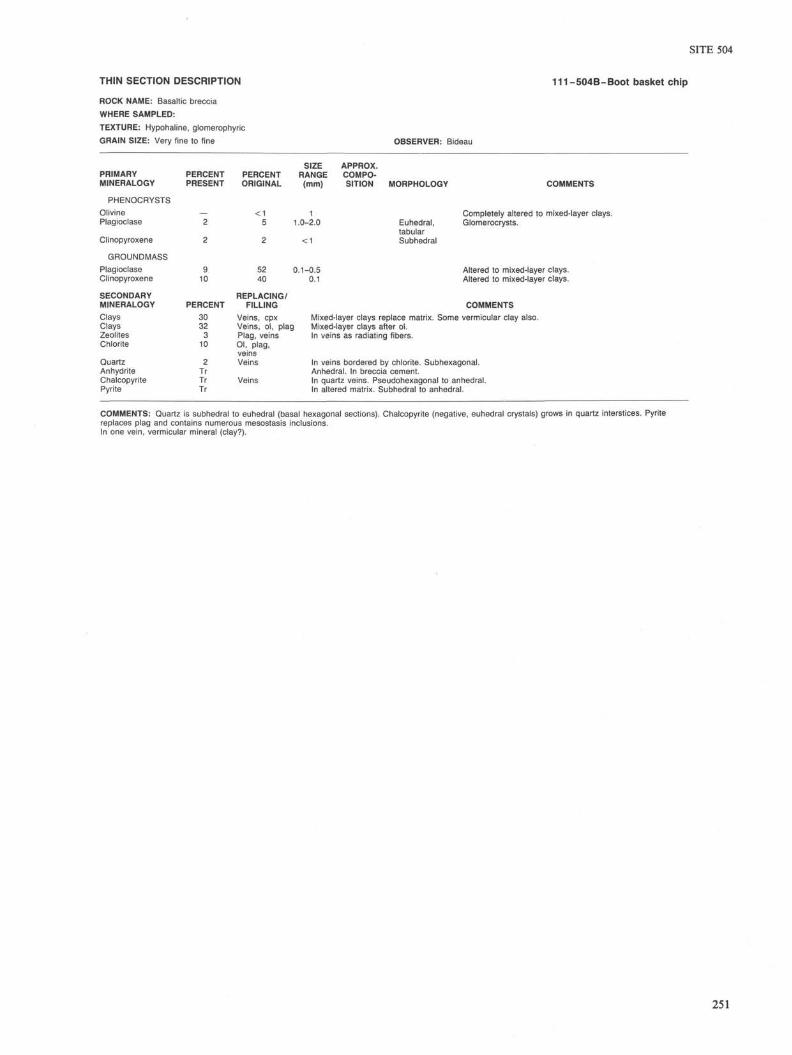
SITE 504
THIN SECTION DESCRIPTION 111-504B-Boot basket chip
ROCK NAME: Basaltic breccia WHERE SAMPLED: TEXTURE: Hypohaline, glomerophyric GRAIN SIZE: Very fine to fine OBSERVER: Bideau
PRIMARY MINERALOGY
PHENOCRYSTS Olivine Plagioclase
Clinopyroxene
GROUNDMASS Plagioclase Clinopyroxene
SECONDARY MINERALOGY Clays Clays Zeolites Chlorite
Quartz Anhydrite Chalcopyrite Pyrite
PERCENT PRESENT
2
2
9 10
PERCENT 30 32
3 10
2 Tr Tr Tr
PERCENT ORIGINAL
<1 5
2
52 40
REPLACING/ FILLING
SIZE APPROX. RANGE COMPO-(mm) SITION
1 1.0-2.0
<1
0.1-0.5 0.1
MORPHOLOGY
Euhedral, tabular Subhedral
COMMENTS
Completely altered to mixed-layer clays. Glomerocrysts.
Altered to mixed-layer Altered to mixed-layer
COMMENTS Veins, cpx Mixed-layer clays replace matrix. Some vermicular clay also. Veins, ol, plag Mixed-layer clays after ol. Plag, veins In veins as radiating fibers. Ol, plag, veins Veins In veins bordered by chlorite. Subhexagonal.
Anhedral. In breccia cement. Veins In quartz veins. Pseudohexagonal to anhedral.
In altered matrix. Subhedral to anhedral.
clays, clays.
COMMENTS: Quartz is subhedral to euhedral (basal hexagonal sections). Chalcopyrite (negative, euhedral crystals) grows in quartz interstices. Pyrite replaces plag and contains numerous mesostasis inclusions. In one vein, vermicular mineral (clay?).