Observed Coherent Trends of Surface and Upper-Air Wind Speed over China since 1960
13
Observed Coherent Trends of Surface and Upper-Air Wind Speed over China since 1960 CHANGGUI LIN Key Laboratory of Tibetan Environment Changes and Land Surface Processes, Institute of Tibetan Plateau Research, Chinese Academy of Sciences, and University of the Chinese Academy of Sciences, Beijing, China KUN YANG AND JUN QIN Key Laboratory of Tibetan Environment Changes and Land Surface Processes, Institute of Tibetan Plateau Research, Chinese Academy of Sciences, Beijing, China RONG FU Department of Geological Sciences, The University of Texas at Austin, Austin, Texas, and Center of Earth System Science, Tsinghua University, Beijing, China (Manuscript received 15 February 2012, in final form 8 November 2012) ABSTRACT Previous studies indicated that surface wind speed over China declined during past decades, and several explanations exist in the literature. This study presents long-term (1960–2009) changes of both surface and upper-air wind speeds over China and addresses observed evidence to interpret these changes. It is found that surface wind over China underwent a three-phase change over the past 50 yr: (i) it step changed to a strong wind level at the end of the 1960s, (ii) it declined until the beginning of the 2000s, and (iii) it seemed to be steady and even recovering during the very recent years. The variability of surface wind speed is greater at higher elevations and less at lower elevations. In particular, surface wind speed over the elevated Tibetan Plateau has changed more significantly. Changes in upper-air wind speed observed from rawinsonde are similar to surface wind changes. The NCEP–NCAR reanalysis indicates that wind speed changes correspond to changes in geopotential height gradient at 500 hPa. The latter are further correlated with the changes of latitudinal surface temperature gradient, with a correlation coefficient of 0.88 for the past 50 yr over China. This strongly suggests that the spatial gradient of surface global warming or cooling may significantly change surface wind speed at a regional scale through atmospheric thermal adaption. The recovery of wind speed since the beginning of the 2000s over the Tibetan Plateau might be a precursor of the reversal of wind speed trends over China, as wind over high elevations can respond more rapidly to the warming gradient and atmospheric circulation adjustment. 1. Introduction Widespread surface wind speed declines have been observed from ground measurements over the past few decades in many tropical and midlatitude regions in- cluding China (McVicar et al. 2012, and references therein). These declines of surface wind speed may con- tribute to declines of atmospheric potential evapora- tion, as measured by pan evaporation (Chen et al. 2006; McVicar et al. 2012; Roderick et al. 2007), and the weakening trend in atmospheric sensible heat over some regions (Duan and Wu 2008; Yang et al. 2011a). Recently, there has been great interest in the causes of the surface wind decline, as it is a key component of global climate change. Nevertheless, a widely accepted explanation has not been reached yet. By investigating normalized difference vegetation index (NDVI) data, Vautard et al. (2010) partly attributed the lowering of Northern Hemisphere atmospheric wind to an increase of surface roughness, but their study did not consider some specific cases such as one happening over the el- evated Tibetan Plateau (TP) where wind speed consid- erably declined over the last 30 yr (Yang et al. 2011b) Corresponding author address: Kun Yang, Institute of Tibetan Plateau Research, Chinese Academy of Sciences, Bldg. 3, Court- yard 16, Chaoyang District, Beijing 100101, China. E-mail: [email protected] 1MAY 2013 LIN ET AL. 2891 DOI: 10.1175/JCLI-D-12-00093.1 Ó 2013 American Meteorological Society
Transcript of Observed Coherent Trends of Surface and Upper-Air Wind Speed over China since 1960

Observed Coherent Trends of Surface and Upper-Air Wind Speed overChina since 1960
CHANGGUI LIN
Key Laboratory of Tibetan Environment Changes and Land Surface Processes, Institute of Tibetan Plateau Research,
Chinese Academy of Sciences, and University of the Chinese Academy of Sciences, Beijing, China
KUN YANG AND JUN QIN
Key Laboratory of Tibetan Environment Changes and Land Surface Processes, Institute of Tibetan
Plateau Research, Chinese Academy of Sciences, Beijing, China
RONG FU
Department of Geological Sciences, The University of Texas at Austin, Austin, Texas, and Center of Earth
System Science, Tsinghua University, Beijing, China
(Manuscript received 15 February 2012, in final form 8 November 2012)
ABSTRACT
Previous studies indicated that surface wind speed over China declined during past decades, and several
explanations exist in the literature. This study presents long-term (1960–2009) changes of both surface and
upper-air wind speeds over China and addresses observed evidence to interpret these changes. It is found that
surface wind over China underwent a three-phase change over the past 50 yr: (i) it step changed to a strong
wind level at the end of the 1960s, (ii) it declined until the beginning of the 2000s, and (iii) it seemed to be
steady and even recovering during the very recent years. The variability of surface wind speed is greater at
higher elevations and less at lower elevations. In particular, surface wind speed over the elevated Tibetan
Plateau has changed more significantly. Changes in upper-air wind speed observed from rawinsonde are
similar to surface wind changes. The NCEP–NCAR reanalysis indicates that wind speed changes correspond
to changes in geopotential height gradient at 500 hPa. The latter are further correlated with the changes of
latitudinal surface temperature gradient, with a correlation coefficient of 0.88 for the past 50 yr over China.
This strongly suggests that the spatial gradient of surface global warming or cooling may significantly change
surface wind speed at a regional scale through atmospheric thermal adaption. The recovery of wind speed
since the beginning of the 2000s over the Tibetan Plateau might be a precursor of the reversal of wind speed
trends over China, as wind over high elevations can respond more rapidly to the warming gradient and
atmospheric circulation adjustment.
1. Introduction
Widespread surface wind speed declines have been
observed from ground measurements over the past few
decades in many tropical and midlatitude regions in-
cluding China (McVicar et al. 2012, and references
therein). These declines of surface wind speed may con-
tribute to declines of atmospheric potential evapora-
tion, as measured by pan evaporation (Chen et al. 2006;
McVicar et al. 2012; Roderick et al. 2007), and the
weakening trend in atmospheric sensible heat over some
regions (Duan and Wu 2008; Yang et al. 2011a).
Recently, there has been great interest in the causes
of the surface wind decline, as it is a key component of
global climate change. Nevertheless, a widely accepted
explanation has not been reached yet. By investigating
normalized difference vegetation index (NDVI) data,
Vautard et al. (2010) partly attributed the lowering of
Northern Hemisphere atmospheric wind to an increase
of surface roughness, but their study did not consider
some specific cases such as one happening over the el-
evated Tibetan Plateau (TP) where wind speed consid-
erably declined over the last 30 yr (Yang et al. 2011b)
Corresponding author address: Kun Yang, Institute of Tibetan
Plateau Research, Chinese Academy of Sciences, Bldg. 3, Court-
yard 16, Chaoyang District, Beijing 100101, China.
E-mail: [email protected]
1 MAY 2013 L I N ET AL . 2891
DOI: 10.1175/JCLI-D-12-00093.1
� 2013 American Meteorological Society
but the surface roughness change is not so significant. In
Australia, McVicar et al. (2012) found that NDVI is
slightly positively correlated with surface wind speed
trends. The regional cooling in south-central China
caused by air pollution was also speculated to be the
cause of the weakening of the East Asia summer mon-
soon (Xu et al. 2006), which needs a further discussion.
Alternatively, the weakening of atmospheric circulation
under the background of global warming was considered
to be the main factor contributing to the decline of
surface wind in several studies (e.g., Duan andWu 2009;
Guo et al. 2011; Jiang et al. 2010; You et al. 2010; Zhang
et al. 2009b).
These previous studies focused more on the wind
speed changes over the globe and China during the past
decades without including the most recent changes or
addressing their elevation dependence. Calculating the
trends of wind speed with respect to elevation in two
mountainous regions in China and Switzerland, McVicar
et al. (2010) uncovered the phenomenon that surface
winds were declining more rapidly at higher elevations
than lower elevations. Yang et al. (2011b) also pointed
out that wind speed over the Tibetan Plateau during the
last 30 yr declined much more than the one averaged
over China, and therefore there is a need to give a de-
tailed investigation on the elevation dependence of wind
speed change and its cause. If so, this elevation de-
pendencemay imply the relationshipwith upper-air wind
speed, which has not been taken into accounting in pre-
vious studies. Figure 3a of Vautard et al. (2010) showed
decreasing upper-air (850 hPa) wind speed trends over
the past three decades (1979–2008) in Asian regions,
which is in contrast with the increasing trends over
European–American regions. This difference was not
discussed as Vautard et al. (2010) focused primarily on
the European–American regions. Zhang et al. (2009a)
also reported the decreasing upper-air wind speed trends
during 1980–2006 over China, especially in the lower
troposphere. However, a longer-term upper-air wind
speed analysis would be helpful to further explore
whether there is a relationship between the surface wind
change and the upper-air wind change.
In this study, we aim to present a comprehensive
analysis on the trends of wind speed over China during
the past 50 yr. To achieve this, it is analyzed from fol-
lowing several aspects: (i) the observed trends of annual
and seasonal mean surface wind speed; (ii) the spatial
distribution of observed trends in surface wind speed;
(iii) the elevation dependence of observed trends in
surface wind speed; (iv) the trends of observed upper-
air wind speed; and (v) the trends in latitudinal gradients
of 500-hPa geopotential height and surface tempera-
ture. The results are given in section 4. The detailed
description of the datasets and trend-calculating methods
applied in this study is presented in section 2. As the
quality and homogeneity of data are critical for long-term
change analysis, we first present cross-validations to
confirm the reliability of the derived wind speed trends
in section 3, in terms of (i) comparison between In-
tegrated Global Radiosonde Archive (IGRA) 850-hPa
and China Meteorological Administration (CMA) sur-
face wind speed and (ii) comparison between IGRA
850-hPa and CMA surface wind speed. In section 5 of
concern and discussed are the causes of the wind speed
changes over China. Conclusions are given in section 6.
2. Datasets and methods
a. CMA surface routine data
CMAprovides for this study a long-term (from January
1960 to December 2009) routine dataset of surface wind
speed observed at 10 m above the surface. At each CMA
station, surface wind speed was measured 6-hourly [at
0200, 0800, 1400, and 2000 Beijing standard time (BST);
BST 5 UTC 1 8 h]. Figure 1 shows the distribution of
CMA stations and their elevations. The elevations of the
CMA stations vary from sea level up to 4800 m above
mean sea level (MSL). There are a total of 125 stations
with elevations greater than 2000 m MSL located in the
TP area. This region exerts profound influences not only
on the local climate and environment but also on the
global atmospheric circulation through its thermal and
mechanical forcing (Yeh and Gao 1979). Meanwhile, its
environment is sensitive to global climate change (Liu
and Chen 2000). Because of its unique environmental
characteristics and close link to the upper-air atmospheric
circulation, the wind speed changes over this region were
highlighted and discussed herein.
b. IGRA upper-air radiosonde data
The radiosonde data gathered in IGRA are used to
analyze the changes of upper-air wind in this study. The
IGRA archive is integrated from different sources with
a sequence of specialized quality assurance algorithms
(Durre et al. 2006). The filled square symbols in Fig. 1
denote the IGRA (totaling 149) stations in China. These
data are available for 1964–2009 for some stations in
China; nevertheless, data over 1973–90 for many stations
are missing. Hence we focused on 1990 onward. Monthly
averaged values of upper-air wind speed at mandatory
levels of 850, 700, 500, 300, and 200 hPa were used here.
c. Other datasets
To further explore the causations of the derived wind
speed changes, several datasets are used in the study.
2892 JOURNAL OF CL IMATE VOLUME 26

First, the National Centers for Environmental Prediction–
National Center of Atmospheric Research (NCEP–
NCAR) reanalysis (Kalnay et al. 1996) was used.McVicar
et al. (2008) showed that of the three common re-
analysis outputs [NCEP–NCAR,NCEP/U.S.Department
of Energy (DOE), and 40-yr European Centre for
Medium-Range Weather Forecasts (ECMWF) Re-
Analysis (ERA-40)] tested, the NCEP–NCAR reanalysis
was best able to capture observed near-surface wind
speed trends during 1979–2001 for Australia. We
therefore used NCEP–NCAR 500-hPa geopotential
height data to examine whether the changes exist in the
large-scale atmospheric circulation. Second, the Had-
ley Centre and Climate Research Unit (CRU) gridded
near-surface temperature dataset, version 3 (Had-
CRUT3; Brohan et al. 2006; Jones et al. 1999; available
at http://www.cru.uea.ac.uk/cru/data/temperature/),
was used to further explore the changes in latitudinal
gradient of surface warming rate. Third and finally, three
climate indiceswere used: (i)ArcticOscillation (AO); (ii)
North Atlantic Oscillation (NAO); and (iii) Pacific de-
cadal oscillation (PDO). AO is an annular mode of at-
mospheric circulation (Thompson and Wallace 1998).
NAO is the difference of atmospheric pressure at sea
level between the Icelandic low and the Azores high
(Wallace and Gutzler 1981). AO and NAO are the
dominant patterns that affect Northern Hemisphere cli-
mate variability, which are themost prevalent inwinter at
themid–high latitudes. Both indices are available online
(at http://www.cpc.ncep.noaa.gov/). PDO is the leading
principal component of monthly sea surface tempera-
ture (SST) anomalies in the North Pacific Ocean
(poleward of 208N) (Mantua et al. 1997); it is available
online (at http://jisao.washington.edu/pdo/PDO.latest).
The period 1960–2009 was used in this study to match
with the temporal extant of the CMA surface dataset.
These indices are examined in terms of their relationship
with the changes in surface wind speed.
d. Analysis procedures
To account for the irregularly distributed CMA sta-
tions, the area-weighted grid average is preferred in
climate analysis. Duan (2009), however, showed that the
station-averaged surface wind speed exhibits changes
similar to those that are grid averaged, although the two
averages have a systematic difference. We therefore
used the simple station averaging to derive the regional
mean wind speed changes. Based on the CMA surface
wind speed dataset, we calculated the seasonal and an-
nual mean values of wind speed at the four measuring
times of day and their daily means at two spatial scales
(China and TP). The station averages are calculated for
the stations that have ‘‘good data records’’ (defined as
data records that have more than 275 observations each
year). There are 472 such CMA stations in China and 64
such stations in TP. Then, the linear trends of their time
FIG. 1. Distribution of CMA stations. The square markers (filled for stations with IGRA
radiosonde data) in various sizes depict the elevation of each site. The nine regions (TP, A, B,
C, D, E, F, G, andH) are distinguished by different colors. The thick curve encloses the regions
with a height above 2000 m MSL.
1 MAY 2013 L I N ET AL . 2893

series are calculated by fitting a linear regression (ordi-
nary least squares). The trend significance is tested using
Student’s t test at the probability level of P , 0.05. At
each station, the linear trend of surface or upper-air
wind speed is also obtained based on the monthly mean
deseasonalized values. The deseasonalization was per-
formed through the process of removing the seasonal
climatology from the time series.
In view of unrealistic surface wind speed trends cal-
culated at a few stations, we fitted the dependence of
wind speed trend on elevation using a robust linear re-
gression to explore the impact of elevation on surface
wind speed trend. The regression method (available in
MATLAB Statistics Toolbox) employs an iteratively
reweighted least squares algorithm with the weight at
each iteration determined by applying a bisquare func-
tion to the residuals from the previous iteration (Huber
1981; Street et al. 1988). It can therefore minimize the
effect of outliers and/or nonstationary variability com-
pared to the ordinary linear least squares regression.
The wind speed changes are investigated through the
pressure gradient force in the upper air. We defined a
high-latitude band (HL; 458–508N) and a low-latitude
band (LL; 208–258N). The upper-air wind speed over
China, especially the TP region located between latitudes
of 258 and 408N, is largely determined by the pressure
difference (or geopotential height gradient) between
the two bands according to the geostrophic approxi-
mation theory. Using NCEP–NCAR reanalysis data, we
calculated the geopotential height difference between the
two bands (with longitudinal range of 708–1408E) at the500-hPa level as used to denote the geopotential height
gradient. Correspondingly, we also examined the dif-
ference of surface temperature between the two latitude
bands based on the CRU data.
3. Cross-validations of the derived wind speedchanges
The quality and homogeneity of data are critical for
long-term change analysis. Instrumental changes, ob-
servational drift, or other human-induced changes may
yield unreal changes in time series. As far as we know,
only air temperature is homogenized for the CMA sta-
tions, while surface wind speed is more sensitive to local
environment so that its homogenization is more difficult
and not done for the CMA stations. The rawinsondewind
data in IGRA have not yet been adjusted for inhomo-
geneity as well, and therefore one needs to be cautious
when using these data for climate analysis (Durre et al.
2006). For instance, Dai et al. (2011) found that the ra-
diosonde humidity records in IGRA need homogeniza-
tion for its trend analysis, because of ubiquitous and large
discontinuities resulting from changes to instrumentation
and observing practices.
In view of the inhomogeneity problem of the CMA
data, any discussion for a subregion can be uncertain and
risky. So, we calculated the wind speed changes aver-
aged over each of nine regions of China to check the
consistency of wind speed changes in China. Following
Duan (2009), the nine regions of China including the TP
were identified based on the rotated empirical orthog-
onal function analysis and climate features. The stations
within each region are shown in different colors in Fig. 1.
The variations of annual mean surface wind speed in the
nine regions are provided in Fig. 2. It can be found that
the surface wind speeds of all regions other than regions
G and H have the similar changes. Particularly, the step
change around the end of the 1960s is an outstanding
phenomenon and seems like a spurious one. Hereafter,
we confirmed a physical basis for the observed step
change based on independent observations.
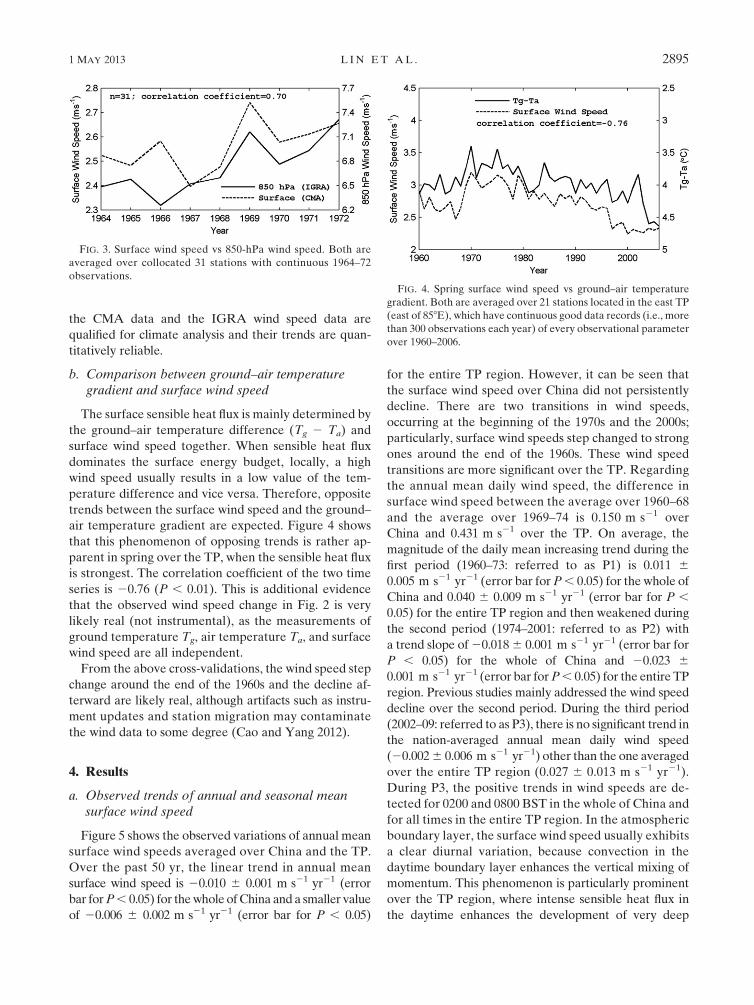
a. Comparison between IGRA 850-hPa and CMAsurface wind speed
Because radiosonde data for 1973–90 are unavailable
for most IGRA stations, 1964–72 is used when analyzing
the wind speed step change around the end of the 1960s.
The annual mean wind speed at 850 hPa averaged over
31 IGRA stations with continuous 1964–72 observations
was compared with CMA surface wind speed averaged
at the collocated stations (Fig. 3). They have similar
changes and their correlation coefficient is 0.70 (P ,0.05). The spatial distribution of trends in upper-air wind
speed derived from IGRA changed similarly with the
ones in surface wind speed, as shown in section 4d. As
the two datasets are independent, we tend to believe both
FIG. 2. Annual mean surface wind speeds averaged over nine
regions of China.
2894 JOURNAL OF CL IMATE VOLUME 26
the CMA data and the IGRA wind speed data are
qualified for climate analysis and their trends are quan-
titatively reliable.
b. Comparison between ground–air temperaturegradient and surface wind speed
The surface sensible heat flux is mainly determined by
the ground–air temperature difference (Tg 2 Ta) and
surface wind speed together. When sensible heat flux
dominates the surface energy budget, locally, a high
wind speed usually results in a low value of the tem-
perature difference and vice versa. Therefore, opposite
trends between the surface wind speed and the ground–
air temperature gradient are expected. Figure 4 shows
that this phenomenon of opposing trends is rather ap-
parent in spring over the TP, when the sensible heat flux
is strongest. The correlation coefficient of the two time
series is 20.76 (P , 0.01). This is additional evidence
that the observed wind speed change in Fig. 2 is very
likely real (not instrumental), as the measurements of
ground temperature Tg, air temperature Ta, and surface
wind speed are all independent.
From the above cross-validations, the wind speed step
change around the end of the 1960s and the decline af-
terward are likely real, although artifacts such as instru-
ment updates and station migration may contaminate
the wind data to some degree (Cao and Yang 2012).
4. Results
a. Observed trends of annual and seasonal meansurface wind speed
Figure 5 shows the observed variations of annual mean
surface wind speeds averaged over China and the TP.
Over the past 50 yr, the linear trend in annual mean
surface wind speed is 20.010 6 0.001 m s21 yr21 (error
bar forP, 0.05) for thewhole ofChina and a smaller value
of 20.006 6 0.002 m s21 yr21 (error bar for P , 0.05)
for the entire TP region. However, it can be seen that
the surface wind speed over China did not persistently
decline. There are two transitions in wind speeds,
occurring at the beginning of the 1970s and the 2000s;
particularly, surface wind speeds step changed to strong
ones around the end of the 1960s. These wind speed
transitions are more significant over the TP. Regarding
the annual mean daily wind speed, the difference in
surface wind speed between the average over 1960–68
and the average over 1969–74 is 0.150 m s21 over
China and 0.431 m s21 over the TP. On average, the
magnitude of the daily mean increasing trend during the
first period (1960–73: referred to as P1) is 0.011 60.005 m s21 yr21 (error bar forP, 0.05) for the whole of
China and 0.040 6 0.009 m s21 yr21 (error bar for P ,0.05) for the entire TP region and then weakened during
the second period (1974–2001: referred to as P2) with
a trend slope of20.0186 0.001 m s21 yr21 (error bar for
P , 0.05) for the whole of China and 20.023 60.001 m s21 yr21 (error bar forP, 0.05) for the entire TP
region. Previous studies mainly addressed the wind speed
decline over the second period. During the third period
(2002–09: referred to as P3), there is no significant trend in
the nation-averaged annual mean daily wind speed
(20.0026 0.006 m s21 yr21) other than the one averaged
over the entire TP region (0.027 6 0.013 m s21 yr21).
During P3, the positive trends in wind speeds are de-
tected for 0200 and 0800 BST in the whole of China and
for all times in the entire TP region. In the atmospheric
boundary layer, the surface wind speed usually exhibits
a clear diurnal variation, because convection in the
daytime boundary layer enhances the vertical mixing of
momentum. This phenomenon is particularly prominent
over the TP region, where intense sensible heat flux in
the daytime enhances the development of very deep
FIG. 3. Surface wind speed vs 850-hPa wind speed. Both are
averaged over collocated 31 stations with continuous 1964–72
observations.FIG. 4. Spring surface wind speed vs ground–air temperature
gradient. Both are averaged over 21 stations located in the east TP
(east of 858E), which have continuous good data records (i.e., more
than 300 observations each year) of every observational parameter
over 1960–2006.
1 MAY 2013 L I N ET AL . 2895

boundary layers (e.g., Luo andYanai 1984;Ma et al. 2005;
Yang et al. 2004; Yeh and Gao 1979). However, no ob-
vious diurnal variation exists in the surface wind speed
trends during all the periods over the TP. Changes in
the boundary layer, therefore, should not be a consider-
able cause of wind speed change, which was also pointed
out by Vautard et al. (2010). This implies that the wind
speed change may be beyond the boundary layer scale.
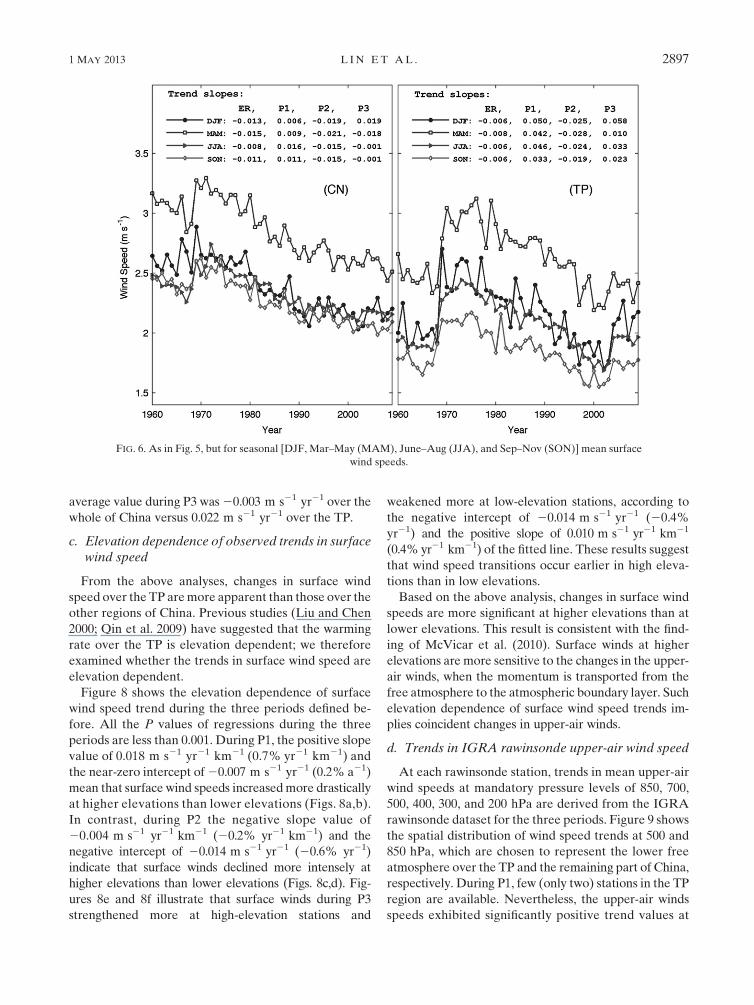
Similar to the annual mean surface winds, seasonal
mean surface wind speeds had transitions at the begin-
ning of the 1970s and the 2000s (not shown). All the four
seasonal mean surface winds consistently step changed
to strong ones during P1 and weakened during P2 sig-
nificantly. During both the strengthening period and the
weakening period, the magnitudes of change for the
seasonal mean surface wind speeds over the TP are
larger than in the whole of China. A positive wind speed
trend in winter [December–February (DJF)] and nega-
tive ones in other seasons are found in the whole of China
duringP3, but noneof them is statistically significant (Fig. 6).
However, the trends in all the seasons other than the spring
are significantly positive during P3 over the TP region.
In a word, during the last 50 yr, there are three periods
of wind speed changes in China. The trends over the TP
are similar to the averaged ones over China but have
larger magnitudes. In particular, the recent recovery
(i.e., positive trend) of wind speed over the TP was
found here, a phenomenon not previously reported in
the literature.
b. Spatial distribution of observed trends in surfacewind speed
Since the changes in surface wind speed over the
whole of China and the TP are somewhat different, their
spatial distribution is examined. Figure 7 shows the spa-
tial distribution of the CMA surface wind speed trends
during the three periods (P1, P2, and P3) defined in
section 4a. Almost all the CMA stations in China ex-
hibited positive trends in surface wind speed during P1,
especially over the TP, where surface wind speeds in-
creased considerably during this period (Fig. 7a). The
averaged trend value is 0.010 m s21 yr21 over the
whole of China versus 0.042 m s21 yr21 over the entire
TP region. During P2, negative trends are dominant,
with values of 20.018 m s21 yr21 over the whole of
China and20.024 m s21 yr21 over the TP (Fig. 7b). The
spatial distribution of surface wind speed trends is
complex during P3 as shown in Fig. 7c, perhaps be-
cause of too short of a period. Nevertheless, surface
wind speeds at a large number of stations, especially
over the TP, turned to increase during P3, although the
wind speeds at the remaining stations still decline. The
FIG. 5. Annual mean surface wind speeds averaged over all CMA stations (left) in China (CN) and (right) in the
TP. Curves with differentmarkers denote the four daily observation hours (0200, 0800, 1400, and 2000BST) and daily
mean (dm). The linear trends (m s21 yr21) during the entire record (ER; 1960–2009), P1 (1960–73), P2 (1974–2001),
and P3 (2002–09) are given in the legend of the figure panels.
2896 JOURNAL OF CL IMATE VOLUME 26
average value during P3 was20.003 m s21 yr21 over the
whole of China versus 0.022 m s21 yr21 over the TP.
c. Elevation dependence of observed trends in surfacewind speed
From the above analyses, changes in surface wind
speed over the TP aremore apparent than those over the
other regions of China. Previous studies (Liu and Chen
2000; Qin et al. 2009) have suggested that the warming
rate over the TP is elevation dependent; we therefore
examined whether the trends in surface wind speed are
elevation dependent.
Figure 8 shows the elevation dependence of surface
wind speed trend during the three periods defined be-
fore. All the P values of regressions during the three
periods are less than 0.001. During P1, the positive slope
value of 0.018 m s21 yr21 km21 (0.7% yr21 km21) and
the near-zero intercept of20.007 m s21 yr21 (0.2% a21)
mean that surface wind speeds increasedmore drastically
at higher elevations than lower elevations (Figs. 8a,b).
In contrast, during P2 the negative slope value of
20.004 m s21 yr21 km21 (20.2% yr21 km21) and the
negative intercept of 20.014 m s21 yr21 (20.6% yr21)
indicate that surface winds declined more intensely at
higher elevations than lower elevations (Figs. 8c,d). Fig-
ures 8e and 8f illustrate that surface winds during P3
strengthened more at high-elevation stations and
weakened more at low-elevation stations, according to
the negative intercept of 20.014 m s21 yr21 (20.4%
yr21) and the positive slope of 0.010 m s21 yr21 km21
(0.4% yr21 km21) of the fitted line. These results suggest
that wind speed transitions occur earlier in high eleva-
tions than in low elevations.
Based on the above analysis, changes in surface wind
speeds are more significant at higher elevations than at
lower elevations. This result is consistent with the find-
ing of McVicar et al. (2010). Surface winds at higher
elevations are more sensitive to the changes in the upper-
air winds, when the momentum is transported from the
free atmosphere to the atmospheric boundary layer. Such
elevation dependence of surface wind speed trends im-
plies coincident changes in upper-air winds.
d. Trends in IGRA rawinsonde upper-air wind speed
At each rawinsonde station, trends in mean upper-air
wind speeds at mandatory pressure levels of 850, 700,
500, 400, 300, and 200 hPa are derived from the IGRA
rawinsonde dataset for the three periods. Figure 9 shows
the spatial distribution of wind speed trends at 500 and
850 hPa, which are chosen to represent the lower free
atmosphere over the TP and the remaining part of China,
respectively. During P1, few (only two) stations in the TP
region are available. Nevertheless, the upper-air winds
speeds exhibited significantly positive trend values at
FIG. 6. As in Fig. 5, but for seasonal [DJF, Mar–May (MAM), June–Aug (JJA), and Sep–Nov (SON)] mean surface
wind speeds.
1 MAY 2013 L I N ET AL . 2897

all the selected levels. During P2, the negative trends
in upper-air wind speeds prevailed under the level of
300 hPa and are significant over the TP at 500 hPa.
During P3, positive trends in upper-air wind speeds in
north China and the TP, and the negative trends in
south China are detected from upper-air wind speeds
above the level of 500 hPa, while the trends at 700 and
850 hPa are more complex.
Therefore, changes in upper-air wind speeds closely
resemble to those in surface wind speeds during the P1
and P2. This resemblance is particularly distinctive
between changes in surface wind speeds and those in
winds at 500 hPa over the TP and between those in
surface wind speeds and those at 850 hPa over non-TP.
Although the spatial distribution of trends in upper-air
wind speeds is not in complete agreement with surface
wind speed trends during P3, the recovery of upper-air
wind speeds is observed over the TP and some non-TP
regions and a similar phenomenon also occurs in sur-
face wind speeds. Since there is an intimate link between
the surface and upper-air winds, changes in atmospheric
circulation may exert more influence on changes in sur-
face wind speeds than local changes in surface rough-
ness, especially for the TP.
e. Trends in latitudinal gradients of 500-hPageopotential height and surface temperature
Changes in geopotential height gradient are inves-
tigated to examine the intimate link between upper-air
and surface winds. Figure 10a shows the temporal vari-
ation of geopotential height difference between the two
latitude bands defined above (LL and HL) over the past
50 yr. The geopotential height gradient strengthened
during P1, weakened during P2, and was enhanced again
during P3. Such variations are synchronous with the ob-
served upper-air and surface wind speed changes. It
qualitatively confirms the coincident changes in regional
atmospheric circulation.
The role of regional surface warming in the changes
of wind speed under the background of global warming
is further explored. Figure 10b shows the difference of
surface temperature between the two latitude bands de-
fined above. Clearly, the interannual variability of the
surface temperature gradient is consistent with the geo-
potential height gradient at 500 hPa (Fig. 10a). Their
correlation coefficient is as high as 0.88.
5. Discussion
The causes of the wind speed changes are currently
not fully understood. Several hypotheses have been
proposed to explain the decline trends in surface wind
speed, such as (i) changes in large-scale atmospheric
circulation (e.g., Duan and Wu 2009; Guo et al. 2011;
Jiang et al. 2010); (ii) increasing surface roughness
(Vautard et al. 2010); (iii) effects of local air pollution
(e.g., Jacobson and Kaufman 2006; Xu et al. 2006); (iv)
influences of urbanization (e.g., Klink 1999; Li et al.
2011); (v) instrumental changes or observational drifts
(e.g., DeGaetano 1998; Thomas and Swail 2011); and
(vi) other possible causes given by McVicar et al. (2012).
However, most of the factors may only explain the
changes in surface wind speed in a local area and/or for
a certain period. We demonstrated a reasonable
FIG. 7. Spatial distribution of CMA surface wind speed trends
during three periods: (a) P1 (1960–73); (b) P2 (1974–2001); and
(c) P3 (2002–09). The positive and negative trends are marked by
regular triangles and inverted triangles, respectively. The filled
triangle indicates that the trend at this station is statistically sig-
nificant (P , 0.05).
2898 JOURNAL OF CL IMATE VOLUME 26

explanation for the nation-wide surface wind speed
changes in China over the last 50 yr.
The impact of instrumental changes or observational
drifts cannot be ignored as it may yield spurious trends.
Nevertheless, according the cross-validations in section 3,
we illustrated that the trends derived from the ob-
served data are not artifacts. The difference between
the trends in urban and rural stations in China is quite
small (Guo et al. 2011; Jiang et al. 2010), so urbanization
should not be a considerable cause of surface wind speed
changes. Direct anthropogenic impact over the TP is
relatively small even though land-use change and in-
dustrialization have occurred over a small fraction of the
TP.Air pollution, therefore, cannot be used to explain the
observed wind speed changes and particularly their ele-
vation dependence. Increasing surface roughness is re-
garded as an important factor, which attributes 20%–60%
of Northern Hemispheric atmospheric stilling (Vautard
et al. 2010). This may explain the contrasting trends
between surface and upper-air wind speed over Europe
and North America. However, this mechanism is not
applicable to China, because the changes in upper-air
wind speed coincided with the changes in surface wind
speed according to the analyses made in section 3. Ad-
ditionally, bare soils and short grasses are the dominant
land-cover types and the surface roughness lengths are
generally small (millimeters to centimeters) over the
TP. The changes in surface roughness are quite in-
significant as trends of NDVI for the TP during 1982–99
are shown to be very small in Beck et al. (2011). Thus, it
is unlikely that the changes of roughness length affect the
surface wind speed so significantly over the plateau.
As shown in the Fig. 10a, the three phases of surface
and upper-air wind speed changes over China corre-
spond well to the changes in the pressure gradient force
and the atmospheric circulation. This substantiates the
FIG. 8. Elevation dependence of CMA surface wind speed trends (slopes in the figure) during the three periods:
(a),(b) P1 (1960–73); (c),(d) P2 (1974–2001); and (e),(f) P3 (2002–09). The unit of elevation dependence for (a),(c),(e)
is m s21 yr21 km21, while for (b),(d),(f) it is % yr21 km21. The filled square markers indicate sites with significant
trend (P , 0.05). The thick black lines show the linear regression between surface wind speed trend and elevation.
1 MAY 2013 L I N ET AL . 2899

explanation that the changes of surface wind speed are
largely induced by the changes in atmospheric circulation
(e.g., Duan and Wu 2009; Guo et al. 2011; Jiang et al.
2010; You et al. 2010; Zhang et al. 2009b). Using a mul-
timodel simulation during 1979–2000, Duan and Wu
(2009) discussed the relationship between the East Asian
subtropical westerly jet and latitudinal temperature
gradient at 500 hPa. In this study, the role of regional
surface warming in the changes of wind speed under the
background of global warming was further explored
(section 4e). The high correlation between the gradient
of NCEP–NCAR 500-hPa geopotential height and the
gradient of CRU surface temperature gradient is not an
accident but has a physical basis. The regional difference
in the surface warming rate may modify the gradient of
geopotential height through thermal adaption, and this
change in free atmospheric circulation will further in-
fluence the surface wind speed change through the
momentum downward transport from free atmosphere
to the atmospheric boundary layer. Therefore, the trends
of the latitudinal gradient in surface temperature during
the three periods approximately correspond to the ones
of surface wind speed over China (see Fig. 5).
Several climate indices are used to characterize the
atmospheric circulation variability. Therefore, it is worth
discussing whether the wind speed change is related to
FIG. 9. Spatial distribution of IGRA upper-air wind speed trends at (a),(c),(e) 500 and (b),(d),(f) 850 hPa during
(a),(b) P1 (1964–72); (c),(d) P2 (1991–2001); and (e),(f) P3 (2002–09). The positive (negative) trends are marked
by circles with (without) a plus sign. The filled circles indicate that the trend at this station is statistically significant
(P , 0.05).
2900 JOURNAL OF CL IMATE VOLUME 26

the indices. As indicated in previous studies (e.g., Gong
and Ho 2003; Gong et al. 2001; Ogi et al. 2003), AO/
NAO variability exerts different impacts on the zonal
mean wind speed at different latitudes of the Northern
Hemisphere. However, both the AO and NAO indices
have increasing (decreasing) trends before (after) 1990
(Figs. 11a,b), and these trends are not in phase with the
changes in wind speeds over China. The PDO can
modulate the impact of ENSO on the East Asian at-
mospheric circulation (e.g., Wang et al. 2008; Yoon and
Yeh 2010), but we found no robust correlation between
the PDO index and changes in wind speeds over China
(Fig. 11c). Therefore, wind speed changes over China
cannot be simply linked with oscillation indices such as
AO/NAO/PDO. Nevertheless, we cannot exclude other
climate indices or circulation patterns that are forcing
the wind speed changes.
6. Conclusions
Based on temporal and spatial analysis of surface wind
speed using the CMA operational meteorological data,
we found that the surface wind speeds in China step
changed to strong ones around the end of the 1960s. The
winds then experienced weakening trend until the
beginning of the 2000s and a possible recovery afterward.
The high-elevation areas such as the Tibetan Plateau
experienced more significant change during both the
step change and decline period. Moreover, synchronous
changes in surface wind and upper-air wind speed were
observed over both the TP and the whole of China.
The deceleration of wind speed over the Tibetan
Plateau since the 1970s was ascribed to the substantial
tropospheric warming in themiddle and high latitudes to
the north of the plateau in two recent studies (e.g., Duan
andWu 2009; Zhang et al. 2009b). Our investigation was
extended for a longer period and a larger region and
supported the basic idea of the previous studies, but note
that here we presented more direct evidence that asso-
ciated wind speed changes with the latitudinal gradient
of the surface temperature (instead of the 500 hPa in the
two earlier studies), which may be easily measured. It is
shown that there is a high correlation coefficient (0.88)
between the latitudinal gradient of the surface temper-
ature and the latitudinal gradient of geopotential height
at 500 hPa in East Asia. The trend of the latter corre-
sponds well to both the weakening and strengthening of
wind speed over the Tibetan Plateau and over the whole
of China. Therefore, the spatial inhomogeneity of global
warming or coolingmay significantly change surfacewind
speeds regionally via thermal adaption. This result
contrasts with those for North America and Europe,
where opposite changes in surface wind and upper-air
wind speed were found and such changes can be partly
explained by the increase of surface roughness lengths
(Vautard et al. 2010). McVicar et al. (2012) note that the
FIG. 10. Interannual variability of (a) the difference of annual
mean NCEP–NCAR reanalysis 500-hPa geopotential height and
(b) the difference of annual mean CRU surface temperature (com-
bined HadCRUT3 temperature anomalies and absolute tempera-
tures for the base period 1961–90) between the low and high latitudes
of China. HL is defined as 458–508N and LL is 208–258N, and the
longitudes of interest are between 708 and 1408E. The differences
between HL and LL are indicated by DGH and DT, respectively.The dashed lines denote the linear trends of DGH (gpm yr21) and
DT (8C yr21) during the three periods. The trend slope values are
given in the figure (i.e., P1, P2, and P3, respectively).
FIG. 11. Annual anomalies of (a) AO, (b) NAO, and (c) PDO
indices during the period of 1960–2009. The plain curves are the
5-yr smoothing averages.
1 MAY 2013 L I N ET AL . 2901

different causes of wind speed trends maybe occurred
at different locations for different periods, and hence
global attribution remains a key scientific challenge.
The intense variability of wind speed over the Tibetan
Plateau is another indicator of the high sensitivity of the
Tibetan Plateau responding to climate change. There-
fore, the recovery of wind speed over the TP since 2002
might imply another transition of the regional atmo-
spheric circulation and be a precursor of the reversal of
wind speed trend over China, noting that both the wind
speed and geopotential height gradient at 500 hPa over
China turned to be increasing during recent years.
Finally, we noticed that the sudden increase of wind
speeds both at the surface and upper troposphere dur-
ing 1969–74 and 2002–09 generally coincided with pe-
riods of strongly negative AO phase. It is necessary to
investigate whether equatorward displacement of jets
occurred over Asian sector and, if so, how such anoma-
lous would contribute to the increase of winds during
those two periods.
Acknowledgments. This work was supported by the
Global Change Program of Ministry of Science and
Technology of China (2010CB951703), the Strategic
Priority Research Program of the Chinese Academy of
Sciences (Grant XDB03030300), and National Natural
Science Foundation of China (Grant 41190083). The
surface station data used in this study were provided by
the Climate Data Center at the CMA National Mete-
orological Information Center. The involvement of Rong
Fu in this work is supported by the Center of Earth Sys-
tem Science at Tsinghua University. We are very grateful
to the anonymous reviewers for their valuable comments
and constructive suggestions.
REFERENCES
Beck, H. E., T. R. McVicar, A. I. J. M. van Dijk, J. Schellekens,
R. A. M. de Jeu, and L. A. Bruijnzeel, 2011: Global evaluation
of four AVHRR-NDVI data sets: Intercomparison and as-
sessment against Landsat imagery.Remote Sens. Environ., 115,
2547–2563, doi:10.1016/j.rse.2011.05.012.
Brohan, P., J. J. Kennedy, I. Harris, S. F. B. Tett, and P. D. Jones,
2006: Uncertainty estimates in regional and global observed
temperature changes: A new data set from 1850. J. Geophys.
Res., 111, D12106, doi:10.1029/2005JD006548.
Cao, L., and Z. Yang, 2012: Progress in research on homogeniza-
tion of climate data. Adv. Climate Change Res., 3, 59–67.
Chen, S., Y. Liu, and A. Thomas, 2006: Climatic change on the
Tibetan Plateau: Potential evapotranspiration trends from
1961–2000. Climatic Change, 76, 291–319, doi:10.1007/s10584-006-9080-z.
Dai, A. G., J. H.Wang, P.W. Thorne, D. E. Parker, L. Haimberger,
andX. L. L.Wang, 2011: A new approach to homogenize daily
radiosonde humidity data. J. Climate, 24, 965–991.
DeGaetano,A. T., 1998: Identification and implications of biases in
US surface wind observation, archival, and summarization
methods. Theor. Appl. Climatol., 60, 151–162, doi:10.1007/
s007040050040.
Duan, A. M., and G. X. Wu, 2008: Weakening trend in the atmo-
spheric heat source over the Tibetan Plateau during recent
decades. Part I: Observations. J. Climate, 21, 3149–3164.——, and ——, 2009: Weakening trend in the atmospheric heat
source over the Tibetan Plateau during recent decades. Part II:
Connection with climate warming. J. Climate, 22, 4197–4212.
Duan, C. F., 2009: Study on the changes and causes of surface wind
speed in China (in Chinese). Nanjing University of In-
formation Science and Technology Rep., 94 pp.
Durre, I., R. S. Vose, and D. B. Wuertz, 2006: Overview of the
Integrated Global Radiosonde Archive. J. Climate, 19, 53–68.
Gong, D.-Y., and C.-H. Ho, 2003: Arctic Oscillation signals in the
East Asian summer monsoon. J. Geophys. Res., 108, D24066,
doi:10.1029/2002JD002193.
——, S.W.Wang, and J. H. Zhu, 2001: East Asian winter monsoon
and Arctic Oscillation. Geophys. Res. Lett., 28, 2073–2076.
Guo, H., M. Xu, and Q. Hu, 2011: Changes in near-surface wind
speed in China: 1969–2005. Int. J. Climatol., 31, 349–358,
doi:10.1002/joc.2091.
Huber, P. J., 1981: Robust Statistics. Wiley, 308 pp.
Jacobson, M. Z., and Y. J. Kaufman, 2006: Wind reduction by
aerosol particles.Geophys. Res. Lett., 33, L24814, doi:10.1029/
2006GL027838.
Jiang, Y., Y. Luo, Z. Zhao, and S. Tao, 2010: Changes in wind speed
over China during 1956–2004. Theor. Appl. Climatol., 99, 421–
430, doi:10.1007/s00704-009-0152-7.
Jones, P. D.,M.New,D. E. Parker, S.Martin, and I. G. Rigor, 1999:
Surface air temperature and its changes over the past 150
years. Rev. Geophys., 37, 173–199.
Kalnay, E., and Coauthors, 1996: The NCEP/NCAR 40-Year Re-
analysis Project. Bull. Amer. Meteor. Soc., 77, 437–471.
Klink, K., 1999: Trends in mean monthly maximum and minimum
surface wind speeds in the coterminous United States, 1961 to
1990. Climate Res., 13, 193–205.
Li, Z., Z. Yan, K. Tu, W. Liu, and Y. Wang, 2011: Changes in wind
speed and extremes in Beijing during 1960–2008 based on
homogenized observations. Adv. Atmos. Sci., 28, 408–420,
doi:10.1007/s00376-010-0018-z.
Liu, X. D., and B. D. Chen, 2000: Climatic warming in the Tibetan
Plateau during recent decades. Int. J. Climatol., 20, 1729–1742.
Luo, H., and M. Yanai, 1984: The large-scale circulation and heat
sources over the Tibetan Plateau and surrounding areas dur-
ing the early summer of 1979. Part II: Heat and moisture
budgets. Mon. Wea. Rev., 112, 966–989.
Ma, Y., and Coauthors, 2005: Diurnal and inter-monthly variation
of land surface heat fluxes over the central Tibetan Plateau
area. Theor. Appl. Climatol., 80, 259–273, doi:10.1007/
s00704-004-0104-1.
Mantua, N. J., S. R. Hare, Y. Zhang, J. M. Wallace, and R. C.
Francis, 1997: A Pacific interdecadal climate oscillation with
impacts on salmon production. Bull. Amer. Meteor. Soc., 78,
1069–1079.
McVicar, T. R., T. G. Van Niel, L. T. Li, M. L. Roderick, D. P.
Rayner, L. Ricciardulli, and R. J. Donohue, 2008: Wind speed
climatology and trends for Australia, 1975–2006: Capturing
the stilling phenomenon and comparison with near-surface
reanalysis output.Geophys. Res. Lett., 35, L20403, doi:10.1029/
2008GL035627.
——,——,M. L. Roderick, L. T. Li, X. G.Mo, N. E. Zimmermann,
and D. R. Schmatz, 2010: Observational evidence from two
mountainous regions that near-surface wind speeds are
2902 JOURNAL OF CL IMATE VOLUME 26

declining more rapidly at higher elevations than lower eleva-
tions: 1960–2006. Geophys. Res. Lett., 37, L06402, doi:10.1029/
2009GL042255.
——, andCoauthors, 2012: Global review and synthesis of trends in
observed terrestrial near-surfacewind speeds: Implications for
evaporation. J. Hydrol., 416, 182–205.
Ogi, M., Y. Tachibana, and K. Yamazaki, 2003: Impact of the
wintertime North Atlantic Oscillation (NAO) on the summer-
time atmospheric circulation. Geophys. Res. Lett., 30, 1704,
doi:10.1029/2003GL017280.
Qin, J., K. Yang, S. Liang, and X. Guo, 2009: The altitudinal de-
pendence of recent rapid warming over the Tibetan Plateau.
Climatic Change, 97, 321–327, doi:10.1007/s10584-009-9733-9.
Roderick, M. L., L. D. Rotstayn, G. D. Farquhar, and M. T.
Hobbins, 2007: On the attribution of changing pan evaporation.
Geophys. Res. Lett., 34, L17403, doi:10.1029/2007GL031166.
Street, J. O., R. J. Carroll, and D. Ruppert, 1988: A note on com-
puting robust regression estimates via iteratively reweighted
least-squares. Amer. Stat., 42, 152–154.Thomas, B. R., and V. R. Swail, 2011: Buoy wind inhomogeneities
related to averaging method and anemometer type: Appli-
cation to long time series. Int. J. Climatol., 31, 1040–1055,
doi:10.1002/joc.2339.
Thompson, D. W. J., and J. M. Wallace, 1998: The Arctic Oscilla-
tion signature in the wintertime geopotential height and
temperature fields. Geophys. Res. Lett., 25, 1297–1300.Vautard, R., J. Cattiaux, P. Yiou, J. N. Thepaut, and P. Ciais, 2010:
Northern Hemisphere atmospheric stilling partly attributed
to an increase in surface roughness. Nat. Geosci., 3, 756–761,
doi:10.1038/ngeo979.
Wallace, J. M., and D. S. Gutzler, 1981: Teleconnections in the
geopotential height field during the Northern Hemisphere
winter. Mon. Wea. Rev., 109, 784–812.
Wang, L., W. Chen, and R. Huang, 2008: Interdecadal modula-
tion of PDO on the impact of ENSO on the east Asian
winter monsoon. Geophys. Res. Lett., 35, L20702, doi:10.1029/
2008GL035287.
Xu, M., C.-P. Chang, C. Fu, Y. Qi, A. Robock, D. Robinson, and
H.-M. Zhang, 2006: Steady decline of east Asian monsoon
winds, 1969–2000: Evidence from direct ground measurements
of wind speed. J. Geophys. Res., 111, D24111, doi:10.1029/
2006JD007337.
Yang, K., T. Koike, H. Fujii, T. Tamura, X. D. Xu, L. G. Bian,
and M. Y. Zhou, 2004: The daytime evolution of the atmo-
spheric boundary layer and convection over the Tibetan Pla-
teau: Observations and simulations. J. Meteor. Soc. Japan, 82,
1777–1792.
——, X. Guo, and B. Wu, 2011a: Recent trends in surface sensible
heat flux on the Tibetan Plateau. Sci. China Earth Sci., 54, 19–
28, doi:10.1007/s11430-010-4036-6.
——, B. Ye, D. Zhou, BWu, T. Foken, J. Qin, and Z. Zhou, 2011b:
Response of hydrological cycle to recent climate changes in the
Tibetan Plateau. Climatic Change, 109, 517–534, doi:10.1007/
s10584-011-0099-4.
Yeh, T., and Y. Gao, 1979: Meteorology of the Qinghai-Xizang
(Tibet) Plateau (in Chinese). Science Press, 278 pp.
Yoon, J., and S. W. Yeh, 2010: Influence of the Pacific decadal os-
cillation on the relationship between El Nino and the northeast
Asian summer monsoon. J. Climate, 23, 4525–4537.
You, Q., S. Kang, W.-A. Flugel, N. Pepin, Y. Yan, and J. Huang,
2010: Decreasing wind speed and weakening latitudinal sur-
face pressure gradients in the Tibetan Plateau. Climate Res.,
42, 57–64, doi:10.3354/cr00864.
Zhang, A., G. Ren, and J. Guo, 2009a: Change trend analyses on
upper-air wind speed over China in past 30 years (in Chinese).
Plateau Meteor., 28, 680–687.
Zhang, X., Y. Ren, Z.-Y. Yin, Z. Lin, and D. Zheng, 2009b: Spatial
and temporal variation patterns of reference evapotranspira-
tion across the Qinghai-Tibetan Plateau during 1971–2004.
J. Geophys. Res., 114, D15105, doi:10.1029/2009JD011753.
1 MAY 2013 L I N ET AL . 2903