O rigin al A rticle - TJPRC
16
www.tjprc.org [email protected] ANALYSIS OF HYDROLOGICAL INFERENCES THROUGH MORPHOMETRIC ANALYSIS: A REMOTE SENSING-GIS BASED STUDY OF KANAKANALA RESERVOIR SUBWATERSHED R. S. SAVITA 1 , U. SATISHKUMAR 2 , H. K. MITTAL 3 , P. K. SINGH 4 , K. K. YADAV 5 , H. K. JAIN 6 & S. M. MATHUR 7 1,3,4,5 Department of Soil and Water Engineering, CTAE, MPUAT, Udaipur, Rajasthan, India 2 Department of Soil and Water Engineering, CAE, UAS, Raichur, Karnataka, India 6 Department of Agricultural Statistics and Computer Application, RCA, MPUAT, Udaipur, Rajasthan, India 7 Department of Farm Machinery and Power Engineering, CTAE, MPUAT, Udaipur, Rajasthan, India ABSTRACT Morphometry means, mathematically quantifying various aspects of a drainage basin. Morphometric parameters bring an idea, to know about rock structure, runoff, infiltration rate, erosion of the soil in the watershed etc. So that the study of morphometric characteristics is in demand, in order to work out a comprehensive development plan, for optimum use of watershed resources. The analysis could be achieved through measurement of linear, aerial and relief aspects. The present study has been undertaken, to compute morphological features of Kanakanala Reservoir Subwatershed, Karnataka. Computed values of Farm factor (R f =0.65), Circulatory ratio (R c =0.7) and Elongation ratio (Re=1) indicated that, the watershed is nearly circular in shape. The texture (7.9) indicated the intermediate texture, lying between coarse and fine. The drainage density (D d =2.37 km/km 2 ) indicated that, the area has a gentle slope, low rainfall and permeable bedrock. Hence, from the study, it is concluded that, the morphometric investigation is useful to bring an idea of watershed characterization so that we could make decision, about watershed prioritization, soil and water conservation and management of natural resources etc. KEYWORDS: Morphometric Parameters, Remote Sensing (RS), Geographical Information System (GIS), Watershed & Prioritization Etc Received: Nov 01, 2017; Accepted: Nov 22, 2017; Published: Dec 06, 2017; Paper Id.: IJASRDEC201750 INTRODUCTION A drainage basin represents a natural hydrological entity which enables surface runoff to a defined channel, ravine, stream or river at a particular point (Chopra et al., 2005). It is identifiable as being of fluvial erosive origin is considered a fundamental topographic, geomorphic and hydrologic areal unit for watershed management (Chorely, 1971). It is the supreme element for management and sustainable development of natural resources. More considerably, it provides the basis for geomorphometric analysis. This technique was introduced Original Article International Journal of Agricultural Science and Research (IJASR) ISSN (P): 2250-0057; ISSN (E): 2321-0087 Vol. 7, Issue 6, Dec 2017, 373-388 © TJPRC Pvt. Lt
-
Upload
khangminh22 -
Category
Documents
-
view
4 -
download
0
Transcript of O rigin al A rticle - TJPRC
www.tjprc.org [email protected]
ANALYSIS OF HYDROLOGICAL INFERENCES THROUGH MORPHOM ETRIC
ANALYSIS: A REMOTE SENSING-GIS BASED STUDY OF
KANAKANALA RESERVOIR SUBWATERSHED
R. S. SAVITA1, U. SATISHKUMAR 2, H. K. MITTAL 3, P. K. SINGH4, K. K. YADAV 5,
H. K. JAIN 6 & S. M. MATHUR 7 1,3,4,5 Department of Soil and Water Engineering, CTAE, MPUAT, Udaipur, Rajasthan, India
2Department of Soil and Water Engineering, CAE, UAS, Raichur, Karnataka, India 6Department of Agricultural Statistics and Computer Application, RCA, MPUAT, Udaipur, Rajasthan, India
7Department of Farm Machinery and Power Engineering, CTAE, MPUAT, Udaipur, Rajasthan, India
ABSTRACT
Morphometry means, mathematically quantifying various aspects of a drainage basin.
Morphometric parameters bring an idea, to know about rock structure, runoff, infiltration rate, erosion of
the soil in the watershed etc. So that the study of morphometric characteristics is in demand, in order to work
out a comprehensive development plan, for optimum use of watershed resources. The analysis could be
achieved through measurement of linear, aerial and relief aspects. The present study has been undertaken, to
compute morphological features of Kanakanala Reservoir Subwatershed, Karnataka. Computed values of
Farm factor (Rf =0.65), Circulatory ratio (Rc=0.7) and Elongation ratio (Re=1) indicated that, the watershed
is nearly circular in shape. The texture (7.9) indicated the intermediate texture, lying between coarse and
fine. The drainage density (Dd=2.37 km/km2) indicated that, the area has a gentle slope, low rainfall and
permeable bedrock. Hence, from the study, it is concluded that, the morphometric investigation is useful to
bring an idea of watershed characterization so that we could make decision, about watershed prioritization,
soil and water conservation and management of natural resources etc.
KEYWORDS: Morphometric Parameters, Remote Sensing (RS), Geographical Information System (GIS),
Watershed & Prioritization Etc
Received: Nov 01, 2017; Accepted: Nov 22, 2017; Published: Dec 06, 2017; Paper Id.: IJASRDEC201750
INTRODUCTION
A drainage basin represents a natural hydrological entity which enables surface runoff to a defined
channel, ravine, stream or river at a particular point (Chopra et al., 2005). It is identifiable as being of fluvial
erosive origin is considered a fundamental topographic, geomorphic and hydrologic areal unit for watershed
management (Chorely, 1971). It is the supreme element for management and sustainable development of natural
resources. More considerably, it provides the basis for geomorphometric analysis. This technique was introduced
Original A
rticle International Journal of Agricultural Science and Research (IJASR) ISSN (P): 2250-0057; ISSN (E): 2321-0087 Vol. 7, Issue 6, Dec 2017, 373-388 © TJPRC Pvt. Lt

374 R. S. Savita, U. Satishkumar, H. K. Mittal, P. K. Singh, K. K. Yadav, H. K. Jain & S. M. Mathur
Impact Factor (JCC): 5.9857 NAAS Rating: 4.13
earlier, by Horton (1932 and 1945) and elaborated by Strahler (1952a and 1964), Langbein (1947), Melton (1958), Smith
(1950), Miller (1953) and Schumm (1956), those who later established the quantitative fluvial geomorphic research (2007).
They were transformed from a purely qualitative and deductive study to a rigorous quantitative science providing hydrologists
with numerical data of practical values (Choudhari et al., 2014). It is necessary to manage watershed, by incorporating
technologies within the natural boundaries of a drainage area, for optimum development of land, water and plant resources.
Also, watershed development programme protects and conserves the environment (Muthamilselvan and Dhivya, 2017).
Clarke (1966), defined morphometry is the measurement and mathematical analysis of the configuration of the earth’s
surface, shape and dimensions of its landforms. This analysis could be achieved through measurement of linear, aerial and
relief aspects of basin (Horton, 1945). This provides a quantitative description of the drainage system which is an important
aspect of the characterization of watersheds (Strahler, 1964). The morphometric characteristics at the watershed scale, may
contain important information regarding its formation and development because, all hydrologic and geomorphic processes
occur within the watershed (Singh, 1992). The influence of drainage morphometry is very significant, in understanding the
landform processes, soil physical properties, erosional characteristics in river basin evaluation, watershed prioritization for soil
and water conservation and natural resources management. In addition to that, it implies the proper utilization of land and
water resources of a watershed for best production with minimum hazard to environmental resources, including people who
live across the watershed (Hlaing et al., 2008 and Patel et al., 2013). The morphometric analysis of a drainage basin/watershed
is important in understanding the hydrologic behavior, as well as groundwater and hydrogeology conditions of the area.
Therefore, it is very important to obtain the morphometric parameters, for management and developmental study of watershed
(Muthamilselvan and Dhivya, 2017).
In recent years, the importance of remote sensing technology for geomorphological studies has increased because, it is
not only cost effective, but also reliable and timely (Murthy, 2000; Leblanc et al., 2003; Tweed et al., 2007 and Magesh et al.,
2012). Integration of Remote Sensing (RS) and Geographic Information System (GIS) technologies have been utilized
worldwide, to identify and examine changes in the landscape and the consequential environmental impacts like gully erosion,
flooding, etc. So that, RS and GIS techniques have also proven to be capable tools in the delineation, characterization and
morphometric analysis of drainage basins worldwide (Paulinus et al., 2016).
MATERIALS AND METHODS
Description of Study Area
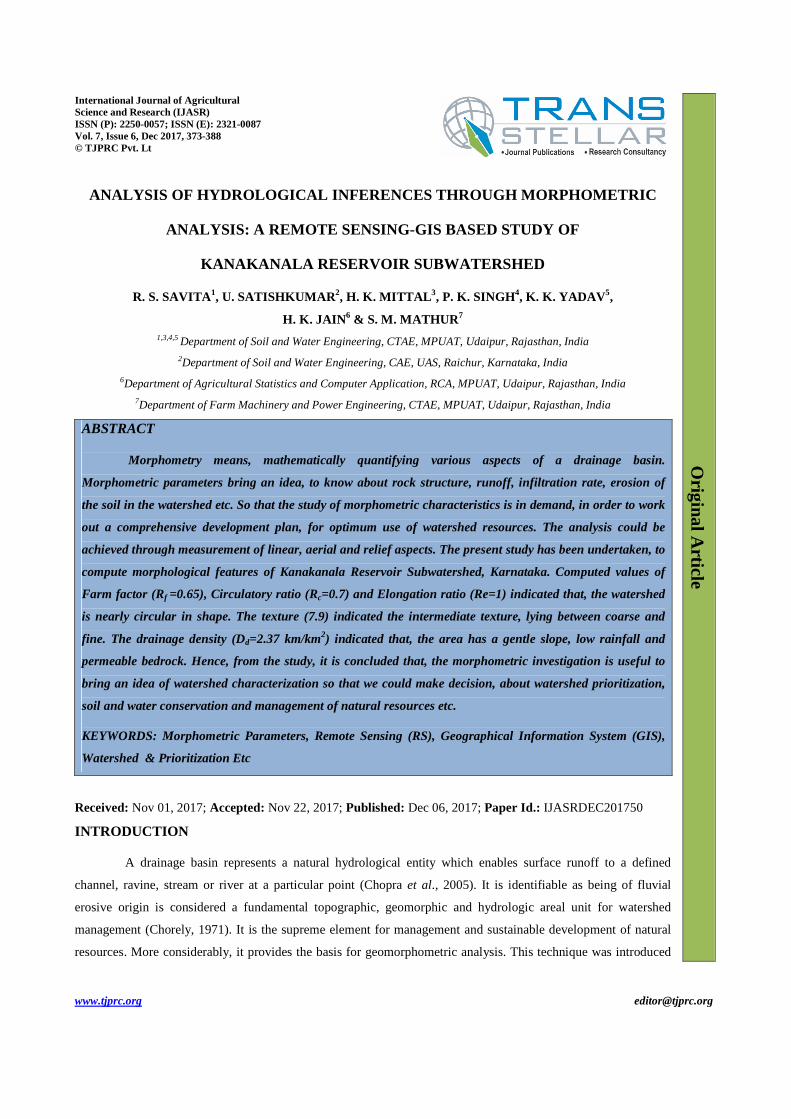
Kanakanala Reservoir Subwatershed covered a maximum part of the Koppal and minimum part of Raichur districts.
This comes under D43E5 toposheet and located at 15° 46' 13.30'' to 15° 54' 21.45'' North latitude and 76° 19' 54.08'' to 76° 27'
15.91'' East longitude. It covers an average area of 195 km2 with an elevation of 500 meters. The major agricultural crops
grown in the study area are Paddy, Jowar, Maize, Cotton, Pulses and Oil seeds. The study area is prevailed with subtropical
climate with mild winters and hot summers. December is the coldest month with mean daily minimum temperature of 16.85
ºC, while April/May is the hottest month with maximum temperature of 45 ºC. The average annual rainfall is 580-600 mm with
the annual numbers of the rainy days 48 days. The location of the Kanakanala Reservoir Subwatershed is shown in the figure 1.
Analysis of Hydrological Inferences through Morphometric Analysis: A Remote 375 Sensing- GIS Based Study of Kanakanala Reservoir Subwatershed
www.tjprc.org [email protected]
Figure 1: Location Map of the Kanakanala Reservoir Subwatershed, Karnataka
Morphometric analysis of a basin needs delineation of the basin boundary and existing drainage network of different
extent and patterns. Survey of India (SOI) toposheets on 1:50000 scale was utilized, for digitization of drainage networks of all
existing orders, after geometric rectification to global coordinate system using ArcGIS 10.1 software. The stream order map is
given in figure 2. The purpose of this work is also, to identify the holistic stream properties and hydrological behavior, from the
measurement of various morphometric attributes, which gives the impetus to forecast the river discharge, drainage basin
characteristics and simulation (Sarmah et al., 2012).
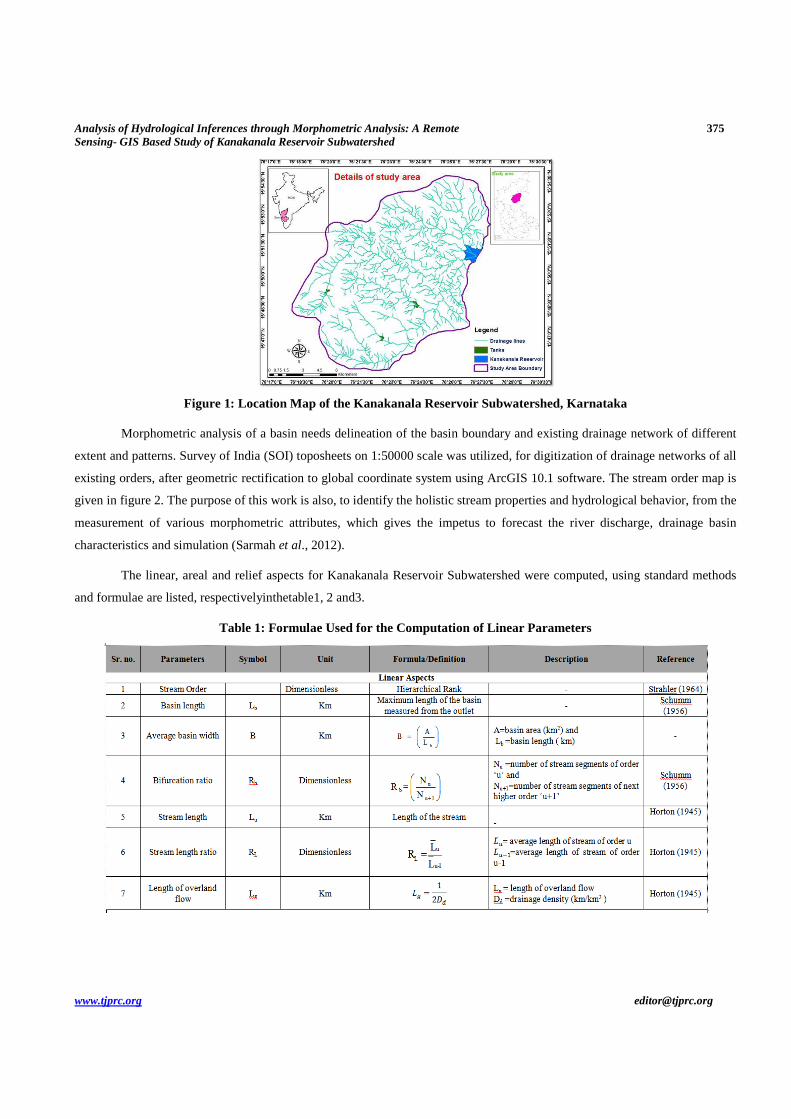
The linear, areal and relief aspects for Kanakanala Reservoir Subwatershed were computed, using standard methods
and formulae are listed, respectivelyinthetable1, 2 and3.
Table 1: Formulae Used for the Computation of Linear Parameters

376 R. S. Savita, U. Satishkumar, H. K. Mittal, P. K. Singh, K. K. Yadav, H. K. Jain & S. M. Mathur
Impact Factor (JCC): 5.9857 NAAS Rating: 4.13
Table 2: Formulae Used for the Computation of Areal Parameters
Table 3: Formulae Used for the Computation of Relief Parameters
RESULTS AND DISCUSSIONS
Linear Aspects of Drainage Network
It refers to the analysis of stream order, stream number, bifurcation ratio, stream length ratio and length of overland
flow. The streams present in the study area have been ordered (figure 2) using Strahler’s system of stream ordering (Strahler,
1957). The results of the linear aspects are presented in table 4.

Analysis of Hydrological Inferences through Morphometric Analysis: A Remote 377 Sensing- GIS Based Study of Kanakanala Reservoir Subwatershed
www.tjprc.org [email protected]
Stream Order
Stream ordering is the first step of quantitative morphometric analysis. The stream taxonomy system developed by
Horton (1945) and complemented by Strahler (1952), has been adopted because; it is having a genetic basis and allows
comparative analysis of drainage basins (Sharma, 2014). In the Strahler method for ordering the network, all the “fingertips”
tributaries are nominated as first order streams and where two of them connect, they form a second order stream. Similarly, two
second order streams join to form a third order stream and so on to the streams of fourth, fifth and higher order. If a sufficiently
large sample is treated, order number is directly proportional to the size of contributing watershed, channel dimensions and to
the stream discharge (Sarmah et al., 2012), because order number is dimensionless. As water travels from headwater stream
towards the mouth, streams gradually increase their width and as well as depth with increasing amount of water discharge
(Sarmah et al., 2012). The trunk stream, through which all discharge of water and sediment passes is therefore the stream
segment of highest order (Nagaraju et al., 2015) and is associated with greater discharge. The drainage pattern in the
Kanakanala Reservoir Subwatershed was found dendritic pattern, which indicates that, the study area is occupied by
homogenous rocks. Drainage pattern replicates surface characteristics, including subsurface formation (Horton, 1945).
Horton (1945), Schumm (1956) and others discussed the relationship between stream order and factors, composing a
drainage basin. The most important results contains, as stream order increases, the number and the mean gradient of streams
decrease in an inverse geometric ratio and as stream order increases, the mean length of streams and the mean area of drainage
basin increase. The shortest and the steepest streams have the smallest drainage basins (Sharma, 2014). The higher amount of
stream order indicates lesser permeability and infiltration (Wandre and Rank, 2013), similarly the lesser amount of stream
order indicates higher permeability and infiltration. The stream orders in Kanakanala Reservoir Subwatershed have gone up to
V orders. The stream order map of the Kanakanala Reservoir Subwatershed is shown in figure 2.
Stream Length (Lu)
Stream length is one of the most significant hydrological features of the drainage basin as it reveals surface runoff
characteristics (Dubey et al., 2015). It is indicative of the contributing area of the basin of that is given stream order (Choudhari
et al., 2014). Total stream length could be obtained, by adding lengths of all streams in a particular order (Nagaraju et al.,
2015). The total stream length of stream segment is maximum, in the first order stream (282.04 km) and it decrease as the
stream order increase as 86.26 km, 54.26 km, 28.26 km and 12.11 km, respectively for II, III, IV and V. This might be due to
the streams flowing from a region of higher to lower altitude, change in rock type and moderately steep slopes and probable
uplift across the basin (Vittala et al., 2005 and Chopra et al., 2005).
The regression line of stream order and log of stream number is shown in figure 3, which was drawn to validate the
Horton’s law of stream numbers. The coefficient of determination was obtained about 0.99. An R2 of 1 indicated that the
regression line perfectly fits the data. The linear pattern indicates the homogenous rock material subjected to weathering-
erosion characteristics of the watershed (Sharma, 2014). Deviation from its general behavior indicates that the terrain is
characterized by variation in lithology and topography (Sharma, 2014). The regression line of log of cumulative stream lengths
and stream order was drawn, to validate the Horton’s law of stream lengths, which is shown in figure 4. The coefficient of
determination was found about 0.86.

378 R. S. Savita, U. Satishkumar, H. K. Mittal, P. K. Singh, K. K. Yadav, H. K. Jain & S. M. Mathur
Impact Factor (JCC): 5.9857 NAAS Rating: 4.13
Figure 2: Drainage Map of the Kanakanala Reservoir Subwatershed
Figure 3: Regression of Logarithm of Number of Streams and Stream Order
Figure 4: Regression of Logarithm of Cumulative Stream Length and Stream Order

Analysis of Hydrological Inferences through Morphometric Analysis: A Remote 379 Sensing- GIS Based Study of Kanakanala Reservoir Subwatershed
www.tjprc.org [email protected]
Bifurcation Ratio
Bifurcation ratio is associated to the branching pattern of a stream network and is defined as the ratio between the total
numbers of stream segments of one order, to that of the next higher order in a drainage basin (Schumn, 1956). Horton (1945)
considered bifurcation ratio is an index of reliefs and dissections. Bifurcation ratio influences the landscape morphometry and
plays significant control, over the “peak” of the runoff hydrograph especially in homogeneous bedrock, (Chorley, 1957).
Strahler (1957) confirmed that, bifurcation ratio shows only a small variation for different regions with different environments,
except where powerful geological control dominates. In 1964 he also noted that, the shape of a drainage basin might possibly
affect stream discharge characteristics.
Bifurcation ratios normally range between 3.0 and 5.0 for basins in which the geologic structures do not distort the
drainage pattern (Suresh, 2012). The lower values of Rb are characteristics of the watersheds, which have suffered less
structural disturbances (Strahler, 1964). High bifurcations with long narrow basins would be expected, to have attenuated flood
discharge periods, whereas round basins of low bifurcation ratio would be expected to have sharply peaked flood discharges.
For the Kanaknala Reservoir Subwatershed the mean bifurcation ratio is found 2.98 which indicated that, watershed has
suffered less structural disturbance (Choudhari et al., 2014). Similar results were obtained by, Waikar and Nilawar, 2014; Eze
and Efiong, 2010 and Choudhari et al., 2014. All linear parameters estimated for Kanakanala Reservoir Subwatershed are
listed in table 4.
Table 4: Linear Parameters of the Kanakanala Reservoir Subwatershed
S. No Parameters Estimated Values 1 Area 19500 ha 2 Perimeter 59035.6 m 3 Length of Basin 17298 m or 17.29 km 4 Average basin width 11270 m or 11..27 km
5 Length of overland flow 2109 m
6
Stream Orders
Number of Stream Order
Stream Length (Lu)
Average Stream Length Bifurcation Ratio (R b)
Stream Length Ratio (Lu)
I 465 282040.63 m 606.54 m B R1 2.90 RL1 0.30 II 160 86269.02m 539.18 m B R2 2.86 RL2 0.63 III 56 54259.94 m 968.93 m B R3 2.67 RL3 0.52 IV 21 28263.94 m 1345.90 m B R4 3.5 RL4 0.42 V 6 12118.23m 2019.71 m Average 2.98 Average 0.46
Stream Length Ratio
If there is a change of stream length ratio from one order to another order, it indicates their late youth stage of
geomorphic development (Singh and Singh, 1997). The variation in stream length ratio is due to change in slope and
topography (Moharir and Pande, 2014). The mean stream length ratio of the Kanakanala Reservoir Subwatershed is found 0.46
and similar results were obtained, by Khare et al., (2014) and Nagaraju et al., (2015).
Length of Overland Flow
It is one of the most important independent variables, affecting both the hydrological and physiographical

380 R. S. Savita, U. Satishkumar, H. K. Mittal, P. K. Singh, K. K. Yadav, H. K. Jain & S. M. Mathur
Impact Factor (JCC): 5.9857 NAAS Rating: 4.13
developments of the drainage basin (Horton, 1945). He expressed it as equal to half of the reciprocal of Drainage Density (Dd).
Length of overland is used to explain the length of flow of water over the ground before it becomes concentrated in definite
stream channels. Generally higher value of length of overland flow is indicative of low relief, where as low value is an
indicative of high relief (Kanth and Hassan, 2012). The shorter the length of overland flow, the quicker the surface runoff from
the streams. The watershed having length of overland flow greater than 0.25 are under very less structural disturbance because
of low runoff and higher overland flow (Patil et al., 2015). For Kanakanala Reservoir Subwatershed, the length of overland
flow is found 2.1 km and similar results were obtained, by Waikar and Nilawar, (2014).
AERIAL ASPECTS OF DRAINAGE BASIN
This aspect of morphological study of drainage basin includes the description of arrangement of areal elements. The
evaluation of basin shape has significant importance, to predict its effect on stream-discharge relationships. The results
obtained are listed in table 5.
Form Factor (Rf)
It is the numerical index normally used to represent different basin shapes, with values to range from (0.1 to 0.8)
(Thronbury, 1966) and it indicates the flow intensity of a basin. If the form factor value is 0.7854 then it represents a perfectly
circular basin (Choudhari et al., 2014), if it is nearer to 0 indicates a highly elongated shape and the value that is closer to 1
indicates circular shape. The drainage basins with high form factor have high peak flow for shorter duration whereas elongated
basin with low form factor would have a flatter peak flow of longer duration. The form factor would be comparatively higher,
if the basin is wider. Consequently, much narrower basins have low form factor values (Sharma, 2014). In the present study,
the value of Rf is estimated about 0.65 (which is less than 0.7854), showing the nature of the watershed to be nearly circular
and similar value obtained by (Nagal et al., 2014).
Circulatory Ratio (Rc)
It is influenced more by the length, frequency and gradient of streams than slope and drainage pattern of the basin
(Strahler, 1957), with value ranging from 0.2 to 0.8. It is one of the significant ratios, which indicates the stage of dissection in
the study region. Its low, medium and high values are correlated with youth, mature and old stage of the cycle of the tributary
of watershed respectively (Aravinda and Balakrishna, 2013). If, the Rc values approaching 1, which indicates that, the basin
shapes are like circular with uniform infiltration and takes longer time to reach excess water at basin outlet (depends on the
prevalent geology, slope and land cover). For the present study the value of circulatory ratio is found 0.7 and similar results
were found by Patil et al., (2015) and Waikar and Nilawar, (2014) by indicating that, the watershed is nearly circular in shape.
Compactness Coefficient (Cc)
It is used to express the relationship of a basin with that of a circular basin having the same area as the basin (Kanth
and Hassan, 2012). It is independent of size of watershed and dependent on the slope (Pareta and Pareta, 2012). Compactness
coefficient is directly proportional to the erosion risk assessment i.e., lower values signifies less vulnerability for risk factors,
while higher values indicates great vulnerability and represents the need of implementation of conservation measures (Ali and

Analysis of Hydrological Inferences through Morphometric Analysis: A Remote 381 Sensing- GIS Based Study of Kanakanala Reservoir Subwatershed
www.tjprc.org [email protected]
Ali, 2014). The compactness coefficient (Cc) for the Kanakanala Reservoir Subwatershed is found 1.19 and similar results
were found by Pareta and Pareta, (2012).
Elongation Ratio (Re)
Elongation ratio (Re) is a very significant index, in the analysis of watershed shape which helps to give information
about the hydrological character of a basin (vinoth et al., 2014). The values of re generally vary from 0.6 to 1.0, over a wide
variety of climatic and geologic types. Values of re are close to 1 for areas of very low relief and varies between 0.6 to 0.9, for
regions of strong relief and steep ground slope (patil et al., 2015). The values of elongation ratios could be grouped into four
categories namely (a) circular (>0.9), (b) oval (0.9 to 0.8), (c) elongated (0.8 to 0.7) and (d) less elongated (<0.7) (choudhari et
al., 2014). Thus, the higher the value of elongation ratio the more circular shape of the basin and vice-versa. The value of
elongation ratio (re) of the study area is 1, which indicated the shape of watershed is nearly circular.
Texture Ratio (Rt)
It indicates the relative spacing of the drainage lines and also it is the measure of the total number of segments of all
order per perimeter of that area (Horton, 1945). Texture ratio depends on a number of natural factors such as climate,
vegetation, rock, rainfall, soil type, infiltration capacity and relief (Choudhari, et al., 2014). The drainage density and drainage
frequency have been collectively defined as drainage texture. Based on the values of Smith in 1950 classified the ranges as
• 0-4 – Coarse
• 4-10 – Intermediate
• 10-15 – Fine
• >15 – Ultra Fine (bad l and topography )
For Kanakanala Reservoir Subwatershed, the texture ratio is about 7.9 indicated the intermediate texture lying
between coarse and fine.
Drainage Density (Dd)
It is the important element of drainage analysis which provides a better quantitative expression to the dissection and
analysis of land forms (Srivastava et al., 2014). Drainage density is affected by the factors that control the resistance to
weathering, permeability of rock formations, vegetations and climate. Horton (1932) introduced drainage density (Dd) into
literature as an expression to indicate the closeness of spacing of channels so that, it determines the time of travel by water.
Drainage densities range from less than 5 km/km2 in areas, where the slopes are gentle, low rainfall and permeable bedrock
(e.g. sandstones). Similarly larger values i.e., more than 500 km/km2 found in upland areas where rocks are impermeable, steep
slopes and total rainfall is high (Sharma, 2014). The drainage density (Dd) of the study area is found 2.37 km/km2 so that it falls
less than 5 km/km2 which indicates that the area has a gentle slope, low rainfall and permeable bedrock (Sharma, 2014). The
value is in line with the Mittal (2002). The low value of drainage density influences greater infiltration and hence the wells in
this region would have good water potential leading to higher specific capacity of wells vice versa (Aravinda and Balakrishna,
2013).

382 R. S. Savita, U. Satishkumar, H. K. Mittal, P. K. Singh, K. K. Yadav, H. K. Jain & S. M. Mathur
Impact Factor (JCC): 5.9857 NAAS Rating: 4.13
Stream Frequency (f)
It might be directly related to the lithological characteristics (Durgesh et al., 2015) and dependant more or less on the
temperature and rainfall of the region (Vinoth et al., 2014). Stream frequency exhibits positive correlation with drainage
density in the watershed, which indicates an increase in stream population with respect to increase in drainage density (Sharma,
2014). It provides an indication of the slope nature and the underlying rock formation of a basin. High stream frequency values
(>5/km2) indicate, occurrence of steep ground slopes with less permeable rocks, which facilitates greater runoff, less
infiltration, sparse vegetation and high relief conditions (Kumar et al., 2010). In the present study the stream frequency is 3.36
km-1 and similar value obtained by Sharma, (2014).
Shape Factor (Sb)
It is inverse proportion with form factor and for Kanakanala Reservoir Subwatershed it is found to be 1.53, which is in
confirmation with the value of Pareta and Pareta, (2012).
Constant of Channel Maintenance
It indicates the requirement of units of watershed surface to bear one unit of channel length (Durgesh et al., 2015).
Constant of channel maintenance is not only depends on climatic regime, vegetation, rock type, permeability and relief but also
on the duration of erosion and climatic history. For present study it is 0.42 km, which indicated that watershed is under the
influence of high structural disturbance, steeps to very steep slopes, low permeability and high surface runoff (Dahiphale et al.,
2014 and Kumar et al., 2010). In table 5 the results of aerial parameters are listed.
Table 5: Aerials Aspects of Kanakanala Reservoir Subwatershed
S. No Aerial Factor Estimated Values 1 Form factor (Rf) 0.65
2 Circulatory ratio (Rc) 0.7
3 Compactness Co-efficient (Cc) 1.19
4 Elongation ratio (Re) 1.00
5 Texture ratio (Rt) 7.9 km-1
6 Drainage density (Dd) 2.37 Km/ km2
7 Stream frequency (F) 3.63 km-1
8 Shape factor (Sb) 1.53
9 Constant of channel maintenance 0.42 km
10 Drainage texture 0.65
Drainage Texture (Rt)
It depends on a number of natural factors such as climate, rainfall, vegetation, rock, soil, infiltration capacity, relief
and stage of development (Smith, 1950) and classified drainage texture into five classes i.e., very coarse (<2), coarse (2-4),
moderate (4-6), fine (6-8) and very fine (>8) (Ali and Ali, 2014). It is estimated 0.65 for the Kanakanala Reservoir
Subwatershed, which falls under very coarse category.

Analysis of Hydrological Inferences through Morphometric Analysis: A Remote 383 Sensing- GIS Based Study of Kanakanala Reservoir Subwatershed
www.tjprc.org [email protected]
RELIEF ASPECTS OF A DRAINAGE BASIN
Relief aspects of a drainage basin replicate the topographical gradient characteristics of the basin and give a bird’s eye
view of the whole area (Pophare and Balpande, 2014). These aspects are important in water resources studies, direction of
stream flow analysis and denudation conditions of the watershed (Ali and Ali, 2014). The high relief value indicates low
gravity of water flow as well as infiltration into the ground and high runoff conditions (Wandre and Rank, 2013). Relief aspects
for the Kanakanala Reservoir Subwatershed are given in table 6.
Relief (H)
Basin relief is an important factor to understand the denudational characteristics (formed as a result of weathering,
mass wasting and erosion caused by different exogenetic geomorphic agents such as glaciers, water, wind etc) of the basin
(Sharma, 2014). It controls the stream gradient, therefore it influences flood patterns and the amount of sediment that could be
transported from basin (Paulinus, et al., 2016). Hadley and Schumm (1961) concluded that, the sediment load increases
exponentially with basin relief. Relief of Kanakanala Reservoir Subwatershed is found to be 211 m, similar result was obtained
by (Bharadwaj et al., 2014).
Relief Ratio (Rh)
Schumm (1956) found that, there is a direct relationship between the relief and gradient of the channel. It measures
overall steepness of the watershed and is also considered as an indicator for the intensity of erosion process operating at the
watershed slopes (Suresh, 2012). It was found that the higher ratios of relief indicated steep slope and high relief, while the
lower ratios indicated the presence of basement rocks that are exposed in the form of small ridges and mounds with lower
degree of slope (GSI, 1981). Relief ratio of the Kanakanala Reservoir Subwatershed found to be 0.0121, indicated that the
discharge capability of watershed is very high and the groundwater potential is insufficient, similar value was obtained by Eze
and Efiong, (2010) and Nagal et al., (2014).
Relative Relief (Rhp)
It is an important morphometric variable, used for the overall assessment of morphological characteristics of terrain
(Suresh, 2012). The relative relief for Kanakanala Reservoir Subwatershed is 0.35%, similar value was obtained by Sreedevi et
al., (2009).
Ruggedness Number
It is used to define the slope steepness and length (Sarmah et al., 2012). If ruggedness value of basin is low, which
implies that area is less prone to soil erosion and have intrinsic structural complexity with relief and drainage density (Pareta
and Pareta, 2012). The calculated Ruggedness number of the Kanakanala Reservoir Subwatershed is 0.49, similar results were
obtained by Mondal and Mistri, (2016), indicates the watershed was less soil erosion prone and has inherent structural
complexity in association with relief and drainage density.
Geometric Number
Geometric number for the Kanakanala Reservoir Subwatershed is 0.5.

384 R. S. Savita, U. Satishkumar, H. K. Mittal, P. K. Singh, K. K. Yadav, H. K. Jain & S. M. Mathur
Impact Factor (JCC): 5.9857 NAAS Rating: 4.13
Table 6: Relief aspects of Kanakanala Reservoir Subwatershed.
S. No Relief Aspects of Stream Network Permissible Values 1 Relief (H) 211 m 2 Relative relief (Rhp) 0.35%
3 Relief ratio (Rh) 0.0121
4 Ruggedness number 0.49
5 Geometric number 0.5
CONCLUSIONS
Computed values of Farm factor (Rf =0.65), Circulatory ratio (Rc=0.7) and Elongation ratio (Re=1) indicated that, the
watershed is nearly circular in shape. The texture (7.9) indicated the intermediate texture, lying between coarse and fine were
found. The drainage density (Dd=2.37 km/km2) indicated that the area has a gentle slope, low rainfall and permeable bedrock
(Sharma, 2014). From the entire study it is concluded that the analysis of the morphometric parameters by Remote Sensing
(RS) and Geographical Information System (GIS) now a day has proved to be capable and quick tool for water resources
planning, conservation and management. Meanwhile morphometric investigation is useful to bring an idea about rock structure,
runoff, infiltration rate and erosion of the soil in the watershed so that we could make decision about watershed prioritization,
soil and water conservation and management of natural resources etc. Finally the study suggests and recommended to develop
best water usage mechanism for better application of the watershed.
REFERENCES
1. Ali, U., & Ali, S. A. (2014). Analysis of drainage morphometry and watershed prioritization of Romushi-Sasar Catchment, Kashmir
Valley, India using Remote Sensing and GIS Technology. International Journal of Advanced Research, 2(12),5-23.
2. Aravinda, P. T., & Balakrishna, H. B. (2013). Morphometric analysis of Vrishabhavathi Watershed using Remote Sensing and GIS.
International Journal of Research in Engineering and Technology, 2(8),514-522.
3. Bharadwaj, A. K., Pradeep. C., Thirumalaivasan, D., Shankar, C. P. & Madhavan, N. (2014). Morphometric analysis of Adyar
watershed. Journal of Mechanical and Civil Engineering. National Conference on Contemporary Approaches in Mechanical,
Automobile and Building sciences. Karpaga Vinayaga College of Engineering and Technology. PP:71-77.
4. Ravi Kumar, Jyoti Lodha, Manoj Joseph & J R Sharma, Remote Sensing and GIS Based Evapotranspiration Analysis in Luni
Upper Sub Basin, International Journal of Agricultural Science and Research (IJASR), Volume 5, Issue 3, May - June 2015, pp.
329-338
5. Chopra, R., Dhiman, R. D. & Sharma, P. K. (2005). Morphometric analysis of sub-watersheds in Gurudaspur district, Punjab
using Remote sensing and GIS techniques. Journal of the Indian Society of Remote Sensing, 33(4),531-539.
6. Chorley, R. J. (1957). Climate and morphometry. Journal of Geology, 65,628-638.
7. Masood Ahmad, Nirmal Kumar & L. B. Roy, GIS Based Decision Support System for Efficient Water Management in SONE Canal
Command Area, International Journal of Civil, Structural, Environmental and Infrastructure Engineering Research and
Development (IJCSEIERD), Volume 5, Issue 2, March - April 2015, pp. 43-56

Analysis of Hydrological Inferences through Morphometric Analysis: A Remote 385 Sensing- GIS Based Study of Kanakanala Reservoir Subwatershed
www.tjprc.org [email protected]
8. Choudhari, K., Panigrahi, B. & Paul, J. C. (2014). Morphometric analysis of Kharlikani watershed in Odisha, India using spatial
information technology. International Journal of Geomatics and Geosciences, 4(4),661-671.
9. Clarke, J. I. (1966). Morphometry from Maps. Essays in Geomorphology. Elsevier Publ. Co., New York, PP:235-274.
10. Dahiphale, P., Singh, P. K. & Yadav, K. K. (2014). Morphometric analysis of sub-basins in Jaisamand catchment using
geographical information system. International Journal of Research in Engineering and Technology, 2(6),189-202.
11. Dubey, S. K., Sharma, D. & Mundetia, N. (2015). Morphometric analysis of the Banas River Basin using the Geographical
Information System, Rajasthan, India. Hydrology, 3(5), 47-54.
12. Prasenjit Bhowmick, S. M. Mukhopadhyay & V. Sivakumar, GIS Based Suitable Sites Selection for Artificial Groundwater
Recharge of Maharashtra State, India, International Journal of Civil Engineering (IJCE), Volume 3, Issue 4, June - July 2014, pp.
33-46
13. Durgesh, C., Punvatkar, V. L. & Usmani, H. V. (2015). Morphometric analysis of Suke Sub-Watershed of Tawa Reservoir
Catchment Area of Hoshangabad District, Madhya Pradesh using GIS Techniques. Journal for Research, 1(10),7-11.
14. Eze, B., & Efiong, J. (2010). Morphometric parameters of the Calabar River Basin: Implication for hydrologic processes. Journal
of Geography and Geology, 2(1),18-26.
15. GSI. (1981). Geological and mineralogical map of Karnataka and Goa. Geological Survey of India.
16. Hadely, R. F., & Schumm, S. A. (1961). Sediment sources and drainage basin characteristics in upper Cheyenne river basin.
United State Geological Survey Water Supply Paper. 1531(B),137-196.
17. Hlaing, K., Haruyama, S. & Aye, M. (2008). Using GIS based distributed soil loss modeling and morphometric analysis to
prioritize watersheds for soil conservation in Bago River Basin of lower Myanmar. Frontiers of Earth Science in China. 2,465-478.
18. Horton, R. (1932). Drainage basin characteristics. Transactions, American Geophysical Union. 13 (1),350-361.
19. Horton, R. E. (1945). Erosional development of streams and their drainage basins; hydrophysical approach to quantitative
morphology. Geological Society of America Bulletin, 56(3),275-370.
20. Kanth, T. A., & Hassan, Z. (2012). Morphometric analysis and prioritization of watersheds for soil and water resource
management in Wular catchment using geo-spatial tools. International Journal of Geology, Earth and Environmental Sciences,
2(1),30-41.
21. Khare, D., Mondal, A., Mishra, P. K., Kundu, S. & Meena, P. K. (2014). Morphometric analysis for prioritization using Remote
Sensing and GIS techniques in a Hilly Catchment in the State of Uttarakhand, India. Indian Journal of Science and Technology,
7(10),1650–1662.
22. Kumar, A., Jayappa, K. S., Deepika, B., & Dinesh, A. C. (2010). Hydrological-drainage analysis for evaluation of groundwater
potential in a watershed basin of southern Karnataka, India: a remote sensing and GIS approach. In Proceedings of the 1st
International Applied Geological Congress, held in Department of Geology, Islamic Azad University—Mashad Branch, Iran.
PP:607-612.
23. Langbein, W. B. (1947). Topographic characteristics of drainage basins. U.S. Geological Survey. Water-Supply Paper, 986
(C),157-159.

386 R. S. Savita, U. Satishkumar, H. K. Mittal, P. K. Singh, K. K. Yadav, H. K. Jain & S. M. Mathur
Impact Factor (JCC): 5.9857 NAAS Rating: 4.13
24. Leblanc, M., Leduc, C., Razack, M., Lemoalle, J., Dagorne, D. & Mofor, L. (2003). Application of Remote Sensing and GIS for
groundwater modeling of large semiarid areas: example of the Lake Chad Basin, Africa. In: Hydrology of Mediterranean and
Semiarid Regions Conference, Montpieller, France. Red Books Series, 278. IAHS, Wallingford, pp. 186e192.
25. Magesh, N. S., Chandrasekar, N. & Soundranayagam, J. P. (2012). Delineation of groundwater potential zones in Theni district,
Tamil Nadu, using remote sensing, GIS and MIF techniques. Geoscience Frontiers. 3(2),189-196.
26. Melton, M. A. (1957). An analysis of the relations among elements of climate, surface properties and geomorphology. Department
of Geology., Columbia Uni, Technical Report, 11. PP:389.
27. Melton, M. A. (1958). Correlating structure of morphometric properties of drainage system and their controlling agents. The
Journal of Geology, 66(4),442-460.
28. Miller, V. (1953). A quantitative geomorphic study of drainage basin characteristics in the Clinch Mountain Area, Virginia and
Tennessee. Project NR 389-402, Technical Report 3, Columbia University, Department of Geology, ONR, New York.
29. Mittal, H. K. (2002). An evaluator study on morphological characteristics and groundwater status in selected treated watershed.
Department of Soil and Water Engineering, CTAE, MPUAT, Udaipur, Rajasthan.
30. Moharir, K. N., & Pande, C. B. (2014). Analysis of morphometric parameters using remote sensing and GIS techniques in the
Lonar Nala, Akola District, Maharashtra, India. International Journal for Technological Research in Engineering, 1(10),1034-
1040.
31. Mondal, B., & Mistri, B. (2016). Analysis of hydrological inferences through morphometric analysis: A Remote Sensing-GIS based
study of Gandheswari River Basin in Bankura District, West Bengal. International Journal of Humanities and Social Science
Studies, II(IV),68-80.
32. Murthy, K. S. R. (2000). Groundwater potential in a semi-arid region of Andhra Pradesh geographical information system
approach. International Journal of Remote Sensing, 21(9),1867–1884.
33. Muthamilselvan, A., & Dhivya Sri, M. (2017). Morphometric analysis of Sweta Watershed, Perambalur District of Tamil Nadu,
India: A Remote Sensing and GIS approach. International Journal of Advances in Remote Sensing and GIS, 5(1),39- 47.
34. Nagal, S., Tignath, S. & Pandey, A. (2014). Morphometric analysis of the Adwa River Basin, tributary of Belan River, India.
International Journal of Advanced Technology and Engineering Research, 4(2),39-45.
35. Nagaraju, D., Siddalingamurthy, S., Balasubramanian, A., Lakshmamma & Sumithra, S. (2015). Morphometric analysis of
Byramangala Watershed, Bangalore Urban District, Karnataka, India. International Journal of Current Engineering and
Technology, 5(3),2156- 2164.
36. Pareta, K., & Pareta, U. (2012). Quantitative geomorphological analysis of a Watershed of Ravi River Basin, H.P. India.
International Journal of Remote Sensing and GIS, 1(1),41-56.
37. Patel, D., Gajjar, C. & Srivastava, P. (2013). Prioritization of Malesari Mini-Watersheds through morphometric analysis: A
Remote Sensing and GIS Perspective. Environmental Earth Sciences, 69,2643-2656.
38. Patil, N. P., Kadale, A. S. & Mhetre, G. S. (2015). Assessment of morphometric characteristics of Karwadi-Nandapur Micro
Watershed using Remote Sensing and Geographical Information System. International Journal of Scientific and Technology
Research, 4(4),175-179.

Analysis of Hydrological Inferences through Morphometric Analysis: A Remote 387 Sensing- GIS Based Study of Kanakanala Reservoir Subwatershed
www.tjprc.org [email protected]
39. Paulinus, U. U., Ifedilichukwu, N. G., Ahamefula, A C., Iheanyichukwu, O. A., Theophilus, E. T. & Edet, I G. (2016). Morphometric
analysis of Sub-watersheds in Oguta and Environs, Southeastern Nigeria using GIS and Remote Sensing data. Journal of
Geosciences and Geomatics, 4(2),21-28.
40. Pophare, A. M., & Balpande, U. S. (2014). Morphometric analysis of Suketi river basin, Himachal Himalaya, India. Journal of
Earth System Science, 1237,1501–1515.
41. Sarmah, K., Jha, L. K. & Tiwari, B. K. (2012). Morphometric analysis of a highland micro-watershed in East Khasi Hills district of
Meghalaya, India: using remote sensing and geographic information system (GIS) techniques. Journal of Geography and Regional
Planning, 5(5),142-150.
42. Schumm, S. A. (1956). Evolution of drainage systems and slopes in Badlands at Perth Amboy, New Jersey. Geological Society of
America Bulletin, 67(5),597-646.
43. Sharma, S. A. (2014). Morphometrical analysis of Imphal River basin using GIS. International Journal of Geology, Earth and
Environmental Sciences, 4(2),138-144.
44. Singh, S. (1992). Quantitative geomorphology of the drainage basin. In: Chauhan TS, Joshi KN (eds) Readings on remote sensing
applications. Scientific Publishers, Jodhpur.
45. Singh, S., & Singh, M. C. (1997). Morphometric analysis of Kanhar river basin. National Geographical Journal of India. 43(1),
31-43.
46. Smith, K. G. (1950). Standards for grading textures of erosional topography. American Journal of Science. 248(9),655-668.
47. Sreedevi, P. D., Owais, S., Khan, H. H. & Ahmed, S. (2009). Morphometric analysis of a watershed of South India Using SRTM
data and GIS. Journal Geological Society of India, 73,543-552.
48. Srivastava, O. S., Denis, D. M., Srivastava, S. K., Kumar. M. & Kumar, N. (2014). Morphometric analysis of a Semi Urban
Watershed, Trans Yamuna, draining at Allahabad using Cartosat (DEM) data and GIS. The International Journal of Engineering
and Science, 3 (11),71-79.
49. Strahler, A. (1952a). Dynamic basis of geomorphology. Geological Society of America Bulletin. 63(9),923-938.
50. Strahler, A. N. (1957). Quantitative analysis of watershed geomorphology. Transactions, American Geophysical Union, 38(6),913-
920.
51. Strahler, A. N. (1964). Quantitative geomorphology of drainage basins and channel networks. In: V.T. Chow (ed), Handbook of
Applied Hydrology. McGraw Hill Book Company, New York, Section 4-11.
52. Suresh, R. (2012). Soil and water conservation engineering. Standard Publishers Distributors. Delhi. PP:793-812.
53. Thronbury. (1966). Principles of geomorphology. 10th print, John Wiley and Sons, Inc. New York, p. 618).
54. Tweed, S. O., Leblanc, M., Webb, J. A. & Lubczynski, M. W. (2007). Remote sensing and GIS for mapping groundwater recharge
and discharge areas in salinity prone catchments, southeastern Australia. Hydrogeology Journal, 15,75-96.
55. Vinoth. M., Suresh, M. & Gurugnanam. B. (2014). Characteristics of drainage morphological studies using GIS in Kolli Hills,
Central of Tamil Nadu, India. International Journal of Remote Sensing and Geosciences, 3(3),10-15.

388 R. S. Savita, U. Satishkumar, H. K. Mittal, P. K. Singh, K. K. Yadav, H. K. Jain & S. M. Mathur
Impact Factor (JCC): 5.9857 NAAS Rating: 4.13
56. Vittala, S. S., Govindaiah, S. & Gowda, H. H. (2005). Evaluation of groundwater potential zones in the sub-watersheds of North
Pennar river basin around Pavagada, Karnataka, India using remote sensing and GIS techniques. Journal of Indian Society of
Remote sensing, 33(4),483–493.
57. Waikar, M. L., & Nilawar, A. P. (2014). Identification of groundwater potential zone using Remote Sensing and GIS Technique.
International Journal of Innovative Research in Science, Engineering and Technology. 3(5),12163-12174.
58. Wandre, S. S. & Rank, H. D. (2013). Assessment of morphometric characteristics of Shetrunji River basin using remote sensing and
geographical information system (GIS). African Journal of Agricultural Research. 8(18), 2003-2015.