Electrical properties of YSZ/Al 2 O 3 composite and YSZ/Al 2 O 3 interface studied by impedance...
7
Electrical properties of YSZ/Al 2 O 3 composite and YSZ/Al 2 O 3 interface studied by impedance spectroscopy and finite element modelling Fan Yang, Xiaofeng Zhao, Ping Xiao ⁎ Materials Science Centre, School of Materials, University of Manchester, M1 7HS, UK abstract article info Article history: Received 24 November 2009 Received in revised form 17 March 2010 Accepted 30 April 2010 Keywords: YSZ/Al 2 O 3 composite Impedance Interface Finite element modelling Electrical properties of the YSZ/Al 2 O 3 composite were measured with use of impedance spectroscopy. Electrical conductivity of the composite decreases with increase in the Al 2 O 3 volume fraction and shows typical percolation behaviour. Decrease in the conductivity around five orders of magnitude occurred when the volume fraction of Al 2 O 3 in the composite exceeds a critical level of 86.1%. The electrical conductivity of the YSZ/Al 2 O 3 interface was examined based on the relaxation frequency analysis and finite element modelling. It was concluded that the YSZ/Al 2 O 3 interface conductivity is higher than that of the YSZ grain boundary but similar to, or lower than that of the YSZ grain. © 2010 Elsevier B.V. All rights reserved. 1. Introduction Yttria stabilized zirconia (YSZ) and Al 2 O 3 are important ceramic materials and have wide range of applications in industry. Their YSZ/Al 2 O 3 composite, which should combine the properties of individual compo- nent, should increase the range of its application. For example, the YSZ/Al 2 O 3 composite has been proposed as electrolyte for planar Solid Oxide Fuel Cell (SOFC) because of its enhanced mechanical and thermal properties compared with conventional YSZ [1]. On the other hand, owing to the immiscibility of YSZ and Al 2 O 3 (the solubility of Al 2 O 3 in 8 mol.% YSZ is around 1 wt.% when sintered at 1500 °C [2]), YSZ/Al 2 O 3 composite is also of scientific interest in understanding the fundamental behaviours of a diphase system [3]. It is also a good system for studying the physical properties of the ceramic/ceramic interface. Electrical properties of the YSZ/Al 2 O 3 composite are not new topics and have been investigated by a number of researchers [1–8]. However, most of the studies have been focused on the effect of adding a small amount of Al 2 O 3 (less than 5 wt.%) to YSZ [4–8]. A review on the effect of the Al 2 O 3 addition on the electrical properties of YSZ grain and grain boundary can be found in Ref. [9,10]. It is summarized that the Al 2 O 3 addition below the solubility limit decreases the grain boundary conductivity by increasing the Schottky barrier height, while the Al 2 O 3 addition above the solubility limit increases the grain boundary conductivity by increasing the grain-to-grain contact area by scavenging SiO 2 from the boundaries between grains [9,10]. For a much wider range of composition, most of work has reported the electrical properties of YSZ/Al 2 O 3 composite with the Al 2 O 3 fraction less than 30 wt.% (around 40 v.%). For example, Feighery and Irvine [2] doped up 24 wt.% Al 2 O 3 into 8 mol% YSZ and found that 10 wt.% Al 2 O 3 can be added to 8 mol.% YSZ without any significant decreases in ionic conducting properties. Further additions of Al 2 O 3 cause a rapid decrease in conductivity due to the large volume fraction of insulating Al 2 O 3 phase. Mori et al. [1] studied the composite with Al 2 O 3 content up to 30 wt.%, and found the conductivity only decreased less than one order of magnitude. Although it is predictable that the conductivity of the YSZ/Al 2 O 3 decreases with further increase in the Al 2 O 3 volume fraction, it is still of interest and importance to study the electrical properties of the composite covering the whole composition range because it can provide valuable information on the diphase system. However, the only work covered the whole composition range of YSZ/Al 2 O 3 composite, limited to the authors’ knowledge, is reported by Peko et al. [3]. They found a strong influence from the microstructural features on the final electrical response of the composite. On the other hand, among numerous studies related to the electrical properties of the YSZ/Al 2 O 3 composite, the effect of the YSZ/Al 2 O 3 interface has been rarely discussed. Kumar et al. [11,12] examined the normalized conductivity (conductivity of a composite/volume fraction of active phase) and proposed that the transport of oxygen ions was enhanced at the YSZ/Al 2 O 3 interface because of the creation of space charge regions in the vicinity of the YSZ-Al 2 O 3 phase boundary. However, due to the blocking effect of Al 2 O 3 , the enhancement of conductivity is not obvious. Guo [5] studied the grain boundary resistance in yttria and alumina codoped-zriconia and discussed the effect of the ZrO 2 /Al 2 O 3 interface. It was proposed the resistance of the Al 2 O 3 /ZrO 2 interface is reduced because of the Al 2 O 3 /ZrO 2 interface potential is lower than the grain boundary interface potential of ZrO 2 . However, the resistance- reducing effect was not obvious due to the pores and the amorphous Solid State Ionics 181 (2010) 783–789 ⁎ Corresponding author. E-mail address: [email protected] (P. Xiao). 0167-2738/$ – see front matter © 2010 Elsevier B.V. All rights reserved. doi:10.1016/j.ssi.2010.04.036 Contents lists available at ScienceDirect Solid State Ionics journal homepage: www.elsevier.com/locate/ssi
-
Upload
independent -
Category
Documents
-
view
1 -
download
0
Transcript of Electrical properties of YSZ/Al 2 O 3 composite and YSZ/Al 2 O 3 interface studied by impedance...
Solid State Ionics 181 (2010) 783–789
Contents lists available at ScienceDirect
Solid State Ionics
j ourna l homepage: www.e lsev ie r.com/ locate /ss i
Electrical properties of YSZ/Al2O3 composite and YSZ/Al2O3 interface studied byimpedance spectroscopy and finite element modelling
Fan Yang, Xiaofeng Zhao, Ping Xiao ⁎Materials Science Centre, School of Materials, University of Manchester, M1 7HS, UK
⁎ Corresponding author.E-mail address: [email protected] (P. Xiao
0167-2738/$ – see front matter © 2010 Elsevier B.V. Aldoi:10.1016/j.ssi.2010.04.036
a b s t r a c t
a r t i c l e i n f oArticle history:Received 24 November 2009Received in revised form 17 March 2010Accepted 30 April 2010
Keywords:YSZ/Al2O3 compositeImpedanceInterfaceFinite element modelling
Electrical properties of the YSZ/Al2O3 composite were measured with use of impedance spectroscopy.Electrical conductivity of the composite decreases with increase in the Al2O3 volume fraction and showstypical percolation behaviour. Decrease in the conductivity around five orders of magnitude occurred whenthe volume fraction of Al2O3 in the composite exceeds a critical level of 86.1%. The electrical conductivity ofthe YSZ/Al2O3 interface was examined based on the relaxation frequency analysis and finite elementmodelling. It was concluded that the YSZ/Al2O3 interface conductivity is higher than that of the YSZ grainboundary but similar to, or lower than that of the YSZ grain.
).
l rights reserved.
© 2010 Elsevier B.V. All rights reserved.
1. Introduction
Yttria stabilized zirconia (YSZ) and Al2O3 are important ceramicmaterials andhavewide rangeof applications in industry. Their YSZ/Al2O3
composite, which should combine the properties of individual compo-nent, should increase the range of its application. For example, theYSZ/Al2O3 composite has been proposed as electrolyte for planar SolidOxide Fuel Cell (SOFC) because of its enhanced mechanical and thermalproperties comparedwith conventional YSZ [1]. On the other hand, owingto the immiscibility of YSZandAl2O3 (the solubility ofAl2O3 in8 mol.%YSZis around 1 wt.% when sintered at 1500 °C [2]), YSZ/Al2O3 composite isalso of scientific interest in understanding the fundamental behaviours ofa diphase system [3]. It is also a good system for studying the physicalproperties of the ceramic/ceramic interface.
Electrical properties of the YSZ/Al2O3 composite are not new topicsand have been investigated by a number of researchers [1–8]. However,most of the studies have been focused on the effect of adding a smallamount of Al2O3 (less than5 wt.%) to YSZ [4–8]. A reviewon the effect ofthe Al2O3 addition on the electrical properties of YSZ grain and grainboundary can be found in Ref. [9,10]. It is summarized that the Al2O3
addition below the solubility limit decreases the grain boundaryconductivity by increasing the Schottky barrier height, while the Al2O3
addition above the solubility limit increases the grain boundaryconductivity by increasing thegrain-to-grain contact area by scavengingSiO2 from theboundaries between grains [9,10]. For amuchwider rangeof composition, most of work has reported the electrical properties of
YSZ/Al2O3 composite with the Al2O3 fraction less than 30 wt.% (around40 v.%). For example, Feighery and Irvine [2] doped up 24 wt.% Al2O3
into 8 mol% YSZ and found that 10 wt.% Al2O3 can be added to 8 mol.%YSZ without any significant decreases in ionic conducting properties.Further additions of Al2O3 cause a rapid decrease in conductivity due tothe large volume fraction of insulating Al2O3 phase. Mori et al. [1]studied the composite with Al2O3 content up to 30 wt.%, and found theconductivity only decreased less than one order of magnitude.
Although it is predictable that the conductivity of the YSZ/Al2O3
decreases with further increase in the Al2O3 volume fraction, it is still ofinterest and importance to study the electrical properties of thecomposite covering thewhole composition range because it can providevaluable information on the diphase system. However, the only workcovered the whole composition range of YSZ/Al2O3 composite, limitedto the authors’ knowledge, is reported by Peko et al. [3]. They found astrong influence from themicrostructural features on the final electricalresponse of the composite.
On the other hand, among numerous studies related to the electricalproperties of the YSZ/Al2O3 composite, the effect of the YSZ/Al2O3
interface has been rarely discussed. Kumar et al. [11,12] examined thenormalized conductivity (conductivity of a composite/volume fraction ofactive phase) and proposed that the transport of oxygen ions wasenhanced at the YSZ/Al2O3 interface because of the creation of spacecharge regions in the vicinity of the YSZ-Al2O3 phase boundary. However,due to theblocking effect of Al2O3, the enhancement of conductivity is notobvious. Guo [5] studied the grain boundary resistance in yttria andalumina codoped-zriconia and discussed the effect of the ZrO2/Al2O3
interface. It was proposed the resistance of the Al2O3/ZrO2 interface isreduced because of the Al2O3/ZrO2 interface potential is lower than thegrain boundary interface potential of ZrO2. However, the resistance-reducing effect was not obvious due to the pores and the amorphous
784 F. Yang et al. / Solid State Ionics 181 (2010) 783–789
phases covering the Al2O3 particles [5]. Therefore, a further investigationof the electrical properties of the YSZ/Al2O3 interface is desirable.
In this work, we studied the electrical properties of the YSZ/Al2O3
composite covering a whole composition range. The effect of theYSZ/Al2O3 interface is discussed from relaxation frequency analysiscoupled with finite element modelling. The purpose of this study is topresent an overall picture of the electrical properties of the compositesystem, and to promote the understanding of the YSZ/Al2O3 interface.
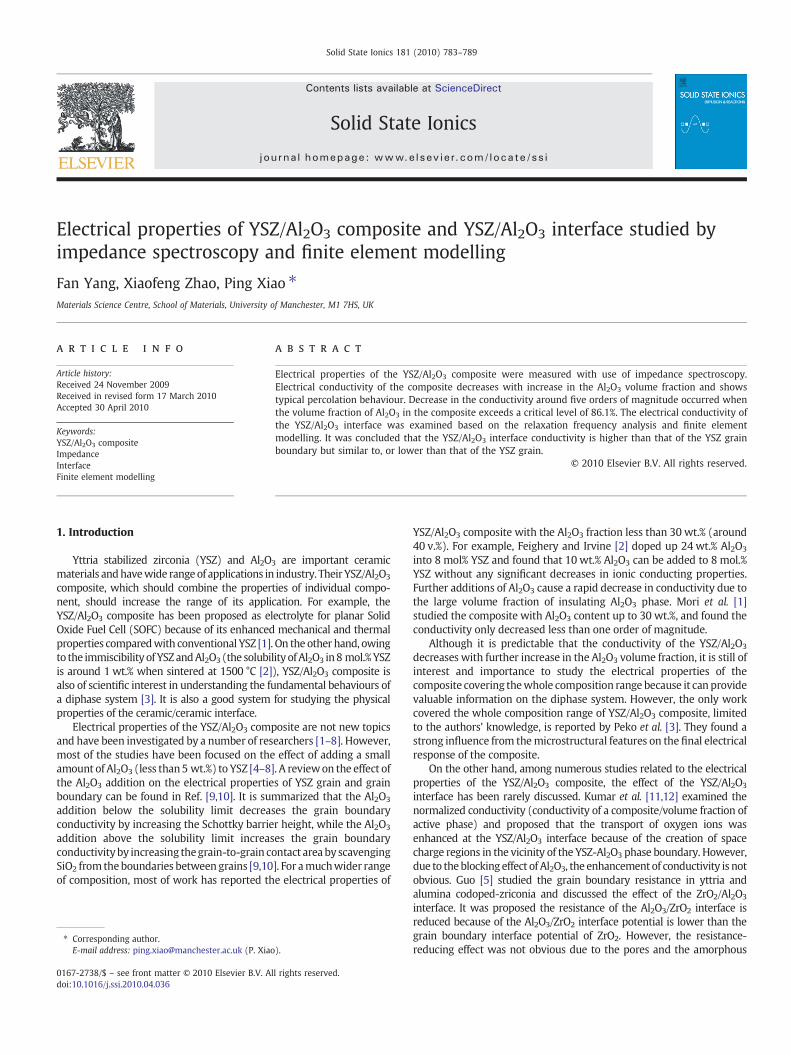
Fig. 1. X-ray diffraction pattern of the YSZ/Al2O3 composite.
2. Experimental procedures
8 mol%YSZpowder (average particle size of 0.25 μm, PI-KEM,UK) andα-Al2O3 powder (average particle size of 0.1-0.3 μm, PI-KEM, UK) wereused as starting materials. The YSZ/Al2O3 composite samples with 20, 40,60, 80, 85, 90% (volume percentage) of Al2O3were produced. Appropriateamounts of YSZ and Al2O3 powders were mixed by ball milling for24 hours in 2-propanol, using zirconia balls as grinding media. Theresulting mixtures were subsequently dried in air overnight, and thenmilledbymortar andpestle andpassed througha45micro sieve. Thefinalmixedpowderswere cold-pressed into cylindrical tablets under auniaxialpressure of 100 MPa, and then sintered at 1500 °C for 4 hours in airwith aheating and cooling rate of 3 °C/min. Pure YSZ andAl2O3 tabletswere alsoobtained using the same cold press and sintering procedures.
Theoretical full density of the YSZ/Al2O3 composite was obtainedaccording to the mixing rule ie,
ρ = νYSZρYSZ + νAl2O3ρAl2O3
ð1Þ
where νYSZ and νAl2O3 are the volume fractions of YSZ and Al2O3, andρYSZ and ρAl2O3 are the theoretical densities of pure YSZ and Al2O3,which are 6.0 and 3.9 g/cm3, respectively. The density of a sinteredspecimen was estimated based on its weight and geometricaldimension, and the relative densities were found to be over 95%.Therefore, the porosity effect has been neglected in this study.
Phase compositions of the YSZ/Al2O3 composite were identified byX-ray diffraction (XRD, Philips X'Pert) method using Cu Kα radiation.The measurements were performed on the sample surfaces with astep scanning mode (step size of 0.05°) at a rage of 0.1° min-1.Microstructure of the YSZ/Al2O3 composite was examined using ascanning electron microscope (SEM, Philips XL30).
Electrical properties of the YSZ/Al2O3 composites were determinedwith AC impedance spectroscopy measurements using a Solatron SI1255 HF frequency response analyser coupled with a Solatron 1296Dielectric Interface (Solartron, UK). Silver paint was coated on twopolished surfaces of a tablet and fired at 350 °C for 1 hour to serve aselectrodes. During impedance measurements, an AC voltage of 0.1 Vwas applied to the sample over a frequency range from 0.1 to 107 Hz atvarious temperatures. Equivalent circuit fittings of the measuredimpedance spectra were carried out using Zview Impedance Analysissoftware (Scribner Associates, Inc., Southern Pines, NC). For a clearcomparison, all the impedance spectra were normalized by a geometricfactorα = 4t
πD2, where t andD denote to sample thickness and diameter,respectively, to eliminate the influence of sample geometry.
Finite element modelling was carried out by using theelectromagnetic module in COMSOL 3.3 software [13] coupledwith MATLAB. The application of the finite element method inimpedance spectra simulation was firstly proposed by Fleig et al.and the fundamentals can be found in Ref. [14]. Descriptions of theboundary conditions and calculation procedures can be found in Ref.[14,15]. Geometric models and physical parameters used for thecalculation are described in part 3.3.
3. Results and discussion
3.1. Microstructure
Fig. 1 illustrates the X-ray diffraction pattern of the YSZ/Al2O3
composite, which reveals the composite consists of tetragonal YSZ andα-Al2O3. No obvious peak shift has been observed, which confirms thesolid solubility between Al2O3 and YSZ is very limited.
The microstructure of the YSZ/Al2O3 composite is shown in Fig. 2.The white phase and the dark phase in the images correspond to YSZand Al2O3 respectively. It can be seen that the minor phase dispersesrandomly in the major phase without large scale agglomerations. Theaverage grain size of YSZ decreases dramatically with increasing Al2O3
volume fraction, from around 10 μm for pure YSZ (not shown) to0.5 μm in the composite with 80 v.% of Al2O3. The change of thecomponent volume fraction and the grain size consequently changesthe quantity of the YSZ/Al2O3 interface. Although it is rather difficultto quantify those interface fractions, it can be roughly estimated fromthe images that, the YSZ/Al2O3 interface first increases with increasingAl2O3 concentration and then decreases with further increasing ofAl2O3. For example, from the SEM images in Fig. 2, the composite with60% Al2O3 has more YSZ/Al2O3 interface than the other three.
3.2. Electrical properties
Impedance spectra of the YSZ/ Al2O3 composite are shown in Fig. 3.Fig. 3(a-f) shows the impedance spectra of the composite whenvolume percentage of Al2O3 varies from 0 to 85%, measured at 350 °C.The Nyquist plot of pure YSZ in Fig. 3(a), which is typical for YSZ,shows two well resolved semicircles, from left to right (highfrequency to low frequency), representing the response from grainand grain boundary, respectively. The Nyquist plots of the YSZ/Al2O3
composites have similar features with that of pure YSZ: twosemicircles are displayed in their Nyquist plots, as can be seen inFig. 3(b-f), indicating the existence of Al2O3 does not add new features(e.g., one or more semicircles) to their impedance spectra. However,the shape of the impedance curve changes with the increase of Al2O3
volume fraction: the semicircle at low frequency increases muchfaster than the high frequency semicircle, therefore at high Al2O3
fraction (e.g., 80 and 85%), the two semicircles become overlappingwith each other so that the two semicircles are not well resolved. Theimpedance spectra in Fig. 3 (a-f) can be fitted by an equivalent circuitof two parallel-aligned resistance-constant phase element (R-CPE) inseries connection (see the solid lines). However, in the cases of thecomposite with 90 v.% Al2O3 and pure Al2O3, the impedances are toolarge to be measured at low temperatures. The Nyquist plot measuredat 800 °C has only one semicircle in each case, as shown in Fig. 3(g)and (h), and the impedance spectra can be fitted by an equivalentcircuit of one parallel-aligned R-CPE.

Fig. 2. Scanning electronmicrographs of the YSZ/Al2O3 composite with different volume percentage of Al2O3. (a) 20% (b) 40% (c) 60% and (d) 80%. The bright area corresponds to YSZgrains and the dark area corresponds to Al2O3. The four images have the same scale bar.
785F. Yang et al. / Solid State Ionics 181 (2010) 783–789
The total resistance (sum of the high frequency and low frequencyresistance) of the YSZ/Al2O3 composite at various temperatures wasobtained from the equivalent circuit fitting and subsequentlyconverted to conductivity. Fig. 4 shows the composition andtemperature dependence of the conductivity of the composite. Itcan be seen that conductivity decreases with increase of volumepercentage of Al2O3. On the other hand, the temperature dependenceof the YSZ/Al2O3 composite obeys Arrhenius law that good linearrelationship can be observed without turning points within themeasured temperature range. Activation energy of each sample can beobtained from the slope of Arrhenius plot. When volume fraction ofAl2O3 varies from 0 to 85%, the activation energy is independent onthe volume fraction of Al2O3, with a value of around 1.07 eV which issimilar to that of pure YSZ. However, with further increase of Al2O3,the activation energy increases to 1.54 eV and 1.68 eV for YSZ+90 v.%Al2O3 and pure Al2O3, respectively. The activation energy valuesindicate that the conduction is mainly dominated by the YSZ phaseeven with high volume fraction of Al2O3 (e.g., 80 v.%).
Fig. 5 shows the dependency of conductivity of YSZ/Al2O3 compositeson the volume fraction of YSZ at 350 °C. The conductivity of thecomposites increases with increase in the YSZ volume fraction andexhibits a typical insulator-conductor transitionwith an increase ofmorethan five orders of magnitude when volume fraction of YSZ increasesfrom 10% to 15%. According to the percolation theory, above thepercolation threshold, the conductivity follows the power laws [16–18]:
σcomp = σYSZðfYSZ − fcÞt for fYSZ N fc; ð2Þ
where σcomp is the conductivity of the composite, σYSZ is theconductivity of the conductive YSZ component; fYSZ is the volumefraction of YSZ and fc is the critical volume fraction (the percolationthreshold); t is the conductivity exponent. Using a least-squares fit,we obtain the percolation threshold of fc=13.9±0.4%. This value isclose to, but slightly lower than the theoretical value of 16% expectedin two phase random composite system [3,19], and it is in agreement
with the reported value of 14±0.2% in similar composite system inRef. [3].
3.3. Effect of YSZ/Al2O3 interface
The Nyquist plot in Fig. 3 does not show additional features relatedto the YSZ/Al2O3 interface, which makes it difficult to obtain theelectrical property of the YSZ/Al2O3 interface. However, furtheranalysis of the relaxation frequencies from the Bode plot (imaginaryimpedance vs frequency) gives some information about the electricalproperty of the YSZ/Al2O3 interface, as discussed in the followingparts.
Fig. 6 shows the Bode plot of the composite with the volumefraction of Al2O3 varying from 0 to 85%, measured at 350 °C. For a clearcomparison, the imaginary impedance was scaled by its maximumvalue. The relaxation frequencies can be obtained by the peakpositions, and are listed in Table 1. It should point out that whenthe volume fraction of Al2O3 exceeds 80%, the high frequency (HF)response overlaps with the low frequency (LF) response, andtherefore only the LF relaxation frequency can be obtained from theBode plot. Fortunately, this does not affect the discussion, since wemainly focused on the LF relaxation frequency change.
The relaxation frequency (f) of a material is determined by itsconductivity and dielectric constant by the following relationship:
2πf =1RC
=1
ð1σ tAÞ⋅ðε0εr A
tÞ=
σε0εr
ð3Þ
where R and C represent the resistance and capacitance; t and Adenote sample thickness and cross section area; σ, ε0 and εr have theircommonly used meanings. In Table 1, the LF relaxation frequencyshows obvious change with Al2O3 volume fraction, indicating anobvious change of either conductivity or dielectric constant. Since thedielectric constant of ceramic materials does not differ significantly, it

Fig. 3. Impedance spectra of the YSZ/Al2O3 composite. (a)-(f) volume percentage of Al2O3 varies from 0 to 85%, measured at 350 °C; (g) and (h) YSZ+90 v.% Al2O3 and pure Al2O3,measured at 800 °C. The red hollow circles represent measured data, while the black solid lines represent the equivalent circuit fitting results. All the impedance data werenormalized by the sample geometry.
786 F. Yang et al. / Solid State Ionics 181 (2010) 783–789
is considered the shift of relaxation frequency is mainly caused by theconductivity change.
In order to testify the validity of the above statement, theconductivities (at 350 °C) of the two responses were calculatedseparately and they were plotted as a function of the volume fractionof Al2O3, as shown in Fig. 7. The HF conductivity was calculated by
Fig. 4. Arrhenius plots of YSZ/Al2O3 composites. The inset shows the cases of high volumepercentage of Al2O3 (90 v.%) and pure Al2O3measured at high temperatures. σ correspondsto the total conductivity of the sample,which is calculated byσ = t
A1
ðRHF + RLF Þ, where t andArefer to the thickness and cross-section area of the sample; RHF and RLF represent theresistance of the high and low frequency response respectively.
σHF = tA⋅ 1RHF
, and it shows an obvious decrease with an increase ofAl2O3 volume fraction. The decrease of HF conductivity is consideredto be caused by the reduction of the conductive YSZ volume fraction,which is confirmed by the little change of normalized conductivity(conductivity divides YSZ volume fraction) with increasing Al2O3
volume fraction (see the open triangles). On the other hand, the LFconductivity (calculated by σsp
LF = tRLFA
CHFCLF
[10]) shows an obvious up-
Fig. 5. Plot of conductivity (350 °C) of the YSZ/Al2O3 composite as a function of thevolume percentage of YSZ. Symbols with asterisk indicate the values are obtained byextrapolation the Arrhenius plot from high temperature to 350 °C.

Fig. 6. Bode plot (imaginary impedance versus frequency) of the YSZ/Al2O3 compositewhen volume fraction of Al2O3 varies from 0 to 85%, measured at 350 °C. The imaginaryimpedance was scaled by its maximum value.
Fig. 7. High-frequency (HF) and low-frequency (LF) conductivities of the YSZ/Al2O3
composites as a function of Al2O3 volume fraction. The black solid triangles representthe HF conductivity calculated by σHF = t
A ⋅ 1RHF
; the black open triangles represent theHF conductivity normalized by the volume fraction of YSZ (σHF/νYSZ); the LFconductivity was calculated according toσsp
LF = tRLFA
CHFCLF
.
787F. Yang et al. / Solid State Ionics 181 (2010) 783–789
going trend when Al2O3 volume fraction varies from 0 to 60%, while itgoes downward with further addition of Al2O3. This trend is inagreement with the LF relaxation frequency change, proving thevalidity of Eq. (3) and confirming the claim that the change of LFrelaxation frequency is mainly caused by the conductivity change.
From Table 1 it can be seen that, with increase of Al2O3 volumefraction, the LF relaxation frequency shifts to higher frequency, reachingits highest value when Al2O3 volume fraction is 60%, and decreasesafterward (TheLF conductivity in Fig. 7 shows the same trend). This trendis generally in agreement with the change of YSZ/Al2O3 interfacefraction in the composite. Therefore, the YSZ/Al2O3 interface might be apossible reason for the LF relaxation frequency change.
However, before we attribute the LF relaxation frequency shift tothe YSZ/Al2O3 interface, other factors which may influence the LFrelaxation frequency should be excluded. First, the existence of theAl2O3 phase might influence the relaxation frequency and its effect isdiscussed as follows. Because of the electrical insulative property ofAl2O3, its effect on the impedance spectroscopy is analogous to theporosity effect, which has already been well established. The earlywork of Brailsford and Hohnke [20] demonstrated that the presence ofpores does not introduce a new arc or other feature in the impedancespectra, but it alters the diameters of the grain or grain boundaryimpedance arc, dependent on the pore location (intragranular orintergranular), by decreasing the “effective” grain or grain boundaryconductivity. The “effective” conductivity decreases monotonicallywith increasing porosity [21]. Therefore, the existence of Al2O3 shoulddecrease either the HF or the LF relaxation frequency. With increasingAl2O3 volume fraction, the relaxation frequency should keep shiftingto lower frequency range. This is in disagreement with ourexperimental observations, thus the shift of the LF relaxationfrequency is not caused by the existence of Al2O3.
Second, as described in part 3.1, the grain size of YSZ decreasesobviously with increase in the Al2O3 volume fraction, thus the influence
Table 1Relaxation frequencies of the YSZ/Al2O3 composite when volume fraction of Al2O3
varies from 0 to 85%, measured at 350 °C. LF and HF stand for low frequency and highfrequency respectively.
Relaxation frequency (Hz)
LF HF
YSZ 3.98×10² 2.51×10⁵
YSZ+20 v.%Al2O3 1.58×10³ 2.51×10⁵
YSZ+40 v.%Al2O3 2.51×10³ 2.51×10⁵
YSZ+60 v.%Al2O3 5.01×10³ 1.58×10⁵
YSZ+80 v.%Al2O3 3.98×10³ –
YSZ+85 v.%Al2O3 1.00×10³ –
of grain size should be clarified first. In Ref [10,22], Guo et al. studied andsummarized the grain size dependences of bulk and grain boundaryconductivity in YSZ. In the case of 8.2 mol% YSZ, the conductivity of YSZgrain is almost independent on the grain size, while the grain boundaryconductivity increases with decrease in grain size [23]. However, thevariation of grain boundary conductivity of YSZ over a wide range ofgrain size, from several nanometers to tens of micrometers, is less thanhalf order ofmagnitude. In addition, in the references, the samples withdifferent grain sizes were obtained by controlling the sinteringtemperature. High sintering temperature causes more yttrium elementor impurity segregations at the grain boundary, leading tomore oxygenvacancy depletion in the grain boundary space charge region, andconsequently decreases the grain boundary conductivity. But in ourcase, all the samples were sintered at the same temperature and heattreated for the same period. YSZ grain size decreases because thepresence of Al2O3 inhibits the grain growth. Therefore, it is reasonable tobelieve that the grain boundary conductivity change caused by grainsize difference is minor in our composite system.
The third possible reason for the shift of LF relaxation frequency isthat the existence of Al2O3 changes the YSZ grain boundaryconductivity. Feighery and Irvine [2] studied the Al2O3 contentdependence of the grain boundary conductivity of 8 mol.% YSZ .They found the grain boundary conductivity increases by 1.5 orders ofmagnitude when the Al2O3 content increases from 0 to 1 wt.%, but itthen decreases gradually with further increasing Al2O3 addition. Forthe composite with 13 wt.% Al2O3, the grain boundary conductivity isaround one order of magnitude higher than of the pure YSZ. Similarphenomenon is also reported in Ref [8,24]. Therefore, the grainboundary conductivity for the composite is higher than that for thepure YSZ, but it decreases with increasing Al2O3 content. If the LFrelaxation frequency change is caused by the grain boundaryconductivity change, it is expected the LF relaxation frequency shiftsto lower frequency range when the volume fraction of Al2O3 increasesfrom 20% to 60%, which is against the results in Table 1.
Excluding the above three factors, the only possible reason for theLF relaxation frequency shift is the presence of the YSZ/Al2O3
interface. And according to Eq. (3), a shift toward higher frequencyrange indicates an increasing conductivity, thus it can be deduced thatthe YSZ/Al2O3 interface is more conductive than the YSZ grainboundary. However, there is still a question to be answered beforewe draw any conclusion: does the YSZ/Al2O3 interface reallycontribute to the LF relaxation frequency? In order to answer thisquestion and investigate the interface effect, a 2-dimensional finiteelement modelling was employed to simulate the impedance spectra

Fig. 8. Geometric models for finite element modelling. Green, white, orange and yellow colours represent YSZ grain, YSZ grain boundary, Al2O3 and YSZ/Al2O3 interface, respectively.The side length of the model is 1, and the grain boundary thickness is 0.01 (arbitrary unit).
788 F. Yang et al. / Solid State Ionics 181 (2010) 783–789
of the composite. The geometric models were established based onthe microstructure of YSZ, as illustrated in Fig. 8. In the modelling, thefollowing simplifications were employed. First, in the real case, thethickness of grain boundary is around several nanometers, which isfar smaller than the grain size. However, for finite element calculation,too thin grain boundary will lead to difficulties in meshing andextensively increase the computation work. Therefore the YSZ grainboundary and the YSZ/Al2O3 interface are treated as thin layers withcertain thickness comparable to grain size. On the other hand, weignore the effect Al2O3 grain boundary due to the insulative propertyof Al2O3. Isolated Al2O3 grains randomly substitute the position of YSZgrains, as shown in Fig. 8(c).
In the calculation, the conductivity of YSZ grain was fixed at1.0×10-3 S/m (close to the value at 350 °C); for the YSZ grainboundary, values of 1.0×10⁻⁵ and 5.0×10⁻⁵ S/m were chosen basedon the fact that the YSZ grain boundary conductivity is usually two orthree orders of magnitude lower than the YSZ grain conductivity [10];the conductivity of Al2O3 was seven orders of magnitude lower thanthat of the YSZ bulk, which was estimated from Fig. 5 as well as Ref.[25]. Dielectric constants of YSZ and Al2O3 were obtained from Ref.[26,27]. Dielectric constant of YSZ grain boundary is the same as itsbulk value since the dielectric constant of ZrO2 is insensitive to itscomposition [28]. The conductivity of the YSZ/Al2O3 interface variesfrom 10-2 to 10-6 S/m, and its dielectric constant is assumed to be thesame as either YSZ or Al2O3. The above physical parameters werelisted in Table 2.
The calculated relaxation frequencies of the above models werealso listed in Table 2. Model (a) and (b) illustrate the effect of grainsize in pure YSZ. The results confirm that the LF relaxation frequencyis only determined by the physical parameters (conductivity) of grainboundary. In model (b), when the grain boundary conductivityincreases, the LF relaxation frequency shifts to higher frequencyrange, as predicted by Eq. (3).
Table 2Finite element calculation results of the relaxation frequencies, showing the effect of YSZ graim and Hz, respectively.
Model YSZ Al2O3
σg εg σgb εgb σ
(a) 1.0×10⁻³ 28 5.0×10⁻⁶ 28 –
(b) 1.0×10⁻³ 28 5.0×10⁻⁶ 28 –
(b) 1.0×10⁻³ 28 1.0×10⁻⁵ 28 –
(c) 1.0×10⁻³ 28 1.0×10⁻⁵ 28 1.0×10⁻¹
(c) 1.0×10⁻³ 28 1.0×10⁻⁵ 28 1.0×10⁻¹
(c) 1.0×10⁻³ 28 1.0×10⁻⁵ 28 1.0×10⁻¹
(c) 1.0×10⁻³ 28 1.0×10⁻⁵ 28 1.0×10⁻¹
(c) 1.0×10⁻³ 28 1.0×10⁻⁵ 28 1.0×10⁻¹
(c) 1.0×10⁻³ 28 1.0×10⁻⁵ 28 1.0×10⁻¹
(c) 1.0×10⁻³ 28 1.0×10⁻⁵ 28 1.0×10⁻¹
Model (c) simulates the microstructure of the YSZ/Al2O3 compos-ite, where YSZ is the major phase. Compared with pure YSZ (model(b)), both the LF and HF relaxation frequency are influenced by thephysical parameters of the YSZ/Al2O3 interface. The LF relaxationfrequency combines the contributions from YSZ grain boundary andthe YSZ/Al2O3 interface, and its shift direction is determined by therelative conductivity magnitude of YSZ grain boundary and YSZ/Al2O3
interface. When σYSZ/Al2O3Nσgb, it shifts to higher frequency range;when σYSZ/Al2O3bσgb, it shifts to lower frequency range. For the HFrelaxation frequency, it moves to higher frequency range only in thecasewhenσYSZ/Al2O3Nσg. In the rest cases, the HF relaxation frequencyremains constant, and shifts to lower frequency range compared withpure YSZ. The modelling results confirm that the YSZ/Al2O3 interfacehas an obvious effect on the LF relaxation frequency of the compositesystem.
There comes an argument that in the YSZ/Al2O3 composites, theoxygen vacancies are blocked by the insulative Al2O3 phase andtherefore they move within the YSZ phase under the electric field.Therefore the YSZ/Al2O3 interfaces seem to be “parallel” to the motionof the oxygen vacancies. Usually it is accepted that the parallelboundaries affect the first semicircle and not the second one [29].However, in this study, both the experimental evidences and themodelling results indicate the YSZ/Al2O3 interface contributes to theLF response (second semicircle) on the impedance spectroscopy. Thisis possibly due to the fact that, the YSZ/Al2O3 interface is notcontinuously connected inside the composite, especially when thevolume fraction of Al2O3 is low. Therefore, although the chargecarriers (oxygen vacancies) move along the YSZ/Al2O3 interface, theyhave to move towards the adjacent YSZ grain for further transpor-tation under the electric field. When the charge carriers move fromthe YSZ/Al2O3 interface to the YSZ grain, they actually move across theinterface (or the space charge region), as illustrated in Fig. 9.Therefore, the YSZ/Al2O3 interface is still “perpendicular” to the
n size and YSZ/Al2O3 interface. The units for conductivity and relaxation frequency are S/
YSZ/Al2O3 interface Relaxation frequency
ε σ ε LF HF
– – – 3.62×10³ 6.51×10⁵
– – – 3.62×10³ 6.51×10⁵
– – – 6.26×10³ 6.51×1050 10 1.0×10⁻² 28 1.42×10⁴ 8.55×1050 10 1.0×10⁻³ 28 1.08×10⁴ 4.95×1050 10 1.0×10⁻³ 10 1.08×10⁴ 4.95×1050 10 1.0×10⁻⁴ 28 8.23×10³ 4.95×1050 10 1.0×10⁻⁴ 10 8.23×10³ 4.95×1050 10 1.0×10⁻⁵ 28 6.26×10³ 4.95×1050 10 1.0×10⁻⁶ 28 4.76×10³ 4.95×10⁵

Fig. 9. Schematic of the current flow in the YSZ/Al2O3 interface. The arrows indicate thecurrent direction.
789F. Yang et al. / Solid State Ionics 181 (2010) 783–789
electric field and consequently contributes to the second semicircle onthe Nyquist plot.
Combining the above modelling results with the experimentalresults, the following several information can be obtained. (1) Boththe YSZ grain boundary and the YSZ/Al2O3 interface contribute to theLF relaxation frequency. (2) The YSZ/Al2O3 interface can not be moreconductive than the YSZ grain. Otherwise the HF relaxation frequencywill shift to higher frequency range, which is in disagreementwith theexperimental observations. (3) The YSZ/Al2O3 interface should bemore conductive than the YSZ grain boundary. The YSZ grainboundary and the YSZ/Al2O3 interface contribute to an effectiveconductivity of the LF response. Because the electrical conductiontends to transport through the “easy path”, the effective conductivityis determined by the fraction of the relatively conductive YSZ/Al2O3
interface. When the Al2O3 volume fraction increases from 20 to 60%,the number of YSZ/Al2O3 interface increases and therefore theeffective conductivity increases, which causes the LF relaxationfrequency moving to higher frequency range. With further increasingAl2O3 fraction to 85%, the number of YSZ/Al2O3 interface decreasesand therefore causes a decreasing of the LF relaxation frequency. Fromthe above analysis, it can be concluded that, the YSZ/Al2O3 interfaceconductivity is higher than the YSZ grain boundary, but lower than orsimilar to the YSZ grain.
Possible reasons for the relatively conductive YSZ/Al2O3 interface areproposed as following. (1) Less siliceous phase exists in the YSZ/Al2O3
interface because of the “scavenging” effect of Al2O3; (2) Less yttriumelement segregates at the YSZ/Al2O3 interface, which releases thedepletion of oxygen vacancies at the heterogeneous boundary; (3) Asproposed by Kumar et al., Al2O3 removes the electron concentrationgradientwhich impedes the transport of theoxygen ions [11,12]; (4)Thelattice strain due to the lattice mismatch between the two materialsmight be an reason for the enhanced conductivity at the interface, as
reported in some YSZ/oxide multilayered thin films in Ref. [30,31].Further work will be carried out to clarify these points.
4. Conclusions
Electrical properties of YSZ/Al2O3 composite and the YSZ/Al2O3
interfacewere studied by impedance spectroscopy coupledwith finiteelement modelling. The conductivity of the composite shows thetypical characteristics expected from the percolation theory, with acritical YSZ volume fraction of 13.9±0.4% for the onset of conduction.Above this YSZ volume fraction, the activation energy has a similarvalue with pure YSZ and it is independent on the Al2O3 fractionbecause the electrical (ionic) conduction is mainly dominated by theYSZ phase. The YSZ/Al2O3 interface is discussed from the relaxationfrequency analysis and finite element modelling. It is found the lowfrequency response combines the contribution from both the YSZgrain boundary and the YSZ/Al2O3 interface and the conductivity ofthe YSZ/Al2O3 interface is higher than YSZ grain boundary but similarto, or lower than the YSZ grain. Although the presence of Al2O3 leadsto a blocking effect which suppresses the composite conductivitybecause of its intrinsic electrical insulation, the conductive YSZ/Al2O3
interface provides a possible way to enhance the ionic conductivity ofYSZ/Al2O3 composite, which is beneficial to its application in SOFC.
References
[1] M. Mori, T. Abe, H. Itoh, O. Yamamoto, Y. Takeda, T. Kawahara, Solid State Ionics 74(1994) 157.
[2] A.J. Feighery, J.T.S. Irvine, Solid State Ionics 121 (1999) 209.[3] J. M’ Peko, D. Spavieri Jr., C. da Silva, C. Fortulan, D. de Souza, M. de Souza, Solid
State Ionics 156 (2003) 59.[4] A. Rizea, D. Chirlesan, C. Petot, G. Petot-Ervas, Solid State Ionics 146 (2002) 341.[5] X. Guo, Solid State Ionics 96 (1997) 247.[6] Y. Ji, J. Liu, Z. Lv, X. Zhao, T. He, W. Su, Solid State Ionics 126 (1999) 277.[7] X. Guo, W. Sigle, J. Fleig, J. Maier, Solid State Ionics 154–155 (2002) 555.[8] A. Yuzaki, A. Kishimoto, Solid State Ionics 116 (1999) 47.[9] X. Guo, J. Am. Ceram. Soc. 86 (2003) 1867.
[10] X. Guo, R. Waser, Prog. Mater. Sci. 51 (2006) 151.[11] B. Kumar, C. Chen, C. Varanasi, J. Fellner, J. Power Sources 140 (2005) 12.[12] B. Kumar, J. Thokchom, J. Am. Ceram. Soc. 91 (2008) 1175.[13] COMSOL Ltd., COMSOL Multiphysics, London.[14] J. Fleig, J. Maier, Electrochim. Acta 4 (1996) 1003.[15] L. Deng, Y. Xiong, P. Xiao, Surf. Coat. Technol. 201 (2007) 7755.[16] D.J. Begman, Phys. Rev. Lett. 44 (1980) 1285.[17] C.–.W. Nan, Prog. Mater. Sci. 37 (1993) 1.[18] Y. Meir, Phys. Rev. Lett. 83 (1999) 3506.[19] D.S. McLachlan, M. Blaszkiewicz, R.E. Newnham, J. Am. Ceram. Soc. 73 (1990)
2187.[20] A.D. Brailsford, D.K. Hohnke, Solid State Ionics 11 (1983) 133.[21] E. Barsoukov, J.R. Macdonald, Impedance Spectroscopy Theory, Experiment, and
Applications, Second Edition, John Wiley & Sons, Inc., USA, 2005, pp. 216–218.[22] X. Guo, Z. Zhang, Acta Mater. 51 (2003) 2539.[23] M.J. Verkerk, B.J. Middelhuis, A.J. Burggraaf, Solid State Ionics 6 (1982) 159.[24] S. Rajendran, J. Drennan, S.P.S. Badwal, J. Mater. Sci. Lett. 6 (1987) 1431.[25] O.T. Ozkan, A.J. Moulson, J. Phys. D Appl. Phys. 3 (1970) 983.[26] N.H. Perry, S. Kim, T.O. Manson, J. Mater. Sci. 43 (2008) 4684.[27] D.R. Lide, CRC Handbook of Chemistry and Physics, CRC Press, LLC, 2004, p. 12.[28] X. Guo, J. Maier, J. Electrochem. Soc. 148 (2001) 121.[29] S. Kim, J. Maier, J. Eur. Ceram. Soc. 24 (2004) 1919.[30] C. Korte, A. Peters, J. Janek, D. Hesse, N. Zakharov, Phys. Chem. Chem. Phys. 10
(2008) 4623.[31] A. Peters, C. Korte, D. Hesse, N. Zakharov, J. Janek, Solid State Ionics 178 (2007) 67.