Nutritional Ecology of Ateles Chamek In Lowland Bolivia: How Macronutrient Balancing Influences Food...
22
Nutritional Ecology of Ateles chamek in lowland Bolivia: How Macronutrient Balancing Influences Food Choices Annika M. Felton & Adam Felton & Jeff T. Wood & William J. Foley & David Raubenheimer & Ian R. Wallis & David B. Lindenmayer Received: 3 March 2009 / Accepted: 10 June 2009 # Springer Science + Business Media, LLC 2009 Abstract All free-living animals must make choices regarding which foods to eat, with the choices influencing their health and fitness. An important goal in nutritional ecology is therefore to understand what governs animals’ diet selection. Despite large variation in the availability of different food items, Peruvian spider monkeys (Ateles chamek) maintain a relatively stable daily protein intake, but allow total energy intake to vary as a function of the composition of available food items. This is referred to as protein-dominated macronutrient balancing. Here we assess the influence of this nutritional strategy on daily and seasonal nutritional intakes, Int J Primatol DOI 10.1007/s10764-009-9367-9 A. M. Felton : A. Felton : J. T. Wood : D. B. Lindenmayer Fenner School of Environment and Society, The Australian National University, Canberra 0200, Australia A. M. Felton (*) Instituto Boliviano de Investigación Forestal (IBIF), Cuarto Anillo Casilla Postal 6204, Santa Cruz de la Sierra, Bolivia e-mail: [email protected] W. J. Foley : I. R. Wallis Department of Botany and Zoology, The Australian National University, Canberra 0200, Australia D. Raubenheimer Institute of Natural Sciences, Massey University, Albany, Private Bag 102 904, Auckland, New Zealand D. Raubenheimer New Zealand Institute for Advanced Study, Massey University, Albany, Private Bag 102 904, Auckland, New Zealand
-
Upload
independent -
Category
Documents
-
view
0 -
download
0
Transcript of Nutritional Ecology of Ateles Chamek In Lowland Bolivia: How Macronutrient Balancing Influences Food...
Nutritional Ecology of Ateles chamek in lowlandBolivia: How Macronutrient BalancingInfluences Food Choices
Annika M. Felton & Adam Felton & Jeff T. Wood &
William J. Foley & David Raubenheimer &
Ian R. Wallis & David B. Lindenmayer
Received: 3 March 2009 /Accepted: 10 June 2009# Springer Science + Business Media, LLC 2009
Abstract All free-living animals must make choices regarding which foods to eat,with the choices influencing their health and fitness. An important goal in nutritionalecology is therefore to understand what governs animals’ diet selection. Despitelarge variation in the availability of different food items, Peruvian spider monkeys(Ateles chamek) maintain a relatively stable daily protein intake, but allow totalenergy intake to vary as a function of the composition of available food items. Thisis referred to as protein-dominated macronutrient balancing. Here we assess theinfluence of this nutritional strategy on daily and seasonal nutritional intakes,
Int J PrimatolDOI 10.1007/s10764-009-9367-9
A. M. Felton :A. Felton : J. T. Wood :D. B. LindenmayerFenner School of Environment and Society, The Australian National University, Canberra 0200,Australia
A. M. Felton (*)Instituto Boliviano de Investigación Forestal (IBIF), Cuarto Anillo Casilla Postal 6204,Santa Cruz de la Sierra, Boliviae-mail: [email protected]
W. J. Foley : I. R. WallisDepartment of Botany and Zoology, The Australian National University, Canberra 0200, Australia
D. RaubenheimerInstitute of Natural Sciences, Massey University, Albany, Private Bag 102 904,Auckland, New Zealand
D. RaubenheimerNew Zealand Institute for Advanced Study, Massey University, Albany, Private Bag 102 904,Auckland, New Zealand

estimate the nutritional value of different foods, and interpret unusual food choices.We conducted continuous all-day observations of focal spider monkeys inhabiting asemideciduous forest in Bolivia. We recorded feeding events, collected foods, andanalyzed their nutrient content. By using the Geometric Framework for nutrition, weshow that individuals reached their daily end-point in nutrient space —balancebetween protein and nonprotein energy intake— by consuming nutritionallybalanced foods or by alternating between nutritionally complementary foods. Themacronutritionally balanced figs of Ficus boliviana were their primary staple foodand therefore dominated their overall nutritional intake. Our results also demonstratethat spider monkeys consumed a diverse array of ripe fruits to overcome periods offig scarcity rather than vice versa; they could obtain sufficient protein on a diet ofpure fruit; and unripe figs constituted a nutritionally rewarding and reliable foodresource. We hope that the approaches taken and the conclusions reached in thisstudy will catalyze further inquiries into the nutritional ecology of frugivorousprimates.
Keywords Ficus . macronutrients . protein . staple food . unripe figs
Introduction
Primates must make choices regarding which foods to include in their daily diet,with these choices influencing their nutritional state and ultimately their health andfitness (Altmann 1998; Beehner et al. 2006). The food choices made will bedetermined primarily by the animal’s regulatory phenotype, but constrained by thenutritional, chemical, and structural composition of the foods in the environment(Lambert 2007; Milton 1993). Quantifying the underpinnings of diet selection ischallenging, especially in studies of wild animals, because it requires precise feedingobservations of individuals over continuous periods, relevant analyses of all foodsconsumed, and a framework to analyze the complex, multivariate nature of the data.
The Geometric Framework for nutrition (GF) is an analytical technique that enablesan understanding of the nutritional strategies of animals (Simpson and Raubenheimer1993; Raubenheimer and Simpson 2004) and the interpretation of food choices thatare otherwise difficult to explain (Robbins et al. 2007). Researchers have successfullyapplied the framework to a range of vertebrate and invertebrate taxa (Chambers et al.1995; Felton et al. 2009b; Raubenheimer and Simpson 2006; Robbins et al. 2007;Ruohonen et al. 2007; Simpson and Raubenheimer 2001, 2005). The GF describesfeeding behavior within an n-dimensional space delineated by axes representingnutrients of interest (Raubenheimer and Simpson 2004). It is possible to identify ananimal’s nutritional intake target within this nutrient space and to relate this target tothe nutritional content of the foods available (Felton et al. 2009a).
Spider monkeys (genus Ateles, subfamily Atelinae) are arboreal primates thatinhabit the canopies of Neotropical forests and primarily consume ripe fruit (Di Fioreet al. 2008; Kinzey 1997). Energy is often proposed to be the primary driver behindatelines’ diet selection (Di Fiore and Rodman 2001; Rosenberger and Strier 1989;Strier 1992), because they frequently select and ingest large volumes of fruits thatare rich in lipids and soluble carbohydrates (Castellanos 1995; Dew 2005). In
A.M. Felton et al.
contrast to this view and other major schools of thought in nutritional ecology(Dearing et al. 2005; Freeland and Janzen 1974; Mattson 1980; Schoener 1971;White 1993), Felton et al. (2009b) determined that spider monkeys (Ateles chamek)in La Chonta, Bolivia, select diets that supply a set amount of protein, rather thanattempting to maximize the ingestion of energy or protein, or to regulate plantsecondary metabolites. Daily protein intake was regulated more tightly thancarbohydrates or fats, and thus disproportionately influenced total energy intake.Further, protein intake did not vary across seasons despite dramatic fluctuations infood availability (Felton et al. 2009b). Research on the spider monkeys in La Chontafurther showed that although their diet contained as much fruit as other Atelesspecies, it differed in 2 respects (Felton et al. 2008). First, figs (Ficus) were a staplefood all through the year. There are no similar reports of a comparable reliance onFicus by this primate genus even though all spider monkeys eat figs (Di Fiore et al.2008). Second, the spider monkeys in La Chonta spent much time consuming unripefigs, even when ripe figs and other ripe fruits were abundant (Felton et al. 2008).
Here we build on the knowledge that diet selection of the La Chonta spidermonkey community is governed by protein-dominated macronutrient balancing. Weuse the Geometric Framework to assess the influence of this nutritional strategy ondaily and seasonal nutritional states of individuals by analyzing the intaketrajectories of individuals and the macronutritional balance of foods consumed. Wealso estimate the nutritional value of different foods, and interpret the unusual foodchoices described in the preceding text in nutritional terms.
Methods
The lead author together with field assistants collected data in the lowlandsubtropical semihumid forest (Holdridge Life Zone System) of the Guarayos ForestReserve, Departmento Santa Cruz, Bolivia. The study area (S: 15°36´26´´ to 15°37´45´´ and W: 62°46´59´´ to 62°47´56´´) was located in an unlogged section of the100,000 hectare forestry concession La Chonta, owned by Agroindustría Forestal LaChonta Ltda. The average annual temperature and precipitation for La Chonta are25°C and 1580 mm, with 4 dry months (<100 mm rain; May–September).
Tall forest dominates the study area, with small sections of low vine forest,chaparral, and swamp (Felton et al. 2008). There were 3 distinct phenologicalperiods (seasons) during the study, including a period of high ripe fruit abundance(late wet season; February to mid-April) followed by a 10-wk period of fruit scarcity(early–mid dry season; mid-April to June) before ripe fruits became more abundantagain (late dry–early wet season; July to September; Felton et al. 2008).
We established a network of trails in the focal individuals’ 360–400 ha territoryand used it for daily observations of focal individuals, monthly phenologicalsurveys, and 1 vegetation survey. We collected basal area information from all trees>10 cm diameter at breast height (DBH) within 71 0.1-ha plots distributedthroughout the home range. A detailed description of the design and sampling ofour phenology surveys appears in Felton et al. (2008).
We spent 5 mo habituating the study community, and thereafter (February 2004–September 2004) systematically collected feeding data via continuous observations
Nutritional Ecology of Ateles chamek
of a focal animal (FA) from dawn to dusk. We observed a total of 18 adult FAs:8 males and 10 females. Females were either lactating or pregnant while caring for ajuvenile. When possible, we followed 10–15 of the FAs for a whole day each month,over 20 d, alternating daily between males and females. For the purpose of thedetailed dietary analyses used here, we include 51 full days during which wesuccessfully observed the individual the entire day and, at most, only brief momentsof feeding were unrecorded (32 d of observations of 8 females, 19 d of 8 males; seeTable III for the distribution of follow days between seasons). We also use data froman additional 19 partial follow days when presenting the nutritional content ofcommonly eaten food items. Because there are no significant differences inmacronutrient intake between sexes or individuals (Felton et al. 2009b), it is unlikelythat the greater number of female follow days represented a bias in our analysis.
We recorded the time of the start and end of each feeding event, and the foodseaten from the categories of ripe fruit/fig, unripe fruit/fig, flower, young leaf, matureleaf, or other. We took detailed notes on which parts of the fruits subjects consumed.We used differences in fruit size, color, and consistency to differentiate betweenimmature and ripe fruits. We calculated feeding rates (number of items consumed/minute) for all food types. We identified and tagged all plants from which themonkeys ate. Within 1 or 2 days of feeding observations, we collected and dried(40–50°C) samples of the food items from these trees (Felton et al. 2009b). Duringthe 51 full day follows, we observed monkeys eating 84 different foods, 69 of whichwe collected and analyzed. FAs spent <1% of their total feeding time eating items wedid not analyze.
We used near infrared reflectance spectroscopy (NIRS; Foley et al. 1998) toestimate the concentrations of total nitrogen, lipid, starch, neutral detergent fiber,ash, polyethylene glycol (PEG) binding capacity, and in vitro digestible nitrogen anddry matter (DM) in all food items. We did this by using standard NIRS procedures(ANON 1995). We refer to Felton et al. (2009b) for descriptions of chemicalanalyses of total nitrogen (total N), water-soluble carbohydrates, starch, and neutraldetergent fiber. We combine values for water-soluble carbohydrates and starch andpresent them as total nonstructural carbohydrates (TNC). We assayed tannins as theamount of PEG bound per unit DM and we estimated the effect of tannins onnitrogen and DM availability via the in vitro digestion procedure described by DeGabriel and others (2008). We estimated available protein as (total N) × (in vitro Ndigestibility) × 6.25. There is some uncertainty whether 6.25 is the best conversionfactor for tropical fruits (Milton and Dintzis 1981), but we use it here to allow forcomparison with other studies. We assumed that lipids were 100% available. Wepresent dry matter digestibility (DMD) as DMD in the absence of PEG (DMD-PEG).
The in vitro measure of protein availability (and DMD) may not accuratelyrepresent in vivo availability, but it at least allowed us to estimate the proportion oftotal nitrogen available to the consumer versus how much was bound up by dietarytannins. To highlight the disparity between concentrations and intakes of availableprotein (available N×6.25) and crude protein (total N×6.25), we include bothmeasures in the tables. We did not analyze termites but instead used the nutrientconcentrations reported by Dufour (1987).
We applied the Geometric Framework to our data (Raubenheimer and Simpson1997; Simpson and Raubenheimer 1995). The framework unifies several nutrition-
A.M. Felton et al.

ally relevant measures within simple geometrical models, thus allowing for a comparisonbetween observed patterns and predicted reference patterns. For the purpose of ouranalysis, TNC and lipids can be regarded as interchangeable energy sources (Ruohonenet al. 2007), because when TNC and lipids are plotted separately against protein intake,they contribute similarly to the nonprotein energy curve. We therefore combined TNCand lipids into one axis (nonprotein energy), with available protein on the other axis.We refer to this 2-dimensional space as the nutritional space. For uniformity, we plottedprotein in energy units (mega joule, MJ), although we could have also used mass units.We calculated the energetic value of each food, using the following conversion factors:16.7 kJ/g TNC, 37.7 kJ/g lipid, and 16.7 kJ g available protein.
Data Analysis
We estimated nutrient intake from each feeding event by multiplying the ingestion timewith the corresponding feeding rate and the nutrient content of the item (Felton et al.2009b). We summed all daily events to obtain the daily nutrient intake. To comparedifferences in nutrient gain versus time spent feeding (nutrient intake efficiency) onripe and unripe figs of Ficus boliviana, we divided the estimated total intake ofnutrient x (g) from item i with the total time spent feeding (minutes) on item i.
We used linear regression to assess the relationship between feeding rates (populationmeans of #items consumed/min) and wet weight of immature and ripe figs belonging toFicus boliviana and F. trigona. We used 1-way ANOVA to test differences in nutrientintake efficiency between unripe and ripe figs of Ficus boliviana. We assessed whetherthe mean observed intake ratio was purely a product of the dominance of figs in theirdiet or whether the nutrient intake balance of individuals was the same regardless ofthe presence of figs. For this purpose, we used 1-way ANOVA to test whether meanintake ratio of days when figs were included in the diet (n=25) was different from theobserved daily intake ratio of days when figs were not consumed at all (n=13).
We plotted daily cumulative intake (x = available protein; y = TNC + lipids) ofindividual spider monkeys and placed these intakes into 3 different categories based onthe following visual characteristics: 1) straight intake trajectories toward the mean intakeratio (population mean of x/y); 2) zigzagging intake trajectories toward the mean intakeratio; and 3) straight intake trajectories toward a point representing a greater intake ofnonprotein energy than average. We used 1-way ANOVA to assess the relationshipbetween the type of intake strategy and habitat-wide food availability (scores originatingfrom phenology surveys). We also used 1-way ANOVA to test the relationship betweenthe type of intake strategy and diet composition (% ripe nonfig fruit and % figs). For the2 latter statistical tests we included data from 38 full follow days where we had completeobservational and nutritional data of everything the focal individuals consumed.
Results
Nutritional Composition of Food Items
Ripe fruit usually contained almost 50% more TNC and lipids than did immaturefruit, which instead had lower DMD and contained more fiber and ash, but similar
Nutritional Ecology of Ateles chamek

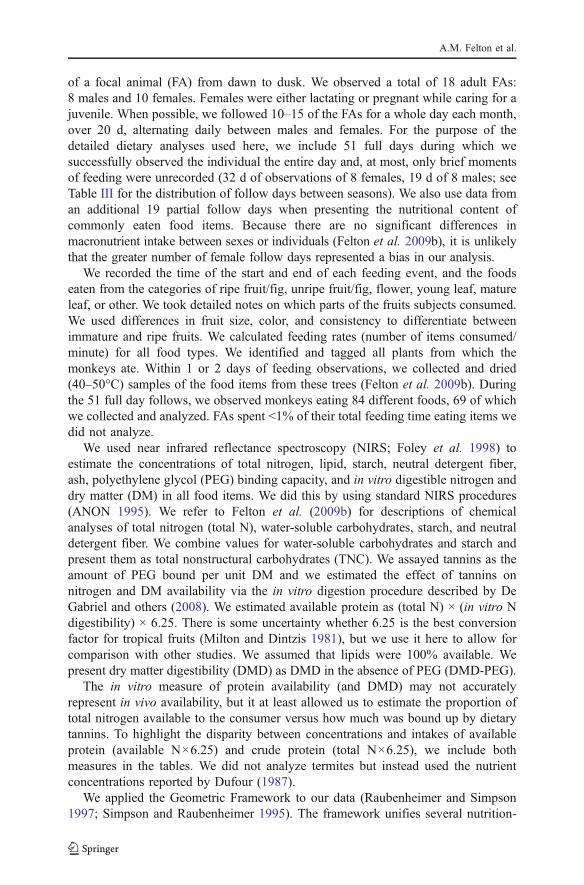
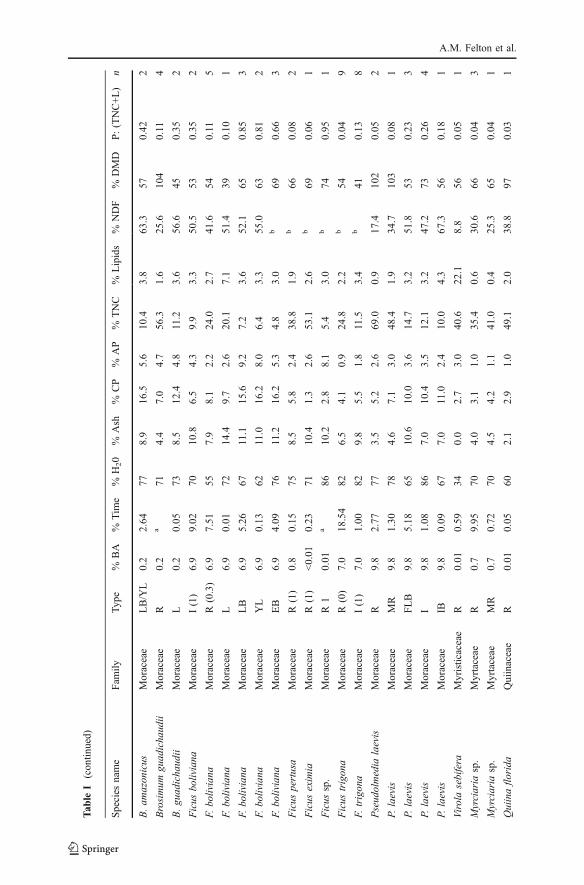
concentrations of available protein (Fig. 1). Young leaves contained more availableprotein and had higher DMD than did mature leaves (Fig. 1). For figs, we refer to theemerging buds, immature figs, and medium-ripe figs collectively as unripe figs,because they had similar composition that was unlike that of ripe figs. Individualsconsumed different combinations of wall/pulp of ripe figs depending on the speciesof Ficus. The nutritional composition of the most commonly eaten combinations offigs and other items is provided in Table I.
Feeding Rates
We recorded 775 different feeding rates (including several replicates per feeding event),thereby supplying information on the rate of ingestion of 76 different food items. Weused this information in calculations of daily nutrient intake. Spider monkeys consumedsmall figs, i.e., less mature for interspecific comparisons, faster than they did larger figs(data for Ficus boliviana and F. trigona, R2=0.70, n=7, p=0.011).
Daily Nutrient Intake and Major Sources of Nutrients
We recorded 904 different feeding events, amounting to 175 h of observation. Spidermonkeys ate 0.4–2.4 kg (mean 1.0 kg ; SE 0.07 kg) of fresh food per day, whichcorresponded to an average of 262 g of DM (Table II). The daily intake of availableprotein remained steady across all 3 phenological seasons, whereas the intake ofcrude protein fluctuated by 75%.
On only 8 of the 51 full follow days did monkeys not eat fruits or leaves of Ficus,with 7 of these days occurring during the period of general fruit scarcity. Spidermonkeys predominantly consumed food items from Ficus boliviana and F. trigona,but also ate figs from 4 less common Ficus sp. (Table I). Ficus trees represented 23%of all food trees, and FAs spent 50% of their feeding time eating various items fromFicus (Table II). This resulted in Ficus supplying the spider monkeys with themajority of their protein, lipids, fiber, and water (Table II). Other main sources ofnutrients were Pseudolmedia laevis and Myrciaria sp. (locally called sahuinto;Table II).
1009080706050403020100
% o
f d
ry m
atte
r
Category of itemsEB, I R F, FB LB, YL L
0.85
0.80
0.75
0.70
0.65
0.60
% D
MD
% Ash% lipids% NDF% AP% TNC% DMD
Fig. 1 Average nutritional composition of food categories eaten by Ateles chamek in La Chonta. EB =emerging buds; I = immature fruits; R = ripe fruits; F = flowers; FB = flower buds; LB = leaf buds; YL =young leaves; L = mature leaves; NDF = neutral detergent fiber; AP = available protein; TNC = totalnonstructural carbohydrates. The secondary axis shows in vitro dry matter digestibility (%DMD), which isrepresented in the figure with black diamonds.
A.M. Felton et al.

Tab
leI
Nutritio
nalcontentsof
food
itemsconsum
edby
Atelescham
ekin
LaChonta,
inorderof
family
Species
name
Fam
ilyTy
pe%
BA
%Tim
e%
H20
%Ash
%CP
%AP
%TNC
%Lipids
%NDF
%DMD
P:(TNC+L)
n
Spondias
mom
bin
Anacardiaceae
R1.5
1.69
835.2
3.3
1.3
57.2
2.5
9.9
800.03
2
Rollin
iaherzog
iiAnn
onaceae
R<0.01
a61
6.9
7.2
3.6
24.7
2.3
55.2
460.17
1
Dendrop
anax
arboreus
Araliaceae
R1.4
2.69
581.2
5.4
3.0
10.6
21.8
53.5
280.07
1
Didym
opan
axmorototon
iAraliaceae
R0.1
0.13
652.5
6.2
6.8
19.4
33.2
14.5
500.10
2
Astrocarium
murum
uru
Arecaceae
R0.7
0.64
684.4
3.0
2.4
58.1
3.4
20.9
720.05
3
Socratea
exhorriza
Arecaceae
R7.0
0.66
854.1
6.8
3.1
35.9
0.4
42.3
700.12
1
Syagrussancon
aArecaceae
F0.02
0.11
957.5
15.0
4.7
32.0
3.6
55.3
570.17
2
Marsdenia
macroph
ylla
Asclepiadaceae
L–
0.19
7614
.514
.010
.18.4
5.0
50.6
840.73
2
Melloaqu
adrivalvis
Bigno
niaceae
L–
0.08
648.0
19.2
14.3
3.3
2.5
67.8
422.25
1
M.qu
adrivalvis
Bigno
niaceae
YL
–0.93
797.1
28.0
25.8
8.0
3.0
38.7
762.47
3
Cordiaallio
dora
Boraginaceae
R1.3
a66
5.0
3.8
1.8
67.4
1.3
26.8
980.04
1
Jacaratia
spinosa
Caricaceae
R0.8
0.87
823.7
7.8
6.1
64.4
1.7
18.6
113
0.13
4
J.spinosa
Caricaceae
L0.8
0.12
7711.9
14.5
6.1
9.8
4.4
65.1
510.44
1
J.spinosa
Caricaceae
YL
0.8
a83
8.8
18.2
6.5
7.4
4.2
59.1
570.56
1
J.spinosa
Caricaceae
FLB
0.8
0.43
8510.8
19.1
9.7
7.6
4.5
55.8
700.77
1
Cecropiaconcolor
Cecropiaceae
R0.03
a62
12.6
11.0
6.4
17.3
7.0
59.2
700.27
3
Huracrepita
nsEup
horbiaceae
I8.6
a–
7.8
11.9
6.6
19.8
1.7
28.8
780.40
1
Sapium
glan
dulosum
Eup
horbiaceae
R0.8
0.73
182.0
8.7
12.1
19.7
34.4
0.0
540.18
1
Machaerium
oblongifo
lium
Fabaceae
YL
–1.29
795.8
19.1
13.5
7.2
5.4
74.9
710.99
4
Inga
edulis
Legum
inosae
R0.4
1.17
731.8
4.2
3.8
72.3
0.8
13.0
114
0.07
3
I.edulis
Legum
inosae
MR
0.4
a–
3.7
9.7
6.2
35.9
1.9
52.1
830.22
4
Ceiba
pentan
dra
Malvaceae
YL
0.2
0.26
7411.8
23.8
15.4
6.7
5.6
67.5
661.14
1
Batocarpusam
azonicus
Moraceae
R0.2
a70
4.8
4.6
4.0
65.6
2.9
12.9
980.08
1
Nutritional Ecology of Ateles chamek
Tab
leI
(con
tinued)
Species
name
Fam
ilyTy
pe%
BA
%Tim
e%
H20
%Ash
%CP
%AP
%TNC
%Lipids
%NDF
%DMD
P:(TNC+L)
n
B.am
azonicus
Moraceae
LB/YL
0.2
2.64
778.9
16.5
5.6
10.4
3.8
63.3
570.42
2
Brosimum
guad
ichaud
iiMoraceae
R0.2
a71
4.4
7.0
4.7
56.3
1.6
25.6
104
0.11
4
B.gu
adicha
udii
Moraceae
L0.2
0.05
738.5
12.4
4.8
11.2
3.6
56.6
450.35
2
Ficus
boliviana
Moraceae
I(1)
6.9
9.02
7010
.86.5
4.3
9.9
3.3
50.5
530.35
2
F.bo
liviana
Moraceae
R(0.3)
6.9
7.51
557.9
8.1
2.2
24.0
2.7
41.6
540.11
5
F.bo
liviana
Moraceae
L6.9
0.01
7214
.49.7
2.6
20.1
7.1
51.4
390.10
1
F.bo
liviana
Moraceae
LB
6.9
5.26
6711.1
15.6
9.2
7.2
3.6
52.1
650.85
3
F.bo
liviana
Moraceae
YL
6.9
0.13
6211.0
16.2
8.0
6.4
3.3
55.0
630.81
2
F.bo
liviana
Moraceae
EB
6.9
4.09
7611.2
16.2
5.3
4.8
3.0
b69
0.66
3
Ficus
pertusa
Moraceae
R(1)
0.8
0.15
758.5
5.8
2.4
38.8
1.9
b66
0.08
2
Ficus
eximia
Moraceae
R(1)
<0.01
0.23
7110
.41.3
2.6
53.1
2.6
b69
0.06
1
Ficus
sp.
Moraceae
R1
0.01
a86
10.2
2.8
8.1
5.4
3.0
b74
0.95
1
Ficus
trigon
aMoraceae
R(0)
7.0
18.54
826.5
4.1
0.9
24.8
2.2
b54
0.04
9
F.trigona
Moraceae
I(1)
7.0
1.00
829.8
5.5
1.8
11.5
3.4
b41
0.13
8
Pseudolmedia
laevis
Moraceae
R9.8
2.77
773.5
5.2
2.6
69.0
0.9
17.4
102
0.05
2
P.laevis
Moraceae
MR
9.8
1.30
784.6
7.1
3.0
48.4
1.9
34.7
103
0.08
1
P.laevis
Moraceae
FLB
9.8
5.18
6510
.610
.03.6
14.7
3.2
51.8
530.23
3
P.laevis
Moraceae
I9.8
1.08
867.0
10.4
3.5
12.1
3.2
47.2
730.26
4
P.laevis
Moraceae
IB9.8
0.09
677.0
11.0
2.4
10.0
4.3
67.3
560.18
1
Virola
sebifera
Myristicaceae
R0.01
0.59
340.0
2.7
3.0
40.6
22.1
8.8
560.05
1
Myrciaria
sp.
Myrtaceae
R0.7
9.95
704.0
3.1
1.0
35.4
0.6
30.6
660.04
3
Myrciaria
sp.
Myrtaceae
MR
0.7
0.72
704.5
4.2
1.1
41.0
0.4
25.3
650.04
1
Quiinaflo
rida
Quiinaceae
R0.01
0.05
602.1
2.9
1.0
49.1
2.0
38.8
970.03
1
A.M. Felton et al.

Tab
leI
(con
tinued)
Species
name
Fam
ilyTy
pe%
BA
%Tim
e%
H20
%Ash
%CP
%AP
%TNC
%Lipids
%NDF
%DMD
P:(TNC+L)
n
Paulliniaelegans
Sapindaceae
R–
0.64
461.5
2.2
1.4
32.0
1.4
13.7
920.06
5
Pou
terianemorosa
Sapotaceae
I2.6
0.66
904.1
2.6
2.0
63.0
3.7
5.8
113
0.04
1
P.nemorosa
Sapotaceae
R/M
R2.6
2.41
948.7
3.2
1.8
39.2
4.4
9.9
100
0.05
7
Guazumaulmifo
liaSterculiaceae
R0.6
3.44
352.7
4.4
1.7
25.8
1.1
57.7
500.09
2
Heliocarpus
american
usTiliaceae
L0.2
2.01
7311.3
16.2
7.1
10.3
4.9
65.5
510.48
6
H.am
erican
usTiliaceae
YL
0.2
0.06
7611.7
19.0
9.5
8.7
5.0
70.1
530.68
1
Ampelocera
ruizii
Ulm
aceae
YL
6.9
0.22
7710.9
23.4
22.3
6.3
3.1
48.9
892.38
5
Celtis
igua
nea
Ulm
aceae
R–
1.69
485.8
7.8
7.1
71.2
0.0
2.6
960.14
2
Urera
baccifera
Urticacaeae
L2.0
0.13
6915.2
17.0
10.4
5.1
3.0
59.3
631.25
1
Vitaceae
sp.1
Vitaceae
AR
–0.01
8611.3
10.3
7.5
7.7
5.9
56.4
800.50
1
Caterpillarc
Aa
8612
.930
.527
.81.8
3.5
60.2
944.09
1
Unidepiphy
teS
a93
13.3
3.5
3.2
27.5
2.1
34.2
100
0.14
1
Minim
um0.01
180.0
1.3
0.9
1.8
0.0
0.0
28.4
0.03
Average
3.15
717.6
10.2
6.2
26.9
4.7
41.1
71.3
0.47
Maxim
um9.75
9515
.230
.527
.872
.334
.474
.9114
4.09
Wedidnotincludeseedsin
fruitin
thenutritional
analysis.
Colum
nheadings:T
ype:EB=who
leem
erging
fruitb
ud;I
=who
leim
maturefruit;MR=pu
lpof
medium
ripe
fruit;R=pu
lpof
ripe
fruit(andarilifpresent);F
=who
leflow
er;
FLB=who
leflow
erbu
d;LB=who
leleaf
bud;
YL=who
leyo
ungleaf;L=matureleaf
exlpetio
le;AR=aerial
root;A=anim
almatter;S=stalk;
%BA=speciesspecific
percentage
ofestim
ated
totalbasalarea
(m2/ha)
oftreesDBH
>10
cm(Feltonet
al.20
08).For
mem
bers
ofArecaceae,%
oftotaldensity
(trees/ha)
ispresented.
(-)=no
basal
area
ordensity
inform
ationavailableforlianas;%
time=percentage
ofthetotalfeedingtim
erecorded
forfocalanim
alsduring
full-dayfollo
ws(51d);%H2O
=proportio
nof
freshweightcompo
sedof
water;CP=crud
eprotein(tot
N×f6.25
);AP=availableproteinestim
ated
from
invitroassay(availableN×6.25);TNC
=totalno
nstructural
carbohydrates(w
ater-soluble
carbohydrates+starch);NDF=neutraldetergentfiber;P:(TNC+L)=ratio
betweenproteinandnonprotein
energy
(TNC+Lipids);%
DMD
=measure
ofdrymatterdigestibility
(see
Methods);%DMD
=100indicates100%
digestibility
oftotaldrymatter;n=numberof
individualplantssourcedforsamples.Inmany
casesseveralsamples
weretakenfrom
thesameplantindividual
atdifferentoccasions.
aFeeding
timenotquantifiedbutobserved
during
partial-follo
wdays.
aNDFvalues
offigpulp
may
have
been
overestim
ated
bytheNIRSandarethereforenotdisplayed.
cNutritio
nalv
aluesof
caterpillarsshould
beinterpretedwith
caution.
Because
thiswas
theonly
sampleconsistin
gof
anim
almaterialNIRSmay
noth
avebeen
ableto
accurately
predictlevelsof
chem
ical
attributes.
Nutritional Ecology of Ateles chamek

Tab
leII
Relativecontributio
nsof
ingested
nutrientsfrom
the10
plantspeciesmostcommonly
consum
edanddaily
intakesof
differentnutrients
Species
Item
%DM
%Water
%Ash
%AP
%TNC
%Lipids
%NDF
%Tim
e
Top10
species(of47),representin
g84%
ofallconsum
eddryweight.
Ficus
boliviana
EB,I,MR,R,LB,YL,L
22.8
15.6
34.2
23.2
10.1
25.6
31.6
28.0
Myrciaria
sp.
MR,R
18.5
15.4
12.6
5.9
19.5
4.2
15.5
10.7
Pseudolmedia
laevis
EB,I,MR,R,FB,YL
16.4
19.1
11.6
14.4
27.9
8.4
11.3
10.4
Ficus
trigona
EB,I,MR,R,LB,YL
7.2
17.0
8.4
4.0
4.4
7.0
7.9
22.1
Spondias
mom
bin
R5.1
5.3
4.4
2.2
8.4
4.9
1.4
1.7
Guazumaulmifo
liaR
4.6
1.4
2.1
2.5
3.4
2.0
7.4
3.4
Jacaratia
spinosa
R,F,
L4.1
5.3
3.4
8.6
6.4
3.5
3.0
1.4
Pou
terianemorosa
I,MR,R
3.6
6.1
2.8
2.2
6.2
5.2
0.6
3.1
Heliocarpus
american
usLB,YL,L
3.4
2.3
6.3
7.7
1.0
6.2
6.2
2.1
Batocarpu
sam
azonicus
LB,YL
2.0
1.7
3.0
3.6
0.6
2.9
3.6
2.7
Ficus
sp.
Allitems
31.3
33.2
43.6
27.7
15.4
33.3
40.2
50.8
DM
Water
Ash
AP(CP)a
TNC
Lipids
NDF
Meandaily
intake
262g
1487
g15
.7g
11.5
g(17.2g)
88.4
g6.6g
94.5
g
SEof
mean
1510
30.9
0.8(0.7)
100.5
6
%of
daily
meandw
tintake
6.0%
4.4%
(6.6%)
34%
2.5%
36%
Datainclude51
full-dayfollo
wsover
theentirestudywith
plantspeciessorted
bytherelativ
eam
ount
ofdrymatteringested.
aCrude
protein(CP=totalN×6.25)intake
presentedforcomparison.
EB=em
erging
fruitbu
d;I=im
maturefruit;MR=medium
ripe
fruit;R=ripe
fruit;F=flow
er;FB=flow
erbu
d;LB=leaf
bud;
YL=yo
ungleaf;L=matureleaf;DM
=dry
matter;water
=proportio
nof
freshweight;AP=availableproteinestim
ated
from
invitroassay(availableN×6.25);TNC
=totalnonstructuralcarbohydrates(w
ater-soluble
carbohydrates+starch);NDF=neutraldetergentfiber;%
time:
percentage
oftotalfeedingtim
e.
A.M. Felton et al.

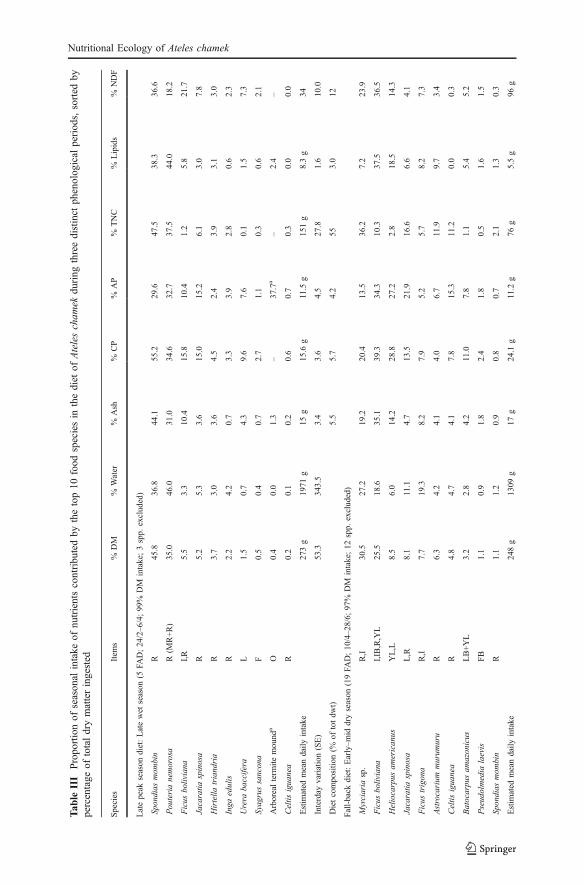
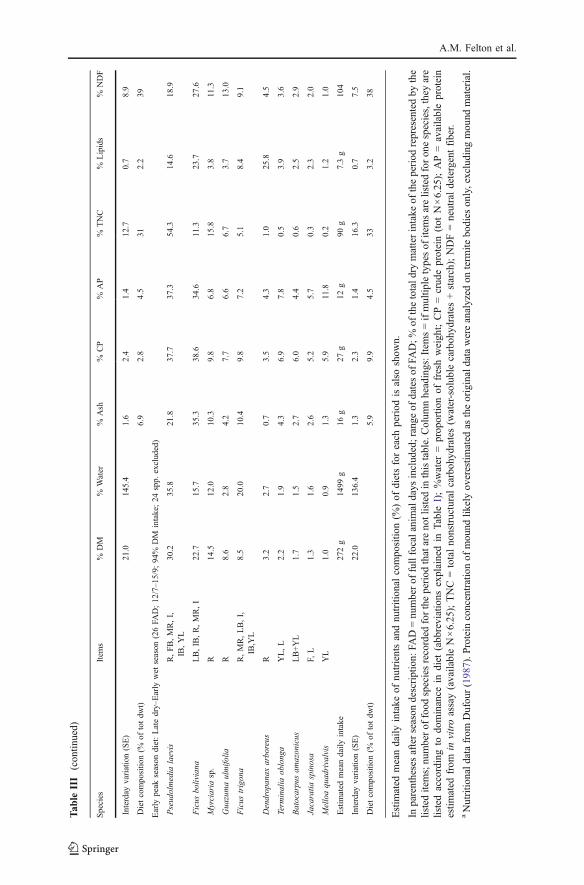
Seasonal Differences in Sources of Nutrients
The relative contributions of different food categories to spider monkeys’ nutrientintake varied among the 3 phenological seasons (Fig. 2), although ripe fruit wasprominent in all seasons. During the period of relative ripe fruit scarcity (dryseason), monkeys relied more on immature fruit and mature leaves than during theprevious peak fruiting season (Fig. 2b vs. 2a). At the beginning of the next peakfruiting season (early wet season), individuals changed from eating mature leaves toyoung leaves, but immature fruit (of which unripe figs constituted 84% of feedingtime) still provided >20% of all nutrients except TNC (Fig. 2c). The effects of thesedietary differences are reflected in the average nutritional state of individuals duringthe study (Fig. 2d). While protein intake remained stable across seasons, theabundance of TNC- and lipid-rich fruit in the habitat during the late peak fruitingseason resulted in monkeys ingesting an average of 52% more nonprotein energythan they did in the period of fruit scarcity (the latter being their fall-back diet;Fig. 2d). Some individuals consumed almost 6 times more energy per day during thepeak fruiting season versus the fruit-scarce period.
Fig Nutrition and Macronutritional Balance of Food Items
Figs were major sources of nutrients for FAs during 6 of the 8 sample months(Table III). Nutrient concentrations of figs varied greatly between species andstages of maturity (Table I). Compared with other fruit, figs contained low tomedium concentrations of lipids, available protein, and TNC (Table I). However,ripe figs of Ficus boliviana, 1 of the 2 most eaten fig species, have a macronutrientbalance that resembles the intake trajectories of the spider monkeys (Fig. 3). Incontrast, most other ripe fruits had higher TNC or lipid content than these ripe figs(Fig. 3). The mean observed ratio of protein energy to nonprotein energy intake ofdays when figs were consumed did not differ significantly from the ratio on thosedays when monkeys did not eat figs (F=3.62, df=36, p=0.07). This supports theconclusion that the ripe figs of Ficus boliviana, 2 other types of figs, and 3 kinds ofnonfig fruits are nutritionally balanced for the spider monkeys (shaded section inFig. 3).
Most (88%) of the unripe figs consumed came from Ficus boliviana. Theseunripe figs had high ratios of protein energy to nonprotein energy (Fig. 3), and hadmore available protein, lipid, and ash than did the ripe figs of the species (Table I).Although the ripe figs of Ficus boliviana contained higher concentrations of crudeprotein than did the immature figs, the reverse was true for available protein(Table I). Also, spider monkeys ingested both available protein (ANOVA, F=19.21,df=32, p<0.001) and lipids (F=4.61, df=32, p=0.039) more efficiently (g nutrientingested/minute feeding) when eating immature figs versus ripe figs of Ficusboliviana, whereas there is no difference in the intake efficiency of TNC (F=2.74,df=26, p=0.11). Spider monkeys always ate unripe figs in combination with otherfood types (mean 5.8 other food types ± 0.7 SE, range 1–10). Usually (79% of days),the other food was predominantly ripe fruit, rich in TNC or lipids (mean 55% ofDM; SE = 7% SE). In the remaining cases, individuals supplemented their unripe figconsumption with nutritionally balanced foods, such as ripe figs or palm fruit.
Nutritional Ecology of Ateles chamek

R
I
F
YL
L
O
0
1
2
3
4
5
6
7
0 0.05 0.1 0.15 0.2
0102030405060708090
100
0102030405060708090
100
0102030405060708090
100
a
bc
TN
C +
lip
id in
take
(M
J)%
of
tota
l nu
trie
nt
inta
ke%
of
tota
l nu
trie
nt
inta
ke%
of
tota
l nu
trie
nt
inta
keash protein lipids TNC NDF water
ash protein lipids TNC NDF water
ash protein lipids TNC NDF water
Protein intake (MJ)
late wet season
dry season
early wet season
a
b
c
d
Fig. 2 Contributions of differ-ent food categories to total nu-trient intakes by spider monkeysduring 3 phenological periods(a–c), and the associated meanmacronutrient intake balance (d).(a) Late wet season (n=5 focaldays). (b) Early–mid dry season(n=19). (c) Late dry–early wetseason (n=26). For explanationsof abbreviations of food catego-ries see Fig. 1 (O = other). (d)Mean seasonal intake ratios ofavailable protein versus nonpro-tein energy that result fromchanging dietary composition inseasons a–c. Vertical bars indi-cate 95% confidence limits. Theunit mega joule (MJ) is used forboth axes for the sake ofuniformity.
A.M. Felton et al.
Tab
leIII
Propo
rtionof
season
alintake
ofnu
trientscontributedby
thetop10
food
speciesin
thediet
ofAtelescham
ekduring
threedistinct
phenological
periods,sorted
bypercentage
oftotaldrymatteringested
Species
Item
s%
DM
%Water
%Ash
%CP
%AP
%TNC
%Lipids
%NDF
Latepeak
season
diet:Latewet
season
(5FA
D;24/2–6/4;99%
DM
intake;3spp.
excluded)
Spondias
mom
bin
R45.8
36.8
44.1
55.2
29.6
47.5
38.3
36.6
Pouterianemorosa
R(M
R+R)
35.0
46.0
31.0
34.6
32.7
37.5
44.0
18.2
Ficus
boliviana
I,R
5.5
3.3
10.4
15.8
10.4
1.2
5.8
21.7
Jacaratia
spinosa
R5.2
5.3
3.6
15.0
15.2
6.1
3.0
7.8
Hirtella
triandria
R3.7
3.0
3.6
4.5
2.4
3.9
3.1
3.0
Inga
edulis
R2.2
4.2
0.7
3.3
3.9
2.8
0.6
2.3
Urera
baccifera
L1.5
0.7
4.3
9.6
7.6
0.1
1.5
7.3
Syagrussancona
F0.5
0.4
0.7
2.7
1.1
0.3
0.6
2.1
Arborealterm
itemound
aO
0.4
0.0
1.3
–37.7a
–2.4
–
Celtis
iguanea
R0.2
0.1
0.2
0.6
0.7
0.3
0.0
0.0
Estim
ated
meandaily
intake
273g
1971
g15
g15.6
g11.5
g151g
8.3g
34
Interday
variation(SE)
53.3
343.5
3.4
3.6
4.5
27.8
1.6
10.0
Dietcompositio
n(%
oftotdw
t)5.5
5.7
4.2
553.0
12
Fall-back
diet:Early–m
iddryseason
(19FA
D;10/4–28/6;
97%
DM
intake;12
spp.
excluded)
Myrciaria
sp.
R,I
30.5
27.2
19.2
20.4
13.5
36.2
7.2
23.9
Ficus
boliviana
I,IB,R,YL
25.5
18.6
35.1
39.3
34.3
10.3
37.5
36.5
Heliocarpus
americanus
YL,L
8.5
6.0
14.2
28.8
27.2
2.8
18.5
14.3
Jacaratia
spinosa
L,R
8.1
11.1
4.7
13.5
21.9
16.6
6.6
4.1
Ficus
trigona
R,I
7.7
19.3
8.2
7.9
5.2
5.7
8.2
7.3
Astrocarium
murum
uru
R6.3
4.2
4.1
4.0
6.7
11.9
9.7
3.4
Celtis
iguanea
R4.8
4.7
4.1
7.8
15.3
11.2
0.0
0.3
Batocarpusam
azonicus
LB+YL
3.2
2.8
4.2
11.0
7.8
1.1
5.4
5.2
Pseudolmedia
laevis
FB
1.1
0.9
1.8
2.4
1.8
0.5
1.6
1.5
Spondias
mom
bin
R1.1
1.2
0.9
0.8
0.7
2.1
1.3
0.3
Estim
ated
meandaily
intake
248g
1309
g17
g24.1
g11.2
g76
g5.5g
96g
Nutritional Ecology of Ateles chamek
Tab
leIII
(contin
ued)
Species
Item
s%
DM
%Water
%Ash
%CP
%AP
%TNC
%Lipids
%NDF
Interday
variation(SE)
21.0
145.4
1.6
2.4
1.4
12.7
0.7
8.9
Dietcompositio
n(%
oftotdw
t)6.9
2.8
4.5
312.2
39
Early
peak
season
diet:Latedry–Early
wet
season
(26FA
D;12/7–15/9;
94%
DM
intake;24
spp.
excluded)
Pseudolmedia
laevis
R,FB,MR,I,
IB,YL
30.2
35.8
21.8
37.7
37.3
54.3
14.6
18.9
Ficus
boliviana
LB,IB,R,MR,I
22.7
15.7
35.3
38.6
34.6
11.3
23.7
27.6
Myrciaria
sp.
R14.5
12.0
10.3
9.8
6.8
15.8
3.8
11.3
Guazumaulmifo
liaR
8.6
2.8
4.2
7.7
6.6
6.7
3.7
13.0
Ficus
trigona
R,MR,LB,I,
IB,YL
8.5
20.0
10.4
9.8
7.2
5.1
8.4
9.1
Dendropanax
arboreus
R3.2
2.7
0.7
3.5
4.3
1.0
25.8
4.5
Term
inalia
oblonga
YL,L
2.2
1.9
4.3
6.9
7.8
0.5
3.9
3.6
Batocarpusam
azonicus
LB+YL
1.7
1.5
2.7
6.0
4.4
0.6
2.5
2.9
Jacaratia
spinosa
F,L
1.3
1.6
2.6
5.2
5.7
0.3
2.3
2.0
Melloaquadrivalvis
YL
1.0
0.9
1.3
5.9
11.8
0.2
1.2
1.0
Estim
ated
meandaily
intake
272g
1499
g16
g27
g12
g90
g7.3g
104
Interday
variation(SE)
22.0
136.4
1.3
2.3
1.4
16.3
0.7
7.5
Dietcompositio
n(%
oftotdw
t)5.9
9.9
4.5
333.2
38
Estim
ated
meandaily
intake
ofnutrientsandnutritional
compositio
n(%
)of
dietsforeach
period
isalso
show
n.
Inparenthesesafterseason
description:
FAD=numberof
fullfocalanimaldays
included;range
ofdatesof
FAD;%
ofthetotald
rymatterintake
oftheperiod
representedby
the
listeditems;numberof
food
speciesrecorded
fortheperiod
thatarenotlistedin
thistable.Colum
nheadings:Items=ifmultip
letypesof
itemsarelistedforon
especies,they
are
listedaccordingto
dominance
indiet
(abb
reviations
explainedin
TableI);%water
=proportio
nof
freshweight;CP=crudeprotein(tot
N×6.25);AP=availableprotein
estim
ated
from
invitroassay(availableN×6.25);TNC=totalnonstructuralcarbohydrates(w
ater-soluble
carbohydrates+starch);NDF=neutraldetergentfiber.
aNutritio
nald
atafrom
Dufour(198
7).P
rotein
concentrationof
mou
ndlik
elyov
erestim
ated
astheoriginaldatawereanalyzed
onterm
itebo
dies
only,excluding
mou
ndmaterial.
A.M. Felton et al.

Daily Tracking Between Feeding Events
By assessing cumulative nutrient intake trajectories across consecutive feedingevents, we found that individuals would attain an average balance between availableprotein and nonprotein energy (TNC+lipids) by maintaining: 1) a straight intaketrajectory (13% of days) or 2) zigzagging trajectory (83% of days). The straightintake trajectory (1) was a result of individuals eating nutritionally balanced foods,whereas the zigzagging trajectory (2) was a result of alternating between foods withhigh or low protein:(TNC+lipid) ratios. Alternatively, they would ingest morenonprotein energy than average by 3) staying on a straight intake trajectory whileeating foods extremely rich in TNC and lipids (4% of days). Individuals were morelikely to concentrate on nutritionally balanced foods (option 1) when ripe figs wereabundant and made up a large part of their diets (Table IV). In contrast, individualswere more likely to mix complementary foods on a daily basis (option 2) when bothripe figs and other ripe fruit were in moderate abundance. Finally, they were morelikely to ingest extremely large amounts of nonprotein energy (option 3) when figswere scarce but other ripe fruits were abundant and therefore highly prominent intheir diet (Table IV). We assume that spider monkeys consumed surplus energywhen using option 3, i.e., more energy than needed to maintain body weight.
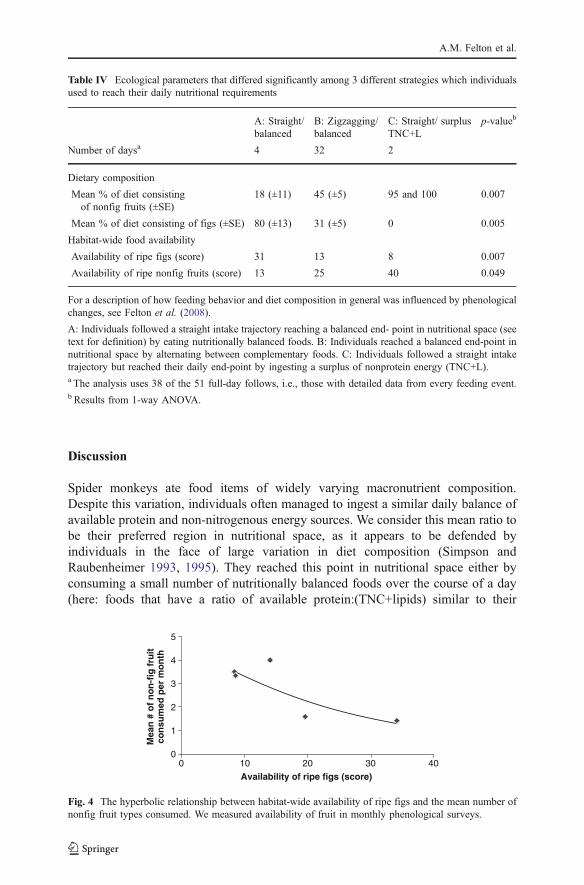
During the months when ripe nonfig fruit was abundant (late wet season, n=3monthly phenological surveys; and early wet season, n=2), there was a negativehyperbolic relationship between the availability of ripe figs and the mean number ofdifferent nonfig fruit types consumed per day (R2=0.72; Fig. 4). During thesemonths, individuals could choose whether to eat a multitude of ripe fruit types, butthey did so only when the availability of ripe figs was low (Fig. 4).
0
0.5
1
1.5
2
2.5
3
0 0.05 0.1 0.15 0.2
Protein (MJ)
TN
C +
lip
ids
(MJ) Spo
ndia
s m
ombi
n (R
)
Pou
teria
nem
oros
a (R
)
Ficu
s trigo
na (R
)
Pseud
olmed
ia la
evis (R
)
Ficus
exim
ia (R
)
Dendropanax a
rbore
us (R)
Guazuma ulm
ifolia
(R)
Ficus pertusa (R
)Ficus boliviana (R)
Socratea exorrhiza (R)Jacaratia spinosa (R)Ficus trigona (I)Celtis iguana (R)
Pseudolmedia laevis (FB)
Ficus boliviana (I)Batocarpus amazonicus (LB)Heliocarpus americanus (L)Terminalia oblonga (YL)Ficus boliviana (LB)
Fig. 3 Ratios of the available protein energy versus nonprotein energy of the 17 most commonly eatenfoods (dashed lines), in relation to the mean observed intake ratio across all observation days (solid line,95% confidence intervals depicted with a shaded area). Each food item is depicted by a dashed line thatrepresents its macronutritional balance in nutritional space and shows the hypothetical intake trajectory ofan individual that is restricted to this food item. We include 2 additional species of Ficus for comparison.R = ripe fruits; I = immature fruits; L = leaves; YL = young leaves; LB = leaf buds; FB = flower buds.
Nutritional Ecology of Ateles chamek
Discussion
Spider monkeys ate food items of widely varying macronutrient composition.Despite this variation, individuals often managed to ingest a similar daily balance ofavailable protein and non-nitrogenous energy sources. We consider this mean ratio tobe their preferred region in nutritional space, as it appears to be defended byindividuals in the face of large variation in diet composition (Simpson andRaubenheimer 1993, 1995). They reached this point in nutritional space either byconsuming a small number of nutritionally balanced foods over the course of a day(here: foods that have a ratio of available protein:(TNC+lipids) similar to their
Table IV Ecological parameters that differed significantly among 3 different strategies which individualsused to reach their daily nutritional requirements
A: Straight/balanced
B: Zigzagging/balanced
C: Straight/ surplusTNC+L
p-valueb
Number of daysa 4 32 2
Dietary composition
Mean % of diet consistingof nonfig fruits (±SE)
18 (±11) 45 (±5) 95 and 100 0.007
Mean % of diet consisting of figs (±SE) 80 (±13) 31 (±5) 0 0.005
Habitat-wide food availability
Availability of ripe figs (score) 31 13 8 0.007
Availability of ripe nonfig fruits (score) 13 25 40 0.049
For a description of how feeding behavior and diet composition in general was influenced by phenologicalchanges, see Felton et al. (2008).
A: Individuals followed a straight intake trajectory reaching a balanced end- point in nutritional space (seetext for definition) by eating nutritionally balanced foods. B: Individuals reached a balanced end-point innutritional space by alternating between complementary foods. C: Individuals followed a straight intaketrajectory but reached their daily end-point by ingesting a surplus of nonprotein energy (TNC+L).a The analysis uses 38 of the 51 full-day follows, i.e., those with detailed data from every feeding event.b Results from 1-way ANOVA.
0
1
2
3
4
5
0 10 20 30 40
Availability of ripe figs (score)
Mea
n #
of
no
n-f
ig f
ruit
con
sum
ed p
er m
on
th
Fig. 4 The hyperbolic relationship between habitat-wide availability of ripe figs and the mean number ofnonfig fruit types consumed. We measured availability of fruit in monthly phenological surveys.
A.M. Felton et al.

observed mean intake), or by alternating between nutritionally complementary foodsthat contained either high or low ratios. We discuss each of these alternatives in turn.
Consuming nutritionally balanced foods represents the most direct route to apreferred region of nutritional space. Three types of figs were nutritionally balanced,as were food items from 3 other plant species: ripe fruit of the tree Jacaratiaspinosa, the liana Celtis iguanea, and the palm Socratea exorrhiza (Fig. 3). Of theseplant species, figs played a disproportionately large role in the spider monkey’s diet.Spider monkeys spent 45% of their feeding time eating figs that provided them withapproximately a third of their total intake of lipids and available protein. Individualswere more likely to follow a straight intake trajectory toward a balancedmacronutritional end-point when ripe figs were highly abundant and comprised alarge proportion of their diet.
We suggest that there are several reasons why figs played a pivotal role in the dietof these spider monkeys. First, Ficus boliviana and F. trigona were relativelycommon in their territory and produced large fruit crops for 8–9 mo of the year(Felton et al. 2008). Second, our findings suggest that these figs are balancednutritionally in relation to the spider monkeys’ nutritional target. As such, thenutrient balance of figs may be more indicative of their value than the concentrationsof individual macronutrients per se, which are generally moderate to low (this study;Conklin and Wrangham 1994; Herbst 1986; Jordano 1983). Our conclusion that figsare nutritionally balanced is not a byproduct of their dominating the diet because themean observed ratio of protein to nonprotein energy intake across days when figswere consumed did not differ significantly from the ratio on days when monkeys didnot eat figs at all. Third, figs contained high concentrations of inorganic material,presumably minerals (ash), and contributed 44% of the monkeys’ total intake ofinorganic material. Figs are extremely rich sources of available calcium (Duhan et al.1992; O’Brien et al. 1998; Ruby et al. 2000; Silver et al. 2000; Wendeln et al.2000), which is critical for maintenance and reproduction (Robbins 1993). Wesuggest that all of these factors contributed to figs being the staple food of spidermonkeys in La Chonta.
Interestingly, the spider monkeys included a large number of other ripe fruit typesin their diet only when ripe figs were scarce, despite the opportunity to do otherwise(Fig. 4). There is a common perception that tropical frugivores regard figs as criticalfall-back foods, rather than as preferred foods when other options are available(Milton et al. 1982; Shanahan et al. 2001). Our results are not congruent with thisopinion and indicate that these spider monkeys eat a diverse array of different fruit toendure periods of fig scarcity (Kinnaird and O’Brien 2005). We tentatively suggestthat the unusually large size of this spider monkey community —55 individuals,mean for communities of Ateles is 31 (Campbell 2008)— is partly attributable to thepreponderance of this nutritionally balanced and mineral-rich staple food. Thisconclusion is relevant to the conservation of spider monkeys in Bolivia becauseFicus boliviana is commercially harvested for timber in this country.
If nutritionally balanced foods were not sufficiently available for spider monkeysto meet their daily requirements, individuals could reach their preferred region innutritional space by eating nutritionally imbalanced but complementary foods(Milton 1982). Although this zigzagging feeding strategy was by far the mostcommonly used (84% of cases), it may have associated costs. Repeated alternation
Nutritional Ecology of Ateles chamek

between foods involves lost feeding time, higher energetic costs of locomotion, andpresumably increased risk of predation (Chambers et al. 1995; Dunbar 1988).Individuals were more likely to employ this zigzagging strategy when ripe figs andother ripe fruit were of low to moderate availability. For example, monkeys alwaysused the zigzagging strategy during the early–mid dry season when ripe fruit wasscarce. Leaves were frequently part of this fall-back diet and individuals wouldsystematically alternate between leaves and the few ripe fruits available. Notably, thepresence or absence of leaves and flowers in the diet did not influence the dailyprotein intake of these monkeys. Researchers often assume that frugivorous primatesmust eat some leaves to obtain sufficient protein (Chapman and Russo 2007;Lambert 2007; Milton 1981, 1993; Oates 1987; Oftedal 1991; Strier 2007; cf. Milton1999). Our results show that this is not the case for spider monkeys at least on adaily basis, because they consistently reached the protein intake target even wheneating only ripe fruit.
During the late wet season when ripe fruits were highly abundant, individualsconsumed large amounts of fruit rich in TNC or lipids (energy-dense fruit, e.g.,Spondias mombin and Pouteria nemorosa), resulting in a dramatically higher totalenergy intake than average (Fig. 2d). We hypothesize that the spider monkeys tookadvantage of these peak season foods by ingesting surplus energy and storing it asfat in preparation for the impending period of food scarcity when total energy intakehalved. This and other ateline species (Ateles paniscus: Milton 1998; Lagothrixlagotricha cana: Peres 1994; Ateles chamek: Wallace 2005) accumulate fat duringperiods of peak fruit abundance, which is a logical strategy for animals experiencingfluctuating food supply. Seasonal accumulation of fat reserves may be crucial forsurvival and reproduction in spider monkeys, and we therefore suggest that energy-dense peak-season foods be given appropriate attention in conservation planning(see also Stevenson 2005).
Researchers can use the framework of protein-dominated nutrient balancing tounravel spider monkey food choices that are difficult to explain using traditionalschools of thought in nutritional ecology. For example, in contrast to other spidermonkey communities studied, the spider monkeys at La Chonta spent much timeconsuming unripe figs (18% of feeding time, primarily from Ficus boliviana) bothduring periods of abundance and scarcity of ripe figs and other fruit (Felton et al.2008). When ripe figs and other fruits were scarce, the consumption of unripe figswas likely a matter of availability (Norconk et al. 1998; Schaefer and Schaefer2006). Unripe figs were always available in the home range, making them a morereliable food source than ripe figs. The more intriguing issue is why spider monkeysate unripe figs when ripe figs and other fruits were available.
Ripe-fruit specialists often avoid unripe fruits because they are usually lesspalatable than ripe fruits (Venu et al. 2005), contain less gross energy (Schaefer et al.2003), and often contain toxins or antifeedants (Cipollini and Levey 1997a, b). Someof this may be true for the unripe figs in this study but, importantly, the unripe figs ofFicus boliviana provided spider monkeys with more lipids and available protein perminute feeding than did their ripe counterparts. This greater efficiency was partlydue to the high concentrations of lipids and available protein, the latter likelyenhanced by the inclusion of protein-rich wasp bodies (Herbst 1986). Anotherreason for the high intake efficiency was the speed at which monkeys could consume
A.M. Felton et al.

the small unripe figs in their entirety. When eating ripe figs monkeys usuallyseparated the juicy pulp from the husk in a relatively time-consuming manner.Further, our data show that the consumption of unripe figs always occurred incombination with other food types, and usually the alternative foods containedrelatively high concentrations of nonprotein energy. Unripe figs thus constituted aneasily harvestable, nutritionally rewarding, and continuously available complemen-tary food.
We emphasize that unripe figs contained less crude protein than their ripecounterparts, whereas the reverse was true for available protein. Further, daily intakeof crude protein by spider monkeys fluctuated by 75% across all 3 seasons, whereasavailable protein intake remained steady. Both of these examples provide ampleevidence of the importance of estimating nitrogen availability to understandaccurately food choice and underlying nutritional goals (Felton et al. 2009a).
Conclusions
We highlight 4 important findings from this study: 1) To reach their daily proteintarget spider monkeys followed 1 of 3 nutrient intake trajectories, the choice ofwhich was influenced by seasonal variation in fruit availability. 2) In contrast toprevailing theory, spider monkeys did not need to supplement their frugivorous dietwith leaves to reach their daily protein target. 3) Our data provided an exception tothe general rule that figs are a less-preferred food that assists animals in overcominglean periods. In our study, spider monkeys consumed a diverse array of differentfruits to endure periods of fig scarcity. 4) During all seasons, unripe figs were asubstantial component of the spider monkeys’ diet. We suggest the reason is thatunripe figs constituted a nutritionally rewarding food resource, especially in terms ofprotein and lipids, that was efficiently harvestable and available throughout theentire year.
Acknowledgments This project was supported through the generous financial assistance of the WildlifeConservation Society, Conservation International, the Rufford Foundation, and the Primate Society ofGreat Britain. We thank the personnel of Instituto Boliviano de Investigación Forestal (IBIF),Agroindustría Forestal La Chonta Ltda, and el Proyecto de Manejo Forestal Sostenible (BOLFOR) forproviding logistical support and expert advice, especially Marielos Peña-Claros, Todd Fredericksen, andJoaquin Justiniano. José and Genaro Chuviña provided integral assistance during all phases of the fieldwork. We also thank Renna Short, Helga Peters, Petter König, and all other volunteers and field workers.We thank Nancy Conklin-Brittain, Francis Marsh, and Rositta Shun Ting Au for guidance and assistancein laboratory work. Advice from Robert Wallace, Ross Cunningham, and Colin Groves contributed to thedesign of this project and Clive Hilliker helped with graphics. We also thank Stephen Simpson forproviding mentorship on the use of the Geometric Framework, and 2 anonymous reviewers for improvingon an earlier version of this paper.
References
Altmann, S. A. (1998). Foraging for survival. Chicago: University of Chicago Press.ANON. (1995). Standard practices for infrared multivariate quantitative analysis (designation E1655–
00). West Conshohocken, PA.: American Society for Testing and Materials.
Nutritional Ecology of Ateles chamek

Beehner, J. C., Onderdonk, D. A., Alberts, S. C., & Altmann, J. (2006). The ecology of conception andpregnancy failure in wild baboons. Behavioral Ecology, 17(5), 741–750.
Campbell, C. J. (2008). Spider monkeys: Behavior, ecology and evolution of the genus Ateles. Cambridge,UK: Cambridge University Press.
Castellanos, H. G. (1995). Feeding behaviour of Ateles belzebuth E. Geoffroy 1806 (Cebidae: Atelinae) inTawadu Forest Southern Venezuela. Ph.D dissertation, The University of Exeter, UK.
Chambers, P. G., Simpson, S. J., & Raubenheimer, D. (1995). Behavioural mechanisms of nutrientbalancing in Locusta migratoria nymphs. Animal Behaviour, 50, 1513–1523.
Chapman, C. A., & Russo, S. E. (2007). Primate seed dispersal: Linking behavioral ecology with forestcommunity structure. In C. J. Campbell, A. Fuentes, K. C. MacKinnon, M. Panger & S. K. Bearder(Eds.), Primates in perspective (pp. 510–524). Oxford: Oxford University Press.
Cipollini, M. L., & Levey, D. J. (1997a). Secondary metabolites of fleshy vertebrate-dispersed fruits:Adaptive hypotheses and implications for seed dispersal. American Naturalist, 150(3), 346–372.
Cipollini, M. L., & Levey, D. J. (1997b). Why are some fruits toxic? Glycoalkaloids in Solanum and fruitchoice by vertebrates. Ecology, 78(3), 782–798.
Conklin, N. L., & Wrangham, R. W. (1994). The value of figs to a hind-gut fermenting frugivore—anutritional analysis. Biochemical Systematics and Ecology, 22(2), 137–151.
De Gabriel, J. L., Wallis, I. R., Moore, B. D., & Foley, W. J. (2008). A simple, integrative assay toquantify nutritional quality for browsing herbivores. Oecologia, 156(1), 107–116.
Dearing, M. D., Foley, W. J., & McLean, S. (2005). The influence of plant secondary metabolites on thenutritional ecology of herbivorous terrestrial vertebrates. Annual Review of Ecology Evolution andSystematics, 36, 169–189.
Dew, J. L. (2005). Foraging, food choice, and food processing by sympatric ripe-fruit specialists:Lagothrix lagotricha poeppigii and Ateles belzebuth belzebuth. International Journal of Primatology,26(5), 1107–1135.
Di Fiore, A., & Rodman, P. S. (2001). Time allocation patterns of lowland woolly monkeys (Lagothrixlagotricha poeppigii) in a neotropical terra firma forest. International Journal of Primatology, 22(3),449–480.
Di Fiore, A., Link, A., & Dew, J. L. (2008). Diets of wild spider monkeys. In C. J. Campbell (Ed.), Spidermonkeys: Behavior, ecology and evolution of the genus Ateles (pp. 81–137). Cambridge, UK:Cambridge University Press.
Dufour, D. L. (1987). Insects as food—a case study from the Northwest Amazon. AmericanAnthropologist, 89(2), 383–397.
Duhan, A., Chauhan, B. M., & Punia, D. (1992). Nutritional value of some nonconventional plant foods ofIndia. Plant Foods for Human Nutrition, 42(3), 193–200.
Dunbar, R. I. M. (1988). Primate social systems. London and Sydney: Croom Helm Ltd.Felton, A. M., Felton, A., Wood, J. T., & Lindenmayer, D. B. (2008). Diet and feeding ecology of the
Peruvian spider monkey (Ateles chamek) in a Bolivian semi-humid forest: the importance of Ficus asa staple food resource. International Journal of Primatology, 29, 379–403.
Felton, A. M., Felton, A., Lindenmayer, D. B., & Foley, W. J. (2009). Nutritional goals of wild primates.Functional Ecology, 23(1), 70–78.
Felton, A. M., Felton, A., Raubenheimer, D., Simpson, S. J., Foley, W. J., Wood, J. T., et al. (2009).Protein content of diets dictates the daily energy intake of a free-ranging primate. BehavioralEcology,. doi:10.1093/beheco/arp021.
Foley, W. J., McIlwee, A., Lawler, I., Aragones, L., Woolnough, A. P., & Berding, N. (1998). Ecologicalapplications of near infrared reflectance spectroscopy a tool for rapid, cost-effective prediction of thecomposition of plant and animal tissues and aspects of animal performance. Oecologia, 116(3), 293–305.
Freeland, W. J., & Janzen, D. H. (1974). Strategies in herbivory by mammals - role of plant secondarycompounds. American Naturalist, 108(961), 269–289.
Herbst, L. H. (1986). The role of nitrogen from fruit pulp in the nutrition of the frugivorous bat Carolliaperspicillata. Biotropica, 18(1), 39–44.
Jordano, P. (1983). Fig-seed predation and dispersal by birds. Biotropica, 15(1), 38–41.Kinnaird, M. F., & O’Brien, T. G. (2005). Fast foods of the forest: The influence of figs on primates and
hornbills across Wallace’s line. In J. L. Dew & J. P. Bouble (Eds.), Tropical fruits and frugivores: Thesearch for strong predictors (pp. 155–184).
Kinzey, W. G. (1997). Ateles. In W. G. Kinzey (Ed.), New World primates: Ecology, evolution, andbehavior (pp. 192–199). New York: Aldine de Gruyter.
A.M. Felton et al.

Lambert, J. E. (2007). Primate nutritional ecology: feeding biology and diet at ecological and evolutionaryscales. In C. J. Campbell, A. Fuentes, K. C. MacKinnon, M. Panger & S. K. Bearder (Eds.), Primatesin perspective (pp. 482–495). Oxford: Oxford University Press.
Mattson, W. J. (1980). Herbivory in relation to plant nitrogen content. Annual Review of Ecology andSystematics, 11, 119–161.
Milton, K. (1981). Food choice and digestive strategies of two sympatric primate species. AmericanNaturalist, 117(4), 496–505.
Milton, K. (1982). Dietary quality and demographic regulation in a howler monkey population. In E. G.Leigh, A. S. Rand & D. M. Windsor (Eds.), The ecology of a tropical forest: Seasonal rhythms andlong-term changes (pp. 273–289). Washington, DC: Smithsonian Institution Press.
Milton, K. (1993). Diet and primate evolution (pp.86–93). Scientific American, Aug.Milton, K. (1998). Physiological ecology of howlers (Alouatta): Energetic and digestive considerations
and comparison with the Colobinae. International Journal of Primatology, 19(3), 513–548.Milton, K. (1999). A hypothesis to explain the role of meat-eating in human evolution. Evolutionary
Anthropology, 8(1), 11–21.Milton, K., & Dintzis, F. R. (1981). Nitrogen-to-protein conversion factors for tropical plant-samples.
Biotropica, 13(3), 177–181.Milton, K., Windsor, D. M., Morrison, D. W., & Estribi, M. A. (1982). Fruiting phenologies of two
Neotropical Ficus species. Ecology, 63(3), 752–762.Norconk, M. A., Grafton, B. W., & Conklin-Brittain, N. L. (1998). Seed dispersal by Neotropical seed
predators. American Journal of Primatology, 45(1), 103–126.Oates, J. F. (1987). Food distribution and foraging behavior. In B. B. Smuts, D. L. Cheyney, R. M.
Seyfarth, R. W. Wrangham & T. T. Struhsaker (Eds.), Primate Societies (pp. 197–209). Chicago:University of Chicago Press.
O’Brien, T. G., Kinnaird, M., & Dierenfeld, E. S. (1998). What’s so special about figs? Nature, 392, 668.Oftedal, O. T. (1991). The nutritional consequences of foraging in primates—the relationship of nutrient
intakes to nutrient-requirements. Philosophical Transactions of the Royal Society of London. Series B,Biological Sciences, 334(1270), 161–170.
Peres, C. A. (1994). Diet and feeding ecology of gray woolly monkeys (Lagothrix lagotricha cana) inCentral Amazonia—comparisons with other atelines. International Journal of Primatology, 15(3),333–372.
Raubenheimer, D., & Simpson, S. J. (1997). Integrative models of nutrient balancing: Application toinsects and vertebrates. Nutrition Research Reviews, 10, 151–179.
Raubenheimer, D., & Simpson, S. J. (2004). Organismal stoichiometry: quantifying non-independenceamong food components. Ecology, 85(5), 1203–1216.
Raubenheimer, D., & Simpson, S. J. (2006). The challenge of supplementary feeding: can geometricanalysis help save the kakapo? Notornis, 53, 100–111.
Robbins, C. T. (1993). WIldlife feeding and nutrition (2nd edition ed.): Academic Press.Robbins, C. T., Fortin, J. K., Rode, K. D., Farley, S. D., Shipley, L. A., & Felicetti, L. A. (2007).
Optimizing protein intake as a foraging strategy to maximize mass gain in an omnivore. Oikos, 116(10), 1675–1682.
Rosenberger, A. L., & Strier, K. B. (1989). Adaptive radiation of the ateline primates. Journal of HumanEvolution, 18(7), 717–750.
Ruby, J., Nathan, P. T., Balasingh, J., & Kunz, T. H. (2000). Chemical composition of fruits and leaveseaten by short-nosed fruit bat, Cynopterus sphinx. Journal of Chemical Ecology, 26(12), 2825–2841.
Ruohonen, K., Simpson, S. J., & Raubenheimer, D. (2007). A new approach to diet optimisation: A re-analysis using European whitefish (Coregonus lavaretus). Aquaculture, 267(1–4), 147–156.
Schaefer, H. M., & Schaefer, V. (2006). The fruits of selectivity: How birds forage on Goupia glabra fruitsof different ripeness. Journal of Ornithology, 147(4), 638–643.
Schaefer, H. M., Schmidt, V., & Winkler, H. (2003). Testing the defense trade-off hypothesis: Howcontents of nutrients and secondary compounds affect fruit removal. Oikos, 102(2), 318–328.
Schoener, T. W. (1971). Theory of feeding strategies. Annual Review of Ecology and Systematics, 2, 369–404.
Shanahan, M., So, S., Compton, S. G., & Corlett, R. (2001). Fig-eating by vertebrate frugivores: A globalreview. Biological Reviews, 76(4), 529–572.
Silver, S. C., Ostro, L. E. T., Yeager, C. P., & Dierenfeld, E. S. (2000). Phytochemical and mineralcomponents of foods consumed by black howler monkeys (Alouatta pigra) at two sites in Belize. ZooBiology, 19(2), 95–109.
Nutritional Ecology of Ateles chamek
Simpson, S. J., & Raubenheimer, D. (1993). A multilevel analysis of feeding behavior - the geometry ofnutritional decisions. Philosophical Transactions of the Royal Society of London. Series B, BiologicalSciences, 342(1302), 381–402.
Simpson, S. J., & Raubenheimer, D. (1995). The geometric analysis of feeding and nutrition—a user’sguide. Journal of Insect Physiology, 41(7), 545–553.
Simpson, S. J., & Raubenheimer, D. (2001). The geometric analysis of nutrient-allelochemicalinteractions: a case study using locusts. Ecology, 82(2), 422–439.
Simpson, S. J., & Raubenheimer, D. (2005). Obesity: the protein leverage hypothesis. Obesity Reviews, 6(2), 133–142.
Stevenson, P. (2005). Potential keystone plant species for the frugivore community at Tinigua Park,Colombia. In J. L. Dew & J. P. Bouble (Eds.), Tropical fruits and frugivores: The Search for StrongPredictors (pp. 37–57): Springer.
Strier, K. B. (1992). Atelinae adaptations—behavioral strategies and ecological constraints. AmericanJournal of Physical Anthropology, 88(4), 515–524.
Strier, K. B. (2007). Primate behavioral ecology (3rd ed.). Columbus, OH: Allyn & Bacon.Venu, D. K., Munjal, S. V., Waskar, D. P., Patil, S. R., & Kale, A. A. (2005). Biochemical changes during
growth and development of fig (Ficus carica L.) fruits. Journal of Food Science and Technology-Mysore, 42(3), 279–282.
Wallace, R. B. (2005). Seasonal variations in diet and foraging behavior of Ateles chamek in a southernAmazonian tropical forest. International Journal of Primatology, 26(5), 1053–1075.
Wendeln, M. C., Runkle, J. R., & Kalko, E. K. V. (2000). Nutritional values of 14 fig species and batfeeding preferences in Panama. Biotropica, 32(3), 489–501.
White, T. C. R. (1993). The inadequate environment: Nitrogen and the abundance of animals. Berlin/Heidelberg/New York: Springer.
A.M. Felton et al.