Numerical simulation of Urban Heat Island effect by the WRF Model with 4-km grid increment: an...
14
University of Tsukuba Title Numerical Simulation of Urban Heat Island Effect by the WRF Model with 4-km Grid Increment: An Inter-Comparison Study between the Urban Canopy Model and Slab Model Author(s) KUSAKA, Hiroyuki; CHEN, Fei; TEWARI, Mukul; DUDHIA, Jimy; GILL, David O.; DUDA, Michael G.; WANG, Wei; MIYA, Yukako Citation Journal of the Meteorological Society of Japan, 90B: 33-45 Issue Date 2012-06 Text version publisher URL http://hdl.handle.net/2241/117403 DOI 10.2151/jmsj.2012-B03 Right © 2012, Meteorological Society of Japan
Transcript of Numerical simulation of Urban Heat Island effect by the WRF Model with 4-km grid increment: an...
University of Tsukuba
TitleNumerical Simulation of Urban Heat Island Effect by the WRFModel with 4-km Grid Increment: An Inter-Comparison Studybetween the Urban Canopy Model and Slab Model
Author(s)KUSAKA, Hiroyuki; CHEN, Fei; TEWARI, Mukul;DUDHIA, Jimy; GILL, David O.; DUDA, Michael G.;WANG, Wei; MIYA, Yukako
Citation Journal of the Meteorological Society of Japan, 90B: 33-45
Issue Date 2012-06
Text version publisher
URL http://hdl.handle.net/2241/117403
DOI 10.2151/jmsj.2012-B03
Right © 2012, Meteorological Society of Japan
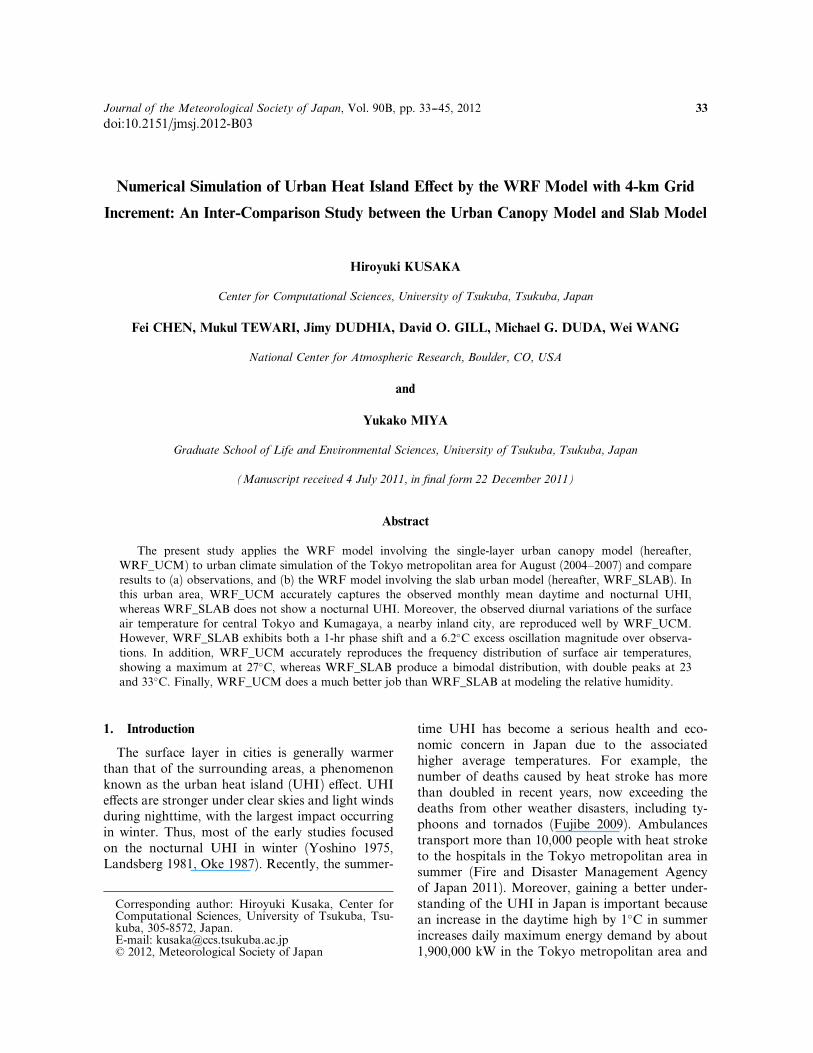
Journal of the Meteorological Society of Japan, Vol. 90B, pp. 33--45, 2012 33
doi:10.2151/jmsj.2012-B03
Numerical Simulation of Urban Heat Island E¤ect by the WRF Model with 4-km Grid
Increment: An Inter-Comparison Study between the Urban Canopy Model and Slab Model
Hiroyuki KUSAKA
Center for Computational Sciences, University of Tsukuba, Tsukuba, Japan
Fei CHEN, Mukul TEWARI, Jimy DUDHIA, David O. GILL, Michael G. DUDA, Wei WANG
National Center for Atmospheric Research, Boulder, CO, USA
and
Yukako MIYA
Graduate School of Life and Environmental Sciences, University of Tsukuba, Tsukuba, Japan
(Manuscript received 4 July 2011, in final form 22 December 2011)
Abstract
The present study applies the WRF model involving the single-layer urban canopy model (hereafter,WRF_UCM) to urban climate simulation of the Tokyo metropolitan area for August (2004–2007) and compareresults to (a) observations, and (b) the WRF model involving the slab urban model (hereafter, WRF_SLAB). Inthis urban area, WRF_UCM accurately captures the observed monthly mean daytime and nocturnal UHI,whereas WRF_SLAB does not show a nocturnal UHI. Moreover, the observed diurnal variations of the surfaceair temperature for central Tokyo and Kumagaya, a nearby inland city, are reproduced well by WRF_UCM.However, WRF_SLAB exhibits both a 1-hr phase shift and a 6.2�C excess oscillation magnitude over observa-tions. In addition, WRF_UCM accurately reproduces the frequency distribution of surface air temperatures,showing a maximum at 27�C, whereas WRF_SLAB produce a bimodal distribution, with double peaks at 23and 33�C. Finally, WRF_UCM does a much better job than WRF_SLAB at modeling the relative humidity.
1. Introduction
The surface layer in cities is generally warmerthan that of the surrounding areas, a phenomenonknown as the urban heat island (UHI) e¤ect. UHIe¤ects are stronger under clear skies and light windsduring nighttime, with the largest impact occurringin winter. Thus, most of the early studies focusedon the nocturnal UHI in winter (Yoshino 1975,Landsberg 1981, Oke 1987). Recently, the summer-
time UHI has become a serious health and eco-nomic concern in Japan due to the associatedhigher average temperatures. For example, thenumber of deaths caused by heat stroke has morethan doubled in recent years, now exceeding thedeaths from other weather disasters, including ty-phoons and tornados (Fujibe 2009). Ambulancestransport more than 10,000 people with heat stroketo the hospitals in the Tokyo metropolitan area insummer (Fire and Disaster Management Agencyof Japan 2011). Moreover, gaining a better under-standing of the UHI in Japan is important becausean increase in the daytime high by 1�C in summerincreases daily maximum energy demand by about1,900,000 kW in the Tokyo metropolitan area and
Corresponding author: Hiroyuki Kusaka, Center forComputational Sciences, University of Tsukuba, Tsu-kuba, 305-8572, Japan.E-mail: [email protected] 2012, Meteorological Society of Japan
its surroundings, as a result of increased air-conditioning demand (e.g., Goto et al. 2004). Also,sleep disruption is common in summer, which leadsto an associated economic loss during businesshours (Ihara et al. 2011). Thus, many Japanesecities require the mitigation of the UHI e¤ect.
Projection of social implications of the futureUHI is a concern for both impact assessment re-searchers and urban residents. These concerns canbe addressed using an urban canopy model (UCM)coupled to a larger-scale atmospheric and climatemodel. In the urban climate study fields, a numberof UCM schemes have been developed (e.g., Brownand Williams 1998, Masson 2000, Kusaka et al.2001, Martilli et al. 2002, Harman et al. 2004, Otteet al. 2004, Kondo et al. 2005, Best 2005, Kandaet al. 2005, Lee and Park 2008, Oleson et al. 2008,Ikeda and Kusaka 2009, Porson et al. 2009, 2010,Aoyagi and Seino 2011). Some researchers havecoupled a UCM to a global climate model (GCM)(McCarthy et al. 2010, Oleson et al. 2011), andothers couple the UCM to a regional climate model(RCM) (e.g., Lemonsu and Masson 2002, Rozo¤et al. 2003, Dupont et al. 2004, Otte et al. 2004,Dandou et al. 2005, Holt and Pullen 2007, Zhanget al. 2007, Chen et al. 2010, Aoyagi and Seino2011).
The Weather Research and Forecasting (WRF)model (Skamarock et al. 2008), a regional atmo-spheric model, has been recently used in the urbanclimate field world-wide since the single-layer UCM(Kusaka et al. 2001) was installed (e.g., IAUC2009, Chen et al. 2010). Performance of the WRFmodel with the single-layer UCM has been alreadyevaluated in many case studies with regards to theUHI and urban boundary layer structure. Miaoet al. (2009) used the WRF with the single-layerUCM to simulate the UHI and boundary layerstructures in Beijing, and showed that the modelcould reproduce the observed diurnal variation ofUHI intensity, the spatial distribution of UHI, thediurnal variation of wind speed and direction, andsmall-scale boundary layer convective rolls andcells over the urban area. Later, Chen et al. (2011)applied this modeling system to the Houston-Galveston area, and found that it did a remarkablejob of capturing the observed nocturnal UHI inten-sity, diurnal rotation of surface winds, as well as thetiming and vertical extent of the sea breeze and itsreversal in the boundary layer. Lin et al. (2008),Shou and Zhang (2010), and Chen et al. (2011) in-vestigated the interaction between UHI and sea
breeze. Miao et al. (2010, 2011) and Lin et al.(2011) evaluated the impact of urbanization onheavy rainfalls. Grossman-Clarke (2010) examinedthe contribution of land-use changes to surface airtemperatures during an extreme heat events in thePhoenix metropolitan area. Takane and Kusaka(2011) examined the record-breaking extreme highsurface air temperature observed in the Tokyo met-ropolitan area and showed the utility of this model-ing system for studying foehn and UHI phenom-ena. Jiang et al. (2008) predicted impacts of landuse change on surface ozone in the Houston. Te-wari et al. (2010) used the WRF model and CFDmodel for urban scale contaminant transport anddispersion simulation. Miao et al. (2010) andZhang et al. (2010) showed that the WRF modelcoupled to the single-layer UCM could reproducethe monthly-average UHI over the Beijing and theYangtze River Delta Economic Belt areas. In thisstudy, we use the WRF model with a single-layerUCM to simulate August surface temperatures andhumidities in the Tokyo metropolitan area. Ourprimary purpose is to evaluate the reproducibilityof UHI and relative humidity (RH) observations.Moreover, to provide useful information for nu-merical model developers, we compare results onthe UHI and RH from coupling the WRF modelto two urban models: the UCM model and theoften-used, traditional slab urban model (SLAB).The comparison also provides useful informationto agencies tasked with safety or power services.
2. Description of the numerical simulation and
urban models
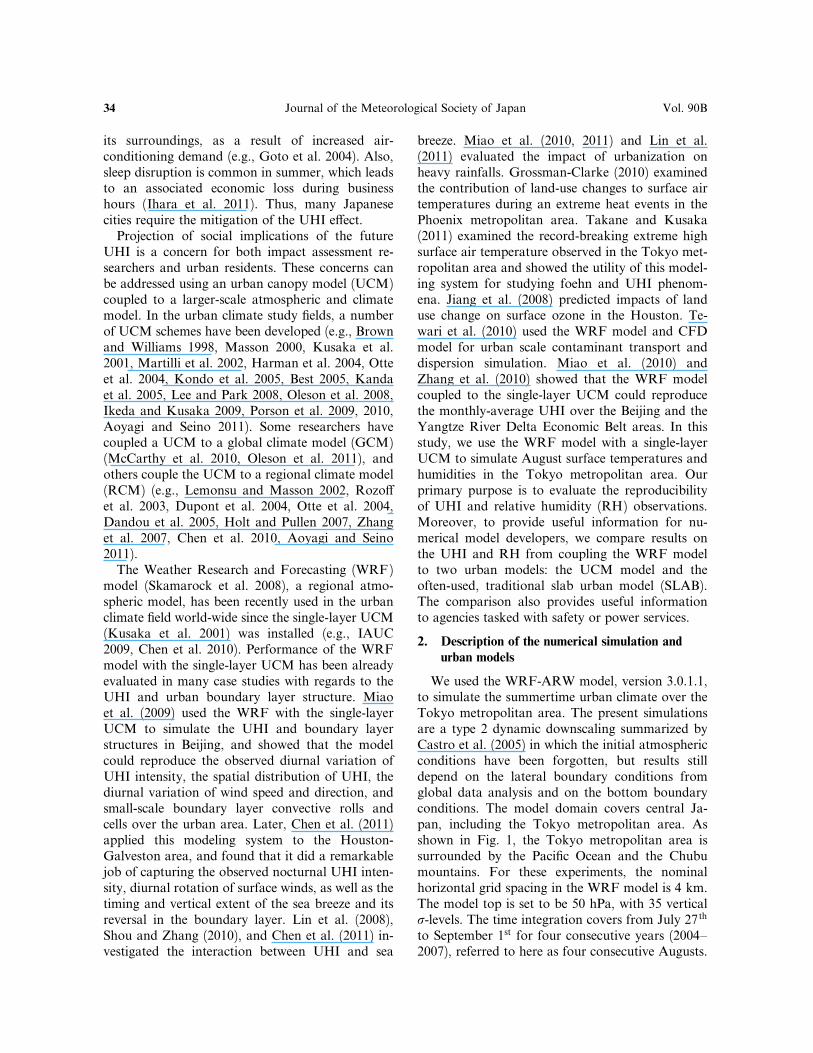
We used the WRF-ARW model, version 3.0.1.1,to simulate the summertime urban climate over theTokyo metropolitan area. The present simulationsare a type 2 dynamic downscaling summarized byCastro et al. (2005) in which the initial atmosphericconditions have been forgotten, but results stilldepend on the lateral boundary conditions fromglobal data analysis and on the bottom boundaryconditions. The model domain covers central Ja-pan, including the Tokyo metropolitan area. Asshown in Fig. 1, the Tokyo metropolitan area issurrounded by the Pacific Ocean and the Chubumountains. For these experiments, the nominalhorizontal grid spacing in the WRF model is 4 km.The model top is set to be 50 hPa, with 35 verticals-levels. The time integration covers from July 27th
to September 1st for four consecutive years (2004–2007), referred to here as four consecutive Augusts.
34 Journal of the Meteorological Society of Japan Vol. 90B
Each month is a single simulation. The first fourdays of each simulation are discarded and consid-ered as the model spin-up.
The atmospheric initial and boundary conditionsare created from 6-hourly Japan MeteorologicalAgency-Regional Analysis data (JMA-RANAL)with 20-km horizontal grid spacing. The land stateinput is provided by the 6-hourly National Centerfor Environmental Prediction-Final Analysis data(NCEP-FNL) with 1.0� horizontal grid spacing.The sea surface temperature field comes from thedaily NCEP-Real Time Global Sea Surface Tem-perature analysis data (NCEP-RTG_SST) with 0.5�
horizontal grid spacing. Our land-use categoriesand terrain-height datasets came from the Geospa-tial Information Authority of Japan.
The simulation uses the following physicsschemes: the Dudhia short-wave radiation scheme,a simple integration scheme that e‰ciently treatsclouds and clear-sky absorption and scattering(Dudhia 1989); the Rapid Radiative TransferModel (RRTM) for long-wave radiation, which ac-counts for multiple bands, trace gases, and micro-physics species (Mlawer et al. 1997); the WRFSingle-Moment 6-class (WSM6) microphysics
scheme, a cold-rain model with water vapor, cloud,rain, ice, snow, and grauple processes (Hong et al.2004); the Yon-Sei University (YSU) planetaryboundary layer scheme, a non-local turbulent di¤u-sion scheme with an explicit entrainment layer andparabolic di¤usion coe‰cient profile in an unstablemixed layer (Hong and Pan 1996, Hong et al.2006); the Kain-Fritsch cumulus parameterizationscheme for the parent domain (Kain and Fritsch1990). Because of the 4-km horizontal grid spacing,we use no Kain-Fritsch cumulus parameterizationscheme in the inner domain. For a land-surfacemodel, the UCM case uses the Noah land surfacemodel (Noah-LSM) (Chen and Dudhia 2001)coupled with a single-layer UCM (Kusaka et al.2001, Kusaka and Kimura 2004a, b), whereas theSLAB case uses the 5-layer thermal di¤usion model(historically called the SLAB model in WRF). Ex-cept for the land-surface model, all configurationsfor SLAB case are the same as those for UCMcase. Model configurations are summarized inTable 1.
The single-layer UCM used in the WRF modelwas developed by Kusaka et al. (2001), and latermodified by Kusaka and Kimura (2004a, b) and
Fig. 1. Topography and land-use of themodel domain. (a) Central location withinAsia. The inset box shows the domain forthe numerical experiments. (b) Topographyof the model domain. T, K, TS, and M in-dicate Tokyo, Kumagaya, Tsukuba, andMaebashi. (c) Land-use of the model do-main. Black, dark gray, medium gray, lightgray, and white mark the classification ofurban, forest, paddy, grass, and water sur-faces. The large black area including To-kyo is the Tokyo Metropolitan Area.
February 2012 H. KUSAKA et al. 35
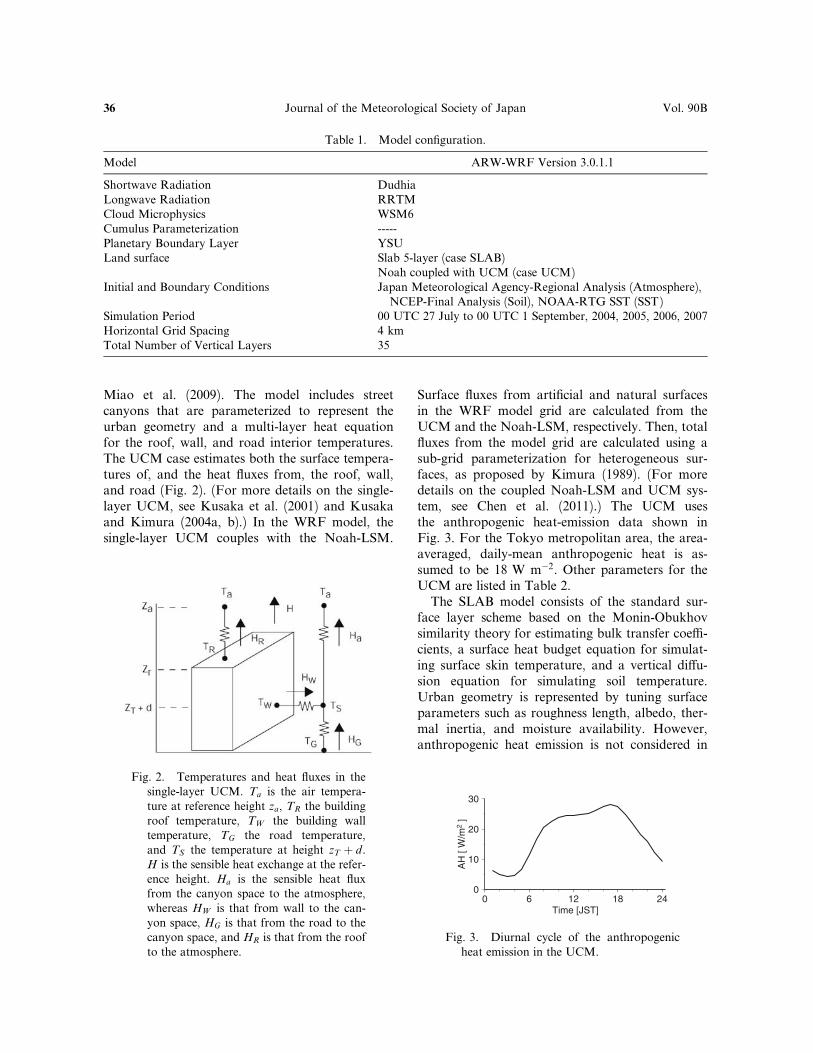
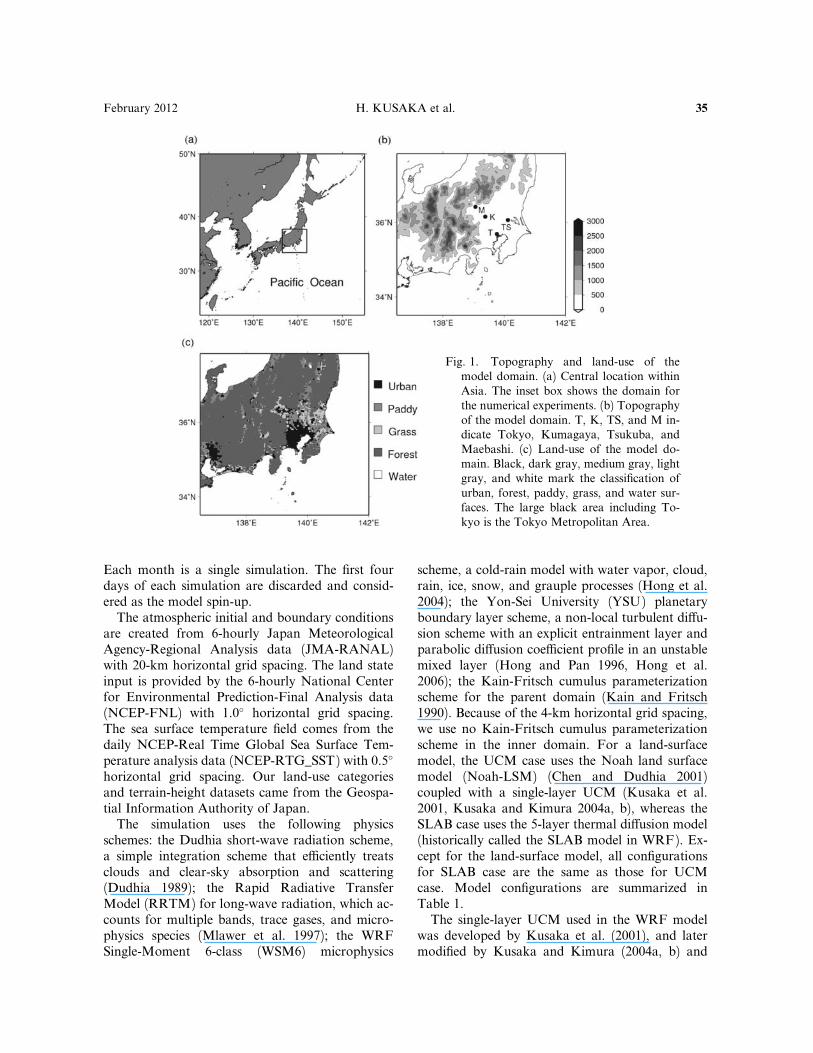
Miao et al. (2009). The model includes streetcanyons that are parameterized to represent theurban geometry and a multi-layer heat equationfor the roof, wall, and road interior temperatures.The UCM case estimates both the surface tempera-tures of, and the heat fluxes from, the roof, wall,and road (Fig. 2). (For more details on the single-layer UCM, see Kusaka et al. (2001) and Kusakaand Kimura (2004a, b).) In the WRF model, thesingle-layer UCM couples with the Noah-LSM.
Surface fluxes from artificial and natural surfacesin the WRF model grid are calculated from theUCM and the Noah-LSM, respectively. Then, totalfluxes from the model grid are calculated using asub-grid parameterization for heterogeneous sur-faces, as proposed by Kimura (1989). (For moredetails on the coupled Noah-LSM and UCM sys-tem, see Chen et al. (2011).) The UCM usesthe anthropogenic heat-emission data shown inFig. 3. For the Tokyo metropolitan area, the area-averaged, daily-mean anthropogenic heat is as-sumed to be 18 W m�2. Other parameters for theUCM are listed in Table 2.
The SLAB model consists of the standard sur-face layer scheme based on the Monin-Obukhovsimilarity theory for estimating bulk transfer coe‰-cients, a surface heat budget equation for simulat-ing surface skin temperature, and a vertical di¤u-sion equation for simulating soil temperature.Urban geometry is represented by tuning surfaceparameters such as roughness length, albedo, ther-mal inertia, and moisture availability. However,anthropogenic heat emission is not considered in
Table 1. Model configuration.
Model ARW-WRF Version 3.0.1.1
Shortwave Radiation DudhiaLongwave Radiation RRTMCloud Microphysics WSM6Cumulus Parameterization -----Planetary Boundary Layer YSULand surface Slab 5-layer (case SLAB)
Noah coupled with UCM (case UCM)Initial and Boundary Conditions Japan Meteorological Agency-Regional Analysis (Atmosphere),
NCEP-Final Analysis (Soil), NOAA-RTG SST (SST)Simulation Period 00 UTC 27 July to 00 UTC 1 September, 2004, 2005, 2006, 2007Horizontal Grid Spacing 4 kmTotal Number of Vertical Layers 35
Fig. 2. Temperatures and heat fluxes in thesingle-layer UCM. Ta is the air tempera-ture at reference height za, TR the buildingroof temperature, TW the building walltemperature, TG the road temperature,and TS the temperature at height zT þ d.H is the sensible heat exchange at the refer-ence height. Ha is the sensible heat fluxfrom the canyon space to the atmosphere,whereas HW is that from wall to the can-yon space, HG is that from the road to thecanyon space, and HR is that from the roofto the atmosphere.
Fig. 3. Diurnal cycle of the anthropogenicheat emission in the UCM.
36 Journal of the Meteorological Society of Japan Vol. 90B
this model. This type of model has been widelyused because of its simplicity. For this study,we used the default parameters settings listed inTable 3.
Hereafter, the experiments with the WRF modelinvolving the single-layer UCM and SLAB arecalled UCM and SLAB, respectively.
3. Results
3.1 Surface air temperature
a. Spatial distribution in the analysis domain
We compare surface air temperatures from theWRF model simulations against data from the Ja-pan Meteorological Agency’s (JMA) AutomatedMeteorological Data Acquisition System (AMe-DAS) network. To account for the di¤erence inthe terrain height between the model grid and theobservation site, we assume a temperature lapserate of �0.0065�C m�1.
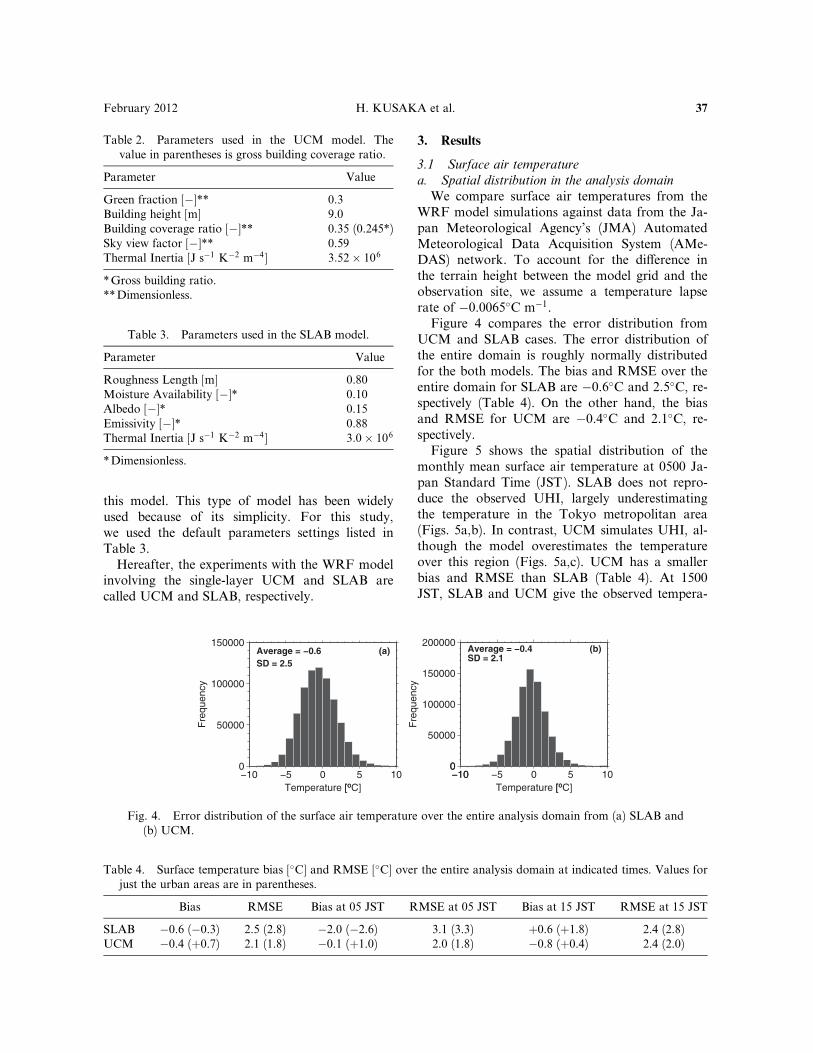
Figure 4 compares the error distribution fromUCM and SLAB cases. The error distribution ofthe entire domain is roughly normally distributedfor the both models. The bias and RMSE over theentire domain for SLAB are �0.6�C and 2.5�C, re-spectively (Table 4). On the other hand, the biasand RMSE for UCM are �0.4�C and 2.1�C, re-spectively.
Figure 5 shows the spatial distribution of themonthly mean surface air temperature at 0500 Ja-pan Standard Time (JST). SLAB does not repro-duce the observed UHI, largely underestimatingthe temperature in the Tokyo metropolitan area(Figs. 5a,b). In contrast, UCM simulates UHI, al-though the model overestimates the temperatureover this region (Figs. 5a,c). UCM has a smallerbias and RMSE than SLAB (Table 4). At 1500JST, SLAB and UCM give the observed tempera-
Fig. 4. Error distribution of the surface air temperature over the entire analysis domain from (a) SLAB and(b) UCM.
Table 2. Parameters used in the UCM model. Thevalue in parentheses is gross building coverage ratio.
Parameter Value
Green fraction [�]** 0.3Building height [m] 9.0Building coverage ratio [�]** 0.35 (0.245*)Sky view factor [�]** 0.59Thermal Inertia [J s�1 K�2 m�4] 3:52� 106
*Gross building ratio.**Dimensionless.
Table 3. Parameters used in the SLAB model.
Parameter Value
Roughness Length [m] 0.80Moisture Availability [�]* 0.10Albedo [�]* 0.15Emissivity [�]* 0.88Thermal Inertia [J s�1 K�2 m�4] 3:0� 106
*Dimensionless.
Table 4. Surface temperature bias [�C] and RMSE [�C] over the entire analysis domain at indicated times. Values forjust the urban areas are in parentheses.
Bias RMSE Bias at 05 JST RMSE at 05 JST Bias at 15 JST RMSE at 15 JST
SLAB �0.6 (�0.3) 2.5 (2.8) �2.0 (�2.6) 3.1 (3.3) þ0.6 (þ1.8) 2.4 (2.8)UCM �0.4 (þ0.7) 2.1 (1.8) �0.1 (þ1.0) 2.0 (1.8) �0.8 (þ0.4) 2.4 (2.0)
February 2012 H. KUSAKA et al. 37
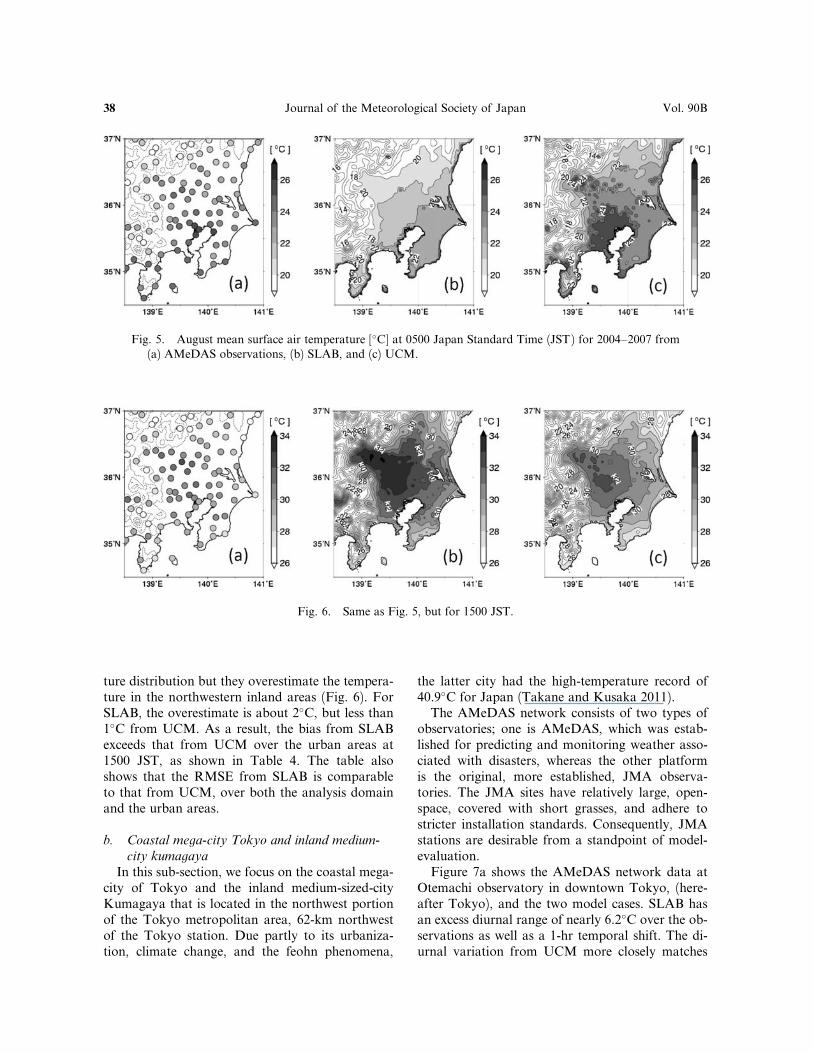
ture distribution but they overestimate the tempera-ture in the northwestern inland areas (Fig. 6). ForSLAB, the overestimate is about 2�C, but less than1�C from UCM. As a result, the bias from SLABexceeds that from UCM over the urban areas at1500 JST, as shown in Table 4. The table alsoshows that the RMSE from SLAB is comparableto that from UCM, over both the analysis domainand the urban areas.
b. Coastal mega-city Tokyo and inland medium-
city kumagaya
In this sub-section, we focus on the coastal mega-city of Tokyo and the inland medium-sized-cityKumagaya that is located in the northwest portionof the Tokyo metropolitan area, 62-km northwestof the Tokyo station. Due partly to its urbaniza-tion, climate change, and the feohn phenomena,
the latter city had the high-temperature record of40.9�C for Japan (Takane and Kusaka 2011).
The AMeDAS network consists of two types ofobservatories; one is AMeDAS, which was estab-lished for predicting and monitoring weather asso-ciated with disasters, whereas the other platformis the original, more established, JMA observa-tories. The JMA sites have relatively large, open-space, covered with short grasses, and adhere tostricter installation standards. Consequently, JMAstations are desirable from a standpoint of model-evaluation.
Figure 7a shows the AMeDAS network data atOtemachi observatory in downtown Tokyo, (here-after Tokyo), and the two model cases. SLAB hasan excess diurnal range of nearly 6.2�C over the ob-servations as well as a 1-hr temporal shift. The di-urnal variation from UCM more closely matches
Fig. 6. Same as Fig. 5, but for 1500 JST.
Fig. 5. August mean surface air temperature [�C] at 0500 Japan Standard Time (JST) for 2004–2007 from(a) AMeDAS observations, (b) SLAB, and (c) UCM.
38 Journal of the Meteorological Society of Japan Vol. 90B
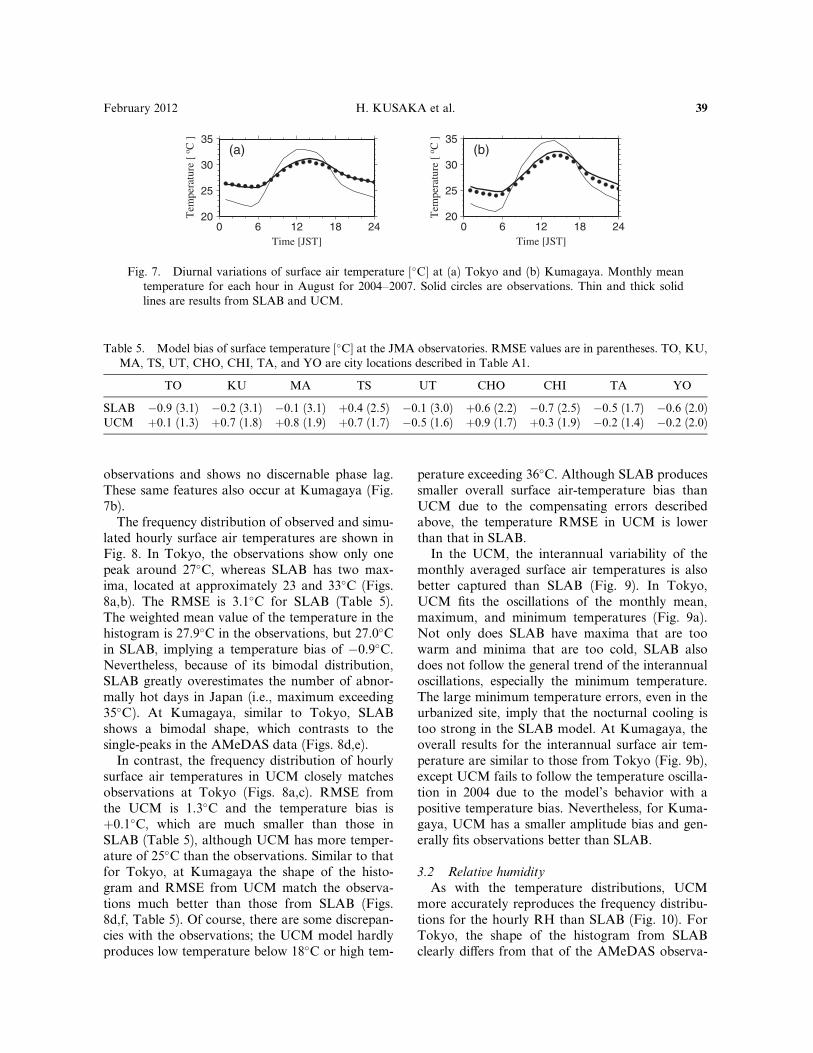
observations and shows no discernable phase lag.These same features also occur at Kumagaya (Fig.7b).
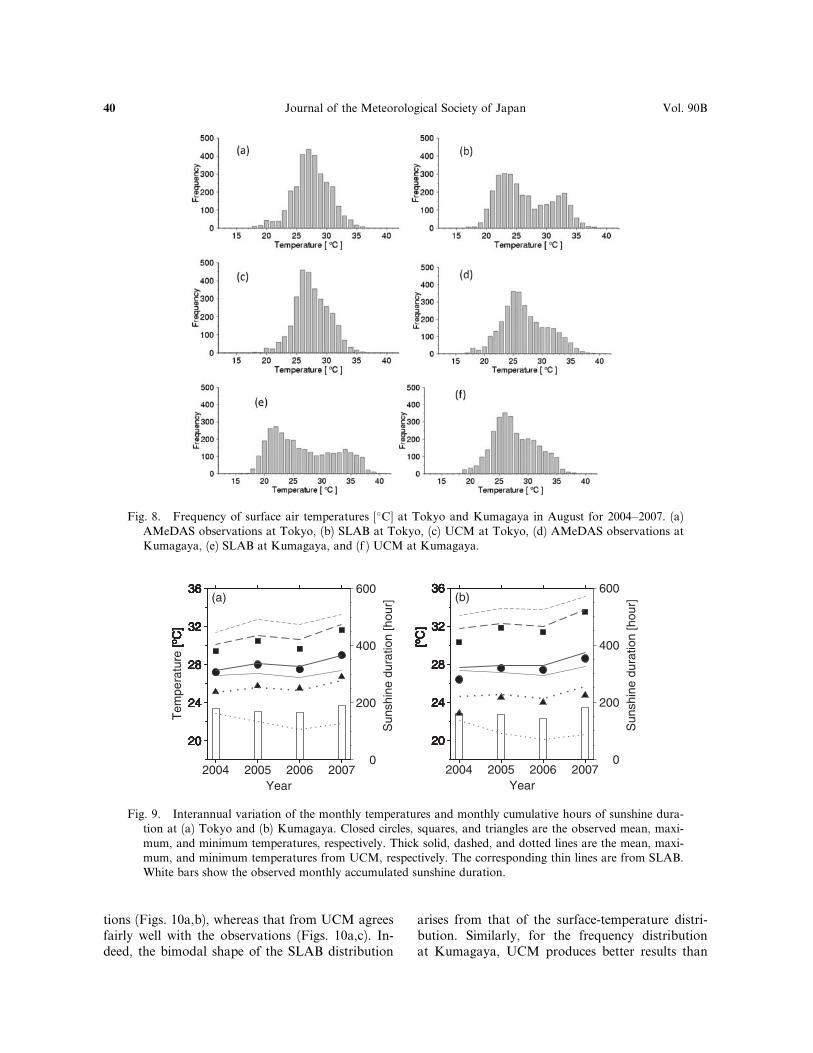
The frequency distribution of observed and simu-lated hourly surface air temperatures are shown inFig. 8. In Tokyo, the observations show only onepeak around 27�C, whereas SLAB has two max-ima, located at approximately 23 and 33�C (Figs.8a,b). The RMSE is 3.1�C for SLAB (Table 5).The weighted mean value of the temperature in thehistogram is 27.9�C in the observations, but 27.0�Cin SLAB, implying a temperature bias of �0.9�C.Nevertheless, because of its bimodal distribution,SLAB greatly overestimates the number of abnor-mally hot days in Japan (i.e., maximum exceeding35�C). At Kumagaya, similar to Tokyo, SLABshows a bimodal shape, which contrasts to thesingle-peaks in the AMeDAS data (Figs. 8d,e).
In contrast, the frequency distribution of hourlysurface air temperatures in UCM closely matchesobservations at Tokyo (Figs. 8a,c). RMSE fromthe UCM is 1.3�C and the temperature bias isþ0.1�C, which are much smaller than those inSLAB (Table 5), although UCM has more temper-ature of 25�C than the observations. Similar to thatfor Tokyo, at Kumagaya the shape of the histo-gram and RMSE from UCM match the observa-tions much better than those from SLAB (Figs.8d,f, Table 5). Of course, there are some discrepan-cies with the observations; the UCM model hardlyproduces low temperature below 18�C or high tem-
perature exceeding 36�C. Although SLAB producessmaller overall surface air-temperature bias thanUCM due to the compensating errors describedabove, the temperature RMSE in UCM is lowerthan that in SLAB.
In the UCM, the interannual variability of themonthly averaged surface air temperatures is alsobetter captured than SLAB (Fig. 9). In Tokyo,UCM fits the oscillations of the monthly mean,maximum, and minimum temperatures (Fig. 9a).Not only does SLAB have maxima that are toowarm and minima that are too cold, SLAB alsodoes not follow the general trend of the interannualoscillations, especially the minimum temperature.The large minimum temperature errors, even in theurbanized site, imply that the nocturnal cooling istoo strong in the SLAB model. At Kumagaya, theoverall results for the interannual surface air tem-perature are similar to those from Tokyo (Fig. 9b),except UCM fails to follow the temperature oscilla-tion in 2004 due to the model’s behavior with apositive temperature bias. Nevertheless, for Kuma-gaya, UCM has a smaller amplitude bias and gen-erally fits observations better than SLAB.
3.2 Relative humidity
As with the temperature distributions, UCMmore accurately reproduces the frequency distribu-tions for the hourly RH than SLAB (Fig. 10). ForTokyo, the shape of the histogram from SLABclearly di¤ers from that of the AMeDAS observa-
Fig. 7. Diurnal variations of surface air temperature [�C] at (a) Tokyo and (b) Kumagaya. Monthly meantemperature for each hour in August for 2004–2007. Solid circles are observations. Thin and thick solidlines are results from SLAB and UCM.
Table 5. Model bias of surface temperature [�C] at the JMA observatories. RMSE values are in parentheses. TO, KU,MA, TS, UT, CHO, CHI, TA, and YO are city locations described in Table A1.
TO KU MA TS UT CHO CHI TA YO
SLAB �0.9 (3.1) �0.2 (3.1) �0.1 (3.1) þ0.4 (2.5) �0.1 (3.0) þ0.6 (2.2) �0.7 (2.5) �0.5 (1.7) �0.6 (2.0)UCM þ0.1 (1.3) þ0.7 (1.8) þ0.8 (1.9) þ0.7 (1.7) �0.5 (1.6) þ0.9 (1.7) þ0.3 (1.9) �0.2 (1.4) �0.2 (2.0)
February 2012 H. KUSAKA et al. 39
tions (Figs. 10a,b), whereas that from UCM agreesfairly well with the observations (Figs. 10a,c). In-deed, the bimodal shape of the SLAB distribution
arises from that of the surface-temperature distri-bution. Similarly, for the frequency distributionat Kumagaya, UCM produces better results than
Fig. 8. Frequency of surface air temperatures [�C] at Tokyo and Kumagaya in August for 2004–2007. (a)AMeDAS observations at Tokyo, (b) SLAB at Tokyo, (c) UCM at Tokyo, (d) AMeDAS observations atKumagaya, (e) SLAB at Kumagaya, and (f ) UCM at Kumagaya.
Fig. 9. Interannual variation of the monthly temperatures and monthly cumulative hours of sunshine dura-tion at (a) Tokyo and (b) Kumagaya. Closed circles, squares, and triangles are the observed mean, maxi-mum, and minimum temperatures, respectively. Thick solid, dashed, and dotted lines are the mean, maxi-mum, and minimum temperatures from UCM, respectively. The corresponding thin lines are from SLAB.White bars show the observed monthly accumulated sunshine duration.
40 Journal of the Meteorological Society of Japan Vol. 90B
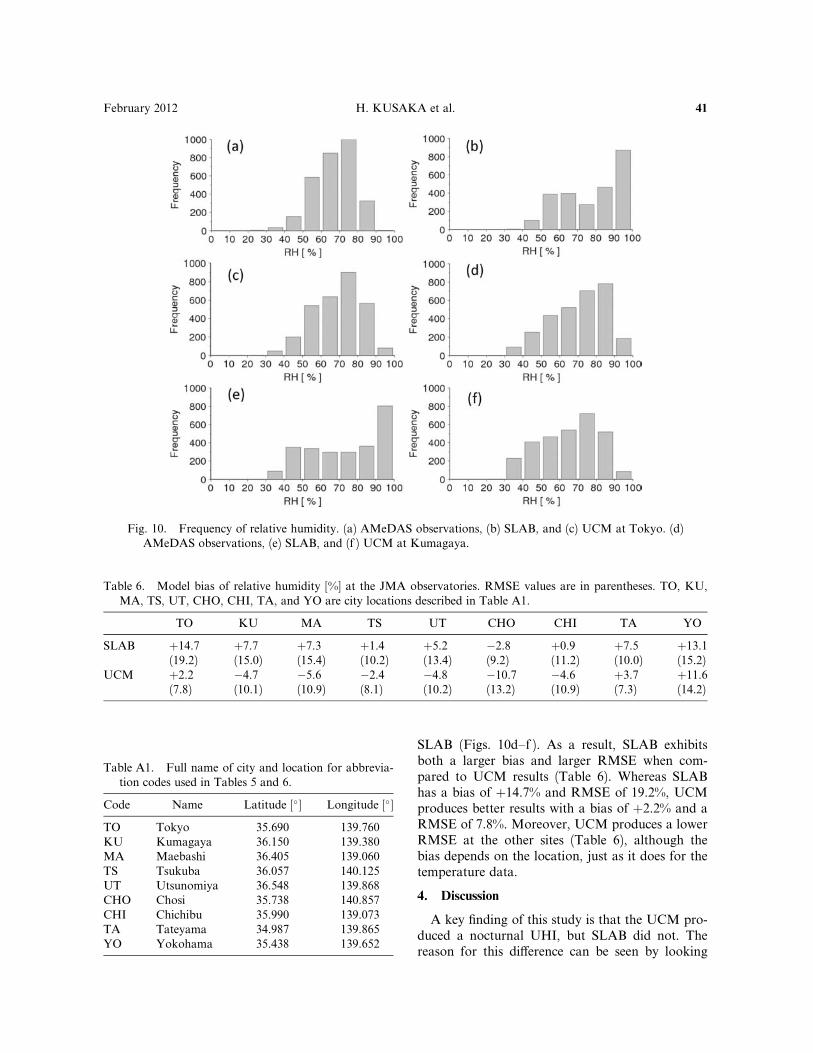
SLAB (Figs. 10d–f ). As a result, SLAB exhibitsboth a larger bias and larger RMSE when com-pared to UCM results (Table 6). Whereas SLABhas a bias of þ14.7% and RMSE of 19.2%, UCMproduces better results with a bias of þ2.2% and aRMSE of 7.8%. Moreover, UCM produces a lowerRMSE at the other sites (Table 6), although thebias depends on the location, just as it does for thetemperature data.
4. Discussion
A key finding of this study is that the UCM pro-duced a nocturnal UHI, but SLAB did not. Thereason for this di¤erence can be seen by looking
Fig. 10. Frequency of relative humidity. (a) AMeDAS observations, (b) SLAB, and (c) UCM at Tokyo. (d)AMeDAS observations, (e) SLAB, and (f ) UCM at Kumagaya.
Table 6. Model bias of relative humidity [%] at the JMA observatories. RMSE values are in parentheses. TO, KU,MA, TS, UT, CHO, CHI, TA, and YO are city locations described in Table A1.
TO KU MA TS UT CHO CHI TA YO
SLAB þ14.7(19.2)
þ7.7(15.0)
þ7.3(15.4)
þ1.4(10.2)
þ5.2(13.4)
�2.8(9.2)
þ0.9(11.2)
þ7.5(10.0)
þ13.1(15.2)
UCM þ2.2(7.8)
�4.7(10.1)
�5.6(10.9)
�2.4(8.1)
�4.8(10.2)
�10.7(13.2)
�4.6(10.9)
þ3.7(7.3)
þ11.6(14.2)
Table A1. Full name of city and location for abbrevia-tion codes used in Tables 5 and 6.
Code Name Latitude [�] Longitude [�]
TO Tokyo 35.690 139.760KU Kumagaya 36.150 139.380MA Maebashi 36.405 139.060TS Tsukuba 36.057 140.125UT Utsunomiya 36.548 139.868CHO Chosi 35.738 140.857CHI Chichibu 35.990 139.073TA Tateyama 34.987 139.865YO Yokohama 35.438 139.652
February 2012 H. KUSAKA et al. 41
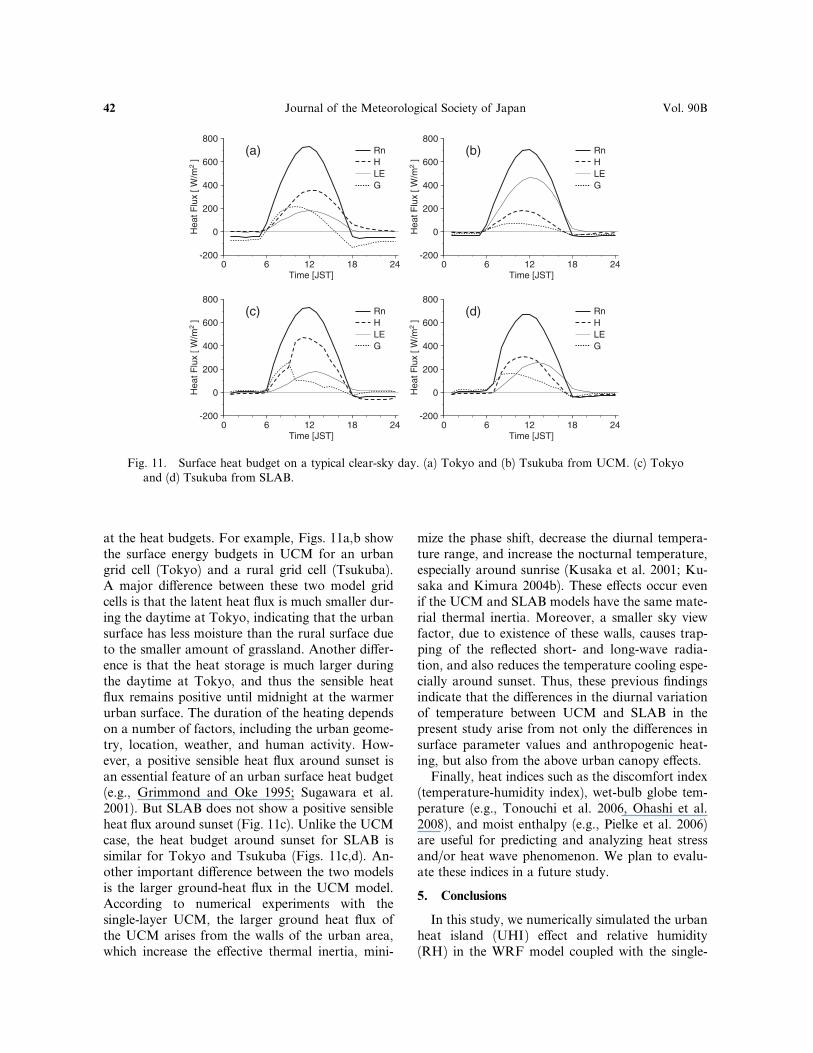
at the heat budgets. For example, Figs. 11a,b showthe surface energy budgets in UCM for an urbangrid cell (Tokyo) and a rural grid cell (Tsukuba).A major di¤erence between these two model gridcells is that the latent heat flux is much smaller dur-ing the daytime at Tokyo, indicating that the urbansurface has less moisture than the rural surface dueto the smaller amount of grassland. Another di¤er-ence is that the heat storage is much larger duringthe daytime at Tokyo, and thus the sensible heatflux remains positive until midnight at the warmerurban surface. The duration of the heating dependson a number of factors, including the urban geome-try, location, weather, and human activity. How-ever, a positive sensible heat flux around sunset isan essential feature of an urban surface heat budget(e.g., Grimmond and Oke 1995; Sugawara et al.2001). But SLAB does not show a positive sensibleheat flux around sunset (Fig. 11c). Unlike the UCMcase, the heat budget around sunset for SLAB issimilar for Tokyo and Tsukuba (Figs. 11c,d). An-other important di¤erence between the two modelsis the larger ground-heat flux in the UCM model.According to numerical experiments with thesingle-layer UCM, the larger ground heat flux ofthe UCM arises from the walls of the urban area,which increase the e¤ective thermal inertia, mini-
mize the phase shift, decrease the diurnal tempera-ture range, and increase the nocturnal temperature,especially around sunrise (Kusaka et al. 2001; Ku-saka and Kimura 2004b). These e¤ects occur evenif the UCM and SLAB models have the same mate-rial thermal inertia. Moreover, a smaller sky viewfactor, due to existence of these walls, causes trap-ping of the reflected short- and long-wave radia-tion, and also reduces the temperature cooling espe-cially around sunset. Thus, these previous findingsindicate that the di¤erences in the diurnal variationof temperature between UCM and SLAB in thepresent study arise from not only the di¤erences insurface parameter values and anthropogenic heat-ing, but also from the above urban canopy e¤ects.
Finally, heat indices such as the discomfort index(temperature-humidity index), wet-bulb globe tem-perature (e.g., Tonouchi et al. 2006, Ohashi et al.2008), and moist enthalpy (e.g., Pielke et al. 2006)are useful for predicting and analyzing heat stressand/or heat wave phenomenon. We plan to evalu-ate these indices in a future study.
5. Conclusions
In this study, we numerically simulated the urbanheat island (UHI) e¤ect and relative humidity(RH) in the WRF model coupled with the single-
Fig. 11. Surface heat budget on a typical clear-sky day. (a) Tokyo and (b) Tsukuba from UCM. (c) Tokyoand (d) Tsukuba from SLAB.
42 Journal of the Meteorological Society of Japan Vol. 90B
layer urban canopy model (UCM) for four consec-utive Augusts (2004–2007) in the Tokyo metropoli-tan area. We compared observations and resultsusing the simpler SLAB land surface model with adi¤erent treatment of urban geometry and anthro-pogenic heat emission. We found the following.
(1) The WRF model with UCM well captures theobserved monthly mean daytime and nocturnalUHI, but the WRF with SLAB did not showa nocturnal UHI. The surface air temperaturebias, compared to observations, averaged overthe entire analysis domain was �0.4�C forUCM and �0.6�C for SLAB, whereas theirRMSE were 2.1 and 2.5�C, respectively.
(2) The observed diurnal variations of the surfaceair temperature at Tokyo and Kumagaya werealso reproduced very well by UCM, but not bySLAB. Case SLAB had both a 1-hr phase shiftand a 6.2�C larger diurnal range when com-pared to observations.
(3) Regarding the frequency distribution of the sur-face air temperature at Tokyo, UCM repro-duced observations much better than SLAB.Both UCM and observations had a maximumfrequency at approximately 27�C, whereasSLAB was bimodal, with peaks around 23 and33�C. The bias for UCM and SLAB were þ0.1and �0.9�C, respectively. The RMSE for UCMand SLAB were 1.3 and 3.1�C, respectively.
(4) The improved bias, RMSE, correlation coe‰-cients, phase error, and frequency distributionfor the surface temperatures from UCM overSLAB lead to an advantage for derived temper-ature index quantities.
(5) UCM also reproduced the observed relative hu-midity better than SLAB.
The results from this report indicate that in theWRF model, the UCM model is more useful asan urban surface model than SLAB, not only for acase study of UHI but also for a dynamic down-scaling study regarding the past/present urban cli-mate simulation and future projections of urbaniza-tion.
Acknowledgements
This work was supported by the Global Environ-ment Research Fund (S-5) of the Ministry of theEnvironment, Japan. Numerical simulations forthe present work have been done under the ‘‘Inter-disciplinary Computational Science Program’’ inthe Center for Computational Sciences, University
of Tsukuba. Free software ‘GMT’ (the GenericMapping Tools) was used in drawing the figures.
References
Aoyagi, T., and N. Seino, 2011: A square prisom urbancanopy scheme for the NHM and its evaluationon summer conditions in the Tokyo metrolpolitanarea, Japan. J. Appl. Meteor., 50, 1476–1496.
Best, M. J., 2005: Representing urban areas withinoperational numerical weather prediction models.Bound.-Layer Meteor., 88, 279–306.
Brown, M., and M. Williams, 1998: An urban canopyparameterization for mesoscale meteorologicalmodels. Proc. of 2nd AMS Urban EnvironmentalSymposium, Albuquerque, New Mexico, Novem-ber 2–7, 1998, American Meteorological Society.
Castro, C. L., R. A. Pielke Sr., and G. Leconcini, 2005:Dynamical downscaling: Assessment of value re-tained and added using the Regional AtmosphericModeling System (RAMS). J. Geophys. Res., 110,D05108, doi:10.1029/2004JD004721.
Chen, F., and J. Dudhia, 2001: Coupling an advancedland-surface/hydrology model with the Penn State/NCAR MM5 modeling system. Part I: Model im-plementation and sensitivity. Mon. Wea. Rev., 129,569–585.
Chen, F., H. Kusaka, R. Bornstein, J. Ching, C. S. B.Grimmond, S. Grossman-Clarke, T. Loridan,K. W. Manning, A. Martilli, S. Miao, D. Sailor,F. P. Salamanca, H. Taha, M. Tewari, X. Wang,A. A. Wyszogrodzki, and C. Zhang, 2010: Theintegrated WRF/urban modeling system: Devel-opment, evaluation, and applications to urban en-vironmental problems. Int. J. Climatol., 31, 273–288.
Chen, F., S. Miao, M. Tewari, J. Bao, and H. Kusaka,2011: A numerical study of interactions betweensurface forcing and sea breeze circulations andtheir e¤ects on stagnation in the greater Houstonarea. J. Geophys. Res., 116, D12105, doi:10.1029/2010JD015533.
Dandou, A., M. Tombrou, E. Akylas, N. Soulakellis,and E. Bossioli, 2005: Development and evalua-tion of an urban parameterization scheme in thePenn State/NCAR Mesoscale Model (MM5).J. Geophys. Res., 110, D10102, doi:10.1029/2004JD005192.
Dudhia, J., 1989: Numerical study of convection ob-served during the winter monsoon experimentusing a mesoscale two-dimensional model. J.
Atmos. Sci., 46, 3077–3107.Dupont, S., T. L. Otte, and J. K. S. Ching, 2004: Simula-
tion of meteorological fields within and above ur-ban and rural canopies with a mesoscale model(MM5). Bound.-Layer Meteor., 113, 111–158.
Fire and Disaster Management Agency of Japan, 2011:
February 2012 H. KUSAKA et al. 43
http://www.fdma.go.jp/neuter/topics/fieldList9_2.html (in Japanese).
Fujibe, F., 2009: Detection of urban warming in recenttemperature trends in Japan. Int. J. Climatol., 29,1811–1822.
Goto, K., K. Yabe, and N. Araki, 2004: Estimation ofmaximum demand sensitivity to the temperaturefor long-term power demand forecast. Proc. Tech-nical Meeting of Power and Energy Division 2004,The Institute of Electrical Engineers of Japan, 13–21 (in Japanese).
Grimmond, C. S. B., and T. R. Oke, 1995: Comparisonof heat fluxes from summertime observations inthe suburbs of four North American cities. J.
Appl. Meteor., 34, 873–889.Grossman-Clarke, S., J. A. Zehnder, T. Loridan, and
C. S. B. Grimmond, 2010: Contribution of landuse changes to near-surface air temperatures dur-ing recent summer extreme heat events in the Phoe-nix metropolitan area. J. Appl. Meteor. Climatol.,49, 1649–1664.
Harman, I. N., J. F. Barlow, and S. E. Belcher, 2004:Scalar fluxes from urban street canyons. Part 2:Model. Bound.-Layer Meteor., 113, 387–410.
Holt, T., and J. Pullen, 2007: Urban canopy modelingof the New York city metropolitan area: A com-parison and validation of single- and multilayerparameterizations. Mon. Wea. Rev., 135, 1906–1930.
Hong, S.-Y., and H.-L. Pan, 1996: Nonlocal boundarylayer vertical di¤usion in a medium-range forecastmodel. Mon. Wea. Rev., 124, 2322–2339.
Hong, S.-Y., J. Dudhia, and S.-H. Chen, 2004: A revisedapproach to ice microphysical processes for thebulk parameterization of clouds and precipitation.Mon. Wea. Rev., 132, 103–120.
Hong, S.-Y., Y. Noh, and J. Dudhia, 2006: A new verti-cal di¤usion package with an explicit treatmentof entrainment processes. Mon. Wea. Rev., 134,2318–2341.
IAUC, 2009: Proceedings of the 7th International Con-ference on Urban Climate (ICUC-7), Yokohama,Japan. June 29–July 3, 2009.
Ihara, T., H. Kusaka, M. Hara, R. Matsuhashi, and Y.Yoshida, 2011: Estimation of mild health disordercaused by urban air temperature increase withmidpoint-type impact assessment methodology. J.Environ. Eng., AIJ, 76, 459–467 (in Japanese withan English abstract).
Ikeda, R., and H. Kusaka, 2009: Proposing the simpli-fication of the multilayer urban canopy model:Intercomparison study of four models. J. Appl.
Meteor., 49, 902–919.Jiang, X., C. Wiedinmyer, F. Chen, Z.-L. Yang, and
J. C.-F. Lo, 2008: Predicted impacts of climateand land use change on surface ozone in the Hous-
ton, Texas, area. J. Geophys. Res., 113, D20312,doi:10.1029/2008JD009820.
Kain, J. S., and J. M. Fritsch, 1990: A one-dimensionalentraining/detraining plume model and its applica-tion in convective parameterization. J. Atmos. Sci.,47, 2784–2802.
Kain, J. S., 2004: The Kain-Fritsch convective parame-terization: An update. J. Appl. Meteor., 43, 170–181.
Kanda, M., T. Kawai, M. Kanega, R. Moriwaki, K.Narita, and A. Hagishima, 2005: A simple energybalance model for regular building arrays. Bound.-Layer Meteor., 116, 423–443.
Kimura, F., 1989: Heat flux on mixtures of di¤erentland-use surface: Test of a new parameterizationscheme. J. Meteor. Soc. Japan, 67, 410–409.
Kondo, H., Y. Genchi, Y. Kikegawa, Y. Ohashi, H.Yoshikado, and H. Komiyama, 2005: Develop-ment of a multi-layer urban canopy model for theanalysis of energy consumption in a big city: Struc-ture of the urban canopy model and its basic per-formance. Bound.-Layer Meteor., 116, 395–421.
Kusaka, H., and F. Kimura, 2004a: Coupling a single-layer urban canopy model with a simple atmo-spheric model: Impact on urban heat island simu-lation for an idealized case. J. Meteor. Soc. Japan,82, 67–80.
Kusaka, H., and F. Kimura, 2004b: Thermal e¤ects ofurban canyon structure on the nocturnal heat is-land: Numerical experiment using mesoscale modelcoupled with urban canopy model. J. Appl. Me-
teor., 43, 1899–1910.Kusaka, H., H. Kondo, Y. Kikegawa, and F. Kimura,
2001: A simple single-layer urban canopy modelfor atmospheric models: Comparison with multi-layer and slab models. Bound.-Layer Meteor., 101,329–358.
Landsberg, H. E., 1981: The urban climate. Academicpress, 269 pp.
Lee, S., and S. Park, 2008: A vegetated urban canopymodel for meteorological and environmental mod-eling. Bound.-Layer Meteor., 126, 73–102.
Lemonsu, A., and V. Masson, 2002: Simulation of asummer urban breeze over Paris. Bound.-Layer
Meteor., 104, 4630–490.Lin, C., F. Chen, J. C. Huang, W. Chen, Y. Liou, W.
Chen, and S. Liu, 2008: Urban heat island e¤ectand its impact on boundary layer developmentand land-sea circulation over northern Taiwan.Atmos. Environ., 42, 5635–5649.
Lin, C., W. Chen, P. Chang, and Y. Sheng, 2011: Impactof the urban heat island e¤ect on precipitation overa complex geographic environment in northernTaiwan. J. Appl. Meteor. Climatol., 50, 339–353.
Liu, C., K. Ikeda, G. Thompson, R. Rasmussen, andJ. Dudhia, 2011: High-resolution simulations of
44 Journal of the Meteorological Society of Japan Vol. 90B
wintertime precipitation in the Colorado Head-waters region: sensitivity to physics parameteriza-tions. Mon. Wea. Rev. doi:10.1175/MWR-D-11-00009.1, in press.
Martilli, A., A. Clappier, and M. W. Rotach, 2002: Anurban surface exchange parameterization for meso-scale models. Bound.-Layer Meteor., 104, 261–304.
Masson, V., 2000: A physically-based scheme for the ur-ban energy budget in atmospheric models. Bound.-Layer Meteor., 94, 357–397.
McCarthy, M. P., M. J. Best, and R. A. Betts, 2010: Cli-mate change in cities due to global warming andurban e¤ects. Geophy. Res. Lett., 37, L09705,doi:10.1029/2010GL042845.
Miao, S., F. Chen, M. A. LeMone, M. Tewari, Q. Li,and Y. Wang, 2009: An observational and model-ing study of characteristics of urban heat islandand boundary layer structures in Beijing. J. Appl.Meteor. Climatol., 48, 484–501.
Miao, S., F. Chen, Q. Li, and S. Fan, 2010: Impacts ofurban processes and urbanization on summer pre-cipitation: A case study of heavy rainfall in Beijingon 1 August 2006. J. Appl. Meteor. Climatol., 50,806–825.
Miao, S., F. Chen, Q. Li, and S. Fan, 2011: Month-averaged impacts of urbanization on atmosphericboundary layer structure and precipitation in sum-mer in Beijing area. Chinese J. Geophys.—Chinese
Edition, 53, 1580–1593.Mlawer, E. J., S. J. Taubman, P. D. Brown, M. J. Ia-
cono, and S. A. Clough, 1997: Radiative transferfor inhomogeneous atmosphere: RRTM, a vali-dated correlated-k model for the longwave. J. Geo-phys. Res., 102 (D14), 16663–16682.
Ohashi, Y., T. Kawabe, Y. Shigeta, Y. Hirano, H. Ku-saka, H. Fudeyasu, and K. Fukao, 2008: Evalua-tion of urban thermal environments in commercialand residential spaces in Okayama city, Japan,using the wet-bulb globe temperature index. Theor.Appl. Climatol., doi: 10.1007/s00704-008-0006-8.
Oke, T. R., 1987: Boundary layer climate 2nd edition.Methuen Co., 433 pp.
Oleson, K. W., G. B. Bonan, J. Feddema, M. Verten-stein, and C. S. B. Grimmond, 2008: An urbanparameterization for a global climate model. 1.Formulation and evaluation for two cities. J. Appl.Meteor. Climatol., 47, 1038–1060.
Oleson, K. W., G. B. Bonan, J. Feddema, and T. Jack-son, 2011: An examination of urban heat islandcharacteristics in a global climate model. Int. J.
Climatol., in press.Otte, T. L., A. Lacser, S. Dupont, and J. K. S. Ching,
2004: Implementation of an urban canopy parame-terization in a mesoscale meteorological model. J.Appl. Meteor., 43, 1648–1665.
Pielke, R. A. Sr., K. Wolter, O. Bliss, N. Doesken, andB. McNoldy, 2006: The July 2005 Denver heatwave: How unusual was it? National Weather Di-
gest, 31, 24–35.Porson, A., I. N. Harman, S. Bohnenstengel, and S. E.
Belcher, 2009: How many facets are needed to rep-resent the surface energy balance of an urban area?Bound.-Layer Meteor., 132, 107–128.
Porson, A., P. A. Clark, I. N. Harman, M. J. Best, andS. E. Belcher, 2010: Implementation of a newurban energy budget scheme in the MetUM. PartI: Descripition and idealzed simulations. Q. J.
Roy. Meteor. Soc., 136, 1514–1529.Rozo¤, C. M., W. R. Cotton, and J. O. Adegoke, 2003:
Simulation of St. Louis, Missouri, land use im-pacts on thunderstorms. J. Appl. Meteor., 42,716–738.
Shou, Y., and D. Zhang, 2010: Impact of environmentalflows on the daytime urban boundary layer struc-tures over the Baltimore metropolitan region. At-mospheric Science Letters, 11, 1–6.
Skamarock, W. C., J. B. Klemp, J. Dudhia, D. O. Gill,D. M. Barker, M. G. Duda, X.-Y. Huang, W.Wang, and J. G. Powers, 2008: A description ofthe advanced research WRF version 3, NCAR/TN-475þSTR, 126 pp.
Sugawara, H., 2001: Heat exchange between urban struc-tures and the atmospheric boundary layer. Ph.D.thesis, Tohoku University, 140 pp.
Takane, Y., and H. Kusaka, 2011: Formation mecha-nisms of the extreme high surface air temperatureof 40.9�C observed in the Tokyo metropolitanarea: Considerations of dynamic foehn and foehn-like wind. J. Appl. Meteor. Climatol., 50, 1827–1841.
Tewari, M., H. Kusaka, F. Chen, W. J. Coirier, S. Kim,A. A. Wyszogrodzki, and T. T. Warner, 2010: Im-pact of coupling a microscale computational fluiddynamics model with a mesoscale model on urbanscale contaminant transport and dispersion. Atmos.
Res., 96, 656–664.Tonouchi, M., K. Maruyama, and M. Ono, 2006:
WBGT forecast for prevention of heat stroke in Ja-pan. Sixth Symposium on the urban environment,American Meteorological Society, session PJ1.1.
Yoshino, M., 1975: Climate in a small area. University ofTokyo press, 549 pp.
Zhang, H., N. Sato, T. Izumi, K. Hanaki, and T. Ara-maki, 2007: Modified RAMS-Urban canopy modelfor heat island simulation in Chongqing, China. J.Appl. Meteor. Climatol., 47, 509–524.
Zhang, N., G., Z. Gao, X. Wang, and Y. Chen, 2010:Modeling the impact of urbanization on the localand regional climate in Yangtze River Delta,China. Theor. Appl. Climatol., 102, 331–341.
February 2012 H. KUSAKA et al. 45