Numerical modelling of sedimentebacteria interaction processes in surface waters
11
This article appeared in a journal published by Elsevier. The attached copy is furnished to the author for internal non-commercial research and education use, including for instruction at the authors institution and sharing with colleagues. Other uses, including reproduction and distribution, or selling or licensing copies, or posting to personal, institutional or third party websites are prohibited. In most cases authors are permitted to post their version of the article (e.g. in Word or Tex form) to their personal website or institutional repository. Authors requiring further information regarding Elsevier’s archiving and manuscript policies are encouraged to visit: http://www.elsevier.com/copyright
Transcript of Numerical modelling of sedimentebacteria interaction processes in surface waters

This article appeared in a journal published by Elsevier. The attachedcopy is furnished to the author for internal non-commercial researchand education use, including for instruction at the authors institution
and sharing with colleagues.
Other uses, including reproduction and distribution, or selling orlicensing copies, or posting to personal, institutional or third party
websites are prohibited.
In most cases authors are permitted to post their version of thearticle (e.g. in Word or Tex form) to their personal website orinstitutional repository. Authors requiring further information
regarding Elsevier’s archiving and manuscript policies areencouraged to visit:
http://www.elsevier.com/copyright
Author's personal copy
Numerical modelling of sedimentebacteria interactionprocesses in surface waters
Guanghai Gao a,*, Roger A. Falconer b, Binliang Lin b,c
aKey Laboratory of Pollution Processes and Environmental Criteria (Ministry of Education), College of Environmental Science and Engineering,
Nankai University, Tianjin 300071, ChinabCardiff School of Engineering, Cardiff University, The Parade, Cardiff CF24 3AA, UKcState Key Hydroscience and Engineering Laboratory, Tsinghua University, Beijing 100084, China
a r t i c l e i n f o
Article history:
Received 28 March 2010
Received in revised form
24 December 2010
Accepted 27 December 2010
Available online 8 January 2011
Keywords:
Numerical modelling
Faecal bacteria
Sediment transport
a b s t r a c t
Faecal bacteria exist in both free-living and attached forms in surface waters. The depo-
sition of sediments can take faecal bacteria out of the water column and to the bed. The
sediments can subsequently be re-suspended into the water column, which can then lead
to the re-suspension of the faecal bacteria of the attached form back into the water
column, where it may desorb from the sediments. Therefore, the fate and transport of
faecal bacteria is highly related to the governing sediment transport processes, particularly
where these processes are significant. However, little attempt has been made to model
such processes in terms of predicting the impact of the sediment fluxes on faecal bacteria
levels. Details are given of the refinement of a numerical model of faecal bacteria transport,
where the sediment transport processes are significant. This model is based on the model
DIVAST (Depth Integrated Velocities And Solute Transport). Analytical solutions for steady
and uniform flow conditions were derived and used to test the sedimentebacteria inter-
action model. After testing the sedimentebacteria interaction model favourably against
known results, the model was then set up for idealised case studies to investigate the
effects of sediment on bacteria concentrations in the water column. Finally the model was
applied to a simplified artificial flooding study to investigate the impact of suspended
sediment fluxes on the corresponding bacteria transport processes. The model predictions
have proved to be encouraging, with the results being compared to field measurements.
ª 2011 Elsevier Ltd. All rights reserved.
1. Introduction
Faecal bacteria are widely used worldwide as indicators to
monitor surface water quality. Faecal bacteria in surface
waters can be considered to exist in two forms, either as free-
living bacteria within the water column, or attached (or
adsorbed) to suspended particles. The bacteria can be trans-
ported and diffused within the water column in their free-
living form, or they can be adsorbed onto the sediments and
then transported and diffused with the sediments. The
adsorbed bacteria can settle out when the suspended particles
deposit on the bed and then be re-suspended with the parti-
cles into the overlying water column when the sediment
particles are re-suspended.
Advances in numerical modelling of hydrodynamic and
water quality processes have made such tools an invaluable
means of predicting faecal contamination levels under
different flow conditions. Numerical models used for pre-
dicting bacterial contamination have generally treated faecal
bacteria as free-living in current studies, such as Lin and
* Corresponding author. Tel.: þ86 15 022623290; fax: þ86 22 23501117.E-mail address: [email protected] (G. Gao).
Avai lab le a t www.sc iencedi rec t .com
journa l homepage : www.e lsev ie r . com/ loca te /wat res
wat e r r e s e a r c h 4 5 ( 2 0 1 1 ) 1 9 5 1e1 9 6 0
0043-1354/$ e see front matter ª 2011 Elsevier Ltd. All rights reserved.doi:10.1016/j.watres.2010.12.030
Author's personal copy
Falconer (2001), Kashefipour et al (2002), and the deposition/
re-suspension and adsorption/desorption processes are not
generally included in the model and with little attempt being
made to model such processes in terms of predicting the
impact of the suspended sediment fluxes on bacteria levels in
the water column. However, in recent years there have been
many studies undertaken to study how bacteria exist in the
sediments, with these studies frequently revealing higher
numbers of indicator and pathogenic bacteria in the sedi-
ments than in the overlaying water column, both in marine
and fresh water systems (Fries et al., 2006; Jamieson et al.,
2004; Characklis et al., 2005). Fries et al. (2006) investigated
the attachment of faecal indicator bacteria to particles in the
Neuse rive estuary, in eastern North Carolina, USA, and found
that an overall average of 38% bacteria associated with parti-
cles. Characklis et al. (2005) found attachment ratios of typi-
cally 30e55% for enterococci in storm water. Gannon et al.
(1983) showed that sedimentation was an important element
in the overall faecal coliform disappearance rates in a river
impoundment.
Suspended sediments can contribute to the disappearance
of faecal bacteria from the water column in different ways.
Attached faecal bacteria are adsorbed by the sediments from
the water column during low energy flow conditions (Howell
et al., 1996). Sediment concentrations also affect the light
penetration rate in the water column, which further affects
the decay rate of faecal bacteria (Stapleton et al., 2007). Allen
et al. (1987) revealed that the water quality testing criteria
generally do not take account of sediments as a potential
reservoir of pathogens. The higher numbers of pathogenic
levels occurring in sediments creates a potential health
hazard from re-suspension and subsequent ingestion from
increasing usage of recreational waters. Therefore, there is
a need to obtain additional information on the survival of
indictor and pathogenic bacteria in sediments and the factors
which contribute to their survival (Allen et al., 1987). Jamieson
et al. (2005) conducted field experiments in Swan Creek,
Canada, by using the bacteria tracer E. coli NAR in their
studies. They found that the bacteria tracer that re-appeared
in the water column coincided with increases in the total
suspended solids load, which indicated that the E. coli NAR
were being re-suspendedwith the sediment load. E. coliNAR is
a form of E. coli that is: resistant to nalidixic acid, non-path-
ogenic, rarely found in the natural environment and
possesses survival characteristics similar to other E. coli
(Jamieson et al., 2004).
Some faecal bacteria modelling efforts have been made to
include sediment effects on bacteria. Steets and Holden (2003)
included sediment effects on faecal bacteria fate and trans-
port in a coastal lagoon by introducing a constant attachment
ratio throughout the modelling period. Jamieson et al. (2005)
developed a model for attached faecal bacteria for steady
state flow conditions. Yang et al. (2008) and Stapleton et al.
(2007) have recently developed bacteria transport models for
the Severn Estuary. Both deposition and re-suspension
processes were modelled for the attached bacteria. However,
similar to Steets and Holden (2003), attachment ratios were
assumed to be constant.
In this study, details are given of the refinement of
a numerical model of faecal bacteria transport to include
sediment effects on bacteria fate and transport in surface
waters, where the sediment transport processes are significant.
This model is based on the model DIVAST (Depth Integrated
Velocities And Solute Transport), which has been successfully
applied tomany sites, such as for predicting hydrodynamic and
faecal bacteria transport processes in Swansea Bay (Lin and
Falconer, 2001), faecal coliform transport in the Ribble Estuary
(Kashefipour et al., 2002) and sediment transport processes in
the Humber Estuary (Lin and Falconer, 1996).
2. Hydrodynamic modelling
For many estuarine and coastal water basins the vertical
velocity component is relatively small in comparison with the
horizontal velocity component. Hence the continuity and
momentum equations can be integrated over the depth of
flow and solved numerically to give the depth averaged
velocity fields (Falconer, 1993). The depth integrated Reynolds
Averaged NaviereStokes equations are shown below:
vx
vtþ vUH
vxþ vVH
vy¼ 0 (1)
vUHvt
þ b
�vU2Hvx
þ vUVHvy
�¼ fVHþ gH
vx
vxþ sxw
r� sxb
r
þ 2v
vx
�3H
vUvx
�þ v
vy
�3H
�vUvy
þ vVvx
��
(2)
vVHvt
þ b
�vUVHvx
þ vV2Hvy
�¼ �fUHþ gH
vx
vyþ syw
r� syb
r
þ v
vx
�3H
�vUvy
þ vVvx
��þ 2
v
vy
�3H
vVvy
�
(3)
where x¼water elevation above (or below) datum;
U,V¼ depth averaged velocity components in the x, y direc-
tions; H¼ xþ h¼ total water depth; h¼water depth below
datum; b¼momentum correction factor; f¼Coriolis param-
eter; sxw,syw¼ surface wind shear stress components in the x,
y direction; sxb,syb¼ bed shear stress component in the x, y
directions; and 3¼ depth averaged eddy viscosity. The
momentum correction factor, the wind and bed shear
stresses, and the depth averaged viscosity are described in
detail in Falconer (1993).
3. Suspended sediment transport modelling
Sediment transport formulations for predicting suspended
sediment fluxes in depth integrated two-dimensional
numerical models are generally based on solving the depth
integrated form of the advective-diffusion equation, which
can be shown to be of the form:
vSHvt
þ vSUHvx
þ vSVHvy
� v
vx
�HDx
vSvx
�� v
vy
�HDy
vSvy
�¼ E� D (4)
where S¼ depth averaged suspended sediment concentra-
tion, E¼ sediment erosion rate, D¼ sediment deposition rate,
and Dx,Dy¼ depth averaged dispersion coefficients in the x
and y directions, respectively.
wat e r r e s e a r c h 4 5 ( 2 0 1 1 ) 1 9 5 1e1 9 6 01952
Author's personal copy
The depth averaged net sediment flux rate for non-cohe-
sive sediment can be expressed in the form (Li et al., 2001;
Yuan, 2007):
E� D ¼ gwsðSe � aSÞ (5)
where ws¼ particle settling velocity, g¼ a profile factor given
by the ratio of the bed concentration Sa (i.e. the concentration
at an elevation ‘a’ above bed) to the depth averaged equilib-
rium sediment concentration, Se¼ depth-averaged equilib-
rium concentration, which can be determined from an
appropriate sediment transport formula such as van Rijn
(1984a,1984b,1993), with this being one of the most widely
used formulations incorporated into computational models
and included in the study reported herein, a¼ Se/S is a sedi-
ment concentration profile factor. The equilibrium concen-
tration is that value which occurs when the sediment flux
vertically upwards from the bed due to turbulence is in equi-
librium with the net sediment flux downwards due to the fall
velocity associated with gravity.
For modelling cohesive sediment transport the governing
depth integrated advective-diffusion Eq. (4) is used, but with
the net sediment flux being rewritten in the following form
(Falconer and Chen, 1996):
D ¼�wsS
h1� sb
sc;d
isb � sc;d
0 sb > sc;d(6)
E ¼�Mhsb�sc;esc;e
isb > sc;e
0 sb � sc;e(7)
where sb¼ bed shear stress, sc,d¼ critical shear stress for
deposition, sc,e¼ critical shear stress for erosion and
M¼ empirical erosion constant.
Most of the parameters included in the above formulations
are sensitive to the sediment characteristics locally. During
numerical modelling studies of estuarine flows the value used
must be chosen with extreme care. Typically values of the
critical stress for erosion and deposition are given in Van Rijn
(1993) for a range of different mud types. For the empirical
erosioncoefficientM, reportedvaluesused in the current study
for the Severn Estuary study are typically in the range of
0.00001e0.0005 for soft naturalmud (Falconer andChen, 1996).
4. Sedimentebacteria interaction model
4.1. Partition of bacteria between sediments and water
The total bacteria concentration in the water column CT is
given by:
CT ¼ Cd þ Cp (8)
where Cd¼ free-living bacteria concentration and Cp¼ at-
tached bacteria concentration in the water column.
For a given concentration of suspended solids, the quantity
of faecal bacteria on the particles is often expressed as amass-
specific concentration P (cfu/unit weight of suspended solids),
so the volume-specific concentration on the particles Cp can
be expressed as:Cp ¼ S$P (9)
where S¼ the suspended solid concentration, and P¼ the
mass-specific bacteria concentration, which can be defined as
follows:
S ¼ Ms
Vwþs(10)
P ¼ CFUp
Ms(11)
whereMs¼ solidmass of sediment, Vwþs¼ total volume of the
water and solids, and CFUp¼ colony forming unit of attached
bacteria.
Chapra (1997) expressed the tendency of bacteria to attach
to the particles by using a partition coefficient of the form:
KD ¼ PCd
(12)
Assuming that the rate at which bacteria are adsorbed and/
or desorbed from a particulate is fast, then a local equilibrium
can be assumed to give:
CT ¼ Cd þ KD$S$Cd (13)
which can be solved to give:
Cd ¼ fdCT (14)
and
fd ¼ 11þ KDS
(15)
where fd is the fraction of free-living bacteria in the water
column.
For the attached bacteria, we have:
Cp ¼ fpCT (16)
where
fp ¼ KDS1þ KDS
(17)
and:
fp þ fd ¼ 1 (18)
4.2. Exchange of bacteria at the sedimentewaterinterface
4.2.1. Bacteria settlementOne of the effects of sediment transport on adsorbed bacteria
is that when the sediment settles out then the adsorbed
bacteria is also taken out of the water column to the bed
sediments. The flux of adsorbed bacteria from the water
column to the bed sediments, Fdep, can be expressed as:
Fdep ¼ qdepP (19)
where Fdep¼ flux of adsorbed bacteria from the water column
to the bed sediments (cfu/cm2/s), qdep¼ sediment deposition
flux (kg/m2/s), and P¼ Cp/S attached faecal bacteria concen-
tration on the suspended sediments (cfu/0.1 g).
wat e r r e s e a r c h 4 5 ( 2 0 1 1 ) 1 9 5 1e1 9 6 0 1953
Author's personal copy
4.2.2. Bacteria re-suspensionThe re-suspension of bacteria from the bed sediments to the
water column Fero, can be expressed as:
Fero ¼ qeroPb (20)
where: Fero¼ re-suspension of bacteria from the bed sedi-
ments to the water column (cfu/cm2/s), Pb¼ bacteria concen-
tration on the bed sediments (cfu/0.1 g), and qero¼ sediment
re-suspension flux rate (kg/m2/s).
To summarise, the net bacteria flux, Fnet, due to settling
and re-suspension of the sediments can be expressed as:
Fnet ¼ max�qero;0
Pb þmin
�qdep; 0
�P (21)
4.2.3. Bacteria concentrations in the bed sedimentsThe concentration of bacteria on the bed sediments, Pb, varies
depending on the exchange of bacteria between the water
column and the bed sediments. However, another reduction
also arises in the bed sediment concentration as a result of the
decay of the bacteriawithin the bed sediments. Assuming that
the deposited sediments from the water column to the bed
and the bed sediments are well mixed immediately after
deposition, then the exchange rate of bed bacteria concen-
tration Pb can be expressed in the following form:
dPb
dt¼ qdep
MbðP� PbÞ � kbPb (22)
where Mb¼mass of bed sediments per unit area, and
kb¼ faecal bacteria decay/growth rate in the bed sediments.
Likewise, in Eq. (22), the mass of bed sediments per unit
area, Mb, also varies temporarily as given by:
dMb
dt¼ qdep � qero (23)
4.3. Governing equations for bacteria transportprocesses
4.3.1. Free-living bacteria transportThe fate and transport of free-living bacteria can be described
by the following two-dimensional depth integrated advection-
diffusion equation:
vCdHvt
þ vCdUHvx
þ vCdVHvy
� v
vx
�HDx
vCd
vx
�� v
vy
�HDy
vCd
vy
�
¼ Cdo þ Cd
t � kCdH (24)
where Cd¼ depth averaged free-living bacteria concentration,
Cod¼ source or sink of free-living bacteria; Ct
d¼ transformation
termdefining the desorption of bacteria from the sediments to
the free-living form and vice versa; and k¼ the decay rate of
bacteria in the water column.
Eq. (24) has been solved to predict bacteria concentration
levels for most studies of bacteria transport modelling, such
as Kashefipour et al. (2002) and Lin and Falconer (2001), with
this representation having been proven to represent the
process accurately for the case where sediment transport is
not significant. However, for studies where sediment trans-
port processes are significant, then solving these equations
alone will not give accurate results since the transport of
bacteria through the process of sediment transport, via
erosion and deposition, have not been included in the trans-
port model.
4.3.2. Attached bacteria transportIn studying the transport of attached bacteria, this part of the
bacteria may be transported and diffused with the sediments.
The fate and transport of attached bacteria can therefore be
described by the following two-dimensional depth integrated
advection-diffusion equation:
vHCp
vtþ vUHCp
vxþ vVHCp
vy� v
vx
�HDx
vCp
vx
�� v
vy
�HDy
vCp
vy
�
¼ Cpo þ Cp
t þ Cpb � kCpH (25)
where Cp¼ depth averaged attached bacteria concentration in
the water column, Cop¼ source or sink of bacteria in its
attached form; Ctp¼ transformation term defining the
adsorption of free-living bacteria to the attached bacteria form
or vice versa; Cbp¼ source term defining the attached bacteria
from or to the bed sediments, for sediment erosion or depo-
sition, respectively; and k¼ the decay rate for bacteria in the
water column.
4.3.3. Total bacteria transportIn order to predict bacteria concentrations correctly, both for
free-living and attached bacteria, then the transport equation
must be solved simultaneously in the numerical model for
both bacterial components. However, there are difficulties in
solving these equations accurately since the transformation
terms are difficult to quantify. The transformation processes
between the free-living and adsorbed state for the bacteria are
very complex, so it is almost impossible to quantify these
terms. Wu et al. (2005) pointed out that in modelling heavy
metals there was a problem in using separate equations to
model dissolved and particulate metals due to the complex
nature of the transformation between the particulate and
dissolved phase. Adding Eqs. (24) and (25) and using Ctd¼�Ct
p
gives
vHCT
vtþ vUHCT
vxþ vVHCT
vy� v
vx
�HDx
vCT
vx
�� v
vy
�HDy
vCT
vy
�
¼ Cdo þ Cp
o þ Cpb � kCTH (26)
where CT¼ depth averaged total faecal bacteria concentra-
tion, Cbp¼ Fnet, which is a source term defining the attached
bacteria from, or to, the bed sediments and Fnet can be
calculated from using Eq. (21) as follows:
Fnet ¼ max�qero;0
Pb þmin
�qdep;0
�P
By solving the total bacteria transport equation, then the total
bacterial concentration level CT is determined, wherein Eqs.
(14) and (16) can then be used to determine the free-living and
attached bacteria levels respectively.
5. Sedimentebacteria interaction modelverification
In this section analytical solutions of the sedimentebacteria
interaction are detailed. Idealised cases are also set up to
wat e r r e s e a r c h 4 5 ( 2 0 1 1 ) 1 9 5 1e1 9 6 01954
Author's personal copy
investigate the effects of different environmental factors and
parameters. The sedimentebacteria interaction model devel-
oped is based on the original DIVASTmodel framework which
was originally developed by Falconer (1984). The DIVAST
model has been used bymany researchers (Wu et al., 2005; Lin
and Falconer, 1997) in the past, so only the new sed-
imentebacteria interaction model has been tested against the
analytical solutions for re-suspension and deposition of
sediment and bacteria. In this section two analytical solutions
for sedimentebacteria interaction case studies have been
investigated, namely for a deposition and re-suspension test.
These solutions were first derived and then the numerical
model was set up for test cases. The numerically predicted
results were compared with the analytical results in order to
test the sedimentebacteria interaction properties of the
numerical model.
5.1. Derivation of analytical solutions
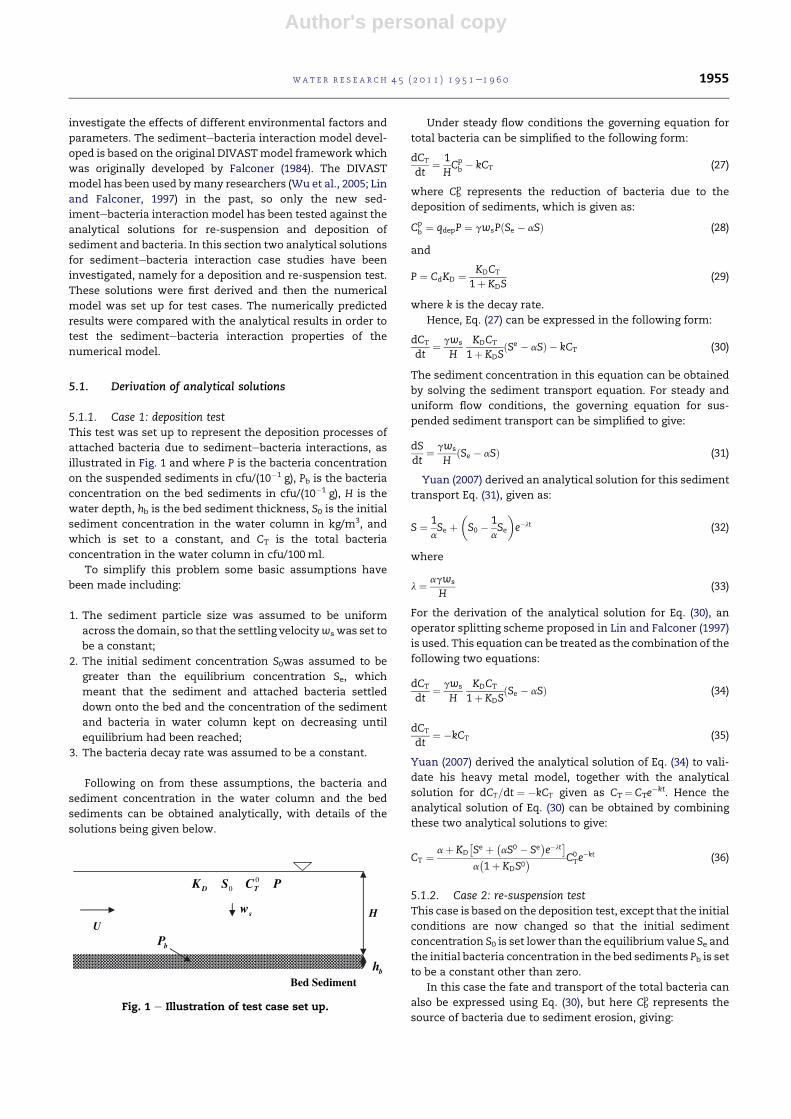
5.1.1. Case 1: deposition testThis test was set up to represent the deposition processes of
attached bacteria due to sedimentebacteria interactions, as
illustrated in Fig. 1 and where P is the bacteria concentration
on the suspended sediments in cfu/(10�1 g), Pb is the bacteria
concentration on the bed sediments in cfu/(10�1 g), H is the
water depth, hb is the bed sediment thickness, S0 is the initial
sediment concentration in the water column in kg/m3, and
which is set to a constant, and CT is the total bacteria
concentration in the water column in cfu/100 ml.
To simplify this problem some basic assumptions have
been made including:
1. The sediment particle size was assumed to be uniform
across the domain, so that the settling velocityws was set to
be a constant;
2. The initial sediment concentration S0was assumed to be
greater than the equilibrium concentration Se, which
meant that the sediment and attached bacteria settled
down onto the bed and the concentration of the sediment
and bacteria in water column kept on decreasing until
equilibrium had been reached;
3. The bacteria decay rate was assumed to be a constant.
Following on from these assumptions, the bacteria and
sediment concentration in the water column and the bed
sediments can be obtained analytically, with details of the
solutions being given below.
Under steady flow conditions the governing equation for
total bacteria can be simplified to the following form:
dCT
dt¼ 1
HCpb � kCT (27)
where Cbp represents the reduction of bacteria due to the
deposition of sediments, which is given as:
Cpb ¼ qdepP ¼ gwsPðSe � aSÞ (28)
and
P ¼ CdKD ¼ KDCT
1þ KDS(29)
where k is the decay rate.
Hence, Eq. (27) can be expressed in the following form:
dCT
dt¼ gws
HKDCT
1þ KDSðSe � aSÞ � kCT (30)
The sediment concentration in this equation can be obtained
by solving the sediment transport equation. For steady and
uniform flow conditions, the governing equation for sus-
pended sediment transport can be simplified to give:
dSdt
¼ gws
HðSe � aSÞ (31)
Yuan (2007) derived an analytical solution for this sediment
transport Eq. (31), given as:
S ¼ 1aSe þ
�S0 � 1
aSe
�e�lt (32)
where
l ¼ agws
H(33)
For the derivation of the analytical solution for Eq. (30), an
operator splitting scheme proposed in Lin and Falconer (1997)
is used. This equation can be treated as the combination of the
following two equations:
dCT
dt¼ gws
HKDCT
1þ KDSðSe � aSÞ (34)
dCT
dt¼ �kCT (35)
Yuan (2007) derived the analytical solution of Eq. (34) to vali-
date his heavy metal model, together with the analytical
solution for dCT=dt ¼ �kCT given as CT¼ CTe�kt. Hence the
analytical solution of Eq. (30) can be obtained by combining
these two analytical solutions to give:
CT ¼ aþ KD
�Se þ �
aS0 � See�lt
a�1þ KDS0
C0Te
�kt (36)
5.1.2. Case 2: re-suspension testThis case is based on the deposition test, except that the initial
conditions are now changed so that the initial sediment
concentration S0 is set lower than the equilibrium value Se and
the initial bacteria concentration in the bed sediments Pb is set
to be a constant other than zero.
In this case the fate and transport of the total bacteria can
also be expressed using Eq. (30), but here Cbp represents the
source of bacteria due to sediment erosion, giving:
00D TK S C P
sw HU
bP
bhBed Sediment
Fig. 1 e Illustration of test case set up.
wat e r r e s e a r c h 4 5 ( 2 0 1 1 ) 1 9 5 1e1 9 6 0 1955
Author's personal copy
Cpb ¼ qeroPb ¼ gwsPbðSe � aSÞ (37)
Assuming a first order decay for the bacteria concentration
in the bed sediments, then we get:
Pb ¼ P0be
�kbt (38)
dCT
dt¼ gws
HP0be
�kbtðSe � aSÞ � kCT (39)
which gives the analytical solution as:
CT ¼�C0T þ P0
be�kbt
a
�Se � aS0
�1� e�lt
�e�kt (40)
5.2. Verification of model against analytical solutions
In this section details are given of the testing of the sed-
imentebacteria interaction model against the analytical
solutions derived in the previous section.
5.2.1. Case 1: depositionThe computational parameters were set as follows:
1. Water depth¼ 1 m;
2. Parameters for sediment transport: a¼ 1, g¼ 1 and the fall
velocity ws¼ 0.001 m/s and the equilibrium sediment
concentration Se was set to 1 kg/m3;
3. The partition coefficient KD was set to10 l/g, as suggested in
Bai and Lung (2005) and the initial sediment and water
column bacterial concentrations were set to be 2 kg/m3 and
100 cfu/100 mlrespectively. These parameter values gave
an initial ratio of attached to total bacteria of about 0.952.
The decay rate in the water column was set to 1 day�1.
4. The initial bacteria bed concentration was assumed to be
zero.
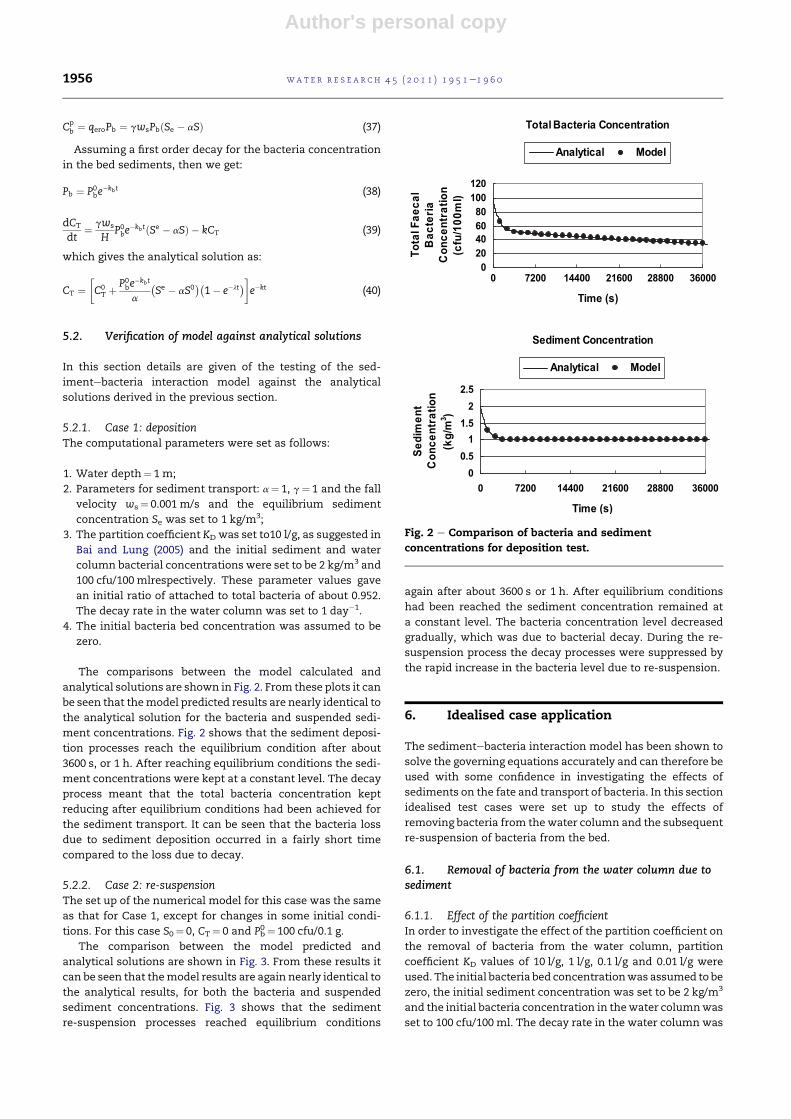
The comparisons between the model calculated and
analytical solutions are shown in Fig. 2. From these plots it can
be seen that themodel predicted results are nearly identical to
the analytical solution for the bacteria and suspended sedi-
ment concentrations. Fig. 2 shows that the sediment deposi-
tion processes reach the equilibrium condition after about
3600 s, or 1 h. After reaching equilibrium conditions the sedi-
ment concentrations were kept at a constant level. The decay
process meant that the total bacteria concentration kept
reducing after equilibrium conditions had been achieved for
the sediment transport. It can be seen that the bacteria loss
due to sediment deposition occurred in a fairly short time
compared to the loss due to decay.
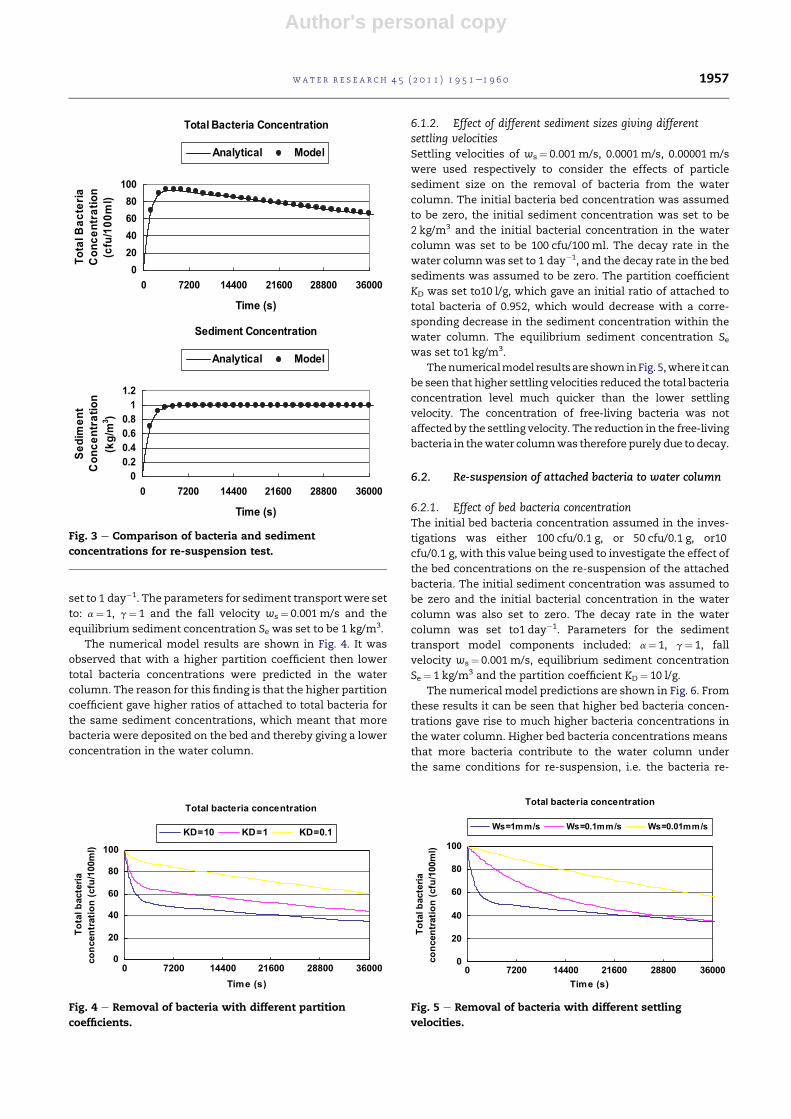
5.2.2. Case 2: re-suspensionThe set up of the numerical model for this case was the same
as that for Case 1, except for changes in some initial condi-
tions. For this case S0¼ 0, CT¼ 0 and Pb0 ¼ 100 cfu/0.1 g.
The comparison between the model predicted and
analytical solutions are shown in Fig. 3. From these results it
can be seen that themodel results are again nearly identical to
the analytical results, for both the bacteria and suspended
sediment concentrations. Fig. 3 shows that the sediment
re-suspension processes reached equilibrium conditions
again after about 3600 s or 1 h. After equilibrium conditions
had been reached the sediment concentration remained at
a constant level. The bacteria concentration level decreased
gradually, which was due to bacterial decay. During the re-
suspension process the decay processes were suppressed by
the rapid increase in the bacteria level due to re-suspension.
6. Idealised case application
The sedimentebacteria interaction model has been shown to
solve the governing equations accurately and can therefore be
used with some confidence in investigating the effects of
sediments on the fate and transport of bacteria. In this section
idealised test cases were set up to study the effects of
removing bacteria from thewater column and the subsequent
re-suspension of bacteria from the bed.
6.1. Removal of bacteria from the water column due tosediment
6.1.1. Effect of the partition coefficientIn order to investigate the effect of the partition coefficient on
the removal of bacteria from the water column, partition
coefficient KD values of 10 l/g, 1 l/g, 0.1 l/g and 0.01 l/g were
used. The initial bacteria bed concentrationwas assumed to be
zero, the initial sediment concentration was set to be 2 kg/m3
and the initial bacteria concentration in thewater columnwas
set to 100 cfu/100 ml. The decay rate in the water column was
Total Bacteria Concentration
0
20
40
60
80
100
120
0 7200 14400 21600 28800 36000
Time (s)
To
tl
aF
ac
el
a
Ba
tc
re
ia
Cc
no
en
tra
tio
n
c(
fu
/10
0m
l)
Analytical Model
Sediment Concentration
0
0.5
1
1.5
2
2.5
0 7200 14400 21600 28800 36000
Time (s)
Se
id
me
tn
Cc
no
en
tra
tio
n
k(
g/m
3
)
Analytical Model
Fig. 2 e Comparison of bacteria and sediment
concentrations for deposition test.
wat e r r e s e a r c h 4 5 ( 2 0 1 1 ) 1 9 5 1e1 9 6 01956
Author's personal copy
set to 1 day�1. The parameters for sediment transport were set
to: a¼ 1, g¼ 1 and the fall velocity ws¼ 0.001 m/s and the
equilibrium sediment concentration Se was set to be 1 kg/m3.
The numerical model results are shown in Fig. 4. It was
observed that with a higher partition coefficient then lower
total bacteria concentrations were predicted in the water
column. The reason for this finding is that the higher partition
coefficient gave higher ratios of attached to total bacteria for
the same sediment concentrations, which meant that more
bacteria were deposited on the bed and thereby giving a lower
concentration in the water column.
6.1.2. Effect of different sediment sizes giving differentsettling velocitiesSettling velocities of ws¼ 0.001 m/s, 0.0001 m/s, 0.00001 m/s
were used respectively to consider the effects of particle
sediment size on the removal of bacteria from the water
column. The initial bacteria bed concentration was assumed
to be zero, the initial sediment concentration was set to be
2 kg/m3 and the initial bacterial concentration in the water
column was set to be 100 cfu/100 ml. The decay rate in the
water columnwas set to 1 day�1, and the decay rate in the bed
sediments was assumed to be zero. The partition coefficient
KD was set to10 l/g, which gave an initial ratio of attached to
total bacteria of 0.952, which would decrease with a corre-
sponding decrease in the sediment concentration within the
water column. The equilibrium sediment concentration Sewas set to1 kg/m3.
Thenumericalmodel resultsare shown inFig. 5,where it can
be seen that higher settling velocities reduced the total bacteria
concentration level much quicker than the lower settling
velocity. The concentration of free-living bacteria was not
affected by the settling velocity. The reduction in the free-living
bacteria in thewater columnwas therefore purely due todecay.
6.2. Re-suspension of attached bacteria to water column
6.2.1. Effect of bed bacteria concentrationThe initial bed bacteria concentration assumed in the inves-
tigations was either 100 cfu/0.1 g, or 50 cfu/0.1 g, or10
cfu/0.1 g, with this value being used to investigate the effect of
the bed concentrations on the re-suspension of the attached
bacteria. The initial sediment concentration was assumed to
be zero and the initial bacterial concentration in the water
column was also set to zero. The decay rate in the water
column was set to1 day�1. Parameters for the sediment
transport model components included: a¼ 1, g¼ 1, fall
velocity ws¼ 0.001 m/s, equilibrium sediment concentration
Se¼ 1 kg/m3 and the partition coefficient KD¼ 10 l/g.
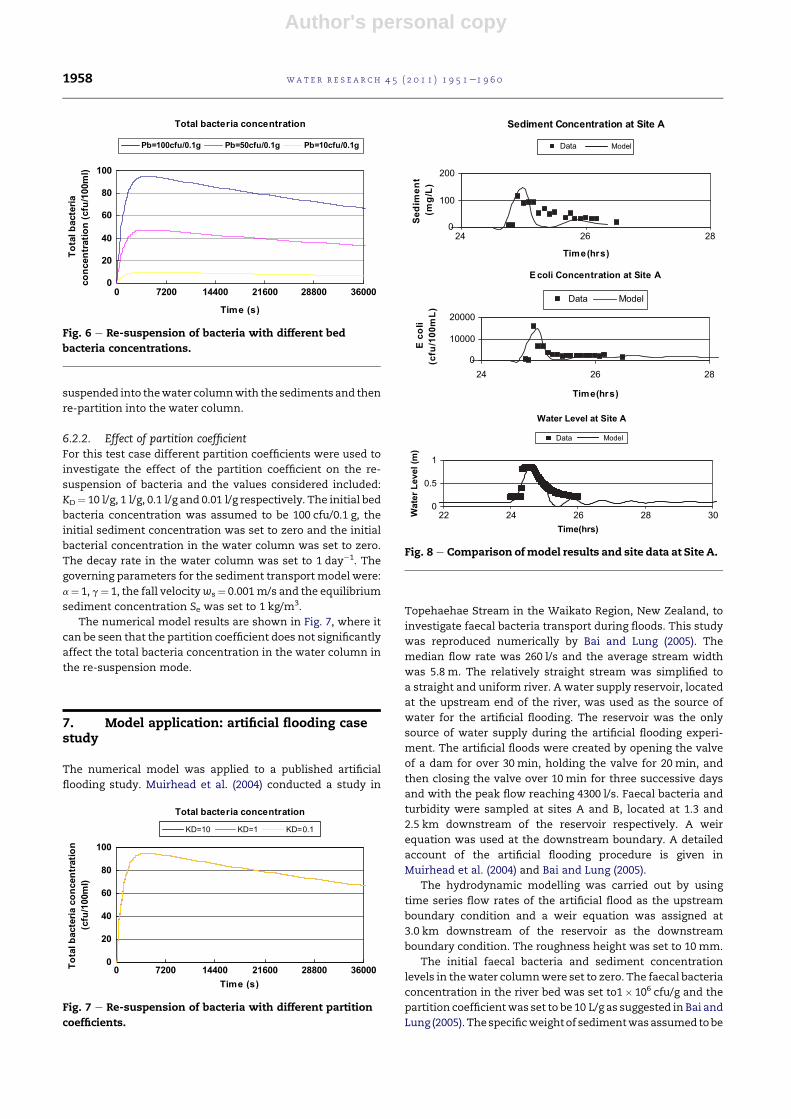
The numerical model predictions are shown in Fig. 6. From
these results it can be seen that higher bed bacteria concen-
trations gave rise to much higher bacteria concentrations in
the water column. Higher bed bacteria concentrations means
that more bacteria contribute to the water column under
the same conditions for re-suspension, i.e. the bacteria re-
0
20
40
60
80
100
0 7200 14400 21600 28800 36000
Time (s)
To
talb
tc
ar
eai
oc
nn
ec
tr
ta
io
n(cfu
m0
01/
l)
Total bacteria concentration
KD=10 KD=1 KD=0.1
Fig. 4 e Removal of bacteria with different partition
coefficients.
Total Bacteria Concentration
0
20
40
60
80
100
0 7200 14400 21600 28800 36000
Time (s)
To
ta
B la
cte
rai
oC
nc
en
tra
tio
n
(c
fu
/0
01
ml)
Analytical Model
Sediment Concentration
0
0.2
0.4
0.6
0.8
1
1.2
0 7200 14400 21600 28800 36000
Time (s)
eS
dim
en
t
oC
nc
en
tra
tio
n
k(
g/m
3
)
Analytical Model
Fig. 3 e Comparison of bacteria and sediment
concentrations for re-suspension test.
0
20
40
60
80
100
0 7200 14400 21600 28800 36000
Time (s)
To
talb
tc
ar
eai
oc
nn
ec
tr
ta
io
n(cfu
m0
01/
l)
Total bacteria concentration
Ws=1mm/s Ws=0.1mm/s Ws=0.01mm/s
Fig. 5 e Removal of bacteria with different settling
velocities.
wat e r r e s e a r c h 4 5 ( 2 0 1 1 ) 1 9 5 1e1 9 6 0 1957
Author's personal copy
suspended into thewater columnwith the sediments and then
re-partition into the water column.
6.2.2. Effect of partition coefficientFor this test case different partition coefficients were used to
investigate the effect of the partition coefficient on the re-
suspension of bacteria and the values considered included:
KD¼ 10 l/g, 1 l/g, 0.1 l/g and 0.01 l/g respectively. The initial bed
bacteria concentration was assumed to be 100 cfu/0.1 g, the
initial sediment concentration was set to zero and the initial
bacterial concentration in the water column was set to zero.
The decay rate in the water column was set to 1 day�1. The
governing parameters for the sediment transport model were:
a¼ 1, g¼ 1, the fall velocityws¼ 0.001 m/s and the equilibrium
sediment concentration Se was set to 1 kg/m3.
The numerical model results are shown in Fig. 7, where it
can be seen that the partition coefficient does not significantly
affect the total bacteria concentration in the water column in
the re-suspension mode.
7. Model application: artificial flooding casestudy
The numerical model was applied to a published artificial
flooding study. Muirhead et al. (2004) conducted a study in
Topehaehae Stream in the Waikato Region, New Zealand, to
investigate faecal bacteria transport during floods. This study
was reproduced numerically by Bai and Lung (2005). The
median flow rate was 260 l/s and the average stream width
was 5.8 m. The relatively straight stream was simplified to
a straight and uniform river. A water supply reservoir, located
at the upstream end of the river, was used as the source of
water for the artificial flooding. The reservoir was the only
source of water supply during the artificial flooding experi-
ment. The artificial floods were created by opening the valve
of a dam for over 30 min, holding the valve for 20 min, and
then closing the valve over 10 min for three successive days
and with the peak flow reaching 4300 l/s. Faecal bacteria and
turbidity were sampled at sites A and B, located at 1.3 and
2.5 km downstream of the reservoir respectively. A weir
equation was used at the downstream boundary. A detailed
account of the artificial flooding procedure is given in
Muirhead et al. (2004) and Bai and Lung (2005).
The hydrodynamic modelling was carried out by using
time series flow rates of the artificial flood as the upstream
boundary condition and a weir equation was assigned at
3.0 km downstream of the reservoir as the downstream
boundary condition. The roughness height was set to 10 mm.
The initial faecal bacteria and sediment concentration
levels in thewater columnwere set to zero. The faecal bacteria
concentration in the river bed was set to1� 106 cfu/g and the
partition coefficientwas set to be 10 L/g as suggested in Bai and
Lung (2005). Thespecificweightof sedimentwasassumedtobe
0
20
40
60
80
100
0 7200 14400 21600 28800 36000
Time (s)
To
ta
bl
tc
ar
eai
oc
nn
ec
tr
ta
oin
(cfu
m0
01/
l)
Total bacteria concentration
Pb=100cfu/0.1g Pb=50cfu/0.1g Pb=10cfu/0.1g
Fig. 6 e Re-suspension of bacteria with different bed
bacteria concentrations.
0
20
40
60
80
100
0 7200 14400 21600 28800 36000
Time (s)
To
ta
bl
tc
ar
eia
oc
nn
ec
tr
ta
oin
(cfu
/m
00
1)l
Total bacteria concentration
KD=10 KD=1 KD=0.1
Fig. 7 e Re-suspension of bacteria with different partition
coefficients.
E coli Concentration at Site A
0
10000
20000
24 26 28
Time(hrs)
c
Eo
li
(c
fu
/m
00
1L
)
Data Model
0
100
200
24 26 28
Time(hrs)
eS
dim
en
t
(m
/g
)L
Data Model
Sediment Concentration at Site A
Water Level at Site A
0
0.5
1
22 24 26 28 30Time(hrs)
Wa
le
ve
L
re
tm
(
)
Data Model
Fig. 8 e Comparison ofmodel results and site data at Site A.
wat e r r e s e a r c h 4 5 ( 2 0 1 1 ) 1 9 5 1e1 9 6 01958
Author's personal copy
2.65. The critical shear stress for sediment re-suspension and
deposition were set to 0.4 and 0.1 N/m2 respectively.
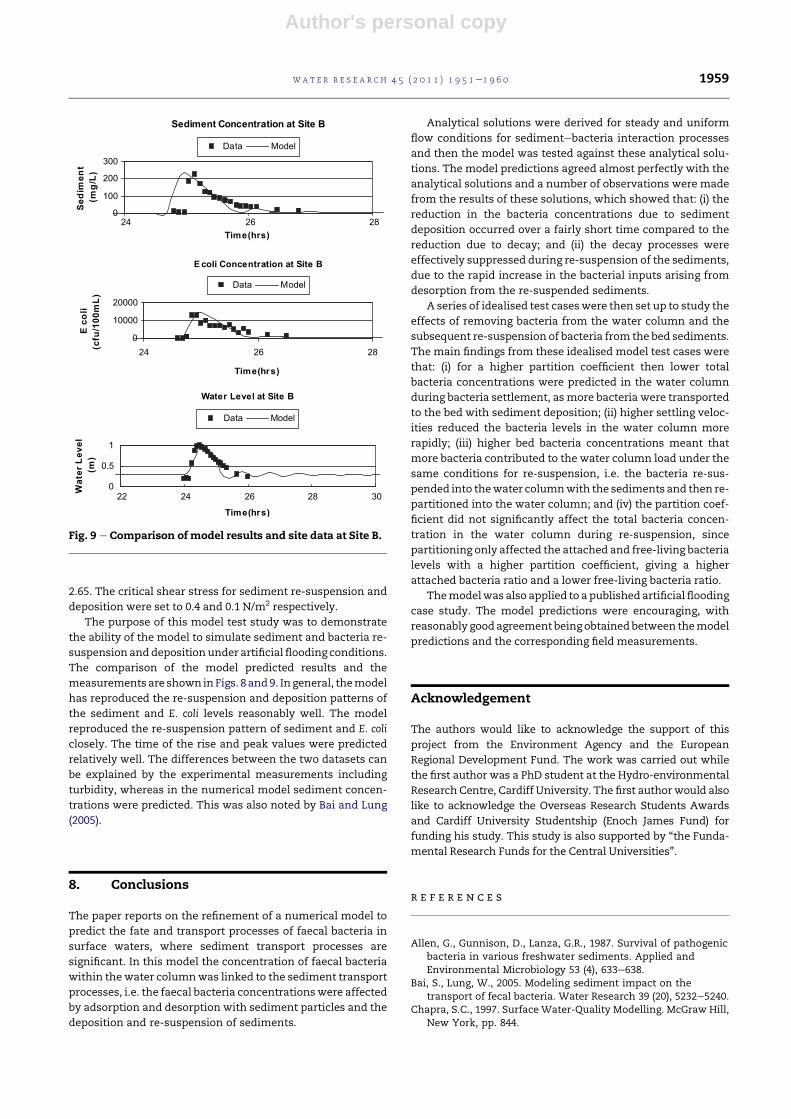
The purpose of this model test study was to demonstrate
the ability of the model to simulate sediment and bacteria re-
suspension anddeposition under artificial flooding conditions.
The comparison of the model predicted results and the
measurementsare shown inFigs. 8 and9. Ingeneral, themodel
has reproduced the re-suspension and deposition patterns of
the sediment and E. coli levels reasonably well. The model
reproduced the re-suspension pattern of sediment and E. coli
closely. The time of the rise and peak values were predicted
relatively well. The differences between the two datasets can
be explained by the experimental measurements including
turbidity, whereas in the numerical model sediment concen-
trations were predicted. This was also noted by Bai and Lung
(2005).
8. Conclusions
The paper reports on the refinement of a numerical model to
predict the fate and transport processes of faecal bacteria in
surface waters, where sediment transport processes are
significant. In this model the concentration of faecal bacteria
within the water columnwas linked to the sediment transport
processes, i.e. the faecal bacteria concentrationswere affected
by adsorption and desorption with sediment particles and the
deposition and re-suspension of sediments.
Analytical solutions were derived for steady and uniform
flow conditions for sedimentebacteria interaction processes
and then the model was tested against these analytical solu-
tions. The model predictions agreed almost perfectly with the
analytical solutions and a number of observations were made
from the results of these solutions, which showed that: (i) the
reduction in the bacteria concentrations due to sediment
deposition occurred over a fairly short time compared to the
reduction due to decay; and (ii) the decay processes were
effectively suppressed during re-suspension of the sediments,
due to the rapid increase in the bacterial inputs arising from
desorption from the re-suspended sediments.
A series of idealised test caseswere then set up to study the
effects of removing bacteria from the water column and the
subsequent re-suspension of bacteria from the bed sediments.
The main findings from these idealised model test cases were
that: (i) for a higher partition coefficient then lower total
bacteria concentrations were predicted in the water column
during bacteria settlement, asmore bacteria were transported
to the bed with sediment deposition; (ii) higher settling veloc-
ities reduced the bacteria levels in the water column more
rapidly; (iii) higher bed bacteria concentrations meant that
more bacteria contributed to the water column load under the
same conditions for re-suspension, i.e. the bacteria re-sus-
pended into thewater columnwith the sediments and then re-
partitioned into the water column; and (iv) the partition coef-
ficient did not significantly affect the total bacteria concen-
tration in the water column during re-suspension, since
partitioning only affected the attached and free-living bacteria
levels with a higher partition coefficient, giving a higher
attached bacteria ratio and a lower free-living bacteria ratio.
Themodelwas also applied to a published artificial flooding
case study. The model predictions were encouraging, with
reasonably goodagreement beingobtainedbetween themodel
predictions and the corresponding field measurements.
Acknowledgement
The authors would like to acknowledge the support of this
project from the Environment Agency and the European
Regional Development Fund. The work was carried out while
the first author was a PhD student at the Hydro-environmental
Research Centre, Cardiff University. The first authorwould also
like to acknowledge the Overseas Research Students Awards
and Cardiff University Studentship (Enoch James Fund) for
funding his study. This study is also supported by “the Funda-
mental Research Funds for the Central Universities”.
r e f e r e n c e s
Allen, G., Gunnison, D., Lanza, G.R., 1987. Survival of pathogenicbacteria in various freshwater sediments. Applied andEnvironmental Microbiology 53 (4), 633e638.
Bai, S., Lung, W., 2005. Modeling sediment impact on thetransport of fecal bacteria. Water Research 39 (20), 5232e5240.
Chapra, S.C., 1997. Surface Water-Quality Modelling. McGraw Hill,New York, pp. 844.
Sediment Concentration at Site B
0
100
200
300
24 26 28Time(hrs)
Se
id
me
tn
(m
/g
)L
0
10000
20000
24 26 28
Time(hrs)
c
Eo
il
c(
fu
/1
00
mL
)
E coli Concentration at Site B
Data Model
Data Model
Data Model
Water Level at Site B
0
0.5
1
22 24 26 28 30
Time(hrs)
Wa
te
rL
e
ve
l
m(
)
Fig. 9 e Comparison of model results and site data at Site B.
wat e r r e s e a r c h 4 5 ( 2 0 1 1 ) 1 9 5 1e1 9 6 0 1959
Author's personal copy
Characklis, G.W., et al., 2005. Microbial partitioning to settleableparticles in storm water. Water Research 39 (9), 1773e1782.
Falconer, R.A., 1984. A mathematical model study of theflushingcharacteristics of a shallow tidal bay. Proceedings ofthe Institution of Civil EngineersdPart 2 Research and Theory77 (3), 311e332.
Falconer, R.A., 1993. An introduction to nearly horizontal flows.Reference Book. In: Abbott, M.B., Price, W.A. (Eds.), CoastalEstuarial and Harbour Engineers. E and F.N. Spon Ltd, London,pp. 27e36 (Chapter 2).
Falconer, R.A., Chen, Y., 1996. Modeling sediment transport andwater quality processes on tidal floodplains. In: Anderson, M.G., Walling, D.E., Bates, P.D. (Eds.), Floodplain Processes. Wiley,Chichester.
Fries, J.S., Characklis, G.W., Noble, R.T., 2006. Attachment offaecal indicator bacteria to particles in the Neuse RiverEstuary, N.C. Journal of Environmental Engineering-ASCE132 (10), 1338e1345.
Gannon, J., Busse, M.K., Schillinger, J., 1983. Faecal coliformdisappearance in a river impoundment. Water Research 17,1595e1601.
Howell, J.M., et al., 1996. Effect of sediment particle size andtemperature on faecal bacteria mortality rates and the fecalcoliform/fecal streptococci ratio. Journal of EnvironmentalQuality 25, 1216e1220.
Jamieson, R.C., Gordon, R., Joy, D., Lee, H., 2004. Assessingmicrobial pollution of rural surface waters. A review of currentwatershed scale modeling approaches. Agricultural WaterManagement 70, 1e17.
Jamieson, R.C., Joy, D., Lee, H., Kostaschuk, R., Gordon, R., 2005.Resuspension of sediment-associated Escherichia ina natural stream. Journal of Environmental Quality 34 (2),581e589.
Kashefipour, S.M., Lin, B., Harris, E., Falconer, R., 2002. Hydro-environmental modelling for bathing water compliance of anesturine basin. Water Research 36 (6), 1854e1868.
Li, Y., Zhao, M., Cao, Zh, 2001. Two-dimensional Fluvial Flow andSediment, Transport Model. China Waterpower Press, Beijing,pp. 189(in Chinese).
Lin, B., Falconer, R.A., 1996. Numerical modelling of three-dimensional suspended sediment for estuarine and coastalwaters. Journal of Hydraulic Research 34 (4), 435e455.
Lin, B., Falconer, R.A., 1997. Tidal flow and transport modellingusing ULTIMAT QUICKEST scheme. Journal of HydraulicEngineering, ASCE 123 (4), 303e314.
Lin, B., Falconer, R.A., 2001. Numerical modelling of 3-d tidalcurrents and water quality indicators in the Bristol Channel.Water and Maritime Engineering, Proceedings of Institution ofCivil Engineers 148 (3), 155e166.
Muirhead, R.W., et al., 2004. Faecal bacteria yields in artificialflood events: quantifying in-stream stores. Water Research38 (5), 1215e1224.
Stapleton, C.M., Wyer, M.D., Kay, D., Bradford, M., Humphrey, N.,Wilkinson, J., Lin, B., Yang, Y., Falconer, R.A., Watkins, J.,Francis, C.A., Crowther, J., Paul, N.D., Jones, K., McDonald, A.T.,2007. Fate andTransport of Particles in Estuaries, vols. I, II, III, IVEnvironment Agency Science Report SC000002/SR1-4.
Steets, B.M., Holden, P.A., 2003. A mechanistic model of runoff-associated fecal coliform fate and transport through a coastallagoon. Water Research 37 (3), 589e608.
Van Rijn, L.C., 1984a. Sediment transport, part I: bed loadtransport. Journal of Hydraulic Engineering, ASCE 110 (10),1431e1457.
Van Rijn, L.C., 1984b. Sediment transport, part II: suspended loadtransport. Journal of Hydraulic Engineering, ASCE 110 (11),1613e1641.
Van Rijn, L.C., 1993. Principles of Sediment Transport in Rivers,Estuaries and Coastal Seas. Aqua Publications, Netherlands.
Wu, Y., Falconer, R.A., Lin, B., 2005. Modelling trace metalconcentration distributions in estuarine waters. Estuarine,Coastal and Shelf Science 64 (4), 699e709.
Yang, L., Lin, B., Falconer, R.A., 2008. Modelling enteric bacterialevels in coastal and estuarine waters. Proceedings ofInstitution of Civil Engineers, Engineering and ComputationalMechanics 161 (EM4), 179e186.
Yuan, D., 2007. Development of An Integrated Hydro-environmental Model and its Application to a Macro-tidalEstuary. PhD Thesis. Cardiff University.
wat e r r e s e a r c h 4 5 ( 2 0 1 1 ) 1 9 5 1e1 9 6 01960