Modeling of dissolved oxygen levels in the bottom waters of the Lower St. Lawrence Estuary: Coupling...
20
Modeling of dissolved oxygen levels in the bottom waters of the Lower St. Lawrence Estuary: Coupling of benthic and pelagic processes Philippe Benoit a, * , Yves Gratton b , Alfonso Mucci a a Department of Earth and Planetary Sciences, McGill University, 3450 Universite ´, Montre ´al, QC, Canada H3A 2A7 b INRS-ETE, Universite ´ du Que ´bec, 490 de la Couronne, Que ´bec, QC, Canada G1K 9A9 Accepted 8 September 2005 Available online 27 January 2006 Abstract Recent measurements of dissolved oxygen (DO) along the Laurentian Channel in Eastern Canada revealed the presence of hypoxic waters in the bottom 50 m of the water column. At hypoxic oxygen levels, many fish species cannot survive or reproduce, and the microbial life community undergoes significant modifications. The cumulative effect of a substantial sediment oxygen demand along the Lower St. Lawrence Estuary (LSLE) is proposed as the possible cause of this DO depletion. To verify this hypothesis, a laterally integrated, two-dimensional model of the DO distribution was implemented for the bottom waters of the Laurentian Channel along a transect of stations sampled in July 2003. The fluid transport was parameterized in a simple advection– diffusion finite element grid where sedimentation of organic matter (OM) feeds the processes that lead to O 2 depletion in the deep waters. Two major types of OM are considered in this study: a fast-reacting marine component that originates from autochthonous material produced in surface waters, and a more refractory terrestrial component originating from continental river discharges. To counterbalance the OM oxygen sink, the deep, landward mean circulation continuously brings O 2 -rich waters from the Atlantic. Both the DO and the early diagenesis model parameters were calibrated using field data collected between 1985 and 2003. Our physical parameter sensitivity study reveals that vertical diffusion from the oxygenated upper water column has the greatest impact on deep DO concentrations. The diagenetic model reproduces the oxygen penetration depths and fluxes very well along the Gulf of St. Lawrence portion of the Channel but overestimates the sediment oxygen demand in the LSLE. We propose that the sediment oxygen demands calculated from DO gradients, measured by voltammetric micro-electrodes, across the sediment–water interface of cores retrieved in the Lower St. Lawrence Estuary are underestimated. D 2005 Elsevier B.V. All rights reserved. 1. Introduction Coastal environments that display water column dis- solved oxygen (DO) deficiencies are becoming more prevalent due to anthropogenic nutrient loading and the ensuing eutrophication of the water system (Nixon, 1995; Diaz and Rosenberg, 1995; Cloern, 2001; Gray et al., 2002). As the DO levels decrease, many aquatic organisms will retreat from these waters whereas benthic community assemblages will be modified (Breitburg, 2002; Gray et al., 2002; Wu, 2002). Severe hypoxia is defined as the threshold below which significant impacts on the biota are observed and corresponds to DO levels 0304-4203/$ - see front matter D 2005 Elsevier B.V. All rights reserved. doi:10.1016/j.marchem.2005.09.015 * Corresponding author. Present address: School of Earth and Ocean Sciences, University of Victoria, P.O. Box 3055 STN CSC, Victoria, BC, Canada V8W 3P6. E-mail address: [email protected] (P. Benoit). Marine Chemistry 102 (2006) 13 – 32 www.elsevier.com/locate/marchem
Transcript of Modeling of dissolved oxygen levels in the bottom waters of the Lower St. Lawrence Estuary: Coupling...
www.elsevier.com/locate/marchem
Marine Chemistry 10
Modeling of dissolved oxygen levels in the bottom waters of
the Lower St. Lawrence Estuary: Coupling of benthic
and pelagic processes
Philippe Benoit a,*, Yves Gratton b, Alfonso Mucci a
a Department of Earth and Planetary Sciences, McGill University, 3450 Universite, Montreal, QC, Canada H3A 2A7b INRS-ETE, Universite du Quebec, 490 de la Couronne, Quebec, QC, Canada G1K 9A9
Accepted 8 September 2005
Available online 27 January 2006
Abstract
Recent measurements of dissolved oxygen (DO) along the Laurentian Channel in Eastern Canada revealed the presence of
hypoxic waters in the bottom 50 m of the water column. At hypoxic oxygen levels, many fish species cannot survive or reproduce,
and the microbial life community undergoes significant modifications. The cumulative effect of a substantial sediment oxygen
demand along the Lower St. Lawrence Estuary (LSLE) is proposed as the possible cause of this DO depletion. To verify this
hypothesis, a laterally integrated, two-dimensional model of the DO distribution was implemented for the bottom waters of the
Laurentian Channel along a transect of stations sampled in July 2003. The fluid transport was parameterized in a simple advection–
diffusion finite element grid where sedimentation of organic matter (OM) feeds the processes that lead to O2 depletion in the deep
waters. Two major types of OM are considered in this study: a fast-reacting marine component that originates from autochthonous
material produced in surface waters, and a more refractory terrestrial component originating from continental river discharges. To
counterbalance the OM oxygen sink, the deep, landward mean circulation continuously brings O2-rich waters from the Atlantic.
Both the DO and the early diagenesis model parameters were calibrated using field data collected between 1985 and 2003. Our
physical parameter sensitivity study reveals that vertical diffusion from the oxygenated upper water column has the greatest impact
on deep DO concentrations. The diagenetic model reproduces the oxygen penetration depths and fluxes very well along the Gulf of
St. Lawrence portion of the Channel but overestimates the sediment oxygen demand in the LSLE. We propose that the sediment
oxygen demands calculated from DO gradients, measured by voltammetric micro-electrodes, across the sediment–water interface
of cores retrieved in the Lower St. Lawrence Estuary are underestimated.
D 2005 Elsevier B.V. All rights reserved.
1. Introduction
Coastal environments that display water column dis-
solved oxygen (DO) deficiencies are becoming more
0304-4203/$ - see front matter D 2005 Elsevier B.V. All rights reserved.
doi:10.1016/j.marchem.2005.09.015
* Corresponding author. Present address: School of Earth and Ocean
Sciences, University of Victoria, P.O. Box 3055 STN CSC, Victoria,
BC, Canada V8W 3P6.
E-mail address: [email protected] (P. Benoit).
prevalent due to anthropogenic nutrient loading and the
ensuing eutrophication of the water system (Nixon,
1995; Diaz and Rosenberg, 1995; Cloern, 2001; Gray
et al., 2002). As the DO levels decrease, many aquatic
organisms will retreat from these waters whereas benthic
community assemblages will be modified (Breitburg,
2002; Gray et al., 2002; Wu, 2002). Severe hypoxia is
defined as the threshold below which significant impacts
on the biota are observed and corresponds to DO levels
2 (2006) 13–32
P. Benoit et al. / Marine Chemistry 102 (2006) 13–3214
below 62.5 Amol L�1 or 2 mg L�1 (Rabalais and Turner,
2001). The proliferation of hypoxic and anoxic (i.e., no
measurable DO) areas along inhabited coastlines is con-
sidered one of the most critical environmental problems
menacing marine ecosystems in modern times
(GESAMP, 2001; USCOP, 2004).
Recent measurements of DO along the Laurentian
Channel (LC) of the Lower St. Lawrence Estuary
(LSLE; see Fig. 1) in Eastern Canada revealed the
presence of persistent, year-round hypoxic waters in
the bottom 50 m of the water column, with concentra-
tions as low as 51.2 (F 0.2) Amol L�1 (16.2% satura-
tion) recorded in July 2003 (Fig. 2). A limited set of
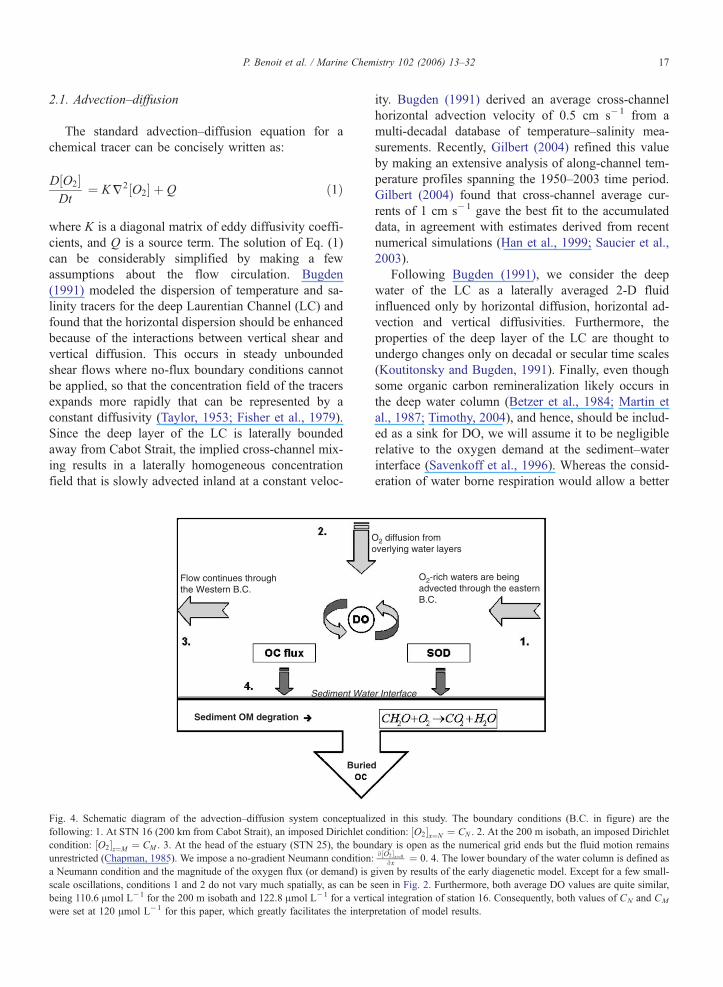
historical data (Fig. 3) reveals that DO levels have been
decreasing for at least the last 70 yr, with a trend
perhaps evolving towards anoxia within the next few
decades (Fig. 3; Gilbert et al., 2005). The area presently
bathed in hypoxic waters is estimated at more than
1300 km2. Recent studies (Plante et al., 1998) have
shown that the continuous exposure of Atlantic cod
(Gadus morhua), a species common to the St. Lawr-
ence ecosystem, to similar DO levels (i.e., 21% satura-
tion) for 96 h will result in the death of 50% of the fish.
Accordingly, the presence of a hypoxic region in the
LSLE may already have had profound negative impacts
on this marine ecosystem and the Canadian economy
52
51
50
49
48
47
46
45
70 68 66 64
Longit
Latit
ude
(•N
)
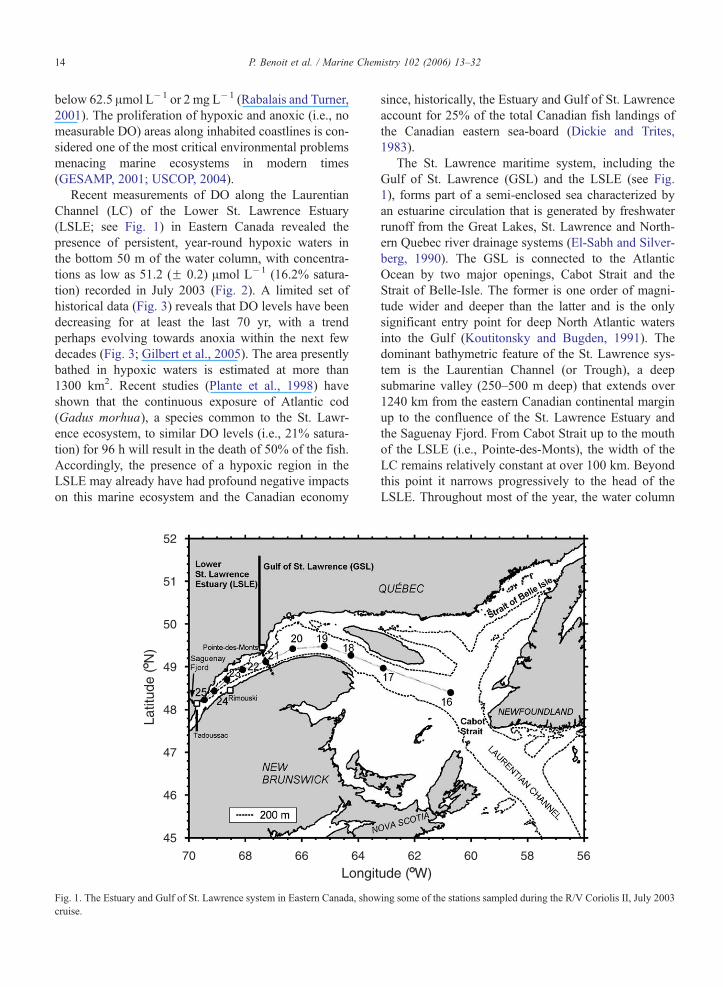
Fig. 1. The Estuary and Gulf of St. Lawrence system in Eastern Canada, show
cruise.
since, historically, the Estuary and Gulf of St. Lawrence
account for 25% of the total Canadian fish landings of
the Canadian eastern sea-board (Dickie and Trites,
1983).
The St. Lawrence maritime system, including the
Gulf of St. Lawrence (GSL) and the LSLE (see Fig.
1), forms part of a semi-enclosed sea characterized by
an estuarine circulation that is generated by freshwater
runoff from the Great Lakes, St. Lawrence and North-
ern Quebec river drainage systems (El-Sabh and Silver-
berg, 1990). The GSL is connected to the Atlantic
Ocean by two major openings, Cabot Strait and the
Strait of Belle-Isle. The former is one order of magni-
tude wider and deeper than the latter and is the only
significant entry point for deep North Atlantic waters
into the Gulf (Koutitonsky and Bugden, 1991). The
dominant bathymetric feature of the St. Lawrence sys-
tem is the Laurentian Channel (or Trough), a deep
submarine valley (250–500 m deep) that extends over
1240 km from the eastern Canadian continental margin
up to the confluence of the St. Lawrence Estuary and
the Saguenay Fjord. From Cabot Strait up to the mouth
of the LSLE (i.e., Pointe-des-Monts), the width of the
LC remains relatively constant at over 100 km. Beyond
this point it narrows progressively to the head of the
LSLE. Throughout most of the year, the water column
62 60 58 56
ude (•W)
ing some of the stations sampled during the R/V Coriolis II, July 2003
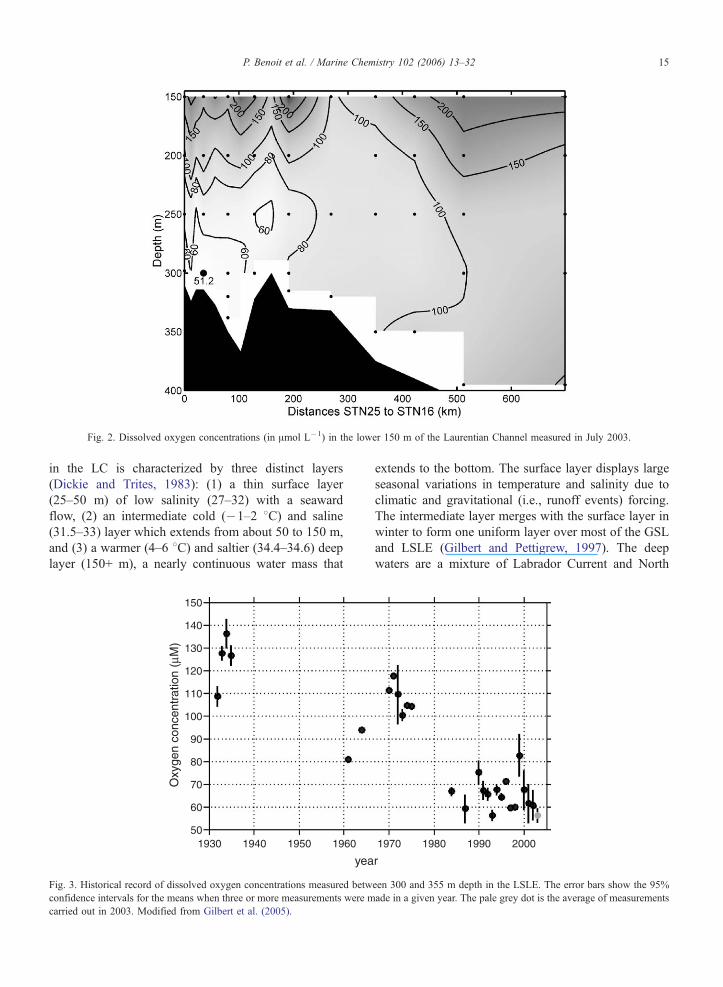
Fig. 2. Dissolved oxygen concentrations (in Amol L�1) in the lower 150 m of the Laurentian Channel measured in July 2003.
P. Benoit et al. / Marine Chemistry 102 (2006) 13–32 15
in the LC is characterized by three distinct layers
(Dickie and Trites, 1983): (1) a thin surface layer
(25–50 m) of low salinity (27–32) with a seaward
flow, (2) an intermediate cold (�1–2 8C) and saline
(31.5–33) layer which extends from about 50 to 150 m,
and (3) a warmer (4–6 8C) and saltier (34.4–34.6) deep
layer (150+ m), a nearly continuous water mass that
150
140
130
120
110
100
90
80
70
60
501930 1940 1950 1960
Oxy
gen
conc
entr
atio
n (µ
M)
yea
Fig. 3. Historical record of dissolved oxygen concentrations measured betw
confidence intervals for the means when three or more measurements were m
carried out in 2003. Modified from Gilbert et al. (2005).
extends to the bottom. The surface layer displays large
seasonal variations in temperature and salinity due to
climatic and gravitational (i.e., runoff events) forcing.
The intermediate layer merges with the surface layer in
winter to form one uniform layer over most of the GSL
and LSLE (Gilbert and Pettigrew, 1997). The deep
waters are a mixture of Labrador Current and North
1970 1980 1990 2000
r
een 300 and 355 m depth in the LSLE. The error bars show the 95%
ade in a given year. The pale grey dot is the average of measurements

Table 1
Characteristics of the sampled stations in the Laurentian Channel
Stations Latitude Longitude Depth (m) Distance from
channel head
(km)
25 48813.98V 69827.00V 310 0
24 48825.99V 68806.01V 314 34.9
23 48842.04V 68839.05V 350 79.8
22 48856.04V 68805.44V 322 128.4
21 49806.97V 67816.93V 330 191.5
20 49825.37V 66819.39V 332 268.9
19 49829.00V 65811.89V 375 350.6
18 49816.06V 64815.86V 390 422.3
17 48857.98V 63807.02V 409 512.3
16 48823.96V 60844.05V 434 698.2
P. Benoit et al. / Marine Chemistry 102 (2006) 13–3216
Atlantic waters in proportions and whose properties
were found to vary on a decadal or secular time scale
(Bugden, 1991; Gilbert et al., 2005).
Hypoxia occurs naturally in fjords, inland seas and
deep basins whose bathymetric features (e.g., high sills)
restrict water circulation and the renewal of bottom
waters (e.g., Nordberg et al., 2001). The development
of hypoxic waters in shallow or seasonally stratified,
open coastal and estuarine environments (e.g., the Gulf
of New Mexico, Rabalais and Turner, 2001) as a result
of eutrophication has been on the rise but such areas are
not hypoxic throughout the year since they are typically
ventilated through fall and winter mixing events. In
contrast, the hypoxic region in the LSLE is a persistent
feature that appears to be a geologically recent phe-
nomenon (Gilbert et al., 2005). The oxygen deficient
area is confined within the bottom waters of the Laur-
entian Channel (LC) and is isolated from the normoxic
upper layers by a steep density gradient that only allows
weak diffusion of oxygen through its boundary. Given
the simple hydrodynamic regime of the deep layer,
Gilbert et al. (2005) identified three factors that might
be responsible for the emergence of hypoxic bottom
waters in the LSLE: (1) a change in the properties of the
oceanic water mass at the edge of the continental shelf
that supplies the deep water to the LC, (2) an increase in
the flux of terrigenous and/or marine organic matter
(OM) to the seafloor of the LC, and (3) a decrease in the
mean landward flow velocity and subsequent increase
in the residence time of the deep waters in the LC. The
latter was discounted because there is no evidence from
field data (D. Gilbert, pers. comm.) or hydrodynamic
modeling studies (Saucier et al., 2003) that the land-
ward advection velocity of bottom waters has decreased
significantly from the 1930s to the mid-1980s. Gilbert
et al. (2005) demonstrated that an increase in the tem-
perature of oceanic waters at the continental margin
boundary of the LC could account for roughly two
thirds of the observed decrease in oxygen concentra-
tions in the LSLE whereas the remainder of the de-
crease in DO levels was ascribed to an increase in OM
export to the seafloor of the LC since European settle-
ment.
In this paper, we present results of a preliminary
modeling effort to constrain the DO budget in the dee-
pest layer of the LSLE. Given the complexities (e.g.,
feedback mechanisms) inherent to modeling eutrophi-
cation, we limited ourselves to the most obvious conse-
quence of eutrophication which, according to Gray et al.
(2002), is the development of hypoxic waters resulting
from the degradation of sedimenting particulate organic
carbon. The proper question to ask then is: dCan the
present sediment oxygen demand (SOD) along the sea-
floor of the Laurentian Channel (LC) account for the
recent development of hypoxic waters in the LSLE?T Toanswer this question, we constructed a 2-D advection–
diffusion model for the deep layer of the LC, subject to
varying fluxes of organic carbon (OC) at the sediment–
water interface and, through catabolic processes, con-
comitant sinks of DO for the water column. In the
following two sections, we describe, in detail, the phys-
ical and chemical parameterizations of the model where-
as we later focus on the model results following a
physical parameter sensitivity analysis carried out
under varying OC flux regimes. We then present a
discussion of the results and conclude with recommen-
dations for future undertakings.
2. Water column parameterization
The system considered is a 2-D representation of the
deep waters of the Laurentian Channel (LC), where the
advection–diffusion of DO from the Atlantic Ocean is
counterbalanced by respiration of sedimentary organic
matter (OM). The model requires the solution of two sets
of differential equations, a mass-transfer equation of DO
in the water column coupled to general diagenetic equa-
tions that describe the accumulation of OM and the
resulting oxygen demand at or near the sediment–water
interface. The latter is used as a boundary condition to
the former. The finite flow system under consideration
reaches from x =0 to x =N (700 km) horizontally and
from z =0 (300 m depth) to z =M (100 m depth) verti-
cally. This corresponds to a transect along the deep layer
of the LC between stations 25 and 16, as displayed on
Fig. 1. This region was chosen a priori because it con-
tains all the stations sampled during the R/V Coriolis II
July 2003 cruise. Table 1 provides information about
each station.
P. Benoit et al. / Marine Chemistry 102 (2006) 13–32 17
2.1. Advection–diffusion
The standard advection–diffusion equation for a
chemical tracer can be concisely written as:
D O2½ �Dt
¼ Kj2 O2½ � þ Q ð1Þ
where K is a diagonal matrix of eddy diffusivity coeffi-
cients, and Q is a source term. The solution of Eq. (1)
can be considerably simplified by making a few
assumptions about the flow circulation. Bugden
(1991) modeled the dispersion of temperature and sa-
linity tracers for the deep Laurentian Channel (LC) and
found that the horizontal dispersion should be enhanced
because of the interactions between vertical shear and
vertical diffusion. This occurs in steady unbounded
shear flows where no-flux boundary conditions cannot
be applied, so that the concentration field of the tracers
expands more rapidly that can be represented by a
constant diffusivity (Taylor, 1953; Fisher et al., 1979).
Since the deep layer of the LC is laterally bounded
away from Cabot Strait, the implied cross-channel mix-
ing results in a laterally homogeneous concentration
field that is slowly advected inland at a constant veloc-
Flow continues throughthe Western B.C.
Sediment Wate
Buried
Sediment OM degration
Fig. 4. Schematic diagram of the advection–diffusion system conceptualiz
following: 1. At STN 16 (200 km from Cabot Strait), an imposed Dirichlet co
condition: O2½ �z¼M ¼ CM . 3. At the head of the estuary (STN 25), the boun
unrestricted (Chapman, 1985). We impose a no-gradient Neumann condition
a Neumann condition and the magnitude of the oxygen flux (or demand) is g
scale oscillations, conditions 1 and 2 do not vary much spatially, as can be s
being 110.6 Amol L�1 for the 200 m isobath and 122.8 Amol L�1 for a verti
were set at 120 Amol L�1 for this paper, which greatly facilitates the interp
ity. Bugden (1991) derived an average cross-channel
horizontal advection velocity of 0.5 cm s�1 from a
multi-decadal database of temperature–salinity mea-
surements. Recently, Gilbert (2004) refined this value
by making an extensive analysis of along-channel tem-
perature profiles spanning the 1950–2003 time period.
Gilbert (2004) found that cross-channel average cur-
rents of 1 cm s�1 gave the best fit to the accumulated
data, in agreement with estimates derived from recent
numerical simulations (Han et al., 1999; Saucier et al.,
2003).
Following Bugden (1991), we consider the deep
water of the LC as a laterally averaged 2-D fluid
influenced only by horizontal diffusion, horizontal ad-
vection and vertical diffusivities. Furthermore, the
properties of the deep layer of the LC are thought to
undergo changes only on decadal or secular time scales
(Koutitonsky and Bugden, 1991). Finally, even though
some organic carbon remineralization likely occurs in
the deep water column (Betzer et al., 1984; Martin et
al., 1987; Timothy, 2004), and hence, should be includ-
ed as a sink for DO, we will assume it to be negligible
relative to the oxygen demand at the sediment–water
interface (Savenkoff et al., 1996). Whereas the consid-
eration of water borne respiration would allow a better
O2 diffusion fromoverlying water layers
O2-rich waters are beingadvected through the easternB.C.
r Interface
ed in this study. The boundary conditions (B.C. in figure) are the
ndition: O2½ �x¼N ¼ CN . 2. At the 200 m isobath, an imposed Dirichlet
dary is open as the numerical grid ends but the fluid motion remains
:B O2½ �x¼0
Bx¼ 0. 4. The lower boundary of the water column is defined as
iven by results of the early diagenetic model. Except for a few small-
een in Fig. 2. Furthermore, both average DO values are quite similar,
cal integration of station 16. Consequently, both values of CN and CM
retation of model results.
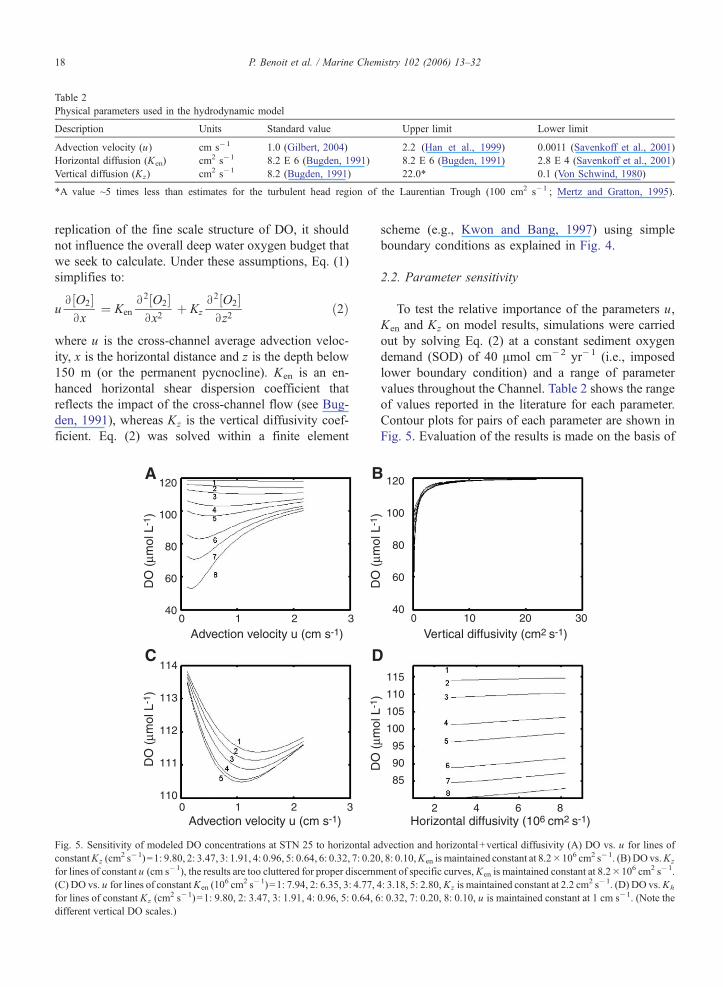
Table 2
Physical parameters used in the hydrodynamic model
Description Units Standard value Upper limit Lower limit
Advection velocity (u) cm s�1 1.0 (Gilbert, 2004) 2.2 (Han et al., 1999) 0.0011 (Savenkoff et al., 2001)
Horizontal diffusion (Ken) cm2 s�1 8.2 E 6 (Bugden, 1991) 8.2 E 6 (Bugden, 1991) 2.8 E 4 (Savenkoff et al., 2001)
Vertical diffusion (Kz) cm2 s�1 8.2 (Bugden, 1991) 22.0* 0.1 (Von Schwind, 1980)
*A value ~5 times less than estimates for the turbulent head region of the Laurentian Trough (100 cm2 s�1 ; Mertz and Gratton, 1995).
P. Benoit et al. / Marine Chemistry 102 (2006) 13–3218
replication of the fine scale structure of DO, it should
not influence the overall deep water oxygen budget that
we seek to calculate. Under these assumptions, Eq. (1)
simplifies to:
uB O2½ �Bx
¼ Ken
B2 O2½ �Bx2
þ Kz
B2 O2½ �Bz2
ð2Þ
where u is the cross-channel average advection veloc-
ity, x is the horizontal distance and z is the depth below
150 m (or the permanent pycnocline). Ken is an en-
hanced horizontal shear dispersion coefficient that
reflects the impact of the cross-channel flow (see Bug-
den, 1991), whereas Kz is the vertical diffusivity coef-
ficient. Eq. (2) was solved within a finite element
A
C
B
D
120
100
80
60
40
110
111
112
113
114
0 1 2 3
0 1 2 3
Advection velocity u (cm s-1)
Advection velocity u (cm s-1)
DO
(µm
ol L
-1)
DO
(µm
ol L
-1)
Fig. 5. Sensitivity of modeled DO concentrations at STN 25 to horizontal a
constantKz (cm2 s�1)=1: 9.80, 2: 3.47, 3: 1.91, 4: 0.96, 5: 0.64, 6: 0.32, 7: 0.20
for lines of constant u (cm s�1), the results are too cluttered for proper discernm
(C) DO vs. u for lines of constantKen (106 cm2 s�1)=1: 7.94, 2: 6.35, 3: 4.77,
for lines of constant Kz (cm2 s�1)=1: 9.80, 2: 3.47, 3: 1.91, 4: 0.96, 5: 0.64, 6
different vertical DO scales.)
scheme (e.g., Kwon and Bang, 1997) using simple
boundary conditions as explained in Fig. 4.
2.2. Parameter sensitivity
To test the relative importance of the parameters u,
Ken and Kz on model results, simulations were carried
out by solving Eq. (2) at a constant sediment oxygen
demand (SOD) of 40 Amol cm�2 yr�1 (i.e., imposed
lower boundary condition) and a range of parameter
values throughout the Channel. Table 2 shows the range
of values reported in the literature for each parameter.
Contour plots for pairs of each parameter are shown in
Fig. 5. Evaluation of the results is made on the basis of
120
100
80
60
40
110
115
95
90
85
105
100
2 4 6 8
0 10 20 30
DO
(µm
ol L
-1)
DO
(µm
ol L
-1)
Horizontal diffusivity (106 cm2 s-1)
Vertical diffusivity (cm2 s-1)
dvection and horizontal+vertical diffusivity (A) DO vs. u for lines of
, 8: 0.10,Ken is maintained constant at 8.2�106 cm2 s�1. (B) DO vs.Kz
ent of specific curves,Ken is maintained constant at 8.2�106 cm2 s�1.
4: 3.18, 5: 2.80,Kz is maintained constant at 2.2 cm2 s�1. (D) DO vs.Kh
: 0.32, 7: 0.20, 8: 0.10, u is maintained constant at 1 cm s�1. (Note the
P. Benoit et al. / Marine Chemistry 102 (2006) 13–32 19
the DO levels generated at the lower left corner of our
simulation region (i.e., bottom of STN 25 shown in Fig.
4) since these waters will be undergoing the largest DO
depletion given their long residence time and proximity
to the sediment oxygen sink.
Fig. 5A–D shows the effects of varying each phys-
ical parameter within the boundaries described in
Table 2. Fig. 5A, B and D reveals the sensitivity of
water column DO to the vertical diffusivity (Kz). At
low Kz values, significant depletion of DO occurs in
the water column. This is best seen in Fig. 5B where
the inflexion point occurs at a Kz on the order of
3 cm2 s�1. DO levels are also highly responsive to
variations of the advection velocity (u). At low ad-
vection velocities and vertical diffusivities, DO levels
in the water column reach minimum values but coun-
terbalance each other when one of them is high (Fig.
5A). This is consistent with the balance of DO sources
described by Eq. (2). At large Kz values, the transfer of
oxygen from the upper water column is faster than the
rate of oxygen consumption by respiration at depth. As
Kz decreases, the influence of u on DO levels becomes
increasingly important as it determines the residence
time of the water in the bottom layer, i.e., a measure of
the time it remains isolated from the atmosphere and
subject to DO depletion by catabolic processes. Of the
three physical parameters considered, Ken has the least
impact, as can be clearly seen in Fig. 5C and D. There
is a minimal change of DO over the range of horizontal
diffusivities considered, thus we shall keep the standard
value of 8.2�106 cm2 s�1 for all subsequent calcula-
tions performed in this publication.
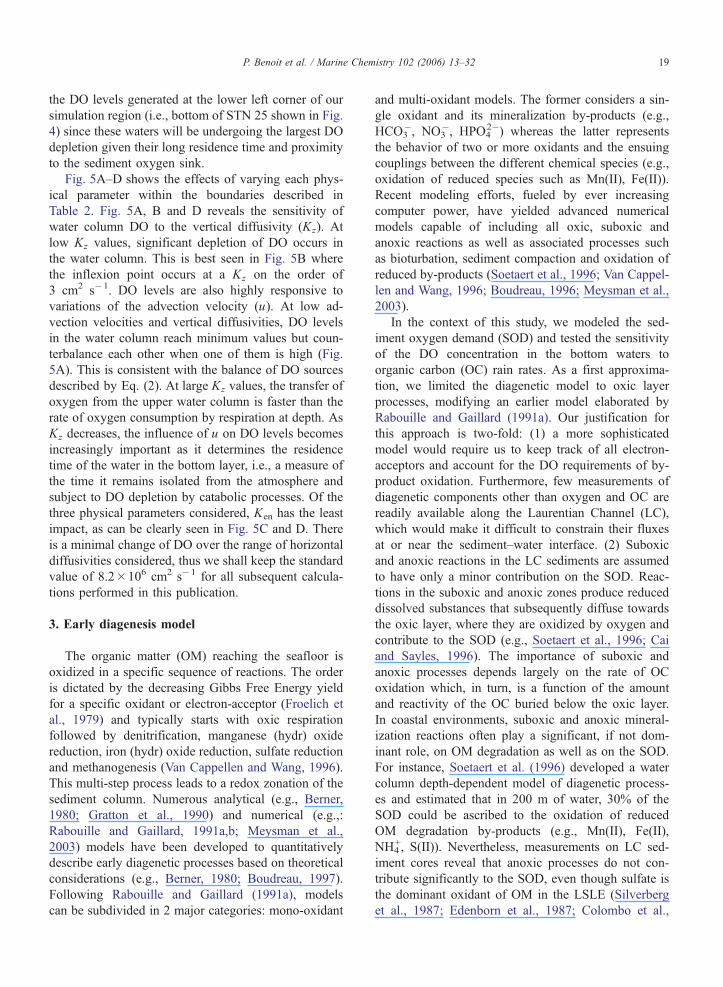
3. Early diagenesis model
The organic matter (OM) reaching the seafloor is
oxidized in a specific sequence of reactions. The order
is dictated by the decreasing Gibbs Free Energy yield
for a specific oxidant or electron-acceptor (Froelich et
al., 1979) and typically starts with oxic respiration
followed by denitrification, manganese (hydr) oxide
reduction, iron (hydr) oxide reduction, sulfate reduction
and methanogenesis (Van Cappellen and Wang, 1996).
This multi-step process leads to a redox zonation of the
sediment column. Numerous analytical (e.g., Berner,
1980; Gratton et al., 1990) and numerical (e.g.,:
Rabouille and Gaillard, 1991a,b; Meysman et al.,
2003) models have been developed to quantitatively
describe early diagenetic processes based on theoretical
considerations (e.g., Berner, 1980; Boudreau, 1997).
Following Rabouille and Gaillard (1991a), models
can be subdivided in 2 major categories: mono-oxidant
and multi-oxidant models. The former considers a sin-
gle oxidant and its mineralization by-products (e.g.,
HCO3�, NO3
�, HPO42�) whereas the latter represents
the behavior of two or more oxidants and the ensuing
couplings between the different chemical species (e.g.,
oxidation of reduced species such as Mn(II), Fe(II)).
Recent modeling efforts, fueled by ever increasing
computer power, have yielded advanced numerical
models capable of including all oxic, suboxic and
anoxic reactions as well as associated processes such
as bioturbation, sediment compaction and oxidation of
reduced by-products (Soetaert et al., 1996; Van Cappel-
len and Wang, 1996; Boudreau, 1996; Meysman et al.,
2003).
In the context of this study, we modeled the sed-
iment oxygen demand (SOD) and tested the sensitivity
of the DO concentration in the bottom waters to
organic carbon (OC) rain rates. As a first approxima-
tion, we limited the diagenetic model to oxic layer
processes, modifying an earlier model elaborated by
Rabouille and Gaillard (1991a). Our justification for
this approach is two-fold: (1) a more sophisticated
model would require us to keep track of all electron-
acceptors and account for the DO requirements of by-
product oxidation. Furthermore, few measurements of
diagenetic components other than oxygen and OC are
readily available along the Laurentian Channel (LC),
which would make it difficult to constrain their fluxes
at or near the sediment–water interface. (2) Suboxic
and anoxic reactions in the LC sediments are assumed
to have only a minor contribution on the SOD. Reac-
tions in the suboxic and anoxic zones produce reduced
dissolved substances that subsequently diffuse towards
the oxic layer, where they are oxidized by oxygen and
contribute to the SOD (e.g., Soetaert et al., 1996; Cai
and Sayles, 1996). The importance of suboxic and
anoxic processes depends largely on the rate of OC
oxidation which, in turn, is a function of the amount
and reactivity of the OC buried below the oxic layer.
In coastal environments, suboxic and anoxic mineral-
ization reactions often play a significant, if not dom-
inant role, on OM degradation as well as on the SOD.
For instance, Soetaert et al. (1996) developed a water
column depth-dependent model of diagenetic process-
es and estimated that in 200 m of water, 30% of the
SOD could be ascribed to the oxidation of reduced
OM degradation by-products (e.g., Mn(II), Fe(II),
NH4+, S(II)). Nevertheless, measurements on LC sed-
iment cores reveal that anoxic processes do not con-
tribute significantly to the SOD, even though sulfate is
the dominant oxidant of OM in the LSLE (Silverberg
et al., 1987; Edenborn et al., 1987; Colombo et al.,
P. Benoit et al. / Marine Chemistry 102 (2006) 13–3220
1996a). For example, whereas Edenborn et al. (1987)
assume that 5% to 25% of OC mineralization occurs
by sulfate reduction in the St. Lawrence Estuary, little
or no reduced S(II) migrates up to the suboxic and
oxic zones in these sediments because it is rapidly
sequestered by the precipitation of iron sulfide miner-
als due to the abundance of reactive Fe(III) (Gagnon
et al., 1995). Furthermore, a study conducted by
Anschutz et al. (2000), on sediment cores recovered
from STA 23 in the LSLE, revealed that most of the
Fe(II) and Mn(II) diffusing from the suboxic sediment
is oxidized by nitrate whereas the latter is reduced to
nitrogen gas which does not contribute to the SOD.
Under these conditions, we assume that oxic OM
mineralization outweighs other reactions in determin-
ing the magnitude of the oxygen flux at the sediment–
water interface in the LC.
3.1. Biochemical reactions
The stoichiometry of the oxic mineralization reac-
tion is dictated by the composition of the sedimentary
organic matter (OM) (Mucci et al., 2000). The latter is
poorly constrained given the variability of organic ma-
terial sources to the seafloor. In the absence of quanti-
tative compositional data and given the relative
reactivity of the OM reaching the sediment–water in-
terface, the OM is commonly assigned a Redfield stoi-
chiometry (Redfield et al., 1963):
ðCH2OÞxðNH3ÞyðH3PO4Þ þ ðx þ 2yÞO2YxHCO�3
þ yNO�3 þ H3PO4 þ yH2O
þ ðx þ yÞHþ ð3Þ
where x is the moles of carbon and y the moles of
nitrogen. The origin of particulate OM is often deter-
mined by its C /N ratio, a low ratio (6 to 9) is typical of
autochthonous OM (i.e., algae or planktonic material,
Redfield ratio=6.6) whereas a high ratio (10+) is char-
acteristic of material of allochtonous origin (i.e., terres-
trial, vascular plants, etc.) (Colombo et al., 1996a). The
OM reaching the sediment–water interface is consumed
fractionally according to the reactivity of its individual
molecular constituents (e.g., proteins, amino acids,
polysaccharides, lipids, etc.). Accordingly, the reactiv-
ity of each substrate decreases with time as the more
reactive constituents are degraded. This process has
been represented by exponential models in which the
OM decays in direct proportion to its own concentra-
tion and irrespective of the oxidant concentration
(multi-G models, e.g., Berner, 1964; Berner, 1980;
Westrich and Berner, 1984; Soetaert et al., 1996; Bou-
dreau, 1996):
BC
Bt¼XNi¼1
kiCi ð4Þ
where C is the carbon concentration, i is a specific
fraction of the OM and k is the first order degradation
rate constant of fraction i in units of reciprocal time.
Following Colombo et al., (1996a,b), we defined two
major types of organic carbon (OC) on the basis of their
C /N ratios: a reactive autochthonous marine compo-
nent with elevated nitrogen content (C /N=x /y =106 /
16=6.6), and an allochtonous, terrestrial component
with lower nitrogen content and reactivity (C /N=x /
y =106 /8.83=12). The dependence of the carbon deg-
radation rate on the quantity of the available oxidant is
modeled using Monod kinetics (Rabouille and Gaillard,
1991a,b). The latter couples the effectiveness of a given
mineralization pathway to the decrease in the quantity
of oxidant available in the system. In other words, the
oxidation reaction occurs until the DO concentration
becomes negligible. Under these assumptions, Eq. (4)
becomes:
BCi
Bt¼ kiCi
O2
O2 þ Kmð Þ ð5Þ
where Ci is the concentration of the i-th component
of the OC per volume of solid, O2 is the oxygen
concentration per volume of interstitial water and Km
is the Monod saturation constant. We selected a
value of Km=8 Amol L�1 O2, following Boudreau
(1996).
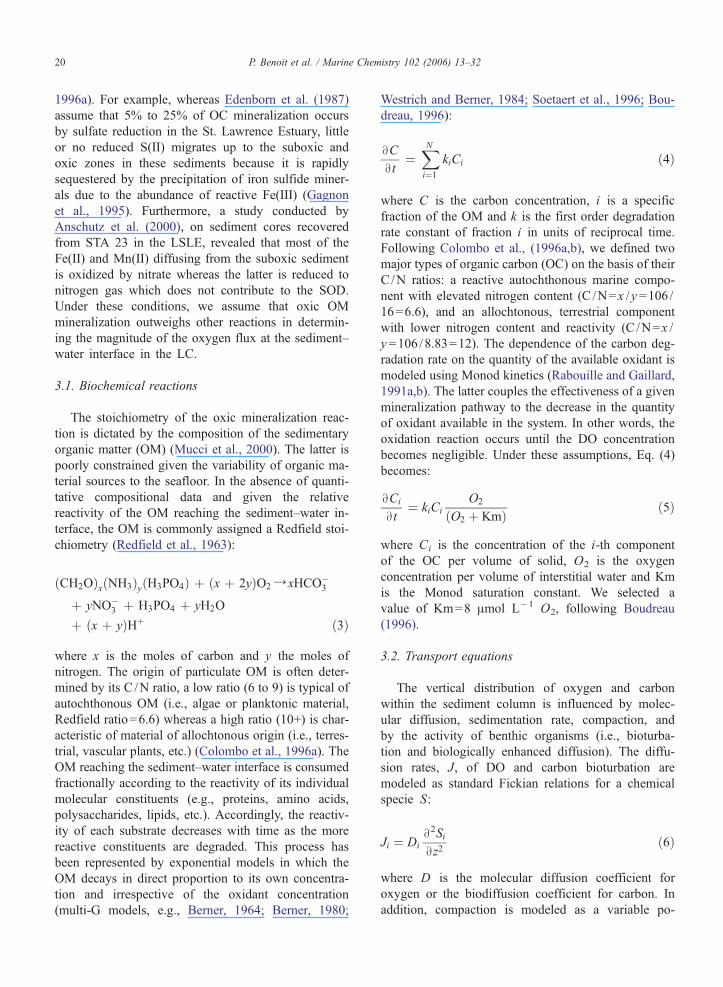
3.2. Transport equations
The vertical distribution of oxygen and carbon
within the sediment column is influenced by molec-
ular diffusion, sedimentation rate, compaction, and
by the activity of benthic organisms (i.e., bioturba-
tion and biologically enhanced diffusion). The diffu-
sion rates, J, of DO and carbon bioturbation are
modeled as standard Fickian relations for a chemical
specie S:
Ji ¼ Di
B2Si
Bz2ð6Þ
where D is the molecular diffusion coefficient for
oxygen or the biodiffusion coefficient for carbon. In
addition, compaction is modeled as a variable po-
P. Benoit et al. / Marine Chemistry 102 (2006) 13–32 21
rosity with depth, which in turn depends on advec-
tion or sedimentation rate (Rabouille and Gaillard,
1991a):
/y ¼ /f wf ð7Þ
1� /ð Þw ¼ 1� /f
� �wf
where / is the porosity, m is the liquid phase advection
and w the solid phase advection velocity or sedimenta-
tion rate. The subscript f refers to values at infinite
sediment depth. The advection rate at the sediment–
water interface is taken to be the incoming organic
carbon (OC) sedimentation rate (i.e., total sedimentation
rate times the OC content). Following Rabouille and
Gaillard (1991a), the differential steady-state mass bal-
ance in the sediment column can be quantitatively writ-
ten as:
� B
Bz� /D
BS
Bzþ m/C
� �þX
R ¼ 0 ð8Þ
where R represents the rate of substratum bacterial oxi-
dation. By substituting Eqs. (5) – (7) into (8), we obtain
the diagenetic equation for each carbon fraction (i =1 for
marine carbon and i=2 for terrestrial carbon):
1� /ð ÞDB
B2Ci
Bz2� BCi
Bz1� /f
� �wf þ DB
B/Bz
� �
¼ 1� /ð ÞkiCi
O2
O2 þ Kmð9Þ
and for oxygen:
/Dox
B2O2
Bz2þ BO2
Bz/f mf � Dox
B/Bz
� �
¼ 1� /ð Þc O2
O2 þ Km
XNi¼1
kiCi: ð10Þ
The boundary value problem of Eqs. (9) and (10) is
solved by using a set of prescribed boundary condi-
tions. Eq. (9) is subject to a given flux F of OC at the
sediment–water interface:
Fi ¼ 1� /ð ÞDB
BCi
Bzþ w 1� /ð ÞCi z ¼ 0 ð11Þ
whereas the oxygen concentration at the sediment–
water interface is provided by the overlying water
column:
O2 ¼ O2BW z ¼ 0: ð12Þ
At the lower sediment boundary, both carbon and
oxygen concentrations are assumed to reach a steady-
state no-flux condition:
BCi
Bz¼ BO2
Bz¼ 0 z ¼ Z: ð13Þ
3.3. Model implementation
The set of three non-linear and coupled differential
Eqs. (9) and (10) was solved using a finite difference
code that implements the 3-stage Lobatto IIIa colloca-
tion formula (Ascher et al., 1988). This technique
divides the solution interval in a mesh of points upon
which a system of algebraic equations is solved by
applying the boundary conditions. The returned solu-
tion must satisfy the relative error tolerance criteria of
10�3, else the mesh will adapt and a new solution will
be provided. The sediment column is given a thickness
of 5 cm segmented into 0.01 cm layers. The flux of
oxygen into the sediment was calculated from the
computed profiles by estimating the linear concentra-
tion gradient across the sediment–water interface by a
least–squares fitting procedure, and using this gradient
in Fick’s diffusion law Eq. (6). The model was imple-
mented within the MatLabR programming environment
(The Mathworks) on a 1.8 GHz personal computer.
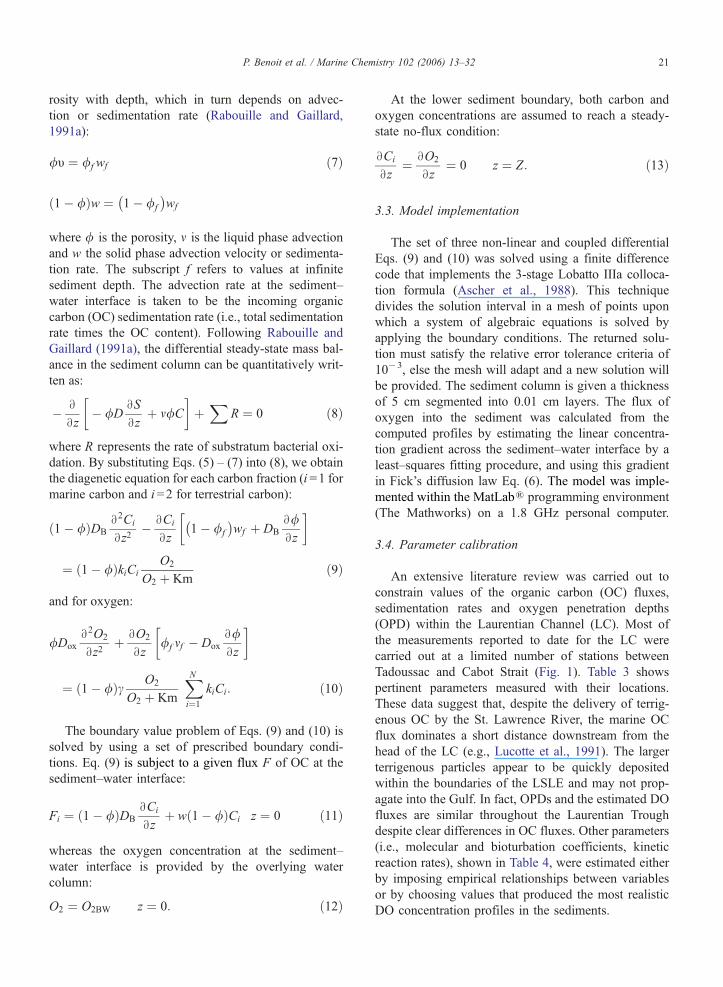
3.4. Parameter calibration
An extensive literature review was carried out to
constrain values of the organic carbon (OC) fluxes,
sedimentation rates and oxygen penetration depths
(OPD) within the Laurentian Channel (LC). Most of
the measurements reported to date for the LC were
carried out at a limited number of stations between
Tadoussac and Cabot Strait (Fig. 1). Table 3 shows
pertinent parameters measured with their locations.
These data suggest that, despite the delivery of terrig-
enous OC by the St. Lawrence River, the marine OC
flux dominates a short distance downstream from the
head of the LC (e.g., Lucotte et al., 1991). The larger
terrigenous particles appear to be quickly deposited
within the boundaries of the LSLE and may not prop-
agate into the Gulf. In fact, OPDs and the estimated DO
fluxes are similar throughout the Laurentian Trough
despite clear differences in OC fluxes. Other parameters
(i.e., molecular and bioturbation coefficients, kinetic
reaction rates), shown in Table 4, were estimated either
by imposing empirical relationships between variables
or by choosing values that produced the most realistic
DO concentration profiles in the sediments.
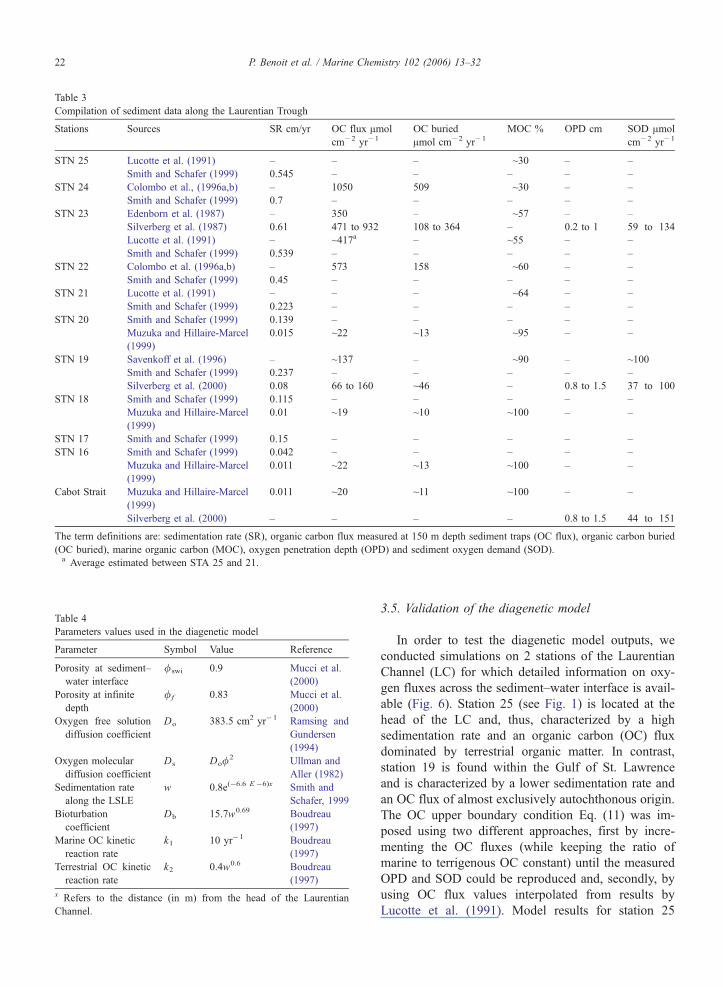
Table 3
Compilation of sediment data along the Laurentian Trough
Stations Sources SR cm/yr OC flux Amol
cm�2 yr�1
OC buried
Amol cm�2 yr�1
MOC % OPD cm SOD Amol
cm�2 yr�1
STN 25 Lucotte et al. (1991) – – – ~30 – –
Smith and Schafer (1999) 0.545 – – – – –
STN 24 Colombo et al., (1996a,b) – 1050 509 ~30 – –
Smith and Schafer (1999) 0.7 – – – – –
STN 23 Edenborn et al. (1987) – 350 – ~57 – –
Silverberg et al. (1987) 0.61 471 to 932 108 to 364 – 0.2 to 1 59 to 134
Lucotte et al. (1991) – ~417a – ~55 – –
Smith and Schafer (1999) 0.539 – – – – –
STN 22 Colombo et al. (1996a,b) – 573 158 ~60 – –
Smith and Schafer (1999) 0.45 – – – – –
STN 21 Lucotte et al. (1991) – – – ~64 – –
Smith and Schafer (1999) 0.223 – – – – –
STN 20 Smith and Schafer (1999) 0.139 – – – – –
Muzuka and Hillaire-Marcel
(1999)
0.015 ~22 ~13 ~95 – –
STN 19 Savenkoff et al. (1996) – ~137 – ~90 – ~100
Smith and Schafer (1999) 0.237 – – – – –
Silverberg et al. (2000) 0.08 66 to 160 ~46 – 0.8 to 1.5 37 to 100
STN 18 Smith and Schafer (1999) 0.115 – – – – –
Muzuka and Hillaire-Marcel
(1999)
0.01 ~19 ~10 ~100 – –
STN 17 Smith and Schafer (1999) 0.15 – – – – –
STN 16 Smith and Schafer (1999) 0.042 – – – – –
Muzuka and Hillaire-Marcel
(1999)
0.011 ~22 ~13 ~100 – –
Cabot Strait Muzuka and Hillaire-Marcel
(1999)
0.011 ~20 ~11 ~100 – –
Silverberg et al. (2000) – – – – 0.8 to 1.5 44 to 151
The term definitions are: sedimentation rate (SR), organic carbon flux measured at 150 m depth sediment traps (OC flux), organic carbon buried
(OC buried), marine organic carbon (MOC), oxygen penetration depth (OPD) and sediment oxygen demand (SOD).a Average estimated between STA 25 and 21.
Table 4
Parameters values used in the diagenetic model
Parameter Symbol Value Reference
Porosity at sediment–
water interface
/swi 0.9 Mucci et al.
(2000)
Porosity at infinite
depth
/f 0.83 Mucci et al.
(2000)
Oxygen free solution
diffusion coefficient
Do 383.5 cm2 yr�1 Ramsing and
Gundersen
(1994)
Oxygen molecular
diffusion coefficient
Ds Do/2 Ullman and
Aller (1982)
Sedimentation rate
along the LSLE
w 0.8e(�6.6 E �6)x Smith and
Schafer, 1999
Bioturbation
coefficient
Db 15.7w0.69 Boudreau
(1997)
Marine OC kinetic
reaction rate
k1 10 yr�1 Boudreau
(1997)
Terrestrial OC kinetic
reaction rate
k2 0.4w0.6 Boudreau
(1997)
x Refers to the distance (in m) from the head of the Laurentian
Channel.
P. Benoit et al. / Marine Chemistry 102 (2006) 13–3222
3.5. Validation of the diagenetic model
In order to test the diagenetic model outputs, we
conducted simulations on 2 stations of the Laurentian
Channel (LC) for which detailed information on oxy-
gen fluxes across the sediment–water interface is avail-
able (Fig. 6). Station 25 (see Fig. 1) is located at the
head of the LC and, thus, characterized by a high
sedimentation rate and an organic carbon (OC) flux
dominated by terrestrial organic matter. In contrast,
station 19 is found within the Gulf of St. Lawrence
and is characterized by a lower sedimentation rate and
an OC flux of almost exclusively autochthonous origin.
The OC upper boundary condition Eq. (11) was im-
posed using two different approaches, first by incre-
menting the OC fluxes (while keeping the ratio of
marine to terrigenous OC constant) until the measured
OPD and SOD could be reproduced and, secondly, by
using OC flux values interpolated from results by
Lucotte et al. (1991). Model results for station 25
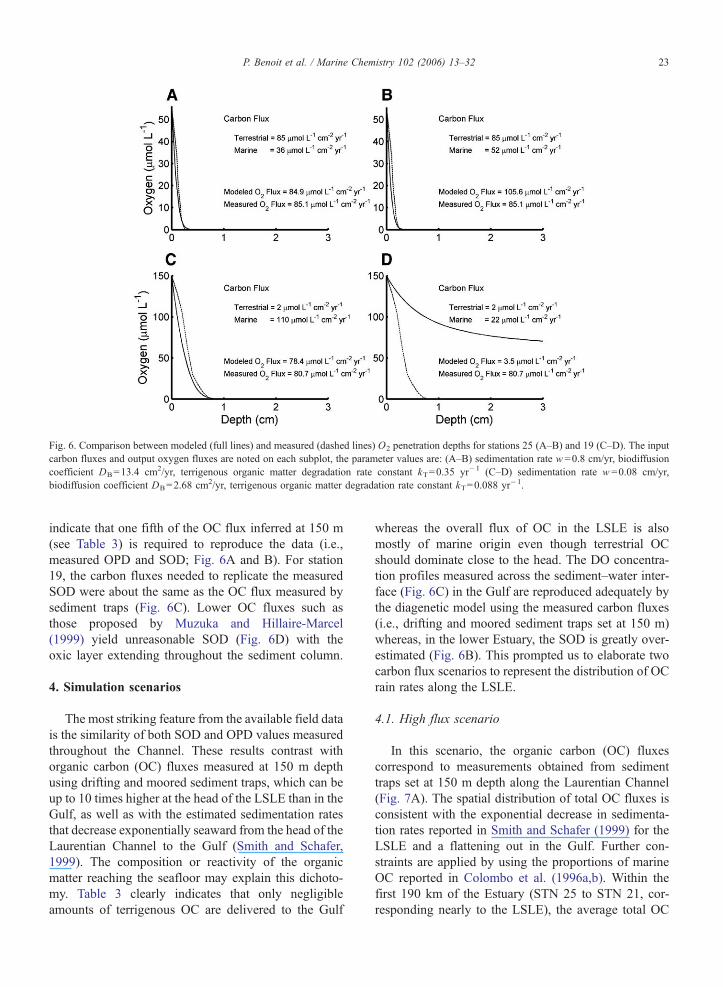
Fig. 6. Comparison between modeled (full lines) and measured (dashed lines) O2 penetration depths for stations 25 (A–B) and 19 (C–D). The input
carbon fluxes and output oxygen fluxes are noted on each subplot, the parameter values are: (A–B) sedimentation rate w =0.8 cm/yr, biodiffusion
coefficient DB=13.4 cm2/yr, terrigenous organic matter degradation rate constant kT=0.35 yr�1 (C–D) sedimentation rate w =0.08 cm/yr,
biodiffusion coefficient DB=2.68 cm2/yr, terrigenous organic matter degradation rate constant kT=0.088 yr�1.
P. Benoit et al. / Marine Chemistry 102 (2006) 13–32 23
indicate that one fifth of the OC flux inferred at 150 m
(see Table 3) is required to reproduce the data (i.e.,
measured OPD and SOD; Fig. 6A and B). For station
19, the carbon fluxes needed to replicate the measured
SOD were about the same as the OC flux measured by
sediment traps (Fig. 6C). Lower OC fluxes such as
those proposed by Muzuka and Hillaire-Marcel
(1999) yield unreasonable SOD (Fig. 6D) with the
oxic layer extending throughout the sediment column.
4. Simulation scenarios
The most striking feature from the available field data
is the similarity of both SOD and OPD values measured
throughout the Channel. These results contrast with
organic carbon (OC) fluxes measured at 150 m depth
using drifting and moored sediment traps, which can be
up to 10 times higher at the head of the LSLE than in the
Gulf, as well as with the estimated sedimentation rates
that decrease exponentially seaward from the head of the
Laurentian Channel to the Gulf (Smith and Schafer,
1999). The composition or reactivity of the organic
matter reaching the seafloor may explain this dichoto-
my. Table 3 clearly indicates that only negligible
amounts of terrigenous OC are delivered to the Gulf
whereas the overall flux of OC in the LSLE is also
mostly of marine origin even though terrestrial OC
should dominate close to the head. The DO concentra-
tion profiles measured across the sediment–water inter-
face (Fig. 6C) in the Gulf are reproduced adequately by
the diagenetic model using the measured carbon fluxes
(i.e., drifting and moored sediment traps set at 150 m)
whereas, in the lower Estuary, the SOD is greatly over-
estimated (Fig. 6B). This prompted us to elaborate two
carbon flux scenarios to represent the distribution of OC
rain rates along the LSLE.
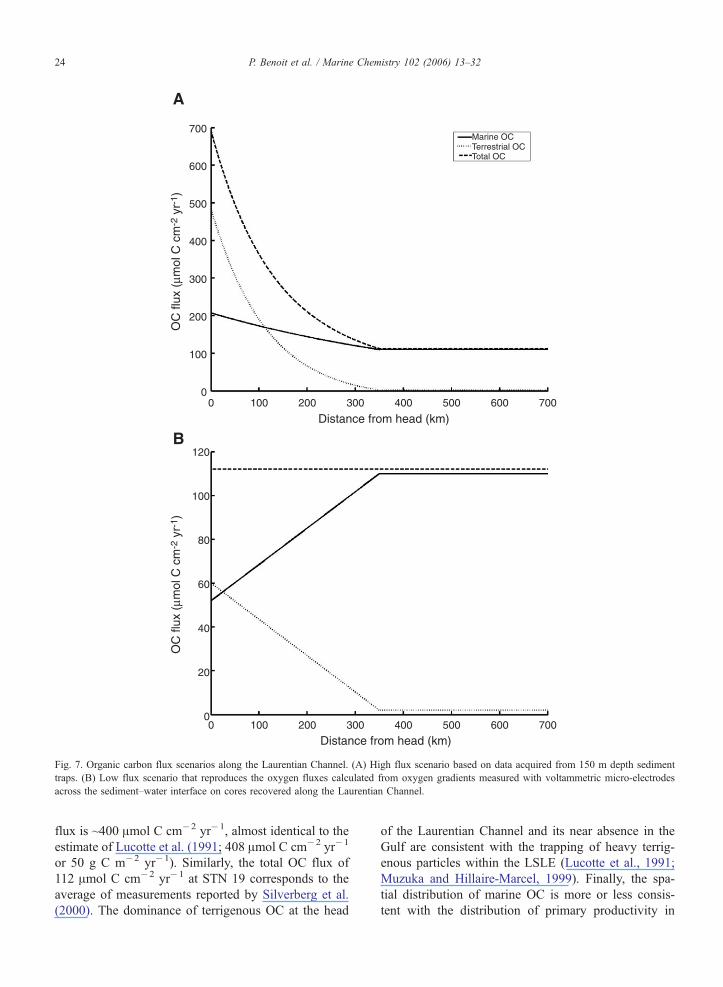
4.1. High flux scenario
In this scenario, the organic carbon (OC) fluxes
correspond to measurements obtained from sediment
traps set at 150 m depth along the Laurentian Channel
(Fig. 7A). The spatial distribution of total OC fluxes is
consistent with the exponential decrease in sedimenta-
tion rates reported in Smith and Schafer (1999) for the
LSLE and a flattening out in the Gulf. Further con-
straints are applied by using the proportions of marine
OC reported in Colombo et al. (1996a,b). Within the
first 190 km of the Estuary (STN 25 to STN 21, cor-
responding nearly to the LSLE), the average total OC
120
100
100 200 300 400 500 600 700
80
60
40
20
00
100 200 300 400 500 600 7000
100
200
300
400
500
600
700
0
Distance from head (km)
Distance from head (km)
OC
flux
(µm
ol C
cm
-2 y
r-1 )
OC
flux
(µm
ol C
cm
-2 y
r-1 )
A
B
Marine OCTerrestrial OCTotal OC
Fig. 7. Organic carbon flux scenarios along the Laurentian Channel. (A) High flux scenario based on data acquired from 150 m depth sediment
traps. (B) Low flux scenario that reproduces the oxygen fluxes calculated from oxygen gradients measured with voltammetric micro-electrodes
across the sediment–water interface on cores recovered along the Laurentian Channel.
P. Benoit et al. / Marine Chemistry 102 (2006) 13–3224
flux is ~400 Amol C cm�2 yr�1, almost identical to the
estimate of Lucotte et al. (1991; 408 Amol C cm�2 yr�1
or 50 g C m�2 yr�1). Similarly, the total OC flux of
112 Amol C cm�2 yr�1 at STN 19 corresponds to the
average of measurements reported by Silverberg et al.
(2000). The dominance of terrigenous OC at the head
of the Laurentian Channel and its near absence in the
Gulf are consistent with the trapping of heavy terrig-
enous particles within the LSLE (Lucotte et al., 1991;
Muzuka and Hillaire-Marcel, 1999). Finally, the spa-
tial distribution of marine OC is more or less consis-
tent with the distribution of primary productivity in
P. Benoit et al. / Marine Chemistry 102 (2006) 13–32 25
the LSLE and the Gulf (90–180 g C m�2 yr�1), of
which ~7% to 10% is believed (Therriault et al., 1990;
Savenkoff et al., 1996; Silverberg et al., 2000) to
reach the sediment–water interface.
4.2. Low flux scenario
In this scenario, the organic carbon (OC) flux is
adjusted to reproduce the SOD calculated from oxygen
gradients measured by voltammetric micro-electrodes
across the sediment–water interface in cores recovered
along the Laurentian Channel (Fig. 7B). Accordingly,
the OC fluxes in the Gulf are similar for both scenarios
but significantly smaller in the LSLE. Consequently, we
must forgo the exponential relationship between the
sedimentation rate and distance from the head of the
LSLE (Smith and Schafer, 1999) and impose linear
functions for simplicity. The dominance of terrigenous
OC at the head and subsequent disappearance in the Gulf
are still represented but the spatial distribution and mag-
nitude of the marine OC flux are modified to reproduce
the sediment geochemical data. The marine OC flux at
STN 25 is set at 7% (Savenkoff et al., 1996) of the
minimum average primary production of the region
(i.e., 90 g C m�2 yr�1; Therriault et al., 1990) and
corresponds to a flux of 52 Amol C cm�2 yr�1. Com-
bined with a terrigenous OC flux of 60 Amol C cm�2
yr�1, it yields a SOD of 84 Amol cm�2 yr�1, roughly the
value measured in July 2003 (~85 Amol cm�2 yr�1 C.
Magen, pers. comm.). The total OC flux remains nearly
constant throughout the Estuary and consistent with the
fact that almost all the SOD (i.e., fluxes) measurements
carried out along the Laurentian Channel fall within the
75 to 100 Amol cm�2 yr�1 range (see Table 3).
5. Discussion
Results of the model simulations, i.e., the computed
oxygen concentrations in the bottom waters of the
LSLE at STN 25 (lower left corner of Fig. 4) are
presented in Fig. 8 for both carbon flux scenarios. For
each scenario, two physical parameters were varied
over realistic ranges: the horizontal advection u and
the vertical diffusivity coefficient Kz. For the sake of
clarity, only four Kz values are presented: (1) Kz =
11 cm2 s�1, a large value more akin to turbulent
rivers, but one order of magnitude smaller than the
estimates of Mertz and Gratton (1995) for the head of
the Laurentian Channel, (2) Kz=2.2 cm2 s�1, derived
by Bugden (1991) from fitting an equation similar to
Eq. (2) to temperature and salinity profiles within the
deep waters of the LC, (3) Kz =0.45 cm2 s�1, a value
obtained by inverse modeling of nutrient budgets for
the St. Lawrence maritime system by Savenkoff et al.
(2001), and (4) Kz =0.1 cm2 s�1, a value reminiscent of
a poorly mixed estuary, more commonly associated
with deep ocean basins (Von Schwind, 1980). Fig. 9
shows contour plots of DO concentrations within the
calculation domain, one for each carbon flux scenario
(Fig. 9A and B) as well as the corresponding steady-
state oxygen demand at the sediment–water interface
(Fig. 9C and D).
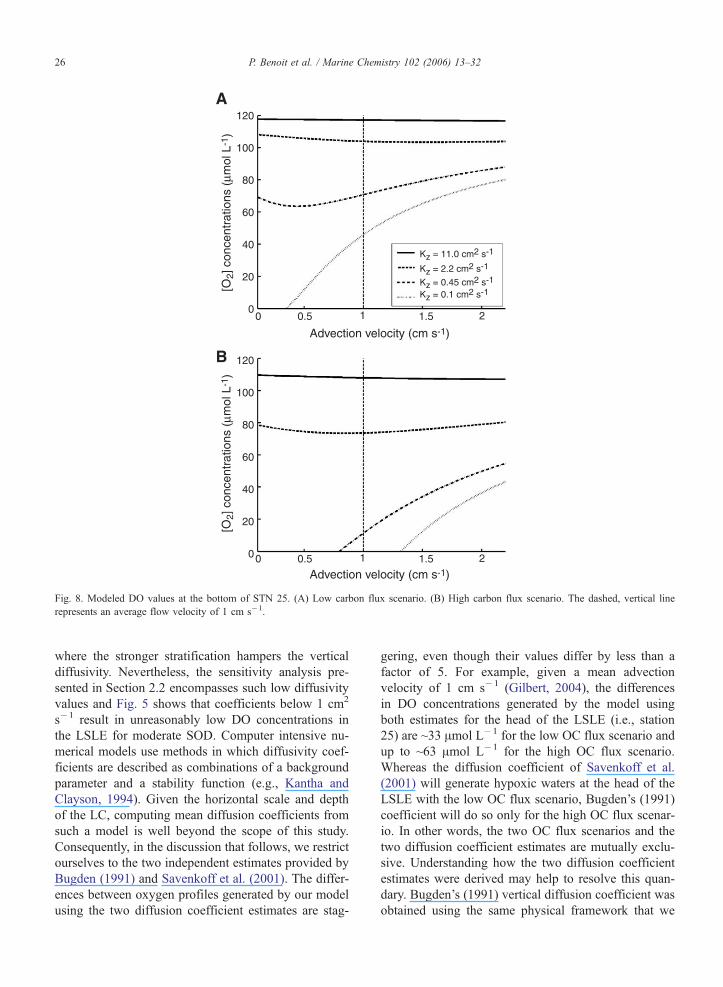
5.1. Parameter variations
As expected and revealed in Fig. 8A and B, the high
organic carbon (OC) flux scenario generates a much
greater depletion of DO in the bottom waters of the
LSLE. The absolute and relative DO depletion between
the two OC flux scenarios is enhanced as the vertical
diffusivity coefficient, Kz, decreases. These results un-
derline the sensitivity of the system to the vertical
diffusivity relative to the other two physical parameters
(i.e., advective velocity and horizontal diffusivity) con-
sidered in the model. As illustrated in Fig. 5B, there is a
very sharp response (i.e., gradient in DO concentra-
tions) of the system when Kz falls below a critical
value of ~3 cm2 s�1. In other words, the system is
relatively insensitive to the advection velocity, u, when
the vertical diffusivity is high, but along-channel ad-
vection of bottom waters becomes the main vector of
DO to the system at low vertical diffusivities. Results
obtained at various Ken are not shown because of its
minimal impact on the DO budget. The DO distribution
pattern shown in Fig. 9B reproduces satisfactorily the
data illustrated in Fig. 2, despite the simplifying
assumptions used in constructing the model, such as
neglecting topography, time-dependence and assuming
constant DO at the upper and eastern boundaries of the
calculation domain. The spatial (i.e., along-channel)
DO gradient in the bottom waters is reproduced in
both scenarios and reasonable DO values are obtained
at the head of the LSLE when the high OC flux scenario
is coupled to realistic physical parameters.
Given the sensitivity of model results to Kz, this
parameter should be better constrained. Unfortunately,
very few estimates of mean diffusivity coefficients in the
deep Laurentian Channel (LC) can be found in the
literature, partly due to the difficulties in accounting
for turbulence. Earlier, independent estimates of Kz for
shallower depths in the LSLE (i.e., ~0.6 to 1.3 cm2 s�1
at 100 m depth) are available from Bugden (1981).
However, these values were calculated for depths near
the thermocline (i.e., between 50 and 100 m depth),
120
100
60
80
40
20
0
120
100
60
80
40
20
0
A
B
Advection velocity (cm s-1)
0.50 1 1.5 2
0.50 1 1.5 2
Advection velocity (cm s-1)
[O2]
con
cent
ratio
ns (
µmol
L-1
)[O
2] c
once
ntra
tions
(µm
ol L
-1)
Kz = 11.0 cm2 s-1
Kz = 2.2 cm2 s-1
Kz = 0.45 cm2 s-1
Kz = 0.1 cm2 s-1
Fig. 8. Modeled DO values at the bottom of STN 25. (A) Low carbon flux scenario. (B) High carbon flux scenario. The dashed, vertical line
represents an average flow velocity of 1 cm s�1.
P. Benoit et al. / Marine Chemistry 102 (2006) 13–3226
where the stronger stratification hampers the vertical
diffusivity. Nevertheless, the sensitivity analysis pre-
sented in Section 2.2 encompasses such low diffusivity
values and Fig. 5 shows that coefficients below 1 cm2
s�1 result in unreasonably low DO concentrations in
the LSLE for moderate SOD. Computer intensive nu-
merical models use methods in which diffusivity coef-
ficients are described as combinations of a background
parameter and a stability function (e.g., Kantha and
Clayson, 1994). Given the horizontal scale and depth
of the LC, computing mean diffusion coefficients from
such a model is well beyond the scope of this study.
Consequently, in the discussion that follows, we restrict
ourselves to the two independent estimates provided by
Bugden (1991) and Savenkoff et al. (2001). The differ-
ences between oxygen profiles generated by our model
using the two diffusion coefficient estimates are stag-
gering, even though their values differ by less than a
factor of 5. For example, given a mean advection
velocity of 1 cm s�1 (Gilbert, 2004), the differences
in DO concentrations generated by the model using
both estimates for the head of the LSLE (i.e., station
25) are ~33 Amol L�1 for the low OC flux scenario and
up to ~63 Amol L�1 for the high OC flux scenario.
Whereas the diffusion coefficient of Savenkoff et al.
(2001) will generate hypoxic waters at the head of the
LSLE with the low OC flux scenario, Bugden’s (1991)
coefficient will do so only for the high OC flux scenar-
io. In other words, the two OC flux scenarios and the
two diffusion coefficient estimates are mutually exclu-
sive. Understanding how the two diffusion coefficient
estimates were derived may help to resolve this quan-
dary. Bugden’s (1991) vertical diffusion coefficient was
obtained using the same physical framework that we
A
C
B
D
SO
D (
µmol
cm
-2 s
-1)
Dep
th (
m)
Distance from STN 25 (km)Distance from STN 25 (km)0 200 400
0 200 400
600 8000 200 400 600 800
100
20
40
60
80
100
20
40
60
80
100
3000 200 400100 300
-500
-400
-300
-200
-100
0
-85
-80
-75
-70
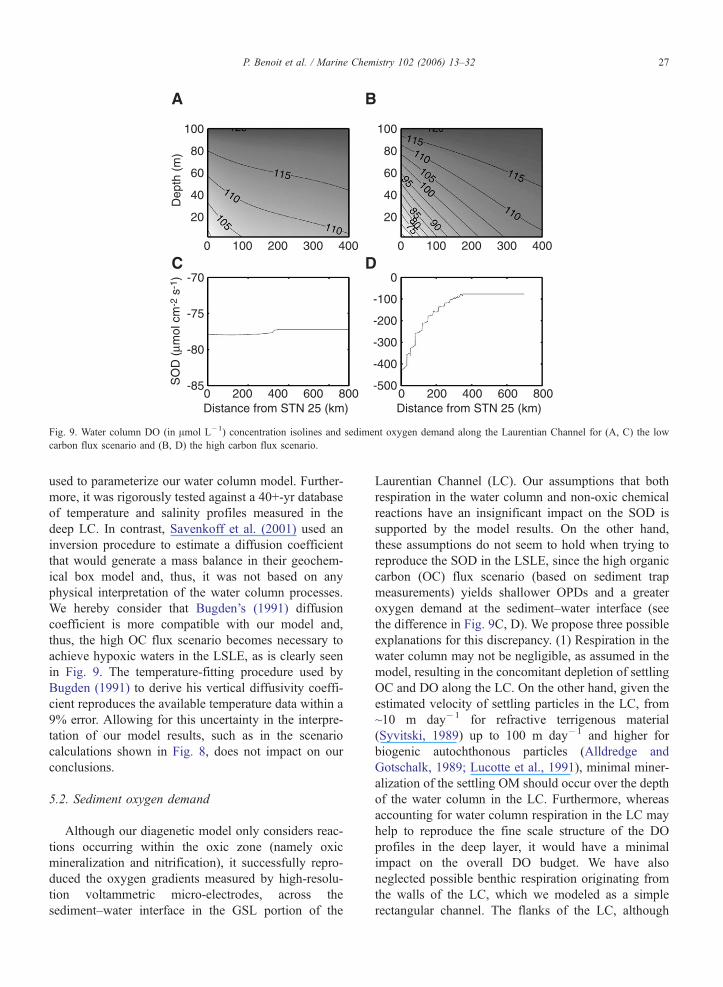
Fig. 9. Water column DO (in Amol L�1) concentration isolines and sediment oxygen demand along the Laurentian Channel for (A, C) the low
carbon flux scenario and (B, D) the high carbon flux scenario.
P. Benoit et al. / Marine Chemistry 102 (2006) 13–32 27
used to parameterize our water column model. Further-
more, it was rigorously tested against a 40+-yr database
of temperature and salinity profiles measured in the
deep LC. In contrast, Savenkoff et al. (2001) used an
inversion procedure to estimate a diffusion coefficient
that would generate a mass balance in their geochem-
ical box model and, thus, it was not based on any
physical interpretation of the water column processes.
We hereby consider that Bugden’s (1991) diffusion
coefficient is more compatible with our model and,
thus, the high OC flux scenario becomes necessary to
achieve hypoxic waters in the LSLE, as is clearly seen
in Fig. 9. The temperature-fitting procedure used by
Bugden (1991) to derive his vertical diffusivity coeffi-
cient reproduces the available temperature data within a
9% error. Allowing for this uncertainty in the interpre-
tation of our model results, such as in the scenario
calculations shown in Fig. 8, does not impact on our
conclusions.
5.2. Sediment oxygen demand
Although our diagenetic model only considers reac-
tions occurring within the oxic zone (namely oxic
mineralization and nitrification), it successfully repro-
duced the oxygen gradients measured by high-resolu-
tion voltammetric micro-electrodes, across the
sediment–water interface in the GSL portion of the
Laurentian Channel (LC). Our assumptions that both
respiration in the water column and non-oxic chemical
reactions have an insignificant impact on the SOD is
supported by the model results. On the other hand,
these assumptions do not seem to hold when trying to
reproduce the SOD in the LSLE, since the high organic
carbon (OC) flux scenario (based on sediment trap
measurements) yields shallower OPDs and a greater
oxygen demand at the sediment–water interface (see
the difference in Fig. 9C, D). We propose three possible
explanations for this discrepancy. (1) Respiration in the
water column may not be negligible, as assumed in the
model, resulting in the concomitant depletion of settling
OC and DO along the LC. On the other hand, given the
estimated velocity of settling particles in the LC, from
~10 m day�1 for refractive terrigenous material
(Syvitski, 1989) up to 100 m day�1 and higher for
biogenic autochthonous particles (Alldredge and
Gotschalk, 1989; Lucotte et al., 1991), minimal miner-
alization of the settling OM should occur over the depth
of the water column in the LC. Furthermore, whereas
accounting for water column respiration in the LC may
help to reproduce the fine scale structure of the DO
profiles in the deep layer, it would have a minimal
impact on the overall DO budget. We have also
neglected possible benthic respiration originating from
the walls of the LC, which we modeled as a simple
rectangular channel. The flanks of the LC, although
P. Benoit et al. / Marine Chemistry 102 (2006) 13–3228
quite steep, should nevertheless harbor an active SOD.
To determine whether or not this additional sink could
influence the deep water DO budget of the LSLE will
require the implementation of a more realistic geometry
in future models. (2) The organic matter delivered to the
sediment–water interface in the LSLE may be more
reactive (i.e., larger k in Eq. (4)) than we assumed
and generate a larger SOD. Yet, calculations carried
out using rate constants ranging from values represen-
tative of very labile organic material, that is easily
degraded in the upper layers of the water column
(i.e., marine OC k =24 yr�1, terrestrial OC k =
1.2 yr�1; Westrich and Berner, 1984), down to refrac-
tive material found in deep oligotrophic sites (i.e.,
marine and terrestrial OC average k b1 yr�1; Sayles
et al., 1994) produce less than a 1% difference in the
ultimate SOD at the head of LSLE. These changes were
negligible compared to the effects of other variables
such as the OC flux or the bottom water oxygen con-
centrations. Similar findings in model sensitivity tests
were reported by Soetaert et al. (1996). (3) Finally, the
large discrepancies in the model results between the
LSLE and the GSL may result from an underestimation
of the oxygen fluxes obtained from measured OPDs or
DO gradients across the sediment–water interface
(SWI). As described in Section 3.2, oxygen fluxes
across the SWI were estimated under the assumption
that the transport of DO through the clayed sediment
occurs mainly by molecular diffusion, a common as-
sumption for non-permeable sediments (e.g., Bouldin,
1968; Di Toro et al., 1990; Rabouille and Gaillard,
1991a; Cai and Sayles, 1996; Silverberg et al., 2000;
House, 2003). Whereas the application of tortuosity-
corrected molecular diffusion coefficients (i.e., Fick’s
first law) does reproduce sufficiently well the SOD for
sediment cores sampled in the GSL, the oxygen profiles
modeled using measured OC fluxes in the LSLE are far
steeper than the measured micro-electrode profiles (see
Fig. 6 for details). More realistic modeled profiles could
be generated if diffusion was accelerated near the sed-
iment–water interface. Several external factors can also
influence the validity of the oxygen fluxes estimated
from micro-electrode measurements or incubation
experiments carried out on-board ship. According to
Glud et al. (2003), the major sampling errors associated
with pore water measurements come from the mechan-
ical disturbance of the sediment core as it is recovered
and the possible undersampling of large faunal speci-
mens due to the restrictive coring size. These errors
were found to be somewhat alleviated by making in situ
measurements, which are not available for the deep
Laurentian Channel. Nevertheless, the findings of
Glud et al. (2003) indicate that laboratory measure-
ments generally underestimate the SOD and overesti-
mate the OPD and, thus, our model DO uptake rate
results should be considered as minimum approxima-
tions. Another possible error in the evaluation of DO
sediment uptake is attributed to the inherent 1-D as-
sumption generally used when computing fluxes across
the sediment–water interface. Both Roy et al. (2002)
and Glud et al. (2003) showed that the use of a 3-D
seabed topography resulted in up to a 10% increase in
SOD from the traditional 1-D models, which is far less
than the 5-fold difference observed in our results.
Alternatively, the effects of an enhanced diffusive
transport, due to the mixing of pore waters by small
organisms (meiofauna and microzoobenthos), as pro-
posed by many authors (e.g., Archer and Devol, 1992;
Meile et al., 2001; Meile and Van Cappellen, 2003;
Glud et al., 2003) could explain discrepancies bet-
ween SOD estimates derived from in situ benthic cham-
ber measurements (e.g., Hall et al., 1989) and fluxes
calculated from vertical high-resolution pore water con-
centration profiles obtained by voltammetric micro-
electrodes (e.g., Luther et al., 1998) in coastal environ-
ments. Estimates of DO fluxes at the SWI derived by
both methods, when available, indicate that, in areas of
relatively small SOD (~100–150 Amol cm�2 yr�1,
commonly found in deeper ocean basins), the differ-
ence is often negligible, whereas for regions with larger
SOD (N200 Amol cm�2 yr�1, usually in shallower
coastal settings), molecular diffusion underestimates
the oxygen fluxes (Jahnke, 2001; Meile and Van Cap-
pellen, 2003). Our modeling results largely agree with
this observation, as the sediment DO profiles in a
region with low SOD (i.e., the GSL) are reproduced
very well by our simple diagenetic model (Fig. 6C).
Furthermore, the modeling results imply that the LSLE
is required to harbor large SOD for hypoxia to occur in
the water column, yet the SOD derived from micro-
electrode measurements are much smaller than the
modeled values (see Fig. 6B). According to Meile
and Van Cappellen (2003), molecular diffusion may
account for as little as 20% of the total SOD in coastal
environments, consistent with our high OC flux model
results but incompatible with field measurements that
reveal invariant OPDs despite large variations in OC
accumulation rates along the LC. In the presence of an
oxygenated water column, there appears to be a thresh-
old OC flux beyond which the ODP and sediment pore
water oxygen profile are minimally affected. At the
present time, too few comparisons of oxygen fluxes
estimated from ship-board DO micro-electrode profiles
and whole core incubations are available for the LC to
P. Benoit et al. / Marine Chemistry 102 (2006) 13–32 29
speculate on the origin of this mechanism (biological or
otherwise) and hence refine the diagenetic model.
6. Conclusions
In this paper, we elaborated a simple 2-D coupled
advection–diffusion-diagenetic model to test the sen-
sitivity of DO level in the deep waters of the Laur-
entian Channel (LC) to varying organic carbon (OC)
fluxes at the sediment–water interface and to physical
parameters of the circulation regime. An extensive
literature review of the regional water column and
sediment properties was conducted in order to better
constrain all the model parameters. Although many
assumptions were used in the conception of the
model (i.e., steady-state, prescribed hydrodynamic
flow, diagenesis restricted to oxic mineralization, use
of empirical extrapolations, etc.), it is able to generate
appreciable DO depletion along the LC when realistic
water column parameters are used. This meets the
objectives set forth by this model as a tool to inves-
tigate the benthic–pelagic coupling in the LC. As to
the question put forth in the introduction: dCan the
present SOD along the seafloor of the Laurentian
Channel account for the recent development hypoxic
waters in the LSLE?T, our model results indicate that
oxic mineralization of OC plays an important role in
generating hypoxic bottom waters in the LSLE. These
results are also likely to support other lines of evi-
dence about claims of eutrophication in the LSLE. For
example, Gilbert et al. (2005) showed that while the
properties of the waters entering the LC since the
1980s underwent only minimal changes, the DO gra-
dient between Cabot Strait and the LSLE has contin-
ually increased during that period of time, possibly
due to rising reactive OC fluxes to the seafloor and a
concomitant increase in SOD. Other evidence of in-
creased reactive OC deposition comes from recent
proxy studies on sediment cores taken in the LSLE.
A compilation of the preserved OC in a sediment core
taken near STN 25 by St-Onge et al. (2003) showed a
gradual increase in y13C since the 1970s, which the
authors interpret as a higher contribution of marine
organic matter to the sediment. This shift in isotopic
composition was related to greater abundances of
dynocysts and organic linings of benthic foraminifera
by Thibodeau et al. (2004). According to Cloern
(2001), such variations in both these sedimentary
proxies are commonly associated with eutrophied ma-
rine ecosystems. Thus, the integration of our study
results with geochemical and micro-paleontological
proxies, serves to show that a gradual increase in
the accumulation rates of particulate OC in the
LSLE, possibly due to the eutrophication of the sys-
tem, would produce a concomitant depletion in DO
levels as revealed by the different carbon flux scenario
model calculations.
According to a sensitivity analysis of the model,
the most important parameters in controlling DO
levels in the LSLE were the vertical diffusivities in
the water column and the reactive OC rain rate. The
diagenetic model successfully reproduces the sediment
oxygen profiles measured in the Gulf portion of the
LC but fails to do so in the LSLE. Nevertheless, a
greater SOD than calculated from measured DO gra-
dients (i.e., micro-electrode profiles) is required to
reproduce the observed DO depletion in the water
column of the LSLE. The diagenetic model results
hence support the hypothesis that oxygen fluxes cal-
culated using molecular diffusion and oxygen gradi-
ents obtained from micro-electrode profiles greatly
underestimate the actual SOD at large OC accumula-
tion rates. In order to resolve this conundrum, SOD
measurements obtained using different methods (i.e.,
on-board and in situ micro-electrode profiles, core
incubations, benthic chambers, etc.) should be carried
out in order to refine the diagenetic model. Future
modeling efforts should be directed towards adding
time-dependency to the benthic–pelagic coupling, in
order to verify claims that eutrophication may be at
least partly responsible for the development of hyp-
oxic bottom waters in the LSLE. Additional improve-
ments would be achieved by a more realistic system
setting (variable width, depth and advective velocity)
for the LC, and use of depth-dependant vertical diffu-
sivities based on the strong (20 cm s� 1) tidal veloc-
ities found in the LSLE.
Acknowledgements
This research was funded by National Sciences and
Engineering Research Council (NSERC) of Canada
Discovery grants to A.M. and Y.G. as well as by a
graduate scholarship from NSERC and a McGill Tom-
linson fellowship to P. Benoit. Discussions and com-
ments by B. Sundby were very helpful. Special thanks
go to D. Gilbert for a thoughtful review of this manu-
script and for providing the data for Fig. 3 and the code
to generate Fig. 1, and to C. Magen for providing
sediment oxygen profiles. The authors also wish to
thank the captain and crew of the R/V Coriolis II for
their assistance and enthusiasm as well as acknowledge
the two anonymous reviewers for their constructive
criticism of the original draft of this paper.
P. Benoit et al. / Marine Chemistry 102 (2006) 13–3230
References
Alldredge, A.L., Gotschalk, C.C., 1989. Direct observations of the
mass flocculation of diatoms blooms: characteristics, settling
velocities and formation of diatom aggregates. Deep-Sea Res., I
36, 159–171.
Anschutz, P., Sundby, B., LeFrancois, L., Luther III, G.W., Mucci, A.,
2000. High resolution profiles and fluxes of redox species in
continental margin sediments: implications for the cycles of nitro-
gen, iodide, manganese, and iron. Geochim. Cosmochim. Acta 64,
2751–2763.
Archer, D., Devol, A.H., 1992. Benthic oxygen fluxes on the Washing-
ton shelf and slope: a comparison of in situ microelectrode and
chamber flux measurements. Limnol. Oceanogr. 37, 614–629.
Ascher, U.M., Mattheij, R.M.M., Russell, R.D., 1988. Numerical
Solution of Boundary Value Problems for Ordinary Differential
Equations. Prentice-Hall Inc., New Jersey.
Berner, R.A., 1964. An idealized model of dissolved sulfate dis-
tribution in recent sediments. Geochim. Cosmochim. Acta 28,
1497–1503.
Berner, R.A., 1980. Early Diagenesis: A Theoretical Approach. Prin-
ceton University Press, Princeton, NJ.
Betzer, P.R., Showers, W.J., Laws, E.A., Winn, C.D., DiTullio, G.R.,
Kroopnick, P.M., 1984. Primary productivity and particle fluxes
on a transect of the equator at 1538W in the Pacific Ocean. Deep-
Sea Res. 31, 1–11.
Boudreau, B.P., 1996. A method-of-line code for carbon and nutrient
diagenesis in aquatic sediments. Comput. Geosci. 22, 249–284.
Boudreau, B.P., 1997. Diagenetic Models and Their Implementation.
Springer-Verlang, New York.
Bouldin, D.R., 1968. Models for describing the diffusion of oxygen
and other mobile constituents across the mud–water interface.
J. Ecol. 56, 77–87.
Breitburg, D., 2002. Effects of hypoxia, and the balance between
hypoxia and enrichment, on coastal fishes and fisheries. Estuaries
25, 767–781.
Bugden, G.L., 1981. Salt and heat budgets for the Gulf of St.
Lawrence. Can J. Fish Aquat. Sci. 38, 1153–1167.
Bugden, G.L., 1991. Changes in the temperature–salinity character-
istics of the deeper waters of the Gulf of St. Lawrence over the
past several decades. In: Therriault, J.-C. (Ed.), The Gulf of St.
Lawrence: Small Ocean or Big Estuary? Can. Spec. Publ. Fish.
Aquat. Sci., vol. 113, pp. 139–147.
Cai, W.-J., Sayles, F.L., 1996. Oxygen penetration depths and fluxes
in marine sediments. Mar. Chem. 52, 123–131.
Chapman, D.C., 1985. Numerical treatment of cross-shelf open
boundaries in a barotropic coastal ocean model. J. Phys. Ocea-
nogr. 15, 1060–1075.
Cloern, J.E., 2001. Our evolving conceptual model of the coastal
eutrophication problem. Mar. Ecol. Prog. Ser. 210, 223–253.
Colombo, J.C., Silverberg, N., Gearing, J.N., 1996a. Biogeochem-
istry of organic matter in the Laurentian Trough. I. Composition
and vertical fluxes of rapidly settling particles. Mar. Chem. 51,
277–293.
Colombo, J.C., Silverberg, N., Gearing, J.N., 1996b. Biogeochemistry
of organic matter in the Laurentian Trough, II. Bulk composition
of the sediments and relative reactivity of major components
during early diagenesis. Mar. Chem. 51, 295–314.
Di Toro, B.M., Paquin, P.R., Subburamu, K., Gruber, D.A., 1990.
Sediment oxygen demand model: methane and ammonia oxida-
tion. J. Environ. Eng. 116, 945–985.
Diaz, J.R., Rosenberg, R., 1995. Marine benthic hypoxia: a review, its
ecological effects and the behavioural responses of benthic macro-
fauna. Oceanogr. Mar. Biol. Ann. Rev. 33, 245–303.
Dickie, L., Trites., R.W., 1983. The gulf of St. Lawrence In: Dickie,
L., Trites, R.W. (Eds), Estuaries and Semi-Enclosed Seas. Elsevier
Scientific Publication, Amsterdam, pp. 403–425.
Edenborn, H.M., Silverberg, N., Mucci, A., Sundby, B., 1987. Sulfate
reduction in the sediments of a deep coastal environment. Mar.
Chem. 21, 329–345.
El-Sabh, M.I., Silverberg, N., 1990. The St. Lawrence Estuary:
introduction. In: El-Sabh, M.I., Silverberg, N. (Eds.), Oceanogra-
phy of a Large-scale Estuarine System. Springer-Verlag, New
York, pp. 1–9.
Fisher, H.B., List, E.J., Koh, R.C.Y., Imberger, J., Brooks, N.H.,
1979. Mixing in Inland and Coastal Waters. Academic Press,
New York, NY.
Froelich, P.N., Klinkhammer, G.P., Bender, M.L., Luedtke, N.A.,
Heath, G.R., Cullen, D., Dauphin, P., Hammond, D., Hartman,
B., Maynard, V., 1979. Early oxidation of organic matter in
pelagic sediments of the eastern equatorial Atlantic: suboxic
diagenesis. Geochim. Cosmochim. Acta 43, 1075–1090.
Gagnon, C., Mucci, A., Pelletier, E., 1995. Anomalous accumula-
tion of acid-volatile sulphides in a coastal marine sediment
(Saguenay Fjord, Canada). Geochim. Cosmochim. Acta 59,
2663–2675.
GESAMP, 2001. A sea of troubles. GESAMP Rep. Stud. 70, 1–35.
Gilbert, D., 2004. Propagation of temperature signals along the north-
west Atlantic continental shelf edge and into the Laurentian
Channel. Abstract, ICES CIEM Annual Science Conference Sep-
tember 22–25, Vigo, Spain.
Gilbert, D., Pettigrew, B., 1997. Interannual variability (1948–1994)
of the CIL core temperature in the Gulf of St. Lawrence. Can. J.
Fish Aquat. Sci. 54, 57–67.
Gilbert, D., Sundby, B., Gobeil, C., Mucci, A., Tremblay, G.H., 2005.
A seventy-year record of diminishing deep-water oxygen levels in
the St. Lawrence estuary—the northwest Atlantic connection.
Limnol. Oceanogr. 50, 1654–1666.
Glud, R.N., Gundersen, J.K., Roy, H., Jørgensen, B.B., 2003. Sea-
sonal dynamics of benthic O2 uptake in a semienclosed bay:
importance of diffusion and faunal activity. Limnol. Oceanogr.
48, 1265–1276.
Gratton, Y., Edenborn, H.M., Silverberg, N., Sundby, B., 1990. A
mathematical model for manganese diagenesis in bioturbated
sediments. Amer. J. Sci. 290, 246–262.
Gray, J.S., Wu, R.S.-S., Or, Y.Y., 2002. Effects of hypoxia and organic
enrichment on the coastal marine environment. Mar. Ecol. Prog.
Ser. 238, 249–279.
Hall, P., Anderson, L.G., Rutgers van der Loeff, M.M., Sundby, B.,
Westerlund, S.F.G., 1989. Oxygen uptake kinetics in the benthic
boundary layer. Limnol. Oceanogr. 34, 734–746.
Han, G., Loder, J.W., Smith, P.C., 1999. Seasonal-mean hydrography
and circulation in the Gulf of St. Lawrence and on the eastern
Scotian and southern Newfoundland shelves. J. Phys. Oceanogr.
29, 1279–1301.
House, W.A., 2003. Factors influencing the extent and development
of the oxic zone in sediments. Biogeochemisty 63, 317–333.
Jahnke, R.A., 2001. Constraining organic matter cycling with benthic
fluxes. In: Boudreau, B.P., Jørgensen, B.B. (Eds.), The Benthic
Boundary Layer. Oxford University Press, pp. 144–179.
Kantha, L.H., Clayson, C.A., 1994. An improved mixed layer
model for geophysical applications. J. Geophys. Res. 99,
25235–25266.
P. Benoit et al. / Marine Chemistry 102 (2006) 13–32 31
Koutitonsky, V.G., Bugden, G.L., 1991. The physical oceanography
of the Gulf of St. Lawrence: a review with emphasis on the
synoptic variability of the motion. In: Therriault, J.-C. (Ed.),
The Gulf of St. Lawrence: Small Ocean or Big Estuary? Can.
Spec. Publ. Fish. Aquat. Sci., vol. 113, pp. 57–90.
Kwon, Y.W., Bang, H., 1997. The Finite Element Method Using
MATLAB. CRC Press, Boca Raton, FL.
Lucotte, M., Hillaire-Marcel, C., Louchouarn, P., 1991. First-order
organic carbon budget in the St. Lawrence Lower Estuary from
13C data. Estuar. Coast. Shelf Sci. 32, 297–312.
Luther, G.W. III, Brendel, P.J., Lewis, B.L., Sundby, B., LeFrancois,
L., Silverberg, N., Nuzzio, D.B., 1998. Simultaneous measure-
ment of O2, Mn, Fe, I- and S(-II) in marine porewaters with a
solid-state voltammetric microelectrode. Limnol. Oceanogr. 43,
325–333.
Martin, J.H., Knauer, G.A., Karl, D.M., Broenkow, W.W., 1987.
VERTEX: carbon cycling in the northeast Pacific. Deep-Sea
Res. 34, 267–285.
Meile, C., Van Cappellen, P., 2003. Global estimates of enhanced
solute transport in marine sediments. Limnol. Oceanogr. 48,
777–786.
Meile, C., Koretsky, C., Van Cappellen, P., 2001. Quantifying bioir-
rigation in aquatic sediments: an inverse modelling approach.
Limnol. Oceanogr. 46, 164–177.
Mertz, G., Gratton, Y., 1995. The generation of transverse flows by
internal friction in the St. Lawrence Estuary. Cont. Shelf Res. 15,
789–801.
Meysman, F.J.R., Middelburg, J.J., Herman, P.M.J., Heip, C.H.R.,
2003. Reactive transport in surface sediments. II. Media: an
object-oriented problem-solving environment for early diagenesis.
Comput. Geosci. 29, 301–318.
Mucci, A., Sundby, B., Gehlen, M., Arakaki, T., Zhong, S., Silver-
berg, N., 2000. The fate of carbon in continental shelf sedi-
ments of eastern Canada: a case study. Deep-Sea Res., II 47,
733–760.
Muzuka, A.N.N., Hillaire-Marcel, C., 1999. Burial rates of organic
matter along the eastern Canadian margin and stable isotope
constraints on its origin and diagenetic evolution. Mar. Geo.
160, 251–270.
Nixon, S.W., 1995. Coastal marine eutrophication: a definition, social
causes, and future concerns. Ophelia 41, 199–220.
Nordberg, K., Filipsson, H.L., Gustafsson, M., Harland, R., Roos, P.,
2001. Climate, hydrographic variations and marine benthic hyp-
oxia in Koljoe Fjord. Swed. J. Sea Res. 46, 187–200.
Plante, S., Chabot, D., Dutil, J.-D., 1998. Hypoxia tolerance in
Atlantic cod. J. Fish Biol. 53, 1342–1356.
Rabalais, N.N., Turner, R.E., 2001. Hypoxia in the northern Gulf of
Mexico: description, causes and change. In: Rabalais III, N.N.,
Turner, R.E. (Eds.), Coastal Hypoxia: Consequences for Living
Resources and Ecosystems. American Geophysical Union,
Washington, D.C., pp. 1–37.
Rabouille, C., Gaillard, J.-F., 1991a. A coupled model representing
the deep-sea organic carbon mineralization and oxygen consump-
tion in surficial sediments. J. Geophys. Res. 96, 2761–2776.
Rabouille, C., Gaillard, J.-F., 1991b. Towards the edge: early diage-
netic global explanation. A model depicting the early diagenesis
of organic matter, O2, NO3, Mn and PO4. Geochim. Cosmochim.
Acta 55, 2511–2525.
Ramsing, N., Gundersen, J., 1994. Seawater and Gases. Tabulated
Physical Parameters of Interest to People Working with Micro-
sensors in Marine Systems. Version 1.0. Revised Tables Com-
piled at Max Planck Institute for Marine Microbiology, Bremen,
Germany.
Redfield, A.C., Ketchum, B.J., Richards, F.A., 1963. The influence of
organisms on the composition of seawater. In: Hill, M.R., (Ed.)
The Sea. J. Wiley and Sons, pp. 26–77.
Roy, H., Huttel, M., Jørgensen, B.B., 2002. The role of small-scale
sediment topography for oxygen flux across the diffusive bound-
ary layer. Limnol. Oceanogr. 47, 837–847.
Saucier, F.J., Roy, F., Gilbert, D., Pellerin, P., Ritchie, H., 2003.
Modeling the formation and circulation processes of water masses
and sea ice in the Gulf of St. Lawrence, Canada. J. Geophys. Res.
108, 3269–3289.
Savenkoff, C., Vezina, A.F., Packard, T.T., Silverberg, N., Ther-
riault, J.-C., Chen, W., Berube, C., Mucci, A., Klein, B.,
Mesple, F., Tremblay, J.-E., Legendre, L., Wesson, J., Ingram,
R.G., 1996. Distributions of oxygen, carbon, and respiratory
activity in the deep layer of the Gulf of St. Lawrence and their
implications for the carbon cycle. Can. J. Fish. Aquat. Sci. 53,
2451–2465.
Savenkoff, C., Vezina, A.F., Smith, P.C., Han, G., 2001. Summer
transports of nutrients in the Gulf of St. Lawrence estimated by
inverse modelling. Estuar. Coast. Shelf Sci. 52, 565–587.
Sayles, F.L., Martin, W.R., Deuser, W.G., 1994. Response of benthic
oxygen demand to particulate organic carbon supply in the deep
sea. Nature 371, 686–689.
Silverberg, N., Bakker, J., Edenborn, H.M., Sundby, B., 1987. Oxy-
gen profiles and organic carbon fluxes in Laurentian Trough
sediments. Neth. J. Sea Res. 21, 95–105.
Silverberg, N., Sundby, B., Mucci, A., Zhong, S., Arakaki, T., Hall, P.,
Landen, A., Tengberg, A., 2000. Remineralization of organic
carbon in eastern Canadian continental margin sediments. Deep-
Sea Res., II 47, 699–731.
Smith, J.N., Schafer, C.T., 1999. Sedimentation, bioturbation, and Hg
uptake in the sediments of the estuary and Gulf of St. Lawrence.
Limnol. Oceanogr. 44, 207–219.
Soetaert, K., Herman, P.M.J., Middelburg, J.J., 1996. A model of
early diagenetic processes from the shelf to abyssal depths. Geo-
chim. Cosmochim. Acta 60, 1019–1040.
St-Onge, G., Stoner, J.S., Hillaire-Marcel, C., 2003. Holocene paleo-
magnetic records from the St. Lawrence Estuary, eastern Canada:
centennial to millennial-scale geomagnetic modulation of cosmo-
genic isotopes. Earth Planet. Sci. Lett. 209, 113–130.
Syvitski, J.P.M., 1989. Quaternary sedimentation in the St. Lawr-
ence Estuary and adjoining areas, eastern Canada: an overview
based on high resolution seismography. Geogr. Phys. Quat. 43,
291–310.
Taylor, G.I., 1953. Dispersion of soluble matter in solvent flowing
slowly through a tube. Proc. Royal Soc. London. Series A. 219,
186–203.
Therriault, J.-C., Legendre, L., Demers, S., 1990. Oceanography and
ecology of phytoplankton in the St. Lawrence Estuary. In: El-
Sabh, M.I., Silverberg, N. (Eds.), Oceanography of a Large-scale
Estuarine System. Springer-Verlag, New York, pp. 269–281.
Thibodeau, B., de Vernal, A., Mucci, A., 2004. Development of
micropaleontological and geochemical indicators of eutrophica-
tion in the St. Lawrence Estuary. Abstract, Spring AGU Meeting
May 17–21, Montreal, QC, Canada.
Timothy, D.A., 2004. Organic matter remineralisation and biogenic
silica dissolution in a deep fjord in British Columbia, Canada: a
regression analysis of upper ocean sediment-trap fluxes. Deep-Sea
Res., I 51, 439–456.
P. Benoit et al. / Marine Chemistry 102 (2006) 13–3232
Ullman, W.J., Aller, R.C., 1982. Diffusion coefficients in nearshore
marine sediments. Limnol. Oceanogr. 27, 552–556.
USCOP, 2004. Preliminary Report of the US Commission on Ocean
Policy—Governor’s Draft. U.S. Commission on Ocean Policy,
Washington, D.C.
Van Cappellen, P., Wang, Y., 1996. Cycling of iron and manganese in
surface sediments: a general theory for the coupled transport and
reaction of carbon, oxygen, nitrogen, sulfur, iron, and manganese.
Amer. J. Sci. 296, 197–243.
Von Schwind, J.J., 1980. Geophysical Fluid Dynamics For Oceano-
graphers. Prentice-Hall, Englewood Cliffs.
Westrich, J.T., Berner, R.A., 1984. The role of sedimentary organic
matter in bacterial sulfate reduction: the G model tested. Limnol.
Oceanogr. 29, 236–249.
Wu, R.S.-S., 2002. Hypoxia: from molecular responses to ecosystem
responses. Mar. Pollut. Bull. 45, 35–45.