Numerical measurement of contact pressure in the tibiofemoral joint during gait
6
Numerical measurement of contact pressure in the tibiofemoral joint during gait Normahira Mamat @Mohamad Nor Biomedical electronic engineering, School of Mechatronic Engineering, Ulu Pauh, Arau, Perlis. Noor Azuan Abu Osman, Atalullah Oshkour Biomedical engineering, Faculty of Engineering, University of Malaya, Kuala Lumpur Abstract— In this study, the mechanical responses for the knee joint model in various degrees of flexion and loadings during gait are investigated. Three gait phases consisting of heel strike (HS) (5.5°), single limb stance (SLS) (15.5°), and toe-off (TO) (4.5°) are considered to represent the gait cycle while simulated loading conditions applied for each phase are 2.25 times body weight (BW), 1.85 times BW, and 3.5 times BW, respectively, where the BW is 495 N. The knee images are imported from a computerized tomography (CT) scan to Mimics version 13.1 software for smoothing and constructing to the three-dimensional (3D) model of the tibio-femoral (TF) joint. Finite element analysis (FEA) using the ABAQUS v.6.7 software was performed to simulate the biomechanical patterns of the tibiofemoral (TF) joint. The knee joint is modeled with femur condyles, tibia plateau, and menisci attachment. The contact pressure toward these 3 components is investigated at each medial and lateral compartment of the joint parts. The simulating results are verified and compared with well-known results in the literatures, which showed that contact pressure behaved much greater on the medial compartments than on the lateral compartments throughout the phases. Meanwhile, it was found that the peak contact pressure occurred during TO. Keywords- Tibiofemoral; Femur; Tibia; Menisci; Medial Compartment. I. INTRODUCTION The knee joint is an underlying part of human locomotion that provides mobility and stability features. The knee joint consists of two joint structures, the tibio-femoral joint and the patella-femoral joint [1]. The tibio-femoral (TF) joint is exposed to compressive force during walking gait where the contact point of forces occurs at the distal end of the femur and the proximal end of the tibia of the knee joint [2]. The menisci, cartilage, ligament, and muscles are soft tissues that facilitate the optimal motion at the knee joint. Knee articulation gives six degrees of freedom (DOF) with three rotations: internal-external, abduction-adduction, and flexion- extension, and with three translations: anterior-posterior, medial-lateral, and distraction-compression [3]. However, the flexion-extension pattern is the largest component of knee motion during gait [4]. Besides that, any alteration and disturbance to these kinematic positions produce the disorderliness of the whole joint. The presence of the menisci as knee fibrocartilaginous disks that interpose the tibial plateau and femoral condyles provides the optimal stress distribution and contact area on the articular cartilage and subchondral bone [5]. The medial and lateral menisci, covering roughly 60% and 80% of the articular surfaces of the tibial plateau, respectively, function to increase the congruence between the articular surfaces of the femur and the tibia, to participate in weight bearing across the joint, as shock absorbers, to aid in lubrication, and are involved in the locking mechanism of the knee joint [1]. The transmitted load of TF joint forces are distributed about 60% to 70% via the medial compartment and the rest via the lateral compartment. This loading distribution is influenced by the factors of (i) the relatively larger medial condyle and (ii) the relative shift of the load-bearing axis more medially in single limb stance during dynamic activity [6]-[9]. In the meantime, the higher forces on the medial side relative to the lateral side resulted in a significantly denser or stronger medial side of the tibia compared to the lateral side [10]-[13]. The joint reaction forces transmitted to the TF joint can range from 2 to 4 times of body weight as associated with the contribution of hamstrings, quadriceps, and ligaments forces and up to 24 times body weight during high-impact activities [14, 15]. The loading conditions during gait that were derived by Morrison and Wilk et al. were applied in the load simulation [16, 17]. Joint reaction force includes the compressive loads from muscles, ligaments, and other structures crossing the joint, thus it was sometimes called the joint intersegmental force. During the gait cycle, the joint reaction force shifted from the medial to the lateral tibial plateau. In the stance phase, when the force reached its peak value, it was sustained mainly by the medial plateau; in the swing phase, when the force was minimal, it was sustained primarily by the lateral plateau [18]. Furthermore, motion of the medial femoral condyle in the transverse plane is greater than the lateral femoral condyle during the stance phase of gait as reported by Kozanek et al. [19]. As flexion at the knee joint increases, the translational motion increases in proportion to knee motion because of the shape of the femoral condyles. The angulations between the femur and the tibia result in unequal load in the medial and lateral condyles [20]. The value of determining in vivo forces and torques could lead to three important factors: (i) to predict how new design will perform; (ii) to simulate the 2012 International Conference on Biomedical Engineering (ICoBE),27-28 February 2012,Penang 978-1-4577-1991-2/12/$26.00 ©2011 IEEE 38
Transcript of Numerical measurement of contact pressure in the tibiofemoral joint during gait
Numerical measurement of contact pressure in the tibiofemoral joint during gait
Normahira Mamat @Mohamad Nor Biomedical electronic engineering,
School of Mechatronic Engineering, Ulu Pauh, Arau, Perlis.
Noor Azuan Abu Osman, Atalullah Oshkour Biomedical engineering, Faculty of Engineering, University of Malaya,
Kuala Lumpur Abstract— In this study, the mechanical responses for the knee joint model in various degrees of flexion and loadings during gait are investigated. Three gait phases consisting of heel strike (HS) (5.5°), single limb stance (SLS) (15.5°), and toe-off (TO) (4.5°) are considered to represent the gait cycle while simulated loading conditions applied for each phase are 2.25 times body weight (BW), 1.85 times BW, and 3.5 times BW, respectively, where the BW is 495 N. The knee images are imported from a computerized tomography (CT) scan to Mimics version 13.1 software for smoothing and constructing to the three-dimensional (3D) model of the tibio-femoral (TF) joint. Finite element analysis (FEA) using the ABAQUS v.6.7 software was performed to simulate the biomechanical patterns of the tibiofemoral (TF) joint. The knee joint is modeled with femur condyles, tibia plateau, and menisci attachment. The contact pressure toward these 3 components is investigated at each medial and lateral compartment of the joint parts. The simulating results are verified and compared with well-known results in the literatures, which showed that contact pressure behaved much greater on the medial compartments than on the lateral compartments throughout the phases. Meanwhile, it was found that the peak contact pressure occurred during TO.
Keywords- Tibiofemoral; Femur; Tibia; Menisci; Medial
Compartment.
I. INTRODUCTION The knee joint is an underlying part of human
locomotion that provides mobility and stability features. The knee joint consists of two joint structures, the tibio-femoral joint and the patella-femoral joint [1]. The tibio-femoral (TF) joint is exposed to compressive force during walking gait where the contact point of forces occurs at the distal end of the femur and the proximal end of the tibia of the knee joint [2]. The menisci, cartilage, ligament, and muscles are soft tissues that facilitate the optimal motion at the knee joint. Knee articulation gives six degrees of freedom (DOF) with three rotations: internal-external, abduction-adduction, and flexion-extension, and with three translations: anterior-posterior, medial-lateral, and distraction-compression [3]. However, the flexion-extension pattern is the largest component of knee motion during gait [4]. Besides that, any alteration and disturbance to these kinematic positions produce the disorderliness of the whole joint. The presence of the menisci as knee fibrocartilaginous disks that interpose the tibial
plateau and femoral condyles provides the optimal stress distribution and contact area on the articular cartilage and subchondral bone [5]. The medial and lateral menisci, covering roughly 60% and 80% of the articular surfaces of the tibial plateau, respectively, function to increase the congruence between the articular surfaces of the femur and the tibia, to participate in weight bearing across the joint, as shock absorbers, to aid in lubrication, and are involved in the locking mechanism of the knee joint [1].
The transmitted load of TF joint forces are distributed about 60% to 70% via the medial compartment and the rest via the lateral compartment. This loading distribution is influenced by the factors of (i) the relatively larger medial condyle and (ii) the relative shift of the load-bearing axis more medially in single limb stance during dynamic activity [6]-[9]. In the meantime, the higher forces on the medial side relative to the lateral side resulted in a significantly denser or stronger medial side of the tibia compared to the lateral side [10]-[13]. The joint reaction forces transmitted to the TF joint can range from 2 to 4 times of body weight as associated with the contribution of hamstrings, quadriceps, and ligaments forces and up to 24 times body weight during high-impact activities [14, 15]. The loading conditions during gait that were derived by Morrison and Wilk et al. were applied in the load simulation [16, 17].
Joint reaction force includes the compressive loads from muscles, ligaments, and other structures crossing the joint, thus it was sometimes called the joint intersegmental force. During the gait cycle, the joint reaction force shifted from the medial to the lateral tibial plateau. In the stance phase, when the force reached its peak value, it was sustained mainly by the medial plateau; in the swing phase, when the force was minimal, it was sustained primarily by the lateral plateau [18]. Furthermore, motion of the medial femoral condyle in the transverse plane is greater than the lateral femoral condyle during the stance phase of gait as reported by Kozanek et al. [19]. As flexion at the knee joint increases, the translational motion increases in proportion to knee motion because of the shape of the femoral condyles. The angulations between the femur and the tibia result in unequal load in the medial and lateral condyles [20]. The value of determining in vivo forces and torques could lead to three important factors: (i) to predict how new design will perform; (ii) to simulate the
2012 International Conference on Biomedical Engineering (ICoBE),27-28 February 2012,Penang
978-1-4577-1991-2/12/$26.00 ©2011 IEEE 38
orthopedic surgery procedures and prediction of clinical outcome; and (iii) to investigate the loading mechanisms that contribute to degenerative joint disease as well as movement modifications or clinical interventions to reduce these effects [21].
Finite element models (FEMs) have been used extensively to determine biomechanical factors at the knee joint that will respond to contact stresses, kinematics, fatigue, impulsive movements, and types of loading conditions [22]. FEMs have been used to analyze the natural knee and knee implants. The natural knee FEM results can be used as a guideline to determine whether the kinetic or kinematic responses from implant FEA are reasonable [22, 23]. A number of computational analyses have been developed to study natural knee and prosthetic knee mechanics. Explicit finite element (FE) analyses have recently been used to investigate the TKA kinematics and contact stress during dynamic loading, static, and quasi-static conditions [22], whereas Rawlinson et al. used a series of static analyses to evaluate the gait cycle [24].
Knowledge of healthy knee joint kinematics and kinetics are valuable for identifying possible causes of joint diseases and for developing treatment options including partial and total knee arthroplasty (TKA). Efficient computer models present an effective way of evaluating the characteristics of designs. Predicted contact stress and area at knee articulations of TF and patello-femoral joints indicated the optimal clinical performance of the designs. This was proven when some of the inventors developed the knee replacement models by using the theoretical and experimental methods to improve their models. In the United States alone, there are about 500,000 knee replacements annually and at least 150 types of knee implant models are currently available worldwide [25].
The aim of the present work is to develop a 3D TF model by constructing in Mimics then simulating it using explicit FE, ABAQUS to measure the contact pressures for each component with respect to each gait phase. The obtained results are verified to previous FE data. The loading conditions in various phases of gait are applied to the 3D model as quasi-static simulation and are cited to the knee flexion angles of gait.
II. METHOD
A. Subject A healthy female subject (age = 24 years, mass =
49.5 kg, and height = 1.62 m) with no historical knee joint disorder participated in the study. The lower extremity was scanned as the selected region to analyze. Prior to scanning, the subject was briefed regarding the procedures involved and signed the consent form. B. CT scan image acquisition
CT scan was used to acquire the 3D geometry of knee joint images. This scanning was conducted at the Department of Biomedical Imaging, University Malaya Medical Center (UMMC), Kuala Lumpur, Malaysia. The type of CT scan used was a 16-slice multidetector (Siemens
Somatom Sensation 16) with slice thicknesses of 0.549 mm, consisting of 512x 512 pixels to produce the knee image within 989 slices; the scan was performed at 0° gantry tilt.
The volumetric data were then transferred via a computer and the image displayed was an uncompressed file in Digital Imaging and Communications in Medicine (DICOM) format. The saved file was exported to Mimics software.
C. Images segmentation and smoothing
CT images were imported to Mimics version 13.1 (Materialise, Leuven, Belgium) to reconstruct a 3D model of the knee joint which consisted of a femur and a tibia, cartilages, and menisci. CT scan images in DICOM format were imported and the contrast in Mimics was adjusted at -1024 to +3071 for easy viewing. The threshold value was then selected for bone and soft tissue. The selection value is crucial for the accuracy of the resulting model. The thresholding value for bone is 148 to 1872. The threshold also functions to separate the hard tissue and soft tissue.
Three components of the 3D model were transformed to do remeshing for reducing the amount of triangular meshes. This step is important so that the simulation time is reduced during FE analyses. The final step of modeling is to save the 3D models of tibia, femur, and menisci separately for analysis in the finite element software.
D. Finite element simulations
The 3D models of the knee joint in .INP format were imported to ABAQUS v.6.7 for FE simulation.
1) Knee joint model An explicit FEA was applied to the models of hollow
femur and tibia bone, cartilages, and menisci as deformable solids model. Tetrahedral block-structure meshes of the bones and soft tissues were constructed with the nodes and elements of each model’s component presented in Table 1.
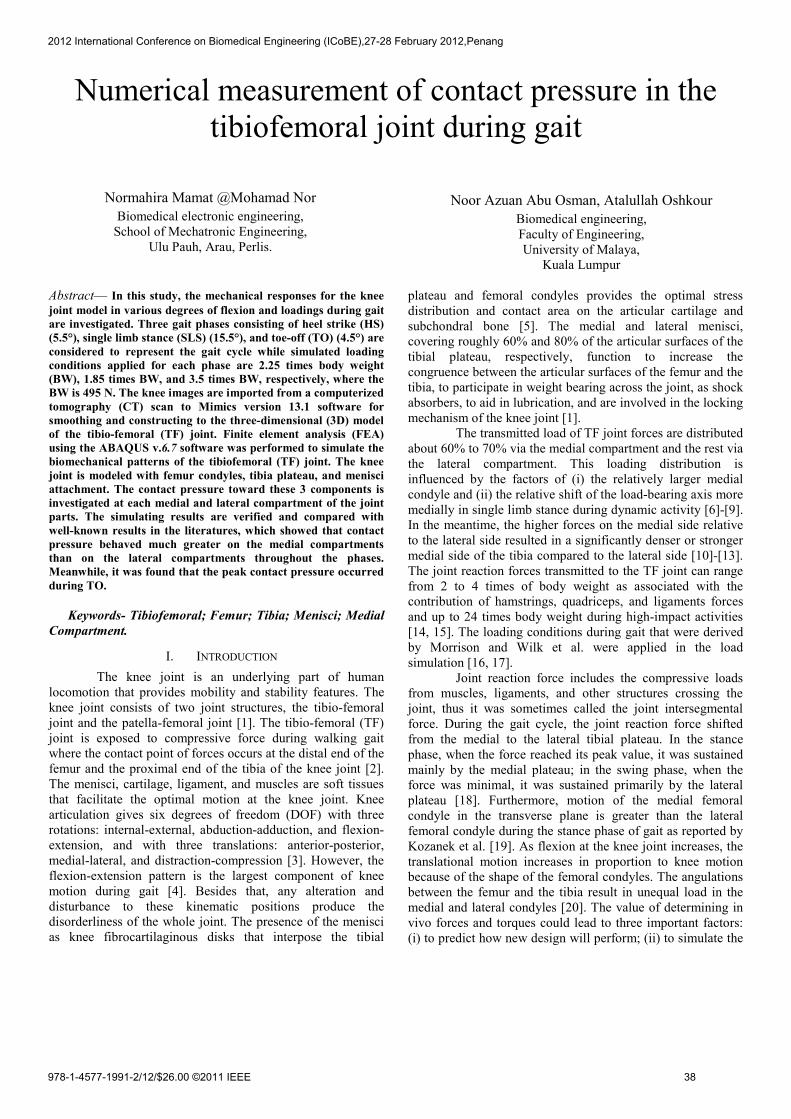
Frictionless non-linear contact was assumed for the articulations of TF joint with 6 potential contact areas [26]. There were two at the medial compartment, two at the lateral compartment (femoral condyle cartilage-meniscus and meniscus-tibia plateau cartilage), femur bone-cartilage, and tibia bone-cartilage (Fig. 1).
TABLE I. NUMBER OF NODES AND ELEMENTS OF JOINT MODEL
Component Nodes Elements Femur bone Tibia bone
Femur cartilage Tibia cartilage
Menisci
10950 7304 3087 1244 3233
47423 30456 10493 4123
11471
39
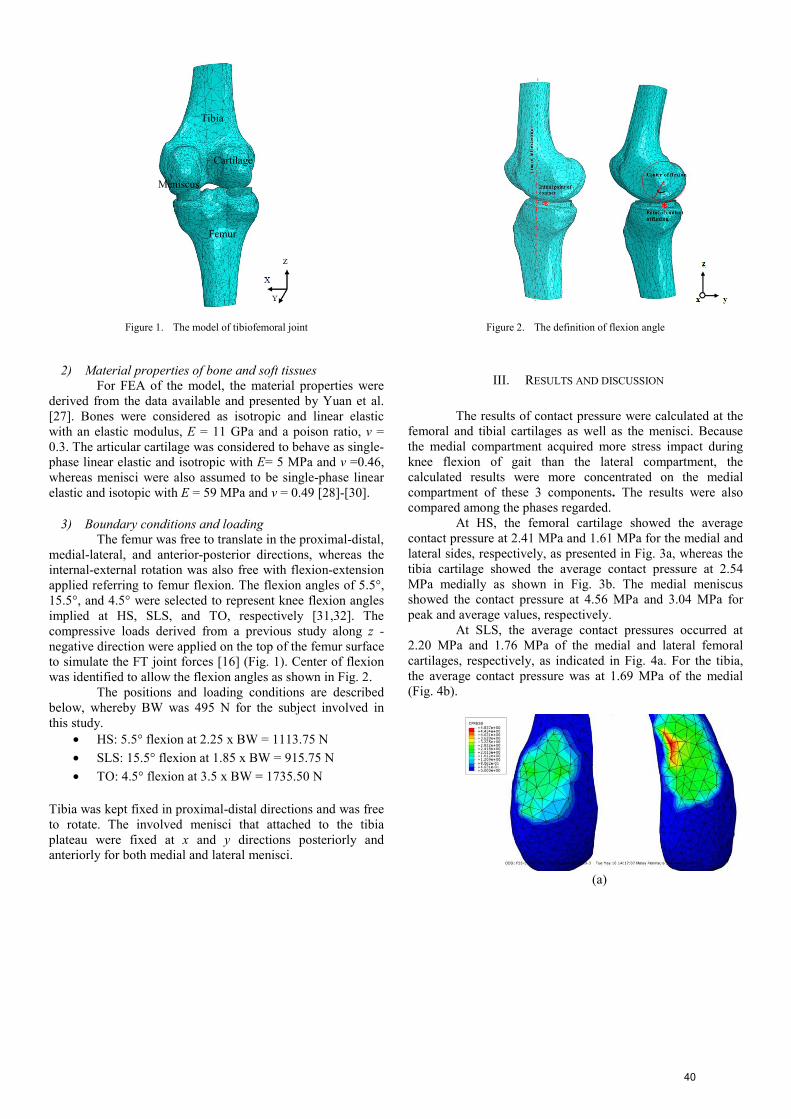
Figure 1. The model of tibiofemoral joint
2) Material properties of bone and soft tissues
For FEA of the model, the material properties were derived from the data available and presented by Yuan et al. [27]. Bones were considered as isotropic and linear elastic with an elastic modulus, E = 11 GPa and a poison ratio, ν = 0.3. The articular cartilage was considered to behave as single-phase linear elastic and isotropic with E= 5 MPa and ν =0.46, whereas menisci were also assumed to be single-phase linear elastic and isotopic with E = 59 MPa and ν = 0.49 [28]-[30].
3) Boundary conditions and loading The femur was free to translate in the proximal-distal,
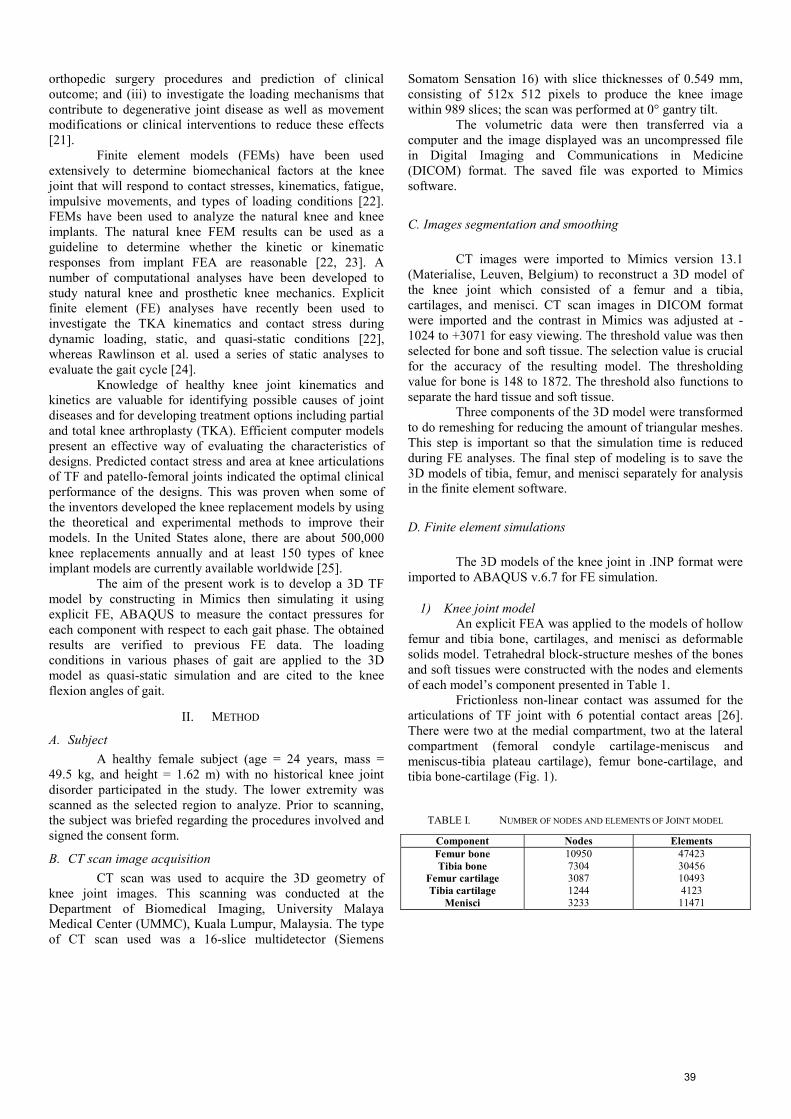
medial-lateral, and anterior-posterior directions, whereas the internal-external rotation was also free with flexion-extension applied referring to femur flexion. The flexion angles of 5.5°, 15.5°, and 4.5° were selected to represent knee flexion angles implied at HS, SLS, and TO, respectively [31,32]. The compressive loads derived from a previous study along z -negative direction were applied on the top of the femur surface to simulate the FT joint forces [16] (Fig. 1). Center of flexion was identified to allow the flexion angles as shown in Fig. 2.
The positions and loading conditions are described below, whereby BW was 495 N for the subject involved in this study.
• HS: 5.5° flexion at 2.25 x BW = 1113.75 N • SLS: 15.5° flexion at 1.85 x BW = 915.75 N • TO: 4.5° flexion at 3.5 x BW = 1735.50 N
Tibia was kept fixed in proximal-distal directions and was free to rotate. The involved menisci that attached to the tibia plateau were fixed at x and y directions posteriorly and anteriorly for both medial and lateral menisci.
Figure 2. The definition of flexion angle
III. RESULTS AND DISCUSSION
The results of contact pressure were calculated at the femoral and tibial cartilages as well as the menisci. Because the medial compartment acquired more stress impact during knee flexion of gait than the lateral compartment, the calculated results were more concentrated on the medial compartment of these 3 components. The results were also compared among the phases regarded.
At HS, the femoral cartilage showed the average contact pressure at 2.41 MPa and 1.61 MPa for the medial and lateral sides, respectively, as presented in Fig. 3a, whereas the tibia cartilage showed the average contact pressure at 2.54 MPa medially as shown in Fig. 3b. The medial meniscus showed the contact pressure at 4.56 MPa and 3.04 MPa for peak and average values, respectively.
At SLS, the average contact pressures occurred at 2.20 MPa and 1.76 MPa of the medial and lateral femoral cartilages, respectively, as indicated in Fig. 4a. For the tibia, the average contact pressure was at 1.69 MPa of the medial (Fig. 4b).
(a)
Cartilage
Femur
Tibia
Meniscus
40
(b)
Figure 3. Contact pressure during HS (a) femoral cartilage (b) tibia cartilage
(a)
(b)
Figure 4. Contact pressure during SLS (a) femoral cartilage (b) tibia
cartilage
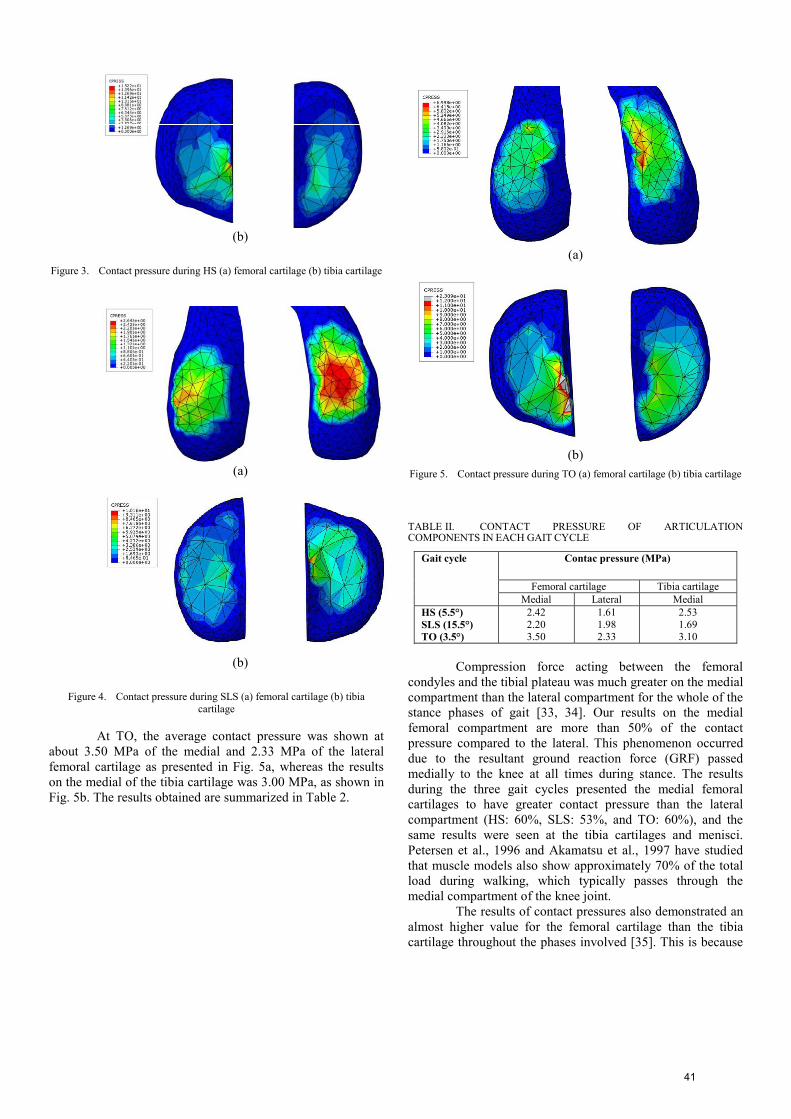
At TO, the average contact pressure was shown at about 3.50 MPa of the medial and 2.33 MPa of the lateral femoral cartilage as presented in Fig. 5a, whereas the results on the medial of the tibia cartilage was 3.00 MPa, as shown in Fig. 5b. The results obtained are summarized in Table 2.
(a)
(b)
Figure 5. Contact pressure during TO (a) femoral cartilage (b) tibia cartilage
TABLE II. CONTACT PRESSURE OF ARTICULATION COMPONENTS IN EACH GAIT CYCLE
Gait cycle Contac pressure (MPa)
Femoral cartilage Tibia cartilage Medial Lateral Medial
HS (5.5°) SLS (15.5°) TO (3.5°)
2.42 2.20 3.50
1.61 1.98 2.33
2.53 1.69 3.10
Compression force acting between the femoral
condyles and the tibial plateau was much greater on the medial compartment than the lateral compartment for the whole of the stance phases of gait [33, 34]. Our results on the medial femoral compartment are more than 50% of the contact pressure compared to the lateral. This phenomenon occurred due to the resultant ground reaction force (GRF) passed medially to the knee at all times during stance. The results during the three gait cycles presented the medial femoral cartilages to have greater contact pressure than the lateral compartment (HS: 60%, SLS: 53%, and TO: 60%), and the same results were seen at the tibia cartilages and menisci. Petersen et al., 1996 and Akamatsu et al., 1997 have studied that muscle models also show approximately 70% of the total load during walking, which typically passes through the medial compartment of the knee joint.
The results of contact pressures also demonstrated an almost higher value for the femoral cartilage than the tibia cartilage throughout the phases involved [35]. This is because
41
the femoral cartilage is mainly exposed to compression with orientation to normal articular surface by showing higher stresses on the medial condyle. Our results showed that contact pressure during HS for the medial tibia is slightly high than femoral, while during SLS and TO, contact pressures for the medial femoral were 57% and 54%, respectively, higher than the medial tibial.
During TO, where the foot almost lifts from the ground and the body weight is shifted to the other leg, the greater compressive force of TF is distributed unevenly. This condition contributed the highest contact pressure at medial comparing to the rest of the gait cycles. Meanwhile, during HS, the foot is just starting to contact the ground, thus the contact pressures are not spread evenly and tend to shift to the medial compartment.
The simulation in the SLS condition indicated a more even distribution of stress over both compartments (medial: 53%, lateral: 47%). This is due to the fact that body weight transferred to the knee joint was equal for both compartments, whereby the medial contact pressure was much lower [33]. The SLS phase has figured the balancing of the TF joint in this position.
Contact pressure on the menisci depicted that the highest peak value occurred during TO due to the phenomenon of foot lifting, followed by the HS phase. Meanwhile, the peak contact pressure during SLS was not present on the medial menisci but was distributed equally at 3.27 MPa on both sides of the medial and lateral menisci.
According to Yuan et al., the contact pressure of tibia and femoral cartilages were nearly the same during the stance phases. Their study obtained that the contact pressure averaged at 1.8 to 2.8 MPa, whereas contact pressure in the present study averages at 1.6 to 3.8 MPa. In addition, the contact pressures were also much higher in the medial compartment during HS and TO because the forces were not distributed equally within these two phases.
As the load increased at TO, the contact pressure also increased, as reported by Haox et al. and Ashvin et al. [33, 36]. Also, the highest contact pressures toward all components are usually found at TO, as found in the present study, or 45% of the gait cycle [33]. As reported by Yuan et al., the muscles were not necessarily constructed in this model because the flexion angles are small in a gait cycle, hence, this would not influence the stress results in the TF joint [27].
The FEA results were able to provide the optimum contact pressure in designing a knee implant. Computational analysis of the intact knee joint can measure the desirable range of contact pressure, contact area, as well as compression stress, in the conception of a functional and operable TKR.
Some limitations have been confronted in the present study from 3D modeling to the finite element analysis. The modeled TF joint was constructed with a less precise cartilage thickness and an incomparable geometry of a crescent-shaped menisci, with other soft tissues surrounding the knee joint. Because of this problem, main ligaments (ie; ACL, MCL, PCL, and LCL) also cannot be defined and constructed as the
ligaments also play a role in the contribution of joint forces at articulation.
IV. CONCLUSION
A 3D model of the TF joint, including femur, tibia, cartilages layers, and menisci, was developed and analyzed under compression loadings for flexion in a gait cycle. It presented a better understanding of the role of each component at the knee joint, especially the menisci in load transmission during biomechanics of the human knee joint. The model has been compared with reported results to validate the reasonable contact pressure of the TF joint. The results give a better understanding of the mechanical behavior of the joint during gait phases, and are further useful in designing a suited TKR. The average contact pressure of cartilages encountered by the present and previous studies (ranging from 2 to 3.5 MPa) could be developed to implement the knee joint replacement. In fact, the use of precise 3D FEMs can obtain the design and test knee prosthetic implants, and improve surgical techniques.
REFERENCES
[1] Nigel P, Deren F, Roger S. Anatomy and human movement: structure and function, 2nd ed. 1994, Oxford: Jordon Hill.
[2] Monica S, Alberto R, Franco M.M. FE dynamic analysis of a knee joint prosthesis during walking cycle, Summer Bioengineering Conference, June 25-29, Sonesta Beach Resort in Key Biscayne, Florida: 2003.
[3] Marans HJ, Jackson RW, Glossop ND, Young C. Anterior cruciate ligament insuffciency: A dynamic three-dimensional motion analysis. American Journal of Sports Medicine 1989; 17: 325-32.
[4] Takeda Y, Xerogeanes JW, Livesay GA, Fu FH, Woo SL. Biomechanical function of the human anterior cruciate ligament. Journal of Arthroscopy 1994;10: 140-7.
[5] Fukubayashi T, Kurosawa H: The contact area and pressure distribution pattern of time knee. A study of normal and osteoarthrotic knee joints. Acta Orthop Scand 1980;51: 871-87.
[6] Hsu RW, Himeno S, Coventry MB, Chao EY. Normal axial alignment of the lower extremity and load-bearing distribution at the knee. Clinical Orthopaedics and Related Research 1990; 255:215–27.
[7] Johnson F, Leitl S, Waugh W. The distribution of load across the knee. A comparison of static and dynamic measurements. Journal of Bone and Joint Surgery Br 1980; 62(3):346–9.
[8] Kettelkamp DB, Chao EY. A method for quantitative analysis of medial and lateral compression forces at the knee during standing. Clinical Orthopaedics and Related Research 1972; 83:202–13.
[9] Harrington IJ. Static and dynamic loading patterns in knee joints with deformities. Journal of Bone and Joint Surgery Am 1983; 65(2):247–59.
[10] Akamatsu Y, Koshino T, Saito T, Wada J. Changes in osteosclerosis of the osteoarthritic knee after high tibial osteotomy. Clinical Orthopedics and Related Research 1997;334: 207-214.
[11] Behrsen JC, Walker PS, Shoji H. Vriation in strength and structure of cancellous bone at the knee. Journal of Biomechanics 1974;7: 201-207.
[12] Harada Y, Wevers HW, Ing I, Cooke TDV. Distribution of bone strength in the proximal tibia. Journal of Arthroplasty 1988;3: 167-175.
[13] Petersen MM, Olsen C, Lauritzen JB, Lund B, Hede A. Late changes in bone mineral density of the proximal tibia following total or partial medial meniscectomy: A randomized study. Journal of Orthopaedic Research 1996; 14:16-21.
[14] Morrison JB. Bioengineering analysis of force actions transmitted by the knee joint. Journal of Biomedical Engineering 1968;3: 164–70.
42
[15] Woo S, An K, Arnoczky S. Anatomy Biology, and Biomechanics of Tendon, Ligament, and Meniscus, in Simon S (ed): Orthopaedic Basic Science. Park Ridge, IL, American Academy of Orthopaedic Surgeons, 1994, pp 45-88.
[16] Morrison JB. The mechanics of the knee joint in relation to normal walking. Journal of Biomechanics 1970;3(1):51– 61.
[17] Wilk KE, Escamilla RF, Fleisig GS, Barrentine SW, Andrews JR, Boyd ML. A comparison of tibiofemoral joint force and electromyographic activity during open and closed kinetic chain exercises. Am Journal of Sports Medicine 1996;24: 518–27
[18] Kettelkamp, D.B., and Jacobs, A W. Tibiofemoral contact area Determination and implications. Journal of Bone and Joint Surgery 1972. 54-A:349-356.
[19] Kozanek M, Hosseini, Liu F, Van de Velde SK, Gill TJ, Rubash HE. Tibofemoral kinematics and condylar motion during the stance phase of gait. Journal of Biomechanics 2009;42:1877-1884.
[20] Kapandi JA. The physiology of the joints, vol. 2, Lower limb. 5th ed. 1985.Edinburgh: Churchill Livingstone.
[21] Komistek RD, Kane TR, Mahfouz M, Ochoa JA, Dennis DA. Knee mechanics: a review of past and present techniques to determine in vivo loads, Journal of Biomechanics 2005;38: 215-228.
[22] Halloran J.P, Petrella A.J, Rullkoetter P.J. Explicit finite element modeling of total knee replacement mechanics. Journal of Biomechanics 2004;38:323-331.
[23] Brandi C.Carr, Tarun Goswani. Knee implant:review of models and biomechanics. Materials and design 2009;30:398-413.
[24] Rawlinson, J., Furman, B., Li, S., Bartel, D., 2001. Kinematics, stresses, and damage from a TKR simulator and a finite element model. Transactions of the 47th Annual Meeting, Orthopaedic Research Society.
[25] American Academy of Orthopaedic Surgeons, 2002. Available at <http://www.aaos.org >.
[26] Murakam,T., The lubrication in natural synovial joints and joint prostheses. JSME International Journal 1990, 33: 465-474.
[27] Yuan G, Xushu Z, Weiyi C. Three-dimensional finite element simulation of total knee joint in gait cycle. Acta mechanica solida sinica 2009;22(4):347-351.
[28] Li G, Lopez O, Rubash H. Variability of a three-dimensional finite element model constructed using magnetic resonance images of a knee for joint contact stress analysis. ASME J Biomech Eng 2001; 123: 341–346
[29] Pena E, Calvo B, Martinez MA. A three-dimensional finite element analysis of the combined behaviour of ligaments and menisci in the healthy human knee joint. Journal of Biomechanics 2006;39: 1686-1701.
[30] LeRoux MA, Setton L.A. Experimental and biphasic FEM determinations of the material properties and hydraulic permeability of the meniscus in tension. ASME Journal of Biomechanics Engineering 2002;124: 315–321.
[31] Lafortune MA, Cavanagh PR, Sommer 3rd HJ, Kalenak A. Three dimensional kinematics of the human knee during walking. Journal of Biomechanics 1992;25(4):347–57
[32] Reinschmidt C, van Den Bogert AJ, Murphy N, Lundberg A, Nigg BM. Tibiocalcaneal motion during running, measured with external and bone markers. Clinical Biomechanics (Bristol, Avon) 1997;12(1):8–16.
[33] Ashvin T, James CHG, Shamal DD. Contact stresses in the knee joint in deep flexion. Medical Engineering & Physics 2005; 27: 329-335.
[34] Shelbourne, K.B., M.R. Torry and M.G. Pandy. Muscle, ligament and joint contact forces at the knee during walking. Medicine & Science in sports & exercise. Journal of the American college of sports medicine, 1948-1956.
[35] Pena E, Calvo B, Martinez MA, Palance DA, Doblare M. Finite element analysis of the effect of meniscal tears and meniscectomies on human knee biomechanics. Clinical Biomechanics 2005; 20:498-507.
[36] Hao,Z.X., Jin,D.W. and Zhang,J.C., etc., Finite element analysis of in vivo tibio-femora l con tact features with menisci. Journal of Tsinghua University, 2008, 48(2): 176-179.
43