Estimation of Tibiofemoral and Patellofemoral Joint Forces ...
14
Citation: Glitsch, U.; Heinrich, K.; Ellegast, R.P. Estimation of Tibiofemoral and Patellofemoral Joint Forces during Squatting and Kneeling. Appl. Sci. 2022, 12, 255. https://doi.org/10.3390/ app12010255 Academic Editor: Hanatsu Nagano Received: 3 November 2021 Accepted: 23 December 2021 Published: 28 December 2021 Publisher’s Note: MDPI stays neutral with regard to jurisdictional claims in published maps and institutional affil- iations. Copyright: © 2021 by the authors. Licensee MDPI, Basel, Switzerland. This article is an open access article distributed under the terms and conditions of the Creative Commons Attribution (CC BY) license (https:// creativecommons.org/licenses/by/ 4.0/). applied sciences Article Estimation of Tibiofemoral and Patellofemoral Joint Forces during Squatting and Kneeling Ulrich Glitsch * , Kai Heinrich and Rolf Peter Ellegast Institute for Occupational Safety and Health of the German Social Accident Insurance (IFA), 53757 Sankt Augustin, Germany; [email protected] (K.H.); [email protected] (R.P.E.) * Correspondence: [email protected]; Tel.: +49-30-130010 Abstract: This study examined the differences of knee joint forces between lowering to, or rising from squat, and typical final postures of squatting and kneeling. A biomechanical model of the lower limb was configured considering large knee flexion angles, multiple floor contact points, and the soft tissue contact between the thigh and calf. Inverse dynamics were used to determine muscle and compressive joint forces in the tibiofemoral and patellofemoral joints. Data were obtained from a group of 13 male subjects by means of 3D motion capturing, two force plates, a pressure-sensitive pad, and electromyography. During lowering into the kneeling/squatting positions and rising from them, the model exhibited the anticipated high maximum forces of 2.6 ± 0.39 body weight (BW) and 3.4 ± 0.56 BW in the tibiofemoral and patellofemoral joints. Upon attainment of the static terminal squatting and kneeling positions, the forces fell considerably, remaining within a range of between 0.5 and 0.7 BW for the tibiofemoral joint and 0.9 to 1.1 BW for the patellofemoral joint. The differences of the knee joint forces between the final postures of squatting and kneeling remained on average below 0.25 BW and were significant only for the tibiofemoral joint force. Keywords: knee joint forces; high knee flexion; thigh-calf contact; inverse dynamics 1. Introduction Kneeling and deep squatting are common activities in daily living and typical postures in certain occupations, such as carpet layer or tile setter, and in social-cultural and religious contexts, specifically in Asia and the Middle East. Nevertheless, despite this common practice the knowledge about the biomechanics of squatting and kneeling, in particular with regards to the associated knee joint forces, is still low. A couple of epidemiological studies suggest that prolonged squatting and kneeling is a risk factor for the development of osteoarthritis [1–6]. In recent years, some European coun- tries (such as Denmark NBoII [7] and Germany BMAS [8]) have recognized osteoarthritis of the knee joint as an occupational disease caused by kneeling and squatting over a longer term. The mechanical stress of the knee joint cartilage during squatting and kneeling is under consideration as a potential pathomechanism [9–13]. The reasoning for this is based on the basic principle that knee bending in a standing position causes a strong increase in the tibiofemoral and patellofemoral compressive joint forces. Based on inverse dynamics model approaches, several studies calculated peak tibiofemoral joint compressive forces from 4 to 7 body weight (BW) during lowering to or rising from squat [14–18]. Associated patellofemoral compressive peak forces ranging from 4 to 9 BW were reported [15,19]. Adopting these results to the final static postures of deep squatting and kneeling is critical because most of the studies focused on peak forces during the rising and lowering motion, which may entail a considerable inertial force component due to acceleration and deceleration. Further, peak loads may be associated with positions distinct from the final postures of static squatting and kneeling [14, 15, 17, 18]. The major experimental issue, however, is the disregarding of the soft-tissue contact force of thigh and calf at full knee Appl. Sci. 2022, 12, 255. https://doi.org/10.3390/app12010255 https://www.mdpi.com/journal/applsci
-
Upload
khangminh22 -
Category
Documents
-
view
0 -
download
0
Transcript of Estimation of Tibiofemoral and Patellofemoral Joint Forces ...
�����������������
Citation: Glitsch, U.; Heinrich, K.;
Ellegast, R.P. Estimation of
Tibiofemoral and Patellofemoral Joint
Forces during Squatting and
Kneeling. Appl. Sci. 2022, 12, 255.
https://doi.org/10.3390/
app12010255
Academic Editor: Hanatsu Nagano
Received: 3 November 2021
Accepted: 23 December 2021
Published: 28 December 2021
Publisher’s Note: MDPI stays neutral
with regard to jurisdictional claims in
published maps and institutional affil-
iations.
Copyright: © 2021 by the authors.
Licensee MDPI, Basel, Switzerland.
This article is an open access article
distributed under the terms and
conditions of the Creative Commons
Attribution (CC BY) license (https://
creativecommons.org/licenses/by/
4.0/).
applied sciences
Article
Estimation of Tibiofemoral and Patellofemoral Joint Forcesduring Squatting and KneelingUlrich Glitsch * , Kai Heinrich and Rolf Peter Ellegast
Institute for Occupational Safety and Health of the German Social Accident Insurance (IFA),53757 Sankt Augustin, Germany; [email protected] (K.H.); [email protected] (R.P.E.)* Correspondence: [email protected]; Tel.: +49-30-130010
Abstract: This study examined the differences of knee joint forces between lowering to, or risingfrom squat, and typical final postures of squatting and kneeling. A biomechanical model of the lowerlimb was configured considering large knee flexion angles, multiple floor contact points, and thesoft tissue contact between the thigh and calf. Inverse dynamics were used to determine muscle andcompressive joint forces in the tibiofemoral and patellofemoral joints. Data were obtained from agroup of 13 male subjects by means of 3D motion capturing, two force plates, a pressure-sensitivepad, and electromyography. During lowering into the kneeling/squatting positions and rising fromthem, the model exhibited the anticipated high maximum forces of 2.6 ± 0.39 body weight (BW) and3.4 ± 0.56 BW in the tibiofemoral and patellofemoral joints. Upon attainment of the static terminalsquatting and kneeling positions, the forces fell considerably, remaining within a range of between0.5 and 0.7 BW for the tibiofemoral joint and 0.9 to 1.1 BW for the patellofemoral joint. The differencesof the knee joint forces between the final postures of squatting and kneeling remained on averagebelow 0.25 BW and were significant only for the tibiofemoral joint force.
Keywords: knee joint forces; high knee flexion; thigh-calf contact; inverse dynamics
1. Introduction
Kneeling and deep squatting are common activities in daily living and typical posturesin certain occupations, such as carpet layer or tile setter, and in social-cultural and religiouscontexts, specifically in Asia and the Middle East. Nevertheless, despite this commonpractice the knowledge about the biomechanics of squatting and kneeling, in particularwith regards to the associated knee joint forces, is still low.
A couple of epidemiological studies suggest that prolonged squatting and kneeling is arisk factor for the development of osteoarthritis [1–6]. In recent years, some European coun-tries (such as Denmark NBoII [7] and Germany BMAS [8]) have recognized osteoarthritisof the knee joint as an occupational disease caused by kneeling and squatting over a longerterm. The mechanical stress of the knee joint cartilage during squatting and kneeling isunder consideration as a potential pathomechanism [9–13]. The reasoning for this is basedon the basic principle that knee bending in a standing position causes a strong increase inthe tibiofemoral and patellofemoral compressive joint forces.
Based on inverse dynamics model approaches, several studies calculated peak tibiofemoraljoint compressive forces from 4 to 7 body weight (BW) during lowering to or rising fromsquat [14–18]. Associated patellofemoral compressive peak forces ranging from 4 to 9 BWwere reported [15,19]. Adopting these results to the final static postures of deep squatting andkneeling is critical because most of the studies focused on peak forces during the rising andlowering motion, which may entail a considerable inertial force component due to accelerationand deceleration. Further, peak loads may be associated with positions distinct from thefinal postures of static squatting and kneeling [14,15,17,18]. The major experimental issue,however, is the disregarding of the soft-tissue contact force of thigh and calf at full knee
Appl. Sci. 2022, 12, 255. https://doi.org/10.3390/app12010255 https://www.mdpi.com/journal/applsci
Appl. Sci. 2022, 12, 255 2 of 14
flexion [14,15,17,19–21]. Using a pressure-sensitive map, Zelle et al. [22] reported average thigh-calf contact forces of 31 ± 9.3 to 34 ± 9.7% BW per leg during deep kneeling and squattingrespectively. Based on their results from 2007, Zelle et al. [23] calculated compressive knee jointforces at full flexion as 3.07 BW during a theoretical estimated downward squatting movement.Using a similar experimental setup and pressure-sensitive map Pollard et al. [24] found overallhigher soft-tissue contact forces. The thigh-calf contact forces observed were 39 ± 14% BWfor squatting and 36 ± 10% BW for deep kneeling-including a possible gluteus-heel contact of11 ± 6% BW. Overall, the soft-tissue contact force on the dorsal side of the leg decreased theknee flexion moment by an average of 48%. However, Pollard et al. [24] did not calculate anymuscle or articular knee joint forces.
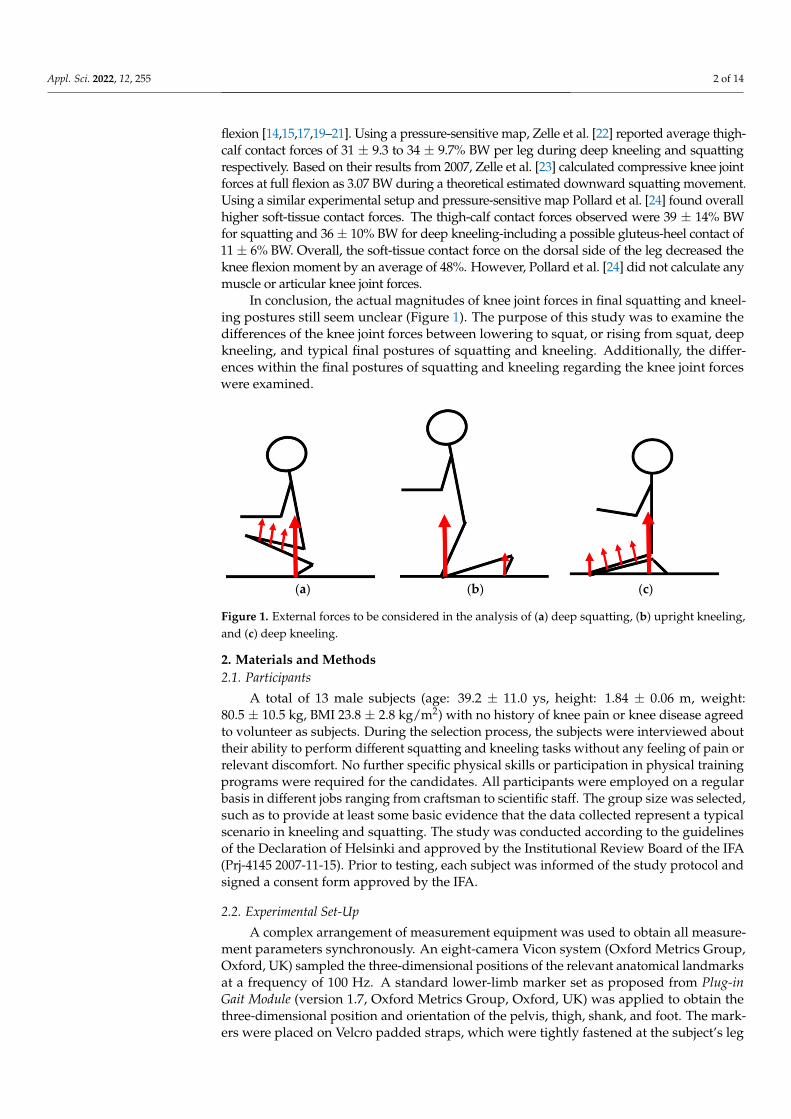
In conclusion, the actual magnitudes of knee joint forces in final squatting and kneel-ing postures still seem unclear (Figure 1). The purpose of this study was to examine thedifferences of the knee joint forces between lowering to squat, or rising from squat, deepkneeling, and typical final postures of squatting and kneeling. Additionally, the differ-ences within the final postures of squatting and kneeling regarding the knee joint forceswere examined.
Appl. Sci. 2022, 11, x FOR PEER REVIEW 2 of 14
contact force of thigh and calf at full knee flexion [14,15,17,19–21]. Using a pressure-sensitive map, Zelle et al. [22] reported average thigh-calf contact forces of 31 ± 9.3 to 34 ± 9.7% BW per leg during deep kneeling and squatting respectively. Based on their results from 2007, Zelle et al. [23] calculated compressive knee joint forces at full flexion as 3.07 BW during a theoretical estimated downward squatting movement. Using a similar experimental setup and pressure-sensitive map Pollard et al. [24] found overall higher soft-tissue contact forces. The thigh-calf contact forces observed were 39 ± 14% BW for squatting and 36 ± 10% BW for deep kneeling-including a possible gluteus-heel contact of 11 ± 6% BW. Overall, the soft-tissue contact force on the dorsal side of the leg decreased the knee flexion moment by an average of 48%. However, Pollard et al. [24] did not calculate any muscle or articular knee joint forces.
In conclusion, the actual magnitudes of knee joint forces in final squatting and kneeling postures still seem unclear (Figure 1). The purpose of this study was to examine the differences of the knee joint forces between lowering to squat, or rising from squat, deep kneeling, and typical final postures of squatting and kneeling. Additionally, the differences within the final postures of squatting and kneeling regarding the knee joint forces were examined.
(a) (b) (c)
Figure 1. External forces to be considered in the analysis of (a) deep squatting, (b) upright kneeling, and (c) deep kneeling.
2. Materials and Methods 2.1. Participants
A total of 13 male subjects (age: 39.2 ± 11.0 ys, height: 1.84 ± 0.06 m, weight: 80.5 ± 10.5 kg, BMI 23.8 ± 2.8 kg/m2) with no history of knee pain or knee disease agreed to volunteer as subjects. During the selection process, the subjects were interviewed about their ability to perform different squatting and kneeling tasks without any feeling of pain or relevant discomfort. No further specific physical skills or participation in physical training programs were required for the candidates. All participants were employed on a regular basis in different jobs ranging from craftsman to scientific staff. The group size was selected, such as to provide at least some basic evidence that the data collected represent a typical scenario in kneeling and squatting. The study was conducted according to the guidelines of the Declaration of Helsinki and approved by the Institutional Review Board of the IFA (Prj-4145 2007-11-15). Prior to testing, each subject was informed of the study protocol and signed a consent form approved by the IFA.
2.2. Experimental Set-Up A complex arrangement of measurement equipment was used to obtain all
measurement parameters synchronously. An eight-camera Vicon system (Oxford Metrics Group, Oxford, UK) sampled the three-dimensional positions of the relevant anatomical landmarks at a frequency of 100 Hz. A standard lower-limb marker set as proposed from Plug-in Gait Module (version 1.7, Oxford Metrics Group, Oxford, UK) was applied to obtain
Figure 1. External forces to be considered in the analysis of (a) deep squatting, (b) upright kneeling,and (c) deep kneeling.
2. Materials and Methods2.1. Participants
A total of 13 male subjects (age: 39.2 ± 11.0 ys, height: 1.84 ± 0.06 m, weight:80.5 ± 10.5 kg, BMI 23.8 ± 2.8 kg/m2) with no history of knee pain or knee disease agreedto volunteer as subjects. During the selection process, the subjects were interviewed abouttheir ability to perform different squatting and kneeling tasks without any feeling of pain orrelevant discomfort. No further specific physical skills or participation in physical trainingprograms were required for the candidates. All participants were employed on a regularbasis in different jobs ranging from craftsman to scientific staff. The group size was selected,such as to provide at least some basic evidence that the data collected represent a typicalscenario in kneeling and squatting. The study was conducted according to the guidelinesof the Declaration of Helsinki and approved by the Institutional Review Board of the IFA(Prj-4145 2007-11-15). Prior to testing, each subject was informed of the study protocol andsigned a consent form approved by the IFA.
2.2. Experimental Set-Up
A complex arrangement of measurement equipment was used to obtain all measure-ment parameters synchronously. An eight-camera Vicon system (Oxford Metrics Group,Oxford, UK) sampled the three-dimensional positions of the relevant anatomical landmarksat a frequency of 100 Hz. A standard lower-limb marker set as proposed from Plug-inGait Module (version 1.7, Oxford Metrics Group, Oxford, UK) was applied to obtain thethree-dimensional position and orientation of the pelvis, thigh, shank, and foot. The mark-ers were placed on Velcro padded straps, which were tightly fastened at the subject’s leg
Appl. Sci. 2022, 12, 255 3 of 14
and pelvis region. The markers on the shoes were directly attached using double-sidedadhesive tape.
The ground contact forces at the foot and knee of the right leg were measured by twoforce plates (type: 9286A, Kistler Instruments, Winterthur, Switzerland) flush-mounted inthe floor. For kneeling, the measurement area of the relevant force plate was covered witha standard kneepad cushioning material to protect the knee from the hard surface.
The thigh-calf contact force was detected by a pressure-sensitive pad (dimensions:250 mm × 120 mm, Paromed, Neubeuern, Germany) containing 24 piezo-resistive sensors(each with a respective area of 5 cm2) and fixed with elastic straps to the dorsal surfaceof the thigh. The resultant contact force was assumed to act normal to the bisector of thetibial and femoral longitudinal axes at the center of pressure with respect to the knee jointcenter and was updated at intervals of 20 ms. A threshold limit of 40 N was applied to theresultant pad force as an indication of thigh-calf contact.
In parallel, the surface electromyography (EMG) of the quadriceps muscle wasrecorded at 1000 Hz using two channels–rectus femoris and vastus medialis. Follow-ing band-pass filtering (f c = 20/500 Hz), the raw signals were RMS-filtered (∆t = 0.2 s)and normalized with respect to a maximum voluntary contraction (MVC) (EMG-DSP V1.0,Biomed, Jena, Germany). The channel indicating the higher %MVC values was selected torepresent the activity of the quadriceps muscle.
2.3. Protocol
The test protocol covered the static postures of squatting, kneeling, and deep kneeling(ankle joint dorsal flexed, Kiza position) with three repetitions of each task. The mo-tions of lowering into a squat and rising from a deep squatting posture adjacent to theaforementioned static posture were also analyzed. Three of the subjects were asked toperform additionally three 10-min endurance tests involving static squatting, kneeling anddeep kneeling. These tests were intended to provide a qualitative indication of perceivedmusculo-physiological stress in order to verify the model predictions in terms of addingempirical evidence. Finally, these three subjects performed three repetitions of quasi-staticknee bending to allow comparisons with other established knee joint models.
2.4. Procedures
The participants were asked to wear comfortable but not too loose clothing to easilyallow the performance of the kneeling tasks and safety shoes or at least robust sports shoes.The laboratory in which the measurements were conducted was not air-conditioned and thetemperatures varied in the relevant season between 22 and 24 ◦C. All measurements wererecorded during normal office hours but at varying daytimes depending on the availabilityof the participant and free laboratory capacities. Prior to the measurements, all subjectsperformed familiarization exercises with the tests until they felt comfortable. The correctperformance of the different tasks was observed by at least two researchers. Each trial wasimmediately inspected after the recording in terms of proper hitting of the force plates andachieving final static kneeling and deep squatting postures.
2.5. Analytical Model
A 3-D model of the lower limb consisting of the three segments namely foot, shank,and thigh was configured for calculation of the knee joint forces arising during kneelingand squatting tasks (Figure 2). The sagittal plane was defined by the centers of the ankle,knee, and hip joints. The static knee joint axis was aligned with the line passing through themost prominent point of the lateral and the medial epicondyles. The midpoint between themost prominent point of the lateral and the medial epicondyles is referred to as the kneejoint center. The ankle joint center was defined by the midpoint between the malleoli, andthe hip joint center was derived by a procedure based on the geometry of the pelvic iliacspines according to the Plug-in Gait module (version 1.7, Oxford Metrics Group, Oxford,UK). The sagittal planes of the ankle and knee joints were defined by the planes orthogonal
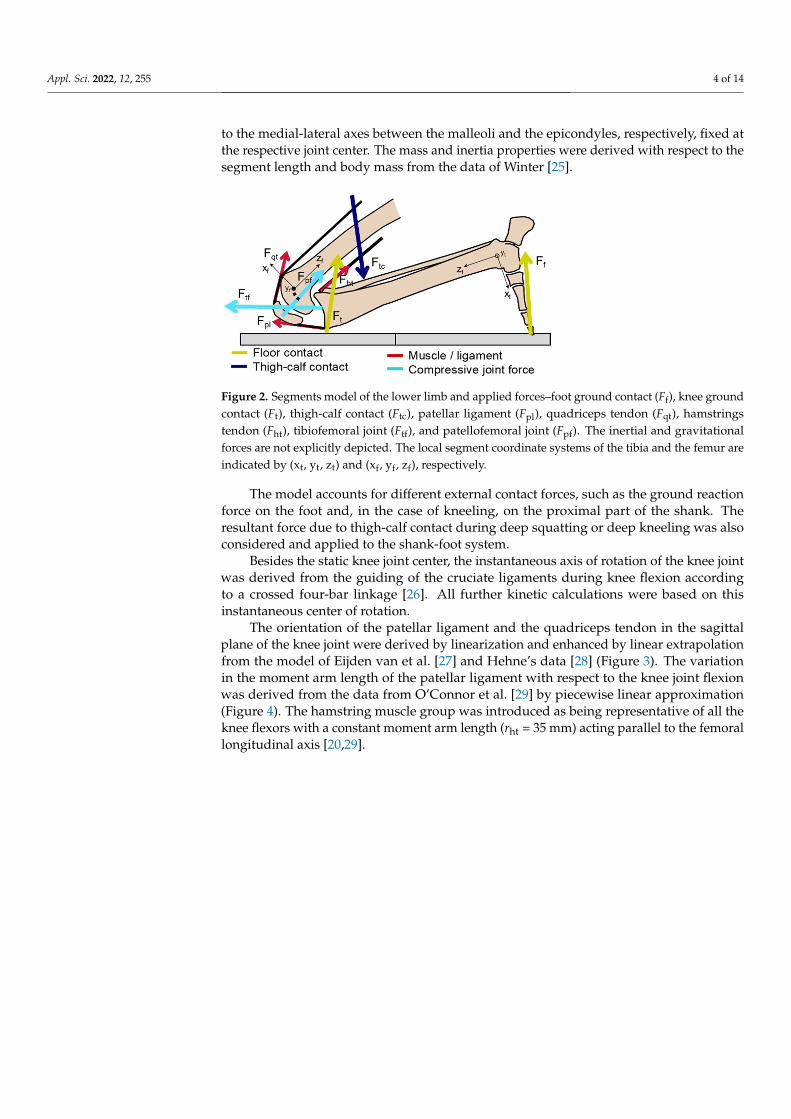
Appl. Sci. 2022, 12, 255 4 of 14
to the medial-lateral axes between the malleoli and the epicondyles, respectively, fixed atthe respective joint center. The mass and inertia properties were derived with respect to thesegment length and body mass from the data of Winter [25].
Appl. Sci. 2022, 11, x FOR PEER REVIEW 4 of 14
malleoli, and the hip joint center was derived by a procedure based on the geometry of the pelvic iliac spines according to the Plug-in Gait module (version 1.7, Oxford Metrics Group, Oxford, UK). The sagittal planes of the ankle and knee joints were defined by the planes orthogonal to the medial-lateral axes between the malleoli and the epicondyles, respectively, fixed at the respective joint center. The mass and inertia properties were derived with respect to the segment length and body mass from the data of Winter [25].
Figure 2. Segments model of the lower limb and applied forces–foot ground contact (Ff), knee ground contact (Ft), thigh-calf contact (Ftc), patellar ligament (Fpl), quadriceps tendon (Fqt), hamstrings tendon (Fht), tibiofemoral joint (Ftf), and patellofemoral joint (Fpf). The inertial and gravitational forces are not explicitly depicted. The local segment coordinate systems of the tibia and the femur are indicated by (xt, yt, zt) and (xf, yf, zf), respectively.
The model accounts for different external contact forces, such as the ground reaction force on the foot and, in the case of kneeling, on the proximal part of the shank. The resultant force due to thigh-calf contact during deep squatting or deep kneeling was also considered and applied to the shank-foot system.
Besides the static knee joint center, the instantaneous axis of rotation of the knee joint was derived from the guiding of the cruciate ligaments during knee flexion according to a crossed four-bar linkage [26]. All further kinetic calculations were based on this instantaneous center of rotation.
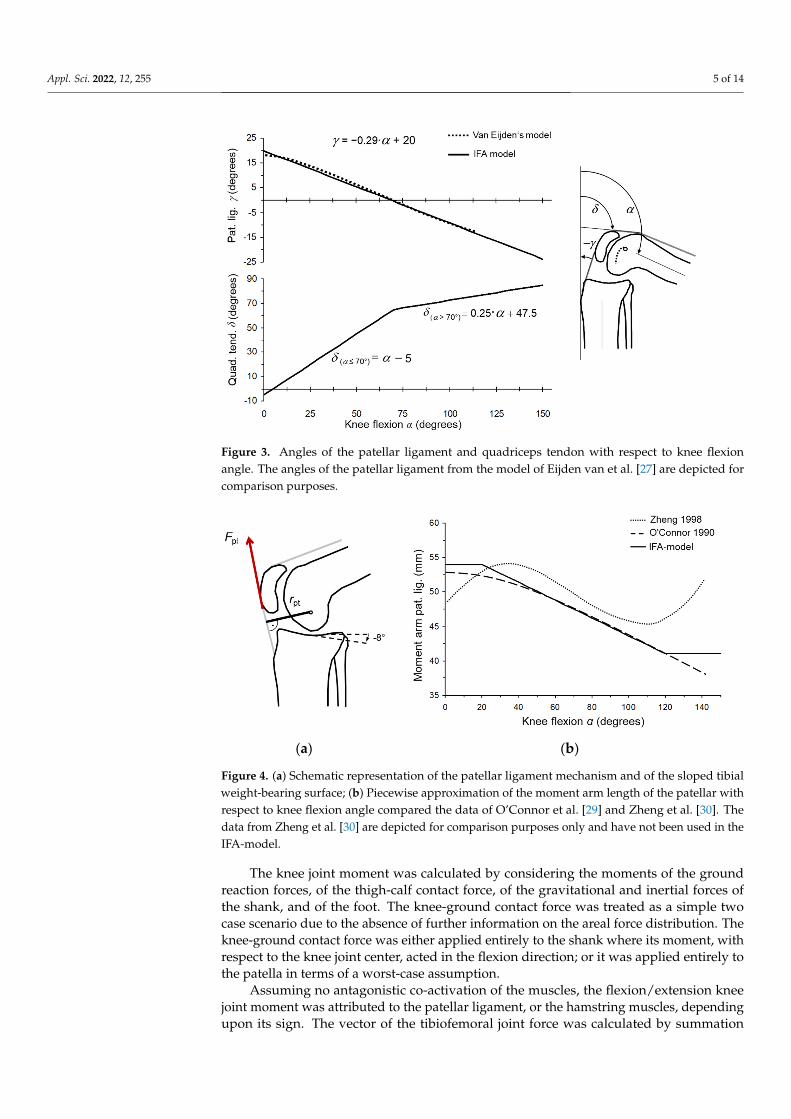
The orientation of the patellar ligament and the quadriceps tendon in the sagittal plane of the knee joint were derived by linearization and enhanced by linear extrapolation from the model of Eijden van et al. [27] and Hehne’s data [28] (Figure 3). The variation in the moment arm length of the patellar ligament with respect to the knee joint flexion was derived from the data from O’Connor et al. [29] by piecewise linear approximation (Figure 4). The hamstring muscle group was introduced as being representative of all the knee flexors with a constant moment arm length (rht = 35 mm) acting parallel to the femoral longitudinal axis [20,29].
Figure 2. Segments model of the lower limb and applied forces–foot ground contact (Ff), knee groundcontact (Ft), thigh-calf contact (Ftc), patellar ligament (Fpl), quadriceps tendon (Fqt), hamstringstendon (Fht), tibiofemoral joint (Ftf), and patellofemoral joint (Fpf). The inertial and gravitationalforces are not explicitly depicted. The local segment coordinate systems of the tibia and the femur areindicated by (xt, yt, zt) and (xf, yf, zf), respectively.
The model accounts for different external contact forces, such as the ground reactionforce on the foot and, in the case of kneeling, on the proximal part of the shank. Theresultant force due to thigh-calf contact during deep squatting or deep kneeling was alsoconsidered and applied to the shank-foot system.
Besides the static knee joint center, the instantaneous axis of rotation of the knee jointwas derived from the guiding of the cruciate ligaments during knee flexion accordingto a crossed four-bar linkage [26]. All further kinetic calculations were based on thisinstantaneous center of rotation.
The orientation of the patellar ligament and the quadriceps tendon in the sagittalplane of the knee joint were derived by linearization and enhanced by linear extrapolationfrom the model of Eijden van et al. [27] and Hehne’s data [28] (Figure 3). The variationin the moment arm length of the patellar ligament with respect to the knee joint flexionwas derived from the data from O’Connor et al. [29] by piecewise linear approximation(Figure 4). The hamstring muscle group was introduced as being representative of all theknee flexors with a constant moment arm length (rht = 35 mm) acting parallel to the femorallongitudinal axis [20,29].
Appl. Sci. 2022, 12, 255 5 of 14
Appl. Sci. 2022, 11, x FOR PEER REVIEW 5 of 14
Figure 3. Angles of the patellar ligament and quadriceps tendon with respect to knee flexion angle. The angles of the patellar ligament from the model of Eijden van et al. [27] are depicted for comparison purposes.
(a) (b)
Figure 4. (a) Schematic representation of the patellar ligament mechanism and of the sloped tibial weight-bearing surface; (b) Piecewise approximation of the moment arm length of the patellar with respect to knee flexion angle compared the data of O’Connor et al. [29] and Zheng et al. [30]. The data from Zheng et al. [30] are depicted for comparison purposes only and have not been used in the IFA-model.
The knee joint moment was calculated by considering the moments of the ground reaction forces, of the thigh-calf contact force, of the gravitational and inertial forces of the shank, and of the foot. The knee-ground contact force was treated as a simple two case scenario due to the absence of further information on the areal force distribution. The knee-ground contact force was either applied entirely to the shank where its moment, with respect to the knee joint center, acted in the flexion direction; or it was applied entirely to the patella in terms of a worst-case assumption.
Assuming no antagonistic co-activation of the muscles, the flexion/extension knee joint moment was attributed to the patellar ligament, or the hamstring muscles, depending upon its sign. The vector of the tibiofemoral joint force was calculated by summation of the intersegment force at the tibiofemoral cross-section and the tendon forces. The compression component of the tibiofemoral joint force was aligned orthogonal
Figure 3. Angles of the patellar ligament and quadriceps tendon with respect to knee flexionangle. The angles of the patellar ligament from the model of Eijden van et al. [27] are depicted forcomparison purposes.
Appl. Sci. 2022, 11, x FOR PEER REVIEW 5 of 14
Figure 3. Angles of the patellar ligament and quadriceps tendon with respect to knee flexion angle. The angles of the patellar ligament from the model of Eijden van et al. [27] are depicted for comparison purposes.
(a) (b)
Figure 4. (a) Schematic representation of the patellar ligament mechanism and of the sloped tibial weight-bearing surface; (b) Piecewise approximation of the moment arm length of the patellar with respect to knee flexion angle compared the data of O’Connor et al. [29] and Zheng et al. [30]. The data from Zheng et al. [30] are depicted for comparison purposes only and have not been used in the IFA-model.
The knee joint moment was calculated by considering the moments of the ground reaction forces, of the thigh-calf contact force, of the gravitational and inertial forces of the shank, and of the foot. The knee-ground contact force was treated as a simple two case scenario due to the absence of further information on the areal force distribution. The knee-ground contact force was either applied entirely to the shank where its moment, with respect to the knee joint center, acted in the flexion direction; or it was applied entirely to the patella in terms of a worst-case assumption.
Assuming no antagonistic co-activation of the muscles, the flexion/extension knee joint moment was attributed to the patellar ligament, or the hamstring muscles, depending upon its sign. The vector of the tibiofemoral joint force was calculated by summation of the intersegment force at the tibiofemoral cross-section and the tendon forces. The compression component of the tibiofemoral joint force was aligned orthogonal
Figure 4. (a) Schematic representation of the patellar ligament mechanism and of the sloped tibialweight-bearing surface; (b) Piecewise approximation of the moment arm length of the patellar withrespect to knee flexion angle compared the data of O’Connor et al. [29] and Zheng et al. [30]. Thedata from Zheng et al. [30] are depicted for comparison purposes only and have not been used in theIFA-model.
The knee joint moment was calculated by considering the moments of the groundreaction forces, of the thigh-calf contact force, of the gravitational and inertial forces ofthe shank, and of the foot. The knee-ground contact force was treated as a simple twocase scenario due to the absence of further information on the areal force distribution. Theknee-ground contact force was either applied entirely to the shank where its moment, withrespect to the knee joint center, acted in the flexion direction; or it was applied entirely tothe patella in terms of a worst-case assumption.
Assuming no antagonistic co-activation of the muscles, the flexion/extension kneejoint moment was attributed to the patellar ligament, or the hamstring muscles, dependingupon its sign. The vector of the tibiofemoral joint force was calculated by summation
Appl. Sci. 2022, 12, 255 6 of 14
of the intersegment force at the tibiofemoral cross-section and the tendon forces. Thecompression component of the tibiofemoral joint force was aligned orthogonal to the tibialweight-bearing surface, which was set to decline by 8◦ in the posterior direction [31].
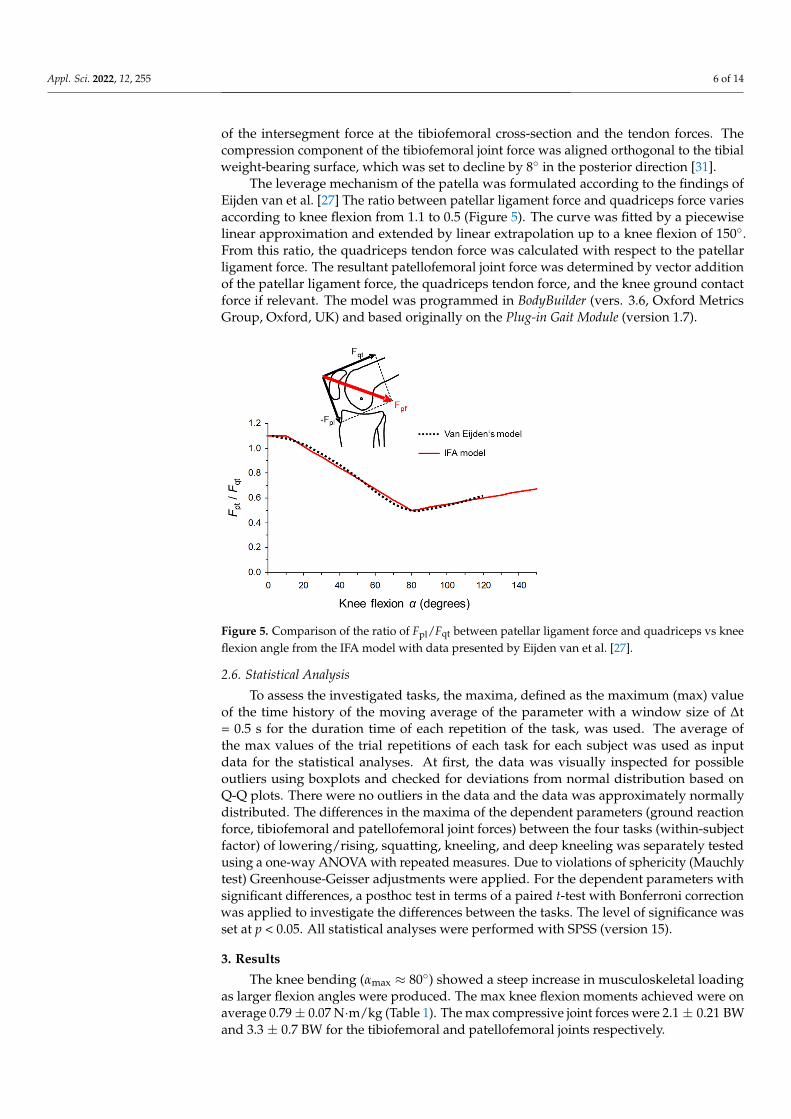
The leverage mechanism of the patella was formulated according to the findings ofEijden van et al. [27] The ratio between patellar ligament force and quadriceps force variesaccording to knee flexion from 1.1 to 0.5 (Figure 5). The curve was fitted by a piecewiselinear approximation and extended by linear extrapolation up to a knee flexion of 150◦.From this ratio, the quadriceps tendon force was calculated with respect to the patellarligament force. The resultant patellofemoral joint force was determined by vector additionof the patellar ligament force, the quadriceps tendon force, and the knee ground contactforce if relevant. The model was programmed in BodyBuilder (vers. 3.6, Oxford MetricsGroup, Oxford, UK) and based originally on the Plug-in Gait Module (version 1.7).
Appl. Sci. 2022, 11, x FOR PEER REVIEW 6 of 14
to the tibial weight-bearing surface, which was set to decline by 8° in the posterior direction [31].
The leverage mechanism of the patella was formulated according to the findings of Eijden van et al. [27] The ratio between patellar ligament force and quadriceps force varies according to knee flexion from 1.1 to 0.5 (Figure 5). The curve was fitted by a piecewise linear approximation and extended by linear extrapolation up to a knee flexion of 150°. From this ratio, the quadriceps tendon force was calculated with respect to the patellar ligament force. The resultant patellofemoral joint force was determined by vector addition of the patellar ligament force, the quadriceps tendon force, and the knee ground contact force if relevant. The model was programmed in BodyBuilder (vers. 3.6, Oxford Metrics Group, Oxford, UK) and based originally on the Plug-in Gait Module (version 1.7).
Figure 5. Comparison of the ratio of Fpl/Fqt between patellar ligament force and quadriceps vs knee flexion angle from the IFA model with data presented by Eijden van et al. [27].
2.6. Statistical Analysis To assess the investigated tasks, the maxima, defined as the maximum (max) value
of the time history of the moving average of the parameter with a window size of ∆t = 0.5 s for the duration time of each repetition of the task, was used. The average of the max values of the trial repetitions of each task for each subject was used as input data for the statistical analyses. At first, the data was visually inspected for possible outliers using boxplots and checked for deviations from normal distribution based on Q-Q plots. There were no outliers in the data and the data was approximately normally distributed. The differences in the maxima of the dependent parameters (ground reaction force, tibiofemoral and patellofemoral joint forces) between the four tasks (within-subject factor) of lowering/rising, squatting, kneeling, and deep kneeling was separately tested using a one-way ANOVA with repeated measures. Due to violations of sphericity (Mauchly test) Greenhouse-Geisser adjustments were applied. For the dependent parameters with significant differences, a posthoc test in terms of a paired t-test with Bonferroni correction was applied to investigate the differences between the tasks. The level of significance was set at p < 0.05. All statistical analyses were performed with SPSS (version 15).
3. Results The knee bending (αmax ≈ 80°) showed a steep increase in musculoskeletal loading as
larger flexion angles were produced. The max knee flexion moments achieved were on average 0.79 ± 0.07 N.m/kg (Table 1). The max compressive joint forces were 2.1 ± 0.21 BW and 3.3 ± 0.7 BW for the tibiofemoral and patellofemoral joints respectively.
Figure 5. Comparison of the ratio of Fpl/Fqt between patellar ligament force and quadriceps vs kneeflexion angle from the IFA model with data presented by Eijden van et al. [27].
2.6. Statistical Analysis
To assess the investigated tasks, the maxima, defined as the maximum (max) valueof the time history of the moving average of the parameter with a window size of ∆t= 0.5 s for the duration time of each repetition of the task, was used. The average ofthe max values of the trial repetitions of each task for each subject was used as inputdata for the statistical analyses. At first, the data was visually inspected for possibleoutliers using boxplots and checked for deviations from normal distribution based onQ-Q plots. There were no outliers in the data and the data was approximately normallydistributed. The differences in the maxima of the dependent parameters (ground reactionforce, tibiofemoral and patellofemoral joint forces) between the four tasks (within-subjectfactor) of lowering/rising, squatting, kneeling, and deep kneeling was separately testedusing a one-way ANOVA with repeated measures. Due to violations of sphericity (Mauchlytest) Greenhouse-Geisser adjustments were applied. For the dependent parameters withsignificant differences, a posthoc test in terms of a paired t-test with Bonferroni correctionwas applied to investigate the differences between the tasks. The level of significance wasset at p < 0.05. All statistical analyses were performed with SPSS (version 15).
3. Results
The knee bending (αmax ≈ 80◦) showed a steep increase in musculoskeletal loadingas larger flexion angles were produced. The max knee flexion moments achieved were onaverage 0.79 ± 0.07 N·m/kg (Table 1). The max compressive joint forces were 2.1 ± 0.21 BWand 3.3 ± 0.7 BW for the tibiofemoral and patellofemoral joints respectively.

Appl. Sci. 2022, 12, 255 7 of 14
Table 1. Max external and internal loads during different activities and postures of the 13 subjects forthe three repetitions (Mean ± SD).
Knee FlexionAngle
(Degrees)
Ground ReactionForce of Right Leg
(BW *)
Thigh-CalfContact Force
(BW)
EMGQuadriceps(%MVC **)
Knee FlexionMoment(N·m/kg)
QuadricepsForce(BW)
TibiofemoralJoint Force
(BW)
Patello-Femoral Joint
Force (BW)
Knee bends(quasi static)
***77 ± 6 0.52 ± 0.08 - **** 28 ± 9 0.79 ± 0.07 3.2 ± 0.62 2.1 ± 0.21 3.3 ± 0.77
Lowering tosquat/rising
from deepkneeling
- 0.77 ± 0.17 0.46 ± 0.19 64 ± 40 0.93 ± 0.16 3.7 ± 0.63 2.6 ± 0.39 3.4 ± 0.56
Squatting 156 ± 6 0.57 ± 0.03 0.49 ± 0.09 9 ± 8 0.28 ± 0.05 1.0 ± 0.16 0.7 ± 0.14 0.9 ± 0.15Kneeling 111 ± 6 0.56 ± 0.03 - 11 ± 8 0.23 ± 0.09 0.9 ± 0.38 0.5 ± 0.20 1.1 ± 0.30
Deep kneeling 150 ± 6 0.55 ± 0.03 0.47 ± 0.05 5 ± 2 0.23 ± 0.05 0.9 ± 0.17 0.5 ± 0.12 0.8 ± 0.20
* BW: force as expressed as a multiple of body weight; ** MVC: max voluntary contraction; *** The knee bendswere only performed by three subjects; **** -: parameter not applicable.
In squatting and deep kneeling, the load bearing of the thigh-calf contact showedstrong reciprocal correspondence to the quadriceps EMG activity. When the thigh-calf con-tact force increased during lowering, the quadriceps activity was reduced to approximatelyrest level at full contact (Figure 6).
Appl. Sci. 2022, 11, x FOR PEER REVIEW 7 of 14
Table 1. Max external and internal loads during different activities and postures of the 13 subjects for the three repetitions (Mean ± SD).
Knee Flexion Angle
(Degrees)
Ground Reaction Force
of Right Leg (BW * )
Thigh-Calf Contact
Force (BW)
EMG Quadriceps (%MVC **)
Knee Flexion Moment (N.m/kg)
Quadriceps Force (BW)
Tibiofemoral Joint Force
(BW)
Patello- Femoral Joint
Force (BW)
Knee bends (quasi static) ***
77 ± 6 0.52 ± 0.08 - **** 28 ± 9 0.79 ± 0.07 3.2 ± 0.62 2.1 ± 0.21 3.3 ± 0.77
Lowering to squat/rising from deep kneeling
- 0.77 ± 0.17 0.46 ± 0.19 64 ± 40 0.93 ± 0.16 3.7 ± 0.63 2.6 ± 0.39 3.4 ± 0.56
Squatting 156 ± 6 0.57 ± 0.03 0.49 ± 0.09 9 ± 8 0.28 ± 0.05 1.0 ± 0.16 0.7 ± 0.14 0.9 ± 0.15 Kneeling 111 ± 6 0.56 ± 0.03 - 11 ± 8 0.23 ± 0.09 0.9 ± 0.38 0.5 ± 0.20 1.1 ± 0.30
Deep kneeling 150 ± 6 0.55 ± 0.03 0.47 ± 0.05 5 ± 2 0.23 ± 0.05 0.9 ± 0.17 0.5 ± 0.12 0.8 ± 0.20 * BW: force as expressed as a multiple of body weight; ** MVC: max voluntary contraction; *** The knee bends were only performed by three subjects; **** -: parameter not applicable.
In squatting and deep kneeling, the load bearing of the thigh-calf contact showed strong reciprocal correspondence to the quadriceps EMG activity. When the thigh-calf contact force increased during lowering, the quadriceps activity was reduced to approximately rest level at full contact (Figure 6).
Figure 6. A typical example of the time histories of dynamic parameters and quadriceps muscle activity (%MVC) during lowering into a squat.
The three subjects successfully completed the endurance tests of maintaining absolutely static kneeling, squatting, or deep kneeling postures for ten minutes. None complained of any kind of knee strain.
During upright kneeling, the average knee-flexion angle of the 13 test subjects was 111° ± 6°, compared to angles of 150° ± 6° to 156° ± 6° reached during squatting and deep
Figure 6. A typical example of the time histories of dynamic parameters and quadriceps muscleactivity (%MVC) during lowering into a squat.
Appl. Sci. 2022, 12, 255 8 of 14
The three subjects successfully completed the endurance tests of maintaining ab-solutely static kneeling, squatting, or deep kneeling postures for ten minutes. Nonecomplained of any kind of knee strain.
During upright kneeling, the average knee-flexion angle of the 13 test subjects was111◦ ± 6◦, compared to angles of 150◦ ± 6◦ to 156◦ ± 6◦ reached during squatting and deepkneeling. In the static postures, the weight tended to be distributed slightly more onto theright leg, at 0.52 to 0.57 BW.
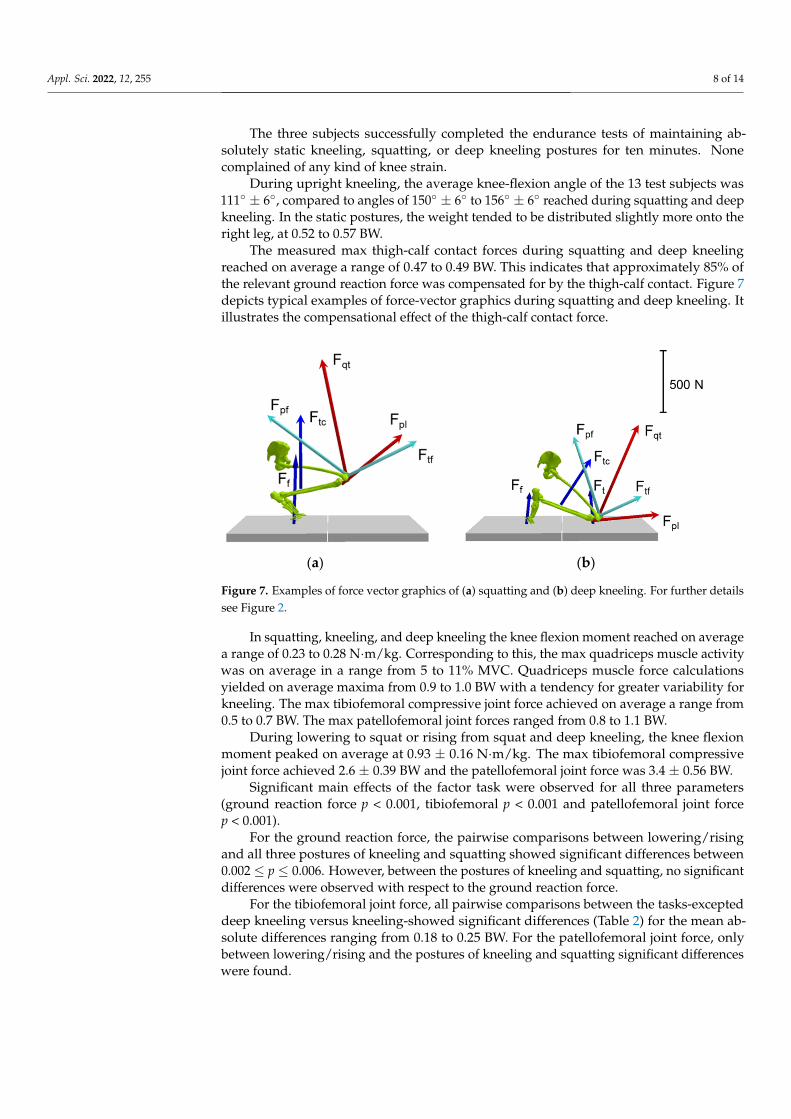
The measured max thigh-calf contact forces during squatting and deep kneelingreached on average a range of 0.47 to 0.49 BW. This indicates that approximately 85% ofthe relevant ground reaction force was compensated for by the thigh-calf contact. Figure 7depicts typical examples of force-vector graphics during squatting and deep kneeling. Itillustrates the compensational effect of the thigh-calf contact force.
Appl. Sci. 2022, 11, x FOR PEER REVIEW 8 of 14
kneeling. In the static postures, the weight tended to be distributed slightly more onto the right leg, at 0.52 to 0.57 BW.
The measured max thigh-calf contact forces during squatting and deep kneeling reached on average a range of 0.47 to 0.49 BW. This indicates that approximately 85% of the relevant ground reaction force was compensated for by the thigh-calf contact. Figure 7 depicts typical examples of force-vector graphics during squatting and deep kneeling. It illustrates the compensational effect of the thigh-calf contact force.
(a) (b)
Figure 7. Examples of force vector graphics of (a) squatting and (b) deep kneeling. For further details see Figure 2.
In squatting, kneeling, and deep kneeling the knee flexion moment reached on average a range of 0.23 to 0.28 N·m/kg. Corresponding to this, the max quadriceps muscle activity was on average in a range from 5 to 11% MVC. Quadriceps muscle force calculations yielded on average maxima from 0.9 to 1.0 BW with a tendency for greater variability for kneeling. The max tibiofemoral compressive joint force achieved on average a range from 0.5 to 0.7 BW. The max patellofemoral joint forces ranged from 0.8 to 1.1 BW.
During lowering to squat or rising from squat and deep kneeling, the knee flexion moment peaked on average at 0.93 ± 0.16 N.m/kg. The max tibiofemoral compressive joint force achieved 2.6 ± 0.39 BW and the patellofemoral joint force was 3.4 ± 0.56 BW.
Significant main effects of the factor task were observed for all three parameters (ground reaction force p < 0.001, tibiofemoral p < 0.001 and patellofemoral joint force p < 0.001).
For the ground reaction force, the pairwise comparisons between lowering/rising and all three postures of kneeling and squatting showed significant differences between 0.002 ≤ p ≤ 0.006. However, between the postures of kneeling and squatting, no significant differences were observed with respect to the ground reaction force.
For the tibiofemoral joint force, all pairwise comparisons between the tasks-excepted deep kneeling versus kneeling-showed significant differences (Table 2) for the mean absolute differences ranging from 0.18 to 0.25 BW. For the patellofemoral joint force, only between lowering/rising and the postures of kneeling and squatting significant differences were found.
Figure 7. Examples of force vector graphics of (a) squatting and (b) deep kneeling. For further detailssee Figure 2.
In squatting, kneeling, and deep kneeling the knee flexion moment reached on averagea range of 0.23 to 0.28 N·m/kg. Corresponding to this, the max quadriceps muscle activitywas on average in a range from 5 to 11% MVC. Quadriceps muscle force calculationsyielded on average maxima from 0.9 to 1.0 BW with a tendency for greater variability forkneeling. The max tibiofemoral compressive joint force achieved on average a range from0.5 to 0.7 BW. The max patellofemoral joint forces ranged from 0.8 to 1.1 BW.
During lowering to squat or rising from squat and deep kneeling, the knee flexionmoment peaked on average at 0.93 ± 0.16 N·m/kg. The max tibiofemoral compressivejoint force achieved 2.6 ± 0.39 BW and the patellofemoral joint force was 3.4 ± 0.56 BW.
Significant main effects of the factor task were observed for all three parameters(ground reaction force p < 0.001, tibiofemoral p < 0.001 and patellofemoral joint forcep < 0.001).
For the ground reaction force, the pairwise comparisons between lowering/risingand all three postures of kneeling and squatting showed significant differences between0.002 ≤ p ≤ 0.006. However, between the postures of kneeling and squatting, no significantdifferences were observed with respect to the ground reaction force.
For the tibiofemoral joint force, all pairwise comparisons between the tasks-excepteddeep kneeling versus kneeling-showed significant differences (Table 2) for the mean ab-solute differences ranging from 0.18 to 0.25 BW. For the patellofemoral joint force, onlybetween lowering/rising and the postures of kneeling and squatting significant differenceswere found.
Appl. Sci. 2022, 12, 255 9 of 14
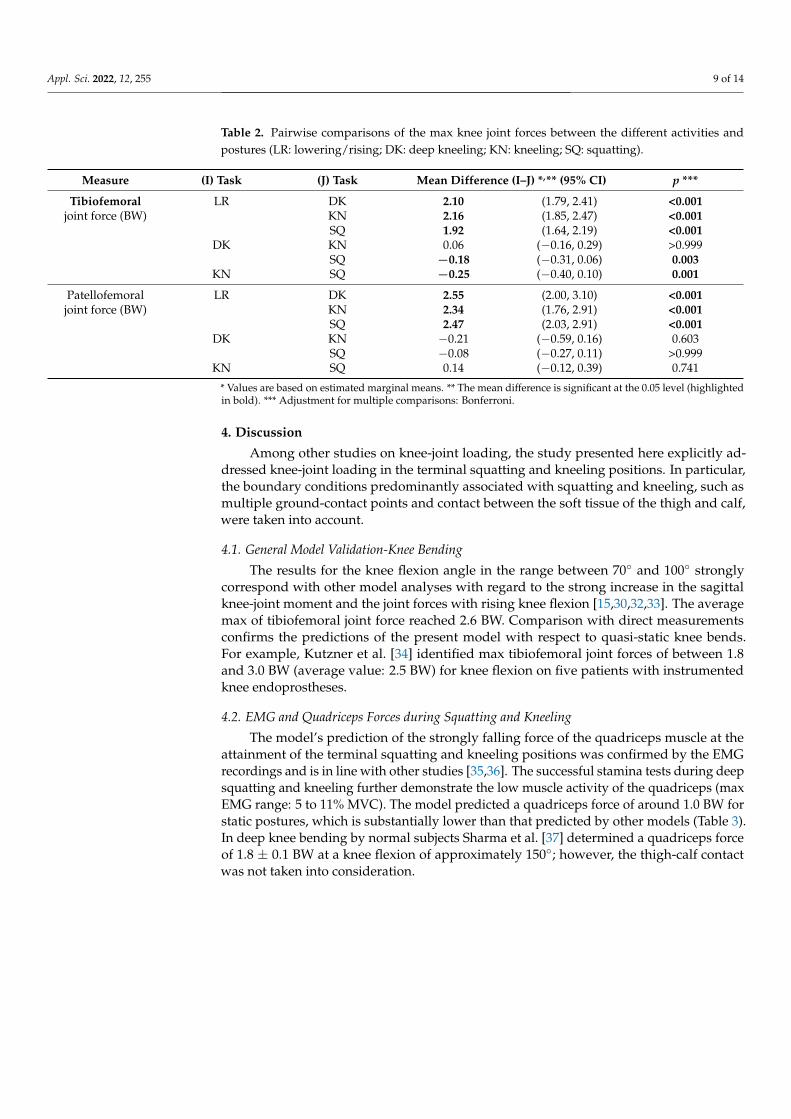
Table 2. Pairwise comparisons of the max knee joint forces between the different activities andpostures (LR: lowering/rising; DK: deep kneeling; KN: kneeling; SQ: squatting).
Measure (I) Task (J) Task Mean Difference (I–J) *,** (95% CI) p ***
Tibiofemoral LR DK 2.10 (1.79, 2.41) <0.001joint force (BW) KN 2.16 (1.85, 2.47) <0.001
SQ 1.92 (1.64, 2.19) <0.001DK KN 0.06 (−0.16, 0.29) >0.999
SQ −0.18 (−0.31, 0.06) 0.003KN SQ −0.25 (−0.40, 0.10) 0.001
Patellofemoral LR DK 2.55 (2.00, 3.10) <0.001joint force (BW) KN 2.34 (1.76, 2.91) <0.001
SQ 2.47 (2.03, 2.91) <0.001DK KN −0.21 (−0.59, 0.16) 0.603
SQ −0.08 (−0.27, 0.11) >0.999KN SQ 0.14 (−0.12, 0.39) 0.741
* Values are based on estimated marginal means. ** The mean difference is significant at the 0.05 level (highlightedin bold). *** Adjustment for multiple comparisons: Bonferroni.
4. Discussion
Among other studies on knee-joint loading, the study presented here explicitly ad-dressed knee-joint loading in the terminal squatting and kneeling positions. In particular,the boundary conditions predominantly associated with squatting and kneeling, such asmultiple ground-contact points and contact between the soft tissue of the thigh and calf,were taken into account.
4.1. General Model Validation-Knee Bending
The results for the knee flexion angle in the range between 70◦ and 100◦ stronglycorrespond with other model analyses with regard to the strong increase in the sagittalknee-joint moment and the joint forces with rising knee flexion [15,30,32,33]. The averagemax of tibiofemoral joint force reached 2.6 BW. Comparison with direct measurementsconfirms the predictions of the present model with respect to quasi-static knee bends.For example, Kutzner et al. [34] identified max tibiofemoral joint forces of between 1.8and 3.0 BW (average value: 2.5 BW) for knee flexion on five patients with instrumentedknee endoprostheses.
4.2. EMG and Quadriceps Forces during Squatting and Kneeling
The model’s prediction of the strongly falling force of the quadriceps muscle at theattainment of the terminal squatting and kneeling positions was confirmed by the EMGrecordings and is in line with other studies [35,36]. The successful stamina tests during deepsquatting and kneeling further demonstrate the low muscle activity of the quadriceps (maxEMG range: 5 to 11% MVC). The model predicted a quadriceps force of around 1.0 BW forstatic postures, which is substantially lower than that predicted by other models (Table 3).In deep knee bending by normal subjects Sharma et al. [37] determined a quadriceps forceof 1.8 ± 0.1 BW at a knee flexion of approximately 150◦; however, the thigh-calf contactwas not taken into consideration.
Appl. Sci. 2022, 12, 255 10 of 14
Table 3. Comparison of cited studies that investigated knee joint forces during kneeling and squattingpostures—means and standard deviation.
Author Activity ModelApproach
MeasurementEquipment
Knee FlexionAngle
(Degrees)
Knee JointMoment(N·m/kg)
QuadricepsForce (BW 1)
TibiofemoralJoint Force
(BW)
PatellofemoralJoint Force
(BW)
Dahlkvist et al. [15]Slow loweringto/slow rising
from squat
2D inverse,EMG
MOCAP 2, 1FP 3, EMG 4 140 8 5.1 ± 0.2 4.9 ± 0.3 6.1 ± 1.9
Pollard et al. Squatting 3D inverse MOCAP, 2 FP,PSM 5,9 155 ± 10 8 0.7 ± 0.5
[24] Deep kneeling 155 ± 10 8 0.5 ± 0.3Kneeling 110 ± 10 8 0.2 ± 0.1
Nagura et al. [17] Full squat 2D inverse,EMG
MOCAP, 1 FP,EMG, 155 0.7 8 4.5 ± 1.1 8 6.7 ± 1.9 8
Smith et al. [20] Squatting heelsdown
2 × 2Dinverse MOCAP, 1 FP 135 ± 10 8 2.0 ± 0.5 8
Squatting heelsup 145 ± 5 8 3.0 ± 0.5 8
Thambyah [21] Squatting 2D inverse MOCAP, 1 FP 142 ± 5 0.8 ± 0.3 8 2.3 ± 1.0
Sharma et al. [37] Squat (normalknees) 3D inverse FLIM 6, 1 FP 150 8 1.8 ± 0.1 1.9 ± 0.1
Zelle et al. [23] Squatting 2D inverse KINSIM 7,PSM 9 155 3.1
Bedo et al. [14]lowering
to/rising fromsquat
3D inverse MOCAP,KINSIM 145 7.0
Lu et al. [16]lowering
to/rising fromsquat
3D inverseMOCAP, FP,
EMG,KINSIM
139.9 ± 4.9 1.1 ± 0.3 8 4.6 ± 1.4 8
1 Force as expressed as a multiple of body weight; 2 Motion capturing system; 3 Force plate; 4 Electro myography;5 Pressure-sensitive map; 6 Fluoroscopic imaging; 7 Kinematic simulation; 8 Estimated from graph 9 PSM formeasuring thigh-calf contact force was used in a separate measurement.
4.3. Tibiofemoral Joint Forces during Squatting and Kneeling
The ANOVA test showed that the different forms of squatting and kneeling may notappear vastly different to lowering/rising with regards to the ground reaction force butis significantly lower regarding the tibiofemoral joint forces. The max tibiofemoral jointforces were more than 80% lower than those of rising from a squat.
The tibiofemoral joint forces of between 0.5 and 0.7 BW estimated in this study forsquatting, kneeling, and deep kneeling are substantially lower than those of earlier studies(Table 3), [14–17,20,23]. This difference can be very likely explained by one or a combinationof the factors of thigh-calf contact, multiple ground contacts, and moment arm of the groundreaction force with respect to the knee joint.
In contrast to the results presented in this paper, the higher knee joint forces of in-vitroknee testing studies can be expected to originate as a result of differences in the externalspecimen-loading geometry and in different levels of applied muscle pre-tensions [23,33].In these in-vitro studies generally, no soft-tissue contact was considered [38,39].
4.4. Patellofemoral Joint Forces during Squatting and Kneeling
At 0.8 to 1.1 BW, the patellofemoral joint forces were also substantially lower forsquatting, kneeling, and deep kneeling than in earlier studies (Table 3), [15,19]. This againcan be explained by the aforementioned reasons. The lowest patellofemoral joint forcesobserved to date are 1.8 ± 0.1 BW reported by Sharma et al. [37], even though the thigh-calfcontact force was not considered in this case.
Even though some significant differences were observed for the max patellofemoraljoint forces within the different forms of squatting and kneeling, these were only marginal.Opposed to this, notable is that the different forms of squatting and kneeling despite theirdistinctive characteristics with regards to leg position and floor support result in similarmagnitudes of the knee joint forces.
4.5. Relevance of Thigh-Calf Contact Forces during Squatting and Kneeling
During kneeling, the relatively low compressive knee joint forces can be primarilyattributed to the distribution of the ground reaction forces onto the knee and the foot,
Appl. Sci. 2022, 12, 255 11 of 14
during deep squatting and deep kneeling these forces are critically dependent on thesoft-tissue contact forces at the posterior surface of the leg [23,24]. Our study indicatesthat approximately 85% of the relevant ground reaction force is compensated for by thethigh-calf contact. These boundary conditions drastically reduced the knee flexion momentand the consequent quadriceps muscle force, which are seen as a requirement for sustainingsquatting and deep kneeling postures.
Zelle et al. [22] reported averaged thigh-calf contact forces of between 62 and 68% ofthe ground reaction force of one leg for deep kneeling and squatting, assuming an equalload distribution between the two legs. Considering their observation of a significantload shift to the dominant leg of approximately 20%, the soft-tissue contact forces yield74 to 82% of the relevant ground reaction force. By applying these averaged thigh-calfcontact forces to a simulated downward squatting movement, Zelle et al. [23] calculatedtibiofemoral compressive joint forces of 2.9 BW and patella ligament forces of almost thesame magnitude. This would correspond to a quadriceps force of 4.3 BW when applyingthe patellar model used in the present study. This is rated as a very high muscular load inthe context of a static resting posture, and this overestimation may be explained in part bythe assumption that the ground reaction force must always pass through the ankle joint.
Pollard et al. [24] reported soft-tissue contact forces 10% greater than those reportedby Zelle et al. [23], whilst ultimately still obtaining flexion moments for squatting and deepkneeling more than twice as high as those in the present study. However, the large standarddeviation, almost in the magnitude of the mean value, indicates that in some of the trialsthe knee joint moment was close to zero and that the quadriceps force could have beeneven lower than that found in this study.
4.6. Limitations
This approach presented here delivered reasonable results, but some limitations needto be considered. The tibiofemoral joint was modeled with one degree of freedom only,which is a common issue of analytical knee models [16,40,41]. Consequently, neither kneeabduction nor torsion moments have to be compensated by the surrounding muscles. Incombination with the assumption of reciprocal muscle recruitment, the present modelmay underestimate the compressive joint force to some extent. The model does not con-sider side effects from the stress of the knee joint capsule, nor of the medial and lateralligaments and the cruciate ligaments. It is assumed, however, that these effects do notcontribute substantially to the compressive joint force at the tibiofemoral joint, providedfull mobility in terms of flexion of the knee joint is guaranteed. The model would otherwisehave overestimated the tibiofemoral joint force during knee bends compared to the directmeasurements of Kutzner et al. [34]. However, the results can be expected to differ stronglyin the case of persons with limited knee joint mobility. In particular, among patients withendoprosthetic knee joints, the conditions at max knee joint flexion may be completelydifferent and prevent the results from being transferred.
Owing to the lack of suitable data, the anatomical model characteristics had to begained by the extrapolation of existing models. The presence of shear forces, in particular,may lead to different knee joint articulation patterns which may have a considerable impacton the muscle force predictions. However, the EMG data indicated low muscular activityoverall for deep kneeling and squatting which supports the legitimacy of the model.
Keeping the pressure-sensitive pad in place for a few exercises and covering the wholecontact area of the thigh and calf presented difficulties at times. In a few cases in whichthe heels came into contact with the buttocks, the pad was too small and thus would havecaused an underestimation of the thigh-calf contact force.
The small sample size of 13 participants might be seen as an issue. However, it wasnot the goal of the study to estimate the knee joint forces of the total working populationor similar. Our study results will only be applicable for people who can easily achievethe final postures of squatting and kneeling. The large differences in the knee joint forcesbetween lowering into or rising from the squat and the different postures of squatting and
Appl. Sci. 2022, 12, 255 12 of 14
kneeling can be verified with such a sample size. If there might be undetected significantdifferences between the different squatting and kneeling positions these would be ofmarginal relevance from the biomechanical perspective.
5. Conclusions
In the debate on the knee joint loading associated with kneeling, squatting, and kneebending, the present study proposes certain quantitative measures for a comprehensiveassessment method of these tasks. The study’s outcome suggests that for the static posturesof squatting, kneeling, and deep kneeling at rest the compressive knee joint forces aresignificantly lower than has been suggested by earlier studies. The model predictions weresupported by the EMG measurements and the successful stamina tests. The results indicatethe importance of simultaneous measurement of all kinematic and dynamic parametersin one trial. For future investigations, it might be interesting to verify if females achievesimilar or even higher load reductions in final squatting and kneeling postures. In thediscussion on the risk of developing knee osteoarthritis due to prolonged squatting andkneeling other mechanisms should be taken more into consideration, such as neuronaldisturbance of knee proprioceptors which may affect the neuromuscular control duringrising and walking [42]. This may pose an injury risk for the knee joint which could finallyresult in osteoarthritis of the knee joint.
Author Contributions: Conceptualization, U.G. and R.P.E.; methodology, U.G.; software, U.G.;validation, K.H. and R.P.E.; investigation, U.G.; writing—original draft preparation, U.G. and R.P.E.;writing—review and editing, R.P.E., K.H. and U.G.; supervision, R.P.E.; project administration, U.G.All authors have read and agreed to the published version of the manuscript.
Funding: This research received no external funding.
Institutional Review Board Statement: The study was conducted according to the guidelines ofthe Declaration of Helsinki and approved by the Institutional Review Board of IFA (Prj. 414515 November 2007).
Informed Consent Statement: Informed consent was obtained from all subjects involved in the study.
Data Availability Statement: The data is not publicly accessible due to data protection regulations.
Conflicts of Interest: The authors declare no conflict of interest.
References1. Cooper, C.; McAlindon, T.; Coggon, D.; Egger, P.; Dieppe, P. Occupational physical activity and osteoarthritis of the knee. Ann.
Rheum. Dis. 1994, 53, 90–93. [CrossRef] [PubMed]2. Sandmark, H. Primary osteoarthritis of the knee in men and women as a result of lifelong physical load from work. Scand J. Work
Environ. Health 2000, 26, 20–25. [CrossRef]3. Zhang, Y.; Hunter, D.; Nevitt, M.; Xu, L.; Niu, J.; Lui, L.; Yu, W.; Aliabadi, P.; Felson, D. Association of squatting with increased
prevalence of radiographic tibiofemoral knee osteoarthritis: The Beijing Osteoarthritis Study. Arthritis Rheumatol. 2004, 50,1187–1192. [CrossRef] [PubMed]
4. Seidler, A.; Bolm-Audorff, U.; Abolmaali, N.; Elsner, G. The role of cumulative physical work load in symptomatic kneeosteoarthritis—A case-control study in Germany. J. Occup. Med. Toxicol. 2008, 14, 14. [CrossRef]
5. Verbeek, J.; Mischke, C.; Robinson, R.; Ijaz, S.; Kuijer, P.; Kievit, A.; Ojajärvi, A.; Neuvonen, K. Occupational Exposure to KneeLoading and the Risk of Osteoarthritis of the Knee: A Systematic Review and a Dose-Response Meta-Analysis. Saf. Health Work2017, 8, 130–142. [CrossRef]
6. Wang, X.; Perry, T.A.; Arden, N.; Chen, L.; Parsons, C.M.; Cooper, C.; Gates, L.; Hunter, D.J. Occupational Risk in KneeOsteoarthritis: A Systematic Review and Meta-Analysis of Observational Studies. Arthritis Care Res. 2020, 72, 1213–1223.[CrossRef]
7. NBoII. Guide to Occupational Diseases—Reported on or after 1st January 2005, 5th ed.; National Board of Industrial Injuries:Copenhagen, Denmark, 2007.
Appl. Sci. 2022, 12, 255 13 of 14
8. BMAS. Merkblatt zur Berufskrankheit 2112 der Anlage 1 zur Berufskrankheiten-Verordnung: Gonarthrose durch eine Tätigkeit imKnien oder vergleichbare Kniebelastung mit einer kumulativen Einwirkungsdauer während des Arbeitslebens von mindestens13.000 Stunden und einer Mindesteinwirkungsdauer von insgesamt einer Stunde pro Schicht. [Leaflet of occupational disease no.2112: Knee osteoarthritis caused by working while kneeling or similar knee straining with a cumulative duration of exposure ofat least 13,000 hours per life and at least one hour per day]. Gem. Minist. Bek. des BMAS vom 30.12.2009—IVa 4-45222-2122 2010,61, 98–103.
9. Gritzka, T.L.; Fry, L.R.; Cheesman, R.L.; LaVigne, A. Deterioration of articular cartilage caused by continuous compression in amoving rabbit joint. A light and electron microscopic study. J. Bone Jt. Surg. Am. Vol. 1973, 55, 1698–1720. [CrossRef]
10. Fujisawa, T.; Kuboki, T.; Kasai, T.; Sonoyama, W.; Kojima, S.; Uehara, J.; Komori, C.; Yatani, H.; Hattori, T.; Takigawa, M. ARepetitive, Steady Mouth Opening Induced an Osteoarthritis-like Lesion in the Rabbit Temporomandibular Joint. J. Dent. Res.2003, 82, 731–735. [CrossRef]
11. Nakamura, S.; Arai, Y.; Takahashi, K.A.; Terauchi, R.; Ohashi, S.; Mazda, O.; Imanishi, J.; Inoue, A.; Tonomura, H.; Kubo, T.Hydrostatic pressure induces apoptosis of chondrocytes cultured in alginate beads. J. Orthop. Res. 2006, 24, 733–739. [CrossRef][PubMed]
12. Laudanski, A.F.; Buchman-Pearle, J.M.; Acker, S.M. Quantifying high flexion postures in occupational childcare as they relate tothe potential for increased risk of knee osteoarthritis. Ergonomics, 2021; in press. [CrossRef]
13. Nonnenmann, M.W.; Anton, D.C.; Gerr, F.; Yack, H.J. Dairy farm worker exposure to awkward knee posture during milking andfeeding tasks. J. Occup. Environ. Hyg. 2010, 7, 483–489. [CrossRef] [PubMed]
14. Bedo, B.L.S.; Catelli, D.S.; Lamontagne, M.; Santiago, P.R.P. A custom musculoskeletal model for estimation of medial and lateraltibiofemoral contact forces during tasks with high knee and hip flexions. Comput. Methods Biomech. Biomed. Eng. 2020, 23, 658–663.[CrossRef]
15. Dahlkvist, N.J.; Mayo, P.; Seedhom, B.B. Forces during squatting and rising from a deep squat. Eng. Med. 1982, 11, 69–76.[CrossRef]
16. Lu, Y.; Mei, Q.; Peng, H.-T.; Li, J.; Wei, C.; Gu, Y. A Comparative Study on Loadings of the Lower Extremity during Deep Squatin Asian and Caucasian Individuals via OpenSim Musculoskeletal Modelling. BioMed Res. Int. 2020, 2020, 1–10. [CrossRef][PubMed]
17. Nagura, T.; Matsumoto, H.; Kiriyama, Y.; Chaudhari, A.; Andriacchi, T.P. Tibiofemoral joint contact force in deep knee flexion andits consideration in knee osteoarthritis and joint replacement. J. Appl. Biomech. 2006, 22, 305–313. [CrossRef]
18. Wilk, K.; Escamilla, R.; Fleisig, G.; Barrentine, S.; Andrews, J.; Boyd, M. A comparison of tibiofemoral joint forces and electromyo-graphic activity during open and closed kinetic chain exercises. Am. J. Sports Med. 1996, 24, 518–527. [CrossRef]
19. Reilly, D.; Martens, M. Experimental analysis of the quadriceps muscle force and patello-femoral joint reaction force for variousactivities. Acta Orthop. Scand. 1972, 43, 126–137. [CrossRef]
20. Smith, S.; Cockburn, R.; Hemmerich, A.; Li, R.; Wyss, U. Tibiofemoral joint contact forces and knee kinematics during squatting.Gait Posture 2008, 27, 376–386. [CrossRef] [PubMed]
21. Thambyah, A. How critical are the tibiofemoral joint reaction forces during frequent squatting in Asian populations? Knee 2008,15, 286–294. [CrossRef] [PubMed]
22. Zelle, J.; Barink, M.; Loeffen, R.; De Waal Malefijt, M.; Verdonschot, N. Thigh-calf contact force measurement in deep knee flexion.Clin. Biomech. 2007, 22, 821–826. [CrossRef] [PubMed]
23. Zelle, J.; Barink, M.; de Waal Malefijt, M.; Verdonschot, N. Thigh-calf contact: Does it affect the loading of the knee in thehigh-flexion range? J. Biomech. 2009, 42, 587–593. [CrossRef]
24. Pollard, J.; Porter, W.; Redfern, M. Forces and moments on the knee during kneeling and squatting. J. Appl. Biomech. 2011, 27,233–241. [CrossRef] [PubMed]
25. Winter, D.A. Biomechanics and Motor Control of Human Movement, 2nd ed.; John Wiley & Sons: New York, NY, USA, 1990.26. Menschik, A. Biometrics [Biometrie]; Springer: Berlin, Germany, 1987. (In German)27. Eijden van, T.; Kouwenhoven, E.; Verburg, J.; Weijs, W. A mathematical model of the patellofemoral joint. J. Biomech. 1986, 19,
219–229. [CrossRef]28. Hehne, H. Biomechanics of the patellofemoral joint and its clinical relevance. Clin. Orthop. Relat. Res. 1990, 258, 73–85. [CrossRef]29. O’Connor, J.; Shercliff, T.; Fitzpatrick, D.; Goodfellow, J. Knee Ligaments: Structure, Function, Injury, and Repair; Daniel, D.M.,
Akeson, W.H., O’Connor, J.J., Eds.; Raven Press: New York, NY, USA, 1990; pp. 201–237.30. Zheng, N.; Fleisig, G.; Escamilla, R.; Barrentine, S. An analytical model of the knee for estimation of internal forces during exercise.
J. Biomech. 1998, 31, 963–967. [CrossRef]31. Yamaguchi, G.; Zajac, F. A planar model of the knee joint to characterize the knee extensor mechanism. J. Biomech. 1989, 22, 1–10.
[CrossRef]32. Escamilla, R. Knee biomechanics of the dynamic squat exercise. Med. Sci. Sports Exerc. 2001, 33, 127–141. [CrossRef]33. Mason, J.; Leszko, F.; Johnson, T.; Komistek, R. Patellofemoral joint forces. J. Biomech. 2008, 41, 2337–2348. [CrossRef]34. Kutzner, I.; Heinlein, B.; Graichen, F.; Bender, A.; Rohlmann, A.; Halder, A.; Beier, A.; Bergmann, G. Loading of the knee joint
during activities of daily living measured in vivo in five subjects. J. Biomech. 2010, 43, 2164–2173. [CrossRef] [PubMed]35. Pejhan, S.; Denroche, S.K.; Frew, G.J.; Acker, S.M. Effects of Knee Savers on the quadriceps muscle activation across deep knee
bending postures. Appl. Ergon. 2019, 80, 193–199. [CrossRef] [PubMed]
Appl. Sci. 2022, 12, 255 14 of 14
36. Gallagher, S.; Pollard, J.; Porter, W.L. Electromyography of the thigh muscles during lifting tasks in kneeling and squattingpostures. Ergonomics 2011, 54, 91–102. [CrossRef]
37. Sharma, A.; Leszko, F.; Komistek, R.; Scuderi, G.; Cates, H., Jr.; Liu, F. In vivo patellofemoral forces in high flexion total kneearthroplasty. J. Biomech. 2008, 41, 642–648. [CrossRef]
38. Hofer, J.; Gejo, R.; McGarry, M.; Lee, T. Effects on tibiofemoral biomechanics from kneeling. Clin. Biomech. 2011, 26, 605–611.[CrossRef]
39. Wilkens, K.; Duong, L.; McGarry, M.; Kim, W.C.; Lee, T. Biomechanical effects of kneeling after total knee arthroplasty. J. Bone Jt.Surg. 2007, 89, 2745–2751. [CrossRef]
40. Catelli, D.S.; Wesseling, M.; Jonkers, I.; Lamontagne, M. A musculoskeletal model customized for squatting task. Comput. MethodsBiomech. Biomed. Eng. 2019, 22, 21–24. [CrossRef] [PubMed]
41. Carbone, V.; Fluit, R.; Pellikaan, P.; van der Krogt, M.M.; Janssen, D.; Damsgaard, M.; Vigneron, L.; Feilkas, T.; Koopman, H.F.J.M.;Verdonschot, N. TLEM 2.0—A comprehensive musculoskeletal geometry dataset for subject-specific modeling of lower extremity.J. Biomech. 2015, 48, 734–741. [CrossRef]
42. Tennant, L.M.; Chong, H.C.; Acker, S.M. The effects of a simulated occupational kneeling exposure on squat mechanics and kneejoint load during gait. Ergonomics 2018, 61, 839–852. [CrossRef]