Nuclear architecture dictates HIV-1 integration site selection
17
LETTER doi:10.1038/nature14226 Nuclear architecture dictates HIV-1 integration site selection Bruna Marini 1 , Attila Kertesz-Farkas 2 *, Hashim Ali 1 *, Bojana Lucic 1 {, Kamil Lisek 1 {, Lara Manganaro 1 {, Sandor Pongor 2 {, Roberto Luzzati 3,4 , Alessandra Recchia 5 , Fulvio Mavilio 5,6 , Mauro Giacca 1,4 1 & Marina Lusic 1 1{ Long-standing evidence indicates that human immunodeficiency virus type 1 (HIV-1) preferentially integrates into a subset of transcriptionally active genes of the host cell genome 1–4 . However, the reason why the virus selects only certain genes among all transcriptionally active regions in a target cell remains largely unknown. Here we show that HIV-1 integration occurs in the outer shell of the nucleus in close correspondence with the nuclear pore. This region contains a series of cellular genes, which are preferentially targeted by the virus, and characterized by the presence of active transcription chromatin marks before viral infection. In contrast, the virus strongly disfavours the heterochromatic regions in the nuclear lamin-associated domains 5 and other transcriptionally active regions located centrally in the nucleus. Functional viral integrase and the presence of the cellular Nup153 and LEDGF/p75 integration cofactors are indispensable for the peripheral integration of the virus. Once integrated at the nuclear pore, the HIV-1 DNA makes contact with various nucleoporins; this association takes part in the transcriptional regulation of the viral genome. These results indicate that nuclear topography is an essential determinant of the HIV-1 life cycle. One important aspect of the interaction between HIV-1 and its target cells is the encounter between the viral complementary DNA (cDNA) with the complex architecture of the mammalian nucleus, in which chromosomes and genes are spatially arranged to occupy preferred posi- tions within the three-dimensional space 6 . We analysed the lists of human genes targeted by HIV-1 from six different studies (Extended Data Table 1), containing altogether 1,136 unique gene integration sites in activated T cells carrying the CD4 anti- gen (CD4 1 ); 126 of these genes recurred in two lists, 24 in three, and six in at least four lists, for a total of 156 genes, which we named HIV recur- rent integration genes (RIGs). The probability of detecting this number of specific genes by chance was extremely low (P , 1 3 10 29 ; Extended Data Fig. 1a). RIGs were also highly represented in another list of approx- imately 12,000 integration sites 4 , 5,221 of which were unique genes, as well as in two integration lists generated from patients’ CD4 1 T cells 7,8 (P , 0.001 of detecting these genes by chance). Thus, RIGs are bona fine the hottest spots of HIV-1 integration. We then ranked RIGs according to their frequency and plotted them onto the human chromosome map 9 . Unexpectedly, they appeared to cluster into specific chromosomal regions (Extended Data Fig. 1b). In five out of eight cases, RIGs were also in proximity to the ‘hotter zones’, previously defined as regions with remarkably high HIV-1 integration density 1 (Supplementary Table 1). In these areas, observations hinted at the possibility that the topological distribution of these chromosomal regions inside the nucleus could determine HIV-1 integration. By applying three-dimensional immuno-DNA fluorescence in situ hybridization (FISH), we assessed the position of RIGs and hotter zones in primary CD4 1 T cells from healthy donors. Selected FISH probes, listed in the Supplementary Information, provided topological infor- mation for a total of 169 RIGs and other integration sites located within 10 megabases (Mb) from the centre of the probe (Extended Data Fig. 2). When the radial positions of the RIG FISH signals were binned into three zones of equal area 10,11 (Fig. 1a), a clear gradient in signal localiza- tion was observed, which decreased from the nuclear envelope towards the interior (images of 14 RIGs in Fig. 1b, c; four hotter zones in Fig. 1d). The global distribution of RIGs (n 5 1,420 analysed alleles) was remark- ably different from that of control genes, all of which were expressed in CD4 1 T cells 12,13 (n 5 522): 44% of RIGs mapped in zone 1, 41.5% in zone 2 and only 14.5% in zone 3 versus 25.6%, 47.6% and 26.8% for con- trol genes, respectively (Fig. 1f; representative images of control genes are shown in Fig. 1e). Considering an average of about 7 mm for the nuclear diameter in CD4 1 T cells, 63% of RIGs and hotter-zone alleles were concentrated within about 1 mm below the nuclear membrane. We wanted, therefore, to visualize the position of the HIV-1 DNA itself in infected, primary CD4 1 T-cell nuclei. At 4 days after infection with the VSV-G-pseudotyped HIV-1 NL4-3/E-R- 14 , the vast majority of the pro- viral immuno-FISH signals were in zone 1 (75.2% within 1 mm under the nuclear envelope) (Fig. 2c). The visualized viral DNA was integrated 15 , as also detected by real-time Alu PCR (Fig. 2a), and transcriptionally active (Fig. 2b). A similar distribution was observed in primary macro- phages and the monocytic cell line U937 (Extended Data Fig. 3a, b, respec- tively). Peripheral localization was also observed for a fully competent virus carrying the HIV-1 BRU envelope 16 (Fig. 2d) and, notably, for the wild-type viruses found in CD4 1 T-cells from two HIV-infected patients (Fig. 2e, f). Peripheral localization was also a feature of lentiviral vectors, irrespective of their transcriptional activity (Extended Data Fig. 3c, d), but not of the MoMLV gammaretrovirus, which localized preferen- tially inside the nuclear interior (Extended Data Fig. 3e). In contrast, when integration was impaired, the viral cDNA roamed around the nucleus. This was the case for two HIV-1 clones harbouring single-point mutations in the integrase catalytic domain (class I IN mutations: IN(D64E) and IN(D116N)) 17,18 or for HIV-1 NL4-3/E-R- in the presence of the integrase inhibitor raltegravir; under these conditions, only 10–20% of viruses were found in zone 1 (Fig. 2g). In these cases, the detected viral genomes did not correspond to integrated DNA (Fig. 2h) but were highly enriched in circular forms of viral DNA containing two long terminal repeats (2-LTR circles) (Fig. 2i). We also downregulated the chromatin tethering factor LEDGF/p75 (ref. 19) and the inner nuclear basket protein Nup153 (ref. 20), which are involved in viral DNA inte- gration (Fig. 2j). FISH was performed 48 h after infection when there *These authors contributed equally to this work. 1These authors both contributed as last authors. 1 Molecular Medicine Laboratory, International Centre for Genetic Engineering and Biotechnology (ICGEB), 34149 Trieste, Italy. 2 Protein Structure and Bioinformatics Group, International Centre for Genetic Engineering and Biotechnology (ICGEB), 34149 Trieste, Italy. 3 Struttura Complessa Malattie Infettive, Azienda Ospedaliero-Universitaria, 34134 Trieste, Italy. 4 Department of Medical, Surgical and Health Sciences, University of Trieste, 34129 Trieste, Italy. 5 Department of Life Sciences, University of Modena and Reggio Emilia, 41121 Modena, Italy. 6 Genethon, 91002 Evry, France. {Present addresses: Department of Infectious Diseases, Integrative Virology, University Hospital Heidelberg and German Center for Infection Research, 69120 Heidelberg, Germany (B.L.; M.L.); Laboratorio Nazionale Consorzio Interuniversitario per le Biotecnologie (LNCIB), 34149 Trieste, Italy (K.L.); Department of Microbiology, Icahn School of Medicine at Mount Sinai, New York, New York 10029, USA (L.M.); Pazmany University, Budapest 1083, Hungary (S.P.). 00 MONTH 2015 | VOL 000 | NATURE | 1 Macmillan Publishers Limited. All rights reserved ©2015
-
Upload
independent -
Category
Documents
-
view
0 -
download
0
Transcript of Nuclear architecture dictates HIV-1 integration site selection
LETTERdoi:10.1038/nature14226
Nuclear architecture dictates HIV-1 integrationsite selectionBruna Marini1, Attila Kertesz-Farkas2*, Hashim Ali1*, Bojana Lucic1{, Kamil Lisek1{, Lara Manganaro1{, Sandor Pongor2{,Roberto Luzzati3,4, Alessandra Recchia5, Fulvio Mavilio5,6, Mauro Giacca1,41 & Marina Lusic11{
Long-standing evidence indicates that human immunodeficiencyvirus type 1 (HIV-1) preferentially integrates into a subset oftranscriptionally active genes of the host cell genome1–4. However,the reason why the virus selects only certain genes among alltranscriptionally active regions in a target cell remains largelyunknown. Here we show that HIV-1 integration occurs in the outershell of the nucleus in close correspondence with the nuclear pore.This region contains a series of cellular genes, which are preferentiallytargeted by the virus, and characterized by the presence of activetranscription chromatin marks before viral infection. In contrast,the virus strongly disfavours the heterochromatic regions in thenuclear lamin-associated domains5 and other transcriptionally activeregions located centrally in the nucleus. Functional viral integraseand the presence of the cellular Nup153 and LEDGF/p75 integrationcofactors are indispensable for the peripheral integration of thevirus. Once integrated at the nuclear pore, the HIV-1 DNA makescontact with various nucleoporins; this association takes part in thetranscriptional regulation of the viral genome. These results indicatethat nuclear topography is an essential determinant of the HIV-1life cycle.
One important aspect of the interaction between HIV-1 and its targetcells is the encounter between the viral complementary DNA (cDNA)with the complex architecture of the mammalian nucleus, in whichchromosomes and genes are spatially arranged to occupy preferred posi-tions within the three-dimensional space6.
We analysed the lists of human genes targeted by HIV-1 from sixdifferent studies (Extended Data Table 1), containing altogether 1,136unique gene integration sites in activated T cells carrying the CD4 anti-gen (CD41); 126 of these genes recurred in two lists, 24 in three, and sixin at least four lists, for a total of 156 genes, which we named HIV recur-rent integration genes (RIGs). The probability of detecting this numberof specific genes by chance was extremely low (P , 1 3 1029; ExtendedData Fig. 1a). RIGs were also highly represented in another list of approx-imately 12,000 integration sites4, 5,221 of which were unique genes, aswell as in two integration lists generated from patients’ CD41 T cells7,8
(P , 0.001 of detecting these genes by chance). Thus, RIGs are bonafine the hottest spots of HIV-1 integration.
We then ranked RIGs according to their frequency and plotted themonto the human chromosome map9. Unexpectedly, they appeared tocluster into specific chromosomal regions (Extended Data Fig. 1b). Infive out of eight cases, RIGs were also in proximity to the ‘hotter zones’,previously defined as regions with remarkably high HIV-1 integrationdensity1 (Supplementary Table 1). In these areas, observations hintedat the possibility that the topological distribution of these chromosomalregions inside the nucleus could determine HIV-1 integration.
By applying three-dimensional immuno-DNA fluorescence in situhybridization (FISH), we assessed the position of RIGs and hotter zonesin primary CD41 T cells from healthy donors. Selected FISH probes,listed in the Supplementary Information, provided topological infor-mation for a total of 169 RIGs and other integration sites located within10 megabases (Mb) from the centre of the probe (Extended Data Fig. 2).
When the radial positions of the RIG FISH signals were binned intothree zones of equal area10,11 (Fig. 1a), a clear gradient in signal localiza-tion was observed, which decreased from the nuclear envelope towardsthe interior (images of 14 RIGs in Fig. 1b, c; four hotter zones in Fig. 1d).The global distribution of RIGs (n 5 1,420 analysed alleles) was remark-ably different from that of control genes, all of which were expressed inCD41 T cells12,13 (n 5 522): 44% of RIGs mapped in zone 1, 41.5% inzone 2 and only 14.5% in zone 3 versus 25.6%, 47.6% and 26.8% for con-trol genes, respectively (Fig. 1f; representative images of control genesare shown in Fig. 1e). Considering an average of about 7mm for thenuclear diameter in CD41 T cells, 63% of RIGs and hotter-zone alleleswere concentrated within about 1mm below the nuclear membrane.
We wanted, therefore, to visualize the position of the HIV-1 DNA itselfin infected, primary CD41 T-cell nuclei. At 4 days after infection withthe VSV-G-pseudotyped HIV-1NL4-3/E-R-
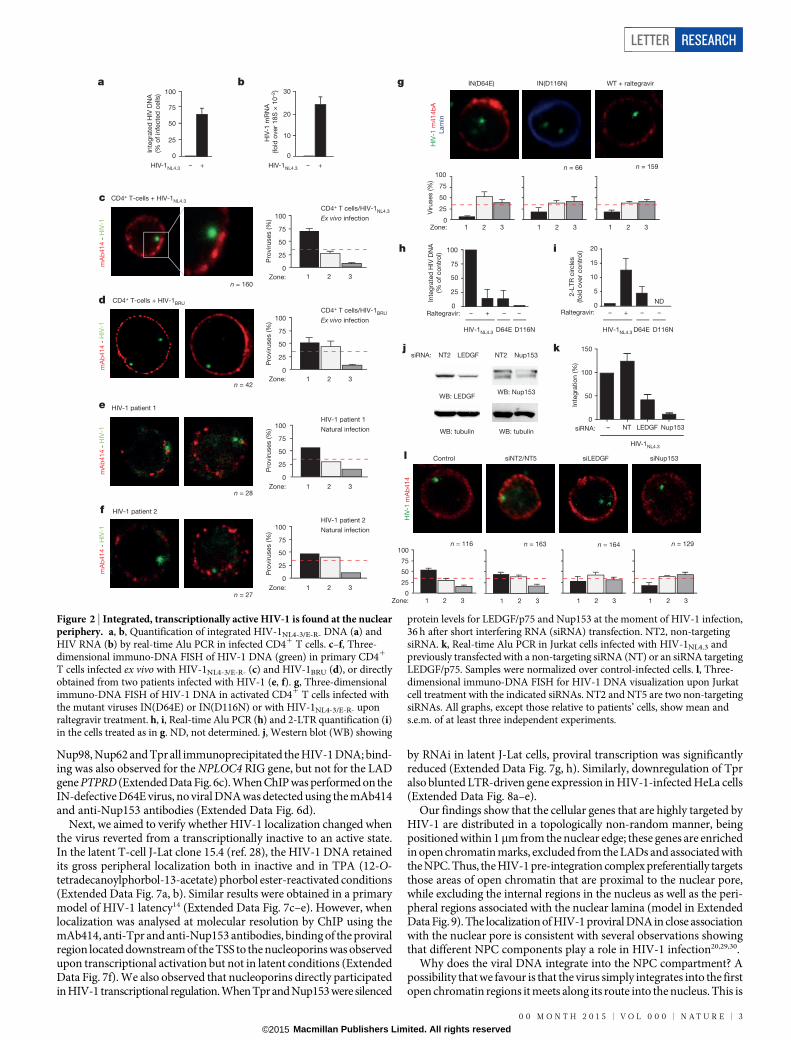
14, the vast majority of the pro-viral immuno-FISH signals were in zone 1 (75.2% within 1mm underthe nuclear envelope) (Fig. 2c). The visualized viral DNA was integrated15,as also detected by real-time Alu PCR (Fig. 2a), and transcriptionallyactive (Fig. 2b). A similar distribution was observed in primary macro-phages and the monocytic cell line U937 (Extended Data Fig. 3a, b, respec-tively). Peripheral localization was also observed for a fully competentvirus carrying the HIV-1BRU envelope16 (Fig. 2d) and, notably, for thewild-type viruses found in CD41 T-cells from two HIV-infected patients(Fig. 2e, f). Peripheral localization was also a feature of lentiviral vectors,irrespective of their transcriptional activity (Extended Data Fig. 3c, d),but not of the MoMLV gammaretrovirus, which localized preferen-tially inside the nuclear interior (Extended Data Fig. 3e).
In contrast, when integration was impaired, the viral cDNA roamedaround the nucleus. This was the case for two HIV-1 clones harbouringsingle-point mutations in the integrase catalytic domain (class I INmutations: IN(D64E) and IN(D116N))17,18 or for HIV-1NL4-3/E-R- in thepresence of the integrase inhibitor raltegravir; under these conditions,only 10–20% of viruses were found in zone 1 (Fig. 2g). In these cases, thedetected viral genomes did not correspond to integrated DNA (Fig. 2h)but were highly enriched in circular forms of viral DNA containing twolong terminal repeats (2-LTR circles) (Fig. 2i). We also downregulatedthe chromatin tethering factor LEDGF/p75 (ref. 19) and the inner nuclearbasket protein Nup153 (ref. 20), which are involved in viral DNA inte-gration (Fig. 2j). FISH was performed 48 h after infection when there
*These authors contributed equally to this work.1These authors both contributed as last authors.
1MolecularMedicine Laboratory, InternationalCentre for Genetic Engineeringand Biotechnology (ICGEB), 34149 Trieste, Italy. 2Protein Structureand Bioinformatics Group, International Centre for GeneticEngineering and Biotechnology (ICGEB), 34149 Trieste, Italy. 3Struttura Complessa Malattie Infettive, Azienda Ospedaliero-Universitaria, 34134 Trieste, Italy. 4Department of Medical, Surgical and HealthSciences, University of Trieste, 34129 Trieste, Italy. 5Department of Life Sciences, University of Modena and Reggio Emilia, 41121 Modena, Italy. 6Genethon, 91002 Evry, France. {Present addresses:Department of Infectious Diseases, Integrative Virology, University Hospital Heidelbergand German Center for Infection Research, 69120 Heidelberg, Germany (B.L.; M.L.); Laboratorio Nazionale ConsorzioInteruniversitario per le Biotecnologie (LNCIB), 34149 Trieste, Italy (K.L.); Department of Microbiology, Icahn School of Medicine at Mount Sinai, New York, New York 10029, USA (L.M.); Pazmany University,Budapest 1083, Hungary (S.P.).
0 0 M O N T H 2 0 1 5 | V O L 0 0 0 | N A T U R E | 1
Macmillan Publishers Limited. All rights reserved©2015

was a marked reduction in HIV-1 integration (Fig. 2k), and the majorityof the signals labelled unintegrated viral DNA16: 72% and 77% of theFISH signals were in zones 2 and 3 for the LEDGF/p75 and Nup153knockdowns, respectively (Fig. 2l). The effect of the Nup153 knock-down was rescued by transfecting an expression plasmid coding for anRNA interference (RNAi)-resistant Nup153 (Extended Data Fig. 4).
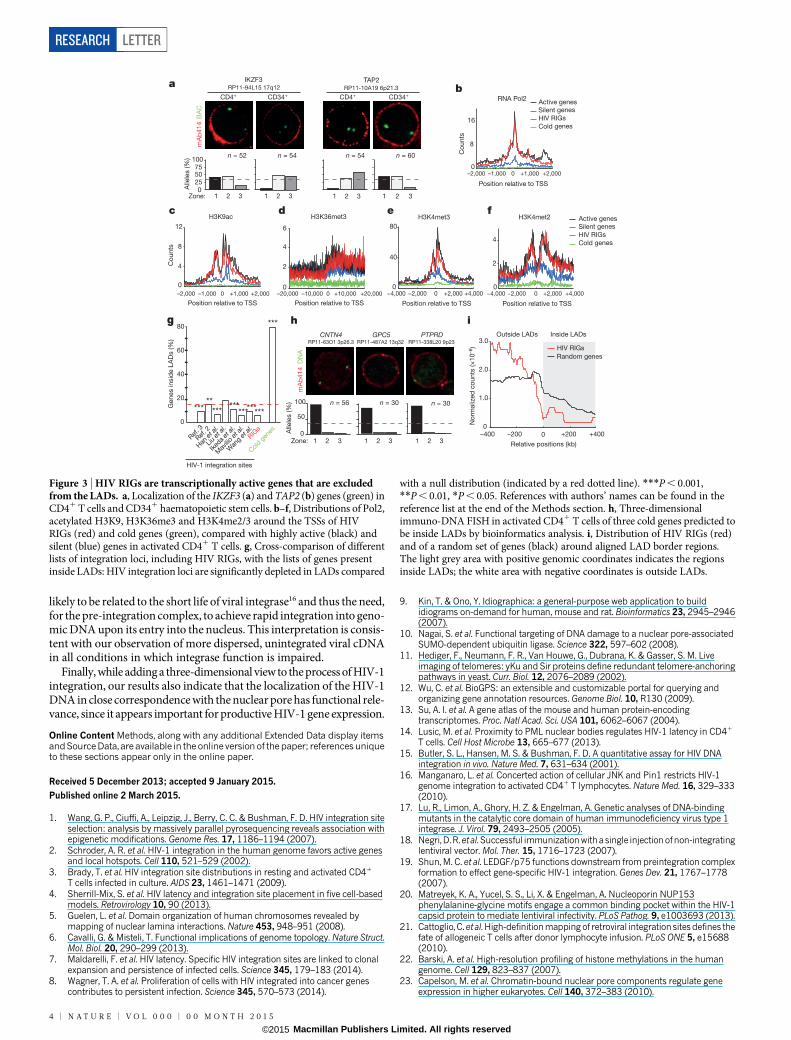
Most of the HIV-1 targets are common in different cell types; how-ever, subtle differences exist. For example, HIV-1 almost never targetsthe IKZF3 locus in CD341 haematopoietic stem cells21 (P , 1 3 10212),whereas the TAP2 gene from the major histocompatibility complex classII locus is never targeted in CD41 T cells (P , 1 3 10213). Strikingly,we observed that IKZF3 localized in zones 1 and 2 in peripheral bloodCD41 T cells (.80% of alleles), while it was almost absent from zone 1in cord blood CD341 cells (,6% alleles; P , 0.001). Conversely, theTAP2 locus was absent from zone 1 in CD41 T cells (,8% of alleles),while it was distributed between zones 1 and 2 in CD341 cells (.90%of alleles; P , 0.001; Fig. 3a).
To understand the chromatin features of RIGs, we compared the avail-able data from chromatin immunoprecipitation sequencing (ChIP-seq)obtained in CD41 T cells for RIGs22, cold genes (defined as transcrip-tionally inactive genes never targeted by HIV-1; F.M. and A.R., unpub-lished observations) and a list of genes corresponding to the 1,000 mostexpressed (active) and 1,000 least expressed (silent) genes from the GNFSymAtlas13. Association of RNA Pol2 with RIGs had a pattern super-imposable to that of active genes, peaking at the transcription start sites(TSSs) (Fig. 3b). In a similar manner, distribution of markers of active
transcription (H3K9ac, H3K36me3, H3K4me3, H4K16ac and H4K20me)was identical for RIGs and active genes (Fig. 3c–e and Extended DataFig. 5). In contrast, markers of facultative (H3K9me2) and constitutive(H3K9me3 and H3K27me3) chromatin were found enriched both oncold genes (where HIV-1 never integrates) and on silent genes, but noton RIGs (Extended Data Fig. 5). Of interest, active genes and RIGs hada superimposable distribution of H3K4me2, which is enriched at thelamin-associated domain (LAD) borders5 (Fig. 3f).
Heterochromatic LADs contain approximately 4,000 transcriptionallyinactive genes5. We found that more than 90% of HIV RIGs lay outsideLADs, while almost 80% of cold genes were inside LADs (P , 0.001compared with a random gene distribution; Fig. 3g). Immuno-FISHimages for three of these cold genes confirmed their localization closeto the nuclear envelope in primary CD41 T cells (Fig. 3h). Finally, whenall the 1,344 known LADs were aligned by their left or right borders,87.2% of RIGs were found outside the LADs, in contrast to a randomdistribution of genes (68.2%; P , 0.001, also taking into account the lowergene density within LADs; Fig. 3i).
Transcriptionally active genes at the nuclear periphery are often asso-ciated with the nuclear pore complex (NPC)23–27. We therefore assessedinteraction of the HIV-1 provirus with the NPC by ChIP assays in primaryCD41 T cells (primer scheme and controls in Extended Data Fig. 6a, b).At 4 days after infection, when RNA Pol2 and the USF1 and p65/RelAtranscription factors were associated with the viral DNA as expected14,both the mAb414 antibody, which recognizes phenylalanine–glycine(FG)-repeats in nucleoporins, and specific antibodies against Nup153,
b
e f
Percentage of nuclear radiusNuclear
envelope
Nuclear
centre
Zone 1 Zone 2 Zone 3
3.0
2.0
1.0
00 19 28 43 100
RIGs and HZs
(n = 1,420)
Control genes
(n = 522)
Lo
ci fr
eq
uency (×1
0–2)
NFATC3RP11-67A1 16q22.1
n = 68
1 2 31 2 31 2 3
1 2 3
1 2 3 1 2 3 1 2 3 1 2 3 1 2 3 1 2 3 1 2 3
1 2 3 1 2 3 1 2 3 1 2 3 1 2 3 1 2 3 1 2 3
Alle
les (%
)
Alle
les (%
)A
llele
s (%
)
Alle
les (%
)
HEATR7ARP11-714N16 8q24.3
n = 78
1 2 3 1 2 3 1 2 3
n = 94
RPTORRP11-28G8 17q25.3
n = 72
SPTAN RP11-216B9 9q34.11
SMG1 RP11-1035H13 16p12.3
n = 86100
0
50
75
25
100
0
50
75
25
Zone: Zone:
n = 132
GRB2RP11-16C1 17q25.1
n = 102
KDM2A RP11-157K17 11q13.2
n = 136
DNMT1 CTD-2240E14 - 19p13.2
n = 100
HZ 2CTD-2517M22 8q24.3
n = 62
HZ 3CTD-2587H24 19q13.42
n = 154
HZ 4RP11-1057N3 8q24.21
n = 118
HZ 1RP11-349I23 4q.25
100
0
50
75
25
n = 90
Zone:
NPLOC4RP11-765O14 17qter
FKBP5RP3-340B19 6p21.31
n = 128
100
0
50
75
25
n = 126n = 52
Zone:
n = 100 n = 52
GAPDHRP11-711C24
12p13.31
ACTN1RP11-226F19
14q24.1
CD28RP5-940J5
2q33.1
CD4RP4-761J14
12p13.31
n = 106 n = 42n = 44
PACS2RP11-521B24
14q32.33
KDM2BRP11-44F24
12q24.31
HEATR6RP11-178C3
17q23
rCD4+
T-cell
nucleus
Zone: 31000 19 43
21
a
c d
mA
b414 B
AC
mA
b414 B
AC
mA
b414 B
AC
mA
b414 B
AC
Figure 1 | Localization of HIV RIGs at the nuclear periphery. a, Subdivisionof nucleus into three concentric zones of equal area. b–e, Three-dimensionalimmuno-DNA FISH of ten HIV RIGs (b, c), four hotter zones (d) andseven control genes (e) in activated CD41 T cells (green: bacterial artificialchromosome (BAC) probe labelled with DIG (dUTP-digoxygenin) and FITC(fluorescein isothiocyanate); red: NPC staining by mAb414). Below eachrepresentative image, the distribution of the analysed alleles into the three
nuclear zones is shown, normalized over nuclear radius. Evenly distributedrandom genes would be enriched equally in the three zones (red dashed line).The number of alleles analysed is shown at the bottom of each panel. HZ, hotterzone. f, Distribution of the relative distances of all measured alleles from thenuclear envelope (HIV RIGs and hotter zones: n 5 1,420; control genes:n 5 522). The three zones are shown by grey shading. The dashed line indicatesapproximately 1mm from the nuclear edge of the T-cell nucleus.
RESEARCH LETTER
2 | N A T U R E | V O L 0 0 0 | 0 0 M O N T H 2 0 1 5
Macmillan Publishers Limited. All rights reserved©2015
Nup98, Nup62 and Tpr all immunoprecipitated the HIV-1 DNA; bind-ing was also observed for the NPLOC4 RIG gene, but not for the LADgene PTPRD (Extended Data Fig. 6c). When ChIP was performed on theIN-defective D64E virus, no viral DNA was detected using the mAb414and anti-Nup153 antibodies (Extended Data Fig. 6d).
Next, we aimed to verify whether HIV-1 localization changed whenthe virus reverted from a transcriptionally inactive to an active state.In the latent T-cell J-Lat clone 15.4 (ref. 28), the HIV-1 DNA retainedits gross peripheral localization both in inactive and in TPA (12-O-tetradecanoylphorbol-13-acetate) phorbol ester-reactivated conditions(Extended Data Fig. 7a, b). Similar results were obtained in a primarymodel of HIV-1 latency14 (Extended Data Fig. 7c–e). However, whenlocalization was analysed at molecular resolution by ChIP using themAb414, anti-Tpr and anti-Nup153 antibodies, binding of the proviralregion located downstream of the TSS to the nucleoporins was observedupon transcriptional activation but not in latent conditions (ExtendedData Fig. 7f). We also observed that nucleoporins directly participatedin HIV-1 transcriptional regulation. When Tpr and Nup153 were silenced
by RNAi in latent J-Lat cells, proviral transcription was significantlyreduced (Extended Data Fig. 7g, h). Similarly, downregulation of Tpralso blunted LTR-driven gene expression in HIV-1-infected HeLa cells(Extended Data Fig. 8a–e).
Our findings show that the cellular genes that are highly targeted byHIV-1 are distributed in a topologically non-random manner, beingpositioned within 1mm from the nuclear edge; these genes are enrichedin open chromatin marks, excluded from the LADs and associated withthe NPC. Thus, the HIV-1 pre-integration complex preferentially targetsthose areas of open chromatin that are proximal to the nuclear pore,while excluding the internal regions in the nucleus as well as the peri-pheral regions associated with the nuclear lamina (model in ExtendedData Fig. 9). The localization of HIV-1 proviral DNA in close associationwith the nuclear pore is consistent with several observations showingthat different NPC components play a role in HIV-1 infection20,29,30.
Why does the viral DNA integrate into the NPC compartment? Apossibility that we favour is that the virus simply integrates into the firstopen chromatin regions it meets along its route into the nucleus. This is
mA
b414
- H
IV-1
cCD4+ T cells/HIV-1NL4.3
Ex vivo infection
Pro
viruses (%
)P
roviruses (%
)P
roviruses (%
)P
roviruses (%
)
100
0
50
75
25
Zone:
mA
b414 -
HIV
-1
HIV-1 patient 1eHIV-1 patient 1
Natural infection100
0
50
75
25
Zone:
mA
b414 -
HIV
-1
HIV-1 patient 2
HIV-1 patient 2
Natural infection100
0
50
75
25
Zone:
f
mA
b414 -
HIV
-1
dCD4+ T cells/HIV-1BRU
Ex vivo infection100
0
50
75
25
Zone:
CD4+ T-cells + HIV-1BRU
CD4+ T-cells + HIV-1NL4.3
g
h75
100
Raltegravir:
HIV-1NL4.3
Inte
gra
ted
HIV
DN
A
(% o
f co
ntr
ol)
0
25
50
– – –+Raltegravir:0
5
10
15
20
ND
D116ND64E HIV-1NL4.3 D116ND64E
2-L
TR
circle
s
(fo
ld o
ver
co
ntr
ol)
jsiRNA: NT2 LEDGF
WB: tubulin
WB: LEDGF
NT2 Nup153
WB: Nup153
WB: tubulin
HIV-1NL4.3
150
100
– NTsiRNA:
Inte
gra
tio
n (%
)
0
50
LEDGF Nup153
HIV
-1 m
Ab
414
Control siNT2/NT5
n = 163
1 2 3
siLEDGF
n = 164
1 2 3
n = 116100
0
50
75
25
1 2 3
1 2 3
1 2 3
1 2 3
1 2 3
1 2 3 1 2 3 1 2 3
Zone:
siNup153
n = 129
1 2 3
HIV
-1 m
414b
A
Lam
in
IN(D116N) WT + raltegravirIN(D64E)
n = 160
n = 42
n = 28
n = 27
Viruses (%
)
100
0
50
75
25
Zone:
n = 66 n = 159
i
k
l
ba
Inte
gra
ted
HIV
DN
A
(% o
f in
fecte
d c
ells
)0
75
100
50
25
HIV-1NL4.3 – +
HIV
-1 m
RN
A
(fo
ld o
ver
18S
× 1
0–2)
0
30
10
20
HIV-1NL4.3 – +
– + – –
Figure 2 | Integrated, transcriptionally active HIV-1 is found at the nuclearperiphery. a, b, Quantification of integrated HIV-1NL4-3/E-R- DNA (a) andHIV RNA (b) by real-time Alu PCR in infected CD41 T cells. c–f, Three-dimensional immuno-DNA FISH of HIV-1 DNA (green) in primary CD41
T cells infected ex vivo with HIV-1NL4-3/E-R- (c) and HIV-1BRU (d), or directlyobtained from two patients infected with HIV-1 (e, f). g, Three-dimensionalimmuno-DNA FISH of HIV-1 DNA in activated CD41 T cells infected withthe mutant viruses IN(D64E) or IN(D116N) or with HIV-1NL4-3/E-R- uponraltegravir treatment. h, i, Real-time Alu PCR (h) and 2-LTR quantification (i)in the cells treated as in g. ND, not determined. j, Western blot (WB) showing
protein levels for LEDGF/p75 and Nup153 at the moment of HIV-1 infection,36 h after short interfering RNA (siRNA) transfection. NT2, non-targetingsiRNA. k, Real-time Alu PCR in Jurkat cells infected with HIV-1NL4.3 andpreviously transfected with a non-targeting siRNA (NT) or an siRNA targetingLEDGF/p75. Samples were normalized over control-infected cells. l, Three-dimensional immuno-DNA FISH for HIV-1 DNA visualization upon Jurkatcell treatment with the indicated siRNAs. NT2 and NT5 are two non-targetingsiRNAs. All graphs, except those relative to patients’ cells, show mean ands.e.m. of at least three independent experiments.
LETTER RESEARCH
0 0 M O N T H 2 0 1 5 | V O L 0 0 0 | N A T U R E | 3
Macmillan Publishers Limited. All rights reserved©2015
likely to be related to the short life of viral integrase16 and thus the need,for the pre-integration complex, to achieve rapid integration into geno-mic DNA upon its entry into the nucleus. This interpretation is consis-tent with our observation of more dispersed, unintegrated viral cDNAin all conditions in which integrase function is impaired.
Finally, while adding a three-dimensional view to the process of HIV-1integration, our results also indicate that the localization of the HIV-1DNA in close correspondence with the nuclear pore has functional rele-vance, since it appears important for productive HIV-1 gene expression.
Online Content Methods, along with any additional Extended Data display itemsandSourceData, are available in the online version of the paper; references uniqueto these sections appear only in the online paper.
Received 5 December 2013; accepted 9 January 2015.
Published online 2 March 2015.
1. Wang, G. P., Ciuffi, A., Leipzig, J., Berry, C. C. & Bushman, F. D. HIV integration siteselection: analysis by massively parallel pyrosequencing reveals association withepigenetic modifications. Genome Res. 17, 1186–1194 (2007).
2. Schroder, A. R. et al. HIV-1 integration in the human genome favors active genesand local hotspots. Cell 110, 521–529 (2002).
3. Brady, T. et al. HIV integration site distributions in resting and activated CD41
T cells infected in culture. AIDS 23, 1461–1471 (2009).4. Sherrill-Mix, S. et al. HIV latency and integration site placement in five cell-based
models. Retrovirology 10, 90 (2013).5. Guelen, L. et al. Domain organization of human chromosomes revealed by
mapping of nuclear lamina interactions. Nature 453, 948–951 (2008).6. Cavalli, G. & Misteli, T. Functional implications of genome topology. Nature Struct.
Mol. Biol. 20, 290–299 (2013).7. Maldarelli, F. et al. HIV latency. Specific HIV integration sites are linked to clonal
expansion and persistence of infected cells. Science 345, 179–183 (2014).8. Wagner, T. A. et al. Proliferation of cells with HIV integrated into cancer genes
contributes to persistent infection. Science 345, 570–573 (2014).
9. Kin, T. & Ono, Y. Idiographica: a general-purpose web application to buildidiograms on-demand for human, mouse and rat. Bioinformatics 23, 2945–2946(2007).
10. Nagai, S. et al. Functional targeting of DNA damage to a nuclear pore-associatedSUMO-dependent ubiquitin ligase. Science 322, 597–602 (2008).
11. Hediger, F., Neumann, F. R., Van Houwe, G., Dubrana, K. & Gasser, S. M. Liveimaging of telomeres: yKu and Sir proteins define redundant telomere-anchoringpathways in yeast. Curr. Biol. 12, 2076–2089 (2002).
12. Wu, C. et al. BioGPS: an extensible and customizable portal for querying andorganizing gene annotation resources. Genome Biol. 10, R130 (2009).
13. Su, A. I. et al. A gene atlas of the mouse and human protein-encodingtranscriptomes. Proc. Natl Acad. Sci. USA 101, 6062–6067 (2004).
14. Lusic, M. et al. Proximity to PML nuclear bodies regulates HIV-1 latency in CD41
T cells. Cell Host Microbe 13, 665–677 (2013).15. Butler, S. L., Hansen, M. S. & Bushman, F. D. A quantitative assay for HIV DNA
integration in vivo. Nature Med. 7, 631–634 (2001).16. Manganaro, L. et al. Concerted action of cellular JNK and Pin1 restricts HIV-1
genome integration to activated CD41 T lymphocytes. Nature Med. 16, 329–333(2010).
17. Lu, R., Limon, A., Ghory, H. Z. & Engelman, A. Genetic analyses of DNA-bindingmutants in the catalytic core domain of human immunodeficiency virus type 1integrase. J. Virol. 79, 2493–2505 (2005).
18. Negri, D.R.et al.Successful immunization witha single injection ofnon-integratinglentiviral vector. Mol. Ther. 15, 1716–1723 (2007).
19. Shun, M. C. et al. LEDGF/p75 functions downstream from preintegration complexformation to effect gene-specific HIV-1 integration. Genes Dev. 21, 1767–1778(2007).
20. Matreyek, K. A., Yucel, S. S., Li, X. & Engelman, A. Nucleoporin NUP153phenylalanine-glycine motifs engage a common binding pocket within the HIV-1capsid protein to mediate lentiviral infectivity. PLoS Pathog. 9, e1003693 (2013).
21. Cattoglio, C.et al.High-definition mapping of retroviral integration sites defines thefate of allogeneic T cells after donor lymphocyte infusion. PLoS ONE 5, e15688(2010).
22. Barski, A. et al. High-resolution profiling of histone methylations in the humangenome. Cell 129, 823–837 (2007).
23. Capelson, M. et al. Chromatin-bound nuclear pore components regulate geneexpression in higher eukaryotes. Cell 140, 372–383 (2010).
ih
****** *****
***
******
Ref
. 3
Ref. 2
Wan
g et
al.
Han
et al
.
Liu
et al
.
Iked
a et
al.
RIG
s
Col
d gen
es
Mav
ilio et
al.
Gen
es in
sid
e L
AD
s (%
)
HIV-1 integration sites
g
No
rmaliz
ed
co
un
ts (×
10
–6)
Relative positions (kb)
–400 –200 0 +200 +4000
1.0
2.0
3.0HIV RIGs
Random genes
Inside LADsOutside LADs
0
20
40
60
80
n = 30 n = 30n = 56100
0
50
Zone:
RP11-63O1 3p26.3
CNTN4RP11-487A2 13q32
GPC5RP11-338L20 9p23
PTPRD
mA
b4
14
DN
A
b
Co
un
ts
RNA Pol2
00
8
16 HIV RIGs
Cold genes
Silent genesActive genes
HIV RIGs
Cold genes
Silent genesActive genes
Co
un
ts
Position relative to TSS
cH3K9ac
–2,000 –1,000 0 +1,000 +2,000
0
4
8
12
fH3K4met2
Position relative to TSS
−4,000 −2,000 0 +2,000 +4,0000
2
4
Position relative to TSS
H3K36met3
–20,000 –10,000 0 +10,000 +20,0000
2
4
6
dH3K4met3
Position relative to TSS
−4,000 −2,000 0 +2,000 +4,0000
40
80
e
a
n = 54n = 52
RP11-94L15 17q12
IKZF3
Alle
les (%
)
Alle
les (%
)
100
0
5075
25
Zone:m
Ab
41
4 B
AC
1 2 31 2 3 1 2 3 1 2 3
1 2 3 1 2 3 1 2 3
CD4+ CD34+
TAP2RP11-10A19 6p21.3
n = 60n = 54
CD4+ CD34+
***
Position relative to TSS
+1,000 +2,000–1,000–2,000
Figure 3 | HIV RIGs are transcriptionally active genes that are excludedfrom the LADs. a, Localization of the IKZF3 (a) and TAP2 (b) genes (green) inCD41 T cells and CD341 haematopoietic stem cells. b–f, Distributions of Pol2,acetylated H3K9, H3K36me3 and H3K4me2/3 around the TSSs of HIVRIGs (red) and cold genes (green), compared with highly active (black) andsilent (blue) genes in activated CD41 T cells. g, Cross-comparison of differentlists of integration loci, including HIV RIGs, with the lists of genes presentinside LADs: HIV integration loci are significantly depleted in LADs compared
with a null distribution (indicated by a red dotted line). ***P , 0.001,**P , 0.01, *P , 0.05. References with authors’ names can be found in thereference list at the end of the Methods section. h, Three-dimensionalimmuno-DNA FISH in activated CD41 T cells of three cold genes predicted tobe inside LADs by bioinformatics analysis. i, Distribution of HIV RIGs (red)and of a random set of genes (black) around aligned LAD border regions.The light grey area with positive genomic coordinates indicates the regionsinside LADs; the white area with negative coordinates is outside LADs.
RESEARCH LETTER
4 | N A T U R E | V O L 0 0 0 | 0 0 M O N T H 2 0 1 5
Macmillan Publishers Limited. All rights reserved©2015

24. Kalverda, B., Pickersgill, H., Shloma, V. V. & Fornerod, M. Nucleoporins directlystimulate expression of developmental and cell-cycle genes inside thenucleoplasm. Cell 140, 360–371 (2010).
25. Vaquerizas, J. M. et al. Nuclear pore proteins nup153 and megator definetranscriptionally active regions in the Drosophila genome. PLoS Genet. 6,e1000846 (2010).
26. Liang, Y., Franks, T. M., Marchetto, M. C., Gage, F. H. & Hetzer, M. W. Dynamicassociation of NUP98 with the human genome. PLoS Genet. 9, e1003308 (2013).
27. Light, W. H. et al. A conserved role for human Nup98 in altering chromatinstructure and promoting epigenetic transcriptional memory. PLoS Biol. 11,e1001524 (2013).
28. Jordan, A., Bisgrove, D. & Verdin, E. HIV reproducibly establishes a latent infectionafter acute infection of T cells in vitro. EMBO J. 22, 1868–1877 (2003).
29. Brass, A. L. et al. Identification of host proteins required for HIV infection through afunctional genomic screen. Science 319, 921–926 (2008).
30. Konig, R. et al. Global analysis of host-pathogen interactions that regulateearly-stage HIV-1 replication. Cell 135, 49–60 (2008).
Supplementary Information is available in the online version of the paper.
Acknowledgements This work was supported by grants from the Italian NationalResearch Programme on AIDS of the Istituto Superiore di Sanita, Italy, to M.G. and M.L.and from the Young Investigator Grant RF2007-16 of the Italian Ministry of Health toM.L. The authors are grateful to S. Kerbavcic for editorial assistance.
Author Contributions B.M., B.L., K.L. and M.L. performed the immuno-DNA FISH andChIP experiments; A.K.-F., B.M., S.P., M.L. and M.G. analysed the data; A.K.-F., B.M. andS.P. performed the bioinformatics analysis; H.A. and M.L. performed the experimentsusing infectious virus; L.M. generated and analysed integrase-defective HIV-1molecular clones; R.L. contributed to studies in primary cells from patients with HIV;A.R. and F.M. generated lentiviral vectors and analysed integration into CD41 T cellsand CD341 bone marrow cells; M.L. and M.G. conceived and supervised theexperiments and wrote the paper with help from the other authors.
Author Information Reprints and permissions information is available atwww.nature.com/reprints. The authors declare no competing financial interests.Readers are welcome to comment on the online version of the paper. Correspondenceand requests for materials should be addressed to M.G. ([email protected]) orM.L. ([email protected]).
LETTER RESEARCH
0 0 M O N T H 2 0 1 5 | V O L 0 0 0 | N A T U R E | 5
Macmillan Publishers Limited. All rights reserved©2015

METHODSVirus production. For the production of viral stocks, we used a plasmid obtainedfrom the Env- molecular clone pNL4-3/E2R2, a gift from N. Landau. This viralclone harbours a frameshift mutation introduced near the 59 end of the env gene31
and performs a single-round infection once pseudotyped with vesicular stomatitisvirus-G (VSV-G); this renders the virus incapable of spreading (and causing mas-sive cell death).
We produced viral clone HIV-1BRU as previously described16. The integrase (IN)defective packaging plasmid pcHelp/IN-, a gift from A. Cara, contains a D116Nmutation in the IN genome, preventing the function of the IN protein18. The D64Emutant plasmid, which is similarly integration-defective, was obtained from theNational Institutes of Health (NIH) AIDS Research and Reference Reagent Program17.
Lentiviral vector pLV-THM32 was obtained from Addgene, whereas pCCL18–green fluorescent protein (GFP) was modified from ref. 33 to become promoter-less. The gammaretroviral MoMLV vector was a gift from G. Towers.
Infectious viral stocks were generated by transfecting viral DNA in HEK 293Tcells and collecting supernatants after 48 h. Viral production was quantified bymeasuring viral p24 in the supernatants using the Innotest HIV antigen mAB kit(Innogenetics).Primary cell isolation, culture and infection. Primary human CD41 T cells wereisolated by Ficoll gradient separation, followed by purification with CD4 MicroBeads(Miltenyi Biotec). Cells were activated with a cocktail of beads containing 4.5 3 105
beads coated with aCD3 and aCD28 antibodies (Dynabeads Human T-ActivatorCD3/CD28 Dynal/Invitrogen), and plated in complete medium with interleukin-2(IL-2; 30 U ml21, Sigma-Aldrich) for 4 days at 37 uC.
Activated CD41 T cells (1 3 106) were infected with 0.5–0.75mg ml21 of viralp24 for 4–5 h at 37 uC. After infection, cells were kept in culture at 1 3 106 cells permillilitre in complete RPMI 1640 medium supplemented with IL-2 and CD3/CD28beads.
For raltegravir treatment, 10mM raltegravir (obtained from the NIH AIDS Researchand Reference Reagent Program) was added together with the virus during theinfection, and it was later supplemented in the medium.
For generating the primary model of latency, naive CD41 T cells were isolated,cultured and infected as described in ref. 14.
Primary human CD341 cells were isolated, cultured and infected as described inref. 34. Primary human macrophages were isolated and cultured as described inref. 35.
Patients infected with HIV and having a CD4 count less than 3 3 105 ml21 wereenrolled before starting highly active antiretroviral therapy, following informed con-sent. Peripheral blood mononuclear cells obtained from healthy or infected blooddonors according to a study protocol approved by the Ethical Committee of theAzienda Ospedaliero-Universitaria ‘Ospedali Riuniti di Trieste’, Italy, were iso-lated as described previously16.Cell culture and transfection. The Jurkat lymphoblastoid cell line, Jurkat J-Lat15.4 clone and U937 monocytic cell line were kept in culture in complete RPMI1640 medium with the addition of 10% fetal bovine serum (FBS). Cells were testedfor mycoplasmal cell culture contaminants by using a MycoAlert kit from Lonza.
Transfection of Jurkat with p-eGFP–Nup153 expression plasmid36 obtained fromEuroscarf was done using Fugene HD (Promega), according the manufacturer’sinstructions. For the RNAi experiments, 3 3 106 cells were transfected with siRNAsmart pools targeting LEDGF/p75 (PSIP1) (Dharmacon M-015209) or Nup153(Dharmacon M-005283) proteins or with a non-targeting (NT) siRNA as a nega-tive control (Dharmacon, Thermo Scientific). Transfection was performed withthe Amaxa Nucleofection Device II (Amaxa), using an Amaxa nucleofection Kit Vaccording to the manufacturer’s instructions.
For western blot analysis, cells were harvested and homogenized in lysis buffer(20 mM Tris-HCl, pH 7.4, 1 mM EDTA, 150 mM NaCl, 0.5% Nonidet P-40, 0.1%SDS, 0.5% sodium deoxycholate) supplemented with protease inhibitors (Roche)for 10 min at 4 uC and sonicated (Bioruptor) for 5 min. Equal amounts of total cel-lular proteins (30mg), as measured with Bradford reagent (Biorad), were resolvedby 8% SDS–polyacrylamide gel electrophoresis (SDS–PAGE), transferred onto poly-vinylidene difluoride membranes (GE Healthcare) and then probed with primaryantibody (anti-Nup153 (Santa Cruz, sc-101544), anti-LEDGF/p75 (BD Biosciences,611714), anti-GFP (LifeTechnologies, A6455)), followed by secondary antibodyconjugated with horseradish peroxidase. The immunocomplexes were visualizedwith enhanced chemiluminescence kits (GE Healthcare).
Once protein silencing was assessed, cells were infected with 0.5–0.75mg ml21
of p24 of viral clone NL4-3/E-R- as described. At 24 and 48 h after infection, sampleswere collected for further analysis.Integration assay (Alu PCR). Infected cells were tested for integration of HIV-1by isolating genomic DNA from 1 3 106 cells with a DNeasy Tissue Kit (Qiagen).Genomic DNA (100 ng) was subjected to quantitative Alu-LTR PCR for integratedprovirus or for 2-LTR circles as previously described16.
Quantitative reverse transcription PCR. For the quantification of HIV transcriptlevels, RNA was purified from the cells with a Nucleospin RNA II purification kit(Macherey-Nagel). The messenger RNA (mRNA) levels were quantified by TaqManquantitative reverse transcription PCR (qRT–PCR) using HIV-1 or interleukin-2(IL-2) primers and probe14, and housekeeping gene 18S and GAPDH as controls.Luciferase activity assay. Cells were harvested 48 h after infection, and luciferaseactivity was measured using the Luciferase Assay Kit (Promega). Viral expressionwas expressed after normalization over micrograms of total cell extracts.Cell preparation for three-dimensional immuno-DNA FISH. Three-dimensionalFISH combined with immunostaining was performed according to protocols inref. 37. Culture or primary cells were resuspended at 3 3 106 cells per millilitre in5% FBS in PBS and cell suspension was allowed to attach to the glass cover slips,previously coated with poly-L-lysine. Cells were fixed in 4% paraformaldehyde in0.33 hypotonic PBS for 10 min, permeabilized with PBS/0.5% Triton X-100 for10 min and left in PBS/20% glycerol for 1 h. Cells were then blocked in PBS/5% fetalhorse serum (FHS) for 45 min, and primary antibody (anti-NPC mAb414, Covance;anti-LaminB, Abcam ab16048; anti-GFP, LifeTechnologies A6455) was added foran overnight incubation at 14 uC in a humid chamber. The subsequent day, cellswere washed five times in PBS-T (PBS with 0.05% Tween) and the secondary anti-body (Jackson Laboratories) was used for 45 min at 22 uC (1/1,000 dilution). Afterfive washings in PBS-T, cells were additionally crosslinked with EGS (ethyleneglycol-bis(succinic acid N-hydroxysuccinimide ester) (Sigma E-3257) for 10 min,washed and permeabilized again in PBS-T/0.5% Triton X-100. After washing inPBS/0.05% Triton X-100, cells were rinsed and incubated in 0.1 N HCl (freshly pre-pared) for 10 min. Cells were left in PBS/20% glycerol for at least 45 min, and thensubjected to five cycles of freeze and thaw in liquid nitrogen and PBS/20% glycerol.Additional washings in PBS/0.05% Triton X-100 preceded an overnight incuba-tion in 50% formamide/23 SSC (hybridization buffer). The subsequent day, cellswere treated with RNase A (100mg ml21 in 23 SSC) in a humid chamber at 37 uCfor 1 h, were rinsed again in 50% formamide/23 SSC for at least 1 h (or overnight)and were then subjected to hybridization with the appropriate probe.Probes for hybridization in three-dimensional immuno-DNA FISH. For visu-alization of the loci of interest, specific BAC clones (selected from CHORI (Children’sHospital Oakland Research Institute in Oakland, California) sites and purchasedfrom Invitrogen) were isolated according to the manufacturer’s instructions. Thelisting of the BACs with their identities and the genes they contain is provided inthe Supplementary Information. BAC DNA (2mg) was labelled with digoxigeninby Dig-Nick Translation (Roche) at 15 uC.
For the visualization of HIV-1, lentiviral or gamma-retroviral vector DNA inte-grated inside Jurkat or primary CD41 T cells, 2mg of the respective plasmids waslabelled by nick translation in the presence of 16-dUTP Biotin nucleotides at 15 uCfor 3 h.
In both cases, probes were checked on agarose gel and then cleared by using anIllustra Microspin G-25 column (GE Healthcare) and precipitated in the presenceof Cot-1 DNA (Roche) and DNA from herring sperm (Sigma). Finally, after ethanolprecipitation, the probes were resuspended in 10 ml formamide, incubated at 37 uCfor 15–20 min and 10ml of 20% dextran in 43 SSC was added to a final volume of20ml.Hybridization set up and development. The probe (1–10ml) was loaded onto glasscover slips with the cells, followed by sealing with rubber cement, and heat-denaturedon a heat block at 75 uC for 4 min. Hybridization was performed for 48 h at 37 uCin a humid chamber. Three washings in 23 SSC (10 min each) were followed withthree washings in 0.53 SSC at 56 uC.
FISH development for Dig-labelled BACs was performed by using FITC-labelledanti-digoxigenin antibody (Roche), whereas biotin-labelled HIV-1 probes weredetected by a TSA Plus system from Perkin Elmer, allowing signal amplification,by using an anti-biotin antibody (SA-HRP) and a secondary antibody with a fluo-rescent dye (usually FITC for HIV).Microscopy. Three-dimensional-stacks of slides with fixed cells were captured ona Zeiss LSM 510 META confocal microscope (Carl Zeiss Microimaging) with a 363numerical aperture 1.4 Plan-Apochromat oil objective. The pinhole of the micro-scope was adjusted to obtain an optical slice of less than 1.0mm for any wavelengthacquired.
Distances observed between the FISH signals and the nuclear envelope weremeasured using LSM 510 Image Examiner Software (Zeiss) and Volocity (PerkinElmer); measurements were normalized over nuclear radius (defined as half of themiddle of the mAb414-TRITC ring), and then binned into three classes of equalsurface area11.
Measurements were acquired for the alleles of the following genes in activatedCD41 T cells: NPLOC4 (n 5 90), FKBP5 (n 5 128), NFATC3 (n 5 68), HEATR7A(n 5 78), RPTOR (n 5 94), SPTAN (n 5 72), SMG1 (n 5 80), GRB2 (n 5 132), KDM2A(n 5 102), DNMT1 (n 5 136), hotter zone 1 (n 5 118), hotter zone 2 (n 5 100),hotter zone 3 (n 5 62), hotter zone 4 (n 5 154), GAPDH (n 5 52), ACTN1 (n 5 126),
RESEARCH LETTER
Macmillan Publishers Limited. All rights reserved©2015

CD4 (n 5 100), CD28 (n 5 52), HEATR6 (n 5 44), KDM2B (n 5 106), PACS2(n 5 42), IKZF3 (n 5 52), TAP2 (n 5 54), CNTN4 (n 5 56), GPC5 (n 5 30), PTPRD(n 5 30). Measurements were acquired for the alleles of the following genes inCD341 cells: IKZF3 (n 5 54) and TAP2 (n 5 60). Measurements were acquired forthe proviruses in primary macrophages (n 5 18) and the U937 cell line (n 5 30).Measurements were acquired for the proviruses in primary cells upon several con-ditions: 4 days after infection of activated CD41 T cells (n 5 160 HIV-1NL4-3/E-R-
and n 5 42 HIV-1BRU measured in three independent experiments); HIV-1 inCD41 T cells from infected patients (n 5 28 and n 5 27); 4 days after infectionwith mutant viruses IN(D64E) (n 5 30) or IN(D116N) (n 5 66), or cells infectedwith HIV-1NL4.3 upon raltegravir treatment (n 5 159); latent CD41 cells (2 weeksafter infection) with or without CD3/CD28 stimulation (n 5 40 and n 5 33, respec-tively). Measurements were acquired for proviruses in Jurkat or J-Lat cell lines4 days after infection of Jurkat with HIV-1NL4-3/E-R-, in different conditions: notransfection (control, n 5 116), transfections with non-targeting siRNA (siNT2/NT5,n 5 163), LEDGF/p75 siRNA (siLEDGF, n 5 164), Nup153 (siNup153, n 5 129),Nup153 siRNA 1 enhanced GFP (eGFP)–Nup153 (n 5 52). The correspondinggraphs show the average results from three independent experiments. ProviralDNA was analysed in the J-Lat clone 15.4 with and without TPA (n 5 74 andn 5 150, respectively); Jurkat 1 Lentiviral promoter (n 5 19); Jurkat 1 transcription-less lentiviral vector (n 5 51); Jurkat 1 gammaretroviral vector (n 5 88).ChIP. CD41 T cells (40 3 106) were washed twice in PBS before crosslinking with1% final formaldehyde for 10 min at room temperature, followed by terminationof the reaction with 125 mM glycine on ice. The cell pellet was washed twice with PBSand was lysed in 0.5% NP-40 buffer (10 mM Tris-Cl pH7.4, 10 mM NaCl, 3 mMMgCl2, 1 mM PMSF and protease inhibitors). The nuclei obtained were washedonce in the same buffer without NP-40. Lysis of the nuclei was performed using thesame buffer containing 4% of NP-40 at 37 uC for 15 min, upon which micrococcalnuclease was added (120 units of the enzyme), and the reaction was stopped with3 mM EGTA. DNA was additionally sheared by sonication to an average size ofDNA fragments below 500 base pairs. Extracts were pre-cleared by two rounds ofincubation with immunoglobulin-c and agarose beads, followed by centrifugationat 1,200g for 5–10 min. The lysate (400ml) was then incubated with 2–4mg of the indi-cated antibody overnight at 4 uC, followed by incubation for 4 h with MagnaChIPProtein A/G Magnetic Beads (Millipore). Beads were then washed thoroughly withRIPA150, with LiCl-containing buffer and with TE, RNase treated for at least 30 minat 37 uC, and treated with proteinase K for at least 2 h at 56 uC. De-crosslinking ofprotein–DNA complexes was performed by an overnight incubation at 65 uC. DNAwas then extracted by phenol–chloroform extraction followed by ethanol precipi-tation and was quantified by real-time PCR. The following antibodies were usedin the ChIP experiments: mAb414 (Covance, MMS-120R), anti-Pol2 (Santa Cruz,sc-9001X), anti-USF1 (Santa Cruz, sc-229X), anti-NF-kB p65 subunit (Santa Cruz,sc-109X), anti-Nup153 [SA1] (Abcam, ab-96462) and anti-Nup153 (QE5) (Abcam,ab-24700), anti-Nup98 (Cell Signaling, 2598), anti-Nup62 (BD Biosciences, 610497),anti-Tpr (Abcam ab-58344), anti-Mcm2 (Abcam), mouse IgG (Santa Cruz, sc-2025).The graphs of ChIP figures show the mean and s.e.m. from at least three indepen-dent experiments.Bioinformatics and statistical analysis. No statistical methods were used to pre-determine sample size.
Five lists of HIV-1 integration sites were collected from published work2,3,38–40
and an unpublished list of integration sites in CD41 T cells provided by A.R. andF.M. (Extended Data Table 1). HIV-1 RIGs (n 5 156) were genes found in morethan one list (Supplementary Information and Extended Data Table 1); their genomicposition was plotted onto the chromosome map using the Idiographica webtool(http://www.ncrna.org/idiographica (ref. 9); Extended Data Fig. 2). Genomic coor-dinates of eight selected hotter zones, into which HIV-1 integration density wasfound higher than expected, were downloaded from the Bushman Lab website(http://www.bushmanlab.org/tutorials/ucsc)1 and reported in the SupplementaryInformation.
The calculation of the probability of finding 156 genes present in more than onelist by chance was performed by computer simulation. A program was written to
randomly draw, from 25,000 genes, 265, 329, 294, 32, 158 and 58 genes, and to countthe genes drawn more than once. The simulation was repeated 1 3 109 times. Thedistribution obtained is shown in Extended Data Fig. 1. Calculations were per-formed using the Matlab 2011R software (http://www.mathworks.com/).
Expression of HIV RIGs and control genes was derived from published tran-scriptomic data in CD41 T cells, using biogps.org (as in refs 12, 13, 22), and was com-pared with a random sets of genes. Using the non-parametric Mann–Whitney-Wilcoxon test, it was concluded that that HIV RIGs and control genes are moretranscribed than a random sets of genes (P , 0.005).
LAD coordinates were obtained from ref. 5, whereas genes inside LADs werederived from BioMart Ensembl and named LAD genes. Then, the P value of thecommon genes in the LAD genes, HIV RIGs, the six integration lists and cold geneswere calculated by pairwise comparison of each combination, followed by hyper-geometric test (Fig. 3g). The following P values were obtained: ref. 3, P 5 1.27 3 1028;ref. 2, P 5 0.008; ref. 38, P 5 0.001; ref. 40, P 5 0.36; ref. 39, P 5 0.0007; F.M. et al.(unpublished observations), P 5 1.32 3 10215; ref. 1 hotter zones, P 5 0.0003; HIVRIGs, P 5 2.09 3 10210. Eighty per cent of genes that are never targeted by HIV-1(cold genes) are significantly enriched inside LADs (P 5 3.25 3 10219).
The profile of aligned LAD border regions (Fig. 3i) was performed as describedin ref. 5. A x2 test was applied to compare the distribution across the LAD border ofHIV RIGs with the one of 3,000 random genes that were generated without replace-ment using the RSA-tool (http://floresta.eead.csic.es/rsat/random-genes_form.cgi)42.
ChIP-seq profile analyses (Fig. 3b–f and Extended Data Fig. 6) were performedas in refs 22, 42. The 1,000 most expressed and 1,000 least expressed genes wereobtained as in ref. 22. and named active and silent genes, respectively. The TSS coor-dinates of these genes were obtained using the University of California, Santa Cruz(UCSC) Table Browser.
Comparison between groups for expression data was performed using a non-parametric Mann–Whitney–Wilcoxon rank sum test; comparison of gene distri-butions was by a x2 test, with the exception of data shown in Fig. 3g, which wereanalysed by a hypergeometric test. For the FISH, ChIP and real-time PCR results,the reported values are means and s.e.m., calculated from at least three independentsamples. For statistical comparison of three or more groups, one-way analysis ofvariance followed by Tukey’s post-hoc test was used. A value of P , 0.05 was con-sidered significant.
31. Connor, R. I., Chen, B. K., Choe, S. & Landau, N. R. Vpr is required for efficientreplication of human immunodeficiency virus type-1 in mononuclear phagocytes.Virology 206, 935–944 (1995).
32. Wiznerowicz, M. & Trono, D. Conditional suppression of cellular genes:lentivirus vector-mediated drug-inducible RNA interference. J. Virol. 77,8957–8961 (2003).
33. Dull, T. et al. A third-generation lentivirus vector with a conditional packagingsystem. J. Virol. 72, 8463–8471 (1998).
34. Cattoglio, C. et al. Hot spots of retroviral integration in human CD341
hematopoietic cells. Blood 110, 1770–1778 (2007).35. Repnik, U., Knezevic, M. & Jeras, M. Simple and cost-effective isolation of
monocytes from buffy coats. J. Immunol. Methods 278, 283–292 (2003).36. Daigle, N. et al. Nuclear pore complexes form immobile networks and have a very
low turnover in live mammalian cells. J. Cell Biol. 154, 71–84 (2001).37. Solovei, I. & Cremer, M. 3D-FISH on cultured cells combinedwith immunostaining.
Methods Mol. Biol. 659, 117–126 (2010).38. Han, Y., Wind-Rotolo, M., Yang, H. C., Siliciano, J. D. & Siliciano, R. F.
Experimental approaches to the study of HIV-1 latency. Nature Rev. Microbiol. 5,95–106 (2007).
39. Ikeda, T., Shibata, J., Yoshimura, K., Koito, A. & Matsushita, S. Recurrent HIV-1integration at the BACH2 locus in resting CD41 T cell populations during effectivehighly active antiretroviral therapy. J. Infect. Dis. 195, 716–725 (2007).
40. Liu, H. et al. Integration of human immunodeficiency virus type 1 in untreatedinfection occurs preferentially within genes. J. Virol. 80, 7765–7768 (2006).
41. van Helden, J. Regulatory sequence analysis tools. Nucleic Acids Res. 31,3593–3596 (2003).
42. Wang, Z. et al. Genome-wide mapping of HATs and HDACs reveals distinctfunctions in active and inactive genes. Cell 138, 1019–1031 (2009).
LETTER RESEARCH
Macmillan Publishers Limited. All rights reserved©2015

Extended Data Figure 1 | HIV-1 RIGs. a, Probability of recurrence of arandom set of genes in different lists of HIV-1 integration sites. The histogramshows the distribution of the number of genes present at least twice in the sixHIV-1 integration site lists considered; 1 3 109 independent drawings wereevaluated. The distribution peaks around 20 genes, with a maximum observedof 50. The number of RIGs detected experimentally in at least two lists was
instead 156 (P , 1 3 1029). b, Human chromosome map showing thelocalization of 156 HIV RIGs. Genes found in four, three and two HIV-1integration lists are highlighted in red, orange and black, respectively. Hottergenomic regions, favoured for HIV-1 integration as described in ref. 1, arehighlighted in blue and indicated by a star.
RESEARCH LETTER
Macmillan Publishers Limited. All rights reserved©2015
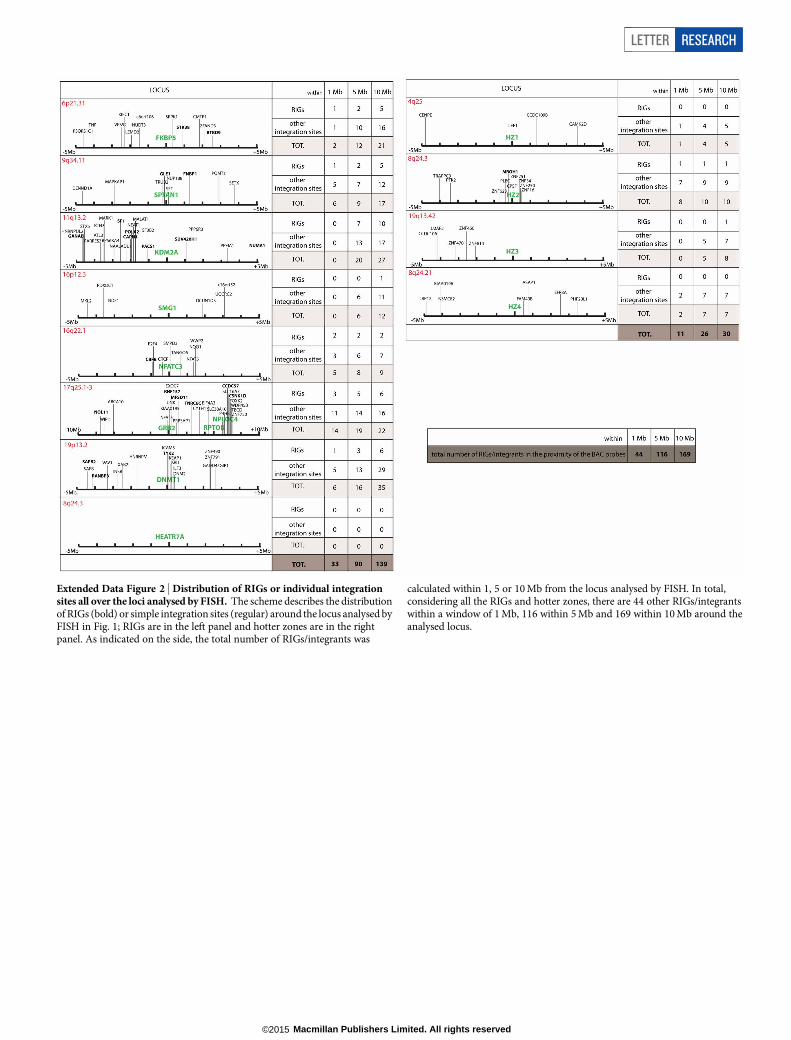
Extended Data Figure 2 | Distribution of RIGs or individual integrationsites all over the loci analysed by FISH. The scheme describes the distributionof RIGs (bold) or simple integration sites (regular) around the locus analysed byFISH in Fig. 1; RIGs are in the left panel and hotter zones are in the rightpanel. As indicated on the side, the total number of RIGs/integrants was
calculated within 1, 5 or 10 Mb from the locus analysed by FISH. In total,considering all the RIGs and hotter zones, there are 44 other RIGs/integrantswithin a window of 1 Mb, 116 within 5 Mb and 169 within 10 Mb around theanalysed locus.
LETTER RESEARCH
Macmillan Publishers Limited. All rights reserved©2015

Extended Data Figure 3 | FISH analysis. a, Representative images ofthree-dimensional immuno-DNA FISH of HIV-1 DNA (green) in humanprimary HIV-1 macrophages stained for mAb414 (red), with relativedistribution of FISH signals according to the three concentric zones. b, FISHof HIV-1 DNA (green) in the HIV-1 infected U937 monocytic cell line.c, Representative images of three-dimensional immuno-DNA FISH of
lentiviral vector pLV-THM (green) in Jurkat cells. d, Representative images ofthree-dimensional immuno-DNA FISH of the promoter-less lentiviral vectorpCCL–18GFP (green) in Jurkat cells. e, Representative images of three-dimensional immuno-DNA FISH of a gammaretroviral vector (green) in Jurkatcells. For all panels, the graphs are organized as described in the main text.
RESEARCH LETTER
Macmillan Publishers Limited. All rights reserved©2015
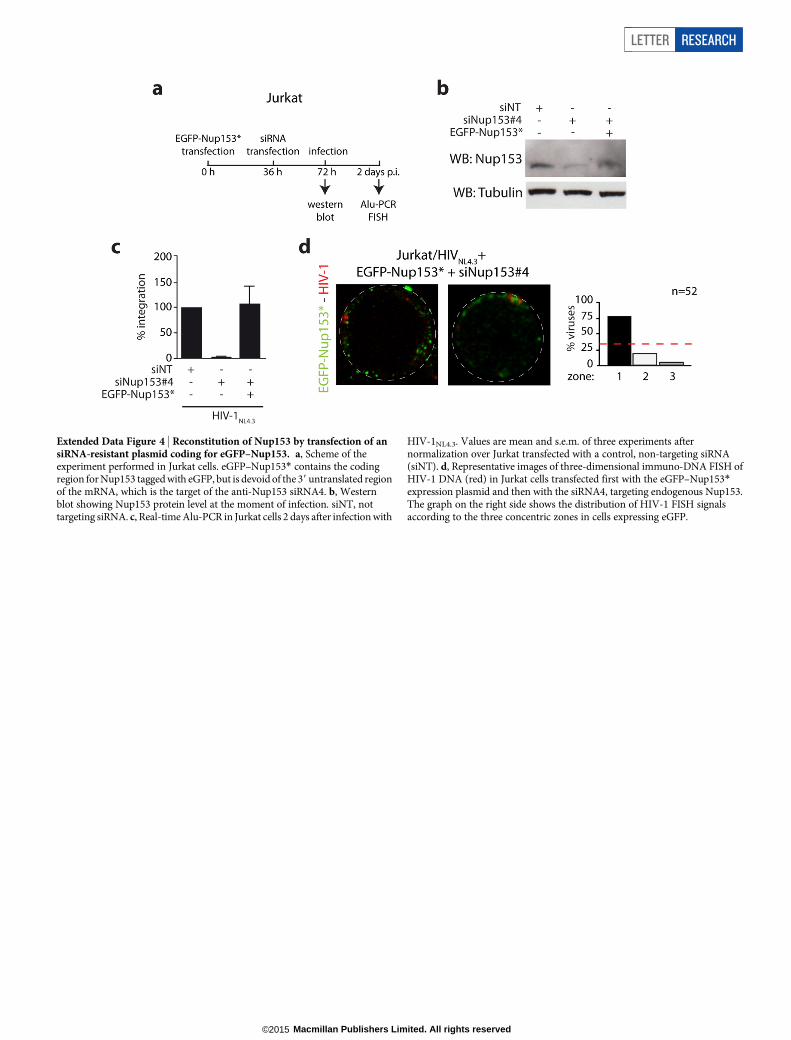
Extended Data Figure 4 | Reconstitution of Nup153 by transfection of ansiRNA-resistant plasmid coding for eGFP–Nup153. a, Scheme of theexperiment performed in Jurkat cells. eGFP–Nup153* contains the codingregion for Nup153 tagged with eGFP, but is devoid of the 39 untranslated regionof the mRNA, which is the target of the anti-Nup153 siRNA4. b, Westernblot showing Nup153 protein level at the moment of infection. siNT, nottargeting siRNA. c, Real-time Alu-PCR in Jurkat cells 2 days after infection with
HIV-1NL4.3. Values are mean and s.e.m. of three experiments afternormalization over Jurkat transfected with a control, non-targeting siRNA(siNT). d, Representative images of three-dimensional immuno-DNA FISH ofHIV-1 DNA (red) in Jurkat cells transfected first with the eGFP–Nup153*expression plasmid and then with the siRNA4, targeting endogenous Nup153.The graph on the right side shows the distribution of HIV-1 FISH signalsaccording to the three concentric zones in cells expressing eGFP.
LETTER RESEARCH
Macmillan Publishers Limited. All rights reserved©2015
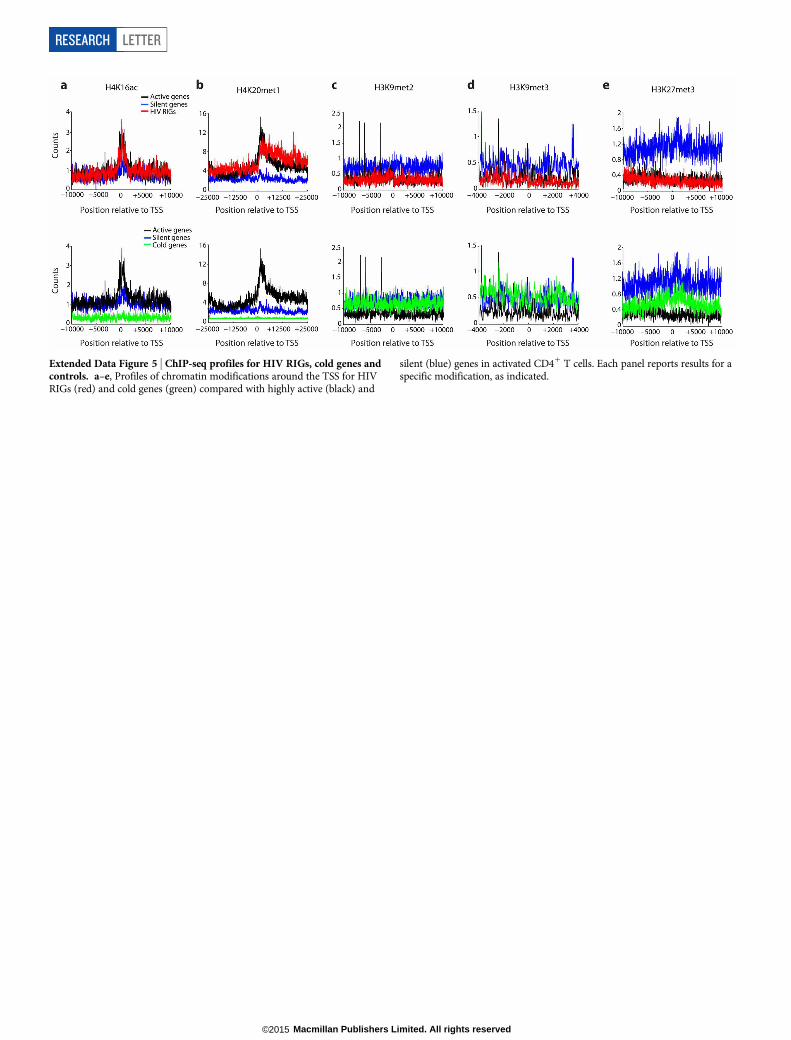
Extended Data Figure 5 | ChIP-seq profiles for HIV RIGs, cold genes andcontrols. a–e, Profiles of chromatin modifications around the TSS for HIVRIGs (red) and cold genes (green) compared with highly active (black) and
silent (blue) genes in activated CD41 T cells. Each panel reports results for aspecific modification, as indicated.
RESEARCH LETTER
Macmillan Publishers Limited. All rights reserved©2015

Extended Data Figure 6 | Association of HIV-1 provirus with nucleoporins.a, Positions of primers used for ChIP on the HIV-LTR (numbering is accordingto the TSS and nucleosomes are shown), the NPLOC4 RIG, the PTPRDcold gene, B48 and B13 genomic controls for DNA standardization. B48 mapswithin the human lamin B2 origin of DNA replication. b, Control ChIP data inCD41 T cells infected with HIV-1NL4-3/E-R-, using total immunoglobulin-cand an antibody against the unrelated Mcm2 cellular protein. For each analysedregion, the amount of immunoprecipitated chromatin using the indicatedantibodies was normalized according to the input amount of chromatin. Meanand s.e.m. from at least three independent experiments. **P , 0.01. c, ChIPresults in CD41 T cells, 4 days after HIV-1 infection, using the indicated
antibodies. The amount of immunoprecipitated chromatin was normalizedaccording to input. Mean and s.e.m. from at least three independentexperiments. **P , 0.01,*P , 0.05. d, ChIP results in CD41 T cells, 4 daysafter infection with wild-type HIV-1 or the IN(D64E) mutant virus. Forthe PPR1 region, corresponding to the viral promoter, the amount ofimmunoprecipitated chromatin using the indicated antibodies (mAb414,Nup153 and Pol2) was calculated according to the input amount of chromatin,and then normalized over the B13 control genomic region. The graphs showthe mean and s.e.m. from three independent experiments. ***P , 0.001;*P , 0.05.
LETTER RESEARCH
Macmillan Publishers Limited. All rights reserved©2015

Extended Data Figure 7 | HIV-1 transcriptional activation is concomitantwith, and requires, nucleoporins binding to the provirus. a, Quantitativereverse transcription PCR measurement of HIV-1 mRNA in mock- orTPA-treated J-Lat 15.4 cells. b, Three-dimensional immuno-DNA FISH ofHIV-1 DNA (green) in J-Lat 15.4 cells stained for NPC (red) before andafter TPA reactivation. c, Scheme of the experiment for the generation of aprimary, cellular model of HIV-1 latency to study HIV-1 DNA localizationin activated and resting primary CD41 T cells. d, Quantitative reversetranscription PCR measurement of HIV-1 mRNA levels in primary infectedCD41 T cells before and after reactivation, normalized over the 18S
housekeeping gene. Latent versus reactivated: P , 0.001. e, Three-dimensionalimmuno-DNA FISH of HIV-1 DNA (green) in latently infected CD41 T cellsstained for the NPC (red) before and after reactivation, with relativedistribution of HIV-1 FISH signals according to the three concentric zonesconsidered in this work. e, ChIP in control and TPA-stimulated J-Lat 15.4 cells,with the indicated antibodies. Mean and s.e.m. from at least three independentexperiments. g, Immunoblot for Tpr (upper panel) and Nup153 (lowerpanel), 36 h after transfection of the indicated siRNAs (NT, non-targetingcontrol). h, Levels of HIV-1 RNA in siRNA-treated J-Lat 15.4 cells after TPAactivation. Mean and s.e.m. from three independent experiments. *P , 0.05.
RESEARCH LETTER
Macmillan Publishers Limited. All rights reserved©2015

Extended Data Figure 8 | Silencing of Tpr in HeLa cells and 15.4 J-Latclones. a, Scheme of the experiment to study HIV-1 integration in infectedHeLa cells after Tpr silencing. b, Western blot showing Tpr protein level at themoment of infection, after treatment of HeLa cells with a non-targetingsiRNA (siNT) or an siRNA targeting Tpr at two different doses. Values aremean and s.e.m. of three experiments after normalization over HeLa cellstransfected with a control non-targeting siRNA. c, Real-time Alu PCR in HeLacells infected with HIV-1NL4.3 and previously transfected with a non-targetingsiRNA (siNT) or an siRNA targeting Tpr at two different doses. Values aremean and s.e.m. of three experiments after normalization over HeLa cells
transfected with a control non-targeting siRNA. d, Luciferase activity assay inHeLa infected with HIV-1NL4.3 and previously transfected with a non-targetingsiRNA (siNT) or an siRNA targeting Tpr at two different doses. Values aremean and s.e.m. of three experiments. Statistical significance: ***P , 0.001;**P , 0.01. e, Real-time PCR quantification of IL-2 mRNA levels in J-Lat15.4 cells. The following conditions were tested: untreated cells, plus TPA (4 h),transfection with non-targeting siRNA or an siRNA targeting Tpr for 24 h,followed by treatment with TPA (4 h). Values are mean and s.e.m. of threeexperiments after normalization over GAPDH. Transcription of interleukin-2(IL-2) was not significantly altered upon Tpr downregulation.
LETTER RESEARCH
Macmillan Publishers Limited. All rights reserved©2015
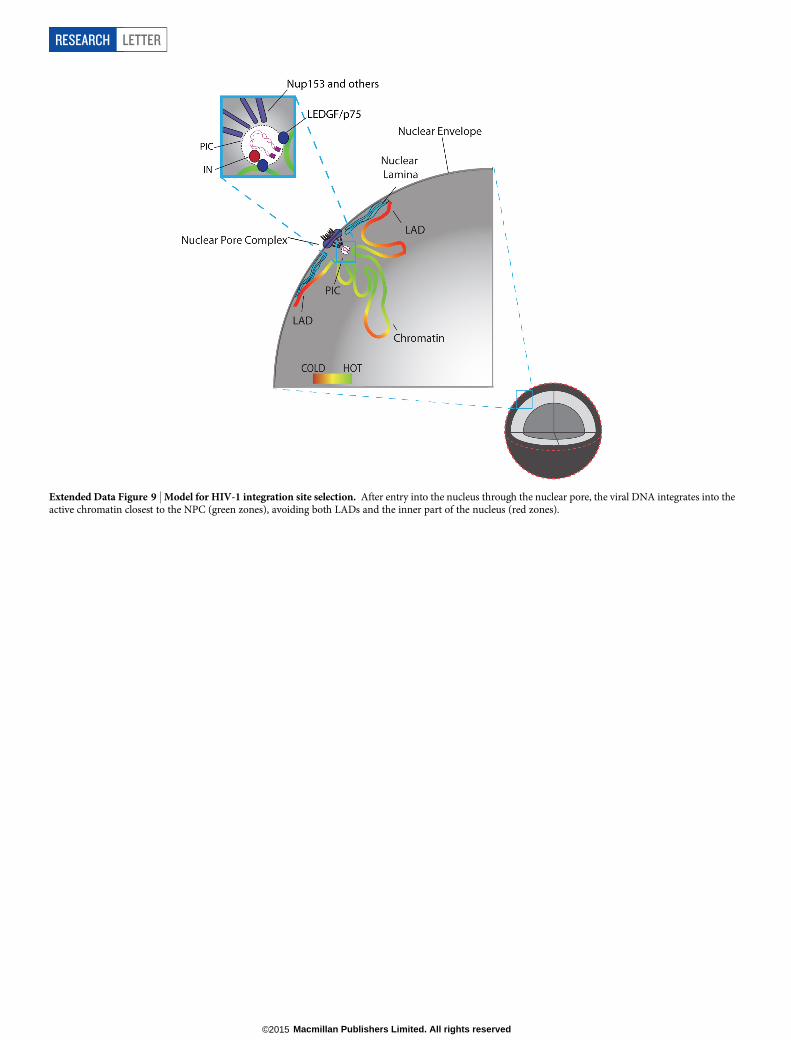
Extended Data Figure 9 | Model for HIV-1 integration site selection. After entry into the nucleus through the nuclear pore, the viral DNA integrates into theactive chromatin closest to the NPC (green zones), avoiding both LADs and the inner part of the nucleus (red zones).
RESEARCH LETTER
Macmillan Publishers Limited. All rights reserved©2015
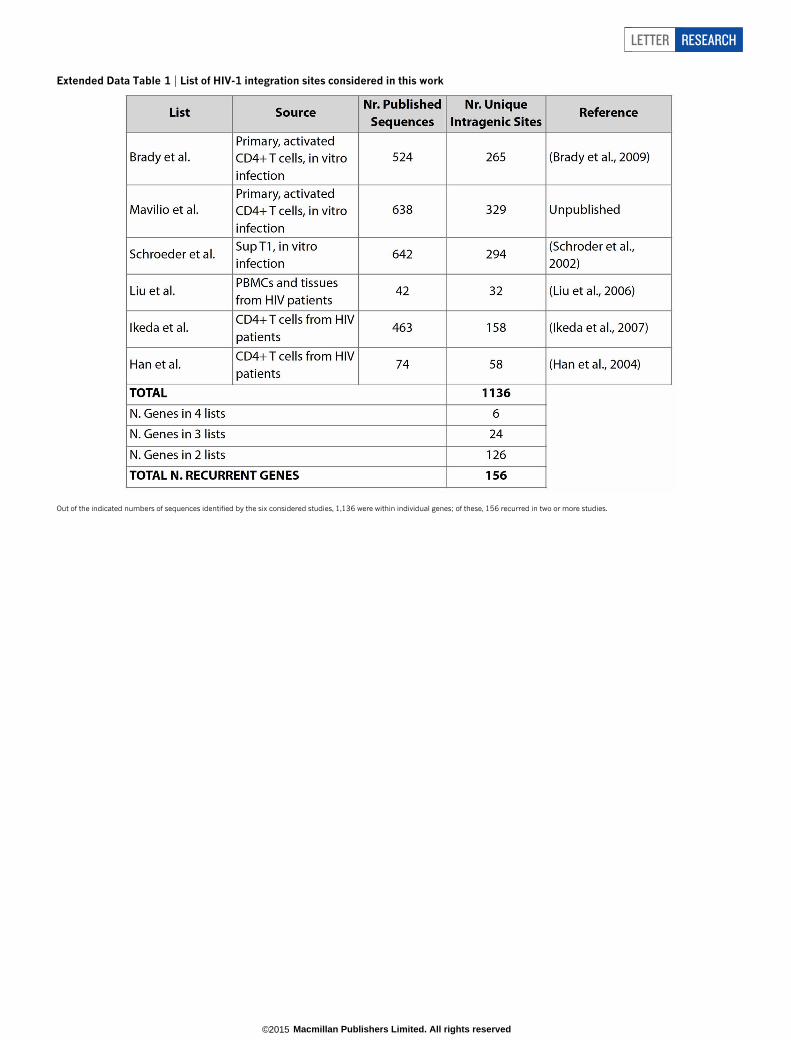
Extended Data Table 1 | List of HIV-1 integration sites considered in this work
Out of the indicated numbers of sequences identified by the six considered studies, 1,136 were within individual genes; of these, 156 recurred in two or more studies.
LETTER RESEARCH
Macmillan Publishers Limited. All rights reserved©2015