SAFEGUARDING NUCLEAR MATERIALS
705
FUEL FABRICATION ENRICHMENT PLANT REACTOR REPROCESSING PLANT SAFEGUARDING NUCLEAR MATERIALS PROCEEDINGS OF A SYMPOSIUM VIENNA 20-24 OCTOBER 1975 VOL . I INTERNATIONAL ATOMIC ENERGY AGENCY, VIENNA, 1 976
-
Upload
khangminh22 -
Category
Documents
-
view
0 -
download
0
Transcript of SAFEGUARDING NUCLEAR MATERIALS

FUEL FABRICATION
ENRICHMENT PLANT
REACTOR
REPROCESSING PLANT
SAFEGUARDING NUCLEAR MATERIALSPROCEEDINGS OF A SYM POSIUM VIENNA2 0 - 2 4 OCTOBER 1975
VOL. I
INTERNATIONAL A T O M I C ENERGY AGENCY, VIENNA, 1 9 7 6

SAFEGUARDING NUCLEAR MATERIALS
VOL.II

The following States are Members o f the International Atomic Energy Agency:
AFGHANISTANALBAN IAALGERIAARGENTINAAUSTRALIAAUSTRIABANGLADESHBELGIUMBOLIV IABRAZILBULGARIABURMABYELORUSSIAN SOVIET
SOCIALIST REPUBLIC CAMBODIA CANADA CHILE COLOMBIA COSTA RICA CUBA CYPRUSCZECHOSLOVAKIA DEMOCRATIC PEOPLE’S
REPUBLIC OF KOREA DENMARKDOMINICAN REPUBLICECUADOREGYPTEL SALVADORETHIOPIAFINLANDFRANCEGABONGERMAN DEMOCRATIC REPUBLICGERMANY, FEDERAL REPUBLIC OFGHANAGREECEGUATEMALAHAITI
HOLY SEEHUNGARYICELANDINDIAINDONESIAIRANIRAQIRELANDISRAELITALYIVORY COASTIAMAICAJAPANJORDANKENYAKOREA, REPUBLIC OF KUWAIT LEBANON LIBERIALIBYAN ARAB REPUBLICLIECHTENSTEINLUXEMBOURGMADAGASCARMALAYSIAMALIMAURITIUSMEXICOMONACOMONGOLIAMOROCCONETHERLANDSNEW ZEALANDNIGERNIGERIANORWAYPAKISTANPANAMAPARAGUAYPERU
PHILIPPINESPOLANDPORTUGALQATARREPUBLIC OF SOUTH VIET-NAMROMANIASAUDI ARABIASENEGALSIERRA LEONESINGAPORESOUTH AFRICASPAINSRI LANKASUDANSWEDENSWITZERLANDSYRIAN ARAB REPUBLICTHAILANDTUNISIATURKEYUGANDAUKRAIN IAN SOVIET SOCIALIST
REPUBLICUNION OF SOVIET SOCIALIST
REPUBLICSUNITED ARAB EMIRATES UNITED KINGDOM OF GREAT
BRITAIN AND NORTHERN IRELAND
UNITED REPUBLIC OF CAMEROON
UNITED REPUBLIC OF TANZANIA
UNITED STATES OF AMERICAURUGUAYVENEZUELAYUGOSLAVIAZAIREZAMBIA
The Agency’s Statute was approved on 23 October 1956 by the Conference on the Statute of the IAEA held at United Nations Headquarters, New York; it entered into force on 29 July 1957. The Headquarters of the Agency are situated in Vienna. Its principal objective is “to accelerate and enlarge the contribution of atomic energy to peace, health and prosperity throughout the world”.
Printed by the IAEA in Austria April 1976

PROCEEDINGS SERIES
S A F E G U A R D I N G
N U C L E A R M A T E R I A L S
PROCEEDINGS OF A SYMPOSIUM ON THE SAFEGUARDING OF NUCLEAR MATERIALS
ORGANIZED BY THEINTERNATIONAL ATOMIC ENERGY AGENCY AND HELD IN VIENNA, 20-24 OCTOBER 1975
In two volumes
V O L . I I
INTERNATIONAL ATOMIC ENERGY AGENCY VIENNA, 1976

SAFEGUARDING NUCLEAR MATERIALS IAEA, VIENNA, 1976
ST I/PU B /408 ISBN 9 2 - 0 - 0 7 0 1 7 6 - 0

FOREWORD
The year 1975 is important to safeguards work in many respects. It marks the fifth anniversary of the coming into force of the Treaty on the Non-Proliferation of Nuclear Weapons. It marks the year in which several important safeguards agreements were signed, and in which others came to practical implementation. It also marks the fifth anniversary since the last general IAEA Symposium on Safeguards Techniques, published by the IAEA in 1970. In the intervening years numerous panel meetings, consultants’ meetings and working group meetings were held, and numerous technical papers were written by safeguards experts throughout the world.
Some might say that the interval had been too long. All should agree that it was time to review the developments and experience of the last five years, and to bring together in one place a larger forum than had been possible with the panel or consultants’ meetings. Accordingly the International Atomic Energy Agency convened in Vienna an International Symposium on the Safeguarding of Nuclear Materials. The symposium, which took place from 20 to 24 October 1975, was attended by 225 participants, representing 34 countries and three international organizations.
As is evidenced by these Proceedings, the agenda for the symposium covered a wide range of topics. Of the total of 95 papers that were included, 49 were presented by the authors and 46 were presented by nine rapporteurs who summarized groups of closely related papers. It is significant to note that, in contrast to the many theoretical papers presented in 1970, most of the papers concerned actual practical experience in the operation of material control systems, non-destructive measurement techniques, or safeguards procedures. The emphasis placed by United States authors on physical security and real-time material control is also worthy of note.
It cannot be claimed that all the problems of international safeguards have been solved. On the other hand, that important progress has been achieved was clearly demonstrated at the symposium. The participants showed clearly during the meeting that the remaining problems are receiving active attention throughout the world; this augurs well for their eventual solution.

EDITORIAL NOTE
The papers and discussions have been ed ited b y the editorial s ta ff o f the International A to m ic Energy A gency to the ex ten t considered necessary fo r the reader’s assistance. The views expressed and the general s ty le a d o p ted remain, however, the responsibility o f the-nam ed authors or participants. In addition, the views are n o t necessarily those o f the governm ents o f the nom inating M em ber S ta tes or o f the nom inating organizations.
Where papers have been incorporated into these Proceedings w ith o u t resetting b y the Agency, this has been done w ith the know ledge o f the authors and their governm ent authorities, and their cooperation is gratefully acknowledged. The Proceedings have been prin ted b y com position typ ing and ph o to -o ffse t lithography. Within the lim itations im posed b y this m ethod, every effort has been m ade to maintain a high editorial standard, in particular to achieve, wherever practicable, consistency o f units and sym bols and con form ity to the standards recom m ended b y com peten t international bodies.
The use in these Proceedings o f particular designations o f countries or territories does n o t im ply any judgem ent b y the publisher, the IAEA, as to the legal status o f such countries or territories, o f their au thorities and institu tions or o f the delim ita tion o f their boundaries.
The m ention o f specific com panies or o f their p rodu cts or brand names does no t im ply any endorsem ent or recom m endation on the pa rt o f the IAEÄ.
A uthors are them selves responsible fo r obtaining the necessary perm ission to reproduce copyrigh t m aterial fro m o th er sources.

CONTENTS OF VOLUME 2
INSTRUMENTATION AND MEASUREMENT METHODS (Session 7, and Session 8, Part I)
The Agency programme for the development of safeguards techniques andinstrumentation (IAEA-SM-201/101) ................................................................................ 3E. Löpez-M enchero, A.J. WaliguraDiscussion .......................................................................................................................... 14
Activities of the European Safeguards Research and Development Association(ESARDA) (IAEA-SM-201/82) ........................................................................................ 17A.R. A nderson
Some Agency contributions to the development of instrumental techniquesin safeguards (1AEA-SM-201/96) 37T.N. Dragnev, M. de Carolis, A. Keddar, Yu. Konnov, G. Martinez-Garcia,A.J. WaliguraDiscussion ........................................................................................................................... 61
Physical standards and valid calibration (IAEA-SM-201/19) .............................................. 63D . B. Sm ithDiscussion ........................................................................................................................... 70
Analytical services for Agency Safeguards (IAEA-SM-201/98) 73E. Lopez-M enchero, M.N. R yzh ov , B. Clark, E. Szabö, T.M. Beetle, S. DeronDiscussion .......................................................................................................................... 87
Recent developments in the dissolution and automated analysis of plutonium anduranium for safeguards measurements (IAEA-SM-201/18) .............................................. 91D.D. Jackson, S.F. Marsh, J.E. Rein, G.R. Waterbury
Methods of sample preparation and analysis for wide variations in material types —A requirement for a national or an international safeguards laboratory(IAEA-SM-201/22) ................................................................................................................ 107C.D. Bingham, J.M. Scarborough, C.E. P ietri
Experience of the Central Control Laboratory (CCL) in accounting for andcontrolling nuclear material in Czechoslovakia (1AEA-SM-201/43)................................. 117M. Krivänek, J. Krtil, F. Sus, J. M oravec
Analyse precise de references secondaires pour le contröle des matieres fissiles(IAEA-SM-201/55) ................................................................................................................ 123P. Cauchetier, C. Guichard, F. Regnaud
Experiences of shipper-receiver differences in plutonium oxide transactions(1AEA-SM-201 /63) ................................................................................................................ 133K.A. Swinburn, l.R . M cGowan
Note on an interlaboratory examination of mixed uranium-plutonium oxide fuelfor qualification for reactor use (IAEA-SM-201/64) ......................................................... 151N. Parkinson
An accurate potentiometric titration of 5-25 mg uranium (IAEA-SM-201/65) ................ 157J. Slanina, F. Bakker, W.A. Lingerak

Применение м етодов радиометрии и спектроф отом етрии для целейгарантий (IAEA-SM-201/106) ...................................................................................... 165А .А . Л и п о в с к и й , Ю .В . Х о л ь н о в(The use of radiometric and spectrophotometric techniques for safeguards purposes, A.A. Lipovskij, Yu.V. Khol’nov)
The problem of analytical interlaboratory differences in practical safeguards(IAEA-SM-201/109) ......................................................................................................... 175W. Beyrich
Instruments and data analysis methods for volume measurements(1AEA-SM-201/25) .............................................................................................................. 187S. C. SudaDiscussion .......................................................................................................................... 196
Evaluation of a gamma-spectroscopy gauge for uranium-plutonium assay(IAEA-SM-201/1) .............................................................................................................. 199A. Notea, Y. Segal
Advanced instrumentation for nuclear monitoring (IAEA-SM-201/24) ............................. 215G. A rm antrout, A. M cG ibbon, S. Sw ierkow ski, J. Sherohman, J. Yee
Gamma-ray spectrometry for in-line measurements of 235 U enrichment in a nuclearfuel fabricating plant (IAEA-SM-201/46) 223P. M atussek, H. O ttm ar
Gamma-spectrometric determination of isotopic composition without use of standards(IAEA-SM-201/66) .............................................................................................................. 235R . J.S. Harry, J.K. Aaldijk, J.P. Braak
Techniques for identification and estimation of fissile materials (IAEA-SM-201/85) ........ 247M.R. Iyer, P.P. Chakraborty
CONTAINMENT AND SURVEILLANCE (Session 8, Part II)
Development of a safeguards system for containment and surveillance at uraniumenrichment plants (IAEA-SM-201/11)................................................................................ 265G.A. H am m ond, L.R . S tie ffDiscussion .......................................................................................................................... 276
Testing of techniques for the surveillance of spent fuel flow and reactor power atPickering Generating Station (IAEA-SM-201/67) 279D.B. Sinden, J.G. H odgkinson, J.W. Campbell, H.D. KosankeDiscussion .......................................................................................................................... 294
Tamper-indicating radiation surveillance instrumentation (IAEA-SM-201/12) 297W.H. Chambers, J.F. N eyDiscussion .......................................................................................................................... 303
Application of tamper-resistant identification and sealing techniques for safeguards(IAEA-SM-201/5) 305S. J. Crutzen, R. Haas, P.S. Jehenson, A. Lam ourouxDiscussion .................. 338
NON-DESTRUCTIVE MEASUREMENTS (Session 9, Part I)
Operational experience in the non-destructive assay of fissile material in GeneralElectric’s nuclear fuel fabrication facility (IAEA-SM-201/8) .......................................... 341J.P. S tew artDiscussion ........................................................................................................................... 345

О некоторы х м етод ах и приборах, разработанны х в Б олгарии для недеструктивного ан али за ядерны х м атериалов(IAEA-SM-201/92) ........................................................................................ 347Н . С . Б а ч в а р о в , Т . Н . Д р а г н е в . Ж. С . К а р а м а н о в а ,X. М ю н н и н г , А . И . Т р и ф о н о в , В . И . Х р и с т о в (Some techniques and instruments developed in Bulgaria for the nondestructive analysis of nuclear materials: N.S. Bachvarov et al.)Discussion ........................................................................................................................... 356
MEASUREMENTS IN REPROCESSING FACILITIES (Session 9, Part II)
Euratom experience of verification methods in reprocessing facilities(IAEA-SM-201 /70) .............................................................................................................. 361H.-J. A renz, E. Van der StijIDiscussion ........................................................................................................................... 375
Summary of experience with heavy-element isotopic correlations (IAEA-SM-201/10)..... 377D.E. Christensen, R .A . Schneider
Reprocessing plant temporal response analysis as the basis for dynamic inventoryof in-process nuclear material (IAEA-SM-201/21) ........................................................... 395W. B. Seefeldt, S.M. Zivi
Data treatment for the isotopic correlation technique (IAEA-SM-201/39) ......................... 405C. Foggi, W.L. Zijp
Isotope correlations based on fission-product nuclides in LWR irradiated fuels:A theoretical evaluation (IAEA-SM-201/44) ................................................................... 425C. Foggi, F. Frenquellucci, G. Perdisa
IAEA bank of correlated isotopic composition data (IAEA-SM-201/100) ......................... 439S. Sanatani, P. S iw y
Improvements and experience in the analysis of reprocessing samples(IAEA-SM-201/2) 449L. Koch, H.-J. A renz, A. von Baeckmann, A. Cricchio, R. D e M eester,M. R om kow ski, E. Van der Stijl, M. Whilhelmi
A simplified method for preparing micro-samples for the simultaneous isotopicanalysis of uranium and plutonium (IAEA-SM-201/9) .................................................. 461J.A. Carter, R .L. Walker, R.E. E by, C.A. Pritchard
Non-destructive control of fissile material in solid and liquid samples arising froma reactor and fuel reprocessing plant (IAEA-SM-201/53) .............................................. 471H.P. Filss
An independent method for input accountability in reprocessing plants (MAGTRAP)(IAEA-SM-201/87) ..........................................................................:............... ................... 485C.K. M athews, H.C. Jain, V D . Kavimandan, S.K. Aggarwal
An accurate procedure to safeguard the fissile material content of input and outputsolutions of reprocessing plants (IAEA-SM-201 /108) ................ ,..................................... 493P. D e Bievre, J. V anA udenhove
HIGH-TEMPERATURE GAS REACTORS (Session 10, Part I)
In-plant non-destructive assay of HTGR fuel materials (IAEA-SM-201/33)......................... 501T. L. A tw ell, E.R. Martin, H.O. M enlove

Verification of the 235U flow at the output of the THTR fuel fabrication plant(IAEA-SM-201/73) ............................................................................................................. 521M. Cuypers, E. Van der Stricht, M. Boursier, M. Corbelini
Non-destructive measurement of 235U and 233U content in HTR fuel elements bydelayed neutron analysis (1AEA-SM-201/83) ................................................................... 533P. Cloth, N. Kirch, F.J. Krings
MIXED-OXIDE FUELS (Session 10, Part II)
Fast-response fuel-rod calorimeter (IAEA-SM-201/30) ...................................................... . 541N. S. Beyer, R.B. Perry, R.N. Lew is
Non-destructive assay equipment for quantitative determination of nuclearmaterial in a plutonium fuel fabrication facility (IAEA-SM-201/41) ............................. 551K. Onishi, H. A kutsu, T. Itaki, K. Miyahara, Y. Tokoro, M. Tsutsum i
Non-destructive analysis of plutonium fuel plates for physical inventory verification ata fast critical assembly (FCA) (IAEA-SM-201/42) ........................................................... 565T. Numakunai, H. Tatsuta, K. Endo
Safeguards system for the LMFBR prototype power plant SNR-300 (KKW Kalkar)(IAEA-SM-201/50) .............................................................................................................. 581Chr. Brückner, P. Van der Hulst, H. Krinninger
Non-destructive measurement of plutonium and uranium in process wastesand residues (IAEA-SM-201/61) ........................................................................................ 589B.J. M cDonald, G.H. Fox, W.B. Brem ner
Fast flux test facility (FFTF) fuel-pin non-destructive assay measurements(IAEA-SM-201/84) .............................................................................................................. 599P. Goris, A. W. DeMerschman
NON-DESTRUCTIVE MEASUREMENTS OF REACTORS AND REACTOR FUELS (Session 10, Part III)
Determination of burnup and plutonium content in irradiated fuels by gamma-spectrometry measurements of radioactive fission products (IAEA-SM-201/3) ............ 613M. P ao le tti Gualandi, P. Peroni, M. Bresesti, M. Cuypers, D. D 'Adam o, L. L ezzo li
Isotopic assay in irradiated fuel by neutron resonance analysis (IAEA-SM-201/4) ............ 625H. G. Priesm eyer, U. Harz
Cooling-time determination of the nuclear fuel for a VVR-S reactor(IAEA-SM-201/86) .............................................................................................................. 633I. Ursu, E. Rodean, O.M. Färcasiu, V. Ionescu, R. Dumitrescu, P.S. Stänescu,T. Ropescu, C. D eberth
Application of neutron activation analysis, gamma spectrometry and nuclear trackdetectors for reactor fuel assay (IAEA-SM-201/93).......................................................... 641P. Raics, M. Vdrnagy, S. Nagy, S. D aröczy
A method - and its application — for non-destructive determination of nuclearmaterial quantities (IAEA-SM-201/94) ............................................................................ 651H. Daoud, K. Engelhardt

Chairmen of Sessions................................................................................................................. 659Secretariat of the Symposium .................................................................................................. 659List of Participants..................................................................................................................... 661Index of Preprint Symbols........................................................................................................ 675Author Index.............................................................................................................................. 679Transliteration Index................................................................................................................. 683


Session 7 and Session 8, Part I
INSTRUMENTATION AND MEASUREMENT METHODS

Chairman (Session 7): A.R. ANDERSON (United Kingdom)
Chairman (Session 8): A. A. LIPOVSKIJ (USSR)
Papers IA EA -SM -201/18, 22, 43, 55, 63, 64, 65, 106 and 109 were presented byC. D. BINGHAM as Rapporteur
Papers IA EA -SM -201/1, 24, 46 , 66 and 85 were presented byR. J .S. HARRY as Rapporteur

IAEA -SM -201/101
THE AGENCY PROGRAMME FOR THE DEVELOPMENT OF SAFEGUARDS TECHNIQUES AND INSTRUMENTATION
E. LOPEZ-MENCHERO, A.J. WALIGURA Department of Safeguards and Inspection,International Atomic Energy Agency,Vienna
Abstract
THE AGENCY PROGRAMME FOR THE DEVELOPMENT OF SAFEGUARDS TECHNIQUES AND INSTRUMENTATION.
The programme of the D ivision o f D evelopm ent concentrates attention upon a variety o f tech n ical problems and tasks to enable the A gency safeguards system to ach ieve its safeguards objectives most eco n o m ic a lly for the A gen cy, the M ember States and the nuclear facility operators. The programme must take into account the changes w hich m ay occur in the A gen cy ’s tasks as a consequence o f im plem entation of safeguards in States with important nuclear a ctiv ities . This paper attem pts to sum m arize where the Agency methods and techniques developm ent programme stands on m eeting defined tech n ical ob jectives, to point out where the m ain problems l ie and to offer some guidelines for their solution.
1. INTRODUCTION
The developm ent of safeguards techniques is at a turning point:
(a) Part E of the IAEA Safeguards T echnical Manual, which p resen ts a wide va r ie ty of developed techniques, has been published [ 1]; and
(b) The D iv ision of D evelopm ent of the IAEA Departm ent of S afeguards and Inspection has identified where the A gency m ethods and techniques developm ent program m e stands on m eeting defined tech n ica l ob jectives ,has pointed out where the m ain prob lem s lie , and offered som e gu idelines for th e ir solution [2].
The safeguards techniques developm ent program m e a im s to strengthen safeguards e ffec tiv e n e ss by im proving:
(a) The accu racy of m easu rem en ts on which the op erator's m ateria l accountancy is based;
(b) The accu racy of the instrum ental techniques u sed by the in sp ecto rs to v er ify the op era tor 's accountancy and by broadening the choice of th ese in stru m ental techniques;
(c) The re lia b ility of the instrum ental su rve illan ce techniques which com plem ent the m easu rem ent of quantities of nuclear m aterial; and
(d) The t im e lin e s s of gathering and in terp reting data.
The in stru m ental approach m ust take into con sideration the pecu liar n eed s of the w orld-w ide in spection activ ity on which the ver ifica tion is based: portability , rob u stn ess , ea se of checking, repair and calibration,
3

4 LOPEZ-MENCHERO and WALIGURA
need for secu red continuity of knowledge. The quantification of the cr iter ia with resp ec t to accu racy and t im e lin e ss is a sy stem s stud ies topic, but m axim izing the return from investm ent and running co s ts of individual in stru m ental techn iques to reach the estab lish ed tech n ica l goals is a target of a m ethods and techniques developm ent program m e.
T his program m e m ay be structured in the follow ing tech n ica l areas:
(a) M easurem ent of m a ss or volume;(b) Sam pling, ch em ica l an a lysis and re la ted ch em ica l standards;(c) N on-destru ctive an a lysis and re la ted p h ysica l standards;(d) U se of iso top ic com position data;(e) Containment and su rveillan ce .
2. TECHNICAL AREAS OF THE PROGRAMME
2.1. M easurem ent of m a ss or volum e
E xp erience with m easurem ent of volum e or weight of the liquid content of accountability v e s s e ls has shown the need for developm ent of techniques which fa c ilita te the v er ifica tio n p ro ce ss . The A gency is seek in g a tam p er- res ista n t sy stem of accuracy at le a st equal to the conventional dip tube system . T im e domain re flec tom etry (TDR) for the m easurem ent of the liquid le v e l in nuclear m ater ia l accountability v e s s e ls is a p ossib le solution. The technique is based upon the m easurem ent of the tim e that it takes for an e le c tr ic a l pulse to trave l through a m edium , which is a function of the nature of th is m edium (liq u id s, gas). Such a sy stem would help to make in sp ectors' work as independent as p ossib le from subjective con sid erations. TDR has been su c c e ss fu lly u sed for in terface le v e l control in m ix e r -s e t t le r s of a fu e l re p r o ce ss in g fa c ility . The A gency is now sp onsoring a dem onstration of its application for the m easurem ent of the liquid le v e l in accountability v e s s e ls of fuel re p r o ce ss in g fa c il it ie s [ 3, 4].
V erifica tion of vo lu m etr ic sy stem s is so m etim es difficult; a typ ica l exam ple i s the ca se of the input accountability v e s s e l of a rep ro cessin g fa c ility . R e-ca lib ration of the v e s s e l is u sually requ ired to validate the data, but fa c ility op erators r e s is t doing th is for good reason s. An independent v er ifica tion of the m easurem ent would be ex trem ely u sefu l. The use of a tra c er technique i s a p ossib le approach. Such a technique to m easu re the liquid volum e in re p r o ce ss in g fa c il it ie s has not gained wide acceptance becau se of the com p lexity of the procedure and the concern for p ro cess incom patib ility . A proven tra cer technique which could be used as an independent technique for verify in g the stated volum e of an input batch is of great in te re st for safegu ard s purposes. The A gency i s seek ing an opportunity to dem onstrate, under operational con stra in ts, as an a lternative to d irect volum e m easu rem en ts, a tra cer technique which p erm its the calcu lation of the volum e by the determ ination of a dilution factor on the b a s is of concentration m easu rem en ts.
The use of iso top ic com position data, which corroborate data used for independent estim ation of the plutonium input content of the accountability v e s s e l without the need for vo lu m etric m easu rem en ts, has con sid erable safeguards value. The use of a data bank for the developm ent and application of th is technique is the subject of an A gency paper at th is Sym posium [ 5].

IAEA-SM-201/101 5
2.2. Sam pling and an a lysis
Highly rad ioactive or tox ic so lu tions contained in an in sta lled v e s s e l are sam pled rem ote ly . C entral or individual sam pling fa c il it ie s m ay be used . With an in sp ector observing the sam pling, it is u su a lly not p ossib le to identify the v e s s e l being sam pled. The A gency has additional problem s in ensuring that the sam p les are not tam pered with from the point of sam pling to shipm ent. The developm ent of m ethods using corre la tion s of iso top ic com position data has reached a point where it is a proven too l in verify in g the sou rce and quality of sam p les. It is expected that the use of the iso top ic data bank w ill be incorporated soon into the v er ifica tion p ro ce ss .
Control of the quality of the an a lyses i s an im portant subject for sa fe guards. It im p lie s the proper u se of appropriate ch em ica l standards. This subject i s dealt with in a separate paper for th is Sym posium by B eetle et al. [ 6].
The tim e ly shipm ent of Pu and of rep ro cessin g input solu tion sam p les p oses prob lem s for the operation of a decentra lized an alytica l se rv ic e like the one the A gency is managing. R esu lts of dem onstration p rogram m es using n an ogram -sized sam p les indicate that re lia b le iso to p ic an a lysis of plutonium and uranium m ay be done with m inim al ch em istry and sam ple handling. A res in -b ea d separation technique and m odern h igh -re solution m a ss sp ec tro m eters perm it the determ ination in n an ogram -sized sam p les of the iso top ic com position of uranium and plutonium. T heir to ta l content m ight a lso be determ ined by the isotop e dilution technique. Such sm all sam p les m ay be handled and shipped without heavy sh ield ing and thus have a b en efic ia l influence upon handling, transportation and in surance co sts . Simple ch em ical treatm ent a lso red u ces separation co s ts and e lim in a tes in terferen ce of e lem en ts such as am ericiu m and curium . The A gency is encouraging the strengthening and refin ing of th is method.
Another area where further developm ent m ay be required is in the an alytica l m ethods of m ater ia l in the U /T h fuel cy c le , including rapid d is solu tion techniques. S im ilar attention m ay need to be d irected to the an a lysis of m ater ia l involved in the Pu r e -c y c le in ligh t-w ater th erm a l'rea c to rs and in fa st b reed er rea cto rs .
Autom ated an a lysis of nuclear m ateria l could so lve som e of the problem s a sso c ia ted with rep resen ta tive sam pling and the tim e delay in obtaining an alytica l r e su lts . E xam ples of current A gency in itiated and co-ordinated p rogram m es in th is area are the in sta lla tion and dem onstration in a rep ro ce ss in g fa c ility of an X -r a y ab sorptiom eter for continuous Pu determ ination in the product accountability v e s s e l equipped with a TDR probe, alpha counting of Pu in w aste s trea m s and m onitoring of hu lls [7 ]. In a second re p r o ce ss in g fa c ility , TDR m easu rem en ts are being done in the input accountab ility v e s s e l and hulls are being m onitored [4 ]. In a th ird rep ro cess in g fa c ility , a prototype gam m a ab sorp tiom eter i s being in sta lled in the Pu product solution storage sy stem [8].
2.3 . N on -d estru ctive an a lysis
In creasin g u se is being made of portable NDA instru m ents in A gency in sp ection s. In the A gen cy's developm ent program m e, em p hasis is p laced on reason ably p riced com pact, ligh t-w eight, portable equipm ent, which can be u sed to provide rapid m ater ia l a ssa y . The next step is to up-grade the

6 LOPEZ-MENCHERO and WALIGURA
m easu rem ent capability , i .e . to develop m ore accurate and com prehensive techniques.
The A gency has, up to now, laid em p hasis on the p a ssiv e non-destructive m ethods, p articu lar ly on those which use the sign atu res of gam m a rays.The reason is that p a ssiv e techniques are m ore e a s ily adaptable to portable equipm ent for the in sp ector who frequently tra v e ls . H ow ever, owing to som e of the b asic lim itations of th ese techniques, v iz . u n certa in ties due to strong absorption in the ca se of uranium and consid erab le m easurem ent tim e, the A gency is a lso beginning to s tr e s s the application of active in terrogation m ethods.
The variation and com binations of the b asic NDA techniques, which have b een proposed, are being evaluated, or are actually being u sed in nuclear in sta lla tion s , are a lm ost as num erous as the configurations and com positions of nuclear m a ter ia ls . Although a technique m ay be con sid ered developed in gen era l, its e ffec tive application m ay be unique and require further developm ent effort to fit a particu lar m easurem ent case .
In a com panion paper for th is Sym posium , Dragnev et al. [9] review the p ractica l application of u sing the p a ssiv e gam m a-ray technique to m easu re the uranium enrichm ent in UFg cy lin d ers, the Pu content in h eterogen eou s w aste and ash, the quantity and iso top ic com position of Pu in bulk m ateria l, and the m easurem ent carried out on irrad ia ted fuel for id en tification p urposes or for the determ ination of burnup.
E xcellen t re su lts w ere obtained on n on-destructive determ ination of the 235U enrichm ent of low enriched uranium in UF6 cy lind ers using in tr in sic Ge d etectors [ 10]. H owever, a further developm ent effort i s d esired , particu la r ly to reduce the m easurem ent tim e of 235U content and for checking tota l uranium . T argets in m easurem ent of uranium enrichm ent in U F6 in cold trap s and containers in enrichm ent fa c il it ie s or in equipm ent being rem oved in 'black b oxes' from the m ater ia l balance area containm ent, are a ccu ra c ies of about ± 2 - 5 % at one sigm a lev e l.
Further developm ent is needed to overcom e sp ec ific problem s in verify in g bulk quantities of plutonium in store . The A gency has co -op erative arrangem ents underway with se v er a l M em ber States to im prove the accuracy of NDA for the m easu rem ent of the iso top ic and to ta l quantity of plutonium and to reduce the m easurem ent tim e [ 11 - 13]. An accuracy of about ± 3 - 5% at one sigm a le v e l for a m easurem ent tim e of about 10 m in is a reasonable goal for the im m ediate future.
An im portant developm ent item is a technique for the determ ination of the 235U content of unirradiated LWR fuel a sse m b lie s , s in ce a sign ificant fraction of the to ta l inventory and e sse n tia lly a ll the output of an LWR fuel fabrication fa c ility is in the form of a sse m b lie s , the ab sen ce of quantitative determ ination of their 235U content im p lie s use of con ta in m en t/su rveillan ce techn iques (sec tio n 2.5 of th is paper). An a sse ssm e n t of the d ifficu lties inherent in d ifferent p ossib le approaches is being m ade. A short-len gth BWR fu e l a ssem b ly which w ill se rv e as a re feren ce standard has been p rocured, and NDA exp erim en ts aim ed at attaining an accu racy of ± 2 - 3% at one sigm a le v e l for determ ining 235U content are underway. W hile NDA of the plutonium and uranium content in m ixed -oxide rods has been dem onstrated, it i s fo re see n that re se a rch and developm ent w ill be n e c e ssa r y to so lve the problem of m easu rin g plutonium and uranium content in unirradiated a sse m b lie s . The problem d ese rv e s attention.
M ethods for the m easurem ent of irrad iated fu e l have a lso been sp ec ified by the A gency as an im portant area for developm ent. F or exam ple, highly

IAEA -SM -201/101 7
enriched irrad ia ted U /A l fuel in a reactor storage pond can rep resen t a sign ificant fraction of the tota l inventory if t im e ly r e p r o ce ss in g i s not p erform ed. Even with rep ro cessin g , the r e su lts m ay not be con sid ered independent of the reactor operator o r m ay not be availab le soon enough to safeguard the reactor effec tive ly . The accuracy which the A gency is seek ing for the d eterm ination of both uranium and 235U is ± 1 - 3% at one sigm a J ev e l.
A s im ila r situation e x is ts with the determ ination of the uranium and 235U content of the core of a sp ec ific re se a rch reactor and plutonium and/or uranium and 235U content of sp ec ific c r it ica l a sse m b lie s during or after operation. An independent m ethod of determ ining the in -c o re inventory is sought sin ce the fu e l in the core rep resen ts a sign ifican t fraction , in som e c a se s 90%, of the tota l inventory and it is often the lim itin g factor in the inventory v er ifica tion for safeguards. An in itia l objective for NDA m ea su re m ent to determ ine core inventory has been se t at attaining an accuracy of ± 10% at one sigm a le v e l for plutonium and 235U.
D etectors are the m ost cru c ia l com ponents in p a ssiv e gam m a techniques. The developm ent of h igh -reso lu tion in tr in sic Ge d etectors, which require cooling only when they are in u se , is one of the m ost sign ificant ach ievem en ts in the detector fie ld in recent y ea rs. The use of h igh -re solution d etectors is n e c e ssa r y in order to perform cr it ic a l NDA m easu rem en ts by gam ma sp ectrom etry of irrad iated fuel a sse m b lie s , plutonium p la te le ts , P u 0 2 and m ixed oxide in p e lle ts , rods and certa in scrap . With the advent of high- reso lu tion in tr in s ic Ge d etectors, it becam e p o ss ib le , for the f ir s t tim e , for the A gency to m ake such m easu rem en ts in the fie ld u sing portable equipm ent. P rev io u sly , the inconvenience and other problem s inherent in transportation and the use of Ge(Li) d etectors, which require constant cooling at liquid nitrogen tem p eratu res, precluded th eir use by the Agency. The A gency has been u sing in tr in s ic Ge d etectors for m ore than four y ea r s and they have proved to be, so far, the m ost su itable h igh -reso lu tion d etectors for gam m a sp ectro m etr ic m easu rem en ts. The d etectors in u se are of the planar type with volum e up to 30 cm 3. R esolution of the A gency type of d etectors is about 2.0 keV for 60Co (1332 keV). In som e fie ld situ ation s, liquid nitrogen required to coo l in tr in sic germ anium d etectors is difficult to obtain and a m eans to m inim ize the need to u se it by u tiliz in g , for exam ple, a m iniature e le c tr ic a l cooling sy stem , is being sought.
The developm ent of a detector with reso lu tion , e ffic ien cy and r e l i ab ility com parable to in tr in sic germ anium , but which does not require cooling at a ll is of im portance to A gency safeguards. D etectors made from CdTe or Hgl cr y sta ls are a p rom isin g approach to the problem . Further re se a rch and developm ent on growing such c r y sta ls and producing the d etectors for safeguards application with a volum e of around 1 cm 3 and en ergy reso lu tion substan tia lly b etter than that of Nal(Tl) appear w ell justified .
The developm ent of e lec tr o n ic s optim ized to h igh -reso lu tion s e m iconductor d etectors req u ires m ore attention. A recen t A gency activ ity in th is area involved the u se of CdTe d etectors for gam m a m easurem ent of 235U enrichm ent in sid e LWR fu e l a sse m b lie s . To u se the CdTe detector, two m iniaturized , lo w -n o ise p re -a m p lifier s , which could be in serted b etw een the row of rods in an LWR fuel a ssem b ly , w ere developed for the A gency1.
IAEA Contract No. P O /612 /73 .

FIG .l. Several A gency specia l m iniaturized pre-am plifiers. One A gen cy/C d T e detector can be seen at the low er right listed as IAEA N o. 3 8 8 9 /2 .
FIG.2. The N okia system , i .e . 1600-ch an nel m u lti-an alyser , intrinsic germanium detector and cassettetape recorder.

IAEA -SM -201/101 9
FIG.3. Gamma high-resolution five -ch ann el analyser used with sem i-conductor detectors. The preprogramming p lu g -in m odules are seen at the le ft o f the analyser.
FIG.4. Beta reflectom eter used for rapid and precise determ ination of the uranium concentration o f powder or p e lle t sam ples.

10 LOPEZ-MENCHERO and WALIGURA
One of the sp ec ia l m iniaturized p re-a m p lifiers developed for th is purpose is shown in F ig . l . U sing CdTe d etectors of 0.1-cm 3 volum e with the optim ized p re -a m p lifier s , a reso lu tion of around 7 - 1 1 keV for the 122-keV line of 57Co w as achieved . T his is about one and a half t im e s b etter than that obtained u sing the sam e CdTe detector with a com m ercia l m odel p re-a m p lifier , and its ab ility to operate at v er y high counting ra te s is an advantage. D egradations of the en ergy spectrum at high counting ra tes greater than 50 000 p u ls e s /s w ere found to be neglig ib le.
The Nokia 1600 m ulti-ch ann el an a lyser sy stem (Nokia/G e) has been u sed by the A gency for the la st four y ea r s . The h igh -reso lu tion spectrum is recorded in the fie ld in a sm a ll d ig ita l c a sse tte tape and the data are co m p u ter-p ro cessed at H eadquarters. The sam e e lec tr o n ic s can be used for spontaneous f is s io n counting-rate m easu rem en ts. The total weight of the sy stem is 27.6 kg. In trinsic Ge d etectors with a volum e of up to 50 cm 3 m ounted in a 1 .7 -litr e Dewar w ill be u sed in the Nokia sy stem in the near future. The sy stem is su itable for a wide range of a ssa y m easurem ent prob lem s. The Nokia sy stem is shown in F ig .2.
D esp ite the many v ir tu es of the Nokia m ulti-ch ann el an a lyser , its s iz e and many sop h istica ted fea tu res render it unsuitable in som e c a se s for routine transportation by in sp ectors . T h erefore , the A gency is encouraging the developm ent of an an alyser which can b est be d escrib ed as an analogue to the stab ilized a ssa y m eter (SAM) in ter m s of operating sim p lic ity , weight and s iz e . Under an A gency contract, a five-ch an n el an a lyser sy stem (Gamm a), which can be u sed with sem i-con d u ctor d etectors such as in tr in sic Ge and CdTe, has been developed2. The Gamma is a v er y com pact sp ectrom eter, w eighing approxim ately 5 kg. A number of custom fea tu res designed to im prove ea se of operation and v e r sa tility with regard to power supply w ere built into the instrum ent. An in terestin g feature is that the particu lar peak of in te re st can be se t by p re-p rogram m ed p lug-in m odules. T his program m able feature sign ifican tly red u ces the le v e l of operator sk ill required for routine a ssa y applications of the instrum ent. The unit is shown in F ig .3 .
S evera l co m m ercia l f irm s have in itiated the developm ent of sm all, com pact equipm ent with fea tu res s im ila r to the Nokia and a m ulti-ch ann el an a lyser , w eighing about 12 kg, is expected to be operational b efore the end of th is year.
Another exam ple of a new instrum ent that the A gency is now using in in sp ection s for routine a ssa y application is a beta re flec to m eter . This instrum ent, shown in F ig .4, and developed under an A gency contract [14], d etects the in ten sity of re flec ted beta p a rtic les when u sed with powder containing uranium . T his in ten sity is d irectly proportional to the uranium concentration. The weight of the instrum ent is about 2 kg. Routine use of the beta re flec to m eter g iv es rapid determ ination of the uranium concentration of powder or p e lle ts at fa c il it ie s handling nuclear m ateria l in bulk form .T his instrum ent has dem onstrated the capability of su bstan tia lly reducing an alytica l co s ts by determ ining routinely, in one-m inute m easu rem ent tim e, the uranium concentration of the m easured sam ple with an accuracy of ± 0.1 - 0.2% at the one sigm a leve l.
A u n iv ersa lly accepted system of p h ysica l standards is a fundam ental elem en t for providing for cred ib ility of the statem ents produced by the A gency as a re su lt of its ver ifica tion a ctiv itie s on the op erator 's data. Such a sy stem
2 IAEA Contract No. P O /673 /73 .

IAEA -SM -201/101 И
would fa c ilita te the use of o n -s ite instrum entation and reduce the amount of equipm ent to be transported by the in sp ectors. D evelopm ent underway in estab lish in g the A gen cy's p hysical standards in clu d es the procurem ent of se ts of BW R/PW R p e lle ts and rod standards, a BWR m ock-up fuel a ssem b ly , U /A l p lates and an M TR-type fuel assem b ly . S pecification s for plutonium powder, p e lle ts and rods are being defined. The A gency intends to make th ese standards availab le to M em ber States for calibrating th e ir in sta lled n on -d estru ctive m easurem ent sy ste m s, checking working standards, and so on.
A fe a s ib ility study within the A gency i s underway on the design and construction of a m obile lab oratory to be put into operation in 197 6. The m obile laboratory is intended both for the transportation of NDA equipm ent, including som e p h ysica l standards, and for perform ing NDA m easu rem ents at the fa c ility s ite . The m obile laboratory i s to be equipped with a variety of p a ssiv e a ssa y sy stem s to make m easu rem ents on various s iz e s of inventory sam p les and bulk m ater ia l containers up to 5 -g a l drum s. A ctive techniques m ight a lso be carr ied out using sm a ll so u rces, i .e . 1.5 g 238PuL i, as in the A gency VERPACS, and such transportab le sy stem s m ight be included in the m obile laboratory for providing additional m easu rem ent capability .
Autom ation of m easurem ent sy stem s with r e a l-tim e output is a v ery d esirab le ach ievem ent and the A gency encourages the developm ent plans which are underway in se v er a l M em ber States and hopes to profit by th ese developm ents. The A gency m ay enter into such developm ent program m es at a la ter date.
2.4. U se of iso top ic com position data
The A gency is settin g up a bank of corre la ted iso top ic data and planning to apply, in actual v er ifica tion a c tiv itie s , the iso top ic corre la tion technique for the v er ifica tion of plutonium input in rep ro cess in g fa c il it ie s and for co n sisten cy ch ecks of data. As a lread y pointed out, th is i s the subject of a separate A gency paper [ 5].
2.5. Containment and su rveillan ce
F or the past five y ea r s , the A gency has been developing and using containm ent and su rve illan ce sy stem s for safegu ard s p urposes and has accum ulated con sid erab le exp erience in the use of such sy stem s.
Com plete op tica l su rve illan ce sy stem s in routine safeguards use co n sist of cam era , t im er , power sou rce and secu re container. Several types of s in g le -fra m e cam eras, tr ig g ered by a tim ing d evice, are u tilized . The choice of a sy stem which u se s super 8 - , 16- or 35-m m large m agazine capacity cam eras depends on the requ irem en ts of a particu lar application and the environm ent within which the sy stem should perform . Under te st i s a sy stem featuring light se n sitiv e se n so r s which can be se lec te d to fram e a defined fie ld of view , such as the area above a spent storage pond through which a fuel cask p a sse s . Any m otion in the fie ld of view causing a change in light in ten sity tr ig g e r s the cam era. Each p icture fram e photographed by th is sy stem contains date and tim e of p icture taking. In addition to the tr ig g er in g by op tica l m otion se n so r s , the cam era can be set by the in sp ector to take p ictu res reg u la r ly at chosen in terva ls.
O ptical su rv e illa n ce sy stem s which require developm ent include secu red Video a sse m b lie s for unattended su rve illan ce of a rea s for periods

12 LOPEZ-MENCHERO and WALIGURA
of three to s ix m onths in poor light or in f ie ld s of radiation which tend to fog the film . A study is now underway to determ ine the fea s ib ility of using a very sm all, v e r sa t ile , low -pow er V idicon sy stem for com pact optical im age production. A fter p ictu res have been recorded on a m agnetic tape, the tape can be rep layed on a m onitor d irectly , which e lim in ates developm ent of the film . The p o ss ib ility of a TV sy stem based on in fra -red light is a lso under study. The A gency exp ects to have a sy stem which has m any of these fea tu res ready for dem onstration tow ards the end of 1975.
In certain situ ation s, where cam eras are now in u se , the A gency has to use conventional o n -s ite wet p ro cessin g of film . Such p ro cessin g has many p rob lem s. The dry p ro cessin g curren tly availab le does not alw ays produce sa tis fa cto ry r e su lts . An im proved dry p ro cessin g m ethod for developing film in the fie ld is needed.
A M em ber State, in a joint effort with the A gency and another M em ber State, has in sta lled prototype d ev ices at an on-load fuelled nuclear power station to a s s e s s th e ir u se fu ln e ss for safeguards. T hese d ev ices con sist of a g a m m a -sen sitiv e device p laced on the conveyor tube to provide a count of spent fuel bundles p assin g to or from the cooling pond and a neutron sen sitiv e tra ck -e tch m onitor adapted to record the reactor power le v e l and to m onitor the m ovem ent of spent fuel from or to the reactor. The status of th is dem onstrative program m e is given in paper IA E A -SM -201/67 [15]. Instrum ents of th is unattended and tam p er-ind icatin g sy stem are expected to have applications in safeguarding other typ es of fa c il it ie s .
T a m p er-resis ta n t in stru m ental techniques for m onitoring the power le v e l of a rea cto r and the flow of irrad iated fuel in on -load -fu elled reactor power sta tion s with a d irect data read-out would offer a sign ificant advantage over techniques such as neutron sen sitiv e tra ck -e tch m onitors which require re tr ie v a l of the m onitor in order to p ro ce ss the f ilm or tapes. A secu red d irect read-out sy stem would, in addition to elim inating film p rocessin g , reduce the need to en ter p laces which are not alw ays a c c e s s ib le to in sp ectors . The A gency has underway the developm ent and testin g of two system s: one b ased on the u se of CdS d etectors [ 16], the second using so lar c e lls as d etectors [17].
Another su rve illan ce d evice ready for testin g in a fu e l rep ro cessin g fa c ility i s a m onitor to detect the tran sfer of so lu tions through unauthorized rou tes. The design of a re p r o ce ss in g fa c ility n orm ally p rovid es many alternative tra n sfer rou tes (pipes) to achieve operational f lex ib ility . U nauthorized or inadvertent use of such alternate rou tes is of concern to the operator and the safeguards authority. The princip le of the m onitor is based upon the shift of heat flux as detected by therm ocou ples mounted on the ex ter io r of piping which conveys a m otive force to the jet tran sfer system . The m onitor is designed for unattended use and location in an a c c e s s ib le zone such as the se rv ic e area [18].
The absence of n on -destructive ver ifica tion techniques for unirradiated fu e l a sse m b lie s w ill becom e a problem of in crea sin g concern with the advent of plutonium fuel. If the unique identity of each fu e l a ssem b ly can be estab lish ed upon fabrication and re -id en tified upon a rr iv a l at the reactor, the containm ent p rin cip le can be e ffec tiv e ly applied. Seals containing in tern al m arks (inclu sion ), e .g . cap se a ls could be used for identification of LWR fuel e lem en ts em ploying u ltrason ic techniques; how ever, objections from reactor op erators m ay m ake it d ifficult to u se them in p ractice when the se a ls are le ft on the fuel e lem en ts during th e ir irrad iation in the reactor.

IAEA -SM -201/101 13
O ptical su rve illan ce of unirradiated fuel from the point of com pletion at the fabrication plant to the entrance to the reactor m ight be the only approach le ft. More developm ent is needed in th is regard and su ggestion s of new approaches would be w elcom e.
A pplication of se a ls is now a conventional safeguards m easu re in routine u se . The A gency m eta llic se a l, cu rrently in u se , though cheap and ex trem ely sim p le to apply, has to be returned to H eadquarters for re-id en tifica tion .
The A gency is seek ing im proved v a r ie t ie s of se a ls that can be re -id e n tif ied in p lace . A M em ber State has developed a sea lin g sy stem which is based on fibre op tics and s a t is f ie s th is requ irem ent. A fter fie ld application, a light sou rce and v iew er are used to check the unique random optical fin ger-p rin t form ed by the ends of the strands of f ib r es which act as light guides and which are secu red to the connecting co llar . Any attempt to cut and r e - s e a l the fibre bundle, or to pull one end out from the co llar w ill d estroy the unique fin ger-p rin t. T his fibre optic sea lin g sy stem has undergone con sid erable developm ent during the la st few y e a r s . The A gency is evaluating th is type of sea lin g sy stem for operational use.
3. CO-ORDINATION OF SAFEGUARDS TECHNIQUES RESEARCH ANDDEVELOPMENT ACTIVITIES IN MEMBER STATES
The A gency has to r e a lis e th is program m e m ainly by co-ordinating re se a rch to be carr ied out in M em ber States. A gency fa c il it ie s are lim ited to the E lec tro n ics and M echanical W orkshops, P h y s ica l and C hem ical L ab oratories and Safeguards A nalytical L aboratory at Seibersdorf.
The A gency Safeguards' budget, which fo r e s e e s the p o ss ib ility of contracting sc ien tific s e r v ic e s from M em ber S tates and the purchasing of sc ien tific equipm ent, does not, how ever, provide for fu ll financing of a ll the cost of the sc ien tific s e r v ic e s involved. T h erefore , the rea liza tion of the program m e is conditioned by the contributions and donations of M em ber States to cover partly the cost of sc ien tific s e r v ic e s and equipment.
A team of about eight p ro fess io n a ls has been fo re see n for the appropriate co-ordination of re se a rch a c tiv itie s and p rovision of equipment.
W orking groups of exp erts from M em ber States and the lia iso n between A gency staff and different national in stitu tions have resu lted in a continuous co-ord in ation betw een the A gen cy's needs and re se a rch a c tiv itie s in M em ber States. F ifty A gency sponsored re se a r c h or tech n ica l con tracts and nine c o s t- fr e e re se a rch agreem en ts, concluded in the past five y ea r s , have contributed to the advanced statu s of developm ent techniques which are re flec ted in the Safeguards T ech nica l Manual.
Future developm ent might be b etter accom plished by form aliz ing re se a rch co-ordination p rogram m es in w ell-d efin ed a rea s of in vestigation , for instance:
(a) Installed instrum entation in fuel r e p r o ce ss in g and m ixed -oxide ■ fuel fabrication fa c ilit ie s;
(b) Installed instrum entation in uranium iso top ic enrichm ent fa c ilit ie s ;(c) Instrum ental techniques for containm ent and su rve illan ce of
re a c to rs and cr it ic a l fa c ilit ie s ;(d) P ortab le instrum entation techniques for n on -d estru ctive an alysis;

14 LOPEZ-MENCHERO and WALIGURA
(e) Control of the quality of n on -destructive an a lysis and related p h ysica l standards;
(f) P r o c e s s an a lysis f ie ld exp erim en ts and analytical quality control program m e;
(g) C orrelation of iso top ic com position data.
Some of th ese co-ordination p rogram m es are already underway.
R E F E R E N C E S
[1 ] INTERNATIONAL ATOMIC ENERGY AGENCY, IAEA Safeguards T echnical Manual Part E: Methods and T echniques, IAEA, Vienna (1975).
[2 ] INTERNATIONAL ATOMIC ENERGY AGENCY, Advisory Group M eeting on the Review o f the Status of Safeguards Techniques and Identification o f the O bjectives for their D evelopm ent in 1 9 7 6 -1 9 8 0 ,3 - 7 March 1975 , Final Rep. not published.
[3 ] POZZI, F ., Testing and demonstration in a reprocessing facility o f unattended instrumentation for determ ination o f fissile m aterial in leached hulls and for Pu content in product stream , IAEA Research Contract 1686/RB.
[4 ] TOMMASO, C ., D evelopm ent and demonstration o f advanced instrumental methods to determ ine the volum e o f an input accountab ility vessel and the residual nuclear m aterial retained in leached hulls,IAEA Research Contract 1687/RB.
[5 ] SANATANI, S . , SIWY, P., IA E A -SM -201/100, these Proceedings, Vol. II.[6 ] SZABÖ. E., BEETLE, T ., CLARK, B ., IA E A -SM -201/98, these Proceedings, Vol. II.[7 ] POZZI, F., Testing and demonstration of autom ation o f the nuclear m aterials accountability controls
at irradiated fuel reprocessing fa c ilit ie s , IAEA Research Contract 1565/RB.[8 ] WHITTAKER, A ., T esting of a gam m a absorptiom eter, IAEA Research Contract 1558/RB.[9 ] DRAGNEV, T ., DE CAROLIS, M ., KEDDAR, A .,KONNOV, Y u ., MARTINEZ-GARCIA, G ., WALIGURA, A .J.,
IA E A -S M -201/96, these Proceedings, Vol. II.[1 0 ] DRAGNEV, T ., MARTINEZ-GARCIA, G ., A ccurate non-destructive 235U enrichm ent measurements in
UF6 cylinders through gam m a spectrometry with germanium intrinsic detectors, IAEA-STR/51.[1 1 ] BEETS, C ., D evelopm ent, demonstration and application o f non-destructive instrumental techniques
for assay of P u 02 , IAEA Research Contract 1330/RB.[1 2 ] BEETS, C ., D evelopm ent and evaluation of NDA techniques for measurem ent of U and Pu at m ixed
oxide fuel fabrication plants, IAEA Research Contract 1384/RB.[1 3 ] GARDNER, N ., Evaluation and optim ization o f non-destructive techniques for m easurem ent o f bulk
m aterial (Plutonium oxide) under plant conditions, IAEA Research Contract 1692/RB.[1 4 ] INTERNATIONAL ATOMIC ENERGY AGENCY, IAEA Instruction Manual for the Use o f the Beta R eflecto-
m eter , Ш 1 No. 8, Dept, of Safeguards and Inspection, Internal Rep. (1975).[1 5 ] SINDEN, D .B., e t a l . , IA E A -S M -201/67, these Proceedings, Vol. II.[1 6 ] SOUCH, A ., D evelopm ent and testing o f irradiated fuel monitor for on-load fu elled reactor, IAEA
Research Contract 1461/RB.[1 7 ] IAEA, Int. Report.[1 8 ] GOLDER, J ., N uclear m aterial transfer m onitor, IAEA Research Contract 944/RB.
D I S C U S S I O N
V.M. SINCLAIR: One of the m ain accounting p rob lem s in rep ro cessin g is the m easurem ent of input, e sp e c ia lly as regard s volum e m easurem ent in the accountancy tank or other v e s s e l . T rends tow ards h igher fuel ratin gs, sh orter cooling t im e s and h igher fuel concentrations — which are-current developm ents in the rep ro cess in g fie ld — w ill aggravate th ese problem s b ecause of, f ir s t , h igher liquor tem p eratu res and, second, gas evolution due to r a d io ly s is . Is the A gency looking into the m easurem ent o f 11 weight" or "m ass" of the input liquor rather than volum e?

IA EA -SM -201/101 15
A .J. WALIGURA: Y es. We are collaborating, under an A gency contract, in the in sta lla tion of an autom ated and com puterized, sy stem b ased on the stra in gauge technique for w eighing and reporting the content of the input accountability , plutonium load-out and storage v e s s e ls for the Pow er R eactor and N uclear D evelopm ent Corporation, a rep ro cess in g fa c ility in Japan.
M. CUYPERS: What are the A gency's future intentions in the fie ld of the preparation, ch aracterization and distribution of p hysica l standards for NDA? And could you com m ent on a ctiv itie s in the area of control of quality in NDA and re la ted p hysica l standards.
A .J. WALIGURA: E fforts are underway to es ta b lish a com plete s e r ie s of p rim ary p hysica l standards and re feren ce m a ter ia ls for u se in the m ea su re m ent of each type of key nuclear m ateria l. S evera l s e r ie s of p hysical standards, such as low -en riched p e lle ts , PWR and BWR rod s, and plutonium p la te le ts , have already been estab lish ed . An exam ple of the procedure the A gency u se s to authenticate its p hysica l standards is given in the F inal Draft (June 1971) of the IAEA Consultants' M eeting on P h y s ica l Standards for N on-D estru ctive (NDA) M easurem ents of N uclear M aterial.
Ju st as a laboratory u se s standards or re feren ce m ater ia ls for quality control of its m ethods, so the A gency is planning to use p hysica l standards for quality control. We intend to make our authenticated p h ysica l standards availab le to M em ber States for the purpose of prim ary calibration , c r o ss calibration with working standards or c r o ss checks of n on -destructive a n a ly sis sy stem s.
G.R. KEEPIN: In view of your introductory rem ark s on portable and in -p lant NDA in stru m en ts, I would lik e to m ake it c lea r that, although I did not d iscu ss portable in stru m ents in m y paper3, we at LASL u tilize both typ es of NDA instru m ents ex ten sive ly . In the DYMAC sy stem , for exam ple, portable gam m a-ray and neutron detection equipm ent w ill be used in determ ining m ateria l hold-up in appropriate portions of the SNM p ro ce ss line.
Turning to a som ewhat broader topic, I want to take th is opportunity to com m ent rath er gen era lly on the program m e of the IAEA's D iv ision of Safeguards D evelopm ent and its tech n ica l contribution to the developm ent and use of NDA techniques and in stru m ents. We in the USERDA safeguards re se a rch and developm ent program m e at L os A lam os have been in creasin g ly im p ressed , e sp e c ia lly in the la st year or two, with the A gen cy's growing l i s t of accom p lish m en ts, a s evidenced , for exam p le, by papers p resen ted at th is Sym posium , in th is rap id ly advancing area of high technology, which i s so fundam ental to effec tive and workable safeguards. The A gency is indeed to be com plim ented on it s sign ificant contribution not only to orig inal R&D, but a lso in fo ster in g and co-ordinating R & D in M em ber States in the area of n on -destructive m easurem ent technology. I, for one, would offer ev ery encouragem ent to the A gency to continue and, as appropriate, even to expand its im portant tech n ica l contribution to e ffec tive safeguards.
A .J. WALIGURA: Thank you.
3 IA E A -SM -201/32, these Proceedings, Vol. I.


I AE А-S М -201 /82
ACTIVITIES OF THE EUROPEAN SAFEGUARDS RESEARCH AND DEVELOPMENT ASSOCIATION (ESARDA)
A. R. ANDERSON*Nuclear Materials Accounting Control Team ,AERE, Harwell,Didcot, Oxon,United Kingdom
Abstract
ACTIVITIES OF THE EUROPEAN SAFEGUARDS RESEARCH AND DEVELOPMENT ASSOCIATION (ESARDA).The role of ESARDA Is described in co-ordinating research and developm ent work related to
safeguards carried out by various organizations within the European Econom ic Com m unity. ESARDA's ob jectives, its organization, and future orientation are review ed and the results of some activ ities are described. Major attention is focused on the results of co llaborative activ ities through working groups but contributions from individual participants are also sum m arized.
1. INTRODUCTION
The European Sa fe gu a rd s R & D A s s o c ia t io n (ESARDA) e x i s t s to c o o rd in a te the re se a rc h and development work re la te d to sa fe g u a rd s c a r r ie d ou t by tho se la b o r a t o r ie s ope rated d i r e c t l y by the European Com m ission and by o th e r o r g a n is a t io n s w it h in the European Econom ic Community. F o r c l a r i t y o f p re se n t a t io n the development o f ESARDA i s not t re a te d s t r i c t l y c h r o n o lo g ic a l ly but r a th e r i t s p re se n t c o m p o sit io n , o b je c t iv e s and o r g a n is a t io n a re d e sc r ib e d f i r s t . I t s p la n s f o r the o r ie n t a t io n o f fu tu re c o l la b o r a t iv e work a re then d is c u s s e d and f i n a l l y the r e s u l t s ach ie ve d to date a re sum m arised.
2 . THE COMPOSITION OF ESARDA
A lth o u g h the name ESARDA o n ly came in t o b e in g tow ards th e end o f 1973 the o r g a n is a t io n had i t s o r i g i n in the s ig n in g o f a c o o p e ra t io n c o n t ra c t between Euratom and G fK in 1969. The purpose o f t h i s c o n tra c t was to harm onise the re se a rc h work between the two o r g a n is a t io n s and to en su re a mutual exchange o f in fo rm a t io n and t e c h n ic a l a s s i s t a n c e . S in c e then o th e r o r g a n is a t io n s from d if f e r e n t European c o u n t r ie s have p a r t ic ip a t e d in t h i s c o l la b o r a t iv e work and a t p re se n t the f o l lo w in g o r g a n is a t io n s a re re p re se n te d on ESARDA.
- A tom energ ikom m issionen (AEK-Denmark)- C en tre d *E tu d e s N u c le a ir e s (CEN-SCK Be lg ium )- C om itato N a z io n a le pe r l 'E n e r g i a N uc leare (C N E N -Ita ly )- Com m ission o f the European Com m unities (Euratom )- G e s e l l s c h a f t f ü r K e rn fo rsch u n g (G fK -F e d e ra l R e p u b lic o f Germany)- R e a c to r Centrum N ederland (RCN-Nederland)- U n ite d Kingdom Atom ic En e rg y A u t h o r it y (U KAEA-U nited Kingdom)
Present Chairman o f European Safeguards R & D Association {ESARDA).
17

18 ANDERSON
Thus ESARDA i s a un ique forum in w hich re p re se n ta t iv e s o f the s a fe gu a rd in g a u t h o r i t y (Euratom ) and R & D o r g a n is a t io n s can meet on a re g u la r and fre q u e n t b a s i s to d is c u s s and c o l la b o ra te on t h e i r R & D a c t i v i t i e s and t e c h n ic a l developm ents re le v a n t to s a fe g u a rd s . Fu rthe rm ore , a s the R & D o r g a n is a t io n s re p re se n te d on ESARDA have c lo se c o n ta c t s w ith the n u c le a r p la n t o p e ra to r s in t h e i r own c o u n t r ie s they can act a s an e f f e c t iv e two-way channe l o f com m unication on t e c h n ic a l a sp e c ts o f s a fe g u a rd s . T h is two-way f lo w o f in fo rm a t io n ha s added v a lu e in th a t t e c h n ic a l developm ents s t im u la te d by sa fe g u a rd s requ irem ents a re o fte n u s e fu l f o r o p e ra t io n a l pu rpo se s and, c o n v e r se ly , p la n t o p e ra t io n a l expe rie nce w ith measurement and o th e r accountancy te ch n iq u e s i s h e lp fu l in m a in ta in in g the re le va n ce o f s a fe g u a rd s developm ent.
I t must be em phasised, however, t h a t ESARDA i s not a forum f o r the d i s c u s s io n o f p o l i t i c a l i s s u e s r e la te d to sa fe g u a rd s r e g u la t io n s w ith in the EEC as th e re a re o th e r p ro p e r ly c o n s t it u t e d p ro cedu re s f o r the se m a tte rs.T h is d i s t i n c t i o n i s v e ry im portant as i t a llo w s the re p re se n ta t iv e s o f the s a fe g u a rd in g a u t h o r it y to c o l la b o ra te on a t e c h n ic a l b a s i s , w h ile r e t a in in g t h e i r independence a s an in s p e c t in g a u t h o r it y .
3 . OBJECTIVES OF ESARDA
The ge n e ra l purpose o f ESARDA as s ta te d in the C o n tra c t i s nto co ve r c o l la b o r a t io n on re se a rc h work in the f i e l d o f s a fe g u a rd s o f sou rce and s p e c ia l f i s s i l e m a te r ia ls 0 . T h is o b je c t iv e i s s ta te d w it h in the con te x t o f c o n s id e ra t io n s w h ich la y down the ge n e ra l d i r e c t io n o f c o l la b o r a t io n in the f i e l d o f development and a p p l ic a t io n o f n u c le a r sa fe g u a rd s and s t r e s s the te c h n ic a l and econom ic advantages to be enjoyed by such c o l la b o r a t io n . I n fu l f i lm e n t o f t h i s o b je c t iv e , i t i s p o s s ib le to s p e c i f y s u b s id ia r y aim s a s f o l lo w s .
( i ) The a vo idance o f un n e ce ssa ry d u p l ic a t io n o f s im i l a r work in d i f f e r e n t la b o r a t o r ie s .
( i i ) The e x te n s io n o f p roposed programmes to the m utual b e n e f it o f two o r more members.
( i i i ) The e xe cu tio n o f c o l la b o r a t iv e work among a l l the members in v o lv in g t e c h n ic a l programmes, w ork ing g roup s on s p e c ia l i s e d t o p ic s , s c i e n t i f i c m eetin g s, e tc .
4 . ORGANISATION
The a c t i v i t i e s o f ESARDA a re d ire c te d by a S t e e r in g Committee w hich c o n s i s t s o f r e p re se n ta t iv e s from a l l the c o n t r a c t in g p a r t ie s . I n ge ne ra l the S t e e r in g Committee dete rm ine s and im plem ents the p o l ic y o f aESARDA and in p a r t i c u la r i t s f u n c t io n s a re ,
( i ) to ha rm onise the c u rre n t perform ance o f the re se a rc h programmes under the c o n tra c t ,
( i i ) to su g g e s t ways in w hich the se programmes cou ld be adapted to fu tu re developm ent,
( i i i ) to encourage j o in t e xe cu tio n o f p a r t s o f the programme,
( iv ) to r e so lv e in d iv id u a l p rob lem s a r i s in g from such j o in t a c t i v i t i e s , and
(v ) to o r g a n ise t e c h n ic a l and s c i e n t i f i c m eetin g s.

IAEA-S М -201/8 2 19
^ STEERING COMMITTEE
PROJECT LEADERS* COMMITTEE
W orking G roups, C o l la b o r a t iv e Programmes,
T e ch n ic a l M e e t in g s
FIG. 1. Organizational structure of ESARDA.
The c o n tra c t f u r t h e r s t a t e s th a t the b a s i s f o r c o l la b o r a t io n w i l l be d e f in e d by the S t e e r in g Committee, th u s v e ry s e n s ib ly i t does no t s t ip u la t e p re c is e boundary c o n d it io n s but le a v e s the judgement on the p ro p e r a rea s f o r c o l la b o r a t io n to the c o n t in u in g a sse ssm ent and a p p ro va l by the S t e e r in g Committee.
To f u l f i l the se f u n c t io n s , the S t e e r in g Committee ha s de le ga te d much o f the d e t a ile d t e c h n ic a l work t o a v e ry s im p le s t r u c t u r e o f sub-com m ittees (F ig u re 1) to fo rm u la te p ro p o sa ls f o r c o n s id e ra t io n and a p p ro va l by the S t e e r in g Committee. Each p a r t i c ip a t in g o r g a n is a t io n ha s d e s ig n a te d a P ro je c t Leade r to be g e n e r a l ly r e sp o n s ib le f o r the c o o rd in a t io n o f i t s own R & D p ro grammes, and th e y com prise the P ro je c t Lea d e rs* Committee w h ich d e a ls w ith the d e t a ile d a n a ly s i s o f the t e c h n ic a l programmes and the r e s u l t s a r i s in g .Summarised p re se n ta t io n s , in c lu d in g recom m endations on the e x te n s io n o r in t e g r a t io n o f programmes, a re then made t o the S t e e r in g Committee f o r i t s cons id e r a t io n .
A n o th e r v e ry u s e fu l and im portant fu n c t io n o f the A s s o c ia t io n i s the o r g a n is a t io n o f W orking G roups on s p e c ia l i s e d t o p ic s o r to make d e ta ile d a rrangem ents f o r j o in t re se a rc h programmes. G e n e ra lly , the P ro je c t Leade rs* Committee w i l l fo rm u la te the o b je c t iv e s o f such w o rk in g g roup s f o r su b m iss io n to the S t e e r in g Committee and, f o l lo w in g i t s a p p ro v a l, w i l l ap p o in t a c o o rd in a t o r to be re sp o n s ib le f o r the a c t i v i t i e s o f the g roup . A t p re se n t the p r in c ip a l w o rk in g g roup s a re concerned w ith
( i ) n o n -d e s t ru c t iv e a s s a y (NDA) te ch n iq u e s,
( i i ) d e s t ru c t iv e a n a ly s i s ,

20 ANDERSON
( i i i ) i s o t o p ic c o r r e la t io n and a n a ly s i s o f in p u t to re p ro c e s s in g p la n t s , and
( iv ) in t e g r a l expe rim ents, ie expe rim ents d e s ign ed to t e s t a range o f sa fe g u a rd in g te ch n iq u e s.
There have a ls o been o th e r w ork ing groups on system s a n a ly s i s J39-421, and s e a l in g and id e n t i f i c a t io n te ch n iq u e s Г з , 17 ] b u t, as t h e i r i n i t i a l o b je c t iv e s have been l a r g e l y a ch ie ved and t h e i r work re p o rted , th e y a re a t p re se n t in abeyance.
The membership o f th e se w ork ing groups i s no t co n f in e d to p a r t ic ip a n t s in ESARDA as peop le from o th e r o r g a n is a t io n s who can and would w ish to make a p o s i t i v e c o n t r ib u t io n to t h e i r a c t i v i t i e s a re in v it e d to take p a r t . T h is has many advan tage s, p e rm it t in g , f o r example, the p a r t ic ip a t io n by re p ro c e s s in g p la n t o p e ra to r s in the w o rk in g group on i s o t o p ic c o r r e la t io n s , and o f re a c to r o p e ra to r s and fu e l f a b r ic a t o r s in the w ork ing group on s e a l in g and id e n t i f i c a t io n .
5. FUTURE ORIENTATION OF ESARDA*S WORK
In the immediate fu tu re the m ajor em phasis o f a l l ESARDA p a r t ic ip a n t s w i l l be d ire c te d tow ards the development and a p p l ic a t io n o f t e c h n ic a l m easuring sy stem s under p la n t c o n d it io n s . C o l la b o r a t io n w it h in the A s s o c ia t io n sh o u ld a s s i s t in the f i n a l development s ta g e s o f such te ch n iq u e s, a vo id u n ne ce ssa ry d u p l ic a t io n , and en su re t h e i r e a r l ie s t w idesp read a p p l ic a t io n . In a d d it io n any p la n t o p e ra to r may u se the c o l le c t iv e e x p e r t ise o f the o r g a n is a t io n s re p re se n te d in ESARDA to a s s i s t in s e le c t in g the most a p p ro p r ia te m easuring te ch n iqu e f o r h i s p a r t i c u la r a p p l ic a t io n , t a k in g in to c o n s id e ra t io n the re le v a n t t e c h n ic a l, econom ic and o p e ra t io n a l f a c t o r s in a d d it io n to the s a fe guard s re q u irem e n ts. T h is w i l l in v o lv e p a r t ic ip a n t s in ESARDA c o l la b o r a t in g to c a r r y out r ig o r o u s e v a lu a t io n s o f measurement methods and in d e ve lop in g a p p ro p r ia te s ta n d a rd s p a r t i c u la r l y in the f i e l d o f NDA te ch n iq u e s .
I t i s g e n e ra l ly re c o g n ise d th a t the ra p id grow th in the n u c le a r in d u s t r y w i l l le a d t o a c o n t in u in g need f o r a re d u c t io n in the manpower used f o r ons i t e Sa fe gu a rd s in s p e c t io n s (p e r u n it o f m a te r ia l sa fe g u a rd e d ). In o rd e r to a ch ie ve t h i s i t w i l l become in c r e a s in g l y n e c e ssa ry to automate, s ta n d a rd ise and s t re a m lin e many sa fe g u a rd in g and the co r re sp o n d in g o p e ra t io n a l a c t i v i t i e s . ESARDA w i l l c o l la b o ra te in R & D a c t i v i t i e s tow ards t h i s ge ne ra l o b je c t iv e . T h is work w i l l in v o lv e f o r example the autom ation o f m easurements, the p ro c e s s in g and t r a n s m is s io n o f d a ta , the development o f p r a c t ic a l r e a l tim e n u c le a r m a te r ia l a ccountancy sy stem s in c lu d in g s ta n d a rd ise d p ro cedu re s f o r p h y s ic a l in v e n to ry t a k in g ,a n d the more e x te n s iv e u se o f Containm ent and S u r v e i l la n c e m easures, a l l o i w h ich c o u ld p ro v id e econom ic and o p e ra t io n a l b e n e f it s bo th to the sa fe g u a rd in g a u t h o r i t ie s and to the n u c le a r p la n t o p e ra to r s . A no the r im portant fa c e t o f t h i s a c t i v i t y w i l l be to c o n s id e r to g e th e r ge ne ra l d e s ig n con ce p ts f o r new n u c le a r p la n t s w hich c o u ld le a d to a more econom ic sa fe g u a rd in g system and m in im ise in te r fe re n c e w ith p la n t o p e ra t io n s . S im i l a r l y a s the ba lan ce changes between n u c le a r f u e ls , f o r example f a s t o r h ig h tem perature re a c to r fu e l as compared t o s l i g h t l y e n r ic h e d therm al re a c to r f u e l , ESARDA w i l l endeavour to en su re th a t adequate development work i s m a in ta ined to p ro v id e m easuring sy stem s a p p ro p r ia te t o the sa fe g u a rd in g o f the fu e l c y c le w h ich i s in u se o r contem plated a t any tim e.
Some a t t e n t io n w i l l be g iv e n in the fu tu re to s p e c ia l t e c h n ic a l a sp e c ts in su p p o rt o f the p h y s ic a l p ro te c t io n o f n u c le a r m a te r ia ls . P h y s ic a l p ro t e c t io n p ro cedu re s w it h in in d iv id u a l s t a t e s in the EEC a re the r e s p o n s ib i l i t y

IA EA -SM -201/82 21
o f the re le v a n t S t a t e ’ s a u t h o r i t ie s so th a t c o l la b o r a t io n w it h in the framework o f ESARDA w i l l be r e s t r ic t e d to p u re ly t e c h n ic a l 'm a t t e r s . Such a re a s o f c o l la b o ra t io n c o u ld in c lu d e the development o f s u r v e i l la n c e and conta inm ent te ch n iq u e s , and s t u d ie s on th e p o s s i b i l i t y o f re d u c in g the " d iv e r s io n v a lu e " o f n u c le a r m a te r ia l.
6 . PRESENT A C T IV IT IE S OF WORKING GROUPS
A s one o f the main b e n e f i t s o f the c o l la b o r a t io n w it h in ESARDA a r i s e s from the a c t i v i t i e s o f the W orking G roups w h ich in c lu d e p a r t ic ip a n t s from n u c le a r p la n t s , from R & D o r g a n is a t io n s and from the sa fe g u a rd in g a u t h o r it y , i t i s u s e fu l to sum m arise the scope o f t h e i r p re se n t a c t i v i t i e s .
6 .1 . N o n -D e st ru c t iv e A s s a y Group
T h is Group has a s i t s o b je c t iv e s the s t a n d a rd is a t io n o f methods u sed f o r NDA measurement and the e s ta b lish m e n t o f a p p ro p r ia te p h y s ic a l s ta n d a rd s f o r in t e r - c a l ib r a t io n between d i f f e r e n t te ch n iq u e s. There a re extrem elyd i f f i c u l t p r a c t ic a l prob lem s to overcome in m eeting th e se o b je c t iv e s and the Group ha s s e t i t s e l f the i n i t i a l aim s o f
( i ) d raw ing up a d e t a i le d in v e n to ry o f the methods u sed and the e xpe rie nce ga ined in n u c le a r p la n t s w it h in the EEC, and
( i i ) d e v is in g a s im p le in t e r - o r g a n i s a t io n com parison e x e rc ise to t r y to g a in some s t a t i s t i c a l l y s i g n i f i c a n t in fo rm a t io n on the perform ance l im i t s o f a chosen te ch n iq u e .
Once the b a s i s o f th e work ha s been more f i r m ly e s t a b l is h e d th e re seems l i t t l e doubt th a t the Group w i l l be se e k in g a s s i s t a n c e and c o l la b o r a t io n on a w id e r in t e r n a t io n a l b a s i s .
6 .2 . D e s t r u c t iv e A n a ly s i s Group
The w ork in g group on D e s t r u c t iv e A n a ly s i s i s d i r e c t in g i t s a c t i v i t i e s tow ards
( i ) e n su r in g a c o n t in u in g su p p ly o f re le v a n t chem ica l s ta n d a rd s w it h in the EEC,
( i i ) c o n s id e r in g the m e r it s o f a r ra n g in g in t e r - p la n t comp a ra t iv e a n a ly s i s e x e r c is e s on te ch n iq u e s u sed f o r ro u t in e w ork. I n the p a st many o f the in t e r n a t io n a l in t e r la b o ra to r y com parison s have in v o lv e d s p e c ia l i s e d R & D o r g a n is a t io n s and, from bo th the com m ercial and sa fe g u a rd s v ie w p o in ts , th e re i s some m e rit in c o n s id e r in g an e x e rc ise in v o lv in g o n ly the ro u t in e chem ical la b o r a t o r ie s p ro v id in g a s e r v ic e to n u c le a r p la n t s ,
( i i i ) autom ation and a d a p ta t io n o f s p e c ia l measurement system sl i k e X - r a y f lu o re sc e n c e , mass sp ectrom etry , e tc , f o r p la n t o p e ra t io n .
6 .3 . In p u t A n a ly s i s and I s o t o p ic C o r r e la t io n Group
T h is Group i s c o n s id e r in g the prob lem s o f in p u t a n a ly s i s to re p ro c e s s in g p la n t s and the p r a c t ic a l u s e fu ln e s s o f i s o t o p ic c o r r e la t io n s . F o llo w in g d i s c u s s io n s w ith re p re se n ta t iv e s o f re le v a n t n u c le a r p la n t o p e ra to r s in Europe

22 ANDERSON
the Group concluded th a t f u r t h e r development o f the c o r r e la t io n techn ique cou ld be u s e fu l f o r both sa fe g u a rd s and o p e ra t io n s . In c re a se d con fid ence in the a p p l ic a t io n o f th e te ch n iq u e , however, s t i l l depends on c o l le c t io n o f s u f f i c i e n t da ta w hich have been generated in ro u t in e a n a ly s i s a s w e ll a s tho se ob ta in e d in expe rim enta l a c t i v i t i e s . I n o rd e r t o g a in the maximum b e n e f it from th e se da ta an i s o t o p ic c o r r e la t io n d a ta bank has been se t up a t the I s p r a e s ta b lish m e n t so th a t in fo rm a t io n p ro v id e d by European u t i l i t i e s on a c o n f id
e n t ia l b a s i s can be e va lu a te d to p ro v id e a b e t te r u n d e rsta n d in g o f the c o r re c t c o r r e la t io n s . In p ro v id in g the se data the v a r io u s u t i l i t i e s have been a ssu re d th a t no in fo rm a t io n w i l l be re le a se d w ithou t t h e i r agreement as t h i s i s e s s e n t i a l l y an R & D e x e rc is e . A s ye t the data c o l le c t io n ha s concent ra t e d on heavy is o to p e c o r r e la t io n s but the w o rk in g group i s en cou rag ing e xpe rim enta l a c t i v i t i e s in the f i e l d s o f f i s s i o n gas c o r r e la t io n s and o th e r f i s s i o n p roduct c o r r e la t io n s . The group i s a ls o c o n s id e r in g the r e la t io n s h ip between v a r io u s inp u t a n a ly se s and i s o t o p ic c o r r e la t io n s th u s p ro v id in g a l i n k w ith the w ork ing group on in t e g r a l expe rim ents. Members o f the group a re a s s i s t i n g the In t e r n a t io n a l Atom ic Ene rgy Agency (IA EA ) in s e t t in g up a s im i l a r d a ta bank.
6 . 4 . W ork ing Group on In t e g r a l Expe rim en ts
T h is group i s concerned w ith the development and e xe cu tio n o f experim ents in w h ich v a r io u s sa fe g u a rd s te ch n iq u e s a re employed to a c o n t r o l le d p ro d u c t io n campaign o v e r a s i g n i f i c a n t p e r io d o f t im e . I n g e n e ra l the main o b je c t iv e s o f such expe rim ents in c lu d e the e v a lu a t io n o f measurement e r r o r s , the t e s t in g o f d i f f e r e n t in stru m e n ts and te ch n iq u e s, and the a n a ly s i s o f "o p e ra t in g l o s s e s " , a l l d ire c te d tow ards c lo s in g the m a te r ia l ba lance f o r an a c tu a l cam paign.
One o f the m ajor e x e rc ise s in t h i s f i e l d was the M o l - I I I experim ent at Eurochem ic in Be lg ium w h ich has been re p o rted e lsew here £ l ] . A t p re se n t the group i s concerned w ith com p le ting i t s su c c e s so r , the M o l - IV experim ent. The f i r s t p a rt o f the experim ent was concerned w ith PWRs, the re p o rt o f which has a lre a d y been is su e d £2] , w h ile the second p a rt i s concerned w ith BWRs and i t i s hoped to re p o rt the se r e s u l t s tow ards the end o f 1975 o r the b e g in n in g o f 1976. I t i s o f in t e r e s t to note the wide ra n g in g c o l la b o r a t io n in t h i s l a t t e r e x p e r iment in v o lv in g in a d d it io n to ESARDA, re p re se n ta t iv e s from ACDA, B M I, GE, USA; CEA, EDF, F rance ; ENEL, I t a l y ; Eurochem ic, NEA; GKN, N e th e rlan d s; IAEA.In the se expe rim ents the f o l lo w in g measurements were made a t the inpu t to the re p ro c e s s in g p la n t .
B e fo re D i s s o l u t io n
( i ) Gamma measurements o f some f i s s i o n p roduct r a t io s on the ir r a d ia t e d fu e l a s se m b lie s , in the re a c to r s to ra g e poo l and at Eurochem ic. .
( i i ) F i s s i o n p roduct and mass spectrom etry measurements on re p re se n ta t i v e sam ples o f the fu e l p e l le t s b e fo re d i s s o lu t io n .
F o llo w in g D i s s o lu t io n
( i ) C o n ve n tio n a l vo lum e/concen tra t ion m easurements.
( i i ) P lu ton ium /uran ium r a t io s by c o n v e n t io n a l a n a ly s i s and by mass spectrom etry .
( i i i ) Mass sp ectrom etry measurements o f p lu ton ium and uran ium iso to p e com p o sit io n .
( iv ) Gamma measurements o f some f i s s i o n p roduct r a t i o s .

IA EA -SM -201/82 23
I t i s o f cou rse d i f f i c u l t to sum m arise the r e s u l t s o f su ch e x te n s iv e expe rim ents in a few words but i t i s p o s s ib le to re co rd the ge n e ra l c o n c lu s io n s a s f o l lo w s .
( i ) I f used w ith ca re the v a r io u s measurement and i s o t o p ic c o r r e la t io n methods f o r in p u t a n a ly s i s can be u sed e f f e c t i v e l y as a c r o s s check on the f i s s i l e m a te r ia l con te n t, w h ich i s im portant from the v e r i f i c a t i o n v ie w p o in t.
( i i ) The data gathered on i s o t o p ic c o r r e la t io n s p ro v id e a v e rys i g n i f i c a n t in p u t to the e x i s t in g d a ta banks and th e re fo re to o u r ge ne ra l u n d e rsta n d in g o f the a p p l i c a b i l i t y o f i s o t o p ic c o r r e la t io n s .
( i i i ) R e s u lt s from i s o t o p ic c o r r e la t io n s can show v e ry r a p id ly any unexpected r e s u l t s f o l lo w in g d i s s o l u t io n o f an in d iv id u a l ba tch o f f u e l e lem ents, w h ich cou ld be u s e fu l to the. p la n t o p e ra to r .
The fu tu re in t e n t io n s o f the group are to e s t a b l i s h d a ta on f i s s i o n p roduct r a t io s and heavy iso to p e r a t io s by p o s t - i r r a d ia t io n e xam ination (P IE ) o f i r r a d ia t e d m ixed uran ium /p lu tbn ium ox id e f u e ls in advance o f re p ro c e s s in g . These da ta w i l l p ro v id e a u s e fu l b a s i s f o r com parison when e v e n tu a l ly i t i s p o s s ib le to compare them w ith d a ta f o l lo w in g d i s s o l u t io n at a re p ro c e s s in g p la n t .
7. SURVEY OF RESULTS TO DATE
In sum m arising the r e s u l t s o f an e x te n s iv e range o f work c a r r ie d ou t by ESARDA members th e re must a lw ays be some a r b i t r a r y ch o ice in the method o f p re se n ta t io n . However, to s t r e s s the e s s e n t ia l in t e g r a t io n o f the a c t i v i t i e s o f ESARDA p a r t ic ip a n t s the summary o f a c t i v i t i e s i s f i r s t p re se n ted in term s o f o b je c t iv e s r a th e r than by l i s t i n g the in d iv id u a l c o n t r ib u t io n s o f the v a r io u s members. The names o f the o r g a n is a t io n s p a r t ic ip a t in g in each a rea o f a c t i v i t y are a ls o g iv e n and i t i s hoped th a t the f o l lo w in g method o f p re s e n ta t io n w i l l be the most u s e fu l .
( i ) Development and a p p l ic a t io n o f s p e c i f i c measurement te ch n iq u e s,
( i i ) Improvements in n u c le a r m a te r ia l accountancy.
( i i i ) Development and e v a lu a t io n o f s u r v e i l la n c e and containm ent te c h n iq u e s .
( i v ) O the r t e c h n ic a l o b je c t iv e s .
These t e c h n ic a l c o n t r ib u t io n s a re sum m arised in Tab le I w h ich i s d e s ign ed a s a s im p le re fe re n ce document to in d ic a te in a s u c c in c t form the o b je c t iv e o f the w ork, the m a te r ia ls in v o lv e d , the te ch n iqu e used and o r g a n is a t io n s who have p a r t ic ip a t e d in some way o r o th e r .
Much o f the work sum m arised in t h i s t a b le ha s a lre a d y been p re sen ted at the ESARDA Rome Symposium [д] and the re m a in in g p a rt o f t h i s s e c t io n o£ the paper s im p ly h ig h l i g h t s some exam ples o f work perform ed by the d if fe r e n t members. I t sh o u ld r i g h t l y be em phasised a t t h i s p o in t th a t some o f the work c a r r ie d ou t b y ESARDA members ha s been perform ed under IAEA development con tr a c t s th u s dem on stra t in g the in t e r n a t io n a l in t e g r a t io n o f t h e i r sa fe g u a rd s a c t i v i t i e s .
T e x t con tinues on p .29

to4^
TABLE I SUMMARY OF ESARDA A C T IV IT IE S ANALYSED BY TECHNICAL OBJECTIVES
1. PRACTICAL MEASUREMENT SYSTEMS
OBJECTIVE MATERIAL TECHNIQUE ORGANISATIONS INVOLVED
Uranium Enrichm ent Measurement
UFg Gamma sp e c tro m e try ) P a s s iv e ne u tron )
UKAEA ( + IAEA ) RCN (+US)
U02 (b u lk ) Gamma sp e c trom e try CEN, UKAEA, G fK
U02 (LWR fu e l) Gamma sp e c trom e try CEN, UKAEA
MTR fu e l Gamma sp e c trom e try RCN, Euratom
U -235 con tent Measurement
U02 (LWR fu e l) Gamma sp e c trom e try CEN
MTR fu e l Gamma sp e c trom e try Eu ra tom , UKAEA, AEK
U-Th f u e l e lem ents A c t iv e neu tron Gamma sp ectrom etry
Eu ratom , GfK
T o ta l U con tent and C o n c e n tra t io n
MTR fu e l Gamma a b so rp t io n RCN, Euratom
U s o lu t io n s Gamma/X-ray a b so rp t io n UKAEA, CNEN
Automated X - r a y f l u o r . G fK ( a l s o f o r a c t iv e d i s s o l v e r s o lu t io n )
Pu I s o t o p ic C om posit ion
A l l Pu Automated mass sp e c t . G fK, Euratom
AN
DE
RSO
N

TABLE I( c o n t i n u e d )
1. PRACTICAL MEASUREMENT SYSTEMS ( con tin ue d )
OBJECTIVE MATERIAL TECHNIQUE ORGANISATIONS INVOLVED
T o ta l Pu con ten t and co n c e n t ra t io n
Pu p la t e le t s ) O x id e s )
Gamma sp ectrom etry P a s s iv e neu tron
UKAEA, Euratom
Pu s o lu t io n s Gamma/X-ray a b so rp t io n X - r a y f lu o re sc e n c e
UKAEA, CNEN, G fK
Pu fu e l p in s Gamma sp e c t + a b so rp *n P a s s iv e neu tron
GfKEuratom
Thorium con te n t U-Th f u e ls Gamma sp ectrom etry GfK
I r r a d ia t e d fu e l MTR f u e ls Gamma spectrom etry RCN, AEK, CEN, Euratom
Gamma a b so rp t io n RCN, Euratom
LWR f u e ls Gamma sp e c trom e try CEN, Euratom
D is s o l v e r s o lu t io n Gamma sp e c trom e try CEN, Euratom
Automated X - r a y f l u o r . GfK
W aste Accountancy Uranium waste Gamma sp e c trom e try A c t iv e neu tron
UKAEAG fK , Euratom
P lu ton ium w aste Gamma sp ectrom etry P a s s iv e neu tron
UKAEA, G fKUKAEA, Euratom , GfK
Leached h u l l s Gamma sp ectrom etry A c t iv e neu tron
UKAEA, G fK UKAEA, G fK
toСЛ
IAE
A-S
M-201/82

to05
TABLE I 2 . IMPROVEMENT OF NUCLEAR MATERIAL ACCOUNTANCY(co n t in u e d )
OBJECTIVE MATERIAL TECHNIQUE ORGANISATIONS INVOLVED
Improvement o f A ccu ra cy and E f f i c ie n c y o f A ccou n t in g
A l l U se o f com puters UKAEA, GfK
E r r o r p ro p a g a t io n ) s t u d ie s )
G fK, RCN, UKAEA
System a n a ly s i s AEK, CEN, Euratom , G fK, RCN, UKAEA
P la n t measurements CEN, CNEN, UKAEA, G fK, Euratom
In t e r la b o r a t o r y t e s t s CEN, Euratom , GfK, RCN, UKAEA
Improvements to re co rd -k e e p in g and re p o r t in g
A l l Report form d e s ig n AEK, Euratom
A ssu ra n ce o f c o n s is t e n c y o f accountancy data
A l l I s o t o p ic c o r r e la t io n CEN, Eu ra tom , CNEN, UKAEA, GfK
AN
DE
RSO
N

TABLE I( c o n t i n u e d )
3 . DEVELOPMENT & EVALUATION OF SURVEILLANCE & CONTAINMENT TECHNIQUES
OBJECTIVE MATERIAL TECHNIQUE ORGANISATIONS INVOLVED
A ssu ra n c e o f in t e g r i t y o f c o n ta in e r s , e tc
B u lk m a te r ia ls ) F u e l a sse m b lie s )
T a m p e r-in d ic a t in g s e a ls
Euratom , CNEN
P la n t s o lu t io n s A ccountancy tan k Measurem ents
GfK
S u r v e i l la n c e o f d iv e r s io n ro u te s
A l l Doorway m o n ito rs Cameras
G fK, UKAEA RCN (+US)
R e a c to r d isc h a rg e m o n ito r in g
Ir r a d ia t e d fu e l Gamma a c t i v i t y d e te c t io n
UKAEA
R e a c to r power m o n ito r in g
N eutron f l u x i n t e g 'n Thermal power i n t e g 'n T rack e tch m on ito rs
AEKAEKUKAEA ( + IAEA )
to
IAE
A-SM
-201/82

to00
TABLE I 4 . OTHER TECHNICAL OBJECTIVES(con t in u e d )
OBJECTIVE MATERIAL TECHNIQUE ORGANISATIONS INVOLVED
P r o v i s io n o f s ta n d a rd s f o r NDA
A l l A l l te ch n iq u e s ( f o r c a l ib r a t io n )
Euratom , G fK, UKAEA
Improvement o f sam p lin g methods
A l l D e s t r u c t iv e a n a ly s i s methods
Euratom
O p t im isa t io n o f Sa fe gu a rd s e f f o r t
In t e g r a l expe rim ents on s p e c i f i c p la n t s
GfK, CNEN, CEN
Sa fe gu a rd s T r a in in g C o u rse s
O r g a n is a t io n o f c o u rse s o f in s t r u c t io n
Euratom
In t e r n a t io n a l l i a i s o n on Sa fe gu a rd s m atte rs
P a r t ic ip a t io n in in t e r n a t io n a l m eetin gs, a n a ly t ic a l e x e r c is e s , e tc
A E K , CEN, Euratom CNEN, G fK, RCN, UKAEA
P r o v is io n o f S tan d a rd s f o r d e s t ru c t iv e a n a ly s i s
A l l A l l te ch n iq u e s ( f o r c a l ib r a t io n )
Euratom
ANDER
SON

IAEA -S M -201/82 2 9
7.1» A tom energikom m issionen (Denmark)
AEK have made s t u d ie s c o n ce rn in g the in t e g r a t io n o f Sa fe g u a rd s re p o r t in g requ irem ents w ith th o se o f the n a t io n a l accountancy system [[4]. They have a ls o re p o rte d on e a r l i e r e xpe rie nce w ith , in t e r a l i a , ru n n in g sy stem s f o r the measurement and in t e g r a t io n o f r e a c to r therm al power and re a c to r neu tron f lu x , both o f w h ich have been in o p e ra t io n s in c e 1969.
7 .2 , C en tre d fE tu de s N u c le a ire s (B e lg iu m )
A s w e ll as t h e i r v a lu a b le c o n t r ib u t io n in c o - o rd in a t in g the M o l - IV e x e rc is e (a lr e a d y d e s c r ib e d ) , CEN a ls o took an a c t iv e p a rt in the e a r l i e r M o l - I I I e x e rc ise [ lj . They have a ls o been p a r t i c u la r l y a c t iv e in a p p ly in g s im p le gamma sp e c t ro m e tr ic te ch n iq u e s to the measurement o f uran ium enrichm ent and U -235 con ten t under p la n t c o n d it io n s in c lu d in g work on i r r a d ia t e d fu e l e lem ents £5] . P a r t ic u l a r m ention may be made o f the u se o f s t a b i l i s e d gamma s c i n t i l l a t i o n c o u n te rs to measure the enrichm ent o f incom ing package s o f low - e n r ic h e d UO2 £ б ] . The in f in i t e - d e p t h c o u n t in g tech n iqu e was u sed w ith a measurement tim e o f o n ly 30 second s p e r package. The o v e r a l l r e la t iv e s ta n d a rd d e v ia t io n (RSD) compared w e ll w ith the p r e c i s io n o f mass sp e c t ro m e tr ic measurements on the same m a te r ia l,
7 .3 . Com itato N a z io n a le p e r l * E n e r g ia N uc leare ( I t a l y )
CNEN have undertaken s t u d ie s o f d e s t ru c t iv e a n a ly s i s o f U and Pu £ 7- 9] and o f f i s s i l e m a te r ia l c o n t r o l methods at the Pu fu e l f a b r ic a t io n p la n t at C a sa c c ia [io j and a t the Eu rex re p ro c e s s in g p la n t £ l l ] . I n co n n e c t io n w ith the l a t t e r p a r t i c u la r a t t e n t io n sh o u ld be drawn to the developm ent o f th e Time Domain R e fle c to m e try (TDR) te ch n iqu e [12J f o r the measurement o f l i q u id le v e l s in p la n t accountancy ta n k s and m ixe r s e t t l e r u n i t s and to developm ent o f the X - r a y a b so rp t io m e te r (MAX-1) f o r Pu and U co n tin u o u s d e te rm in a tio n [13] . In the TDR method a s p e c ia l l y d e s ign ed c o a x ia l probe d ip s in t o the s o lu t io n in the tan k and i s connected to a s i g n a l g e n e ra to r and m easuring sy stem . The p o s i t io n o f the l i q u i d le v e l in the tan k i s determ ined by m easuring the tim e taken f o r r e f le c t io n o f a s i g n a l from the d i s c o n t in u i t y o f the probe impedance w hich o c c u rs a t the s o lu t io n s u r fa c e . The system i s capab le o f m easuring l i q u id depth to ± 2 mm.
The MAX-1 m easu ring head i s a s t a t i c compensated doub le beam a b so rp t io n system . The two beams o u tp u ts a re p ro ce ssed and the r e s u l t i s re corded by a d a ta p r in t e r . The system can be used to measure Pu and U c o n c e n t ra t io n s in pure s o lu t io n s o r in s o lu t io n s , in c lu d in g e f f lu e n t s , s l i g h t l y contam inated w ith f i s s i o n p ro d u c ts o r o th e r im p u r it ie s . The minimum d e te c t io n le v e l i s 0 . 5 g/1 up to a maximum o f 150 g / l. Advantages o f the MAX-1 in c lu d e e x c e lle n t s t a b i l i t y and r e p r o d u c ib i l i t y , the absence o f b u lk y m oving p a r t s and compactn e s s .
7 .4 , Com m ission o f the European Com m unities
The jJo in t R e sea rch C en tre o f Euratom (JRC) ha s .a la r g e R and D programme c o v e r in g a lm ost a l l a sp e c ts o f sa fe g u a rd s , in c lu d in g system a n a ly s i s s t u d ie s o f the com plete a p p l ic a t io n o f s a fe g u a rd s m easures to r e a l p la n t s . A la r g e amount o f work i s perform ed in a s s i s t i n g the Sa fe gu a rd s D ire c to ra t e on the p r a c t ic a l p rob lem s encountered^ d u r in g the a c tu a l a p p l ic a t io n o f sa fe g u a rd s . P a r t ic u l a r no te sh o u ld be taken o f the JRC a c t i v i t y in the f i e l d s o f i s o t o p ic c o r r e la t io n s , n o n -d e s t ru c t iv e a s s a y (NDA) methods and conta inm ent and s u r v e i l la n c e m ethods. T h e ir c o n t r ib u t io n t o the f i e l d o f i s o t o p ic c o r r e la t io n s ha s a lre a d y been sum m arised (S e c t io n 6 . 3 . )

30 ANDERSON
S e v e ra l NDA in s t r u m e n ts , ba se d on th e u se o f n e u t ro n and gamma te c h n iq u e s , ha ve been d e v e lo p e d w h ic h ha ve fo u n d a w id e a p p l i c a t io n f o r s a fe g u a rd s o p e ra t i o n s i n n u c le a r p la n t s . O f p a r t i c u l a r i n t e r e s t i s th e d e v e lo p m e n t o f th e V a r ia b le D e a d - t im e C o u n te r (VDC) f o r th e m easurem ent o f th e sp o n ta n e o u s f i s s i o n n e u t ro n a c t i v i t y o f p lu t o n iu m - c o n ta in in g m a te r ia ls £ l4 ] . I n e x p e r i m en ts c a r r ie d o u t i n f a b r i c a t i o n and r e p ro c e s s in g p la n t s , t h i s in s t r u m e n t p ro v e d t o be an e x t r e m e ly u s e fu l t o o l f o r th e c o n t r o l o f p lu to n iu m f u e ls in d i f f e r e n t fo rm s (w a s te , s c ra p , r o d s ) . D a ta a n a ly s is f o r th e VDC has been a u to m a te d b y u s in g a s m a ll c o m p u te r .
O th e r w o rk in c lu d e s th e d e v e lo p m e n t o f gamma s c a n n e rs f o r th e c o n t r o l o f MTR f u e ls [15] and o f an a p p a ra tu s , ba sed on th e d e la y e d n e u t ro n te c h n iq u e , f o r th e c o n t r o l o f HTR f u e l p e b b le s £l6 ] . These in s t r u m e n ts ha ve been i n s t a l le d i n f u e l f a b r i c a t i o n p la n t s and a re r o u t i n e l y u t i l i s e d f o r s a fe g u a rd s o p e r a t io n s .
I n th e c o n ta in m e n t and s u r v e i l l a n c e f i e l d , th e JRC has d e v e lo p e d a s y s te m o f u n iq u e ly i d e n t i f i a b l e s e a ls , u s in g th e random d i s t r i b u t i o n o f in c lu s io n s o r d e fe c ts i n a p l a s t i c o r m e t a l l i c m a t r ix as th e u n iq u e f e a tu r e [3] . The d i s t r i b u t i o n o f th e in c lu s io n s i n a p a r t i c u l a r s e a l can be d e te rm in e d b y s tu d y in g t h e i r u l t r a s o n i c r e f l e c t i o n s and a s p e c ia l a p p a ra tu s has been d e v e loped f o r t h i s p u rp o s e £17] • I n o r d e r t o v e r i f y th e i n t e g r i t y o f th e s e a l , a se co n d m easurem en t o f th e u l t r a s o n i c r e f l e c t i o n p a t t e r n i s made and com pared w i t h th e o r i g i n a l . S e a ls ha ve be en d e v e lo p e d w h ic h can be f i t t e d t o b o th MTR and LWR f r e s h and i r r a d i a t e d f u e l e le m e n ts , as w e l l as a ty p e s u i t a b le f o r g e n e ra l u se on c o n t a in e r s . P r a c t i c a l a sse ssm e n t t e s t s a re i n p ro g re s s p t7 b | .
7«5« G e s e l ls c h a f t f u r K e rn fo rs c h u n g , F e d e r a l R e p u b l ic o f G e r m a n y
G fK ha ve made an im p o r ta n t c o n t r i b u t io n t o s a fe g u a rd s t h in k in g in g e n e ra l and t o th e d e v e lo p m e n t o f b a s ic f e a tu r e s o f an in t e r n a t io n a l s y s te m o f s a fe g u a rd s u n d e r th e n o n - p r o l i f e r a t i o n t r e a t y £18- 25] • A t p r e s e n t th e y a re m a in ly in v o lv e d i n th e a n a ly s is and s o lu t io n o f p r a c t i c a l p ro b le m s a s s o c ia te d w i t h th e im p le m e n ta t io n o f i n t e r n a t io n a l s a fe g u a rd s s y s te m s .
I n th e a re a o f s y s te m a n a ly s e s , G fK ha ve d e v e lo p e d among o th e r s fo r m a l is e d m e thod s f o r s ta te m e n ts t o b e made b y s a fe g u a rd s o r g a n is a t io n s on th e b a s is o f t h e i r v e r i f i c a t i o n a c t i v i t i e s , on th e o p t im is a t io n o f in s p e c t io n e f f o r t s , f o r d e te rm in in g th e d i f f e r e n t com pone n ts o f MUF ( M a t e r ia l U n a cco u n te d F o r ) and f o r th e e v a lu a t io n o f v a r io u s e r r o r com pone n ts o f a m easurem en t s y s te m 26- 28] .
G fK in t r o d u c e d th e id e a o f i n t e g r a l e x p e r im e n t i n th e f i e l d o f s a fe g u a rd s R & D w o rk . Up t o th e p r e s e n t t im e , th e y ha ve c a r r ie d o u t 5 i n t e g r a l e x p e r im e n ts i n p lu t o n iu m - f a b r ie a t io n and re p ro c e s s in g p la n t s £ l , 29—3 т| • in c lu d in g o r g a n is a t io n o f th e M o l - I I I e x p e r im e n t and p a r t i c i p a t i o n in th e M o l- IV e x p e r im e n t £2 ] .
One c o n t r i b u t io n o f p a r t i c u l a r v a lu e i n th e g e n e ra l c o n te x t o f i n t e r n a t io n a l c o l l a b o r a t i o n was th e p la n n in g , o r g a n is a t io n and e v a lu a t io n o f th e ID A -7 2 e x e r c is e , i n w h ic h 22 la b o r a t o r ie s f ro m 11 c o u n t r ie s p a r t i c i p a t e d in an in te r c o n ip a r is o n o f th e i s o t o p ic d i l u t i o n a n a ly s is m e thod f o r th e d e te rm in a t i o n o f u ra n iu m and p lu to n iu m c o n te n ts i n in p u t and p r o d u c t s o lu t io n s fro m a r e p ro c e s s in g p la n t £ ) 2 ] , I n t e r - l a b o r a t o r y RSDs ra n g e d fro m a b o u t 0 .5 - 0 .9 % f o r U and Pu c o n c e n t r a t io n s , w i t h P u /U r a t i o v a lu e s h a v in g RSDs ra n g in g fro m a b o u t 0 .6 - 1 .4 %.
I n th e p a s t a c o n s id e r a b le am ount o f e f f o r t h a s been d i r e c t e d b y th e G fK to w a rd th e d e v e lo p m e n t and in v e s t ig a t i o n o f n o n - d e s t r u c t iv e m easurem ent te c h n iq u e s f o r s a fe g u a rd s and p ro c e s s c o n t r o l p u rp o s e s . B o th gamma s p e c t ro m e try

IA EA -SM -201/82 31
and n e u t ro n c o in c id e n c e te c h n iq u e s ha ve been d e v e lo p e d f o r th e a s s a y o f U and Pu i n r e a c t o r f u e l s | з з ] i i n c lu d in g an o n - l i n e m e thod f o r U -23 5 i n UO2 p o w d e r[ 3 4 ] , and f o r th e a s s a y o f p lu t o n iu m - c o n ta in in g w a s te s [ 3 5 j .
A n o th e r im p o r ta n t a s p e c t o f th e G fK e f f o r t i s th e a u to m a t io n and a d a p ta t i o n o f d e s t r u c t i v e m e thods o f a n a ly s e s f o r s a fe g u a rd s and p la n t r e q u ire m e n ts . I n p a r t i c u l a r t h i s ha s been a im ed a t th e X - r a y f lu o r e s c e n c e £36] and mass s p e c t r o m e t r ic m e thod s £37] j w i t h a u to m a t ic sam p le p r e p a r a t io n p ro c e s s e s and in s t r u m e n t lo a d in g and o p e r a t io n r e s u l t i n g i n im p ro v e d r e p r o d u c i b i l i t y , f a s t e r a n a ly s is , and a r e d u c t io n o f th e e f f o r t r e q u ir e d [ 38] .
7 , 6 , R e a c to r C e n tru m N e d e r la n d
The m a in c o n t r ib u t io n s fro m RCN ha ve been i n th e f i e l d s o f s t a t i s t i c s and e r r o r p r o p a g a t io n [3 9 - 4 з ] ( e s p e c ia l l y in th e ESARDA sy s te m a n a ly s is w o rk in g g r o u p ) , d e s t r u c t i v e a n a l y t i c a l m e thod s £ 4 4 -4 5]1 and s e m i- c o n d u c to r gamma s p e c t r o m e t r y [4 6 - 4 8 ] . P a r t i c u la r m e n t io n m ust be made o f th e te c h n iq u e s f o r gamma s p e c t r o r a e t r ic d e te r m in a t io n o f is o to p e r a t i o s w i t h o u t r e fe r e n c e t o e x te r n a l s ta n d a rd s [ 4 8 ] .
7 .7 * U n i te d K ingdom A to m ic E n e rg y A u t h o r i t y
The i n i t i a l in p u t o f th e UKAEA t o ESARDA in c lu d e d an e x te n s iv e b a c k g ro u n d o f w o rk on S a fe g u a rd s R & D i n v o l v in g , f o r e x a m p le , d e v e lo p m e n t o f NDA t e c h - n iq u e s [ 4 9 - 5 2 ] , s t a t i s t i c a l s a m p lin g p la n s [5 3 -5 4 | and v e r i f i c a t i o n p ro c e d u re s[ 5 5 - 5 6 ] .
M ore r e c e n t l y management c o n s id e r a t io n s w i t h i n th e UKAEA ha ve le d t o th e d e s ig n , c o n s t r u c t io n and c o m m is s io n in g o f a m o b i le la b o r a t o r y f o r n o n -d e s t ru c t i v e m easurem en ts on n u c le a r m a t e r ia ls . T h is la b o r a t o r y i s e q u ip p e d w i t h a ra n g e o f in s t r u m e n ts in c lu d in g gamma s p e c tro m e te rs ( f r o m s in g le c h a n n e l t o m u lt i - c h a n n e l a n a ly s e r s ) , c o in c id e n c e n e u tro n c o u n t in g e q u ip m e n t, and th e G u l f i s o t o p ic s o u rc e a ss a y sy s te m ( IS A S ) . D u r in g th e c o m m is s io n in g phase o f th e la b o r a t o r y v i s i t s ha ve been made t o a l l UKAEA e s ta b l is h m e n ts , t o a sse ss th e p ro b le m s in v o lv e d i n i t s o p e r a t io n and t o gauge th e e f f e c t iv e n e s s o f th e m e thod s use d [ 5 7 ] . A m o s t e f f e c t i v e m e thod was fo u n d t o be th e c o n s is te n c y t e s t , i n w h ic h o p e r a to r s d a ta a re p l o t t e d a g a in s t s u i t a b le ND m easurem ent r e s u l t s ; in c o n s is t e n t r e s u l t s a re e a s i l y i d e n t i f i e d and can be s u b je c te d t o f u r t h e r in v e s t ig a t i o n .
8 . SUMMARY AND CONCLUSIONS
In d e s c r ib in g th e w o rk o f ESARDA we have t r i e d t o show th e e x te n t o f t e c h n ic a l c o l l a b o r a t i o n w h ic h e x i s t s w i t h in th e EEC i n th e f i e l d o f s a fe g u a rd s . U n d o u b te d ly th e r e a l b e n e f i t s , as w e l l as th e u n q u a n t i f ia b le a d v a n ta g e s , a r i s i n g fro m t h i s c o l la b o r a t io n a re g r e a te r th a n th e sum o f th e i n d i v id u a l p a r t s ; i t i s e x p e c te d t h a t w h a t has been a c h ie v e d so f a r w i l l a c t as a f i r m b a s is f o r th e c o n t in u in g d e v e lo p m e n t o f a t e c h n i c a l l y - e f f e c t i v e and c o s t - e f f e c t i v e s a fe g u a rd s s y s te m . I n so d o in g , o f c o u rs e , th e p re s e n t i n d i v id u a l and c o l l e c t i v e i n t e r a c t i o n w h ic h i s e n jo y e d w i t h th e IAEA and many o r g a n is a t io n s i n d i f f e r e n t c o u n t r ie s w i l l be f u r t h e r d e v e lo p e d t o o u r m u tu a l b e n e f i t .
REFERENCES
T i ] KRAEMER, R . , BEYRICH, W ., J o in t I n t e g r a l S a fe g u a rd s E q u ip m e n t (JEX f O ) ^ a t th e E u ro c h e m ic R e p ro c e s s in g P la n t , M o l, B e lg iu m . J o in t E u ra to m /G fK
r e p o r t EUR 45 76e , KFK 1 1 00 , ( 1 9 7 1 ) .

32 ANDERSON
[ V ] BEETS, C . , c o n t r ib u t io n s t o th e J o in t S a fe g u a rd s P r o je c t , M o l- IV , CEN R e p o r t BLG 486 ( 1 9 7 3 ) .
[ 3 ] P r a c t i c a l A p p l ic a t io n s o f R & D i n th e F ie ld o f S a fe g u a rd s (P ro c o f ESARDA Sym posium , Rome, M a rch 1 9 7 4 ) . CNEN Rome (1 9 7 5 ) .
£ 4 j FREDERIKSEN, P . , F e a tu re s o f th e D a n is h S ys tem o f N u c le a r M a te r ia l C o n t r o l t o c o m p ly w i t h IAEA NPT R e q u ire m e n ts , IA E A -S M -2 0 1 /7 6 , theseProceedings, Vol.L
Г 5] BEETS, C . , e t a l , A s p e c t du C o n t r o le d * I n s t a l l a t i o n s de L ' I n d u s t r i eGeneva C o n fe re n c e S T I PUB 3 0 0 /V o l 9 P a p e r A C o n t 4 9 /P /2 8 6 p 449 (1 9 7 1 ) .
jjSJ BEETS, C . , e t a l , D e ve lo p m e n t D e m o n s tra t io n and A p p l i c a t io n o f N on- D e s t r u c t iv e I n s t r u m e n ta l T e c h n iq u e s f o r A ssa y o f S p e c ia l N u c le a r M a te r ia ls D u r in g F a b r ic a t io n o f LWR F u e l . IAEA C o n t r a c t N o. 1 0 4 2 /B .
£7] PUGNETTI, G . , M e thod s f o r th e B u rn -u p D e te r m in a t io n , CNEN/RT/CHI (6 3 )2 2 .
Q f| P O ZZ I, F . , I s o t o p ic and C o n c e n t r a t io n A n a ly s is o f U as a R o u t in e C o n t r o l i n th e E u re x P la n t , CNEN/RT/CHI ( 7 2 ) 9 .
Р Л P O ZZI, F . , The A n a ly t i c a l L a b o r a to r ie s o f th e E u re x R e p ro c e s s in g P la n t and th e F i r s t MTR C am p a ign , CNEN/RT/CHI ( 7 3 ) 4 .
pLo] G IA N N IN I, M . , e t a l , Gamma S p e c tro m e try N o n - d e s t r u c t iv e M easure f o r th e Pu c o n te n t D e te r m in a t io n in U02 + PU02 P e l l e t s , C N EN /R T /F I (7 4 )3 2 .
p H ] IAEA/CNEN RESEARCH CONTRACT, T e s t in g and D e m o n s tra t io n o f A u to m a tio n o f th e N u c le a r M a t e r ia l A c c o u n t a b i l i t y C o n t r o l a t I r r a d i a t e d F u e l R e p ro c e s s in g F a c i l i t i e s , IAEA/CNEN R e s e a rc h C o n t r a c t Number 1565/R B D ecem ber 1974
pL2^ DE CAROLIS, M ., BARDONE, G . , TDR M e thod and A p p a ra tu s f o r M easurem ent o f L e v e ls and P h y s ic a l C h a r a c t e r i s t i c s o f M o v in g o r S t a t i c L iq u id s and F lu id s i n P ip e l in e s o r T a n k s , CNEN/RT/CHI (7 4 ) 7 .
. [ l 3 j M AX-1, M e a s u r in g H ead , CNEN P a te n t 4 7 5 5 9 3 /7 3 .
pL4 j BERG, R . , e t a l , On th e D e te r m in a t io n o f th e Pu 240 i n S o l id W asteC o n ta in e r s b y S p o n ta n e o u s F is s io n N e u tro n M e a su re m e n ts . A p p l i c a t io nt o R e p ro c e s s in g P la n t W a s te . E u ra to m r e p o r t EUR 5158 E (1 9 7 4 ) .
£15] MIRANDA, U . , e t a l , C o n t r ib u t io n t o S a fe g u a rd s S tu d ie s i n F a b r ic a t io n P la n t s , IAEA S ym posium on S a fe g u a rd s T e c h n iq u e s , K a r ls r u h e (1 9 7 0 ) .V o l _1 1 0 5 .
[ l 6 ] CUYPERS, M . , e t a l , The V e r i f i c a t i o n o f th e U235 C o n te n t i n THTR F u e l P e b b le s , IA E A -S M -2 0 1 /7 3 , these Proceedings, V ol.I I .
f l7 “ l (a ) B0RL00, S . , CRUTZEN, S . , U l t r a s o n ic S ig n a tu r e , E u ra to m r e p o r t EURL J 5108 E ( 1 9 7 4 ) . (b ) CRUTZEN, S . , e t a l # p a p e r IA E A -S M -2 0 1 /5 , th e s e
Proceedings.
[ l 8 ] HAFELE, W ., e t a l , S a fe g u a rd s S ystem S tu d ie s and F u e l C y c le A n a ly s e s ,KFK 900 ( 1 9 6 8 ) .
Г191 AVENHAUS, R . , GUPTA, D . , E f f e c t i v e A p p l i c a t io n o f S a fe g u a rd s Manpower L J and o th e r T e c h n iq u e s i n N u c le a r F u e l C y c le . S a fe g u a rd s T e c h n iq u e s
(P ro c Symp K a r ls r u h e 1970) _1 IAEA V ie n n a ( 1 9 7 0 ) .

IA EA -SM -201/82 33
[20] HAFELE, W ., NENTWICH, D . , M odern S a fe g u a rd s a t R e p ro c e s s in g P la n t and R e a c to r s . S a fe g u a rd s T e c h n iq u e s (P ro c Symp K a r ls r u h e 1970) 1 IAEA V ie n n a (1 9 7 0 ) .
0 1 ^ GUPTA, D . , e t a l , O p t im is e d M a t e r ia l A c c o u n t in g S ystem f o r S a fe g u a rd sin a N u c le a r F u e l C y c le . A /C o n f 4 9 /P /4 1 5 ICPUAE V o l 9 ( 1 9 7 1 ) . г
[22J. HAFELE, W ., S ystem s A n a ly s e s i n S a fe g u a rd s o f N u c le a r M a t e r ia l A /C o n f 49/P/771 4 ICPUAE V o l 9 (1971).
£23] GUPTA, D . , e t a l , S a fe g u a rd s M e asu re s and E f f o r t s i n C o n c e p tu a l F a b r ic a t i o n P la n ts f o r U ra n iu m and P lu to n iu m C o n ta in in g F u e l E le m e n ts . KFK 910 (1 9 6 9 ) .
241 HAGEN, A . , e t a l , D e ve lo p m e n t o f S a fe g u a rd s P ro c e d u re s f o r a R e p ro c e s s in g P la n t s i m i l a r t o th e Wak T y p , KFK 1102 ( 1 9 7 0 ) .
£25] BRUCKNER, C . , e t a l , P r e l im in a r y C o n ce p t o f a S a fe g u a rd s S ystem f o r th eLMFBR P ro to ty p e SNR 3 0 0 (KKW KALKAR), IA EA -SM -201/50, these Proceedings Vol.I.
Пзб! AVENHAUS, R . , GUPTA, D . , E f f e c t i v i t y and C o s t O p t im is a t io n o f S a fe g u a rd s S y s te m s , KFK 1101 ( 1969) .
j"27 j AVENHAUS, R . , e t a l , S a fe g u a rd s S ta te m e n ts B ased on R e le v a n t C om ponents o f M a t e r ia l U n a cco u n te d F o r (M U F ), KFK 1103 (1 9 7 2 ) .
£28] AVENHAUS, R . , e t a l , O p t im is a t io n o f S a fe g u a rd s E f f o r t s , KFK 1109 (1 9 7 4 ) .
[ 2.9] GMELIN, W ., e t a l , S a fe g u a rd s E x e r c is e a t th e F a b r ic a t io n P la n t ALKEM, KFK 901 (1 9 6 9 ) .
P jo j KRAEMER, R . , e t a l , B e s c h re ib u n g e in e s K o n t r o l le x p e r im e n te s in d e r W ie d e ra u fa rb e itu n g s a n l^ a g e E u ro c h e m ic , KFK 907 (1 9 ^ 9 ) •
n i l KRAEMER, R . , e t a l , I n t e g r a l S a fe g u a rd s E x e rc is e s i n a F a b r ic a t io n and R e p ro c e s s in g P la n t . S a fe g u a rd s T e c h n iq u e s (P ro c Symp K a r ls r u h e 1970)1 IAEA V ie n n a ( 1 9 7 0 ) .
И BEYRICH, W ., DROSSELMEYER, E . , I n t e r l a b o r a t o r y E x p e r im e n t ID A -7 2 on Mass S p e c t r o m e t r ic I s o to p e D i l u t i o n A n a ly s is , KFK 1905 (1 9 7 5 ) .
J33J KRAPPEL, W ., A to m k e rn e n e rg ie 23 (1 9 7 4 ) .
[34] OTTMAR, H . , e t a l , O n - l in e B es tim m ung d e r 23 5 u -A n re ic h e ru n g an O x id is c h e m U ra n in d e r P r o z e s s l in ie e in e r LW R -B ren ne le m en t F a b r ik a t io n s a n la g e .NUCLEX 75 S p e z ia lk o l lo q u iu r a C ( 1 9 7 5 ) .
[35! BORK, G . , e t a l , P r o je k t S p a l t s t o f f f l u s s k o n t r o l l e , J a h r e s b e r ic h t 1973 S 2 -4 5 B IS 2 - 5 6 , KFK 1980 ( 1 9 7 M .
[37]
[3 8 ]
VON BAECKMANN, A . , IAEA S T l/P U B /3 3 7 p33 (1 9 7 3 ) .
PELLA, P .A . , VON BAECKMANN, A . , A n a l C h im A c ta 47 pp 431 - 438 (1 9 б 9 ) .
BOHK, G . , e t a l , P r o je k t S p a l t s t o f f f l u s s k o n t r o l l e , J a h r e s b e r ic h t 1970 S 105 - 161 (1 9 7 1 ) .

34 ANDERSON
[3 9 ] Z IJ P , W .L . , e t a l , G u id e l in e s f o r th e E v a lu a t io n o f D a ta i n N u c le a r M a t e r ia l A c c o u n t a b i l i t y and S a fe g u a rd s S t a t i s t i c a l M e thod s and E xa m p le s , ESARDA sym posium on P r a c t i c a l A s p e c ts o f R & D i n th e f i e l d o f S a fe g u a rd s , Rome 1 9 7 4 ; c o n t r ib u t e d p a p e r .
[4 0 ] Z IJ P , W .L . , Some S t a t i s t i c a l T e s ts R e le v a n t t o N u c le a r M a t e r ia l A c c o u n ta n c y and S a fe g u a rd s , R e p o r t RCN-201 (ESARDA-3) R e a c to r C e n tru m N e d e r la n d ,P e t te n ( 1 9 7 4 ) .
Z IJ P , W .L . , Sam ple S iz e s f o r S t a t i s t i c a l E s t im a t io n and D is c re p a n c y D e te c t io n , R e p o r t RCN-202 (ESARDA-4) R e a c to r C en trum N e d e r la n d , P e t te n ( 1 9 7 4 ) .
[4 2 ] Z IJ P , W .L . , G u id e l in e s f o r th e T re a tm e n t o f E r r o r s i n N u c le a r M a te r ia l A c c o u n ta n c y and S a fe g u a rd s , R e p o r t RCN-204 (ESARDA-2) R e a c to r C en trum N e d e r la n d , P e t te n (1 9 7 4 ) .
[4 3 ]
[4 4 ]
[4 5 ]
[4 6 ]
[4 7 ]
[4 8 ]
[4 9 ]
[5 0 ]
N
m
[ 4]
[55]
Z IJ P , W .L . , R IE FFE, H .C h . , C a l ig r a p h - a C o m p u te r P rog ram f o r th e C a lc u la t io n o f a C a l i b r a t i o n G raph and i t s A s s o c ia te d E r r o r , R e p o r t RCN-224, R e a c to r C en trum N e d e r la n d , P e t te n (1 9 7 5 ) .
TOLK, A . , VAN RAAPHORST, J .G . , A n a ly s is o f U n i r r a d ia t e d U ra n iu m -o x id e N u c le a r F u e l , A n a ly t i c a l M e thods in th e N u c le a r F u e l C y c le , IAEA V ie n n a (1 9 7 2 ) .
SLANINA, J . , e t a l , An A c c u ra te P o te n t io m e t r ie T i t r a t i o n o f 5 t o 25 mg U ra n iu m , IA E A -S M -201/65, these Proceedings, Vol.II.
KREYGER, P . J . , e t a l , N o n - d e s t r u c t iv e B u rn -u p D e te rm in a t io n b y 145 keV gam m a-ray A b s o r p t io n , S a fe g u a rd s T e c h n iq u e s V o l 1 , IAEA V ie n n a (1 9 7 0 ) .
HARRY, R . J . S . , E x p e r ie n c e w i t h G e -L i D e te c to r s , I n t e r n a t i o n a l m e e tin g on n o n - d e s t r u c t iv e m easurem ent and i d e n t i f i c a t i o n te c h n iq u e s i n n u c le a r s a fe g u a rd s , I s p r a I t a l y , 2 0 -2 2 S e p te m be r 1 9 7 1 .
HARRY, R . J . S . , e t a l , Gamma S p e c t r o m e tr ic D e te rm in a t io n o f I s o t o p ic C o m p o s it io n w i t h o u t u se o f S ta n d a rd s , IA E A -S M -2 0 1 /6 6 ( t h i s s y m p o s iu m ).
BROWN, F . , e t a l , A p p l i c a t io n o f I n s t r u m e n ta l M e thod s t o th e D e te rm in a t io n o f N u c le a r F u e l M a te r ia ls f o r S a fe g u a rd s , UKAEA R e p o r t COS 15 (1 9 7 0 ) .
TERREY, D .R . , HORNSBY, J . B . , P ro b le m s in th e N o n - d e s t r u c t iv e M easurem ent o f U -23 5 E n r ic h m e n t i n U ra n iu m H e x a f lu o r id e , UKAEA R e p o r t COS 23 (1 9 7 3 ) *
HORNSBY, J . B . , e t a l , N o n - d e s t r u c t iv e D e te rm in a t io n o f U ra n iu m E n r ic h m e n tb y a D e la y e d N e u tro n T e c h n iq u e , UKAEA R e p o r t COS 24 (1 9 7 3 ) .
TERREY, D R , DIXON, A .P . , A P o r ta b le Gamma A b s o r p t io m e te r f o r S a fe g u a rd s Use in N u c le a r F u e l P ro c e s s in g P la n t s , UKAEA R e p o r t COS 28 (1 9 7 5 ) .
BROWN, F . , e t a l , S a m p lin g o f S to re s f o r S a fe g u a rd s P u rp o s e s , UKAEA R e p o r t COS 4a ( 1969) .
BROWN, F . , e t a l , A M ode l S ystem f o r th e S a fe g u a rd s I n s p e c t io n o f a Z e ro -e n e rg y F a s t R e a c to r I n v e n to r y , UKAEA R e p o r t COS 20 (1 9 7 0 ) .
BROWN, F . , e t a l , The A p p l i c a t io n o f S a fe g u a rd s T e c h n iq u e s t o a L a rg e Z e ro -e n e rg y F a s t R e a c to r F a c i l i t y , UKAEA R e p o r t COS l k (1 9 7 0 ) .

IA EA -SM -201/82 35
[56] TERHEY, D .R . , e t a l , V e r i f i c a t i o n o f th e P lu to n iu m C o n te n t o f I r r a d i a t e d F u e l E le m e n ts f ro m a Z e ro -e n e rg y F a s t R e a c to r , UKAEA R e p o r t COS 25 (1 9 7 3 ) .
ANDERSON, A .R . , e t a l , V e r i f i c a t i o n o f N u c le a r M a t e r ia l A c c o u n ts as a Management F u n c t io n , IA E A -S M -2 0 1 /6 0 , these Proceedings, Vol.I.


IA EA -SM -201/96
SOME AGENCY CONTRIBUTIONS TO THE DEVELOPMENT OF INSTRUMENTAL TECHNIQUES IN SAFEGUARDS
T .N . DRAGNEV, M. de CAROLIS, A. KEDDAR,Yu. KONNOV, G. MARTINEZ-GARCIA, A.J. WAUGURA Department of Safeguards and Inspection,International Atom ic Energy Agency,Vienna
Abstract
SOME AGENCY CONTRIBUTIONS TO THE DEVELOPMENT OF INSTRUMENTAL TECHNIQUES IN SAFEGUARDS.R ecent A gency exp erien ce in th e developm ent and application o f non-destructive an a ly tica l techniques
and instrum ental surveillance for international nuclear m aterial safeguards is described. T he reported safeguards techniques are intended for fie ld use by inspectors and th e results w ere obtained under fie ld conditions in different countries. The results o f the follow ing projects are briefly reported: uranium enrichm ent measurements o f UFe in storage cylinders; 235 U content m easurem ents o f MTR core plates; plutonium content and isotopic abundance m easurem ents of Pu02 in storage cylinders and sm all sam ples; plutonium content m easurem ents in solid waste, ash and rinse solutions; measurem ents of irradiated MTR fu el e lem en t burnup and integrity; and m easurem ents o f the LWR fu el assem blies burnup, coo lin g tim e and plutonium accum ulation .
An overall v iew of experience in the developm ent and application o f several different system s o f e lectro- op tica l surveillan ce equipm ent is also presented. For m ore details, references are m ade to the corresponding IAEA Safeguards T ech n ica l Reports.
1. INTRODUCTION
During the la s t few y e a rs , the Agency has accum ulated significant experience in the development and application of non-destructive analytical techniques and instrum ental su rveillance for safeguards m easurem ents and surveillance of sp ecial nuclear m a teria ls . Because of the international ch a ra cte r of the nuclear m ateria l safeguards to be applied by the Agency and the n ecessity of carrying out independent verification m easurem ents in different countries of the world, this experience is connected mainly with passive non-destructive methods and techniques on the basis of portable or easily transportable instrum entation.
The reported contributions on the development of these techniques are intended for in-plant use by in sp ectors and the experim ental resu lts were obtained under com parable conditions in different countries. The strong support of colleagues working in the field of development, of operators and in sp ectors of different fa c ilit ie s , where corresponding experim ents were carried out, is acknowledged with great appreciation.
37

38 DRAGNEV et a l.
2. PASSIVE NON-DESTRUCTIVE ANALYSIS OF UNIRRADIATED NUCLEAR MATERIALS
2 .1 . G eneral com m ents
F o r quantitative non-destructive analysis of U -bearing m ateria l, passive gamma spectrom etry is the technique m ost widely used by the Agency because:
(a) T h ere are sev eral intense, ch a ra cte ris tic gamma ray s connected with the decay of the m ost im portant U isotope: 2 3 5 U;
(b) In m ost ca se s , the in tensities of neutrons em itted by uranium are not adequate fo r m easurem ents;
(c) Gamma sp ectrom etric m easurem ents are sim ple and re liab le ;(d) The related instrum entation is readily portable.
P assiv e non-destructive m easurem ents of Pu are also widely used by the Agency because:
(a) T h ere are many intense gamma rays with high energies and, hence, high penetrating power, which ca rry inform ation from deep within the m easured m ateria l;
(b) Pu isotopes with even num bers, and particu larly the abundant 2 4 0 Pu, generate penetrating high-energy neutrons with sufficient in tensities to make p re c ise quantitative m easurem ents of them.
The w ell-oriented efforts of the IAEA Division of Development concerning the instrum entation of non-destructive m easurem ents of nuclear m ateria ls have resulted in the creation and su ccessfu l testing of the following system s:
(a) In trin sic Ge detector/N okia/gam m a sp ectrom etric system
This system has an additional module for selection and counting of fast (nanosecond range) multiple (up to four out of four) coincidences of spontaneous fission neutrons and gamma ray s. An im portant feature of this system is the cassette tape record er which allows fast (less than one minute) recording of the m easured sp ectra on a norm al cassette in the field for processing on -site o r fo r further computerized processing in more detail at H eadquarters. This is the most powerful tool fo r Agency safeguards m easurem ents at p resent. Most of the resu lts reported here were obtained with this system .
(b) In trin sic Ge detector ’Gamma' pre-program m ed five-channel sp ectro m etric system
This unites the im portant features of high-resolution Ge spectrom etry with portability and ease of operation. This system was developed recently and is s t ill under te s t.

IAEA-SM -201/96 39
(c) E b erlin e Stabilized A ssay M eter (SAM)
This is a stabilized scin tillation d etector/sin gle-ch an n el analyser.It has a neutron counting probe and corresponding e lec tro n ics . Because of its sm all size and weight it is , at present, the instrum ent m ost used by Agency in sp ectors.
(d) C ollapsible and w ater-tight probes/neutron coincidence counting system
This is intended fo r 2 4 0 Pu content m easurem ents of different Pu-bearing m ateria ls through selecting and counting spontaneous fission neutrons.
(e) P assiv e A ssay F iss io m e te r (PAF)
T his is an independent system of four large, cy lind rical p lastic detectors and fast (nanosecond range) multiple (up to four out of four) coincidence counting e lectro n ics for selecting and counting Pu spontaneous fission s on different Pu-bearing m ateria ls .
(f) VERPACS
This is a system for passive and active interrogation m easurem ents of different nuclear m ateria ls . It has a compact 106 n /s (2 3 8 P u /L i) isotopic neutron source for active interrogation m easurem ents. It uses four large p lastic sc in tilla to r detectors, turn-table, neutron source d river and fast (nanosecond range) multiple (three out of four) coincidence counting equipment for selecting and counting spontaneous and/or induced fission s in m easured sam ples.
(g) B eta re flecto m eter and beta-excited radiation analysis system s
These a re sim ple and effective system s for special nuclear m aterial elem ent concentration m easurem ents in homogeneous feed m ateria ls or fuel p e llets . They use a sm all (0 .1 mCi) S r source and detect either the intensity of the reflected beta p artic les or the excited KX and brem sstrahlung rays as a m easure of special nuclear m ateria ls elem ent concentration in the m easured sam ple.
2 .2 . Gamma sp ectro m etric isotope abundance m easurem ents of homogeneous nuclear m ateria ls
The tran sm ission of 23&U gamma rays through high Z nuclear m ateria ls is ra th er low and this is the main difficulty with gamma sp ectrom etric m easurem ents of U when large sam ples are to be m easured. However, in homogeneous U m ateria ls , the attenuation of these gamma rays can be accu rately taken into account when the 235U to total uranium ratio has to be determ ined. A nalysis of the m easured intensities of 23 5 и gamma rays dem onstrated (1 -3 ] that, when the m easured sam ples are "in fin itely thick"(e. g. the thickness is g reater than ~ 4 g /cm 2 of U), th e ir in tensities are d irectly proportional to the 2 3 5 U/Utot ratio of m easured sam ple. This feature is used in the so -ca lled "enrichm ent m easurem ent technique" where

40 DRAGNEV et a l.
the intensity of 186-keV gamma rays of 235U is used as a m easure of U enrichm ent of the m easured sam ple. This sim ple and p ractica l technique can be used widely for U enrichm ent m easurem ents of various item s like UF6 in storage cylinders, U oxides in different containers, unirradiated or slightly irrad iated fuel elem ents and so on.
The sam e principle can be used for Pu o r Th isotopic abundance m easurem ents under s im ila r conditions, e . g. P u 0 2 in different containers, m ixed-oxide fuel elem ents and so on. F o r example, in the case of mixed U 0 2 - P u 0 2 fuel, the in tensities of gamma rays with energ ies 129. 3, 148. 6 , 152. 8 and 185. 7 keV will be correspondingly proportional to the ra tio s of 2 3 9 Pu, M1 Pu, 238Pu and 235U to the sum of the total U and Pu present in the sam ple. These general considerations were tested under field conditions on re a l m ixed-oxide fuel elem ents using the Agency in trin sic Ge-Nokia gamma sp ectro m etric system and the resu lts prove that the technique is very sim ple and p ractica l.
It is im portant to indicate that the resolution of scin tillation sp ectro m eters, particu larly of those based on single-channel an aly sers, is adequate only fo r a re str ic te d number of cases of fresh , unirradiated, well-known U m a teria ls . F o r re -cy c led U, for Pu and for U /Pu mixed fuel elem ents, h igh-resolution Ge d etecto r/sp ectro m etric system s are required in order to obtain re liab le and accurate re su lts .
2 .3 . M easurem ents of uranium m aterials
2 .3 .1 . Uranium enrichm ent of UFß in storage cylinders
(a) Specificity of the U F6 m easurem ents: T h ere are some special d ifficu lties in m easuring the U enrichm ent of UFg in large, thick-w alled storage cylinders because of:
(i) The much higher coefficients of absorption for low -energy gamma ray s and the large quantity of UF6 in the cylinder resu lt in distortion of the spectrum of em itted gamma ray s, enhancement of high-energy gamma rays of U, and a low photo-peak to continuum ratio for 186-keV gamma ray s;
(ii) The d ifficu lties in m easuring the cylinder wall thickness and correctin g for attenuation of 186-keV gamma rays in this wall;
(iii) The p resence in some cylinders (particu larly if they are not washed out a fter each emptying) of additional activity which frequently significantly in terferes with m easurem ents when scintillation sp ectrom eters are used.
F ie ld experience [1 4 -1 6 ] has dem onstrated that use of a sing lechannel scintillation spectrom eter does not give adequately accurate re su lts . It was found n ecessary to use high-resolution Ge d etectors in order to obtain meaningful and accurate m easurem ents.
(b) M easurem ent conditions and set-up: The m easurem ents w ere perform ed in the open in the general UFß cylinder storage are a at BN FL (Springfield Works) in the United Kingdom. The cylinders w ere types 0007 (UK) and30 A (USA) used fo r low enriched U, 48 F cylinders used for natural

IA EA -SM -201/96 41
FIG. 1 . G e gam m a spectrom etric measurem ents set up for measurem ents on UF6 cylinders.
uranium and 0236 cylinders used fo r depleted U. The enrichm ent of U ranged from 0 .3 0 to 2 .90% . The enriched U was re -cy c le d m ateria l.
The arrangem ent used for m easurem ents is shown in F ig . 1. The thickness of the cylinder wall at the position of m easurem ent was m easured with a sm all, handy u ltrasonic gauge [1 7 ] . The m easured sp ectra were recorded on m agnetic tape ca sse ttes for processing and evaluation on site using the Nokia 1600-channel an alyser and an H P-65 calcu lator and, later, by the Agency computer at H eadquarters. The m easurem ent tim e was in the range of 30 min but optimization of the m easurem ent set-up should lead to a m easurem ent tim e ranging from 5 - 1 0 min, depending upon the efficiency of the Ge detector.
(c) R esu lts and conclusions: The gamma sp ectra of sev era l UFg cylinders taken with the in trin sic germanium sp ectrom eter are shown in F ig . 2. These sp ectra , and p articu larly the intensity ratios of uranium K X -ray s to 186-keV gamma ray s, give valuable qualitative inform ation on the thickness of the cylinder wall and also enable accurate determ ination of the enrichm ent

CYLINDER . CYLINDER WALL ENRICH. WT UFTYPE No. THICKNESS % Ug60007 91 0.990 2.691 19890007 130 0.830 2.A11 5800007 A0 0.857 1.216 6110236 01A603 0.675 0.309 195730 A 119 1.950 2.658 2160
A 8F 166 1.795 0.718 12160
/ 4li A ^ .M V lA ^ ^ V’'*W ^ A y V 4jivii|(UIj
V yv>irh^ \A V vi',
130
•Vr 40
DEPLETEDVV-^W-'-T^ jy ,
О И 603
to
Ö5О2m<
.,*- WvVv4/vli V*W',I
' ■ '^ * w v >. 166
FIG .2 . Low-energy gam m a spectra o f the radiations from the storage cylinders with UF6.

IA EA -SM -201/96 43
of m easured m ateria l. The resu lts of the m easurem ents collected in Table I dem onstrate that:
(i) Ge gamma sp ectro m etric enrichm ent m easurem ents of UF6 in storage cylinders are p ractica l, fast and re lia b le . R e-cy cled m ateria l and deposits of radioactive decay products on the cylinder wall do not cause d ifficu lties. The attainable accu racy 1
for 5 - 1 0 min m easurem ent tim e is b etter than ± 1 % (relative) at one sigm a lev el and is re str ic ted by the accuracy of the determ ination of the cylinder wall th ickness. The attainable accu racy of enrichm ent m easurem ents of UFg in sampling bottles should be of the order of ± 0 . 2 % (relative) at one sigm a level.
(ii) The use of the u ltrasonic thickness gauge is recommended for m easurem ents of the cylinder wall thickness at the m easurem ent position.
(iii) The use of short, wide co llim ators (~ 5 mm thick and 50 mm ind ia m .) is recommended for such m easurem ents, not only to reduce the m easurem ent tim e but also to m axim ize the photo-peak to Compton ratio .
2. 3. 2. M easurem ents of 235U content of MTR core plates
R ecently there was an opportunity to m easure, under field conditions,18 uranium MTR core plates with various enrichm ents, s izes and th ick n esses.
The 235U content of the p lates, determ ined through combined destructive and non-destructive m easurem ents, were known to have an accuracy of ± 0. 2% (relative) at one sigm a level. Scintillation sp ectrom eters have been used by the facility operator to make the NDA m easurem ents with specially designed and fabricated apparatus fo r positioning and counting the p lates.
The resu lts of the m easurem ents made with the Nokia/Ge system , re s tr ic te d in tim e and using a relatively sim ple counting arrangem ent, w ere found to have the sam e accu racy of ± 0 . 2 % (relative) at one sigm a lev el as the stated value. The re su lts a lso indicate that, if m ore carefu l m easurem ents are done with sem i-conductor sp ectrom eters, an accuracy in determ ining 235U content in such types of plates of the order of ± 0.1% (relative) at one sigm a lev el could be achieved.
2 .4 , M easurem ents of plutonium m ateria ls
2 .4 .1 . P u 0 2 in storage containers
The D ivision of Development recently evaluated the p o ssib ilities of using different non-destructive techniques to verify Pu content and isotopic com position in storage containers without opening in order to sam ple or to exam ine the contents of the containers [1 0 ] . Combined gamma sp ectro m etric and ca lo rim e tric m easurem ents are considered [19] as being amongst the m ost suitable techniques fo r this purpose. As a suitable ca lo rim eter was not available, the p o ssib ilities of verifying the o p erator's statem ent using only the gross weight and Ge gamma spectrom etry m easu rements were evaluated.
A ccuracy as used in this paper means th e overall lim its o f error o f th e system expressed as re la tive error.

4^
T A B L E I. RESU LTS OF THE Ge GAMMA SPEC TR O M ETR Y MEASUREMENTS OF URANIUM ENRICHMENT OF U F 6 STORAGE CYLINDERS
Cylindertype
CylinderNo.
Weight(kg)
Enrichment (known °Jo)
Thickness(c m )
Correct C .R .c % enr.
D eterm ined enrichm ent (%)
48 F 164 12210 0 .7 1 8 1 .7 9 0 8 6 .7 7 0 .7 3 5
0007 040 611 1 .2 1 6 0 .8 2 5 8 3 .9 7 1 .2 0 5
0007 130 580 2 .4 1 1 0 .8 3 0 8 5 .8 9 2 .4 4 3
30 A 038 2150 2 .6 3 1 1 .9 6 5 8 4 .1 3 2 .6 1 1
30 A 119 2160 2 .6 5 8 1 . 190a 8 6 .2 0 2 .7 0 3
30 A 119 2160 2 .6 5 8 1 . 950b 8 3 .7 0 2 .6 2 4
0007 99 1348 2 .6 8 5 0 .8 6 0 8 4 .5 9 2 .6 7 9
0007 91 1989 2 .6 9 1 0 .9 9 0 8 2 .6 7 2 .6 2 4
8 4 .7 7 ± 1 .4 4
a Thickness o f the bottom of the cylinder, b Thickness o f the sid e o f the cylinder. c C . R. = counting rate.
DR
AG
NE
V et al,

IAEA- S M -2 0 1 /96 45
The analysis and the prelim inary m easurem ents dem onstrated that it is possible to make combined Ge gamma sp ectro m etric / gross weight m easu rements which can assu re an insp ector that:
(a) T h ere is Pu inside the m easured container and that its quantity is g reater than 95% of the declared value;
(b) The declared isotopic com position of Pu is co rre c t within an accuracy of ± 1% fo r 239Pu and 241Pu and of ± 2 - 15% for 23 8 Pu and 240Pu (depending upon th e ir re lative abundance) at one sigm a level;
(c) The use of a detector with la rg e active volume and the high resolution of the system will strongly facilita te the use of high-energy gamma rays fo r these m easurem ents.
2 .4 . 2. 239Pu and 241Pu isotopic ra tio and content in sm all sam ples
The p o ssib ilities for using the germanium gamma spectrom etry technique to verify the Pu content and isotopic com position in sm all sam ples w ere also tested . A nalysis of Pu sam ples le s s than 0 .1 g dem onstrated that, on the basis of data processin g in the field, it is easy to determ ine the absolute quantities of 239Pu and 24 1 Pu and 2 3 9 P u /241Pu ra tio s . The accuracy of these m easurem ents under field conditions was in the range of 1 - 2 % at one sigm a lev el. 129-keV gamma rays of 239Pu and 148. 6 keV gamma rays of M1Pu w ere used.
2 .4 . 3. 2 4 0 P u /239Pu and 2 4 0 P u/Pu ra tio s in large sam ples
Some work has been done on gamma sp ectrom etric determ ination of the 2 3 9 P u /240Pu isotopic ratio but they are all based on the use of their low -energy gamma rays [20, 2 1 ] . As the penetrability of these gamma rays is very low and there are strong in terferen ces of other isotopes with low -energy gamma ray s, it is extrem ely difficult to use these gamma rays for accurate non-destructive determ ination of the 2^°P u /239Pu ra tio in other than sm all homogeneous liquid sam ples. To make m easurem ents of Pu in solid form , specially in the case of a larg e quantity, a new nondestructive technique for m easuring the 2 4 0 P u /239Pu isotopic ratio , based on high-energy gamma ray s of these isotopes in the 640-650 keV range, has been developed [2 2 ] . M easurem ents in Pu plates and РиОг sam ples w ere perform ed with a 65-cm 3 Ge(Li) detector with a resolution of 1 .7 2 keV, (FWHM) for 1 . 33-M eV gamma rays in the laboratory and with an 11-c m 3 in trin sic Ge detector under field conditions. The accuracy under laboratory conditions was better than 1% at one sigm a lev el. Under field conditions, using the in trin sic Ge detector, the experim ents also dem onstrated the validity of this method but the tim e required for the analysis was too long owing to the sm all volume of the detector. Soon the field experim ents w ill be repeated with a large-volum e (50 cm 3) coaxial in trin sic Ge d etector.
2 .4 .4 . Pu content of solid waste in drums, ash and rin se solutions
Solid heterogeneous Pu waste stored in large containers norm ally contains various inactive m ateria ls and constitutes one of the m ost difficult cases for Pu assay m easurem ents. This part of the paper sum m arizes

4^05
FIG .3 . Spectrum o f Pu from Pu solid-w aste drums.
DR
AG
NE
V et al,

1AEA-SM -201/96 47
som e of the resu lts of the collaboration p ro ject being perform ed under an Agency R esea rch Contract [2 3 ] . The purpose of the program m e was to develop, te s t and evaluate non-destructive techniques for the m easurem ent of Pu in solid waste contained in standard 2 5 -litre drum s.
A fter non-destructive m easurem ents, the drums w ere opened, the waste segregated and incinerated and then the Pu content of the resulting ash, incom bustible p ieces of waste and rinse solutions from the scrubber system was m easured by the sam e NDA techniques used to make NDA m easurem ents of the drum s. The Pu content of all ash sam ples is in the p ro cess of being determined by chem ical analysis and a detailed com parison will be made with resu lts obtained by NDA.
Two non-destructive techniques were used:
(a) Spontaneous fission counting-rate m easurem ents using the Agency's YERPA CS.
(b) H igh-resolution gamma sp ectrom etric m easurem ents using the A gency's portable Ge detector/N okia analyser system .
The attractive featu res of spontaneous fission rate m easurem ents are the higher penetrability of both fast neutrons and high-energy gamma rays which provide a low er sensitiv ity to the variations in the m atrix .
The weak featu res of these techniques are the very high sensitivity to gamma ray s of the large scintillation detectors, which leads to the high rate of accidental coincidence counts, despite the short coincidence tim es, p articu larly for Pu waste which contains other radioactive m ateria ls .A lso the detection of multiple coincidences is much m ore dependent on the distribution of the Pu within the container. F u rth er, it is n ecessary to know the isotopic composition of the Pu.
The m ost a ttractive featu res of high-resolution gamma sp ectrom etric m easurem ents are the accu racy of m easurem ents and the unique ch aracter of the sp ectra (Fig . 3). A lso attractive is the fact that the sam e m easu rement contains inform ation about the total Pu content and isotopic abundances, esp ecially the m ost im portant Pu isotopes, both f iss ile isotopes (239Pu and 2 4 1 Pu) and n o n -fissile isotopes (238Pu and 2 4 0 Pu). Because of the very low background of gamma sp ectrom etric technique m easurem ents and the re latively high em ission rate and penetrability of 414-keV gamma rays of 239Pu used fo r assay m easurem ent, a very sm all quantity of Pu in waste drums, ash, incom bustible sam ples and rin se solutions can be determ ined. During this campaign, for exam ple, Pu quantities of as little as 20 mg Pu in 1 - li tre rinse solutions w ere reliab ly m easured.
The main problem of gamma spectrom etry m easurem ents of total Pu in larg e heterogeneous sam ples is the n ecessity of having a reasonable co rrectio n fo r self-absorp tion of the gamma rays in the Pu itse lf, absorption in the m atrix and in the container w all.
In the course of this p ro ject, a simple approach to the problem of co rrectin g m easured in ten sities fo r self-absorption and absorption effects was developed and used. The m easured intensity ratio of two gamma ray s, 129 and 414 keV, from the sam e isotope, 2 3 9 Pu, was used as a m easure of self-absorption and absorption properties of the m easured sam ple.Using known referen ce sam ples for drum s, ash and rin se solutions, a correla tion was established between the 129/414-k eV m easured ratio and

00
T A B L E 11(a). CALIBRATION OF GAMMA SPECTRO M ETRIC MEASUREMENTS OF P a WASTE DRUMS D istance between the cen tra l axis of the drum and the detector su rface = 8 8 cm DRAST = Drums with different ash standards
d r a s t \ .N o.
Pu
(g )r =
UlAI414
(cou n ts/m in )R
(cou n ts/m in per g) ^ c a lcx 100
R
(°1°)
1 1 6 .3 3 .8 7 7 7 1 .8 6 5 4 .4 0 9 4 .5 2 1 2 .5
3 4 5 .0 2 .9 4 4 1 8 3 .8 8 4 .0 8 6 3 .8 5 9 - 5 .5
4 8 9 .3 1 .3 9 3 2 4 7 .1 7 5 2 .7 6 8 2 .7 6 0 - 0 .2
5 1 0 5 .6 1 .7 5 5 3 1 7 .7 2 5 3 .0 0 9 3 .0 1 7 0 .2
6 1 1 8 .0 1 .831 3 5 8 .0 2 5 3 .0 3 4 3 .0 7 1 1 . 2
7 13 4 .3 2 .0 9 3 4 2 6 .8 0 3 .1 7 8 3 .2 5 6 2 .5
R = 0 .7 0 8 8 r + 1 .7 7 2 8
DR
AG
NE
V et al,

TA B L E 11(b). CALIBRATION OF GAMMA SPECTRO M ETRIC MEASUREMENTS OF Pu WASTE ASH D istance between the cen tra l axis of the drum and the detector su rface = 8 8 cm AS = D ifferent ash standards
Pu RR eale
R c a - x 100S T > \ (g )
г = -12.1 4M (counts/m in) (cou n ts/m in per g)
R
(%)ASH
A S -l 1 6 .3 4 .0 5 7 82 .7 0 6 5 .0 7 4 5 .1 1 4 0 .8
A S-2 2 8 .7 3 .1 8 6 13 5 .2 5 4 .7 1 3 4 .4 7 0 - 5 .2
A S-3 4 5 .03 .3 0 2 2 0 2 .2 2 5 4 .4 9 4 4 .5 5 6 1 .43 .2 6 6 2 0 0 .2 0 0 4 .4 4 9 4 .5 2 9 1 .8
A S-4 8 9 .31 .9 1 3 3 1 6 .2 8 3 .5 4 2 3 .5 3 0 - 0 .32 . 048 3 3 0 .7 0 3 .7 0 3 3 .6 3 0 - 2 .0
A S-5 1 0 5 .62 .0 2 8 3 8 2 .5 0 3 .6 2 2 3 .6 1 5
3 .7 0 4- 0 .2
2 .1 4 8 3 7 2 .2 7 5 3 .5 2 5 5 .1
A S-6 115 1 .9 9 0 4 1 4 .6 7 5 3 .6 0 6 3 .5 8 7 - 0 .51 .9 9 5 4 1 5 .6 2 5 3 .6 1 4 3 .5 9 1 - 0 .6
A S-7 13 4 .32 .0 4 7 4 7 3 .4 5 3 .5 2 5 3 .6 2 9 2 .92 .0 5 7 4 99 . 95 3 .7 2 3 3 .6 3 6 - 2 .3
R = 0 .7 3 8 6 r + 2 .1 1 7 0
co
IAE
A- S
M-201/96

50 DRAGNEV et a l.
TA BLE III. RESU LTS OF THE NDA MEASUREMENTS DURING THE Pu SOLID-WASTE INCINERATION CAMPAIGN
\ Pu content (g)
Operator stated value
Gamma spectrometry (corrected for attenuation)
VERPACS
Input 1428 1131 1369
Output 1083 ' 1251
D ifference 48 118
the ■ registered counting rate of 414-keV gamma rays per one gram of Pu in the sam ple.
Corresponding data for the referen ce drums and ash are shown in T ab les Ila and lib .
The distance between the detector and the axis of the sample container was norm ally fixed at 8 8 cm ; m easurem ent tim e was 10 min. To maintain this m easurem ent tim e with sam ples containing sm all quantities of Pu, the distance was reduced to 49 cm . Rinse solutions w ere m easured directly in contact with the detector which was protected by a p lastic cover.
The repeated m easurem ents on different sam ples and m easurem ents on known sam ples considered as 'unknown' using this procedure and calibration indicate that the accuracy of the m easurem ents of Pu in solid waste drums is in the range of ± 1 0 % and accu racy of the m easurem ents of Pu in ash sam ples is b etter than ± 5% at one sigm a level.
The sam e 're fere n ce sam ples' for Pu solid-w aste drums and ash w ere used fo r calibration of the m easurem ents using VERPACS. However, as its sensitiv ity is low er, it was not possible to m easure the incom bustible p ieces and rin se solutions containing sm all quantities of Pu with it . To com pare total Pu quantities at the input and output of the waste incineration facility , sm all Pu quantities were taken into account by gamma sp ectrom etric analy sis . The resu lts of the m easurem ents are sum m arized in Table III.
D estructive analysis of the ash sam ples should give additional in form ation on the perform ance of the two techniques and p articu larly on their a ccu ra c ies . Even now, however, it is possible to make some conclusions and recom m endations in this resp ect:
(i) Ge gamma spectrom etry may su ccessfu lly be used alone for Pu assay m easurem ents in 2 5 -litre solid-w aste drum s. The procedure used to c o rre c t for self-absorption and absorption is sim ple, p ractica l and significantly im proved the accuracy of the m easurem ents.
(ii) Spontaneous fission counting-rate m easurem ents can be used as an independent technique for m easurem ents of-Pu content only if the isotopic com position of the m easured m ateria ls is known. The sensitiv ity of th is technique is not great enough to m easure sam ples with a 2 4 0 Pu equivalent content of le ss than 2 g with an accu racy better than ± 2 0 % at one sigm a level.

IA EA -SM -201/96 51
The spontaneous fission counting m easurem ents based on the use of therm alized neutron coincidence counting technique w ere also applied to the waste drums [2 4 ] .
3. NON-DESTRUCTIVE MEASUREMENTS OF IRRADIATED F U E L
3 .1 . MTR fuel-elem ent burnup, cooling tim e and integrity verification
The purpose of the experim ents with MTR fuel [25] was to investigate to what degree the resu lts of gamma spectrom etry m easurem ents under routine conditions can be used to:
(i) Confirm the fuel elem ents' stated cooling tim es;(ii) Confirm the fuel elem ents' stated burnup;(iii) Check whether a ll fuel tubes or plates are within the elem ent or
whether some of them have been replaced by dummies.
M easurem ents of irrad iated MTR assem b lies are sim pler than those of irrad iated LWR-type assem b lies because:
(i) P ra c tic a lly only 235u fission s take p lace;(ii) The tem peratures of the fuel elem ents during irrad iations are low and
there should be no m igration of the isotopes which are m ost im portant fo r these m easurem ents;
(iii) Absorption and self-absorption correction s can relatively easily and accu rately be taken into account.
Gamma sp ectrom etric m easurem ents were taken [25] on sixteen Mark-3 elem ents (ten curved fuel p lates arranged in a h elica l pattern) and on one M ark-4 elem ent (four concentric fuel tubes). To exam ine the feasib ility of using gamma m easurem ents to verify the f is s ile m ateria l content, a sp ecial experim ent was carried out. Nine 40-m in gamma m easurem ents w ere made mid-way along the outer tube of one Mark-4 elem ent. Each m easurem ent was made on a different combination of fuel tubes inside the outer tube.
Repeated m easurem ents on the sam e fuel elem ent also perm itted the o v er-a ll p recision of this type of gamma m easurem ent to be determ ined.
The gamma sp ectra of three fuel elem ents with s im ila r burnups but with d ifferent cooling tim es are shown in F ig . 4 . The sp ectra are very sp ecific and they c learly dem onstrate the decay of different peaks during the cooling tim e.
The data from the sp ecial m easurem ents on the Mark-4 fuel elem ent are presented in Table IV .
The resu lts from routine m easurem ents on 16 Mark-3 and one Mark-4 com plete elem ents, determ ined using the Agency computer and program are given in Table V.
The natural logarithm of 1 4 4 (C e/P r) to 137Cs activity ratio was used for cooling-tim e determ ination. This appears to be a useful quantitative m easure of cooling tim es when they are longer than one y ear. L inear co rrela tio n was established between the reported burnups of different fuel

52 DRAGNEV et al,
E(keV)
,103 D B 0 3 5
T :311 d
B:6 6 8 0 MW D t " 1
A j
FIG.4 . G e gam m a spectra from fu e l elem ents with different coo lin g tim es.

TA B L E IV. RESU LTS OF THE Ge GAMMA SPECTRO M ETRIC MEASUREMENTS ON DISMANTLED MARK-4 ELEM EN T
E(keV)
Com bination o f tubes
662137Cs
766 95 Nb
796134Cs
N 796
^662
N,se
^662
1 . (1+2+3+4) 12189 74678 4493 0 .3686 6 .1 2 7
2 . ( 2+3+4) 9861 59628 3822 0 .3 8 7 6 6 .0 4 7
3. ( 3+4) 6071 38736 2300 0 .3 7 8 9 6 .3 8 0
4 . ( 4) 3386 20372 1436 0 .4241 6 .0 1 7
5. (1+2+3 ) 8421 51937 3209 0 .3 8 1 1 6 .1 6 8
6. (1+2+ 4) 8102 49693 3057 0 .3773 6 .1 3 3
7. (1+ 3+4) 9055 56071 3580 0 .3 9 5 4 6 .1 9 2
8. (1+2 ) 5440 32594 2076 0 .3 8 1 6 5 .9 9 2
9. (1 ) 2737 16983 986 0 .3602 6 .2 0 5
A verage va lu e 0 .3 8 3 9 6 .1 4 0
2 RSD 4 . 7 % 1 .9 2 % ■
Cross-Section o f the Elem ent Mark 4 /5
сл00
IAE
A-S
M-201/96

сл
TA B L E V. RESU LTS OF THE Ge GAMMA SPECTRO M ETRIC MEASUREMENTS ON MARK-3 F U E L ELEM EN TS
E(keV)
Elementscod e
N796N662
^696^662
гсоо1(operator)
Bopburnup
<%)
tm eas “ too Jop
С5И
Bmeas • Bod Bop (%)
1580 0 .2 6 0 0 .1 1 4 0 551 38 - 5 .1 9 .6
1545 0 .1 6 2 0 .0 9 8 9 578 2 8 .3 1 .4 6 .1
1550 0 .171 0 .0777 607 3 4 .9 1 0 .7 - 4 .6
1548 0 .204 0 .0732 606 3 7 .4 1 3 .0 4 .2
1445 0 .2 0 5 0 .0548 776 4 5 .0 - 7 .5 - 1 0 .3
1517 0 .0 8 3 0 .0553 804 2 2 .1 0 .2 - 5 .7
1443 0 .141 0 .0829 804 3 2 .1 - 9 .5 - 6 .5
1573 0 .231 0 .1125 552 3 8 .3 - 3 .8 0 .4
1551 0 .2 2 5 0 .0923 579 3 9 .7 1 .6 - 0 .6
1575 0 .1 3 1 0 .0921 609 2 3 .3 8 .5 1 3 .9
1552 0 .1 8 9 0 .1142 608 3 2 .6 1 .8 е л
1544 0 .1 2 1 0 .1104 637 2 5 .0 1 .9 - 0 .1
1537 0 .1 4 0 0 .0 6 2 0 750 3 0 .4 - 2 .7 - 2 .3
1512 0 .1 7 8 0 .0721 774 3 8 .9 - 1 .0 - 5 .2
1513 0 .1 4 9 0 .0625 802 3 1 .4 - 4 .1 1 .6
1279 0 .2 1 0 0 .0563 802 4 4 .6 1 .7 - 1 .0
4519 0 .3 8 7 0 .1947 352 4 2 .6 - 4 .0 2 2 .7
DR
AG
NE
V et al.

IA EA -SM -201/96 55
elem ents and the m easured 134Cs to 137Cs activity ra tio s corrected for the corresponding cooling tim es. Previously determined cooling tim es were used fo r these co rrectio n s. The agreem ent between the o p erator's estim ations of burnups and these determ inations was within the e r ro rs of these m easurem ents. The correlation between two gamma sp ectrom etric burnup m easures - 137Cs activ ities and 134Cs to 137Cs activity ra tios - was used as a m easure of fuel-elem ent in tegrity . The data from routine m easurem ents of Mark-3 elem ents w ere used to estab lish the param eters of this co rrela tio n and it was then applied to the sp ecial m easurem ents of M ark-4 elem ents. The corresponding data a re presented in Table VI. D espite the d ifference between these two types of fuel elem ents, the resu lts w ere found to be quite sa tisfactory and useful for corresponding quantitative verification m easurem ents of fuel-elem ent in teg rities .
3 ,2 , LWR fuel assem bly burnup, cooling tim e and Pu/U m easurem ents
M easurem ents s im ilar to those described in 3 .1 w ere made on low enriched irrad iated power re a cto r fuel assem blies [1 5 ,1 6 ] . The only significant difference in the m easurem ent setup is that fuel assem blies usually a re kept v ertica l and the tube co llim ator approaches them from the side, at an angle. This fa c ilita te s the scanning of the fuel assem bly through its v ertica l movement. Usually the agreem ent between m easured and stated data is b etter than 7%.
F u rth er m easurements were perform ed on natural uranium irrad iated fuel assem b lies using the hot ce ll of the A - l N uclear Pow er Plant at Bohunice, Czechoslovakia. The m easurem ent set-up in this case consisted of co llim ator in the hot ce ll wall and germanium gamma sp ectrom eters.The com parison between non-destructive gamma spectrom etry and destructive m ass spectrom etry resu lts are given in [28] and are the su bject of a paper by Km oäena et a l. [18] at this Symposium.
An in terestin g com parison between non-destructive and destructive m easurem ents of irrad iated low enriched uranium fuel for PWR and BWR re a cto rs is given in R ef. [ 2 9 ] .
P re c is e destructive and non-destructive gamma m easurem ents on the sam e fuel have been perform ed in the plutonium recy cle te s t re a cto r (PRTR) in the USA [ 3 0 ] . The data obtained through NDA m easurem ents were introduced into the Agency computer and the resu lts obtained allow us to make a com parison of the published destructive resu lts and those obtained by non-destructive m easurem ents [3 1 ] . L in ear reg ressio n analysis on the corresponding non-destructive and destructive data was applied. Again, significant proportionality between 1 3 4C s /137Cs activity ra tio s and burnup or Pu/U ratios was established in quite a wide range of burnup. The corresponding relative standard deviations a re ± 2. 0% and ± 1. 3%. R esu lts are shown in F ig . 5.
A detailed com parison between destructive and non-destructive m easurem ents in BWR fuel is made in R ef. [ 3 2 ] . All these data confirm that NDA gamma spectrom etry m easurem ents can be used su ccessfully fo r inspection verification m easurem ents of irrad iated fuel. F u rth er, it now appears that, if a suitable technique for calibration of the m easurem ents is achieved, gamma spectrom etry m easurem ents can be used to give re liab le quantitative burnup and nuclear m ateria l content data.

сло
T A B L E VI. RESU LTS OF THE Ge GAMMA SPECTRO M ETRIC MEASUREMENTS FO R CHECKING THE IN TEGRITY OF THE MARK-4 F U E L ELEM EN T
Number o f missing tubes
0 1 2 3
Tubes present (1+2+3+4) ( 2+3+4) (1+2+3 ) (1+2+ 4) (1+ 3+4) A v ( l) ( 3+4) (1+2 ) A v(2) ( 4) (1 ) A v(3)
Cpc (RbO)-CQ a Co
- 3 .8 -2 4 .8 -3 5 .1 -3 7 .1 - 3 1 .9 < -3 2 .2> -5 3 .1 -5 8 .0 < - 5 5 .6> -7 5 .8 - 7 8 .0 < - 7 6 .9>
a ^bO = corrected measured intensity ratios of 134C s /137Cs N 662
Cqc = calcu lated (based on the correlation) counting rate o f 662-keV gam m a rays o f 137Cs Cq = measured valu e.
DR
AG
NE
V et al,

IAEA- S M -2 0 1 /96 57
FIG .5 . Correlations betw een Pu/U ratios and burnups and IS4C s /ls,Cs activ ity ratios.
At present, development in this area is oriented towards calibrating the sim ple gamma sp ectrom etric m easurem ents with:
(i) Special standards;(ii) Other types of m ore difficult and tim e-consum ing but m ore absolute
m easurem ents;(iii) T h eoretica l calcu lations.

58 DRAGNEV et a l.
4. SURVEILLANCE INSTRUMENTATION
Surveillance instrum ents, e . g. cam eras, m onitors, sea ls , are used to detect or indicate unauthorized movements of nuclear m ateria l. The instrum ents usually provide permanent reco rd s. Consequently, such inform ation could reduce the inspection effort [ 3 3 ] . The Agency has routinely been using various types of cam era surveillance assem b lies for international safeguards since 1971 [3 4 ].
P rese n t efforts of the Agency are directed towards improving cam era system s which are now in use, either by incorporating various useful featu res into the existing system s or by following new approaches. Each sp ecific su rveillance system has unique but different capability which has been designed o r adapted to the sp ecific and/or total requirem ents for su rveillance application. V ersatility , adaptability and cost are taken into consideration in the development of sp ecific sy stem s. The system should, above a ll, be re liab le and produce good quality p ictures, even in poor light. One should also have a convenient m eans of analysing and evaluating the p ictu res taken.
The need to operate a cam era system for long unattended periods im plies that the film capacity should be sufficiently la rg e . To m eet this condition and the general requirem ent of sim plicity and re liab ility of operation, a cam era system developed by F lig h t R esearch C o ., USA, has been chosen and fully tested by the Agency [ 3 5 ]. T h is is a 35-m m or 16-m m high-resolution cam era with a p re -se t frequency of picture taking and an arrangem ent to record date, tim e, number of p ictures taken on each fram e as shown in F ig . 6 . Recording of date and tim e on each fram e is extrem ely helpful during the subsequent evaluation of pictures as one can easily determ ine the tim e when p articu lar events took p lace. The m ost im portant featu res of the cam era are its robust construction and its sim plicity of operation. The cam era has a capacity of up to 10 000 p ictures on a single film cartrid g e . P ic tu res can be taken at p re -s e t fixed in tervals; fram e ra tes can range from one per second to one per hour. Although these cam eras lack an autom atic exposure control, the shutter speed can be adjusted as low as 1/15 s and the len ses with F / 1 .4 :2 5 mm (16-m m unit) and f /4 .0 :1 7 mm (35-m m unit) are powerful enough to produce good pictures
FIG .6 . Test picture by th e flight research.

IA E A -SM -201/96 59
in norm al light. The angle of view for the 35-m m version is 73°. The cam eras are run on mains power and are enclosed in sp ecia l m etal containers which can be sealed.
One of the problem s of surveillance cam eras is that they take a very larg e number of p ictu res, m ost of which are without any useful inform ation but which s till have to be examined individually by the insp ector. In other words, it would be useful to have a cam era which takes p ictures only when something of in terest, say a movement of m ateria l, takes place in the field of view. F o r this purpose a prototype surveillance cam era was developed by the National Bureau of Standards, USA, with optical motion d etectors.The motion detectors monitor selected spots in the cam era field of view and command the cam era to record a p icture when there is motion at any one of these locations. Motion in these a re a s is detected by attendant changes in luminance levels which exceed a predeterm ined rate of change. Numerous spots can be sep arately positioned over c r it ic a l a re as to be monitored without incurring a larm s from those a reas which are unimportant or su b ject to norm al activity [ 36] .
The NBS cam era can also take p ictu res a t fixed in tervals ranging from2. 5 min to 10 h, irresp e ctiv e of the motion sen so rs . A lock-out interval system lim its the rate at which p ictu res are taken in a case of excessive motion. There is an arrangem ent to record on each fram e the tim e of p icture taking. The system is norm ally run on mains power (115 or 230 V,50 - 60 Hz) but it can also continue operation via an in ternal battery pack during short periods (not longer than 24 h) of power outage.
The NBS system used a B olex H -16 movie cam era with a wide-angle len s, f / l . 6 1 0 mm and a m otor drive fo r sing le-fram e mode; 16-m m film s are used and the maximum capacity for a 30-m ro ll is 4000 fra m es. This unit has also been tested in sev eral field s ite s over long periods and the re su lts obtained w ere sa tisfactory .
P ic tu res taken by a photographic cam era can be analysed and evaluated only a fte r the film has been p rocessed . This is often a tim e-consum ing and elaborate p ro cess . It would, th erefore, be a great advantage fo r an insp ector to be able to evaluate the reco rd s of su rveillance im m ediately on his a rriv a l at the s ite . This could be done using the magnetic recording p rincip le . A system com prising a com m ercially available television cam era, a tim er and a video reco rd er was constructed in the Agency. This unit is now being field tested and resu lts are awaited. The main problem is to obtain a system which works reliab ly in the pulsed mode and has a sufficiently larg e tape capacity to la s t sev era l months if p ictures are required to be taken every 15 min. The development of another advanced model of a su rveillance system based on a m agnetic tape recording which would m eet the main specifications is underway.
A part from cam eras, som e m onitors are being tested as surveillance instrum ents. Among these, the neutron flux monitor based on the tra ck -e tch technique has shown prom ise as a fuelling m onitor, i . e. as a device for recording the number of irrad iated fuel bundles discharged from the core of a re a cto r during a given period. This monitor is particu larly applicable to on-load fuelled re a cto rs [ 37] . F o r such re a cto rs , a spent fuel bundle counter, based on response to gross gamma radiation of the fuel, has been developed and su ccessfu lly tested in a Candu-type reacto r which norm ally

60 DRAGNEV et a l.
d isc h a rg e s about 1000 fuel bundles a month. R e su lts so f a r indicate thatth is dev ice can be used fo r accountability p u rp o se s . E x p erien ce with bothth ese d ev ice s i s rep o rted a t th is Sym posium in a se p a ra te p ap er [ 3 7 ].
R E F E R E N C E S
[1 ] INTERNATIONAL ATOMIC ENERGY AGENCY, Instructions for th e use of the LP-4840 m u lti-chan n el analyser (N okia), IAEA Internal Rep. IM I-7 (March 1974).
[2 ] Programmable Four-Channel Analyser N P-361, G am m a-M uvek, Budapest (1974).[3 ] INTERNATIONAL ATOMIC ENERGY AGENCY, The SAM -1 system for non-destructive analysis of nuclear
m aterials, IAEA Internal Rep. IM I-3 (March 1974).[4 ] INTERNATIONAL ATOMIC ENERGY AGENCY, T he SAM -2 system for non-destructive analysis o f nuclear
m aterials, IAEA Internal Rep. IM I-4 (March 1974).[5 ] CHRISTOV, V . , e t a l . , Studies on th e optim al design o f a portable apparatus for Pu m easurem ents
using th e neutron co in c id en ce technique, IAEA Research Contract 989/RB (D e c . 1973).[6 ] CZOCK, K .H . , DRAGNEV, T . N . , MENZEL, J .H . , WAUGURA, A .J . , Evaluation o f versatile passive-
a c tiv e counting system (VERPACS) for non-destructive analysis of Pu, IAEA Internal R ep ., STR-43 (S ep t. 1973).
[7 ] DRAGNEV, T .N . , MARTlNEZ-GARCtA, G ., A new possibility for non-destructive assay m easurem ents o f U , IAEA Internal R e p ., ST R -45(Jan . 1974).
[8 ] BACHVAROV, N .S . , et a l . , IA E A -SM -201/92, these Proceedings, V ol. II.[9 ] INTERNATIONAL ATOMIC ENERGY AGENCY, Instructions for th e use of the beta reflectom eter, IAEA
Internal Rep. IM I-8 (A u g . 1975).[1 0 ] LA VIE, J .M ., BARTHOUX, A . , DELCROUX, V . , DESCOSSES, J . , LEVAL, M ., Appareil de controle
non destructif de l'en rich issem ent de l'uranium , C riticality Control o f F issile M aterials (Proc. Sym p. Stockholm , 1965), IAEA, Vienna (1966) 377.
[1 1 ] REILLY, T .D . , WALTON, R .B ., PARKER, J .L ., Rep. LA-4605-M S (1970).[1 2 ] BEETS, C . , COENS, J . , DRAGNEV, T . , GOOSSENS, H . , MOSTIN, N . . in P eacefu l Uses A tom ic Energy
(Proc. C onf. G eneva, 1971) 9, IAEA, V ien n a(1972) 449 .[1 3 ] DRAGNEV, T .N . , MARTlNEZ-GARCfA, G . , Enrichment measurem ents o f low enriched U fu el rods,
IAEA Internal Rep. S T R -47 (S ep t. 1974).[1 4 ] HORNSBY, J .B ., BUNDY, J .K ., TERREY, D .R ., N on-destructive determ ination o f uranium enrichm ent
by a delayed neutron technique, UKAEA, COS-24 (March 1973).[1 5 ] WALTON, R .B ., REILLY, T .D . , PARKER, J .L ., MENZEL, J .H ., MARSHALL, E .D ., FIELD, L .W .,
M easurements o f UFe cylinders with portable instruments, N u cl. T echn . 21 (F eb . 1974).[1 6 ] DRAGNEV, T .N . , MARTlNEZ-GARClA, G ., A ccurate non-destructive 235U enrichm ent m easurem ents
in UF6 cylinders through gam m a spectrometry with germ anium intrinsic d etector, IAEA InternalRep. STR-51 (1975 ).
[1 7 ] INTERNATIONAL ATOMIC ENERGY AGENCY, Instructions for the use of the d ig ita l ultra-sonic thickness m eter gau ge D -m eter DM 1, IAEA Internal Rep. I M I-25 (Jan. 1975).
[1 8 ] DRAGNEV, T .N . , SIWY, P. P . , Combined gross w eight gam m a spectrometry measurem ents o f plutonium in storage cylinders (to b e published).
[1 9 ] STROHM, W .W ., HAUENSTEIN, M .F . : Proceedings of th e Symposium on th e C alorim etric Assay of Plutonium . 2 4 -2 5 October 1973, M LM -2177.
[2 0 ] GUNNINK, R ., Plutonium isotop ic m easurem ents by gam m a ray spectrom etry, UCRL-75, 1 0 5 (1 9 7 3 ).[2 1 ] UMEZAWA, H . , SUZUKA, T . , ISHIKAWA, S . , Private com m unication , 1974.[2 2 ] DRAGNEV, T .N . , SCHÄRF, К . , N on-destructive gam m a spectrometry measurem ent of 2S9Pu/240Pu and
240pu/p u ratio, Int. J. A ppl. Radiat. Isotopes 26 (1975) 1 2 5 -2 9 .[2 3 ] DRAGNEV, T .N . , DE CAROLIS, M ., KEDDAR, A . , N on-destructive measurem ents o f Pu in solid wastes,
ash and rinse solutions, IAEA Internal Rep, STR-56 (to be published).[2 4 ] BERG, R ., BIRKHOFF, G . , BODNAR, L ., BUSCA, G ., LEY, J . , SWENNEN, R ., On the determ ination of
th e 240Pu in solid w aste containers by spontaneous fission neutron measurem ents: A pplication to reprocessing plant w aste, ETR-280 (F eb .1974 ).
[2 5 ] DRAGNEV, T .N . , DIAZ-DUQUE, R ., PONTES, B ., Safeguards gam m a measurem ents on spent MTR fu el, IAEA Internal Rep. STR-41 (M ay 1973).
[2 6 ] DRAGNEV, T .N . , BEETS, C . , Joint Integral safeguards experim ent (JEX-70) at the Eurochemic reprocessing p lant, M ol, Belgium , Rep. EUR-4576e (1971) Chap. 3; KFK-1100 (1971).

IA EA -SM -201/96 61
[2 7 ] DRAGNEV, T .N . , BURGESS, K ., Gamma measurements o f spent fu el at NPD, Canada, IAEA Internal Rep. STR-39 (March 1973).
[2 8 ] INTERNATIONAL ATOMIC ENERGY AGENCY, IAEA Research Contract 1443/RI/RB, Progress Report: An application o f gam m a and isotopic correlation techniques for safeguards id en tification and verification purposes (F eb . 1975).
[2 9 ] BRESESTI, A .M ., BRESESTI, M ., "Application o f gam m a ray techniques in safeguards. Report on Symp. on Practical A spects o f R&D in the Field of Safeguards, Rome, 7 -8 March 1974.
[3 0 ] CHRISTENSEN, D .E . , MATSEN, R .P ., D estructive and non-destructive burn-up data from natural U 02 fu e l, BNWL-1568. AEC R&D Rep. (M ay 1971).
[3 1 ] DRAGNEV, T .N . , Experim ental techniques for measuring burn-up non-destructive techniques: Gamma spectrom etry, IAEA Internal Rep. S T R -48(O ct. 1974).
[3 2 ] NATSUME, S . , MATSUURA, H . , OKASHITTA, H . , UMEZAWA, H . , EZURE, H . , Research Contract Rep. 1119/RI/RB (O ct. 1975).
[3 3 ] INTERNATIONAL ATOMIC ENERGY AGENCY, Safeguards T ech n ica l M anual, Part E, Chapter 10 .[3 4 ] NAKICENOVIC, S . , et a l . . IA E A -SM -201/105, these Proceedings, V ol. I .[3 5 ] INTERNATIONAL ATOMIC ENERGY AGENCY, Instructions for th e use o f th e flight research surveillance
system , IAEA Internal Rep. IM I-17 (March 1975).[3 6 ] INTERNATIONAL ATOMIC ENERGY AGENCY, Instructions for the use o f the NBS surveillance system ,
IAEA Internal Rep. IM I-18 (to be published).[3 7 ] HODGKINSON, J .D ., e t a l . , IA E A -S M -201/67, these Proceedings, V ol. II.
D I S C U S S I O N
P . DUMESNIL: Could you please clarify some points re lating to the in trin sic germ anium . F ir s t , was the detector warmed up a fte r each period of operation? Second, how many cy cles can the detector go through without its ch a ra c te r is tic s being altered? And third, how long does it take for the detector to s ta rt working a fter warming up?
T .N . DRAGNEV: Y e s , the in trin sic Ge detectors w ere warmed up a fter each period of use. We are trying to reduce the number of (cooling/ warming) cy cles, but as the volume of the Dewar flask is only 1. 7 li tr e s , i t is d ifficult to cool the detectors over the weekends.
We have used different d etectors for about three y ears and have recycled them many (30 - 50) tim es, but we have never observed any d eterioration in their perform ance. I am re fe rrin g mainly to th e ir energy resolution . We do not have enough data on possible changes in their e ffic ien ces . We have not noticed any strik ing a lteration s, however.
In reply to your third question, the time required to s ta rt m easurem ents a fter the Dewar flask has been filled with liquid nitrogen is le s s than 100 m inutes.
B . J . McDONALD: Perhaps you could supply some experim ental details of your technique for cooling-tim e m easurem ents.
T . N. DRAGNEV: R elative spent-fuel cooling-tim e m easurem ents are easy . The m easurem ent data are obtained from the sam e gamma spectrum that is used for burnup m easurem ents.
We used sev era l isotopic activity ratios for this purpose:
(i) 95N b/95Z r activity ra tio . These isotopes are genetically related and the ratio can be used for absolute quantitative m easurem ents when the re a cto r is shut down after establishm ent of their equilibrium ;
(ii) 95Z r / 137Cs activity ratio , when it is difficult to use the above.

62 DRAGNEV et a l.
T hese two ratios can be used for cooling tim es of up to 1. 5 y ears:
(iii) 1 4 4 (C e /P r ) /137Cs activity ratio fo r longer cooling tim es;(iv) 1 3 4 C s /137Cs activity ratio fo r the longest cooling tim es.
A ll these ra tio s can be used fo r absolute m easurem ents of the time elapsing between two m easurem ents. If only one m easurem ent is made, the la s t three ratios, a fter correction , can be used for relative m easurements of cooling tim es and for a consistency check of the o p erator's data.
M. C UYPERS: Was the sam e calibration curve used fo r the calibration of MTR co re s of different sizes?
And is a Ge(Li) gam m a-ray detector suitable for use by an inspector under field conditions? Is it not n ecessary to have rather highly trained personnel if the instrum entation is to be used properly?
T .N . DRAGNEV: As I have already mentioned, the range of enrichm ents, concentrations and s izes of the m easured MTR core plates was narrow . We considered the ra tios of num bers of net counts under the 185. 7-keV peak and total 235U content in gram s. These ratios were constant within the stated p recision - 0 . 2 % - the re lative standard deviation at one sigm a level.
G e(Li) sp ectrom etric system s are not suitable fo r field use because Ge(Li) d etectors are not portable. However, in trin sic Ge gam m a-ray sp ectrom eters can be used by insp ectors in the field; in fact, some in sp ectors have been using them for quite a long tim e. F o r example, there have been m easurem ents on spent MTR fuel elem ents in A ustralia by Agency in sp ecto rs. M easurem ents with these sp ectrom eters may be m ore difficult than with scintillation instrum ents, but there is no doubt that analyses of the m easurem ents are e a s ie r when Ge gamma sp ectrom eters are used. Of cou rse, insp ectors should be trained to use this system ju st as they a re trained in the use of scintillation sp ectrom etric system s.
M .R . IY E R : In 235U enrichm ent m easurem ents by passive gamma spectrom etry, how is the problem of non-homogeneity of the sam ples dealt with? And, further, in taking the ratio of 1 4 4 (C e/P r) to 137Cs for the cooling-tim e determ ination, how is the effect of the m igration of 137Cs taken into account?
T .N . DRAGNEV: Up till now we have m easured only homogeneous sam ples, such as UO2 and из<Э8 powders, UF6 in large storage cylinders, fuel elem ents and so on, using the "enrichm ent m easurem ent technique".One possible way of checking inhomogeneity is to use the intensity ra tio s of m easured lines from the sam e isotope, e . g. the 143. 8 -keV and 185. 7-keV gamma lines from 2 3 5 U. But this is not a very sensitive m easure. The "enrichm ent m easurem ent technique" is itse lf not very sensitive to the inhom ogeneities within the m easured part of the sam ple.
In answ er to your second question, 137Cs m igration e ffects , significant for this type of m easurem ent, have not been observed so fa r in LWR, HWR, MTR and re se a rc h re a cto r fuels.

PHYSICAL STANDARDS AND VALID CALIBRATION*
IAEA-SM -201/19
D. B. SMITHLos Alamos Scientific Laboratory,Los Alamos, New Mexico,United States of America
Abstract
PHYSICAL STANDARDS AND VALID CALIBRATION.The desire for improved nuclear m aterial safeguards has led to the developm ent and use of a number
of techniques and instruments for th e non-destructive assay (NDA) o f sp ecia l nuclear m aterial. This paper discusses sources of potential bias in NDA measurem ents and suggests m ethods of elim in atin g the effects o f bias in assay results. Examples are g iven of instruments in w hich these m ethods have been successfully applied. T he results o f careful attention to potential sources o f assay bias are a sign ificant reduction in the number and com p lex ity o f standards required for valid instrument calibration and m ore cred ib le assay results.
1. INTRODUCTION
From th e b eg in n in g o f th e n u c le a r energy program , i t has been re co g n iz e d th a t c e r t a i n s p e c ia l n u c le a r m a te r ia ls (SNM) o f f e r p o t e n t i a l t a r g e t s f o r d iv e r s io n w hich cou ld pose s e r io u s t h r e a t s to th e p u b lic h e a lth and s a f e t y and to n a t io n a l and in t e r n a t io n a l s e c u r i t y . S a feg u ard s program s a re d ir e c te d tow ards d e te r r in g and p re v e n tin g such t h r e a t s from b ein g c a r r ie d s u c c e s s f u l ly in to a c t io n . The c a p a b i l i t y f o r a c c u r a te and ra p id measurem ent o f n u c le a r m a te r ia ls i s key to p r o t e c t io n a g a in s t c o v e r t d iv e r s io n and t h e f t from f u e l - c y c l e f a c i l i t i e s . T h is need has le d to th e developm ent and u se o f a number o f te ch n iq u e s and in stru m en ts f o r th e n o n d e s tr u c tiv e a ssa y (NDA) o f s p e c ia l n u c le a r m a t e r ia l .
The g o a l o f NDA measurem ent o f n u c le a r m a te r ia l i s th e d e te rm in a tio n o f th e r e l a t i v e or a b s o lu te mass o f one or more n u c lid e s o f i n t e r e s t in a c o n ta in e r o f m a t e r ia l . T y p ic a l l y , t h i s d e te rm in a tio n i s made by com paring th e observ ed re sp o n se o f th e unknown amount o f m a te r ia l to th e resp o n se o f one or more known p h y s ic a l s ta n d a rd s by means o f a fu n c t i o n a l r e la t io n s h ip e s t a b l i s h e d by c a l i b r a t i o n . B ecau se an a ssa y r e s u l t can be no b e t t e r th an th e p h y s ic a l s ta n d a rd s used f o r c a l i b r a t i o n , s p e c i f i c a t i o n and f a b r ic a t i o n o f c a l i b r a t i o n s ta n d a rd s must be accom p lish ed c a r e f u l ly to en su re a p p l i c a b i l i t y to th e in ten d ed a ssa y p roblem .
The c a l i b r a t i o n o f an NDA in stru m en t i s s t r i c t l y v a l id o n ly f o r th e a ssa y o f in v e n to ry item s w hich do n o t d i f f e r from th e p h y s ic a l s ta n d a rd s used f o r c a l i b r a t i o n w ith r e s p e c t to any p ro p e rty to which th e in stru m en t i s s e n s i t i v e . In c o n t r a s t to ch e m ica l a n a ly s is in w hich most sam ples a re
* Work performed under the auspices o f the US Energy Research and D evelopm ent Administration.
63

64 SMITH
redu ced to stan d ard s o lu t io n s f o r su bsequ en t com parison to s im ila r s o lu t io n s c o n ta in in g known amounts o f th e n u c l id e ( s ) o f i n t e r e s t , in most NDA m easurem ents th e o bserv ed resp o n se depends n ot o n ly on th e mass o f SNM p re s e n t in th e item b ein g a ssa y e d , bu t o f te n a ls o depends on one o r more a d d it io n a l p r o p e r t ie s o f th e ite m . For t h i s re a s o n , th e most p r e c is e and a c c u r a te knowledge o f th e mass o f th e n u c l id e ( s ) o f i n t e r e s t in th e p h y s ic a l s ta n d a rd s and th e most c a r e f u l c a l i b r a t i o n a re i n s u f f i c i e n t to en su re u n b iased a ssa y r e s u l t s . E f f e c t s which p e r tu rb th e o bserv ed re sp o n se o f th e a ssa y i n s t r u ment f o r a g iven mass o f th e n u c l id e ( s ) o f i n t e r e s t c o n s t i t u t e p o t e n t i a l so u rce s o f a ssa y b ia s which must be i d e n t i f i e d and th en rem oved, c o n t r o l le d , o r e v a lu a te d to p e rm it c o r r e c t io n s to be made in th e measurement r e s u l t s . F a i lu r e to do so w i l l r e s u l t in a ssa y e r r o r s w hich a re n o t e s tim a te d by even th e most c a r e f u l e r r o r p ro p a g a tio n p ro c e d u re s , and whose v ery p re se n c e may go co m p le te ly u n reco g n iz e d . I t i s th e se measurem ent b i a s e s , cau sed by d i f f e r e n c e s betw een th e m a te r ia l b e in g assay ed and th e p h y s ic a l stan d ard s used fo r in stru m en t c a l i b r a t i o n , which w i l l u lt im a te ly c o n s t i t u t e th e l i m i t o f our a b i l i t y to c o n tr o l s p e c ia l n u c le a r m a t e r ia l .
The req u irem en t th a t th e mass o f th e n u c l id e ( s ) o f i n t e r e s t in a p h y s ic a l s tan d ard used f o r c a l i b r a t i o n must be a c c u r a te ly known and w e ll documented i s u n iv e r s a l ly re c o g n iz e d , and i s n o t t r e a te d in t h i s p a p e r. T h is paper does d is c u s s th e l e s s w e ll re c o g n iz e d , and o f te n more d i f f i c u l t problem o f en su rin g th a t th e p h y s ic a l s ta n d a rd s used in c a l i b r a t i n g an NDA in stru m en t a re a p p ro p r ia te f o r th e a ssa y o f th e m a te r ia l in q u e s t io n . Su bsequ ent s e c t io n s d i s cu ss p o t e n t i a l so u rce s o f a ssa y b i a s , methods o f e l im in a tin g b i a s , exam ples o f c u r r e n t NDA in s tru m e n ta tio n in which th e se methods a re a p p lie d , and f i n a l l y , c u r r e n t e f f o r t s to g e n e ra te con cen su s s ta n d a rd s w hich w i l l make p o s s ib le more in t e r l a b o r a to r y com p arisons o f NDA in stru m e n ts and a ssa y r e s u l t s .
2 . POTENTIAL SOURCES OF BIAS
The ob serv ed re sp o n se o f an NDA in stru m en t i s s e n s i t i v e to a wide v a r i e t y o f e f f e c t s which can b ia s th e a ssa y r e s u l t . Among th e s e e f f e c t s a re c o n ta in e r geom etry and co m p o sitio n ,SNM d i s t r i b u t i o n , and th e n a tu re and amount o f m a tr ix m a te r ia l p r e s e n t .
S p e c ia l n u c le a r m a te r ia l u s u a lly i s p la ce d in to c o n t a in e r s f o r s t o r a g e , h a n d lin g , and m easurem ent. The observ ed re sp o n se o f an NDA in stru m en t i s o f te n s e n s i t i v e to c o n ta in e r d im ensions o r co m p o sitio n . For exam ple, in th e a ssa y o f uranium by f a s t n eu tro n in t e r r o g a t io n , th e s u b s t i t u t io n o f a p o ly e th y le n e c o n ta in e r f o r one c o n s tru c te d o f m eta l can s i g n i f i c a n t l y in c r e a s e th e ob serv ed re sp o n se f o r a g iv en amount o f SNM b ecau se o f th e a d d it io n a l n eu tro n m od eration o c c u rr in g even in v ery th in - w a lled p l a s t i c c o n t a in e r s . L ik e w ise , m a te r ia l to be assay ed i s o f te n p la c e d in one o r more p l a s t i c bags and th en in to a m eta l c o n t a in e r . T h is p r a c t i c e can r e s u l t in a b ia s e d measurement i f th e c a l i b r a t i o n s ta n d a rd s do n o t a ls o c o n ta in th e a d d it io n a l in n e r b a g ( s ) .

IAEA -SM -201/19 65
The d is t r ib u t i o n o f SNM w ith in th e c o n ta in e r can p e rtu rb th e o bserv ed re sp o n se f o r a g iv en amount o f m a t e r ia l . I f th e NDA in stru m en t p rod u ces a n on-u niform re sp o n se a t v a r io u s lo c a t io n s w ith in i t s d e t e c t io n cham ber, th e m easured resp o n se w i l l depend on th e d is t r ib u t i o n o f th e SNM w ith in i t s co n t a i n e r . Even i f th e re sp o n se p e r u n it mass i s uniform th rou gh ou t th e d e t e c t io n cham ber, d i s t r ib u t i o n o f th e n u c l id e ( s ) o f i n t e r e s t in p a r t i c l e s o r lumps can cau se e r r o r in th e m easured re sp o n se b ecau se o f s e l f - a b s o r p t io n o f e m itte d r a d ia t io n s and s e l f - s h i e l d i n g o f in c id e n t gamma ray s o r n eu tro n s in a c t iv e sy ste m s. Only i f p a r t i c l e s iz e i s u niform and w e ll c o n t r o l le d (as in th e c a s e o f some p ro d u ct o r feed m a t e r i a l ) , w i l l c a l i b r a t i o n sta n d a rd s e l im in a te t h i s problem .
In n u c le a r m a te r ia l th e is o to p e s o f uranium and p lu t o nium and t h e i r r a d io a c t iv e decay p ro d u cts a re o f te n en co u n tered in v a ry in g p r o p o r t io n s . I f th e observ ed re sp o n se o f an NDA in stru m en t i s s e n s i t i v e to r a d io is o to p e s o th e r th an th e n u c lid e (s ) o f i n t e r e s t , th e i s o t o p ic com p osit io n must be i d e n t i c a l to t h a t o f th e c a l i b r a t i o n sta n d a rd s or a ssa y e r r o r s can r e s u l t .
The p e n e t r a b i l i t y o f in c id e n t or em erging gamma ra y s o r n eu tro n s i s o f te n s i g n i f i c a n t l y a f f e c t e d by th e co m p o sitio n and d i s t r i b u t i o n o f th e e x tra n e o u s m a t e r ia ls which com p rise th e m a tr ix su rrou nd ing th e SNM. Gamma ray s may lo s e en erg y or be t o t a l l y ab so rb e d . In c id e n t or em erging n eu tro n s can lo s e en erg y , be p a r a s i t i c a l l y absorbed and thus l o s t from th e sy stem , or be absorbed in f i s s i l e n u c le i and produce f i s s i o n ( m u l t i p l i c a t io n ) . M a trix m a te r ia l may produce e i t h e r an in c r e a s e o r a d e c re a se in th e o b serv ed re sp o n se . D if fe r e n c e s in th e m a tr ix co n ta in e d in m a te r ia l to be assay ed and in th e c a l i b r a t i o n s ta n d a rd s can lead to la r g e a ssa y e r r o r s .
3 . ELIMINATION OF ASSAY BIAS
S e v e ra l p ro ced u res can b e , and have b ee n , used to e l im in a te th e e f f e c t s o f so u rc e s o f b ia s in NDA m easurem ents. The c h o ic e o f p ro ced u re depends la r g e ly on th e NDA in stru m en t and th e a ssa y p rob lem , and r e q u ir e s , o f c o u rs e , th a t th e p o t e n t i a l so u rce o f b ia s f i r s t be re co g n iz e d and id e n t i f i e d .
E lim in a t io n o f a so u rce o f b ia s i s th e p r e fe r r e d p ro ced u re . Choosing an NDA te ch n iq u e which i s in s e n s i t iv e to th e p e r tu rb in g e f f e c t f r e q u e n t ly w i l l e l im in a te or s i g n i f i c a n t l y red u ce th e a ssa y e r r o r . For exam ple, f a s t n eu tro n in t e r r o g a t io n i s u s u a lly a more a p p r o p r ia te te ch n iq u e th an therm al n eu tro n in t e r r o g a t io n f o r th e a ssa y o f inhomogeneous or lumpy uranium . In a d d it io n ,NDA in stru m e n ts o f te n can be d esig n ed to be i n s e n s i t iv e to r e c o g n ized p e r tu rb in g e f f e c t s .
S e g re g a tio n o f m a te r ia l to be assay ed in to c a t e g o r ie s having s im ila r p r o p e r t ie s p e rm its independent in stru m en t c a l i b r a t i o n f o r each c a te g o r y . T h is p ro ced u re r e q u ir e s m aintenance o f a la r g e number o f p h y s ic a l s ta n d a rd s and o fte n r e l i e s on a d m in is tr a t iv e c o n t r o l to en su re th a t each in v e n to ry item i s p ro p e r ly c a te g o r iz e d

66 SMITH
and assay ed u sin g th e a p p ro p r ia te in stru m en t c a l i b r a t i o n . I t may, how ever, be th e o n ly p ro ced u re a v a i la b le f o r some ty p es o f scra p and w aste .
I f a so u rce o f b ia s can be id e n t i f i e d bu t can n ot be e l im i n a te d , i t s e f f e c t on th e ob serv ed re sp o n se can o fte n be q u a n ti f ie d by means o f a d d it io n a l or a u x i l i a r y m easurem ents (o r c a l c u la t io n s ) to p e rm it a c o r r e c t io n to be made. O ften such a u x i l i a r y m easurem ents a re in c o rp o ra te d in to th e in stru m en t d e s ig n , and th e n e c e s s a r y c o r r e c t io n s become an in t e g r a l p a r t o f th e au to m a tic d a ta re d u c t io n a s s o c ia te d w ith most c u r r e n t NDA in s tru m e n ts .
There a re many exam ples o f c u r r e n t NDA in stru m en ts and system s w hich i l l u s t r a t e th e u se o f one or more o f th e s e p ro ced u res to e l im in a te o r red u ce th e e f f e c t s o f re co g n iz e d so u rces o f p o t e n t i a l b ia s in a ssa y m easurem ents. S e v e ra l o f th e s e i n s t r u m ents a re d e s c r ib e d below .
4 . SMALL SAMPLE ANALYSIS SYSTEM
The a p p l ic a t io n o f NDA te c h n iq u e s to th e a ssa y o f sm all sam ples o f h ig h -te m p e ra tu re g a s -c o o le d r e a c t o r ' (HTGR) fu e l i l l u s t r a t e s th e e x te n t to w hich so u rce s o f p o t e n t ia l b ia s must be in v e s t ig a t e d and t r e a te d to en su re a c c u r a te a ssa y r e s u l t s . H ig h -tem p era tu re g a s -c o o le d r e a c t o r s a re fu e le d w ith elem en ts c o n ta in in g s i l i c o n - c a r b i d e co a te d m icro sp h e res o f mixed e n rich e d uranium c a r b id e and thorium c a r b id e . T h is m a te r ia l was d esigned to be h ig h ly r e s i s t a n t to ch e m ica l a t t a c k . As a r e s u l t , ch em ica l a n a ly s is o f even sm a ll in v e n to ry sam ples o f t h i s m a te r ia l i s d i f f i c u l t and e x p e n s iv e . In a d d it io n , b ecau se o f d is s o lu t io n p rob lem s, th e r e s u l t s o f ch em ica l a ssa y a re l e s s p r e c i s e and l e s s a c c u r a te th an th e r e s u l t s ch e m ica l a n a ly s is u s u a lly produces fo r o th e r m a t e r ia ls . For th e s e r e a s o n s , th e Los Alamos S c i e n t i f i c L ab o ra to ry Sm all Sample A ssay System [ l ] has been a p p lie d to t h i s a ssa y problem .
T h is a ssa y system i s based on in t e r r o g a t io n o f th e sam ples w ith 300- to 600-keV n eu tro n p u ls e s from a 3.75-M eV Van de G ra a ff a c c e l e r a t o r and co u n tin g d elay ed n eu tro n s from f i s s i o n betw een p u ls e s . Keeping th e upper l i m i t o f th e in t e r r o g a t in g n eu tro n energy w e ll below f e r t i l e - m a t e r i a l f i s s i o n th r e s h o ld s makes th e re sp o n se o f th e system unique to th e 235ц th e sam ples and r e l a t i v e l y ind ep end ent o f th e thorium c o n te n t . Thermal n eu tro n in t e r r o g a t io n was r e je c t e d b ecau se th e in d iv id u a l f u e l p a r t i c l e s are s u f f i c i e n t l y dense to e x h i b i t s e l f - a b s o rp tio n e f f e c t s a t t h i s en erg y . S in c e s e l f - a b s o rp tio n i s h ig h ly dependent on p a r t i c l e s iz e and d e n s i ty , th e rm a l-n e u tro n in t e r r o g a t io n would r e q u ir e e x a c t s ta n d a rd s f o r each sm a ll range o f p a r t i c l e d iam eter and m e tic u lo u s s e g r e g a t io n o f sam p les.
The sm a ll-sa m p le a ssa y chamber i s c o n s tru c te d w ith 1 .9 -c m - t h ic k B4 C w a lls to e l im in a te m ic ro a b so rp tio n e f f e c t s in th e fu e l p a r t i c l e s due to th e p re se n c e o f th erm al and re s o n a n c e -re g io n n eu tro n s in th e in t e r r o g a t in g sp ectru m . The in t e r r o g a t in g f lu x i s m on itored by a c y l i n d r i c a l f i s s i o n chamber which su rrounds th e sam ple a ssa y p o s i t io n . T h is c lo s e co u p lin g o f th e m on itor to th e

IAEA-SM -201/19 67
sam ple h e lp s com pensate f o r sm a ll f lu x -d e p r e s s io n e f f e c t s produced by i n s e r t io n o f th e sam ple in to th e cham ber. The f i s s i o n chamber c o n ta in s 235ц so th a t n eu tro n s p e c t r a l s h i f t s - - s u c h as th o se cau sed by Van de G ra a ff t a r g e t d e t e r i o r a t i o n - - w i l l n o t change th e c a l i b r a t i o n o f th e sy stem .
Even w ith t h i s a t t e n t io n to d e t a i l in th e system d e s ig n , b ia s e s o f th e o rd e r o f 1 -2 1 s t i l l can o ccu r in th e a ssa y o f HTGR sam ples due to d i f f e r e n c e s betw een th e makeup o f a ssa y sam ples and th e s ta n d a rd s used to c a l i b r a t e th e sy stem . These r e s id u a l e f f e c t s a re removed by measurement o f th e e f f e c t o f sam ple param et e r s on th e a ssa y re sp o n se . T y p ic a l p aram eters in v e s t ig a t e d and t h e i r range o f e f f e c t a r e : f i s s i l e q u a n tity o f C +0 .077$/gf i s s i l e ) , i n e r t d i lu t io n (up to 2% in a 5-cm 3 v i a l ) , sam ple h e ig h t (1% ov er a range o f 25 mm), hydrogen c o n te n t (+ 0 .1 l/m g o f H ), and thorium c o n te n t (+0 .1 2 % /g o f T h ) . R e la t iv e ly crude e s t im a te s o f th e v a lu e s o f th e s e p a ra m e te rs in th e sam ples a re s u f f i c i e n t to c o r r e c t a ssa y v a lu e s to a d eg ree c o n s is t e n t w ith th e p r e c is io n o f th e a s s a y s .
These e f f o r t s to remove th e e f f e c t s o f so u rce s o f b ia s r e s u l t in a n o n d e s tr u c tiv e a ssa y w hich i s independent o f th e ch em ica l and p h y s ic a l form o f th e m a t e r ia l . V a lid c a l i b r a t i o n i s now a ch iev e d u sin g a sm all number o f u ran iu m -oxid e s ta n d a rd s w hich ■ can be more e a s i l y and more a c c u r a te ly f a b r ic a t e d than p a r t i c l e s ta n d a r d s .
5. RANDOM DRIVER
The Random Sou rce I n t e r r o g a t io n System L 2 -3 J o r "Random D r iv e r " i s a com pact, n o n d e s tr u c tiv e a ssa y in stru m e n t used p r i n c i p a l l y to d eterm in e th e e n r ich e d uranium c o n te n t o f c o n ta in e r s up to ~20-& c a p a c i ty . AmLi n eu tro n so u rce s a re used to induce f i s s i o n s in th e 235u p r e s e n t in th e unknown m a t e r ia l . R e la t iv e ly few f i s s i o n s o ccu r in th e 238ц b ecau se th e n e u tro n -e n e rg y spectrum o f th e AmLi so u rce s i s below th e f i s s i o n th r e s h o ld f o r The induced f i s s i o n s a re ob serv ed by c o in c id e n c e co u n tin g th e tim e c o r r e la t e d f i s s i o n n eu tro n s w ith two f a s t - p l a s t i c s c i n t i l l a t i o n d e t e c to r s lo c a te d on o p p o s ite s id e s o f th e a ssa y cham ber. By r e q u ir in g th e d e t e c t io n o f n eu tro n s in b o th d e t e c to r s w ith in a s h o r t tim e i n t e r v a l , i t i s p o s s ib le to d is t in g u is h th e tim e- c o r r e la t e d induced f i s s i o n n eu tro n s ( ~ 2 .5 n e u t r o n s / f i s s io n ) from th e randomly produced so u rce n e u tro n s . The c o in c id e n c e co u n tin g r a t e i s p r o p o r t io n a l to th e q u a n tity o f 235ц t be m a te r ia l b e in g assay ed and thus p ro v id e s a m easure o f th e uranium c o n te n t .
A number o f te c h n iq u e s a re used in t h i s in stru m en t to remove th e e f f e c t s o f p o t e n t i a l so u rc e s o f a ssa y b i a s . The in t e r r o g a t in g n eu tro n s a re n o t th e rm a liz e d , and th e a ssa y chamber i s lin e d w ith b o r a l to p re s e rv e th e "h a rd n e s s " o f th e n eu tro n sp ectru m , thus en su rin g good n eu tro n p e n e t r a b i l i t y throu gh th e sam ple. The d e t e c to r s a re s h ie ld e d w ith le a d to redu ce s e n s i t i v i t y to f i s s i o n gamma ray s (which do n o t r e a d i ly p e n e tr a te dense m a t e r ia l) and to red u ce unwanted y-y c o in c id e n c e e v e n ts . F u rth e r gamma-ray c o in c id e n c e r e je c t i o n i s accom p lish ed by a p p ro p r ia te f a s t tim in g in th e d e t e c to r c o in c id e n c e lo g ic c i r c u i t r y . B ecau se c o in c id e n t gamma ra y s have v ery s h o r t f l i g h t tim es in th e system r e l a t i v e to f a s t n e u tro n s , t h i s te ch n iq u e i s v ery e f f e c t i v e .

68 SMITH
Two te ch n iq u e s a re used to redu ce th e e f f e c t s o f lo ad in g v a r ia t io n s betw een sam p les. The sample i s r o ta te d d u ring a ssa y to m inim ize th e e f f e c t o f asym m etric lo a d in g o f m a te r ia l w ith in th e c o n t a in e r , and th e AmLi so u rce s a re p o s it io n e d to produce a n e a r ly u niform re sp o n se p r o f i l e ov er th e ty p ic a l range o f con t a i n e r f i l l h e ig h ts (7 5 -2 0 0 mm). The r e s id u a l change in o v e r a l l re sp o n se f o r a g iv en amount o f m a te r ia l i s l e s s than \\ ov er t h i s range o f f i l l h e ig h ts . N e v e r th e le s s , th e m easured v e r t i c a l re sp o n se d a ta a re s to r e d in th e d ata re d u c tio n com puter, and a f i l l - h e i g h t c o r r e c t io n , based on th e sample f i l l h e ig h t e n te re d by th e o p e r a to r , i s g e n e ra te d and a u to m a tic a l ly a p p lie d to th e a ssa y d a ta .
The e f f e c t o f in tro d u c in g m od erating m a te r ia l in to th e a ssa y chamber i s to redu ce th e energy o f th e in t e r r o g a t in g s p e c trum , which in c r e a s e s th e r a t e o f induced f i s s i o n in 2 3 5 U. L ig h t elem en t m od erating m a te r ia l can appear e i t h e r as m a tr ix o r in p o ly e th y le n e c o n ta in e r s and b ag s. Because th e ty p e o f c o n ta in e r ( i . e . , m e ta l o r p o ly e th y le n e ) used f o r most m a t e r ia l b ein g assay ed i s d ic t a t e d by th e p ro c e ss s ta g e in w hich th e m a te r ia l o c c u r s , a ssa y d a ta must be c o r r e c te d fo r p e r tu r b a t io n s cau sed by m od erating m a te r ia l in th e sam ple cham ber. T h is c o r r e c t io n i s based on th e re sp o n se o f two 3He p r o p o r t io n a l c o u n te rs lo c a te d a d ja c e n t to th e sample a ssa y p o s i t io n w hich m onitor th e in t e r r o g a t in g n eu tro n f l u x . The f lu x -m o n ito r r a t i o , which i s th e r a t i o o f th e 3He c o u n t- r a te w ith th e sam ple in th e chamber to th e ^He c o u n t- r a te w ith the chamber em pty, p ro v id e s a m easure o f th e change in energy o f th e in t e r r o g a t in g n eu tro n sp ectru m . A c o r r e c t io n f a c t o r [ 3 ] which i s a fu n c tio n o f th e f lu x -m o n ito r r a t i o and an e x p e r im e n ta lly d eterm ined c o n s ta n t i s a u to m a tic a l ly g e n e ra te d and a p p lie d to th e a ssa y d a ta by th e computer which i s an in t e g r a l p a r t o f t h i s in s tru m e n t.
E lim in a t io n o f th e e f f e c t s o f p o t e n t i a l so u rce s o f a ssa y b ia s by in stru m en t d esig n and a u x i l i a r y m easurem ents has g r e a t ly reduced th e number, and co m p lex ity o f p h y s ic a l s ta n d a rd s re q u ire d f o r c a l i b r a t i o n . A s in g le c a l i b r a t i o n i s v a l id f o r a wide range o f c o n t a in e r s , f i l l h e ig h t s , and m a tr ix co m p o sitio n . F u rth erm o re , b ecau se e x te n s iv e s e g r e g a t io n o f m a te r ia l b ein g assay ed i s no lo n g e r r e q u ir e d , p o t e n t i a l m isuse o f th e in stru m en t ( i . e . , a tte m p ting to a ssa y m a te r ia l f o r w hich th e c a l i b r a t i o n i s n o t v a l id ) has been a p p r e c ia b ly red u ced .
6 . SEGMENTED GAMMA SCAN
The Segmented Gamma Scan (SGS) [ 4 ] System i s based on d e t e c t io n o f gamma ra y s sp o n tan eo u sly em itted by n u c le i o f f i s s i l e m a te r ia l u ndergoing a ssa y ( 2 3 °P u , 239pU) 2 3 5 и ). A p r in c ip a l so u rce o f b ia s in a ssa y te ch n iq u e s based on d e t e c t io n o f gamma ra y s i s a t te n u a t io n o f th e em itted gamma ra y s by m a te r ia l betw een th e e m itt in g n u cle u s and th e d e t e c to r . T h is a t te n u a t io n changes g r e a t ly w ith b o th gamma-ray energy and th e d e n s ity o f th e m a te r ia l throu gh w hich th ey must p a s s . Thus m a tr ix in h o m o g en eities produce a v a ry in g r e la t io n s h ip betw een d e te c te d co u n ts and f i s s i l e co n t e n t .
In th e SGS sy stem , th e e f f e c t o f r a d ia l in h o m o g en eities in th e m a t e r ia l b e in g assay ed i s la r g e ly removed by r o t a t in g th e

IAEA-SM -201/19 69
sam ple. V e r t i c a l in h o m o g e n e itie s a re t r e a te d by making th e gamma scan m easurem ents in d is c r e t e seg m ents. For each in d iv id u a l s e g ment th e gamma-ray tr a n s m is s io n o f th e sam ple i s m easured and assumed u niform f o r th a t segm ent, though i t may v ary from segm ent to segm ent. T h is measurem ent i s made a u to m a tic a l ly by means o f a s e p a r a te tr a n s m is s io n so u rce which i s view ed throu gh th e sample b e in g assay ed and compared w ith a known tr a n s m is s io n v a lu e o b ta in e d from a background run ta k en w ith no sample p r e s e n t in th e sy stem .The a t te n u a t io n c o r r e c t io n and f i s s i l e c o n te n t i s computed f o r each segm ent, and th e r e s u l t s from each segm ent a re combined to produce a f i n a l a ssa y r e s u l t .
B ecau se o f th e d e t a i le d c o r r e c t io n made f o r gamma-ray a t te n u a t io n in th e sam p le, th e SGS a ssa y r e s u l t s a re r e l a t i v e l y independent o f th e d e n s ity o f th e sam ple. T h is p e rm its a c a l i b r a t i o n o f th e system w hich i s v a l id f o r a wide range o f m a te r ia ls u sin g on ly a l im it e d number o f p h y s ic a l s ta n d a rd s . W ithout t h i s in d e pendence, a la r g e in v e n to ry o f s ta n d a rd s would have to be o b ta in e d and m a in ta in e d . In f a c t , s in c e m erely shak in g a sam ple w i l l o f te n produce s i g n i f i c a n t changes in th e d e n s ity and m easured t r a n s m is s io n , i t would be v i r t u a l l y im p o ss ib le to m atch sta n d a rd s to sam ples and co n se q u e n tly im p o ss ib le to a c h ie v e an a c c u r a te a ssa y .
7. CONSENSUS STANDARDS
B ecau se o f th e wide v a r i e t y o f p h y s ic a l and ch em ica l forms in which n u c le a r m a te r ia l a p p e a rs , th e v a r ie t y o f c o n ta in e r s in to w hich i t i s p la c e d , and th e p o s s ib le s e n s i t i v i t y o f NDA. m easurements to d i f f e r e n c e s betw een c a l i b r a t i o n s ta n d a rd s and th e m a te r ia l b e in g a ssa y e d , d eterm in in g th a t th e c a l i b r a t i o n o f an NDA i n s t r u ment i s indeed v a l id f o r a ssa y o f a g iv en c l a s s o f m a te r ia l i s d i f f i c u l t .
One method o f in v e s t ig a t in g th e a cc u ra cy o f a ssa y r e s u l t s i s p o s t - a s s a y ch em ica l a n a ly s i s ; e i t h e r a n a ly s is o f sam ples o f u n q u e stio n a b ly homogeneous m a te r ia l o r com p lete re co v e ry o f s e le c t e d c o n ta in e r s o f m a t e r ia l . However, p o s t-a s s a y a n a ly s is i s u s u a lly tim e-consu m ing and e x p e n s iv e , p a r t i c u l a r l y i f th e m a te r ia l in q u e s t io n i s th e f i n a l p rod u ct o f some o p e r a tio n such as th e f a b r ic a t i o n o f f u e l e le m e n ts .
An a l t e r n a t iv e method i s in t e r la b o r a t o r y com parison o f NDA in stru m e n ts and a ssa y r e s u l t s . However, such in t e r la b o r a to r y com p arisons a re co m p lic a te d by th e same a ssa y problem s which o r ig in a te d th e need f o r com p arison . At th e p r e s e n t tim e s e v e r a l s ta n d a r d s -w r it in g o r g a n iz a tio n s a re w orking on con sen su s s t a n dards w hich , i t i s hoped, w i l l a l l e v i a t e t h i s p roblem . One o f th e s e g ro u p s 1 i s c u r r e n t ly d ev elo p in g sta n d a rd s in th e fo llo w in g a r e a s :
Subcom m ittee INMM-9[5] e n t i t l e d "N o n d e stru c tiv e A ssay" and sponsored by th e I n s t i t u t e o f N u clear M a te r ia ls Management (INMM) f o r th e Am erican N a tio n a l Stan dards I n s t i t u t e (AN SI).

70 SMITH
a . M a te r ia l C l a s s i f i c a t i o nb . C o n ta in e r S ta n d a r d iz a tio nc . P h y s ic a l S tan d ard sd. Measurement C o n tro lse . Measurement T echniqu esf . A utom ation Methods
S e v e ra l o f th e s e stan d ard s d i r e c t l y ad d ress th e problem s d is c u s s e d in t h i s p a p e r , and com p lian ce w ith th e com pleted s t a n dards n ot o n ly should f a c i l i t a t e in t e r la b o r a t o r y com parison o f in stru m e n ts and a ssa y r e s u l t s bu t a ls o should improve th e a cc u ra cy o f NDA m easurem ents.
REFERENCES
[ 1 ] EVANS, A. E . , Rep. LA -5557-PR ( 1 9 7 4 ) , 1 .[ 2 ] FOLEY, J . E . , U. S. P a te n t No. 3 ,7 3 6 ,4 2 9 , May 2 9 , 1973 .[ 3 ] ATWELL, T. L . , EAST, L. V ., and MENLOVE, H. 0 . Rep. LA -5889-
PR (1975), 3. See also Atwell, IA EA -SM -201/33, these Proceedings, Vol.II.
[ 4 ] MARTIN, E. RAY, JONES, DAVID F . , and SPEIR, L. G .,Rep. LA-Б652-М ( 1 9 7 4 ) .
[ 5 ] BISHOP, D. M ., N u cl. M ater. M anage., 4_ 3 ( 1 9 7 5 ) .
D I S C U S S I O N
C . D. BINGHAM: As an illu stration of the calibration dilem m a which you d escrib e , the Los Alamos and New Brunswick L aboratories have recently completed a com parison program m e of chem ical and non-destructive assay of mixed uranium, thorium oxide powder and silicon -carb id e-coated p artic les of (U ,T h)02 for high-tem perature gas-cooled re a cto r fuel.
Both lab orato ries used identical and w ell-ch aracterized oxide powders for calibration m ateria ls , but employed slightly different containers.
Mixed-oxide resu lts averaged over nearly 200 sam ples showed a mean difference of -0 .7% (relative), and a range of -3 .5 to +25%. Coated p artic le resu lts showed an average d ifference of about + 1 %.
D . B. SMITH: Y e s, that is a good exam ple. The sou rces of this bias are not yet known, but both lab oratories are working on the problem .
J .L . JAECH : E xp erts have been discussing these problem s for y ea rs , and it is evident that much progress has been made in finding appropriate solutions. I hope, however, that we shall not have to wait until a ll problem s are solved to the satisfaction of all experts before consensus standards are w ritten on the topics you mention in your paper. Standards can always be revised as m ore p rogress is made. It would be helpful to all of us here if you could give us an idea when we might expect to see in itial drafts of these standards, and what the projected final dates of issue as ANSI standards might be.
D .B. SMITH: Consensus standards on the topics I have discussed are being pursued by the sev era l task fo rces in Sub-Com m ittee INMM-9.These task forces are all actively engaged in writing at the present tim e, with in itial drafts expected in the spring of 1976. Since the resulting

IAEA-SM -201/19 71
standards wül be issued by the A m erican National Standards Institute (ANSI), draft review , approval, etc. will delay their appearance by perhaps an additional y ear.
H .P. F IL SS : Is your counting rate lowered by self-sh ield ing or d isadvantage facto rs when concentrated p artic les or pellets are m easured?Or is the mean energy of the interrogating neutrons so high that these effects do not occur?
D .B. SMITH: The Random D river has been used extensively for assay of HTGR fuel p a rtic le s . The interrogating energy spectrum is kept sufficiently high so that self-sh ield ing within the p artic les is not a problem . Both experim ent and neutron transport calculations show that had therm al neutron interrogation been used, a —10-25% self-sh ield ing effect (depending on p article diam eter) would have been present.


ANALYTICAL SERVICES FOR AGENCY SAFEGUARDS
IA EA-SM -201/98
E. LOPEZ-MENCHERO, M .N. RYZHOV, B. CLARK,E. SZABO, T .M . BEETLE, S. DERON Department of Safeguards and Inspection, International Atomic Energy Agency,Vienna, Austria
Abstract
ANALYTICAL SERVICES FOR AGENCY SAFEGUARDS.T h e A gency is setting up, in co-operation w ith Member States, a network o f an a ly tica l laboratories
(NWAL) w hich w ill provide th e A gency w ith th e an a ly tica l services required by its safeguards verification a c tiv ity . T h e network w ill consist o f national laboratories providing th e serv ice under A gency contract and a Safeguards A n alytica l Laboratory (SAL) operated by A gency staff. Experiments h ave b een carried out to id en tify problem s in transport o f sam ples, to in vestigate th e stab ility o f sam ple m aterials and to establish procedures for reporting results. The experim ents (PAFEX) have also enabled us to c o l le c t inform ation on th e accuracy o f various ana ly tica l methods used in th e laboratories participating in th e experim ents. S pecification s for SAL fa c ilit ie s w ere set by th e A gen cy , w hich contracted w ith th e Austrian Studiengesellschaft fur A tom energie (OSGAE) to rent fa c ilit ie s satisfying th e specification s. OSGAE has nearly com pleted the fa c ilit ie s w hich are b ein g equipped by th e A gen cy w ith th e highest quality equipm ent. This paper reports on experience gained in th e use o f an a ly tica l services and on results o f PAFEX experim ents, and it describes SAL fa c ilit ie s and equipm ent.
1. INTRODUCTION
The conclusion of the Agency's safeguards verification activity is based on o p erato r's data a fter the Agency has accepted them as re liab le .
The operator may obtain the total amount of each elem ent of nuclear m ateria l and the isotopic com position by m easurem ents which include sam pling and analysis. The v erification of the o p erator's data im plies, as w ell, a sam pling and a determ ination by the Agency of content and isotopic com position of nuclear m ateria l in sam ples. Agency sam ples a re drawn by the operator in the presence of the inspector. The analytical program m e is to be designed and im plemented by the Agency, which should m aintain a quality control program m e to ensure the quality of the data on which the acceptance of the o p erato r's data is based.
The Agency has ca rrie d out detailed studies of the nuclear m ateria l to be sampled and analysed and the sampling procedures and analytical methods m ost likely to be used.
F o re c a s t studies have been made on the number of sam ples and analyses to be expected. The estim ate of the s ize of the population of the different types of sam ples to be taken by Agency inspectors has been done on the b asis of a fo re ca s t of the type, number and annual throughput of nuclear fa c ilit ie s to be under safeguards [1]. It seem s that about 1500 sam ples would need to be analysed in 1976 and m ore than 5000 sam ples in 1980.
73

-J
FIG. 1 . A nalytical ac tiv ities in the framework o f th e IAEA Safeguards V erifica tion sch em e.
LÖ
PEZ
- ME
NC
HER
O et al,

IAEA-SM -201/98 75
2. CONCEPT FO R THE PROVISION OF ANALYTICAL-SERVICES
2.1. Network of A nalytical L aboratories (NWAL)
Three concepts w ere considered fo r the provision of analytical serv ices . The f ir s t was that the Agency would analyse a ll sam ples in fa c ilit ie s of its own. The second was to set up a network of analytical lab oratories (NWAL) which would provide the required analytical se rv ice s under Agency contract. The third was to se t up a network of analytical lab oratories (NWAL) which would con sist of lab oratories providing se rv ice s under Agency contract and an Agency Safeguards A nalytical Laboratory (SAL) operated by Agency staff.
The third approach was selected to make use of existing fa c ilit ie s , to have the possibility of controlling the quality of analyses by intercom parison of data from different lab oratories and to enable the Agency to have a laboratory of its own where sp ecia l ca ses may be investigated in d irect contact between the safeguards and the laboratory staff. Econom ic co n sid erations led to the incorporation of SAL as one m ore NWAL laboratory providing routine analytical se rv ic e , while reserv in g part of its work capacity to support a quality control program m e and to investigate p articu lar problem s upon request of esp ecia lly assigned Agency safeguards staff.
The analytical activ ities in the fram ew ork of the Agency safeguards v erification are shown in F ig .l . It is assum ed that the operator obtains sam ples for h is own use as well as sam ples for the Agency. F o r each batch selected for Agency m easurem ents, one or two sam ples a re sent to the Safeguards H eadquarters and from th ere these sam ples are distributed to the network of lab oratories.
The prim ary ob jective of the network of lab oratories is to provide data fo r the evaluation of the op erato r's accountancy. The b asic mode of evaluation is through paired com parison of the o p erator's and the netw ork's m easurem ents. As shown in F ig .l , a d irect com parison can be made between the o p erator's laboratory resu lts for a particu lar batch of m ateria l and the NWAI resu lts .
The su ccess in using the network w ill depend on solving many p ractica l problem s. These include m aintaining sam ple integrity under adverse conditions of transport; finding p ractica l and econom ic means of meeting the various regulations for the safe transport of the sam ples; and m eeting Agency requirem ents for tim elin ess in reporting re su lts . A se r ie s of experim ents have been perform ed to investigate the actual magnitude of these problem s under re a l environm ental conditions.
2 ,2 . Quality Control Program m e
The Agency w ill m aintain a Quality Control Program m e (QCP) to ensure the quality of m easurem ents made by the network. The ob jectives of QCP are to make periodic assessm en ts of the random and system atic e r ro rs of the data of the lab oratories in the network; to detect b iases in the data of the lab orato ries; to review periodically the capability and perform ance lim its of the m easurem ent accu racy of each of them.
The QCP may con sist of an internal quality control program m e at each network laboratory, which w ill provide a b asis for quality statem ents and w ill be su b ject to periodic audit by the Agency; analysis of common re fe ren ce standards by a ll lab oratories in the network; analysis of duplicate

76 LOPEZ-MENCHERO et a l.
TA BLE I. PARTICIPATING LABORATORIES IN THE IAEA PROCESS ANALYSIS FIE L D EXPERIM EN TS (PA FE X I and II)
N am e o f Laboratory C ountry/Organization Responsible O fficial
N uclear Research Institute C zechoslovakia M. Krivanek
C entre d'Etudes Nucl^aires de Grenoble France A. Huart
Bundesanstalt für Materialprüfung Fed. Rep. o f Germany D. T h ie le
Bhabha A tom ic Research Centre India M .V . Ramaniah
Japan A tom ic Research Institute, Tokai Establishment Japan S. Tsujimura
Reactor Centrum Nederland Netherlands J. G. Van Raaphorst
AB A tom energi, Studsvik Sweden G. Blomquist
A tom ic Energy Research Establishment United Kingdom G .W .C . Milner
Khlopin Radium Institute USSR A. A. Lipovskij
New Brunswick Laboratory USA C. D. Bingham
C entral Bureau o f N uclear Measurements Euratom P. D e BiSvre
IAEA Seibersdorf Laboratory IAEA S. Deron
Eurochemica Belgium R. Berg, R. Swennen
ALKEMb Fed. Rep. o f Germany K .D . Kuhn
a Supplier o f PuQ,, Pu-nitrate solution for PAFEX I and Input solution for PAFEX II. b Supplier o f uranium -plutonium m ix ed -o x id e p ellets for PAFEX I.
sam ples by both SAL and the other network lab oratories so as to achieve a one-to-one com parison between SAL and the network; and analysis of data provided by the lab oratories from inspection sam ples from a single production m ateria l in a single facility .
3. T E ST OF THE CONCEPT
3.1. P ro ce ss A nalysis F ield Experim ent (PA FEX)
Two IAEA P ro ce ss A nalysis F ield E xp erim ents, P A FE X I and P A FE X II, w ere carrie d out in 1974 and 1975 as a preparatory step in establishing the network of analytical lab oratories. L aboratories from eight M ember States participated in PA FEX I: Czechoslovakia, the F ed era l Republic of Germ any, F ra n ce , India, Japan, USSR, the United Kingdom, and the United States of A m erica. In P A FEX II, lab oratories from the above- mentioned Member States, Netherlands, Sweden, and Euratom took part.The nam es of these lab oratories are listed in Table I. The Agency’s Seibersd orf Laboratory took part in both experim ents.

IAEA-SM -201/98 77
TA BLE II. PA PEX I EXPER IM EN T RESU LTS (Pu-concentration m easurem ents)
T ype o f m aterial Pu (w t. °}о) SD ± l o RSDNumber o f
determ inations
Plutonium nitrate 1 .766 0 .004 0 .2 3 91
Plutonium ox id e 8 6 .5 8 0 .1 6 2 0 .1 9 198
Pu-U m ixed ox id e 3 .4 6 0. 012a 0 .3 5a 73
T h ese two estim ates do not contain system atic error variance ow ing to differences in tim es o f analyses.
These experim ents w ere designed to evaluate, on a te s t-ru n b a s is , the operational problem s in carrying out the safeguards analytical work in a network of lab orato ries. The purpose was to estab lish procedures fo r management of the A gency's safeguards analytical program m e, taking into consideration the manipulation of the sample m ateria l prior to its analysis, the sam ple transp ort, the timing for receip t of the resu lts by the Agency, and the setting up of specifications for the quality of the analyses.
P A FE X I was lim ited to the determ ination of the plutonium and uranium content and the isotopic com position of plutonium in the following plant m a teria ls : plutonium n itrate solution from the output of a fuel rep rocessin g fa cility , plutonium dioxide derived from the low -tem perature ignition of of plutonium oxalate, and plutonium-uranium oxide p ellets (type PWR). The sam ples of production grade plutonium nitrate and PuC^ w ere obtained from the Eurochem ic fuel rep ro cessin g facility (Mol, Belgium) and the plutonium- uranium pellets from the ALKEM fuel fabrication facility (Hanau, FRG).
The sam ples w ere distributed to the nine participating lab oratories.The lab oratories determ ined the plutonium concentration of each sample. D eterm inations of plutonium weight per cent w ere made on each sam ple or sub-sam ple. The plutonium isotopic com position was determined for m ass num bers 238, 239, 240, 241 and 242 in at least one of the sam ples. The plutonium content was usually m easured by potentiom etric titration and by controlled potential coulom etry, the form er being the m ost frequent method used for determ ining the uranium content. The su rface ionization m ass spectrom etry technique was used for plutonium isotopic composition d eterm ination. Some lab orato ries m easured the 238Pu content by alp ha-pu lse- height analysis. The participating lab oratories w ere requested to analyse standard re fe ren ce m ateria ls — the plutonium concentration of N BS/949/d and the plutonium isotopic com position of NBS 947.
The sub-sam pling and aliquoting of plutonium nitrate solution, dioxide powder and m ixed-oxide pellets did not show an im portant effect on the resu lts of plutonium content and isotopic determ ination. The variances of those effects might be used in designing the analytical quality control program m e and inspection plans. Table- II shows estim ates of the average standard deviation without lab oratory-to -laboratory d ifferences. F o r plutonium-uranium oxide the estim ates include effects of random e r ro rs , but do not include the tim e effect since all the analyses for that m ateria l w ere perform ed at the sam e tim e [2 ].

p lu to n iu m
FIG. 2 . PAFEX-II experim ent.
LO
PEZ
-ME
NC
HE
RO
et al.

IAEA-SM -201/98 7 9
TA BLE III. URANIUM ISOTOPIC COMPOSITION OF UNSPIKED INPUT SOLUTION SAM PLES (PA FE X II)
Lab.No.
Uranium isotopic com position (w t. ° /o )
234 235 236 238
1 0. 012 1 .1 8 9 0 .2 4 8 98. 551
2 0. 0135 1 .2 0 1 0 .2 4 7 98 .533
3 0. 0114 1 .1 8 9 9 0 .2483 9 8 .5504
4 0 ,0 1 1 9 1 .1920 0 .2497 98. 547
5 0 .0123 .1 .1 8 6 0 .2 4 6 4 98 .556
6 0. 01204 1 .1 8 9 0 0 .2473 9 8 .5 5 2
7 - 1 .1961 0 .2546 98. 550
8 0 .0120 1 .1 8 8 0 .2473 98. 553
9 0. 0136 1 .1898 0 .2511 98 .546
10 0. 0153 1 .1 9 0 0 .2 4 5 5 98 .5 4 9
11A 0. 0120 1 .1 7 9 0 .2 4 5 8 98. 563
11B 0. 0120 1 .1803 0 .2 4 3 0 98. 5647
12 0. 01174 1 .1913 0 .2473 98. 5495
X 0. 0125 1 .1831 0 .2478 98 .551
P A FE X II was lim ited to the determ ination of the plutonium and uranium content and th eir isotopic com position in the input solution of a fuel rep ro cessin g facility . The solution was obtained from the Eurochem ic rep ro cessin g facility [3].
The outline of the P A FEX II experim ent is shown in F ig .2. The isotope dilution m ass spectrom etry technique with the "d ry spike" method was used. Diluted input solution was spiked with a m ixture of calibrated high purity 233U and 242Pu [4]. The "dry spike" method consisted of evaporation to dryness (in Seibersdorf) of the aliquot of the pure spike solution which was contained in a 1 0 -m l penicillin-type bottle, shipment of the dried aliquot to Eurochem ic, addition of an aliquot of the diluted (1 :2 0 0 ) input solution to the bottle containing the spikes and evaporation to dryness. A norm al g lass vial was used and the dried m a teria l was recovered from the g lass su rface with n itric acid by the lab oratories.
Average resu lts of the data on uranium isotopic com position of the unspiked input solution sam ples are shown in Table III.
The plutonium n itrate solution sam ples w ere packed in 12 glass sam ple v ials (KIMAX type) closed with p lastic "p olyseal" screw caps. The caps w ere secured by tapes. The taped v ials w ere wrapped in plastic bags and in serted in polyethylene tubes (25 mm outside diam eter and 150 mm long) which also contained some Verm iculite to absorb the acid solution in case of breakage. The weighted plutonium dioxide sam ples (1.5 g) w ere each contained in penicillin-type g lass bottles. The sam ple container was inserted in an aluminium tube, closed with a taped screw cap and sealed in a double

80 LOPEZ- MEN CHERO et a l.
p lastic bag. The pellets of plutonium-uranium oxide w ere packed in plastic containers and bagged in double polyethylene envelopes. The second containm ent was a sealed inner tin can, which also contained v erm icu lite, and the can was placed in a Type В USA DOT 6 M 15 gallon modified container or in a United Kingdom Type В GB: 0818H container in the case of solid plutonium sam ples only. The documentation and ce rtif ica te s w ere given to the lab oratories to obtain sp ecia l perm ission for transportation.
Transportation of the diluted input solution of the rep rocessin g facility was carried out in the United Kingdom Type В GB: 0818K container with cork therm al shield. The weighed sam ples w ere packed in penicillin-type g lass bottles with approxim ate contents of 10 m l. The g lass sam ple bottles w ere packed in p lastic bags and placed in a lead pot (Harwell design No. 1384). A fou r-holders sealed interm ediate tin container (Harwell design No. 0304) was used.
A ll containers w ere received in the lab oratories in an acceptable condition and contents w ere in accordance with the given specifications. There were sev era l cases where a significant delay in receiv ing the sam ples at the laboratory occurred owing to delay in the dispatch of inform ation in the shipment concerned, custom s regulations, im proper choice of the route selected , etc.
3,2. Start-up of provision of Safeguards analytical serv ices by national lab oratories and by the IAEA Seibersd orf Laboratory
Since O ctober 1974 sev era l hundred sam ples of m ore than 25 different types of nuclear m ateria l (Table IV) have been analysed by eight lab oratories. Most of the operational problem s have been resolved; s t ill , tim e delays rem ain in transporting the sam ples to the lab oratories and in getting the re su lts of analyses to Headquarters.
E stim ates of the present magnitude of e r ro r variances have been compiled from data obtained from the lab oratories. Period ic te sts of the magnitude of the random and system atic e r ro r variance for each laboratory/ tech n iqu e/m ateria l combination w ill be perform ed and quality control charts and te st procedures will be developed for a quality control programme.
4. THE IAEA SAFEGUARDS ANALYTICAL LABORATORY (SAL)
4 .1 , Requirem ents
(a) Type of analyses
The analytical capability of SAL shall be such that sam ples taken from any key m easurem ent point of the fuel cycle could be analysed and that the data from these analyses w ill suffice for safeguards accounting verification requirem ents. M ajor em phasis shall be placed on the determ ination of concentration and isotopic com position of uranium and plutonium feed and product sam ples. The capability shall also ex ist for analysis of thorium and the various U -Pu scrap , w aste, and re-w ork m ateria ls as w ell as the quantitative determ ination of in terfering elem ental im purities.

IAEA-SM -201/98 81
TA BLE IV. T Y PE S OF SAM PLES ANALYSED BY NWAL IN 1974-1975
235u (w t. 7«)
No. Type o f m aterialU -content
(w t. °lo ) D epl, Nat.LEU
0. 8 -5LEU5-20
HEU> 2 0
1 U -m eta l - 9 9 . 9 X X X2 U -T i 9 9 .2 5 X3 U -S i a lloy 9 6 .2 X4 U3-S i 9 5 .9
5 U -A l-S i a lloy 9 5 .0
6 U-M o a lloy 9 8 .0 X7 U -carb ide 9 5 .2 X X8 U -M o.-Ti 9 2 .0 X9 UQ, p e lle t 8 8 . 1 X X X X
1 0 UO2 powder 8 7 .0 X X X X X1 1 U3Q8 powder 8 4 .4 X X X X1 2 U 0 3 powder 8 3 .2 X13 u f 4 7 5 .8 X14 A m m onium diuranate 7 2 .2 X X X15 Uranyl am m onium tricarbonate 5 3 .7 X16 Uranyl nitrate hexahyd. 4 7 .4 X X17 U -A l a lloy 2 0 X18 U -graphite 2 0 X19 UCVThOz 2 . 6 X2 0 U -Z r a lloy 1 . 6 X21 UCVPuOfc 70 X22 иОг-РиОг 97 X23 Input solution from
reprocessing (diluted) 0 . 2
X
24 Solid heterogeneous sam ples 1-70 X X X X25 Liquid w aste 0 .1 X
Note: PuOi and Pu nitrate solution , and ThO^ sam ples w ere also received .
(b) Number of determ inations
While the Agency shall m aintain a degree of flexib ility during the running-in period of SAL and the re s t of NWAL, SAL should dem onstrate a level of analytical productivity in ord er to be co st-e ffec tiv e according to Table V.

82 LOPEZ-MENCHERO et a l.
TA BLE V. DESIGN WORKLOAD OF SAL
Function Annual workload (determ inations/year)
1. Mass spectrom etry 2800
2. Plutonium analysis 1000
3. Uranium analysis 2000
(c) Quality of analyses
The p recision and accuracy of SAL analyses should be at least as good as those of the op erato r's and the other lab oratories of the network.
(d) Equipment
SAL will be equipped with the m ost modern scien tific equipment available in order to perm it rapid and accurate analyses on a routine basis utilizing fully automated system s whenever feasib le . M ajor analytical instrum ents a re one single and one tw o-stage therm al em ission m ass sp ectrom eter with computer system s; one em ission spectrograph; one automated controlled potential coulom eter; two automated potentiom etry titra to rs ; one u.v. - v isib le double-beam spectrophotom eter; and scin tillation and sem i-conductor gamma sp ectrom eters.
(e) Quality control
In addition to functioning as a participating laboratory of NWAL, SAL w ill enable the Agency to im plem ent an analytical quality control programme of NWAL including the use of standard sam ples and distribution of duplicates of the sam e sam ple to different lab oratories of NWAL.
4 .2 . P resen t Safeguards analytical work
The Agency's Laboratory at Seibersdorf has been adapted to analyse sam ples of safeguarded nuclear m ateria l for the interim period during the construction of SAL. The present fa c ilit ie s consist of a plutonium laboratory with four glove boxes and one fume cupboard; a computerized single-stage therm al em ission m ass sp ectrom eter; a uranium laboratory with manual and sem i-autom atic potentiom etric titra to rs and auxiliary equipment; furnaces for gravim etry; scin tillation gamma spectrom etry, etc.
A staff of three professionals and five technicians a re engaged in sample analyses. In addition, two professionals and three technicians spend part of their tim e on equipment and procedure development and training for future SAL work.

IAEA-SM -201/98 83
During the past twelve months 350 sam ples w ere analysed in this facility . Of these the m ajority w ere low -enriched uranium -oxide powder and pellet sam ples. A few sam ples w ere plutonium oxide. As mentioned before, the Seibersd orf laboratory was a participant in the two P A FEX experim ents. It also participated in the SAL program m e.
4 .3 . Future
(a) F a cility
The new SAL facility at Seibersd orf was constructed by the Studieng esellsch aft für Atom energie (SGAE) according to the A gency's technical specifications within the constraints of a fixed arch itectu ra l arrangem ent. That is , the new laboratory is an extension of an existing wing of the A ustrian R esearch C entre. The building is a tw o-storey concrete and brick structu re of about 600 m 2 usable space. On both flo o rs , room s 6 m wide and 4 m wide are separated by a 2-m co rrid or. Separate room s are provided for m ass spectrom etry, uranium chem istry , plutonium chem istry , impurity determ ination, radiom etry, and the usual supporting activ ities such as furnace room , balance room , storage, etc. Three separate and distinct exhaust a ir ventilation system s are provided (glove boxes, fume cupboard, room s) to m aintain the required a ir changes, d irection of flow and negative p ressu re d ifferentials for contamination control. Included are 21 alpha glove boxes (F ig .3) and 15 fume cupboards.
(b) Equipment
The equipment previously mentioned under R equirem ents (Section 4.1.(d)) is automated and computerized (F ig s 4 -8 ). Of sp ecial note is the tw o-stage ORNL-type pulse-counting m ass sp ectrom eter. This instrum ent w ill enable the Agency to analyse nanogram -size sam ples, thereby potentially solving troublesom e adm inistrative, regulating and transport problem s. A lso, this instrum ent w ill be an essen tia l tool in the program m e of acquiring isotopic com position data.
(c) Staff
The anticipated start-u p of SAL is four p rofessionals, 10 or 11 technicians and sev era l c le r ic a l and/or operative personnel.
(d) Capability
During the f ir s t y ear of operation the following workload is forecasted : uranium concentration — 600 sam ples; plutonium concentration — 300 sam ples, and uranium and plutonium isotopic com position — 600 sam ples.

8 4 LOPEZ-MENCHERO et a l.
FIG. 3 . Alpha g love boxes.
FIG. 4 . Electronic balan ce . This is a component o f the uranium autom atic titrator.

IAEA-SM -201/98 8 5
FIG. 5 . A utom atic cou lom eter. This instrument has been developed by th e Harwell Research Establishment.
FIG. 6 . Sam ple charger, titration stand and controller for uranium titration.

86 LÖPEZ-MENCHERO et a i.
FIG. 8. T w o-stage pulse-counting mass spectrom eter.

IAEA-SM -201/98 87
5. CONCLUSIONS
The resu lts of the two P ro ce ss Analysis F ield E xperim ents, the experience in starting up the safeguards analytical serv ices to the Agency and the status of SAL fa c ilit ie s and equipment, prove that the analytical se rv ice s requirem ents of the IAEA Safeguards V erification activ ities can be routinely provided by a network of analytical lab oratories including SAL.
However, a sh o rt-te rm program m e should aim at improving inner containers for liquid sam ples; reducing the tim e between taking sam ples and reporting the analytical re su lts ; com m issioning of SAL; and organizing the SAL team to reach the optimum workload.
A C K N O W L E D G E M E N T S
Su ccess of PA FEX experim ents has been made possible by the support and excellen t co-operation of the States and the lab oratories involved. The States have made available to the IAEA highly qualified experts to discuss the design and the resu lts of the experim ents. A ll analytical determ inations w ere made fre e of charge to the Agency and many lab oratories have used m ore than one analytical technique to provide m ore inform ation for evaluation. A ll lab oratories dem onstrated a high quality in perform ing analytical d e te rm inations and provided detailed descriptions of their methods to the IAEA.
The co-operation of the two companies which provided sam ples of nuclear m ateria l fo r P A FEX should be stresse d . They not only prepared the sam ples, but also collected inform ation pertaining to the m ateria l and ca rrie d out a se r ie s of additional m easurem ents.
Special thanks are due to the A ustrian Government and the Studieng esellsch aft für Atom energie for their support of the IAEA international safeguards work by constructing nuclear analytical fa c ilit ie s .
R E F E R E N C E S
[ 1 ] FRITTUM, H. , GMEIIN, W. , LOPEZ-MENCHERO, E . , RYZHOV, M. , SZABO, E . , IAEA Control o f th e Operator's Data; T he A ssociated A nalytical Q uality Control Programme, IAEA DSI STR-40 (1973).
[ 2 ] INTERNATIONAL ATOMIC ENERGY AGENCY, Results o f the First IAEA Plutonium Analysis Field Experiment for Safeguards (PAFEX-I), V ienna, IAEA DSI STR 49 (N ov. 1974).
[ 3 ] INTERNATIONAL ATOMIC ENERGY AGENCY, T echn ica l Information for Laboratories Participating in th e IAEA PAFEX II Experiment, IAEA DSI, V ienna (Oct. 1974).
[ 4 ] SITES, J . , DERON, S. , Calibration o f the m ixed 233U / 242Pu spiking solution for PAFEX II experim ent, IAEA Seibersdorf Lab. (June 1975),
[ 5 ] CARTER, J. A . , WALKER, R .L ., EBY, R .E ., PRITCHARD, C .A . , "A sim p lified m ethod for the preparation o f m icro-sam ples for the sim ultaneous isotop ic analysis o f uranium and plutonium , IA E A -S M -201/9 , these Proceedings, V ol. II.
D I S C U S S I O N
G. ROUSSEL: When determ ining the overall uncertainty of an inventory, does the Agency take into account re su lts of in terlaboratory tests ?G enerally speaking, they tend to contain much g rea ter system atic e rro rs than might be expected.

88 LOPEZ-MENCHERO et a l.
E . SZABÖ: It was because the Agency recognized th is fact that it decided to se t up a network of safeguards lab oratories ra th er than re ly on the serv ices of a single laboratory. This system enables the Agency to ca rry out continuous m onitoring of the in terlaboratory d ifferences. In addition, the main task of the laboratories in the network is to elim inate such d ifferences, w herever detected, either in the analysis of inspection sam ples or during participation in in ter laboratory com parisons (PA FEX ,SAL etc .).
At present, the network shows excellen t in terlaboratory agreem ent on the analysis of m ateria ls such as uranium m etal, oxides and uranyl nitrate solutions. We do not yet have any routine experience in the analysis of plutonium m ateria ls but the resu lts of P A F E X -I give reason to expect sm aller d ifferences than 0.1 X 10"1 2.
P A F E X -II w ill identify the perform ance to be expected in the isotope dilution analysis of input solutions for rep rocessin g plants.
F o r m ost types of m ateria ls the position of the Agency is lim ited by sampling difficu lties and not by analytical e r ro rs .
P. De B IE V R E : I would like to endorse the point ra ised by Mr. R oussel and s tre s s its im portance. Perhaps I could take the opportunity of asking whether the Agency intends to keep to the uncertainty in tervals for MBA inventories d iscussed by Mr. Rom etsch in his introductory paper at this m eeting1. If so , m ost of the analytical lab oratories w ill encounter difficulties in view of the fact that th e ir own analytical uncertainty is also as large as, or even g rea ter than, the total uncertainty figures quoted by Mr. Rom etsch fo r an MBA inventory.
E . SZABO: I would suggest that you re fe r to Mr. Hough's comments on this point during the discussion that followed presentation of h is paper2. The Agency v erifie s the o p erator's data and if no significant difference is found, those data a re accepted. The figures mentioned by Mr. Rom etsch rep resent detection levels achievable by operators and reviewed by Agency panels, as mentioned by Mr. Ryzhov.
Secondly, the in terlaboratory d ifferences a re known and their actual s ize depends very much upon the type of analy sis , type of m ateria l and experience gained by the lab oratories. I am sure the 0.2% lev el fo r uranium oxide is no longer a challenge to the analytical lab oratories. Nor is the0.8% level mentioned by M r. Rom etsch for irrad iated m ateria l input for rep ro cessin g plants very fa r from the present capacity of lab oratories (see IDA-723, P A FE X -II).
As I said in my answ er to Mr. R ou ssel, one of the m ajor objectives of the network is to reduce in terlaboratory d ifferences.
H.T. YOLKEN: It is c le a r from many in ter laboratory te s ts that the cu rrent lev el in the theory of destructive chem ical and isotopic analysis of nuclear m ateria ls is far b etter than the cu rrent state of the practice of it.The im portance of the training and education of laboratory staff (and also th e ir specialization in high quality m easurem ents) for the purpose of ra isin g
1 See T able I in paper IA E A -SM -201/103, th ese Proceedings, V ol. I.2 IA E A -SM -201/99, th ese Proceedings, V ol. I.3 BEYRICH, W ., DROSSELMEYER, E . , ''Inter-laboratory experim ent ID A -72 on mass spectrom etric
dilution analysis", Kernfcrschungszentrum, Karlsruhe, KFK-1905, July 1975.

IAEA-SM -201/98 89
the level of p ractice cannot be s tresse d enough. In addition, the document standards fo r destructive analysis of nuclear m ateria ls cu rrently under preparation by the International Organization for Standardization4 should lead to im provement.
P .J . De B IE V R E : I want to exp ress concern on behalf of colleagues who have been working in the area of accu rate analytical m easurem ents for a long tim e, but who might not have had occasion to d iscuss such m atters with safeguards experts.
Over the last s ix y ea rs or so a number of in terlaboratory te s t program m es have been ca rrie d out, dem onstrating a much la rg e r in terlaboratory spread than the in tralaboratory p recision or accuracy . A valid conclusion from th ese program m es, th erefore , is that the m easurem ent quality is not as good as people believe. But that is only half the story . In very few cases w ere carefu lly ch aracterized m ateria ls used, i.e . m ateria ls with accurately or absolutely known f is s i le m ateria l content, but whenever they w ere used, the program m es eventually dem onstrated a significant difference between the ch aracterization value and the average of laboratory m eans. This is a very im portant point for a final judgement on absolute f is s i le m ateria l content and could contribute extrem ely in teresting data for further conclusions from in terlaboratory te s ts . I therefore advocate very strongly that future program m es should use m ateria ls carefu lly ch aracterized beforehand. In terlaboratory te s t program m es are too expensive for us not to do so.
ISO /T C 85/SC 5.


IAEA-SM -201/18
RECENT DEVELOPMENTS IN THE DISSOLUTION AND AUTOMATED ANALYSIS OF PLUTONIUM AND URANIUM FOR SAFEGUARDS MEASUREMENTS*
D. D. JACKSON, S. F. MARSH, J. E. REIN,G.R. WATERBURYLos Alamos Scientific Laboratory,Los Alamos, New Mexico,United States of America
Abstract
RECENT DEVELOPMENTS IN THE DISSOLUTION AND AUTOMATED ANALYSIS OF PLUTONIUM AND URANIUM FOR SAFEGUARDS MEASUREMENTS.
The status of a programme to d evelop assay methods for plutonium and uranium for safeguards purposes is presented. The current effort is d irected m ore towards analyses o f scrap-type m aterial with an end goal o f precise autom ated methods that also w ill be ap plicab le to product m aterials. A guiding philosophy for the analysis o f scrap-type m aterials, characterized by heterogeneity and d ifficu lt dissolution, is relatively fast dissolution treatm ent to carry out 9 0 or m ore so lub ilization o f the uranium and plutonium , analysis o f th e soluble fraction by precise autom ated methods, and gam m a-counting assay o f any residue fraction using sim ple techniques. A T eflon-conta iner m eta l-sh e ll apparatus provides acid dissolutions o f typ ical fu e l-c y c le m aterials at temperatures to 275°C and pressures to 340 atm . G as-solid reactions at elevated temperatures are promising to separate uranium from refractory m aterials by the formation o f vo la tile uranium compounds. The condensed compounds then are dissolved in acid for subsequent analysis. An autom ated spectrophotom eter has been p laced in operation for the determ ination o f uranium and plutonium.
.T he measurem ent range is 1 to 14 m g of either elem en t with a re lative standard deviation of 0. 5°}o over most o f the range. The throughput rate is 5 m in per sam ple. A second-generation autom ated instrument, w hich w ill use a precise and sp ecific electroan a ly tica l m ethod as its operational basis, is being developed for the determ ination o f plutonium.
INTRODUCTION
The prim ary purpose o f a ch e m ica l c h a r a c t e r iz a t io n o f n u c le a r f u e l m a t e r ia ls f o r s a fe g u a rd s p u rp oses i s th e d e te rm in a tio n o f t h e i r p lutonium and uranium c o n t e n ts . N u clear f u e l c y c le m a t e r ia ls ran g e from sc ra p m a t e r ia ls , u s u a lly c h a r a c t e r iz e d by nonhom ogeneity, d i f f i c u l t - t o - d i s s o l v e r e f r a c t o r y comp o n en ts , and low l e v e l s o f p lutonium and uranium , t o u niform p rod u ct m a t e r ia ls w ith h ig h l e v e l s o f p lutonium and uranium . The te ch n o lo g y d e s c r ib e d in t h i s paper i s d ir e c t e d more to th e developm ent o f a ssa y m ethods f o r p lutonium and uranium in s c r a p -ty p e sam ples a lth o u g h th e e v e n tu a l g o a l i s h ig h ly p r e c i s e autom ated methods t h a t w i l l be a p p l ic a b le to p rod u ct m a t e r ia ls .
* Work performed under the auspices o f the US Energy Research and D evelopm ent A ssociation.
9 1

92 JACKSON et al.
An a ssa y scheme b e in g developed f o r s c ra p -ty p e m a t e r ia ls i s to d is s o lv e 90% o r more o f th e p lutonium and uranium ra p id ly and su b se q u e n tly to a n a ly z e th e s o lu b i l iz e d f r a c t io n by p r e c i s e , r e l a t i v e l y r a p id , autom ated methods and th e r e s id u e f r a c t i o n by r a p id , l e s s p r e c i s e , gam m a-counting a s s a y s . The r e l a t i v e stan d ard d e v ia t io n o f th e o v e r a l l a n a ly s is i s no w orse th an 0.7% when th e r e l a t i v e s tan d ard d e v ia t io n s o f th e autom ated a n a ly s is and th e gamma a ssa y a re 0.5% and 5%, r e s p e c t i v e l y .
D e scrib e d in t h i s paper i s th e s t a t u s o f d is s o lu t io n te c h n iq u e s in v o lv in g aqueous a c id and g a s - s o l id r e a c t io n s a t h ig h te m p e ra tu re s , gamma a ssa y s f o r p lutonium and uranium d esig n ed f o r s i m p l i c i t y , an autom ated sp e ctro p h o to m eter f o r th e d e te rm in a tio n o f p lutonium and uranium , and an autom ated e l e c t r o a n a l y t i c a l method now b e in g developed f o r th e d e te rm in a tio n o f p lu ton iu m .
DISSOLUTION OF FUEL CYCLE MATERIALS
T e flo n -C o n ta in e r M e ta l-S h e l l A pparatus
An a p p a ra tu s c o n s is t in g o f a T e flo n c o n ta in e r in a m eta l s h e l l has been developed f o r th e d is s o lu t io n o f sam ples in v a r io u s a c id m ix tu re s a t te m p e ra tu re s to 275°C and p re s s u r e s to 340 atm . T h is a p p a ra tu s , shown in F ig . 1 , has ad v an tag es
Г 1 2 3 1compared to th e s e a le d , fu sed s i l i c a tu b e , ’ ’ o f ( a )h an d lin g e a s e , (b ) r e u s a b le c o n t a in e r s , ( c ) c a p a b i l i t y to u se h y d r o f lu o r ic a c id , and (d ) r e t e n t io n o f th e sam ple in a con t a i n e r u s e f u l f o r a d d it io n a l ch e m ica l tr e a tm e n ts . I t s o p era t in g te m p e ra tu re l i m i t i s low er th an t h a t o f th e s i l i c a tu be a p p a r a tu s .
The a p p a ra tu s , in a s l i g h t l y m o d ified d e s ig n , i s b ein g m anu factu red by th e P a rr In stru m en t Company, M o lin e , I I , USA. Two s h e l l s a r e a v a i la b l e . The s t a i n l e s s s t e e l s h e l l used fo r o x id iz in g a c id s i s c o n s tru c te d w ith ..a r u p tu r e -d is c system th a t p ro v id e s s a f e v e n tin g in c a s e o f o v e r p r e s s u r iz a t io n . A cids used have been HNOg, HgSC^, HC104 , HNOg - HgSO^ m ix tu re s ,HN03 - HF m ix tu re s , and HN03 - H2S04 - HF m ix tu re s . Then ic k e l s h e l l i s used f o r h a lid e a c id s , HF, HC1, and H Br, w ith and w ith ou t sm a ll amounts o f o x id iz in g a c id s .
The T e flo n c o n t a in e r , based on a N a tio n a l Bureau o f Г4]S ta n d a rd s d e s ig n , has a lon g ta p e re d c o n ta c t s u r fa c e w ith
i t s l i d to p ro v id e a t i g h t s e a l . S p rin g te n s io n a p p lie d to th e l i d m a in ta in s th e s e a l as th e c o n ta in e r c o n t r a c t s upon c o o l in g . C o n ta in e rs f a b r ic a t e d from TFE T e flo n (E . I . DuPont de Nemours, I n c . ) have been reu sed up to 20 tim e s a lth o u g h th e r e i s a slow and i r r e v e r s i b l e sh rin k a g e from an i n i t i a l volume o f 30 ml to a f i n a l volume o f about 10 m l.
In t h i s a p p a ra tu s , th e q u a n tity o f sam ple u s u a lly d i s so lv e d i s 0 .1 to 1 g in an a c id volume o n e -h a lf o r l e s s o f th e c o n ta in e r volum e. As d is c u s s e d in th e INTRODUCTION s e c t i o n , a m ajor u se i s th e a tta in m e n t o f 90% and g r e a t e r s o lu b i l iz a t io n

IAEA-SM -201/18 93
o f th e p lutonium and uranium in d i f f i c u l t - t o - d i s s o l v e m a te r ia l s . T y p ic a l f u e l - c y c l e m a t e r ia ls t r e a t e d in th e ap p ara tu s and th e d e g re e s o f d is s o lu t io n a t ta in e d a re summarized in T a b le I .
G a s -S o lid R e a c t io n s
An in v e s t ig a t io n o f v a r io u s g a s - s o l id r e a c t io n s i s underway. Use o f a p lasm a g e n e r a to r in which g as a t reduced p r e s su re i s e x c i t e d to f r e e r a d i c a l s d id n ot c o n v e rt th e plutonium and uranium in even m o d era te ly r e f r a c t o r y m a t e r ia ls (su ch as U30 8 ) to more s o lu b le compounds. G ases t r i e d were t r i f l u o r o -ch lorom eth ane and e le m e n ta l c h lo r in e .
A more p ro m isin g te c h n iq u e i s th e fo rm a tio n o f v o l a t i l e uranium (and p lu ton iu m ) compounds w ith r e a c t i v e g a se s a t e l e v a te d te m p e ra tu re s . The v o l a t i l e compounds t r a n s p o r t and con dense in a c o o le r s e c t io n o f th e ap p ara tu s where th ey a re subs e q u e n tly d is s o lv e d sim p ly by d is s o lu t io n in a c id . I n i t i a l s t u d ie s w ith c h lo r in e gas and v a r io u s uranium compounds have g iv en an in s ig h t o f th e r e a c t io n s th a t o ccu r and show prom ise

9 4 JACKSON et al.
Table I. DISSOLUTION OF NUCLEAR FUEL CYCLE MATERIALS IN TEFLON-CONTAINER METAL-SHELL APPARATUS
, 4 и их ,Material___________ Acid Mixture^ ' Shell Solubi l i z e d , p '%
U 0 2 - Zr02 - Nb HF - H N 0 3 Ni > 99
H N 0 3 - HF Steel > 99
Nb - U Alloy HF - HN°3 Ni ■ > 99h 2 s o 4 - HNOg- HF Steel > 99h 2 s o 4 - HF Steel > 99
U - Nb - Zr - Hf HF - HNO« Ni > 99alloy HNOg
О- HF Steel 99
U 0 2 - Zr02 - Zr HC1 Ni > 99
P u 0 2 , High-fired H N 0 3 - HF Steel > 99HC1 - h c i o 4 Ni > 99
(U - P u)02 , 1600°C H № 3 Steel > 99Fired HC1 Ni > 99
Scrap MaterialsU - Calcined Ash HN03 - HF Steel 70 -Dissolver Sludge H N 0 3 - HF Steel > 99
HC1 -• HF Ni > 90
Brick Fines HN°3 - 'h f Steel < 10HC1 -■ HF Ni < 10
UC - ThC - SiC - C - Triso F u e l (a) (b) (c)
HNOg
H № 3
- HF
- HF - H2°2
Steel
Steel
>
>
9 9 (d)
9 9 (e)
(a) Concentrated acids used with largest concentration acidlisted first. _
(b) Generally overnight reaction at 270 - 275 C.(c) HTGR fuel microspheres with UC - ThC kernel and pyro
lytic carbon and SiC coats.(d) 0.1-g samples in 16M HNOg - 2M HF.(e) 0 . 3 - g samples in 0.5 ml 16M HNO„ - 0.5 ml 29M H F ,
5 ml 30% H 20 2 .

IA EA -SM -201/18 9 5
Table II. VOLATILIZATION OF URANIUM COMPOUNDS WITH CHLORINE AT TEMPERATURES TO 1000°C
Weight Percent Volatilized
Temperature.(°C)
U Compound Time ,(h) 800°C 950°C 1000°C
uo2 7 50 - 100
U 3°8 7 nil 26 -
5.5 - - 6010 - - 10012 - - 100
u° 3 7 slight - -8 - - 8012 - - 100
uc2 8 86 - 88uc9 (After 8 - - 100
Prepxidation in A i r ) .
for practical application. Uranium oxides, UOg, U O3 , andUgOg, and uranium carbide (UC2 ) of approximately 0 .1-gquantities were reacted with approximately 0.2- atm C l2 up to1000°C in a sealed quartz tube. As shown in Table II, the volatilization order was UOg > UOg ~ U g O g . The residue fromthe U C2 after reaction at 1000°C subsequently volatilized completely when heated in air at 1000°C indicative of only carbon. Another U C2 sample that was first heated in air at1000°C, was completely volatilized in C l2 at 1000°C.
For practical purposes, uranium is volatilized completely from UOg, UOg, UgOg, and uranium carbide by reaction with C l2at 1000°C in about 8 h. This reaction can be preceded by an air (or oxygen) reaction to produce uranium oxide. A simple quartz tube apparatus was constructed that provides for controllable atmospheres and use in a horizontal tube furnace.The sample is placed in a quartz boat and the volatilized uranium condenses in a portion of the tube outside the heated zone. After removal of the boat, the tube is placed in a vertical position and the condensate is dissolved in hot nitric acid to effect complete recovery.

9 6 JACKSON et al.
A refractory scrap material, apparently consisting in part of urania-zirconia fuel, was reacted with Clg over arange of temperatures. At temperatures up to 500°C, ZrCl^with a sublimation point of 331°C,volatilized to produce distortion of the fuel matrix. However, the uranium in the residue was not sufficiently soluble in hot nitric acid for practical use. The 500°C-heated residue was further heated at 950°C in a Cl„ atmosphere resulting in 96% volatilization of the uranium.
This promising technique of high-temperature gas-solid reactions will be evaluated further for uranium materials and then for plutonium materials using a variety of reactive gases.
GAMMA ASSAY OF URANIUM AND PLUTONIUM
Techniques stressing operational simplicity and low-cost235equipment have been developed for gamma assays of U in
239uranium-containing material and of Pu in plutonium- containing and mixed uranium-plutonium materials. These techniques, intended primarily for assay of residues remaining after acidic reactions in the Teflon-container metal- shell dissolution apparatus, involve collection of the sample on a 25-mm diam membrane filter, mounting of the filter on a suitable support, and counting over selected gamma-energy regions using a Nal(Tl) detector and a single channel analyzer. The measurement precisions, obtained with uranium
235calibration materials having U enrichment ranging from natural to 93% and with plutonium calibration materials con-
одл 241taining 2.3 to 15.1 at.% uPu and 0.05 to 1.4 at.% Pu,have been about 5% relative standard deviation.
235The 185-keV gamma photopeak of U is counted to assay for uranium. It is necessary to correct for Compton contri-
ooobutions from U daughters at this energy based on a gammacount rate at a nearby energy region. At this relatively low gamma energy, a correction for matrix absorption must be considered. The correction factor is determined from the rela-
235tive count-rates of a U standard by itself and then with the sample placed between the standard and the detector.
For the assay of plutonium, the 392-472 keV region of239 Pu photo peaks is counted. The selected gamma-energy region was determined for a particular Nal detector-associated electronics system. Other systems with different resolution may require a slightly different gamma-energy region to provide insensitivity to plutonium isotopic variations. The exact region to be used must be established with calibration m a terials of varying isotopic composition. 235
235The assay of U in uranium-plutonium mixtures by relatively simple Ge(Li) detector counting systems was not attained with precisions better than 10% relative standard

IA EA -SM -201/18 9 7
deviation. During the course of the investigation, a process[5]was developed that provides for the preparation of count
ing calibrations containing known mixtures of uranium and plutonium. Measured quantities of uranyl nitrate and plutonium nitrate as solutions were mixed, reduced with sodium
4 + 3 +formaldehyde sulfoxylate and dense U and Pu oxalates were quantitatively coprecipitated using room temperature hydrolysis of diethyl oxalate.
AUTOMATED SPECTROPHOTOMETER FOR THE DETERMINATION OF URANIUM AND PLUTONIUM
An automated spectrophotometer analyzer was constructed for the determination of uranium and plutonium, separately or in mixtures. This analyzer uses an extraction-spectrophoto-
Г ß 7"|metric method. ’ J The instrument holds up to 24 samples and analyzes them at a rate of 5 min per sample. The measurement range is about 1 to 14 mg of uranium or plutonium with a precision better than 0.5% relative standard deviation from the upper limit to about the 3-mg level, thence increasing to about 1.5% at the 1-mg level.
The analytical method was selected for its operational simplicity and high specificity, and, hence, applicability to scrap materials containing a wide variety of diverse elements. The sequential operations, done in tubes made from precision- bore tubing with no transfers of solutions, are: (1) additionof 0.5 ml or less sample aliquot containing 1 to 14 mg of u r a nium or plutonium, (2) addition of an aluminum nitrate salting solution containing the complexing agent, tetrapropyl- ammonium nitrate, to form the uranium or plutonium complex,
where X is uranium or plutonium, (3) addition of an organic extractant of 2-nitropropane or 4-methyl 2-pentanone, (4) m i x ing to extract the complexes, (5) allowing time for phase dis- engaugement, and (6) measuring the absorbance of the uranium or plutonium complex in the organic phase and printing the result. ,
The major components of the instrument (Fig. 2) are a turntable, reagent dispensers, a mixer, an interference filter spectrophotometer, and a control system. The maximum size of the instrument was established by the requirement that it fit into a glovebox that is 0.91 m wide, 0.79 m deep, and 0.84-m high with a sloping front. The electronic portion of the instrument is located outside the glovebox and is connected to it with cables.
Гх0 2 (№ 3 ) з |j"(Prop)4Nj

98 JACKSON e t al.
FIG. 2. Automated spectrophotometer.
The analyst delivers 0.5 ml or less sample aliquot by volume or weight into a tube, and for the plutonium determination adds a pellet of silver(II) oxide to produce P u 6+ prior to placing the tube into the turntable. The analyst sets a front panel switch that selects an optical filter system for uranium or plutonium, then initiates a switch on the front panel to start the automated operations. The paper tape printout includes a sample identification number, a four- digital number proportional to the uranium or plutonium content, and designates whether uranium or plutonium was determined. Interlocks stop instrument operation should a component fail. The instrument also stops after the last sample is processed.
The 0.58-m-dia. turntable that holds the tubes rotates to stations for the various operations. Rotation is provided by a Geneva-drive, intermittent-motion assembly which avoids rapid acceleration and provides reproducible positioning. To ensure accurate positioning of the tubes, a tapered pin driven by a pneumatic cylinder engages a hole drilled into the outer circumference of the turntable after each rotational increment. The turntable holes, in which the tubes fit, are lined with Teflon to avoid scratching of the tubes, and are binary

IA EA -SM -201/18 9 9
FIG. 3. Reagent delivery system .
coded by a series of small holes in the bottom of the turntable. Five roller-actuated miniature switches mounted under the turntable sense these holes and transmit a signal for the sample identification readout.
The tubes are simply made from precision-bore, 19.05-mm- dia. tubing, with a stated tolerance of ± 0 . 0 5 mm. The tube diameter was experimentally determined as the best compromise to provide efficient mixing and phase disengagement, minimum error in the effective optical p ath length caused by slight differences of tube positioning, and an appropriate optical path length and h e i g h t . A flare at the top of the tube provides positional stability in the turntable and a larger opening for reagent additions.
No commercial equipment was available that was resistant to the corrosive salting solution and organic extractant reagents. A system was developed (Fig. 3) that delivers various reagents by piston displacement dispensers in which only glass and Teflon contact the reagents. A small 3-way Teflon valve actuated by a pneumatic cylinder controls the flow of the reagents. The delivery rate and tip size of the delivery system are important factors that influence the precision of the delivered quantities. A pneumatic-hydraulic cylinder

100 JACKSON et al.
FIG. 4. M ixing-extraction system .
system smoothly moves gas-tight syringes to provide very precise deliveries. The precision of the system, determined by weighing delivered multiplicates, was better than 0.02% relative standard deviation for both 4-ml deliveries of the viscous aluminum nitrate salting solution and 3-ml deliveries of the organic extractant.
To achieve 99.9% extraction of the uranium and plutonium complexes, necessary for high reliability, the highly viscous aqueous phase and the low-density organic phase must be vigorously mixed at a large surface interface. This is accomplished with a Teflon-covered, 25-mm-long by 10-mm-diam, cylindrical stirring bar driven by a 1200 rev/min magnet (Fig. 4). To assure dependable coupling at this high spin

IA EA -SM -201/18 101
FIG. 5. Filter spectrophotom eter readout system.
rate, the driving dual magnet rotates at a height 12-mm above the bottom of the tube. It lowers to a position below the tube when not in use to permit movement of the tubes during their indexing rotation. The extraction efficiently occurs at the large interface area created by the vortex and there is no emulsion formation nor splattering.
The phases disengage in less than 1 min to give an optically clear organic phase. Although there is no splattering, aqueous droplets adhere to the tube wall at the organic phase position to cause an erratic decrease in the effective optical path length. A saturated solution of aluminum nitrate, therefore, is added to raise the organic phase to a clear region of the tube prior to the absorbance measurement.
A simple, rugged spectrophotometer (Fig. 5), using narrow-bandpass interference filters as the monochromator, was constructed to measure the absorbance of the sharp peaks. To minimize variability caused by base-line shift, absorbances are sequentially measured using a pair of filters at the w a v e lengths of the peak and at an adjacent valley. The absorbance difference, proportional only to the concentrations of the extracted uranium or plutonium, is automatically computed and printed as the measure of uranium or plutonium. Using a

1 0 2 JACKSON et al.
grating spectrograph, the measured wavelength of the peaks and adjacent valleys for the uranium and plutonium complexes were452.5 and 460.0 nm for uranium, 501.4 and 518.0 nm for the most sensitive plutonium peak, and 807.0 and 7 6 8.0 nm for a less sensitive plutonium peak. The molar absorbance for the most sensitive plutonium peak is about twice that for the uranium peak'with correspondingly increased sensitivity. The molar absorbance for plutonium at the 807.0-nm peak is about one- third that at the 5 0 1.4-nm peak. It is used for samples containing chromium which oxidizes to extractable Cr®+ upon the addition of the silver(II) oxide and causes positive bias at the 501.4-nm peak. This element is the only significant interference. Uranium and plutonium do not interfere with each o t h e r .
All six interference filters have about 50% peak transmit- tances, less than 1.4-nm bandwidths, and transmittance outside the bandwidth less than 0.01% from the ultraviolet through the infrared. The wavelength centers of maximum transmittance were purposely specified to be slightly higher than the peak wavelengths to. allow for exact matching by slight rotation of . the filters in the collimated light path. The light source is a 45-W quartz-iodine lamp powered by an electronically regulated d.c. power supply that maintains a constant light intensity and spectrum output. A simple lens and slit provides a collimated light beam for the interference filters. The selected filter pair is sequentially moved into the light path by a pneumatic-hydraulic cylinder system for the absorbance measurements.
The chamber for the absorbance measurement provides precise positioning of the tubes and virtually complete exclusion of stray light. The tube bottom fits into a cone-shaped depression in a lifting mechanism operated by a hydraulic cylinder. When lifted into the chamber, a spring-loaded tapered piece made of Kel-F slides into the tube to exactly position the tube relative to the light path. This mode of positioning is superior to one based on the exterior of the tube b e cause the wall thickness of precision-bore tubing is variable. As the tube is lifted into place, a spring-loaded shield presses firmly against the bottom of the turntable and a baffle drops into a circumferential groove on the top of the turntable to block out stray light. The shutter is operated by a spring-extended pneumatic cylinder. The detector is a 929 photodiode connected to a high-gain amplifier.
The electronic readout system uses a microcomputer and programable-read-only-memory (PROM) chips to control the m e a surement sequence. Input data to the microcomputer include the photodiode detector current (after analog-to-digital conversion), the turntable binary code position of the tube in the measurement chamber, and identification of the selected filter pair. The microcomputer (1) controls external valves that operate the shutter and the peak-valley interference filter pair, (2) initiate the current measurements, (3) provides appropriate time delays, (4) performs data manipulation, and(5) supplies signals to the digital recorder to print on paper

IAEA -SM -201/18 103
tape a four-digit value proportional to peak-minus-valley absorbance, turntable position, and the designation of the filter pair used.
The use of PROMs with readily changeable software coupled with the microcomputer gives a system of high flexibility. The sequence and timing of operations are accurately controlled and can be easily altered by program changes.
ELECTROANALYTICAL METHOD FOR THE AUTOMATED DETERMINATION OF PLUTONIUM
A program is underway to develop an automated instrument for an electrochemical determination of plutonium with features of (1) high specificity, (2) precision of 0.1 to 0.2% relative standard deviation, and (3) sensitivity of low-milligram plutonium levels. There is no reported method for plutonium with these combined features. Two systems are being investigated. The first involves the extraction of a plutonium complex into an organic solvent to provide specificity followed by an electrometric measurement of the plutonium in an o r ganic phase without its physical separation from the aqueous phase. The second involves a preliminary reduction of pluto-
3+ 3+nium to Pu , an oxidation in a medium in which Pu is notoxidized but potentially interfering diverse ions are oxi-
3+dized, addition of complexing agents that reduce the Pu4+ 3+ 4+Pu potential, and oxidation of the Pu to Pu
A versatile apparatus, schematically shown in Fig. 6 , has been assembled to provide capability for investigating a variety of electrometric titration systems and that also will serve as the basis for the automated instrument. It consists of commercial components centered around a Princeton Applied Research Corporation 173D Potentiostat/Galvanostat, 179 Digital Coulometer, and a Hewlett-Packard 9821 desk-top p r o grammable calculator. The instruments are interfaced for two- way communication. The calculator controls most functions of the potentiostat and coulometer and receives and processes data from them. Also interfaced and under control of the calculator are a scanner, a digital multimeter, a digital-to- analog converter, and a plotter. The potentiostat has a compliance voltage of ± 100 V atcurrents up to 1 A. The digitalcoulometer has an integration reproducibility of 0.02% full scale.
With the apparatus, titrimetric conditions such as eon- trolled-potential and controlled-current are done under control of the calculator, and the electrolysis measurements of interest, such as current, voltage, coulomb, and time, are monitored through the calculator. The electrolysis data can be processed on-line, decisions made, and conditions adjusted, or the data can be stored on a magnetic tape cassette for later analysis. The digital-to-analog converter permits selection by the calculator of any desired control potential when

104 JACKSON et al.
FIG. 6. Schem a of versatile electroan aly tica l apparatus for the investigation o f autom ated plutonium determ inations.
operating in the controlled-potential mode or of the current level when operating in constant-current mode. During all phases of an electrolysis, the on-line digital plotter can record a variable of interest, usually a plot of l og,_ current vs time or electrode potential vs time. u
The programmable calculator uses a simple language readily mastered by personnel without prior programming experience, and programs are easily modified to provide a high level of flexibility. The extreme flexibility of the electrometric system, as operated by the programmable calculator, permits a thorough testing and evaluation of the various parameters that influence the electrometric titration. Many programs have been written for the calculator to allow control and operation of the system in different modes. For example, one program carries out a controlled-potential coulometric titration through the prereduction step, the measuring oxidation step, halts the electrolysis at the endpoint, and plots, on-line, log10 current vs time.
The operation is automatic once the electrolysis is started including setting the reduction potential, initial clearing of the coulometer, electrolysis to the desired back- ground-current level for the reduction step, clearing of the coulometer, switching to the oxidation potential, and electrolyzing to the desired background-current-level endpoint.

IA EA -SM -201/18 1 0 5
At the endpoint, the electrolysis is stopped and the accumulated coulomb reading is outputted. The electrolysis is interrupted at any time and can be controlled manually or returned to any place in the automatic mode.
REFERENCES
[1] WICKERS, E., SCHLECT, W. G . , GORDON, C. L . , Preparing refractory oxides, silicates, and ceramic materials for analysis by heating with acids in sealed tubes at elevated temperatures, J. Res. Nat. Bur. Stand. 33 (1944) 451.
[2] GORDON, C. L., SCHLECT, W. G . , WICKERS, E., Use of sealed tubes for the preparation of acid solutions of samples for analysis or for small-scale refining: pressures of acids heated above 1000°C, J. Res. Nat.Bur. Stand. 33 (1944) 457.
[3] METZ, C. F . , WATERBURY, G. R . , Sealed-tube dissolution nfethod with applications to plutonium-containing m a t e r i als, Los Alamos Scientific Laboratory report LASL- 3554(1966).
[4] SHIELDS, W. E., National Bureau of Standards, Private Communication (1971).
[5] MARSH, S. F . , ORTIZ, M. R . , REIN, J. E., Coprecipitation of uranium and plutonium oxalates using sodium formaldehyde sulfoxylate reduction and diethyl oxalate hydrolysis precipitation, Los Alamos Scientific Laboratory report LA-5876-MS (1975).
[6] MAECK, W. J., KUSSY, M. E., BOOMAN, G. L . , REIN, J. E., Spectrophotometric extraction methods specific for uranium, Anal. Chem. J31 (1959) 1130.
[7] MAECK, W. J., KUSSY, M. E., BOOMAN, G. L . , REIN, J. E., Spectrophotometric extraction method specific for plutonium, Anal. Chem. 33 (1961) 998.


IA EA -SM -201/22
METHODS OF SAMPLE PREPARATION AND ANALYSIS FOR WIDE VARIATIONS IN MATERIALS TYPES - A REQUIREMENT FOR A NATIONAL OR AN INTERNATIONAL SAFEGUARDS LABORATORY
C .D . BINGHAM, J. M. SCARBOROUGH, C.E. PIETRI New Brunswick Laboratory,US Energy Research and Development Administration,New Brunswick, New Jersey,United States of America
Abstract
METHODS OF SAMPLE PREPARATION AND ANALYSIS FOR WIDE VARIATIONS IN MATERIALS TYPES —A REQUIREMENT FOR A NATIONAL OR AN INTERNATIONAL SAFEGUARDS LABORATORY.
A laboratory serving a national or international safeguards programme receives product sam ples or scrap m aterials o f uranium or plutonium of a broad spectrum of m atrices for analysis. These m aterials may have been treated over a wide tem perature range rendering them , to varying degrees, refractory.The requirem ent, therefore, is to be ab le to m easure accurately the uranium or plutonium content in these w idely varying m ateria l types. The New Brunswick Laboratory (NBL) whose m ission is to provide ana ly tica l chem istry support for the USA Safeguards programme, has enjoyed considerable success in preparing and analysing a broad spectrum of m aterial types. Results o f comparisons o f ch em ica l m easurem ents on sim ilar m aterials prepared by various treatments are discussed. The Safeguards Laboratory either needs a m easurem ent m ethod which is insensitive to other elem ents or needs to use a sim ple, se le c tiv e separation o f the desired e lem en t. T he method o f D avies and Gray is h ighly sp ecific for uranium. M odifications to this m ethod developed by NBL permit unbiased m easurements with a routine precision of better than 0 .1 °}o (RSD) on sam ples containing at least 50 m g uranium. The e ffec t o f im purity elem ents on th e accuracy and precision o f this m ethod has been exten sively investigated . A tributyl phosphate (TBP) extraction is com p atib le with the BNL titrim etric m easurem ent for uranium and provides accep tab le rem oval o f a ll elem en ta l interferents excep t gold , iod ine and tech n etium . Safeguards analysis o f plutonium -containing m aterials encom passes sim ilar diversity o f sam ple m atrices. Investigation o f the m echanization o f the separation and measurem ent of plutonium is described.
Introduction
Laboratories which support national or international safeguards efforts incur a challenge and responsibility not experienced by the normal private, industrial or government laboratory. These latter laboratories may become extensively involved in characterizing newly developed materials or in testing product materials for conformance to specifications. The analytical chemistry requirements of these activities are not insignificant; however the efforts are frequently limited to a relatively few types of materials or matrices. In contrast, a Safeguards Laboratory may receive product-quality samples of uranium or plutonium metals, their alloys (binary, ternary or more c o m p l e x ) , oxides (sintered over a range of temperature or i nsintered), carbides,
1 0 7

108 BINGHAM et al.
TABLE I.
SOLUBILIZATION METHODS FOR URANIUM MATERIALSMaterial Treatment
U, U03, U 308, UF4 Dissolve in HN03. Fume sample aliquant with H2S04.
U02 powders and pellets, ammonium diuranate, wastes, U02~Th02, etc.
Dissolve in HN03 and filter.Fuse residue in NaHS04 or Na2C03, combine solutions.Fume sample aliquant in sulfuric acid.
Ore concentrates Dissolve in nitric acid. Fume sample aliquants with H2S04 and HF.
HTGR fuel beads 1. Ignite to remove carbon. Fuse with Na2C03. Dissolve cake and fume with H2S04 and HFto remove silica. Precipitate U with NH40H to remove excess fusion salts. Dissolve residue in HN03 and proceed. Fume sample aliquants in H2S04.
2. Ignite to remove carbon. Treat with Cl2 at 900°C to decompose SiC, ignite as in 1, dissolve as with U02-Th02.
uc, uc2 Ignite and dissolve in HN03. Fuse any residue. Fume sample aliquant in H2S04.
U-Al, U-Si, U02-SS Dissolve in HC1-HN03. Fume with perchloric acid, filter. Volatilize silica with HF, fuse remaining residue with Na2C03. Fume sample aliquant in HC104.
Fissium alloy Fissium dross
Dissolve in HC1-HN03. Treat residue with NaOCl and NaOH and acidify with HC1. Combine solutions. Fume sample aliquant in HC104. (Residue from dross requires fusion with NaOH).
Ash samples Fuse with Na2C03-NaN03 (5:1) and NaHS04 as necessary. Dissolve cake in HN03-HC104. Volatilize silica with HF and fume with HC104. Fume sample aliquant with H2S04.
U02-Zr02-Nb-Zr, U02-BeO
Dissolve in HN03-HF. Fume sample aliquant in H2S04 or HC104. (Large quantities of Nb may be removed by precipitation with S02 if desired.)
Dissolver so- lutions
Organic solutions Wastes
Homogenize and reconstitute multiphase mixtures where necessary. Destroy organics with hot H2S04- HNOo. Fume sample aliquant inH2S04.
U-Zr Dissolve in HF. Fume sample aliquant in H2S04 or HC104.

IAEA-SM-2 0 1 /2 2 109
TAB L E II.
SOLUBILIZATION METHODS FOR PLUTONIUM MATERIALS
Material Treatment
Pu, Pu-Al 6 N HC1 or 18 N H 2S 04U-Pu-Mo 3 N HC1 - 8 N H N O 3 - 0.1 N HFP u 0 2 , (U-Pu)Qa 8 N H N 0 3 - 0.1 N HF; fuse
in N a H S 04P u 0 2 , fired > 800°C fuse in N a H S 0 4 ; sealed
tube - H C 1 + H C 1 04(U-Pu)C ignite, 8 N H N 0 3-0.1 N HF;
fuse in N a H S 04"calcined ash" leach in 8 N H N 0 3-0.1 N HF,
fuse in N a H S 0 4 ; fuse in N a H S 04
"brick residues" - (A120 3 , MgO, CaO, Р е20з> Si02)
fuse in N a H S 04
"grinder sludge" - (SiC)
fuse in N a H S 04
Pu-fissium sealed t u b e -HCl+HC104
nitrides, etc. In a d d i t i o n the laboratory may also receive scrap materials, residues from recovery processes, etc. - materials of a broad spectrum of matrices and which have been treated over a wide range of temperature rendering them, to varying degrees, refractory. The requirement therefore is to be able to accurately measure the uranium or plutonium content in these widely varying material types.
Sample Preparation
The New Brunswick Laboratory (NBL), whose mission is to provide analytical chemistry support for the USA safeguards program, has enjoyed considerable success in preparing and analyzing a broad spectrum of material types. Tables I and II summarize the solubilization methods employed by NBL for uranium and/or plutonium materials. Although these methods have proved to be successful, the tables are by no means an exhaustive compilation.
As indicated in Tables I and II, solubilization by basic or acidic fusion is applicable to many matrix type and sample sizes; however, the high salt

Ce Pr Ne Pm Sm Eu Gd Tb Dy Ho Er Tm Yb Lu
Th Pa U•
Np Pu Am Cm Bk Cf Es Fm Md No Lw
Element must be removed
Element removed = by TBP separation
(seeTable III)
FIG. 1. Interferences in the NBL titrim etric m ethod.*(1) Less than M P fo Au does not interfere.
(2) Alpha activ ity equipm ent to 232U in concentrations up to 1 °}o o f the tota l uranium content does not interfere.
He Mo Interference removed V 7= No interference к . = by sample treatment X
(see Table III) / N
110 B
ING
HA
M et al.

IA EA -SM -201/22 111
content of the resulting solution detracts from the versatility of the fusion treatment. Uranium can be separated by precipitation or by solvent extraction without biasing the ensuing measurement.
Dr. Waterbury's group at the Los Alamos Scientific Laboratory (LASL) has investigated the extensive application of the sealed tube [1] or pressurized tube [2] method for solubilizing refractory materials. Some prior knowledge of the matrix composition is required to choose the acid mixture which gives the best results and does not rupture the tube. A disadvantage of this method, if any exists, lies in its limitation to relatively small samples (~ 0.5 g ) . Where the concentration of uranium in the matrix is low, as in scrap material, measurement imprecisions result. For matrices containing higher proportions of uranium, accurate and precise measurements are possible. The method usually produces a clear solution, free of excess salts on which measurements are easily made.
A material type which has given many analytical chemists problems in solubilization is the SiC-coated (U,Th)C2 kernal being used in several types of high temperature reactor in the world. A recently completed interlaboratory comparison [3] of uranium measurement in HTGR-type fuel particles revealed that three different sample preparation methods - grind-burn- leach, high-temperature chlorination, and N a 2C 0 3 fusion - resulted in solutions whose assay by titrimetric and coulometric methods gave essentially the same chemical r e s u l t .
Uranium Assay
A laboratory must be able to solubilize a wide variety of material types. In addition it must also have a measurement method which is insensitive to impurity elements or it must use a method to separate uranium or plutonium from most impurities. At NBL both situations exist. For measurement of uranium, the method of Davies and Gray [4] is highly specific.With the NBL modification [5,6], it is now possible routinely to measure samples containing as little as0.05 g of uranium to a precision of 0.08$ (relative standard devia t i o n - R S D ) . The potential interferences associated with this method have been examined in great detail [7]. Every element in the periodic table, with certain obvious exceptions, has been experimentally tested as a potential interferent. An element is considered an interferent if its presence in a concentration of 15$ or less of the uranium present introduces an analysis error greater than 0.1$(relative). Figure 1 summarizes the results of these studies at NBL. Note that few elements interfere and most of the interferences are removed by sample treatment. The remaining interfering elements can be removed by a separation described below. Now one has a measurement method which, in fact, is

112 BINGHAM et al.
TABLE III.
SAMPLE TREATMENTS W H ICH REMOVE INTERFERENCES TO THE NBL TITRIMETRIC MEASUREMENT OF URANIUM
Element Treatment
M o , T c , Ru, Os Fume sample aliquant inCl, Br, of F
large excesses 3-5 ml H C I O4 and/or H 2S 04
I Add bromine water, evaporate, fume in H C 1 04 or H 2S 04
As, Sb, Sn Add small amount of K2C r20 7 to sample aliquant prior to Fe(II) reduction step
V, Mn, M o , R u , P d , TBP ExtractionaAg, Os, Ir, Pt, Hg,As, Sn, Sb, Cl, Br
> 10$ Au Reduce to metal and separate
Note: All of the interfering elements are listed inthis table.
a Kerosene interferes and cannot be used as a solvent for T B P in this application. Kerosene causes large (20-40$) negative errors. Cyclohexane is a satisfactory substitute for C C 1 4 .
specific for uranium! High alpha activity, equivalent to ~ 1$ 2 32U does not interfere. The sample treatments which remove interferences are summarized in TableIII.
During the course of these interference studies, the existence of a nearly universal method for eliminating interfering elements from samples was determined [8].The method involves converting the sample to a solution 4-5 N in nitric acid and extracting the uranium with 30$ tributyl phosphate in carbon tetrachloride. The presence of diverse ions, chloride, sulfate, perchlorate in reasonable amounts does not adversely affect the extraction. Large amounts of A 1 ( N 03)3 N a N 03 or NaCl also can be tolerated. The only interfering elements not effectively removed by the extraction are iodine, technetium and gold. The C C 1 4-TBP phase from the extraction may subsequently be titrated like an aqueous sample with the same high precision and accuracy.

IA EA -SM -201/22 113
The assay of fissium (U-Mo, Ru, Rh, Pd) alloy or fissium dross is an example of the analysis of a complex matrix containing elements which interfere in the uranium measurement. A very simple pretreatment step produces a solution suitable for measurement by the NBL titrimetric method. The sample is dissolved in aqua regia. A small amount of residue after filtration is dissolved by treatment with sodium hydroxide and sodium hypochlorite followed by acidification with HC1 and combined with the main solution. Volume is adjusted to obtain the desired uranium concentration range and the solution weighed. Appropriately sized weighed aliquots are taken for analysis. The subsample solution is fumed with 5 ml of perchloric acid. Final volume of the aliquot is adjusted to 15 ml or less. Fuming in H C 1 04 eliminates ruthenium and chloride ion which interfere with the uranium m e a s u r e m e n t . Molybdenum causes premature oxidation of ferrous ion in the presence of nitric acid, which in turn prevents complete reduction of U(VI), thereby biasing the measurement. Fuming in H C 1 04 eliminates nitrates and thereby eliminates Mo interference. Palladium is not present in an amount sufficient to cause a detectable interference.
Alternately, a sample aliquot may be evaporated to dryness on a steam bath, dissolved in 4-5 N H N 0 3 and the uranium extracted with 30$ TBP in C C 1 4 . The separated organic phase can be titrated directly. Measurements on fissium materials and synthesized standard solutions treated by the two methods agree to better than 0.08$ (relative) when 100 mg of uranium is titrated.
It is worthwhile to note that, with a slight modification [9] of the basic method, several grams of uranium may be titrated with a typical precision of 0.005$ RSD.
The simplicity of the operations in the NBL-modified Davies-Gray method inspired mechanization of the uranium measurement to reduce the time expended in "hands on" measurements. Four such systems have been used successfully at NBL. They are automated to handle samples from the end of the preparation through a printout of the titration data. Three systems simply automate the manual titrimetric procedure in which standard potassium dichromate is used as a titrant.Two of these systems dispense titrant via motor driven burets, but use slightly different modes of end-point approach and detection. In the third system the titrant addition is measured g r avimetrically. All three systems are capable of measurement precisions of0.10$ RSD. The fourth system is based on the internal electrogeneration of vanadate ion (V^"5) which, in essence, is the titrant [10]. A prototype of this system has been operated intermittently at NBL over a period of several years with information being used

114 BINGHAM et al.
primarily for the design and fabrication of a production model. This system, being built at Lawrence Livermore Laboratory for NBL, is in final stages of assembly and checkout. The system operates under minicomputer control and will accommodate up to 44 samples in a single loading. It incorporates an internal quality control program and is further programmed to identify a number of fault conditions which could result in incorrect measurements. When it is supplied with appropriate sample, sample solution, and aliquant weight data, it will compute and print thfe uranium content of each sample, including control standards, which it has measured.
Plutonium Assay
Safeguards analysis of plutonium materials encompasses a similar diversity of sample matrices and sample preparation treatments. Unfortunately, as yet there is no measurement method as specific for plutonium as Davies-Gray is for uranium so some trade-off between separation and additional measurements is usually made. Many laboratories use controlled- potential coulometry with 0.5M H 2S 04 as the electrolyte for measuring plutonium. The presence of iron interferes with the plutonium measurement and a separate iron determination must be performed to correct the coulometric data. Titration in 1M H C 1 04 does not suffer from an iron interference; however,PuVI is not easily reduced and its unsuspected presence usually results in a biased measurement.
NBL has been investigating the utility of a mechanized ion-exchange separation/purification of plutonium solutions. AUTOSEP [11] involves loading a Pu solution onto Dowex-1 from 8 M H N 0 3 , washing with 8 M H N O 3 and eluting with 0.1 M HCT-0.01 M HF.The eluate in its beaker/coulometry cell is fumed, then moved to a coulometry station where under AUTOCOULOMETRY [12] samples are automatically analyzed by controlled-potential coulometry. Working full- scale models of the above systems, which are glove- box compatible are being tested and evaluated in NBL's new plutonium laboratory. AUTOALIQUOT provides for weighed aliquots to be taken from a solution and later loaded into AUTOSEP. This combined system, when fully automated, will permit a 5-fold increase in sample throughput with no degradation in accuracy or precision compared to the method previously used at NBL.
The standard of technology is thus being advanced to better meet the requirements of safeguards.
REFERENCES
[1] METZ, C.F., WATERBURY, G.R., USAEC Rep. LA-3554 (1966).

IA EA -SM -201/22 115
[2] DAHLBY, J.W., GEOFFRION, R . R . , WATERBURY, G . R . , USAEC Rep. LA-5776 (1975).
[3] BINGHAM, C.D., BRACEY, J.T., Evaluation of the HTGR Interlaboratory Comparison Program, Phase II, USERDA Rep. NBL-279 (1975).
[4] DAVIES, W., GRAY, W . , Talanta 11 (1964) 1203.
[5] EBERLE, A.R., LERNER, M . W . , GOLDBECK, C . G . , RODDEN, C.J., USAEC Rep. NBL-252 (1970).
[6] ------- , New Brunswick Laboratory TitrimetricMethod for the Determination of Uranium - Basic Procedure, USAEC Rep. NBL-272 (1974) Appendix A.
[7] BODNAR, L.Z., LERNER, M . W . , SCARBOROUGH, J . M . , USAEC Rep. NBL-272 (1974) 5.
[8] BODNAR, L.Z., LERNER, M . W . , SCARBOROUGH, J . M . , USAEC Rep. NBL-272 (1974) 12.
[9] EBERLE, A.R., LERNER, M . W . , USAEC Rep. NBL-262(1972) 5.
[10] GOLDBECK, C . G . , LERNER, M . W . , USAEC Rep. NBL-265 (1972) 5.
[11] WEISS, J.R., WENZEL, A.W., P I E T R I , C.E., USAEC Rep. NBL-272 (1974) 74.
[12] WEISS, J.R., WENZEL, A.W., PIETRI, C . E . , USAEC Rep. NBL-272 (1974) 78.
9

t

IA EA -SM -201/43
EXPERIENCE OF THE CENTRALCONTROL LABORATORY (CCL) IN ACCOUNTINGFOR AND CONTROLLING NUCLEAR.MATERIAL IN CZECHOSLOVAKIA
M. KRTVANEK, J. KRTIL, F. SUS, J. MORAVEC Nuclear Research Institute, Rez,Czechoslovakia
Abstract
EXPERIENCE OF THE CENTRAL CONTROL LABORATORY (CCL) IN ACCOUNTING FOR AND CONTROLLING NUCLEAR MATERIAL IN CZECHOSLOVAKIA.
The four years o f experience obtained in accounting for and controlling nuclear m aterials w ithin the framework o f the C zechoslovak safeguards system and with the co-operation o f the IAEA is discussed. The methods for determ ining uranium, thorium, and plutonium in various nuclear m ateria ls, from the aspect of both ch em ica l and isotopic com position , have been developed and introduced into routine use. The transport, storing, and preparation o f sam ples for analysis, as w ell as experim ental d ev ices , calibration , and com parative tests, are involved. The errors evaluated are given. Other methods have also been established at the CCL for solving some problems in nuclear fuel control such, for exam p le , as the determ ination o f burnup and nuclear spectrom etry. Participation in the PAFEX-I and PAFEX-II experim ents is noted.
The C entral Control L aboratory (CCL) was estab lish ed as part of the State sy stem for the purpose of accounting for and controlling nuclear m a ter ia l in C zechoslovak ia . Its functional independence of a ll MBAs in C zech oslovak ia w as estab lish ed by statute.
Under the d irection of the Departm ent of N uclear Safety and Safeguards of the CSAEC, a sy stem of s ta t is t ic a l sam pling of nuclear m a ter ia ls for p erform ing p h ysica l in ven tories has been elaborated each year. The sam pling has been carr ied out by the Departm ent of N uclear Safety and Safeguards of the CSAEC, while the CCL p artic ip ates in taking rep resen ta tive sam p les from individual MBAs to perform its own independent control. The sam p les m ust be p erfectly hom ogeneous and rep resen ta tive . During transport no p h ysica l or ch em ica l changes m ay occur. T his feature is im portant, e sp e c ia lly for powder sam p les which can e a s ily be affected by oxidation or m oisture w h ereas, for liquid sa m p les, the p o ss ib ility of th e ir evaporation m ust be elim inated . T h erefore , the sam p les are transported in a ir -p roo f p la stic con ta iners which w ere so m etim es sea led . A lso the conditions for storin g the sam p les in a lab oratory and for preparing them for an a lysis m ust be such that any changes in the sam p les are prevented.
Knowledge of the im purity content is v er y im portant for obtaining c o r rect and re lia b le an alytica l r e su lts . When the required data are not supplied by the operator, the sam ple is analysed by e m iss io n spectrography, the p rocedure for determ ining uranium being m odified according to the re su lts obtained.
W ithin the fram ew ork of the control of nuclear m ater ia ls for the CSSR safegu ard s sy stem , U and Th have been e sp e c ia lly estim ated in uranium and thorium fu e ls , re sp ec tiv e ly , at the CCL. S evera l m ethods for d eter m ining U, Pu, and Th [ 1 - 4 ] have been studied. The m ain em p hasis was placed on the m ethods that d isp lay high p rec is io n and accu racy of re su lts .
117

118 К RI VAN EK et al.
F or the P A FE X -I and PA FE X -II exp erim en ts, organized by the IAEA, the follow ing sa m p les w ere analysed: P u(N 03)4, P u0 2, P u(U)0 2, and input solution from the BWR reactor. Methods to control burnup have been developed and the control has been perform ed.
DETERMINATION OF URANIUM IN URANIUM FUELS
Sam ples of 10 - 20 g U 02 and 50 - 100 g am m onium diuranate have been m o stly analysed. The U 0 2 sam p les w ere d elivered a s p e lle ts or powders, w hile am m onium diuranate was subm itted for an a lysis as a su spension (« 50% H20 ) or as a ca lcin ed diuranate.
The oxide fu e ls w ere hom ogenized by a sp ec ia l grinding p ro ce ss in a N2 atm osphere. By storin g in a ir , the com position of U 0 2 sam p les was changed by oxidation to U3Og (the change in U content w as 0.2% over three m onths — se e Table I); th erefore, the sam p les w ere stored in a N2 atm osphere. The su spension of am monium diuranate w as dried at 50°C to a constant weight for 8 h and hom ogenized without using the inert atm osphere. The rep resen ta tive sam p les (~ 2 g) of U 0 2 and diuranate for the an a lysis w ere prepared by quartering and storing in polyethylene m edicine bottles.
W eighed am ounts of U 02 or diuranate, containing 200 - 240 mg U, w ere d isso lved in 4M H N03 with heating; the sam ple volum e and HN03 concentration for the an a lysis w ere adjusted to 2 m l and a m axim um of 3M.
On the b a s is of a com parison of the te sted m ethods [ 2] a reduction- oxidation titra tion and a grav im etr ic m ethod (weighing of U3Os) w ere chosen as the m ain m ethod and as the control an alytica l m ethod, re sp ec tiv e ly . The redox titra tion s w ere b ased on the m ethods of D av ies , G rey [ 5] and E berle et al. [ 6], which w ere v er ified and m odified; in p rin cip le , a ll U in the sam ple w as reduced to U(IV) by an e x c e s s of F e 2+, in the p resen ce of NH2S03H an(j H3PO4. U(IV) w as titrated with a standard I^C^CNj solution. By using E b e r le 's m ethod [ 6], a VOSO4 solution was added to the U(IV) solution im m ed ia te ly b efore titration.
A rad iom eter (Denmark) titration se t, con sistin g of a TTT1C titra tor, autom atic A BU -12 burette, and a record er , was used for the titration . The equivalence w as indicated p oten tiom etrica lly , u sing the P t-SC E e lec tro d es.The equ ivalence point was determ ined from a graphical record or read -o ff im m ed iate ly on the burette.
F or the calibration , the uranium N B S -U -950a (U3Os) and N B S-U -960 (m etal) standards w ere used . The m ultip lication correction factor was1.0006 - 1.0008.
The content of U in oxide fu e ls was 87 - 87.2%. Am m onium diuranate contained 40% U for the su spension and 70% U- for the ca lcin ed sam ple.Each sam ple w as analysed at le a st five tim es; for one titra tion determ ination, a sam ple amount corresponding to 1 m m ol U w as taken. The determ ination erro r w as ± 0.04 - 0.08 re l. %. F or the grav im etr ic an a lysis (applied esp e c ia lly to oxide fu e ls) , 1 g U3Og w as w eighed after annealing. The erro r w as ± 0.005 re l. %. The r e su lts of the grav im etr ic and titra tion determ ination agreed w ell (within a few thousandths per cent) with each other.
The accu racy of the m ethods for determ ining U, u sed at the CCL, was tested by a com parative experim ent; the sam e sam p les w ere analysed sim u ltan eou sly at the CCL and SAL at Seibersdorf. The re su lts of th is com p arison w ere sa tis fa c to ry (m axim um d ifferen ce of 0.05%).

IA EA -SM -201/43 1 1 9
TABLE I. CHANGE OF U CONCENTRATION IN U 02 DURINGITS STORAGE
Date o f analysis (1974)
U in U 0 2m
D ifference
6.6 87.11 -
7 .8 86.94 - 0.17
15.9 86.81 - 0.30
DETERMINATION OF Th IN THORIUM FUELS
The sam p les of m eta llic Th w ere the m ost frequently analysed . They w ere trea ted as uranium m a ter ia ls b efore the a n a ly sis . The sam p les (200 m g Th) w ere d isso lved in a m ixture of 3M H N03 + 0.01N HF. The aliquot; containing K 20 m g Th, w ere taken for individual determ inations. The d eterm ination w as based on the titration of Th(IV) by a solution of Com plexon III, u sing xy len ol orange as an in dicator, in a ch loroacetate buffer, with a v isu a l indication of the equivalence. The solution of Com plexon III was standardized by a h ighly pure m eta llic Bi. Each determ ination w as carried out at lea st five t im e s , u sing two independently w eighed sam ple am ounts. V alues of
99% Th w ere obtained. F or the 2 0 -m g am ounts of Th, the determ ination e r ro r was 0.15 - 0.20 re l. %.
ANALYSIS OF THE PLUTONIUM AND MIXED (Pu + U) FUELS
B e sid es the an a lyses of uranium fu e ls for the C zechoslovak safeguards sy stem , plutonium and m ixed (Pu+U) fu e ls w ere a lso analysed at the CCL in co -op eration with IAEA, in the fram ew ork of PA FEX -I; Pu(N03)4, powdery P u 02, and Pu(U)Oz w ere the sam p les. The redox titration m ethods, b ased on the reduction of Pu(VI) and oxidation of U(IV), w ere u sed for determ ining Pu and U. The r e su lts obtained agreed w ell with those p roduced by seven other lab ora tories participating in the PA FE X -I.
DETERMINATION OF ISOTOPIC COMPOSITION OF URANIUM
A m ethod w as elaborated f ir s t of a ll to evaluate uranium fuel within the fram ew ork of the C zechoslovak control sy stem [7 ]. The developm ent of the procedure started from papers published by Bokelund [ 8], Stevens and H arkens [ 9], and Shields [10].
The b asic exp erim en ta l device con sisted of a TH -5 V arian Mat m a ss sp ectro m eter , com pleted with a m a ss se lec to r , a sp ec tro sy stem SS 006, and a F acit punching m achine; the sp ectra w ere treated with a com puter.
The a n a ly ses w ere made by u sing a su rface-ion iza tion ion sou rce, with a double-filam ent (Re) exchangeable unit. The a cce lera tion voltage is 10 kV. A F araday cup co llec to r or an e lec tron m ultip lier are the d etectors for m easu rin g ion ic cu rren ts of the low-abundance 234U and 236U m a sses .The gain is 5 X 1 0 s, the reso lv in g power being adjusted to « 500.

120 KRIVAn e K e t al.
The d evice was tested and calibrated by NBS standards. The m ass discrim ination factor was calcu lated from 12 independent an a lyses of the NBS-U 500 standard. The R/Rg value of 1.0015 + 0.0005 was obtained. The function of the apparatus and the d e tec to r -sy s te m lin ear ity w ere tested by the NBS-U 930, U 020, and U 015 standards. The deviations w ere “ 0.1 re l. %.
An in itia l so lu tion , containing h ighly pure U 02(N 03)2, with a concentration of “ 5 mg U /m l in IM HNO3 i s prepared. On to the annealed Re filam ent,
5 hgU is loaded. The exchangeable unit is loaded in the sou rce, the space is evacuated to “ 5 X 10"7 torr and the sam ple is degased. The working tem perature of the ion ization filam ent is adjusted to 2020 ± 10°C and the ion ic current of the m ost-abundant m a ss is kept at 4 -10 X 10‘n A. By m eans of the m a ss se le c to r , u sing the plateau pumping technique, the m ass and background in te n s itie s are recorded . Two s e r ie s of 12 scan s are re g ister ed with 5 data in the point being m easured . The low-abundance m a sse s are record ed independently with the e lec tron m ultip lier.
The sp ectra are re g is ter ed in a punched tape and p ro cessed by a com puter, u sing a hom e-m ade program . The algorithm includes the tim e - dependence of in ten sity , correction s for background and m a ss d iscrim ination , calcu lations of a tom ic and weight per cent as w ell as standard deviation, and exclu des the random w ise deviated points. The variance an a lysis is used for the s ta tis t ic a l evaluation of re su lts .
The m ain part of the sam ple needs a ch em ical treatm ent and iso la tion of uranium , which need not be quantitative. The extraction with ethyl ether or MIBK is m ost convenient for the separation of uranium from inactive m a ter ia ls . F rom the A1U, ZrU a llo y s , uranium is separated u sing a Dowex 1 stron gly b a sic anion exchange re s in in 6M HC1 or a m ixture of 6M HCl + 0.5M HF. A tw o -sta g e separation is used for iso la tin g U from the burned-up fuel; the extraction with 0.5M TTA in xylene and the separation with Dowex 1 in HC1 are the f ir s t and second sta g es , re sp ec tiv e ly . The decontam ination factor for Pu and m ost separation products is 104-109.
F or determ ining the iso top ic com position of Pu, “ 0.1 jug Pu is loaded on the filam en t. The ion ic cu rren ts are recorded with the e lec tron m ultip lier, the gain being 5 X 10⁻⁵. The sp ectra are treated as d escrib ed above. The N B S-Pu 947 standard w as u sed for the calibration. The abundance of 238Pu i s checked o -sp e c tr o m e tr ic a lly . The p rec is io n of the iso top ic ratio d eterm ination, ex p re sse d in the standard deviation, l ie s within the range of R = 0.02 - 1 and is b etter than 0.3%.
Pu is iso la te d from the sam p les and separated from uranium and f is s io n products:
(a) By a tw o -sta g e extraction with 0.5M TTA xylene solution in 1M acid (НСЮ4 + HN03); from the organ ic phase, Pu is re -ex tra c te d with10M. HN03;
(b) By a separation with a Dowex 1 X 4 stron gly b a sic anion exchange r e s in from 7M_HN03 at 50 - 60°C. A partition ratio of 106 Pu:U is reached.
DETERMINATION OF BURNUP
A p r e c ise determ ination of the burnup of a nuclear fuel provides in form ation about e ffec tiv e u tiliza tion of the fuel and the b asic data for construction and control of the operation of nuclear re a cto rs . D irect d estructive m ethods for determ ining burnup, studied at the CCL, w ere b ased on m easurem ent

IA EA -SM -201/43 121
(a) Of the change of iso top ic fuel com position during the irrad iation(b) Of the activ ity (amount) of a convenient active or in active f is s io n
product — m onitor of the burnup.Method (a) showed sa tis fa cto ry r e su lts for high burnup d eg rees (« 10%).
F or m ethod (b), 137Cs, 106Ru, 144Ce, and 95Zr w ere u sed as rad ioactive burnup m onitors, which w ere se lec te d according to the irrad iation tim e and type of the nuclear fuel to be analysed . The p rec is io n of the burnup determ ination by rad iom etric m ethods was 5 - 10% The stable iso to p es , e sp e c ia lly 148Nd, which w as determ ined by the m a ss-sp e c tr o m e tr ic m ethod of iso top ic dilution, w ere applied for estim atin g burnup. The p rec is io n of th is m ethod was 2 - 5% [11 , 12].
NUCLEAR SPECTROMETRY
To check the iso to p ic com position and content of U and Pu, the 7 - and o '-sp ectrom etry served as additional m ethods. F or th ese purposes, CCL is equipped with two 1000-channel and one 4096-ch ann el P lu rim at-20 a n a ly sers with a M ulti-8 com puter and d etectors of good p aram eters. F or the 7 - sp ec tro m etr ic m ethod, the Ge(Li) and Si(Li) d etectors are used. The reso lv in g power of a 7 7 -cm 3 Ge(Li) was 2.5 keV and that of a Si(Li) detector was 560 eV for 1332.4 keV and 59.6 keV, re sp ec tiv e ly . The d evice m akes it p o ssib le to obtain the 7 -sp e c tr a in low - and h igh -en ergy reg ion s. A Si detector with a reso lv in g power of 25 keV is applied to alpha m easu rem ent of iso top ic Pu com position. Pu is ch em ica lly iso la ted by an extraction with TTA and loaded on to a s ta in le s s - s t e e l d isc by evaporation, or e lec tr o ly tica lly . In addition to the 7-sp e c tr o m e tr ic m ethod for determ ining iso top ic U com position, a lab oratory control m ethod u sing delayed neutrons has been developed [13].
CCL co llab ora tes with the departm ent of sem iconductor detectors for the u se of sp ec ia l d etectors of ex tra-p ure Ge and CdTe for the nond estru ctive control of fuel m a ter ia ls under both laboratory and fie ld conditions.
R E F E R E N C E S
[1 ] SPEVÄCk OVÄ, V ., KRUMLOvX., I.., Radiochem. Radioanal. Lett. 14 (1973) 190.[2 ] SPEVACÜKOVA, V ., KRUMLOVÄ, L ., Methods for an accurate determ ination o f uranium, Final Rep.
INR (1973).[3 ] KRTIL, J ., KUVIK, V ., SPEVACKOVA, V ., Methods for an accurate determ ination o f p lutonium , Final
Rep. INR (1973).[ 4 ] KRTIL, J ., KUVIK, V ., Sp Ev ÄCk OVÄ, V ., Determ ination o f plutonium in the presence o f fluoride ions,
Final Rep. INR (1973).[5 ] DAVIES. W ., GRAY, W ., Talanta П _(1964) 1203.[6 ] EBERLE, A .R ., LERNER, M .W ., GOLDBECK, C .G .. RODDEN, C .J., in Safeguards Techniques (Proc. Symp.
Karlsruhe, 1970) 2 , IAEA, Vienna (1970) 27.[7 ] SUS, F. STEPANKOVA, E., Proc. 3r4 CMEA Symp. Studies in the Field of Reprocessing, Mariänskd
L ä z n S (1974).[8 ] BOCKELUND, M ., Isotopic analysis o f submicrogram amounts o f uranium, Rep. ER-199 (1966).[9 ] STEVENS, M .S ., MARKENSS, H .L ., Method 2500, S elected M easurement Methods for Plutonium and
Uranium in the N uclear Fuel C ycle (RALPH. J.J., Ed.) TID 7029 (1963).[1 0 ] SHIELDS, W.R., (Ed.). NBS T ech. Note 277 (1966).[1 1 ] KRIVÄNEK, M .. KRTIL, J., in A nalytical Chemistry of N uclear Fuels (Proc. Panel, Vienna 1970), IAEA,
Vienna (1972) 131.[1 2 ] KRTIL, J ., KRIVÄNEK, M ., BULOVlC, V .. DJORDEVlC, M ., MAXIMOVlC, Z ., in A nalytical Methods
in the N uclear Fuel C ycle (Proc. Symp. V ienna, 1971), IAEA, V ienna (1972) 491.[1 3 ] KUKULA, F ., in Proc. CMEA Symp. Studies in the Field o f Reprocessing 2 , CAEC (1972) 162.


IAEA-SM-201/55
ANALYSE PRECISE DE REFERENCES SECONDAIRES POUR LE CONTROLE DES MAT IE RES FISSILES
P. CAUCHETIER, C. GUICHARD, F. REGNAUD CEA, Centre d'Studes nucl6aires
de Fontenay-aux Roses,Fontenay-aux-Roses,France
Abstracc-Rösumd
ACCURATE ANALYSIS OF SECONDARY REFERENCES FOR THE MEASUREMENT OF FISSIONABLE MATERIALS.Titrations o f th e oxidation-reduction typ e are used either as a m ethod o f measuring fissionable m aterials
in cases where th e product being analysed is o f sufficient purity, or as an isotope dilution calibration method in th e case o f irradiated fuels containing numerous interfering elem en ts. T h e results described in th e paper refer to uranium and plutonium . In th e effort to ach ieve accuracy account is taken o f three factors: the experim ental conditions under w hich dissolving and titration take p lace; the quantitative characteristics o f th e reactions and th e possib ility o f system atic errors; the ch em ica l behaviour o f the neptunium and am ericium present in the plutonium in sm all quantities. With the operational procedures used, accuracies ranging b etw een 0 .0 2 and 0.1% can b e a tta in ed , depending on th e individual case. T h e authors conclude that a program m e o f research on the transuranium elem ents must be pursued if accurate analysis o f future fuels is to be possible.
ANALYSE PRECISE DE REFERENCES SECONDAIRES POUR LE CONTROLE DES MATURES FISSILES.Les titrages par oxydorfcduction sont u tilises soit corrime m £thode de m esure des m a g r e s fissiles dans le
cas oü le produit ä analyser est suffisam m ent pur, soit com m e m £thode d'6talonnage de la dilution isotopique dans le cas des com bustibles irradi^s qui contiennent de nombreux elSm ents genants. Les r§sultats pr&sent£s ic i se rapportent ä Turanium et au plutonium . La recherche de la precision est fa ite com pte tenu de trois facteurs: les conditions exp€rim entales de dissolution et d e titrage, la quantitativitä des reactions et la possib ilitS d'erreurs systSm atiques, le com portem ent chim ique du neptunium et de T am frlcium presents en p etites q u an tity dans le plutonium . Les modes op&ratoires utilises donnent des precisions comprises suivant les cas entre 0 ,0 2 et 0 ,1 °Jo et Ton conclut ä la n£cessit£ de poursuivre un programme d'£tudes sur les transuraniens pour assurer Tana lyse precise des com bustibles futurs.
INTRODUCTION
^ a u gm en ta tion de la production des m a tieres f is s i le s et le souci cr o issa n t de la secu r ite dans P in d u str ie n u clea ire entrainent le b esoin d'une con n aissan ce p r e c ise des quantites m is e s en jeu aux d ifferen ts stad es d'un procede ou p resen tes dans un lot de fabrication . Pour repondre a cette dem ande/ le s m ethodes d 'analyse doivent e tre appliquees dans des conditions exp erim en ta les c h o is ie s de fa fon ä restre in d re P in terva lle de.confiance qui qualifie leu r reprodu ctib ilite et v ^ r ifie es sous P an gle de leu r exactitude.Un m oyen, u n iverse llem en t reconnu dans le s la b o ra to ires , d*eviter P erreu r system atiq u e e s t R utilisation d*etalons ou de r e fere n c es seco n d a ires . En ce qui concerne Puranium et le plutonium , le s t itra g es par oxydoreduction sont u til ise s so it com m e m ethode de m esu re , dans le cas ou le produit a an a lyser es t su ffisam m ent pur, so it com m e m ethode d'etalonnage de la dilution isotop iqu e, dans le cas des com bustib les ir ra d ies qui contiennent
123

124 CAUCHETIER et a l.
de nom breux e lem en ts genants. Ces m ethodes conviennent a l'etalonnage de so lu tions de re feren ce et, dans le s rfesultats p resen tes ic i , la rech erch e de la p rec is io n e s t fa ite eom pte tenu de tro is facteurs:— le s conditions exp erim en ta les de d isso lu tion et de prelevem ent,— la quantitativite des reaction s et la p o ss ib ilite d 'erreu rs system atiq u es,— le com portem ent chim ique de transuraniens en p resen ce de plutonium .
1. CONDITIONS EXPERIMENTALES
L 'u tilisa tion d 'etalons ch im iques, l'etalonnage de re feren ces secon d aires et l'a n a ly se p r e c ise d 'echantillons de com b ustib les supposent le re sp ec t de s tr ic te s conditions ex p er im en ta les . Deux etapes sont exam inees: la quantitativite de la d isso lu tion et l'exactitud e des p r ise s d 'e ss a i.
1 . 1 . D isso lu tion
Deux cas se p resen tent suivant que 1'echantillon e s t facilem en t ou d iffic ilem en t so lu b le.
L es echantillons m eta lliq ues d'uranium ou de plutonium sont d issou s dans des flacons « v e r r a v is s » (recip ien ts e n v e r r e P yrex m unis d'un col a v is su r leq u el s'adapte un bouchon avec joint de polytetrafluoro-eth ylene). Pendant la d isso lu tion , le flacon e s t muni d'un petit entonnoir qui perm et la m ise a l'a ir et a rr e te le s p rojection s. A pres la d isso lu tion , le flacon es t muni de son bouchon d 'orig in e.
Pour le s oxydes re fr a c ta ir e s , un d isso lv e u r com prenant deux com partim ents concentriques surm ontes d'un refrigeran t e s t u tilise ( f i g . l ) . Le produit ä d issou d re est place dans un com partim ent centra l muni d'un System e a debordem ent; l'ac id e d'attaque occupe le s deux com partim ents. Quand le reg im e de chauffage e s t etab li, l'ac id e condense renou velle d'une fapon continue le m ilieu d'attaque. Ce System e presen te l'avantage d 'ev iter le s p ertes par p rojection , de m ettre facilem en t en evidence un eventuel resid u et d 'a m elio rer l'attaque de produits r e fr a c ta ir e s . 2,5 g de P u 0 2 pur fr itte ä 1700°C sont d isso u s en une quinzaine d 'heures par un m elange acide H N 03 14 M /HF 0,1 M. Le cas de l'attaque nitrique e s t p a rticu liere - m ent favorab le, l'azeo trop e ayant une com position v o is in e de 14 M.
1 . 2 , F ractionn em en ts et pesfees
L es fractionnem ents de solution sont fa its par p esee et cheque etape de l'a n a ly se e s t ca lcu lee de fagon a n'introduire qu'une in certitude faible par rapport a la p rec is io n rech erch ee . Le tableau I donne un exem ple des conditions op era to ires u til ise e s dans le cas d'un titrage de plutonium par une solution de su lfate cer iq u e .
Pour e lim in er au m axim um l'in flu en ce de 1'evaporation et des variations de conditions a tm osp h eriq u es, le s fractionnem ents de solution sont effectu es sans interruption et im m ediatem ent ap res la p esee de la solution d'attaque. L es p e se e s sont co r r ig ee s de la p ou ssee de l'a ir .

IAEA-SM-201/S5 125
FIG. 1. Schem a d'un appareil de dissolution d'oxydes rOfractaires.
TABLEAU I. PRECISION DES PESEES DANS UN TITRAGE OXYDO- REDUCTEUR
Nature du pr£lfevementQ u an tity m ises
en jeu
<g)
Prgcision des peseesabsolue ,
. . re la tive (mg)
Etalon NBS ~ 0, 5 m asse certifiee
Plutonium de rSf&rence 0 ,5 ä 1 ± 0 ,0 5 lO-4
Solution d’attaque 50 ä 80 ± 0 ,2 0 ,0 5 - 10"4
Aliquotes de la solution d'attaque г 10 ± 0 ,2 0, 2 ' 10"4
Solution titrante de C e (IV) ~ 5 0 ± 5 IO-4

126 CAUCHETIER et al.
2. REACTIONS DE TIT R A GE
Le plutonium et l'uranium sont doses par titrages oxydoreducteurs, une solution etalonnee de Ce (IV) servant d'agent oxydant. Les titrages sont fa its par pesee et le point equivalent est determ ine par spectrophoto- m etrie de l'orthophenanthroline ferreu se utilisee comme indicateur. L 'app areillage est du type de celui deja d ecrit [ 1 ].
2 .1 . Etalonnage de la solution de cerium (IV)
La solution de Ce (IV), d'environ 10’ 2 M est titree au moyen d'etalons du «N ational Bureau of Standards» (NBS). Des com paraisons effectuees sur une meme solution titrante indiquent des eca rts -types re la tifs de:
0,02% avec l'anhydride arsenieux 83 c,0,02% avec l'oxalate de sodium 40 h,0 ,0 3 a 0,04% avec le plutonium 949 c,0 ,02% avec l'uranium m etallique 960.
La plus grande difference entre les resu ltats obtenus par les quatre methodes est in ferieu re a 0,07% et n 'est pas significative si l ’on tient compte egalement des m arges d 'e rreu r indiquees dans les certifica tio n s.Dans la pratique courante, la solution de sulfate cerique est titre e au moyen d'uranium ou de plutonium suivant le meme mode operatoire que l'elem ent a d oser, et ce titre est system atiquem ent v erifie au moyen de l'anhydride arsen ieu x.
La solution de Ce (IV) est conservee a tem perature constante (20 ±1)°C dans des flacons de v erre de 1 litre soigneusement nettoyes et bouches, le risque principal etant du aux poussieres atm ospheriques qui peuvent reduire Ce (IV). Cheque flacon une fois ouvert est consomme dans la journee. L es variations de titre observees sont in ferieu res a 0,01% au bout de tro is m ois.
2 .2 . Analyse de l'uranium
L'uranium est determ ine par ce rim etr ie apres reduction de U (VI) en U (IV) par T i (III). Cette methode non selectiv e est applicable a des solutions pures exem ptes de fer et de plutonium, done a des solutions u tilisees comme re fe re n c e s . Pour am elio rer la precision du dosage, deux m odifications sont apportees d l'an cien mode operatoire [ 2 ]:
— l'a c id ite sulfurique est augmentee de fapon a ra len tir la reoxydation de T i (III) et ä am elio rer la quantitativite de la reduction de l'uranium ;
— un large exces de Е е (III) par rapport a la stoechiom etrie de la reaction
U (IV) + 2 F e (III) - U (VI) + 2 F e (II)
est ajoutb au moment du titrag e .Le System e U (VI)/U (IV) est un System e lent. Avec un exces de F e (III),
U (IV) est quantitativement oxyde et la reaction suivie est ce lle de l'oxydation de F e (II) par Ce (IV).

IAEA-SM -201/55 127
2 .2 .1 . Mode operatoire
A la p rise d’e ssa i contenant 50 a 100 mg d'uranium, a jouter su cce ssiv e- ment en agitant:— 20 m l d’un melange acide H2 S 0 4 1, 2 M /HN03 1 .3 M.— 2 ml d'acide sulfamique 1 M,— 2 m l d'une solution de T iC l3 1 M.
M aintenir l'agitation i0 minutes et a jouter:— 0 ,5 ml d'une solution de F eC l3 2 M,— 0 ,5 ml d'une solution d'orthophenanthroline ferreu se 10~ 3 M.
T itr e r ensuite par le sulfate cerique.
2 .2 .2 . Application
La cd rim etrie a ete appliqude a l'etalonnage d'une solution d'uranium -233 u tilisee comme traceu r en dilution isotopique. Le titre de la solution de sulfate cerique a ete determ ine au moyen des etalons NBS uranium et anhydride arsdnieux. L es valeurs obtenues ont ete les suivantes:— 0, 94426 • 10" 5 equivalent-gram m e de solution avec l'etalon uranium;— 0, 94418 • 10“ 5 equivalent-gram m e de solution avec l'eta lon As2 0 3
( I 616 dissolution);— 0, 94402 • 10" 5 equivalent-gram m e de solution avec l'etalon AS2 O3
(2 ё dissolution).L 'estim ation de 1 'ecart-typ e dans le s tro is cas etait s = 0 ,0 0 0 2 * 10 ’ 5
equivalent-gram m e (calcu l effectue sur une s e r ie de 6 determ inations).En prenant comme valeur moyenne du titre 0, 94415 • 10" 5 equivalent-
gram m e et en tenant compte de la purete isotopique de 99, 56% du traceu r, determ inde par sp ectrom etrie de m asse , la teneur en uranium -233 de la solution a ete trouvee egale a
(2, 17076 ± 0 ,0 0 0 3 6 ) 10" 5 a tom e-gram m e/gram m e de solution,
l'in terv a lle de confiance etant calcu le d p artir d'une sd rie de 6 determ inations.
2 .3 , Analyse du plutonium
Deux methodes sont u tilisees pour l'analyse du plutonium, ayant pour principe so it l'oxydation de Pu (III) en Pu (IV) apres reduction du plutonium par T i (III), so it, apres oxydation du plutonium par 1'oxyde argentique, la reduction de Pu (VI) en Pu (IV) par un exces de F e (II) et le titrage en retour de l'e x c e s de F e (II) [ 3 ] ,
La p rem iere est p referee pour l'etalonnage des produits purs en raison de la sim plicite de son mode op erato ire . Lorsque cette methode est u tilisee pour etalonner une solution de Ce (IV), le s resu ltats obtenus en comparant les differents dtalons NBS sont en bon accord a un niveau de precision voisin de 0 , 05%.
La deuxidme a l'avantage d 'etre applicable en presence d'uranium, m ais la com paraison des etalonnages m et en evidence un ecart system atique: le titre de la solution de Ce (IV) qu'on obtient par cette methode est d'environ 0,2%) plus fa ib le . L es potentiels d 'equilibre des system es AG (I)/A g (0) et F e (III)/F e (II) etant vo isin s, l'exp lication la plus probable est l'oxydation d'une petite quantite de F e (II) par Ag (I).

128 CAUCHETIER et a l.
Cette constatation m et en evidence l'in te re t d 'u tiliser un etalon ou une re feren ce suivant le meme mode operatoire et dans le s m em es conditions que le dosage. A cette condition, l'em ploi de l'oxyde argentique re ste in teressan t car les reproductib ilites obtenues se situent au niveau de 0 , 0 2 %. L'oxydation en Pu (VI) par l'acid e perchlorique perm et au ssi d 'ev iter cet ecart system atique.
2 .3 .1 . Mode operatoire de la methode au titane (III)
A la p rise d 'e ssa i contenant environ 100 mg de plutonium, ajouter su ccessivem ent en agitant:— 20 ml d'un melange acide H2 S 0 4 0 ,5 M/HNO3 1 M,— 2 ml d'une solution de n itrate d'aluminium 0, 2 M pour com plexer,— le s fluorures u tilises ä la dissolution,— 2 ml d'acide sulfamique 1 M_,— 1 m l d'une solution de T iC l3 1 M.
M aintenir l'agitation 10 m inutes, a jouter 0 ,5 ml d'orthophenanthroline ferre u se 1 0 "3 M et t i tr e r par le sulfate cerique.
2 .3 .2 . Mode operatoire de la methode ä l'oxyde argentique
Diluer la p rise d 'e ssa i contenant environ 50 mg de plutonium par le m elange sulfonitrique et a jouter tro is portions d’une centaine de mg d’oxyde argentique en agitant 5 minutes entre chaque addition; la solution est encore noire 1 0 minutes apres la derniere addition.
D etruire l'e x ce s d'oxyde argentique par chauffage ä legere ebullition pendant 5 m inutes. L a is s e r re fro id ir . A jouter successivem ent en agitant:— 2 0 m l de m elange sulfonitrique (id. 2 .3 .1 ) ,— 2 ml de n itrate d'aluminium 0, 2 M,— 2 ml d'acide sulfamique 1 M,— une quantite exactem ent pesee (environ 25 g) d'une solution de
F e (II) 2, 5 • 10" 3 M en milieu sulfurique 0, 5 M,— 0 ,5 ml d'orthophenanthroline ferre u se .
T itr e r par le sulfate cerique.Une partie aliquote de la solution de F e (II), au ssi proche que possible
de la quantite u tilisee pour le dosage du plutonium, est titre e par Ce (IV).
3. IN TERFEREN C E DES TRANSURANIENS DANS L E S DOSAGES DE PLUTONIUM
L es com bustibles actuels peuvent contenir des quantites, non negligeables au niveau de l'analy se p re cise , de neptunium et d 'am ericium . Le neptunium est form e dans le reacteu r suivant les schem as
238U (n, 2n) 237U 237Np
et
235 U (n, y) 236U (n, 7 ) “ 'U237 T 237 Np
'et accesso irem en t, ensuite, par d ecro issance de 241Am
IAEA-SM -201/55 129
L e s deux principaux isotopes de 1'am ericium sont form es respectivem ent par captures conduisant a 243Am par l'in term ed iaire de 243Pu et par em ission ß~ de 2 4 1 Pu. Le plutonium produit ä l'heu re actuelle a des teneurs felevees en 241Pu qui, etant donne sa periode de 15 ans, donne rapidement des
^ f 241quantites appreciables de Am.
3 .1 . Neptunium
L e neptunium presente des proprietes voisines de ce lle s du plutonium v is -a -v is des reactions d'oxy dor eduction.
3 .1 .1 . Dans la methode au titane (III), le neptunium est reduit ä l'e ta t de valence (IV), m ais la cinetique de reoxydation de Np (IV) par Ce (IV) est lente et l'orthophenanthroline ferreu se est oxydee avant Np (IV). Les teneurs en neptunium habituellem ent rencontrees etant fa ib les, on peut con sid erer que l'in terfere n ce est negligeable.
3 .1 .2 . Dans le cas du dosage de Pu (VI) en retou r, le neptunium est dose en meme temps que le plutonium: il est oxyde en Np (VI) par l'oxyde argentique et Np (VI) est reduit en Np (IV) par F e (II). Dans le m ilieu H2SO4 0, 5 M/HNO3 1 M, toutefois, la reaction n 'est pas quantitative, les resu ltats sont peu reproductibles et presentent une erreu r par defaut de 3 a 4%. Deux hypotheses sont possibles: ou bien F e (II) ne rfeduit pas quan- titativem ent Np (VI) en Np (IV), ou bien la quantite im portante de F e (III) en fin de titrage perm et la reoxydation d'une fraction de Np (IV). La quantitativste du dosage du neptunium est obtenue en portent la concentration sulfurique a 2, 5 M.
Le com portem ent des differents etats de valence du neptunium a ete exam ine su r resin e anion Dowex 1 X 4 en milieu nitrique 8 M, en vue de re a lis e r sa separation du plutonium. Np (VI) est partiellem ent reduit en Np (V) par la resin e et son com portem ent est s im ila ire ä celui de U (VI): il est partiellem ent fixe et il faut laver par de grands volumes pour l'e lim in e r . Np (V) est peu stable dans ce m ilieu. Np (IV) peut etre obtenu au moyen d'un melange d'hydrazine et d'eau oxygenee et son coefficient de partage est eleve. Il est possible que cette methode puisse etre appliquee, m ais les e ssa is n'ont pas encore ete en trep ris pour v er if ie r le comportement de Pu (III) sur la re s in e .
3 .2 . Am ericium
L es couples AM(III)/Am (VI) et Am (III)/Am (V) sont des system es tre s oxydants et l 'e ta t de valence (VI) est generalem ent obtenu au moyen de persulfate en presence d 'argent.
3 .2 .1 . Dans la methode au T i (III), l'am ericiu m n 'in terfere pas, Am (III) ne pouvant etre oxyde par Ce (IV). L 'absence d 'in terferen ce a en outre ete v erifiee en appliquant le mode operatoire ä des solutions d 'am ericium . Les resu ltats sont rassem b les dans le tableau II: le s consommations de solution titrante correspondent a la correction d 'indicateur et au blanc des reactifs et ne sont pas significativem ent d ifferentes.

130 CAUCHETIER et al.
TABLEAU II. COMPORTEMENT DE L'AMERICIUM DANS LA METHODE AU T i (III)
Americium ajoutS0 382
(Mg)764 1910
Quantit£ de solution de Ce (IV)(mg) 64 64 67 64
TABLEAU III. IN TERFEREN CE DE L'AMERICIUM SUR LE DOSAGE DU PLUTONIUM
Solution de plutonium
(g)
Am/Pu<?]o)
Pu dos€ (m g/g)
Ecart relatifсу»)
15,2660 0 3,6767 -
15,3454 0,7 3,6774 + 0,02
15,4795 1 ,4 3,6780 + 0,035
3 .2 .2 . Dans la methode a l'oxyde argentique, l'in terfere n ce de l'am ericiu m a ete estim ee en rea lisan t des essa is en solutions synthetiques: ä des p rises d 'e ssa i d'un plutonium pauvre en 2 4 1Pu, des quantites d 'am ericium representant des teneurs com p rises entre 0 et 1,4% ont ete a jou tees. Les resu ltats sont rasse m b le s dans le tableau III. Les ecarts maximaux sont du meme ordre que l'e c a rt-ty p e qui ca ra c te r ise la reproductib ilite du dosage et on ne peut done conclure a une difference sign ificative. L 'in te r feren ce de l'am ericiu m peut e tre negligee dans les dosages de plutonium de com positions isotopiques courantes.
D 'au tres e ssa is ont ete effectues, dans les m em es conditions op era- to ire s , su r des solutions contenant plusieurs m illigram m es d 'am ericium en l'ab sen ce de plutonium. Ces essa is donnent un signal positif m ais d isp erse. L 'ensem ble des resu ltats ne perm et pas ä l'heu re actuelle d 'in terp reter les reactions qui se produisent et un program m e d'etude des reactions d'oxydo- reduction, appuye par la spectrophotom etrie des pics d'absorption de Am (III), Am (IV) et Am (VI), est en cours d 'execution.
CONCLUSION
L es methodes d ecrites perm ettent d 'etalonner des re fe ren ces uranium et plutonium avec des p recisions com p rises entre 0 ,0 2 et 0 ,05% et, si l'on tient compte des questions pratiques de conditionnement et de conservation des solutions qui n'ont pas ete abordees dans ce texte, l'u tilisation de ces re fe ren ces perm et de garantir des dosages a 0 , 1 % pres (reproductibilite et exactitude).

IAEA-SM -2 01/55 131
A ces niveaux de precision , l 'e r r e u r de l'o rd re de 10" 4 com m ence a devoir etre p rise en consideration et, dans le cas du plutonium, il convient de se preoccuper de la filiation des isotopes rad ioactifs. Un plutonium de re fe ren ce a 95% de 239Pu produit par d ecro issan ce 27 ppm de 235U par an. Cette valeur est negligee jusqu'a present dans le s analyses m ais e ile pourrait devenir significative pour un plutonium dont la derniere date de purification se ra it tre s ancienne.
Dans un futur proche, des quantites im portantes de plutonium vont etre produites dans les reacteu rs a eau. La composition isotopique moyenne est de 1% en isotope 238, de 20% en isotope 240 et de 10% en isotope 241, et conduit par d ecro issan ce a des teneurs non negligeables en uranium et surtout en am ericiu m . L'etude des proprietes chimiques des transuraniens, a in si que celle des methodes d e-separation, est done ä poursuivre pour a ssu re r un controle p recis des quantites de m atieres f is s i le s .
R E F E R E N C E S
[1 ] CAUCHETIER, P. , GUICHARD, C. , Rapport CEA-R-4233 (1971).[2 ] CORPEL, J. . REGNAUD, F . , Anal. Chim. Acta 27 (1962) 36.[3 ] CORPEL, J. , REGNAUD, F. , Anal. Chim. Acta 35 (1966) 508.


IAEA-SM -201/63
EXPERIENCES OF SHIPPER-RECEIVER DIFFERENCES IN PLUTONIUM OXIDE TRANSACTIONS
K .A. SWINBURN, I.R. McGOWAN British Nuclear Fuels Ltd,Windscale Works,United Kingdom
Abstract.
EXPERIENCES OF SHIPPER-RECEIVER DIFFERENCES IN PLUTONIUM OXIDE TRANSACTIONS.Plutonium oxide has the property of absorbing moisture, carbon dioxide e tc ., to the extent that it is
necessary to take special steps to determine the plutonium content in such a way as to avoid shipper- receiver differences. This paper describes a method used internationally for several years for correcting for any absorption. The consignee witnesses the weighing of the bulk material (D kg) at the tim e of blending and sampling at the consignor's Works, and also the weighing of the sample (C g). Immediately before analysis the sample is reweighed (B g) and assayed for plutonium (A%). The weight of plutonium is then
A100
В* C
x D kg
The accepted weight is the average between consignor’s and consignee’s figures after both have used the formula indicated. It goes on to give actual assay and fissile content figures obtained by BNFL and its consignees for the international transactions already referred to, and concludes that the method of approach results cumulatively in a negligible shipper-receiver difference. Individual transactions are shown to be commercially acceptable and, it is considered, also acceptable for safeguards purposes. It is suggested that for safeguarded material the safeguards inspectors might also be able to be present at, and themselves witness, the blending, sampling and weighing operations, and at the same tim e take their own samples for analysis. It is further suggested that the principle could be extended to accountancy for plutonium in plutonium nitrate solutions provided leakage does not occur from the sample vials.
1. INTRODUCTION
1 .1 . When plutonium oxide is tran sferred from one establishm ent to another it is im portant for reasons of economy and security to account quantitatively fo r the amount of plutonium involved in the tra n sfe r . It is a lso n ecessary where such transactions are com m ercial ones to avoid sh ip p er-rece iv er d ifferences so that disputes regarding payment for the m ateria l do not a r is e . But the concept of accurate accountancy fo r plutonium in plutonium oxide at both shipper and re ce iv e r works is also of in tere st to safeguards philosophy.
1 .2 . Such accurate accountancy is made m ore difficult because it is now well established that plutonium oxide has the property for adsorbing m oisture, carbon dioxide, e tc . [ 1 - 3 ] . The amount of such adsorption depends upon a number of variab les such as the route of preparation of the oxide, the calcination tem perature, the sp ecific su rface area and the humidity of the atm osphere. F ig u re 1 shows a typical weight in crease for fresh ly prepared W indscale plutonium oxide. Sh ip p er-rece iv er d ifferences
.133

134 SWINBURN and McGOWAN
FIG .l. Weight increase in freshly calcined plutonium oxide,stored in stainless-steel screw-capped sample container.
would c learly a r ise due to this adsorption property unless sp ecial p re cautions w ere taken. Two ways ex ist to overcom e this difficulty. The f ir s t method is to prevent the m aterial from adsorbing by using in ert and very dry atm ospheres [4 , 5 ] . The second method is to co rre c t for any adsorption which takes place [ 6 ].
1. 3. The f ir s t method has the drawback that a ll m aterial transported must be sufficiently well sealed to prevent adsorption. M oreover, such adsorption may be p referen tia l, i . e . it may adsorb m oisture in the top one inch of su rface exposed, leaving the core of m ateria l dry. On the other hand, the heat form ed by radioactivity may mean that adsorption does not take place, but that m oisture, e t c . , is actually desorbed from the su rface and again this desorption may be preferen tia l and may take place only on the su rface of the m ateria l. A further difficulty a lso a r ise s in that the re ce iv er w ill a lso have to use dry atm ospheres and w ill have to empty the m ateria l en tirely from its containers in order to reweigh before sampling. These drawbacks lead one to suppose that the only really satisfactory method of accountancy for the plutonium by the re ce iv e r is to empty the whole of the m ateria l, reblend it and take a representative sample for analysis.
1 .4 . The second method does not use special dry atm ospheres but attem pts to m inim ize the adsorption of m oisture by using tightly fitting containers, and then c o rre c ts for any adsorption. This second method was

IAEA- SM -201/63 1 3 5
devised by BN FL and has been used by them ever since th e ir f ir s t plutonium oxide was exported. The purpose of th is paper is to d escribe this second method and to show the actual resu lts obtained in its use over many y ears for a la rg e number of transactions with five other countries.
2. DESCRIPTION OF THE CORRECTION METHOD FO R PLUTONIUM OXIDE ACCOUNTANCY
2 .1 . T h eoretica l considerations
The theory behind this method, which has been used in Europe and elsew here fo r many y ears , is to co rre c t for any adsorbed m oisture e t c . , on the plutonium oxide sam ple. Thus, supposing a fter having taken a sam ple of weight C g, the bulk of plutonium oxide left is D g, then the amount of plutonium in the bulk m ateria l is :
^ x total amount of plutonium in the sample
It therefore rem ains to find the total amount of plutonium in the sam ple. This is done by weighing the sam ple im m ediately before an assay (B g) and then assaying for plutonium (A%). The total amount of plutonium in the sam ple is then:
» 0 in each case = 880.00 g
FIG.2 . Illustrating principle for correction (the weights are imaginary and impossible in practice but are used purely for illustrative purposes).

136 SWINBURN and McGOWAN
T h erefo re , the total amount of plutonium in the bulk m ateria l is
DC В
which can be rew ritten
A1 0 0
Вx - x D
In p ractice , is the co rrectio n factor for the m oisture adsorption in the sam ple.
To illu stra te th is theory using figures ra th er than sym bols, use can be made of F ig . 2. It must be assumed that there are no e r ro rs whatsoever, either of blending or of weighing or of analy sis . Supposing after taking two sam ples (SI fo r the shipper and S2 for the receiv er) there rem ains in the bulk can exactly 1 0 0 0 g plutonium oxide, and supposing each sample on being taken weighed exactly 10 g. Following the sample SI and assum ing the analysis to be perform ed im m ediately, then the f ir s t operation is to reweigh the sam ple and once m ore th is gives exactly 10 g. The assay is then perform ed and assum e that this is 88.00% . The sam ple contains 8 . 8 g plutonium and hence the total plutonium content in the can is :
1 0 0 0
1 0x 8 . 8 = 880 g
When we follow sample S2 which we now know must contain 8 . 8 g of plutonium, le t us assum e that this has been kept for some long tim e and has adsorbed so much m oisture e t c . , that on reweighing, instead of the 1 0 g that it was originally it now is exactly 11 g. Then the assay figure, in order to give the 8 . 8 g plutonium originally in the sam ple, must now be 80. 0 0 % and once m ore the form ula:
A1 0 0
x § x D
gives 880 g of plutonium in the bulk m ateria l.If the f is s ile plutonium content of the bulk m ateria l is required then
an isotopic abundance must be determined and the f is s ile isotopes with re sp ect to total plutonium can thus be obtained (E%). The f is s ile content of the bulk m ateria l then becom es:
А В _ E 100 X C X ° X 100
2 .2 . P ra c tic a l consideration
It w ill be seen from the above theory that, for the re ce iv er to be able to account fo r the plutonium, he will require the weight D which is the weight of bulk m ateria l at the sh ipper's w orks. He will a lso require

IAEA-SM -201/63 137
weight C which is the weight of the sample at the sh ip p er's w orks. In addition, he will a lso need the ta re weight of his sample container so that when he reweighs it at the re c e iv e r 's works the new net weight В can be calcu lated . The re ce iv er , th erefore, needs to send a representative to the sh ipper's works at the tim e of weighing and sampling to w itness and check a ll these weights for him self.
P rom the point of view of accountancy, having witnessed the weighings at the sh ip per's works, the re ce iv e r does not need to reweigh the bulk m ateria l when it is delivered to his works.
Two p ractica l points are worth stressin g . F irs t ly , the weights C and D (i. e . sample and bulk m aterial) should be obtained im m ediately a fter blending and sampling, since any undue delay might allow d ifferential adsorption,e . g. the bulk m ateria l might heat up and lose weight, whilst the sample adsorbs m oisture e t c . , and gains weight. Such an occurrence would invalidate the "aliquot theory" in the second sentence of 2 .1 . Secondly, it is im portant that weight В is obtained im m ediately before weighing out aliquots of the sample fo r assay since obviously no m oisture should be adsorbed or desorbed between these two operations. If it w ere, then the total amount of plutonium in the sample would not be co rre ctly obtained.
3. ACTUAL RESU LTS
3 .1 . G eneral
Over the la s t sev era l y ears , 58 batches of m ateria l have been accounted for both by the shipper (BN FL) and by the re ce iv er (one of five other countries) using the method in Section 2. It is now possible to publish these accountancy figures to show how the co rrectio n method described above has functioned.The following su b-sections will p resen t and briefly d iscuss the figures obtained for:
The adsorption co rrectio n factor ВC
The co rrected per cent plutonium in the sam ples of plutonium oxide
The weight of plutonium in the plutonium oxide batches __A_ В 100 X C x D
The determ ination of per cent f is s ile plutonium isotopes (E)
/ A ВThe per cent f is s ile content with resp ect to plutonium oxide (tqq x x E
The f is s ile plutonium content of the batches of plutonium oxide ' A В n E \i ö ö x c x D x m )
B ecau se of com m ercial confidentiality reason s, it is not possible to identify any resu lt with a p articu lar country, nor is it possible to give weights

138 SWINBURN and McGOWAN
TABLE I
CORRECTION FACTORS (B/C) FOR MOISTURE, ETC. PICK-UP
Actual factors reported to BNFL in descending order:
1.0066 1.0040 1.0014 1.0007 1.0001
1.0064 1.0036 1.0013 1.0006 1.0001
1.0060 1.0030 1.0013 1.0005 1.00001.0058 1.0026 1.0011 1.0004 1.0000
1.0055 1.0024 1.0010 1.0004 0.99961.0051 1.0020 1.0010 1.0003 0.99941.0048 1.0020 1.0010 1.0003 0.99941.0047 1.0016 1.0009 1.0002 0.99931.0041 1.0015 1.0008 1.00021.0040 1.0014 1.0007 1.0001
of batches fo r any p articu lar country, nor is it possible to give weights of batches for any p articu lar analysis (the weights of batches concerned vary from ju st under 1 kg to alm ost 25 kg total plutonium).
3 ,2 . C orrection factor
The co rrectio n facto rs are known fo r 48 of the batches and are presented in T able I. It w ill be seen that
(a) 42 sam ples gained in weight and 4 lo st in weight;(b) The highest gain is equivalent to a co rrectio n of 0. 6 6 % to be added to the
r e c e iv e r s ' assay figure;(c) The average gain in weight is equivalent to a co rrectio n of 0.19% to be
added to the re c e iv e r s ' assay figure.
3 .3 . D eterm ination of corrected per cent plutonium in plutonium oxide (A x
The resu lts of the determ ination of plutonium in plutonium oxide are given in Table II and are represented graphically in F ig . 3. It should be noted that, based on the 58 batches,
(a) 24 sh ip p er-re ce iv er d ifferences are negative and 33 positive;(b) The average sh ip p er-rece iv er d ifference is + 0.050% absolute,
i . e. 0. 057% re la tiv e ;(c) The standard deviation of the d ifference is ± 0 .14% absolute.
CQ|U

IAEA-SM -201/63 1 3 9
P a rt of the + 0 . 050% absolute can be explained by the fact that 2 4 1 Pu decays during storag e. Thus, if the re ce iv e r analyses the sample on average four weeks a fter the shipper analyses the sam ple, it would be expected that the re c e iv e r 's assay figure would be le ss than the sh ipper's by about 0 . 015% because of decay of 2 4 1 Pu to 241Am. This average tim e between the carrying out of the assay at the shipper and re ce iv er works is not known p recisely but it is known that sam ples a re not actually despatched from BN FL (W indscale) to its custom ers for an average of 27 d a fter taking the sample (this v a ries between 2 and 61 d in individual ca se s ) . Using this average, one third of the d ifference is accounted for.
If the weight of plutonium oxide in each batch had been exactly the sam e then the cumulative BN FL plutonium content of these batches would have differed by + 0.057% (see 3 .3(b) above) from the cumulative cu stom ers' contents. In p ractice the cumulative BN FL weight of plutonium in these 58 batches differed by + 0, 075% from the cumulative cu sto m ers ' content. T h is indicates that in general the resu lts with poorer agreem ent re fe rred to batches of higher plutonium oxide content and this is considered to be en tire ly fortuitous.
F o r com m ercial purposes the mean of shipper and re ce iv e r figures is taken as the agreed figure and cumulatively, th erefore, the agreed figure is 0. 038% different from both BN FL and re ce iv e rs .
3, 5. D eterm ination of f is s ile isotopes with resp ect to total Pu isotopes (E)
The f is s ile isotopes for 55 of the transactions are presented in Table III and are shown graphically in F ig . 4. It is to be noted that
(a) T h ere are 14 negative and 38 positive d ifferences;(b) The average sh ip p er-receiv er difference is + 0. 059% absolute,
i . e. 0. 073% relative;(c) The standard deviation of the d ifferences is ± 0.12% absolute.
Again, it should be noted that approxim ately 0. 015% of the 0. 059% can be accounted for by the fact that the sample is analysed by the re ce iv er approxim ately one month la ter than the shipper on average.
3 ,6 . P e r cent f is s ile content with resp ect to Pu oxide ( t-t— x — x E
T his is known fo r 55 tran sactio n s and the figures are given in Table IV and are shown graphically in F ig . 5. It should be noted that
(a) T h ere are 13 negative and 40 positive d ifferences;(b) The average sh ip p er-rece iv er difference is + 0.096% absolute,
i . e. 0.136% relative;(c) The standard deviation of the difference is ± 0 .17% absolute.
Text continues on p.146

ООСОСОСОСОСОСОСОООСОСОСОСОСОСОООСОСООООЭ ая шz“О “ПCO^COU^COU^lOCO^^-OVOUimCONVOlO —'CO —'COOCOOOrorOOJVJ'sJO OaiCOUDLOlOOJ С Г”
ооооооооооооооооооэоосасооооооооооооооооо eБЯ 1ЛNjNjNjSJ(^SJ-s|Vj-sJfflN|V|4jNjV|Nj4|Sjss|N4 r+-о оСООСО-Р*СОСО-Р»ГООСО-ОГ\ЗСЛ —' CT) vi О -Р» —' —' C 3СЛС0(ЛГ0СЛЮ(ЛООГ0№МООЮ(л)(Л(ЛШ1> fDs
33 (/>ая fD 3-оo o o o o o o o o o o o o o o o o o o o CD fD "a cr -‘•-ao o o o o o o o o o o — *roro со < a>^^^■ ^LnCnvJCOCDlO^OOO —' СО СЛ СГ» ОТ О —' a> -s“5 1
СОСОСОСОСОСОСОСОСОСОСООЭСОООСОООООООСОСО &Я Ш~a tjСОГОГОГО-ОГО—'ГОГО —'ОСЛЫО1^Г\Зи>^>О1С0 О-Р=»СЛ-Р»0—*CD—*—*—‘СООСЛ1Л —1 -Si LO СО W C f—
оcСООООООООООЭОООООЭСОООООООООСООООООООООО ая <л-о о—1 —* —1 —‘CD —> —■ —' —'00-P*wOT-P»roc^^»aioj С 3^ —i4^ui-j rooojaiuiaivjNCJO-e»co4s*4s»-P‘ п>“S
+ + + + + + + + + + + + + + + 1 1 1 1 33 со ая а> =з-оo o o o o o o o o o o o o o o o o o o o CD fD 33er -i.-a—« O O O O O O O O O O O O о о о о V) < а>со со —'сососоаэсоспстт-р»сосого —• —• —• —> —■ rt» -s -s 1
ООСООЭОЭСОООООООООООСОСООООООООЭОЭОО ая таzТЭ ~n-Р СЛСЛОСОСОГОГОО ОСЛ—*ГОГОСЛ.£»ГО—1 C I—
оcсо оэсосооэсососососооэсооэоэсо со со со ая со•-J -*«J "vj "О '••J -О '—1 -«J ««О СЛ "О --О—J —J -«J ~-4 --О -О r+-о оОГО —‘COO—‘OO-C^COOJO —' —1 СО СО О О C 3—'•‘•ОСОСЛОЭСЛСЛСОСООСООООСОГОСГ» —' fD-1
33 со+ + + + + + + + + + + + + + + + + + ая fD zrno o o o o o o o o o o o o o o o o o CD fD T3 О- -^тз-рЬСОСОРОГОГОГОГОРО—* —■ —1 —• —' —' —> —' —1 </> < fDCOü1-*COawOOOCOCONl^^^^i^^ fD -s -5 1
о иn v m o от рш? NHfiaNiMs
TABLE II

Freq
uenc
yIAEA-SM -201/63 141
% Difference
F IG .3 . Graphical presentation of differences in T ab le II (Pu in Р1Ю2 ),
0.40
to
0.49

TABLE I I I
Determination of F is s i le Pu Isotopes with respect to Total Pu Isotopes
BNFL % Fiss
Customer % Fiss
Shipper- Receiver
% abs
BNFL % Fiss
Customer % Fiss
Shipper- Receiver
% absBNFL
% F issCustomer % Fiss
Shipper- Receiver
% abs
78.81 79.01 0.20 78.96 78.94 + 0.02 82.43 82.28 + 0.1579.46 79.60 • 0.14 79.87 79.85 + 0.02 81.20 81.05 + 0.1578.26 78.37 0.11 76.73 76.71 + 0.02 79.67 79.52 + 0.1579.85 79.96 _ 0.11 91.36 91.34 + 0.02 80.99 80.84 + 0.1582.26 82.37 0.11 79.44 79.41 + 0.03 82.44 82.29 + 0.1579.41 79.52 0.11 82.37 82.33 + 0.04 75.61 75.45 + 0.1678.92 79.02 _ 0.10 80.72 80.67 + 0.05 80.61 80.44 + 0.1779.46 79.55 _ 0.09 82.38 82.33 + 0.05 81.06 80.89 + 0.1782.33 82.38 _ 0.05 82.36 82.30 + 0.06 79.53 79.35 + 0.1881.03 81.07 _ 0.04 79.47 79.41 + 0.06 81.78 81.60 + 0.1876.64 76.68 _ 0.04 91.33 91.27 + 0.06 82.48 82.30 + 0.1881.61 81.64 _ 0.03 78.95 78.88 + 0.07 91.37 91.15 + 0.2280.90 80.93 _ 0.03 81.20 81.12 + 0.08 , 79.81 79.57 + 0.2481.11 81.12 _ 0.01 82.38 82.30 + 0.08 74.70 74.45 + 0.2579.60 79.60 0 79.41 79.31 + 0.10 74.74 74.25 + 0.4979.98 79.98 0 82.37 82.27 + 0.1082.37 82.37 0 82.41 82.29 + 0.1279.46 79.45 + 0.01 81.71 81.57 + 0.1491.39 91.37 + 0.01 82.43 82.29 + 0.1479.03 79.02 + 0.01 82.38 82.24 + 0.14
142 SW
INBU
RN and M
cGO
WA
N

Freq
uenc
y
IAEA-SM -201/63 143
Difference ignoring the +ve or -ve sign of the difference
XXJOOCXХЛХХХЗСS m ug
Шxxxxxx
XXX3QOUUUCB§8S88a5 m
ОCO оCM о о <33 03СМd+ d+ d+ о d1 ©1 о12 о о о о о о03CO 03CM оз 03о о о осмd+ d+ d+ d+ о о1 о1
03о 03 03см 03со 03о о о Ö Öо о о о о
о осм осо о<■о о о о о
% Difference
F IG .4 . Graphical presentation o f differences in T able III (fissile Pu with respect to Pu).

Table IV
% F is s i le Pu Content with respect to Fu Oxide
BNFL%
Customer%
Shipper- Receiver % abs
BNFL *%
Customer%
Shipper- Receiver % abs
BNFL%
Customer%
Shipper- Receiver
% abs
69.12 69.40 -0 .28 71.71 71.67 +0.04 71.81 71.63 +0.1869.03 69.29 -0 .26 71.58 71.53 +0.05 70.85 70.63 +0.2268.79 68.96 -0 .17 71.60 71.55 +0.05 71.74 71.52 +0.2268.34 68.49 -0 .15 69.08 69.02 +0.06 71.91 71.68 +0.2371.82 71.95 -0 .13 70.69 70.62 +0.07 71.35 71.11 +0.2480.01 80.13 -0 .12 67.03 66.96 +0.07 71.92 71.67 +0.2580.02 80.13 -0.11 65.65 65.58 +0.07 70.96 70.70 +0.2670.93 71.02 -0 .09 71.82 71.75 +0.07 69.99 69.71 +0.2869.46 69.53 -0 .07 71.75 71.67 +0.08 69.86 69.57 +0.2968.68 68.75 -0 .07 68.92 68.84 +0.08 80.04 79.73 +0.3169.41 69.44 -0 .03 71.73 71.64 +0.09 79.98 79.66 +0.3269.83 69.86 -0 .03 69.74 69.63 +0.11 70.63 70.20 +0.4369.67 69.68 -0.01 68.85 68.73 +0.12 65.40 64.95 +0.4569.39 69.39 0 68.85 68.73 +0.12 65.36 64.91 +0.4571.62 71.62 0 71.00 70.88 +0.12 69.58 69.04 +0.5469.83 69.82 +0.01 71.24 71.10 +0.1469.44 69.42 +0.02 67.15 66199 +0.1670.85 70.83 +0.02 71.87 71.70 +0,1770.42 70.38 +0.04 71.05 70.88 +0.1771.80 71.76 +0.04 71.26 71.09 +0.17
14
4
SWIN
BURN
and McG
OW
AN

IAEA-SM -201/63 145
BIMLF — Customer
8 8
Difference ignoring the +ve or -ve sign of the difference
XXX
Щ
mШШШ» ax x xx x x
3D«XXXx x xx x x ___x x x x x xpoooocX x x x x x
% Difference
FIG. 5, Graphical presentation of differences in T ab le IV (fissile pu in Р1Ю2 ),

1 4 6 SWINBURN and McGOWAN
3. 7. The f is s i le Pu weight in the oxide x x D x YqqJ
If the weight of plutonium oxide in each batch had been exactly the sam e then the cumulative BN FL f iss ile plutonium content of these batches would have differed by + 0.136% (see 3. 6 (b) above) from the cumulative cu sto m ers ' contents. In p ractice the cumulative BN FL f is s ile plutonium weight differed by + 0.149% from the cumulative cu stom ers ' contents. Thus, once m ore this indicates poorer agreem ent with batches of higher plutonium oxide contents and again this is m erely fortuitous.
F o r com m ercial purposes the mean is taken as the agreed figure and th is is on average 0.075% from both shipper and re ce iv e r .
4. DISCUSSION
4 . 1 . As described above, this method of accountancy for plutonium does not use very dry atm ospheres in glove boxes. Reasonable care is taken to prevent the adsorption of m oisture, by sealing cans tightly, by taking sam ples in s ta in le ss -s te e l containers with tight-fitting threaded lid s, e tc . D espite these precautions the resu lts shown in section 3. 2 prove the n ecessity to co rre c t for the adsorption of m oisture, e tc . Without such a co rrectio n it is c le a r that e r ro rs of up to 0 . 6 % or even higher could be caused
4. 2. The d ifference in the corrected percentage of plutonium is probably the m ost im portant point from the safeguards point of view.
In th is connection it is fe lt that the in ter-lab oratory com parisons presented h ere com prise a m ost stringent te st since they cover the resu lts from six different cou ntries. The method of analysis used by BN FL is given in som e detail in Appendix 1 but briefly it com p rises a redox titr im e tric procedure [ 7] re ferred to a plutonium dioxide standard [ 8 ] . It is not known exactly what methods are used by other countries or what working standards or prim e standards the other countries may employ. It is suspected that one custom er uses coulom etry and another uses a different titr im e tric method from BN FL, and it is expected that an NBS standard is also employed. Despite a ll this the bias of the resu lts cumulatively is 0. 05% absolute and alm ost one third of this amount can be explained by 2 4 1 Pu decay. This is highly sa tisfactory and stands com parison with other published resu lts [4 , 9 ] .
In considering standard deviations it should be borne in mind that the anticipated standard deviation arising solely from a single analysis is accepted to be between ± 0. 06% and ± 0.10% . The standard deviation of the d ifferences could therefore be expected to lie between ± 0. 08% and ± 0.14% , w hereas in fact the standard deviation as reported in section 3. 3 is ± 0 .14% .It can be seen, th erefo re , that the standard deviation is not out of line substantially with that which could be anticipated.
T h erefo re , these s ta tis t ic s suggest that one can expect the shipper- re ce iv er d ifference fo r the corrected percentage of plutonium in plutonium dioxide to have a bias not greater than 0. 05% absolute and a reproducibility with a 95 -99 . 7% confidence level ( i .e . 3 x standard deviation) of le s s than ± 0.45% absolute. These figures are considered to be entirely satisfactory from a com m ercial viewpoint and it is believed should be considered com pletely sa tisfactory from the safeguards viewpoint.

IAEA-SM -201/63 147
It should be noted that the bias is likely to be able to be reduced if sufficient notice is taken of the decay of 2 4 1 Pu. But from a com m ercial point of view th is ex tra care is not n ecessary providing the resu lts are obtained within one month or so of each other.
4. 3. In considering the determ ination of f is s ile isotopes there would appear to be a significant difference between the number of negative and positive d ifferences and hence the average d ifference of 0 .059% absolute could probably be reduced somewhat if the m atter was thoroughly investigated. However, it is fe lt that this would be so costly in relation to the possible im provem ent that it would be uneconomical to undertake such an investigation. Again it should be noted that approxim ately a quarter of this figure can be accounted for by the decay of 2 4 1 Pu.
When considering the standard deviation, it should be noted that the W indscale method uses a therm al ionization m ass sp ectrom etric method and it is believed that m ost of the other resu lts will have been obtained by a s im ila r method. It is also considered that the standard deviation of the d ifferences (± 0 . 1 2 % absolute) is in line with that which would be anticipated by a ll countries concerned.
4. 4. One point of safeguards philosophy must be mentioned in this d iscussion . If a single difference w ere picked out of the tables for the determ ination of plutonium or of f is s ile content of plutonium oxide then this could be quite high, for instance in the order of 0. 5%. It is , however, noted that as one accum ulates figures over the y ears , then any such large difference is replaced by a virtually negligible bias and this shows the im portance to safeguards of recording and accum ulating figures from a ll sou rces to ensure that a reasonably long-term point of view is taken.
4. 5. It is noted in section 2. 3 that the re ce iv e r w itnesses the blending and sampling at the sh ipper's w orks. If Safeguards' insp ectors w ere wishing to check the transaction there seem s to be no reason why they should' not also attend at the same tim e to take th e ir sam ple. Indeed to use this method it is n ecessa ry to be present at the sam e tim e since for com m ercial and operational reasons it is not reasonably p racticab le to reblend, reweigh and re-sam p le purely fo r Safeguards purposes, e. g. the m aterial will be sealed by the re ce iv e r whilst a t the sh ip per's works, the shipper would have staff receiv ing further radiation if reblends w ere needed, and this position is not to lerab le.
5. CONCLUSIONS
5 .1 . It is concluded that the method of accountancy for plutonium in plutonium oxide by co rrectin g for any adsorption has been com pletely validated by the resu lts presented, which have been accum ulated over many y ea rs of experience.
5 .2 . It is further concluded that this method of approach gives shipper- re ce iv e r d ifferences which are negligible when a long -term view is taken.

148 SWINBURN and McGOWAN
5 .4 . It is further suggested that the principle could be extended to accountancy for plutonium in plutonium n itrate solutions. In this case the sam ples would be weighed before despatch and a fter receip t to m easure any evaporation that may have occurred .
5. 3. It i s su g g ested that S a feg u ard s In sp e c to rs m ight a lso be ab le to bep re se n t and th em se lv e s w itn ess the blending, sam p lin g and weighing operation sand at the sam e tim e take th e ir own sa m p le s of oxide fo r a n a ly s is .
a p p e n d ix l
THE DETERMINATION OF PLUTONIUM IN PLUTONIUM OXIDE BY REDOX TITRATION
An accu rately weighed quantity of the sample of plutonium oxide, about0 .2 5 g, is dissolved in a m ixture of hydrochloric and hydrofluoric acids.The solution is evaporated to low bulk in the presence of a sm all amount of sulphuric acid, and it is then diluted with a m ixture of 1M n it r ic /0. 5M sulphuric acid. To this solution is added excess titanium (III) chloride solution to reduce the plutonium quantitatively to the trivalent stage. The m ixture is then allowed to stand until the excess titanium (III) ions have been oxidized by the n itric acid whilst the plutonium rem ains as plutonium (III). The p ro g ress of these reactions is followed potentiom etrically by means of platinum and calom el electrod es. The plutonium (III) is then oxidized quantitatively to plutonium (IV) by m eans of cerium (IV) sulphate solution which is added by weight burette until a sm all e x cess is present. The excess cerium (IV) is titrated with ferrou s ammonium sulphate solution, and the equivalence point is m easured potentiom etrically.
Plutonium dioxide re feren ce standard is weighed, dissolved and titrated as described above, alongside the sam ple. The plutonium /cerium (IV) sulphate solution weight ratio , which is obtained from the analysis of the re feren ce standard, is used to calcu late the plutonium content of the sam ple. The plutonium atom ic weights appropriate to the re feren ce standard and sam ple are used.
Iron and uranium are the most common im purities which in terfere quantitatively with the plutonium determ ination and they are determined sep arately and corrected for.
REFERENCES
[ l l MOSELEY, J . D ., WING, R. 0 . , Properties o f Plutonium Oxide, RFP-503 (1965).
[ 2 ] STAKEBAKE, 0. L ., DRINGMAN, M. R ., Hygroscopicity of Plutonium Oxide RFP-1056 (1968).
[ 3 ] McGOWAN, I . R ., JOHNSON, C. R ., SWINBURN, K. A ., IAEA-SM-149/23, Analytical Methods in the Nuclear Fuel Cycle, IAEA Vienna (1972).

IAEA-SM -201/63 1 4 9
[ 4 I SMITH,-F. M., Plutonium Oxide Measurement S tu d ies, HEOt-SA-290 (1971).
[Б ] GUTMACHER, R. G ., STEPHENS, F . , ERNST, K ., TUREL, S. P ., SHEA, T. E ., Methods for the Accountability of Plutonium Dioxide,WASH-1335, (1974).
[V ] SWINBURN, K. A ., Plutonium Accountancy in Commercial Transactions involving Plutonium Oxide, BNFL Report 83(W) (1972).
Г7 П Analytical Method for the Determination of Plutonium in Plutonium Oxide by Redox T itra tio n , UKAEA, PG Report 868(W), (1968).Revised method to be published.
^ 8 3 SWINBURN, K. A ., McGOWAN, I . R ., An approach to the use o fPlutonium Dioxide as a chemical Reference Standard fo r Plutonium,BNFL Report 205(W) (1975).
[93 BYRNE, J . T . , CALDWELL, С. E ., DELNAY, R. N., MOSELEY, J . D.,OETTING, F. L ., Measurements involved in Shipping Plutonium Oxide, RFP-502. (1965).


IAEA-SM -201/64
NOTE ON AN INTERLABORATORY EXAMINATION OF MIXED URANIUM- PLUTONIUM OXIDE FUEL FOR QUALIFICATION FOR REACTOR USE
N. PARKINSONUnited Kingdom Atomic Energy Authority,Windscale,United Kingdom
Abstract
NOTE ON AN INTERLABORATORY EXAMINATION OF MIXED URANIUM-PLUTONIUM OXIDE FUEL FOR QUALIFICATION FOR REACTOR USE.
Experimental fuel for the United Kingdom fast reactor programme is fabricated and characterized on three sites, Windscale, Harwell and Aldermaston. The assessment of fuel behaviour relies partly on analytical data and it is important that there is good correlation between the results obtained from different laboratories. The assay of uranium, plutonium and isotopic abundance, oxygen-metal ratio and carbon content in mixed oxide are key areas. This note reports results obtained on an experimental batch of mixed oxides of enriched uranium and plutonium, by the analytical sections at AERE, Harwell, BNFL, Windscale and AWRE, Aldermaston. There was good agreement on assay of U, Pu and isotopes, although preliminary trials on the m aterial indicated the possibility of discrepancies when assaying non-standard m aterials. A significant difference was noted between oxygen-metal ratio results obtained by the X-ray method and those obtained by thermochemical means.
1 . INTRODUCTION
UK f a s t r e a c t o r f u e l d e v e lo p m e n t s t u d i e s u t i l i s e f a c i l i t i e s o n a numb e r o f s i t e s f o r t h e m a n u f a c tu r e a n d a n a l y s i s o f f u e l . T h e re i s a v a r i a b l e v o lu m e o f w ork a n d s m a l l d i f f e r e n c e s i n t e c h n i q u e s c a n b e p r e s e n t b e c a u s e o f o v e r a l l p ro g ram m es a t d i f f e r e n t s i t e s . How ever, f u e l d e v e l o p e r s m u s t b e c o n f i d e n t t h a t a n a l y t i c a l r e s u l t s r e p o r t e d b y d i f f e r e n t l a b o r a t o r i e s a r e s t r i c t l y c o m p a ra b le s i n c e a s s e s s m e n t o f f u e l - e le m e n t p e r fo rm a n c e r e l i e s i n t e r a l i a o n a n a l y t i c a l d a t a .
A r e a s o f c o n c e r n i n t h e p e r fo r m a n c e o f LMFBR o x id e f u e l e le m e n t s a r e t h e p o s s i b i l i t y o f c h e m ic a l i n t e r a c t i o n b e tw e e n i r r a d i a t e d f u e l a n d c l a d d i n g , a n d f u e l a n d c o o l a n t i n d e f e c t e d e l e m e n t s . O p e r a t i n g c o n d i t i o n s i n f u e l dem and a k n o w le d g e o f m ass a n d l i n e a r r a t i n g s f o r t h e r m a l c a l c u l a t i o n s . T he i s o t o p i c c o m p o s i t i o n o f p lu to n iu m a n d u ra n iu m c o m p o n e n ts o f f u e l d e te r m i n e s t h e e f f e c t i v e Piv/(U + P u ) r e q u i r e d t o o b t a i n t h e c o r r e c t n e u t r o n i c a n d t h e r m a l p r o p e r t i e s . T h e UK u s e s a f o r m u la o f t h e t y p e :
К = X ( [2 3 9 P u ] + a [ 23 8 p u ] + ь [2 4 0 р ц ] + c [2 4 lp u ] + d [2 J+2Pu] ) + (-|_X) e [ 23 5 u ]
w h e re X r e p r e s e n t s t h e f r a c t i o n o f p lu to n iu m i n t h e U -P u m ix tu r e ( c a 0 . 3 ) , t o a c h i e v e t h e d e s i r e d p e r fo r m a n c e c o n d i t i o n s , s i n c e c o n s t a n t i s o t o p i c comp o s i t i o n o f p lu to n iu m c su in o t b e g u a r a n t e e d . T he c o n s t a n t s a , b , c , d a n d e a r e a p p r o x im a te ly 0 . 2 , 1 . 5 , 0 . 1 , 0 . 4 a n d 0 . 8 , r e s p e c t i v e l y .
C h e m ic a l p a r a m e t e r s o f im p o r ta n c e a r e o x y g e n - m e ta l r a t i o (O/M ) a n d c a r b o n c o n t e n t , b o t h o f w h ic h h a v e b e e n r e c o g n i s e d a s s i g n i f i c a n t i n f u e l - c l a d c o r r o s i o n m e c h a n is m s , a n d t h e f o r m e r o n t h e i n t e r a c t i o n b e tw e e n so d iu m c o o l a n t a n d f u e l a t b r e a c h e s i n t h e c l a d d i n g .
151

152 PARKINSON
A c c o r d in g ly a t r i p a r t i t e a n a l y t i c a l e x a m in a t io n o f a n e x p e r i m e n t a l o x id e f u e l w as a g r e e d b e tw e e n BNFL ( W in d s c a l e ) , AEEE ( H a r w e l l ) a n d AWRE ( A ld e r m a s to n ) , a n a l y t i c a l l a b o r a t o r i e s , t h e w o rk b e i n g s p o n s o r e d b y UKAEA R e a c to r D e v e lo p m e n t L a b o r a t o r i e s (R D L ), W in d s c a le , w h e re f a s t r e a c t o r p lu to n iu m f u e l d e v e lo p m e n t i s c a r r i e d o u t .
2 . THE SCHEME
A s i n g l e b a t c h o f g r a n u l a r m ix ed o x id e w as sa m p le d i n t o t h r e e c o n t a i n e r s , e a c h o f w h ic h w as s e a l e d a n d d e s p a tc h e d t o t h e s i t e s . F iv e d e t e r m i n a t i o n s o f e a c h p a r a m e te r w ere r e q u i r e d u s i n g s t a n d a r d t e c h n i q u e s c u r r e n t l y p r a c t i s e d a t t h e s i t e s . R e s u l t s w e re t o b e r e p o r t e d t o RDL w i th no I n t e r - L a b o r a t o r y d i s c u s s i o n s .
3 . THE MATERIAL
G r a n u l a r m ix e d -o x id e f u e l w as p r e p a r e d fro m lo w e n r i c h e d u ra n iu m d i o x id e ( o b t a i n e d b y t h e r m a l d e n i t r a t i o n o f u r a n y l n i t r a t e ) a n d p lu to n iu m d i o x i d e ( o b t a i n e d fro m a n o x a l a t e p r e c i p i t a t i o n r o u t e ) , b l e n d i n g , m i l l i n g , g r a n u l a t i o n w i t h C r a n c o , d e b o n d in g i n c a r b o n d i o x id e w i t h f i n a l s i n t e r i n g i n a r g o n -4 # h y d r o g e n . T h i s t e c h n i q u e d i f f e r s o n ly i n t h e b l e n d i n g p r o c e d u r e o f U a n d Pu fro m t h e s t a n d a r d PFR r o u t e , w h e re l i q u i d b l e n d i n g a n d c o - p r e c i p i t a t i o n b y am m onia i s u s e d f o r m ix e d - o x id e p o w d e r m a n u f a c tu r e .T h e n o m in a l c o m p o s i t i o n w as 6<3% UO2 (2 3 5 u 6 . 2 5 $ ) 31% P u D j.
4 . URANIUM AND PLUTONIUM ASSAY
D i s s o l u t i o n o f t h e o x id e f u e l i s a n e c e s s a r y s t e p i n t h e a s s a y . T h e re a r e m in o r d i f f e r e n c e s i n t e c h n i q u e s e m p lo y e d a t t h e s i t e s . I n p r e l i m i n a r y w o rk AWRE r e p o r t e d a d i f f e r e n c e i n t h e a p p a r e n t s o l u b i l i t y o f t h e m a t e r i a l c o m p a re d w i t h t h a t o n t h e s t a n d a r d PFR f u e l . T he f u e l w as a s s a y e d u s i n g t h e s t a n d a r d m e th o d a n d b y a m o d if i e d t e c h n i q u e s i m i l a r t o t h a t u s e d b y a n o t h e r l a b o r a t o r y t o d e te r m in e i f d i f f e r e n c e s w o u ld o c c u r . C o n t r o l t e s t s u s i n g p r e v i o u s l y a n a l y s e d s t a n d a r d m a t e r i a l s w e re a l s o r u n . I t w as show n t h a t a s i g n i f i c a n t d i f f e r e n c e w as o b t a i n e d o n t h e e x p e r i m e n t a l f u e l u n d e r a n a l y s i s b u t t h a t t h e r e w as no s i g n i f i c a n t d i f f e r e n c e o n s t a n d a r d m a t e r i a l s .
T h i s r e s u l t i s o f im p o r ta n c e b e c a u s e i t show s t h a t a n a l y t i c a l l a b o r a t o r i e s s h o u ld b e in fo rm e d o f c h a n g e s o n s o u r c e m a t e r i a l s , f a b r i c a t i o n t e c h n i q u e s e t c . s i n c e i t c a n h a r d l y b e e x p e c te d t h a t e v e r y p o s s i b i l i t y , h a s b e e n c o v e r e d i n d e v e l o p i n g p r o c e d u r e s f o r n o n - s t a n d a r d , o n e o f f m a t e r i a l s .
T he r e s u l t s a r e g i v e n i n T a b l e s I a n d I I .
D i f f e r e n c e s n o t e d a r e n o t s i g n i f i c a n t . A g re em e n t o n u ra n iu m a s s a y (maximum d i f f e r e n c e o f 0 . 1 5 %) a n d p lu to n iu m (maximum d i f f e r e n c e o f 0 .22% ) i s c o n s i d e r e d t o b e v e r y s a t i s f a c t o r y . H o w ev e r, t h e r e s u l t o n t h e a s s a y s w h e re i n i t i a l s o l u b i l i t y d i f f e r e n c e s w e re s u s p e c t e d show u n a c c e p t a b l e d i s c r e p a n c i e s .
5 . ISOTOPIC ABUNDANCES
R e s u l t s o f i s o t o p i c a b u n d a n c e m e a su re m e n ts a r e g iv e n i n T a b l e s I I I an d IV . Good a g re e m e n t i s n o t e d g e n e r a l l y f o r u r a n iu m . B e c a u se l e s s t h a n0 .1 a t .% o f 2 3 o p u i s n o r m a l ly p r e s e n t i n t h e p lu to n iu m u s e d f o r f u e l m anuf a c t u r e i t s c o n t r i b u t i o n t o t h e r e a c t i v i t y a s s e s s m e n t i s s m a l l a n d c a n be n e g l e c t e d f o r p r a c t i c a l p u r p o s e s . AWRE m e a su re m e n ts w e re o n p lu to n iu m

IA EA -SM -201/64 153
TABLE I . URANIUM ASSAY, (wt.%)
S i t e 1 2 3 4 5 Mean
W 6 0 .5 1 6 0 .5 7 6 0 .5 9 6 0 .5 9 6 0 . 5 8 6 0 .5 9
H 6 0 .5 3 6 0 .8 7 6 0 . 3 2 6 0 .4 3 6 0 . 3 2 6 0 .4 9
A 6 0 .4 6 6 0 .5 8 6 0 .5 4 6 0 . 6 6 6 0 . 5 8 6 0 . 5 8
A* 6 0 .9 7 6 1 .2 7 6 1 . 2 6 6 0 . 8 8 6 1 . 0 7 6 1 .0 7
A* R e s u l t s u s i n g u n m o d if ie d m e th o d .
TABLE I I . PLUTONIUM ASSAY, (w t.% )
S i t e 1 2 3 4 5 Mean
W 2 7 .4 9 2 7 .5 6 2 7 . 5 4 2 7 .5 4 2 7 .6 0 2 7 .5 5
H 2 7 .4 5 2 7 .5 8 2 7 . 5 0 2 7 .7 3 2 7 .5 4 2 7 .5 6
A 2 7 .5 0 2 7 .5 2 2 7 . 5 3 2 7 .4 9 2 7 .4 6 2 7 .5 0
A* 2 7 .1 6 2 7 .2 0 2 7 . 2 1 2 7 .1 5 2 7 .2 5 2 7 .1 9
A* R e s u l t s u s i n g u n m o d if ie d m e th o d .
TABLE I I I . URANIUM ISOTOPE ABUNDANCE, ( a t .% )
S i t e I s o t o p e 1 2 3 4 5 Mean
W 2 3 4 0 .0 6 0 .0 6 0 . 0 6 0 .0 6 0 . 0 6 0 . 0 6
2 3 5 6 .3 9 6 .3 2 6 .2 0 6 .2 6 6 .4 1 6 .3 2236 0 .0 7 0 .0 7 0 . 0 8 0 .0 8 0 .0 7 0 .0 7238 9 3 .4 8 9 3 .5 5 9 3 .6 6 9 3 .6 0 9 3 .4 6 9 3 .5 5
H 2 3 4 0 . 0 6 0 .0 6 0 . 0 6 0 . 0 6 0 .0 6 0 . 0 6
235 6 .2 0 6 .1 6 6 .2 1 6 .1 7 6 .2 0 6 . 1 9236 0 . 0 8 0 . 0 8 0 . 0 8 0 .0 8 0 . 0 8 0 . 0 8238 9 3 .6 6 9 3 .7 0 9 3 .6 6 9 3 .6 9 9 3 .6 6 9 3 .6 8
A 2 3 4 0 .0 6 0 .0 6 0 .0 6 0 .0 6 0 .0 6 0 . 0 6
235 6 .2 4 6 .2 3 6 .2 0 6 .2 3 6 .1 8 6 .2 2236 0 .0 7 0 .0 7 0 . 0 8 0 .0 8 0 .0 8 0 . 0 82 3 8 9 3 .6 3 9 3 .6 4 9 3 .6 6 9 3 .6 3 9 3 .6 8 9 3 .6 5

1 5 4 PARKINSON
TABLE IV. PLUTONIUM ISOTOPE ABUNDANCE, (at.% )
S i t e I s o t o p e 1 2 3 4 5 Mean
W 238 0 . 0 8 0 . 0 8 0 . 0 8 0 . 0 8 0 .0 8 0 . 0 8
239 7 9 .6 9 7 9 .6 5 7 9 . 7 2 7 9 .7 2 7 9 .5 2 7 9 .6 6240 1 7 .3 1 1 7 .3 5 1 7 . 2 9 1 7 . 2 9 1 7 .4 8 1 7 .3 4241 2 . 5 0 2 .5 0 2 . 5 0 2 .4 9 2 . 5 0 2 . 5 0242 0 .4 3 0 .4 2 0 .4 2 0 .4 2 0 .4 2 0 .4 2
H 238 0 .0 7 0 . 0 6 0 . 0 7 0 .0 7 0 .0 7 0 .0 72 3 9 7 9 .7 4 7 9 .8 0 7 9 .8 2 7 9 .7 3 7 9 .7 3 7 9 .7 824o 1 7 .3 3 1 7 .2 7 1 7 .2 4 1 7 .3 3 1 7 .3 3 1 7 .2 9241 2 .4 4 2 .4 4 2 .4 4 2 .4 5 2 .4 5 2 .4 4242 0 .4 3 0 .4 3 0 .4 2 0 .4 2 0 .4 3 0 .4 3
A 238 _ _ _ _2 3 9 7 9 .7 7 7 9 .7 2 7 9 .6 5 7 9 .6 7 7 9 .6 7 7 9 .7 024o 1 7 .2 9 1 7 .3 2 1 7 .3 3 1 7 .2 6 1 7 .3 0 1 7 .3 0241 2 .5 1 2 . 5 ^ ■2.59 2 .6 4 2 . 6 1 2 .5 8242 0 .4 3 0 .4 2 0 .4 3 0 . 4 3 0 .4 2 0 .4 3
TABLE V. RATIO OF OTHER P u ISOTOPES TO 23 9 p u
S i t e 238P u/ 2 3 9 p u 240 p u /2 3 9 P u 2 i*1P u /2 3 9 P u 242P u/2 3 9 P u
W 0 .0 0 1 0 0 .2 1 7 7 0 .0 3 1 4 0 .0 0 5 3
H 0 . 0 0 0 9 0 .2 1 6 7 0 .0 3 2 3 0 .0 0 5 4
A - 0 . 2 1 7 1 0 .0 3 2 4 0 .0 0 5 4
u n s e p a r a t e d fro m u ra n iu m s o t h a t no e n t r y i s show n i n T a b le IV . I n o r d e r t o co m p are t h e t h r e e s e t s o f a n a l y s e s , t h e v a l u e s o f t h e r a t i o ( o t h e r i s o t o p e s o f P u ) / ( 23 9 p u ) h a v e b e e n c a l c u l a t e d a n d a r e g iv e n i n T a b le V . A g re e m e n t i s g e n e r a l l y g o o d , t h e b i g g e s t d i s c r e p a n c y b e in g i n t h e 2i+1 p u v a l u e s .
I s o t o p i c a b u n d a n c e m e a su re m e n ts m u s t b e m ade f i r s t o n s o u r c e m a t e r i a l s t o c a l c u l a t e t h e r e q u i r e d p lu to n iu m c o n t e n t t o a c h i e v e th e s p e c i f i e d " K " . T h e p ro b le m o f s e p a r a t i o n o f u ra n iu m sind p lu to n iu m d o e s n o t t h e n o c c u r . T he d i v e r g e n c e s i n r e s u l t s o n p lu to n iu m n o te d a b o v e r e p r e s e n t no m ore t h a n 0 .1% s p r e a d i n "K" v a l u e .
6 . OXYGEN-METAL RATIO
T he r e s u l t s a r e g i v e n i n T a b le V I .
The d i f f e r e n c e b e tw e e n r e s u l t s o f W in d s c a le an d AERE o n t h e o n e h a n d , a n d AWRE o n t h e o t h e r i s r e g a r d e d a s s i g n i f i c a n t . T he m e th o d s u s e d b y t h e tw o fo rm e r e s t a b l i s h m e n t s a r e b a s e d u p o n th e r m o g r a v im e t r y o r e q u i l i b r a t i o n

IAEA-SM -201/64 155
TABLE VI. 0 /(U + Pu) IN MIXED OXIDE
S i t e 1 2 3 A 5 Mean
W 1 .9 9 1 1 .9 9 2 1 .9 9 2 1 .9 9 2 1 .9 9 2 1 .9 9 2
H 1 .9 9 1 1 .9 9 1 1 .9 9 0 1 .9 9 1 1 .9 9 1 1 .9 9 1
A 1 .9 7 8 1 .9 7 7 1 . 9 8 1 1 .9 8 3 1 . 9 8 1 1 .9 8 0
TABLE V I I . CARBON CONTENT OF MIXED OXIDE ( p p m w t . )
S i t e 1 2 3 it 5 Mean
W 15 17 11 7 6 11
H 7 7 7 9 6 7
A 12 12 13 12 11 12
w i t h CO/CO2 m i x t u r e s , g i v i n g a d i r e c t m e a s u re m e n t . I n t h e c a s e o f AWRE r e s u l t s t h e s e a r e b a s e d o n X - ra y l a t t i c e p a r a m e te r m e a su re m e n ts w h ic h may b e a f f e c t e d b y l o c a l v a r i a t i o n s i n p lu to n iu m c o n t e n t o r i m p u r i t i e s d e p e n d in g o n s a m p le p r e p a r a t i o n . S in c e t h e m a in i n t e r e s t i n t h e d a t a i s t h e e f f e c t o f v a r y i n g o x y g e n p o t e n t i a l i n f u e l e le m e n t s o n c l a d a t t a c k , o r s o d iu m - f u e l i n t e r a c t i o n i t se e m s m ore a p p r o p r i a t e t o d e te r m in e t h i s p a r a m e te r b y a c h e m ic a l , r a t h e r t h a n a p h y s i c a l m e th o d . C h a n g e s o f0 .0 1 o x y g e n -m e ta l r a t i o u n i t s r e p r e s e n t s l a r g e c h a n g e s i n o x y g e n p o t e n t i a l .
7 . CARBON
T he r e s u l t s o f c a r b o n d e t e r m i n a t i o n s a r e g iv e n i n T a b le V I I . The a n a l y t i c a l t e c h n i q u e s a l l u s e d c o m b u s tio n t o CO2 w i t h m a n o m e tr ic o r c o u lo m e t r i c f i n i s h . T he r e s u l t s a r e c o n s i d e r e d t o b e v e r y s a t i s f a c t o r y a t t h e lo w c a r b o n l e v e l s n o t e d i n t h i s m a t e r i a l .
8 . DISCUSSION
T h is w o rk h a s i n d i c a t e d t h a t t h e t h r e e l a b o r a t o r i e s c a n p ro d u c e r e s u l t s o n t h e a s s a y o f u ra n iu m a n d p lu to n iu m w h ic h do n o t d i f f e r s i g n i f i c a n t l y b u t t h a t c a r e i s n e e d e d i n t h e a n a l y s i s o f n o n - s t a n d a r d m a t e r i a l s . W here a c h a n g e i n m a t e r i a l s o r p r o c e s s i s e f f e c t e d i t se e m s s e n s i b l e t o e x p l a i n t h i s t o t h e a n a l y t i c a l l a b o r a t o r i e s , d ra w in g a t t e n t i o n t o p o s s i b l e e x p e c te d d i f f e r e n c e s e v e n th o u g h p r e v io u s e x p e r i e n c e o n s t a n d a r d m a t e r i a l s h a s b e e n e n t i r e l y s a t i s f a c t o r y . T h is p o i n t i s r e g a r d e d a s b e i n g n o te w o r th y f o r s a f e g u a r d s i n s p e c t i o n s . The u s e o f s t a n d a r d m a t e r i a l s f o r c h e c k in g a n a l y t i c a l t e c h n i q u e s , e ^ . N a t io n a l B u re a u o f S t a n d a r d s s a m p le s i s n o t n e c e s s a r i l y a m eans o f c o v e r i n g t h i s

156 PARKINSON
p r o b le m . I s o t o p i c a b u n d a n c e m e a su re m e n ts a r e u n l i k e l y t o b e a f f e c t e d by s u c h c o n s i d e r a t i o n s i n t h e f u e l f a b r i c a t i o n f i e l d s i n c e i t i s d i f f i c u l t t o e n v i s a g e m eans o f s e p a r a t i o n o f u ra n iu m o r p lu to n iu m i s o t o p e s i n t h e p r o c e s s e s u s e d .
F o r 0/M m e a s u re m e n ts w h e re t h e d a t a i s m a in ly t o b e u s e d i n o x y g e n p o t e n t i a l s t u d i e s i n i r r a d i a t e d f u e l i t se e m s a p p r o p r i a t e t o s p e c i f y a t e s t w h ic h m o st c l o s e l y r e l a t e s t o t h e u s e o f t h e d a t a , ip . a th e rm o c h e m ic a l m e th o d .
I t i s r e c o g n i s e d t h a t t h e i n t e r c o m p a r i s o n o f r e s u l t s n o t e d i n t h i s w ork e f f e c t i v e l y sh o w s t h e p o s i t i o n a t t h e t im e t h e w o rk w as c a r r i e d o u t . L o n g - te rm d e v e lo p m e n t o r p r o d u c t i o n r e q u i r e s t h a t t h e r e s h o u ld b e a g re e m e n t b e tw e e n p a r t i c i p a t i n g l a b o r a t o r i e s o v e r t h e p e r i o d o f t h e p r o j e c t .
9 . ACKNOWLEDGEMENTS
T h e a u t h o r w is h e s t o e x p r e s s h i s t h a n k s t o Mr K. A. S w in b u rn an d D r J. C. D a l to n (BNFL, W in d s c a le ) , D r G.W.C. M i ln e r (AEEE, H a rw e l l ) a n d Mr F. H. C r i p p s (AWRE, A ld e rm a s to n ) who w ere r e s p o n s i b l e f o r c a r r y i n g o u t t h e a n a i l y t i c a l w o rk d e s c r i b e d i n t h i s n o t e .
A N A C C U R A T E P O T E N T I O M E T R I C T I T R A T I O N O F 5 - 2 5 m g U R A N I U M
IA EA -SM -201/65
J. SLANINA, F. BARKER, W.A. LINGERAK Reactor Centrum Nederland, Petten The Netherlands
Abstract
AN ACCURATE POTENTIOMETRIC TITRATION OF 5 - 25 mg URANIUM.A potentiometric titration of 5 to 25 mg uranium is described. Sulphamic and phosphoric acid are
added to the sample (volume 1 m l), U VI is reduced to U IV by Fe2+ and the excess of Fe2+ is oxidized by a mixture of nitric acid , sulphamic acid and ammonium molybdate; vanadyl sulphate is added to ensure a sharp end-point of the titration. The resultant U IV is titrated automatically with 0.02500N potassiumdichromate using a platinum indicator electrode. The automatic titration is performed both with a com mercial titrator (Mettler) and with an R.C.N. titrator which waits after each addition until the equilibrium is reached. Using the Mettler titrator an accuracy of О.Об о relative was reached. The R.C.N. setpoint titrator gave results with an accuracy of 0.04°}о relative at the 20-m g U level. Each titration takes 5 to 7 min.
INTRODUCTION
The amount of uranium available for analysis in re se a rc h or safeguarding is often lim ited. N evertheless the accu racy of the uranium determ inations should be better than 0.05% relative. In general g rav im etric [1 ], coulom etric [2 ] or potentiom etric [ 3 , 4] methods can achieve a sufficient accuracy.
The g rav im etric methods require full knowledge of m etallic im purities and are not suitable for the range of 5 - 25 mg uranium.
C oulom etric methods can achieve a sufficient accu racy in this range but these methods take too much tim e (15 - 30 min), if a pre-reduction is required (e .g ., if iron is present).
The adaptation by E b erle et al. [ 4] of the potentiom etric titration of uranium proposed by Davies and Gray [ 3] has resulted in a fast method (5 min), which can attain an accu racy better than 0.05% relative in the range of 60 to 200 mg of uranium. In this method, phosphoric acid and sulphamic acid are added to the sam ple; a ll uranium is reduced to U IV by ferrou s sulphate and the ex cess of ferrou s ions is oxidized by a m ixture of n itric acid, sulphamic acid and ammonium molybdate. As the titration of U IV with dichrom ate tends to be sluggish, vanadyl sulphate is added to ensure a sharp end-point of the titration .
When using th is method sev era l problem s were encountered when we tr ied to reduce the amount of sam ple by a facto r of 1 0 , taking a tenth of the sample volume and of a ll reagents prescribed .
The titration volume is quite sm all so a titration v esse l of 20 ml maximum is used.
157

158 SLANINA e t al.
The resp o n se tim e of the platinum indicator e lectrod e is short (< 1 s) in the beginning but in c r e a se s d ra stica lly after about 20 titra tion s, so cleaning with an ab rasive after ten determ inations is n ecessa ry .
The g la ss fr it of an A g/A gC l re feren ce elec trod e b ecom es black after som e titra tion s and gets plugged. A ca lom el elec trod e in a 20% sulphuric acid e lec tr o ly te bridge functions properly.
S ystem atic e r r o r s can a r ise if part of the V(IV) is oxid ized, by air, to V(V). To prevent th is the vanadyl solution should be prepared in acid m edium and checked frequently for V(V).
To make su re that no negative e r r o r s can occur due to n itrogen oxid es rem aining after the F e2+-NC>3 reaction , we p ass a gentle stream of CO2 through the solution. T his rem o v es the ox id es within a few seconds.
The sam ple volum e m ust be 0.8 - 1.2 m l, otherw ise e r r o r s of 0.5% m ay occur [4].
The titra tion m ust be com pleted within 6 m in [ 4] but the resp on se of the platinum elec trod e i s v er y slu ggish near the end-point. T his m akes it ex trem ely d ifficult to obtain an accuracy of 0.05% with a m anual titration , so an autom atic titra tion has to be applied. We in vestigated two p ossib le solu tions for th is problem , an autom atic titration with a M ettler titra tor, and an autom atic titration with a set-p o in t titrator.
METTLER TITRATOR
In th is m ethod the com m ercia l M ettler (Switzerland) titra tor was u sed in com bination with a Hewlett Packard m inicom puter. T his titra tor d eliv e rs the titrant continuously until a p reset potential is reached; above th is p reset potential the titra tor adds fixed in crem en ts. A fter each addition the titra tor w aits until the f ir s t derivative of the sign a l is below a certain lev e l; th is m eans that equilibrium is reached . The elec trod e potential and the volum e d elivered are tran sferred to the m inicom puter by m eans of an in terface . A fter a p rese t num ber of step s the in flection point is calcu lated according to the m ethod of W olff and Fortuin [ 6, 7].
SET-POINT TITRATOR
The second solution is a titra tion to a p reset potential, i .e . the potential at the in flection point of the titration curve. B ecau se of the slow resp on se of the indicator elec trod e near the in flection point, the overshoot of the se t point i s consid erab le if a titration with only a proportional band is used . We u se a d ifferantiator (a m odification of an apparatus d escrib ed by C allicott and Carr [ 5]) to interrupt the titra tor until the change in sign a l of the indicator e lec trod e i s le s s than 0.2 m V / s. Both t itr a to rs should be capable of attaining an accu racy of 0.05% after proper calibration.
EXPERIM ENTAL
Standards should be co rrected for air buoyancy and tem perature co rrection s m ust be made if n ece ssa r y . B u rettes m ust be calibrated.

IAEA -SM -201/65 159
R eagents
A ll reagen ts are pro analyse u n less stated otherw ise:
Sulpham ic acid solution: 150 g sulpham ic acid per litre;P hosphoric acid: 86. 6% Baker No. 6024.F erro u s sulphate solution: 280 g (NH4)2F e(S 0 4)2. 6H20 and 200 m l H2S 0 4 1:1 per litre .N itr ic acid , sulpham ic acid , am m onium -m olybdate solution: 5 0 0 m lH N 0 3 con e., 4 .0 g (NH4)6. Mo70 24 and 15 g sulpham ic acid p er litre .Vanadyl solution: 11 g VOS04 M erck and 110 m l H2S0 4 1:1 litre . D ichrom ate titrant: 0.02500N p rim ary standard grade Baker No. 1415. Uranium standard: NBS U3O8 950a.
Apparatus
M ettler titra tor
A m p lifier DK 10 C ontroller DK 11 Increm ent con tro ller DK 15 Buret DV 11 10,0 m l Interface CT 10 and CT 13 HP 9830 d esk -top com puter Dig. V oltm eter DK 13
Set-point titra tor
A m plifier: RCN design input im pedance > 2 .1 0 13ß adjustable gain and offset;Titrator: Methohm E 450 equipped with an adjustable proportional band, pulse frequency and pulse length;Buret: Methrohm E 424 10.0 ml;D ifferentiator: according to C allicott and Carr [ 5], adapted as follow s: The output sign a l of the d ifferentiator i s com pared with an adjustable le v e l. If the output voltage of the d ifferentiator (and so the rate of r is e at the input) is above the chosen le v e l a contact is broken, se e F ig . l . The tim e constant of the d ifferentiator i s adjustable between 1 and 20 s.A ll d eta ils about the am plifier and d ifferentiator w ill be sent on request.
PROCEDURE
The preparation of the sam p les and the rem oval of in terfer in g sp ec ie s are d escrib ed by E b erle et a l. [4 ].
A 0.8 - 1.2 m l portion of sam ple containing 5 - 2 5 mg of uranium is w eighed in the titra tion v e s se l; 0.1 m l of sulpham ic acid solution and 4.5 m l 86% phosphoric acid is added. The solution is s t irr ed with a m agnetic s t ir r e r , after a few secon d s 0.5 m l of the ferrou s sulphate solution i s added and the

160 SLANINA et al.
FIG .l. S et-point titrator.1. Platinum vidicator electrode2. D ouble-junction ca lom el electrode3. H igh-im pedance am plifier R.C.N.4 . Titrator metrohm E 4505 . D ifferentiator R.C.N.6. Piston buret metrohm E 424-107. Titrant
v e s s e l is sw ir led carefu lly . A fter 1 m in 1 m l of the H N03-su lph am ic acid- m olybdate m ixture is added and im m ed iate ly a gentle stream of C 02 i s p assed through the solution. A dark colour appears which van ish es within a few secon ds. T r a ce s of F e 2+ on the w alls of the titration v e s s e l are washed away by sw irling. The solution m ust stand for 3 m in after clearing; 4 .0 m l vanadyl sulphate solution is added by pipetting in such a way that the w alls of the v e s s e l and the sm a ll COz in let tube are rinsed .
M ettler titration
The se t point for sw itching norm al to in crem en ta l titration is set betw een 450 and 475 mV v e r su s ca lom el re feren ce e lectrod e . Increm ents of 0.01 m l are added. The in crem en t con tro ller i s adjusted in such a way that a new in crem en t is added as soon as the sign a l of the indicator e lectrod e r is e s le s s than 0.1 m V /s . At le a st four in crem en ts m ust be added b efore and after the in flection point to avoid e r r o r s in the calcu lation of the end-point.
Set-point titration
The se t point is se t at 602 mV v er su s ca lom el e lec trod e . The proportional band is adjusted to 120 mV. The tim e constant i s set to 1 s and the sw itch ing le v e l of the d ifferentiator is se t to interrupt the titration, if the elec trod e sign a l r i s e s m ore than 0.2 m V /s .
RESULTS
A ccuracy and reprodu cib ility te s ts
P erform an ce of the instru m ents
In th ese te s t s a large stock solu tion w as u sed to elim inate e r r o r s in the sam ple preparation. NBS U3Og 950a w as heated for 1 h at 950°C. An aliquot was d isso lv ed in H N03 and made up to w eight, th is stock solution (500.00 g) contained 25.000 m g U /g . W eighed portions of th is solution w ere taken and titrated .

IAEA -SM -201/65 161
M ettler apparatus
g so l. taken n 'И ' 'R T ^ S ‘— * 1 0 0 % s----------------- — U theor.___________ ___
0.9 - 1.0 8 99.95 0.05
(n = No. of determ inations; s = estim ate of the standard deviation)
RCN set-p o in t titration
so l. taken П TT x ioo%U theor. S
0.9 - 1.0 8 100.00 0.040.5 - 0.6 5 100.00 0.050.2 - 0.3 5 100.01 0.03
T est of the tota l procedure
T hree portions of U3Og of about 500 mg w ere d isso lv ed and made up to weight. The resu ltin g so lu tions contained 25 m g U /g .
M ettler apparatus
so l. g . so l. taken n U m eas. x U theor. s
1 0.8 - 1.0 5 99.95 0.022 0.8 - 1.0 5 99.91 0.023 0.8 - 1.0 7 99.90 0.05
RCN set-p o in t titration
so l. g. so l. taken n U “ e a s ' X 100% U theor. s
1 0.8 - 1.0 4 99.95 0.022 0.8 - 1.0 5 99.92 0.013 0.8 - 1.0 5 99.87 0.03
C onclusion
Both the M ettler titra tor and the set-p oin t titra tor give accurate re su lts which are of com parable p rec ision .

162 SLANINA et a l.
T yp ica l exam p les of a n a ly ses titrated with the se t-p o in t titrator
150 - 200 mg of sam ple w ere d isso lved and diluted to 10.00 g.
(1) D eterm ination of U in U 02(N 03)2 .6 H 20
T itr im etr ic
Sample n %U found % U the or. S
1 4 47.45 47.41 0.012 5 47.46 47.41 0.033 5 47.43 47.41 0.01
M erck P .A . 5 47.45 47.41 0.02
C oulom etric
Sample n %U found % U the or. s
1 3 47.41 47.41 0.03
(2) D eterm ination of evaluation program ,
U in UFg month 11
n
obtained from New Brunsw ick, , tube 739.
%UF6 found s
analytical
T itr im etr ic 4 99.94 0.03C oulom etric 4 99.94 0.05
Mean of 10 laboratories: 99.95% UF6
(3) D eterm ination of U in m eta ls and a lloys.
T itr im etr ic
Sample type n % U found s
U Si Al 4 94.70 0.04U Si A l 4 94.84 0.05U m eta l 3 99.71 0.02
REMARKS
The potential of the indicator elec trod e at the beginning of the titration i s so m etim es high so the titra to rs cannot start. In that case 1 m l of titrant m ust be added m anually. We are try in g to so lve th is problem .
The sm a ll titration volum e m akes th is m ethod attractive for u se in glove b oxes as litt le w aste is produced when active so lu tions of uranium are titrated .

IA EA -SM -201/65 163
A C K N O W L E D G E M E N T
We are indebted to M e ssr s . C .F .A . Prum au and P. B orst of our e le c tr o n ic s departm ent for the developm ent of the am p lifier and d ifferen tiator and to Mr. J.G . van Raaphorst for m any stim ulating d iscu ss io n s .
R E F E R E N C E S
[1 ] UKAEA, P.G. Rep. 133 (I960).[2 ] LINGANE, J.J., A nal. Chim. A cta 50 (1970) 11.[3 ] DAVIES, W ., GRAY, W ., Talanta 11 (1964) 1203.[4 ] EBERLE, A .R ., LERNER, M .W ., GOLDBECK, C .G ., RODDEN, C .J., NBL Rep. 252 (1970).[5 ] CALLICOTT, R.H., CARR, P.W ., A nal. Chem. 46 (1974) 1840.[6 ] FORTUIN, J.M .H ., A nal. Chim. A cta 24 (1961) 175.[7 ] WOLF, S ., Z . A nal. Chem. 250 (1970) 13.


I A E A -S M - 2 0 1 / 106
ПРИМЕНЕНИЕ МЕТОДОВ РАДИОМЕТРИИ И СПЕКТРОФОТОМЕТРИИ ДЛЯ ЦЕЛЕЙ ГАРАНТИЙ
А . А . ЛИПОВСКИЙ , Ю .В. ХОЛЬ НОВ Радиевый институт им. В . Г . Хлопина,Ленинград,Союз Советских Социалистических Республик
Abstract-Аннотация
THE USE OF RADIOMETRIC AND SPECTROPHOTOMETRIC TECHNIQUES FOR SAFEGUARDS PURPOSES.T h e paper discusses certain aspects o f the determ ination o f th e uranium and plutonium concentrations
in irradiated fuel solutions delivered to th e reprocessing p lant. At th e present le v e l o f an a ly tica l error, th e techniques ava ilab le for use in safeguards in clud e, in addition to isotope d ilu tion , a h igh-precision rad iom etric m ethod for determ ining plutonium and a d ifferential spectrophotom etric m ethod for uranium.
П Р И М Е Н Е Н И Е М Е Т О Д О В Р А Д И О М Е Т Р И И И С П Е К Т Р О Ф О Т О М Е Т Р И И Д Л Я ЦЕЛЕЙ Г А Р А Н Т И Й .
О бсуж даю тся н ек о то р ы е асп ек т ы п р обл ем ы оп р ед ел ен и я к онцентр аций у р а н а и плутония в р а с т в о р а х о б л у ч ен н о г о я д е р н о г о г о р ю ч его , п оступаю щ и х н а з а в о д по п е р е р а б о т к е . Для ц ел ей гар ан ти й при со в р е м е н н о м у р о в н е п о г р е ш н о ст е й а н а л и зо в н ар я ду с м е т о д о м и зо т о п н о го р азбав л ен и я м о г у т бы ть и сп ол ьзован ы п р ецизионны й р а д и о м ет р и ч еск и й м е т о д для о п р ед ел ен и я плутон ия и м е т о д д и ф ф ер ен ц и ал ь н ой с п е к т р о ф о т о м е т р и и для оп р ед ел ен и я у р а н а .
*Для т о го , чтобы установить количество ядерных материалов при их
инвентаризации или при передаче, необходимо провести анализ образцов этих материалов. Если аналитик имеет дело с гомогенным материалом, из которого сравнительно легко отобрать представительный обр азец , то для анализа обычно используются различные химические методы . Выбор м етода анализа в основном зависит от количества материала, которое может быть отобрано для анализа, от его физического состояния и от требований к точности определений. М етоды , используемые в настоящее время для целей гарантий, основаны на успехах в развитии аналитической химии урана и плутония и соответствующих технических ср едств . Эти методы описаны в ряде обзоров и за последние годы неоднократно обсуж дались в литературе [ 1 -8 ] .
Рассмотрение имеющихся данных показы вает, что наибольшая точность определений достигается при анализе чистых материалов. По-видимому, на современном уровне наших знаний и технических возможностей деструктивных методов достигнут некоторый компромисс между количеством образца, точностью и стоимостью анализа.
Методы недеструктивного анализа дешевле и легче поддаются автоматизации. Однако состояние развития методов недеструктивного анализа, несмотря на достигнутые успехи и значительные усилия , предпринятые за пять л ет , прошедших после симпозиума по технике гарантий в Карлсруэ в 1970 г . , таково, что пока еще они нуждаются в тщательной проверке с помощью деструктивных методов анализа. Имеется много нерешенных вопросов, связанных со стандартами для калибровки недеструктивных м етодов. Точность этих м етодов, хотя и удовлетворяет в ряде случаев требованиям контроля операций, не соответствует задачам учета
1 6 5

166 ЛИПОВСКИИ и хольнов
ядерных материалов в целях гарантий. Поэтому можно полагать, что деструктивные методы должны использоваться сейчас и будут использоваться достаточно долгое время для определения количества ядерного м атериала в ключевых точках ядерного топливного цикла.
В настоящее время наибольшая озабоченность проявляется по отношению к определению делящихся материалов в растворах отработавшего ядерного горючего на входе на завод по его переработке. Эта зона баланса материалов является одной из наиболее критических точек ядерного топливного цикла. Широко распространенным методом анализа растворов отработавшего топлива на заводах по переработке облученного ядерного горючего является сегодня метод изотопного разбавления в сочетании с м асс-спектром етрией. Этот метод имеет большие преимущества по сравнению с другими методами, так как характеризуется неплохой точностью и воспроизводимостью при низких концентрациях анализируемых элем ентов. При этом одновременно определяется и и зотопный состав урана и плутония. Опыт ряда международных экспериментов , среди которых в первую очередь следует назвать JE X -70 , Ш А-72 и P A F E X -2 , показы вает, что рассматриваемый метод позволяет проводить анализ растворов облученного ядерного горючего, разбавленных в 200-250 р аз. Для анализа требуется обр азец , содержащий всего несколько м г урана и 10-15 мкг плутония. Это сущ ественно снижает уровень активности, что облегчает проблемы транспортировки образцов и дает возможность проводить химические операции по подготовке пробы к анализу в обычном перчаточном боксе.
Следует зам етить, что в литературе, посвященной методу изотопного разбавления с масс-спектрометрическим завершением анализа, часто указываются очень низкие пределы ошибок, обычно не достигаемы е в практике применения метода в условиях заводов по переработке облученного горючего. Сравнение результатов различных лабораторий, участвовавших в JEX -70 и Ш А -72, и других данных показы вает, что метод характеризуется относительным стандартным отклонением 0,5-0 ,8% . Однако при этом межлабораторные отклонения соответствуют величинам, в 2 -3 раза превышающим внутрилабораторные погрешности [5,8] . Таким обр азом , воспроизводимость результатов внутри каждой отдельной лаборатории еще не является достаточной характеристикой точности м етода.
Для целей гарантий упомянутые межлабораторные расхождения в результатах при определении количества ядерного материала являются сущ ественными. Чтобы исключить возможность получения недостаточно достоверных результатов, целесообразно использовать различные независимые методы анализа. При этом возникает возможность вскрыть присущие тому или иному методу смещения и систематические погреш ности.
В применении к высокоактивным растворам, поступающим на завод по переработке облученного ядерного топлива, в цитированной выше литературе не описаны достаточно чувствительные м етоды , позволяющие проводить анализ таких растворов с точностью, сравнимой с получаемой в масс-спектрометрическом варианте метода изотопного разбавления.
В связи с проведением работ по экспериментам P A F E X -Ih PA FEX -2 в Радиевом институте им . В . Г . Хлопина была предпринята попытка оценить возможность применения других методов для прецизионных определений концентраций урана и плутония.

I A E A - S M - 2 0 1 / 106 167
Растворы , поступающие на завод по переработке облученного ядерного топлива, обычно содержат 200-400 г /л урана, 0 ,4-0 ,6 г /л плутония и продукты деления, соответствующие кампании, отвечающей умеренной глубине выгорания (5 • 103 — 3 • 104 МВт • с у т /т ) . Отношение U /P u в таких растворах может меняться в довольно широком интервале, что и будет определять возможную величину коэффициента разбавления, необходимого для уменьшения активности анализируемых образцов.Т ак, например, в эксперименте PA FE X -2 участникам были предоставлены пробы, отобранные из разбавленного (1 : 250) исходного раствора.В этом растворе отношение U /P u = 150. Общее количество материала в образце ~ 1 ,8 мгТГ и ~ 1 2 м к г Р и . Исходя из этих условий , нами были рассмотрены возможные методы анализа.
Для анализа урана в образцах такого типа должны быть использованы достаточно чувствительные методы . Обычно такие методы , как правило, характеризуются сравнительно высокими погрешностями и не пригодны для целей гарантий. Так, например, спектрофотометрический м етод, основанный на измерении оптической плотности растворов окрашенных комплексных соединений шестивалентного уранас арсеназоШ , имеет коэффициент вариации 5% [9] . Тем не менее имеется возможность сущ ественно уменьшить погреш ность, если использовать метод дифференциальной спектрофотометрии. В первоначальном варианте этот метод был использован для анализа чистых содержаний урана при его концентрации "40 м г/м л [10] . Некоторые видоизменения метода позволили нам использовать его при анализе образцов PAFEX-1 . При этом были
ТАБЛИЦА I . ОПРЕДЕЛЕНИЕ УРАНА МЕТОДОМ ДИФФЕРЕНЦИАЛЬНОЙ СПЕКТРОФОТОМЕТРИИ (С0 = 1 ,5 мкг/мл)
О б р а зе ц N9 Н ай ден о U
( % ве с )
О б р а зе ц № Н ай ден о U
(% в е с )
1 100 ,14 11 1 0 0 ,1 2
2 99 ,6 1 12 9 9 ,9 8
3 1 0 0 ,1 1 13 9 9 ,9 2
4 1 0 0 ,3 1 14 9 9 ,8 8
5 1 0 0 ,2 4 15 9 9 ,7 8
6 99 ,9 1 16 1 0 0 ,1 4
7 9 9 ,8 6 17 9 9 ,7 0
8 99 ,8 5 18 1 0 0 ,1 2
9 9 9 ,6 5 19 1 0 0 ,2 110 100 ,20
X = 99,98% SD = 0 ,21
( s x) „ at = 0,10(S x ) cct = 0 ,0 6(sx)„„„„ = 0,12

168 ЛИПОВСКИЙ и хольнов
ТАБЛИЦА II . ОПРЕДЕЛЕНИЕ УРАНА В ПРИСУТСТВИИ ПЛУТОНИЯ (U /P u = 40) МЕТОДОМ ДИФФЕРЕНЦИАЛЬНОЙ СПЕКТРОФОТОМЕТРИИ Сц = 2 ,7 м к г /м л , ПРИСУТСТВУЕТ АСКОРБИНОВАЯ КИСЛОТА
О б р а зе ц № Н айден о U(% в ес )
О б р а зе ц № Н ай ден о U (% в ес )
1 9 9 ,9 7 10 9 9 ,5 3
2 9 9 ,4 8 11 9 9 ,4 0
3 9 9 ,3 8 12 9 9 ,0 3
4 9 8 ,9 5 13 9 9 ,4 5
5 9 9 ,5 2 14 1 0 0 ,0 4
6 1 0 0 ,0 8 15 1 0 0 ,0 1
7 1 0 0 ,2 5 16 1 0 0 ,0 4
8 9 9 ,4 9 17 9 9 ,6 8
9 9 9 ,3 5
X = 99 ,63% SD = 0 ,3 8
<SX>c , =(S x )chct = 0 ,0 6
<S X > ™ . ' » Л
получены приемлемые значения погреш ностей, сравнимые с погрешностями других м етодов. Для анализа образцов с малым содержанием урана представлялось возможным использовать принцип дифференциальной спектрофотометрии и интенсивно окрашенные растворы комплекса UVI с арсеназо III .
В таблицах I -III представлены некоторые полученные нами результаты , иллюстрирующие возможности м етода. Работа проводилась на образцах урана с природным изотопным составом . В се значения погрешностей определены в 95% доверительном интервале.
Представленные данные показывают, что метод дифференциальной спектрофотометрии может быть применен для определения урана в разбавленных растворах облученного ядерного горючего. Полная погрешность метода определяется в основном статистической погрешностью. В присутствии значительных количеств продуктов коррозии (F e ) , плутония и продуктов деления (Z r), мешающих определению, метод не требует сложной химической подготовки проб к анализу.
Для определения плутония в разбавленных растворах, где его концентрация составляет 10-15 м к г /г , вероятно, также могли быть использованы подходящие спектрофотометрические методы . Однако в этом случае трудно рассчитывать на получение приемлемой точности определений. Кроме того , для анализа потребовалось бы отделение урана от плутония, что могло явиться дополнительным источником погреш ностей.

IAEA -SM - 2 0 1 /1 0 6 169
ТАБЛИЦА III . ОПРЕДЕЛЕНИЕ УРАНА В ПРИСУТСТВИИ ЭЛЕМЕНТОВ-ПРИМЕСЕЙ (Сц = 1 ,5 мкг/мл)
a) U /F e = 40
О б р а з е ц ® Н ай ден о U О б р а зе ц NS Н ай ден о U ( % в е с ) (% в е с )
1 10 0 ,1 1
2 1 0 0 ,1 8
3 1 0 0 ,2 9
4 9 9 ,6 5
5 9 9 ,9 6
б 9 9 ,9 7
7 1 0 0 ,3 4
8 1 0 0 ,0 7
9 1 0 0 ,2 3
X = 100,09%SD = 0 ,21
(^х)сист = 0 ,0 6
(Sx)cTaT = 0 ,1 6(Sx > 0 ,1 7л ПОДИ
б ) U /Z r = 1 0 0 , п р и с у т с т в у е т щ ав ел ев ая к и сл о т а
О б р а зе ц N2 Н ай ден о U{% в ес )
1 99 ,8 1
2 9 9 ,7 5
3 1 0 0 ,0 3
4 9 9 ,7 8
5 1 0 0 ,3 6
X = 99,95%SD = 0 ,2 6
^Х^стаг = 0 ,3 2
SX>c„c, * 0 ,0 6
^Х^оля = 0 ,3 2
Представлялось целесообразным для определения концентрации плутония использовать другой м етод . При проведении исследований в этом направлении в Радиевом институте был усовершенствован радиометрический м етод . При этом погрешности определения концентрации плутония были снижены до уровня 0,2-0 ,3% , что удовлетворяет современным требованиям измерений для гарантий.
Прямое определение концентрации плутония в растворе по активности взятых аликвот можно провести, если известен изотопный состав плутония (измеряется м асс-спектром етрически). При этом погрешность результата определяется суммой следующих основных погрешностей:
а) погрешностей взвешивания аликвот;б) погрешности измерения суммарной активности изотопов плутония
в аликвотах;в) погрешности измерения изотопного состава плутония;г) погрешностей значений периодов полураспада изотопов плутония.

-оо
ТАБЛИЦА IV . ОПРЕДЕЛЕНИЕ КОНЦЕНТРАЦИИ ПЛУТОНИЯ РАДИОМЕТРИЧЕСКИМ МЕТОДОМ
К онцентрац ия Pu в о б р а з ц е (в е с %)С - срад ^кулО б р а зе ц Р ад и ом ет р и я К ул он ом ет р и я *
С(%) SD оГ%> SD 238Ри ^ Р и 24uPu 241 Pu 242 Pu Чкул
N B S -9 4 9 /d 1 0 0 ,1 2 0 ,1 0 1 0 0 ,1 6 0 ,1 1 0 ,0 0 5 9 7 ,6 2 2 ,3 2 0 ,0 5 0 ,0 0 7 0 ,04%
Р а с т в о р н и т р а т а Pu 1 ,7665 0 ,0 0 4 1 1 ,7672 0 ,0 0 1 3 1 ,1 8 6 9 ,4 7 1 7 ,9 7 9 ,2 6 2 ,1 2 0 ,04%
С м е с ьок и сл ов U и Pu 3 ,4 6 3 0 ,0 0 9 3 ,4 7 5 0 ,004 0 ,1 5 77 ,71 1 8 ,1 9 3 ,3 0 0 ,6 5 0 ,36%
О кись Pu 8 6 ,6 5 0 ,1 3 8 6 ,7 7 6 0 ,0 9 0 ,2 7 6 7 5 ,4 8 1 8 ,4 9 4 ,6 7 1 ,09 0 ,1 3
ЛИ
ПО
ВС
КИ
Й
и хо
ль
но
в

I A E A - S M -2 0 1 / 106 171
Пункты а) и в) не играют решающей роли при определении суммарной погреш ности. Периоды полураспада основных изотопов плутония —238Pu , 239Pu и 240Рл известны сейчас с погрешностью 0 ,1 -0 ,2%. Принципиальным ограничением применения радиометрического метода в систем е гарантий являлся до настоящего времени пункт б ), т . е . собствен но радиометрия. Активность изотопов плутония в аликвотах определялась ранее измерением чисел о -ч а ст и ц , испускаемых источниками, изготовленными из аликвот. При этом использовалась различная "геометрия" измерений: в угле 4тг, 2тг или в определенном телесном у г л е . В этих условиях при вычислении активности аликвот приходится вводить большие поправки на уменьшение эффективности счета а -ч а с тиц вследствие поглощения их в вещ естве источника, подложке и т .д .При этом и з -з а неопределенностей самих поправок погрешности в значениях активности в лучшем случае составляют величины 0,5-1% .
Для определения активности аликвот раствора плутония нами применен разработанный в Радиевом институте метод 4ъа -Х -сов п ад е- ний [11] . В этом случае точность определения активности изотопов плутония практически не зависит от эффективности регистрации а -ч а ст и ц . В работе [11] показано, что этот метод позволяет получить погрешности в значении активности 0,05-0,1% в 95% доверительном . интервале.
Применение прямого метода для анализа проб М АГАТЭ, однако, связано с дополнительными ошибками. Прямой радиометрический метод требует предварительного полного химического выделения плутония из растворов, содержащих другие нуклиды, претерпевающие а -р а с п а д , в частности изотопы урана и америция. Ошибки в этом случае связаны с потерями плутония при его выделении.
Поэтому мы применяли метод изотопного разбавления (изотоп 238Ри) в совокупности с а - спектрометрией. Использовано то обстоятельство, что энергетически о-частицы Pu отделены от а-частиц других изотопов плутония. С помощью низкофонового полупроводникового а-сп ек тр ом етр а определялось отношение активности 238 Pu к сумме активностей в сех других изотопов плутония. Погрешность определения этого отношения составляла ~ 0 ,1%. Был приготовлен калиброванный раствор 238Ри с точно определенной методом 4710"-Х-совпадений удельной активностью. Выделение плутония из анализируемого раствора производилось дважды — до и после добавления "метки" — взвешенного количества калиброванного раствора Pu. В обоих случаях измерялось отношение активности 238Ри к сум м е активностей остальных изотопов:
А + А238 238
а) В =" 238
Здесь 1 238 — известная активность метки. Из этих двух уравнений определяются A2gg и А 2 , а по известному изотопному составу находятся и компоненты А£ . Далее по периодам полураспада рассчитывается концентрация плутония.
В таблЛУ приведены результаты анализа проб МАГАТЭ по программе PA FE X -1 радиометрическим методом в сравнении с результатами кулонометрического м етода. Как видно из таблЛ У , разница результатов

172 ЛИПОВСКИЙ и холь нов
радиометрического и кулонометрического определений концентрации плутония находится в пределах погрешности. При этом существенно менялся изотопный состав препаратов. Это обстоятельство можно считать косвенным подтверждением правильности использованных нами значений Tj^ изотопов плутония (24065± 50 лет - 239Ри, 6537 ± Ю лет - 240 P u ). В табл.IV приводятся также результаты проверки радиометрического метода по стандартному образцу N B S -9 4 9 /d . Здесь также не обнаружено значимой разницы между результатами двух м етодов.
Ниже приводятся результаты анализа составляющих погрешностей радиометрического метода (в доверительном интервале 0,95) при проверке метода по стандартному образцу
SD = 0,10%(1х>стах = 0,Ю%(5х>сист = °>21%<SA o„„ = ° -23%
Из представленных результатов сл едует , что точность разработанного радиометрического метода с использованием изотопного разбавления позволяет применять его при определении концентрации плутония в растворах для целей гарантий. Обладая всеми достоинствами, присущими методу изотопного разбавления, описанный метод пригоден для определения малых концентраций плутония в пробах сложного состава с высокой точностью и надежностью. Дополнительным преимуществом метода является возможность более точного определения содержания 23SPu. Кроме т о го , по сравнению с масс-спектрометрическим вариантом метода изотопного разбавления в радиометрическом методе в качестве метки используется более дешевый изотоп 238Pu. При этом его расход значительно меньше.
Как видно из предыдущ его, погрешности определения концентрации плутония радиометрическим методом прямым образом связаны с погрешностями в значениях периодов полураспада изотопов плутония и, главным обр азом , ими и определяются. М ежду т ем , согласно литературным данным [12-15] , результаты измерений Tjyg 239Pu противоречивы.Группа работ, например [12-14] , в которых используется радиометрический метод (прямой счет) дает = 24 400 л ет , в то время как калориметрический метод [15] приводит к Т-^ = 24 065 ± 50 л ет . Разница значений 1,4% при погреш ностях, указанных авторами работ [13-15], равна 0 ,1 -0 ,2%. В связи с этим в Радиевом институте была выполнена работа [16] по определению Т^239 Pu также радиометрическим м етодом , но с использованием 4па-Х -совпадений. Концентрация плутония в растворе измерялась кулонометрическим м етодом . Полученное значение Tjyg = 24 060 ± 38 лет практически совпадает с результатом работы [15] , выполненной калориметрическим м етодом . Погрешность 0 ,16% приведена для 95% доверительного интервала. Необходимо отметить совпадение результатов, полученных двумя сущ ественно разными методами.
Представленные результаты исследований по развитию методов определения концентрации урана и плутония в растворах, отчасти моделирующих растворы облученного материала, поступающего на завод по переработке ядерного топлива, позволяют рассматривать м етоды радиометрии и дифференциальной спектрофотометрии как дополняющие метод изотопного разбавления с масс-спектрометрическим окончанием.

IA E A -SM - 2 0 1 / 106 1 7 3
В заключение следует подчеркнуть целесообразность использования различных методов для целей гарантий. Необходимо приветствовать усилия М АГАТЭ, направленные на проведение международных сравнений методов анализа для целей гарантий. Результаты экспериментов позволяют М АГАТЭ и участвовавшим в них лабораториям оценить состояние вопроса в целом и используемые методы , в частности. Можно утверж дать, что такие эксперименты приносят большую п ользу, так как они являются действенным средством улучшения техники и методов гарантий.
Л И Т Е Р А Т У Р А
[1] М А Р К О В , В . К . , "В о з м о ж н о с т и д е с тр у кти в н ы х м етодов определения ядерного горю чего в разли чны х м атер и ал ах " , S a fe g u a rd s T e c h n iq u e s (Р го с . S ym p. K a r l s r u h e . 1970) 2, IA E A , V ie n n a (1970) 3.
[2J R O D D E N , C . J . , Se lected m e a su re m e n t m ethod s fo r p lu ton ium in the n u c le a r fuel cyc le , T ID - 7 0 2 9 (1972).
[3] R E I N . J . E . , M E T Z , C . F . , "T h e ap p lic a t io n o f iso top e d ilu t io n m a s s s p e c t r o m e t ry to the d e te rm in a t io n o f u ra n iu m and p lu ton ium in n u c le a r fu e ls ", A n a ly t ic a l C h e m is t r y o f N u c le a r F u e ls . (P ro c . P a n e l, V ien na , 1972) IA E A , V ie n n a (1972) 97.
[4] B O K E L U N D , H . , " A re v ie w o f a ccou n tab ility a n a ly se s at E u ro c h e m ic " , ib id . p . 13.
[5] . W O O D M A N , F . J . , " S u m m a r y o f e x p e r ie n ce o f som e p lu ton ium and u ra n iu mm etho d s at W in d sc a le " , ib id . p. 81.
[6] B IN G H A M , C . D . , L E R N E R , M . W . , N u c l. T e c h n . 23 (1972) 106.171 J A C K S O N , D . D . , R E IN , J . E . , W A T E R B U R Y , G . R . , N u c l. T e c h n . 23 (1972) 132.[8J V o n B A E C K M A N N , A . , "D e s t r u c t iv e a n a ly s is of n u c le a r m a te r ia ls fo r s a fe
g u a rd s " , P r a c t ic a l A p p l ic a t io n s of R and D in the F ie ld o f S a fe g u a rd s (P ro c . S ym p . R om e , 1974) 363.
[91 Л У К Ь Я Н О В , В .Ф . , С А В В И Н , С . Б . , Н И К О Л Ь С К А Я , И . В . , Ж урн. А нал ит.Х и м . 15 3 (1960) 311 .
[10] B A C O N , 'A . , M I L N E R , G . W . C . , A n a ly s t 81 965 (1956) 456.[ I l l А Н Ц И Ф Е Р О В , В . Т . , Г Е Й Д Е Л Ь М А Н , А . М . , П Р Е О Б Р А Ж Е Н С К А Я , Л .Д . ,
Р А З У М О В С К И Й , Л .А . , Х О Л Ь Н О В , Ю. В . , Прикладная Ядерная С пе ктр оскоп и я, А т о м и з д а т , М . , J5 (1975) 198.
[12] W E S T R U M , E . F . , N N E S - P P R В - 1 4 (1949) 1717.[13] M A R K IN , T . L . , L I n o r g . N u c l. C h e m . 9 3 (1959 ) 320.[141 Д О К У Ч А Е В , Я . П . , А т . Э н е р г. £ 1 (1959) 74.[15] O E T T IN G , F . L . , A I M E 17 (1970) 154 in N S A 25 25723 (1971).[161 А Л Е К С А Н Д Р О В , Б . М . , А Н Ц И Ф Е Р О В , В . Т . и др. , И з в .А Н С С С Р , Серия
ф изич. 39 3 (1975) 482 .


THE PROBLEM OF ANALYTICAL INTERLABORATORY DIFFERENCES IN PRACTICAL SAFEGUARDS
IA EA-SM -201/109
W. BEYRICH*Kernforschungszentrum Karlsruhe, Karlsruhe,Federal Republic of Germany
Abstract
THE PROBLEM OF ANALYTICAL INTERLABORATORY DIFFERENCES IN PRACTICAL SAFEGUARDS.The an a ly tica l data o f the IDA -72 interlaboratory comparison experim ent on mass spectrom etric
isotope abundance measurem ents o f 235U (0 . 7 and 2%), 239Pu (72%) and 241Pu (9%) and on the determ ination of uranium and plutonium concentrations (1 m g /g so l. and 1 0 p g /g s o l . , respectively) by isotope dilution analysis were evaluated with respect to their interlaboratory differences. Em pirical distribution curves were obtained in d icating that for m ost of the types of analyses considered re lative d ifferences in the order of 2% betw een two laboratories must be expected rather frequently i f the laboratories work under routine conditions. The values are about a factor of 5 low er for the m easurem ent o f the highly abundant z3sPu isotope. S pecific problems encountered in the determ ination o f plutonium concentration may cause excessively high deviations in these analyses. Characteristic data were obtained for the re la tive standard deviations o f the laboratory m ean values. Higher values signify that the ana ly tica l result is suspicious. After exclu sion of a ll laboratory m ean values identified in this way, sign ificant im provements were ach ieved in nearly a ll cases for the distribution o f the interlaboratory d ifferences o f the remaining group o f data. In to ta l, about 20% o f a l l laboratory m ean values had to be rejected applying such a criterion.
Knowledge of the analytical d ifferen ces between la b o ra to ries , which m ust be expected in routine operation, is of b asic im portance for p ractica l sa fegu ard s. It is needed for judging deviations ob served betw een the an a lyses of an op erator's and a safeguards lab oratory , for a b etter understanding of sh ip p er -rec e iv er d ifferen ces , and for the definition of lim its which when exceeded demand an an a lysis to be done by an independent party.
To get a c le a r p icture of the actual situation, the r e su lts obtained by m a ss sp ectrom etry in the IDA-72 in terlaboratory com parison experim ent[ l ] , re la tiv e to the isotop ic com p osition m easu rem ents of uranium and plutonium as w e ll as the determ ination of concentrations of th ese e lem en ts , w ere evaluated as fo llow s: F o r all p ossib le com binations of two lab ora tories out of the group of a ll participants in a certa in type of an a ly sis , the re la tive d ifferen ces in the analytical r e su lts w ere ca lcu lated . Then, by appropriate grouping and counting of th ese data,an em p ir ica l d istribution curve was obtained.
F igu re 1 show s the re su lt of th is evaluation m ethod for the determ ination of the 235U abundance of about 2% in the uranium of a diluted active feed so lu tion originating from a rep ro cess in g plant. As th ese an a lyses w ere perform ed by 18 lab ora tories on two sam p les each , a total of L = 36
17individual analytical data w ere known. C onsequently, N = 2 • 7} n = 306
n = l
* D elegated from Euratom, CEC.
1 7 5

176 BEY RICH
FIG. 1. Mass spectrom etric abundance determ ination of 235U; distribution o f re lative d ifferences betw een laboratory m eans.
FIG. 2. Mass spectrom etric abundance determination of ~ 2% 235U; distribution o f relative standard deviationsof laboratory means.

IA EA -SM -201/109 177
com binations of two la b ora tories and, h en ce, the sam e num ber of d ifferen ces of the analytical r e su lts w ere availab le for a study of their d istribution .The so lid lin e (F ig .l) rep resen ts the ta il part of the d istribution curve obtained by th is em p ir ica l m ethod. It shows that, for exam ple, P = 5% of the d ifferen ces is h igher than about D = 2.0% or, in other w ords, that 100 - P = 95% of the p airs of va lu es deviate le s s than D = 2.0%., Maximum re la tiv e d ifferen ces of nearly 3% w ere observed}
T h ese r e su lts d escr ib e the actual situation on the b a s is of the exp er im ental data obtained in the extended IDA-72 interlaboratory test? F rom the safegu ard s point of view an am elioration is certa in ly d esira b le . T h erefore , it was investigated to which extent an im provem ent may be obtained by the exc lu sion of individual va lu es on the b a s is of a w ell-d efin ed cr iter ion , preferab ly applicable by the analysing laboratory itse lf . A p aram eter su itab le for th is purpose is the re la tiv e standard deviation1 * 3 of the m ean value obtained by the lab oratory from repetition an a ly ses . S ince, in the IDA-72 experim ent a ll determ inations w ere made in tr ip lica te , these re la tiv e standard deviations are known and it was p ossib le to te st the effec tiv e n e ss of such a cr iter ion : F o r the 235u abundance m easu rem ents d iscu ssed b efore , the d istribution of the re la tiv e standard deviations of the individual lab oratory m ean valu es is shown in F ig .2. As indicated, it can be rep resen ted in good approxim ation by two stra igh t lin es of d ifferent s lo p es . T his su g g ests that the re la tiv e standard deviations of the m ea su rem ents contributing to the steep sec tio n be con sid ered as "typical" of th is type of an a lysis and exp licab le by the usual s ta tis tic a l spread of sin g le d eterm inations w h ereas, in the flat part of the cu rve, an a lyses predom inate which include at le a s t one sin g le determ ination disturbed by "additional" e r ro r so u rces lik e cross-con tam in ation , m alfunction of in stru m en ts, etc .At the background of th is in terpretation it is m eaningful to con sid er value S0 of the re la tiv e standard deviation to be the ch a ra c ter istic m axim um value of the sp ec ific analytical problem , which is g iven by the in tersection of the steep stra igh t lin e and the a b sc is sa . H ow ever, for the definition of a m easu rem ent cr iter io n , th is is the lo w est value which should be used.
A ccording to the r e su lts shown in F ig .2, S0 = 0.45% is obtained in the exam ple d iscu sse d . To define the cr iter io n , the next fu ll d ecim al of 0.5% w as ch osen and, consequently, 8 out of the 36 laboratory m ean va lu es (22%) w ere excluded, which showed a re la tiv e standard deviation exceed ing this value. The new d istribution of the re la tiv e d ifferen ces for the rem aining laboratory m ean valu es is g iven by the dashed lin e in F ig . l . The im provem ent is obvious and detailed stud ies have shown that th is curve re f le c ts the optim um conditions attainable by application of such a cr iter ion . Further reduction of the re la tiv e standard deviations to lerated m ay even change the d istrib ution for the w orse . T his dem onstrates that for re la tiv e standard deviations below the ch a ra c ter istic value S0 no relation sh ip e x is ts betw een the accuracy of a laboratory m ean value and its re la tive standard deviation which is in agreem ent with the con sid eration s m ade before.
1 For the considerations in this paper the signs o f the re la tive differences betw een the results o f two laboratories and o f the re lative standard deviations discussed below are unimportant and not taken into account.
It should be noted that in this experim ent, each ana ly tica l result of a laboratory was the m ean value o f three sin g le determ inations. Therefore, the distribution curves for the interlaboratory d ifferences g iven in this paper apply only for this case and m ay change for the worse i f only double determ inations are m ade as usual in practice.
3 In the figures and in the tab le the abbreviation RSD is used.

1 7 8 BEYRICH
FIG. 3. Mass spectrom etric abundance determ ination of ~0. T jo 235U; distribution o f re la tive d ifferences betw een laboratory m eans.
FIG. 4 . Mass spectrom etric abundance determination of ~ 0 .7% 235U; distribution of relative standarddeviations of laboratory means.

IAEA -SM -201/109 1 7 9
FIG. 5. Mass spectrom etric abundance determ ination of ~ 7 2 °jo 2S9Pu; distribution of re la tive d ifferences b etw een laboratory m eans.
FIG. 6. Mass spectrom etric abundance determination of ~ 72°jo 239Pu; distribution of relative standarddeviations of laboratory means.

180 BEYRICH
FIG. 7. Mass spectrom etric abundance determ ination of ~ 9 . 2°]o Z41Pu; distribution of re lative differences betw een laboratory m eans.
FIG. 8. Mass spectrom etric abundance determination of ~ 9 .2% 241Pu; distribution of relative standarddeviations of laboratory means.

IAEA-S М -201/109 181
D eterm inations of the 235U isotope abundance in a synthetic so lu tion of natural uranium and of the iso top es 239Pu (=72%) and 241Pu (=9.2%) in diluted active feed so lu tion w ere evaluated in the sam e m anner. The r e su lts are rep resen ted in F ig s 3 to 8. C om parison of the re la tiv e d ifferen ces D belonging to the sam e value of the ordinate (e .g ., P = 5% as indicated in the figu res) shows a steady in crea se with d ecreasin g isotop ic abundance.The sam e tendency is ob served for the ch a ra c ter istic re la tiv e standard deviation S0 with the exception of the low value in the c a se of natural uranium a n a ly sis . The favourable analytical conditions of c lean sam ple m ateria l without f is s io n products in th is synthetic sam ple solu tion offer an explanation. The ch a ra c ter istic shape of the d istribution curve for the re la tiv e standard deviations of the laboratory m ean va lu es d iscu ssed b efore is confirm ed in a ll c a s e s and allow s m eaningful values to be se lec te d for the cr iter ion .By its application sign ifican t im provem ents are achieved again for the distribution of the re la tiv e d ifferen ces betw een the laboratory m ean values (dashed lin e s in F ig s 3 and 7). Only in the c a se of the 239Pu isotope was no am elioration ob served . H ow ever, it should be noted that for th is highly abundant isotop e the re la tiv e d ifferen ces betw een the laboratory m ean va lu es w ere found to be about a factor of 5 low er than for the other iso top ic an alyses con sid ered .
A s m entioned above, a lso the concentration determ inations of uranium and plutonium carried out by isotope dilution an a lysis in the IDA-72 experim ent w ere evaluated. T h ese data depend stron gly on the d eta ils of the exp erim en ta l procedure. The r e su lts g iven in the follow ing are based only on th ose concentration va lu es which w ere obtained when each analytical step — including spiking and the preparation and ca libration of the spike solu tion — was perform ed by each laboratory itse lf.4 F or th ese a n a lyses , a synthetic sam ple so lu tion had been used which contained about 1 m g U /g and 10 pg P u /g .
The r e su lts of the evaluation are presented in F ig s 9 to 12. Compared with the determ ination of iso top ic abundance, l e s s data w ere availab le, b ecau se only 10 lab ora tories participated in th is part of the IDA-72 experim ent. In the c a se of uranium (F igs 9 and 10) the re la tiv e d ifferen ces betw een the lab oratory m ean valu es do not exceed 3.0%, as with the ca se of the uranium isotope determ ination d iscu ssed p rev iou sly . A very sign ifican t im provem ent of their d istribution is obtained after exc lu sion of two laboratory m ean valu es (20%) with re la tive standard deviations of m ore than 0.4%.
F or plutonium (F igs 11 and 12) the d istribution of the re la tiv e d ifferen ces betw een the laboratory, m ean valu es is strongly disturbed by a substantial fraction of very high va lu es up to nearly 80%. They are due to the e x c e s s iv e data obtained by 4 of the 10 la b o ra to r ies , which w ere explained in the IDA-72 experim ent m ainly by cross-con tam in ation and by the u se of insuff ic ien t r igorou s valency adjustm ent p roced u res. By application of the cr iter io n based on the re la tiv e standard deviation , three of th ese four va lu es are excluded, w hereas one rem ain s and ca u ses the la rg e ta il of the
4 These are the values obtained in the "self-spike” experim ent o f ID A -72. The determ ination of concentrations on samples of diluted activ e feed solution performed in the "standard" experim ent is not considered in this con text, s ince the samples were not spiked by the individual laboratories.

BEY RICH182
FIG. 9. Uranium concentration determ ination by isotope dilution analysis; distribution o f re lative d ifferences betw een laboratory m eans.
FIG. 10. Uranium concentration determination by isotope dilution analysis; distribution of relative standarddeviations of laboratory means.

IAEA -SM -201/109 1 8 3
FIG, 11. Plutonium concentration determ ination by isotope dilution analysis; distribution o f relative differences betw een laboratory m eans.
FIG. 12. Plutonium concentration determination by isotope dilution analysis; distribution of relativestandard deviations o f laboratory means.

TABLE I. COMPILATION OF RESULTS
A nalyticaldeterm ination
Experimentalconditions
C haracteristicRSD of
lab. means 0 d o )
Number of lab. m eans used
L
Percentage of lab. means excluded
Q(So)07»)
Number N of lab.differences
on w hich evaluation is based
R elative d ifference D {°Jo) betw een two lab , m eans exceed ed in P
per cen t o f the case P = 1 0 °jo Р = Ь а}о P = 2Pjo
235 у 36 (a ll availab le) 0 306 1 .7 2 .0 2 .4abundance diluted active о .4 5by MS feed solution 28 (w ith RSD r=0. 5*Уо) 22 169 1 .4 1 .6 1 .8 S
235 и ~ 0. 7%, 18 (a ll available) 0 153 2. 05 2 .5 2 .9abundance synthetic 0. 35by MS solution 16 (with RSD sO . 4<7o) 11 120 1 . 8 5 2. 25 2 .6
239 pu ~72<7o, 30 (a ll available) 0 210 0. 40 - 0 .4 , 0 . 6„abundance diluted active 0. 08by MS feed solution 27 (with RSD s o . 0&7o) 10 171 0.4„ 0 .4 , 0.6„
241 Pu ~ 9. 27«, 30 (a ll availab le) 0 210 1 .3 1. 65 2 .1abundance diluted active о . з 3 .by MS feed solution 25 (with RSD s o . 4%) 17 150 0 .9 1 .0 5 1- 25
Uranium ~ 1 m g /g s o l . , 10 (a ll available) 0 45 2 .0 2 .5 2 .8concentration synthetic 0 .4 0by IDA solution 8 (w ith RSD < 0 . 4 ° /о ) 20 28 1 .1 1 .3 1 .4
Plutonium ~ 10 Mg/g sob . 10 (a ll availab le) 0 45 R elative d ifferenceconcentration synthetic 0. 37 D > y jo for P = 67°Jo of the casesby IDA solution R elative d ifference
6 (with RSD < 0 .47 i) 40 15 D > З о for P = ЗЗ^о o f the cases
184 BEY
RIC
H

IAEA-SM -201/109 185
distribution curve at high va lu es of the re la tive d ifferen ces D (F ig . 11, dashed curve). At low va lu es, the usual d istribution , as found in the other c a s e s , is c lea r ly superim posed .
Sum m arizing, it can be concluded that at the p resen t sta te , in terlab oratory d ifferen ces of around 2% have to be expected rather frequently in p ractica l safegu ard s for m ost types of an a lyses con sid ered , if the lab ora tories work under routine conditions. V alues about a factor of five low er — as ob served for the m a ss sp ectrom etr ic 239Pu determ ination — can be expected with great probability in all c a s e s w here the isotope in question is c le a r ly m ore abundant than each of the other iso to p es. Interlab oratory d ifferen ces above 3% m ay occur when the plutonium concentration is determ ined by isotop e dilution an a lyses . S ignificant im provem ents are obtained if only those laboratory m ean values are con sid ered w hose re la tiv e standard d eviation s are within certa in lim its predeterm ined on the b a s is of the " ch aracteristic" va lu es obtained. In p ra ctice , how ever, th is req u irem ent can be m et only by additional analytical efforts of the lab ora tories .If the p ercentage of the analytical data excluded in th ese evaluations is taken as a m easu re , about 10 to 25% are found for the iso top ic abundance m easu rem en ts and the determ ination of uranium con centration s, and 40% in the c a se of plutonium concentration an a lysis . T h ese figu res are com piled in Table I, together with the other r e su lts p resen ted in th is paper.
R E F E R E N C E
[1 ] BEYRICH, W. , DROSSELMEYER, E ., Rep. KFK 1905 (1975).


IA EA -SM -201/25
INSTRUMENTS AND DATA ANALYSIS METHODS FOR VOLUME MEASUREMENTS
S.C . SUDABrookhaven National Laboratory,Upton, New York,United States of America
Abstract
INSTRUMENTS AND DATA ANALYSIS METHODS FOR VOLUME MEASUREMENTS.In recent years there has been renewed interest and effort in the United States o f A m erica on methods
for accurately determ ining SNM content in tanks and other process vessels. A m erican N ational Standard N 1 5 .1 9 was developed to provide criteria and procedures for calibration o f tanks and to promulgate specifications for such m easurem ents. D evelopm ental work in the area o f statistica l treatm ent o f the calibration data was performed in the preparation o f the standard. Criteria based on an a ly tica l studies were developed for choosing the appropriate linear calibration m odel. These studies were follow ed by calibration experim ents, jointly sponsored by NBS, ERDA and ACDA for evaluating liquid le v e l instruments. This report describes these activ ities and som e results.
1. INTRODUCTION
During the last three years, a number of studies on method of measurements of volume in process tanks have been conducted in the United States. These studies involve calibration techniques, instrument evaluation, simulation studies, and statistical methods for the treatment of data. The initial study was conducted by the writing group of American National Standard N15.19 entitled "Volume Calibration Techniques for Nuclear Materials Control" [1]. Subsequent studies were directed to specific aspects identified by the writing group as areas where the existing methodology was not sufficiently tested or understood. The first major effort was an analytical study which involved a simulation model and synthetic data. The second was an experiment jointly funded by the National Bureau of Standards (NBS), the United States Energy Research and Development Administration (ERDA), and the United States Arms Control and Disarmament Agency (ACDA) which involved an assessment of liquid pressure and level instrumentation. These two studies have been completed and preliminary results are available. Another experiment is currently in progress at NBS and proposals for other small-scale experiments have been made. This paper is a review of these activities.
2. WRITING GROUP STUDIES
2.1. Least Squares Models
The developmental work that was carried out during the preparation of American National Standard N15.19 involved a study of criteria for choosing the appropriate linear model to fit to the calibration data. A controversy has long existed on the issue of whether the cumulative model or the classical model for independent data gives the correct results. A basic difference exists in the assumptions regarding the measurement error.
1 8 7

I CALIBRATION со00Random E r r o r System atic E rro r
FIG. 1. Hierarchy o f errors in measurem ents based on a calibration equation.
vans

IA EA -SM -201/25 189
Let Xj[ represent measurements of liquid added to a tank and measurements of the height of liquid level. The fundamental relationship between the tank content and the measured level is assumed to be:
у = a + ЬХ (Eq. 1)where у = measured level
a = у interceptb = slopeX = Xx^; the sum of the measured volumes.The cumulative error model assumes the dependent variable у is measured
without error and attributes to a given point X = Ex- , the measurement error associated with it and all previous points. The classical model assumes the independent variable x is measured without error and that the measurement errors in у are independently and randomly distributed. The appropriate model is the one whose underlying assumptions are more closely satisfied by what is known about the errors affecting the two variables [2].
In the calibration of a tank both x^ and yi are subject to measurement error. The tank is calibrated by adding measured quantities of liquid to the tank and measuring the liquid level. The data of interest in this study were those where the x^ measurements are based on precision provers whose calibration is traceable to the National Bureau of Standards. Under these conditions, x -l measurements of great accuracy can be obtained. However, the sums of the measured x- values, X = Exi( are cumulative in nature. Errors in у are a function of the sensing and response instruments. Typically the larger error is in the measurement.
The criterion adopted by the writing group specifies that the independent model is applicable when precision provers are used and the number of incremental additions for a calibration pass is not large (e.g. 20); and that the cumulative model should be used when the number of incremental additions is large (e.g. 60) or the random errors associated with the incremental additions are appreciable.
2.2. Error Components of the Calibration Equation
The writing group also studied the propagation of the error components in the calibration curve. The hierarchy of error in measurements based on a calibration curve is shown in Figure 1. In the upper portion of Figure 1, the variable X denotes the sum of the measured calibration increments, x^, (i.e.X = Ex^) and the variable у denotes the measured response either liquid level or pressure. In the lower portion of Figure 1, the observed level у is corrected for temperature and density as appropriate and enters the calibration equation as Y. The derived volume or weight factor is X. The least-squares equation relates у and X. The calibration equation which is the equation of use during plant operation relates Y and X. Figure 1 is based on the following concepts:
A. The error in each echelon (primary standards, secondary standards, calibration parameters and volume measurement) includes the error of all higher echelons.
B. The error in the calibration equation is systematically perpetuated in all determinations for which it is used.
C. The error components for a future у measurement include the process precision of the instruments (random error) and the error associated with the calibration equation (systematic error).
2.3. Analysis of Calibration Data
The Writing Group prepared a guide for the statistical treatment of the data. ANSI N15.19 recommends several techniques for evaluating the precision

190 SUD A
o f th e f i t t e d l i n e s and p ro p o s e s th e u se o f a n a ly s is o f c o v a r ia n c e t o c o l l e c t i v e l y t e s t a num ber o f le a s t - s q u a r e s e q u a t io n s t o d e te rm in e w h e th e r a l l th e d a ta p o in t s can be p o o le d to fo rm th e c a l i b r a t i o n e q u a t io n .
3 . ANALYTICAL STUDIES
3 .1 . R e s id u a l E r r o r and th e V a r ia n c e o f th e S lo p e
The c o n d i t io n s u n d e r w h ic h th e c u m u la t iv e and c l a s s i c a l m o d e ls a re ap p l i c a b l e w e re s tu d ie d b y Suda and S hepard [ 3 ] . The tw o in d ic e s o f a c c e p t a b i l i t y ch o se n f o r t h i s a sse ssm e n t w e re th o s e p re s e n te d b y M a nde l i n [ 4 ] , v i z ; 1 ) th e e s t im a te o f th e s ta n d a rd e r r o r o f th e s lo p e , and 2) th e random ness i n th e r e s id u a l e r r o r . M a n d e l n o te s t h a t th e v a r ia n c e e s t im a te o f th e s lo p e g iv e n b y th e i n c o r r e c t m e thod r e s u l t s i n a s e r io u s u n d e r - e s t im a t io n o f th e v a r ia n c e o f th e s lo p e . T h is i s a ca se w h e re th e m inim um v a r ia n c e i s n o t a v a l i d c r i t e r i o n on th e a c c e p t a b i l i t y o f a s t a t i s t i c a l p a ra m e te r . M a nde l f u r t h e r s ta t e s t h a t th e la c k o f ra ndom ness i n th e r e s id u a ls in d ic a t e s th e p re s e n c e o f cu m u la t i v e e r r o r i n th e d a ta . I n [ 3 ] th e a u th o rs s tu d y th e s e p r o p e r t ie s u s in g s im u la t e d c a l i b r a t i o n d a ta and e x p e r im e n ta l d a ta f ro m s e v e r a l s o u rc e s .
3 .2 . S im u la t io n S tu d ie s
S y n th e t ic v a lu e s f o r x , у d a ta p o in t s w e re g e n e ra te d u s in g a de sk comp u te r and a t a b le o f random n u m b e rs . The g e n e r a l iz e d e r r o r e q u a t io n i s :
Y + e = a + b £ ( x . + e ) + e (E q . 2)i у i x t м
w h e re x = a s s ig n e d vo lu m eу = c a lc u la te d l i q u i d l e v e l a = in t e r c e p t b = s lo p e ex = N (0, 1) ax ey = N (0, 1) aye t = f i x e d e r r o r a s s o c ia te d w i t h ta n k im p e r fe c t io n s .
The N (0 ,1 ) a re random n o rm a l d e v ia te s w i t h mean z e ro and v a r ia n c e 1 .I n th e s im u la t io n s tu d y e t was s e t e q u a l t o z e ro and th e e f f e c t s o f ey and ex e x a m in e d . O b s e rv a t io n s o f ex and ey w e re g e n e ra te d b y m u l t ip l y i n g v a l ues o f ax and ay , r e s p e c t i v e l y , b y ra n d o m ly d ra w n n o rm a l d e v ia te s N ( 0 , 1 ) .
M u l t ip l e r e a l i z a t i o n s o f th e c a l i b r a t i o n e x p e r im e n t w i t h a g iv e n s e t o f ax and ay v a lu e s w e re o b s e rv e d b y r e p e a t in g th e p ro c e s s u s in g a new s e t o f N (0, 1) d e v ia te s .
By v a r y in g th e v a lu e s o f ax and ay and u s in g th e same s e r ie s o f N (0 ,1 ) d e v ia te s , cha nges in d e p e n d e n t o f th e random e f f e c t s i n th e s ta n d a rd e r r o r o f th e s lo p e w e re o b s e rv e d .
The r e s u l t s o f t h r e e d i f f e r e n t s t a t i s t i c a l t e s t s f o r c u m u la t iv e e r r o r b a se d on th e e s t im a te o f th e s ta n d a rd e r r o r o f th e s lo p e a re shown i n T a b le I . A l l t h r e e t e s t s c l e a r l y i d e n t i f i e d th e p re s e n c e o f c u m u la t iv e e r r o r i n th e i n d e p e n d e n t v a r ia b le i n th e a b se n ce o f e r r o r i n th e d e p e n d e n t v a r ia b le ( i . e . dy = 0 .0 0 . H o w e ve r, as th e c o n t r i b u t io n o f e r r o r f ro m th e d e p e n d e n t v a r ia b le in c re a s e d t o cry = 0 .1 6 , th e s e n s i t i v i t y d e c re a s e d . The mean s q u a re s u c c e s s iv e d i f f e r e n c e t e s t (MSSD) was fo u n d t o be s e n s i t i v e i n d e t e c t in g s e r i a l c o r r e la t i o n s and t r e n d s and was s u c c e s s fu l i n i d e n t i f y i n g th e e r r o r i n b o th th e v o l ume and l i q u i d d a ta . P r e l im in a r y r e s u l t s o f th e s e s tu d ie s w e re used b y th e ANSI N 15 .19 w r i t i n g g ro u p .
C a r e fu l a t t e n t i o n w as p a id t o th e d i s t r i b u t i o n and b e h a v io r o f th e r e s id u a l e r r o r o f th e s y n t h e t i c d a ta . The a u th o r s fo u n d t h a t , c o n t r a r y t o p o p u la r b e l i e f , th e p re s e n c e o f la r g e c u m u la t iv e e r r o r d id n o t r e s u l t i n a d is p la y o f l a c k o f ra ndom ness i n th e r e s id u a l e r r o r .

IA EA -SM -201/25 191
TA BLE I. SUMMARY OF TE ST RESULTS FOR THE ESTIM A TES OF THE STANDARD ERROR OF THE SLO PE (SYNTHETIC DATA)
O y /a x 0 .0 0 0 .0 4 0 .0 8 0 .1 6
0 .0 0 c , v , h 2 c , V , H2 c , v , h 2
0 .0 2 L c , v , h 2 c , V , H2 c , v , h 2
0 .0 4 LH3 c , V , H2 c , v , h 2
0 .0 8 L LH3
c , v , h 2
0 .1 6 L LH3
C = The a u th o r s ' r a t i o t e s t s n o te d th e p re s e n c e o f c u m u la t iv ee r r o r .
V = MSSD t e s t in d ic a te d d o m in a n t e r r o r i s i n th e v o lu m e .L = MSSD t e s t in d ic a t e s d o m in a n t e r r o r i s i n th e l i q u i d l e v e l . H2 = Second and t h i r d h y p o th e s e s i n th e a n a ly s is o f c o v a r ia n c e
w e re r e je c t e d .H3 = T h i r d h y p o th e s is i n th e a n a ly s is o f c o v a r ia n c e was r e
je c t e d .
4 . FIRST NBS EXPERIMENT
4 .1 . Tank C a l i b r a t i o n a t NBS
The i n i t i a l e x p e r im e n t in v o lv e d th e c a l i b r a t i o n o f a 3 3 0 0 - l i t e r p ro c e s s ta n k b y th e N a t io n a l B u re a u o f S ta n d a rd s . One o f th e g o a ls o f th e ta n k c a l i b r a t i o n e x p e r im e n t was to e v a lu a te th e a c c u ra c y and a p p l i c a b i l i t y o f f i v e d i f f e r e n t l i q u i d - l e v e l m e asu re m en t s y s te m s . T h re e o f th e s e m easurem en t sys te m s in v o lv e d m o d e ls w h ic h a r e r e c e n t a d d i t io n s t o th e in s t r u m e n ts a v a i la b le t o th e n u c le a r in d u s t r y . The seco nd g o a l was t o d e m o n s tra te th e u se o f s t a t i s t i c a l m e th o d o lo g y p re s e n te d i n A m e r ic a n N a t io n a l S ta n d a rd N 1 5 .1 9 .
The re s p o n s e in s t r u m e n ts w e re :
1 . R uska X R -38 P re s s u re C o u n te r . T h is i s th e p r e s s u re in s t r u m e n t NBS a c q u ire d f o r i t s 1970 ta n k c a l i b r a t i o n [ 5 ] . The in s t r u m e n t c o n s is t s o f a b o u rd o n tu b e s e n s o r , s e rv o f o l lo w e r and m e c h a n ic a l c o u n te r .
2 . R uska DDR-6000 D i g i t a l P re s s u re G auge. An im p ro v e d v e r s io n o f th e a b o v e . The in s t r u m e n t c o n s is t s o f a q u a r tz b o u rd o n tu b e s e n s o r and n u l l - f o r c e b a la n c e s e rv o a m p l i f i e r .
3 . B e l l and H o w e ll E le c tro m a n o m e te r (B & H ). The in s t r u m e n t c o n s is t s o f a p r e s s u re b e l lo w s , f o r c e b a la n c e t r a n s d u c e r and s e rv o a m p l i f i e r .
4 . T im e D om ain R e f le c t r o m e t r y (T D R ). The H e w le t t P a c k a rd m o d e l 1 8 0 A /1 8 1 5 A /1 8 1 7 /1 1 0 6 A was o r i g i n a l l y i n s t a l l e d a t th e M id w e s t F u e l R e c o v e ry F a c i l i t y , M o r r i s , I l l i n o i s .
5 . S ig h t G la s s w i t h m i l l i m e t r e g r a d u a t io n . NBS d e s ig n and i n s t a l l a t i o n .
The e x p e r im e n t was c o n d u c te d i n e a r l y 1975 a t th e N a t io n a l B u re a u o f S ta n d a rd s , G a i th e r s b u r g , M a ry la n d . P a r t i a l fu n d in g o f th e e x p e r im e n t was

192 SUDA
p r o v id e d b y EKDA. D a ta ta k in g and m in o r s u p p o r t i n o th e r a re a s was g iv e n b y th e T e c h n ic a l S u p p o rt O r g a n iz a t io n a t BNL. The R uska DDR-6000 and th e B e l l and H o w e ll in s t r u m e n ts w e re lo a n e d a t no c o s t t o NBS b y th e r e s p e c t iv e manuf a c t u r e r s f o r t e s t in g and e v a lu a t io n . TDR in s t r u m e n ts w e re made a v a i la b le b y ACDA. The BDM C o r p o r a t io n , u n d e r c o n t r a c t t o ACDA, s e t up and o p e ra te d th e TDR e q u ip m e n t.
The e x p e r im e n t in v o lv e d e ig h t c a l i b r a t i o n pa sse s and tw o ta n k w e ig h in g s . The f i r s t pa ss was made t o c h e c k th e i n t e g r i t y o f th e b u b b le r l i n e s . The f i l l e d and em p ty w e ig h ts o f th e ta n k w e re o b ta in e d a f t e r th e seco nd pa ss to r e c o n f i r m th e a c c u ra c y a s s o c ia te d w i t h th e p ro c e d u re f o r d e te r m in in g th e i n c re m e n ts o f w a te r . Pass 4 in v o lv e d th e in t r o d u c t io n o f a num ber o f s m a ll i n c re m e n ts o f w a te r t o p r o v id e d a ta on th e s e n s i t i v i t y o f th e in s t r u m e n ts .
P asses f i v e th ro u g h e ig h t w e re d e s ig n e d t o s a t i s f y th e d a ta re q u ire m e n ts o f ANSI N 1 5 .1 9 re g a r d in g th e m in im um o f 16 w a te r in c re m e n ts f o r a c a l i b r a t i o n p a s s .
4 .2 . P re s s u re P ro b e M easu re m en ts
A s e p a ra te b u b b le r l i n e was i n s t a l l e d i n th e ta n k f o r ea ch in s t r u m e n t . E ach b u b b le r l i n e was s u p p l ie d w i t h gas b y a s e p a ra te d r y n i t r o g e n b o t t l e .I n a d d i t i o n , th e DDR-6000 and B&H l i n e s w e re e q u ip p e d w i t h p u rg e ro to m e te rs to a u t o m a t ic a l ly c o n t r o l th e f lo w o f g a s .
D a ta r e c o r d in g f o r th e X R -38 w e re made a t s t i l l c o n d i t io n s and a re a d in g ta k e n as th e b u b b le b ro k e away fro m th e end o f th e b u b b le r l i n e a t th e r a t e o f one b u b b le e v e ry 20 s e c o n d s . T h re e re a d in g s w e re ta k e n a t each p o in t .
C o n d i t io n s f o r th e o th e r tw o p r e s s u re in s t r u m e n ts w e re a t a gas f lo w o f one s ta n d a rd c u b ic f o o t p e r h o u r f o r ea ch b u b b le r l i n e . An RC f i l t e r i n t e g r a t in g th e v o l t a g e o u tp u t o v e r o n e -s e c o n d i n t e r v a l s was r e q u i r e d to p ro d u c e a s te a d y d i g i t a l v o l tm e te r d is p la y . Two re a d in g s o f th e m axim a w e re made f o r each p o in t and in s t r u m e n t . D a ta w e re ta k e n c o n c u r r e n t ly .
C hecks on th e z e ro o f f s e t o f th e p r e s s u re gauges w e re made a t th e end o f ea ch c a l i b r a t i o n p a s s . The b o u rd o n tu b e and m e c h a n ic a l s e rv o s y s te m f o r th e X R -38 w e re " e x e r c is e d " a c c o rd in g to m a n u fa c tu re r re c o m m e n d a tio n s a t th e s t a r t o f each c a l i b r a t i o n d a y . The X R -38 and th e D D R -6000, w i t h no e x e r c is in g , showed n o z e ro o f f s e t f o r a l l c h e c k s m ade. Z e ro o f f s e t on th e B e l l and H o w e ll was t y p i c a l l y 0 .0 7 c e n t im e te r s o f w a te r a f t e r f o u r h o u rs o f o p e r a t io n o f s e m i- c o n t in u o u s l i n e p r e s s u r e . T h is h y s t e r e s is e f f e c t c o u ld p e rh a p s be e l im in a te d b y c y c l in g th e in s t r u m e n t t o f u l l p r e s s u re s e v e r a l t im e s a t th e s t a r t o f each c a l i b r a t i o n ru n .
4 .3 . A n a ly s is o f P re s s u re P ro b e D a ta
The p re s s u re p ro b e d a ta w e re f i t t e d b y th e m e thod o f l e a s t s q u a re s . The r e s id u a l у p l o t s show n o te a b le la c k o f f i t o f th e l i n e a r le a s t - s q u a r e s l i n e s b u t good a g re e m e n t b e tw e e n th e f o u r c a l i b r a t i o n p a sse s and th e th r e e i n s t r u m e n ts . On th e b a s is o f th e s i m i l a r i t y i n th e shape o f th e r e s id u a l у p lo t s f o r th e th r e e in s t r u m e n ts , i t can b e de duced t h a t th e s h o r t - t e r m t r e n d s r e s u l t i n g i n r e l a t i v e l y la r g e f l u c t u a t i o n s a r e n o t due t o th e p r e s s u re i n s t r u m e n ts b u t t o im p e r fe c t io n s i n th e ta n k . I n f a c t , s t r u t s f o r s u p p o r t in g th e b u b b le r l i n e s w e re i n s t a l l e d a t l e v e l s c o r re s p o n d in g to 3 0 0 , 1800 and 2900 k i lo g r a m s w a te r b u t c a lc u la t io n s o f th e d is p la c e m e n t due t o th e s t r u t s does n o t a c c o u n t f o r a l l th e f l u c t u a t i o n . Some la c k o f f i t i s s im p ly due to th e n o n - u n i f o r m i t y o f th e ta n k . T h is i s e r r o r t h a t i s r e p re s e n te d b y th e e t te rm .
The l a r g e s t d e v ia t io n fro m l i n e a r i t y i s a b o u t 0 .1 0 c e n t im e t r e s and i n c lu d e s th e c o n t r i b u t io n o f th e m easurem en t e r r o r i n y . I f th e ta n k had been a p e r f e c t c y l in d e r and i f s t r u t s had n o t b e e n i n s t a l l e d i n th e t a n k , th e ta n k e r r o r , e t , w o u ld h a ve be e n z e r o . I n p r a c t i c e th e ta n k e r r o r i s o f t e n m asked b y th e m e asu re m en t e r r o r i n y .
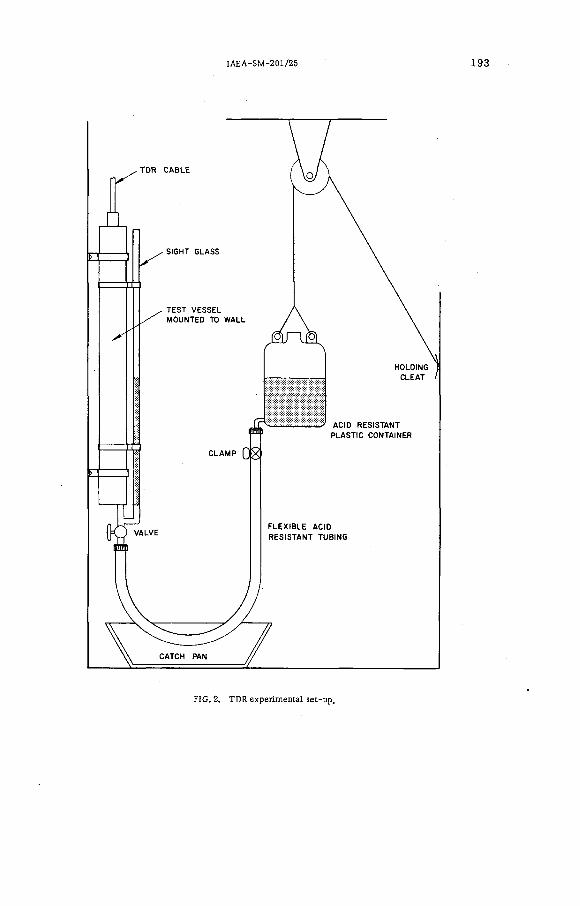
IA EA -SM -201/25 193
FIG. 2. TDR experimental set-up.

194 SUDA
The m easurem en t e r r o r o f у as d e te rm in e d i n [ 6] f ro m th e a g re e m e n t among th e in s t r u m e n ts i s 0 .03 c e n t im e t r e s .
T e s ts o f s ig n i f i c a n c e i n d i c a t e th e t h r e e in s t r u m e n ts ha ve v i r t u a l l y e q u a l p r e c is io n .
4 .4 . S ig h t G la s s and TDR M easu re m en ts
The e x p e r im e n t p r o v id e d e x c e l le n t d a ta on th e p r o p e r t ie s o f s ig h t - g la s s m e a su re m e n ts . I t was o b s e rv e d t h a t th e s ig h t g la s s i s b a s i c a l l y a l i q u i d m anom e te r and as such r e q u i r e s th e same k in d o f m o n i t o r in g , c o n t r o l o r c o r r e c t io n s f o r te m p e ra tu re and d e n s i t y as a l i q u i d m a n o m e te r. The e x p e r im e n t d e m o n s tra te d th e need f o r i n s t a l l i n g te m p e ra tu re s e n s o rs on th e s ig h t g la s s and f o r r e c i r c u l a t i n g pumps o r a i r j e t s f o r m o v in g th e l i q u i d th ro u g h th e s ig h t g la s s . NBS a n a ly s is o f th e d a ta in d ic a t e s t h a t th e p r e c is io n and q u a li t y o f s ig h t - g la s s d a ta w hen p r o p e r ly re d u c e d i s e q u a l t o t h a t o f th e p re s s u re m e a su re m e n ts . NBS i s p r e p a r in g a r e p o r t on th e c a l i b r a t i o n e x p e r im e n t w h ic h in c lu d e s th e a n a ly s is o f s ig h t - g la s s d a ta and th e r e s u l t s o f d e n s i t y p ro b e c a l i b r a t i o n s [ 6] .
The TDR e q u ip m e n t w as o p e ra te d b y BDM i n th e c o a x ia l l i n e m o n i to r in g mode and th e re s p o n s e c u rv e was a u t o m a t ic a l ly p lo t t e d on g ra p h p a p e r . The l i n e m o n i t o r in g re s p o n s e i s a v o l t a g e s te p f u n c t io n w i t h a s h a rp r e t u r n to th e b a se l i n e . M e asu re m en ts o f l i q u i d l e v e l w e re b a se d on th e h o r i z o n t a l d i s ta n c e on th e p l o t f ro m th e im p e dan ce m is m a tc h i n d i c a t i n g th e to p o f th e p ro b e t o a c a l i b r a t e d p o in t w h e re th e c u rv e s t a r t s downw ard due t o a s h o r t i n th e c i r c u i t a t th e s u r fa c e o f th e l i q u i d . The r e s u l t s w e re m a n u a lly re d u c e d b y BDM.
P o in ts o f d i s c o n t i n u i t y w e re n o te d a t p o in t s on th e p ro b e w h e re c e ra m ic s p a c e rs w e re use d t o c e n te r th e in n e r tu b e w i t h i n th e o u te r tu b e . The a c c u r a c y o b ta in e d ra n g e d fro m 1 .2 t o 1 .7 c e n t im e te r s o f l i q u i d l e v e l d e p e n d in g on th e p o s i t io n o f th e l i q u i d l e v e l on th e TDR p ro b e [ 7 ] . The in c o n c lu s iv e r e s u l t s o f t h i s p a r t o f th e e x p e r im e n t le a d t o th e se co n d NBS e x p e r im e n t .
5 . SECOND NBS EXPERIMENT
5 .1 . E v a lu a t io n o f TDR T e c h n iq u e s
The se co n d NBS e x p e r im e n t in v o lv e s o n ly TDR e q u ip m e n t and a s t a in le s s s t e e l ta n k 10 c e n t im e te r s i n d ia m e te r and 2 m e te r h ig h f a b r i c a t e d b y NBS. A s c h e m a tic d ia g ra m o f th e c a l i b r a t i o n s e tu p i s shown i n F ig u r e 2 . A new p ro b e f r e e o f c e ra m ic s p a c e rs and o th e r f a c t o r s c a u s in g im p e dan ce m ism a tch e s was f a b r i c a t e d b y NBS. One o f th e g o a ls o f t h i s e x p e r im e n t i s t o s tu d y th e a f f e c t s o f p ro b e c h a r a c t e r i s t i c s on th e TDR re s p o n s e p a t t e r n s .
The e x p e r im e n t a t th e t im e o f t h i s w r i t i n g i s s t i l l i n p r o g r e s s . D a ta ba se d on w a te r as th e c a l i b r a t i n g l i q u i d ha ve b e e n ta k e n . T h is w as fo l lo w e d b y c a l i b r a t i o n s u s in g n i t r i c a c id and UNH s o l u t io n . A n o th e r g o a l o f t h i s e x p e r im e n t i s t o com pare TDR re s p o n s e p a t t e r n s ba se d on w a te r , n i t r i c a c id and UNH s o lu t io n .
I n th e t h i r d ph ase o f t h i s e x p e r im e n t th e s e n s o r s y s te m w i l l be o p e ra te d i n th e t i m e - i n t e r v a l mode w h e re th e t im e i t ta k e s a n e l e c t r o n i c p u ls e to t r a v e l th e le n g th o f th e c a b le and r e t u r n i s m e a s u re d . D a ta ta k in g i n t h i s mode i s e a s i l y a u to m a te d f o r in s ta n ta n e o u s o n - l i n e m e a su re m e n ts . B ecause th e t i m e - i n t e r v a l mode does n o t p r o v id e a n y in f o r m a t io n on th e i n t e g r i t y o f th e l i n e , l i n e m o n i to r in g d a ta m u s t s t i l l b e c o l le c t e d i f c o n t in u e d c h e c k s on th e i n t e g r i t y o f th e l i n e i s t o be m a in ta in e d . The id e a l s y s te m w o u ld in c o r p o r a t e b o th o f th e s e f e a tu r e s and w o u ld in v o lv e a m in i c o m p u te r t o s t o r e th e c a l i b r a t i o n t r a c e and d a ta f o r m e asu re m en t p u rp o s e s and t o s t o r e s e v e r a l o f th e m o s t r e c e n t t r a c e s f o r m a k in g ju d g e m e n ts a b o u t th e i n t e g r i t y o f th e l i n e s .

IA EA -SM -201/25 195
B ecause th e a c c u ra c y o f th e t i m e - i n t e r v a l m e asurem en ts does n o t depend on th e s iz e o f th e g ra p h and s in c e many o b s e r v a t io n s can b e o b ta in e d i n a fe w m ic ro s e c o n d s , th e p r e c is io n o f th e s e d a ta i s e x c e l l e n t . T e c h n iq u e s w h ic h a l lo w d a ta t r a n s l a t i o n fro m one c a l i b r a t i o n p o in t t o a n o th e r a p p e a r t o be needed to make t h i s a f u l l s e r v ic e s y s te m . These re m a in t o be d e v e lo p e d .
P r e l im in a r y d a ta a n a ly s is show im p ro v e d r e s o lu t i o n w i t h th e new p ro b e . C o n t ra r y t o e x p e c ta t io n s ba sed on u n p u b lis h e d f in d in g s o f o th e r TDR t e s t in g , no s i g n i f i c a n t s h i f t o r change o f s lo p e on th e downward p o r t i o n o f th e c u rv e was o b s e rv e d due t o th e u se o f d i f f e r e n t c a l i b r a t i n g l i q u i d s . I n th e f i n a l a n a ly s is o f th e m easurem en t d a ta , a c c u ra c y a p p ro a c h in g t h a t o f th e p re s s u re p ro b e s i s a n t i c ip a t e d .
6. CONCLUSIONS
I t ha s b e e n shown t h a t s u f f i c i e n t l y p r e c is e m e asu re m en ts o f l i q u i d i n la r g e p ro c e s s ta n k s can be a c h ie v e d u s in g p re s s u re p ro b e s and fo r c e b a la n c e e le c t ro m a n o m e te rs . The l i m i t i n g f a c t o r on th e c a l i b r a t i o n e r r o r o f a ta n k w i l l g e n e r a l ly depend on th e im p e r fe c t io n s and n o n - u n i f o r m i t y o f th e ta n k w h ic h a re s y s te m a t ic i n n a tu r e a t a g iv e n l e v e l o f th e ta n k . I n d u s t r y a c c e p te d c a l i b r a t i o n p ro c e d u re s a r e c o n ta in e d i n ANSI S ta n d a rd N 1 5 .1 9 . A u to m a ted d a ta r e c o r d in g and d i g i t a l o u tp u t f e a tu r e s a re a v a i la b le u s in g e le c t r o m a nom e te rs , th e re b y e l im in a t i n g e r r o r s due t o p a r a l l a x and f a u l t y r e a d in g s o f w a te r m anom e te rs and e r r o r s due t o t r a n s c r i p t i o n .
The a p p ro a c h to ta n k c a l i b r a t i o n s h o u ld be t h a t o f d e te r m in in g th e a c t u a l ta n k c o n f ig u r a t io n as w e l l as th e goodness o f th e f i t t o a l i n e a r m o d e l. I f th e d e p a r tu r e fro m l i n e a r i t y o f th e t r u e ta n k g e o m e try adds o n ly n e g l i g i b l y to th e s y s te m a t ic e r r o r o f th e m e a su re m e n t, th e n th e l i n e a r c a l i b r a t i o n m o d e l s h o u ld be u se d .
The ra n g e o f c a l i b r a t i o n e r r o r (o n e s ta n d a rd d e v ia t io n ) f o r e le c t r o m a nom e te rs i s 0 .0 3 t o 0 .0 5 c e n t im e te r s o f w a te r . U s in g f o r c e b a la n c e e le c t r o m a nom e te rs th e l i m i t i n g f a c t o r on th e c a l i b r a t i o n e r r o r o f a ta n k w i l l gene r a l l y depend on th e im p e r fe c t io n s and n o n - u n i f o r m i t y o f th e ta n k .
The u se o f TDR sys te m s b y in s p e c to r s f o r m o n i to r in g and v e r i f y i n g th e c o n te n t o f in p u t and o u tp u t ta n k s a t w e t c h e m ic a l f a c i l i t i e s a p p e a rs t o be p r a c t i c a l w i t h th e l i m i t o f e r r o r s l i g h t l y l a r g e r th a n t h a t f o r e le c tro m a n o m e t e r s .
F u tu re t e s t s o f p r e s s u re p ro b e s ys te m s and w a te r , n i t r i c a c id and UNH s o lu t io n s w i l l depend on th e a v a i l a b i l i t y o f a s u i t a b le s e tu p a t an o p e r a t in g f a c i l i t y . F a c i l i t i e s a t NBS a r e l i m i t e d and e x i s t i n g c o n d i t io n s do n o t p e r m i t a la r g e - s c a le s e tu p f o r su ch t e s t in g . S tu d ie s on th e d r a in t im e o f R a s c h ig r i n g p a cke d v e s s e ls h a ve be en p ro p o s e d .
A d d i t io n a l t e s t s on c o r r e c t io n f a c t o r s a p p l ie d t o th e d a ta re m a in t o be m ade. O p e ra t in g d a ta fro m a c h e m ic a l p r o c e s s in g p la n t show t h a t th e p r e s s u re p ro b e re a d in g s r i s e as th e s o lu t io n i n th e ta n k c o o ls [ 8] . T h is i s th e o p p o s i te e f f e c t o b s e rv e d w i t h th e l i q u i d l e v e l . I n [ 8] i t i s c o n je c tu re d t h a t th e lo w e r p ro b e re a d in g a t th e h ig h e r te m p e ra tu re i s due s o le l y to th e c r o s s - s e c t io n a l e x p a n s io n o f th e ta n k . I t i s a rg u e d t h a t th e v e r t i c a l exp a n s io n o f th e ta n k and b u b b le r tu b e e lo n g a t io n i s s e l f - c a n c e l i n g . An e x p e r i m ent t o t e s t t h i s h y p o th e s is ne eds t o be p e r fo rm e d .
F i n a l l y , th e e le m e n ts o f a m easurem en t q u a l i t y c o n t r o l p ro g ra m need to b e s p e c i f ie d and t e s te d and a s tu d y made on th e l i m i t o f e r r o r c a lc u la t io n s b a se d on th e a p p ro a c h p re s e n te d i n F ig u r e 1 . C le a r l y , th e t e s t s p e r fo rm e d b y NBS, ERDA and ACDA do n o t a c c o u n t f o r random e r r o r o f su ch in s t r u m e n ts due to p la n t o p e r a t in g c o n d i t io n s . The m e thod s f o r c o m b in in g th e s e e r r o r s a lo n g w i t h th e c a l i b r a t i o n , s a m p lin g and a n a l y t i c a l c h e m is t r y e r r o r s t h a t make up th e e r r o r a s s o c ia te d w i t h th e SNM c o n te n t o f a ta n k ne ed t o be s p e c i f ie d .

196 SUDA
ACKNOWLEDGEMENTS
I t i s a p le a s u re to a ckn o w le d g e th e w o rk do ne b y members o f th e Mass and V olum e S e c t io n o f th e N a t io n a l B u re a u o f S ta n d a rd s . I w is h t o th a n k James W h e ts to n e , R andy S c h o o n o v e r, Jo h n H o u se r and H a r r y Ku o f NBS, L o r in S t i e f f o f ACDA and B a r r e t t P a rs o n s o f BDM C o r p o r a t io n f o r t h e i r c o n t r ib u - t io n s .
My s p e c ia l th a n k s t o Don S hepard o f A t l a n t i c R i c h f i e ld H a n fo rd Company f o r h i s s u g g e s t io n s and a s s is ta n c e o v e r th e p a s t t h r e e y e a rs i n s t a t i s t i c a l m e thod s and d a ta a n a ly s is .
REFERENCES
[1 ] A m e r ic a n N a t io n a l S ta n d a rd N 1 5 .1 9 , V o lum e C a l i b r a t i o n T e c h n iq u e s f o r N u c le a r M a t e r ia l C o n t r o l , A N S I, New Y o rk (1 9 7 5 ) .
[ 2 ] JAECH, J . L . , S t a t i s t i c a l M e thod s i n N u c le a r M a t e r ia ls C o n t r o l , T ID 2 6 2 9 8 , U .S . G ove rnm ent P r i n t i n g O f f i c e , W a s h in g to n , D .C . (1 9 7 3 ) 1 2 9 -1 3 0 .
[ 3 ] SUDA, S .C . , SHEPARD, D . F . , E f f e c t s o f M e asure m en t E r r o r i n L in e a r C a l i b r a t i o n E q u a t io n s , BNL 5 0 4 3 2 , B ro o k h a v e n N a t io n a l L a b o r a to r y , U p to n , New Y o rk (1 9 7 5 ) .
[ 4 ] MANDEL, J . , The S t a t i s t i c a l A n a ly s is o f E x p e r im e n ta l D a ta , I n t e r s c ie n c e P u b l is h e r s , Jo h n W ile y and S ons, New Y o rk (1 9 6 4 ) 2 9 5 -3 0 3 .
[ 5 ] SCHOONOVER, R .M ., HOUSER, J . F . , P re s s u re Type L iq u id L e v e l G auges, NBS 1 0 3 9 6 , N a t io n a l B u re a u o f S ta n d a rd s , W a s h in g to n , D .C . (1 9 7 0 ) .
[ 6] SCHOONOVER, R .M ., KU, H . , WHETSTONE, J . , HOUSER, J . F . , L iq u id L e v e l I n s t r u m e n ta t io n i n V o lum e C a l ib r a t io n s , NBS, t o be p u b l is h e d .
[ 7 ] PARSONS, B .B . , F ie ld T e s t and E v o lu t io n o f T im e D om ain R e f le c t r o m e t r y (TDR) L iq u id L e v e l M o n i to r f o r S a fe g u a rd U se , BDM C o r p o r a t io n , t o be p u b l is h e d .
[ 8] SUDA, S .C . , T h e rm a l E x p a n s io n i n th e V o lum e o f a P ro c e s s V e s s e l, NFS, D ecem ber (1 9 6 6 ) , u n p u b l is h e d r e p o r t .
D IS C U SS ION
G. ROUSSEL: In the volume calibration for an im perfect cylinder doesn't one need to rep lace a le a st-sq u a res calibration line by a curve calculated with a seven or eight degree polynomial?
S.C . SUDA: I would have strong reservation s about fitting any tank calibration data with a seven or eight degree polynomial. Nor would I know how to handle the e r ro r analysis if, for instance, the tank had been calibrated using water and was being used to m easure UNH solutions. At this point we a re out of the area of p recise m easurem ents.
On the other hand, if I w ere dealing with a tank which had multiple sectio n s, I would divide the tank into regions and fit each region with a straight lin e, if such w ere possible. I have found data for which a second- or th ird -ord er polynomial provided a better fit than a straight line and have made use of them. In fitting data with h igher-ord er equations, the calibrating liquid should closely approximate the m easuring liquid since tem perature and density correction s are com plicated in this case .
J .L . JAECH : F u rth er to M r. R ou ssel's question, it has occurred to me that if the data a re truly cumulative in nature, the plotted points might give the appearance of being non-linear and one might consequently be led to fit the data with a higher-ordered polynomial, when in fact the relationship is lin ea r. However, since you mention at the end of Section 3.2

IA E A -SM -201/25 197
that your sim ulation studies did not show a lack of random ness in the residual data — which su rp rises m e, incidentally, — my observation may not be valid. Would you ca re to comment?
S.C . SUDA: The sim ulation studies that I perform ed in collaboration with M r. Shepard1 produced some resu lts that w ere unanticipated. This was one of them. By using the sam e se r ie s of random unit norm al deviates and increasing the e r ro rs in x in succeeding runs, we w ere able to sim ulate ever la rg e r deviations from the straight line. The point is that the la rg e r e r ro rs in x increased the amplitude of the deviations; they did not change the order of the signs of the residual e r ro rs . I will be happy to send you a copy of the rep ort containing these resu lts as soon as it is re leased .
C.G. HOUGH: The cumulative e r ro r model has two p ractica l advantages over the independent e r ro r model. One is that when the models are inverted to pred ict volume from an observed level reading, the slope and intercept estim ates and the residual e r ro r estim ates a re the sam e, whereas this is not true for the independent model. Second, when a tank has two regions with different slopes, it is much ea s ie r to jo in the two lin es together using the cumulative model, w hereas the independent model may jo in together at points which do not coincide with the engineering drawings. Hence, even though the te st for cumulative e r ro r is not significant, wouldn't there be advantages in retaining the cumulative model - especially since the b asic p rocess of adding weighed increm ents of liquid is a cumulative p ro cess?
As a side comment, I would mention that we made extensive calibration te sts using w ater and UNll on a re a l tank at Hanford alm ost 28 y ears ago.We cam e to the conclusion that the independent model seriou sly underestim ated the e r ro rs , so I am surprised at your Monte C arlo re su lts .
S.C . SUDA: Since I am presupposing the use of a computer to perform the le a st-sq u a re s calcu lations, the additional calculations of the slope and intercept for the inverted equation and the associated estim ate of variance should present no problem . The calculations are straightforw ard and are given in ANSI N15.19. I don't believe that ease of calculation, in this day and age of the com puter, is a good cr ite r io n for choosing a m athem atical model.
With regard to your second point relating to a tank which has two regions and the problem of determ ining the point of in tersection of the two lin es , since the le a st-sq u a res estim ates of the cumulative model are based only on the f ir s t and la s t point, determ ination of the exact c ro ss -o v e r point becom es very im portant and may be difficult to effect if the transition region is not sharp and w ell-defined. The method for calibrating this so rt of tank is not to co lle ct data in the transition region, but to le t the two le a st-sq u a re s fits determ ine the point of in tersection . In the use of the tank the tran sition region should, of cou rse, be avoided, but when a m easu rement has to be made in that region the operator should rem em ber that the e r ro r estim ates for the point will requ ire sp ecial computations.
In response to your side comment I have found, in the analysis of my own calibration data and the data of o thers, that with the cumulative model I am hard put to decide which data point should be made the la s t one. If I stop too la te , I norm ally find m yself in the cu rvilinear header region of the tank, which will resu lt in a seriou s system atic e r ro r in the cen tra l
1 Ref. [ 3] of the paper.

198 SUDA
region. If I stop early , how can I avoid using the tank outside the region of calibration? These problem s do not ex ist with the independent model. My experience is that the independent model gives valid estim ates of the variance under specified conditions. The value of the sim ulation studies is that they were used to define these conditions.

IA EA -SM -201/1
E V A L U A T I O N O F A G A M M A - S P E C T R O S C O P Y G A U G E F O R U R A N I U M - P L U T O N I U M A S S A Y
A. NOTEA, Y , SEGAL Technion-Israel Institute of Technology,Haifa, Israel
Abstract
EVALUATION OF A GAMMA-SPECTROSCOPY GAUGE FOR URANIUM-PLUTONIUM ASSAY.A procedure is presented for the characterization of a gamma passive method for non-destructive
analysis of nuclear fuel. The approach provides an organized and systematic way for optimizing the assay system. The key function is the relative resolving power defined as the smallest relative change in the quantity of radionuclide measured that may be detected within a certain confidence level. This function is derived for nuclear fuel employing a model based on empirical parameters. The ability to detect changes in fuels of binary and trinary compositions with a 50-cm 3 Ge(Li) at a 1-min counting period is discussed. As an example to a binary composition, an enriched uranium fuel was considered. The 185-keV and 1001-keV gamma lines are used for the assay of 235U and 238U, respectively. As a trinary composition a plutonium- containing fuel was examined. The plutonium was identified by the 414-keV gamma line. The interference of the high-energy lines is carefully analysed, and numerical results are presented. For both cases the range of measurement under specific accuracy demands is determined. The approach described is suitable also for evaluation of other passive as well as active assay methods.
1 . INTRODUCTION
П 2 lThe em p loym e n t o f p a s s iv e gamma s p e c t r o s c o p y 1 ’ J f o r th e a s s a y o f
f u e l c o m p o s it io n i s m a in ly a t th e p r o d u c t io n s ta g e o f f u e l e le m e n ts . The
m a in d ra w b a ck i n th e use o f t h i s m e th o d i s th e a b s o r p t io n i n th e f u e l and
th e c la d d in g . The a b s o r p t io n i s a f u n c t io n o f th e e m it te d p h o to n e n e rg y ,
th e c o m p o s it io n and g e o m e try o f th e sam p le ( p e l l e t s , p in s , e t c . ) and i t s
d e n s i t y . I n m e ta l f u e l th e mean f r e e p a th a t 185 keV i s 0 .0 4 cm, t h a t o f
414 keV i s 0 .2 cm and t h a t o f 1 MeV i s 0 .7 cm. H ence , th e e n e rg y s p e c tru m
o f p h o to n s e m it te d fro m th e sam p le s u r fa c e d i f f e r s c o n s id e r a b ly f ro m t h a t
e x p e c te d fro m n u c le a r d a ta . F o r hom ogeneous sam p les t h i s d i f f i c u l t y i s
ove rcom e b y u s in g s ta n d a rd s f o r th e c a l i b r a t i o n o f th e gauge s y s te m .
In th e p r e s e n t p a p e r a m e thod f o r th e e v a lu a t io n o f th e p e r fo rm a n c e o f
a ssa y s ys te m s i s d e s c r ib e d . The a p p ro a ch e n a b le s th e c o m p a r is o n o f sys te m s
and th e d e s ig n o f an o p t im a l gauge f o r a s p e c i f i c f u e l c o m p o s it io n .
The u s e fu ln e s s o f th e c o n c e p ts i s d e m o n s tra te d f o r th e assa y o f a, . - . 235 , 238,, , „ . 235,, 238,, .b in a r y f u e l c o m p o s it io n : U and U , and a t r i n a r y o n e : U , U and 239239
P u, w i t h a s p e c i f i c g a u g e .
199

200 NOTEA and SEGAL
2 . CHARACTERISTICS OF THE ASSAY SYSTEM
The m o s t c o m p le te in f o r m a t io n t h a t may b e o b ta in e d fro m a gamma assa y
s y s te m a b o u t th e com ponents i n th e f u e l i s th e p u ls e - h e ig h t s p e c tru m . The
m a jo r e le m e n ts c o m p r is in g th e s p e c tru m a re th e t o t a l a b s o r p t io n p e a k s , th e
Com pton d i s t r i b u t i o n s and th e b a c k g ro u n d . The e n e rg y d i s t r i b u t i o n o f
p h o to n s im p in g in g on a d e t e c t o r may b e o b ta in e d b y p r o c e s s in g th e p u ls e -
h e ig h t s p e c tru m u s in g th e s p e c t ro m e te r re s p o n s e s t o m o n o e n e rg e t ic p h o to n[3 ]
beams . The d e t a i le d in f o r m a t io n a c q u ire d i n t h i s way i s som ew hat cum
b e rs o m e , w h i le f o r n o n - d e s t r u c t iv e a n a ly s is o f f u e l le s s in f o r m a t io n i s
r e q u i r e d . H e n ce , in s te a d o f a m u lt id im e n s io n a l s p e c t ro m e te r re s p o n s e
f u n c t i o n , th e f o l lo w in g fe w c h a r a c t e r i s t i c s a re u s u a l l y enough t o d e s c r ib e
th e re s p o n s e o f th e a ss a y s y s te m :
a ) in tr in s ic peak efficiency e^ : r a t i o b e tw e e n th e num ber o f c o u n ts
a t th e f u l l e n e rg y j p e a k t o th e num ber o f p h o to n s w i t h e n e rg y E .
h i t t i n g th e s p e c t ro m e te r s u r f a c e . On d e a l in g w i t h f u e l com ponent
w h ic h e m its s e v e r a l h ig h i n t e n s i t y p h o to n s w i t h e n e rg ie s i n a n a rro w
span' i t i s c o n v e n ie n t t o u se as " e f f i c i e n c y " th e "w h o le g ro u p
e f f i c i e n c y " . T h is e f f i c i e n c y i s d e f in e d as th e r a t i o o f c o u n ts i n th e
" c ro w d " p h o to p e a k s ra n g e t o th e nu m ber o f p h o to n s , b e lo n g in g t o t h i s
g ro u p , w h ic h h i t th e s p e c t ro m e te r .
b ) maximum height o f peak : h e ig h t o f t o t a l a b s o r p t io n pe a k
i n p u ls e - h e ig h t s p e c tru m (se e F ig . 1 ) .
c ) height of Compton " ta i l" : h e ig h t o f Com pton d i s t r i b u t i o n
m e asu re d a t lo c a t io n j , due to 'p h o to n s o f e n e rg y E ^ , (se e F ig . 1 ) .
d) Compton to peak ratio" j i
t h i s r a t i o i s d e f in e d as
nj i
C . . /P .j i l ( 1 )
d e n o te s th e c o n t r i b u t io n o f p h o to n s w i t h h ig h e r e n e rg ie s th a n E^
e m it te d fro m th e same r a d io n u c l id e as j .
e ) resolution r.1
i t s m axim um, (s e e F ig . 1 ) .
w id th ( i n keV ) o f th e pe ak a t h a l f

IA EA -SM -201/1 201
PU LSE HEIGHT
FIG. 1. Schematic presentation of a pulse-height spectrum composed of superposition of m photon energies lines.
f ) b a c k g r o u n d l e v e l ^ j o ' c o n t r ib u t io n o f p h o to n s e m it te d n o t
fro m th e sam p le u n d e r i n v e s t ig a t i o n to th e c o u n ts le v e l u n d e r pe ak j ,
(s e e F ig . 1 ) . The b a c k g ro u n d i s s p e c i f ie d i n c o u n ts p e r i n t e r v a l o f
t im e p e r keV .
The above p a ra m e te rs a re o b ta in e d d i r e c t l y f ro m c a l i b r a t i o n m e a su re
m e n ts . These v a lu e s e n a b le a s y s te m a t ic and o r g a n iz e d a p p ro a c h t o th e
c h a r a c t e r i z a t io n and o p t im iz a t io n o f a f u e l a s s a y s y s te m .
3 . MODEL DERIVATION
The m o de l r e f e r s t o th e a n a ly s is o f a sa m p le com posed o f m n u c l id e s .
The s p e c t r o m e te r 's c h a r a c t e r i s t i c s m e n tio n e d i n th e p r e v io u s p a ra g ra p h a re
e m p lo y e d as g iv e n v a lu e s i n th e ra n g e s o f i n t e r e s t . I t i s assumed t h a t th e
b a c k g ro u n d i s i n v a r i e n t d u r in g th e m e a s u re m e n t-p e r io d , and t h a t i t s
s p e c tru m as a f u n c t io n o f th e p u ls e h e ig h t i s kno w n .
The p u ls e - h e ig h t s p e c tru m p re s e n te d i n F ig . 1 i s d e s c r ib e d as a s u p e r
p o s i t io n o f th e re s p o n s e s t o n gamma l in e s and a b a c k g ro u n d .

202 NOTEA and SEGAL
The highest energy peak is indicated by 1 and the lowest energy by m.
emitted from the sample surface, and thus the gauge response might be defined a s :
where G is a geometry factor.
When many samples are analyzed the responses may essen tia lly be obtained by:
(a) employing a pulse-height multichannel analyzer with an on-line computer which determines the response to x. from the areas in a defined range.
(b) use of scalers and single-channel analyzers. The scalers provide the counts in each peak range and from these values the response is determined.
In both approaches the area of the to ta l absorption peak which is taken for R(Xj) is usually not the en tire area. The fraction of the area which is counted is controlled by the width of the peak, in other words, the "window opening" should be defined. As the peak is superimposed on the level composed of background and Compton ta i ls contributions, the width has a d irect influence on the s t a t is t ic a l accuracy of the measurements.
The response of the testing system and it s accuracy are combined by re la tiv e resolving power fu n c tio n ^ which serves for the characterization and optimization of the system. The re la tiv e resolving power of the system for the detection of is defined as the sm allest re la tiv e change in thephoton emission rate that may be detected with a certain confidence level.
R(x.) G e .x. 1 1
(counts/unit time)j = 1 , 2 , . . . , m
(2 )
Pr (Xj) = /2 bc[R (x..)]/X j (6R/6Xj) (3)
where a(R) - standard deviation in Rb - constant determined by the confidence level required.
e .g . b = 1 for confidence level of 68.3%,b = 2 for 95.5%.

lA E A -SM -201/1 203
I f the uncertainty in the response may be attributed mainly to s t a t is t ic a l flu ctuation , then
a [R (x .)] = {[R (x .) + 2 B . ] / t } 1 / 2 (4)
where - number o f counts due to background and Compton ta i ls underthe peak j . (Counts per unit tim e).
t - counting in terv a l. For sim plicity i t was assumed in theabove equation that the counting duration of B is equal to the counting period of the sample.
The value o f B. is obtained by summation over a l l the contributions of the 1
Compton ta i ls belonging to d ifferent photon energies j > i .
B.3 Г
Л =nB ..
31 (S)
where i = 0 refers to background component.
The B „ values depends on the window width chosen for the peak j .I t is convenient to express the width in units o f the energy resolution r ^ .
width of peak i = a .r . .J ] (6 )
The constant a is chosen by the designer of the system.
The terms B ^ of eq. (5) are expressed as a function of C„ (the average height of the i component contribution to the level under peak j ) (see Fig. 1) by the re lation
B .. J i
a .r . C.. J 1 J i ( j > i) (7)
The units of C ^ are counts per energy in terv a l. Substituting eqs. (2 ),(4 ), (5) and (7) in (3) y ield s:
Pr ( X j ) ± b t G e.x.
J. J■ G e.x. + 2 a .r .
J 1 3 1 t Ci i1 / 2 (8 )

204 NOTEA and SEGAL
FIG. 2. Pulse-height spectrum of 95% enriched 235U in the energy range up to 300 keV.
The re la tiv e resolving power presented in eq. 8 serves as a criterion for the s u ita b ility of d ifferent measuring systems for analysis of a sp e cific fuel composition. On the other hand,eq. 8 may also be used for specifying the required performance o f the spectrometer and i t s associated e lectro n ics. As the system performance is specified by Рг (х^), i t turns out that on specifying the constraint
Pr (x .) £ q (9)
The designer has to choose a system for which the parameters G, e^., ,r_., and t f u l f i l the condition. Solving the inequality (9) yields
the range of that might be measured within the imposed constraint.
4. BINARY COMPOSITION FUEL
The use of the model described above is illu stra te d here for a fuelcomposed of two components. The two components may be radionuclides which
23S 238belong eith er to the same element, e .g . U and U, or to d ifferent 239 238elements e .g . Pu and U. The more detailed discussion is given for
enriched uranium fuel assayed by a Ge(Li) spectrometer o f 50 cm 3. The content 235of U is determined through the in tensity of the 185 keV line and that of
238U from the 1001 keV of 2 3 4 raP a ^ . The emission rate of the 185 keV ,4 235not considering s e l f absorption, is about 4 * 10 y/sec per gram of U
and that of 1001 keV is about 75 y/sec per gram of 2 3 8 u^7^.

IAEA-SM -201/1 205
FIG. 3. Pulse-height spectrum of natural uranium in the energy range up to 300 keV.
The count-rate level under the 1001 keV is mainly background C.^,while that under the 185 keV is the sum of background C^g and Comptondistributions of the 1001 keV, 767 keV and a few extra minor in tensity lines
238in i t s v ic in ity ; these lines are emitted from the decay chain of U. Inaddition, there are the Compton distributions of the low in tensity lines in
235the v ic in ity o f 200 keV from U and very low contributions from i t s decay235chain. The contribution of the U lines with energies above 185 keV is
235demonstrated in Fig. 2 for a thin sample of 95% enriched U. The contri- 2 38bution of U high-energy photons under the peak of 185 keV is presented
in Fig. 3 in which the spectrum from natural uranium is shown.
Usually, the photopeak can be represented quite sa tis fa c to r ily by a Gaussian d istribu tion . For a Gaussian peak whose area is normalized the maximum height is given by 1 /s^ * 2 тГ , where s^ is the standard deviation of the distribution
s. = Г ./2 .3 6 ( i = 1 , 2 , . . . , m) ( 1 0 )
The maximum height of an unnormalized peak of area n is expressed by:
pi = ni / s i m ( i d
The width of the peak a. determines the fraction f . of the to ta ll lcounts in the peak that w ill be used in the analysis. The value f^ is

206 NO'TEA and SEGAL
termed in the following as the "window e ffic ie n cy ". Hence, the response
given by eq. (2) may also be expressed by
RCxj) f .n.1 1
(12)
From eqs. (1 0 ) , (11) and (12 ):
P. 2.36 R< V
J b . r i f i(13)
From equations (1 ) , (2 ) , (7) and (11) the following expression is obtained:
„ 2 .36 r ei XiB .. = -------G a . r .n . . —^ Ш ^ ^ r i f i
(14)
Now the re la tiv e resolving power eq. (8) has the form:
P (x .) = r r - F ^ - — (G e.x. + 1.88G a.r. r v У / t G e ^ 1 j j ] ]
e. x. l lc. J i10 , L ix r . f . J i= l J l i
1 / 2 (15)
When a certa in value q is imposed fo r the re la tiv e resolving power the
lower lim it fo r the measurement of x^ is obtained through eqs. (9) and
(15).
Xjlim tGe.q.^1 + 1 + 3 .76 f . tGa.
J
j-1 E . X .1 1
. г . С. * I Д . . - Уl A j o H r . f .1 / 2 (16)
I t is c le a r th at the lowest lim it of detection is presented by q = 1
because beyond i t the re la tiv e resolving power is above 100%.
The optima] window width suggested by Ross 8 H a r r i s ^ is 1 .25 times the resolu tion ; th is value is a t about a th ird of the peak height. With th is width the window efficien cy is f^ = 0 .8 5 , which is determined by integratin g
over the Gaussian d istrib u tio n . Confidence level of 68.3% corresponds to
b = 1.

IA EA -SM -201/1 207
TABLE I : Numerical Values Used for the Calculation of the
Relative Resolving Power for the Binary Fuel Composition, According to Eqs. (18) and (19)
Indicationxl {x 38> x2 (x 3s)
Radionuclide 238u 235
Photon energy (keV) 1001 18S
Emission ra te (Photons/sec. g) 754
4.10
Geometrical efficien cy Ge 3.2 x l(T 4 2 .7 x i o '3
Energy resolution (keV) 3 2
Compton to peak ra tio s - Л21 = 3
- n22 = 0 .1
Background (c p s /keV) c io = ° - 2 C20 = 2
Counting period (sect ) 60 60
With these values eq. (IS) turns to
1 / 2
P (x.)г У
(— —) rG6 j 1/ j - 1 П ■ • £
1X . + 2 .7 7 г . С. + У - Ü - 1
x.3 3 n j o i = i r i
£ .3
power for 1001 keV of 234mPa is
x.1 / 2
(17)
7 1 / 2 . 1 / 2
W = Ц ? Cxi + 2 ' 77ri c io> (18)

208 NOTEA and SEGAL
FIG. 4. The relative resolving power for the detection of 238U as a function of its quantity in the sample, in presence of different background levels. Self-absorption effects were not considered.
235To obtain the re la tiv e resolving power for the 185-keV line of U the235 238contributions from the background B2Q U and U gamma lines have to
be taken into account. The in ten sity ra tio s between the photon lines
emitted from the same radionuclides are taken constant when a sp e cificseries of samples are analyzed. Hence, an e ffe c tiv e value of might be
used. This quantity represents the to ta l contributions from the lines of the 238и decay chain to the level under the 185-keV peak, re la tiv e to the
height of the 1001-keV photopeak.
The re la tiv e resolving power fo r the detection of the 185-keV line is
given by:
w 2 1 / 2 1 r_i— ) —4 g c 2 J x 2
Л. 1 ^ 2 2
X 2 + 2 - 7 7 r2(C20 + ^ f 4 Xl + 7T X:1 / 2
(19)
The values n21 and migbt be obtained from calib ration withstandard samples id en tica l in geometry with the samples to be examined. Sometimes an in e rt m aterial should be added to simulate s e lf absorption.
The re la tiv e resolving power was calculated fo r a system possessing238the ch a ra c te ris tics presented in Table I . The Pr (x p fo r U calculated

IA EA -SM -201/1 209
FIG. 5. The relative resolving power for the detection of 33SU as a function of its quantity in the sample, in presence of different quantities of 238U. Self-absorption was not considered.
according to eq. 18 is shown in Fig. 4 . In the figure the photon ra te - x1238 ^was transformed to grams of U and was indicated by x . The influence ofJO
background on the P (x ) is demonstrated by changing i t from 0 to 2 cps/keV.Г Oo
For Р^Сх^д) = 100% and counting time of 60 sec . the lower lim it of
detection is 1 .4 g for a background level of zero. This value increases to 1 .7 g when the background increases to 2 cps/keV.I t is worthwhile to in d icate th at under the sta ted counting duration, even a sample of 100 g cannot.be determined with b e tte r than 10%.
Increasing the counting time by a fa c to r of 10^ ( i .e . 1 .67 hours) improves
the P (x . ) by one order of magnitude.X jo
235In Fig. 5 Pr C ^ or U (calculated according to equation (19)) ispresented. Here also the photons emission ra tes were transformed to grams
235 238of U (X ) and U (x ) . Due to the high photon emission ra te from235 :,0238 238U re la tiv e to th at of U, the presence of U in terfere with the
235 238assay of U quantities only below 1 gram. In con trast to U, 100 grams235of U can be determined with an accuracy of 0.2% (6 8 .3 confidence level
and 60 sec. counting tim e).
The photon flu x emitted from a sample depends on i t s geometry, density
and cladding due to s e lf absorption and sca tte rin g . These e ffe c ts w ill

210 NOTEA and SEGAL
TABLE I I : Numerical Values Used for the Calculations of the
Relative Resolving Power for Trinary Fuel Composition,
According to Eqs. (18 ), (19) and (20)
Indication Xl (x383 W X3^X35-*
Radionuclide 238U 239_Pu 235u
Photon energy (keV) 1001 414 185
Emission ra te (Photons/sec. g) 75 2 x 1044
4 x 10
Geometrical efficien cy Ge 3.2 x 10~4 1.1 x 1 0 '3 2 .7 x 1 0 '3
Energy resolution (keV) 3 2 .5 2
Compton to peak ra tio s - n21 = 0.35 n31 = 3
- n22 = 0.02 1132 = ° - 6
- - лзз = о л
Background (c p s /keV) 0 .2 1 2
Counting period (sec ) 60 60 60
modify the numerical values of the emission ra te s , geometrical efficien cy
and Compton to peak r a t io s , which are lis te d in Table I . I t is obvious
th at parameters appearing in Table I have to be determined fo r each counting
system.
5. TRINARY COMPOSITION FUEL
The three component matrix to be dealt w ith, is plutonium-uranium fu el. I t is assumed th at the plutonium in the investigated series of samples is
taken from the same batch and thus i t s isotopic composition is constant.

IA EA -SM -201/1 211
FIG. 6. The relative resolving power for the assay of a39Pu in presence of 238U. Self-absorption was not taken into account.
239 240 241 242This assumption turns the various isotopes Pu, Pu, Pu and Pu to 239 239one unit represented by Pu. The quantity of Pu added to the enriched
uranium is checked through the detection of the 414-keV lin e , whereas the
level of enrichment is determined by measuring the lines previously men-OTC
tioned: 135 keV for U and 1001 keV for U.
The re la tiv e resolving power for 1001 keV has the same form as eq. 18.
239The 414-keV photopeak of Pu is " s it t in g " on contributions from the 238higher U lines and the plutonium lin e s . The to ta l contributions from the
238lines of U decay chain is characterized by n91, which describes the ra tio238between the counts level due to U under the 414-keV line re la tiv e to the
height of 1001-keV lin e . The to ta l contribution from the higher lines of 239Pu and the other plutonium isotopes is indicated by n^ 2 • This quantity
is the ra tio between the contributions under the 414 keV and i t s height.
The expression fo r the re la tiv e resolving power for the 414-keV line of 239Pu is id en tica l with th at of eq. (1 9 ).
235The re la tiv e resolving power of the 185-keV gamma line of U depends238on the contributions from the U and the plutonium lin es . The contribu- 238
238tion of the lines from U to the count level under the 185 keV expressed

212 NOTEA and SEGAL
FIG. 7. Relative resolving power for 235U assay in presence of 238U and 239Pu. Self-absorption was not considered.
as a ra t io to the height of the 1001-keV line is indicated by n ^ . The
contributions of plutonium lines re la tiv e to the maximum height of the
414-keV line is n32- лзз the re la tio n between the number of counts dueto the lines of 235U and the 185-keV maximum height. Using these indications
the P2 x3 :''s turned from eq. (17) to be:
P (x„)г 4 У2 1 / 2 1
(— — 1 —tGe3 x3 X3 + 2 ' 77Ы с зоn31 fl_ x ]_32 z_ 2 _ x
r l E3 Xl + r 2 e3 * 2'33 1 / 2
239 235The re la tiv e resolving power functions for the assay of Pu and U
were determined by employing eqs. (19) and (20) with the numerical values239presented in Table I I . Figure 6 presents рг (хзд) of Pu in presence of
various quan tities of 2^ \ l . The presence of 235ц almost does not contribute239to the counts under the 414 keV of Pu. Therefore the curves in Fig. 6
are sim ilar to those of Fig. 5 . I t is seen from Fig. 6 th at th e 're la tiv e239 235resolving power of Pu is worse by about a fa c to r c f 2 than th at of U
238in presence of U, (see Fig. 5 ) .
235The accuracy of U measurement does not depend on the quantity of238 235U for samples containing more than one gram of U, (see F ig . 7 ) .
239However, the accuracy is highly sen sitive to the presence of Pu in the
sample.

IA EA -SM -201/1 213
6 . DISCUSSION
The approach presented here is not sp e c ific to gamma passive methods, and i t may be used for the evaluation of other passive or active methods.On considering an assay method the response function R and the error a(R) associated with i t has to be determined. The knowledge of these two functions enables the determination of Pr . The re la tiv e resolving power is a powerful tool for comparing the performance o f various assay systems independent of the physical principles they are based on. Knowing the dependence of on the design parameters o f the system enables anoptimization through proper choice o f detectors, counting geometry and operating conditions of the system.
R E F E R E N C E S
[1] AUGUSTON, R.H., e t a l . , Development of techniques for active and passive assay of fissionable m aterials, "Safeguards Techniques",I.A.E.A. Vienna, 1970, Vol. I I , p. 53.
[2] RASMUSSEN, N.C., A review of passive methods, Proc. Symp.Safeguards Research and Development, Rep. WASH 1147 (1969) 96.
[3] HEATH, R .L ., HELMER, R.G., SCHMITTROTH, L.A., CAZIER, G.A.,IDO-17017 USAEC (April 1965).
[4] NOTEA, A., SEGAL, Y ., A general approach to the design of radiation gauges, Nuclear Technology 24_, (1974) 73.
[5] ROSS, D.A., HARRIS, C.C., "Measurement o f rad io activ ity ", chap. V, Principles o f nuclear medicine (Wagner, H.N., J r . , Ed),W.B. Saunders Co., London (1968).
[6 ] WALTON, R .B ., WHITTED, E . I . , FORSTER, R.A., Gamma-Ray assay of low- enriched uranium waste, Nuclear Technology 24, (1974) 81.
[7] LEDERER, C.M., HOLLANDER, J .M ., PERLMAN, I . , "Table of Isotopes", John Wiley 8 Sons, In c ., New York (1968).


A D V A N C E D I N S T R U M E N T A T I O N F O R N U C L E A R M O N I T O R I N G *
IA EA -SM -201/24
G. ARMANTROUT, A. McGIBBON,S. SWIERKOWSKI, J. SHEROHMAN, J. YEE Lawrence Livermore Laboratory,University of California,Livermore, California,United States of America
Abstract
ADVANCED INSTRUMENTATION FOR NUCLEAR MONITORING.Research on semiconductor radiation detectors is described. Computational models were developed
to calculate the energy band structure, carrier mobility, and carrier lifetim e of proposed detector materials, and a computer spectrum simulation that accurately predicts the potential performance of the materials as detectors. The paper also reports on a self-contained, field-portable spectrometer for laboratory-grade pulse-height analysis of gam m a-ray spectra suitable for use under extreme environmental conditions and isolated locations by personnel not trained in electronics.
INTRODUCTION
E f f e c t i v e c o n t r o l o f n u c le a r m a t e r ia ls depends on th e a c c u ra te d e t e c t io n , i d e n t i f i c a t i o n , and q u a n t i f i c a t io n o f r a d io a c t i v e is o to p e s . The a b i l i t y t o p e r fo r m th e s e o p e r a t io n s depends on th e r a d i a t i o n d e te c to r and th e s p e c tro m e te r s y s te m t h a t p ro c e s s e s th e s ig n a l fro m th e d e t e c t o r . We a re d e v e lo p in g d e te c to r s a t LLL f o r use i n n u c le a r f u e l in v e n to r y c o n t r o l ; o n - l i n e m o n i to r in g i n f u e l r e p r o c e s s in g p la n t s and u ra n iu m m i l l s ; q u a n t i t a t i v e a n a ly s is o f i n t e n t i o n a l o r a c c id e n t a l r e le a s e s o f r a d i o a c t i v i t y v i a g a seous d is c h a r g e s , c o o l in g e f f l u e n t , o r p a r t i c u l a t e m a t t e r ; and n u c le a r m a t e r ia ls c o n t r o l i n f i e l d c o n d i t io n s . These o p e r a t io n s r e q u i r e d e te c to r s w i t h h ig h r e s o lu t io n and s e n s i t i v i t y , and a re o f t e n b e s t m e t w i t h f i e l d - p o r t a b le s p e c tro m e te r s y s te m s . We r e p o r t th e re s e a rc h on s e m ic o n d u c to r d e te c to r s a t LLL and th e d e v e lo p m e n t o f a p u ls e - h e ig h t a n a ly z e r f o r use i n f i e l d c o n d i t io n s .
RADIATION DETECTORS
An ‘ ‘ i d e a l ’ ’ d e te c to r g e n e ra te s an a n a lo g s ig n a l t h a t i s an e x a c t r e p r e s e n t a t io n o f th e y - r a y e n e rg y in c id e n t upon th e d e t e c t o r . I n p r a c t i c e , th e i n t e r a c t i o n b e tw e e n th e y - r a y and th e d e te c to r ( in c lu d in g su ch e f f e c t s as Com pton s c a t t e r i n g and a n n i h i l a t i o n q u a n ta g e n e r a t io n ) m o d i f ie s c o n s id e r a b ly th e e n e rg y a c t u a l l y d e p o s ite d i n th e d e t e c t o r . T h is d e p o s ite d e n e rg y ca u se s i o n i z a t i o n t h a t m u s t be sen sed by e x t e r n a l e le c t r o n i c s . I n th e case o f s e m ic o n d u c to r d e t e c t o r s , t h i s i o n i z a t i o n i s c o l le c t e d a t th e te r m in a ls o f th e d e te c to r and in t e g r a t e d f o r ea ch e v e n t . P re s e n t d e te c to r s d i s t o r t th e s e n s in g o f t h i s v e r y s m a ll s i g n a l , and p ro d u c e a s i g n i f i c a n t s p re a d in th e in d ic a t e d y - r a y e n e rg y .
* This work was performed under the auspices of the US Energy Research and Development Administration.
215

216 ARMANTROUT et a l.
S c i n t i l l a t o r d e te c to r s can be r e l a t i v e l y la r g e (up t o 1 ms) , can be o p e ra te d a t a m b ie n t te m p e r a tu r e , and have th u s fo u n d w id e a p p l i c a t io n . H o w e ve r, t h e i r r e s o lu t i o n i s c o m p a ra t iv e ly p o o r , m a k in g r a d io i s o t o p i c id e n t i f i c a t i o n and q u a n t i f i c a t i o n m ore d i f f i c u l t o r im p o s s ib le b e cause o f t h e i r i n a b i l i t y t o s e p a ra te a d ja c e n t y - r a y s and to d is c r im in a t e a g a in s t b a ck g ro u n d c o u n ts . S e m ic o n d u c to r ge rm an ium d e te c to r s , by c o n t r a s t , ha ve e x c e l le n t - e n e rg y r e s o lu t i o n (up t o tw o o rd e rs o f m a g n itu d e b e t t e r th a n th e s c i n t i l l a t o r s ) b u t a re l i m i t e d by t h e i r vacuum and c ry o g e n ic re q u ire m e n ts w h ic h make t h e i r a p p l i c a t i o n t o p o r t a b le sys te m s v e r y d i f f i c u l t . New s e m ic o n d u c to r d e te c to r m a t e r ia ls w i t h o u t th e s e d is a d v a n ta g e s a re b e in g re s e a rc h e d .
A p p ro a c h t o D e te c to r R e s e a rc h
We need t o know w h ic h c h a r a c t e r i s t i c s o f a m a t e r ia l a f f e c t i t s p e r fo rm a n c e as a d e t e c t o r ; how new d e te c to r m a te r ia ls a re b e s t i d e n t i f i e d ; and i f an im p ro v e d d e te c to r m a t e r ia l w i l l p e r fo r m b e t t e r th a n a v a i la b le s c i n t i l l a t o r s . T h is l a s t q u e s t io n i s c o m p le x b e cause f a c t o r s su ch as r e l a t i v e p h o to e le c t r ic /C o m p to n i n t e r a c t i o n p r o b a b i l i t y m u s t be c o n s id e re d i n a d d i t io n t o e f f i c i e n c y and r e s o lu t i o n . O th e r c o m p l ic a t in g f a c t o r s in c lu d e s iz e , f r a g i l i t y , s t a b i l i t y , c o n v e n ie n c e , and c o s t .
The m a t e r ia l p r o p e r t ie s o f g r e a te s t im p o r ta n c e a re th e a to m ic num ber o f th e d e te c to r m a t e r i a l , th e e f f e c t iv e n e s s w i t h w h ic h th e io n iz e d c h a rg e can be t r a n s p o r te d , th e p re s e n c e o f b a c k g ro u n d i o n i z a t i o n ( n o is e ) , and th e u n i f o r m i t y o f re s p o n s e o v e r th e t o t a l vo lu m e o f th e d e te c to r .
F o r th e e f f i c i e n t d e t e c t io n o f y - r a y s , a h ig h a to m ic num ber e le m e n t i s ne eded b e ca u se th e c r o s s - s e c t io n f o r th e p h o t o e le c t r i c i n t e r a c t i o n i s p r o p o r t io n a l t o Z 5. T h u s , we c o n s id e r p r o m is in g o n ly th o s e e le m e n ts i n w h ic h Z i s g r e a te r th a n 48 . The r e d u c t io n o f b a c k g ro u n d i o n i z a t i o n r e q u i r e s th e u se o f la r g e b a n d g a p , Eg , ( g r e a t e r th a n 1 .5 eV) s e m ic o n d u c to rs and i n s u la t o r s . H o w e ve r, th e in c r e a s e i n bandgap i s r e la t e d t o an in c re a s e i n c r y s t a l i o n i c i t y , w h ic h in c re a s e s p o la r l a t t i c e s c a t t e r i n g , s e v e r e ly l i m i t s c h a rg e c a r r i e r m o b i l i t y , and th u s in d ic a t e s a l i m i t o f Eg le s s th a n 2 .0 eV. These c o n d i t io n s (Z g r e a te r th a n 48 and 1 .5 eV < Eg < 2 .0 eV) p la c e r e s t r i c t i v e l i m i t s on new m a t e r ia ls . An even s t r o n g e r r e s t r i c t i o n i s th e c h a rg e c o l l e c t i o n re q u ire m e n t o f th e s e m a t e r ia ls . C harge c o l l e c t i o n depends on th e m o b i l i t y o f th e c h a rg e c a r r i e r s ( e le c t r o n s and h o le s ) and on th e r e l a t i v e e x c i t e d - s t a t e l i f e t i m e o f th e s e c a r r i e r s .
A s u rv e y o f th e in f o r m a t io n on s e m ic o n d u c to r m o b i l i t i e s and l i f e t i m e s shows v e r y fe w p r o m is in g m a t e r ia ls a s id e fro m ge rm an ium and s i l i c o n . O f th e s e o th e r m a t e r ia ls , c o n s id e ra b le em p h a s is has been p la c e d on cadm ium t e l l u r i d e and g a l l iu m a r s e n id e w i t h m ore r e c e n t w o rk b e in g done on m e rc u r ic io d id e . [ 1 - 3 ] H o w e ve r, l i t t l e in f o r m a t io n on c a r r i e r m o b i l i t y o r l i f e t i m e i s a v a i la b le f o r many o f th e compound s e m ic o n d u c to rs h a v in g m easu re d o p t i c a l e n e rg y bandgaps i n th e d e s ir e d ra n g e . Some o f th e s e m a t e r ia ls , su ch as b is m u th t r i - i o d i d e , may show p ro m is e as d e te c to r m a t e r ia ls . H o w e ve r, s u b s t a n t i a l e f f o r t , t im e , and money w o u ld be r e q u i r e d t o g ro w ea ch m a t e r ia l and e v a lu a te i t i n te rm s o f i t s p o t e n t i a l use as a d e t e c t o r .
We ha ve ta k e n an a l t e r n a t e a p p ro a c h and have d e v e lo p e d a num ber o f c o m p u ta t io n a l m o d e ls t o s e le c t new m a t e r ia ls f o r c o n s id e r a t io n and to comp a re t h e i r u l t im a t e e f f e c t iv e n e s s w i t h a v a i la b le d e te c to r s . The co m p u ta t i o n a l a p p ro a c h in v o lv e s tw o p o r t io n s . F i r s t , we d e v e lo p e d th e m o d e ls and c o m p u te r codes needed t o c a lc u la t e th e e n e rg y band s t r u c t u r e , c a r r i e r m o b i l i t y , and c a r r i e r l i f e t i m e o f th e s e m a t e r ia ls . The r e s u l t s o f th e s e c o m p u ta t io n s p r o v id e th e p r e v io u s ly unknow n d a ta needed t o d e te rm in e th e p o t e n t i a l u se o f th e m a t e r ia l as a d e t e c t o r . S econ d , we d e v e lo p e d codes f o r s im u la t in g th e a c t u a l p e r fo rm a n c e o f th e m a te r ia ls as d e te c to r s . These a r e c o m p re h e n s iv e cod es t h a t p r o v id e f o r th e y - r a y p h y s ic s in t e r a c t i o n s and d e te c to r g e o m e t r ic a l e f f e c t s , and a ls o in c lu d e th e e f f e c t s o f n o n - id e a l iz e d c h a rg e t r a n s p o r t i n th e m a t e r ia l .

IAEA-S М -201/24 217
FIG. 1. An experimental spectrum taken with a 20-mm3 cadmium telluride detector for a m ixed57 Co and 241Am source (A), and a computer generated simulation of the same spectra (B).
C a lc u la te d and E x p e r im e n ta l R e s u lts
Band s t r u c t u r e s and m o b i l i t i e s w e re c a lc u la te d w i t h th e codes f o r s e v e r a l m a t e r ia ls . The r e s u l t s s u g g e s t t h a t p o t e n t i a l d e te c to r m a t e r ia ls i n c lu d e cadm ium s e le n id e , b is m u th t r i - i o d i d e and t i n s e le n id e - s u lp h id e [S n S e x S (2 -X) b These m a te r ia ls ha ve c a lc u la te d c h a rg e t r a n s p o r t p r o p e r t ie s b e t t e r th a n m e r c u r ic i o d id e , w h ic h i s a lr e a d y a u s e f u l d e te c to r f o r X - r a y s and lo w -e n e rg y y - r a y s .

218 ARMANTROUT et a l.
FIG. 2. A 137 Cs spectrum taken with a 0 .77-cm 2 X 0 .2-mm-thick mercuric iodide detector operating at 700-V bias.
The c o m p u te r s p e c tru m s im u la t io n ( . p a r t i a l l y d e s c r ib e d , i n an e a r l i e r p u b l i c a t i o n [ 4 ] ) p r e d ic t s q u i t e a c c u r a te ly th e p e r fo rm a n c e o f p r e s e n t d e te c to r s . An exa m p le o f th e a c c u ra c y o f s u ch a s im u la t io n i s shown i n F ig . 1 , w h ic h com pares th e s im u la te d and e x p e r im e n ta l s p e c t r a f o r a c a d m ium t e l l u r i d e d e te c to r w i t h a m ix e d 57C o and 21,1 Am s o u rc e .
An e xa m p le o f th e p a r a m e t r ic s tu d ie s t h a t ha ve been c o n d u c te d i s m e rc u r ic io d id e d e te c to r r e s o lu t i o n as a f u n c t io n o f th ic k n e s s and c h a rg e - c o l l e c t i o n e f f i c i e n c y f o r 137Cs. The r e s u l t s in d ic a t e t h a t an im p ro v e m e n t f a c t o r o f 50 i n c h a rg e c o l l e c t i o n i s needed f o r good d e te c to r r e s o lu t io n i f re a s o n a b le e f f i c i e n c y i s t o be r e ta in e d .
A c tu a l g ro w th and a p p l i c a t io n o f new d e t e c t o r m a t e r ia ls i s a n e c e s s a ry p o r t i o n o f o u r d e te c to r d e v e lo p m e n t p ro g ra m . E x te n s iv e g ro w th o f new m a te r i a l s has been d e la y e d p e n d in g th e f i n a l r e s u l t s o f o u r a n a l y t i c a l e f f o r t . H o w e ve r, s i g n i f i c a n t r e s u l t s have been o b ta in e d a t LLL w i t h m e r c u r ic io d id e d e te c to r s [ 5 ] and w o rk i s c o n t in u in g f o r s p e c ia l a p p l i c a t io n s . An i n d i c a t i o n o f th e p r e s e n t c a p a b i l i t y o f i n m e r c u r ic io d id e d e te c to r p e r fo rm a n c e i s shown i n F ig . 2 . The s p e c tru m i s f o r l3 7 Cs and was ta k e n w ith , a m e r c u r ic io d id e d e te c to r 0 .7 7 cm2 b y 0 .2 mm t h i c k . The c r y s t a l was grow n and k i n d l y s u p p l ie d b y H e in z S c h o lz o f P h i l l i p s R e s e a rc h L a b o r a t o r ie s , A a ch e n , F e d e r a l R e p u b l ic o f G e r m a n y . 1I n t e r e s t in g fe a tu r e s in c lu d e r e s o lu t i o n b e t t e r th a n t h a t o f a so d iu m io d id e s c i n t i l l a t o r and th e p re s e n c e o f a f lu o r e s c e n t X - r a y esca pe p e a k b e lo w th e 6 6 2 -ke V y - r a y b e cause o f th e th in n e s s o f th e d e t e c t o r . W h ile s i g n i f i c a n t d e v e lo p m e n t w o rk re m a in s , t h i s i s i n d i c a t i v e o f th e p e rfo rm a n c e t h a t can be e x p e c te d w i t h h ig h -Z s e m ic o n d u c to rs .
R e fe re n c e t o a company o r p r o d u c t name does n o t im p ly a p p ro v a l o r r e c om m end a tion o f th e p r o d u c t by th e U n iv e r s i t y o f C a l i f o r n i a o r th e U .S . E n e rg y R e s e a rc h and D e ve lo p m e n t A d m in is t r a t io n t o th e e x c lu s io n o f o th e rs t h a t may be s u i t a b le .

IAEA-SM -201/24 219
FIG. 3. Photograph of the complete spectrometer system, showing the storage compartment for the detector and the tripod and data-recording camera which are carried in the lid.
GAMMA SPECTROMETER SYSTEMS
The L a w re n ce L iv e rm o re L a b o ra to r y H a za rd s C o n t r o l D e p a rtm e n t has s p e c i f i c need f o r f i e l d - p o r t a b l e e q u ip m e n t i n d e a l in g w i t h n u c le a r a c c id e n ts . H o w e ve r, a v a i la b le e q u ip m e n t c a n n o t i d e n t i f y s p e c i f i c is o to p e s i n f i e l d c o n d i t io n s w i t h o u t la b o r a to r y - g r a d e in s t r u m e n ts r e q u i r i n g la r g e b a t t e r i e s , po w e r c o n v e r to r s , and v e h ic le s . The H a za rd s C o n t r o l D e p a rtm e n t th u s p ro p o s e d b u i l d in g a f i e l d - p o r t a b l e s p e c tro m e te r c a p a b le o f s o p h is t ic a te d p u ls e - h e ig h t a n a ly s is . The p r o t o t y p e , c o m p le te d i n f a l l 1 9 7 3 , i s c o m p le te ly p o r t a b le , s e l f - c o n t a in e d , and has some o f th e c o m p u ta t io n a b i l i t y o f c o m p u te r a n a ly z e rs ( F ig . 3 ) .

220 ARMAN TROUT et al.
FIG. 4. Front panel of the spectrometer, showing the easy system to use keyboard and the graphical and numerical displays.
D e s c r ip t io n
The s p e c tro m e te r c o n ta in s a 2 5 6 -c h a n n e l p u ls e - h e ig h t a n a ly z e r t h a t d i s p la y s th e s p e c t r a i n e n e rg y (ke V ) u n i t s ; a 50 x 50-mm i n t e r n a l so d iu m io d id e d e t e c t o r : a c h a rg e a m p l i f i e r ; a h ig h - v o l t a g e s u p p ly f o r th e d e t e c t o r ; a d a ta r e c o r d in g ca m e ra ; a 4 0 - d i g i t n u m e r ic a l d is p la y c o u p le d w i t h a 30 * '50-mm c a th o d e - ra y tu b e g r a p h ic a l d is p la y ; and re c h a rg e a b le b a t t e r i e s . I t i s 204 x 280 x 560 mm and w e ig h s 19 k g : s m a ll enough t o be c a r r ie d on a c o m m e rc ia l a i r l i n e and l i g h t enough f o r one p e rs o n t o t r a n s p o r t c o m f o r t a b l y . T h e u n i t m e e ts th e M IL s ta n d a rd 810B t r a n s p o r t a t io n s p e c i f i c a t i o n f o r h a n d - c a r r ie d e q u ip m e n t.
F ig u r e 4 i s a p h o to g ra p h o f th e c o n t r o l p a n e l . B ecause th e in s t r u m e n t i s d e s ig n e d f o r a s p e c i f i c p u rp o s e , th e r e a re fe w c o n t r o ls . ( L a b o r a to r y in s t r u m e n ts a re d e s ig n e d t o w o rk i n many modes and t o i n t e r f a c e w i t h o th e r s y s te m s . We com prom ised t h i s f l e x i b i l i t y f o r s im p le o p e r a t io n and co n s t r u c t i o n p u rp o s e s . ) The s m a ll num ber o f c o n t r o ls makes th e w e a th e rp ro o f s e a l in g m ore e f f e c t i v e . K e y b o a rd s w itc h e s a re w a te r p r o o f , and e a s ie r t o use th a n r o t a r y s w itc h e s . The u n i t w i l l o p e ra te i n te m p e ra tu re s o f -3 0 t o 70°C i n 95% h u m id i t y , and i s ‘ ‘ s p la s h p r o o f . ’ ’ F o r o p e r a to r s w e a r in g b u lk y g lo v e s , a s p e c ia l t o o l i s p r o v id e d t o d e p re s s th e k e y b o a rd s w itc h e s and t o a d ju s t th e p o te n t io m e te r s .
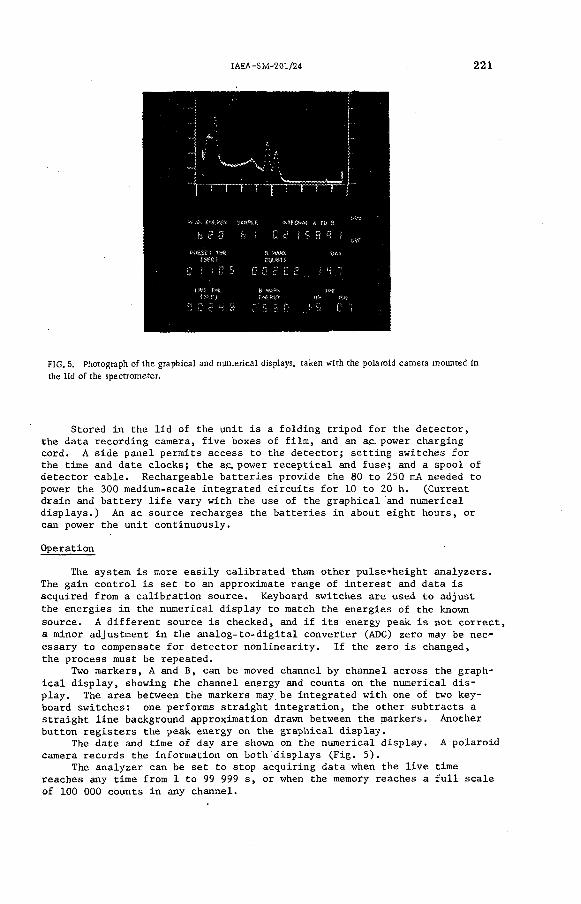
IA E A -SM -201/24 2 2 1
FIG. 5. Photograph of the graphical and numerical displays, taken with the polaroid camera mounted in the lid of the spectrometer.
S to re d i n th e l i d o f th e u n i t i s a f o ld in g t r i p o d f o r th e d e t e c t o r , th e d a ta r e c o r d in g ca m e ra , f i v e bo xe s o f f i l m , and an ac. po w e r c h a rg in g c o rd . A s id e p a n e l p e r m its a cce ss to th e d e t e c t o r ; s e t t in g s w itc h e s f o r th e t im e and d a te c lo c k s ; th e a.c. p o w e r r e c e p t i c a l and fu s e ; and a s p o o l o f d e t e c t o r c a b le . R e c h a rg e a b le b a t t e r i e s p r o v id e th e 80 t o 250 mA ne eded to po w e r th e 300 m e d iu m -s c a le in t e g r a t e d c i r c u i t s f o r 10 t o 20 h . ( C u r re n t d r a in and b a t t e r y l i f e v a r y w i t h th e use o f th e g r a p h ic a l and n u m e r ic a l d i s p la y s . ) An ac s o u rc e re c h a rg e s th e b a t t e r i e s i n a b o u t e ig h t h o u rs , o r can p o w e r th e u n i t c o n t in u o u s ly .
O p e ra t io n
The s y s te m i s m ore e a s i l y c a l ib r a t e d th a n o th e r p u ls e - h e ig h t a n a ly z e r s . The g a in c o n t r o l i s s e t t o an a p p ro x im a te ra n g e o f i n t e r e s t and d a ta i s a c q u ire d fro m a c a l i b r a t i o n s o u rc e . K e yb o a rd s w itc h e s a re use d t o a d ju s t th e e n e rg ie s i n th e n u m e r ic a l d is p la y to m a tch th e e n e rg ie s o f th e known s o u rc e . A d i f f e r e n t s o u rc e i s c h e c k e d , and i f i t s e n e rg y p e a k i s n o t c o r r e c t , a m in o r a d ju s tm e n t i n th e a n a l o g - t o - d i g i t a l c o n v e r te r (ADC) z e ro may be n e c e s s a ry t o com pensa te f o r d e t e c t o r n o n l i n e a r i t y . I f th e z e ro i s ch a n g e d , th e p ro c e s s m u s t be re p e a te d .
Two m a rk e rs , A and B , can be moved c h a n n e l b y c h a n n e l a c ro s s th e g ra p h i c a l d is p la y , s h o w in g th e c h a n n e l e n e rg y and c o u n ts on th e n u m e r ic a l d i s p la y . The a re a b e tw e e n th e m a rk e rs may be in t e g r a t e d w i t h one o f tw o k e y b o a rd s w itc h e s : one p e r fo rm s s t r a i g h t i n t e g r a t io n , th e o th e r s u b t r a c t s as t r a i g h t l i n e b a c k g ro u n d a p p ro x im a t io n draw n be tw e e n th e m a rk e rs . A n o th e r b u t t o n r e g i s t e r s th e p e a k e n e rg y on th e g r a p h ic a l d is p la y .
The d a te and t im e o f day a re shown on th e n u m e r ic a l d is p la y . A p o la r o id cam era r e c o rd s th e in f o r m a t io n on b o th d is p la y s ( F ig . 5 ) .
The a n a ly z e r can be s e t t o s to p a c q u i r in g d a ta when th e l i v e t im e re a c h e s any t im e fro m 1 t o 99 999 s , o r when th e memory re a c h e s a f u l l s c a le o f 100 000 c o u n ts i n any c h a n n e l.

222 ARMANTROUT e t al.
The detector is intended for operation in its protective well, but can be hung from the tripod, which is carried in the cover. Other types of detectors, such as germanium or mercuric iodide, may be used if compatible with the charge sensitive preamplifier. High voltage to the detector is supplied on the same cable as the returned signal and must be capacitively coupled if the user is not interested in using the high voltage provided.
SECOND-GENERATION SPECTROMETER SYSTEM
Many changes were suggested by potential users of the spectrometer, and as a result, the prototype will not be produced. Instead, these changes are included in the design of a second-generation analyzer now under construction. The more important features of the second-generation analyzer are listed below.
• 1024- or 256-channel operation• Four groups of 256 channels, which may be moved, added, or subtracted
• Eight MHz ADC clock rate• Optional use of newly developed semiconductor radiation detectors• Log or linear display• New energy multiplier circuit of the form: Displayed energy of channel = (channel No.)(keV/channel const) + keV offset
• SX70 Polaroid camera to photograph the displays; fully automatic operation produces ten photos in 20 s if desired
• FSK telemetered data output to an analog tape recorder or through the telephone system
• The analyzer will stop on preset live-time, on preset count in a specific channel, or on overflow in any channel.
• The amplifier gain is shown on the numerical display and is controlled in seven binary steps from the keyboard.
• Coincidence input for sophisticated measurements• 48 digit numerical light emitting diode display• Only one calibration run is necessary to set energy readout.• The sodium iodide detector is rugged and protected against temperature changes.
• The fiberglass case is waterproof and unbreakable.• The analyzer meets military transportation specifications.• The unit is lighter.• The unit is protected from salt spray environments.
R E F E R E N C E S
[1]. Ponpon, J. P. , e t a l . , ‘ ‘P ro p e r t ie s o f Vapour Phase Grown M e rc u r ic Io d id e S in g le C r y s t a l D e t e c t o r s , ’ ’ IE E E T ran s. N u c l. S e i . , N S -2 2 ,No. 1, p. 182 (1 975 ).
[2|. M i l l e r , G. S. , “ A B r ie f Review of Recent Advances in Compound Sem icon ' d u c to r s f o r R a d ia t io n D e t e c t o r s , ’ ’ IE E E T ran s. N u c l. S e i . , N S -1 9 ,No. 1, p. 251 (1 972 ).
[3] . Malm, H. , et. a l . , “ Gamma Ray E f f ic ie n c y Com parison f o r S i ( L i ) , Ge,CdTe, and H g l D e t e c t o r s , ” IE E E T ran s. N u c l. S e i . , N S -2 0 , No. 1, p. 500 (1973)7
[4] . Sw ie rk o w sk i, S. P . , and A rm antrou t, G. A ., “ P ro g n o s is f o r H igh -ZSem iconductor D e t e c t o r s , ” IE E E T ran s. N u c l. S e i . , N S -2 2 , No. 1, p. 205 (1 975 ).
[5] . Sw ie rk o w sk i, S. P. , A rm antrou t, G. A . , and W ichner, R. , “ RecentAdvances w ith H g l2 X -Ray D e t e c t o r s , ” IE E E T ran s. N u c l. S e i . , N S -2 1 , No. 1, p. 302 (1 97 4 ).

IAEA-SM-201/46
GAMMA-RAY SPECTROMETRY FOR IN-LINE MEASUREMENTS OF 235U ENRICHMENT IN A NUCLEAR FUEL FABRICATING PLAN
P. MATUSSEK, H. OTTMAR Institut für Angewandte Kernphysik, Kernforschungszentrum Karlsruhe,Karlsruhe,Federal Republic of Germany
Abstract
GAMMA-RAY SPECTROMETRY FOR IN-LINE MEASUREMENTS OF 235U ENRICHMENT IN A NUCLEAR FUEL FABRICATING PLANT.
The non-destructive enrichm ent assay technique using gam m a-ray spectrometry has been applied for in - lin e m onitoring the 235U enrichm ent in a LWR fuel fabricating plant. The in - lin e system measures con tinuously the enrichm ent o f low -enriched U 0 2 powder prior to p e lle tiz in g with re lative precisions and accuracies o f es at two sigm a. The precisions obtained during a continuous four-w eek run are consistent with counting statistics proving the system 's insensib ility to environm ental influences. The e ffec t o f variable sam ple age upon the assay accuracy has been studied in more d etail both at laboratory and at fie ld sites. If present, it can be elim in ated through proper calibration procedures. A new calibration technique based upon reference sam ples having the same enrichm ent but different age has been successfully used to calibrate the in - lin e system .
1. INTRODUCTIONThe spectrometry of the 185.7 keV gamma ray emitted in the radioactive
decay of 235tj has proven a valuable method to measure nondestructively the 235U enrichment in a variety of uranium-bearing nuclear materials. Due to its simplicity, nondestructive character, speed and low cost the gamma- spectrometric enrichment measurement is now increasingly being used as an alternative or complementary method to conventional analysis procedures.The technique is generally applied whenever the immediate availability of an assay result is desired. The accuracies now attained in gammaspectro- metric enrichment analyses on certain categories of uranium materials compare well to that available in analytical techniques.
Like other nondestructive assay techniques,the enrichment measurement using gamma-ray spectrometry appears well suited for in-line application in nuclear facilities providing thereby not only relevant real time information for safeguards hut also economic benefits through its potential employment for continuous process and quality control measurements.The convincing in-line demonstration of this ambivalent potential of nondestructive assay techniques seems to he a promising way to accelerate their deployment in nuclear facilities.
In this paper an in-line system will be described which continuously measures the 235u enrichment of low-enriched UO2 powder in a LWR fuel fabricating plant. In the course of implementing an appropriate measurement system for this particular purpose the response of different types of instruments to various factors related both to inherent properties of the
2 2 3

2 2 4 MATUSSEK and OTTMAR
material being assayed and to extraneous factors determined Ъу the system's environment,have been carefully studied. In particular, the effect of variable sample age upon the assay result has been investigated in more detail for the practical case of evaluating the 235u enrichment from Hal spectra by means of the normal two-window technique. Äs a result of a series of laboratory measurements it will be shown that variations in the sample age can introduce errors in the order of some per cent unless proper calibration procedures are used.
2. SYSTEM DESCRIPTIONThe in-line system reported here is presently installed at the
Reaktorbrennelemente-Union (RBU) in Hanau, Germany. The setup being so far used should be considered as a test equipment demonstrating the feasibility and the potential of in-line enrichment measurements at the particular site of interest rather than the final version of a fully automated system which is being assembled after the successful completion of a series of test measurements.The measured 235ц enrichment data will be equally important both for safeguards and process control purposes.
A schematic outline of parts of the process line along with the position of the enrichment monitor is shown in the left part of Fig. 1. The detector head of the enrichment meter is tightly mounted to the outer wall of a cylindric container (diameter = 27 cm) which serves as a buffer for uranium oxide powder before it is to be pelletized in a pellet press located just below the container. The sample material viewed by the detector through the 0.3-cm-thick container wall mainly consists of U0„ powder having some recovered scrap as UgOg added to it for process operational reasons.lt is sufficiently thick to fulfil the requirements of the gamma- spectrometric enrichment measurement principle [l].
The blending of the scrap material with the fresh UOg feed material coming from the UFg UOp conversion facility occurs in large turnable mixers from which the buffer container ahead of the pellet press is discon- tinuously charged in time intervals of several hours, typical quantities of a single charge being in the order of 200 kg of uranium oxide powder. After the completion of a refilling cycle the filling level starts slowly to decrease as the powder is processed to the pellet press. The level usually sinks below the gamma detector which is located in the lower part of the container. In order to get meaningful assay results, a level sensor just above the gamma detector monitors the filling level. The enrichment measurements are stopped when the height of the powder column has reached a level approximately 20 cm above the gamma detector as indicated by the level sensor. Monitoring the powder level is presently accomplished by a transmission measurement which uses the 1 2 7 5-keV gamma ray from a ^^Na gamma source located opposite to a 7-6-cm by 7.6-cm Nal(Tl) detector. This initial setup will later on be replaced by a more simple capacitive level sensor.
The gamma detector is a 5-1 cm by 1.3 cm Nal(Tl) scintillation detector which views the sample material through a It cm 0 x 1.5 cm long lead collimator. It is surrounded by a 0.5 cm thick cadmium absorber and a lt-cm- thick lead shielding. Pulses from the preamplifier coupled to the detector are fed through a double-shielded 70-m-long cable to the system electronics which is located in a room outside the process area. A block diagram of the electronics is shown in the right part of Fig. 1. The amplifier, spectrum stabilizer and single channel analyzers are standard NIM modules.

IAEA-SM-201/46 2 2 5
TO SINTERING, GRINDING
FIG .l. Block diagram o f U 0 2 enrichm ent in -lin e monitor.
235The evaluation of the U enrichment follows the usually applied two- window technique setting one single-channel analyzer on the 185-7 keV peak and another one on a background portion above this gamma line. A typical gamma, spectrum of low-enriched uranium measured at the in-line position is shown in Fig. 2. The energy regions selected by the two single-channel analyzers extend from 132 to 215 keV and from 235 to 315 keV, respectively (these are not identical to the window settings indicated in Fig. 2). A timer-scaler system scales the single-channel analyzer count-rates from which the 235ц enrichment is computed by means of an arithmetic unit. Both the computed 235u enrichment( which appears also at a LED display)and the window count-rates are printed for documentation. The count-rate from the background window may serve as a batch monitor because the time elapsed between the conversion of UFg to U0„ (which is accompanied with a chemical separation of gammaactive 23&ц daughter products) and the moment of enrichment assay usually differs for different batches, hence resulting in different background radiation from the ingrowing 238y daughter products.
Since both the detector in the process line and the system electronics outside the process area are exposed to temperature variations of 10° C and more, electronic gain stabilization is a mandatory prerequisite when accurate assay results are to be obtained. To this end electronic gain stabilization is performed with the help of the 59.5-keV reference peak produced
2lt1 . .by a 1-yC Am gamma source which has been positioned between the cadmiumabsorber and the housing of the Nal crystal. This gamma source provides sufficient peak count-rate (- 5000 pulse/sec) for proper gain stabilization. The stabilization on a low-energy gamma line has been preferred to the stabilization technique using the alpha peak of an 2*11^ source seeded into the Nal crystal for reasons discussed below.

226 MATUSSEK and OTTMAR
FIG.2. T ypical gam m a spectrum as measured at the in - lin e position.
3. EFFECT OF SAMPLE AGE AND CALIBRATION PROCEDURES
The uranium oxide assayed by the in-line system exhibits the inherent parameter of variable age .This results in a variable background of Compton scattered high-energy gamma rays from the 238y daughter product 2 3чтра_ The background level underneath the l85.?-keV line may vary by more than a factor of 10 depending whether the UOp from the conversion facility is immediately processed to the pellet presses or stored awaiting further processing. With the low-resolution Nal systems a correction for this Compton background is usually provided by the count-rate from a single background window set adjacent to the 185.7-keV gamma line. The 235u enrichment is then assumed to follow from the calibration equation
% 235U = aP - ЪВ (1)where P and В are count-rates observed in the 185-7-keV peak window and in an adjacent background window, and a and b are calibration constants.
The calibration expression (1) may lead to systematic errors in the enrichment assay result when the same set of calibration constants is used for the 235u enrichment evaluation from count-rates measured on samples spanning a wide range of sample ages. In general the total count-rates in the peak and background window are composed of three different components,
P - P35 + P3gв - в35 + b38 + PA + B„
(2)(3)

IAEA -SM -201/46 2 2 7
where the subscripts 35, 38 and A denote contributions from 235fj, 23 % daughter products and ambient background (i.e. background not produced by materials in the sample), respectively. Together with the proportionality relations
p35 = a • B35 p38 = ß • Вз8 Рл = Y • В,
and introducing the abbreviation у = 'jpg', eqs. (2) and (3) can be combined to give the expression
p35 = yp - yßB + у(б-у)Вд (It)Since p35 , the net 235ц counts in the peak window, is proportional to the enrichment, eq. (It) leads to the general calibration relation
% 235U = aP - ЪВ + c (5)As can be seen from eq. (H ), the a d d it io n a l con stan t c v a n ish e s when
e it h e r the ambient background can be ne g le c te d o r when the shape o f the Compton continuum o f h ig h -e n e rg y gamma ra y s from the sample i s id e n t ic a l to the shape o f the ambient background (ß =y ).
The effect of the sample age upon_the enrichment assay result has been studied on three low-enriched UOg samples { 0 . 7 2 k 5 % , 1 . k 5 2 % , 3.185%). After an initial chemical separation of 238jj daughter products these samples have been repeatedly analyzed within a period of 66 days in a low-background laboratory. A 7.6-cm by 7-6-cm Nal detector surrounded by a 5-cm-thick lead shielding and a multichannel analyzer providing various digitally selected energy windows have been used for these measurements. Some of the results obtained from least-squares fitting the mass-spectrometric enrichment values together with the corresponding count—rates from energy windows 171 to 199 keV and 250 to 292 keV to the calibration eqs. (1) and (5) afe shown in Fig. 3. To determine the calibration constants, count-rates measured at sample ages ranging from 1 to 66 days (А), to 66 days (B) and 1 to 7 days (C) have been selected for the least-squares fits to both calibration expressions .
As illustrated in the left part of Fig. 3, the enrichment values evaluated from the calibration expression (1) show a distinct dependence upon the sample age, irrespective. of the fitting procedure used for the regression of the calibration constants. This is due to the different spectrum shapes observed at the laboratory site for the ambient background and the Compton continuum produced by high-energy gamma rays from the sample. Whereas the ambient background remained constant throughout the measurements, the Compton continuum level raised by more than a factor of 10 in the course of the measurements. As a consequence of the different spectrum shapes of the two background components, the shape of the total background changed in the course of the measurements as the relative contribution of the ambient background to the total.count-rate in the background window decreased from an initial value of the order of 10 to 15 % to less than 1 % when 238u and its daughter product 23 *mpa had nearly reached secular equilibrium.
The effect of the changing background shape is accounted for by the constant term in eq. (5). As demonstrated in the right part of Fig. 3, age independent enrichment values are obtained with the calibration expression(5) except for the case (C) where data measured between 1 and 7 days after the chemical separation have been taken for the regression of the calibration constants. The averages computed from all data points (corresponding to sample ages of 1 to 66 days) as derived from calibration fits (A) and (B)

228 MATUSSEK and OTTMAR
FIG.3. R elative deviation o f gam m a-enrichm ent values from m ass-spectrom etric reference values as a function o f sam ple age. Data obtained from least-squares fits to calibration Eq. (1) Cleft) and to calibration Eq.(5) (right). For details see text.
TABLE I. COMPARISON OF ENRICHMENT VALUES OBTAINED BY VARIOUS METHODSP r e c is io n s stated at the 95% confidence le v e l
Method Enrichment (w t. 235U)
Mass spectrom etry a 0.7245 ± 0.012 1.452 ± 0.012" 3.185 ± 0.012
Ge(Li) D etector 0.7231 ± 0.0030 1.4572 ± 0.0040 3.185 b
N al D etector 0Fit A 0.7224 ± 0.0042 1.4555 ± 0.0066 3.1843 ± 0.0110Fit В 0.7210 ± 0.0036 1.4539 ± 0.0066 3.1826 ± 0 .0120
Reference values for evaluation o f N al results.
N orm alization value.
For details see text.

IAEA-SM-201/46 2 2 9
TABLE II. EVALUATION OF CALIBRATION DATA BY DIFFERENT FITTING PROCEDURES
Sam pleage
(days)
C ounts/10 m in Enrichment (wt. 235U)
P ВFit I a Fit II a
Mass specrr. ref. value
6 298 600 253475 0.754 0.751 0.753
37 551 868 463177 1.445 1.447 1.448
1 235 962 64 571 1.902 1.900 1.903
10 363 228 199 047 1.969 1.969 1.963
2 340 386 77 851 2.890 2.892 2.882
3 363461 82418 3.093 3.096 3.107
calibration a 1 .0 6 9 T 0 " 5 1.073-10" 5
constants b - 9 .620-10"6 - 9.639-10" 6
c 0 - 8 .5 6 6 T 0 -3
Least-squares fit with calibration function °jo 235U = aP + bB (Fit I) and % 235U = aP + ЬВ + c (Fit II).
to the calibration eq. (5) are listed in Table I. The results from measurements with a high-resolution Ge(Li) detector are given for comparison proving very good consistency with the two data sets from the Nal measurements. Similiar Nal results have been obtained using different window settings.
It w as expe cte d that the background conditions for the in - lin e sy stem would be different from the laboratory conditions in that the spectrum shape of the ambient background radiation which in the process area almost exclusively arises from surrounding uranium materials should tend to be the same as the shape of the Compton continuum caused by the 23™pa radiation from the assayed sample. The radiative conditions to which the in-line system is exposed have been investigated in the course of calibration measurements performed near the actual in-line site at a 1:1 model of the in-line container. Six UOg standard materials having different age and isotopic composition have been used for these calibration measurements. From each standard material, quantities of about 60 to 100 kg have been filled into the container and the count rates from peak and background windows measured. The results obtained from least-squares fitting the count-rates and the corresponding 2350 enrichment as determined by mass-spectrometric analyses to the calibration eqs. (1) and (5) are summarized in Table II. Apparently there is no difference in the results from the two different fitting procedures proving a negligible effect from the ambient background (which is mainly due to the large amount of sample material located in the measurement container).The window c o u n t -ra te s a ls o l i s t e d in the T a b le are ave rage s o f at le a s t ten 10-m in counts.
For plant operational reasons uranium material with the same nominell enrichment is processed in one process line during several weeks or even months. Therefore initial calibration measurements or frequent recalibrations which usually need samples of at least two different enrichments seem difficult to perform at the actual in-line position. If, however, the calibration expression (1) has proven adequate for the enrichment evaluatim

2 3 0 MATUSSEK and OTTMAR
as it did for the particular in-line system reported here, the calibration constants a and Ъ can also he accurately determined from measurements on samples having the same enrichment hut different ages. A calibration procedure based upon this type of sample material, which normally occurs within one process line at intervals of several days, has been successfully applied to calibrate the in-line system.
k . PERFORMANCE TESTS
Prior to the installation of the in-line system described in section 2, test measurements have been performed using a commercially available single module stabilized assay meter (SAM2). It turned out, however, that the stability of this instrument was not sufficient under the environmental conditions within the process area. Major sources of instabilities within this system used in conjunction with an Americium-doped Nal crystal have been localized in the course of a series of laboratory measurements [2].They are mainly due toi) the shift of the gamma equivalent energy of the reference alpha pulse
with temperature when the electronic compensation for this effect has not properly been pe: " ’ ’ ' 1 ' ' ’ ecause each Nalterm temperature variations occur which do not allow the detector toarrive at thermal equilibrium with its surroundings,
ii) gain shifts of the non-stabilized amplifiersiii) the decrease of the system's resolution with increasing temperature.
The shift of the gamma equivalent energy of the reference alpha pulse with temperature has been eliminated by heating the crystal at a constant temperature of - k 2 C. Having done this and.the location of the peak window selected in such a manner that the peak count rate sensitivity's dependence on temperature variations was minimized, the systematical error in the assay result has been reduced to about 1 % for temperature variations of - 5 C around a mean temperature of - 20 C. The system's sensitivity to temperature variations increased rapidly at temperatures above -25 C, whereas it has proved to work relatively stably at temperatures below -20 C. The temperature behaviour is demonstrated in Fig. It, which shows the results from two different runs performed on stationary sample material at the inline position. The measurement time for each data point was 20 min. The relative standard deviation of all data points measured at the lower temperatures (Fig.lta) has been computed to be О .36 % which favorably compares to the value of 0 . 2 b % as calculated from counting statistics.The dashed lines in Fig. It indicate customer's enrichment specification limits of ± 0 .0 5 wt.% 235ц to -55 observed for the nominal enrichment value of 3.30 wt.% 235u.
A temperature stability better than an order of magnitude compared to that exhibited by the alpha-stabilized assay meter has been attained with the gamma-stabilized system. The performance of the in-line system described in section 2 has been tested during a continuous four-week run where a total of 801 data points have been collected. The results of these in-line measurements are summarized in Table III. The mean values and the corresponding standard deviations listed in the Table have been computed from the results of a series of single measurements performed each day, the number of which has been dependent upon plant operation conditions. The measurement time chosen for a single measurement waSglQOO sec at a net 185.7 keV peak count rate of = 170 counts/sec per % J5U. The observed relative precisions at the two sigma level range from = 0 .H % to 0 .8 %,
crystal has its own when short-

IAEA-SM-201/46 2 3 1
TIME(HOURS)
FIG.4. In -lin e assay results from an a lp h a-stab ilized enrichm ent meter.
depending upon the absolute enrichment value and the sample age. They are fully consistent with the precisions calculated from counting statistics, proving the system's insensitivity to environmental influences which,among others ,have been characterized by temperatures varying between - 25°C and 35 C during these measurements. The system's stability is also demonstrated by the excellent correspondance of data measured at different days on the same batch material. For comparison, the results from laboratory sample analyses are included in the Table. The data labeled 'gamma' are results from analyses routinely performed by the plant operator on dissolved samples using a Nal well counter. There is good agreement between the inline results and these laboratory sample analyses except for batch 5/5 where they differ by approximately 1 %. In this case the in-line results have been confirmed by an additional mass-spectrometric sample analysis.
The in-line system has been calibrated with data points measured prior to the four-week run on sample materialshaving the same enrichment of 2.5% but different sample ages. During the following measurement period there happened to be a change in the enrichment of the processed material (2.5%-K3.2%), providing achance to check the quality of the initial calibration. As can be seen from the results in Table III, the in-line system calibrated in such a manner has accurately measured the enrichments of the higher enriched batches.

2 3 2 MATUSSEK and OTTMAR
TABLE III. SUMMARY OF ENRICHMENT VALUES MEASURED WITH A GAMMA-STABILIZED IN-LINE SYSTEM DURING A CONTINUOUS FOUR-W EEK RUNP r e c is io n s , ex p re sse d in wt. % 235U, are stated at the 95% confidence lev e l.
DayNumber of
analysesBatch Mean Errora
Statist.error
Sam ple analyses
Gamma Mass spectr.
1 7 22 /3 2.499 0.015 2.491 ± 0.0282 23 2.495 0.018 0.016 2.504 £ 0.0363 27 2.493 0.015 2.502 £ 0.0364 44 2.495 . 0.014
5 24 2 4 /4 2.507 0.0206 4 2.513 0.0227 32 2.510 0.020 0.019
8 27 2.512 0.015 2.510 ± 0.0369 9 2.517 0.016 2.495 ± 0.028
10 16 3 /6 ., 3.195 0.018 3.194 ± 0.03611 5 3.190 0.011 3.211 £ 0.03612 43 3.193 0.012 0.014
13 72 3.193 0.01414 26 3.193 0.016 3.194 £ 0.036
15 33' 5 /5 3.196 0.011 0.014 3.217 £ 0.036 * 3 .196 ± 0.01216 16 3.190 0.014 3.235 £ 0.036
16 7 7 /7 , 3.184 0.00817 43 3.188 0.014 3.190 ± 0.03618 17 3.187 0.018 0.014 3.195 ± 0.03619 9 3.185 0.01620 19 3.185 0.010
21 44 8 /8 3.183 0.013 0.014 3.178 £ 0.036 3.197 £ 0.012
22 30 3.181 0.015 3.189 £ 0.036
23 33 9 /9 3.189 0.014 3.202 ± 0.036
24 22 3.187 0.01225 57 3.189 0.012 0.01426 72 3.192 0.01627 40 3.188 0.016
These values refer to the 95% con fid en ce le v e l obtained in single m easurem ents.
5- CONCLUSIONSThe gamma-stabilized in-line system used to measure continuously the
2350 enrichment of uranium oxide material in the process line of a nuclear fuel fabricating plant has successfully demonstrated the potential of the nondestructive 235u enrichment assay technique. As experimentally verified, the method can also account for the particular type of sample materials characterized by varying inherent background radiation levels without introducing systematic errors into the assay result. In addition, the
\

IAEA-SM-201/46 2 3 3
constistency of measured precisions with counting statistics shows that sensitive nuclear assay instrumentations can he successfully operated in process areas, far away from controlled laboratory conditions, when appropriate provisions are met to eliminate the impact of environmental influences upon the instrument's performance.
Apart from providing relevant data for safeguards purposes, the high- quality data measured hy the in-line system appear also extremely useful for process enrichment control. This has been fully recognized by the plant operator. As a first consequence, each of the six process lines present in the facility will be equipped with an enrichment monitor, thus allowing an accurate 235u enrichment assay of the total material processed within the plant. The system now being assembled for this purpose will be somewhat different from that described in this paper in that the detector pulses from the six enrichment monitors will be coupled, via analog-to-digital converters, to a small computer used for data processing and process controlling. Features incorporated, like digital stabilization techniques and digital window settings (completed by test programs periodically excecuted by the computer to test the instruments for certain accuracy limits and to diagnose any system faults), will add a high degree of long-term stability and reliability to the entire system.
REFERENCESП] REILLY, T.D., WALTON, R.B., PARKER, J.L., USAEC Rep. LA-W05-MS
(1970) 19.[2] MATUSSEK, P.,' OTTMAR, H. , PIPER, I . , in BORK. G. , ed. , KFK 2206
(1975) Chapter 2.1.2.[3] MENEFEE,J. , CHO, Y. , IEEE Transactions on Nucl. Science, NS-13
(1966) 159.
i

!

IAEA-SM-201/66
GAMMA-SPECTROMETRIC DETERMINATION OF ISOTOPIC COMPOSITION WITHOUT USE OF STANDARDS
R.J.S. HARRY, J.K. AALDUK, J.P. BRAAK Reactor Centrum Nederland, Petten,The Netherlands
Abstract
GAMMA-SPECTROMETRIC d e t e r m in a t io n o f is o t o p ic c o m p o s i t io n w i t h o u t u s e o f s t a n d a r d s .A m ethod has been developed to determ ine th e mass ratio o f gam m a-em ittin g nuclides from on ly one
Ge(Li) gam m a-ray spectrum . T he m ethod is e ffec tiv e regardless o f sam ple geom etry or th e ch em ica l and physical state o f th e sam ple. A standard sam ple is not necessary, the basic assumption b eing that th e nuclides to b e determ ined have th e sam e a tom ic ratio throughout th e sam ple. From th e Ge(Li) gam m a-ray spectrum th e peak areas are determ ined. U se is m ade o f the fact that the detection e ffic ien cy o f a Ge(Li) spectrometer is a sm ooth function o f energy for energies larger than 120 keV , and that the re la tive em ission ratios o f the sp ecified photons from each n uclid e are known from th e literature. For th e particular photon energies o f a n uc lid e th e re la tive effic ien cy as a function o f energy is determ ined in th e sp ecific sam ple, in th e sp ecific geom etry o f that m easurem ent. In com bining this inform ation from th e different nuclides in the sam e sam ple a fin a l re la tiv e detection e ffic ien cy as a function o f energy is obtained. Using this e ffic ien cy curve, th e photopeak counting rates and the known values o f th e gam m a abundances, the mass ratios o f th e nuclides can b e determ ined. Ge(Li) gam m a-ray spectra o f various sam ples h ave b een used in this m ethod. For instance, the uranium enrichm ent has been determ ined in sam ples o f various ch em ica l and physical sta te. The co e ffic ie n t o f variation in th e resulting enrichments is about З^о o f th e declared enrichm ents o f th e sam ples.
INTRODUCTION
The high reso lu tion of Ge(Li) gam m a-ray sp ec tro m eters and the d iscr e te photon en er g ie s , which are ch a ra c ter istic for the em itting n u clid es, rendered gam m a sp ectrom etry one of th e,favourite techniques for n on -destructive safegu ard s m easu rem en ts [1]. N orm ally one u tilize s a standard sou rce and com p ares the counting ra tes of som e ch a ra c ter istic peaks in the sp ectra of the standard sou rce and the sam p les to be analysed . Special care has to be taken to en su re that the d etection geom etry for the standard is equal to that for the sa m p les. S om etim es advantage is taken from the strong gam m a- absorption in high Z -m a ter ia ls lik e uranium and plutonium . F rom bulk m a te r ia ls one can se le c t sam p les of an equal su rface and "infinite th ickness" by proper co llim ation [2]. V ariation s in density w ill r e su lt in variations in the effec tiv e d istance betw een the "infinite thick" sam ple and the d etector.
In a ll gam m a-ray sp ec tra the photopeak a rea s are rep resen ta tiv e for the a c tiv itie s of the em itting n u clid es. A proper evaluation of the gam m a-ray sp ectrum can y ie ld the inform ation on the ra tios o f the a c tiv itie s or the iso top ic com p osition of the sa m p les, r e g a rd le ss of sam ple geom etry. When the d ifferent gam m a-em ittin g n uclid es have the sam e ratio throughout the sam p le under in vestigation , the m ethod that w ill be d escrib ed h ere enables one to d eterm in e, fo r in stan ce , the plutonium uranium ra tio , or the uranium enrichm ent, in sam p les of any geom etry and com p osition from one Ge(Li) gam m a-ray sp ectrum without any need for a standard for com parison .
235

236 HARRY et al.
PRINCIPLE OF THE METHOD
Many n uclid es em it gam m a rad iation of which the en erg ie s and their abundances in prin cip le are w e ll known from n uclear p h ysics litera tu re [3, 4]. F rom th is it is known in what ra tio s the num ber of photons of sp ecified en erg ie s o f one nuclide are em itted . This is a lso true fo r a se t of nuclides p resen t in a known ra tio , e .g . in the ca se of a se cu la r equilibrium betw een a m other and daughter nuclide.
The p r o c e sse s of gam m a-absorp tion and sca tter in g in the sou rce and in the m a ter ia ls betw een sou rce and d etector , as w e ll a s the d etector e ffic ien cy , w ill d eterm ine the fina l counting rate for each sp ec ified photon energy.F rom the m easu red spectrum the num ber of counts for the photon en erg ie s of one nuclide can be extracted , w hile the re la tiv e abundances of the photons are known from litera tu re . F rom th ese data a se t of points relatin g the photon en ergy to the d etection e ffic ien cy of the sam p le-d e tec to r geom etry
1д21 I_____ I___ I I I I I I I
Efficiency(relative) - ------------л ^ £ ( Е | )
/ *
10- 1 11 11
i i !“1 1 !|l
! ! /
! f ,(EI>
/
Energy (kev)
FIG. 1. Graphical illustration o f th e m ethod for uranium enrichm ent determ ination, x = photopeak counting e ffic ien cy o f 234Pam о = photopeak counting effic ien cy o f 235UAfter m u ltip lication by a factor к a sin g le smooth curve is obtained.

IAEA-SM-201/66 2 3 7
of the p articu lar m easu rem en t is determ ined . Sets of points of the en er g y - effic ien cy re la tion for d ifferent n uclid es are com bined by a le a s t-sq u a r e s procedure into one sm ooth function. F rom th is re la tiv e e ffic ien cy curve the re la tiv e am ounts of the n uclid es can be derived .
A s an illu s tr a tiv e exam ple the enrichm ent d eterm ination of uranium w ill be d escr ib ed in m ore d eta il. Let 234A denote the activ ity of 234P am, a daughter product in secu la r equ ilibrium with 238U, and 235a the activ ity of 235U in a uranium sam p le. The photopeak counting ra te s derived from the gam m a-ray spectrum of 234P a m sa tis fy the follow ing relation:
234 234J R(Ep) = £ (Ep).-«p4J4A
w here :
R(Ep)
e(Ep)
ъ
, £ 234„ mthe p - t h photon energy o f Pa
expe rim enta l v a lu e f o r the photopeak co u n t in g ra te
the photopeak d e te c t io n e f f ic ie n c y
abundance o f the p - t h photon energy
235F o r the n u c l id e U one has in the same way:
235R(Eq) = c(Eq) . Yq. 235A
235where the ind e x q r e f e r s to gamma ra y s from U.
It is assu m ed that the ratio of the num ber of 234p am and 235u atom s is the sam e throughout the sam ple. F o r the particu lar c a se under con sid eration the function e(E) is then only a function of energy. F o r en erg ie s larger than the en ergy of the К -absorption ed g es , it w ill vary only sm oothly. The points of the en er g y -e ffic ie n c y relation derived from the photon en erg ie s o f 234Para and 235U, r e sp e c tiv e ly , m ust lie on the sam e curve. The graphical rep resen ta tion of F ig . l g iv e s an illu stra tio n how both parts of the curve have to be com bined by m ultip lication of the 23Su part by a factor k. This factor к is dependent on the ratio of the a c tiv itie s o f both n uclid es.
кA ( 238U) _ A ( 234Pam)
a ( 235u > a(235u)X (238U ).N (
X (235U ).N (
238
23521u)
w here :
A = a c t i v i t y
X = decay co n sta n t
N = number o f atoms
The enrichm ent e i s now g iv e n by:
N(235U)n ( 235u )+ n ( 238u )
_______ _J__________ ;
l+ k ; X ( 235U )/ X (238U)e =

2 3 8 HARRY et al.
In the ab sen ce of secu la r equilibrium betw een 238u and 234Pam a co rrectio n can be applied if the date of separation is known.
The en erg y -e ffic ien cy re la tio n is approxim ated as fo llow s:
Y. = ln e ( E . ) = aQ+ a , ! . * a ^
w here :
X = ln E
In m any other p ractica l applications th is approxim ation has g iven a so lu tion which sa t is f ie s the n eed s. T here are no sp e c ia l p hysica l co n sid er a tion s underlying th is m odel. Inclusion of h ig h er-o rd er term s in the p o ly nom ial is only reason ab le if enough inform ation from the sp ectra can be d erived . C alcu lations with 4, 5 and 6 term s gave re su lts that agreed within 2.5% with the effic ien cy m easu rem en ts.
The to ta l e ffic ien cy curve is m ade by fittin g together the parts for the n uclid es of in te re st , u sing a le a s t-sq u a r e s fitting procedure. For that purpose the follow ing ex p ress io n is m inim ized:
S = I g . . { ( Y . + A . . K ) - ( a 0+ a 1X .+ a 2X^+a3X ^ ) }
where:
X = In E
Y = lne
К = In k
in w h ich:
E^= ene rgy o f photon r a d ia t io n under c o n s id e ra t io n
e^= r e la t i v e d e te c t io n e f f ic ie n c y f o r t h i s r a d ia t io n
2g^= the w e ig h in g f a c to r , equa l to 1/s^
s^= sta n d a rd d e v ia t io n in the photopeak c o u n t in g ra te
235к = m u l t ip l ic a t io n f a c t o r f o r U v a lu e s
a g , a j . . . a 3= param eters
Л.= 0 f o r ^ ^ P a m photopeaks1 235
1 f o r U photopeaks
The factor к has been determ ined by iteration in the follow ing way: the ex p re ss io n for S has b een evaluated for th ree va lu es of k , v iz .:
kj- k + ( j - 2 ) . ^ , j- 1,2,3w here:
к = the f i r s t g u e ss, o r the v a lu e from the p re ced in g i t e r a t io n
n = the number o f i t e r a t io n s

IAEA-SM-201/66 2 3 9
C onvergency w ill be reach ed when the final value of к l ie s in the in terva l Irk, l |k . In the other ca se к w ill reach an asym ptotic value which is im p o ssib le on p h ysica l grounds.
F or each iteration a parabola through the three points (Sj,kj) has been calcu lated as:
S j = b Q + b , k . + b 2k ^
The value of kminimum which m in im izes Sj is obtained by the condition dS/dk = 0.
Iterations w ill continue until kminimum - к < 0.001. This condition has b een reached in le s s than 10 itera tion s.
When the factor к has been determ ined the enrichm ent of the m easu red sam ple can be ca lcu lated using the form ula:
i + k . X ( 2 3 5 u ) / X ( 2 3 8 u )
The absolute e ffic ien cy is elim inated in the determ ination of the enrichm ent; how ever, in the derivation it is involved through the follow ing re la tion for the num ber of a to m s:
* X .y .e (E )
w here :
A = the a c t i v i t y o f the is o to p e con s id e re d
X = the decay co n sta n t
Y = the gamma abundance
e (E ) = the a b so lu te photopeak e f f ic ie n c y v a lu e
N = the number o f atoms
P = the photopeak a rea o f the gamma-rays con s id e re d
The absolute photopeak e ffic ien cy valu e, e(E ), in clu d es the detector effic ien cy , the geom etry factor, the absorption factor and the se lf-a b so rp tio n factor. The enrichm ent can be calcu lated by taking into account the average value of the num ber of atom s obtained from se v e r a l photopeaks of a nuclide. By taking the ra tio of the num ber of atom s for two n uclid es the absolute effic ien cy is elim inated .
DETERMINATION OF THE GAMMA ABUNDANCES OF 235U AND 234p am
In the f ir s t attem pt to apply the m ethod d escr ib ed , d ifficu lties w ere encountered s in ce litera tu re va lu es for the gam m a abundances were in co n sisten t with our m easu rem ent r e su lts . E sp e c ia lly in the determ ination

2 4 0 HARRY et al.
TABLE I. MEASURED AND LITERATURE VALUES OF THE GAMMA ABUNDANCES OF 235U AND 234p am
у -energy (keV)
Present worka №)
Ref. [6 ] (%)
_ present work Ratio r „ , . . . —
Ref. [6 ]
For 23SU
143.78 0.1067 ±0 .4 0.107 ±1 1.00
163. 36 0.0506 ±0.5 0. 0485 ± 1 1.04
185.72 0. 576 ±0.4 0.561 ±1 1.03
194.94 0.00624 ±1.0 0.00615 ±1 1.01
202.13 0.0108 ±2.1 0. 0107 ± 1 1.01
205.31 0.0494 ±0.5 0. 0487 ± 1 1.01
For z34Pa™
63.33b 0.0425 ±4.9 -
258.30 0. 000770 ±0.8 0. 000730 ±3 1.06
742.80 0. 000870 ±2.0 0. 000950 ±2 0.92
766.50 0.00343 ±1.2 0.00313 ±1 1.10
1001.40 0.00889 ±0.7 0.00828 ±1 1.07
1738.5 0. 000242 ±3.0 0.000212 ± 1 1.14
1831.9 0. 000179 ±4.8 0. 000175 ±1 1.02
a The error is the external standard deviation. b 63-keV photopeak o f z34Th.
of the uranium enrichm ent the resu lt is stron gly influenced by the position of the point for the 258-keV radiation from 234p am on the effic ien cy curve. T h erefore , we decided to check the gam m a abundances of 235u and of 234p am (daughter nuclide of 238U) [5].
The gam m a abundances w ere determ ined with a Ge(Li) detector for w hich the effic ien cy was calibrated in p revious exp erim en ts. Three sam p les of uranium w ere used: one depleted uranium m eta l fo il, a uranium - alum inium a lloy with natural uranium , and a 90% en rich ed uranium -alum inium fo il. In th ese exp erim en ts d ifferent sa m p le-d e tecto r d istan ces w ere used . C orrection s w ere applied for the gam m a absorption in the sam ple and for the counting’ g eo m e tr ie s . S ystem atic e r r o r s are p resen t in the sp ec ifica tion s of the sam p les u sed , in the d etector e ffic ien cy , and in the m odel applied for the ca lcu lation of the peak a re a s . T h ese er ro r s w ill add to an expected e r ro r of about 2.5%. The gam m a abundances determ ined are sum m arized in Table I. F o r com p arison the va lu es of Gunnink [6], who a lso used Ge(Li) d e tec to r s , are a lso m entioned.

IAEA-SM-201/66 2 4 1
TABLE II. INFLUENCE OF AN ALUMINIUM ABSORBER ON THE ENRICHMENT VALUE
Alum inium absorber thickness
(mm)
Measured value D eclared va lu e "
Including 63-k eV photons
Excluding 63-keV photons
0 0. 966 1. 005
2 0 .947 0 .987
10 0. 832 0 .9 8 0
TABLE III. SINGLE AND COLLECTIVE DETERMINATION OF URANIUMENRICHMENTe d = d eclared enrichm entes = exp erim en ta l enrichm ent u sing the sep arate e ffic ien cy curves e c = exp erim en ta l enrichm ent u sing the co llec tiv e e ffic ien cy curves

242 HARRY et al.
TABLE IV. ENRICHMENT DETERMINATION IN URANIUM SAMPLES OF VARIOUS CHEMICAL AND PHYSICAL STATES es = exp erim en ta l enrichm ent ed = declared enrichm ent
Mass
Cg)C h em ica l and/or physical state ed
(%)e s
CM
fs_
ed
2 2 6 3 .4 U3Og powder 0 .2 2 0 .2 1 5 0. 977
87 1 .8 A m m onium -di-uranate 0 .717 0 .7 3 5 1 .0 2 5
1193.7 U 0 2; s o l-g e l , 10 pm 0.717 0 .7 5 0 1 .046
1358 .4 U 0 2; polluted scrap 2 .8 3 2 .8 3 1.000
1 0 4 3 .0 U3Ofc powder 3 .1 6 3 .2 8 1 .0 3 8
3 0 7 .1 U3Og powder 3 .8 0 3 .5 5 0 .9 3 4
1221 .1 U30 8 powder and U 0 2 pellets 6 6 .0 3 1 .0 0 5
4 7 7 .1 U 0 2from salt bath ( 7 4 .3'Уо U 0 2) 8 .1 4 8 .1 4 1.000
572 .9 U3Ob powder 20 2 1 .9 8 1 .0 9 9
5 1 4 .0 A m m onium -di-uranate 20 17 .60 0. 880
For a ll samples: ___
( 4
= 1.0004
= 0.04
For th e first eight samples:
= 1 .0 0 3
- l j = 0 . 025
THE INFLUENCE OF AN ALUMINIUM ABSORBER
A sam ple of uranium oxide p e lle ts with 1.55% enrichm ent, in a 1 -m m - thick alum inium canning, has b een used to m easu re a p o ssib le influence of alum inium ab sorb ers on the enrichm ent determ ination. We a lso tried to include the 63-keV photons from 234Th in the ca lcu lation of the effic ien cy cu rve. As can be expected the m ethod of enrichm ent determ ination fa ils if the 63-keV photons are u sed , owing to the lack of in form ation on the effect of alum inium ab sorb ers on the low -en ergy ta il of the effic ien cy -en erg y re la tion derived from the m easu red sp ectrum . A straightforw ard application of the m ethod to uranium sam p les in polyethylene b ottles did not indicate a sign ifican t d iscrep an cy when the 63-keV photons w ere included in the ca lcu la tion s. The r e su lts are su m m arized in Table II.

IAEA-SM-201/66 243
TABLE V. DETERMINATION OF THE ISOTOPIC COMPOSITION IN MIXED-OXIDE SAMPLES
239Pu M1Pu
D eclared value 2 .9 0 0. 0194
2 .8 4 0. 0194Measured values
2 .9 1 0. 0205
MEASUREMENTS ON NINE SIMILAR SAMPLES OF URANIUM DIOXIDE PELLETS WITH DIFFERENT ENRICHMENTS
When a s e r ie s of s im ila r sam p les is m easu red , one effic ien cy curve can be used for a ll m easu rem en ts. Nine sam p les w ere u sed , co n sistin g of uranium dioxide p e lle ts in a 1 -m m -th ick alum inium canning w ith en r ic h m en ts varying betw een 3.9 and 0.405%. The r e su lts are lis ted in Table III. R esu lts of th is experim ent show that the application of a co llec tiv e effic ien cy cu rve for a se t of s im ila r sam p les redu ces the erro r per m easu rem ent with a factor 2. The average m easu red enrichm ent throughout th is s e r ie s of m easu rem en ts is sign ifican tly la rg er than the declared va lu e, which m ight be due to a sy stem a tic erro r . H ow ever, in the experim ent d escrib ed in the next paragraph th is sy stem a tic e r r o r was not presen t.
ENRICHMENT DETERMINATIONS ON URANIUM SAMPLES OF VARIOUS CHEMICAL AND PHYSICAL STATE
Ten d ifferent uranium sam p les stored in o n e - litr e polyethylene b ottles w ith a d iam eter of 90 m m , have been m easu red with a Ge(Li) d etector. The m ethod d escrib ed b efore g iv es the r e su lts lis ted in Table IV. The 20% enrich ed sam p les (the la st two in the table) showed in th e ir sp ectra d is tu r bances from 228Th and daughter n u clid es. This is p resum ably the m ain rea so n that th ese m easu rem en ts gave large deviations. The agreem ent betw een the m easu red enrichm ent and the declared enrichm ent does not su g g est any sign ifican t sy stem a tic er ro r . The average deviation of 2.5% p er m easu rem en t illu s tr a te s the m er its of the m ethod.
ISOTOPIC COMPOSITION DETERMINATION OF MIXED-OXIDE FU EL
In a f ir s t exp erim en t two sam p les of m ixed plutonium -uranium oxide w ere m easu red to d eterm in e the plutonium uranium ratio . The 186-keV photopeak is the only peak of 235U that could be determ ined accu rately in the sp ectra . Contributions from the plutonium gam m a rays dom inate the sp ectrum . The ra tio s 239P u /235U and 241P u /235U are com pared with the d eclared v a lu es in Table V. The r e su lts are encouraging for undertaking further s im ila r m easu rem en ts. As in the c a se of uranium enrichm ent determ ination , the gam m a abundances m ust a lso be checked and evaluated by the sam e com puter program for peak area determ ination to avoid the introduction of sy stem a tic e r r o r s from th is sou rce.

2 4 4 HARRY et al.
TABLE VI. COMPARISON OF THREE METHODS OF PEAK AREA DETERMINATION
Photon energy 60 keV 186 keV 208 keV 414 keV
N uclide MIAm 235U 237ц 239pu
, , result o f m ethod I AveraS e 0 f result o f m ethod III
1 .047 0 .9 4 0 0. 986 0 .9 9 8
Standard deviation for individual ratio
0. 008 0. 018 0 .007 0 .0 1 0
, result o f m ethod H AveraS e 0 f result o f m ethod III
1 .043 1. 025 1.007 1 .0 0 9
Standard deviation for individual ratio
0. 015 0. 04 0 .0 0 8 0. 017
ERROR DISCUSSION
The m ain erro r com ponent of our m ethod is determ ined by the random and sy stem a tic e r r o r s of the procedure for the determ ination of photopeak a re a s . To in vestiga te th is erro r sou rce th ree d ifferent procedures for peak a rea determ ination w ere com pared. A s e r ie s of 45 s im ila r sp ectra of m ixed -ox id e fuel sa m p les w ere analysed by the three com puter program s. M ethods I and II are based on lin ear approxim ations of the background continuum and add a ll counts above th is lin e as peak area . Method III f its a G aussian curve to the points in the peak. The re su lts of th is com parison are lis te d in Table VI.
T h ese re su lts show that the sy stem a tic erro r of th is orig in can be about 6%. A check of the gam m a abundances with the sam e peak area ca lcu lation can be helpfu l to e lim in ate a part of th is er ro r contribution. T here w ill rem ain an e r ro r sou rce that depends on d ifferen ces in the actual shapes of the sp ec tra m easu red .
CONCLUSIONS
The b asic assu m p tion that u nd erlies the m ethod is that the d ifferent gam m a-em ittin gn u clid es are distributed in the sam e ra tio over the sam ple.In the c a se of m easu rem en ts on cy lin d ers with uranium h exafluorid e, for in stan ce , th is assu m p tion is often not valid owing to p o ss ib le d ep osits on the cylind er w a lls .
In the m easu rem en ts of uranium enrichm ent an im portant ro le is played by the 258-keV peak, for w hich the gam m a abundance is re la tiv e ly low.This req u ires the application of d etectors with a high e ffic ien cy an d /or longer counting t im e s .
F o r the c a s e s con sid ered in th is report the re la tiv e sy stem a tic and random e r r o r s of the m ethod are both about 3%. Further work has to be done to in vestiga te the erro r so u rces re la ted to the com puter program s for peak area determ ination in other c a s e s .

IAEA-SM-201/66 245
W ithin the con stra in ts m entioned b efore it is a sa tisfy in g m ethod which can e a s ily be applied without the need for:
P r e se n c e of re fere n c e sou rces;Knowledge of the counting geom etry; andC orrection p rocedu res for absorption and se lf-a b so rp tio n .
R E F E R E N C E S
[ 1 ] BRESESTI, A .M . , BRESESTI, M. , Practical A pplications o f R & D in the Field o f Safeguards, Proc. ESARDA-Sym p., Rome, 1974, CNEN, Rome (1975) 307.
[ 2 ] DRAGNEV, T . , N on-destructive assay techniques for nuclear safeguards m easurem ents, A tom . Energy Rev. 11 2 (1973) 341.
[ 3 ] ORNL, "Nuclear Data Sheets", Oak Ridge National Laboratory.[4 ] LEDERER, C .M . , et a l . , T ab le o f Isotopes (6th Edn), W iley , New York (1968).[ 5 ] BRAAK, J. P . , AALDUK, J .K . , Personal C om m unication , D eterm ination o f the gam m a abundances
o f Z35U and 2S1Pam , Rep. R C N -75-080 (1975).[ 6 ] GUNNINK, R . , TINNEY, J. F . , Analysis o f Fuel Rods by Gamma-Ray Spectroscopy, Rep. UCRL-51086
(1971).


IAEA-SM-201/85
TECHNIQUES FOR IDENTIFICATION AND ESTIMATION OF FISSILE MATERIALS
M. R. IYER, P. P. CHAKRABORTY Health Physics Division,Bhabha Atomic Research Centre,Bombay,India
Abstract
TECHNIQUES FOR IDENTIFICATION AND ESTIMATION OF FISSILE MATERIALS.An e ffe c t iv e fissile m aterial m anagem ent programme ca lls for developing fast and sufficiently accurate
techniques o f fissile m aterial estim ation. The gam m a spectrum and delayed neutron activ ity from fission products at short decay tim es have been investigated for the three fissile m aterials 233U, 235U and 23sPu using a N al(T l) detector, an array o f BF3 counters and a fast sam ple transfer fa c ility located in a reactor in order to evo lv e id en tification and estim ation techniques for fiss ile m aterials. These investiations led to methods for identifying fissile m aterials from their fin e structures and spectral behaviour. The gamma spectrum, together with the delayed neutron activ ity , has been used in estim ating fiss ile m aterials in a m atrix. D espite the lim ita tion o f detector resolution and the large number o f gam m as associated with fission products a t short decay tim es, certain signatures o f the fissile m aterials have been established in their fission-product gam m a spectra. For quantitative estim ation o f fissile m aterial ratios, the gam m a- gam m a and gam m a -d elayed neutron ratios have been exp lo ited . A discrim ination ratio o f 2 has been obtained for 23!'U -239Pu m ixture in the gam m a-gam m a m ethod. A 90:10 235U -339Pu m ixture can be analysed with better than 5% error by this method. 1
1. INTRODUCTION
F a st and su ffic ien tly accurate techniques of f i s s i le m ateria l estim ation are n e c e ssa r y for an effec tive f is s i le m ateria l m anagem ent program m e. A ctive m ethods, making use of the c h a ra c ter is tic s of f is s io n products, p resen t p rom isin g p o ss ib ilit ie s for such techniques.
E a st and Keepin [ l] have carried out detailed in vestigation s on f is s io n - product gam m as using a Ge(Li) d etector . T h is has resu lted in estab lish in g sign atu res of f i s s i le m a ter ia ls in the ob served gam m a sp ectra of f is s io n products from 235u and 239Pu. B ecau se of the high reso lu tion of the detector the d ifferen ce in in ten sities of som e of the gam m a lin es could be d irectly corre la ted with the d ifferen ce in y ie ld s of the re sp ec tiv e f is s io n products giving r is e to th ese lin e s . Rapid quantitative m ethods of estim ating f is s i le m ateria l ra tio s in sam p les using th ese are not read ily fea s ib le b ecau se of the efforts n ece ssa r y to analyse the sp ectra . They a lso studied the delayed neutron decay ra tes and noted that the com bined m easu rem ent of delayed neutrons and gam m as should prove u sefu l in a ssa y applications.
In the p resen t work, in ord er to develop f is s i le m ater ia l identification and estim ation techniques the gam m a sp ectra and delayed neutron activity of f is s io n products in the tim e range of a few secon ds to m inutes after f is s io n from the therm al f is s io n of 233U, 235U and 239Pu, have been studied using a Nal(Tl) d etector and BF3 cou n ters. Both id en tification and quantita tive m ethods of an a lysis of f i s s i le m a ter ia ls in a m atrix are developed using the above ch a r a c te r is tic s . P re lim in ary re su lts of th ese stu d ies on fiss io n -p ro d u ct gam m a spectrum c h a ra c ter is tic s w ere reported ea r lie r [2 ].
2 4 7

2 4 8 IYER and CHAKRABORTY
2. EXPERIM ENTAL TECHNIQUE
The experim ental setup used in the in vestigation s c o n s is ts of a fa st pneum atic sam ple tran sfer fa c ility capable of tran sferr in g the sam ple from the irrad iation point to the detector within a second [3] . The irrad iation point located at a tangential beam hole of the APSARA reactor at Trom bay has a therm al neutron flux of 4.6 X 10¹⁰ n • cm -2 -s"1 with a cadm ium ratio of6.2 at 400 kW reactor power. An e lec tr o n ic s sy stem reco rd s and con tro ls the irrad iation , decay and counting tim es of the sa m p les. Sam ples are contained in standard p ersp ex ca p su les . F or gam m a m easu rem en ts a 3 in X 3 in Nal(Tl) d etector kept in a w ell-sh ie ld e d cham ber is used.A 512-channel an alyser is used to record the p u lse -h e igh t spectrum from the d etector. The delayed neutrons are m easured using an array of s ix B F3 counters em bedded in a se m i-c y lin d r ica l paraffin block.
3. GAMMA SPECTRA FROM FISSION PRODUCTS
Sam ples of 233U, 235U and 239Pu in the 50 to 500 ug range sea led in polythene p ie c e s w ere used in the in vestiga tion s. The gam m a sp ectra w ere studied for a wide range of irrad iation decay and counting tim es (from 5 to 600 s). The ch a ra c ter is tic s of the sp ec tra w ere found to depend on the irrad iation and decay tim e s . Though the N al(Tl) d etector used in the stu d ies has a re la tiv e ly poor reso lu tion (9% at 662 keV) and the number of gam m a lin e s expected from f is s io n products at sh ort d ecay tim es are la r g e , se v e r a l stru ctu res are noticed in the sp ectra . T h ese stru ctu res cannot be attributed to a s in g le gam m a lin e , but could have been the resu lt of the bunching of a num ber of gam m a en er g ie s . This resu lted in the appearance or d isappearance of som e stru ctu res in the sp ectra for d ifferent irrad iation and decay t im e s . The sp ec tra for irrad iation t im e s varying from 5 to 50 s after a decay of 1 s showed s im ila r ch a r a c te r is tic s , and th ere w ere no sign ifican t d ifferen ces in the stru ctu res for the three f is s i le m a te r ia ls . F igu re 1 (inset) shows a typ ica l spectrum o f239Pu f is s io n products after a 5 0 -s irrad iation tim e and a 1 -s d ecay tim e . Two peaks at 360 and 510 keV are n oticeab le in th is sp ectrum . The evolution of th is spectrum for 23SU and239Pu fis s io n products with decay tim e ranging from 10 to 110 s are shown in F ig . l . The 360-keV peak b ecam e prom inent at 10 s and started d isappearing at h igher decay tim e s . The 510-keV peak a lso started d isappearing beyond 60 s decay. The peaks at 580 and 680 keV started appearing from 10 s o f decay. The evolution of stru ctu res with decay tim es for 335U is a lso found to be m ore or l e s s s im ila r as can be se en from the F ig u re , the only d ifferen ce being a stru ctu re at 820 keV in the c a se of 235U, for decay t im es beyond 60 s.
F ig u re s 2 and 3 show the fiss ion -p rod u ct gam m a sp ectra recorded in 100 s at d ifferen t decay t im e s , for 50 s irrad iation . In F ig .2 decay tim es are 10, 100 and 200 s . In th is s e t of sp ec tra stru ctu res around 360, 510,680 keV are com m on in a ll three c a s e s . The 510-keV peak is m ore in tense in the c a se of 239Pu. The stru cture at 820 keV is found to be p resen t in the c a se of 233U and 235U, but absent in the c a se of 239Pu fis s io n products. M oreover , the stru ctu res at 360 and 510 keV se em to decay fa ste r than the other

IAEA-SM-201/85 2 4 9
2 0 k e V / c h 2 0 k e V /c h
FIG. 1. Gamma spectra o f fission-products after 50 s irradiation.
stru ctu res in all the c a s e s . In F ig .3 sp ectra at 50, 250, 450 and 600 s decay are shown. In th ese c a s e s a lso the stru ctu res around 360, 510,580, 680 keV se em to be com m on for all the c a s e s but no stru cture at 820 keV at 50 s decay for 239Pu is found; but th is stru cture appears at higher decay t im e s . Some m ore stru ctu res at h igher en erg ie s are a lso found to be p resen t in th ese sp ec tra . The stru ctu re at 1700 keV at 450 s decay is found to be typ ica l of 235U. T his stru cture did not appear even at e a r lie r decay t im es for the sam e isotop e.

CO
UN
TS
FO
R
100
SE
CO
ND
S
250 IYER and CHAKRABORTY
FIG, 2, D ecay studies o f fission-product gam m as at short tim es (irradiation tim e 50 s).
From the above stud ies it is seen that the stru ctu res at 820 and 1700 keV can be used effec tiv e ly as sign atu res for identifying the f is s i le m a te r ia ls . The absen ce of the 820-keV peak can be used to identify 239Pu and the p resen ce of the 1700-keV peak can be used to identify 235U. In the c a se of 233U and 235U the 820-keV peak is found to be absent at up to 10 s decay and then it b ecom es prom inent around 100 to 200 s . Further, th is peak sta r ts appearing at decay t im es of m ore than 250 s , even in the c a se of 239Pu. Hence an optim um counting tim e of 200 s after a d ecay of 20 s should be adopted for the signature. F o r the 1700-keV peak in 235U spectrum a counting tim e of 100 s after 450 s decay is to be adopted for the signature.
F ig u res 4 and 5 show the ch a ra c ter is tic s stru ctu res in the 8 2 0 -and 1700-keV reg io n s , r e sp ec tiv e ly , for the three f is s i le m a ter ia ls .
CO
UN
TS
F
OR
10
0 S
EC
ON
DS

CO
UN
TS
FO
R
IOO
sIAEA-SM-201/85 251
FIG. 3. Decay studies of fission-product gammas (at different decay tim es after 50 s irradiation).
CO
UN
TS
FOR
10
0 S
.

CO
UN
TS
252 IYER and CHAKRABORTY
FIG. 4, Fission-product gam m a signature of 233U, 235U and 239Pu.

CO
UN
TS
FOR
100
s.
lAEA-SM-201/85 2 5 3
FIG. 5. FIssfon-product gamma signature.

254 IYER and CHAKRABORTY
4. R ELA T IV E INTENSITIES OF GAMMAS IN VARIOUS EN ERG Y GROUPS
In th ese stu d ies, the sam ple weights w ere so chosen that the fission ra te during irrad iatio n is m ore o r le s s equal. The sam p les w ere irrad iated fo r 50 s and w ere counted fo r 200 s after 10 s decay.
The 233U and 235U fissio n -p ro d u ct gam m a s p e c tra norm alized to 239Pu fissio n -p ro d u ct gam m a sp ectru m (channel by channel) a re shown in F i g .6. The 233U fission -p rod u ct sp ectru m norm alized to that for 235U is also given. This is done by taking the ra tio s :
Counts in the i th channel for 235U11 I ■ ■ ■ I ■ I ■ I INHIHH ■■■IIMIHI — T H» ■ C l C e
Counts in the i th channel for 239Pu
T hese ra tio s depend on the fission ra te s in the sam p les. H ow ever, the ra tio of counts in two different channels in the sam e sp ectru m is independent of the fission ra te and is c h a ra c te r is tic of the fiss ile m a te ria l. This is re la ted to R(i) in the following way: L e t
Q -235 C— 2 3 5 (1) C -235(h ) and _ 0 -2 3 9 (1 )
C -239(h )
w here C -2 3 5 (l) and C -235(h ) a re the counts in 1^ and hth channels in 235U fission -p rod uct gam m a sp ectru m . S im ilar notations hold for the ca se of 239Pu also .
Q -235 _ 0 -2 3 5 (1 ) / С - 2 35(h) _ C -2 3 5 (l) /C -2 3 9 (l)Q -2 3 9 C -2 3 9 (l) /C -2 3 9 (h ) C -2 3 5 (h )/C -2 3 9 (h )
R(l)R(h)
T hus, if the ra tio s R(i) a re significantly different in two channels 1 and h, then the c h a ra c te r is tic ra tio s Q -235 and Q -239 will also be different from each o th er, thus making it possible to d iscrim in ate between the two fiss ile m a te ria ls by knowing th ese ra tio s . The ra tio R(i) in F ig .6 is found to be n early con stan t up to the 2 .8-M eV channel and in cre a se s for the >2 .9 -M e V channel. The p rop er channel o r group of channels for calcu latin g the ra tio s Q -235 and Q -239 can then be optim ized by studying the ra tio s R (i). F ro m this study it is seen that m axim um d iscrim in ation fo r Q -235 and Q -239 can be obtained if we se le c t the two groups of channels as 180 to 520 keV and > 2 .9 MeV. T ypical ra tio s fo r the th ree fissile m a te ria ls are shown in Table I.
T h ese ra tio s have been studied for other counting tim es also , ranging from 50 to 300 s . It was concluded from these studies that the ra tio R(i) does not change m uch with counting tim e within the tim e ran ge investigated. A counting tim e of 200 s was hence se lected .
A typ ical se t of the ra tio s is illu strated in Table I. They a re distinctly different for the th ree fiss ile m a te ria ls , though the d iscrim in ation facto r between 233U and 235U is not that prom inent as com p ared with the other two p a irs . The re la tiv e value of th ese ra tio s with re sp e c t to that fo r 235U is also given in Table I.

IAEA-SM -201/85 2 5 5
FIG. 6. Relative spectral intensities vs channel number.
T A B L E I. CHARACTERISTIC RATIO FOR FISSILE M ATERIALS
Fissilem aterial
Sam plew eight
(Mg)
Counts in180-520 keV
channel C(l)
Counts above 2. 9 MeV channel
C(h)
' C (l) C(h)
Ratio relative to 23SU
233ц 188, 6 493 635 8091 61 .01 0. 793
” 5U 179 .5 478 5 6 8 . 6217 76. 94 1. 000
339Pu 197 .8 548 642 3575 153 .47 1. 995

T A B L E II, D ELA YED NEUTRON TO GROSS GAMMA RATIO
Counts for 10 s Counts for 20 s Counts for 50 s Counts for 100 s
Sam ple gam m a neutronR
gam m a n e u t r o nR
gam m a ne utronR
gam m a neutronR
counts/s counts/s counts/s counts/s counts/s counts/s counts/s counts/s
гззц 5 1 4 4 .1 7 8 .9 0 .0153 6 0 0 2 .2 7 1 .8 0. 0119 7 4 8 6 .6 6 2 .1 0. 0083 7 752. 1 4 3 .2 0 .0 0 5 6
235U 33 053 .3 7 6 2 .6 0. 0231 37 3 2 3 .8 681. 9 0. 0183 4 1 9 0 2 .4 5 2 7 .8 0. 0126 42 3 3 8 .4 3 5 5 .6 0. 0084
239pu 2 8 4 0 7 .3 3 4 8 .1 0. 0122 30 4 0 1 .7 3 0 0 .9 0. 0099 34776. 4 2 5 8 .9 0 .0 0 7 4 34 6 9 3 .3 1 8 7 .1 0. 0054
R for 233U /R for 235U: 0. 662 0 .6 5 1 0 .6 5 8 0. 666
R for 339Pu/R for 235U: 0. 528 0. 541 0 .5 8 7 0. 643
R for 233U/R for 239U: 1. 254 1. 202 1. 121 1. 037
T im e of irradiation = T im e of counting 1-s delay before counting R = ratio o f counts
256 IYER and C
HA
KR
ABO
RTY

IAEA-SM -201/85 257
Such ra tio s can be used to estim a te the re la tiv e com p osition of two f is s i le m a te r ia ls in a m ixtu re. The ratio expected for a m ixture of known 235pj_239pu com p osition can be worked out from the counts in the two groups of channels obtained with 235U and 239Pu sam p les sep ara te ly . A ca libration curve for the 239P u /235U ratio can be constructed from th ese by using standard sam p les of known com position . The sy stem a tic erro r in th ese ra tio s is found to be about 5%.
5. INVESTIGATION OF D ELA YED NEUTRON ACTIVITY RELA TIV E ' TO FISSION-PRODUCT GAMMA ACTIVITY
In these investigations the delayed neutron activity has been studied re la tiv e to fissio n -p ro d u ct gam m a activity in variou s energy groups as well as fo r g ro ss gam m as, for the th ree fissile m a te ria ls 233U, 235U and 239Pu. An a rra y of B F 3 cou n ters as d escrib ed e a r l ie r was used for counting the delayed neutrons. The fission -p rod u ct gam m a and delayed neutron activ ities have been counted sim ultaneously. In the f ir s t set of investigations the tim e of irrad ia tio n and tim e of counting w ere kept the sam e and the sam ples w ere counted after 1 s decay.
The ra tio of counts R due to delayed neutrons to that due to g ro ss gam m as for variou s tim es of irrad iatio n and counting is given in Table II.The observed n /y ra tio d e cre a se s with tim e as expected . A varia tio n of n /y ra tio with fissile m a te ria l was also noticed. Though the exp erim ent was not aim ed at obtaining the absolute value of the ra tio s , the trend of the varia tio n in the ra tio s with the fissile m a te ria l ag rees with the rep orted values of the p er cent of delayed neutrons in variou s fission reactio n s [4].The re la tiv e values of the ra tio s with re s p e c t to the ra tio fo r 235U are indicated in Table II. Though the ra tio s th em selves d e cre a se with tim e, the re la tiv e values of the ra tio s with re s p e c t to 235U rem ain s alm ost constant with in creasin g irrad iatio n and counting tim e s . Thus, to estim ate fiss ile m a te ria l ra tio s using n /y ra tio s an irrad iatio n and counting tim e of 20 s seem s optimum.
The ra tio R in different gam m a energy groups was also studied for the th ree fiss ile m a te ria ls . R atios obtained for counts above 0 .5 - , 1 - and2-M eV channels for counting tim es of 10, 20 , and 50 s (irrad iatio n tim e being equal to counting tim e) a re given in Table III. The ra tio s d e cre a se with counting tim e fo r each of the energy groups. The re la tiv e values of these ra tio s with re s p e c t to that of 235U a re also indicated in the T able.F ro m this it can be seen that the d iscrim in ation between the th ree fiss ile m a te ria ls is b e tte r fo r a counting tim e of 20 s in the energy channel above 0 .5 MeV. The studies with g ro ss gam m as also gave the sam e counting tim e as the optim um . H ow ever, ra tio s with gam m as above the0 .5 -M eV channel seem to be slightly b e tte r and this can be selected for estim ating re la tiv e values of fiss ile m a te ria ls in sam p les.
The behaviour of n /y ra tio s for > 0 .5 -M e V channel with an irrad iation tim e of 20 s at variou s decay tim es was studied, keeping the delayed neutron counting tim e fixed at 20 s . Table IV su m m arizes th ese ob servation s.
° 239 235F ro m this Table it can be observed that Pu to U d iscrim in ation is b e tte r with a decay of 10 min o r m o re . In conclusion we can p resrib e the com bination of decay and counting tim es for the variou s p a irs of fissile m a te ria ls as given in Table V.

T A B L E III. D ELA YED NEUTRON TO GAMMA RATIO ABOVE D IFE E R E N T EN ER G Y CHANNELS
Sam ple
Counts for 10 s Counts for 20 s Counts for 50 s
gam m a above; gam m a above; gam m a above:
0. 5 MeV 1 MeV 2 MeV 0. 5 MeV 1 MeV 2 MeV 0 .5 MeV 1 MeV 2 MeV
233u 0. 0495 0 .1122 0. 6915 0. 0431 0. 0882 0 .5 7 9 7 0, 0264 0. 0620 0 .3 9 9 8
235 и 0. 0751 0 .1617 1. 6604 0. 0593 0. 1342 0 .8 2 3 7 0. 0381 0. 0839 0 .2 2 0 5
239Pu 0. 0433 0. 0947 0 .7087 0. 0328 0. 0764 0 .5721 0. 0239 0. 0552 0 .4 2 8 4
R for 233U/R for 235U: 0. 659 0 .694 0. 652 0 .7 2 6 0. 657 0 .7 0 4 0 .6 9 4 . 0. 739 0. 725
R for 239Pu/R for 235U: 0 .5 6 3 0 .5 8 6 0. 668 0 .5 5 2 0 .5 6 9 0 .6 9 4 0. 628 0 .6 5 8 0. 777
R for 233U/R for 239 Pu: 1 .169 1.183 0. 976 1 .4 2 6 1. 155 1 .013 1 .1 0 6 1 .1 2 2 0. 934
T im e o f irradiation = T im e o f counting 1 s delay before counting R = ratio of counts
258 IYER and C
HA
KR
ABO
RTT

T A B L E IV. D ELA YED NEUTRON TO GAMMA RATIO AT D IF F E R E N T D ECA Y TIMES OF GAMMA A C TIVITY
Sam pleGamma above 0 . 5-M eV channel after a d ecay tim e of:
2 m in 5 m in 10 m in 15 m in 20 min 30 min
ш и 0 .2 6 8 0 .5 9 3 1 .4 6 6 2 .4 9 3 3 .8 4 6 3 .4 6 0
И5и 0.456 1 .126 2. 898 4 .9 2 6 6 .3 2 9 6 .4 1 0
239 Pu 0. 251 0. 681 1 .5 1 3 2 .3 2 5 3 .1 0 5 2 .9 7 6
R for Z33U/R for Z35U: 0 .5 8 8 0. 527 0 .5 0 6 0 .5 0 6 0 .6 0 7 0. 540
R for 239Pu/R for 235U: 0. 550 0. 605 0 .5 2 2 0 .4 7 2 0 .4 9 0 0 .4 6 4
R for Z33U/R for 239Pu: 1. 067 0. 871 0 . 969 1. 072 1 .2 3 8 1, 162
Irradiation tim e = 20 s N eutron-counting tim e = 20 s G am m a-counting tim e = 100 s R = ratio o f counts
IAE
A-S
M-201/85
259

260 IYER and CHAKRABORTY
T A B L E V. RECOMMENDED IRRADIATION, DECAY AND COUNTING TIM E FO R THE RATIOS
Fissilem aterialm ixture
Irradiation tim e (s)
D elayed neutron counting tim e (s)
Gamma (> 0 .5 MeV) counting tim e (s)
Relativeratioscount
for:after a delay
Of;
countfor;
after a
delayof;
239P u -z35U 20 20 s 1 S 100 600 0. 522233ц_235ц 20 20 s 1 S 100 600 0 .5 0 6
!33y_239pu 20 20 s 1 s 10 1 1 .426
As com p ared with the gam m a-gam m a method the sensitivity of the n /y method is b etter in the c a se of the 233u-235U m ixtu re w hereas both the gam m a-gam m a and n /y methods are suitable fo r 239P u -233U m ixtu re and the fo rm e r is recom m ended fo r the 239P u -233U m ixtu re .
6. CONCLUSION
The p resen t work has aim ed at developing identification and estim ation techniques fo r fiss ile m a te ria l m ixtu res using th eir fission -p rod u ct gam m a s p e c tra and delayed neutron activ ities . As such ho attem pt has been made to co n v ert the observed s p e c tra into photon s p e c tra . Baumung et al. [5] and E a s t and Keepin [l ] have used h igh -resolu tion G e(Li) d e tecto rs for the identification of f issile m a te ria ls . With such d etecto rs one can identify and m easu re the inten sities of individual gam m a lin es due to a p a rticu lar fission product and then c o rre la te with the fission yield of the product. In the p resen t w ork, by using a com p aratively poor resolu tion N al(Tl) d etecto r, c e rta in s tru c tu re s in the sp e c tra have been established which have been shown to se rv e as sign atu res of the fissile m a te ria ls . H ow ever, the peaks in the observed sp e c tra cannot be attributed to any single fission product, but ra th e r re su lt from the bunching of se v e ra l gam m a en ergies at various decay tim es. The sig n atu res, of co u rse , a re fo r the p articu lar irrad iatio n , decay and counting tim es established for it, as also for the p a rticu lar d etecto r size and so u rce -d e te c to r geom etry .
The sign atu res as such can be used only for identification of fissile m a te ria ls . F o r the quantitative estim ation , varia tio n in the behaviour of the fissio n -p ro d u ct gam m as and delayed neutrons from variou s fissile m a te ria ls has been exploited. These ra tio s again cannot be con sid ered as p rim ary p ro p erties of fission p rod ucts, as no attem pt has been made to con vert the observed sp e c tra to photons s p e c tra . Such a p roced ure would have sm oothed out any c h a ra c te r is tic d ifferen ces in s tru c tu re s . The ra tio s worked out also depend on the d etecto r s iz e , s o u rc e -d e te c to r geom etry e tc . This sim ple approach has given a som ew hat sen sitive method com parable to other methods [б], esp ecially for 233u - 239Pu and235 U -239Pu m ix tu res .

IAEA-S М -201/85 261
'D elayed neutron p e cu rso rs a re the sam e for all fissio n s, and since th eir yield and re la tiv e com position in the fission of different fissile m a te ria ls is different, one would exp ect th eir g ro ss decay ra te s to be different [1 ,4 ]. In the p resen t work we have worked out ce rta in ra tio s of delayed neutron to fissio n -p ro d u ct gam m a activ ities fo r v ario u s fissile m a te ria ls and have shown that th ese ra tio s can be used for estim atin g fiss ile m a te ria l ra tio in sam p les.
A C K N O W L E D G E M E N T S
Our s in ce re thanks a re due to D r. A .K . Ganguly, D ire c to r , C hem ical Group, BARC for his valuable guidance and to M r. S.D. Soman, Head, Health P h y sics Division, BARC for his keen in terest in the work. The a ssista n ce ren d ered by M r. S.G. Sahasrabudhe in ca rry in g out the e xp erim ents is gratefully acknowledged.
R E F E R E N C E S
[1 ] EAST, L. V . , KEEPIN, G. R., "Fundamental fission signatures and their application to safeguards",Physics and Chemistry o f Fission (Proc. Symp. V ienna, 1969), IAEA, Vienna (1969) 647.
[2 ] IYER, M. R ., CHAKRABORTY, P. P ., "Identification and estim ation o f fissile m aterials", paper presented at Int. M eeting N on-destructive M easurement and Identification Techniques in N uclear Safeguards,Ispra, Italy, 1971.
[3 ] CHAKRABORTY, P. P . , GANGULY, A .K ., Use o f short-lived therm al neutron induced rad ioactivity for rapid non-destructive analysis, Rep. BARC/H P/TM -21 (1968).
[4 ] AMIEL, S . , "Delayed neutrons in fission", Physics and C hem istry o f Fission, (Proc. Sym p. V ienna, 1969), IAEA, Vienna (1969) 569.
[5 ] BAUMUNG, K . , BOHNEL, K . , KLUNKER, J . , KÜCHLE, M ., WOLFF, J . , "Investigations into nondestructive safeguards techniques", Safeguards Techniques (Proc. Sym p. V ienna, 1970) 2, IAEA,Vienna (1970) 177.
[6 ] BIRKHOFF, G ., BONDER, L ., LEY, J . , D eterm ination o f the 235U, 239Pu and 240Pu contents in m ixed fissile m aterials by m eans of ac tiv e and passive neutron techniques, Rep, EUR 4778 e (1972).


Session 8, Part II
CONTAINMENT AND SURVEILLANCE

Chairman: A. A. LIPOVSKIJ (USSR)

IA EA -SM -201/11
DEVELOPMENT OF A SAFEGUARDS SYSTEM FOR CONTAINMENT AND SURVEILLANCE AT URANIUM ENRICHMENT PLANTS
G.A. HAMMONDDivision of Safeguards and Security,US Energy Research & Development Administration,Washington, D.C.
L.R. STIEFFUS Arms Control & Disarmament Agency,Washington, D .C.,United States of America
Abstract
DEVELOPMENT OF A SAFEGUARDS SYSTEM FOR CONTAINMENT AND SURVEILLANCE AT URANIUM ENRICHMENT PLANTS.
The status o f a programme to develop a safeguards system for uranium enrichm ent plants is presented with specia l em phasis on containm ent and surveillance. Under this program m e, safeguards instrumentation and techniques have been developed and evaluated for possible use in international inspections which must operate under the general guidelines o f INFCIRC/153 and such additional constraints as lim ited inspector access. A United States Working Group defined performance requirements for instruments or procedures for each key measurem ent point o f a reference plant m odel. These requirements were defined on the basis o f the assumptions, constraints and ground rules o f a project plan including trade-offs betw een econom ics, con fid en ce in d etection , and probable accep tab ility to the IAEA and plant m anagem ent. It was assumed that IAEA inspectors would be ab le to verify independently the operators’ routine m aterial balance inventories, ex cep t m aterial in separations equipm ent, using check weights and secure sea ls, and to observe the co llec tio n of duplicate sam ples for independent analysis.
Instruments and techniques which have been developed and tested are as follows: Both unattended and inspector operated radiation monitors for the surveillance at portals for personnel, packages and vehicles; unattended cam eras for optical surveillance; tam per-ind icating and tam per-resistant techniques and seals to protect radiation m onitors, and associated equipm ent, data, cam eras, e tc .; techniqes w hich use on the isotop ic concentration o f 234U , 235U and 236U to verify independently the operators reports on flow of nuclear m aterial; and portable and in - lin e gam m a and neutron instrumentation for non-destructive analysis o f 234U and 235U in UF6 and for surveillance purposes.
INTRODUCTION
In early 1971, U. S. Government and contractor personnel began a general review of the problems associated with safeguarding uranium enrichment plants in the context of activities that might be undertaken by an international safeguards authority. These reviews led to four U. S. papers presented at the IAEA Working Group on Safeguards Procedures for Isotope Enrichment Facilities, June 12-16,1972. [ 1 , 2 , 3 , 41 At the conclusion of the June 1972 meeting, the IAEA Working Group recommended that a second international meeting on enrichment plant safeguards should be held not later than two years and that the participants should continue to develop and demonstrate containment/surveillance equipment, NDA instrumentation and make results available to the IAEA as soon as possible. In accordance
2 6 5

266 HAMMOND and STIEFF
with these recommendations the U . S . assembled in the fall of 1972 a Technical Working Group on Enrichment Plant Safeguards.* During May 1974, consultants from several countries, including the U. S . , met in Vienna to report on their individual safeguards studies and review the IAEA's draft "Safeguards Procedures and Techniques for Isotopic Enrichment Facilities" dated April 1974.
In addition, U. S . representatives have met jointly with European Tripartite representatives in the USA during April 1973 and again during September 1973 to discuss plans and objectives and to establish a cooperative research effort. As part of these efforts, the Tripartite has recently field tested at the URENCO Ltd. centrifuge facility at Almelo, The Netherlands, aU. S . surveillance camera and both passive neutron and gamma enrichment m eters.
OBJECTIVES AND ASSUMPTIONS
The objective of the U. S . effort is to design and evaluate an effective perimeter surveillance system which will allow the Agency to verify independently all receipts and shipments of source and special nuclear material (SNM) and the amount and enrichment of SNM produced within the plant; and to make use of "containment and su rveillance to help ensure the completeness of flow measurements and thereby simplify thi application of safeguards and concentrate measurement efforts at key measurement points." [ 5 ]
It is assumed for the purposes of the U. S. study that IAEA inspection of an isotope enrichment facility will be limited in geographical access due to sensitive technology, and in inspection effort. [6] Inspectors would not have access to the interior of the isotope separation cascade but would have continuous access to all feed and take-off points and to the exterior or perimeter of the cascade. For small plants, inspection might be intermittent. Under these conditions cost effective IAEA safeguards will be possible only through optimum use of containment/surveillance instrumentation and procedures. [7] Within the bounds of these major constraints, inspection procedures must be formulated which satisfy IAEA objectives and requirements.
The U. S. Technical Working Group defined performance requirements for instruments or procedures for each key measurement point of a "reference plant model". [8] These requirements were defined on the basis of the assumptions, constraints and ground rules of a "project plan" [9] including tradeoffs between economics, confidence in detection, and probable acceptability to inspectors and plant management. Alternatives were also identified for supplemental inspection ability. Consistent with the reference plant model, key measurement points include all feed and take-off points, waste stream s, weighing and sampling facilities and storage a re a s .
1 The U. S. Technical Working Group includes representatives from:USAEC, now USERDA (U. S. Energy Research £ Development Administration);U. S. Arms Control & Disarmament Agency; National Bureau of Standards; Brookhaven National Laboratory; Goodyear Atomic Corporation-Portsmouth Gaseous Diffusion Plant; Union Carbide Corporation-Oak Ridge Gaseous Diffusion Plant; Sandia Laboratories; and Los Alamos Scientific Laboratory.

IAEA-SM -201/11 267
All UFg cylinders of feed, product and tails are assumed to be weighed by the plant operator and independently verified, as required, by inspectors using check w eights. It is also assumed that the inspector would observe the collection of UFg cylinder samples of which a selected subset would be analyzed independently by the IAEA. Feed cylinders are assumed to be protected by inspectorate seals from the time of sampling until attached for feeding. Product and tails cylinders can be sealed when filled and/or at sampling. UF traps and waste would be measured separately.
In order to ensure complete knowledge of all flows across the perimeter of the plant, the U. S . Technical Working Group concluded that it would be necessary to maintain continuous surveillance at all portals through which nuclear m aterials, vehicles, sensitive packages and personnel might pass. The entry and exit of sensitive packages containing isotope separation components present a particularly difficult problem. It was necessary to assume that these movements would be limited to specific points of the perimeter requiring radiation detectors with predetermined alarm levels. Such measurements can be simplified if the packages are standardized and moved through a portal specially designed for the packages. For added assurance of flow, the operator should declare expected times of transfer allowing inspector attendance. Locks and inspectorate seals can be used between those intervals.
METHODS AND TECHNIQUES
Within the framework of the identified objectives and assumptions, theU. S . Technical Working Group has undertaken the development, testing and evaluation of prototype instruments and techniques for possible use in a perimeter safeguards system for uranium enrichment plants.
Radiation Monitors
Radiation monitors were identified by the Working Group for both primary and supplemental modes of surveillance and inspection as follows:
1. A prototype, unattended doorway monitor with data storage and tamper- indicating features was designed, fabricated, and tested by LASL and Sandia Laboratories for primary monitoring at personnel portals. 110]
The design objective for radiation sensitivity was that the doorway monitor should detect unshielded about ten grams of 235u or one gram of 239pu in metallic, compact geometry. In addition, the monitor should record alarm events in such a way that an occupant could be identified, should operate independently of line power if necessary for up to eight hours and should fit into a standard industrial doorway.
The personnel doorway monitor consists of a tam per-resistant enclosure containing a detector a rray , signal conditioning electronics, power supplies, alarm logic c ircu its , occupancy monitor, alarm recording 8 mm camera with a capacity of 3,600 individual frames and a tamper-indicating envelope. The external dimensions of the assembly are 2.02 meters (height) by 1.7 meters (width) by 0 .98 meters (depth).

268 HAMMOND and STIEFF
In the final configuration and in tests with samples in extreme corn ers, the sensitivity of the personnel monitor remained at one gram for plutonium for 50% detection but the 235y detection limit was approximately 50 gram s.
2. A prototype unattended loading area or shipping-dock monitor was also designe fabricated, and tested by LASL and Sandia Laboratories for primary monitoring at vehicle portals to the restricted area. [11]
The design objective of shipping-dock monitor was to detect a relatively large mass of material such as .unenriched feed which must be available in multithousand kilogram quantities for production of significant quantities of enriched material. The unit was designed to provide surveillance of a nominal 3 m wide by 3 m high door.
A plastic gamma-ray scintillator (51 mm diameter x 914 mm long) was chosen because it was expected that the shipping dock monitor would experience rapid changes in temperature which might damage large Nal detectors. The electronics package was designed to fit, with the plastic scintillator, in a tamper- resistant, cylindrical container similar to that used in the personnel monitor.As in the personnel monitor, background update logic is provided and should the shipping dock monitor be incapacitated by outside radiation shielding, a record will be made on film. An 8-mm camera is used to photographically record all alarm events. The monitor requires 1.25 meters by 0.31 meters of floor space and has a maximum height of 2 .0 m eters. The monitor does not provide lighting for the monitored area . Illumination required to record activity in the monitored space is approximately 1800 lumen/m etre^.
Tests indicate that the sensitivity will vary depending upon installation param eters, such as radiation background, and portal size at specific facilities.
3. The functions of unattended personnel portal and shipping-dock monitors can be supplemented with a sensitive, hand-held, inspector-operated survey instrument for random checks of packages and vehicles and for effectiveness of the fixed monitors. Hand-held monitors require rather high gamma-ray sensitivity to meet proposed performance standards of detection, scanning speed and source distance. In addition, the normal methods of a signal readout utilizing visible or audible count ratemeters are not very desirable for this application. Fitting the instrument with a device for sounding an alarm, if a preset count-rate is exceeded, makes the system more practical. The alarm level must be set such that false alarms are infrequent.
A hand-held monitor using a 38 mm x 38 mm Nal (Tl) scintillator was designed by LASL [12] which stores detector counts digitally for a preset short period of time (normally 0.1 second to 0 .5 second for personnel search) and sounds an alarm if the preset trip level is exceeded during the interim. The process is repeated continually.
Tests of sensitivity were performed using a 10-gram spherical 235ц SOurce which was moved past the monitor at a speed of 0 .5 m/ s . At a distance of closest approach equal to 0 .2 m, the detection probability was greater than 95%.

IAEA-SM -201/11 269
4. The monitoring and assay of sensitive packages were investigated in depth by LASL [13] with a number of active and passive techniques. The detection sensitivity of the various methods was determined relative to the packages specified in the reference model. The results of these studies indicated that the detection sensitivity was strongly dependent on package size and material content. For this reason the Technical Working Group decided not to undertake the design of a prototype package monitor until a specific enrichment plant had been selected for test and evaluation.
Optical Surveillance
Surveillance by means of unattended camera or TV systems has long been regarded as an important element of the IAEA safeguards systems . The U. S . Working Group recognized that optical surveillance would also play a major role in any perimeter safeguards system for uranium enrichment plants. Television surveillance systems usually employ the concept of remote recording as part of a central data collection station. [14] The cost of ensuring secure transmission of the television image, however, is relatively high. A less expensive, self-contained camera system can provide reliable and credible surveillance over extended periods of unattended operation but may add significantly to the duties of the inspector.
A tam per-resistant 16-mm camera surveillance system was designed and built by the National Bureau of Standards for use at feed, withdrawal points and storage areas. [15] A digital clock/tim er provides signals for the readout display of time in days, hours, and minutes in addition to providing timing signals for the operation of the camera at one of several predetermined fixed time intervals. The date-time display is turned on only during the photographic camera exposure period. The oscillator, timing, and counting circuits, however, continue to operate from a separate battery without interruption, consuming less than lmW of power. The batteries charged from the AC power lines provide for a short carry -o v er during periods of power outage. The system is also designed to operate directly from two external 12-volt batteries. Also, the camera can be triggered by a motion detector which permits selective recording of pictures when motion occurs in preselected areas. The use of motion detectors reduces the number of pictures taken as well as protects the camera from various forms of deception.
Tamper-Resistant Techniques
Tam per-resistant, tamper-indicating techniques developed by the Sandia Laboratories [ 16, 17 ] have been utilized to protect both the data and the instrumentation developed for the perimeter safeguards system. Several different techniques provide positive evidence of attempts to gain access to the instrumentation.While the techniques are different in detail, each exploits the necessity of material removal to penetrate the enclosure surrounding the instrumentation.Once the material is removed, the techniques used make undetectable repair very difficult, if not impossible.
Radiation detectors, cam eras, signal processing electronics and data collected are surrounded by transparent cylinders of glass or plastic with a highly reflective metal coating on the interior su rfaces. When a penetration

270 HAMMOND and STIEFF
of the cylinder is made, the metal surface at that point must be removed. The metal surface cannot be replaced until the penetration is closed, but the interior surface is then no longer accessible for repair. Additionally, the reflective metal surface enables the detection of even very small penetrations. Access to each radiation monitor's camera for film-changing purposes is provided by a transparent door with a metallized interior surface. The door is bolted to the glass cylinder. Removal of the door requires destruction of a seal laced through the bolts. In addition, each time the door is open, an irreversible electromechanical counter within the cylinder is incremented.Similar techniques are used to protect the 16-mm surveillance camera.Verification of the seals and container integrity should not take more than 15 minutes.
Protective shipping packages, specialized-usage vehicles, controlled methods for weighing and sampling, and tam per-resistant sealing procedures for UFg cylinders and sample containers have been in use for several years at U . S . enrichment plants. [18, 19, 20] Customers for toll-enriched UFg may witness and verify these procedures and operations. Sealing procedures include use of plastic envelopes and numbered mechanical se a ls .
Additional sealing techniques were evaluated for possible use in a perimeter safeguards system. One promising solution to the problem of checking the identity and integrity of a seal in the field which has been under development in the U . S . involves the use of fiber optics . A fiber optic seal uses the random orientation of the large number of glass fibers in fiber optic bundles to provide a unique fingerprint. The integrity of the seal is checked by the undiminished transmission of light through the fiber optic bundle. The present version of inspector assembled seal is made in the field using an aluminum collet and a compressible rubber gasket. [21] The two ends of the fiber optic bundle are stripped of their protective jacket and inserted into the aluminum collet. The two ends of the bundle are held together by the compressed gasket. A small, Polaroid identification microphotograph of the roughly polished ends of the fiber bundle is made by the inspector after completing the assembly of the seal.
Minor Isotope Safeguards Techniques (MIST)
The use of isotopic data on the minor uranium isotopes (*J U and U) in the external streams of a cascade coupled with feed and withdrawal rates provided by the operator have been shown by Blumkin and Von Halle 122, 23, 24, 25J to be of potential value in safeguarding a uranium enrichment plant. In a perimeter safeguards system where inspections are intermittent and inspector access to the cascade is limited, the inspector should be able to detect, from an independent analysis of the feeds, products and tails any significant departures from the declared flow sheet. In addition, it is desirable, in a safeguards system that relies heavily on unattended instrumentation, to incorporate totally different techniques which may be redundant but which, in the event of a component failure, would provide adequate backup.
A large number of steady-state, multicomponent cascade gradient and productivity calculations have demonstrated that 234u concentrations, and

IAEA-SM-201/11 271
236u when introduced in feed, vary relative to the 235y concentrations in a characteristic way with a cascade flowsheet. Determination of isotopic composition of cascade feed and withdrawal streams in conjunction with their flow rate measurements can be used to corroborate (or contradict) the validity of material accountability resu lts. The techniques are non-intrusive and insensitive to process technology.
It has been demonstrated that the minor isotopic content of enrichment cascades is characteristically affected by such operational considerations as:
1. product enrichment;
2. tails depletion or equivalently the feed rate;
3. isotopic composition of and the rate at which uranium other than natural is fed; and
4. enrichment and withdrawal rate of any additional side stream s.
In applying MIST it will be necessary to establish models and to set standards whereby inspectors can decide whether observed changes in the concentrations are significant. The standards will depend on the analytic precision of the measurements and the normal range of cascade fluctuations.
Nondestructive Analysis * 1
Theoretical gradient calculations and experimental verification of predicted 234u( 235u ( ancj 236y concentrations in feed and withdrawal streams also have important implications in the area of nondestructive analysis of UFg.Blumkin and Von Halle have shown [26, 27 1 that predicted and measured minor isotope concentrations are in agreement with each other within the limits of error of measurements made with high precision, two-stage mass spectrom eter. This agreement, particularly for the case of 234ц, suggests using the measured concentrations of 234jj an(j the calculated 235^/234^ ratjos of all stream s. Many of the problems that have been encountered in the nondestructive measurements of the 235u content of the UFg feed, product and tails cylinders using portable gamma or neutron enrichment meters can be overcome if the 234y concentrations are measured directly using neutron counting techniques and the 2 3 5 jj is obtained either from the calculated 235^ /234^ r a t j o s or from gamma measurements under carefully controlled conditions.
1. An in-line monitor to provide a continuous 235u assay of the UFg product was installed at the Portsmouth Gaseous Diffusion Plant in the summer of 1973 to prevent the inadvertent filling of the large , low enriched product cylinders with more highly enriched uranium which is also available within the same area . The monitor uses independent gamma and neutron detectors which provide redundancy, when only 235y is reported. If the enrichment reported by the control unit goes above or below preset lim its, a high or low alarm is trig g ered . A detailed description of the monitor has been described byT.D. Reilly. [ 28 ]

272 HAMMOND and STIEFF
The gamma-ray system uses a Nal scintillation detector to count the 185.7-keV gamma-ray from 235u using two single-channel analyzers, one set over the 235jj peak (130-230 keV) and the other above the peak at 240-340 keV to provide a correction for the Compton background. After calibration of the gamma system using mass spectrometric data, the 235ц enrichment can be measured to an accuracy of 0.5% at the two sigma level.
The neutron system measures predominantly the fast neutrons produced by spontaneous fission and those produced in the reaction between the alpha particles from the decay of uranium and fluorine, 1^F(a,n)22Na.This system can measure either the concentration directly or the concentration indirectly if a Z33U /Z34U ratj0 js known or assumed. A pipe section 7.6 cm dia. by 30 cm in length defines the volume of the liquid UFg sample analyzed and is surrounded by 16 3He proportional counters in a polyethylene moderator. The accuracy of the neutron measurements is 2.5% at the two sigma level. For periods of approximately one week the standard deviation of the relative difference between the neutron assay and the laboratory sample was approximately 1.3%. The enrichment monitor in this mode fully met all of its design objectives for 235u enrichment and its performance has been very satisfactory. In the spring of 1974, the neutron system of the monitor was recalibrated to read directly in % Z34U. The purpose of the modification was to determine if the in -line monitor could provide continuous measurements of the Z33U /234U гац 0 0f the liquid UFg product with sufficient precision to be used in the application of the minor isotope safe- . guard techniques (MIST) to a gaseous diffusion plant. A comparison of the monitor results and mass spectrometric measurements made on twelve related UF samples shows that the two sets of measurements are in agreement for 235jj Wjthin 1% and for Z34U within 2.5% if all of the error is assigned to the NDA analyses. [ 29 ] These preliminary results suggest that an in-line gamma- neutron monitor could be used in the application of minor isotope techniques to enrichment plant safeguards.
2. The continuing need for precise NDA methods for UFg has led to an evaluation of a 4 it neutron counter for Z34U measurements described in detail by Walton and Van Dieman. [30] This instrument was specifically designed for the 234ц analysis of the standard IS and 2S UFg sample cylinders routinely used at all U. S. gaseous diffusion plants. The 4 tt neutron detector consists of a single ring of 14 'Tie (20 in. active length, 4-atm filling) counters embedded in a polyethylene cylinder having a central cavity for a 2S cylinder or the smaller IS cylinder. The counting rate from normal UFg is about 10 cou n ts/s/kg UFg.
Data on 234jj concentrations have been obtained from the 4 Л neutron counter on 19 2S cylinders of UFc ranging in 23TJ assay from 0.3 to 3.97% (wt) and 5 IS cylinders ranging in^35u assay from 80 to 97.65% (wt) . [31] For the low and high enriched samples the mean of the relative differences between the neutron and high precision mass spectrometer analysis is 0.58%and -0.60% respectively and the standard deviation (la ) of the relative differences is 2.5% and 0.6%, respectively. Although these preliminary results on IS and 2S cylinders are very encouraging, further improvements in making Z34U measurements using this NDA technique are anticipated.

IAEA-SM -201/11 273
3. The reliability and reproducibility of two passive gamma-ray techniques for enrichment verification have been investigated. [32]
The tests were conducted with a portable Eberline Instrument Corporation's Stabilized Assay Meter II (SAM-II) equipped with a 5.1-cm-diameter by 1.27-cm Nal (Tl) detector and a portable battery power supply. The detector contains a small 241Am seed for alpha particles to provide constant energy pulses for electronic stabilization. This unit, with two separate channels, sca lers, and digital rate multiplier can provide a direct digital readout of enrichment. This technique of using intensity of the 185.7-keV gamma ray from 235u and instrumentation have seen wide use in the U.S . Accuracy is on the order of 10% or better limited by cylinder wall variations, non-uniformity of solid UF^ and unrecognized "dirty" cylinders.
Field tests have also been made utilizing gamma rays from both 235U and 238U . Variations in the diameter of cylinders and in distance from the detector have little effect on the resu lts . However, variations in cylinder wall thickness can introduce errors up to about 5% and data on the age of the UFg should be known.
4. Three independent neutron techniques for field assay of large UFg cylinders using portable equipment have been investigated; I 33 ] two passive techniques using 3He and %le detectors respectively and one active neutron technique using ^He detectors and a 238puLf or ^ A m L i neutron source. The detectors have been used with Eberline SAM II as well as the MS-2 miniscaler also manufactured by Eberline.
The % 235u is determined directly from the active ^He measurement. The mass of UFg in the cylinder and % 234u can be determined from the passive 3He and % e measurement. In general, the precision of these nondestructive analyses is on the order of 10%. The measurements on a given UFg cylinder can be made in the field in about 30 m inutes.
CONCLUSIONS
1. Preliminary tests of prototype tamper-resistant cameras and radiation monitors (personnel and loading dock) indicate that these componentsof an unattended safeguards surveillance system would provide a credible and independent means of monitoring significant flows of nuclear material through designated portals in the perimeter of an enrichment plant.
2. Detailed studies indicate that it will be difficult to design a general- purpose radiation monitor for packages containing sensitive isotope separations equipment. Agreement between plant operators and inspectors on administrative measures controlling the movement of sensitive packages will simplify the design of the radiation monitor.
3. A sensitive , hand-held, radiation surveillance monitor has been tested which should assist an inspector in spot checks of packages and veh icles.
4. Isotopic data on the concentrations of the minor uranium isotopes,23% and 236jj( jn ац feed, product and tails streams can be used by

274 HAMMOND and STIEFF
the inspector to independently verify the cascade flow sheets of an enrichment plant and to supplement the safeguards provided by materials accountancy, containment and surveillance.
5. In-line and transportable gamma and neutron instrumentation can be used to provide precise, nondestructive assay of 234U and 235U in UFg feed and withdrawal stream s, and standard size shipping and sampling cylinders. The use of such precise NDA methods should increase the feasibility of using minor isotope safeguards technigues in the verification of cascade flow-sheets and provide the inspectors with a reliable field method of verifying the assays of UFg in cylinders and traps.
6. Although a number of prototype components of an enrichment plant perimeter safeguards system s have been developed and are undergoing test, a complete evaluation of the system 's effectiveness can be determined best by actual application to a specific enrichment plant.This evaluation should include the most refined material accountancy techniques, extensive use of containment and surveillance and a detailed mathematical model of the specific plant parameters including all key measurement points, flow-rates and full isotopic characteristics. The IAEA "Design Information Questionnaire" should provide much of the information required for the mathematical model.
REFERENCES
[ 1] IAEA safeguards at isotope separation plants, U. S . paper presented at IAEA technical working group on safeguards procedures for isotopic enrichment facilities, June 12-16, 1972.
[ 2] KOUTS, HERBERT J . C . , WILLIAMS, JAMES M ., Information relative to safeguards at gas centrifuge plants (1972) .
[ 3] KOUTS, HERBERT J . C . , WILLIAMS, JAMES M ., Information relative to safeguards at gaseous diffusion plants (1972) .
[ 4] BLUMKIN, S ., VON HALLE, E . , Review of the Performance of Separation Casca and the Behavior of the Minor Uranium Isotopes, Union Carbide Corporation, Nuclear D ivision, ORGDP Rep. К-ОА-2ЮЗ (1972) .
[ 5] The Structure and Content of Agreements Between the Agency and States Required in Connection with the Treaty on the Non-Proliferation of Nuclear Weapons, IAEA, INFCIRC/153 (1971) paragraph 46.
[ 6] INFCIRC/153, paragraphs 46 and 80.
[ 7] See reference [1 ] .
[ 8] KOUTS, HERBERT J . C . , Reference Uranium Enrichment Plant (1972).

IAEA-SM-201/11 275
[ 9] A Perimeter Safeguards System for Enrichment Plants, (A joint U. S . ArmsControl and Disarmament Agency and U. S . Atomic Energy Commission Project Plan) (1972) .
[10] CHAMBERS, W. H ., NEY, J. F. , "Tamper-indicating radiation surveillance instrumentation (IAEA-SM-201/12) , th ese P roceed in gs, Vol.II.
I l l ] See reference [10] .
[12] CHAMBERS, W. H. , A perimeter safeguards system for uranium enrichment plants: methods, techniques and components: radiation surveillance, LASL Rep. A-2-75-304 (1975), unpublished.
[13] See reference [12] .
[14] LAUG, О. В. , YEE,K.W., Tam per-resistant television surveillance system .National Bureau of Standards, NBSIR 75-707 (1975) .
[15] "NBS Camera Keeps Eye on Nuclear Fuel," National Bureau of Standards Technical News Bulletin, Dimensions, January (1975) 6-7.
[16] See reference [10] .
[17] MCMANUS, J . G. , ENGEL, A.V. JR. , "Tamper-resistant unattended safeguards techniques (IAEA-SM-133/8)," Proceedings of a Symposium on Progress in Safeguards Techniques, V ol.I, IAEA, Vienna (1970) .
[18] BARTON, J . C . , Handling of UF Cylinders at the Oak Ridge Gaseous Diffusion Plant, Union Carbide Corporation, Nuclear Division, ORGDP Rep. K-L-6321 (1973) .
[19] WOLTZ, F . E . , DEVITO, V . J . , UFß Toll Enrichment Handling Procedures at the Portsmouth Site of the USAEC, Goodyear Atomic Corporation, Rep. GAT-T-2073(1973) .
[20] DEVITO, V . J . , "Material Surveillance and Verification Program at a Uranium Enriching Plant (IAEA-SM-201/23), th ese P roceed in gs, Vol.I.
[21] ULRICH, R . R . , Fiber Optic Seals: Glass and Plastic Fiber Optic Safing Systems for International Safeguards and Arms Control Applications, U. S. Army Material Command, Harry Diamond Laboratories Rep. (1975) .
[22] BLUMKIN, S . , VON HALLE, E . , The Behavior of the Uranium Isotopes in Separation Cascades, Part I: Ideal Cascades, Union Carbide Corporation, Nuclear D ivision, ORGDP Rep. K-1839, P a r t i (1972) .
[23] BLUMKIN, S . , VON HALLE, E . , The Behavior of the Uranium Isotopes in Separation Cascades, Part II: A Short Cascade Designed for the Production of Power Reactor Fuel, Union Carbide Corporation, Nuclear D ivision, ORGDP Rep. K-1839, Part 2 (1973) .
J24] BLUMKIN, S . , VON HALLE, E . , The Behavior of the Minor Uranium Isotopes in Separation C ascades, Part III: A Long Cascade Designed for the Production

of a Small Quantity of Highly Enriched Uranium Simultaneously with a Much Larger Quantity of Power Reactor Fuel, Union Carbide Corporation, Nuclear D ivision, ORGDP Rep. K-1839, Part 3 (1974).
[25] BLUMKIN, S . , VON HALLE, E . , The Behavior of the Minor Isotopes in Separation Cascades Part IV: Special Topics: A. The Effect of the Magnitude of the Separation Factor; B. The Effect of Process Gas Losses; C. The Effect of Cascade Non-Ideality, Union Carbide Corporation, Nuclear Division, ORGDP Rep. K-1839 Part 4, (1974) .
[26] BLUMKIN, S ., VON HALLE, E . , Minor Isotopic Measurements in a Gaseous Diffusion Cascade, Union Carbide Corporation, Nuclear Division, ORGDP Rep. K-OA-2273 (1973) .
[27] BLUMKIN, S . , VON HALLE, E . , A Preliminary Report on the Minor Isotopic Measurements in a Gaseous Diffusion Cascade: MIST Test П ., Union Carbide Corporation, Nuclear Division, ORGDP Rep. K-OA-2388, (1973) .
[28] REILLY, T . D. , MARTIN, E. R. , PARKER, J . L. , SPEIR, L. G. , WALTON, R. B. ,A continuous in -line monitor for UF, enrichment, Nuclear Technology, 23 Sept (1974) 318-327.
[29] STIEFF, L . R . , WOLTZ, F . E . , REILLY . T . D . , On-line measurement of the isotopic composition of uranium in UFg, Institute of Electrical and Electronic Engineers, Transactions on Nuclear Science, N S-22, February (1975) 731-733.
[30] WALTON, R.B . , VAN DIEMAN, P . , Neutron Detector for Analysis of UFg in 2S Cylinders, LASL Rep. LA-5771-PR (1974) .
[31] STIEFF, L.R. , WALTON, R.B. , REILLY, T . D . , FIELDS, L J 7 . , WALKER, R . L . , MULLINS, W. T . , THOMS, J .1 . ,"Neutron measurement of U isotopic abundance UFfi samples", Proceedings of the 16th Annual Meeting, Institute of Nuclear Materials Management, New Orleans, June 1975.
[32] See reference [12] .
[33] See reference [12] .
276 HAMMOND and STIEFF
D I S C U S S I O N
H.A. HUGHES: Safeguarding enrichm ent plants is a subject which has been ex e r c is in g a num ber of us for som e y ea r s . In p articu lar the T ripartite Group in Europe, which has been operating pilot centrifuge plants and is building la r g e r -s c a le p lants, has been concerned with ensuring that these plants are e ffec tiv e ly safeguarded.
I think that it i s worth repeating that nuclear m a ter ia l accounting can be perform ed m ore accu rately at an enrichm ent plant than at any other type of nuclear fa c ility , and in particu lar the ex trem ely sm a ll p ro ce ss inventory of a centrifuge cascad e red u ces considerably that part of the uncertainty a sso c ia ted with the MUF com pared to a diffusion plant, so that even if

IAEA-SM-201/11 277
in sp ection a c c e s s to the cascad e is r e s tr ic te d , the problem is not s ig n ifican tly w orsened.
At the second working group to which you r e fer , the T rip artite Group p resen ted an an a lysis of the expected uncertainty in c lo sin g the m ateria l b alance, based on the proposed accounting sy stem for the la rg er plants.T his was accepted as sa tis fa c to ry and, indeed, our exp erien ce to date on pilot p lants appears to bear out our an a lysis .
H ow ever, certa in prob lem s w ere identified: (1) could accounting data be v er ified on a continuous b a s is , and (2) was it p o ss ib le to v er ify sm a ll quantities of m ateria l brought out of the cascad e area in sea led packages?
It was agreed that we would carry out a tr ia l of the cam era developed by our co lleagu es in the United States of A m erica , and I p refer to think of such a d evice as a m eans of providing continuous or sem icontinuous v er ifica tio n of accounting reco rd s or data.
L ately the United Kingdom au th orities have agreed to ca rry out two re se a rch co-ordination con tracts with the Agency. One of th ese is intended to develop a way of ver ify in g the derived estim ate of 235U in cold trap s, which form s the la r g est part of the p ro ce ss inventory. The other is a fe a s ib ility study for a m ethod of m easu rin g the 235U content of sea led packages brought out from the cascad e.
I am in favour of the princip le of in -lin e instrum entation to provide continuous 235U a ssa y . I am le s s happy about the use of MIST for two reason s. One is that I don't think in sp ecto rs should need so m any independent m eans of ver ify in g the sam e data. The other is that by a com bination of random and regu lar in sp ectio n s, an in sp ector could pick up undeclared changes in the flow -sh eet, s in ce sign ifican t changes cannot be m ade at a ll ea s ily .
G.A. HAMMOND: In gen eral, I agree with the com m ents with regard to the u se of m inor iso to p ic data (MIST); in a safeguards sy stem which r e l ie s h eavily on unattended instrum entation it is im portant to incorporate techn iques which, in the event of other com ponent fa ilu re , would provide adequate back-up. With the p ossib le u se of the p r e c ise NDA m ethods d iscu ssed , the fe a s ib ility and u tility of MIST are in creased . The techniques are n on -in tru sive and in sen sitiv e to p ro ce ss technology.
Yu. KONNOV: In your report you m entioned the su rve illan ce sy stem developed by the United States N ational Bureau of Standards. Some m otion se n so r s w ere in corporated in th is sy stem , which we think i s of im portance as it should enable us to bypass the co llec tion of u n n ecessa ry inform ation.
The A gency has been testin g the sam e type of sy stem . Plant te s t s by the A gency in the Soviet Union and in B elgium have shown that the p er form ance of the m onitors is excellen t when the area under su pervision has perm anent illum ination .
What is your exp erien ce of the u se of th is system ?G.A. HAMMOND: Motion is detected by sen sin g a rate of change in
lum inance. I am not aware of any " fa lse alarm" in cid en ts, resu ltin g in e x c e s s iv e use of f ilm . Perhaps som e rev is io n could be made in the sen so r c ircu its or on the occasion of a red esign of the cam era sy stem . We appreciate the com m ent in any case . The se n so r s for m otion d etec tors con sist of an array of p h otoce lls m ounted in the film plane. Up to ten photocells of the array can be se le c te d to m onitor the requ ired a rea s. S en sitiv ity is a grey sc a le change of one tw entieth of the white le v e l for ob jects m oving at a rate of one fiftie th of the h orizontal p icture coverage per second.


IAEA-SM -201/67
TESTING OF TECHNIQUES FOR THE SURVEILLANCE OF SPENT FUEL FLOW AND REACTOR POWER AT PICKERING GENERATING STATION
D.B. SINDEN.J.G. h o d g k in so n Atom ic Energy Control Board, Ottawa,Canada
J.W. CAMPBELLSandia Laboratories, Albuquerque, New Mexico
H.D. KOSANKE General Electric Company,Vallecitos Nuclear Center,Pleasanton, California,United States of America
P resented b y R.M. Sm ith
Abstract
TESTING OF TECHNIQUES FOR THE SURVEILLANCE OF SPENT FUEL FLOW AND REACTOR POWER AT PICKERING GENERATING STATION.
The Pickering Generating Station is com prised o f four "on-power" fu elled CANDU reactors. Fuel is irradiated and discharged continuously at a rate o f approxim ately 1000 fuel bundles per month. To d etect diversion o f spent fuel from such a system it is necessary to provide an independent m easurem ent o f spent fuel flow out o f the reactor. An estim ate o f plutonium production is also possible i f reactor power can be independently monitored. Instruments have been designed to monitor fuel flow and reactor power. Prototypes, built in the United States o f A m erica under a USA/Canada co-op era tive program m e, have been undergoing tests at the Pickering station since August 1973. One design responds to neutron radiation and has application both as a fuel m onitor and reactor power m onitor. The other relies on gross gam m a radiation from the fuel and functions as a fuel monitor. The design parameters o f these monitors were chosen to m in im ize the com p lex ity of the equipm ent and to provide inform ation necessary to the safeguards inspector. The test data has been com p iled to perm it an assessment o f the u tility o f these d evices as safeguards tools. Both the reactor power monitor and fuel monitors have been assessed with respect to the design criteria. The cap ab ilities and lim itation s that have been demonstrated during testing are defined. Potential applications of the equipm ent in the safeguards regim e are explored in light o f the cap ab ilities o f the instruments.
1. Introduction
The application of sa fegu ard s to a continuously fu elled pow er re a cto r p o ses unique prob lem s to the sa fegu ard s in sp e c to r . Spent F u e l at the P ick erin g G enerating Station i s d isch arged to the s t o r age bay at a ra te of ap proxim ately 1000 bundles p e r month when the fou r r e a c to rs are at fu ll p ow er. The plutonium contained in th ese fuel bundles can be ca lcu la ted by the op erator to w ithin 1 o r 2%, h ow e v e r , v er ifica tio n of th e se q uan tities m ust be p o ss ib le by an in depen dant in sp e c to r . Spent fu e l from a CANDU re a c to r i s m oved from the re a cto r face to the sto ra g e bay through se v e r a l s ta g e s . At P ick er in g ,
279

280 SINDEN et al.
C l _NEW FUEL
FUEL
FUEL TRANSFER FLOW
FUELLING MACHINE BRIDGENEW FUEL LOADING AREAPNEUMATIC HOISTNEW FUEL LOADING MECHANISMSHIELD GATENEW FUEL MAGAZINETRANSFER MECHANISMFUEL TRANSFER PORTFUELLING MACHINEREACTORSPENT FUEL ELEVATOR SPENT FUEL CONVEYOR CONVEYOR UNLOADER STORAGE LOADER BASKET IN STORAGE BAY
A - F uelling M achine Snout M onitor В - T ran sfer Port M onitorC - Gamma Sensitive Bundle Counter D - R eactor P ow er M onitor
FIG .l. Fuel transfer flow and m onitor position.

IAEA-SM -201/67 281
spent fu e l i s re ce iv e d from the rea cto r fa ce by th e fu e llin g m achine and i s su bsequently d isch arged into the tra n sfe r m ech a n ism . In the tra n sfe r m ech an ism , the fu e l is p laced onto an e lev a to r and then low ered to a trench com m on to a ll the re a c to rs; it is then conducted through th is trench into the storage b ay . It m ust be rem em b ered that a CANDU rea cto r m ay be fu e lle d /d e -fu elled from e ith er s id e of the ca land ria; for th is re a so n , any m onitoring in stru m en tation d e sign ed fo r u se on e ith er the fuellin g m achine o r tr a n s fe r p ort, which are the c r it ic a l points in the fuel flo w s, m ust be in sta lle d on both s id e s of the rea cto r (F ig . 1). M onitoring of spent fu e l bundles p assin g through the trench would enable an in sp ecto r to be sa t is f ie d that fuel leav in g the re a cto r face had in fact p a ssed through the trench and should be co n tained within the con fines of the storage bay. O p tica l su rv e illa n ce of the storage bay area u sing ca m era s would allow th e in sp ecto r a ju d g em ent on the se cu r ity of the co n ten ts . D etailed in terp reta tion of m onitor data and co rre la tio n with sta tion record s is a m ajor part of the eq u ip m ent evaluation to en su re that the m onitoring m ethods are capable of providing an in sp ecto r with unam biguous in form ation . In addition, know ledge of the g r o s s rea cto r pow er would enable an e s tim a te of plutonium content of the spent fu e l to be m ade.
A m onitoring network of s e c u r e , in sp e c to r - in sta lle d in stru m en ts which would "observe" a ll re -fu e llin g op era tio n s, would enable unattended safegu ard s to be adequately applied to the re a c to r sy s te m .
2. M onitoring Instrum entation
AVork perform ed by the G . E . V a llec ito s N u c lea r C entre on neutron flux record ing d ev ices u sing the Track Etch technique^1) has resu lted in the developm ent of in stru m en ts su itable for unattended m onitoring of both the p a ssa g e of spent fuel bundles and rea cto r p ow er. Sandia L a b o ra to r ies , A lbuquerque, have a lso developed a prototype sa fegu ard s instrum ent c a pable of unattended m onitoring of the p a ssa g e of sp en t fuel b u n d le s^ ).T his in stru m ent u se s G e ig er-M u eller tubes to d etec t the ch a ra c ter istic gam m a radiation p ro file o f e ith er s in g le bundles or two bundles on the conveyor cart.
In both c a s e s the equipm ent re se a rch and d evelopm ent effort has b een sp onsored by .the U . S . A rm s C ontrol and D isarm am en t A gen cy .
2 .1 T rack E tch - (D escrip tion)
T his technique r e lie s on the fact that when f is s io n o ccu rs in a thin la y er of f iss io n a b le m a te r ia l, the f is s io n fragm en ts have s u f f ic ien t k inetic en ergy to escap e from the su rfa ce (F ig . 2 ). A sou rce f is s io n e d by. a neutron flu x , i s p laced c lo se to a f ilm of p o ly ester p la stic m a ter ia l; the f is s io n fragm en ts cau se dam age track s in the p la stic which m ay be su bsequ en tly m ade v is ib le b y etching. (F ig . 3 , 4 ) .A film of the p la stic m a ter ia l i s drawn s lo w ly p a st a block containing
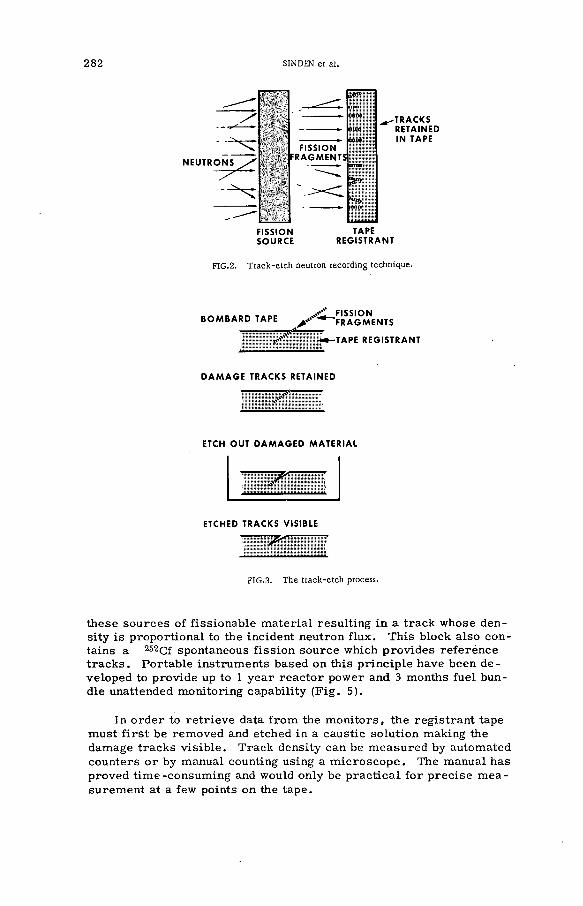
282 SIN DEN et al.
TRACKS RETAINED IN TAPE
FISSION TAPESOURCE REGISTRANT
FIG.2. T rack-etch neutron recording technique.
BOMBARD TAPE FISSIONFRAGMENTSTAPE REGISTRANT
DAMAGE TRACKS RETAINED
ETCH OUT DAMAGED MATERIAL
ETCHED TRACKS VISIBLE
------- ^ ---------
FIG.3. The track-etch process.
th e se so u rc es of f is s io n a b le m ater ia l resu ltin g in a track w hose dens ity i s proportional to the incident neutron flu x . T h is block a lso co n ta ins a 252Cf spontaneous f is s io n so u rce which p ro v id es re feren ce tr a c k s . P ortab le in stru m en ts based on th is p r in c ip le have been d e veloped to p rovide up to 1 y ea r re a cto r power and 3 m onths fuel bund le unattended m onitoring cap ab ility (F ig . 5).
In o rd er to re tr ie v e data from the m o n ito rs , th e reg istra n t tape m ust f ir s t be rem oved and etched in a cau stic so lu tion m aking the dam age track s v is ib le . T rack d en sity can be m easu red by autom ated cou n ters o r by m anual counting u sing a m ic r o sc o p e . The m anual has proved tim e-co n su m in g and would on ly be p r a c tic a l for p r e c ise m e a su rem en t at a few points on the tap e .

IAEA-SM -201/67 283
FIG.4. Exposed test tape.
The m ost p ra ctica l a n a ly s is technique yet d ev ised depends on a m easu rem en t of the tape r e f le c tiv ity . The light r e f le c te d , being p r o p ortional to the track d en sity , can be m easu red w ith a photom eter as ■ the tape is m oved past a light so u r c e . An apparatus has been co n stru cted which w ill m ake th is m easu rem en t and produce a str ip chart record of the r e s u lts .
The in sta lla tion and rem oval of track-etch sp en t fuel bundle m onitors req u ires p eriod ic a c c e s s to the fuellin g m achine and fu e l tra n sfe r p ort. A c c e s s to th e se a rea s i s o ften re s tr ic te d by health and sa fety co n sid er a tio n s , con stra in ts w hich tended to r e duce the con ven ience of the in sta lla tio n . H ow ever , with proper p recaution s and planning, routine s e r v ic e and data co llec tio n can be accom p lish ed without d ifficu lty , but with the added co st o f the in cr ea se d tim e req u ired .
A re a cto r pow er m onitor w as in sta lled in the b io lo g ic a l sh ie ld in one of the start-Aip ion iza tion cham ber lo c a tio n s . A gain the n a ture of the s it in g req u ires carefu l scheduling and adequate p recautions fo r health and sa fe ty during in sta lla tion or re m o v a l. T his m onitor, h ow ever , has the cap ab ility of operating for one y e a r , so the co n stra in ts are not a s grea t a p rob lem .

284 SINDEN et al.
2 .2 Sandia Bundle C ounter - (D escrip tion)
The bundle counter u se s G e ig er -M u e ller (G-M) tubes to d e te c t the ch a r a c te r is tic gam m a radiation p ro file o f s in g le bundles o r bundle p a irs (F ig . 6 , 7 ) . G-M tubes w ere s e le c te d for the g a m ma rad iation d etec tor b ecau se of th e ir la rg e u se fu l dynam ic range and b eca u se the outputs are d irectly com patib le w ith d ig ita l c i r cu itry . D ig ita l c ircu itry has advantages o v er an alog in sta b ility , dynam ic range and r e s is ta n c e to radiation e f f e c ts . The d igita l lo g ic d eterm in es when a bundle/bundles are p resen t based on the p u lse rate from the G-M tu b es. The p u lse rate th resh o ld is a d justab le o v er th ree ord ers of m agnitude. The co llim ated d etectors are sp aced 1 .5 bundle lengths apart so that for a s in g le bundle, the G-M tubes do not s e n se the bundle s im u lta n eo u sly . When a p air of bundles is tr a n sfe rr ed , the bundles are sen sed by both G-M tubes sim u lta n eo u sly . T h ese two m utually ex c lu siv e ev en ts p erm it the

IAEA-SM -201/67 285
FIG.6. Pickering conveyor counter.
DETECTORA
DETECTORВ
150 kR /h (TYPICAL)GAMMA PROFILE
No. 1 BUNDLE I No. 2 BUNDLEО_______________ о _______________ о
FIG.7. D etection technique.
logic to id entify s in g le and p air tr a n s fe r s . The lo g ic id en tifie s the d irection of the tra n sfe r by determ in ing which d etec to r s e n s e s the bundle(s) f ir s t . A ll of th is in form ation is used to record the tr a n s fe r on one of four corresp ond ing counters: "single bundle to bay", "bundle p air to bay", 'feingle bundle to rea cto r" , o r "bundle p air to rea cto r" .
A ll d e te c to r s , e le c tr o n ic s and cou n ters are contained w ithin a tam p er-in d ica tin g e n c lo su r e . The en clo su re p ro tec ts the va lid ity of the data c o llec te d by providing ir re v o ca b le ev id en ce of tam pering with the con ta in er. Although the container is con stru cted of three differen t m a te r ia ls , each r e lie s on the ex trem e d ifficu lty of unde- tectab ly rep lacin g su rfa ce m a ter ia l once it has b een rem oved to gain a c c e s s to the in te r io r .

286 SINDEN et al.
P enetration of the m irrored domes req u ires rem oval of some part of the aluminized in terio r su rfa ce . R ep air o f the re flectiv e su rface requ ires that the hole in the g lass be closed f ir s t , but the in te rio r su rface is then no longer a cc e ss ib le to the in tru d er. The su rface of the "im pervium " bases below the g lass domes is a uniquely anodized aluminum. Inside the aluminum sh e ll is an epoxy m atrix of alumina and hardened stee l sp h eres. Undetectable r e p air of the resu lting large hole is very difficult because of the unique su rface co lou r. Surrounding the e le c tr ic a l w ires which connect the two bases is a p re -s tre s se d g lass tube. A ttem pts to gain a cc e ss to the signal w ires resu lts in the entire tube sh atterin g , s im ila r to a shattered automobile windshield. Replacem ent with a s im ila r tube is not possible because the w ires a re attached within the g lass dom es.
The design of the bundle counter includes a rech arg eab le s t o r age battery to bridge tem porary lo sse s of e le c tr ic a l power supplied by the generating station . The capacity of the battery will perm it s ix hours of instrum ent operation. If th is cap acity is exceeded, an ir re v e rs ib le electrom ech an ical counter is advanced when the battery voltage drops to an unacceptable lev el. Since power outages of this duration a re very abnorm al, the increm enting of th is counter is also an indication of "tam pering" by disconnecting the bundle counter from station power.
The previous rem arks on servicing and inspection apply to this counter a lso , but with the added inconvenience, in th is evaluation, due to the confined area in which the counter is in sta lled .
The secu re readout from the counter is contained within the tam per-indicating housing, thus an in sp ector must en ter the trench in o rd er to sa tisfy h im self that any reading obtained from a seco n dary rem ote readout is tru e .
3. Evaluation of Instrum entation
The main aim s of the in itia l phase of the m onitoring equipment evaluation w ere tw o-fold; f irs t ly to investigate the c o r r e la tion between recorded data and station operating re co rd s and secondly to a s se ss any problem in installation and serv ic in g of the equipment that might be encountered by an insp ector during routine d ata-co llectio n . In a fin al an aly sis , both aspects m ust be given con sideration ; a technically p erfect instrum ent would not be used fo r a safeguards application if the required siting o r routine servicing p ro cedures w ere unacceptable to either the station operator or the in sp ecto r s .
3 .1 Sandia Bundle Counter P erform ance
The irrad ia ted fuel bundle counter was installed at P ickering on D ecem ber 4 , 1973. The radiation from the fuel bundles was found to

IAEA -SM -201/67 287
be an o rd er of magnitude m ore intense than the instrum ent was o r i ginally designed to accom m odate. A fter adjustm ent of the detection thresholds a s e r ie s of four life te s ts were conducted. During each of th ese te s ts the bundle counter perform ed w ell until total exposure of a G-M tube reached between 100 ,000 and 3 00 ,000 rad. The bundle counter agreed to within 1 .2 percent of the plant o p era to r 's record s of 620 bundles tran sfe rred to the bay during the f ir s t te s t . M ost of this e r r o r o ccu rred when six single bundles w ere counted as bundle p a irs . A nalysis of th is o ccu rren ce determ ined the cause to be the in tense gam ma radiation (mentioned above) from a single bundle penetrating the shielding around the G-M tubes to the extent that both d etectors sensed the bundle sim ultaneously . To reduce this problem , the detector th re sh - holds w ere ra ise d . During the second te s t , the plant op erator tr a n s ferre d 938 bundles to the bay while the bundle counter indicated a net of 919 bundles (e r ro r of le ss than 2 .1 p ercen t). F o r the third test p e r iod, the op erator tran sfe rred 1672 bundles to the bay and the bundle counter indicated a net of 1597 bundles to the bay, o r an e r ro r of 4 .5 p ercen t. E ight hundred and forty-tw o bundles were tran sferred with the bundle counter indicating a net of 835, o r an e r r o r of approxim ately0 .8 percent (7 bundles) during the fourth period . In each c a s e , the e r ro rs occurred at the end of the G-M tube life ( i .e . 100 ,000 - 300 ,000 rad).
On O ctober 17, 1974, sev era l m odifications w ere made to the bundle counter to in c re a se tube life and im prove the single bundle detection cap ability . The collim ation of the detectors was in creased and m ore shielding was added between them to enhance the d etecto r 's ability to d iscrim inate between a single bundle and a p a ir, as well as reduce the radiation exposure of the tube during each tra n s fe r . G-M tube life is related to the total number of d ischarges (counts) that occur in the tube. The counts p er second of a G-M tube a re proportional to the radiation dose- rate to which the tube is exposured. Changes w ere made in the electro n ic c ircu itry associated with the tubes to reduce the number of d ischarges which occu r for a given radiation d ose-rate . During the in itia l te s t of the m odifications, the bundle counter reg istered the sam e 678 bundles recorded by the op erator. The life te s t of the G-M tubes using the m odifications was begun on D ecem ber 4 ,1974. On May 16, 1975, six single bundles w ere tran sfe rred to the spent fuel bay and re g iste red by the bundle counter as s ix p a irs .P r io r to this the counter and the o p era to r 's record s agreed with 1464 bundles tra n sfe rred to the bay. Additional shielding will be added to the bundle counter to reduce the sim ultaneous detection of radiation from single-bundle tr a n s fe rs . Studies a re being con ducted to determ ine whether fu rth er separation of the detectors w ill enhance the identification of single-bundle tra n sfe rs without degrading the reg istra tio n of bundle p air tr a n s fe rs .
To date, the bundle counter has recorded over s ix thousand fuel assem bly tra n sfe rs to the spent fuel bay with an average e r ro r of le ss than 2 p ercen t. M ost of the e r ro r occurred either during G-M tube fa ilu re , evidenced by e r ra tic operation o r as a

TR
AC
K
DE
NS
ITY
чFIG.8. >^ast fuelling m achine monitor channel No. 3; 40 X m agn ification horizontal axis: m icroscope vernier, 1 div = 5 m in.
288 SIN
DE
N et al.

IA EA -SM -201/67 289
re su lt of single bundle tran sfers being recorded as bundle p a ir s . Additional development work is planned to bring the bundle counter to its full design potential. On o ccasio n , the bundle counter has proven useful to plant personnel in identifying in accu racies in spent fuel bay reco rd s and can s im ila rly provide an in sp ector a sim ple m eans of documenting the change in spent fuel bay inventory during h is ab sen ce.
3 .2 T rack -Etch P erform ance
3 .2 .1 Spent F u el M onitor
Spent fuel m onitors have been installed at P ick erin g since A p ril 1973. In itia lly one side of one re a cto r was instrum ented, how ever, a d esire to te s t fully the co rrela tio n s between neutron flux and fuel movem ents sim ultaneously at both faces of the r e a c to r , resulted in one re a c to r being fully instrum ented with four m o n ito rs .
A typical tra ce fo r a s e r ie s of norm al fuelling movements (F ig . 8) shows a c le a r signature fo r each fuelling operation at the re a cto r fa ce . Unfortunately the resolution of this record is not high enough to enable a determ ination of the number of fuel bundles tra n sfe rred in each o p era tion . The fuelling machine may accept from one to 12 bundles at this position. A typical tr a c e resulting from fuel d ischarge from the fu e lling machine through the tra n sfe r port (F ig . 9) shows a coincidence of activity at both locations indicating that the fuel was moved along the norm al flow path and thus not klong a diversion path. H ere too, r e s o lution is such that the d iscrete elem ents cannot be counted.
Attem pts have been made to analyse individual fuelling operations by manual counting (F ig .1 0 ). The subsequent im provem ent in re so lu tion enables the individual peaks to be related to activ ities at the r e a c to r fa c e . Again,how ever, resolution has not been attained which will enable individual fuel bundles to be counted. It appears that bundle p a irs can be identified , how ever, that evidence, to date is not conclu sive .
3 .2 .2 R eacto r Pow er M onitor
Pow er m onitors have been installed fo r up to one-year periods and operated without m echanical p roblem s. A y e a r of re a cto r o p era tion can be recorded and data extracted efficiently with the photom eter. A specimen trace (F ig . 11) re la te s well with the actual operation data readily showing shut-downs o r power fluctuations lasting only a few hou rs. With such a d evice, an in sp ector can gain reasonable co n fidence in the accu racy of station operating re co rd s . Pow er changes can be m onitored with a p recisio n of 10%. It is n ecessa ry to d e te rmine a flux level equivalent to a known re a c to r power level before absolute m easurem ents can be m ade.

FIG.9. East transfer port m onitor channel No. 3; 40 x m agnification horizontal axis: m icroscope vernier, 1 div = 5 min.
290 SIN
DE
N et al.

FIG
.10. E
ast fuellin
g mach
ine snout 10 bundle refu
elling.
TRACKS PER FIELD I 0.15 mm2 )
T 62 L9/T0S-P4S-V3VI
TIM
E
ON
AP
RIL 10,1974
П5
0___________
1200____________1210____________
1220____________1230_____________1240
________1250
1300 1310

292 SINDEN et al.
F IG .ll. Comparison of tape and reactor records.
3 .2 .3 R elia b ility
T rack-etch m onitors have been installed at P ick erin g under n o rm al operations conditions since A pril 1973 . In that periodnot one m echanical o r e le c tr ic a l fa ilu re has occu rred nor has the reg istran t tape suffered any m easurable d eterioration from te m peratu re or radiation.
3 . 2 . 4 Routine Data C ollection
These m onitors must be a cce ss ib le in ord er to re triev e the data reco rd . At P ick erin g , the fuel monitoring instru m ents are located in an are a su b ject to high radiation fields and substantial airborne tritiu m concentrations. A cce ss th erefo re is re stric ted to periods during which fuel is not being moved and usually requ ires that personnel w ear full p lastic protective clothing. The preparation and waiting fo r these conditions to be met may req u ire the insp ector to be on stand-by for one to two days. An alternative would be to r e quire the shut-down of fuelling operations at the in sp ec to r 's convenience fo r tlie period required to make a radiation survey and re triev e the data. This period would generally not extend beyond 1/2 hour. This alternative may not always be available if station operation is not to be unduly effected .
The power m onitor has been in serted into existing penetrations in the biological shield and can be in serted or rem oved at full re a cto r power. This operation can be accom plished in le s s than 1/2 hour and does not in terfere with station operation.

IA EA -SM -201/67 293
4 . A ssessm en t of the Equipment T r ia ls at P ickerin g
The evaluation involved instrum entation which could possibly make up an unattended safeguards concept fo r a continuously fuelled re a c to r . It is not the intention h ere to attempt a detailed analysis of p articu lar instrum ent behavior in a sp ecific location but m ainly to com m ent on experience gained in operation of the equipment in a m ann er s im ila r to that expected by independent safeguards in sp ecto r.
4 .1 C orrelation of Data with Station R ecord s
The instrum entation as installed at P ick erin g could give a good ov era ll view of the re a c to r operation and fuel flow . If one assu m es a starting number fo r spent fuel bundles in the storage bay, analys is of G-M bundle counter data from the spent fuel trench would give figures for the number of bundles the in sp ector would expect to find added to the bay inventory. The number of bundles removed from the re a cto r through d e-fuelling operations would then be in ferred from track -etch m onitor data obtained at the fuelling machine and tra n sfe r port locations on both sides of the re a c to r . The weak point h e re , is that during norm al re a cto r operation it is the p ra c tic e to load batches of (8) eight o r 10(ten) new fuel bundles, in p a irs , into a channel at one fuelling. F o r this reason m ost of the present data from these locations is associated with (four) o r 5 (five) bundle p a irs and it is d ifficult at present to a ss e s s the possib ility of r e s o lv ing single bundle tr a n s fe rs . However, good co rrela tio n s of tra ck - etch data with known fuelling events have been obtained and the work is continuing.
4 .2 A cce ss ib ility to Safeguards Inspectors
A s previously m entioned, the location environm ent for each of the instrum ents h as, n e c e ssa r ily , s tr ic tly controlled a cc e ss for health and safety re a so n s . Entry to these locations by an insp ector to eith er se rv ice the instrum entation o r to observe installation o r rem oval, req u ires carefu l scheduling and the com plete e x e rc ise can be tim e consuming esp ecially if protective equipment must be worn. The station op erator controls a cc e ss and naturally can only allow such work during periods when the le a st disruption is anticipated.In a large generating station with continuous fuelling, convenient a c c e s s "windows" a re not ea s ily pre-planned hence an insp ector could spend a considerable amount of tim e w aiting.
5 . Conclusions
The evaluation program presently underway at P ickering has already identified a re a s of applicability fo r unattended safeguards instrum entation in a continuously fuelled re a c to r . Problem s exist in ce rta in a re a s of data in terp retation , but it is p ossib le that these

2 9 4 SINDEN et al.
could be resolved by fu rth er work. The problem of a cce ss to con trolled a re a s fo r routine data co llection is-m ain ly one of tim e con sumption and it is not possible at this stage to provide a cost e s t i m ate. C arefu l planning on a fixed routine b a s is , how ever, would enable co sts to be m inim ized.
R EFER EN C ES
1. Development of N uclear R eacto r and F u el M onitors fo r Unattended Safeguards A pplication, G eneral E le c tr ic Company, V a llec ito s , F in a l Report A C D A /ST -223 , June 1973.
2 . C A M PB E L L , J . W . , TODD, J . L . , "An Irradiated F u el Bundle C ounter" Sandia L ab o ra to ries , SAN D75-0390, Ju ly 1975.
D I S C U S S I O N
P. d'OULTREMONT: Would you comment on the nature of the neutron flux recorded by the tra ck -e tch detector when it m onitors the motion of fresh and spent fuel bundles.
F u rth er, under present circu m stances, what is the sensitiv ity of the detector in te rm s of g of 235U?
R. M. SMITH: The neutrons m easured from fresh (unirradiated) fuel are due f ir s t , to neutron background from the reaction at the position where the monitor is located; as the fuelling machine is moved around for various operations, the monitor attached to this machine w ill show varying background. They are due, second, to spontaneous fission of the uranium in the fuel. The neutrons m easured from spent (irradiated) fuels are either due to the f ir s t cause above, or to delayed neutrons (this would only apply when the irrad iated bundle is f ir s t withdrawn from the reacto r); or e lse to photoneutrons created by gamma rays from fission products in the fuel striking the heavy water that surrounds the fuel.
With regard to sensitiv ity , we have never determ ined this ch a ra cte ris tic for the m onitor, but it w ill vary with the amount of fissionable m ateria l in the sou rces and the amount of moderating m ateria l around the monitor.
R.M. IYER: How does the record on the tape agree with the actual re a cto r power?
R.M. SMITH: The density of the track s is not d irectly related to the total power, but is a m easure of the neutron flux at the position where the tra ck -e tch m onitor is located with resp ect to the re a cto r v essel. This flux may not be d irectly related to the re a cto r power, since the following factors can depress or ra ise the neutron flux at that position: (a) presence nearby of fuel bundles with a long burnup, i.e . fission products with high neutron cro ss -se c tio n s ; (b) presence nearby of highly enriched control rods or rods containing cobalt; (c) presence nearby of shutdown rods or empty positions in the re a cto r for these rods.

IA EA -SM -201/67 295
As indicated by the graphs in F i g . l l , the power level indicated in the tra ck -e tch tape is a poor representation of the re a cto r power level when the monitor operates fo r short periods. The power output as indicated by the tape is much m ore accurate for longer periods of re a cto r operation, but we have not established the extent of the variance.
Since power re a cto rs norm ally operate for long periods with few outages, we anticipate that the e r ro r would be sm all for such operation. Our objective is to check the plutonium production, so we do not think that the high e r ro r for short periods of operation is significant.


IA EA -SM -201/12
TAMPER-INDICATING RADIATION SURVEILLANCE INSTRUMENTATION
W .H . CHAMBERSLos Alamos Scientific Laboratory,Los Alamos, New Mexico
J .F , NEY Sandia Laboratory,Albuquerque, New Mexico,United States of America
Abstract
TAMPER-INDICATING RADIATION SURVEILLANCE INSTRUMENTATION.Prototype personnel and shipping-dock portal monitors suitable for unattended use were fabricated and
tested . The requirement for continuous operation with only periodic inspection along with a desire for m inim um costs and m inim um interference with normal plant operation imposed unique design constraints.This paper describes the design, operation, and performance o f the detection and data-recording instrumentation, as w ell as th e tam per-ind icating techniques required to protect the co llec ted data. The essentia l e lem ents o f either o f the two instruments include a gam m a d etector array, signal conditioning electron ics, d ig ita l alarm lo g ic circuitry, power supplies, a m icrow ave occupancy m onitor, surveillance cam era, irreversible electrom ech an ica l counters, and the appropriate tam per-ind icating en velope protecting these elem en ts.Attempts to penetrate the tam per-ind icating en velope require m aterial rem oval, and undetectable repair is very d ifficu lt, i f not im possib le. The techniques for joining major sub-assem blies and providing unique seals are also described. The personnel doorway has a d oub le-p o le array o f N al(T l) detectors, and outputs are taken from a sin g le-ch an n el pulse-height analyser with a window set at 60 to 250 keV and the low er le v e l discrim inator at >60 keV . A slid ing interval counter is used to m ake comparisons with an accum ulated background at the 4 a le v e l. Logic design, sensitivity for specia l nuclear m aterials, fa lse-a larm data, and test procedures are described in d eta il. The shipping-dock monitor had different design constraints and therefore uses a s in g le , long, cy lin drical plastic scin tillator. Som e differences in signal conditioning and processing are also described.
INTRODUCTION
The w ork re p o rte d he re was p a rt o f the c o n t in u in g e f f o r t to deve lop in s t ru m e n ta t io n f o r p o s s ib le a p p l ic a t io n by the IA EA to augment pe r im e te r s a fe g u a rd s a t an enrichm ent p la n t w ith a re a s o f l im it e d a c c e ss . I t was in ten ded t h a t ,p e rso n n e l and v e h ic u la r a c ce ss to th e se a re a s be m on itored by unattended in s t ru m e n ts to d e tec t the u n a u th o r ize d t r a n s f e r o f s p e c ia l n u c le a r m a te r ia ls a c ro s s the boundary o r to v e r i f y a u th o r iz e d flo w s.C e r ta in un ique d e s ig n fe a tu re s were re q u ire d to a l lo w the m o n ito rs to op e ra te r e l i a b l y and c o n t in u o u s ly w ith o u t in s p e c to r s u r v e i l la n c e , in c lu d in g such fu n c t io n s a s data s to ra g e and t a m p e r * in d ic a t in g p r o te c t io n o f the components n o t n o rm a lly found i n doorway m o n ito rs in use i n US f a c i l i t i e s .
2 9 7

298 CHAMBERS and NEY
2. PR IN C IPAL DESIGN ELEMENTS
2 .1 P e rso n n e l Doorway M o n ito r
The p e rso n n e l doorway m on ito r c o n s i s t s o f an e n c lo su re c o n ta in in g a d e te c to r a r ra y , s i g n a l c o n d it io n in g e le c t r o n ic s , power s u p p l ie s , a larm lo g i c c i r c u i t s , a m icrowave occupancy m on ito r, a la rm re c o rd in g camera, i r r e v e r s ib l e e le c t ro m e ch a n ic a l c o u n te rs , and a t a m p e r - in d ic a t in g enve lope. D e s ig n d e c is io n s such a s d e te c to r type and e le c t r o n ic c i r c u i t d e t a i l s a re based on w ork p r e v io u s ly done to deve lop a p e rso n n e l m on ito r f o r the US sa fe g u a rd s system . Frequent re fe re n ce w i l l be made to the e a r l i e r p u b l ic a t io n s . [1 ,2 ]
The d e s ig n g u id e l in e s re q u ire d tha t the doorway be unattended and th e re fo re the m on ito r sh o u ld re co rd a la rm e ve n ts in such a way th a t the occupancy o f the m on ito r cou ld be v e r i f i e d a lo n g w ith the tim e o f the event and the r a d ia t io n l e v e l s . An a d d it io n a l d e s i r a b le c a p a b i l i t y was the id e n t i f i c a t i o n o f the occupant. F u rth e r , the m on ito r sh o u ld de tec t and in d ic a t e tam pering and sh o u ld ope rate in d e p e n d e n t ly o f l i n e power f o r sh o r t p e r io d s o f tim e i f n e c e ssa ry . The s e n s i t i v i t y g o a l was th a t the doorway sh o u ld d e tec t about ten grams o f 235U o r one gram o f 239Pu in compact m e t a l l ic geometry.
I n i t i a l l y , an attem pt was made to c o n ta in a l l d e te c to r s , e le c t r o n ic s , power s u p p l ie s , occupancy m on ito r and camera in a s i n g l e c y l i n d r i c a l p o le in o rd e r to s im p l i f y the t a m p e r - in d ic a t in g package. The s in g le - p o le geometry d id no t appear to a llo w room fo r lo n g p l a s t i c s c i n t i l l a t o r s , so N a l( T l) d e te c to r s were se le c te d from typ e s found s u i t a b le in e a r l i e r work. Each s c i n t i l l a t o r i s a 3 .2 cm x 6 .4 cm x 20 .3 cm re c t a n g u la r p r ism in o rd e r to f i t in t o the p o le .
S e n s i t i v i t y measurements made on a s i n g l e p o le w ith P b -sh ie ld e d passagew ay in d ic a te d two prob lem s. The f i r s t was th a t the le ad s h ie ld in g in the passagew ay and beh ind the d e te c to r i n the p o le d id no t p revent s c a t t e r in g o f backg round r a d ia t io n in t o the d e te c to r s by a p e rso n p a s s in g th ro ugh the doorway. Such s c a t te re d r a d ia t io n d u r in g p a ssa g e was s i g n i f ic a n t enough to cause fre q u e n t f a l s e a la rm s. The second problem was tha t body s h ie l d in g was e f f e c t iv e enough f o r 235U so th a t the s e n s i t i v i t y go a l cou ld no t be a ch ie ve d f o r a so u rce c a r r ie d on the s id e away from the p o le . Fo r the se re a so n s a tw o -p o le geom etry was s e le c te d f o r the f i n a l lo g ic .
T h is geom etry i s shown in F ig . 1 w ith o u t the tamper—in d ic a t in g e n c lo su re s so th a t the lo c a t io n o f some o f the components can be seen.
The fo u r s c i n t i l l a t o r s a re in s ta g ge re d p o s i t io n s because the n e ce ssa ry d e te c to r lo c a t io n s in the c e n t r a l p o le a re no t optimum. The camera and i t s a s s o c ia te d o p t ic a l t r a in a r e lo c a te d h ig h on the p o le in o rd e r to v iew the e n t i r e e n c lo su re by means o f the convex m ir ro r v i s i b l e a t the r ig h t top. The m icrowave occupancy m on ito r used to c o n t r o l the fra m in g ra te o f the camera i s lo c a te d j u s t below i t . The l i g h t f i x t u r e s a re in c lu d e d in o rd e r to p ro v id e p ro p e r i l l u m in a t io n f o r the camera.
F ig u re 2 shows s c h e m a t ic a l ly the components o f the doorway m on ito r. The d e te c to r s i g n a l i s p a ssed th ro ugh a s in g le - c h a n n e l a n a ly z e r (SCA) and bo th the lo w e r - le v e l d is c r im in a t o r and window ou tpu t o f the a n a ly z e r a re used. The window i s s e t a t ap p ro x im a te ly 60 to 250 keV f o r 235U. The low er—le v e l d is c r im in a t o r p a sse s a l l p u ls e s > 60 keV and i s a p p ro p r ia te f o r d e te c t in g 2 39Pu o r 238U. A s l i d i n g i n t e r v a l cou n te r i s used to s c a le each SCA ou tp u t. The m ajor i n t e r v a l i s one second and the re a re fo u r sub in t e r v a l s . A backg round count f o r each channe l i s s e p a ra te ly accum ulated o ve r tw enty s l i d i n g i n t e r v a l a ccu m u la t ion p e r io d s . The background p lu s fo u r sigm a i s used a s an a la rm le v e l . Each s l i d i n g in t e r v a l count i s compa red to the a la rm le v e l , and i f the a la rm le v e l i s exceeded w h ile the doorway i s o ccup ie d , the camera i s enab led . I f the doorway i s unoccup ied

IAEA-S М -201 /12 299
FIG. 1. View o f personnel doorway m onitor without tam per-ind icating envelopes in p lace.
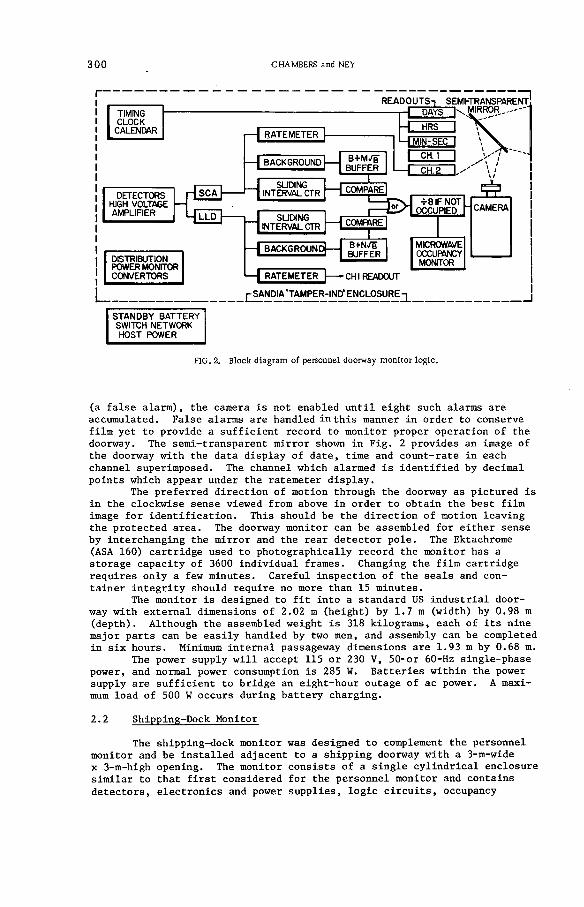
300 CHAMBERS and NEY
TIMINGCLOCKCALENDAR
READOUTS!
n t RATEMETER
- L BACKGROUND B+MVbBUFFER
DAYSSEMI-TRANSPARENT,
MIRRORHRS
—I MIN-SEC I CH.1
-I CH.2
DETECTORS HIGH VOLTAGE AMPLIFIER
H sc aI— INTERVAL CTR ---1 COMPARE!
! = E >4*8 IF NOT
OCCUPIED4 lld |— SLIDING — 1 COM FARE 1
DISTRIBUTION POWER MONITOR CONVERTORS
T—I BACKGROUND!— B+N/I
!________
4 RATEMETER~|— »CHI READOUT j-SANDIA 'TAMPER-IND' ENCLOSURE
MICROWAVEOCCUFANCYMONITOR
STANDBY BATTERY SWITCH NETWORK HOST POWER
FIG. 2. Block diagram o f personnel doorway monitor lo g ic .
(a f a l s e a la rm ) , the camera i s no t enab led u n t i l e ig h t su ch a larm s a re accum ulated. F a ls e a la rm s a re hand led in t h i s manner i n o rd e r to con se rve f i lm ye t to p ro v id e a s u f f i c i e n t re co rd to m on ito r p ro p e r o p e ra t io n o f the doorway. The se m i- t ra n sp a re n t m ir ro r shown in F ig . 2 p ro v id e s an image o f the doorway w ith the data d is p la y o f date , tim e and c o u n t -ra te in each channe l supe rim posed . The channe l w h ich a larm ed i s id e n t i f ie d by dec im al p o in t s w h ich appear under the ra tem eter d is p la y .
The p re fe r re d d i r e c t io n o f m otion th ro ugh the doorway a s p ic tu re d i s i n the c lo c k w ise sen se v iew ed from above in o rd e r to o b t a in the b e s t f i lm image f o r id e n t i f i c a t io n . T h is sh o u ld be the d i r e c t io n o f m otion le a v in g the p ro te c te d a rea . The doorway m on ito r can be a ssem bled f o r e i t h e r sen se by in t e r c h a n g in g the m ir ro r and the re a r d e te c to r p o le . The Ektachrome (ASA 160) c a r t r id g e used to p h o to g ra p h ic a l ly re co rd the m on ito r ha s a s to ra g e c a p a c ity o f 3600 in d iv id u a l fram es. C hang in g the f i lm c a r t r id g e r e q u ir e s o n ly a few m inu te s. C a re fu l in s p e c t io n o f the s e a ls and cont a in e r i n t e g r i t y sh o u ld re q u ire no more than 15 m in u te s .
The m on ito r i s d e s ign e d to f i t in t o a s ta n d a rd US in d u s t r ia l d oorway w ith e x te rn a l d im en sion s o f 2 .02 m (h e ig h t ) by 1 .7 m (w id th ) by 0 .98 m (d e p th ). A lth o u g h the assem bled w e igh t i s 318 k i lo g ra m s , each o f i t s n in e m ajor p a r t s can be e a s i l y hand led by two men, and a ssem b ly can be com pleted in s i x h o u rs . Minimum in t e r n a l passagew ay d im en s ion s a re 1 .9 3 m by 0 .68 m.
The power su p p ly w i l l a ccept 115 o r 230 V, 5 0 -o r 60-Hz s in g le -p h a se power, and norm al power consum ption i s 285 W. B a t t e r ie s w it h in the power su p p ly a re s u f f i c i e n t to b r id g e an e ig h t -h o u r ou tage o f ac power. A m aximum lo a d o f 500 W o c c u rs d u r in g b a t t e ry c h a rg in g .
2 .2 S h ip p in g -D o c k M o n ito r
The sh ip p in g -d o c k m on ito r was d e s ig n e d to complement the p e rso n n e l m on ito r and be i n s t a l l e d ad jacen t to a s h ip p in g doorway w ith a 3-m -w ide x 3 -m -h igh open ing . The m o n ito r c o n s i s t s o f a s i n g l e c y l i n d r i c a l e n c lo su re s im i l a r to th a t f i r s t c o n s id e re d f o r the p e rso n n e l m on ito r and c o n ta in s d e te c to r s , e le c t r o n ic s and power s u p p l ie s , l o g i c c i r c u i t s , occupancy

IA EA -SM -201/12 301
m o n ito rs and camera. Fo r i n i t i a l s e n s i t i v i t y measurements t h i s concept was mocked up w ith N a l ( T l ) s c i n t i l l a t o r s o f the s i z e u sed in the p e rso n n e l m o n ito r, and s t a t i c measurements were made u s in g a 295—gram c y l i n d r i c a l 93% 23SU so u rce . The mass s e n s i t i v i t y o f the mockup, w h ich d id no t have the m inor gamma a tte n u a t io n o f a tamper in d ic a t in g e n c lo su re , was e st im ated to be about 60 grams 235U in a 25 -pR background. The reduced s e n s i t i v i t y r e la t i v e to the p e rso n n e l doorway m on ito r i s , o f co u rse , p r im a r i l y due to the la r g e op en ing to be m on itored by a s in g l e s e t o f d e te c to r s . I n i t i a l t e s t in g was a l s o conducted w ith a 51-mm -dia. x 914-m m -long p l a s t i c s c in t i l l a t o r (NE 1 0 2 ), because i t was expected th a t the s h ip p in g -d o c k m on ito r w ould e xp e rie nce ra p id changes in tem perature w h ich m ight damage la r g e N a l s c i n t i l l a t o r s . E v a lu a t io n was c a r r ie d out by s e t t in g up the d e te c to r u s in g a SCA window from about 85 to 1000 keV and m e asu r ing the count—ra te f o r m eta l sp h e re s o f dep le ted uran ium and f o r sm a ll c y l in d e r s (Type I S , 400-gram con te n t) c o n ta in in g n a t u r a l and d ep le ted UF6 . From the ob se rved count—ra te s f o r so u rc e s , bo th ba re and sh ie ld e d by 3/4 in . Pb, the re q u ire d so u rce count fo r 50% d e te c t io n was e st im a te d , and the sou rce w h ich p roduce s the re q u ire d c o u n t -ra te was determ ined by s c a l in g .
The ch o ice was made to use the p l a s t i c s c i n t i l l a t o r and i t s le n g th was accommodated in a p e r so n n e l-d o o rw a y - l ik e p o le by m o d ify in g the e le c t r o n ic s package . The l o g ic b lo c k d iagram i s s im i l a r to th a t shown f o r the p e rso n n e l doorway m on ito r. A lth o u g h o n ly a lo w e r - le v e l d is c r im in a t o r s i g n a l i s used, two ch an ne ls a re m a in ta in ed . The f i r s t channe l i s the s i g n a l a la rm channe l where a 4a a la rm le v e l i s used. The second channe l i s used to a la rm i f the m on ito r sh o u ld be s h ie ld e d in such a way a s to p re ve n t i t s norm al fu n c t io n . The a la rm le v e l f o r t h i s i s 12 s igm as below the norm al background. T h is fe a tu re i s p re se n t because the o p t ic a l sy stem i s no t lo o k in g d i r e c t l y a t the d e te c to r p o le . The fa c t th a t the d e te c to r had been s h ie ld e d w i l l be made o b v io u s by a s e r ie s o f f i lm fram es w ith a la rm s in the second channe l.
The backg round update tim e f o r the sh ip p in g -d o c k m on ito r lo g ic rem ains a t 20 m ajor i n t e r v a l s , and the m ajor i n t e r v a l i s s t i l l d iv id e d in t o 4 s u b - in t e r v a l s . The le n g th o f the m ajor i n t e r v a l i n t h i s ca se i s fo u r second s in s t e a d o f one second a s used f o r the p e r so n n e l m on ito r. T h is change i s based on dynam ic measurements made w ith the o r i g i n a l mockup o f the sh ip p in g -d o c k m on ito r.
The m o n ito r r e q u ir e s 1 .25 m by 0 .31 m o f f l o o r space and ha s a maximum h e ig h t o f 2 .0 m. The a ssem bled m on ito r w e igh s 129 k ilo g ra m s. Complete i n s t a l l a t i o n o f the m on ito r, in c lu d in g a t t a c h in g the m on ito r to the f l o o r and the m ir ro r to the w a l l , can be a ccom p lished in fo u r h o u rs. The power su p p ly u t i l i z e s e it h e r 50 o r 60 Hz, 115 o r 230 V, s in g le -p h a s e power. The m on ito r n o rm a lly draws 85 -W o f power. An e ig h t—hour ac power in t e r r u p t can be b r id g e d by the b a t t e r ie s w it h in the power su p p ly . Maximum e l e c t r i c a l lo a d d u r in g b a t t e r y c h a rg in g i s 300 w a tts.
No l i g h t i n g i s p ro v id e d by the system f o r the m on itored a rea . I l l u m in a t io n re q u ire d to re co rd a c t i v i t y in the m on ito red space i s a p p rox im a te ly 1800 lumen/m2 . M o n ito r data i s s to re d on 3600 fram es o f Ektachrom e, ASA 160 f i lm . C hang in g the f i lm c a r t r id g e shou ld take o n ly a few m inu te s. V e r i f i c a t i o n o f the s e a ls and c o n ta in e r s i n t e g r i t y sh o u ld take no more than f i v e m inutes. 3
3. TAMPER-IND ICATING TECHNIQUES
Tamper—in d ic a t in g te ch n iq u e s a re u t i l i z e d to p ro te c t the data c o l le c ted by m o n it o r s . [3 ,4 ] S e v e ra l d i f f e r e n t te ch n iq u e s c o l l e c t i v e l y p ro v id e unam biguous e v idence o f attem pts to g a in a c ce ss to the in s t ru m e n ta t io n .

302 CHAMBERS and NEY
W h ile the se te ch n iq u e s a re d i f f e r e n t in d e t a i l , each depends on the need to remove m a te r ia l i n o rd e r to p e n e tra te the e n c lo su re su r ro u n d in g the in s t ru m e n ta t io n . Once m a te r ia l i s removed, the te ch n iq u e s a re such tha t un d e te c ta b le r e p a ir i s v e ry d i f f i c u l t , i f n o t im p o s s ib le .
The r a d ia t io n d e te c to r s , s i g n a l p ro c e s s in g e le c t r o n ic s and data re c o rd in g camera a re su rrounded by t ra n sp a re n t c y l in d e r s w ith a h ig h ly r e f le c t i v e m eta l c o a t in g on the i n t e r i o r su rfa ce s.- When a p e n e t ra t io n o f the c y l in d e r i s made, the m etal su r fa c e a t th a t p o in t must be removed.The m eta l s u r fa c e can no t be re p la ce d u n t i l the p e n e t ra t io n i s c lo se d , bu t the i n t e r i o r su r fa c e i s then no lo n g e r a c c e s s ib le f o r r e p a ir . A d d it io n a l l y , the r e f le c t i v e m etal su r fa c e enhances the d e te c t io n o f any p e n e t ra t io n . The e l e c t r i c a l in te r c o n n e c t io n o f the two g la s s c y l in d e r s o f the p e r so n n e l doorway m on ito r i s p ro te c te d by a p r e - s t r e s s e d g la s s tube.Any p e n e t ra t io n o f the tube, f o r a c ce ss to the s i g n a l w ire s w it h in i t , ca u se s the e n t i r e tube to s h a t t e r . Replacem ent o f the tube w ith a c o u n te rf e i t i s no t p o s s ib le , because the w ire s te rm in a te w it h in the volume p ro te c te d by the m e ta ll iz e d c y l in d e r s . The p re - s t r e s s e d g la s s tube and m e ta ll iz e d c y l in d e r s a re jo in e d by an anod ized alum inum f ix t u r e . The dye used i n the anod ized su r fa c e i s v e ry d i f f i c u l t to match i f the su r fa c e i s pen e tra te d . The f i x t u r e i s h e ld c lo se d by a s e r ie s o f b o l t s th rough w hich a un ique s e a l i s la ce d . A cce ss to the i n t e r i o r o f the f i x t u r e re q u ir e s d e s t r u c t io n o f the s e a l o r p e n e t ra t io n o f the s u r fa c e , both o f w h ich a re e a s i l y d e te c ta b le .
The s h ip p in g -d o c k m on ito r re q u ir e s o n ly one m e ta ll iz e d g la s s c y l in d e r to p ro te c t the r a d ia t io n d e te c to r s , s i g n a l p r o c e s s in g e le c t r o n ic s and the camera. The c y l in d e r a tta ch e s to an anod ized alum inum ba se , and the i n t e r face between the c y l in d e r and the ba se i s a ccom p lished w ith the same type o f b o l t s and s e a l a s u t i l i z e d in the p e rso n n e l doorway.
A cce ss to the camera to change f i lm in e it h e r m on ito r i s p ro v id e d by a t ra n sp a re n t door w ith a m e ta ll iz e d i n t e r i o r su r fa c e . The door i s b o lte d to the g l a s s c y l in d e r . Removal o f the door r e q u ir e s d e s t ru c t io n o f a s e a l la ce d th ro ugh the b o lt s . I n a d d it io n , each tim e the door i s opened, an i r r e v e r s ib l e e le c t ro m e ch a n ic a l cou n te r w it h in the c y l in d e r i s increm ented. In t e r r u p t io n o f e l e c t r i c a l power to a m on ito r e i t h e r f o r a p e r io d exceed ing the standby b a t t e ry c a p a b i l i t y , o r a s a r e s u l t o f tam pering w ith the un p ro tec ted power su p p ly , i s de tec ted by e l e c t r i c a l v o lta g e s e n so r s w it h in the e le c t r o n ic s s e c t io n o f the m on ito r. D e te c t io n o f such a l o s s o f power i s d is p la y e d on a second i r r e v e r s ib l e e le c t ro m e ch a n ic a l coun te r.
4. TESTS AND EVALUATION
E v a lu a t io n o f the doorway in c lu d e d a d e te rm in a t io n o f the f a l s e -a la r m r a te due to s t a t i s t i c a l f lu c t u a t io n s and a se p a ra te d e te rm in a tio n o f the s e n s i t i v i t y o f the doorway by h a v in g in d iv id u a l s w a lk th rough w ith so u rce s .
I n i t i a l l y the f a l s e -a la r m ra te was c a lc u la te d u s in g a computer model o f the l o g ic c i r c u i t and a Monte C a r lo sam p lin g tech n iqu e . The a larm p r o b a b i l i t y can be m u lt ip l ie d by the number o f t e s t s pe r hour to o b ta in the h o u r ly a la rm ra te . A t a background accu m u la t ion tim e o f 20 m ajor in t e r v a l s , the expected a la rm ra te from s t a t i s t i c a l f lu c t u a t io n s i s 0 .6 per hour per channe l o r 1 .2 pe r hou r f o r the l o g ic package a s used. The most a ccu ra te e xp e rim e n ta l f a l s e -a la r m data were ob ta in e d from f i lm re c o rd s made o ve rn ig h t o r o ve r weekends. The ra te o b ta in e d from such re c o rd s i s 1 .0 a la rm s pe r ho u r ove r a tim e p e r io d o f some 239 h o u rs.
The s e n s i t i v i t y o f the doorway fo r d e te c t in g 235U and 2 39pu was
determ ined in the same manner a s f o r a ttended doorw ays. That i s , a sou rce lo c a te d on the body p a sse s th ro ugh the volume o f the doorway no rm a lly

IA EA -SM -201/12 303
occup ied . The a re a s o f low e st s e n s i t i v i t y were f i r s t id e n t i f ie d . Then the so u rce s i z e re q u ire d f o r ro u g h ly 50% p r o b a b i l i t y o f d e te c t io n in the nom ina l 25 uR background was determ ined, and the o v e r a l l d e te c t io n ra te u s in g w a lk -th ro u g h s by e ig h t d i f f e r e n t in d iv id u a l s was determ ined. R e su lt s in t h i s ca se showed th a t the head and fo o t r e g io n s were the low e st s e n s i t i v i t y a re a s . The re q u ire d so u rce f o r 0 .53 p r o b a b i l i t y o f d e te c t io n was a 30-gram c y l in d e r o f uran ium o f 93% enrichm ent (2 7 .4 grams 235U co n te n t ), w h ich i s e q u iv a le n t to a 32-gram 2350 sphe re . The re q u ire d 239Pu sou rce f o r 0 .69 p r o b a b i l i t y o f d e te c t io n was a 1 .07 -gram sphe re (1 gram 239Pu con te n t) o f 93.5% 239Pu a s s p e c i f i e d . [2 ] Because t h i s i s an unattended doorway, a d d it io n a l t e s t s were made m oving the so u rce th rough the doorway a t the f a r t h e s t c o rn e rs . I n t h i s ca se , the s e n s i t i v i t y f o r p lu ton ium rem ained a t 1 gram f o r 50% d e te c t io n , but the 235U s e n s i t i v i t y was now about 50 gram s. Because the sh ip p in g -d o c k m on ito r i s an o p e n -s id e d system , s e n s i t i v i t i e s a re more d i r e c t l y re la te d to s p e c i f i c f a c i l i t i e s . Some t e s t s o f t h i s n a tu re a re c u r r e n t ly under way.
The fa l s e -a la r m ra te f o r the s h ip p in g -d o c k m on ito r i s reduced because the a la rm ra te f o r the -1 2 sigm a channe l i s n e g l i g ib le and the +4 sigm a channe l i s sa m p lin g a t h a l f the ra te o f the p e rso n n e l m on ito r. The s t a t i s t i c a l a la rm ra te i s th u s 1/8 o f the p e r so n n e l m on ito r ra te o r 0.15 a la rm s/hou r.
REFERENCES
[1 ] SAMPSON, T. E . , e t a l . , P o r t a l M o n ito r f o r D iv e r s io n S a fe gu a rd s, T ran s. Amer. N u c l. Soc. Xl_, 302 (1 97 3 ).
[2 ] CHAMBERS, W. H . , e t a l . , P o r t a l M o n ito r f o r D iv e r s io n Sa fe gu a rd s, LASL Rep. LA -5681 (1 97 4 ).
[3 ] McMANUS, J . G . , ENGEL, A .V . J R . , "T a m p e r- re s is ta n t Unattended Sa fe gu a rd s Techn ique s ( IA E A -SM -1 3 3 / 8 ), " P ro ce e d in g s o f a Symposium on P ro g re s s in Sa fe gu a rd s T e chn ique s, V o l. I , IAEA, V ienna (1970 ).
[4 ] CAMPBELL, J . W., TODD, T. L . , "A n I r r a d ia t e d F u e l Bund le C o u n te r , " 16 th Ann. M e e tin g I n s t i t u t e o f N u c le a r M a t e r ia l s Management, New O r le a n s , June 1975.
D I S C U S S I O N
V . M. SINCLAIR: Do you not think that a fa lse -a la r m rate of one per hour, i .e . 24 per working day, is unacceptably high for a sy stem in an operating plant?
W. H. CHAMBERS: The fa lse -a la r m rate of one per hour is from counting s ta tis t ic a l fluctuations alone. If the doorway is not occupied sim u ltan eou sly , no cam era record is m ade u n less eight such events have occu rred sequ en tia lly .
B . LOVE: If m ateria l is p assed through the personn el doorway m onitor without the sim ultaneous p resen ce of a human body in the se n s itiv e area of the m icrow ave occupancy m onitor, le t us say , for exam ple, by pulling

304 CHAMBERS and NEY
the m ateria l through with a p iece of str in g , would this be treated by the sy stem as a fa lse a larm , and no photographic record obtained?
W.H. CHAMBERS: Y es , u n less p assage of the rad ioactive m ateria l through the m onitor took lon ger than eight secon d s. In that ca se , the cam era would record the tim e and radiation le v e l even though no occupant was p resen t.

IAEA-SM-201/5
APPLICATION OF TAMPER-RESISTANT IDENTIFICATION AND SEALING TECHNIQUES FOR SAFEGUARDS
S.J. CRUTZEN*. R. HAAS**,P .S . JEHENSON*. A, LAMOUROUX***Joint Research Center,Euratom, Ispra, Italy **D irectorate o f Euratom Safeguards,Luxembourg
Abstract
APPLICATION OF TAMPER-RESISTANT IDENTIFICATION AND SEALING TECHNIQUES FOR SAFEGUARDS.A fiv e years' research and developm ent programme has established a tam per-resistant id en tification
and sealing technique w hich lends itse lf to m any applications in the fie ld o f nuclear m aterials safeguards. Routine ap plication o f general-purpose seals has proved th e practical va lid ity o f th e ultrasonic id en tifica tion system . A rivet sea l based on th e sam e principle has been applied in th e last year to a large number o f MTR fu el bundles. An experim ental programme for th e application o f cap seals to BWR fu el bundles is still under w ay. On th e basis o f this encouraging exp erien ce research and developm ent work for th e id en tifica tion o f other types o f fu el bundles is continuing.
1. GENERAL
1.1. B a s ic con sid eration s
1 .1 .1 . Introduction
The im plem entation of a m odern nuclear safegu ard s sy stem req u ires that v er ifica tio n s be m ade of m easu rem en ts of nuclear m a te r ia ls . In th is way tim e ly detection of d iv ersio n of sign ifican t quantities of nuclear m ater ia l can be ach ieved [1]. The v er ifica tio n m easu rem en ts and their in terpretation , how ever, constitute a heavy load on the safeguards sy stem , e .g . in m an pow er, s e r v ic e s for d estru ctive a n a ly sis and in strum ents for nondestructive a ssa y . In addition, in terferen ce with plant operations and the need for se r v ic e s are in ev itab le , even if they are kept to a m inim um .
1 .1 .2 . Containment by se a ls
To m in im ize effort and keep in terferen ce with plant operation as low as p o ssib le [2], repeated m easu rem en t of item s or b atches m ust be avoided and, w herever p o ss ib le , be rep laced by su itable containm ent. The application of se a ls s e r v e s th is purpose b ecau se it a scerta in s that no a lteration of the contents of the containm ent has occurred . Of co u rse , se a ls m ust be positioned in such a way that they can be v er ified at any tim e.
305

306 CRUTZEN et a l.
The follow ing types of containm ent are su itab le for sea lin g:
(a) Storage con ta in ers, com partm ents or racks for n uclear m a ter ia l which is out of p ro ce ss betw een su c c e ss iv e in ven tories;
(b) F u el bundles during their whole life tim e , e .g . from fabrication to re p r o ce ss in g . The p ossib le uncertainty of the iso top ic com position of fu e l a fter irrad ia tion is a particu lar rea so n for the ch oice of a sea lin g technique to dem onstrate that none of the or ig in a l m a ter ia l has been p h ysica lly rem oved . The sea lin g of fuel bundles m ay a lso be fea sib le for only a part of th e ir life tim e;
(c) F u ll core loadings of se v e r a l hundred fuel e lem en ts , which rem ain in the sam e p osition in the rea cto r v e s s e l over a period of continuous operation of, typ ica lly , a year (e .g . LWPRs);
(d) Shipping con ta iners for nuclear m ateria l;
(e) Autom atic (non-attended) apparatus, such as ca m era s or m easu rem ent d ev ices or sam ple tak ers which m ay be positioned in a production lin e , for the su rv e illa n ce of m ater ia l flow;
(f) S pecia l equipm ent which is requ ired to change the com p osition of fuel bundles (e .g . bun dle-tu rn ingm ach in es in PWRs);
The requ irem en t of t im ely detection of d iversion can be m et by repeated (sta tis t ic a l) v er ifica tio n of the se a ls . Any inventory of sea led item s is reduced to a s im p le a rith m etica l accounting procedure, provided that nuclear tran sform ation s can be a s se s se d .
1 .1 .3 . C h a ra cter istics required for se a ls
Any type of s e a l m ust sa tis fy a number of c r iter ia . A s the se a ls are u sed for the containm ent of stra teg ic m a ter ia l, it m ust be in ferred that a p rosp ective d iverter would be prepared to em ploy refined m ethods to tam per with a se a l in ord er to evade detection . C onsequently the v er ifica tio n of a se a l m ust allow an unam biguous statem ent, whether it has been intentionally dam aged or not. T h erefore , a se a l m ust be
(a) Uniquely id en tifiab le and re -id en tifia b le even after con sid erab le tim e;
(b) R esistan t to any ad verse effect of the environm ent (ch em ica ls , radiation, m ech an ica l damage);
(c) P o sit iv e ly ta m p er-res is ta n t; th is m ust be true for the surrounding stru ctu re and the container as w ell;
(d) Irreproducib le; s in ce m a ter ia l, d im ensions and identifying apparatus cannot be con sid ered c la ss if ie d , any reproduction m ust be im practica l.
O bviously, the conventional s e a ls , such as used by cu stom s o ffic e s , etc . which are only re -id en tified by their su p erfic ia l appearance, do not

IA E A -SM -201/5 307
FIG. 1. G eneral-use seals.
m ee t th e se high standards. T h erefore , a se a l has b een developed, where the m a ter ia l d isp lays p rop erties which are produced in a random m anner in the production p ro ce ss of the se a l m ater ia l. In th is way conditions (a) and(d) are sa tis f ie d , the other conditions being m et by the u se of a convenient m atr ix m a ter ia l and by an u ltrason ic id en tification procedure. Since a sin g le s e a l is irrep rod u cib le by d esign , only through the production of a very large s e r ie s would it be p o ssib le to find a substitute se a l su ffic ien tly s im ila r to an orig in a l to be used for substitution. A s e r ie s of the ord er of 104 is con sid ered su ffic ien t in order to render a substitution im p ractica l (se e 3.1.4).
1 .2 . Status of developm ent of the u ltrason ic id en tification technique
The m ethod for u ltrason ic id en tification of natural or a r t if ic ia l m arks w hich has b een developed at Ispra is now w ell known [3, 4]. The m ain applications of th is prin cip le (se e 2.1) cover gen era l-p u rp ose s e a ls , LWR cap se a ls , r iv e t s e a ls and s ta in le s s - s t e e l se a ls (without in clu sion s of foreign m a ter ia ls) ( s e e 2.2). In 2.3 the sta te of developm ent of the various elem en ts of the id en tification chain is given. Som e, usually m inor, m odifications of fuel bundles are requ ired to a llow the application of se a ls (see 2.4).S pecia l to o ls are developed for application and re co v e ry of se a ls .
1 .3 . Status of application of s e a ls fo r safeguards
The u ltrason ic type of se a l has b een tested in variou s applications.Since the re su lts are v ery sa tis fa cto ry , the conventional se a ls are gradually being rep laced by the u ltrason ic type of gen era l-p u rp ose se a ls . The exp er ien ce obtained and the problem s s t i l l to be so lved to fa c ilita te routine application are d iscu sse d in 3.1. A p articu lar application, the sea lin g of the core of ligh t-w ater power re a c to rs is d iscu ssed in 3.2. The r iv et se a l has b een applied to a la rg e number of MTR fuel bundles ( s e e 3.3). The m ain

308 CRUTZEN et a l.
FIG. 2 . Sealing o f BWR fu el bundle.
fTv
4

IA EA -SM -201/5 3 0 9
FIG. 3 . PWR seal locked on the standard nut.
FIG. 4 . Sealed foot o f PWR fu el bundle.

310 CRUXZEN et a l.
exp er ien ce has been drawn from the re se a r c h rea cto r plants H F R -P etten and BR 2 Mol. The concept of fuel-bundle id en tification over its full life tim e has a lso been applied to BWR fuel bundles in a lim ited exp erim en ta l cam paign (see 3.4).
2. ULTRASONIC ALLY IDENTIFIED SEALS AND MARKING DEVICES
2,1. U ltrason ic signature
The m ethod of u ltrason ic signature is based upon the introduction of natural or a r t if ic ia l m arkings into the p iece to be identified . T hese m arkings m ay co n sis t of in clu sion s or d efects which are random ly d isp ersed in a m atrix . The id en tification is carried out by u ltrason ic in terrogation. An e le c tr ic a l analog sign a l is obtained as resp on se . Other d etection m ethods have a lso been tested (eddy cu rren ts, X -ray flu o r esc en ce , e tc .) but up to now the u ltrason ic m ethod has given the b est r e su lts . The follow ing top ics have b een ex ten siv e ly studied in the R + D program m e in ord er to ach ieve a unique id en tification system :
C hoice of m arking sy stem and m atr ix m ateria l;F abrication of the seal;C hoice of the m easu rem en t chain and the handling p ro ce sse s;P racticab ility of the sy stem under operating conditions.

IA E A -SM -201/5 311
FIG. 6. Sealed HFR Petten bundle n o zz le .
2.2. S eals and m arking d ev ices [4, 5]
2 .2 .1 . F abrication
The m ain ch a ra c ter is tic s of the se a ls (com position , geom etr ica l fo rm s, typ es of in clu sion s) depend on th eir p ractica l applications. D ifferent m ethods b ased on powder m eta llu rgy techniques have been estab lish ed for the fabrication of d ifferent types of se a ls :
With a light m atr ix (p lex ig la s , alum inium , SAP) containing in clu sion s of bronze or tungsten, etc .;
With a heavy m atr ix (s ta in le ss s tee l) containing in clu sion s (tungsten, e tc .) , or without in clu sion s of fore ign m a te r ia ls but identified by their own p articu lar stru cture.
2 .2 .2 . G eneral-p urpose se a ls
The g en era l-p u rp ose s e a ls are com posed of a box and a cap, both m ade of s in tered m a ter ia l (p la s tic s , alum inium co m p o sites , s ta in le ss s tee l) with m eta llic in c lu sion s. The se a l is c lo sed by sim p ly p ress in g th ese two parts togeth er. An in tern al sp rin g provides an ir r e v e r s ib le c lo su re . R e-opening is im p o ssib le without destroyin g the m a ter ia l stru ctu re, which surrounds the locking sy stem (F ig .l) . Of co u rse , th ese se a ls have to be used with tam p er-p roo f w ire s .

312 CRUTZEN et a l.
FIG. 7 . Identification p la te and identification technique o f PWR fuel-bundle grid.
2.2 .3 . Cap se a ls
T his type of s e a l is designed for the id en tification of ligh t-w ater reactor fu e l bundles. The s e a l is a cap m ade of s ta in le ss s te e l which, follow ing the gen era l p rin cip le , contains random ly d istributed in c lu sion s. It is applied to one or m ore t ie -r o d s of a fuel bundle, in ord er to lock down the nuts, which hold the grid plate in p lace. The d eta ils of application are shown in F ig .2 . The bundles m ay be repaired if n e c e ssa r y (e.g . fa iled fuel pins replaced). H ow ever, b efore rem oving the grid p late, the se a l(s ) m ust be detached from the t ie rod. T hese s e a ls are id en tifiab le but cannot be used again. T h erefore , a new se a l m ust be attached to another tie rod after rep a ir of the bundle.
Such a s e a l m ay be sep ara te ly attached to the tie rod or m ay form a unity with the nut, in ord er to avoid vibrations and to fa c ilita te positioning and extraction . T his solution has b een proposed for sea lin g the foot of the PWR fu e l bundles (F ig s 3 and 4).
2 .2 .4 . R ivet se a ls
This type of se a l (F ig .5) w as d esigned and fabricated for u se on the box of MTR fuel bundles [5]. In one particu lar application, the r iv et, so to say , lock s the edge plate to the elem en t foot (F ig .6). Thus, the elem en t cannot be d ism antled and p la tes cannot be pulled off. Only the d isc of the se a l (r ive t head) is m arked with in clu sion s. The cy lin d rica l foot of the se a l is inevitab ly d estroyed when the se a l is rem oved , which rend ers the se a l unusable for a new sea lin g .

IA EA -SM -201/5 313
FIG. 8 . FBR fuel-b u nd le identification disc and ultrasonic identity .
2 .2 .5 . S ta in le s s - s te e l se a ls without in clu sion s
To avoid the principal objections ra ised by plant operators (such as the u se of sin tered m a ter ia l, tungsten in clu sion s and the p o ss ib ility of erosion ), a fabrication m ethod was in vestigated to obtain standard extruded s ta in le ss s te e l w ith gas bubbles as in clu sion s. In the current d esign , two parts of a d isc (hollow box and cover) m achined from the d esired b ase m ateria l are b razed together with n ick e l-b ra ze [6]. Sm all chips of the b ase m ater ia l occupy the cavity betw een box and cover; h ow ever, a sm a ll quantity of b raze jo ins the m ain parts of the d isc , where th ere is contact, but gas bubbles rem ain betw een the chips which can be c lea r ly identified by u ltr a so n ic s . This fabrication m ethod has been u sed su c c e ss fu lly for the fabrication of new prototype s e a ls or ta m p er -r es is ta n t unique id entification d ev ices (TUID):
Cap se a ls for LWR fuel bundles,G eneral-p urpose s ta in le s s - s t e e l s e a ls ,Identification d ev ices for PWR and FBR fuel bundles (TUID)
U sually the TUID is w elded into the stru cture to be identified. It is im portant to note that it is only after w elding that the TUID attains its fina l identity.

314 CRUTZEN et a l.
FIG. 10. Ultrasonic signature.

IA EA -SM -201/5 315
FIG. 11. Ultrasonic id en tification chain .
2 .2 .6 . Identification d evice for PWR fuel bundles
When the fuel bundle is sea led at its foot by cap s e a ls , id en tification can be m ade e a s ily by the in ser tio n in the upper grid of a TUID (see F ig .7). The m a te r ia l of the plate is the sam e as that of the stru ctu re. R e-w eld in g after extraction by m achining would change the identity.
The su rv e illa n ce of the PWR bundle by a TUID is p ractica l as long as th ere is ev idence that the equipm ent for turning the bundles over has not b een operated (which m eans that no rep a ir of the bundle has taken place and that the se a l at the bundle foot m ust not have been tam pered with).
2 .2 .7 . Identification d isc for FBR bundles
With the sam e p rin cip le , a life tim e id en tification of FBR fuel bundles is p o ssib le . It w as found that the quite se v e r e sp ec ifica tio n s of the FBR concern ing
M aterial sp ec ifica tio n s P re se n c e of sodium Im puritiesT em perature reg im e (up to 600°C and therm al shocks)
can be m et by a d isc-sh a p ed TUID (se e 2.2.5) w elded into the bundle foot (F ig s 8 and 9).

316 CRUTZEN e t a 2.
( 1 ) + ( 2 ) + ( 3 ) = REDUCED CHAIN
( 1 ) + ( 2 ) + ( 4 ) + ( 5 ) = COMPLETE CHAIN
FIG. 12. C om plete id en tifica tion chain.
FIG. 13. Portable id en tifica tion apparatus (IAEA property).

IA EA -SM -201/5 317
FIG. 14. Portable id en tifica tion apparatus (IAEA property).
FIG. 15. Underwater scanner for BWR bundle cap seals.

318 CRUTZEN et a l.
2.3. Identification equipm ent
2 .3 .1 . U ltrason ic equipm ent [7]
The gen era l m ethod is based on the fact that u ltrason ic w aves are re flec te d owing to the large d ifferen ces in acou stic im pedance between m atr ix and in c lu sio n s. Standard focu sed tran sd u cers are u sed for the in terrogation in ord er to s e le c t the region of in te re st co rrectly . The in te r rogation and resp o n se s ign a ls are produced and p ro cessed by com m ercia l u ltrason ic equipm ent. The evaluation of the m easu red id en tities (se e 3.1.4) has shown good reprodu cib ility of the id en tities.
2 .3 .2 . R ecording the identity
The e le c tr ic a l output s ign a ls are recorded in analog form (by pen or photographic re co r d e r , s e e F ig . 10). The prim ary data (Ai) obtained are e a sy to in terp ret and m ay be u sed en tire ly or partia lly as an identity card. The analog data can be coded in d ig ita l form for autom atic storage and p ro cessin g . F ig u res 11 and 12 illu stra te the m easu rem ent equipm ent indicating d ifferent a ltern a tives.

IA E A -SM -201/5 319
FIG. 18. Underwater scanner for PWR fu el-bundle Identification.
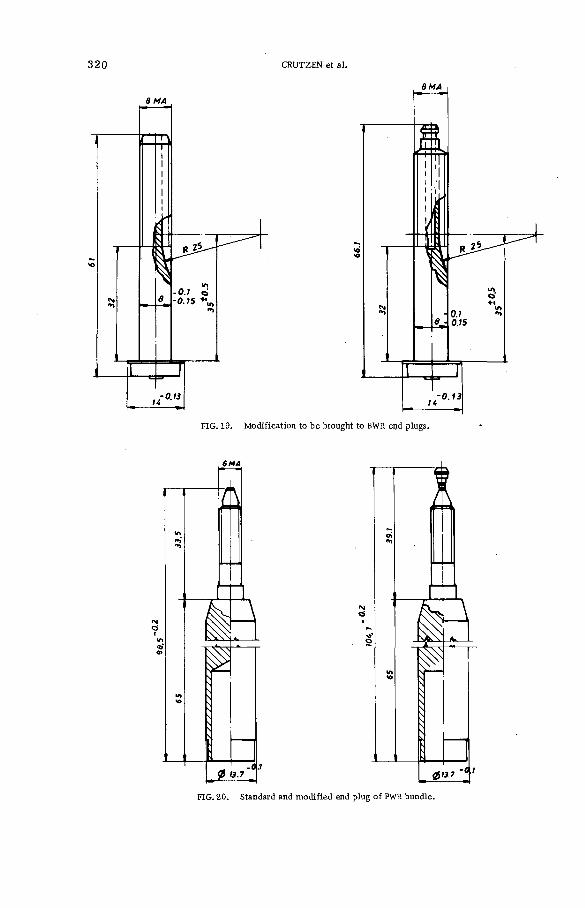
320 CRUTZEN et a l.
FIG. 19. M odification to b e brought to BWR end plugs.
FIG. 20 . Standard and m odified end plug o f PWR bundle.

IA EA -SM -201/5 321
FIG .21. Seat to b e prepared on HFR fu el boxes.
2 .3 .3 . Portable apparatus
Although the equipm ent shown in F ig . l l is tran sp ortab le , a portable apparatus has been developed for the IAEA for m easu rem en ts on the spot. T his apparatus is se lf-co n ta in ed and able to identify a ll types of se a ls (F ig s 13 and 14). A secon d prototype w ill be furnished to both IAEA and Euratom . This new v er s io n w ill have autom atic gain con tro l o f the sign a l am p lifier and d ig ita l output from a m inicom puter: the developm ent of autom atic com p arison and m agnetic data f ile s is planned.
2 .3 .4 . M echanical d ev ices for scanning
The se a l or identity d ev ice has to be scanned rapid ly by the tran sdu cer along a w ell-d efin ed path. A m ech an ica l scanning d ev ice is th erefore part of the id en tification equipm ent (F ig .14). A ll gen era l-p u rp ose se a ls , unirradiated cap s e a ls and fre sh or irrad iated r iv e t s e a ls can be scanned by the d ev ice used at headquarters.

322 CRUTZEN et a l.
FIG. 22 . Seat to be prepared on CAMEN MTR fu el boxes.
ф - f - t 4
|b*ilfe ' ’i jk
5 & ?
IS fJ l
FIG. 23 . HFR fu el-bundle riveting grip.

IA EA -SM -201/5 323
FIG .24 . HFR fuel-bundle seal extraction tool used at M arcoule reprocessing plant.
A ll activated fuel-bundle s e a ls or se a ls not detached from the irradiated fu e l bundle should be re -id en tified under an adequate depth of w ater (e .g ., cap se a ls for BWR and PWR fuel bundles and r iv et se a ls for MTR). Special scanning d ev ices have been built as prototypes. F igu re 15 shows the m ech an ica l part to be u sed in a BWR cooling pond or at the re p r o ce ss in g plant. F igu re 16 show s the m ech an ica l part to be u sed on MTR fuel bundles in ponds. Scanners for both FBR and PWR TUIDs have been designed (F ig s 17 and 18) and laboratory exp erim en ts perform ed.
The stab ility of the u ltrason ic tran sdu cer (p ie zo e lec tr ic crysta l) in high rad iation fie ld s s t i l l p resen ts problem s: the life tim e of the tran sdu cer and thus the number of id en tifica tion s, which can be perform ed co rrectly depend on the radiation flux of the fuel bundle. Shielding of the transducer is n early im p o ssib le and sp ec ia l tran sd u cers would lead , at the p resen t tim e , to prohibitive c o s ts .
2,4 . T ech nologica l req u irem en ts for the application of se a ls on fuel bundles
2 .4 .1 . N e c e ssa r y m odifications to fu e l elem en ts or bundles
LWR fuel bundles: Both BWR and PWR fu e l bundles can be sea led u sing cap se a ls . T h ese s e a ls are positioned on the top or bottom of one or m ore

324 CRUTZEN et a l.
FIG. 25 . Underwater extraction grip to b e used for BWR fuel-b u nd le cap seals (dism antling o f bundles for repair).
t ie -r o d s; the end p iece has to be m odified in ord er to lock the non-return sp rin g of the se a l. This m odification can co n sis t of a prolongation of the stud and the in clu sion of a groove at the top (P ig s 19 and 20). The fea s ib ility and re lia b ility of such m odifications have been studied by AEG, SIEMENS and EXXON N uclear Company. M odifications of som e t ie -r o d s have been done; the co st being ca rr ied by the Isp ra re se a r c h program m e. F or the routine application of se a ls such m odifications would in cr ea se the co st of the fu e l bundles by an in sign ifican t amount.
MTR fu e l b o x e s : A sea t for the r iv et se a l has to be .prepared on the fuel box. Depending on the fu e l-e le m e n t type, th is m achining has to be done b efore or after a ssem b lin g the bundle (see F ig s 21 and 22 and 3 .3 .2).
FBR and PWR fuel bun dles: The TUID (se e 2.2.5) has to be introduced into som e part of the stru ctu re, b efore a ssem b lin g the bundle. The r isk s and co s ts are thus grea tly reduced. P reparation of the se a t and w elding of

IA EA -SM -201/5 325
FIG .26. Underwater sealing o f BWR fu el bundles.
the TUID is done b efore the m ajor m achining of the stru ctu ra l com ponent (F ig s 7 and 9).
2 .4 .2 . T ools requ ired for application and extraction of se a ls
F o r the application of MTR se a ls a r ivetin g grip w as developed (F ig .23). T his grip is a lso u sed for the ex traction of se a ls from a fresh bundle, as requ ired for in term ed iate ver ifica tion . A fter irrad ia tion the se a ls are u su ally extracted from the cu t-o ff end p ieces under w ater with a m odified grip (F ig .24).
No sp e c ia l to o ls are requ ired for the application of cap se a ls (BWR and PWR bundles). F or the ex traction of cap se a ls under w ater a sp ec ia l too l w as constru cted (F ig .25) which can be used w hile the bundle is in the stripping m achine. A lso new cap se a ls can be applied at a d istance (F ig .26 and 3.4.2).
Another too l w as constructed for the extraction of r iv et se a ls from irrad ia ted , but s t i l l com p lete , MTR bundles and te sted (F igs 27 and 28, se e 3 .3 .4).

326 CRUTZEN et a l.
FIG. 28 . Underwater rivet sea l extraction .

IA E A -SM -201/5 327
FIG. 29 . Usual customs sea l.
FIG. 30 . Fixation o f th e w ires in th e seal.

3 2 8 CRUTZEN et al.
FIG.31. G eneral-use p lexiglass seals; parameters calcu lated taking into account both am plitude and abscissae o f th e elem entary responses.
3. STATUS OF APPLICATION OF SEALS FOR SAFEGUARDS
3.1. T a m p er-r es is ta n t s e a ls for containers and sto re s
3 .1 .1 . C ustom s se a ls
The conventional se a l i s used by the Safeguards D irectora te for sea lin g UF6 b o ttle s , scra p con ta in ers, doors and so on (F ig .29). This se a l is not highly ta m p er -r es is ta n t but is s im ila r to that used up to now by custom s au th orities.
The va lid ity of th is very cheap d ev ice m ust s t i l l be accepted for sh o r tterm su rv e illa n ce or id entification and sea lin g of low stra teg ic value m a te r ia ls . U se is m ade of th ese se a ls m ain ly during in ven tory-tak ing in fab rication plants.
3 .1 .2 . T a m p er-r es is ta n t se a ls
When n uclear m a te r ia ls are put under containm ent for extended periods of tim e in ord er to avoid repeated p h ysica l m ea su rem en ts, ta m p er -r es is ta n t se a ls are applied to the containm ent stru ctu res. G radually the standard cu stom s s e a l is being rep laced by the ta m p er -r es is ta n t gen eral-p u rp ose s e a l with u ltrason ic signature (see sec tio n 2). This rep lacem ent depends of co u rse on the p r ice of the ta m p er -r es is ta n t se a l. It is about 1 0 ,- U.A. each for a sm a ll fab rica tion s e r ie s . H ow ever, with la r g e -s c a le u se of th ese s e a ls , m ore econom ic fabrication m ethods could be em ployed and it is hoped that the p rice of each s e a l in a s e r ie s of 10, 000 s e a ls can be reduced to below 5 ,- U.A.

IA EA -SM -201/5 329
3 .1 .3 . P roced ure for the u se of the ta m p er -r es is ta n t se a l
(a) Both parts of the se a l (box and cover) are identified at headquarters; the identity record (photographic form up to now) is filed and the se a ls are d elivered to in sp ecto rs , together with the secu r ity w ire. On the sp ot, the two ends of the w ire are joined through the box, and tw isted together on a thin alum inium d isc (F ig .30). A ltern atively the two w ire ends can be joined by crim ping. The se a l cover is clipped on to the box and, owing to the non-return sy stem , re -op en in g of the se a l is im p o ssib le without m odifying the u ltrason ica lly checked identity ofthe sea l.
(b) F o r the v er ifica tio n of the se a l two procedures are p ossib le: The se a l is detached by cutting the w ire a fter v isu a l in sp ection of its in tegrity .A new se a l is put on the container if su rv e illa n ce has to be m aintained. The s e a l is returned to headquarters for re -id en tifica tio n (current procedure)The se a l is re -id en tified on the spot u sing a portable u ltrason ic id en tification d ev ice (se e 2 .3 .3).
3 .1 .4 . R eliab ility of the identity [8]
A ll the unique iden tification techniques proposed for safeguarding f is s i le m a te r ia ls as a ru le provide the feature of ta m p er -r es is ta n ce . In the presen t c a s e , the m ethod m akes u se of random prop erties re la ted to the fabrication p ro ce ss of the se a l, which rep resen t a unique identity. H ow ever, uncerta in ties a r ise from the ca libration of the detection equipm ent and the data treatm ent sy stem .
The f ir s t 50 s e a ls identified by the Safeguards D irectora te and r e id en tified after p lacing on se v e r a l types of con ta iners w ere used as a sam ple to determ in e the actual confidence in terva l for the p rim ary identity data (se e 2 .3 .2 and F ig .10 ). F o r the am plitudes |H J and the a b sc is sa |H2 |, va lu es of 4.5 and 5% w ere found.
The m ain p aram eters in the d etailed evaluation are:
I = the num ber of d etected in clu sion s (prim ary data Aj) for one identity e = the probability of erro r on one prim ary value of the identity being
outside the confidence in terva l H;P = the probability of e r ro r on the identity К = the num ber of p o ssib le d ifferent id en tities
T h ese p aram eters are linked as shown in F ig . 31. F rom the diagram it appears that if f iv e to sev en in clu sion s are detected on average, the value of К is high enough quite independently of the value of P , which is im posed as a requ irem ent.
In other w ords tam pering with the se a l by substitution is im p ossib le owing to th is high num ber of d ifferent id en tities (10s).

330 CRUTZEN et a l.
3.1 .5 . C onclusions on the gen era l-p u rp ose se a ls
Within the la s t two y e a r s 260 p la stic se a ls have been applied during in sp ection s. A wide spectrum of application was covered:
The unique re -id en tifica tio n of the se a ls on a routine b a sis proved the high re lia b ility of the sy stem (se a l fabrication and id en tification technique); a ll the b asic req u irem en ts se t forth in 1 .1 .3 are fu lfilled . A ccidental su p erfic ia l dam age on p lex ig la ss se a ls w ere noticed after transportation of con ta iners. In a ll c a s e s , the identity of the se a l w as m aintained. Howe v e r , it is obvious that the ch oice of the m atr ix m a ter ia l of the se a l (p le x ig la s s , alum inium or s ta in le ss stee l) m ust be con sisten t with the am bient conditions. As a m atter of fact, up to now, the p la stic se a ls have perform ed w ell in a ll applications. But s in ce the SAP v er s io n is availab le new field te s t s w ill be in itiated soon.
A s far as the se a l it s e lf is concerned , a ll c r iter ia are fu lfilled . Howe v e r , the intact se a l p roves that the content of the container is untouched only if the w ire , eyeh o les of the container and the container it s e lf are a ll a lso untam pered. In se v e r a l c a se s of broken w ire s the situation was s a t i s factor ily explained as the resu lt of handling conditions, v ibrations an d/or sharp ed ges. W ires of h igher r e s is ta n c e , protection for edges and, la st but not le a s t , adequate p rovision at the c lo su re of the containers would help to im prove the situation considerably .
It is apparent that the container m ust be a lso checked for its in tegrity . The various d esign s should be such to fa c ilita te th is operation.
So fa r , the s e a ls have alw ays been re -id en tified at headquarters. The re la tiv e ly sm a ll num ber of tam p er-p roof se a ls used allow ed th is procedure. In the light of our exp er ien ce , th is procedure can be m aintained in many c a s e s in the future. H ow ever, in c a s e s w here the resu lt of the re - id e n tif i- cation would in fluence the in sp ection program m e, portable equipm ent is required (se e 2 .3 .3 ). This is typ ica lly the ca se w here, for in stan ce, a large num ber of con ta iners are each sea led in a com m on storage area and w here s ta tis t ic a l ch ecks m ust be conducted during an inspection . The d isco v ery of a tam pered se a l would have an im m ediate influence on the inspection program m e.
3.2. R eactor se a ls
3 .2 .1 . Introduction
The norm al inventory of a ligh t-w ater power rea cto r plant co n sis ts of:
O verseas sh ipm ents Comm unity in ternal tran sports R eactor core loadings C ontainers for UF6 V arious con ta iners in fabrication
619
1050
and re p r o ce ss in g plants 130
A few fr e sh e lem en ts in the dry sto ra g e , e .g . sp a res from la st refuelling;

IA EA -SM -201/5 331
The fu e l e lem en ts of the core;The irrad iated e lem en ts in wet storage aw aiting shipm ent to
re p r o c e ss in g or in term ediate storage.
G enerally around the 9th to 10th month of the operation period the plant r e c e iv e s a num ber of new fuel e lem en ts , equivalent to about 1 /3 of the core loading. On d isch arge , the irrad iated fuel e lem en ts are allow ed to cool down in the pool for 6 to 8 m onths before being shipped. On average the rea cto r core re p r esen ts about 2 /3 of the fuel inventory of the plant.
Depending on the type of ligh t-w ater power reactor (PWR and BWR) and on its power the plant inventory l ie s betw een 50 to 100 tons of uranium typ ica lly enriched to 2.5% (1250 to 2500 kg 235U). This enorm ous quantity of uranium is the rea so n for the application of s e a ls to the core containm ent.
3 .2 .2 . C riter ia for se a l application
The se a l on the containm ent of a reactor core loading m ust be applied in accordance with the b asic p rin cip les given in 1.1.3. H ow ever, the sp ec ific situation c a lls for additional com m ents:
(a) The p lacing and reco v ery of the se a l m u st be p ractica l and the procedures as sim p le as p o ss ib le , taking into account the d ifferent containm ents ofa core (v e s s e l and sh ield stru ctu re with the d ifferent ways of a c c e s s to the core for the m ovem ent of fr e sh or irrad iated fuel bundles) and the radiation le v e ls at the p ossib le p laces for sea lin g .
(b) The v er ifica tio n of the se a l m u st be p o ss ib le during rea cto r operation.
(c) The rea cto r operation m ust not be affected by the se a l, th is m eans that any work conducted during operation (th is in clu d es a ll types of m aintenance work on equipm ent and a lso rep a ir work on irrad iated fuel bundles) m ust leave the se a l untouched. T h erefore , the design and p osition of the se a l m ust be ch osen such as to m in im ize the p o ssib ility of accid en ta l dam age.
The core loading m ust be v er ified by adequate ver ifica tion procedures during the loading procedure. H ow ever, from that tim e (when the v e s s e l cover is put in p lace) to the application of a se a l to the sh ie ld b locks betw een 1 and 10 d m ay p ass which m ust be covered by another type of adequate su rv e illa n ce in ord er to en su re that the core loading is unchanged when the s e a l is applied. A s e a l d irectly on the rea cto r v e s s e l is norm ally im p ossib le (s e e com m ents (a) and (b)).
Since the C ontrol A uthority cannot in terfere with the program m e of a power station , con sid erab le co llaboration is required betw een plant operator and Authority. The plant operator m ust:
Give im m ediate n otice of any accid en ta l break or intended rem oval of a se a l (owing to changes in planning);
Com m unicate in advance the operation sch ed u les and the relevant m odification of it;

332 CRUTZEN et a l.
FIG.32 . Riveting grip for CAMEN MTR fu el bundles.
and the C ontrol Authority m ust be ready to adjust the in sp ection schedule a lso on the b a s is of short notice.
3 .2 .3 . P osition of the se a l
T here is no standard so lu tion for the way a reactor is sea led . The fo llow in g so lu tions have been adopted in the past, for 14 ligh t-w ater rea cto rs
(a) At the le v e l of the v e s s e l cover it s e lf , w here the s e a l is applied between bolt and nut or betw een two adjacent bolts or nuts re sp ec tiv e ly . This so lu tion is no longer used w here th ere is an a ltern ative becau se the s e a l cannot be v er ified during rea cto r operation.
(b) At the con crete sh ield b lock s, which cover the core w ell. In th is ca se the m eta llic w ire jo ins two or m ore sh ield b locks through th eir e y e h o les . A pplication, check and reco v ery of s e a ls are easy .
(c) B etw een the platform and the fuel tra n sfer lock. Since irrad iated elem en ts m ust be tra n sferred under w ater, they cannot be rem oved from the core w e ll, if the lock is c losed .
(d) B etw een instrum entation bridge and the edge of the upper platform surrounding the rea cto r core w ell. T his is p o ssib le in certa in c a s e s , w here the core w e ll sta y s open during operation and w here a fuel tra n sfer channel connects the bottom of the core w e ll w ith the w et storage .

IA EA -SM -201/5 333
FIG. 33. Riveting grip for BR2 MTR fu el bundles.
A lso other so lu tion s m ay be envisaged; how ever, they have not been exp loited-in p ractice:
(e) Iso lation of the con tro l which activates the tra n sfer channel betw een rea cto r w ell and w et storage (a lternative to c a se (d)).
(f) B lockage of the fu e l tran sfer m achine by a se a l. In th is way at le a st no irrad iated e lem en ts can be m oved.
3 .2 .4 . C onclusions on rea cto r se a ls
Solutions (b), (c), (d), are v ery p ractica l. H ow ever, sp ec ia l p rovision s from the rea cto r d esign could s t i l l fa c ilita te the application of se a ls in two r e sp e c ts : to reduce the se a lin g -w ir e length and to provide a "natural" p rotection for w ire and se a l against unintended rupture. In p articu lar, so lu tion (b) su ffers in th is re sp ec t b ecau se the sh ielded rea cto r su rface is so m etim es used as w orking platform ; on the other hand, the se a l can be in sp ected at any tim e . The d o se -r a te s reported at the p osition of the se a ls a re up to about 100 m re m /h . The se a l th erefore absorb s up to 103 rem in tegrated d ose during the operation cy c le . The gen era l-p u rp ose p lastic se a ls show no d etectab le d eter ioration in appearance or during subsequent id en tification . The SAP v e r s io n w as orig in a lly developed for th is application.
3.3. R ivet s e a l for MTR fuel bundles [7]
3 .3 .1 . Introduction
MTR fuel bundles contain highly enriched uranium (150 to 400 g, even 600 g 235U), which is a highly s tra teg ic m ateria l; the developm ent and

334 CRUTZEN et a l.
application of a su itable sea lin g m ethod w as th erefore an urgent requirem ent. The r iv et se a l as d escrib ed in sectio n 2 a llow s the sea lin g and unambiguous id en tification of MTR fuel bundles during the life tim e of th ese bundles.
The se a l is p laced at a point of the stru cture w here m achining has to be done for p artia l or com plete d ism antling of the fuel bundle; th is leads n e c e s sa r ily to extraction or d estru ction of the se a l (see 2 .2 .4).
T h ese r iv et se a ls have up to now b een used on a rather large exp erim en ta l sc a le . During the la st y ea r , 230 se a ls have been applied to d ifferent typ es of MTR elem en ts , at various fabrication plants.
3 .3 .2 . Preparation of the fuel bundle
Owing to the d ifferent d esign s the preparation of the fuel bundle ( i .e . , the m achining procedure for the sea t of the sea l) i s d ifferent for each type.
E ven though a ll tech n ica l prob lem s w ere so lved sa tis fa c to r ily , it m ust be pointed out that a m achining step after fuel-bundle a ssem b ly b ears the r isk that the bundle could be dam aged at th is la s t stage. This leads to a c o s t for the preparation of the r iv et sea t, which in clu d es a substantia l contribution b ecau se of th is r isk . T ypical exam p les for the preparation procedure h ighlight th is problem :
(a) HFR fuel b u n d les: The fuel bundle has at both ends a type of n ozzle.The sea t for the se a l is th erefore m achined into the zone w here the n ozzle (of the foot of the bundle) overlap s with the edge plate. The r iv et head is counter-sunk into the edge plate.
The to lera n ces are rather c lo se in order to avoid that either the r iv e t head protrudes from the edge p late, or that the cou n ter-sin kin g too l cuts com p letely through the edge plate. In the f ir s t ca se the se a l m ight be dam aged when the fuel elem en t is tra n sferred into the reactor channel or the storage box. In the second c a s e , the edge plate m ight be rem oved without destroyin g the se a l. The r iv e t sea t has to be m ade as one of the la st step s of the fuel fabrication cy c le . The tim e required for the m odification was estim ated to be 0.5 h according to te s ts perform ed on a dummy elem en t. With the help of a sp ec ia l too l, which a llow s the h ole and the r e c e s s for the r iv et head to be m achined in one operation and with a d ev ice for rapid and p r e c ise positioning of the fuel elem ent on the bench, the tim e could be further reduced. As exp erience in c r e a se s , it is hoped that the cost of m achining and the co st attributable to r isk can be reduced considerably .
The r ivetin g grip is rather bulky, b ecau se it has to reach through the n ozzle of the bundle (F ig .23).
(b) CAMEN F isa fuel bun dles: The upper ex trem ity of the box is not provided with a n ozzle. T h erefore , the se a l is located at the edge plate v ery near to the fuel p lates (F ig .22). The preparation of the sea t can thus be done p rior to the fu e l-e le m e n t m ounting. The extra co s ts are th erefore n eg lig ib le .The r ivetin g grip is s im p le and p o ck et-s ize (F ig .32).
(c) BR2 M ol fu e l bundles: The sea t of the s e a l is prepared on the com bs which hold the curved fu e l p la tes (F ig .33). A gain, th is h o le , positioned

IA EA -SM -201/5 335
c lo se to the fu e l p la te s , can be m achined b efore the fu e l bundle is assem b led .
The r ivetin g grip is sim p le and p o ck et-s ize .
3 .3 .3 . Sealing p rocedure
The fu e l bundles are routinely sea led at the fabrication plants. The se a ls are identified at headquarters and applied to the bundle by the in sp ector just a fter p hysica l m easu rem ent of the f i s s i l e m a ter ia l quality and quantity.
3 .3 .4 . Identity ch ecks
The identity of the fuel bundle m ay be checked at d ifferent points in thefu e l cyc le :
(a) Identity check b efore irrad ia tion : F or the identity v er ifica tio n of fr e sh fu e l bundles (in the dry storage of a reactor plant, for exam ple) the se a l is extracted and rep laced by a new one (using alw ays the sam e grips); the s e a l is re -id e n tif ied at headquarters or on the spot u sing a portable apparatus.
(b) Identity check after irrad iation: F or the rem oval of the se a l in the pond 3 to 10 m below the w ater su rfa ce , the r ivetin g grip was m odified by:
Tube for guiding the extraction punch just in front of the se a l, with a locking sy stem ,
R em ote con tro l of the extraction punch,D isc reco v ery pocket which can be opened at d istance.E xtractions w ere perform ed for dem onstration at 10 m d istance
and at 3 m d istan ce , corresponding to the d ifferent ex trem e p ositions at which the fu e l bundle can be located in the coolin g pond. T h ese operations w ere perform ed in the HFR coo lin g pond on four irrad iated se a led fu e l bundles.
(c) Identity check b efore r e p r o c e ss in g : B efore r e p r o ce ss in g , the se a ls are rem oved for re -id en tifica tion . In one ca se the s e a ls are rem oved in the coolin g pond of the reactor plant, b ecau se the bundles m ust be cut very c lo se to the fu e l p lates owing to the lim ited d im ensions of the tran sport container. In other c a se s the s e a l is extracted at the re p r o ce ss in g plant.
A sim p le too l (F ig .24) w as constructed for the standard operation to be done on fuel bundles or cu t-o ff end p ieces of fu e l bundles. The procedure was defined in co llaboration with the M arcoule plant. The contract radiation in ten sity was about 1 m r e m /h when the s e a l was rem oved from the w ater. A fter rough clean ing no su p erfic ia l con tam ination was found and the se a l did not contam inate the identification apparatus. The re -id en tifica tio n of the f ir s t irrad iated se a ls was m ade at Ispra and a v ery sa tis fa cto ry corresp ond en ce with the orig in a l identity w as obtained.

336 CRUTZEN et a l.
3 .3 .5 . C onclusions on MTR r iv e t s e a ls
A fter ex ten sive stu d ies the id entification m ethod u sing r iv e t se a ls was introduced into safeguards p ractice for M TR-type rea cto r plants;
The preparations of the fuel bundles for the application of the se a ls are sim p le and p resen t no danger for the co rrect operation of the fu e l bundles;
The m anipulations for the application and reco v ery of the se a ls presen t no problem s;
The se a l r e s is t s irradiation; the low activ ity and the absen ce of con tam ination problem s perm it the u se of the standard procedure for r e - id e n t if ication . Since the se a lin g cam paigns started only in m id -1974 , only a few s e a ls have been re co v e re d up to now. The identity rem ained unaffacted;
The c o s ts of the se a lin g cam paigns can be ju stified by the reduction of s a f e guards effort which would o th erw ise be required for the sam e re su lts . Since the application is s t i l l perform ed on a quite lim ited s c a le , it is to be expected that sim p lifica tion s in fuel preparation p rocedu res w ill help to reduce sign ifican tly the exp en se of m achining the r iv et seat; the p rice v a r ies con sid erab ly for d ifferent types of e lem en t (up to 1 8 ,- U .A.; the r iv et cu rren tly co s ts 6 .- U .A .) owing to co sts attributed to the damage r isk , if the sea t is m achined as one of the la s t step s in the production p ro cess .
3.4 . BWR fuel-bundle se a ls
3 .4 .1 . Introduction
The cap se a ls (se e sec tio n 2) have been developed s in ce 1970 for sea lin g the fuel bundles from the fabrication plant to the re p r o ce ss in g plant, throughout the rea cto r cy c le . The ESARDA W orking Group on Identification and Sealing T echniques proposed that a te s t under nom inal operation conditions be undertaken. A lso an agreem en t w as reached with plant op erators to accep t an exp erim en ta l cam paign to prove r e lia b ility during the reactor fuel cy c le . The m ain tech n ica l prob lem s about which the rea cto r op erators w ere concerned w ere:
V ibrations o f the cap s e a l leading p o ssib ly to a lo s s o f the se a l in the prim ary circu it. The large to lera n ces of the b lockage d evice for the fix in g nut (se e F ig .2) m ay in p rin cip le allow such vibrations; and
E r o sio n of the sin tered s ta in le s s - s t e e l m atr ix of the sea l.
A s se en from 2 .2 .3 and 2 .2 .5 we now have the m eans of avoiding th ese points of concern .
3 .4 .2 . E xp erim en ts perform ed
(a) M odification of the fu e l b un dles: The proposal for the m odification of the end-plug of the t ie -r o d s to r e c e iv e se a ls w as studied and tech n ica lly accepted by AEG for the fuel bundles of the re a c to rs KWL (Lingen,

IA E A -SM -201/5 337
F ed er a l Republic of Germany) and KRB (G undrem m ingen, F ed era l Republic of Germ any). The m odifications w ere m ade for 8 bundles (4 bundles for KWL, 4 bundles for KRB) at the KRT fabrication plant (KWU).
(b) Sealing of fuel bundles at the r e a c to r s : At both rea cto r plants (Lingen and Gundremm ingen) 8 se a ls w ere applied on the 4 prepared fuel bundles, stay in g eith er in the dry storage or in the pool. S ince the fuel bundles m ight have had to be rep a ired during th e ir life tim e at the rea cto r plant, it had to be dem onstrated that the extracting too ls allow ed extraction of s e a ls under w ater from irrad iated bundles. T h erefore , s e a ls w ere extracted and new ones w ere applied on fu e l bundles in the "stripp ing m achine" (3 m below w ater le v e l) . At G undrem m ingen th is operation was perform ed in the p resen ce of GFK and IAEA r e p r e se n ta tiv e s . E xtraction and re se a lin g takes about 1 m in (F igs 25 and 26).
(c) T e sts going on : Since 1972 the 14 s e a ls (one bundle is s t i l l in the dry storage of KWL) have follow ed the norm al cy c le of the fuel. At each refu e llin g of both rea cto rs one s e a l is extracted , v isu a lly in spected and re -id e n tif ied (up to now at Ispra). So far only two se a ls have been reco v ered owing to the long shutdown p eriods which have occurred .The re -id en tifica tio n , as w e ll a s the v isu a l in sp ection of the extracted s e a ls , w as su c c e ss fu l. The id en tification of s e a ls under w ater in the pool without ex traction and rep lacem ent of the se a l was tested in the lab oratory only. The te s t s of the underwater id en tification apparatus w ill be done soon at the KWL plant.
3 .4 .3 . C onclusions on BWR fu e l se a ls
F rom the tech n ica l point of v iew , the p artia l r e su lts obtained so far a re p ositive . T h erefore , the Safeguards Authority intends to u se th is technique to the extent p o ssib le for the su rve illan ce of the ligh t-w ater power rea cto r fuel cy c le .
4. GENERAL CONCLUSIONS
A s a resu lt of an ex ten sive re se a r c h and developm ent program m e (sin ce 1970) the D irectora te of Euratom Safeguards has today at its d isp osa l a ta m p er -r es is ta n t se a lin g and id en tification technique.
G eneral-p urpose se a ls in p la stic and SAP are in routine use.S im ilarly the la r g e -s c a le exp erim en ts with MTR r iv et se a ls show that
the m ethod of fu e l-e le m e n t se a lin g is su ited for routine application.The exp erim en ts on BWR fuel-bundle sea lin g lead us to b e liev e that for
th e se re a c to rs a lso fuel-bundle se a ls are fea s ib le from fabrication to rep ro cessin g .
C onsequently, re se a r c h and developm ent work for other types of fuel bundles has been in itiated and is w e ll advanced.
Since the sealing of fuel bundles ov er the whole fuel cy cle sim plifies the application of safeg u ard s, the Safeguards D ire cto ra te intends to m ake use of this technique to the la rg e s t exten t possible. F u el sealing p erm its not only s ta tis tic a l checks on fuel-bundle inventories but a lso allows the taking

338 CRUTZEN et a l.
of com p lete in ven tories with m inim um in terferen ce with the plant operation (if the reactor core is sea led ). This technique b ecom es p articu larly attractive with the advent of Pu re c y c le in LWRs.
Current developm ents on the id entification equipm ent w ill perm it the u se of fa s te r and e a s ie r id en tification and re -id en tifica tio n p rocedures.
R E F E R E N C E S
[ 1 ] A greem ent betw een Euratom and the IAEA in Im plem entation o f th e Treaty on th e Non-Proliferation o f Nuclear W eapons, Art. 28 . 32a and'b.
[23 Idem , A rticles 5 and 7 .[3 ] JEHENSON, P. , CRUTZEN, S . , BORLOO, E. , JANSEN, J . , ProcSdgs d’id en tification ä preuve de fraude
en vue du controle d e la circulation des matibres fissiles par la technique du "containm ent", Safeguards Techniques (Proc. Symp. Karlsruhe, 1970) 2 , IAEA, V ienna (1970) 215.
[ 4 ] CRUTZEN, S . , JEHENSON, P . , "Surveillance and containm ent techniques", Sym p. Practical Applications o f Research and D evelopm ent in the Field o f Safeguards, Rome, March 7 -8 , 1974.
[ 5 ] CRUTZEN, S. , JEHENSON, P . , BORLOO, E ., BUERGERS, W ., A rivet seal for safeguarding th e MTR fu el e lem en ts, EUR 5110e, JRC Ispra (1974).
[ 6 ] OLISt, A . , Private C om m unication , Nicrobraz, Paris.[ 7 ] BORLOO, E . , CRUTZEN, S . , Ultrasonic signature, EUR 5108e, JRC Ispra (1974).[ 8 ] CRUTZEN, S . , BORLOO, E . , C onfidence and tamper resistance o f an ultrasonic signature, EUR 5109e,
JRC Ispra (1975).
D I S C U S S I O N
R. A. BERTHET: Is it alw ays p ossib le to identify the s e a ls with the portable equipm ent without having to rem ove them from the sea led m a te r ia ls? If so , what are the d im ensions of the part of the equipm ent used for id en tification?
A second question i s , how do you intend to decontam inate the identification d ev ice after su bm ersion in the pond in the ca se of subm erged se a ls ?
S. J. CRUTZEN: The se a ls are identified in a ll c a s e s by m eans of the portable equipm ent. None of the s e a ls , excep t the "all-purpose" type, should be rem oved. The d im ensions of the identifying unit a re le s s than200 X 200 X 300 m m .
In the ca se of subm erged s e a ls , it is only the m echan ica l part (200 X 200 X 300m m ) that i s subm erged , being connected by e le c tr ic cab le to the portable equipm ent. This m echan ica l scanning d ev ice is designed for the reactor or re p r o ce ss in g pond, and should be kept in the contam inated equipm ent sto re .

Session 9 Part I
NON-DESTRUCTIVE MEASUREMENTS

Chairman: A. von BAECKMANN (IAEA)

IA E A -SM -201/8
OPERATIONAL EXPERIENCE IN THE NON-DESTRUCTIVE ASSAY OF FISSILE MATERIAL IN GENERAL ELECTRIC'S NUCLEAR FUEL FABRICATION FACILITY
J .P . STEWART General Electric Company,Wilmington, N . C . ,United States of America
Abstract
OPERATIONAL EXPERIENCE IN THE NON-DESTRUCTIVE ASSAY OF FISSILE MATERIAL IN GENERAL ELECTRIC'S NUCLEAR FUEL FABRICATION FACILITY.
Operational exp erien ce in the non-destructive assay o f fissile m aterial in a variety o f forms and containers and incorporation o f the assay devices into the accountability m easurem ent system for General E lectric’s W ilm ington Fuel Fabrication F acility m easurem ent control programme is d eta iled . D escription of the purpose and related operational requirements o f each non-destructive assay system is also included . In addition, the accountab ility data acquisition and processing system is described in relation to its in teraction with the various non-destructive assay d evices and scales used for accountability purposes within the fa c ility .
. I . INTRODUCTION
The General E lectric Nuclear Fuel Fabrication F a c i lity , located near Wilmington, North Carolina, produces reactor components and nuclear fuel arrays for use in Boiling-Water Power Reactors. The f a c i l i t y contains p e lle t sin terin g and grinding operations, and fuel-rod loading and assembly operations. The fin ished product i s an array o f low-enriched (U-235) nuclear fuel rods forming a completed fuel bundle. Nondestructive assay techniques are employed at c r it ic a l points in the fuel fabrication process to monitor process parameters and to assay the f i s s i l e content and related physical parameters o f various types o f Uranium-bearing m aterials. A centralized accountability data acquisition and processing system provides a real-tim e safeguards and accountability data base for the Wilmington f a c i l i t y , u til iz in g d irect input o f sca le and balance weights and nondestructive assay values from a variety o f process measurement p oints.
II . FUEL-ROD ASSAY
The f i s s i l e assay of complete nuclear fuel rods by the Californium-252 Fuel-Rod Scanning System provides measurement and evaluation of the outgoing product and i s key to the nondestructive assay a c t iv i t ie s at the f a c i l i t y . This d ev ice, a fuel-rod scanner u t il iz in g a Californium-252 neutron source, i s the resu lt o f an enrichment v er ifica tio n program that began with the in s ta lla t io n o f the large array o f passive fuel-rod scanners in 1969. These devices u t i l iz e the 185-keV gamma radiation from the decay o f Uranium-235 within the fuel p e lle ts to monitor axial enrichment d istrib u tion within fuel rods. The required throughput o f the passive scanning f a c i l i t y was soon exceeded by the fuel-rod output o f the fabrication f a c i l i t y . Thus, the Californium-252 Fuel-Rod Scanning System Cl^was developed and fabricated at
341

342 STEWART
FIG. 1. Block diagram - Californium-252 fuel-rod scanning system.
General E lec tr ic 's V a llecitos Nuclear Center in V a lle c ito s , C alifornia. The system was designed to f u l f i l l the following requirements: (a) the thermalneutron flu x had to be in the range o f 5 x 10^ neutrons per square centimeter per second with a therm al-to-fast neutron ratio greater than 10,000 to avoid s ig n if ic a n t contribution to the f is s io n spectrum by Uranium-238; (b) a minimum sou rce-to-detector distance to optimize the s ig n a l, but su ff ic ie n t to give a low background rate from the Californium source; (c) adequate personnel sh ield in g; (d) m ultiple irrad iation channels for production rod scanning f le x ib i l i t y and maximum, throughput cap ab ility with spacing between channels adequate to prevent excessive adjacent channel in teraction and to accomodate a fuel-rod scanning system.
In i t s present configuration, the Californium-252 Fuel-Rod Scanning System measures fuel-rod d en sity , enrichment, nuclear poison content, and f i s s i l e (U-235) content. The system employs a dedicated minicomputer system based on a cartridge d isc u n it , a nine-track magnetic tape u n it, a high-speed e le c tr o s ta t ic p r in te r /p lo tter , and related operator-computer term inals. The minicomputer acquires fuel-rod count data from the background, d en sity , and enrichment detectors (Figure 1) through a CAMAC crate and related in terfacing e lec tro n ics . The minicomputer also actuates the rod-handling system through the CAMAC crate providing automated rod-loading and discharge functions. The handling system has the cap ab ility to be enlarged providing an automated rod ser ia l number reading and v er ifica tio n sta tion that is integral with the rodhandling system. The use o f CAMAC electron ics in th is system has allowed the in terfacing of the counting e lectron ics with the minicomputer in a manner that is straightforward and permits a maximum u til iz a t io n of maintenance personnel.

IAEA-SM -201/8 343
The count data from the CAMAC system is processed by the minicomputer through d en sity , enrichment, and f i s s i l e ca libration fun ction s, and is checked for quality lim its related to fuel uniformity and output in a variety of forms, including hard copy. The hard-copy record includes a graphic record o f the density and enrichment d istrib u tion s along the fuel rod. It is th is record that becomes the permanent record of the scanning process. Direct computer-to-computer transfer of f i s s i l e scanning data from the system minicomputer to the central accountability data acq uisition system is a lso provided. The f i s s i l e measurement cap ab ility o f the Californium-252 Fuel Rod Scanning System is summarized in Table I.
I II . ENRICHMENT CONTROL
U-235 enrichment control i s mandatory in a multi-enrichment processing f a c i l i t y such as Wilmington. In -lin e enrichment measurement devices C2D have been developed using modular e lec tron ics and microprocessor technology to assay the enrichment of process containers (fiv e -g a llo n p a ils ) o f Uranium Dioxide (U02) powder and, based on the resu lts o f the assay measurement proc e ss , to control various types of process equipment. These d ev ices, called SAM-II, are s tr a te g ic a lly placed within the manufacturing process to ver ify the enrichment of process containers prior to the powder blending and p e lle t pressing operations. In addition , these devices are used for the enrichment v er if ica tio n o f U02 powder for o f f s i t e shipment. The measurement cap ab ility of the SAM-II system is summarized in Table I. These devices also have prov ision for d irect input of enrichment v er ifica tio n data to the centralized accountability data acquisition system. The u til iz a t io n of these enrichment v e r if ica tio n devices in the enrichment control system within the Wilmington f a c i l i t y assures that improper processing o f U02 powder is detected and corrected in a tim ely manner.
IV. WASTE ASSAY
The nondestructive assay o f process discards and contaminated m aterials i s a lso a c tiv e ly pursued at the Wilmington f a c i l i t y . Process discards which are to be returned to the manufacturing process via the waste-recovery system are assayed for f i s s i l e co n ten t^ 3 3 using a device that employs coincident
TABLE I
NONDESTRUCTIVE ASSAY SYSTEMS
MEASUREMENT CAPABILITIES
SYSTEM CAPABILITY(ONE SIGMA)
Californium-252 Fuel Rod Scanning System
± 0.5% Relative(U-235)
SAM-II Enrichment Assay System ± 0.5% Relative(w/o U-235)
Isotopic Source Adjustable Fissometer
± 5.0% Relative(U-235)
"Elephant Gun" Assay System ±10.0% Relative(U-235)

344 STEWART
f is s io n event counting, an Isotopic Source Adjustable Fissometer. This device is incorporated at the feed end o f the waste-recovery process and assays process discards in fiv e -g a llo n p a ils . The device provides an a lternate method for f i s s i l e content determination of process discards as opposed to weighing and sampling and subsequent laboratory analyses. Waste from the o n -s ite incinerator i s a lso assayed using th is device prior to recovery or burial.
Contaminated m aterials such as discarded piping or crushed cans are assayed prior to recovery or burial for Uranium and Uranium-235 content u til iz in g a nondestructive assay device developed by a j'oint e ffo r t o f the General E lec tr ic Company and Los Alamos S c ie n t if ic Laboratory C Q . This d ev ice, ca lled the "Elephant Gun", employs a large gamma-ray detector and modular e lec tro n ics to scan large boxes of contaminated m aterials. The measurements are input to the central data acq uisition system via remote term inals. Contaminated m aterials such as absolute f i l t e r s and combustible waste are assayed for both accountability and nuclear sa fety purposes using a nondestructive assay device sim ilar to the "Elephant Gun". The measurement c a p a b ilit ie s o f the Isotopic Source Adjustable Fissometer and the "Elephant Gun" are summarized in Table I.
V. STANDARDIZATION
The standardization o f nondestructive assay devices i s central to the useful 1 ness o f nondestructive assay techniques for safeguards and accountability . The standards program for nondestructive assay systems at the Wilmington f a c i l i t y encompasses the design , fab rication , q u a lific a tio n , documentation, and maintenance o f nondestructive assay standards o f several types. For example, f u l l - s i z e fuel-rod standards have been designed to be representative of production fuel rods and fabricated using process equipment under process conditions. S u ffic ie n t samples were randomly se lected for submission to m ultiple laboratories and the resu ltant data processed using s t a t is t ic a l techniques designed to minimize 1aboratory-to-laboratory d ifferences and the resu lts documented. The end product i s a s e t o f primary fuel-rod standards which have been characterized in enrichment, d en sity , and U-235 content.These standards are kept under s t r ic t physical control and are examined regularly for cladding in te g r ity and p e lle t uniformity using an image X-Ray technique. Replacement standards are fabricated and q u a lified whenever the primary standards are adjudged unusable by the examination process. All nond estructive assay standards are fabricated and q u a lified using th is process and examined regularly to determine the representative requirements of the standard/product relation sh ip .
VI. CENTRAL DATA ACQUISITION SYSTEM
The Wilmington f a c i l i t y u t i l iz e s a centralized data acq uisition and processing sy stem C 53to provide realtim e acq uisition and processing of accounta b il ity data from the manufacturing process lin es and related peripheral areas. A dual computer design has been se lected and is in operation in the simultaneous acq u isition of accountability data. That i s , each computer subsystem continuously crosschecks received data with that from the other system and error messages are issued to cognizant management personnel for corrective action as necessary. The dual-system approach a lso enhances the r e l ia b i l i ty o f the overall system as the malfunction of a subsystem w ill not degrade the acq u isition and processing o f accountability data from the manufacturing areas. Data input terminals are located at c r it ic a l points within the process areas for user a c c e s s ib i lity and are designed to provide tu tor ia l user in teraction with the central computer system. That i s , the user i s led through the various information requirements by the central

IAEA-SM-201/8 345
computer system by the use o f data request messages requiring user response. The accuracy and adequacy of user responses are also checked by the system.The system can also produce sta tio n -to -s ta tio n material balances and the production, via o f f - l in e computer, o f material balance reports for use by the f a c i l i t y ' s inventory management function.
The a p p lica b ility of the central accountability data acq u isition and processing system to safeguards is best illu stra te d by the interaction of the system with various sca les and balances used within the manufacturing process for accountability purposes. Weight data from the sca les are d irectly input to the central computer system through the aforementioned remote data entry term inals. Software provisions provide on -lin e v er if ica tio n of sca le calibration and ca libration v er ifica tio n data. Error messages are sent to appropriate sta tion s for corrective action in the event o f improper usage of the sc a le . Additional software provisions ver ify the range and adequacy of sca le weight data associated with product containers.
VII. CONCLUSION
The application of nondestructive assay instrumentation at General E lec tr ic 's Wilmington Fuel Fabrication F a c ility enhances safeguards and accountability by providing on -line information regarding the f i s s i l e or enrichment content o f process m aterials. Such data is u tiliz e d at c r it ic a l points in the process for monitoring o f processing parameters and for material balancing purposes. The combination of th is data, through a realtim e data acquisition system, including d irect input o f sca le and balance information, enhances e f f ic ie n t plant management and contributes to the fu lf illm e n t of the General E le c tr ic 's safeguards commitment to so c iety .
REFERENCES
fl] Duckart, A. C ., e t a l , "Nuclear Fuel Rod Active Gamma Scan System",General E lec tr ic Company NEDE-20580, July(1974).
[2] Walton, R. B ., e t a l , "Measurements of UF6 Cylinders With Portable Instruments", Nucl. Technol., 21_ (1974) 133.
[3] Stewart, J. P ., Weber, H ., "Calibration and Q ualification of the Isotopic Source Adjustable Fissometer(ISAF) for Assay o f Low- Enriched Discrepant Uranium M aterials", In stitu te of Nuclear Materials Management Summer Meeting Proceedings(1975).
Й Stewart, J. P ., e t a l , "Development, T esting, and U tiliza tio n of the 'Elephant Gun' for Measurement of Heterogeneous Radioactive Residuals", In stitu te o f Nuclear Materials Management Proceedings,Vol. I I , No. 3 (1973).
[б] Stewart, J. P . , e t a l , "Practical Applications o f On-line DataProcessing Systems for Material Control and Quality Assurance", Ibid.Vol. I I , No. 3 (1973).
D I S C U S S I O N
R. BERG: The proper safeguarding of a rep ro cessin g plant starts, in my opinion, with knowledge of the tota l amount of uranium entering the fa c ility . A ccord ingly , I should lik e to ask you how accurate i s your ca lcu lation of the to ta l amount of uranium contained in a fuel elem en t.

346 STEWART
J .P . STEWART: I w ill provide those d eta ils at a la ter stage; in the m eantim e I certa in ly agree with your com m ent.
J .L . JAECH: Could you p lea se c larify the function of the fu e l-rod assay sy stem with resp ect to the enrichm ent of a fuel rod? You state that the tota l 235U content of a rod is determ ined, but th is is only a ver ifica tion m easu rem ent, as far a s I understood, and not an accountability number? U n less the ,±0.5% capability value in Table I is m ostly random error ,I don't see how the LEMUF (lim it of erro r on m ateria l unaccounted for) lim its can be achieved . I would think that sy stem a tic e r r o r s in calibration would be lim itin g . How is the 0.5% divided into sy stem a tic and random errors?
I a lso have a com m ent to m ake. You stated that the data w ere p ro cessed by m eans of s ta tis tic a l techniques designed to m in im ize lab oratory-to - laboratory d ifferen ces. There is no way in which s ta tis t ic s can m inim ize such d ifferen ces; they ex ist and do not depend on how the data are analysed.I p resum e you m ean that the e ffec ts of such d ifferen ces are reduced through averaging r e su lts from the various lab ora tories. Is that correct?
J .P . STEWART: The ±0.5% capability value in Table I is a ll random er ro r . I did not include the sy stem a tic erro r at a ll. A s far as your com m ent i s concerned, you are ab solu tely right.
C.D. BINGHAM: You have indicated an uncertainty of 0.5% in the 235U content of a fuel rod. What i s the uncertainty in the 235U content of your calibration rods?
J .P . STEWART: A pproxim ately ±0.2% 235U.P. d'OULTREMONT: Could you te ll m e the rate for rejection of good
rods by the scanner under the presen t operating conditions?J .P . STEWART: I'm afraid that th is in form ation i s proprietary.H. KENDRICK: In view of the d ifficu lties about which we have been
hearing th is week with regard to standards, m atrix e ffec ts and so on in applying NDA techniques, I wonder if you would com m ent on the am bitious com m itm ent G eneral E le c tr ic has m ade regarding the routine u se of NDA techniques in such a large com m ercia l production facility?
J .P . STEWART: The com m itm ent is based on the relationship between in sp ection effort and m anpower lim ita tion s. We have to re ly on NDA tec h niques to fu lfil the quality in sp ection needs of th is very large throughput fa c ility .

IAEA -SM -2 0 1 / 92
О НЕКОТОРЫХ МЕТОДАХ И ПРИБОРАХ, РАЗРАБОТАННЫХ В БОЛГАРИИ,ДЛЯ НЕДЕСТРУКТИВНОГО АНАЛИЗА ЯДЕРНЫХ МАТЕРИАЛОВ
Н . С . БАЧВА РО В, Т . Н. Д РАГНЕВ ,Ж . С . КАРАМАНОВА, Х.МЮННИНГ,А . И. Т РИФОНОВ, В . И . ХРИСТОВ Институт ядерных исследований и ядерной энергетики Академии наук НРБ,С офия,Народная Республика Болгария
Abstract-Resumen
SOME TECHNIQUES AND INSTRUMENTS DEVELOPED IN BULGARIA FOR THE NON-DESTRUCTIVE ANALYSIS OF NUCLEAR MATERIALS.
The authors give a brief description o f some techniques and instruments designed for non-destructive analysis o f special nuclear materials. The focus o f attention is on methods of determining the concentration o f nuclear materials and on the instrumentation involved, e .g . the beta reflection technique and beta- reflectometer, the X-ray fluorescence method with beta particle excitation, and also the requisite gamma spectrometers. Two improved versions of portable neutron coincidence counting instruments for measuring plutonium are described, and also the performance characteristics o f mini-preamplifiers for CdTe semiconductor detectors.
О НЕКОТОРЫ Х М ЕТОДАХ И П РИ БО РА Х , РАЗРАБОТАННЫ Х В БОЛГАРИИ,ДЛЯ Н ЕДЕСТРУКТИВНОГО АНАЛИЗА ЯДЕРНЫ Х М АТЕРИ АЛО В.
Д ается краткое описание нескольких методик и приборов, предназначенны х для н ед е структивного анализа специальных ядерны х м атериалов. О сновное внимание уделя ется м етодам для определения концентрации ядерны х м атериалов и соответствующ им аппаратурам: бета-отр аж ател ьн ом у м етоду и бета -р еф л ек том етр у и рентгеноф луоресцентном у м етоду при возбуж дении бета-ч асти ц ам и и соответствующ им гам м а -сп ек тр о м етр а м . Описываются два усоверш енствования портативной нейтронно-коинцидентной аппаратуры для и зм ер е ния плутония, а также некоторы е характеристики миниатюрных предусилителей для полупроводниковых детек торов из C dT e.
1 . ВВЕДЕНИЕ
В последние годы усиленно и успешно разрабатываются методы и приборы для недеструктивного анализа ядерных материалов. Это связано с быстрым развитием ядерной промышленности, а также с необходимостью осуществления гарантий.
Для развивающихся стран недеструктивные аналитические методы особенно привлекательны и з -з а своей простоты и малой стоимости.
Настоящий доклад суммирует вкратце некоторые из результатов исследовательской деятельности, проводимой в этом направлении в институте ядерных исследований и ядерной энергетики Академии наук Народной Республики Болгарии (А Н Н РБ).
347

348 Б А Ч В А Р О В и д р .
Р и с .1 . С хем атическое изображ ение расположения источника ( 1 ) , образца (2) , счетчиков (3) и поглотителя (4) .
2 . МЕТОДЫ И ПРИБОРЫ ДЛЯ ИЗМЕРЕНИЯ КОНЦЕНТРАЦИИ СПЕЦИАЛЬНЫХ ЯДЕРНЫХ МАТЕРИАЛОВ
Концентрация специальных ядерных материалов — один из основных параметров их уч ета . Известные методы пассивных измерений сп ециальных ядерных материалов (особенно для урана) не дают достаточно информации о концентрации элемента в измеряемых образцах. Скорее они являются методами определения изотопного состава.
В институте ядерных исследований и ядерной энергетики АН НРБ было разработано в течение последних лет несколько методик недеструк тивного определения концентрации специальных ядерных материалов.
2 .1 Бета-отражательный метод и аппаратура
Как и звестн о , бета-отражательный метод определения концентрации основан на зависимости между плотностью потока обратно рассеянных (отраженных) бета-частиц и средним атомным номером рассеивающего вещ ества [1,2] . Он особенно подходит для определения концентрации тяжелых элементов или их соединений в см еси с легкими элементами или их соединениями.
Была исследована центральная геометрия взаимного расположения системы: радиоактивный источник — измеряемая проба — детек тор (р и с. 1).В качестве источника использовался 90Sr —90Y , а в качестве детектора — счетчик Гейгера-М юллера типа С Б Т -10 . В результате этих исследований была определена оптимальная геометрия, при которой достигается наилучшая чувствительность. Это было использовано для конструирования компактного портативного прибора с возможностью питания как от сети переменным током , так и от аккумуляторной батареи (р и с .2 ).

Испытания прибора и результаты его использования на практике показали:
— возможность его успешного применения для определения концентраций урана, плутония или тория или их суммарной концентрации в порошкообразных материалах, таблетках и растворах;
— минимальное количество измеряемого материала - порядка нескольких граммов;
— метод достаточно чувствителен и при высоких концентрациях, характерных для ядерных материалов;
— при наличии подходящих эталонов достижимая воспроизводимость

350 Б А Ч В А Р О В и д р .
Т А Б Л И Ц А I . Р Е З У Л Ь Т А Т Ы О Т Н О С И Т Е Л Ь Н О Г О И З М Е Р Е Н И Я Ч И С Т Ы Х П Р О Б U 0 2 и U 30 8 С К О Н Ц Е Н Т Р А Ц И Я М И У Р А Н А , С О О Т В Е Т С Т В Е Н Н О 8 8 , 1 5 % И 8 4 , 8 0 %
В рем я изм ерения для накопления 1 0 6 регистрированны х импульсов
и3о6
tj(ceK)
ио2
%(сек)t l / t 2
С реднеариф м етическаявеличина
357,78 345,7 1 ,03495
С реднеквадратичноеотклонение
1,47 1,60 0,00073
О тносительное ср ед н е квадратичное отклонение (%)
0,41 0 ,46 0 ,07
и т о ч н о с т ь и з м е р е н и я к о н ц е н т р а ц и и б ы л и в п р е д е л а х 0 , 1 - 0 ,3% з а в р е м я и з м е р е н и я о т 1 д о 5 м и н у т .
С л е д у е т о б р а т и т ь в н и м а н и е н а с л е д у ю щ и е н е д о с т а т к и б е т а - о т р а ж а т е л ь н о г о м е т о д а :
1 . О н н е д о с т а т о ч н о с е л е к т и в е н , т . е . н е м о ж е т р а з л и ч а т ь э л е м е н т ы с б л и з к и м и а т о м н ы м и н о м е р а м и ; н а п р а к т и к е п р и а н а л и з е я д е р н ы х м а т е р и а л о в э т о т н е д о с т а т о к н е т а к с у щ е с т в е н е н , т а к к а к о б ы ч н о п а р а л л е л ь н о п р о в о д я т с я и г а м м а - с п е к т р о м е т р и ч е с к и е и з м е р е н и я д л я о п р е д е л е н и я и з о т о п н о г о о б о г а щ е н и я , к о т о р ы е у с т р а н я ю т э т у н е о п р е д е л е н н о с т ь ;
2 . П р и и з м е р е н и и п о р о ш к о о б р а з н ы х п р о б р а з м е р з е р е н н е д о л ж е н п р е в ы ш а т ь 1 0 0 ц ; с л а б у ю з а в и с и м о с т ь м е ж д у п л о т н о с т ь ю п о т о к а о т р а ж е н н ы х б е т а - ч а с т и ц и к р у п н о с т ь ю з е р е н п р о б ы м о ж н о о п р е д е л и т ь , е с л и р а с п о л а г а т ь п о д х о д я щ и м и э т а л о н н ы м и п р о б а м и ;
3 . С ч е т н а я х а р а к т е р и с т и к а с ч е т ч и к о в Г е й г е р а - М ю л л е р а м е н я е т с я п р и т е м п е р а т у р н ы х и з м е н е н и я х , а т а к ж е с т е ч е н и е м в р е м е н и п р и д л и т е л ь н о й р а б о т е , ч т о о с о б е н н о з а м е т н о в п е р в ы е 3 0 - 4 0 м и н у т п о с л е в к л ю ч е н и я п р и б о р а : , э т о , о д н а к о , н е о т р а ж а е т с я н а т о ч н о с т и и з м е р е н и я , к о г д а о н о п р о в о д и т с я о т н о с и т е л ь н ы м с п о с о б о м , т . е . к о г д а с к о р о с т ь с ч е т а и з м е р я е м о й п р о б ы о т н о с и т с я к с к о р о с т и с ч е т а э т а л о н н о й п р о б ы .
И з п р и в е д е н н ы х в т а б л . 1 р е з у л ь т а т о в в и д н о , ч т о д л я и н д и в и д у а л ь н ы х п о с л е д о в а т е л ь н ы х и з м е р е н и й о т н о с и т е л ь н ы е с р е д н е к в а д р а т и ч н ы е о т к л о н е н и я в р е м е н с о о т в е т с т в е н н о р а в н ы 0 , 4 1 % и 0 , 4 6 % , а о т н о с и т е л ь н о е с р е д н е к в а д р а т и ч н о е о т к л о н е н и е о т н о ш е н и й с о о т в е т с т в у ю щ и х в р е м е н р а в н о т о л ь к о 0 , 0 7 % . И з э т о г о м о ж н о с д е л а т ь в ы в о д , ч т о д л я д о с т и ж е н и я б о л ь ш е й т о ч н о с т и п р и о п р е д е л е н и и к о н ц е н т р а ц и и н е о б х о д и м о р е з у л ь т а т к а ж д о г о и н д и в и д у а л ь н о г о и з м е р е н и я п р о б ы о т н о с и т ь к с о о т в е т с т в у ю щ е м у р е з у л ь т а т у и з м е р е н и я э т а л о н а . Э т о о с о б е н н о в а ж н о п р и р а б о т е в н а ч а л ь н о м и н т е р в а л е в р е м е н и , п о к а п р и б о р е щ е т е м п е р а т у р н о н е с т а б и л и з и р о в а л с я .
2 . 2 . Р а д и о и з о т о п н ы й р е н т г е н о ф л у о р е с ц е н т н ы й м е т о д а н а л и з а
Д р у г и м м е т о д о м , к о т о р ы й у с п е ш н о р а з р а б а т ы в а е т с я д л я и з м е р е н и я к о н ц е н т р а ц и и с п е ц и а л ь н ы х я д е р н ы х м а т е р и а л о в , я в л я е т с я р а д и о и з о т о п -

I A E A - S M - 2 0 1 /9 2 3 5 1
Р и с .З . С пектр бета -в озбуж ден н ого излучения U3 Oß .
н ы й р е н т г е н о ф л у о р е с ц е н т н ы й м е т о д . И н ф о р м а ц и я , п о л у ч е н н а я э т и м м е т о д о м , я в л я е т с я б о л е е с п е ц и ф и ч н о й п о с р а в н е н и ю с п о л у ч а е м о й б е т а - о т р а ж а т е л ь н ы м м е т о д о м .
Р е н т г е н о ф л у о р е с ц е н т н ы й м е т о д и с п о л ь з у е т х а р а к т е р и с т и ч е с к и е р е н т г е н о в с к и е л и н и и э л е м е н т о в , в о з б у ж д е н н ы е п р и п о м о щ и в н е ш н е г о р а д и о а к т и в н о г о и с т о ч н и к а . К о н ц е н т р а ц и я о п р е д е л я е м о г о э л е м е н т а н а х о д и т с я о т н о с и т е л ь н ы м с п о с о б о м — н а о с н о в а н и и з а в и с и м о с т и и н т е н с и в н о с т и х а р а к т е р и с т и ч е с к о й л и н и и о т к о н ц е н т р а ц и и о п р е д е л я е м о г о э л е м е н т а в э т а л о н н ы х о б р а з ц а х .
И с с л е д о в а л а с ь ц е л е с о о б р а з н о с т ь в о з б у ж д е н и я р е н т г е н о в с к и х л и н и й у р а н а г а м м а - и б е т а - и с т о ч н и к а м и .
В н а ч а л е д л я в о з б у ж д е н и я х а р а к т е р и с т и ч е с к и х К - л и н и й у р а н а б ы л и с п о л ь з о в а н г а м м а - и с т о ч н и к 57С о ( 3 ] .
Н а р я д у с о п р е д е л е н и е м к о н ц е н т р а ц и и о п р е д е л я л о с ь и о б о г а щ е н и е у р а н а п о и н т е н с и в н о с т и г а м м а - л и н и и у р а н а - 2 3 5 с э н е р г и е й 1 8 5 , 7 к э В и з т о г о ж е с п е к т р а .
Д л я р е г и с т р и р о в а н и я р е н т г е н о в с к о г о и г а м м а - с п е к т р о в и с п о л ь з о в а л с я п о л у п р о в о д н и к о в ы й С е ( Ы ) - д е т е к т о р о б ъ е м н о г о т и п а ( 1 0 с м 3 ) с р а з р е ш е н и е м 2 к э В н а л и н и ю с э н е р г и е й 1 2 2 к э В этС о и м н о г о к а н а л ь н ы й а н а л и з а т о р .
Р е з у л ь т а т ы п о к а з а л и , ч т о п р и и с п о л ь з о в а н и и г а м м а - и с т о ч н и к а в ы с о к а я ч у в с т в и т е л ь н о с т ь м е т о д а д о с т и г а е т с я т о л ь к о п р и н е б о л ь ш и х к о н ц е н т р а ц и я х . П р и б о л ь ш и х к о н ц е н т р а ц и я х ( в ы ш е 4 0 % ) ч у в с т в и т е л ь н о с т ь м е т о д а п о с т е п е н н о у б ы в а е т .
В п о с л е д с т в и и и с с л е д о в а л а с ь в о з м о ж н о с т ь и с п о л ь з о в а н и я б е т а - и с т о ч н и к а д л я в о з б у ж д е н и я К - л и н и й у р а н а . П р и м е н я л с я 90S r - 90Y а к т и в н о с т ь ю п о р я д к а 0 , 2 м К и . И з м е р е н н ы й с п е к т р в о з б у ж д е н н о г о и з л у ч е н и я о т о б р а з ц а Ц Ц ( ~ 1 г ) п р е д с т а в л е н н а р и с . З .
Р е з у л ь т а т ы п о к а з ы в а ю т , ч т о к о н т р а с т н о с т ь п р и б е т а - в о з б у ж д е н и и м е н ь ш е , ч е м в с л у ч а е г а м м а - в о з б у ж д е н и я . П р и б е т а - в о з б у ж д е н и и , о д н а к о , з а в и с и м о с т ь с к о р о с т и с ч е т а о т к о н ц е н т р а ц и и б о л е е л и н е й н а в ш и р о к о м и н т е р в а л е к о н ц е н т р а ц и й .

352 Б А Ч В А Р О В и д р .
Р и с .4 . Зависим ости интенсивности рентгеновских Кр-лучей урана от концентрации образца при возбуж дении ß - источника(х) и 7 - источника { • ) .
Д л я с р а в н е н и я н а р и с . 4 п о к а з а н а з а в и с и м о с т ь и н т е н с и в н о с т и- л и н и й ( I KJ о т к о н ц е н т р а ц и и у р а н а в о б р а з ц а х в д в у х с л у ч а я х ;
2 ß57а ) п р и в о з б у ж д е н и и г а м м а - и с т о ч н и к о м С о ;
б ) п р и в о з б у ж д е н и и б е т а - и с т о ч н и к о м 90S r - eoY .К а к в и д н о и з р и с у н к а , п р и г а м м а - в о з б у ж д е н и и д л я н и з к и х к о н ц е н т
р а ц и й м е т о д б о л е е ч у в с т в и т е л е н . В ы ч и с л е н и я п о к а з ы в а ю т , ч т о ч у в с т в и т е л ь н о с т ь в э т о й о б л а с т и к о н ц е н т р а ц и и п о л у ч а е т с я п о р я д к а 1 % и з м е н е н и я с к о р о с т и с ч е т а н а 1% и з м е н е н и я к о н ц е н т р а ц и и ( 1 % / % ) . П р и в ы с о к и х к о н ц е н т р а ц и я х ч у в с т в и т е л ь н о с т ь п о с т е п е н н о у м е н ь ш а е т с я и с т а н о в и т с я п о р я д к а 0 , 2 % / % д л я о б л а с т и к о н ц е н т р а ц и й 8 5 % .
П р и в о з б у ж д е н и и б е т а - и с т о ч н и к о м у д о в л е т в о р и т е л ь н а я ч у в с т в и т е л ь н о с т ь м е т о д а с о х р а н я е т с я и п р и в ы с о к и х к о н ц е н т р а ц и я х . Э т о о б у с л а в л и в а е т с я о т с у т с т в и е м с и л ь н о г о п о г л о щ е н и я п е р в и ч н о г о и з л у ч е н и я в у р а н е
П р е д с т а в л я е т и н т е р е с и с п о л ь з о в а т ь к о м б и н и р о в а н н ы й б е т а - г а м м а - и с т о ч н и к , е с л и н е о б х о д и м о и м е т ь л и н е й н о с т ь г р а ф и к а д л я ш и р о к о г о д и а п а з о н а к о н ц е н т р а ц и й .
Т а к и м о б р а з о м , р е з у л ь т а т ы п о к а з а л и п р е и м у щ е с т в а б е т а - в о з б у ж д е н и я д л я а н а л и з а т а к и х м а т е р и а л о в , к а к U 0 2 , U 30 8 и д р у г и х п о д о б н ы х .
Р а з р а б о т а н н ы й м е т о д и м е е т с л е д у ю щ и е в а ж н ы е п о л о ж и т е л ь н ы е о с о б е н н о с т и :
1 . В о з м о ж н о с т ь и с п о л ь з о в а н и я т о й ж е с а м о й г а м м а - с п е к т р о м е т р и ч е с к о й а п п а р а т у р ы , к о т о р а я п р и м е н я е т с я д л я о п р е д е л е н и я и з о т о п н о г о с о с т а в а с п е ц и а л ь н ы х я д е р н ы х м а т е р и а л о в :
а ) G e г а м м а - с п е к т р о м е т р а с в ы с о к о й р а з р е ш а ю щ е й с п о с о б н о с т ь ю , к о г д а н у ж н о и з м е р я т ь о б р а з ц ы , с о д е р ж а щ и е б о л е е о д н о г о т я ж е л о г о э л е м е н т а ;
б ) с ц и н т и л л я ц и о н н о г о с п е к т р о м е т р а д л я и з м е р е н и я о б р а з ц о в с о д н и м т я ж е л ы м э л е м е н т о м .

I A E A -S M - 2 0 1 / 92 3 53
В а ж н о о т м е т и т ь , ч т о в о б о и х в а р и а н т а х н е о б х о д и м а я а п п а р а т у р а я в л я е т с я п о р т а т и в н о й и А г е н т с т в о у ж е и с п о л ь з у е т е е д л я д р у г и х и з м е р е н и й .
2 . Д о с т и ж и м а я в о с п р о и з в о д и м о с т ь м е т о д а - п о р я д к а 0 , 1 % . Т а к к а к э т о т м е т о д п о с у щ е с т в у а к т и в н ы й , э т у в о с п р о и з в о д и м о с т ь м о ж н о п р и п о д х о д я щ е м и с т о ч н и к е д о с т и ч ь з а в р е м я и з м е р е н и я п о р я д к а н е с к о л ь к и х м и н у т .
3 . Ч у в с т в и т е л ь н о с т ь м е т о д а у д о в л е т в о р и т е л ь н а и д л я и н т е р в а л а в ы с о к и х к о н ц е н т р а ц и й у р а н а ( н а п р и м е р , в и н т е р в а л е к о н ц е н т р а ц и й 8 4 - 8 8 % о н а б о л е е 0 , 5 % и з м е н е н и я с к о р о с т и с ч е т а н а 1% и з м е н е н и я к о н ц е н т р а ц и и ) .
4 . М е т о д о ч е н ь п р о с т и д о с т у п е н . И з м е р е н и я о т н о с и т е л ь н ы . Н е о б х о д и м о и м е т ь т о л ь к о н е с к о л ь к о с т а н д а р т н ы х п р о б д л я к а л и б р о в к и а п п а р а т у р ы .
Г л а в н ы й н е д о с т а т о к м е т о д а — э т о м а л а я п р о н и ц а е м о с т ь в о з б у ж д а ю щ и х б е т а - ч а с т и ц . П р е д с т о и т и с с л е д о в а т ь з а в и с и м о с т ь т о ч н о с т и м е т о д а о т г р а н у л о м е т р и ч е с к и х х а р а к т е р и с т и к и с с л е д у е м ы х о б р а з ц о в и о т и х м а т р и ч н о г о с о с т а в а .
У к а з а н н ы е в ы ш е п р е и м у щ е с т в а м е т о д а д е л а ю т е г о о с о б е н н о п о д х о д я щ и м д л я и с п о л ь з о в а н и я п р и и з м е р е н и и к о н ц е н т р а ц и и с п е ц и а л ь н ы х я д е р н ы х м а т е р и а л о в и н с п е к т о р а м и А г е н т с т в а .
3 . Н Е Й Т Р О Н Н Ы Е И З М Е Р Е Н И Я И П Р И Б О Р Ы
К а к и з в е с т н о , в е р о я т н о с т ь с п о н т а н н ы х д е л е н и й я д е р ч е т н ы х п л у т о н и е в ы х и з о т о п о в ( 2 3 8 , 2 4 0 , 2 4 2 ) д о в о л ь н о в ы с о к а я . П р и э т о м о н и и з л у ч а ю т о к о л о т р е х б ы с т р ы х н е й т р о н о в и с е м ь в ы с о к о э н е р г е т и ч е с к и х г а м м а - к в а н т о в . Э т о п о з в о л я е т п о и з м е р е н и я м с к о р о с т и с о в п а д е н и й н е й т р о н о в и л и н е й т р о н о в и в ы с о к о э н е р г е т и ч е с к и х г а м м а - л у ч е й о п р е д е л я т ь к о л и ч е с т в а э т и х п л у т о н и е в ы х и з о т о п о в в и з м е р я е м ы х о б р а з ц а х , с о д е р ж а щ и х п л у т о н и й . Д е т е к т и р о в а н и е и и з м е р е н и е с к о р о с т и с ч е т а н е й т р о н о в и с о в п а д е н и й н е й т р о н о в , и з л у ч а е м ы х я д е р н ы м и м а т е р и а л а м и , к а к м е р а и х к о л и ч е с т в а п р и в л е к а т е л ь н о и з - з а и х б о л ь ш е й ( п о с р а в н е н и ю с г а м м а - л у ч а м и ) п р о н и ц а е м о с т и ч е р е з э т и м а т е р и а л ы .
С у щ е с т в у ю т , в о с н о в н о м , д в а т и п а п р и б о р о в д л я и з м е р е н и я с к о р о с т и с п о н т а н н ы х д е л е н и й :
В п е р в о м т и п е р е г и с т р и р у ю т с я т е р м а л и з о в а н н ы е з а м е д л и т е л е м н е й т р о н ы д е л е н и я , в ы л е т а ю щ и е и з о б р а з ц а , с и с п о л ь з о в а н и е м г а з о н а п о л н е н н ы х с ч е т ч и к о в — B F 3 и л и 3Н е [ 4 ] .
В т о р о й т и п с в я з а н с п р я м ы м д е т е к т и р о в а н и е м н е й т р о н о в , а и н о г д а и г а м м а - л у ч е й д е л е н и я [5 ] . Т а к к а к п е р в ы й т и п д е т е к т о р о в б о л е е п р о с т о й и п о д х о д я щ и й д л я с о з д а н и я н е о б х о д и м о й г е о м е т р и и и з м е р е н и я , о н и б о л е е ш и р о к о и с п о л ь з у ю т с я . О д н а к о и х п р и м е н е н и е д л я ц е л е й и н с п е к ц и о н н ы х и з м е р е н и й з а т р у д н я е т с я с л е д у ю щ и м и д в у м я ф а к т о р а м и :
а ) З а м е д л и т е л и , о б ы ч н о и с п о л ь з у е м ы е д л я т е р м а л и з а ц и и и э ф ф е к т и в н о й р е г и с т р а ц и и н е й т р о н о в , д о в о л ь н о о б ъ е м и с т ы и т я ж е л ы , ч т о д е л а е т в с ю а п п а р а т у р у н е п о р т а т и в н о й . Д л я п р е о д о л е н и я э т о й т р у д н о с т и н а м и б ы л р а з р а б о т а н с к л а д ы в а ю щ и й с я к о н т е й н е р и з л е г к о й п л а с т м а с с ы , к о т о р ы й н а м е с т е и з м е р е н и я р а з в о р а ч и в а е т с я и з а п о л н я е т с я о б ы к н о в е н н о й в о д о й , и с п о л ь з у е м о й в к а ч е с т в е з а м е д л и т е л я . В о в р е м я т р а н с п о р т и -

354 Б А Ч В А Р О В и д р .
Р и с .5 . CdTe детекторы и предусилители.
Р и с .6 . Г а м м а -с п е к т р 1P1Hf . Н апр яж ен ие - 7 0 0 В . С к о р о ст ь с ч е т а - 50 000 о т с ч / с . Э н е р г е т и ч еск и е разр еш ен и я : 57 к эВ — 6,4 к э В , 133 к эВ — 8 ,0 к э В , 346 к эВ - 9 ,2 к эВ .

IA E A - S M - 2 0 1 /9 2 355
р о в к и в о д а в ы л и в а е т с я и к о н т е й н е р с к л а д ы в а е т с я , ч т о с у щ е с т в е н н о у м е н ь ш а е т е г о о б ъ е м и в е с ;
б ) В т о р а я т р у д н о с т ь с в я з а н а с о с р а в н и т е л ь н о д о л г и м в р е м е н е м т е р м а л и з а ц и и н е й т р о н о в ( п о р я д к а 1 0 0 м к с ) . Э т о с и л ь н о у в е л и ч и в а е т м е р т в о е в р е м я а п п а р а т у р ы и с о з д а е т т р у д н о с т и п р и б о л ь ш и х с к о р о с т я х с ч е т а . Д л я у м е н ь ш е н и я в л и я н и я э т о г о ф а к т о р а б ы л о п р е д л о ж е н о [6 ] и с п о л ь з о в а т ь с м е щ е н н ы е р е г и с т р ы . Э т а и д е я б ы л а и с п о л ь з о в а н а в р а з р а б о т а н н о й н а м и э л е к т р о н н о й а п п а р а т у р е , в р е з у л ь т а т е ч е г о б ы л о д о с т и г н у т о п я т и к р а т н о е у м е н ь ш е н и е е е м е р т в о г о в р е м е н и [7 ] .
В д а л ь н е й ш е м б ы л и с д е л а н ы р а с ч е т ы и н е к о т о р ы е п р е д в а р и т е л ь н ы е э к с п е р и м е н т ы д л я в ы я с н е н и я в о з м о ж н о с т и и с п о л ь з о в а н и я м е т о д а н е й т р о н н ы х с о в п а д е н и й д л я и з м е р е н и я п л у т о н и я , н а к о п л е н н о г о в т е п л о в ы д е л я ю щ и х э л е м е н т а х в о д о - в о д я н ы х э н е р г е т и ч е с к и х р е а к т о р о в [8] .О н и п о к а з а л и , ч т о п р и в ы г о р а н и я х б о л ь ш е 10 0 0 0 М В т • с у т / т у р а н а к о л и ч е с т в о 240Р и , н а к о п л е н н о г о в т е п л о в ы д е л я ю щ и х с б о р к а х , м о ж н о и з м е р я т ь с х о р о ш е й т о ч н о с т ь ю . Д л я э т о г о , р а з у м е е т с я , н у ж н о и м е т ь с о о т в е т с т в у ю щ у ю з а щ и т у д л я н е й т р о н н ы х с ч е т ч и к о в о т г а м м а - л у ч е й п р о д у к т о в д е л е н и я , н а к о п л е н н ы х в т в э л а х .
4 . М И Н И А Т Ю Р Н Ы Е С П Е К Т Р О М Е Т Р И Ч Е С К И Е П Р Е Д У С И Л И Т Е Л И Д Л Я П О Л У П Р О В О Д Н И К О В Ы Х Д Е Т Е К Т О Р О В И З C d T e
Б ы л и р а з р а б о т а н ы и и з г о т о в л е н ы д л я М А Г А Т Э д в а а н а л о г и ч н ы х т и п а м и н и а т ю р н ы х с п е к т р о м е т р и ч е с к и х п р е д у с и л и т е л е й , с о о т в е т с т в е н н о д л я д в у х т и п о в д е т е к т о р о в и з C d T e . Д е т е к т о р ы и п р е д у с и л и т е л и п о к а з а н ы н а р и с . 5 . О д и н и з н и х п р е д н а з н а ч а л с я д л я п о м е щ е н и я в м е с т е с д е т е к т о р а м и м е ж д у р я д а м и т е п л о в ы д е л я ю щ и х э л е м е н т о в с в е ж и х ( н е о б - л у ч е н н ы х ) с б о р о к и и з м е р е н и я о б о г а щ е н и я у р а н а .
Р а з р а б о т а н н ы е п р е д у с и л и т е л и в 1 0 - 1 0 0 р а з м е н ь ш е п о о б ъ е м у с т а н д а р т н ы х п р е д у с и л и т е л е й . В т о ж е в р е м я о н и о б е с п е ч и в а ю т г о р а з д о л у ч ш е э н е р г е т и ч е с к о е р а з р е ш е н и е д л я в с е г о у с и л и т е л ь н о г о и с п е к т р о м е т р и ч е с к о г о т р а к т а , о с о б е н н о п р и б о л ь ш и х с к о р о с т я х с ч е т а . С п е к т р ы , п о л у ч е н н ы е д е т е к т о р а м и и з C d T e ( р а з р а б о т а н н ы м и в С Ш А ) и э т и м и п р е д у с и л и т е л я м и , п о к а з а н ы н а р и с . 6 . К а к в и д н о и з с п е к т р о в , э т и д е т е к т о р ы и п р е д у с и л и т е л и я в л я ю т с я в а ж н ы м ш а г о м н а п у т и м и н и а т ю р и з а ц и и а п п а р а т у р ы , ч т о о ч е н ь в а ж н о д л я о с у щ е с т в л е н и я н е з а в и с и м ы х и н с п е к ц и о н н ы х и з м е р е н и й . Д л я э ф ф е к т и в н о г о и с п о л ь з о в а н и я э т о й с и с т е м ы ж е л а т е л ь н о у в е л и ч и т ь н а п о р я д о к а к т и в н ы й о б ъ е м д е т е к т о р а и с у щ е с т в е н н о у л у ч ш и т ь е г о р а з д е л и т е л ь н у ю с п о с о б н о с т ь , ч т о н е п о в л и я е т н а п о р т а т и в н о с т ь а п п а р а т у р ы .
Л И Т Е Р А Т У Р А
11] ZUMW ALT, L .R . , US АЕС-R ep . N o . A E C U -567 (1949).[2] M Ü LLER , R .H . , A n al. C h em .2 9 (1957) 969.[3] В ACH VAROV, N i , DRAGNEV, T . , GEORGIEV, S . , KARAMANOVA, J . , RUSKOV, T . ,
TOM OV, T . , R a d ioch em . R a d ioan a l. L e t t . (14)1, 1 -8 (1973).(4 | OMOHUNDRO, R .J . , M ARCHETI, F . A . , R ep . NRL 2005 (1969).15] GOZANI, T . , CO STELLO , D .C . , T r a n s . A m . N u c l. S o c . 13 2(1970) 746.16] BÖ H N EL, K . , P r o c . C onf. N u c lea r So lu tion to W orld E n erg y P r o b le m s , T r a n s . A m .
N u cl. S o c . 15 2(1972) 671.

356 Б А Ч В А Р О В и д р .
[V] I A E A R e s e a r c h C o n tra c t N o . 9 8 9 / R B .[8] Х РИ С Т О В , В . , T РИФОНОВ , A . , 11 Развитие и применение нейтрон но-коинцидентн ого
м етода для измерения P u , накопленного в тепловыделяющих эл ем ен тах водо-водяны х эн ергети ч еск и х реакторов" , Труды сим позиум а "Опыт эксплуатации и использования исследовательских реакторов" , 30 . I X . -4 . X . 1974 г . , г .П р е д е а л , Румыния .
D I S C U S S I O N
B .J . McDONALD: Could you explain what you m eant when you said you u sed a m ixed fast and slow system to reduce the reactor therm alization tim e?
T.N . DRAGNEV: I think your question is based on a m isunderstanding. T here was no "m ixed fast and slow" sy stem . H ow ever, five sh ifted r e g is te r s w ere introduced into the delay lin e for determ ination of the accidental counts. T h is red u ces the "dead" tim e of the f ir s t step (reg ister ) in the delay line and of the instrum ent as a whole by a factor of five . The idea is s im ila r to that of Böhnel.
P . d'OULTREMONT: A ssum ing that the G eiger counters in the beta re flec to m eter m ust be to som e extent se n sitiv e to gam m a ra y s , what are the lim ita tion s on the in stru m en t's ca p a b ilitie s , i .e . sen sitiv ity and accuracy, resu ltin g from the gam m a activ ity of the sam p le, particu larly in the ca se of Pu?
N.S. BACHVAROV: The G eiger counters in the beta re flec to m eter are sligh tly se n sitiv e to gam m a ra y s . So far we have not ob served any effect by gam m a activ ity from the fre sh uranium sam p les on the r e su lts of our concentration m easu rem en ts. We do not have any quantitative data for Pu m easu rem en ts.
P . DUMESNIL: R eferrin g to the CdTe d etec to rs, what i s th e ir u sefu l volum e, and what sort of reso lu tion do you get, for in stance, with 137C s?
T .N . DRAGNEV: The volum e of the d etectors used was in the range of 10 m m 3. In th is in vestigation we w ere concerned m ainly with the perform ance of the p ream p lifiers for the CdTe d etec tors. The d etectors th em se lv es w ere m ade by Hughes R esea rch L ab oratories and TYCO L aboratories in the United S tates of A m erica .
A s regard s reso lu tion , sin ce the volum e of the d etec tors was rather sm a ll, the efficien cy attained in detecting 137Cs gam m a rays — 662 keV — was not very high. We do not b elieve that d etectors a s sm a ll as th is are su itab le for sp ec tro m etr ic an a lyses of such h igh-energy gam m a ra y s . But for the 482-keV gam m a rays of 181Hf, the reso lu tion was 14 keV FWHM.
M. CUYPERS: A re there any r e su lts availab le on the sm a H -size CdTe d etectors as applied to fuel a sse m b lie s? A re th ese d etectors used in a sp ec tro m etr ic mode or just with a low er d iscr im in ator m ode?
T .N . DRAGNEV: At p resen t there are no re su lts for fuel a sse m b lie s with the thin d etec to r /p rea m p lifier sy stem . The reason is that both the detector and the p ream p lifier are stiH slightly th icker than the gap between the row s of rod s, 3.7 m m and 3.4 m m , re sp ec tiv e ly . T his sy stem has been used and we have som e data on a fuel a ssem b ly m ock-up in which the gap betw een the row s was sligh ly w ider. The r e su lts w ere obtained at the

I A E A - S M - 2 0 1 / 92 357
A gency with sp ec tro m etr ic m easu rem en ts of the 186-keV gam m a rays of 235U. The re su lts se em p rom isin g . Two to five m inutes' m easu rem ent tim e was n ece ssa r y in order to determ ine the enrichm ent of the m easu red rods with an accuracy of ± 5% re la tiv e at one sigm a le v e l. T here is no m ajor tech n ica l d ifficu lty , in p rin cip le , in preparing eith er a CdTe detector or p ream p lifier with a th ick n ess of 3 m m , for exam p le, which could be in ser ted betw een row s of BWR fuel a sse m b lie s .


Session 9 (Part II)
MEASUREMENTS IN REPROCESSING FACILITIES

Chairman: A. von BAECKMANN (IAEA)
Papers IAEA-SM -201/10, 21, 39, 44 and 100 were presented byC. BEETS as Rapporteur
Papers IAEA-SM -201/2, 9, 53, 87 and 108 were presented byL. KOCH as Rapporteur

EURATOM EXPERIENCE OF VERIFICATION METHODS IN REPROCESSING FACILITIES
IA EA -SM -201/70
H.-J. ARENZ, E. VAN DER STUL Directorate of Euratom Safeguards,Luxembourg
Abstract
EURATOM EXPERIENCE OF VERIFICATION METHODS IN REPROCESSING FACILITIES.The start o f safeguards inspection o f reprocessing plant is briefly review ed and the changeover from
interm ittent inspection to continuous inspection is outlined. The m ethods, which are subdivided into sa feguards im plem entation before startup, during operation, and after shutdown of the fac ility — are described. The step -by-step procedure o f approval based on the Euratom Treaty guarantees a good know ledge o f both process and facility by the inspectors before startup. The description o f the inspectors' manual stresses the follow ing points: A ccounting procedures used for flow and inventory measurement; verification and independent m easurem ents to be performed by the inspectors; and surveillance measures applied during inspection . The theoretical assumptions for a conceptual inspection plan for a m odel reprocessing plant h ave had to be m odified in the ligh t o f d ifficu lties encountered in actual operating conditions. A w ide range o f exam ples is g iven , discussing inventory-taking with detection o f hidden inventory, input and output measurem ent com paring results of control laboratories with plant results, waste m anagem ent and m easurements with non-destructive d evices and various practical problems encountered during inspection. Surveillance and containm ent measures are also briefly discussed. The necessity o f an independent m aterial balance m ade by the Safeguards Authority is discussed. A ttention is paid to the m aterial balance as a whole and to its com ponents, and the extent to w hich the degree o f independence m ay be improved by surveillance and containm ent measures. The necessity o f further developm ent work in particular for input measurements is pointed out.
1. GENERAL
Euratom began safeguarding rep ro cessin g plant with the startup of the E urochem ic fa c ility in Mol (Belgium ) in 1966. B efore that tim e the storage pond rece iv ed certa in am ounts of irrad ia ted fuel which w ere subm itted to safeguards under an interm ittent in spection schedule. It should be noted that the whole sy stem of safeguards of E urochem ic was developed in c lo se collaboration with the staff of the fa c ility and it should be m entioned that the Euratom Safeguards D irectorate was given valuable help by exp erts from the French A tom ic E nergy C om m ission.
The concept of continuous control adopted as a resu lt of th is collaboration was agreed by a joint working group estab lish ed within the fram ew ork of the A greem ent for C o-operation betw een United States of A m erica and Euratom . (USAEC was the owner of the lea sed m ater ia l r e p r o ce sse d in the beginning.)
In Table I the re p r o ce ss in g fa c il it ie s in sid e the European Community are lis ted .
361

362 ARENZ and VAN DER STUL
TABLE I. REPROCESSING FACILITIES INSIDE THE EUROPEAN COMMUNITY
CapacityPlant Location Fuel t U /year
existing
EUROCHEMICBelgium
LWR-HWR-MGR . 100Mol or or
MTR 1.5
FranceUP 1 , SAP '
Marcoule MGR + MTR experim ental fuelMGR
UP 2 , H A O + U P 2*
La Hague LWR-HWR 800 a
AT 1 La Hague FBC 0.4
FB
Italy
Eurex-1 Saluggia MTR 0.3or or
LWR 25MGR
Itrec Rotondella Th + U 4
UnitedKingdom
Dounreay MTR 0.5or
FB 10
W indscale MGRAGR + LWR + HWR OO о © er
Fed. Rep. of Germany
WAK 1 Karlsruhe LWR + HWR 50
Start-up expected 1976 /77 — capacity for LWR Fuel
k C apacity for oxide fuel
C FB = fuel bundle
2. METHODS OF SAFEGUARDS
2.1. Safeguards b efore startup
The European Com m unity for A tom ic E nergy (Euratom ) recogn ized from the v er y beginning the sp ec ia l status of re p r o ce ss in g fa c il it ie s in the fuel cycle . It is stated c lea r ly in A rtic le 78, second paragraph, of the E uratom Treaty:

1AEA-SM -201/70 363
"The p r o c e s se s to be u sed for ch em ical p ro cess in g of irrad iated m ateria l sh a ll be subject to the approval of the C om m ission to the extent that i s n e c e ssa r y for the achievem ent of the p urposes stated in A rtic le 77';1
T h ese leg a l term s have found th eir p ractica l im plem entation by m eans of an in stru ction by the C om m ission to the Safeguards D irectora te^ 1]
In e s se n c e a s tep -b y -s te p procedure of approval has been developed to enable the In spectors to ach ieve a good knowledge of both p ro ce ss an dfacility .
The f ir s t step c o n s is ts of a declaration by the fa c ility of the plans indicating:
A detailed plan of the layout of the fa c ility A ch em ica l f lo w -sh eetA d escrip tion of instrum entation and m ethods used for m easu rin g the nuclear m ater ia l content in
The incom ing m ateria l The outgoing m ateria lThe m ater ia l tra n sferred from one MBA to another The stored m ateria l
A d escrip tion of the ch em ica l and p h ysica l an a lyses u sed for m ater ia ls accountancy and p r o c e ss -c o n tr o l purposes;A d escrip tion of the tech n ica l book-keeping sy stem (log sh ee ts , etc .) and accountability sy stem from the storage pond to the fina l product storage , including
C h a ra cter istics of the tanks and other equipm ent u sed in inventory takings;Sam ple-taking equipm ent and the m ethods used;Equipment u sed for hom ogenizing so lu tions from which sam p les are to be taken;M easuring d ev ices u sed for density, p ressu r e , volum e and tem perature;Methods of reca lib ration of a ll sign ifican t inventory tanks;A d escrip tion of the w aste m anagem ent sy stem indicating the sam e item s as m entioned above.
A fter any requ ested changes have been m ade in accordance with d is cu ssio n s betw een the in sp ector team s and the fa c ility involved , the C om m ission g iv e s a p artia l approval which is binding to both p a rties , i .e . the C om m ission cannot urge any other changes afterw ards and the fa c ility has to renew its application if (m ajor) changes are envisaged.
The next step is a thorough check on the fa c ility during and after construction . The in sp ecto rs v er ify that construction is in agreem ent with the plans subm itted. The la st step i s to v er ify the functioning and the internal
1 ARTICLE 71.Within the framework o f this Chapter, the Commission shall satisfy itse lf that, in the territories of
M ember States,(a) Ores, source m aterials and sp ecia l fissionable m aterials are not diverted from their intended uses as stated by the users; and(b) The provisions concerning supplies and any specia l undertaking concerning measures o f control entered into by the C om m unity in an agreem ent concluded with a third country or an international organization are observed.

364 ARENZ and VAN DER STIJL
safegu ard s sy stem of the fa c ility during the cold te s t s . C alibration and sam pling m ethods are checked during th is period. It has been found u sefu l to extend th is period to the "warm test" program m e
Only after acceptable r e su lts are obtained does the C om m ission , on the advice of the Safeguards D irectorate , g ive fina l approval to the plant operator. The approval is again binding onboth p arties under the conditions m entioned above.
The m ain advantages of the procedure are as follow s:The In sp ectors acquire a thorough knowledge of the fa c ility before it
sta rts operating and b efore safeguards on the nuclear m ateria l have to be applied. Although gen era lly speaking the re p r o ce ss in g plants have no p ro cess step s involving co m m ercia lly sen sitiv e inform ation , in p ractice the active part of the fa c ility is in a cces ib le to the in sp ecto rs for obvious reason s. H ow ever, as a re su lt of the above-m entioned procedure the in sp ectors need not ob serve a ll p o ssib le in le ts and ou tlets in th is area as they know which product can be expected through ev ery individual p ipeline. M oreover, sin ce they have ob served the calibration of a ll sign ificant v e s s e ls and assu red th e m se lv e s of the proper functioning of the plant equipm ent and in stru - m entation'used to determ ine the am ounts of nuclear m ateria l involved, they can ju stify the u se of th is data to es ta b lish th e ir own m ateria l balance. It w ill be c lea r that th is red u ces con sid erab ly the in sp ection effort needed com pared with a situation in which ev ery pipeline has to be con sid ered as a potential cland estin e in let or outlet. H owever, it should not be overlooked that the situation is m ore com plex in re a lity than p resen ted in the short d escrip tion above [2].
2 .2 . Safeguards during operation
The m ain points of action for safegu ard s co n s is ts , a s in a ll ch em ical industry control, of ver ify in g the incom ing and outgoing m ateria l flow s com bined with the startin g and ending p hysica l inventory.
The MBA p rin cip le was applied from the v ery beginning of safeguards although it w as not ca lled thus. T h is was a lo g ic a l consequence of the way fu e l w as handled. N early a ll fa c il it ie s started as storage fa c il it ie s , i.e . irrad ia ted fu e l e lem en ts w ere stored for longer or sh orter p eriods.
The ta sk s to be perform ed by the in sp ecto rs are la id down in a manual for each fa c ility taking its sp ec ific a sp ec ts into account.
The work can be divided into two m ain parts:A d m in istrative control: The in sp ecto rs check reg u la r ly that a ll data
needed for the m a ter ia l balance and introduced into the plant accountability sy stem is supported by the tech n ica l record system . M oreover, the cons is te n c y of the accountability sy stem with the m onthly returns to the C om m ission accord ing to R egulation No. 8, i s sy stem a tica lly ver ified .
P h y s ica l verification : The in sp ecto rs v er ify a ll m ain m easu rem en ts p erform ed by the fa c ility , i .e . a rr iv a l of irrad ia ted fuel, input and output m easu rem en ts, w aste flow s, p h ysica l inventory takings, calibration of tanks and instru m ents and an a lyses perform ed at the plant laboratory. M oreover, independent m easu rem en ts are perform ed such as sam ple taking follow ed by an a lysis in se le c te d control lab oratories of input and output batches and to the extent n e c e ssa r y during inventory-tak ing. In addition, su rve illan ce and containm ent m ea su res are applied. Sealing is frequently u sed for inventory item s im m ob ilized for long periods.

IA EA -SM -201/70 365
TABLE II. THEORETICAL MATERIAL BALANCE REPORT
Individual transfer Total transfer
ComponentN o. of
transferskg U Or (kg) ° s (kg) g Pu ° R (g) °S (§) kg U g Pu
Input 40 175 1.75 0.88 875 CO CO 4 .4 7 000 35 000
HAW 25 0.5 0.1 0.1 10 2 2 12.5 250
MLW 13 1 0.2 0.2 30 6 6 13 390
Product 513 1 394.9 7 3.5 1 1453 .3 60 30 6 974.5 34 360
Beg. Inventory 30 6 6 300 60 60
End. Inventory 30 6 6 ■ 300 60 60
2.3. Safeguards after shutdown
The C om m ission has been faced with a c lo sin g plant on one occasion , n am ely the E urochem ic fa c ility at Mol. It happens that fa ir ly large am ounts of m ater ia l appear during the w ash-out. As the rin sin g i s s t il l going on no fig u res can be given as yet; F or th is reason it should be noted that the p resen ce of in sp ecto rs w ill be n e c e ssa r y for a long period although the in sp ection effort has been reduced considerably.
The MUF value over the life span of the fa c ility can only be rev iew ed when the rin sin g i s finished.
3. EXPERIENCE
T ab les II and III sum m arize a m odel m ater ia l balance report of a r e p r o ce ss in g cam paign. In the follow ing, p ractica l exp erien ce is com pared with the th eo re tica l assu m p tions u tilized for the variou s m ateria l balance com ponents.
3.1. Inventory taking
The in ventory-tak ing is u su a lly perform ed betw een rep ro cess in g cam paigns, where the U - and P u-containing liq u ors are co llec ted in a sm a ll num ber of tanks. Only a rough rin sin g is m ade.
F igu re 1 shows the weight of * 241 Pu in the sequence of input batches of low irrad ia ted fu e l e lem en ts at the beginning of a cam paign. Although re cy c le d acid containing tr a c e s of Pu was u sed for the d isso lu tion , the higher241Pu p ercen tages for the f ir s t batches could only be explained by a reappearance of Pu from the previous cam paign which has a five tim es higher averaged 241 Pu percentage. It is in terestin g to note that th is Pu reappeared in the "head-end" betw een a recy c led acid tank and the input accountability tank; s im ila r e ffec ts can be expected for the r e s t of the in sta lla tion . To ob serve th e se , one would need to analyse the iso top ic concentrations on the product batches tran sferred to the product storage tanks, which would not be done in norm al plant operation.
I

TABLE III. THEORETICAL ESTIMATION OF ERROR CONNECTED WITH TABLE II
Component n OjR + n 2 OjS o input3 0 -
о HAW = 0 о MLW = 0 о HAW = 0+ MLW = 0
oproduct= 0
о in ven tories = 0
о input = 2 O output = 2 о input i 1 a outpur 1
Input 34 073.6 8 518.4
HAW 2 600MLW 6 552Product 18 900 4 725Inventories 14400
ЕП o?R + n 2q R 7 6 525 .6 42 4 5 2 73 925 6 9 973 .6 67 373.6 57 625.6 6 2 1 2 5 .6 5 0 9 7 0 .4 62 350.6 36 795.4
o MUF, R + S 276.63 206.04 271.89 264.53 259.56 240.05 249.25 225.77 249.70 191.82
°fo o f throughput 0.79 0.59 0.78 0.76 0.74 0.69 0.71 0.65 0.71 0.55
R = random S = system atic i = sequence
36
6
AR
EN
Z and V
AN
DER
STU
L

IA EA -SM -201/70 367
FIG .l. 241 Pu in the sequence o f input batches.
So, a determ ination of the hidden inventory of the previous cam paign having a different iso top ic com position , can only be perform ed on the changes of the m ean iso top ic concentration in the input and output batches for the subsequent cam paign.
Although the change of iso to p ic concentration m ay be sign ifican t, the hidden inventory of a p revious cam paign cannot be estim ated with su fficient accuracy , owing to the fact that a s e r ie s of assum ptions have to be adopted such as the iso top ic com position of the Pu originating from the previous cam paign (the output com position has been adopted arb itrar ily ). The m ateria l b alances with or without hidden inventory are g iven in Table IV.

'TABLE IV. MATERIAL BALANCES
368 ARENZ and VAN DER STUL
Pu b alan ce, no hidden Pu b alance, hiddeninventory taken into account inventory taken into account
8 Putot g 241 Pu 8 Putot g 241 Pu
Beginninginventory 142.3 12.3 142.3 12.3
Hiddeninventory - - 1 660.4 143 .8
Input 51467 .6 1 749.9 5 1 467 .6 1 749.9
Output 35 899.7 1 284.5 35 899.7 1 284.5
Endinginventory 12180 .4 459 .2 12180 .4 459 .2
MUF 3 529.8 10 .5 a 5 1 9 0 .2 185.7
This shows the presence of important quantities of 241 Pu.M oreover, the accuracy o f the 241 Pu determ ination is much lower than the total Pu determ ination.
3.2. Input m easu rem ents
M ass sp ec tro m etr ic m easu rem ents u tiliz in g the iso top ic dilution method and vo lu m etr ic m easu rem en ts are gen era lly applied for input determ inations on so lu tions of d isso lv ed fuel.
A ccu racies reported for input m a ss-sp e c tr o m e tr ic m easu rem ents are m o stly 0.5 - 1% (1.6). A ccording to th is , one has to assu m e that d ifferen ces g rea ter than 1 - 2% are with 95% probability sign ificant (м- te s t for two population m eans; 6^ and 6 | known and unequal; Mj = p2 = 2).
In Table V percentage d ifferen ces for input m easu rem en ts perform ed by safegu ard s lab oratories and rep ro cess in g fa c il it ie s are reported sep arate ly for fa c il it ie s and the recent cam paign. In num erous com p arison s the analytical r e su lts d iffer m ore than one would expect according to the standard deviations stated by the lab ora tories for their method.
One can se e that the m ean d ifferen ces vary from one in sta lla tion or cam paign to another. The sam ple re p resen ta tiv en ess is a m ain problem .On one occasion , ex trem ely high burnup fuel resu lted in se lf-b o ilin g input so lu tions. The rep resen ta tiv en ess of the sam p les at the d isso lv e r stage i s not en sured under th ese conditions and, together with the operator, the input was deduced from a partly decontam inated solution (after the f ir s t extraction). Such p rob lem s m ay occur regu larly in the future, when fast reactor p rogram m es becom e m ore im portant.
In som e c a s e s d ifferen ces could be explained by the p resen ce of so lid s in the sam ple solution. A geing d ifferen ces due to an a lyses at different t im e s in the d ifferent lab ora tories m ust be avoided.
The sy stem a tic negative d ifferen ce for Campaign I of F a c ility A with regard to the p ositive d ifferen ce for Campaigns II and III, which was explained a lso by the fact that d ifferent analytical standards w ere used by the plant laboratory, show the u se fu ln ess of com paring th ese standards.

IA EA -SM -201/70 369
TABLE V. COMPARISON OF ANALYTICAL RESULTS ON INPUT SAMPLES BETWEEN EURATOM AND PLANT OPERATORS „ Euratom - O p erators v ^
0 Euratom
Facility Campaign ■7“ u tot °jo 235 U * Putot % 239 Pu
д% A I - 0.55 ± 1.65 + 1 .0 ± 0.65 - 1 .77 ± 2.11 + 0.07 ± 0.09
о (Euratom) ± 0.5% ± 0.3% ± 1.0% ± 0.3%a (Operator) i 1.0% ± 0.3% i 3.0% ± 0.3%
12 measurements
д% II + 1.07 ± 1.82 + 3.21 ± 2.35 + 1 .45 ± 1.23 + 0.24 ± 0.29
о (Euratom) ± 0.5% ± 0.3% ± 0.5% ± 0.3%о (Operator) i 1.5% ± 0.3% ± 1.5% i 0.3%
9 measurements
д % III + 0.26 ± 0.24 + 0.73 ± 1.27 + 0.89 ± 0.64 + 0 .12 ± 0.19
о (Euratom) ± 0.5% ± 0.3% ± 0.5% ± 0.3%о (Operator) ± 1.5% ± 0.3% ± 1.5% ± 0.3%
3 measurements
д% В I + 0.65 ± 0.93 + 0.68 ± 2.47 - 1 .08 ± 4 .72 - 0.34 ± 0.25
8 measurements
II - 0.06 ± 1.08 - 0 .12 ± 0.16 HEU-Campaign
6 measurements
о (Euratom) ± 0.5% ± 0.3% i 0.5% ± 0.3%о (Operator) i 1.5% i 0.3% ± 1.5% ± 0.3%
The u se of iso to p ic corre la tion techniques for the input determ ination w as ru led out in c a se s where plutonium bearing recy c led acid was used for d isso lu tion . The Pu in recy c led acid som etim es reached 10% of the total Pu m easu red in the input. Another problem w as that Pu so lid s in the recy c led acid w ere d isso lv ed in the d isso lu tion step , so that the recy c led Pu was underestim ated.
One of the fa c il it ie s m odified the "head-end" p ro ce ss in such a way that the Pu b earing recy c led acid w as no longer u sed for the d issolu tion and the input so lu tion w as f ilter ed b efore sam pling. The im provem ent can be seen by com paring d ifferen ces obtained for Pu an a ly ses p erform ed on cam paigns of fuel from the sam e reactor b efore and after p ro ce ss m odification.

370 ARENZ and VAN DER STUL
% d ifferen ces before % d ifferen ces after
+ 2.06 + 3.69+ 2.54 + 2.51+ 11.6 + 0.97+ 3.92 + 1.89- 33.28 a + 1.36+ 3.44 + 1.78- 1 1 .6 9 3 - 0.68“ 0.88 + 0.81
+ 0.73a T h ese r e su lts w ere obtained on diluted and spiked sam p les
analysed on behalf of the fa c ility by the Euratom laboratory.
A s far as the m ethods applied by the Euratom Control L ab oratories are concerned, the an alytica l p rocedu res are d iscu ssed in other papers [ 3, 4].
3.3. Output m easu rem ents
Table VI g iv e s som e r e su lts of output m easu rem en ts on uranium and plutonium products. In E uratom 's exp erien ce no prob lem s occu rred for Pu so lu tions of low concentration.
D ifferen ces found in analysing Pu sam p les of high concentration w ere con sid erab ly reduced, if the sam p les w ere analysed sim u ltan eou sly very soon after sam pling. A lso , f ilter in g of the Pu product solu tions reduced the deviation in the analytical r e su lts , but th is does not so lve the problem of having Pu so lid s in the sam ple. For Pu oxide sam p les sy stem a tic d ifferen ces w ere found when the m oisture take-up had not been m easu red and in particu lar when the sam p les w ere stored for long p eriods before analysing. A lso , the choice of sam ple con ta iners can affect the m oisture take-up. The trend to reduce the sam ple s iz e and quantity u tilized for an a lysis could lead to erron eou s re su lts as the P u 0 2 p a rtic les are often inhom ogeneous on a m ic r o -s c a le . T h erefore , the use of the BNFL m ethod can be advised [ 5].
A s far as uranium output m easu rem en ts are concerned , no m ajor problem s a ro se , as can be seen from Table VI, except in a ca se w here the use of a fa lse standard w as detected afterw ards.
3.4. Solid w aste
At a quantity of about 165 kg Pu, m easured as input during a LEU cam paign, 3.3 kg Pu w as sent to liquid w aste and 4 kg to the so lid w aste.The liquid w aste i s m easu red before d isposal; how ever, it appears that in m any fa c il it ie s the fig u res m entioned for so lid w aste are m ainly es tim a tes derived from h is to r ic a l data estab lish ed from tim e to tim e. On one occasion th is data w as ex te n siv e ly checked by the Safeguards D irectorate in c o llaboration with the E urochem ic Company and the Euratom Joint N uclear R esearch C entre, Ispra, and it was concluded in th e ir report that the m ea su rem ents can be u sed with confidence for accountability and safeguards purposes if the ^ЧРи content obtained i s m ultip lied by the appropriate factor.
Although h igh -reso lu tion gam m a sp ec tro m etr ic m easu rem en ts have proved to be helpfu l in ach ieving an o v era ll plutonium figure, adm in istrative control by both the plant operator and the in sp ecto rs , com bined with tagging

IAEA -SM -201/70 371
TABLE VI. COMPARISON OF ANALYTICAL RESULTS OF OUTPUT SAMPLES BETW EEN EURATOM AND PLANT OPERATORS oj0 = Euratom - O perator ^ qq
Euratom
Facility Campaign 7>u 7» M5u 7» Pu
A 7» A I - 0 .98 ± 1.46 + 0.71 ± 0.82
11 measurements
A 7> II - 0 .55 ± 0.42 0 + 0.16 + 0.25
7 measurements
A7> В I + 0 .08 ± 0.22 - 0.37 ± 1.59 - 2 .34 ± 2.02
10 measurements
A% II + 0.24 ± 0.28 + 0.01 ± 0.17
25 measurements
A 7° C I + 0.03 ± 1.52 + 0.40 ± 0.49
17 measurements
A 7° D I + 0.'57 ± 1.34 - 0 .56 ± 0.50
7 measurements
о (Euratom) ± 0 . 3 7 » ± 0 . 3 7 , * 0.37»о (Operator) ± 0.57» ± 0.57» i 0.57o
and sea lin g techniques (e .g ., a segregation according to orig in and tim e of f illin g the drum s, and an alytica l r e su lts ) , se em to be n e c e ssa r y for obtaining re lia b le data. The tech n ica l d eta ils of th is m easurem ent m ethod are published by Birkhoff et al. [ 6].
F in a lly , from the safegu ard s point of view , it should not be overlooked that the Pu in the so lid w aste could be recovered to a large extent, in contrast to that contained in liquid w aste.
3.5. H ulls m onitoring
Table VII shows the m ethods applied for hulls m onitoring in Community r e p r o ce ss in g fa c il it ie s , u tiliz in g a ch op -an d-leach p ro ce ss .
W here m easu rem en ts are perform ed, fission -p rod u ct activ ity is m easu red and the ra tio s U /F P and P u /U , as a ssayed on the d isso lv e r solution, are u tilized . R esu lts of WAK ex p er ien ces to determ ine the average U+Pu amount rem ain ing on the leach ed h u lls, showed that the P u/U ratio was different from that of the d isso lv e r solution. In fact, the P u /U ratio was much higher.

3 7 2 ARENZ and VAN DER STUL
TABLE VII. HULL MEASUREMENTS APPLIED IN COMMUNITY REPROCESSING FACILITIES UTILISING A CHOP-AND-LEACH PROCESS
Facility M easurement method
Dounreay Neutron interrogation for fissile material
W indscale у -m easurem ent o f 144 Pr, activ ity o f 144Pr per gram U in dissolver solution and ratio U/Pu is measured
A T-1 La Hague
n-m easurem ent, quantities remaining on hulls are considered to be n il i f measurement result is beyond a set va lu e, otherwise a hull rinsing w ill be performed
HAO La Hague
y-m easurem ent
WAK No measurements; a fixed percentage o f the dissolved fuel with its U/Pu ratio is assumed to remain on the hulls; this quantity has been established upon measurements
3.6. W aste m easu rem en ts
Contribution of the w aste flow s to the o v era ll uncertain ty of the m ateria l balance statem ent is not high.
E rror propagation for the assu m ed w aste tra n sfe rs of the m odel m ateria l balance show s that the contribution of the w aste-m easu rem en t e r r o r s to the total MUF (including random and sy stem a tic er ro r s) is low (see Table III and Table VIII), and would rem ain low even if the w aste amount in crea sed by a factor of 2 or 3. Inspection effort has to be applied p rim arily to detect sy stem a tic e r r o r s on w aste m easu rem en ts, and to obtain hom ogeneous and rep resen ta tive sam p les (sam pling of h ighly active w aste stored on s ite show edhigher Pu v a lu es than the tota l quantity accum ulated from the individual w aste tra n sfers).
3.7. A ctiv itie s betw een cam paigns
It happens frequently that the resu lt of a ll output m easu rem en ts are reported when the input va lu es for various reason s are not yet known. From the safeguards point of view , th is situation is not sa tis fa c to ry and m akes the value of random sam pling of inputs doubtful.
The a c tiv itie s of the fa c il it ie s between cam paigns, such as the w ash-out of the extraction plant, evidently influence the to ta l output figure. F or th is reason , the in sp ection effort on the fa c il it ite s has to be m aintained over th ese periods.
Am ounts of Pu m easu red during a w ash-out ranged from 1 to 3 kg in m ed iu m -sized fa c il it ie s . H owever, the rem ark s under Section 3.1 concerning hidden inventory should be kept in mind.

IA EA -SM -201/70 373
TABLE VIII. INFLUENCE OF WASTE FLOWS ON TOTAL MUF
Model 2X 3X
HAW + MLW as % o f Pu throughput 1.83 3.66 5.49
MUF, R + S (g Pu) 276.63 327.08 386.98
MUF, R + S as °}o o f Pu throughput 0.79 0.93 1.11
Assuming no measurem ent error on waste stream s, the MUF could be reduced to (g Pu) in all three cases
259.56 259.56 259.56
The im provem ent in MUF is therefore(g Pu) 17.07 67.52 127.40
3.8. S urveillance and containm ent m ea su res
Owing to tech n ica l and operational d ifficu lties such as b locked tran sfer or sam ple lin es , or the recy c lin g of m a ter ia l or m aintenance of equipm ent, the plant operator is often obliged to change for lon ger or sh orter periods the m a ter ia l routing as given in the d esign inform ation. To anticipate th ese p o ss ib ilit ie s su rve illan ce m ea su res over the whole p r o c e ss have been found v er y u sefu l. F or exam ple, when the Pu hold-up in one fa c ility in crea sed to ten t im e s the design value, the in sp ecto rs did not need extra in spection effort as they w ere fu lly aware of the rea so n s for it.
M oreover, su rve illan ce appears to be u sefu l for the calibration of instrum entation and an alytica l m ethods.
Containment m ea su res have been ex te n siv e ly used to avoid repetition of m easu rem en ts by the sea lin g of inventory item s such as transport conta in e rs of fina l products. With the agreem ent of the plant operator, the entrance to in ven torized s to r e s has a lso been sea led .
3.9. MUF
Table IX g iv e s som e U and Pu MUF va lu es as a percentage of throughput of actual cam paigns. Com plex ch em ica l behaviour such as p lating-out, the form ation of unsoluble p o ly m erisa te s and heavy organ ic p hases under certain uncontrolled p r o c e ss conditions are gen era lly accepted rea so n s, often confirm ed during intercam paign w ash-ou ts or by changes of the iso top ic Pu concentrations of the follow ing cam paign, for Pu MUF va lu es far higher than those predicted. The sam pling of w aste strea m s containing so lid s a lso ca u ses a problem ; th ese so lu tions tend to be underestim ated.
4. CONCLUSIONS
The amount of nuclear m ater ia l which could be d iverted is indicated by the MUF and the quality of th is value is d irec tly re la ted to the a MUF.

374 ARENZ and VAN DER STIJL
TABLE IX. MUF VALUES FOR SEVERAL CAMPAIGNS
FacilityU - MUF
°jo of throughputPu - MUF
°jo of throughput
A 0.57 7.420.24 6.020.65 0.300.66 . 1 .751.86 6.48
1.03*2.062.800.48
HEU-Campaign
1.15 ,
В + 6.6 - 0.60- 0.73 + 9.83- 1.77 + 7.31
The in sp ecto rs have, th erefore, to v er ify the op erator 's MUF and cx MUF. The recom m ended way to do so is by the estab lish m en t of an independent m ateria l balance by the in sp ectors th e m se lv e s which would m ean a repetition of the p lant's m easu rem en ts for a m ateria l balance: sam pling, analysing, volum e m easu rem en ts and weighing at a ll key m easu rem ent points. At the in tern ationally accepted le v e l to detect 0.5% d iversion with 95% confidence th is would s t i l l lead to ex trem ely high in spection co s ts (for instance the in sp ection co s ts for the m odel cam paign of Section 3 would be of the order of 10% of the r e p r o ce ss in g costs).
A s has been d iscu ssed , a s ta tis tic a l sam pling for v er ifica tio n of the w a stes could be perform ed. C onsidering the inputs and the products, the chosen 0.5% at 95% confidence lead s, how ever, to a se m i-r ep e titio n of the work [ 7 ] as stated in Section 2.
The data reported in Section 3, sub-paragraphs 3.2, 3.3 and 3.9, based on m easu rem en ts with a p rec is io n equal to in ternational standards, show d ifferen ces h igher than those predicted on th eo re tica l assum ptions. In th is context, it is in terestin g to ob serve that a ll an alytica l lab ora tories concerned participated in in terlaboratory te s ts [ 8].
Many efforts are m ade to im prove in sp ection m ethods, such as the application of iso to p ic corre la tion s [ 9 - 11 ], and in th is fram ew ork the a c tiv itie s of the ESARDA group should be m entioned. H ow ever, in the p re sent situation and for econ om ica l rea so n s , probably a lso in the future, the control m ea su res are supplem ented by su rve illan ce and containm ent m ea su res [12]. Surveillance, together with a thorough knowledge of the fa c ility and the p r o c e ss , rep resen ts a factor which is im portant but d ifficult to quantify, and to som e extent com pensates for the lack of independence owing to low er m easu rem ent effort. As has been d iscu ssed above, the input and output determ inations are the m ain contributors to the o v era ll m ateria l balance accuracy , i .e . the effort of independent m easu rem ents should be concentrated in th ese key m easurem ent points, if a h igher degree of independence i s required.

IA EA -SM -201/70 375
R E F E R E N C E S
[1 ] Internal Docum ent EURATOM C om m ission, E U R /C /5355/62 - f/js l.[2 ] HAFELE, W ., NENTWICH, D ., IAEA — Symposium on Progress in Safeguards Techniques, Karlsruhe
(1970) Doc. S M -133 /103 .[3 ] KOCH, L., e t a l . , IA E A -SM -201/2 , these Proceedings, Vol. II.[ 4 ] DE BIEVRE, P ., VAN AUDENHOVE, J ., IA E A -SM -201/108, these Proceedings, Vol. II.[5 ] SWINBURN, K .A ., McGOWAN, I.R., IA E A -SM -201/63,these Proceedings, Vol. II.[6 ] BIRKHOFF, G ., e t a l . , On the Determ ination o f the Pu-240 in solid w aste containers by spontaneous
fission neutron m easurem ents, EURATOM Rep. EUR5158e (1974).[7 ] BROWN, F ., GOOD, P .T ., PARKER, J.B., Panel on Safeguards System A nalysis, IAEA, Vienna (1969)
D oc. PL-353-11.[ 8] Mol IV Experiment.[9 ] FOGGI, C ., in Proc. Symp. ESARDA, Rome (1974) 183.
[1 0 ] KOCH, L., COTTONE, G ., "Input analyses at the reprocessing plant," Proc. Reaktortagung Karlsruhe, 1973 , p. 338.
[1 1 ] CHRISTENSEN, D .E., SCHNEIDER, R .A., STEWART, K .B ., Summary o f experience with the use of isotop ic correlation safeguards techniques, BNWL - SA -4273 (1972).
[1 2 ] GUPTA, D .. in Proc. ESARDA Symp. Rome (1974) 405.
D I S C U S S I O N
A . R. ANDERSON: Have you any explanation for the much h igher Pu/U ra tio s in the leached hulls than in the leach ing solution?
E. VAN DER STIJL: U nfortunately, I am not a reactor p h y sic ist , so I can't r e a lly answ er the question. Perhaps Mr. B erg of the WAK Co.2 would sa y som ething.
R. BERG: It is true that at the WAK plant a h igher than "normal" Pu/U ratio has been found. During the Mol III safeguards exp erim en t, at the req u est of Mr. Schneider of the B attelle M em orial Institute we analysed the ch em ica l decladding solution at the EUROCHEMIC plant at Mol and found a sign ifican tly different iso to p ic p icture both for U and Pu, indicating a higher burnup at the fu e l-e lem en t su rface. H ence, the h igher P u /U ratio in hulls does not su rp rise me.
B. McDONALD: F or se v e r a l y ea r s now at BNFL W indscale, we have been routinely making a m easu rem ent of the 144P r d isin tegration rate, together with d isso lv ed solu tion a n a ly sis , for determ ination of und isso lved oxide fuel. We have sp ec ifica lly looked for e ffec ts due to fission -p rod u ct r e c o il into the hulls both by plant m easu rem ent and by ch em ica l an a lysis of hull sam p les. There is no doubt that som e fission -p rod u ct r e c o il m ust occur, but our r e su lts show that the effect i s low er than our lim it of detection for fu e l lo s s , i .e . about 0.07% of the in itia l fuel charge. T his conclusion ap plies to the fu e l so far p ro cessed , ranging from 10 MW/t rating(10 000 MWd/t irradiation) to 30 MW/t rating (35 000 M W d/t. irradiation).I agree with Mr. A nderson's com m ent that eith er plutonium m igration or, m ore probably, the v er y variab le uranium f is s io n rate in som e fu e ls could explain the WAK resu lt on P u /U ratio d ifference.
V.M. SINCLAIR: I would like to point out that in fa st reactor fuel r e p r o ce ss in g the so lid w aste, e sp e c ia lly from the head end, is of much g rea ter sign ifican ce than you have indicated in your paper, though I r e a lis e ,
2 WAK = G esellschaft für W iederaufarbeitung von Kernbrennstoff mbH.

376 ARENZ and VAN DER STUL
of co u rse , that your data la rg e ly re fer to low -en rich ed or depleted uranium fu e l re p r o ce ss in g . With Pu fu e ls la rg er am ounts of Pu w ill be a sso c ia ted with the so lid w aste and it should be appreciated that the u se of p assive neutron counting w ill not be too re liab le , s in ce m any of the neutrons w ill be com ing from curium and p ossib ly h igher actin id es depending on cooling tim e , rating etc. A lso , a ,n contributions w ill be p resen t and m ust be dealt with. T his situation w ill pose a m ajor problem for the in spector.
C.G. HOUGH: I note that in T ables V and VI of the paper the m ea su re ment er ro r standard deviations for Euratom are b etter than those of the operator. Could you com m ent on this?
Second, for the problem of m ateria l ca r ry -o v er betw een cam paigns, have you con sid ered looking at cum ulative MUF in stead of treatin g each cam paign MUF separately?
E. VAN DER STUL: Since th ese va lu es w ere given by the Euratom con tro l lab oratory and the fa c ility , I think Mr. de B ievre m ight be in a b etter p osition to com m ent.
A s regard s the question of cum ulative MUF, from the fig u res in Table IX you can se e that the individual MUFs are rather im portant. The low er value in the third cam paign b alances the others to a certa in extent, but the cum ulative fig u res are s t i l l far h igher than those predicted.
P .J . De BIEVRE: There is indeed a d ifferen ce betw een a (Euratom) and ct (Operator) and the d ifference i s even la rg er when one co n sid ers that the c o -c a lled a (Euratom ) value is in fact an accu racy ( i .e . , a to ta l uncertainty).M. Van D er Stijl had of cou rse to ca ll it a sigm a in o r d e n to make p ossib le a com parison with O perator sigm a va lu es.
T his only p roves once m ore that th ere are large d ifferen ces in the m easu rem ent perform ance of d ifferent lab ora tories (as in terlaboratory te s ts have a lread y shown). Hence — and th is is the tim e and the place to say so — m easu rem ent perform an ces can in gen era l be im proved quite consid erab ly , thereby m aking for b etter safeguarding.

IA EA -SM -201/10
SUMMARY OF EXPERIENCE WITH HEAVY-ELEMENT ISOTOPIC CORRELATIONS
D.E. CHRISTENSEN, R. A . SCHNEIDER Battelle Northwest Laboratories,Richland, Washington,United States of America
Abstract
SUMMARY OF EXPERIENCE WITH HEAVY-ELEMENT ISOTOPIC CORRELATIONS.Research and developm ent o f isotopic correlation safeguards techniques have been activ e ly pursued
at B attelle Northwest sin ce 1969. In April 1972, a working group m eetin g was convened by the International A tom ic Energy A gency on the use of isotopic data in safeguards. A general concensus o f the group was that correlation techniques offer sign ificant safeguard values and that they should be used. The purpose of this report is to sum m arize.the work accom plished sin ce then with particular emphasis on the results obtained during the past year. The data base has been enlarged considerably since 1972. Data from 33 reactors representing four reactor types are included. The sources of data have been (1) dissoluCion batch data from three reprocessing plants, N uclear Fuel Services, I n c . , Eurochemic and W indscale Head End Plant;(2) dissolution batch remeasurem ent data from N uclear Audit and Testing Company, N ucler Surveillance and Audit Corporation, Oak Ridge N ational Laboratory, Transuranium Laboratory and N ational Bureau o f Standards; (3) post-irradiation experim ent data from several laboratories; and (4) ca lcu lated data from bumup codes. The data of (1) and (2) above were provided from agreem ents with u tilities and reprocessing plants and are now in the public dom ain along with data of (3) and most of the data of (4 ). The d evelop m ent of isotopic correlations has therefore been done using a strong data base. Q uantification o f correlation properties such as the effec t due to reactor design changes and reactor operation variations has been possible. A detailed search for optim al correlations for pressurized and boiling-w ater reactor fuels has been done e ffic ien tly because o f the strong data base. The search was accom plished using descriptive indices derived from the data rather than using a rigorous sta tistica l approach. The word correlation as used here has a unique m eaning pertaining to relationships betw een isotopic data. The word is not used in the ordinary statistica l sense.
1. INTRODUCTION
The purpose of th is paper is to summarize the experience gained since 1972 with a program ca lled Isotopic Correlation Safeguards Techniques.[1]The program is sponsored by the U. S. Arms Control and Disarmament Agency and has been supported in the past by the U. S. Atomic Energy Commission.The goal o f the program has been to provide a means o f verify ing plutonium input from irradiated reactor fu e ls to a chemical reprocessing plant. The technique has been developed for use by the International Atomic Energy Agency.
The particu lar emphasis o f th is paper is on the use of heavy element iso top ic correlations in a v er ifica tio n ro le . Information presented in cludes the follow ing:
• Basis for the use of corre la tion s.• D efin ition o f correlations and correlation ra tio s .• Id en tifica tio n of useful correlations and a description of
th e ir properties.
3 7 7

378 CHRISTENSEN and SCHNEIDER
• Description of the data base of measurements for four reactor types which use natural or low-enriched 235U fu e ls ; pressurized water reactors, PWRs; boiling water reactors, BWRs; heavy water reactors, HWRs; and graphite moderated reactors, GMRs.
• Example of the application of correlation ratios to the data base, range of resu lting values and propagation of measurement uncerta in ties.
• Complete l is t in g of references for heavy-element iso top ic correlation data.
Previous work [2-19] has shown the value o f heavy-element iso top ic correlations to international safeguards. Applications are centered on that part o f the fuel cycle which extends from the output of fuel fab rication through the input to reprocessing. The key point for the application of these techniques is a t the input accountability tank at a chemical reprocessing f a c i l i t y .
The fa ct that relation ship s were availab le has long been recognized .[20] Both burnup experiments and calcu lational burnup codes have been used to study the transmutation o f uranium to plutonium. The transmutation of isotopes is p rin cip ally governed by simple fir st-o rd er d ifferen tia l equations.[21 ] However, the c o e ffic ie n ts o f these equations have depended on numerous core d e ta ils and operating h istory . The complexity o f core models, of cross-section s o f the iso top es, and of approximations needed to solve the equations has obscured the indication of simple re la tion sh ip s.
I t was therefore impressive that the re lation ship s were evident in the measurements made for dissolved spent fuel a t a chemical reprocessing plant. Here the measurement represents large amounts of fu e l , or a random sample of a whole core, in the form o f one-tonne batches. Thus, the relationships are averaged over large quan tities of fuel y e t they have appeared simple and, more than th a t, a fa ir ly unique feature for a particu lar core in q u estion .[21] Nature is not encumbered by core models, cross-section models, e t c . , and produces highly con sistent re la tion sh ip s. A factor of importance a lso which has aided the observation of re lation ship s is that the measurements represent the latest development and provide the best accuracy obtainable.
2. BASIS FOR CORRELATIONS
The need to ver ify the measured amount of plutonium in spent fuel at input to a reprocessing plant is the reason for having developed the concepts presented here. The plutonium-to-uranium ratio method [9] is used to determine the plutonium content of chemical plant d isso lver batches independently. The method is defined by the following equation:
Plutonium Amount at Input = Final Uranium x Pu/U Ratio (1)
and i t u t i l iz e s measurements from three sources: (1) The measured in it ia luranium amount at fabrication . (2) The measured amount of heat produced during irrad ia tion . Both are independent of the reprocessing p lant. From these two sources the fin a l uranium amount is determined. (3) From the reprocessing plant comes the measured Pu/U values.
To obtain an independent value o f plutonium content using the Pu/U ratio method then, i t must be shown independently that the Pu/U values measured by a reprocessing plant are correct. The purpose of applying is o topic correlations i s to contribute to th is v e r if ica tio n . Correlations

IA EA -SM -201/10 3 7 9
provide an important complement and supplement to independent measurements of input batches by inspectors.
Once the Pu/U values are ver ified by iso top ic correlations the plutonium amount as determined by equation(1) may be used to ver ify the amount measured by a reprocessing f a c i l i t y . D ifferences of 1 to 1.5% r e la t iv e , or le s s , between measured plutonium input and plutonium input by E quation(l)[11, 13, 15, 17, 22] have been observed. The 1.5% is considered a r e a l is t ic upper lim it where larger d ifferen ces may require additional in v estig a tiv e action . As actual inspection a c t iv i t ie s are performed, a practical upper lim it can resu lt.
The d ifferen ce in plutonium input actu ally reduces to an evaluation of sh ipper-receiver d ifferences for to ta l uranium. An evaluation of these d ifferen ces has been previously reported. [23] Considering shipper- receiver data of the Nuclear Fuel Services Plant at West V alley, New York, long-term agreement has been ex ce llen t (+ 0.05%) and the standard deviation of a sh ipper-receiver d ifference is nearly that expected [1 ,15] for measurement uncertain ties (0.56% versus 0.54%).
3. DEFINITION OF CORRELATIONS
An iso top ic correlation is a functional relationship between the measured i s o t o p i c w e ig h t p e r c e n t s o f uranium and plutonium or the Pu/U m a ss r a t i o o f a given input d isso lu tion batch. The re lation ship s are inherent due to natural law and include such relation sh ip s as Pu/U versus 235U, and 236U versus 235U. The Pu/U and 236U are treated as dependent variables and 235U as an independent variable.
An iso top ic correlation r a t io , which is the principal tool o f the technique, is defined as the ra tio of the dependent variable minus i t s in i t ia l value over the independent variable minus i t s in i t ia l value. In mathematical terms the iso top ic correlation ra tio i s the slope of the correlation function and, when a correlation i s lin ea r , the correlation ra tio w ill have a constant value within measurement varia tion s. Random measurement variations a ffectin g chemical reprocessing input batch data can thus be tested by applying correlation ra tio s such as (Pu/U ) /235d and a236u/ 235D. The д and D or depletion are used to indicate the d ifference between fin a l and in it ia l values. The Pu/U ra tio is zero in i t ia l ly and the d ifferen ce between in it ia l and fin a l values i s w ritten simply as Pu/U.
The s ta t i s t ic a l variation of correlation ra tio s derived from lin ear correlations is con sisten t with the propagation o f random measurement varia tion s. For example, the in i t ia l and f in a l 235U weight percents are measured to 0.2 to 0.5 percent re la tiv e and the Pu/U ra tio is measured to0 .8 to 1.5 percent r e la t iv e . These variations resu lt in variations in the (Pu/U)/235D ra tio of 0 .8 to 2 percent r e la t iv e . Testing measured spent fuel batch data by applying iso to p ic correlations i s thus done a t the same level as measurement uncertainty. Both measured and remeasured data confirm th is re su lt .
I t i s easy to understand that several batches o f spent fuel o f a given in i t ia l enrichment a ll a t the same exposure leve l would y ie ld correlation ra tio s o f the same value, within measurement varia tion s. However, a constant correlation ra tio value i s a lso observed from several batches of a given fuel even though the exposure o f the fuel may vary a factor of two or more. The re la tiv e deviations mentioned in the previous paragraph are typical o f both cases.

380 CHRISTENSEN and SCHNEIDER
Not a ll correlations involve the Pu/U r a tio . The goal i s to check the Pu/U versus the iso top ic data. Thus, the iso top ic data themselves must be checked and then used to check the Pu/U data. In th is way, i f a corre la tion ra tio i s id en tified as in co n sisten t, i t i s known whether or not the Pu/U ra tio or the iso top ic data is a t fa u lt .
4 . CORRELATIONS IDENTIFIED
A d eta iled search for useful correlations has been under way for natural and s l ig h t ly enriched uranium fu e ls which are used to fuel PWRs, GMRs, BWRs and HWRs. Useful correlations are defined in th is case as correlations that are lin ea r . The problem has not been that lin ear corre la tion s are r e la t iv e ly few in number, but rather that there are many lin ear or near lin ear correlations that can be formed. Several c r ite r ia were applied in the se lec tio n o f applicable corre la tion s. They include:
(1) Best lin ear in d ices .(2) Apply to more than one reactor type.(3) S ta t is t ic a l ly id en tify in con sisten t data.(4) Easily used.(5) Limited additional information requirements.
in addition , such properties as e f fe c ts due to reactor design changes including changing in i t ia l 2 3 5U enrichment and cladding m aterial, e f fe c ts due to reactor operating h istory , exposure averaging and enrichment averaging must be investigated and understood.
To provide an indication of the number of p o ten tia lly useful correla tion s in vestiga ted , consider the isotopes 233U and 2 39Pu along with the Pu/U ra tio . From the two isotopes such variables as the follow ing resu lt: 23SU, 239Pu, 235D, 100-239Pu , 2SsU x 239Pu, A(235U x 239Pu), 235U(100-239Pu), 235U/239Pu, A(235U/239Pu) , 239Pu/235U, A(239Pu/235U) and (100-239Pu)/235U. The 100-239Pu variab le , which denotes the change in 239Pu, is treated with greater ease than 235D (235U depletion) because the in i t ia l iso top ic composition of 239Pu is 100% 239Pu for natural and s l ig h t ly enriched uranium fu e ls . (The in i t ia l weight percent is 100% 239Pu even though there is no plutonium in i t ia l ly . As soon as the f i r s t plutonium atom is formed, however, i t is 239Pu.) The in it ia l 23SU weight percent is generally known but a present goal is to develop correlations which do not depend on information from other sources.
The 23SU, 239Pu and Pu/U ratio can be raised to various powers. It was decided to lim it the power to the number four for variables representing both s in g le isotopes and variables which represent combinations of 235U, 239Pu and Pu/U. That i s , for example, the sum o f the powers of 235U and 239Pu in each of the two re la tion sh ip s, 235U x 239Pu, and 239U/239pu would not be greater than four. Powers were a lso applied to the variables 100-239Pu and 235D. However, these variables were not used in any denominator o f another variable since they are zero at zero exposure and resu lt in in i t ia l values o f the variable going to in f in ity .
A tota l o f 154 variables involving only 235U and 239Pu along with th e ir in i t ia l values were formed. Including Pu/U increased the number of variables formed su b sta n tia lly . The methods used thus presented a convenient way to in vestiga te a large number of variables in a system atic approach and are being extended to 2 36U, 21,0Pu, 21,1Pu and 21,2Pu.

lA E A -SM -201/10 381
TABLE ICORRELATIONS IDENTIFIED FOR USE
CORRELATION CORRELATION RATIOY VARIABLE X VARIABLE
239L 100 - " vPu 235d (100 - 23<>Pu)P50239 239 2. 5VPux(100- '3VPu> a [23V ( 239pu>2] 239Pu x (100 - 239Pu)/a [235U»(239Pu)2]
7 л/239_ .2 3. Д( Pu) a(23v 4 u) Д(239Ри)2/Д.235и«239Ри)
239 2 239 4. г ” р и ) М 1 0 0 - Pu) 235U (100 - 239Pu) (239Pu)2/235U
5. Pu/U 235d (Pu/UI^D
6. Pu/U 100 - 239PU (Pu/U)/(100- 239Pul
7. Pu/U д[(235и)2,239Ри] (Pu/UI/Д [|235u)2/^9pu]
T he Д , D and 100-239Pu a r e u sed to in d ica te the d if fe r e n c e s b e tw een fin a l and in it ia l v a lu e s .
From the above number of variab les, seventy correlations have been formed. Twenty of these correlations were further investigated and from these the seven correlations l is te d in Table 1 were se lected as the most usefu l. The most, accurate iso top ic measurements are those of 23SU and 239Pu, accounting for the use of these in the f ir s t four se le c tio n s . These correlation s are used to check 235U and 239Pu which are in turn used to check Pu/U using correlations 5, 6 and 7 o f Table I . Q uantitative comparisons of the correlations are given in Section 6 a fter a description o f the data thus u tiliz e d is presented in Section 5.
5. DESCRIPTION OF DATA BASE
The se lec tio n o f correlations based on the properties discussed above has progressed e f f ic ie n t ly because of the substantial amount of data now ava ilab le . Input batch measurements for spent fu e ls from several power reactors representing a broad international data base has been co llected and tested by applying correlation ra tio s . The data base includes 353 batch measurements representing 28 spent fuel lo ts from 14 reactors,4 PWR's, 6 BWR's, 2 HWR's and 2 GMR's, see Table II . These data were measured by various chemical reprocessing plants and include individual batch values for Pu/U, 231,U, 238U, 236U, 23 8u, 2 38Pu, 239Pu,29°Pu, 21,:1Pu,and 21t2Pu.
A to ta l o f 226 measurements on duplicate input batch samples measured by laboratories other than the reprocessing plant are a lso included in the data base. A lso, measured iso top ic data from serveral p ost-irrad iation experiments (burnup data) have been co llected and these data now represent 205 burnup samples. The data base includes calcu lated iso to p ic data

382 CHRISTENSEN and SCHNEIDER
r TABLE I I
SU M M ARY OF DATA COLLECTED FOR ISO T O P IC CORRELATIONS
DATA BASE - AUGUST \, 1975
NUMBER OF INPUT BATCHES
REACTORS MEASURED REMEASURED
I. PRESSURIZED WATER
L CONNECTICUT YANKEE2. DIABLO CANYON3. FORT CALHOUN4. INDIAN POINT 15. POINT BEACH 16. SAN ONOFRE 17. SAXTON8. SENA9. TRINO
10L VVER1L YANKEE ROWE
TOTAL
II. GRAPHITE-MODERATED
L AGR2. CALDERHALL3. CHAPEL CROSS4. NPR5. WINDSCALE AGR
TOTAL
III. BOILING-WATER
1. BIG ROCK POINT 12. BROWNS FERRY 13. DODEWAARD4. DRESDEN 15. GAR1GLIANO6. HUMBOLDT BAY7. KRB8. LACROSSE9. NINE MILE POINT 1
10L OYSTER CREEK 1 1L VAK12. JPDR-1
TOTAL
IV. HEAVY-WATER
L NPD(CANDU)2. DOUGLAS POINT3. GENT1LLY I4. PICKERING5. NRU
TOTAL
TOTAL 33 REACTORS
NUMBER OF BURNUP NUMBER OF SETSSAMPIES CALCULATED DATA REFERENCE
11
(24.25) (26)
1 [271l [22.2811
6 3 129,30119 131,321
133123 3 [11,12,3415 [351
33 5 [2,7,16,27,36,37,38186 16
1 [3911 (40!
24 1411
[41124 2
3 142.4312 112,261
73
[441[2,16,45)
18 [41,4613 [17,4711 [4811 [49!1 15011 (501
10 1 111, 12,51130 (52)65 16
6 1 111, 12,53,5411 (21,5411 (5411 (541
24 155130 4
2Ö5 38 SETS
20 20
27 2930 10
89 82166 141
111021
23
62 183120 2015 28
3 4
154 "70
9 93 6
“12 T5
ЗЙ 226
from reactor burnup codes providing theoretical support to isotopic correlations. This portion of the data base now totals 1048 points. The addition of burnup and calculated data extends the number of reactors represented from 14 to 33. References for all data in the public domain are included in Table II.
The measured and remeasured batch data constitute the principal part of the data base and are augmented by the burnup and calculated data. Batch data from Yankee Rowe, Windscale AGR, Dresden 1 and Garigliano plus the burnup data and calculated data represent exposure ranges greater than 5,000 MWd/MTxand contribute to defining linear indices. Fuels of initial enrichments from natural to 4.9 weight percent 235U, having different claddings,
1 MT = metric tons throughout this paper.

IAEA-S М -201/10 3 83
and irradiated in different reactor types are represented so that effects due to reactor design are evident from the data. These fuels also represent several operational schemes such that effects due to reactor operation are observed from the data. Information as to exposure averaging effects is obtained by comparing burnup results (which represent pellet data and thus have incurred no exposure averaging) to batch data representing several assemblies at the same exposure level and then to other batch data representing dissolving of assemblies of exposures differeing more than 5000 MWd/MT. In addition,batch data are in the data base representing the dissolution of fuels of different initial enrichments so that enrichment averaging effects can be quantified.
The data base thus provides definition of correlation properties which when understood makes it possible to successfully apply correlation ratios. All the data indicated in Table II are organized in this regard and are used concurrently to investigate a given correlation. Thus, with the amount of data and the large number of potentially useful correlations available, the selection of optimum useful correlations is the present challenge of the development work. Enlarge the scope of possible variables by incorporating 2 36U, 2l(0Pu, 21,1Pu and 2Ц2Ри and it becomes evident that correlation development is not hampered by the lack of linear correlations but by the development of methods whereby the properties of a large number of potentially useful correlations are conveniently investigated and understood.
The data base is an effective safeguards tool in and of itself because of the correlations available. Measurement history from several laboratories is inherent in the data stored using correlations. Performance comparisons become evident as the data base increases. Perhaps the most important aspect of the data base is that correlations from new measurements being made should be consistent with the past results and properties defined by the data base. The data base thus contributes in a positive way to the future analyses of reprocessing input measurements. [56]
6. TEST FOR LINEARITY
To provide quantitative information as to how linear a correlation was and whether the correlation was linear for different fuels and reactor types, the following procedures were decided upon:
a) First, to list for comparison the percent standard deviation, % a , of a correlation ratio from the NPD data set, see Table III. That is, for a given correlation, a mean correlation ratio value and a a can be determined for a data set. Where a correlation is linear the a will be commensurate with the propagation of random measurement variations. Where a correlation is nonlinear, the a will reflect propagation of random measurement variation plus additional variation due to nonlinearity of the correlation. The a becomes larger as nonlinearity increases. Thus, the% a is an indicator of how linear or nonlinear a correlation function may be. In the case of NPD data, a % a near 1% or less is looked for. The exposure range of the data set is from approximately 5000 to 7000 MWd/MT and larger deviations indicate that a correlation is more nonlinear than desired. For example, a 4.0% a in this case indicates that a correlation ratio changes 34%, comparing values at zero exposure to values of 5000 MWd/MT.
b) Second, to note the mean correlation ratio value of Dresden 1 spent fuel lots which were initially enriched to 1.474 wt.% 235U. The first lot represents an exposure level of approximately 5000 MWd/MT. A second lot

384 CHRISTENSEN and SCHNEIDER
T A B L E I I I
L I N E A R I N D I C E S A N D M E A N R A T I O V A L U E S FOR C O R R E L A T I O N S
CORRELATION NO. (TABLE 1)
LINEAR INDICES MEAN RATIO VALUES 8
NPD DRESDEN 1 YANKEE ROWE NPD DRESDEN 1 YANKEE ROWE%0 % DIFF. %o NAT. 1.474 3.404 4.935
1. 1.05 0.72 2.93 64.5 42.5 19.5 13.2
2 0.53 0.95 1.21 35.5x10 19.2X10'2 8.50x10 5.81x10
3 1.01 1.03 1.05 94.0 53.8 24.0 16.5
4 3.97 1.44 1.30 18.7X10³ 6.36X10³ 2.69X10³ L85xl03
5 1.25 2.45 0.91 7.35X10³ 6.23xl03 5.78X10³ 4.99xl03
6 1.35 1.63 2.83 114 147 297 379
7 2.38 0.17 0.87 79.8x10^ 32.3x10** 13.lx 10^ 7.88x10**
Pu/U is in units of grams Pu/tonne U. The absolute values for correlations 1, 2, 5 and 7 are shown.
represents an exposure level of approximately 10,000 MWd/MT and a third lot represents fuel exposed from 8500 to 12,000 MWd/MT. If the mean correlation ratio values for all three fuel lots were the same the correlation was considered linear over the exposure range indicated. To summarize this information for comparison, the % difference (% diff.) between the mean ratio values of fuel lots one and two are listed in Table III. In this case a % difference of 2.5% or less was desired. A difference of 2.5% is used because reactor operation factors are present and result in additional variation between fuel lot one and two besides nonlinearity. This is particularly the case when the Pu/U is involved.
c) The third procedure was to list for comparison the % a of a correlation ratio from the Yankee Rowe Core V data set. These fuels were initially enriched to 4.101 wt.% 235U and the exposure range of these data is from 9700 to 25,000 MWd/MT. In this case a % a of 1.5% or less was desired.
The above procedures fairly well cover the enrichment range of natural uranium to 4.9 wt.% 235U and include three reactor types using these fuels. The values of linear indices given in Table III are supported by the burnup and calculated data results indicating that the procedures also apply to a wide range of exposures from zero to 30,000 MWd/MT.
The correlations numbered one and five of Tables I and III have been used for some time now and can be considered as standards with which to compare the other correlations. Correlations two and three, involving 235U and 239Pu, are seen to be as useful as correlation number one. Correlation four was selected because it can be used independently of other information sources, requiring only the 23SU and 239Pu as measured by the reprocessing plant. The correlation is particularly useful for BWR and PWR fuels.

IA EA -SM -201/10 385
Correlation two has the lowest linear indices overall and number three has the next lowest. Correlation number one has been found easy to use in the past indicating that correlations two, three and even four (except for natural uranium fuels) are also used with ease. Each of the four correlations identify inconsistent data that are known to be present in the data base, except as noted for correlation four.
A certain amount of nonlinearity can be effectively dealt with so that a nonlinear correlation is also useful. [57] Generally speaking, future spent-fuel lots from larger reactors are expected to be at the same exposure level and will not show exposure variations of more than 3000 MWd/MT. On this basis, nonlinear correlations whose correlation ratios may vary 20% from 0 through 30,000 MWd/MT also provide reasonable tests of measurement variations. Correlation number one is an example of a slightly nonlinear correlation for the PWR enrichment range from 3.5 to 4.9 wt.%235U and is convenient to use. Effective use of nonlinear correlations is accomplished by keeping track of the exposure levels of spent fuels.
The linear indices of correlations five, six and seven, Table 111, which involve the Pu/U ratio do not clearly indicate an advantage of any one of the correlations over the other two. However, the indices are more complicated than for correlations one through four due to the fact that Pu/U

386 CHRISTENSEN and SCHNEIDER
FIG. 2. Correlation ratio results summary of GMR and PWR data.
is more sensitive to neutron environments than either 235U and 239Pu weight percents. The sensitivity shows up particularly for BWR's and the 2.45% difference shown in the Dresden 1 column is not due to nonlinearity of the correlation. Correlation five thus does have the overall best linear indices. Correlation six is slightly nonlinear in the PWR 3.5 to 4.9 wt.%235U enrichment range (as was correlation 1) and correlation seven is nonlinear for natural uranium fuels. However, correlations six and seven are free of some of the sensitivity of the Pu/U ratio to neutron spectrum which is an incentive for using them.
Correlation five has been used since the beginning of isotopic correlations and its properties have been reported. [58] The correlation is easy to use as are correlations six and seven. All three correlations identify inconsistent data that are known to be present in the data base.

IA EA -SM -201/10 387
о (— <tXg3as(Xоо
IN ITIAL 235Uwt.%
FIG. 3. Composite figure showing correlation ratio results summary for ICI data base.
7. DEFINITION OF OTHER PROPERTIES
The effect of reactor design changes, in particular the effect of changing the initial enrichment, is summarized in the second part of TableIII. This is done by listing the correlation mean value for NPD data, natural uranium fuels, for Dresden 1 fuel lot one, 1.474 wt.% and for Yankee Rowe Cores II-III and Core VI, 3.404 and 4,935 wt.%235U, respectively. It is seen from the values listed in Table III that the 235u-239Pu correlation ratios decrease as the initial 235U enrichment increases. In the case of correlations five, six and seven involving the Pu/U ratio, correlation ratio five decreases, correlation ratio six increases and correlation ratio seven decrease as the enrichment increases.
A complete listing of ratio values is appropriate within the scope of this report. However, due to the need for brevity, these tables have been omitted. Instead, a graphical surmary, Figures 1, 2 and 3, is presented for

388 CHRISTENSEN and SCHNEIDER
correlation number one to permit the review of most correlation properties mentioned earlier which have not been described. In Figure 1, values for the correlation ratio (100-239Pu)/235D from BWR and HWR measured data, both dissolution batch data and post-irradiation data, are shown as a function of initial 235U enrichment values. Figure 2 presents the ratio results from PWR and GMR data. Figure 3 is a composite of Figures 1 and 2 comparing all the results except the GMR results.
The figures show the variation of the ratio as the initial enrichment changes, as discussed above. Other variations due to design of reactor types are also evident from the figures, particularly between HWR, GMR and BWR results representing the same enrichment range, natural through2.5 wt.%235U. The difference between BWR and PWR results is not as pronounced where both reactor types have fuels in the same enrichment range,2.7 to 3.7 wt.%23SU. Results from calculated data which are not shown evidence the same trends as discussed above and in subsequent paragraphs.
Exposure averaging effects are illustrated by the results shown in the figures as well. The post-irradiation experiment results are lower by 2 to 4% than the dissolution batch results for BWR and PWR data. The averaging affects the plutonium isotopes, in this case 239Pu, causing the 100- 9Pu part of the ratio to be larger. This occurs when the exposure is averaged from pellet to pellet, to a rod and from rod to rod, to an assembly.
Further exposure averaging effects are illustrated by the results that lie above the boxes that have been drawn in. These batches were made up of assemblies whose exposures differed more than 5000 MWd/MT. For the BWR results shown in Figure 1, exposure differences were as large as 15,000 MWd/MT and resulted in ratio values which were higher by 15% over comparable batch results [42] which had not undergone exposure averaging during dissolution.
Enrichment averaging effects were less pronounced than exposure averaging effects. Enrichment averaging causes the (100-239Pu)/235D ratio to be 1 to 2% higher than a comparable batch value which did not result from mixing assemblies of differing initial enrichments.
Two final variations for the (100-239Pu)/235D ratio are evident from Figure 2. The first is concerning GMR results from burnup data. The data [40] represented temperature variations from 449°K to 666°K and the correlation ratio increased from 74.2 to 95.1 as the temperature increased.As a result this correlation ratio may not be effective to test measurement variation for these GMR fuels. The second concerns two data points whose initial 235U enrichment is near 3.4 wt.% which lie separate (and high) from the rest of the data. The highest point represents a batch whose 235U was mismeasured and the lower point represents a batch which contained an unirradiated assembly.
Reactor operation variations have little effect on correlation number one and therefore are not discussed in this report. However, these variations do affect the Pu/U ratio and can be found discussed in reference [58].
8. CONCLUSIONS
The amount of isotopic data now available has provided a strong foundation for the development of isotopic correlation safeguards techniques.Within the framework of reprocessing data, post-irradiation data and burnup- calculational data, quantitative definition of correlation properties

IA EA -SM -201/10 389
outlined in Section 4 has been accomplished. Once the properties of correlations are known, it is then possible to use the various correlations where they apply in an optimal mode. BWR and PWR fuels are thus far the best defined.
Correlations can always be applied for verifying Pu/U ratio values of spent fuels. Correlations have been observed from all the data collected and thus correlation ratios have been applied successfully to these data. Because the physical laws governing irradiation of nuclear fuels are immutable, isotopic relationships are a common characteristic of spent fuels from any given reactor. In this respect work is underway to investigate correlations for plutonium recycle fuels as data from three postirradiation experiments [30,31,32] are now available. The same will be done for nigh-temperature gas-cooled and fast reactor fuels as more data become available.
For application of the verification methods the safeguards authority needs (a) to accumulate the proper data [1,21] from fabrication, reactor operation and from the reprocessing facility which pertain to a given reprocessing campaign; and (b) to test the Pu/U ratio values via correlation ratios against the isotopic data collected as well as against verified data which comprise the data base. The test is that, for a given correlation ratio, a constant value results from the data of each input batch of the campaign representing a given initial enrichment fuel. The verification is that the correlation ratio values agree with past history, that their a values are equal to values expected from propagation of error techniques and that the plutonium determined by Equation(1)using the tested Pu/U values agrees with the measured plutonium to within 1.5% or better.
The use of isotopic correlation techniques implies that duplicate samples of each input batch are obtained by the safeguards authority. A certain number [59] will be analyzed particularly to check for bias. However, by the use of isotopic correlations it may not be necessary to remeasure every input batch of a campaign to verify that the Pu/U ratios measured by the reprocessing facility are correct.
Once tested and verified, the new data become part of the data base.The correlation ratio values from these data are considered to be established values. That is, subsequent data from similar spent fuels are required to match the established ratio values for verification. Isotopic correlations once established are therefore an independent check of fuel to be reprocessed. That is, if plutonium were lost prior to sampling and measurement at the accountability tank, the Pu/U correlations would indicate a discrepancy between established values and measured values. Further investigative action may then be undertaken to resolve the discrepancy. Procedures to perform these techniques have been written [59] and are presently undergoing editing. In addition, a report discussing correlation properties in detail is underway.
REFERENCES
[1] CHRISTENSEN, D. E., Ed. Reference Manual for the Safeguards Use of Isotopic Correlations, WEC-199 IV (1972).
[2] CHRISTENSEN, D.E., SCHNEIDER, R. A., Consistency Evaluation of Accountability Data for a Chemical Processing Plant, BNWL-CC-2346, Rev. (1969).

390 CHRISTENSEN and SCHNEIDER
[3] MOEKEN, H. H. Ph, BOKELUND, H., Eurochemic Technical Report, ETR-235 (1969).
[4] CHRISTENSEN, D. E., EWING, R. A., GAINES, E. P., JR., KRAEMER, R., SCHNEIDER, R. A., STIEFF, R. L., WINTER, H., A summary of results obtained from the first MIST experiment at Nuclear Fuels Services,West Valley, New York, ACDA/TR-35 (1970). Safeguard Techniques,(Proc. Symp. Karlsruhe, 1970)1 IAEA, Vienna (1970) 563.
[5] KOCH, L., BRAUN, H., CRICCHIO, A., Some correlations between isotopes of Xe, Kr, U, Pu and burn-up parameters for various thermal and fast reactors, Ibid. Ip. 539.
[6] MOEKEN, H. H. Ph., Some developments in input accountability at Eurochemic, Ibid. 1 p. 551.
[7] CHRISTENSEN, D. E., MATSON, R. P., SCHNEIDER, R.A., WOLKENHAUER, W. C. The Safeguards Value of Chemical Plant Measurements Relating to Burnup - Yankee Cores V and VI, BNWL-1473 (1970).
[8] SCHNEIDER, R.A., CHRISTENSEN, D. E., GRANQUIST, D. P., Uranium-235 Depletion as a Potential Independent Cross-Check of the Plutonium Content of Spent Power Reactor Fuels, BNWL-SA-3304 (1970), Eleventh Annual Meeting of Institute of Nuclear Materials Management,Gatlinburg, Tennessee (1970).
[9] STEWART, К. B., SCHNEIDER, R. A., Properties of the Pu estimate based on weighted Pu/U values, See Ref. [4], 1 p. 583.
[10] HAFELE, W., NENTWICH, 0., Modern safeguards of reactors and reprocessing plants, Ibid. 1 p. 3.
[11] CHRISTENSEN, D. E., SCHNEIDER, R. A., STEWART, К. B., Minor Isotopes Safeguards Techniques - Application of Isotopic Correlations to Spent Fuels of JEX-70, BNWL-SA-3749 (1971), KFK 1100 (1971).
[12] CHRISTENSEN, D. E., ODEN, D. R., PREZBINDOWSKI, D. L., SCHNEIDER, R.A. STEWART, К. B., Techniques for Safeguarding Plutonium Produced in Nuclear Fuels, ACDA/WEC-189 I, and The Safeguards Value of Chemical Plant Measurements Relating to Burnup - CANDU, CdN, VAK and TRINO Fuels, ACDA/WEC-189 II (1971)
[13] SCHNEIDER, R. A., STEWART, К. B., CHRISTENSEN, D. E., PREZBINDOWSKI,D. L., The safeguards value of isotopic correlations, BNWL-SA-3929, 12th Annual Meeting of the Insitute of Nuclear Materials Management, Palm Beach Shore, Florida [1971).
[14] BENNETT, C. A., Validating safeguard information, presented at IAEA Working Group on the Use of Isotopic Composition Data in Safeguards, Vienna, Austria, April 10-14, 1972.
[15] SCHNEIDER, R. A., STEWART, К. B., CHRISTENSEN, D. E., The Use of Isotopic Correlations in Verification, BNWL-SA-4251 (1972), presented at IAEA Working Group on the Use of Isotopic Composition Data in Safeguards, Vienna, Austria, April 10-14, 1972.

IA EA -SM -201/10 391
[16] CHRISTENSEN, D. E., SCHNEIDER, R. A., STEWART, К. B., Summary of Experience with the use of Isotopic Correlation Safeguard Techniques, BNWL-SA-4273 (1972), presented at IAEA Working Group on the Use of Isotopic Composition Data in Safeguards, Vienna, Austria , April 10-14 1972.
[17] CHRISTENSEN, D. E., Application of Isotopic Correlation Safeguard Techniques to Verify the Plutonium Content of Humboldt Bay Spent Fuel, BNWL-SA-4274 (1972), presented at IAEA Working Group on the Use of Isotopic Composition Data in Safeguards, Vienna, Austria, April 10-14, 1972.
[18] PREZBINDOWSKI, D. L., Theory of Present and Future Safeguards Applications of Isotopic Ratios, BNWL-SA-4276 (1972), presented at IAEA Working Group on the Use of Isotopic Composition Data in Safeguards, Vienna, Austria, April 10-14, 1972.
[19] CHRISTENSEN, D. E., Application of MIST to the Nuclear Fuel Cycle - Nuclear Material's Safeguarding, ACDA/WEC-199 I (Summary) (1972).
[20] RIDER, B. F., RUSSEL, J. L., Jr., HARRIS, D. W., PETERSON, J. P., Jr., The Determination of Uranium Burnup in MWd/TON, GEAP-3373 (1960).
[21] BEETS, C., Role of measurements of nuclear materials in safeguards, presented at Symposium on Practical Applications of Research and Development in the Field of Safeguards, Rome, March 7,8, 1974.
[22] CHRISTENSEN, D. E., Isotopic Correlation Safeguards Techniques: Reprocessing of Indian Point 1 Spent Fuels, ACDA/ST-227 IV (1973).
[23] SCHNEIDER, R. A., The Use of Isotopic Correlations in Nuclear Materials Safeguards, BNWL-B-100 (1970).
[24] R0SZT0CZY, Z, KERN, R., Setup of ISOCHECK Method for Determining Heavy-Isotope Content in the Operating Fuel Elements of Connecticut Yankee Core I, CEND-287 (1966).
[25] EWING, R. A., Process Inventory Determination by Isotopic Techniques (Safeguards Applications), ACDA/WEC-214 (1972).
[26] DE0NIGI, D. E., et al., "Theoretical Analyses of Plutonium Buildup and Uranium Depletion in Pressurized Water and Boiling Water Power Reactors," IAEA-513/RB (Research Contract Y-49024) (August 1968).
[27] PREZBINDOWSKI, D. L., "Calculation of 236Pu and Z38Pu in the Discharge Fuel of Light Water Power Reactors," BNWL-1523 (September 1970)
[28] VALERIN0, M. F., R0SZT0CZY, Z. R., and KERN, R., "Setup of ISOCHECK Method for Determining Heavy-Isotope Content in Operating Fuel Elements of Indian Point Core B," CEND-268 (June 1966).
[29] WALLACE, T. W., "EEI-Westinghouse Plutonium Recycle Demonstration Program Progress Report," WCAP-4167-7 (February 1975).
[30] VALERIN0, M. F., R0SZT0CZY, Z. R. and KERN, R., "Setup of ISOCHECK Method for Determining Heavy-Isotope Content in the Operating Fuel Elements of San Onofre Core I," CEND-272 (July 1966).
392 CHRISTENSEN and SCHNEIDER
[31] NODVIK, R. J., "Saxton Core II Fuel Performance Evaluation - Part II - Evaluation of Mass Spectrometric and Radiochemical Analyses of Irradiated Saxton Plutonium Fuel," WCAP-3385-56 Pt. II (July 1970).
[32] G00DSPEED, R. C., "Saxton Plutonium Project Quarterly Progress Report for the Period Ending June 30, 1973," WCAP-3385-36 (July 1973). See also WCAP-3385-31 and 57.
[33] CHRISTENSEN, D. E., SCHNEIDER, R. A., REPPOND, E. B., "Application of Heavy Element Isotopic Correlation Safeguard Techniques to Sena, Douglas Point 1 and Trino Reactor Fuels," Contributions to the Joint Safeguards Experiment Mol IV at the Eurochemic Reprocessing Plant,Mol, Belgium, edited by BEETS, C., BLG-486 (Sept. 1973).
[34] BRESESTI, A.M., et al., "Post-Irradiation Analysis of Trino Vercellese Reactor Fuel Elements," EUR-4909e (1972).
[35] GABESKEREYA, V. A., et al., "Study of the Buildup of Plutonium Isotopes in the Fuel of the VVER-1 Reactor of the Novo-Voronezhskiy Atomic Power Station," JPRS 55882 (May 1972.)
[36] CACCIAPOUTI, R. J. "Evaluation of the Yankee Method for Calculating Uranium Depletion and Plutonium Production in Exposed Fuel," YAEC- 1060 (May 1972).
[37] VALERINO, M. F., ROSZTOCZY, Z. R., and KERN, R., "Setup of ISOCHECK Method for Determining Heavy-Isotope Content in the Operating Fuel Elements of Yankee Core V," CEND-271 (June 1966). See also CEND-316 (October 1967).
[38] MELCHAN, J. B., "Yankee Core Evaluation Program, Final Report," WCAP- 3017-6094 (Jan. 1971). See also WCAP-6068, 6071, 6081, 6082, 6083, 6085 and 6086.
[39] HARTLEY, A. J., "Plutonium Concentrations and Compositions in Advanced Gas-Cooled Reactors at Various Enrichments and Several Values of Irradiation," TRG-2176(R), IAEA-938/RB (1971).
[40] PHILLIPS, C. J., "WIMS Results for the Long-Term Irradiation Changes in the Calder Hall Reactors," AEEW-M934 (1970).
[41] GOOD, P. T., "UKAEA Note on the Use of Isotopic Composition Data in Safeguards, Vienna, 10-14 April 1972," presented at IAEA Working Group on the Use of Isotopic Composition Data in Safeguards, Vienna, Austria, April 10-14, 1972.
[42] CHRISTENSEN, D. E., and REPPOND, E. B., "Isotopic Correlation Safeguards Techniques: Examples from Applying the Techniques to SeveralFuels," ACDA/ST-227 V (To be published).
[43] KERN, R., SHESLER, A. T., and ROSZTOCZY, Z. R., "Setup of ISOCHECK Method for Determining Heavy-Isotope Content in the Operating Fuel Elements of Big Rock Point, CEND-292 (February 1967).
[44] BRAND, P., CRICCHEO, A, and KOCH, L., "Feasibility Study of the Use of Radioactive Fission Product Correlations for the Determination of Burnup and Heavy-Isotopes Composition of BWR Dodewaard Fuel,"EUR 5141e (1974).

IAEA-SM -201/10 393
[45] KERN, R and SHESLER, A. T., "Setup of ISOCHECK Method for Determining Heavy-Isotope Content in the Operating Fuel Elements of Dresden 1 Core IV," CEND-289 (January 1967). See also CEND-317 (November 1967).
[46] ARUMMA, A., et al., "Experimental and Theoretical Determination of Burnup and Heavy Isotope Content in a Fuel Assembly Irradiated in the Garigliano Boiling Water Reactor," EUR-4638e (July 1971).
[47] VALERINO, M. F., ROSZTOCZY, Z. R., and KERN, R., "Setup of ISOCHECK Method for Determining Heavy-Isotope Content in the Operating Fuel Elements of Humboldt Bay Core II," CEND-281 (September 1966). See also CEND-318 (December 1967).
[48] Private communications, WALKER, R. L., (August 1974) and BEETS, C.,(May 1975). Data are to be published.
[49] VALERINO, M. F., ROSZTOCZY, Z. R., and KERN, R., "Setup of ISOCHECK Method for Determining Heavy-Isotope Content in the Operating Fuel Elements of LaCrosse Core I," CEND-275 (August 1966).
[50] KERN, R., et al., "Setup of ISOCHECK Method for Determining Heavy- Isotope Content in the Operating Fuel Elements of Nine Mile Point Core I," CEND-299 (April 1967). See CEND-290 for Oyster Creek.
[51] KOCH, L., HOCHSTEIN, P., POHL, P., and WOLFF, U., "Postirradiation Examination of a Fuel Bundle of the VAK-Reactor and Comparison with Calculations," EUR-4690d (1971).
[52] UMEZAWA, H., private communication (July 28, 1975). Data are to be published.
[53] DURET, M. F., et al., "Plutonium Production in NPD," AECL-3995 (August 1971).
[54] HALSELL, M. J., "Graphs and Tables of the Isotopic Composition of Plutonium Produced in Canadian D20 Moderated Reactors," AECL-2631.
[55] DURHAM, R. W., and CORRWEAU, V., "Burnup Determination of a Fuel String by Chemical and Isotopic Analyses," AECL-4313 (February 1973).
[56] KOCH, L, BRAND, P., CRICCHIO, A., SOMMER, D., and ZAFFERO, B., "Isotope Correlations - A New Tool in Fuel Management" presented at European Nuclear Society, Paris, France (April 1975).
[57] CHRISTENSEN, D. E., KOTTWITZ, D. A., PREZBINDOWSKI, D. L., and SCHNEIDER, R. A., "Reactor Physics Aspects of Isotopic Correlations," Trans. Am. Nucl. Soc., 21 , 490 (1975).
[58] CHRISTENSEN, D. E., and SCHNEIDER, R. A., "The Purpose of Isotopic Correlation Safeguards Techniques, "ACDA/ST-227 II (to be published).
[59] CHRISTENSEN, D. E., "Isotopic Correlation Safeguards Techniques Procedures Manual," ACDA/ST-227 III (to be published).


IAEA-SM -201/21
REPROCESSING PLANT TEMPORAL RESPONSE ANALYSIS AS THE BASIS FOR DYNAMIC INVENTORY OF IN-PROCESS NUCLEAR MATERIAL*
W .B. SEEFELDT, S. M. ZIVI Argonne National Laboratory,Argonne, Illinois,United States of America
Abstract
REPROCESSING PLANT TEMPORAL RESPONSE ANALYSIS AS THE BASIS FOR DYNAMIC INVENTORY OF IN-PROCESS NUCLEAR MATERIAL.
In a fuel reprocessing plant operating at steady-state with respect to SNM concentrations, flow-rates and inventory, it appears possible to estimate the in-process inventory of SNM by observation and correlation of input and output isotopic compositions of the SNM. Variations of input isotopic concentration may be deliberately introduced as an arbitrarily shaped history of tracer SNM solution having a different isotopic composition from the inventory. If, in normal operations, significant fluctuations in isotopic composition occur in the input to the plant, these fluctuations can be used instead of a deliberately injected tracer. Optimal filter methods are proposed for correlating the isotopic composition input fluctuations with those that comprise the output response. In contrast with the tracer-step displacement method for performing a dynamic inventory, the temporal response methods described do not indicate in-process material at a discrete instant of tim e, but rather the steady-state inventory during the measurement period. The expected advantage of the temporal response analysis over the step-displacement method is the relative ease with which the former can be executed, and consequently, less disturbance to plant operations.
I. INTRODUCTION
Verification of the in-process inventory of special nuclear materials (SNM) in a fuel reprocessing plant is one important element in a materials accountability program. Dynamic inventory methods (i.e., methods which can be applied while a plant is in more-or-less normal operation) offer means of determining the inventory relatively quickly and with minimal disruption of plant operations. The purpose of this paper is to present analyses of a family of "new" methods for performing dynamic inventory, new in the sense that they seem not to have been considered seriously in the past.
Previous dynamic inventory demonstrations and analyses [1], [2], [3] have used a method which we will call the "Step Displacement" method, wherein the in- process material is displaced by a tracer-batch of feed material that is suddenly introduced at the input of the plant (or section thereof) in the place of "normal" feed material. The influx of tracer-batch material is maintained until all of the in-process material has been displaced into measurement vessels. Tracer material is nominally identical to "normal" feed material, but it is distinguished by its isotopic composition, which is deliberately selected to be differentiable. The new methods discussed here also utilize tracers that are
* Work performed under the auspices of the USNRC.
395

396 SEEFELDT and ZIVI
discernable by isotopic composition, but they do not require a tracer-batch large enough to displace the entire in-process material in order to make an inventory measurement. Consequently, the methods discussed here appear potentially employable with less disruption of normal plant operations than would be so for the Step Displacement method.
The "new" methods utilize the temporal response of the isotopic composition in the plant's output, following a measured input disturbance in isotopic composition. From the history of the output isotopic composition, the average residence time of nuclear material in the plant is inferred. The product of residence time and nuclear material feed rate equals the in-process inventory of nuclear material, for steady-state operation. The most basic technique is the injection of an infinitesimal pulse of tracer material at the input, and the observation of the history of the emergence of the tracer in the output of the plant to determine the residence time, the infinitesimal pulse method leads directly to the other techniques discussed here, namely* the finite pulse input and the correlation of random fluctuations. In the temporal response methods, as contrasted with the step displacement method, the in-process material is not displaced by the tracer but rather serves as a carrier for the tracer. This is especially advantageous when the in-process inventory is large with respect to individual feed batches; i.e., when it would be difficult to form batch of tracer material large enough to displace the in-process material.
II. THE INFINITESIMAL AND FINITE PULSE METHODS
A._____Concepts
In a plant operating at steady state, with a constant inventory of nuclear material over time interval T, the inventory can be confirmed by determining the residence time of the average particle of nuclear material in its travel from plant input to output. If this residence time is т hours and the feed rate of nuclear material is F kg/hr, the in-process inventory, I, of nuclear material is:
I = t F (1)
The average residence time т can be measured in a plant operating at steady state if a quantity L kg of tracer material is injected into the inlet flow in a pulse of infinitesimal width and a measurement is made of the elapsed time until that tracer pulse appears at the outlet. In the simplest case where there is no mixing, the tracer would preserve its idealized pulse shape all during its course through the plant, and the measurement of residence time would be exceedingly simple and obvious. In a real plant, mixing and dispersion in time will occur, with the result that the tracer will appear at the outlet in a distended pulse, the shape of which is determined by the nature of the flow through the plant. Suppose that between time t and t + dt (where time zero corresponds to the time of pulse injection at the inlet) a quantity of tracer CFdt is observed leaving the plant at the outlet. In this notation, C is the concentration of tracer in the nuclear material (i.e., the isotope fraction of tracer isotope). The residence time of that sample of tracer is t, and the sample contains a fraction CFdt/L of the total L kg of injected tracer. The average residence time of the injected pulse is the weighted summation of residence times of various samples, where the weighting factor is the fraction of total tracer material in the given sample. That is,

IAEA-SM -2 01/21 397
and
( 2 )
(3)
In the above derivation, it was tacitly assumed that the injected tracer was unique with respect to the materials normally present in the plant throughput. This is not necessary, and is generally not the case. For example, 2t,0Pu might comprise 10% of the total plutonium in the normal plant throughput, but 40% of the tracer material. The derivation of Eqs. (2) and (3) is valid with the substitution of C(t)-C0 in place of C, where C(t) designates the total concentration of the monitored isotope and C0 the background concentration of that isotope in the normal throughput. Hence, Eq.(3) can be rewitten in a form more amenable to application.
[C(t)-C0]tdt (4)
оThe inventory, I, determined in Eq.(4) is the quantity of nuclear mate
rial in process during the time the injected tracer pulse propagates through the plant. That is, the pulse method determines an inventory in existence over the time interval of the measurement, and not at a discrete moment. This is why steady-state operation is required during the measurement. By contrast, the step displacement method determines the inventory as of the instant of introduction of the step, and does not impose a steady-state requirement. Both the step displacement and the infinitesimal pulse methods depend on C0 being essentially constant and known. The correlation method described later relaxes the requirement that CQ be constant.
An infinitesimal inlet pulse of tracer allows the simple derivation of Eq.(4), but is not a practical form to use in plant operations. It can be shown that Eq.(4) with modified limits of integration as in Eq.(5), applies to any symmetrically shaped input disturbance of finite width, so long as time zero is chosen as the midpoint of the input disturbance. This is referred to as the finite pulse technique.
I =
where T^
+T„
H [C(t)-CQ]tdt (5)
sampling period prior to midpoint of symmetrical input pulse
sampling period subsequent to midpoint of symmetrical input pulse.

398 SEEFELDT and ZIVI
The limits of integration in Eq.(5) need not be symmetrical about time zero, but must be such as to start the integration at least as early as when the finite input pulse begins, and T2 must be such as to continue integration until virtually all of the tracer material has passed through the plant.
Regarding the independent variable, which has been chosen as time in the discussion until now, cumulative mass throughput of nuclear material could just as well serve as the independent variable, and is often more convenient. With G as the cumulative feed, we have:
and
( 6 )
G
f /[C(g)-C0(g)]gdg (7)
A computed example of the finite pulse method is given in Figs. 1 and 2 where a rectangular shaped pulse of tracer is simulated to be injected at the inlet of two well-mixed tanks connected in series. Each tank has an inventory of 0.5 kg plutonium, and isotope fraction C(G) is monitored at the output of the second tank. Fig. 1 is a schematic of the system and Fig. 2 shows the history of 239Pu fraction at the inlet to the first tank and outlet of the second tank, as well as the inventory computed by Eq.(7). The computed inventory approaches 1 kg asymptotically, and reaches its ultimate value at about 7 kg of cumulative feed (corresponding to 7 times the total inventory in this case) after the midpoint of the input pulse.
SNM THROUGHPUT RATE* F Kg/time
CUMULATIVE INPUT* G" f* Fd»’
0.5 Kg SNM, EACH
FIG. 1. S chem atic diagram of tw o-vesse l system used for analysis.

IAEA-SM -201/21 399
H ISTO RY OF ISOTO PE FRRCTION F i n i t e P u l s e In p u t
2 w e l l _ m lxe d t a n k s In s e r i e s 0 . 5 kg I n v e n t o r y e a c h ta n k
COZ Ö* Оf—8 ? . OCL Q L_COZD0_
*<0/ ---------- INPUT/ ...............OUTPUT
O- --------1-------- 1 1------- “ 1-------- 1---0-0 2-0 VO 6-0 8-0 10-0 12-0 11-0 16-0 18-0 20-0
G, KG FEED
INVENTORY CALCULATION
СЭ
FIG. 2. Finite pulse input and output, and inventory calculation.
B._____ Errors
Errors in inventory determinations by the finite pulse method arise from the combination of errors inherent in measuring C(t), C0, t, F, and L, or their corresponding variables in Eq.(7), plus errors introduced by departures of the real plant from the assumed idealized conditions of steady state. Errors in F2 and L as used in Eq.{5) would combine as the square root of the sum of their squares. Errors involving the integrand require a somewhat more complicated analysis.
. Let C(t), or C0, or both be subject to instrument random noise or to random fluctuations in the actual isotope composition of the monitored product stream. Represent these fluctuations as pulses of random magnitude (positive

400 SEEFELDT and ZIVI
or negative) occurring at random times (a uniform probability distribution in time). In this formulation, a train of random impulses m., each weighted by its time of occurrence is added to the integral in Eq.(S).1
I RL [C(t)-Cj t dt + E. m. t. L ' ' 0 1 1 1
(8 )
Each mi represents an erroneous input of C(t) at at ti- The magnitudes of the various mi are described by a probability distribution with a mean of zero and a mean-square magnitude W . The mean rate of occurrence of impulses mi is V events per unit time. The expectation value of the error due to noise or fluctuations can be shown to be
E O p = v S* § \ 2 [T3 + T3] (9)
mean squared inventory error due to spurious isotope fraction fluctuations, either real or instrumental
expectation value of e2
mean rate of occurrence of spurious impulsive signals
mean squared magnitude of spurious signals
F, L, Tr T2 as defined in Eq.(5).
where e2 = I
E(e2) = I
V =
In instances where the quantity V m2 is large enough to generate a significant error e t , and where it results from real fluctuations in isotope composition at the input and output of the plant, considerable improvement can be achieved by including the random fluctuations in the analysis. That is, measured fluctuations at the input can be viewed as part of the excitation of the plant, in combination with the finite pulse that is deliberately introduced.For this case, Eq.(7) no longer suffices for computing the inventory. This leads to the use of correlation methods by which the residence time is inferred from a correlation of inlet and outlet perturbations in isotope composition. In the limiting case where the random fluctuations in isotopic composition are large, it is conceivable that the deliberate introduction of a tracer pulse could be dispensed with altogether, and a running computation of in-process inventory could be performed on those naturally occurring perturbations. The correlation methods discussed below would eliminate the need for symmetry in an intentionally injected tracer pulse.
III. CORRELATION METHODS
If the plant can be represented as a stationary linear system, then it is possible in principle to deduce the plant's pulse-response and hence the average residence-time by correlating the observed inlet and outlet perturbations. The transfer-function of the plant (its response to a sinusoidal excitation, as a function of frequency w) can be determined from inlet and outlet perturbations in isotope fraction by Fourier transformation as follows [4]:

IA EA -SM -201/21 401
H (со)
where Н(ш)
c1(t)
C(t)
F { C(t) }
F { c(t) }F { Cj(t) }
transfer-function of the plant
isotope-fraction at inlet
isotope-fraction at outlet00
/ C(t)e.-jut
dt
( 1 0 )
The response of the plant to a hypothetical inlet unit-pulse (infinitesimal width) of tracer is found as.the inverse Fourier transform of the transfer function
Cu(t) = F'1 (Н(ш)} (11)
where F"1 {Н(ш)1 is the inverse Fourier transform
C (t) = ideal unit-pulse response, or weighting function.
Then, if there is a sufficiently long record of C^(t) and C(t), if the plant is truly linear, and if C(t) is the response only to (t), Eq.(ll) would provide the pulse response function C to be used in Eq.(3) for the inventory. These ideal conditions are unlikely to be met in practice, and therefore other computational techniques are proposed, but the above Fourier transform method forms the underlying foundation for those other methods. The "other" methods referred to were developed in the fields of optimal data smoothing, predicting, and control. Examples are the Weiner filter [5] and the Kalman filter [6]. They operate on the input and output time series (in this case, the records of input and output tracer isotope fraction), and produce an optimal estimate of the plant's unit-pulse response Cu (t) operating on the input.
The Weiner filter technique has been applied to the synthesized input and output isotope-fraction data of Fig. 3 representing a single finite pulse superimposed on a background of small step changes, to compute the unit-pulse response of the "plant" considered previously.1 The results of the computation are shown in Fig. 4 where the estimated unit-pulse response is compared with the known response of the two well-mixed tanks of Fig. 1. The independent variable employed in Fig. 4 is G, and the unit pulse response plotted is the equivalent of [C(G) - C0]/L, as it appears in Eq.(7). Carrying out the integration indicated by Eq.(7) yields a computed inventory of 0.991, as compared with the known 1.0 kg No noise was included in the problem (i.e., in synthesizing the plant output, plant input was simply operated on by the deterministic model of the plant), and therefore the computation should in-principle give the exact unit pulse response,
1 The authors are pleased to acknowledge consultation with Dr. K. D. Saunders of Argonne National Laboratory. The computations of the unit pulse response of Fig. 4 were performed following the work of Kerr and Surber [8] and using matrix inversion subroutine LINV2F of the International Mathematics and Statistics Library, Inc.

402 SEEFELDT and ZIVI
H ISTO R Y 0 Г ISO T O P E FRACTION Pu 2 3 9 f r a c t i o nО
INPUTOUTPUT
40*0 50*0 60*0G, KG FEED
FIG. 3. Finite pulse superimposed on background fluctuations, for input to Weiner filter calculations.
except for numerical round-off and truncation errors in performing the computation. The numerical errors are determined by the details of the computational procedure. In this illustrative case, 300 data points were used from the simulated plant input and output series, these being sampled at a constant interval of 0.10 kg.
The dominant error in a real case of estimating the pulse-response of a plant would probably arise from measurement uncertainties and noise, such as random sampling errors. The bounding magnitude of this error can be computed theoretically, knowing the distribution and magnitude of the noise and the nature of the specific plant (e.g., its unit pulse response)[7]. Hence, it appears that temporal response analysis should be capable of estimating the in- process inventory of a steady-state operating plant and the bounding error of that estimate. By this technique, the excitation can now be any arbitrarily shaped perturbation of isotopic composition including non-symmetrical pulses or naturally occurring changes in inlet isotope fraction of the isotope chosen to serve as the tracer. Investigations involving more realistic plant simulations and various computational schemes are being pursued in the continuing research.
IV. REQUIREMENTS FOR APPLICATION OF TEMPORAL RESPONSE METHODS
In order to re a liz e the potential ben efits of tim ely and routine v e r i f i cation o f in-process inventory by temporal response methods, an automated systemfor frequently sampling the process streams and analyzing the abundance ra tio of

IA EA -SM -201/21 403
IS O T O P E FRA CTIO N UNI T P U L SE R ESPO N SE
WEINER FILTER
о оa :clC- in cn o ' tofM3 T _|Q_
■ THEORETICRL
-*□0 ,—I— t-0 2-0 3-0
G, KG FEED
I а°ааааппфоов0 аовоо4-0
FIG. 4. Unit pulse response calculated by Weiner filter method, compared with theoretical response.
one or more pairs of isotopes will be required. The sampling interval will have to be short relative to the response time of the plant or section thereof. A very large number of samples could be involved, and isotopic analysis methods that do not require elaborate sample preparations will be necessary. One such method might be gamma-ray spectroscopy [9] which has been demonstrated with counting times of t.ens of minutes. Other measurement schemes are under consideration for considerably more rapid measurements [10].
The other requirement, as mentioned earlier, is that the plant must be essentially at steady-state during the interval of the measurement, except for isotope composition. An operating strategy of constant inlet concentrations, flow-rates, etc., is probably desirable for other reasons, and if so, materials inventory by temporal response methods would not impose severe operating restrictions.
V. CONCLUSION
It is probably possible to conduct timely routine dynamic inventories of in-process nuclear material in fuel reprocessing operations, using techniques based on the temporal response of the plant. Our continuing work is directed

404 SEEFELDT and ZIVI
to more complete analyses of error in the computed inventory and to suitable methods of measuring tracer isotopes. The benefit of employing the methods described here would be that of having a capability for maintaining an on-going inventory, one that provides knowledge of in-process material during a time interval T immediately prior to the computation (where T is the measurement time, probably several residence times). This time could be made short by conducting simultaneous dynamic inventories on those portions of the plant where major amounts of nuclear material reside. Even if only occasional, rather than continual, verification is required, the temporal response methods would appear to offer advantages of convenience and minimum disruption of operations.
REFERENCES
[1] KRAEMER, R., ROTA, A., Experimental Demonstration of a New Physical Inventory Technique by Means of Isotope Analysis, Ch. 5, EUR-4576e,KFK-1100, Joint Integral Safeguards Experiment (JEX-70), EUROCHEMIC Reprocessing Plant, Mol, Belgium, January 1970-July 1971.
[2] EWING, R. A., "Process Inventory Determination by Isotopic Techniques (Safeguards Applications)", Battelle Columbus Laboratories Report,March 31, 1972.
[3] SEEFELDT, W. B., BEAN, С. H., BERNSTEIN, G. J., "Some Considerations Enabling Dynamic Inventory in Fuel Cycle Facilities", Nuclear Materials Management, II, No. 3.
[4] BLACKMAN, R. B., "Linear Data Smoothing and Prediction in Theory and Practice", Addison Wesley, 1965.
[5] WEINER, N., "Extrapolation, Interpolation, and Smoothing of Stationary Time Series", John Wiley & Sons, 1949.
[6] KALMAN, R. E., "A New Approach to Linear Filtering and Prediction Problems", Trans. Amer. Soc. Mech. Eng., J. of Basic Engng., March 1960.
[7] LANING, J. H., BATTIN, R. H., "Random Processes in Automatic Control", McGraw-Hill, 1956.
[8] KERR, R. B., and SURBER, W. H., "Precision of Impulse-Response Identification Based on Short, Normal Operating Records", Institute of Radio Engineers Transactions on Automatic Control, AC6, p. 173, 1961.
[9] GUNNINK, R., "Status of Plutonium Isotopic Measurements by Gamma-Ray Spectrometry", Trans. Amer. Nucl. Soc., 21_ June 1975.
[10] GREEN, D. W., ZIVI, S. M., "On Optical Methods for Active Rapid Measurements of Isotope Composition of Bulk Special Nuclear Materials", to be published.

IAEA-SM -2 01 /39
DATA TREATMENT FOR THE ISOTOPIC CORRELATION TECHNIQUE
C. FOGGICEC, Joint Research Centre, Ispra,Italy
W.L. ZUPReactor Centrum Nederland, Petten,The Netherlands
Abstract
DATA TREATMENT FOR THE ISOTOPIC CORRELATION TECHNIQUE.Research and development regarding isotopic correlations is being promoted by the establishment of a
Data Bank of Isotopic Compositions sponsored by ESARDA. A general computer program, called ISOCORR, is in preparation, which performs theoretical analysis of correlations and compares calculated and experimental data. A special computer program, called CORRELATIO, was written, which can handle linear correlation problems, in particular the case (which is not considered in normal textbooks) where both variables have comparable errors of random nature. Some isotopic correlation data available from the ESARDA data bank are treated with this program to illustrate its merits.
1. INTRODUCTION
N uclear fuel in a re a cto r undergoes changes in its isotopic com position — depletion of the f is s ile isotopes in itially present, buildup of heavy elem ents, and buildup of fission products. These changes are often correlated in a sim ple m anner, and the isotope correla tion technique has been studied during the past few y ears from the aspect of implementing safeguards procedures [ 1 ].
R esea rch and development concerning a correlation technique requ ire that the following tools are established:
(a) P h y sica l models (and associated computer codes) for th eoretica l calcu lations of relationships between isotopic concentrations with a view to:
Understanding the background of observed correlation s;Specifying the applications and th eir lim its;Interpreting the experim ental data; andExtrapolating the application of correlation s to new fuel types or to higher fuel burnup or to different irradiation conditions.
(b) Experim ental data on isotopic composition of irrad iated fuels with a view to:
Verifying the co rrectn ess of the physical models assum ed as a basis for th eo retica l calcu lations; andC reating co rrelation s for application to sp ecific re a cto r fuels.
(c) S ta tis tica l models (and associated computer codes) for evaluating the experim ental data.
405

406 FOGGI and ZDP
Owing to the im portance of the correlation technique in safeguards, many steps have been taken for its development.
In 1973 ESARDA created a Working Group on Isotopic C orrelation Studies and has decided to sponsor the preparation and operation of a Data Bank of Isotopic Composition (BIC), to be located at E u ratom 's Join t R esearch C entre (Ispra Establishm ent).
The IAEA consultants' m eeting on the Use of Isotopic Composition Data in Safeguards, Vienna 1974, expressed the need for improved data bank softw are. It is hoped that the experiences of the IAEA and ESARDA data banks w ill be shared so as to improve the existing softw are in view of extensive future needs.
Within this fram ew ork, re se a rch and developments on the ESARDA Data Bank has started . The f ir s t input to the Bank was obtained from the Transuranium Institute of K arlsru he (JRC of Euratom ) and has already been made operational on the IB M -370/165 computer at Isp ra. Fu rth er data, originating from European u tilities and rep rocessin g plants, will be collected . In the m eantim e, codes for processing these data are being prepared.
This report outlines a main program (ISOCORR), which perform s th eo retica l analysis of correlation s and the com parison of calculated and experim ental data, and a program (CORRELATIO) which evaluates s ta tis tica lly the data contained in the Bank. This program can handle linear correla tion problem s, in particu lar the case (which is not considered in norm al textbooks) where both variab les have com parable e rro rs of random nature.
2. THE ISOCORR CODE
The ISOCORR code perform s burnup calculations and determ ines isotopic co rrela tio n s for single fuel p ellets; they a re then compared with the experim ental composition data stored in the Data Bank. The code is subdivided into three main sections, operating autom atically one a fter the other:
Section A perform s burnup calculations;Section В re triev e s the experim ental composition data contained
in the Data Bank; andSection C com pares experim ental and calculated com position data
and plots both of them.
The block diagram of the code is shown in F ig .l . The code is written in FO RTRA N -IV for the IB M -370 com puter. It is now being developed and will be ready early 1976. In p articu lar, section A has nearly been com pleted, while section В and C have not yet been finished. The final structu re of section C will be kept flexible so as to m eet the specific requirem ents of the u se rs . Section A is mainly composed of routines derived from the codes ISO TEX -1 (Ref.[2]) and SQINT (R ef.[3l), suitably modified. It ca lcu lates the concentrations of 82 nuclides (17 heavy nuclides with Z > 92 and 65 fission products) as a stepwise function of the burnup level.

IA EA -SM -201/39 407
F IG .l. Block diagram of ISOCORR.
A general library of nuclear data (including fission y ields, branching ra tio s , decay constants, activation c ro ss -se c tio n ra tio s , absorption and fission cro ss -se c tio n s) is associated to the code.
The cro ss -se c tio n s contained in th is general lib rary have been obtained in a one-group form alism , by averaging over the whole neutron spectrum . Several sets of c ro ss -se c tio n s have been included in the general lib ra ry , each one corresponding to a different choice of the neutron spectrum used in the averaging procedure.
The various sp ectra considered are representative of pressurized water re a c to rs ; they have been evaluated for different values of the in itia l enrichm ent, of the w ater-to -fu el volume ratio , of the fuel burnup, as specified in the lis t in Table I.
When perform ing the burnup calculation, the code ISOCORR (section A) prepares the appropriate lib rary of c ro ss -se c tio n s at the beginning of each tim e-step , by suitable interpolation of the data provided by the general lib rary . This task is accom plished by a group of routines taken from the SQINT code.
The resu lts of section A calcu lations are stored on a disk for subsequent evaluation in the section C of the code. A print-out is also available. Section В reads the isotopic com position data stored in the Bank, se le c ts those which are to be com pared with the th eo retica l resu lts , and perform s th e ir s ta tis tic a l evaluation. This la tte r task is accom plished by a group of routines derived from the CORRELATIO code, described in th is rep ort. The Bank, in its present stru ctu re, contains data which have been provided by the Transuranium Institute of the JR C -Euratom (K arlsruhe Establishm ent). A ll data re fe r to light-w ater power re a cto rs in the European Community, and originate from lab orato ries after postirrad iation examination of fuel p ellets or after rep rocessin g cam paigns.

408 FOGGI and ZDP
TA BLE I. PARAM ETERS WHICH CHARACTERIZE THE NEUTRON SPECTRUM
Fuel type u o 2
Cladding Zircaloy
Fuel initial enrichment 2.03.04 .0
W ater-to-fuel volume ratio 1.201.642.20
Fuel burnup (MWd/t U) 0150
4 5008 800
13 20017 50021 80026 20030 500
The data include Pu and U isotopic com positions (2 3 5U, 236U, 2 3 8U; 239Pu, “ °pu, 2 4 1 Pu, 242Pu and som etim es also 2 3 8Pu), the burnup fraction, and in some ca ses also isotopic data for a few stable fission products p i X e , 1 3 2X e , 8 3K r, MK r, 8 6 K r, 1 3 1X e, 1 3 2X e, 1 3 4X e, 136X e , 14 3Nd, 14 5Nd,146Nd, 1 4 8 Nd) and for a few radioactive fission products (134C s, 1 3 7C s, 154E u). The resu lts of the calculations perform ed by section В are stored on disk for subsequent evaluation in section C of the code. A print-out is also available.
Section C will com pare the resu lts of the th eo retica l calculations perform ed in section A with the experim ental data evaluated by section B. The com parison will include a joint graphical representation . Fu rth er development of this section can be made when m ore sp ecific requirem ents a re available. 3 * * * * * * * * * * *
3. THE CORRELATIO CODE
3.1. Introduction
In isotope correla tion studies one tr ie s to estab lish linear relationsbetween depletion and buildup of selected groups of isotopes. Sincevalues for depletion and buildup of isotopes are su bject to system atic andrandom e r ro rs related to operating conditions of the re a cto r, to m easu rement e r ro rs in the resu lts of destructive or non-destructive an alysis, orto u ncertainties in calculated burnup data, often a large variability ex istsin both the x - and у -values constituting the correla tion diagram . Whentrying to fit a lin ear functional relationship to the (x,y) points in the c o r r e lation diagram , one has to take into account the v ariab ilities in bothcoordinates.

IA EA-SM -201/39 409
This work d escrib es a m athem atical model for calculating the s ta tis t ic a l re liab ility of lin ear relationship. When both observables have independent and random e r ro rs , calculations with th is model, and also with the m ore fam iliar model with e rro rs only in one d irection, can be perform ed with the CORRELATIO program . On the b asis of the le a s t- squares principle this program determ ines the p aram eters, and their standard deviations, for the best fitting straight line. Should both v a riables under consideration be subject to e r ro r , the straight line is the orthogonal reg ressio n line, and the method is then called the minimum distance method.
The CORRELATIO program can provide plots showing the confidence regions for a given confidence level. The m ost relevant form ulae for the p aram eter and the standard deviations is given in the following paragraphs. As an illu stration the resu lts are given of a few calculations of data for spent fuel assem blies of the Garigliano R eactor. This program was made to facilita te the s ta tis tic a l analysis of the isotope correlation data which are collected in the ESARDA data bank at the Euratom Jo in t R esearch C enter at Isp ra.
3.2. Theory
The CORRELATIO program , w ritten in FORTRAN, originally for a CD C -6600 com puter, determ ines on the basis of the le a st-sq u a res principle the param eters and their standard deviations of the straight line, for which the sum of the squares of the deviations from a se r ie s of n points (x j.y ;) , representing experim ental data, to this line is a minimum. Neglecting the m athem atical details and derivations the approach is outlined by giving only the m ost im portant form ulae n ecessary for understanding the way to the resu lt. In the calculations the following tra n s form ation of coordinates is advantageous:
X i = x f / s x = ( x i~ x c ) / s x and Y£ = y i / s x = ( y i - y c ) / s y
where:
x c = [Gx ] / [ g] and y c = [G y ] / [G ]
s | = [Gx x ] / [ g] and Sy = [G y y ] / [G ]
In the form ulas here the summation convention of Gauss is used. This im plies that the square brackets denote summation over a ll values of the summation p aram eter. The system of (X,Y) coordinates defined in this way, leads to the relations:
[G xx ] = [ g] and [GYY] = [ g]
The co rrela tio n coefficien t, generally defined by the relation:
r x y -feSy]/[c]
Sx Sy
takes here the form:
r x y = [ сЖу ] / [ g]

410 FOGGI and ZIJP
B e tte r accuracy in computer calcu lations, especially im portant when computer word-length must be taken into consideration; Independence of p aram eters on scaling factors ;O ccurrence of sym m etry in equations when the X and Y variables are both su bject to m easurem ent e rro r ;Easy allowance for s ta tis tic a l weights;Inclusion of the case where the X - and Y-values have specified e r ro rs s(x j) and s(yj ).
Of cou rse, the m ore sim ple ca ses (without specified e r ro rs , thus without weights) are included in the general fram ew ork as sp ecia l ca ses . The le a st-sq u a res principle im plies that the straight line passes through the centre of gravity. The line can therefore be described by the relations:
y - y c = b ( x - x c ) ; у = BX; Хсоэф + Ysin<(> = 0
The angle ф denotes the angle between the norm al to the line and the positive X -a x is . F u rth erm o re , one can write:
В = tgi|>
where ф denotes the angle between the transform ed line and the positive X -a x is .
The program can consider three types of deviations:C ase 1: e r ro rs only in the Y -d irection
The approach p resen ted h ere has the follow ing advantages:
drii = ( y i - y c ) ”b (x i - x c )
and
Dni = dni/sy = Y£ - (b .sx/sy ).X i
C ase 2: e r ro rs only in the X -d irection :
d5 i = (y i_yc ) /b - (x i_xc )
and
= d5 i^ sx = (sy/b .Sx).Y i-X i
C ase 3: e r ro rs in both d irections:
Dn i = x i cos<t> + Yisin<(>
F o r each of these three ca se s CORRELATIO distinguishes two c la sse s :
Where individual e r ro rs are specified; and where these e r ro rs are unknown.

IAEA-SM -201/39 411
The straight lin es, which are found by m inim izing these deviations are called resp ectively (a) the reg ressio n line of у upon x;(b) the reg ressio n line of x upon y; (c) the orthogonal reg ressio n line.
It is well known that the s ta tis tic a l weights are in general inversely proportional to the corresponding v ariances. If the invididual e rro rs are known one has to take:
for case 1 :
1/G n i = s 2 (Dn i ) = s 2 ( y i ) / s 2
for case 2 :
1 /Ggi = s2 (D ji) = s2 ( x i ) / s 2
for case 3:
1 /G n i = s 2 (Dn i ) = c o s 2 (t>.s2 ( x i ) / s 2 + s in 2$ . s2 ( y £ ) / s 2
The proper choice of the weights requ ires a knowledge of the values of s2 and s 2, which in turn, according to their definition, depend on the values of tne s ta tis tica l weights.
If a ll x values are exactly known, one has s(Xj) =0 for a ll i, and G ,,^ l / s 2 (yj). This relation allows the calculation of the values of s2
and s2, so that th ereafter one can calcu late Gvi - s 2/ s 2(yi ).An analogous procedure applies to the case where a ll у -values are exactly known.
The application of the procedure for determining the orthogonal re g re ssio n line, where the deviations s(x j) and s (y j) have to be taken into account, im plies an iteration .
As f ir s t approximation to the weights one may take = 1 for a ll i. R em ark : If the points have no specified e r ro r values assigned to
them one has to assum e that a ll s ta tis tic a l weights are equal. Since in th is ca se the absolute magnitude of the G-values win cancel in the form ulas for a ll p aram eters (except for u2, defined la ter on), one may take for convenience a ll weights equal to 1. Under these conditions one may delete the G -facto rs in a ll [ ] expressions. F o r the slope of the transform ed and untransform ed straight lin es one finds:
in case 1 :
вл = [GnX Y ] / [G n]
= Bn»(sy/Sx) = rx y ( sy /sx)
in case 2 :
1/B5 = [gcxy] / [ g?]
1/b ^ = ( 1 / B g ) . ( s y / s x ) = r Xy . ( s y / s x )

412 FOGGI and ZIJP
in case 3:
Bn = tg i|i = ±1 w i t h s ig n В = s ig n [GnXY]
Bn = Bn ‘ ( sy / sx )
R em ark : The values for rxy and (Sy/sx) in the different cases ar.e only equal to each other, if Ggj, and Gni are proportional to each other for a ll i.
In that case one has:
= Bn = 1 and b5 -bn = bn
The expression for the sums of squares are as follows:
ca se 1 :
O n DnDr,] - [СЛ] - 2 В Л [СПХ У ]+В 2[С Л] = [ с л ] - B „ [ с лХУ]
case 2 :
[ g5d 5d 5] = [ g5] - ( 2 / b 5 ) s [ g5x y ] + ( i / b 5 ) 2 [ g5] = [ g5] - 0 / b 5 ) [ g5x yJ
case 3:
[GnDnDn] = c o s 2 { [G nl - 2 B n [G n X Y ]+ B 2 [Gn] } = [ c n ] - B n [Gn XY]
Rem ark: When x and у denote values for physical quantities, then the above sums of squares are dim ensionless and independent of scale units.
The variance of Dn is given by:
s2 (Dn) = [GnDnDjAn^)
Once [GnDnDn] has been determ ined, one can estim ate the quantities a 2
and a2, which denote the variances of the deviations in the m easured values x and у from th eir true value:
s2 (Dn) . s2 I W n l / s i n ^ = 2 g 2 [GnDnDn] ^ X (n - 2 ) x ( n - 2 )
. 2 /Т, _ .2 [ Gn Bn®n] / c o s 2ij) „ , [Gn Dn Dn]" sy ( n - 2 ) " L Sy (n - 2 )
The estim ated .variances of xc and yc are related to the variation of x ; and y j, resp ectiv ely , around the reg ressio n line. The variances of the coordinates of the centre of gravity are as follows:

IA EA -SM -201/39 413
case 1 :
s 2 (x c ) = о
_2 / „ v - 5Л (Р Л ) _
C " [Gn] (n-2) [Gn]
case 2 :
s 2 (x s = s l ( pc> = sM GCDSDgl[GC] ' (n-2) [Gjt]
S2 (yc ) = о
ca se 3:
2 , ч _ s | ( p n ) 2 sx • [^ п ^ п ^ п ! S (.X / = —........— — ■ 1 ' i i[Gn] (n -2 ) [gJ
s2(yc) = sJS S L = i i L ^ s l[Gn] (n-2) [Gn]
F o r the variance of the slope of the line one obtains the following expressions:
case 1 :
s2 (Bn)[G D Dn]
( n - 2 ) [Gn XX]
s2( V fi . [GnDnDnJ
sx [Gnl
v 2 (b ~ ) = s 2 = 1 [GnDnDn](b n ) 2 ( r x y ) 2 (n - 2 ) [G n]
case 2 :
s 2 ( l / B 5 )[GgDgDg]
( n - 2 ) [Gj YY]
S2 ( l / b s ) ± [GsDsDd4 tGd
_ s 2 (b £ ) = _ 1 ____ [GgPgPg]
‘ 5 ( b ~ ) 2 ( r Xy ) 2 (n - 2 ) [ g^ ]

414 FOGGI and ZUP
case 3:
(n-2) [GnXx] cos2i|<
s2 (bn) = f i . GnDnDnJ(n-2) [Gn] cos2i|<
_ s2 (bn) 2 [GnDnDn]v >.Dn l ---- : : ■ = -----------—_
(bn) (n-2) [gJ
The expression y-yc = b ( x - x c ) gives as intercept with the Y -ax is :
a = yc - b .xc
Since the quantities xc,yc and b are independent of each other, one obtains the general relation:
s 2 (a) = s(yc ) + b2 s2 (xc ) + x2 .s 2 (b)
which gives by substitution of the appropriate expresssion:
for case 1 :
s2 (a?) = S .(n -2 ) . [G5] • {> +
for case 2 :
s2 ( i n) = . { 1 + Ü ]n (n -2 ) .[G ,l 1 s2
for case 3:
, 2 4 &nDnDnl . xcis (an} = , * Гг 1 • i 2 + — I(n 2) . [GnJ sx
R em ark : The f ir s t coefficient 2 in the expression for s 2 (an) a r ise sfrom l/ c o ^ ip = 2 ; the second value 2 a r ise s from two erro r contributions,i .e . s2 (xc ) and ^ (y c ). The variance of a predicted y0 value, in case of an exact x 0 value, is given by:
s2 (y0) = s2 (yc ) + b2 .s 2 (xc ) + (x0 -x c ) 2 .s 2 (b)
In case the variance of a predicted y0 value is desired for a m easured x 0 value, one has to extend this form ula. Let x0 be the m easured value.

IAEA-SM“ 201 /39 415
obtained as a weighted average of a se r ie s of observations x oi, with weights equal to goi = l / s 2 (x0i). The estim ated variance s 2 (x0) can then be calculated as:
s2 (x0) = l/ [g 0]
This value can then be substituted in the relation:
s2 (y0) = s 2 (yc ) + b2 (xc ) + b2 .s 2 (x0) + (x0 -x c ) 2 .s 2 (b)
Since the sum of squares has (n-2) degrees of freedom , for the calcu lation of the confidence lim its for a predicted y0 one needs the values of the students' t-d istribution for (n-2 ) degrees of freedom at a specified confidence level. The 100(l-a)% confidence interval for y0 is given by
Уо - tn -2 ,a / 2 -s(y0) < y0pUre < Уо + tn -2 ,a /2 •s(y0)
The CORRELATIO program distinguishes the following modes:
Mode 1: Mode 2: Mode 3: Mode 4: Mode 5: Mode 6 :
e r ro rs only in Y -d irection ; e r ro rs only in Y -d irection ; e r ro rs only in X -d irectio n ; e r ro rs only in X -d irectio n ; e r ro rs in both d irections; e r ro rs in both d irections;
individual e r ro rs unknown; individual e rro rs specified; individual e r ro rs unknown; individual e r ro rs specified;
individual e rro rs unknown; individual e rro rs specified.
In each mode the output gives values for:
a, s (a ) , b, s (b ), r and s(r)
F u rth erm ore, a plot can be made showing the input points and the confidence region for a specified confidence level. A fter having determined a and s(a), and also b and s(b) one can apply a s ta tis tica l te s t, the t- te s t , to investigate at a given confidence lev el (say 95%, i.e . a =0 .05) whether the intercept a and the slope b deviate significantly from their expected values (respectively a and ß). The te s t s ta tis tics for the t - te s t are:
a - ot s(a)
and b - В s(5)
If these values a re sm aller than the c r it ic a l values, one may conclude that the deviations from th eir expected values a re not significant. Also the good ness-of-fit param eter i^ = Smin / r (where v =n - 2 is the number of degrees of freedom ) is related to a sta tis tica l te s t. The quantity u2.r follows a x2“distribution with v =n - 2 degrees of freedom .
F o r a given confidence level the c r it ic a l value of w2 can be derived by dividing the tabulated c r it ic a l values of the x2“ distribution by the number of degrees of freedom .
If u2 is le ss than the c r it ic a l value, one may assum e that a ll deviations from expected pattern (i.e . the straight line) have a random ch aracter and are consistent with the s ta tis tic a l weights assigned to the points ( x ; ,y .).

TA BLE II. ISOTOPIC COMPOSITION DATA OF 18 SAM PLES TAKEN FROM GARIGLIANO F U E L ASSEM BLIES [4]E ach date is , when possible , followed by its coefficien t of variation (in b rack ets , as per cent).
sam p lecode
235U / 238U 2 36jj j l 38ц b u r n - u p ( i n %)
2l,0P u / 239Pu 292P u / 2 39Pu 8dK r / 86K r 132X e / 134Xe i n i t i a le n r i c h m e n t
A! 0 .0 0 7 9 8 ( 0 . 4 0 ) 0 .0 0 1 6 5 ( 1 . 1 0 ) 1 .1 26 0 .2 9 9 8 ( 0 . 2 0 ) 0 .0 231 ( 0 . 8 0 ) 0 .5 7 6 3 ( 0 . 2 5 ) 0 .6 6 7 8 ( 0 . 2 0 ) 0 .0 1 6A3 0 .0 1 2 7 5 ( 0 . 8 0 ) 0 .0 0 1 9 3 ( 1 . 7 0 ) 1 .118 0 .2 3 6 5 ( 0 . 3 0 ) 0 .0 1 4 0 ( 0 . 6 0 ) 0 .5 671 ( 0 . 8 9 ) 0 .6 5 0 1 ( 0 . 1 8 ) 0 .021A5 0 .0 1 2 2 2 ( 0 , 6 0 ) 0 .0 0 1 7 8 ( 1 . 2 0 ) 1 .1 28 0 .2 3 5 2 ( 0 . 3 0 ) 0 .0 1 4 0 ( 1 . 0 0 ) - 0 .021A9 0 .0 057 1 ( 0 . 5 0 ) 0 .0 0 1 8 9 ( 1 . 3 0 ) 1 .499 0 .4 1 3 0 ( 0 . 3 0 ) 0 .0 4 8 0 ( 0 . 5 0 ) 0 .5 9 0 2 ( 0 . 4 3 ) 0 .6 8 2 4 ( 0 . 1 3 ) 0 .0 1 6BJ 0 .0 0 8 7 4 ( 1 . 0 0 ) 0 .0 0 1 4 6 ( 0 . 8 0 ) 1 .046 0 .2 6 1 7 ( 0 . 4 0 ) 0 .0 1 7 5 ( 0 . 8 0 ) 0 .5 9 2 3 ( 0 . 7 2 ) 0 .6 6 5 4 ( 0 . 2 9 ) 0 .0 1 6B2 0 .0 1 2 7 0 ( 0 . 5 0 ) 0 .0 0 1 9 5 ( 2 . 3 0 ) 1 .094 0 .2 2 7 9 ( 0 . 2 0 ) 0 .0 1 2 8 ( 1 . 2 0 ) 0 .5 6 9 8 ( 0 . 1 7 ) 0 .6 5 5 0 ( 0 . 2 8 ) 0 .0 21B8 0 .0 1 0 8 3 ( 0 . 8 0 ) 0 .0 0 2 0 5 ( 1 . 2 0 ) 1 .2 93 0 .2 8 8 7 ( 0 . 2 0 ) 0 .0 2 0 0 ( 0 . 9 0 ) 0 .5 7 0 7 ( 0 . 4 9 ) 0 .6 6 1 4 ( 0 . 6 4 ) 0 .0 21Cl 0 .0 1 2 6 5 ( 0 . 8 0 ) 0 .0 0 1 9 4 ( 2 . 2 0 ) 1 .138 0 .2 3 3 8 ( 0 . 4 0 ) 0 .0 1 4 3 ( 1 . 4 0 ) 0 .5 671 ( 0 . 3 9 ) 0 .6 5 3 1 ( 0 . 3 7 ) 0 .0 21C3 0 .0 1 3 9 0 ( 0 . 8 0 ) 0 .0 0 1 7 2 ( 1 . 4 0 ) 0 .9 7 2 0 .1 9 4 6 ( 0 . 3 0 ) 0 .0 0 9 3 ( 0 . 9 0 ) 0 .5 6 8 7 ( 0 . 4 0 ) 0 .6 5 1 7 ( 0 . 4 0 ) 0 .021D2 0 .0 1 3 3 8 ( 0 . 4 0 ) 0 .0 0 1 7 8 (1 .6 0 ) 1 .008 0 .2 0 0 9 ( 0 . 2 0 ) 0 .0 1 0 2 ( 1 . 3 0 ) 0 .5 6 7 9 ( 0 . 3 6 ) 0 .6 5 2 4 ( 0 . 3 9 ) 0 .021D4 0 .0 1 3 7 3 ( 0 . 3 0 ) 0 .0 0 1 7 7 ( 0 . 8 0 ) 0 .941 0 .1 8 2 7 ( 0 . 2 0 ) 0 .0 0 8 7 ( 1 . 8 0 ) 0 .5 6 5 0 ( 0 . 4 0 ) 0 .6 491 ( 0 . 4 0 ) 0 .021E l 0 .0 1 2 4 3 ( 1 . 5 0 ) 0 .0 0 1 9 6 ( 2 . 3 0 ) 1 .153 0 .2 3 0 2 ( 0 . 3 0 ) 0 .0 1 3 8 ( 0 . 7 0 ) 0 .5 7 3 2 ( 0 . 4 0 ) 0 .6 5 6 6 ( 0 . 6 0 ) 0 .021E5 0 .0 1 3 7 6 ( 0 . 4 0 ) 0 .0 0 1 6 9 ( 1 . 3 0 ) 0 .9 5 0 0 .1 8 2 5 ( 0 . 3 0 ) 0 .0 0 8 5 ( 0 . 9 0 ) 0 .5 6 7 8 ( 0 . 1 4 ) 0 .6 5 5 3 ( 0 . 2 3 ) 0 .0 21C7 0 .0 1 2 3 7 ( 0 . 3 0 ) 0 .0 0 1 8 9 ( 1 . 2 0 ) 1.121 0 .2 2 5 8 ( 0 . 2 0 ) 0 .0 1 3 0 ( 1 . 2 0 ) 0 .5 7 0 2 ( 0 . 3 0 ) 0 .6 5 8 8 ( 0 . 2 0 ) 0 .0 21H2 0 .0 113 1 ( 0 . 9 0 ) 0 .0 020 1 ( 1 . 6 0 ) 1 .273 0 .2 6 9 1 ( 0 . 2 0 ) 0 .0 181 ( 1 . 1 0 ) 0 .5 681 ( 0 . 2 8 ) 0 .6 6 1 0 ( 0 . 2 2 ) 0 .0 21H8 0 .0 1 0 6 6 ( 1 . 1 0 ) 0 .0 0 2 0 3 ( 2 . 2 0 ) 1 .351 0 .2 9 3 8 ( 0 . 4 0 ) 0 .0 2 1 5 ( 1 . 3 0 ) 0 .5 8 5 5 ( 0 . 3 0 ) 0 .6 6 7 0 ( 0 . 2 0 ) 0 .021J1 0 .0 0 6 4 9 ( 0 . 4 0 ) 0 .0 0 1 8 5 ( 1 . 3 0 ) 1 .3 70 0 .3 6 1 3 ( 0 . 2 0 ) 0 .0 3 8 4 ( 1 . 0 0 ) 0 .5 9 5 9 ( 1 . 5 7 ) 0 .6 8 1 7 ( 0 . 1 7 ) 0 .0 1 6J9 0 .0 0 5 5 7 ( 0 . 6 0 ) 0 .0 0 1 9 7 ( 1 . 5 0 ) 1 .542 0 .4 1 9 2 ( 0 . 2 0 ) C .05 18 ( 0 . 5 0 ) 0 .5 9 6 6 ( 0 . 5 0 ) 0 .6 8 5 7 ( 0 . 2 0 ) 0 .0 1 6
I n t h e p l o t s and i n T a b l e I I t h e f o l l o w i n g a b b r e v i a t i o n s and d e f i n i t i o n s a r e u s e d :2 3 5 U г 1 i 1
D5 = d e p l e t i o n o f 235U = 1 - {1
O 'Su 236U i n i t i a l e n r i c h m e n t238U 238U
RPU = p l u t o n i u m r a t i o( 21t2P u / 239Pu)
( 2 k 0 P a / 2 3 9 P u ) 2
416 FO
GG
I and ZD
P

IAEA-SM -201/39 417
TA BLE III. RESU LTS OBTAINED FOR ISOTOPIC COMPOSITION DATA OF SAM PLES FROM THE GARIGLIANO REACTOR
p a r a m e te r Y 2 3 6 ц /2 3 8 ц 2 3 6 ц / 2 3 8ц 2 3 6 ц /2 3 8 ц b u r n - u p b u r n - u p RPU
p a r a m e te r X 2 3 5 ц /2 3 8 ц 2 3 5 ц / 2 38ц D5 81* K r / 86K r 132Х е / 13Ч е D5
mode .6 6 6 2 2 6
n 13 5 18 17 17 18
s lo p e b - 0 .1 1 1 7 - 0 . 1 5 0 0 0 .0 0 1 8 4 4 0 -1646 0 .1 3 3 8 0 .1 5 7 8
v ( b ) , i n % 1 5 .0 11 .4 3 1 .4 2 2 .4 13 .4 18.1
i n t e r c e p t a 0 .0 0 3 2 7 0 0 .0 0 2 8 0 0 0 .0 0 0 9 4 1 4 - 0 .0 8 3 1 1 - 0 .0 7 6 7 6 0 .1 8 5 0
v ( a ) , i n % 6 . 6 4 . 6 2 8 .9 2 5 .4 15 .6 7 .4
r x y - 0 . 8 7 6 5 - 0 .9 8 0 4 0 .2 0 9 9 0 .7 5 5 6 0 .8 8 6 9 0 .7 3 8 0
"v ( ^ x y ) » i n % 16 .6 11 .6 11 .6 2 2 .4 13 .4 2 2 .9
f i g u r e 1 2 3 4 5 6
If, however, io2 is la rg e r than the c r it ic a l value one has to conclude that the deviations from the line are larg er than can be expected from the s ta tis tica l weights assigned. This might occur when the random e r ro rs quoted are too sm all, or when the model of a lin ear relationship is not applicable.
3.3. Illu strative example
To show the p o ssib ilities of the CORRELATIO program , the resu lts are shown of its application to the isotopic com position data of 18 sam ples from fuel assem b lies, irrad iated in the Garigliano Boiling Water R eactor. The data listed in Table II were taken from R ef.[4]. The resu lts are shown in Table III and in F ig s 2 to 7.

418 FOGGI and 2ЦР
FIG .2 . Relationship betw een the 236u / 238u ratio and the 235u / 238u ratio (ser ies o f 13 sam ples). The curved linesshow the 95% confidence region.
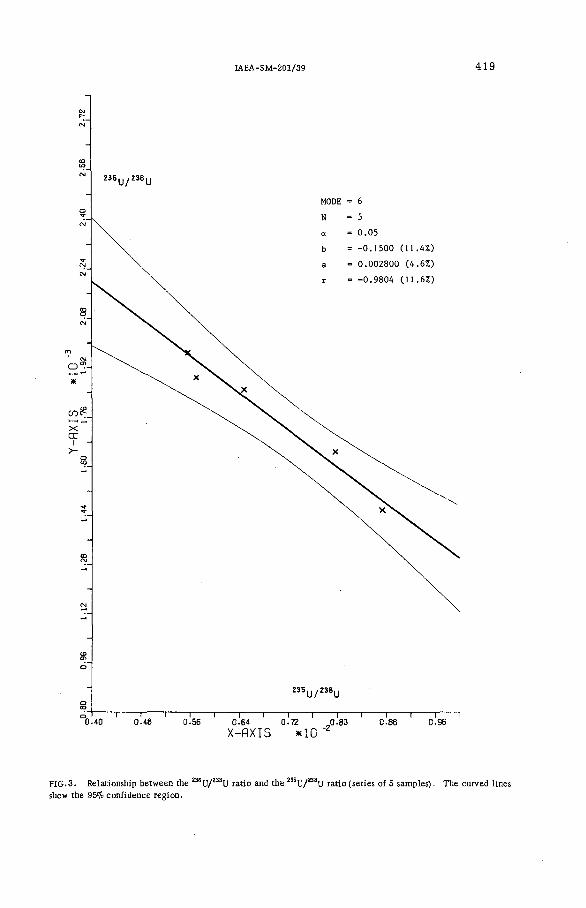
IAEA -SM -201/39 419
FIG .3. Relationship betw een the 236u / 238u ratio and the 2S5U /a 8 U ratio (series o f 5 sam ples). The curved linesshow the 95% confidence region.

420 FOGGI and ZUP
FIG.4 . Relationship betw een the 236u / 2S8U ratio and the depletion o f 2S5U . Thedepletion o f 2S5U is defined below T able II. The curved lines show the 95% confidence region.

IA EA-SM -201/39 421
FIG. 5. Relationship between the bumup fraction and the 84К г/к Кг ratio. The curved lines show the 95% confidence region.

Y-P
XIS
*1
00.
70
0.80
0.
90
t.OO
l .
10
1.20
1.
30
1.40
1 .
SO
1.60
1.
70
1.80
1.
90
422 FOGGI and ZUP
FIG. 6 . Relationship betw een the burnup fraction and the ^ X e / ^ X e ratio. The curved lines show the 95^оconfidence region.
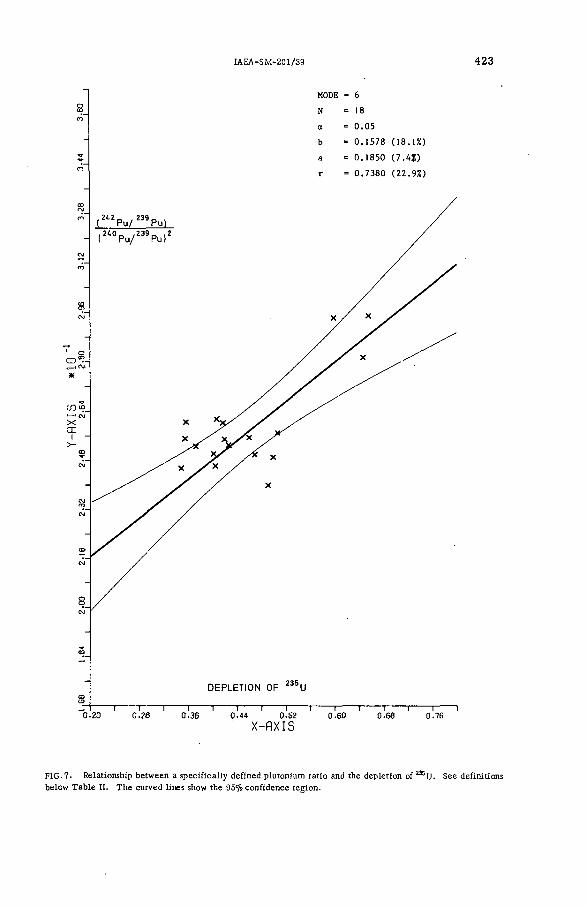
Y_j
qXjg
ж
Ю1,
84
2,00
,
2.16
2.
32
2.48
,
2.64
2.
80
2;9
6 3.
12
3.28
3-
44
3-60
IAEA -SM -201/39 423
MODE = 6
N = 1 8
о = 0 .0 5
b = 0 .1 5 7 8 (18.1% )
a = 0 .1 8 5 0 ( 7 .4 * )
r = 0 .7 3 8 0 (22.9% )
0 -2 0 0.28
DEPLETION OF 235U
I------1------1------1------1------1----- 1—0.36 0.44 0.52 0.60
X-flXIS
“ I— 0-6 8
“ 1 0.76
1
FIG .7- Relationship between a specifically defined plutonium ratio and the depletion of 235U- See definitions below Table II. The curved lines show the 95% confidence region.

424 FOGGI and ZUP
R E F E R E N C E S
[1] BERG, R ., FOGGI, C ., KOCH, L ., KRAEMER, R., WOODMAN, F .J . , "Values and use of isotopic correlations in irradiated fuels", in Proc. Symp. Practical Aspects of R and D in the Field of Safeguards, Rome, March 7-8, 1974 (CNEN, Rome, 1975).
[2] SOLA, A ., ISOTEX-1. Code de calcul de concentrations isotopiques et de rapports de concentrations,EUR-5111 (1974).
[3] BIANCO, A ., et a l . , "Messa a punto di un metodo per il calcolo di noccioli arricchiti in plutonio ai fini del riciclo del plutonio nei reattori term ici", EUR-3891 (1968).
[4] ARIEMMA, A ., BRAMATI, L ., GALL1ANI, M ., PAOLETTI GUALANDI, M ., ZAFFIRO, B ., CRICCHIO, A. KOCH, L . , Experimental and theoretical determination o f burnup and heavy isotope content in a fuel assembly irradiated in the Garigliano Boiling Water Reactor, EUR-4638e (CEC, Luxembourg, 1971).

IAEA-SM -201/44
I S O T O P E C O R R E L A T I O N S B A S E D O N F I S S I O N - P R O D U C T N U C L I D E S IN L W R I R R A D I A T E D F U E L S A T h e o r e t i c a l E v a l u a t i o n
C. FOGGI, F. FRENQUELLUCCI*.G. PERDISA*CEC Joint Research Centre, Ispra, Italy
Abstract
ISOTOPE CORRELATIONS BASED ON FISSION-PRODUCT NUCLIDES Ш LWR IRRADIATED FUELS.A THEORETICAL EVALUATION.
A parametric survey of correlations between burnup and fission-product buildup has been carried out for LWR fuels. Variable parameters are: fuel enrichment (2-3-4 wt.^o) and moderator-to-fuel volume ratio (1 .2 — 1.64 — 2 .2 ). The fission-product nuclides considered are isotopes 83Kr, 84Ki and ^K r; ш Хе, ^ X e , “ X e; U5Nd, “ *N0, “ Nd; B4Cs, B1Cs; and B4Eu . The calculated correlations have been compared with experimental results from Garigliano. Trino Vercellese and VAK reactor fuels.
1. INTRODUCTION
"Iso top ic-correlation -tech n iqu e" is that branch of reacto r physics which investigates the relationships (commonly term ed correla tion s) between accum ulation and depletion of the different isotopes in nuclear fuels subjected to irrad iation . The isotopes which are taken into account are those of the heavy elem ents (U,Pu) and those of the fission-product elem ents.
C orrelations are mainly used to predict and verify the f is s ile content in irrad iated fuels. The consistency of isotopic analyses perform ed at the rep rocessin g plant can also be verified by the co rrela tio n technique [1 ]. Isotopic co rrelation s are generally divided into three main c la sse s , depending upon the isotopes which are taken into consideration:
(a) Heavy-isotope correlation s: only isotopes of the heavy elem ents (mainly U and Pu) are considered in th is c la ss . One of the te rm s of the co rrela tio n s may be the burnup of the fuel.
(b) Stable fission-product correlation s: one term of the correlation is # based on stable isotopes of fission-product elem ents; the other term is based on isotopes of the heavy elem ents or som etim es the fuel burnup.
(c) Radioactive fission-product correlation s: one term of the correlation is based on isotopes of the heavy elem ents (or som etim es the fuel burnup); the other term is based on radioactive isotopes of fission products.
* Euratom scholarship holders

426 FOGGI e t a l.
The three c la sse s of correlation s exhibit m arked d ifferences in resp ect of:
T h eir present state of developmentThe techniques applicable for experim ental determinationT h eir field of applicationT h eir dependence upon the reacto r ch a ra cte ris tics and power history.
C orrelation s are the subject of both th eo retica l and experim ental investigation [1]. T h eoretica l investigation is generally carrie d out by perform ing accurate burnup calcu lations, from which correlation s are derived. Experim ental investigation is based on detailed m easurem ent of irrad iated fuel isotopic com position, from which correlation s are derived [2 -5 ].
This report d escribes the th eoretica l investigations which are being ca rrie d out at the Join t R esearch C entre of Euratom , on the correlations based on fission-product nuclides. Some resu lts are reported.
2. CHOICE OF FISSION PRODUCTS
The radioactive fission products which can be considered for correlations are few in number. The nuclides which are retained must exhibit the following ch a ra cte ris tics :
*H alf-life reasonably long (at least 2 yr) aHowing the recording of the whole power history of the re a cto r ;
F iss io n yield reasonably large (at least some tenths of a per cent) so that the nuclide will be produced in sufficient amounts;
W ell-defined у -lin e s , at energies g reater than 100 keV, with reasonably large branching value to allow easy and accurate m easurem ent.
C areful analysis of a ll radioactive fission products has proved that only three nuclides are suitable for establishing correlation s in LWR fuels, namely 134Cs (h alf-life 2.1 y r), 137Cs (half-life 30 yr) 154Eu (half-life 8.5 yr).
On the other hand, stable fission products which can be considered for co rrelation s are num erous. Exp erim enters have, up to now, confined their attention to the isotopes of K r, Xe and Nd only. The reasons for this choice are:
Kr and Xe are gaseous and so may be easily separated from the bulk of the irrad iated fuel and analysed in a m ass spectrom eter.
Nd is routinely separated from the bulk of the fuel, since 148Nd is commonly used as a burnup indicator; the Nd is therefore easily available for analysis in a m ass spectrom eter.
The isotopes which have been retained for correlation s are S3K r, 84K r, 8 6K r; 1 3 1X e, 1 3 2 X e, 1 3 4 X e; 145Nd, 146Nd, 1 4 8 Nd.

IAEA-S М -201/44 427
3. CHOICE OF THE TERM S OF THE CORRELATION
A correlation shows the relationship between two quantities. In our analysis the f ir s t of these two quantities is the fuel burnup (expressed as the fraction of heavy atoms initially present which have been burnt).
The second quantity to be used in the correlation is based on the concentration ratio of two fission-product nuclides. The choice of a concentration ratio instead of an absolute concentration is dictated by consideration of ease and accuracy of m easurem ent.
To produce co rrela tio n s which represent straight line relationships, this second quantity must be an increasing function of the fuel burnup; this requirem ent im poses a lim itation on the number of quantities that can be taken into consideration. A fter analysis of a ll possible ra tio s , the following ones have been retained:
134C s , 154E u
137Cs 137Cs
^ K r , 86K r , 84Kr86K r 83K r 6äKr
132X e 134X e 132X e
131X e 131X e 131Xe
146Nd , 146Nd , 148Nd145N d 148N d 145N d
4. CALCULATION PROCEDURE
The decay chains which include the fission-product nuclides considered in our analysis are shown in F ig s 1 and 2. The calculation of the concentrations of the various nuclides has been perform ed with the point burnup codes ISO TEX -1 [6 ]; the resulting correlation s have been compared with the experim ental resu lts by m eans of the code ISOCORR [7]. The nuclear data which have been used in the calculations are taken from the following sou rces:
F iss io n y ield s, decay constants, branching ratios: values reported by Sola [6 ];
C ro ss-se ctio n s : average values calculated with the GGC-II code [8 ], or derived from the W estcott therm al c ro ss -se c tio n s and the resonance in tegral reported in R ef. [9].
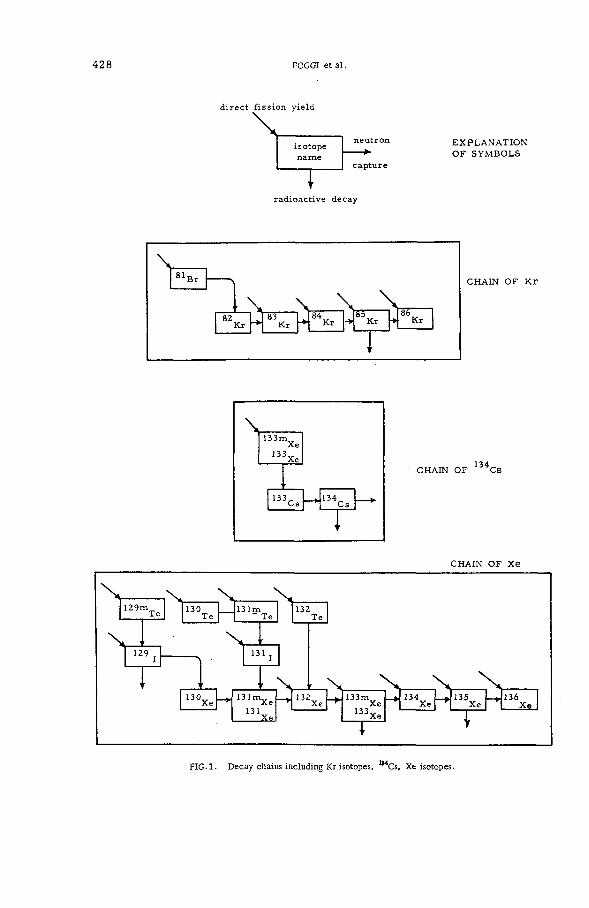
428 FOGGI et a l.
d ire c t f i s s io n y ie ld
E X P L A N A T IO N O F S Y M B O L S
C H A IN O F 134C S
C H A IN O F x e
F IG .l. Decay chains including Kr isotopes, ^ C s , Xe isotopes.

IA EA -SM -201/44 429
C H AIN OF Nd
1A4C HAIN OF Eu
FIG. 2. Decay chains including Nd isotopes and ^ E u .
As is well known, som e of the nuclear data found in the litera tu re are not accurate enough for an accurate calculation to be made. The inaccuracy of fission yields is in general not very large; the sam e holds for the decay constants, with the sole exception (as fa r as we are aware) of 154Eu, whose h a lf-life was quoted as 16 yr [ 1 0 ] but is m ore likely to have the value8.5 y r [11, 12]. The main sou rces of e r ro r in the calculation are the average c ro ss -se c tio n s . This is so for two reasons — the values of the c r o s s - section as a function of energy may not be known to sufficient accuracy and the neutron spectrum used in the averaging procedure may not have been evaluated accurately enough. Fortunately, not a ll the c ro ss -se ctio n s which
Text continues on p.437

430 FOGGI et al.
FIG .3. Correlation between burnup (FT) and MKr/86Kr atom ratio: dependence on fuel enrichment and moderator-to-fuel volume ratio.
FIG.4 . Correlation b etw een burnup ( F^) and 84K r/86Kr atom ratio: comparison with experim ental resultsfrom VAK reactor fuel.

IAEA -SM -201/44 431
FIG-5. Correlation between burnup (F j ) and ^K r/^K r atom ratio : comparison with experimental results from Garigliano reactor fuel.
FIG.6 . Correlation betw een burnup (F j ) and MKr/®Kr atom ratio: com parison with experim ental results fromGarigliano reactor fu el.

432 F O G G Ie ta l.
FIG-7. Correlation between burnup (F-p) and ü2X e /U4Xe atom ratio: Dependence on fuel enrichment and moderator-to-fuel volume ratio.
FIG. 8 . Correlation betw een burnup (FpO and 32X e /134Xe atom ratio: comparison with experim ental resultsfrom Garigliano reactor fu el.

IAEA -SM -201/44 433
from Trino Vercellese reactor fuel.
FIG-10. Correlation betw een bumup (F j ) and ^ X e /^ X e atom ratio: com parison with experim ental resultsfrom VAK reactor fu el.

434 FOGGI et a l.
moderator-to-fuel volume ratio.
FIG-12. Correlation betw een bumup (F j ) and ^ N d /^ N d atom ratio: comparison with experim ental resultsfrom VAK reactor fu el.

IAEA -SM -201/44 435
from Trino Vercellese reactor fuel.
FIG. 14 . Correlation betw een burnup (F^) and ^ N d /^ N d atom ratio: comparison with experim ental resultsfrom Garigliano reactor fu el.

436 FOGGI et a l.
FIG-15. Correlation between burnup (F«p) and 154Eu/ü7Cs atom ratio : comparison with experimental results from Trino Vercellese reactor fuel.

IAEA -SM -201/44 437
FIG .16. Correlation between bumup (Fp) and 134C s/137Cs atom ratio: Comparison with experimental results from Trino Vercellese reactor fuel.
appear in the decay chains play an im portant ro le in the calculation. A carefu l analysis showed that only the following cro ss -se ctio n s are im portant (and must th erefore be known with good accuracy):
F o r calculation of K r isotope concentrations: c ro ss -se c tio n s of 83K r;
F o r calculation of Xe isotope concentrations: c ro ss -se c tio n s of 1 2 9 I,1 3 1X e, 1 3 5Xe;
F o r calculation of Nd isotope concentrations: c ro ss -se c tio n s of 1 4 1P r, 1 4 3 Nd, 1 4 5Nd, 1 4 7Nd;
F o r calculation of C s isotope concentrations: c ro ss -se c tio n s of ® C s and 134C s;
F o r calculation of 154Eu concentration: c ro ss -se c tio n s of I5t)Sm, ls lSm, 1 5 2 Sm, 153E u ,1 5 4Eu.

438 FOGGI et a l.
5. PARAMETRIC ANALYSIS
With the codes and the procedures described in the preceding section, a p aram etric survey has been perform ed. Only LWR fuels have been considered (U02 type, Z ircaloy cladding), with enrichm ents ranging from 2 to 4 wt.% and m od erator-to -fu el volume ratios between 1.2 and 2 .2 . A total of 9 ca ses has been analysed. The various co rrelation s obtained are presented in F ig s 3 -16 . The param eter FT rep resen ts the fraction of in itia l heavy atoms which have been burnt (and is roughly proportional to burnup). The lab el on each curve shows the fuel enrichm ent (wt.%) and the m oderator- to -fu el volume ratio to which the curve re fe rs . F ig u res 3 to 6 report correlation s based on K r isotopes; F ig s 7 to 10 report correlation s based on Xe isotopes; F ig s 11 to 14 report correlation s based on Nd isotopes;F ig .15 rep orts the 1 5 4E u /131Cs correlation ; and F ig .16 reports the 1 3 4C s /137Cs correlation .
As can be seen, there is a m arked dependence of the correlation s on fuel enrichm ent and m od erator-to -fu el volume ratio . In the case of the 1 3 4 C s /137Cs correlation , there is also a strong dependence on the fuel power history; this effect is now being analysed. It must be rem arked that one consequence of this dependence is that the correlation for a single fuel pellet is substantially different from the correlation for complete fuel batches. Com parison with experim ental resu lts from Trino V erce llese [2, 5], Garigliano [3] and VAK [4] reacto r fuels was satisfactory , with some minor correction s to a few nuclear data.
R E F E R E N C E S
[1] BERG, R., FOGGI, C ., KOCH, L ., KRAEMER, R., WOODMAN, F .J . , Value and use of isotopic correlations in irradiated fuels, Symp. Practical Aspects of Rand D in the Field of Safeguards, Rome (1974).
[2] BRESESTI, M ., et a l . , Post irradiation examination of a fuel assembly discharged from the Trino Vercellese reactor after the 2nd irradiation cycle, Euratom Rep. (in preparation).
[3] ARIEMMA, A ., BRAMATI, L ., GALLIANI, M ., PAOLETTI GUALANDI, M ., ZAFFIRO, B ., CRICCHIO.A. KOCH, L ., Experimental and theoretical determination of bum-up and heavy isotope content in afuel assembly irradiated in the Garigliano Boiling Water Reactor, Euratom Rep. EUR 4638 (1971).
[4] KOCH, L ., HOCHSTEIN, P .. POHL, P ., WOLFF, U ., Nachbestrahlungsuntersuchungen eines Brennelementbündels des VAK-Reaktor und Vergleich mit Rechnungen, Euratom Rep.EUR 4690 (1971).
[5] BRESESTI, A .M ., e t a l . , Post-irradiation analysis of Trino Vercellese reactor fuel elements, Euratom Rep EUR 4909 (1972).
[6] SOLA, A ., ISOTEX-1: Code de calcul de concentrations isotopiques et de rapports de concentrations, Euratom Rep. EUR 5111 (1974).
[7] FOGGI, C ., ZIJP, W .L ., Data treatment for isotopic correlation technique, IAEA-SM-201/39.These Proceedings, V ol.II.
[8] SMITH, C .V ., VIEWEG, H .A ., GGG-II: a program for using the GAM-11 and GATHER-II Spectrumcodes in preparing Multigroup Cross-Sections input on punched cards......... General Atomic Rep.,GA-4436 (1963).
[9] POPE, A .L ., STORY, J . S . , "Therm al average, resonance integral and fission-spectrum average neutron capture cross-sections of nuclides with Z=30 to 68", in Proc. Panel Fission Product Nuclear Data,Bologna (1973) IAEA-169 (Internal report).
[10] LEDERtK, C .M ., HOLLANDER, J .M ., PERLMAN, I ., Table of Isotopes, Wiley and sons, New York (1967)[11] GUNNINK, R ., NIDAY, J .B ., ANDERSON, R .P ., MEYER, R .A ., Gamma Ray Energies and Intensities,
Lawrence Radiation Lab.Rep. UCID 15439 (1969).[12] EMERY, J .F . , REYNOLDS, S .A ., WYATT, E .J . , GLEASON, G .I . , Half-lives of radionuclides-IV,
Nucl. Sei. Engng <Ш(1972) 319-323.

I A E A B A N K O F C O R R E L A T E D I S O T O P I C C O M P O S I T I O N D A T A
IAEA-SM -201/100
S. SAN AT AN IDepartment of Safeguards and Inspection
P, SIWYDepartment of Technical Operations, International Atomic Energy Agency, Vienna
Abstract
IAEA BANK OF CORRELATED ISOTOPIC COMPOSITION DATA.With the progress in the development of isotopic correlation techniques (ICT) for safeguards, a need
was felt to set up a computerized data bank to store all relevant isotopic data which might be useful for the application of the techniques. Such a data bank is being set up in the Agency with the co-operation of scientists in different centres interested in ICT. The following kinds of data will be stored in the present version of the data bank, called Mark I:
Batch data from input batches to a reprocessing plant; Destructively measured data on irradiated pellets/sm all samples; Non-destructively measured data on irradiated pellets/sm all samples; Calculated data on irradiated pellets/sm all samples; Isotopic data on fresh fuel (measured by fabricator or laboratory); Calculated data on spent fuel rods or assemblies; Non-destructively measured data on irradiated fuel rods or assemblies; Batch composition data, i.e . list of assemblies constituting a given batch.
Four standardized report forms were agreed upon for submission of data for storage in the bank. Software for updating, retrieving and processing data has been developed and samples of test data are being used to check the operation of Mark I. Based on the experience gained with Mark I, further refinements and improvements in the software and in the formats for collection of data would be undertaken to yield Mark II of the data bank. A co-ordinated research programme among a small group of centres with this objective is underway.
INTRODUCTION
In the last few y ears a body of techniques and procedures, called Isotopic C orrelation Techniques (ICT), has been developed for using isotopic data of U and Pu and values of Pu/U ra tio , m easured at the input of a rep rocessin g plant for strengthening safeguards verification [1 -5 ]. In addition to such data, non-destructive and destructive analysis data of irradiated p ellets or sm all sam ples (or even NDA data of irradiated fuel rods or assem blies) com prising also data on various fission products, have been found very useful for the application of ICT.
In view of the large amounts of data already available from rep rocessing plants and analytical lab oratories and in view of s t ill la rg e r amounts of data expected to becom e available in the near future it appeared desirable to co llect and store system atically all relevant data in a computerized data bank. The main point was to store data in a w ell-defined form at so that subsequent re triev a l or processing for com parison of old or h isto rica l data with new data, is easy.
439

440 SANATANI and SIWY
1. EA R LIEST VERSION OF THE IAEA DATA BANK
In our f irs t attempt to set up a Data Bank, we experim ented with data from Yankee, Rowe rep rocessing compaigns (Cores I-V I) provided to us by Battelle Northwest L aboratories, USA, in 1972. F o r each input batch, we had data on four isotopes of U and five of Pu plus U -total and P u -to tal — making a total of eleven variab les numbered X j . . . x n . Fu rther variables were formed by taking ra tio s, squ ares, cubes, etc. of the variab les x x to xn so that in a ll 35 variab les were obtained for each batch.
The computer was program m ed to print out a 35 X35 correlation m atrix for these v ariab les, based on data from all the batches of a particu lar core . Next, about 20 correlation s were chosen and the computer was asked to print out the slope and intercept of the linear le a st-sq u a res fit for these co rre la tio n s, say, Pu/U versu s 2 3 5 D. Scatter of the m easured points about the fitted line (residuals) and also sev era l other s ta tis tica l param eters of the reg ressio n analysis were also autom atically printed out. In this way o u tliers, if any, in the data set could be im m ediately spotted. The computer was also programmed to pool together two sim ilar sets of data.
Although the data base of our f ir s t data bank was too sm all, storage and re triev a l program m es, and esp ecially the package of s ta tis tica l program m es, proved to be operable and m ore than adequate for present needs.
1. 1. P rese n t version of the IAEA Data Bank
The present version of the Data Bank em erged from a se r ie s of consultations with experts in other cen tres in terested in this problem.In p articu lar, based on the existing data banks at the Transuranium Institute, K arlsru he, and at the IAEA, a m odification was undertaken by a jo int group from these two cen tres [6 ]. It was recognized that considerable expansion of the data base, i. e. the types of data to be stored, was d esirable and instead of trying to co rre la te , with the brute force of the computer, each conceivable variable against another, it would be better to se lec t only a few prom ising correlation s to s ta rt with.
Sample data, for trying out the bank wfere provided to us in an agreed form at, by sev era l experts who agreed to co-operate with us in the data bank p ro ject. The software in P L /I language to suit the IA EA 's IBM 370/145 computer is being developed in the IAEA by the Computer Section. The f ir s t version of the expanded Data Bank as it now stands will be called Mark I and the main featu res are described in the following paragraphs.
2. FEA TU RES OF THE IAEA DATA BANK
2.1. Kinds of data stored
Although the isotopic com position data of U, Pu m easured at the input of a rep rocessin g facility (batch data) form a cornerstone in the applications of IC T, other kinds of data are also im portant for following accurately the flow of nuclear m ateria l from one facility to another. F o r exam ple, sm all sample data in contrast to batch data, provide us with inform ation on local

IAEA -SM -201/100 441
variations of burnup within a core and can be used for checking purposes in the absence of batch data. S im ilarly , NDA data or calculated data on irradiated p ellets, rods or fuel assem blies can be compared with advantage with corresponding m easured (destructively) data if available. In some ca ses NDA and calculated data might be the only data that are available for a p articu lar fuel and hence of much importance for re feren ce .
The data bank has thus been designed to store a much wider variety of data than in itially planned. These are listed below:
Batch data from input batches to a rep rocessing plant;
D estructively m easured data on irradiated p e lle ts /sm a ll sam ples;
N on-destructively m easured data on irrad iated p e lle ts /sm a ll sam ples;
Calculated data on irradiated p e lle ts/sm a ll sam ples;
Isotopic data on fresh fuel (measured by fabricator or laboratory);
Calculated data on sf^ent fuel rods or assem blies;
N on-destructively m easured data on irradiated fuel rods or assem blies;
Batch composition data, i. e. lis t of assem blies constituting a givenbatch.
2.2. C ollection of data for Data Bank — ICT report form s anddata form at
To m aintain uniform ity in the form at in which data is provided for storage in the bank, a set of report form s was agreed upon (see F ig s 1-4). Suppliers of data were requested to provide data only in the suggested form at using form s 1-4, leaving blanks where no inform ation was available. The form s, though sim ilar in appearance to those used under safeguards ag reem ents (ICRs, P IL s , e tc . ) for reporting inform ation to the IAEA, cover a much larg er range of data than required under safeguards implementation. However, the data bank, being at the present stage a re search and development effort which depends on a voluntary supply of u nrestricted data, it was thought appropriate to ask for a ll data that seem ed relevant for development of ICT.
Report form s 1, 2 and 3 (Figs 1-3) com prise isotopic composition data of U and Pu (in a dozen possible alternative units); U -, Pu- and Th-total; f iss ile U, f iss ile Pu; fission-product ratios and 137Cs absolute. There is- provision to store associated m easurem ent e r ro r , again in sev era l possible alternative units, corresponding to each entry. F o r rep rocessin g plants which recy cle acid back to the input, there is provision to store batch isotopic data either corrected or uncorrected for recy cle . S im ilarly , there is an indication to show whether the heavy isotope data (mainly 241Pu) of fission-product data reported to us have been corrected for natural radioactive decay or not. If not, knowing the dates of discharge and of analysis, and corresponding h a lf-liv es the data can be easily corrected for decay.
Report form 4 (Batch Composition Data — F ig . 4) serv es as a link between form s 1 and 3. Information provided on this form is vital for comparing predicted and m easured amounts of nuclear m ateria l in an input batch.
Text continues on p.446

FIGЛ
. IC
T R
eport form 1.
Reprocessing data.
zttAMIS p u v INVAVNVS

FIG.2. ICT Report form 2. Measured and calculated post-irradiation pellet and assembly data.
IAEA
-SM-201/100
44
3

F1G.3.
1CT Report form
3. Fresh fuel and calculated assem
bly data.
* Ы ** jJ •Э
J £ _-4 04 .Л
I toN> W U> W
• fc»/ tt! it D ivj
H -o V c
£ AО О p p
£
l\> ro
♦О П С С С0 0 1 1 1I I ГО ГО POГО N Ы Ы UЫ Ы Ф р\ Ol40 00 < н
Card Number
'MBAf a b r ic a t o r
'MBAla b o ra to r y
Remeasurement
Update mode
© SOas,
P :H-* < <*4>
U n it
U n it
U n itfc•p» Э УР■) о и *-■
Ö un it
MBAr e a c to r
Ke ac to r type
» p p Г Э C+ p ©
C lad d in gIn it .r.he m .st.C o n tro l roeth.
>Number o f ro d s
**Core No*
mA M IS puc IN VA V M VS

Ca
rd
Num
ber
Name o r No. o f a n a ly se d batch
3
О(->Q,0) U b О
<n<< Иa s
о
0)ТЭ0Ecj+*flj'SD
Name o r No. o f fu e l element
tb £----
------
---—
MBA
fab
ric
ato
r
1 U
pd
ate
m
ode
|
Name o r No. o f fu e l element
a !ba
fab
ric
ato
r
<rTJ0 £01 ■H П Tj0a
Name o r No. o f fu e l element
3 M
BAfa
bri
ca
tor
I U
pd
ate
m
odel
Name o r No. o f fu e l elem ent
St ÄM
BA fab
ric
ato
r uö03D■»w
p
Name o r No. o f fu e l element
f t *M
BAfa
bri
ca
tor
4|1 1 1 1 1 1 1 1 t [ 1 1 1 1 1 1 1 1 1 1 1 1 1 1 1 1 1 1 1 1 1 1 1 1 1 1 1 1 1 1 I 1 1 M 1 1 1 1 1 1 1 1 1 1 . 1 11 1 1 1 1 > 1 1 J 1 1 1 1 1 1 1 i 1 1 1 1 1 1 i t 1 1 i 1 1 1 1 1 1 1 1 1 1 1 1 1 1
i'll 1 1 1 1 1 1 1 1 1 1 I 1 1 1 1 1 1 1 1 1 1 1 1 1 1 1 1 1 1 1 1 1 1 1 1 1 1 1 1 1 1 1 1 1 1 1 1 1 1 1 1 1411 1 1 1 1 1 1 1 1 1 1 1 1 1 1 1 1 1 1 1 1 1 1 1 M 1 1 11 1 1 1 1 1 1 1 1 1 1 1 1 1 1 m i
fill 1 1 1 1 > 1 1 1 1 1 1 1 1 1 1 1 1 1 1 1 1 1 1 1 1 1 1 1 1 1 1 1 1 1 1 1 1 1 1 1 1 1 1 1 1 1 11 11 1 1 14,1 1 1 1 1 1 1 1 ■ 1 1 1 1 1 1 1 1 1 1 1 1 1 1 1 1 1 1 1 1 1 1 1 1 1 1 1 1 i n 1 1 1 1 1 1 1 i 1 1 1 1 1 1 1 1 1 1 1 14I1 > 1 1 1 t ) ! i 1 1 1 1 1 1 1 1 1 1 t > 1 1 1 1 1 1 1 1 1 1 1 1 1 1 1 1 1 1 1 1 1 1 1 1 1 1 1 1 1 1 1 1 1 1 1 1 1 1 14|1 i i 1 1 1 1 1 1 1 1 1 1 1 1 1 1 1 1 1 1 1 1 1 1 1 1 1 1 1 1 1 1 1 1 1 1 1 1 1 1 1 1 1 1 1 1 1 1 1 1 1 1 1 1 1 1 1 1 1 14|l 1 1 1 1 1 1 1 1 1 1 1 1 1 1 1 1 1 1 1 ! 1 1 1 1 1 1 1 1 1 1 1 1 1 1 1 1 1 1 1 1 1 1 1 1 1 1 1 1 1 1 1 1 1 1 1 11 1 1 1
411 1 1 1 1 1 1 1 i f i 1 1 1 1 1 1 1 1 1 1 1 1 1 M 11 1 1 1 1 1 m i 1 1 1 1 1 1 1 1 1 1 1 1 i 1 1 1 1 1411 1 1 1 1 1 1 1 1 11 1 1 1 1 1 1 1 1 1 1 1 1 1 1 1 1 1 1 1 1 1 1 1 1 1 1 1 1 1 1 1 1 1 1 1 1 1 1 1 1 1 1 1
_4ll 1 1 ! 1 1 1 1 1 1 1 1 1 1 1 1 1 1 1 1 1 1 i. 1 1 1 1 1 1 1 1 1 1 1 1 1 1 1 1 1 1 1 1 1 1 1 1 1 1 1 1 1 1 1 1 1 1 1 1 1 1.411. 1 1 1 1 1 1 1 - i - i 1 1 1 1 1 1 1 1 1 1 1 1 I 1 1 1 1 i 1 1 1 1 1 1 1 1 1 1 1 1 1 1 1 1 1 1 1 1 1 1 1 1 1 1 1 1 1 1 1 1 1
411 1 1 1 1 1 1 1 1 11 1 1 1 1 1 1 1 1 1 1 1 1 1 1 1 1 1 1 1 1 1 1 1 1 1 i 1 m i 1 1 1 1 1 1 1 - l - L J J 1 1 1 1 1 и 1 1 1'i)i 1 1 1 1 1 1 1 1 11 1 1 1 1 1 1 1 1 1 1 1 1 1 1 1 1 1 1 1 1 1 1 1 1 1 1 1 1 1 1 I I 1 1 ! 1 1 1 1 1 1 1 1 1 1 1 1 1 1 1-iii 1 1 1 1 1 1 1 1 11 1 1 1 1 1 1 1 1 1 1 1 1 1 1 1 1 1 1 1 1 1 1 1 1 1 1 1 1 1 1 1 1 1 1 1 1 1 1 1 1 1 1 1 1 1 1 1 1 1 1411 1 1 1 1 1 1 1 1 t 1 1 1 1 1 M 1 1 1 1 1 1 1 1 1 1 1 1 1 1 1 1 1 1 1 1 1 1 1 1 1 1 1 1 1 1 1 1 1 1 1 1 1 1 1 1 1 1 1 1411 1 1 1 1 1 1 1 1 11 1 1 1 1 1 1 1 1 1 1 1 11 1 1 1 1 1 1 1 1 1 I I 1 1 1 1 1 1 1 1 1 1 1 1 1 1 1411
■ 4U
4 ii
1 1 1 1 1 1 1 1 11 1 1 1 1 1 1 1 1 1 1 1 1 1 1 1 1 1 J _ L _ L _ 1 1 1 1 1 1 1 1 1 1 1 1 1 1 1 1 1 1 1 1 1 I I I 1 M 1 1 11 1 1 1 I 1 1 . ..1 1 1 1 1 1 1 11 1 1 1 1 1 1 и 1 1 1 1 1 1 1 1 1 1 1 1 1 1 1 1 1 1 1 1 1 1 1 1 1 1 1 1 1 1 1 1 1 1 1 11 I 1 1 1 1 1 1 11 1 1 1 1 1 1 1 i 1 1 1 1 1 1. 1 1 1 1 1 1 1 1 1 1 1 1 1 1 1 1 1 1 1 1 1 1 1 1 1 1 1 1 1 1 1 1 1 1 1 1
4M 1 1 1 1 1 1 1 1 11 1 1 1 1 1 1 1 1 1 1 1 1 1 1 1 1 1 1 1 1 1 1 1 1 1 1 1 I I 1 1 1 1 1 1 1 I I 1 1 1 1 14 ii 1 1 1 1 1 1 1 1 11 1 1 1 1 1 1 1 1 1 1 1 1 1 1 1 1 1 1 1 1 1 1 1 1 1 1 1 1 1 1 1 1 1 1 1 1 1 1 1 1 1 1 1 1 1 1 1 1 1 1
4)1 1 1 1 1 1 1 1 1 11 1 1 1 1 1 1 1 I 1 I 1 1 1 1 1 1 1 1 1 1 1 1 1 1 1 1 1 1 1 1 1 1 1 1 1 1 1 1 i 1 1 1 1 1 1 1 1 • 1 1v 1 1 1 1 1 1 1 1 11 1 1 1 1 1 1 1 1 1 1 1 1 1 1 1 1 1 1 1 1 1 1 1 1 1 I I 1 1 1 1 1 1 1 1 1 1 1 1 1 1 1 1 1 1 1 1 1 1 14,1 1 1 1 1 1 1 1 1 1 1 1 1 1 1 1 1 1 1 1 1 1 1 1 1 1 1 1 1 1 1 t 1 1 1 1 1 1 1 1 1 1 1 1 1 1 1 1 m i 1 1 1 1 1 1 1 m i
JLi L.l. 1 1 1 1 .1 . 1 11 1 ,l-i_L 1.I...1 1 1 1 .1 .J - I .L 1 1 1 1 1 1 1 i 1 1 1 1 1 1 . 1 . 1 1 1 i 1 1 1 1 1 i - i - 1 1 l_ l_L.l.. 1 1 l_ L4H L.l.I I 1 l . l 1.1. I..I-L I I I I 1 I 1 1 .1 .1 И I LJ I I I I I I I I I I i I I I I I I I I I I I I I I I I I I I I I I I I I1 3 11 16 14 13 37 42 5 0 S S 63 68 16
FIG.4. ICT Report form 4. Batch composition data.
IAE
A-SM
-201/100 445

446 SANATANI and SIWY
For batch and p elle t data (F igs 1 and 2)
Name and number of analysed batch, pellet;
MBA code for re p r o ce sso r or laboratory, if available;
Type of data: batch or pellet;
Burnup of irrad iated fuel or p elle t if m easured by re p r o ce sso r or laboratory (in d ifferent p o ssib le alternative units);
H ead-end m easu red d iscard of U and Pu (in gram s or percentage of input);
Date of an a lysis .
F or fuel a ssem b ly data (Fig. 3)
Nam e or num ber of fuel a ssem b ly
MBA code of fabricator, reactor and laboratory
R eactor type
Cladding
In itial ch em ica l state of fuel
Control method
Void fraction (average for a cyc le) for BWR
Num ber of rods per a ssem b ly Core number
Date of an a lysis by fabricator and laboratory
Date of d isch arge
Calculated exposure
Apart from iso top ic data, which are the only ones that enter intocorre la tion s and form ulae for r e g r e ss io n an a lysis e tc . , other u sefu lau xiliary data are lis te d as headings in the reporting form s. E xam ples are
3. SOFTWARE FOR THE DATA BANK
A s already m entioned, the com puter program s for the data bank are being developed in the IAEA. They w ill be in the P L /I language. Data can be provided in d ifferent alternative units for quantities like isotop ic com position , burnup, e r r o r s , e tc . but they w ill be in tern ally stored in the bank in one sp ecified unit for each quantity.
D eta ils on the softw are and explantion of the report form s are given in R ef. [7].
3.1 . P r o c e ss in g of data
Once data have been co llec ted and stored , the next step is to p ro ce ss the data to study corre la tion s between different v a r ia b le s . L inear r e g re s

IAEA-SM-2 0 1 /1 00 447
an a lysis and s ta tis t ic a l te s t s developed for the or ig in a l v er s io n of the data bank in the A gency are s t il l being used for th is purpose. Further d evelopm ent, e sp e c ia lly in the se lec tio n of a sm a ll num ber of co rre la tio n s that look p rom isin g are fo reseen . F or purposes of testin g out the Data Bank Mark I, the follow ing co rre la tio n s w ere chosen:
236U v s 235U
P u/U vs 235 jj
240pu/239 Pu VS 235U /
235D vs 134C s /137Cs
240Pu v s ш Х е / 131 Xe
240Pu vs 242P u / 241Pu
and studied for batch, p elle t and calcu lated data from LWR fuel cy c le .
4. FUTURE PLANS FOR THE DATA BANK
Once Mark I b ecom es fu lly op erab le, further refinem ents and1 im p rovem ents in the softw are and data form at w ill be undertaken if n e c e ssa r y to provide the next v ersio n of the data bank to be term ed Mark II. A co ordinated resea rch program m e on the data bank is under way to th is end.
S im ultaneously, with the developm ent of the softw are of the data bank, stud ies w ill continue on developm ent of procedures for actual application of ICT so that the data bank can se rv e as a u se fu l too l for safegu ard s.Data on fuel types which have not been covered yet (e. g., Pu r e c y c le , fast b reed ers , e tc . ) w ill have to be studied next to expand the scope of the data bank.
V arious fea tu res have had to be le ft out in the in itia l stages of setting up the bank, e . g., d iscrim ination in the quality of iso top ic data from different so u rc es , u se of data from output batches of a rep ro cess in g plant. T hese are expected to be taken up in due cou rse. 5
5. CONCLUSION
A Bank of C orrelated Isotopic Data is being se t up in the A gency after a s e r ie s of consu ltations with exp erts and further resea rch and developm ent are under way. From r e su lts obtained so far, Isotopic C orrelation s T echniques have proved to be a p rom isin g too l for safeguards and the m ain purpose of the data bank would be to store large am ounts of "historical" data for com parison with new data as they becom e availab le. Another purpose w ill be to help in the gen eral developm ent of ICT for safeguards by com puterizing a c c e s s to old data.

448 SANATANI and SIWY
A C K N O W L E D G E M E N T S
The authors w ish to acknowledge gratefu lly the continuing cooperation of the follow ing exp erts in the setting up of the IAEA Bank of C orrelated Isotopic Com position Data: L. Koch and other m em bers of the Transuranium Institute, K arlsruhe; D. E, C hristen sen , B attelle M em orial Institute, R ichland, USA; F . Houck, A rm s Control and D isarm am ent A gency, USA;C. Be,ets, Centre d'etude n u c lea ir es , Mol, Belgium and H. Um ezaw a, Japan A tom ic E nergy R esearch Institute, Tokai-M ura, Japan. The encouragem ent by M e ssr s E. L opez-M enchero, A. J . W aligura and C. G. Hough of the IAEA is a lso thankfully acknowledged.
R E F E R E N C E S
[ 1 ] CHRISTENSEN, D.E., et a l., in Safeguards Techniques (Proc. Symp. Karlsruhe, 1970) 2 , IAEA,Vienna (1970) 563.
[2 ] STEWART, K.B., SCHNEIDER, R.A.. Ibid.2 (1970) 583.[3 ] KOCH, L.. e t a l., Ibid.2 (1970 ) 539.[4 ] MOEKEN, H.H.Ph., BOKELUND, H., Ibid. 2 (1970) 551.[5 ] INTERNATIONAL ATOMIC ENERGY AGENCY. Safeguards T ech n ica l Manual Part E, Chapter 7 (1975).[6 ] BRANDALISE, B„ CRIECHIO, A ., KOCH, L„ KSCHWEDT, H„ SANATANI. S„ SIWY, P., Euratom
Rep. (to be published).[7 ] SIWY, P., Outline o f the IAEA ICT data base; Coding rules for ICT report forms, (unpublished IAEA
papers).

IMPROVEMENTS AND EXPERIENCE IN THE ANALYSIS OF REPROCESSING SAMPLES
IA EA -SM -201/2
L. KOCH*, H .J. ARENZ**, A. von BAECKMANN*A. CRICCHIO* R. DE MEESTER* M, ROMKOWSKI*. E, VAN DER STIJL** M. WILHELMI** European Institute for Transuranium Elements,
Karlsruhe, Federal Republic of Germany * * Directorate of Eurotom Safeguards,
Luxembourg+ Institute für Radiochemie, Karlsruhe,
Federal Republic of Germany
Abstract
IMPROVEMENTS AND EXPERIENCE IN THE ANALYSIS OF REPROCESSING SAMPLES,
Improvements in the analysis of input samples for reprocessing were obtained. To cope with the decom position of reprocessing input solutions owing to the high rad ioactivity, an alum inium capsule technique was d eveloped. A known am ount o f the dissolver solution was w eighed into an alum inium can, dried, and the capsule was sealed . In this form, the sam ple could be stored over a long period and could be redissolved later for the analysis. The isotope correlation technique offers an attractive alternative for measuring the plutonium isotopic content in the dissolver solution. Moreover, this technique allow s for consistency checks o f ana ly tica l results. For this purpose, a data bank o f correlated isotopic data is in use. To im prove the effic ien cy of an a ly tica l work, four autom atic instruments have been developed. The conditioning of samples for th e U-Pu isotopic measurement was achieved by an autom atic ion exchanger. A mass spectrom eter, to w hich a high vacuum lock is connected , allow s the autom atic measurem ent of U-Pu sam ples.A process-com puter controls the heating, focusing and scanning processes during the m easurem ent and evaluates th e data. To ease the data handling, alpha-spectrom etry as w e ll as a b a lan ce have been autom ated.
1. INTRODUCTION
During the re p r o ce ss in g of spent nuclear fuel, in tensive safeguarding is requ ired and, m oreover, the h igh est standards for the in spection system are ca lled for. E xp erience gained during in sp ection s and an a lyses of sam p les resu lted in im provem ents which are. partly under te s t and partly operational. F rom the d ifferent lab ora tories engaged in safeguards an alytica l m easu rem en ts, only the p ro g re ss m ade at the European Institute for T ransuranium E lem en ts is d escrib ed h ere .
The m ain p rob lem s that have been exp erienced are a sso c ia ted with the high rad ioactiv ity of the re p r o ce ss in g input sam p les and the eventual Pu lo s s e s during the p r o c e ss . Solutions to th ese prob lem s have b een found in the fie ld s of sam pling ver ifica tion , volum e m easu rem en ts, data con sis te n c y checking and im proved effic ien cy of an alytica l work.
At m ost of the r e p r o ce ss in g p lants, the m ethod ch osen for an input a n a ly sis is the vo lu m e/con cen tration m ethod, which req u ires a d eterm in ation of the amount of d isso lv e r so lu tion and an an a lysis of the uranium and plutonium con centration s. The m easu rem ents which have to be perform ed for a s in g le input an a lysis are the following:
449

450 KOCH et a l.
Volum e and density m easu rem en ts of the d isso lv e r solutionD ilution of the sam pleSpiking of the sam ple for isotope dilutionM easurem ent of the isotope ra tio s by m a ss sp ectrom etry
Not only the p rec is io n of the m easu rem ent but a lso the calibration e r ro r s of the instrum ents and p rocedu res involved w ill determ ine the accuracy of the input a n a ly sis . In addition, se v er a l other potential so u rces of erro r are ob served in routine operation:
U nrep resen tative sam pling of the d isso lv e r solu tionsU ncorrected recy c lin g of fuel m ateria lL o sse s of fuel to the head-end w asteC ross-con tam in ation of sam p lesA geing effec ts in the sam ple during storage
2. SAMPLING
The rep resen ta tiv ity of a rep ro cess in g input sam ple and its storage stab ility has to be ensured. High rad ioactiv ity lead s to a decom position of the solu tion and m ay cau se Pu plating. The n ece ssa r y im m ediate an a lysis is not p o ssib le in any instance; th erefore, concepts of dry or so lid spiking[1,2] have been proposed . A s a com p lete sam pling is requ ired , the A l- cap su le technique o ffers a cheap alternative; its fea s ib ility has already been dem onstrated [1].
2.1 . Alum inium encapsuled sam ples
R ad io lysis of the d isso lv e r solution in cr ea se s with in creased exposure to the d ischarged fuel. Thus, sam p les of a rep ro cess in g input batch containing highly burnt fuel cannot be stored long enough to allow a re fere e a n a ly s is , which m ay be required to be carr ied out se v e r a l w eeks la ter .With the concept of A l-en cap su led sa m p les, the problem of storage in stab ility can be circum vented . The p rin cip le of th is technique is s im p le . A known amount of the d isso lv e r solution is weighed into an alum inium cap su le, dried, and the cap su le sea led . In th is form , the sam ple can be stored for y e a r s . When the sam ple is required for a n a ly sis , it is r e d isso lv ed together with the alum inium can. T his con cep th as b een tested in the fram ew ork of the in ter-lab oratory te s t ID A -72, by lab ora tories of d ifferent cou n tr ies [1]. The r e su lts indicate that th is technique is at le a s t as good as a d irect an a lysis of the solution which req u ires an im m ediate spiking (F ig .l) .
2.2 . P roced ure of the alum inium cap su le technique
An aliquot of the d isso lv e r sam ple was weighed in an alum inium cap su le. The solu tion was then carefu lly dried, precaution being taken that no sputtering had occurred during evaporation. L ater , the alum inium capsu le was c lo sed . F or the subsequent a n a ly sis the can, together with the evaporated sam p les, is d isso lv ed . This g iv es the advantage that a ll the m ateria l of the sam ple is m ade availab le for the a n a ly sis .

IAEA -S M -2 0 1 /2 451
FIG. 1. ID A -72 a lum in ium -capsu le experim ent; 239Pu concentration of input sam ple o f A -I (□ ) and A -II ( A) contained in alum in ium -capsu les in comparison to sam ple A (•) prepared im m ediately for analysis.
Procedure:
(1) P re-w eigh ed alum inium cap su le is in serted into an alum inium block and filled carefu lly with 1 m l of the sam ple solution;
(2) The cap su le is weighed again;(3) The alum inium block is heated up to 80°C. To sp eed up the evaporation
a stream of filtered a ir is p assed over the su rface of the so lu tions.About 2 h are needed to com p letely evaporate the sam ple;
(4) F or d isso lu tion the cap su le is p laced in a 200 -m l con ica l flask; 10 drops of 8M H N 03 (containing 3 g Hg (N03)2/ l i tr e are added;
(5) The flask is slow ly heated until the d isso lu tion sta rts (caution: the reaction is v igorou s, coo ling m ay be n ecessary );
(6) The acid is added dropw ise until the cap su le is d isso lv ed . An e x c e s s of 2 m l of acid is added to avoid r e cr y sta lliz a tio n during cooling.
3. VERIFICATION OF VOLUME MEASUREMENT
3.1. B alance of p re- and p o st-irra d ia tio n uranium
The ver ifica tion of an input a n a ly sis is p o ss ib le by a balance of uranium for the in itia l and spent fuel. If a m a ss balance is not applied but instead the in itia l and p o st-irra d ia tio n heavy atom s as w ell as the f iss io n ed ones are accounted for in the m ater ia l, any co rrectio n s for m a ss lo s s e s due to energy production and decay are avoided.

452 KOCH e t a l.
E U i , o = £ U i + E P u t( in itia l m etal atom s) (final U atoms) (final Pu and TPu atoms)
+ F; (1)(fissioned atoms)
T his check is only se n sitiv e for erro rs in the amount of uranium , not in the uranium isotop ic com position . Pu and Ft can be obtained from reactor calcu lation s or predicted by the Isotope C orrelation Technique. A variant of the m ass balance technique is the P u /U ratio m ethod which was developed at BN FL W indscale and is used there instead of the vo lu m e/con cen tration m ethod. Equation (1) can be transform ed according to:
E Pui / E u i = £ P u i / ( E U i . o - E P “ i - E F i ) (2)
The advantage of a balance of p re- and p ost-irrad ia tion fuel atom s, when used for ver ifica tion p u rp oses, is the p o ssib ility of detecting lo s s e s of U an d/or e r ro r s in the accountability of the d isso lv e r so lu tion s. L o s se s of Pu,how ever, which a r ise for instance from incom plete fuel d isso lu tion , w ill not be detected . It should be pointed out that the method req u ires accurate inform ation about the in itia l fuel am ount, rUi , 0 , and is not sp ec ific for the iso top ic com p osition of U and Pu.
3.2. Isotope co rre la tio n technique (ICT) * 4
In the p ast it has been observed that p ost-irrad ia tion isotop ic data an d /or fuel p aram eters such as the fuel exp osu re, Pu buildup or 235 U depletion , show an interdependence which can be ex p ressed as sim p le co rre la tio n s . Data used in the exam ples of the ICT are exp ressed as atom ra tio s and, if applicab le, th ese are n orm alized to the in tia l m eta l atom s (IMA) of the fuel, which fo llow s from Eq. ( l ) :
( £ U i + E Pui + E pi ) / E u i,o = £ U i IMA + E p U( IMA +FIMA (3)
The isotope corre la tion technique (ICT) d escrib ed below (F igs 2,3,4) offers an attractive a lternative to m easu rem ent of the P u -iso top ic content, of which the Pu amount is obtained by Eq.(3) using the in itia l fuel weight.
4. IMPROVED EFFICIENCY OF ANALYTICAL WORK BY AUTOMATION
At p resen t, m a ss sp ectrom etr ic isotope dilution an a lysis has to be em ployed for the rep ro cess in g input a n a ly s is . To in cr ea se the throughput of sam p les and to reduce the analytical c o s ts , an autom ation of the an alytica l p ro ce ss w as started [3]. Within ESARDA, a joint effort of the Projekt Spaltstoffflusskon tro lle of GfK (SpFK) and the European Institute for Transurnaium E lem en ts resu lted in an autom ation in the laboratory.To a la rg e extent, the work was sponsored by SpFK. A d escrip tion of the instrum entation and the exp er ien ces gained during their application is

IAEA -S M -2 0 1 /2 453
FIG. 2. Isotope correlation bumup (FIMA °Jo) vs 132X e /131X e ratio. H istorical data (o) o f BWR Garigliano, K ahl, Dodewaard. Checked data ( + ) o f PWR KWO and Trino V erce llese .
242„ /241лPu/ Pu
FIG. 3. Isotope correlation 240Pu IMA vs ^ P u /^ P u for BWR G arigliano spent fuel.

454 KOCH et a l.
FIG. 4. Isotope correlation of 240Pu IMA vs 241Pu/242Pu.
FIG. 5. Autom ate for U /Pu separation.

IA EA -SM -201/2 455
given. The autom ation is com p rised of alpha sp ectrom etry , w eighing of sam p les and sp ike so lu tion s, ch em ica l conditioning of U and Pu m a ss sp ec tro m etr ic sa m p les, m a ss sp ectro m etr ic m easu rem en ts, and data handling and evaluation.
4.1. Sam ple conditioning
An autom atic unit for separating uranium and plutonium from irradiated n uclear fu els s e r v e s to prepare the sam p les of the iso top ic ratios' for m easu rem en t by m a ss sp ectrom etry . The m ethod of separation is based on the adsorption of uranium and plutonium in an ion-exchanger colum ns follow ed by se le c tiv e w ashing out of the e x c e s s uranium and final elution from the colum n of uranium and plutonium . F or adding the washing and elution so lu tions and sam pling up to 5 fraction s, m etering pum ps, m agnetic va lv es and ligh t b a rr ier s for le v e l control are used. Six sam p les can be p ro cessed at once in one apparatus. The equipm ent is controlled by a TTL technique sy stem (tr a n s is to r -tr a n s is to r log ic) (F ig .5).
4.2 , Isotopic an a lysis
M ass sp ectrom etry and alpha sp ectrom etry are em ployed to analyse the isotop ic com p osition of nuclear m a ter ia ls such as uranium , plutonium , am ericiu m and curium . T his technique com bined with isotope dilution, is a lso su itab le for determ ining the isotope content and at p resen t is the only routine quantitative a n a ly sis m ethod for irrad iated m a ter ia ls [5,6].
4 .2 .1 . Autom atic balance
The weight of the sam ple and sp ike containing so lu tions are obtained by m eans of an autom atic b alance. A METTLER H 20 E Spezial balance was m odified for th is purpose. To avoid additional m anipulations in sid e the glove box, the w eighing is in itiated by foot-operated rem ote control.The w eight d isplay unit had to be in creased by one d igit to m eet the req u irem ents of accu racy . The w eight is tran sm itted via a sp ec ia l in terface , con sistin g of a p a ra lle l to s e r ia l con verter and an ASCII encoder, to a te le typ e. A fter record ing the an a lysis num ber e tc ., the w eights are punched in a predeterm ined sequence on to the tape which is ready for p ro cessin g by the com puter.
4 .2 .2 . Alpha sp ectrom eter
An autom atic sam ple changer from the firm F r ieek e & Hoepfner connected to a m ethane flow counter and to a S i-sem icon d u ctor detector is used for a lp h a-sp ectrom etr ic a n a ly ses . The sam ple changer a llow s the autom atic an a lysis of up to 30 sam p les per load . Each sam ple is analysed for its total alpha activ ity by the flow counter and its alpha spectrum by the sem iconductor d etector com bined with a 400-channel an alyser.
The data derived from each sin g le m easu rem en t, i .e . counting tim e, cr o ss-a lp h a cou n tin g-rate and the content of the 400-channel an a lyser , are recorded on paper tape in ASCII-8 by m eans of a S iem ens puncher for subsequent handling.

456 KOCH et al.
FIG. 6. Autom atic mass spectrom eter.
4 .2 .3 . A utom atic m a ss sp ectrom eter
A fully autom atic m a ss sp ectrom eter allow ing continuous m easu rem ent of uranium , plutonium and neodymium sa m p les, has been developed to such an extent that the sam ple placed on the sam ple c a r r ie r is m erely introduced into the sy stem and the r e su lts are printed out a s isotop ic ra tio s , atom per cent and w eight per cent (F ig .6).
The sa m p les are introduced v ia a high vacuum lock w here they are preheated so that once placed in the m a ss sp ectrom eter so u rce , the m ea su rem ent can start at once. T h is e lim in ates the usual preheating in m ass sp ec tro m eters and the autom atic instrum ent is used only for m easu rem ent p u rp oses. The lock sy stem co n s is ts of three cham bers arranged lin early with high vacuum sea lin g betw een each through the use of v a lv es. Only the m edium cham ber is connected with the an a lyser head of the m a ss sp ectro m eter .
F o r m a ss sp ectro m etr ic m easu rem en ts, a CH5-TH s e r ia l production unit was extended so that op eration s, as the control of sa fety functions, sam ple heating, focu sin g , m easu rem ents and data re p r o ce ss in g including erro r com putation, run autom atically . The manual operations are e ssen tia lly perform ed by u se of step m otors operated by a p ro ce ss com puter, which at the sam e tim e com m ands the interplay of the lock and the m ass sp ectrom eter .
4 .2 .4 . A utom atic data evaluation
M ass and alpha sp ectrom etry techniques im ply the generation of rather high quantities of sou rce data, which are recorded for a sin g le an a lysis

IAE A -S М -201/2 457
FIG. 7 . A utom atic data evaluation.

458 KOCH et al.
during a period of about a week. T h erefore , the handling of th ese data is not only ted ious, but subject to frequent human e r r o r s , caused by in correct record ing and m istaken m ixing of data of d ifferent sa m p les. F or this reason , the developm ent of an autom atic evaluation was in itiated [7].
The data generated by the b alance, m a ss and alpha sp ec tro m eters as w ell as the input and p aram etric data relevant to each type of a n a ly sis , are handled and reduced by the m ain program MAINBANK.
The gen era l organization of th is program is shown in the flo w -sh ee t of F ig .7 and is b rie fly d escrib ed . MAINBANK sta rts with the ca ll of the su b-rou tine WAYS which reads the input data card s. The f ir s t input card contains in form ation on the type of data to be handled, so that a com puted GO TO autom atically s e le c ts the next sub-program to b e ca lled and the control is consequently tran sferred to GO MASS, GO ALFA, GOWEGT and GOINPT. Each of the f ir s t three program s p ro ce ss the experim ental data from the m a ss sp ec tro m eter , the alpha sp ectrom eter and the balance, r e sp ec tiv e ly , and s to r e s the reduced ones in a lab elled com m on block. The control is then returned to MAINBANK which c a lls the sub-routine BANK. T his su b-rou tine con tro ls the reduced data according to the type of an a lysis and s to r e s the relevant ones in the sm a ll data bank, IDABANK, provided that the an a lysis code to which the data belong, has already been filed into IDABANK.
The sub-program GOINPT handles the punched tape containing the data which ch a ra c ter ize and identify the a n a ly sis and s to r e s them d irectly in IDABANK. The su b-rou tine GRAPHE d isp lays then the actual fillin g sta te of IDABANK. The control is su c c e ss iv e ly g iven to the sub-routine TEST which ch ecks for the com p leten ess of the reduced data needed for a com plete a n a ly s is . In'the affirm ative c a se , the sub-program BURNUP is ca lled next for the com putation of the heavy nuclide amount an d/or of the burnup.
5. ISOTOPE CORRELATION TECHNIQUE (ICT)
The ICT could be su cc ess fu lly applied to check the con sisten cy of an alytica l r e su lts , to d etect fuel in ternally recy c led into the head-end, and to com pare 235U depletion and isotop ic Pu buildup with h isto r ic a l data.F or this purpose a data bank was se t up.
5.1. Isotope corre la tion s
During the p o st-irra d ia tio n exam inations of spent fu e ls of Vakahl [8], G arigliano [9], T rino V e r c e lle se [10] and Dodewaard [11], isotope c o r re la tions based on the isotop ic ra tio s of f is s io n g a se s have been ob served and th ese w ere applied during the rep ro cess in g of Sena and Trino V er ce lle se fuel at E u rochem ic, Mol [ l 2 ] , and during the rep ro cess in g of KW Obrigheim fuel at WA K arlsruhe [13]. The la tter plant u ses the ch op -an d-leach p r o c e ss , which hom ogenizes the fuel to such an extent that the iso top ic abundance of the f is s io n gas is constant throughout a d isso lu tion . T h erefore, sam p les taken at the exhaust stack can be used to determ ine the burnup or heavy iso top e content by f is s io n -g a s corre la tion s at the beginning of the d isso lu tion

IA EA -SM -201/2 459
of the spent fuel a s se m b lie s . To illu stra te the capability and the u n iversa lity of th is corre la tion type, the 132X e /131Xe vs per cent FIMA co rre la tio n is given in F ig .2. The r e su lts re fe r to d ifferent PWRs and BW Rs.
Isotope co rre la tio n s betw een heavy iso top es have a lread y been applied at se v e r a l p laces in ord er to check the con sisten cy of r e su lts from rep roc e ss in g input an a ly ses or p o st-irra d ia tio n exam inations. S ystem atic er r o r s , e.g . a b ias in the rep ro cess in g data, can be detected if the "new data" are checked with the isotope corre la tion s obtained from approved "h istorica l data". Such a v er ifica tio n is illu stra ted for the c a se of 240Pu IMA built up in G arigliano spent fuel (F ig .3).
5.2. Bank of corre la ted isotop ic data * 6
H isto r ica l data on the an a lyses of spent fu els accum ulated in the past are stored in a data bank to be used for ICT purposes. The data can be re tr iev ed according to five c r ite r ia (F ig .7):
R eactor typeR eactor nameR eactor coreSam ple type (rep ro cessin g batch or pellet)Initial 235U enrichm ent
B e s id e s the content of uranium and plutonium iso to p es, the isotop ic ra tio s of X e, C r, Nd and som e se lec te d lo n g -liv in g gam m a active nuclides are stored .
S evera l su b -rou tin es are used to ca lcu late the le a s t-sq u a r e s fit equation of the isotope corre la tion s and the deviation betw een h isto r ic a l and new data. A new data bank which should rep lace the above-m entioned one w ill be developed by a joint effort betw een IAEA and others [13].
6. APPLICATION AND EXPERIENCE
The techniques and in strum ents d escrib ed have been used in routine an a lysis of re p r o ce ss in g input sa m p les. The fea s ib ility could be proven for each of them , w hereas the ration alization effect of the autom ation would only be apparent for a h igher sam ple throughput. T h is, how ever, would requ ire an im provem ent of the p resen t re lia b ility of the autom ated in stru m en ts. The com p lex problem of rep resen tative sam pling s t i l l d ese rv e s som e attention. The behaviour of Pu in the d isso lu tion step s and the p o ssib le plating of th is elem en t from d isso lv e r solu tions has not b een su ffic ien tly studied. ICT could be of help h ere as dem onstrated in an exam ple (F ig .4), w here the co rrectio n s of rep ro cess in g input an a lysis w ere v er ified . They b ecam e n e c e ssa r y b ecau se Pu of e a r lie r batches had to be recyc led to the input so lu tions.
R E F E R E N C E S
[1 ] BEYRICH, W ., DROSSELMEYER, E . , IDA -72 Exp. KFK-1905 (1975).[2 ] DeBIEVRE, P ., Van AUDENHOVE, J . , IA EA -SM -201/108, those Proceeding, V ol.II.

460 KOCH et a l.
[3 ] WILHELMI, M ., e t a l . , in Safeguards Techniques (Proc. Sym p. Karlsruhe, 1970) 2, IAEA, Vienna (1970) 165.
[4 ] BOL, D. , BRAN DAUSE, B ., BIER, A . , DE ROSSI, M ., KOCH, L .. EUR-5141 (1974).[5 ] KOCH, L ., R adiochim . Acta 12 (1969) 160-62.[6 ] KOCH, L ., GEERLINGS, M .W ., Radiochim. Acta U _(1969) 4 9 -5 1 .[7 ] GERIN, F . , et a l . , (1975) EUR to be published.[8 ] KOCH, L ., et a l . , EUR-4690 (1971).[9 ] ARIEMMA, A ., e t a l . , EUR-4638 (1971).
[1 0 ] BRESESTI, A .M ., et a l . , EUR-4909 (1972).[1 1 ] BRAND, P . , e t a l . , EUR-5141e (1974).[1 2 ] KOCH, L ., COTTONE, G ., Reaktortagung Karlsruhe (1973).[1 3 ] SANATANI, S . , SIWY, P . , IA EA -SM -201/100, these Proceedings, V ol.II.

IA EA -SM -201/9
A SIMPLIFIED METHOD FOR PREPARING MICRO-SAMPLES FOR THE SIMULTANEOUS ISOTOPIC ANALYSIS OF URANIUM AND PLUTONIUM *
J.A . CARTER, R.L. WALKER, R.E. EBY,C.A. PRITCHARDOak Ridge National Laboratory,Oak Ridge, Tennessee,United States of America
Abstract
A SIMPLIFIED METHOD FOR PREPARING MICRO-SAMPLES FOR THE SIMULTANEOUS ISOTOPIC ANALYSIS OF URANIUM AND PLUTONIUM.
In this sim p lified technique a basic anion resin is em ployed to se le c tiv e ly adsorb plutonium and uranium from 8M H N 03 solutions containing dissolved spent reactor fuels. After a few beads o f the resin ate equilibrated with the solu tion , a sin g le bead is used for establishing the isotopic com position of plutonium and uranium.The resin-bead separation essen tia lly removes a ll possible isobaric in terference from such elem ents as am ericium and curium and at the sam e tim e elim in ates most fission-product contam ination in the mass spectrom eter. Sm all aliquots o f dissolver solution that contain 1 0 ' 6g U and 1 0 “8 g Pu are adequate for preparing about ten resin beads. By em p loying a sin g le focusing, tandem m agn et-typ e mass spectrom eter, equipped with pulse counting for ion d etection , sim ultaneous plutonium and uranium assays are obtained. The quantity o f each elem en t per bead m ay be as low as 10"9 to 1 0 “10 g. The carburized bead, which forms as the filam ent is h eated , acts as a reducing point source and em its a predom inance o f m eta llic ions as co m pared with oxide ion em ission from direct solution loadings. In addition to isotopic abundance, the technique o f isotope dilution can be coupled with the ion -exch an ge bead separation and used e ffec tiv e ly for measuring the total quantity o f U and Pu. The technique possesses many advantages such as reduced radiation hazards from the in fin ite ly sm aller sam ples, thus less shield ing and transport cost for sam ple handling; greatly sim p lified ch em ica l preparations that e lim in a te fission products and actinide isobaric interferences; and the minor isotopes are more precisely established.
INTRODUCTION
The need t o a na lyze i s o t o p i c a l l y v e ry sm a ll sam ples o f p lu ton iu m and uran ium i n d i s s o l v e r s o lu t io n s o f sp en t re a c to r f u e ls prom pted an i n v e s t i g a t io n in t o the p o s s i b i l i t y o f u s in g an ion r e s in s f o r the s e p a ra t io n o f b o th e lem ents and d ir e c t lo a d in g o f a s in g le r e s i n bead on to a mass sp e c trom e te r f i la m e n t. T h is approach p e rm its a n a ly s i s o f Pu fre e from i s o b a r ic in t e r fe re n c e s from am eric ium and curium s in c e the se e lem ents do no t adsorb on a n ion r e s in from 7 -8 M Ш О ^ s o lu t io n s , Pu and U have been a n a ly ze d in t h i s la b o ra to r y f o r some tim e irom a d ir e c t lo a d in g o f a d i s s o l v e r s o lu t io n , b u t o n ly the 239, 240, and 242 is o to p e s were c le a r o f in t e r fe re n c e s in the Pu a n a ly s i s ? i s o t o p i c U a n a ly s i s , however, c o u ld be done from such s o lu t io n s w ith o u t s e r io u s p rob lem s. D ire c t lo a d in g s o f d i s s o l v e r s o lu t io n are t r o u b le some due to the h ig h c o n c e n t ra t io n o f s a l t s and f i s s i o n p ro d u c ts loaded w ith the U and Pu. F re q u e n t ly u s in g d i r e c t lo a d in g o f s o lu t io n , the i s o t o p ic
* Research co-sponsored by the US Energy Research and D evelopm ent Administration and by an Interagency A greem ent betw een the US Arms Control and Disarmament A gency with ERDA.
461

462 CARTER et al.
measurement was made on the PuO^* io n s because i t was d i f f i c u l t t o i n t r o duce enough re d u c in g agent ( in o u r system , benzene vapor) to o b ta in m etal io n e m is s io n . A d i s c u s s io n o f the re d u c t io n methods used f o r im p rov in g the m eta l io n e m is s io n i s g iv e n by A rden and G ale.
Many in v e s t ig a t io n s o f a n io n exchange r e s in s e p a ra t io n s o f p lu ton ium from v a r io u s io n s have been re p o rte d . ' 1 The method chosen f o r t h i s work in v o lv e s the use o f Dowex 1-X2 an ion r e s in in a s o lu t io n o f 7 -8 M HNC>3 ; unijer th e s| c o n d it io n s , Pu and U have d i s t r ib u t io n c o e f f ic ie n t s o f 10 and 10 , r e s p e c t iv e ly . T h is fa v o ra b le Pu d i s t r ib u t i o n coup led wittj the f a c t t h a t Pu/U r a t i o i n spen t re a c to r d i s s o l v e r s o lu t io n s i s about 10 makes a d e s ir a b le s i t u a t io n f o r Pu and U f o r a s im u lta n e ou s de te rm in a tion . An e q u i l ib r a t io n o f r e s in w ith 7 -8 M HNO^ a c id s o lu t io n o f the d i s s o l v e r s o lu t io n enhances the Pu c o n ce n tra t io n in r e la t io n to the uranium . T h is tech n iqu e p o s se s se s many o b v io u s advan tage s, such a s:
1. Sm a ll sam ples may be han d led and sh ip p e d w ith o u t heavy s h ie ld in g , th u s re d u c in g s h ip p in g c o s t s .
2. S im p le chem ica l t rea tm ent reduces se p a ra t io n s c o s t s .
3. M e ta l io n s i g n a l s a re enhanced by o rd e rs o f m agnitude from p o in t so u rce , thu s more p re c is e data are ob ta in ed .
4. M in o r is o to p e s needed f o r " f i n g e r p r in t " sa fe g u a rd s a sse ssm en t are more p r e c i s e ly e s t a b l is h e d .
5. C ontam ina tion i s l e s s l i k e l y from the m inor sam ple treatm ent.
6. C ontam ina tion o f the in s t ru m e n t w ith f i s s i o n p ro d u c ts i s v i r t u a l l y e lim in a te d .
7. The am eric ium and curium do n o t a d so rb , th u s e l im in a t in g these in t e r fe re n c e s in the a n a ly s i s .
EXPERIMENTAL PROCEDURE
Acceptance by many in v e s t ig a t o r s o f an ion r e s in f o r the a d so rp t io n o f a n io n ic com plexes le d t o the s e le c t io n o f Dowex-1 a s the a d so rb in g medium f o r t h i s in v e s t ig a t io n . A n a ly t ic a l re age n t grade Dowex-1, 2% c r o s s - l in k e d , 100-200 mesh r e s in conve rted to the n i t r a t e form and e q u i l ib r a t e d w ith 8 M HNO^ p ro v id e s a r e s in w h ich ha s the d e s ire d a d so rp t io n c h a r a c t e r i s t ic s f o r Pu and U. An a l iq u o t o f d i s s o l v e r s o lu t io n c o n ta in in g a p p ro p r ia te concent r a t io n s o f uran ium and p lu ton ium i s p ip e t te d in t o a sm a ll c e n t r ifu g e cone c o n ta in in g s e v e ra l p re pa red r e s in bead s. D i s s o l v e r s o lu t io n s no t a t 8 M HNO are a d ju s te d t o t h i s m o la r it y w ith d i s t i l l e d 16 M HNO^. The r e s in beads a re a llo w e d t o e q u i l ib r a t e in 0 . 1 - 0 .2 ml o f t h i s s o lu t io n f o r 24-48 h o u rs , w h ich i s enough tim e f o r the beads t o ad so rb bo th U and Pu i n s u f f i c i e n t amounts t o a llo w s im u lta n e ou s mass sp e c tro m e tr ic a n a ly s i s o f each elem ent.
A s in g l e bead i s taken from s o lu t io n by em p loy ing a sm a ll g l a s s lo o p (F ig . 1) th a t su r ro u n d s the r e s in bead. T h is a llo w s one t o remove a bead from the s o lu t io n f o r t ra n s fe re n c e t o a mass sp ectrom ete r f ila m e n t. T h is p rocedu re i s n o t d i f f i c u l t , e s p e c ia l l y w ith the a id o f a s te reom ic ro sco p e . When the bead i s removed from the cone, e x c e ss s o lu t io n re m a in in g w ith the bead i s removed by to u c h in g the end o f the lo o p to a c le a n , a d so rb in g t i s s u e .

IA EA -SM -201/9 463
FIG.2. Mass spectrom eter "V''-shaped rhenium filam ent loaded with resin bead.
The bead i s then t r a n s fe r r e d t o a rhenium V -type f ila m e n t ( F ig . 2) u s in g a tu n g ste n ne ed le b y to u c h in g the bead to the f ila m e n t. The bead lo aded onto the f ila m e n t i s shown i n F ig . 2 in s e t . S e v e ra l te ch n iq u e s have been t r ie d t o e n su re bead re te n t io n w h ile h a n d lin g and in s e r t i n g the lo aded f ila m e n t in t o the mass spectrom ete r. C rim p ing the f ila m e n t to g e th e r ha s been found to be the most s a t i s f a c t o r y method i n term s o f sam ple i n t e g r i t y and bead re t e n t io n ; c o l lo d io n and o th e r g lu e in g agen ts have been s a t i s f a c t o r i l y te s te d .

464 CARTER et al.
FIG.3. ORNL tandem m agnet mass spectrometer.
The ORNL mass sp ectrom ete r (F ig . 3) u sed in t h i s in v e s t ig a t io n i s o f the s in g l e - f o c u s in g tandem magnet type d e sc r ib e d p re v io u s ly . Io n s arede tec ted b y a secon da ry e le c t ro n m u l t ip l ie r b e h in d the r e c e iv e r s l i t . The p u ls e s w h ich r e s u l t from io n s h i t t i n g the f i r s t dynode a re a m p lif ie d and counted. The in s tru m e n t ha s 30-cm ra d iu s and 90° d e f le c t io n in each magnet w hich g iv e s a spectrum th a t i s v e ry c le a n because o f the re d u c t io n o f s c a t t e re d io n s (abundance s e n s i t i v i t y o f 10 ) . O n ly z o n e - re f in e d rhenium i s u sed f o r m aking the s i n g l e "V " f i la m e n t s . The sa m p le -h a n d lin g d e v ice which p e rm its m ounting and i n s t a l l i n g f i v e o r fs i x loaded "V " f i la m e n ts a t once ha s been d e sc r ib e d by C h r i s t ie and Cameron.
F i r s t , Pu i s i s o t o p i c a l l y a na lyze d a t the low e st p o s s ib le f ila m e n t tem perature w h ich w i l l g iv e r e l i a b le r e s u l t s . The tem pe ra tu re , ^ s u a l l y be tween 1 4 0 0 — 1500°C, sh o u ld ne ve r exceed 1500°C. j^ gve 1500°C, U e m iss io n becomes s i g n i f i c a n t and w i l l add to the ob se rved Pu s i g n a l . A f t e r comp le t in g the Pu a n a l y s i s , the tem pej^gure sh o u ld be g r a d u a l ly r a i s e d to 1600 - 1700°c to b u rn o f f the Pu so t h a t in t e r fe re n c e i s e l im in a te d in thesub sequen t u ran ium a n a ly s i s . When Pu e m is s io n becomes i n s i g n i f i c a n t , the U i s a n a ly ze d by in c r e a s in g the+ f ila m e n t tem perature (1 7 5 0 — 1850°) t o the optimum e m is s io n range f o r U io n s .
EXPERIMENTAL RESULTS AND D ISCUSSION
When a n a ly z in g spen t re a c to r f u e l sam p les, the amount o f Pu loaded p e r bead f o r i s o t o p ic a n a ly s i s was unknown; however, good a n a ly se s were a ch ie ve d from a l iq u o t s c o n ta in in g 30 ng Pu and e q u i l ib r a t e d w ith s i x to

IA EA -SM -201/9 465
TABLE I . PLUTONIUM ISO TOPIC ANALYSIS AT VARIOUS CONCENTRATIONS
Pu (ng/bead)
Atom P e rce n t238 239 240 241 242
0 .003 (.023) 94 .0 5.64 0 .31 0 .027
0 .05 0.0124 94.150 5.556 0 .261 0.0182
0.6 0.0095 94.152 5.563 0.257 0 .0173
3.0 0 .0095 94.149 5.565 0 .258 0.0179
10 ng Pu S td . 0.0096 94.136 5.572 0.265 0 .0175
te n r e s in bead s. A ssum ing 100% lo a d in g e f f ic ie n c y , each bead w ould cont a in from 3-5 ng Pu. In o rd e r t o e s t a b l i s h more p r e c i s e ly the amount on each bead and a l s o determ ine the minimum m o u n t th a t c o u ld be a n a lyze d , c o n t r o l le d expe rim ents were conducted. Graded s ta n d a rd s o lu t io n s o f Pu were u se d t g determ ine the r e s in - l o a d in g e f f ic ie n c y o v e r a c o n c e n t ra t io n range o f 10 . From each expe rim ent, one bead was removed f o r i s o t o p ic a n a ly s i s and a no the r f o r m e asu r ing by а-c o u n t in g th e Pu a d so rp t io n e f f i c i ency. The e f f i c ie n c y ranged from 30-60% o v e r the c o n c e n t ra t io n range o f 0 .1 t o 100 ng Pu.
The minimum sam ple loaded on a bead th a t w i l l g iv e r e l i a b le d a ta on a l l i s o t o p e s i s about 0 .5 ng; the r e s u l t s o f t h i s experim ent are t a b u la te d in T a b le I. The U -23|3gontam inant from the f ila m e n t and/or re a g e n ts s t a r t a f f e c t in g the sm a ll Pu peak. Below 0 .05 ng Pu , the s i g n a l s a re to o low to o b t a in w o rth w h ile d a ta on any is o to p e s except p o s s ib l y 239 and 240. The extreme s e n s i t i v i t y enhancement o f the i.on-exchange b e a d -p u lse c o g g i n g masg^^ spectrom etry te ch n iqu e i s in d ic a t e d b y the i s o t o p ic v a lu e s f o r Pu and Pu from the bead c o n ta in in g o n ly 0 .00 3 ng Pu.
The a b i l i t y to measure s e q u e n t ia l ly the i s o t o p ic com p o sit io n o f Pu and U depends p r im a r i l y upon the i n i t i a l U/Pu r a t io . The e f f e c t o f v a r io u s i n i t i a l U/Pu r a t io s was s tu d ie d t o determ ine the r a t io s t h a t w ould g iv e re l i a b l e a n a ly s i s from a s in g l e bead lo a d in g . E xp e r im e n ta l ev idence in d ic a t e s t h a t U/Pu r a t io s o f 100 o r la r g e r are s a t i s f a c t o r y f o r the i s o t o p ic d e te rm in a t io n o f b o th e lem ents, b u t , however, when the U/Pu r a t i o i s 10 o r l e s s , o n ly Pu i s o t o p ic v a lu e s a re m easurab le.
I n o rd e r t o e v a lu a te the remote p o s s ib le mass d is c r im in a t io n e f f e c t o f the io n -excha nge r e s in bead, NBS uran ium and p lu ton iu m sam ples were a na lyze d b y the bead te ch n iq u e . The i s o t o p ic d a ta f o r U (SRM U-015) and Pu (SRM-947) are sum m arized i n T a b le s 2 and 3, r e s p e c t iv e ly . The com parison s f o r a l l i s o top e s f a l l w it h in the 95% con fidence l im i t s o f the m easurements; t h u s , the re i s n o t any o b se rva b le mass d is c r im in a t io n c o n t r ib u t io n in the ion -exchange chem ical p u r i f ic a t io n . In T a b le I I I the Pu2y a lu e s were c o r re c te d to 13 O ctobe r 1971; a fc. .. o f 14 .3yrw as used f o r Pu. The p r e c i s io n and accu racy by w h ich the m in o r is o t o p e s are measured on th e se re fe re n ce s ta n d a rd s i s in d ic a t iv e o f the c a p a b i l i t y o f the tw o -sta ge OHNL-type mass spectrom ete r.

466 CARTER e t al.
TABLE I I . ISO TO PIC ANALYSIS OF SRM U-015 STD. BY RES IN BEAD METHOD
Atom P e rce n t-D a te A na lyze d (7 -8 -75 )234 235 236 238
1 0.00846 1.537 0 .0163 98 .438
2 0.00856 1.548 0.0165 98 .428
3 0.00851 1.540 0.0165 98.435
4 0.00865 1.526 0.0164 98.449
ORNL Avg. 0 .00854 1.538 0.0164 98.437
S. D. 0 .00008 0.009 0.0001 0.009
NBS C e r t i f ie dVa lue 0.00850 1.5323 0.0164 98 .443
TABLE I I I . ISO TO P IC ANALYSIS OF SRM-947 STD. BY RESIN BEAD METHOD
Atom Pe rce n t Date A na lyze d (7 -1 -75 )238 239 240 241 242
1 0.292 76.303 18.412 3.808 1.185
2 0 .294 76.281 18.421 3.823 1.181
3 0.291 76.321 18.440 3.784 1 .178
4 0.293 76.264 18.421 3.818 1 .187
Avg. 0 .29 2 76.293 18.424 3.808 1.183
S. D. 0 .001 0.025 0.012 0 .017 0.004
C o rr. t o 10/13/71 - Va lue
ORNL0 .29 8 75.717 18.290 4 .521 1.174
10/13/71 - Va lue 95% C. L.
NBS0.296
±0 .00675.696±0.022
18.288±0 .022
4 .540±0 .006
1.180±0 .004

IA EA -SM -201/9 467
A c o r re c t io n fo r^ ^g U con tam in a tion in the Pu mass p o s i t io n can bg^g made by sc a n n in g the U posijj^gn w h ile a n a ly z in g Pu and c o r re c t in g the Pu f o r the a p p ro p r ia te amount o f U a f t e r d e te rm in in g the i s o t o p ic 238/235 r a t i o from the uran ium a n a ly s i s .
238_Pu
c o rre c te d238 /235 238
Pu - I U • ___ U,235.
The e f f e c t iv e n e s s o f t h i s c o r re c t io n was determ ined by i s o t o p i c a l l y m e asu r in g the 238/239 Pu r a t i o o f a t y p ic a l d i s s o l v e r s o lu t io n a f t e r c h e m ic a lly s e p a ra t in g the Pu u s in g the t h e n o ly t r if lu o ro a c e to n e (TTA) e x t r a c t io n method. A r a t i o o f 0.01156 compares v e ry w e l l w ith the r e s in bead va lu e o f 0 .01158 . To make such a c o r re c t io n , i t i s n e c e ssa ry t h a t the backg round o f the c o u n t in g system be e x c e e d in g ly low; i . e . , 1-2 counts/m in.
The c o r re c t io n can o n ly be made p r a c t ic a l on h ig h b u m -u p f u e l where the Pu-238/239 r a t i o i s >0 .01 and the 23Jj^35 r a t i o i s <50. I f the delu g e d a n a ly s i s re q u ir e s th a t a r e l i a b le °Pu measurement be made and the
U c o r re c t io n method i s im p ra c t ic a l, uran ium can be removed from the bead b y w a sh in g w ith d i lu t e (up t o 3 M) n i t r i c a c id .
As a fu r t h e r u t i l i t y t e s t o f the re s in -b e a d te ch n iqu e f o r low le v e ls o f Pu, the is o t ^ g e d i l u t io n te ch n iqu e was u s e d ^ g a n a ly ze Pu con ce n tra t io n s below 10 g le v e l s . A h ig h ly e n r ic h e d Pu s p ik e was e q u i l ib r a t e d w ith the Pu i n the sam ple p r i o r t o the ion -exchange bead p u r i f ic a t io n . The r e s u l t s summ arized in Tab le I V are compared t o the v a lu e s o b ta in e d by a -sp ectrom etry . The agreement i s co n s id e re d e x c e lle n t f o r such low Pu le v e ls . The is o to p e d i l u t io n mass sp e c t ro m e tr ic techn ique w ith the r e s in bead o f f e r s more s a fe g u a rd in g in fo rm a t io n a t low e r Pu co n c e n t ra t io n s than does a - spe c t ro m e try .
The s im u lta n e ou s method f o r Pu and U has been used on sp en t re a c to r f u e l sam ples i n t h i s la b o ra to ry f o r o ve r one y e a r. Some t y p ic a l ro u t in e r e s u l t s from d i s s o l v e r s o lu t io n s are shown in T a b le V. P lu ton ium i s o t o p ic a n a ly se s were done by the re s in -b e a d method, and f o r com parison pu rpo se s a f t e r chem ical se p a ra t io n u s in g TTA. Uranium i s o t o p ic a n a ly se s were a l s o made on the same bead lo a d in g f o l lo w in g the p lu ton iu m a n a ly se s . The comp a r is o n shows an apparent b ia s between the two methods; in a l l the r e s u l t s (Tab le V) , the 241 and 242 is o to p e s are h ig h e r b y the TTA method than by r e s in bead. S in c e on the ave rage 90 p e rcen t o f the d if fe re n c e between the methods i s i n the 241 is o to p e , the sou rce o f the b ia s i s a p p a re n t ly due to the p o o re r decon tam ina tion o f am eric ium by TTA. the r e s in bead t^g lj-n iq u e , on the o th e r hand, t e s t s have shown th a t AAm in t e r fe re n c e on Pu i s n e g l i g ib le .
R e s in beads have been s to r e d a s a rc h iv e sam ples f o r a p e r io d o f one y e a r and s t i l l a re u s e fu l f o r e s t a b l i s h in g bo th the U and Pu i s o t o p ic v a lu e s . R a d ia t io n damage t o the r e s in bead ha s n o t been ob se rved .
CONCLUSIONS
R e s u lt s from the se expe rim ents in d ic a t e t h a t r e l i a b le i s o t o p ic a n a ly s i s o f p lu ton iu m and uran ium in sp e n t re a c to r f u e ls can be done w ith m in im al ch e m istry and sample h a n d lin g on v e ry sm a ll sam p les. An a l iq u o t o f a t y p ic a l d i s s o l v e r s o lu t io n c o n ta in in g a pp rox im a te ly 10 yg U, 50 n g Pu, and 10 y c i o f f i s s i o n p ro d u c ts would be s u f f i c i e n t sam ple f o r m aking the

468 CARTER et al.
TABLE IV . LOW LEVEL PU ANALYSIS - COMPARISON WITH a SPECTROMETRY
Sample T o ta l P u a (d is/m in)No. ( g > Mass Spec a -Spe c
MS-1 1.5 X i o ' 11 2.43 2.44
MS-2 1 .6 X i c f 12 0.258 0 .244
MS-3 5 .3 X i c f 13 0.087 0 .08
aMeasured by is o to p e d i l u t io n mass spectrom e t r y a f t e r a d so rp t io n on bead.
TABLE V. PLUTONIUM ISO TOPIC COMPOSITION COMPARISON - RESIN BEAD v s TTA EXTRACTION
P lu ton iu m I s o t o p ic A n a ly s i s (at.%) S e p a ra t io nMethod238 239 240 241 ' 242
0 .628 68.082 21.254 7.893 2.143 RB0.626 67.824 21.245 8.137 2.168 TTA
0.826 70.799 17.198 9 .333 1.844 RB0.822 70.569 17 .328 9 .401 1.880 TTA
0.635 68 .059 21.257 7.883 2.166 RB0 .637 67.745 21.282 8.162 2.174 TTA
0 .815 71.319 17.042 9 .067 1.757 RB0.814 71.179 17.065 9.176 1.766 TTA
RB = DOWEX 1-X2 A n ion R e s in bead.TTA = T h e n o y lt r if lu o ro a c e to n e e x t ra c t io n .
d e te rm in a t io n s . The p r e c i s io n o f an a n a ly s i s expresse{J3|s r e la t i v e s ta n d a rd d e v ia t io n i s <1% on m ajor is o to p e s . The a s s a y o f Pu, i f i n the range o f 0 .1 a t .% , c a n ^ g measured by the s im p l i f ie d re s in -b e a d te ch n iq u e . Ways o f im p rov in g the Pu a ssa y are dem onstrated. The re s in -b e a d te ch n ique coup led w ith is o to p e d i l u t io n i s v e ry u s e fu l f o r v e ry lo w - le v e l Pu m easurem ents.
The main advantages o f t h i s s im p l i f ie d method a re :
1. D ecreased a n a ly t i c a l la b o ra to ry se p a ra t io n c o s t s . F o r example, f i e l d in s p e c to r s c o u ld adapt the se p a ra t io n s tech n iqu e and m a il 3 o r 4 beads t o the la b o ra to ry f o r mass a n a ly s i s .
2. R e duc tion o f r a d ia t io n h a za rd s in h a n d lin g sm a ll sam ples in an u n sh ie ld e d la b o ra to ry .

IA EA -SM -201/9 469
3. R eduction o f sample t r a n s p o r t a t io n c o s t s i n the Sa fe gu a rd s p rogram s. Decontam ination f a c to r s f o r f i s s i o n p ro d u c ts are h ig h ; Am, Cm and C f are com p lete ly sepa ra ted .
2384. P ro v id e s a second tech n iqu e f o r o b t a in in g r e l i a b le Pu v a lu e s .
The le s s e n in g o f r a d ia t io n h a za rd i n s h ip p in g and the r e s u l t i n g s a v in g in t r a n s p o r t a t io n c o s t s p ro b a b ly a re the most im p o rta n t ad van tage s. T h is a spe ct o f the method w ou ld be v e ry im po rtan t i n Sa fe gu a rd s a n a ly se s w hether on a n a t io n a l o r in t e r n a t io n a l b a s i s .
A C K N O W L E D G M E N T S
Encouragem ent and s u g g e s t io n s b y Mr. L o r in S t i e f f o f the U. S . Arms C o n t ro l and Disarm am ent Agency are g r a t e f u l l y acknow ledged. A s s is t a n c e by the s t a f f o f the Mass Spectrom etry Group i s g r e a t ly a p p re c ia te d .
REFERENCES
[1] Arden, J . W. and G ale, N. H ., "S e p a ra t io n o f T race Amounts o f Uranium and Thorium and T h e ir D e te rm ina tion by Mass S p e c tro m e tr ic Is o to p e D i l u t i o n , " A na l. Chem., V o l. 46, No. 6 , May 1974, 687-691 .
[2] Buchanan, R. F . , F a r i s , J . P . , O r la n d in i, K. A . , and Hughes, J . P . ,U. S. A t. E n e rg y Comm. Rept. T ID -756 0 (1958 ).
[3] K r e s s in , I . K. and W aterbury, G. R . , "The Q u a n t it a t iv e S e p a ra t io n o f P lu ton ium From V a r io u s Io n s by A n ion E x ch an ge ," A n a l. Chem. 34 (1 2 ),1598 (1962) .
[4] W h ite , F. A. and C o l l i n s , T. L . , "A ^T w o-Stjge M agn e t ic A n a ly z e r f o r I s o t o p ic R a t io D e te rm in a tion s o f 10 to 10 o r G re a te r , " A pp l.S p e c t r y . , 8(4) , 169 (1954 ).
[5] D ie t z , L. A ., P a ch u ck i, C. F . , S h e f f ie ld , J . C . , Hance, A. B . , and Hanrohan, L . R . , "F u r t h e r Development o f the Tw o-Stage Mass Spectrom e t e r f o r I s o t o p ic A n a ly s i s o f Uranium " A n a l. Chem., 32_, 1276 ( I9 6 0 ) . 6 7 8
[6] Cameron, A. E . , C h r i s t ie , W. H ., McKown, H. S . , R a ine y , W. T . , J r . , and Sm ith , D. H ., "A n a ly t i c a l Mass Spectrom etry a t Oak R id ge N a t io n a l L a b o ra to r y , " ORNL-4643 (1971 ).
[7] C h r i s t ie , W. H. and Cameron, A. E . , Rev. S e i . In s t ru m ., 37 , 336 (1 966 ).
[8] Moore, F. L. and Hudgens, J . E . , J r . , "S e p a ra t io n and D e te rm ina tiono f P lu ton iu m by L iq u id - L iq u id E x t r a c t io n , " A n a l. Chem., 29, 1767 (1 957 ).


IAEA- SM -201/53
NON-DESTRUCTIVE CONTROL OF FISSILE MATERIAL IN SOLID AND LIQUID SAMPLES ARISING FROM A REACTOR AND FUEL REPROCESSING PLANT
H.P. FUSSKernforschungsanlage Jülich GmbH,Jülich,Federal Republic of Germany
Abstract
NON-DESTRUCTIVE CONTROL OF FISSILE MATERIAL Ш SOLID AND LIQUID SAMPLES ARISING FROM A REACTOR AND FUEL REPROCESSING PLANT.
The non-destructive control o f fissile m aterial is demonstrated under h o t-c e l l conditions with a rad ioactive neutron source and solid and liquid sam ples arising from a reactor and fuel reprocessing plant.It is accom plished with an assay which is based on the transport o f fast fission neutrons in boron- or cadmium- poisoned water. The measured count-rate from fission neutrons is used for the ca lcu la tion o f the fissile m aterial content. T he presence o f fission products (up to 100 C i), o f fertile m aterial and probably also o f spontaneous neutron em itters does not norm ally change the fission count-rate by m ore than 1% . Calibration curves are measured for spherical fuel elem en ts o f the AVR reactor, for h ighly enriched fuel particles, for fuel powder and for liquid solutions. The linear term o f the calibration curves for these types o f samples varies in the range o f 7.5 + 20°/o. When the type o f sam ple is known, the error in the determ ination is less than 47o (for typ ical concentrations). The zero le v e l is equ ivalent to 4 mg 235 U with therm al neutrons and to 40 mg with epitherm al neutrons. Self-sh ield ing , flux depression and additional moderation are discussed as probable reasons for the variation o f the parameter, and a m ethod for the control o f the m oderation is given . Epithermal neutron irradiation is shown to be advantageous with concentrated sam ples o f highly enriched m aterial. This non-destructive m ethod is compared with other methods such as the ch em ica l analysis o f liquid solutions.
1. INTRODUCTION
The n on -destructive m easu rem ent of f is s i le m ater ia l in nuclear fuel m ateria l after its u se in the reactor is d ifficult but n e c e ssa r y for p ro ce ss control. At Jü lich , the pilot plant JUPITER is being constructed for the re p r o ce ss in g of h igh-tem perature fuel e lem en ts which contain h ighly enriched uranium . Solid sam p les play an im portant ro le in th is p ro ce ss and the follow ing types of sam p les m ust be expected:
(1) Irradiated fuel e lem en ts of the AVR te s t reactor
(2) F uel k ern els and fuel powder which are obtained in the burning step of the r e p r o ce ss in g p ro ce ss
(3) Liquid sam p les which a r ise from the d isso lu tion of the fuel
(4) V arious kinds of scrap , f i lte r s , p rec ip ita tes and d isso lv e r res id u es of variou s com position
Each sam ple m ay contain f is s io n products from 0 to 100 Ci and m ust be handled in a h o t-c e ll fa c ility by rem ote techn iques. It was n e c e ssa r y to develop a re liab le a ssa y for the n on -d estru ctive control of th ese sam p les
471

472 F1LSS
F1G.1. Improved assay for non-destructive control.
under h o t-c e ll conditions [1], which would not su ffer from the p resen ce of f is s io n products or from fer tile m ater ia l in the sam ple like 232Th and 238U. T h erefore, the Sb-B e neutron sou rce was chosen for the active in terrogation of th is m ateria l. Since irrad iated fuel m ust be handled in a hot c e ll anyway, the additional sh ield ing of 100 Ci 124Sb from the Sb-Be neutron sou rce is no problem . The neutrons of th is source w ill only sp lit f is s i le m ater ia l. F a s t -f is s io n neutrons are then produced and these neutrons are s e le c tiv e ly re g is ter ed on account of their h igher en ergy to indicate the p resen ce of f is s i le m ateria l.
2. THE OPERATION OF THE ASSAY
Our im proved a ssa y is shown in F ig . 1. The irrad iation fa c ility is in the upper part and the f is s io n neutrons are se le c tiv e ly counted by the low er BF3 tube, em bedded in polyethylene. In the centre of the sou rce , the sam p les are irrad iated at a therm al neutron flux of 106/ s cm 2 which is obtained from 100 Ci 124Sb. D eta ils about the geom etry and the neutron fluxes are given in R ef. [2].
The f is s i le m a ter ia l in the sam ple is sp lit, involving the em iss io n of fa s t- f is s io n neutrons, which are separated from the sou rce neutrons by d ifferent relaxation on their way from the orig in to the counter according to th e ir d ifferent en er g ie s . The hydrogen sca tter in g c r o s s - s e c t io n d ecr ea ses from 17.5 b at 24 keV to 2.9 b at 2 MeV, and the source neutrons are scattered and th erm alized to a much h igher d egree than the f is s io n neutrons.

IAEA-SM -201/53 473
TABLE I. INFLUENCE OF THE TRANSPORT MEDIUM ON THE RELAXATION OF THE DIFFERENT NEUTRONS
Transport m edium (17 cm betw een the bottom o f the source and the upper surface o f the detector)
Registered count-rate o f the neutron counter resulting from
Source neutrons (from 200 Ci 1 2 4 Sb)
(cou n ts/s)
Fission neutrons (from 1 g 235 U )
(counts/s)
Pure water 976 + 474
0.4 molar H3 BO3 in water + Cd 1 . 2 + 317shield around thep olyeth y lene moderator
T his concept of separation can only be achieved if therm al neutron diffusion is stopped by poisoning. Table I show s the advantage of our a ssa y com pared with a pure water a ssa y , which was u sed p rev iou sly 13]. R elaxation cu rves with variou s neutron ab sorb ers are given in R ef. [2]. Table I shows that the sou rce-n eu tron count-rate is reduced from m ore than tw ice the fission -n eu tron count-rate in pure water to a value approxim ately equivalent to 4 m g 235U in poisoned water. The sou rce-n eu tron contribution is thus at an unim portant background le v e l.
In an a lternative approach, the sou rce neutrons and the f iss io n neutrons can be separated by p u lse-h eigh t an a ly sis . Among these a ssa y s[4], the a ssa y of M enlove e t a l. 15] is s im ila r in the irrad iation part.
3. THE PERFORMANCE OF THE ASSAY WITH IRRADIATED FUEL
The BF3 tube of the neutron detector op erates in a 7- flux of up to 104 R/ h , which re su lts from the 124Sb so u rces. Inspection of the p u lse - height spectrum as w ell as the low sou rce-n eu tron count-rate in dicates that the A l-w a lled BF3 tubes u sed operate sa tis fa c to r ily . B oron-lined tubes are only n e c e ssa r y at h igher d o se -r a te s . A s long as the rad ioactiv ity of the sam ple is below that of the 124Sb so u rces (~ 100 Ci) the perform ance of the counting is not changed.
R adioactive f is s io n products em itting 7-r a y s above 1.66 MeV, esp e c ia lly 140 La and 144P r, produce irregu lar photo-neutrons. It was found that th is contribution rea ch es 2% in fuel e lem en ts rem oved from the reactor one month before [2]. At the tim e of m easu rem ent, the m ain part d ecays with a h a lf- life of 12.8 d (140Ba), so that two m onths after the rem ova l from the reactor the contribution i s below 1%.
Another irregu lar neutron contribution m ay a r ise from nuclides that undergo spontaneous f is s io n . This type of fuel could not yet be in vestigated in our a ssa y , but M enlove et al. [5] have m easu red recyc led plutonium . They found a contribution of <1% of the induced cou n t-rate.

474 FILSS
The r e su lts from the two a ssa y s seem to be com parable on th is point. Spontaneous neutron em itters w ill therefore probably not play an im portant ro le . Anyway, both kinds of irregu lar neutrons can be com pensated for by rem oving the 124Sb so u rc es . When the 124Sb so u rces are rem oved, the source-neutron flux is sw itched off and the rem aining count-rate can afterw ards be subtracted as being due to irregu lar neutrons.
4. CALIBRATION CURVES FOR VARIOUS TYPES OF SAMPLE
In the flux of the sou rce neutrons, a ll f is s i le iso top es undergo fiss io n . In a constant neutron flux, the neutron e m iss io n P from different f is s i le iso top es is d ifferent. R elated to 1 g of the iso top e, the re la tive va lu es of the neutron e m iss io n P w ere calcu lated as
P (233U) = 0.944
P (235xj) = 1.000
P (239Pu) = 1.502
in R ef. [2] from sou rce data in Ref . 16]. The va lu es of P show that, under lim ited conditions, 1 g 233U w ill y ie ld the sam e neutron count-rate as 0.944 g 235U. The follow ing ca libration cu rves were a ll m easu red with 235U. If other f is s i le n uclid es are to be determ ined , th ese factors m ust
FIG.2. Calibration curve for AVR fu el elem en ts.

IAEA" SM -201/53 475
F1G.3. C alibration curve for liquid sam ples.
be con sid ered . Since the va lu es are s im ila r for 233U and 235U, they can be taken as equal with the resu lt that the neutron count-rate is dependent on the sum of the m a sse s from 233u and 235U. This sum is im portant in the ca lcu lation of the effec tive m a ss in sa fegu ard s, and a v er y d irect determ ination of th is quantity is obtained h ere.
The changing in tensity of the Sb-B e neutron sou rce (ti of 124Sb = 60.4 d) is som etim es con sid ered as a drawback. In our a ssa y an AVR fuel elem en t of the UCC type, containing 1 g 235U was u sed as a standard and counted ev ery day at the beginning or end of a m easu rem ent.
A fter subtraction of the background, the m easu red count-rate of a sam ple C was divided by the cou n t-rate of the standard UCC elem en t and m ultip lied by 100 c o u n ts /s . The value X, obtained by Eq. (1), is ca lled the "norm count-rate" .
X _ Cme spted Cp ^ ю о c o u n ts /s = norm count-rate (1)^ и сс'Ч
In th is way, co u n t-ra tes which w ere m easu red on d ifferent days and even with d ifferent so u rces of 124Sb can be com pared.
The follow ing ca libration cu rves show the relation between the norm cou n t-rate X m easu red in c o u n ts /s and the 235U content Y m easu red in mg.

476 FILSS
FIG.4. Calibration curve for solid m aterial samples and therm al neutron irradiation.
Without sy stem a tic deviation s, the relation is given by
Y = AX + BX2
for
Y < 1000 m g 2S5U with therm al neutron irrad iation and for
Y < 5000 m g 235U with ep itherm al neutron irradiation
The sam p les w ere n orm ally m easu red for 1000 s . The m easured points of the ca libration , together with the resp ec tiv e fitted curve (X = norm cou n t-rate , Y = content of 235U), are shown in F ig s 2-5.
The p aram eters A, В of the function Y = AX + BX2 are fitted by le a s t-sq u a r e s approxim ation. A ll p aram eters from therm al neutron irrad iation are sp ec ified in Table II. D eta ils of the sam ple preparation

IAEA-SM -201/53 477
Ol'E
3000
2500
2000
иЙ 1500Ol
500
5 10 15 20 cpsNorm Count Rate = x
FIG.5. Calibration curve for solid m aterial samples and epitherm al neutron irradiation.
and m easu rem ent are given in the follow ing se c tio n s . The fitted p aram eter s for solid m ater ia l and ep itherm al irrad iation are shown in F ig . 5.In the range below 1 g 235U, the lin ear term is the im portant one. It is the only one that can be expected , if the source flux rem ain s unchanged.The quadratic term r e su lts from the flux perturbation.
4.1. S ph erica l fuel e lem en ts of the AVR type
The fuel e lem en ts of the AVR te s t reactor are graphite b alls of 6 cm diam. and a total weight of 200 g. The standard type or ig in a lly contained 1 g 235U as coated p a r tic le s of (Th,U) d icarbide or (Th, U) d ioxide. S pecia l test e lem en ts w ere used for ca libration with different 235u content. The fuel elem en ts were en clo sed in an alum inium box and transported by lift to the irrad iation p osition . The m easu red points of th is calibration curve are shown in F ig . 2.

478 FILSS
TA BLE II. F IT T E D PARAM ETERS A AND В OF THE CALIBRATION CURVES WITH THERMAL NEUTRON IRRADIATION
Y = AX + B X 2
X = norm count-rate in cou nts/sY = content of 235 U in mg
Type of sample A В
AVR fuel elements 8.89 0.010
иОг(ЫОз)2 solution 6.15 0.049
(ТЬ(и)Ог kernels
400 /ли diam ., 71.027« 235U
7.24 0.043
U 02 kernels 8.88 0.041
180 ц т diam ., 71.027« 235U
U 02 powder 79.2% Z35U, in the flat shape 7.70 0.044
UO2 powder distributed over a large volume 8.66 0.024
0 __I__I__l__I__I__I__I— I— I__ I------10 50 100 mlTotol Volume of the Solution
FIG.6. Count-rate reduction by water in liquid samples.

IAEA -SM -201/53 479
4.2 . Liquid sam ples
Liquid sam ples cannot be m easured in glass bottles since the boron of the g lass is a strong absorber of slow neutrons. A 100-m l polyethylene bottle with a wide neck was used as a standard v esse l.
This bottle was centred using a polyethylene ring of 31 g in the middle of the sample lift and transported directly to the irrad iation position. The count-rate of the sample is , in addition, dependent on the amount of water in the sam ple. F igure 6 shows the variation of the neutron count-rate with a constant quantity of 235U and varying amounts of water.
This variation of the count-rate must be m ainly attributed to the absorption of neutrons in water and to a sm aller degree to the enlarged mean distance between the sample position and the detector. F igure 3 shows the calibration curve for liquid sam ples which was obtained by pipetting fixed volumes of U 0 2 (N03 ) 2 solution (10 mg 2 3 5 U /m l) into the bottle. Each quantity of 235и corresponds to a certa in volume.
If a sample of unknown com position but known volume is to be d etermined, only an approximate value is obtained from F ig . 4. This value must be multiplied with the count-rate of the calibrating volume and divided by the count-rate for the re a l volume according to F ig . 3, provided no further neutron absorbers are present in the sam ple.
4.3. F u el powder and fuel kernels
Highly enriched solid fuel strongly absorbs therm al neutrons and it can only be m easured in a fixed standard geom etry. In this m easurem ent, the m ateria l was usually distributed on the bottom of the p lexig lass v esse l shown in F ig . 7(a). The m ateria l there adopts the shape of a flat disc of constant diam eter. Sm all amounts of kernels could not be optim ally fixed.In this case , a round piece of filterin g paper should be inserted at the bottom to prevent the kernels from rolling. The thickness of the p lexig lass wall (hydrogenous m ateria l) influences the m easured cou nt-rate . In a v esse l with a thicker wall (150 g instead of 75 g) 10% deviations were observed.With the v esse l shown in F ig . 7(b), a m ore uniform distribution of the m ateria l was obtained.
0 = 75 g G =230g
FIG.7. Vessels for measuring highly enriched solid material samples.

480 FUSS
TA BLE III. SOLID F U E L (PA RTICLES WITHOUT COATING)
No. Type CompositionDiam.(pm )
Enrichment<$>)
235U in total sample (wt.%)
1 Mixed particles (Th.lDOz 400 9 3 7.536
Th : U = 10 : 1 kernels
2 Feed particles uo2 180 83 71.02
3 Fuel powder uo2 - 90 79.1
Three types of solid m ateria l specified in Table III were used for the calibration . These are expected to occur in the rep rocessin g of THTR fuel.
In the case of therm al irrad iation , the p lexig lass v esse l was enclosed in the standard aluminium box and, in the case of epitherm al irradiation, in an aluminium box lined with 0.5 mm Cd (see section 4 .5 ). The boxes were transported by lift to the irradiation position.
F igure 4 shows the calibration curves for fuel types 1, 2, 3 enclosed in v e sse l in F ig . 7(a). The calibration curves for types 1 and 3 are sim ilar. This type of solid fuel is mainly expected in the future rep rocessing campaign.
The calibration curve for the concentrated feed p artic les of type 2 shows a distinct deviation. This is certain ly due to self-sh ield ing in the individual p artic les which is discussed in section 4,4.
When the U 0 2 powder was distributed m ore uniform ly — by use of the v esse l in F ig . 7(b) — a different curve was obtained with the param eters given in Table II. This type of sample may occur as mixed dust or as loaded filte r . The curve and the fitting obtained resem b les m ore closely the calibration curve of the sp herical fuel elem ents which have a sim ilar distribution.
4 ,4 , Self-sh ield ing of therm al neutrons in the fuel kernel and irrad iation with epitherm al neutrons
The observed deviation of the calibration curve for type 2 is expected to be due to self-sh ield ing in the individual fuel kernel. An estim ation of the magnitude of this effect is attempted in th is section. As a resu lt, the benefit of using epitherm al neutron irrad iation for this type of fuel is dem onstrated and discussed.
The neutron absorption in sp herical probes has been treated by Becku rts and W irtz [7]. They calculate C, the activation per second of a sp herical probe of radius R and m acroscopic cro ss -se c tio n E. A combination of their form ula 11.2. 29 with 11.2.30b leads to Eq. (3).
C = ttR 2e " 2 £ aR l - e ' 2 £ aR "
_1 + EaR ' 2 . ( E aR )2 . (3)

IAEA -SM -201/53 481
TA BLE IV. ABSORPTION PR O PER TIES OF F U E L KERNELS FOR THERMAL NEUTRONS a a(2 3 5 U) = 680 b
Type Density 235U /cm 3 !(cm *)
R(cm) (<W
1 9.8 0.74 g = 1.9 x 10²¹ 1.29 0.02 0.019 « 2
2 10.9 7.78 g = 2 x 10²² 13.6 0.009 0.092 « 9
By expansion of Eq. (3) into a Taylor s e r ie s , Eq. (4) is obtained:
43 I R E. 4 (4)
The second term in the brackets yields the magnitude of the deviation due to self-sh ield ing. The absorption properties for the fuel kernels of types 1 and 2 are shown in Table IV.
According to the last column of Table IV self-sh ield ing is expected to reduce the neutron em ission by 2% in fuel kernels of type 1 and by 9% in kernels of type 2. The fitting of m easured points in F ig . 4 indicates even a somewhat higher deviation, which is possible since the flux perturbation in the surrounding neutron field was not considered in this approximation. It is thus evident that deviations must be expected in concentrated feed kernels of type 2 .
As a counterm easure, epitherm al neutrons can be used for irradiation.In the epitherm al region, the c ro ss -se ctio n s are by an order of magnitude lower and the influence of self-sh ield ing must be lower by the same order and therefore not m easurable.
F o r an irrad iation with epitherm al neutrons in this assay , the sample container was wrapped with Cd. The epitherm al neutron flux in the ir ra d iation position is known from R ef. [2]. The experim ental resu lts obtained with a Cd-lined box are shown in F ig . 5. With epitherm al neutrons, all types of solid fuel resu lt in the same calibration curve and the same p aram eters of the fitting. Here the type does not influence the m easurem ent.As a drawback, the total count-rate is only 10% compared with therm al irrad iation . The zero level of the count-rate is not changed in the assay since only fast neutrons are transported to the counter. But at a count- rate from f is s ile m ateria l reduced to 1 0 %, the constant zero level is equivalent to 40 mg 235U compared with 4 mg in the case of therm al irradiation. The sm allest detectable quantity of fiss ile m ateria l which is related to the zero level is not as low as in the therm al case . Epitherm al irrad iation is therefore only advantageous for sam ples of unknown and concentrated m ateria l which may include kernels and p artic les .

482 FILSS
TA BLE V. FISSILE ISOTOPE DETERMINATION IN VARIOUS SAM PLES USING THE SPECTRUM COUNTER
SampleFission
products(Ci)
гз5и + Z33u
(g>
Count-rate (counts/s)
Spectrum-counter
(counts/s)
Blank 0 0 0.5 46.360
Test element 0 0.014 3.1 42.220
Non-irrad.AVR-fuel
0 1 164.0 42.380
IrradiatedAVR-fuel
100 0.69 123.5 42.300
50 ml U 02(N 03)2 solution(10 g 235 U/litre)
0 0.5 99.3 34.050
5. FLU X PERTURBATION AND MODERATION
Flux perturbation and additional m oderation of the source neutrons are probably the m ost im portant factors leading to different calibration curves for therm al neutrons. The flux depression was m easured by Menlove et al. [5] with a fission detector. A fter correction for flux depression th e ir calibration curves showed a better proportionality.This could not yet be m easured in our assay.
Additional m oderation is very im portant in liquid sam ples which f r e quently occur in the course of rep rocessin g . The degree of moderation could be experim entally controlled in our assay by a boron-lined (or B F 3 ) tube, which was positioned d irectly underneath the source part of the assay.It is the upper tube in F ig . 1, which is surrounded by boric acid. T h erefore, much of its cou nt-rate , which is indicated as "spectrum counter" in the last column of Table V, resu lts from epitherm al neutrons.
Without any sample (blank) the source spectrum is not additionally moderated and the "spectrum counter" reco rd s the highest count-rate of 46 300 cou nts/s (line 1 of Table V).
The spectrum is slightly moderated by the graphite of the fuel elem ents in lines 2 -4 . The recorded value of the spectrum counter is lower but constant for these three fuel elem ents which have the same m atrix composition (196 g graphite). F o r the liquid solution, the lowest value of the spectrum counter occu rs in connection with the highest degree of moderation. 6
6 . DISCUSSION OF ERRORS AND CONCLUSION
A variety of sam ples is expected in the rep rocessin g of nuclear fuel, among which are highly enriched fuel powder, fuel p a rtic le s , fuel elem ents

IAEA-SM -201/53 483
and liquid solutions. C alibration curves for these types of sam ples were m easured and can be represented by a linear and a quadratic term of the m easured fission count-rate. The linear term of these calibration curves v aries in the range of 7.5 + 20%, provided the geom etry of the m easu rement is as specified. This range of e r ro r must be anticipated for unknown sam ples (black boxes) of reasonable composition. The e r ro r will be beyond this range if strong neutron absorbers and lumps of enriched fiss ile m ateria l cannot be precluded. In such cases a m easurem ent with epitherm al neutrons is advantageous.
A lower range of e r ro r is expected if the type of sample can be sp ecified, e. g. as liquid solution. In this case the mean square deviation of the points of the calibration curve can be used for the determ ination of the range of e r ro r . It is 4%, and this lim it was also obtained in subsequent determ inations. This value is above the a value of the count-rate and must therefore be attributed to system atic e r ro rs such as fixation and pipetting. These e r ro rs are higher than those obtained in the chem ical analysis of liquid sam ples. But it must be recognized that h ere, sam ples like fuel elem ents can be m easured d irectly , while otherwise a great deal of p re paratory work would be needed before they could be determined by chem ical analysis. If a ll steps of sampling and sample preparation are included in the consideration of the e r ro r , the ranges of e r ro r will be m ore com parable.
The resu lt of this non-destructive determ ination is a digital count-rate which is im m ediately obtained and from which the content of 235U can be im m ediately calculated. The main advantage of the described method is that radioactive fission products, fertile m ateria l and spontaneous neutron em itters do not appreciably influence the m easurem ent. If their contribution to the m easured count-rate is expected to be above 1 %, it can be subtracted by removing the 124Sb sou rces. We therefore conclude that this determ ination is re liab le , accurate and fast, well suited for process control and safeguarding purposes esp ecially with irrad iated fuel. It has proved to operate under the difficult conditions of a h o t-ce ll facility .
This paper rep orts the f irs t detailed calibration curves that were m easured with this assay . The range of e r ro r may be reduced by further re sea rch , esp ecially for fixed types of sam ples.
A C K N O W L E D G E M E N T S
I am indebted to P ro fe sso r D r. E . M erz, d irector of the Institute for Chem ical Technology of the Kernforschungsanlage Jü lich , for his stim ulating in terest in neutron interrogation for fiss ile m ateria l accounting. I wish to thank my co llaborators, Mr. Hausmann and M rs. H rastnik, who assisted in perform ing many of the m easurem ents.
R E F E R E N C E S
[1 ] FILSS, P., Non-destructive control of fissile material containing radioactive fission products with aSb-Be-neutron source by selective transport of fission neutrons in hydrogenous material. Rep. JÜ1-1046-CT (Feb. 1974).

484 F1LSS
[2] . FILSS, P., "Fissile isotope determination in irradiated fuel elements and waste samples, using Sb-Be neutrons", Proc. European Nuclear Conf., April 1975, Paris. To be published by Pergamon Press in Progress in Nuclear Energy Series (Ann. of Nucl. Sei. Engng).
[ 3] BOEHNEL, K., Assay of light water reactor rods for their uranium-235 content, Nucl. Technol. 19 (1973) 199.[4 ] Int. Meeting Non-Destructive Measurement and Identification Techniques in Nuclear Safeguards,
Ispra/Italy, 20-22 September 1971.[5 ] MENLOVE, H.O., FORSTER, R.A., MATTHEWS, D.L., A photoneutron antimony-124-beryllium system
for fissile material assay, Nucl. Technol. 1£(1973) 181.[6] Reactor Physics Constants, ANL-5800, Second Edn.[7 ] BECKURTS, K.H., WIRTZ, K., Neutron Physics, Springer, Berlin, Gottingen, Heidelberg, New York (1964).

IA EA -SM -201/87
A N I N D E P E N D E N T M E T H O D F O R I N P U T
A C C O U N T A B I L I T Y I N R E P R O C E S S I N G
P L A N T S ( M A G T R A P )
C.K. MATHEWS, H.C. JAIN, V.D. KAVIMANDAN,S.K. AGGARWAL Radiochemistry Division,Bhabha Atomic Research Centre,Trombay, Bombay,India
Abstract
AN INDEPENDENT METHOD FOR INPUT ACCOUNTABILITY IN REPROCESSING PLANTS (MAGTRAP).A new technique for measuring the total plutonium in an accountability tank is described which does
not require knowledge of the total volume of solution in the tank. This is the Magnesium Tracer technique for the Accountability of Plutonium (MAGTRAP). This method depends on the addition of natural magnesium as a tracer and the subsequent isotope dilution of an aliquot using a spike with known 26M g/242Pu ratio. By measuring only the isotope abundance ratios of 26Mg/24Mg and 239Pu/242Pu in the mixture, the quantity of the plutonium in the accountability tank can be calculated. The weight of the aliquot is also not necessary if the magnesium blank is negligible; otherwise an approximate value is sufficient to make the necessary blank correction. The magnesium tracer technique can also be used to check the volume (or weight) calibration of the tank. Several experiments were carried out in the input accountability tank of the Fuel Reprocessing Plant at Tarapur to assess the accuracy of this method. The weight (or volume) of the solution in the tank could be measured independently with an accuracy better than 0.5%. Experiments were also conducted to measure the total uranium and plutonium in the accountability tank using the tracer technique. The accuracy is better than 1%. The tracer technique was also used to arrive at optimum sparging times to ensure the homogeneity of the solution in the tank. 1
1. INTRODUCTION
The input end of the rep rocessin g plant is the f ir s t point in the fuel cycle where the plutonium produced in re a cto rs can be m easured. The current p ractice for m easuring plutonium entering the rep rocessing plant is to determ ine the total amount of this elem ent in each batch in an accountability tank by the volum e-concentration method [ 1 ]. The volume of the d issolver solution in the accountability tank is m easured by m anom eters which are p recalibrated for this purpose. The concentration of plutonium in the solution is usually determ ined by isotope dilution m ass spectrom etry. Thus, the e r ro r in the m easurem ent of plutonium in a d issolver batch a r ise s from the e r ro rs in the values of both the total volume and the concentration, the la tte r implying the determ ination of the size of the sam ple. Any change in tank calibration will give a bias to the m easurem ent. What is m ore, it is difficult to v erify independently the volume which is read off from calibration curves.
485

486 MATHEWS et al.
We proposed in 1969 an independent method for m easuring the total plutonium in the accountability tank when the volumes of the solution in the tank and the sample aliquot are not known [ 2]. The method (MAGTRAP1) m akes use of natural magnesium as a tr a c e r which is added to the accountability tank and u ses isotope dilution with a double spike of 26Mg and 242Pu fo r determining the plutonium-to-magnesium ratio and hence the quantity of plutonium in the tank. L ab o rato ry -sca le studies were carried out in 1970-71 and on obtaining encouraging resu lts , some experim ents were conducted in the rep rocessin g plant at Trom bay in 1972-73. These la tter experim ents did not conclusively establish the accuracy of the method because of a number of problem s.
This paper d escribes the resu lts of the experim ents carried out in the Fuel R eprocessing Plant at Tarapur to a sse ss the p recision and accuracy in the use of magnesium tr a c e r to determine independently the volume or weight of the solution in the tank as well as to estab lish the validity of the method by m easuring total uranium as well as plutonium. It was also possible to arriv e at optimum durations of a ir-sp arg in g required to ensure the homogeneity of the solution in the accountability tank.
2. PRIN CIPLE
A known quantity (WMg) of natural magnesium is added to the tank containing plutonium. A fter thorough mixing, sm all aliquots of the solution are withdrawn and spiked with a m ixture of M2Pu and 26Mg in an accurately known ratio (Rj). The aliquot size of either the sample or the spike need not be known. The isotope ratios ^ P u / ^ P u (r M^j ancj ^M g/^M g (R ^ 1 ) are m easured in the spiked solution. The total amount of plutonium, wj in the tank is then given by the equation
W = W -R • . g R Si(Pu) M f(P_u)_
Mg ' (r “ 9 - R 2s/9) ? R st(M g) M *(M g ) (1)
where R j/j and Rj re fe r to the ratio of the abundance of the i-th isotope to that of the j- th isotope (i, j etc., num erically given by the last digit of the m ass number and the re feren ce isotope j is 24 in the case of Mg and 239 in the case of Pu; thus R 6 = R 6/ 4 = 2 6M g/24Mg) and the su p erscrip ts S, M and о re fe r to the (unspiked) sam ple, spiked m ixture and natural magnesium respectively . The summation is over a ll the isotopes of the elem ent given in the bracket and the Mj (X) re fe rs to the m ass of the i-th isotope of elem ent X. It m ay b e noted that ij R 3 (Pu) M ?(Pu) = <(At.Wt SpJ (AFg)s,i .e . the average atom ic weight of plutonium divided by the atom ic fraction of 239P u in the unspiked sample.
The above equation im plies that (i) the spike solution does not contain 239Pu and MMg, and(ii) magnesium is absent in the tank before tra c e r magnesium is added ( i .e ., no blank). These conditions are not, in general,
1 MAGTRAP - Magnesium Tracer Techniques for the A ccountability o f Plutonium.

IA EA -SM -201/87 487
satisfied and hence correction s have to be made. The f ir s t of the above e r ro rs can be accu rately taken care of by multiplying E q .(l) with the factor
1 - r V rSp212.
1 ' K / J * 6 / 4
where the su p erscrip t Sp re fe rs to the spike solution. Equation (1) now becom es
W_ W.Mg
■ R (r ;m . - R,•mL(R^/n - R„SJ2/9 2 /9 '
y d - r ^ / r 1/9>
d - K J Rm]
чЛ R -(Pu) -M ^(Pu) (2)
p R*(Mg) • M®(Mg)
To co rre ct fo r the second factor, viz. magnesium blank, an additional m easurem ent is n ecessary . There are two alternatives:
(a) An accurate correction for blank can be made by carrying out the double spike (26Mg + 2 4 2 Pu) isotope dilution in a (blank) sample of the tank solution taken before the addition of tr a c e r and analysing it in the sam e way as the sample collected a fter tr a c e r addition. If Eq.(2) is re -w ritten as
then it can be shown that blank co rrectio n can be accom plished by m ultiplying Eq.(2) by
1 + Z TZ b - Z T
where the su p erscrip ts b and T re fe r to the values of Z before and after the addition of magnesium tra c e r . This method of blank co rrectio n involves double-spiking followed by the m easurem ent of both magnesium and plutonium isotope ratios. MAGTRAP, using this alternative fo r blank correction , is re fe rre d to as M AGTRAP-I in th is paper.
(b) However, if blank co rrectio n is sm all, then an approximate knowledge of the magnesium concentrations both in the blank and in the sample aliquots (Cb and CT, respectively) would be sufficient for correction . Equation (2) must now be multiplied by the factor
Here the co rrectio n factor involves only magnesium concentrations — no plutonium isotope ratio m easurem ent is involved as in alternative (a). Knowledge of concentrations does imply that of aliquot s iz es , but these need be known with much le ss accu racy than is otherw ise required. F o r exam ple, if the blank is only 1 0 % of the tr a c e r added, then the aliquot s izes need be known with ten tim es poorer accu racy than is demanded in plutonium m easu rement. In other words, volume m easurem ent by pipetting would be adequate

488 MATHEWS et al.
2.1. M easurem ent of the volume or weight of the solution in the tank (M AGTRAP-V)
If only the weight (or volume) of the solution in the tank is desired (for verifying tank calibration), then after the addition of the tr a c e r a known aliquot (Wa[) of the solution is mixed with a known quantity of 26Mg spike.F ro m the 2 6M g/MMg ratio m easured in this m ixture, one calcu lates the quantity of natural magnesium in the aliquot (x). The weight (or volume) of the to ta l solution is then given by Wx = (WMg/x) • Wal, the units of Wal determ ining that of Wx .
This variation of the magnesium tr a c e r technique (lim ited to volume m easurem ent) is called MAGTRAP-V in this paper. A. s im ilar technique using L i tr a c e r was investigated by Bokelund [ 3] recently with inconclusive resu lts .
and th is re lax a tio n m ak es the handling of d is so lv e r solution e a s ie r . Whenth is m ethod i s app lied fo r blank co rrectio n , the technique i s r e fe r r e d to a sM AG TRAP-II.
3. EXPERIM EN TA L
3.1. G eneral description of the experim ents
The experim ental work described in this paper con sists of two parts.
(1) To check the validity of the magnesium tr a c e r method for m easuring the weight (or volume) of the solution in the tank, four experim ents were carried out after filling the accountability tanks with known quantities of dem ineralized w ater. Sam ples were withdrawn from the tank to check the magnesium blank. A known amount of magnesium stock solution, whose concentration was accu rately m easured, was added to the tank. In a ll but one experim ent, the solution was added through a | -in ch s ta in le ss -s te e lline (F S P Line) going straight into the tank from the operating gallery outside the ce ll and this was flushed down with a few litr e s of water. In one case , however, the magnesium solution was added d irectly into the tank by someone clim bing on top of the tank when the ce ll was s t ill inactive. After different durations of a ir-sp arg in g , rep licate sam ples w ere withdrawn and weighed aliquots of these w ere spiked with known quantities of the spike solution containing 26Mg in an accurately known concentration. The relative isotopic abundances of 26Mg and MMg were m easured in this spiked solution and from this data, concentration of magnesium in the tank solution was calculated.
(2) Experim ents 5 and 6 were carried out to check the validity of the tr a c e r method as well as to arrive at optimum sparging tim e in sim ulated d issolver solutions. In experim ent 5, the tank contained about 2250 kg of solution with a uranium concentration of about 250 m g/g. In this experim ent, the total uranium was estim ated by using 233U as the spike. In fact, a mixed spike containing 233U and 26Mg was used and the 2 3 5U/233U ra tio was m easured for calculating the quantity of natural uranium. In experim ent 6 , the accountability tank contained about 2 0 0 0 kg of solution containing uranium at about 250 m g/g concentration and very sm all quantities of plutonium. In this case , a mixed spike of 2 6 Mg, 233U and М2Ри was used and the isotope ratios

IA EA -SM -201/87 489
TA BLE I. W EIGHT/VOLUME M EASUREM EN T'BY MAGNESIUM TRACER METHOD
Expt.No.
Weight of solution in the tank (kg)
Error№)
Measured directly byMeasured by magnesium
tracer methodWeighing D.P. measurement3
I - 1012.0 1016.34 + 0.43
II 1056.75 1055.0 1061.0 + 0.40
III 1509.74 1510.27 1504.26 - 0.35
IV 1508.04 1505.46 1509.48 + 0.1
D.P. = differential pressure
2 3 5U /233U and 2 3^Pu/2 2Pu were m easured for calculating the total amounts of uranium and plutonium, respectively .
The magnesium, plutonium and uranium were chem ically separated before m ass sp ectrom etric analysis. The separation procedure developed for this purpose is described elsew here [4].
3.2. Magnesium isotope ra tios
The isotope ratios were m easured using a V arian MAT CH-5 m ass sp ectrom eter. A good deal of investigation was required to arriv e at optimum conditions for these m easurem ents because of the p ossibility of isotope fractionations. The procedure finally arrived at involved the loading of a drop of a solution of MgCl2 (containing about 10 fig of Mg) on the sample filam ent of a preheated double-filam ent sample in sert and a w ell-defined schedule for heating the filam ent [ 5]. M easurem ents were taken at filam ent tem peratu res of 5.5 - 6.0 A (ionizing filam ent) and 1 .4 - 1.8 A (sam ple filam ent). This gave very good reproducibility.
4. RESU LTS
4.1. Experim ents 1 to 4 (MAGTRAP-V)
The resu lts of four experim ents conducted in the accountability tanks of Tarapur R eprocessing P lant for volume m easurem ent are sum m arized in Table I, where the weight of the solution in the tank as m easured by the tr a c e r technique is compared with that m easured d irectly by weighing or obtained from the d ifferential p ressure reading. The agreem ent is obviously very good, the mean e r ro r being only 0.3%.

490 MATHEWS e t a l.
T A B L E II. TO T A L URANIUM ESTIM A TED IN TH E TANK
SampleNo.
Total uranium measured by tracer method (kg)
Total uranium measured by volume-concentration method
(kg)Weight of uranium
usingMAGTRAP-I
Weight of uranium using
MAGTRAP-II
Volume measured by MAGTRAP-V
Volume given by D.P. a
measurement
I 550.07 548.25 547.33 543.05
II 549.71 547.53 546.58 543.59
III 548.31 547.07 546.13 542.11
Mean 549.36 547.62 546.68 542.92
D.P. = differential pressure
TA BLE III. TOTAL URANIUM ESTIM ATED IN THE ACCOUNTABILITY TANK
Sample
Total uranium measured by tracer method
(kg)
Total uranium measured by volume-concentration method
(kg)No. Weight of Weight of Volume measured Volume given by
uranium using uranium using by D.P. aMAGTRAP-I MAGTRAP-II MAGTRAP-V measurement
I 492.41 492.23 493.56 495.76
II 498.77 498.06 497.17 499.38
III 489.27 489.07 493.76 495.95
IV 496.21 495.74 493.30 495.49
V 491.40 491.45 491.92 494.10
Mean 493.61 493.31 493.94 496.14± 3.82 ± 3.57 ± 1.94 ± 1.95
D.P. = differential pressure
4.2. Experim ents 5 and 6 (M AGTRAP-I and II)
Table II sum m arizes the resu lts of experim ent 5 and Tables III and IV those of experim ent 6 . Several se ts of values have been obtained by processing rep lica te sam ples. Column 2 gives the total uranium or plutonium obtained using M AGTRAP-I. Column 3 gives the total uranium/plutonium calculated using M AGTRAP-II. Sample aliquot s izes have been used in M AGTRAP-II only for blank correction . Column 4 gives the value of total uranium/plutonium calculated using the concentration obtained from isotope

IA EA -SM -201/87 491
TA BLE IV. TOTAL PLUTONIUM ESTIM ATED IN THE ACCOUNTABILITY TANK
Sample
Total plutonium measured by tracer method
_____________________<g)
Total plutonium measured by volume-concentration method
(g)No.
Weight of plutonium using
MAGTRAP-I
Weight of plutonium using
MAGTRAP-II
Volume measuredby
MAGTRAP-V
Volume given by D.P. a
measurement
I 2.827 2.826 2.835 2.848
II 2.843 2.842 2.837 2.850
III 2.845 2.839 2.867. 2.880
IV 2.827 2.827 2.814 2.827
V 2.853 2.849 2.852 2.865
Mean 2.839 2.837 2.841 2.854
± 0.012 ± 0.009 ± 0.020 ± 0.020
D.P. ~ differential pressure
dilution data and the volume of the solution as deduced from m easured magnesium concentration (M AGTRAP-V). Column 5 also lis ts the amount of total uranium/plutonium by the volum e-concentration method but here the volume has been obtained from the d ifferential pressu re m anom eter reading as used in the plant. The agreem ent between these four se ts is indeed very good and dem onstrates that the magnesium tr a c e r method gives very good accuracy. It is rem arkable that the method gives b etter than 0.5% accuracy in the determ ination of total plutonium even at very low levels.
4 .3 . Magnesium blank
Magnesium blank is in the range of 6 to 10 Mg/g in the f ir s t four experim ents. This level of blank a r is e s from the dem ineralized water that is used in in the plant. The high blank level of « 67 Mg/g in the uranium solution in experim ent 5 is not representative of d issolver solution. Even in experim ent 6 , where the blank level is a third of that in experim ent 5, the blank is higher than what is expected in the d issolver solution.
To estim ate the blank levels in the accountability tanks at Tarapur, we have m easured the blanks in the possible sources. The uranium oxide (of the fuel) contains 3.3 ppm and the n itric acid used for dissolution contains1.2 ppm magnesium. The dem ineralized water contains le ss than 10 ppm magnesium. Thus, the magnesium blank level in the d issolver solution is expected to be « 10 M g /g, which is only 5% of the magnesium added as tra ce r .

492 MATHEWS et al.
5. CONCLUSIONS
On the basis of experim ents conducted at the Tarapur R eprocessing Plant, it has been established that:
(1) The magnesium tr a c e r technique (MAGTRAP-V) can be used to m easure the volumes of solutions in accountability tanks with an accuracy of ± 0.5%. This method of volume (or weight) m easurem ent is com pletely independent because it involves only the addition of a known quantity of magnesium into the tank and the subsequent m easurem ent of magnesium concentration in aliquots of the solution by isotope dilution m ass spectrom etry. Blank correction is also n ecessary .
(2) A ir-sp arging at 10 lb /in 2 gauge for about 25 - 30 min ensured sample homogeneity in very dilute solutions w hereas sparging period had to be in creased to about 45 min in uranium solutions.
(3) Total uranium and plutonium in the accountability tank could be m easured with very good accuracy using this technique (M AGTRAP-I or II) without knowing the volume of the solution in the tank.
A C K N O W L E D G E M E N T S
The authors wish to thank Dr. M.V. Ramaniah, Head, Radiochem istry Division and Shri N. Srinivasan, P ro je c t D irector, R eactor R esearch Centre for th e ir encouragem ent and unstinting support from the tim e the original proposal was made in August 1969. They are grateful to Shri A.N. Prasad ,Head, Fu el R eprocessing Division and Shri M .K.T. N air, Engineer-in -C harge, Fu el R eprocessing P lant, Tarapur but for whose w hole-hearted co-operation this work would not have been possible. The assistan ce rendered by S /S h ri D.D. B ajpai, N.S. Venkitachalam ,. S. V aradarajan and A. Dakshinamoorthy of Fu el R eprocessing Plant, Tarapur and Shri Vasant Kumar of the Fuel R eprocessing Division, Trom bay, are gratefully acknowledged. Thanks are also due to our colleagues in m ass spectrom etry group, esp ecia lly Shri B. Saha, Kum. Bagyalakshm i, Shri P .M . Shah and Shri P .A . Ramasubram anian who have helped at various stages of this work. L ast but not the least, the authors acknowledge the contributions of Shri S.A. Chitam bar, esp ecially during the in itia l stages of this work.
R E F E R E N C E S
[1 ] SRINIVASAN, N.. in Safeguards Techniques,(Proc. Symp. Karlsruhe, 1970) 1 , IAEA, Vienna (1970) 155.[2 ] MATHEWS, C .K ., in Proc. Seminar on Accountability and Management of Fissile Materials, Trombay,
April 1971, BARC/I-165 (1972) 17.[3 ] BOKELUND, H., ETR-266, Eurochemic, Belgium (1970).[4 ] MATHEWS, C .K ., IAIN, H .C., CHITAMBAR, S .A ., KAVIMANDAN, V.D., AGGARWAL, S .K ., An
independent method for input accountability in reprocessing plants: Magnesium Tracer Technique for the A ccountability of Plutonium (MAGTRAP), BARC-809 (1975).
[5 ] AGGARWAL,S.K., KAVIMANDAN, V.D., MATHEWS, C .K ., Isotopic analysis of magnesium, BARC-830 (1975).

IA EA -SM -201/108
A N A C C U R A T E P R O C E D U R E
T O S A F E G U A R D T H E F I S S I L E
M A T E R I A L C O N T E N T O F I N P U T
A N D O U T P U T S O L U T I O N S O F
R E P R O C E S S I N G P L A N T S
P. DE BIEVRE, J. VAN AUDENHOVE Central Bureau for Nuclear Measurements,Geel, Belgium
Abstract
AN ACCURATE PROCEDURE TO SAFEGUARD THE FISSILE MATERIAL CONTENT OF INPUT AND OUTPUT SOLUTIONS OF REPROCESSING PLANTS.
A procedure is described by which to assay accurately fissile m aterial contents of input and output solutions of reprocessing plants, using well-defined solid spikes and isotope dilution mass spectrometry. The procedure has been used in measurements performed at the request of the Directorate of Euratom Safeguards in the 1972-1975 period and some results are given. The procedure allows the fissile element contents to be guaranteed at the time and place of sample-taking (i.e . of safeguards inspection), which is an improvement, over guaranteeing such contents at the time and place of analysis.
Safeguarding rep rocessin g plants requ ires physical sam ple-taking and accurate determ ination of the f is s ile m ateria l content in order to support effectively any adm inistrative inspection and to back up safeguards authorities. P ossib le procedures for such sam ple-taking and determ inations involve sam ple-taking in hot ce lls and decontamination or dilution of hot sam ples.
These operations are perform ed at considerable cost and one can never be sure that the identity of the sample with resp ect to its U and Pu isotopic composition as well as to its U and Pu elem ent concentrations is retained. M oreover, most analyses are perform ed with considerable delay at a location fa r distant from the place where the sample was taken. Consequently the field analysis values are applicable — as a ll analysis values — to the tim e and place of the analysis and not n ecessa rily to the tim e and place of sam ple-taking. The la tter requirem ent is , however, b asic to any safeguards inspection system .
Within the fram ew ork of the m easuring support to the Safeguards Author itie s of the European Econom ic Community (Contrdlede Secu rite, Luxembourg) given since 1966, we have established at the CBNM a procedure using Isotope Dilution M ass Spectrom etry to circum vent these disadvantages, at the same tim e guaranteeing to these Safeguards Authorities values for f is s ile m ateria l content which are essen tia lly free from most e r ro r p ossib ilities arising during the tim e between sam ple-taking and analysis.
The procedure runs as follows (see flow -sheet in P ig .l) : 1
(1) The Safeguards A uthorities communicate to CBNM very rough estim ates of U and/or Pu isotopic and chem ical concentrations of the dissolved fuel they want to sample for a check analysis.
493

494 DE BIEVRE and VAN AUDENHOVE
FIG .l. Flow-sheet of in-situ duplicate spiking and subsequent chemical operations and measurements.
(2) CBNM prepares and delivers to the Safeguards Inspector appropriate solid spikes (U m etal or U /Pu alloy), suited to the particu lar problem concerned, and which can be handled easily , safely and quantitatively. These spikes are accu rately defined with resp ect to U and Pu content and isotopic composition by:
(a) T h eir quantitative preparation (levitation alloying)(b) Isotope dilution assay against prim ary standards(c) M ass sp ectrom etric isotopic analysis
(3) A spike is dissolved in a weighed sample of the solution to be investigated in the (hot ce ll of the) rep rocessing plant (a non-diluted sample !).
(4) A fter homogenization of the solution an arb itrary fraction of it is decontaminated from fission products and tran sfe rred out of the hot cell.

IA EA -SM -201/108 495
TA B L E I. MEASUREMENT RESU LTS OF IN-SITU DUPLICATE SPIKING OF U /Pu SOLUTIONS (R esults over the period 1972-1975)
(rag/g)
U
Isotopic composition (at. 7») (pg/g)
Pu
Isotopic composition (at. V )
1.526
154.0 0.0121 888.6 66.644
154.0 1.0949 883.2 21.434
0.2916 8.234
98.6014 2.162
146.7 0.0076 250.9 0.969
146.6 0.5992 251.5 69.397
0.0101 19.521
99.3831 8.111
2.002
173.0 0.0161 1461 0.812
173.0 1.7852 1472 70.429
0.3231 17.184
97.8756 9.708
1.867
234 235 236 238 у238 239 240 24l 242
(5) The inspector sends the spiked sample containing only m illigram amounts of U and m icrogram amounts of Pu to CBNM (sam ples are radiation- free since free from fission products).
( 6 ) The procedure is perform ed in duplicate (see F ig .l ) , i.e . two different solid spikes I-II (different weights) and two different sam ples I-II (different weights) are used. A separate non-spiked sample is taken forU and Pu isotopic analysis (III).
A fter m ass sp ectrom etric m easurem ents, coinciding resu lts of the duplicate spiking combined with previous spike definition allow CBNM to certify accu rately to the Safeguards Authorities the f is s ile m ateria l concentration (U and/or Pu) at the tim e and place of sam ple-taking.
See T ables I and II for some resu lts obtained over the period 1972-1973.
PREPARATION O F U AND U /Pu SPIKES
Induction levitation m elting techniques have been devised at CBNM to achieve re feren ce alloys certified to ± 0.5% composition variation with ± 0.5% homogeneity.

496 DE BIEVRE and VAN AUDENHOVE
TA BLE II. MEASUREMENT RESU LTS OF INSPIRING OF U SOLUTIONS
SITU DUPLICATE
U Pu
(m g/g)Isotopic composition
(at. °lo)< Mg/g)
Isotopic composition (at. ЭД
160.6 0.0060 63.6 0.058
160.7 0.5763 63.0 87.219
0.0735 11.291
99.3442 1.258
0.174
2.049 0.802
2.054 80.189
6.693
12.316
1.047 0.797
1.051 78.961
10.985
9.257
U Pu№ «M
Relative deviation from the 0.00 0.31average of duplicate measurements 0.04 0.12
0.00 0.380.03 0.500.120.19
Conventional methods for the preparation of alloys, such as melting by induction heating in a re fra cto ry cru cib le , arc-m eltin g or electron-beam melting, frequently suffer from sev era l disadvantages, e.g. contamination by the crucible m ateria l, difficulty of casting sm all quantities, and poor homogeneity. Such drawbacks can, however, be avoided by employing the technique of induction levitation heating in an in ert-g as atm osphere. In this p rocess the purest m etals com m ercially available are taken in quantities of 1 0 - 2 5 g and m elted together in argon and without any physical contact in a conical induction coil. The molten m etal is subjected to intense agitation by the action of eddy cu rrents generated by the m agnetic field of the coil. Upon completion of the operation, the molten m etal is poured into a cold mould to ensure rapid solidification.
Large se r ie s of preparations over an 8 -y ear period have proved that this method perm its quantitative alloying without contamination. F u rth erm ore, the m icro -stru ctu re of many alloys is very homogeneous owing to the rapid solidification of the m elt.

IA EA -SM -201/108 497
L o sses occurring during the preparation of U -Pu alloys were so sm all and the homogeneity so good that the com position of 2 0 -m g quantities of alloy did not vary m ore than 0.5% (relative) from the value which was ca lculated from the m asses of the components before alloying.
CHARACTERISTICS OF THE PROCEDURE
R esults are certified for tim e and place of sam ple-taking and not tim e and place of analysis; sm all amounts of sample and spike resu lts in easy handling; hence no m ateria l cost; insignificant transportation costs; Insignificant radiation r isk during transport; flexibility : f its the particu lar f is s i le m ateria l concerned; re liab le (see figures); up to now not one m ajor e r ro r has occu rred (has been operational in rep rocessin g plants since beginning of 1972 a fter extensive laboratory-testing) and, finally, tam p erproof: coinciding resu lts of duplicate isotope dilution provide unequivocal conclusions. On the other hand, if the slightest e r ro r occu rs in whatever step of the en tire procedure, it shows up in the non-coincidence of the duplicate final resu lts ; in other words it is exposed.


S e s s i o n 1 0 , P a r t I
H I G H - T E M P E R A T U R E G A S R E A C T O R S

Chairman-, O. E. JONES (United States of America)
Papers IA EA -SM -201/33, 73 and 83 were presented byH. BÜKER as Rapporteur

I N - P L A N T N O N - D E S T R U C T I V E A S S A Y
O F H T G R F U E L M A T E R I A L S *
IA EA -SM -201/33
T. L. ATWELL, E.R. MARTIN, H. O. MENLOVE Los Alamos Scientific Laboratory,Los Alamos, New Mexico,United States of America
Abstract
IN-PLANT NON-DESTRUCTIVE ASSAY OF HTGR FUEL MATERIALS.The performance characteristics of three different non-destructive assay systems for the measurement
of HTGR fuel are described. These include the segmented gamma scanner which uses the passive gamma-ray emission from the 235U together with a segment-by-segment axial scan and transmission with an external source to correct for gam m a-ray absorption. The Random Driver is an active, fast-neutron interrogation system which employs 24lAmLi ( a , n) neutron sources to induce fissions in the sample fissile m aterial. This system is applicable to bulk samples of (HTGR fuel particles and large groups of fuel rods. The third system considered is the 252C f Fuel Rod Assay System which uses thermal neutron interrogation and prompt-fission neutron counting to measure the total fissile content in a fuel rod or stack. In addition, the pellet-to-pellet or rod-to-rod uniformity is measured by counting the delayed gamma rays in a Nal(Tfi) through-hole detector.
1. INTRODUCTION ,
High-precision nondestructive assay (NDA) instrumentation for measurement of fissile material in the processing stages of reactor fuels is of interest both from a safeguards and a quality-control standpoint. Nondestructive assay and s afeguards techniques are especially important in the measurement and control of High-Temperature Gas-Cooled Reactor (HTGR) fuel because:
7 X c1. The characteristically high U enrichment (93%)
places high safeguards importance on the fuel,
2. The inherent particle nonuniformity makes uniform sampling of process batches difficult, and
3. The dissolution of the silicon-carbide coated particles for chemical analyses is quite difficult.
This paper discusses three NDA instruments developed at the Los Alamos Scientific Laboratory (LASL) which have d e m o n strated the accuracy, precision, and operational stability needed for in-plant application to HTGR first generation fuel (235u). These are:
• 1. The Random Driver Mod-III L1-4Л for measuring in-process fissile particles, high level process scrap (> 50 g an( fuel rods (in groups of 100);
* Work performed under the auspices of the US Energy Research and Development Administration.
501

502 ATWELL et a l.
2. The Segmented Gamma Scanner [4-6] for measuring low density scrap and waste (< 200 g U ) ; and
3. The 2^ 2Cf Fuel Rod Assay System (PAPAS) [7-9] for measuring stacks of rods prior to their insertion into the graphite fuel elements.
Both the Random Driver and the Segmented Gamma Scanner have been undergoing testing and evaluation at the General Atomic Company (GAC), Sorento Valley Plant since November 1974. The 252cf Fuel Rod Assay System was originally developed [lO-ll] at LASL several years ago for NDA of LWR- and FBR-type fuel rods. Depending on the specific application, different types of moderator cores are employed. This generic type of instrument has seen widespread industrial use over the past few years.
2. BRIEF DESCRIPTION OF THE HTGR FUEL FABRICATION PROCESS
The first operational HTGR power reactor, the 330-MWe Fort St. Vrain Reactor, is scheduled for startup in early 1976. Its core will be loaded with about 870 kg uranium and 19,500 kg thorium. The core requires some 1482 graphite fuel elements, each of which is loaded with ^3000 rods of dimension 12-mm diam by 51-mm length. The individual rods are manufactured from a blend of coated fissile and fertile particles bonded together with pitch.
The fissile particles consist of kernels of mixed UC_ and ThC- ranging in diameter from 100-300 microns which are subsequently coated with an inner carbon coating, a silicon-carbide intermediate coating, and then an outer carbon coating to p r o duce a final particle diameter of 360-560 microns. The process of converting UC^ fuel to TRISO-coated fissile particles requires ten manufacturing stages and yields eight material categories of NDA measurement. Present production containers for this in-process fuel range from 2-4 liters in volume and contain from 50-1500 g uranium at 93% 235U enrichment. The Th/U blending ratios in the fissile kernels range from 3.6 to 4.3 by w e i g h t .
Fertile particles consist of 300-600 micron TI1C 2 kernels plus a coat of ^130 microns. To produce rods, the fissile and fertile particles are blended to achieve final Th/U ratios from 10:1 to 35:1 depending on their future location in the reactor core.
3. RANDOM DRIVER--MOD III
Random Driver is an active, fast-neutron interrogation system which employs a 2/*^AmLi (a,n) neutron source to induce fissions in the fissile material within a sample; hence, it "drives" the sample. The AmLi source energy (En = 525 keV) is below the fission threshold of 238ц an^ 232j]1) yet as sufficiently energetic to achieve the penetrability required for assaying HTGR particle samples of high fissile mass; i.e., self-shielding effects both within a fuel particle and shadowing of one particle by another are minimized.

IA EA -SM -201/33 503
along diagonal comers of the sample cavity.
Borol
FIG. 2. Top view of Random Driver M od4II. The instrument will accommodate samples up to 153 mm diam . by 365 mm high.
The "randomness" of the driver pertains to the nature of the AmLi source which emits single neutrons randomly in time. This characteristic enables a pair of fast neutron scintillation detectors to distinguish noncorrelated source neutrons from prompt fission neutrons by demanding that two events be detected within a short coincidence interval, typically 40 ns

504 ATWELL et a l.
FIG. 3. Complete system showing the Random Driver Mod-III, the electronics console with PDP-11/05 minicomputer, and the teletype unit.
The Random Driver Mod-II I, shown in Figs. 1 and 2, is an upgraded version of the original Random Driver [12-13J for active-neutron interrogation of high-enrichment uranium in matrices and/or mass ranges which disallow passive gamma ray techniques because of self-absorption problems. The Mod-Ill instrument is equipped w ith a PDP-11/0S minicomputer with 12 к of memory for both automated data reduction and for the g e neration of calibration functions using weighted, least-squares fitting routines. The complete system is shown in Fig. 3.
The Mod-III version differs from the original Random Driver in three main aspects. First, four stationary AmLi neutron sources 0 5 . 5 x 10^ n/s each, mounted in cylindrical tungsten gamma shields) are arranged in a nickel-reflected irradiation cavity to achieve a spatially "flat" fast-neutron flux distribution. The steel-backed nickel reflector provides good source-to-sample coupling and increases the effective source strength by about 50% over a totally steel-reflected cavity. A plot of the vertical response vs sample fill height is given in Fig. 4, along with a sketch of the relative locations of the sources and sample rotator. This plot was generated by integrating the instrument's point-wise response over the sample fill height. As shown, the change in overall response is less than 1% over the range of typical fill heights

IAEA-SM-2 0 1 /33 505
Relative Response
FIG. 4. Plot of relative vertical response vs sample fill height. The flatness in response for fill heights between 75 and 200 mm was achieved by vertically separating the sources as shown.
Nevertheless, the vertical response data are stored in the computer's memory and a fill-height correction factor is generated by a software subroutine based on the s a m p l e ’s fill height as entered by the operator.
Secondly, the Mod-III version of Random Driver was made less sensitive to variations in heavy-element matrix by reducing its sensitivity to prompt-fission gamma rays that are emitted in coincidence with a multiplicity of about 6. This compares to a fission neutron multiplicity of about 2.5 for 235ц_Although coincidence detection of prompt gamma rays would increase the response and, therefore, improve the counting precision, this technique would change the assay results for each thorium loading because the y - y coincidence response is sensitive to the square of the gamma-ray transmission of the sample. Rejection of coincident gamma rays in the Random Driver Mod-III is accomplished by time-of-flight discrimination; the circuit is given in Fig. 5. Only events separated by a5- to 40-ns interval are sensed. Because coincident gamma rays have very short flight times (<2 ns) from sample to scintillator, the technique works well.

Rig
ht
1 Le
ftsc
intil
lato
r sc
intil
lato
r
Pilot RCA 8575 E C 8 G EG8G EGSG EG8G EGSG LRS TC-546 PF Or tec base T 120/IM C 102 B/N T 120/N T 105/N T 120/N 322 A scalers
FIG. 5. Block diagram for the electronics for the Random Driver Mod-Ill, The gate generator output is 35 ns and delays A and В are 5 ns, yielding a coincidence time window from 5-40 ns. Delays C and D are 155 ns, resulting in an accidential tim e window from 155-190 ns.
506 A
TWELL et al.

IA EA -SM -201/33 507
random s o u r c e ! 5 - n s t im e d i s c 25 n s / d i v
" I . . .
“j ' I ' f I j
i 4: 1
®Co s o u r c e no t im e d i s c “ 25 n s / d i v-----1-----1-----!---
i II .
! I
ч Т "
2 9 2 - g 2 3 5 U no t im e d i s c 25 n s / d i v •. I
■ I.... г ..
i.
2 9 2 - g 2 3 5 U 5 - n s t im e d i s c 25 n s / d i v
__L
I
i ’ " p " ! ' " j " j 1”" 11 \ ' j ^" I ” " j " ' ' I
FIG. 6. Time-dependent coincidence curves for a 60Co source, a random background source, and the response induced in an HTGR sample (292 g Z35U) by the Random Driver with and without tim e-of-flight discrimination.
Shown in Fig. 6 are time-dependent response curves for a uCo source, a random background source, and a HTGR sample
with and without time discrimination. The amount of time d i s crimination is adjusted by varying the length of the "short delay." The relatively thick lead shielding (5 cm) separating the scintillators from the sample cavity serves three purposes:(1) it reduces the passive gamma-ray background from the sample and the AmLi source, thereby decreasing the accidental c o i n c i dence rate from uncorrelated singles events, (2) it serves as a fast-neutron "pile" that provides for better time discrimination between y-y and n-n coincidences and also increases neutron detection efficiency, and (3) it tends to dampen out p e r t u r bations on the fast-fission neutrons caused by variations in the heavy-element matrix from sample to sample.
The third consideration in adapting the Random Driver to the NDA of HTGR fuel particles was to develop a method by which the sample's induced response could be corrected for per t u r b a tions on neutron flux due to the presence of light-element matrix and container materials. The effect of introducing m o d erating material into the Random Driver is to shift the high- energy spectrum of the interrogating-neutron flux downward, which in turn increases the rate of induced fissions in 235u.

508 ATWELL et a l.
480
440
400
360
320
280
240
200
160
120
80
40
0О 40 80 120 160 200 240 280 320 360 400 440 480 520 560 600 640 680 720
-
Z b *
^ KEY:
ZERO BIAS LINE /0 CALIBRATION STANDARDS □ SILICON CARBIDE COATED
PARTICLES (SMALL KERNELS) 4 SILICON CARBIDE COATED
- PARTICLES (URGE KERNELS) • OUTER CARBON COATED
PARTICLES (SMALL KERNELS)■ OUTER CARBON COATED
PARTICLES (LARGE KERNELS)- ▲ INNER CARBON COATED
PARTICLES (LARGE KERNELS)
COMPARISON OF 62 DIFFERENT BATCHES: PROPORTIONAL BIAS = + 0.64% t 1.28% (95% 1
/ 1 _ l ____I I i i i
STANDARD ERROR - ±5.8g
-J____1____1— 1 1 1 ( 1 1 1
235U mass, g (chemistry)
FIG. 7. Comparison of Random Driver non-destructive assay and chem ical analysis.
The l ig h t -e le m e n t m a tr ix r a t i o (grams o f carb on and s i l i c o n p er gram o f 2 *5и ) i n th e pr o c e ss f u e l in c r e a s e s as th e TRISO- c o a t in g p ro c e s s p ro c e e d s , ran g in g from abou t 2 .5 a f t e r th e f i r s t c o a t in g to about 23 a f t e r th e f i n a l c o a t in g . As an exam ple, f o r a g iv en amount o f an in c r e a s e in th e carbon ands i l i c o n m a tr ix from 400 to 4000 g r e s u lte d in an in c r e a s e in th e in d u c e d - f is s io n r a t e o f a p p ro x im ate ly 1 3 1 . P o ly e th y le n e c o n ta in e r s and b a g s , b ecau se o f th e s tro n g m od erating power o f hydrogen, have an even more pronounced e f f e c t .
, To m o n ito r s h i f t s in th e in te r r o g a t in g - n e u tr o n f l u x , two “’He p r o p o r t io n a l c o u n te rs (4-atm f i l l p r e s s u r e ) a re used as shown in F ig . 2 .
The re sp o n se from th e s e d e t e c to r s i s used to make c o r r e c t io n s f o r th e measurement p e r tu r b a t io n s cau sed by th e sam ple and c o n t a in e r .
B ecau se o f th e tem p e ra tu re s e n s i t i v i t y o f d e te c to r s em ploying p h o to m u lt ip l ie r tu b e s , th e d e te c to r must e i t h e r be g a in - s t a b i l i z e d or th e re sp o n se must be c o r r e c te d f o r tem p e ra tu re ch an g es. S in c e th e in h e r e n t ly poor r e s o lu t io n o f a p l a s t i c s c i n t i l l a t o r i s n o t condu cive to g a in s t a b i l i z a t i o n , th e a l t e r n a t i v e i s to c a l c u la t e a c o r r e c t io n based upon an e s t a b l i s h e d te m p era tu re c o e f f i c i e n t . The tem p eratu re c o e f f i c i e n t was measured a t GAC to be 0 .4 5 4 /° C . A f te r c o r r e c t in g f o r te m p e ra tu re , in a d d it io n to f i l l h e ig h t and f lu x c o r r e c t io n s , th e Random D riv e r p r e c i s io n was 1 . 0 - 1 . S% (2 s tan d ard d e v ia t io n s ) f o r 1000 second s co u n tin g tim e and a mass o f 2 0 0 -4 0 0 g o f 2 3 5 u.

IA EA -SM -201/33 509
The Random D riv e r c a l i b r a t i o n had a s tan d ard e r r o r o f + 1 .2 $ and agreem ent on a b a tc h by b a tc h b a s is w ith ch em ica l a ssa y was w ith in th e p r e d ic te d e r r o r .
The r e s u l t s o f GAC' s in - p la n t e v a lu a t io n program [ 4 J a re summarized in T ab le I and F ig . 7. T ab le I shows th e r e s u l t s o f com paring th e Random D riv e r a ssa y r e s u l t s w ith an a ssa y by sam pling and a n a ly s is by bo th D av ies-G ray t i t r a t i o n and X -ray f lu o r e s c e n c e . The second column g iv e s th e number o f independent b a tc h e s com pared, columns 3 and 4 th e t o t a l 233U ancj a 2 a (95$ c o n fid e n c e l i m i t ) e s t im a te o f th e u n c e r t a in i t y in th e b i a s .For c a t e g o r ie s 4 and 5 , th e o u te r carbon co a ted p a r t i c l e s , th e -’Ll m asses ranged ov er 200 g and, t h e r e f o r e , a p r o p o r t io n a l and c o n s ta n t b ia s a re a ls o re c o rd e d . The l a s t two columns show th e m easured s ta n d a rd d e v ia t io n in th e d i f f e r e n c e s from b a tc h to b a tc h and th e s ta n d a rd d e v ia t io n p r e d ic te d from th e e r r o r s in th e ch e m ica l a ssa y and th e Random D riv e r a ssa y com bined. The ch e m ica l a ssa y e r r o r s in c lu d e th e sam pling e r r o r d eterm ined from th r e e sam ples from each b a tc h . The Random D riv e r e r r o r in c lu d e s th e c a l i b r a t i o n e r r o r p r e d ic te d from th e w eighted l e a s t sq u a re s f i t t i n g r o u t in e .
A s i g n i f i c a n t b ia s i s on ly p re s e n t f o r th e in n e r carb o n - co a te d p a r t i c l e s ( la r g e k e r n e ls ) . The Random D riv e r c a l i b r a t io n was g e n e ra te d u sin g p r im a r i ly o u te r c a rb o n -c o a te d m a t e r ia ls and, t h e r e f o r e , a d d it io n a l in n e r c a rb o n -c o a te d s ta n d ard s must be p rep ared to a c c u r a te ly d eterm in e th e p ro p er c a l i b r a t io n f o r in n e r c a rb o n -c o a te d m a t e r ia ls . However, as shown in F ig . 7 , th e in n e r c a r b o n -c o a te d b a tc h e s a l l co n ta in e d a p p ro x im a te ly 400 g o f 235u and th e b ia s co u ld be a lo c a l b ia s in th e c a l i b r a t i o n cu rve t h a t can be c o r r e c te d by a d d it io n a l s ta n d a rd s a t s l i g h t l y h ig h e r m asses.
F ig u re 7 i s a g r a p h ic a l p r e s e n ta t io n o f th e Random D riv e r a ssa y r e s u l t s and th e ch e m ica l a ssa y r e s u l t s f o r th e t o t a l o f 62 d i f f e r e n t b a tc h e s o f m a t e r ia l , in c lu d in g th e 7 s ta n d a rd s .The t o t a l mass assay ed was ap p ro x im a te ly 1 7 .7 kg o f 233U and th e Random D riv e r r e s u l t s were on ly 30 g (-0 .1 7 % ) low er than th e ch e m ica l a ssa y r e s u l t s . However, a l i n e a r r e g r e s s io n o f th e two s e t s o f d ata y ie ld a p r o p o r t io n a l b ia s o f + 0 .6 4 +_ 1.28%(2o) f o r th e Random D riv e r r e l a t i v e to c h e m is try . The c o n c lu s io n can be made from t h i s d a ta and th e l a s t two columns in T ab le I t h a t th e agreem ent betw een th e Random D riv e r and c h e m istry i s w ith in th e p r e d ic te d e r r o r s o f th e two methods and th a t th e re a re no m ajo r (>1%) u n id e n t if ie d so u rce s o f e r r o r in th e Random D riv e r te c h n iq u e .
A secon d ary a p p l ic a t io n f o r Random D riv e r l i e s in th e NDA o f HTGR rod s in th e g reen s t a t e ( i . e . c o n ta in in g hydrocarbon p i t c h ) and f i r e d rods in groups o f 1 0 0 , u sin g th e s p e c ia l p o ly e th y le n e a d a p te r shown in F ig . 8 . B a tch e s o f th e s e rods range in f i s s i l e lo a d in g from 0 . 1 - 0 . 4 g /r o d , and in Th/U r a t i o from 1 0 - 3 0 . The use o f th e a d a p te r in c r e a s e s th e c o in c id e n c e re sp o n se from -^0.3 c o u n ts / s -g 235u in th e normal f a s t - i n t e r - r o g a tio n mode to v9 c o u n ts / s -g in th e m oderated mode.
C ounting p r e c i s io n i s 0.5% (2a) f o r 1000 s c o u n ts . The d e s ig n o f th e p o ly e th y le n e a d a p te r was o p tim ized fo r minimum

++
TABLE I . COMPARISON OF RANDOM DRIVER AND CHEMICAL ASSAY ON HTGR COATED PARTICLES [REF . 4 ]
NumberB a tc h e s
T o t a l U - 235 (C he mi s t r y )
T o t a l U - 235 (RD)
R e l a t i v e B ia s + 2 ct
S ta n d a r d D e v i a t i o n in D i f f e r e n c e s
C a te g o ry Measured P r e d i c t e d *
1. In n e r Carbon Coated P a r t i c l e s (Lar ge K e r n e l s )
13 5 , 2 9 8 5 , 3 6 8 + 1 . 3 0 + 0.88% +1 .59% ±1.48%
2. S i l i c o n Carbide Coated P a r t i c l e s (Small K e r n e l s )
15 4 , 7 9 5 4 , 7 5 1 -0 . 9 2 % + 0.88% ±1.70% ±1.55%
3. S i l i c o n Ca rb ide Coated P a r t i c l e s (L ar g e K e r n e l s )
14 5 , 4 4 0 5 , 4 0 8 -0 . 5 9 % ± 1.10% ±1.66% ±1.40%
4. Outer Carbon Coated P a r t i c l e s (Smal l K e r n e l s )
6 6 9 2 . 1 6 8 7 . 8 ( - 0 . 6 3 % )- 1 .8 8 % + 5 .5 0% ** + 1 . 4 5 + 6 . 0 g+
± 3 . 23 Grams
± 1 . 4 4Grams
S. Outer Carbon Coated P a r t i c l e s (Lar ge K e r n e l s )
7 1 , 5 2 2 1 , 5 0 2 ( - 1 . 3 1 % )- 0 .3 9 % ± 1 .2 0 % ** - 2 . 0 ± 3 . 0 g+
+ 1 . 8 7 Grams
± 2 . 1 5Grams
* In c lu d e s sampling e r r o r f o r ch e m ic a l a s s a y and c a l i b r a t i o n e r r o r f o r Random D r i v e r .** P r o p o r t i o n a l b i a s o v e r ran ge o f 200 grams.
C o n s t a n t b i a s ove r ra n g e o f 200 grams.
51
0
ATW
ELL et al.

IAEA-S M -2 0 1/33 511
FIG. 8. Polyethylene adapter sp ecia lly designed for therm al irradiation o f HTGR fu el rods. Each o f the four sleeves holds 25 rods for assays in groups o f 100. The vertical response as a function o f s leev e position is flat to within Zfc,
s e n s i t i v i t y to ch ang es in the hydrogen and car bo n c o n t e n t o f f u e l r o d s . P r e l i m i n a r y r e s u l t s from GAC do n o t r e v e a l any s t a t i s t i c a l l y s i g n i f i c a n t d i f f e r e n c e between the r e s p o n s e to g re e n v e r s u s f i r e d r o d s . The o p t i o n o f u s i n g s e p a r a t e c a l i b r a t i o n c u r v e s f o r g r e e n and f i r e d rods a l s o r e m a i n s , i f r e q u i r e d .
4 . SEGMENTED GAMMA SCANNER
The Segmented Gamma S can ne r (SGS) i s a h i g h - r e s o l u t i o n G e ( L i ) gamma-ray a s s a y sy s tem f e a t u r i n g f u l l y automated segment - by-segment a x i a l s c a n and a s s a y , wi th b u i l t - i n t r a n s m i s s i o n and l i v e - t i m e c o r r e c t i o n s . The SGS t h a t was e v a l u a t e d a t GAC f o r HTGR f u e l i s shown in F i g . 9 . I n s e n s i t i v i t y to a x i a l inh omo ge ne i ty and to m a t e r i a l co m p o s i t i o n make th e Segmented Gamma S can ne r p r i m a r i l y a p p l i c a b l e to l o w - d e n s i t y s c r a p and w a st e m a t e r i a l s . This h i g h l y v e r s a t i l e i n s t r u m e n t can accommodate a s s a y s o f l e s s tha n a gram o f 23 5y c o n t a i n e r s as l a r g e as 5 g a l ( ass um ing , o f c o u r s e , t h a t th e m a t r i x m a t e r i a l p e r m i t s an a c c u r a t e t r a n s m i s s i o n m e a s u r e m e n t ) , a few grams o f 23 9p u j n th e same s i z e c o n t a i n e r and l e s s th a n a gram o f 238p^_

512 ATWELL et ah
FIG, 9, Segm ented gam m a scan instrument.
The upper l i m i t f o r uranium a s s a y i s a h e a v y -e le m e n t m a t r i x (U + Th) " t h i c k n e s s " o f ^3 g / c m 2 a c r o s s the d ia m t e r o f the s a m p l e .
A Data G e n e ra l -C o m p a t ib le mi nicomputer (Nova 1 2 0 0 , DCC D-116 o r K e ro n ix ) w i th 8 к o f memory i s employed f o r d a t a a n a l y s i s and sy s tem c o n t r o l . The computer per for ms the f u n c t i o n s o f d a t a c o l l e c t i o n from th e s t a b l i z e d a n a l o g - t o - d i g i t a l c o n v e r t e r (ADC), s e t t i n g o f measurement windows, b a c k ground peak s u b t r a c t i o n s , c o r r e c t i o n f a c t o r c a l c u l a t i o n s , sc an t a b l e c o n t r o l l e r and i n t e r a c t i v e d i s p l a y d r i v e r . The d i s p l a y a t the top o f the e l e c t r o n i c s c h a s s i s in F i g . 9 p e r m i t s o p e r a t o r a n a l y s i s o f d e t a i l e d sp ec t rum d i s p l a y s and e x a c t ch ann el i d e n t i f i c a t i o n w i th th e u s e r - i n t e r a c t i v e c u r s o r p r o v id ed in t h e s o f t w a r e . In a d d i t i o n , f o l l o w i n g the sample a n a l y s i s a p r o p a g a t e d e r r o r a n a l y s i s i s per for med on a se gm en t -b y-s egm ent b a s i s , p r o v i d i n g an e s t i m a t e o f propagaged s t a t i s t i c a l e r r o r - - a f e a t u r e n o t p r e v i o u s l y a v a i l a b l e on gamma i n s t r u m e n t s , and no t p o s s i b l e w i t h o u t the computer c a p a b i l i t y .
The c o n t r o l sys tem a u t o m a t i c a l l y a d j u s t s the i n t e r n a l p a r a m e t e r s to accommodate e i t h e r p lutonium o r uranium a s s a y s ,

IA EA -SM -201/33 5 : з
a c c o r d i n g to the number o f d a t a windows e n t e r e d . For uranium a s s a y , th e 18 5 -k eV gamma from 2 3 % i s b r a c k e t e d by y t t e r b i u m peaks a t 177 and 198 keV, whose r e s u l t s a r e the n i n t e r p o l a t e d to y i e l d an a c c u r a t e measurement o f t r a n s m i s s i o n a t 185 keV. U n f o r t u n a t e l y , a t lower l e v e l s o f uranium (below about 50 g) C o m p t o n - s c a t t e r e d photons from th e ^ ^ Y b 198 keV-peak tend t o mask th e uranium s i g n a t u r e , t h e r e b y r e q u i r i n g a tw o -p ass a s s a y f o r a c c u r a t e r e s u l t s . This tw o -p a ss a s s a y i s a u to m a t i c a l l y done w i t h o u t any o p e r a t o r i n t e r v e n t i o n by means o f a c o m p u t e r - c o n t r o l l e d t u n g s t e n s h u t t e r on the t r a n s m i s s i o n s o u r c e h o l d e r . This s h u t t e r p e r m i t s tw o -p a ss a s s a y s , which a r e n e c e s s a r y to measure a c c u r a t e l y 235ц j ow l e v e l s . During t h e uranium measurement the s h u t t e r s h i e l d s the t r a n s m i s s i o n s o u r c e from th e d e t e c t o r and thus r e d u c e s the s o u r c e - r e l a t e d background.
235 57Fo r l i v e - t i m e c o r r e c t i o n s on U measurement a Co s o u r c e i s u se d . This s o u r c e i s a f f i x e d to th e G e ( L i ) d e t e c t o r and i s used d u r in g th e t r a n s m i s s i o n measurement and th e 235ц m e a s u r e ment . ( F o r p lu tonium a s s a y , 2 5 g e и з е ц as the t r a n s m i s s i o n s o u r c e and l 3 3 Ba as th e l i v e - t i m e s o u r c e . )
As a n o t h e r phase o f GAC' s i n - p l a n t i n s t r u m e n t a t i o n e v a l u a t i o n program, the Segmented Gamma S can ne r was t e s t e d f o r the a s s a y o f s c r a p and w a s t e m a t e r i a l s in c o n t a i n e r s r a n g in g in volume from 1 - 2 0 l . The i n s t r u m e n t p ro v e d r e l i a b l e and s t a b l e under normal p l a n t o p e r a t i n g c o n d i t i o n s and has a p r e c i s i o n o f 3 . 0 - 4 . 0 % (2 s t a n d a r d d e v i a t i o n s ) f o r most m a t e r i a l s f o r a co u n t in g t ime o f 7 . 9 s / cm of sc a n h e i g h t .
Table I I shows the r e s u l t s o f comp ar i so n o f the Segmented S can ne r and c h e m ic a l a n a l y s i s o f the i n s o l u b l e m a t e r i a l from s c r a p r e c o v e r y . A l i n e a r r e g r e s s i o n o f the p a i r e d d a t a i s shown in F i g . 10 and i n d i c a t e s t h a t th e d i f f e r e n c e s a r e o u t s i d e the e r r o r in the Segmented S c a n n e r . However, t h i s p a r t i c u l a r m a t e r i a l i s e x t r e m e l y r e s i s t a n t to uranium e x t r a c t i o n and the e r r o r in the ch e m ic a l a s s a y may add to th e d i s a g r e e m e n t in r e s u l t s . The a c c u r a c y o f the s c a n n e r was e s t i m a t e d to be +2.5% (2 a ) f o r s c r a p in l e s s tha n 2 - 1 c a n s . A co mp ar i so n o f "scrap a s s a y wi th ch e m ic a l a s s a y u s in g a sodium h y d r o x id e f u s i o n and GeLi s p e c t r o m e t r y o f the r e s i d u a l s y i e l d e d a b i a s o f +2.4% r e l a t i v e to c h e m i s t r y and b a t c h by b a t c h d i f f e r e n c e s o u t s i d e the e r r o r e s t i m a t e s .
5. 25 2 Cf FUEL-ROD ASSAY SYSTEM (PAPAS)
The PAPAS a s s a y sys tem p r e v i o u s l y used f o r LWR f u e l - r o d measurements i s shown in F i g . 1 1 . This sys tem u se s th e r m a l - n e u t r o n i n t e r r o g a t i o n and p r o m p t - f i s s i o n n e u t r o n co u n t in g to measure th e t o t a l f i s s i l e c o n t e n t in a f u e l rod or s t a c k .In a d d i t i o n to th e f a s t - n e u t r o n d e t e c t i o n f o r t o t a l 235u d e t e r m i n a t i o n , th e p e l l e t - t o - p e l l e t o r r o d - t o - r o d u n i f o r m i t y i s measured by c o u n t i n g the d e l a y e d gamma r a y s in a 19 -mm -th ick Nal t h r o u g h - h o l e d e t e c t o r . The v a r i a b l e gamma-ray a b s o r p t i o n i s r e l a t i v e l y u ni m p o r t a n t f o r t h i s s c a n b e ca u s e i t i s only n e c e s s a r y to measure r e l a t i v e v a r i a t i o n s o f s e v e r a l p e r c e n t . However, i t i s n e c e s s a r y to d e t e rm in e the a b s o l u t e v a l u e o f t o t a l 235ц co n t e n t to 0 .5%.

TABLE I I . COMPARISON OF SEGMENTED SCANNER AND CHEMICAL ASSAY OF SCRAP RECOVERY INSOLUBLES [REF . 4 ]
ScrapI n s o lB a tc hNo.
UraniumWeight
P e r c e n tP e r c e n tS o lu b l e
C o r r e c t i o n
F a c t o rU-235(Chem)
U-235fSS)
±■2 a D i f f e r e n c e ±2a Grams (% R e l a t i v e )
1153 0. 21 75 2 . 3 3 . 9 4 3 . 6 2 + 0 . 1 4 - 0 . 3 2 ± 0 . 1 4 ( - 8 . 1 % )4672 0 . 3 4 56 2 . 6 4 . 0 0 3 . 3 0 ± 0 . 0 8 - 0 . 7 0 ± 0 . 0 8 ( - 1 7 . 5 % )1148 ■ 0 .464* 52 3 . 0 9 . 2 8 1 1 . 5 2 ± 0 . 2 4 + 2 . 2 4 ± 0 . 2 4 ( - 2 4 . 1 % )4516 0 . 7 0 64 3 . 3 1 8 . 2 6 1 8 . 4 1 ± 0 . 4 1 + 0 . 5 1 + 0 . 4 1 (+0 .8 % )
4 7 ЗА 0 . 7 4 64 3 . 4 2 1 . 9 5 2 1 . 8 9 ± 0 . 2 2 - 0 . 0 6 ± 0 . 2 2 ( - 0 . 3 % )4776 0 . 9 3 58 3 . 3 1 2 . 9 2 1 2 . 9 6 ± 0 . 2 9 + 0 . 0 4 ± 0 . 2 9 (+0 .3 % )4570 1 . 0 4 51 4 . 2 2 5 . 3 3 2 5 . 1 0 ± 0 . 3 9 - 0 . 2 3 ± 0 . 3 9 ( - 0 . 9 % )4033 1 . 2 9 35 4 . 2 1 9 . 3 5 2 1 . 7 5 ± . 0 . 1 5 + 2 . 4 0 ± 0 . 1 5 ( + 12 .4 % )
944 1 . 5 0 90 3 , 8 3 6 . 1 8 3 7 . 8 0 + 0 . 3 4 + 1 . 6 2 ± 0 . 3 4 (+ 4 .5 % )500 1 . 5 9 74 > 6 . 0 4 6 . 6 0 5 0 . 3 5 + 0 . 3 3 + 3 . 7 5 ± 0 . 3 3 (+ 8 .0 % )
4552 1 . 1 8 * 26 3 . 6 1 6 . 5 2 1 7 . 9 2 ± 0 . 1 4 + 1 . 4 0 ± 0 . 1 4 (+ 8 .5 % )4740 1 . 7 2 * 18 3 . 2 2 5 . 8 0 1 9 . 3 5 + 0 . 2 0 - 6 . 4 5 ± 0 . 2 0 ( + 25 .0 % )1125 1 . 7 1 65 5 . 5 2 2 . 9 2 2 2 . 8 7 + 0 . 3 6 - 0 . 0 5 ± 0 . 3 6 ( - 0 . 2 % )4609 1 . 7 7 80 5 . 5 5 5 . 9 5 5 9 . 8 4 + 0 . 4 7 3 . 8 9 ± 0 . 4 7 ( + 6.'9%)4620 2 . 6 1 66 5 . 0 5 9 . 0 4 6 4 . 0 6 + 0 . 3 6 5 . 0 2 ± 0 . 3 6 (+8 .5 % )1095 2 . 6 8 * 42 4 . 8 3 4 . 8 4 3 4 . 7 1 ± 0 . 2 1 - 0 . 1 3 + 0 . 2 1 ( - 0 . 4 % )4691 3 . 2 0 57 > 6 . 0 2 3 . 3 6 1 9 . 2 2 ± 1 . 8 0 - 4 . 1 4 ± 1 . 8 0 ( - 1 8 . 0 % )4700 4 . 3 5 76 > 9 . 0 9 4 . 5 2 1 1 1 . 3 6 ± 4 . 0 0 + 1 6 . 8 ± 4 . 0 0 (+ 1 8 .0 % )
T o t a l s * * 3 6 6 . 2 8 3 7 5 . 10 + 8 . 8 2 (+2 .4% )
* Uranium e x t r a c t e d from i n s o l u b l e r e s i d u e u s i n g sodium h y d r o x id e f u s i o n . Re s i du e co unt ed u s in g Ge( Li ) S p e c t r o m e t r y f o r a l l o t h e r s am p le s .
** E x c lu d in g b a t c h e s w i th c o r r e c t i o n f a c t o r s > 6 . 0 .

IA EA -SM -201/33 515
FIG, 10, Comparison o f segm ented scanner and ch em ica l assay o f scrap insolubles.
FIG. 11. S chem atic diagram o f the pin and p ellet assay system (PAPAS). The direction of fuel-rod travel is from right to le ft .

516 ATWELL et a l.
TABLE I I I . FUEL ROD ASSAY SYSTEM PERFORMANCE FOR A 1-mg 2 5 2 Cf SOURCE
P a ra m e te rMode ra t or Core
W . E . P . a -C ch2 - d2 o
Delayed gamma r a y ^ 9 5 , 3 6 0 c o u n t s / s 1 0 0 , 4 0 0 c o u n t s / s
Prompt f i s s i o n n e u t r o n c 4 , 5 2 8 c o u n t s / s 5 , 5 2 4 c o u n t s / s
F a s t - n e u t r o n s i g n a l / b k g . c 0 . 3 2 0 . 9 7
a For t h i s c a s e , th e W .E .P . r e p r e s e n t s h e a v y - w a t e r ex ten de d p o l y e s t e r r e s i n .
b 2 3 SS i g n a l c o r r e s p o n d s to th e n e t r a t e f o r a 0 . 2 g U/ rodHTGR f u e l s t a c k measured w i th a 1 . 9 - by 5 . 0 - by 5 .0 - c mNal t h r o u g h - h o l e d e t e c t o r .
S i g n a l c o r r e s p o n d s to n e t r e s p o n s e from the p r o m p t - f i s s i o n n e u t r o n s measured by th e ^He d e t e c t o r s .
FIG. 12. Response rate (cou n ts/s) for 4He fast-neutron detectors in PAPAS measuring 7 5 -cm -lo n g HTGRfuel-rod stacks.

IA E A -SM -201/33 517
The PAPAS f u e l —rod a s s a y sys tem has been m o d if ie d from i t s c o n f i g u r a t i o n f o r LWR f u e l rod s f o r the measurement o f HTGR f u e l - r o d s t a c k s . The m o d i f i c a t i o n from th e g r a p h i t e c o r e 1 8 J to a D2O c o r e was r e q u i r e d to g i v e a more f a v o r a b l e s i g n a l / b a c k - ground r a t i o in the f a s t - n e u t r o n d e t e c t o r s s i n c e HTGR f u e l rod s have 3,5 t im es l e s s f i s s i l e l o a d in g p e r u n i t l e n g t h than LWR f u e l r o d s . Monte C a r l o n e u t r o n t r a n s p o r t c a l c u l a t i o n s [ 8 ] were p er f or me d to d e te rm in e the optimum m o d e ra t o r c o n f i g u r a t i o n which c o n s i s t s o f 38 -m m -th ick CH? s u rr o u n di ng the 2 5 2 q£ s o u r c e - This c o r e i s e n c l o s e d by 10 -m m -th ick l e a d f o r gamma-ray s h i e l d ing f o l lo w e d by 136-mm o f D~0 f o r n e u t r o n t h e r m a l i z a t i o n . The n e t e f f e c t o f t h i s m o d i f i c a t i o n was to s l i g h t l y i n c r e a s e the d e la y ed gamma-ray r a t e a t the N a l ( T l ) d e t e c t o r , to i n c r e a s e the p r o m p t - n e u t r o n s i g n a l a t the ^He d e t e c t o r s by 22%, and to i n c r e a s e th e ^He d e t e c t o r s i g n a l / b a c k g r o u n d r a t i o by a f a c t o r o f 3 , as shown in Table I I I .
F i g u r e 12 shows th e r e s p o n s e from the f a s t - n e u t r o n ^He d e t e c t o r s in PAPAS f o r th e d i f f e r e n t f u e l - r o d l o a d i n g s , and shows t h a t the r e s p o n s e i s o n ly s l i g h t l y n o n l i n e a r o v e r the e n t i r e ra n g e o f l o a d i n g s . Note t h a t t h e r e i s s t i l l c o n s i d e r a b l e s e l f - s h i e l d i n g o f th e th e rm a l n e u t r o n s in th e i n d i v i d u a l (Th/U)C2 m i c r o s p h e r e s ( m i c r o a b s o r p t i o n ) , bu t t h a t the a b s o r p t i o n e f f e c t i s ro u g h ly th e same f o r a l l the r o d s . F i g u r e 13 shows th e n o rm a l iz e d r e s p o n s e p e r gram v e r s u s a v e r a g e l o a d in g f o r th e 0 . 7 5 - m - l o n g columns o f HTGR r o d s . The maximum v a r i a t i o n in th e re s p o n s e was + _l% f o r th e f a s t - n e u t r o n c o u n t i n g and +6% f o r th e delayed-gamma r a y c o u n t i n g . This l o s s of a c c u r a c y f o r th e delayed-gamma r a y r e s p o n s e can be a t t r i b u t e d to the d i f f e r e n t thor ium l o a d i n g s in the rod s and to th e nonuniform d i s t r i b u t i o n o f p a r t i c l e s , which r e s u l t s in v a r i a b l e a b s o r p t i o n o f the gamma r a y s .
FIG. 13. Response variations for fast-neutron counting compared with d elayed-gam m a-ray counting for the sam e therm al-neutron interrogation.

518 ATWELL et a l.
Position in Fuel Tube
FIG. 14. Uranium -235 loading variations in 7 5 -cm -lon g stacks of HTGR fu el rods. The dual curves are for repeat scans on the sam e rods with the follow ing com position: (a) average loading o f 0 .1 0 2 7 g 235U/rod w ith one high rod co n ta in in g -0.1937 g 235U /rod; (b) "uniform" colum n of 0 .1937 g 235U/rod; (c) uniform colum n o f green fu el rods ( ~ 0 . 17 g 235U/rod; and (d) stack o f 0 .1 7 g 235U/rod with one low rod (0 . 1027 g 235U /rod) and one dummy graphite rod.
235In a d d i t i o n to the t o t a l U c o n t e n t , the r o d - t o - r o d v a r i a t i o n s in a f u e l column a re measured u s i n g the Nal d e t e c t o r to co u n t d e la y e d gamma r a y s . F i g u r e 14 shows a s u p e r p o s i t i o n o f the 235U s ca n s f o r f o u r of the f u e l - r o d s t a c k s . The f u e l tub es were u n i f o r m l y moved throu gh the s c a n n e r ( 0 . 2 5 mg o f z ^ 2Cf) a t a r a t e o f 25 mm/s ( i . e . , 2 s / r o d ) . This r a t e c o u ld be i n c r e a s e d by a p p r o x i m a t e l y a f a c t o r o f fo u r by u s in g a 1-mg 2 2Cf s o u r c e o r by c o u n t i n g wi th fo u r Nal d e t e c t o r s in s e r i e s .The double t r a c e s f o r ea ch sc an in F i g . 14 were o b t a i n e d by im m ed ia te ly r e p e a t i n g the scan o f e a ch rod b e f o r e th e a c t i v a t i o n from t h e p r e c e d i n g s c a n had c o m p l e t e l y d ie d away. This double sc an can be used to s e p a r a t e the co u n t in g s t a t i s t i c a l f l u c t u a t i o n s from the f i s s i l e lo a d i n g v a r i a t i o n s i n the f u e l column. The top s c a n (a ) in F i g . 14 co r r e s p o n d s to a lo a d i n g o f 0 . 1 0 2 7 g 2 ^ U / r o d w i th one h ig h rod c o n t a i n i n g 0 , 1 9 3 7 g 2 ^ ^ U / ro d . The se co nd sc a n (b) c o r r e s p o n d s to a " u n i f o rm " column o f 0 . 1 9 3 7 g 2 3 5 u / r o d , but t h e r e a r e l a r g e v a r i a t i o n s from th e a v e r a g e l o a d i n g . The t h i r d sc a n ( c ) i s f o r a more r e c e n t l y f a b r i c a t e d

IA EA -SM -201/33 519
unifo rm column o f g r e e n f u e l rods (з,0 . 1 7 g ^ ^ ^ U / r o d l . and the bottom s c a n (d) c o r r e s p o n d s to a s t a c k o f 3 ,0 .17 g 2 3 5 U/ rod f u e l wi th one low rod ( 0 . 1 0 2 7 g ^ ^ ^ U /r o d ) and one dummy g r a p h i t e rod . The s c a n s in F i g . 14 show t h a t rod s u b s t i t u t i o n s can be d e t e c t e d e a s i l y in a f u e l s t a c k and t h a t d e t a i l e d i n f o r m a t i o n i s a v a i l a b l e on the lo a d i n g v a r i a t i o n s in the uni form s t a c k s .
6. CONCLUSION
Al though the Random D r i v e r i s c a p a b l e o f a s s a y i n g HTGR rod s w i th good a c c u r a c y throu gh th e use o f th e p o l y e t h y l e n e a d a p t e r , th e 252(-.£ pu e £ R0 d Assay System i s s u p e r i o r in terms o f i t s c a p a b i l i t y f o r r o d - t o - r o d u n i f o r m i t y measurement , i t s h ig h r a t e o f rod t h r o u g h - p u t (2 r o d s / s ) , and i t s c o n d u c i v e n e s s to 100% t h r o u g h - p u t measurements a t modern p r o d u c t i o n p l a n t s . Looking toward “3.5ц reCy Ci e f u e l s , v e r y h ig h gamma—r a y r a d i a t i o n l e v e l s
232from U d a u g h te r s would d i s a l l o w the use of b oth the Segmented Gamma S ca nne r and the Random D r i v e r ( i n i t s p r e s e n t c o n f i g u r a t i o n ) . However, e x c l u d i n g t h e gamma—ra y - d e p e n d e n t r o d - t o - r o d u n i f o r m i t y measurement , the 252^ measure the f i s s i l e c o n t e n t o f “ J U r e c y c l e d e t e c t o r s a r e v e r y i n s e n s i t i v e to h ig h gamma r a y f i e l d s .
"Cf F u el —Rod Assay System can 233U r e c y c l e rod s s i n c e the
252Looking toward advanced s y s t e m s , t h e Cf S h u f f l e r Assay System [ l 4 ] shows a g r e a t d e a l o f pr om is e f o r r a p i d s i n g l e rod a s s a y s (0.5% p r e c i s i o n in 1 min u s i n g ther ma l i n t e r r o g a t i o n ) and f o r t o t a l f u e l —elem ent a s s a y u s in g f a s t - n e u t r o n i n t e r r o g a t i o n . The " S h u f f l e r " u se s a h i g h - s p e e d T e l e f l e x h e l i x -w o u nd c a b l e d r i v e n by a s te p p i n g motor to a c c o m p l i s h 0 . 5 s t r a n s f e r t imes o f an i n t e n s e 2 5 2 ^ £ s o u r c e back and f o r t h between a s h i e l d e d - dwel l p o s i t i o n and the i r r a d i a t i o n p o s i t i o n . Helium-3 d e t e c t o r s co u n t d e l a y e d n e u t ro n s from the sample .
233Other advanced sy s te m s f o r U r e c y c l e f u e l s i n c l u d e p h o t o n e u t r o n i n t e r r o g a t i o n sys t em s such as Sb-Be and Ra-Be f o r s u b t h r e s h o l d i n t e r r o g a t i o n wi th prompt n e u t r o n d e t e c t i o n wi th t h r e s h o l d - b i a s a b l e ^He d e t e c t o r s .
ACKNOWLEDGEMENT
The a u t h o r s wish t o e x p r e s s t h e i r a p p r e c i a t i o n to J . E. Gl anc y , E. C. Snooks, and W. Whit temore o f Genera l Atomic Company f o r th e compreh en sive i n - p l a n t e v a l u a t i o n s t u d i e s th ey have p er f or me d and the i n v a l u a b l e d a t a they have compi led on LASL's Random D r i v e r and Segmented Gamma Scanner i n s t r u m e n t s .
We a l s o g i v e s p e c i a l thanks to our c o l l e a g u e s , L. R. Cowder,D. F. J o n e s , L. G. S p e i r and J . W. Woolsey f o r e l e c t r o n i c and m e c h a n ic a l d e s i g n and e n g i n e e r i n g .

520 ATWELL et a l.
REFERENCES
[ 1 Л ATWELL, T. L . , FOLEY, J . E , , and EAST, L, V, ,J o u r n a l o f the I n s t i t u t e o f N u c le a r M a t e r i a l s Management, INMM I I I 3 ( 1 9 7 4 ) 1 7 1 .
[ 2 ] ATWELL, T. L . , EAST, L. V. and MENLOVE, H. 0 . ,Rep. LA-S889-PR (1 9 7 5 ) 3 - 1 1 .
[ 3 ] At w e l l , t . l . , cowder, l . w. , Canada , t . r . , andCLOSE, D. A . , Rep. LA-6040 -PR ( 1 9 7 5 ) .
[ 4 ] GLANCY, J . E . , and SNOOKS, E. C . , Rep. GA-A13385 ( June 1 9 7 5 ) .
[ 5 ] MARTIN, E. R . , JONES, D. F . , and SPEIR, L. G. ,Rep. LA-5652-M ( 1 9 7 4 ) .
[ 6 ] MARTIN, E. R . , Rep. LA-5889 -PR ( 1 9 7 5 ) 1 3 - 1 4 .0
[ 7 ] MENLOVE, H. 0 . , ' N o n d e s t r u c t i v e a s s a y o f HTGR f u e l r o d s " , P r o c . 1 6 t h Annual Meet ing o f the I n s t i t u t e of N u c l e a r M a t e r i a l s Management ( June 1 9 7 5 ) ( t o be p u b l i s h e d ) .
1—1
00 1 _1
FORSTER, Rep. LA-
R. A . , FOREHAND, H. M . , J r . , 5091 -PR (1 9 7 2 ) 8 .
and MENLOVE, H. 0
[ 9 ] FORSTER,FOREHAND6 8 0 .
R. A . , MENLOVE, H. 0 . , PARKER , H. M . , J r . , T r a n s . Am. Nucl .
, J . L . , and S o c . 15 (1 9 7 2 )
[ 1 0 ] MENLOVE, Rep. LA-
H. 0 . , FORSTER, R. A . , SMITH, 4705-MS (1 9 7 1 ) 6 - 8 .
D. B. ,
[ 1 1 ] MENLOVE,FOREHAND
H. 0 . , FORSTER, R. A . , SMITH, , H. M. , J r . , Rep. LA-4794-MS
D. B . , and ( 1 9 7 1 ) 8 - 1 0 .
[ 1 2 ] FOLEY, J . E . , Rep. LA-5078-MS ( 1 9 7 2 ) .
[ 1 3 ] FOLEY, J . E . , and COWDER, L. W . , Rep. LA- 5692-MS (1 9 7 4 )
[ 1 4 ] MENLOVE, H. 0 . , Rep. LA-5771 -PR (1 9 7 4 ) 7.

IAEA -S М -201 /73
VERIFICATION OF THE 235U FLOW AT THE OUTPUT OF THE THTR FUEL FABRICATION PLANT
M. CUYPERS* E. VAN DER STRICHT**,M. BOURSIER**, M, CORBELINI** Joint Research Centre, Euratom, Ispra, Italy
** Directorate of Euratom Safeguards, Luxembourg
Abstract
VERIFICATION OF THE 235U FLOW AT THE OUTPUT OF THE THTR FUEL FABRICATION PLANT.An outline is g iven o f the method o f verification o f 2J5U content at the end o f a fu el pebble production
lin e , A study has been m ade of the statistica l sam pling effort, taking due account o f Safeguards Authority requirements, fuel specifications and production practices. It was necessary to design a random sampling d ev ice w hich is described. The sam ples pass through the measurem ent facility , which is based on delayed neutron counting, after irradiation of th e fu el pebble with californ iu m -252 sources. Emphasis has been laid on autom ation and reduction o f inspection tim e as w ell as on containm ent and tem per-resistance.The sam pling capacity and the precision o f the measurem ent permit the tim ely d etection o f a diversion of less than 0, 5%.
1 . GENERAL
The independent ver if i ca t ion b y the Eura tom inspection authority of the t o t a l quantity of U-235 leaving the fuel fabrication plant in the form of AVR or THTR fuel has been studied. The sampling plan and the technical features of the control apparatus instal led for this purpose are described. The material to be measured as the final product of the plant consists of 60-mm-diameter graphite spheres, having a central core of 50 mm containing a mixture of graphite and graphite-coated par t i c les of (U, Th) oxides. The specif i cat ion of the nuclear material content i s as follows: each pebble containsО.96 (±5%) g o f 93% enriched uranium and 9-62 (±1%) g o f thorium. The specif i ca tions for I c A pebbles are to be met within ± 0 .1 % for Ü and Th. The finished pebbles are fed d i rec t ly from the production line at a ra t e of one element every 14 seconds to the shipment drums. Each drum (200 l i t r e s ) contains 1000 elements which correspond to one day's production. The smallest homogeneous batch i s composed of 2000 elements. Ten drums are shipped at a time. The t o t a l production i s 2 X 10⁵ elements a year .
2. THE VERIFICATION APPROACH
The requirements from the operator as well as from the Safeguards authority, which have influenced the choice of the ver if i ca t ion system are the following:
( i ) The system should give the minimum inspection time and effort at the plant. ;
521

522 CUYPERS et al.
(ii) No intrusiveness: sampling and measurement as far as possibleon end products.
(iii) No access to the pebbles should be possible after the pebbles have been measured by the inspector and before shipment, in order to avoid substitution of elements in the time between the verification and shipment.
(iv) No alteration of the production rate: for in-line measurementof the U-235 content of each individual pebble a fast response and a high level of reliability and automation of the apparatus must be reached.
(v) No damage to the product: the pebbles sampled 'by the Safeguardsauthority have already passed the final quality control.
(vi) The origin of the selected elements must be retraceable to avoid mixing up the selected pebbles when they are fed back to the shipment drums.
(vii) No delay of shipments.
It was specifically to comply with the 3rd and 4th requirement that it was finally decided to proceed in the following way: to count thenumber of pebbles introduced in the shipping drum, select a number of pebbles, and then measure those samples, representative of a batch. Accordingly, an in-line random sampling device was designed to be fitted directly on top of the drums. The in-line sampling device must have the following characteristics:
- count all pebbles (only a pebble should trigger the counter)- sample pebbles according to a preselected programme- provide containment for all the pebbles that have passed through.The major factor which influenced the final decision on the design
and the number of sampling devices to be installed, was the reduction of the time spent by an inspector in the plant. In fact with ten such devices mounted and sealed on top of ten empty drums, production can go on for two weeks without the inspector being present, except on the last day of this period to disconnect the 10 tubes containing the samples for measurement, to reset the sampling devices, and to mount and seal them on ten new empty drums.
3. DETERMINATION OP THE SAMPLE SIZE AND SAMPLING CAPACITY
Statistical techniques can be applied without difficulty to the control of the flow at this point of the plant. Population parameters and measurement precision are well defined so that one could by setting the safeguards requirements, easily calculate the sampling capacity both for a verification by attribute and by variables. But this capacity was also constrained by the operator's statement that he was not willing to accept more than 1% sampling. In practice, this figure was taken as the starting point and the evaluation of the statements,

IAEA-SM -201/73 523
TABLE I. DETECTION PROBABILITIES l- f(o )*
Proportion of empty units
Number of empty units
Probability of occurrence
0 .25 250 0.9450.20 200 0.8940.10 100 0.6530.07 70 0 .5 12
0.02 20 0 .18 4
* for a proportion of 10% and sampling without replacementД 00ч /900ч K 0 } ( 10 1
900 . 899 ..
f ^ = /1000ч ( 10 >
10 0 0 . 999 ..= 0.347
which could, he made with a sample of 10 per 1 000, was performed. Ttoo cases are considered here:
. probability of detection of an empty item
. detection of a difference between the declared value and the observed value.
3.1 Detection of an empty item
Take first the event that at least one empty item occurs in a sample of ten taken from a thousand items. Table I gives the probability of such an occurrence as a function of the proportion of empty items.
This means, for example, that the presence of 1% empty items has approximately a one-in-two chance of being detected in one inspected drum. It can be calculated that 35 pebbles out of 1 000 have to be sampled to give approximately a one-in-two chance of detecting one empty item when the proportion is 2%. It requires 138 samples toreach the 95% probability level.
Two further aspects of the problem may be mentioned here.The first is that the occurrence of the event "one empty item" does
not permit any statement about the real value of the proportions of empty items present in the population. Let us recall that in the case of the binomial distribution for such an event in a sample of ten, the confidence interval of the proportion at the 95% probability level ranges fron 0.001 to 0.44.

524 CUYPERS e t a l.
И is therefore clear that the occurrence of the event "one empty" would lead the inspector to take further action to determine this proportion.
The practical consequence for the operator is that shipment of the product may possibly be delayed.
The second aspect is the timely detection of the diversion of a significant amount of material. This case can be best explained by means of Pig. 1, which shows the relationship between the sample size and the inverse of the proportion of empty items (1/D %) for a binomial distribution. This figure shows also on the у-axis: the correspondingvalues of the proportion of empty items (D%); the number of pebbles to be produced to have a diversion of 1 kg of uranium, assuming an even distribution of diversion throughout one year's production; and the time-scale in years (assuming a yearly production of 200 000 pebbles.) for the production of these pebbles.
Let us set a diversion limit of 1 kg of 93% enriched uranium, corresponding to the substitution of 1 000 pebbles by empty ones in one year, or 0.5% of the production. The 95% probability of detection is reached with 600 samples} that is with the 60th drum which is well before the middle of the period of one year; after one year the 99% probability level is reached.
3.2 Detection of a difference between the declared value and the observed value (Variable sampling)
Here we must fix also the limiting parameters.Let us assume the following values:
- difference to be detected 2%- normal distribution of population- standard deviation of measurement 1%- smallest homogeneous population 2 000 items- population standard deviation 5% for U-235 content- risk of failing to detect the difference when there is one, ß = 0.05
- risk of falsely concluding that there is a difference, a = 0,05.The total variability of observed values,
V tot я . / V2 + V2V pop mes = 5«1where V is the coefficient of variation,
is taken equal to 5 for simplification. The difference, d, to be detected in terms of the standard deviation,V , is,
_ — where x is the mean of observeda - x “ *P = JZ* =0,4 values andV 5 where x0 is the mean of declaredvalues.
596 for a hyper geometric distribution

IAEA -S M -201 /73 525
FIG. 1. Relationship betw een sam ple s iz e , diversion factor and detection tim e , based on the binom ial distribution, p = d etection probability.

526 CUYPERS et a l.
According to Natrella Л 7 . ТаЪ1е 16,for d = 0 ,4 <* = 0 .0 5 and ß > - 0,05
the sample size is given as 82 + 2 = 84*This means that -42 pehhles would have to he taken at random in
each of the two drums in a hatch.If, however, the hypothesis of equality between the five hatches
of a shipment is verified, it can he calculated that the sampling capacity of 100 pehhles out of 10 000 is sufficient to detect a 1,8% difference, and likewise for 100 000 pebbles and a sample of 1 000 this difference drops to 0,57%«
Experience showed that the supposed 5% standard deviation for the population is in fact of the order of 1% which means that the above values can he reduced by a factor of 5«
We can therefore conclude that a 1% sampling capacity is fully adequate to meet the safeguards requirements.
4. DESCRIPTION OP THE FUEL PEBBLE SAMPLING DEVICE (FPSD)
As mentioned previously the fuel pebble sampling device (FPSD) is mounted and sealed on top of the shipping drum as illustrated in Fig. 2. Each sampling device can select randomly up to 10 samples out of 1 000 pehhles. After a thousand pehhles have passed, the FPSD interrupts the flow of elements to the drum and the plant operator has to take another drum also equipped with a FPSD, with another sampling programme. The FPSD has the capacity to receive one pebble every 10 seconds (the fuel production frequency is 14 seconds).
The principle of the device is shown in Fig. 3. When a fuel element enters the feed tube of the FPSD, it is taken by a continuously rotating (6 rpm) transport cylinder, acting as a gate, which introduces one element at a time into the apparatus.
At 90° from the entry position, the element operates a microswitch SW 1, which triggers the counter. At 180° the element falls into a vertical channel. At this point there are two possibilities.
If the number of the counted fuel element n coincides with a number N, preselected by the sample selection switches, the switching door, which in its normal position interrupts the passage to the drum, remains in position and the element is directed to the sample output.
If, however, n N, a driving magnet receives a signal, the switching door is opened, and the element falls into the shipping drum.
At 180° from microswitch SW,, a second microswitch SW2 is mounted to verify that the element introduced in the FPSD has actually been released into the vertical channel. If this is not the case, SW2 is triggered and the FPSD is blocked.

IA EA -SM -201/73 527
FIG, 2, General layout of Fuel Pebble Sampling D ev ice on shipping drum.
The selection is controlled by the sample selection switches, which sure preset by the inspector. They are not visible from the outside and a seal has to be broken to have access to them. When the power supply to the apparatus is interrupted, no element can be introduced into the drum, because the transport cylinder is blocked.
The whole mechanism is enclosed in a cast aluminium alloy box and all screws giving access to the interior of this box are sealed to prevent any external triggering of the microswitches or driving motors.
5. DESCRIPTION OP THE U-235 MEASUREMENT APPARATUS
The 10 sampling tubes which have been disconnected by the inspector from the FESD's are, without transfer of the pebbles, put in a sample- tube loading unit on top of the measurement apparatus, which is installed inside the plant.

528 CUYPERS e t a l.
Microsw'rtch swl
FIG. 3. Schem e of the Fuel Pebble Sampling D ev ice .
Hie measurement of the U-235 content of the samples is based on thermal neutron irradiation of a pebble and delayed neutron counting.
Hie samples are released automatically, one at a time, into the irradiation facility. In this facility the sample is irradiated for 60 seconds in a thermal neutron flux of 5 X 1C>5 n/sec cm2, produced by four Cf-252 neutron sources (4 X 20 ug) placed in a polythene moderator. Pig. 4 gives a general lay-out of 4he system.
After transfer of the sample by gravity (distance 3 m) from the irradiation facility to the counting facility (transfer + waiting time = 2 seconds) the delayed neutrons, produced by fission of the U-235 are counted, after thermalisation, by eight He3 neutron detectors, for 40 seconds. The sample is finally released to the sample unloading unit. While one sample is counted, another sample is irradiated.This means that the total analysis time per sample is approximately one minute.
The delayed neutron activity obtained from the sample is then compared to a calibration curve established by the use of fuel pebbles having a known amount of U-235•
Due to the small quantity of fissile material present in the sample (~ 1 g) and to the large quantity of Th-232 present, a subthreshold neutron spectrum must be used for the assay of the U-235«

IAEA-SM -201/73 529
SAM PLE LOADING UNIT
POLYETHYLENE NEUTRON MODERATOR
SAM PLE
CALIFORNIUM SOURCES
I 1 1 1 4 1 1 '~П 0 250 500 mm
SAMPLE UNLOADING UNIT
FIG.4 . General layout o f the Z35U m easurem ent system .

530 CUTPERS et al.
In order to minimize "the error due to the existing inhomogeneous distribution of the U-Th particles within the fuel elements, it was sought to obtain in the irradiation facility a neutron flux as constant as possible along the radius of the pebble, by using four Cf 252 sources, and a delayed neutron response in the counting facility as independent as possible of the geometrical position of the U-235 in 'the fuel element, using eight He^ detectors (20 cm active length).
The complete apparatus is designed for the fully automatic analysis of up to 100 samples without the intervention of the inspector.Underneath the counting facility a sample unloading unit with 10 tubes (up to 10 elements per tube) is attached. Through the automatic operation, the elements in the unloading unit are in identified positions and in the same sequence as they were presented for analysis. This last point is of importance since it permits the return of the analysed samples to their correct output drums as was requested by the fabricator.
6. ERROR EVALUATION
An analysis has been made of the error components of the measurement method.
Under plant conditions the precision of the activity measurement on one sample is 1.6% (la). Counting statistics for a single measurement range from 1,0 to 1.3%. Normally all sampled pebbles are measured once only.
The contribution of fission of other fissionable material at higher energies are <0,35% for Th-232 and < 0.05% for U-238 as measured experimentally with specially produced pebbles.
A theoretical and experimental study to evaluate the thermal neutron flux depression along the radius of the fuel pebble during irradiation was conducted and it was found to be approximately 2%.
The calibration of the instrument was done using a set of 15 reference samples taken from the normal production. Relevant characteristics were determined such as the relative amounts of U-235 and Th-232 by means of gamma ray spectrometry (Ge (Li) ) in two different laboratories (Hannover University and J.R.C. Ispra) /~2_7, £~Ъ_/ and finally t?y the destructive analysis of 5 of these samples. Furthermore, a radiography of all samples was made to have an idea of the spatial distribution of the coated particles within the pebbles.
7. CONCLUSIONS
The inspection procedure which has been worked out fulfils the requirements of low intrusiveness and low disturbance to the operator. It gives the inspectors containment of the verified production and enables them to make quantitative statements both by attribute and variable about the amount of U-235 shipped from the plant. The maximum possible sampling rate of 1% is amply sufficient to detect in adequate time diversion of significant amounts of fissile material.

IA EA -SM -201/73 531
Due to the application of sealing and automation it is possible to safeguard with twelve days of inspection (half a day per fortnight) the yearly output of 200 000 elements totalling 200 kg of highly enriched uranium.
The application of the measurement system can easily be extended to other types of material such as powders and particles through the use of hollow polythene spheres at the centre of which the samples can be located. Proper calibration of the instrument for this purpose is now under way.
R E F E R E N C E S
[1 ] NATRELLA, M. G . , Experimental Statistics, NBS Handbook No. 91.[2 ] KRAPPEL, W ., Atom kernenergie 23 (1974) 23.[3 ] BRESESTI, A. M ., BRESESTI, M ., Private com m unication .


IAEA-SM -201/83
NON-DESTRUCTIVE MEASUREMENT OF 235U AND 233U CONTENT IN HTR FUEL ELEMENTS BY DELAYED NEUTRON ANALYSIS
P. CLOTH, N. KIRCH, F.J . KRINGS Institut für Reaktorentwicklung, Kernforschungsanlage Jülich GmbH, Jülich,Federal Republic of Germany
AbstractNON-DESTRUCTIVE MEASUREMENT OF 235U AND 233U CONTENT IN HTR FUEL ELEMENTS BY DELAYED NEUTRON ANALYSIS.
Studies h ave been m ade on a non-destructive m ethod capable o f determ ining th e isotop ic vector o f fissionable m aterial f * U and 233U) in irradiated HTR fu el elem ents o f th e uranium -thorium c y c le . The vector is determ ined by delayed neutron analysis. Experimental feasib ility studies h ave b een performed and a design concept for a real testing fa c ility is g iven . A p ilo t setup has b een built allow ing th e m ain aspects derived from th e experim ental and th eoretica l studies to b e tested .
INTRODUCTION
The non-destructive determ ination of fissionable m ateria l has becom e increasingly im portant in the fram ew ork of safeguards. Several methods for m easuring the total content of fissionable m ateria l, esp ecially in fuel elem ents, have been developed. Most of these methods, however, are re s tr ic te d to unirradiated fuel and do not determ ine the isotopic composition. The analysis of delayed neutrons from fission s induced in the fuel provides a possibility of overcom ing both problem s. The yields ßi of certa in groups of delayed neutrons induced by therm al fission are significantly different between 235u and 233u , as shown in Table I. The ratio of these yields is th erefore a m easure for the isotopic composition. The problem is to m easure the contribution of the adequate groups separately . However, because of the large d ifference in the lifetim es of those groups, separation can be achieved.
ADOPTED METHOD AND EXPERIM EN TA L F EA SIB IL IT Y STUDY
The b est procedure for obtaining maximum inform ation would be. a com plete analysis of h alf-liv es a fter irrad iation by a short neutron pulse. But neutron intensity of the available so u rces is too low for this method.
The method adopted here allows a longer total irrad iation tim e without losing too much inform ation from the short-lived groups. Irradiation has to be done in in terv a ls , between which the short-lived components can be
533

534 COTH et a l.
TABLE I. GROUP CONSTANTS OF DELAYED NEUTRONS OF 235U AND 233U (T herm al fission )
Group h (s-1) 6i (235U) ß; (” 3U ) %
1 0. 0125 0. 052 0 .057
2 0. 0321 0 .3 4 6 0.197
3 0 .1 2 5 0 .3 1 0 0 .1 6 6
4 0 .313 0 .6 2 4 0 .1 8 4
5 1 .1 3 0 .1 8 2 0. 034
6 2 .7 5 0 .066 0. 022
---------------------------------— t [ s l
FIG. 1. D elayed neutrons during and after interval irradiation.
counted. The lo n g -liv ed com ponents can be taken after the irrad iation has b een stopped and a certa in delay tim e to a llow for the decay of the sh o rt-liv ed on es. The optim um tim e of the irrad ia tion in terva l was found by ca lcu lation to be around 1 s with a 1 :1 corresp ond en ce of counting and irrad iation tim e. The behaviour of the curve of delayed neutrons during such a procedure is shown in F ig . 1, together with a ca lcu lated cu rve , which w as obtained with a neutron output of le s s than 109 s"1 from a 14-M eV neutron generator. Although fiv e sw eep s w ere su perp osed , the s ta tis t ic s are rather poor, showing the need for a sou rce strength of lO ^ n /s , w hich can be provided by co m m erc ia lly availab le neutron gen era tors. E r ro r s due to fa st f is s io n can be kept at a n eg lig ib le le v e l if the sou rce neutrons are w e ll m oderated.
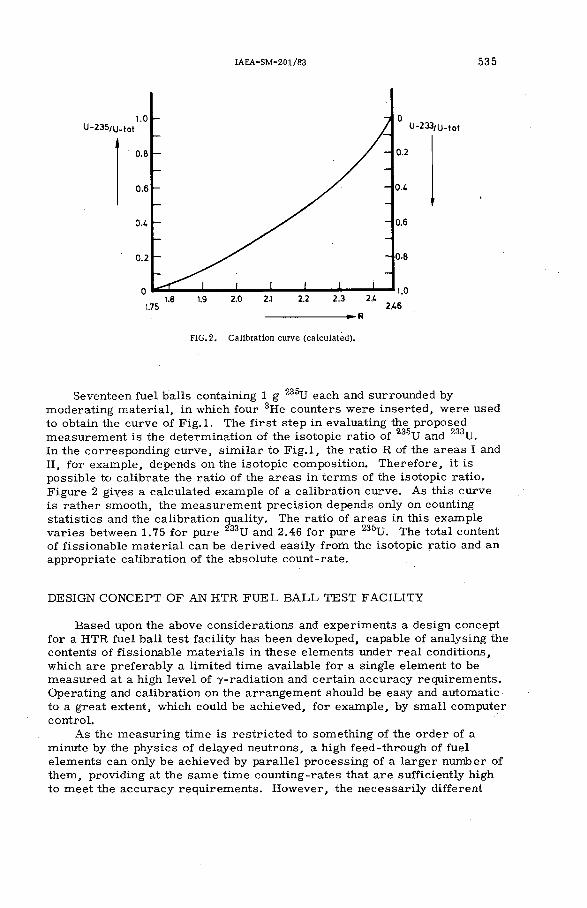
IAEA-SM -201/83 535
U-233,и-tot
FIG. 2 . Calibration curve (ca lcu la ted ).
Seventeen fuel b a lls containing 1 g 23®U each and surrounded by- m oderating m a ter ia l, in which four 3He counters w ere in ser ted , w ere used to obtain the curve of F ig . l . The f ir s t step in evaluating the proposed m easu rem en t is the determ ination of the iso top ic ra tio of U and U.In the corresponding cu rve, s im ila r to F ig . l , the ratio R of the a rea s I and II, for exam ple, depends on the iso top ic com position . T h erefore , it is p o ssib le to ca lib rate the ratio of the a rea s in term s of the iso top ic ratio . F igu re 2 g iv es a ca lcu lated exam ple of a ca libration cu rve. As th is curve is rather sm ooth, the m easu rem en t p rec is io n depends only on counting s ta t is t ic s and the ca libration quality. The ratio of a rea s in th is exam ple v a r ie s betw een 1.75 for pure 233U and 2.46 for pure 235U. The tota l content of fiss io n a b le m a ter ia l can be derived e a s ily from the iso top ic ratio and an appropriate calibration of the absolute cou n t-rate.
DESIGN CONCEPT OF AN HTR FUEL BALL TEST FACILITY
B ased upon the above con sid eration s and exp erim en ts a d esign concept for a HTR fuel b a ll te s t fa c ility has b een developed, capable of an alysin g the contents o f f iss io n a b le m a ter ia ls in th ese elem en ts under r e a l conditions, which are preferab ly a lim ited tim e availab le for a sin g le elem en t to be m easu red at a high le v e l of -/-radiation and certa in accuracy requ irem en ts. O perating and ca libration on the arrangem ent should be ea sy and autom atic to a great extent, which could be ach ieved , for exam p le, by sm a ll com puter control.
A s the m easu rin g tim e is r e s tr ic te d to som ething of the ord er of a m inute by the p h ysics o f delayed neutrons, a high feed-through of fuel elem en ts can only be ach ieved by p a ra lle l p ro cess in g of a la rg er num ber of them , providing at the sam e tim e cou n tin g-rates that a re su ffic ien tly high to m eet the accu racy req u irem en ts. H ow ever, the n ecessarH y d ifferent

536 COTH et a l.
FIG. 3 . Schem a o f th e p ilot experim ent setup.
p osition s occupied by the s in g le e lem en ts during the irrad iation and m easu rin g c y c le m ean , in gen era l, a d ifferent e ffic ien cy in d etectin g the delayed neutrons. This d irec tly a ffects the accu racy and, th ere fo re , sp ec ia l p rov ision has to be m ade to overcom e th is d ifficulty. ' A sp h erica l a ssem b ly of m oderator m a te r ia l, fuel b a lls and neutron counters with the neutron sou rce in the cen tre would avoid th is geo m etr ica l dependence of the effic ien cy , but a m ore convenient arrangem ent would be a circu lar-p lan e array of fu e l e lem en ts surrounding the sou rce again , allow ing u tilization of the fre e ax ia l d im ension for m oving the e lem en ts to , and rem oving them from , th e ir p ositions of m easu rem ent. A stack of such a rr a y s , if n ece ssa r y to in cr ea se the num ber of e lem en ts p ro cessed sim u ltan eou sly , would not probably d isturb too m uch the p osition independence of the effic ien cy . The c irc u la r array of fu e l e lem en ts is surrounded by a s im ila r one of neutron cou n ters. This in vo lves another sou rce of inhom ogeneity of the counting effic ien cy . The se n s it iv it ie s of cou n ters, e .g . of the 3He or the BP3 types can d iffer con sid erab ly am ong p ie c e s , thus d isturbing the counting sym m etry . C onsequently, it is proposed to rotate the fuel e lem en ts again st the counter array se v e r a l t im e s during the m easu rin g procedure.
It is presum ed that good o v era ll p erform ance of the whole a ssem b ly w ill be ach ieved with a v e r t ic a l ax is of sym m etry and thus a lso of rotation.
THE PILOT EXPERIM ENT
The outcom e of the preced ing chapters has been tested by a pilot in sta lla tion , which a lread y re f le c ts the m ain fea tu res of the d esign concept.

IAEA-SM -201/83 537
This setu p , how ever, has been built with a h orizonta l ax is o f rotation, b ecau se the availab le neutron generator has a h orizonta l acce lera to r and d rift tube. An o v er a ll v iew of the in sta lla tion is shown in F ig .3 .
The arrangem ent has been optim ized by calcu lations to g ive a high th erm al neutron flux d en sity at fu e l p osition and good effic ien cy of the d etectors by m eans of a re flec to r . The target o f the neutron generator is surrounded by a 20 -m m -th ick iron cylind er follow ed by 30 m m polyethylene. The container for the fuel b a lls is m ade of graphite, b ecau se it has a low er absorption c r o s s - s e c t io n for th erm al neutrons. E ight 3He counters with a6 -bar p ressu r e are positioned w ithin a polyethylene ring follow ed by a 265-m m -th ick r e flec to r of the sam e m ater ia l. An 80 -m m -th ick lead cylind er is p laced betw een fu e l e lem en ts and d etectors as a y-rad iation sh ield allow ing burned-up e lem en ts to be p ro cessed . To e lim in ate the differen t e ff ic ie n c ie s of the counters and p o ss ib le d isturbance by asym m etr ic d istrib ution of fiss io n a b le m a ter ia l in the fuel e lem en ts , the apparatus b a s ica lly co m p rises a w heel bearing the fu e l b a lls , which is surrounded by an outer sta tic sectio n of lead sh ield and polyethylene r e flec to r containing the cou n ters. During m easu rem en t the w heel sp ins at 300 rpm , and provides 16 p ositions to be loaded with up to th ree fuel b a lls each. Thus, a large va r ie ty of load sch em es sim u lating d ifferent fuel d istrib ution s can be v er ified . Finding the optim um irrad iation and counting program m e along with the study of p rec is io n and reprodu cib ility of the iso top ic vec to r d e te r m ination , dependent on the d istribution of f iss io n a b le m a ter ia l w ithin the m easu rin g volum e and in the fuel b a lls th e m se lv e s , are the m ain ob jectives of th is exp erim en t. M ost o f the m easu rem en ts can be perform ed with a se t of te s t fu e l e lem en ts of an exactly known content and a d istribution of 235u only; h ow ever, a fina l te s t s e r ie s with a m ixed loading of 235U and 233U fu e l e lem en ts is planned.

/

Session 10, Part II
MIXED-OXIDE FUELS

Chairman: O.E. JONES (United States of America)
Papers IAEA-SM-201/30, 41, 42, 50, 61 and 84 were presented byA.W. DeMERSCHMAN as Rapporteur

IA EA -SM -201/30
FAST-RESPONSE FUEL-ROD CALORIMETER*
N. S. BEYER, R. B. PERRY, R, N. LEWIS Argonne National Laboratory,Argonne, Illinois,United States of America
Abstract
FAST-RESPONSE FUEL-ROD CALORIMETER.This paper concerns fuel-rod calorim etry equipm ent and techniques developed at Argonne N ational
Laboratory for the non-destructive analysis o f the plutonium content o f plutonium -loaded fuel rods. A discussion is presented w hich covers the manner in w hich these calorim etric measurem ents are m ade, the basic design features, and the m easurem ent precision. The emphasis is upon the ANL M odel IV Fast-Response Fuel-Rod C alorim eter, which is the new est, most sophisticated instrument. The M odel IV instrument, which features a new m icro-processor controller-readout system , has a therm al power m easurem ent precision of less than ±0. l^o re la tive for a sin g le m easurem ent; and can com p lete a m easurem ent in 15 m inutes. It can handle fu el rods containing m ixed -ox id e fuel colum ns up to 92 cm long. Conversion to and readout directly in grams o f plutonium can also be accom plished with this new instrument at a sin g le measurem ent precision o f ±0. 2 re la tive.
I n t r o d u c t i o n
T h is p a p e r d is c u s s e s th e c a lo r im e t r i c in s t r u m e n t a t io n d e v e lo p e d a t A rg o n n e N a t io n a l L a b o r a to r y (AN L) f o r m a k in g n o n d e s t r u c t iv e m e asu re m en ts o f th e p lu to n iu m c o n te n t o f f u e l r o d s . M e a su re m e n ts w i t h th e s e in s t r u m e n ts a r e r e l a t i v e l y f a s t ( i . e . , 15 to 20 m in u te s ) w hen com pare d to th e s e v e r a l h o u rs u s u a l l y r e q u i r e d w i t h m o re c o n v e n t io n a l c a lo r im e t e r s and f o r t h i s re a s o n a r e c a l l e d " f a s t - r e s p o n s e " .M o s t o f th e d is c u s s io n c o n c e rn s th e ANL M o d e l IV F u e l Rod C a lo r im e te r , w h ic h i s th e n e w e s t and m o s t s o p h is t i c a t e d in s t r u m e n t . H o w e v e r, t o p r o v id e some b a c k g ro u n d and c o n t i n u i t y w h e re n e e d e d , a s m a ll am oun t o f d is c u s s io n i s d e v o te d to th e f i r s t t h r e e m o d e ls w h ic h h a v e b e e n d e s c r ib e d p r e v io u s ly i n th e l i t e r a t u r e [1 ] . [2].
The p r e c i s io n o f th e m e a su re m e n ts t h a t ca n be made w i t h th e M o d e l IV c a lo r im e t e r i s c o n s id e r a b ly b e t t e r ( i . e . , + 0 .1 to 0 .2 p e r c e n t r e l a t i v e ) th a n ca n be a t t a in e d w i t h o t h e r n o n d e s t r u c t iv e a s s a y (NDA) in s t r u m e n t a t io n . I t i s a ls o p o s s ib le to c a l i b r a t e w i t h a h ig h e r d e g re e o f d e p e n d a b i l i t y and a c c u ra c y b e ca u se e l e c t r i c a l l y h e a te d c a l i b r a t i o n ro d s c a n b e u se d w h ic h may b e s ta n d a r d iz e d a g a in s t w e l l - e s t a b l i s h e d and h i g h l y a c c u r a te e l e c t r i c a l s ta n d a r d s . T h ese d e s i r a b le a t t r i b u t e s , c o u p le d w i t h a n o n d e s t r u c t iv e m e asu re m en t o f re a s o n a b le d u r a t io n , make th e s e c a lo r im e t e r s a t t r a c t i v e f o r s a fe g u a rd s m e a s u re m e n ts .
The p r e s e n t a t io n c o n s is t s o f t h r e e g e n e ra l a r e a s : 1 ) N a tu re o f th e M e a su re m e n t, 2 ) I n s t r u m e n t D e s ig n F e a tu r e s , and 3 ) M e asu re m en t R e s u l ts and C o n c lu s io n s . B e ca u se c a lo r im e t r y ha s n o t y e t come i n t o w id e s p re a d u se f o r s a fe g u a rd s NDA, a b r i e f d is c u s s io n w i l l b e p r e s e n te d on th e a p p l i c a t i o n o f b a s ic p r i n c i p l e s t o th e i n t e r p r e t a t i o n o f th e m e a s u re m e n ts . A n d , th e g e n e ra l s te p s t h a t a r e f o l lo w e d i n a c t u a l l y m a k in g a c a l o r i m e t r i c m e asu re m en t o f a p lu to n iu m lo a d e d f u e l r o d w i t h th e ANL c a lo r im e t e r s .
* Work performed under the auspices o f the US Energy Research and D evelopm ent Administration.
541

542 BEYER et a l.
FIG. 1. Line diagram of the basic components of the ANL Model IV Fast-Response Fuel-Rod Calorimeter.
N a tu re o f the Measurem ent
P lu to n iu m a s s a y w ith the se c a lo r im e te r s i s done by m aking e l e c t r i c a l power ( i . e . , w a ttage ) m easurem ents. M easurem ents a re made o f the number o f w a tts th a t a re needed to h e a t the measurement chamber and keep i t a t a c o n s ta n t tem perature When the measurement chamber c o n ta in s a p lu to n iu m -lo a d e d f u e l ro d , l e s s e l e c t r i c a l h e a t in g ( i . e . , l e s s w attage ) i s needed to m a in ta in the chamber tem perature becau se some h e a t i s s u p p l ie d from the r a d io a c t iv e decay o f the f u e l i n the rod . T h is r a d io a c t iv e h e a t in g comes p r im a r i l y from the p lu ton ium is o t o p e s and from a d a u gh te r product, am e ric ium -241, and i s d i r e c t l y p r o p o r t io n a l to the amount o f each c o n ta in e d i n the rod . Any c o n t r ib u t io n from tlie uran ium p o r t io n o f a m ixed o x id e lo aded rod i s too sm a ll to have m easureab le s i g n i f i c a n c e . T h e re fo re , the d i f fe r e n c e i n the w attage re q u ire d to h e a t an empty measurement chamber (o r when th e chamber c o n ta in s a rod w ith no p lu ton iu m i n i t ) and the w attage re q u ire d whe i t c o n t a in s a p lu to n iu m loaded rod i s d i r e c t l y p ro p o r t io n a l to the amount o f p lu to n iu m and am eric ium -241 i n the f u e l ro d . To co n ve rt t h i s d i f fe r e n c e m easure from w a tt s to grams o f each o f the p lu ton iu m is o to p e s and o f the a m e r ic iu m -2 4 1 , i s o t o p i c abundance r a t i o s ( i . e . , w e ig h t p e rce n t) and the s p e c i f i c power c o n s ta n t ( i . e . , w atts/gram ) a re u sed . The s p e c i f i c power c o n s ta n t s a re r e l i a b l y known an u s u a l l y the i s o t o p ic abundance r a t i o s have been w e ll c h a ra c te r iz e d f o r the p lu to n iu m b le nd b e in g c a lo r im e t r i c a l l y a ssa ye d . The c o n v e r s io n h a s been d e s c r ib p r e v io u s ly by B e ye r, et a l. [ 1 ] , [ 2 ] , and by N u tte r , O 'H a ra and Rodenburg [ 3 ] , [4 o f Mound L a b o ra to r y . In some c a se s , t h i s c o n v e rs io n to grams o f m a te r ia l i s re q u ire d . However, i t i s n o t n e c e s sa ry i f t r a n s f e r s o f p lu to n iu m fu e l ro d s a re made by a c c e p t in g the agreem ent between heat o u tpu t determ ined by a r e c e iv e r and th a t p re d ic te d by a s h ip p e r . O r, i f a c c o u n t a b i l i t y m easurements th a t a re made a f t e r r e c e ip t a re made on t h i s b a s i s . I n t h i s s i t u a t io n , w attage m easurem ents w ould be compared and the e x c e lle n t p r e c i s io n and a ccu ra cy ( i . e . , c u r r e n t ly + 0. o r l e s s f o r a s i n g l e measurement) th a t i s p o s s ib le w ith the se in s t ru m e n ts c o u ld be a p p lie d to th e s a fe g u a rd in g o f p lu to n iu m f u e l .
The simplest way of describing how measurements are made with the ANL fastresponse rod calorimeters is to consider the instruments as constant-temperature

FIG. 2. Photograph of the ANL Model IV Calorimeter.
IAE
A-S
M-201/30
543

FIG. 3. Function block diagram of the ANL Model IV Calorimeter,
544 BEY
ER et al.

IA EA -SM -201/30 545
oven s. They a re ope ra ted by e le c t r o n ic feedback c o n t r o l c i r c u i t s w h ich v e ry p re c i s e l y ( i . e . , to + 20 m ic ro d e g re e s) m a in ta in the tem perature o f the oven ( i . e . , measurement cham ber). And, a re p ro v id e d w ith the means o f v e ry p r e c i s e l y m e a su r in g the e l e c t r i c a l power ( i . e . , w attage) re q u ire d to m a in ta in the measurement chamber tem perature . The b a s ic components o f the ANL fa s t - re sp o n s e f u e l rod c a lo r im e te r s a re shown in F ig u r e 1, w h ich i s a l i n e d raw ing o f the M odel IV c a lo r im e te r . They a re a l s o shown i n F ig u r e 2, w h ich i s a pho tog raph o f M ode l IV . The P re h e a te r , w h ich appea rs i n the upper le f t -h a n d co rn e r o f F ig u r e 1 , i s used to warm fu e l ro d s b e fo re m e a su r in g them. The C a lo r im e te r Measurement Box, w h ich i s a tta ch e d to the P re h e a te r , c o n ta in s the measurement chamber, the rm a l g u a rd s , tem perature s e n so r s , and a few c i r c u i t b o a rd s . The C o n t ro l C o n so le ( la b e le d a s E le c t r o n ic s on the r i g h t s id e o f F ig u r e 1) c o n ta in s the m ain e le c t r o n ic feedback c o n t r o l c i r c u i t s w h ich a u t o m a t ic a l ly c o n t r o l the o p e ra t io n o f the a p p a ra tu s . The HP 45 R e a d o u t/ C o n t ro l le r , lo c a te d i n the low e r l e f t o f F ig u r e 1 , i s the p a r t o f the in s t ru m e n t w h ich p ro v id e s readou t o f the e l e c t r i c a l power m easurem ents. I t cont a in s an HP 45 pocke t c a lc u la t o r w h ich p ro v id e s some c o n t r o l f e a tu re s to the re adou t and a u t o m a t ic a l ly p ro c e s se s some o f the measurement r e s u l t s .
The s te p s i n m aking a measurement w ith th e se fo u r b a s ic com ponents a re a s f o l lo w s . 1) A f u e l rod i s in s e r t e d i n the p re h e a te r. A f t e r h e a t in g f o r 10 m in u te s a m eter on the c o n t r o l c o n so le in d ic a t e s i t i s w i t h in + 0 .0001°C o f the tem perature o f the measurement chamber and i s re ady to be m easured. 2) A no the r f u e l rod i s now in s e r t e d in t o the p re h e a te r. A s i t i s in s e r t e d , i t p u she s the p reheated rod ahead o f i t in t o the measurement chamber. 3) The c i r c u i t s w h ich c o n t r o l the h e a t in g o f the measurement chamber a u to m a t ic a l ly s t a r t to o p e ra te .I n 15 m in u te s the measurement chamber tem perature ha s s t a b i l i z e d to w it h in + 20 m ic ro deg ree s C o f the measurement tem perature. 4) The HP 45 R e a d o u t/ C o n t ro l le r a u t o m a t ic a l ly se n se s t h i s tem perature s t a b i l i z a t i o n and in d ic a t e s the e l e c t r i c a l power (w a tts ) re q u ire d to s u s t a in i t and c o n v e rt s t h i s to grams o f p lu ton ium , to g e th e r w ith a c a lc u la t io n o f the measurement p r e c is io n .
In s t ru m e n t D e s ig n Fe a tu re s
The b a s ic hardw are o f the ANL in s t ru m e n ts c o n s i s t s o f c o n c e n t r ic c y l in d e r s w h ich a re wrapped w ith h e a te r -w ire c o i l s and s e n so r -w ir e c o i l s . The c y l in d e r s a re su rrou nded by a i r . No w a te r b a th i s u sed w ith the' ANL rod c a lo r im e t e r s . They a re " d r y " c a lo r im e t e r s . The e a r l i e r m odels ( i . e . , M od e ls I and I I ) w h ich a re d e sc r ib e d i n R e fe re nce [1 ] , and the l a t e s t in s t ru m e n t ( i . e . , M ode l IV ) u se th re e c y l in d e r s . M ode l I I I , d e sc r ib e d i n R e fe re n ce [2 ] h a s o n ly two c y l in d e r s . The c y l in d e r s a re housed i n a measurement box. F o r M ode ls I I I and IV , tem perature o f the i n t e r i o r o f the box i s c o n t r o l le d by a box h e a te r . These b a s ic f e a tu re s can be more e a s i l y d e sc r ib e d by r e f e r r i n g to F ig u r e 3, w h ich i s a f u n c t io n a l b lo c k d iag ram o f M ode l IV . The l e f t s id e o f F ig u r e 3 c o n ta in s the th re e c o n c e n t r ic c y l in d e r s la b e le d T3 , T2 , and T 3 , w h ich a re the tem peratures o f each. The o u te r c y l in d e r tem peratu re , T j , i s m a in ta in e d a few d eg ree s above the tem perature o f the i n t e r i o r o f the box. T2 i s warmer than T j , and T3 (th e measurement chamber) i s warmer than T2 . The tem perature o f the measurement chamber, T 3 , m ust be se t a t a tem perature h ig h enough to a s s u r e th a t the w attage re q u ire d to h e a t the measurement chamber i s g r e a te r than the w attage (o r h e a t in g ) s u p p lie d by the r a d io a c t iv e decay o f the f u e l i n a ro d . A box h e a te r c o n t r o l s the tem perature o f the i n t e r i o r o f the box, T , above am bient room tem perature . The two o u te r c y l in d e r s and the box p ro v id e ^ th e rm a l p ro te c t io n f o r the measurement chamber and make i t p o s s ib le to m a in ta in the measurement chamber tem perature, T 3 , to w it h in + 20 m ic ro d eg ree s C. The measurement chamber i s one m eter i n le n g th and can be u sed to m easure f u e l colum ns up to a p p ro x im a te ly 98 c e n t im e te rs i n le n g th .E n tra n c e and e x i t g u a rd s a re shown a t the ends o f the c y l in d e r s i n F ig u r e 3.These gu a rd s a re s h o r t h e a t e r - c y l in d e r s ( i . e . , about 8 c e n t im e te rs ) w h ich a re

BEYER et al.

IA EA -SM -201/30 547
used to m a in ta in a ze ro therm a l g ra d ie n t a t the e n tran ce and e x i t to the m easurement chamber. They a re re q u ire d because f u e l r o d s o f te n extend beyond the ends o f t h e i r f u e l colum n and, i n t h i s ca se , p ro v id e p ro te c t io n a g a in s t h e a t lo s s e s (o r m a in ta in the lo s s e s v e r y c o n s ta n t ) ou t o f the ends o f the measurement chamber. The p re h e a te r i s d ia g ra m m a t ic a lly re p re se n te d i n the upper le f t - h a n d c o rn e r o f F ig u r e 3. I t s p u rpo se and degree o f tem perature c o n t r o l was d e sc r ib e d in the p re v io u s s e c t io n . F o r M od e ls I I I and IV , the p re h e a te r i s a p p ro x im a te ly 2 .5 m eters i n le n g th and t h e re fo re can be used f o r f u e l ro d s up to th a t le n g th . The h e a te r - c o n t r o l and te m p e ra tu re -se n se c i r c u i t s w h ich p ro v id e au tom atic c o n t r o l a re a ls o shown in F ig u r e 3. A f t e r s e t t i n g T j , T2 , T3 , T and the p re h e a te r tem perature ( i . e . , so w attage to m a in ta in T 3 i s g r e a te r than the f u e l w a tta g e ), the a n a ly s t does no t need to a d ju s t any c o n t r o l s when m aking a measurement. A rod i s m e re ly pushed in t o the. measurement chamber a f t e r p reheating*, the tem p e ra tu re -se n se c o i l s d e tec t i t s p re se nce and a u to m a t ic a l ly a d ju s t to p ro v id e a re adou t o f the w attage and, in the ca se o f M ode l IV , com putes the grams o f p lu ton ium .
F ig u r e 4 i s a p ic t u r e o f the M a in C o n t ro l C o n so le and the R e a d o u t/ C o n t ro l le r f o r M ode l IV . The M a in C o n t ro l C o n so le shows the m eters f o r m o n ito r in g the a u to m atic measurement o p e ra t io n and c o n t r o l knobs f o r the i n i t i a l a d ju stm e n ts . The R e a d o u t/ C o n t ro l le r i s one o f the most in t e r e s t in g im provem ents th a t h a s been made i n the ANL Model IV F u e l Rod C a lo r im e te r . I t a l s o a p p ea rs i n F ig u r e 2. An HP 45 pocket c a lc u la t o r was in c o rp o ra te d in t o the c i r c u i t r y o f the R e a d o u t/ C o n t ro l le r and was programmed to p e r i o d i c a l l y m o n ito r the therm a l power s i g n a l to compute:(a ) the p o in t a t w h ich therm a l s t a b i l i z a t i o n i s s u f f i c i e n t to p ro v id e a d e s ire d measurement p r e c i s io n ( u s u a l ly + 0 .1 % o r l e s s ) ; (b ) the mean v a lu e o f the therm al power measurement by u s in g the a p p ro p r ia te s p e c i f i c power c o n s ta n t (w atts/gram ) w h ich h a s been s to re d i n the HP 45 memory by the a n a ly s t . A sm a ll p r in t e r , w h ich i s a l s o p a rt o f the R e a d o u t/ C o n t ro l le r , p ro v id e s a h a rd -co p y p r in t o u t o f the above v a lu e s . The HP 45 may a ls o be used o f f - l i n e f o r o th e r com pu ta t ion s.
R e s u lt s and C o n c lu s io n s
T h is s e c t io n in c lu d e s a d i s c u s s io n o f ou r e xp e rie n ce i n e v a lu a t in g m easurement r e l i a b i l i t y o f the ANL f u e l rod c a lo r im e te r s . A lth o u g h e xp e rie n ce w ith M od e ls I , I I , and I I I h a s been re p o rte d p r e v io u s ly i n the l i t e r a t u r e [1 ] , [2 ] , a b r i e f re v ie w i s p re se n te d fo r the sake o f p r o v id in g backg round c o n t in u it y .
M ode ls I and I I were d e s ig n e d to s p e c i f i c a l l y h an d le the sm a ll ( i . e . , 6 in c h e s lo n g by 3/8 in c h d iam ete r) f u e l ro d s used in the Zero Power P lu to n iu m R e ac to r (Z P P R ). These sm a l l, p o r ta b le in s t ru m e n ts were used to v e r i f y , on a sam p lin g b a s i s , the p lu ton iu m con te n t o f the ZPPR f u e l ro d s . The e xp e rie n ce ga ined in u s in g th e se in s t ru m e n ts to m easure the ZPPR ro d s was v e ry u s e fu l because i t was p o s s ib le to compare the c a lo r im e t r ic measurement r e s u l t s w ith o th e r e x te n s iv e a n a ly s e s made by b o th n o n d e s t ru c t iv e and d e s t r u c t iv e te ch n iq u e s ( i . e . , gamma ra y c o u n t in g , n e u tro n c o in c id e n c e , and chem ica l m easurem ents). A tho rough com parison o f r e s u l t s h a s been p re se n te d i n the l i t e r a t u r e [1 ] , [4 ] so o n ly one s e t o f r e s u l t s i s p re se n te d h e re . The r e s u l t s were a s f o l lo w s :
MEASUREMENTTECHNIQUE
MEAN VALUEw t.% TOTAL PLUTONIUM1
C a lo r im e try 26 .5126 .4826 .6026 .4226 .26
C hem ica l (R e c e iv e r) C hem ica l (S h ip p e r ) Gamma RayN e utron C o in c id e n c e
The u n c e r t a in t y o f the mean v a lu e f o r a l l c a se s was ap p ro x im a te ly 0 .2% r e la t i v e o r l e s s .

548 BEYER e t al.
FIG. 5. Calibration of the ANL Model III Calorimeter using an electrically simulated fuel rod.
The measurement re sp o n se tim e f o r M odel I , w h ich d id no t have a p re h e a te r, was 90 m in u te s . M ode l I I used p re h e a t in g and re sponded in 20 to 30 m in u te s.
The M ode l I I I in s t ru m e n t [2 ] was b u i l t f o r the pu rpo se o f exam in ing the p o s s i b i l i t y o f a p p ly in g the d e s ig n con ce p ts o f M ode ls I and I I to an in stru m e n t w it h a lo n g e r measurement chamber and im p ro v in g upon the measurement p r e c i s io n and re sp o n se tim e. The in s t ru m e n t was a b le to h an d le a 9 2 -c e n t im e te r f u e l columi had a measurement re sp o n se tim e o f from 13 to 23 m in u te s , and the s i n g l e m easurement p r e c i s io n f o r therm al power m easurements was ap p ro x im a te ly 0 .2% r e la t i v e . The lo n g - te rm s t a b i l i t y o r p r e c i s io n , a s in d ic a te d by the u n c e r t a in t y i n the meai v a lu e o f the the rm a l power, was l e s s than 0.1% r e la t i v e . I n i t i a l l y t h i s in s t ru m e n t was e v a lu a te d by m e asu r in g g roup s o f ZPPR p in s p la ce d en d -to -e n d to s im u la te lo n g e r f u e l co lum ns. L a t e r i t was m o d if ie d to hand le f u e l ro d s f o r the F a s t F lu x T e s t F a c i l i t y (FFTF) w h ich a re about 237 ce n t im e te rs lo n g , bu t c o n ta in a f u e l colum n o f about 91 c e n t im e te rs . S t u d ie s w ith t h i s m o d if ie d in s t ru m e n t le d to the developm ent and c o n s t r u c t io n o f the M ode l IV c a lo r im e te r .
The c a l i b r a t io n o f M ode ls I I I and IV was done by com parat ive m easurem ents o f : 1 ) f u e l r o d s w h ich had been w e ll c h a ra c te r iz e d by ch em ica l and mass sp e c t ro 'm e tr ic m easurem ents; 2) ro d s ( i . e . , ZPPR ro d s) tha t had been a ssa ye d by the la rg i h i g h - p r e c i s io n , w a te r-b a th c a lo r im e te r s o f Mound L a b o ra to ry ; and 3) e l e c t r i c a l l y s im u la te d f u e l ro d s b u i l t f o r t h i s p u rp o se . The fa c t th a t i t i s p o s s ib le to c o n s t r u c t and u se e l e c t r i c a l l y s im u la te d f u e l ro d s w ith the ANL f u e l - r o d c a lo - im e te rs i s a f o r tu n a te c irc u m sta n ce , s in c e the d e te rm in a t io n o f the " r e a l " v a lu e o f the power s u p p l ie d b y the f u e l i s i n t h i s ca se independent o f the u n c e r t a in t i a s s o c ia t e d w ith mass sp e c t ro m e tr ic and/or chem ica l a n a ly s e s w h ich u s u a l ly form a b a s i s f o r d e te rm in in g the a ccu ra c y o f o th e r n o n d e s t ru c t iv e a s s a y in s t ru m e n ts . The e l e c t r i c a l m easurem ents w ith an e l e c t r i c a l f u e l rod can be tra c e d to the h ig i p r e c is e e l e c t r i c a l s ta n d a rd s a v a i la b le th ro ugh o r g a n iz a t io n s l i k e the U. S .

IA EA -SM -201/30 549
N a t io n a l Bu reau o f S ta n d a rd s . F ig u r e 5 shows a re ce n t c a l i b r a t io n o f the m o d if ie d ( i . e . , f o r FFTF f u e l ) Model I I I in s t ru m e n t. C a l ib r a t io n s o f t h i s typ e w it h s im i l a r r e s u l t s have a l s o been made o f the M odel IV in s t ru m e n t. I t was made w it h an e l e c t r i c a l l y s im u la te d FFTF f u e l ro d . A l i n e a r le a s t - s q u a r e s f i t to the m easurement d a ta in d ic a t e d a s lo p e o f -1 .0 0 0 1 + 0 .0008 and in t e r c e p t o f 317 .32 m i l l i w a tts w it h an u n c e r t a in t y o f + 0 .1 6 m i l l iw a t t s o r a p p ro x im a te ly + 0 .0 5% . R e p e t it iv e
m easurem ents made w it h the M ode l IV in s tru m e n t u s in g fo u r FFTF f u e l r o d s re v e a le d th a t the p r e c i s io n f o r a s i n g l e measurement o f the therm al power i s o f the o rd e r o f 0 .1% o r l e s s and can be o b ta in e d i n no t more than 15 m in u te s. The o v e r a l l measurement p r e c i s io n ( i . e . , in c lu d in g u n c e r t a in t ie s in the c o n v e r s io n f a c t o r s , s p e c i f i c power c o n s ta n t s , and mass sp e c t ro m e tr ic a n a ly s e s ) o b ta in e d f o r a d e te r m in a t io n o f the gram s o f p lu to n iu m in FFTF type ro d s was + 0 . 2 % r e l a t i v e a t the one sigm a co n f id e n c e le v e l . The s t a b i l i t y o ve r a 1 2 -h o u r p e r io d was on the o rd e r o f + 0 .02% r e la t i v e .
REFERENCES
[1 ] BEYER, N. S . , LEW IS, R. N . , PERRY, R. B . , "A P o r ta b le D ry C a lo r im e te r f o r the N o n d e s t ru c t iv e A s s a y o f M ixe d -O x id e F u e l R o d s , " N u c le a r M a t e r ia l s Management, 1 , 3 (1 973 ) 170 -196 .
[2 ] BEYER, N. S . , LEW IS, R. N . , PERRY, R. B . , "F a s t -R e sp o n se F u e l Rod C a lo r im e te r w it h a 3 6 - In c h F u e l Column C a p a c it y , " N u c le a r M a t e r ia l s Management, I I I ,(1974) 118.
[3 ] NUTTER, J . D ., O ’HARA, F. A . , RODENBURG, W. W., "The U se o f C a lo r im e t r y i n N u c le a r M a t e r ia l s M anagem ent," P ro ce e d in g s o f the I n s t i t u t e o f N u c le a r M a t e r ia l s Management, E le v e n th A nnua l M e e t in g , New O r le a n s , (1975) 101.
[4 ] O 'HARA, F. A . , NUTTER, J . D . , RODENBURG, W. W., D INSM0RE, M. L . , "C a lo r im e t r y f o r S a fe g u a rd s P u rp o se s — D e te rm in a t io n o f P lu ton ium i n R e a c to r Feed M a t e r i a l , " AEC R e sea rch and Developm ent R e p o rt , MLM-1798 (1 9 7 2 ).
[5 ] BEYER, N. S . , PERRY, R . B . , BRANDENBURG, R. W ., LEW IS, R. N . . "F o u r P a s s iv e A s s a y Te chn ique s A p p lie d to M ixe d -O x id e F u e l , " ANL-7906 (1 9 7 2 ).


IA E A -SM -201/41
N O N - D E S T R U C T I V E A S S A Y E Q U I P M E N T F O R Q U A N T I T A T I V E D E T E R M I N A T I O N O F N U C L E A R M A T E R I A L IN A P L U T O N I U M F U E L F A B R I C A T I O N F A C I L I T Y
K. ONISHI, H. AKUTSU, T. ITAKI,K. MIYAHARA, Y. TOKORO, M. TSUTSUMI Tokai Works, Power Reactor and Nuclear Fuel Development Corporation,Ibaraki-ken,Japan
Abstract
NON-DESTRUCTIVE ASSAY EQUIPMENT FOR QUANTITATIVE DETERMINATION OF NUCLEAR MATERIAL IN A PLUTONIUM FUEL FABRICATION FACILITY.
In the Plutonium Fuel Fabrication Facility (PFFF) of PNC, nuclear materials are received in the form of oxide powder for both plutonium and uranium as raw material, and are shipped to the reactor site as the sub-assembly after passing through fabrication processes such as pellet preparation, fuel-rod fabrication and assembling. This production line has some strategic points where the non-destructive assay is available for safeguards techniques. In this facility, four strategic points for non-destructive assay were established as follows; (1) receiving of nuclear m aterial; (2) shipping of sub-assembly; (3) fuel rod; (4) contaminated waste and scrap of the fuel power or pellets. The results obtained from a calorimeter, у-scanner, and neutron coincidence meter were prepared for these strategic points, and are reported.
1. INTRODUCTION
In the Plutonium Fuel F ab rica tion F a cility (P F F F ) of PNC, P u 0 2- U 0 2
m ixed-oxide fuel for a heavy-w ater re a cto r (HWR) and fast breed er re a cto r (FBR ) a re being fabricated . The flow diagram of pellet fabrication process and fuel-rod assem bling p rocess is shown in F ig s 1 and 2 . N uclear m ateria ls are received in the form of oxide powder for both uranium and plutonium as raw m ateria l and are, shipped in the form of the sub-assem bly after passing through the fabrication p rocess composed of pellet preparation, fuel-rod fabrication and assem bling. This production line has som e stra teg ic points where the non-destructive assay is available for safeguards.
The stra teg ic points would receiv e P u 0 2 powder and U 0 2 powder as raw m ateria l, scrap pellets or powder of PuO^-U02 mixed oxide, solid waste from all the p ro cesse s , fuel-rod loading the mixed oxide, and the sub- assem bly to be shipped to the re a cto r s ite . F o r a few y ears we have been doing re se a rch and development on the utilization of non-destructive assay for the above stra teg ic points. Among them, a у-sca n n er for fuel rods of the experim ental re a c to r "Jo y o " and a drum scanner for solid w aste, are in p ractica l use, and now we have been su ccessfu l in providing a ca lo rim eter for the sealed P u 0 2 powder and scrap of the P u 0 2 -U 0 2 mixed oxide, a у -scan n er for the HWR fuel rod of low plutonium content, a neutron coincidence m eter for the su b-assem bly and a drum scanner for the solid waste sealed in the drum. F o r the next step, we plan to prepare a carton
551

552 ONISHI et al.
FIG. 1. Flow diagram of mixed-oxide fabrication process.
FIG. 2, Flow diagram of assem bling process.

IAEA -SM -201/41 553
C on tro l P an elH ig h -S e n s it iv eM icro-V oltm eter
FIG. 3. Drawing of calorimeter.
scanner for the solid w aste, a f ilte r scanner for absolute f ilte r , and active interrogation method for P u 0 2 - U 0 2 m ixed-oxide scrap . This paper d escribes the resu lts of experim ents on the ca lo rim eter and 7 -sca n n er for the HWR fuel rod, and the neutron coincidence m eter for the "Jo y o " sub-assem bly .
2. CALORIM ETER
The non-destructive assay method of plutonium by calorim etry has been developed in some countries. Our ca lo rim eter was prepared by rem odelling the-sm all twin conduction-type ca lo rim eter generally used for other purposes in Japan, in order to determ ine the plutonium content in the m ixed-oxide pellets or the plutonium dioxide powder as raw m ateria l. The ca lo rim eter and details of sam ple ce ll portion a re shown in F ig s 3 and 4. As seen from F ig .3 , this ca lo rim eter con sists of polystylene foam to cut off room -tem p erature fluctuation, a pipe circulating the constant tem perature w ater, a polystylene foam ( 6 cm thick) which reduces the tem perature fluctuation of the circulating water and keeps an aluminium

554 ONISHI et al.
FIG. 4. Details of sample cell portion of the calorimeter.
block at constant tem perature, and two units of the ce ll for the sample and re feren ce sides. The circulating water is controlled at ±0.05°C, and the aluminium block is kept at ±0.02°C .
Both c e lls are closely attached to the aluminium block by 8 therm omodules as shown in F ig .3 . The therm al conductivity of one therm omodule is about 0.04 cal/degC per s and the electrom otive force is about6.5 m V/degC. The 8 thermomodules of each ce ll are connected in se r ie s , and both these 8 thermomodule se r ie s are connected in the opposite polarity in order to rem ove the fluctuation effect of the aluminium block tem perature. The generated voltage is determined by m icrovoltm eter and reco rd er,V -F converter, s c a le r and p rin ter. The e le c tr ica l c ircu it of this ca lo rim eter is shown in F ig .5.
2.1. Experim ent
2 .1 .1 . Stability of the zero point (background)
The twin design of this ca lo rim eter seem s to reduce the effect of room -tem p erature fluctuation, but when the room tem perature fluctuates widely, the sm all d ifference of the therm al conductivity between the two

IA EA -SM -201/41 555
FIG. 5. Diagram of electrical circuit of calorimeter.
5
>
o.
A1 Temp. 20°C
l-l^pV*
9.00 —I-------1-------- 1--------'--------1—9.00 9.00
1st day (2/5) 2nd day (2/6) 3rd day (2/8)
FIG. 6. Stability of zero point for calorim eter.

556 ONISHI et al.
S tan d ard H eater (u )
FIG, 7. Calibration curve by standard heater.
FIG. 8. T im e to equilibrium by 0. 01-W standard heater.

IAEA -S M -201/41 557
side ce lls might give a background effect to the electrom otive fo rce . The electrom otive force was m easured in the condition of the empty c e ll, and its fluctuation was found le s s than ±2 uV as shown in F ig .6 . This experim ent was done in Febru ary , and the daytime room tem perature was controlled at 20°C by heating, and at night at about 10°C. This background value seem s to be sufficiently sm all to determ ine the plutonium sam ple.
2 .1 .2 . C alibration curve by the standard heater
The ca lo rim eter has a standard heater of 7 ranges (0.05W ~ 5W) for calibration . The calibration curve is shown in F ig .7, and is considered to be satisfactory for plutonium assay . The relation of the tim e and voltage is shown in F ig .8 . The tim e required to reach equilibrium was approxim ately 10 h, and this stead y-state condition was continued for longer than 3 d. The fluctuation of the voltage was not detected, and reproducibility was b etter than 0 . 1 %.
2 .1 .3 . D eterm ination of plutonium content in the plutonium dioxide powder
The plutonium dioxide powder with known isotopic com position, plutonium content and 241Am content, was sampled in the s ta in le ss -s te e l v esse l by using an accu rate balance and sealed in a p lastic bag. This sam ple was loaded in the sam ple side ce ll and the m easurem ent was started . The data obtained is shown in Table I. The calculated value (Wj) is obtained from isotopic com position, plutonium content, 241Am content and sp ecific power of the isotopes, and the m easured value is the data obtained by our c a lo r im eter. The m ajor source of e r ro r for the m easured value is uncertainty in the 238Pu isotopic com position and its e r ro r is estim ated at about 2% of the calculated value for the used plutonium sam ples. The sp ecific power data of the isotope cam e from the Mound Laboratory [l] .
TA BLE I. ANALYTICAL DATA OF P u 0 2 POWDER
Sampling Pu metal CalculatedCalorimeter value Error
No. weight Pu02 (g)
weight
(g)
value (Wj) (W/g Pu) Measured
value (W)w2
(W/g Pu)
Wj-W2---------x 100°!o
w,
1 5.098 4 .45 0. 00371 0. 0165 0. 00371 0. 00
2 11.010 9.61 0.00371 0. 0356 0. 00371 0.00
3 22.067 19. 26 0. 00371 0.0714 0.00371 0.00
4 148.01 128.86 0. 00376 0. 4890 0. 00379 -0. 80
5 295.0 256. 85 0. 00378 0. 9659 0.00376 +0. 53
6 1517.0 1320.85 0. 00375 4. 981 0.00377 +0,53
7 1630. 0 1416.80 0.00379 5. 359 0. 00377 +0.53
8 1839.0 1598.46 0.00380 6. 045 0. 00378 +0.53

558 ONISHI et al.
2 .1 .4 . Determ ination of the plutonium content in P u 0 2 -U 0 2 mixed oxide
Scrap of P u 0 2-U 0 2 m ixed-oxide pellets was sampled in a plastic bottle, and this mixed oxide contained 17.7% P u 0 2 and 82.3% U02, which is enriched in 235U by 23%. P r io r to this m easurem ent, specific powder of the 23% enriched uranium was determ ined, and its resu lt was 6.85 X 1СГ6 W/g.When the above m ixed-oxide sam ple was m easured by the ca lo rim eter, the m easured value showed 0.6135 W, and the calculated value was 0.6102 W. The ca lo rim eter confidence value compared very well with the calculated value.
3. у -SCANNER FOR THE F U E L ROD
With the 7 - scanning method, we checked a ll the fuel rods fabricated for the fast b reed er re a cto r . All fuel rods have the sam e plutonium content of m ixed-oxide pellet stack in the middle and blanket pellet stacks (depleted uranium -dioxide pellet) on both sides. T herefore, it is necessary to check whether both kinds of pellet stacks are loaded in the right position. This quality control is the reason why we use the 7 -scanning method. H ere, the gross 7 -ra y scanning method is chosen, so it is im possible to determ ine the plutonium content accurately , but it can c learly distinguish core m ixed- oxide pellet from blanket pellet in a fuel rod. This 7 -scan n er is not described in this paper.
In another p ro ject for the development of a heavy water re a cto r (HWR) p ro ject, we prepared a new 7 -scan n er for the fuel rod. B ecau se the HWR
FIG. 9. Block diagram of e lec tr ica l circuit for a у -scanner.

IAEA-SM-201/41 559
fuel assem bly con sists of two kinds of rod which contain different plutonium- enriched pellets (0.55 wt.% f is s ile Pu for outer region fuel rod and 0.8 wt.% f is s ile Pu fo r inner region fuel rod), these two kinds must be distinguished from each other for the quality control by the у-scan n er. The 239Pu content is determ ined from m easured у-intensity of Pu (384-keV com plex), while low -energy y -ra y (mainly 60 keV M1Am) is reduced in intensity by a3-m m -th ick A l-Cu alloy plate set at the su rface of the d etectors. The block diagram of the e le c tr ica l c ircu it is shown in F ig .9 . y -ray s are detected by 3 Nal(Tl) y -ra y d etectors set in the equipment because the inspection room for this scanner is too lim ited in space for the total length of the fuel rod to be scanned by one detector. The detected signals are passed through independently of each other: p re-am p lifier, single-channel pulse-height an alyser, rate m eter, reco rd er and sc a le rs 1, 2 and 3, and total counts of s c a le r s 1, 2 and 3 are recorded by sc a le r 4. The Pu content is calculated from these total counts. The y -ray spectrum of plutonium is shown in F ig . 10. But we could not obtain the com plete data because of shortage of tim e a fter preparing this у -scan n er. However, it was found that the accu racy is about 1% for the Pu content in the fuel rod of the plutonium isotopic com position belonging to a single lo t and may be b etter than 4% for the plutonium with the fluctuation of its isotopic ratio which is generally used for a fabrication campaign of a se r ie s of fuels. A fuel rod containing com pletely different plutonium gave a very different resu lt, and this may lim it the availability of this y -scan n er for safeguards.
FIG, 10, y-ray spectrum for a PuC^-UO^ pellet loading fuel rod.

610
560 ONISHI et al.
i I■ «- ЮОф
______________ 404ф
FIG. 11. Detector assembly of neutron coincidence meter.
3He COUNTERS
FIG. 12. E lectrica l system of neutron coincidence m eter.

IAE A -S M -201/41 561
4. NEUTRON COINCIDENCE M ETER
The neutron coincidence technique was applied to determ ine the plutonium content in a F B R -ty p e fuel su b-assem bly . This equipment and e le c tr ica l c ircu it are shown in F ig s 11 and 12. As shown in F i g . l l , part of the detector was constructed by arranging six 3He proportional counters (active length:10 in; p ressu re : 4 atm ; diam .: 1 in) and cadmium m etal as a neutron absorber in the polyethylene m oderator (450 mm outer diam ., 600 mm high) which has a 1 0 0 -m m -d iam . hole in the centre so that the specim en sub- assem bly can be inserted .
The F B R type sub-assem bly includes 91 fuel rods in hexagonal wrapper tube which has an outer fa ce -to -fa ce distance of 74.7 mm between the p aralle l sides. The overall length of the sub-assem bly is 2970 mm and total weight is approxim ately 60 kg. A sp ecial sub-assem bly that includes 84 fuel rods was prepared for the monitoring of neutron flux in the re a cto r . This su b-assem bly includes 91 fuel rods, or 13 kg P u 0 2-U 0 2 p ellets, in which is contained 2 kg Pu m etal or about 380 g 2 4 0 Pu.
The signals detected by six 3He counters, are classified into three patterns by a gate generator, and each pattern signal is counted by three s c a le r s . S ca le r 1 record s a ll neutron signals. S ca le r 2 record s the signals that occur within a se t tim e interval which is programmed by the gate generator, a fter the f ir s t signal (trigger pulse) acts on sc a le r 2. S ca le r 3 reco rd s the signals that occur in a tim e interval identical to that in s c a le r 2, a fter the set interm ediate tim e is spent. This se t tim e is program m ed by the gate generator, and decided by the fading tim e of the neutron in the polyethylene m oderator of the detector.
5. EXPERIM EN T
5.1. C alibration curve
The response of the detector was calibrated by the actual F B R -ty p e fuel rods and su b-assem bly , whose Pu content and the isotopic composition and PUO2 -UO2 m ixed-oxide weight are already known. F ig u re 13 shows the calibration curve of neutron coincidence counting and F ig .14 shows the calibration curve for total neutron counting. The calibration curve for the data of neutron coincidence counting was not lin ear, owing to the dead tim e of the counter which c o rre c ts the counting lo ss by the next form ula.
Ns = K X (Sc - S b) j l + ^ k j
N : Spontaneous fission neutron yieldSc : Coincidence counts by s c a le r 2Sb : Delayed coincidence counts by sc a le r 3St : Total counts by s c a le r 1tg : Gate generator cycle tim eT : Counting time

562 ONISHI et al.
FIG. 13. Calibration curve by coincidence count.

IA EA -SM -201/41 563
FIG. 14. Calibration curve for gross neutron counting.
The calibration curve for total neutron counts has good linearity as shown in F ig .14, since isotopic com position and chem ical com position of nuclear m ateria l are relatively constant in this F B R fuel fabrication campaign.When one sub-assem bly is counted for a period of 2000 s, accuracy is ± 2 % for the neutron coincidence count and ±0 . 1 % for the gross neutron count.
6 . CONCLUSION
The resu lts of the experim ents on the three non-destructive assay units a re described in this paper. These were prepared not only for safeguards requirem ents but for quality assu rance for fuel production. All three units w ere found to be effective for safeguards by accu racy , sim ple stru ctu re, ease of m aintenance and low 'cost.
The ca lo rim eter will be used with very good accuracy for plutonium dioxide contained in cans, and p rocess scrap . It should be mentioned that the ca lo rim eter takes only a minimum time of an inspector for verification by the use of sealing, in spite of its long m easurem ent tim e.
The neutron coincidence m eter is characterized by good accuracy , le ss than 0 . 1 % by g ross counting and 2 % by neutron coincidence counting for the F B R -ty p e fuel sub-assem bly . This will be applied not only for v e r if ication purposes, but also for quality assu rance of a final fuel product for the re a cto r site .

564 ONISHI et al.
The 7 - scanner for the fuel rod is widely used in many fa c ilit ie s for quality control rath er than for safeguards. The accuracy of this scanner, using Nal d etectors, may lim it availability for inventory-taking of safeguards, although it works well for quality control and verification for safeguards.
R E F E R E N C E S
[1 ] O'HARA, F. A . , NUTTER, J . D . , RODENBURG, W .W ., D1NSMORE, M. L . , Calorimetry for safeguards purposes, MLM-1798 (1972).
[2 ] OETTING, F. L . , Determination of plutonium in plutonium oxide by calorimetry, J. Inorg. Chem.27 (1965).
[3 ] WEITKAMP, C . , 8EISSWENGER, H ., SCHNEIDER. V .W ., Accuracy of calorimetric plutonium determination, KFK-1299 (1971).
[4 ] AUGUSTSON, R. H ., MENLOVE, H. O ., WALTON, R. B ., EAST, L .V ., EVANS, A .E ., KRICK, M .S ., "Development of techniques for active and passive assay of fissionable m aterials", Safeguards Techniques (Proc. Symp. Karlsruhe, 1970) 2, IAEA, Vienna (1970) 53.

IA EA-SM -201/42
N O N - D E S T R U C T I V E A N A L Y S I S O F P L U T O N I U M F U E L P L A T E S F O R
P H Y S I C A L I N V E N T O R Y V E R I F I C A T I O N A .T A F A S T C R I T I C A L A S S E M B L Y ( F C A )
T. N U M A K U N A I, H. T A T SU T A , K. ENDO,Japan Atom ic Energy Research Institute,Ibaraki-ken,
Japan
Abstract
NON-DESTRUCTIVE ANALYSIS OF PLUTONIUM FUEL PLATES FOR PHYSICAL INVENTORY VERIFICATION AT A FAST CRITICAL ASSEMBLY (FCA).
The objective of this study is to develop the instrumentation and techniques, which JAERI personnel and inspectors, both IAEA and local, may use to identify the plutonium plates of the fast critical assembly (FCA) safely and simply without opening the birdcage. Two non-destructive techniques were developed using gam m a- ray and neutrons. The gam m a-ray technique is to measure gamma rays emitted from each plates using a Nal detector, three-slit inclined collimator and rotating device. Plutonium plates are contained in the birdcage basket which has radial gaps. The detector and the collimator were fixed on top of the birdcage, which was rotated during measurement. When a plate was in line with the coUimator, the gam m a-ray intensity showed a high peak in the intensity change. The number of plutonium plates was obtained by counting these high peaks and the plates were verified as Pu since the gam m a-ray energy was peculiar to plutonium. The neutron technique is to measure gross neutrons emitted from a ll plates contained in the birdcage by using four BF3 counters positioned in a cylindrically arranged paraffin moderator. Since the plutonium isotopic composition for each type of plate was known, the total yield of spontaneous fission neutron could be calculated. The number of plates was obtained through measurement of total counts of neutrons and the relation between the number of plates and total neutron counts for each type of plate.
1. INTRODUCTION
One of the problem s fo r the safeguards inspection of nuclear m ateria ls is the verification of the storage inventory of certa in types of re a cto rs , such as a fast c r it ic a l facility where the storage inventory of unirradiated and irrad iated fuel changes frequently. The present verification of the Pu plates con sists of confirm ing the book inventory, the sampling of the birdcage to be opened, and counting the number of plates contained. There is a strong incentive to develop the method of verification for Pu plates without removing them from th eir container.
The ob ject of this development is to sim plify and to enable verification and identification of Pu plates kept in storage. Experim ents of gam m a-ray and neutron m easurem ent have been perform ed to develop instrum entation and techniques, which JA E R I personnel and insp ectors, both IAEA and local, may use to identify and m easure Pu plates of the fast c r it ic a l assem bly (FCA) safely, simply and with the required accuracy .
565

566 NUMAKUNAI et a l.
TA BLE I. T Y P E OF PLUTONIUM PLA TES
No.Type of plate
(in )Pu weight (Pu fis s .)
(g)
Pu fiss.(%>
Origin
1 2x4x1 /16 70.647(64 .873) 92 USA
2 2x4x1/16 70.667 (65.027) 92 UK
3 2x2x1/16 35 .347(32 .448) 92 USA
4 2x2x1/16 35 .287(32 .466) 92 UK
5 2x1x1 /16 16 .894(15 .512) 92 USA
6 Ex. 2x2x1 /16 29 .623(27 .208) 92 USA
7 2x2x1 /32 6.823 ( 6.266) 92 USA
8 2x2x1 /16 40.093 (32.597) 81 UK
9 2x1x1 /16 19 .964(16 .233) 81 UK
10 2x2x1/16 42 .904 (32 .475 ) 75 UK
11 Tr. 2x2x1/16 32.816 (30.179) 92 UK
TA BLE II. ISOTOPIC COMPOSITION
Type of plate 239 Pu + 241 Pu !49pu 238 pu 242Pu
2x4x1 /16
2x2x1 /16
2x1x1 /16
Ex. 2x2x1 /16
2 x2x 1 /32
91 .9 ± 1 .0 8 .0 ± 0.5 0.10 0.15
2x2x1 /16
2x1x1 /16
81 .0 ± 1 .0 18 .5 ± 0.5 0.1 0.5
2x2x1 /16 75 .0 ± 1 . 0 22 .0 ± 0.5 0.5 2 .5
2. Pu PLA TES AND BIRDCAGE STORAGE CONTAINER
The Pu plates are used for various re se a rch in fast re a cto r physics, the type and isotopic com position of which are shown in T ables I and II, resp ectively . The plates are made of Pu and aluminium alloy, and sheathed with sta in less steel.
The birdcage is an aluminium a ir-tig h t container, fixed in a cubic separation fram e for cr itica lity reasons as shown in F ig . 1. The Pu plates are stored in the birdcage basket. The maximum number of plates stored is 20 for type I basket, 40 for type II.

FIGЛ . Birdcage.

IAE
A-SM
-201/42 567

568 NUMAKUNAI et a l .
3. PRIN C IPLE OF TECHNIQUE
The Pu plates contained in one birdcage are of the sam e type because of requirem ents of book inventory and fuel-m anagem ent regulations, and the number of plates in the birdcage changes frequently depending on FCA loading schedule.
In im plementing safeguards it is usual for the physical inventory verification of nuclear m ateria ls to be based on weight m easurem ent. In the case of FCA Pu verification with required accuracy , weight m easurem ent is achieved with difficulty owing to health physics control and cr itica l management. The aim of this program m e is to develop a method of verifying the inventory on the number of plates by non-destructive m easurem ent.
The instrum entation principle is to in crease the re liab ility of the m easurem ent by extending an acceptable lim it of s ta tis tica l deviations due to the radiation m easurem ents. Two methods are available for counting the number of plates:
Method 1: M easurem ent of radiations em itted from each Pu plateMethod 2: M easurem ent of gross radiations em itted from all Pu plates
contained in the birdcage
The acceptable deviation lim its for Method 1 is la rg e r than those of Method 2. In this program m e both these methods w ere developed.
F o r Method 1, m easurem ent of gamma rays is suitable because of the ease of the radiation collim ation system , while for Method 2 the m easurem ent of neutrons is preferable because of spontaneous fission from Pu plates.
4. TECHNIQUE ON GAMMA-RAY MEASUREMENT
4 .1 . Energy spectrum of gamma rays em itted from Pu plates * 59
To verify the identity of the Pu plates, the m easured gamma rays have to be sp ecific fo r the Pu and sufficient in intensity. Also, it is desirable that there a re no other gam m a-rays with energy close to that to be m easured. As a resu lt of investigation, 51. 6 -keV gam m a-rays em itted from 239Pu seem to be suited for the condition described above. To exam ine the relative intensity of gam m a-rays, the energy spectrum for eleven types of Pu plates are m easured by a Si(Li) detector. The m easurem ents were carried out using the birdcage as under actual conditions. The resu lts showed that the intensity of 51. 6 -keV gam m a-rays was insufficient; however,59. 5-keV gam m a-rays em itted from 2 4 1 Am, whose composition was not listed in the sh ip per's data, was very high. Furth erm ore, 59. 5-keV gam m a- rays w ere detected from a ll types of Pu plates and the intensity was su fficiently high not to have been affected by the irrad iation history of in -co re experim ents.
Radioactive isotopes which em it gamma rays of energies close to 59. 5 keV and with long h a lf-liv es are very few, so that there should be no e r ro r in counting the number of plates by the m easurem ent of 59. 5-keV gam m a-rays except in the case of substitution by an 241Am source. The sub-

IAEA-SM -201/42 569
stLtution could be detected by neutron m easurem ent because 241Am does not em it neutrons. As a resu lt of these considerations, the number of plates was counted on the basis of a m easurem ent of the intensity change of 59. 5-keV gamma ray s.
4 , 2 . C ollim ator detector system
Gamma rays w ere detected by using a collim ator and detector, fixed on the top of the container, and the intensity change of gamma rays was m easured by a rotating birdcage. To count the number of plates in a short tim e, a N al(Tl) sc in tilla to r was adopted fo r high sensitiv ity and ease of maintenance in routine operation.
F o r one-by-one counting of the plate, the co llim ator must have a high geom etrical resolution because of the co arse energy resolution of N al(Tl).It is also n ecessary for the incident gamma rays from the cen tra l part of container, where a gap between plates is sm all compared with the outer side, to be excluded. To m eet this requirem ent, an inclined collim ator was devised. To in crease the intensity of incident gamma ray s, a th re e -s lit co llim ator was designed. The centre line of each co llim ator s lit in tersects
FIG .2 . Collimator detector system of the gam m a-ray technique.

570 NUMAKUNAI et a l.
FIG .3. Difference of energy spectrum of gam m a rays owing to measuring position.
at the top of Pu plate edge. Cadmium plates, 1 mm thick, were inserted between the s lits to keep the incidence of gamma rays from the adjacent Pu p lates.
The sc in tilla to r window was covered by 0. 5-m m -th ick beryllium fo il. To d ecrease the noise signals, three rectangular sc in tilla to rs , whose area covers only the a rea of the collim ator outlet, w ere prepared and embedded in a light 2-in -d iam . pipe. The detector was shielded by a thick iron cylinder. The co llim ator detector system is shown in F ig . 2.
The energy band of the gam m a-rays was selected by a single-channel analy ser. The intensity change of gamma rays was recorded in a multichannel s c a le r .
4. 3. R esu lts of gam m a-ray technique
It may be estim ated that the energy spectrum of the gamma rays m easured at the position where the plate is ju st in line with the collim ator s lit , is d ifferent from that m easured, where the plate is not in line, owing to the scatterin g of incident gamma ray s. The energy spectrum of the Pu

IAEA-SM -201/42 571
plate (2x2x1/16, 92%, UK) m easured at two positions, described above, by N al(Tl) is shown in F ig . 3. The resu lts indicate that the spectrum peak m easured between the Pu plates shifts to a low er region compared with that m easured at the position where the plate is ju st in line with the collim ator s lit . It is c le a r that the energy band of the single-channel analyser is best se t at 59. 5 ~ 64. 5 keV instead of 54. 5 ~ 64. 5 keV for the enlargem ent of the gam m a-ray intensity change.
In routine operation it is preferable to fix the number of channels of s c a le r and the rotating speed per cycle, and repeat the rotation until a c le a r peak is obtained. In tin's m easurem ent the number of channels and the rotating speed were fixed at 300 channels and 60 seconds per cycle.
The intensity change of gamma rays m easured using a th r e e -s lit inclined co llim ator and set at the energy band of a single-channel analyser as described above for Pu plates (2x4x1/16, 92%, UK), (2x2x1/16, 92%, UK) and (2x2x1/16, 92%, -US) are shown in F ig s 4, 5 and 6 . The number of rotations for the plates was six cy cles in F ig s 4 and 5 and one cycle in F ig . 6 , because the intensity of 59. 5-keV gam m a-rays em itted from the Pu plates fo r the form er was the low est.
As can be seen from these F ig u re s , the number of Pu plates contained in the birdcage can be counted by m easuring the intensity change of gamma ray s. The difference of m easurem ent time owing to the difference of gam m a-ray intensity com plicates p ractica l operation as shown in F ig s 4 and 5. On the other hand, the fundamental requirem ent for verification or sh o rt- tim e m easurem ent was satisfied as seen from F ig . 6 .
4 .4 . D iscussion on gam m a-ray technique
The advantage of the gam m a-ray technique for physical inventory verification of Pu plates is to perm it a large m argin of deviations caused by s ta tis tica l fluctuation in the radiation m easurem ent, not affected by change of background level and free from any s ta tis tica l treatm ent for m easured values, because this technique is based on detection whether or not a plate ex is ts . The m easurem ent time fo r one birdcage by gamma- ray technique is sufficiently sh orter than the conventional method.
The gam m a-ray detector is not portable; however, if the in trin sic Ge detector is available in the future, it will be possible to develop a portable instrum ent that can be set on top of the birdcage and which ro tates.
5. TECHNIQUE ON NEUTRON MEASUREMENT
5 .1 . E m ission rate of spontaneous neutron
The Pu plates contain many Pu isotopes, and heavy even-even nuclei, such as 2 3 8 Pu, 240Pu and 2 4 2 Pu, are well known as spontaneous fission nuclei. The neutron em ission rates from various types of Pu plates were calculated using the decay constant by spontaneous fission and the average number of em itted neutrons per fission and are shown in Table III.

Inte
nsi
ty
(cou
nts/
chan
nel,
12
sec.
Channel Number
F IG .4 . Intensity change of gamma rays for plate (2 x 4 x 1 / 1 6 , 92%, UK).

Inte
nsi
ty
(co
un
ts/
ch
an
ne
l,1
2
sec.
C hannel Number
FIG. 5 . Intensity change of gam m a rays for p la te (2 x 2 x 1 /1 6 , 92%, UK).
572 N
UM
AK
UN
AI et al.

IAEA-SM-201/42 573
FIG .6 . Intensity change of gam m a rays for p la t e ( 2 x 2 x l /1 6 , 92%, US).
TABLE III. SPONTANEOUS NEUTRONS OF PLUTONIUM PLATES
T ype o f p la te
Contents o f fissile :T otal em ission rate
(x 103 n/s)238 pu
CS)
240pu
(g>
242 Pu
(g)
2 x 4 x 1 /1 6 (92%) 0 .07 5 .6 0 .1 5 .2
2 x 2 x 1 /1 6 (9 2 % ) 0 .03 2.8 0 .05 2 .6
2 x 2 x 1 /1 6 (8 1 % ) 0 .0 4 7 .4 0 .2 6 .9
2 x 2 x 1 /1 6 (75%) 0 .2 1 9 .2 1 .1 1 0 .5
2 x 1 x 1 /1 6 (8 1 % ) 0 .0 2 3 .7 0 .1 3 .4
2 x 1 x 1 /1 6 (9 2 % ) 0 .0 6 1 .2 4 0 .0 2 1 .2

574 NUMAKUNAI et a l.
FIG. 8. Fuel storage room and working area of FCA; Pu plates are stored in A and B. Point P indicates theposition of the experim ent.

IAEA-SM-201/42 575
5 .2 . D etector sy stem
A wide v ariety of d etec tors m ay be used for fa st neutrons. In this developm ent, B F 3 counters with paraffin m oderators w ere used as therm al neutron d etec to rs, a s reaction en ergy (Q = 2. 8 MeV) of the 10B(n, a) is higher than (Q = 0. 77 MeV) of the He(n, p) reaction . The output pulse depends on Q value of reaction .
In con sideration of the b irdcage structure and sim p le operation of the instrum ent, a d etector sy stem has been designed to fit on the upper su rface of the container. The radius of the paraffin m oderator i s 80 mm and the height is 200 m m . F our BF3 counters w ere placed in the m oderator along the ax is of the cy lind er. One was positioned at the centre a x is , and the others w ere arrayed in a concentric c irc le (radius: 50 mm) with an in terva l of 120°. The paraffin cy lin d rica l block was sea led by a 0. 5 -m m -th ick cadm ium sh eet. The detector sy stem with a carrying grip w eighs about10. 5 kg.
The sen s itiv ity resp on se of the cy lind rica l m oderator d etector sy stem to neutron en ergy w as calcu lated by the six -grou p d iffusion equation (code: W ANDA-6 [1 ]) and under conditions of the perpendicular in cid en ce of neutrons on the ax is of the cy lin d rica l m oderator, and of infinite length. F igu re 7 show s the re la tiv e se n s itiv ity obtained by W ANDA-6 for the case of 8. 5 -cm and 15 -cm paraffin th ick n ess.
5 .3 . R esu lts of neutron technique
5 .3 .1 . Background count-rate
F igu re 8 show s the arrangem ent of the fuel storage . The th ick n ess of the con crete w alls around the storage i s about 50 cm , but sm a ll fraction s of neutrons leak from the w all and the iron d oors. During inventory v er ifica tio n work, the iron doors w ill often be open or c losed , and leaking neutron flux w ill change tim e to tim e . F lu ctuation s of the background cou n t-ra tes caused by changes in the above conditions m ust be le s s than the cou n t-rates of spontaneous neutron from one plate in the b irdcage. The background m easu rem en ts at FCA w ere carried out under conditions where the doors w ere open or c lo sed and by using paraffin sh ie ld s in se v er a l arrangem ents a s follow s:
C ase 1: U se of one thick paraffin sh ield (10 cm thick) against the storage side
C ase 2: U se of a thick paraffin sh ield again st three s id es except opposite the storage side
C ase 3: U se of four thick paraffin sh ie ld s again st a ll s id esC ase 4: U se of four thin paraffin sh ie ld s (5 cm thick) against a ll s id esC ase 5: No paraffin sh ield
Table IV show s the va lu es of background cou n t-rates for the above conditions.
If actual v er ifica tio n a c t iv it ie s could conducted under the sam e conditions as ca se 2 with both d oors open, the fluctuation of the background cou n t-rates could be said to be le s s than 50 cou n ts/m in .

5 7 6 NUMAKUNAI et a l.
TABLE IV. COMPARISON OF BACKGROUND COUNT-RATES
Paraffinshield
C ount-rate (counts/m in)
Door A : closed Door В : closed
Door A : closed Door В: open
Door A: open Door B: closed
Door A: open Door B: open
Case 1 - - 740 ± 35 -
Case 2 420 ± 25 (430) 450 ± 25 (460)
Case 3 - - 390 ± 20 -
C ase 4 630 (680) (730) 780 ± 30
Case 5 1170 ± 50 1350 ± 35 1600 ± 40 1760 ± 70
FIG. 9. Linear re la tion of count-ra te to the number of plates (2 x 4 x 1 /1 6 , 92<7o. UK and US),

IAEA-SM-201/42 577
FIG .10 . Linear relation o f count-rate to the number o f p lates (2 x 2 x 1 /1 6 , 9270, UK).
5 .3 .2 . L inear relation betw een cou n t-rates and the num ber of p lates
The lin ea r relation of cou n t-rates to the num ber of p la tes is the m ost im portant ch a ra c ter istic for ver ify in g Pu am ounts. E xp erim en ts w ere carried out at p osition P in F ig . 7. The m easu rem ents w ere made in 1 min without the use of the paraffin sh ie ld . The r e su lts show a good lin ea r relation betw een cou n t-ra tes and the number of Pu p la tes . F ig u re s 9, 10 and 11 are the r e su lts obtained with the Pu p la tes (2x4x1/16, 92%, UK and US), (2x2x1/16, 92%, UK) and (2x1x1/16, 92%, US), re sp ec tiv e ly .
5. 3. 3. U niform ity in neutron y ie ld of p lates
E xp erim en ts to check the uniform ity in the neutron y ie ld of p la tes in the b irdcage w ere carried out. The standard deviation was le s s than about 2%.
5. 3. 4. U niform ity of d etector se n sitiv ity
S e n s it iv it ie s of the three outer BF3 counters in the m oderator m ust be the sam e to d etect one p late r e g a rd le ss of its p osition in the container.

5 7 8 NUMAKUNAI et a l.
Number o f P la te
FIG .11 . Linear relation o f count-rate to th e number of p lates ( 2 x 1 x 1 /1 6 , 92^0, US).
The m axim um d ifferen ce of e ffic ien cy between the outer three counters was l e s s than 1. 5% at the operation voltage.
5. 3. 5. Angular dependence of se n sitiv ity
P e r cent standard deviation of cou n t-rates to the average cou n t-rates owing to the d ifferen ce of the p osition of the Pu plate in the b irdcage was about 3%, and the m axim um deviation from the average was 5%. .
5 .4 . D isc u ss io n on neutron technique
A s d escrib ed in sectio n 5. 3, se v e r a l factors are involved in the fluctuation of the cou n t-ra tes . The follow ing in vestigation s w ere made under conditions w here the instrum ent was sh ielded by three th ick paraffin sh ie ld s (case 2 in T able IV).
(a) The m axim um d ifferen ce in le v e l of background cou n t-rates m ust be le s s than 50 cou n ts/m in
(b) The standard deviation of background of the instrum ent was found to be about 2 5 cou n ts/m in (ergG)

IAEA-SM-201/42 579
(c) The standard deviation .of cou n t-ra tes due to the non-uniform ity of d etector se n s itiv ity was about 3% of the average value (crdet)
(d) The standard deviation of fluctuation of neutrons em itted from a plate w as obtained exp erim en ta lly at about 2% (npi ) .
If the follow ing re la tion would e x is t between the cou n t-ra tes p er plate and fluctuations caused by many fa cto rs, an evaluation of the true number of p la tes in the b irdcage m ight be gained by m easu rin g the neutron cou n t-rates,
Ns S 2 I Nd + Nst I (1)
w here Ns is the cou n t-rates for one p late in the b irdcage, Nd the non- s ta tis t ic a l change of cou n t-rates caused by opening or c lo sin g the iro n -d o o rs, and Nst the s ta tis t ic a l fluctuation of cou n t-rates gained by the follow ing equation:
N sc 3-/Ö IBG+ <72
dec + a 2Pi (2)
Table V g ives the calcu lated r e su lts on the above re la tion s fo r various types of Pu p la tes and show s that a ll types are con sisten t with the relation (1) excep t for p la tes (2x1x1/16 , 92%, US). If the change of condition for iron doors does not occur in ver ifica tion , the sta tis tic a l fluctuation of cou n t-rates on the plate (2x1x1/16 , 92%, US) is sligh tly le s s than the cou n t-rates per plate of the other types.
TABLE V. STATISTICAL FLUCTUATIONS OF BACKGROUND COUNT-RA.TE
T ype o f p late Ns(cou n ts/m in )
Nd(counts/m in)
Nst(counts/m in)
2 | N d + Nst 1 (counts/m in)
2 x 4 x 1 /1 6 (9 2 % ) г о о ~ 50 ~ 107 ~ 314
2 x 2 x 1 /1 6 (9 2 % ) 300 82 264
2 x 2 x 1 /1 6 (81%) 800 115 330
2 x 2 x 1 /1 6 (7 5 % ) 1400 169 439
2 x 1 x 1 / 1 6 (92%) 160 77 254
2 x 1 x 1 /1 6 (81%) 400 ” 87 274
6. CONCLUSION
Two nondestructive a n a ly sis techniques w ere developed for the physica l inventory v er ifica tion of Pu p la tes contained in the b ird cage. One of them is the gam m a-ray technique, that is , the num ber of p la tes was counted one by one from the in ten sity change of 59. 5-keV gam m a-rays using a th r e e -s l it inclined co llim ator , N al(T l) d etector , s in g le-ch an n el an a lyser , m u ltichannel sc a le r and rotating d ev ice . The th r e e -s l it inclined co llim ator was used to in c r e a se the in ten sity of incident gam m a-rays and to r e a lis e a high geom etr ica l reso lu tion . The en ergy band of gam m a rays w as se lec te d by a sin g le -ch a n n e l an a lyser at 59. 5 ~ 64. 5 keV to am plify the in tensity change.

580 NUMAKUNAI et a l.
The m easu rem ent tim e for one b irdcage is 60 s at the m inim um and 360 s at the m axim um , and v ery sh ort com pared with conventional m ethods.
The second i s the neutron technique, which co n sis ts of four BF3 counters, cy lin d rica l paraffin m oderator, am p lifier and sc a le r . The fluctuation of background cou n t-ra tes, uniform ity of d etector se n sitiv ity and neutron y ie ld w ere exam ined. The relation between the cou n t-rates p er plate and the fluctuations caused by many fa cto rs w ere analysed s ta tis tic a lly . A s a resu lt of th ese an a lyses , it can be said that the num ber of p la tes contained in the b ird cage can be obtained by the neutron technique according to the calibration data which was obtained in advance for each type of Pu p late.
Each of these two m ethods, when em ployed alone, cannot d etect whether the Pu p la tes w ere substituted by another gam m a-ray or neutron sou rce. T h erefore , adequate use of both m ethods would identify the p hysica l inventory v er ifica tion and v er ify it in term s of the num ber of Pu p la tes and their id en tification .
R E F E R E N C E
[1 ] RYUFUKU, H ., TATSUTA, H . , SHIROTANI, T . , Japan. J. Appl. Phys. 5 (1966) 1039.

IAEA-SM-201/50
SAFEGUARDS SYSTEM FOR THE LMFBR PROTOTYPE POWER PLANT SNR-300 (KKW KALKAR)
Chr. BRUCKNERKernforschungszentrum Karlsruhe
P. VAN DER HULST Schnell - Brüter-Kernkraftwerks -
gesellschaft mbH, Essen
H. KRINNINGER Internationale Natrium-
Brutreaktor-Bau GmbH, Bensberg,Federal Republic of Germany
Abstract
SAFEGUARDS SYSTEM FOR THE LMFBR PROTOTYPE POWER PLANT SNR-300 (KKW KALKAR).Requirements for the design o f the safeguards system are defined for sp ecific characteristics o f the
fu el-h an dlin g system o f this sod iu m -coo led power p lant, taking in to consideration the strategic value of the specia l nuclear m aterial (SNM) present under several physical forms and conditions in the plant. The sa feguards system proposed confines a ll safeguards measures to the fuel-handling area within the reactor building and fu lly benefits from the double "containment" ava ilab le on s ite , nam ely the containm ent stem m ing from fu el-h an dlin g requirements under sodium or inert gas and from the fu lly enclosed and non-dism ountable design o f the core and blanket assem blies. The control o f the flow o f fissile m aterials throughout the plant, and o f the physical inventory can h en ce be conven iently based upon the accountab ility o f the assem blies containing SNM. This can be realized by a fo llow -u p o f the handling operations performed with fresh core assem blies and with spent core and blanket assem blies.
INTRODUCTION
The follow ing safeguards m ea su res are envisaged:
(1) Identification of fre sh fu e l a sse m b lie s by m eans of tem porary " ta m p er-resista n t unique identity devices" (TUIDs);
(2) Sealing of the occupied p ositions in the new fuel store;(3) A sp e c ia l instrum entation on the e x - v e s s e l Handling M achines
(activ ity m easurem ent sy stem , position sen sin g sy stem , data record ing system );
(4) A cam era su rv e illa n ce sy stem for the fuel-handling area.
The tem porary TUIDs attached to the fr e sh core a sse m b lie s w ill be rem oved on s ite by the safeguards authority in sp ector , and th ese a sse m b lie s m ay be id en tified by checking the TUID fin ger-p rin t.
581

582 BRUCKNER et al.
To avoid additional handling operations on fre sh core a sse m b lie s and to reduce the in spection effort, the p ositions occupied by the a sse m b lie s in the new fu e l store w ill be sea led by the in sp ector. Thus, the inventory check of the New F uel Store is rep laced by a sim p le control of the identity and in tegrity of th ese se a ls .
Once in the sod iu m /in ert gas environm ent the su rveillan ce of a sse m b lie s containing SNM is taken over by instrum entation on the e x - v e s s e l handling m achines. This instrum entation is capable of d ifferentiating betw een fresh and spent core and blanket a sse m b lie s and is able to detect the location, date and tim e of handling operations. Thus, it en ab les the lo c a l and in tegra l a ssem b ly inventory and inventory changes to be controlled . In fact, th is instrum entation enables a d iversion of SNM from the sod iu m /in ert gas area to be d iscovered by m eans of operational handling equipment.
The aim of the additionally in sta lled cam era sy stem is the su rveillan ce of the handling area to detect d iversion s by use of unusual handling equipment. The com bination of th ese four safeguards m ea su res r e su lts in an efficien t and com plete su rve illan ce of the SNM at the SN R -300 LMFBR power plant.
1. BASIC REQUIREMENTS
The developm ent of the safeguards sy stem s is based on four fundam ental conditions. The f ir s t condition is the fulfilm ent of the requ irem en ts of the V erifica tion A greem ent, nam ely to enable the tim e ly detection by the Safeguarding A uthority of the d iversion of a sign ificant quantity of nuclear m ateria l, and to introduce the m eans of ea r ly detection , thus deterring such a d iversion (para. 28), at the sam e tim e ensuring as a p rereq u isite an optim um effic ien cy and cost e ffec tiv e n e ss by the u se of the m ost advanced instru m ents and techniques availab le (para. 7).
Secondly, the safeguards concept w ill m eet the requ irem ent that
O bjective and im m ediate statem ents concerning the r e su lts of sa fe guards are p ossib leAn unjustified accusation against the plant operator is excluded;The operator w ill not be ham pered in plant operation.
The third condition is that, in order to sim p lify the safeguards m ea su res , fu ll benefit be taken of the ch a ra c ter is tic s of the reactor and the d esign of it s com ponents, p articu larly with resp ec t to core and blanket a sse m b lie s and the handling fea tu res of the SNM. F in a lly it is required that only su ffic ien tly tested instru m ents be used.
2. CHARACTERISTICS OF CORE AND BLANKET ASSEMBLIES AND OF THE FUEL-HANDLING SYSTEM
2.1. F uel a sse m b lie s
An im portant feature of a LMFBR is the ex isten ce of fre sh core a sse m b lie s each containing se v e r a l k ilogram s of plutonium. Seen from

IAEA-SM-201/60 583
TABLE I. CLASSIFICATION SET FOR NUCLEAR MATERIAL AVAILABLE ON SITE
Assembly type EnvironmentTemperature
CC)
Decayheat(kW)
Surfacedose-rate
Unirradiated core assem blies
Air 25 - ~ 3 0m rem /h
Sodium 2 0 0 -2 5 0 - - 3 0m rem /h
Irradiated core and blanket assem blies
Argon > 450 < 1.5 > 1 0 6 R/h
Sodium 200 -2 5 0 < 12 > 1 0 6 R/h
a safegu ard s point of view the follow ing c la ss if ic a tio n can be se t for the nuclear m ateria l availab le on site:
(a) The p rev iou sly m entioned fre sh core a sse m b lie s with se v e r a l k ilo gram s of plutonium
(b) Irradiated core a sse m b lie s containing se v e r a l k ilogram s of plutonium as they cannot e a s ily be handled owing to th e ir high activ ity
(c) Irradiated blanket a sse m b lie s containing only le s s e r am ounts of plutonium as they cannot be e a s ily handled b ecau se of th e ir activ ity .
This c la ss if ic a tio n is lis te d in m ore detail in Table I.In a ll presen t d esigns the typ ica l p rop erties of fast b reed er reactor
c o r es (com pact fuel region , large ax ia l and rad ia l flux and power grad ients, high lin ear rating) lead to a "closed" core a sse m b ly concept. Hence the head and foot fitted to the wrapper tube form a b a rr ier for a c c e s s to the nuclear m ateria l. In th is context it should be m entioned that the SNR core a sse m b lie s cannot be taken apart on s ite .
2.2 . Fuel-handling system
A ll handling operations on a sse m b lie s ( i .e . , core , blanket, absorber, diluent and re flec to r a sse m b lie s) w ill only occur in the handling area.
T his handling area is a w ell-d efin ed area in sid e the reactor building. With the exception of rece ip t and shipm ent a ll a s se m b lie s rem ain in th is area during th e ir stay in the nuclear power plant. O utside the handling area only shipping ca sk s, not individual a sse m b lie s , w ill be handled. This procedure i s valid without any exception for the core and blanket assem b lies Only th ese a sse m b lie s w ill be con sid ered from now on, s in ce only they are subject to safegu ard s m ea su res.
A fter a rr iv a l the fre sh core a sse m b lie s w ill be stored in the New F uel Store in c lo sed buckets under air atm osphere.
The transportation of a sse m b lie s between the reactor v e s s e l and the fuel-handling sta tion s occu rs by m eans of a sh ielded and g as-tigh t flask ( e x - v e s s e l Handling M achine I) which is it s e lf transported by m eans of a Coordinate D rive Machine.

584 BRUCKNER e t al.
The operations in sid e the reactor v e s s e l are carr ied out by m eans of a tr ip le rotating sh ield plug sy stem and an in -v e s s e l Handling Machine.
A ll fuel-handling stations arranged below the operating floor are kept under an argon atm osphere when they contain rad ioactive and sod ium -w etted m a ter ia ls , and they are provided with locks c lo sed by g as-tigh t radiation- sh ield ed b locks.
A fter decay and Na w ashing, the core a sse m b lie s and, in the case of a com plete rea cto r unloading, a lso blanket a sse m b lie s , w ill be tem p orarily stored in the g a s-c o o le d store which is cooled by forced argon circulation .
Should the a sse m b lie s be N a-w ashed b efore shipm ent they w ill be tra n sferred from the sod iu m -coo led store into the g a s-co o le d sto re , p assin g through the washing ce ll. To avoid sodium contam ination after washing they w ill be m oved from the w ashing c e ll to the g a s-co o le d store by m eans of a secon d e x - v e s s e l Handling M achine (EXHM II) on the Coordinate D rive M achine.
3. THE SAFEGUARDS SYSTEM
A ll safegu ard s m ea su res are focu sed only on that area of the plant where the handling of core and blanket a sse m b lie s is carr ied out, nam ely the handling area w ithin the reactor building. The p rev iou sly d escrib ed core and blanket a sse m b lie s ch a ra c ter is tic s and the fea tu res of the fu e lhandling sy stem of the plant, together with the safegu ard s m ea su res, form the b a s is for the safeguards sy stem .
3.1. Safeguards m easu res
The fo llow ing safeguards m ea su res are applied:
F resh core a sse m b lie s are tem p orarily m arked with TUIDs attached on the a sse m b ly head by an in sp ector at the fu e l factory.
Storage p osition s in the new fuel store occupied by fre sh core a ssem b lie are sea led .
The e x - v e s s e l Handling M achines I and II (EXHM I and II) are equipped with in stru m en ts, allow ing (i) a ta m p er -r es is ta n t qualitative d istinction betw een fr e sh core a sse m b lie s , irrad ia ted core and blanket a sse m b lie s , and for other a sse m b lie s (re fle c to r , ab sorb er and diluent a sse m b lie s) which are a lso handled by th ese m achines u sing the detection of the ch a ra c ter istic radiation em itted (activ ity m easu rem ent on the handling fla sk s) by those a sse m b lie s containing SNM; (ii) a ta m p er -r es is ta n t lo ca tio n /tim e su r ve illa n ce of the EXHM I and II operations with fre sh core and burnt-up core and blanket a sse m b lie s; and (iii) a ta m p er -r es is ta n t recording of the data generated by the instrum entation d escrib ed above.
The handling area i s under su rve illan ce by a cam era sy stem to detect any d iversion of a sse m b lie s containing SNM by m eans of unusual handling equipm ent.

IAEA-SM-201/5O 585
3.2. D escrip tion of the safeguards sy stem
The design of the fuel-handling sy stem (para. 2) defines, together with the evaluation of the stra teg ic value of the different types of a sse m b lie s on site (sta te of the fuel and a ssem b ly environm ent), are fundam entals for the design of the safeguards system .
F or safegu ard s purposes the handling area is sp lit up into two different handling and storage area s ch aracterized by the a ssem b ly environm ent, n am ely a ir atm osphere and sodium or inert gas atm osphere. In the area under a ir atm osphere the safeguarding is perform ed by m eans of tem porary TUIDs and the s e a ls attached to the new fuel s to re , hence im plying a reg istra tio n of individual core a sse m b lie s . In the area under sodium or argon atm osphere the safeguarding is based on a reg istra tio n of the tra n sfers of a sse m b lie s , supplem ented by cam era su rve illan ce . The d ifferentiation betw een fre sh core a sse m b lie s , spent core a sse m b lie s and spent blanket a sse m b lie s is p erform ed by m eans of sp ec ia l instrum entation on the handling fla sk s.
3.2.1. Safeguarding of unirradiated core a sse m b lie s handled in air
The TUID is attached tem p orarily to the core a sse m b ly head during the fin a l quality control procedure ca rr ied out at the fabrication plant. The safeguarding authority r e g is te r s the TUID fin ger-p rin t in the p resen ce of the core a ssem b ly supplier. At the sam e tim e the T U ID -assem b ly re feren ce table i s estab lish ed by the authority. One copy of th is re feren ce table is m ade availab le to the rea cto r operator.
The attachm ent of a TUID to core a sse m b lie s is an efficien t m eans of reducing the in spection effort during shipm ent or rece ip t in spection of core a sse m b lie s . Thus, a perm anent in sp ector on s ite during d elivery periods of core a sse m b lie s can be avoided. The inventory-taking at the new fu e l store at su itably chosen tim e in terva ls is then suffic ien t to su rvey the shipping and storage of core a sse m b lie s . During inventory-tak ing the TUID is rem oved without additional handling of the core a sse m b lie s , its fin ger-p r in t is record ed and com pared with the sou rce record contained in the TUID a ssem b ly re feren ce table. T h ereafter, the occupied storage p osition s w ill be sea led by the safeguards in sp ector. T his procedure redu ces the in sp ecto r 's effort for the subsequent inventory checks of the new fuel sto re . With p rior notice to the Safeguards Authority th ese se a ls can be broken by the operator (in the ca se of tran sfer of c o r e -a s se m b lie s from new fuel store to sod iu m -coo led store). In such a case the tra n sfe rs w ill be recorded by the instrum entation on the e x - v e s s e l Handling M achine I (se e 3.2.2). M oreover, it is guaranteed that, with sim p le tech n ica l equipment (TUID, s e a ls on New F uel Store), those a sse m b lie s with the highest d iversion potential could be identified and loca lized . A su itable in spection stra tegy (inspection frequency) of the new fu e l store guarantees the safe and t im e ly detection of the d iversion of unirradiated core a sse m b lie s .
3 .2 .2 . Safeguarding sod ium -w etted core and blanket a sse m b lie s
On an average, betw een d eliv ery and shipm ent to the rep ro cess in g plant, the core and blanket a sse m b lie s rem ain about th ree to four y ea rs on site . During th is period m ost of the tim e the a sse m b lie s rem ain under sodium ,

586 BRUCKNER e t al.
w here they are in a cc ess ib le to d irect safeguards m ea su res such as id entification and counting for inventory-taking. The geom etr ic arrangem ent of handling location s in the handling area and the ch a ra c ter istic radiation em itted by those a sse m b lie s containing sp ec ia l nuclear m ateria l ju stif ie s the settin g up of an instrum ented safeguards sy stem con sistin g of:
An activ ity m easurem ent sy stem for qualitative d istinction between fre sh core and spent core and spent blanket a sse m b lie s Instrum entation for the data acquisition and record ing of fuel-handling operations with the e x -v e s s e l Handling M achine I by m eans of the detection and su rveillan ce of location and tim e.
The data produced by th is instrum entation are only recorded if a sse m b lie s containing sp ec ia l nuclear m ateria l are handled.
F or the id en tification of those handling operations which have to be recorded the activ ity m easurem ent sy stem is a lso used.
The instrum entation should be set up in a se lf-su rv e y in g mode. Faults on the instrum entation have to be recorded , together with the date and location of the occu rren ce.
T a m p er-resista n t contacts (position sen sin g system ) sign a ls to the data acq uisition sy stem the location of e x - v e s s e l Handling Machine I.
A fter the e x - v e s s e l Handling Machine I rea ch es a certa in location the relevant contact activa tes the control mode of the data acquisition system and the relevant data rep resen tin g the loca tion s, date and tim e are stored.At the sam e tim e the count-rate detected by the .activ ity m easurem ent sy stem is checked. Should the count-rate exceed the sum of the background and the te st sign a l count-rate by a predeterm ined factor, then the counters of the activ ity m easu rem ent system are r e se t and counting starts.
A fter a rr iv a l at another handling location a ll n e c e ssa r y data are recorded by the d ata-record in g system .
B ased upon th ese data an inventory-taking sp lit into a ssem b ly ca tegories can be estab lish ed p eriod ica lly and u sed to check the op erator 's record s and rep orts. By such com parisons the d iversion of a sse m b lie s in a cc ess ib le to d irect safeguards m ea su res by m eans of operational handling equipment w ill be detected.
The cam era sy stem su rveys the area adjacent to the sod ium -cooled store in ord er to d iscover d iversion s from th is store and the surrounding handling location s by m eans of unusual handling equipm ent. Since those actions are v er y tim e-con su m in g a low record ing frequency se e m s to be sufficient.
3 .2 .3 . Safeguarding of irrad iated core and blanket a sse m b lie s handled in inert gas atm osphere
The washing c e ll is the in terface betw een the "sodium environment" and the in ert gas atm osphere. Each a ssem b ly leav in g the sodium region has to p ass through th is c e ll. The inert gas atm osphere region co v ers w ashing c e ll, observation c e ll, g a s-co o le d store and shipping cask load and unload station. Handling operations in th is region are ex c lu siv e ly carried out with the e x - v e s s e l Handling M achine II. It is fo re see n that the sam e equipm ent as d escrib ed in para. 3.2.2 w ill su rvey the handling operations with the e x - v e s s e l Handling Machine II.

IAEA-SM-201/50 587
Since the instrum entation for loca liz in g the p o ssib le p ositions of e x - v e s s e l Handling M achine I can a lso be used to lo c a liz e operations of e x - v e s s e l Handling M achine II, only an additional activ ity m easurem ent sy stem has to be in sta lled . Applying the sam e procedure as d escrib ed in para. 3 .2 .2 , the safeguarding authority can, from the data recorded , derive the inventory of the g a s-co o le d sto re . C ross-ch eck in g with the op erator's data again en ab les the authority to detect a d iversion of a sse m b lie s from th is reg ion by m eans of operational handling equipm ent.
The cam era sy stem su rveys the area adjacent to the g a s-co o le d store so as to d isco v er d iversion s by m eans of unusual handling equipm ent.


IA EA -SM -201/61
NON-DESTRUCTIVE MEASUREMENT OF PLUTONIUM AND URANIUM IN PROCESS WASTES AND RESIDUES
B.J. MCDONALD, G.H. FOX BNFL, Windscale
W.B. BREMNER UKAEA, Dounreay,United Kingdom
Abstract
NON-DESTRUCTIVE MEASUREMENT OF PLUTONIUM AND URANIUM IN PROCESS WASTES AND RESIDUES.Routine m ethods used for m easurem ent o f the plutonium and uranium content o f wastes and residues
ate described. In the case o f com bustible w aste an autom ated monitor measuring the plutonium input to an incinerator, and exercising cr itica lity control over the p lant, is discussed. Methods used for plutonium and uranium measurem ent o f large and sm all volum es o f waste include gam m a spectrometry and neutron interrogation. Process residues, m ostly as fuel cladding (hulls) are an important item in plant accountancy and process control. Routinely used techniques are described for determ ination o f 235U in fast reactor fuel hulls and o f residual fuel in therm al oxide fuel hulls. Plant exp er ien ce , precision , accuracy, and possible errors are discussed. The use o f an isotherm al calorim eter for cr itica lity and plant accountancy on process slags is discussed.
1. COMBUSTIBLE PROCESS WASTES
Combustible process waste may be divided into two categories; waste containing economically recoverable quantities of fissile material, waste containing small amounts of fissile material not economically recoverable. Waste in both categories must be monitored for accountancy and criticality purposes, but the methods employed may be influenced by the categorisation of the waste.
1.1 Waste Incinerator Input Monitor
A plutonium waste burning incinerator is in operation at BNFL Windscale and an automated input monitor is in use in this plant for criticality and plant throughput control. Paper, rubber, polythene and PTC waste containing recoverable amounts of plutonium is fed to the furnace via the monitor in packets weighing about 1 kg and measuring 15 cm diameter by 23 cm long. A block diagram of the input monitor is shown in Fig 1. The monitoring operation is under the control of an Olivetti 101 Programms and a logic interface. The sequence is controlled by status signals from a pneumatic ram which moves the packets into and out of the monitor, and allows the program in the Olivetti 101 to proceed through its various stages. The Olivetti program calculates the weight of plutonium in each packet and adds this weight to the total weight fed since plant start-up. The new total weight is then tested against a preset criticality weight limit, and only if the total is less than the limit can the packet be fed through to the furnace by the ram, and the next packet moved into the monitoring position. If the total weight is greater than the limit
589

5 9 0 McDo n a l d e t ai.
FIG .l. Incinerator plant input monitor.
the ram is inhibited and audible and visual alarms are actuated. No further packets can be fed through the monitor until the system is reset using the correct code input to the Olivetti 101 via its keyboard.
The operating sequence is as follows. A 'call ram' button is pressed by the operator causing the ram to move from position 2 to position 3 and then return to position 1 (see Pig l). There is a 15-second wait at position 1 to allow the operator to place a packet of waste in front of the ram, to be transferred to the monitoring position as the ram returns to position 2. The packet lies on rollers at the monitoring position and these are set in motion by the arrival of the ram at position 2, together with a timer for a 5-minute counting period close to a 7.5 x 7-5 °m Nal(Tl) stabilised detector p.}. The plutonium content is measured by means of the 380-keV group of gamma emissions using a channel from 355-405 keV. The scaler reads out into the Olivetti 101 and the program calculates the weight of plutonium, adds it to the previous total and tests the new total as noted above. If the new total is less than the limit the Olivetti 101 prints out the weight of plutonium in the packet, the total weight since startup and the total number of packets since start-up. The 'call ram' button can now be pressed causing the ram to go first to position 3» so feeding the packet out of the monitor into the furnace, and then return to position 1 to receive the next packet. Automatic background and standardisation routines are incorporated in the operating sequence and provision is made to correct for fission-product interference in the energy channel. Every hour a background is taken to update the background used to give the nett count from each packet. Every eight hours a small plutonium source is exposed to the detector and a weight of plutonium is calculated by the normal program.This weight is tested against upper and lower limits contained in the program and if it falls outside the limits an error routine prevents

IAEA-SM -201/61 591
use of the monitor until a correct standardisation is achieved. In any fault condition the monitor can he switched from automatic to manual operation to enable diagnostic.and repair action to he taken.The ram and roller mechanism are enclosed in a glovehox, and the detector in its castle and the roller-drive motor are outside the glovehox.
The relatively small size of the waste packets enables accurate measurements of plutonium content to he made. To reduce variations in sensitivity from different positions in the packet, whilst still maintaining high sensitivity, the detector-to-packet distance is kept small at about 20 cm, and a variable thickness absorber is placed in front of the detector. The shape of the absorber was calculated to equalise radial and longitudinal sensitivity and a first version was made from lead and aluminium. A series of measurements in-situ using small plutonium sources in packets of waste enabled the absorber dimensions to be optimised, so that the variation in sensitivity over the volume of the packet was just less than 4%. The sensitivity was measured as 20,000 counts per 5 minutes per gram of plutonium. The monitor was calibrated from 0-10 grams of plutonium per packet using plutonium standard solutions dispersed on Vermiculite as a stable light element matrix. The calibration was slightly curved above about 5 grams and a least-squares analysis gave good fits to first- and second- order polynomials. In order to conserve space in the-01ivetti 101 program the first order fit was used. The accuracy of the monitor is better than 5% and its precision (Зз limits) is 0.6% at 5 gram, 1.4% at 1 gram and 4.2% at 0.1 gram.
Over the past three years many thousands of packets have been monitored and the system has functioned efficiently as a criticality control and, together with a measurement of the plutonium content of the product ash, as an accountancy instrument. Over several incinerator campaigns the input-output figures have agreed to better than 10% but as yet no comparison between chemical recovery figures and input figures is available. Maintenance effort has been required on the roller system and its drive, on the mechanical parts of the Olivetti 101, and on the piston of the ram. The waste" incinerator operates on a campaign basis and this has enabled servicing to be carried out without interfering with plant operation.
1.2 Large Drum Monitor
A large proportion of the combustible waste generated at a reprocessing site contains very little fissile material. At ВИТЬ Windscale this waste is held in 210-litre drums (55 US gallons). A monitor to measure the plutonium content of these large drums has been in use for several years PT- The instrument uses two 2.5 x 5-75 cm Ual(Tl) detectors to measure the 380-keV gamma emissions as the drum is rotated for a 5-minute counting period. A digital display gives a direct read-out of plutonium content, after automatic background subtraction. The sensitivity variation over the volume of the drum is reduced to 15% using lead absorbers and the counting precision for a 5-minute count is ±- 6% (2з limits) for 2 grams of plutonium in the drum. The working limit of detection in a normal background is about 200 mg with a precision of A 50% (2з limits). This monitor was designed to be moved from buidling to building and the detector shielding is therefore not as extensive as in a permanent installation. The detectors see a large volume of waste and this also makes the system sensitive to high local backgrounds. In a low background situation the monitor will detect 50 mg of plutonium in a drum with a precision of A 60% (2C limit) in a 30-minute counting period.

592 McDo n a l d e t ai.
The monitor i s calibrated from 0-20 grams using standard plutonium so lu tion s dispersed on verm icu lite. Absorption e f fe c ts cause non lin e a r ity above 20 grams plutonium content and inaccurate re su lts are in ev ita b le; i f accurate r e su lts are required high content drums should be repacked. I t i s e s se n tia l to check the se tt in g o f the single-channel analyser d a ily to ensure that the plutonium spectrum from each detector i s properly located in the energy channel from 555 keV to 405 keV. A small sealed plutonium source i s provided for th is purpose.
1.3 Small Drum Monitor
Pibreboard drums 40 cm diameter by 60 cm long containing waste contaminated with uranium-235 are monitored at DERE using a single 5 cm x 5 cm Hal(Tl) detector scanning along the length of the horizontally rotating drum £3J. As long as the surface dose-rate from any fission- product activity in the waste is less than 10 mE/hr satisfactory results are obtained using a 50-KeV channel on the 185-KeV gamma emission from uranium-235« The detection limit is 0.025g and a precision of + ICP/o (2a) is obtained at the 5-g level. The stability is checked using a standard drum. Drums containing more than lg of 235u are returned to the plant for recovery and those containing less than lg are either incinerated or stored.
1 .4 Califomium-252 Source Interrogation Monitor
A califomium-252 spontaneous fission source, giving a total neutron output of 1 x 10' fast neutrons per second,is in routine use at DEBE for measurement of the uranium-235 content of bags of soft waste having surface gamma dose-rates up to 750 mE/hr. The 252cf source is contained in a well-shielded castle, from which it is transferred pneumatically to the irradiation position at the mid-point of the side of the sample chamber. The sample chamber has a volume of 3 litres and is surrounded by 12 cm depth of oil. The oil provides moderation for both the interrogating neutron flux and the delayed neutrons, which are counted by a ring of 8 BP, detectors in paraffin wax moderators immersed in the oil. A 2-minute irradiation by the 252gf source is followed, after returning the source to its castle, by a 30-second count of delayed neutrons. The bag of waste is then turned through 180° and the irradiation and counting repeated. Before removing the waste bag a background count is taken so that the delayed neutron count can be corrected. The monitor is calibrated from 2-20 grams using known weights of 235u dispersed in soft waste. The sensitivity varies over the volume of the sample chamber by a factor of 2.8, but this is reduced in practice by the rotation of the waste bag referred to. The detection limit is 2g of uranium-235-
2. PHOCESS BESIDUES
Monitoring systems are in routine use for measurement of the fissile material content of fuel cladding (hulls) remaining after reprocessing of fast reactor fuel at DEEE and for measurement of fuel remaining with hulls after reprocessing of thermal reactor oxide fuel at BHPL Windscale. The different techniques used reflect the difference in the type of fuel reprocessed (highly enriched uranium-235 fast reactor fuel and low enrichment oxide fuel) and the greatly different scale of the two reprocessing plants.It is necessary to account for losses of uranium-235 and oxide fuel in the two reprocessing cycles, and in addition the oxide fuel hull monitor is used as a process control instrument.

IAEA-SM-201/61 593
2.1 A Hull Monitor for Thermal Oxide Fuel Reprocessing
The oxide fuel reprocessing plant at BHFL Windscale reprocesses low enrichment fuel from advanced gas-cooled, pressurised-water and hoiling-water reactors. The fuel assemblies are sheared without dismantling into a 38-cm-diameter dissolver basket and the fuel is dissolved in nitric acid. The normal batch size is 350 kg of fuel, with which is associated approximately 100 kg of stainless steel or 140 kg of Zircaloy-2. The activation product activity of a batch of hulls is about 104 curies. A small fraction of the fuel remains undissolved in the hulls and it is important to ensure that this fraction is acceptably small, so that the hulls may be disposed of. As an item in the overall plant accountancy it is necessary to know the weight of fuel lost with the hulls. The hull monitor has been in use since 1969 in all the reprocessing campaigns on the plant and has proved its value as a process control instrument [4]. A detailed feasibility study of available techniques showed that for large-scale reprocessing a gamma spectrometric technique, using the 2.18 MeV photopeak of 144Pr, was most suitable. Active and passive neutron methods were rejected for this application because of severe practical difficulties in making measurements on the large-diameter dissolver basket, and the problems involved in calibration for many different types of fuel.
Fig. 2 shows the arrangement of the monitor, which is located in the west dissolver cell of the oxide fuel plant beneath the shear cave.The 38-cm-diameter dissolver basket, containing a depth of about 150 cm of hulls weighing about 100 kg, is lowered by crane from the shear cave into the re-entrant cylinder. The filled height of the basket is monitored in 15-cm-high sections by two 7-5 x 7.5 cm Hal(Tl) detectors located at 255 cm from the basket centre, at the ends of collimators defining the 15-cm-high section. As will be seen the detectors are well shielded by the collimators, by lead on the north wall, and by the

594 MCDONALD et al.
south wall. The shielding provides an attenuation in excess of 10Ö for 1-MeY gamma radiation from any point in the re-entrant cylinder. The ends of the collimators are closed hy a 10-cm thickness of lead absorber, and a further 10-cm thickness of lead can be placed on the detector carriages in front of the detectors. The south detector is in a lead castle on the outside of the south wall. It can easily be moved aside to allow use of a Ge(Li) detector for investigational work. The north detector, located 22 cm from the inside face of the north wall, runs on a track and is easily accessible. Each detector has a separate head amplifier and БИТ unit, these feed a common main amplifier through a passive network. The amplifier output is fed either to a single-channel analyser, scaler and timer or to a multichannel analyser In routine use the 2.18-MeY photo-peak is measured using an energy channel from 2.0-2.4 MeV.A detailed discussion of the design is given in reference [4j. It is essential to use a large dissolver basket to detector distance to reduce the variation in radial sensitivity across the dissolver basket. The longitudinal variation in sensitivity is also very small if only a 15 cm height is monitored at a distance of 255 cm. The lead absorbers in the collimator apertures and in front of the detectors have a two-fold purpose. They are essential in order to reduce the total count-rate in the detectors to 1-2 x 10⁴ counts per second, and so avoid significant gamma pile-up into the 2.18-MeV photopeak. In addition,the high-intensity lower-energy activation product gamma radiation (mostly from °®Со, 58cb and 54Mn for steel hulls, and 95 Zr/ Nb and 60co for Zircaloy) is much more effectively absorbed than the low-intensity high-energy 144pr radiation. A ratio of at least 4s1 in favour of 144pr radiation is estimated.
A batch of hulls is monitored by first lowering the dissolver basket fully into the re-entrant cylinder and washing with water. The basket is then raised in 15-cm increments, using scale marks on the basket, measuring the counts in the 2.18-MeY photopeak for 2 minutes at each increment. The total count from the batch is then corrected for background using a figure for the particular basket (all baskets are numbered). The total disintegration rate of l44Pr is calculated by dividing by the counting efficiency (determined in-situ during plant commissioning), and the weight of fuel found from the relationship,
Total Disintegration rate of 144pr „ „ „ ,——:—7------ 77--------- г— 1 --------- :— — Grams o f fu e l.Disintegration rate of '44Pr per gram of uraniumThe disintegration rate of 144pr per gram of uranium is found by analysis of a routinely taken sample of the dissolver solution, and lies between 10"*0 and 10"^ dpm per gram. The process operator can now decide whether to dispose of the batch of hulls or releach. In practice the disposal decision may be taken on the nett total count for batches of similar fuel. The time taken is 25-30 minutes and no difficulties have occurred in operation of the monitor by process labour. Technical supervision is maintained for stability checks made two or three times weekly, and also to maintain the limit on total count-rate for different fuels by increasing or decreasing the detector carriage lead absorber thickness (with consequent changes in the counting efficiency). The average sensitivity is approximately 2 x 10⁴ counts per kilogram of fuel and it is possible to detect about 200 grams of fuel in the hulls, i.e. about0.01% of the original fuel weight.
The counting precision has been measured as + 4% (23 )for approximately 1 kg of fuel in the batch of hulls. In addition, a figure of - 14%

IAEA-SM-201/61 595
(2з) was obtained by repeatedly retipping and remonitoring a batch of hulls. The latter figure is a measure of the radial sensitivity variation, and compares with a value of ± 6.3% derived during in-situ calibration of the monitor. There are several additional possible sources of error whose importance is difficult to predict C4J. In brief, these are self-absorption of 144Pr radiation in fuel and in assembly end pieces giving negative errors, fission-product recoil into the hulls during irradiation giving positive errors and longitudinal rating variations along fuel assemblies giving either positive or negative errors. Several attempts have been made to measure accuracy during reprocessing using a successive leaching and monitoring method. Comparison of hull monitor figures with chemical analyses for uranium leached out agree to better than 20%.
2.2 A Monitor for Fast Reactor Fuel Hulls
At the Dounreay Experimental Reactor Establishment a method has been developed for determination of undissolved fast reactor fuel retained with the hulls C5J. The technique involves neutron irradiation of a 10-cm-diameter by 45-cm-long can (containing about 2 kg of hulls) using a neutron generator, followed by delayed neutron counting of the short-lived neutron emissions from bromine,iodine, rubidium and other fission products. This measurement gives the fissile content of the hulls directly, by interpolation on a calibration curve obtained using known weights of uranium-235 contained in cans full of steel swarf and cuttings. The method has been used routinely for several years both for fuel hulls and other solid residues containing fissile material and having associated gamma activity of the order of 1000 Ci-MeV. Although uranium-235 is the main fissile isotope of interest measurement of plutonium content of residues can also be made.
FIG.3. Neutron interrogation hull monitor.

5 9 6 McDo n a l d e t ai.
The general layout of the facility is shown in Pig 3. A re-entrant sample tube through the cave roof allows the can of hulls to he lowered out of the transport castle down into the interrogation head. This is a 63-cm-diameter 57-cm-high annulus of paraffin wax in a steel container. The 13-cm-diameter sample tube passes through the centre and is encased in 5 cm of lead to give a first-stage attenuation of gamma radiation from the hulls, for the benefit of the neutron detectors.Eight neutron detectors are located symmetrically in holes in the paraffin wax moderator around the central sample tube. Each hole is lined with 2.3 cm of lead to further reduce the gamma radiation from the hulls at the neutron detector. The neutron detectors used are 2.5 cm diameter BFj counters with an active length of 31 cms and a neutron sensitivity of 12.5 cps/n/cnr/sec for thermal neutrons. The interrogation head also contains a recess to accommodate the neutron tube close to the sample tube. The Philips PW5320 sealed neutron tube giving a maximum output of 3 x 10"Ю fast neutrons/sec has been found to be the most reliable of the 14r-MeV neutron systems tested. A small BFj counter is located in the moderator opposite the neutron tube to monitor the thermal flux during an irradiation. The fast-neutron output of the tube is checked using small copper foils 2.5 cm in diameter, and measuring the 9.8-min u activity from the °2Cu(n,2n) ^3cureaction which has a 12-MeV threshold. A standard pin, containing 3 grams of uranium-235, can also be lowered into the moderator near the sample cavity. This is used during each measurement to check that the sample gamma activity is not causing pile-up in the BFj counters.The operating sequence is as follows. First lower the standard pin into the interrogation head and start the irradiation timer. The standard pin is irradiated for 2 minutes and after a 5-second delay the count timer starts and accumulates the delayed neutron count for 1 minute. At the end of the count the total count and the flux monitor count are printed out. The standard pin is raised out of the head and the sample can is lowered until the bottom of the can is in the interrogation head (a window in the re-entrant tube enables the position of the can to be seen). Start the count timer and measure the neutron background count-rate. Start the irradiation timer, causing a 2-minute neutron irradiation 5-second delay and 1-minute delayed neutron count. Lower the sample can 8 cm and repeat the irradiation sequence. Continue monitoring in 8-cm sections until a maximum delayed neutron count has been reached. Reposition the sample can at the maximum position and lower the standard pin into the head again. Irradiate both standard and sample can together to check for gamma pile-up interference. From the corrected delayed neutron count the amount of uranium-235 can be interpolated from a calibration curve made using known weights of uranium-235 in sample cans containing metal swarf. Before interpolation of a result on the calibration curve the counts are normalised to a flux monitor total count of 2.30 x 10⁵ counts per minute.A measurement of positional error was made by placing small uranium- 235 sources close to the tube target and 10 cm above and below on the far side of the sample chamber. The relative sensitivity over a 10-cm distance was found to be 2:1. The method of measuring the uranium-235 content by finding the position of the maximum count will tend to reduce the error in grams due to variation in position of the fuel in relation to the neutron tube target. The working limit of detection is 1 gram of uranium-235 in 2 kg of fuel hulls. A precision of i 16% (2o limits) has been measured using the standard pin. This leads to the conclusion that a combined accuracy of i 30% (2P) in the range 10- 100 grams and + 50% (2o) in the range 1-10 grams should be obtained.

IAEA-SM-201/61 5 9 7
Measurements have also been carried, out on plutonium residues and mixed uranium-plutonium fuel.
2.3 Calorimetry of Slags
Isothermal calorimetry is used routinely at BRPL Windsoale to determine the plutonium content of slags and residues. The results are used for accountancy and criticality control purposes. The technique has proved successful in dealing with otherwise intractable and physically large residues. The calorimeter is a four unit plus reference system, housed in a thermostated room. The samples, weighing several kilograms, are temperature equilibrated in the room before insertion in the calorimeter. The equilibration time in the calorimeter varies with sample weight and for a 15-kg sample is about 72 hours. An experimental precisionof + 5%(2o) is obtained routinely. A measure of accuracy was obtained by measuring the weight of a piece of plutonium metal of known isotopic composition. The result was within 0.5% of the true weight.
R E F E R E N C E S
[1 ] WILLIAMS, D ., e t a l . , N ucl. Inst. Meth. 39 (1966) 141.[2 ] FOX, G .H ., MCDONALD, B.J., BNFL Rep. 55(W) 1974.[3 ] COLE, H .A ., N ucl. Inst. Meth. 65 (1968) 45.[4 ] FOX, G .H ., MCDONALD, B.J., BNFL Rep. 213 (1975).[5 ] BREMNER, W .B., e t a l . , UKAEA M emo 6803(D) (1975).


IAEA-SM-201/84
FAST FLUX TEST FACILITY (FFTF) FUEL-PIN NON-DESTRUCTIVE ASSAY MEASUREMENTS*
P. GORIS, A.W. DeMERSCHMAN Hanford Engineering Development
Laboratory, Richland, Wash.,United States of America
Abstract
FAST FLUX TEST FACILITY (FFTF) FUEL-PIN NON-DESTRUCTIVE ASSAY MEASUREMENTS.*The Hanford Engineering D evelopm ent Laboratory (H£DL) is evaluating u tilization o f a 252C f fuel-p in
scanner as a non-destructive assay technique to determ ine shipper-receiver assays o f fissile m aterials in liq u id -m eta l fast-breeder reactor-type fuel pins. A ll fast flux test fac ility (FFTF) fu el pins produced for cores 1 and 2 are bing assayed with the fuel scanner. Results have been com pared with ch em ica l m easurem ents. In a set o f 49 pins, using six scans per p in , no sign ificant differences were observed betw een non-destructive assay and ch em ica l assay on six randomly se lected p ellets from each fuel pin after it had been destructed. Shipper-receiver differences for outer core fuel pins under HEDL calibration o f the fu el-p in scanner agree with ch em ica l shipper-receiver differences within experim ental lim itations. Q uality control data over a tw o-year period in volv ing 1286 observations for seven fu el-p in standards in d icate a long-term random error o f 0.84*70 re lative standard deviation per single fu el-p in assay. A random variation o f 3=0.84% per single fu el-p in assay has li t t le or no e ffec t on the uncertainty in total Puf in sta tistica lly large numbers o f fuel pins. Long-term agreem ent with g iven quality control fuel pins ranges from - 0.23% to + 0.12%. The overall w eighted averaged agreem ent is -0 .10% , which indicates an apparent bias trend for the fu el-p in scanner under the present tw o-point calibration technique. In a large number o f fuel pins com posing a shipment, the uncertainty for total fissile p lutonium , as determ ined by the fu el-p in scanner, is due to the uncertainty o f assay o f the fu el-p in standards.
INTRODUCTION
The Westinghouse Hanford Company located at Richland, Washington, is the prime contractor for construction and operation o f the Fast Flux Test F a c ility (FFTF) for the United States Energy Research and Development Administration (ERDA). The FFTF is the primary t e s t f a c i l i t y for development of the Liquid Metal Fast Breeder Reactor (LMFBR).
Fabrication contracts are in place with United States commercial plants for 36,000 normal uranium oxide-plutonium oxide fuel pins co n stitu ting FFTF cores 1 and 2. These contracts are e s se n tia lly complete, and fabrication o f fuel assemblies is underway at the Westinghouse Hanford Engineering Development Laboratory (HEDL).
HEDL is evaluating a Cf-252 fuel-p in scanner on cores 1 and 2 fuel pins to demonstrate f e a s ib i l i ty o f fuel-p in scanners for shipper-receiver measurements in the LMFBR program. Accountability acceptance measurements of FFTF fuel pins are currently based on chemical analyses o f p e lle t lo t
* Work performed under the auspices o f the US Energy Research and D evelopm ent Adm inistration, and the US N uclear Regulatory Com m ission.
599

600 GORIS and DeMERSCHMAN
FIG .l. Fuel-pin p e lle t uniformity by passive gam m a-ray analysis.
samples which are taken during production lo t runs in the vendor plant. As an over-check, o f lo t sampling, p e lle ts from fuel pins which have been destru ctiv e ly tested are a lso analyzed. Each of the 36,000 fuel pins in cores 1 and 2 w ill have been nondestructively assayed at the conclusion of the contracts. The Cf-252 fuel-p in scanner in use was designed and b u ilt by the Los Alamos S c ie n t if ic Laboratory.[1]
Important advantages o f the fuel-p in scanner are:
• 100% assay of a ll fuel pins received in a minimum period. Five minutes required per pin
■ R e lia b ility . The uncertainty o f to ta l f i s s i l e material in a large number o f fuel pins is due e s se n tia lly to uncertainty in chemical standardization of ca libration fuel pins,
• Low operational cost o f approximately $2 per pin.
• P e lle t uniformity in d ication . Passive gamma measurements give a p e lle t - to -p e l le t v er ifica tio n of fuel consistency.
Figure 1 is a passive gamma recording of 60-keV Am-241 and 100-to 500-keV Pu gamma emissions from an FFTF production fuel pin. These traces are a very se n s itiv e indication o f fuel-p el le t in con sisten cies as noted by d eflec tion s in Figure 1 which are probably due to a p e lle t batch d iffe r ence.
CALIBRATION
Figure 2 gives a typical p lot relatin g neutron induced high-energy gamma count-rate and Pu f i s s i l e content for FFTF-type fuel p ins. Deviation from lin e a r ity is due primarily to neutron absorption and is approximated by the function R = A(1 - eB ”u). FFTF fuel-p in assay is carried

IAEA-SM-201/84 601
xlO3
FIG.2. Fuel-pin scanner count-rate vs Pu fiss ilie content o f fu el pin.
out at two le v e ls on ly, indicated as inner core (<v 30 grams Puf per pin) and outer core (л 37 grams Pu-f per p in ). The function R - A(1 - e^ Pu) has an appreciable curvature or deviation from lin ea r ity over a wide range of Puf values. Within the inner core to outer core range, however, deviation from lin e a r ity is quite sm all. The maximum deviation from lin ea r ity is ^0.25% in th is range.
Basic formulae are given as follow s for c la r if ic a tio n and reference in connection with fuel-p in scanner ca libration . A two-point nonlinear c a l i bration has been u tiliz e d for FFTF cores 1 and 2 assay.
Fundamental Relation
R = A(1 - eB Pu) (1)
where
R is the background corrected delayed high-energy gamma count-rate.
A is a ca libration parameter related to the flux o f the exc ita tion neutrons.
В is a ca libration parameter defining the nonlinear curve shape.
Pu is the ca libration value for plutonium f i s s i l e content of the fuel pin standard.

602 GORIS and DeMERSCHMAN
В Shaping Parameter
R„ a» 81QBe о Ro - Ri ( 2 )
R - j, R0 are observed count-rates for inner core fuel-p in standard Pu-j and outer core standard PUq. В is determined by itera tio n by means of (2 ). Once estab lished from a large number o f Rn- and Rq values, В functions as a constant defining the curve shape.
Routine Calibration
Ri (1 - eB Pui ) + R0 (1 - eB Puo)
‘ 0 . eB Pui ) 2 + (1 - eB Puo )2(3)
(3) is a nonlinear least-squares regression an alysis for the c a l i bration parameter A which changes gradually due to Cf-252 neutron source decay and which may change because of e lectron ic d r if t a f fectin g the count-rate. A is reevaluated every 4 hours during routine operation.
Fuel Pin F is s i le Content
Pux = 1/B ln (1 - Rx/A) (4)
Pux is calcu lated for each fuel pin in terms o f the constant B, the observed count-rate R , and the ca libration parameter A applying at the time o f assay.
The two-point ca libration system u til iz in g a fuel-p in standard at in ner and outer core le v e ls i s s l ig h t ly nonlinear throughout th is range because of neutron flux depression. A nonlinear least-squares f i t is made in terms of fuel-p in standard chemical values and th e ir corresponding background corrected count-rates according to (3 ) , It is en tire ly p ossib le under such a calibration to have biased resu lts at one core level and reasonably accurate resu lts at the other core le v e l. In general, accuracy of resu lts at a given core level w ill tend to follow accuracy o f the associated core level fuel-p in standard even though the calibration is a lso a function o f a fuel—pin standard at another core le v e l. Figure 3 i l lu s tr a te s th is point in terms o f p ossib le deviations from true ca lib ration . А, В, C, and D, o f Figure 3 represent cases where the true and experimental calibration curves have d ifferen t slopes and are therefore in agreement at one point as indicated. I f the true and experimental ca libration curves are d ifferen t but have the same slope as indicated by E, then the curves w ill have no point in common. The most probable cause for deviation from true ca lib ration is incorrect Pu f i s s i l e values for fuel-p in standards. Background corrected count-rates (R) are generally correct within counting s t a t i s t ic s for actual q uan tities o f f i s s i l e plutonium in the fuel-p in standards. Dev iation s resu lting from incorrect fuel-p in standard values w ill resu lt in a con sisten t bias since a ll fuel pins assayed under such conditions w ill be affected s im ilar ly .
1(A) in Figure 3 represents'the case in which one fuel-p in standard is
correct. Total f i s s i l e plutonium values for a large number of pins at the level associated with an accurately known fuel-p in standard w ill have e s se n tia lly the same degree of accuracy as the fuel-p in standard. However,

IAEA-SM-201/84 603
о-----о TRUE CALI BRATION
• ---- * EXPERIMENTALCALIBRATION
□ AGREEMENT POINT FOR TRUE ANDEXPERIMENTAL CALIBRATIONS
FIG.3. D eviations in fu el-p in scanner tw o-point calibration.
fuel pins at the opposite core level w ill be associated with an error in crement APuf as indicated in Figure ЗА. The error increment w ill be in the same d irection and in approximate proportion to the error in the fuel-p in standard value.
Figure 3C represents the case where both fu e l-p in standards are associated with the same re la tiv e error. The experimental and true ca libration curves coincide at point (0 ,0 ) . Figure 3D is a special case in which errors in fu e l-p in standard values are of opposite sign . Note that the

604 GORIS and DeMERSCHMAN
BACKGROUND CORRECTED RESPO N SE OF
FUEL P IN (CPS)
FIG.4. Fuel-pin scanner calibration techniques.
point of intersection of the experimental and true calibration curves in this case occurs between the two points of calibration. Even though both calibration standards might be in error in this case, a quality control standard fuel pin whose value coincides with the point of intersection might lead to an erroneous conclusion that the two-point calibration is accurate. In order to avoid this situation, a minimum of two quality control fuel-pin standards are necessary with a two-point fuel-pin scanner calibration technique. The standards should be at the same Puf level as the fuel pins being assayed.
The slope of a curve based on a large number of quality control observations at each core level would be indicative of direction and magnitude of fuel-pin standard inaccuracies. Figure 3E represents the case in which experimental and true calibration curves differ by a constant amount. A point of intersection does not exist under this condition. Note that such a condition could not be indicated by a single quality control fuel-pin standard.
Sensitivity of the fuel-pin scanner to assigned chemical values for the calibration fuel-pin standards is demonstrated by the following comparison giving assay results on a total shipment basis for HEDL and vendor assigned values to the same production fuel pins used as calibration standards :
HEDL
Vendor
4 P U f
Inner CoreGrams Pu^ Grams Puf
in in ShipmentStandard (789 Ptrrs)
30.46 23586.4
30.37 23492.2
-0.305» -0.40%
Outer CoreGrams Pu^ Grams Puf
in in ShipmentStandard (1080 Pins)
37.14 39852.4
37.23 39962.4
+0.2455 +0.28%

IA EA -SM -201/84 605
Note that results tend to follow direction and magnitude of change in fuel-pin standard value at a given core level even though the calibration is based on two different fuel-pin values. Deviation from true values is of course not known for either HEDL or vendor stated values; however, assuming that one set of values is essentially correct, then assay values deviate according to Figure 3D depending on which values are used to calibrate the fuel-pin scanner. This comparison demonstrates the importance of highly accurate Puf chemical values for fuel-pin standards. The uncertainty for fuel-pin scanner evaluation of total Puf from many hundreds of pins in a shipment reduces essentially to a systematic uncertainty and bias associated with fuel-pin standard values. The random variation of S=0.84% per single fuel-pin assay has little or no effect on the uncertainty in total Puf in statistically large numbers of fuel pins.
In order to make fuel-pin fissile comparisons, computer programs have been set up at HEDL for pin-by-pin calculations under different calibration parameters. For each fuel pin received, a fuel-pin number, lot number, shipment number, vendor Puf content, plus A and R values for fuel-pin scanner assay are stored on magnetic tape. Results for variable calibration parameters are thus very rapidly computed for total shipment Puf values involving many hundreds of fuel pins.
The two-point calibration technique utilized for FFTF cores 1 and 2 is indicated in Figure 4A. HEDL is also investigating calibration techniques illustrated by Figures 4B, C, and D. The advantage of a calibration technique such as 4D lies in the fact that FFTF fuel pins are usually assayed either as complete inner core or outer core fuel pins. A calibration can be made for a given Puf level independent of other levels. Since the Puf content of fuel pins at a given level is held within very narrow tolerances, a calibration relation can be utilized which is essentially linear within these tolerances. Reliability would be improved somewhat by the increased number of fuel-pin standards used as a cluster at designated Puf levels.
NONDESTRUCTIVE ASSAY (NDA) - CHEMICAL COMPARISON ON DESTRUCTED FUEL PINS
Routine quality assurance inspection of FFTF cores 1 ahd 2 fuel pins calls for destructive analysis of 1 fuel pin per shipping lot 120 fuel pins). The pins selected for destructive analysis are repeatedly scanned by the fuel-pin scanner; statistical pellet sampling and chemical analysis is then carried out on destructed pin fuel columns. Results for 15 inner core and 34 outer core fuel pins are summarized by Table I. The NDA program is based on six scans taken on each fuel pin with a minimum 4-hour interval between scans to allow for cooling. Each scan is based on a different calibration. The chemical assay program is based on controlled potential coulometric assay of 6 randomly selected fuel-pellet samples from the approximate 145 pellets per fuel pin, The same chemical assay technique used in routine assay of FFTF fuel pins is used for destructed fuel- pin assay.
Results indicate very close agreement between vendor chemical assay, HEDL chemical assay, and HEDL fuel-pin scanner values under this program. Statistical comparison based on Student's "t" distribution indicates no significant differences between any of the three sets of data for both the inner and outer core levels. Although the number of fuel pins assayed thus far in the program is less than half the number scheduled for precision assay, the data show that precision fuel-pin scanning is comparable to precision coulometric chemical assay for-FFTF type fuel.

TABLE I
PRECISION NONDESTRUCTIVE ASSAY VS CHEMICAL ASSAY OF DESTRUCTED FUEL PINS
Pu Fissile/Pin, (g)
(A)Vendor
ChemicalAssay
(B)HEDL
ChemicalAssay*
(C)HEDL
Fuel-PinScanner** ***
(A-B)Shipper-Receiver
Difference
(A-C)Shipper-Receiver
Difference
(B-C)HEDL
Difference
Totals 448.18 447.68 447.82 +0.50 +0.36 -0.14
(15 Pins) Mean 29.879 29.845 - 29.855 (+0.Ш) (+0.08%) (-0.03%)
Std Dev 0.2380 0.2261 0,2319 *** **★ ***
Totals 1246.16 1240.83 1244.72 +5.43 +1.44 -3.89Outer Core Mean 36.652 36.495 36.609 (+0.43%) (+0.12%) (-0.31%)(34 Pins) Std Dev 0.3254 0.2853 0.2640 *** ★ ** ★★★
* HEDL chemical assay values based on averages of 3 to 6 pellet samples per pin.
** HEDL fuel pin scanner values based on averages of 6 scans per pin.
*** Not a significant difference,
606 G
0R1S and D
eMER
SCH
MA
N

TABLE II
г е т р I I I Г
Grams Pu Fissile
Number of Pins per Shipment
VendorChemicalAssay
HEDLChemicalAssay
Shipper-Receiver Differences (g) <%)
HEDLFuel-Pin
Scanner Assay
Shipper-Receiver Differences (g) (% >
865 31961.9 32067.3 -105.4 -0.33 32042.5 - 80.6 -0.25375 13817.7 13841.0 - 23.3 -0.17 13875.0 - 57.3 -0.41658 24337.7 24231.2 +106.5 +0.44 24508.3 -170.6 -0.70792 29222.3 29280.8 - 58.5 -0.20 29388.9 -166.6 -0.57677 24715.2 24694.1 + 21.1 +0.08 24821.6 -106.4 -0.43960 36078.7 35120.8 - 42.1 -0.12 35207.9 -129.2 -0.37600 21757.4 21732.7 + 24.7 +0.11 21784.8 - 27.4 +0.13741 27218.8 27081.5 +137.3 +0.50 27097.7 +121.1 -0.44761 28074.5 27988.0 + 86.5 +0.31 27874.3 +200.2 +0.71728 26444.8 26509.8 - 65.0 -0.25 26423.4 + 21.4 +0.08867 31803.4 31847.6 - 44.2 -0.14 31736.3 + 67.1 +0.21660 24203.3 24145.8 + 57.5 +0.24 24030.1 +173.2 +0.72252 9244.7 9281.9 - 37.2 -0.40 9273.6 - 28.9 -0.31517 19132.1 19171.9 - 39.8 -0.21 19230.0 - 97.9 -0.511165 43024.7 43026.2 - 1.5 -0.003 43134.0 -109.3 -0.25966 35647.2 35651.1 - 3.9 -0.01 35790.3 -143.1 -0.411057 38831.2 38924.3 - 93.1 -0.24 39094.9 -263.7 -0.681079 39621.9 39619.9 + 2.0 +0.005 39822.0 -200.1 -0.51
13720 504137.5 504215.9 - 78.4 (-0.02%) 505135.6 -998.1 (-0.20%)
IAE
A-S
M-201/84
6 0 7

608 GORIS and DeMERSCHMAN
FFTF OUTER CORE
STAN DARD 38-5
37.5 -37.14 g
Pu F IS S IL E 37.0 -
36.5 -
36.0 - 1 36.12
N 253
MEAN 37.09 g
Д -0 1 3 %
SD 0 9 0 %
FFTF INNER CORE ,
STAN DARD 31.5
29.5 J
31.06rUCL г IV 3 1 0 _
30.46 g 3015 -j
Pu F IS S IL E
30.0 -
M A Y JUN JUL AUG SEP
1974
29.64
OCT NOV DEC
N 253
MEAN 30.46 g
Д o oo
SD 0 8 7 %
FIG.5. Fuel-pin scanner quality control.
Since a 100% fuel-pin scanner assay program requires full time plus some overtime for one instrument at the rate FFTF fuel pins have been received, a compromise was necessary in determining the number of replicate scans that could be feasibly carried out on pins prior to destruction.Six scans per pin was selected as a number that would not seriously hinder routine operations and yet provide an acceptable degree of precision. The same considerations were given to the analytical chemistry laboratory load. Costs for precision chemical assay of destructed fuel pins are much higher than for the fuel-pin scanner, and some restriction was necessary on the number of fuel pellets that could be sampled from each destructed fuel-pin for chemical assay. The program called for six randomly selected fuel- pellet samples from each destructed fuel pin.
FFTF FUEL-PIN SHIPPER-RECEIVER DIFFERENCES
Table II summarizes HEDL chemical assay and fuel-pin scanner shipper- receiver differences for 13,720 outer core FFTF fuel pins. Fuel-pin scanner shipper-receiver differences should be somewhat in line with chemical assay shipper-receiver differences due to the fact that calibration fuel pins were standardized by the chemical assay technique. Shipper-receiver differences given by Table II support chemical assay shipper-receiver differences within experimental limitations.
Chemical shipper-receiver differences exceeding 0.5% have been observed on specific fuel-pin shipments. These shipper-receiver differences are possibly functions of short-term bias affecting both shipper and receiver chemical measurements to varying degrees and at random times.

IA EA -SM -201/84 609
FFTF-HI STANDARD FUEL PIN 36.0
_35,4Jg___ J5JL-.Pu F IS S IL E
35.0 -
34.5 J
35.83
34.86
N 46
MEAN 35.33 g
A -0.23%
SD 082%
FFTF-I 35.0
STANDARDFUEL P IN '
33.86.g______34.0 _ :
Pu F IS S IL E 33 5 _
33.0 J
34.52
33.34
N 47
MEAN 33.88 g
Л + О 0 6 %
SD 082%
FFTF-LI STANDARD FUEL PIN
33.0 -j 325 -
32 09 q Pu FISSILE 320 ‘
31.5 J
3293
N43
MEAN 3213 g
Д +012%
SD 090%
SEP OCT NOV DEC
1974
FIG.6. Fuel-pin scanner quality control — p e lle t blended standards.
Should fuel-pin standardization take place at a time when HEDL chemical assay is affected by bias, then subsequent fuel-pin scanner assays would be affected by such bias. The long-term fuel-pin scanner shipper-receiver difference of -0.20% may possibly be affected by such bias. If the nature of bias affecting chemical assay is random short-term then the long-term chemical shipper-receiver difference would be expected to be quite small as indicated by Table II. The importance of accurately assigned fuel-pin standard chemical values cannot be over-emphasized under these conditions.
An important distinction is made between FFTF fuel-pin shipper- receiver differences based on HEDL chemical vs fuel— pin scanner assay. The chemical assay technique depends on random sampling of fuel pellets from vendor production lots. Five to fifteen pellet samples per lot forwarded to HEDL represent the total Pu'f content for many hundreds of fuel pins.The total Puf content thus related to chemical assay does not take into account discrepancies (or possible diversion) in fuel-pin loading and transportation. Fuel-pin scanner assay, on the other hand, has been used for 100% verification of all fuel—pin receipts. Furthermore, the period to assay the large number of fuel pins comprising a shipment (5 minutes per fuel pin) has been considerably less than the time required to complete chemical and isotopic assay in a chemical laboratory. The fuel-pin scanner therefore provides for rapid and direct assessment of discrepancies which may have occurred during the interval between fuel-pellet sampling and fuel pin receiving. HEDL and vendor chemical assay methods for fuel-pin shipment Puf evaluation utilize similar sampling and chemical techniques. Very close snipper-receiver agreement may be attained under these conditions;

610 GORIS and DeMERSCHMAN
however, discrepancies or diversion occurring after sampling would not be indicated by receiver's chemical measurements. The 100% verification potential of fuel-pin scanners is therefore very important to safeguards in the LMFBR program.
FUEL-PIN SCANNER QUALITY CONTROL
The quality control program for the fuel-pin scanner is based primarily on the inner and outer core fuel-pin standards used to calibrate the instrument at 4-hour intervals during routine operation. The high-energy gamma count-rate for each standard fuel pin at the time of a given calibration is related to the previous calibration. Assay values for the calibration standards are thus calculated and printed out as routine fuel-pin assays. A given quality control result under this program would be characterized by a minimum 4-hour interval between calibration and assay time. However, the interval might be several days depending on weekend interruptions, etc. Quality control data therefore take into account electronic drift or other fluctuations which may occur between time of calibration and time of assay. Figure 5 gives typical results for the fuel-pin standard quality control program.
A second quality control program is based on pellet blended fuel pins as quality control standards for intermediate points on the calibration curve between the inner and outer core levels. Figure 6 gives typical results for the pellet blended standard quality control program. Calibration for the intermediate points is based on fuel-pin standards at the inner and outer core levels.
Quality control results are primarily a measure of reproducibility. Accuracy is a function of assigned chemical values to calibration fuel-pin standards and to the degree of accuracy by which the В-shaping parameter is determined. Figure 3 illustrates manners in which the two-pin calibration technique may deviate from true calibration according to uncertainty of assigned chemical values to fuel-pin calibration standards. Quality control results may be very reproducible even though affected by any of the deviations from true calibration according to Figure 3.
Quality control data over a 2-year period involving 1286 observations for 7 fuel-pin standards indicate a long-term random error of 0.84% relative standard deviation per single fuel-pin assay. Long-term agreement with given quality control fuel pins ranges from -0.23% to +0.12%. The overall weighted average agreement is -0.10% which indicates an apparent bias trend for the fuel-pin scanner under the present two-point calibration technique.

Session 10, Part III
NON-DESTRUCTIVE MEASUREMENTS OF REACTORS AND REACTOR FUELS

Chairman: O. E. JONES (United States of America)
Papers IA EA -SM -201/3, 4 , 86, 93 and 94 were presented byD. L. TOLCHENKOV as Rapporteur

IA EA -SM -201/3
DETERMINATION OF BURNUP AND PLUTONIUM CONTENT IN IRRADIATED FUELS BY GAMMA-SPECTROMETRY MEASUREMENTS OF RADIOACTIVE FISSION PRODUCTS
M. PAOLETTI GUALANDI, P. PE RON I ENEL, Italy 'M. BRESESTI, M. CUYPERS, D. D'ADAMO, L. LEZZOLI Euratom Joint Research Centre, Ispra,Italy
Abstract
DETERMINATION OF BURNUP AND PLUTONIUM CONTENT IN IRRADIATED FUELS BY GAMMA- SPECTROMETRY MEASUREMENTS OF RADIOACTIVE FISSION PRODUCTS.
Experim ental and th eoretical investigations were carried out on fuels irradiated in the Trino V ercellese PWR and in th e Garigliano BWR, in order to study the correlations betw een radioactive fission products, w hich can be determ ined by m eans o f gam m a spectrom etry m easurem ents, and burnup and plutonium content. Experiments were carried out on fuel assem blies and fuel solutions (solutions from reprocessing plants and solutions o f separately dissolved fu el p ellets). The results of the experim ents in d icate that non-destructive m easurem ents o f th e 1 * * * * * * * * * * * 13,Cs activ ity can be used for the relative bumup determ ination in fu el assem blies.The results of the experim ents in d icate also that th e measurements of the 134C s /137Cs activ ity ratio can be used for the re la tive determ ination o f the Pu/U mass ratio in fuel assem blies and fu el solutions. However, the use o f the correlation betw een these two quantities is strongly lim ited by the in fluence of the irradiation histoty.
1. INTRODUCTION
The work presented in this paper was carrie d out partly under theE u ratom -EN EL R esearch Contract No.071 -66-6 T E E I, and partly in the fram ew ork of the collaboration agreem ent between EN EL and EuratomJoin t R esearch C entre, N o.055-71-PIPG I, established for the developmentof techniques for f is s ile m ateria l control.
The main point of the collaboration agreem ent concerns the study of theisotope co rrelation s in irrad iated fuels. EN EL is interested in this kindof study as these correlation s can improve the consistency and accuracyof f is s ile m ateria l balances. The Euratom Jo in t R esearch C entre isinterested in the sam e studies in connection with the development of sa fe guards techniques.
The work presented in this paper is oriented towards exploring the possibility of correlatin g , for LWR fuels, the inform ation gathered through gamma m easurem ents of radioactive fission products with the data on burnup and plutonium content obtained from chem ical analyses perform ed during rep rocessin g operations and post-irrad iation examinations and from nuclear code calcu lations.
P a rt of the resu lts reported in the present paper have already been published 1.1 — 4]. This paper presents a com prehensive analysis of previous and new resu lts in order to make an assessm en t of the re a l p o ssib ilities
613 .

TABLE I. LIST OF THE EXPERIMENTS
Reactor fuel Fuel form measuredNumber of
measured samplesEnrichment
(%)
Burnup range (M W d/t U)
Number of irrad. cy c les
Trino 1 Pellet solutions 18 2 .7 2 - 3. 13 - 3 .9 0 3 200 - 18 700 1(End o f c y c le 1)
Trino 2 Pellet solutions 23 3. 13 15 200 - 25 000 2
(End of c y c le 2)Assem blies 12 3. 13 - 3 .9 0 19300 - 22 000 2
Reprocessing solutions 14
о05COCOCO 19 500 - 22 100 2
Trino 3 Assemblies 16 3. 90 - 4. 00 19700 - 28 700 2-3(End o f c y c le 3)
Garigliano Assemblies(End o f cy c le 3)
9 X 9 9 av. 2. 02 15 600 - 18 300 3
8 x 8 2 av. 2 .3 0 7 3 0 0 - 14400 1-2
TABLE II. STANDARD DEVIATIONS (%) OF THE BURNUP AND PLUTONIUM BUILDUP CORRELATIONS IN THE DIFFERENT EXPERIMENTSWithin b rack ets standard deviations (%) of the reproducib ility m easu rem en ts on the re fere n c e sam p les
Experiment 137C s/bum up13JC s / ,37Cs
Pu/UI54Eu/ 137Cs
Pu/U
Trino 2 assem blies 2 .3 (1 . 2) 1. 2 (0 .7 ) 5. 6 ( 5 .2 )
Trino reprocessing solutions - 1 .3 (0 .5 ) 2 . 0 (1 . 0)
Trino 3 assem blies 2 .5 (2 .4 ) 2. 0 (0 . 8) 8 .7 (6 .8 )
Garigliano assem blies 1 .4 (1 .7 ) 3 .9 (0 .5 ) -
61
4
PAO
LE
TT
I GU
AL
AN
DI et al.

IAEA -SM -201/3 615
of the gam m a-sp ectrom etry m easu rem ents for the determ ination of burnup and plutonium content in irrad iated fu e ls . Other re se a rch groups have developed s im ila r co rre la tio n s [5-7].
The m easu red fu els w ere irradiated in the Trino V e r c e lle se and G arigliano re a cto rs .
The Trino V e r c e lle se nuclear power station is equipped with an 825~MW(th) p ressu r ize d -w a te r rea cto r . The f ir s t core c o n s is ts of three region s of 40 a sse m b lie s with 2.72, 3.13 and 3.90% en richm ents in 235U.The reload a sse m b lie s have a 4% enrichm ent. The square fuel a sse m b lie s contain 208 fuel rods arranged in a 15 X 15 array . P ortion s of the p eriph eral row s of fuel rods are om itted to provide s lo ts for the p assage of the con tro l-rod b lad es. The centra l rod is a lso om itted to provide sp ace for an in -c o r e instrum entation thim ble. The fuel rods are SS clad , have a p elle t d iam eter of 0.89 cm and an active length of 265 cm .
The G arigliano nuclear power station is equipped with a 506-MW(th) b o ilin g -w ater reactor. The reactor core c o n s is ts of 208 fuel a sse m b lie s .The fuel a sse m b lie s of the f ir s t co re con sisted of an 81-rod bundle in a 9 X 9 array (pellet d iam eter 1.19 cm , average enrichm ent 2.02%); the reload fuel a sse m b lie s co n sis t of a 64-rod bundle in an 8 X 8 array (pellet diam eter 1.29 cm , average enrichm ent 2.30%). The fuel rods are Z irca loy clad and have an active length of 270 cm . The exp erim en ts w ere carried out in the y e a r s 1971-1975 and a l i s t is given in T able I.
2. EXPERIM ENTAL TECHNIQUES
A detailed d escrip tion of the experim ental techniques can be found in R e f .[ l - 4 ] .
2.1 . G am m a-spectrom etry m easu rem ents
The detection sy stem con sisted of a Ge(Li) d etector connected through an ADC to a 4 К or 8 К com puter. The com puter was u tilized both to accum ulate the gam m a sp ectra and to determ ine autom atically the net a rea s of the gam ma photopeaks (137Cs 662 keV, 134Cs 796+802 keV, 1S4Eu 1274 keV).
M easurem ents on fuel a sse m b lie s
The fuel a sse m b lie s w ere positioned in sid e the spent fuel pool by m eans of a jib crane, in front of a co llim ation system and kept in p osition by a guide anchored to the pool wall.
The co llim ation sy stem co n sisted of a fixed lead co llim ator located in a hole bored through the pool w all and of a m ovable co llim ator , equipped with an ax ia lly variab le s lit , located outside the pool together with the instrum entation.
The m easu rem en ts w ere perform ed by positioning the a ssem b ly corner in front of the detector b ecau se theory and exp erien ce had shown that in th is way the influence of an im p erfect positioning of the a ssem b ly is much le s s than in the c a se of sid e m easu rem en ts.

616 PAOLETTI GUALANDI et a l.
The m easu rem en ts w ere perform ed on each corner at se v er a l axial le v e ls (8-9 le v e ls ) and the sum of the counts was used as an in tegra l value for the a ssem b ly . The total counting tim es w ere 40 to 100 m in.
To check the reproducib ility of the m easu rem en ts one fuel a ssem b ly for each experim ent was m easured p eriod ica lly . The r e su lts are reported (between brack ets) in Table II.
M easurem ents on fuel so lu tions
The absolute a c tiv itie s (d isintegrations) of the rad ioactive f is s io n products in the fuel so lu tions w ere m easured using a Ge(Li) detector calibrated by m eans of re feren ce so u rces of known activ ity .
2.2, M easurem ents of P u /U ratios
The m easu rem en ts of P u /U ratios in the p e lle t so lu tions w ere carried out in the lab ora tories of the Ispra and K arlsruhe E stab lish m ents of the Euratom Joint R esearch C entre by m eans of isotope dilution with 242Pu and 233u sp ik es and m a ss sp ectrom etry . The accuracy of the P u /U ratio determ ination is betw een 1 and 2% . The m easu rem ents on the rep ro cess in g so lu tions w ere carr ied out by the operator of the rep ro cess in g plant.
3. THEORETICAL EVALUATIONS
3.1. Burnup and plutonium buildup ca lcu lations
When exp erim en ta l data on burnup and plutonium buildup produced by ch em ica l a n a ly sis w ere not availab le , the r e su lts of the gam m a-sp ectrom etry m easu rem en ts w ere corre la ted with data generated by m eans of com puter code ca lcu la tion s.
F or this purpose the cod es used w ere th ose norm ally em ployed by ENEL for the determ ination of power and burnup d istributions in its LWRs:
F or Trino V e r c e lle se BURSQUID [8]: la ttice constants and (x-y) diffusion code;F or G arigliano an ENEL rev ised FLARE [9]: a th ree-d im en sion a l co a r se m esh code.
The adequacy of th ese cod es was a scerta in ed by m eans of in -co re instrum entation and gam m a-scanning m easu rem en ts.
3.2. Mutual rod -sh ie ld in g correction s
The gam m a activ ity m easu rem ents are influenced by mutual fu e l-rod sh ield ing [10]. This effec t is due to the attenuation undergone by the gam ma rays when they c r o s s the fuel a ssem b ly reg ion s lying on the path towards the d etector . B eca u se of the very strong sh ield ing effec t of the fuel rods only the p erip h era l rods contribute sign ifican tly to the m easu rem ent. So, for the sam e total activ ity em itted , substantia lly d ifferent activ ity d is tr ibutions in the a ssem b ly can g ive r is e to d ifferent m easu red va lu es. To a s s e s s the m agnitude of th is effect and to ca lcu late a co rrectio n coeffic ien t

IAEA-SM-201/3 617
that a llow s the m easu rem ent to be brought back to the actual value, with a fa ir d egree of approxim ation, the code ATTENUA was developed which takes into account the geom etry of the a ssem b ly , the energy of the gam m a rays of in terest, the activ ity d istribution in sid e the a ssem b ly , and the geom etry of the m easu rem ent sy stem .
To com pute a su ffic ien tly accurate rod -b y-rod activ ity d istribution to be fed to ATTENUA, the ATTIVA code was developed, which r e c e iv e s as input at the d ifferent burnup le v e ls , from the BURSQUID code, for each rod, the absolute va lu es of the neutron flux, the f is s io n c r o s s - s e c t io n s of f is s i le iso to p es, and the data essen tia l to the ca lcu lation of the absorption c r o s s -s e c t io n s of the various f is s io n products.
F rom th ese data the code ca lcu la tes the rod -b y-rod activ ity d is tr ibution for the f is s io n nuclide con sid ered , on the b a sis of which the ATTENUA code ca lcu la tes the co rrectio n fa cto rs , that is the ra tio s of the actual to m easu red a c tiv itie s .
F or the G arigliano rea cto r th ese attenuation factors for th e 137Cs 662-keV gam m a ray change by about 3% in the burnup range of 0 to 20 000 M W d/tU and by about 1% for the d ifferen ce in the fuel a ssem b ly rod array .
F or the Trino V e r c e lle se rea cto r , where the rods in the a sse m b lie s have a ll the sam e enrichm ent and the water gap is narrow, the changes in the lo c a l power d istribution are sm a ll. So the attenuation factors for 662-keV 137Cs and 796 - 802 keV 134Cs gam ma ra y s , change by l e s s than 1%.
3.3. R adioactive decay co rrectio n s
The iso top es of in te re st may have a re la tiv e ly short h a lf- life and consequently decay noticeably during irrad iation. T h erefore , it is n ecessa ry to ca lcu la te correction factors to allow com p arison betw een a sse m b lie s which are irrad iated with d ifferent power h is to r ie s . F or th is purpose the ATTIVA code was used requiring as input the power h is to r ie s of the d ifferent sam p les (a ssem b lies or solu tions) and of a hypothetical re feren ce sam ple with constant rating.
The co rrectio n factor is the ratio betw een the a c tiv itie s calcu lated by ATTIVA, for the burnup le v e l of the sam ple, using the constant power rating and the rea l power h istory .
In the c a se of the 134C s /137Cs and 154E u /137Cs activ ity ra tios the re fere n c e power rating was 10 MW/t for the G arigliano fuel and 20 MW/t for the Trino fuel. The co rrectio n s for 134C s /137Cs can in som e c a s e s reach 30%, w hile for 154E u /137Cs they are of a few per cent.
In the c a se of the corre la tion betw een 137Cs activ ity and burnup the re feren ce power rating was in ifin ite , that is , a nul decay was assu m ed.The co rrectio n factors reach m axim um valu es of a few per cent.
A nother co rrectio n factor was introduced for th is la s t corre la tion , to take into account the d ifferen ce in the fuel density (kg per axial length unit of the a ssem b ly) betw een the two types of G arigliano fuel a sse m b lie s (8 X 8 and 9 X 9).
3.4. T h eoretica l isotop e corre la tion s
To es tim a te the range of valid ity of the co rre la tio n s involving rad ioactive f is s io n products and to determ ine the p aram eters influencing th ese
T e x t continues on p .6 2 2

618 PAOLETTI GUALANDI et a l.
FIG. 1. G arigliano Plant; Influence of the void fraction on the correlation betw een 134C s /137Cs and Pu/U.
FIG. 2. Trino V erce llese plant; Influence o f the fuel enrichm ent on the correlation betw een 134Cs/ 137Cj
and Pu/U.

IAEA -SM -201/3 6 1 9
FIG. 3. Trino V ercellese plant: Influence o f the power rating on the correlation betw een 134C s /13,Cs and Pu/U .
FIG. 4 . G arigliano plant: Influence of the void fraction on the correlation betw een 154E u /lslCs and Pu/U .

620 PAOLETTI GUALANDI et al,
FIG. 5. Correlations betw een bumup and m Cs measured on fu el assem blies o f the Trino V ercellese and G arigliano reactors.
FIG. 6. Correlations betw een Pu/U and 134C s /1S7Cs measured on solutions o f fuel pellets,

IA EA -SM -201/3 6 2 1
FIG. 7. Correlations betw een Pu/U and 134C s /13,Cs for solutions o f fuel p ellets , after radioactive decay corrections (see section 3. 3).
FIG. 8. Correlations betw een Pu/U and 134C s / ls,Cs. measured on fuel assem blies, after radioactive decay corrections (see section 3. 3).

6 2 2 PAOLETTI GUALANDI et a l.
co rre la tio n s , a s e r ie s of ca lcu lation s have been carried out, by m eans of the ATTIVA code, on a zero -d im en sion a l m odel.
F igu re 1 shows the corre la tion betw een P u /U m a ss ratio and 134C s /137Cs activ ity ratio for d ifferent va lu es of void fraction s in the G arigliano fuel.The corre la tion is e s sen tia lly lin ea r and independent of the void fraction s except for high void fraction s (50%) and burnup va lu es above 20 000 M W d/tU.
F igu re 2 shows the sam e corre la tion for the three d ifferent en rich m ents of the f ir s t Trino V e r c e lle se co re , 2 .72, 3.13 and 3.90%. The corre la tion is e s sen tia lly lin ea r up to 30 000 M W d/tU and sligh tly influenced by the in itia l fuel enrichm ent.
H ow ever, the corre la tion is strongly influenced by the power le v e l of the irrad iation as shown in F ig .3 , where it can be ob served that for the sam e P u /U ratio , there are d ifferent 134C s /137Cs activ ity ra tio s for fuel a sse m b lie s irrad iated at d ifferent power le v e ls . T his is due to the fact that different irrad iation p eriods are required to obtain a certa in P u /U ratio and consequently the decay of the rad ioactive f is s io n products is d ifferent.
A th eo re tica l an a lysis has a lso b een carried out for the corre la tion betw een P u /U m a ss ratio and 154E u /137Cs activ ity ratio . T his corre la tion is e s se n tia lly independent of the power le v e l and the fuel enrichm ent; how ever, th is corre la tion deviates from lin ear ity above 20 000 M W d/tU in d ifferent ways depending on the void fraction s, as shown in F ig .4 for the G arigliano fuel. T his behaviour can be explained by con sid erin g the high value of the 154Eu neutron capture c r o ss -se c t io n .
4. ANALYSIS OF THE CORRELATIONS
4.1. C orrelation betw een 137Cs and burnup (m easurem en ts on fuel a sse m b lie s)
137Cs is cu rrently used as burnup indicator for fuel so lu tions and sin g le fuel rod s. A s the th eoretica l calcu lations (see sectio n 3.2) have shown that, for a sse m b lie s of the sam e reactor , the gam m a-ray attenuation factors are very s im ila r , a proportionality can be pred icted betw een burnup and 137Cs activ ity m easu red on fuel a sse m b lie s .
The r e su lts obtained in the d ifferent exp erim en ts, corrected for attenuation and d ecay, are reported in F ig .5 and confirm this statem ent.In Table II the standard deviations of the 137C s/burnup ratios in the d ifferent exp erim en ts are reported.
4.2. C orrelation betw een 134C s /137Cs and P u/U
F igu re 6 shows that the co rre la tio n s , ob served on the p e lle ts of the Trino 1 and T rino 2 fu e ls , are lin ea r , in agreem en t with the th eoretica l p red iction s. It can a lso be ob served that the two s e ts of data do not fit together.
T h erefore , it was deem ed n ece ssa r y to introduce the th eoretica l radioactive decay co rrectio n factors as m entioned in 3.3. The corrected values are reported in F ig .7 which shows that the two se ts of data fit together w ell.In F ig .7 a d iscrep ancy is ob served betw een experim ental data and the th eoretica l cu rve. This can be explained by the inaccuracy in the nuclear data used for the th eo retica l ca lcu lation of the curve and a lso by the uncertainty in the sin g le p e lle t power h istory used for the decay correction .

IA EA -SM -201/3 623
The n on -d estru ctive m easu rem en ts perform ed on the fuel a sse m b lie s , unloaded from the Trino V e r c e lle se plant at the end of second and third irrad iation cy c le , have been corre la ted with the P u /U th eo retica l values and a good proportionality has b een observed . The standard deviations of the ra tio s betw een 134C s /137Cs (end of the irradiation) and P u /U are reported in Table II. A lso , in th is c a se the th eoretica l decay co rrectio n factors have been applied to the experim ental va lu es and the corrected va lu es are reported in F ig .8, together with the th eoretica l cu rves n orm alized to fit the exp er im ental data. T h is n orm alization is required b ecau se the exp erim en ta l 134C s /137Cs ra tio s are ex p ressed in term s of count ra tios and not in term s of d isin tegration ra tio s .
The slight effect due to the d ifferent in itia l enrichm ents in the Trino 2 fuel is in agreem en t with the th eoretica l prediction. In th is experim ent the two se ts of data (Trino 2 and 3 - 3.90% enrichm ent) do not a g ree , d iffering by about 6%. The m ain reason s for th is d iscrepancy m ay be: inaccuracy of the decay correction s; d ifferen ces in the d etection system em ployed in the two exp erim en ts; in accuracy in the P u /U com puter code p red iction s.
Table II a lso shows a good value (1.3%) for the standard deviation for the ratio betw een 134C s /137Cs and P u /U , as m easured in the rep ro cess in g so lu tion s.
By con trast, the experim ent carried out on the G arigliano fuel a sse m b lie s indicated that the standard deviation of this corre la tion is much higher (3.9%) owing to the strong d ifferen ces in the power h istory of each a ssem b ly , in sp ite of the co rrectio n introduced to take this factor into account. T his co rrectio n reached m axim um values of 30%.
4.3. C orrelation betw een * 154E u /137Cs and P u /U
In Table II are reported the standard deviations of the ra tio s between154E u / 137Cs and P u /U for the Trino V er ce lle se fuel a sse m b lie s . In the nond estru ctive m easu rem en ts, the reproducib ility was very poor: thus, no general con clusion can be drawn, although the r e su lts obtained on the re p r o ce ss in g solu tions are quite sa tisfactory .
5. CONCLUSIONS
The exp erim en ts perform ed on the fuel a sse m b lie s have shown that n on -d estru ctive m easu rem en ts o f 137C s a c tiv itie s can be u tilized for the determ ination of re la tiv e burnup va lu es in fuel a sse m b lie s . The co rrectio n s to be introduced to take into account d ifferen ces in rod array and irrad iation h isto ry , proved to be quite sm a ll.
A bsolute m easu rem en ts of burnup in fuel a sse m b lie s could a lso be envisaged through a su itable ca libration of the detection system by m eans of fuel a sse m b lie s w hose burnup should be determ ined by ch em ical an a lyses during r e p r o ce ss in g op eration s. The variation in tim e of the detection sy stem effic ien cy could be con trolled by m easuring at d ifferent t im es a re feren ce rad ioactive sou rce .
The corre la tion betw een 134C s /137Cs activ ity ratio and P u /U m ass ratio i s stron gly influenced by the power h istory which h as to be v ery w ell known. T h erefore , th is corre la tion is of m inor in te re st for safeguards purposes w hile it can be useful for the u tilitie s which know quite accurately

624 PAOLETTI GUALANDI et a l.
the irrad iation h istory of their a sse m b lie s . This corre la tion can be used for the determ ination of re la tive P u /U d istributions in fuel a sse m b lie s by m eans of non-destructive m easu rem ents and for a con sisten cy check of P u /U valu es in fuel so lu tions (rep ro cessin g and p ost-irrad ia tion exam inations).
The p o ssib ility of using the corre la tion obtained from a se t of data m easu red on a fuel batch for the p red iction of the plutonium content in a su c c e s s iv e fuel batch, on the b a sis of gam m a m easu rem en ts, has a lso been in vestigated . Though sev era l, so u rces of er ro r s ex ist in th is operation, the r e su lts obtained are quite encouraging.
The d ifficulty connected with the use of the 134C s /137Cs activ ity ratio m akes a p o ssib le use of the corre la tion betw een 154E u /137Cs activ ity ratio and P u /U m a ss ratio m ore in terestin g . In fact the h a lf- life of 154Eu (8.5 yr) is m uch lon ger than the h a lf- life of 134Cs (2.05 y r). Consequently,154E u is l e s s se n s itiv e to the variations in the power h istory . M easurem ents on re p r o ce ss in g fuel so lu tions have shown a proportionality betw een the 154E u /137Cs activ ity ratio and P u /U . T his is in agreem en t with the th eo retica l p red iction s.
106Ru and 144Ce have no potential in terest for the developm ent of co rre la tio n s s in ce their h a lf- liv e s are too short (re sp ectiv e ly 368 and 285 d). 95Z r /95Nb (h a lf - liv e s 64 and 35 d, re sp ec tiv e ly ) can g ive inform ation on the power d istribution even after long cooling p er iod s, but not a s accurately as 140La, being rep resen ta tive of a period of se v er a l m onths.
R E F E R E N C E S
[ 1] BRESESTI, A. M ., e t a l . , Post-irradiation analysis of Trino V ercellese reactor fu el e lem en ts, EURATOM Rep. EUR-4909 (1972).
[ 2 ] BANNELLA, R ,, et a l . , Relative m easurements o f bumup and plutonium content in PWR assem blies,Trans. A m . N ucl, Soc. 15 (1972) 681.
[3 ] BRESESTI, A. M ., e t a l . , Investigations on radioactive fission product correlations; Gamma spectrometry measurem ents on spent fuel assem blies discharged from the Trino V erce llese reactor at the end of the 2nd irradiation c y c le , Euratom Rep* EUR-5334 (1975).
[4 ] ADILETTA, G . , e t a l . , Investigations on radioactive fission product correlations; Gamma spectrometry m easurem ents on spent fu el assem blies o f the Garigliano reactor, Euratom Rep. EUR-5289 (1975).
[5 ] BEETS, C . , e t a l . , Contributions to the joint safeguards experim ent MOL IV at the Eurochemic reprocessing p lant-M ol-B elg ium , CEN Rep. BLG -486 (1973).
[6 ] BRAND, P . , CRICCHIO, A ., KOCH, L ., Feasibility study o f the use o f radioactive fission product correlations for the determ ination o f burnup and heavy isotopes com position o f BWR Dodewaard fuel,Euratom Rep. EUR-5141 (1974).
[7 ] MATSUURA, S . , e t a l . , N on-destructive gam m a-ray spectrom etry on spent fuels of a: boiling water reactor, J. N ucl. S ei. T echn. 12^1 (1975) 24.
[8 ] BURSQUID: A Multigroup Bumup Programme, Reactor and Fuel Section, Construction D ivision ENEL (1975).[ 9 ] DELP, D. L ., et a l . , FLARE: A tridim ensional boiling water reactor simulator, Rep. GEAP-4598 (1964).
[1 0 ] PAOLETTI GUALANDI, M ., PE RON I, P . , S elf-sh ield ing e ffec t in fuel assem bly gam m a scanning,Trans. Am. N ucl. Soc. 17 (1973) 474.

IAEA -S M -2 0 1 /4
ISOTOPIC ASSAY IN IRRADIATED FUEL BY NEUTRON RESONANCE ANALYSIS*
H.G. PRIESMEYER, U. HARZ Institut für Reine und Angewandte Kernphysik der Universität Kiel,Federal Republic of Germany
Abstract
ISOTOPIC ASSAY IN IRRADIATED FUEL BY NEUTRON RESONANCE ANALYSIS.Taking into account the known parameters o f resonances in certain fissile and fission-product n uclei,
the amount o f m aterial in a sam ple m ay be found by a sim ple neutron tim e -o f-f l ig h t transmission m easurem ent. Experiments o f this kind have been performed with the Fast Chopper facility o f IKK at the FRG-1 research reactor in G eesthacht as part of the research programme for the investigation of unknown fission - product resonances in gross-fission-product sam ples. Neutron transmission analysis is a sim ple and independent method to y ie ld absolute contents o f U -2 3 5 /2 3 6 /2 3 8 , P u -239 /240 , 131X e, 152Sm an d 133Cs, which a ll have very prom inent resonances below 20 eV , in a single spectrom eter run. The analysis may be carried out im m ed ia te ly after reactor shutdown, sin ce the high radioactivity o f the samples does not a ffect the m easurem ents. Results o f the latest experim ents on low -enrichm ent U 02 fu e l-e lem en t powder are discussed in the paper.
INTRODUCTION
During the m easu rem en ts on irradiated nuclear fuel with the aid of the P ast-N eu tron -C h opp er T im e -o f-P lig h t Spectrom eter at the FRG-1 in G eesthacht, a num ber of reson an ces could be identified in the g r o s s - f is s io n - product tra n sm iss io n sp ectra , which belong to certa in stab le fission -p rod u ct or heavy m eta l iso to p es. T h ese reso n a n ces, of which the p aram eters are known from tab les lik e the recen t BNL 325/III. Edn, m ay be used to ca lcu late the amount of the corresponding iso top es in the g ro ss-f iss io n -p r o d u ct m ateria l, b ecau se the depth of the reson ance d ep ressio n in the tra n sm issio n spectrum is a function of the total neutron c r o s s - s e c t io n a T and the sam ple th ickn ess N. Thus, a T being known, N m ay be ca lcu lated . Up to now a num ber of sam p les have been investigated . The r e su lts of th ese exp erim en ts have b een published in R e f .t l] . (An early experim ent of the sam e kind was reported by Sim pson et a l. [2].) T his paper d eals with the r e su lts of m ea su rem ents on low -en rich m en t (2.8%) U 0 2 fuel. The sam ple has been produced from p ulverized p e lle ts from a KWO (Kernkraftwerk O brigheim , nuclear power plant) fuel rod with a burnup of 18 500 MWd/t U. It was investigated in the 0.2 to 50 eV energy range. Special in terest w as for the energy range below 1.5 eV, w here reson an ces of 239Pu and240Pu can be expected .
* Supported by GKSS under contract No. 521 097 (co-operation G K SS-U niveBität K iel).
625

626 PRIESMEYER and HARZ
CHOPPERBEAM HOLE
COLLIMATORREACTOR FLIGHT TUBE
FIG. 1. Principle of the experim ental set-up.
The exp erim en ta l se t-u p
F igu re 1 shows the p rin cip le of the experim ental se t-u p . In front of the beam hole of FRG-1 within con crete sh ield ing the chopper is in sta lled .The neutrons com ing from the rea cto r core are co llim ated b efore they str ik e the sam ple. Then the continuous beam is chopped into neutron b u rsts of about 10 to 20 qs duration which, after a second co llim ation , en ter a flight path about 40 m long. At the end of the flight path 11 6L i g la s s - sc in tilla to r d etec tors are in sta lled . The t im e -o f-flig h t spectrum is recorded by a HP 2116 В com puter. The neutron TOF sp ectra with "sam ple in beam " and "sam ple out of beam " m inus the corresponding background counting ra tes are com pared and the tra n sm issio n is ca lcu lated . The p osition of the sam ple in front of the rotor en su res that gam ma radiation from the reactor and the sam ple w ill only fa ll on the d etectors during the short opening tim e of the rotor and then be sh ielded again by the rotor in the shut position .On the other hand, for the 40-m flight path, neutrons betw een 0.2 and 50 eV have flight tim es betw een 6.8 and 0 .4 m s. This is the reason why the high rad ioactiv ity of the irrad iated fuel does not a ffect the m easu rem en ts, which m ight be expected , s in ce L i-g la s s d etectors are gam m a- se n s itive .
M easurem ents and r e su lts
The IKK F ast-C h opp er is sp ec ia lized for h igh -reso lu tion reson ance in vestigation of rad ioactive m ateria l. M easurem ents below 20 eV for content determ inations would req u ire a sim p ler chopper con stru ction and sh orter flight path. To ca lcu la te the amount of the m entioned iso top es, a sin g le sp ectrom eter run covering the energy range betw een approxim ately 15 and 0.2 eV is su ffic ien t. S ince we wanted to in vestigate the tra n sm iss io n up to 50 eV, two d ifferent runs at d ifferent rotor sp eed s w ere m ade, the

TRANSMISSION
0.20
o,<o
о.бо
о.so
1.00
f1g . 2. Gross-fission-product transmission from 2 .5 to 50 eV.
IAE
A-S
M-201/4
627

TRANSMISSION
0.2
0
0.<
0
0.6
0
0.8
0
1.0
0
FIG. 3. Gross-fission-product transmission from 0. 2 to 1. 5 eV,
628 PR
IESMEY
ER and H
AR
Z

IA EA -SM -201/4 629
TABLE I. HEAVY METAL CONTENTS OF THE KWO SAMPLES IN m g /g FUEL.
Isotope (m g /g fuel)
235u 1 0 .6
236u 2 . 68
238u ^ 970
»9pu 4 .6 4
!4Vu 1 .21
2«pu 0 .1 0 6
TABLE II. RESONANCE ENERGIES AND PEAK CROSS-SECTIONS
Resonance Peak totalIsotope energy cross-section
(eV) (b)
235ц 12.4 1 930-11.6 1460
» U 5.45 38200 .
238u 6. 67 21500
23sPu 0.296 4 900
2"Vu 1. 056 170 000
242Pu 2. 67 72 000
re su lts of which are shown in F ig s 2 and 3. The am ounts of m ateria l which we ca lcu la te a re given in Table I in m g /g fuel. They com pare within l e s s than 20% or b etter with r e su lts of m a ss-sp e c tr o m e tr ic and X -ray flu o r esc en ce m easu rem en ts m ade at K arlsruhe.
The m ajor con cern of the m ethod is to be certa in that no fission -p rod u ct reson an ces a re underlying the prom inent reson an ces in the m entioned iso top es or that at le a s t th e ir contributions are n eg lig ib le . T his is certa in ly no lon ger true above about 14 keV, w here in creasin g reson ance density and d ecreasin g sp ec tro m eter reso lu tion inhibit the a n a ly s is . But at low er en erg ie s som e w e ll-r e so lv e d reson an ces are located at the expected en erg ie s and can be assign ed to the heavy m eta ls .
Table II show s the reson ance en erg ies and corresponding peak c r o s s - sec tio n va lu es which may be used for the a n a ly sis .
P o ss ib le erro r so u rc es are the sta tis tic a l accuracy of the t im e -o f-flig h t sp ectra and u n certa in ties in the reson ance p aram eters used . F rom the r e su lts of the U 02 sam ple it is ju stified to hope for a d ecr ea se in the e r ro r s

TR
AN
SM
ISS
ION
0.2
0
0.3
0
0.<
0
0.5
0
0.6
0
0.1
0S HB P E A N A L Y S I S OF
CHOPPER RUN 1 7 3
T R A N S M I S S I O N DBTB
B N B L T S I S RUN 1 7 3 - 0 1 / 0 2 / 0 1
FIG. 4. SHAPE-fit o f the 1. 056-eV resonance o f 240Pu together with a sm all resonance of 235U at 1 .1 3 eV .
63
0
PRIESM
EYER
and HA
RZ

IAEA -SM -201/4 631
by ca librating the sp ectrom eter with sam p les of known am ounts. More m easu rem en ts on irradiated fuel with d ifferent burnup h is to r ie s and U en rich m ents, and additional m a ss sp ectrom etr ic cou n ter-ch eck s w ill be needed to low er the erro r lim its from the p resen t approxim ate 10% to perhaps 5%. T his lim it can be reached as we have shown for the sam p les with burnt h igh-en rich m ent fuel (c .f .t lj) .
D ep isch et al. [3] have tried the method on unirradiated plutonium sam p les and report on the isotope content of 239P u /240Pu, which d iffers by no m ore than 5% from the data g iven by the m anufacturer. F or the 0 .296 -eV reson ance of 239Pu with a peak c r o s s - s e c t io n of 4900 b it is n ece ssa r y to con sid er the influence of the 235U resonance at about the sam e energy and with a peak c r o s s - s e c t io n of 102 b. Obviously it depends on the ratio of the am ounts of the two iso top es and m ay be estim ated for a sam ple th ickn ess of about 3 X lCf4 a to m s/b of both Pu and U (as is the c a se for the KWO sam ple) to be about 3%. About the sam e influence m ay be expected from the contribution of the 0 .257 -eV resonance of 241Pu. So an estim ate for the 239Pu content with an uncertainty of about 6% m ay be r e a lis t ic . But, e sp e c ia lly for th is reson an ce, sh ort m easuring tim es m ay be expected s in ce it is located on the h igh-en ergy wing of the rea cto r M axwell sp ectrum .
A s an exam ple for the an a lysis F ig .4 shows the shape fit of the 1 .056-eV 24°pu reson an ce .
The principal advantage of the neutron reson ance an a lysis method over other m ethods is that the am ounts of the m entioned h eavy-m eta l iso top es can be found as absolute va lu es, without ch em ica l treatm ent of the sam ple, and without the need for any cooling tim e. The only nuclear data needed are the reson an ce p aram eters. F rom the safeguards point of view it m ay be n ece ssa r y to have a m ethod for h eavy-m eta l determ ination in spent fuel.With the neutron reson ance an a lysis m ethod, fuel e lem en ts m ay be in vestigated b efore dilution. The follow ing p resen t d isadvantages of the m ethod m ay be considered: an in tensive ep itherm al neutron sou rce is needed, the chopper t im e -o f-flig h t sp ectrom eter is a rather com plicated d evice and for the an a lysis a la rg e com puter is n ece ssa r y . A reactor with high ep itherm al flux is certa in ly the m ost convenient neutron sou rce .The t im e -o f-flig h t sp ectrom eter m ay be considerably sim p lified . It may worked with constant rotor sp eed , it m ay be in creased in in tensity , in ord er to reduce the m easu rin g t im e s , and o n -lin e an a lysis m ay be in sta lled .
SUMMARY
Neutron reson an ce an a lysis as an independent m eans for an absolute a ssa y of h eavy -m eta l contents in irradiated nuclear fuel m ay be ea s ily carried out, even n on -d estru ctively , by a s im p le energy-dependent tran sm iss io n m easu rem ent. R esu lts from a low -en rich m en t UOg fuel elem ent are co n sisten t with the r e su lts of other m ethods. M ore m easu rem ents on irrad iated fuel have to be done in co -op era tion with in stitu tion s, which can supply irrad iated fuel with d ifferent uranium contents, enrichm ents and burnup h is to r ie s . T h is a llow s the erro r lim its and m easu rin g tim es to d ecr ea se . The d etectab le am ounts of m ateria l are in the reg ion of m g /g fuel. M easuring tim es of an hour per sam ple are obtainable.

632 PRIESMEYER and HARZ
The amount of the unused uranium and the bred plutonium may be determ ined sim u ltan eou sly . No cooling tim es are n ece ssa r y to perform the m easu rem ent.
R E F E R E N C E S
[ 1 ] PRIESMEYER, H .G ., HARZ, U . , ATKE 25_( 1975) 109.[2 ] SIMPSON, OESTREICH, BERRETH, 6th Int. Conf. Nondestructive Testing, Hanover, 1-5 lu n e, 1970,
Rep. N o .N 3 .[3 ] DEPISCH, F . , HICK, H ., WEINZIERL, P . , Acta Physica Austriaca 25 (1967) 279.

IA EA -SM -201/86
COOLING-TIME DETERMINATION OF THE NUCLEAR FUEL FOR A VVR-S REACTOR
I. URSU, E. RODEAN, O.M. FARCA§IU,V. IONESCU, R. DUMITRESCU, P.S. STANESCU,T. RO§ESCU, C. DEBERTH Institute of Atomic Physics, Bucharest,Romania
Abstract
COOLING-TIME DETERMINATION OF THE NUCLEAR FUEL FOR A VVR-S REACTOR.The coo lin g tim e for exposed nuclear fuel in a light-w ater-m oderated research reactor of 10<7o enriched
fu el was studied for 30 EK -10-type fuel assem blies. For this purpose, the scanning of the fuel assem blies was done with a m ob ile m ech an ica l d ev ice and a Ge(Li) detector coupled to a m ultichannel analyser. The fuel assem blies were im m ersed in the coo lin g pond under a 3 -m -th ick layer o f w ater, and the measurements were performed at various angles. The system atic experim ents ind icated that the im m ersion angle makes an important contribution to the quality o f the results. The optimum value o f this angle was also established. The experim ental results show that many fission-product isotopes can be used for the co o lin g -tim e determ ination; in this report the optimum ch o ice o f these isotopes for this type o f reactor is given. It was also found that the total tim e interval can be divided into a few subgroups, each o f w hich has an equation o f a sp ecific an alytical form. The use o f the com bined experim ental results and o f theoretical ca lcu lation allows coo lin g tim es, w hich agree w ell with the real valu es, to be predicted.
INTRODUCTION
The m easu rem ent of the irrad ia ted nuclear fuel p aram eters in the cooling pond of a nuclear re se a rch reactor is one of the m ain p urposes of the national safegu ard s system .
Thus, coo lin g -tim e determ ination of the nuclear fuel a sse m b lie s is n e c e ssa r y both for safeguards in spection and as in itia l data in the subsequent burnup m easu rem ent of spent fuel by m eans of gam m a-ray sp ectrom etry .
A v er y in terestin g m ethod and device for gam m a identification of the irrad iated fuel a sse m b lie s has been reported [ 1, 2, 5], w here an a ir channel is u sed in the w ater for gam m a rays and an im m ersio n angle of 45°.
T his paper d esc r ib es how we u sed the sam e m ethod, but with an optim ized im m ersion angle, for se v er a l n on -d estru ctive gam m a-ray sp ec tr o m etry m easu rem en ts, corre la ted with the cooling tim e of nuclear fuel a sse m b lie s type EK -10 of the VVR-S nuclear reactor from the Institute of A tom ic P h y s ic s in B ucharest.
Thus, it is p o ssib le to v er ify op erators' statem ents on the cooling period of th is fu e l elem ent by u sing non-destructive gam m a sp ectrom etr ic m easu rem en ts of the irrad ia ted fuel a sse m b lie s .
633

6 3 4 URSU et a l.
MEASUREMENT CONDITIONS
The gam m a sp ec tro m etr ic m easu rem en ts w ere carried out on spent nuclear fuel a sse m b lie s of 10% enrichm ent EK -10 type im m ersed in the cooling pond under a 3 -m -th ick layer of water.
The m echan ica l m easuring device (F ig .l) was made in our institu te [4] including the fo llow ing parts:
Two alum inium tubes E j and E 2 which form an a ir channel for f is s io n - product gam m a rays;
Two guiding tubes D: and D2, bound by supporting tube B;Tube C n eed ed to support the nuclear fuel a ssem b ly I during m easurem ents;Tube H is u sed to handle the nuclear fuel assem b ly;The lead c o llim a to r -filte r at the upper end of tube E2 in front of theGe(Li) detector.
The design of th is portable device m akes it p o ssib le to change the im m ersio n angle from 20 to 110°.
The e lec tro n ic equipm ent co m p rises the follow ing parts:
A Ge(Li) d etector with 30 cm3 active volum e and 2.2 keV reso lu tion at 1332 keV;
Charge p ream p lifier , lin ear am plifier e tc ., etc.;A m ultichannel an a lyser with 4096 channels;Printing device;X -Y record er.
EXPERIM ENTAL MEASUREMENTS
F ission -p rod u ct gam m a-ray sp ectra m easu rem en ts of 30 irrad iated fuel a sse m b lie s (EK -10 type) from 500 up to 2300 keV w ere carried out. The tim e n e c e ssa r y for one routine m easurem ent of a fuel a ssem b ly was 20 m in (10 m in for m easu rem ent and 10 m in for data printing and for changing the fuel assem b ly).
The obtained gam m a-ray sp ectra w ere reduced by m eans of PEGGY 3 com puter program w ritten in FORTRAN IV for an IBM 3 7 0 /135 com puter.
The influence of the im m ersion angle (the angle between Ej. and D2 tubes) on the obtained sp ectra was m easured .
The variation of the im m ersion angle between 20 and 90° showed that peak area s or peak ra tio s m ay change up to 50% for different an gles. In subsequent m easu rem en ts we chose the optim um im m ersion angle of 90°. The m easu rem ent point was chosen in the "30-cm " position of the fuel a ssem b ly active length; th is w as estab lish ed to be the optim um p osition by longitudinal scanning m easu rem en ts (F ig .2).
It is w ell known [ 1] that activ ity ra tio s of som e f is s io n products can provide u sefu l in form ation in connection with the cooling tim e and burnup of the spent nuclear fuel.

IA EA -SM -201/86 635
FIG .l. M echanical measuring d ev ice .

6 3 6 URSU et al.
FIG.2. R elative axial distributions of134Cs(605 k e V )/137Cs(662 keV) activ ity ratios ( О ) 134Cs(797 k eV )/137Cs(662 keV) activ ity ratios fET) 137Cs:662-keV activ ities ( x _ )134Cs: 605-k eV activ ities ( Д )134Cs: 797-k eV activ ities ( e )
To find the optim um coo lin g -tim e m onitors, we con sid ered the follow ing gam m a-ray peak area ratios:
134C s(605 k eV )/137Cs(662 keV) 144Pr (696 k eV )/137Cs(662 keV)95Z r(724 k eV )/137Cs(662 keV) 134C s(797 k e V )/13t : s (662 keV)
144Pr(2186 keV )/137Cs(662 keV)
In F ig s 3 - 7 the above-m entioned ra tio s are grap h ica lly rep resen ted as a function of cooling tim e. The slope of each exp erim en ta l curve is d irectly corre la ted with the h a lf- life of the f is s io n product from the num erator of the con sid ered ratio . E xperim ental points of th ese cu rves w ere fitted by m eans of an ETALON com puter program with a function of the fo llow ing form:
R = ex p -tC jt - C2)
where R is the ratio va lu e, t is cooling tim e in y ea r s , and and C2 are constants.

IAEA-SM-201/86 637
FIG-3- D ependence o f 134Cs(605 k e V )/137Cs(662 keV) activ ity ratios on coo lin g tim e .
FIG-4. D ependence o f 144Pr(696 k e V )/137Cs(662 keV) activ ity ratios on coo lin g tim e.

638 URSU et al.
FIG.5. D ependence o f 95Zr(724 k eV )/137Cs(662 keV) activ ity ratios on coo lin g tim e.
FIG.6. D ependence o f l34Cs(797 k e V )/137Cs(662 keV) activ ity ratios on coo lin g tim e .

IAEA-SM-201/86 639
The coo lin g-tim e m easu rem en ts can be perform ed with e r r o r s between 2 and 15% if we use the follow ing ra tio s as su itable quantitative m onitors:
(1) The activ ity ratio 95Zr(724 k eV /131C s(662 keV) for cooling tim e from 0.5 to 1.5 yr;
(2) The activ ity ratio 144P r(696 k eV )/137C s(662 keV) for cooling tim e from 1.5 to 3 yr;
(3) The activ ity ratio 144Pr(2186 k eV )/137Cs(662 keV) for cooling tim e from 3 to 7 yr.
CONCLUSIONS
With the help of the h igh -re solution gam m a-ray sp ectrom etry and using the d evice d escrib ed in th is paper, it is p ossib le by routine m easu rem ents to v er ify the cooling tim e of spent fuel. The device i s transportab le, it can be carried in a van, and can at the sam e tim e be u sed for other m ea su rem ents in the national safegu ard s sy stem [ 5 ].
Our r e su lts in dicate that the gam m a sp ectro m etr ic m ethod using h igh -reso lu tion d etec tors is p ractica l and fa st for spent fuel identification from the asp ect of safeguards.
640 URSU et al.
A C K N O W L E D G M E N T
The authors are indebted to the sp e c ia lis ts of our nuclear reactor,Dr. C. N icoresteanu , I. V iisoreanu and V. N eica , for th e ir a ss is ta n ce , and to Dr. A. Stefanescu for h is constructive com m ents and su ggestion s. At the sam e tim e we thank L. Defta and M. C aisin for th e ir help in co llectin g and p ro cessin g the raw data.
R E F E R E N C E S
[1 ] DRAGNEV, T ., BEETS, C ., Identification o f irradiated fuel elem en ts, EUR 4576 e - KFK 1100 (1971).[2 ] BEETS, C ., DRAGNEV, T ., "Aspects o f the control o f representative industrial installations'', Peaceful
Uses A tom ic Energy (Proc. 4th UN Conf. G eneva, 1971) 9 , IAEA, Vienna (1972) 449.[3 ] ROSMUSSEN, H .C ., in Proc. Symp. Safeguards Research and D evelopm ent, Rep. 1 WASH 1076 (1967) 130.[4 ] BREVET (Patent), R.S.R. No. 77411.[ 5] COHEN, I ., GUNDERSEN, G ., "Field experience with the AEC m easurem ent van”, Institute o f Nuclear
M aterials M anagem ent. (T w elfth Annual M eeting, West Palm Beach 1971) 2 (1971) 549.

APPLICATION OF NEUTRON ACTIVATION ANALYSIS, GAMMA SPECTROMETRY AND NUCLEAR TRACK DETECTORS FOR REACTOR FUEL ASSAY*
P. RAICS, M. VARNAGY, S. NAGY, S. DAROCZY Institute of Experimental Physics,Kossuth University, Debrecen,Hungary
IA EA -SM -201/93
Abstract
a p p l ic a t io n o f n e u t r o n a c t i v a t i o n a n a l y s i s , g a m m a s p e c t r o m e t r y a n d n u c l e a r t r a c k
DETECTORS FOR REACTOR FUEL ASSAY.A com bined p assive -active assay technique is being developed for non-destructive determ ination o f the
238U /235U ratio in fresh uranium fu el elem en ts. T he passive assay using gam m a rays o f th e uranium isotopes m akes it also possib le to estim ate the sam ple thickness and the absolute am ount. T he a c tiv e interrogation is based on t h e 23i:U (n ,2 n )23,U reaction at 14 M eV. These methods are fairly independent of the sam ple geom etry and in h om ogen eities. Preliminary experim ental results are also presented. A possible m ethod for the nondestructive m easurem ent of fu el burnup is outlined . This is based on the counting o f spontaneous fission neutrons by so lid -sta te nuclear track detectors. Investigation o f the detector-jum ping spark counter system is described.
1. INTRODUCTION
The n on -d estru ctive determ ination of the iso top ic com position of fiss io n a b le e lem en ts in rea cto r fu e ls can be carried out by eith er p a ss iv e or active m ethods or by both. The p a ss iv e a ssa y is based on the natural rad ioactiv ity of the iso to p e s . Gamma rays or neutrons from spontaneous f is s io n are detected and the alpha d ecay heat can a lso be m easu red . The active in terrogation techniques use neutron- or gam m a-induced f is s io n or other n uclear rea ctio n s . Prom pt or delayed neutrons and gam m as are counted or the induced rad ioactiv ity is observed through gam m a-ray detection . T h ese m ethods can a lso be applied to fre sh and spent fuel.
The techniques and instrum entation of the p rocedu res and the nuclear data req u irem en ts are rev iew ed in the literatu re in d eta il, e . g. [1 , 2, 3 ] . T h is paper is lim ited to d escrib in g p relim in ary exp erim en ts which w ere m ade to obtain exp erien ce with a com bined p a ss iv e -a c tiv e a ssa y for the n on -d estru ctive determ ination of the 238U /235U гац 0 fn fre sh fuel e lem en ts . The p rin cip le of the p roced u res and their r e su lts w ill a lso be d iscu ssed .A p o ss ib le m ethod to m easu re the fuel burnup by the d etection of neutrons from spontaneous f is s io n of transuranic e lem en ts i s a lso m entioned.
* Work partly supported by the International A tom ic Energy Agency
641

642 RAICS et a l.
TABLE I. DECAY DATA OF 235U AND 238U
235ц !38u
Ey (k eV ) !y (%) E y (k eV ) Iy (7»)
1 43 .776 1 0 .2 0 ± 0 .3 0 742 .70 0 .0 9 0 5 ± 0 .0023
1 63 .363 4 .7 6 0 .1 5 76 6 .2 7 0 .3 0 7 0 .0 0 6
1 85 .718 5 2 .9 1 .0 786 .28 0 .0 5 2 0 0 .0016
2 0 2 .1 3 3 -I1 0 0 1 .0 0 .8 0 3 0 .012
2 0 5 .3 1 1 J
* 2 0 4 .7 8 5 .4 7 0 .13
S p ecific activity S p ecific activity
4 7 9 8 .1 ± 3 .3 7 4 6 .1 9 ± 0 .41
d is /m in . mg 235U d is/m in . mg 238 U
2. INVESTIGATIONS ON A COMBINED PASSIVE-ACTIVE ASSAY METHODFOR DETERMINING THE 238u / 235U RATIO IN FRESH FUELS
The n on -d estru ctive determ ination of the uranium isotop e ratio has to be carried out in variou s p ractica l configurations. T h is re fe r s to the geom etry, the m atrix and wrapping m ateria l and the th ickn ess of the fu e ls .
2 . 1 . P a ss iv e a ssa y with G eLi gam ma sp ectrom etry
D etection of the gam ma rays from the natural rad ioactive decay of 235U and 233U m akes it p o ss ib le to mea'sure th e ir contents. The data of the in tensive lin es (apart from gam m as below 140 keV) are su m m arized in Table I. Gamma en erg ie s of 235U are those reported by Cline (cited in (4]) , sp ec ific a c t iv itie s are from R ef. [ 5 ] , w hile a ll other data are from a p relim in ary evaluation of our exp erim en ts. (The re la tiv e in te n s itie s agree w ell with the data m easu red by Teoh et a l. [ 4 ] . )
It se e m s to be convenient to use the 185- and 1001-keV lin es as a m easu re of the 235u and 238U amount, re sp ec tiv e ly . N ev e rth e less , d ifficu ltie s a r ise b ecau se of the main fea tu res of the uranium gam ma spectrum :
(a) The low energy of a ll 235U lin e s is the m ajor lim ita tion for applying the sim p le p a ss iv e a ssa y to fuels with a con sid erab le th ickn ess or a m atrix of dense m ater ia l. A solution to th is problem is cited in R ef. [1] for hom ogenous sa m p les.
(b) The com plete separation in en ergy of the u sefu l lin es of the two iso top es m ay be an e s se n tia l sou rce of erro r in estim atin g the attenuation when in hom ogen eities occu r. T r a n sm issio n m easu rem en ts with a gam ma sou rce [6 ], of the com parison of the re la tiv e in ten s ities of gam ma lin es , can help to determ ine the re a l correction p r e c ise ly [ 7] .

IA EA -SM -201/93 643
(c) S ince the low in ten sity of the 238U gamma rays is further d ecreased by the detector resp on se , it req u ires a long tim e for sp ectrum storage .
The fo llow ing ex p ress io n can b e,used to determ ine the iso top ic ratio:
„ - E l i - § 1 v 7185 . . П185 Fiooi Iiooi n ,II t: О X X X X - \ -L /m ' a 7i001 lioo i Flg5 Ilg5
w here a5, a8 i s the sp e c ific activ ity of 235U and 238U, resp ec tiv e ly (in d is /m in -m g ), and y , p, F , I are the gam ma branching, detector effic ien cy , attenuation factor and the m easured in ten sity for the given peaks. The re la tiv e attenuation factor is
R _ Fi85 Fiooi
> 1 (2)
which is to be determ ined exp erim en ta lly , cf. problem para (a) in 2 . 1.A m ethod s im ila r to that of Cline [ 7] has been worked out. It takes the absorption and se lf-a b so rp tio n into account u sing the lo w - and h igh-en ergy lin e s sep a ra te ly . The total attenuation is
F -lE
1 - e~M’dЦ -d
x e ^ ’ d' (3)
w here p, d is the attenuation co e ffic ien t and th ick n ess of the m ater ia l of in te r e s t (e. g. U3Os ), p ' and d' are that of the wrapping m ateria l (Al).T h is ex p re ss io n a s a function of en ergy can be fitted by a s im p le exponential curve:
for 143. 776, 163. 363, 185. 718 and 204. 78 keV lin es of 235U,
(4)for 742. 70, 766. 27, 786. 28 and 1001 .0 keV lin e s of 238U.
Fe ~ e"k'E
i? ~ 0 -k *e Fe ~ e
T his approxim ation is valid in a narrow energy in terval for the low - en ergy gam m as and a w ider range fo r the h igh -en ergy on es. U sing litera tu re data [ 8 ] for the co effic ien ts one can ca lcu late these "exponential slopes" a s a function of the U3O8 th ickn ess for a given alum inium wrapping. It can e a s ily be seen that
d = f a(k) = f2 (K), k = f 3(K),R = f 4(k) = f5 (K), F1001 = f 6(k) = f 7(K)
for constant Al th ic k n esses . T h ese functions are shown on F ig . 1. (It is a lso w orth w hile m aking a d s c a le . It i s drawn on the upper part of the F ig u r e .) The к an d /or К factors can be determ ined exp erim en ta lly by the lin es m entioned in Eq. (4) u sing the re la tive in te n s itie s corrected for the gam m a branching and d etector e ffic ien cy . T h ese constants then give the re la tiv e (R) and absolute (F) ab so rp tio n /se lf-a b so rp tio n correction s and an estim ation for the U 3Og th ick n ess, d.

644 RAICS et a l.
0.06 Ql 0.2 03 Of. 0.5 Ю“ Cp6
5°to (K)Ql' ' 0,2 03 OAG5|
d, g/cm2U30e I .* (k>
FIG. 1 . T h e re la tive (R) and absolute (Fmoi) attenuation corrections and the sam ple thickness (d) as a function of к and K.
The m ain fea tu res of th is method are:
(a) F o r к the u ncerta in ties of the A l th ick n ess do not give r is e to sign ifican t e r r o r s in R and d above 2 x 10"3 (0. 2 g /c m 2) w hile F i s a lit t le m ore affected . The situation is quite d ifferent in the ca se of К for which the u sefu l range begins above 2 x 10"4 , i . e . 4 g /c m 2.
(b) The functions of к saturate at about 1 .4 x 10'2 , i . e . 4 g /c m 2 U3Og.The К can be used above th is th ickn ess up to 80 g /c m 2, thus th ese two p o ss ib ilit ie s n ice ly overlap . This is a lso m et by the fact that a su ffic ien tly la rg e amount of 238u would give accurate m easu rem ents for K.
(c) In the th ick n ess range where к w orks w ell the sim ultanious determ ination of К would re su lt an estim ate for the A l th ick n ess.
(d) The determ ination of the uranium amount i s a lso p o ssib le through F1C)oi and the absolute e ffic ien cy .
d, g
/cm
2 U
3O8

IAEA- SM-201/93 645
The m ethod i s applicable in gen eral c a s e s if appropriate gam m as could be found.
A gen eral uncertainty i s expected because of the approxim ation in Eq. (3) being valid only for p a ra lle l b eam s.
2 . 2 . A ctivation a n a ly sis with 14-M eV neutrons
A ctivation a n a ly sis with GeLi sp ectrom etry is not w id ely used to determ in e the iso to p ic ra tio s . The reason i s perhaps the com plexity of the resu ltin g gam m a sp ectra and the in su ffic ien t knowledge of som e nuclear data. G enerally the 238U(n, gamma) and 235U(n, f) reaction s are u tilized for the 238U / 235U determ ination . The gam ma lin e s of appropriately chosen f is s io n products and 239U [9 ] or 239Np [10] can be counted. T h ese m ethods se em to be re lia b le for re la tiv e ly sm a ll sam p les of good geom etry.
An attem pt w as m ade to apply the 14-M eV neutron activation a n a ly sis and the p a ss iv e a ssa y together for the determ ination of the 23Su / 235U ratio. The 238U(n, 2n)237U reaction i s proposed [ 14] which has a re la tiv e ly high c r o s s -s e c t io n at 14. 5 MeV to be about 700 mb. The h a lf- life of the 237U nuclide i s 162 h. One of it s gam m a rays is a 208-keV lin e with a branching in ten sity of 23. 3% [ 11 ] . 235U has it s com plex peak at 204. 78 keV average en ergy . The d ifferen ce between them is sm a ll enough to m ake the fo llow ing approxim ation:
O205 x *205 ~ П2О8 x *208 (6)
It rem ain s valid even for 4 g /c m 2 U30 8 within 1%. [The re la tive attenuation can be estim ated by the p a ss iv e m ethod if n e c e s s a r y .)
U sing the b a sic equations for the activation and in ten sity m easu rem ents the atom or w eight ratio m ay be calcu lated .
1 208 = N 8 X Ф x a x (1 - e~Xu‘T) x y208 x q208 x F2J8 - (7)
1205 = а5 X m 5 X 7 205 X r)205 x F 205 (8)
w here Ф is neutron flux in n /cm 2 • s; a is (n, 2n) c r o s s - s e c t io n in cm 2 ,X is d ecay constant of 237U; T i s irrad iation tim e; and N 8 i s the num ber of 238U atom s. The sa m p les m ust be analysed b efore and after the irrad iation . The exp erim en ta l procedure can be designed by the help of the p a ss iv e a ssa y .
The (n, 2n) c r o s s - s e c t io n sign ifican tly depends on the neutron energy which i s in connection with the sam ple geom etry and s iz e . To avoid this problem and other u n certa in ties re la tiv e m easu rem ents seem to be useful. Standard sam p les of fuel geom etry can a lso be fabricated from natural uranium . The re la tive flux can be m easured e a s ily by A1 fo il activ ity .Then the " sy stem constant", r is determ ined by irrad iating the standard:
r1 - e ~xAi - T- 1 - e _A-u • T’ x
m “m 8 x (9)
w here p r e f e r s to the sp ec ific activ ity of the fo il. Thus
= s i . = 1-т.е ' Хл1Т. x 1 I x I mm 5 _ 1 - e - 4 j T i Ai r I205n (10)

646 RAICS et a l.
(i) 239Np (2. 35 d) is generated by the 238U (n, gamma) reaction and the 239U decay. Ey = 209. 76 keV, 3.42%. If ro o m -sca ttered neutrons are not p resen t the effec t is n eg lig ib le . R elative m easu rem ents are not disturbed.
(ii) F is s io n fragm ents: 149Nd (1. 73 h), 208. 1 keV, 2 . 5 % , 211 . 3 keV, 23% and 134Te (42 min) 210, 8 keV, 22. 2% [ 11] . A 10-h cooling tim e is n ece ssa r y for low enriched sa m p les.
(iii) M atrix effects: 20 2 . 4 - k e V (97%) line of 90Ym (3. 19 h) generated through the 90Zr(n, p) reaction . T his in terferen ce has not yet been investigated in d eta il.
A lum inium m atrix or wrapping can cau se other p rob lem s although its gam m a lin e i s of high energy: the detector sy stem can be overloaded becau se of the in ten sity . This is a lso a problem regarding the f is s io n - product gam ma activ ity .
The ch a ra c ter is tic s of th is method are:
(a) The in hom ogen eities and the sam ple geom etry do not affect the resu lts;
(b) B ecau se of the lim ited p en etrab ility of the gam m a lin es used this m ethod g ives in form ation from re la tiv e ly thin la y e rs only;
(c) The p rocedure i s not rapid: 20-30 h are n ece ssa r y to com plete a p a ss iv e -a c tiv e a ssa y in the b est c a s e s .
2 . 3 , E xperim ental * 60
Apparatus
A GeLi d etector of 40 cm 3 and a 4000-channel an a lyser (Intertechnique) constitute the sp ec tro m eter . R esolution is about 2. 8 keV fo r 200 keV.The e ffic ien cy of the sy stem was determ ined by 226Ra, 182 Та, 149Nd and standard so u rc es .
A neutron generator with analysed deuteron beam of ~ 0 . 5 mA was used. The irrad iation tim e was 1 -6 h depending on the enrichm ent of the sa m p les.
The flux m easu rin g Al fo ils w ere counted in a 47r/3-device.
Sam ples
D isc -sh a p e d sam p les (19 mm in d i a m . ) of variou s th ic k n esses w ere m ade. 235U content: natural, 20, 36. 3 and 92.3%.
F u e ls of EK10 and VVRSzM type w ere availab le . (EK10 data: length 50 cm , d iam eter 10 m m , A l wrapping 1. 5 mm, 10% 235U content; VVRSzM:60 cm , 11 m m , 0 . 75 m m, 36%, tube geom etry, probably UA1 a lloy of 1 m m th ic k n e s s .)
F u e l standards w ere fabricated from natural uranium . T heir length is 10 cm , other d im ensions are the sam e as the reactor fu e ls .
A ll standards and the enriched uranium d isc sam p les are of U30 8.
Interference problems:

IAEA-SM-201/93 647
M easurem ents
The fuel rods have been rotated during irrad iation and gam m a counting, which was made through a 15 -m m -th ick lead co llim ator having a window of 1 5 x 1 5 m m 2 . The co llim ator resp on se as a function of the gam m a energy w as determ ined exp erim en ta lly . The effic ien cy of the d etector sy stem was an average value for the sam ple geom etry.
Com puter program s w ere used to evaluate gam m a sp ectra , decay cu rves and p a ss iv e a ssa y p rob lem s.
2 . 4 . _R esu lts and d iscu ssio n
E xp erim en ts w ere perform ed on uranium standard sam p les of natural abundance to te s t the p a ss iv e a ssa y . D isc a s w ell as fu e l-sh ap ed m ateria ls w ere analysed on the b a sis of the k. The th ick n ess i s in the in terva l of 0 . 0 7 - 2. 36 g / c m 2 . The average iso top ic ratio is found to be 135. 89 ± 1 . 16 which is le s s than the rea l one by 2. 8%. A ll m easured va lu es including the fuel standards are l e s s than expected; thus the d ifferen ce is sy stem a tic .The sam ple th ick n ess and the absolute 235U content are overestim ated by a factor of 1 . 10 and 1. 02, re sp ec tiv e ly . A ll th ese prob lem s m ay be caused by in su ffic ien t accu racy of the gam m a branching in ten s ities and the effic ien cy . It se e m s worth w hile revaluating the m easu rem en ts on the decay data and e ffic ien cy .
TABLE II. RESULTS OF THE PASSIVE AND ACTIVE ASSAY a
Sam ple Passive A ctive A verage
1 . 20% 19 .6 7 1 8 .3 0 1 8 .9 6n - 4 4 .0 8 4 4 .4 6 3 4 .2 7 4m5 = 1 6 9 .6 5 1 8 1 .8 9d = 0 .3528 0 .3 8 5
2 . 36.3% 3 7 .3 3 3 4 .6 1 3 5 .9 2n = 1 .7548 1 .6 7 8 8 1 .8 8 9 4 1 .7 8 4m5 =: 3 0 7 .8 9 325 .77d = 0 .3528 0 .3 6 5
3 . 92.3% 90 .2 9 90 .8 5 90 .56n = 0.08342 0 .1076 0 .1007 0 .1 0 4m5 = 7 9 3 .5 2 8 3 5 .2 3d = 0 .3576 0 .3 6 0
4 . VVPSzM fu el. 36% 3 5 .5 5 3 7 .2 0 3 6 .3 6n = 1 .7 7 8 1 .8 1 3 1 .6 8 8 1 .751m5 = 5300 6980d = 0 .2 5 0 .4 2
5 . EK10 fu e l, 10% 9 .66 1 0 .0 4 9 .8 5n = 9 9 .3 5 8 .9 6 9 .1 5m5 = 8000 7490d = 2 .2 9 2 .3 0
a For d efin ition o f sym bols, s ee section 2 .4 .

648 RAICS et al.
R esu lts for the p a ss iv e and the com bined p a ss iv e -a c tiv e a ssa y of enriched sam p les are su m m arized in Table II. The w eight per cent content is ca lcu lated from the m easu red iso top ic ratio , n with 234U n eglected . The f ir s t three r e su lts re fer to d isc sa m p les. The 235U content in sam ple 1 and the fu e ls are nom inal while the other two have m a ss sp ec tro m etr ic c e r t if ic a tion. The 235U m a ss , m 5 in mg, the th ick n ess, d in g /c m 2 as U30 8, are a lso indicated . (The VVRSzM fuel is of UA1 alloy which ca u ses the estim ated th ick n ess to be w ro n g .)
It is evident that the h ighly enriched sam p les are unfavourable b ecause of the d ifficu lties in the m easu rem en ts and evaluation . Now, in the ca se of the p a ss iv e a ssa y the iso top ic ra tios are h igher than expected in con trast to the p revious exp erim en t. The deviations are not too large except for sam ple 3. The active in terrogation se e m s to have a greater sy stem atic er ro r , e sp e c ia lly for the d isc-sh ape powder sa m p les. It m ay be caused by uncerta in ties of the re la tiv e flux determ ination when high flux is used.
The erro r in the ratio i s estim ated from the exp erim en ts and is 2 - 4% for the re la tiv e m ethod of p a ss iv e -a c tiv e a ssa y in the m edium enrichm ent region . R ecen tly sy stem a tic e r r o r s have dom inated. The accuracy of the p a ss iv e technique is estim ated to be 5 - 8% for the above conditions but it i s now p ra ctica lly the sam e as for the com bined m ethod.The re a l e r r o r s could be an alysed by the m easu rem ents of a s e r ie s of enriched sam p les of the given geom etry.
It may be concluded that th ese m ethods would give re lia b le r e su lts in good con d itions. The advantage is the s im p lic ity of the n e c e ssa r y exp erim en ta l fa c il it ie s . The m ain disadvantage is the re la tiv e ly long tim e n e c e ssa r y for the a n a ly s is .
3. POSSIBLE METHOD OF BURNUP DETERMINATION USING SOLID-STATE NUCLEAR TRACK DETECTORS FOR NEUTRONS FROMSPONTANEOUS FISSION
V arious n on -d estru ctive p roced u res are used to determ in e the fuel burnup: gam ma sp ectrom etry of the f is s io n fragm en ts, activation an a lysis , neutron a d so rp tio n -tra n sm iss io n , and ca lorim etry [ 12] . G enerally the spent fuel in vestiga tion s are d ifficu lt becau se of the high background from gam m a ra y s . The long cooling tim e needed by som e of the m ethods may so m etim es be a prob lem .
3 . 1 . The p rin cip le of the m ethod
The spontaneous f is s io n neutron activ ity of the spent fu e ls m ay be a m easu re of the g ro ss amount of the transuranic elem en ts generated during the reactor operation . Although the contribution of the iso to p es to neutron activ ity i s v ery d ifferent and depends on the burnup le v e l th is m ethod would give inform ation about the burnup it s e l f . The neutrons can be detected by so lid -s ta te n uclear track d etec to rs (SSNTD) with con verters even in a high gam m a background.
E stim ation s on the expected neutron in ten s ities w ere carried out for different exp osu res fo r b o ilin g -w ater rea cto r fu e ls of 1. 5% enrichm ent.

IA EA -SM -201/93 649
The ca lcu lation s w ere based on data for spontaneous f is s io n sign atures and the com p osition of fu e ls [ 13 ] . Supposing the con verter fo ils to be 70% 235U for the SSNTD, the m inim um irrad iation tim e w as calcu lated for the f is s io n neutron sp ectrum and for th erm alized neutrons. T h is la tter ca se would require approxim ately 10 m in for a fuel elem en t of 1 kg uranium at 10000 MW d/t exp osu re.
3 . 2 . E xperim ental
R ecen tly the SSNTD has been exam ined. F o r rapid data evaluation a jum ping-spark counter was built. It i s applicable to count-etched f is s io n - fragm ent tracks in p olym er fo ils of 5 - 20 pm th ick n esses in a continuous or a s tep -b y -s te p reg im e.
E xp erim en ts w ere carried out with M acrofol KG of 10, 12 and 15 pm , a K im fol of 12 pm and a M elinex S of 12 and 19 pm thick. The fo ils w ere irrad iated by f is s io n fragm ents from a 252Cf sou rce to find the optim al etching and sparking p roced u res. U sin g th ese conditions the counting c h a ra c ter is tic s of the sy stem are: R eproducib ility uncertainty 0. 1%, total counting effic ien cy 98 - 100%, slope of the p lateau in the 450 - 850 V in terval 0. 0 0 5 / V.
The effec t of the high gam ma background on the d etector c h a ra c ter istic s w as exam ined at a 2. 5, 9. 5 and 34. 5 Mrad dose of 60Co. F or 9. 5 Mrad a 0. 3, and for 34. 5 Mrad a 0. 7 -tr a ck /cm 2 background w as ob served at a counter vo ltage of 900 V.
R E F E R E N C E S
Ш KEEPIN, G .R ., BRAMBLETT, R .L .. HIG1N BOTHAM, W .A ., 4th Int. Conf. Peacefu l Uses A tom .■Energy (Proc. UN Conf. G eneva, 1971) j), IAEA, Vienna (1972) 413 .
[2 ] THORPE. M .M ., Sym p. A ppl. N ucl. D ata S e i. T echn . (Paris, 1973) IA E A /SM -170/54 (LA -UR -73 -2 2 6 ).[3 ] WEITKAMP, C . , in Fission Product N uclear Data (Proc. Panel, Bologna, 1973) 1 , IAEA, Vienna
(1974) 191 (Internal p u b l.) .[4 ] TECH, W ., CONNOR, R .D .,. BETTS, R .H ., N ucl. Phys. A228 3 (1974) 432 .[51 JAFFEY, A .H ., FLYNN, K .F . , GLENDENIN, L .E ., BENTLEY, W .C ., ESSUNG, A .M ., Phys. Rev. 46 5
(1971) 1889.[6 ] PARKER, J .L ., e t a l . , La-4705-M S (1971) 12 , cited in R e f .[ 2 ] .[7 ] CLINE, J .E ., ANCR-1055 (1972), cited in Ref. [ 2 ] .[8 ] STORM. E ., ISRAEL, H .I . , N uclear Data Tables A7 (1970) 565.[9 ] TURKSTRA,. J . , STEYN, W .M ., DeWET, W .J ., N ucl. Inst. Methods 63 (1968) 269.
[1 0 ] MANTEL, M ., GILAT, J . , AMIEL, S . , in Proc. Int. Conf. Mod. Trends A ct. An. (Proc. Conf. Maryland, 1968) 1 , NBS. S pec. Publ. 3 1 2 /4 8 2 .
[1 1 ] BOWMAN, W .W .,‘ MacMURDO, K .W ., A tom ic Data and N uclear Data Tables 13 (1974) 89 .[1 2 ] MAECK, W .I ., Fission Product Nuclear Data (Proc. Panel, Bologna 1973) J., IAEA, Vienna (1974) 163.[1 3 ] DRAGNEV, T .N . , private com m unication .[1 4 ] RAIOS, P . , A tom ik i, K ozl 13 4 (1 9 7 1 ) 165. In Hungarian


IA EA -SM -201/94
A METHOD - AND ITS APPLICATION - FOR NON-DESTRUCTIVE DETERMINATION OF NUCLEAR MATERIAL QUANTITIES
H. DAOUD, K. ENGELHARDT Hochtemperatur-Reaktor bau GmbH,Mannheim,Federal Republic of Germany
A METHOD - AND ITS APPLICATION - FOR NON-DESTRUCTIVE DETERMINATION OF NUCLEAR MATERIAL QUANTITIES.
T he THTR-burnup measurem ent reactor is a sm all cr itica l 235U /graphite assem bly designed to m easure th e burnup in fu el e lem ents discharged from the THTR p ebble- bed-reactor core. T he inform ation obtained is used to op tim ize the burnup for each individual fu e l e lem en t, and th e core configurations by directing th e flow o f fissib le m ateria l accord ingly. T he THTR fu el elem ents containing an amount of fiss ile m aterial roll through a tube at the centre o f the assembly on a 7-second c y c le . Ion chambers rem ove from the tube m easure the transient due to the passage o f the fu el elem en t; im m ediately afterwards the system is autom atically re -stab ilized before passage o f the next fu el e lem en t. An analysis o f the transient ind icates the am ount o f the fiss ile m ateria l in the fu el e lem en t.
1. GENERAL THEORY
The p hysica l p rin cip le of the method is that a sam ple which is introduced into a c r it ic a l reactor at the position r, cau ses a reactiv ity change p(r) of the sy stem . p(r) depends on the geom etr ica l data and the neutron p h ysics p aram eters of the sam ple on the one hand, and the neutron p h ysics p rop erties of the reactor, e sp e c ia lly at the position r on the other. The neutron reaction s, i . e . fiss io n , capture, m oderation and scatter in g , which m ainly occur between the neutrons in the reactor and the n uclei of the sam ple, in fluence the neutron population in the reactor and cause the reactiv ity change p(r). In general, it fo llow s from the perturbation theory [1 ] that the reactiv ity changes caused by a perturbation at the p osition r in the rea cto r owing to fis s io n , absorption, m oderation, and sca tter in g m a ter ia ls are
Abstract
К (1)
(2)К
Pm(r ) (3)К
6 5 1

652 DAOUD and ENGELHARDT
psw = -Sample
[6 DF V l f ( r ) V $ F(r) + SDjbVSjbfr) V $ th(r)] dv
К (4)where
Pf(r), Pa(r)'| The rea ctiv ity change due to fiss io n , absorption, pm(r), ps(r)J m oderation, and sca tter in g m ater ia ls
Ф±(г) - T herm al fluxФР(г) - F a st flux6 D th> 6 Dp - Perturbation in therm al and fa st diffusion coeffic ien t
- Adjoint solution
5 Ea, b v £f ] P erturbation in therm al absorption, therm al f is s io n6 Er j and rem oval
dv - A volum e elem en t at r of assu m ed perturbation position
к - J v Ef$fh(r) Фл (г) dvreactor
(In Eqs (1) and (2) we n eg lec t the fa st absorption and the fa s t f is s io n in com parison with the therm al absorption and therm al fission )G enerally
P(r) = pf (r) + pa(r) + pm(r) + ps (r) (5)
If we n eg lect the e ffec t of flux d ep ression due to the sam ple, .the . perturbation equations are lin ear in the quantity of m a ter ia ls p resen t within the sam p le. Thus, if the s ig n a l/u n it weight of each nuclide is obtained by calibration a s in fluence function R;(r)
. p(r) = ^ W 1R 1(r) (6)1
being the w eight of nuclide i. A ccording to Eqs (1) to (4) the influence functions Ri(r) are dependent on the neutron flu xes, im portance functions, and their d erivations which are functions of position . F or m a ter ia ls in which the neutrons cau se d ifferent neutron reaction s, the Rj(r) are gen erally independent of each other. Should it be p o ssib le to m easu re the reactiv ity change due to a sam ple at d ifferent p osition s in the reactor, for which the in fluence functions Ri(r) are known, one can obtain the quantity of the m a teria ls for which the Rj(r) are not proportional to each other.
2. APPLICATION OF THE METHOD IN TH TR-300
2 . 1 . Introduction
The THTR pebble-bed rea cto r [ 2] , which i s now under construction by HBR (H ochtem peratur-R eaktorbau GmbH) for HKG (H ochtem peratur- K ernkraftw erk GmbH), has a core con sistin g of sp h erica l fuel e lem en ts in a s ta tis t ic a lly arranged bed, surrounded by b locks of re flec to r graphite.

IA EA -SM -201/94 653
F I G .l . Spherical fu el elem en ts for THTR p ebble-bed reactor.
Each of the 60 -m m -d iam . sp h erica l fuel e lem en ts (F ig. 1) for th is reactor type typ ica lly c o n s is ts of a fu e l-b ear in g graphite m atrix of 50 m m diam . en clo sed by a fu e l-fr e e zone of 5 m m th ick n ess. The fuel e lem en ts are m ade up of about 192 g graphite containing the fuel in the form of coated p a r tic le s . The constituents of the fuel in a fre sh fuel elem en t are about 1 g of highly enriched uranium (93%) per e lem en t a s f i s s i l e m ateria l plus10. 2 g thorium as fe r tile m ater ia l. The contents of f is s i le and fer tile m a ter ia ls change with irrad iation tim e . The irrad iation of the fuel elem en t lea d s to reductions of fe r tile and f i s s i l e m ateria l. The f is s i le m ateria l is partly replaced by con version of the fer tile m ateria l, and f is s io n products are produced by burnup of the f i s s i l e m a ter ia ls .
The re fu ellin g of the p ebble-bed reactor is carried out by continuous recy c lin g of the fuel e lem en ts into the core . The elim ination of the burnt- up e lem en ts from the cy c le and the recy c lin g of the r e s t of the fuel e lem en ts and the fr e sh e lem en ts to d ifferen t regions of the pebble-bed core, according to th e ir sta te of burnup, make it n e c e ssa r y for the fuel-handling fa c ility of the THTR to be provided with an in sta lla tion to m easu re the sp ec ific nuclear p ro p erties of the e lem en ts . F o r this a burnup m easu rem ent fa c ility , using the p rin cip le d iscu sse d in sectio n 1, was developed; as a prototype fa c ility the 100-W ADIBKA-1 reactor was operated in the HRB lab ora tories . T h eoretica l and exp erim en ta l work was carried out on the ADIBKA-1 reactor to study the p h ysica l p rob lem s of the method and to op tim ize the fa c ility to be used fo r TH TR -300. The p ositive re su lts of that work led to the d ecision to build a burnup m easu rem ent rea cto r as a fa c ility for TH TR -300. A contract w as p laced with the UKAEAto supply a 500-W so lid -(g ra p h ite)- m oderated rea cto r (SMR) for th is purpose.
2 . 2 . The burnup m easu rem en t fa c ility
The so lid -m od era ted rea cto r (SMR) [3] i s graphite-m oderated , and in the form of a cube with an o v era ll s iz e of core plus re flec to r of approxim ately 2 -m sid e length. The core zone it s e lf is approxim ately 1 m wide by 1 .2 m high by 1 .2 m lon g. T his zone i s being loaded with fuel until the required e x c e s s rea ctiv ity of 0. 8 N has been ach ieved . The fuel is h ighly enriched (93% 235U) uranium in the form of uranium /alum inium

654 DAOUD and ENGELHARDT
a lloy str ip s approxim ately 1 m m thick by 15 m m w ide, which slid e into s lo ts in the graphite. The fu e l-e le m e n t guide tube (FEGT) through which the sp h erica l fuel e lem en ts of THTR are ro lled by gravity for m easurem ent n early fo llow s the horizontal a x is of the co r e . A ctually th is tube is inclined by 5° to the horizontal and the fuel channels are s im ila r ly arranged, so that they a re p a ra lle l to th is tube. The tube a sse m b ly c o n s is ts of an outer Z irca lo y tube and an inner s te e l tube. The la tte r has a d iam eter of 80 m m.
2 . 3 . D eterm ination of the contents of the THTR fuel e lem en ts using the burnup m easu rem ent fa c ility
The reactiv ity p ro file of a THTR fuel elem ent as a function of the p osition in the fu e l-e lem en t guide tube co n s is ts of two sca tter in g peaks Psi and p s2, when the fuel e lem en t is at the points of g rea test flux gradient. T h ese two sym m etr ic peaks a r ise p rim arily owing to the graphite in the fuel e lem en t. At the core centre the sca tter in g effec t is com paratively sm a ll and the reactiv ity is m ainly caused by uranium , thorium , and f is s io n p rod ucts. It is th erefore the core centre reactiv ity pc which is of prim e in te r e st to d eterm ine the contents of f is s io n m ateria l of the fuel elem en t, but the height of the sid e peaks is n e c e ssa r y to a s s e s s a correction for the effec t of sm a ll variations in the graphite contents of the THTR fuel elem en t.
In the ca se of TH TR -fuel elem en ts a definite relation e x is ts between the Th and fiss io n -p ro d u ct contents on the one hand, and the uranium , 233 U and 235U, contents on the other, so that only graphite and uranium are independent of each other. The determ ination of reactiv ity change, caused by a fuel elem en t, in two p osition s, for which the influence functions of graphite and uranium are lin ea r ly independent, w ill lead , accord ing to Eq. (6), to the determ ination of the contents of the fuel e lem en t. In the ca se of the THTR burnup m easu rem ent fa c ility one needs to d eterm ine the rea ctiv ity change, caused by the fuel e lem en t to be m easured , in the sca tter in g peaks psl and ps2 and in the core centre pc, in order to determ ine the contents of the fuel elem en t.
The on -lin e determ ination of the re a c t iv it ie s [4] i s made dynam ically u sing the in v er se point k inetic equation to deduce the reactiv ity change of the sy stem from the flux tran sien t produced as the fuel e lem en t r o lls through the co r e . The flux tran sien t is taken at 1 0 -m s in terv a ls and the resu ltin g rea ctiv ity data are then analysed to find the rea ctiv ity of the fuel e lem en t in the sca tter in g peaks psi ,2 and in the core centre pc . In further a n a ly s is of the data the m ean of psl and ps2 is used as' the height of the sca tter in g peak.
2 . 4 . C alibration exp erim en ts on the burnup m easu rem ent fa c ility
The b a sic ca libration p r o c e s se s involved standard fuel elem en ts of known com position , giving a variation in the w eight of 235U, 232 Th, Cu and graphite. The Cu w as used a s a therm al ab sorb er to sim u late the effect of f is s io n products in the irrad iated THTR fuel e lem en ts . The fuel e lem en ts which w ere used fo r calibration exp erim en ts (Table I), f e l l into two groups, one group (1, 2, 3, 9) d esigned to give d irect m ea su res of the influence functions of 235U, Th, Cu and graphite, and the other group (4, 5, 6, 7, 8, 9)

IAEA-SM-201/94 6 5 5
TABLE I. LIST OF THE SIMULATED THTR FUEL ELEMENTS
Identitynumber
IrradiationContents
sim ulation(d)
C Th Z35U Cu
(g) (g) (m g ) (g )
1 - 1 7 0 .3 - - -
. 2 - 17 1 .7 - 2 7 8 .3 -
3 - 1 7 0 .5 9 .3764 2 7 7 .3 -
4 0 1 6 9 .4 10 .1963 960 .6 -
5 200 16 9 .3 1 0 .0514 6 1 4 .3 3 .2 3 1 2
6 600 1 7 1 .2 9 .7514 3 6 0 .8 5 .0992
7 800 1 6 9 .8 9 .6012 3 1 1 .1 5 .5 4 2 7
8 940 1 7 2 .2 9 .5025 2 9 1 .9 5 .7 7 2 5
9 1100 17 0 .1 9 .3 8 0 9 2 7 7 .4 5 .9 7 7 8
TABLE II. REACTIVITIES IN CORE SCATTERING PEAKS p5 l , psl AND IN CORE CENTRE pc OBTAINED IN THE CALIBRATION EXPERIMENTS
IrradiationFuel elem en t
R eactivities(m N )
• Pc Psl Ps2
0 4 + 13 .0 5 + 2 0 .8 5 + 2 0 .8 9
200 5 + 3 .7 5 4 + 1 7 .0 + 1 6 .5 5
606 6 - 3 .0 2 + 1 4 .6 9 + 13 .9 1
800 7 - 4 .3 + 14 .18 + 1 3 .3 7
940 8 - 4 .9 1 + 1 4 .0 7 + 1 3 .2 7
1100 9 - 5 .27 + 1 3 .8 5 + 13 .0 1
- 0
- 1 - 2 .8 5 + 13 .68 + 12 .9 1
- 2 + 3 .81 + 16 .4 1 + 1 5 .8 8
- 3 - 1 .6 + 1 4 .8 4 + 1 4 ,1 2
to provide a range of sim ulated irrad iation le v e ls from 0 to 1100 d to dem onstrate that sa tis fa c to ry r e su lts could be attained over the fu ll range of THTR fu e l-e le m e n t irrad iation .
The m easu rem en ts w ere carr ied out at a reactor power of 500 W.The r e su lts of th ese m easu rem en ts are lis te d in Table II.In F ig . 2 the dynam ic rea ctiv ity changes (reactiv ity v er su s ro llin g tim e
of the fuel e lem en ts through the burnup m easurem ent facility ) caused by THTR fuel e lem en ts sim u lating d ifferen t irrad iation le v e ls , are shown.

656 DAOUD and ENGELHARDT
FIG.2 . D ynam ic reactiv ity changes (reactiv ity versus rolling tim e of the fu el elem en ts through the burnup m easurem ent fa c ility ) caused by THTR fu el elem en ts sim ulating different irradiation le v e ls .
The va lu es of the influence functions obtained in the calibration exp erim en ts w ere confirm ed by
(a) U sing them and the r e a c tiv it ie s in the sca tter in g peaks and in the core centre obtained in the ca libration exp erim en t runs to deduce the uranium quantities of the v ariou s fuel e lem en ts .
(b) C arrying out a further se t of fu e l-e lem en t runs on the fa c ility and an alysin g the data d irectly on -lin e to determ ine the uranium quantities.
The r e su lts of the above exp erim en ts showed that the actual uranium quantities in the fuel e lem en ts and the exp erim en ta l va lu es agree to within 2 m g for the fuel e lem en ts with high burnup (8, 9) an.d within an average of 5 m g for the other fuel e lem en ts . A standard deviation of uranium weight of ± 3. 5 m g w as obtained from th ese exp erim en ts.

IAEA-SM-201/94 6 5 7
The fa c ility w as fin a lly operated on -line for a f iv e -d a y te s t without stopping. H ere a s e t of fu e l e lem en ts was circu lated for jl h /d on a 7 -s cy c le . D uring th is 5-d te s t the fa c ility showed ex ce llen t operating behaviour. The exp erim en ta l re su lts from the 5-d te s t have confirm ed that the r e su lts are substan tia lly b etter than the target accuracy (± 3. 5 m g 235U ach ieved com pared with a ± 15-m g target).
R E F E R E N C E S
[1 ] M eyhreblian and Holms; R eactoi A nalysis, M cG raw -H ill (1960).[2 ] HECKER, R ., RAUSCH, W ., SCHULTEN, R ., D evelopm ent o f high temperature therm al reactors in
Germ any, EUR 3493 e (1 9 6 7 ) .[3 ] JOHNSTONE, I . , GUNNILL, G . , LAWRENCE, L. A. J . , "The design o f a low power reactor for the
o n -lin e measurem ent o f burn-up o f THTR fu e l” , Post-Irradiation Exam ination Techniques, V o l.C , BNES (1972) 133.
[4 ] EMERY, P .K .F . , LAWRENCE, L .A .J . , D irect d ig ita l control o f a nuclear m easurem ent reactor. Trends in o n -lin e com puter control system , IEE (1975).


CHAIRMEN OF SESSIONS
S essio n 1 C .A . BENNETT
S essio n 2 H.A. HUGHES
S ession 3 W. RÖHNSCH
S essio n 4 B. SHARPE
S ession 5 A. BURTSCHER
S essio n 6 W .L. ZIJP
S ess io n 7 A.R. ANDERSON
S ession 8 A .A . UPOVSKIJ
S essio n 9 A. von BAECKMANN
S ession 10 O.E. JONES
United S tates of A m erica
United Kingdom
Germ an D em ocratic Republic
D irectorate of Euratom Safeguards (CEC)
A ustria
N etherlands
United Kingdom
USSR
International A tom ic Energy Agency
United S tates of A m erica
SECRETARIAT
Scientific J .E . LOVETT D epartm ent of Safeguards andS ecr e ta r ie s S. SANATANI Inspection , IAEA
A dm in istrativeS ecretary
R. NAJAR D ivision of E xternal R ela tion s, IAEA
Editor M onica KRIPPNER D ivision of P ub lica tion s, IAEA
R ecord s O fficer J.H. RICHARDSON D ivision of Languages, IAEA
6 5 9


LIST OF PARTICIPANTS
A U S T R A L I A
M cDonald, N .R . Australian Embassy,M attiellistrasse 2 -4 , 1040 V ienna, Austria
A U S T R IA
Burtscher, A . Österreichische Studiengesellschaft fflr A tom energie, Lenaugasse 10, 1080 Vienna
Fleck, C. Atom institut der österreich ischen Hochschulen, Schflttelstrasse 115, 1020 Vienna
H eintschel, H .G . H ygienisch-Bakteriologische Untersuchungsanstalt der Stadt W ien,
Feldgasse 9 , 1080 Vienna
HSfferl, F. A tom institut der österreich ischen Hochschulen, Schflttelstrasse 115, 1020 Vienna
K ellner, E .K . Atom institut der österreich ischen Hochschulen, Schflttelstrasse 115, 1020 Vienna
Oszuszky, F .J. österreich isch e Elektrizitätswirtschafts-AG, Am Hof 6, 1010 Vienna
Schm idt, F.W . Bundeskanzleramt, Hohenstaüfengasse 3, 1010 Vienna
Schneeberger, M .F . Kernkraftwerk Planungsgesellschaft, Jacquingasse 1 6 /1 8 , 1030 Vienna
Wagner, H .K . Bundesministerium für Inneres, RossauerlSnde 1, 1090 Vienna
Werner, R. Bundesministerium fflr Inneres, Herrengasse 7, 1010 Vienna
B E L G I U M
Beets, C .N . Centre d’ etude de l ’ energie nucleaire,B-2400 Mol
d'O ultrem ont, P. C onseil et realisation techniques S . A . , Chaussee d 'A lsem berg 473 , B -1180 Brussels
6 6 1

6 6 2 LIST OF PARTICIPANTS
BRAZIL
Bittencourt, X .C . Brazilian N uclear Energy Com m ission,Rua General Severiano 90, Rio de Janeiro
BULGARIA
Batchvarov, N .S . Institute for N uclear Research and N uclear Energy,Bui. Lenin 72 , Sofia 13
CANADA
Craik, N .G . C an atom L td .,1134 St. Catherine St. West, Montreal H3G 2L6
Sm ith, R. M. W hiteshell N uclear Research Establishment,Pinawa, M anitoba, ROE ILO
CZECHOSLOVAK SOCIALIST REPUBLIC
Km osena, J. A tom ic Power Plant,Jasl. Bohunica
Krivänek, M . N uclear Research Institute,25068 Rez
Kubant, J. Institute o f N uclear Fuels,Praha 5 - Zbraslav
Lukavsky, J. C zechoslovak A tom ic Energy Com m ission,Slezska 9, Prague 2
Mrkous, P. Skoda Works, Pilsen
DENMARK
Frederiksen, P .O . . Research Establishment Ris5,D K -4000 Roskilde
EGYPT
Effat, K .E .A . A tom ic Energy Establishment,101, Kasr Eleiny S t . , Cairo
FINLAND
Heinonen, O .J . University o f H elsinki, Department o f Radiochemistry,Unioninkatu 35 , SF-00170 Helsinki 17
Koponen, H. E. The Institute o f Radiation Protection,Box 268, SF-00101 Helsinki 10

LIST OF PARTICIPANTS 663
M anninen, J. A tom ic Energy O ffice,Ministry o f Trade and Industry, Aleksanterink 10, SF-00170 Helsinki 17
Patrakka, E. T . TVO Power Company,Kutojant 8, 02610 Espoo 61
RautjSrvi, J .S . The Institute o f Radiation Protection, Box 268, SF-00101 Helsinki 10
FRANCE
A m al, T. CEA, Centre d 'etudes nucieaires de C adarache, B .P . 1, 13115 S t-P au l-lez-D u ran ce
Berthet, R.A. Com m issariat d T en erg ie atom ique, 2 9 -3 3 rue de la Federation, 75015 Paris
Bordes-Pages, H .A . Com m issariat & T en er g ie atom ique, 2 9 -3 3 rue de la Federation, 75015 Paris
Busquet, P.R. Com missariat ä T en erg ie atom ique, 2 9 -3 3 rue de la Federation, 75015 Paris
Candes, P. -H . Framatome,77-81 rue du Mans, 92403 C ourbevoie
C hotin, M .M . CEA, Centre de production de plutonium de M arcoule, 30200 Chusclan, Gard
D um esnil, P. CEA, C entre d* etudes nucieaires d e Saclay , B .P. 2, 91190 G if-sur-Y vette
G oul^e, P .F . Intertechnique,B .P . 1, 78370 Plaisir
G u illet, H .J. CEA, Centre d ‘ etudes nucieaires de Cadarache, B .P. 1, 13115 S t-P au l-lez-D u ran ce
L ecom te, F. Com missariat ä T en erg ie atom ique, 2 9 -3 3 rue de la Federation, 75015 Paris
Regnaud, F .A . CEA, Centre d*etudes nucieaires de Fontenay-aux-Roses, B .P . 6, 92260 Fontenay-aux-Roses
Roussel, G. Com missariat ä T en erg ie atom ique, 2 9 -3 3 rue de la Federation, 75015 Paris
Tam as, M arie-C laude CEA, Centre d ’ etudes nucieaires de Fontenay-aux-Roses, B .P. 6, 92260 Fontenay-aux-Roses
GERMAN DEMOCRATIC REPUBLIC
K am pf, T . Zentralinstitut fOr Kernforschung Rossendorf, 8051 Dresden, Postfach 19

664 LIST OF PARTICIPANTS
Rflhnsch, W. S taatliches Am t ffir A tom sicherheit und Strahlenschutz,W aldow allee 117, 1157 Berlin— Karlshorst
S itz lack , G. S taatliches Am t fflr A tom sicherheit und Strahlenschutz,Lehndorffstrasse 42 , Berlin-r Karlshorst
Winkler, R. VEB Kernkraftwerk "Bruno Leuschner",Greifswald
GERMANY, FEDERAL REPUBLIC OF
Berg, R. G esellschaft zur W iederaufarbeitung von Kernbrennstoffen mbH,
Leopoldshafen - Eggenstein 2
Beyrich, W. G esellschaft fflr Kernforschung mbH,Postfach 3640, D -75 Karlsruhe
Bödege, R.J. V erein igte Elektrizitätswerke W estfalen, Postfach 941, 4600 Dortmund
Braatz, U .H . Vereinigung Deutscher Elektrizitätswerke, Stresem annallee 23 , D -6000 Frankfurt 70
Brinkmann, H. Rheinisch-W estfälisches Elektrizitätswerk, Betriebsverwaltung Biblis, D -6843 Biblis
Brflckner, Chr. G esellschaft fflr Kernforschung mbH, Postfach 3640 , D -75 Karlsruhe
Bueker, H .H . Kernforschungsanlage Jfllich GmbH, Postfach 1913, D -517 Jfllich
Cloth, P. Kernforschungsanlage Jfllich GmbH,Postfach 1913, D -517 Jfllich
Daoud, H. Hochtemperatur-Reaktorbau,Postfach 5360, G ottlieb -D aim ler Str. 8, D -68 Mannheim
DOrr, R. G esellschaft fflr Kernforschung mbH, Postfach 3640, D -75 Karlsruhe
Filss, H .P . Kernforschungsanlage Jfllich GmbH, Postfach 1913, D -517 Jfllich
Freytag, A . Permanent M ission o f the Federal Republic o f Germany to the International Organizations in Vienna,
M etternichgasse 3, 1030 V ienna, Austria
G elfort, E. Energieversorgung Schwaben, Rastalter Str. 9, 7505-E ttlingen
Hagenberg, W. A lkem ,Postfach 1100 69, 645 Hanau, D egussagelände
H ecker, R. Kernforschungsanlage Jfllich GmbH, Postfach 1913, D -517 Jfllich
Heger, H. Rheinisch-W estfälisches Elektrizitätswerk, D -43 Essen

LIST OF PARTICIPANTS 665
H eil, J.J. Bundesministerium für Forschung und T echn olog ie, Stresemannstrasse 2, D -53 Bonn
Hein, H .J. G esellschaft zur Wiederaufarbeitung von Kernbrennstoffen mbH,
D -7515 Leopoldshafen
H einzelm ann, M. Kernforschungsanlage Jülich GmbH, Postfach 1913, D -517 Jülich
Kirch, N. Kernforschungsanlage Jülich GmbH, Postfach 1913, D -517 Jülich
K otte, U. Kernforschungsanlage Jülich GmbH, Postfach 1913, D -517 Jülich
Krinninger, H .L . Internationale Natriumbrutreaktorbau GmbH, D -506 Bensberg, Friedrich Ebert Strasse
Kurtze, W.R. Hochtemperatur- Reaktorbau,Postfach 5360, G ottlieb -D aim ler Str. 8, D -68 Mannheim
Lang, H. Kernforschungsanlage Jülich GmbH, Postfach 1913, D -517 Jülich
M ainka, Elisabeth G esellschaft für Kernforschung mbH, Postfach 3640, D -75 Karlsruhe
Matussek, P. G esellschaft für Kernforschung mbH, Postfach 3640, D -75 Karlsruhe
N ägele , G. G esellschaft für Kernforschung mbH, Postfach 3640, D -75 Karlsruhe
Onnen, Sanda G esellschaft für Kernforschung mbH, Postfach 3640, D -75 Karlsruhe
Ottmar, H. G esellschaft für Kernforschung mbH, Postfach 3640, D -75 Karlsruhe
Priesm eyer, H .G . Institut für Kernphysik der U niversität K iel, Reaktorstation,D -2054 G eesthacht
S tein , G. Kernforschungsanlage'Jülich GmbH, Postfach 1913, D -517 Jülich
Tam berg, T . Bundesanstalt für Materialprüfung, Unter den Eichen 87, 1 Berlin 45
Theenhaus, R. Kernforschungsanlage Jülich GmbH, Postfach 1913, D -517 Jülich
GREECE
M itsonias, K. N uclear Research Centre D em ocritos, A ghia Paraskevi, A ttiki

6 6 6 LIST OF PARTICIPANTS
HUNGARY
Biro, T . Institute o f Isotopes,P .O . Box 77 , 1525 Budapest
Raics, P. Institute o f Experimental Physics,Kossuth University,Bern t£r 1 8 /a , H -4026 Debrecen
INDIA
Iyer, R .M . Bhabha A tom ic Research Centre,Bombay 85
IRAN
Sarram, M . A tom ic Energy O rganization o f Iran,P .O . Box 3327, Tehran
ISRAEL
N otea, A . Department o f Nuclear Engineering,T echnion, Haifa
ITALY
Bresesti, M. . JRC-Euratom, Ispra (VA) (S ee also under CEC)
C occh i, A . EN EL- D .C .O . ,Via G.-B. Martini 3 , 00186 Rome
Sansone, C. A gip N ucleare,Corso Porta Romana 68, 20122 Milan
Vanni, P. C om itato N azionale Energia N ucleare, V ia le Regina Margherita 125, 00198 Rome
V enchiarutti, R. C om itato N azionale Energia N ucleare, V ia le Regina Margherita 125, 00198 Rome
Zifferero, M. C om itato N azionale Energia N ucleare, V ia le Regina Margherita 125, 00198 Rome
JAPAN
Hirai, K. N uclear M aterial Control Center,Akasaka Park B ld g .,2 -3 -4 Akasaka, M inato-ku, Tokyo
Inoue, K. Power Reactor and N uclear Fuel D evelopm ent Corporation, 1-913 Akasaka, M inato-ku, Tokyo

LIST OF PARTICIPANTS 667
Muto, T . Power Reactor and N uclear M aterial D evelopm ent Corporation,
Tokai Works, Tokai-m ura, Ibaraki-ken
Num akunai, T . Japan A tom ic Energy Research Institute, T ökai-m ura, N aka-gun, Ibaraki-ken
O zawa, Y. Hitachi Research Laboratory o f H itachi L td ., Kugicho 4026 , H itach i-shi, Ibaraki-ken
Sasaki, T . Japanese Embassy,Renngasse 10 /V , 1010 V ienna, Austria
U chida, N. Roshiba Research and D evelopm ent Center,4 -1 U kish im a-cho, K awasaki-ku, K aw asaki-city
U m ezaw a, H. Japan A tom ic Energy Research Institute, Tokai-m ura, N aka-gun, Ibaraki-ken
Yoshioka, K. Toshiba - Shibaura Electric C o . ,13-12 , 3 ch om e, M ita, M inatoku, Tokyo 108
MEXICO
C astillo-C ruz, C. N uclear Energy Institute,Insurgentes sur 1079,Apartado Postal 2 7 -1 9 0 , M exico 18 D .F .
NETHERLANDS
Harry, R .J .S . Reactor-Centrum Nederland, Westerduinweg 3 , Petten (N .H .)
Hulst, P. van der N. V. Kema,U trechtsew eg 310, Arnhem
Slanina, J. Reactor-Centrum Nederland, Westerduinweg 3 , Petten (N .H .)
Z ijp , W .L. Reactor-Centrum Nederland, Westerduinweg 3 , Petten (N .H .)
NORWAY
F eyling, R. Institutt for A tom energi, P .O . Box 40 , 2007 K jeller
M ichelsen , H. M. Norwegian N uclear Energy Safety Authority, Pottem akerveien 4 , Oslo 5
M oelsaeter, M. Norwegian N uclear Energy Safety Authority, Pottem akerveien 4 , Oslo 5

668 LIST OF PARTICIPANTS
PAKISTAN
M . Nawaz Pakistan A tom ic Energy Com m ission,P .O . Box 1114 Islam abad, Pakistan
PHILIPPINES
Siazon , D. Permanent Mission o f the Philippines to the IAEA,Peter Jordan Strasse 19, 1190 V ienna, Austria
POLAND
Z elen ay , T .Z . Institute o f N uclear Research,05-400 Otwock Swierk
ROMANIA
Farcagiu, O .M . Institute o f A tom ic Physics,P .O . Box 5206, Bucharest
SOUTH AFRICA
Schirnding, K .R .S . von Permanent M ission o f South Africa to the IAEA,Renngasse 10, 1010 V ienna, Austria
SPAIN
S ev illa Benito, A. Junta de Energia Nuclear,Avenida Com plutense 22,Ciudad Universitaria, Madrid 3
V illota Ruiz, P. Junta de Energia Nuclear,A venida C om plutense 22,Ciudad Universitaria, Madrid 3
SWEDEN
Andersson, B. Research Institute o f National D efen ce , Section 211,S - 10450 Stockholm 80
Nilsson, Anita Birgitta Swedish N uclear Power Inspectorate,Box 43058, 10072 Stockholm
SWITZERLAND
Hausherr, В. Swiss Federal O ffice o f Energy,P .O . Box, 3001 Berne
UNION OF SOVIET SOCIALIST REPUBLICS (USSR)
Lipovskij, A .A . V .G . Khlopin Radium Institute, Leningrad 22, Roentgen 1

LIST OF PARTICIPANTS 669
Rumyantsev, A .N . I. V. Kurchatov Institute o f A tom ic Energy, Moscow
S lizo v , V .P . Institute o f N uclear Energy, A cadem y o f S cien ce ,Minsk
T olchenkov, D .L . Permanent M ission o f the USSR to the IAEA, W ohllebengasse 4 , 1040 V ienna, Austria
UNITED KINGDOM
Adamson, A .S . Nuclear M aterials A ccounting Control T eam , A ERE Harwell, D idcot, Oxon
Anderson, A ,R . N uclear M aterials A ccounting Control T eam , AERE Harwell, D idcot, Oxon
Brown, F. A tom ic Energy D ivision ,Department o f Energy,Thames House South, M illbank, London S .W .l
C oates, A .H . British N uclear Fuels L td ., Springfields Works, Salw ick, Preston, Lancs
Dodsworth, N. British N uclear Fuels L td ., Risley, Warrington, Lancs
Ellingsen, J.E. A tom ic Energy D ivision,Department o f Energy, *Thames House South, M illbank, London S .W .l
Hart, G. British N uclear Fuels L td ., Capenhurst Works, Chester, Ches
Hughes, H.A. British N uclear Fuels L td ., Risley, Warrington, Lancs
James, R. H. A tom ic Weapons Research Establishment, Alderm aston, Berks
Jennings, D .R. British N uclear Fuels L td .,W indscale Works, S ella fie ld , S easca le , Cumbria
M cDonald, B. British N uclear Fuels L td .,W indscale Works, Seasca le , Cumbria
M ummery, G .B . Central E lectricity Generating Board, 20 N ew gate Street, London E .C . 1
Parkinson, N . Reactor D evelopm ent Laboratory, W indscale, S e lla fie ld , S easca le , Cumbria
Rawson, D .F . UKAEA, Risley, Warrington, Lancs

670 LIST OF PARTICIPANTS
S in cla ir, V .M . Dounreay Experimental Reactor Establishment, Dounreay, Thurso, Caithness
S tanley , Mary British N uclear Fuels L td ., Risley, Warrington, Lancs
UNITED STATES OF AMERICA
A tw ell, T .L .
Bartels, W .C .
Bean, С. H.
Bennett, C . A .
Beyer, N .S .
Bingham, C .D .
Boright, J.P .
C am pbell, M .H .
C arnesale, A.
Carter, J .A .
Chambers, W .H .
Chanda, R .N .
Chapman, R. E.
Christensen, D .E .
Los A lam os S c ien tific Laboratory,University o f C alifornia, Los Alam os,P .O . Box 1663, Los A lam os, NM 87545
US Energy Research and D evelopm ent Administration, D ivision o f Safeguards and Security,Washington, DC 20545
Argonne N ational Laboratory,9700 S. Cass A v e . , Argonne, IL 60439
New Brunswick Laboratory,P .O . Box 150, New Brunswick, NJ 08816
Permanent Mission o f the USA to the IAEA, Schm idgasse 8, 1080 V ienna, Austria
Exxon N uclear C o. I n c . ,2955 G eorge Washington Way, Richland, WA 99352
Havard University,9 D ivin ity A v e ., Cam bridge, MA 02138
H olifield National Laboratory,Oak Ridge, TN 37830
Los A lam os S cien tific Laboratory,University o f C alifornia,P .O . Box 1663, Los A lam os, NM 87545
R ockwell International, Rocky Flats Plant,P .O . Box 464 , Golden, CO
International Security Affairs,Energy Research and D evelopm ent Administration, W ashington, DC
B attelle P ac ific Northwest Laboratories,B attelle Boulevard, Richland, WA 99352
B attelle , Human Affairs Research Center, 4000 S .E . 41st Street, S ea ttle , WA 98105
Argonne N ational Laboratory,Q uantitative V erification and Safeguards, 9700 S. Cass A v e . , Argonne, IL 60439
DeM erschman, A .W . W estinghouse Hanford,P .O . Box 1970, Richland, WA 99352

LIST OF PARTICIPANTS 671
D eV ito, V .J. Goodyear A tom ic C o rp .,P .O . Box 628, Piketon, OH 45661
D onnelly, W. C ongressional Research Library o f Congress, W ashington, DC
Eisenstein, M. US N uclear Regulatory C om m ission, Washington, DC 20555
Evans, Constance B. C om m ittee on G ovt. Operations, US Senate, Washington, DC
Hammond, G.A. US Energy Research and D evelopm ent A dm inistration, Washington, DC 20545
H ighfill, R.R. ORTEC, 100 Midland Rd., Oak Ridge, TN 37830
Houck, F .S . US Arms Control and Disarm am ent A gency, State D ept. Bldg,W ashington, DC 20451
Jackson, D .D . Los A lam os S cien tific Laboratory, University o f C alifornia, P .O . Box 1663, Los A lam os, NM 87544
Jaech, J.L. Exxon N uclear C o. In c .,2101 Horn Rapids R d ., Richland, WA 99352
Jones, O .E. Sandia Laboratories, Albuquerque, NM 87115
Kanter, M .A . Argonne National Laboratory,Bldg 15, 9700 S. Cass A v e . , Argonne, IL 60439
K eepin, G.R. N uclear Analysis Research Group,Los A lam os S c ien tific Laboratory, University o f C alifornia,P .O . Box 1663,Los A lam os, NM 87544
Kendrick, H. S cien ce A pplications I n c . ,1651 Old Meadow Road, McLean, VA 22101
Labowitz, A .M . Permanent Mission o f the USA to the IAEA, Schm idgasse 14, 1080 V ienna, Austria
Mahy, J .F . Permanent Mission o f the USA to the IAEA, Schm idgasse 14, 1080 Vienna, Austria
Marlow, K .W . N aval Research Laboratory,cod e 6603M , Washington, DC 20375
Oyster, D .E . US Arms Control and Disarmament A gency, State D ept. Bldg, Washington, DC 20451
Ransom, H .E. US Energy Research and D evelopm ent Administration, Box 550, Richland, WA 99352
Rosenbaum, D .M . MITRE C o rp ., W estgate Research Park,M cLean, VA 22207

672 LIST OF PARTICIPANTS
Schleter, J .C . US N ational Bureau o f Standards, Washington, DC 20234
Shea, T .E . O ffice o f Research, US N uclear Regulatory C om m ission, Washington, DC 20555
Sm ith, D .B . Los Alam os S cien tific Laboratory, University o f C alifornia, P .O . Box 1663, Los A lam os, NM 87545
Stewart, J.P . General E lectric,P .O . Box 780, W ilm ington, NC
Suda, S .C . Brookhaven N ational Laboratory,29 Cornell A v e . , Upton, NY 11973
Y olken, H .T . US National Bureau o f Standards, Washington, DC 20234
Zavadoski, R.W . US Energy Research and D evelopm ent Administration, Brussels O ffice , 40 Blvd. du Regent,
.1000 Brussels, Belgium
ORGANIZATIONS
CEC (COMMISSION OF THE EUROPEAN COMMUNITIES)
Bi^vre, P .J. de C entral Bureau for Nuclear M easurements, 2440 G eel, Belgium
Bresesti, M. Joint Research Centre, Euratom,21020 Ispra(S ee also under Italy)
B om m elle , P .G . 29 rue A ldringen, Luxembourg
Crutzen, S .J .J .R . CCR Euratom, 1-21020 Ispra (VA), Italy
Cuypers, M . CCR Euratom, 1-21020 Ispra (VA), Italy
Foggi, C. Joint Research Centre, Euratom, 21020 Ispra (Varese), Italy
Haas, R, 30 P lace G uillaum e, GD17 E - l , Luxembourg
Koch, L.W . G esellschaft fflr Kernforschung,Postfach 2266, D -75 Karlsruhe, Federal Republic o f Germany
Kschwendt, H. D irectorate o f Euratom Safeguards,30 , P lace G uillaum e, GD17 E - l , Luxembourg
Love, B. D irectorate o f Euratom Safeguards,30 , P lace G uillaum e, GD17 E - l , Luxembourg
Miranda, U. D irectorate o f Euratom Safeguards,30, P lace G uillaum e, GD17 E-Л, Luxembourg
Rota, A. 29, rue Aldringen, Luxembourg

LIST OF PARTICIPANTS 673
Sam sel, G .E . European Institute o f Transuranium Elem ents,Postfach 2266, D -75 Karlsruhe, Federal Republic o f Germany
S ch leich er, H .W . D irectorate o f Euratom Safeguards, CEC, rue A ldringen, Luxembourg
Sharpe, B.W . D irectorate o f Control and Security, 29 rue A ldringen, Luxembourg
Stanners, W. D irectorate o f Euratom Safeguards, 29 rue A ldringen, Luxembourg
Van der S tijl, E. D irectorate o f Euratom Safeguards, 29 rue Aldringen, Luxembourg
Van der Stricht, E. A. D irectorate o f Euratom Safeguards,30 , P lace G uillaum e, GD17 E - l , Luxembourg
IAEA (INTERNATIONAL ATOMIC ENERGY AGENCY)
Baeckmann, A .H .E . von D ivision o f D evelopm ent, IAEA, V ienna, Austria
B eetle , T .M . D ivision o f D evelopm ent, IAEA, Vienna, Austria
Beranek, J . D ivision o f Operations, IAEA, Vienna, Austria
Buechler, C .L . D ivision o f Operations, IAEA, Vienna, Austria
C zock , K .H . Division o f Research and Laboratories, IAEA, V ienna, Austria
Deron, S .T . D ivision o f Research and Laboratories, IAEA, Seibersdorf, Austria
Dragnev, T .N . D ivision o f D evelopm ent, IAEA, Vienna, Austria
Fiedler, R. D ivision o f Research and Laboratories, IAEA, Seibersdorf, Austria
Fortakov, V .B . D ivision o f Operations, IAEA, V ienna, Austria
Frenzel, W. Section A m ericas, D ivision o f Operations, IAEA, V ienna, Austria
G m elin , W .R. D ivision o f D evelopm ent, IAEA, Vienna, Austria
Hough, C .G . D ivision o f D evelopm ent, IAEA, V ienna, Austria
Jirota, J .A . D ivision o f Research and Laboratories, IAEA, Seibersdorf, Austria

674 LIST OF PARTICIPANTS
Konnov, Yu. Division o f D evelopm ent, IAEA, V ienna, Austria
Kuhn, E. Division o f Research and Laboratories, IAEA, Seibersdorf, Austria
Kurihara, H. Division o f D evelopm ent, IAEA, V ienna, Austria
Lopez-M enchero Ord6nez, E .M . Department o f Safeguards and Inspection, IAEA, V ienna, Austria
M iguel, M. Division o f Research and Laboratories, IAEA, Seibersdorf, Austria
N akicen ov ic , S. D ivision o f Operations, IAEA, Vienna, Austria
N ishiwaki, Y. D ivision o f N uclear Safety and Environmental Protection, IAEA, V ienna, Austria
Rometsch, R. Department o f Safeguards and Inspection, IAEA, V ienna, Austria
Ryzhov, M .N . D ivision o f D evelopm ent, IAEA, V ienna, Austria
Schärf, К. D ivision o f Research and Laboratories, IAEA, Seibersdorf, Austria
S ites, J. D ivision o f Research and Laboratories, IAEA, Seibersdorf, Austria
S w ietly , H .K . D ivision o f Research and Laboratories, IAEA, Seibersdorf, Austria
Szab6, E. D ivision o f D evelopm ent, IAEA, V ienna, Austria
Thorstensen, S .E . D ivision o f Operations, IAEA, V ienna, Austria
W aligura, A .J . D ivision o f D evelopm ent, IAEA, V ienna, Austria
W oelfl, Elke D ivision o f Research and Laboratories, IAEA, Seibersdorf, Austria
ISO (INTERNATIONAL ORGANIZATION FOR STANDARDIZATION)
Brffckner, Chr. G esellschaft für Kernforschung mbH,Postfach 3640, 75 Karlsruhe, Federal Republic o f Germany (see also under Federal Republic o f Germany)

INDEX OF PREPRINT SYMBOLS (IAEA-SM-201)
P a p e r S y m b o l A u t h o r s V o l u m e P a g e
IAEA-SM-201 /
1 N otea, Segal II 1992 Koch et al. II 4493 Paoletti Gualandi et al. II 6134 Priesmeyer, Harz II 6255 Crutzen et al. II 3057 Stea I 2878 Stewart II 3419 Carter et al. II 461
10 Christensen, Schneider II 377
11 Hammond, S tieff II 26512 Chambers, Ney II 29713 Bean, Norderhaug I 23314 Jaech I 54516 Chambers I 28118 Jackson et al. II 9119 Smith II 6321 Seefeldt, Zivi II 39522 Bingham et al. II 10723 D eV ito I 46124 Arman trout et al. II 21525 Suda II 18729 Walker et al. I 51730 Beyer et al. II 54131 Chanda et al. I 32532 Keepin, Maraman I 30533 A tw ell et al. II 50135 Jones I 21536 Schleter I 19938 Bennett I 11539 Foggi, Zijp II 40540 Muto e t al. I 35341 Onishi et al. II 55142 Numakunai et al. II 56543 Knvänek et al. II 11744 Foggi et al. II 42545 Bödege et al. I 16546 Matussek, Ottmar II 22348 Bahm et al. I 36549 Bahm et al. I 31950 Brückner et al. II 581
6 7 5
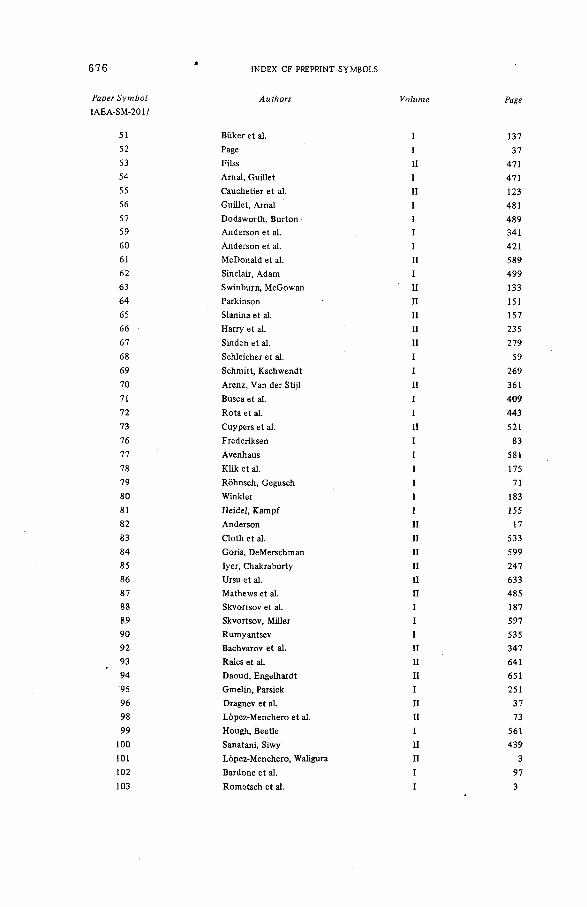
P a g e
137
37
471
471
123
481
489
341
421
589
499
133
151
157
235
279
59
269
361
409
443
521
83
581
175
71
183
155
17
533
599
247
633
485
187
597
535
347
641
651
251
37
73
561
439
3
97
3
INDEX OF PREPRINT SYMBOLS
A u t h o r s V o l u m e
Büker et al. I
Page IFilss II
Arnal, Guillet I
Cauchetier et al. II
Guillet, Arnal I
D odsworth, Burton IAnderson et al. I
Anderson et al. I
McDonald et al. II
Sinclair, Adam I
Swinburn, McGowan II
Parkinson II
S lan in aeta l. II
Harry et al. II
Sinden et al. II
Schleicher et al. I
Schm itt, Kschwendt I
Arenz, Van der Stijl II
Busca et al. I
Rota et al. I
Cuypers et al. II
Frederiksen I
Avenhaus I
Klik et al. I
Röhnsch, Gegusch I
Winkler I
Heidel, Kampf I
Anderson II
Cloth et al. II
Goris, DeMerschman II
Iyer, Chakraborty II
Ursu et al. II
Mathews et al. II
Skvortsov et al. I
Skvortsov, Miller I
Rumyantsev I
Bachvarov et al. II
Raics et al. II
Daoud, Engelhardt II
Gmelin, Parsick I
Dragnev et al. II
Lopez-M enchero et al. II
Hough, Beetle I
Sanatani, Siwy II
Lopez-M enchero, Waligura II
Bardone et al. I
R om etsch et al. I

INDEX OF PREPRINT SYMBOLS 677
P a p e r S y m b o l
IAEA-SM -201/A u t h o r s V o l u m e P a g e
104 Rom etsch et al. I 27
105 N akicenovic I 379
106 Lipovskij, KhoFnov II 165
107 Onnen I 333
108 De Bievre, Van Audenhove II 493
109 Beyrich и 175
110, Babaev et al. I 609


AUTHOR INDEX(including participants in d iscu ssio n s)
Roman numbers are volum e numbers. Arabic numbers underlined in d icate the first page of a paper by an author.Other Arabic numbers denote the page numbers
of discussion com m ents.
A aldijk, J.K .: II 235 Abbakumov, ЕЛ.: I 609 Adam , W .B.: I 501 A dam son, A ,S .: I 341, 351, 421 A ggarw al, S.K,: II 485 Akutsu, H.: I 353; II 551 A nderson, A ,R ,: I 15, 36, 95, 113,
267, 321, 341, 351, 421, 441, 459, 531; II _17, 375
A oki, M.: I 353 A renz, H .-J .: II 361, 449 A rm antrout, G.: II 215 A rn el, T .: I 471, 481 A tw ell, T .L .: II 501 A venhaus, R.: I 581 Babaev, N .S.; I 609 Bachvarov, N .S.: II 347, 356 Baeckm ann, A. von: II 449 Bahm , W.: I 19, 365 Bakker, F .: II 157 Bardone, G.: I 97 B a r te ls , W.C.: I 35, 56, 134, 230,
247, 302B ean, C.H.: I 233, 247, 248 B e etle , T.M .: 1 561, 580; 1173 Bennett, C .A.: 1 115, 133, 134,
231, 459, 595 B erg , R.: II 345, 375 B erthet, R .A.: II 338 B eyer , N .S.: II 541 B eyrich , W.: II 175 Bingham , C .D.: I 301, 532, 559;
II 70,107, 346 B ödege, R.: I 165, 279 B om m elle , P ,: I 59 B achvarov, N .S.: II B o u rs ier , M.: II 521 B raak, J .P .: II 235~B raatz , U„: I 165
B rem n er, W .B.: II 589B r e s e s t i , M.: II 613B ruckner, C h r .: I 365, 580; II 581Bilker, H .: I 137Burton, M .L.: I 489B u sca , G .: I 409Busquet, P .R .: I 542Cam pbell, J.W .: II 279C aro lis , M. de: II 37C arter, J .A .: II 4 6 ~C auchetier, P .: II 123 Chakraborty, P .P .: II 247 C ham bers, W.H.: 1 2 8 1 7 2 8 6 ,4 4 1 ;
II 297, 303-304 Chanda, R .N.: I 325 C hristen sen , D .E .: II 377 Clark, В .: II 73 Cloth, P .: II 533 C oates, A .H .: I 594 C orbelin i, M .: II 521 C ricch io , A .: II 449 Crutzen, S .J.: II 305, 338 C uypers, M.: I 302; II 15, 62,
356, 521, 613 D'Adamo, D.: II 613 Daoud, H.: II 651 D aröczy, S.: II 641 De Bifevre, P .: 1Г 88-89, 376, 493 D eberth, С.: II 633 De M eester , R.: II 449 D eM erschm an, A.W .: II 599 Deron, S,: II 7 3 D eV ito, V .J.: 1 4 6 1 ,4 7 0 Dodsworth, N.: I 489 Dragnev, T .N .: iflT f, 61 -62 , 347,
356D um esnil, P .: I 95, 532
II 61, 356D um itrescu , R.: II 633
679

680 AUTHOR INDEX
Eby, R .E .: II 461Effat, K .E .A .: I 36, 231E isen ste in , M .: I 56Endo, К.: II 565Engelhardt, К.: II 651F ärca§ iu , O.M. II 633F i ls s , Н .Р .: I 418T532; II 71, 471F isc h e r , D .A .V .; 115F ogg i, С.: II 405, 425Fortakov, V ,B ,: I 113, 407F ox, G.H.; II 589F red erik sen , P . ; I 83, 95, 96F ren q u ellu cc i, F ,: H~425G egusch, M .: I _7_1G m elin, W .R.: I~251, 278Golubev, L .I.: I 187Good, P .T .: I 3477421G oris, P .: II 599Guichard, С.: II 123G uillet, H.: I 47lTT81H aas, R.: II 305Hammond, G .A.; II 265, 277H arlan, R.A,: I 325H arry, R .J.S .: II 235Hartm ann, G .; I 365H arz, U.: II 625H eger, H.; I 165H eidel, S.: 155Hodgkinson, J.G .; II 279Houck, F .S .: I 16Hough, C.G.: I 3, 27, 321, 458,
561, 580; f f 197, 376 H ughes, H .A.: I 56, 70, 82, 286,
323, 419; II 276 Ionescu, V.: II 633 Itaki, T .: II 551 Iyer, M.R.: I 95, 321, 441;
II 62, 247, 294 Jackson , D .D .: II 91 Jaech, J .L .: I 15,"35, 133, 213,
247, 351, 419, 459, 532, 545,558, 595; II 70, 196, 346
Jain, H .C .: II 485 Jehenson , P .S .; II 305 Jon es, O .E.: I 133,~2l5, 231,
248, 407 Kampf, T .: 155 Karam anova, Zh.S.: II 347 Kavimandan, V .D .: II 485 Keddar, A .: 1137Keepin, G.R.: I 16, 268, 280, 305,
321-323 , 340, 532; II 15
K endrick, H.: I 133, 323; II 346 Khol'nov, Yu.V.: II 165 K hristov, V .I .: II 347 KLik, F ,: I _1V5 K irch, N.: II 533 Km ogena, J.: I 175 Koch, L .: II 449 Konnov, Yu.: II 37, 277 Konoplev, A .P .: "Tl87 Kosanke, H .D.: II 279 Kotte, U.: 1137 K rings, F .J .: II 533 K rinninger, H.: II 581 KFivänek, M .: II 117~K rtil, J.: II 117 Kschwendt, H.: I 269, 279 Kulakov, G.A.: I 187 Kurihara, H.: I 27 Lam ouroux, А .: ~П 305 L a w le ss , J .L .: I 325 L ew is, R .N .: II 541 L e zz o li, L . : II 613 L ingerak, W.A.: II 157 L ipovskij, A .A .: II 165 L öp ez-M en ch ero , E.: 1 3 , 27;
II 3, 73L ove, В .: I 409, 532; II 303 L ovett, J.: I 470, 607 Lukavsk#, J.: I 175 M aram an, W .J.: I 305 M arsh, S .F .: 1191 M artin, E .R .: II 501 M artinez-G arcia , G .: II 37 M athews, C .K .: II 485 M atussek, P .: II 223 McDonald, B .J .: 1Гб1, 356, 589 McGibbon, A .: II 215 McGowan, I.R.: II 133 M enlove, H .O .: II 501 M iller , O.A.: I 1_87, 597, 609 M inges, G .P .: I 325 M iranda, U.: I 59T~II M iyahara, К .: II 551 M oravec, J.: II 117 Murphey, W.M.: I 115 Muto, T.: 1353 Münning, K h.: II 347 N ägele, G .: I 19 Nagy, S.: II 641 N akicenovid, S.: I 379, 407 N ey, J .F .: II 297 Norderhaug, L .R .: I 233

AUTHOR INDEX 681
Notea, A .: II 199 Numakunai, T,: II 565 O nishi, К .: II 551 Onnen, Sanda: I 333, 340 Ottm ar, H.: II 223 d'O ultrem ont, P . : II 294 Ovchinnikov, F .Y a.: I 187 P age, R.G.: 137 Panitkov, Yu.: I _3 P ao le tti Gualandi, M .: II 613 P ark in son , N.: II 151 P a rsick , R.: I 251, 267, 268 P erd isa , G .: II 425 P eron i, P . : II 613 P er ry , R .B .: II 541 P ie tr i, C .E .: II 107 P o zz i, F .: I 97 P r ie sm e y e r , H.G.: II 625 P ritchard , C .A .: II 461 R aics, P .: II £41 R ansom , H .E.: 1 531-533 Regnaud, F . : II 123 Rein, J .E .: 1191 Rodean, E.: II 633 Röhnsch, W.: I 71, 82 R om etsch , R.: I 3 , 15 -17 , 27 Rom kowski, M .: II 449 R ogescu , T.: II 633 Rota, A .: I 268, 407, 441, 443,
459, 460, 580R ou sse l, G.: I 286, 459, 533, 558;
II 87, 196Rum yantsev, A .N .: I 535, 543, 607 Ryzhov, M .N.: I 3, 27, 36; II 73 Sanatani, S.: II 439Sazykin, A .A .: I 609 Scarborough, J.M .: II 107 S ch leich er, H.W.: 1 5 9 7 7 0 ,1 1 2 ,
419S ch leter , J .C .: I 199, 213 Schm itt, M.: I 59, 269 Schneider, R.A.: I 517; II 377 S eefeld t, W .B.: II 395 Segal, Y.: II 199 S ellin gsch egg , D.: I 19 Sharpe, B.W .: I 59, 9 6 , 321, 340 Shea, T .E .: I 287, 301, 302 Sherohm an, J .: II 215 Sherr, T .S.: I 115
S incla ir , V.M .: I 247, 501; II 14, 303, 375
Sinden, D .B .: II 279 Siwy, P .: II 439 Skvortsov, S .A .: I 187, 595 Slanina, J.: II 157 Smith, D .B .: l f 6 3 , 70-71 Smith, R.M .: II 294 Stänescu, P .S .: II 633 Stanley, Mary: I 279 Stanners, W.: I 286, 443 Stein, G .: I 137 Stewart, J .P .: II 341, 346 Stewart, K .B.: 1517; II Stieff, L .R .: II 265 Suda, S.C .: II 187, 196-197 Sus, F .: II 117 Sw ierkow ski, S.: II 215 Swinburn, K .A.: II 133~Szab6, E .: 1 1 7 3 ,8 8 Tatsuta, H.: II 565 T errey , D .R.: 1 3 4 1 ,4 2 1 Tokoro, Y.: II 551 Trifonov, A .I.: II 347 T sutsum i, M.: I 353; II 551 Ursu, I.: II 633 Valovid, J.: I 175 Van Audenhove, J.: II 493 Van d er H ulst, P .: II 581 Van der S tijl, E .: II 361, 375-376,
449Van der Stricht, E .: I 409, 419,
443, 521Värnagy, M.: II 641 V enchiarutti, R.: I 97 Verbin, Yu.V.: 609 W aligura, A .J .: II 3, 15, 37 W alker, A .C .: I 517 W alker, R .L .: II 461 W aterbury, G.R.: II 91 W hilhelm i, M .: II 449 W inkler, R.: I 183 Y ee, J.: II 215 Yolken, H .T.: II 88 Z affiro , B .: 197 Z ifferero , M.: 1 9 7 , 1 1 2 , 1 1 3 Zijp, W .L.: II 405 Z ivi, S.M .: II 395


TRANSLITERATION INDEX
А ббакумов, Е . И . Б абаев , Н. С. БаЧваров, Н. С. Вербин, Ю.В. Винклер, Р . Гайдель, С . Голубев, Л. И. Д р а г н е в , Т . Н . Кампф, Т . Караманова, Ж. С. Коноплев, А .П . Кулаков, Г . А . Л иповский,А .А . Миллер, О .А . Мюннинг, X . Овчинников, Ф.Я . Румянцев, А .Н . Сазыкин, А .А . Скворцов, С .А . Трифонов", А . И . Хольнов, Ю.В . Х ристов ,В . И .
Abbakumov, Е Л . Babaev, N. S . B achvarov, N. S . V erbin , Yu. V. W inkler, R.H eidel, S.Golubev, Е Л . D ragnev, T. N. Kampf, Т. Karam anova, Zh. S. Konoplev, А. P. Kulakov, G. A. L ipovskij, A. A. M iller , О. A. Münning, H. Ovchinnikov, F . Ya. R um yantsev, A. N. Sazykin, A. A. Skvortsov, S . A. T rifonov, A. E Khol'nov, Y u.V . K hristov, V. I.

The following conversion table is provided for the convenience o f readers and to encourage the use o f SI units.
FACTORS FOR CONVERTING UNITS TO SI SYSTE M EQUIVALENTS*
SI base units are the metre (m), kilogram (kg), second (s), ampere (A ), kelvin (K), candela (cd) and mole (mol).[F or fu rther in form ation, see International Standards ISO 1000 (1973), and ISO 31/0 (1974) and its several parts]
M u lt ip ly b y fo obtain
Mass
pound mass (avoirdupois) 1 Ibm = 4.536 X IO ’ 1 kgounce mass (avoirdupois) 1 ozm = 2.835 X 101 gton (long) (= 2240 Ibm) 1 ton = 1.016 X 10³ kgton (short) (= 2000 Ibm) 1 short ton = 9.072 X 10² kgtonne (= m etric ton) 1 1 = 1.00 X 10³ kg
L ength
statute mile 1 mile = 1.609 X 10° kmyard 1 yd a 9.144 X 1 0 '1 mfoo t 1 n = 3.048 X 1 0 '1 minch 1 in = 2.54 X 1 0 '2 mmil (= 1 0 '3 in) 1 mil = 2.54 X 10‘ 2 mm
A rea
hectare 1 ha = 1.00 X 10⁴ m2(statute m ile)2 1 mile2 = 2.590 X 10° km 2acre 1 acre = 4.047 X 10³ m2yard2 1 yd 2 = 8.361 X 1 0 '1 m2СЧ*->ОО 1 f t 2 = 9.290 X 10⁻² m2inch2 1 in2 = 6.452 X 102 mm2
V o lum e
yard3 1 yd3 = 7.646 X 10"1 m3
о о w 1 f t 3 2.832 X 1 0 '2 m3inch3 1 in3 = 1.639 X 104 mm3gallon (Brit, or Imp.) 1 gal (Brit) = 4.546 X 10“ 3 m3gallon (US liquid). 1 gal (US) r 3.785 X 1 0 '3 m3litre 1 I — 1.00 X 1 0 '3 m3
Force
dyne 1 dyn 1.00 X 10~5 Nkilogram force 1 kgf = 9.807 X 10° Npoundal 1 pdl = 1.383 X 10_I Npound force (avoirdupois) 1 Ib f = 4.448 X 10° Nounce force (avoirdupois) 1 ozf = 2.780 X 1 0 '1 N
P ow er
British thermal unit/second 1 Btu/s = 1.054 X 10³ Wcalorie/second 1 cal/s = 4.184 X 10° Wfo o tp o u n d force/second 1 f t lb f / s = 1.356 X 10° Whorsepower (electric) 1 hp = 7.46 X 10² whorsepower (metric) (= ps) 1 ps = 7.355 X 10² whorsepower (550 f t lbf/s) 1 hp = 7.457 X 10² w
Factors are given exactly or to a maximum o f 4 significant figures
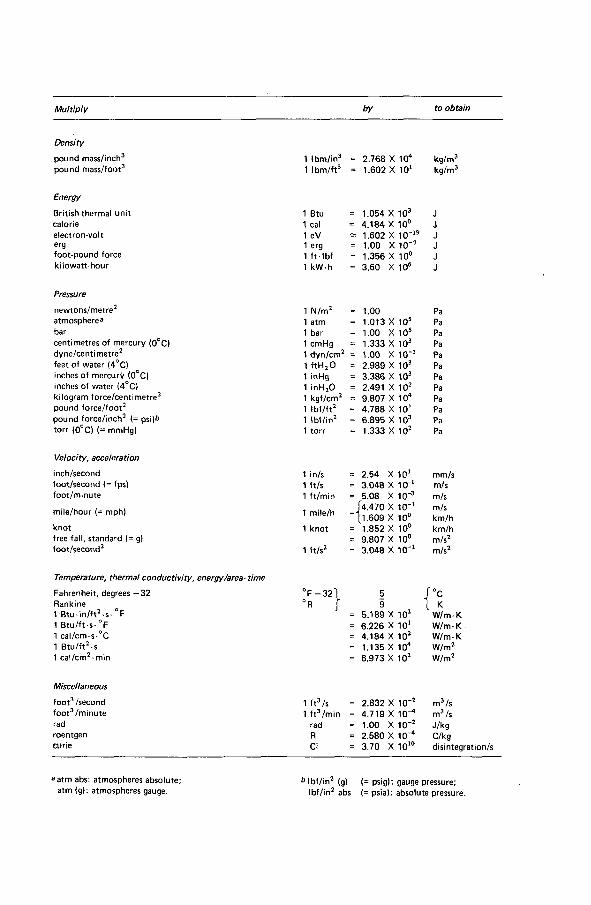
M u lt ip ly b y to obtain
D ensity
pound mass/inch3 1 lbm/in3 = 2.768 X 10⁴ kg/m3pound mass/foot3 1 lbm/ft3 = 1.602 X 101 kg/m3
Energy
British thermal unit 1 Btu = 1.054 X 10³ Jcalorie 1 cal = 4.184 X 10° Jelectron-volt 1 eV “ 1.602 X 10'19 Jerg 1 erg = 1.00 X 10‘ 7 Jfoot-pound force 1 ft-lb f = 1.356 X 10° Jkilowatt-hour 1 kW-h = 3.60 X 10⁶ J
Pressure
newtons/metre2 1 N/m2 = 1.00 Paatmosphere3 1 atm = 1.013 X 10s Pabar 1 bar = 1.00 X 10s Pacentimetres of mercury <0°C) 1 cmHg = 1.333 X 10³ Padyne/centimetre2 1 dyn/cm2 = 1.00 X 10’ 1 Pafeet of water (4°C) 1 ftH20 = 2.989 X 10³ Painches of mercury (0°C| 1 inHg = 3.386 X 10³ Painches of water (4°C) 1 inHjO = 2.491 X 10² Pakilogram force/centimetre2 1 kgf/cm2 = 9.807 X 10⁴ Papound force/foot2 1 lb f/ft2 = 4.788 X 101 Papound force/inch2 (= p$i)* 1 lbf/in2 = 6.895 X 10³ Patorr (0°C) (= mmHg) 1 torr = 1.333 X 10² Pa
Velocity, acceleration
inch/second 1 in/s = 2.54 X 101 mm/sfoot/second (= fps) 1 It/s = 3.048 X 10'1 m/sfoot/minute 1 ft/min = 5.08 X 10‘3 m/s
mile/hour (= mph) 1 mile/h (4.470 X 10"‘ [1.609 X 10°
m/skm/h
knot 1 knot = 1.852 X 10° km/hfree fall, standard (= g) = 9.807 X 10° m/s2foot/second2 1 ft/s2 = 3.048 X 10~l m/s2
Temperature, therm al cond uct iv ity , energy/area- time
Fahrenheit, degrees— 32 ° F -3 2 l 5 Г сRankine ° R I 9 l к1 Btu-'m/ft2-s- °F = 5.189 X 10² W/m-К1 Btu/ft-s- °F = 6.226 X 101 W/m-К1 cal/cm-s*°C = 4.184 X 10² W/m-К1 Btu/ft2-s = 1.135 X 10⁴ W/m21 cal/cm2-min = 6.973 X 10² W/m2
M isce llaneous
foot3 /second 1 ft3 / s = 2.832 X 10‘ 2 m3 /sfoot3 /minute 1 f t3 /min = 4.719 X 10"1 m3/srad rad = 1.00 X 10‘ 2 J/kgroentgen R = 2.580 X 10~* C/kgcurie Ci = 3.70 X Ю10 disintegration/s
3atm abs: atmospheres absolute; atm (g): atmospheres gauge.
b lbf/in2 (g) (= psig); gauge pressure;lbf/in2 abs (= psia): absolute pressure.


HOW TO ORDER IAEA PUBLICATIONS
П Exclusive sales agents for IAEA publications, to whom all ordersand inquiries should be addressed, have been appointed in the following countries:
UNITED KINGDOM Нет Majesty's Stationery Office, P.O. Box 569, London SE 1 9NH
UNITED STATES OF AMERICA UNIPUB, P.O. Box 433, Murray Hill Station, New York, N.Y. 10016
In the following countries IAEA publications may be purchased from the sales agents or booksellers listed or through your major local booksellers. Payment can be made in local currency or with UNESCO coupons.
AR G EN TIN A
A U S TR A LIABELGIUMCANADA
C.S.S.R.
FRANCE
HUNGARY
IN D IA
ISRAELIT A LY
JAPANNETHERLANDS
PAKISTANPOLAND
ROM ANIA SOUTH AFR IC A
SPAIN
SWEDENU.S.S.R.
YU G O SLAVIA
Comisiön Nacional de Energi'a Atömica, Avenida del Libertador 8250, Buenos AiresHunter Publications, 58 A Gipps Street, Collingwood, Victoria 3066Service du Courrier de I'UNESCO, 112, Rue du Tröne, B-1050 BrusselsInformation Canada, 171 Slater Street, Ottawa, Ont. К 1 A OS 9S.N.T.L., Spälenä 51, CS-110 00 PragueAlfa, Publishers, Hurbanovo nämestie 6, CS-800 00 BratislavaOffice International de Documentation et Librairie, 48, rue Gay-Lussac,F-75005 ParisKultura, Hungarian Trading Company for Books and Newspapers,P.O. Box 149, H-1011 Budapest 62Oxford Book and Stationery Comp., 17, Park Street, Calcutta 16; Oxford Book and Stationery Comp., Scindia House, New Delhi-110001 Heiliger and Co., 3, Nathan Strauss Str., Jerusalem Libreria Scientifica, Dott. de Biasio Lucio "aeiou".Via Meravigli 16, 1-20123 MilanMaruzen Company, Ltd., P.O.Box 5050, 100-31 Tokyo InternationalMarinus Nijhoff N.V., Lange Voorhout 9-11, P.O. Box 269, The HagueMirza Book Agency, 65, The Mall, P.O.Box 729, Lahore-3Ars Polona, Centrala Handlu Zagranicznego, Krakowskie Przedmiescie 7,WarsawCartimex, 3-5 13 Decembrie Street, P.O.Box 134-135, Bucarest Van Schaik's Bookstore, P.O.Box 724, Pretoria Universitas Books (Pty) Ltd., P.O.Box 1557, Pretoria Diaz de Santos, Lagasca 95, Madrid-6 Calle Francisco Navacerrada, 8, Madrid-28C.E. Fritzes Kungl. Hovbokhandel, Fredsgatan 2, S-103 07 Stockholm Mezhdunarodnaya Kniga, Smolenskaya-Sennaya 32-34, Moscow G-200 Jugoslovenska Knjiga, Terazije 27. YU-11000 Belgrade
Orders from countries where sales agents have not yet been appointed and requests for information should be addressed directly to:Publishing Section,
$ International Atomic Energy Agency,Kärntner Ring 11, PO.Box 590, A-1011 Vienna, Austria

76-
0301
3


IN TER N ATIO N AL ATOMIC ENERGY AGENCY V IE N N A , 1976
SUBJECT GROUP: V II Miscellaneous/Safeguards and Inspection