Nuclear and Cell Morphological Changes during the Cell Cycle and Growth of the Toxic Dinoflagellate...
15
Protist, Vol. 166, 146–160, February 2015 http://www.elsevier.de/protis Published online date 21 January 2015 ORIGINAL PAPER Nuclear and Cell Morphological Changes during the Cell Cycle and Growth of the Toxic Dinoflagellate Alexandrium minutum Carlos Dapena a , Isabel Bravo a , Angeles Cuadrado b , and Rosa Isabel Figueroa a,c,1 a Instituto Espa ˜ nol de Oceanografía (IEO), Subida a Radio Faro 50, 36390 Vigo, Spain b Universidad de Alcalá (UAH), Dpto de Biomedicina y Biotecnologia, 28801 Alcalá de Henares, Spain c Aquatic Ecology, Biology Building, Lund University, 22362 Lund, Sweden Submitted July 7, 2014; Accepted January 8, 2015 Monitoring Editor: Marina Montresor Elucidation of the cell cycle of dinoflagellates is essential to understand the processes leading to their massive proliferations, known as harmful algal blooms. In this study, we used imaging flow cytometry (IFC) to monitor the changes in DNA content and nuclear and cell morphology that occur during clonal growth of the toxic species Alexandrium minutum Halim. Our results indicate that the population was in S phase (C→2C DNA content) during the light period, whereas haploid cells with a C DNA content peaked only during a short interval of the dark period. The timing of the phases, identified based on the nuclear morphology and cytoplasmic-to-nuclear (CNR) ratio of the cells, suggests that the length of the G2/M phase is regulated by nutrient levels whereas the beginning of S phase is clock controlled. In addition we found that up to 7% of individual cells achieved a DNA content higher than 2C, indicative of either zygote formation and replication (homothallism), or of double-haploid cells able to divide (poly- ploid forms). Cells belonging to different cell cycle phases (G1-S-G2/M) could be readily discriminated based on nuclear size. Our study provides evidence of cell-cycle plasticity during clonal growth and unambiguously characterizes the cell-cycle phases of this dinoflagellate species. © 2015 The Authors. Published by Elsevier GmbH. This is an open access article under the CC BY-NC-ND license (http://creativecommons.org/licenses/by-nc-nd/4.0/). Key words: Cell-cycle; cytoplasmic-to-nuclear ratio (CNR); dinoflagellates; growth; nuclear size. Introduction During the cell cycle, eukaryotic cells undergo asexual division to yield two genetically identical daughter cells. The cell cycle proceeds in three stages: i) interphase, marked by three distinct 1 Corresponding author; e-mail rosa.fi[email protected], rosa.fi[email protected] (R.I. Figueroa). phases: G1, in which growing cells exhibit high metabolic activity; S, during which cellular DNA is replicated; and G2, a temporal gap between S phase and the following division in which cells accumulate the nutrients needed for the divi- sion process; ii) mitosis (M phase), during which there is nuclear division, or karyokinesis; and iii) cytokinesis, when cytoplasmic division marks the completion of cell division and thus of the cell cycle. The molecular events that determine a cell’s http://dx.doi.org/10.1016/j.protis.2015.01.001 1434-4610/© 2015 The Authors. Published by Elsevier GmbH. This is an open access article under the CC BY-NC-ND license (http://creativecommons.org/licenses/by-nc-nd/4.0/).
Transcript of Nuclear and Cell Morphological Changes during the Cell Cycle and Growth of the Toxic Dinoflagellate...

1
Protist, Vol. 166, 146–160, February 2015http://www.elsevier.de/protisPublished online date 21 January 2015
ORIGINAL PAPER
Nuclear and Cell Morphological Changesduring the Cell Cycle and Growth of theToxic Dinoflagellate Alexandriumminutum
Carlos Dapenaa, Isabel Bravoa, Angeles Cuadradob, and Rosa Isabel Figueroaa,c,1
aInstituto Espanol de Oceanografía (IEO), Subida a Radio Faro 50, 36390 Vigo, SpainbUniversidad de Alcalá (UAH), Dpto de Biomedicina y Biotecnologia, 28801 Alcalá deHenares, Spain
cAquatic Ecology, Biology Building, Lund University, 22362 Lund, Sweden
Submitted July 7, 2014; Accepted January 8, 2015Monitoring Editor: Marina Montresor
Elucidation of the cell cycle of dinoflagellates is essential to understand the processes leading to theirmassive proliferations, known as harmful algal blooms. In this study, we used imaging flow cytometry(IFC) to monitor the changes in DNA content and nuclear and cell morphology that occur during clonalgrowth of the toxic species Alexandrium minutum Halim. Our results indicate that the population wasin S phase (C→2C DNA content) during the light period, whereas haploid cells with a C DNA contentpeaked only during a short interval of the dark period. The timing of the phases, identified based onthe nuclear morphology and cytoplasmic-to-nuclear (CNR) ratio of the cells, suggests that the length ofthe G2/M phase is regulated by nutrient levels whereas the beginning of S phase is clock controlled. Inaddition we found that up to 7% of individual cells achieved a DNA content higher than 2C, indicative ofeither zygote formation and replication (homothallism), or of double-haploid cells able to divide (poly-ploid forms). Cells belonging to different cell cycle phases (G1-S-G2/M) could be readily discriminated
based on nuclear size. Our study provides evidence of cell-cycle plasticity during clonal growth andunambiguously characterizes the cell-cycle phases of this dinoflagellate species.© 2015 The Authors. Published by Elsevier GmbH. This is an open access article under the CC BY-NC-NDlicense (http://creativecommons.org/licenses/by-nc-nd/4.0/).Key words: Cell-cycle; cytoplasmic-to-nuclear ratio (CNR); dinoflagellates; growth; nuclear size.
Introduction
During the cell cycle, eukaryotic cells undergoasexual division to yield two genetically identicaldaughter cells. The cell cycle proceeds in threestages: i) interphase, marked by three distinct
Corresponding author;e-mail [email protected], [email protected](R.I. Figueroa).
phases: G1, in which growing cells exhibit highmetabolic activity; S, during which cellular DNAis replicated; and G2, a temporal gap betweenS phase and the following division in which cellsaccumulate the nutrients needed for the divi-sion process; ii) mitosis (M phase), during whichthere is nuclear division, or karyokinesis; and iii)cytokinesis, when cytoplasmic division marks thecompletion of cell division and thus of the cellcycle. The molecular events that determine a cell’s
http://dx.doi.org/10.1016/j.protis.2015.01.0011434-4610/© 2015 The Authors. Published by Elsevier GmbH. This is an open access article under the CC BY-NC-NDlicense (http://creativecommons.org/licenses/by-nc-nd/4.0/).

Cell Cycle Analysis of Alexandrium minutum 147
progress through the cell cycle are ordered anddirectional, such that the cycle is irreversible. Thereis also an additional stage, called G0, composedof cells that have exited the cycle and stoppeddividing. These quiescent cells in G0 cannot bedifferentiated from those in G1, either morpholog-ically or based on their DNA content. However,G0 cells can be activated to re-enter the cellcycle at G1 (see, for example, the review byPardee 1989). The transition between differentphases of the cell cycle is controlled by cyclins andcyclin-dependent kinases (CDKs), which are highlyconserved among eukaryotes. In concert with otherspecies-specific components, cyclins and CDKsregulate the cell cycle itself. Aside from the recog-nition of the various phases of the cell cycle,eukaryotic diversity in cell-cycle control remainslargely unexplored, in part because most of themodel species have been unikonts (Harashimaet al. 2013).
The cell cycle is composed of two cycles: theDNA division cycle and the growth cycle, whichincludes the synthesis of all other macromolecules(Vaulot et al. 1986). The DNA synthesis pattern ofmany phytoplankton species suggests that a circa-dian clock controls the timing of cell division, withlight- and dark-sensitive periods (Chisholm 1981;Chisholm and Brand 1981). Dinoflagellates are uni-cellular protists, with many species forming harmfulalgal blooms (e.g., Hallegraeff 1993; Smayda1997). Discrimination between dinoflagellate life-and cell-cycle stages is essential to understandthe development of dinoflagellate blooms. Duringdinoflagellate division, cytokinesis occurs duringthe day, and karyokinesis/mitosis generally atnight (Hastings and Sweeney 1964). However,Karentz (1983) observations suggest that there isa huge diversity in the group, different dinoflag-ellate species differing in their division patterns.For example, DNA synthesis and cell divisionmay be in phase or not, being hypothesized thatthey are in phase in populations with divisionrates of less than one per day, whereas in theothers (e.g. Gymnodinium nelsoni or Pyrocystisfusiformis), there is segregation of DNA replicationand cell division between different L:D cycles. Thesame study points to that G1, G2 and S lengthcould be specifically regulated among species.Supporting this diversity, DNA synthesis and celldivision have been described in dinoflagellateseither as a continuous process, similar to that inprokaryotes, or as following a typical eukaryoticG1-S-G2-M phase-transition model (Allen et al.1975; Polikarpov and Tokareva 1970; Spector et al.1981), albeit with several singular features (Bhaud
et al. 2000). The dinoflagellate nucleus, referredto as the dinokaryon (Rizzo 1991), has manyunusual characteristics, most notably its very largegenome size. Indeed, the dinoflagellate genomeis among the largest of all eukaryotic genomes(Hou and Lin 2009). Dinoflagellate chromosomes,organized by means of a cholesteric liquid crys-tal structure, are visible throughout the cell cycle(Chow et al. 2010; Rill et al. 1989), but in manyrespects their morphology resembles that seenin other eukaryotes (Figueroa et al. 2014). Thechromosomes divide via closed mitosis, with apermanent nuclear envelope and through cytoplas-mic channels (Soyer-Gobillard et al. 1999), butthey lack detectable histones, despite the fact thatrecent studies demonstrated the existence of allcore histone mRNA sequences (Lin et al. 2010;Roy and Morse 2012). The characteristics of thedinoflagellate nucleus have been attributed to theacquisition of prokaryotic genes during evolution,which may also explain the diversity and relativelyslow growth rates of dinoflagellates. The latter hasbeen attributed to their having a Rubisco enzyme,which inefficiently distinguishes CO2 from O2 andprobably originated from anaerobic protobacteria(Wong and Kwok 2005).
In the dinoflagellate Lingulodinium polyedrum,S phase, and not mitosis, was gated by the cir-cadian clock (Homma and Hastings 1989; Lidieet al. 2005). Nonetheless, the results of Dagenais-Bellefeuille et al. (2008) in this species areconsistent with a circadian clock controlling boththe G2/M and S phases. Nutrients have been con-sidered as potential modulators of the cell cyclephases, but the length of the G2 phase in phyto-plankton growing under different nutritional levelsremained constant in the study by Olson andChisholm (1986).
Blooms of the cosmopolitan and toxin-producingdinoflagellate Alexandrium minutum Halim occurworldwide in shallow systems such as estuaries,bays, lagoons, and harbors (Bravo et al. 2010;Garcés et al. 2004; Giacobbe et al. 1996; Touzetet al. 2010). Their negative effects, including pro-duction of the toxin that causes paralytic shellfishpoisoning, have been well-documented in humansand in other species. Growth in Alexandrium,including A. minutum, is mainly achieved throughasexual division (mitosis). Sexual reproduction canbe induced by, among other factors, phosphatedeficiency and apparently involves more than twocompatible mating types (complex heterothallism),given that self-fertilization in clonal strains has yet tobe observed (Figueroa et al. 2007). In dinoflagellateecology, sexual reproduction has several benefits in
148 C. Dapena et al.
addition to the potential for genetic recombination;mainly in those species in which leads to restingcyst formation (see Bravo and Figueroa 2014 andreferences therein). Resting cysts are benthic formsthat are highly resistant to adverse conditions, andthey can remain viable in the sediments for upto 100 years (Miyazono et al. 2012). Germinationand subsequent divisions (meiosis) of the restingcyst restore its haploid life-stage. Apart from thecyst stage, which in most dinoflagellate speciesis morphologically very different from planktonicforms, the life- and cell-cycle stages of Alexandriumare in general very similar. Resting cysts are wellcharacterized by the absence of flagella, a doublecell wall, and the presence of brownish pigmentdeposits. However, most characteristics considereduseful in distinguishing flagellated stages (vege-tative stages, gametes, and mobile zygotes) arein fact misleading. For example, regarding size,gametes are generally considered to be smaller,and zygotes larger than vegetative cells (see therevision by Bravo and Figueroa 2014). However,for A. minutum, gametes with a size similar to thatof the population average and zygotes, howeversmaller, have been observed (Figueroa et al. 2007).Immediately after their formation, mobile zygotespossess two trailing flagella, unlike the uniflag-ellate cells of vegetative stages. However, thischaracteristic is easily lost by cells under stressor after cell fixation. Therefore, the identificationof Alexandrium life and cell cycle stages is oftenvery challenging but essential to understand growthand survival strategies of these organisms in theirnatural habitats.
In their study of toxin production during thecell cycle in Alexandrium fundyense, Taroncher-Oldenburg et al. (1997) showed that prolongeddarkness arrested the cells in a light-dependentpart of the cell cycle (G0), which prevented bothprogression through G1 and division. DNA synthe-sis (S phase) started just before the beginning ofthe dark period, reaching a maximum that coin-cided with the middle of G2/M phase. Earlier studiesshowed that at the G1/S boundary, eukaryoticcells must pass a size threshold, whereas at theG2/M boundary a prerequisite for further cell-cycleprogression is the completion of DNA synthesis(Elledge 1996). In this study, we asked whetherthis pattern was also relevant for A. minutum andif cells of this species could be unambiguouslycharacterized according to their cell-cycle-specificmorphology and their nuclear and cellular sizes.To answer this question and to determine the tim-ing of each cell-cycle phase, we used imaging flowcytometry (IFC) and followed nuclear and cellular
morphologies to study a darkness-synchronizedclone of the dinoflagellate Alexandrium minutumover a period of 53 h.
Results
Growth
During the first light:dark period (28–48 TPS: TPS,time post-synchronization in hours) the numberof cells doubled, from 3290 ± 42.4 cells mL-1 to6313 ± 245.4 cells mL-1 (0.94 div day-1). Duringthe second light:dark period, growth was slower,with the population increasing from 6313 ± 245.4cells mL-1 to 8735 ± 49.5 cells mL-1 (0.47 div day-1).Although the cell cycle was evaluated by flowcytometry for only the first 53 h, growth of theclonal culture was followed until day 8 post-synchronization, reaching over 30,000 cells mL-1.
DNA Content
The cells were classified according to their DNAcontent, as determined by the peaks in the nuclearfluorescence histogram of Figure 1, as C, C→2C,and 2C. At the beginning of the study (28 h TPS)(Fig. 1A) and under light conditions (08:00–20:00),these histograms showed the presence of one mainpeak, with a relatively high coefficient of variation(CV), which widened over time. However, as thecells progressed through the dark period (20:00),two additional peaks clearly appeared. The oneto the left of the first peak corresponded to G1(1C DNA content) and the other, at the far right,to 2C (2C/C=1.95). Consequently, the main peakobserved under light conditions was that of S phase(C→2C). Still during the dark period, at 04:00, or44 h TPS in Figure 1, the G1 peak shifted slightly,towards the position of the S-phase peak. The latterwas maintained in the second light period, startingat 48 h TPS (Fig. 1), until the dark period (20:00or 60 h TPS), during which time the size of the2C peak started to increase. Note that the mainposition of the cell population during the secondlight period (C→ 2C peak) was closer to the 1Cposition than during the first light period. Addition-ally, peaks corresponding to 1C and 2C occurredlater, 2 h after the onset of the dark period (22:00),whereas the decrease in the 2C peak stopped2 h after the beginning of the third light period,rather than during the dark period, as observedbefore. The size of the 2C peak was significantlysmaller in the second than in the first dark period.At the beginning of the third light period, the mainpeak shifted slightly towards the C→2C peak, as

Cell Cycle Analysis of Alexandrium minutum 149
Figure 1. DNA intensity histograms obtained every 2 h for the studied light:dark periods. The dark bar on theleft of the panels indicates the dark period. TPS = Time post-synchronization.

150 C. Dapena et al.
Figure 2. Percentage of cells in the different phases of the cell cycle as shown by a trend line and the standarderror (gray-shaded area). (A) 27–54 h post-synchronization, (B) 55–79 h post-synchronization, (C) All samplesare organized by DNA content level. The dark bars along the bottom indicate the dark period. >2C indicatescells with DNA content higher than 2C.

Cell Cycle Analysis of Alexandrium minutum 151
Figure 3. Data on cell and nuclear area. Box-and-whisker plots summarizing cell (A) and nuclear area (B),with the median, first and third quartiles, and minimum and maximum values. (C) The regression lines per cellphase.
observed before; however the displacement wasagain less than during the first light period.
Consistent with the different peak sizes shownin Figure 1, the maximum percentage of cells inG1 or S phase or undergoing division differedsubstantially between the light:dark periods stud-ied (Fig. 2A, B), although the overall tendencieswere similar (Fig. 2C): Maximums of 2C cellsand cells with a >2C DNA content and minimumsof C→2C cells were detected during darkness,whereas C→2C cells reached their maximum num-bers during the light period. In the first light:darkperiod, the percentages of cells in S and G2/M weremarkedly higher than during the following period.This finding was supported by the fact that thebest curve fit was obtained with separate plots, i.e.,27–54 h TPS (Fig. 2A) and 55–79 h TPS (Fig. 2B).
From the graphs in Figure 2, we estimated thatthe beginning of S phase was at 07:00 in bothcycles. G2/M phase started at 18:00 and lasteduntil 06:00 in the first cycle but until 09:00 in thesecond. S phase was also longer (∼2 h) in the sec-ond cycle. Individual cells with a DNA content >2Cwere detected in both cycles and their pattern ofappearance in the dark period was similar to thatof 2C cells, but with a much smaller percentage ofcells: maximally 7.7% in the first cycle and 7.5% inthe second cycle.
Morphology
Cell and nuclear area. Figure 3 shows the average(N>10,000) cellular (Fig. 3A) and nuclear (Fig. 3B)areas together with the cell cycle data for individual

152 C. Dapena et al.
cells. The values corresponding to the differentphases did not overlap, with the largest differencesbetween phases recorded at the nuclear level. Celland nuclear areas were strongly correlated, fol-lowing a linear relationship in all cell-cycle phasesand when data from these phases were pooled(Fig. 3C). After the peak in 2C cells, the averagecell size after division (C) decreased until around400 �m2 in the first light:dark period but reachedclose to 300 �m2 in the second (Fig. 3A), in whichfewer cells underwent division (Fig. 2A-B). This factis shown by a negative correlation in the size of cellsover time, observed for all DNA contents unlessin cells>2C (Supplementary Material Fig. S2). Thecytoplasmic-to-nuclear ratio (CNR) changed overtime and according to DNA content (Fig. 4A), trend-ing to a linear correlation (R2=0.514). The CNRs ofcells with C DNA content overlapped slightly withthose of cells with C→2C, even if the median val-ues differed (Fig. 4A). Pairwise comparisons usingt tests showed highly significant differences in CNRvalues between groups with different DNA content(Supplementary Material Table S1)
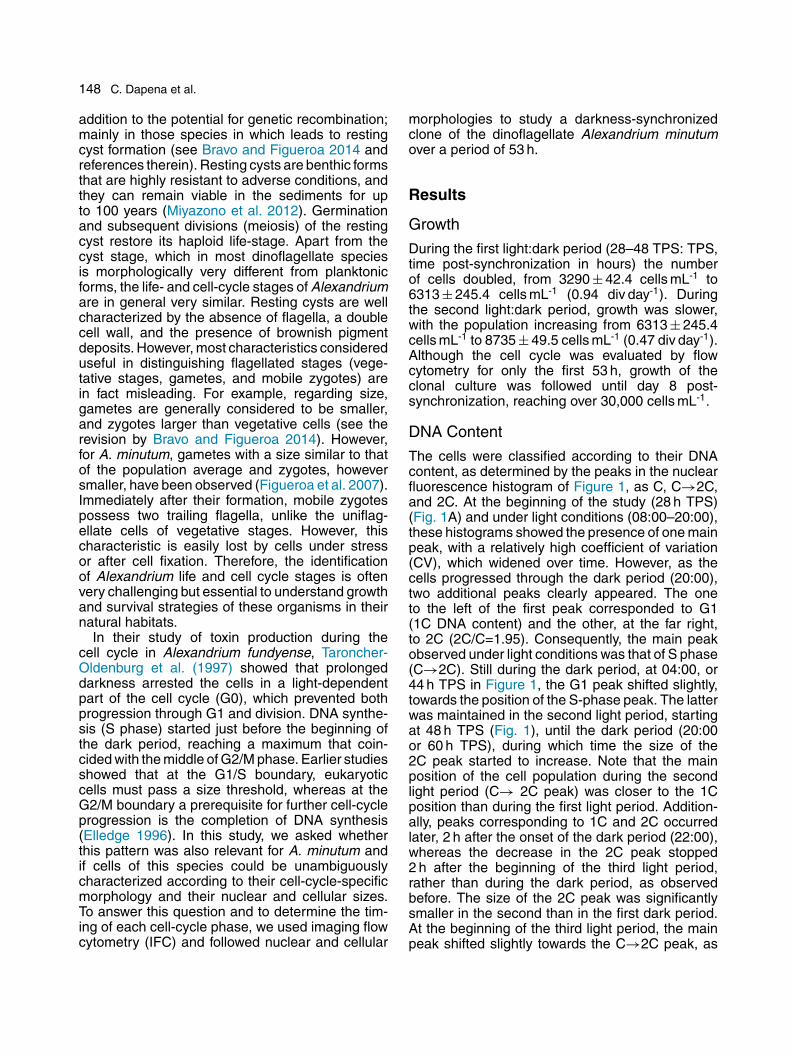
Nuclear morphology during the different cell-cycle stages. The nuclei of cells analyzed by IFCshowed either a roundish or a very weakly lobulatedmorphology for those with a C DNA content, but amore typical U-shaped morphology characteristicof the Alexandrium genus for those with a C→2CDNA content, indicative of S phase (Fig. 5). Threegroups were defined in a specific study of 2C cells:“individual,” “in early cytokinesis,” and “in two-cellchains” (Fig. 6A). The nuclear morphologies wereconsistent with the cellular classification (Fig. 6B),as individual cells had 2C either U-shaped orroundish nuclei; cells in early cytokinesis hadeither two C nuclei or one elongated 2C nucleus;and two-cell chains consisted of two differentiatedcells with two physically separated C nuclei. Thepercentage of individual cells in division wasseen as a distinct peak that corresponded to themaximum of 2C cells per cycle (Fig. 7). The IFC-based determination of cells in early cytokinesisindicated the onset of mitosis at a similar timethan the maximum value of CNR of 2C cells,which peaked at cell division (Fig. 4B). Accordingto the CNRs and the curve followed by cells inearly cytokinesis, mitosis occurred at 21:00–23:00(37-39 h post-synchronization) in the first cycle andat 22:00–01:00 (62–65 h post-synchronization) inthe second cycle (Figs 4B and 7).
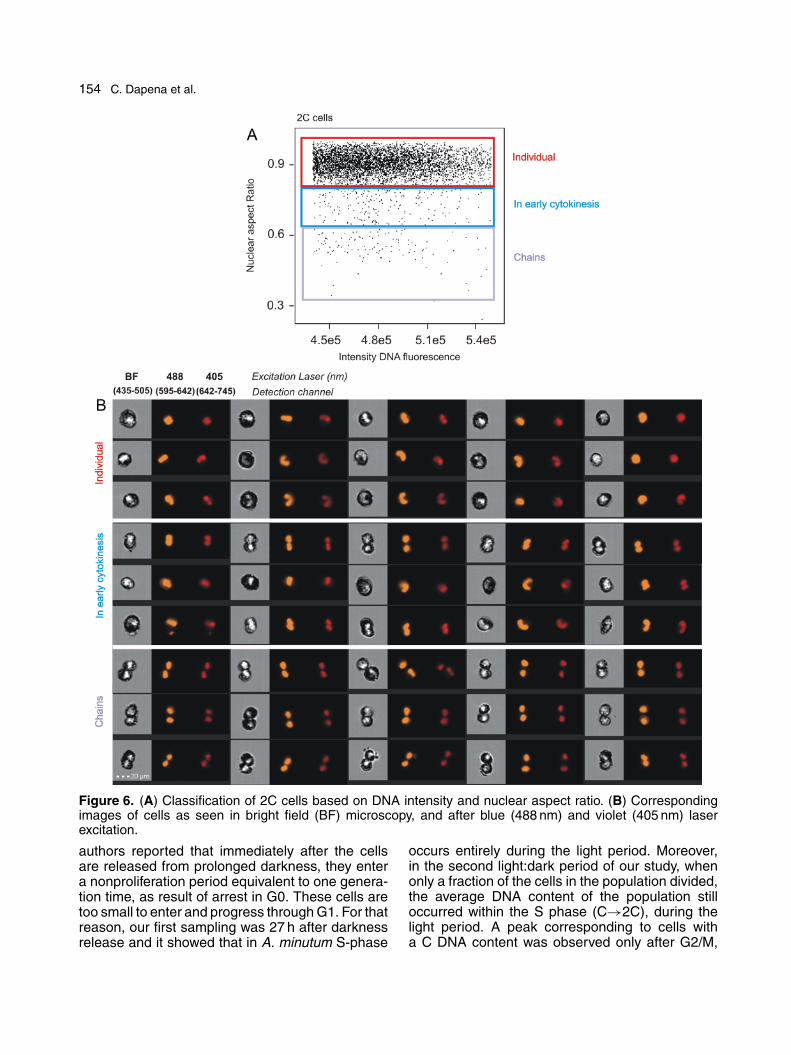
Using more detailed images, taken at highermagnification, together with those obtained by IFC,we reconstructed the cell cycle process. Figure 8A,B shows cells smaller than the minimum size
Figure 4. (A) Cytoplasmic-to-nuclear ratio (CNR)according to cell-cycle phase. The median, first andthird quartiles, and minimum and maximum values areshown. (B) The CNR of 2C cells and the percentageof 2C cells in early cytokinesis relative to the total pop-ulation of 2C cells using locally weighted regression.
needed to enter S phase. The nuclei of these cellsare small and U-shaped, with very shallow con-cavities (Fig. 8A), and are roundish in appearancedepending on the angle of view (Fig. 8B). A 2Cstage, with a well-developed U-shaped nucleus, isshown in Figure 8C; a putative metaphase cell,with well-separated chromosomes, is shown inFigure 8D, and a late metaphase cell, with double-chromatid chromosomes (arrows), in Figure 8E.Our reconstruction of anaphase and telophaseis provided in Figure 8F–H, which shows thesetwo processes until the formation of a two-cellchain, a mitotic product that is subsequently bro-ken to restore the individuality of the cells. The

Cell Cycle Analysis of Alexandrium minutum 153
Figure 5. IFC images of cell and nuclear morphologies of cells with C DNA content (top) and in S phase(bottom) as seen using bright field (BF) microscopy and after blue (488 nm) and violet (405 nm) laser excitation.
cell depicted in Figure 8J has a round nucleusand decondensed chromosomes, similar to manyof the 2C individual cells seen in Figure 6B. Lastly,based on its size and that of its nucleus, the cellin Figure 8K is probably one with a DNA content>2C.
Discussion
The study of dinoflagellate proliferation has consid-erable interest because it can lead to the formationof Harmful Algal Blooms (HABs), with adverseeffects on public health, seafood safety and aqua-culture (Smayda, 2002). The rate of division ofa given population of cells is under tight controlof cell cycle, a key element of this study. Thepresent work focuses in the cell cycle characteri-zation of the cosmopolitan PST-producing speciesAlexandrium minutum, in order to determine boththe timing of the DNA content changes and howcell growth, estimated by cell and nuclear areas,relate to the progression and stages of the cellcycle.
DNA Content Changes
Many phytoplankton species show circadian reg-ulation of cell cycle (Chisholm and Brand 1981;Homma and Hastings 1989; Sweeney and Hastings1958), which exhibit three main characteristics:they are endogenously generated, self-sustaining,and persist under constant conditions, with light vs.dark conditions and temperature among the mostwell-studied (see the review of McClung 2006 andreferences therein). The “escape from light hypoth-esis” (Pittendrigh 1993) posits that organismsgain an advantage by carrying out light-sensitiveprocesses, such as DNA replication, during thedark portion of the cell cycle. However, in somedinoflagellates, such as Lingulodinium polyedrum(Dagenais-Bellefeuille et al. 2008; Homma andHastings 1989), S phase occurs during the darkperiod, whereas in other species, such as Amphi-dinium operculatum (Leighfield and Van Dolah2001; Van Dolah and Leighfield 1999), Kareniabrevis (Van Dolah et al. 2007), and Alexandriumfundyense (Taroncher-Oldenburg et al. 1997) ittakes place, at least in part, during the day. The last
154 C. Dapena et al.
Figure 6. (A) Classification of 2C cells based on DNA intensity and nuclear aspect ratio. (B) Correspondingimages of cells as seen in bright field (BF) microscopy, and after blue (488 nm) and violet (405 nm) laserexcitation.
authors reported that immediately after the cellsare released from prolonged darkness, they entera nonproliferation period equivalent to one genera-tion time, as result of arrest in G0. These cells aretoo small to enter and progress through G1. For thatreason, our first sampling was 27 h after darknessrelease and it showed that in A. minutum S-phase
occurs entirely during the light period. Moreover,in the second light:dark period of our study, whenonly a fraction of the cells in the population divided,the average DNA content of the population stilloccurred within the S phase (C→2C), during thelight period. A peak corresponding to cells witha C DNA content was observed only after G2/M,

Cell Cycle Analysis of Alexandrium minutum 155
Figure 7. Percentage of cells in early cytokinesis(dark green) relative to the maximum percentage of2C cells per cycle (light green). The dark bars alongthe bottom indicate the dark period.
under conditions of darkness. Interference due toRNA content can be ruled out in these obser-vations given the high concentrations of RNAaseused in the study to specifically avoid this prob-lem. Interestingly, and in contrast to L. polyedrum(Dagenais-Bellefeuille et al. 2008), the timing andlength of S and G2 in A. minutum varied with growth,as both phases were shorter in the first cycle,when the growth rate was higher, and longer in thesecond, when there was less growth of the popula-tion. DNA replication and mitosis are controlled byspecific proteins whose rate of synthesis changesduring the cell cycle (Evans et al. 1983; Giardet al. 1973), and growth-dependent variations inthe durations of S and G2 have been demonstratedin different cell lines, e.g., in yeasts. In that study,Slater et al. (1977) examined the relation betweenthe lengths of the cell-cycle phases and the growthrate of the culture. The largest variability was in thelength of G1 (10-fold vs. nearly 2-fold in both S andG2). In dinoflagellate species with division rates ofless than one per day, the cell cycle is said to beruled by the circadian clock, meaning that there isa temporal window through which cells that havereached a minimum size threshold can proceedthrough the cycle (Elledge 1996). This implies cell-cycle control at the S and G2 phases. Indeed,in our experiment these two phases similarly var-ied between light:dark periods, as the differencein the duration of either one was approximately2 h. Cell growth has to be coordinated with the celldivision cycle to allow an appropriate response tonutrient availability (Wong and Kwok, 2005). Our
results show that all cells duplicated during thefirst light:dark period but the population decreasedtheir growth rate during the following one, indi-cating a progressive loss of cell cycle synchrony.The maximum division rate achieved in the firstlight:dark period (A. minutum usually grows at lowerrates) is probably not possible to maintain overlong periods of time, because metabolic needs andnutrient uptake become imbalanced when synchro-nization is lost (e.g., Taroncher-Oldenburg et al.1997; Vaulot et al. 1996). Supporting this the-ory, during the 53 h of our study the trend was adecrease in the average area of C cells, which sug-gests nutritional depletion. Thus, dinoflagellatesare apparently able to rapidly adapt to the availablenutritional resources, modulating their cell-cycleprogression by increasing the length of both G2 andS in response to the number of cells in G1 that areable to reach the minimum threshold size neededfor entry into S phase.
Another implication of our results is related to thevalidity of the estimations of cellular DNA contentin some dinoflagellate species. Those estimateswere mainly based on unsynchronized culturessampled during light conditions (e.g., LaJeunesseet al. 2005). However, according to the results ofour study, the DNA content of some dinoflagellatespecies may be overestimated by this method whenS phase starts immediately before the beginning ofthe light period.
Additionally, another novel result in the presentwork was the detection of individual cells witha >2C DNA content. One explanation could berelated to the sexual cycle of this species. A. minu-tum has been described as a heterothallic species(Figueroa et al. 2007), as two different clones wereshown to be necessary to produce sexual restingcysts. However, that study was unable to determinewhy some zygotes encyst while others divide. Wethink that the existence of cells with a >2C DNAcontent in the clonal culture (in which no restingcysts were ever observed) is best explained by lowlevels of homothallism and zygote division (by mito-sis or meiosis), as suggested by the fact that cellswith a DNA content >2C show a similar trend of2C cells, with peaks during the dark period. Thus,our study is the first to show a circadian rhythm forthe division of dinoflagellate cells with a ploidy leveldifferent than that of haploid cells. While an alterna-tive explanation is the existence of double haploidcells able to divide, as a consequence of a pos-sible polyploidization event, we think that the firsthypothesis is more plausible because the percent-age of these cells increases dramatically following asexual cross, suggesting that sexuality and zygote
156 C. Dapena et al.
Figure 8. High-magnification (1000×) images of the mitotic process in DAPI- and Calcofluor-stained cells, inaccordance with the IFC results. Images D–E correspond to nuclei squashes; the other images were obtainedfrom cell suspensions. Scale bars=10 �m.

Cell Cycle Analysis of Alexandrium minutum 157
formation underlie the origin of cells forming thispopulation (Figueroa et al., unpubl. observ.).
Cell and Nuclear Size during the CellCycle
Nuclear size and shape are carefully controlled ineukaryotic cells, with aberrations in either lead-ing to altered cellular states such as cancer (seethe review by Huber and Gerace 2007 and refer-ences therein). Cell division requires an increasein the cell surface area:volume ratio (Oney et al.2005); indeed, there is a well-established correla-tion between cell and nuclear size, expressed asthe CNR, with changes in DNA content altering cellvolume (see, for instance, the work in yeasts byJorgensen et al. 2007). Early observations formedthe basis of the “karyoplasmic” ratio theory, accord-ing to which eukaryotic cells actively maintain afixed ratio of nuclear to cell volume (Cavalier-Smith2005; Wilson 1925). The validity of this hypothe-sis has been confirmed in cells with a broad rangeof genetic backgrounds and placed in a wide vari-ety of growth conditions, including those that altercell volume and DNA content. But to our knowledgeours is the first study to confirm this relationship indinoflagellates, i.e., the eukaryotes with the highestDNA content (Lin 2011).
The CNR is an important indicator of cell stability.For example, for the multifunctional protein sur-vivin, an inhibitor of apoptosis and a breast cancerbiomarker, the CNR was shown to be an importantpredictor of outcome in tamoxifen-treated patients(Rexhepaj et al. 2010). The variations in the CNRsin our study were mainly but, as evidenced by thedata dispersion, not exclusively limited to DNA con-tent, consistent with reports of factors besides theamount of DNA in the nucleus affecting the CNR.For example, nuclear size might also be subjectto regulation depending on cell-type-specific chro-matin condensation (Swanson et al. 1991). TheCNRs of A. minutum cells in G1 and S overlappedbut increased significantly in cells with a DNA con-tent ≥2C.
The morphological discrimination betweendinoflagellate life- and cell-cycle stages has beendifficult if not impossible but it is essential if we areto understand dinoflagellate blooming patterns inthe field. Our results show that cell and nucleararea, as well as the CNR, can be used to efficientlydistinguish between the cell-cycle stages of thedinoflagellate A. minutum. Further studies are nec-essary to determine whether these relationshipsare maintained between genotypes, along thegrowth curve, and under different environmental
conditions, and to design parameters able toaccurately evaluate the growth of a bloom andforecast its development potential.
Methods
Cell proliferation conditions: The dinoflagellate strain usedin this study was A. minutum strain VGO577, regularly main-tained at the Centro Oceanográfico de Vigo (CCVIEO; CultureCollection of Harmful Microalgae of the Spanish Institute ofOceanography). The strain was isolated in 2002 in Girona(Spain), and a single cell was used to establish a monoclonalculture in 2012, yielding clone H7. Culture conditions were anincubation temperature of 19.5 ◦C ±1 ◦C with an approximateillumination of 90 �mol photons m-2 s-1 and a photoperiod of12:12 h light:dark (L:D). The cells were grown and maintained inL1 medium (Guillard and Hargraves 1993) without added silica.The medium was prepared with Atlantic seawater and adjustedto a salinity of 32 by the addition of sterile distilled water.
Synchronization and sampling: When A. minutum clonalculture H7 reached a concentration of 8,000–10,000 cells mL-1
(corresponding to the exponential growth phase), it was trans-ferred to complete darkness for 66 h (synchronization period),following the method of Taroncher-Oldenburg et al. (1997) andFigueroa et al. 2007. Light conditions were then restored andthe cells were inoculated into fresh L1 medium to a concentra-tion of approximately 2000 cells mL-1 (1.7 L in total). Samplingstarted 27 h after inoculation to allow cell recovery and the initia-tion of division. Supplementary Material Figure S1 summarizesthe experimental setup and sampling protocol. For flow cyto-metric analyses, 50-ml samples were taken every hour for 53 h(starting at 11:00 of the first light cycle and ending at 15:00 pmof the third light cycle) using an automatic water sampler (AWS,EnviroTech Instruments LLC, Chesapeake, VA, USA), allowing1 min of programmed soft magnetic shaking just before samp-ling. In the following, “synchronization” is defined as the periodof 66 h of darkness. For the determination of absolute cell num-bers (cell concentration analyses), two 2-mL samples, the firstat 11:00 and the second at 15:00, were collected manually ondays 1, 2, 3, 4, 7, 8, and 9 post-synchronization and fixed withLugol.
Flow cytometry analyses: Imaging flow cytometry (IFC):Each 50-mL sample was fixed with 0.5% formaldehyde for atleast 10 min, filtered through a 5.0-�m-pore-size membrane fil-ter (Millipore, Ireland), the fluid discarded and the retained cellsresuspended and centrifuged at 5000 × g for 5 min. The pel-let was resuspended in 2–5 mL of cold methanol and storedfor at least 12 h at 4 ◦C to facilitate chlorophyll extraction. Thecells were then washed in PBS (pH 7, Sigma-Aldrich, St.Louis, MO, USA) and the pellet was resuspended in stain-ing solution (30 �g·propidium iodide (Sigma-Aldrich) mL-1 and100 mg RNaseA (Sigma-Aldrich) mL-1 in PBS) for at least 3 hin darkness before analysis. A Flow Sight image flow cytometer(Amnis, Seattle, WA, USA), with two lasers, emitting at 488 and405 nm, was used. The samples were run at low speed and datawere acquired until 15,000–50,000 events were recorded. Ideas6.0 (Amnis) and FlowJo 7.6 (Tree Star, Ashland, OR, USA)were used to compute peak numbers, coefficients of variation(CVs), and peak ratios for the DNA fluorescence distributions ina population. CVs were usually below 7; those above 10 werediscarded from the analyses.
Cell-cycle analyses: The Gradient RMS feature, which enu-merates changes of pixel values in the image to measure thefocus quality of an image, was used to select focused cells,

158 C. Dapena et al.
which have a higher gradient than unfocused cells (Marangonet al. 2012). Aggregates were eliminated using cellular area andnuclear fluorescence and the results verified visually by study-ing the images of both discarded and retained populations.Each cell-cycle phase was delimited by means of a histogramof propidium iodide fluorescence using 405-nm laser excitation,since emission at 488 nm (also recorded) was saturated evenat minimum power. The precision of the phase adjustment wascompared with that obtained using a Sony iCyt EC800 con-ventional flow cytometer and a replicated synchronized clonalsample as control. The percentages and CVs were similar forthe two platforms. Cells were classified as “individual,” in “earlycytokinesis,” or in “two-cell chains” according to the nuclear-aspect ratio (width vs. height of the mask used to more preciselyadjust the area to the U-shaped nucleus) and the intensityof nuclear fluorescence. The precision of the adjustment wasmade manually in the control sample by studying the acquiredimages. With these analyses a general template was built forall samples. The beginning of S phase was set as the time atwhich its value was half of the maximum, whereas the timeof M-phase was estimated as the midpoint of the decreasein the percentage of G2/M cells (Dagenais-Bellefeuille et al.2008). A specific area of an image can be obtained for eachfeature, which was adjusted in the case of the nuclear area bymeans of a mask to include only well-defined nuclei (IDEAS 6.0,Amnis). Cytoplasmic-to-nuclear ratios (CNRs) were calculatedas CNR = Area nucleus
(Area cell−Areanucleus)Microscopy: Cells in selected samples were fixed for flow
cytometry analyses and stained with both DAPI (2 �g mL-1) andCalcofluor to stain the nucleus and thecal plates, respectively.In addition, some samples were treated with Liquinox before fix-ation in ethanol:acetic 3:1 (v/v), The cells were then squashedin a drop of 45% acetic acid onto clean microscope slides. Theslides were frozen to remove the cover and air-dried beforeDAPI staining. The cells were examined using a fluorescencemicroscope (Leica DMR, Germany) and imaged at 1000× mag-nification using a microscope camera (Axiocam HRC, Zeiss,Germany).
Samples for cell-concentration determinations were ana-lyzed in duplicates in an inverted microscope at 100×magnification using a Sedgwick-rafter chamber. At least 400cells were counted.
Statistical analyses: Analyses were performed using thestatistical and programming software R 2.1.12 (R DevelopmentCore Team, 2012), packages “ggplot2” and “scales”, availablethrough the CRAN repository (www.r-project.org/).
Acknowledgements
The present work was funded by a FORMAS(Sweden) project to R. I. Figueroa (Formas215-2010-824) and the project CICAN (CGL2013-40671-R) funded by the Spanish Ministry ofEconomy and Competitiveness.
Appendix A. Supplementary Data
Supplementary data associated with this article canbe found, in the online version, at http://dx.doi.org/10.1016/j.protis.2015.01.001.
References
Allen JR, Roberts TM, Loeblich AR III, Klotz LC (1975)Characterization of the DNA from the dinoflagellate Crypthe-codinium cohnii and implications for nuclear organization. Cell6:161–169
Bhaud Y, Guillebault D, Lennon JF, Defacque H, Soyer-Gobillard S, Moreau H (2000) Morphology and behaviour ofdinoflagellate chromosomes during the cell cycle and mitosis.J Cell Sci 113:1231–1239
Bravo I, Figueroa RI (2014) Towards an ecological understand-ing of dinoflagellate cyst functions. Microorganisms 2:11–32
Bravo I, Fraga S, Figueroa RI, Pazos Y, Massanet A, RamiloI (2010) Bloom dynamics and life cycle strategies of twotoxic dinoflagellates in a coastal upwelling system (NW IberianPeninsula). Deep Sea Res PT II 57:222–234
Cavalier-Smith T (2005) Economy, speed and size matter:evolutionary forces driving nuclear genome miniaturization andexpansion. Ann Bot 95:147–175
Chisholm SW (1981) Temporal patterns of cell division in uni-cellular algae. Can Bull Fish Aquat Sci 210:150–181
Chisholm SW, Brand LE (1981) Persistence of cell divi-sion phasing in marine phytoplankton in continuous lightafter entrainment to light: dark cycles. J Exp Mar Biol Ecol51:107–118
Chow MH, Yan KTH, Bennett MJ, Wong JTY (2010)Birefringence and DNA condensation of liquid crystalline chro-mosomes. Eukaryot Cell 9:1577–1587
Dagenais-Bellefeuille S, Bertomeu T, Morse D (2008) S-phase and M-phase timing are under independent circadiancontrol in the dinoflagellate Lingulodinium. J Biol Rhythms23:400–408
Elledge SJ (1996) Cell cycle checkpoints: preventing an iden-tity crisis. Science 274:1664–1672
Evans T, Rosenthal ET, Youngbloom J, Distel D, Hunt T(1983) Cyclin: a protein specified by maternal mRNA in seaurchin eggs that is destroyed at each cleavage division. Cell33:389–396
Figueroa RI, Garces E, Bravo I (2007) Comparative studyof the life cycles of Alexandrium tamutum and Alexandriumminutum (Gonyaulacales, Dinophyceae) in culture. J Phycol43:1039–1053
Figueroa RI, Cuadrado A, Stüken A, Rodriguez F, FragaS (2014) Ribosomal DNA organization patterns within thedinoflagellate genus Alexandrium as revealed by FISH: Lifecycle and evolutionary implications. Protist 165:343–363
Garcés E, Bravo I, Vila M, Figueroa RI, Masó M, SampedroN (2004) Relationship between vegetative cells and cyst pro-duction during Alexandrium minutum bloom in Arenys de Marharbour (NW Mediterranean). J Plankton Res 26:637–645
Giacobbe MG, Oliva FD, Maimone G (1996) Environmentalfactors and seasonal occurrence of the dinoflagellate Alexan-drium minutum, a PSP potential producer, in a Mediterraneanlagoon. Estuar Coast Shelf Sci 42:539–549
Guillard RRL, Hargraves PE (1993) Stichochrysis immobilisis a diatom, not a chysophyte. Phycologia 32:234–236

Cell Cycle Analysis of Alexandrium minutum 159
Giard DJ, Aaronson SA, Todaro GJ, Arnstein P, Kersey JH,Dosik H, Parks WP (1973) In vitro cultivation of human tumors:establishment of cell lines derived from a series of solid tumors.J Natl Cancer Inst 51:1417–1423
Hallegraeff GM (1993) A review of harmful algal blooms andtheir apparent global increase. Phycologia 32:79–99
Harashima H, Dissmeyer N, Schnittger A (2013) Cellcycle control across the eukaryotic kingdom. Trends Cell Biol23:345–356
Hastings JW, Sweeney BM (1964) Phased Cell Division in theMarine Dinoflagellates. In Zeuthen E (ed) Synchrony in CellDivision and Growth. Interscience, New York, pp 307–321
Homma K, Hastings JW (1989) The S phase is discrete andis controlled by the circadian clock in the marine dinoflagellateGonyaulax polyedra. Exp Cell Res 182:635–644
Hou Y, Lin S (2009) Distinct gene number-genome size rela-tionships for eukaryotes and non-eukaryotes: Gene contentestimation for dinoflagellate genomes. PLoS ONE 4:e6978
Huber M, Gerace L (2007) The size-wise nucleus: nuclear vol-ume control in eukaryotes. J Cell Biol 179:583–584
Jorgensen A, Alfjorden A, Henriksen K, Sterud E (2007)Phylogenetic analysis of the SSU rRNA gene from the piscinediplomonad Spironucleus torosus (Diplomonadida: Hexamiti-nae). Folia Parasitol 54:277–282
Karentz D (1983) Patterns of DNA synthesis and cell division.J Protozool 30:581–588
LaJeunesse TC, Lambert G, Andersen RA, Coffroth MA,Galbraith DW (2005) Symbiodinium (Pyrrhophyta) genomesizes (DNA content) are smallest among dinoflagellates. J Phy-col 41:880–886
Leighfield TA, Van Dolah FM (2001) Cell cycle regulation ina dinoflagellate, Amphidinium operculatum: identification of thediel entraining cue and a possible role for cyclic AMP. J Exp MarBiol Ecol 262:177–197
Lidie KB, Ryan JC, Barbier M, Van Dolah FM (2005) Geneexpression in Florida red tide dinoflagellate Karenia brevis:Analysis of an expressed sequence tag library and developmentof DNA microarray. Mar Biotech 7:481–493
Lin S, Zhang H, Zhuang Y, Bao T, Gill J (2010) Splicedleader-based metatranscriptomic analyses lead to recognitionof hidden genomic features in dinoflagellates. Proc Natl AcadSci USA 107:20033–20038
Lin S (2011) Genomic understanding of dinoflagellates. ResMicrobiol 162:551–569
Marangon I, Boggetto N, Ménard-Moyon C, Venturelli E,Béoutis ML, Péchoux C, Luciani N, Wilhelm C, BiancoA, Gazeau F (2012) Intracellular carbon nanotube translo-cation assessed by flow cytometry imaging. NanoLetters12:4830–4837
McClung CR (2006) Plant circadian rhythms. Plant Cell18:792–803
Miyazono A, Nagai S, Kudo I, Tanizawa K (2012) Viability ofAlexandrium tamarense cysts in the sediment of Funka Bay,Hokkaido, Japan: Over a hundred year survival times for cysts.Harmful Algae 16:81–88
Olson RJ, Chisholm SW (1986) Effects of light and nitrogenlimitation on the cell cycle of the dinoflagellate Amphidiniumcarteri. J Plankton Res 8:785–793
Oney I, Kurnaz IA, Kurnaz ML (2005) Cytoplasmic-to-nuclearvolume ratio affects AP-1 complex formation as an indicator ofcell cycle responsiveness. FEBS Letters 579:433–440
Pardee AB (1989) G1 events and regulation of cell proliferation.Science 246:603–608
Pittendrigh CS (1993) Temporal organization: reflections of aDarwinian clock-watcher. Annu Rev Physiol 55:17–54
Polikarpov GG, Tokareva AV (1970) The cell cycle of thedinoflagellates Peridinium trochoideum (Stein) and Gonyaulaxtamarensis (Stein)(microautoradiographic study). Hydrobiol J6:54–58
Rexhepaj E, Jirstrom K, O’Connor DP, O’Brien SL, Land-berg G, Duffy MJ, Brennan DJ, Gallagher WM (2010)Validation of cytoplasmic-to-nuclear ratio of survivin as an indi-cator of improved prognosis in breast cancer. BMC Cancer10:639
Rill RL, Livolant F, Aldrich HC, Davidson MW (1989) Elec-tron microscopy of liquid crystalline DNA: direct evidence forcholesteric-like organization of DNA in dinoflagellate chromo-somes. Chromosoma 98:280–286
Rizzo PJ (1991) The enigma of the dinoflagellate chromo-somes. J Protozool 38:346–352
Roy S, Morse D (2012) A full suite of histone and histone modi-fying genes are transcribed in the dinoflagellate Lingulodinium.PLoS ONE 7(4):e34340
Slater ML, Sharrow SO, Gart JJ (1977) Cell cycle of Saccha-romyces cerevisiae in populations growing at different rates.Proc Natl Acad Sci USA 74:3850–3854
Smayda TJ (1997) Harmful Algal Blooms: Their ecophysiol-ogy and general relevance to phytoplankton blooms in the sea.Limnol Oceanogr 42:1137–1153
Smayda TJ (2002) Adaptive ecology, growth strategies andthe global bloom expansion of dinoflagellates. J Oceanogr58:281–294
Soyer-Gobillard MO, Gillet B, Geraud ML, Bhaud Y (1999)Dinoflagellate chromosome behaviour during stages of replica-tion. Int Microbiol 2:93–102
Spector DL, Vasconcelos AC, Triemer RE (1981) DNAduplication and chromosome structure in the dinoflagellates.Protoplasma 105:185–194
Swanson JA, Lee M, Knapp PE (1991) Cellular dimen-sions affecting the nucleocytoplasmic volume ratio. J Cell Biol115:941–948
Sweeney BM, Hastings J (1958) Rhythmic cell division inpopulations of Gonyaulax polyedra. J Protozool 5:217–224
Taroncher-Oldenburg G, Kulis DM, Anderson DM (1997)Toxin variability during the cell cycle of the dinoflagel-late Alexandrium fundyense. Limnol Oceanogr 42:1178–1188
Touzet N, Farrell H, Ní Rathaille A, Rodriguez P, AlfonsoA, Botana LM, Raine R (2010) Dynamics of co-occurringAlexandrium minutum (Global Clade) and A. tamarense

160 C. Dapena et al.
(West European)(Dinophyceae) during a summer bloom inCork Harbour, Ireland (2006). Deep Sea Res Pt II 57:268–278
Van Dolah FM, Leighfield TA (1999) Diel phasing of the cellcycle in the Florida red tide dinoflagellate, Gymnodinium breve.J Phycol 35:1404–1411
Van Dolah FM, Lidie KB, Morey JS, Brunelle SA, RyanJC, Monroe EA, Haynes BL (2007) Microarray analysis ofdiurnal and circadian regulated genes in the Florida red tidedinoflagellate Karenia brevis (Dinophyceae). J Phycol 43:741–752
Vaulot D, Olson RJ, Chisholm SW (1986) Light and dark con-trol of the cell cycle in two marine phytoplankton species. ExpCell Res 167:38–52
Vaulot D, Lebot N, Marie D, Fukai E (1996) Effect of phospho-rus on the Synechococcus cell cycle in surface Mediterraneanwaters during summer. Appl Environ Microbiol 62:2527–2533
Wilson EB (1925) The Cell in Development and Heredity.Macmillan, New York
Wong JT, Kwok A (2005) Proliferation of dinoflagellates:blooming or bleaching. Bioessays 27:730–774
Available online at www.sciencedirect.com
ScienceDirect