Modelling spatial variability of saturated hydraulic conductivity ...
ww.sciencedirect.com
i n t e r n a t i o n a l j o u r n a l o f h yd r o g e n e n e r g y x x x ( 2 0 1 4 ) 1e1 0
Available online at w
ScienceDirect
journal homepage: www.elsevier .com/locate/he
Novel way of phase stability of LSGM and itsconductivity enhancement
Ramesh Chandra Biswal*, Koushik Biswas
Department of Metallurgical and Materials Engineering, Indian Institute of Technology, Kharagpur 721302, India
a r t i c l e i n f o
Article history:
Received 28 June 2014
Received in revised form
6 September 2014
Accepted 22 October 2014
Available online xxx
Keywords:
SOFC
LSGM
Impedance spectroscopy
XPS
Pechini method
* Corresponding author. Tel.: þ91 3222 28227E-mail address: [email protected] (R.
Please cite this article in press as: Biswal RInternational Journal of Hydrogen Energy
http://dx.doi.org/10.1016/j.ijhydene.2014.10.00360-3199/Copyright © 2014, Hydrogen Ener
a b s t r a c t
Instead of using various methods to synthesize phase pure Sr- and Mg-doped LaGaO3
(LSGM), it is very interesting to achieve phase purity by changing the stoichiometry and
additional co-doping. In this work, Pechini method is adopted to synthesize LSBGM
(La0.8Sr0.2�xBaxGa0.8Mg0.2O2.8) by co-doping of Ba2þ and Sr2þ at La-site, and Mg2þ at Ga site.
These multi-dopings eliminate the complexities in the synthesis and processing tech-
niques, and desired single phase is achieved more easily. Tolerance factor, which is a
measure of structural symmetry, increases from 0.9622 (in LSGM) to 0.9652 (in LSBGM).
Moreover, an increase in 0.4% free volume occurred due to these multiple dopings at La-
site. Enhancement in free volume and structural symmetry attribute to a higher ionic
conductivity of LSBGM, which is also supported by XPS analysis. Ionic conductivity (0.046 S/
cm at 600 �C) measured by impedance spectroscopic analysis is found to be >44% superior
compared to the LSGM synthesized by similar/different processes. Additionally, a decrease
in activation energy value suggests the lower vacancyedopant interaction in LSBGM.
Copyright © 2014, Hydrogen Energy Publications, LLC. Published by Elsevier Ltd. All rights
reserved.
Introduction
Fuel cell, an electrochemical energy conversion device, is
getting popularity because of its direct conversion of chemical
energy in the fuel to electricity. As its efficiency is not limited
by the Carnot's cycle, it can be much higher than that of
combustion engine. Among the different types of fuel cell,
solid oxide fuel cell (SOFC) is gettingmore attention because of
its fuel flexibility, higher energy conversion efficiency and
durability. Hence, it is believed to be the most promising de-
vice for stationary electrical power generation. Moreover, in
the SOFC system, electrolyte plays the pilot role in deciding
the operating temperature and compatible electrodes. In that
aspect, over past few decades yttria-stabilized zirconia (YSZ)
9.C. Biswal).
C, Biswas K, Novel way(2014), http://dx.doi.org
99gy Publications, LLC. Publ
is extensively used as an electrolytematerial. However, due to
its high operating temperature, compatible electrodes and
interconnect material is of great concern, and subsequently
durability of the cell is a major issue. Afterward, doped ceria
and LaGaO3 based materials are found to be the alternate
electrolyte materials for intermediate temperature SOFC (IT-
SOFC). But in the reducing atmosphere or at slightly higher
temperatures, electronic conductivity is developed within the
ceria based materials due to the reduction of Ce4þ to Ce3þ,which limits its usage as electrolyte material in those condi-
tions [1].
Doped LaGaO3, on the other hand, found to be a promising
candidate for IT-SOFC electrolyte in which, hopping of the
ionic species via vacant sites is the basis of its transport
mechanism [1]. As shown in Fig. 1(a), when La3þ sits at the
of phase stability of LSGM and its conductivity enhancement,/10.1016/j.ijhydene.2014.10.099
ished by Elsevier Ltd. All rights reserved.
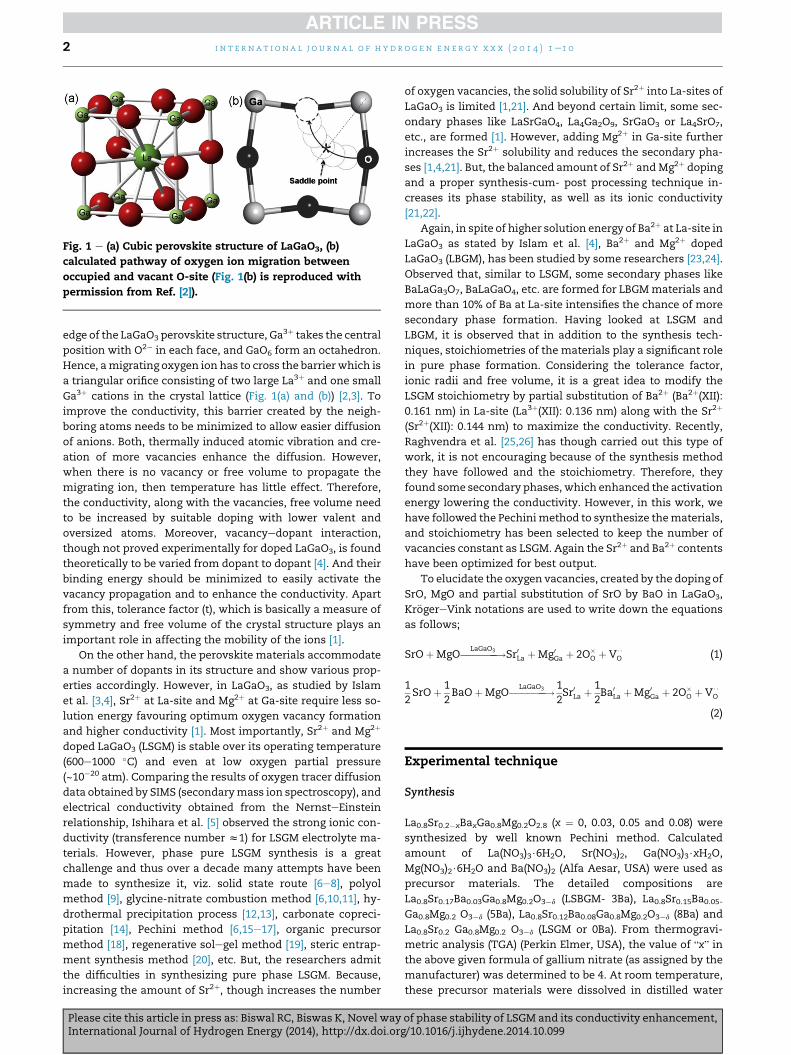
Fig. 1 e (a) Cubic perovskite structure of LaGaO3, (b)
calculated pathway of oxygen ion migration between
occupied and vacant O-site (Fig. 1(b) is reproduced with
permission from Ref. [2]).
i n t e r n a t i o n a l j o u r n a l o f h y d r o g e n en e r g y x x x ( 2 0 1 4 ) 1e1 02
edge of the LaGaO3 perovskite structure, Ga3þ takes the central
position with O2� in each face, and GaO6 form an octahedron.
Hence, amigrating oxygen ion has to cross the barrierwhich is
a triangular orifice consisting of two large La3þ and one small
Ga3þ cations in the crystal lattice (Fig. 1(a) and (b)) [2,3]. To
improve the conductivity, this barrier created by the neigh-
boring atoms needs to be minimized to allow easier diffusion
of anions. Both, thermally induced atomic vibration and cre-
ation of more vacancies enhance the diffusion. However,
when there is no vacancy or free volume to propagate the
migrating ion, then temperature has little effect. Therefore,
the conductivity, along with the vacancies, free volume need
to be increased by suitable doping with lower valent and
oversized atoms. Moreover, vacancyedopant interaction,
though not proved experimentally for doped LaGaO3, is found
theoretically to be varied from dopant to dopant [4]. And their
binding energy should be minimized to easily activate the
vacancy propagation and to enhance the conductivity. Apart
from this, tolerance factor (t), which is basically a measure of
symmetry and free volume of the crystal structure plays an
important role in affecting the mobility of the ions [1].
On the other hand, the perovskite materials accommodate
a number of dopants in its structure and show various prop-
erties accordingly. However, in LaGaO3, as studied by Islam
et al. [3,4], Sr2þ at La-site and Mg2þ at Ga-site require less so-
lution energy favouring optimum oxygen vacancy formation
and higher conductivity [1]. Most importantly, Sr2þ and Mg2þ
doped LaGaO3 (LSGM) is stable over its operating temperature
(600e1000 �C) and even at low oxygen partial pressure
(~10�20 atm). Comparing the results of oxygen tracer diffusion
data obtained by SIMS (secondarymass ion spectroscopy), and
electrical conductivity obtained from the NernsteEinstein
relationship, Ishihara et al. [5] observed the strong ionic con-
ductivity (transference number z1) for LSGM electrolyte ma-
terials. However, phase pure LSGM synthesis is a great
challenge and thus over a decade many attempts have been
made to synthesize it, viz. solid state route [6e8], polyol
method [9], glycine-nitrate combustion method [6,10,11], hy-
drothermal precipitation process [12,13], carbonate copreci-
pitation [14], Pechini method [6,15e17], organic precursor
method [18], regenerative solegel method [19], steric entrap-
ment synthesis method [20], etc. But, the researchers admit
the difficulties in synthesizing pure phase LSGM. Because,
increasing the amount of Sr2þ, though increases the number
Please cite this article in press as: Biswal RC, Biswas K, Novel wayInternational Journal of Hydrogen Energy (2014), http://dx.doi.org
of oxygen vacancies, the solid solubility of Sr2þ into La-sites of
LaGaO3 is limited [1,21]. And beyond certain limit, some sec-
ondary phases like LaSrGaO4, La4Ga2O9, SrGaO3 or La4SrO7,
etc., are formed [1]. However, adding Mg2þ in Ga-site further
increases the Sr2þ solubility and reduces the secondary pha-
ses [1,4,21]. But, the balanced amount of Sr2þ and Mg2þ doping
and a proper synthesis-cum- post processing technique in-
creases its phase stability, as well as its ionic conductivity
[21,22].
Again, in spite of higher solution energy of Ba2þ at La-site in
LaGaO3 as stated by Islam et al. [4], Ba2þ and Mg2þ doped
LaGaO3 (LBGM), has been studied by some researchers [23,24].
Observed that, similar to LSGM, some secondary phases like
BaLaGa3O7, BaLaGaO4, etc. are formed for LBGMmaterials and
more than 10% of Ba at La-site intensifies the chance of more
secondary phase formation. Having looked at LSGM and
LBGM, it is observed that in addition to the synthesis tech-
niques, stoichiometries of the materials play a significant role
in pure phase formation. Considering the tolerance factor,
ionic radii and free volume, it is a great idea to modify the
LSGM stoichiometry by partial substitution of Ba2þ (Ba2þ(XII):0.161 nm) in La-site (La3þ(XII): 0.136 nm) along with the Sr2þ
(Sr2þ(XII): 0.144 nm) to maximize the conductivity. Recently,
Raghvendra et al. [25,26] has though carried out this type of
work, it is not encouraging because of the synthesis method
they have followed and the stoichiometry. Therefore, they
found some secondary phases, which enhanced the activation
energy lowering the conductivity. However, in this work, we
have followed the Pechinimethod to synthesize thematerials,
and stoichiometry has been selected to keep the number of
vacancies constant as LSGM. Again the Sr2þ and Ba2þ contents
have been optimized for best output.
To elucidate the oxygen vacancies, created by the doping of
SrO, MgO and partial substitution of SrO by BaO in LaGaO3,
Kr€ogereVink notations are used to write down the equations
as follows;
SrOþMgO�������!LaGaO3 Sr0La þMg0Ga þ 2O�
O þ V$$O (1)
12SrOþ 1
2BaOþMgO�������!LaGaO3 1
2Sr0La þ
12Ba0
La þMg0Ga þ 2O�
O þ V$$O
(2)
Experimental technique
Synthesis
La0.8Sr0.2�xBaxGa0.8Mg0.2O2.8 (x ¼ 0, 0.03, 0.05 and 0.08) were
synthesized by well known Pechini method. Calculated
amount of La(NO3)3$6H2O, Sr(NO3)2, Ga(NO3)3$xH2O,
Mg(NO3)2$6H2O and Ba(NO3)2 (Alfa Aesar, USA) were used as
precursor materials. The detailed compositions are
La0.8Sr0.17Ba0.03Ga0.8Mg0.2O3�d (LSBGM- 3Ba), La0.8Sr0.15Ba0.05-Ga0.8Mg0.2 O3�d (5Ba), La0.8Sr0.12Ba0.08Ga0.8Mg0.2O3�d (8Ba) and
La0.8Sr0.2 Ga0.8Mg0.2 O3�d (LSGM or 0Ba). From thermogravi-
metric analysis (TGA) (Perkin Elmer, USA), the value of “x” in
the above given formula of gallium nitrate (as assigned by the
manufacturer) was determined to be 4. At room temperature,
these precursor materials were dissolved in distilled water
of phase stability of LSGM and its conductivity enhancement,/10.1016/j.ijhydene.2014.10.099
i n t e r n a t i o n a l j o u r n a l o f h yd r o g e n e n e r g y x x x ( 2 0 1 4 ) 1e1 0 3
separately, followed by mixing in a single beaker and contin-
uous stirring by a magnetic stirrer. To form metal citrate
complex, nearly one mol of citric acid per mol of nitrate of the
precursor material and ethylene glycol (one third mole of
citric acid) were added to the solution with constant stirring.
Solution was then heated for 1 h at 100 �C to reduce the water
content and initiate the polymerization. Gel was formed
slowly with escape of some reddish yellow gases, when the
temperature was raised to ~200 �C. Then the beaker contain-
ing the gel was transferred to a furnace, and thermally treated
at 400 �C for 1 h. It leads to the combustion of the gel, which
ultimately produces the amorphous ash. The resultant ash
was then collected and calcined at 1000 �C for 5 h to remove
the residual carbons. This powderwas finally ground and used
for further processing and characterizations.
Characterizations
The calcined powder was again ground and heat treated for
1 h at 1400 �C in air and was characterized by XRD (Bruker D8
Advance, Germany) using CuKa radiation (l ¼ 0.1541 nm), in
the Bragg angle range 20� � 2q � 100�. Rietveld analysis of the
XRD pattern was done to quantify the phase using X'pert High
Score Plus software.
The calcined powder (at 1000 �C for 5 h) was then pressed
uniaxially at a pressure of 500 Mpa, and these green pellets
were subsequently sintered at 1400 �C for 8 h. Densities of the
sintered pellets were measured by Archimedes principle.
Microstructural analyses of the sintered pellets were carried
out by field emission-scanning electron microscope (FESEM)
(FEI Quanta 250, USA). To analyze the particle morphology,
high-resolution transmission electron microscope (HRTEM)
(JEOL, Japan) was used. In this case, powder was ultrasonically
dispersed in ethanol for 15 min using an ultrasonic probe and
then a drop of dispersed powder spreads over a carbon coated
copper grid. The specific surface area of the calcined powders
were measured after thoroughly degassing under vacuum for
3 h at 300 �C following BET method using NOVA surface area
analyzer (Quanta chrome, USA). The X-ray photoelectron
spectroscopy (XPS) spectra of the samples were carried out
using PHI5000 Versa Probe II (ULV AC - PHI, INC, Japan) system
using the Al Ka (hn¼ 1486.6 eV) as the excitation source with a
hemispherical analyser and a multichannel detector. Carbon
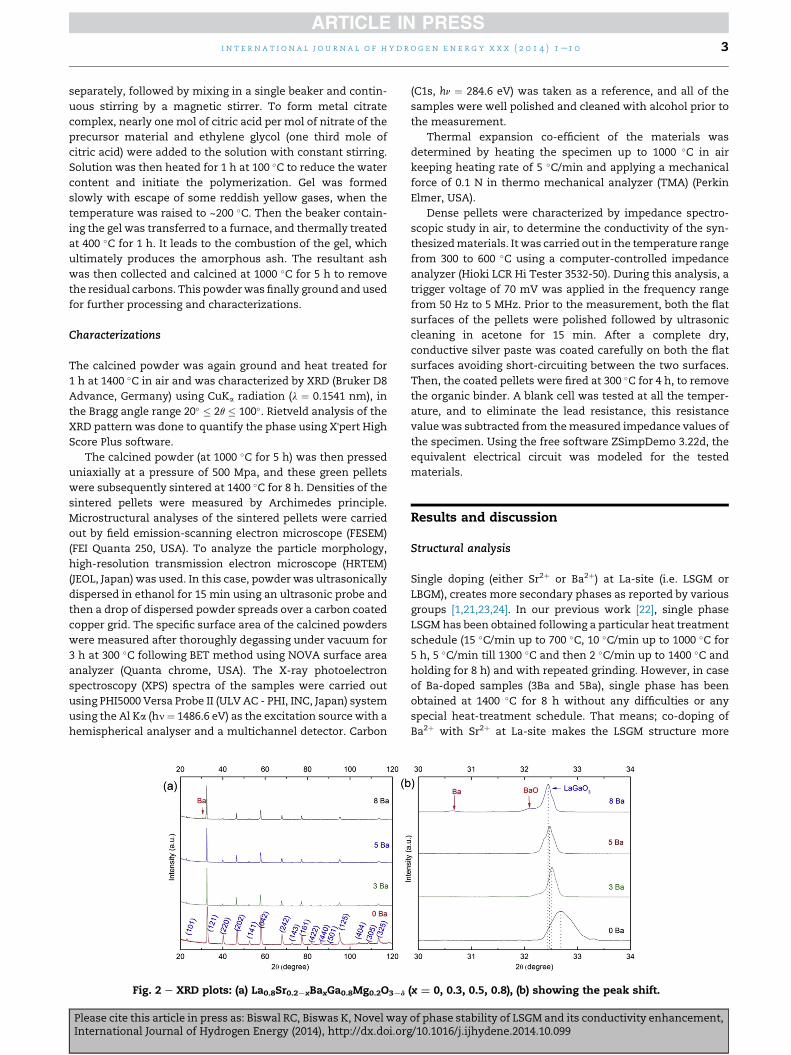
Fig. 2 e XRD plots: (a) La0.8Sr0.2¡xBaxGa0.8Mg0.2O3¡d
Please cite this article in press as: Biswal RC, Biswas K, Novel wayInternational Journal of Hydrogen Energy (2014), http://dx.doi.org
(C1s, hn ¼ 284.6 eV) was taken as a reference, and all of the
samples were well polished and cleaned with alcohol prior to
the measurement.
Thermal expansion co-efficient of the materials was
determined by heating the specimen up to 1000 �C in air
keeping heating rate of 5 �C/min and applying a mechanical
force of 0.1 N in thermo mechanical analyzer (TMA) (Perkin
Elmer, USA).
Dense pellets were characterized by impedance spectro-
scopic study in air, to determine the conductivity of the syn-
thesizedmaterials. It was carried out in the temperature range
from 300 to 600 �C using a computer-controlled impedance
analyzer (Hioki LCR Hi Tester 3532-50). During this analysis, a
trigger voltage of 70 mV was applied in the frequency range
from 50 Hz to 5 MHz. Prior to the measurement, both the flat
surfaces of the pellets were polished followed by ultrasonic
cleaning in acetone for 15 min. After a complete dry,
conductive silver paste was coated carefully on both the flat
surfaces avoiding short-circuiting between the two surfaces.
Then, the coated pellets were fired at 300 �C for 4 h, to remove
the organic binder. A blank cell was tested at all the temper-
ature, and to eliminate the lead resistance, this resistance
value was subtracted from themeasured impedance values of
the specimen. Using the free software ZSimpDemo 3.22d, the
equivalent electrical circuit was modeled for the tested
materials.
Results and discussion
Structural analysis
Single doping (either Sr2þ or Ba2þ) at La-site (i.e. LSGM or
LBGM), creates more secondary phases as reported by various
groups [1,21,23,24]. In our previous work [22], single phase
LSGM has been obtained following a particular heat treatment
schedule (15 �C/min up to 700 �C, 10 �C/min up to 1000 �C for
5 h, 5 �C/min till 1300 �C and then 2 �C/min up to 1400 �C and
holding for 8 h) and with repeated grinding. However, in case
of Ba-doped samples (3Ba and 5Ba), single phase has been
obtained at 1400 �C for 8 h without any difficulties or any
special heat-treatment schedule. That means; co-doping of
Ba2þ with Sr2þ at La-site makes the LSGM structure more
(x ¼ 0, 0.3, 0.5, 0.8), (b) showing the peak shift.
of phase stability of LSGM and its conductivity enhancement,/10.1016/j.ijhydene.2014.10.099
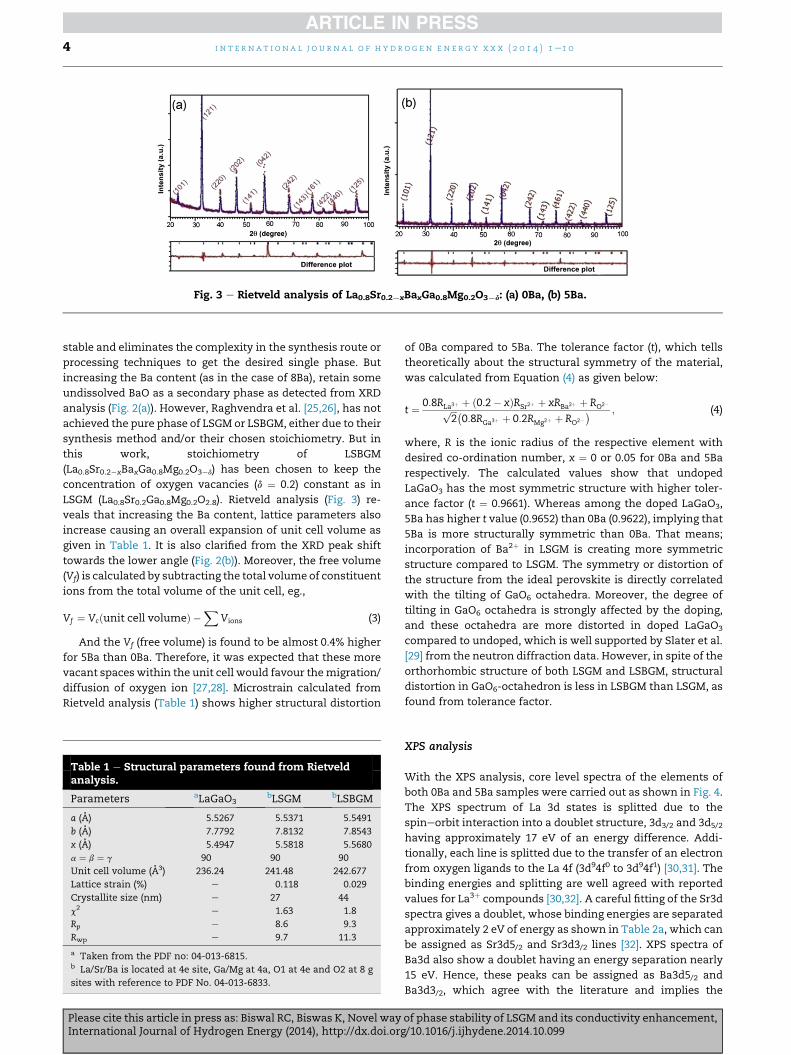
Fig. 3 e Rietveld analysis of La0.8Sr0.2¡xBaxGa0.8Mg0.2O3¡d: (a) 0Ba, (b) 5Ba.
i n t e r n a t i o n a l j o u r n a l o f h y d r o g e n en e r g y x x x ( 2 0 1 4 ) 1e1 04
stable and eliminates the complexity in the synthesis route or
processing techniques to get the desired single phase. But
increasing the Ba content (as in the case of 8Ba), retain some
undissolved BaO as a secondary phase as detected from XRD
analysis (Fig. 2(a)). However, Raghvendra et al. [25,26], has not
achieved the pure phase of LSGM or LSBGM, either due to their
synthesis method and/or their chosen stoichiometry. But in
this work, stoichiometry of LSBGM
(La0.8Sr0.2�xBaxGa0.8Mg0.2O3�d) has been chosen to keep the
concentration of oxygen vacancies (d ¼ 0.2) constant as in
LSGM (La0.8Sr0.2Ga0.8Mg0.2O2.8). Rietveld analysis (Fig. 3) re-
veals that increasing the Ba content, lattice parameters also
increase causing an overall expansion of unit cell volume as
given in Table 1. It is also clarified from the XRD peak shift
towards the lower angle (Fig. 2(b)). Moreover, the free volume
(Vf) is calculated by subtracting the total volume of constituent
ions from the total volume of the unit cell, eg.,
Vf ¼ Vcðunit cell volumeÞ �X
Vions (3)
And the Vf (free volume) is found to be almost 0.4% higher
for 5Ba than 0Ba. Therefore, it was expected that these more
vacant spaceswithin the unit cell would favour themigration/
diffusion of oxygen ion [27,28]. Microstrain calculated from
Rietveld analysis (Table 1) shows higher structural distortion
Table 1 e Structural parameters found from Rietveldanalysis.
Parameters aLaGaO3bLSGM bLSBGM
a (A) 5.5267 5.5371 5.5491
b (A) 7.7792 7.8132 7.8543
x (A) 5.4947 5.5818 5.5680
a ¼ b ¼ g 90 90 90
Unit cell volume (A3) 236.24 241.48 242.677
Lattice strain (%) e 0.118 0.029
Crystallite size (nm) e 27 44
c2 e 1.63 1.8
Rp e 8.6 9.3
Rwp e 9.7 11.3
a Taken from the PDF no: 04-013-6815.b La/Sr/Ba is located at 4e site, Ga/Mg at 4a, O1 at 4e and O2 at 8 g
sites with reference to PDF No. 04-013-6833.
Please cite this article in press as: Biswal RC, Biswas K, Novel wayInternational Journal of Hydrogen Energy (2014), http://dx.doi.org
of 0Ba compared to 5Ba. The tolerance factor (t), which tells
theoretically about the structural symmetry of the material,
was calculated from Equation (4) as given below:
t ¼ 0:8RLa3þ þ ð0:2� xÞRSr2þ þ xRBa2þ þ RO2�ffiffiffi2
p �0:8RGa3þ þ 0:2RMg2þ þ RO2�
� ; (4)
where, R is the ionic radius of the respective element with
desired co-ordination number, x ¼ 0 or 0.05 for 0Ba and 5Ba
respectively. The calculated values show that undoped
LaGaO3 has the most symmetric structure with higher toler-
ance factor (t ¼ 0.9661). Whereas among the doped LaGaO3,
5Ba has higher t value (0.9652) than 0Ba (0.9622), implying that
5Ba is more structurally symmetric than 0Ba. That means;
incorporation of Ba2þ in LSGM is creating more symmetric
structure compared to LSGM. The symmetry or distortion of
the structure from the ideal perovskite is directly correlated
with the tilting of GaO6 octahedra. Moreover, the degree of
tilting in GaO6 octahedra is strongly affected by the doping,
and these octahedra are more distorted in doped LaGaO3
compared to undoped, which is well supported by Slater et al.
[29] from the neutron diffraction data. However, in spite of the
orthorhombic structure of both LSGM and LSBGM, structural
distortion in GaO6-octahedron is less in LSBGM than LSGM, as
found from tolerance factor.
XPS analysis
With the XPS analysis, core level spectra of the elements of
both 0Ba and 5Ba samples were carried out as shown in Fig. 4.
The XPS spectrum of La 3d states is splitted due to the
spineorbit interaction into a doublet structure, 3d3/2 and 3d5/2
having approximately 17 eV of an energy difference. Addi-
tionally, each line is splitted due to the transfer of an electron
from oxygen ligands to the La 4f (3d94f0 to 3d94f1) [30,31]. The
binding energies and splitting are well agreed with reported
values for La3þ compounds [30,32]. A careful fitting of the Sr3d
spectra gives a doublet, whose binding energies are separated
approximately 2 eV of energy as shown in Table 2a, which can
be assigned as Sr3d5/2 and Sr3d3/2 lines [32]. XPS spectra of
Ba3d also show a doublet having an energy separation nearly
15 eV. Hence, these peaks can be assigned as Ba3d5/2 and
Ba3d3/2, which agree with the literature and implies the
of phase stability of LSGM and its conductivity enhancement,/10.1016/j.ijhydene.2014.10.099
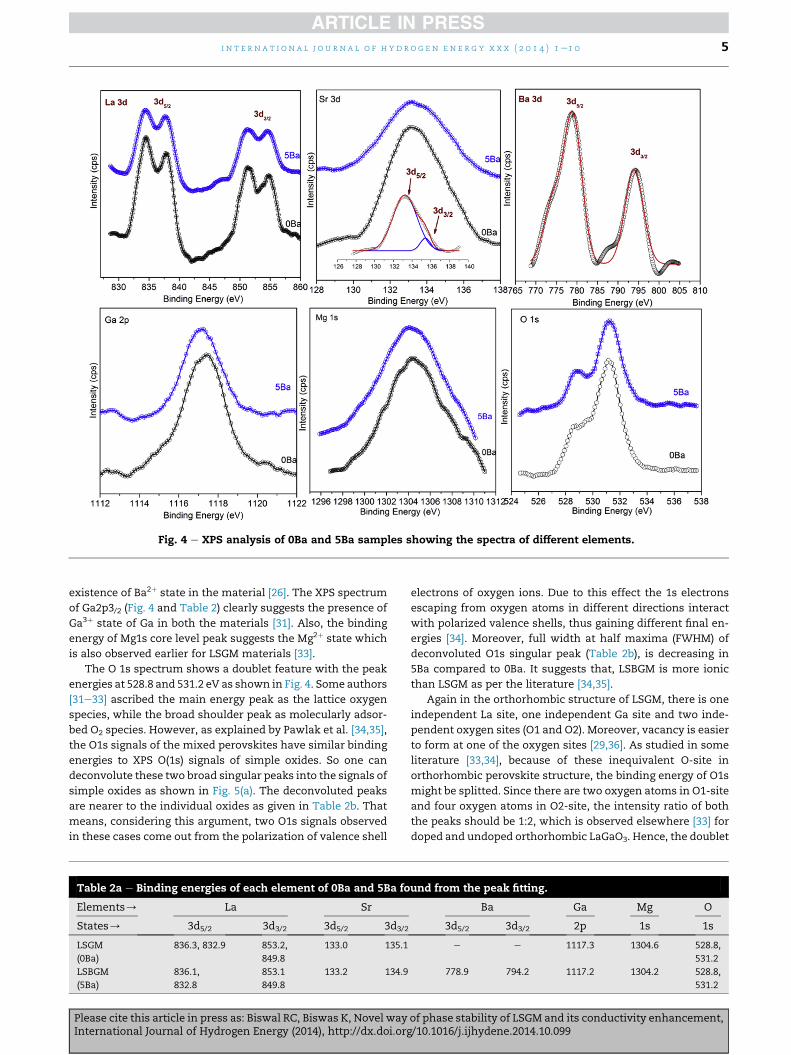
Fig. 4 e XPS analysis of 0Ba and 5Ba samples showing the spectra of different elements.
i n t e r n a t i o n a l j o u r n a l o f h yd r o g e n e n e r g y x x x ( 2 0 1 4 ) 1e1 0 5
existence of Ba2þ state in the material [26]. The XPS spectrum
of Ga2p3/2 (Fig. 4 and Table 2) clearly suggests the presence of
Ga3þ state of Ga in both the materials [31]. Also, the binding
energy of Mg1s core level peak suggests the Mg2þ state which
is also observed earlier for LSGM materials [33].
The O 1s spectrum shows a doublet feature with the peak
energies at 528.8 and 531.2 eV as shown in Fig. 4. Some authors
[31e33] ascribed the main energy peak as the lattice oxygen
species, while the broad shoulder peak as molecularly adsor-
bed O2 species. However, as explained by Pawlak et al. [34,35],
the O1s signals of the mixed perovskites have similar binding
energies to XPS O(1s) signals of simple oxides. So one can
deconvolute these two broad singular peaks into the signals of
simple oxides as shown in Fig. 5(a). The deconvoluted peaks
are nearer to the individual oxides as given in Table 2b. That
means, considering this argument, two O1s signals observed
in these cases come out from the polarization of valence shell
Table 2a e Binding energies of each element of 0Ba and 5Ba fo
Elements/ La Sr
States/ 3d5/2 3d3/2 3d5/2 3d3/2
LSGM
(0Ba)
836.3, 832.9 853.2,
849.8
133.0 135.1
LSBGM
(5Ba)
836.1,
832.8
853.1
849.8
133.2 134.9
Please cite this article in press as: Biswal RC, Biswas K, Novel wayInternational Journal of Hydrogen Energy (2014), http://dx.doi.org
electrons of oxygen ions. Due to this effect the 1s electrons
escaping from oxygen atoms in different directions interact
with polarized valence shells, thus gaining different final en-
ergies [34]. Moreover, full width at half maxima (FWHM) of
deconvoluted O1s singular peak (Table 2b), is decreasing in
5Ba compared to 0Ba. It suggests that, LSBGM is more ionic
than LSGM as per the literature [34,35].
Again in the orthorhombic structure of LSGM, there is one
independent La site, one independent Ga site and two inde-
pendent oxygen sites (O1 and O2). Moreover, vacancy is easier
to form at one of the oxygen sites [29,36]. As studied in some
literature [33,34], because of these inequivalent O-site in
orthorhombic perovskite structure, the binding energy of O1s
might be splitted. Since there are two oxygen atoms in O1-site
and four oxygen atoms in O2-site, the intensity ratio of both
the peaks should be 1:2, which is observed elsewhere [33] for
doped and undoped orthorhombic LaGaO3. Hence, the doublet
und from the peak fitting.
Ba Ga Mg O
3d5/2 3d3/2 2p 1s 1s
e e 1117.3 1304.6 528.8,
531.2
778.9 794.2 1117.2 1304.2 528.8,
531.2
of phase stability of LSGM and its conductivity enhancement,/10.1016/j.ijhydene.2014.10.099
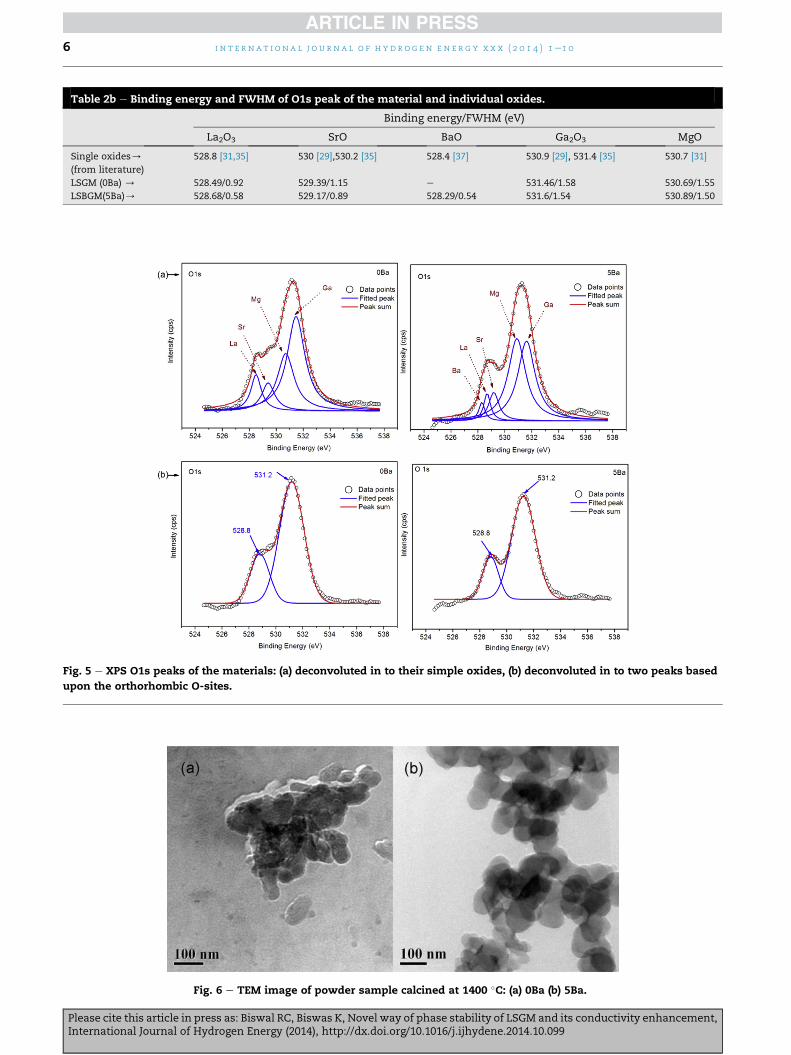
Table 2b e Binding energy and FWHM of O1s peak of the material and individual oxides.
Binding energy/FWHM (eV)
La2O3 SrO BaO Ga2O3 MgO
Single oxides/
(from literature)
528.8 [31,35] 530 [29],530.2 [35] 528.4 [37] 530.9 [29], 531.4 [35] 530.7 [31]
LSGM (0Ba) / 528.49/0.92 529.39/1.15 e 531.46/1.58 530.69/1.55
LSBGM(5Ba)/ 528.68/0.58 529.17/0.89 528.29/0.54 531.6/1.54 530.89/1.50
Fig. 5 e XPS O1s peaks of the materials: (a) deconvoluted in to their simple oxides, (b) deconvoluted in to two peaks based
upon the orthorhombic O-sites.
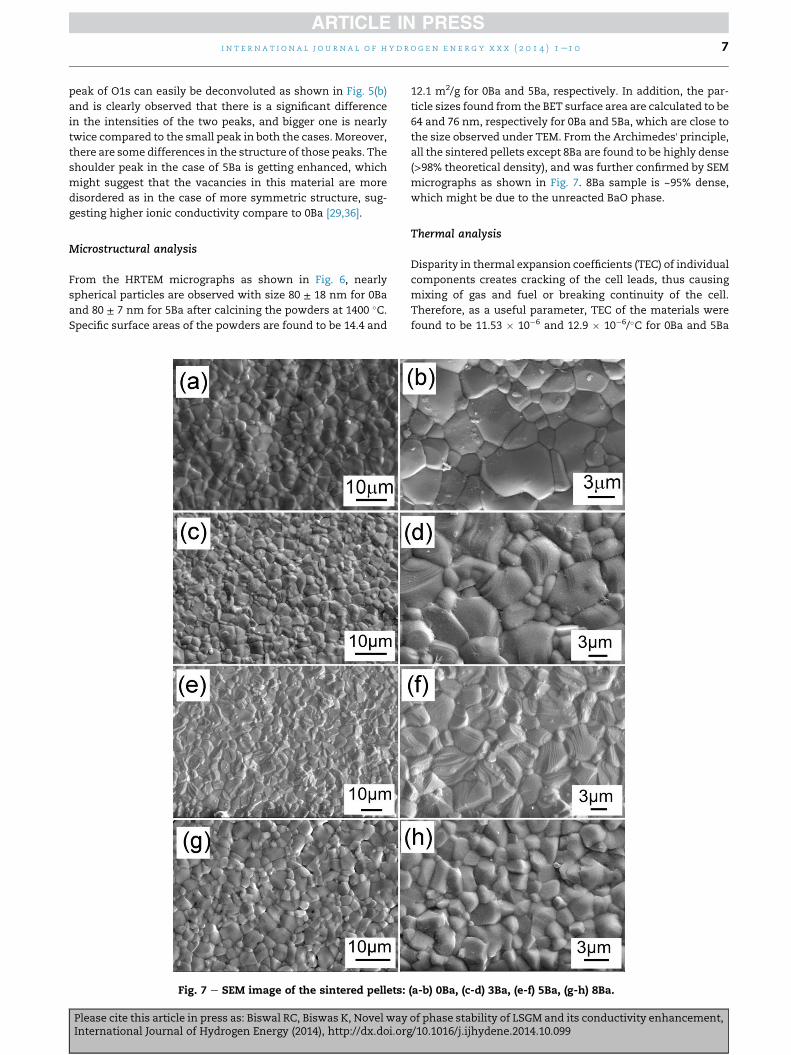
Fig. 6 e TEM image of powder sample calcined at 1400 �C: (a) 0Ba (b) 5Ba.
i n t e r n a t i o n a l j o u r n a l o f h y d r o g e n en e r g y x x x ( 2 0 1 4 ) 1e1 06
Please cite this article in press as: Biswal RC, Biswas K, Novel way of phase stability of LSGM and its conductivity enhancement,International Journal of Hydrogen Energy (2014), http://dx.doi.org/10.1016/j.ijhydene.2014.10.099
i n t e r n a t i o n a l j o u r n a l o f h yd r o g e n e n e r g y x x x ( 2 0 1 4 ) 1e1 0 7
peak of O1s can easily be deconvoluted as shown in Fig. 5(b)
and is clearly observed that there is a significant difference
in the intensities of the two peaks, and bigger one is nearly
twice compared to the small peak in both the cases. Moreover,
there are some differences in the structure of those peaks. The
shoulder peak in the case of 5Ba is getting enhanced, which
might suggest that the vacancies in this material are more
disordered as in the case of more symmetric structure, sug-
gesting higher ionic conductivity compare to 0Ba [29,36].
Microstructural analysis
From the HRTEM micrographs as shown in Fig. 6, nearly
spherical particles are observed with size 80 ± 18 nm for 0Ba
and 80 ± 7 nm for 5Ba after calcining the powders at 1400 �C.Specific surface areas of the powders are found to be 14.4 and
Fig. 7 e SEM image of the sintered pellets:
Please cite this article in press as: Biswal RC, Biswas K, Novel wayInternational Journal of Hydrogen Energy (2014), http://dx.doi.org
12.1 m2/g for 0Ba and 5Ba, respectively. In addition, the par-
ticle sizes found from the BET surface area are calculated to be
64 and 76 nm, respectively for 0Ba and 5Ba, which are close to
the size observed under TEM. From the Archimedes' principle,all the sintered pellets except 8Ba are found to be highly dense
(>98% theoretical density), and was further confirmed by SEM
micrographs as shown in Fig. 7. 8Ba sample is ~95% dense,
which might be due to the unreacted BaO phase.
Thermal analysis
Disparity in thermal expansion coefficients (TEC) of individual
components creates cracking of the cell leads, thus causing
mixing of gas and fuel or breaking continuity of the cell.
Therefore, as a useful parameter, TEC of the materials were
found to be 11.53 � 10�6 and 12.9 � 10�6/�C for 0Ba and 5Ba
(a-b) 0Ba, (c-d) 3Ba, (e-f) 5Ba, (g-h) 8Ba.
of phase stability of LSGM and its conductivity enhancement,/10.1016/j.ijhydene.2014.10.099
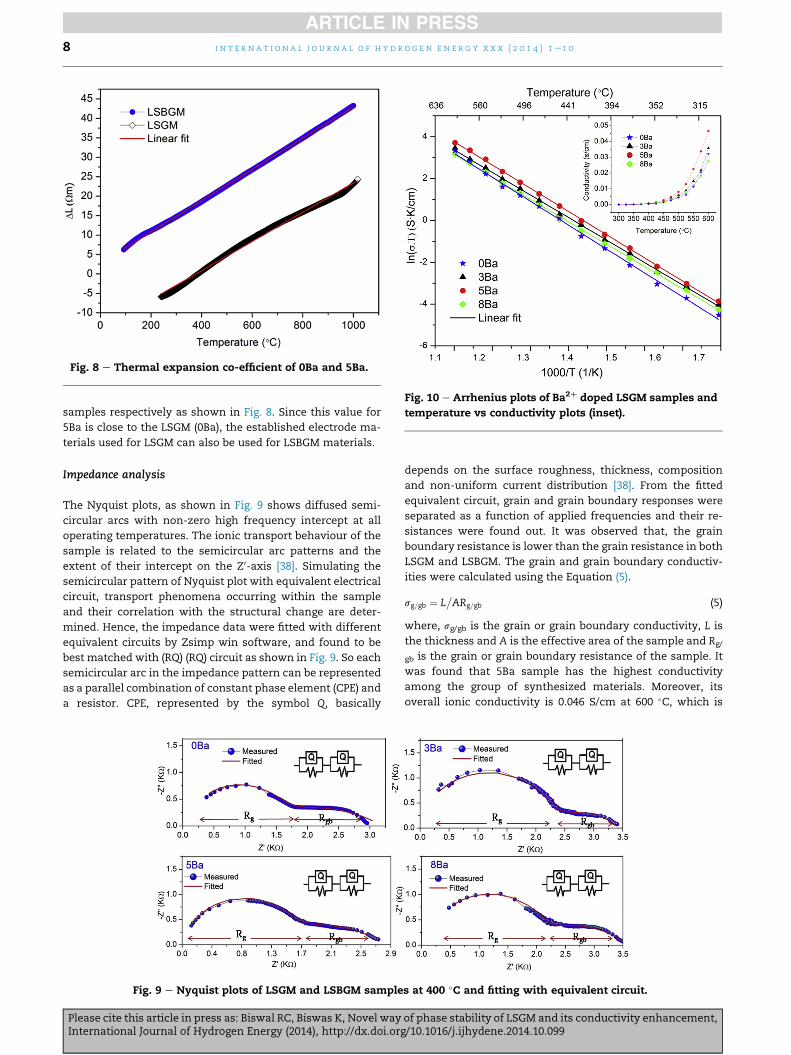
Fig. 8 e Thermal expansion co-efficient of 0Ba and 5Ba.
Fig. 10 e Arrhenius plots of Ba2þ doped LSGM samples and
temperature vs conductivity plots (inset).
i n t e r n a t i o n a l j o u r n a l o f h y d r o g e n en e r g y x x x ( 2 0 1 4 ) 1e1 08
samples respectively as shown in Fig. 8. Since this value for
5Ba is close to the LSGM (0Ba), the established electrode ma-
terials used for LSGM can also be used for LSBGM materials.
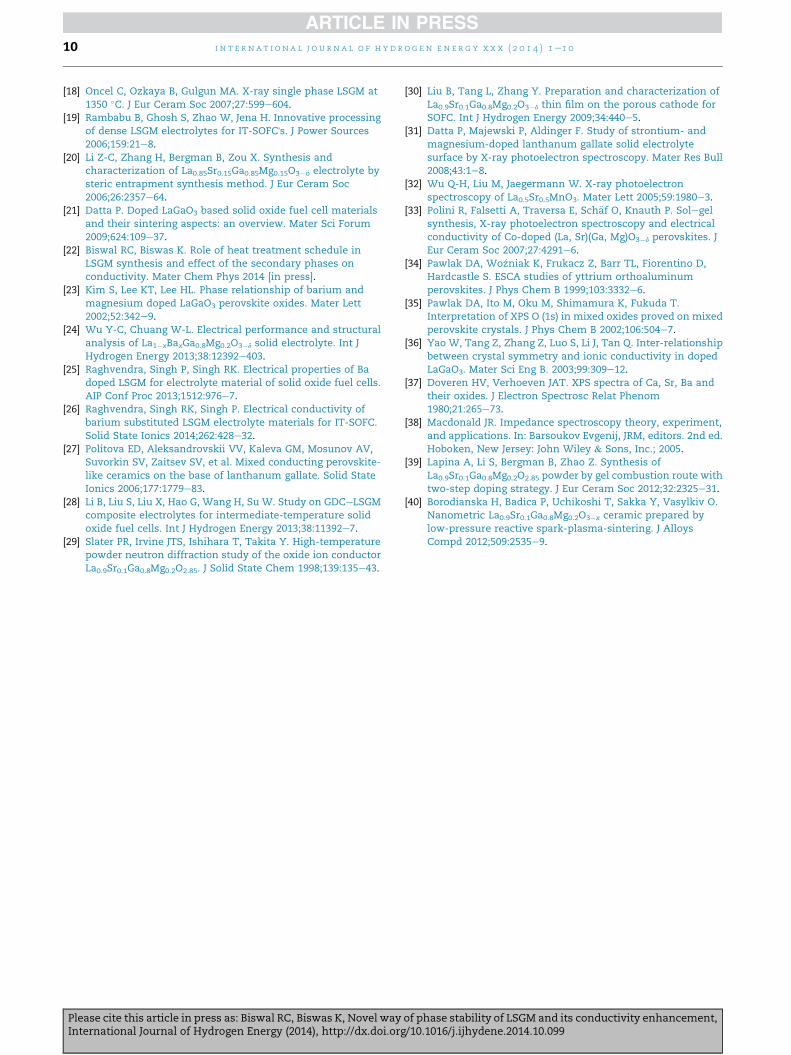
Impedance analysis
The Nyquist plots, as shown in Fig. 9 shows diffused semi-
circular arcs with non-zero high frequency intercept at all
operating temperatures. The ionic transport behaviour of the
sample is related to the semicircular arc patterns and the
extent of their intercept on the Z0-axis [38]. Simulating the
semicircular pattern of Nyquist plot with equivalent electrical
circuit, transport phenomena occurring within the sample
and their correlation with the structural change are deter-
mined. Hence, the impedance data were fitted with different
equivalent circuits by Zsimp win software, and found to be
best matched with (RQ) (RQ) circuit as shown in Fig. 9. So each
semicircular arc in the impedance pattern can be represented
as a parallel combination of constant phase element (CPE) and
a resistor. CPE, represented by the symbol Q, basically
Fig. 9 e Nyquist plots of LSGM and LSBGM sample
Please cite this article in press as: Biswal RC, Biswas K, Novel wayInternational Journal of Hydrogen Energy (2014), http://dx.doi.org
depends on the surface roughness, thickness, composition
and non-uniform current distribution [38]. From the fitted
equivalent circuit, grain and grain boundary responses were
separated as a function of applied frequencies and their re-
sistances were found out. It was observed that, the grain
boundary resistance is lower than the grain resistance in both
LSGM and LSBGM. The grain and grain boundary conductiv-
ities were calculated using the Equation (5).
sg=gb ¼ L�ARg=gb (5)
where, sg/gb is the grain or grain boundary conductivity, L is
the thickness and A is the effective area of the sample and Rg/
gb is the grain or grain boundary resistance of the sample. It
was found that 5Ba sample has the highest conductivity
among the group of synthesized materials. Moreover, its
overall ionic conductivity is 0.046 S/cm at 600 �C, which is
s at 400 �C and fitting with equivalent circuit.
of phase stability of LSGM and its conductivity enhancement,/10.1016/j.ijhydene.2014.10.099
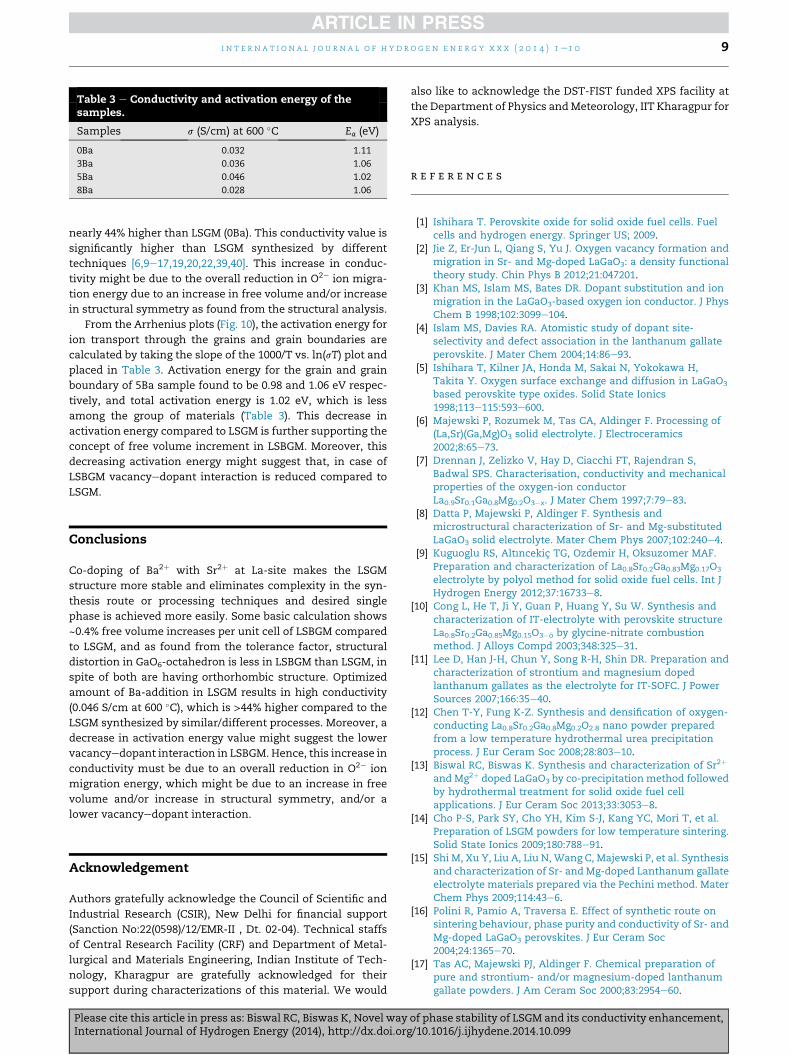
Table 3 e Conductivity and activation energy of thesamples.
Samples s (S/cm) at 600 �C Ea (eV)
0Ba 0.032 1.11
3Ba 0.036 1.06
5Ba 0.046 1.02
8Ba 0.028 1.06
i n t e r n a t i o n a l j o u r n a l o f h yd r o g e n e n e r g y x x x ( 2 0 1 4 ) 1e1 0 9
nearly 44% higher than LSGM (0Ba). This conductivity value is
significantly higher than LSGM synthesized by different
techniques [6,9e17,19,20,22,39,40]. This increase in conduc-
tivity might be due to the overall reduction in O2� ion migra-
tion energy due to an increase in free volume and/or increase
in structural symmetry as found from the structural analysis.
From the Arrhenius plots (Fig. 10), the activation energy for
ion transport through the grains and grain boundaries are
calculated by taking the slope of the 1000/T vs. ln(sT) plot and
placed in Table 3. Activation energy for the grain and grain
boundary of 5Ba sample found to be 0.98 and 1.06 eV respec-
tively, and total activation energy is 1.02 eV, which is less
among the group of materials (Table 3). This decrease in
activation energy compared to LSGM is further supporting the
concept of free volume increment in LSBGM. Moreover, this
decreasing activation energy might suggest that, in case of
LSBGM vacancyedopant interaction is reduced compared to
LSGM.
Conclusions
Co-doping of Ba2þ with Sr2þ at La-site makes the LSGM
structure more stable and eliminates complexity in the syn-
thesis route or processing techniques and desired single
phase is achieved more easily. Some basic calculation shows
~0.4% free volume increases per unit cell of LSBGM compared
to LSGM, and as found from the tolerance factor, structural
distortion in GaO6-octahedron is less in LSBGM than LSGM, in
spite of both are having orthorhombic structure. Optimized
amount of Ba-addition in LSGM results in high conductivity
(0.046 S/cm at 600 �C), which is >44% higher compared to the
LSGM synthesized by similar/different processes. Moreover, a
decrease in activation energy value might suggest the lower
vacancyedopant interaction in LSBGM. Hence, this increase in
conductivity must be due to an overall reduction in O2� ion
migration energy, which might be due to an increase in free
volume and/or increase in structural symmetry, and/or a
lower vacancyedopant interaction.
Acknowledgement
Authors gratefully acknowledge the Council of Scientific and
Industrial Research (CSIR), New Delhi for financial support
(Sanction No:22(0598)/12/EMR-II , Dt. 02-04). Technical staffs
of Central Research Facility (CRF) and Department of Metal-
lurgical and Materials Engineering, Indian Institute of Tech-
nology, Kharagpur are gratefully acknowledged for their
support during characterizations of this material. We would
Please cite this article in press as: Biswal RC, Biswas K, Novel wayInternational Journal of Hydrogen Energy (2014), http://dx.doi.org
also like to acknowledge the DST-FIST funded XPS facility at
the Department of Physics andMeteorology, IIT Kharagpur for
XPS analysis.
r e f e r e n c e s
[1] Ishihara T. Perovskite oxide for solid oxide fuel cells. Fuelcells and hydrogen energy. Springer US; 2009.
[2] Jie Z, Er-Jun L, Qiang S, Yu J. Oxygen vacancy formation andmigration in Sr- and Mg-doped LaGaO3: a density functionaltheory study. Chin Phys B 2012;21:047201.
[3] Khan MS, Islam MS, Bates DR. Dopant substitution and ionmigration in the LaGaO3-based oxygen ion conductor. J PhysChem B 1998;102:3099e104.
[4] Islam MS, Davies RA. Atomistic study of dopant site-selectivity and defect association in the lanthanum gallateperovskite. J Mater Chem 2004;14:86e93.
[5] Ishihara T, Kilner JA, Honda M, Sakai N, Yokokawa H,Takita Y. Oxygen surface exchange and diffusion in LaGaO3
based perovskite type oxides. Solid State Ionics1998;113e115:593e600.
[6] Majewski P, Rozumek M, Tas CA, Aldinger F. Processing of(La,Sr)(Ga,Mg)O3 solid electrolyte. J Electroceramics2002;8:65e73.
[7] Drennan J, Zelizko V, Hay D, Ciacchi FT, Rajendran S,Badwal SPS. Characterisation, conductivity and mechanicalproperties of the oxygen-ion conductorLa0.9Sr0.1Ga0.8Mg0.2O3�x. J Mater Chem 1997;7:79e83.
[8] Datta P, Majewski P, Aldinger F. Synthesis andmicrostructural characterization of Sr- and Mg-substitutedLaGaO3 solid electrolyte. Mater Chem Phys 2007;102:240e4.
[9] Kuguoglu RS, Altıncekic TG, Ozdemir H, Oksuzomer MAF.Preparation and characterization of La0.8Sr0.2Ga0.83Mg0.17O3
electrolyte by polyol method for solid oxide fuel cells. Int JHydrogen Energy 2012;37:16733e8.
[10] Cong L, He T, Ji Y, Guan P, Huang Y, Su W. Synthesis andcharacterization of IT-electrolyte with perovskite structureLa0.8Sr0.2Ga0.85Mg0.15O3�€o by glycine-nitrate combustionmethod. J Alloys Compd 2003;348:325e31.
[11] Lee D, Han J-H, Chun Y, Song R-H, Shin DR. Preparation andcharacterization of strontium and magnesium dopedlanthanum gallates as the electrolyte for IT-SOFC. J PowerSources 2007;166:35e40.
[12] Chen T-Y, Fung K-Z. Synthesis and densification of oxygen-conducting La0.8Sr0.2Ga0.8Mg0.2O2.8 nano powder preparedfrom a low temperature hydrothermal urea precipitationprocess. J Eur Ceram Soc 2008;28:803e10.
[13] Biswal RC, Biswas K. Synthesis and characterization of Sr2þ
and Mg2þ doped LaGaO3 by co-precipitation method followedby hydrothermal treatment for solid oxide fuel cellapplications. J Eur Ceram Soc 2013;33:3053e8.
[14] Cho P-S, Park SY, Cho YH, Kim S-J, Kang YC, Mori T, et al.Preparation of LSGM powders for low temperature sintering.Solid State Ionics 2009;180:788e91.
[15] Shi M, Xu Y, Liu A, Liu N, Wang C, Majewski P, et al. Synthesisand characterization of Sr- and Mg-doped Lanthanum gallateelectrolyte materials prepared via the Pechini method. MaterChem Phys 2009;114:43e6.
[16] Polini R, Pamio A, Traversa E. Effect of synthetic route onsintering behaviour, phase purity and conductivity of Sr- andMg-doped LaGaO3 perovskites. J Eur Ceram Soc2004;24:1365e70.
[17] Tas AC, Majewski PJ, Aldinger F. Chemical preparation ofpure and strontium- and/or magnesium-doped lanthanumgallate powders. J Am Ceram Soc 2000;83:2954e60.
of phase stability of LSGM and its conductivity enhancement,/10.1016/j.ijhydene.2014.10.099
i n t e r n a t i o n a l j o u r n a l o f h y d r o g e n en e r g y x x x ( 2 0 1 4 ) 1e1 010
[18] Oncel C, Ozkaya B, Gulgun MA. X-ray single phase LSGM at1350 �C. J Eur Ceram Soc 2007;27:599e604.
[19] Rambabu B, Ghosh S, Zhao W, Jena H. Innovative processingof dense LSGM electrolytes for IT-SOFC's. J Power Sources2006;159:21e8.
[20] Li Z-C, Zhang H, Bergman B, Zou X. Synthesis andcharacterization of La0.85Sr0.15Ga0.85Mg0.15O3�€o electrolyte bysteric entrapment synthesis method. J Eur Ceram Soc2006;26:2357e64.
[21] Datta P. Doped LaGaO3 based solid oxide fuel cell materialsand their sintering aspects: an overview. Mater Sci Forum2009;624:109e37.
[22] Biswal RC, Biswas K. Role of heat treatment schedule inLSGM synthesis and effect of the secondary phases onconductivity. Mater Chem Phys 2014 [in press].
[23] Kim S, Lee KT, Lee HL. Phase relationship of barium andmagnesium doped LaGaO3 perovskite oxides. Mater Lett2002;52:342e9.
[24] Wu Y-C, Chuang W-L. Electrical performance and structuralanalysis of La1�xBaxGa0.8Mg0.2O3�d solid electrolyte. Int JHydrogen Energy 2013;38:12392e403.
[25] Raghvendra, Singh P, Singh RK. Electrical properties of Badoped LSGM for electrolyte material of solid oxide fuel cells.AIP Conf Proc 2013;1512:976e7.
[26] Raghvendra, Singh RK, Singh P. Electrical conductivity ofbarium substituted LSGM electrolyte materials for IT-SOFC.Solid State Ionics 2014;262:428e32.
[27] Politova ED, Aleksandrovskii VV, Kaleva GM, Mosunov AV,Suvorkin SV, Zaitsev SV, et al. Mixed conducting perovskite-like ceramics on the base of lanthanum gallate. Solid StateIonics 2006;177:1779e83.
[28] Li B, Liu S, Liu X, Hao G, Wang H, Su W. Study on GDCeLSGMcomposite electrolytes for intermediate-temperature solidoxide fuel cells. Int J Hydrogen Energy 2013;38:11392e7.
[29] Slater PR, Irvine JTS, Ishihara T, Takita Y. High-temperaturepowder neutron diffraction study of the oxide ion conductorLa0.9Sr0.1Ga0.8Mg0.2O2.85. J Solid State Chem 1998;139:135e43.
Please cite this article in press as: Biswal RC, Biswas K, Novel wayInternational Journal of Hydrogen Energy (2014), http://dx.doi.org
[30] Liu B, Tang L, Zhang Y. Preparation and characterization ofLa0.9Sr0.1Ga0.8Mg0.2O3�d thin film on the porous cathode forSOFC. Int J Hydrogen Energy 2009;34:440e5.
[31] Datta P, Majewski P, Aldinger F. Study of strontium- andmagnesium-doped lanthanum gallate solid electrolytesurface by X-ray photoelectron spectroscopy. Mater Res Bull2008;43:1e8.
[32] Wu Q-H, Liu M, Jaegermann W. X-ray photoelectronspectroscopy of La0.5Sr0.5MnO3. Mater Lett 2005;59:1980e3.
[33] Polini R, Falsetti A, Traversa E, Sch€af O, Knauth P. Solegelsynthesis, X-ray photoelectron spectroscopy and electricalconductivity of Co-doped (La, Sr)(Ga, Mg)O3�d perovskites. JEur Ceram Soc 2007;27:4291e6.
[34] Pawlak DA, Wo�zniak K, Frukacz Z, Barr TL, Fiorentino D,Hardcastle S. ESCA studies of yttrium orthoaluminumperovskites. J Phys Chem B 1999;103:3332e6.
[35] Pawlak DA, Ito M, Oku M, Shimamura K, Fukuda T.Interpretation of XPS O (1s) in mixed oxides proved on mixedperovskite crystals. J Phys Chem B 2002;106:504e7.
[36] Yao W, Tang Z, Zhang Z, Luo S, Li J, Tan Q. Inter-relationshipbetween crystal symmetry and ionic conductivity in dopedLaGaO3. Mater Sci Eng B. 2003;99:309e12.
[37] Doveren HV, Verhoeven JAT. XPS spectra of Ca, Sr, Ba andtheir oxides. J Electron Spectrosc Relat Phenom1980;21:265e73.
[38] Macdonald JR. Impedance spectroscopy theory, experiment,and applications. In: Barsoukov Evgenij, JRM, editors. 2nd ed.Hoboken, New Jersey: John Wiley & Sons, Inc.; 2005.
[39] Lapina A, Li S, Bergman B, Zhao Z. Synthesis ofLa0.9Sr0.1Ga0.8Mg0.2O2.85 powder by gel combustion route withtwo-step doping strategy. J Eur Ceram Soc 2012;32:2325e31.
[40] Borodianska H, Badica P, Uchikoshi T, Sakka Y, Vasylkiv O.Nanometric La0.9Sr0.1Ga0.8Mg0.2O3�x ceramic prepared bylow-pressure reactive spark-plasma-sintering. J AlloysCompd 2012;509:2535e9.
of phase stability of LSGM and its conductivity enhancement,/10.1016/j.ijhydene.2014.10.099
Copyright © 2022 FDOKUMEN