Notes for the lecture on health and economic development - UiO
21
Notes for the lecture on health and economic development The paper on the curriculum reviews the literature that estimate the effect of different health interventions in developing countries. You are of course not required to remember all the studies that are mentioned. But you should know the main lines of this research (what are they testing) and how they do it, and the main findings. Many individuals in low income countries live short and disease filled life. That is tragic. What makes it extra tragic is that there appear to be medical preventions and treatments available that could reduce mortality and morbidity in poor countries. So why are they not used? Is the problem on the demand side? Are individuals not willing to buy preventive medicines and curable treatments? Is demand low because individuals are so poor, or, or because they lack information of what works and what does not work, or do they discount the future so hard that they they are not willing to pay a small cost today for benefits that come in the future. Are they discounting in an irrational manner? Or is the problem on the supply side? Are health workers not doing their job in a proper way, and if not, why not? Do they lack essential equipment and medicine (cannot do a professional job), do they lack knowledge, or do they lack motivation (will not do a professional job)? The paper by Kremer and Glennerster (K&G) is oriented towards testing policy interventions; what works and what does not. Lots of interesting studies are reviewed, you are of course not expected to remember each of them at exam but be able to discuss critically the how the use of RCT can help design better health interventions. This note look at health and development more from a birds view. Economics $ Health There is a positive association between health indicators and income, both at a country level and individual level: Richer countries tend to have a more healthy population, and within a country 1
-
Upload
khangminh22 -
Category
Documents
-
view
0 -
download
0
Transcript of Notes for the lecture on health and economic development - UiO
Notes for the lecture on health and
economic development
The paper on the curriculum reviews the literature that estimate the effect of different health
interventions in developing countries. You are of course not required to remember all the studies
that are mentioned. But you should know the main lines of this research (what are they testing)
and how they do it, and the main findings. Many individuals in low income countries live short
and disease filled life. That is tragic. What makes it extra tragic is that there appear to be medical
preventions and treatments available that could reduce mortality and morbidity in poor countries.
So why are they not used?
Is the problem on the demand side? Are individuals not willing to buy preventive medicines
and curable treatments? Is demand low because individuals are so poor, or, or because they lack
information of what works and what does not work, or do they discount the future so hard that
they they are not willing to pay a small cost today for benefits that come in the future. Are they
discounting in an irrational manner?
Or is the problem on the supply side? Are health workers not doing their job in a proper way,
and if not, why not? Do they lack essential equipment and medicine (cannot do a professional job),
do they lack knowledge, or do they lack motivation (will not do a professional job)?
The paper by Kremer and Glennerster (K&G) is oriented towards testing policy interventions;
what works and what does not. Lots of interesting studies are reviewed, you are of course not
expected to remember each of them at exam but be able to discuss critically the how the use of
RCT can help design better health interventions. This note look at health and development more
from a birds view.
Economics $ Health
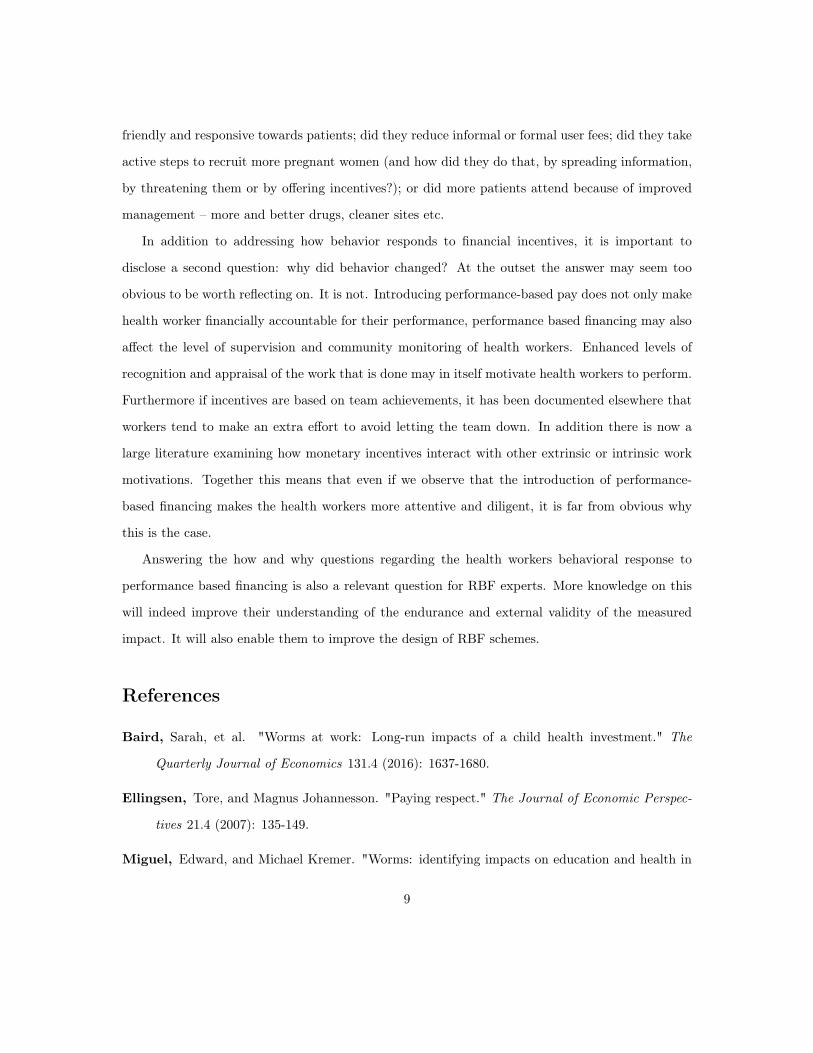
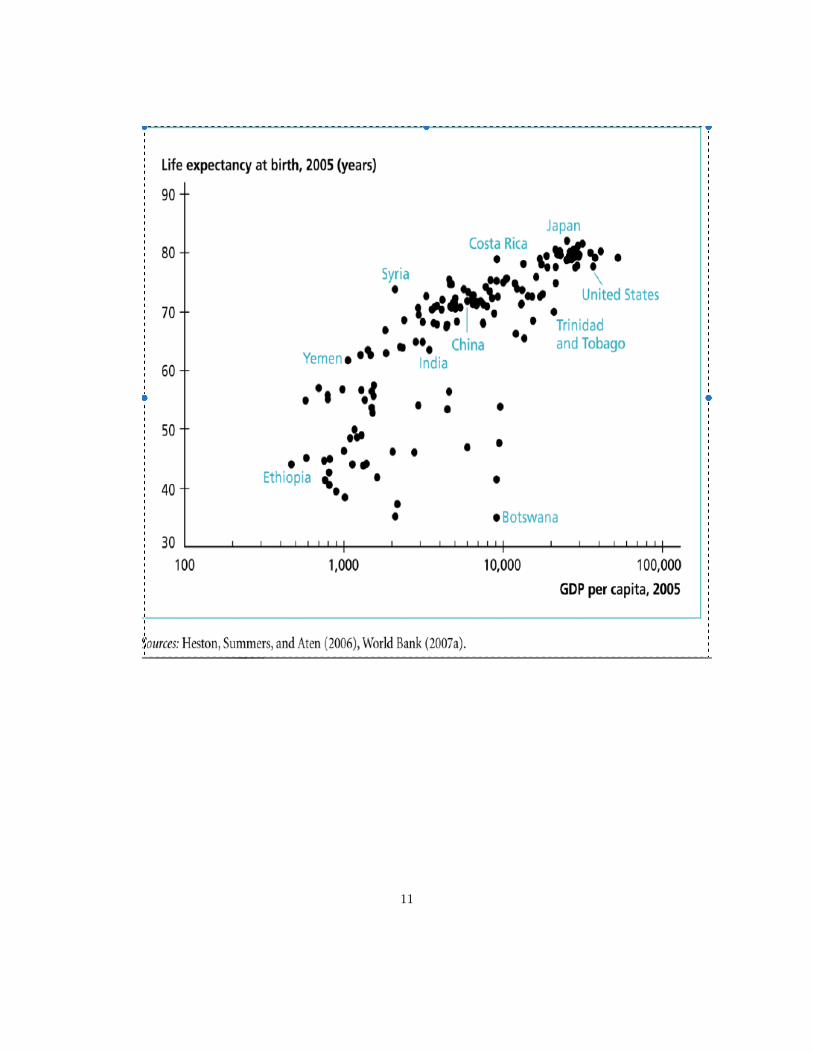
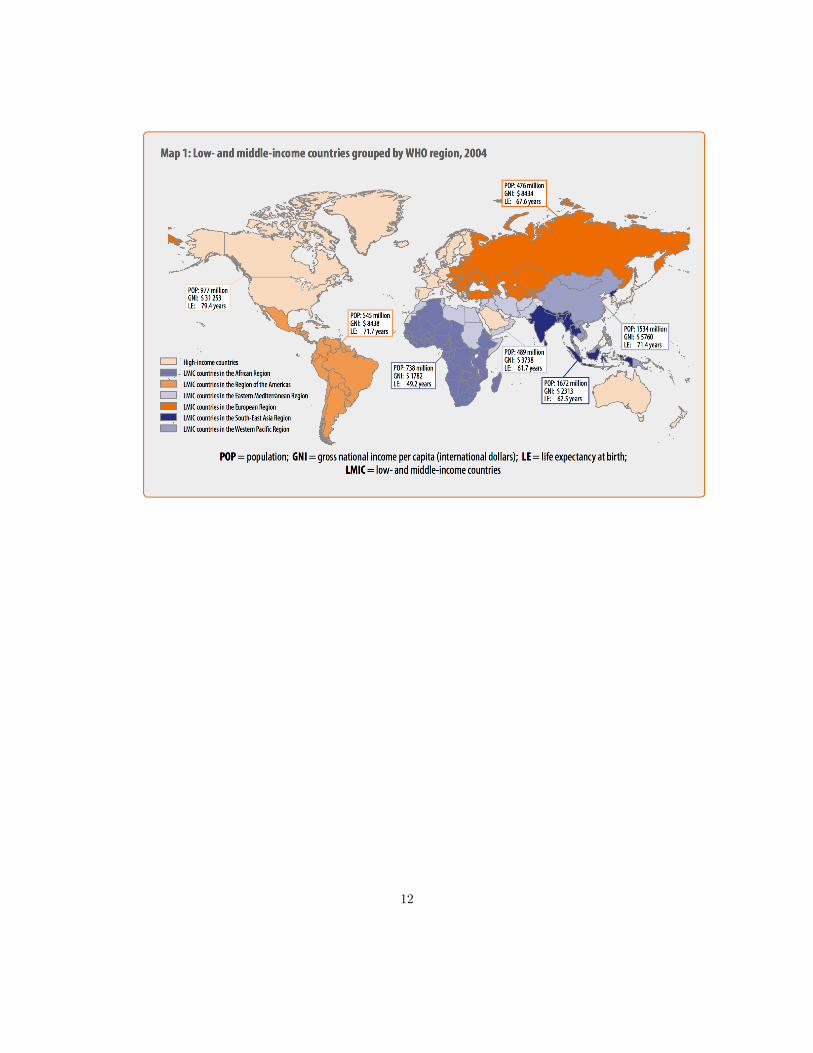
There is a positive association between health indicators and income, both at a country level and
individual level: Richer countries tend to have a more healthy population, and within a country
1
richer families tend to have better health than the poorer families (this is well documented by the
health inequality project run by Raj Chetty at Stanford).
Better health can increase both the quantity and quality of labour and therefore production.
Robert Fogel (Nobel lecture), quantified the contribution of better nutrition to economic growth in
the UK between 1780 and 1980. In 1780, 20% of the adults were unable to do any work because of
malnutrition. In 1980, this was no longer an issue. He also calculated that production per worker
increased (over these 200 years) with 56 % due to better nutrition. All in all he concludes that
improved health (nutrition) explains almost half of the growth in production over this period.
Better health may also improve the quality of labour, the quality of human capital: better health
! longer lives ! more incentives to invest in education ! more production.
The causal link will probably not only go from health to production (income) but also the other
way. More economic resources will improve health outcomes by bettering sanitation, nutrition and
medication. The observation that health both influences and is influenced by the income level in a
society (family) is important. Reverse causality – and also the possibility that there are confounding
variables, things that cause both good health and high income (especially at the individual level,
please find an example) – implies that we need some kind of research design to isolate the causal
effect of income on health outcomes (or health has on income) - probably - influenced by income
(economic development).
The complementarity between health and production will also lead to a multiplier effects. Sup-
pose health h has a causal effect on income y that is equal to � and that the causal effect of income
on health is ↵. We assume that both ↵ and � are positive but less than one to get a stable system.
We have these two equations
h = ↵y + uh (1)
y = �h+ uy (2)
The reduced form for the health equation is given by h = ↵1�↵�uy + 1
1�↵�uh. Hence, if health
increases by one unit for non-income reasons (medical innovation) the new equilibrium implies
that health increases with more than one unit (the initial effect on health increases income which
2
increases health, ...). How would you proceed to estimate how income affects health (to estimate
↵)?
Measure health
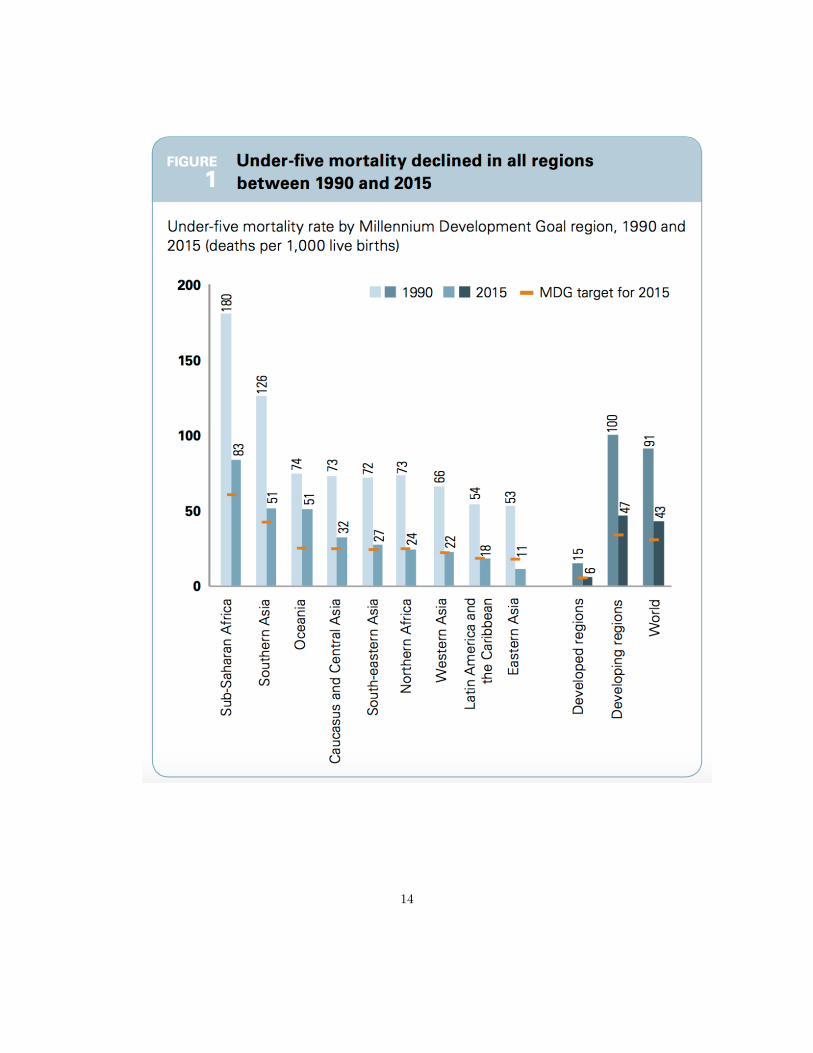
One measure that is often used to capture health is life expectancy at birth. There has also been
a strong focus on child and maternal health (millennium development goals). Maternal and under
five mortality rates are often listed as relevant health outcome measures in developing countries.
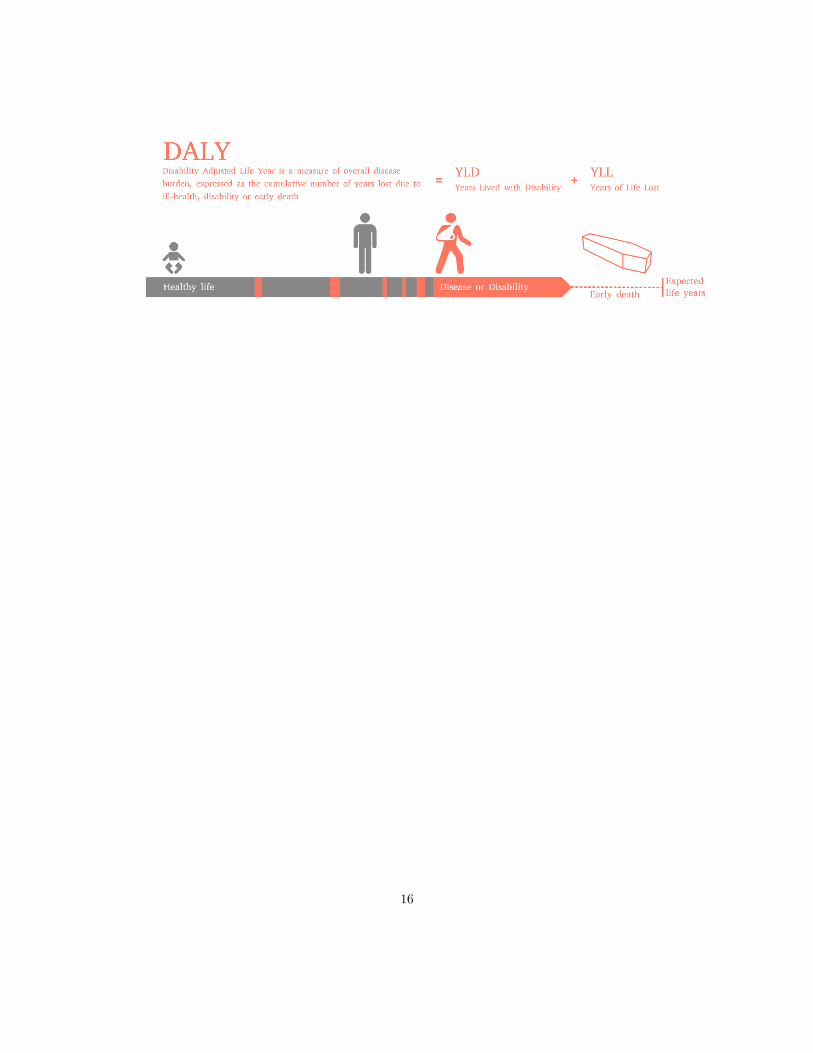
A more comprehensive measure of health is DALY (disability adjusted life year). A DALY is a
year lost due to ill health, either because you die one year earlier than “normal” or live with a
disease that does not reduce you life length, but decrease your life quality, your ability to live a
full life (say you have a disease that make you go blind the last four years of your life): DALY
= years lost due to illness + years lost due to living with a disease that reduce your ability to
live a full life. DALY gives a more comprehensive measure of health burden; makes it possible to
compare mortality and morbidity (and hence the intervention A that prevents early death and B
that only reduces suffering from a disease; we can use this measure to calculate and compare the
cost effectiveness of of different interventions ($ per DALY reduced).
Demand: Health investment decisions
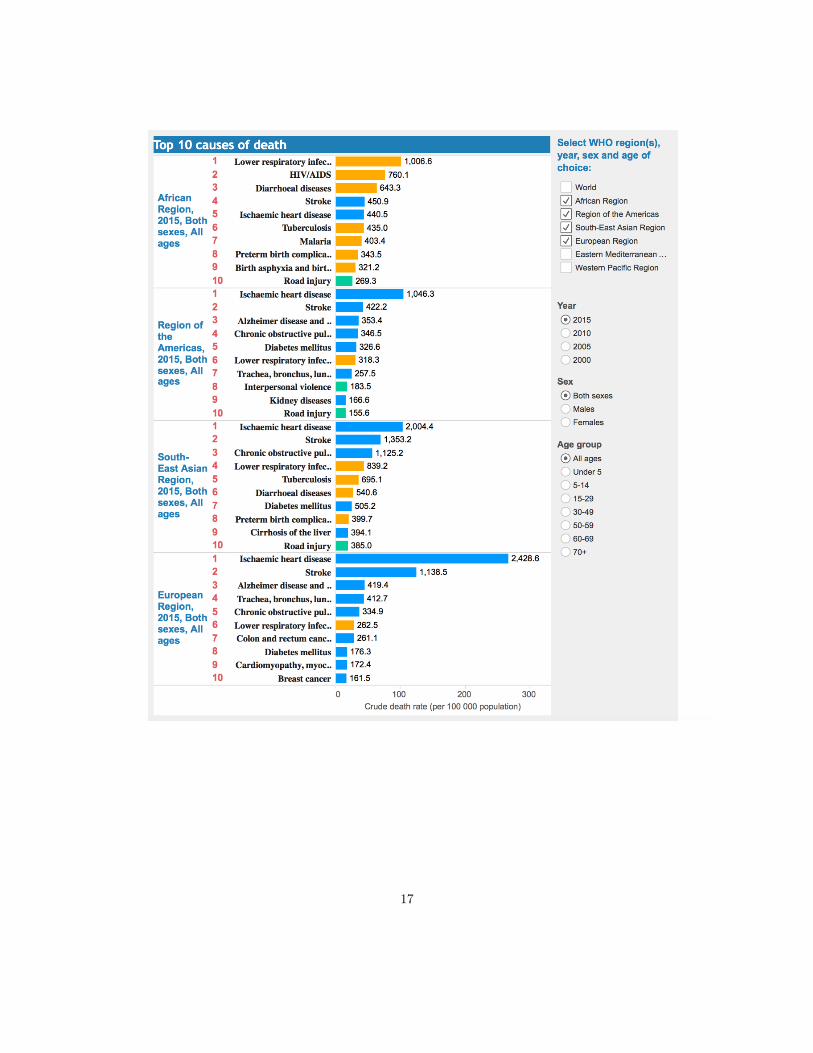
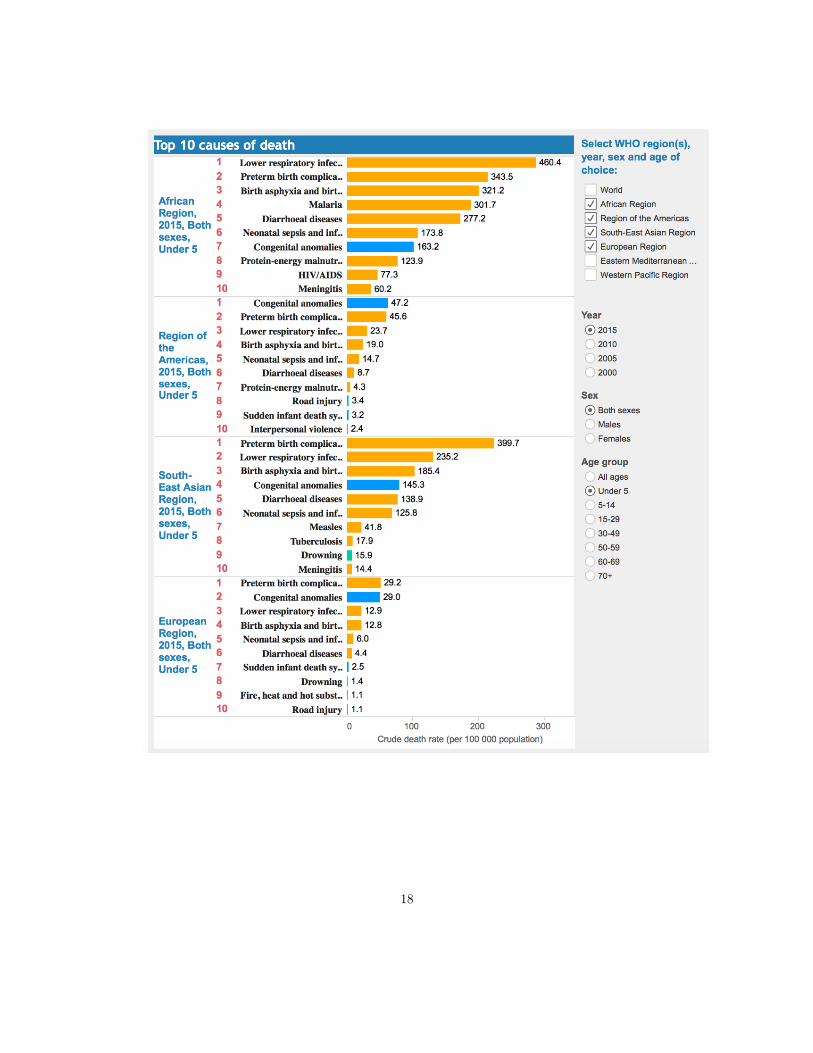
The disease picture - the main killers - are different in poor and rich country (check the figures
presented at the lecture). Many individuals in poor countries suffer and die from diseases that are
contagious, that are possible to prevent or can be treated at a relatively low cost (malaria, diarrhea,
parasites, ...). There are several interesting questions related to preventive care.
1. How efficient are different treatments (taking account of all the effect, i.e. those who accrue to
the person who takes the preventive action and also external effects - deworming will benefit
the person who takes the pill but also the local community (since this persons body will not
be used by the parasites to spread to other indivindividuals). The effectiveness question boils
3
down to what it costs to reduce DALY with one unit with some kind of treatment A. K&G
argue that there appear to be many low hanging fruits in developing countries.
2. Why are they not picked. Why do not poor individuals invest in their health by taking
preventive actions (purify water, use bed-net, vaccinate, ...). Why are take-up rates so low?
Does the take up rate change radically with a small fee for treatment? Can incentives be used
to increase the take up rate? Which incentives work best?
To answer 1 (to assess cost effectiveness) one can use RCT to measure the effect and costs of different
interventions. A classic example is the deworming study by Miguel & Kremer 2004. Miguel and Kre-
mer evaluate a large deworming intervention in Kenya. They argue that in phase 1 of this program
25 randomly chosen schools where given tablets to kill intestinal parasites. They later compare with
control schools (not yet treated with a deworming program), they measure many things, for example
different health outcomes and school attendance. They find both direct and indirect effects. Positive
effects, better health and better school attendance, the most surprising effect is the external effects
(non-treated schools close to treated schools also have positive effects (presumably, by interrupting
worm transmission from one child to the next). All in all they find that treating one child with a
deworming pill will increase schooling with 0.14 years. (Note that these findings are contested and
a re-analysis of the data find less strong effects (https://www.buzzfeed.com/bengoldacre).
There is also a paper that use community-wide experimental variation in a deworming program
for children in Kenyan primary schools, combined with a longitudinal data set tracking these children
into adulthood, to causally identify the effect of improved child health on later life outcomes ( Baird
et al 2016). They find that the long term effect of deworming is more consumption (0.1 meal per
day) and higher labour supply (12%).
According to this research deworming is highly efficient. Still there are lots of individuals
suffering and dying from intestinal parasites. The same is true for other major killers in poor
countries. Two million die due to water born diseases (relatively cheep to purify water). One
million die due to malaria (relatively cheap to reduce exposure by using bed-nets). Immunization
coverage is still relatively low. Why are these “low hanging fruits” not picked?
4
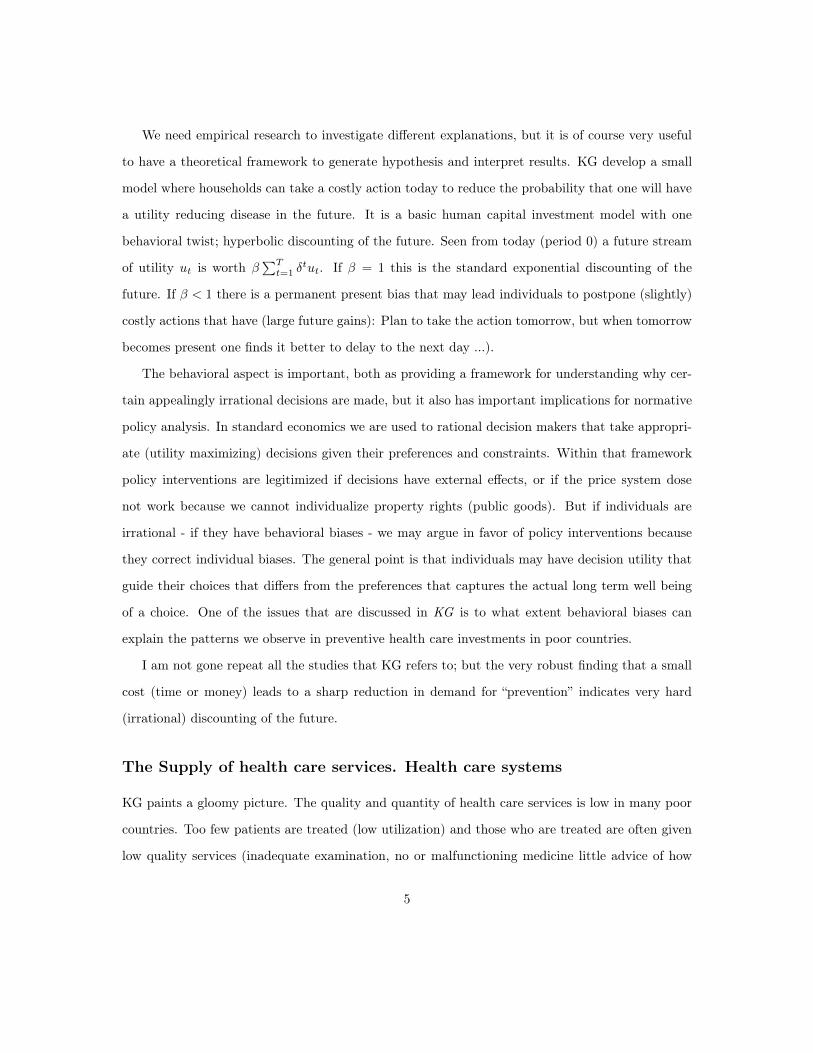
We need empirical research to investigate different explanations, but it is of course very useful
to have a theoretical framework to generate hypothesis and interpret results. KG develop a small
model where households can take a costly action today to reduce the probability that one will have
a utility reducing disease in the future. It is a basic human capital investment model with one
behavioral twist; hyperbolic discounting of the future. Seen from today (period 0) a future stream
of utility ut is worth �
PTt=1 �
tut. If � = 1 this is the standard exponential discounting of the
future. If � < 1 there is a permanent present bias that may lead individuals to postpone (slightly)
costly actions that have (large future gains): Plan to take the action tomorrow, but when tomorrow
becomes present one finds it better to delay to the next day ...).
The behavioral aspect is important, both as providing a framework for understanding why cer-
tain appealingly irrational decisions are made, but it also has important implications for normative
policy analysis. In standard economics we are used to rational decision makers that take appropri-
ate (utility maximizing) decisions given their preferences and constraints. Within that framework
policy interventions are legitimized if decisions have external effects, or if the price system dose
not work because we cannot individualize property rights (public goods). But if individuals are
irrational - if they have behavioral biases - we may argue in favor of policy interventions because
they correct individual biases. The general point is that individuals may have decision utility that
guide their choices that differs from the preferences that captures the actual long term well being
of a choice. One of the issues that are discussed in KG is to what extent behavioral biases can
explain the patterns we observe in preventive health care investments in poor countries.
I am not gone repeat all the studies that KG refers to; but the very robust finding that a small
cost (time or money) leads to a sharp reduction in demand for “prevention” indicates very hard
(irrational) discounting of the future.
The Supply of health care services. Health care systems
KG paints a gloomy picture. The quality and quantity of health care services is low in many poor
countries. Too few patients are treated (low utilization) and those who are treated are often given
low quality services (inadequate examination, no or malfunctioning medicine little advice of how
5
families can take preventive actions to improve their health). Why?
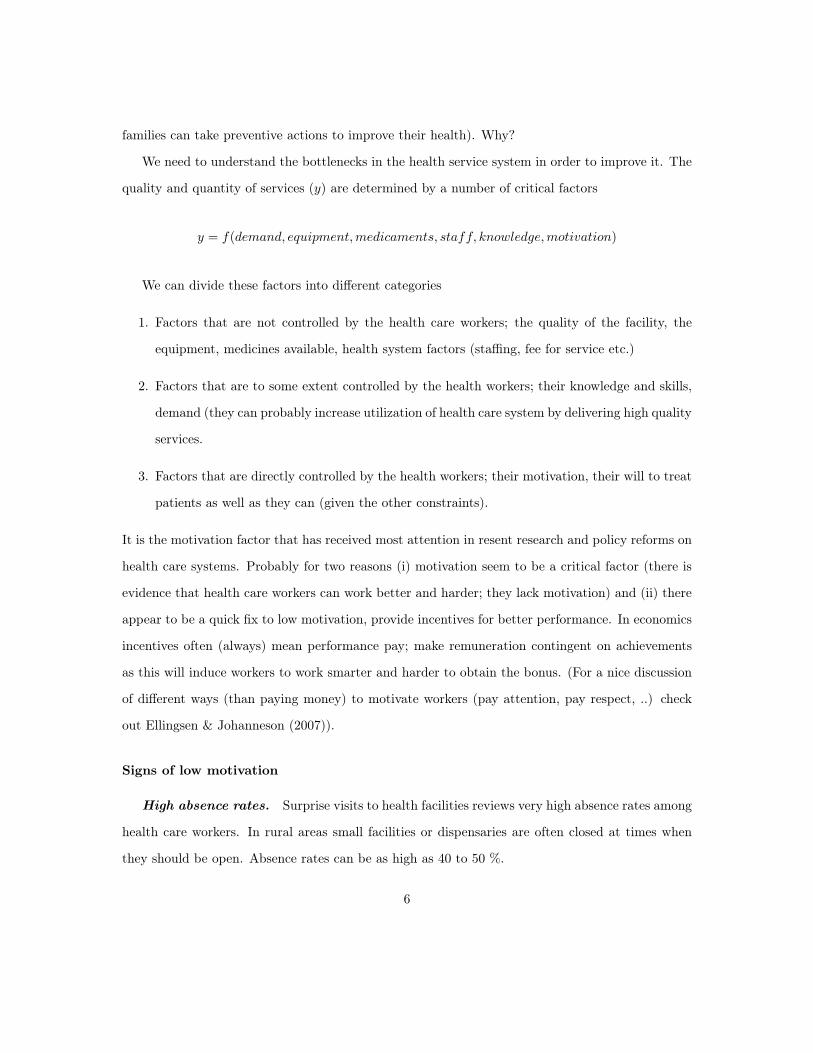
We need to understand the bottlenecks in the health service system in order to improve it. The
quality and quantity of services (y) are determined by a number of critical factors
y = f(demand, equipment,medicaments, staff, knowledge,motivation)
We can divide these factors into different categories
1. Factors that are not controlled by the health care workers; the quality of the facility, the
equipment, medicines available, health system factors (staffing, fee for service etc.)
2. Factors that are to some extent controlled by the health workers; their knowledge and skills,
demand (they can probably increase utilization of health care system by delivering high quality
services.
3. Factors that are directly controlled by the health workers; their motivation, their will to treat
patients as well as they can (given the other constraints).
It is the motivation factor that has received most attention in resent research and policy reforms on
health care systems. Probably for two reasons (i) motivation seem to be a critical factor (there is
evidence that health care workers can work better and harder; they lack motivation) and (ii) there
appear to be a quick fix to low motivation, provide incentives for better performance. In economics
incentives often (always) mean performance pay; make remuneration contingent on achievements
as this will induce workers to work smarter and harder to obtain the bonus. (For a nice discussion
of different ways (than paying money) to motivate workers (pay attention, pay respect, ..) check
out Ellingsen & Johanneson (2007)).
Signs of low motivation
High absence rates. Surprise visits to health facilities reviews very high absence rates among
health care workers. In rural areas small facilities or dispensaries are often closed at times when
they should be open. Absence rates can be as high as 40 to 50 %.
6
A know-do gap. There is also a lot of evidence that health care workers do not treat their
patients according to the guidelines when they are at work. Is this skill or will? To answer,
researchers first measure knowledge through the use of a vignette. Thereafter they (using an expert,
a medical doctor) observe the health worker in patient work and note what the health workers do.
(Or one can also use exit interviews with patients to get at what health workers do). Using this
approach researchers have documented a substantial know-do gap. Health workers do not follow
the guidelines, even though they know the guidelines: they carry out few of the procedures they
should follow to diagnose or treat diseases, they do not spend much time talking to the patients,
they do not give appropriate health advice etc.
Several studies have documented that the health workers spend very little time with each patient
(2 to 3 minutes) and asks very few questions (3 to 4). Brief and inadequate treatment could be
caused not by low motivation but by a very high case load: They have so much to do, so many
patients to attend, that they do not have time to do an adequate job. In some places this is probably
the explanation, but we did a study in rural Tanzania where we found that health workers had a
lot of idle time (there was not a line of patients outside the door). Furthermore we did not find the
effect that a higher caseload lead to lower performance. Hence we concluded that it could not be
“too many patients” that explained the know-do gap.
One thing that is important to convey in this gloomy picture is that the health workers in
Tanzania, and in other poor countries, are made of the same stuff as you and me; they are not
inherently lazy, bad people. They just work in a system that give them very few reasons to
do as good as they can. Good performance is not rewarded; not with money or status (career
opportunities), not with recognition, not with respect etc. Maybe one could say that many health
care providers in poor countries are trapped in a low effort equilibrium (low effort, low rewards,
low expectations).
Performance incentives
One idea that has got a lot of attention, both in research but also in policy, is a system reform
towards paying for performance: Health facilities - and health workers - should be financed based
7
on the output they produce rather on the staffing and other inputs. Performance-based incentive
schemes and reforms are receiving growing attention from governments, aid agencies, donors and
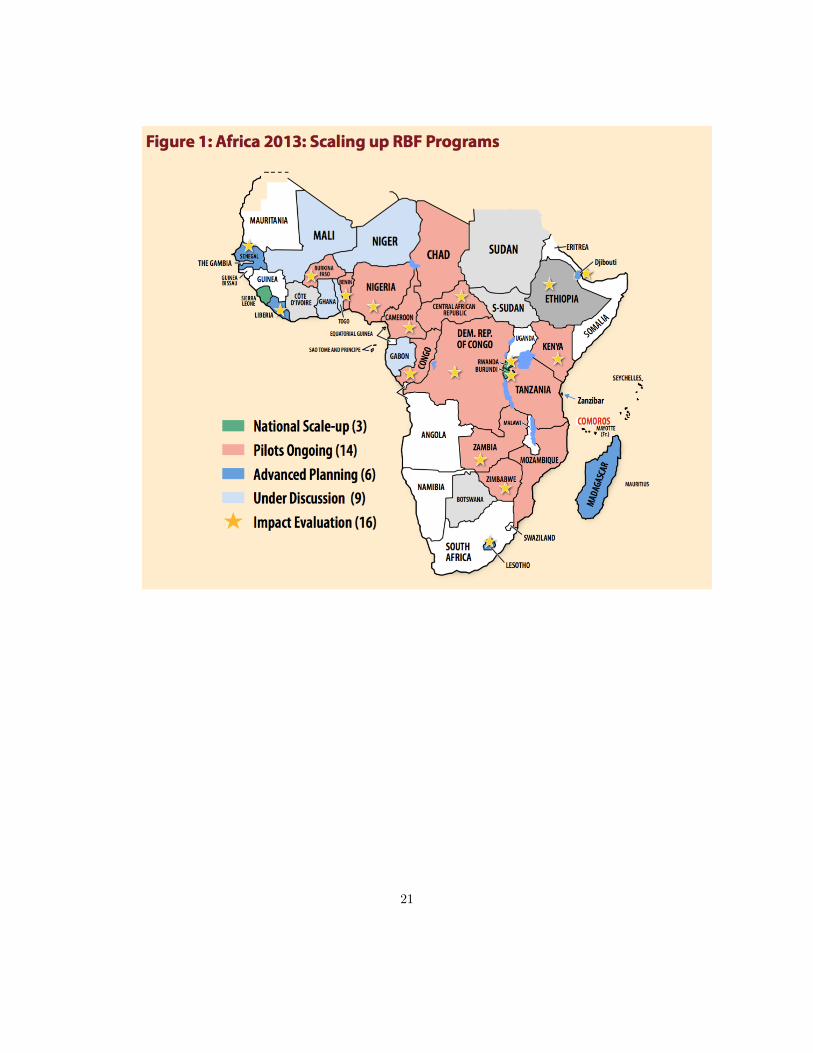
researchers. As for Africa alone, 29 countries are today at least piloting a RBF scheme; three of
them (Rwanda, Burundi and Sierra Leone) have adopted performance-based financing as a core
component of the funding of their whole health system. A major impact evaluation program led
by the World Bank assesses the rapid expansion of performance-based financing of health care.
In KG several studies assessing the effect of paying for performance is reviewed, I am not gone
repeat them here. The general picture is that performance financing (RBF - result based financing)
have a positive impact on the activities that are rewarded (if a facility and the health workers
working there get 4 $ per pregnant women that gives birth at the facility more women will give
birth at the facility). There are few studies of the long term effects of RBF. Critics have argued
that it will undermine the intrinsic motivation for performing well at work, but if this motivation
is low at the outset there is much motivation to crowd out.
Assessments of financial incentives in health care often leave the underlying mechanisms connect-
ing monetary incentives and health outcomes in the dark. They measure what monetary incentives
do to the quantity of health care, few studies ask how and why the change came about. This is
unfortunate since the impact of performance-based financing may depend critically on particular
attributes of the design of the incentive scheme, and may also depend on a number of contextual
variables. Furthermore, changing from input to output-based financing of health care will bring
about additional organizational changes that may affect health workers incentives to perform in
separate ways, making it hard to isolate the effect of monetary incentives.
To be more concrete, suppose performance-based financing provides health facilities with a
fixed sum of money for every woman that gives birth at the clinic. A “what” assessment measures
(hopefully by using credible controls) a y% increase in birth attendance in the performance financed
facilities. This is certainly important information, but we should also make an attempt to find out
how the increase in attendance came about: Did health workers increase the clinical quality of their
work which then attracted more patients to seek assistance at the facility (and if so, did a higher
quality maternity care work reduce the quality provided to other patients); did they become more
8
friendly and responsive towards patients; did they reduce informal or formal user fees; did they take
active steps to recruit more pregnant women (and how did they do that, by spreading information,
by threatening them or by offering incentives?); or did more patients attend because of improved
management – more and better drugs, cleaner sites etc.
In addition to addressing how behavior responds to financial incentives, it is important to
disclose a second question: why did behavior changed? At the outset the answer may seem too
obvious to be worth reflecting on. It is not. Introducing performance-based pay does not only make
health worker financially accountable for their performance, performance based financing may also
affect the level of supervision and community monitoring of health workers. Enhanced levels of
recognition and appraisal of the work that is done may in itself motivate health workers to perform.
Furthermore if incentives are based on team achievements, it has been documented elsewhere that
workers tend to make an extra effort to avoid letting the team down. In addition there is now a
large literature examining how monetary incentives interact with other extrinsic or intrinsic work
motivations. Together this means that even if we observe that the introduction of performance-
based financing makes the health workers more attentive and diligent, it is far from obvious why
this is the case.
Answering the how and why questions regarding the health workers behavioral response to
performance based financing is also a relevant question for RBF experts. More knowledge on this
will indeed improve their understanding of the endurance and external validity of the measured
impact. It will also enable them to improve the design of RBF schemes.
References
Baird, Sarah, et al. "Worms at work: Long-run impacts of a child health investment." The
Quarterly Journal of Economics 131.4 (2016): 1637-1680.
Ellingsen, Tore, and Magnus Johannesson. "Paying respect." The Journal of Economic Perspec-
tives 21.4 (2007): 135-149.
Miguel, Edward, and Michael Kremer. "Worms: identifying impacts on education and health in
9

the presence of treatment externalities." Econometrica 72.1 (2004): 159-217.
10
11
12
13
14
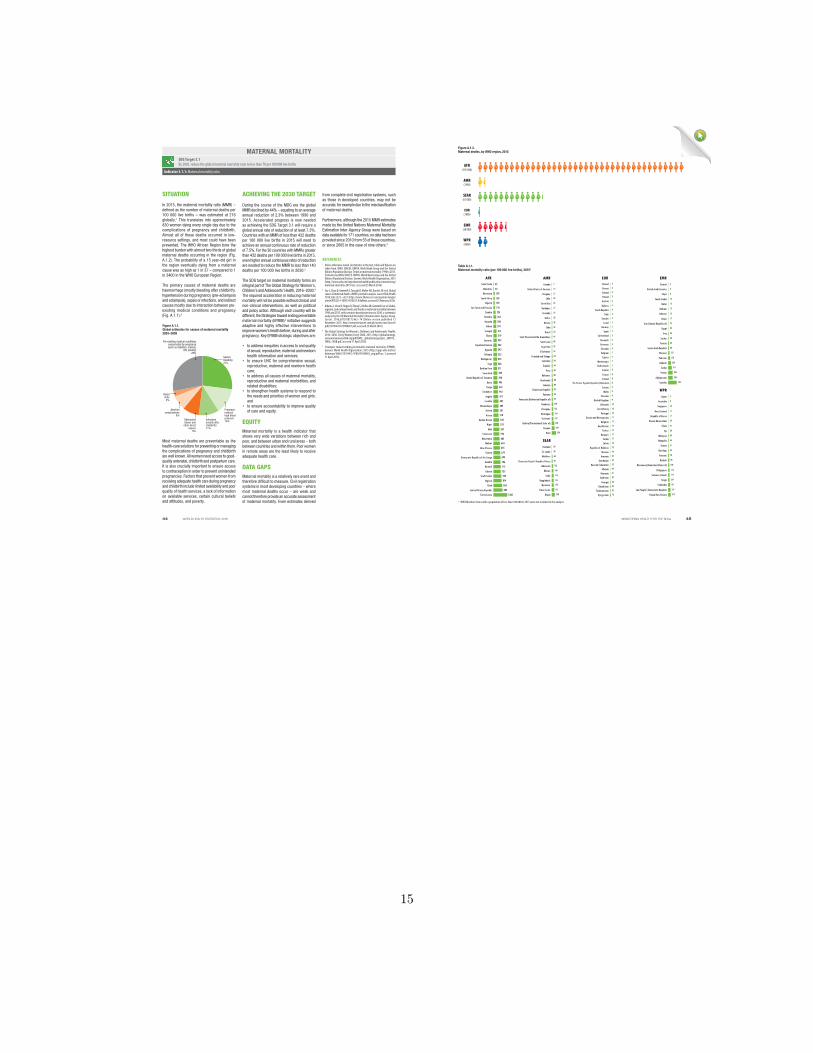
In 2015, the maternal mortality ratio (MMR) – defined as the number of maternal deaths per 100 000 live births – was estimated at 216 globally.1 This translates into approximately 830 women dying every single day due to the complications of pregnancy and childbirth. Almost all of these deaths occurred in low-resource settings, and most could have been prevented. The WHO African Region bore the highest burden with almost two thirds of global maternal deaths occurring in the region (Fig. A.1.2). The probability of a 15 year-old girl in the region eventually dying from a maternal cause was as high as 1 in 37 – compared to 1 in 3400 in the WHO European Region.
The primary causes of maternal deaths are haemorrhage (mostly bleeding after childbirth), hypertension during pregnancy (pre-eclampsia and eclampsia), sepsis or infections, and indirect causes mostly due to interaction between pre-existing medical conditions and pregnancy (Fig. A.1.1).2
Most maternal deaths are preventable as the health-care solutions for preventing or managing the complications of pregnancy and childbirth are well known. All women need access to good-quality antenatal, childbirth and postpartum care. It is also crucially important to ensure access to contraception in order to prevent unintended pregnancies. Factors that prevent women from receiving adequate health care during pregnancy and childbirth include limited availability and poor quality of health services, a lack of information on available services, certain cultural beliefs and attitudes, and poverty.
from complete civil registration systems, such as those in developed countries, may not be accurate, for example due to the misclassification of maternal deaths.
Furthermore, although the 2015 MMR estimates made by the United Nations Maternal Mortality Estimation Inter-Agency Group were based on data available for 171 countries, no data had been provided since 2010 from 55 of these countries, or since 2005 in the case of nine others.3
During the course of the MDG era the global MMR declined by 44% – equating to an average annual reduction of 2.3% between 1990 and 2015. Accelerated progress is now needed as achieving the SDG Target 3.1 will require a global annual rate of reduction of at least 7.3%. Countries with an MMR of less than 432 deaths per 100 000 live births in 2015 will need to achieve an annual continuous rate of reduction of 7.5%. For the 30 countries with MMRs greater than 432 deaths per 100 000 live births in 2015, even higher annual continuous rates of reduction are needed to reduce the MMR to less than 140 deaths per 100 000 live births in 2030.3
The SDG target on maternal mortality forms an integral part of The Global Strategy for Women’s, Children’s and Adolescents’ Health, 2016–2030.4 The required acceleration in reducing maternal mortality will not be possible without clinical and non-clinical interventions, as well as political and policy action. Although each country will be different, the Strategies toward ending preventable maternal mortality (EPMM)5 initiative suggests adaptive and highly effective interventions to improve women’s health before, during and after pregnancy. Key EPMM strategic objectives are:
• to address inequities in access to and quality of sexual, reproductive, maternal and newborn health information and services;
• to ensure UHC for comprehensive sexual, reproductive, maternal and newborn health care;
• to address all causes of maternal mortality, reproductive and maternal morbidities, and related disabilities;
• to strengthen health systems to respond to the needs and priorities of women and girls; and
• to ensure accountability to improve quality of care and equity.
EQUITYMaternal mortality is a health indicator that shows very wide variations between rich and poor, and between urban and rural areas – both between countries and within them. Poor women in remote areas are the least likely to receive adequate health care.
DATA GAPSMaternal mortality is a relatively rare event and therefore difficult to measure. Civil registration systems in most developing countries – where most maternal deaths occur – are weak and cannot therefore provide an accurate assessment of maternal mortality. Even estimates derived
REFERENCES1 Unless otherwise noted, all statistics in the text, table and figures are
taken from: WHO, UNICEF, UNFPA, World Bank Group and the United Nations Population Division. Trends in maternal mortality: 1990 to 2015. Estimates by WHO, UNICEF, UNFPA, World Bank Group and the United Nations Population Division. Geneva: World Health Organization; 2015 (http://www.who.int/reproductivehealth/publications/monitoring/maternal-mortality-2015/en/, accessed 25 March 2016).
2 Say L, Chou D, Gemmill A, Tunçalp Ö, Moller AB, Daniels JD et al. Global causes of maternal death: a WHO systematic analysis. Lancet Glob Health 2014;2(6):e323–e333 (http://www.thelancet.com/journals/langlo/article/PIIS2214-109X(14)70227-X/fulltext, accessed 25 February 2016).
3 Alkema L, Chou D, Hogan D, Zhang S, Moller AB, Gemmill A et al. Global, regional, and national levels and trends in maternal mortality between 1990 and 2015, with scenario-based projections to 2030: a systematic analysis by the UN Maternal Mortality Estimation Inter-Agency Group. Lancet. 2016;387(10017):462–74 (Online version published 12 November 2015: http://www.thelancet.com/pb/assets/raw/Lancet/pdfs/S0140673615008387.pdf, accessed 25 March 2016).
4 The Global Strategy for Women’s, Children’s and Adolescents’ Health, 2016–2030. Every Women Every Child; 2015 (http://globalstrategy.everywomaneverychild.org/pdf/EWEC_globalstrategyreport_200915_FINAL_WEB.pdf, accessed 11 April 2016).
5 Strategies toward ending preventable maternal mortality (EPMM). Geneva: World Health Organization; 2015 (http://apps.who.int/iris/bitstream/10665/153544/1/9789241508483_eng.pdf?ua=1, accessed 11 April 2016).
Figure A.1.1. Global estimates for causes of maternal mortality 2003–2009
Severe bleeding27%
Pre-existing medical conditions exacerbated by pregnancy (such as diabetes, malaria,
HIV, obesity)28%
Pregnany-induced high blood pressure14%Infections
(mostly after childbirth)11%
Obstructed labour and
other direct causes
9%
Abortion complications
8%
Blood clots
3%
SITUATION
Table A.1.1. Maternal mortality ratio (per 100 000 live births), 2015
Cabo Verde
Mauritius
Botswana
South Africa
Algeria
Sao Tome and Principe
Zambia
Namibia
Rwanda
Gabon
Senegal
Ghana
Comoros
Equatorial Guinea
Uganda
Ethiopia
Madagascar
Togo
Burkina Faso
Swaziland
United Republic of Tanzania
Benin
Congo
Zimbabwe
Angola
Lesotho
Mozambique
Eritrea
Kenya
Guinea-Bissau
Niger
Mali
Cameroon
Mauritania
Malawi
Côte d'Ivoire
Guinea
Democratic Republic of the Congo
Gambia
Burundi
Liberia
South Sudan
Nigeria
Chad
Central African Republic
Sierra Leone 1360
156
725
129
138
140
315
224
265
290
291
319
335
342
343
353
353
368
371
389
398
405
442
443
477
487
489
501
510
549
553
587
596
602
634
679
693
706
712
645
789
814
856
882
53
42
AFRCanada
United States of America
Uruguay
Chile
Costa Rica
Barbados
Grenada
Belize
Mexico
Cuba
Brazil
Saint Vincent and the Grenadines
Saint Lucia
Argentina
El Salvador
Trinidad and Tobago
Colombia
Ecuador
Peru
Bahamas
Guatemala
Jamaica
Dominican Republic
Panama
Venezuela (Bolivarian Republic of)
Honduras
Paraguay
Nicaragua
Suriname
Bolivia (Plurinational State of)
Guyana
Haiti 359
229
206
155
150
132
129
95
94
92
89
88
80
68
64
64
63
54
52
48
45
44
39
38
28
27
27
25
22
15
14
7
AMR
Thailand
Sri Lanka
Maldives
Democratic People's Republic of ..
Indonesia
Bhutan
India
Bangladesh
Myanmar
Timor-Leste
Nepal 258
215
178
176
174
148
126
82
68
30
20
SEAR
FinlandGreeceIcelandPolandAustria
BelarusCzech Republic
ItalySweden
IsraelNorway
SpainSwitzerland
DenmarkGermanySlovakiaBelgiumCyprus
MontenegroNetherlands
Croatia
FranceIreland
The former Yugoslav Republic of ..Estonia
MaltaSlovenia
United KingdomLithuania
Luxembourg
PortugalBosnia and Herzegovina
BulgariaKazakhstan
TurkeyHungary
SerbiaLatvia
Republic of MoldovaUkraine
ArmeniaAzerbaijan
Russian FederationAlbania
RomaniaTajikistan
GeorgiaUzbekistan
TurkmenistanKyrgyzstan 76
42
36
36
32
31
29
25
25
25
24
23
18
17
17
16
12
11
11
10
10
10
9
9
9
9
8
8
8
8
7
7
7
7
6
6
6
5
5
5
5
4
4
4
4
4
3
3
3
3
EURKuwait
United Arab Emirates
Libya
Saudi Arabia
Qatar
Bahrain
Lebanon
Oman
Iran (Islamic Republic of)
Egypt
Iraq
Jordan
Tunisia
Syrian Arab Republic
Morocco
Pakistan
Djibouti
Sudan
Yemen
Afghanistan
Somalia 732
396
385
311
229
178
121
68
62
58
50
33
25
17
15
15
13
12
9
6
4
EMR
Japan
Australia
Singapore
New Zealand
Republic of Korea
Brunei Darussalam
China
Fiji
Malaysia
Mongolia
Samoa
Viet Nam
Vanuatu
Kiribati
Micronesia (Federated States of)
Philippines
Solomon Islands
Tonga
Cambodia
Lao People's Democratic Republic
Papua New Guinea 215
197
161
124
114
114
100
90
78
54
51
44
40
30
27
23
11
11
10
6
5
WPR
Democratic People’s Republic of Korea
The Former Yugoslav Republic of Macedonia
Table A.1.1. Maternal mortality ratio (per 100 000 live births), 2015a
ACHIEVING THE 2030 TARGET
a WHO Member States with a population of less than 100 000 in 2015 were not included in the analysis.
Figure A.1.2. Maternal deaths, by WHO region, 2015
AFR(195 000)
AMR(7900)
WPR(9800)
EMR(28 000)
SEAR(61 000)
EUR(1800)
MATERNAL MORTALITYSDG Target 3.1By 2030, reduce the global maternal mortality ratio to less than 70 per 100 000 live births
Indicator 3.1.1: Maternal mortality ratio
44 45WORLD HEALTH STATISTICS: 2016 MONITORING HEALTH FOR THE SDGs
15
16
17
18

19
20
21