Lecture Notes in Computer Science 2822
280
Lecture Notes in Computer Science 2822 Edited by G. Goos, J. Hartmanis, and J. van Leeuwen
-
Upload
khangminh22 -
Category
Documents
-
view
0 -
download
0
Transcript of Lecture Notes in Computer Science 2822

Lecture Notes in Computer Science 2822Edited by G. Goos, J. Hartmanis, and J. van Leeuwen

3BerlinHeidelbergNew YorkHong KongLondonMilanParisTokyo

Nadia Bianchi-Berthouze (Ed.)
Databasesin NetworkedInformation Systems
Third International Workshop, DNIS 2003Aizu, Japan, September 22-24, 2003Proceedings
1 3

Series Editors
Gerhard Goos, Karlsruhe University, GermanyJuris Hartmanis, Cornell University, NY, USAJan van Leeuwen, Utrecht University, The Netherlands
Volume Editor
Nadia Bianchi-BerthouzeUniversity of AizuDepartment of Computer Software, Database Systems Lab.Tsuruga Ikki Machi 965-8580, Aizu Wakamatsu, JapanE-mail: [email protected]
Cataloging-in-Publication Data applied for
A catalog record for this book is available from the Library of Congress
Bibliographic information published by Die Deutsche BibliothekDie Deutsche Bibliothek lists this publication in the Deutsche Nationalbibliografie;detailed bibliographic data is available in the Internet at <http://dnb.ddb.de>.
CR Subject Classification (1998): H.2, H.3, H.4, H.5, C.2
ISSN 0302-9743ISBN 3-540-20111-4 Springer-Verlag Berlin Heidelberg New York
This work is subject to copyright. All rights are reserved, whether the whole or part of the material isconcerned, specifically the rights of translation, reprinting, re-use of illustrations, recitation, broadcasting,reproduction on microfilms or in any other way, and storage in data banks. Duplication of this publicationor parts thereof is permitted only under the provisions of the German Copyright Law of September 9, 1965,in its current version, and permission for use must always be obtained from Springer-Verlag. Violations areliable for prosecution under the German Copyright Law.
Springer-Verlag Berlin Heidelberg New Yorka member of BertelsmannSpringer Science+Business Media GmbH
http://www.springer.de
© Springer-Verlag Berlin Heidelberg 2003Printed in Germany
Typesetting: Camera-ready by author, data conversion by DA-TeX Gerd BlumensteinPrinted on acid-free paper SPIN 10953600 06/3142 5 4 3 2 1 0

V
Preface
The understanding of data semantics in Web-based information systems is theobject of intensive research efforts. The large volume of data on the Internetoriginates a need for accessing the semantic content of that information. Further-more, it requires the personalizing of its search and integration to various typesof users. Two approaches have been proposed in the research literature: integra-tion of Web technologies with database technologies and use of meta-languagessuch as XML. These solutions offer highly structured or semi-structured datathat allow users to perform queries at a higher semantic level. These also facili-tate the dynamic personalization of Web-based applications. Therefore, it is nowimportant to address the question of how one can efficiently query and searchlarge collections of XML documents. And it is also necessary to find new solu-tions, both to support dynamic architectures for Web-based applications and tomodel users’ search and result presentation criteria.
The third international workshop on Databases in Networked Information Sys-tems (DNIS 2003) was held on September 22–24, 2003 at the University ofAizu in Japan on the occasion of its 10th anniversary. The workshop programincluded research contributions, and invited contributions. The session on WebIntelligence included invited papers by Professor Jiming Liu and Professor CyrusShahabi. The session on Information Interchange and Management Systems in-cluded invited papers by Professor Tosiyasu L. Kunii, Professor Elisa Bertino,and Professor Marc Sifer. The session on Information Interchange Among CyberCommunities had invited papers by Professor Toyoaki Nishida, Professor MasaruKitsuregawa, and Dr. Umeshwar Dayal. Finally the session on Knowledge – An-notation and Visualization included the invited contribution by Professor DanielKeim.
The sponsoring organizations and the organizing committee deserve praise forthe support they provided. I would like to thank the members of the programcommittee for their support and all the authors who submitted the results oftheir research to DNIS 2003.
The workshop received invaluable support from the University of Aizu. In thiscontext, I would like to thank Professor Ikegami, President of the University ofAizu, and Professor Mirenkov, Head of the Department of Computer Software,for making the financial support available. I would like to express my gratitude tothe members and chairman of the International Affairs Committee, for support-ing the workshop proposal, as well as to the faculty members at the universityfor their cooperation and support.
September 2003 Nadia Bianchi-Berthouze

VI
Organization
The DNIS 2003 international workshop was organized by the Database Sys-tems Laboratory, University of Aizu, Aizu-Wakamatsu City, Fukushima, 965-8580 Japan.
Executive Committee
Honorary Chair: T. L. Kunii, Kanazawa Institute of Technology, JapanProgram Chair: N. Bianchi-Berthouze, University of Aizu, JapanExecutive Chair: S. Bhalla, University of Aizu, Japan
Program Committee
D. Agrawal, University of California, USAE. Bertino, University of Milan, ItalyS. Bhalla, University of Aizu, JapanN. Bianchi-Berthouze, University of Aizu, JapanP.C.P. Bhatt, Indian Institute of Information Technology, IndiaJ. Biskup, University of Dortmund, GermanyP. Bottoni, University “La Sapienza” of Rome, ItalyL.F. Capretz, University of Western Ontario, CanadaM. Capretz, University of Western Ontario, CanadaB. Chidlovskii, Xerox Research Center Europe, FranceU. Dayal, Hewlett-Packard Laboratories, USAS. Grumbach, INRIA, FranceJ. Herder, Dusseldorf University of Applied Sciences, GermanyS. Jajodia, George Mason University, USAQ. Jin, Waseda University, JapanR. Khosla, La Trobe University, AustraliaM. Kitsuregawa, University of Tokyo, JapanA. Kumar, University of Colorado, USAJ. Li, University of Tsukuba, JapanG. Mansfield, Tohoku University, JapanK. Myszkowski, Max-Planck-Institut fur Informatik, GermanyP.K. Reddy, International Institute of Information Technology, IndiaO. Zaiane, University of Alberta, USA

Organization VII
Additional Reviewers
F. Andres I. Paik M. Simmert H. YuA. Bergholz O.D. Sahin L. SznukV. Kluev C. Shahabi T. Tamura
Sponsoring Institution
International Affairs Committee, University of AizuAizu-Wakamatsu City, Fukushima 965-8580, Japan

VIII Organization
IX
Table of Contents
Web Intelligence
The World Wide Wisdom Web (W4)Jiming Liu . . . . . . . . . . . . . . . . . . . . . . . . . . . . . . . . . . . . . . . . . . . . . . . . . . . . . . . . . . . . . . . . . 1
Web Information Personalization: Challenges and ApproachesCyrus Shahabi and Yi-Shin Chen . . . . . . . . . . . . . . . . . . . . . . . . . . . . . . . . . . . . . . . . . . . 5
An Adaptive E-commerce Personalization Frameworkwith Application in E-bankingQiubang Li and Rajiv Khosla . . . . . . . . . . . . . . . . . . . . . . . . . . . . . . . . . . . . . . . . . . . . . . 16
Accessing Hidden Web Documents by Metasearchinga Directory of Specialty Search EnginesJacky K. H. Shiu, Stephen C. F. Chan, and Korris F. L. Chung . . . . . . . . . . . 27
Hidden Schema Extraction in Web DocumentsVincenza Carchiolo, Alessandro Longheu, and Michele Malgeri . . . . . . . . . . . . . 42
Automatically Customizing Service Pages on the Web for Mobile DevicesYeonghyo Jeon and Eenjun Hwang . . . . . . . . . . . . . . . . . . . . . . . . . . . . . . . . . . . . . . . . . 53
Information Interchange and Management Systems
Author-X – A System for Secure Dissemination and Updateof XML DocumentsElisa Bertino, Barbara Carminati, Elena Ferrari, and Giovanni Mella . . . . . 66
What’s Wrong with Wrapper Approachesin Modeling Information System Integration and Interoperability?Tosiyasu L. Kunii . . . . . . . . . . . . . . . . . . . . . . . . . . . . . . . . . . . . . . . . . . . . . . . . . . . . . . . . . 86
Browsing and Editing XML Schema Documentswith an Interactive EditorMark Sifer, Yardena Peres, and Yoelle Maarek . . . . . . . . . . . . . . . . . . . . . . . . . . . . . 97
On-Line Analysis of a Web Data WarehouseGilles Nachouki and Marie-Pierre Chastang . . . . . . . . . . . . . . . . . . . . . . . . . . . . . . 112
Web Information Integration Based on Compressed XMLHongzhi Wang, Jianzhong Li, Zhenying He, and Jizhou Luo . . . . . . . . . . . . . . 122

X Table of Contents
Information Interchange among Cyber Communities
Supporting the Conversational Knowledge Processin the Networked CommunityToyoaki Nishida . . . . . . . . . . . . . . . . . . . . . . . . . . . . . . . . . . . . . . . . . . . . . . . . . . . . . . . . . . 138
Intelligent Management of SLAs for Composite Web ServicesMalu Castellanos, Fabio Casati, Umeshwar Dayal,and Ming-Chien Shan . . . . . . . . . . . . . . . . . . . . . . . . . . . . . . . . . . . . . . . . . . . . . . . . . . . . 158
PC Cluster Based Parallel Frequent Pattern Miningand Parallel Web Access Pattern MiningMasaru Kitsuregawa and Iko Pramudiono . . . . . . . . . . . . . . . . . . . . . . . . . . . . . . . . . 172
NetIsle: A Hybrid Peer-to-Peer Groupware SystemBased on Push Technology for Small Group CollaborationRoman Shtykh and Qun Jin . . . . . . . . . . . . . . . . . . . . . . . . . . . . . . . . . . . . . . . . . . . . . . 177
An Improved Optimistic and Fault-Tolerant Replication ProtocolLuis Irun-Briz, Francesc D. Munoz-Escoı,and Josep M. Bernabeu-Auban . . . . . . . . . . . . . . . . . . . . . . . . . . . . . . . . . . . . . . . . . . . 188
Knowledge – Annotation and Visualization
Visual Data Mining of Large Spatial Data SetsDaniel A. Keim, Christian Panse, and Mike Sips . . . . . . . . . . . . . . . . . . . . . . . . . 201
An Analysis and Case Study of Digital AnnotationPaolo Bottoni, Stefano Levialdi, and Paola Rizzo . . . . . . . . . . . . . . . . . . . . . . . . . 216
Vectorization of Graphical Components in Sketch-Based InterfacesFernando Ferri and Patrizia Grifoni . . . . . . . . . . . . . . . . . . . . . . . . . . . . . . . . . . . . . . 231
A Data Placement Method of HSMfor Streaming Media Server in Network EnvironmentYaoqiang Xu, Chunxiao Xing, and Lizhu Zhou . . . . . . . . . . . . . . . . . . . . . . . . . . . . 245
Application of Active Real-Time Objects and Rules in Semantic WebSang Bong Yoo and In Han Kim . . . . . . . . . . . . . . . . . . . . . . . . . . . . . . . . . . . . . . . . . 255
Author Index . . . . . . . . . . . . . . . . . . . . . . . . . . . . . . . . . . . . . . . . . . . . . . . . . . . . . . . . . . 271

The World Wide Wisdom Web (W4)
Jiming Liu
Web Intelligence Consortium (WIC) & Computer Science DepartmentHong Kong Baptist University
Kowloon Tong, Hong [email protected]
http://robotics.comp.hkbu.edu.hk/~jiming
Abstract. In this talk, I will address the research and developmentneeds for creating the new paradigm shift in Internet computing. Inparticular, I will present one of the most promising answers to such needs,called World Wide Wisdom Web (W4), and identify several challengesand enabling technologies in building the W4.
1 The Emergence of Web Intelligence (WI)
Web Intelligence (WI) was first introduced by Zhong (Japan), Liu (Hong Kong),Yao (Canada), and Ohsuga (Japan) in 2000 [6], as a joint research effort in de-veloping the next generation Web-based intelligent systems, through combiningtheir expertise in Data-Mining, Agents, Information Retrieval, and Logic.
Broadly speaking, WI encompasses the scientific research and developmentthat explores the fundamental roles as well as practical impacts of Artificial In-telligence (AI), such as autonomous agents and multi-agent systems, machinelearning, data mining, and soft-computing, as well as advanced InformationTechnology (IT), such as wireless networks, grid computing, ubiquitous agents,and social networks, on the next generation of Web-empowered products, sys-tems, services, and activities. WI is the key and the most urgent research fieldof IT today.
2 Web Intelligence (WI) as a Promising Field of Researchand Development
As much more detailed blueprints and issues of Web Intelligence (WI) wereevolved and specified in recent years [4, 5, 7, 8], numerous WI related researchstudies and business enterprises have been established around the world. WIcompanies and research centers or labs have been launched around the globe inUSA, Europe, Japan, and India, etc. Each of them focuses on certain specific WIissues or products/services. As a result, today WI has become a well-defined ITresearch field, publicly recognized and promoted by the IEEE Computer Society.
In the meantime, international forums, such as IEEE International Confer-ence on Web Intelligence (WI01, WI03) and Atlantic Web Intelligence Confer-ence (AWIC03), were also organized with overwhelming interests and positive
N. Bianchi-Berthouze (Ed.): DNIS 2003, LNCS 2822, pp. 1–4, 2003.c© Springer-Verlag Berlin Heidelberg 2003

2 Jiming Liu
responses. Successful experiences in the development of WI technologies havebeen reported as special issues in leading journals and magazines, and docu-mented in details in the first ever hardcover text on Web Intelligence publishedby Springer in 2003 [9].
The challenges of Internet computing research and development in the nextdecade will be Web Intelligence (WI) centric, focusing on how we can intelli-gently make the best use of the widely available Web connectivity. The new WItechnologies to be developed will be precisely determined by human needs in apost-industrial era; namely:
1. information empowerment;2. knowledge sharing;3. virtual social clustering;4. service enrichment;5. practical wisdom development.
In this talk, I will argue that one of the most promising paradigm shifts in WIwill be driven by the notion of wisdom. Developing the World Wide WisdomWeb (W4) will become a tangible goal for WI researchers and practitioners.The W4 will enable us to optimally utilize the global connectivity, as offered bythe Web infrastructure, and most importantly, to gain the practical wisdoms ofliving, working, and playing, in addition to information search and knowledgequeries.
3 WIC: A Consortium for the W4 Research andDevelopment
In order to best exchange and coordinate the W4 research and developmentefforts, and effectively promote and share the WI technologies, Ning Zhong(Maebashi Institute of Technology, Japan) and Jiming Liu (Hong Kong BaptistUniversity), together with Edward A. Feigenbaum (Stanford University, USA),Setsuo Ohsuga (Waseda University, Japan), Benjamin Wah (University of Illinoisat Urbana-Champaign, USA), Philip Yu (IBM T. J. Watson Research Center,USA), and L.A. Zadeh (UC Berkeley, USA), formally established the Web In-telligence Consortium (WIC) in 2002.
The WIC is an international non-profit organization dedicated to the pro-motion of world-wide scientific research and industrial development in the eraof Web and agent intelligence, through collaborations among world-wide WI re-search centers and organizational members, technology showcase at WI confer-ences and workshops, WIC official book and journal publications, WIC newslet-ter, and WIC official releases of new industrial solutions and standards.
4 Towards Wisdom Oriented Computing
The paradigm of wisdom oriented computing is aimed at providing not onlya medium for seamless information exchange and knowledge sharing [2] but also
The World Wide Wisdom Web (W4) 3
a type of man-made resources for sustainable knowledge creation, and scientificand social evolution. The W4 will reply on grid-like service agencies that self-organize, learn, and evolve their courses of actions in order to perform servicetasks as well as their identities and interrelationships in communities. They willalso cooperate and compete among themselves in order to optimize their as wellas others resources and utilities.
Self-organizing, learning agents are computational entities that are capableof self-improving their performance in dynamically changing and unpredictabletask environments. In [3], Liu has provided a comprehensive overview of severalstudies in the field of autonomy oriented computing, with in-depth discus-sions on self-organizing and adaptive techniques for developing various embodi-ments of agent based systems, such as autonomous robots, collective vision andmotion, autonomous animation, and search and segmentation agents. The coreof those techniques is the notion of synthetic or emergent autonomy based onbehavioral self-organization.
5 Turing Test in the 21st Century
In order to effectively develop the new generation WI systems, we need to definebenchmark applications, i.e., a new Turing Test, that will capture and demon-strate the W4 capabilities.
Take the wisdom oriented computing benchmark as an example. We can usea service task of compiling and generating a market report on an existing productor a potential market report on a new product. In order to get such servicejobs done, an information agent on the W4 will mine and integrate availableWeb information, which will in turn be passed onto a market analysis agent.Market analysis will involve the quantitative simulations of customer behaviorin a marketplace, instantaneously handled by other serviced agencies, involvinga large number of grid agents [1]. Since the number of variables concerned maybe in the order of hundreds or thousands, it can easily cost a single system yearsto generate one predication.
References
[1] Berman, F.: From TeraGrid to knowledge grid. Communications of the ACM,44:27-28, 2001. 3
[2] Berners-Lee, T., Hendler, J., Lassila, O.: The semantic Web. Scientific American,284:34-43, 2001. 2
[3] Liu, J.: Autonomous Agents and Multiagent Systems, World Scientific Publishing,2001. 3
[4] Liu, J., Zhong, N., Yao, Y.Y., Ras, Z.W.: The Wisdom Web: New challengesfor Web Intelligence (WI). Journal of Intelligent Information Systems, KluwerAcademic Publishers, 20(1):5-9, 2003. 1
[5] Yao, Y.Y., Zhong, N., Liu, J., Ohsuga, S.: Web Intelligence (WI): Research chal-lenges and trends in the new information age. N. Zhong, Y.Y. Yao, J. Liu, and S.Ohsuga (eds.), Web Intelligence: Research and Development, LNAI 2198, pages1-17, Springer, 2001. 1

4 Jiming Liu
[6] Zhong, N., Liu, J., Yao, Y.Y., Ohsuga, S.: Web Intelligence (WI). In Proceedingsof the 24th IEEE Computer Society International Computer Software and Appli-cations Conference (COMPSAC 2000), pages 469-470, IEEE Computer SocietyPress, Taipei, Taiwan, October 25-28, 2000. 1
[7] Zhong, N., Yao, Y.Y., Liu, J., Ohsuga, S. (eds.): Web Intelligence: Research andDevelopment, LNAI 2198, Springer, 2001. 1
[8] Zhong, N., Liu, J., Yao, Y.Y.: In search of the Wisdom Web. IEEE Computer,35(11):27-31, November 2002. 1
[9] Zhong, N., Liu, J., Yao, Y.Y. (eds.): Web Intelligence, Springer, 2003. 2
Web Information Personalization:
Challenges and Approaches�
Cyrus Shahabi1 and Yi-Shin Chen2
1 Department of Computer ScienceUniversity of Southern CaliforniaLos Angeles, CA 90089-2561, USA
http://infolab.usc.edu/2 Integrated Media Systems CenterUniversity of Southern CaliforniaLos Angeles, CA 90089-2561, USA
Abstract. As the number of web pages increases dramatically, the prob-lem of the information overload becomes more severe when browsing andsearching the WWW. To alleviate this problem, personalization becomesa popular remedy to customize the Web environment towards a user’spreference. To date, recommendation systems and personalized web searchsystems are the most successful examples of Web personalization. By fo-cusing on these two types of systems, this paper reviews the challengesand the corresponding approaches proposed in the past ten years.
1 Introduction
The World Wide Web (WWW) is emerging as an appropriate environment forbusiness transactions and user-organization interactions, because it is conve-nient, fast, and cheap to use. The witness to this fact is the enormous popularityof e-Commerce and e-Government applications. However, since the Web is a largecollection of semi-structured and structured information sources, Web users of-ten suffer from information overload. To alleviate this problem, personalizationbecomes a popular remedy to customize the Web environment for users.
Among all personalization tools, recommendation systems are the most em-ployed tools in e-commerce businesses. Recommendation systems are usuallyused to help the customers to locate the products they would like to purchase.In essence, these systems apply data analysis techniques to progressively gen-erate a list of recommended products for each online customer. The most fa-mous example in e-commerce is the “Customers who bought” feature used inAmazon.comTM, which is basically applied to every product page on its web-sites. With the help of this feature, the Amazon.comTM’s system recommends� This research has been funded in part by NSF grants EEC-9529152 (IMSC ERC)and IIS-0082826, and unrestricted cash gifts from Microsoft, NCR, and Okawa Foun-dation.
N. Bianchi-Berthouze (Ed.): DNIS 2003, LNCS 2822, pp. 5–15, 2003.c© Springer-Verlag Berlin Heidelberg 2003
6 Cyrus Shahabi and Yi-Shin Chen
similar products to the current buyer based on the purchase histories of previouscustomers who bought the same product.
Contrary to the recommendation systems, the personalized web search sys-tems1 have received little attention from the e-commerce domain, even thoughsearch engines have become the indispensable tools in our daily lives. Gener-ally, most modern search engines, e.g., Google2, Yahoo!3, and AltaVista4 do notreturn personalized results. That is, the result of a search for a given queryis identical, independent of the user submitting the query. Hence, by ignoringthe user’s preferences during the search process, the search engines may returna large amount of irrelevance data. To illustrate, consider the search query forthe keywords “web usage”. By this query, some users may look for the informa-tion regarding the usage of the spider web, while other users may be interestedin documents related to the statistical data about World Wide Web usage.
In summary, both the recommendation systems and the personalized websearch systems face the same obstacle of “ambiguity” in users’ needs5. Moreover,both types of systems share the same challenge of striking a compromise betweenthe amount of processed data and the efficiency of the retrieval process. Wereview the challenges and the proposed approaches for both system types inthe remainder of this paper. Section 2 reviews the work on the recommendationsystems. In Section 3, the work on the search systems is discussed.
2 Recommendation Systems
Various statistical and knowledge discovery techniques have been proposed andapplied for recommendation systems. To date, most recommendation systemsare designed either based on content-based filtering or collaborative filtering. Bothtypes of systems have inherent strengths and weaknesses, where content-basedapproaches directly exploit the product information, and the collaboration fil-tering approaches utilize specific user rating information.
2.1 Content-Based Filtering
Content-based filtering approaches are derived from the concepts introduced bythe Information Retrieval (IR) community. Content-based filtering systems areusually criticized for two weaknesses:
1. Content Limitation: IR methods can only be applied to a few kinds ofcontent, such as text and image, and the extracted features can only capturecertain aspects of the content.
1 Note that the web search system is a more general term than search engine wherethe search system includes search engines, search agents, and metasearch systems.
2 http://www.google.com3 http://www.yahoo.com4 http://www.altavista.com5 The ambiguity comes from user perceptions or the disagreements among users’ opin-ions.
Web Information Personalization: Challenges and Approaches 7
2. Over-Specialization: Content-based recommendation system provides rec-ommendations merely based on user profiles. Therefore, users have no chanceof exploring new items that are not similar to those items included in theirprofiles.
2.2 Collaborative Filtering
The collaborative filtering (CF) approach remedies for these two problems. Typ-ically, CF-based recommendation systems do not use the actual content of theitems for recommendation. Collaborative filtering works based on the assumptionthat if user x interests are similar to user(s) y interests, the items preferred by ycan be recommended to x. Moreover, since other user profiles are also considered,user can explore new items. The nearest-neighbor algorithm is the earliest CF-based technique used in recommendation systems [16, 17]. With this algorithm,the similarity between users is evaluated based on their ratings of products,and the recommendation is generated considering the items visited by nearestneighbors of the user. In its original form, the nearest-neighbor algorithm usesa two-dimensional user-item matrix to represent the user profiles. This originalform of CF-based recommendation systems suffers from three problems:
1. Scalability: The time complexity of executing the nearest-neighbor algo-rithm grows linearly with the number of items and the number of users.Thus, the recommendation system cannot support large-scale applicationssuch as Amazon.comTM, which provides more than 18 million unique itemsfor over 20 million users.
2. Sparsity: Due to large number of items and user reluctance to rate the items,usually the profile matrix is sparse. Therefore, the system cannot providerecommendations for some users, and the generated recommendations arenot accurate.
3. Synonymy: Since contents of the items are completely ignored, latent asso-ciation between items is not considered for recommendations. Thus, as longas new items are not rated, they are not recommended; hence, false negativesare introduced.
In order to solve these problems, a variety of different techniques have beenproposed. Some of techniques, such as dimensionality reduction [11, 8], cluster-ing [29], and Bayesian Network [10, 9], mainly are remedies for the scalabilityproblem. These techniques extract characteristics (patterns) from the originaldataset in an offline process and employ only these patterns to generate therecommendation lists in the online process. Although this approach can reducethe online processing cost, it often reduces the accuracy of the recommendingresults. Moreover, the online computation complexity keeps increasing with thenumber of patterns.
Some other techniques, such as association rules [30, 11], content analy-sis [12, 13, 15], categorization [18, 14], are emphasized on alleviating the sparsityand synonymy problems. Basically, these techniques analyze the Web usage data
8 Cyrus Shahabi and Yi-Shin Chen
(from Web server logs) to capture the latent association between items. Subse-quently, based on both item association information and user ratings, the recom-mendation systems can thus generate better recommendation to users. However,the online computation time concurrently increases, as more data are incorpo-rated into the recommendation progress. Additionally, because Web usage datafrom the server side are not reliable [24], the item association generated fromWeb server logs might be wrong.
2.3 Yoda
In an earlier work [1], we introduced a hybrid recommendation system - Yoda,which simultaneously utilizes the advantages of clustering, content analysis, andcollaborate filtering (CF) approaches. Basically, Yoda is a two-step approachrecommendation system. During the offline process, Yoda generates cluster rec-ommendation lists based on the Web usage data from the client-side throughclustering and content analysis techniques. This approach not only can addressthe scalability problem by the preprocessing work, but also can alleviate thesparsity and synonymy problems by discovering latent association between items.Since the Web usage data from the client-side can capture real user navigationbehaviors, the item association discovered by the Yoda system would be moreaccurate. Beside the cluster recommendation lists, Yoda also maintains numer-ous recommendation lists obtained from different experts, such as human expertsof the Website domain, and the cluster representatives of the user ratings. Bythese additional recommendation lists, Yoda is less impacted by the preprocess-ing work as compared to other systems.
During the online process, for each user who is using the system, Yoda esti-mates his/her confidence values to each expert, who provides the recommenda-tion list, based on his/her current navigation behaviors through the PPED dis-tance measure [23] and our GA-based learning mechanism. Subsequently, Yodagenerates customized recommendations for the user by aggregating across rec-ommendation lists using the confidence value as the weight. In order to expeditethe aggregation step, Yoda employs an optimized fuzzy aggregation functionthat reduces the time computation complexity of aggregation from O(N × E)to O(N), where N is the number of recommended items in the final recommen-dation list to users and E is the number of recommendation lists maintained inthe system. Consequently, the online computation complexity of Yoda remainsthe same even if number of recommendation lists increases.
In sum, the time complexity is reduced through a model-based technique,a clustering approach, and the optimized aggregation method. Additionally, dueto the utilization of content analysis techniques, Yoda can detect the latent asso-ciation between items and therefore provides better recommendations. Moreover,Yoda is able to collect information about user interests from implicit web nav-igation behaviors while most other recommendation systems [16, 17, 11, 9, 10]do not have this ability and therefore require explicit rating information fromusers. Consequently, Yoda puts less overhead on the users.
Web Information Personalization: Challenges and Approaches 9
Since content analysis techniques only capture certain characteristics of prod-ucts, some desired products might not be included in the recommendation listsproduced by analyzing the content. For example, picking wines based on brands,years, and descriptors might not be adequate if “smell” and “taste” are more im-portant characteristics. In order to remedy for this problem, in [2] we extendedYoda to incorporate more recommendation lists than just web navigation pat-terns. These recommendation lists can be obtained from various experts, suchas human experts and clusters of user evaluations.
Meanwhile, because PPED is specially designed for measuring the similaritybetween two web navigation patterns including related data such as browseditems, view time, and sequences information, it can only be used for estimatingconfidence values to navigation-pattern clusters. Therefore, a learning mecha-nism is needed for obtaining the complete confidence values of an active usertoward all experts. We proposed a learning mechanism that utilizes users’ rel-evance feedback to improve confidence values automatically using genetic algo-rithms (GA) [5].
To the best of our knowledge, only a few studies [4, 3] incorporate GA forimproving the user profiles. In these studies, users are directly involved in theevolution process. Because users have to enter data for each product inquiry, theyare often frustrated with this method. On the contrary, in our design, users arenot required to offer additional data to improve the confidence values. These con-fidence values are corrected by the GA-based learning mechanisms using users’future navigation behaviors. Our experimental results indicated a significant in-crease in the accuracy of recommendation results due to the integration of theproposed learning mechanism.
3 Personalized Web Search Systems
A variety of techniques have been proposed for personalized web search systems.These techniques, which are adopted from IR systems, face a common challenge,i.e., evaluating the accuracy of retrieved documents. The common evaluationmethod applied in IR systems is precision and recall, which usually requiresrelevance feedback from users. However, obtaining relevance feedback explicitlyfrom users for personalized web search systems is extremely challenging due tothe large size of WWW, which consists of billions of documents with a growthrate of 7.3 million pages per day [33]. Therefore, it is very time consuming andalmost impossible to collect relevance judgments from each user for every pageresulting from a query.
In order to incorporate user preferences into search engines, three majorapproaches are proposed: personalized page importance, query refinement, andpersonalized metasearch systems. Consider each approach in turn.
3.1 Personalized Page Importance
In addition to the traditional text matching techniques, modern web searchengines also employ the importance scores of pages for ranking the search results.

10 Cyrus Shahabi and Yi-Shin Chen
The most famous example is the PageRank algorithm , which is the basis for allweb search tools of Google [34]. By utilizing the linkage structure of the web,PageRank computes the corresponding importance score for each page. Theseimportance scores will affect the final ranking of the search results. Therefore,by modifying the importance equations based on user preference, the PageRankalgorithm can create a personalized search engine.
Basically, personalized importance scores are usually computed based on a setof favorite pages defined by users. In topic-sensitive PageRank [36], the systemfirst pre-computes web pages based on the categories in Open Directory. Next, byusing the pre-computation results and the favorite pages, the system can retrieve“topic-sensitive” pages for users. The experimental results [36] illustrated thatthis system could improve the search engine. However, this technique is notscalable, since the number of favorite pages is limited to 16 [35].
With the aim of constructing a scalable and personalized PageRank searchengine, Jeh and Widom [35] proposed a model based on personalized PageRankvector (PPV). PPV represents the distribution of selection in the model. Theselection of PPV prefers pages related to input favorite pages. For example, thepages linked by the favorite pages and the pages linked to these favorite pageshave higher selected possibilities. Each PPV can be considered as a personalizedview of the importance of pages. Therefore, by incorporating PPV during theselection process, the search engine can retrieve pages closer to user preferences.
In general, since these techniques require direct inputs from users, the systemincreases the usage overhead. As a result, instead of saving time from identifyingrelevant web pages, users could possibly spend more time to personalize thesearch.
3.2 Query Refinement
Instead of modifying the algorithms of search engines, researchers [37, 38, 39, 40]proposed assisting users with the query refinement process. Generally, the queryrefinement process of these systems consists of three steps.
1. Obtaining User Profiles from User: The user profiles could be explic-itly entered by users or implicitly learned from user behaviors. For example,WebMate [39] automatically learns the users’ interested domains througha set of interesting examples; Persona [40] learns the taxonomy of user inter-ests and disinterests from user’s navigation history; the system proposed byLiu et al. [38] can learn user’s favorite categories from his/her search history.Different from these systems, the client-side web search tool proposed byChau et al. [37] requires direct inputs about interesting phrases from users.
2. Query Modification: The systems first adjust the input query based on thecorresponding user profile. Subsequently, the modified query is outsourcedto search engines. For instance, the system proposed by Liu et al. [38] mapsthe input query to a set of interesting categories based on the user profileand confines the search domain to these categories. In Websifter [42], after

Web Information Personalization: Challenges and Approaches 11
a user submits his/her intent, Websifter formulates the query based on user’ssearch taxonomy and then submits the query to multiple search engines6.
3. Refinement: After receiving the query results from the search engine, thesystems refine the response. Occasionally, some search systems would fur-ther filter the irrelevant pages. For example, in the Persona system [40], thesearch results are ranked according to authoritativeness with a graph basedalgorithm. The returned set in Persona only contains the top n documents.Furthermore, Persona would refine the results if the user provides positiveor negative feedback on the response.
In general, maintaining efficiency is the major challenge of the query refine-ment approach. That is, the time complexity of the proposed techniques growswith the size of user profiles, e.g., the number of interested categories, keywords,and domains.
3.3 Personalized Metasearch Systems
It has been reported [41] that the search engine coverage decreases steadily asthe estimated web size increases. In 1999, no search engine can index more than16% of the total web pages. Consequently, searching data by employing onlya single search engine could result in a very low retrieval rate. To solve thisproblem, metasearch systems, such as MetaCrawler7, Dogpile8, and McFind9,are proposed to increase the search coverage by combining several search engines.
Ideally, by merging various ranked results from multiple search engines intoone final ranked list, metasearch systems could improve the retrieval rate. How-ever, since metasearch systems expand the search coverage, the information over-load problem could possibly be intensified. In order to improve the accuracy ofreturned results, researchers proposed different techniques for incorporating userpreferences into metasearch systems.
The first type of personalized metasearch systems [37, 42, 45] adopt thequery refinement approach. Typically, these metasearch systems modify the in-put query based on the corresponding user profile. Some systems[37, 45] canfurther select the outsourcing search engines based on user’s intent. Since thesesystems exploit the query refinement approach, they also inherit the scalabilityproblem from the query refinement approach.
The second types of personalized metasearch systems [43, 44] emphasize onthe merging procedures. By considering user preferences during the mergingprocess, the systems could retrieve different documents even with the same setof input lists from search engines. For example, in Inquirus 2 [44], users can assign(explicitly or implicitly) weights to different search engines and categories. Thefinal rankings of results in Inquirus 2 are aggregated with a weighted average6 Note that aggregating the results from different search engines is the problem of
metasearch, which is described later in Section 3.3.7 http://www.metacrawler.com/8 http://www.dogpile.com/9 http://www.mcfind.com/

12 Cyrus Shahabi and Yi-Shin Chen
process. For another instance, the personalized metasearch engine proposed byZhu et al. [43] merges the lists based on explicit relevance feedback. In thissystem, users can assign “good” or “bad” scores to returned pages. With content-based similarity measure, the system could evaluate final scores to all pages. Notethat the importance degrees of search engines are not considered in this mergingtechnique.
In general, most metasearch systems emphasize on one-phase merging pro-cess, i.e., the system only considers the final score of each page returned froma search engine. However, the final score provided by each search engine is com-posed of several similarity values, where each value corresponds to a feature.For instance, the similarity values can be derived based on the correspondingtitles of the pages, the URLs of the pages, or the summaries generated by thesearch engine. For another example, assume the query submitted by the user is“SARS WHO”, the metasearch system can obtain different scores from the samesearch engine with similar queries (e.g., “SARS WHO”, “SARS and WHO orga-nization”, “SARS on Who magazine”, and “Severe Acute Respiratory Syndromeand WHO organization”) that are generated by a query modification process.Therefore, merging these query scores based on user preferences should also beconsidered.
In our recent work [46], we introduced a new concept, two-phase decisionfusion, where scores returned from the search engines are aggregated basedupon user perceptions on both search engines and the relevant features. Ourexperimental results indicate that as compared to a traditional decision fusionapproach, the retrieval accuracy of the two-phase decision fusion approach issignificantly improved.
References
[1] Shahabi, C., Banaei-Kashani, F., Chen Y.-S., McLeod, D.: Yoda: An Accurateand Scalable Web-based Recommendation System. In Proceedings of Sixth Inter-national Conference on Cooperative Information Systems (2001) 8
[2] Shahabi, C., Chen, Y.-S.: An Adaptive Recommendation System without ExplicitAcquisition of User Relevance Feedback. Distributed and Parallel Databases,Vol. 14. (2003) 173–192 9
[3] Moukas, A.: Amalthea: Information discovery and filtering using a multiagentevolving ecosystem. In Proceedings of 1st Int. Conf. on The Practical Applicationsof Intelligent Agents and MultiAgent Technology (1996) 9
[4] Sheth, B., Maes, P.: Evolving Agents for Personalized Information Filtering. Pro-ceedings of the Ninth IEEE Conference on Artificial Intelligence for Applications(1993) 9
[5] Holland, J.: Adaption in Natural and Artificial Systems. University of MichiganPress, Ann Arbor, Michigan 9
[6] Konstan, J., Miller, B., Maltz, D., Herlocker, J., Gordon, L., Riedl, J.: ApplyingCollaborative Filtering to Usenet News. Communications of the ACM Vol. 40 (3)(1997)
Web Information Personalization: Challenges and Approaches 13
[7] Shahabi, C., Zarkesh, A.M., Adibi, J., Shah, V.: Knowledge Discovery from UsersWeb Page Navigation. In Proceedings of the IEEE RIDE97 Workshop (1997)
[8] Sarwar, B., Karypis, G., Konstan, J., Riedl, J.: Application of DimensionalityReduction in Recommender System – A Case Study. In Proceedings of ACMWebKDD 2000 Web Mining for e-Commerce Workshop (2000) 7
[9] Kitts, B., Freed D., Vrieze, M.: Cross-sell, a fast promotion-tunable customer-item recommendation method based on conditionally independent probabilities.InProceedings of the sixth ACM SIGKDD international conference on Knowledgediscovery and data mining (2000) 437-446 7, 8
[10] Breese, J., Heckerman, D., Kadie, C.: Empirical Analysis of Predictive Algo-rithms for Collaborative Filtering. In Proceedings of the Fourteenth Conferenceon Uncertainty in Artificial Intelligence (1998) 43–52 7, 8
[11] Sarwar, B., Karypis, G., Konstan, J., Riedl, J.: Analysis of RecommendationAlgorithms for e-Commerce. In Proceedings of ACM e-Commerce 2000 Conference(2000) 7, 8
[12] Balabanovi, M., Shoham, Y.: Fab, content-based, collaborative recommendation.Communications of the ACM, Vol 40(3) (1997) 66–72 7
[13] Balabanovi, M.: An Adaptive Web page Recommendation Service. In Proceedingsof Autonomous Agents (1997) 378-385 7
[14] Kohrs, A., Merialdo, B.: Using category-based collaborative filtering in the ActiveWebMuseum. In Proceedings of IEEE International Conference on Multimediaand Expo, Vol 1 (2000) 351–354 7
[15] Lieberman, H., Dyke, N., Vivacqua, A.: Let’s Browse, A Collaborative BrowsingAgent. Knowledge-Based Systems, Vol 12 (1999) 427–431 7
[16] Shardanand, U., Maes, P.: Social Information Filtering, Algorithm for automating”Word of Mouth”. In Proceedings on Human factors in computing systems(1995)210–217 7, 8
[17] Resnick, P., Iacovou, N., Suchak, M., Bergstrom, P., Riedl, J.: GroupLens, AnOpen Architecture for Collaborative Filtering of Netnews. In Proceedings of ACMconference on Cumputer-Supported Cooperative Work (1994) 175–186 7, 8
[18] Good, N., Schafer, J., Konstan, J., Borchers, J., Sarwar, B., Herlocker, J., Riedl,J.: Combining Collaborative Filtering with Personal Agents for Better Recom-mendations. In Proceedings of the 1999 Conference of the American Associationof Artifical Intelligence (1999) 439–446 7
[19] Pazzani, M., Billsus, D.: Learning and Revising User profiles: The Indentificationof Interesting Web Sites. Machine Learning, Vol 27 (1997) 313–331
[20] Tan, A., Teo, C., Learning User Profiles for Personalized Information Dissemina-tion. In Proceedings of Int’l Joint Conf. on Neural Network (1998) 183–188
[21] Lam, W., Mukhopadhyay, S., Mostafa J., Palakal, M.: Detection of Shifts in UserInterests for Personalized Information Filtering. In Proceedings of the 19th Int’lACM-SIGIR Conf on Research and Development in Information Retrieval (1996)317–325
[22] Goldberg, D.E.: Genetic Algorithms in Search, Optimisation, and Machine Learn-ing. Addison-Wesley, Wokingham, England (1989)
[23] Shahabi, C., Banaei-Kashani, F., Faruque, J., Faisal, A.: Feature Matrices:A Model for Efficient and Anonymous Web Usage Mining. In Proceedings ofEC-Web (2001) 8
[24] Shahabi, C., Banaei-Kashani, F., Faruque, J.: A Reliable, Efficient, and ScalableSystem for Web Usage Data Acquisition. InWebKDD’01 Workshop in conjunctionwith the ACM-SIGKDD (2001) 8
14 Cyrus Shahabi and Yi-Shin Chen
[25] Fagin, R.: Combining Fuzzy Information from Multiple Systems. In Proceedingsof Fifteenth ACM Symposyum on Principles of Database Systems (1996)
[26] Hunter, A.: Sugal Programming manual.http://www.trajan-software.demon.co.uk/sugal.htm (1995)
[27] Wu, L., Faloutsos, C., Sycara, K., Payne, T.: FALCON: Feedback Adaptive Loopfor Content-Based Retrieval. In Proceedings of Int’l. Conf. on Very Large DataBases (2000)
[28] Knorr, E., Ng, R., Tucakov, V.: Distance-Based Outliers: Algorithms and Appli-cations. The VLDB Journal, Vol 8(3) (2000) 237–253
[29] Mobasher, B., Cooley, R., Srivastava, J.: Automatic personalization based on Webusage mining. Communications of the ACM, Vol 43(8) (2000) 142–151 7
[30] Mobasher, B., Dai, H., Luo, T., Nakagawa, M.: Web Data Mining: Effectivepersonalization based on association rule discovery from web usage data. In Pro-ceeding of the Third International Workshop on Web Information and Data Man-agement (2001) 7
[31] Rui, Y., Huang, T., Ortega, M., Mehrotra, S.: Relevance feedback: a power toolfor interactive content-based image retrieval. IEEE Transactions on Circuits andSystems for Video Technology, Vol 8(5) (1998) 644–655
[32] Knuth, D. Seminumerical Algorithm. The Art of Computer Programming Volume2, 1997
[33] Lyman, P., Varian, H.R.: How Much Information . Retrieved fromhttp://www.sims.berkeley.edu/research/projects/how-much-info/internet.html(2000) 9
[34] Google: Google Technology. Retrieved from http://www.google.com/technology/(2003) 10
[35] Jeh, G., Widom, J.: Scaling Personalized Web Search. Proceedings of the 12thInternational World Wide Web Conference (2003) 10
[36] Haveliwala, T. H.: Topic-sensitive PageRank. Proceedings of the 11th InternationalWorld Wide Web Conference (2002) 10
[37] Chau, M., Zeng, D., Chen, H.: Personalized Spiders for Web Search and Analysis.Proceedings of ACM/IEEE Joint Conference on Digital Libraries (2001) 10, 11
[38] Liu, F., Yu, C.T., Meng, W.: Personalized web search by mapping user queriesto categories. Proceedings of CIKM (2002) 10
[39] Chen, L., Sycara, K.: WebMate : A Personal Agent for Browsing and Searching.Proceedings of the 2nd International Conference on Autonomous Agents (1998)10
[40] Tanudjaja, F., Mui, L.: Persona: a contextualized and personalized web search.35th Annual Hawaii International Conference on System Sciences (2002) 10, 11
[41] Lawrence, S., Giles, C. L.: Accessibility of Information on the Web . Nature,Vol 400 (1999) 107–109 11
[42] Scime, A., Kerschberg, L.: WebSifter: An Ontology-Based Personalizable SearchAgent for the Web . Proceedings of International Conference on Digital Libraries:Research and Practice (2000) 10, 11
[43] Zhu, S., Deng, X., Chen, K., Zheng, W.: Using Online Relevance Feedback to BuildEffective Personalized Metasearch Engine. Proceedings of Second InternationalConference on Web Information Systems Engineering (2001) 11, 12
[44] Glover, E., Lawrence, S., Birmingham, W.P., Giles, C. L.: Architecture ofa Metasearch Engine that Supports User Information Needs. Proceedings of EighthInternational Conference on Information and Knowledge Management (1999) 11

Web Information Personalization: Challenges and Approaches 15
[45] Glover, E., Flake, G.W., Lawrence, S., Birmingham, W.P., Kruger, A., Giles,C. L., Pennock, D.M.: Improving Category Specific Web Search by LearningQuery Modifications. Proceedings of Symposium on Applications and the Internet(2001) 11
[46] Chen, Y.-S., Shahabi, C., Burns, G.: Two-Phase Decision Fusion Based On UserPreferences. submitted for reviewing (2003) 12
N. Bianchi-Berthouze (Ed.): DNIS 2003, LNCS 2822, pp. 16-26, 2003. Springer-Verlag Berlin Heidelberg 2003
An Adaptive E-commerce Personalization Frameworkwith Application in E-banking
Qiubang Li and Rajiv Khosla
School of BusinessLa Trobe University, Melbourne,
Victoria, Australia{L.Qiubang,R.Khosla}@latrobe.edu.au
Abstract. Internet Personalized services are irresistible developing trend for e-commerce. More and more researchers are committed to personalization field.Many personalization approaches are static and lack of means to improve thepersonalized tasks. This paper proposes an adaptive e-commercepersonalization framework using traditional data mining techniques and agenttechnology as well as user feedback optimisation mechanism to improve thepersonalized services to the e-commerce customer. The behaviours of all theagents in the framework are carefully considered and the framework has beenapplied to an online banking system.
1 Introduction
Today's World Wide Web market is becoming more competitive, so it's moreimportant than ever to provide customers with an interactive, personal Webexperience. Personalization (sometimes called information customization) means toprovide such personalized services to customer. It is like, in a sense, bank staff andcustomer with one-one relationships to discuss the special needs of the customer. Theobjective of web personalization systems in e-commerce is to identify customersonline, understand and predict their buying patterns, identify what they want or needwithout requiring them to ask for it explicitly, and deliver appropriate offers inpersonalized formats directly to them[2].
Currently, four basic techniques of, rule-based filtering, content-based filtering,collaborative filtering and learning-agent technology, are used for web personaliza-tion.
• Rules-based filtering poses users a series of questions (or asks them to meet a setof criteria), and then delivers content appropriate to their responses. The criteriacan be anything from making sure a user lives in a state served by the companysponsoring the site, making sure the site offers products that meet specific needs.Examples of rules-based filtering questions include: What is your zip code? Areyou male or female? Do you use a Mac or a PC? Is your camping trip scheduledfor winter or summer? This approach differs from basic personalization byproviding users with specific content based on their responses. Users are led
An Adaptive E-commerce Personalization Framework with Application in E-banking 17
down a path by answering a set of yes/no or multiple-choice questions ofincreasing specificity and relevance.
• Content-based techniques from the information-filtering and Web databasemanagement communities use keywords, string matching, link patterns, andmanually compiled identifiers to provide simple �Web query languages� forpersonalization. Examples include WebSQL, WebOQL, and Florid. For anexcellent survey of these and other content-based techniques with a databaseflavor, see [3].
• Collaborative filtering (also called group filtering), meanwhile, is designed toserve relevant material to users by combining their own personal preferences withthe preferences of like-minded others. The book selling in Amazon.com, isperhaps the best-known example of this approach. The site asks users to ratebooks on a scale. At the most basic level, it works like this: If one user lovesHarry Potter and The King of Torts, and another loves Harry Potter and HarryPotter Schoolbooks Box Set, then Amazon.com suggests that the first user checkout Harry Potter Schoolbooks Box Set. In this way, users collaborate (albeitwithout truly interacting) to make recommendations to each other.
• Learning agent technology or nonintrusive personalization, instead of askingusers explicitly rating products, tracks users' movements around the e-businessweb site and alters what is presented based on their click trails. Using implicitrating is mainly motivated by its removing the cost to the evaluator of examiningand rating the item and remaining a computational cost in storing and processingthe implicit rating data that is hidden from the user[4].
Among these, no single personalization technology or model works best: Itdepends on what you are trying to accomplish. Collaborative filtering and rules-basedfiltering are not mutually exclusive. In fact, it's often desirable to offer users theopportunity to input information, while at the same time leading them where you wantthem to go. Most collaborative filtering technologies let Web builders weigh certaincriteria more highly than others, adding some rules-based rigidity to help controlwhere users actually go. This is the advantage of hybrid system, which will beadopted in this paper. Further details will be discussed in the next section.
This paper is organized as follows: In the next section, the adaptive e-commercepersonalization framework is proposed. Section 3 illustrates some agent definitions ofthe framework. Section 4 provides some experiment results. Section 5 is related workin the field. Finally, the last section concludes the paper.

18 Qiubang Li and Rajiv Khosla
Fig. 1.Adaptive e-commerce personalization framework
2 Framework of E-commerce Personalization
The architecture of personalization is a multi-agent, distributed, and complex system.From fine-grained to coarse-grained, there are three layers, which is sufficient to thedomain[5], technology-oriented agent layer, optimisation agent layer, and task-oriented (problem solving) agent layer[6,7]. Technology-oriented agent layer focusedon solving any specific problem. It is a reactive layer of personalizationimplementation hierarchy, which needs to accept external sensor input and responseimmediately. The optimisation agent layer is in the middle layer of the personalizationimplementation hierarchy answering customers or users in a knowledge-level view ofthe agent environment. The task-oriented agent layer (also called problem-solvingagent layer in [6]), which is the uppermost implantation hierarchy of personalizationsystem, interacts with users or customers directly. It seems to the users or customerswho possess all the resources of the personalization system. The task-oriented agentlayer coordinates various tasks and finally produces the global behaviours of thepersonalization system. This paper only deals with technology agent layer andproblem solving (task-oriented) agent layer.
The adaptive framework is shown in Fig. 1. It is a hybrid system usingpersonalization techniques fusing rule-based filtering, content-based filtering andlearning agent technology. The function of recommendation agent is to extracting ofrules from user preference, searching similar product results, and recommendingbased on online product database.
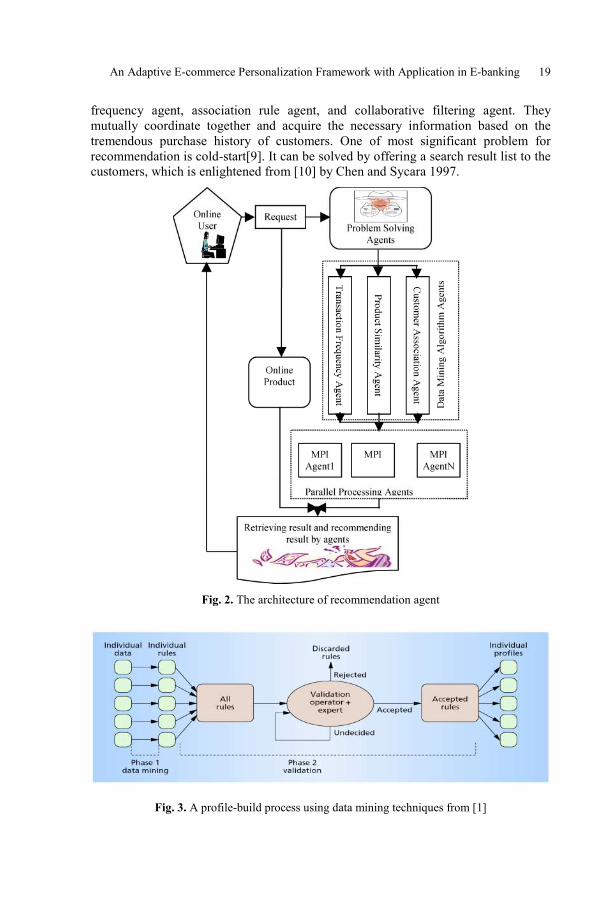
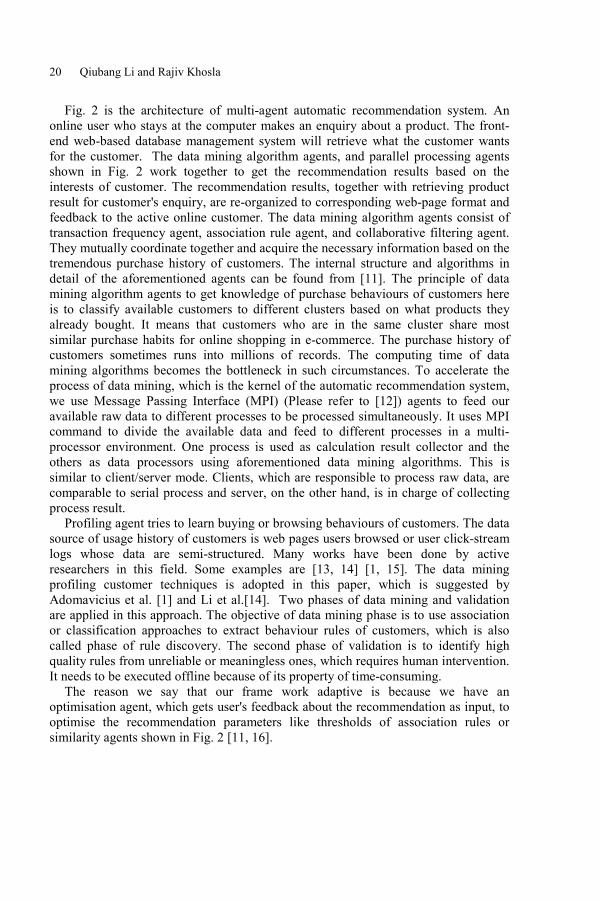
When users express any interests to an online product in the online shopping mall,recommendation agent try to recommend similar products to the customersimultaneously. The construction work of recommendation system agent can be foundat [8] by Li and Khosla. Its architecture is shown in Fig. 2. The problem solvingagents of data mining algorithm agents, and parallel processing agents shown in Fig. 2work sequentially to get the recommendation results based on the interests ofcustomer. The recommendation results, together with retrieving product result forcustomer's enquiry, are re-organized to corresponding web-page format and feedbackto the active online customer. The data mining algorithm agents consist of transaction
An Adaptive E-commerce Personalization Framework with Application in E-banking 19
frequency agent, association rule agent, and collaborative filtering agent. Theymutually coordinate together and acquire the necessary information based on thetremendous purchase history of customers. One of most significant problem forrecommendation is cold-start[9]. It can be solved by offering a search result list to thecustomers, which is enlightened from [10] by Chen and Sycara 1997.
Fig. 2. The architecture of recommendation agent
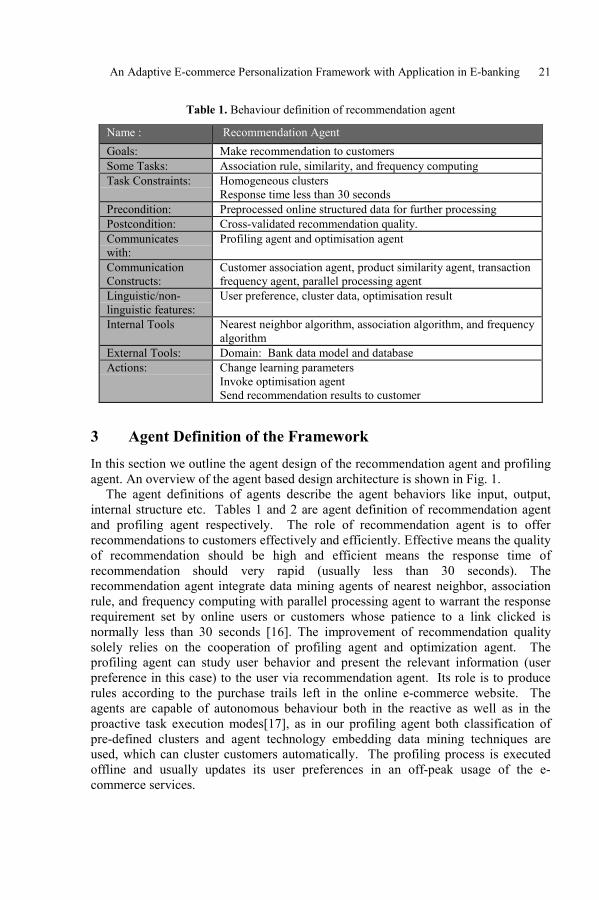
Fig. 3. A profile-build process using data mining techniques from [1]
20 Qiubang Li and Rajiv Khosla
Fig. 2 is the architecture of multi-agent automatic recommendation system. Anonline user who stays at the computer makes an enquiry about a product. The front-end web-based database management system will retrieve what the customer wantsfor the customer. The data mining algorithm agents, and parallel processing agentsshown in Fig. 2 work together to get the recommendation results based on theinterests of customer. The recommendation results, together with retrieving productresult for customer's enquiry, are re-organized to corresponding web-page format andfeedback to the active online customer. The data mining algorithm agents consist oftransaction frequency agent, association rule agent, and collaborative filtering agent.They mutually coordinate together and acquire the necessary information based on thetremendous purchase history of customers. The internal structure and algorithms indetail of the aforementioned agents can be found from [11]. The principle of datamining algorithm agents to get knowledge of purchase behaviours of customers hereis to classify available customers to different clusters based on what products theyalready bought. It means that customers who are in the same cluster share mostsimilar purchase habits for online shopping in e-commerce. The purchase history ofcustomers sometimes runs into millions of records. The computing time of datamining algorithms becomes the bottleneck in such circumstances. To accelerate theprocess of data mining, which is the kernel of the automatic recommendation system,we use Message Passing Interface (MPI) (Please refer to [12]) agents to feed ouravailable raw data to different processes to be processed simultaneously. It uses MPIcommand to divide the available data and feed to different processes in a multi-processor environment. One process is used as calculation result collector and theothers as data processors using aforementioned data mining algorithms. This issimilar to client/server mode. Clients, which are responsible to process raw data, arecomparable to serial process and server, on the other hand, is in charge of collectingprocess result.
Profiling agent tries to learn buying or browsing behaviours of customers. The datasource of usage history of customers is web pages users browsed or user click-streamlogs whose data are semi-structured. Many works have been done by activeresearchers in this field. Some examples are [13, 14] [1, 15]. The data miningprofiling customer techniques is adopted in this paper, which is suggested byAdomavicius et al. [1] and Li et al.[14]. Two phases of data mining and validationare applied in this approach. The objective of data mining phase is to use associationor classification approaches to extract behaviour rules of customers, which is alsocalled phase of rule discovery. The second phase of validation is to identify highquality rules from unreliable or meaningless ones, which requires human intervention.It needs to be executed offline because of its property of time-consuming.
The reason we say that our frame work adaptive is because we have anoptimisation agent, which gets user's feedback about the recommendation as input, tooptimise the recommendation parameters like thresholds of association rules orsimilarity agents shown in Fig. 2 [11, 16].
An Adaptive E-commerce Personalization Framework with Application in E-banking 21
Table 1. Behaviour definition of recommendation agent
Name : Recommendation AgentGoals: Make recommendation to customersSome Tasks: Association rule, similarity, and frequency computingTask Constraints: Homogeneous clusters
Response time less than 30 secondsPrecondition: Preprocessed online structured data for further processingPostcondition: Cross-validated recommendation quality.Communicateswith:
Profiling agent and optimisation agent
CommunicationConstructs:
Customer association agent, product similarity agent, transactionfrequency agent, parallel processing agent
Linguistic/non-linguistic features:
User preference, cluster data, optimisation result
Internal Tools Nearest neighbor algorithm, association algorithm, and frequencyalgorithm
External Tools: Domain: Bank data model and databaseActions: Change learning parameters
Invoke optimisation agentSend recommendation results to customer
3 Agent Definition of the FrameworkIn this section we outline the agent design of the recommendation agent and profilingagent. An overview of the agent based design architecture is shown in Fig. 1.
The agent definitions of agents describe the agent behaviors like input, output,internal structure etc. Tables 1 and 2 are agent definition of recommendation agentand profiling agent respectively. The role of recommendation agent is to offerrecommendations to customers effectively and efficiently. Effective means the qualityof recommendation should be high and efficient means the response time ofrecommendation should very rapid (usually less than 30 seconds). Therecommendation agent integrate data mining agents of nearest neighbor, associationrule, and frequency computing with parallel processing agent to warrant the responserequirement set by online users or customers whose patience to a link clicked isnormally less than 30 seconds [16]. The improvement of recommendation qualitysolely relies on the cooperation of profiling agent and optimization agent. Theprofiling agent can study user behavior and present the relevant information (userpreference in this case) to the user via recommendation agent. Its role is to producerules according to the purchase trails left in the online e-commerce website. Theagents are capable of autonomous behaviour both in the reactive as well as in theproactive task execution modes[17], as in our profiling agent both classification ofpre-defined clusters and agent technology embedding data mining techniques areused, which can cluster customers automatically. The profiling process is executedoffline and usually updates its user preferences in an off-peak usage of the e-commerce services.
22 Qiubang Li and Rajiv Khosla
Table 2. Behaviour definition of profiling agent
Name : Profiling Agent
Goals: Collecting customer-behavioursSome Tasks: Collecting customer data, customer profilingTask Constraints: Homogeneous clustersPrecondition: Preprocessed semi-structured data for further processingPostcondition: Cross-validated profiling quality.Communicates with: Recommendation agentCommunicationConstructs:
Similarity-based rule grouping, template-based filtering,redundant-rule elimination
Linguistic/non-linguisticfeatures:
Rules, cluster data, web pages
Internal Tools Rule-generating algorithmExternal Tools: Domain: online semi-structured web pages and server logsActions: Data validation
Rule extractionRule validation
4 Experiment to the Architecture
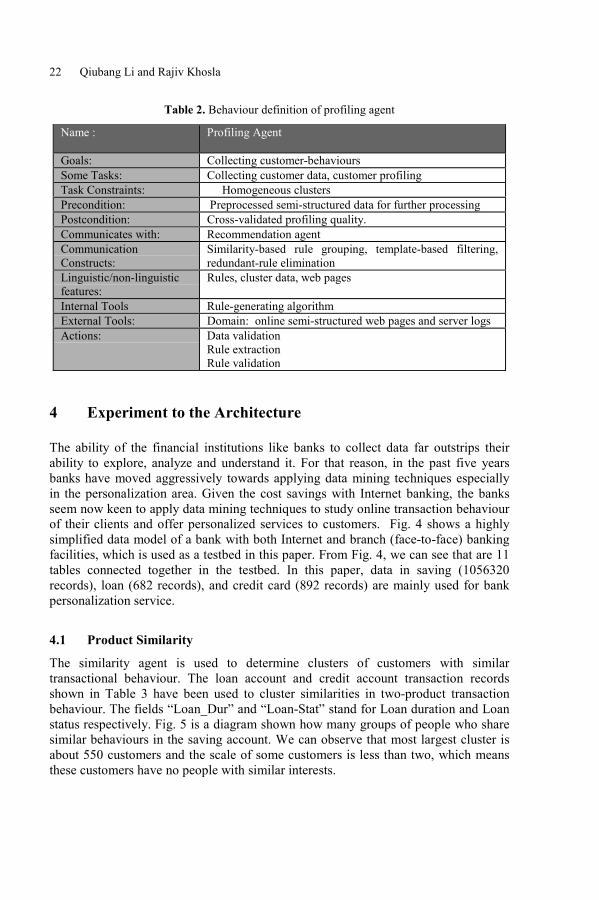
The ability of the financial institutions like banks to collect data far outstrips theirability to explore, analyze and understand it. For that reason, in the past five yearsbanks have moved aggressively towards applying data mining techniques especiallyin the personalization area. Given the cost savings with Internet banking, the banksseem now keen to apply data mining techniques to study online transaction behaviourof their clients and offer personalized services to customers. Fig. 4 shows a highlysimplified data model of a bank with both Internet and branch (face-to-face) bankingfacilities, which is used as a testbed in this paper. From Fig. 4, we can see that are 11tables connected together in the testbed. In this paper, data in saving (1056320records), loan (682 records), and credit card (892 records) are mainly used for bankpersonalization service.
4.1 Product Similarity
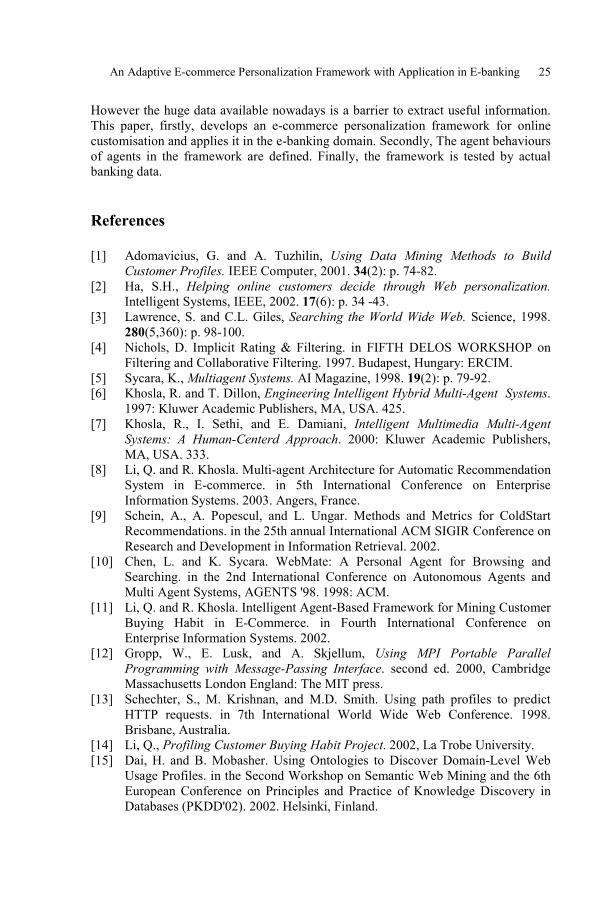
The similarity agent is used to determine clusters of customers with similartransactional behaviour. The loan account and credit account transaction recordsshown in Table 3 have been used to cluster similarities in two-product transactionbehaviour. The fields �Loan_Dur� and �Loan-Stat� stand for Loan duration and Loanstatus respectively. Fig. 5 is a diagram shown how many groups of people who sharesimilar behaviours in the saving account. We can observe that most largest cluster isabout 550 customers and the scale of some customers is less than two, which meansthese customers have no people with similar interests.

An Adaptive E-commerce Personalization Framework with Application in E-banking 23
Fig. 4. Simplified data model of a bank
4.2 Profiling Rules of Banking Products
By implementing profiling agent and applying it to banking products, we getfollowing rules for our experiment.
• More transactions are done from the district where there are more inhabitants.• More transactions are did by those clients whose average salary is also high.• There are 10 clients who have both minus account balance and bad loans.• We have 39 customers who have minus account balance out of them above 11
customers either have bad loans or credit card so that the reason they havenegative account balance but we couldn't find the reason that why 39-11=28customers have minus account balance.
• Account_id 3948 used his credit card to pay his payment the most of 212 timesfor all credit card holders.
• Most of the customers used credit card for household payments.• In general it would be advisable to set business goal to promote credit card usage.
Table 3. Loan Account and Credit Card Transactions
Account_id Card_Type Av_Trans Balance Loan_Amt Loan_Dur Loan_Stat790 1 7559 28826 208128 48 2
1843 1 4922 31652 105804 36 12167 1 8557 34109 170256 24 12824 2 5213 38281 50460 60 33050 1 7280 51572 82896 12 13166 1 5657 23730 177744 48 44337 1 11133 46132 51408 24 14448 1 6946 36681 192744 36 14894 1 9070 43671 117024 24 1

24 Qiubang Li and Rajiv Khosla
Fig. 5. Similarity visualization of computing result
5 Related Work
Currently, many web-based companies use collaborative filtering techniques which isheavily based on getting human intervention for personalization purpose.NetPerceptions tries to obtain or learns user preferences and discover Webinformation sources that correspond to their preferences, and possibly those of otherindividuals with similar interests using explicit rating from users [18]. Theinformation inferences are mainly based on previous personal history and dataaccumulated from customers with similar attribute. Similar cases can be found atGroupLens [19,20] and Firefly [21]. Some other examples using same approachincludes WebWatcher [22] and Syskill & Webert [23]. Syskill & Webert is a systemthat utilizes user profile and learns to rate Web pages of interest using Bayesianclassifier and can suggest web pages based on their relevance to the user interest.
Another personalization approach of Webmate [10] adopting a keyword vector torepresent categories of user interest learns a user profile incrementally and facilitatesuser browsing and searching in the Web by using their profiles. Cooley et al. [24], andBuchner and Mulvenna [25] have applied data mining techniques to extract usagepatterns from Web logs, for the purpose of deriving marketing intelligence. Shahabi etal. [26], Yan et al. [27], and Nasraoui et al. [28] have proposed clustering of usersessions to predict future user behaviour. As users regularly use multiple channels(e.g. web, email, mobile devices), personalization even can apply to this cross-channel. Pazzani [29]suggests a solution for the mobile web in his paper of�Personalization for the Mobile Web: A Position Paper�.
6 Conclusion
Information explosion on the internet is compelling researchers to develop, better andbetter services for e-business and e-commerce Especially customer personalizationservice in e-commerce to attract potential customer is of paramount importance.
An Adaptive E-commerce Personalization Framework with Application in E-banking 25
However the huge data available nowadays is a barrier to extract useful information.This paper, firstly, develops an e-commerce personalization framework for onlinecustomisation and applies it in the e-banking domain. Secondly, The agent behavioursof agents in the framework are defined. Finally, the framework is tested by actualbanking data.
References
[1] Adomavicius, G. and A. Tuzhilin, Using Data Mining Methods to BuildCustomer Profiles. IEEE Computer, 2001. 34(2): p. 74-82.
[2] Ha, S.H., Helping online customers decide through Web personalization.Intelligent Systems, IEEE, 2002. 17(6): p. 34 -43.
[3] Lawrence, S. and C.L. Giles, Searching the World Wide Web. Science, 1998.280(5,360): p. 98-100.
[4] Nichols, D. Implicit Rating & Filtering. in FIFTH DELOS WORKSHOP onFiltering and Collaborative Filtering. 1997. Budapest, Hungary: ERCIM.
[5] Sycara, K., Multiagent Systems. AI Magazine, 1998. 19(2): p. 79-92.[6] Khosla, R. and T. Dillon, Engineering Intelligent Hybrid Multi-Agent Systems.
1997: Kluwer Academic Publishers, MA, USA. 425.[7] Khosla, R., I. Sethi, and E. Damiani, Intelligent Multimedia Multi-Agent
Systems: A Human-Centerd Approach. 2000: Kluwer Academic Publishers,MA, USA. 333.
[8] Li, Q. and R. Khosla. Multi-agent Architecture for Automatic RecommendationSystem in E-commerce. in 5th International Conference on EnterpriseInformation Systems. 2003. Angers, France.
[9] Schein, A., A. Popescul, and L. Ungar. Methods and Metrics for ColdStartRecommendations. in the 25th annual International ACM SIGIR Conference onResearch and Development in Information Retrieval. 2002.
[10] Chen, L. and K. Sycara. WebMate: A Personal Agent for Browsing andSearching. in the 2nd International Conference on Autonomous Agents andMulti Agent Systems, AGENTS '98. 1998: ACM.
[11] Li, Q. and R. Khosla. Intelligent Agent-Based Framework for Mining CustomerBuying Habit in E-Commerce. in Fourth International Conference onEnterprise Information Systems. 2002.
[12] Gropp, W., E. Lusk, and A. Skjellum, Using MPI Portable ParallelProgramming with Message-Passing Interface. second ed. 2000, CambridgeMassachusetts London England: The MIT press.
[13] Schechter, S., M. Krishnan, and M.D. Smith. Using path profiles to predictHTTP requests. in 7th International World Wide Web Conference. 1998.Brisbane, Australia.
[14] Li, Q., Profiling Customer Buying Habit Project. 2002, La Trobe University.[15] Dai, H. and B. Mobasher. Using Ontologies to Discover Domain-Level Web
Usage Profiles. in the Second Workshop on Semantic Web Mining and the 6thEuropean Conference on Principles and Practice of Knowledge Discovery inDatabases (PKDD'02). 2002. Helsinki, Finland.

26 Qiubang Li and Rajiv Khosla
[16] Li, Q. and R. Khosla. Adopting High Performance Computing to Implement E-commerce Intelligent Agent. in 6th International Conference/Exhibition onHigh Performance Computing in Asia Pacific Region (HPC Asia 2002). 2002.Bangalore, India.
[17] Bohte, S., W.B. Langdon, and H.L. Poutre, On current technology forinformation filtering and user profiling in agent-based systems. 2000, CWI,Center for Mathematicas and Computer Science: Amsterdam, the Netherland.
[18] Sarwar, B., et al. Item-based collaborative filtering recommendationalgorithms. in The tenth international World Wide Web conference on WorldWide Web. 2001.
[19] Konstan, J., et al., GroupLens: applying collaborative filtering to Usenet news.Communications of the ACM, 1997. 40(3): p. 77-87.
[20] Herlocker, J., et al. An algorithmic framework for performing collaborativefiltering. in 1999 Conference on Research and Development in Informationretrieval. 1999.
[21] Shardanand, U. and P. Maes. Social information filtering: algorithms forautomating �word of mouth�. in Conference on Human Factors andComputing Systems. 1995. Denver, Colorado, United States: ACMPress/Addison-Wesley Publishing Co. New York, NY, USA.
[22] Armstrong, R.C., T. Joachims, and T. Mitchell Webwatcher: A learningapprentice for the world wide web. in AAAI Spring Symposium on InformationGathering from Heterogeneous, Distributed Environments. 1995.
[23] Pazzani, M., J. Muramatsu, and D. Billsus. Syskill & Webert: Identifyinginteresting web sites. in AAAI Spring Symposium. 1996. Stanford, CA.
[24] Cooley, R., B. Mobasher, and J. Srivastava, Data Preparation for MiningWorld Wide Web Browsing Patterns. Journal of Knowledge and InformationSystems, 1999. 1(1).
[25] Buchner, A. and M.D. Mulvenna, Discovering internet marketing intelligencethrough online analytical web usage mining. SIGMOD Record, 1998. 27(4): p.54-61.
[26] Shahabi, C., et al. Knowledge discovery from users Web-pages navigation. inWorkshop on Research Issues in Data Engineering. 1997. Birmingham,England.
[27] Yan, T., et al. From user access patterns to dynamic hypertext linking. in 5thInternational World Wide Web Conference. 1996. Paris, France.
[28] Nasraoui, O., et al. Mining Web access logs using relational competitive fuzzyclustering. in Eight International Fuzzy Systems Association World Congress.1999.
[29] Pazzani, M.J., Personalization for the Mobile Web: A Position Paper. 2003.
N. Bianchi-Berthouze (Ed.): DNIS 2003, LNCS 2822, pp. 27-41, 2003. Springer-Verlag Berlin Heidelberg 2003
Accessing Hidden Web Documents by Metasearchinga Directory of Specialty Search Engines
Jacky K. H. Shiu, Stephen C. F. Chan, and Korris F. L. Chung
Department of ComputingThe Hong Kong Polytechnic University
Hung Hom, Kowloon, Hong Kong.{cskhshiu,csschan,cskchung}@comp.polyu.edu.hk
Abstract. Many valuable Web documents have not been indexed by generalsearch engines and are only accessible through specific search interfaces.Metasearching groups of specialty search engines is one possible way to gainaccess to large amount of such hidden Web resources. One of the key issues forreturning quality metasearch results is how to select the most relevant specialtysearch engines for a given query. We introduce a method for categorizingspecialty search engines automatically into a hierarchical directory formetasearching. By utilizing the directory, specialty search engines that have ahigh possibility of having relevant information and resources can be easilyselected by a metasearch engine. We evaluate our algorithm by comparing thedirectory built by the proposed algorithm with another one that was built byhuman-judgments. In addition, we present a metasearch engine prototype,which demonstrates that such a specialty search engine directory can bebeneficial in locating essential but hidden Web resources.
1 IntroductionAs the size of the World Wide Web increase dramatically, general Internet searchengines cannot completely satisfy the information needs of all Internet users. A studyshows that major search engines only indexed small fractions of the total Web pages[14]. To increase the coverage of the Internet, metasearch engines have beendeveloped and widely investigated. Though metasearch engines combine the coverageof different general search engines, the coverage of the Internet still limited becausemany of the resources indexed are overlapped in different general search engines. Inaddition, as metasearch engines combine search results from a number of searchengines, the difficulty in finding target information in the search results increasedbecause of the increased size of the combined result list.
One of the obstacles to increasing the coverage of general search engines is thatmany documents available on the Internet are not "crawlable" to their softwarerobots. Robots cannot index documents that are encapsulated by a search interfaceand generated dynamically by Web servers. In this paper, we use the term specialtysearch engines [6] to represent such kinds of specific search interfaces on the Web.As the technologies for dynamically serving Web documents improve continuously,the number of Web site managing documents in such a way increases considerably,
28 Jacky K. H. Shiu et al.
making it increasing difficulties for general search engine to increase their coveragesignificantly. A study shows that resources that are not indexed by general searchengines are hundreds of times greater than those were indexed [3].
As a result, the exploration of the valuable resources covered by specialty searchengines poses a standing challenge. One solution is again metasearching. By using adirectory to organize a variety of specialty search engines, we believe that it ispossible to efficiently select specialty search engines which contain the target relevantinformation and resources for a given query. Therefore, the excessive cost of queryingunsuitable search engines can be reduced. Metasearch engines can benefit from theproposed directory and more hidden but valuable data on the Web can be madeaccessible without degrading the quality of search results.
The rest of the paper is organized as follows. Section 2 gives the necessarybackground to the problem. Section 3 describes the algorithm designed to categorizespecialty search engines automatically into a hierarchical category structure. Section 4explains the experiments done to validate the categorization algorithm. Section 5presents a metasearch engine prototype as a case study to show how metasearchengines can benefit from such a specialty search engine directory. Finally, Section 6presents our conclusion on the study.
2 BackgroundThe major standing challenge for the metasearching environment is how to selectsuitable search engines for metasearching when a particular query is given. Manyapproaches for collection, database and server selection have been proposed in thepast. Representative systems that are similar in the basis of their methodology aregrouped together and summarized in this section.
2.1 Based on Theoretical Model
Callan et al. [4] introduced the CORI algorithm for providing collection selectionbased on the inference network model of information retrieval. The algorithm waswidely evaluated in different studies, and the performance is outstanding. Meng et al.[Meng99] also proposed methods for estimating the usefulness of text databases basedon the probabilistic model. Additionally, Fuhr [7] presented a decision-theoreticmodel for selecting data sources based on the retrieval cost and some typicalinformation retrieval parameters.
2.2 Based on Past Performance
As metasearching in the Web environment and metasearching distributed textcollections have different characteristics, using only theoretic-based algorithms maynot be sufficient. Focusing on metasearch engines, some selection methods aredeveloped based on past performances of the search engines. SavvySearch [6]categorizes search engines into a hierarchical directory for searching. Whilesearching, users need to specify the category to search, and search engines will beselected based on what category has been chosen. MetaSEEK [2] is another
Accessing Hidden Web Documents 29
metasearch index that considers past performance. It utilizes the historical informationof queries searched to handle new query, and select the highest performance searchengine to do metasearching. Conversely, the Inquirus2 [9] metasearch engineconsiders individual user's past feedback. Search engines are grouped into differentcategories. When submitting queries, users need to specify their information needs byselecting a category in which to search. In addition, to guarantee the search quality ata certain level when utilizing the past performances of the search engines, the systemneeds to be executed for some period of time in order to collect enough historicalinformation for the prediction. As a result, there are selection methods developedbased on a pre-built centralized index approach.
2.3 Based on Meta-index or Content Summary
Most of the traditional selection algorithms use statistical data to characterize thecontents of each data source. Statistical data of each data source are combined as alarge centralized index that can be referred to as meta-index or content summaries. Itusually includes the document frequencies of words which appear in the data sourcewith other simple statistics. Relevant data sources are selected by evaluating thedegree of similarity between the given query and the meta-index. ProFusion [8] usesmeta-index in terms of a set of hand-built knowledge base. Each search engine hasone tailor-made knowledge base. Selection is made by mapping the given query to theknowledge bases for the most relevant search engine to search. Yuwono et al. [16]ranked distributed text server by developing a centralized broker which maintains adocument frequencies table for each server. Another method that also requires thecooperation of databases is GlOSS [11]. The meta-index is constructed by combiningthe indices of the databases, which are document frequencies of words. When a queryis accepted, databases are ranked according to their appropriateness to the givenquery. This is done by estimating the number of documents in each database forwhich query similarity was greater than a predefined threshold. A score will becreated for each database through summing up the similarities values, and databaseswill be chosen according to the scores. Instead of using the statistical information ofwords contained to characterize a collection, Xu et al. [15] proposed to use the phaseinformation accompanied by query expansion. It was believed that carrying out acollection selection within such kind of distributed retrieval systems will beeffectively poorer comparing to a single centralized retrieval system. Because most ofthe databases do not release the required information to the public, it is sometimedifficult to build the meta-index in the Web environment although meta-index iswidely investigated and is one of the promising selection algorithms.
2.4 Based On Probe Query
As developing methods for building a meta-index that requires large cooperation ofdatabases is believed to be impractical and not scalable, researchers have developedmethods based on probe queries to create a meta-index without the cooperation ofdatabases. The idea of probe queries draws on the nature of search engine (orsearchable database) in that it returns a set of results for any given query. By sendinga set of sample queries to a search engine and then, downloading and analyzing the

30 Jacky K. H. Shiu et al.
documents from the search results, statistical information can be extracted. This kindof information will be considered as a representative of all the documents inside thatsearch engine. Callan et al. [5] introduced query-based sampling approach tosampling text database contents via the normal process of running queries andretrieving documents. Using this kind of probe queries, indexing or categorizing adatabase needs no cooperative work, which is important when applying search engineselection in the Web environment. Another probe query method introduced byHawking et al. [12] is called Lightweight Probes (LWP). A small amount of probequeries will be submitted to each of the databases at querying time. The probe resultsare non-random, which can greatly improve the efficiency of the probing process. Theadvantage of using probe queries to select search engines is that a metasearch enginecan address a new search engine without cooperation. On the other hand, since the setof probe queries is usually static, the results returned from a search engine are non-random. Whether a search engine can be characterized correctly highly depends onthe quality of the probe queries selected.
3 Search Engine CategorizationIn this section, we further explain the search engine categorization algorithm that washighlighted in [13]. To categorize specialty search engines into a hierarchicaldirectory, we collect sample documents from them. Search engines are thencharacterized based on the contents of the sampled documents. Document samplingtechniques will be used to collect sets of documents contained in different searchengines being categorized. After analyzing the statistical data extracted from thedocuments, each search engine will be ranked for each category in the hierarchyaccording to how relevant they are to those categories. And finally, by keeping onlythe most relevant search engines in each category, a directory of specialty searchengines can be built. Compared to other human-edited Web directories like Yahoo![18], the categorization process we proposed here is more efficient as it can be donein an automatic manner.
3.1 Document Sampling
The sampling method we used here is probe queries. The idea of probe queriesexploit the nature of search engine being that it always returns a set of resultsconsidered relevant to a given query. The sample queries we used were generatedusing words from a predefined hierarchical category.
Instead of constructing a hierarchy from scratch, we decided to utilize a well-known category hierarchy: the DMOZ Open Directory Project (ODP) [17], forcategorizing search engines. Currently, the ODP is the largest and mostcomprehensive human-edited directory for the Web. Tens of thousands volunteereditors are employed to maintain the directory and this makes the directory moreupdated compared to other human-edited directories. As shown in later section, asimplified branch of the ODP is selected for our implementation.
The rationale behind the sampling method is that search engines belonging to acategory should be able to return search results that are relevant to that category. As a
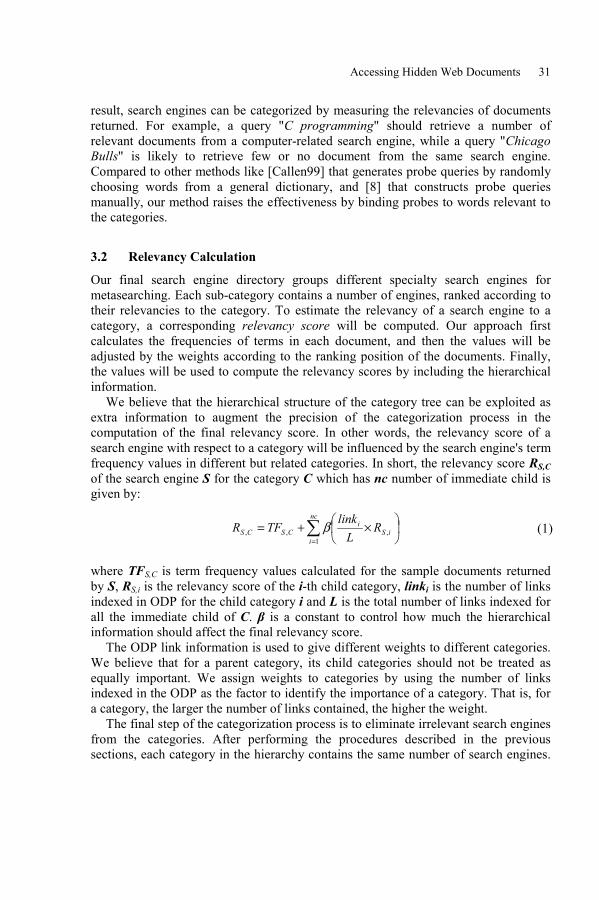
Accessing Hidden Web Documents 31
result, search engines can be categorized by measuring the relevancies of documentsreturned. For example, a query "C programming" should retrieve a number ofrelevant documents from a computer-related search engine, while a query "ChicagoBulls" is likely to retrieve few or no document from the same search engine.Compared to other methods like [Callen99] that generates probe queries by randomlychoosing words from a general dictionary, and [8] that constructs probe queriesmanually, our method raises the effectiveness by binding probes to words relevant tothe categories.
3.2 Relevancy Calculation
Our final search engine directory groups different specialty search engines formetasearching. Each sub-category contains a number of engines, ranked according totheir relevancies to the category. To estimate the relevancy of a search engine to acategory, a corresponding relevancy score will be computed. Our approach firstcalculates the frequencies of terms in each document, and then the values will beadjusted by the weights according to the ranking position of the documents. Finally,the values will be used to compute the relevancy scores by including the hierarchicalinformation.
We believe that the hierarchical structure of the category tree can be exploited asextra information to augment the precision of the categorization process in thecomputation of the final relevancy score. In other words, the relevancy score of asearch engine with respect to a category will be influenced by the search engine's termfrequency values in different but related categories. In short, the relevancy score RS,Cof the search engine S for the category C which has nc number of immediate child isgiven by:
∑=
×+=
nc
iiS
iCSCS R
Llink
TFR1
,,, β (1)
where TFS,C is term frequency values calculated for the sample documents returnedby S, RS,i is the relevancy score of the i-th child category, linki is the number of linksindexed in ODP for the child category i and L is the total number of links indexed forall the immediate child of C. β is a constant to control how much the hierarchicalinformation should affect the final relevancy score.
The ODP link information is used to give different weights to different categories.We believe that for a parent category, its child categories should not be treated asequally important. We assign weights to categories by using the number of linksindexed in the ODP as the factor to identify the importance of a category. That is, fora category, the larger the number of links contained, the higher the weight.
The final step of the categorization process is to eliminate irrelevant search enginesfrom the categories. After performing the procedures described in the previoussections, each category in the hierarchy contains the same number of search engines.
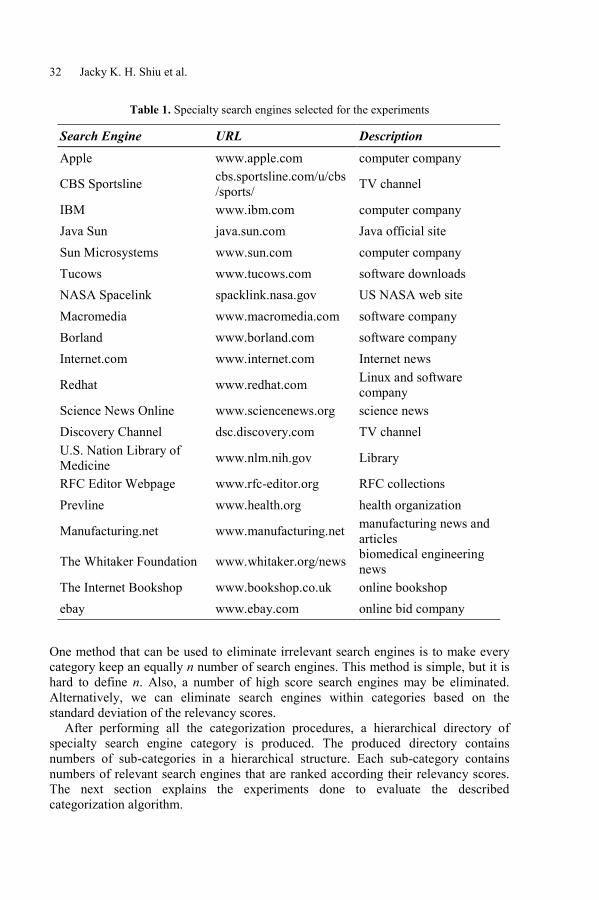
32 Jacky K. H. Shiu et al.
Table 1. Specialty search engines selected for the experiments
Search Engine URL DescriptionApple www.apple.com computer company
CBS Sportsline cbs.sportsline.com/u/cbs/sports/ TV channel
IBM www.ibm.com computer companyJava Sun java.sun.com Java official siteSun Microsystems www.sun.com computer companyTucows www.tucows.com software downloadsNASA Spacelink spacklink.nasa.gov US NASA web siteMacromedia www.macromedia.com software companyBorland www.borland.com software companyInternet.com www.internet.com Internet news
Redhat www.redhat.com Linux and softwarecompany
Science News Online www.sciencenews.org science newsDiscovery Channel dsc.discovery.com TV channelU.S. Nation Library ofMedicine www.nlm.nih.gov Library
RFC Editor Webpage www.rfc-editor.org RFC collectionsPrevline www.health.org health organization
Manufacturing.net www.manufacturing.net manufacturing news andarticles
The Whitaker Foundation www.whitaker.org/news biomedical engineeringnews
The Internet Bookshop www.bookshop.co.uk online bookshopebay www.ebay.com online bid company
One method that can be used to eliminate irrelevant search engines is to make everycategory keep an equally n number of search engines. This method is simple, but it ishard to define n. Also, a number of high score search engines may be eliminated.Alternatively, we can eliminate search engines within categories based on thestandard deviation of the relevancy scores.
After performing all the categorization procedures, a hierarchical directory ofspecialty search engine category is produced. The produced directory containsnumbers of sub-categories in a hierarchical structure. Each sub-category containsnumbers of relevant search engines that are ranked according their relevancy scores.The next section explains the experiments done to evaluate the describedcategorization algorithm.
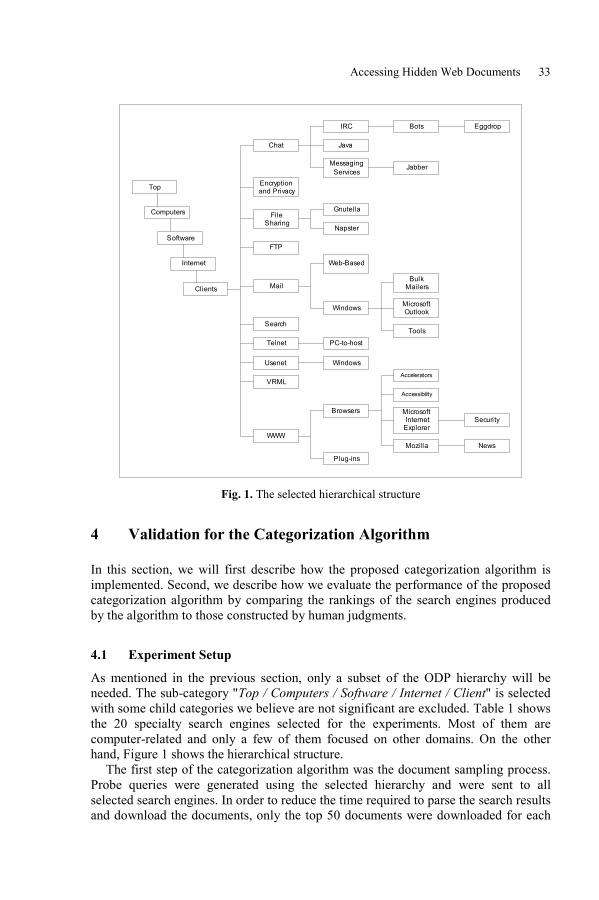
Accessing Hidden Web Documents 33
Computers
Software
Internet
Clients
Chat
IRC Bots Eggdrop
Java
MessagingServices
Jabber
Encryptionand Privacy
FileSharing
Gnutella
Napster
FTP
Web-Based
Windows
BulkMailers
MicrosoftOutlook
ToolsSearch
Telnet PC-to-host
Usenet Windows
VRML
WWW
Browsers
Accelerators
Accessibility
MicrosoftInternetExplorer
Security
Mozilla News
Plug-ins
Top
Fig. 1. The selected hierarchical structure
4 Validation for the Categorization Algorithm
In this section, we will first describe how the proposed categorization algorithm isimplemented. Second, we describe how we evaluate the performance of the proposedcategorization algorithm by comparing the rankings of the search engines producedby the algorithm to those constructed by human judgments.
4.1 Experiment Setup
As mentioned in the previous section, only a subset of the ODP hierarchy will beneeded. The sub-category "Top / Computers / Software / Internet / Client" is selectedwith some child categories we believe are not significant are excluded. Table 1 showsthe 20 specialty search engines selected for the experiments. Most of them arecomputer-related and only a few of them focused on other domains. On the otherhand, Figure 1 shows the hierarchical structure.
The first step of the categorization algorithm was the document sampling process.Probe queries were generated using the selected hierarchy and were sent to allselected search engines. In order to reduce the time required to parse the search resultsand download the documents, only the top 50 documents were downloaded for each
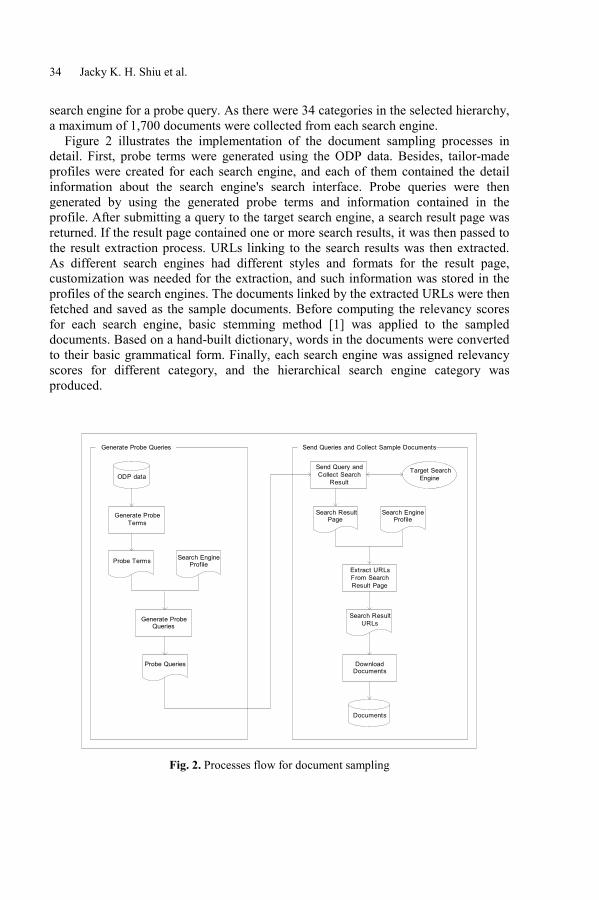
34 Jacky K. H. Shiu et al.
search engine for a probe query. As there were 34 categories in the selected hierarchy,a maximum of 1,700 documents were collected from each search engine.
Figure 2 illustrates the implementation of the document sampling processes indetail. First, probe terms were generated using the ODP data. Besides, tailor-madeprofiles were created for each search engine, and each of them contained the detailinformation about the search engine's search interface. Probe queries were thengenerated by using the generated probe terms and information contained in theprofile. After submitting a query to the target search engine, a search result page wasreturned. If the result page contained one or more search results, it was then passed tothe result extraction process. URLs linking to the search results was then extracted.As different search engines had different styles and formats for the result page,customization was needed for the extraction, and such information was stored in theprofiles of the search engines. The documents linked by the extracted URLs were thenfetched and saved as the sample documents. Before computing the relevancy scoresfor each search engine, basic stemming method [1] was applied to the sampleddocuments. Based on a hand-built dictionary, words in the documents were convertedto their basic grammatical form. Finally, each search engine was assigned relevancyscores for different category, and the hierarchical search engine category wasproduced.
Probe Terms
ODP data
Generate ProbeTerms
Search EngineProfile
Generate ProbeQueries
Probe Queries
Send Query andCollect Search
Result
Target SearchEngine
Search ResultPage
Extract URLsFrom SearchResult Page
Search ResultURLs
DownloadDocuments
Documents
Generate Probe Queries Send Queries and Collect Sample Documents
Search EngineProfile
Fig. 2. Processes flow for document sampling
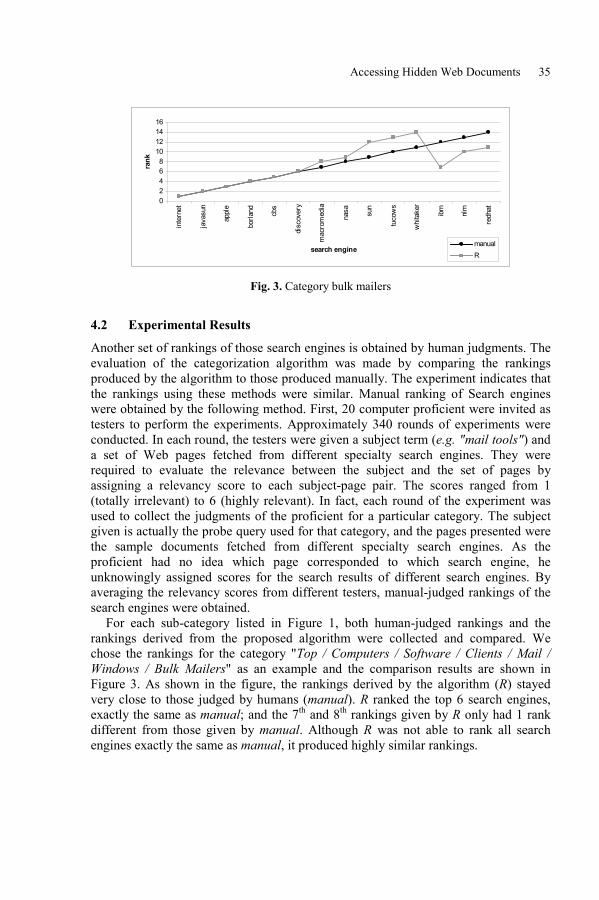
Accessing Hidden Web Documents 35
02468
10121416
inte
rnet
java
sun
appl
e
borla
nd cbs
disc
over
y
mac
rom
edia
nasa sun
tuco
ws
whi
take
r
ibm
nlm
redh
at
search engine
rank
manualR
Fig. 3. Category bulk mailers
4.2 Experimental Results
Another set of rankings of those search engines is obtained by human judgments. Theevaluation of the categorization algorithm was made by comparing the rankingsproduced by the algorithm to those produced manually. The experiment indicates thatthe rankings using these methods were similar. Manual ranking of Search engineswere obtained by the following method. First, 20 computer proficient were invited astesters to perform the experiments. Approximately 340 rounds of experiments wereconducted. In each round, the testers were given a subject term (e.g. "mail tools") anda set of Web pages fetched from different specialty search engines. They wererequired to evaluate the relevance between the subject and the set of pages byassigning a relevancy score to each subject-page pair. The scores ranged from 1(totally irrelevant) to 6 (highly relevant). In fact, each round of the experiment wasused to collect the judgments of the proficient for a particular category. The subjectgiven is actually the probe query used for that category, and the pages presented werethe sample documents fetched from different specialty search engines. As theproficient had no idea which page corresponded to which search engine, heunknowingly assigned scores for the search results of different search engines. Byaveraging the relevancy scores from different testers, manual-judged rankings of thesearch engines were obtained.
For each sub-category listed in Figure 1, both human-judged rankings and therankings derived from the proposed algorithm were collected and compared. Wechose the rankings for the category "Top / Computers / Software / Clients / Mail /Windows / Bulk Mailers" as an example and the comparison results are shown inFigure 3. As shown in the figure, the rankings derived by the algorithm (R) stayedvery close to those judged by humans (manual). R ranked the top 6 search engines,exactly the same as manual; and the 7th and 8th rankings given by R only had 1 rankdifferent from those given by manual. Although R was not able to rank all searchengines exactly the same as manual, it produced highly similar rankings.
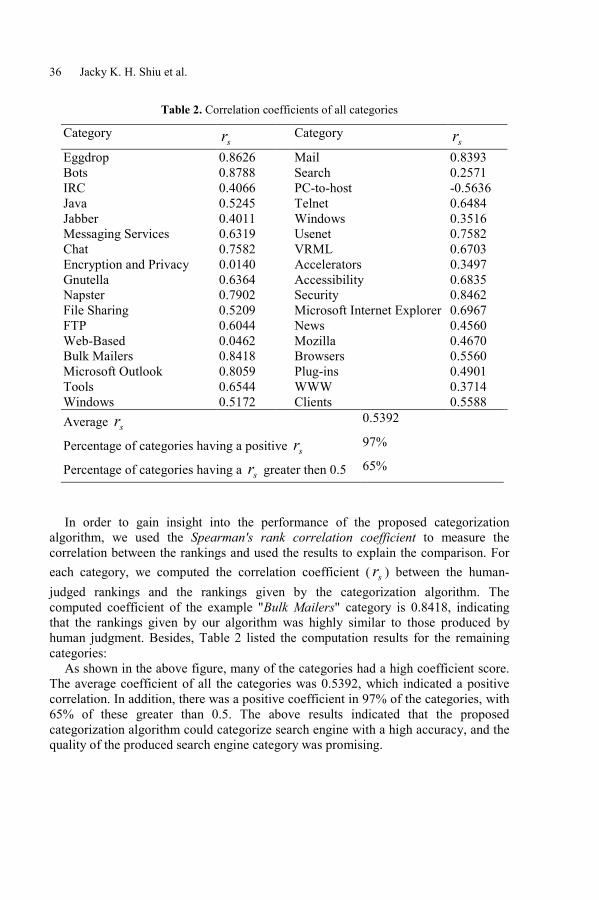
36 Jacky K. H. Shiu et al.
Table 2. Correlation coefficients of all categories
Categorysr Category
srEggdrop 0.8626 Mail 0.8393Bots 0.8788 Search 0.2571IRC 0.4066 PC-to-host -0.5636Java 0.5245 Telnet 0.6484Jabber 0.4011 Windows 0.3516Messaging Services 0.6319 Usenet 0.7582Chat 0.7582 VRML 0.6703Encryption and Privacy 0.0140 Accelerators 0.3497Gnutella 0.6364 Accessibility 0.6835Napster 0.7902 Security 0.8462File Sharing 0.5209 Microsoft Internet Explorer 0.6967FTP 0.6044 News 0.4560Web-Based 0.0462 Mozilla 0.4670Bulk Mailers 0.8418 Browsers 0.5560Microsoft Outlook 0.8059 Plug-ins 0.4901Tools 0.6544 WWW 0.3714Windows 0.5172 Clients 0.5588Average sr 0.5392
Percentage of categories having a positive sr 97%
Percentage of categories having a sr greater then 0.5 65%
In order to gain insight into the performance of the proposed categorizationalgorithm, we used the Spearman's rank correlation coefficient to measure thecorrelation between the rankings and used the results to explain the comparison. Foreach category, we computed the correlation coefficient ( sr ) between the human-judged rankings and the rankings given by the categorization algorithm. Thecomputed coefficient of the example "Bulk Mailers" category is 0.8418, indicatingthat the rankings given by our algorithm was highly similar to those produced byhuman judgment. Besides, Table 2 listed the computation results for the remainingcategories:
As shown in the above figure, many of the categories had a high coefficient score.The average coefficient of all the categories was 0.5392, which indicated a positivecorrelation. In addition, there was a positive coefficient in 97% of the categories, with65% of these greater than 0.5. The above results indicated that the proposedcategorization algorithm could categorize search engine with a high accuracy, and thequality of the produced search engine category was promising.
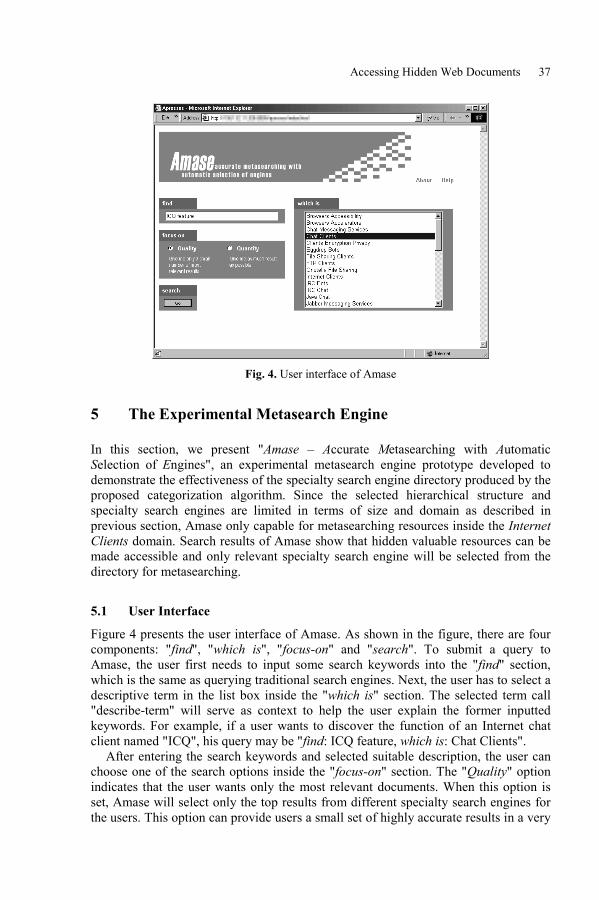
Accessing Hidden Web Documents 37
Fig. 4. User interface of Amase
5 The Experimental Metasearch Engine
In this section, we present "Amase � Accurate Metasearching with AutomaticSelection of Engines", an experimental metasearch engine prototype developed todemonstrate the effectiveness of the specialty search engine directory produced by theproposed categorization algorithm. Since the selected hierarchical structure andspecialty search engines are limited in terms of size and domain as described inprevious section, Amase only capable for metasearching resources inside the InternetClients domain. Search results of Amase show that hidden valuable resources can bemade accessible and only relevant specialty search engine will be selected from thedirectory for metasearching.
5.1 User Interface
Figure 4 presents the user interface of Amase. As shown in the figure, there are fourcomponents: "find", "which is", "focus-on" and "search". To submit a query toAmase, the user first needs to input some search keywords into the "find" section,which is the same as querying traditional search engines. Next, the user has to select adescriptive term in the list box inside the "which is" section. The selected term call"describe-term" will serve as context to help the user explain the former inputtedkeywords. For example, if a user wants to discover the function of an Internet chatclient named "ICQ", his query may be "find: ICQ feature, which is: Chat Clients".
After entering the search keywords and selected suitable description, the user canchoose one of the search options inside the "focus-on" section. The "Quality" optionindicates that the user wants only the most relevant documents. When this option isset, Amase will select only the top results from different specialty search engines forthe users. This option can provide users a small set of highly accurate results in a very
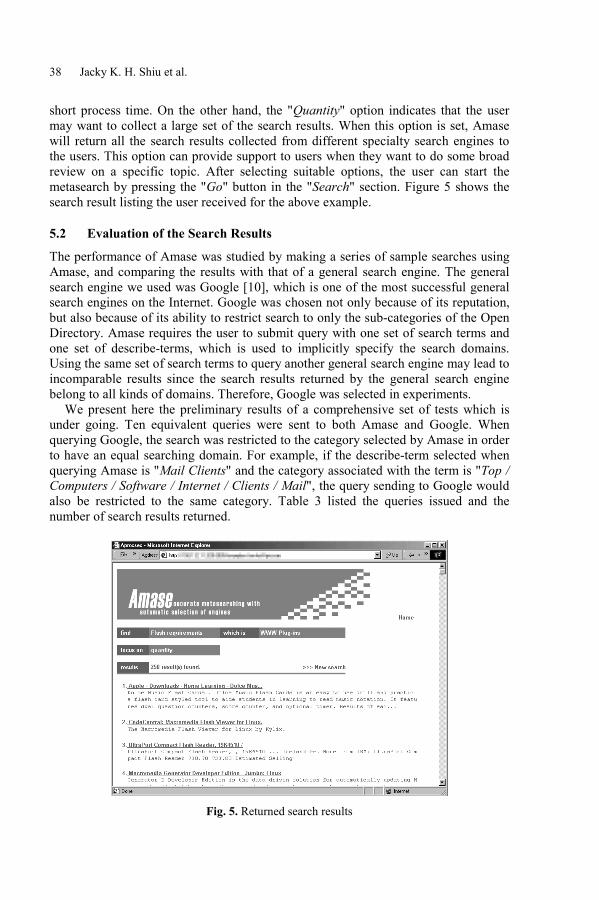
38 Jacky K. H. Shiu et al.
short process time. On the other hand, the "Quantity" option indicates that the usermay want to collect a large set of the search results. When this option is set, Amasewill return all the search results collected from different specialty search engines tothe users. This option can provide support to users when they want to do some broadreview on a specific topic. After selecting suitable options, the user can start themetasearch by pressing the "Go" button in the "Search" section. Figure 5 shows thesearch result listing the user received for the above example.
5.2 Evaluation of the Search Results
The performance of Amase was studied by making a series of sample searches usingAmase, and comparing the results with that of a general search engine. The generalsearch engine we used was Google [10], which is one of the most successful generalsearch engines on the Internet. Google was chosen not only because of its reputation,but also because of its ability to restrict search to only the sub-categories of the OpenDirectory. Amase requires the user to submit query with one set of search terms andone set of describe-terms, which is used to implicitly specify the search domains.Using the same set of search terms to query another general search engine may lead toincomparable results since the search results returned by the general search enginebelong to all kinds of domains. Therefore, Google was selected in experiments.
We present here the preliminary results of a comprehensive set of tests which isunder going. Ten equivalent queries were sent to both Amase and Google. Whenquerying Google, the search was restricted to the category selected by Amase in orderto have an equal searching domain. For example, if the describe-term selected whenquerying Amase is "Mail Clients" and the category associated with the term is "Top /Computers / Software / Internet / Clients / Mail", the query sending to Google wouldalso be restricted to the same category. Table 3 listed the queries issued and thenumber of search results returned.
Fig. 5. Returned search results
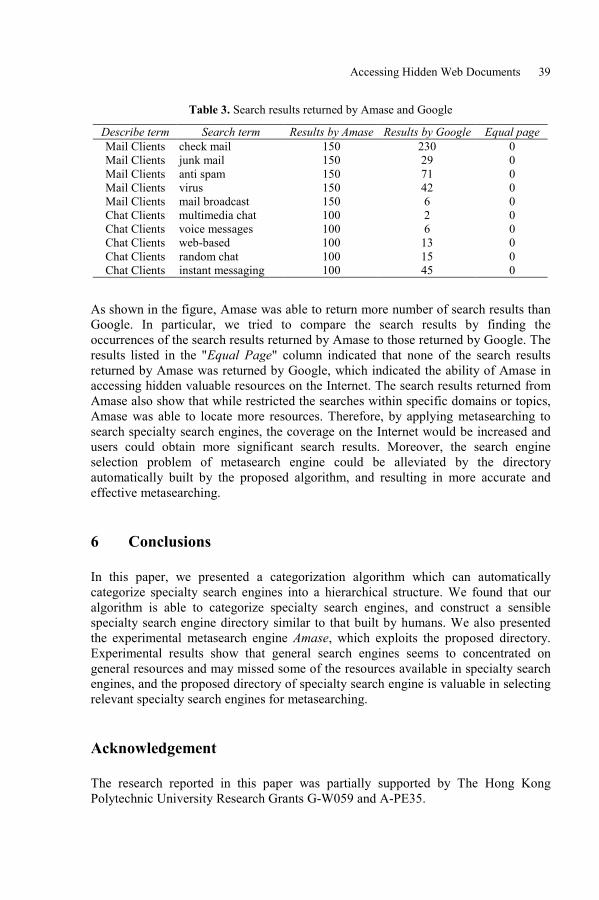
Accessing Hidden Web Documents 39
Table 3. Search results returned by Amase and Google
Describe term Search term Results by Amase Results by Google Equal pageMail Clients check mail 150 230 0Mail Clients junk mail 150 29 0Mail Clients anti spam 150 71 0Mail Clients virus 150 42 0Mail Clients mail broadcast 150 6 0Chat Clients multimedia chat 100 2 0Chat Clients voice messages 100 6 0Chat Clients web-based 100 13 0Chat Clients random chat 100 15 0Chat Clients instant messaging 100 45 0
As shown in the figure, Amase was able to return more number of search results thanGoogle. In particular, we tried to compare the search results by finding theoccurrences of the search results returned by Amase to those returned by Google. Theresults listed in the "Equal Page" column indicated that none of the search resultsreturned by Amase was returned by Google, which indicated the ability of Amase inaccessing hidden valuable resources on the Internet. The search results returned fromAmase also show that while restricted the searches within specific domains or topics,Amase was able to locate more resources. Therefore, by applying metasearching tosearch specialty search engines, the coverage on the Internet would be increased andusers could obtain more significant search results. Moreover, the search engineselection problem of metasearch engine could be alleviated by the directoryautomatically built by the proposed algorithm, and resulting in more accurate andeffective metasearching.
6 Conclusions
In this paper, we presented a categorization algorithm which can automaticallycategorize specialty search engines into a hierarchical structure. We found that ouralgorithm is able to categorize specialty search engines, and construct a sensiblespecialty search engine directory similar to that built by humans. We also presentedthe experimental metasearch engine Amase, which exploits the proposed directory.Experimental results show that general search engines seems to concentrated ongeneral resources and may missed some of the resources available in specialty searchengines, and the proposed directory of specialty search engine is valuable in selectingrelevant specialty search engines for metasearching.
Acknowledgement
The research reported in this paper was partially supported by The Hong KongPolytechnic University Research Grants G-W059 and A-PE35.
40 Jacky K. H. Shiu et al.
References
[1] R. Baeza-Yates, B. Ribeiro-Neto "Modern Information Retrieval". ACM Press /Addison-Wesley Longman (1999)
[2] A. B. Benitez, M. Beigi, and S. F. Chang "Using Relevance Feedback inContent-Based Image Metasearch". IEEE Internet Computing, Vol.2, No.4,pp.59-69 (1998)
[3] Michael K. Bergman "The Deep Web: Surfacing Hidden Value". The Journalof Electronic Publishing, Vol.7, Issue 1 (2001)
[4] James P. Callan, Z. Lu and W. Bruce Croft "Searching distributed collectionswith inference networks". Proceedings of the 18th ACM-SIGIR InternationalConference, Seattle, Washington, USA, July 1995, pp.12-20 (1995)
[5] J. Callan, M. Connell, and A. Du "Automatic Discovery of Language Modelsfor Text Databases". Proceedings of ACM-SIGMOD International Conferenceon Management of Data, Philadelphia, Pennsylvania, USA, 1-3 June 1999,pp.479-490 (1999)
[6] D. Dreilinger, Adele E. Howe "Experiences with Selecting Search EnginesUsing Metasearch". ACM Transactions on Information Systems, Vol.15, No.3,pp.195-222 (1997)
[7] N. Fuhr "A decision-theoretic approach to database selection in networked IR".ACM Transactions on Information Systems, Vol.17, No.3, pp.229-249 (1999)
[8] S. Gauch, G. Wang, and M. Gomez "Profusion: Intelligent fusion frommultiple, distributed search engines". Journal of Universal Computer Science,Vol.2, No.9, pp.637-649 (1996)
[9] E. Glover, S. Lawrence, W. Birmingham, C. Lee Giles "Architecture of aMetasearch Engine that Supports User Information Needs". Proceedings of the8th International Conference on Information Knowledge Management, KansasCity, MO, November 1999, pp.210-216 (1999)
[10] http://www.google.com, 2003[11] L. Gravano, H. Garcia-Molina, A. Tomasic "GlOSS: Text-source discovery
over the Internet". ACM Transactions on Database Systems, Vol.24, No.2,pp.229-264 (1999)
[12] D. Hawking, P. Thistlewaite "Methods for information server selection". ACMTransactions on Information Systems, Vol.17, No.1, pp.40-76 (1999)
[13] Jacky K. H. Shiu, Stephen C F Chan and Korris F L Chung "Developing aDirectory of Search Engines for Meta-Searching" To appear in Proceedings ofthe 4th International Conference on Intelligent Data Engineering andAutomated Learning, Hong Kong, 21-23 March 2003 (2003)
[14] S. Lawrence, C. Lee Giles "Accessibility of information on the Web". Nature,Vol.400 pp.107-109 (1999)
[15] J. Xu and J. Callan "Effective retrieval with distributed collections".Proceedings of the 21st International ACM-SIGIR Conference, Melbourne,Australia, 24-28 August 1998, pp.112-120 (1998)
[16] B. Yuwono and D. L. Lee "Server ranking for distributed text retrieval systemson the Internet". Proceedings of the 5th Annual International Conference onDatabase Systems for Advanced Applications, Melbourne, Australia, April1997, pp.41-49 (1997)

Accessing Hidden Web Documents 41
[17] http://dmoz.org, 2003[18] http://www.yahoo.com, 2003
N. Bianchi-Berthouze (Ed.): DNIS 2003, LNCS 2822, pp. 42-52, 2003. Springer-Verlag Berlin Heidelberg 2003
Hidden Schema Extraction in Web Documents
Vincenza Carchiolo, Alessandro Longheu, and Michele Malgeri
Dipartimento di Ingegneria Informatica e delle TelecomunicazioniFacoltà di Ingegneria � V.le A. Doria 6 � I95125 � Catania
Tel. +39-095-738-2359 � Fax +39-095-738-2397{car,alongheu,mm}@diit.unict.it
Abstract. One of the main limitation when accessing the web is the lack ofexplicit schema about the logical organization of web pages/sites, whosepresence may help in understanding data semantics. Here, an approach toextract a logical schema from web pages based on HTML source code analysisis presented. We define a set of primary tags actually used to give astructural/logical backbone to the page. Primary tags are used to divide the pageinto collections, which represent distinct structural page sections; these arefinally mapped into logical sections according to their semantics, providing alogical page schema. The structuring methodology is applied to some real webpages to test the approach.
1 Introduction
The World Wide Web can be seen as the largest (almost chaotic) data warehouse,from which possibly any information can be accessed. Though, the absence of anexplicit schema about the logical organization of web pages/sites represents asignificant limitation when accessing and retrieving information from the web;indeed, an explicit logical schema would help in understanding data semantics,making it easier and time-saving for users to locate desired information, whereascurrent data comprehension is mainly based on intuition [1].
Web data belong to semi-structured data class, i.e. data with self-contained schema[2], [3], [4], hence the need of extracting schema to improve data management arises[5], [6]. Schema for web data can be constructed at different levels: giving a schemafor a set of logically related sites viewing them as a whole, or examining a single site[7], or finally structuring single pages.
Our work aims at structuring web pages in order to provide them with a logicalschema, i.e. to divide page contents into semantically distinct parts. Such a schema isactually implicitly embedded into the page, hence the term hidden schema. Thisdivision comes from the fact that information placed inside a web page generally donot form a monolithic block, rather it is possible to divide the page into a set oflogical sections which aim to reflect the logical structure given by the author. Logicalsections we introduce come from considering typical web pages, and are:

Hidden Schema Extraction in Web Documents 43
• document information section, containing metadata about the page (e.g. DTD,author);
• logical heading section, used to present the page/site, e.g. title or logo of the site;• logical footer section, containing information as link to webmasters, copyright
notices, etc.;• logical link section, a set of HTML tags representing a physical link (e.g.
clickable images);• index section, a group of logical links having similar properties (e.g. navigation
menus) [9];• logical data section, data where the semantic of the page is mainly placed.• interactive section, i.e. forms for users interaction, as search bar in search
engines.
To extract logical sections, our approach tends to combine both structural andsemantic information about the page [8]; in particular, we first model the page as atree according to the hierarchy of HTML tags, then we locate some specific tagshaving a primary role when giving a structure to the page. We use such primary nodesto create collections, where each collection is a subtree (rooted at one of these nodes)collecting a set of consecutive HTML tags presenting similar structures; in otherwords, collections are introduced to divide the page into distinct structural sections.Collections are finally mapped into logical sections exploiting their semantics; thispaper however does not deal with this last issue (more details can be found in [8]).
Here we first introduce primary tags and their properties, then we definecollections together with the algorithm used for their extraction, finally applying it tosome sample pages to test the approach.
2 Structuring Methodology
2.1 Primary Tags
The idea of primary tags comes from the fact that some tags in web pages are actuallyused to give a structural/logical backbone to the page; more specifically, we considertags with the following features: tags used to arrange page elements (text, images) in atabular or similar representation, e.g. <table>, <frame>; tags used to separate pageelements, as <hr>; tags used to manage forms to allow user interactions. Based onthese considerations, primary tags are: table, hr, frame, form (this set is small in orderto limit the number of collections). We associate to a primary node a set of properties:
• the list of primary tag attributes, so e.g. <table> and <table BORDER=1WIDTH="75%" CELLPADDING=6 ALIGN="RIGHT"> will be considereddifferent (probably even semantically);
• the relative depth, i.e. the number of primary nodes from root (<html>) to thecurrent node;
• the absolute depth, i.e. the number of nodes from root to current node (theordinary depth);
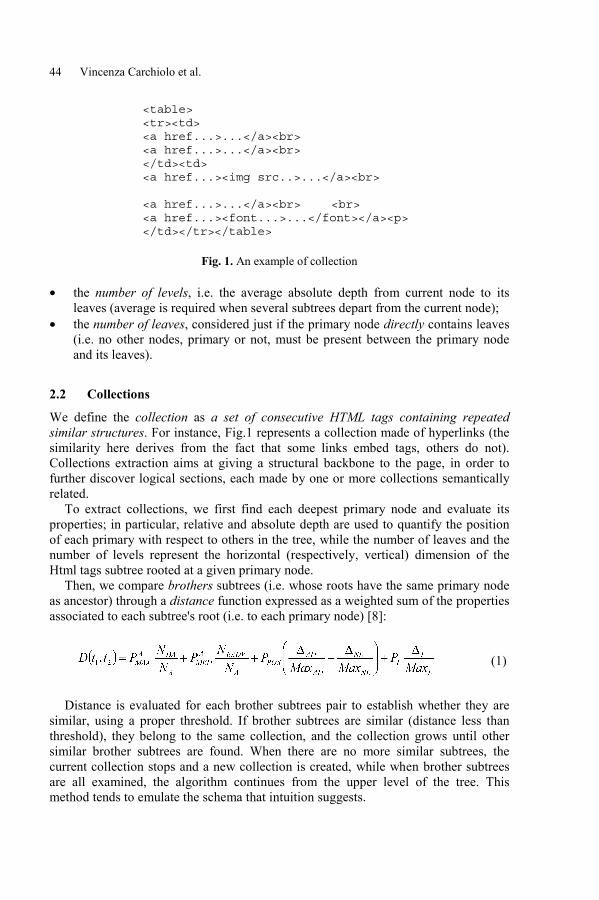
44 Vincenza Carchiolo et al.
<table><tr><td><a href...>...</a><br><a href...>...</a><br></td><td><a href...><img src..>...</a><br>
<a href...>...</a><br> <br><a href...><font...>...</font></a><p></td></tr></table>
Fig. 1. An example of collection
• the number of levels, i.e. the average absolute depth from current node to itsleaves (average is required when several subtrees depart from the current node);
• the number of leaves, considered just if the primary node directly contains leaves(i.e. no other nodes, primary or not, must be present between the primary nodeand its leaves).
2.2 Collections
We define the collection as a set of consecutive HTML tags containing repeatedsimilar structures. For instance, Fig.1 represents a collection made of hyperlinks (thesimilarity here derives from the fact that some links embed tags, others do not).Collections extraction aims at giving a structural backbone to the page, in order tofurther discover logical sections, each made by one or more collections semanticallyrelated.
To extract collections, we first find each deepest primary node and evaluate itsproperties; in particular, relative and absolute depth are used to quantify the positionof each primary with respect to others in the tree, while the number of leaves and thenumber of levels represent the horizontal (respectively, vertical) dimension of theHtml tags subtree rooted at a given primary node.
Then, we compare brothers subtrees (i.e. whose roots have the same primary nodeas ancestor) through a distance function expressed as a weighted sum of the propertiesassociated to each subtree's root (i.e. to each primary node) [8]:
(1)
Distance is evaluated for each brother subtrees pair to establish whether they aresimilar, using a proper threshold. If brother subtrees are similar (distance less thanthreshold), they belong to the same collection, and the collection grows until othersimilar brother subtrees are found. When there are no more similar subtrees, thecurrent collection stops and a new collection is created, while when brother subtreesare all examined, the algorithm continues from the upper level of the tree. Thismethod tends to emulate the schema that intuition suggests.
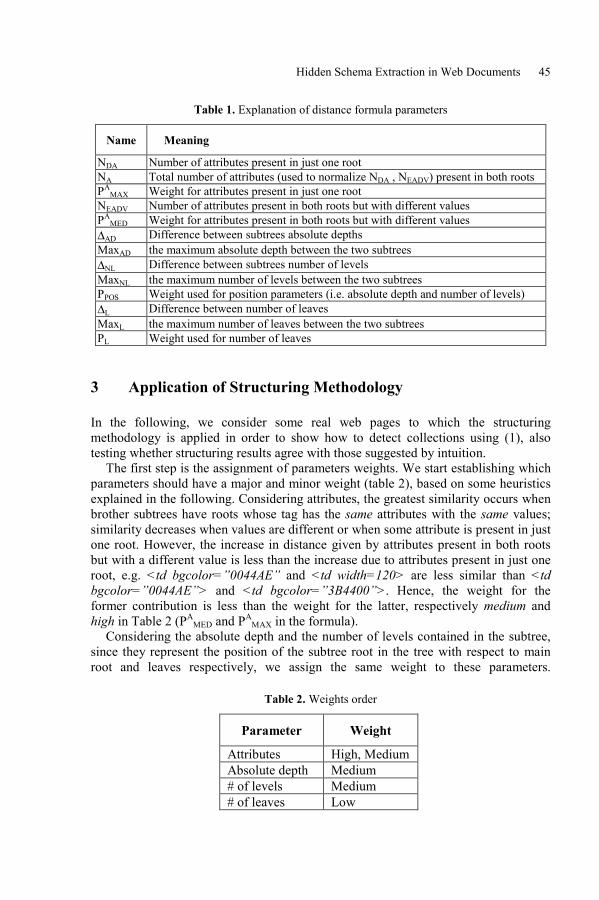
Hidden Schema Extraction in Web Documents 45
Table 1. Explanation of distance formula parameters
Name Meaning
NDA Number of attributes present in just one rootNA Total number of attributes (used to normalize NDA , NEADV) present in both rootsPA
MAX Weight for attributes present in just one rootNEADV Number of attributes present in both roots but with different valuesPA
MED Weight for attributes present in both roots but with different values∆AD Difference between subtrees absolute depthsMaxAD the maximum absolute depth between the two subtrees∆NL Difference between subtrees number of levelsMaxNL the maximum number of levels between the two subtreesPPOS Weight used for position parameters (i.e. absolute depth and number of levels)∆L Difference between number of leavesMaxL the maximum number of leaves between the two subtreesPL Weight used for number of leaves
3 Application of Structuring Methodology
In the following, we consider some real web pages to which the structuringmethodology is applied in order to show how to detect collections using (1), alsotesting whether structuring results agree with those suggested by intuition.
The first step is the assignment of parameters weights. We start establishing whichparameters should have a major and minor weight (table 2), based on some heuristicsexplained in the following. Considering attributes, the greatest similarity occurs whenbrother subtrees have roots whose tag has the same attributes with the same values;similarity decreases when values are different or when some attribute is present in justone root. However, the increase in distance given by attributes present in both rootsbut with a different value is less than the increase due to attributes present in just oneroot, e.g. <td bgcolor=�0044AE� and <td width=120> are less similar than <tdbgcolor=�0044AE�> and <td bgcolor=�3B4400�>. Hence, the weight for theformer contribution is less than the weight for the latter, respectively medium andhigh in Table 2 (PA
MED and PAMAX in the formula).
Considering the absolute depth and the number of levels contained in the subtree,since they represent the position of the subtree root in the tree with respect to mainroot and leaves respectively, we assign the same weight to these parameters.
Table 2. Weights order
Parameter Weight
Attributes High, MediumAbsolute depth Medium# of levels Medium# of leaves Low

46 Vincenza Carchiolo et al.
Moreover, this weight (PPOS in Tab. 5) is less than PAMED and PA
MAX since absolutedepth and number of levels are determined by non primary tags.
Then, we assign a minimum weight (PL in Tab. 5) to the number of direct leavessince a different number of leaves, even if it affects similarity (the less is thedifference, the more similar subtrees will be), it is a structural difference which couldnot be due to semantic reasons, e.g. two tables with different number of rows to bedisplayed may still be semantically related. Finally, no weight is given for relativedepth (it is indeed just used to select brother subtrees).
To quantify weights in order to actually apply (1), we assign values in the range[0,1], in particular the maximum is 1, the medium is 0.5 and the low value is 0.1 (0would erase the corresponding term).
We choose test web pages among home pages, since they have generally a morecomplex structure than inner pages, hence they are more significant. In particular, wechoose the home page of Texas University (http://www.cs.utexas.edu), whosestructure is quite simple, and the home page of Times (http://www.times.com), whichis quite complex; we choose such pages since they belong to completely differentcontext. Tables 3 and 4 represent primary tags properties for Texas University andTimes respectively. In particular, the first column simply denotes a numeric identifierfor each primary tag, all intermediate columns represent tag attributes (except forattributes, which are omitted), and the last column indicate the identifier of theancestor primary tag (e.g., in table 3 the tag 2 is the ancestor of 3,4,5,6). Note thattags ore ordered based on their ancestor (i.e. corresponding brothers subtrees areactually grouped).
Note that actually dynamic Html is frequently used in real pages; the use ofclient/server side programming (Java applets, Active-X technologies, scripting) andstyle sheets indeed affect both the structure and the semantic of the page. To take thisinto account, in tables 3 and 4 we distinguish leaves in the Html tree into ordinarytags and scripting tags (e.g. those including Javascript code), in order to checkwhether the importance given to scripting tags is relevant or not for collectionsextraction when using formula (1). More details about the influence of dynamic Htmlcan be found in [11].
Table 3. Primary tags and their attributes for Texas University home page
Number of leavesPrimarytag ID
RelativeDepth
AbsoluteDepth
Number oflevels Ordinary
tagsScriptingtags
Primary tagAncestor ID
1 1 1 3 1 02 1 1 7 1 03 2 5 3 48 24 2 5 3 8 25 2 3 3 1 26 2 5 3 1 2
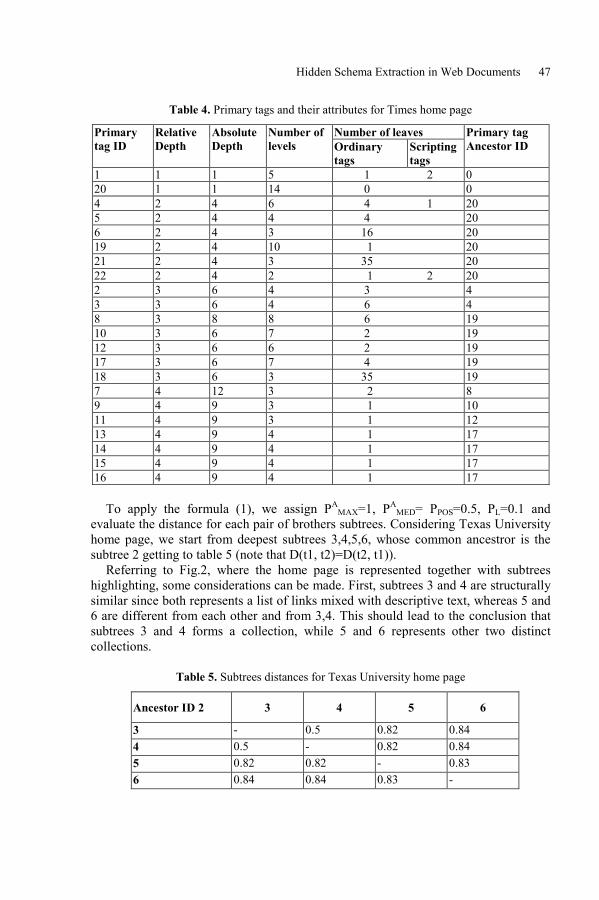
Hidden Schema Extraction in Web Documents 47
Table 4. Primary tags and their attributes for Times home page
Number of leavesPrimarytag ID
RelativeDepth
AbsoluteDepth
Number oflevels Ordinary
tagsScriptingtags
Primary tagAncestor ID
1 1 1 5 1 2 020 1 1 14 0 04 2 4 6 4 1 205 2 4 4 4 206 2 4 3 16 2019 2 4 10 1 2021 2 4 3 35 2022 2 4 2 1 2 202 3 6 4 3 43 3 6 4 6 48 3 8 8 6 1910 3 6 7 2 1912 3 6 6 2 1917 3 6 7 4 1918 3 6 3 35 197 4 12 3 2 89 4 9 3 1 1011 4 9 3 1 1213 4 9 4 1 1714 4 9 4 1 1715 4 9 4 1 1716 4 9 4 1 17
To apply the formula (1), we assign PAMAX=1, PA
MED= PPOS=0.5, PL=0.1 andevaluate the distance for each pair of brothers subtrees. Considering Texas Universityhome page, we start from deepest subtrees 3,4,5,6, whose common ancestror is thesubtree 2 getting to table 5 (note that D(t1, t2)=D(t2, t1)).
Referring to Fig.2, where the home page is represented together with subtreeshighlighting, some considerations can be made. First, subtrees 3 and 4 are structurallysimilar since both represents a list of links mixed with descriptive text, whereas 5 and6 are different from each other and from 3,4. This should lead to the conclusion thatsubtrees 3 and 4 forms a collection, while 5 and 6 represents other two distinctcollections.
Table 5. Subtrees distances for Texas University home page
Ancestor ID 2 3 4 5 6
3 - 0.5 0.82 0.844 0.5 - 0.82 0.845 0.82 0.82 - 0.836 0.84 0.84 0.83 -
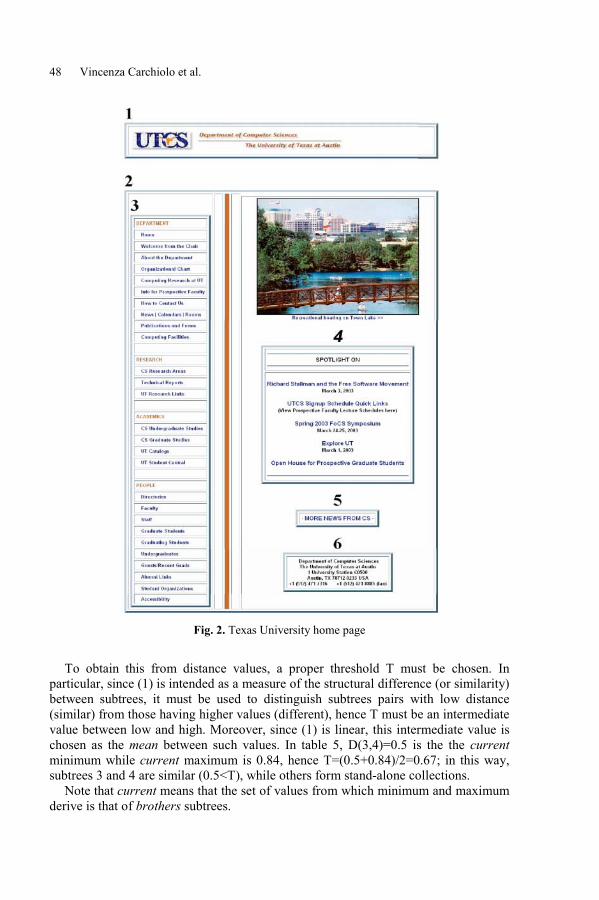
48 Vincenza Carchiolo et al.
Fig. 2. Texas University home page
To obtain this from distance values, a proper threshold T must be chosen. Inparticular, since (1) is intended as a measure of the structural difference (or similarity)between subtrees, it must be used to distinguish subtrees pairs with low distance(similar) from those having higher values (different), hence T must be an intermediatevalue between low and high. Moreover, since (1) is linear, this intermediate value ischosen as the mean between such values. In table 5, D(3,4)=0.5 is the the currentminimum while current maximum is 0.84, hence T=(0.5+0.84)/2=0.67; in this way,subtrees 3 and 4 are similar (0.5<T), while others form stand-alone collections.
Note that current means that the set of values from which minimum and maximumderive is that of brothers subtrees.
Hidden Schema Extraction in Web Documents 49
Also note that this approach (relative threshold) is not suitable when the current setof distances presents a low variance, since this implies that the boundary betweensimilar and not-similar subtrees is not clear. This happens for instance when alldistances have the same value (T would coincide with this unique value) or highlysimilar (e.g. the distances set 1.510, 1.508, 1.512, 1.505, 1.510, 1.513) or finally whenjust a value is present (i.e. brothers are just two subtrees). In all these cases we definean absolute threshold T as the mean between the absolute minimum and maximumvalues, i.e. the lowest value of (1) is 0, whereas its maximum is given by PA
MAX +PA
MED + 2PPOS + PL =2.6 (parameters are indeed normalized with their maximum),hence T=1.3. In this way, if distances are less than T, corresponding subtrees willbelong to the same collection, otherwise stand-alone collections will arise, regardlessof distances distribution.
Referring to Fig.2, next distance concerns with subtrees 1 and 2 (tags at a higherlevel in the tree), and its (single) value is D(1,2)=0.92. Since D(1,2)<T (absolute T isused), 1 and 2 should belong to the same collection. Though, Fig.2 shows that theyare very different, hence an additional factor should be included in (1) to detect this.In particular, subtree 2 includes a scripting tag, i.e. a Javascript function used tomanage the entire menu (subtree 5), therefore we can highlight this difference bygiving scripting tags a higher weight. To do this in (1), we separate scripting fromordinary tags and introduce the additional term PJS ∆J/ MaxJ , where PJS=0.5 is theweight (instead of 0.1), whereas ∆J and MaxJ have the same meaning of ∆L and MaxLin table 1 but referred just to scripting tags. Adding this term leads to D(1,2)=1.62,while absolute T becomes 1.55, therefore D(1,2)>T, accordingly to their appearancein fig. 1. This also shows that scripting tags are relevant when extracting collections.
Considering the Times home page (Fig. 3), several subtrees sets are examined,though some are not considered just to highlight most significant cases. In detail:
• subtrees 13,14,15 and 16 (common ancestor id is 17), present mutual distancesalways with value 0.5; Using the absolute T=1.55, we conclude that all subtreesbelong to the same collection due to their low distance, as it can be also seen inFig. 3
• Considering subtrees with ancestor 19, table 6 shows their distances. Theirdistribution allows to use relative thresold T=(DMIN+DMAX)/2=(0.48+1.24)/2=0.86. Using this value and referring to Fig. 3, subtrees 8 and 10are structurally (hence, graphically) similar and form a collection, whereas 12,17and 18 mutual distances confirm that they are structurally different from eachother and from 8 and 10 (all values are indeed greater than T), as also theirappearance reveal in Fig. 3: 17 includes 4 tables, 12 includes one table, 18 has notable.
• Table 6 shows distances for subtrees 4,5,6,19,21,22 (ancestor 20). Using absoluteT, we get to all separate collections, as their appearances confirm in Fig. 3.
• All subtrees with no brothers (e.g. 7, 9, 11 in table 4) form stand-alonecollections, they however will belong to the collection their ancestor willeventually belong to.
• Finally, highest level subtrees 1 and 20 (i.e. whose ancestor is the <body> tag)are different, as confirmed both by their distance (1.7 is greater than absoluteT=1.55) and by their appearance.
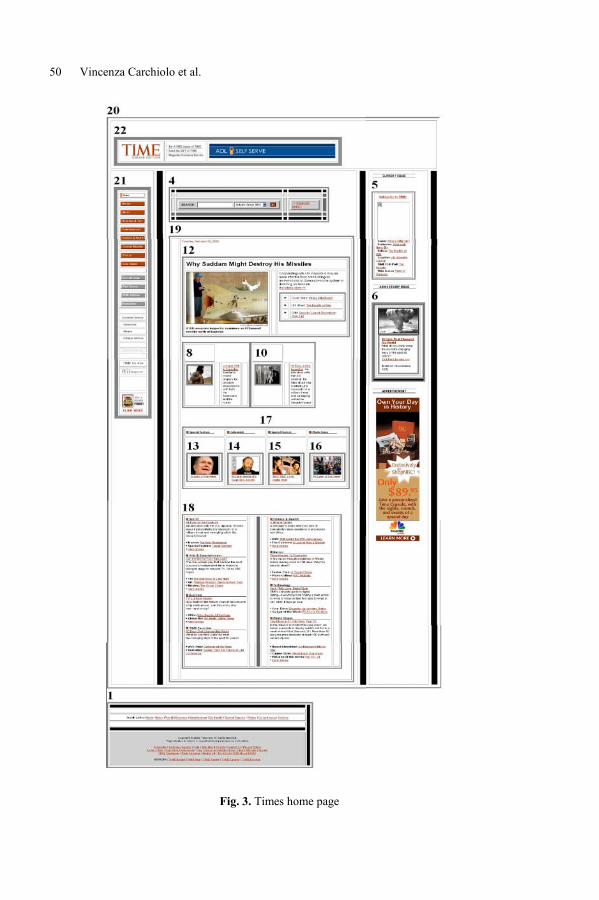
50 Vincenza Carchiolo et al.
Fig. 3. Times home page
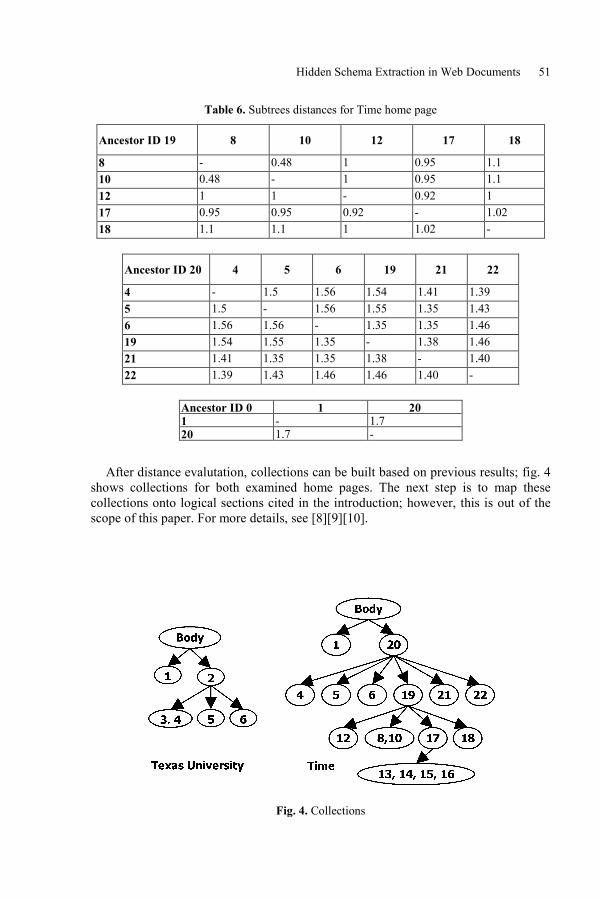
Hidden Schema Extraction in Web Documents 51
Table 6. Subtrees distances for Time home page
Ancestor ID 19 8 10 12 17 18
8 - 0.48 1 0.95 1.110 0.48 - 1 0.95 1.112 1 1 - 0.92 117 0.95 0.95 0.92 - 1.0218 1.1 1.1 1 1.02 -
Ancestor ID 20 4 5 6 19 21 22
4 - 1.5 1.56 1.54 1.41 1.395 1.5 - 1.56 1.55 1.35 1.436 1.56 1.56 - 1.35 1.35 1.4619 1.54 1.55 1.35 - 1.38 1.4621 1.41 1.35 1.35 1.38 - 1.4022 1.39 1.43 1.46 1.46 1.40 -
Ancestor ID 0 1 201 - 1.720 1.7 -
After distance evalutation, collections can be built based on previous results; fig. 4shows collections for both examined home pages. The next step is to map thesecollections onto logical sections cited in the introduction; however, this is out of thescope of this paper. For more details, see [8][9][10].
Fig. 4. Collections
52 Vincenza Carchiolo et al.
4 Conclusions and Future Works
This paper deals with web documents schema extraction, in particular by analyzingHTML source tree. We introduced a set of primary tags actually used to give astructural/logical backbone to the page, classifying them with a set of tree-relatedproperties, in order to divide the page into collections, which represent distinctstructural page sections; collections will be finally mapped into logical sectionsaccording to their semantics.
Several future directions can be exploited:
• distance formula (1) and its threshold can be refined, e.g. evaluating for whichvariance values absolute or relative T must be used, or fuzzy approach may beadopted;
• a significant step is to validate the entire approach through an extensiveapplication of the methodology to a significant set of web pages, both consideringhome/inner pages, as well as covering different site categories (e.g. commercial,institutional, etc);
• another factor to consider in more detail is the analisys of dynamic HTML pages,here actually limited to the use of scripting tags; in [8] some aspects (client vsserver) are examined, but they need to be quantified (i.e. possibly influencing(1)).
References
[1] P.M.G. Apers, Identifying internet-related database reasearch, 2nd Intl. East-West DB Workshop, 1994.
[2] P.Buneman, Semistructured data, Workshop on Management of SemistructuredData, 1997.
[3] S. Abiteboul, Querying Semi-structured Data, Proc. of ICDT, 1997.[4] S. Abiteboul et al., Data on the Web, Morgan Kaufmann, 2000.[5] S. Nestrorov et al., Extracting schema from semistructured data, Proc. of ACM
SIGMOD, 1998.[6] G. Huck et al., Jedi: extracting and synthesizing information form the web,
Proc of 3rd IFCIS Intl CoopIS, 1998.[7] H.G. Molina et al., The TSIMMIS project: integration of heterogeneous
information sources, processing society of japan, 1997.[8] V.Carchiolo, A Longheu, M. Malgeri: Extracting logical schema from the web,
Applied Intelligence, Vol 18, no.3 2003, Kluwer Academic Publishers.[9] A. Longheu, V. Carchiolo, M. Malgeri, Structuring the web, Proc. of DEXA -
Takma � London, 2000.[10] A. Longheu, V. Carchiolo, M. Malgeri, Extraction of hidden semantics from
web pages, Proc. of IDEAL 02 � Manchester, 2002.
N. Bianchi-Berthouze (Ed.): DNIS 2003, LNCS 2822, pp. 53-65, 2003. Springer-Verlag Berlin Heidelberg 2003
Automatically Customizing Service Pages on the Webfor Mobile Devices*
Yeonghyo Jeon1 and Eenjun Hwang1
1Graduate School of Information and Communication, Ajou University, SuwonGyeonggi, Korea
{jeonyh,ehwang}@ajou.ac.kr
Abstract. Recent popularity of mobile devices such as PDA and cellphone hasmade wireless Internet access very crucial. However, most Web contents andservices are optimized for desktop computing environment. Taking differentsystem features of mobile devices such as small display, limited input capabilityand low power into consideration, an alternative access scheme to the Web hasto be invented. On the other hand, personalization plays an important role in thetailored access to the Web contents and services. In this paper, we propose aproxy-based personalizing scheme of Web service pages for mobile users. Itautomatically provides mobile users with the tailored list of Web services wellsuited for diverse mobile devices. Eventually, mobile users can access Webservice pages with minimum navigation on the small display. In addition, userscan be provided with customized services. We have performed several experi-ments on the prototype system and reported some of the results.
1 Introduction
Due to the increasing demand for ubiquitous Internet access and the advance of mo-bile technology, wireless Internet access is getting popular. Particularly, mobile Inter-net access spreads everywhere as supplemental to PC Internet access. According to thesurvey from comScore Networks Inc, 10 million Americans surf from cell phones orPDAs. And they found that of the 19.1 million users owning a PDA, 5 million ac-cesses the Internet with those devices and among the 67.2 million online users thatown a cell phone, 5.8 million accesses the Internet with those devices [1]. Further re-search comes from Computer Industry Almanac Inc.'s analysis of Internet usage acrossmore than 50 countries indicating that of the 1.12 billion Internet users projected forthe end of 2005, a significant number will be using wireless devices such as Web-enabled cell phones and PDAs to go online [2].
However, accessing Web contents and services with mobile devices is inconvenientand restrictive. This is because mobile Internet devices have limited interface and per-formance. Furthermore, Web contents and services are optimized for desktop com- * This work was supported by a grant (M1-0219-24-0000) from the National Research and
Development Program funded by the Ministry of Science and Technology, Republic ofKorea.
54 Yeonghyo Jeon and Eenjun Hwang
puting environment. New PDA series such as Dell AximTM X5 or Compaq iPAQH3900 have more memory and faster processor than existing products. In addition, themajor microprocessor manufacturers such as Intel, Motorola, and Hitachi are trying toimprove those mobile processor. However, small display and limited input capabilitycannot be overcome easily because there is a trade-off between device size and mobil-ity. Many efforts have been done to get over such handicaps. Power Browser [3] andDigestor [4] summarize Web contents and reconstruct the Web pages for mobile de-vices. In addition, a number of companies [5, 6] have been providing basic contenttransformation services. Content transformation can reduce Web contents for mobiledevices. However, Web contents and services can be lost during the transformation.
On the other hand, personalization plays an important role in accessing Web con-tents. Based on the user preference, Web pages can be summarized and reconstructedthrough the personalization process.
There are roughly two kinds of approaches to provide personalization. Implicit per-sonalization uses the personal information provided by the user such as name, address,phone number, age and so on [7]. Explicit personalization is based on the collectionand analysis of Web usage pattern and frequency data. Especially, personalization canbe automated if such information can be collected from log data.
However, personalization based on log analysis has following drawbacks: i) It oftenspoils an original navigation structure. Consequently, users will face difficultysearching or utilizing services from the page. ii) Since it just counts the access fre-quency, it cannot tell the target page. Not all frequently accessed pages can be targetpages. For example, if user usually follows page links P1→ P2 → P3 to access a serv-ice page, then three page's access frequencies are all 1. However, P1 or P2 is not thetarget page. iii) It may not be possible to process all data in a real time due to heavyworkload of log analysis and content transformation.
To overcome such drawbacks, in this paper, we propose a personalization schemefocused on the service page, which makes it possible to find out service with lessnavigation. Mobile users want to find services as soon as possible because wirelesscommunication is more expensive than wired communication. Most mobile servicesprovide service-oriented or menu-based interface. Menu-based interface helps user tonavigate services with limited input capability. Therefore, if personalization systemcan provide Web contents and services similar to mobile services, it enables easysearch for services.
We have implemented a service-oriented personalization system that provides mostfrequently accessed service pages. For easy access, service pages and region list simi-lar to mobile service are generated automatically. Also, in addition to the log data,service related features of the page are considered for the correct identification ofservice.
The structure of the paper is as follows. Section 2 discusses related works. Sec-tion 3 describes service page, service region and examples. Section 4 describes overallsystem architecture and how to detect service page and service region. Section 5 pres-ents some of the experimental results and the last section concludes this paper.
Automatically Customizing Service Pages on the Web for Mobile Devices 55
2 Related Works
So far, many efforts have been done for personalizing Web contents and services,mostly focused on log data. In PROTEUS [8, 9], personalized Web pages are createdfrom pattern and preference by analyzing logs stored in the proxy or Web server. Itanalyzes the access logs, builds a model for each visitor and transforms the site tomaximize the expected utility [8]. However, the process cannot be done in a real timedue to workload. In addition, there is neither content negotiation nor consideration forthe device used. Daily Learner [10] is an intelligent news agent that adopts a content-based machine-learning algorithm. It can learn preference of Palm or desktop users.iMobile [11] provides proxy-based personalized multimedia services. iMobile man-ages user and device profile for adaptive multimedia file service, but not for generalWeb contents. WebViews [12] and WebVCR [13] have taken different approach.WebViews is an extended version of the WebVCR. WebViews creates customizedviews of Web contents and services by recording and analyzing all users' navigationactions. End-users create and maintain simplified views of Web contents and services.However, creating views is manual operation. Once creating customized views, itautomatically navigates to the itinerary pages, extracting specified contents from thosepages.
Another work related to this topic is Web content summarization and reconstruc-tion for heterogeneous mobile devices. Power Browser [3] and Digestor [4] can dy-namically summarize Web pages using transformation proxy. Web Stream Customiz-ers (WSC) [14] are dynamically deployable software modules and can be strategicallylocated between client and server to customize Web contents. Transcoding Proxy [15]is an annotation based transcoding system, where pages are annotated usingWYSIWYG annotation tool. Consequently, Web pages are summarized more accu-rately but not automatically. PageMap [16] performs region-based summarization forWeb pages and constructs a page map composed of summarized regions for the smallscreen.
Web usage mining has been widely studied for Web page personalization system,product recommendation system and Web site optimization. Also, access log mininghas been studied to analyze user browsing behavior and preference. J. Srivastava et al.[17] describes process and data source for Web usage mining. B. Mobasher et al. [18]describes how to mine Web usage patterns and Web contents for the personalizationfrom Web access log. He proposes the recommendation system that can recommendnew content to the visitor. Fenstermacher and Ginsburg [19] describe weaknesses ofserver-side monitoring and propose a client-side monitoring system. S. Dua et al [20]proposes an algorithm to extract access sequences from semi-structured Web accesslog.
3 Service Page Detection for Personalization
In this section, we describe Web page features that are related with service page de-tection and personalization. Some Web pages provide interaction-based services to theuser. Most of these pages contain forms and Web scripts that need data processing at

56 Yeonghyo Jeon and Eenjun Hwang
the server side or dynamic service control. We call such page service page. For exam-ple, assume we make reservation on the Web. If the user wants to reserve any movie,he or she wants to access only the page containing reservation information directly.Probably reservation service page has some forms for user input. In addition, it causesdata processing to the server.
A service page source may has service features such as form tags to take user inputand Web script to provide link to server processes or service control. Also, severalfeatures can be obtained when the user accesses service pages. Service features usu-ally take long response time due to the extra processing time. Especially, in case theuser requests multimedia services for image, audio and video, large amount of net-work resource should be allocated. We name such codes or features as service ele-ments.
Some service elements such as the search form or media player for video in HTMLand sports news section in a news page take only small portion on the whole page.When users want to use a service, only that portion of the page containing the serviceelement is needed. For example, on accessing yahoo or google only for Web search,the search form for keyword input will be sufficient. If the user wants to watch musicvideo, link list for video player launches will be enough. All other service elements areunnecessary. Generally, a page author groups services into blocks and locates serviceelements in a page frame, in a table cell or in a draw layer. We call such a region asservice region. A service region is a small part of service page where service elementsare clustered. Therefore, service regions can be moved to a mobile device using lownetwork bandwidth by simple transformation process.
17
9
8
6
3
2
4
5
(a) (b)
Fig. 1. Service page and region
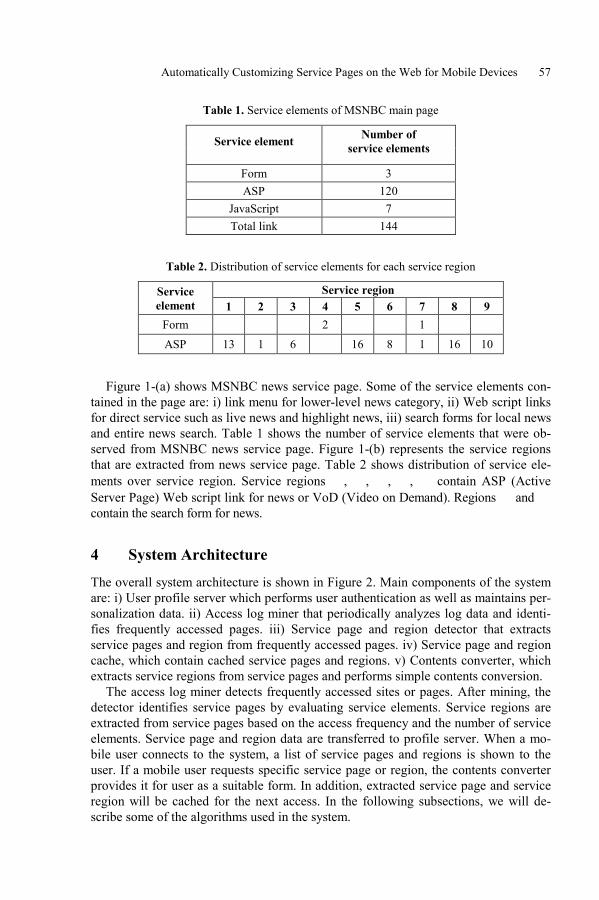
Automatically Customizing Service Pages on the Web for Mobile Devices 57
Table 1. Service elements of MSNBC main page
Service element Number ofservice elements
Form 3ASP 120
JavaScript 7Total link 144
Table 2. Distribution of service elements for each service region
Service regionServiceelement 1 2 3 4 5 6 7 8 9
Form 2 1ASP 13 1 6 16 8 1 16 10
Figure 1-(a) shows MSNBC news service page. Some of the service elements con-tained in the page are: i) link menu for lower-level news category, ii) Web script linksfor direct service such as live news and highlight news, iii) search forms for local newsand entire news search. Table 1 shows the number of service elements that were ob-served from MSNBC news service page. Figure 1-(b) represents the service regionsthat are extracted from news service page. Table 2 shows distribution of service ele-ments over service region. Service regions �, �, �, �, � contain ASP (ActiveServer Page) Web script link for news or VoD (Video on Demand). Regions � and �contain the search form for news.
4 System Architecture
The overall system architecture is shown in Figure 2. Main components of the systemare: i) User profile server which performs user authentication as well as maintains per-sonalization data. ii) Access log miner that periodically analyzes log data and identi-fies frequently accessed pages. iii) Service page and region detector that extractsservice pages and region from frequently accessed pages. iv) Service page and regioncache, which contain cached service pages and regions. v) Contents converter, whichextracts service regions from service pages and performs simple contents conversion.
The access log miner detects frequently accessed sites or pages. After mining, thedetector identifies service pages by evaluating service elements. Service regions areextracted from service pages based on the access frequency and the number of serviceelements. Service page and region data are transferred to profile server. When a mo-bile user connects to the system, a list of service pages and regions is shown to theuser. If a mobile user requests specific service page or region, the contents converterprovides it for user as a suitable form. In addition, extracted service page and serviceregion will be cached for the next access. In the following subsections, we will de-scribe some of the algorithms used in the system.

58 Yeonghyo Jeon and Eenjun Hwang
Fig. 2. System architecture
4.1 User Profile Server
In the web personalization, user identification is a challenging problem. Although IPaddress provides a simple and common solution for user identification, it has a seriousdrawback. Most ISPs (Internet Service Provider) use the DHCP (Dynamic Host Con-figuration Protocol) to manage IP addresses. They randomly assign one of several IPaddresses to each request from users. Thus, the same IP address might be assigned totwo or more users [19]. To identify users, we used a separate profile server to identifythe user more accurately and reduce proxy workload. Also, it manages user preferenceand device profile. When the user first accesses the system, he or she provides simpleauthentication, preference and device profile for the user profile server. Figure 3shows the input form for the user profile server. In the figure, preferential factor pro-vides language, sound and other user preference items. Device profile has specifica-tions for Hardware and Software platform. Hardware platform has device specificationsuch as vendor, model, class of device, screen size, bandwidth and so on. Softwareplatform specification includes OS brand, version and level of HTML support etc.
Users send their profile to the user profile server using CC/PP (Composite Capa-bility/Preference Profiles)[21]. A CC/PP profile is a description of device capabilitiesand user preferences. The RDF (Resource Description Framework)[22] is used to cre-ate profiles. We use simple RDF schema and input form for user profile data. The pro-file DB stores user profile with service page and region data. Authentication profileidentifies users uniquely. Device profiles are used for content conversion process.Figure 4 shows a part of CC/PP profile.
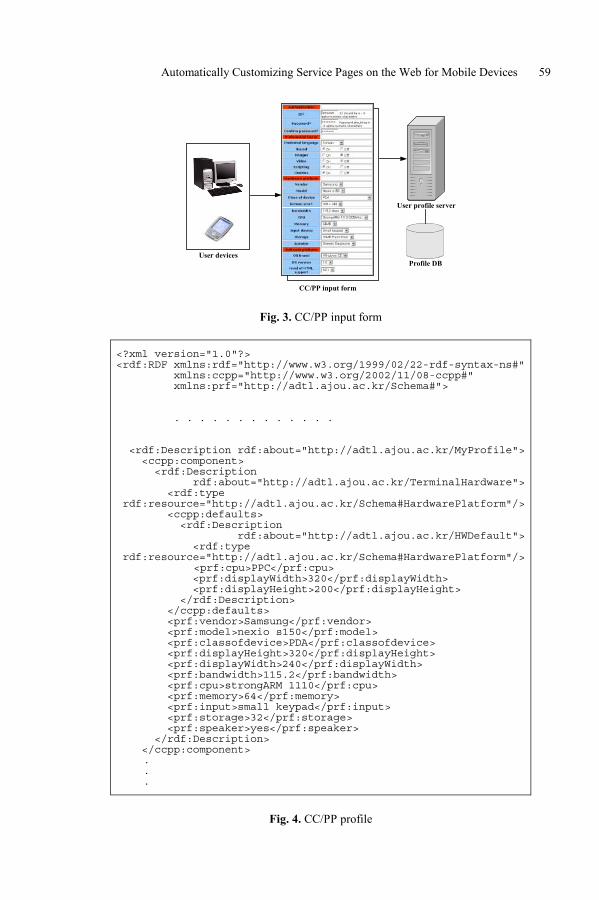
Automatically Customizing Service Pages on the Web for Mobile Devices 59
User devices
CC/PP input form
User profile server
Profile DB
Fig. 3. CC/PP input form
<?xml version="1.0"?><rdf:RDF xmlns:rdf="http://www.w3.org/1999/02/22-rdf-syntax-ns#" xmlns:ccpp="http://www.w3.org/2002/11/08-ccpp#" xmlns:prf="http://adtl.ajou.ac.kr/Schema#">
. . . . . . . . . . . . .
<rdf:Description rdf:about="http://adtl.ajou.ac.kr/MyProfile"> <ccpp:component> <rdf:Description rdf:about="http://adtl.ajou.ac.kr/TerminalHardware"> <rdf:type rdf:resource="http://adtl.ajou.ac.kr/Schema#HardwarePlatform"/> <ccpp:defaults> <rdf:Description rdf:about="http://adtl.ajou.ac.kr/HWDefault"> <rdf:type rdf:resource="http://adtl.ajou.ac.kr/Schema#HardwarePlatform"/>
<prf:cpu>PPC</prf:cpu> <prf:displayWidth>320</prf:displayWidth> <prf:displayHeight>200</prf:displayHeight> </rdf:Description> </ccpp:defaults> <prf:vendor>Samsung</prf:vendor> <prf:model>nexio s150</prf:model> <prf:classofdevice>PDA</prf:classofdevice> <prf:displayHeight>320</prf:displayHeight> <prf:displayWidth>240</prf:displayWidth> <prf:bandwidth>115.2</prf:bandwidth> <prf:cpu>strongARM 1110</prf:cpu> <prf:memory>64</prf:memory> <prf:input>small keypad</prf:input> <prf:storage>32</prf:storage> <prf:speaker>yes</prf:speaker> </rdf:Description> </ccpp:component>
. .
.
Fig. 4. CC/PP profile
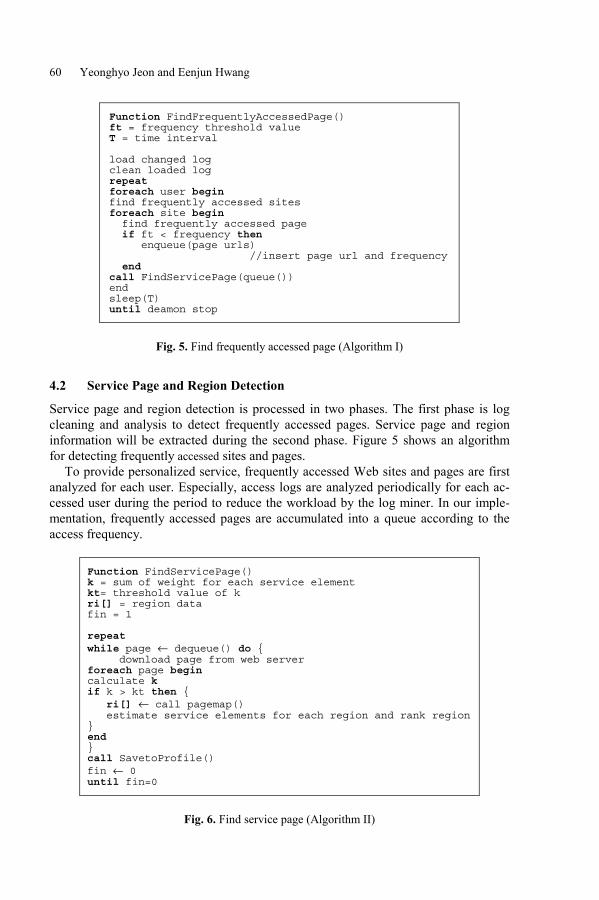
60 Yeonghyo Jeon and Eenjun Hwang
Function FindFrequentlyAccessedPage()ft = frequency threshold valueT = time interval
load changed logclean loaded logrepeatforeach user beginfind frequently accessed sitesforeach site begin find frequently accessed page if ft < frequency then enqueue(page urls) //insert page url and frequency endcall FindServicePage(queue())endsleep(T)until deamon stop
Fig. 5. Find frequently accessed page (Algorithm I)
4.2 Service Page and Region Detection
Service page and region detection is processed in two phases. The first phase is logcleaning and analysis to detect frequently accessed pages. Service page and regioninformation will be extracted during the second phase. Figure 5 shows an algorithmfor detecting frequently accessed sites and pages.
To provide personalized service, frequently accessed Web sites and pages are firstanalyzed for each user. Especially, access logs are analyzed periodically for each ac-cessed user during the period to reduce the workload by the log miner. In our imple-mentation, frequently accessed pages are accumulated into a queue according to theaccess frequency.
Function FindServicePage()k = sum of weight for each service elementkt= threshold value of kri[] = region datafin = 1
repeatwhile page ← dequeue() do { download page from web serverforeach page begincalculate kif k > kt then { ri[] ← call pagemap() estimate service elements for each region and rank region}end}call SavetoProfile()fin ← 0until fin=0
Fig. 6. Find service page (Algorithm II)
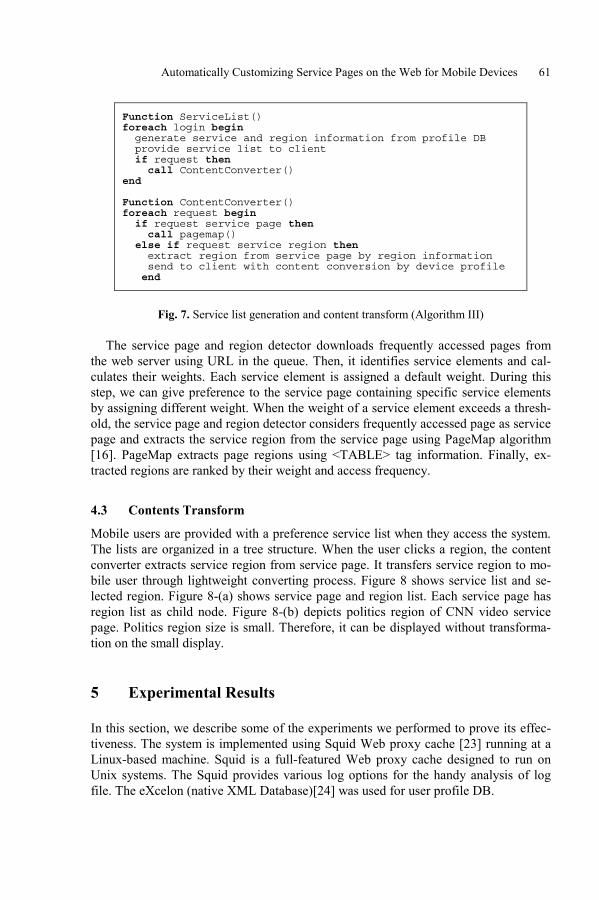
Automatically Customizing Service Pages on the Web for Mobile Devices 61
Function ServiceList()foreach login begin generate service and region information from profile DB provide service list to client if request then call ContentConverter()end
Function ContentConverter()foreach request begin if request service page then call pagemap() else if request service region then extract region from service page by region information send to client with content conversion by device profile end
Fig. 7. Service list generation and content transform (Algorithm III)
The service page and region detector downloads frequently accessed pages fromthe web server using URL in the queue. Then, it identifies service elements and cal-culates their weights. Each service element is assigned a default weight. During thisstep, we can give preference to the service page containing specific service elementsby assigning different weight. When the weight of a service element exceeds a thresh-old, the service page and region detector considers frequently accessed page as servicepage and extracts the service region from the service page using PageMap algorithm[16]. PageMap extracts page regions using <TABLE> tag information. Finally, ex-tracted regions are ranked by their weight and access frequency.
4.3 Contents Transform
Mobile users are provided with a preference service list when they access the system.The lists are organized in a tree structure. When the user clicks a region, the contentconverter extracts service region from service page. It transfers service region to mo-bile user through lightweight converting process. Figure 8 shows service list and se-lected region. Figure 8-(a) shows service page and region list. Each service page hasregion list as child node. Figure 8-(b) depicts politics region of CNN video servicepage. Politics region size is small. Therefore, it can be displayed without transforma-tion on the small display.
5 Experimental Results
In this section, we describe some of the experiments we performed to prove its effec-tiveness. The system is implemented using Squid Web proxy cache [23] running at aLinux-based machine. Squid is a full-featured Web proxy cache designed to run onUnix systems. The Squid provides various log options for the handy analysis of logfile. The eXcelon (native XML Database)[24] was used for user profile DB.

62 Yeonghyo Jeon and Eenjun Hwang
(a) (b)
Fig. 8. Service list and selected region
In order to produce detailed access log, we arranged every requests to go to its Webserver through our system. In general, mobile devices have a small cache, so we ig-nored it in our experiment. Consequently, all the pages visited and links followed wererecorded in the access log. In addition to the preliminary log cleaning, we removedunnecessary information that was generated unintentionally. For example, messengeror adware such as ICQ and MSN are removed since they periodically access web sitesfor advertisements.
Then, we asked twenty users to answer the following questions: First, what is themost frequently accessed web site? Second, What is the most frequently used servicefor each site that was answered at the first question? After answering the requiredquestions, users had used the Web for a week. In this period, the system extractedservice pages and regions. To evaluate its effectiveness, we measured the recall andprecision [25]. Recall is the proportion of relevant service pages retrieved, while pre-cision quantifies the proportion of retrieved service page that are relevant to the fre-quently used service page. We used following variables.
For each user
(1) All pages: All service pages that were extracted from the system.(2) Relevant pages: Service pages that were submitted by the users. We removed
some service pages that were not included in all pages. Removed pages arecaused by users´ wrong answer, popular page becomes unpopular. For example,the user frequently accesses some online stores for shopping. However, afterpurchasing, the users hardly access shopping sites again for a time.
(3) Retrieved pages: Frequently accessed service pages that were extracted from thesystem. We increased the number of retrieved service pages from 5 to 20 by 5.In service list, a service page is shown as a line that has a hyperlink. Generally,cell phone has 5-10 line display and smart phone has about 15 line display. PDAcan display about 20 lines using browser. Thus, we calculated four precisions forvarious display size of mobile devices.
(4) Relevant and retrieved pages: The set of service pages that are both relevant andretrieved.
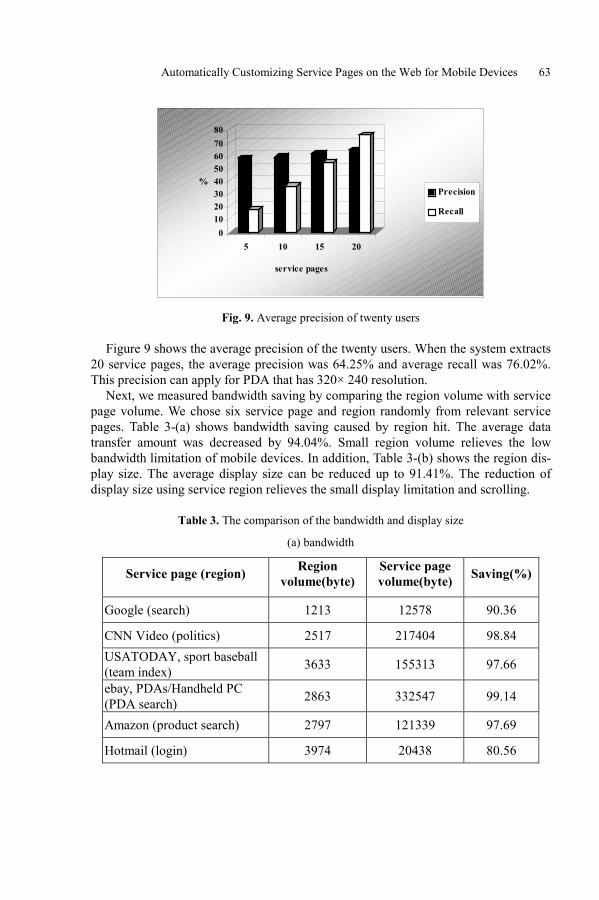
Automatically Customizing Service Pages on the Web for Mobile Devices 63
01020304050607080
%
5 10 15 20
service pages
Precision
Recall
Fig. 9. Average precision of twenty users
Figure 9 shows the average precision of the twenty users. When the system extracts20 service pages, the average precision was 64.25% and average recall was 76.02%.This precision can apply for PDA that has 320× 240 resolution.
Next, we measured bandwidth saving by comparing the region volume with servicepage volume. We chose six service page and region randomly from relevant servicepages. Table 3-(a) shows bandwidth saving caused by region hit. The average datatransfer amount was decreased by 94.04%. Small region volume relieves the lowbandwidth limitation of mobile devices. In addition, Table 3-(b) shows the region dis-play size. The average display size can be reduced up to 91.41%. The reduction ofdisplay size using service region relieves the small display limitation and scrolling.
Table 3. The comparison of the bandwidth and display size
(a) bandwidth
Service page (region) Regionvolume(byte)
Service pagevolume(byte) Saving(%)
Google (search) 1213 12578 90.36
CNN Video (politics) 2517 217404 98.84USATODAY, sport baseball(team index) 3633 155313 97.66
ebay, PDAs/Handheld PC(PDA search) 2863 332547 99.14
Amazon (product search) 2797 121339 97.69
Hotmail (login) 3974 20438 80.56

64 Yeonghyo Jeon and Eenjun Hwang
(b) display size
Service page(region)Service Pagedisplay size
(pixels)
Regiondisplay size
(pixels)Saving(%)
Google (search) 523×427 419×79 85.18
CNN Video (politics) 770×1024(↑) 307×331 87.11USATODAY, sport baseball(team index) 770×1024(↑) 141×117 97.91
ebay, PDAs/Handheld PC(PDA search) 1024×1024(↑) 163×287 95.54
Amazon (product search) 770×1024(↑) 171×75 98.37
Hotmail (login) 649×637 316×205 84.33
6 Conclusions
With the popularity of wireless Internet access, an alternative to browse Web contentson mobile devices is required. In addition, due to enormous amount of information,Web personalization was proposed to provide customized information to each user.Mobile personalization system can personalize every aspect of hardware and software.By a using mobile personalization scheme, limitation of mobile devices can be re-lieved. Also, it can help users to access interesting Web contents and service moreeasily.
In this paper, we proposed a new personalization system that has focused on servicepages. Our system personalizes frequently used service pages by log and service ele-ment analysis. Consequently, users are enabled to access Web services as mobileservices. In addition, the proposed system efficiently reduces content conversionoverhead and overcomes small display of mobile device by region extraction
References
[1] comScore Networks, Inc. - http://www.comscore.com[2] Computer Industry Almanac Inc. - http://www.c-i-a.com[3] O. Buyukkokten, H. Garcia Molina, A. Paepcke and T. Winograd, "Power
Browser: Efficient Web Browsing for PDAs," Proceedings of the Conferenceon Human Factors in Computing Systems, pp. 430-437, 2000
[4] T. Bickmore and B. Schilit, "Digestor: Device-independent Access to the WorldWide Web," Proceedings of the 6th International World Wide Web Conference,pp. 655-663, 1999
[5] AvantGo, Inc. - http://www.avantgo.com[6] Earthlink, Inc. - http://www.earthlink.net[7] C. Sharma, Wireless Internet Enterprise Applications � A Willey Tech Brief,
John Wiley & Sons, Inc, pp.91-93, 2001
Automatically Customizing Service Pages on the Web for Mobile Devices 65
[8] C. R. Anderson, P. Domingos and D. S. Weld, "Personalizing Web Sites forMobile Users," Proceedings of the 10th World Wide Web Conference, 2001
[9] C. R. Anderson, P. Domingos and D. S. Weld, "Adaptive web navigation forwireless devices," Proceedings of the 17th International Joint Conference onArtificial Intelligence, 2001
[10] D. Billsus, M. J. Pazzani and J. Chen, "A learning agent for wireless news ac-cess," Proceedings of the 2000 International Conference on Intelligent User In-terfaces, pp. 33-36, 2000
[11] C. Yih-Farn, H. Huale, R. Jana, S. John, S. Jora, A. Reibman and W. Bin, "Per-sonalized multimedia services using a mobile service platform," WirelessCommunications and Networking Conference, 2002
[12] J. Freire, B. Kumar and D. F. Lieuwen, "WebViews: accessing personalizedweb content and services," Proceedings of the 10th International Conference onWorld Wide Web, pp. 576 - 586, 2001
[13] V. Anupam, J. Freire, B. Kumar and D. Lieuwen, "Automating Web navigationwith the WebVCR," Computer Networks, Vol 33(1-6), pp. 503-517, 2000
[14] J. Steinberg and J. Pasquale, "A web middleware architecture for dynamic cus-tomization of content for wireless clients," Proceedings of the 11th InternationalConference on World Wide Web, Honolulu, Hawaii, USA, 2002
[15] M. Hori, G. Kondoh, K. Ono, S. Hirose and S. Singhal, "Annotation-based webcontent transcoding," Proceeding of 9th International World Wide Web Confer-ence, pp. 197-211, 2000
[16] D. Song and E. Hwang. "PageMap: Summarizing Web Pages for Small DisplayDevices," Proceeding of International Conference on Internet Computing, Vol.2, pp. 506-512, June 2002
[17] J. Srivastava, R. Cooley, M. Deshpande and Tan, P.-N. "Web Usage Mining:Discovery and Applications of Usage Patterns from Web Data," SIGKDD Ex-plorations, Vol. 1(2), pp. 12-23, January 2000
[18] B. Mobasher, R. Cooley and J. Srivastava. "Automatic Personalization Basedon Web Usage Mining," Communications of the ACM, Vol. 43(8), pp. 142-151, August 2000
[19] K.D. Fenstermacher and M. Ginsburg. "Mining client-side activity for person-alization," Advanced Issues of E-Commerce and Web-Based Information Sys-tems (WECWIS 2002), Proceedings of 4th IEEE International Workshop, pp.205-212, 2002
[20] S. Dua, E. Cho and S.S. Iyengar. "Discovery of Web frequent patterns and usercharacteristics from Web access logs: a framework for dynamic Web personal-ization," Application-Specific Systems and Software Engineering Technology,2000. Proceedings of 3rd IEEE Symposium, pp. 3-8, 2000
[21] http://www.w3.org/Mobile/CCPP/ - CC/PP (Composite Capabilities /PreferenceProfiles)
[22] http://www.w3.org/RDF/ - RDF[23] Squid Web Proxy Cache - http://www.squid-cache.org/[24] eXcelon - http://www.exln.com/[25] J. Han and M. Kamber, Data Mining: Concepts and Techniques, Morgan
Kaufmann Publishers, pp. 428-433, 2001

Author-X – A System for Secure Dissemination
and Update of XML Documents
Elisa Bertino1, Barbara Carminati1, Elena Ferrari2, and Giovanni Mella1
1 Dipartimento di Informatica e Comunicazione, Universita degli Studi di MilanoVia Comelico, 39/41, 20135 Milano, Italy
Fax +39-0250316253
{bertino,carminati,mella}@dico.unimi.it2 Dipartimento di Scienze Chimiche, Fisiche e Matematiche, Universita dell’Insubria
ComoVia Valleggio, 11, 22100 Como, Italy
Fax +39-0312386119
Abstract. In this paper we describe the main features of Author-X , aJava-based system providing a comprehensive environment for securingXML documents. The most innovative and relevant features of Author-Xare the support for different dissemination strategies (i.e., push and pull)and for cooperative and distributed updates of XML documents. Thesefunctionalities are obtained through the use of digital signature and en-cryption techniques. In the paper, besides illustrating the general archi-tecture of Author-X , we describe in details the strategies we have devisedfor the support of both information push and distributed updates
1 Introduction
A key requirement of today web-based applications is related to security of infor-mation that are made available and disseminated among users and applications.Even though a large number of techniques are today available to protect datawhen being transmitted across sites, such as cryptography and electronic sig-natures, a truly comprehensive approach for data protection must also includemechanisms for enforcing access control policies, based on data contents, onsubject qualifications and characteristics, as well as on other relevant contex-tual information, such as time. It is today well understood also that, in orderto specify effective access control policies, one must take into account data se-mantics. In database systems for example, data semantics is mainly conveyed byschema information and therefore access control policies are expressed againstthe database schema. Achieving the same level of functionality for web data istoday possible because of the widespread use of XML [11] for describing datathat are circulated across web sites. The advent of XML has thus pushed thedevelopment of access control models and systems. Such models and systemsare crucial in order to facilitate a selective dissemination of XML documents
N. Bianchi-Berthouze (Ed.): DNIS 2003, LNCS 2822, pp. 66–85, 2003.c© Springer-Verlag Berlin Heidelberg 2003
Author-X 67
containing information of different sensitivity levels among (possibly large) usercommunities. An overview of research work can be found in [6].
The development of access control models and systems for XML data poses,however, several requirements. The fact that XML semantic elements, delimitedby application-defined tags, can be directly and independently retrieved thoughXML query languages requires a system able to control access at varying levelswithin the protected documents. In some cases, a single-access control policymay apply to a set of documents; in other cases, different policies may applyto fine-grained portions of the same document. Many other intermediate situa-tions also arise. Therefore, a suitable access control system must have provisionfor variable protection granularity level. Another relevant requirement derivesfrom the need of supporting a variety of data dissemination techniques, suchas for example information push and pull, by yet enforcing the stated accesscontrol policies. Such a need may require the adoption of different access con-trol techniques depending on the information dissemination strategy adopted.A comprehensive access control system must thus provide all those techniquesin order to adapt to various dissemination strategies. Finally, another relevantrequirement is represented by the fact that several new web-enabled applica-tions, such as virtual communities and contract negotiation, require support fordistributed cooperative document updates. Therefore, a suitable access controlsystem must not only support read privileges for the disseminated documents,but it must also provide a large variety of update privileges reflecting the variousmodification operations that are possible on XML documents.
In this paper we discuss how the above requirements can be meet by describ-ing the solutions adopted in the framework of the Author-X system, a Java-based system, for discretionary access control of XML documents. Author-Xtakes into account XML document characteristics, the presence of DTDs/XMLschemas describing the structure of documents at a schema level, and the typesof actions that can be executed on XML documents (i.e., navigation, browsing,and update), as well temporal constraints, for implementing an access controlmechanism tailored to XML. Furthermore, Author-X supports the specificationof subject credentials as a way to enforce access control based on subject quali-fications and profiles, and two different document distribution policies, namelypush distribution for document broadcast, and pull distribution for document dis-tribution on user demand. Finally, Author-X supports distributed cooperativeupdates through a combination of hash functions, digital signature techniquesand digital certificates. The Author-X approach to distributed updates allowsa subject to verify a document’s integrity without requiring interactions withthe document server.
The remainder of this paper is organized as follows. Next section presents anoverview of the Author-X architecture, whereas Section 3 presents the securitypolicies supported by our system. In Section 4 we show how Author-X supportsthe push selective dissemination mode, whereas Section 5 presents the manage-ment of a collaborative and distribute update process. Finally, in Section 6 thepaper presents future work.
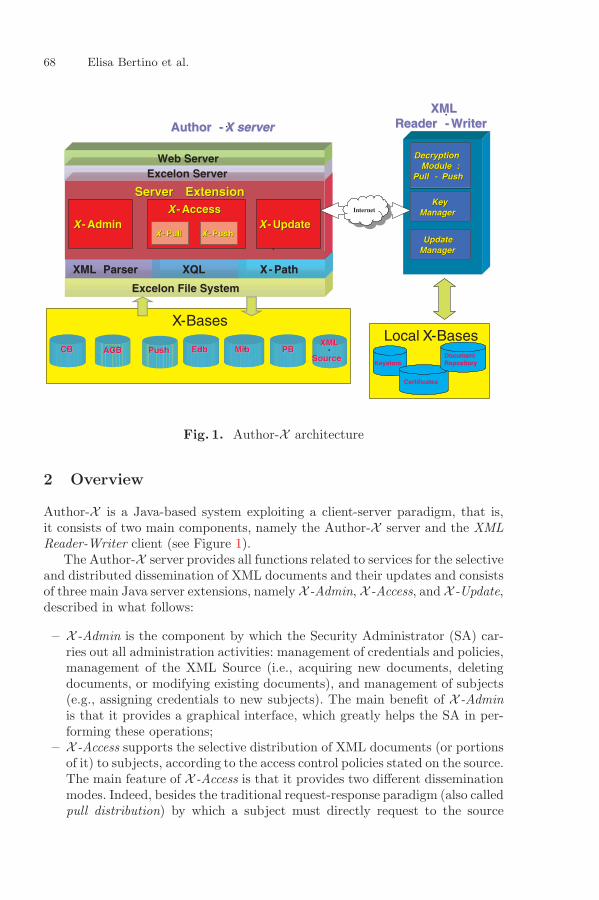
68 Elisa Bertino et al.
Local X-BasesX-Bases
Excelon File System
XMLXML
SourceSource
XMLXML
SourceSource
XML Parser XQL X- PathXML Parser XQL X- Path
Server Server ExtensionExtension
Excelon ServerWeb Server
AuthorAuthor -- X serverX server
PBPBPBPBPushPushCBCBCBCB EdbEdbEdbEdb
XX -- AccessAccessXX -- AdminAdmin
XX -- PullPull
InternetInternet
Keystore
DecryptionDecryptionModuleModule ::
PullPull -- Push Push
UpdateUpdateManagerManager
XMLXMLReaderReader -- WriterWriter
XX -- UpdateUpdate
KeyKeyManagerManager
MibMibMibMib
XX -- PushPush
Certificates
Document Repository
ACBACB
Fig. 1. Author-X architecture
2 Overview
Author-X is a Java-based system exploiting a client-server paradigm, that is,it consists of two main components, namely the Author-X server and the XMLReader-Writer client (see Figure 1).
The Author-X server provides all functions related to services for the selectiveand distributed dissemination of XML documents and their updates and consistsof three main Java server extensions, namely X -Admin, X -Access, and X -Update,described in what follows:
– X -Admin is the component by which the Security Administrator (SA) car-ries out all administration activities: management of credentials and policies,management of the XML Source (i.e., acquiring new documents, deletingdocuments, or modifying existing documents), and management of subjects(e.g., assigning credentials to new subjects). The main benefit of X -Adminis that it provides a graphical interface, which greatly helps the SA in per-forming these operations;
– X -Access supports the selective distribution of XML documents (or portionsof it) to subjects, according to the access control policies stated on the source.The main feature of X -Access is that it provides two different disseminationmodes. Indeed, besides the traditional request-response paradigm (also calledpull distribution) by which a subject must directly request to the source
Author-X 69
the documents of interest when needed, X -Access supports also the pushdistribution, according to which it periodically sends (or when some pre-defined events happen) its documents (or portions of them) to authorizedsubjects. As shown in Figure 1, X -Access consists of two modules, that is,X -Pull and X -Push, which enforce the pull and push distribution mode,respectively;
– X -Update is the component that supports distributed and collaborative up-dates of XML documents. This means that an XML document can undergoa controlled sequential update process in which a sequence of subjects re-ceive the document and may exercise modification operations, according tothe access control policies that apply to it. The key feature is that X -Updatemakes, in most cases, a receiver subject able to locally verify the correctnessof the updates performed on the document, without requiring interactionwith the document server.
All security information managed by Author-X are encoded using XML, thusallowing a uniform protection of data and their related security information.XML documents are managed through the eXcelon XML data server [5] andorganized into an XML native database, called X-bases, which contains fivemain repositories:
– Credential Base (CB): it contains the subject credentials and the credentialtypes;
– Policy Base (PB): it contains the access control policies for the documentsstored in the XML-Source;
– Authoring Certificate Base (ACB): it contains the certificates generated ac-cording to the policies stored in PB;
– Push: it contains the XML representation of all the information needed bythe push dissemination mechanism;
– Encryption Document Base (EDB): it contains the encrypted copy of someof the documents stored in the XML-Source. Such representation is used toenforce information push;
– Management Information Base (MIB): it contains all the information re-quired to manage the collaborative update of documents stored in the XML-Source.
Each subject wishing to interact with the Author-X server needs to be sup-plied with the proper client called XML Reader-Writer. This client provides thefollowing functions: 1) transmission to the server of document access requests;2) decryption of the copies of documents received by the server, when the pushdissemination mode is adopted; 3) management of the collaborative update pro-cesses. In order to perform all these tasks, the XML Reader-Writer needs tomanage a local XML-based database that consists of the following repositories:
– KeyStore: it contains the keys received by the server to decrypt the encrypteddocuments sent by the server itself or by another subject;
– Certificates: it contains the certificates received by the server;
70 Elisa Bertino et al.
– Document Repository: it contains the encrypted documents or the documentpackages received by the server or by another subject;
The architecture we discuss so far is the final result of several efforts carriedout by our group in the last years. The first version of Author-X , describedin [7], includes only the X -Admin and the pull component of X -Access. For thisreason, in this paper we mainly focus on the push dissemination mode and on thecollaborative and distributed updates of XML documents, which are the mostinnovative features of Author-X . Before doing that, we need to briefly introduceAuthor-X security policies, since these are the building blocks of both the pulldissemination mode and the collaborative and distributed updates.
3 Security Policies for XML Documents
In general, security policies in a Web environment specify the principles forthe protection and release of data on the Web. According to this definitionit is possible to distinguish two different categories of security policies: accesscontrol policies and dissemination policies. The former specify the authorizationrules and conditions according to which subjects are allowed to access an XMLdocument (or portions of it). Whereas the latter state the distribution modesunder which the release of data contents should occur. In the following section,we illustrate the security policies supported by Author-X .
3.1 Access Control Policies
An access control policy basically specifies who can access which object and underwhich mode. In the following we describe access control policy specification inAuthor-X by focusing on the most relevant features that the Author-X accesscontrol model provides.
Who – Subject Credentials. Access control policies are based on the notionof credential [10], where a credential is set of attributes, representing subjectproperties (either simple or composite) that are relevant for access control pur-pose, such as for instance the age or the nationality of a subject. To make thetask of credential specification easier, credentials with the same structure aregrouped into credential types. A credential is, thus, an instance of a credential-type, and specifies the set of property values characterizing a given subjectagainst the credential-type itself. Author-X provides an XML-based language,called X -Sec [8], for encoding both credentials and credential types. In particu-lar, in X -Sec a credential-type is modeled as a DTD and a specific credential asan XML document valid according to the DTD representing the correspondingcredential-type. In the DTD simple properties are modeled as empty elements,whereas composite properties are modeled as elements with element content,whose subelements model composite property components. Examples of creden-tial specifications in X -Sec are reported in Figure 2. Each credential contains
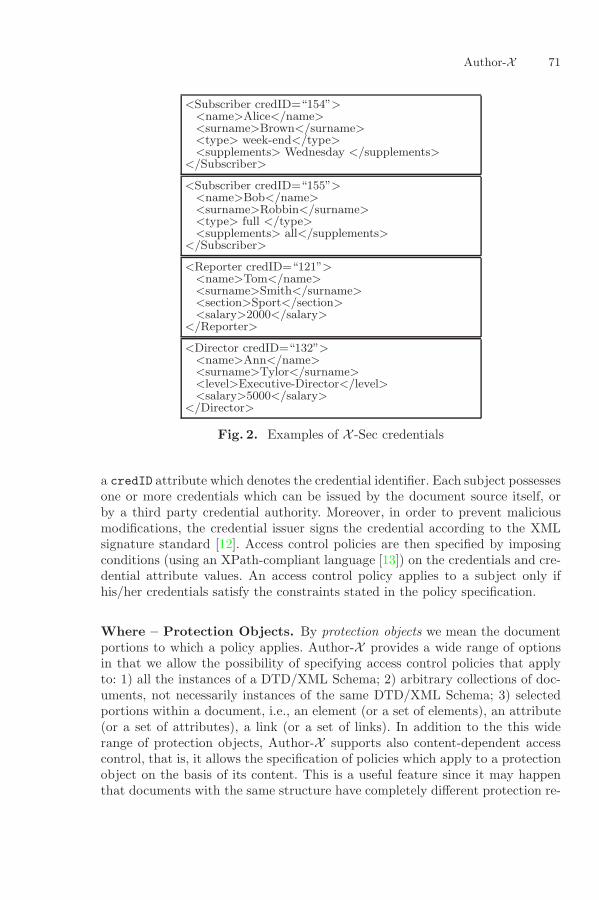
Author-X 71
<Subscriber credID=“154”><name>Alice</name><surname>Brown</surname><type> week-end</type><supplements> Wednesday </supplements>
</Subscriber>
<Subscriber credID=“155”><name>Bob</name><surname>Robbin</surname><type> full </type><supplements> all</supplements>
</Subscriber>
<Reporter credID=“121”><name>Tom</name><surname>Smith</surname><section>Sport</section><salary>2000</salary>
</Reporter>
<Director credID=“132”><name>Ann</name><surname>Tylor</surname><level>Executive-Director</level><salary>5000</salary>
</Director>
Fig. 2. Examples of X -Sec credentials
a credID attribute which denotes the credential identifier. Each subject possessesone or more credentials which can be issued by the document source itself, orby a third party credential authority. Moreover, in order to prevent maliciousmodifications, the credential issuer signs the credential according to the XMLsignature standard [12]. Access control policies are then specified by imposingconditions (using an XPath-compliant language [13]) on the credentials and cre-dential attribute values. An access control policy applies to a subject only ifhis/her credentials satisfy the constraints stated in the policy specification.
Where – Protection Objects. By protection objects we mean the documentportions to which a policy applies. Author-X provides a wide range of optionsin that we allow the possibility of specifying access control policies that applyto: 1) all the instances of a DTD/XML Schema; 2) arbitrary collections of doc-uments, not necessarily instances of the same DTD/XML Schema; 3) selectedportions within a document, i.e., an element (or a set of elements), an attribute(or a set of attributes), a link (or a set of links). In addition to the this widerange of protection objects, Author-X supports also content-dependent accesscontrol, that is, it allows the specification of policies which apply to a protectionobject on the basis of its content. This is a useful feature since it may happenthat documents with the same structure have completely different protection re-
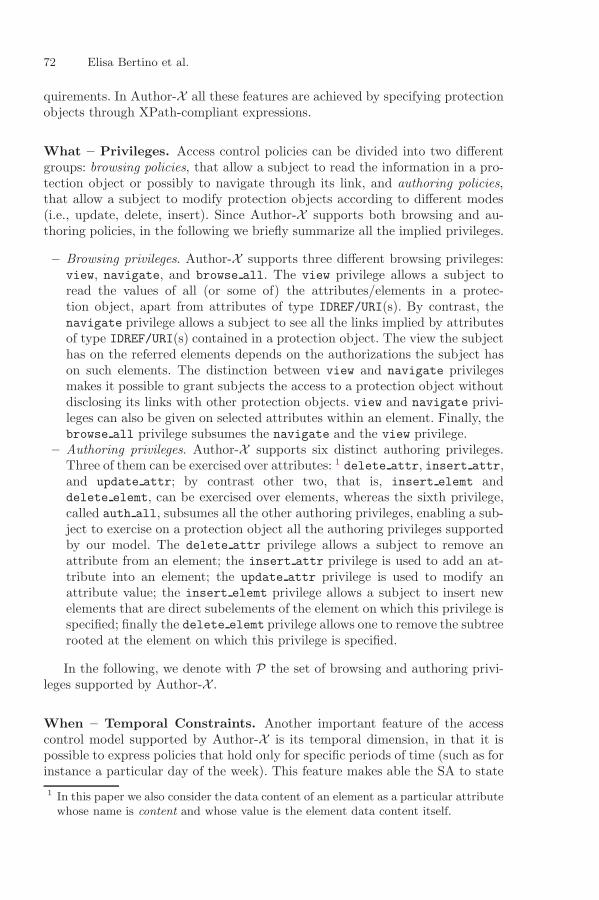
72 Elisa Bertino et al.
quirements. In Author-X all these features are achieved by specifying protectionobjects through XPath-compliant expressions.
What – Privileges. Access control policies can be divided into two differentgroups: browsing policies, that allow a subject to read the information in a pro-tection object or possibly to navigate through its link, and authoring policies,that allow a subject to modify protection objects according to different modes(i.e., update, delete, insert). Since Author-X supports both browsing and au-thoring policies, in the following we briefly summarize all the implied privileges.
– Browsing privileges. Author-X supports three different browsing privileges:view, navigate, and browse all. The view privilege allows a subject toread the values of all (or some of) the attributes/elements in a protec-tion object, apart from attributes of type IDREF/URI(s). By contrast, thenavigate privilege allows a subject to see all the links implied by attributesof type IDREF/URI(s) contained in a protection object. The view the subjecthas on the referred elements depends on the authorizations the subject hason such elements. The distinction between view and navigate privilegesmakes it possible to grant subjects the access to a protection object withoutdisclosing its links with other protection objects. view and navigate privi-leges can also be given on selected attributes within an element. Finally, thebrowse all privilege subsumes the navigate and the view privilege.
– Authoring privileges. Author-X supports six distinct authoring privileges.Three of them can be exercised over attributes: 1 delete attr, insert attr,and update attr; by contrast other two, that is, insert elemt anddelete elemt, can be exercised over elements, whereas the sixth privilege,called auth all, subsumes all the other authoring privileges, enabling a sub-ject to exercise on a protection object all the authoring privileges supportedby our model. The delete attr privilege allows a subject to remove anattribute from an element; the insert attr privilege is used to add an at-tribute into an element; the update attr privilege is used to modify anattribute value; the insert elemt privilege allows a subject to insert newelements that are direct subelements of the element on which this privilege isspecified; finally the delete elemt privilege allows one to remove the subtreerooted at the element on which this privilege is specified.
In the following, we denote with P the set of browsing and authoring privi-leges supported by Author-X .
When – Temporal Constraints. Another important feature of the accesscontrol model supported by Author-X is its temporal dimension, in that it ispossible to express policies that hold only for specific periods of time (such as forinstance a particular day of the week). This feature makes able the SA to state1 In this paper we also consider the data content of an element as a particular attributewhose name is content and whose value is the element data content itself.
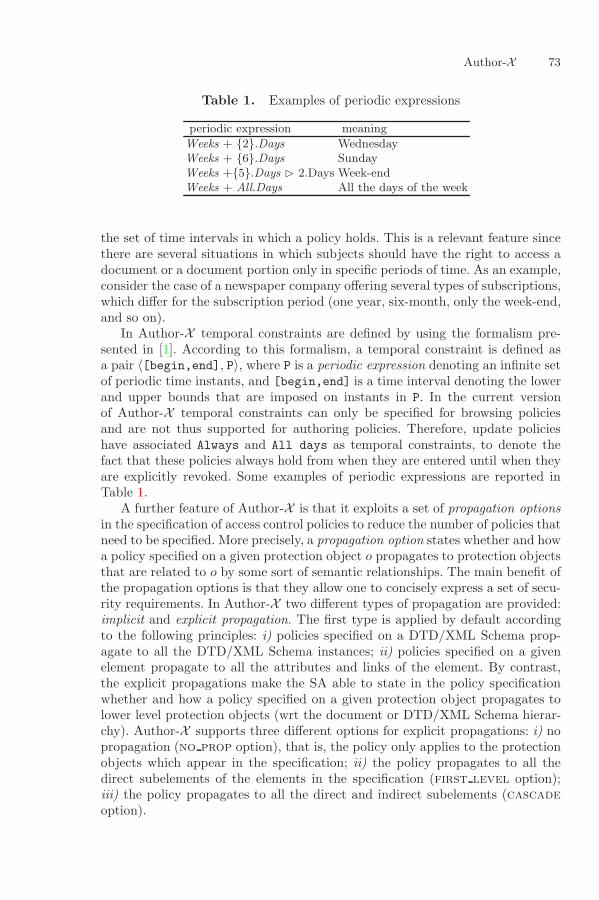
Author-X 73
Table 1. Examples of periodic expressions
periodic expression meaning
Weeks + {2}.Days WednesdayWeeks + {6}.Days SundayWeeks +{5}.Days ✄ 2.Days Week-endWeeks + All.Days All the days of the week
the set of time intervals in which a policy holds. This is a relevant feature sincethere are several situations in which subjects should have the right to access adocument or a document portion only in specific periods of time. As an example,consider the case of a newspaper company offering several types of subscriptions,which differ for the subscription period (one year, six-month, only the week-end,and so on).
In Author-X temporal constraints are defined by using the formalism pre-sented in [1]. According to this formalism, a temporal constraint is defined asa pair 〈[begin,end], P〉, where P is a periodic expression denoting an infinite setof periodic time instants, and [begin,end] is a time interval denoting the lowerand upper bounds that are imposed on instants in P. In the current versionof Author-X temporal constraints can only be specified for browsing policiesand are not thus supported for authoring policies. Therefore, update policieshave associated Always and All days as temporal constraints, to denote thefact that these policies always hold from when they are entered until when theyare explicitly revoked. Some examples of periodic expressions are reported inTable 1.
A further feature of Author-X is that it exploits a set of propagation optionsin the specification of access control policies to reduce the number of policies thatneed to be specified. More precisely, a propagation option states whether and howa policy specified on a given protection object o propagates to protection objectsthat are related to o by some sort of semantic relationships. The main benefit ofthe propagation options is that they allow one to concisely express a set of secu-rity requirements. In Author-X two different types of propagation are provided:implicit and explicit propagation. The first type is applied by default accordingto the following principles: i) policies specified on a DTD/XML Schema prop-agate to all the DTD/XML Schema instances; ii) policies specified on a givenelement propagate to all the attributes and links of the element. By contrast,the explicit propagations make the SA able to state in the policy specificationwhether and how a policy specified on a given protection object propagates tolower level protection objects (wrt the document or DTD/XML Schema hierar-chy). Author-X supports three different options for explicit propagations: i) nopropagation (no prop option), that is, the policy only applies to the protectionobjects which appear in the specification; ii) the policy propagates to all thedirect subelements of the elements in the specification (first level option);iii) the policy propagates to all the direct and indirect subelements (cascadeoption).
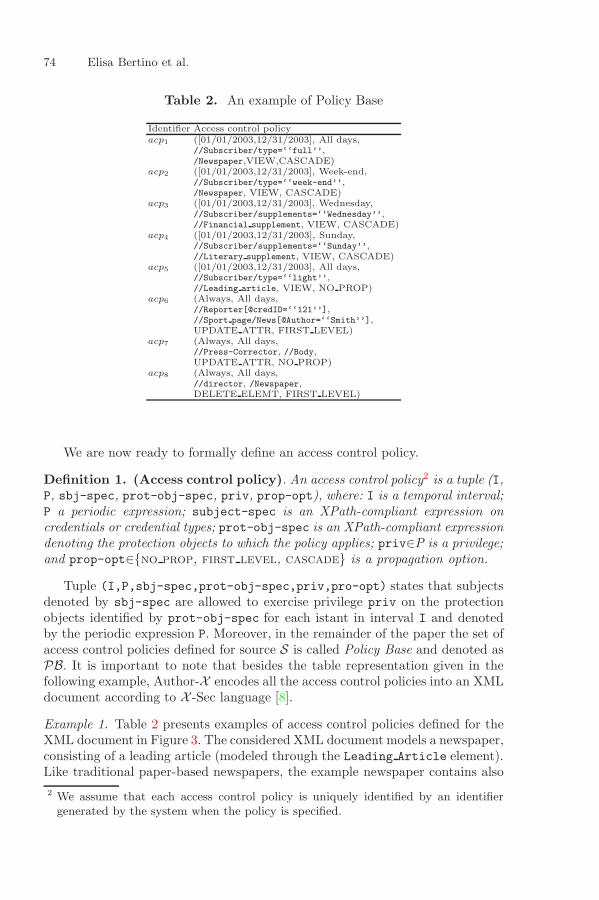
74 Elisa Bertino et al.
Table 2. An example of Policy Base
Identifier Access control policyacp1 ([01/01/2003,12/31/2003], All days,
//Subscriber/type=‘‘full’’,/Newspaper,VIEW,CASCADE)
acp2 ([01/01/2003,12/31/2003], Week-end,//Subscriber/type=‘‘week-end’’,/Newspaper, VIEW, CASCADE)
acp3 ([01/01/2003,12/31/2003], Wednesday,//Subscriber/supplements=‘‘Wednesday’’,//Financial supplement, VIEW, CASCADE)
acp4 ([01/01/2003,12/31/2003], Sunday,//Subscriber/supplements=‘‘Sunday’’,//Literary supplement, VIEW, CASCADE)
acp5 ([01/01/2003,12/31/2003], All days,//Subscriber/type=‘‘light’’,//Leading article, VIEW, NO PROP)
acp6 (Always, All days,//Reporter[@credID=‘‘121’’],//Sport page/News[@Author=‘‘Smith’’],UPDATE ATTR, FIRST LEVEL)
acp7 (Always, All days,//Press-Corrector, //Body,UPDATE ATTR, NO PROP)
acp8 (Always, All days,//director, /Newspaper,DELETE ELEMT, FIRST LEVEL)
We are now ready to formally define an access control policy.
Definition 1. (Access control policy). An access control policy2 is a tuple (I,P, sbj-spec, prot-obj-spec, priv, prop-opt), where: I is a temporal interval;P a periodic expression; subject-spec is an XPath-compliant expression oncredentials or credential types; prot-obj-spec is an XPath-compliant expressiondenoting the protection objects to which the policy applies; priv∈P is a privilege;and prop-opt∈{no prop, first level, cascade} is a propagation option.
Tuple (I,P,sbj-spec,prot-obj-spec,priv,pro-opt) states that subjectsdenoted by sbj-spec are allowed to exercise privilege priv on the protectionobjects identified by prot-obj-spec for each istant in interval I and denotedby the periodic expression P. Moreover, in the remainder of the paper the set ofaccess control policies defined for source S is called Policy Base and denoted asPB. It is important to note that besides the table representation given in thefollowing example, Author-X encodes all the access control policies into an XMLdocument according to X -Sec language [8].
Example 1. Table 2 presents examples of access control policies defined for theXML document in Figure 3. The considered XML document models a newspaper,consisting of a leading article (modeled through the Leading Article element).Like traditional paper-based newspapers, the example newspaper contains also2 We assume that each access control policy is uniquely identified by an identifiergenerated by the system when the policy is specified.
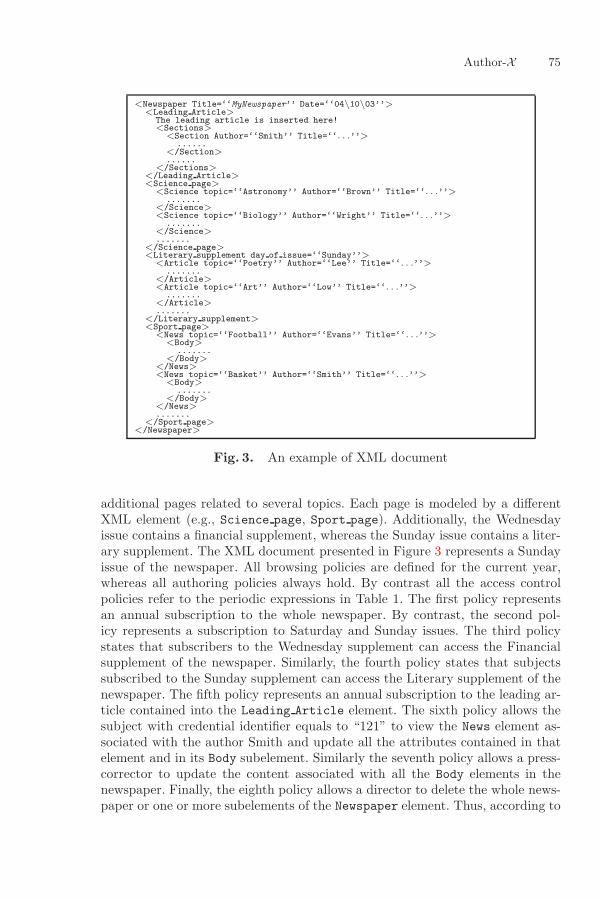
Author-X 75
<Newspaper Title=‘‘MyNewspaper’’ Date=‘‘04\10\03’’><Leading Article>
The leading article is inserted here!<Sections>
<Section Author=‘‘Smith’’ Title=‘‘. . .’’>......
</Section>......
</Sections></Leading Article><Science page>
<Science topic=‘‘Astronomy’’ Author=‘‘Brown’’ Title=‘‘. . .’’>.......
</Science><Science topic=‘‘Biology’’ Author=‘‘Wright’’ Title=‘‘. . .’’>
.......</Science>.......
</Science page><Literary supplement day of issue=‘‘Sunday’’>
<Article topic=‘‘Poetry’’ Author=‘‘Lee’’ Title=‘‘. . .’’>.......
</Article><Article topic=‘‘Art’’ Author=‘‘Low’’ Title=‘‘. . .’’>
.......</Article>.......
</Literary supplement><Sport page>
<News topic=‘‘Football’’ Author=‘‘Evans’’ Title=‘‘. . .’’><Body>
.......</Body>
</News><News topic=‘‘Basket’’ Author=‘‘Smith’’ Title=‘‘. . .’’>
<Body>.......
</Body></News>.......
</Sport page></Newspaper>
Fig. 3. An example of XML document
additional pages related to several topics. Each page is modeled by a differentXML element (e.g., Science page, Sport page). Additionally, the Wednesdayissue contains a financial supplement, whereas the Sunday issue contains a liter-ary supplement. The XML document presented in Figure 3 represents a Sundayissue of the newspaper. All browsing policies are defined for the current year,whereas all authoring policies always hold. By contrast all the access controlpolicies refer to the periodic expressions in Table 1. The first policy representsan annual subscription to the whole newspaper. By contrast, the second pol-icy represents a subscription to Saturday and Sunday issues. The third policystates that subscribers to the Wednesday supplement can access the Financialsupplement of the newspaper. Similarly, the fourth policy states that subjectssubscribed to the Sunday supplement can access the Literary supplement of thenewspaper. The fifth policy represents an annual subscription to the leading ar-ticle contained into the Leading Article element. The sixth policy allows thesubject with credential identifier equals to “121” to view the News element as-sociated with the author Smith and update all the attributes contained in thatelement and in its Body subelement. Similarly the seventh policy allows a press-corrector to update the content associated with all the Body elements in thenewspaper. Finally, the eighth policy allows a director to delete the whole news-paper or one or more subelements of the Newspaper element. Thus, according to

76 Elisa Bertino et al.
the credentials in Figure 2 and the access control policies in Table 2, Alice canaccess the whole newspaper during the week-end, and the Financial supplementon Wednesday. By contrast, Bob can read all newspaper issues for the wholeyear; Tom can always update the sport news whose author is himself, whereasAnn can delete the whole newspaper or one of its portions.
3.2 Dissemination Policies
Once the access control policies for a given source have been specified, XMLdocuments belonging to the source can be released to subjects, on the basis ofthe specified policies. Author-X supports two different dissemination policies,which are described in the following:
– Pull policies. This is the traditional mode according to which access controlusually takes place in conventional DBMSs. If the pull mode is adopted, thesubjects explicitly require the XML documents (or portions of documents)when needed. Upon a document request, Author-X first verifies whether therequesting subject is entitled to access the requested document, accordingto the specified access control policies. Based on these authorizations, thesubject is returned a view of the requested document(s), consisting of alland only those portions for which he/she has a corresponding authorization.When no authorizations are found, the access is denied.
– Push policies. Besides the traditional pull mode, also a push disseminationmode can be adopted in Author-X . Indeed, this distribution mode is particu-larly suited for XML documents that must be released to a large communityof subjects and which show a regular behaviour with respect to their re-lease. According to the push modality, Author-X periodically (or when somepre-defined events happen) sends (portion of) its documents to authorizedsubjects, without the need of an explicit access request by the subjects. Alsoin this case, different subjects may have privileges to see different, selectedportions of the same document based on the specified access control policies.To respect these different privileges, the mechanism enforcing informationpush must ensure a different view for each different subject.
In the following sections we focus only on the information push mechanismof Author-X since it represents the most novel approach to data dissemination.We refer the interested reader to [7] for a detailed description of information pullmechanism implemented in Author-X .
4 Selective Dissemination: Author-X Push
Supporting information push entails generating different physical views of thesame document for each group of subjects to which the same access control poli-cies apply. This implies, in the worst case, the generation of a different viewfor each different subject. Moreover, after the generation of the view, the push

Author-X 77
title
date
titletitleAuthor Author
titleAuthor
topic
titleAuthor
topic
&2Literary _supplementScience_page
Leading _Article
ScienceScience
Section
Sport_page
news
Newspaper
&5 &8 &11
&4
&7&6
Pc128
Pc128
Pc1258
Pc128
Pc1248
Pc128
Pc128
Pc128
Pc128
Pc128 Pc128
Pc128
Pc128
Pc128Pc128
titletitleAuthor Author
ArticleArticle
&10&9
Pc1248
Pc1248
Pc1248
Pc1248
Pc1248 Pc1248
&3Pc128
Sections
&13
Body
&12
titleAuthor
&15
Body
&14
news
Pc128
Pc1268 Pc128
Pc1268 Pc1268 Pc1268 Pc128 Pc128Pc128
Pc1278
Pc12678
topic
&1
Pc128
Fig. 4. Policy configurations for the XML document in Figure 3
dissemination mechanism must properly deliver all these views to the interestedsubjects. In this scenario, we need to take in consideration that due to the pos-sibly high number of subjects accessing an XML source, and the wide range ofaccess granularities provided by Author-X , the number of these views may be-come considerable large and thus such an approach cannot be practically applied.To efficiently support information push we therefore have adopted an approachbased on the use of encryption techniques. More precisely, our approach consistsof using different encryption keys for encrypting different portions of an XMLdocument, on the basis of the specified access control policies. According to thisapproach, all portions of an XML document to which the same policy config-uration applies are encrypted with the same secret key, where with the termpolicy configuration we denote a set of access control policies belonging to PB.Then, the same encrypted copy of the document (called well-formed encrypteddocument, hereafter) is distributed to all subjects, whereas each subject onlyreceives the key(s) for the portion(s) he/she is enabled to access.
In the following to better clarify our approach we first briefly explain theencrypted document generation. Then we describe the key assignment schemeadopted in such a scenario.
4.1 Well-Formed Encryption
The first step to efficiently support the information push is the development of astrategy to generate a correct document encryption. In Author-X the generationof the document encryption consists of two main steps: first, the XML documentundergoes a marking phase in which each document node is marked with theaccess control policies that apply to it; then, all nodes marked by the samepolicy configuration are grouped and encrypted with the same key. An additionalkey, called default key, is generated to encrypt those portions of the documentwhich are not marked by any policy. The encrypted copy of the document isthen placed into the Encrypted Document Base (i.e., EDB), which stores the
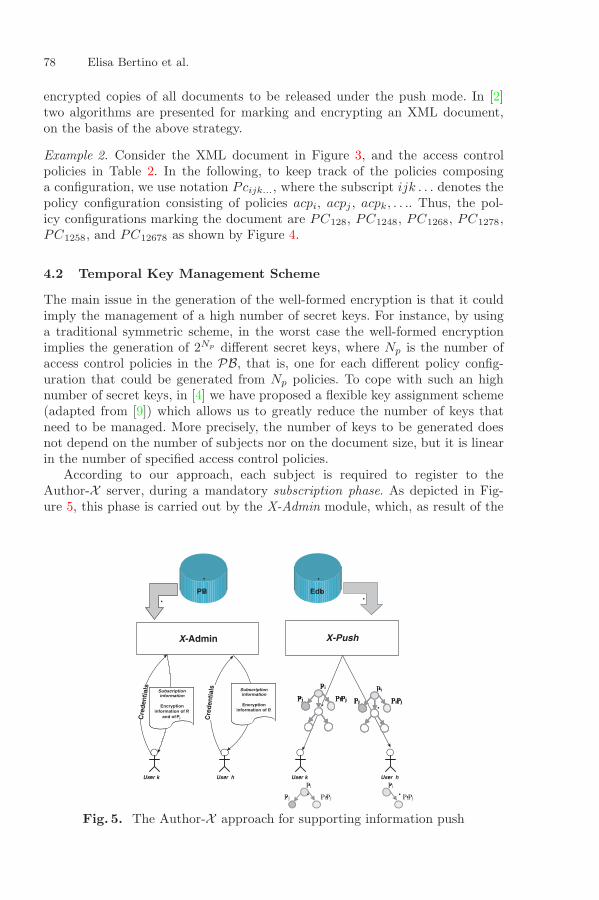
78 Elisa Bertino et al.
encrypted copies of all documents to be released under the push mode. In [2]two algorithms are presented for marking and encrypting an XML document,on the basis of the above strategy.
Example 2. Consider the XML document in Figure 3, and the access controlpolicies in Table 2. In the following, to keep track of the policies composinga configuration, we use notation Pcijk..., where the subscript ijk . . . denotes thepolicy configuration consisting of policies acpi, acpj , acpk, . . .. Thus, the pol-icy configurations marking the document are PC128, PC1248, PC1268, PC1278,PC1258, and PC12678 as shown by Figure 4.
4.2 Temporal Key Management Scheme
The main issue in the generation of the well-formed encryption is that it couldimply the management of a high number of secret keys. For instance, by usinga traditional symmetric scheme, in the worst case the well-formed encryptionimplies the generation of 2Np different secret keys, where Np is the number ofaccess control policies in the PB, that is, one for each different policy config-uration that could be generated from Np policies. To cope with such an highnumber of secret keys, in [4] we have proposed a flexible key assignment scheme(adapted from [9]) which allows us to greatly reduce the number of keys thatneed to be managed. More precisely, the number of keys to be generated doesnot depend on the number of subjects nor on the document size, but it is linearin the number of specified access control policies.
According to our approach, each subject is required to register to theAuthor-X server, during a mandatory subscription phase. As depicted in Fig-ure 5, this phase is carried out by the X-Admin module, which, as result of the
X-Admin X-Push
Cre
den
tial
s
PB
User k User k
Cre
dent
ials
User h
Pi
Pj PiPj
Pi
Pj PiPjPj PiPj
Pi
Pj PiPj
Pi
Pj PiPjPj PiPj
User h
Pi
Pj PiPj
Pi
PiPj
Subscriptioninformation
Encryptioninformation of Pi
and of Pj
Subscriptioninformation
Encryptioninformation of Pi
Edb
Fig. 5. The Author-X approach for supporting information push
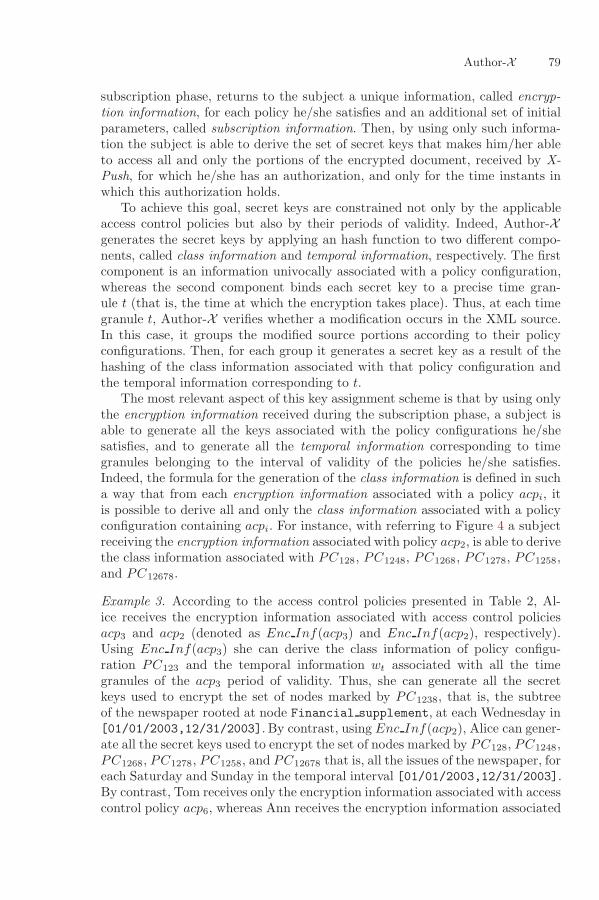
Author-X 79
subscription phase, returns to the subject a unique information, called encryp-tion information, for each policy he/she satisfies and an additional set of initialparameters, called subscription information. Then, by using only such informa-tion the subject is able to derive the set of secret keys that makes him/her ableto access all and only the portions of the encrypted document, received by X-Push, for which he/she has an authorization, and only for the time instants inwhich this authorization holds.
To achieve this goal, secret keys are constrained not only by the applicableaccess control policies but also by their periods of validity. Indeed, Author-Xgenerates the secret keys by applying an hash function to two different compo-nents, called class information and temporal information, respectively. The firstcomponent is an information univocally associated with a policy configuration,whereas the second component binds each secret key to a precise time gran-ule t (that is, the time at which the encryption takes place). Thus, at each timegranule t, Author-X verifies whether a modification occurs in the XML source.In this case, it groups the modified source portions according to their policyconfigurations. Then, for each group it generates a secret key as a result of thehashing of the class information associated with that policy configuration andthe temporal information corresponding to t.
The most relevant aspect of this key assignment scheme is that by using onlythe encryption information received during the subscription phase, a subject isable to generate all the keys associated with the policy configurations he/shesatisfies, and to generate all the temporal information corresponding to timegranules belonging to the interval of validity of the policies he/she satisfies.Indeed, the formula for the generation of the class information is defined in sucha way that from each encryption information associated with a policy acpi, itis possible to derive all and only the class information associated with a policyconfiguration containing acpi. For instance, with referring to Figure 4 a subjectreceiving the encryption information associated with policy acp2, is able to derivethe class information associated with PC128, PC1248, PC1268, PC1278, PC1258,and PC12678.
Example 3. According to the access control policies presented in Table 2, Al-ice receives the encryption information associated with access control policiesacp3 and acp2 (denoted as Enc Inf(acp3) and Enc Inf(acp2), respectively).Using Enc Inf(acp3) she can derive the class information of policy configu-ration PC123 and the temporal information wt associated with all the timegranules of the acp3 period of validity. Thus, she can generate all the secretkeys used to encrypt the set of nodes marked by PC1238, that is, the subtreeof the newspaper rooted at node Financial supplement, at each Wednesday in[01/01/2003,12/31/2003]. By contrast, using Enc Inf(acp2), Alice can gener-ate all the secret keys used to encrypt the set of nodes marked by PC128, PC1248,PC1268, PC1278, PC1258, and PC12678 that is, all the issues of the newspaper, foreach Saturday and Sunday in the temporal interval [01/01/2003,12/31/2003].By contrast, Tom receives only the encryption information associated with accesscontrol policy acp6, whereas Ann receives the encryption information associated
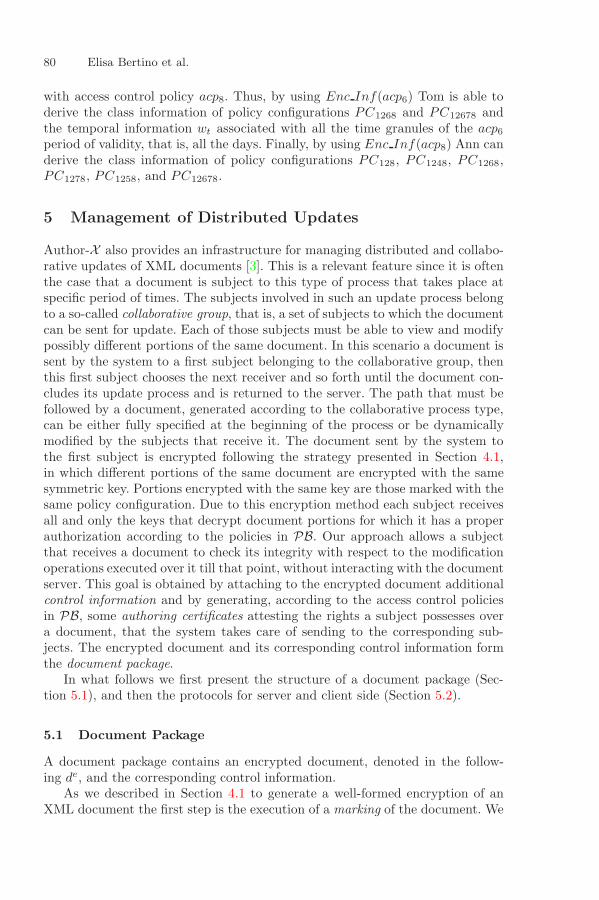
80 Elisa Bertino et al.
with access control policy acp8. Thus, by using Enc Inf(acp6) Tom is able toderive the class information of policy configurations PC1268 and PC12678 andthe temporal information wt associated with all the time granules of the acp6
period of validity, that is, all the days. Finally, by using Enc Inf(acp8) Ann canderive the class information of policy configurations PC128, PC1248, PC1268,PC1278, PC1258, and PC12678.
5 Management of Distributed Updates
Author-X also provides an infrastructure for managing distributed and collabo-rative updates of XML documents [3]. This is a relevant feature since it is oftenthe case that a document is subject to this type of process that takes place atspecific period of times. The subjects involved in such an update process belongto a so-called collaborative group, that is, a set of subjects to which the documentcan be sent for update. Each of those subjects must be able to view and modifypossibly different portions of the same document. In this scenario a document issent by the system to a first subject belonging to the collaborative group, thenthis first subject chooses the next receiver and so forth until the document con-cludes its update process and is returned to the server. The path that must befollowed by a document, generated according to the collaborative process type,can be either fully specified at the beginning of the process or be dynamicallymodified by the subjects that receive it. The document sent by the system tothe first subject is encrypted following the strategy presented in Section 4.1,in which different portions of the same document are encrypted with the samesymmetric key. Portions encrypted with the same key are those marked with thesame policy configuration. Due to this encryption method each subject receivesall and only the keys that decrypt document portions for which it has a properauthorization according to the policies in PB. Our approach allows a subjectthat receives a document to check its integrity with respect to the modificationoperations executed over it till that point, without interacting with the documentserver. This goal is obtained by attaching to the encrypted document additionalcontrol information and by generating, according to the access control policiesin PB, some authoring certificates attesting the rights a subject possesses overa document, that the system takes care of sending to the corresponding sub-jects. The encrypted document and its corresponding control information formthe document package.
In what follows we first present the structure of a document package (Sec-tion 5.1), and then the protocols for server and client side (Section 5.2).
5.1 Document Package
A document package contains an encrypted document, denoted in the follow-ing de, and the corresponding control information.
As we described in Section 4.1 to generate a well-formed encryption of anXML document the first step is the execution of a marking of the document. We

Author-X 81
recall that during this phase each portion of the document is marked with theaccess control policies that apply to it. We introduce at this point the notion ofregion, that is, the set of all document portions to which the same policy con-figuration applies. The regions of a document can be distinguished in modifiableand non-modifiable regions according to the privileges associated with the policyconfiguration of that region. A region is modifiable whether at least an accesscontrol policy that apply to it contains a privilege in the set {delete attr,delete elemt, or update attr}, whereas a region is considered non-modifiableotherwise. Note that a region r to which an insert attr|insert elemt priv-ilege applies is classified as non-modifiable, because an operation of insertionadds to the document a new region, leaving unmodified region r. Basic portionsthat compose a region are denoted with the term atomic elements. An atomicelement can be the start and end tags of an element, the data content of anelement, or an attribute. Each atomic element is identified by the identifier ofthe corresponding document element e,3 followed by the reserved name: “tags”,if the atomic element is the pair of tags of e, “content”, if it is the data contentof e or the name of an attribute of e otherwise.
Example 4. Example of atomic elements in the XML document in Figure 3 are:a) &6.tags corresponding to: “< Science >” “< /Science >”;b) &4.Author corresponding to: “Author = “Smith””;c) &2.content corresponding to: “The leading article is inserted here”.
Control information, added by the document server to the encrypted docu-ment, consists of some hash values and digital signatures computed over docu-ment portions. Non-modifiable and modifiable portions are protected region byregion, generating proper control data structures, containing control informationfor each non-modifiable or modifiable region, denoted with the terms NMRd andMRd respectively.
Structure NMRd contains for each non-modifiable region nmr an hash valuecomputed over the content associated with the atomic elements belonging to nmritself. These hash values are computed at the beginning of the update process,and are not modifiable by any subject that receives the package. They are usedby the client protocol to check the integrity of the non-modifiable regions of thedocument.
To generate structure MRd it is first necessary to generate for each atomicelement, belonging to a modifiable region, an hash value computed over its corre-sponding content in the document. These hash values, contained in the structureMAEd, are used to enable the client protocol to check also the integrity of thecontent associated with each single atomic element. MRd contains for each mod-ifiable region mr four hash values: 1) the first is computed over the mr contentby the last but one subject (slast−1) that operated over mr; 2) the second iscomputed over the hash values associated with the atomic elements belongingto mr by the last but one subject (slast−1) that operated over mr; 3) the thirdis computed over the mr content by the last subject (slast) that operated over3 In this paper element identifiers are represented as &n, where n is a natural number.
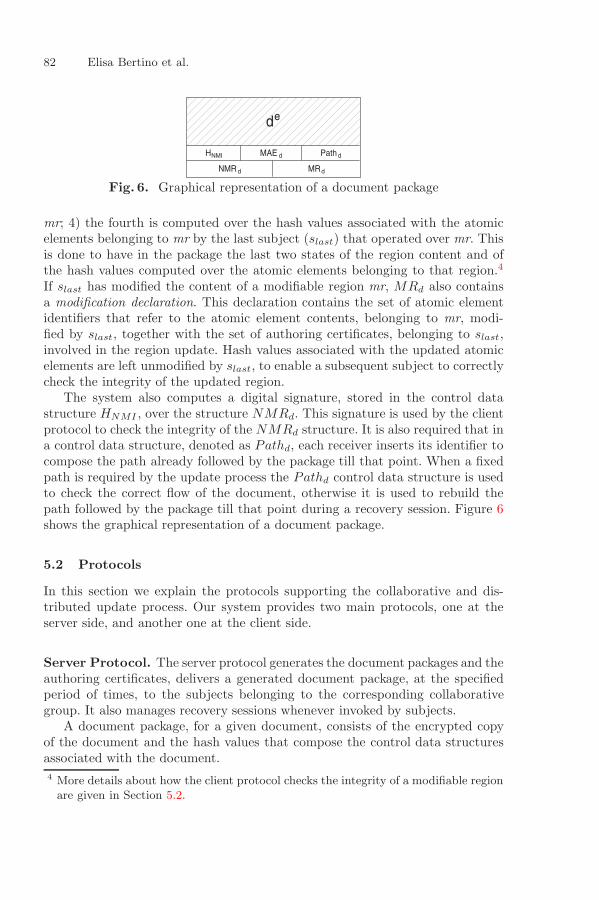
82 Elisa Bertino et al.
��������de
HNMI MAE d Path d
NMR d MRd
Fig. 6. Graphical representation of a document package
mr; 4) the fourth is computed over the hash values associated with the atomicelements belonging to mr by the last subject (slast) that operated over mr. Thisis done to have in the package the last two states of the region content and ofthe hash values computed over the atomic elements belonging to that region.4
If slast has modified the content of a modifiable region mr, MRd also containsa modification declaration. This declaration contains the set of atomic elementidentifiers that refer to the atomic element contents, belonging to mr, modi-fied by slast, together with the set of authoring certificates, belonging to slast,involved in the region update. Hash values associated with the updated atomicelements are left unmodified by slast, to enable a subsequent subject to correctlycheck the integrity of the updated region.
The system also computes a digital signature, stored in the control datastructure HNMI , over the structure NMRd. This signature is used by the clientprotocol to check the integrity of the NMRd structure. It is also required that ina control data structure, denoted as Pathd, each receiver inserts its identifier tocompose the path already followed by the package till that point. When a fixedpath is required by the update process the Pathd control data structure is usedto check the correct flow of the document, otherwise it is used to rebuild thepath followed by the package till that point during a recovery session. Figure 6shows the graphical representation of a document package.
5.2 Protocols
In this section we explain the protocols supporting the collaborative and dis-tributed update process. Our system provides two main protocols, one at theserver side, and another one at the client side.
Server Protocol. The server protocol generates the document packages and theauthoring certificates, delivers a generated document package, at the specifiedperiod of times, to the subjects belonging to the corresponding collaborativegroup. It also manages recovery sessions whenever invoked by subjects.
A document package, for a given document, consists of the encrypted copyof the document and the hash values that compose the control data structuresassociated with the document.4 More details about how the client protocol checks the integrity of a modifiable regionare given in Section 5.2.
Author-X 83
The system also generates, according to the policies in PB, and signs properauthoring certificates containing the following information:
– priv: it is an authoring privilege;– prot-obj: it is a set of atomic elements belonging to a modifiable region, if
priv is equal to delete attr, insert attr, update attr or insert elemt, otherwiseit is a set of atomic elements belonging to one or more modifiable regions;
– sbj id: it is a subject identifier specifying who can exercise the privilege privover the protection object prot-obj.
Authoring certificates are inserted in the corresponding modification decla-ration by a subject whenever it modifies a portion of a document for whichit has a proper authorization. In particular they are used by a subject to de-termine which authoring privileges it can exercise and over which portions ofa document. Moreover they are used to guarantee other subjects, checking theintegrity of a document d, that the declared modification operations were exe-cuted by an authorized subject and over the correct portions of d.
Example 5. Consider three users Tom (sbj id=“s10”), Bob (sbj id=“s54”) andAnn (sbj id=“s102”) with credentials reporter, press-corrector, and director, re-spectively. The following three authoring certificates are generated according tothe policies in Table 2 and information in Figure 4:
– (update attr, {&12.topic, &12.Author, &12.title}, s10);– (update attr, {&15.content}, s54);– (delete elemt, {&2.tags, &3.tags, &4.tags, &4.topic, &4.Author, &4.title},
s102).
At the beginning of a collaborative and distributed update process the serverprotocol chooses the subject that must firstly receive the document package andthen sends it to this subject. Whenever a subject finds that the received docu-ment package is corrupted the server protocol opens a recovery session in whichit rebuilds the last correct version of the document package. This is achievedby requiring to the subjects in the collaborative group the last version of thatdocument package that they received. Then the server protocol checks the in-tegrity of the received document versions and chooses the correct received onethat contains the longest path followed by the document package, and sends itto the subject that sent the recovery request.
Client Protocol. The client protocol is executed by a subject whenever itreceives a document package. Such a protocol enables a receiver to check theintegrity of the portions of the document for which it possesses an authorization,to exercise the authoring privileges according to the access control policies in PB,and to send the updated document package to a subsequent receiver.
To check the integrity of a non-modifiable region nmr the client protocollocally computes an hash value over its content and then compares it with the
84 Elisa Bertino et al.
one, associated with nmr, stored in the NMRd structure. If the two hash valuesmatch the nmr content is correct, otherwise it is corrupted. Integrity of the hashvalues stored in NMRd are checked using the digital signature stored in HNMI .By contrast to check the integrity of a modifiable region mr, the client protocolfirstly checks whether the last subject that operated over that region has modifiedit. We denote with the term modified a modifiable region for which a modificationdeclaration is stored in MRd. A region is denoted as confirmed when it resultsnot to have been modified.
A confirmed region is checked by locally computing an hash value over itscontent and another over the hash values that cover the atomic elements belong-ing to that region. If these two hash values match those stored in MRd for thatregion by slast−1 and by slast, then the region is considered correct, otherwise itis corrupted.
A modified region is checked first by verifying that the atomic elements de-clared as modified were updated according to the authoring certificates storedin the modification declaration and that those certificates are valid. A certificateis valid if it belongs to slast and its content is not corrupted. Then the clientprotocol checks that the atomic elements not declared as modified have kept thecontent they had before the update. This is done by comparing the hash values,stored in MAEd, associated to these atomic elements with those locally com-puted over the current content of these atomic elements in the document. Theintegrity of the hash values in MAEd is checked using the hash value computedby slast−1 over them.
The client protocol after the checking phase enables a subject to modifythe document content according to the information contained in the authoringcertificates it has received by the system. For each updated region the clientprotocol inserts in MRd a modification declaration and the new computed hashvalues over the new region content and the hash values that cover the atomicelements belonging to that region.
Finally the client protocol allows a subject to choose the next subject towhich sending the document package, and then it delivers the package to thechosen subject.
6 Conclusion
In this paper we have presented Author-X , a comprehensive system for securingXML documents, which provides several innovative features, such as the supportfor different dissemination strategies (i.e., push and pull) and for the cooperativeand distributed update of XML documents.
Even though Author-X is a very comprehensive system, supporting a largevariety of functions, there is still room for extensions to the system. An openissue that we aim at addressing in the near future is how to enforce temporalconstraints when dealing with distributed cooperative updates. Because a tem-poral constraint states that a given subject may modify a given document onlywithin a specified time frame, a distributed cooperative update process may

Author-X 85
easily undergo denial-of-rights attacks by which a malicious subject may holda document and send it to the legitimate subject only after the specified timeframe has expired. Thus, the legitimate subject is denied the right to exercisethe privileges it holds. Another direction concerns the development of policiesgoverning the specification of dissemination strategy policies according to sub-ject profiles and contextual information. Thus, by using such policies one caneasily tailor the dissemination strategies for different subjects and/or conditionsand time of use.
References
[1] E. Bertino, C. Bettini, E. Ferrari, and P. Samarati An Access Control ModelSupporting Periodicity Constraints and Temporal Reasoning. ACM Transactionon Database Systems, TODS, 23(3):231–285, 1998. 73
[2] E. Bertino, and E. Ferrari. Secure and Selective Dissemination of XML Doc-uments. ACM Transactions on Information and System Security 5(3): 290-331(2002). 78
[3] E.Bertino, E.Ferrari, G.Mella, A Framework for Distributed and CooperativeUpdates of XML Documents, Proc. of the 16th Annual IFIP WG 11.3, WorkingConference on Data and Application Security, Cambridge, UK, July 2002, pp211-227. 80
[4] E. Bertino, B. Carminati, E. Ferrari. A Temporal Key Management Scheme forBroadcasting XML Documents, Proc. of the 9th ACM Conference on Computerand Communications Security (CCS’02), Washington, November, 2002, ACMPress. 78
[5] The Excelon Home Page. http://www.exceloncorp.com 69[6] C. Geuer Pollmann. The XML Security Page. Available at:
http://www.nue.et-inf.uni-siegen.de/∼geuer-pollmann/
xml security.html. 67[7] E. Bertino, S. Castano, e E. Ferrari. Author-X : a Comprehensive System for Se-
curing XML Documents, IEEE Internet Computing, 5(3):21–31, May/June 2001.70, 76
[8] E. Bertino, S. Castano, E. Ferrari. On Specifying Security Policies for Web Docu-ments with an XML-based Language. Proc. of SACMAT’2001, ACM Symposiumon Access Control Models and Technologies, Fairfax, VA, May 2001. 70, 74
[9] Wen-Guey Tzeng. A Time-Bound Cryptographic Key Assignment Scheme forAccess Control in a Hierarchy IEEE TKDE, 14(1):182–188, 2002. 78
[10] M. Winslett, N. Ching, V. Jones, I. Slepchin. Using Digital Credentials on theWorld Wide Web. Journal of Computer Security, v.5 n.3, p.255-267, Dec. 1997.70
[11] World Wide Web Consortium. Extensible Markup Language (XML) 1.0, 1998.Available at: http://www.w3.org/TR/REC-xml 66
[12] World Wide Web Consortium. XML Signature Syntax and Processing, 2002.Available at: http://www.w3.org/TR/2002/REC-xmldsig-core-20020212/ 71
[13] World Wide Web Consortium. XML Path Language (Xpath), 1.0, 1999. W3CRecommendation. Available at: http://www.w3.org/TR/xpath. 71
N. Bianchi-Berthouze (Ed.): DNIS 2003, LNCS 2822, pp. 86-96, 2003. Springer-Verlag Berlin Heidelberg 2003
What's Wrong with Wrapper Approachesin Modeling Information System Integration
and Interoperability?
Tosiyasu L. Kunii
IT InstituteKanazawa Institute of Technology
1-15-13 Jingumae, Shibuya-kuTokyo 150-0001 Japan
Phone +81-3-5410-5280, FAX [email protected]
http://www.kunii.com/
Abstract. Among the largest impact research themes at the time of world-widerecession, the key subject is how to cope with mega company formations and e-government (digital government) projects that depend on the successes ofinformation system integration. The current information system integrationapproaches such as wrapper approaches basically create combinatorialinterfacing and/or combinatorial data conversion making the integrationpractically impossible because of interfacing explosion and/or computationalexplosion. A linear approach to overcome the combinatorial explosion ispresented and discussed.
1 What Are Impact Projectsat the Time of World-Wide Recession?
It has been a while since I have stated the following: �Web information managementsystems are emerging as key players in the global society we live [Kunii98]. As amatter of fact, the global society has been driven by cyberworlds on the Web.Cyberworlds are types of information worlds created on the Web with or withoutdesign. The major key players of cyberworlds include e-finance that trades a GDP-equivalent a day and e-manufacturing that is transforming industrial production intoWeb shopping of product components and of assembly factories. We can handle thecomplexity and the growth speed of such cyberworlds only through Web informationmanagement systems by processing them instantly as needed [Kunii2002a].�
However, the international situations have changed a lot in a year. Continued gulfwars, ever prevailing international terrorisms and SARS (severe acute respiratorysyndrome) have been spreading economic havoc, forcing companies andgovernmental organizations to merge for survival as mega corporations and digitalgovernments. Organization-wise merges do not save anything much any longer. Itrather simply aims at eliminating further workplaces, resulting in more and more lay-offs to make the economy worse. First of all it does not usually mean organizational
What's Wrong with Wrapper Approaches in Modeling Information System Integration 87
operation merge. The main reason is that the current information system technologyprovides element-by-element operation merge with inevitable combinatorialexplosion. It is well known that the combinatorial explosion is the source of sky highcost coupled with almost infinite delay of operation merge after the organizationalmerge.
Thus, since the expectation of prolonged recession causes more and moreorganizations to merge, the project that has the largest impact factor is that on non-combinatorial organizational operation merge. As such, the ideal is linear.
2 How the Combinatorial Explosionof Organizational Operation Merge Has Brought in?
Major changes of information worlds are now requiring the world model changes.The combinatorial explosion of organizational operation merge is the result of theindividual designers working hard to create their �best� interfaces for the merge.Such �hard work� creates different designs for interfacing of the different informationsystems in charge of individual organizational operations.
The situation is very similar to that when the relational model was proposed by E.F. Codd in 1970 [Codd]. At that time, commercial database management systems(DBMS) were pointer-based such as CODASYL and IBM IMS. When data changesoccurred at some organization, the databases had to be updated manually. Atindividual customer sites, employees of DBMS companies were sort of sold to thecustomer sites spending the whole lives for manual data and pointer updates. Theydid best database design updating the pointers. That tragedy was saved by dataindependence of the relational model. When I organized Codd's seminar on therelational model in 1970 in Tokyo inviting major DBMS vendors and experts,everybody refused to get it recognized as a DBMS model by the reason the modellacked pointers! The trend to refuse to recognize the value of the relational model indata independence had continued for at least a decade. I myself in supporting dataindependence had been treated as a foe of the DBMS community by experts, althoughI have organized Database Technical Committee and Research Group at InformationProcessing Society of Japan in 1972 and served as Vice-Chairman, and was a memberof IFIP Working Group 2.6 on Data Bases soon after (1974 to 1992).
For information system integration, there is no model currently. Hence, thecombinatorial explosions. One of the cases causing the combinatorial explosions iswhat's called �wrappers�. Wrappers can wrap anything in any style, creating varietiesof �flexible� designs and ending up with remarkable design combinations to explode.
Before going into the detailed analysis of the current and possible world models forinformation system integration, let us look back the way I was on information systemintegration since 1974.
2.1 The Inductive Inference Approach for Information System Integration
In 1974, I have discussed with E. F. Codd on the problem of inconsistency infunctional dependency when we have time-dependent database systems. The problem
88 Tosiyasu L. Kunii
I faced occurred when I was designing an image database for image analysis. It is atypical time dependent database as often seen in active image databases where newimage data instances are constantly flowing in. New data instances may destroyexisting functional dependency requiring constant data renormalization. The answerhe gave me was very firm that the relational model he designed is under assumptionof the world model such that the functional dependencies are wholly controlled byone person called a data administrator as typically seen in managing the database ofone organization. He also clarified that any model beyond the world model ofassuming one data administrator was outside of his interest. So I had to solve theproblem myself. To avoid laborious manual work of renormalization, I have devisedan automated renormalization scheme based on mechanical inductive inference oncumulative image database up to the point in time [Kunii74]. It is equivalent tojoining all the relations to turn them into one relation and mechanically inducefunctional dependencies for automated renormalization. The same situation ariseswhen we integrate multiple information systems where up to the point in time ofintegration, we can automate renormalization of integrated database by the sameinductive scheme.
2.2 Design Criteria for Distributed Database Systems
In 1977, Tosiyasu L. Kunii and Hideko S. Kunii have started to work on distributeddatabase systems and the design criteria. We have shown that an abstract designapproach can avoid the combinatorial complexity [Kunii77]. Since it was before thedawn of the Internet-based databases, it was on a very general modeling.
Starting from the classifications of the current distributed database systems, thiswork has identified their two major objectives: the database sharing among thesubsystems, and the increase of system adaptivity. The design approaches to meetthese respective objectives, that is, compositional- and decompositional- approachesare identified.
The design criteria related to these approaches are elucidated: the minimum UpperBound of Information Translation Amount (UBITA) in database sharing as a criterionfor the compositional design approach; the maximum locality as a criterion for thedecompositional design approach. Different design models are tested against thesedesign criteria, by taking typical distributed database system environments. In pursuitof highly adaptive design for very general evolving heterogeneous distributeddatabase systems, an abstract design approach is proposed. It is expected that thisdesign also minimizes the system maintenance load which has already taken up withthree times more man power than the system development work. In this approach,Applications (A), Data (D), Machines (M), and a system Controller (C) are identifiedas major logical subsystems of an evolving heterogeneous distributed databasesystem. Two sets of three independences (3Is, that is, Application-, Data-, andMachine- Independences) criteria are proposed for adaptive evolving heterogeneoussystem design:
1. 3Is for a non-cascading system design to prevent a change in any one of the A-,D-, and M- subsystems from cascading into the other two logical subsystems, and
What's Wrong with Wrapper Approaches in Modeling Information System Integration 89
2. 3Is for an invariant system controller to keep the system controller invariantunder any change in the A-, D-, or M- subsystems.
It is also shown that the conventional data independence is insufficient for adaptivesystem design. A virtualization method is discussed as a way to fulfill the two sets ofthe 3Is criteria.
3 How to Meet the Application-,Data-, and Machine- Independence Criteria?
It is extremely hard to meet the application-, data-, and machine- independencecriteria.
Theorem: Adjunctions spaces represent the information common to all applications,data and machines to meet the application-, data-, and machine- independencecriteria.
Proof: We give an intuitive proof. The only way to achieve the goal is to find a veryhigh level of abstraction mechanism to abstract the information common to allapplications, data and machines. It has been 26 years to find the answer to meet thecriteria by finding the meaning of �common� and what's common as �adjunctionspaces in algebraic topology [Kunii2003]. �To be common� means �to be equivalentso that the equivalent information is shared to be common�. Equivalence relationsmathematically define the meaning of to be equivalent. Equivalent information formsadjunction spaces via identification functions on quotient spaces that are also calledidentification spaces. Then, adjunctions spaces represent the information common toall applications, data and machines to meet the application-, data-, and machine-independence criteria. Q.E.D.
The adjunction spaces also model the common properties of dominant commercialinformation systems being used by major private and public organizations byabstracting the common properties to be equivalent among different informationsystems as adjunction spaces, thus serving as a novel data model that can integrateinformation systems linearly and hence avoiding the combinatorial explosion of theintegration workload. For automated linear interface generation after the linearintegration at the adjunction space level, we use an incrementally modular abstractionhierarchy [Kunii2002a] as shown below such that we are interfaced to existinginformation systems to the extent we realize linear interoperability to perform theintegrated system-wide tasks.
1. The homotopy level;2. The set theoretical level;3. The topological space level;4. The adjunction space level;5. The cellular space level;6. The representation level;7. The view level.
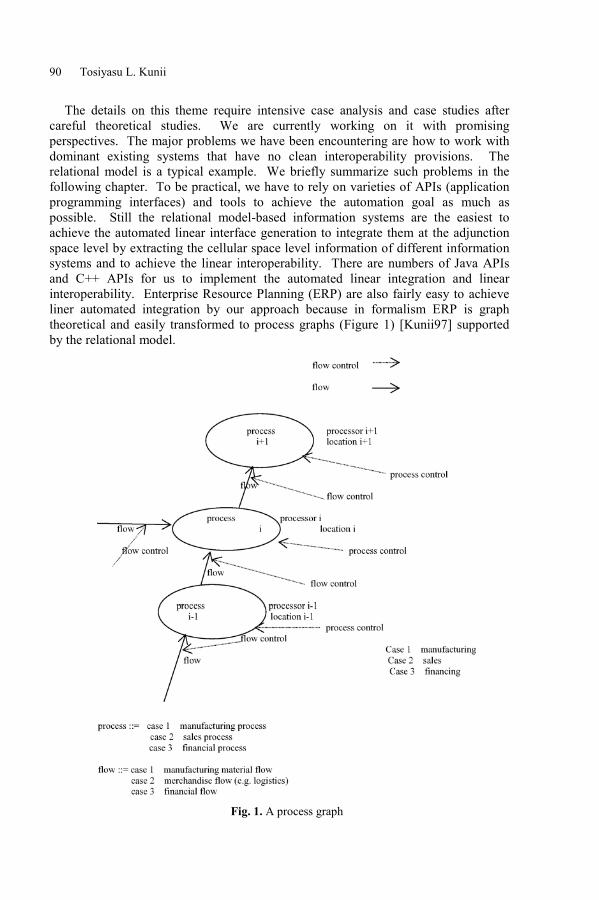
90 Tosiyasu L. Kunii
The details on this theme require intensive case analysis and case studies aftercareful theoretical studies. We are currently working on it with promisingperspectives. The major problems we have been encountering are how to work withdominant existing systems that have no clean interoperability provisions. Therelational model is a typical example. We briefly summarize such problems in thefollowing chapter. To be practical, we have to rely on varieties of APIs (applicationprogramming interfaces) and tools to achieve the automation goal as much aspossible. Still the relational model-based information systems are the easiest toachieve the automated linear interface generation to integrate them at the adjunctionspace level by extracting the cellular space level information of different informationsystems and to achieve the linear interoperability. There are numbers of Java APIsand C++ APIs for us to implement the automated linear integration and linearinteroperability. Enterprise Resource Planning (ERP) are also fairly easy to achieveliner automated integration by our approach because in formalism ERP is graphtheoretical and easily transformed to process graphs (Figure 1) [Kunii97] supportedby the relational model.
Fig. 1. A process graph
What's Wrong with Wrapper Approaches in Modeling Information System Integration 91
The process graphs are generalized to enjoy the theoretical properties of theincrementally modular abstraction hierarchy by representing them in the adjunctionspaces first followed by the cellular spaces as needed. Abundant ontologicalproperties appear in process graphs, very often with nesting as we worked out in 1980under the name of recursive graphs [Kunii80]. It also is called conceptual graphs[Sowa84, Sowa2002, Schärfe]. It is being formulated by the incrementally modularabstraction hierarchy. The recursive graph (conceptual graph) formulation in theincrementally modular abstraction hierarchy obviously requires the topological spacesto be half Hausdorff (T0). Therefore, since the most of the topological researches arein the Hausdorff topological spaces (T2), we have to restart the formulation from T0.
4 Comparison with the Relational Model,the Entity Relationship Model, UML, and XML
As I have proven in the previous DNIS paper [Kunii2002a], none of the currentlypopular information models such as the relational model, UML, and XML have theinformation modularity simply because they are not based on the disjoint unions ofinformation. Hence, modular Web information modeling based on equivalence toidentify necessary information does not apply to any of them.
Suppose on the Web a company X is searching for a joint venture partnercompany, say Y. After the successful search, a joint venture (JV) is formed such thatX�Y / (x ~ f (y) | " y Î Y0) via an attaching function f An attaching map f where f: Y0
→ X |Y0�Y. Y0�Y is the part of company Y running the JV with the correspondingpart f( Y0) of company X. As a model, this JV model belongs to, and is exactlyidentical with, the adjunction space model explained so far. Now, let us suppose acompany X is searching for a company, say Y, to merge and acquire (M&A) Y. Aftersuccessful M&A, denoting the part Y0 of Y (Y0�Y) merged to X, we get the union ofX and Y joined by the part Y0�Y common to that of Y such that X�Y / (x ~ f (y) | "y Î Y0). In the relational model, the join operation performs M&A, but the relationalmodel fails to support JV. Union by join in manufacturing makes the product partsirreplaceable and makes it impossible to enjoy the advantages of e-manufacturing.The frame of a bicycle in Figure 2 is built by fusing the parts via join operations, andhence the parts are hard to be replaced or interchanged. The entity relationship (ER)model is basically an intuitive graph theoretical model, and the model itself fails tosupport the identification by equivalence. So is UML.
XML is flexible, born from bibliographic markup language SGML. It consists ofnested pairs of brackets, lacking formalisms to validate the ever-expanding andcomplicated nesting. When the system being constructed becomes very large as usualin any practices, it falls apart by the lack of the formal and hence automatedmechanism of validation. We have to formulate XML in the half Hausdorffspaces T0.

92 Tosiyasu L. Kunii
Fig. 2. The frame of a bicycle made by fusing components via join operations
5 What Has Been Popular in General such as �Wrappers�and What's Wrong with Them?
There have varieties of approaches in information system integration andinteroperability. Let us browse through them.
5.1 Standardizing vs. Theorizing
Standardizing is on the assumption for the existing systems to be rebuilt to follow agiven specification called the �standard�. For information systems as theinfrastructure of major social organizations, the cost of the rebuilding is prohibitivelyhigh to make the assumption usually invalid.
Posing theorizing as a counter-concept of standardization, let us examine it. If wedefine theorizing in the following way, it becomes valuable: Theorizing meansreasoning on the required features of major information systems followed byabstracting the common features of such systems to find the consistent logicalstructures called theories.
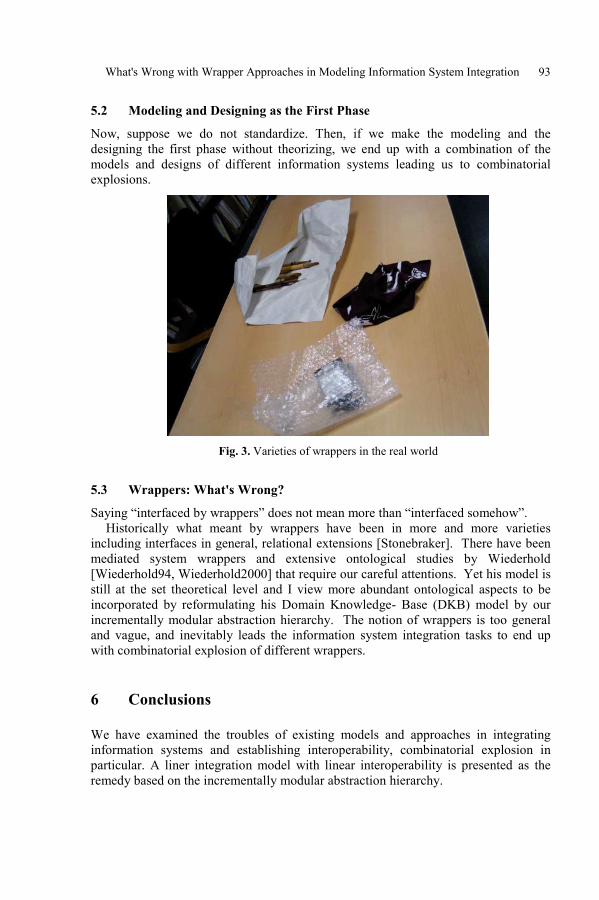
What's Wrong with Wrapper Approaches in Modeling Information System Integration 93
5.2 Modeling and Designing as the First Phase
Now, suppose we do not standardize. Then, if we make the modeling and thedesigning the first phase without theorizing, we end up with a combination of themodels and designs of different information systems leading us to combinatorialexplosions.
Fig. 3. Varieties of wrappers in the real world
5.3 Wrappers: What's Wrong?
Saying �interfaced by wrappers� does not mean more than �interfaced somehow�.Historically what meant by wrappers have been in more and more varieties
including interfaces in general, relational extensions [Stonebraker]. There have beenmediated system wrappers and extensive ontological studies by Wiederhold[Wiederhold94, Wiederhold2000] that require our careful attentions. Yet his model isstill at the set theoretical level and I view more abundant ontological aspects to beincorporated by reformulating his Domain Knowledge- Base (DKB) model by ourincrementally modular abstraction hierarchy. The notion of wrappers is too generaland vague, and inevitably leads the information system integration tasks to end upwith combinatorial explosion of different wrappers.
6 Conclusions
We have examined the troubles of existing models and approaches in integratinginformation systems and establishing interoperability, combinatorial explosion inparticular. A liner integration model with linear interoperability is presented as theremedy based on the incrementally modular abstraction hierarchy.
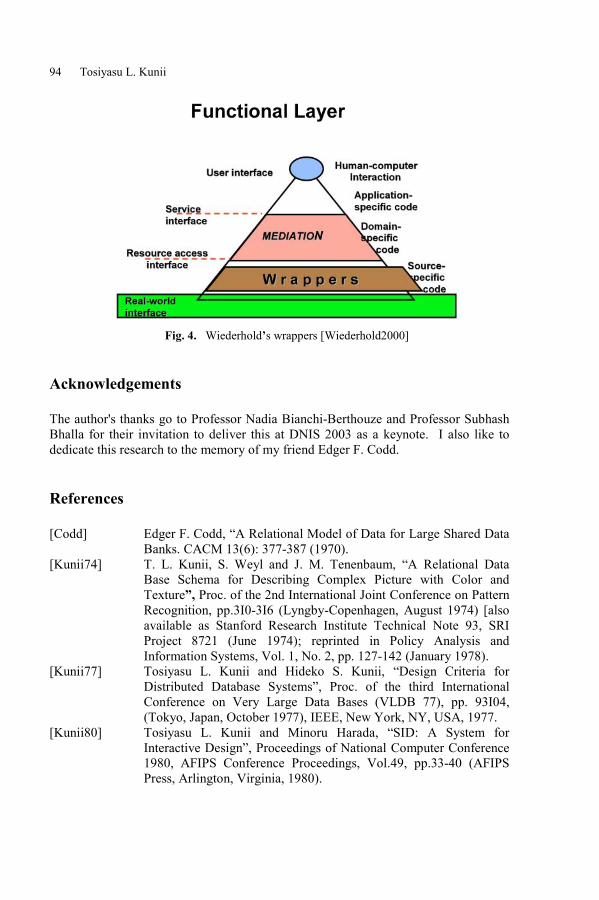
94 Tosiyasu L. Kunii
Fig. 4. Wiederhold�s wrappers [Wiederhold2000]
Acknowledgements
The author's thanks go to Professor Nadia Bianchi-Berthouze and Professor SubhashBhalla for their invitation to deliver this at DNIS 2003 as a keynote. I also like todedicate this research to the memory of my friend Edger F. Codd.
References
[Codd] Edger F. Codd, �A Relational Model of Data for Large Shared DataBanks. CACM 13(6): 377-387 (1970).
[Kunii74] T. L. Kunii, S. Weyl and J. M. Tenenbaum, �A Relational DataBase Schema for Describing Complex Picture with Color andTexture�, Proc. of the 2nd International Joint Conference on PatternRecognition, pp.3I0-3I6 (Lyngby-Copenhagen, August 1974) [alsoavailable as Stanford Research Institute Technical Note 93, SRIProject 8721 (June 1974); reprinted in Policy Analysis andInformation Systems, Vol. 1, No. 2, pp. 127-142 (January 1978).
[Kunii77] Tosiyasu L. Kunii and Hideko S. Kunii, �Design Criteria forDistributed Database Systems�, Proc. of the third InternationalConference on Very Large Data Bases (VLDB 77), pp. 93I04,(Tokyo, Japan, October 1977), IEEE, New York, NY, USA, 1977.
[Kunii80] Tosiyasu L. Kunii and Minoru Harada, �SID: A System forInteractive Design�, Proceedings of National Computer Conference1980, AFIPS Conference Proceedings, Vol.49, pp.33-40 (AFIPSPress, Arlington, Virginia, 1980).
What's Wrong with Wrapper Approaches in Modeling Information System Integration 95
[Kunii97] Tosiyasu L. Kunii, �The 21st Century Manufacturing Automationand the Social Impact�, Proceedings of International Conference onManufacturing Automation (ICMA'97), April 28-30, 1997, HongKong, pp.21-29 , A. T .Tan, T. N. Wong and I. Gibson, Editors(Department of Mechanical Engineering, University of HongKong).
[Kunii98] Tosiyasu L. Kunii and Annie Luciani, Eds., �Cyberworlds�,Springer-Verlag, 1998.
[Kunii2000] Tosiyasu L. Kunii, �Discovering Cyberworlds�, Vision 2000 of theJanuary/February, 2000 Issue of IEEE Computer Graphics andApplications, pp. 64-65.
[Kunii99] Tosiyasu L. Kunii and Hideko S. Kunii, �A Cellular Model forInformation Systems on the Web - Integrating Local and GlobalInformation -�, 1999 International Symposium on DatabaseApplications in Non-Traditional Environments (DANTE'99),November 28-30, 1999, Heian Shrine, Kyoto, Japan, Organized byResearch Project on Advanced Databases, in cooperation withInformation Processing Society of Japan, ACM Japan, ACMSIGMOD Japan, pp. 19-24, IEEE Computer Society Press, LosAlamitos, California, U. S. A.
[Stonebraker] Michael Stonebraker and Paul Brown, �Object-Relational DBMSs �Tracing the Next Great Wave-�, Morgan Kaufmann Publishers, Inc.,San Francisco, CA USA, 1999.
[Kunii2002a] Tosiyasu L. Kunii, �Web Information Modeling: The AdjunctionSpace Model�, Proceedings of the 2nd International Workshop onDatabases in Networked Information Systems (DNIS 2002), pp. 58-63, The University of Aizu, Japan, December 16-18, 2002, LectureNotes in Computer Science, Subhash Bhalla, Ed., Springer-Verlag,December, 2002.
[Kunii2002b] Tosiyasu L. Kunii, �Cyber Graphics�, Proceedings of the FirstInternational Symposium on Cyber Worlds (CW2002), November6-8 2002 Tokyo, Japan, pp. 3-7, IEEE Computer Society Press, LosAlamitos, California, November 2002.
[Kunii2003] Tosiyasu L. Kunii, Masumi Ibusuki, Galina I. Pasko, Alexander A.Pasko, Daisuke Terasaki, and Hiroshi Hanaizumi, �Modeling ofConceptual Multiresolution Analysis by an Incrementally ModularAbstraction Hierarchy�, Transactions of Institute of Electronics,Information and Communication Engineers, in press, July 2003.
[Sowa84] John F. Sowa: �Conceptual Structures: Information Processing inMind and Machine�, Addison-Wesley 1984.
[Sowa2002] John F. Sowa, �Architectures for intelligent systems�, IBM SystemsJournal 41(3): 331-349 (2002).
[Schärfe] Henrik Schärfe, �Online Course in Knowledge Representation usingConceptual Graphs�, http://www.hum.auc.dk/cg/index.html.

96 Tosiyasu L. Kunii
[Wiederhold94] Gio Wiederhold, �Interoperation, Mediation, and Ontologies�,Proceedings of International Symposium on Fifth GenerationComputer Systems FGCS94), Workshop on HeterogeneousCooperative Knowledge-Bases, Vol. W3, pp. 33-48, ICOT, Tokyo,Japan, December 1994.
[Wiederhold2000] Gio Wiederhold, �Mediated Systems�, http://www-db.stanford.edu/pub/gio/slides/.
N. Bianchi-Berthouze (Ed.): DNIS 2003, LNCS 2822, pp. 97-111, 2003. Springer-Verlag Berlin Heidelberg 2003
Browsing and Editing XML Schema Documentswith an Interactive Editor
Mark Sifer1, Yardena Peres2, and Yoelle Maarek2
1 School of IT, University of SydneyNSW, 2006, Australia
[email protected] Knowledge Management Group, IBM Research Lab in Haifa
Matam, 31905, Israel{yardena,yoelle}@il.ibm.com
Abstract. With the advent of the web there has been a great demand for datainterchange between existing applications using internet infrastructure and alsobetween newer web services applications. The W3C XML standard is becomingthe internet data interchange format, even though the initial XML standard wasnot well suited to this. The XML Schema recommendation which added morerigorous data structuring and data typing provides much better support for de-fining such data centric XML documents. While data centric XML documentsare typically produced by applications there are still a wide range of situationswhere manual document creation is required. This paper presents an XML edi-tor design which supports the creation of XML Schema based documents. Weshow how an interface that uses a tight coupling between grammar and contentviews facilitates the rapid creation of data centric documents. We show how ourinterface supports browsing and editing of documents where XML schema spe-cific extensions such as subtyping are present. Our design is realised in theXeena for Schema tool which we demonstrate.
1 Introduction
With the advent of the web there has been increasing demand for data interchangebetween existing applications using internet infrastructure and also between newerweb services applications. The W3C XML [4] recommendation is becoming theinternet data interchange format. Such XML data will typically be produced by appli-cations. However during application development and maintenance there remains asignificant need for manual creation, editing and browsing of XML data by applica-tion and system developers. XML editors can fill this need.
XML or rather the eXtensible Markup Language defines a standard way to markupdata and documents as text files. These files (or data streams) which are referred to asdocuments may be restricted to comply with a gram-mar -- a Document Type Defini-tion (DTD) or an XML Schema [13], but this is not compulsory. Tags are used to
98 Mark Sifer et al.
denote the start and end of elements which are nested, forming a tree of elements. Amid level element may denote a whole purchase order record while a leaf element maycapture a numeric cost. Data interchange between applications, in addition to a com-mon data format, requires a data exchange protocol such as the Simple Object AccessProtocol (SOAP) [10].
XML was originally developed as a simplified version of the Standard GeneralizedMarkup Language (SGML) [7] for the web. SGML is primarily used for maintaininglarge technical document collections. SGML grammars are defined with DTDs whichinclude complex features that were not included when XML DTDs were defined.However, a general limitation of DTDs is their poor support for data typing. RecentlyXML Schema has been defined to add much richer data and structure typing whichbetter supports data oriented applications and data exchange.
Specific applications of XML include MathML (Mathematics Markup language),X3D (XML 3D) and XHTML (XML HTML). These applications define how dataintended for display in a web browser should be marked up, where display rules aredefined in separate style sheets. Because of the increasing availability of XML soft-ware libraries, XML is also being used as a data storage format for persistent datawhen the overhead of a database is not needed. Such applications of XML can alsorequire a generic XML editor for the creation and editing of XML data and docu-ments.
Because XML documents are human readable text files, a standard text editor canbe used as a generic XML editor. For users that are already familiar with XML syntax,using a text editor can the easiest way of creating or modifying small XML docu-ments. Otherwise a dedicated XML editor may be easier to use. In this paper we pres-ent our design for an interactive XML editor design for documents which conform toan XML Schema. The benefits of our editor are: (i) users do not need to know XMLsyntax, (ii) they do not need to remember the schema grammar and (iii) through theuse of interactive templates users can rapidly build and alter XML documents.
This paper extends the treatment of our editor in [9] where support for browsingXML documents was de-scribed. It provides a full treatment of editing including op-erations for changing types and support for W3C XML schema subtyping.
In the second section an example XML document fragment is introduced. Re-quirements for an editor are established in section three. Browsing and editing ofdocuments is shown in sections four and five, while XML schema specific support isdetailed in section six. Validation is covered in section seven. Then finally, relatedwork is described and conclusions given
2 Example
In this section we introduce the main data and schema example used in this paper, asmall addressbook document.
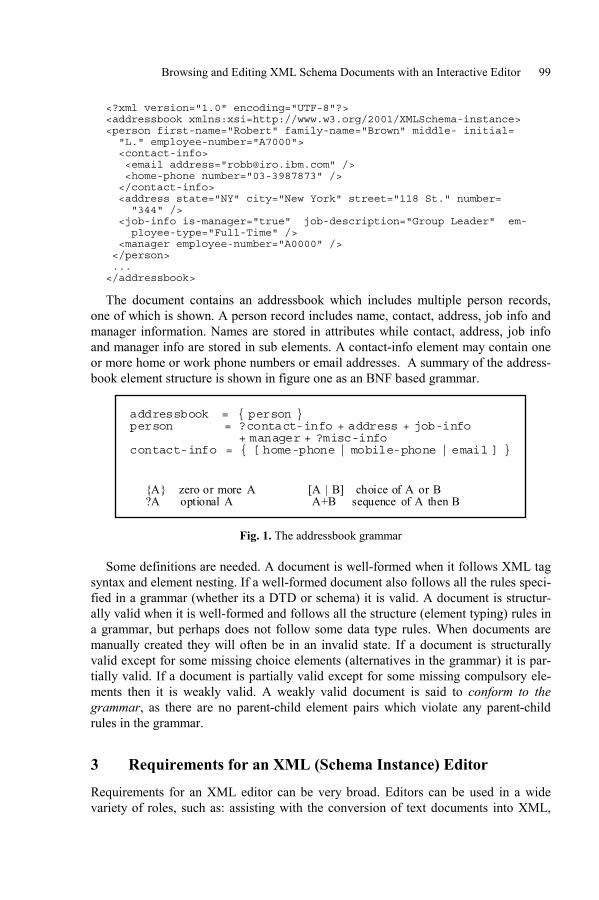
Browsing and Editing XML Schema Documents with an Interactive Editor 99
<?xml version="1.0" encoding="UTF-8"?><addressbook xmlns:xsi=http://www.w3.org/2001/XMLSchema-instance><person first-name="Robert" family-name="Brown" middle- initial= "L." employee-number="A7000"> <contact-info> <email address="[email protected]" /> <home-phone number="03-3987873" /> </contact-info> <address state="NY" city="New York" street="118 St." number= "344" /> <job-info is-manager="true" job-description="Group Leader" em- ployee-type="Full-Time" /> <manager employee-number="A0000" /> </person> ...</addressbook>
The document contains an addressbook which includes multiple person records,one of which is shown. A person record includes name, contact, address, job info andmanager information. Names are stored in attributes while contact, address, job infoand manager info are stored in sub elements. A contact-info element may contain oneor more home or work phone numbers or email addresses. A summary of the address-book element structure is shown in figure one as an BNF based grammar.
{A} zero or more A ?A optional A
[A | B] choice of A or B A+B sequence of A then B
addressbook = { person } person = ?contact-info + address + job-info + manager + ?misc-info contact-info = { [ home-phone | mobile-phone | email ] }
Fig. 1. The addressbook grammar
Some definitions are needed. A document is well-formed when it follows XML tagsyntax and element nesting. If a well-formed document also follows all the rules speci-fied in a grammar (whether its a DTD or schema) it is valid. A document is structur-ally valid when it is well-formed and follows all the structure (element typing) rules ina grammar, but perhaps does not follow some data type rules. When documents aremanually created they will often be in an invalid state. If a document is structurallyvalid except for some missing choice elements (alternatives in the grammar) it is par-tially valid. If a document is partially valid except for some missing compulsory ele-ments then it is weakly valid. A weakly valid document is said to conform to thegrammar, as there are no parent-child element pairs which violate any parent-childrules in the grammar.
3 Requirements for an XML (Schema Instance) Editor
Requirements for an XML editor can be very broad. Editors can be used in a widevariety of roles, such as: assisting with the conversion of text documents into XML,
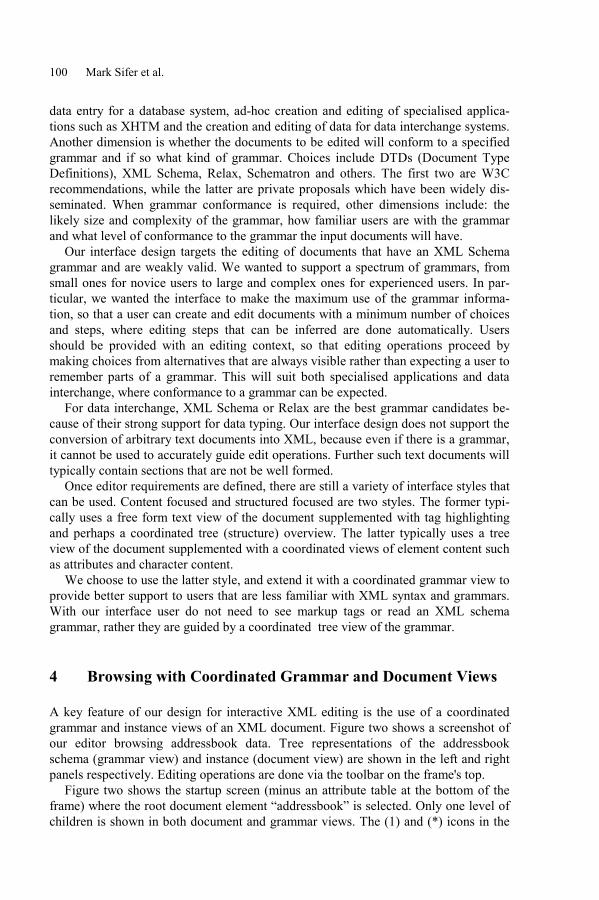
100 Mark Sifer et al.
data entry for a database system, ad-hoc creation and editing of specialised applica-tions such as XHTM and the creation and editing of data for data interchange systems.Another dimension is whether the documents to be edited will conform to a specifiedgrammar and if so what kind of grammar. Choices include DTDs (Document TypeDefinitions), XML Schema, Relax, Schematron and others. The first two are W3Crecommendations, while the latter are private proposals which have been widely dis-seminated. When grammar conformance is required, other dimensions include: thelikely size and complexity of the grammar, how familiar users are with the grammarand what level of conformance to the grammar the input documents will have.
Our interface design targets the editing of documents that have an XML Schemagrammar and are weakly valid. We wanted to support a spectrum of grammars, fromsmall ones for novice users to large and complex ones for experienced users. In par-ticular, we wanted the interface to make the maximum use of the grammar informa-tion, so that a user can create and edit documents with a minimum number of choicesand steps, where editing steps that can be inferred are done automatically. Usersshould be provided with an editing context, so that editing operations proceed bymaking choices from alternatives that are always visible rather than expecting a user toremember parts of a grammar. This will suit both specialised applications and datainterchange, where conformance to a grammar can be expected.
For data interchange, XML Schema or Relax are the best grammar candidates be-cause of their strong support for data typing. Our interface design does not support theconversion of arbitrary text documents into XML, because even if there is a grammar,it cannot be used to accurately guide edit operations. Further such text documents willtypically contain sections that are not be well formed.
Once editor requirements are defined, there are still a variety of interface styles thatcan be used. Content focused and structured focused are two styles. The former typi-cally uses a free form text view of the document supplemented with tag highlightingand perhaps a coordinated tree (structure) overview. The latter typically uses a treeview of the document supplemented with a coordinated views of element content suchas attributes and character content.
We choose to use the latter style, and extend it with a coordinated grammar view toprovide better support to users that are less familiar with XML syntax and grammars.With our interface user do not need to see markup tags or read an XML schemagrammar, rather they are guided by a coordinated tree view of the grammar.
4 Browsing with Coordinated Grammar and Document Views
A key feature of our design for interactive XML editing is the use of a coordinatedgrammar and instance views of an XML document. Figure two shows a screenshot ofour editor browsing addressbook data. Tree representations of the addressbookschema (grammar view) and instance (document view) are shown in the left and rightpanels respectively. Editing operations are done via the toolbar on the frame's top.
Figure two shows the startup screen (minus an attribute table at the bottom of theframe) where the root document element �addressbook� is selected. Only one level ofchildren is shown in both document and grammar views. The (1) and (*) icons in the
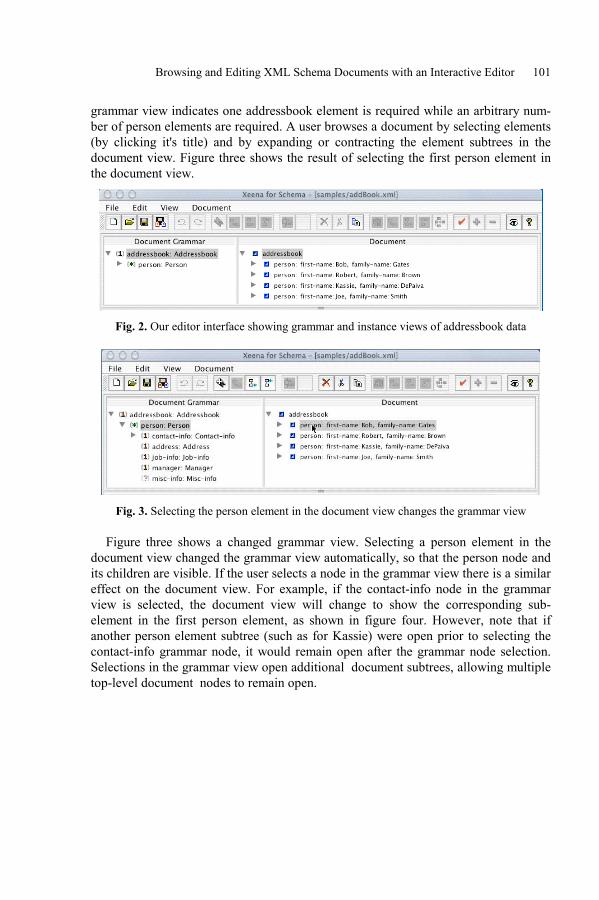
Browsing and Editing XML Schema Documents with an Interactive Editor 101
grammar view indicates one addressbook element is required while an arbitrary num-ber of person elements are required. A user browses a document by selecting elements(by clicking it's title) and by expanding or contracting the element subtrees in thedocument view. Figure three shows the result of selecting the first person element inthe document view.
Fig. 2. Our editor interface showing grammar and instance views of addressbook data
Fig. 3. Selecting the person element in the document view changes the grammar view
Figure three shows a changed grammar view. Selecting a person element in thedocument view changed the grammar view automatically, so that the person node andits children are visible. If the user selects a node in the grammar view there is a similareffect on the document view. For example, if the contact-info node in the grammarview is selected, the document view will change to show the corresponding sub-element in the first person element, as shown in figure four. However, note that ifanother person element subtree (such as for Kassie) were open prior to selecting thecontact-info grammar node, it would remain open after the grammar node selection.Selections in the grammar view open additional document subtrees, allowing multipletop-level document nodes to remain open.

102 Mark Sifer et al.
Fig. 4. Selecting the contact-info grammar node changes the document view
Moving the grammar cursor from person to contact-info has moved the documentcursor to the contact-info element within the first person element, which has beenmade visible by unfolding the document tree. The transitions from figure two to threeand from three to four show there is a tight coupling between the grammar and docu-ment views. Changing the cursor in one view, changes the other view so the corre-sponding cursor is visible and selected. The purpose of this tight coupling is to sup-port editing operations.
5 Editing with Coordinated Grammar and Document Views
The main task of an XML editor is to support the creation and editing of XML docu-ments. This is done through editing operations such as adding, moving, changing anddeleting elements. When an XML document conforms to a grammar, elements can notbe added anywhere. Particular elements can only appear in certain contexts which aredefined by the grammar. Our interface uses a grammar view panel to provide userswith a continuous grammar context to guide editing.
5.1 Adding and Moving Elements
As noted in section four, the grammar view and document share a coordinated cursorwhich is shown as the selected grammar node and document element in each view.Highlighting is also used to indicate which grammar nodes have been instantiated inthe document. For example in figure four, the selected contact-info node and three ofits siblings have coloured (dark) icons, while the fourth sibling misc-info has aghosted icon. Glancing across at the document view reveals the selected contact-infoelement has only three sibling elements. There is no misc-info element.
The difference in icon colour in the grammar view highlights the misc-info infoelement could be added into the document at the current document cursor position byselecting the misc-info grammar node then clicking the add element button on theupper toolbar. A misc-info element would then be added in the correct position in thedocument view. The coordinated grammar view has highlighted via icon colouring
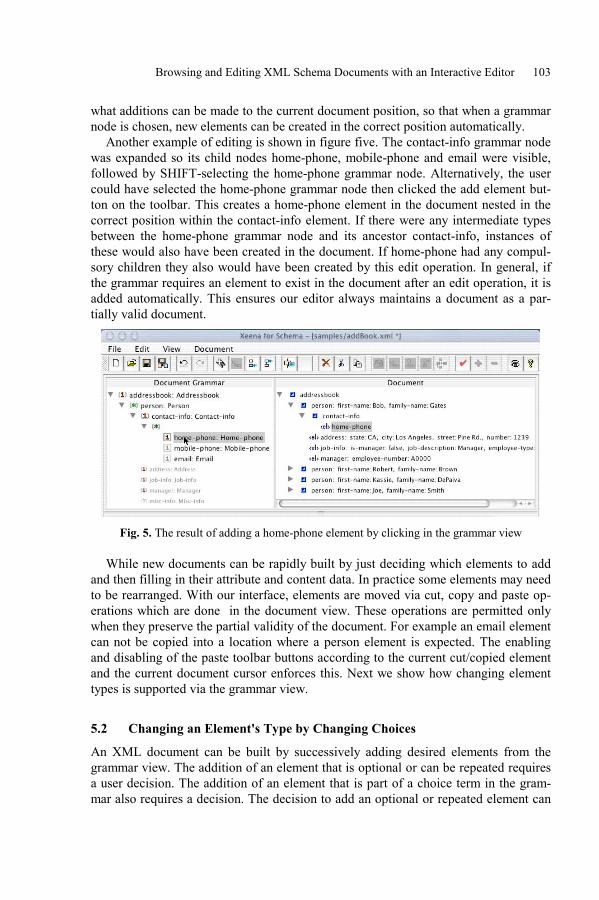
Browsing and Editing XML Schema Documents with an Interactive Editor 103
what additions can be made to the current document position, so that when a grammarnode is chosen, new elements can be created in the correct position automatically.
Another example of editing is shown in figure five. The contact-info grammar nodewas expanded so its child nodes home-phone, mobile-phone and email were visible,followed by SHIFT-selecting the home-phone grammar node. Alternatively, the usercould have selected the home-phone grammar node then clicked the add element but-ton on the toolbar. This creates a home-phone element in the document nested in thecorrect position within the contact-info element. If there were any intermediate typesbetween the home-phone grammar node and its ancestor contact-info, instances ofthese would also have been created in the document. If home-phone had any compul-sory children they also would have been created by this edit operation. In general, ifthe grammar requires an element to exist in the document after an edit operation, it isadded automatically. This ensures our editor always maintains a document as a par-tially valid document.
Fig. 5. The result of adding a home-phone element by clicking in the grammar view
While new documents can be rapidly built by just deciding which elements to addand then filling in their attribute and content data. In practice some elements may needto be rearranged. With our interface, elements are moved via cut, copy and paste op-erations which are done in the document view. These operations are permitted onlywhen they preserve the partial validity of the document. For example an email elementcan not be copied into a location where a person element is expected. The enablingand disabling of the paste toolbar buttons according to the current cut/copied elementand the current document cursor enforces this. Next we show how changing elementtypes is supported via the grammar view.
5.2 Changing an Element's Type by Changing Choices
An XML document can be built by successively adding desired elements from thegrammar view. The addition of an element that is optional or can be repeated requiresa user decision. The addition of an element that is part of a choice term in the gram-mar also requires a decision. The decision to add an optional or repeated element can
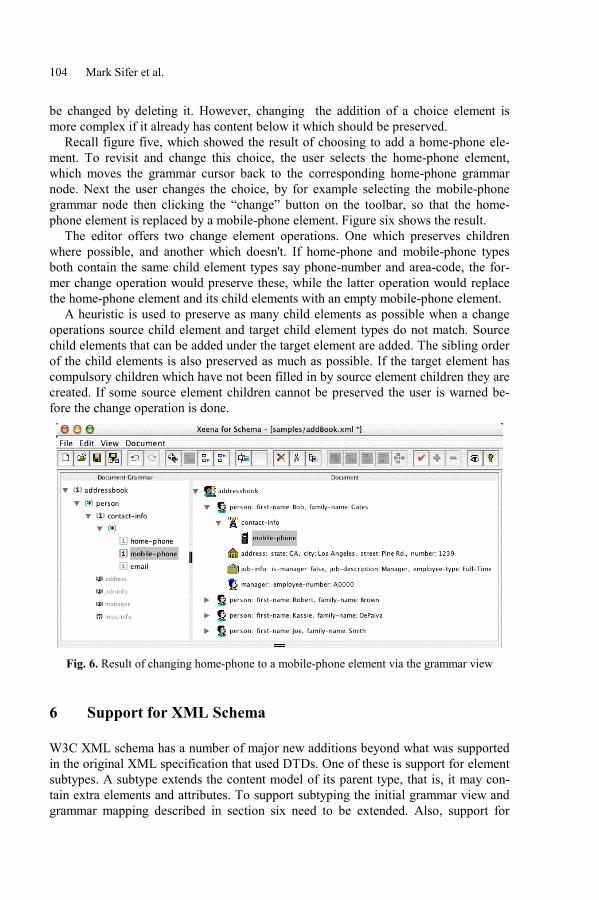
104 Mark Sifer et al.
be changed by deleting it. However, changing the addition of a choice element ismore complex if it already has content below it which should be preserved.
Recall figure five, which showed the result of choosing to add a home-phone ele-ment. To revisit and change this choice, the user selects the home-phone element,which moves the grammar cursor back to the corresponding home-phone grammarnode. Next the user changes the choice, by for example selecting the mobile-phonegrammar node then clicking the �change� button on the toolbar, so that the home-phone element is replaced by a mobile-phone element. Figure six shows the result.
The editor offers two change element operations. One which preserves childrenwhere possible, and another which doesn't. If home-phone and mobile-phone typesboth contain the same child element types say phone-number and area-code, the for-mer change operation would preserve these, while the latter operation would replacethe home-phone element and its child elements with an empty mobile-phone element.
A heuristic is used to preserve as many child elements as possible when a changeoperations source child element and target child element types do not match. Sourcechild elements that can be added under the target element are added. The sibling orderof the child elements is also preserved as much as possible. If the target element hascompulsory children which have not been filled in by source element children they arecreated. If some source element children cannot be preserved the user is warned be-fore the change operation is done.
Fig. 6. Result of changing home-phone to a mobile-phone element via the grammar view
6 Support for XML Schema
W3C XML schema has a number of major new additions beyond what was supportedin the original XML specification that used DTDs. One of these is support for elementsubtypes. A subtype extends the content model of its parent type, that is, it may con-tain extra elements and attributes. To support subtyping the initial grammar view andgrammar mapping described in section six need to be extended. Also, support for
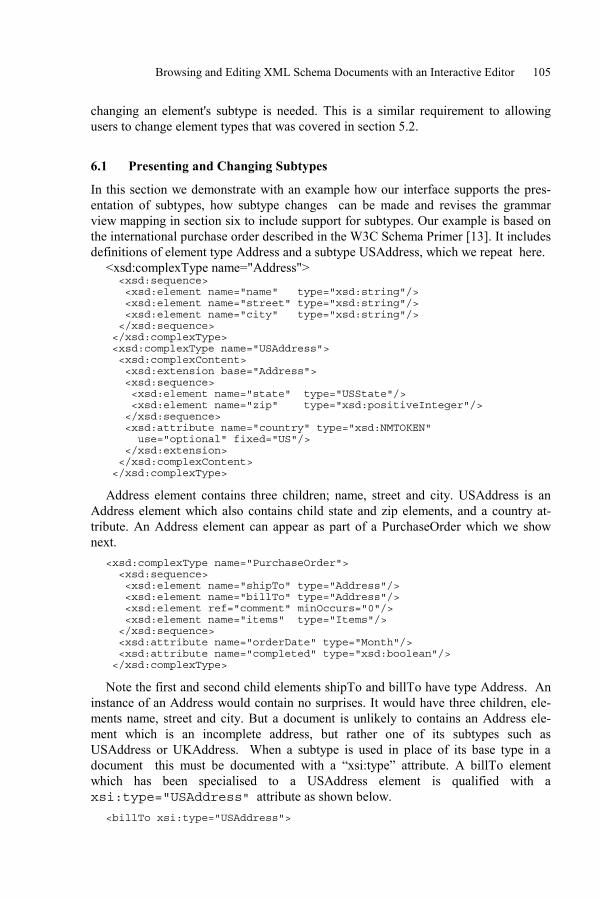
Browsing and Editing XML Schema Documents with an Interactive Editor 105
changing an element's subtype is needed. This is a similar requirement to allowingusers to change element types that was covered in section 5.2.
6.1 Presenting and Changing Subtypes
In this section we demonstrate with an example how our interface supports the pres-entation of subtypes, how subtype changes can be made and revises the grammarview mapping in section six to include support for subtypes. Our example is based onthe international purchase order described in the W3C Schema Primer [13]. It includesdefinitions of element type Address and a subtype USAddress, which we repeat here.
<xsd:complexType name="Address"> <xsd:sequence> <xsd:element name="name" type="xsd:string"/> <xsd:element name="street" type="xsd:string"/> <xsd:element name="city" type="xsd:string"/> </xsd:sequence> </xsd:complexType> <xsd:complexType name="USAddress"> <xsd:complexContent> <xsd:extension base="Address"> <xsd:sequence> <xsd:element name="state" type="USState"/> <xsd:element name="zip" type="xsd:positiveInteger"/> </xsd:sequence> <xsd:attribute name="country" type="xsd:NMTOKEN" use="optional" fixed="US"/> </xsd:extension> </xsd:complexContent> </xsd:complexType>
Address element contains three children; name, street and city. USAddress is anAddress element which also contains child state and zip elements, and a country at-tribute. An Address element can appear as part of a PurchaseOrder which we shownext.
<xsd:complexType name="PurchaseOrder"> <xsd:sequence> <xsd:element name="shipTo" type="Address"/> <xsd:element name="billTo" type="Address"/> <xsd:element ref="comment" minOccurs="0"/> <xsd:element name="items" type="Items"/> </xsd:sequence> <xsd:attribute name="orderDate" type="Month"/> <xsd:attribute name="completed" type="xsd:boolean"/> </xsd:complexType>
Note the first and second child elements shipTo and billTo have type Address. Aninstance of an Address would contain no surprises. It would have three children, ele-ments name, street and city. But a document is unlikely to contains an Address ele-ment which is an incomplete address, but rather one of its subtypes such asUSAddress or UKAddress. When a subtype is used in place of its base type in adocument this must be documented with a �xsi:type� attribute. A billTo elementwhich has been specialised to a USAddress element is qualified with axsi:type="USAddress" attribute as shown below.
<billTo xsi:type="USAddress">
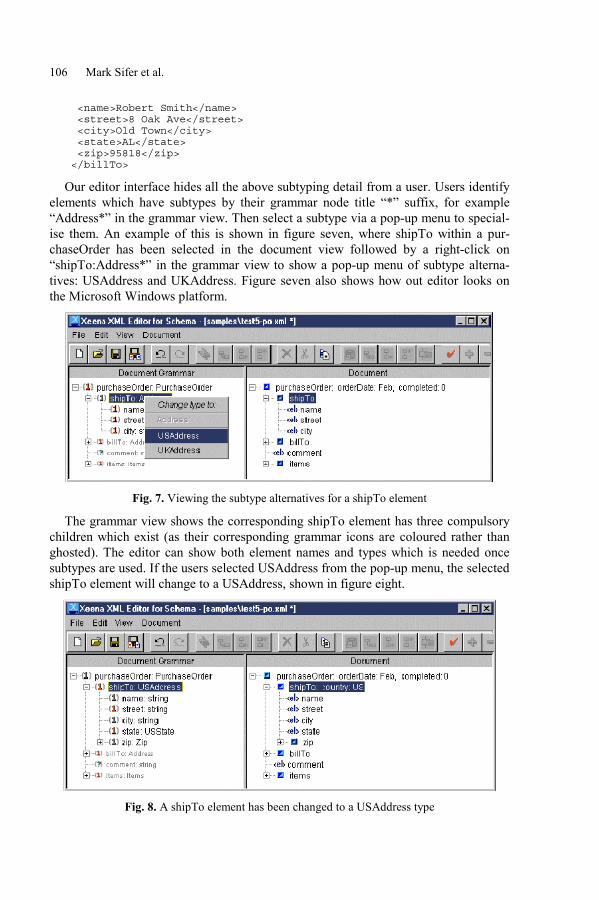
106 Mark Sifer et al.
<name>Robert Smith</name> <street>8 Oak Ave</street> <city>Old Town</city> <state>AL</state> <zip>95818</zip> </billTo>
Our editor interface hides all the above subtyping detail from a user. Users identifyelements which have subtypes by their grammar node title �*� suffix, for example�Address*� in the grammar view. Then select a subtype via a pop-up menu to special-ise them. An example of this is shown in figure seven, where shipTo within a pur-chaseOrder has been selected in the document view followed by a right-click on�shipTo:Address*� in the grammar view to show a pop-up menu of subtype alterna-tives: USAddress and UKAddress. Figure seven also shows how out editor looks onthe Microsoft Windows platform.
Fig. 7. Viewing the subtype alternatives for a shipTo element
The grammar view shows the corresponding shipTo element has three compulsorychildren which exist (as their corresponding grammar icons are coloured rather thanghosted). The editor can show both element names and types which is needed oncesubtypes are used. If the users selected USAddress from the pop-up menu, the selectedshipTo element will change to a USAddress, shown in figure eight.
Fig. 8. A shipTo element has been changed to a USAddress type
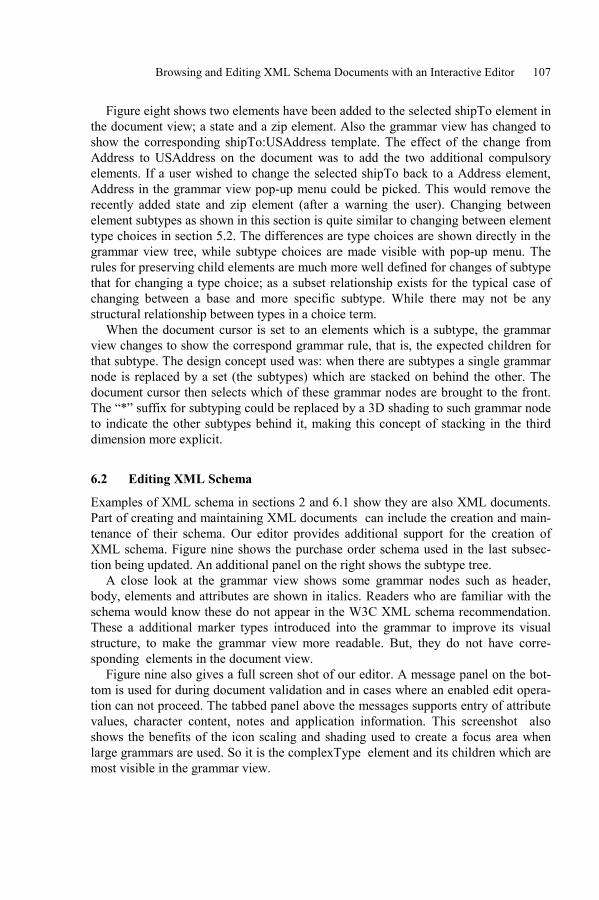
Browsing and Editing XML Schema Documents with an Interactive Editor 107
Figure eight shows two elements have been added to the selected shipTo element inthe document view; a state and a zip element. Also the grammar view has changed toshow the corresponding shipTo:USAddress template. The effect of the change fromAddress to USAddress on the document was to add the two additional compulsoryelements. If a user wished to change the selected shipTo back to a Address element,Address in the grammar view pop-up menu could be picked. This would remove therecently added state and zip element (after a warning the user). Changing betweenelement subtypes as shown in this section is quite similar to changing between elementtype choices in section 5.2. The differences are type choices are shown directly in thegrammar view tree, while subtype choices are made visible with pop-up menu. Therules for preserving child elements are much more well defined for changes of subtypethat for changing a type choice; as a subset relationship exists for the typical case ofchanging between a base and more specific subtype. While there may not be anystructural relationship between types in a choice term.
When the document cursor is set to an elements which is a subtype, the grammarview changes to show the correspond grammar rule, that is, the expected children forthat subtype. The design concept used was: when there are subtypes a single grammarnode is replaced by a set (the subtypes) which are stacked on behind the other. Thedocument cursor then selects which of these grammar nodes are brought to the front.The �*� suffix for subtyping could be replaced by a 3D shading to such grammar nodeto indicate the other subtypes behind it, making this concept of stacking in the thirddimension more explicit.
6.2 Editing XML Schema
Examples of XML schema in sections 2 and 6.1 show they are also XML documents.Part of creating and maintaining XML documents can include the creation and main-tenance of their schema. Our editor provides additional support for the creation ofXML schema. Figure nine shows the purchase order schema used in the last subsec-tion being updated. An additional panel on the right shows the subtype tree.
A close look at the grammar view shows some grammar nodes such as header,body, elements and attributes are shown in italics. Readers who are familiar with theschema would know these do not appear in the W3C XML schema recommendation.These a additional marker types introduced into the grammar to improve its visualstructure, to make the grammar view more readable. But, they do not have corre-sponding elements in the document view.
Figure nine also gives a full screen shot of our editor. A message panel on the bot-tom is used for during document validation and in cases where an enabled edit opera-tion can not proceed. The tabbed panel above the messages supports entry of attributevalues, character content, notes and application information. This screenshot alsoshows the benefits of the icon scaling and shading used to create a focus area whenlarge grammars are used. So it is the complexType element and its children which aremost visible in the grammar view.

108 Mark Sifer et al.
Fig. 9. Updating the purchase order schema in our editor
7 Document Validation
The paper so far, has concentrated on presenting our grammar and document viewdesign, illustrated with screenshots from our XML editor, Xeena for Schema. Ourdesign relies on an edited document conforming to the grammar, so a well definedmapping can be established between the grammar and document views. We use a toolview to enforce this partial validity. A partially valid document may still have missingelements when choices have not been made, missing attributes, wrong data types andother non-structural deviations from what the schema requires. A user makes a docu-ment valid by using the editors validation operation which highlights invalid portionsof the document, then manually fixes them.
A glance a the toolbar of several editor screen shots reveals one button which is al-ways enabled is the third button from the right whose icon is a red tick. This is thevalidation check operation button. While our editor does its own structural validationit relies on XERCES an XML parser component, to do full validation. When a userstarts validation all invalid elements are highlighted in the document view in red and asummary of the errors is shown in the message panel at the bottom of the editor frame.The plus and minus buttons next to the validate button allows a user to navigatethrough the list of invalid elements.
Validity here means W3C XML Schema validity. In the introduction alternatives toW3C schema were mentioned. Our editor could be extended to support other grammarbased alternatives if the Xerces parser component also supported it. Internally all
Browsing and Editing XML Schema Documents with an Interactive Editor 109
Xeena for Schema operations and data structures operate on a simple BNF grammar.When Xeena starts, it converts the document schema it is given, expanding all macro's(groups), unnesting all anonymous types and unfolding all subtypes into a simple flatBNF grammar. This is done by a single conversion class. So other grammars basedschema such as Relax (which follows the data type part of the W3C schema defini-tion) could be supported by rewriting this one class.
8 Related Work
Many syntax directed program editors have been developed. Editors such asSUPPORT [16] and Pan [2] sup-ported both structural and content editing. Structuralediting proceeds top-down as nodes are elaborated according to grammar rules, whilecontent editing is bottom-up; users directly edit text fragments which are parsed andintegrated into the rest of the document.
Grif [5] and Rita [3] are editors for document preparation systems. They use docu-ment grammars to provide context sensitive type information to guide editing. Theyuse coordinated content and structure views. The structure view shows the elementtree structure. Rita also uses an additional panel which shows the alternatives of aselected element when the grammar contains a choice. Arbitrary cut and paste of ele-ment subtrees can require type transformation [1]. This has been added to Grif [8].
Xeena [12], the previous version of our tool provides a content sensitive templatefor adding types. However the template presents types as an ordered list (by typename) which makes choosing a type and seeing the relationships between them diffi-cult. XML Spy [14] presents a document with a nested tree view. Like the originalXeena it uses a separate panel to show which elements that can be added at the currentdocument position. This interface works well for form based data entry. Howeverchanging a document's element structure is difficult without the multi-level grammarview that our editor provides.
Large grammars can result in large and deep grammar trees. Navigating such deephierarchical trees appears to be difficult for users [15]. TreeViewer [11] uses font,shade, size and animated transitions to help navigate such trees. Many interfaces forinformation visualisation which use multiple views of data coordinated with synchro-nised cursors have been built [6].
9 Conclusions
A quick survey of current program editors shows that tree based grammar directedediting has not been adopted by programmers even though many research syntax di-rected were developed. Such research essentially ended in the late 1980s. Program-mers found these editors to be too rigid; cutting and pasting content was often diffi-cult. Experienced programmers did not require grammar guidance, they knew thegrammars. For them syntax highlighting was a better solution.
110 Mark Sifer et al.
However we argue the situation for XML documents authors is different. Unlikeprogram languages XML document grammars can be very large and varied, so that anauthor can not reasonably know the full grammars well. Further a diverse range ofpeople may need to create XML documents, some doing so only occasionally. Ideallyapplication specific editors can assist users to create these documents. But in manycases application specific editors will not exist and a generic XML editor will be used.In these later cases, making a user aware of the document grammar as they edit shouldmake using a generic editor easier for them. We presented an editor design targeted atsuch users, implemented as the Xeena for Schema tool.
We presented a novel design, based on the use of coordinated grammar and docu-ment views where the gram-mar view acts as an interactive template which showswhat documents changes are possible in any given context, and provides a multi-leveldocument overview. Example uses of our design were given. With our interface, usersare able to create and edit XML documents by making choices from presented alter-natives, and are able to later revisit and change those choices. Users do not need toremember the grammar . However, the major tradeoff of our design is the requirementthat input documents are weakly valid, that is, they follow their grammar elementstructure rules but may be incomplete. Weakening this constraint remains future work.
Acknowledgements
Mark Sifer was with the IBM Research Lab in Haifa, Israel when this work was done.We wish to thank Roni Raab for her help in programming parts of Xeena for Schema,and the rest of the Knowledge Management group for their feedback.
References
[1] Akpotsui E., Quint V. and Cecile Roisin.: Type modeling for document trans-formation in structured editing systems. Mathematical and Computer Modeling,Vol 25(4), Feb 1997, 1-19.
[2] Balance, R.A., Graham S.L. and Van De Vanter M.L.: The Pan language-basedediting system. Proceedings of the Fourth ACM SIGSOFT Symposium onSoftware Development Environments, 1990.
[3] Cowan D.D., Mackie E.W., Pianosi G.M. and Smit G. V.: Rita � an editor anduser interface for manipulating structured documents. Electronic Publishing,John Wiley, Vol 4(3), Sept. 1991, 125-150.
[4] Extensible Markup Language (XML) 1.0 (Second Edition), W3C Recommen-dation, 6 October 2000, http://www.w3.org/TR/2000/REC-xml-20001006.
[5] Furuta R., Quint V. and Andre J.: Interactively editing structured documents.Electronic Publishing, John Wiley, Vol 1(1), April 1988, 19-44.
[6] North, C. and Shneiderman, B.: A taxonomy of multiple window coordinations.Technical Report dCS-TR-3854. University of Maryland, College Park, Dept ofComputer Science, 1997.
Browsing and Editing XML Schema Documents with an Interactive Editor 111
[7] Overview of SGML Resources. http://www.w3.org/Markup/SGML.[8] Roisin C., Claves P. and Akpotsui E.: Implementing the cut-and-paste operation
in a structured editing system. Mathematical and Computer Modeling, Vol26(1), July 1997, 85-96.
[9] Sifer, M., Peres Y. and Maarek Y.: Xeena for Schema: creating XML data withan interactive editor. Proceedings of the Second International Workshop onDatabases in Networked Information Systems (DNIS), Springer LNCS 2544,Aizu, Japan, Dec. 2002, 133-146.
[10] SOAP Version 1.2 Part 0: Primer, W3C Working Draft 26 June 2002,http://www.w3.org/TR/2002/WD_soap12_part0-20020626.
[11] Wittenbug, K. and Sigman, E.: Visual Focusing and Transition Techniques,Proceedings of the IEEE Symposium on Visual Languages, (1997) 20-27.
[12] Xeena at Alphaworks. http://www.alphaworks.ibm.com/tech/xeena.[13] XML Schema Part-0: Primer, W3C Recommendation, 2 May 2001,
http://www.w3.org /TR/2001/REC-xmlschema-0-20010502.[14] XML Spy. http://www.xmlspy.com/manual.[15] Zaphiris P., Shneiderman B. and Norman K. L.: Expandable indexes versus
sequential menus for searching hierarchies on the world wide web, (1999) 99-15, http://www.cs.umd.edu/hcil/pubs/tech-reports.shtml.
[16] Zelkowits, M.: A small contribution to editing with a syntax directed editor.Proceedings of the ACM SIGSOFT/SIGPLAN Software Engineering Sympo-sium on Practical Software Development Environments. 1984.
On-Line Analysis of a Web Data Warehouse
Gilles Nachouki and Marie-Pierre Chastang
IRIN, Faculte des Sciences et des Techniques,2, rue de la Houssiniere, BP 44322 Nantes Cedex 03, France
{nachouki,chastang}@irin.univ-nantes.fr
Abstract. This paper describes the design of a system, which facili-tates Accessing and Interconnecting heterogeneous data sources. Datasources can be static or active: static data sources include structuredor semistructured data like databases, XML and HTML documents; ac-tive data sources include services which are localised on one or severalservers including web services. The main originality of this work is tomake interoperability between actives and/or static data sources basedon XQuery language. As an example of using our approach, we’ll givea scenario for analyzing log files basing on OLAP (On Line AnalyticalProcessing) literature.
1 Introduction
The problem of interconnecting and accessing heterogeneous data sources is anold problem known under the name of Interoperability. As organisations evolveover time interoperability was and is still an important field of current researchin both academic and industry. In the past interoperability was limited to struc-tured data sources like databases. Interoperability is the ability of two or moresystems (or components) to exchange information and to use the informationthat has been exchanged. Interoperability can be classified in two approaches [7]:static approach (tightly coupled approach) and dynamic approach (loosely cou-pled approach). In the static approach, semantic heterogeneity is resolved whena new component database is incorporated in the system. The first stage of thisapproach uses a Wrapper that translates the database schema from its localdata model into a Canonical Data Model. The second stage uses a Mediatorthat combines multiple component schemes into an integrated schema, in whichinconsistencies are resolved and duplicates are removed. In some systems, allcomponent schema are integrated in a single global schema, while in others,multiple integrated schema exist for end-users. In the dynamic approach, se-mantic heterogeneity is resolved by the end-user at query time. In this approachthe end-users are not provided with a predefined view. Instead, they are givendirect access to the component schemes at query time by means of a querylanguage or a graphical user interface. This approach uses a metadata resourcedictionary that contains descriptions of the component schemes and includingconversion information. With the advent of the World Wide Web (WWW) datamanagement has branched out from traditional framework to deal with the vari-ety of information available on the WWW [2]. In the literature many project and
N. Bianchi-Berthouze (Ed.): DNIS 2003, LNCS 2822, pp. 112–121, 2003.c© Springer-Verlag Berlin Heidelberg 2003
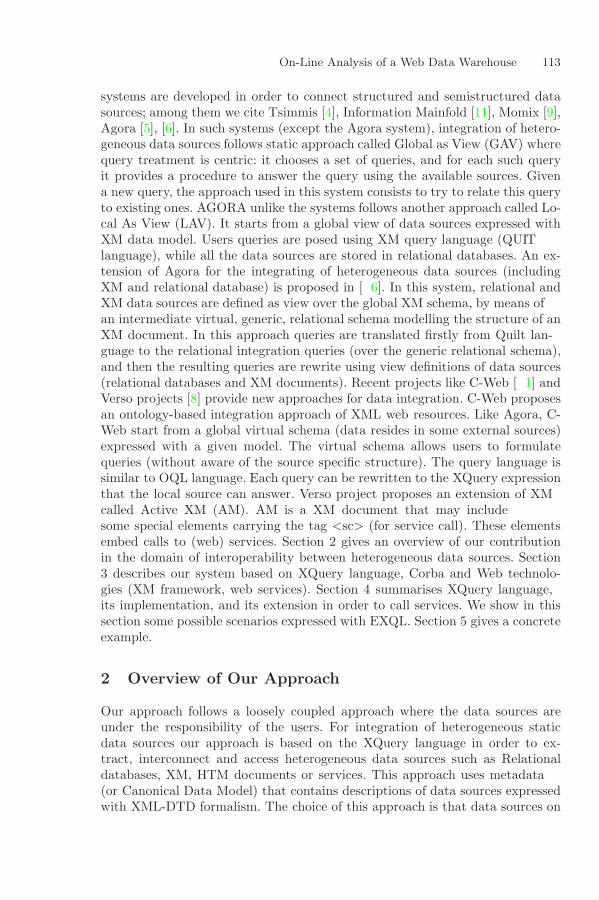
On-Line Analysis of a Web Data Warehouse 113
systems are developed in order to connect structured and semistructured datasources; among them we cite Tsimmis [4], Information Mainfold [11], Momix [9],Agora [5], [6]. In such systems (except the Agora system), integration of hetero-geneous data sources follows static approach called Global as View (GAV) wherequery treatment is centric: it chooses a set of queries, and for each such queryit provides a procedure to answer the query using the available sources. Givena new query, the approach used in this system consists to try to relate this queryto existing ones. AGORA unlike the systems follows another approach called Lo-cal As View (LAV). It starts from a global view of data sources expressed withXML data model. Users queries are posed using XML query language (QUILTlanguage), while all the data sources are stored in relational databases. An ex-tension of Agora for the integrating of heterogeneous data sources (includingXML and relational database) is proposed in [6]. In this system, relational andXML data sources are defined as view over the global XML schema, by means ofan intermediate virtual, generic, relational schema modelling the structure of anXML document. In this approach queries are translated firstly from Quilt lan-guage to the relational integration queries (over the generic relational schema),and then the resulting queries are rewrite using view definitions of data sources(relational databases and XML documents). Recent projects like C-Web [1] andVerso projects [8] provide new approaches for data integration. C-Web proposesan ontology-based integration approach of XML web resources. Like Agora, C-Web start from a global virtual schema (data resides in some external sources)expressed with a given model. The virtual schema allows users to formulatequeries (without aware of the source specific structure). The query language issimilar to OQL language. Each query can be rewritten to the XQuery expressionthat the local source can answer. Verso project proposes an extension of XMLcalled Active XML (AXML). AXML is a XML document that may includesome special elements carrying the tag <sc> (for service call). These elementsembed calls to (web) services. Section 2 gives an overview of our contributionin the domain of interoperability between heterogeneous data sources. Section3 describes our system based on XQuery language, Corba and Web technolo-gies (XML framework, web services). Section 4 summarises XQuery language,its implementation, and its extension in order to call services. We show in thissection some possible scenarios expressed with EXQL. Section 5 gives a concreteexample.
2 Overview of Our Approach
Our approach follows a loosely coupled approach where the data sources areunder the responsibility of the users. For integration of heterogeneous staticdata sources our approach is based on the XQuery language in order to ex-tract, interconnect and access heterogeneous data sources such as Relationaldatabases, XML, HTML documents or services. This approach uses metadata(or Canonical Data Model) that contains descriptions of data sources expressedwith XML-DTD formalism. The choice of this approach is that data sources on
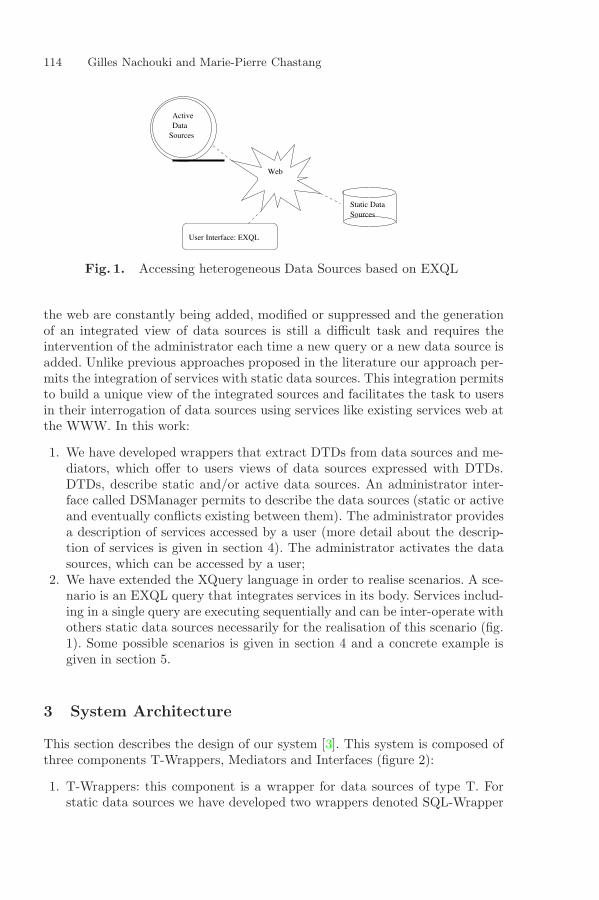
114 Gilles Nachouki and Marie-Pierre Chastang
Web
User Interface: EXQL
Static Data
ActiveData
Sources
Sources
Fig. 1. Accessing heterogeneous Data Sources based on EXQL
the web are constantly being added, modified or suppressed and the generationof an integrated view of data sources is still a difficult task and requires theintervention of the administrator each time a new query or a new data source isadded. Unlike previous approaches proposed in the literature our approach per-mits the integration of services with static data sources. This integration permitsto build a unique view of the integrated sources and facilitates the task to usersin their interrogation of data sources using services like existing services web atthe WWW. In this work:
1. We have developed wrappers that extract DTDs from data sources and me-diators, which offer to users views of data sources expressed with DTDs.DTDs, describe static and/or active data sources. An administrator inter-face called DSManager permits to describe the data sources (static or activeand eventually conflicts existing between them). The administrator providesa description of services accessed by a user (more detail about the descrip-tion of services is given in section 4). The administrator activates the datasources, which can be accessed by a user;
2. We have extended the XQuery language in order to realise scenarios. A sce-nario is an EXQL query that integrates services in its body. Services includ-ing in a single query are executing sequentially and can be inter-operate withothers static data sources necessarily for the realisation of this scenario (fig.1). Some possible scenarios is given in section 4 and a concrete example isgiven in section 5.
3 System Architecture
This section describes the design of our system [3]. This system is composed ofthree components T-Wrappers, Mediators and Interfaces (figure 2):
1. T-Wrappers: this component is a wrapper for data sources of type T. Forstatic data sources we have developed two wrappers denoted SQL-Wrapper
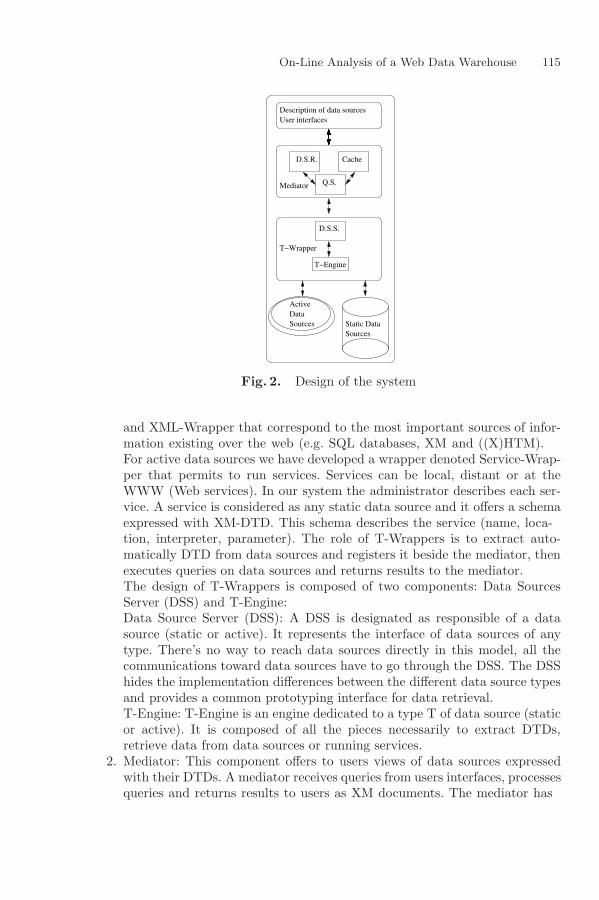
On-Line Analysis of a Web Data Warehouse 115
D.S.R. Cache
Q.S.
Description of data sources
D.S.S.
T−Engine
User interfaces
Mediator
T−Wrapper
ActiveDataSources Static Data
Sources
Fig. 2. Design of the system
and XML-Wrapper that correspond to the most important sources of infor-mation existing over the web (e.g. SQL databases, XML and ((X)HTML).For active data sources we have developed a wrapper denoted Service-Wrap-per that permits to run services. Services can be local, distant or at theWWW (Web services). In our system the administrator describes each ser-vice. A service is considered as any static data source and it offers a schemaexpressed with XML-DTD. This schema describes the service (name, loca-tion, interpreter, parameter). The role of T-Wrappers is to extract auto-matically DTD from data sources and registers it beside the mediator, thenexecutes queries on data sources and returns results to the mediator.The design of T-Wrappers is composed of two components: Data SourcesServer (DSS) and T-Engine:Data Source Server (DSS): A DSS is designated as responsible of a datasource (static or active). It represents the interface of data sources of anytype. There’s no way to reach data sources directly in this model, all thecommunications toward data sources have to go through the DSS. The DSShides the implementation differences between the different data source typesand provides a common prototyping interface for data retrieval.T-Engine: T-Engine is an engine dedicated to a type T of data source (staticor active). It is composed of all the pieces necessarily to extract DTDs,retrieve data from data sources or running services.
2. Mediator: This component offers to users views of data sources expressedwith their DTDs. A mediator receives queries from users interfaces, processesqueries and returns results to users as XML documents. The mediator has
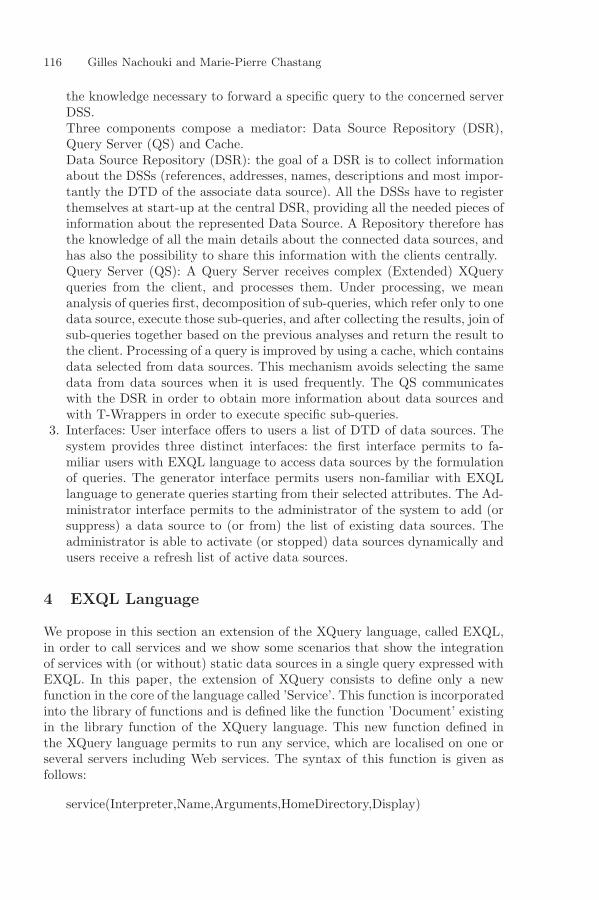
116 Gilles Nachouki and Marie-Pierre Chastang
the knowledge necessary to forward a specific query to the concerned serverDSS.Three components compose a mediator: Data Source Repository (DSR),Query Server (QS) and Cache.Data Source Repository (DSR): the goal of a DSR is to collect informationabout the DSSs (references, addresses, names, descriptions and most impor-tantly the DTD of the associate data source). All the DSSs have to registerthemselves at start-up at the central DSR, providing all the needed pieces ofinformation about the represented Data Source. A Repository therefore hasthe knowledge of all the main details about the connected data sources, andhas also the possibility to share this information with the clients centrally.Query Server (QS): A Query Server receives complex (Extended) XQueryqueries from the client, and processes them. Under processing, we meananalysis of queries first, decomposition of sub-queries, which refer only to onedata source, execute those sub-queries, and after collecting the results, join ofsub-queries together based on the previous analyses and return the result tothe client. Processing of a query is improved by using a cache, which containsdata selected from data sources. This mechanism avoids selecting the samedata from data sources when it is used frequently. The QS communicateswith the DSR in order to obtain more information about data sources andwith T-Wrappers in order to execute specific sub-queries.
3. Interfaces: User interface offers to users a list of DTD of data sources. Thesystem provides three distinct interfaces: the first interface permits to fa-miliar users with EXQL language to access data sources by the formulationof queries. The generator interface permits users non-familiar with EXQLlanguage to generate queries starting from their selected attributes. The Ad-ministrator interface permits to the administrator of the system to add (orsuppress) a data source to (or from) the list of existing data sources. Theadministrator is able to activate (or stopped) data sources dynamically andusers receive a refresh list of active data sources.
4 EXQL Language
We propose in this section an extension of the XQuery language, called EXQL,in order to call services and we show some scenarios that show the integrationof services with (or without) static data sources in a single query expressed withEXQL. In this paper, the extension of XQuery consists to define only a newfunction in the core of the language called ’Service’. This function is incorporatedinto the library of functions and is defined like the function ’Document’ existingin the library function of the XQuery language. This new function defined inthe XQuery language permits to run any service, which are localised on one orseveral servers including Web services. The syntax of this function is given asfollows:
service(Interpreter,Name,Arguments,HomeDirectory,Display)
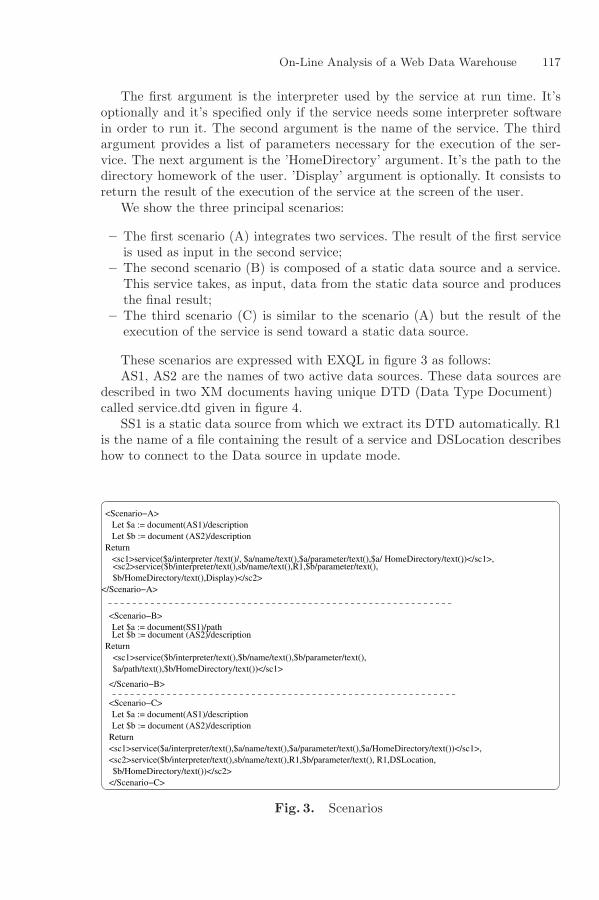
On-Line Analysis of a Web Data Warehouse 117
The first argument is the interpreter used by the service at run time. It’soptionally and it’s specified only if the service needs some interpreter softwarein order to run it. The second argument is the name of the service. The thirdargument provides a list of parameters necessary for the execution of the ser-vice. The next argument is the ’HomeDirectory’ argument. It’s the path to thedirectory homework of the user. ’Display’ argument is optionally. It consists toreturn the result of the execution of the service at the screen of the user.
We show the three principal scenarios:
– The first scenario (A) integrates two services. The result of the first serviceis used as input in the second service;
– The second scenario (B) is composed of a static data source and a service.This service takes, as input, data from the static data source and producesthe final result;
– The third scenario (C) is similar to the scenario (A) but the result of theexecution of the service is send toward a static data source.
These scenarios are expressed with EXQL in figure 3 as follows:AS1, AS2 are the names of two active data sources. These data sources are
described in two XML documents having unique DTD (Data Type Document)called service.dtd given in figure 4.
SS1 is a static data source from which we extract its DTD automatically. R1is the name of a file containing the result of a service and DSLocation describeshow to connect to the Data source in update mode.
<Scenario−A> Let $a := document(AS1)/description Let $b := document (AS2)/descriptionReturn
<sc2>service($b/interpreter/text(),sb/name/text(),R1,$b/parameter/text(),$b/HomeDirectory/text(),Display)</sc2>
</Scenario−A>
,
Let $b := document (AS2)/descriptionReturn
<Scenario−B>
$a/path/text(),$b/HomeDirectory/text())</sc1>
Let $a := document(SS1)/path
<sc1>service($b/interpreter/text(),$b/name/text(),$b/parameter/text(),
</Scenario−B>
Let $a := document(AS1)/description Let $b := document (AS2)/descriptionReturn
<Scenario−C>
<sc1>service($a/interpreter /text()/, $a/name/text(),$a/parameter/text(),$a/ HomeDirectory/text())</sc1>,
<sc2>service($b/interpreter/text(),sb/name/text(),R1,$b/parameter/text(), R1,DSLocation,$b/HomeDirectory/text())</sc2>
</Scenario−C>
<sc1>service($a/interpreter/text(),$a/name/text(),$a/parameter/text(),$a/HomeDirectory/text())</sc1>,
Fig. 3. Scenarios

118 Gilles Nachouki and Marie-Pierre Chastang
<!ELEMENT description (interpreter,name,parameter,HomeDirectory)><!ELEMENT parameter(para*)><!ELEMENT interpreter (#PCDATA)><!ELEMENT HomeDirectory (#PCDATA)><!ELEMENT name (#PCDATA)><!ELEMENT para (#PCDATA)>
Fig. 4. Data Type Document of active data sources
Other scenarios are possible and can be deduced from the three one givenabove. In the following section we show a concrete example using services withstatic data sources in order to realise a specific scenario.
5 Concrete Example: Web Usage Understanding
In this section we use the approach proposed in [10] in order to test our sys-tem. [10] provides an OLAP based approach (called Web Usage UnderstandingSystem) to analyze the traffic of users when navigating on the Web. For moreefficiency in using this tool, we have made it accessible via EXQL. In this ap-plication, we present a concrete scenario using the folowing data sources (Loginfiles for our laboratory doctorants):
the log file covering the period from 24/03/2002 to 31/03/2002.the log file covering the period from 31/03/2002 to 07/04/2002.the log file covering the period from 07/04/2002 to 14/04/2002.
This section includes programs to create the database schema, to add logfiles in the data bases, to update the data warehouse dimensions and to resetthe fact table. The administrator interface DSManager makes these data sourcesaccessible by the user and the user interface (called SwingClient) is connectedto the DSManager in order to obtain the structure of these data sources. Usersnot familiar with EXQL language can use the generator interface in order toformulate their queries. Otherwise, users can put directly their queries into theinterface and obtain the result from it.
The scenario we suggest is the following: Build a data warehouse for the Webusage understanding from login’s log files. In the following we give the structureof the data sources (active and static) :
The active data Source bdcr, which creates the data warehouse multidimen-sional structure, is given in figure 5(a). The active data Source aclfservice whichadds log filescontained in ’logs’ to the data warehouse is given in figure 5(b).Theactive data source ’majdservice’ which updates the dimension tables of the datawarehouse is given in figure 5(c).The active data source ftiservice which resetsthe fact table of the data warehouse once dimension tables were updated is givenin figure 5(d).The active data source cube which launchs the visualisation of themultidimensional data as an hypercube is given in figure 5(e). The static datasource ’logs’ which contains logfiles to be added to the data warehouse is givenin figure 5(f).
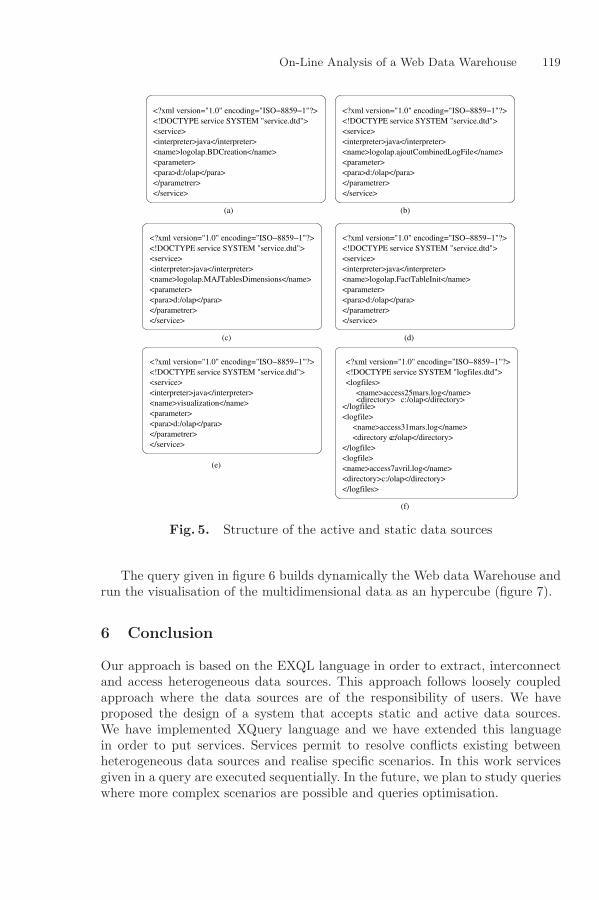
On-Line Analysis of a Web Data Warehouse 119
<?xml version="1.0" encoding="ISO−8859−1"?><!DOCTYPE service SYSTEM "service.dtd"><service><interpreter>java</interpreter><name>logolap.BDCreation</name><parameter><para>d:/olap</para></parametrer></service>
<?xml version="1.0" encoding="ISO−8859−1"?><!DOCTYPE service SYSTEM "service.dtd"><service><interpreter>java</interpreter>
<parameter><para>d:/olap</para></parametrer></service>
<name>logolap.FactTableInit</name>
<?xml version="1.0" encoding="ISO−8859−1"?><!DOCTYPE service SYSTEM "logfiles.dtd"><logfiles>
<name>access25mars.log</name><directory> c:/olap</directory>
</logfile><logfile> <name>access31mars.log</name> <directory c:/olap</directory></logfile><logfile><name>access7avril.log</name><directory>c:/olap</directory></logfiles>
<?xml version="1.0" encoding="ISO−8859−1"?><!DOCTYPE service SYSTEM "service.dtd"><service><interpreter>java</interpreter>
<parameter><para>d:/olap</para></parametrer></service>
<name>visualization</name>
<?xml version="1.0" encoding="ISO−8859−1"?><!DOCTYPE service SYSTEM "service.dtd"><service><interpreter>java</interpreter>
<parameter><para>d:/olap</para></parametrer></service>
<name>logolap.ajoutCombinedLogFile</name>
<?xml version="1.0" encoding="ISO−8859−1"?><!DOCTYPE service SYSTEM "service.dtd"><service><interpreter>java</interpreter>
<parameter><para>d:/olap</para></parametrer></service>
<name>logolap.MAJTablesDimensions</name>
(a) (b)
(c) (d)
(e)
(f)
c:
Fig. 5. Structure of the active and static data sources
The query given in figure 6 builds dynamically the Web data Warehouse andrun the visualisation of the multidimensional data as an hypercube (figure 7).
6 Conclusion
Our approach is based on the EXQL language in order to extract, interconnectand access heterogeneous data sources. This approach follows loosely coupledapproach where the data sources are of the responsibility of users. We haveproposed the design of a system that accepts static and active data sources.We have implemented XQuery language and we have extended this languagein order to put services. Services permit to resolve conflicts existing betweenheterogeneous data sources and realise specific scenarios. In this work servicesgiven in a query are executed sequentially. In the future, we plan to study querieswhere more complex scenarios are possible and queries optimisation.

120 Gilles Nachouki and Marie-Pierre Chastang
<results>Let $a := document("bdcr")/serviceReturn<Result1><crDW>service($a/interpreteur/text(),$a/name/text(),$a/parameter/para/text())</crDW>,
,
</results></Result3>
<Result3></Result2><Fti>service($d/interpreteur/text(),$d/name/text(),$d/parameter/para/text())</Fti>
<Mtd>service($c/interpreteur/text(),$c/name/text(),$c/parameter/para/text())</Mtd>,<Result2>
ReturnLet $d := document("ftiservice")/serviceLet $c := document("majdservice")/service</Result1><Aclf>service($e/interpreteur/text(),$e/name/text(),$b/directory/text(),$b/name/text(),$e/parameter/para/text())</Aclf>Return
For $b in document("logs")/logfiles/logfileLet $e in document("aclfservice")/service
<Visu>service($c/interpreteur/text(),$c/name/text(),$c/parameter/para/text()) </Visu>
Fig. 6. EXQL: Web traffic analysis
Fig. 7. Visualisation of the multidimensional data as an hypercube
References
[1] B.Amman & al. Ontology-based integration of xml web resources. In proceedingof the International Semantic Web Conference, pages 117–131, 2002. 113
[2] D. Suciu & al. Report on webdb 2000. In 3rd International Workshop on the Weband databases, 2000. 112
[3] G. Nachouki & al. Extracting, Interconnecting and Accessing Heterogeneous DataSources: An XML Query Based Approach. Springer-Verlag, Iran, 2002. 114
On-Line Analysis of a Web Data Warehouse 121
[4] H. Garcia-Molina & al. Integrating and accessing heterogeneous informationsources in tsimmis. In proceeding of the AAAI symposium on information gather-ing, California, 1995. 113
[5] I. Manolescu & al. Living with xml and relational. In in proceedings of the 26thVLDB Conference, Egypt, 2000. 113
[6] I. Manolescu & al. Answering xml queries over heterogeneous data sources. In inproceedings of the 27th VLDB Conference, Italy, 2001. 113
[7] P. Sheth & al. Federated databases systems for managing disributed heteroge-neous and’autonomous databases. ACM Computing Survey, 22(3):183–236, 1990.112
[8] S. Abiteboul & al. Active xml: A data-centric perspective on web services. InBDA 2002, Paris, 2002. 113
[9] S. Bergamaschi & al. Integration of Information from Multiple Sources of TextualData. Springer-Verlag, 1999. 113
[10] S.Naouali & al. Web rafic analysis. In proceeding of the Information and Knowl-edge System (IKS), US Virgin Islands, 2002. 118
[11] T. Kirk & al. The information manifold. In working Notes of the AAAI sym-posium on information gathering from Heterogeneous Distributed Environments,California, 1995. 113
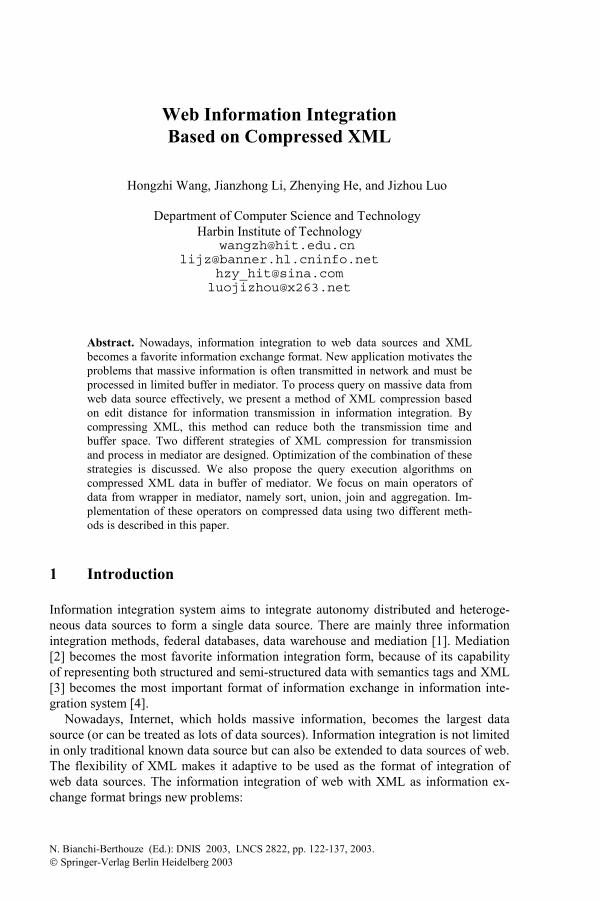
N. Bianchi-Berthouze (Ed.): DNIS 2003, LNCS 2822, pp. 122-137, 2003. Springer-Verlag Berlin Heidelberg 2003
Web Information IntegrationBased on Compressed XML
Hongzhi Wang, Jianzhong Li, Zhenying He, and Jizhou Luo
Department of Computer Science and TechnologyHarbin Institute of Technology
[email protected]@banner.hl.cninfo.net
[email protected]@x263.net
Abstract. Nowadays, information integration to web data sources and XMLbecomes a favorite information exchange format. New application motivates theproblems that massive information is often transmitted in network and must beprocessed in limited buffer in mediator. To process query on massive data fromweb data source effectively, we present a method of XML compression basedon edit distance for information transmission in information integration. Bycompressing XML, this method can reduce both the transmission time andbuffer space. Two different strategies of XML compression for transmissionand process in mediator are designed. Optimization of the combination of thesestrategies is discussed. We also propose the query execution algorithms oncompressed XML data in buffer of mediator. We focus on main operators ofdata from wrapper in mediator, namely sort, union, join and aggregation. Im-plementation of these operators on compressed data using two different meth-ods is described in this paper.
1 Introduction
Information integration system aims to integrate autonomy distributed and heteroge-neous data sources to form a single data source. There are mainly three informationintegration methods, federal databases, data warehouse and mediation [1]. Mediation[2] becomes the most favorite information integration form, because of its capabilityof representing both structured and semi-structured data with semantics tags and XML[3] becomes the most important format of information exchange in information inte-gration system [4].
Nowadays, Internet, which holds massive information, becomes the largest datasource (or can be treated as lots of data sources). Information integration is not limitedin only traditional known data source but can also be extended to data sources of web.The flexibility of XML makes it adaptive to be used as the format of integration ofweb data sources. The information integration of web with XML as information ex-change format brings new problems:
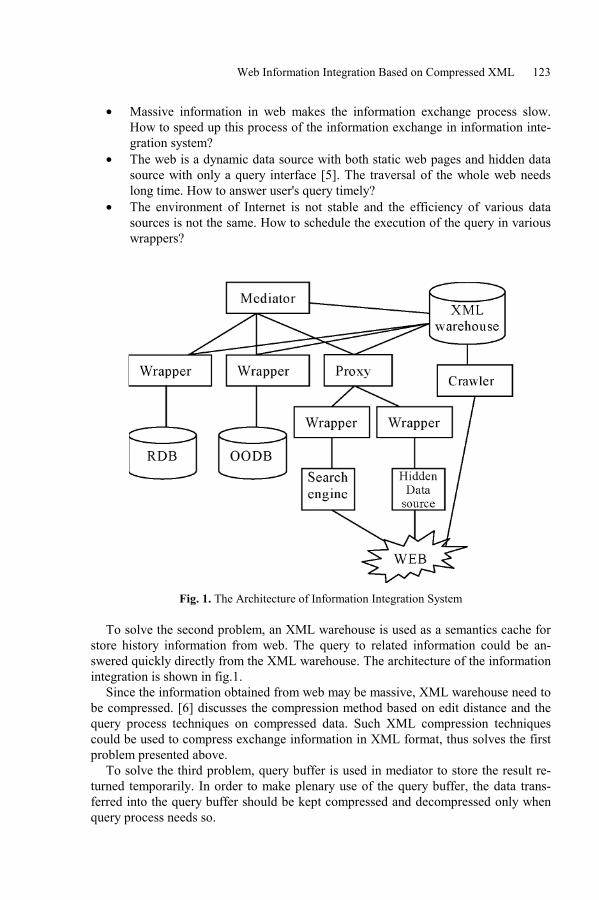
Web Information Integration Based on Compressed XML 123
• Massive information in web makes the information exchange process slow.How to speed up this process of the information exchange in information inte-gration system?
• The web is a dynamic data source with both static web pages and hidden datasource with only a query interface [5]. The traversal of the whole web needslong time. How to answer user's query timely?
• The environment of Internet is not stable and the efficiency of various datasources is not the same. How to schedule the execution of the query in variouswrappers?
Fig. 1. The Architecture of Information Integration System
To solve the second problem, an XML warehouse is used as a semantics cache forstore history information from web. The query to related information could be an-swered quickly directly from the XML warehouse. The architecture of the informationintegration is shown in fig.1.
Since the information obtained from web may be massive, XML warehouse need tobe compressed. [6] discusses the compression method based on edit distance and thequery process techniques on compressed data. Such XML compression techniquescould be used to compress exchange information in XML format, thus solves the firstproblem presented above.
To solve the third problem, query buffer is used in mediator to store the result re-turned temporarily. In order to make plenary use of the query buffer, the data trans-ferred into the query buffer should be kept compressed and decompressed only whenquery process needs so.

124 Hongzhi Wang et al.
The contributions of this paper are:
• Various strategies of compressed data in XML format based on edit distanceare proposed in various component of information integration system withXML warehouse. The strategies behave differently in a variety of different ap-plications.
• The algorithms of query execution in mediator to integrate data obtained di-rectly from data sources and XML warehouse is presented.
This paper is organized as follows. Section 2 gives the compression method ofXML based on edit distance. The algorithms of query execution are presented in sec-tion 3 and section 4 sums up related work. Section 5 draws the conclusion.
2 Compression of XML Data Based on Edit Distance
Data in XML format could be represented as a tree, whose root is the outer tag, non-leaf nodes are tags and leaf nodes are values. The data in XML format with just oneroot is called an XML data set. The edit distance is defined as the operations list be-tween two XML data sets. The operations are defined as follows:
• Insert (n, k, T): insert XML tree T as the kth child of node n.• Delete (n, k, T): delete XML tree T, which is the kth child of node n.• Update (n, v, ov): change the label of node n from v to ov.• Move (n, k, m, p): move the sub-tree in the pth child of m to the kth child of n.• Swap (n, k, m, p): exchange the sub-tree in the pth child of m and the kth child of n.• Copy (n, k, m, p): copy the sub-tree in the mth child of p into the kth child of n.• Nop (): do nothing to the tree
As proved in [6], the operations satisfied commutative law and integrate law, andfor each operation, the inverse operation could be found. Therefore, the operationsform a group.
It is different between the compress strategies of XML warehouse and informationexchange in XML format.
As for the compression of XML warehouse, XML data items are clustered based ontheir edit distance and the cost on the operations. Each cluster could be considered asa graph with power with the XML data items as nodes and the edit distance betweentwo XML data items as power, so the minimal spanning tree of this cluster can begenerated. For each cluster, a center which makes the total cost of the edit distance inthe cluster minimal is chosen. The center is stored as a whole XML document and theother XML data items in the cluster only the base information such as creation timeand original location are stored. The edit distance in minimal spanning tree is alsostored. Each XML data item in the cluster could be reconstructed by the center and thepath of edit distance from center to it in the minimal spanning tree. The detail of com-pression algorithms and query process for compressed XML warehouse based on editdistance is given in [6]. From each cluster, an XML schema could be extracted as therepresentation of the cluster, which is defined as represent schema.
Web Information Integration Based on Compressed XML 125
The data in information exchange require linear scan, that is to say, the XML dataitem should be processed one by one. Hence the compression strategy of exchangedata needs the information to be compressed as a list with the head a whole XML dataitem and XML data items are only represented as edit distance. Take future informa-tion transmission acceleration into consideration, the operator could be predigested.Only operator Delete and Update could be changed. The results of change are:
• Delete (n, k): delete the kth child of node n.• Update (n, v): change the label of node n to v.
After such changes, the operations of delete and update need not to contain originalvalues, which will lead to the result that the operations miss reversibility and the listdoes not support reconstruct former XML data item with latter ones. But the XMLdata item list is just used in data transmission, which makes reconstruction not a re-quired task.
Fig. 2. The comparison of two compress structures
There are two choices for the design of the structure of the XML data item list, oneis to store the center the edit distances between whom to other XML data items totransform and other XML data items are represented as the edit distance between itand the center, as is called structure based on center (SBC in brief), the other choice isthat all the XML data items are arranged into a list, the whole first XML data item andthe edit distance between each other XML data item and its last XML data item isstored, as is called structure based on order (SBO in brief). The two choices are shownin fig.2. In the figure, a square represents a XML page and a circle represents an editdistance operation.
126 Hongzhi Wang et al.
The selection depends on the relation between the data to be sent by the wrapper.Sometimes, the result to be returned contains the relation of order. In this case, struc-ture based on center should be used. The reason is that the information reaching insuch order is easy to process by mediator. The instance that SBO should be used isthat the size of XML data item is quite large for the buffer in mediator. In multi se-quence algorithms, SBC is preferred because the times of edit distance computation isfewer in SBC than those in SBO. In other instances, the choice depends on the esti-mation of the query process efficiency based on the predicted parameters of the resultreturned by the data source.
3 Query Process on Compressed XML Data
The mediator considers data sources as a view in integration system through the wrap-per and the capability of wrapper is described as the part of local schema of the datasource related to global schema. In mediator, the basic query plan is generated as theintegration of the result and task of the wrappers, just like the join or union and scanof tables in relational database. And in each data source, the task assigned by mediatoris executed. The query operators of query process in mediator are therefore mainlyoperators processing the result from multiple data sources.
The buffer size is limited in mediator for storing the result from various datasources temporarily for processing. Since there may be so many data sources to querythat the result returned could not fit in the buffer, the disposition of the query to wrap-per should be scheduled well to make the buffer large enough for query process inmediator.
In this section, the definitions of the operators in mediator are presented at first.And then the implementation of them is given. All these are based on compressedXML data.
3.1 The Definitions of Operators in Mediator
The task of mediator for query execution is mainly to integrate the result returned bywrapper based on the query plan. Hence the operators could be abstracted from theoperations in mediator. The goal of defining these operators is to discuss the imple-mentation of the query in mediator and schedule the query task. These operators areshown as following:
• Join
Integrate two XML data item together based on some criteria. Since the treestructure of XML data item is more complex than relation, there are various typesof join operator, the implementation of which are different. According to the formstructure of join, the types and their representation can be classified as followings:
� Connect join (S1 ⊕ [condition][tag]S2)
Web Information Integration Based on Compressed XML 127
Connect every XML tree T1 in S1 and T2 in S2 into one XML tree with thetag as the root while S1 and S2 as the two child of root.
� Merge join (S1 ⊗ [condition]S2)
Merge every XML tree T1 in S1 and T2 in S2 into one XML tree with theroot of T1 as the root and T2 are connected onto the root.
The condition of join permits regular expression and since there may be morethan one tag. According to the condition, the types of join are presented as fol-lowing:
� One-join: if there are more than one objects, only one object satisfies thecondition then the condition is true.
� All-join: If there are more than one objects, all the object satisfies the condi-tion, then the condition is true.
� Con-join: If the number of objects satisfying condition is larger than athreshold, the condition is true.
• Union (S1∩S2)
Intersection of XML data item set S1 and S2. It is different from relational op-erator in that there is no schema limit for two union sets. That is to say, every twoXML data item sets could be union.
• Sort (Sort[condition]S)
Sort the XML documents in S based on the condition condition. Condition de-fines the comparison rules. Since the comparison of complex object is not well-defined, the condition is needed to define the order relation between complexobject.
• Group and Aggregationγ[condition](S)
Group the XML documents in S based on the rules defined in condition. Thecondition is defined as the object to group with the rules to judge if two objectsshould be grouped together.
3.2 The Implementation of the Operators in Mediator
In this part, the implementation of the operators join, union, sort and aggregation,which form the main operation in mediator, is described. Since the query plan in me-diator may contain more than one operation, the middle result is stored on externalmemory. The operation should be implemented for both received XML data itemsequence from network and those stored on the secondary memory. The algorithmspresented in this paper can fit in the two instances.
In order to describe the algorithms, the iterator functions are defined as following.The implementation of these iterators could be operated on accepted data from net-work and load data from disk.
• Open(s): open a compressed XML data item sequence s.
128 Hongzhi Wang et al.
• Getfirst(s): get the first XML data item of a sequence s.• Getnextopera(s): get next edit operation in the sequence s. if a complete ∆ of a
XML data item is accepted, a special symbol is accepted.• Getpreviousopera(s): get previous operation in the sequence s. It should be noted
that the operation the function returns is the inverted operation of the original op-eration in the sequence.
• output(s): Put next edit operation in the sequence s. if a complete ∆ of a XML dataitem is accepted, a special symbol is outputted.
• Close(s): close a compressed XML data item s.
It is supposed that the two sequences to be processed are s1={x11, x12, �, x1n} ands2={x21, x22, �, x2m}.
3.2.1 Sort
For the limitation of buffer's space, we assume that the part of the result in compressedXML format could be stored in the buffer could be as little as possible during queryprocess. In order to decrease I/O cost of mediator and distribute the cost to the datasource, if sort is needed in any step, the operator could be pre-executed in data sourceand in mediator and therefore the implementation of sort operator only needs to mergethe returned results.
Both of the algorithms of merging SBO sequences and SBC sequences are similarto common merge join while some details are different. The first step of the two algo-rithms is to compare the head XML data items in the two sequences by the compari-son condition and output the smaller one while leave the sorted objects in buffer. Forlater XML data item represented by edit distance, only the operations related to sortobject are considered. The operations are executed on the left sort object. When twoXML data item generated symbols are both met, they are compared and the operationsequence of the smaller one is outputted.
It is worth noticing that the output sequence is not the original sequence becausethe former XML data item in the output XML data item sequence may not be the onein the original sequence. The methods of processing this instance in SBO and SBC aredifferent.
If they are SBO, at first the edit distance between two head XML data items iscomputed. The edit distances of the XML data items on processing of two sequencesare computed when new XML data item flows into buffer. Supposing that the XMLdata items in buffer are x1i and x2j, and the x1i-1 is just outputted by comparison, theedit distance between x1i and x2j is computed as follows:
Edit_distance(x1i, x2j)=optim(invert(edit_distance(x1i-1, x2j))+edit_distance(x1i, x1i-1))
In the formula, function invert() is to compute the inversion of the edit distance,function optim() is to optimize the edit distance and the symbol �+' is overloaded forconnecting two edit distances. The implementation of invert() and optim() is in [6].Since edit_distance(x1i-1, x2j) and edit_distance(x1i, x1i-1) are already computed, theprocess is effective.
if X1i is smaller, edit_distance(x1i, x1i-1) is outputted.Otherwise, edit_distance(x2j, x1i-1)=invert(x1i-1, x2j) is outputted.
Web Information Integration Based on Compressed XML 129
If they are SBC, the edit distance between x11 and x21 is also computed at first. It isSupposed that the XML data items in buffer are x1i and x2j, the first XML data itemoutput is x11, the last XML data item output is x1i-1. If x1i is smaller than x2j by com-parison, edit_distance(x1i, x11) is outputted. Otherwise, edit_distance(x2j, x11)=invert(edit_distance(x11,x21))+edit_distance(x2j, x21) is outputted, in whichedit_distance(x11,x21) and edit_distance(x2j, x21) are already know. The other instancecould be processed in the method similar to this.
The brief description of the algorithm of merging two SBO sequences together is inalgrithm1 of appendix A and that of algorithm of merging two SBC sequence togetheris in algrithm2 of appendix A.
From these two algorithms, it could be seen that the algorithms of SBO and SBC isquite similar except some details of computing edit distance. In the following discuss,only the algorithms of SBO are described.
3.2.2 Union
The result is assumed to be already sorted by data sources on the object with the mostvalues, as is judged by statistics in catalog. The implementation of union is quitesimilar to that of sort, except that with the same object value, all of the XML dataitems should be checked.
For the two sequences S1 and S2, x11 and x21 are compared at first. If they have dif-ferent sort object, output the XML data item with the smaller one object. If they havesame sort object, all the XML data items in the sequences with the sort object shouldbe scanned. It is supposed that S1'={x1i1, x1i1+1,�, x1i2} in S1 and S2'={x2j1, x2j1+1, �,x2j2} in S2 all have the same sort value. Edit_distance(x1i1, x2j1) is computed at first andif it is nop, they are considered the same and one of them could be eliminated. TheXML data items in S1' and S2' are checked nest-loop. In order to simplify computing,the edit distance could also be computed with the edit distance computed previously.The course of union S1' and S2' in SBC mode is described in algrithm3 of appendix A.
Of course, the extreme instance is that the data source could execute sort and elimi-nate repetition of the result with all the objects in the XML data item. That is to say,each object in the XML data item should be defined an order relationship. Based onthe relationship, the object could be sorted completely. This is an ideal instance be-cause define the order relationship for each object automatically in mediator is a hardwork especially for the object permitting repetition in schema and the efficiency ofquery for data source may decrease a lot.
3.2.3 Join
There are various types of operator join. If the join condition is comparison, sortmerge join is considered because the data source could pre-sort the result. The opera-tion sequence is like merge sort with the difference of the process of result becausetwo XML data items in sequence should be connected. In different join mode andXML compress mode, the connect method is various.
For nature join, only the sub-sequences with same join object value should be nest-looped. While for join with unequal object, the sequence will be scanned for manytimes. External memory must be used to accomplish the operation. Since the compres-sion of XML could shrink the size of XML data a lot, one block brings into buffer
130 Hongzhi Wang et al.
may holds many XML data items. The max and min of current block of internal couldbe used to accelerate the process. The algorithm of nature join is quite like that ofunion. For x1i and x2j in S1 and S2 respectively, if they have equal join value, in con-nect join the additional root tag is numbered the smallest number and the XML tree x1iand x2j is retraversed for new number. The same process is adaptive for merge joinexcept that only x2j needs to be renumbered as the sub tree of x1i. During the processon compressed XML sequences, the change of number are reflected in the number oftree nodes in operations in sequence. The new number of x11 and x21 need to be com-puted by traversal. For each sequence, an offset in number could be defined. Thenumber of node in generated tree by join is the offset added to the offset. When thereare sub-tree added or deleted from x1i, the only the offset of x2j is changed. Thechange of the operation in sequence is to add the offset to the node number in theoperation.
The detail of the algorithm for SBC is in algrithm4 of appendix.
3.2.4 Aggregation
As discussed above, as much as work is pushed to the data source, so is the group byand aggregation. The particular instance is the aggregation function avg, as could notbe computed directly by the avg value of the XML. To compute this kind of aggrega-tion, the result returned holds two objects of sum and count. The avg could easy tocount from the value of sum and count.
The result generating of aggregation is simpler since the merge of two XML dataitem with the same group object needs only change the value in the operation relevantto the aggregation object. The detail of the algorithm for SBC is in algrithm5 of ap-pendix.
3.2.5 Extension of the Algorithm to Multiple Compressed Sequence
In order to accelerate the process, multiple compressed sequences could be processedtogether. Join between various sequences relates to different objects and the synchro-nization is quite difficult for join with limited buffer. The multiple compressed se-quence operators are only sort, union and aggregation.
The returned result sorted, the result with the same sort value could be processedtogether. N sequences S1={x11,x12,�x1m1}, S2={x21,x22,�x2m2} ,�., Sn={xn1,xn2, �xnmn} is supposed to be operated together. The implementation of sort in SBO mode isdiscussed in detail and that of other operators is similar.
The process order is as multi merge sort to output the smallest value each time. Thefeature of the process in out algorithm is that the XML data item is represented by editdistant. To merge the edit distance in various sequence into one, the edit distancesbetween each on processing one should be kept in buffer. Because of the inversionand connectable properties, supposing current process XML data items are x1i1, x2i2,�., xnin, only the edit_distance(x1i1, x2i2), edit_distance(x2i2, x3i3), �, edit_distance(xn-
1in-1, xnin) need to be maintained in buffer. In SBO mode, supposing k is smaller than rif xkik is outputted and the last XML data item outputted is xrir-1, the edit distance be-tween xkik and xrir-1 is computed by the following formula:
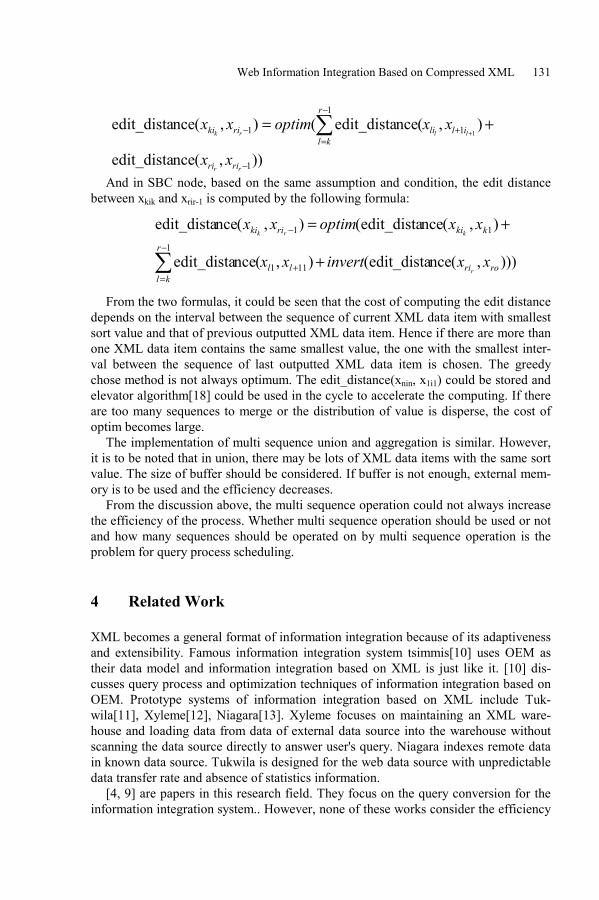
Web Information Integration Based on Compressed XML 131
And in SBC node, based on the same assumption and condition, the edit distancebetween xkik and xrir-1 is computed by the following formula:
))),(nceedit_dista(),(nceedit_dista
),(nceedit_dista(),(nceedit_dista
111
1
11
rorill
r
kl
kkiriki
xxinvertxx
xxoptimxx
r
krk
+
+=
+
−
=
−
∑From the two formulas, it could be seen that the cost of computing the edit distance
depends on the interval between the sequence of current XML data item with smallestsort value and that of previous outputted XML data item. Hence if there are more thanone XML data item contains the same smallest value, the one with the smallest inter-val between the sequence of last outputted XML data item is chosen. The greedychose method is not always optimum. The edit_distance(xnin, x1i1) could be stored andelevator algorithm[18] could be used in the cycle to accelerate the computing. If thereare too many sequences to merge or the distribution of value is disperse, the cost ofoptim becomes large.
The implementation of multi sequence union and aggregation is similar. However,it is to be noted that in union, there may be lots of XML data items with the same sortvalue. The size of buffer should be considered. If buffer is not enough, external mem-ory is to be used and the efficiency decreases.
From the discussion above, the multi sequence operation could not always increasethe efficiency of the process. Whether multi sequence operation should be used or notand how many sequences should be operated on by multi sequence operation is theproblem for query process scheduling.
4 Related Work
XML becomes a general format of information integration because of its adaptivenessand extensibility. Famous information integration system tsimmis[10] uses OEM astheir data model and information integration based on XML is just like it. [10] dis-cusses query process and optimization techniques of information integration based onOEM. Prototype systems of information integration based on XML include Tuk-wila[11], Xyleme[12], Niagara[13]. Xyleme focuses on maintaining an XML ware-house and loading data from data of external data source into the warehouse withoutscanning the data source directly to answer user's query. Niagara indexes remote datain known data source. Tukwila is designed for the web data source with unpredictabledata transfer rate and absence of statistics information.
[4, 9] are papers in this research field. They focus on the query conversion for theinformation integration system.. However, none of these works consider the efficiency
)),(nceedit_dista
),(nceedit_dista(),(nceedit_dista
1
1
1
1 1
−
+
−
=− +=
+∑
rr
llrk
riri
illi
r
klriki
xx
xxoptimxx
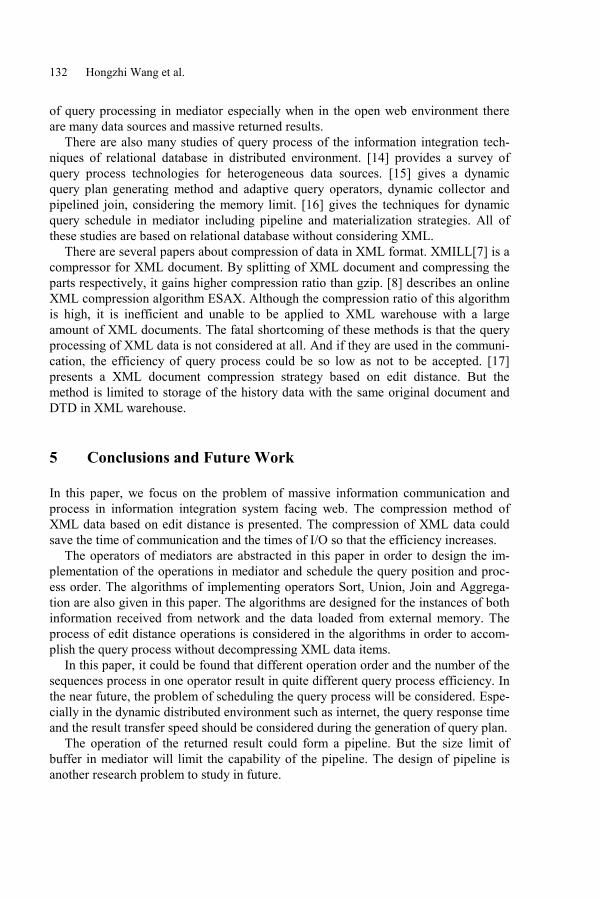
132 Hongzhi Wang et al.
of query processing in mediator especially when in the open web environment thereare many data sources and massive returned results.
There are also many studies of query process of the information integration tech-niques of relational database in distributed environment. [14] provides a survey ofquery process technologies for heterogeneous data sources. [15] gives a dynamicquery plan generating method and adaptive query operators, dynamic collector andpipelined join, considering the memory limit. [16] gives the techniques for dynamicquery schedule in mediator including pipeline and materialization strategies. All ofthese studies are based on relational database without considering XML.
There are several papers about compression of data in XML format. XMILL[7] is acompressor for XML document. By splitting of XML document and compressing theparts respectively, it gains higher compression ratio than gzip. [8] describes an onlineXML compression algorithm ESAX. Although the compression ratio of this algorithmis high, it is inefficient and unable to be applied to XML warehouse with a largeamount of XML documents. The fatal shortcoming of these methods is that the queryprocessing of XML data is not considered at all. And if they are used in the communi-cation, the efficiency of query process could be so low as not to be accepted. [17]presents a XML document compression strategy based on edit distance. But themethod is limited to storage of the history data with the same original document andDTD in XML warehouse.
5 Conclusions and Future Work
In this paper, we focus on the problem of massive information communication andprocess in information integration system facing web. The compression method ofXML data based on edit distance is presented. The compression of XML data couldsave the time of communication and the times of I/O so that the efficiency increases.
The operators of mediators are abstracted in this paper in order to design the im-plementation of the operations in mediator and schedule the query position and proc-ess order. The algorithms of implementing operators Sort, Union, Join and Aggrega-tion are also given in this paper. The algorithms are designed for the instances of bothinformation received from network and the data loaded from external memory. Theprocess of edit distance operations is considered in the algorithms in order to accom-plish the query process without decompressing XML data items.
In this paper, it could be found that different operation order and the number of thesequences process in one operator result in quite different query process efficiency. Inthe near future, the problem of scheduling the query process will be considered. Espe-cially in the dynamic distributed environment such as internet, the query response timeand the result transfer speed should be considered during the generation of query plan.
The operation of the returned result could form a pipeline. But the size limit ofbuffer in mediator will limit the capability of the pipeline. The design of pipeline isanother research problem to study in future.

Web Information Integration Based on Compressed XML 133
References
[1] H. Garcia-Molina, J. D. Ullman, J. Widom: Database System Implementation.Prentice Hall. 2000.
[2] G. Wirderhold: Mediators in the Architecture of Future Information Systems.IEEE Computer� 25:38-49.
[3] T. Bray� J. Paoli� C. M. Sperberg-McQueen: Extensible markup language(XML) 1.0. W3C Recommendation. Feb.1998.http://www.w3.org/TR/REX-xml.
[4] V. Christophides, S. Cluet, and J. Simeon: On Wrapping Query Languages andEfficient XML Integration. In Proc. of ACM SIGMOD Conf. on Managementof Data, Dallas, TX., May 2000.
[5] S. Raghavan H. Garcia-Molina: Crawling the Hidden Web. In 27th Interna-tional Conference on Very Large Data Bases. 2001. Rome, Italy.
[6] H. Wang, J. Li, Z. He: An Effective Storage Strategy for Compressed XMLWarehouse. In Proc. of National Database Conference of China 2002.
[7] H. Liefke and D. Suciu: XMill: an ecient compressor for XML data. In Pro-ceedings of the 2000 ACM SIGMOD International Conference on Managementof Data.
[8] J. Cheney: Compressing XML with Multiplexed Hierarchical Models. in Pro-ceedings of the 2001 IEEE Data Compression Conference, pp. 163-172.
[9] Manolescu, D. Florescu, D. Kossmann: Answering XML Queries over Hetero-geneous Data Sources . SIGMOD2001.
[10] Papakonstantinou, S. Abiteboul, H. Garcia-Molina: Object Fusion in MediatorSystems. VLDB'96.
[11] Z. Ives , A. Halevy , D. Weld: Integrating Network-Bound XML Data. DataEngineering Bulletin 24(2) 2001
[12] L. Xyleme: A dynamic warehouse for XML data of the Web. IEEE Data Engi-neering Bulletin. 2001.
[13] J. Naughton, et al: The Niagara Internet Query System. IEEE Data EngineeringBulletin, 2001.
[14] D. Kossmann: The state of the art in distributed query processing. ACM Com-puting Surveys 32(4), December 2000.
[15] Z. G. Ives, D. Florescu, M. Friedman, A. Levy, D. S. Weld: An Adaptive QueryExecution System for Data Integration, Proceedings of the SIGMOD Confer-ence, Philadelphia, Pennsylvania (1999).
[16] L. Bouganim, F. Fabret, P. Valduriez, C. Mohan: Dynamic Query Scheduling inData Integration Systems. 16th International Conference on Data Engineering.February 28 - March 03, 2000.San Diego, California.
[17] Marian, S. Abiteboul, G. Cob´na, L. Mignet: Change-centric management ofversions in an XML warehouse. VLDB 2001.
[18] Silberschatz, P. Baer Galvin, G. Gagne: Operating System Concepts(Sixth Edi-tion). John Wiley & Sons,Incl. 2001.
[19] H. Wang. Research of Information Integration in distribute Environment. Thesisof Bachelor Degree of Harbin Institute of Technology. 2001.
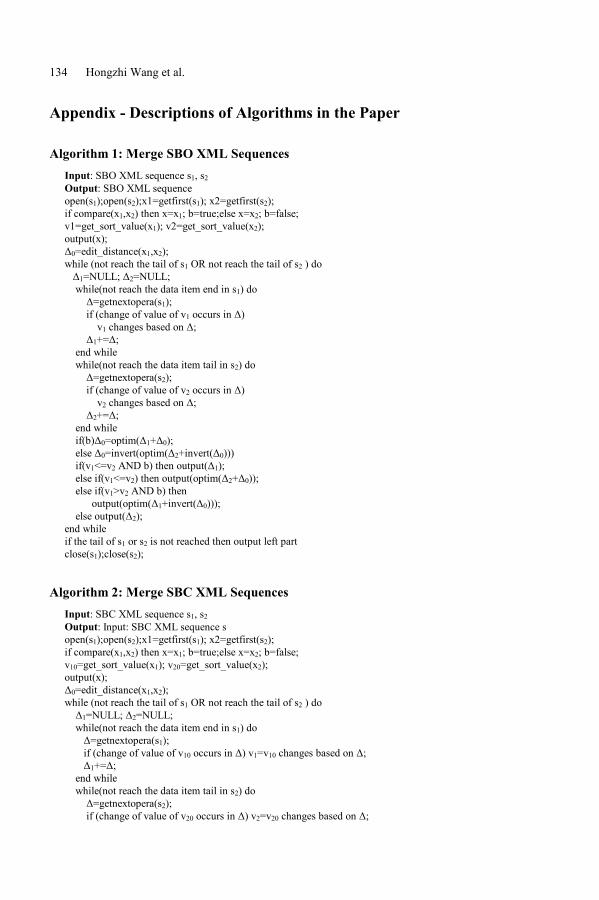
134 Hongzhi Wang et al.
Appendix - Descriptions of Algorithms in the Paper
Algorithm 1: Merge SBO XML SequencesInput: SBO XML sequence s1, s2Output: SBO XML sequenceopen(s1);open(s2);x1=getfirst(s1); x2=getfirst(s2);if compare(x1,x2) then x=x1; b=true;else x=x2; b=false;v1=get_sort_value(x1); v2=get_sort_value(x2);output(x);∆0=edit_distance(x1,x2);while (not reach the tail of s1 OR not reach the tail of s2 ) do ∆1=NULL; ∆2=NULL; while(not reach the data item end in s1) do ∆=getnextopera(s1); if (change of value of v1 occurs in ∆) v1 changes based on ∆; ∆1+=∆; end while while(not reach the data item tail in s2) do ∆=getnextopera(s2); if (change of value of v2 occurs in ∆) v2 changes based on ∆; ∆2+=∆; end while if(b)∆0=optim(∆1+∆0); else ∆0=invert(optim(∆2+invert(∆0))) if(v1<=v2 AND b) then output(∆1); else if(v1<=v2) then output(optim(∆2+∆0)); else if(v1>v2 AND b) then output(optim(∆1+invert(∆0))); else output(∆2);end whileif the tail of s1 or s2 is not reached then output left partclose(s1);close(s2);
Algorithm 2: Merge SBC XML SequencesInput: SBC XML sequence s1, s2Output: Input: SBC XML sequence sopen(s1);open(s2);x1=getfirst(s1); x2=getfirst(s2);if compare(x1,x2) then x=x1; b=true;else x=x2; b=false;v10=get_sort_value(x1); v20=get_sort_value(x2);output(x);∆0=edit_distance(x1,x2);while (not reach the tail of s1 OR not reach the tail of s2 ) do ∆1=NULL; ∆2=NULL; while(not reach the data item end in s1) do ∆=getnextopera(s1); if (change of value of v10 occurs in ∆) v1=v10 changes based on ∆; ∆1+=∆; end while while(not reach the data item tail in s2) do ∆=getnextopera(s2); if (change of value of v20 occurs in ∆) v2=v20 changes based on ∆;

Web Information Integration Based on Compressed XML 135
∆2+=∆; end while if(v1<=v2 AND b) then output(∆1); else if(v1<=v2) then output(optim(∆2+∆0)); else if(v1>v2 AND b) then output(optim(∆1+invert(∆0))); else output(∆2);end whileif the tail of s1 or s2 is not reached then output left part;close(s1);close(s2);
Algorithm 3: Unoin SBC XML SequencesInput: SBC XML sequence s1, s2Output: SBC XML sequence sopen(s1);open(s2);x1=getfirst(s1); x2=getfirst(s2);if compare(x1,x2) then x=x1; b=true;else x=x2; b=false;v10=get_sort_value(x1); v20=get_sort_value(x2); output(x); ∆0=edit_distance(x1,x2);while (not reach the tail of s1 OR not reach the tail of s2 ) do r=false; ∆1=NULL; ∆2=NULL; while(not reach the data item end in s1 AND r==false) do ∆=getnextopera(s1); if (change of value of v10 occurs in ∆) then r= true;v1=v10 changes based on ∆; ∆1+=∆; if(r==false) store ∆to buffer B; end while while(v2<v1) do ∆=getnextopera(s2); if (change of value of v20 occurs in ∆) v2=v20 changes based on ∆; ∆2+=∆; output(∆) end while if(v2>v1) then∆0=optim(invert(∆2))+∆0; output(∆0); output B;∆0=∆0+∆1; else while (v2==v1) do while (the end of XML data item in s2 is not reached) do ∆= getnextopera(s2); if (change of value of v10 occurs in ∆) then r=true; break; ∆2+=∆; end while if(r==false) then for each XML data item in B represented in ∆i do if(optim(∆i+invert(∆2))!=nop ) then ∆2=NULL; if it is the first XML data item in the loop to output output(optim((∆2+invert(v0)); else output(optim(∆2 without the symbol of item's end)); End if End if End ifEnd whileif the tail of s1 or s2 is not reached then output left part;close(s1);close(s2);
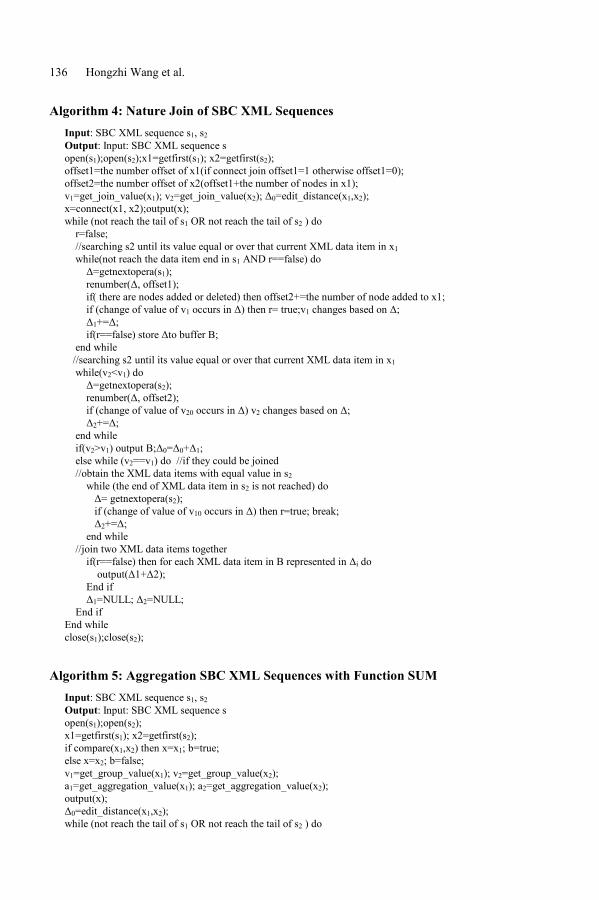
136 Hongzhi Wang et al.
Algorithm 4: Nature Join of SBC XML SequencesInput: SBC XML sequence s1, s2Output: Input: SBC XML sequence sopen(s1);open(s2);x1=getfirst(s1); x2=getfirst(s2);offset1=the number offset of x1(if connect join offset1=1 otherwise offset1=0);offset2=the number offset of x2(offset1+the number of nodes in x1);v1=get_join_value(x1); v2=get_join_value(x2); ∆0=edit_distance(x1,x2);x=connect(x1, x2);output(x);while (not reach the tail of s1 OR not reach the tail of s2 ) do r=false; //searching s2 until its value equal or over that current XML data item in x1 while(not reach the data item end in s1 AND r==false) do ∆=getnextopera(s1); renumber(∆, offset1); if( there are nodes added or deleted) then offset2+=the number of node added to x1; if (change of value of v1 occurs in ∆) then r= true;v1 changes based on ∆; ∆1+=∆; if(r==false) store ∆to buffer B; end while //searching s2 until its value equal or over that current XML data item in x1 while(v2<v1) do ∆=getnextopera(s2); renumber(∆, offset2); if (change of value of v20 occurs in ∆) v2 changes based on ∆; ∆2+=∆; end while if(v2>v1) output B;∆0=∆0+∆1; else while (v2==v1) do //if they could be joined //obtain the XML data items with equal value in s2 while (the end of XML data item in s2 is not reached) do ∆= getnextopera(s2); if (change of value of v10 occurs in ∆) then r=true; break; ∆2+=∆; end while //join two XML data items together if(r==false) then for each XML data item in B represented in ∆i do output(∆1+∆2); End if ∆1=NULL; ∆2=NULL; End ifEnd whileclose(s1);close(s2);
Algorithm 5: Aggregation SBC XML Sequences with Function SUMInput: SBC XML sequence s1, s2Output: Input: SBC XML sequence sopen(s1);open(s2);x1=getfirst(s1); x2=getfirst(s2);if compare(x1,x2) then x=x1; b=true;else x=x2; b=false;v1=get_group_value(x1); v2=get_group_value(x2);a1=get_aggregation_value(x1); a2=get_aggregation_value(x2);output(x);∆0=edit_distance(x1,x2);while (not reach the tail of s1 OR not reach the tail of s2 ) do

Web Information Integration Based on Compressed XML 137
∆1=NULL; ∆2=NULL; if(b==true) then while(not reach the data item end in s1) do ∆=getnextopera(s1); if (change of value of v1 occurs in ∆)v1 changes based on ∆; if (change of value of a1 occurs in ∆)a1 changes based on ∆; ∆1+=∆; end while else while(not reach the data item end in s2) do ∆=getnextopera(s2); if (change of value of v2 occurs in ∆) v2 changes based on ∆; if (change of value of a2 occurs in ∆) a2 changes based on ∆; ∆2+=∆; end while end if if(v1<v2 AND b) then output(∆1); b=true else if(v1<v2) then output(optim(∆2+∆0)); b=true else if(v1>v2 AND b) then output(optim(∆1+invert(∆0))); b=false; else if(v1<v2)output(∆2);b=false; else if(b) output(∆1); add operation update(the position of aggregation object in x1,a1, a1+a2); add XML data item end symbol; else output(∆2); add operation update(the position of aggregation object in x2,a1, a1+a2); add XML data item end symbol;end whileclose(s1);close(s2);

138
N. Bianchi-Berthouze (Ed.): DNIS 2003, LNCS 2822, pp. 138-157, 2003. Springer-Verlag Berlin Heidelberg 2003
Supporting the Conversational Knowledge Processin the Networked Community
Toyoaki Nishida
Graduate School of Information Science and Technology, The University of Tokyo7-3-1 Hongo, Bunkyo-ku, Tokyo 113-8656, Japan
Abstract. Communities play an important role for knowledge creation in theknowledge society. Conversational communications play a primary means forsupporting a collective activity of people for knowledge creation, management,and application. In this paper, I propose a framework of the conversationalknowledge process for supporting communities, and present the knowledgechannel approach featuring knowledge cards for representing conversationalunits, the knowledge lifecycle support, and the strategic control of informationstream. I show some implemented systems to show how these ideas areimplemented.
1 Community as a Ground of Knowledge Creation
Community is a collection of people who build and share the common context. Acommunity serves as a ground for creating both tacit and explicit knowledge, whichmight be called the community knowledge process. Communities of practice, a groupof people who share common work practice, develop informal networks ofrelationships cutting across organizational boundaries in search for bettercooperation[1]. Those social networks not only enable the organization to accomplishtasks faster or better but also create novel knowledge.
The purpose of this research is to develop a suite of technologies to facilitatecommunity knowledge creation. Special care should be taken for designing thecommunication infrastructure for supporting activities of vital communities in orderto meet community-specific nature of communication.
First, informal communication is critical for building and maintaining a sharedunderstanding of the nature of potential knowledge sources in the community. Byexchanging informal evaluation of the knowledge sources with respect to thecoverage and reliability, the community as a whole establishes its own context thatserves as a ground for building task-oriented, intensive human relations.
Second, the designer should take into account the fact that each unit of community-oriented communication are rather of the secondary importance than the primary, forthe community-related information is more about the ground of people's activity, suchas making new human relations or maintaining existing ones, than urgent mission-oriented subjects such as those for team collaboration or workflow execution.Community-oriented interactions can be easily interrupted by more urgent formal

Supporting the Conversational Knowledge Process in the Networked Community 139
interactions. Community-oriented interactions are characterized as a backgroundprocess that is executed when no foreground process runs. Accordingly, thecommunication infrastructure for communities need to pay a lot of attentions toincrease the incentive for using the system. Unlike the users of team-group supportsystems who are requested to use the system as a means for fulfilling their mission,the users of community support systems are less motivated due to the lack of suchexternal force.
There are several heuristics for such community communication channel toeffectively function. The cost-effect ratio is improved by increasing merits ordecreasing the cost of accessing the community communication channel. Firstly,there is an opportunities for the background communication channel to be accessedwhen people are released from the tasks, such as at the break time or differ time.Radio broadcasting programs and quite often TV broadcasting programs in Japan areeffectively designed to attract people when people are relaxed. Secondly, thecommunity communication channel might be embedded into the background, or"ground" in terms of Gestalt psychology, of cognition, so that people can concentrateon the primary task. Thirdly, the incentive of publishing information might beincreased by enhancing the we-feeling of the community or providing enoughreciprocity for the submission.
In addition, a community is a collection of people with potentially conflicting goalsand interests. The community support system need to have functions for mediating orarbitrating conflicts in the community and decision making based on community widediscussion. The communication support systems should be fair in terms of messagecollection and delivery, for a community medium might have a much potential powerfor consensus making.
Certain difficulties are known in social psychology such as spiral of science orminority effect that might have community-wide discussion run into disastroussituations or lead to inappropriate conclusions [2,3]. The designer should carefullyavoid pitfalls of collective silliness.
2 Requirementsfor Facilitating Community Knowledge Process
We address to build a powerful communication facility for effectively supportingcommunity knowledge process. In order for this goal to be satisfied, the followingrequirements need to be met.
2.1 Supporting Reality Sharing
Competitive knowledge contains much tacit knowledge; enough description may notbe given, or knowledge contains much incompleteness and inconsistency or the ideamight be very hard to articulate. In such circumstances, linguistic means of encodinginformation or knowledge is hard to apply. The reality should be communicated byweaker means so that the tacit idea is transferred without being verbalized.Knowledge and information need to be substantiated in the user's daily living space so

140 Toyoaki Nishida
that the user can understand the meaning from her/his own viewpoints. A virtualreality using a large immersive display will help the user understand the reality. Itshould noted, however, that perceptual information need to be combined with verbalinformation to give the user a clear and structured message about the subject.
2.2 Supporting Social Awareness
Awareness is critical to support collective intelligence. Awareness is information thatenables people to act. Social awareness provides with information about other agents'activities and knowledge. Awareness is partial information that enables people tomonitor critical events in the environment while shifting primary attention away fromthe subject. Information and computational support (ICS) for social awareness iscritical for a network communities whose members are geographically distributed.
2.3 Supporting Context and Knowledge Sharing
In order for a collection of people to be a community, they share a common context:social rules and principles, the discourse of universe, human relations, thebackground, and so on. Those propositions are often tacit, and hardly spokenexplicitly in the community, which frequently puzzles new comers, and even havecommunity members misunderstand each other's claim. ICS should be able to helpcommunity members build and maintain the shared context.
2.4 Supporting Collaborative Work
Even though the primary function of a community is to develop and maintain humanrelations, collaborative work is necessary from time to time. Traditionally, CSCW(computer-assisted collaborative work) is the area for designing a number of usefultools that help people collaborate [4]. Seamless transition between the communityoriented support and the more group or team oriented support are needed.
2.5 Supporting Knowledge Cycle
Today's knowledge is dynamic in the sense that it changes quickly and soon becomesobsolete. Knowledge should accompany proper process of keeping it fresh byincorporating new pieces of knowledge. In other words, knowledge is not like adurable good that sustains its value once it is built, rather it becomes more like aconsummatory goods that quickly loose its value after it is introduced. Accordingly,he knowledge cycle in the community need to be sustained properly.
The more knowledge is applied, the more opportunity arises as for knowledgecreation. Through exercises of knowledge applications, people build an expertiseabout when and where to apply the knowledge, what are the expected benefits andunderlying risks, and what are the limitations of the knowledge. Through applications,the learners raise questions or comments, urging instructors to reply. ICS shouldintegrate the knowledge creation, application, and maintenance phases.

Supporting the Conversational Knowledge Process in the Networked Community 141
2.6 Supporting Dispute Resolution
It is quite probable that one community member's interest may be inconsistent withanother member in the community. It is desirable that the community has a means forpredicting, preventing, and resolving disputes in the community without resorting tothe external authority. In particular, ICS should facilitate mutual understanding bycirculating enough information to tame ignorance and remove sources ofmisunderstanding.
2.7 Supporting Large Scale Arguments
The potential of a community can be fully exploited by enabling the community-widediscussion. The goal is quite a challenging problem when a community is as large asa city. ICS should permit the user to be aware of arguments that are relevant to her/hisown problem, understand its structure, raise questions, submit proposals, and take aleadership when appropriate.
3 Conversational Knowledge Process
Conversations play a critical role in the community knowledge process. Theconversational knowledge process is a term we coined to refer to a collective activityfor knowledge creation, management, and application where conversationalcommunications are used as a primary means of interaction among participatingagents. It refers to the collection of community-wide concurrent process ofconversations that contributes to community knowledge creation. The conversationalknowledge process allows for the accumulation and use of very high densityinformation about a given subject which is invaluable for understanding not onlyissues related to the subject but also people in the community.
3.1 The Role of Conversations in Knowledge Creation
Conversations not only provide the most natural communication means but alsofacilitate the functions of knowledge creations, heuristic production of stories fromdifferent points of view, tacit-explicit knowledge conversion, and entrainment to thesubject.
(1) Heuristic Production of Stories from Different Points of View
Conversations allow a heuristic composition of stories in a style agreed by acommunity. In each conversation, attempts are made to structure fragments ofknowledge pieces, either tacitly or explicitly possessed by participants into a largerpieces of knowledge in search for possible viewpoints, connections and clusters toencompass the given collection of pieces.
Conversation is an improvisational social process in which agents from differentviewpoints collaborate and negotiate from time to time in search for the social andpersonal satisfaction. The flow of conversation changes dynamically according tomicro-macro interaction of participants' thought.

142 Toyoaki Nishida
(2) Tacit-Explicit Knowledge Conversion
Messages communicated with conversations are on the boundary of tacit and explicitknowledge. Conversations give a good opportunity and motivation to externalizetacit knowledge. In discussions, each participant tries to Fig. out the idea intoexpressions that have an intended effect, such as propose, counter propose, support,challenge, negate, etc, in the conversational discourse. In debate, participants try tobe the most expressive, in search for new points to win the game.
On the other hand, people can make conversation or discussion to examine thegiven subject from different points of view. Exercises of applying knowledge mayallow people to find and socialize how pieces of knowledge are associated with eachother and identify a critical cluster of knowledge that is most relevant to thediscussion.
(3) Entrainment to the Subject
In order to understand the given subject deeply, one should be involved in the subjectand capture the problem as her/his own. Conversations tend to entrain the audienceby providing enough sympathy, facilitating to simulates the role of a playingcharacter.
Conversations will facilitate reality sharing, for they reflect how people articulatethe world. Conversations will support social awareness, for they provide a handymeans for communicating references to other people and events that the speakerconsider worth communicating. It will help context sharing in the community, forconversations often encourage people recheck issues in a community that are tacitlyshared in the community but not written in anywhere. Even though conversationsmay not directly address dispute resolution or supporting large scale arguments, theycontribute to establishing a firm ground for mutual understanding with a densecollection of daily thoughts.
In the meanwhile, conversations have limitations as well. Logically precisearguments or visual information are not well communicated by spoken languagealone. Furthermore, conversations are volatile. Both the content and the context maybe lost quite easily, for it is difficult to reproduce the same mental state as thesituation where the conversation was made. Even though conversations are recorded,it is pretty hard to recover the implications of conversations after the conversationsession or correcting the transcript is time consuming, tedious task. These weaknessshould be somehow compensated by advanced information and communicationtechnology.
3.2 Conversation-Story Spiral
In order to exploit the benefits of conversation and compensate for its limitations, Ipropose a model called the conversation-story spiral. The model shown in Fig.1suggests that we use two modes of knowledge representation. The story archive is amedia-oriented representation of knowledge. It is suitable for representing the staticaspects of knowledge, such as the structure or relation. In contrast, the conversationprocess is the interaction-oriented representation. It allows for representing howcomponents of knowledge interact with each other. These two modes of knowledge
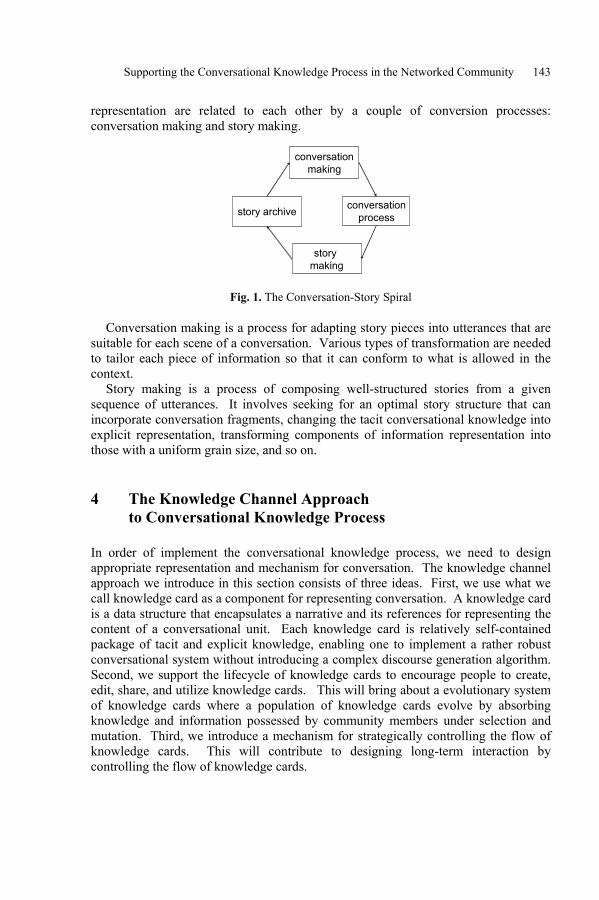
Supporting the Conversational Knowledge Process in the Networked Community 143
representation are related to each other by a couple of conversion processes:conversation making and story making.
conversationmaking
story archive conversationprocess
story making
Fig. 1. The Conversation-Story Spiral
Conversation making is a process for adapting story pieces into utterances that aresuitable for each scene of a conversation. Various types of transformation are neededto tailor each piece of information so that it can conform to what is allowed in thecontext.
Story making is a process of composing well-structured stories from a givensequence of utterances. It involves seeking for an optimal story structure that canincorporate conversation fragments, changing the tacit conversational knowledge intoexplicit representation, transforming components of information representation intothose with a uniform grain size, and so on.
4 The Knowledge Channel Approachto Conversational Knowledge Process
In order of implement the conversational knowledge process, we need to designappropriate representation and mechanism for conversation. The knowledge channelapproach we introduce in this section consists of three ideas. First, we use what wecall knowledge card as a component for representing conversation. A knowledge cardis a data structure that encapsulates a narrative and its references for representing thecontent of a conversational unit. Each knowledge card is relatively self-containedpackage of tacit and explicit knowledge, enabling one to implement a rather robustconversational system without introducing a complex discourse generation algorithm.Second, we support the lifecycle of knowledge cards to encourage people to create,edit, share, and utilize knowledge cards. This will bring about a evolutionary systemof knowledge cards where a population of knowledge cards evolve by absorbingknowledge and information possessed by community members under selection andmutation. Third, we introduce a mechanism for strategically controlling the flow ofknowledge cards. This will contribute to designing long-term interaction bycontrolling the flow of knowledge cards.

144 Toyoaki Nishida
Knowledge cardKnowledge card
Knowledge cardKnowledge card
Knowledge card server
Knowledge card
ECA ECA
Knowledge card editor
Knowledge channel control policy
Fig. 2. A general framework of the knowledge channel approach
4.1 The Architecture of the Knowledge Channel Approach
The knowledge channel approach uses the data structure called knowledge card as arepresentation of the conversation unit (Fig.2). A knowledge card is a data structurethat encapsulates a narrative and its references for representing the content of aconversational unit. Another data structure called a story is used to represent adiscourse structure consisting of one or more knowledge card. A knowledge cardserver stores knowledge cards and provides them for knowledge card clients.Embodied conversational agent take knowledge cards to generate utterances inconversations. Knowledge channel is a conduit connecting the server and the clientwhere knowledge card flow is controlled strategically. Both the knowledge cardserver and the knowledge card client can control the knowledge card flow using theknowledge channel control policy.
This approach can approximate the conversational knowledge process even with asimple mechanism, and better with a more sophisticated dialogue engine. Tacitknowledge can be embedded into each knowledge card such as visual images orsound, even though it cannot be encoded into knowledge representation. The currentnatural language processing techniques such as document classification orsummarization may be applied to turn the collection of knowledge cards into astructured knowledge.
I illustrate how the conversational knowledge process is implemented in (a) thepublic opinion channel, which is a participatory broadcasting system that collectssmall talks and broadcasts stories reorganized from the archive of small talks, (b)EgoChat which is a conversational agent system based on the talking-virtualized-egosmetaphor, and (c) S-POC which is an integrated communication support system.
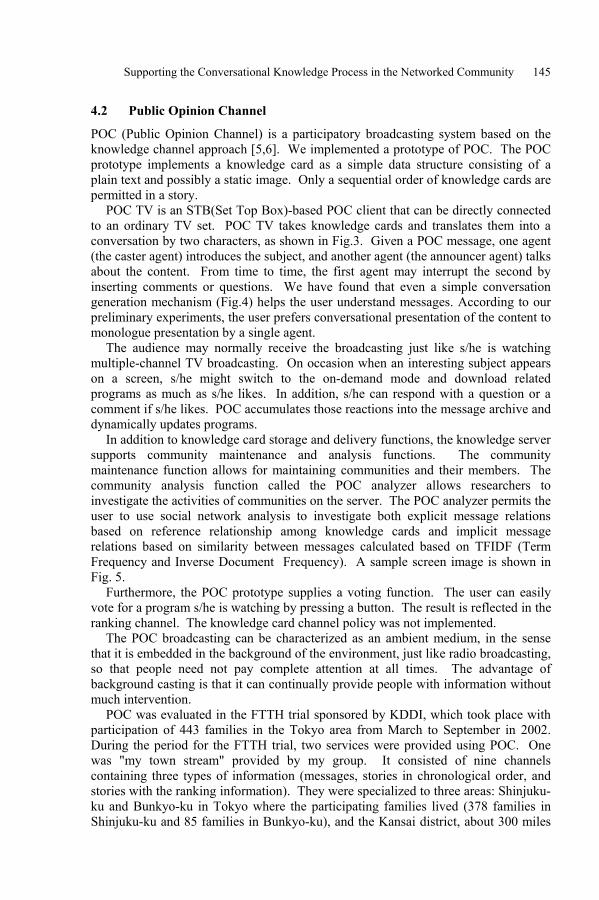
Supporting the Conversational Knowledge Process in the Networked Community 145
4.2 Public Opinion Channel
POC (Public Opinion Channel) is a participatory broadcasting system based on theknowledge channel approach [5,6]. We implemented a prototype of POC. The POCprototype implements a knowledge card as a simple data structure consisting of aplain text and possibly a static image. Only a sequential order of knowledge cards arepermitted in a story.
POC TV is an STB(Set Top Box)-based POC client that can be directly connectedto an ordinary TV set. POC TV takes knowledge cards and translates them into aconversation by two characters, as shown in Fig.3. Given a POC message, one agent(the caster agent) introduces the subject, and another agent (the announcer agent) talksabout the content. From time to time, the first agent may interrupt the second byinserting comments or questions. We have found that even a simple conversationgeneration mechanism (Fig.4) helps the user understand messages. According to ourpreliminary experiments, the user prefers conversational presentation of the content tomonologue presentation by a single agent.
The audience may normally receive the broadcasting just like s/he is watchingmultiple-channel TV broadcasting. On occasion when an interesting subject appearson a screen, s/he might switch to the on-demand mode and download relatedprograms as much as s/he likes. In addition, s/he can respond with a question or acomment if s/he likes. POC accumulates those reactions into the message archive anddynamically updates programs.
In addition to knowledge card storage and delivery functions, the knowledge serversupports community maintenance and analysis functions. The communitymaintenance function allows for maintaining communities and their members. Thecommunity analysis function called the POC analyzer allows researchers toinvestigate the activities of communities on the server. The POC analyzer permits theuser to use social network analysis to investigate both explicit message relationsbased on reference relationship among knowledge cards and implicit messagerelations based on similarity between messages calculated based on TFIDF (TermFrequency and Inverse Document Frequency). A sample screen image is shown inFig. 5.
Furthermore, the POC prototype supplies a voting function. The user can easilyvote for a program s/he is watching by pressing a button. The result is reflected in theranking channel. The knowledge card channel policy was not implemented.
The POC broadcasting can be characterized as an ambient medium, in the sensethat it is embedded in the background of the environment, just like radio broadcasting,so that people need not pay complete attention at all times. The advantage ofbackground casting is that it can continually provide people with information withoutmuch intervention.
POC was evaluated in the FTTH trial sponsored by KDDI, which took place withparticipation of 443 families in the Tokyo area from March to September in 2002.During the period for the FTTH trial, two services were provided using POC. Onewas "my town stream" provided by my group. It consisted of nine channelscontaining three types of information (messages, stories in chronological order, andstories with the ranking information). They were specialized to three areas: Shinjuku-ku and Bunkyo-ku in Tokyo where the participating families lived (378 families inShinjuku-ku and 85 families in Bunkyo-ku), and the Kansai district, about 300 miles
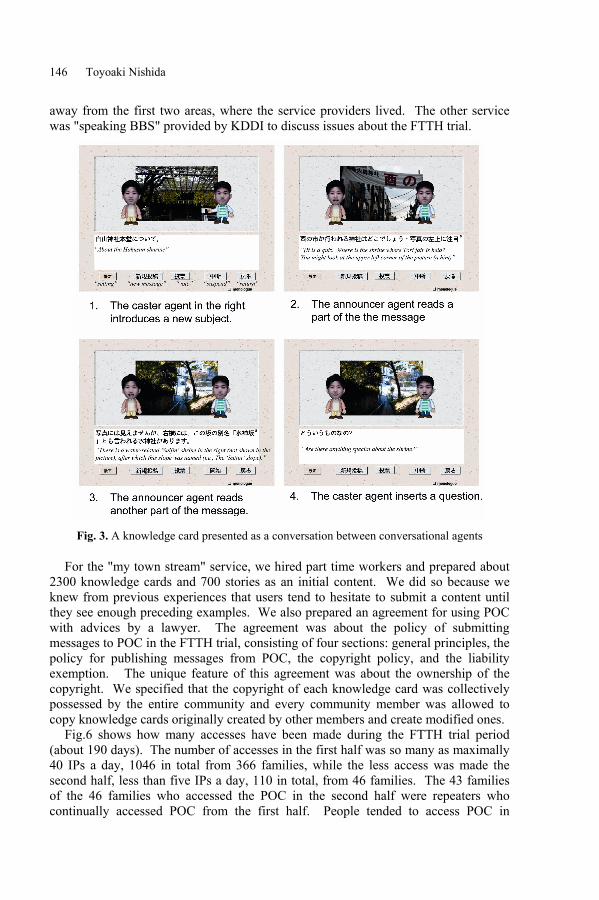
146 Toyoaki Nishida
away from the first two areas, where the service providers lived. The other servicewas "speaking BBS" provided by KDDI to discuss issues about the FTTH trial.
Fig. 3. A knowledge card presented as a conversation between conversational agents
For the "my town stream" service, we hired part time workers and prepared about2300 knowledge cards and 700 stories as an initial content. We did so because weknew from previous experiences that users tend to hesitate to submit a content untilthey see enough preceding examples. We also prepared an agreement for using POCwith advices by a lawyer. The agreement was about the policy of submittingmessages to POC in the FTTH trial, consisting of four sections: general principles, thepolicy for publishing messages from POC, the copyright policy, and the liabilityexemption. The unique feature of this agreement was about the ownership of thecopyright. We specified that the copyright of each knowledge card was collectivelypossessed by the entire community and every community member was allowed tocopy knowledge cards originally created by other members and create modified ones.
Fig.6 shows how many accesses have been made during the FTTH trial period(about 190 days). The number of accesses in the first half was so many as maximally40 IPs a day, 1046 in total from 366 families, while the less access was made thesecond half, less than five IPs a day, 110 in total, from 46 families. The 43 familiesof the 46 families who accessed the POC in the second half were repeaters whocontinually accessed POC from the first half. People tended to access POC in
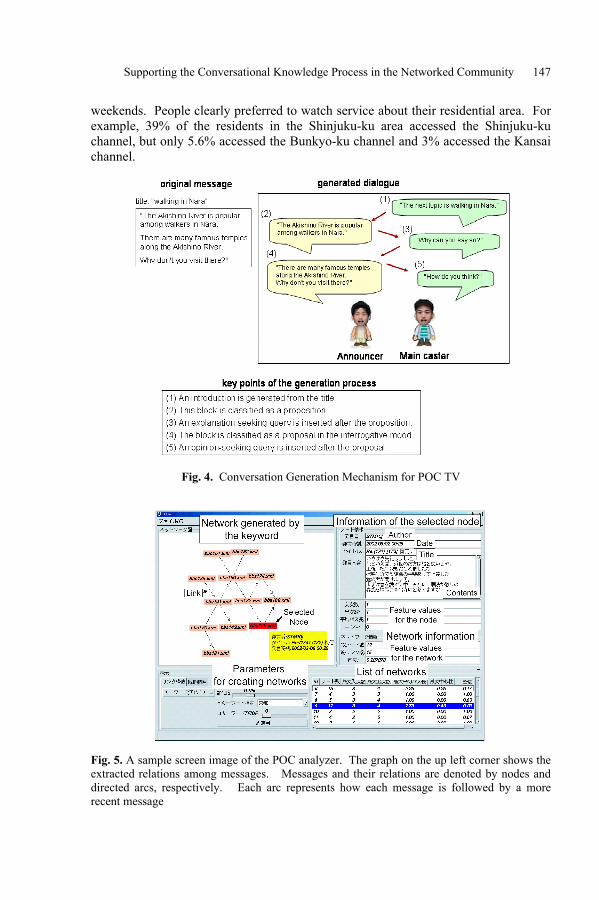
Supporting the Conversational Knowledge Process in the Networked Community 147
weekends. People clearly preferred to watch service about their residential area. Forexample, 39% of the residents in the Shinjuku-ku area accessed the Shinjuku-kuchannel, but only 5.6% accessed the Bunkyo-ku channel and 3% accessed the Kansaichannel.
Fig. 4. Conversation Generation Mechanism for POC TV
Fig. 5. A sample screen image of the POC analyzer. The graph on the up left corner shows theextracted relations among messages. Messages and their relations are denoted by nodes anddirected arcs, respectively. Each arc represents how each message is followed by a morerecent message
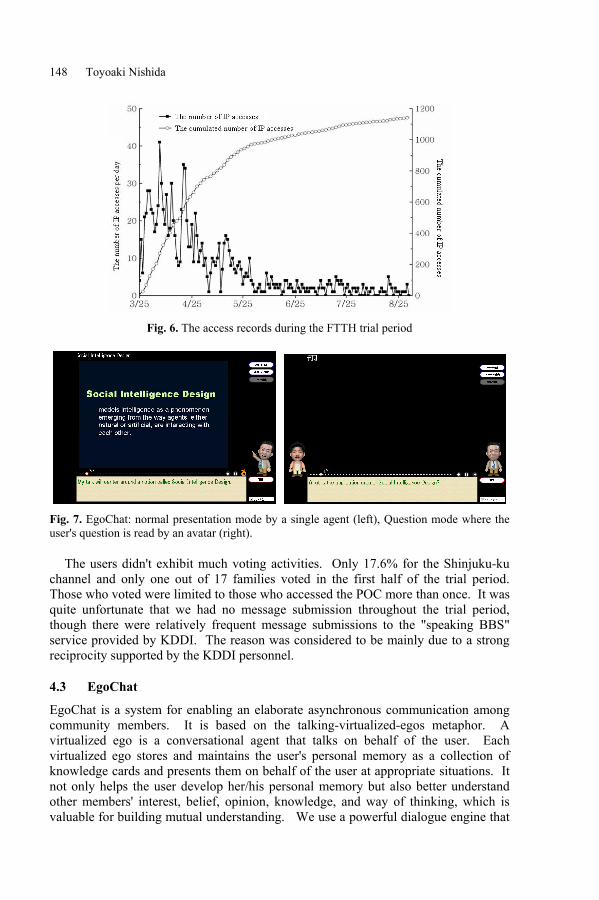
148 Toyoaki Nishida
Fig. 6. The access records during the FTTH trial period
Fig. 7. EgoChat: normal presentation mode by a single agent (left), Question mode where theuser's question is read by an avatar (right).
The users didn't exhibit much voting activities. Only 17.6% for the Shinjuku-kuchannel and only one out of 17 families voted in the first half of the trial period.Those who voted were limited to those who accessed the POC more than once. It wasquite unfortunate that we had no message submission throughout the trial period,though there were relatively frequent message submissions to the "speaking BBS"service provided by KDDI. The reason was considered to be mainly due to a strongreciprocity supported by the KDDI personnel.
4.3 EgoChat
EgoChat is a system for enabling an elaborate asynchronous communication amongcommunity members. It is based on the talking-virtualized-egos metaphor. Avirtualized ego is a conversational agent that talks on behalf of the user. Eachvirtualized ego stores and maintains the user's personal memory as a collection ofknowledge cards and presents them on behalf of the user at appropriate situations. Itnot only helps the user develop her/his personal memory but also better understandother members' interest, belief, opinion, knowledge, and way of thinking, which isvaluable for building mutual understanding. We use a powerful dialogue engine that

Supporting the Conversational Knowledge Process in the Networked Community 149
permits a virtualized ego to answer questions by searching for the best match from apotentially large list of question-answering pairs prepared in advance (Fig. 7).
EgoChat provides a couple of unique features. First, it integrates personal andinterpersonal knowledge life cycles [7]. At earlier stages of the lifecycle whenknowledge is not well captured, the user might want to describe her/his idea as one ormore knowledge card and have the virtualized ego to present them for personalreview. After a while when the knowledge becomes clear and evident to the user,s/he might want to delegate her/his virtualized ego to her/his colleagues to present theidea and ask for critiques. The automatic question answering facility of EgoChat willencourage the audience to ask questions or give comments. The virtualized ego canreproduce the question-answering session with the audience so the owner can reviewthe interactions. It will highly motivate the owner to supply more knowledge orimprove existing knowledge for better competence.
Second, EgoChat allows for describing a channel policy that is used to define thecontrol strategies of the sender and the receiver. Four types of strategies are identifieddepending on whether the strategy is about the order of programs in a single programstream or about the way multiple program streams are mixed, and whether theprogram scheduling is static or dynamic, as shown in Table.1. The skeleton of theactual flow structure of knowledge cards for a given pair of the sender and receiver isdetermined by resolving constraints of their channel policies. It can be visuallypresented to the user by the dynamic program table, as shown in Fig.8 [8].
4.4 S-POC
S-POC was designed to serve as an integrated communication environment for amulti-faceted community activities such as risk communication. S-POC supportsreality sharing based on visual images, knowledge sharing, and community-widediscussion for decision-making (Fig.9).
Table 1. Four strategies in the knowledge channel policy

150 Toyoaki Nishida
Fig. 8. Example of dynamic program table
The S-POC uses the POC system as a knowledge sharing engine and extends it inseveral respects. First, S-POC allows for sophisticated presentation mechanism usingan embodied conversational agent. Second, it supports video editing andpresentation. Third, it allows a community discussion support system to be pluggedin [9,10].
Fig. 9. The framework of S-POC
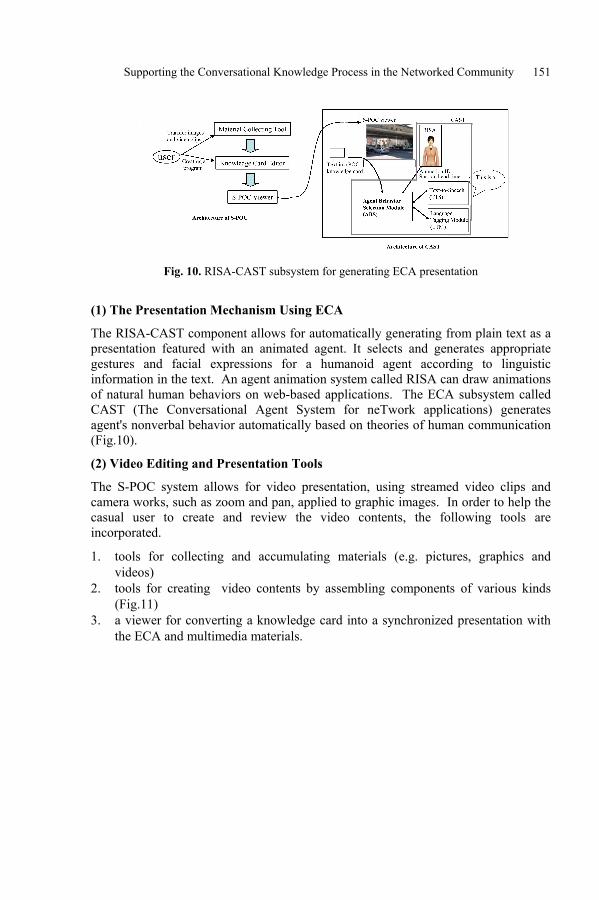
Supporting the Conversational Knowledge Process in the Networked Community 151
Fig. 10. RISA-CAST subsystem for generating ECA presentation
(1) The Presentation Mechanism Using ECA
The RISA-CAST component allows for automatically generating from plain text as apresentation featured with an animated agent. It selects and generates appropriategestures and facial expressions for a humanoid agent according to linguisticinformation in the text. An agent animation system called RISA can draw animationsof natural human behaviors on web-based applications. The ECA subsystem calledCAST (The Conversational Agent System for neTwork applications) generatesagent's nonverbal behavior automatically based on theories of human communication(Fig.10).
(2) Video Editing and Presentation Tools
The S-POC system allows for video presentation, using streamed video clips andcamera works, such as zoom and pan, applied to graphic images. In order to help thecasual user to create and review the video contents, the following tools areincorporated.
1. tools for collecting and accumulating materials (e.g. pictures, graphics andvideos)
2. tools for creating video contents by assembling components of various kinds(Fig.11)
3. a viewer for converting a knowledge card into a synchronized presentation withthe ECA and multimedia materials.
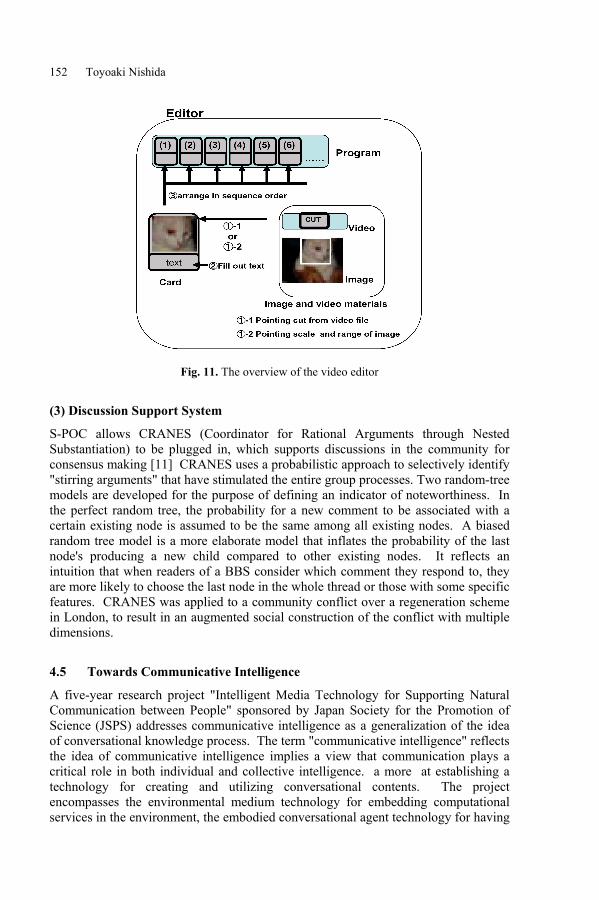
152 Toyoaki Nishida
Fig. 11. The overview of the video editor
(3) Discussion Support System
S-POC allows CRANES (Coordinator for Rational Arguments through NestedSubstantiation) to be plugged in, which supports discussions in the community forconsensus making [11] CRANES uses a probabilistic approach to selectively identify"stirring arguments" that have stimulated the entire group processes. Two random-treemodels are developed for the purpose of defining an indicator of noteworthiness. Inthe perfect random tree, the probability for a new comment to be associated with acertain existing node is assumed to be the same among all existing nodes. A biasedrandom tree model is a more elaborate model that inflates the probability of the lastnode's producing a new child compared to other existing nodes. It reflects anintuition that when readers of a BBS consider which comment they respond to, theyare more likely to choose the last node in the whole thread or those with some specificfeatures. CRANES was applied to a community conflict over a regeneration schemein London, to result in an augmented social construction of the conflict with multipledimensions.
4.5 Towards Communicative Intelligence
A five-year research project "Intelligent Media Technology for Supporting NaturalCommunication between People" sponsored by Japan Society for the Promotion ofScience (JSPS) addresses communicative intelligence as a generalization of the ideaof conversational knowledge process. The term "communicative intelligence" reflectsthe idea of communicative intelligence implies a view that communication plays acritical role in both individual and collective intelligence. a more at establishing atechnology for creating and utilizing conversational contents. The projectencompasses the environmental medium technology for embedding computationalservices in the environment, the embodied conversational agent technology for having
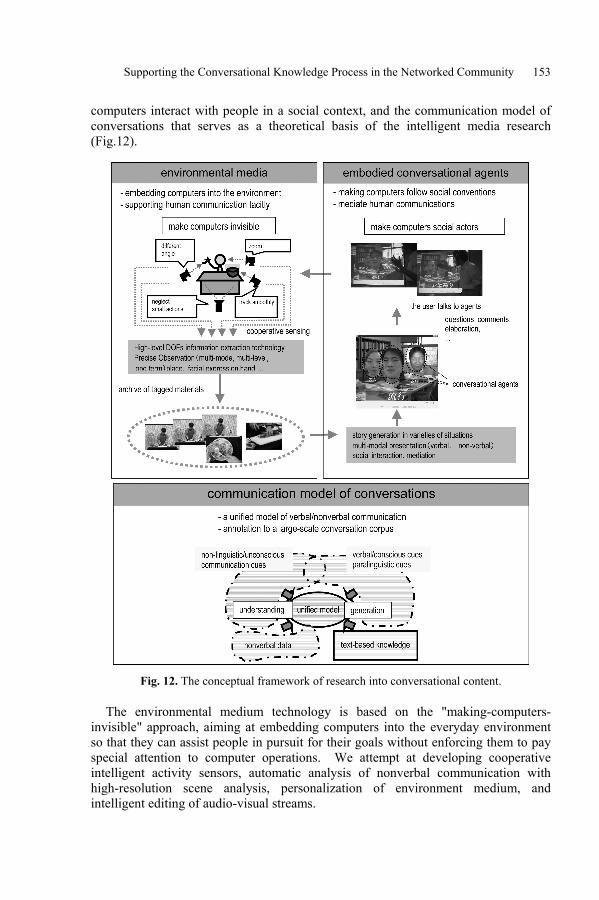
Supporting the Conversational Knowledge Process in the Networked Community 153
computers interact with people in a social context, and the communication model ofconversations that serves as a theoretical basis of the intelligent media research(Fig.12).
Fig. 12. The conceptual framework of research into conversational content.
The environmental medium technology is based on the "making-computers-invisible" approach, aiming at embedding computers into the everyday environmentso that they can assist people in pursuit for their goals without enforcing them to payspecial attention to computer operations. We attempt at developing cooperativeintelligent activity sensors, automatic analysis of nonverbal communication withhigh-resolution scene analysis, personalization of environment medium, andintelligent editing of audio-visual streams.

154 Toyoaki Nishida
The embodied conversational agent technology is based on the "making-computers-social-actors" approach, aiming at developing embodied conversationalagents that can make conversation with people by following various socialconventions. The embodied conversational agent is characterized as an interfacebetween people and conversational content. We attempt at developing virtualizedegos that can talk on behalf of the user, socially intelligent robots that facilitateconversations among people, and agents that can create stories from their experiences.
In research into the communication model of conversations, we aim at establishinga theoretical foundation of conversational content. We focus on formulating a unifiedmodel of verbal and nonverbal communication, developing a language-centrictechnology for editing and summarization of conversational contents and building alarge-scale corpus of conversations that accumulates conversation records withannotations to verbal and nonverbal events.
5 Social Intelligence Design
The evolution of media technology supported by the progress of ICT may have bothpositive and negative sides. On the positive side, an enormous number ofopportunities has arisen. In fact, an enormous number of new applications andbusinesses are springing up every day in collaborative environment, e-learning,knowledge management, community support systems, digital democracy, and so on.On the negative side, the advent of a new technology brings about new socialproblems that did not occur with the old technology. In addition to new kinds ofcrimes and ethical problems, some effects of ICT are very subtle, yet fairlydestructive to our spiritual world.
In social psychology, it is known that some fundamental mechanisms of a grouphinder constructive discussions and rational decision-making. Notorious examplesinclude the "flaming war" (i.e., a barrage of postings containing abusive personalattacks, insults, or chastising replies to other people) and the "spiral of silence" (i.e.,the social pressure discouraging people from expressing their views when they thinkthey are in the minority). These phenomena might be amplified in the networksociety and bring about unexpected negative impacts on human society.
Social intelligence design is a new research area aimed at designing new computer-mediated communication systems based on in-depth understanding of intelligence asa social phenomenon [12,13]. Social intelligence design centers on understanding anddesigning social intelligence. As a personal attribute, social intelligence is contrastedwith other kinds of intelligence such as problem-solving intelligence (ability to solvelogically complex problems) or emotional intelligence (ability to monitor one's ownand others' emotions and to use the information to guide one's thinking and actions).
Alternatively, social intelligence might be attributed to a collection of agents anddefined as an ability to manage complexity and learn from experiences as a functionof the design of social structure. This view emphasizes the role of social conventionsthat constrain the way individual agents interact with each other. A good socialculture will allow the members of the community to learn from each other.
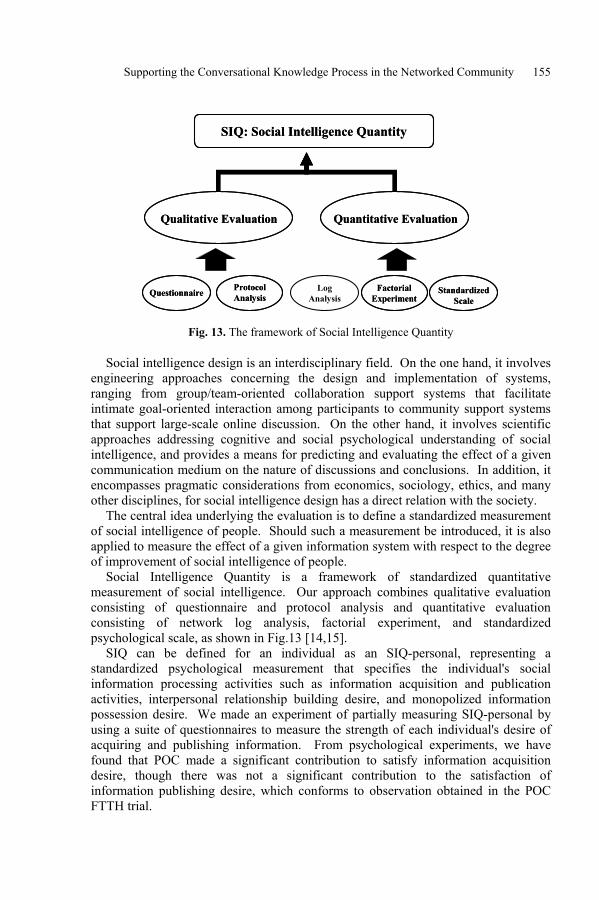
Supporting the Conversational Knowledge Process in the Networked Community 155
SIQ: Social Intelligence QuantitySIQ: Social Intelligence Quantity
Quantitative EvaluationQuantitative EvaluationQualitative EvaluationQualitative Evaluation
QuestionnaireQuestionnaire ProtocolAnalysisProtocolAnalysis
LogAnalysis
FactorialExperiment
FactorialExperiment
StandardizedScale
StandardizedScale
Fig. 13. The framework of Social Intelligence Quantity
Social intelligence design is an interdisciplinary field. On the one hand, it involvesengineering approaches concerning the design and implementation of systems,ranging from group/team-oriented collaboration support systems that facilitateintimate goal-oriented interaction among participants to community support systemsthat support large-scale online discussion. On the other hand, it involves scientificapproaches addressing cognitive and social psychological understanding of socialintelligence, and provides a means for predicting and evaluating the effect of a givencommunication medium on the nature of discussions and conclusions. In addition, itencompasses pragmatic considerations from economics, sociology, ethics, and manyother disciplines, for social intelligence design has a direct relation with the society.
The central idea underlying the evaluation is to define a standardized measurementof social intelligence of people. Should such a measurement be introduced, it is alsoapplied to measure the effect of a given information system with respect to the degreeof improvement of social intelligence of people.
Social Intelligence Quantity is a framework of standardized quantitativemeasurement of social intelligence. Our approach combines qualitative evaluationconsisting of questionnaire and protocol analysis and quantitative evaluationconsisting of network log analysis, factorial experiment, and standardizedpsychological scale, as shown in Fig.13 [14,15].
SIQ can be defined for an individual as an SIQ-personal, representing astandardized psychological measurement that specifies the individual's socialinformation processing activities such as information acquisition and publicationactivities, interpersonal relationship building desire, and monopolized informationpossession desire. We made an experiment of partially measuring SIQ-personal byusing a suite of questionnaires to measure the strength of each individual's desire ofacquiring and publishing information. From psychological experiments, we havefound that POC made a significant contribution to satisfy information acquisitiondesire, though there was not a significant contribution to the satisfaction ofinformation publishing desire, which conforms to observation obtained in the POCFTTH trial.
156 Toyoaki Nishida
SIQ can also be defined for a community as an SIQ-collective, representing thecommunity's status of information and knowledge sharing or knowledge creation.SIQ-collective specifies the degree of community activities. SIQ-collective might bemeasured by observing individuals' behavior. In early communities wherecommunity maintenance functions are more dominant than community performancefunctions to increase the identity of communities, information acquisition desire andinterpersonal relationship building desire might be more intensively associated withSIQ-collective. In contrast, information publication desire might be more associatedwith SIQ-collective, for community performance function becomes more prominent.
6 Concluding Remarks
In this paper, I have pointed out that communities play an important role forknowledge creation in the knowledge society and conversational communicationsplay a primary means for supporting a collective activity of people for knowledgecreation, management, and application. I have proposed a framework of theconversational knowledge process for supporting communities, and present theknowledge channel approach featuring knowledge cards for representingconversational units, the knowledge lifecycle support, and the strategic control ofinformation stream. I have shown some implemented systems -- POC, EgoChat, andS-POC -- to show how these ideas are implemented.
References
[1] Etienne Wenger. Communities of Practice -- Learning Meaning, and Identity,Cambridge University Press, 1998.
[2] Noelle-Neumann, Elisabeth The Spiral of Silence: Public Opinion--Our SocialSkin. 2d edition. 1984, 1993
[3] Janis, I. L., Groupthink, 2nd Edition, Houghton Mifflin Company, Boston,1982.
[4] S. Kelly and M. Jones, “Groupware and the Social Infrastructure ofCommunication,” Comm. ACM, Dec. 2001, pp. 77-79.
[5] T. Nishida, ed., Dynamic Knowledge Interaction, CRC Press, Boca Raton, Fla.,2000.
[6] T. Fukuhara, M. Chikama, and T. Nishida. A Platform for Investigating aKnowledge Creating Community: Community Analysis and MaintenanceFunctions in the Public Opinion Channel. to be presented at Social IntelligenceDesign SID 2003, 6-th – 8th July 2003, Royal Holloway University of London,Egham, Surrey U.K.
[7] Hidekazu Kubota, Koji Yamashita, Toyoaki Nishida, Conversational ContentsMaking a Comment Automatically, Best PhD paper award, In: E. Damiani, R.J. Howlett, L. C. Jain, and N. Ichalkaranje (eds.): Proc. KES 2002, pp. 1326-1330, KES'2002 Sixth International Conference on Knowledge-BasedIntelligent Information & Engineering Systems, 16, 17 & 18 September 2002,Crema, Italy, 2002

Supporting the Conversational Knowledge Process in the Networked Community 157
[8] H. Kubota and T. Nishida. Channel Design for Strategic KnowledgeInteraction. to be presented at: KES'2003 Seventh International Conference onKnowledge-Based Intelligent Information & Engineering Systems, Universityof Oxford, United Kingdom 3, 4 & 5 September 2003.
[9] Y. Nakano, T. Murayama, D. Kawahara, S. Kurohashi, and T. Nishida.Embodied Conversational Agents for Presenting Intellectual MultimediaContents. to be presented at: KES'2003 Seventh International Conference onKnowledge-Based Intelligent Information & Engineering Systems, Universityof Oxford, United Kingdom 3, 4 & 5 September 2003.
[10] T. Murayama, Y. Nakano, and T. Nishida. Participatory Broadcasting SystemUsing Interface Agent and Multimedia, to be presented at Social IntelligenceDesign SID 2003, 6-th – 8th July 2003, Royal Holloway University of London,Egham, Surrey U.K.
[11] M. Horita and N. Iwahashi. On Discovery of Stirring Arguments: A Random-Tree Approach to Collaborative Argumentation Support, to be presented atSocial Intelligence Design SID 2003, 6-th – 8th July 2003, Royal HollowayUniversity of London, Egham, Surrey U.K.
[12] T. Nishida. Social Intelligence Design for Web Intelligence, Special Issue onWeb Intelligence, IEEE Computer, Vol. 35, No. 11, pp. 37-41, November,2002.
[13] Toyoaki Nishida. Social Intelligence Design -- An Overview, in: Takao Terano,Toyoaki Nishida, Akira Namatame, Yukio Ohsawa, Shusaku Tsumoto, andTakashi Washio (eds): Exploring New Frontiers on Artificial Intelligence -Selected Papers from the First International Workshops of Japanese Society ofArtificial Intelligence -, Lecture Notes on Artificial Intelligence LNAI2253,Springer Verlag, December 2001.
[14] Koji Yamashita and Toyoaki Nishida: SIQ (Social Intelligence Quantity):Evaluation Package for Network Communication Tools, APCHI 2002 -- 5thAsia Pacific Conference on Computer Human Interaction - Beijing, China, 1-4November 2002.
[15] Ken'ichi Matsumura. The factors to activate communication in the networkcommunity –New comers or Messages? -, to be presented at Social IntelligenceDesign SID 2003, 6-th – 8th July 2003, Royal Holloway University of London,Egham, Surrey U.K.
N. Bianchi-Berthouze (Ed.): DNIS 2003, LNCS 2822, pp. 158-171, 2003. Springer-Verlag Berlin Heidelberg 2003
Intelligent Management of SLAsfor Composite Web Services
Malu Castellanos, Fabio Casati, Umeshwar Dayal, and Ming-Chien Shan
Hewlett-Packard1501 Page Mill Road, MS 1142, Palo Alto, CA, 94304, USA
{malu.castellanos,fabio.casati,umeshwar.dayal,ming-chien.shan}@hp.com
Abstract. For every business, managing the Service Level Agreements (SLAs)stipulated with its customers is a crucial activity. Failing to meet an SLA maylead to contractual penalties and in loss of revenues generated by customersresorting to other providers to obtain the services they need. In this paper wepresent a framework and an infrastructure for intelligent SLA management,applicable when services are delivered as Web services. The goal of theplatform is that of assisting service providers in monitoring SLA violations, inpredicting SLA violations before they occur so to try corrective actions, and inanalyzing SLA violations to understand their causes and therefore help identifyhow to improve operations to meet the SLA.
1 IntroductionOne of the most intriguing and neglected aspects of Web services is their capability oflinking IT operations with business operations. In fact, Web service technology isdesigned with the purpose of automating B2B interactions. Furthermore, Webservices offer operations that are typically at a high level of abstraction (i.e., at thelevel of business operations such as orderGoods or makePayment, rather than at thelevel of IT operations such as getID or incrementCounter).
The combination of these two factors makes it natural to use Web services forcoarse grained B2B interactions, so that there is a close performance and qualityrelationship between a business exchange (e.g., a customer ordering a product from aservice provider) and a Web service operation (e.g., the orderGoods operationmentioned above). This close relationship makes it possible and even necessary tomanage IT operations based on business goals and, conversely, makes it possible tomonitor, control, and optimize business operations by monitoring, controlling, andanalyzing IT operations [2,3].
A particularly important aspect in the relationship is related to the management ofService Level Agreements (SLA) [8]. An SLA defines the quality of the serviceoffered by a provider to a customer and the circumstances under which this quality isguaranteed. For example, an SLA could state that 90% of the operations executedbetween 9AM and 5PM should complete within 3 seconds, or that orders of silk tiesover 1000 pieces should be received within 15 days of the order or within 10 daysfrom the payment.
It is essential that service providers are able to meet the SLAs stipulated with theircustomers, as SLAs are one of the main metrics by which customers judge the quality
Intelligent Management of SLAs for Composite Web Services 159
of the services offered by service providers, not to mention that SLAs are often part ofa contract. Therefore, missing SLAs not only implies the risk of losing a customer,but comes with consequences such as payments of penalties. For example, the abovementioned SLA about the time to deliver silk ties could be associated to a penaltystating that the customers should be refunded in part or in full if the SLA is not met.
From the examples and considerations above, it is clear that service providers willgreatly benefit from the capability of monitoring SLA violations, of understandingwhy (e.g., under which conditions) SLAs are not met and to predict whether an SLAwill be met or not. Explanations of why SLAs are missed can help providers either incorrecting the problem (e.g., adding more resources, changing the shipping company,or ordering products from a different supplier) or in revising the SLA for futureinteractions if the problems cannot be corrected with acceptable costs. Predictions ofSLA violations can help providers in taking corrective actions on the fly, wherepossible, or at least can enable providers to promptly inform customers about thepotential problem (e.g., delay in the order). Although this may not avoid payments ofpenalties, it goes a long way towards improving the relationships between customersand suppliers.
This paper presents a set of techniques and outlines the architecture of a system,partially implemented at HP Labs, that allows service providers to manage SLAs forWeb services. In particular, we argue that thanks to the above mentioned relationshipsbetween Web services and business interactions, SLAs stipulated with customers canbe monitored by looking at Web service execution data, logged by the Web servicesplatform. Furthermore, we show how SLA can not only be monitored, but alsoexplained and predicted by using data mining techniques.
We focus in particular on a specific class of Web services, that of compositeservices, i.e., Web services implemented by composing other services by means of aprocess flow. The reason for focusing on composite services is twofold: first, asservice composition technologies continue to improve, as standardization effortsmove forward, and as the service oriented paradigm becomes widely accepted, moreand more Web services are expected to be composite. Second, the fact that a service iscomposite allows visibility into its definition and execution. This characteristic makescomposite services particularly suited to analyzing and predicting SLA violations.This work has been developed in the context of the Business Process Intelligencework developed at HP Labs [1].
2 Approach
2.1 A Sample Composite Service
In this section we introduce an example related to supply chain management (SCM).This example will be used throughout the paper to illustrate the concepts. Theexample is about a Web service named buy_ties. This service is in charge of all theoperations related to the processing of silk tie orders placed by customers. Thoseoperations available to the customers are specified in an interface described inWSDL[4]. Next we show a possible customer interface for the buy_ties, abstractingfrom any particular description language. The operations are prefixed with in or out

160 Malu Castellanos et al.
qualifiers to denote whether the operation is invoked by the customer or is initiated bythe provider:
in quote_request (product id, quantity, city)out quote (quote #, product id, quantity, city, price)in order_request (quote #)out confirm_order (order #, product id, quantity, city, price)out cancel_order (order #)out confirm_shipment (order #, date)
The interface lets a customer know how to interact with the buy_ties service in thebusiness exchanges with the company offering it. The interface is all a customer seesabout this service, but internally buy_ties service is implemented by composing a setof simpler services which are orchestrated by a business process depicted in Figure 1(this process is a simplification of a real one).
invoke quote
receivequote
request
send quote
receive order
request
invoke check stock
send cancel order
send confirm order inStock=false
inStock=trueinvoke check
shipment
send confirm shipment
shippingAvail=false
shippingAvail=true
invoke quote
receivequote
request
send quote
receive order
request
invoke check stock
send cancel order
send confirm order inStock=false
inStock=trueinvoke check
shipment
send confirm shipment
shippingAvail=false
shippingAvail=true
Fig. 1. Buy_tie composite service
A customer invokes the operations of the buy_ties service with some expectationson the service quality. These expectations, based on different aspects of the service,are formalized in an SLA in order to obtain a guarantees from the service provider. Inour approach we assume that SLAs are defined by business users, typically by meansof sentences expressed in natural language and possibly written in a contract. Oncesuch an SLA has been defined, an IT manager maps the definition performed innatural language into definitions expressed in a programming language, so that theycan be executed by a management system to monitor SLA compliance. In our systemwe assume that SLA clauses are mapped to SQL queries that can be then run on top ofcomposite service execution data. Some example SLA clauses for our example couldbe the following (here we assume that the provider's name is �Ties & Ties�):
• Clause A: Provider �Ties & Ties� guarantees that the time to deliver ties tocustomer �ABC� cannot exceed 48 hours from the time the order is received bythe provider to the time the goods arrive to the customer.
• Clause B: Provider �Ties & Ties� guarantees a response time of 5 minutes forsending a quote from the time the quote is requested by customer �ABC� to thetime it is sent to this customer.
• Clause C: Provider �Ties & Ties� guarantees not to cancel more than 3% of theorders placed by customer �ABC�.
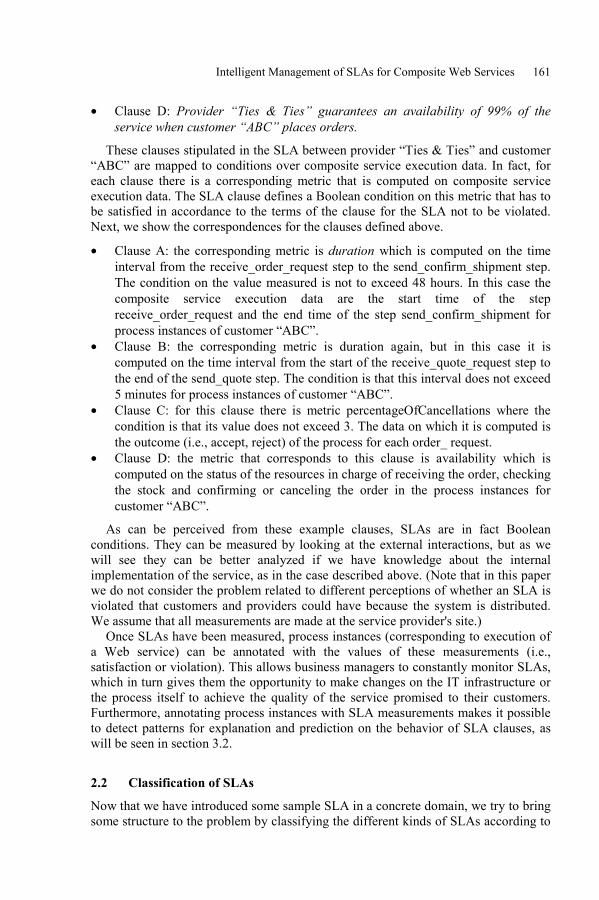
Intelligent Management of SLAs for Composite Web Services 161
• Clause D: Provider �Ties & Ties� guarantees an availability of 99% of theservice when customer �ABC� places orders.
These clauses stipulated in the SLA between provider �Ties & Ties� and customer�ABC� are mapped to conditions over composite service execution data. In fact, foreach clause there is a corresponding metric that is computed on composite serviceexecution data. The SLA clause defines a Boolean condition on this metric that has tobe satisfied in accordance to the terms of the clause for the SLA not to be violated.Next, we show the correspondences for the clauses defined above.
• Clause A: the corresponding metric is duration which is computed on the timeinterval from the receive_order_request step to the send_confirm_shipment step.The condition on the value measured is not to exceed 48 hours. In this case thecomposite service execution data are the start time of the stepreceive_order_request and the end time of the step send_confirm_shipment forprocess instances of customer �ABC�.
• Clause B: the corresponding metric is duration again, but in this case it iscomputed on the time interval from the start of the receive_quote_request step tothe end of the send_quote step. The condition is that this interval does not exceed5 minutes for process instances of customer �ABC�.
• Clause C: for this clause there is metric percentageOfCancellations where thecondition is that its value does not exceed 3. The data on which it is computed isthe outcome (i.e., accept, reject) of the process for each order_ request.
• Clause D: the metric that corresponds to this clause is availability which iscomputed on the status of the resources in charge of receiving the order, checkingthe stock and confirming or canceling the order in the process instances forcustomer �ABC�.
As can be perceived from these example clauses, SLAs are in fact Booleanconditions. They can be measured by looking at the external interactions, but as wewill see they can be better analyzed if we have knowledge about the internalimplementation of the service, as in the case described above. (Note that in this paperwe do not consider the problem related to different perceptions of whether an SLA isviolated that customers and providers could have because the system is distributed.We assume that all measurements are made at the service provider's site.)
Once SLAs have been measured, process instances (corresponding to execution ofa Web service) can be annotated with the values of these measurements (i.e.,satisfaction or violation). This allows business managers to constantly monitor SLAs,which in turn gives them the opportunity to make changes on the IT infrastructure orthe process itself to achieve the quality of the service promised to their customers.Furthermore, annotating process instances with SLA measurements makes it possibleto detect patterns for explanation and prediction on the behavior of SLA clauses, aswill be seen in section 3.2.
2.2 Classification of SLAs
Now that we have introduced some sample SLA in a concrete domain, we try to bringsome structure to the problem by classifying the different kinds of SLAs according to
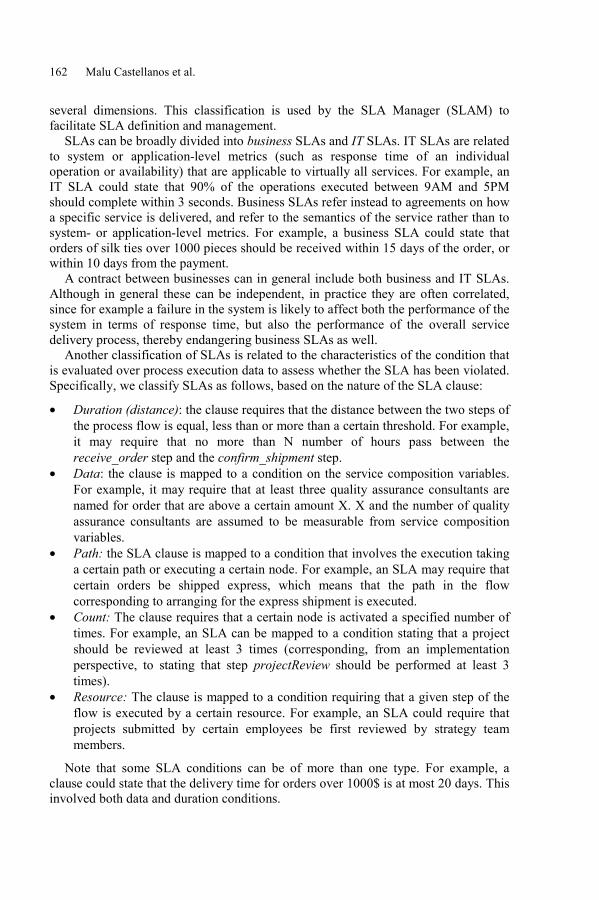
162 Malu Castellanos et al.
several dimensions. This classification is used by the SLA Manager (SLAM) tofacilitate SLA definition and management.
SLAs can be broadly divided into business SLAs and IT SLAs. IT SLAs are relatedto system or application-level metrics (such as response time of an individualoperation or availability) that are applicable to virtually all services. For example, anIT SLA could state that 90% of the operations executed between 9AM and 5PMshould complete within 3 seconds. Business SLAs refer instead to agreements on howa specific service is delivered, and refer to the semantics of the service rather than tosystem- or application-level metrics. For example, a business SLA could state thatorders of silk ties over 1000 pieces should be received within 15 days of the order, orwithin 10 days from the payment.
A contract between businesses can in general include both business and IT SLAs.Although in general these can be independent, in practice they are often correlated,since for example a failure in the system is likely to affect both the performance of thesystem in terms of response time, but also the performance of the overall servicedelivery process, thereby endangering business SLAs as well.
Another classification of SLAs is related to the characteristics of the condition thatis evaluated over process execution data to assess whether the SLA has been violated.Specifically, we classify SLAs as follows, based on the nature of the SLA clause:
• Duration (distance): the clause requires that the distance between the two steps ofthe process flow is equal, less than or more than a certain threshold. For example,it may require that no more than N number of hours pass between thereceive_order step and the confirm_shipment step.
• Data: the clause is mapped to a condition on the service composition variables.For example, it may require that at least three quality assurance consultants arenamed for order that are above a certain amount X. X and the number of qualityassurance consultants are assumed to be measurable from service compositionvariables.
• Path: the SLA clause is mapped to a condition that involves the execution takinga certain path or executing a certain node. For example, an SLA may require thatcertain orders be shipped express, which means that the path in the flowcorresponding to arranging for the express shipment is executed.
• Count: The clause requires that a certain node is activated a specified number oftimes. For example, an SLA can be mapped to a condition stating that a projectshould be reviewed at least 3 times (corresponding, from an implementationperspective, to stating that step projectReview should be performed at least 3times).
• Resource: The clause is mapped to a condition requiring that a given step of theflow is executed by a certain resource. For example, an SLA could require thatprojects submitted by certain employees be first reviewed by strategy teammembers.
Note that some SLA conditions can be of more than one type. For example, aclause could state that the delivery time for orders over 1000$ is at most 20 days. Thisinvolved both data and duration conditions.

Intelligent Management of SLAs for Composite Web Services 163
Besides typing based on the kind of condition being monitored, SLAs can beclassified based on their complexity. In particular, we distinguish between basic andcomposite SLAs. Basic SLAs are defined by a boolean condition over serviceexecution data, as described above. Basic SLAs are sometimes called SLA clauses orService Level Objectives (SLOs) in the literature. Composite SLAs are defined interms of conjunction of SLOs or even other SLAs.
A final classification is based on whether the SLA is specific, that is, it is definedon each process instance (i.e., the SLA condition can be evaluated by looking at theexecution data of a process instance) or involves instead the aggregated analysis ofmany instances (we call these generic SLAs). The examples above are all related toSLAs for one instance. An example of SLA on aggregate execution data is "at least95% of the orders should be delivered within 3 days, and no order should be deliveredin more than 30 days". Note that while in instance-based SLA whether an SLA isviolated or not can be computed at the end of the process instance and the result of thecomputation never changes, for generic SLAs whether an SLA is violated or not canchange with time.
3 Architecture and Implementation
The SLA Management (SLAM) platform offers three main features: SLA monitoring,SLA explanation, and SLA predictions. In the following we describe the architectureand give some implementation details on the SLAM platform, showing how it canprovide these features.
3.1 SLA Monitoring
Figure 2 shows the architecture of the proposed SLA management system. SLAclauses and SLAs are specified to the system through the SLA definer. SLA clausescan be specified in two ways: the first consist in defining an SQL query over processexecution data that returns the list of process instances that violate that clause.
The second is to reuse one of the functions built into the SLA managementsystems. In fact, SLAM comes with a large set of predefined, parametric functionsthat enable the computation of most SLAs. The functions are grouped according tothe types of SLAs identified in the previous section, to facilitate the user in quicklyidentifying the appropriate function to be used for a certain SLA clause. For example,one of these functions is distanceGreaterThan(N1,N2,T). The function returns a list ofprocess instances for which the time elapsed between the completion of node N1 andnode N2 is greater than the threshold T. N1 can assume the special value 'start',denoting the start of the process, while N2 can take the special value 'end', denotingthe completion of the process. Many SLAs of the duration type, that involvesconditions on the time elapsed between the execution of certain nodes in a process (oron the duration of the whole process) can be specified using this function. This is forexample the case of clauses A and B of our simple case study.
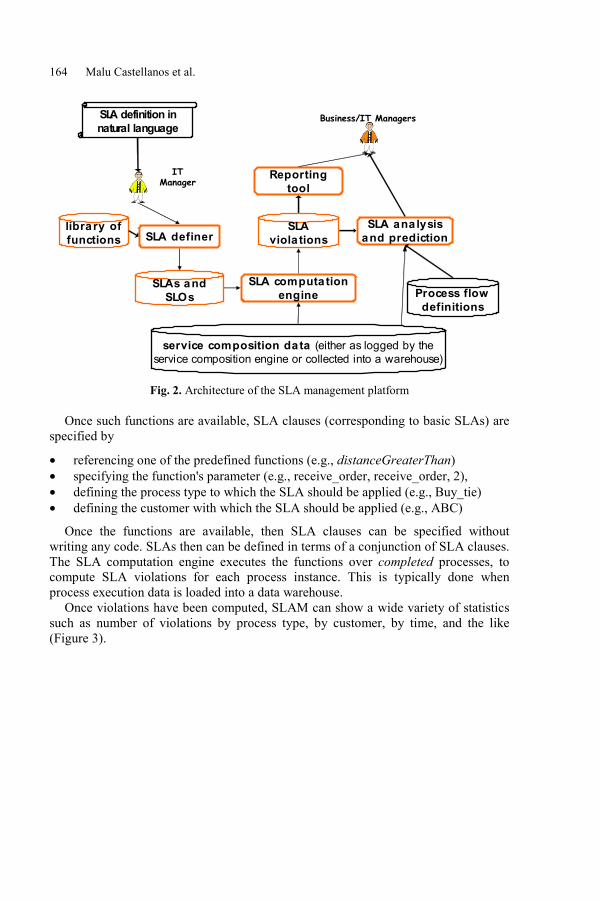
164 Malu Castellanos et al.
SLA computation engine
SLA viola tions
service composition data (either as logged by the service composition engine or collected into a warehouse)
SLA definer
SLAs and SLOs
Business/IT Managers
IT Manager
Reporting tool
SLA ana lysis and prediction
SLA definition in natural language
library of functions
Process flow definitions
Fig. 2. Architecture of the SLA management platform
Once such functions are available, SLA clauses (corresponding to basic SLAs) arespecified by
• referencing one of the predefined functions (e.g., distanceGreaterThan)• specifying the function's parameter (e.g., receive_order, receive_order, 2),• defining the process type to which the SLA should be applied (e.g., Buy_tie)• defining the customer with which the SLA should be applied (e.g., ABC)
Once the functions are available, then SLA clauses can be specified withoutwriting any code. SLAs then can be defined in terms of a conjunction of SLA clauses.The SLA computation engine executes the functions over completed processes, tocompute SLA violations for each process instance. This is typically done whenprocess execution data is loaded into a data warehouse.
Once violations have been computed, SLAM can show a wide variety of statisticssuch as number of violations by process type, by customer, by time, and the like(Figure 3).
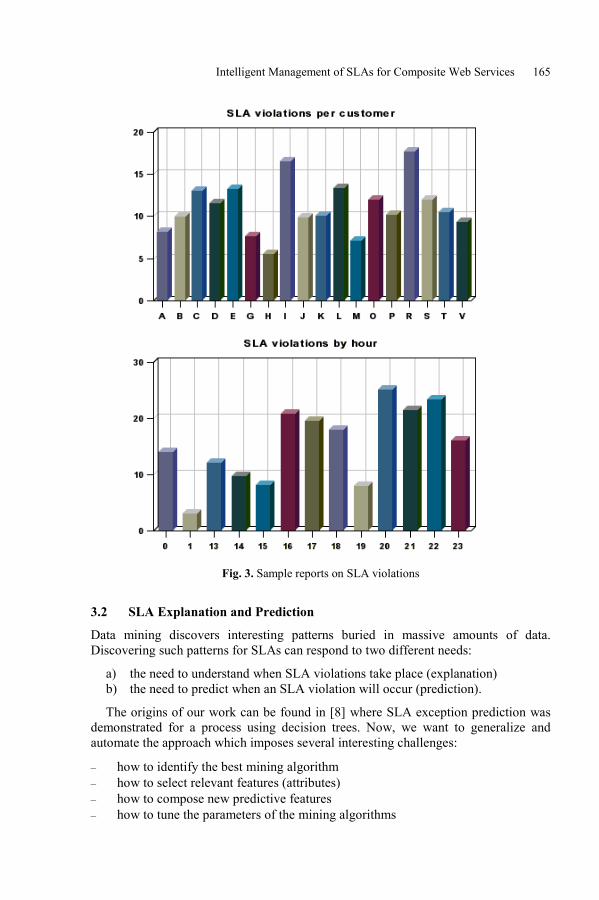
Intelligent Management of SLAs for Composite Web Services 165
Fig. 3. Sample reports on SLA violations
3.2 SLA Explanation and Prediction
Data mining discovers interesting patterns buried in massive amounts of data.Discovering such patterns for SLAs can respond to two different needs:
a) the need to understand when SLA violations take place (explanation)b) the need to predict when an SLA violation will occur (prediction).
The origins of our work can be found in [8] where SLA exception prediction wasdemonstrated for a process using decision trees. Now, we want to generalize andautomate the approach which imposes several interesting challenges:
� how to identify the best mining algorithm� how to select relevant features (attributes)� how to compose new predictive features� how to tune the parameters of the mining algorithms
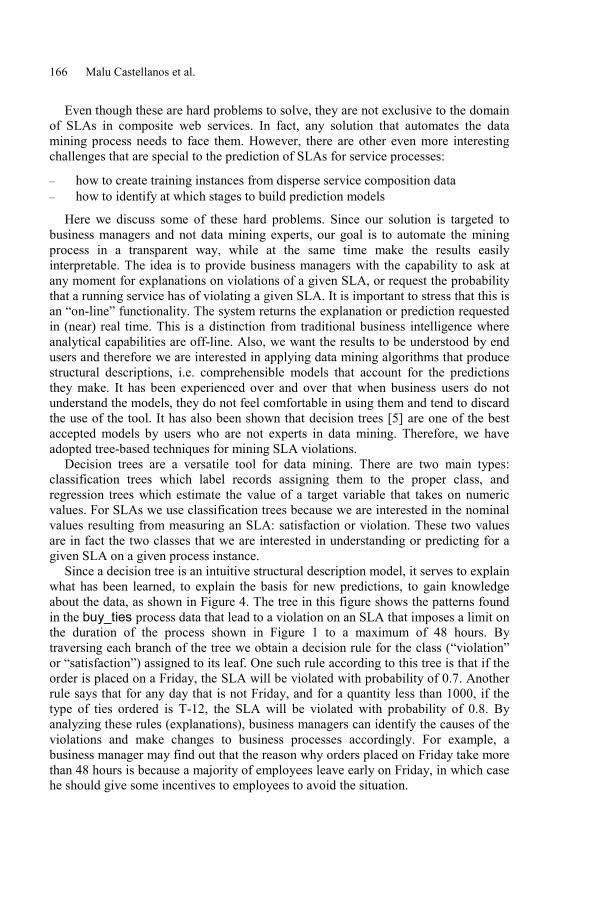
166 Malu Castellanos et al.
Even though these are hard problems to solve, they are not exclusive to the domainof SLAs in composite web services. In fact, any solution that automates the datamining process needs to face them. However, there are other even more interestingchallenges that are special to the prediction of SLAs for service processes:
� how to create training instances from disperse service composition data� how to identify at which stages to build prediction models
Here we discuss some of these hard problems. Since our solution is targeted tobusiness managers and not data mining experts, our goal is to automate the miningprocess in a transparent way, while at the same time make the results easilyinterpretable. The idea is to provide business managers with the capability to ask atany moment for explanations on violations of a given SLA, or request the probabilitythat a running service has of violating a given SLA. It is important to stress that this isan �on-line� functionality. The system returns the explanation or prediction requestedin (near) real time. This is a distinction from traditional business intelligence whereanalytical capabilities are off-line. Also, we want the results to be understood by endusers and therefore we are interested in applying data mining algorithms that producestructural descriptions, i.e. comprehensible models that account for the predictionsthey make. It has been experienced over and over that when business users do notunderstand the models, they do not feel comfortable in using them and tend to discardthe use of the tool. It has also been shown that decision trees [5] are one of the bestaccepted models by users who are not experts in data mining. Therefore, we haveadopted tree-based techniques for mining SLA violations.
Decision trees are a versatile tool for data mining. There are two main types:classification trees which label records assigning them to the proper class, andregression trees which estimate the value of a target variable that takes on numericvalues. For SLAs we use classification trees because we are interested in the nominalvalues resulting from measuring an SLA: satisfaction or violation. These two valuesare in fact the two classes that we are interested in understanding or predicting for agiven SLA on a given process instance.
Since a decision tree is an intuitive structural description model, it serves to explainwhat has been learned, to explain the basis for new predictions, to gain knowledgeabout the data, as shown in Figure 4. The tree in this figure shows the patterns foundin the buy_ties process data that lead to a violation on an SLA that imposes a limit onthe duration of the process shown in Figure 1 to a maximum of 48 hours. Bytraversing each branch of the tree we obtain a decision rule for the class (�violation�or �satisfaction�) assigned to its leaf. One such rule according to this tree is that if theorder is placed on a Friday, the SLA will be violated with probability of 0.7. Anotherrule says that for any day that is not Friday, and for a quantity less than 1000, if thetype of ties ordered is T-12, the SLA will be violated with probability of 0.8. Byanalyzing these rules (explanations), business managers can identify the causes of theviolations and make changes to business processes accordingly. For example, abusiness manager may find out that the reason why orders placed on Friday take morethan 48 hours is because a majority of employees leave early on Friday, in which casehe should give some incentives to employees to avoid the situation.
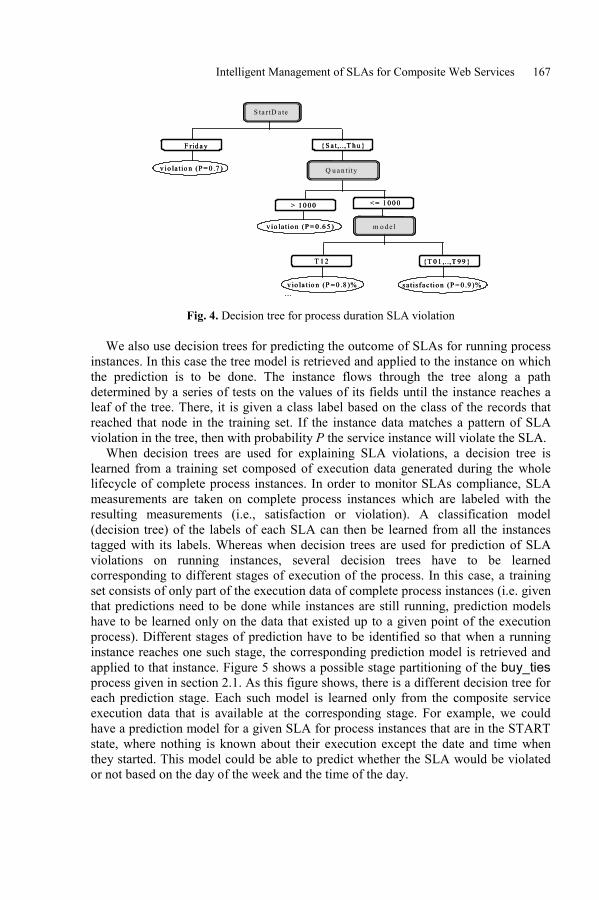
Intelligent Management of SLAs for Composite Web Services 167
S ta rtD a te
F rid a y { S a t,. .,T h u }
v io la t io n (P = 0 .7 )
v io la tio n (P = 0 .8 )% �
v io la t io n (P = 0 .6 5 ) m o d e l
> 1 0 0 0 < = 1 0 0 0
sa t isfa c tio n (P = 0 .9 )%
Q u a n tity
T 1 2 {T 0 1 ,..,T 9 9 }
S ta rtD a te
F rid a y { S a t,. .,T h u }
v io la t io n (P = 0 .7 )
v io la tio n (P = 0 .8 )% �
v io la t io n (P = 0 .6 5 ) m o d e l
> 1 0 0 0 < = 1 0 0 0
sa t isfa c tio n (P = 0 .9 )%
Q u a n tity
T 1 2 {T 0 1 ,..,T 9 9 }
Fig. 4. Decision tree for process duration SLA violation
We also use decision trees for predicting the outcome of SLAs for running processinstances. In this case the tree model is retrieved and applied to the instance on whichthe prediction is to be done. The instance flows through the tree along a pathdetermined by a series of tests on the values of its fields until the instance reaches aleaf of the tree. There, it is given a class label based on the class of the records thatreached that node in the training set. If the instance data matches a pattern of SLAviolation in the tree, then with probability P the service instance will violate the SLA.
When decision trees are used for explaining SLA violations, a decision tree islearned from a training set composed of execution data generated during the wholelifecycle of complete process instances. In order to monitor SLAs compliance, SLAmeasurements are taken on complete process instances which are labeled with theresulting measurements (i.e., satisfaction or violation). A classification model(decision tree) of the labels of each SLA can then be learned from all the instancestagged with its labels. Whereas when decision trees are used for prediction of SLAviolations on running instances, several decision trees have to be learnedcorresponding to different stages of execution of the process. In this case, a trainingset consists of only part of the execution data of complete process instances (i.e. giventhat predictions need to be done while instances are still running, prediction modelshave to be learned only on the data that existed up to a given point of the executionprocess). Different stages of prediction have to be identified so that when a runninginstance reaches one such stage, the corresponding prediction model is retrieved andapplied to that instance. Figure 5 shows a possible stage partitioning of the buy_tiesprocess given in section 2.1. As this figure shows, there is a different decision tree foreach prediction stage. Each such model is learned only from the composite serviceexecution data that is available at the corresponding stage. For example, we couldhave a prediction model for a given SLA for process instances that are in the STARTstate, where nothing is known about their execution except the date and time whenthey started. This model could be able to predict whether the SLA would be violatedor not based on the day of the week and the time of the day.
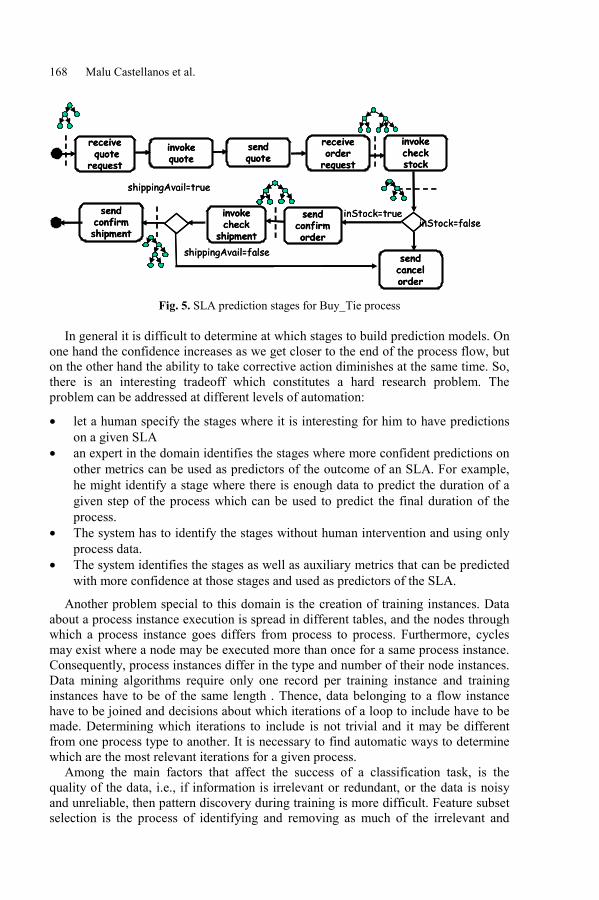
168 Malu Castellanos et al.
invoke quote
receivequote
request
send quote
receive order
request
invoke check stock
send cancel order
send confirm order
inStock=falseinStock=trueinvoke
check shipment
send confirm shipment
shippingAvail=false
shippingAvail=true
invoke quote
receivequote
request
send quote
receive order
request
invoke check stock
send cancel order
send confirm order
inStock=falseinStock=trueinvoke
check shipment
send confirm shipment
shippingAvail=false
shippingAvail=true
Fig. 5. SLA prediction stages for Buy_Tie process
In general it is difficult to determine at which stages to build prediction models. Onone hand the confidence increases as we get closer to the end of the process flow, buton the other hand the ability to take corrective action diminishes at the same time. So,there is an interesting tradeoff which constitutes a hard research problem. Theproblem can be addressed at different levels of automation:
• let a human specify the stages where it is interesting for him to have predictionson a given SLA
• an expert in the domain identifies the stages where more confident predictions onother metrics can be used as predictors of the outcome of an SLA. For example,he might identify a stage where there is enough data to predict the duration of agiven step of the process which can be used to predict the final duration of theprocess.
• The system has to identify the stages without human intervention and using onlyprocess data.
• The system identifies the stages as well as auxiliary metrics that can be predictedwith more confidence at those stages and used as predictors of the SLA.
Another problem special to this domain is the creation of training instances. Dataabout a process instance execution is spread in different tables, and the nodes throughwhich a process instance goes differs from process to process. Furthermore, cyclesmay exist where a node may be executed more than once for a same process instance.Consequently, process instances differ in the type and number of their node instances.Data mining algorithms require only one record per training instance and traininginstances have to be of the same length . Thence, data belonging to a flow instancehave to be joined and decisions about which iterations of a loop to include have to bemade. Determining which iterations to include is not trivial and it may be differentfrom one process type to another. It is necessary to find automatic ways to determinewhich are the most relevant iterations for a given process.
Among the main factors that affect the success of a classification task, is thequality of the data, i.e., if information is irrelevant or redundant, or the data is noisyand unreliable, then pattern discovery during training is more difficult. Feature subsetselection is the process of identifying and removing as much of the irrelevant and
Intelligent Management of SLAs for Composite Web Services 169
redundant information as possible. Regardless of the fact that decision tree inducerstry to focus on relevant features by testing their values, feature selection prior tolearning is beneficial. Reducing the dimensionality of the data reduces the size of thehypothesis space and allows algorithms to operate faster and more effectively, evenaccuracy can be improved in some cases, and the result is a more compact, easilyinterpreted representation of the concept learned. In our approach we use correlation-based feature selection [6] because it can handle both, discrete and continuousfeatures and discrete and continuous classification problems and has been shown tooutperform and do more feature selection than other popular attribute estimatorsparticularly for decision trees. The hypothesis behind this method is that �goodfeature subsets contain features highly correlated with the class, yet uncorrelated witheach other�.
The task related to features is not only about selection, but also about deriving newfeatures from existing ones. Just as in semantic feature selection, constructing newfeatures is totally dependent on semantics. For example, it seems important to derive anew feature that indicates how many times each node was executed even though wewon't capture features for each such iteration. Analogously, it seems meaningful tobreak down the timestamp features into new components, like day of the week, weekof the month, day of the month, and so on. A pattern could be found that indicates thata given SLA is often violated when an order is placed during the last week of themonth. Feature selection and feature construction comprise the feature engineeringtask.
Given that we know the semantics of the process data model used in our platformand the semantic of the SLA classes defined in section 2.2, we are able to do somemanual filtering to discard some irrelevant features which otherwise could be foundas relevant but that are uninteresting for an explanatory model. This is what we calledsemantic feature selection, which unfortunately is not possible when the semantics ofthe data is unknown, as is the case when the feature set is enriched with businessspecific data like customers or orders. The rest of the attributes are left in the hands ofcorrelation-based feature selection which eliminates attributes that are foundirrelevant or redundant. To illustrate the idea, let us suppose that we have thefollowing partial process schema and that we want to obtain an explanation model fororders that violate a duration type SLA:
PROCESS (ID, Name, Description, AvgTime, Status)PROCESS_INSTANCE (ID, Process, StartTime, EndTime, Status)NODES (ID, Process, Name, Type)NODE_INSTANCE (ID, Process, Node, StartTime, EndTime, Status, Resource)
Joining all data related to each flow instance is not the right approach. Repeatingthe same data about the �order' FLOW for each order flow instance is useless giventhat the corresponding attribute values will be the same for all instances, i.e.,irrelevant data. The same happens with the data about the NODES for each nodeinstance. Also, ID data is not a relevant feature, in fact, since it is unique for eachinstance it is not predictive at all. For those nodes that are involved in a cycle, onlythe first and last iteration are captured but the number of iterations is computed andadded as a feature. Also each StartTime and EndTime of a flow instance and a nodeinstance are broken down into derived components like those mentioned above and
170 Malu Castellanos et al.
added as new features of a flow instance. Then, these new flow instances areprocessed by the correlation based feature selection algorithm to select a relevantsubset of attributes. The flow instances are then projected on this subset and the resultconstitutes the training set to be mined by the decision tree inducer.
The configuration of the mining algorithm is also challenging. Decision trees haveseveral parameters that need to be set to achieve the best performance. Theseparameters are typically related to the splitting criteria, pruning criteria and node orleaf size. An automatic way to tune this parameters needs to be found. The key is infinding a good strategy to explore the search space efficiently. Currently we areinvestigating the use of some ideas from design of experiments that have previouslybeen applied on other learning methods at HP Labs [7].
4 Conclusions
This paper has presented concepts, techniques, and an architecture for measuring andpredicting business SLAs defined on Web services. We have motivated why Webservices naturally enable the measurement of business SLA and has shown how SLAcan be monitored and predicted in the case of composite Web service, a class of Webservices likely to gain importance in the near future.
Although the results presented in this paper are useful in their own right, there areseveral other aspects of SLA management that need to be addressed to provide acomprehensive solution. Specifically, an SLA specification language is needed so thatusers can easily define SLAs, possibly through a GUI. These specifications need thento be mapped to a condition on service execution data, so that the SLA can bemeasured by the tool.
Another interesting area of research is that of SLA analysis focused on providingintelligent explanations about which are the causes of SLA violations. Finally, tocompletely address all the issues related to SLA management, we plan to address theproblem of advising users on how to take corrective actions so that a serviceexecution that is at risk of missing an SLA can be corrected. In a few cases, it is evenpossible to envision that the system automatically takes corrective actions.
References
[1] D. Grigori, F. Casati, U. Dayal, M. Castellanos, M. Sayal, and M.C. Shan.Business Process Intelligence. Computers in Industry, special issue onworkflow mining. To appear.
[2] F. Casati and V. Machiraju. Business Visibility with Web Services. Makingsense of your IT operations and of what they mean to you. Proceedings of theUMICS workshop. Velden, Austria. June 2003
[3] F. Casati, U. Dayal and M.C. Shan. Business-oriented Management of Webservices. ACM Communications, October 2003.
[4] Erik Christensen et al. Web Services Description Language (WSDL) 1.1. W3CNote. March 2001

Intelligent Management of SLAs for Composite Web Services 171
[5] J. R. Quinlan. Induction of decision trees. Machine Learning, 1:81--106, 1986.[6] M. Hall. Correlatioin-based Feature Selection for Discrete and Numeric Class
Machine Learning. Proceedings of the Seventeenth International Conference onMachine Learning, Stanford University, CA. Morgan Kaufmann Publishers.
[7] C.Staelin. Parameter Selection for Support Vector Machines. Technical reportHPL-2002-354. Hewlett-Packard Laboratories, Palo Alto, CA, December 2002.
[8] A. Sahai et al. Automated SLA Monitoring for Web Services. IEEE/IFIPDSOM 2002, Montreal, Canada, October 2002.
[9] D. Grigori et al. Improving Business Process Quality through ExceptionUnderstanding, Prediction, and Prevention. VLDB 2001, Rome, Italy,September 2001.

PC Cluster Based Parallel Frequent Pattern
Mining and Parallel Web Access Pattern Mining
Masaru Kitsuregawa and Iko Pramudiono
Institute of Industrial Science, The University of Tokyo4-6-1 Komaba, Meguro-ku, Tokyo 153-8505, Japan
{kitsure,iko}@tkl.iis.u-tokyo.ac.jp
Abstract. The need for scalable and efficient frequent pattern mininghas driven the development for parallel algorithms. High cost perfor-mance platforms like PC cluster are also becoming widely available.Modern algorithms for frequent pattern mining employs complicated treestructure. Here we report the development of the tree based parallel min-ing algorithms on PC cluster: Parallel FP-growth and an extension tomine web access patterns called Parallel WAP-mine.
1 Introduction
Frequent pattern mining has become one popular data mining technique. It alsobecomes the fundamental technique for other important data mining tasks suchas association rule, correlation and sequential pattern.
FP-growth has set a new standard for frequent pattern mining [4]. FP-growthcompresses transaction database into on-memory data structure called FP-treeand then decompose mining tasks into smaller ones in the form of conditionalpattern bases. Conditional pattern bases is a subdatabase of all patterns thatco-occur with a particular itemset. FP-growth shows better performance thanpreviously reported algorithms such as Apriori [1].
Further performance improvement can be expected from parallel execution.Pioneering works on parallel algorithm for frequent pattern mining were donein [3, 5]. Those algorithms are based on Apriori [1]. Particularly, developmentof parallel algorithms on large scale shared nothing environment such as PCcluster has attracted a lot of attention since it is a promising platform for highperformance data mining. A better memory utilization schema for shared noth-ing machines called Hash Partitioned Apriori (HPA) was proposed in [7].
Here we develop parallel algorithms based on modern tree based miningalgorithms: Parallel FP-growth and an extension to mine web access patternscalled Parallel WAP-mine. We verify the efficiency of our algorithms throughreal implementation on a PC cluster. We also examine the bottlenecks of theparallelization and also methods to balance the execution efficiently on shared-nothing environment.
N. Bianchi-Berthouze (Ed.): DNIS 2003, LNCS 2822, pp. 172–176, 2003.c© Springer-Verlag Berlin Heidelberg 2003
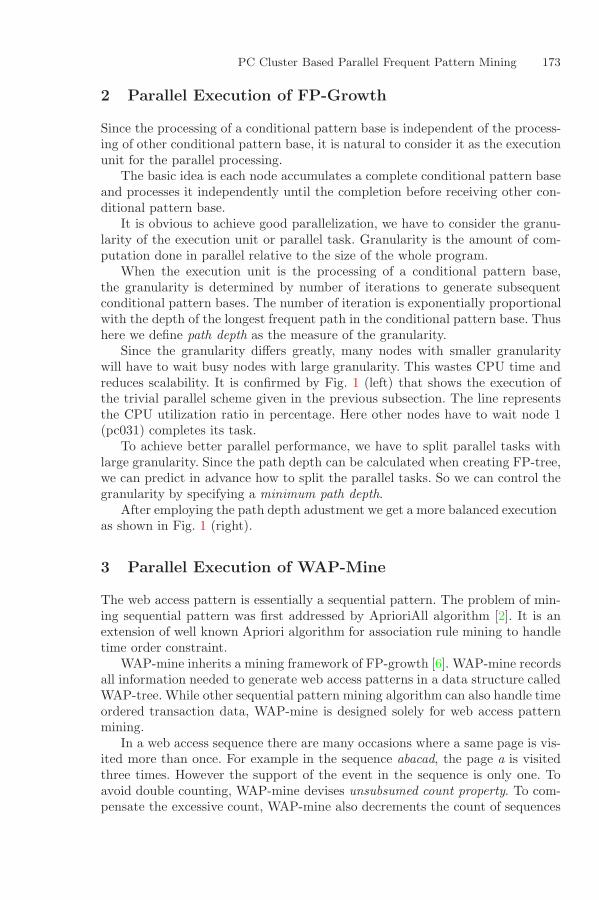
PC Cluster Based Parallel Frequent Pattern Mining 173
2 Parallel Execution of FP-Growth
Since the processing of a conditional pattern base is independent of the process-ing of other conditional pattern base, it is natural to consider it as the executionunit for the parallel processing.
The basic idea is each node accumulates a complete conditional pattern baseand processes it independently until the completion before receiving other con-ditional pattern base.
It is obvious to achieve good parallelization, we have to consider the granu-larity of the execution unit or parallel task. Granularity is the amount of com-putation done in parallel relative to the size of the whole program.
When the execution unit is the processing of a conditional pattern base,the granularity is determined by number of iterations to generate subsequentconditional pattern bases. The number of iteration is exponentially proportionalwith the depth of the longest frequent path in the conditional pattern base. Thushere we define path depth as the measure of the granularity.
Since the granularity differs greatly, many nodes with smaller granularitywill have to wait busy nodes with large granularity. This wastes CPU time andreduces scalability. It is confirmed by Fig. 1 (left) that shows the execution ofthe trivial parallel scheme given in the previous subsection. The line representsthe CPU utilization ratio in percentage. Here other nodes have to wait node 1(pc031) completes its task.
To achieve better parallel performance, we have to split parallel tasks withlarge granularity. Since the path depth can be calculated when creating FP-tree,we can predict in advance how to split the parallel tasks. So we can control thegranularity by specifying a minimum path depth.
After employing the path depth adjustment we get a more balanced executionas shown in Fig. 1 (right).
3 Parallel Execution of WAP-Mine
The web access pattern is essentially a sequential pattern. The problem of min-ing sequential pattern was first addressed by AprioriAll algorithm [2]. It is anextension of well known Apriori algorithm for association rule mining to handletime order constraint.
WAP-mine inherits a mining framework of FP-growth [6]. WAP-mine recordsall information needed to generate web access patterns in a data structure calledWAP-tree. While other sequential pattern mining algorithm can also handle timeordered transaction data, WAP-mine is designed solely for web access patternmining.
In a web access sequence there are many occasions where a same page is vis-ited more than once. For example in the sequence abacad, the page a is visitedthree times. However the support of the event in the sequence is only one. Toavoid double counting, WAP-mine devises unsubsumed count property. To com-pensate the excessive count, WAP-mine also decrements the count of sequences
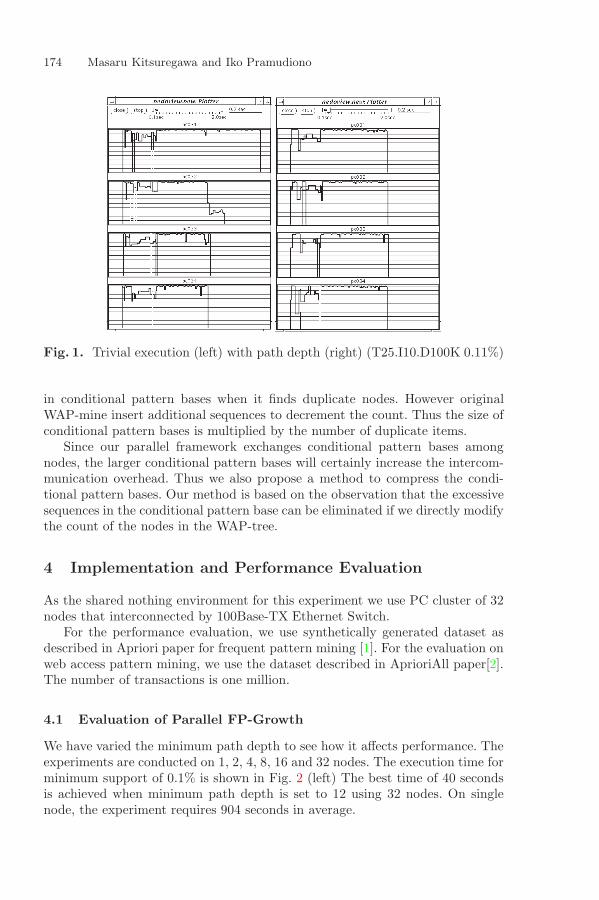
174 Masaru Kitsuregawa and Iko Pramudiono
Fig. 1. Trivial execution (left) with path depth (right) (T25.I10.D100K 0.11%)
in conditional pattern bases when it finds duplicate nodes. However originalWAP-mine insert additional sequences to decrement the count. Thus the size ofconditional pattern bases is multiplied by the number of duplicate items.
Since our parallel framework exchanges conditional pattern bases amongnodes, the larger conditional pattern bases will certainly increase the intercom-munication overhead. Thus we also propose a method to compress the condi-tional pattern bases. Our method is based on the observation that the excessivesequences in the conditional pattern base can be eliminated if we directly modifythe count of the nodes in the WAP-tree.
4 Implementation and Performance Evaluation
As the shared nothing environment for this experiment we use PC cluster of 32nodes that interconnected by 100Base-TX Ethernet Switch.
For the performance evaluation, we use synthetically generated dataset asdescribed in Apriori paper for frequent pattern mining [1]. For the evaluation onweb access pattern mining, we use the dataset described in AprioriAll paper[2].The number of transactions is one million.
4.1 Evaluation of Parallel FP-Growth
We have varied the minimum path depth to see how it affects performance. Theexperiments are conducted on 1, 2, 4, 8, 16 and 32 nodes. The execution time forminimum support of 0.1% is shown in Fig. 2 (left) The best time of 40 secondsis achieved when minimum path depth is set to 12 using 32 nodes. On singlenode, the experiment requires 904 seconds in average.
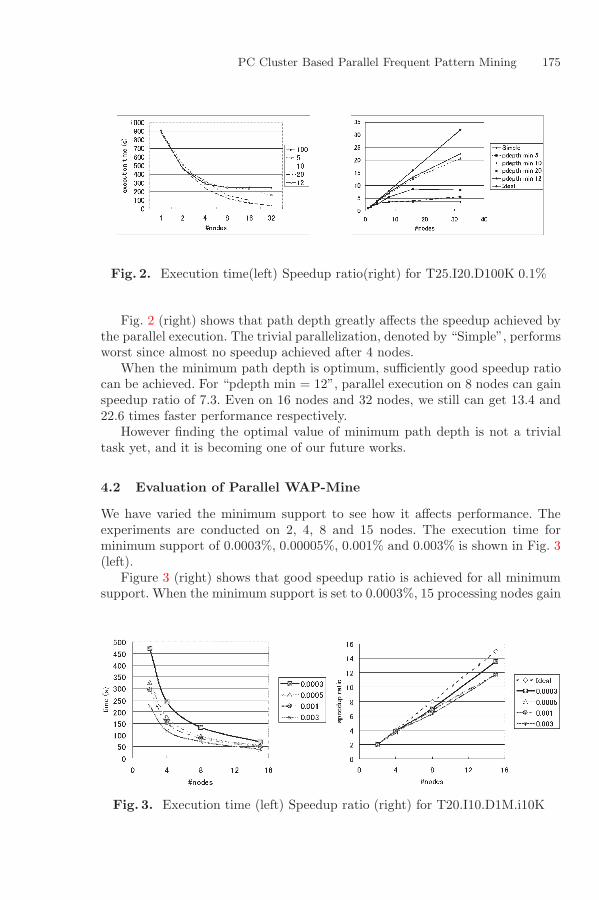
PC Cluster Based Parallel Frequent Pattern Mining 175
Fig. 2. Execution time(left) Speedup ratio(right) for T25.I20.D100K 0.1%
Fig. 2 (right) shows that path depth greatly affects the speedup achieved bythe parallel execution. The trivial parallelization, denoted by “Simple”, performsworst since almost no speedup achieved after 4 nodes.
When the minimum path depth is optimum, sufficiently good speedup ratiocan be achieved. For “pdepth min = 12”, parallel execution on 8 nodes can gainspeedup ratio of 7.3. Even on 16 nodes and 32 nodes, we still can get 13.4 and22.6 times faster performance respectively.
However finding the optimal value of minimum path depth is not a trivialtask yet, and it is becoming one of our future works.
4.2 Evaluation of Parallel WAP-Mine
We have varied the minimum support to see how it affects performance. Theexperiments are conducted on 2, 4, 8 and 15 nodes. The execution time forminimum support of 0.0003%, 0.00005%, 0.001% and 0.003% is shown in Fig. 3(left).
Figure 3 (right) shows that good speedup ratio is achieved for all minimumsupport. When the minimum support is set to 0.0003%, 15 processing nodes gain
Fig. 3. Execution time (left) Speedup ratio (right) for T20.I10.D1M.i10K

176 Masaru Kitsuregawa and Iko Pramudiono
13.6 times faster performance. Our algorithm suitably balances the processingload and keeps the intercommunication overhead low. When the minimum sup-port is lower, the overhead is relatively smaller, thus the speedup is improved.
5 Conclusion
We have reported the development of parallel data mining algorithms that de-signed to run on shared-nothing environment. Two tree based algorithms havebeen implemented on top of a PC cluster system : Parallel FP-growth to minefrequent patterns and Parallel WAP-mine to mine web access patterns.
Although the tree data structure is complex and naturally not suitable forparallel processing on shared-nothing environment, the experiments show ouralgorithms can achieve reasonably good speedup ratio.
References
[1] R. Agrawal and R. Srikant. ”Fast Algorithms for Mining Association Rules”. InProceedings of the 20th International Conference on VLDB, pp. 487–499, Septem-ber 1994. 172, 174
[2] R. Agrawal and R. Srikant. ”Mining Sequential Patterns”. In Proc. of Interna-tional Conference of Data Engineering, pp. 3–14, March 1995. 173, 174
[3] R. Agrawal and J.C. Shafer. “Parallel Mining of Associaton Rules”. In IEEETransaction on Knowledge and Data Engineering, Vol. 8, No. 6, pp. 962–969,December, 1996. 172
[4] J. Han, J. Pei and Y. Yin ”Mining Frequent Pattern without Candidate Genera-tion” In Proc. of the ACM SIGMOD Conference on Management of Data, 2000172
[5] J. S.Park, M.-S.Chen, P. S.Yu ”Efficient Parallel Algorithms for Mining Associa-tion Rules” In Proc. of 4th International Conference on Information and Knowl-edge Management (CIKM’95), pp. 31–36, November, 1995 172
[6] J. Pei, J. Han, B. Mortazavi-asl and H. Zhu “Mining Access Patterns Efficientlyfrom Web Logs” In Proc. of fourth Pacific-Asia Conference in Knowledge Dis-covery and Data Mining(PAKDD’00), 2000. 173
[7] T. Shintani and M. Kitsuregawa “Hash Based Parallel Algorithms for MiningAssociation Rules”. In IEEE Fourth International Conference on Parallel andDistributed Information Systems, pp. 19–30, December 1996. 172
NetIsle: A Hybrid Peer-to-Peer Groupware
System Based on Push Technologyfor Small Group Collaboration
Roman Shtykh1 and Qun Jin2
1 Research and Development Division, Access Co., Ltd.2-8-16 Sarugaku-cho, Chiyoda-ku, Tokyo 101-0064, Japan
[email protected] Department of Human Informatics and Cognitive Sciences
School of Human Sciences, Waseda University2-579-15 Mikajima, Tokorozawa-shi, Saitama 359-1192, Japan
http://www.f.waseda.jp/jin/
Abstract. This paper describes small group collaboration solutionsbased upon push technology, which provides awareness for collaboration,reduces efforts for necessary information discovery, and makes userscollaboration initiators, active information providers and new valuescreators. The push technology-based tools, i.e. File Pusher, Scheduler,NetIsle Mailer, etc., are implemented in a hybrid peer-to-peer general-purpose groupware system, called NetIsle, which has been developed byusing Java RMI and sockets and can be run on any platform where JavaVM is available.
Keywords: Push technology, peer-to-peer, groupware, collabora-tion in small groups, active information provider.
1 Introduction
Work in groups has always been an interesting and, at the same time, diffi-cult topic for research. Since the birth of computers and networks, Computer-Mediated Communication (CMC) has become the center of attention. Collabo-ration took new forms, and new problems arose at the same time.Many software giants and researchers have proposed their solutions for work
in groups to speed up information flow and ease group collaboration. Here areseveral examples of them:
– IBM Lotus Notes, IBM Lotus QuickPlace [1]– Microsoft Exchange Server [2]– Novell GroupWize [3]– GroupServe’s GroupPort [4]
All the above products are pursuing similar goals – provide dynamic collabora-tion solutions. Various existing technologies have been used, and new ones are
N. Bianchi-Berthouze (Ed.): DNIS 2003, LNCS 2822, pp. 177–187, 2003.c© Springer-Verlag Berlin Heidelberg 2003
178 Roman Shtykh and Qun Jin
being created to success at market. Moreover, every developer has his/her ownpoint of view on how to contribute to smooth online collaboration, so that ev-ery product has its original characteristics and concepts that serve the basis forevery project.We have been developing our own groupware system called NetIsle that is
based on our vision of what the group collaboration is and how to facilitateit, combining old well-known technologies, such as push technology, distributedcomputing, and new promising ones, such as peer-to-peer (P2P) technology.We have created a number of tools for online collaboration and integrated
them into a single framework, so that the tools can be easily accessed and usedwhen they are needed. The system can be configured in no time and used on anyplatform that has a Java Virtual Machine (JVM) [5]. The system is mobile – nospecial administration is necessary. Therefore, the group members can changetheir place on the Internet, re-organize the group painlessly, and no one has todo a hard job for group administration (if anybody wishes, he/she can though).Doing this, we have been trying to ensure that the system will be flexible andcompatible to the dynamic process of group collaboration.NetIsle targets uniform open groups, where anyone can join a group and leave
it freely – only a good leadership and the will of members to work together areimportant in such a system to collaborate efficiently. The groupware is for task-oriented users who know what problems they need to solve, and by using theintegrated tools they can create a high-grade group that possesses the functionsoutlined by McGrath and Hollingshead [6]: production, well-being and membersupport.NetIsle is a general-purpose system, which can be used for Intranet coopera-
tion inside companies or educational institutions, or by any groups that want tocreate their online community on the Internet. Some modifications of the systemto use it for specific purposes can be done though 1.The aims of our groupware system are as follows:
– to support collaboration and cooperation of uniform open groups, and quicknavigation within the information space by providing an environment witha number of tools for users to interact;
– to help solve common problems at shorter time;– to ensure fast information transfer in shared space; and– to provide an equal opportunity for all members to participate.
By making use of push technology, we believe that in such a system a usercan be not only a passive information receiver (as it happens in many caseswhen we are watching TV, listening to the radio), but also can be an activeinformation provider. If we take a look at many present applications that arebased on push technology, most of them are used mainly by big corporations andthe mass media to send pieces of information to the recepients. In our system,1 Presently, we are developing NetIsle-EM that is a modified NetIsle groupware systemfor educational purpose by integrating NetIsle with MOO (Multi user dimensionObject-Oriented) environments.

NetIsle: A Hybrid Peer-to-Peer Groupware System 179
we try to provide equal opportunities for all users of the system to create andshare information, to be an active creator of community values in real-timecollaboration process.In this paper, we make a focus upon push-type tools and functional units
of the system; all the other tools are described in [7]. The rest of this paper isorganized as follows. Section 2 explains why small groups are targeted for ourgroupware system. Section 3 provides an overview of push technology, and de-scribes our view of new media community that transforms users from passiveinformation receivers to active senders, by using push technology. Section 4 dis-cusses design and implementation of the NetIsle push-type tools: File Pusher,Scheduler, NetIsle Mailer, and other functional units. Finally, Section 5 summa-rizes the results of this paper, and gives future research direction.
2 Small Groups
Process of collaboration in small and large groups is different. Due to this, systemdesign for different kinds of groups is also different. As we mentioned above,NetIsle groupware system is for collaboration within small groups. Let us try toexplain why such small groups are targeted.Actually, if we take a look at some groupware definitions, we can say that
groupware is typically for usage within purpose-oriented small groups. For in-stance, here is a definition given by Johansen [8] – “Groupware is a generic termfor specialized computer aids that are designed for the use of collaborative workgroups. Typically, these groups are small project-oriented teams that have im-portant tasks and tight deadlines. Groupware can involve software, hardware,services and/or group process support.”So why small groups are targeted in our groupware system? Small groups
are quite stable, productive and flexible units of society. Usually they do notsubgroup – in case of not more than 12 or 18, as we know from teaching practices.However, if a key member changes in a really small group, the group developmenthas to start all over again. That is the main disadvantage of small groups.Smaller size groups contribute to the sense of groupness because they al-
low for greater mutual awareness to take place among group members and, asa result, create greater opportunities for affiliative interactions to take place.Conversely, larger groups normally produce less of a sense of groupness becausethey foster less perception of mutual awareness. As the number of group mem-bers increases beyond a certain point, the ratio of individual interactions willdecrease, along with the perception of groupness.“Humans form effective, coordinated, division-of-labor groupings at several
levels of aggregation. At each level, there is a problem of metasystem transi-tion.” [9] “At each level, there is also not only competition between other group-ings at the same level, but also competition between the interests of the smallerincorporated units and the interests of the larger encompassing unit.” [10] Smallgroups are not likely to subdivide and competition in them is directed for achiev-ing something that will be a mutual benefit for every group member.
180 Roman Shtykh and Qun Jin
3 Push Technology and New Media Community
Push technology is not new, and it has been generally limited to informationtransmission from one big source of information (such as a news site, customersupport center, etc.) to its users or customers. But if we enable all users to sendand share information, it makes them not just passive information recepients,but also active participants in information creation. Anybody can become aninformation provider in this case.
3.1 Short Overview of Push Technology
Push technology is a set of technologies that deliver information directly toa user, automate the search and retrieval function.“The term push technologycan be used to describe anything from Webcasting to selective content deliveryusing sophisticated evolutionary filtering” [11] “Push technology has been toutedas an alternative to the way the World Wide Web currently operates, where usersgo online to search for information.” [12]Push technology is not as new as peer-to-peer technology. It drew attention
of many software developers and companies, and many of them started develop-ing push-type systems in mid-1996 to help users retrieve only the informationthey specify as relevant. For this purpose, a number of HTTP protocol enhance-ments and multicast protocols for push distribution were developed. The goodexamples of software products that have been created by using push technologyare Keryx Notification System by Keryxsoft (a group in Hewlett Packard Labo-ratories) [13], Webcanal [14], PointCast [15], ANATAGONOMY [16]. Nowadayspush technology is used in reseach on combination with new technologies likeXML [17], and wireless data broadcasting [18], [19].Many companies use this technology to deliver information to employees,
collaborate, update their clients’ software, and for many other purposes. Themodern software representatives of push technology software can be Netpresen-ter [20] and BackWeb e-Accelerator [21].Push technology speeds up the process of obtaining information, saves time
of many people. Repeatedly searching the Web for information on a particulartopic can be both time-consuming and frustrating. Push technology can help bydelivering or pushing information directly to one’s desktop. Not much effort willbe made to obtain the information wanted.Traditionally, pushing is done by the following way. On getting a certain
user’s information, a vendor’s server will search the Web for it, and the retrievedinformation is filtered and sent to the user’s desktop. It is different from “pull”when a user has to search necessary information and download it himself/herself.The main disadvantage of using push technology is the quality of information
received, and its relevance. This kind of problem arises because the filtering isdone at server side by some special algorithms that can overlook some thingsand it is difficult to provide necessary information just taking keywords fromuser profiles.
NetIsle: A Hybrid Peer-to-Peer Groupware System 181
NetIsle is designed for a small group of task-oriented users, so that irrelevantinformation is unlikely to be sent, since the collaboration community membersare interested in producing a good result in a short period of time. We expectit can eliminate the main disadvantage of using push technology and its bestfeatures will be mostly utilized.In push-type systems, some technical problems, like network overload and
decreased performance on the client side, can be observed. But as far as testingis being done, we have not experienced any serious problems with it, since ourtargets are small-scale groups.
3.2 Using Push Technology to Transform Userfrom Passive Receiver to Active Sender
At the days of the first introduction of new media like TV and radio, mediawere almighty and general public was powerless to influence the media. Therewere no interaction between them – people were just passive receivers of uni-directional information flow. Nowadays, things are changing – people want tomake influence upon many things and information flow becomes bi- and multi-directional. People choose interactivity and participation instead of passivenessand unidirectionality.Similar things are happening in the computer world due to the rapid popu-
larization of the Internet, a new media community. Today computer is not onlya machine for calculating complex equations and perform industrial tasks, butit is also a human-oriented tool to help solve individual problems. Nevetherless,in many cases people are just information recepients when they are accessingWeb through their PC browsers, and even if some information is exchanged orrenewed it happens slowly and its discovery can take from several minutes toseveral days.Applying push technology to groupware enables users to exchange informa-
tion fast and share it in many forms. By enabling collaborative group membersto push information, we believe that they become not only passive informationreceivers, but also active initiators of collaboration, information senders and,finally, participants in new values creation.
4 NetIsle Push-Type Tools
NetIsle is a hybrid-type peer-to-peer groupware solution for collaboration insmall groups. It was started from creating a peer-to-peer collaboration environ-ment with our big concern about push technology [7]. NetIsle provides supportfor cooperative work on the process level, i.e. focuses on tools by using whichusers can cooperate, and provide little support on content level [22]. It gives usersa shared workspace with a number of tools for synchronous and asynchronouscommunication. We hope that those who use the groupware find the utilitiesflexible, easy to learn and applicable in many ways familiar to team members.In this section, we give a description about the design and implementation
of these push-type tools.
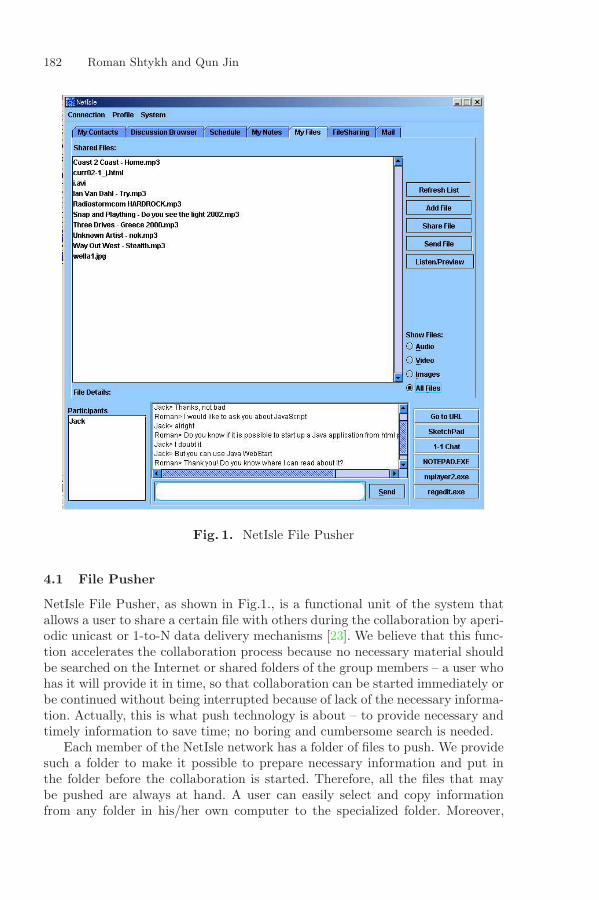
182 Roman Shtykh and Qun Jin
Fig. 1. NetIsle File Pusher
4.1 File Pusher
NetIsle File Pusher, as shown in Fig.1., is a functional unit of the system thatallows a user to share a certain file with others during the collaboration by aperi-odic unicast or 1-to-N data delivery mechanisms [23]. We believe that this func-tion accelerates the collaboration process because no necessary material shouldbe searched on the Internet or shared folders of the group members – a user whohas it will provide it in time, so that collaboration can be started immediately orbe continued without being interrupted because of lack of the necessary informa-tion. Actually, this is what push technology is about – to provide necessary andtimely information to save time; no boring and cumbersome search is needed.Each member of the NetIsle network has a folder of files to push. We provide
such a folder to make it possible to prepare necessary information and put inthe folder before the collaboration is started. Therefore, all the files that maybe pushed are always at hand. A user can easily select and copy informationfrom any folder in his/her own computer to the specialized folder. Moreover,
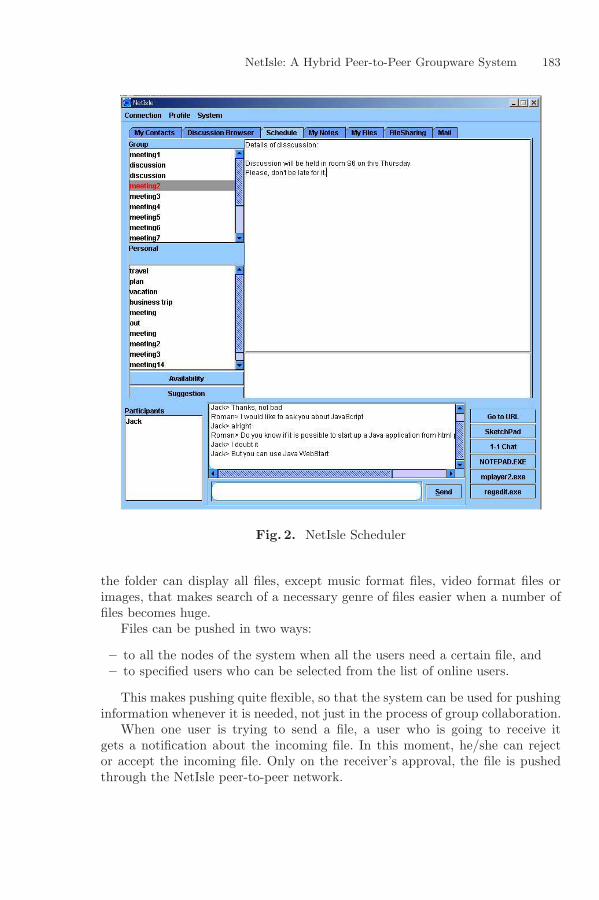
NetIsle: A Hybrid Peer-to-Peer Groupware System 183
Fig. 2. NetIsle Scheduler
the folder can display all files, except music format files, video format files orimages, that makes search of a necessary genre of files easier when a number offiles becomes huge.Files can be pushed in two ways:
– to all the nodes of the system when all the users need a certain file, and– to specified users who can be selected from the list of online users.
This makes pushing quite flexible, so that the system can be used for pushinginformation whenever it is needed, not just in the process of group collaboration.When one user is trying to send a file, a user who is going to receive it
gets a notification about the incoming file. In this moment, he/she can rejector accept the incoming file. Only on the receiver’s approval, the file is pushedthrough the NetIsle peer-to-peer network.
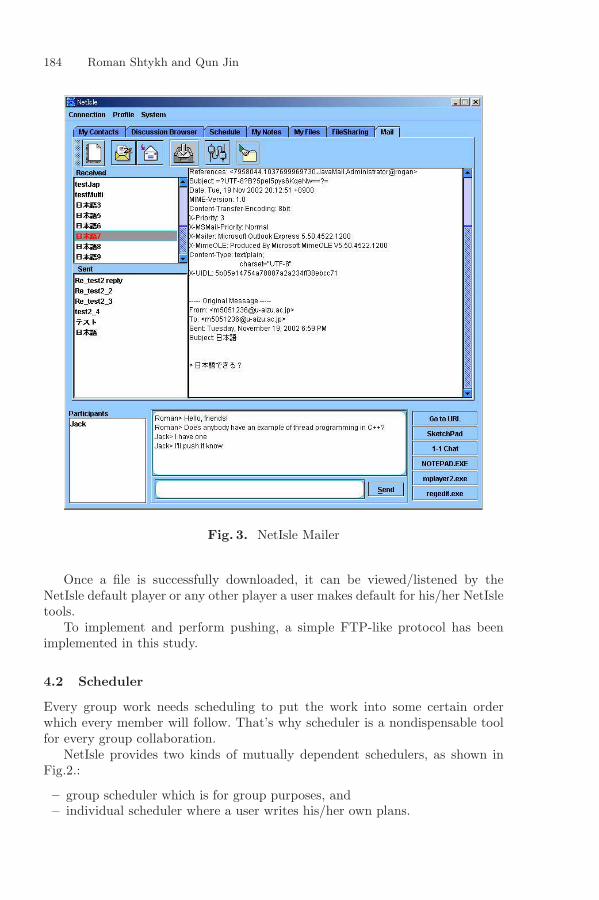
184 Roman Shtykh and Qun Jin
Fig. 3. NetIsle Mailer
Once a file is successfully downloaded, it can be viewed/listened by theNetIsle default player or any other player a user makes default for his/her NetIsletools.To implement and perform pushing, a simple FTP-like protocol has been
implemented in this study.
4.2 Scheduler
Every group work needs scheduling to put the work into some certain orderwhich every member will follow. That’s why scheduler is a nondispensable toolfor every group collaboration.NetIsle provides two kinds of mutually dependent schedulers, as shown in
Fig.2.:
– group scheduler which is for group purposes, and– individual scheduler where a user writes his/her own plans.
NetIsle: A Hybrid Peer-to-Peer Groupware System 185
By providing two schedulers in the system, we optimize scheduling mech-anism to some extend. When one user plans a group meeting, he/she makesa suggestion to the entire group about date and time of the online meeting.Other members need to do nothing – a suggestion will travel from one schedulerto another checking personal schedulers of the members. If all the members donot have any personal plans for the suggested date and time, the suggestionwill be automatically added to the group schedule of every member. Otherwise,a person who made a suggestion has to change date and time of the onlinemeeting.Before posting a suggestion, one can also check if all members are available
in the suggested date and time by using “Availability” function.It would be good to implement a function that could run at the background
and notify a user about upcoming scheduled events, but such a function has notbeen implemented yet.
4.3 NetIsle Mailer
NetIsle Mailer shown in Fig.3. is a multilingual mail client program that hasall main functions of any application of this kind, plus a direct message pusher.Here we will not describe common mail functions; instead we will pay attentionto system-specific functions.All collaboration group members may be interested in a received or a newly
composed mail message, which can be pushed through the NetIsle network tobe shared and discussed by all. It is a kind of serverless newsgroup where allmessages have their unique ID, composed from a sender’s name and a randomlygenerated number, and get into members’ mailboxes. Such messages are groupedseparately from ordinary mail messages and distinguished by color.If some of the group members are offline, messages are not lost for them and
will be delivered as soon as they come online. For this purpose, there is a simplemail agent which periodically checks if a certain message is delivered to all theonline members. If some user was previously offline (he/she has not received themessage) and becomes online, the agent finds it out and sends the message tothat user. The message state for the user becomes “SENT.” The agent is workingin the background of the system, therefore, it does not hinder the main workbeing done by a user.
4.4 Other Functional Units
Besides the functional units we described above, there are two other utilitiesthat make use of push technology in the system. They are Personal ContactsList and NetIsle Notepad.Personal Contacts List is a list of one’s friends and associates who do not
necessarily use the NetIsle system. By choosing a certain item in the list, one caneasily get a friend’s profile, go to his/her home page or send an email. A profilecan be viewed, added, modified and deleted.
186 Roman Shtykh and Qun Jin
Furthermore, every new user who wants to use a NetIsle application hasto create his/her own profile and if that user wants to share it with all groupmembers or one certain member, he/she can push the profile through the NetIslenetwork and get it added to the contact list of another user on that user’spermission. So that no manual adding should be done.NetIsle Notepad is just another simple editing program that allows users to
write their ideas, save them and share now or later.Again, since NetIsle utilizes push technology to its full, a text that is being
edited in the notepad can be pushed to other peers and opened in the mainwindow or another window not to overwrite other user’s writings (it is doneon the receiver’s selection). Sometimes we can’t write a long text in the chatwindow because it is very time-consuming and sometimes we want to share ourideas soon. In this case, NetIsle Notepad can be used.
5 Conclusions
This paper describes push technology and its usage in group collaborationthrough NetIsle groupware system which is based on its strengths. Push technol-ogy enables users to be not only passive information receivers, but also be activeinformation providers. Information is not searched by all collaborative groupmembers – it is provided by a member who possesses the piece of informationwhen it is necessary. That is why we consider the use of push technology thatis important in groupware implementation, though it has some disadvantages,such as unnecessary and irrelevant information can be supplied. But in the caseof NetIsle such information can be rejected and the group itself is supposed tobe small and task-oriented, so that unnecessary information is not likely to bepushed.The present pilot system is implemented as a general-purpose groupware.
The next phase of development is to apply it for educational purpose usingMOO (Multi user dimension Object-Oriented) [24] environments and additingother education-specific tools. The system is constantly being developed andenhanced. Although it has been tested and a preliminary evaluation has beendone, it should be evaluated in a real time situation of group collaboration.
Acknowledgment
This work has been partly supported by 2000-2002 JSPS (Japan Society forthe Promotion of Science) Grant-in-Aid for Scientific Research Contract No.12558012, 2002 University of Aizu Research Grants Nos. R-9-1 and G-25, and2003 Waseda University Grant for Special Research Project No. 2003A-917. Theauthors wish to express their gratitude.
NetIsle: A Hybrid Peer-to-Peer Groupware System 187
References
[1] IBM Lotus Software, http://www.lotus.com/ 177[2] Microsoft Exchange Server, http://www.microsoft.com/exchange/ 177[3] Novell GroupWize 6, http://www.novell.com/products/groupwise/ 177[4] GroupPORT, http://www.groupport.com/ 177[5] The Source for Java (TM) Technology, http://java.sun.com 178[6] McGrath, J., and Hollingshead, A., Groups Interacting with Technology. Thou-
sand Oaks, Califf.: Sage, 1994. 178[7] Shtykh, R., and Jin, Q., “A Push-Type Groupware System to Facilitate Small
Group Collaboration,” Proceedings of First International Symposium on CyberWorlds, November 2002, pp.354–363. 179, 181
[8] Johansen, R., Groupware: Computer Support for Business Teams, New York: FreePress, 1988. 179
[9] Turchin, V., and Joslyn, C., “The Metasystem Transition,”http://pespmc1.vub.ac.be/MST.html 179
[10] Campbell, D.T., and Heilighen, F., “Human society,”http://pespmc1.vub.ac.be/SOCIETY.html 179
[11] Kendall, Julie E., and Kendall, Kenneth E., “Information delivery systems: anexploration of Web pull and push technologies,” Communications of the AIS,April 1999. 180
[12] LEARN THE NET: Glossary, http://www.learnthenet.com/english/glossary/push.htm 180
[13] Keryxsoft, http://keryxsoft.hpl.hp.com/ 180[14] Liao, Tie, “Webcanal: Multicast Based Push,”
http://webcanal.inria.fr/arch/w3c push ws /w3c push liao.html 180[15] InfoGate Inc., http://www.pointcast.com/ 180[16] Kamba, T., Sakagami, H., and Koseki, Y., “Automatic Personalization on Push
News Service,”http://www.w3.org/Architecture/9709 Workshop/paper02/paper02.ppt 180
[17] Bonifati Angela, Ceri Stefano, and Paraboschi Stefano, “Pushing reactive servicesto XML repositories using active rules,” Proceedings of the Tenth InternationalConference on World Wide Web. April 2001, pp.633–641. 180
[18] Celik Aslihan, and Datta Anindya, “A scalable approach for broadcasting datain a wireless network,” Proceedings of the 4th ACM International Workshop onModeling, Analysis and Simulation of Wireless and Mobile Systems, July 2001,pp.131–138. 180
[19] Olsson Daniel, and Nilsson Andreas, “MEP: a media event platform,” MobileNetworks and Applications, June 2002, Volume 7, Issue 3, pp.235–244. 180
[20] Netpresenter, http://www.netpresenter.com 180[21] BackWeb, http://www.backweb.com 180[22] Borghoff, U., and Schlichter, J., “Computer-Supported Cooperative Work: Intro-
duction to Distributed Applications,” Springer-Verlag, 2000. 181[23] Franklin Michael, and Zdonik Stan, “Data in your face”: push technology in
perspective,” ACM SIGMOD Record, Proceedings of the 1998 ACM SIGMODInternational Conference on Management of Data, June 1998, Volume 27, Issue 2,pp.516–519. 182
[24] MOO home page, http://www.moo.mud.org/ 186
An Improved Optimistic
and Fault-Tolerant Replication Protocol�
Luis Irun-Briz, Francesc D. Munoz-Escoı, and Josep M. Bernabeu-Auban
Instituto Tecnologico de Informatica, Universidad Politecnica de Valencia46071 Valencia, Spain
{lirun,fmunyoz,josep}@[email protected]
Abstract. In this paper, a protocol is proposed that provides the ad-vantages of lazy approaches, forestalling their traditionally found disad-vantages. Thus, our approach reduces the abortion rates, and improvesthe performance of the system. It can also use a dynamic computationof the protocol threshold, approximating its results to the optimal ones.In addition, fault tolerance has been included in the algorithm, usinga pseudo-optimistic approach, and avoiding to block any local activity,and minimizing the interference over any node in the system.A complete description of these algorithms is presented here. Finally,and empirical validation is also discused.
1 Introduction
Consistency requirements introduce a new parameter in the problem of repli-cation in order to achieve fault tolerance and performance enhancement in dis-tributed systems. In some areas – as distributed databases – this conforms a mainproblem to solve.
The concurrency control can be solved[1, 2, 3] using different techniques.Pessimistic techniques use ”locks“ to avoid conflicting transactions to break theconsistency, and optimistic techniques are based on timestamps. The main dis-advantage of pessimistic techniques is the degradation of the performance, dueto the temporal block of the concurrent transactions. Its main advantage is thelow abortion rate that the pessimistic techniques introduce.
Moreover, the optimism principle is also applied in the propagation of theupdates in models where a particular transaction is not executed in every node inthe system. In such systems, a notification of the updates performed by a trans-action must be propagated to the rest of nodes.
The pessimistic propagation is commonly known as Eager, and performs theentire diffusion of the updates during the commit phase, making the commitphase more expensive, but ensuring that every replica in the system holds an� This work has been partially supported by the EU grant IST-1999-20997 and the
Spanish grant TIC99-0280-C02-01.
N. Bianchi-Berthouze (Ed.): DNIS 2003, LNCS 2822, pp. 188–200, 2003.c© Springer-Verlag Berlin Heidelberg 2003
An Improved Optimistic and Fault-Tolerant Replication Protocol 189
updated value for its objects. In the other hand, optimistic propagation[4] –described in the literature as Lazy update protocols [5, 6] –, delays the updatepropagation over the commit phase. This makes the commit phase faster, butcomplicates the consistency control, and increases the abortion rate, due to theaccesses to outdated objects.
The inconvenience of lazy and optimistic approaches can be attenuated if theprobability of an object to be outdated is included in a more careful design ofthe concurrency protocol.
Moreover, fault tolerance can also be benefitted from this approach, includingit in a modification of the basic algorithm. Many recovery protocols use eagerpessimistic approaches, making it necessary to temporally block transactionsalive during the recovery process. In the other hand, lazy optimistic approachesfor recovery protocols increase the abortion rate in the node being recovered. Inthe middle point, our proposal avoids to block transactions, and minimizes theabortion rate, using the principle of role migration.
We provide in this paper an statistical exploit of the expression for the abor-tion rate caused by the use of lazy replication, describing a new algorithm tosolve the concurrency control in a distributed transactional system (e.g. dis-tributed databases). Moreover, this algorithm makes use of the lazy paradigm,and maintains the optimistic approach in a certain degree. In addition, we pro-vide fault-tolerance to the protocol, making use of the same principle, avoidingto block any transaction in the system during the recovery phase.
To this end, the following section describes a basic optimistic lazy protocol forthe concurrency control. Section 3 presents a modification of the basic algorithm,introducing a prediction of the probability of outdate in order to improve thebehavior of the abortion rate, and an experimental validation of the expressionis then shown. In section 4, the modification to provide self-recovery ability tothe protocol is detailed. Section 5 compares this protocol with other systems.Finally, section 6 gives some conclusions.
2 An Optimistic Lazy Protocol
The basic consistency protocol presented in this section is a variation of oneof the consistency protocols currently implemented in the GlobData Project[7](described in [8]).
In the GlobData project, a software platform is used to support databasereplication. This platform, is called COPLA, and provides an object-orientedview of a network of relational DBMSs. The COPLA architecture is structuredin three different layers, which interact using CORBA interfaces, enabling theplacement of each layer in a different machine. Thus, multiple applications (run-ning in different nodes) may access the same database replica using its local”COPLA Manager”. The COPLA Manager of each node propagates all updateslocally applied to other database replicas using its replication management com-ponents.
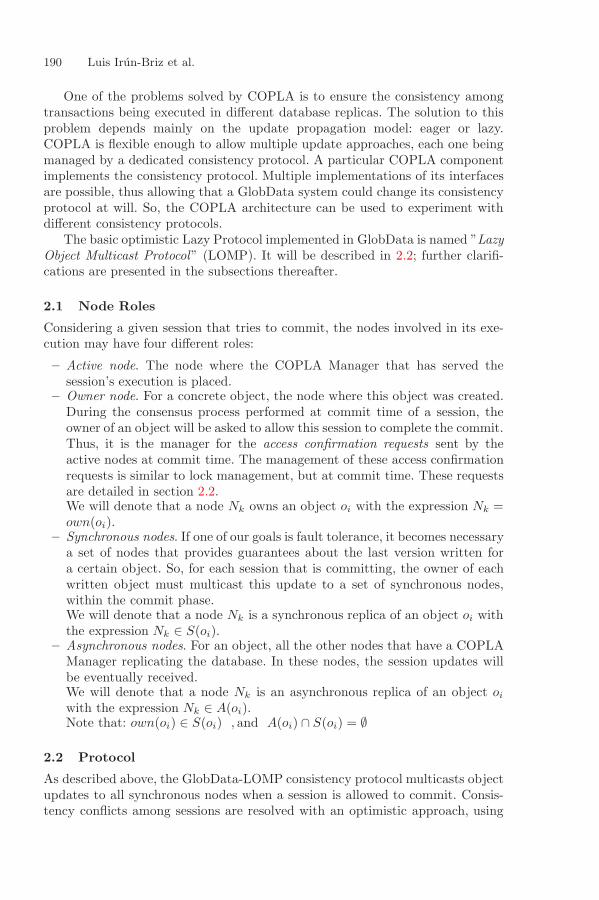
190 Luis Irun-Briz et al.
One of the problems solved by COPLA is to ensure the consistency amongtransactions being executed in different database replicas. The solution to thisproblem depends mainly on the update propagation model: eager or lazy.COPLA is flexible enough to allow multiple update approaches, each one beingmanaged by a dedicated consistency protocol. A particular COPLA componentimplements the consistency protocol. Multiple implementations of its interfacesare possible, thus allowing that a GlobData system could change its consistencyprotocol at will. So, the COPLA architecture can be used to experiment withdifferent consistency protocols.
The basic optimistic Lazy Protocol implemented in GlobData is named ”LazyObject Multicast Protocol” (LOMP). It will be described in 2.2; further clarifi-cations are presented in the subsections thereafter.
2.1 Node Roles
Considering a given session that tries to commit, the nodes involved in its exe-cution may have four different roles:
– Active node. The node where the COPLA Manager that has served thesession’s execution is placed.
– Owner node. For a concrete object, the node where this object was created.During the consensus process performed at commit time of a session, theowner of an object will be asked to allow this session to complete the commit.Thus, it is the manager for the access confirmation requests sent by theactive nodes at commit time. The management of these access confirmationrequests is similar to lock management, but at commit time. These requestsare detailed in section 2.2.We will denote that a node Nk owns an object oi with the expression Nk =own(oi).
– Synchronous nodes. If one of our goals is fault tolerance, it becomes necessarya set of nodes that provides guarantees about the last version written fora certain object. So, for each session that is committing, the owner of eachwritten object must multicast this update to a set of synchronous nodes,within the commit phase.We will denote that a node Nk is a synchronous replica of an object oi withthe expression Nk ∈ S(oi).
– Asynchronous nodes. For an object, all the other nodes that have a COPLAManager replicating the database. In these nodes, the session updates willbe eventually received.We will denote that a node Nk is an asynchronous replica of an object oi
with the expression Nk ∈ A(oi).Note that: own(oi) ∈ S(oi) , and A(oi) ∩ S(oi) = ∅
2.2 Protocol
As described above, the GlobData-LOMP consistency protocol multicasts objectupdates to all synchronous nodes when a session is allowed to commit. Consis-tency conflicts among sessions are resolved with an optimistic approach, using

An Improved Optimistic and Fault-Tolerant Replication Protocol 191
object versions. To this end, the protocol uses some meta-data tables in thedatabase where the current object versions can be stored.
In summary, it processes the following steps:
1. There is no consistency control when a session performs an access to anobject.
2. At commit time, the consistency control performs a voting round for everyowner node of the accessed objects of the session.
3. If all the owner nodes conform this commit, the session can continue, andcompletes the commit. Then, an update message is multicasted to everysynchronous replica for each updated object.
4. If any of the owner nodes reply with a denial vote, then the conflicting objectsare updated (the adequate value is included in the denial message), and thesession is aborted.
5. An asynchronous process is run in the system in order to multicast to everyasynchronous replica the updated objects in each node.
The full description of the protocol process can be found in [9].
3 COLUP:The Cautious Optimistic Lazy Update Protocol
An expression for the probability for an object oi to cause the abortion of a ses-sion has been presented in [9]. This expression can be used to predict the con-venience for a session to ensure that an object that is asynchronously updatedhas a recent version in the local database.
The complete expression can be written as follows:
PAoutd(oi) = 1−(1−
∑k nwk
K × N
)δ(oi)×∑
k wtpsk
(1)
Where:
– K is the number of nodes in the system.– N is the amount of objects maintained by the system (i.e. the distributed
database).– nwk is the number, in mean, of objects written per write-transaction in the
node k of the system.– wtpsk is the number of write-transactions committed per second in the
node k of the system.– δ(oi) the elapsed time the object oi has not been updated in the node where
the session accessing the object is executed.
The expression can be calculated with a few parameters. Only nwk and wtpsk
must be collected in the nodes of the system in order to obtain the expression.Thus, it becomes possible for a node to estimate the convenience for an object

192 Luis Irun-Briz et al.
to be locally updated before being accessed by a session. This estimation willbe performed with a certain degree of accuracy, depending on the “freshness” ofthe values of nwk and wtpsk the node has.
In order to apply these results, it becomes necessary to establish a thresholdof PA(oi) to consider the object “convenient to be updated”. An adequate valuefor this threshold should minimize the number of abortions caused by accessesto outdated objects, and keeping low the number of updates for the system.
The higher the threshold is, the less number of abortions will occur in thesystem, but the higher updates will be done, and a higher overhead will beintroduced in the system. This threshold can be approximated at run time,dealing with a behavior near to the optimum.
To implement this principle a new request message is required. Now, theactive node for a session sends “update requests” to the owners of the accessesobjects, in order to get the updated versions for such objects. This update requestmessage can be sent along the session execution, in order to update (in a certaindegree) the objects accessed by the session.
This technique reduces the probability of abortion caused by the accesses tooutdated objects within the sessions.
3.1 Modification of the LOM Protocol
The way the COPLA manager decides to send or not an update request for anobject that is about to be accessed is quite simple:
1. During the life of a session, an access to an object oi is requested by the appli-cation. This access is intercepted by the COPLA manager of the active node,and then the probability of being outdated is calculated for the object oi. Ifthe active node is a synchronous (or owner) node for oi, this probability is0. This is because the protocol ensures that incoming updates of the objectwill abort every transaction conflicting with the updated object.If the active node is an asynchronous node for oi, then the COPLA managerwill use the expression of PA(oi). To perform this calculation, it is neededδ(oi): the time elapsed from the last local update of oi.
2. If this probability exceeds a certain threshold Tc, then the COPLA managersends the update request to the owner of oi. If the threshold is not reached,the protocol continues as described in section 2.2. This value can be adjustedat run time, in order to obtain results near to the optimum.
3. In other case, after the COPLA manager allows the session to continue, itwaits for the update response. This response indicates whether the localversion of oi is updated, or outdated (then, the response contains the newestversion for the object). If the local version must be updated, then the updateis applied in the local database, and the update time is also written down.
4. Once the COPLA manager has ensured that oi is updated, the requiredaccess to the object can continue.
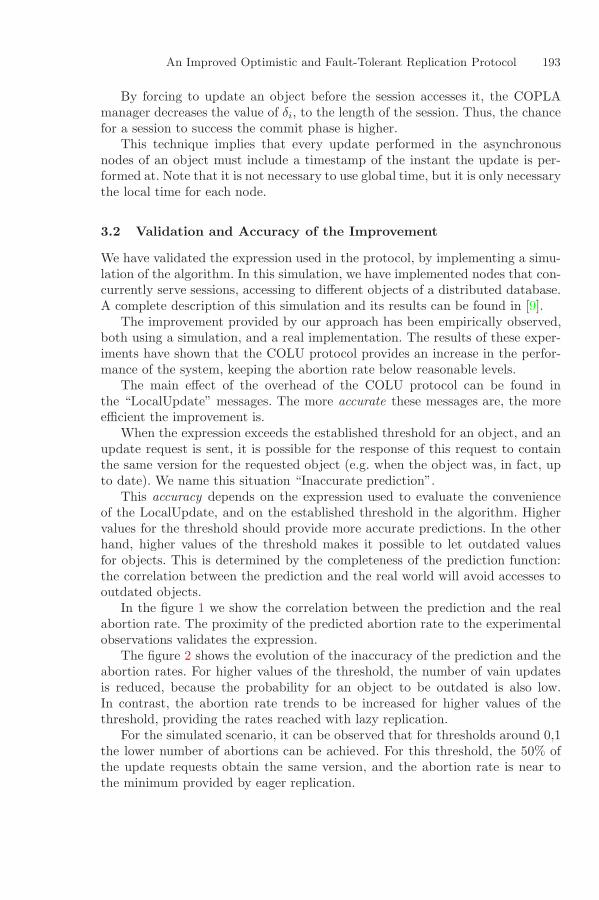
An Improved Optimistic and Fault-Tolerant Replication Protocol 193
By forcing to update an object before the session accesses it, the COPLAmanager decreases the value of δi, to the length of the session. Thus, the chancefor a session to success the commit phase is higher.
This technique implies that every update performed in the asynchronousnodes of an object must include a timestamp of the instant the update is per-formed at. Note that it is not necessary to use global time, but it is only necessarythe local time for each node.
3.2 Validation and Accuracy of the Improvement
We have validated the expression used in the protocol, by implementing a simu-lation of the algorithm. In this simulation, we have implemented nodes that con-currently serve sessions, accessing to different objects of a distributed database.A complete description of this simulation and its results can be found in [9].
The improvement provided by our approach has been empirically observed,both using a simulation, and a real implementation. The results of these exper-iments have shown that the COLU protocol provides an increase in the perfor-mance of the system, keeping the abortion rate below reasonable levels.
The main effect of the overhead of the COLU protocol can be found inthe “LocalUpdate” messages. The more accurate these messages are, the moreefficient the improvement is.
When the expression exceeds the established threshold for an object, and anupdate request is sent, it is possible for the response of this request to containthe same version for the requested object (e.g. when the object was, in fact, upto date). We name this situation “Inaccurate prediction”.
This accuracy depends on the expression used to evaluate the convenienceof the LocalUpdate, and on the established threshold in the algorithm. Highervalues for the threshold should provide more accurate predictions. In the otherhand, higher values of the threshold makes it possible to let outdated valuesfor objects. This is determined by the completeness of the prediction function:the correlation between the prediction and the real world will avoid accesses tooutdated objects.
In the figure 1 we show the correlation between the prediction and the realabortion rate. The proximity of the predicted abortion rate to the experimentalobservations validates the expression.
The figure 2 shows the evolution of the inaccuracy of the prediction and theabortion rates. For higher values of the threshold, the number of vain updatesis reduced, because the probability for an object to be outdated is also low.In contrast, the abortion rate trends to be increased for higher values of thethreshold, providing the rates reached with lazy replication.
For the simulated scenario, it can be observed that for thresholds around 0,1the lower number of abortions can be achieved. For this threshold, the 50% ofthe update requests obtain the same version, and the abortion rate is near tothe minimum provided by eager replication.
194 Luis Irun-Briz et al.
0
20
40
60
80
100
0 0.2 0.4 0.6 0.8 1
% o
utda
ted
PA_outd
Completeness of the prediction
Predicted abortionsActual abortions
Fig. 1. Completeness
0
10
20
30
40
50
60
70
80
90
0 0.1 0.2 0.3 0.4 0.5 0.6 0.7 0.8 0.9 1
%
Threshold
Inaccuracy and Abortion rate
abortion Eagerabortion Lazy
abortion PAinaccuracy PA
Fig. 2. Accuracy
4 Providing Self-Recovery Ability to COLUP
In section 3 we have presented a lazy update protocol, with a good behavior inrespect to the abortion rate and an empirical mechanism to obtain the optimumvalue for the threshold of P (oi) has been also shown. However, the calculus ofPA(oi) can be used for other techniques than the evaluation of the conveniencefor an update. This is the case of the Fault Tolerance. In this section, we willshow a modification of the COLU Protocol, in order to provide fault toleranceto the protocol. This modification is based on two principles: role migration, andthe calculation of PA(oi).
An Improved Optimistic and Fault-Tolerant Replication Protocol 195
4.1 Modification of the COLU Protocol
Each node in the system runs a copy of a membership monitor. This monitor isa piece of software that observes a preconfigured set of nodes, and notifies itslocal node about any change in this set (either additions or eliminations). Eachnode is labeled with a number, identifying it, and providing an order betweenevery node in the system. The membership monitor used for the LOM Protocolis described in [10], and can be also used to provide the membership service toour COLU Protocol. The rest of this section shows the differences between theLOM and the COLU protocols.
1. When the membership monitor notices a node failure (let Nf be the failednode), a notification is provided to every surviving node in the system. Thisnotification causes for each receiving node to update a list of alive nodes.The effect of these notifications will be a logical migration of the ownershipsof the failed node. Further steps will explain the term logical.
2. During the execution of a session, a number of messages can be sent to thedifferent owners of the objects accessed by this session. If a message must tobe sent to a failed owner Nf , then it will be redirected to the new owner forthe involved object. This new owner can be assigned in a deterministic wayfrom the set of synchronous replicas of the object (e.g. electing as new ownerthe node with an identifier immediately higher to the failed one). Let Nn bethe new owner for the accessed object.The determinism of the election is important to guarantee that every sur-viving node redirects its messages to the same node (Nn).Note that the messages sent to a node can involve more than one object.This will generate a unique message to the new owner, because every objectin the original message had the same owner, and so, will have the samesubstitute.
3. When the synchronous replica Nn receives a message considering the node asan owner, then the message is processed as if Nn was the original owner. Tothis end, if the received message was an access confirmation request, then thelock management must be performed by Nn, replying the request as shownin section 2.2. Moreover, if the received message was an update request, thenthe new owner should reply to the message sending the local version of theobject. The update message will be detailed in further steps.This behavior maintains the consistence because the new owner of an objectwill be always elected from the set of synchronous replicas of the object.This guarantees that the value for the object maintained in the new owneris exactly the same value the failed owner had.
4. Whenever the original owner node Nf is recovered from the failure, everyalive node will be notified by its local membership monitor. Then, furthermessages sent from the nodes to the owner Nf must not be redirected to Nn,because the node Nf has been recovered now.The alive nodes recognizes the recently recovered node by sending a greetingmessage. A greeting message sent from a node Na to the recently recovered
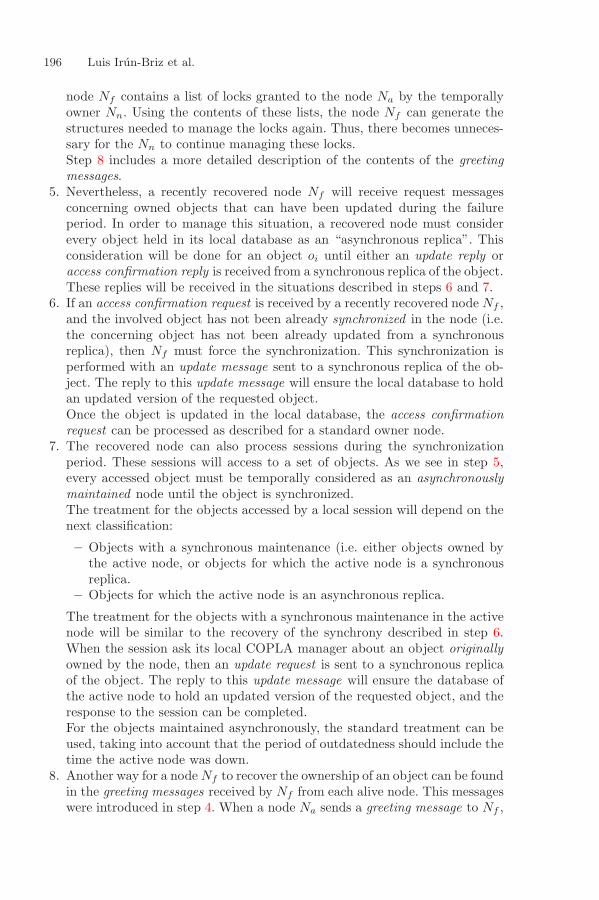
196 Luis Irun-Briz et al.
node Nf contains a list of locks granted to the node Na by the temporallyowner Nn. Using the contents of these lists, the node Nf can generate thestructures needed to manage the locks again. Thus, there becomes unneces-sary for the Nn to continue managing these locks.Step 8 includes a more detailed description of the contents of the greetingmessages.
5. Nevertheless, a recently recovered node Nf will receive request messagesconcerning owned objects that can have been updated during the failureperiod. In order to manage this situation, a recovered node must considerevery object held in its local database as an “asynchronous replica”. Thisconsideration will be done for an object oi until either an update reply oraccess confirmation reply is received from a synchronous replica of the object.These replies will be received in the situations described in steps 6 and 7.
6. If an access confirmation request is received by a recently recovered node Nf ,and the involved object has not been already synchronized in the node (i.e.the concerning object has not been already updated from a synchronousreplica), then Nf must force the synchronization. This synchronization isperformed with an update message sent to a synchronous replica of the ob-ject. The reply to this update message will ensure the local database to holdan updated version of the requested object.Once the object is updated in the local database, the access confirmationrequest can be processed as described for a standard owner node.
7. The recovered node can also process sessions during the synchronizationperiod. These sessions will access to a set of objects. As we see in step 5,every accessed object must be temporally considered as an asynchronouslymaintained node until the object is synchronized.The treatment for the objects accessed by a local session will depend on thenext classification:
– Objects with a synchronous maintenance (i.e. either objects owned bythe active node, or objects for which the active node is a synchronousreplica.
– Objects for which the active node is an asynchronous replica.
The treatment for the objects with a synchronous maintenance in the activenode will be similar to the recovery of the synchrony described in step 6.When the session ask its local COPLA manager about an object originallyowned by the node, then an update request is sent to a synchronous replicaof the object. The reply to this update message will ensure the database ofthe active node to hold an updated version of the requested object, and theresponse to the session can be completed.For the objects maintained asynchronously, the standard treatment can beused, taking into account that the period of outdatedness should include thetime the active node was down.
8. Another way for a node Nf to recover the ownership of an object can be foundin the greeting messages received by Nf from each alive node. This messageswere introduced in step 4. When a node Na sends a greeting message to Nf ,

An Improved Optimistic and Fault-Tolerant Replication Protocol 197
the message not only contains a list of locks obtained by Na, but it alsocontains the last version for each locked object oi. This information is enoughfor Nf to consider synchronized each object oi.
9. In order to ensure that a recently-recovered node Nf achieves a correctstate for its originally synchronized objects (i.e. the node receives an updatemessage for each object oj that satisfy Nf ∈ S(oi)), an asynchronous processbecomes necessary to be run.This process, will be executed as a low-priority process, and will send anupdate request for each object not already synchronized in Nf .Note that the interference of such process in the performance of Nf shouldbe low, because it will only be scheduled during idle periods.
10. The asynchronous process should also include the update, in the local data-base of the recovered node Nf , of any new object created during the time thenode was failed. To perform this update, a simple algorithm may be followedby Nf just at the beginning of its recovery:– When Nf recovers from a failure, a query is performed to the local
database in order to retrieve the identifier for the more recently insertedobject owned by every node in the system. This can be done due tothe construction of the object identifiers. As a consequence of these re-quests, Nf knows, for each node, the last inserted object.
– Until Nf has received the information from its local database, it will belocked any update in its local database. This ensures that the response ofthe requests does not includes any update performed after the recoveryof Nf .
– In addition, and concurrently with these requests, every node in thesystem sends the greeting message to the recovered node. In this mes-sage, explained in 8, additional information can be included. Moreover,a greeting message sent from a node Ni to Nf will include the identifierof the more recently object created by the node Ni.
– The comparison of the information contained in the greeting messages,with the values collected from the local database, makes Nf know, foreach node Ni, the lost insertions for each node (i.e. the range of objectsinserted during the failure).
– In addition to these object identifiers, the asynchronous process performsfurther requests to its local database in order to retrieve a complete listof object identifiers owned by each node in the system, and managed ina synchronous way in Nf .
– Objects contained in this list of synchronous identifiers will be consideredas asynchronously maintained objects, until an update message will besent to its owner node, and an up-to-date value is guaranteed in thelocal database of Nf . Then, the identifier can be removed from the listof synchronous identifier.
In order to update every object in the local database, the asynchronousprocess will use the collected information about lost insertions to performupdate requests to each owner node about these objects.
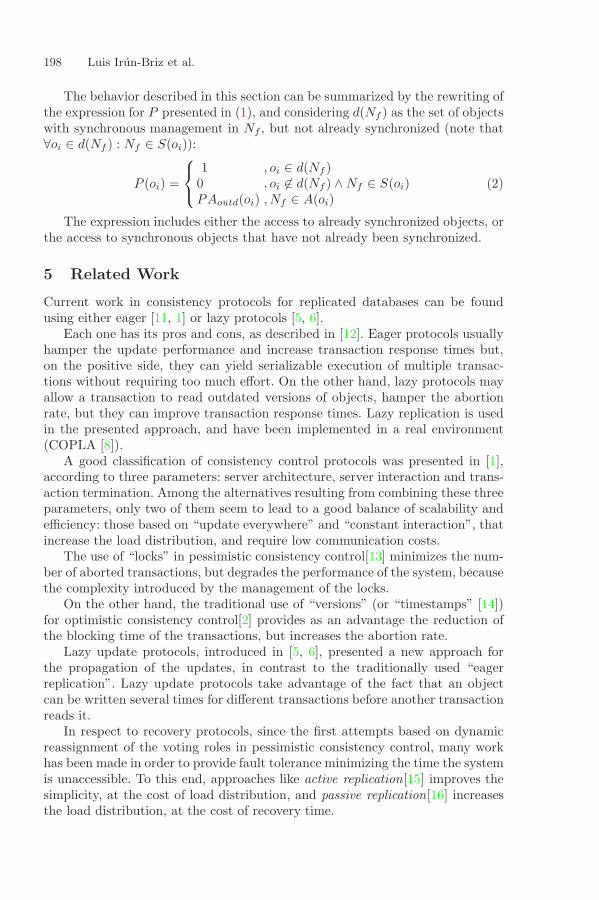
198 Luis Irun-Briz et al.
The behavior described in this section can be summarized by the rewriting ofthe expression for P presented in (1), and considering d(Nf ) as the set of objectswith synchronous management in Nf , but not already synchronized (note that∀oi ∈ d(Nf ) : Nf ∈ S(oi)):
P (oi) =
1 , oi ∈ d(Nf )0 , oi �∈ d(Nf ) ∧ Nf ∈ S(oi)PAoutd(oi) , Nf ∈ A(oi)
(2)
The expression includes either the access to already synchronized objects, orthe access to synchronous objects that have not already been synchronized.
5 Related Work
Current work in consistency protocols for replicated databases can be foundusing either eager [11, 1] or lazy protocols [5, 6].
Each one has its pros and cons, as described in [12]. Eager protocols usuallyhamper the update performance and increase transaction response times but,on the positive side, they can yield serializable execution of multiple transac-tions without requiring too much effort. On the other hand, lazy protocols mayallow a transaction to read outdated versions of objects, hamper the abortionrate, but they can improve transaction response times. Lazy replication is usedin the presented approach, and have been implemented in a real environment(COPLA [8]).
A good classification of consistency control protocols was presented in [1],according to three parameters: server architecture, server interaction and trans-action termination. Among the alternatives resulting from combining these threeparameters, only two of them seem to lead to a good balance of scalability andefficiency: those based on “update everywhere” and “constant interaction”, thatincrease the load distribution, and require low communication costs.
The use of “locks” in pessimistic consistency control[13] minimizes the num-ber of aborted transactions, but degrades the performance of the system, becausethe complexity introduced by the management of the locks.
On the other hand, the traditional use of “versions” (or “timestamps” [14])for optimistic consistency control[2] provides as an advantage the reduction ofthe blocking time of the transactions, but increases the abortion rate.
Lazy update protocols, introduced in [5, 6], presented a new approach forthe propagation of the updates, in contrast to the traditionally used “eagerreplication”. Lazy update protocols take advantage of the fact that an objectcan be written several times for different transactions before another transactionreads it.
In respect to recovery protocols, since the first attempts based on dynamicreassignment of the voting roles in pessimistic consistency control, many workhas been made in order to provide fault tolerance minimizing the time the systemis unaccessible. To this end, approaches like active replication[15] improves thesimplicity, at the cost of load distribution, and passive replication[16] increasesthe load distribution, at the cost of recovery time.

An Improved Optimistic and Fault-Tolerant Replication Protocol 199
6 Conclusion
Lazy update protocols have not been widely exploited due to its excessive abor-tion rate on scenarios with high probability of access conflicts. Nevertheless,such protocols can provide important improvements in the performance of a dis-tributed system, when the abortion rate can be kept low, and the locality of theaccesses is appreciable.
We have presented an algorithm based on statistical techniques, that makesuse of the prediction of the probability for an accessed object to be out of date(PAoutd(oi)), and cause a further abortion of the accessing transaction.
This protocol, remains a lazy update behavior, and uses this prediction toreduce its abortion rate, improving thus the performance of the system. In addi-tion, the design of this protocol allows its variation from a pure lazy protocol, toa “paranoid” behavior (in the last case, it is comparable to an eager protocol).
In addition, a modification of this protocol is also described, providing self-recovery ability, in order to include fault tolerance in the algorithm. This mod-ification, introduced as a lazy recovery mechanism, allows the re-incorporationof a fault node without interfere in the rest of nodes in the system, and avoidingto block any transaction in the system -even in the recovered node- during therecovery phase.
As a result, the complete protocol provides the advantages of lazy approaches,forestalling their traditionally found disadvantages, and including fault toleranceat a very low costs. Thus, our approach reduces the abortion rates, improvingthe performance of the system, and allowing the recovery phase to avoid blockingof the sessions during the recovery process.
References
[1] Wiesmann, M., Schiper, A., Pedone, F., Kemme, B., Alonso, G.: Database repli-cation techniques: A three parameter classification. In: Proc. of the 19th IEEESymposium on Reliable Distributed Systems (SRDS’00). (2000) 206–217 188,198
[2] Kung, H.T., Robinson, J.T.: On optimistic methods for concurrency control. ACMTransactions on Database Systems 6 (1981) 213–226 188, 198
[3] Eswaran, K.P., Gray, J., Lorie, R.A., Traiger, I.L.: The notions of consistency andpredicate locks in a database syste m. Communications of the ACM 19 (1976)624–633 188
[4] Thomas, R.H.: A majority consensus approach to concurrency control for multiplecopy databases. ACM Transactions on Database Systems 4 (1979) 180–209 189
[5] Breitbart, Y., Korth, H.F.: Replication and consistency: being lazy helps some-times. In: Proceedings of the sixteenth ACM SIGACT-SIGMOD-SIGART sym-posium on Principles of Database Systems, ACM Press (1997) 173–184 189,198
[6] Holliday, J., Agrawal, D., Abbadi, A.E.: Database replication: If you must belazy, be consistent. In: Proceedings of 18th Symposium on Reliable DistributedSystems SRDS’99, IEEE Computer Society Press (1999) 304–305 189, 198
200 Luis Irun-Briz et al.
[7] Instituto Tecnologico de Informatica: GlobData Web Site (2002) Accessible inURL: http://globdata.iti.es. 189
[8] Munoz, F., Irun, L., Galdamez, P., Bernabeu, J., Bataller, J., Banul, M.C.: Glob-data: A platform for supporting multiple consistency modes. Information Systemsand Databases (2002) 137–143 189, 198
[9] Irun, L., Munoz, F., Decker, H., Bernabeu-Auban, J.M.: Colup: The cautiousoptimistic lazy update protocol. In: XI Jornadas de Concurrencia. (2003) 191,193
[10] Munoz Escoı, F.D., Gomis Hilario, O., Galdamez, P., Bernabeu-Auban, J.M.:HMM: A membership protocol for a multi-computer cluster. In: Anexo de lasactas de las VIII Jornadas de Concurrencia, Cuenca, Espana (2000) 195
[11] Agrawal, D., Alonso, G., El Abbadi, A., Stanoi, I.: Exploiting atomic broadcastin replicated databases. Lecture Notes in Computer Science 1300 (1997) 496–503198
[12] Gray, J., Helland, P., O’Neil, P., Shasha, D.: The dangers of replication anda solution. In: Proc. of the 1996 ACM SIGMOD International Conference onManagement of Data, Canada (1996) 173–182 198
[13] Bernstein, P.A., Shipman, D.W., Rothnie, J.B.: Concurrency control in a systemfor distributed databases (SDD-1). ACM Transactions on Database Systems 5(1980) 18–51 198
[14] Bernstein, P.A., Hadzilacos, V., Goodman, N.: Concurrency Control and Recoveryin Database Systems. Addison Wesley, Reading, MA, EE.UU. (1987) 198
[15] Schneider, F.B.: Replication management using the state-machine approach. InMullender, S.J., ed.: Distributed Systems. 2a edn. ACM Press, Addison-Wesley,Wokingham, Reino Unido (1993) 166–197 ISBN 0-201-62427-3. 198
[16] Budhiraja, N., Marzullo, K., Schneider, F.B., Toueg, S.: The primary-backupapproach. In Mullender, S.J., ed.: Distributed Systems. 2a edn. ACM Press,Addison-Wesley, Wokingham, Reino Unido (1993) 199–216 ISBN 0-201-62427-3.198
Visual Data Mining of Large Spatial Data Sets
Daniel A. Keim, Christian Panse, and Mike Sips
University of Konstanz, Germany{keim,panse,sips}@informatik.uni-konstanz.de
Abstract. Extraction of interesting knowledge from large spatial data-bases is an important task in the development of spatial database sys-tems. Spatial data mining is the branch of data mining that deals withspatial (location) data. Analyzing the huge amount (usually tera-bytes)of spatial data obtained from large databases such as credit card pay-ments, telephone calls, environmental records, census demographics etc.is, however, a very difficult task. Visual data mining applies human vi-sual perception to the exploration of large data sets. Presenting datain an interactive, graphical form often fosters new insights, encourag-ing the formation and validation of new hypotheses to the end of betterproblem-solving and gaining deeper domain knowledge. In this paper wegive a short overview of visual data mining techniques, especially thearea of analyzing spatial data. We provide some examples for effectivevisualizations of spatial data in important application areas such as con-sumer analysis, e-mail traffic analysis, and census demographics.
Keywords: Information Visualization, Visual Data Mining, Visualiza-tion of Spatial Data, Visualization and Cartography, Spatial Data Mining
1 Visual Data Mining
Progress in technology allows today’s computer systems to store and exchangeamounts of data that until very recently were considered extraordinarily vast.Almost all transactions of everyday life, such as purchases made with a creditcard, web pages visited or telephone calls made are recorded by computers. Thisdata is collected because it is a potential source of valuable information, pro-viding a competitive advantage to its holders. The data is often automaticallyrecorded via sensors and monitoring systems. Government agencies also providea wealth of statistical information that can be applied to important problemsin public health and safety, combined with proprietary data. Even simple trans-actions of every day life, such as paying by credit card or using the telephone,are typically recorded by computers. Usually many parameters are recorded,resulting in data with a high dimensionality. With today’s data managementsystems, it is only possible to view quite small portions of this data. If the datais presented textually, the amount of data that can be displayed is in the rangeof some hundred data items, but this is like a drop in the ocean when dealingwith data sets containing millions of data items. Having no possibility to ade-quately explore the large amounts of data that have been collected because of
N. Bianchi-Berthouze (Ed.): DNIS 2003, LNCS 2822, pp. 201–215, 2003.c© Springer-Verlag Berlin Heidelberg 2003

202 Daniel A. Keim et al.
their potential usefulness, the data becomes useless and the databases become’Data Dumps’. Finding valuable details that reveal the structure hidden in thedata, however, is difficult.
1.1 Visual Exploration Paradigm
Visual Data Exploration usually follows a three step process: Overview first,zoom and filter, and then details-on-demand (which has been called the Infor-mation Seeking Mantra [35]). First, the user needs to get an overview of the data.In the overview, the user identifies interesting patterns or groups in the data andfocuses on one or more of them. For analyzing these patterns, the user needs todrill-down and access details of the data. Visualization technology may be usedfor all three steps of the data exploration process. Visualization techniques areuseful for showing an overview of the data, allowing the user to identify inter-esting subsets. In this step, it is important to keep the overview visualizationwhile focusing on the subset using another visualization. An alternative is todistort the overview visualization in order to focus on the interesting subsets.This can be performed by dedicating a larger percentage of the display to the in-teresting subsets while decreasing screen space for uninteresting data. To furtherexplore the interesting subsets, the user needs a drill-down capability in orderto observe the details about the data. Note that visualization technology doesnot only provide visualization techniques for all three steps but also bridges thegaps between them.
1.2 Classification of Visual Data Mining Techniques
There are a number of well known techniques for visualizing large data sets, suchas x-y plots, line plots, and histograms. These techniques are useful for data ex-ploration but are limited to relatively small and low dimensional data sets. Overthe last years, a large number of novel information visualization techniques havebeen developed, allowing visualizations of multidimensional data sets withoutinherent two- or three-dimensional semantics. Nice overviews of the approachescan be found in a number of recent books [5] [32] [37] [42]. The techniques canbe classified based on three criteria [17] (see also figure 1):
– the data to be visualized– the visualization technique– and the interaction technique used
The data type to be visualized [35] may be one-dimensional data, such astemporal (time-series) data, two-dimensional data, such as geographical maps,multidimensional data, such as relational tables, text and hypertext, such as newsarticles and web documents, hierarchies and graphs, such as telephone calls, andalgorithms and software.The visualization technique used may be classified as: Standard 2D/3D dis-plays, such as bar charts and x-y plots, Geometrically transformed displays, such
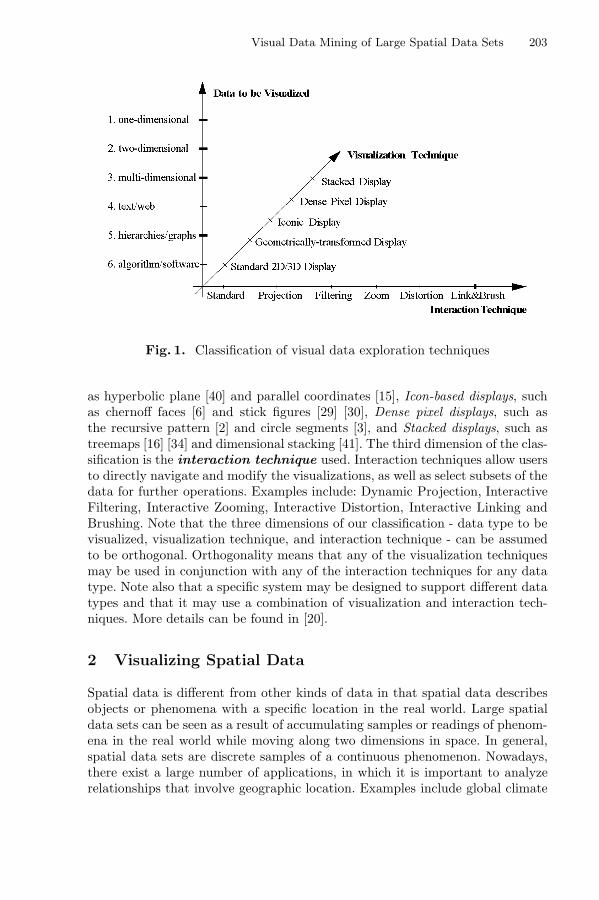
Visual Data Mining of Large Spatial Data Sets 203
Fig. 1. Classification of visual data exploration techniques
as hyperbolic plane [40] and parallel coordinates [15], Icon-based displays, suchas chernoff faces [6] and stick figures [29] [30], Dense pixel displays, such asthe recursive pattern [2] and circle segments [3], and Stacked displays, such astreemaps [16] [34] and dimensional stacking [41]. The third dimension of the clas-sification is the interaction technique used. Interaction techniques allow usersto directly navigate and modify the visualizations, as well as select subsets of thedata for further operations. Examples include: Dynamic Projection, InteractiveFiltering, Interactive Zooming, Interactive Distortion, Interactive Linking andBrushing. Note that the three dimensions of our classification - data type to bevisualized, visualization technique, and interaction technique - can be assumedto be orthogonal. Orthogonality means that any of the visualization techniquesmay be used in conjunction with any of the interaction techniques for any datatype. Note also that a specific system may be designed to support different datatypes and that it may use a combination of visualization and interaction tech-niques. More details can be found in [20].
2 Visualizing Spatial Data
Spatial data is different from other kinds of data in that spatial data describesobjects or phenomena with a specific location in the real world. Large spatialdata sets can be seen as a result of accumulating samples or readings of phenom-ena in the real world while moving along two dimensions in space. In general,spatial data sets are discrete samples of a continuous phenomenon. Nowadays,there exist a large number of applications, in which it is important to analyzerelationships that involve geographic location. Examples include global climate
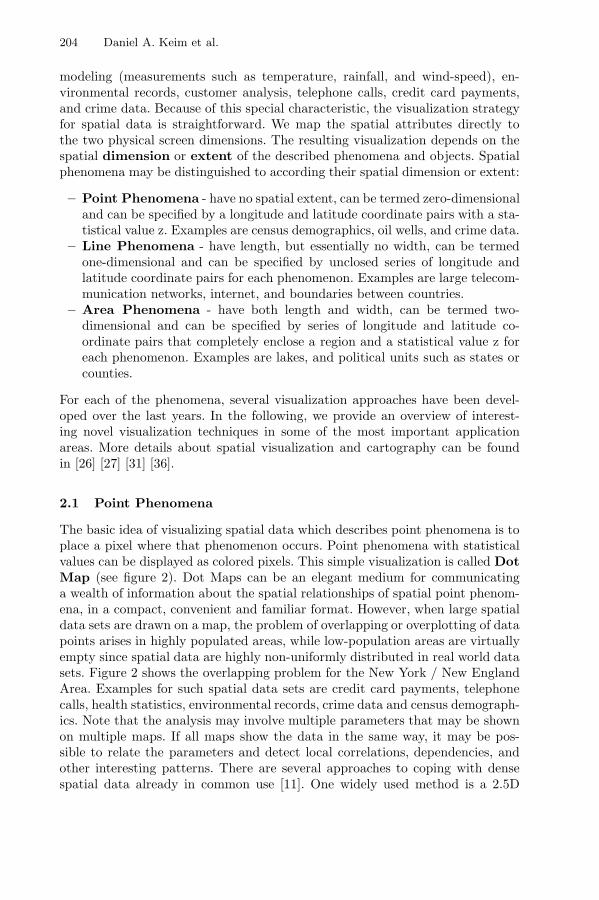
204 Daniel A. Keim et al.
modeling (measurements such as temperature, rainfall, and wind-speed), en-vironmental records, customer analysis, telephone calls, credit card payments,and crime data. Because of this special characteristic, the visualization strategyfor spatial data is straightforward. We map the spatial attributes directly tothe two physical screen dimensions. The resulting visualization depends on thespatial dimension or extent of the described phenomena and objects. Spatialphenomena may be distinguished to according their spatial dimension or extent:
– Point Phenomena - have no spatial extent, can be termed zero-dimensionaland can be specified by a longitude and latitude coordinate pairs with a sta-tistical value z. Examples are census demographics, oil wells, and crime data.
– Line Phenomena - have length, but essentially no width, can be termedone-dimensional and can be specified by unclosed series of longitude andlatitude coordinate pairs for each phenomenon. Examples are large telecom-munication networks, internet, and boundaries between countries.
– Area Phenomena - have both length and width, can be termed two-dimensional and can be specified by series of longitude and latitude co-ordinate pairs that completely enclose a region and a statistical value z foreach phenomenon. Examples are lakes, and political units such as states orcounties.
For each of the phenomena, several visualization approaches have been devel-oped over the last years. In the following, we provide an overview of interest-ing novel visualization techniques in some of the most important applicationareas. More details about spatial visualization and cartography can be foundin [26] [27] [31] [36].
2.1 Point Phenomena
The basic idea of visualizing spatial data which describes point phenomena is toplace a pixel where that phenomenon occurs. Point phenomena with statisticalvalues can be displayed as colored pixels. This simple visualization is called DotMap (see figure 2). Dot Maps can be an elegant medium for communicatinga wealth of information about the spatial relationships of spatial point phenom-ena, in a compact, convenient and familiar format. However, when large spatialdata sets are drawn on a map, the problem of overlapping or overplotting of datapoints arises in highly populated areas, while low-population areas are virtuallyempty since spatial data are highly non-uniformly distributed in real world datasets. Figure 2 shows the overlapping problem for the New York / New EnglandArea. Examples for such spatial data sets are credit card payments, telephonecalls, health statistics, environmental records, crime data and census demograph-ics. Note that the analysis may involve multiple parameters that may be shownon multiple maps. If all maps show the data in the same way, it may be pos-sible to relate the parameters and detect local correlations, dependencies, andother interesting patterns. There are several approaches to coping with densespatial data already in common use [11]. One widely used method is a 2.5D
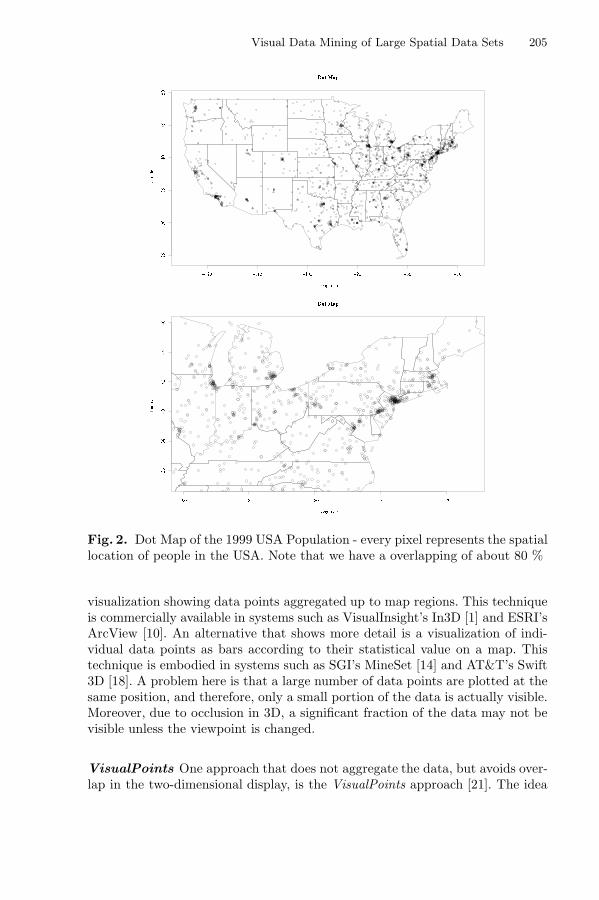
Visual Data Mining of Large Spatial Data Sets 205
Fig. 2. Dot Map of the 1999 USA Population - every pixel represents the spatiallocation of people in the USA. Note that we have a overlapping of about 80 %
visualization showing data points aggregated up to map regions. This techniqueis commercially available in systems such as VisualInsight’s In3D [1] and ESRI’sArcView [10]. An alternative that shows more detail is a visualization of indi-vidual data points as bars according to their statistical value on a map. Thistechnique is embodied in systems such as SGI’s MineSet [14] and AT&T’s Swift3D [18]. A problem here is that a large number of data points are plotted at thesame position, and therefore, only a small portion of the data is actually visible.Moreover, due to occlusion in 3D, a significant fraction of the data may not bevisible unless the viewpoint is changed.
VisualPoints One approach that does not aggregate the data, but avoids over-lap in the two-dimensional display, is the VisualPoints approach [21]. The idea
206 Daniel A. Keim et al.
(a) 0:00 am (EST) (b) 6:00am (EST)
(c) 12:00pm (EST) (d) 6:00pm (EST)
Fig. 3. The figures display the U.S. Telephone Call Volume at four differenttimes during one day. The idea is to place the first data items at their correctposition, and then move overlapping data points to the nearby free position
is to reposition pixels that would otherwise overlap. The basic idea of the repo-sitioning algorithm is to recursively partition the data set into four subsets con-taining the data points in equally-sized subregions. Since the data points maynot fit into the four equally size subregions, we have to determine new extentsof the four subregions (without changing the four subsets of data points) suchthat the data points in each subset can be visualized in their corresponding sub-region. For an efficient implementation, a quadtree-like data structure managesthe required information and supports the recursive partitioning process. Thepartitioning process works as follows. Starting with the root of the quadtree, ineach step the data space is partitioned into four subregions. The partitioning ismade such that the area occupied by each of the subregions (in pixels) is largerthan the number of pixels belonging to the corresponding subregion. A problemof VisualPoints is that in areas with high overlap, the repositioning depends onthe ordering of the points in the database. That is, the first data item found inthe database is placed at its correct position, and subsequent overlapping data
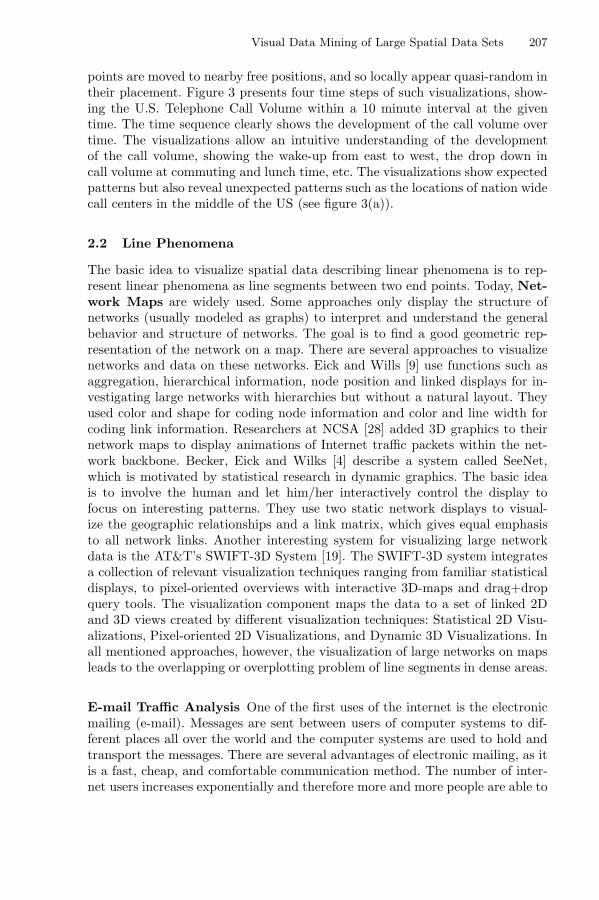
Visual Data Mining of Large Spatial Data Sets 207
points are moved to nearby free positions, and so locally appear quasi-random intheir placement. Figure 3 presents four time steps of such visualizations, show-ing the U.S. Telephone Call Volume within a 10 minute interval at the giventime. The time sequence clearly shows the development of the call volume overtime. The visualizations allow an intuitive understanding of the developmentof the call volume, showing the wake-up from east to west, the drop down incall volume at commuting and lunch time, etc. The visualizations show expectedpatterns but also reveal unexpected patterns such as the locations of nation widecall centers in the middle of the US (see figure 3(a)).
2.2 Line Phenomena
The basic idea to visualize spatial data describing linear phenomena is to rep-resent linear phenomena as line segments between two end points. Today, Net-work Maps are widely used. Some approaches only display the structure ofnetworks (usually modeled as graphs) to interpret and understand the generalbehavior and structure of networks. The goal is to find a good geometric rep-resentation of the network on a map. There are several approaches to visualizenetworks and data on these networks. Eick and Wills [9] use functions such asaggregation, hierarchical information, node position and linked displays for in-vestigating large networks with hierarchies but without a natural layout. Theyused color and shape for coding node information and color and line width forcoding link information. Researchers at NCSA [28] added 3D graphics to theirnetwork maps to display animations of Internet traffic packets within the net-work backbone. Becker, Eick and Wilks [4] describe a system called SeeNet,which is motivated by statistical research in dynamic graphics. The basic ideais to involve the human and let him/her interactively control the display tofocus on interesting patterns. They use two static network displays to visual-ize the geographic relationships and a link matrix, which gives equal emphasisto all network links. Another interesting system for visualizing large networkdata is the AT&T’s SWIFT-3D System [19]. The SWIFT-3D system integratesa collection of relevant visualization techniques ranging from familiar statisticaldisplays, to pixel-oriented overviews with interactive 3D-maps and drag+dropquery tools. The visualization component maps the data to a set of linked 2Dand 3D views created by different visualization techniques: Statistical 2D Visu-alizations, Pixel-oriented 2D Visualizations, and Dynamic 3D Visualizations. Inall mentioned approaches, however, the visualization of large networks on mapsleads to the overlapping or overplotting problem of line segments in dense areas.
E-mail Traffic Analysis One of the first uses of the internet is the electronicmailing (e-mail). Messages are sent between users of computer systems to dif-ferent places all over the world and the computer systems are used to hold andtransport the messages. There are several advantages of electronic mailing, as itis a fast, cheap, and comfortable communication method. The number of inter-net users increases exponentially and therefore more and more people are able to
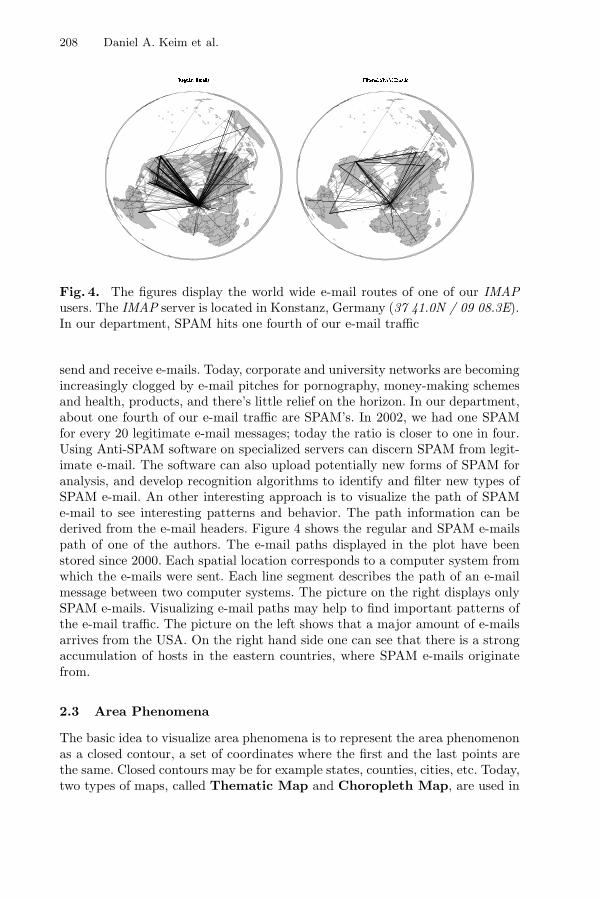
208 Daniel A. Keim et al.
Fig. 4. The figures display the world wide e-mail routes of one of our IMAPusers. The IMAP server is located in Konstanz, Germany (37 41.0N / 09 08.3E).In our department, SPAM hits one fourth of our e-mail traffic
send and receive e-mails. Today, corporate and university networks are becomingincreasingly clogged by e-mail pitches for pornography, money-making schemesand health, products, and there’s little relief on the horizon. In our department,about one fourth of our e-mail traffic are SPAM’s. In 2002, we had one SPAMfor every 20 legitimate e-mail messages; today the ratio is closer to one in four.Using Anti-SPAM software on specialized servers can discern SPAM from legit-imate e-mail. The software can also upload potentially new forms of SPAM foranalysis, and develop recognition algorithms to identify and filter new types ofSPAM e-mail. An other interesting approach is to visualize the path of SPAMe-mail to see interesting patterns and behavior. The path information can bederived from the e-mail headers. Figure 4 shows the regular and SPAM e-mailspath of one of the authors. The e-mail paths displayed in the plot have beenstored since 2000. Each spatial location corresponds to a computer system fromwhich the e-mails were sent. Each line segment describes the path of an e-mailmessage between two computer systems. The picture on the right displays onlySPAM e-mails. Visualizing e-mail paths may help to find important patterns ofthe e-mail traffic. The picture on the left shows that a major amount of e-mailsarrives from the USA. On the right hand side one can see that there is a strongaccumulation of hosts in the eastern countries, where SPAM e-mails originatefrom.
2.3 Area Phenomena
The basic idea to visualize area phenomena is to represent the area phenomenonas a closed contour, a set of coordinates where the first and the last points arethe same. Closed contours may be for example states, counties, cities, etc. Today,two types of maps, called Thematic Map and Choropleth Map, are used in
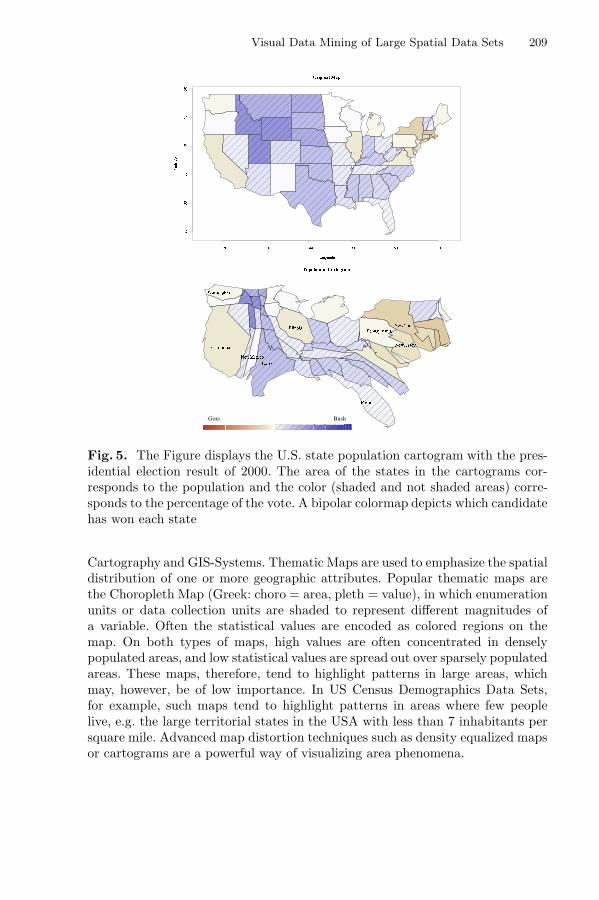
Visual Data Mining of Large Spatial Data Sets 209
Fig. 5. The Figure displays the U.S. state population cartogram with the pres-idential election result of 2000. The area of the states in the cartograms cor-responds to the population and the color (shaded and not shaded areas) corre-sponds to the percentage of the vote. A bipolar colormap depicts which candidatehas won each state
Cartography and GIS-Systems. Thematic Maps are used to emphasize the spatialdistribution of one or more geographic attributes. Popular thematic maps arethe Choropleth Map (Greek: choro = area, pleth = value), in which enumerationunits or data collection units are shaded to represent different magnitudes ofa variable. Often the statistical values are encoded as colored regions on themap. On both types of maps, high values are often concentrated in denselypopulated areas, and low statistical values are spread out over sparsely populatedareas. These maps, therefore, tend to highlight patterns in large areas, whichmay, however, be of low importance. In US Census Demographics Data Sets,for example, such maps tend to highlight patterns in areas where few peoplelive, e.g. the large territorial states in the USA with less than 7 inhabitants persquare mile. Advanced map distortion techniques such as density equalized mapsor cartograms are a powerful way of visualizing area phenomena.
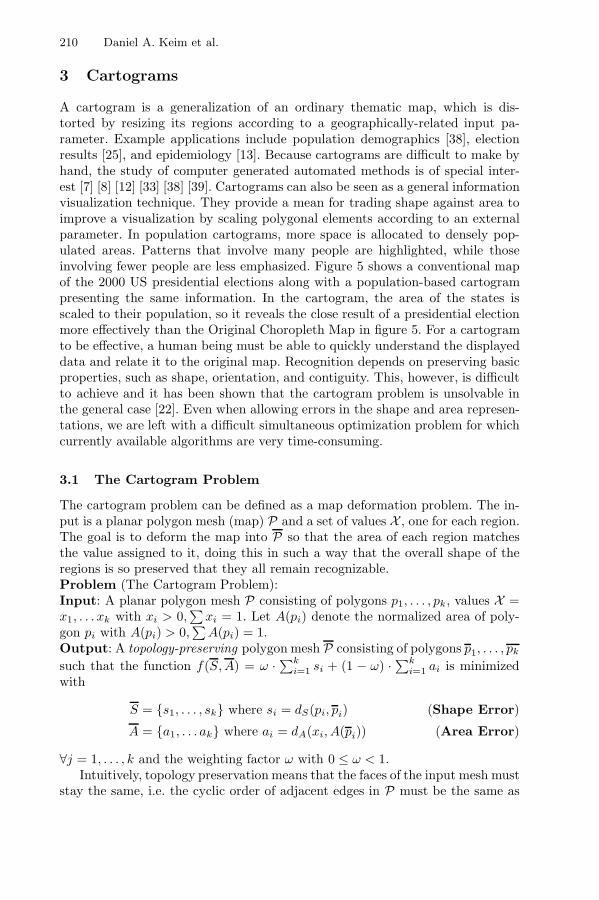
210 Daniel A. Keim et al.
3 Cartograms
A cartogram is a generalization of an ordinary thematic map, which is dis-torted by resizing its regions according to a geographically-related input pa-rameter. Example applications include population demographics [38], electionresults [25], and epidemiology [13]. Because cartograms are difficult to make byhand, the study of computer generated automated methods is of special inter-est [7] [8] [12] [33] [38] [39]. Cartograms can also be seen as a general informationvisualization technique. They provide a mean for trading shape against area toimprove a visualization by scaling polygonal elements according to an externalparameter. In population cartograms, more space is allocated to densely pop-ulated areas. Patterns that involve many people are highlighted, while thoseinvolving fewer people are less emphasized. Figure 5 shows a conventional mapof the 2000 US presidential elections along with a population-based cartogrampresenting the same information. In the cartogram, the area of the states isscaled to their population, so it reveals the close result of a presidential electionmore effectively than the Original Choropleth Map in figure 5. For a cartogramto be effective, a human being must be able to quickly understand the displayeddata and relate it to the original map. Recognition depends on preserving basicproperties, such as shape, orientation, and contiguity. This, however, is difficultto achieve and it has been shown that the cartogram problem is unsolvable inthe general case [22]. Even when allowing errors in the shape and area represen-tations, we are left with a difficult simultaneous optimization problem for whichcurrently available algorithms are very time-consuming.
3.1 The Cartogram Problem
The cartogram problem can be defined as a map deformation problem. The in-put is a planar polygon mesh (map) P and a set of values X , one for each region.The goal is to deform the map into P so that the area of each region matchesthe value assigned to it, doing this in such a way that the overall shape of theregions is so preserved that they all remain recognizable.Problem (The Cartogram Problem):Input: A planar polygon mesh P consisting of polygons p1, . . . , pk, values X =x1, . . . xk with xi > 0,
∑xi = 1. Let A(pi) denote the normalized area of poly-
gon pi with A(pi) > 0,∑
A(pi) = 1.Output: A topology-preserving polygon mesh P consisting of polygons p1, . . . , pk
such that the function f(S, A) = ω · ∑ki=1 si + (1 − ω) · ∑k
i=1 ai is minimizedwith
S = {s1, . . . , sk} where si = dS(pi, pi) (Shape Error)
A = {a1, . . . ak} where ai = dA(xi, A(pi)) (Area Error)
∀j = 1, . . . , k and the weighting factor ω with 0 ≤ ω < 1.Intuitively, topology preservation means that the faces of the input mesh must
stay the same, i.e. the cyclic order of adjacent edges in P must be the same as

Visual Data Mining of Large Spatial Data Sets 211
in P . This can be expressed formally by saying that the pseudo-duals1 of theplanar graphs represented by P and P should be isomorphic. Even a simplevariant of the cartogram problem, which even ignores issues of shape preser-vation (ω = 0), is likely to be NP-complete. Since it may be impossible tosimultaneously fulfill the area and shape constraints, the functions f(·.·), dS(·, ·)and dA(·, ·) model the error of the output cartogram.
3.2 The CartoDraw Algorithm
The basic idea of CartoDraw is to incrementally reposition the vertices of themap’s polygons by means of scanlines. Local changes are applied if they reducethe total area error without introducing an excessive shape error [22]. The mainloop iterates over a set of scanlines. For each scanline, it computes a candidatetransformation of the polygons, and checks it for topology and shape preser-vation. If the candidate transformation passes the tests, it is made persistent,otherwise it is discarded. The order of scanline processing depends on their po-tential for reducing area error. The algorithm iterates over the scanlines untilthe area error improvement over all scanlines falls below a threshold. The inputscanlines are arbitrary lines and may be automatically computed or interactivelyentered. The idea for distorting the polygon mesh is to use line segments (calledcutting lines) perpendicular to scanlines at regular intervals. Consider the twoedges on the boundary of the polygon intersected by a cutting line on either sideof the scanline. These edges divide the polygon boundary into two connectedchains. Now, if the area constraints require that the polygon expands, the al-gorithm applies a translation parallel to the scanline to each vertex of the twoconnected pieces of the boundary (in opposite directions) to stretch the polygonat that point. Similarly, if a contraction is called for, the direction of translationis reversed.
3.3 VisualPoints-Approach
The basic idea of using the visual point approach for Cartogram generation is toinsert points into each polygon, where the number of these points correspondsto the statistical parameter. After the quadtree is constructed, it is applied todistort the vertices of the polygon mesh. Each vertex is repositioned separately:First the cell of the quadtree containing the vertex is determined. Then the newposition of the vertex is calculated by scaling the cells of the quadtree on eachlevel according to the desired size of the cells (corresponding to the numberof pixels). By repositioning each vertex, we iteratively construct the distortedpolygon mesh. Figure 6 shows a VisualPoints (see also section 2.1) populationcartogram representing the accomplished bachelor degrees in the USA in com-parison with a CartoDraw cartogram. A comparison of both approaches can befound in [23] [24].
1 The pseudo-dual of a planar graph is a graph that has one vertex for each face andan edge connecting two vertices if the corresponding faces are adjacent.

212 Daniel A. Keim et al.
Fig. 6. The Figure displays (1) the U.S. state population cartogram computedwith VisualPoints, and (2) the U.S. state population cartogram computed withCartoDraw showing the accomplished bachelor degrees or higher in the USA in2000. The area of the states in the cartograms corresponds to the populationand the grey level of the areas correspond to the percentage of the accomplishedbachelor degrees or higher
4 Conclusion
Visual Data Mining is an important research area. Many data sources providedata with spatial attributes. In this article, we describe an overview of methodsfor visualizing large spatial data sets containing point, line and area phenomena.The results show that the visualization of spatial data can be extremely helpfulfor visually exploring large spatial data sets.
Visual Data Mining of Large Spatial Data Sets 213
Acknowledgements
We would like to thank Florian Mansmann for helping us with the e-mail trafficanalysis and Carmen Sanz Merino for her useful comments.
References
[1] I. Advizor Solutions. Visual insight in3d. http://www.advizorsolutions.com/ ,Feb. 2003.
[2] M. Ankerst, D.A. Keim, and H.-P. Kriegel. Recursive pattern: A technique forvisualizing very large amounts of data. In Proc. Visualization ’95, Atlanta, GA,pages 279–286, 1995.
[3] M. Ankerst, D.A. Keim, and H.-P. Kriegel. Circle segments: A technique forvisually exploring large multidimensional data sets. In Visualization ’96, HotTopic Session, San Francisco, CA, 1996.
[4] R.A. Becker, S.G. Eick, and A.R. Wilks. Visualizing network data. IEEE Trans-actions on Visualization and Computer Graphics, 1(1):16–28, 1995.
[5] S. Card, J. Mackinlay, and B. Shneiderman. Readings in Information Visualiza-tion. Morgan Kaufmann, 1999.
[6] H. Chernoff. The use of faces to represent points in k-dimensional space graphi-cally. Journal Amer. Statistical Association, 68:361–368, 1973.
[7] B.D. Dent. Cartography: Thematic Map Design, 4th Ed., Chapter 10. WilliamC. Brown, Dubuque, IA, 1996.
[8] J.A. Dougenik, N. Chrisman, and D.R. Niemeyer. An algorithm to constructcontinuous area cartograms. The Professional Geographer, 37(1):75–81, 1985.
[9] S.G. Eick and G. J. Wills. Navigating large networks with hierarchies. In Proc.IEEE Conf. Visualization, pages 204–210, 25–29 1993.
[10] ESRI. Arc view. http://www.esri.com/software/arcgis/arcview/index.html ,Feb. 2003.
[11] G. Geisler. Making information more accessible: A survey of information, visual-ization applications and techniques.http://www.ils.unc.edu/~geisg/info/infovis/paper.html, Feb. 2003.
[12] S. Gusein-Zade and V. Tikunov. A new technique for constructing continuouscartograms. Cartography and Geographic Information Systems, 20(3):66–85, 1993.
[13] S. Gusein-Zade and V. Tikunov. Map transformations. Geography Review,9(1):19–23, 1995.
[14] S.M. Homepage. Sgi mineset. http://www.sgi.com/software/mineset.html ,Feb. 2002.
[15] A. Inselberg and B. Dimsdale. Parallel coordinates: A tool for visualizing multi-dimensional geometry. In Proc. Visualization 90, San Francisco, CA, pages 361–370, 1990.
[16] B. Johnson and B. Shneiderman. Treemaps: A space-filling approach to the vi-sualization of hierarchical information. In Proc. Visualization ’91 Conf, pages284–291, 1991.
[17] D. Keim. Visual exploration of large databases. Communications of the ACM,44(8):38–44, 2001.
[18] D. Keim, E. Koutsofios, and S.C. North. Visual exploration of large telecom-munication data sets. In Proc. Workshop on User Interfaces In Data IntensiveSystems (Invited Talk), Edinburgh, UK, pages 12–20, 1999.

214 Daniel A. Keim et al.
[19] D. Keim, E. Koutsofios, and S.C. North. Visual exploration of large telecom-munication data sets. In Proc. Workshop on User Interfaces In Data IntensiveSystems (Invited Talk), Edinburgh, UK, pages 12–20, 1999.
[20] D. Keim and M. Ward. Visual Data Mining Techniques, Book Chapter in: In-telligent Data Analysis, an Introduction by D. Hand and M. Berthold. SpringerVerlag, 2 edition, 2002.
[21] D.A. Keim and A. Herrmann. The gridfit algorithm: An efficient and effective ap-proach to visualizing large amounts of spatial data. IEEE Visualization, ResearchTriangle Park, NC, pages 181–188, 1998.
[22] D.A. Keim, S.C. North, and C. Panse. Cartodraw: A fast algorithm for generatingcontiguous cartograms. Trans. on Visualization and Computer Graphics, March2003. Information Visualization Research Group, AT&T Laboratories, FlorhamPark.
[23] D.A. Keim, S.C. North, C. Panse, and J. Schneidewind. Efficient cartogramgeneration: A comparison. In InfoVis 2002, IEEE Symposium on InformationVisualization, Boston, Massachusetts, pages 33–36, October 2002.
[24] D.A. Keim, S.C. North, C. Panse, and J. Schneidewind. Visualpoints contracartodraw. Palgrave Macmillan – Information Visualization, March 2003.
[25] C. J. Kocmoud and D.H. House. Continuous cartogram construction. ProceedingsIEEE Visualization, pages 197–204, 1998.
[26] M.-J. Kraak, F. Ormeling, and M.-J. Kroak. Cartography: Visualization of SpatialData. Addison-Wesley Pub Co, 1996.
[27] A.M. MacEachren. How Maps Work: Presentation, Visualization, and Design.The Guilford Press, New York, 1995.
[28] NCSA. Visualization study of the nsfnet, Feb. 2003.http://archive.ncsa.uiuc.edu/SCMS/DigLib/text/technology/
Visualization-Study-NSFNET-Cox.html.[29] R.M. Pickett. Visual Analyses of Texture in the Detection and Recognition of
Objects. Academic Press, New York, 1970.[30] R.M. Pickett and G.G. Grinstein. Iconographic displays for visualizing multidi-
mensional data. In Proc. IEEE Conf. on Systems, Man and Cybernetics, IEEEPress, Piscataway, NJ, pages 514–519, 1988.
[31] E. Raisz. Principles of Cartography. McGraw-Hill, New York, 1962.[32] H. Schumann and W. Muller. Visualisierung: Grundlagen und allgemeine Meth-
oden. Springer, 2000.[33] S. Selvin, D. Merrill, J. Schulman, S. Sacks, L. Bedell, and L. Wong. Transfor-
mations of maps to investigate clusters of disease. Social Science and Medicine,26(2):215–221, 1988.
[34] B. Shneiderman. Tree visualization with treemaps: A 2D space-filling approach.ACM Transactions on Graphics, 11(1):92–99, 1992.
[35] B. Shneiderman. The eye have it: A task by data type taxonomy for informationvisualizations. In Visual Languages, 1996.
[36] T.A. Slocum. Thematic cartography and visualization. Prentice Hall, UpperSaddle River, NJ, 1999.
[37] B. Spence. Information Visualization. Pearson Education Higher Education pub-lishers, UK, 2000.
[38] W. Tobler. Cartograms and cartosplines. Proceedings of the 1976 Workshop onAutomated Cartography and Epidemiology, pages 53–58, 1976.
[39] W. Tobler. Pseudo-cartograms. The American Cartographer, 13(1):43–40, 1986.

Visual Data Mining of Large Spatial Data Sets 215
[40] J. Walter and H. Ritter. On interactive visualization of high-dimensional datausing the hyperbolic plane. In Proc. ACM SIGKDD International Conference onKnowledge Discovery and Data Mining, pages 123–131, 2002.
[41] M.O. Ward. Xmdvtool: Integrating multiple methods for visualizing multivariatedata. In Proc. Visualization 94, Washington, DC, pages 326–336, 1994.
[42] C. Ware. Information Visualization: Perception for Design. Morgen Kaufman,2000.
An Analysis and Case Study
of Digital Annotation
Paolo Bottoni, Stefano Levialdi, and Paola Rizzo
Department of Computer Science, University of Rome “La Sapienza”Via Salaria 113, 00198, Rome. Italy
{bottoni,levialdi}@[email protected]
Abstract. Digital annotation of multimedia objects is an activity cen-tral to many important tasks, such as studying, commenting on, indexingand retrieving. Although annotation is becoming widespread, a formalaccount of it is lacking. We argue that an algebraic definition of the func-tions and of the data types involved in digital annotation is essential inthe design of tools. Moreover, it allows designers to establish syntactic,semantic and pragmatic aspects of the annotation activity. This paperstarts this enterprise by providing a formal analysis of digital annota-tions, seen as special types of documents dependent on the existence ofother documents. This analysis allows a distinction to be made betweenannotations and other types of digital entities. Moreover, we identify op-erations and procedures that should be enabled by annotation systems.As a case study, the UCAT annotation system is described.
1 Introduction
Annotation is an important modality of interaction with digital objects (webpages, text files, programs, etc.) besides browsing and editing. It supports crucialcognitive and collaborative functions [1] such as: remembering – by highlightingthe most significant parts of the annotated document; thinking – by addingone’s own new ideas, critical remarks, questions; clarifying – by reshaping theinformation contained in the document into one’s own verbal representations;and sharing – by supporting discussion about the document.
Several tools are starting to offer the possibility of constructing personalisedannotations. Among them we quote Annotea and Banco, which will be morethoroughly discussed in Section 9. Such tools make it possible to create personaldata bases of annotated digital documents. On the other hand, the possibil-ity of publishing such personal annotations poses the problem of defining somecommon semantics, or at least convention, which make different personal an-notations usable within a community or across communities. To this end, someformal definition of what a digital annotation is appears to be a prerequisite tothis enterprise. Strangely enough, there is not an agreement yet on the defini-tion of digital annotation, or on how to distinguish it from other digital entities(e.g. hyperlinks, metadata, newsgroup messages). Furthermore, an analysis of
N. Bianchi-Berthouze (Ed.): DNIS 2003, LNCS 2822, pp. 216–231, 2003.c© Springer-Verlag Berlin Heidelberg 2003
An Analysis and Case Study of Digital Annotation 217
the basic operations, to be enabled by a digital annotation system, seems to belacking. This paper addresses such issues and describes a case study.
In our view, a digital annotation can be considered a digital object (or simplyan object) attached to (portions of) other objects. A user is any person who canaccess, process, annotate and retrieve an object. In the next two sections, weformally define digital objects as tuples of attribute-value pairs, and annotationsas objects with additional specific attributes.
The relationship between an object and an annotation is defined in Section 4by specialising the notion of visual sentence (vs) [2] to multimedia objects. Visualsentences were originally introduced in relation to images; here, a vs is specialisedto be a tuple formed by: (a) the annotated object; (b) the related annotations,(c) a comment function from structures in the object to the annotations, and(d) a localisation function from annotations to structures in the object.
The distinction between annotations and other objects, addressed in Sec-tion 5, is based on a special attribute of annotations named location. Section 6describes a set of basic operations on objects and annotations that should be sup-ported by annotation systems. In Section 7, the UCAT system (User CenteredAnnotation Tool) [3] is described as a case study. Section 8 describes relatedwork, while the last section concludes the paper and mentions future work.
2 Digital Objects
A digital object o is a typed tuple of attribute-value pairs: o = typeName((attr1;val1), (attr2; val2), . . ., (attrn; valn)). The type name denotes the category anobject belongs to: it is a string such as program, file, image, annotation, andthe like. Types are defined in an object hierarchy; here we only define annota-tions as a specialisation of objects. The attributes can be used for indexing andretrieving the object, and may for instance be author, title, creationDate,modificationDate, size. Two mandatory attributes are the following:
id. A unique identifier; its value is an element from an infinite set of identifiers.In this paper, identifiers are represented by alphanumeric strings. There canbe several copies of an object, i.e. objects having the same values for the sameattributes except id. Multiple copies of an object can have different annotationsrelated to them.
contents. The actual content of a digital object; its value is specified by a func-tion f : S → V , that may be empty. The support S of the object is a subset ofa Cartesian product formed with initial segments of the integer numbers; the vo-cabulary V , on which the value of contents is formed, is a finite set of symbols.The content can in general be considered as some sentence from a language, andit can be formed according to some syntax or semantics. The vocabulary canconsist of different types of symbols according to the object type: characters fortext, colors for images, image sequences for movie clips, and so on. A vocabularymay mix symbols of different kinds (as in multimedia objects), or may includesymbols which are interpreted as references to other objects (e.g. a web page
218 Paolo Bottoni et al.
may contain links to image, sound, or movie objects). For example, in a textualobject, the support is simply the set {1, . . . , n}, where n is the number of char-acters in the object, and V is formed by alphanumeric and punctuation symbols.In a similar way, if the object is an image, the support is given by the cartesianproduct of two sets, usually rows and columns, and the vocabulary is formed bythe possible grey values or RGB triples, etc., according to how the pixel is coded.In some cases, the content can also include symbols whose meaning conveys in-formation for rendering (portions of) the document, as is the case of HTMLtags. It is often the case that the value of contents for an object is not renderedcompletely, or even in coherence with any ordering imposed on the set S. Forexample a video projection can be stopped, rewound, replicated, etc. We canthen speak of views of digital objects to indicate the portion of contents thatis rendered at any given instant or interval of time.
3 Digital Annotations
A digital annotation (or simply annotation) is an object a of type annotation,related to (portions of) of the content of one or more objects. Analogously to anyother object, an annotation can be defined by functions on different supportsand vocabularies, i.e. it can be an image, or text, etc. An annotation can beannotated in its turn. An object of type annotation has at least the followingadditional attributes.
location. A reference to the annotated portion(s) of the object(s). In our ap-proach, the value of this attribute is computed by a localisation function thatwill be defined in the next section.
placeHolder. This allows the rendering of indications of the presence of anno-tations. It takes values in an alphabet of symbols, to each of which a possiblerepresentation in the different sensory modalities is associated. So, for instance,if a text document is presented visually and a visual representation is providedfor the symbol ph denoting the value of the placeHolder, ph will be representedby a visual mark (such as an icon, or an oval surrounding a portion of the objectcontents). If the same text is presented aurally, ph will be rendered via someauditory mark in the sound stream (if such a mark is defined for it). In general,it is the task of the rendering system to present the place holders in the chosenmodality. In some situations the rendering of the placeHolder can be exploitedto access the contents of the annotation, whereas in others it only signals thepresence of an annotation. Typically, in visual systems, the placeHolder isa hot-spot. When clicking on it, the relative annotation is shown. In auditorymodalities some special sound indicates the presence of some annotation relativeto the contents at that location, but some other tool must be used to access theannotation. The representations of the placeHolder may have a shared seman-tics, i.e. a meaning common to a set of users (e.g., underlining a sentence mightbe used for signalling that the sentence is important), or it might have a privatesemantics, i.e. a meaning understandable only to the annotation creator (e.g.,
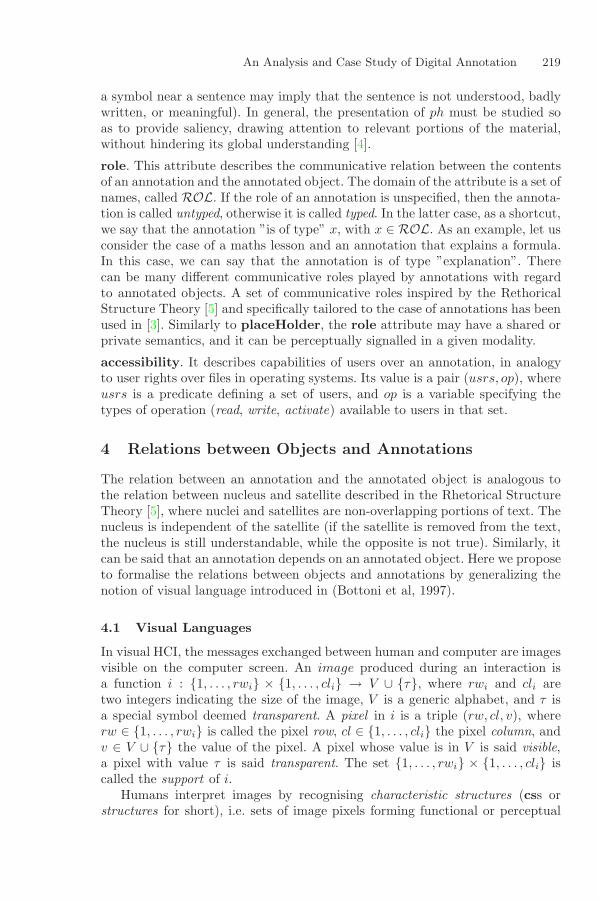
An Analysis and Case Study of Digital Annotation 219
a symbol near a sentence may imply that the sentence is not understood, badlywritten, or meaningful). In general, the presentation of ph must be studied soas to provide saliency, drawing attention to relevant portions of the material,without hindering its global understanding [4].
role. This attribute describes the communicative relation between the contentsof an annotation and the annotated object. The domain of the attribute is a set ofnames, called ROL. If the role of an annotation is unspecified, then the annota-tion is called untyped, otherwise it is called typed. In the latter case, as a shortcut,we say that the annotation ”is of type” x, with x ∈ ROL. As an example, let usconsider the case of a maths lesson and an annotation that explains a formula.In this case, we can say that the annotation is of type ”explanation”. Therecan be many different communicative roles played by annotations with regardto annotated objects. A set of communicative roles inspired by the RethoricalStructure Theory [5] and specifically tailored to the case of annotations has beenused in [3]. Similarly to placeHolder, the role attribute may have a shared orprivate semantics, and it can be perceptually signalled in a given modality.
accessibility. It describes capabilities of users over an annotation, in analogyto user rights over files in operating systems. Its value is a pair (usrs, op), whereusrs is a predicate defining a set of users, and op is a variable specifying thetypes of operation (read, write, activate) available to users in that set.
4 Relations between Objects and Annotations
The relation between an annotation and the annotated object is analogous tothe relation between nucleus and satellite described in the Rhetorical StructureTheory [5], where nuclei and satellites are non-overlapping portions of text. Thenucleus is independent of the satellite (if the satellite is removed from the text,the nucleus is still understandable, while the opposite is not true). Similarly, itcan be said that an annotation depends on an annotated object. Here we proposeto formalise the relations between objects and annotations by generalizing thenotion of visual language introduced in (Bottoni et al, 1997).
4.1 Visual Languages
In visual HCI, the messages exchanged between human and computer are imagesvisible on the computer screen. An image produced during an interaction isa function i : {1, . . . , rwi} × {1, . . . , cli} → V ∪ {τ}, where rwi and cli aretwo integers indicating the size of the image, V is a generic alphabet, and τ isa special symbol deemed transparent. A pixel in i is a triple (rw, cl, v), whererw ∈ {1, . . . , rwi} is called the pixel row, cl ∈ {1, . . . , cli} the pixel column, andv ∈ V ∪ {τ} the value of the pixel. A pixel whose value is in V is said visible,a pixel with value τ is said transparent. The set {1, . . . , rwi} × {1, . . . , cli} iscalled the support of i.
Humans interpret images by recognising characteristic structures (css orstructures for short), i.e. sets of image pixels forming functional or perceptual

220 Paolo Bottoni et al.
Fig. 1. An example of visual sentence
units. The cs recognition results in the association of that structure with a mean-ing. From an abstract point of view, a cs is a copy of an image in which selectedpixels maintain the original values and the others are mapped to the transparentsymbol. Formally, given an image i and a selection function selcs : {1, . . . , rwi}× {1, . . . , cli} → {0, 1}, the function induces a restriction of the i function to aset E, made up of elements (r, c) such that selcs(r, c) = 1. The set E is calledthe support of the structure.
The computer, on its side, captures every gesture of the user and interpretsit with respect to the image using a description of the latter. The description isa set of attributed symbols: each of them consists of a type name – the symbol –and a tuple of properties which uniquely describes the cs. A cs, its associated at-tributed symbol, and the relation between them identify a characteristic pattern(cp). The relation between the css in the image and the attributed symbols in thedescription is specified by two functions. An interpretation function (int) asso-ciates css in an image with attributed symbols in a description. A materialisationfunction (mat) associates attributed symbols in a description with css in an im-age. A visual sentence (vs) is defined as a triple (image, description, (int,mat)).A visual language (VL) is a set of vss.
Figure 1 shows an example of vs. The image (top) is a diagram representinga Petri net, where circles stand for places, rectangles stand for transitions, andarrows stand for the relations between them (the two axes are used only asreference and are not part of the image component). The description (bottom)is a set d of attributed symbols, each of them corresponding to a cs (a circle,rectangle, or arrow) in the image and describing its functional meaning in thePetri net. In the synthetic syntax used in Figure 1, the type name (place, trans,rel) is the first value of each tuple and the second value is the identifier; theother values are for attributes concerning the location of each component ofthe net and its relations with respect to other components. The two arrows
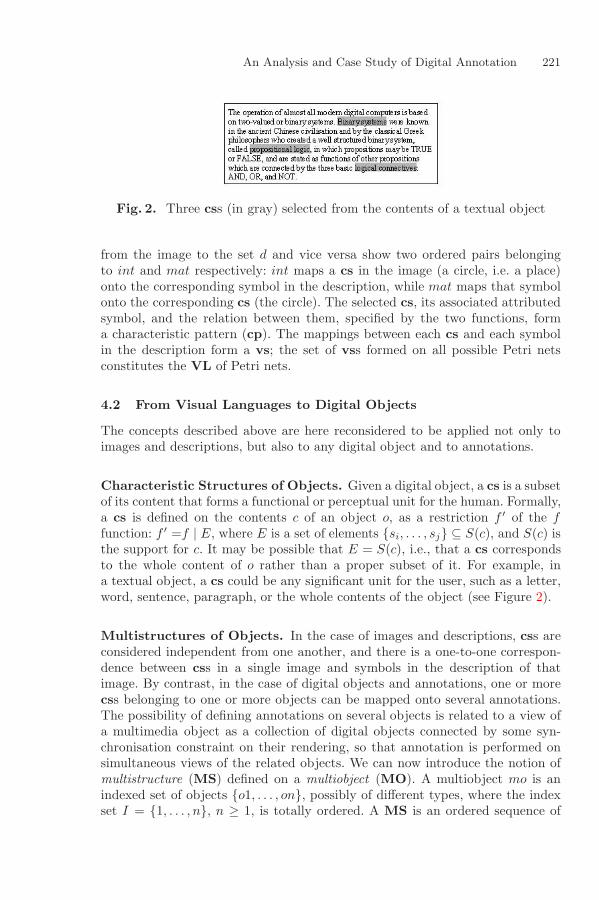
An Analysis and Case Study of Digital Annotation 221
Fig. 2. Three css (in gray) selected from the contents of a textual object
from the image to the set d and vice versa show two ordered pairs belongingto int and mat respectively: int maps a cs in the image (a circle, i.e. a place)onto the corresponding symbol in the description, while mat maps that symbolonto the corresponding cs (the circle). The selected cs, its associated attributedsymbol, and the relation between them, specified by the two functions, forma characteristic pattern (cp). The mappings between each cs and each symbolin the description form a vs; the set of vss formed on all possible Petri netsconstitutes the VL of Petri nets.
4.2 From Visual Languages to Digital Objects
The concepts described above are here reconsidered to be applied not only toimages and descriptions, but also to any digital object and to annotations.
Characteristic Structures of Objects. Given a digital object, a cs is a subsetof its content that forms a functional or perceptual unit for the human. Formally,a cs is defined on the contents c of an object o, as a restriction f ′ of the ffunction: f ′ =f | E, where E is a set of elements {si, . . . , sj} ⊆ S(c), and S(c) isthe support for c. It may be possible that E = S(c), i.e., that a cs correspondsto the whole content of o rather than a proper subset of it. For example, ina textual object, a cs could be any significant unit for the user, such as a letter,word, sentence, paragraph, or the whole contents of the object (see Figure 2).
Multistructures of Objects. In the case of images and descriptions, css areconsidered independent from one another, and there is a one-to-one correspon-dence between css in a single image and symbols in the description of thatimage. By contrast, in the case of digital objects and annotations, one or morecss belonging to one or more objects can be mapped onto several annotations.The possibility of defining annotations on several objects is related to a view ofa multimedia object as a collection of digital objects connected by some syn-chronisation constraint on their rendering, so that annotation is performed onsimultaneous views of the related objects. We can now introduce the notion ofmultistructure (MS) defined on a multiobject (MO). A multiobject mo is anindexed set of objects {o1, . . . , on}, possibly of different types, where the indexset I = {1, . . . , n}, n ≥ 1, is totally ordered. A MS is an ordered sequence of
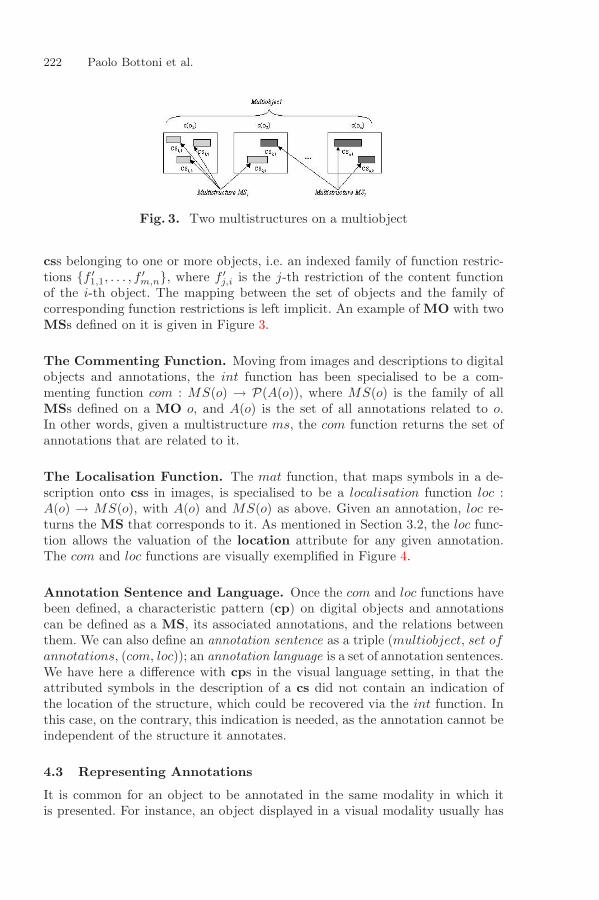
222 Paolo Bottoni et al.
Fig. 3. Two multistructures on a multiobject
css belonging to one or more objects, i.e. an indexed family of function restric-tions {f ′1,1, . . . , f
′m,n}, where f ′j,i is the j-th restriction of the content function
of the i-th object. The mapping between the set of objects and the family ofcorresponding function restrictions is left implicit. An example of MO with twoMSs defined on it is given in Figure 3.
The Commenting Function. Moving from images and descriptions to digitalobjects and annotations, the int function has been specialised to be a com-menting function com : MS(o) → P(A(o)), where MS(o) is the family of allMSs defined on a MO o, and A(o) is the set of all annotations related to o.In other words, given a multistructure ms, the com function returns the set ofannotations that are related to it.
The Localisation Function. The mat function, that maps symbols in a de-scription onto css in images, is specialised to be a localisation function loc :A(o) → MS(o), with A(o) and MS(o) as above. Given an annotation, loc re-turns the MS that corresponds to it. As mentioned in Section 3.2, the loc func-tion allows the valuation of the location attribute for any given annotation.The com and loc functions are visually exemplified in Figure 4.
Annotation Sentence and Language. Once the com and loc functions havebeen defined, a characteristic pattern (cp) on digital objects and annotationscan be defined as a MS, its associated annotations, and the relations betweenthem. We can also define an annotation sentence as a triple (multiobject, set ofannotations, (com, loc)); an annotation language is a set of annotation sentences.We have here a difference with cps in the visual language setting, in that theattributed symbols in the description of a cs did not contain an indication ofthe location of the structure, which could be recovered via the int function. Inthis case, on the contrary, this indication is needed, as the annotation cannot beindependent of the structure it annotates.
4.3 Representing Annotations
It is common for an object to be annotated in the same modality in which itis presented. For instance, an object displayed in a visual modality usually has
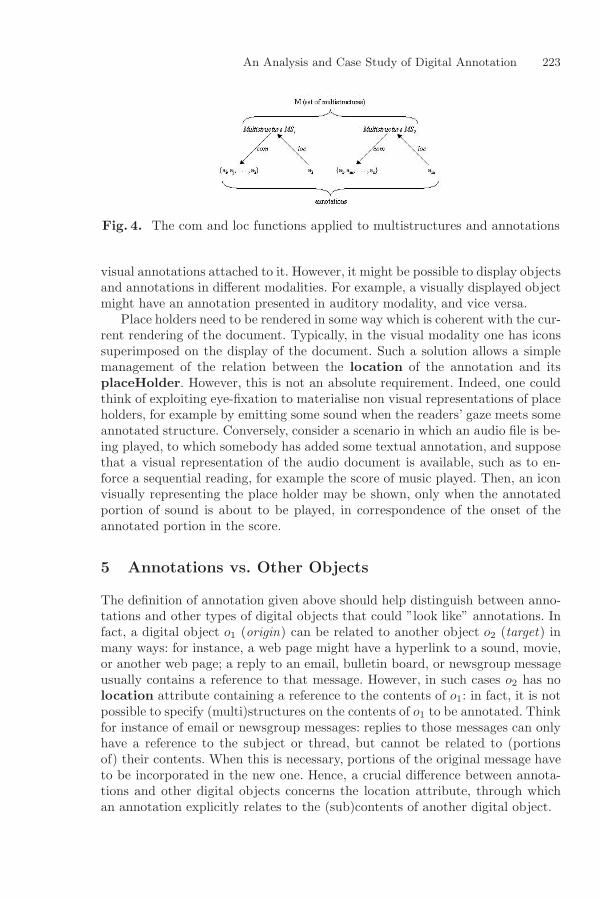
An Analysis and Case Study of Digital Annotation 223
Fig. 4. The com and loc functions applied to multistructures and annotations
visual annotations attached to it. However, it might be possible to display objectsand annotations in different modalities. For example, a visually displayed objectmight have an annotation presented in auditory modality, and vice versa.
Place holders need to be rendered in some way which is coherent with the cur-rent rendering of the document. Typically, in the visual modality one has iconssuperimposed on the display of the document. Such a solution allows a simplemanagement of the relation between the location of the annotation and itsplaceHolder. However, this is not an absolute requirement. Indeed, one couldthink of exploiting eye-fixation to materialise non visual representations of placeholders, for example by emitting some sound when the readers’ gaze meets someannotated structure. Conversely, consider a scenario in which an audio file is be-ing played, to which somebody has added some textual annotation, and supposethat a visual representation of the audio document is available, such as to en-force a sequential reading, for example the score of music played. Then, an iconvisually representing the place holder may be shown, only when the annotatedportion of sound is about to be played, in correspondence of the onset of theannotated portion in the score.
5 Annotations vs. Other Objects
The definition of annotation given above should help distinguish between anno-tations and other types of digital objects that could ”look like” annotations. Infact, a digital object o1 (origin) can be related to another object o2 (target) inmany ways: for instance, a web page might have a hyperlink to a sound, movie,or another web page; a reply to an email, bulletin board, or newsgroup messageusually contains a reference to that message. However, in such cases o2 has nolocation attribute containing a reference to the contents of o1: in fact, it is notpossible to specify (multi)structures on the contents of o1 to be annotated. Thinkfor instance of email or newsgroup messages: replies to those messages can onlyhave a reference to the subject or thread, but cannot be related to (portionsof) their contents. When this is necessary, portions of the original message haveto be incorporated in the new one. Hence, a crucial difference between annota-tions and other digital objects concerns the location attribute, through whichan annotation explicitly relates to the (sub)contents of another digital object.
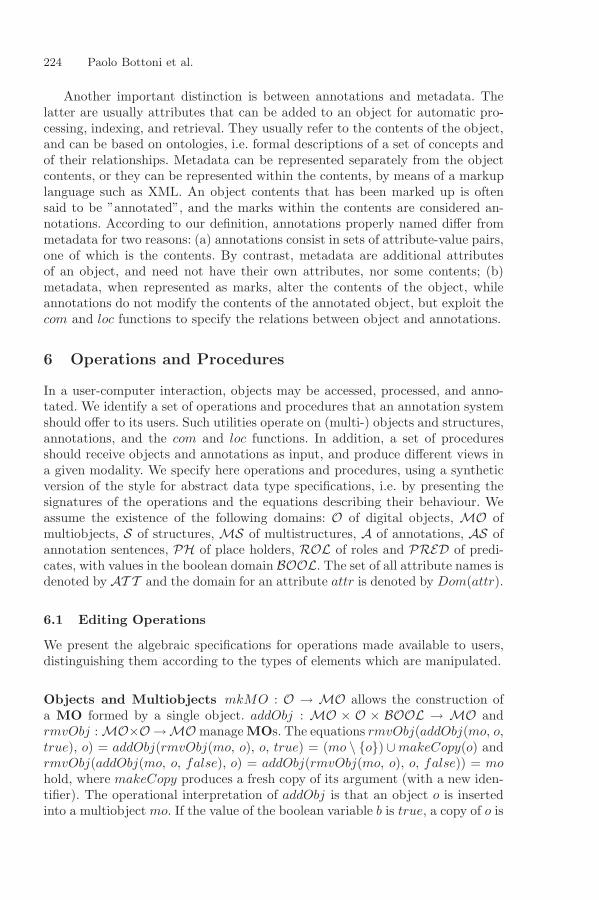
224 Paolo Bottoni et al.
Another important distinction is between annotations and metadata. Thelatter are usually attributes that can be added to an object for automatic pro-cessing, indexing, and retrieval. They usually refer to the contents of the object,and can be based on ontologies, i.e. formal descriptions of a set of concepts andof their relationships. Metadata can be represented separately from the objectcontents, or they can be represented within the contents, by means of a markuplanguage such as XML. An object contents that has been marked up is oftensaid to be ”annotated”, and the marks within the contents are considered an-notations. According to our definition, annotations properly named differ frommetadata for two reasons: (a) annotations consist in sets of attribute-value pairs,one of which is the contents. By contrast, metadata are additional attributesof an object, and need not have their own attributes, nor some contents; (b)metadata, when represented as marks, alter the contents of the object, whileannotations do not modify the contents of the annotated object, but exploit thecom and loc functions to specify the relations between object and annotations.
6 Operations and Procedures
In a user-computer interaction, objects may be accessed, processed, and anno-tated. We identify a set of operations and procedures that an annotation systemshould offer to its users. Such utilities operate on (multi-) objects and structures,annotations, and the com and loc functions. In addition, a set of proceduresshould receive objects and annotations as input, and produce different views ina given modality. We specify here operations and procedures, using a syntheticversion of the style for abstract data type specifications, i.e. by presenting thesignatures of the operations and the equations describing their behaviour. Weassume the existence of the following domains: O of digital objects, MO ofmultiobjects, S of structures, MS of multistructures, A of annotations, AS ofannotation sentences, PH of place holders, ROL of roles and PRED of predi-cates, with values in the boolean domain BOOL. The set of all attribute names isdenoted by AT T and the domain for an attribute attr is denoted by Dom(attr).
6.1 Editing Operations
We present the algebraic specifications for operations made available to users,distinguishing them according to the types of elements which are manipulated.
Objects and Multiobjects mkMO : O → MO allows the construction ofa MO formed by a single object. addObj : MO × O × BOOL → MO andrmvObj : MO×O →MO manageMOs. The equations rmvObj(addObj(mo, o,true), o) = addObj(rmvObj(mo, o), o, true) = (mo \ {o}) ∪makeCopy(o) andrmvObj(addObj(mo, o, false), o) = addObj(rmvObj(mo, o), o, false)) = mohold, where makeCopy produces a fresh copy of its argument (with a new iden-tifier). The operational interpretation of addObj is that an object o is insertedinto a multiobjectmo. If the value of the boolean variable b is true, a copy of o is
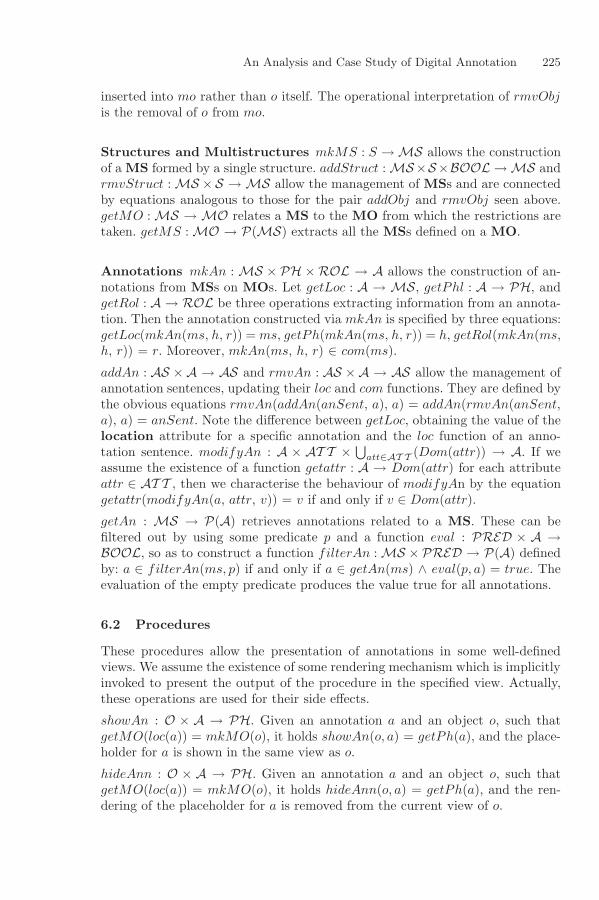
An Analysis and Case Study of Digital Annotation 225
inserted into mo rather than o itself. The operational interpretation of rmvObjis the removal of o from mo.
Structures and Multistructures mkMS : S → MS allows the constructionof a MS formed by a single structure. addStruct : MS×S×BOOL → MS andrmvStruct : MS ×S → MS allow the management of MSs and are connectedby equations analogous to those for the pair addObj and rmvObj seen above.getMO : MS → MO relates a MS to the MO from which the restrictions aretaken. getMS : MO → P(MS) extracts all the MSs defined on a MO.
Annotations mkAn : MS × PH ×ROL → A allows the construction of an-notations from MSs on MOs. Let getLoc : A → MS, getPhl : A → PH, andgetRol : A → ROL be three operations extracting information from an annota-tion. Then the annotation constructed via mkAn is specified by three equations:getLoc(mkAn(ms, h, r)) =ms, getPh(mkAn(ms, h, r)) = h, getRol(mkAn(ms,h, r)) = r. Moreover, mkAn(ms, h, r) ∈ com(ms).addAn : AS ×A → AS and rmvAn : AS ×A → AS allow the management ofannotation sentences, updating their loc and com functions. They are defined bythe obvious equations rmvAn(addAn(anSent, a), a) = addAn(rmvAn(anSent,a), a) = anSent. Note the difference between getLoc, obtaining the value of thelocation attribute for a specific annotation and the loc function of an anno-tation sentence. modifyAn : A × AT T ×
⋃att∈AT T (Dom(attr)) → A. If we
assume the existence of a function getattr : A → Dom(attr) for each attributeattr ∈ AT T , then we characterise the behaviour of modifyAn by the equationgetattr(modifyAn(a, attr, v)) = v if and only if v ∈ Dom(attr).getAn : MS → P(A) retrieves annotations related to a MS. These can befiltered out by using some predicate p and a function eval : PRED × A →BOOL, so as to construct a function filterAn : MS ×PRED → P(A) definedby: a ∈ filterAn(ms, p) if and only if a ∈ getAn(ms) ∧ eval(p, a) = true. Theevaluation of the empty predicate produces the value true for all annotations.
6.2 Procedures
These procedures allow the presentation of annotations in some well-definedviews. We assume the existence of some rendering mechanism which is implicitlyinvoked to present the output of the procedure in the specified view. Actually,these operations are used for their side effects.
showAn : O × A → PH. Given an annotation a and an object o, such thatgetMO(loc(a)) = mkMO(o), it holds showAn(o, a) = getPh(a), and the place-holder for a is shown in the same view as o.
hideAnn : O × A → PH. Given an annotation a and an object o, such thatgetMO(loc(a)) = mkMO(o), it holds hideAnn(o, a) = getPh(a), and the ren-dering of the placeholder for a is removed from the current view of o.
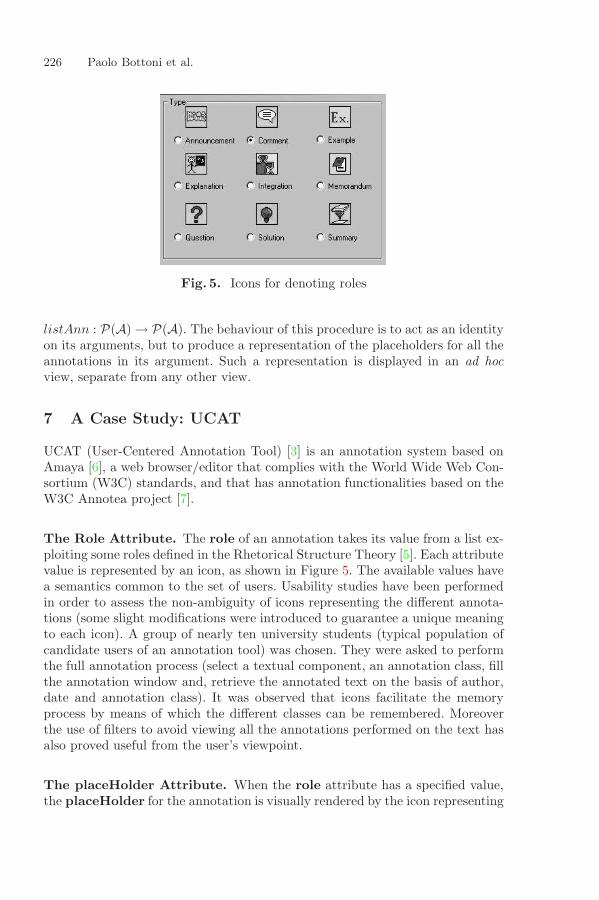
226 Paolo Bottoni et al.
Fig. 5. Icons for denoting roles
listAnn : P(A) → P(A). The behaviour of this procedure is to act as an identityon its arguments, but to produce a representation of the placeholders for all theannotations in its argument. Such a representation is displayed in an ad hocview, separate from any other view.
7 A Case Study: UCAT
UCAT (User-Centered Annotation Tool) [3] is an annotation system based onAmaya [6], a web browser/editor that complies with the World Wide Web Con-sortium (W3C) standards, and that has annotation functionalities based on theW3C Annotea project [7].
The Role Attribute. The role of an annotation takes its value from a list ex-ploiting some roles defined in the Rhetorical Structure Theory [5]. Each attributevalue is represented by an icon, as shown in Figure 5. The available values havea semantics common to the set of users. Usability studies have been performedin order to assess the non-ambiguity of icons representing the different annota-tions (some slight modifications were introduced to guarantee a unique meaningto each icon). A group of nearly ten university students (typical population ofcandidate users of an annotation tool) was chosen. They were asked to performthe full annotation process (select a textual component, an annotation class, fillthe annotation window and, retrieve the annotated text on the basis of author,date and annotation class). It was observed that icons facilitate the memoryprocess by means of which the different classes can be remembered. Moreoverthe use of filters to avoid viewing all the annotations performed on the text hasalso proved useful from the user’s viewpoint.
The placeHolder Attribute. When the role attribute has a specified value,the placeHolder for the annotation is visually rendered by the icon representing
An Analysis and Case Study of Digital Annotation 227
Fig. 6. Icons for place holders
Fig. 7. An annotated page
it. Conversely, if the role attribute is unspecified, the placeHolder may be visu-ally rendered with an icon from a different set. For example, if the user wants tocreate an annotation for signaling a point to be remembered, he/she can choosefrom the set of icons shown in Figure 6, without specifying the role attribute.Figure 7 shows a view of an annotated web page where several place holdersare displayed. Other types of rendering, other than visual, are not currentlyimplemented in UCAT, but are under study.
Annotation Search. Any annotated object can be sought in order to findannotations related to it. Figure 8 shows the window available for setting thesearch parameters, while Figure 9 displays the result of a search: an annotation(on the left window in the forefront) and its placeHolder (on the bottom inthe background).
8 Related Work
A formal definition of annotation seems to be missing in the literature. Usuallythe notion of annotation is defined pragmatically, by specifying what it is for(role) and how it is supported by a software system (architecture and interface).
[1] analyses the cognitive roles of annotations, and [8, 9] illustrate field studieson them. [1] also presents a wide overview of implemented annotation systems
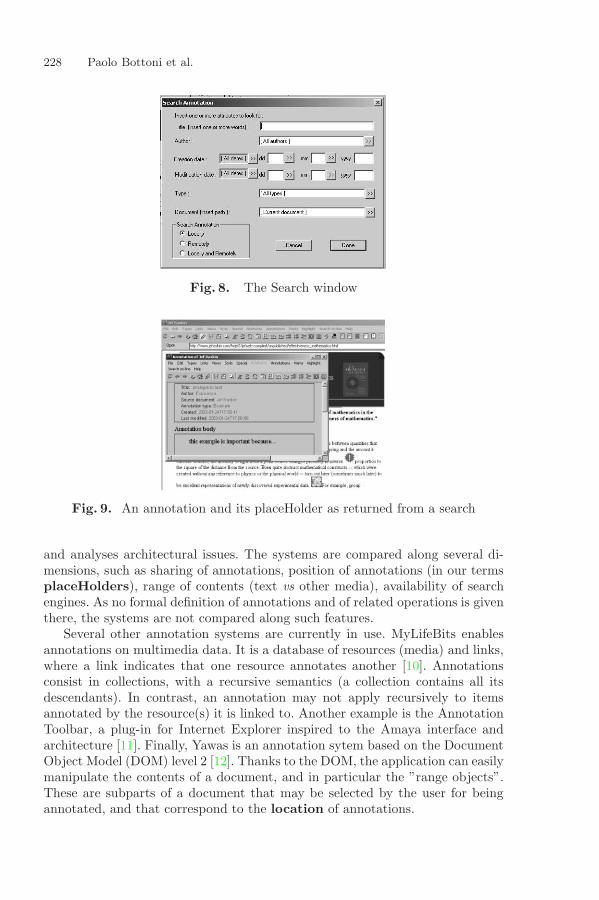
228 Paolo Bottoni et al.
Fig. 8. The Search window
Fig. 9. An annotation and its placeHolder as returned from a search
and analyses architectural issues. The systems are compared along several di-mensions, such as sharing of annotations, position of annotations (in our termsplaceHolders), range of contents (text vs other media), availability of searchengines. As no formal definition of annotations and of related operations is giventhere, the systems are not compared along such features.
Several other annotation systems are currently in use. MyLifeBits enablesannotations on multimedia data. It is a database of resources (media) and links,where a link indicates that one resource annotates another [10]. Annotationsconsist in collections, with a recursive semantics (a collection contains all itsdescendants). In contrast, an annotation may not apply recursively to itemsannotated by the resource(s) it is linked to. Another example is the AnnotationToolbar, a plug-in for Internet Explorer inspired to the Amaya interface andarchitecture [11]. Finally, Yawas is an annotation sytem based on the DocumentObject Model (DOM) level 2 [12]. Thanks to the DOM, the application can easilymanipulate the contents of a document, and in particular the ”range objects”.These are subparts of a document that may be selected by the user for beingannotated, and that correspond to the location of annotations.
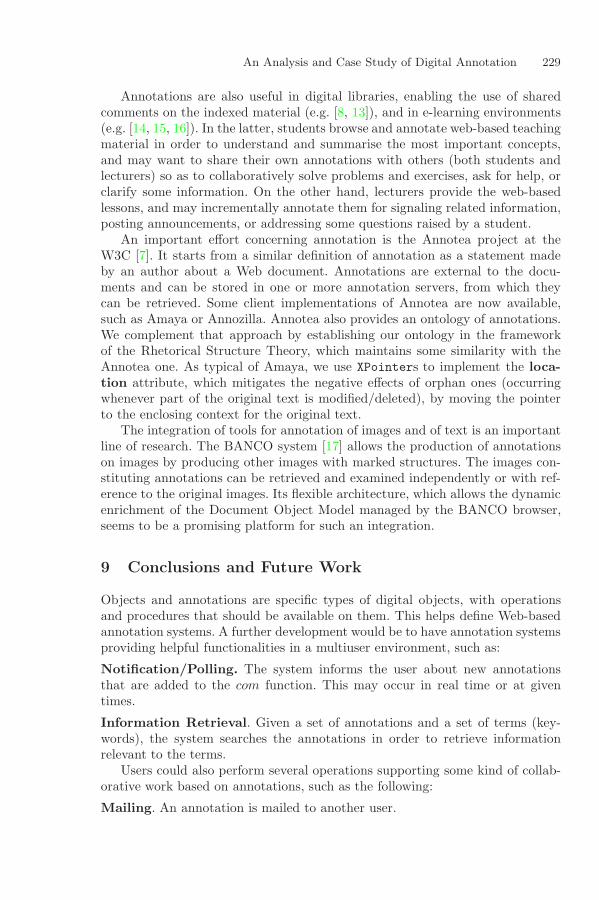
An Analysis and Case Study of Digital Annotation 229
Annotations are also useful in digital libraries, enabling the use of sharedcomments on the indexed material (e.g. [8, 13]), and in e-learning environments(e.g. [14, 15, 16]). In the latter, students browse and annotate web-based teachingmaterial in order to understand and summarise the most important concepts,and may want to share their own annotations with others (both students andlecturers) so as to collaboratively solve problems and exercises, ask for help, orclarify some information. On the other hand, lecturers provide the web-basedlessons, and may incrementally annotate them for signaling related information,posting announcements, or addressing some questions raised by a student.
An important effort concerning annotation is the Annotea project at theW3C [7]. It starts from a similar definition of annotation as a statement madeby an author about a Web document. Annotations are external to the docu-ments and can be stored in one or more annotation servers, from which theycan be retrieved. Some client implementations of Annotea are now available,such as Amaya or Annozilla. Annotea also provides an ontology of annotations.We complement that approach by establishing our ontology in the frameworkof the Rhetorical Structure Theory, which maintains some similarity with theAnnotea one. As typical of Amaya, we use XPointers to implement the loca-tion attribute, which mitigates the negative effects of orphan ones (occurringwhenever part of the original text is modified/deleted), by moving the pointerto the enclosing context for the original text.
The integration of tools for annotation of images and of text is an importantline of research. The BANCO system [17] allows the production of annotationson images by producing other images with marked structures. The images con-stituting annotations can be retrieved and examined independently or with ref-erence to the original images. Its flexible architecture, which allows the dynamicenrichment of the Document Object Model managed by the BANCO browser,seems to be a promising platform for such an integration.
9 Conclusions and Future Work
Objects and annotations are specific types of digital objects, with operationsand procedures that should be available on them. This helps define Web-basedannotation systems. A further development would be to have annotation systemsproviding helpful functionalities in a multiuser environment, such as:
Notification/Polling. The system informs the user about new annotationsthat are added to the com function. This may occur in real time or at giventimes.
Information Retrieval. Given a set of annotations and a set of terms (key-words), the system searches the annotations in order to retrieve informationrelevant to the terms.
Users could also perform several operations supporting some kind of collab-orative work based on annotations, such as the following:
Mailing. An annotation is mailed to another user.
230 Paolo Bottoni et al.
Replying. A user replies to an annotation by creating a related annotation.
Voting. The user communicates to other users his/her vote about an annotation(e.g., an evaluation of the annotation, or the decision on whether publishing onthe web the annotation or not).
References
[1] Ovsiannikov, I., Arbib, M., McNeill, T.: Annotation technology. InternationalJournal of Human-Computer Studies 50 (1999) 329–362 216, 227
[2] Bottoni, P., Costabile, M.F., Levialdi, S., Mussio, P.: Defining visual languagesfor interactive computing. IEEE Transactions on Systems, Man, and CyberneticsA-27 (1997) 773–782 217
[3] Bonifazi, F., Levialdi, S., Rizzo, P., Trinchese, R.: A Web-based annotation toolsupporting e-learning. In: Proceedings of the Working Conference on AdvancedVisual Interfaces: AVI 2002. (2002) 123–128 217, 219, 226
[4] Itti, L.: Models of Bottom-Up und Top-Down Visual Attention. Ph.D. Thesis,California Institute of Technology (2000) http://ilab.usc.edu/bu/. 219
[5] Mann, W.C., Thompson, S.A.: Rhetorical structure theory: A theory of text or-ganization. Technical report, ISI/RS-87-90, Information Sciences Institute, Uni-versity of Southern California (1987) 219, 226
[6] Vatton, I., Kahan, J., Carcone, L., Quint, V.: Amaya. Technical report,http://www.w3.org/Amaya (1996) 226
[7] Kahan, J., Koivunen, M.R., Prud’Hommeaux, E., Swick, R.R.: Annotea: Anopen RDF infrastructure for shared Web annotations. In: Proc. of the WWW10International Conference. (2001) 226, 229
[8] Marshall, C.C.: Annotation: from paper books to the digital library. In: Proceed-ings of the ACM Digital Libraries ’97 Conference. (1997) 131–140 227, 229
[9] Marshall, C.C.: Toward an ecology of hypertext annotation. In: Proc Hypertext’98. (1998) 40–49 227
[10] Gemmell, J., Bell, G., Lueder, R., Drucker, S., Wong, C.: Mylifebits: fulfilling thememex vision. ACM Multimedia (2002) 235–238 228
[11] Raman, R., Venkatasubramani, S.: Annotation tool for semantic web. In: Pro-ceedings of WWW2002. (2002) 228
[12] Denoue, L., Vignollet, L.: An annotation tool for web browsers and its applicationsto information retrieval. In: Proceedings of RIAO2000. (2000) 228
[13] Nichols, D.M., Pemberton, D., Dalhoumi, S., Larouk, O., Belisle, C., Twidale,M.B.: DEBORA: Developing an interface to support collaboration in a digitallibrary. In: Research and Advanced Technology for Digital Libraries. Springer,Lecture Notes in Computer Science, 1923 (2000) 239–248 229
[14] Bargeron, D., Grudin, J., Gupta, A., Sanocki, E., Li, F., LeeTiernan, S.: Asyn-chronous collaboration around multimedia applied to on-demand education. Jour-nal of MIS 18 (2002) 117–145 229
[15] Smith, B., Blankinship, E., Lackner, T.: Annotation and education. IEEE Mul-timedia 7 (2000) 84–89 229
[16] LeeTiernan, S., Grudin, J.: Fostering engagement in asynchronous learningthrough collaborative multimedia annotation. In: Proc. INTERACT 2001. (2001)229

An Analysis and Case Study of Digital Annotation 231
[17] Carrara, P., Fresta, G., Mussio, P.: SVG: more than a markup language for vectorgraphics. In: Proceedings of EuroWeb 2001 International conference on ”The Webin Public Administration. (2001) 229
N. Bianchi-Berthouze (Ed.): DNIS 2003, LNCS 2822, pp. 231-244, 2003. Springer-Verlag Berlin Heidelberg 2003
Vectorization of Graphical Componentsin Sketch-Based Interfaces
Fernando Ferri and Patrizia Grifoni
Istituto di Ricerche sulla Popolazione e Politiche Sociali, CNRVia Nizza 128, 00198 Roma
{f.ferri,p.grifoni}@irp.rm.cnr.it
Abstract. Sketching rapidly communicates ideas through approximate visualpictures with low overhead (pencil and paper), it is easy to correct and reviseand does not require specialized knowledge or precision. A picture can containcharacters, symbols and graphical components. Usually, the recognition ofgraphical components and their vectorization follows the text and symbolsdetection phase in pattern recognition algorithms. This paper presents analgorithm which analyses a hand-drawn sketch and recognizes and vectorizesthe graphical components of the sketch. The proposed algorithm is based on theassumption that the sketched picture is given by an array of pixel and thegraphical components are represented by black pixels on a white background.The algorithm uses a representation based on coding horizontal sequences ofblack pixels identified in the image. The algorithm consists of two steps: thefirst one identifies the horizontal sequences of black pixels and stores them in alist L, the second step reads the list L, recognizes and stores the graphicalcomponents in different lists classified by types.
1 Introduction
Drawing is a simple, common, and expressive way to represent concepts,relationships and information. The most natural and convenient way to input graphicobjects is to draw sketches on a tablet using a pen, just like drawing on a real sheet ofpaper. When drawing a visual image, the user tends to divide the graphic objects intoseveral primitive shapes. Then the system analyzes the sketch and presents the userwith the most similar but regular shape that is intended by the user. Users can alsoadjust the recognition and regularization results suggested by the system by interactingduring the phase of recognition. This process is specified as graphic recognition. Forexample, in recognition of formal sketches (those created with a specific diagramnotation), systems have been designed for UML, Math, Engineering diagrams, andothers [1] [2] [3] [4] [5] [6]. Finite state machines, flowcharts, networks, programclass structures, and file systems are only a few examples of applications that areeasier to understand using this method.
The transformation from a raster representation to a vectorial one is a question thathas to be frequently dealt with in the management and processing of visual images.Vectorial representation describes sketches in terms of graphical components (withtheir geometry). The transformation must preserve topological features and
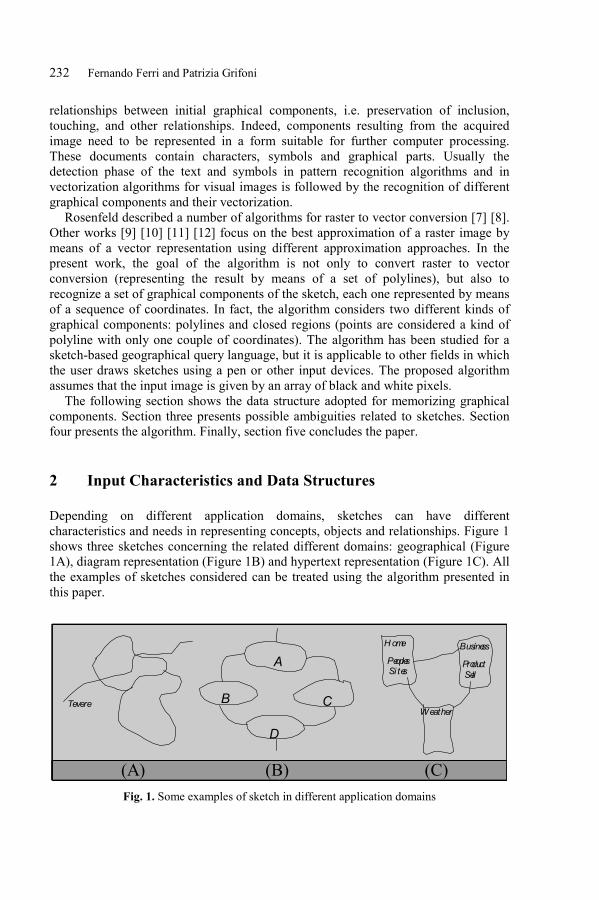
232 Fernando Ferri and Patrizia Grifoni
relationships between initial graphical components, i.e. preservation of inclusion,touching, and other relationships. Indeed, components resulting from the acquiredimage need to be represented in a form suitable for further computer processing.These documents contain characters, symbols and graphical parts. Usually thedetection phase of the text and symbols in pattern recognition algorithms and invectorization algorithms for visual images is followed by the recognition of differentgraphical components and their vectorization.
Rosenfeld described a number of algorithms for raster to vector conversion [7] [8].Other works [9] [10] [11] [12] focus on the best approximation of a raster image bymeans of a vector representation using different approximation approaches. In thepresent work, the goal of the algorithm is not only to convert raster to vectorconversion (representing the result by means of a set of polylines), but also torecognize a set of graphical components of the sketch, each one represented by meansof a sequence of coordinates. In fact, the algorithm considers two different kinds ofgraphical components: polylines and closed regions (points are considered a kind ofpolyline with only one couple of coordinates). The algorithm has been studied for asketch-based geographical query language, but it is applicable to other fields in whichthe user draws sketches using a pen or other input devices. The proposed algorithmassumes that the input image is given by an array of black and white pixels.
The following section shows the data structure adopted for memorizing graphicalcomponents. Section three presents possible ambiguities related to sketches. Sectionfour presents the algorithm. Finally, section five concludes the paper.
2 Input Characteristics and Data Structures
Depending on different application domains, sketches can have differentcharacteristics and needs in representing concepts, objects and relationships. Figure 1shows three sketches concerning the related different domains: geographical (Figure1A), diagram representation (Figure 1B) and hypertext representation (Figure 1C). Allthe examples of sketches considered can be treated using the algorithm presented inthis paper.
A
B C
D
Te v e r e
H o m e
W e a t h e r
B u s in es s
Pr od uc tSell
P eo plesSi t es
(A) (B) (C)Fig. 1. Some examples of sketch in different application domains

Vectorization of Graphical Components in Sketch-Based Interfaces 233
The algorithm uses a representation based on coding horizontal sequences of blackpixels identified in the sketch. Horizontal sequences of black pixels are stored in arecord that contains the following fields:
� vv contains the row index,� valInf contains the index of the column of the pixel which starts the horizontal
sequence,� valSup contains the index of the column of the pixel that ends the horizontal
sequence.
Using this kind of representation, the part of a sketch formed by three horizontalsequences of black pixels, in Figure 2, could be stored using the following threerecords:
sequence1. vv:=14; sequence2. vv:=15; sequence3. vv:=15;sequence1. valInf:=11; sequence2. valInf:=9; sequence3. valInf:=15;sequence1. valSup:=14; sequence2. valSup:=10; sequence3. valSup:=16;
A
B C
D
Te v e r e
H o m e
W e a t h e r
B u s in es s
Pr od uc tSell
P eo plesSi t es
(A) (B) (C)
Column
Row
141516
1213
9 10 11 12 13 14 15 16
Fig. 2. A part of a sketch
3 Possible Ambiguities Contained in the Sketch
Sketches drawn by the user can have multiple interpretations [13] [14]. This occursbecause, on one hand, a unique space is used to express different kinds of informationand, on the other hand, signs on the sketch may not completely represent the semanticof the information related to the sign.
For example, the sketch in Figure 3A representing a diagram can have somedifferent interpretations. Two of them are shown in Figure 3B and Figure 3C. Inparticular, Figure 3B considers the sketch formed by ten graphical components: fourclosed regions (A, B, C, D) and six polylines (1-6). Figure 3C considers the sketchformed by seven graphical components: five closed regions (A, B, C, D, E) and justtwo polylines (1-2). Obviously, because the sketch is a diagram, the correctinterpretation is Figure 3B. However, changing the application domain can lead tochanges in determining the correct interpretation. So, if the sketch in Figure 3A is (nolonger a diagram but) a map, Figure 3B is probably the correct interpretation.
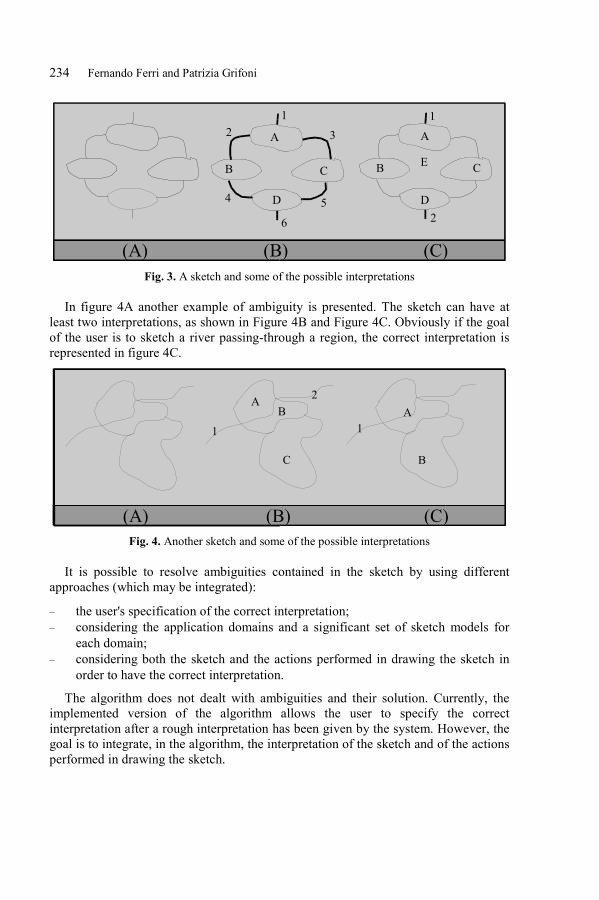
234 Fernando Ferri and Patrizia Grifoni
(A) (B) (C)
A
B C
D
1
2
3
5
6
4
12 A
B C
D
E
Fig. 3. A sketch and some of the possible interpretations
In figure 4A another example of ambiguity is presented. The sketch can have atleast two interpretations, as shown in Figure 4B and Figure 4C. Obviously if the goalof the user is to sketch a river passing-through a region, the correct interpretation isrepresented in figure 4C.
A
B C
D
Te v e r e
H o m e
W e a t h e r
B u s in es s
Pr od uc tSell
P eo plesSi t es
(A) (B) (C)(A) (B) (C)
AAB
BC
1 1
2
Fig. 4. Another sketch and some of the possible interpretations
It is possible to resolve ambiguities contained in the sketch by using differentapproaches (which may be integrated):
� the user's specification of the correct interpretation;� considering the application domains and a significant set of sketch models for
each domain;� considering both the sketch and the actions performed in drawing the sketch in
order to have the correct interpretation.
The algorithm does not dealt with ambiguities and their solution. Currently, theimplemented version of the algorithm allows the user to specify the correctinterpretation after a rough interpretation has been given by the system. However, thegoal is to integrate, in the algorithm, the interpretation of the sketch and of the actionsperformed in drawing the sketch.
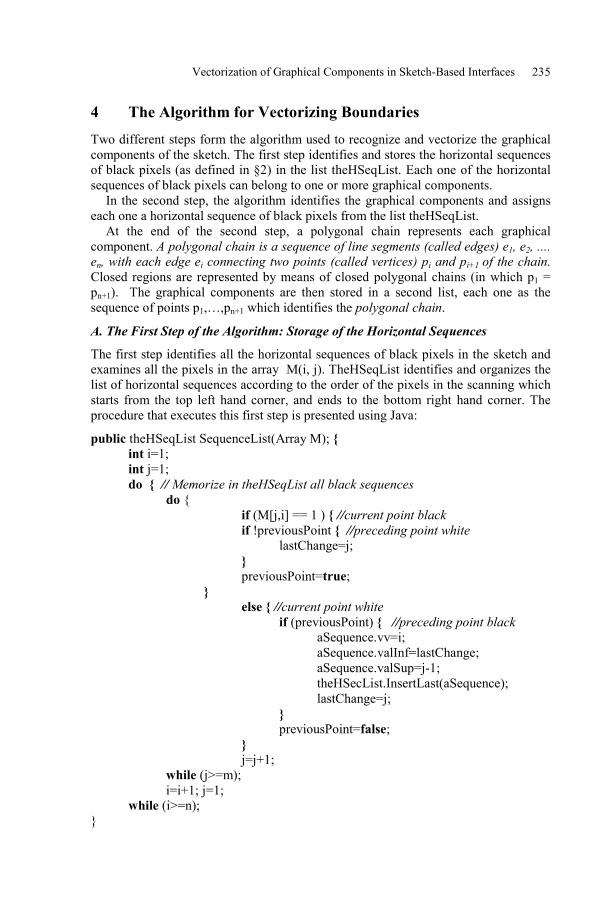
Vectorization of Graphical Components in Sketch-Based Interfaces 235
4 The Algorithm for Vectorizing BoundariesTwo different steps form the algorithm used to recognize and vectorize the graphicalcomponents of the sketch. The first step identifies and stores the horizontal sequencesof black pixels (as defined in §2) in the list theHSeqList. Each one of the horizontalsequences of black pixels can belong to one or more graphical components.
In the second step, the algorithm identifies the graphical components and assignseach one a horizontal sequence of black pixels from the list theHSeqList.
At the end of the second step, a polygonal chain represents each graphicalcomponent. A polygonal chain is a sequence of line segments (called edges) e1, e2, ....en, with each edge ei connecting two points (called vertices) pi and pi+1 of the chain.Closed regions are represented by means of closed polygonal chains (in which p1 =pn+1). The graphical components are then stored in a second list, each one as thesequence of points p1,�,pn+1 which identifies the polygonal chain.
A. The First Step of the Algorithm: Storage of the Horizontal Sequences
The first step identifies all the horizontal sequences of black pixels in the sketch andexamines all the pixels in the array M(i, j). TheHSeqList identifies and organizes thelist of horizontal sequences according to the order of the pixels in the scanning whichstarts from the top left hand corner, and ends to the bottom right hand corner. Theprocedure that executes this first step is presented using Java:
public theHSeqList SequenceList(Array M); {int i=1;int j=1;do { // Memorize in theHSeqList all black sequences
do {if (M[j,i] == 1 ) { //current point blackif !previousPoint { //preceding point white
lastChange=j;}
previousPoint=true;}
else { //current point whiteif (previousPoint) { //preceding point black
aSequence.vv=i;aSequence.valInf=lastChange;aSequence.valSup=j-1;theHSecList.InsertLast(aSequence);lastChange=j;
}previousPoint=false;
}j=j+1;
while (j>=m);i=i+1; j=1;
while (i>=n);}

236 Fernando Ferri and Patrizia Grifoni
The complexity of this first step is O(n X m) where n is the number of rows and m isthe number of columns of the array associated with the sketch.
B. The Second Step of the Algorithm: The Vectorization of the Boundaries
This step identifies the different components of the sketch. The algorithmdistinguishes two different kinds of horizontal sequences:
� sequences associated to an edge identified as typeA sequence,� sequences which present a convergence among two or more than two different
edges, identified as typeB sequence. The convergence point is the point in whichtwo or more than two different edges of graphical components meet.
In Figure 5 typeB sequences are highlighted.
A
B C
DTe v e r e
H o m e
W e a t h e r
B u s in es s
Pr od uc tSell
P eo plesSi t es
(A) (B) (C)
TypeAsequences
TypeBsequences
Fig. 5. Different kinds of sequences
The algorithm has to distinguish between two types of components: regions andpolylines. The algorithm recognizes closed regions, by default, and any otherhorizontal sequence belongs to polyline components of the sketch. The algorithmstarts from the horizontal sequence that it first meets, during the scanning of thesketch (from the top-left hand corner to the bottom-right hand corner).After the first horizontal sequence the algorithm continues the scanning activity andperforms two different actions:
� it identifies the horizontal sequence, belonging to the same component, whichfollows in a clockwise direction by making a local search in the TheHSeqList.This action stops when the algorithm meets the first convergence point or nofurther sequences have been detected,
� it identifies the horizontal sequence, belonging to the same component, thatfollows in a counterclockwise direction by making a local search in theTheHSeqList. This action continues until the algorithm meets the sameconvergence point met in the clockwise direction or no further sequences havebeen detected.
Local search only involves two rows adjacent to the row of the current sequence.Indeed, the sequence which follows may only involve these two rows. For this reasonif the sequence is associated to the row value i, then the local search involves the i-1and the i+1 rows. These sequences are adjacent to the current sequence in the
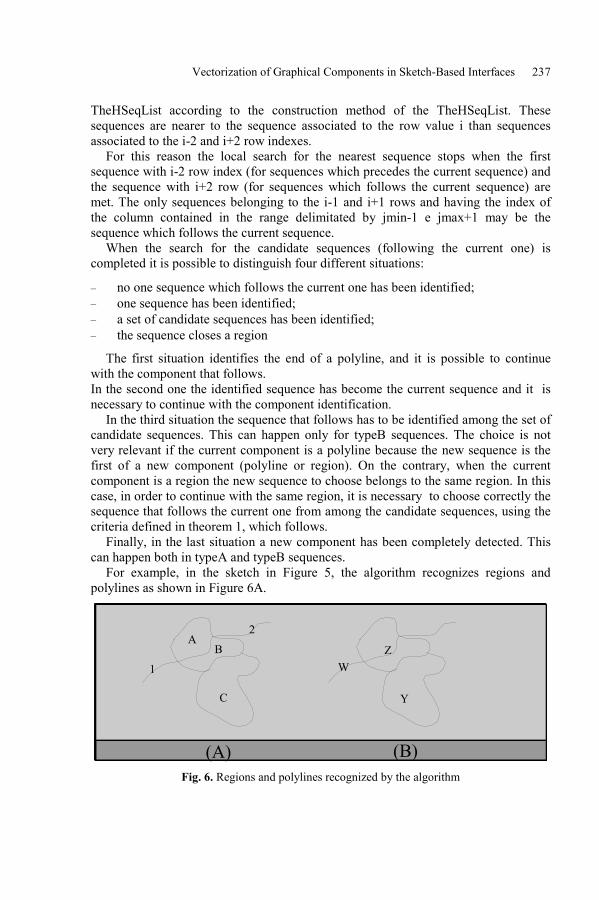
Vectorization of Graphical Components in Sketch-Based Interfaces 237
TheHSeqList according to the construction method of the TheHSeqList. Thesesequences are nearer to the sequence associated to the row value i than sequencesassociated to the i-2 and i+2 row indexes.
For this reason the local search for the nearest sequence stops when the firstsequence with i-2 row index (for sequences which precedes the current sequence) andthe sequence with i+2 row (for sequences which follows the current sequence) aremet. The only sequences belonging to the i-1 and i+1 rows and having the index ofthe column contained in the range delimitated by jmin-1 e jmax+1 may be thesequence which follows the current sequence.
When the search for the candidate sequences (following the current one) iscompleted it is possible to distinguish four different situations:
� no one sequence which follows the current one has been identified;� one sequence has been identified;� a set of candidate sequences has been identified;� the sequence closes a region
The first situation identifies the end of a polyline, and it is possible to continuewith the component that follows.In the second one the identified sequence has become the current sequence and it isnecessary to continue with the component identification.
In the third situation the sequence that follows has to be identified among the set ofcandidate sequences. This can happen only for typeB sequences. The choice is notvery relevant if the current component is a polyline because the new sequence is thefirst of a new component (polyline or region). On the contrary, when the currentcomponent is a region the new sequence to choose belongs to the same region. In thiscase, in order to continue with the same region, it is necessary to choose correctly thesequence that follows the current one from among the candidate sequences, using thecriteria defined in theorem 1, which follows.
Finally, in the last situation a new component has been completely detected. Thiscan happen both in typeA and typeB sequences.
For example, in the sketch in Figure 5, the algorithm recognizes regions andpolylines as shown in Figure 6A.
A
B C
D
Te v e r e
H o m e
W e a t h e r
B u s in es s
Pr od uc tSell
P eo plesSi t es
(A) (B) (C)(A) (B)
AZB
YC
1 W
2
Fig. 6. Regions and polylines recognized by the algorithm
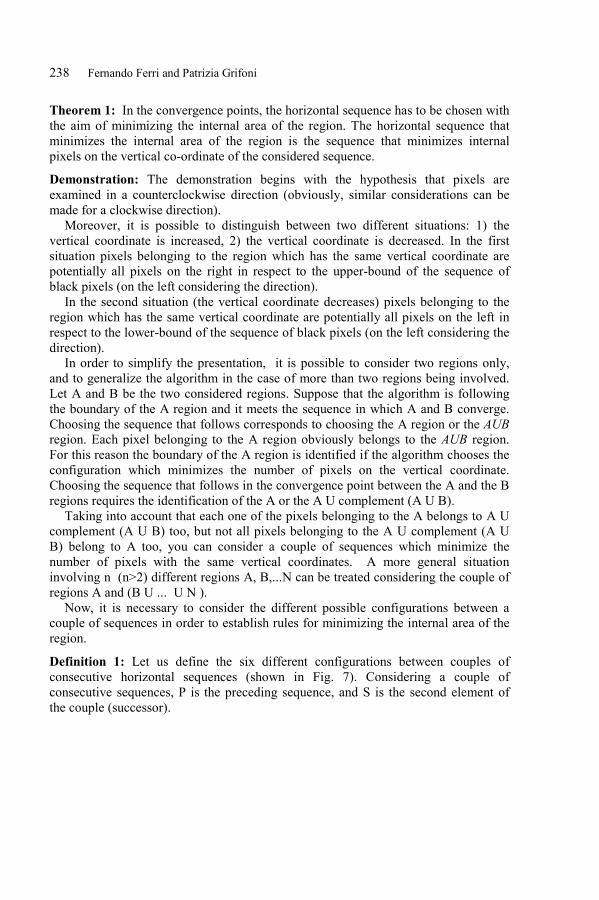
238 Fernando Ferri and Patrizia Grifoni
Theorem 1: In the convergence points, the horizontal sequence has to be chosen withthe aim of minimizing the internal area of the region. The horizontal sequence thatminimizes the internal area of the region is the sequence that minimizes internalpixels on the vertical co-ordinate of the considered sequence.
Demonstration: The demonstration begins with the hypothesis that pixels areexamined in a counterclockwise direction (obviously, similar considerations can bemade for a clockwise direction).
Moreover, it is possible to distinguish between two different situations: 1) thevertical coordinate is increased, 2) the vertical coordinate is decreased. In the firstsituation pixels belonging to the region which has the same vertical coordinate arepotentially all pixels on the right in respect to the upper-bound of the sequence ofblack pixels (on the left considering the direction).
In the second situation (the vertical coordinate decreases) pixels belonging to theregion which has the same vertical coordinate are potentially all pixels on the left inrespect to the lower-bound of the sequence of black pixels (on the left considering thedirection).
In order to simplify the presentation, it is possible to consider two regions only,and to generalize the algorithm in the case of more than two regions being involved.Let A and B be the two considered regions. Suppose that the algorithm is followingthe boundary of the A region and it meets the sequence in which A and B converge.Choosing the sequence that follows corresponds to choosing the A region or the AUBregion. Each pixel belonging to the A region obviously belongs to the AUB region.For this reason the boundary of the A region is identified if the algorithm chooses theconfiguration which minimizes the number of pixels on the vertical coordinate.Choosing the sequence that follows in the convergence point between the A and the Bregions requires the identification of the A or the A U complement (A U B).
Taking into account that each one of the pixels belonging to the A belongs to A Ucomplement (A U B) too, but not all pixels belonging to the A U complement (A UB) belong to A too, you can consider a couple of sequences which minimize thenumber of pixels with the same vertical coordinates. A more general situationinvolving n (n>2) different regions A, B,...N can be treated considering the couple ofregions A and (B U ... U N ).
Now, it is necessary to consider the different possible configurations between acouple of sequences in order to establish rules for minimizing the internal area of theregion.
Definition 1: Let us define the six different configurations between couples ofconsecutive horizontal sequences (shown in Fig. 7). Considering a couple ofconsecutive sequences, P is the preceding sequence, and S is the second element ofthe couple (successor).
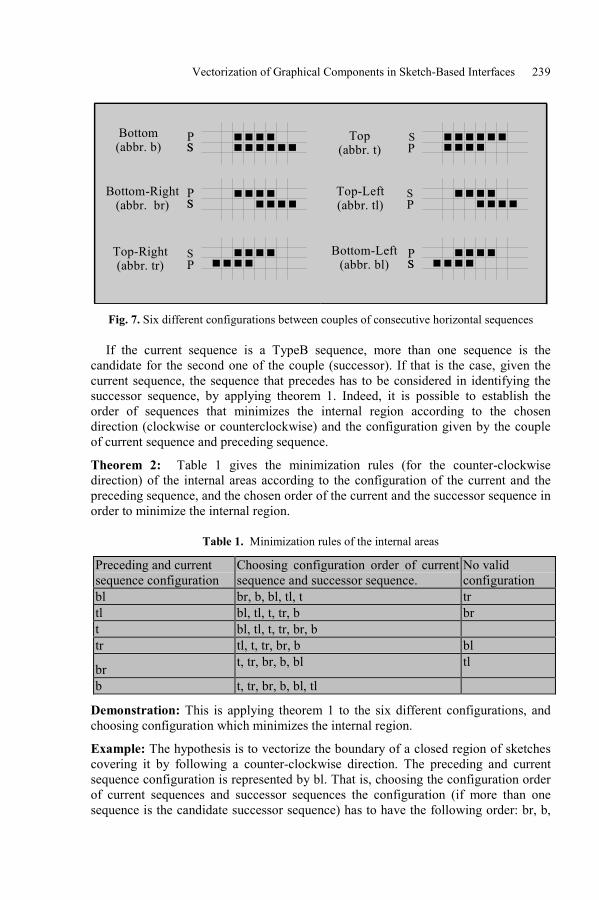
Vectorization of Graphical Components in Sketch-Based Interfaces 239
SSS PP
SSP
SSPS
P
SP
Bottom(abbr. b)
Bottom-Right(abbr. br)
Top-Right(abbr. tr)
Top(abbr. t)
Bottom-Left(abbr. bl)
Top-Left(abbr. tl)
Fig. 7. Six different configurations between couples of consecutive horizontal sequences
If the current sequence is a TypeB sequence, more than one sequence is thecandidate for the second one of the couple (successor). If that is the case, given thecurrent sequence, the sequence that precedes has to be considered in identifying thesuccessor sequence, by applying theorem 1. Indeed, it is possible to establish theorder of sequences that minimizes the internal region according to the chosendirection (clockwise or counterclockwise) and the configuration given by the coupleof current sequence and preceding sequence.
Theorem 2: Table 1 gives the minimization rules (for the counter-clockwisedirection) of the internal areas according to the configuration of the current and thepreceding sequence, and the chosen order of the current and the successor sequence inorder to minimize the internal region.
Table 1. Minimization rules of the internal areas
Preceding and currentsequence configuration
Choosing configuration order of currentsequence and successor sequence.
No validconfiguration
bl br, b, bl, tl, t trtl bl, tl, t, tr, b brt bl, tl, t, tr, br, btr tl, t, tr, br, b bl
br t, tr, br, b, bl tl
b t, tr, br, b, bl, tl
Demonstration: This is applying theorem 1 to the six different configurations, andchoosing configuration which minimizes the internal region.
Example: The hypothesis is to vectorize the boundary of a closed region of sketchescovering it by following a counter-clockwise direction. The preceding and currentsequence configuration is represented by bl. That is, choosing the configuration orderof current sequences and successor sequences the configuration (if more than onesequence is the candidate successor sequence) has to have the following order: br, b,
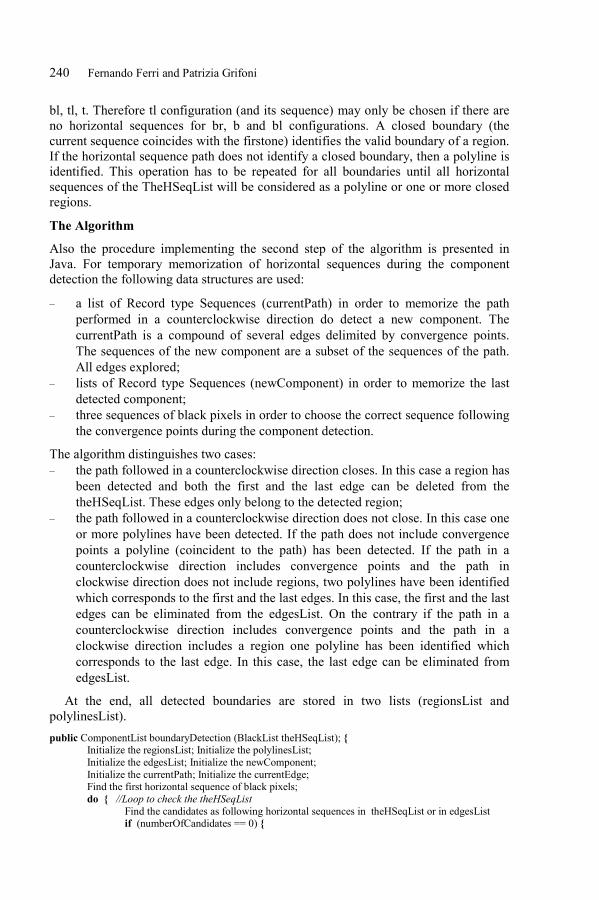
240 Fernando Ferri and Patrizia Grifoni
bl, tl, t. Therefore tl configuration (and its sequence) may only be chosen if there areno horizontal sequences for br, b and bl configurations. A closed boundary (thecurrent sequence coincides with the firstone) identifies the valid boundary of a region.If the horizontal sequence path does not identify a closed boundary, then a polyline isidentified. This operation has to be repeated for all boundaries until all horizontalsequences of the TheHSeqList will be considered as a polyline or one or more closedregions.
The Algorithm
Also the procedure implementing the second step of the algorithm is presented inJava. For temporary memorization of horizontal sequences during the componentdetection the following data structures are used:
� a list of Record type Sequences (currentPath) in order to memorize the pathperformed in a counterclockwise direction do detect a new component. ThecurrentPath is a compound of several edges delimited by convergence points.The sequences of the new component are a subset of the sequences of the path.All edges explored;
� lists of Record type Sequences (newComponent) in order to memorize the lastdetected component;
� three sequences of black pixels in order to choose the correct sequence followingthe convergence points during the component detection.
The algorithm distinguishes two cases:� the path followed in a counterclockwise direction closes. In this case a region has
been detected and both the first and the last edge can be deleted from thetheHSeqList. These edges only belong to the detected region;
� the path followed in a counterclockwise direction does not close. In this case oneor more polylines have been detected. If the path does not include convergencepoints a polyline (coincident to the path) has been detected. If the path in acounterclockwise direction includes convergence points and the path inclockwise direction does not include regions, two polylines have been identifiedwhich corresponds to the first and the last edges. In this case, the first and the lastedges can be eliminated from the edgesList. On the contrary if the path in acounterclockwise direction includes convergence points and the path in aclockwise direction includes a region one polyline has been identified whichcorresponds to the last edge. In this case, the last edge can be eliminated fromedgesList.
At the end, all detected boundaries are stored in two lists (regionsList andpolylinesList).public ComponentList boundaryDetection (BlackList theHSeqList); {
Initialize the regionsList; Initialize the polylinesList;Initialize the edgesList; Initialize the newComponent;Initialize the currentPath; Initialize the currentEdge;Find the first horizontal sequence of black pixels;do { //Loop to check the theHSeqList
Find the candidates as following horizontal sequences in theHSeqList or in edgesListif (numberOfCandidates == 0) {
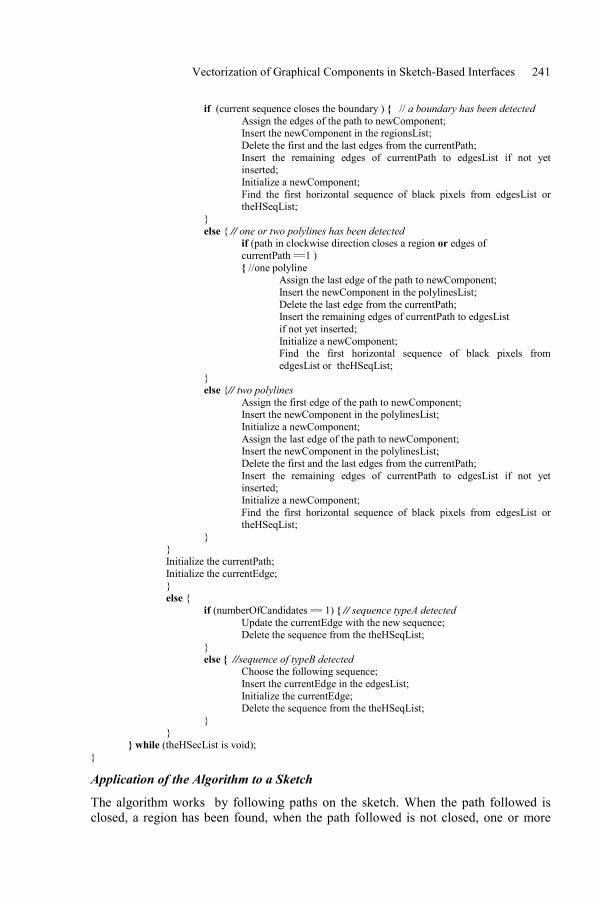
Vectorization of Graphical Components in Sketch-Based Interfaces 241
if (current sequence closes the boundary ) { // a boundary has been detectedAssign the edges of the path to newComponent;Insert the newComponent in the regionsList;Delete the first and the last edges from the currentPath;Insert the remaining edges of currentPath to edgesList if not yet
inserted;Initialize a newComponent;Find the first horizontal sequence of black pixels from edgesList or
theHSeqList;}else { // one or two polylines has been detected
if (path in clockwise direction closes a region or edges of currentPath ==1 )
{ //one polylineAssign the last edge of the path to newComponent;Insert the newComponent in the polylinesList;Delete the last edge from the currentPath;Insert the remaining edges of currentPath to edgesList
if not yet inserted;Initialize a newComponent;Find the first horizontal sequence of black pixels from
edgesList or theHSeqList;}else {// two polylines
Assign the first edge of the path to newComponent;Insert the newComponent in the polylinesList;Initialize a newComponent;Assign the last edge of the path to newComponent;Insert the newComponent in the polylinesList;Delete the first and the last edges from the currentPath;Insert the remaining edges of currentPath to edgesList if not yet
inserted;Initialize a newComponent;Find the first horizontal sequence of black pixels from edgesList or
theHSeqList;}
}Initialize the currentPath;Initialize the currentEdge;}else {
if (numberOfCandidates == 1) { // sequence typeA detectedUpdate the currentEdge with the new sequence;Delete the sequence from the theHSeqList;
}else { //sequence of typeB detected
Choose the following sequence;Insert the currentEdge in the edgesList;Initialize the currentEdge;Delete the sequence from the theHSeqList;
}}
} while (theHSecList is void);}
Application of the Algorithm to a Sketch
The algorithm works by following paths on the sketch. When the path followed isclosed, a region has been found, when the path followed is not closed, one or more
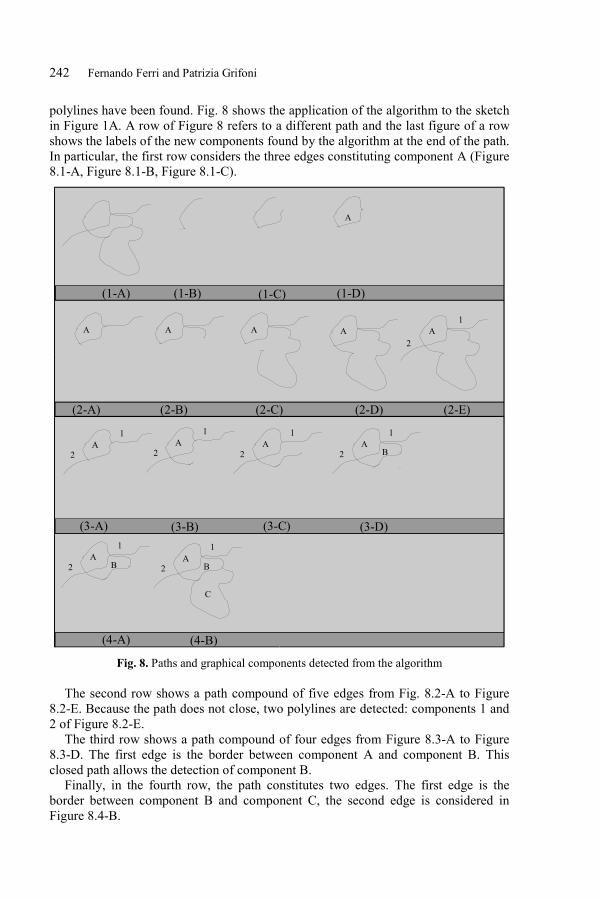
242 Fernando Ferri and Patrizia Grifoni
polylines have been found. Fig. 8 shows the application of the algorithm to the sketchin Figure 1A. A row of Figure 8 refers to a different path and the last figure of a rowshows the labels of the new components found by the algorithm at the end of the path.In particular, the first row considers the three edges constituting component A (Figure8.1-A, Figure 8.1-B, Figure 8.1-C).
A
B C
D
Te v e r e
H o m e
W e a t h e r
B u s in es s
Pr od uc tSell
P eo plesSi t es
(A) (B) (C)(1-A) (1-B) (1-C)
(2-A) (2-B) (2-C)
(3-A) (3-B) (3-C)
(4-A)
A
AA A A A
A
1
2
2
1A
2
1A
2
1A
2
1
B
A2
1
BA
2
1
B
C
(1-D)
(2-D) (2-E)
(3-D)
(4-B)
Fig. 8. Paths and graphical components detected from the algorithm
The second row shows a path compound of five edges from Fig. 8.2-A to Figure8.2-E. Because the path does not close, two polylines are detected: components 1 and2 of Figure 8.2-E.
The third row shows a path compound of four edges from Figure 8.3-A to Figure8.3-D. The first edge is the border between component A and component B. Thisclosed path allows the detection of component B.
Finally, in the fourth row, the path constitutes two edges. The first edge is theborder between component B and component C, the second edge is considered inFigure 8.4-B.
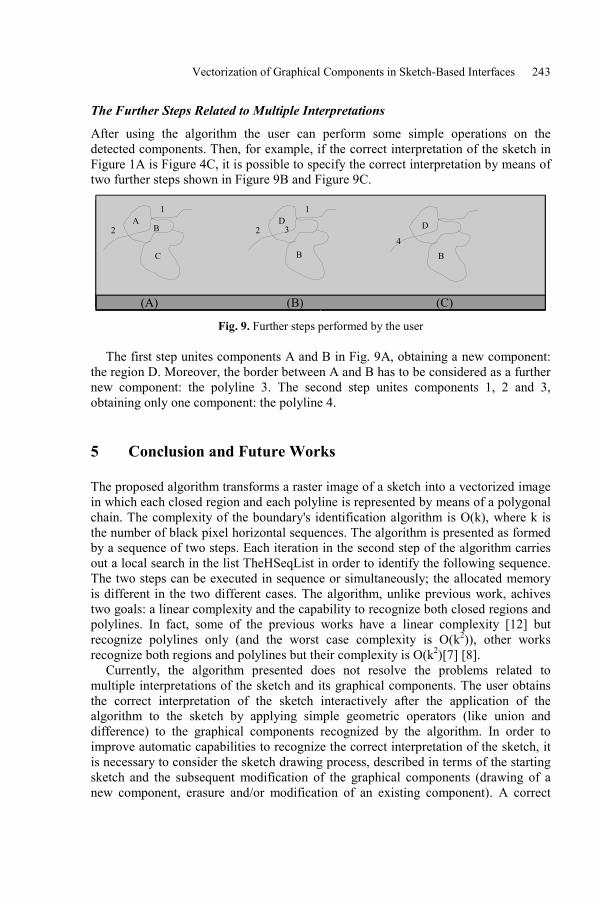
Vectorization of Graphical Components in Sketch-Based Interfaces 243
The Further Steps Related to Multiple Interpretations
After using the algorithm the user can perform some simple operations on thedetected components. Then, for example, if the correct interpretation of the sketch inFigure 1A is Figure 4C, it is possible to specify the correct interpretation by means oftwo further steps shown in Figure 9B and Figure 9C.
(A) (B) (C)
D2
1
B
(A)
A2
1
B 3
C
D
4
B
(B) (C)
Fig. 9. Further steps performed by the user
The first step unites components A and B in Fig. 9A, obtaining a new component:the region D. Moreover, the border between A and B has to be considered as a furthernew component: the polyline 3. The second step unites components 1, 2 and 3,obtaining only one component: the polyline 4.
5 Conclusion and Future Works
The proposed algorithm transforms a raster image of a sketch into a vectorized imagein which each closed region and each polyline is represented by means of a polygonalchain. The complexity of the boundary's identification algorithm is O(k), where k isthe number of black pixel horizontal sequences. The algorithm is presented as formedby a sequence of two steps. Each iteration in the second step of the algorithm carriesout a local search in the list TheHSeqList in order to identify the following sequence.The two steps can be executed in sequence or simultaneously; the allocated memoryis different in the two different cases. The algorithm, unlike previous work, achivestwo goals: a linear complexity and the capability to recognize both closed regions andpolylines. In fact, some of the previous works have a linear complexity [12] butrecognize polylines only (and the worst case complexity is O(k2)), other worksrecognize both regions and polylines but their complexity is O(k2)[7] [8].
Currently, the algorithm presented does not resolve the problems related tomultiple interpretations of the sketch and its graphical components. The user obtainsthe correct interpretation of the sketch interactively after the application of thealgorithm to the sketch by applying simple geometric operators (like union anddifference) to the graphical components recognized by the algorithm. In order toimprove automatic capabilities to recognize the correct interpretation of the sketch, itis necessary to consider the sketch drawing process, described in terms of the startingsketch and the subsequent modification of the graphical components (drawing of anew component, erasure and/or modification of an existing component). A correct
244 Fernando Ferri and Patrizia Grifoni
interpretation of the different operations performed during the sketch drawing couldallow automatic recognition reducing erroneous interpretation.
References
[1] E. Lank, J. Thorley, S. Chen and D. Blostein, �An on-line system forrecognizing hand drawn UML diagrams�, Proceedings of the InternationalConference on Document Analysis and Recognition, ICDAR 2001, Seattle,September 2001, pp. 356-360.
[2] R. Zanibbi, D. Blostein, J. Cordy, "Recognizing Mathematical ExpressionsUsing Tree Transformation", IEEE Transactions on Pattern Analysis andMachine Intelligence, Vol. 24, No. 11, pp. 1455-1467, November 2002.
[3] D. Blostein, E. Lank, R. Zanibbi, �Treatment of Diagrams in Document Image,in Theory and Application of Diagrams, Eds. M. Anderson, P. Cheng, V.Haarslev, Lecture Notes in Computer Science, Vol. 1889, Springer Verlag,2000, pp. 330-344.
[4] T. Kanungo, R. Haralick, D. Dori, �Understanding Engineering Drawings. ASurvey.� Proc. Int. Workshop on Graphic Recognition. University Park.Pennsylvania. Aug 1995. pp. 119-130.
[5] A.D. Blaser, M. J. Egenhofer, �A Visual Tool for Querying GeographicDatabases.� Proc. ACM AVI 2000, Palermo 2000, pp. 211-216.
[6] Lin, M. Thomsen, J.A. Landay, �A Visual Language for Sketching Large andComplex Interactive Designs� Proc. ACM CHI 2002, Minneapolis 2002, pp.307-314.
[7] Rosenfeld, �Algorithms for Image/Vector Conversion�, Computer Graphics, n.12, pp.135-139, 1978
[8] Rosenfeld and A.C. Kak, Digital Image Processing, New York; AcademicPress, Cap 11, 1987.
[9] D. Dori, Orthogonal Zig-Zag: an Algorithm for Vectorizing EngineeringDrawings Comared with Hough Transform, Advances in Engineering Software1997, 28(1): 11-24.
[10] U. Montanari, �A note on the minimal length polygonal approximation to adigitized contour.� Communications of the ACM 1970; 13(1):41-47.
[11] S.H.Y. Hung, T. Kasvald, �Critical points on a perfectly 8- or perfectly 6-connected thin binary line.� Pattern Recognition 1983; 16:297-284.
[12] D. Dori, W. Liu., �Sparse Pixel Vectorization: An Algorithm and itsPerformance Evaluation� IEEE Transactions on Pattern Analysis and MachineIntelligence, Vol. 21, No. 3, pp. 202-215, March 1999
[13] F. Favetta, M.A. Aufaure-Portier, �About Ambiguities in Visual GIS QueryLanguages: A Taxonomy and Solutions�. in Advances in Visual InformationSystems, Ed. R. Laurini, Lecture Notes in Computer Science, Vol. 1929,Springer Verlag, 2000, pp. 154-165.
[14] P. Bottoni, M.F. Costabile, S. Levialdi, P. Mussio, �Formalising visuallanguages. Proc. IEEE Symposium on Visual Languages '95, 1995, pp 45-52.
N. Bianchi-Berthouze (Ed.): DNIS 2003, LNCS 2822, pp. 245-254, 2003. Springer-Verlag Berlin Heidelberg 2003
A Data Placement Method of HSM for Streaming MediaServer in Network Environment*
Yaoqiang Xu1, Chunxiao Xing2, and Lizhu Zhou2
Department of Computer Science and Technology, Tsinghua UniversityBeijing, 100084, China
Fax: +86-10-627711381 [email protected]
2 {xingcx,dcszlz}@mail.tsinghua.edu.cn
Abstract. Streaming media service, such as video-on-demand (VOD), is gettingpopular in network environment. To get high cost/performance ratio,Hierarchical Storage Management (HSM) is adopted by streaming mediaservers in such services. However, if HSM system places the media object, saya movie, exclusively in a tertiary storage device, the response time to an ondemand service will be too long to be satisfactory. This paper presents a newdata placement method based on prearrangement strategy in HSM for streamingmedia server. By prearranging the head part of media objects on disk, streamingdata accesses can get immediate response, and in concurrent, tertiary storagedevice can be prepared for continuous access. The paper discusses a method tocalculate the head data length of media objects and an algorithm to read data inHSM. Simulation result shows that with a low disk storage cost, the responsetime of the HSM system can be reduced to a large extent, and the performanceof the whole system is enhanced significantly.
1 Introduction
With the development of network, streaming media services, e.g., video-on-demand(VOD), news-on-demand (NOD), etc., are becoming more and more popular. Largemedia server always has thousands of media objects, and need to deliver them tothousands of users over the network. To place all the objects, many of which arerarely accessed, in disk, the storage cost will be very high. As the result, distributedhierarchical storage is proposed to get high cost/performance ratio [1-3].
Figure 1 shows the typical structure of media servers based on distributedhierarchical storage. In this structure, media objects with high access probability arestored in Video File Server (VFS). VFS has local secondary storage device such asdisk or RAID. It accepts on demand requests and delivers services. Other objects arestored in Archive Server (AS) on the network. The main storage device of AS istertiary storage device, such as tape library and CD tower, whose storage cost is much * Supported by the National Natural Science Foundation of China under Grant
No.60221120146; the National Grand Fundamental Research 973 Program of China underGrant No.G1999032704.
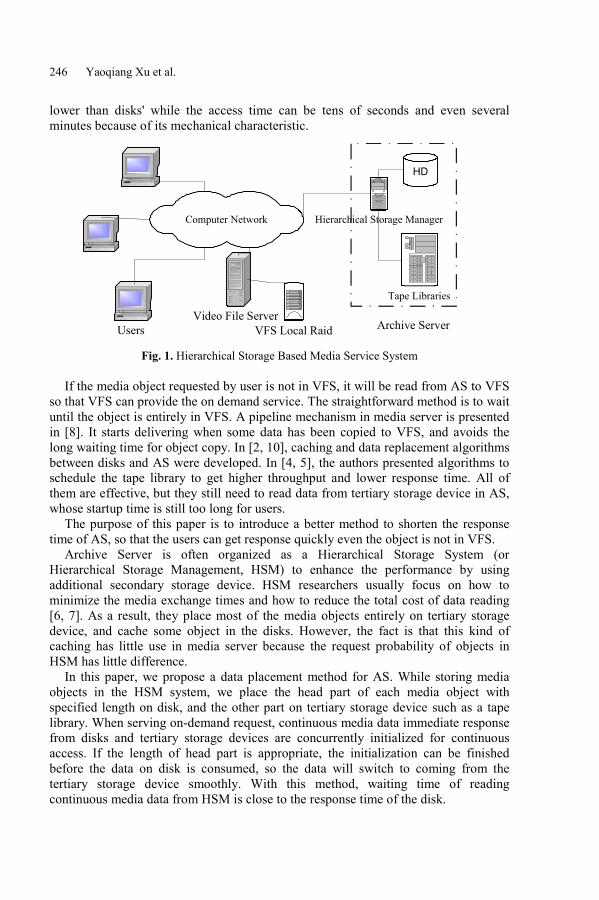
246 Yaoqiang Xu et al.
lower than disks' while the access time can be tens of seconds and even severalminutes because of its mechanical characteristic.
UsersVideo File Server
VFS Local Raid
Tape Libraries
Archive Server
HD
Hierarchical Storage ManagerComputer Network
Fig. 1. Hierarchical Storage Based Media Service System
If the media object requested by user is not in VFS, it will be read from AS to VFSso that VFS can provide the on demand service. The straightforward method is to waituntil the object is entirely in VFS. A pipeline mechanism in media server is presentedin [8]. It starts delivering when some data has been copied to VFS, and avoids thelong waiting time for object copy. In [2, 10], caching and data replacement algorithmsbetween disks and AS were developed. In [4, 5], the authors presented algorithms toschedule the tape library to get higher throughput and lower response time. All ofthem are effective, but they still need to read data from tertiary storage device in AS,whose startup time is still too long for users.
The purpose of this paper is to introduce a better method to shorten the responsetime of AS, so that the users can get response quickly even the object is not in VFS.
Archive Server is often organized as a Hierarchical Storage System (orHierarchical Storage Management, HSM) to enhance the performance by usingadditional secondary storage device. HSM researchers usually focus on how tominimize the media exchange times and how to reduce the total cost of data reading[6, 7]. As a result, they place most of the media objects entirely on tertiary storagedevice, and cache some object in the disks. However, the fact is that this kind ofcaching has little use in media server because the request probability of objects inHSM has little difference.
In this paper, we propose a data placement method for AS. While storing mediaobjects in the HSM system, we place the head part of each media object withspecified length on disk, and the other part on tertiary storage device such as a tapelibrary. When serving on-demand request, continuous media data immediate responsefrom disks and tertiary storage devices are concurrently initialized for continuousaccess. If the length of head part is appropriate, the initialization can be finishedbefore the data on disk is consumed, so the data will switch to coming from thetertiary storage device smoothly. With this method, waiting time of readingcontinuous media data from HSM is close to the response time of the disk.

A Data Placement Method of HSM for Streaming Media Server 247
The remainder of this paper is organized as follows: section 2 discusses thecharacteristics of tertiary storage device and continuous media service, and section 3introduces the data placement method. A way to calculate head part length of mediaobject and an algorithm to read data in HSM is also described in this section.Section 4 gives the simulation results and performance analysis. Section 5 is theconclusion.
2 Characteristics of Tertiary Storage Deviceand Continuous Media Service
The two most widely used tertiary storage devices are tape library and CD tower. Theformer uses tape as storage media, which has large capacity and low cost; the latteruses CD which can be randomly accessed and has better performance.
Tertiary storage device usually has one or more drives to hold the removablemedia, many slots to place the media, and a robot arm to transfer media between theslots and the drives. The media is placed in the slot before and after being accessed.The response time for reading data from tertiary storage device can be calculated as
seekTmountTloadTresponseT ____ ++= (1)
where T_load refers to the time needed for the robot arm to load the media from slotto drive, whose typical value is about 10 seconds; T_mount is the time between themedia being put into the drive and ready to be operated; and T_seek refers to the timeneeded for the drive to seek to the desired position. T_seek is short for CD tower,while for tape libraries, it can be tens to hundreds of seconds, depending on theperformance of the device and the target position.
When the media is ready, tertiary storage device can be read or written with highspeed (see table 1).
Table 1. Performance Summary of Storage Device
Storage media Response time(s) Data read rate (Mega bytes/s)Sony DTF tape library 143 12Ampex DST tape library 25 14.2IDE hard disk 0 8
Continuous media service requires short response time and specified data rate.Waiting is always boring when the user requests a media object, so the ideal responsetime should be zero. But the requirement for data rate is low. For instance, theplayback rate of MPEG2 video stream is about 4.5Mbps, or 0.6Mbyte/s.
Table 1 shows the data read performance of two tape libraries and common IDEhard disk. The data of Sony DTF comes from [9] and that of Apex DST comes from[7]. We can see that the data reading rate of the storage device is much higher than theplayback rate of media. However, when the response time is concerned, onlysecondary storage device can meet the need of media service.
Another feature of media service is: many requests only focus on a few mediaobjects. This access rule approximately follows Zipf(0) distribution [1, 10]. That is, if
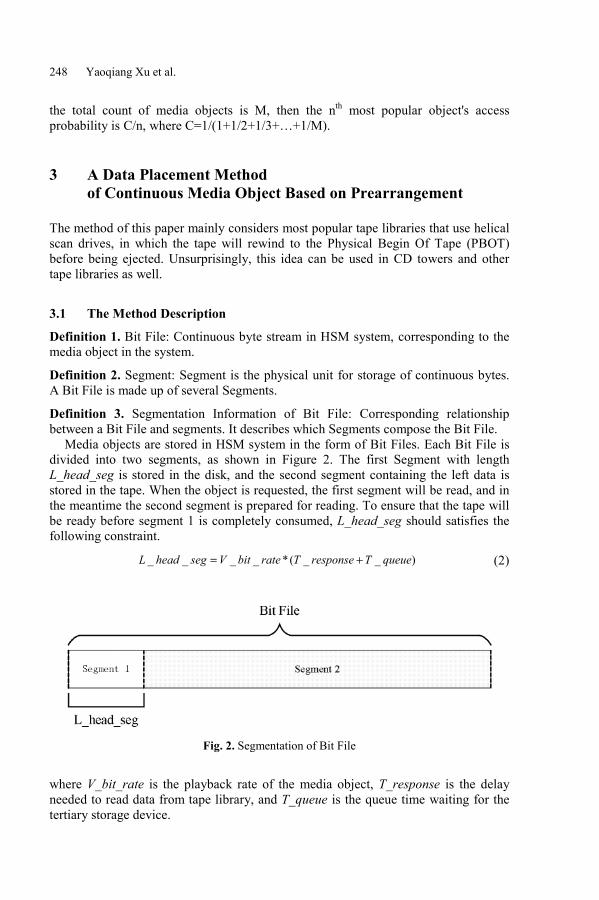
248 Yaoqiang Xu et al.
the total count of media objects is M, then the nth most popular object's accessprobability is C/n, where C=1/(1+1/2+1/3+�+1/M).
3 A Data Placement Methodof Continuous Media Object Based on Prearrangement
The method of this paper mainly considers most popular tape libraries that use helicalscan drives, in which the tape will rewind to the Physical Begin Of Tape (PBOT)before being ejected. Unsurprisingly, this idea can be used in CD towers and othertape libraries as well.
3.1 The Method Description
Definition 1. Bit File: Continuous byte stream in HSM system, corresponding to themedia object in the system.
Definition 2. Segment: Segment is the physical unit for storage of continuous bytes.A Bit File is made up of several Segments.
Definition 3. Segmentation Information of Bit File: Corresponding relationshipbetween a Bit File and segments. It describes which Segments compose the Bit File.
Media objects are stored in HSM system in the form of Bit Files. Each Bit File isdivided into two segments, as shown in Figure 2. The first Segment with lengthL_head_seg is stored in the disk, and the second segment containing the left data isstored in the tape. When the object is requested, the first segment will be read, and inthe meantime the second segment is prepared for reading. To ensure that the tape willbe ready before segment 1 is completely consumed, L_head_seg should satisfies thefollowing constraint.
)__(*____ queueTresponseTratebitVsegheadL += (2)
Fig. 2. Segmentation of Bit File
where V_bit_rate is the playback rate of the media object, T_response is the delayneeded to read data from tape library, and T_queue is the queue time waiting for thetertiary storage device.

A Data Placement Method of HSM for Streaming Media Server 249
Ignoring the startup, the tape's seek time can be represented as:
seekVaddrSseekT
___ = (3)
where S_addr means the target position in the tape, and V_seek is the seek rate of thetape.
From expression (1), (2), and (3), we can get:
)_____(*____ queueT
seekVaddrSmountTloadTratebitVsegheadL +++= (4)
In this formula, T_queue is unknown before the request is actually executed. Now,the problem becomes finding an estimation method for computing T_queue.
3.2 Computation of T_queue
The appropriate computation of T_queue is got via simulation. To do this, we firstbuild the queue model of the continuous media server. Secondly, we simulate therunning of the system by giving different configuration (different system workload,different drive number etc.) and record the delay of every tape request. In this way,we get the distribution of T_queue. Finally, we determine an appropriate formula forT_queue to ensure that most HSM request will get response before Segment 1 isconsumed.
The queue model of media server is shown in Figure 3, which is used to describethe response time. The procedure of reading data from HSM's disk is not describedhere because it can be ignored when compared with the response time.
If the media object referred by the On Demand request is in the local disk of VFS,it can be read and start playback immediately. Otherwise we need to get data fromHSM system (the AS). With the data placement method above, this procedure shouldbe divided into two parts: a) reading data from disk of HSM; b) reading data fromtape of HSM. Procedure a) is ignored in Figure 3 for briefness because it's verysimple. The processing steps of tape request are as follows:
� Stay in the schedule queue until a drive is free;� Request the robot arm to load the tape to the drive, locate the data position and
read the data;� After all data is read, eject the tape and use robot arm to place it into a slot.
The On Demand requests usually obey Poisson distribution (because the intensityof the requests changes very slowly). And the access probability of media objectfollows Zipf(0) distribution. Let Drive's Process Ability µ be the number of requeststhat a drive can process in a time unit, and Request Intensity λ be the number ofrequests that arrive at the HSM system in a time unit. The number of drives is K. Wedefine the workload of HSM system as
µλρ*
(K)K
= (5)
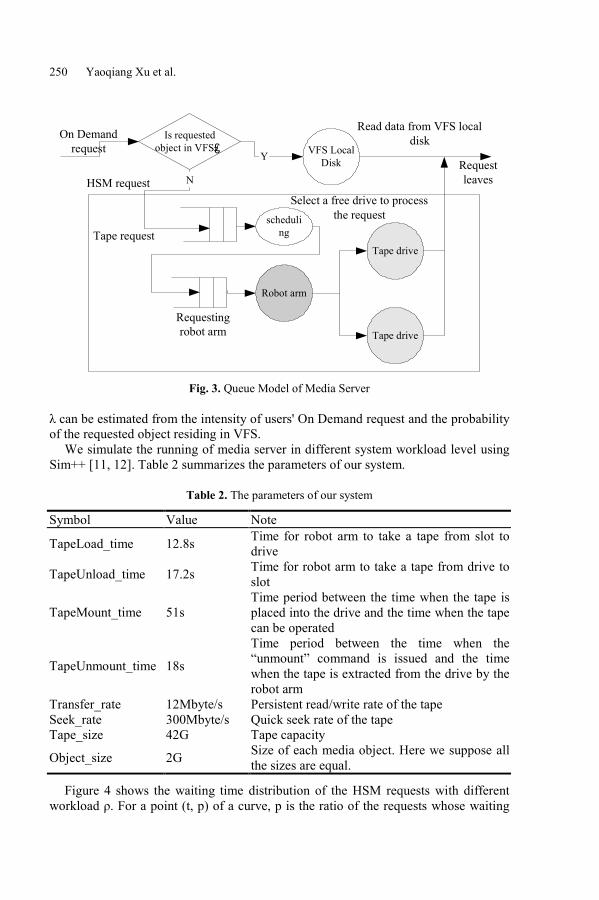
250 Yaoqiang Xu et al.
Is requestedobject in VFS£¿ VFS Local
DiskY
Robot arm
Tape drive
Tape drive
Read data from VFS localdisk
Requestleaves
scheduling
Select a free drive to processthe request
Requestingrobot arm
Tape request
On Demandrequest
NHSM request
Fig. 3. Queue Model of Media Server
λ can be estimated from the intensity of users' On Demand request and the probabilityof the requested object residing in VFS.
We simulate the running of media server in different system workload level usingSim++ [11, 12]. Table 2 summarizes the parameters of our system.
Table 2. The parameters of our system
Symbol Value Note
TapeLoad_time 12.8s Time for robot arm to take a tape from slot todrive
TapeUnload_time 17.2s Time for robot arm to take a tape from drive toslot
TapeMount_time 51sTime period between the time when the tape isplaced into the drive and the time when the tapecan be operated
TapeUnmount_time 18s
Time period between the time when the�unmount� command is issued and the timewhen the tape is extracted from the drive by therobot arm
Transfer_rate 12Mbyte/s Persistent read/write rate of the tapeSeek_rate 300Mbyte/s Quick seek rate of the tapeTape_size 42G Tape capacity
Object_size 2G Size of each media object. Here we suppose allthe sizes are equal.
Figure 4 shows the waiting time distribution of the HSM requests with differentworkload ρ. For a point (t, p) of a curve, p is the ratio of the requests whose waiting
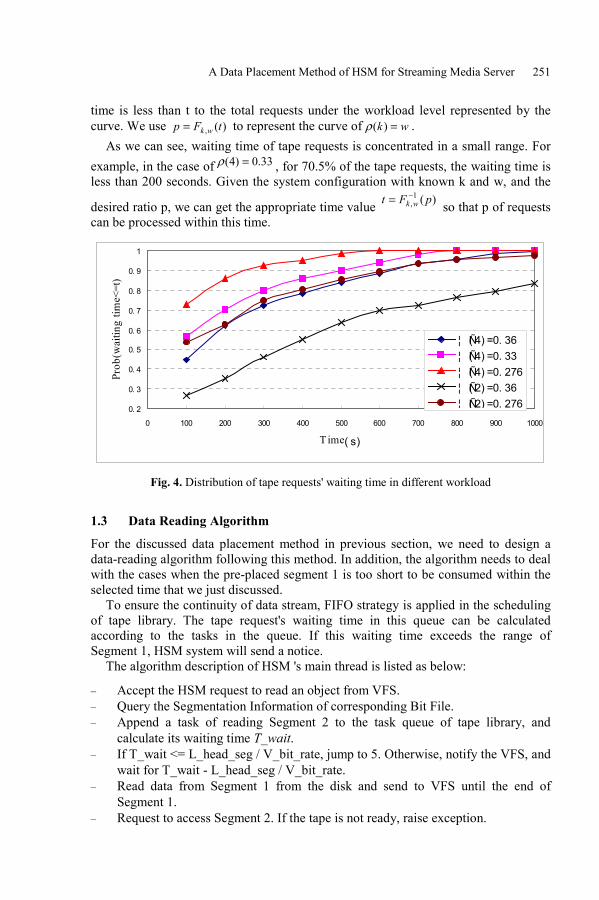
A Data Placement Method of HSM for Streaming Media Server 251
time is less than t to the total requests under the workload level represented by thecurve. We use )(, tFp wk= to represent the curve of wk =)(ρ .
As we can see, waiting time of tape requests is concentrated in a small range. Forexample, in the case of 33.0)4( =ρ , for 70.5% of the tape requests, the waiting time isless than 200 seconds. Given the system configuration with known k and w, and the
desired ratio p, we can get the appropriate time value )(1, pFt wk−= so that p of requests
can be processed within this time.
0. 2
0. 3
0. 4
0. 5
0. 6
0. 7
0. 8
0. 9
1
0 100 200 300 400 500 600 700 800 900 1000
Time( s)
Prob
(wai
ting
time<
=t)
¦ Ñ( 4) =0. 36¦ Ñ( 4) =0. 33¦ Ñ( 4) =0. 276¦ Ñ( 2) =0. 36¦ Ñ( 2) =0. 276
Fig. 4. Distribution of tape requests' waiting time in different workload
1.3 Data Reading Algorithm
For the discussed data placement method in previous section, we need to design adata-reading algorithm following this method. In addition, the algorithm needs to dealwith the cases when the pre-placed segment 1 is too short to be consumed within theselected time that we just discussed.
To ensure the continuity of data stream, FIFO strategy is applied in the schedulingof tape library. The tape request's waiting time in this queue can be calculatedaccording to the tasks in the queue. If this waiting time exceeds the range ofSegment 1, HSM system will send a notice.
The algorithm description of HSM 's main thread is listed as below:
� Accept the HSM request to read an object from VFS.� Query the Segmentation Information of corresponding Bit File.� Append a task of reading Segment 2 to the task queue of tape library, and
calculate its waiting time T_wait.� If T_wait <= L_head_seg / V_bit_rate, jump to 5. Otherwise, notify the VFS, and
wait for T_wait - L_head_seg / V_bit_rate.� Read data from Segment 1 from the disk and send to VFS until the end of
Segment 1.� Request to access Segment 2. If the tape is not ready, raise exception.
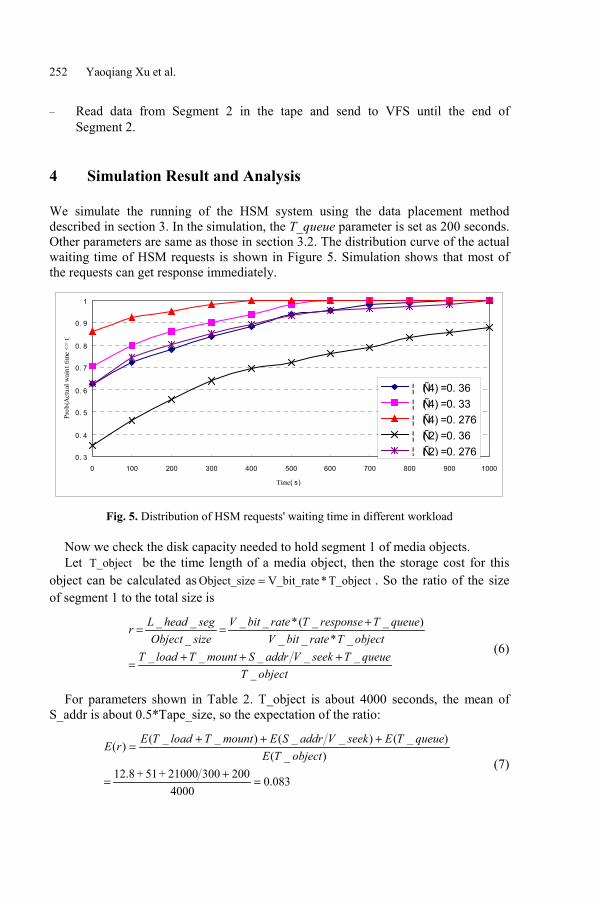
252 Yaoqiang Xu et al.
� Read data from Segment 2 in the tape and send to VFS until the end ofSegment 2.
4 Simulation Result and Analysis
We simulate the running of the HSM system using the data placement methoddescribed in section 3. In the simulation, the T_queue parameter is set as 200 seconds.Other parameters are same as those in section 3.2. The distribution curve of the actualwaiting time of HSM requests is shown in Figure 5. Simulation shows that most ofthe requests can get response immediately.
0. 3
0. 4
0. 5
0. 6
0. 7
0. 8
0. 9
1
0 100 200 300 400 500 600 700 800 900 1000
Time( s)
Prob
(Act
ual w
aint
tim
e <=
t)
¦ Ñ( 4) =0. 36¦ Ñ( 4) =0. 33¦ Ñ( 4) =0. 276¦ Ñ( 2) =0. 36¦ Ñ( 2) =0. 276
Fig. 5. Distribution of HSM requests' waiting time in different workload
Now we check the disk capacity needed to hold segment 1 of media objects.Let T_object be the time length of a media object, then the storage cost for this
object can be calculated as T_object*V_bit_rateeObject_siz = . So the ratio of the sizeof segment 1 to the total size is
objectTqueueTseekVaddrSmountTloadT
objectTratebitVqueueTresponseTratebitV
sizeObjectsegheadLr
______
_*__)__(*__
___
+++=
+==(6)
For parameters shown in Table 2. T_object is about 4000 seconds, the mean ofS_addr is about 0.5*Tape_size, so the expectation of the ratio:
083.04000
20030021000+ 51 + 12.8)_(
)_()__()__()(
=+
=
+++=
objectTEqueueTEseekVaddrSEmountTloadTErE
(7)
A Data Placement Method of HSM for Streaming Media Server 253
If the total capacity of the HSM system is R, the disk space for storing the firstsegments of objects is about R*0.083.
Another conclusion we can draw from Figure 4 is that under the same workload,the request's waiting time is shorter if there are more drives. As the result, we shouldtry to use large tape libraries.
5 Conclusion
By analyzing the access characteristics of tertiary storage devices and the feature ofmedia service system, this paper proposes a data placement method for continuousmedia service. Simulation results show that with this method, at a small storage costthe response performance of HSM and the media service system can be enhancedsignificantly.
References
[1] Scott A. Barnett, Gary J. Anido. A Cost Comparison of Distributed andCentralized Approaches to Video-on-Demand. IEEE Journal on Selected Areasin Communications 14(6): 1173-1183, 1996
[2] D. W. Brubeck and L. A. Rowe. Hierarchical storage management in adistributed VOD system. IEEE Multimedia, 3(3): 37-47, 1996
[3] Ying-Dar Lin, Horng-Zhu Lai, Yuan-Cheng Lai. A hierarchical networkstorage architecture for video-on-demand services. Proceedings 21st IEEEConference on Local Computer Networks, 355-364, 1996
[4] S. W. Lau, J. C. S. Liu. Scheduling and data layout policies for a near-linemultimedia storage architecture. Multimedia Systems, 5(5): 310-323, 1997
[5] Jing Shi, Chungxiao Xing and Lizhu Zhou. Efficiently Scheduling Tape-resident Jobs. In the 19th IEEE Symposium on Mass Storage Systems, 305-309, 2002
[6] S. Christodoulakis, P. Triantafillou, and F. Zioga. Principles of optimallyplacing data in tertiary storage libraries. Proc. of Intl. Conf. on Very Large DataBases, Athens, Greece. 236-245, 1997
[7] Jiangtao Li, Sunil Prabhakar. Data Placement for Tertiary Storage. In the 19thIEEE Symposium on Mass Storage Systems, 193-207, 2002
[8] Shahram Ghandeharizadeh, Ali Dashti, and Cyrus Shahabi. A pipeliningmechanism to minimize the latency time in hierarchical multimedia storagemanagers. Computer communications, 18(3): 170-184, 1995
[9] T. Johnson and E. L. Miller. Performance measurements of tertiary storagedevices. In Proc. of 24th Intl. Conf. on Very Large Data Bases, New York, 50-61, 1998
[10] Yang Daoliang, Ren Xiaoxia and Chang Ming. Study on Data ReplacementAlgorithm in Continuous Media Server with Hierarchical Storage. 16th IFIPWorld Computer Congress, Beijing, 2: 1387-1394, 2000

254 Yaoqiang Xu et al.
[11] Paul A. Fishwick. Simpack: Getting Started with Simulation Programming in Cand C++. In 1992 Winter Simulation Conference, Arlington, VA, 154-162,1992
[12] SimPack Toolkit. http://www.cise.ufl.edu/~fishwick/simpack/simpack.html[13] J. A. Buzacott and J.G. Shanthikumar. Stochastic Models of Manufacturing
Systems, Prentice Hall, 1993
N. Bianchi-Berthouze (Ed.): DNIS 2003, LNCS 2822, pp. 255-269, 2003. Springer-Verlag Berlin Heidelberg 2003
Application of Active Real-Time Objectsand Rules in Semantic Web*
Sang Bong Yoo1 and In Han Kim2
1 School of Computer Science, Inha UniversityIncheon, Korea
Fax: [email protected]
2 Department of Architectural Engineering, Kyung-Hee UniversityYong-In Si, Korea
Abstract. As more real-world data are included in the Web, requirements tocapture more meaning of the data have rapidly increased. Semantic Web hasbeen proposed by W3C to be the next generation of web by representing themetadata using RDF (Resource Description Framework). Even though themetadata encoded in RDF have rich semantics and high potential for providinglots of intelligent features, there have not been enough efforts to utilize them inpractical Web application areas. In this paper, we model the Semantic Web asan active environment that consists of a set of real-time objects each consistingof a set of attributes, functions, and active rules. A real-time object can bechanged spontaneously or triggered by demands (via messages) in real-time.The semantics of such a distributed, real-time object system can be describedcompletely by a formal logical foundation that is the ordinary first order lan-guage (that is time-invariant) plus a set of time-varying constructs. The declara-tiveness and inference capability of formal logic are coupled with real-time dis-tributed objects in order to enable the users to encode easily the domain knowl-edge into rules. The design and application of active real-time objects and rulesare presented using working examples.
1 Introduction
As the Internet prevails all over the world, requirements to handle the data on the Webhave been increased rapidly. The Semantic Web, which was initiated by W3C, is aneffort to capture more meaning of the data on the Web [3, 9, 16, 20, 22]. RDF (Re-source Description Framework) is the primary tool to serialize the metadata from theWeb, which enables software agents or human can understand the contents [21, 23].XML was introduced to enhance the syntax and semantics of Web data over HTMLby using meaningful tags with structured schemata. For example, by using XML we
* The work reported here has been supported by the Grant Number (R01-2001-000-00467-0)
from the Korea Science & Engineering Foundation.
256 Sang Bong Yoo and In Han Kim
can represent the same person as an employee in one place or as a customer in anotherplace. However, XML has a limited capability to capture the interrelationship amongobjects. Metadata and RDF have been introduced in order to complement XML withrich semantics of the relationship among objects. Even though many active researchand development efforts are being conducted in order to apply the Semantic Web topractical uses, the current paradigm of the Semantic Web cannot handle effectivelyexisting Web environments due to the followings:
� Active Objects: Recently the Web accommodates a large number of autonomous�network devices� � (wired or wireless) PDA, workstations, databases, and otherdevices � that are all connected via an intranet or the Internet. These �networkdevices� are active: they not only receive information, but also deliver informa-tion (e.g., instructions, commands). In addition, many of such devices may pos-sess states and need to be controlled dynamically (e.g., oxygen valves). To man-age a dynamic environment as described, special control and communicationmechanisms are required to be developed.
� Real-Time, Distributed Processes: Because there are many indeterministicfactors in real-time distributed environments (e.g., order and time of message de-liveries), it usually needs trial and error to encode the overall distributed controlprocesses in conventional programs. The domain knowledge is intermixed withprogram constructs in conventional programming methods, which makes themaintenance of the software labor-intensive especially in distributed environ-ments. In this paper, we couple the declarativeness and inference capability offormal logic with real-time distributed objects in order to enable the users to en-code easily the domain knowledge into rules.
An active environment has been modeled as a set of real-time objects each consistingof a set of attributes, states and methods that can be changed or executed spontane-ously or triggered by demands (via messages) in real-time. The semantics of such adistributed, real-time object system can be described completely by a formal logicalfoundation called Active Real-Time Semantic Web (ARTSW) [24] that is the ordinaryfirst order language (that is time-invariant) plus a set of time-varying constructs (seeFig. 1). The ARTSW can be used to describe the constraints on top of the real-timeobjects, or it can be used as a specification language that defines the semantics of adynamic environment.
Not only the Web pages in HTML or XML but also all the resources connectedthrough networks are identified and controlled in ARTSW. In the metadata defined byRDF and encoded in XML, summaries, classifications, relationship, contexts, or con-trol logics as for network resources are specified. Each ARTSW agent runs on anembedded controller or on a stand-alone machine independently and communicateswith the ARTSW server or other agents. Because each agent is portable and has built-in capability of real-time management and rule processing, the users only need todefine the semantics and constraints into rules. With this approach, the knowledgeencoded in rules is orthogonal to other built-in modules in ARTSW, therefore eachrule is defined separately and can be easily updated with automatic validation.ARTSW can relieve the developers from real-time network programming details.
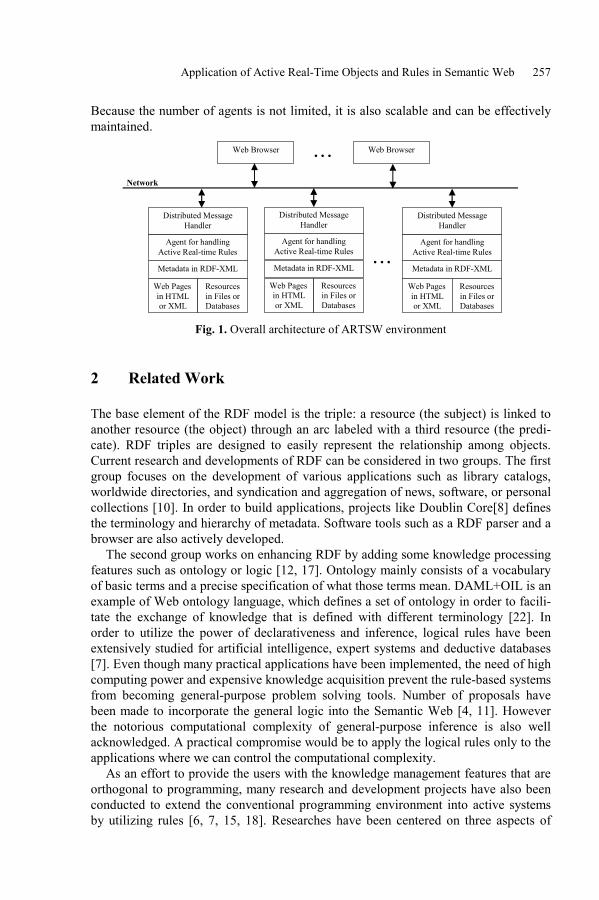
Application of Active Real-Time Objects and Rules in Semantic Web 257
Because the number of agents is not limited, it is also scalable and can be effectivelymaintained.
Web Pages in HTML or XML
Resources in Files or Databases
Metadata in RDF-XML
Agent for handling Active Real-time Rules
Distributed Message Handler
Web Browser Web Browser • • •
Network
• • •
Web Pagesin HTML or XML
Resources in Files or Databases
Metadata in RDF-XML
Agent for handling Active Real-time Rules
Distributed Message Handler
Web Pagesin HTML or XML
Resources in Files or Databases
Metadata in RDF-XML
Agent for handling Active Real-time Rules
Distributed Message Handler
Fig. 1. Overall architecture of ARTSW environment
2 Related Work
The base element of the RDF model is the triple: a resource (the subject) is linked toanother resource (the object) through an arc labeled with a third resource (the predi-cate). RDF triples are designed to easily represent the relationship among objects.Current research and developments of RDF can be considered in two groups. The firstgroup focuses on the development of various applications such as library catalogs,worldwide directories, and syndication and aggregation of news, software, or personalcollections [10]. In order to build applications, projects like Doublin Core[8] definesthe terminology and hierarchy of metadata. Software tools such as a RDF parser and abrowser are also actively developed.
The second group works on enhancing RDF by adding some knowledge processingfeatures such as ontology or logic [12, 17]. Ontology mainly consists of a vocabularyof basic terms and a precise specification of what those terms mean. DAML+OIL is anexample of Web ontology language, which defines a set of ontology in order to facili-tate the exchange of knowledge that is defined with different terminology [22]. Inorder to utilize the power of declarativeness and inference, logical rules have beenextensively studied for artificial intelligence, expert systems and deductive databases[7]. Even though many practical applications have been implemented, the need of highcomputing power and expensive knowledge acquisition prevent the rule-based systemsfrom becoming general-purpose problem solving tools. Number of proposals havebeen made to incorporate the general logic into the Semantic Web [4, 11]. Howeverthe notorious computational complexity of general-purpose inference is also wellacknowledged. A practical compromise would be to apply the logical rules only to theapplications where we can control the computational complexity.
As an effort to provide the users with the knowledge management features that areorthogonal to programming, many research and development projects have also beenconducted to extend the conventional programming environment into active systemsby utilizing rules [6, 7, 15, 18]. Researches have been centered on three aspects of
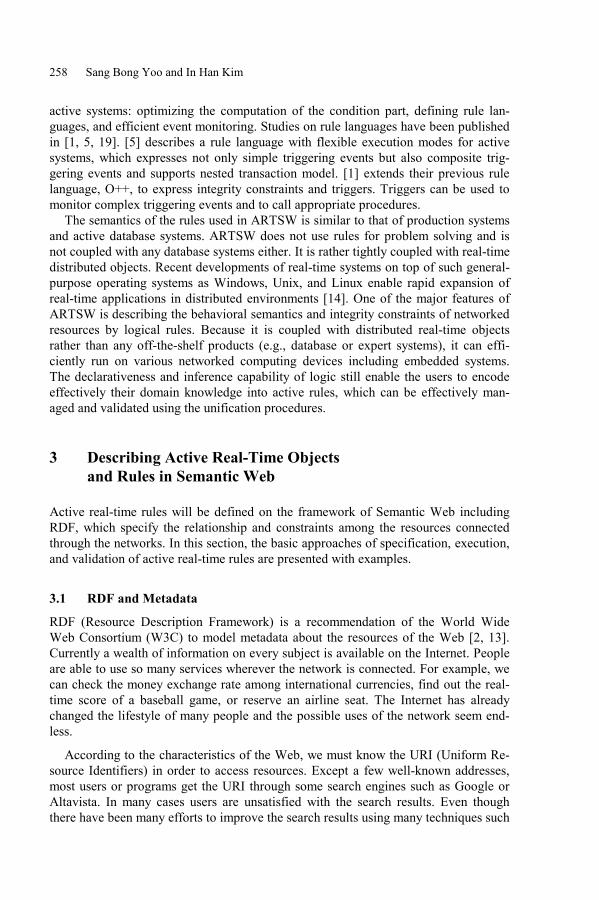
258 Sang Bong Yoo and In Han Kim
active systems: optimizing the computation of the condition part, defining rule lan-guages, and efficient event monitoring. Studies on rule languages have been publishedin [1, 5, 19]. [5] describes a rule language with flexible execution modes for activesystems, which expresses not only simple triggering events but also composite trig-gering events and supports nested transaction model. [1] extends their previous rulelanguage, O++, to express integrity constraints and triggers. Triggers can be used tomonitor complex triggering events and to call appropriate procedures.
The semantics of the rules used in ARTSW is similar to that of production systemsand active database systems. ARTSW does not use rules for problem solving and isnot coupled with any database systems either. It is rather tightly coupled with real-timedistributed objects. Recent developments of real-time systems on top of such general-purpose operating systems as Windows, Unix, and Linux enable rapid expansion ofreal-time applications in distributed environments [14]. One of the major features ofARTSW is describing the behavioral semantics and integrity constraints of networkedresources by logical rules. Because it is coupled with distributed real-time objectsrather than any off-the-shelf products (e.g., database or expert systems), it can effi-ciently run on various networked computing devices including embedded systems.The declarativeness and inference capability of logic still enable the users to encodeeffectively their domain knowledge into active rules, which can be effectively man-aged and validated using the unification procedures.
3 Describing Active Real-Time Objectsand Rules in Semantic Web
Active real-time rules will be defined on the framework of Semantic Web includingRDF, which specify the relationship and constraints among the resources connectedthrough the networks. In this section, the basic approaches of specification, execution,and validation of active real-time rules are presented with examples.
3.1 RDF and Metadata
RDF (Resource Description Framework) is a recommendation of the World WideWeb Consortium (W3C) to model metadata about the resources of the Web [2, 13].Currently a wealth of information on every subject is available on the Internet. Peopleare able to use so many services wherever the network is connected. For example, wecan check the money exchange rate among international currencies, find out the real-time score of a baseball game, or reserve an airline seat. The Internet has alreadychanged the lifestyle of many people and the possible uses of the network seem end-less.
According to the characteristics of the Web, we must know the URI (Uniform Re-source Identifiers) in order to access resources. Except a few well-known addresses,most users or programs get the URI through some search engines such as Google orAltavista. In many cases users are unsatisfied with the search results. Even thoughthere have been many efforts to improve the search results using many techniques such
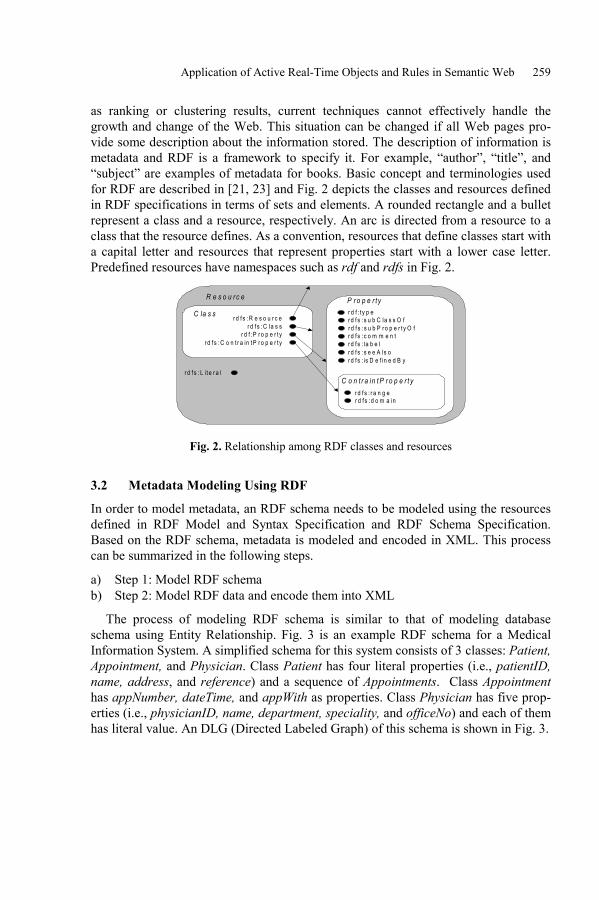
Application of Active Real-Time Objects and Rules in Semantic Web 259
as ranking or clustering results, current techniques cannot effectively handle thegrowth and change of the Web. This situation can be changed if all Web pages pro-vide some description about the information stored. The description of information ismetadata and RDF is a framework to specify it. For example, �author�, �title�, and�subject� are examples of metadata for books. Basic concept and terminologies usedfor RDF are described in [21, 23] and Fig. 2 depicts the classes and resources definedin RDF specifications in terms of sets and elements. A rounded rectangle and a bulletrepresent a class and a resource, respectively. An arc is directed from a resource to aclass that the resource defines. As a convention, resources that define classes start witha capital letter and resources that represent properties start with a lower case letter.Predefined resources have namespaces such as rdf and rdfs in Fig. 2.
r d f s :R e s o u r c eC la s sr d f s :C la s s
rd f s :C o n t r a in tP ro p e r t yr d f :P ro p e r t y
R e s o u r c e P r o p e r ty
r d f s :L i t e ra l
r d f : t y p e
r d f s : s u b P ro p e r t y O f r d f s : s u b C la s s O f
r d f s : c o m m e n t r d f s : la b e l r d f s : s e e A ls o r d f s : is D e f in e d B y
C o n t r a in t P r o p e r t y r d f s : r a n g e r d f s :d o m a in
Fig. 2. Relationship among RDF classes and resources
3.2 Metadata Modeling Using RDF
In order to model metadata, an RDF schema needs to be modeled using the resourcesdefined in RDF Model and Syntax Specification and RDF Schema Specification.Based on the RDF schema, metadata is modeled and encoded in XML. This processcan be summarized in the following steps.
a) Step 1: Model RDF schemab) Step 2: Model RDF data and encode them into XML
The process of modeling RDF schema is similar to that of modeling databaseschema using Entity Relationship. Fig. 3 is an example RDF schema for a MedicalInformation System. A simplified schema for this system consists of 3 classes: Patient,Appointment, and Physician. Class Patient has four literal properties (i.e., patientID,name, address, and reference) and a sequence of Appointments. Class Appointmenthas appNumber, dateTime, and appWith as properties. Class Physician has five prop-erties (i.e., physicianID, name, department, speciality, and officeNo) and each of themhas literal value. An DLG (Directed Labeled Graph) of this schema is shown in Fig. 3.
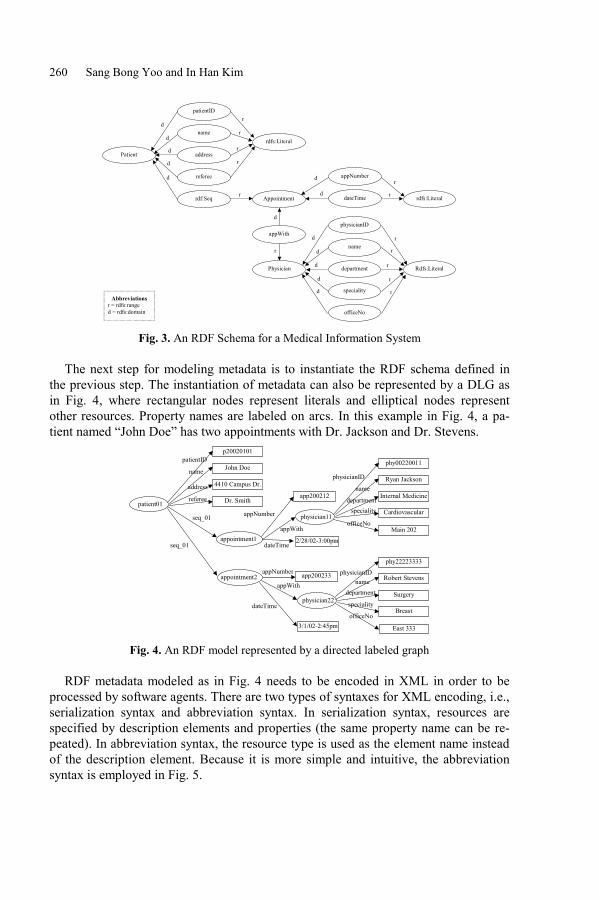
260 Sang Bong Yoo and In Han Kim
physicianID
name
department
speciality
officeNo
Rdfs:Literal
rdfs:Literal name
Patient
patientID
address
referee
Appointment rdf:Seq
Physician
dateTime
appNumber
rdfs:Literal
Abbreviations r = rdfs:range d = rdfs:domain
rd
r
r
r
r
r
d
d
d
d
d
r
d
d
d
d d
d
r
r
r
r
r
appWith
d
r
Fig. 3. An RDF Schema for a Medical Information System
The next step for modeling metadata is to instantiate the RDF schema defined inthe previous step. The instantiation of metadata can also be represented by a DLG asin Fig. 4, where rectangular nodes represent literals and elliptical nodes representother resources. Property names are labeled on arcs. In this example in Fig. 4, a pa-tient named �John Doe� has two appointments with Dr. Jackson and Dr. Stevens.
patient01
p20020101 patientID
John Doe name
4410 Campus Dr.
Dr. Smith
appointment1
address
referee
seq_01 physician11
physician22
phy00220011
physicianID Ryan Jackson name
Internal Medicine
Cardiovascular
departmentspeciality
officeNoMain 202
phy22223333
Robert Stevens
Surgery
Breast
East 333
app200233
2/28/02-3:00pmdateTime
appNumber
dateTime
appNumber physicianIDname
department
speciality
officeNo
appointment2
seq_01
app200212
3/1/02-2:45pm
appWith
appWith
Fig. 4. An RDF model represented by a directed labeled graph
RDF metadata modeled as in Fig. 4 needs to be encoded in XML in order to beprocessed by software agents. There are two types of syntaxes for XML encoding, i.e.,serialization syntax and abbreviation syntax. In serialization syntax, resources arespecified by description elements and properties (the same property name can be re-peated). In abbreviation syntax, the resource type is used as the element name insteadof the description element. Because it is more simple and intuitive, the abbreviationsyntax is employed in Fig. 5.
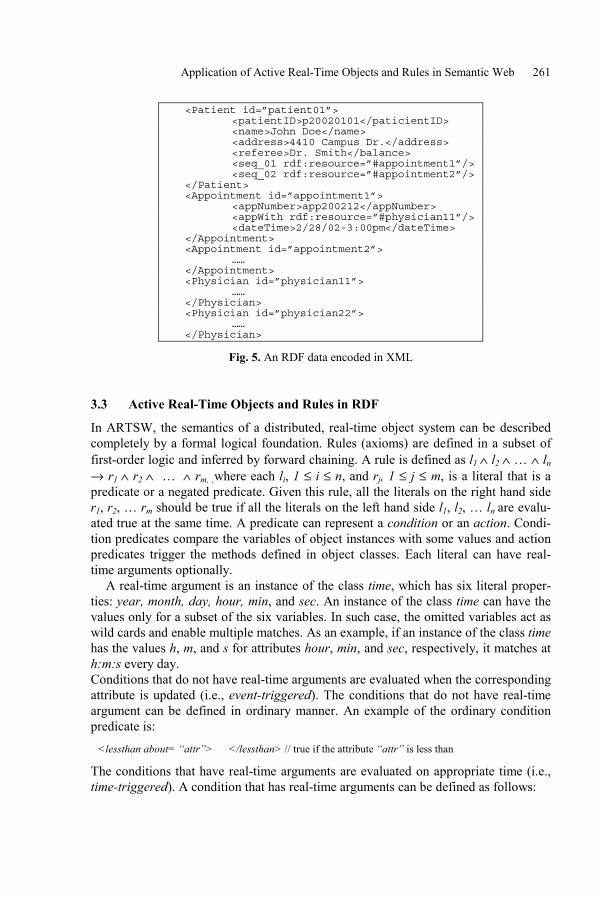
Application of Active Real-Time Objects and Rules in Semantic Web 261
<Patient id=”patient01”><patientID>p20020101</paticientID><name>John Doe</name><address>4410 Campus Dr.</address><referee>Dr. Smith</balance><seq_01 rdf:resource=”#appointment1”/><seq_02 rdf:resource=”#appointment2”/>
</Patient><Appointment id=”appointment1”>
<appNumber>app200212</appNumber><appWith rdf:resource=”#physician11”/><dateTime>2/28/02-3:00pm</dateTime>
</Appointment><Appointment id=”appointment2”>
……</Appointment><Physician id=”physician11”>
……</Physician><Physician id=”physician22”>
……</Physician>
Fig. 5. An RDF data encoded in XML
3.3 Active Real-Time Objects and Rules in RDF
In ARTSW, the semantics of a distributed, real-time object system can be describedcompletely by a formal logical foundation. Rules (axioms) are defined in a subset offirst-order logic and inferred by forward chaining. A rule is defined as l1 ∧ l2 ∧ � ∧ ln
→ r1 ∧ r2 ∧ � ∧ rm, ,where each li, 1 ≤ i ≤ n, and rj, 1 ≤ j ≤ m, is a literal that is apredicate or a negated predicate. Given this rule, all the literals on the right hand sider1, r2, � rm should be true if all the literals on the left hand side l1, l2, � ln are evalu-ated true at the same time. A predicate can represent a condition or an action. Condi-tion predicates compare the variables of object instances with some values and actionpredicates trigger the methods defined in object classes. Each literal can have real-time arguments optionally.
A real-time argument is an instance of the class time, which has six literal proper-ties: year, month, day, hour, min, and sec. An instance of the class time can have thevalues only for a subset of the six variables. In such case, the omitted variables act aswild cards and enable multiple matches. As an example, if an instance of the class timehas the values h, m, and s for attributes hour, min, and sec, respectively, it matches ath:m:s every day.Conditions that do not have real-time arguments are evaluated when the correspondingattribute is updated (i.e., event-triggered). The conditions that do not have real-timeargument can be defined in ordinary manner. An example of the ordinary conditionpredicate is:
<lessthan about= �attr�> � </lessthan> // true if the attribute �attr� is less than �
The conditions that have real-time arguments are evaluated on appropriate time (i.e.,time-triggered). A condition that has real-time arguments can be defined as follows:
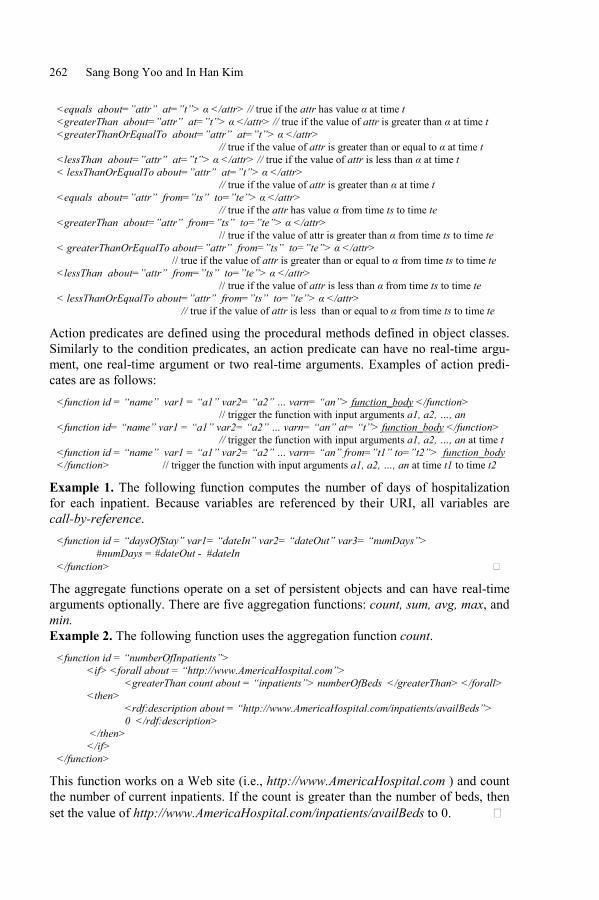
262 Sang Bong Yoo and In Han Kim
<equals about=�attr� at=�t�> α </attr> // true if the attr has value α at time t<greaterThan about=�attr� at=�t�> α </attr> // true if the value of attr is greater than α at time t<greaterThanOrEqualTo about=�attr� at=�t�> α </attr> // true if the value of attr is greater than or equal to α at time t<lessThan about=�attr� at=�t�> α </attr> // true if the value of attr is less than α at time t< lessThanOrEqualTo about=�attr� at=�t�> α </attr> // true if the value of attr is greater than α at time t<equals about=�attr� from=�ts� to=�te�> α </attr> // true if the attr has value α from time ts to time te<greaterThan about=�attr� from=�ts� to=�te�> α </attr> // true if the value of attr is greater than α from time ts to time te< greaterThanOrEqualTo about=�attr� from=�ts� to=�te�> α </attr> // true if the value of attr is greater than or equal to α from time ts to time te<lessThan about=�attr� from=�ts� to=�te�> α </attr> // true if the value of attr is less than α from time ts to time te< lessThanOrEqualTo about=�attr� from=�ts� to=�te�> α </attr> // true if the value of attr is less than or equal to α from time ts to time te
Action predicates are defined using the procedural methods defined in object classes.Similarly to the condition predicates, an action predicate can have no real-time argu-ment, one real-time argument or two real-time arguments. Examples of action predi-cates are as follows:
<function id = �name� var1 = �a1� var2= �a2� � varn= �an�> function_body </function> // trigger the function with input arguments a1, a2, �, an<function id= �name� var1 = �a1� var2= �a2� � varn= �an� at= �t�> function_body </function> // trigger the function with input arguments a1, a2, �, an at time t<function id = �name� var1 = �a1� var2= �a2� � varn= �an� from=�t1� to=�t2�> function_body</function> // trigger the function with input arguments a1, a2, �, an at time t1 to time t2
Example 1. The following function computes the number of days of hospitalizationfor each inpatient. Because variables are referenced by their URI, all variables arecall-by-reference.
<function id = �daysOfStay� var1= �dateIn� var2= �dateOut� var3= �numDays�> #numDays = #dateOut - #dateIn</function> !
The aggregate functions operate on a set of persistent objects and can have real-timearguments optionally. There are five aggregation functions: count, sum, avg, max, andmin.Example 2. The following function uses the aggregation function count.
<function id = �numberOfInpatients�><if> <forall about = �http://www.AmericaHospital.com�>
<greaterThan count about = �inpatients�> numberOfBeds </greaterThan> </forall><then>
<rdf:description about = �http://www.AmericaHospital.com/inpatients/availBeds�> 0 </rdf:description> </then>
</if></function>
This function works on a Web site (i.e., http://www.AmericaHospital.com ) and countthe number of current inpatients. If the count is greater than the number of beds, thenset the value of http://www.AmericaHospital.com/inpatients/availBeds to 0. !
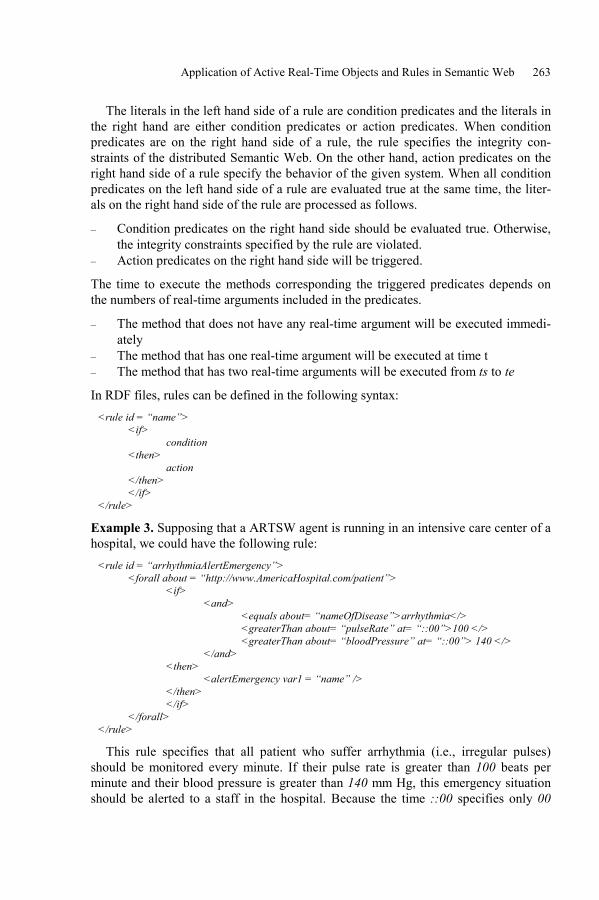
Application of Active Real-Time Objects and Rules in Semantic Web 263
The literals in the left hand side of a rule are condition predicates and the literals inthe right hand are either condition predicates or action predicates. When conditionpredicates are on the right hand side of a rule, the rule specifies the integrity con-straints of the distributed Semantic Web. On the other hand, action predicates on theright hand side of a rule specify the behavior of the given system. When all conditionpredicates on the left hand side of a rule are evaluated true at the same time, the liter-als on the right hand side of the rule are processed as follows.
� Condition predicates on the right hand side should be evaluated true. Otherwise,the integrity constraints specified by the rule are violated.
� Action predicates on the right hand side will be triggered.
The time to execute the methods corresponding the triggered predicates depends onthe numbers of real-time arguments included in the predicates.
� The method that does not have any real-time argument will be executed immedi-ately
� The method that has one real-time argument will be executed at time t� The method that has two real-time arguments will be executed from ts to te
In RDF files, rules can be defined in the following syntax:<rule id = �name�> <if>
condition<then>
action</then></if>
</rule>
Example 3. Supposing that a ARTSW agent is running in an intensive care center of ahospital, we could have the following rule:
<rule id = �arrhythmiaAlertEmergency�><forall about = �http://www.AmericaHospital.com/patient�>
<if><and>
<equals about= �nameOfDisease�>arrhythmia</><greaterThan about= �pulseRate� at= �::00�>100 </><greaterThan about= �bloodPressure� at= �::00�> 140 </>
</and><then>
<alertEmergency var1 = �name� /></then>
</if></forall>
</rule>
This rule specifies that all patient who suffer arrhythmia (i.e., irregular pulses)should be monitored every minute. If their pulse rate is greater than 100 beats perminute and their blood pressure is greater than 140 mm Hg, this emergency situationshould be alerted to a staff in the hospital. Because the time ::00 specifies only 00
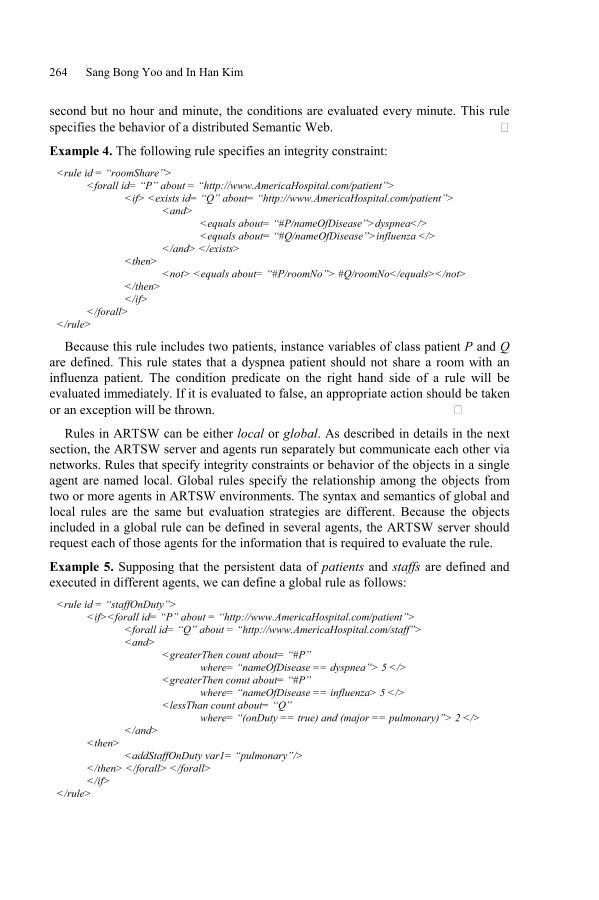
264 Sang Bong Yoo and In Han Kim
second but no hour and minute, the conditions are evaluated every minute. This rulespecifies the behavior of a distributed Semantic Web. !
Example 4. The following rule specifies an integrity constraint:<rule id = �roomShare�>
<forall id= �P� about = �http://www.AmericaHospital.com/patient�><if> <exists id= �Q� about= �http://www.AmericaHospital.com/patient�>
<and><equals about= �#P/nameOfDisease�>dyspnea</><equals about= �#Q/nameOfDisease�>influenza </>
</and> </exists> <then>
<not> <equals about= �#P/roomNo�> #Q/roomNo</equals></not></then></if>
</forall></rule>
Because this rule includes two patients, instance variables of class patient P and Qare defined. This rule states that a dyspnea patient should not share a room with aninfluenza patient. The condition predicate on the right hand side of a rule will beevaluated immediately. If it is evaluated to false, an appropriate action should be takenor an exception will be thrown. !
Rules in ARTSW can be either local or global. As described in details in the nextsection, the ARTSW server and agents run separately but communicate each other vianetworks. Rules that specify integrity constraints or behavior of the objects in a singleagent are named local. Global rules specify the relationship among the objects fromtwo or more agents in ARTSW environments. The syntax and semantics of global andlocal rules are the same but evaluation strategies are different. Because the objectsincluded in a global rule can be defined in several agents, the ARTSW server shouldrequest each of those agents for the information that is required to evaluate the rule.
Example 5. Supposing that the persistent data of patients and staffs are defined andexecuted in different agents, we can define a global rule as follows:
<rule id = �staffOnDuty�><if><forall id= �P� about = �http://www.AmericaHospital.com/patient�>
<forall id= �Q� about = �http://www.AmericaHospital.com/staff�><and>
<greaterThen count about= �#P�where= �nameOfDisease == dyspnea�> 5 </>
<greaterThen conut about= �#P�where= �nameOfDisease == influenza> 5 </>
<lessThan count about= �Q�where= �(onDuty == true) and (major == pulmonary)�> 2 </>
</and><then>
<addStaffOnDuty var1= �pulmonary�/></then> </forall> </forall></if>
</rule>
Application of Active Real-Time Objects and Rules in Semantic Web 265
This rule specifies that if the numbers of patients who suffer from dyspnea is graterthan 5, the numbers of patients who suffer from influenza are also greater than 5 andthe number of staff who is on duty and whose major is pulmonary is less than 2 then astaff whose major is pulmonary should be added to the duty list. In order to evaluatethis rule, the ARTSW server should request the agents that manage the persistentobjects for the numbers of patients and staffs who meet the given conditions. !
4 Validation of Active Real-Time Rules
One of the main advantages of using logical rule is that we can analysis a set of rulesbased on mathematical unification and inference methods. In this work, we will extendthe knowledge assimilation procedure to the rules with real time. We will explore theconcepts of contradiction, redundancy, and independency of a set of logical rules withtime and develop the procedures to verify these properties. Given a set of existingrules R and a rule k to be added, we can classify the knowledge assimilation probleminto the following cases:
a) Contradiction between A New Rule and The Current Rule Base.k is said to be inconsistent with R if (k ∧ R) can derive a contraction, which is rep-resented by the empty clause, nil.
b) Subsumption.In general, one clause C1 subsumes another clause C2 if all the conditions andconclusions of some instance of C1 are contained among the conditions and con-clusions of C2. The subsuming clauses are more general than the subsumed clauseand possibly have fewer conditions or fewer conclusions. Although redundancycan be traced as a special case of subsumption such that k is said to be redundantwith respect to R if k can be derived from R. In this work, redundant rules will behandled differently even if a redundant rule is a special case of subsumed rules.For example, consider the case in which we try to add a rule p1(a, Y) ∧ p2(Y, Z) →p3(a, Z) into a rule base which has the rule p1(X, Y) ∧ p2(Y, Z) → p3(X, Z) explic-itly or implicitly. In this case, the new rule is redundant because it can be obtainedby instantiating the variable X with a constant a.
c) Independency.A rule is said to be independent on the current rule base if the rule neither contra-dicts nor is provable from the current rule base. In this case, the rule can be as-similated into the rule base.
Several knowledge assimilation methods have been proposed for logic and deductivedatabases. Because the logic system used in this work includes the real-time argu-ments, the proposed methods should be modified. Because real-time arguments notonly specify exact times but also define time intervals, the assimilation process needsspecial considerations.
Example 6. The following two clause do not match each other but contradict becauseit specify different values for the same object.
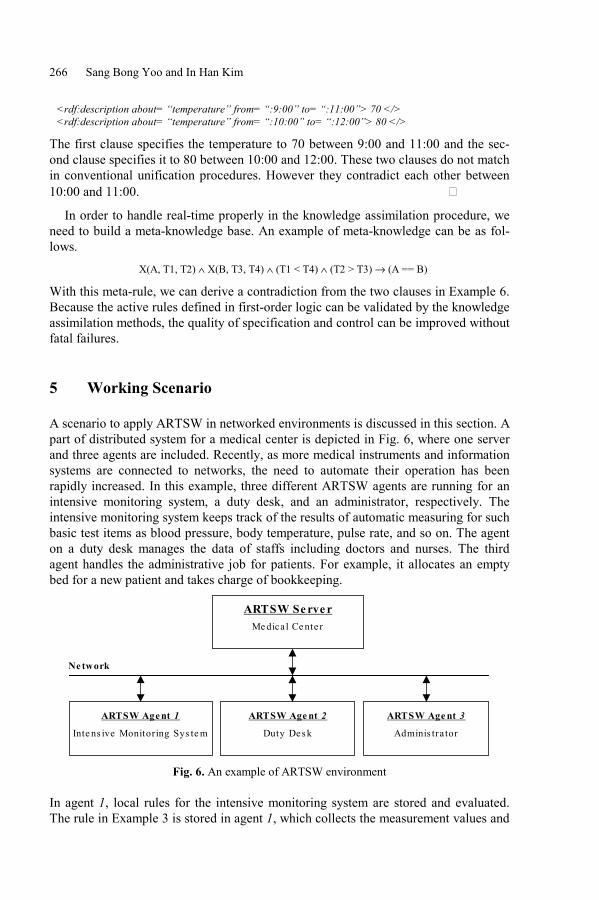
266 Sang Bong Yoo and In Han Kim
<rdf:description about= �temperature� from= �:9:00� to= �:11:00�> 70 </><rdf:description about= �temperature� from= �:10:00� to= �:12:00�> 80 </>
The first clause specifies the temperature to 70 between 9:00 and 11:00 and the sec-ond clause specifies it to 80 between 10:00 and 12:00. These two clauses do not matchin conventional unification procedures. However they contradict each other between10:00 and 11:00. !
In order to handle real-time properly in the knowledge assimilation procedure, weneed to build a meta-knowledge base. An example of meta-knowledge can be as fol-lows.
X(A, T1, T2) ∧ X(B, T3, T4) ∧ (T1 < T4) ∧ (T2 > T3) → (A == B)
With this meta-rule, we can derive a contradiction from the two clauses in Example 6.Because the active rules defined in first-order logic can be validated by the knowledgeassimilation methods, the quality of specification and control can be improved withoutfatal failures.
5 Working Scenario
A scenario to apply ARTSW in networked environments is discussed in this section. Apart of distributed system for a medical center is depicted in Fig. 6, where one serverand three agents are included. Recently, as more medical instruments and informationsystems are connected to networks, the need to automate their operation has beenrapidly increased. In this example, three different ARTSW agents are running for anintensive monitoring system, a duty desk, and an administrator, respectively. Theintensive monitoring system keeps track of the results of automatic measuring for suchbasic test items as blood pressure, body temperature, pulse rate, and so on. The agenton a duty desk manages the data of staffs including doctors and nurses. The thirdagent handles the administrative job for patients. For example, it allocates an emptybed for a new patient and takes charge of bookkeeping.
ARTSW Se rve r Me dical Ce nte r
ARTSW Age nt 1
Inte ns ive Monitoring Sys te m
ARTSW Age nt 2
Duty Des k
ARTSW Age nt 3
Adminis tra tor
Ne twork
Fig. 6. An example of ARTSW environment
In agent 1, local rules for the intensive monitoring system are stored and evaluated.The rule in Example 3 is stored in agent 1, which collects the measurement values and
Application of Active Real-Time Objects and Rules in Semantic Web 267
deals with abnormal cases. The rule in Example 4 specifies the restrictions on sharinga room among patients and it is stored in agent 2. The global rule in Example 5 moni-tors the numbers of patients and staffs on duty. If the number of staffs on duty is lessthan certain regulation it automatically run a function to add more staffs. This globalrule is stored in the Medical Center Server.
Having defined the above three rules in agent 1, agent 3, and the server, respec-tively, rule triggering modules continuously monitor the literals on left hand sides. Inagent 3, in case any patient having dyspnea is allocated to the same room with a pa-tient having influenza, the local rule defined in agent 3 is violated. Once a violationoccurs, the allocating procedure is blocked and the situation is informed to an admin-istrator. The conditions in the rule defined in agent 1 are evaluated every minute. Ifany patient having arrhythmia suffers from high pulse rate and blood pressure as de-fined on the left hand side of the rule, the patient's name will be informed to the staffsin agent 2.
Supposing that the persistent objects of staffs and patients are managed by agent 2and agent 3, respectively, the aggregate function count in the global rule should beevaluated by agent 2 and agent 3. Because the given literals are event-triggered, theywill be evaluated whenever the values of patients and staffs are updated. Suppose thatthe numbers of patients having dyspnea and influenza are 5 and 6, respectively, andthe number of on-duty staff whose major is pulmonary is 1. Currently not all the con-ditions of the left hand side of the rule are true. Once a new patient having dyspnea ischecked in, the rule will be fired and the function addStaffOnDuty will be executed inagent 2.
6 Conclusion
The design principles and operational model of the active real-time objects and rulesis presented in this paper. As networks (i.e., the Internet and intranets) proliferate inrecent computing environments, software development and maintenance become amajor bottleneck in distributed Web systems. One of the major goals of the providingthe active real-time objects and rules is to provide the users a portable and scalabledistributed tool that has built-in real-time communication capabilities. By supportingformal rules to define the semantics and behavior of Semantic Web, domain knowl-edge can be easily encoded and managed without involving into the details of commu-nication and real-time programming. The advantages of using the active real-timeobjects and rules over conventional distributed real-time programming are summa-rized as follows:
� Because the active real-time objects and rules arespecified in RDF format that isencoded in XML syntax, it can be easily extended on top of existing Web appli-cations.
� Because all the resources connected through the network can be identified byURI, the active real-time objects and rules can be directly built on HTML, XML,or other file systems. With proper optimization modules, it will outperform ex-isting information systems by eliminating data transformations.
268 Sang Bong Yoo and In Han Kim
� Defining the business rules or control logics in terms of the first order logic, itrelieves the users from complicated real-time and network programming andmaintenance.
� Because the active rules are defined in first-order logic can be validated byknowledge assimilation methods, the quality of specification and control can beimproved without fatal failures.
Prospected application areas of the active real-time objects and rules are many softreal-time distributed Web systems such as Distributed Control and Management Sys-tems, Electronic Commercial Systems, information appliances, VOD systems, andgame software. In order to be more powerful, it needs to be extended with variousdevelopment tools. Even current execution model allows cascade rule triggering; theusers are responsible for the consequences. In order to be more reliable tool, more ruleanalysis and simulation tools should prevent possible malfunctions such as infinitetriggering and indeterministic behaviors.
References
[1] R. Agrawal and N. Gehani, "Ode(Object database and environment): The lan-guage and the data model," Proceedings of the ACM SIGMOD InternationalConference on Management of Data, pp36-45, Portland, Oregon, May 1989.
[2] Kal Ahmed et al., Professional XML Meta Data, Wrox Press, Nov. 2001.[3] Tim Berners-Lee, J. Hendler, and Ora Lassila, �The Semantic Web � A new
form of Web content that is meaningful to computers will unleash a revolutionof new possibilities,� Scientific American, May 2001.
[4] H. Boley, S. Tabet, and G. Wagner, �Design Rationale for RuleML: A MarkupLanguage for Semantic Web Rules,� Proc. of Semantic Web Symposium, Stan-ford University, July 2001.
[5] S. Chakravarthy, B. Blaustein, A.P. Buchmann, M.Carey, U.Dayal,D.Goldhirsch, M.Hsu, R.Jauhari, R.Ladin, M.Livny, D.McCarthy, R.McKee,and A.Rosenthal, "HiPAC: A research project in active, time-constrained data-base management," Technical Report XAIT-89-02, Xerox Advanced Informa-tion Technology, Cambridge, Massachusetts, July 1989.
[6] S. Ceri, C. Gennaro, S. Paraboschi, and G. Serazzi, �Effective scheduling ofdetached rules in active databases,� IEEE Trans. on Knowledge and Data Engi-neering, Vol. 15, Issue 1, Jan/Feb 2003, pp. 2-13.
[7] Datta and S.H. Son, �A study of concurrency control in real-time, active data-base systems,� IEEE Trans. on Knowledge and Data Engineering, Vol. 14, Is-sue 3, May/Jun 2002, pp. 465-484.
[8] Doublin Core Metadata Initiative website http://dublincore.org/[9] Stefan Decker et al., �The Semantic Web: The Roles of XML and RDF,� IEEE
Internet Computing, Vol 4(5), pp. 63-74, Sept/Oct 2000.[10] Andreas Eberhart, Survey of RDF data on the Web, Dec 2001, available at
http://www.i-u.de/schools/eberhart/rdf/
Application of Active Real-Time Objects and Rules in Semantic Web 269
[11] James Farrugia, �Logics for the Semantic We,� Proc. of Semantic Web Sympo-sium, Stanford University, July 2001.
[12] R. Fikes and D. McGuinness, An Axiomatic Semantics for RDF, RDF Schema,and DAML+OIL, Technical Report KSL-01-01, Knowledge Systems Labora-tory, Stanford University, 2001.
[13] Johan Hjelm, Creating the Semantic Web with RDF: Professional Developer'sGuide, John Wiley & Sons, 2001.
[14] Kim, K. H., �Real-time Object-oriented Distributed Software Engineering andThe TMO Scheme,� International Journal of Software Engineering andKnowledge Engineering, Vol. 9, No. 2, 251-276, 1999.
[15] K. C. Kim, S. B. Yoo, K. W. Ko, and S. K. Cha, �Active System for Heteroge-neous ODBMS Using Mobile Rule Codes,� Lecture Notes in Computer Science1884 (2000 ADBIS-DASFAA), Springer-Verlag, pp. 93-106, September 2000.
[16] McBride, �Jena: a semantic Web toolkit,� IEEE Internet Computing, Vol. 6,Issue 6, Nov/Dec 2002, pp. 55-59.
[17] Drew McDemott and Dejing Dou, Embedding Logic in DAML/RDF, Nov.2001, available at ftp://ftp.cs.yale.edu/pub/mcdermott/papers/wwwconf.pdf
[18] Paton, N. W. and Diaz, O., �Active Database Systems,� ACM Computing Sur-veys, 31(1), pp. 63-103, 1999.
[19] Steve Ross-Talbot, �Java Rules in J2EE,� Java Developer's Journal, Vol. 6,Issue 9, September 2001.
[20] Sheth, �Managing Semantic Content for the Web,� IEEE Internet Computing,Vol. 6, Issue 4, July/Aug 2002, pp. 80-87.
[21] World Wide Web Consortium, Resource Description Framework (RDF)Schema Specification 1.0, W3C Candidate Recommendation 27 March 2000,available at http://www.w3.org/TR/2000/CR-rdf-schema-20000327/
[22] World Wide Web Consortium website http://www.w3.org/2001/sw/[23] World Wide Web Consortium, Resource Description Framework (RDF) Model
and Syntax Specification, W3C Recommendation 22 February 1999, availableat http://www.w3.org/TR/1999/REC-rdf-syntax-19990222/
[24] S. Yoo and P.C-Y. Sheu, �Describing Distributed Real-time Objects withLogic,� Sixth International Conference on Integrated Design and Process Tech-nology, Pasadena, California, USA, June 2002, pp. 1-7.