Human metabolism lecture notes - Inside EWU
408
-
Upload
khangminh22 -
Category
Documents
-
view
0 -
download
0
Transcript of Human metabolism lecture notes - Inside EWU


Human metabolism lecture notes
Michael Palmer, MD
Department of Chemistry
University of Waterloo
Waterloo, ON N2L 3G1
Canada
This version is from Friday 10th April, 2015. The latest electronic version of these notesand accompanying slides is available for free at
watcut.uwaterloo.ca/webnotes/Metabolism/.
No other website is authorized to publicly distribute these notes or accompanying slides.A printed version (full color, hardcover binding) is now available at amazon and other
retailers. For bulk orders at reduced rates, contact me directly.
Copyright© Michael Palmer, 2014. All rights reserved (see section 20.3 for details). Cover design byJana Rade (impactstudiosonline.com). The cover illustration is a model of a glycogen molecule.

Preface
These lecture notes, and the accompanying slides, are intended for teaching human
metabolism at the undergraduate level. They aim to give a big picture view of the
field that takes into account physiological and some clinical aspects. They also
strive to be up to date. Some biochemistry texts present all the latest and greatest
enzyme crystal structures, but seem stuck in the 1960s when it comes to updating
metabolic pathways. It is likely that these notes are not completely free from
this disease either, and I therefore welcome any corrections and suggestions for
improvement.
The notes and the slides are meant to be used in conjunction; the notes mostly
present the slides in sequence, augmenting each with explanatory text. Keeping
the figures and the corresponding text closely together may not always look as
polished as a conventional book layout, but it makes on-screen reading easier. This
structure also encourages me to stay on topic and to advance the plot with each
successive slide. Finally, it makes it easier to recapitulate or anticipate the content
of a lecture; this goes for both the students and the lecturer.
Another conscious choice is to make these materials freely available. The text
is entirely my own work. So is the majority of the images; all exceptions are listed
in chapter 20. Regarding those images, I would like to thank all individuals and
institutions who gave me permission to reuse them in these notes. In particular, I
thank Katharina Glatz of Basel University for permission to use multiple histologi-
cal pictures from her excellent website pathorama.ch. You are free and welcome to
use these notes and slides for self-study or for classroom teaching. Some restric-
tions apply concerning the copying and redistribution of these materials; refer to
the copyright notice in chapter 20 for details. I hope that, in return, you will bring
to my attention any errors or shortcomings that you may notice.
I would also like to thank my students, who have helped to improve these
notes by challenging and questioning me about the material and its presentation.
In particular, Stefanie Malatesta and Julia Plakhotnik have helped substantially in
this manner.
These notes were put together with a collection of excellent free software
tools. Apart from the well-known tools LATEX, Pymol, and Gnuplot, I would like to
highlight the outstanding chemfig LATEX package written by Christian Tellechea
that was used to draw all of the chemical structures and reaction mechanisms.
iii


Contents
Preface . . . . . . . . . . . . . . . . . . . . . . . . . . . . . . . . . . . . . . . . . . . . . iii
Chapter1 Introduction. . . . . . . . . . . . . . . . . . . . . . . . . . . . . . . . . . 1
1.1 Motivation: Why would you study metabolism? . . . . . . . . . . . . . . 1
1.2 Significance of metabolism in medicine . . . . . . . . . . . . . . . . . . . . 1
1.3 Catabolic and anabolic reactions . . . . . . . . . . . . . . . . . . . . . . . . 2
1.4 Diversity of metabolism: pathways in plants and bacteria . . . . . . . . 3
1.5 Types of foodstuffs. . . . . . . . . . . . . . . . . . . . . . . . . . . . . . . . . 4
1.6 The digestive system . . . . . . . . . . . . . . . . . . . . . . . . . . . . . . . . 6
1.7 Answers to practice questions. . . . . . . . . . . . . . . . . . . . . . . . . . 15
Chapter2 Refresher . . . . . . . . . . . . . . . . . . . . . . . . . . . . . . . . . . . 17
2.1 Preliminary note . . . . . . . . . . . . . . . . . . . . . . . . . . . . . . . . . . . 17
2.2 How enzymes work: active sites and catalytic mechanisms . . . . . . . 17
2.3 Energetics of enzyme-catalyzed reactions . . . . . . . . . . . . . . . . . . 20
2.4 The role of ATP in enzyme-catalyzed reactions . . . . . . . . . . . . . . . 22
2.5 Regulation of enzyme activity . . . . . . . . . . . . . . . . . . . . . . . . . . 23
2.6 Answers to practice questions. . . . . . . . . . . . . . . . . . . . . . . . . . 29
Chapter3 Glycolysis . . . . . . . . . . . . . . . . . . . . . . . . . . . . . . . . . . . 31
3.1 Overview of glucose metabolism . . . . . . . . . . . . . . . . . . . . . . . . 31
3.2 Reactions in glycolysis . . . . . . . . . . . . . . . . . . . . . . . . . . . . . . . 33
3.3 Mechanisms of enzyme catalysis in glycolysis . . . . . . . . . . . . . . . 34
3.4 Glycolysis under aerobic and anaerobic conditions . . . . . . . . . . . . 40
3.5 Transport and utilization of glucose in the liver and in other organs. 42
3.6 Answers to practice questions. . . . . . . . . . . . . . . . . . . . . . . . . . 44
Chapter4 Catabolism of sugars other than glucose . . . . . . . . . . . . . . 47
4.1 Dietary sugars other than glucose . . . . . . . . . . . . . . . . . . . . . . . 47
4.2 Degradation of fructose and sucrose . . . . . . . . . . . . . . . . . . . . . 48
4.3 Lactose and galactose . . . . . . . . . . . . . . . . . . . . . . . . . . . . . . . 50
4.4 Sorbitol is an intermediate of the polyol pathway . . . . . . . . . . . . . 53
4.5 Answers to practice questions. . . . . . . . . . . . . . . . . . . . . . . . . . 54
v

Contents
Chapter5 Pyruvate dehydrogenase and the citric acid cycle . . . . . . . . 57
5.1 Overview. . . . . . . . . . . . . . . . . . . . . . . . . . . . . . . . . . . . . . . . 57
5.2 Structure and function of pyruvate dehydrogenase . . . . . . . . . . . . 58
5.3 Regulation of pyruvate dehydrogenase . . . . . . . . . . . . . . . . . . . . 62
5.4 The citric acid cycle. . . . . . . . . . . . . . . . . . . . . . . . . . . . . . . . . 63
5.5 Regulation of the citric acid cycle. . . . . . . . . . . . . . . . . . . . . . . . 67
5.6 Reactions that divert and replenish TCA cycle intermediates . . . . . . 68
5.7 Answers to practice questions. . . . . . . . . . . . . . . . . . . . . . . . . . 68
Chapter6 The respiratory chain . . . . . . . . . . . . . . . . . . . . . . . . . . . 71
6.1 Introduction . . . . . . . . . . . . . . . . . . . . . . . . . . . . . . . . . . . . . 71
6.2 Overview. . . . . . . . . . . . . . . . . . . . . . . . . . . . . . . . . . . . . . . . 72
6.3 ATP synthesis can be separated from electron transport . . . . . . . . 73
6.4 Molecules in the electron transport chain . . . . . . . . . . . . . . . . . . 75
6.5 The energetics of electron transport . . . . . . . . . . . . . . . . . . . . . . 79
6.6 Interfacing different types of electron carriers . . . . . . . . . . . . . . . 82
6.7 How is electron transport linked to proton pumping? . . . . . . . . . . 85
6.8 ATP synthesis . . . . . . . . . . . . . . . . . . . . . . . . . . . . . . . . . . . . 87
6.9 Auxiliary shuttles for the mitochondrial reoxidation of cytosolic
NADH. . . . . . . . . . . . . . . . . . . . . . . . . . . . . . . . . . . . . . . . . . 92
6.10 Regulation of the respiratory chain . . . . . . . . . . . . . . . . . . . . . . 94
6.11 ATP yield of complete glucose oxidation . . . . . . . . . . . . . . . . . . . 97
6.12 Answers to practice questions. . . . . . . . . . . . . . . . . . . . . . . . . . 99
Chapter7 Gluconeogenesis. . . . . . . . . . . . . . . . . . . . . . . . . . . . . . . 101
7.1 Introduction . . . . . . . . . . . . . . . . . . . . . . . . . . . . . . . . . . . . . 101
7.2 Reactions in gluconeogenesis . . . . . . . . . . . . . . . . . . . . . . . . . . 102
7.3 Energy balance of gluconeogenesis. . . . . . . . . . . . . . . . . . . . . . . 105
7.4 Interactions of gluconeogenesis with other pathways. . . . . . . . . . . 106
7.5 Regulation of gluconeogenesis . . . . . . . . . . . . . . . . . . . . . . . . . 108
7.6 Answers to practice questions. . . . . . . . . . . . . . . . . . . . . . . . . . 111
Chapter8 Glycogen metabolism . . . . . . . . . . . . . . . . . . . . . . . . . . . 113
8.1 Overview. . . . . . . . . . . . . . . . . . . . . . . . . . . . . . . . . . . . . . . . 113
8.2 Glycogen structure . . . . . . . . . . . . . . . . . . . . . . . . . . . . . . . . . 113
8.3 Glycogen synthesis and degradation. . . . . . . . . . . . . . . . . . . . . . 116
8.4 Regulation of glycogen metabolism . . . . . . . . . . . . . . . . . . . . . . 121
8.5 Interorgan relationships in glycogen metabolism . . . . . . . . . . . . . 123
8.6 Glycogen storage diseases . . . . . . . . . . . . . . . . . . . . . . . . . . . . 126
8.7 Answers to practice questions. . . . . . . . . . . . . . . . . . . . . . . . . . 128
Chapter9 The hexose monophosphate shunt . . . . . . . . . . . . . . . . . . 131
9.1 Outline of the pathway . . . . . . . . . . . . . . . . . . . . . . . . . . . . . . 131
9.2 Reactions in the hexose monophosphate shunt. . . . . . . . . . . . . . . 132
9.3 The physiological role of NADPH . . . . . . . . . . . . . . . . . . . . . . . . 136
9.4 Glucose-6-phosphate dehydrogenase deficiency . . . . . . . . . . . . . . 142
vi

Contents
9.5 Answers to practice questions. . . . . . . . . . . . . . . . . . . . . . . . . . 144
Chapter10 Triacylglycerol metabolism . . . . . . . . . . . . . . . . . . . . . . . 147
10.1 Overview. . . . . . . . . . . . . . . . . . . . . . . . . . . . . . . . . . . . . . . . 147
10.2 Digestion and uptake of dietary triacylglycerol . . . . . . . . . . . . . . . 149
10.3 Utilization of fatty acids: β-oxidation . . . . . . . . . . . . . . . . . . . . . 153
10.4 Ketone body metabolism . . . . . . . . . . . . . . . . . . . . . . . . . . . . . 160
10.5 Fatty acid synthesis. . . . . . . . . . . . . . . . . . . . . . . . . . . . . . . . . 164
10.6 The glyoxylate cycle . . . . . . . . . . . . . . . . . . . . . . . . . . . . . . . . 170
10.7 Answers to practice questions. . . . . . . . . . . . . . . . . . . . . . . . . . 171
Chapter11 Cholesterol metabolism . . . . . . . . . . . . . . . . . . . . . . . . . . 173
11.1 Biological significance of cholesterol. . . . . . . . . . . . . . . . . . . . . . 173
11.2 Cholesterol synthesis . . . . . . . . . . . . . . . . . . . . . . . . . . . . . . . 174
11.3 Regulation of cholesterol synthesis . . . . . . . . . . . . . . . . . . . . . . 179
11.4 Cholesterol transport . . . . . . . . . . . . . . . . . . . . . . . . . . . . . . . 182
11.5 Bile acid metabolism and transport . . . . . . . . . . . . . . . . . . . . . . 188
11.6 Cholesterol and atherosclerosis . . . . . . . . . . . . . . . . . . . . . . . . . 190
11.7 Cholesterol metabolism and the treatment of atherosclerosis . . . . . 198
11.8 Gene defects in cholesterol transport and metabolism . . . . . . . . . . 202
11.9 Answers to practice questions. . . . . . . . . . . . . . . . . . . . . . . . . . 204
Chapter12 Amino acid metabolism . . . . . . . . . . . . . . . . . . . . . . . . . . 207
12.1 Metabolic uses of amino acids . . . . . . . . . . . . . . . . . . . . . . . . . . 207
12.2 Transamination of amino acids . . . . . . . . . . . . . . . . . . . . . . . . . 209
12.3 Nitrogen disposal and excretion . . . . . . . . . . . . . . . . . . . . . . . . 211
12.4 Degradative pathways of individual amino acids . . . . . . . . . . . . . . 219
12.5 Hereditary enzyme defects in amino acid metabolism . . . . . . . . . . 223
12.6 Answers to practice questions. . . . . . . . . . . . . . . . . . . . . . . . . . 227
Chapter13 Hormonal regulation of metabolism. . . . . . . . . . . . . . . . . . 229
13.1 Hormones that affect energy metabolism . . . . . . . . . . . . . . . . . . 229
13.2 Insulin . . . . . . . . . . . . . . . . . . . . . . . . . . . . . . . . . . . . . . . . . 230
13.3 Other hormones . . . . . . . . . . . . . . . . . . . . . . . . . . . . . . . . . . . 240
13.4 Answers to practice questions. . . . . . . . . . . . . . . . . . . . . . . . . . 246
Chapter14 Diabetes mellitus . . . . . . . . . . . . . . . . . . . . . . . . . . . . . . 247
14.1 Introduction . . . . . . . . . . . . . . . . . . . . . . . . . . . . . . . . . . . . . 247
14.2 Mechanism of renal glucose loss . . . . . . . . . . . . . . . . . . . . . . . . 248
14.3 Metabolic dysregulation in diabetes mellitus . . . . . . . . . . . . . . . . 252
14.4 The role of coxsackieviruses in the pathogenesis of type 1 diabetes . 256
14.5 Therapy of diabetes . . . . . . . . . . . . . . . . . . . . . . . . . . . . . . . . 259
14.6 Answers to practice questions. . . . . . . . . . . . . . . . . . . . . . . . . . 267
Chapter15 Biosynthetic pathways using tetrahydrofolate and vitamin
B12 . . . . . . . . . . . . . . . . . . . . . . . . . . . . . . . . . . . . . . . . 269
15.1 Overview. . . . . . . . . . . . . . . . . . . . . . . . . . . . . . . . . . . . . . . . 269
vii

Contents
15.2 Tetrahydrofolate-mediated carbon transfer reactions. . . . . . . . . . . 269
15.3 Folate antimetabolites as antimicrobials . . . . . . . . . . . . . . . . . . . 274
15.4 Cobalamin-dependent methylation reactions . . . . . . . . . . . . . . . . 275
15.5 Folate and vitamin B12 deficiency syndromes . . . . . . . . . . . . . . . . 280
15.6 Answers to practice questions. . . . . . . . . . . . . . . . . . . . . . . . . . 284
Chapter16 Nucleotide metabolism . . . . . . . . . . . . . . . . . . . . . . . . . . 287
16.1 Introduction . . . . . . . . . . . . . . . . . . . . . . . . . . . . . . . . . . . . . 287
16.2 Overview of metabolic pathways for nucleotides . . . . . . . . . . . . . . 290
16.3 Purine synthesis . . . . . . . . . . . . . . . . . . . . . . . . . . . . . . . . . . . 290
16.4 Utilization of dietary nucleic acids . . . . . . . . . . . . . . . . . . . . . . . 295
16.5 Purine degradation and salvage pathways . . . . . . . . . . . . . . . . . . 297
16.6 Diseases related to purine degradation . . . . . . . . . . . . . . . . . . . . 301
16.7 Synthesis and degradation of pyrimidines . . . . . . . . . . . . . . . . . . 305
16.8 Synthesis of deoxyribonucleotides . . . . . . . . . . . . . . . . . . . . . . . 308
16.9 Nucleotide antimetabolites as anticancer and antiviral drugs. . . . . . 309
16.10 Answers to practice questions. . . . . . . . . . . . . . . . . . . . . . . . . . 318
Chapter17 Iron and heme metabolism. . . . . . . . . . . . . . . . . . . . . . . . 321
17.1 Structure and function of heme . . . . . . . . . . . . . . . . . . . . . . . . . 321
17.2 Heme biosynthesis . . . . . . . . . . . . . . . . . . . . . . . . . . . . . . . . . 322
17.3 Disruptions of heme synthesis . . . . . . . . . . . . . . . . . . . . . . . . . 327
17.4 Heme degradation . . . . . . . . . . . . . . . . . . . . . . . . . . . . . . . . . 330
17.5 Iron uptake, transport and storage . . . . . . . . . . . . . . . . . . . . . . . 335
17.6 Answers to practice questions. . . . . . . . . . . . . . . . . . . . . . . . . . 337
Chapter18 Metabolism of drugs and xenobiotics. . . . . . . . . . . . . . . . . 339
18.1 Functional significance . . . . . . . . . . . . . . . . . . . . . . . . . . . . . . 339
18.2 Cytochrome P450 enzymes. . . . . . . . . . . . . . . . . . . . . . . . . . . . 341
18.3 Phase II reactions . . . . . . . . . . . . . . . . . . . . . . . . . . . . . . . . . . 346
18.4 Reductive drug metabolism . . . . . . . . . . . . . . . . . . . . . . . . . . . 350
18.5 Anti-tumor drugs that are preferentially activated in tumor cells . . . 351
18.6 Answers to practice questions. . . . . . . . . . . . . . . . . . . . . . . . . . 353
Chapter19 Enzyme and gene therapy of enzyme defects . . . . . . . . . . . 355
19.1 General considerations . . . . . . . . . . . . . . . . . . . . . . . . . . . . . . 355
19.2 Adenosine deaminase deficiency . . . . . . . . . . . . . . . . . . . . . . . . 359
19.3 Enzyme therapy of lysosomal enzyme defects . . . . . . . . . . . . . . . 363
19.4 Answers to practice questions. . . . . . . . . . . . . . . . . . . . . . . . . . 368
Chapter20 Credits and copyright . . . . . . . . . . . . . . . . . . . . . . . . . . . 371
20.1 Preliminary note . . . . . . . . . . . . . . . . . . . . . . . . . . . . . . . . . . . 371
20.2 Individual image credits. . . . . . . . . . . . . . . . . . . . . . . . . . . . . . 372
20.3 Copyright notice. . . . . . . . . . . . . . . . . . . . . . . . . . . . . . . . . . . 374
Bibliography . . . . . . . . . . . . . . . . . . . . . . . . . . . . . . . . . . . . . . . . . 375
viii

Contents
Index . . . . . . . . . . . . . . . . . . . . . . . . . . . . . . . . . . . . . . . . . . . . . . 385
ix


Chapter 1
Introduction
1.1 Motivation: Why would you study metabolism?
Long answer: You have a generous and warm character, and you have spent too
much time in front of the family TV set. You are therefore determined to become
a famous doctor and save many, many lives every hour of the day, without asking
anything in compensation but the admiring gazes of the populace, and may be a
Rolls Royce. Metabolism is an ever so tiny part of the vast knowledge you have
set out to master in order to fulfill your destiny.
Wrong? Alternate long answer: You have the inquisitive mind of a Sherlock
Holmes and the financial savvy of a Howard Hughes, and you have determined
that soaking medical doctors for damages is the best road to wealth and fame. Un-
derstanding the biochemical basis of medicine will help you to stun your audiences
in court and grind the defendants and their counsels into the dust.
Wrong again? Then try the short answer: You want to pass your exam.
1.2 Significance of metabolism in medicine
• hereditary enzyme defects
• diabetes, atherosclerosis, gout
• antimetabolites in the chemotherapy of cancers and infections
• inactivation and elimination of xenobiotics and drugs
Notes: Metabolism is a central theme in biochemistry; it keeps cells and organisms
alive, by giving them the energy they need to carry on and the building blocks they
require for growth and propagation. Metabolism is also an important theme in
medicine and pharmacy. Genetic defects of metabolic enzymes, while not among
the most common forms of disease, are nevertheless common enough to warrant
the routine screening of newborns. Knowledge of the metabolic pathways that
1

2 1 Introduction
will be affected by a genetic enzyme defect is important to understand its clinical
manifestations and to devise strategies for proper diagnosis and treatment.
While metabolic diseases that result from single enzyme defects are compar-
atively rare, there are metabolic diseases which are much more common, such as
diabetes mellitus and gout. Atherosclerosis, which is even more common, is not a
purely metabolic disease; however, its initiation and progression are determined
to a large extent by metabolic factors. In all these cases, an understanding of the
underlying metabolic aspects is the basis for prevention and treatment.
Even with diseases that are not primarily due to metabolic aberrations, meta-
bolic pathways often provide important targets for drug therapy. Cases in point
are malignant tumors and autoimmune diseases, which are commonly treated with
antimetabolites that disrupt cell proliferation and promote programmed cell death
(apoptosis). Antimicrobial drugs often target enzymes in vital metabolic pathways
of bacteria and parasites. Conversely, many drugs that target receptors other than
enzymes require metabolic modification for activation or elimination.
From all this, it should be quite clear that metabolism matters to all those who
pursue a career in medicine or a related field, and who want to truly understand
what they are doing. These lecture notes aim to supply this required foundation.
1.3 Catabolic and anabolic reactions
Foodstuffs Small intermediates
Small intermediates CO2 +H2O
Complexbiomolecules
NADP+
NADPH+H+
ADP+Pi
ATP
O2
Notes: The metabolism of animals and humans can be divided into catabolic re-
actions (blue arrows) and anabolic ones (green). The word “catabolic” means
the same as “degradative,” but it is Greek and therefore sounds a whole lot more
erudite and scholarly. A large share of the substrates broken down in catabolism
are used for producing ATP, the “electric energy” of the cell. Just as electricity
can be used to drive just about any household job, ATP is used for almost every
energy-requiring task in cell biology. Because of its key role in the life of the cell,
we will devote a good deal of space—chapters 3–6—to the metabolic pathways that
allow the cell to regenerate ATP.
The word “anabolic” might be translated as “constructive.” Anabolic pathways
are the opposite of catabolic ones, that is, they create new biomolecules. They
produce small molecules and building blocks that are not sufficiently available

1.4 Diversity of metabolism: pathways in plants and bacteria 3
in the food, as well as macromolecules, in particular proteins and nucleic acids.
Apart from building blocks and ATP, anabolic pathways also require a good deal of
reducing power, mostly in the form of NADPH. One major pathway that supplies
NADPH is the hexose monophosphate shunt, which is covered in chapter 9.
Some pathways can function both in a catabolic and an anabolic context. An
example is the citric acid cycle, which breaks down acetyl-CoA but also participates
in the synthesis of amino acids. Such pathways are sometimes referred to as
amphibolic.
1.1 Explain the concepts of anabolic, catabolic, and amphibolic pathways.
1.4 Diversity of metabolism: pathways in plants and bacteria
Pathway Organisms
photosynthesis plants andcyanobacteria
nitrogen fixation specialized soil bacteria
oxidation or reduction ofinorganic minerals
archaebacteria
acid- and gas-producingfermentations
anaerobic bacteria
Notes: While the scope of this text is mostly restricted to human metabolism, it is
useful to take a brief look beyond these confines. There are several mainstream
metabolic pathways that occur in all classes of living organisms. A good example is
glycolysis, the main pathway of glucose degradation, which is found all the way up
from Escherichia coli to Homo sapiens. On the other hand, some of the metabolic
processes in plants or in distinct groups of microbes are quite different from those
found in man or animals.
Photosynthesis enables plants to create glucose—and from it, the carbon
skeletons of all their other metabolites—from nothing but CO2 and water. The
same is true of blue-green algae or cyanobacteria.1 Organisms incapable of photo-
synthesis are heterotrophic, which means that they must feed on other organisms.
In contrast, photosynthesis makes organisms autotrophic, that is, capable of feed-
ing themselves.2 Note, however, that plant life also depends on pathways other
than photosynthesis. An example is the degradation of starch, which is stored in
large amounts in plant seeds such as wheat and rice as well as in bulbs such as
potatoes. The pathways of starch utilization employed by plants are analogous to
those found in animals.
1Indeed, cyanobacteria are the prokaryotic precursors of chloroplasts, the photosynthetic or-ganelles of plants. Like mitochondria, chloroplasts are endosymbionts of prokaryotic origin and stillretain their own genomes and ribosomes.
2Carnivorous plants could be considered both autotrophs and heterotrophs. It seems, however,that plants evolved this lifestyle mostly to secure a supply of organic nitrogen rather than of carbon.

4 1 Introduction
Nitrogen fixation, that is, the reduction of atmospheric nitrogen (N2) to ammo-
nia (NH3), is performed by the bacterium Sinorhizobium meliloti and related soil
bacteria. All other living organisms require nitrogen in already reduced form, and
therefore depend on these bacteria. The word Rhizobium—the former first name
of this bacterium—means “living on roots”. Sinorhizobium meliloti thrives on the
roots of plants, which take up the surplus ammonia supplied by the bacteria and
utilize it for synthesizing their own amino acids; the plants, in turn, provide the
bacteria with a nutrient-rich environment. This symbiotic process is common with
legumes such as alfalfa, soy beans, and peas. Including these plants in crop rota-
tion schemes helps to keep the soil supplied with reduced nitrogen. Alternatively,
the nitrogen fixation bottleneck can be bypassed altogether by supplying reduced
nitrogen with chemical fertilizers. 3
Some archaebacteria, which live in exotic environments such as submarine
volcanic hot springs, have developed correspondingly exotic metabolic pathways.
For example, some of these organisms are capable of extracting energy from the
oxidation of iron or the reduction of sulfur.
While all these pathways are certainly very interesting, we will not consider
them any further in these notes. Instead, we will confine the discussion to the
major metabolic pathways that occur in the human body. We will also relate these
pathways to human health and disease, and to some of the therapeutic strategies
that have been developed for metabolic diseases.
In the remainder of this chapter, we will start with a broad overview of food-
stuffs and their digestion and uptake in the intestinal organs. This will provide
some important context for the detailed discussion of metabolic pathways in the
subsequent chapters.
1.2 In the metabolism of heterotrophs like Homo sapiens, what are the ultimate sourcesof organic carbon and of reduced nitrogen?
1.5 Types of foodstuffs
• carbohydrates
• protein
• fat
• nucleic acids
3Until the early 20th century, the only practical source of nitrogen fertilizer was guano, whichis accumulated, dried bird poop. It is found in large deposits on cliffs and islands off the SouthAmerican west coast, and clippers ferrying the precious stuff used to go back and forth betweenChile or Peru and Europe or North America.
In 1909, Haber and Bosch devised a synthetic method for producing nitrogen fertilizer, as well asnitrogen-based explosives. In this process, the reaction N2 + 3 H2 2 NH3 is induced by brute force:a mixture of the two gases is compressed to very high pressures and heated to high temperaturein the presence of a metal catalyst. The method has been in use ever since for producing nitrogenfertilizer. Among all the great inventions that have propelled the growth of the world population,the Haber-Bosch process likely is the single most important one.

1.5 Types of foodstuffs 5
Notes: The three major categories of foodstuffs relevant to human metabolism are
named on every box of cereal or cup of yogurt; and in case you do not remember
them, I suggest you run out right now to buy some such scholarly piece of grocery;
dollar for dollar, its educational value might exceed that of your attendance of this
class.
The fourth item in the list above, nucleic acids, could as well have been sub-
sumed under carbohydrates, since only the ribose and deoxyribose contained in
them have significant nutrient value. The pathways that would allow the reuse of
the bases for nucleotide and nucleic acid synthesis exist in principle, but experi-
mental studies indicate that ingested bases are mostly degraded and excreted (see
section 16.4).
1.5.1 Breakdown of foodstuffs: Overview
Glycogen
Carbohydrates
Glucose
Pyruvate
Proteins
Amino acids
Acetyl-CoA
CO2 + H2O
Triacylglycerol (fat)
Fatty acids
Ketone bodies
ADP + Pi
ATP
Notes: In the first stage of their utilization, all foodstuffs are split into their build-
ing blocks; this happens mostly during digestion in the small intestine. After the
building blocks—mainly glucose, amino acids, and fatty acids—have been taken up
and distributed through the blood stream, complete breakdown to CO2 and H2O
proceeds intracellularly via pyruvate and acetyl-CoA, which function as central
hubs of foodstuff utilization.
Glucose can transiently be stored in polymeric form as glycogen, which evens
out the peaks and valleys of glucose supply during the day. If required, additional
glucose can be produced via gluconeogenesis from amino acids whose degradation
yields pyruvate.
When other forms of substrate carbon are in short supply, fatty acids—either
taken up with the food or released from fat tissue—can be converted via acetyl-
CoA to ketone bodies, which represent a more water-soluble transport form of
carbon than the fatty acids themselves.
This slide is of course simplified and contains several approximations. For
example, some carbohydrates do not directly yield glucose upon depolymerization;
these may then be converted to glucose through dedicated adapter pathways. Sim-
ilarly, the breakdown of some amino acids does not yield pyruvate or acetyl-CoA

6 1 Introduction
but instead produces citric cycle intermediates. Like pyruvate, these intermediates
can also be converted to glucose if needed.
1.3 Name the three major products of foodstuff digestion in the small intestine, and thetwo central hubs of cellular foodstuff utilization.
1.6 The digestive system
StomachLiver
Small intestine Large intestine
Pancreas
Liver
Pancreatic duct
Duodenum
Bile bladder
Bile duct
Notes: The digestive system contains the intestinal hollow organs, that is, the
esophagus, stomach, small and large intestine. In addition, it also comprises the
pancreas and the liver, both of which arise through budding and outgrowth from
the primordial intestine during embryonic development.
1.6.1 Intestinal organs: functional overview
Organ Function
stomach killing of microbes contained in thefood; protein denaturation
small intestine breakdown of macromolecules to smallmolecules, uptake of the latter
large intestine fluid and ion reuptake
pancreas production of digestive enzymes and ofhormones
liver production of bile; metabolichomeostasis
Notes: The mucous membrane of the stomach produces gastric acid, HCl, which
denatures proteins and kills microbes contained in the food. The pancreas supplies
most of the digestive enzymes, whereas the liver provides bile acids, which are

1.6 The digestive system 7
essential for the solubilization of fat. The bile and the pancreatic juice also contain
large amounts of sodium bicarbonate, which neutralizes the gastric acid; the milieu
inside the small intestine is slightly alkaline.4
The digestive enzymes secreted by the pancreas into the gut do most of the
work involved in digestion of ingested foodstuffs. Therefore, depolymerization of
foodstuff macromolecules occurs extracellularly.5
1.4 Name the digestive organs and summarize their functions.
1.6.2 The portal circulation
Portal vein
Liver veinAbdominal arteries
Systemic circulation
Liver artery
Notes: Upon uptake, most solutes will be exported on the other side of the mu-
cosal cells and then find themselves in the blood stream. A peculiarity of the
intestines is that all blood drained from them is first passed through the liver
before being released into the general circulation. This serves a twofold purpose:
1. It gives the liver a chance to take excess amounts of substrates—glucose,
amino acids—out of circulation and to store and process them. This serves to
4The bile duct and the pancreatic duct join the duodenum, that is, the uppermost part of thesmall intestine, at the same site (termed the papilla duodeni major). Bile stones traveling down thebile duct may get stuck at this orifice and obstruct both secretory ducts. On top of bile colics, thismay then result in acute pancreatitis, in which the backed-up pancreatic enzymes start digesting thepancreas itself. This is both exceedingly painful and a major, acutely life-threatening calamity.
5Extracellular digestion is employed by most organisms. Even bacteria secrete digestive enzymesand take up substrates only at the stage of the monomeric breakdown products. Why is that so?
An obvious answer is that there are no transport mechanisms for the uptake of macromoleculesacross the cell wall. While that is true, there is a deeper reason—taking up macromolecules ina non-specific way would open the door for all kinds of viruses and Trojan horses. Extracellulardigestion constitutes a firewall that excludes hazardous macromolecules.
Exceptions to the rule above are amoebas, which ingest not only macromolecules but even wholebacteria. However, the ingested bacteria remain confined within membrane vesicles called phago-somes, which get swiftly flooded with acid as well as aggressive chemicals and enzymes that kill anddegrade the bacteria. The same occurs in our phagocytes, which are an essential part of our immunesystem (see slide 9.3.7).

8 1 Introduction
maintain stable blood nutrient concentrations, which is important for the well-
being of the more sensitive and fastidious cells in the other organs.
2. The bacteria that reside in the large intestine produce ammonia and other
toxic metabolites, which are cleared by the liver. In patients with liver failure,
these toxic metabolites spill over into the systemic circulation, which among other
things will lead to disturbances of cerebral function. The detoxifying activity of
the liver also affects many drugs; the inactivation of drugs by the liver immediately
following intestinal uptake is known as the first pass effect (see slide 18.1.3).
The large vein that drains all the blood from the intestines and channels it
to the liver is the portal vein; together with its tributaries, it forms the portal
circulation. Aside from the intestines, the pancreas and the spleen also have their
blood drained into the portal vein.
In addition to the blood carried by the portal vein, which is at least par-
tially oxygen-depleted, the liver also receives a direct supply of oxygen-rich blood
through the liver artery. The two feeds branch out in parallel throughout the liver
and eventually merge within the tissue of the liver lobules (see below), from which
all blood is then drained toward the venous side of the general circulation.
1.5 What is the portal circulation, and which organs participate in it?
1.6.3 Liver tissue structure
AAAAAAAAAAAAAAAAA BBBBBBBBBBBBBBBBB
CCCCCCCCCCCCCCCCC
Central vein
Sinusoid
Portal vein branch
Bile duct tributary
Liver artery branch
Notes: The liver has a peculiar tissue structure that is optimized for rapid and
efficient solute exchange between the percolating blood and the liver cells. While
in the tissues of most organs the blood is contained in capillaries with clearly
defined boundaries and walls, the liver has a sponge-like structure that permits
direct contact of the blood plasma with the liver cells.
A: The liver is organized into functional units called lobules, which measure
~2 mm across. In this tissue cross section, several lobules are demarcated by
strands of connective tissue that are stained red.

1.6 The digestive system 9
B: Blood from branches of the portal vein and of the liver artery percolates
each lobule and flows towards its central vein, which drains it into the general
circulation. Bile duct branches drain bile from each lobule toward the intestine.
C: Higher magnification shows the sponge-like structure of the liver tissue. In
life, blood flows through the sinusoids, which in this tissue section are visible as
the voids between strands of liver cells. The intimate contact of the liver tissue
with the percolating blood maximizes the rate of solute exchange between cells
and blood plasma.
1.6.4 Blood flow and bile flow within the liver lobule
Liver artery branch
Portal vein branch
Bile duct tributary
Liver vein tributary
Notes: The epithelial cells in each liver lobule are arranged in parallel layers. The
basolateral side of each cell faces the blood-filled sinusoid, while the apical side
faces a bile duct tributary. These finest, uppermost bile duct branches are so thin
that they can only be visualized using special histological techniques or by electron
microscopy.
The liver cells extract solutes from the blood, modify them, and export them
either back into the bloodstream or directly into the bile. This process is very
efficient; with some solutes, extraction and modification is almost complete during
a single pass through the liver.
1.6 Liver tissue is organized into functional units. What is the name of such a unit, andwhat does its function entail?
1.6.5 The stomach: functions of gastric acid
• HCl, pH 1–2
• secreted by specialized cells in the mucous membrane (parietal cells)
• kills germs contained in food; patients with lack of gastric acid are at increased
risk of intestinal infection
• denatures food proteins and makes them accessible to cleavage by proteases
Notes: The activity of the HCl-secreting parietal cells is controlled by histamine
H2 receptors; accordingly, H2 receptor blockers such as ranitidine are effective in

10 1 Introduction
the suppression of acid secretion. Another class of drugs used to the same end
inhibit the ATP-dependent proton pump that actually brings about the secretion
of acid.
Once upon a time, excessive secretion of gastric acid was considered the main
cause of gastric and duodenal ulcers. We now know that that the true cause of
ulcers is the bacterium Helicobacter pylori, and accordingly we treat this disease
with antibiotics. Nevertheless, inhibitors of gastric acid secretion continue to be
used as well, since gastric acid aggravates the ulcers and disturbs their healing.
Individuals that lack gastric acid, due either to a disease or to drugs that
inhibit acid secretion, are more susceptible to orally contracted infectious diseases
such as cholera, Salmonella enterocolitis, and intestinal tuberculosis.
1.6.6 Gastric acid and pepsin in protein digestion
Notes: At very low pH, a protein molecule will become extensively protonated
and thereby accumulate positive charges. The mutual repulsion of these positive
charges will destabilize the protein and cause it to unfold. In this unfolded form,
all the peptide bonds become exposed and accessible to proteases.
Protein digestion is initiated right away in the stomach by the protease pepsin,
which is produced by the stomach mucous membrane. The peptide fragments will
no longer refold, even after the pH has reverted to slightly above neutral values in
the small intestine. Peptide digestion can therefore continue and be completed by
the pancreatic proteases and peptidases encountered there.
While most proteins will be unfolded by gastric acid, there are exceptions; an
obvious and important one is pepsin itself. Similarly, the coat proteins of many
pathogenic viruses, for example poliovirus or hepatitis A virus, are fairly resistant
to gastric acid as well. These viruses are therefore able to traverse the stomach
intact and then infect the mucous membranes of the intestine.
1.7 What is the physiological function of gastric acid?

1.6 The digestive system 11
1.6.7 Function of the exocrine pancreas
• secretion of digestive enzymes
– amylase
– proteases, peptidases
– lipases
– DNAse, RNAse
• secretion of bicarbonate to neutralize gastric acid
Notes: The exocrine pancreas produces all the major depolymerizing enzymes for
digestion. Therefore, if the pancreas is not working properly—often as a result of
acute or chronic pancreatitis—maldigestion of all types of foodstuff results.
When the acidified food passes from the stomach to the duodenum, it is neu-
tralized by copious amounts of bicarbonate that is contained in the pancreatic
juice, the bile, and the secretions of gland tissue embedded in the mucous mem-
branes of the duodenum itself. Accordingly, the pH optima of the pancreatic
enzymes are in the neutral to slightly alkaline range.6
1.6.8 Roles of bile in digestion
• Bile acids solubilize triacylglycerol and make it accessible to pancreatic lipase
• Bicarbonate contributes to the neutralization of gastric acid
Notes: Among its many other functions, the liver also serves as an exocrine gland.7
The digestive juice secreted by the liver is known as bile and is rich in bile acids,
which are important in solubilizing fat so as to render it accessible to enzymatic
cleavage by pancreatic lipase.8 Bile that is not needed immediately is diverted
to the bile bladder, where it is concentrated and stored. In the bile concentrate,
solutes may exceed their solubility limit and start to precipitate or crystallize
within the bile bladder, forming gallstones. This occurs most commonly with
cholesterol and bilirubin, both of which are excreted with the bile (see chapters 11
and 17, respectively).
Like the pancreatic juice, the bile is also rich in sodium bicarbonate and con-
tributes to the neutralization of the acidified stomach content as it enters the
duodenum. Unlike the pancreatic juice, however, the bile does not contain diges-
tive enzymes. Disruption of bile secretion will therefore cause deficient digestion
of fat only, but not of proteins or carbohydrates.
6If you already have some lab experience, you may have treated cells with trypsin or fragmentedDNA with pancreatic DNAse, and may remember that these enzyme work best at pH 7.5–8.
7An exocrine gland secretes outwardly; this definition includes secretions into the digestive tract.An endocrine gland secretes into the bloodstream. The products of endocrine glands are invariablyhormones.
8Bile acids solubilize fat (triacylglycerol) effectively because they are detergents with a highcritical micellar concentration (see slide 10.2.2). For the same reason, they are also useful forremoving tough stains from your laundry.

12 1 Introduction
The greater share of the bile acids is taken up again in the lowermost section
of the small intestine, that is, the terminal ileum. Via the portal vein, they return
to the liver, where they are extracted and again secreted.
1.8 Describe and distinguish the roles of pancreatic juice and of bile in the digestion offoodstuffs.
1.6.9 The small intestine
Notes: The small intestine comprises, from top to bottom, the duodenum, the
jejunum, and the ileum. Small substrate molecules produced by the digestive
enzymes within the gut are taken up by active transport across the mucous mem-
brane of the small intestine. The capacity for substrate uptake is obviously related
to the surface area. Accordingly, the mucous membrane is highly folded so as
to maximize the surface available for substrate uptake. This slide illustrates how
surface maximization is realized all hierarchical levels of tissue and cell structure.
The inner surface of the small intestine has circular folds, which in turn are
covered by villi. The individual epithelial cells that cover the villi are, on their
luminal surfaces, covered by microvilli. The blood that perfuses the villi of the
intestinal mucosa (red arrow) and carries away the absorbed nutrients is drained
toward the liver via the portal vein (see slide 1.6.2).
1.6.10 Microscopic structure of the small intestine
Notes: These microscopic pictures of the mucous membrane illustrate the villi
and microvilli in the small intestine. The left panel shows a low-power view of
a section across a circular fold, which is covered by a dense mane of villi. The
right panel shows an electron-microscopic image of microvilli atop an individual
epithelial cell.

1.6 The digestive system 13
1.6.11 Amylose and amylopectin are polymers of α-d-glucose
Notes: As an example of foodstuff processing in the small intestine, let us take
a quick look at the digestion of starch. The constituents of starch are amy-
lose and amylopectin. Amylose (black) is an unbranched α(1 4) polymer of
d-glucose. Amylopectin additionally contains branches (blue) that are attached
through α(1 6)-glycosidic bonds.
O. . .
OH
OH
CH2OH
O
O
OH
OH
CH2OH
O
O
OH
OH
CH2O
OH
OH
CH2OH
O
O
OH
OH
CH2OH
O
O
OH
OH
CH2OH
O
O. . .
O
O
OH
OH
CH2OH
O
O
OH
OH
CH2OH
O
O
OH
OH
CH2OH
O
O. . .
1.6.12 Amylase breaks down starch to maltose and isomaltose
Notes: In the small intestine, amylose and amylopectin are broken down by pan-
creatic amylase. The main product is maltose, which is produced from amylose
and from the linear α(1 4) stretches of amylopectin. Isomaltose originates from
the α(1 6) branching points of amylopectin.
OH
OH
OH
CH2OH
O
O
OH
OH
CH2OH
O
OH
OH
OH
OH
CH2O
OH
OH
CH2OH
O
OH
O
OH
Maltose Isomaltose

14 1 Introduction
The two disaccharides are cleaved to glucose by maltase and isomaltase, respec-
tively. These enzymes are anchored to the surfaces of the epithelial cells of the
intestinal mucosa. The same epithelial cells then take up glucose by active trans-
port (see next slide).
1.6.13 Mechanism of glucose uptake from the gut
Gut lumen Cytosol Interstitial fluid
Glucose Glucose Glucose
2 Na+ 2 Na+
SGLT1 GLUT2
Notes: After digestion, the metabolites have to be taken up by the epithelial cells
at the inner surface of the small intestine. In most cases, nutrients are taken
up by active transport, which can transport solutes energetically uphill, that is,
against their concentration gradients. Active transport is necessary to ensure the
quantitative uptake of the nutrients.
In the case of glucose, active transport is driven by the simultaneous uptake
of two sodium ions per molecule of glucose. This coupling is effected by the
SGLT1 transporter. Sodium (secreted as bicarbonate) is plentiful in the gut lumen,
while its concentration is low inside the cells. An additional driving force is the
membrane potential: the cytosol is electrically negative relative to the extracellular
space. The uphill transport of glucose is therefore driven by the simultaneous
downhill movement of sodium. Similar transporters exist for other sugars, e.g.
galactose, and for amino acids and nucleosides.
On the basolateral side of the intestinal epithelia—that is, the side that faces
the surrounding tissue, not the gut lumen—glucose is released into the extracel-
lular space, from where it can freely diffuse into the bloodstream to reach the
liver. The export from the epithelial cells is mediated by GLUT transporters.
These operate by passive transport, also known as facilitated diffusion (see slide
3.5.1). In other organs, GLUT transporters mediate the uptake of glucose. GLUT
transporters are found in all cells of the body (see section 3.5).
1.9 Explain how starch is processed in the small intestine.
1.10 Which forces affect the transport of glucose by the SGLT?

1.7 Answers to practice questions 15
1.6.14 The large intestine
• Anaerobic milieu—99% of all bacteria in the large intestine are strict anaerobes
• Bacteria degrade non-utilized foodstuffs, reducing osmotic activity of gut con-
tent
• Mucous membrane recovers water and electrolytes
• Bacterial metabolism releases potentially toxic products (e.g. ammonia), which
are taken up and inactivated by the liver
Notes: The cumulative volume of the fluids secreted into the stomach and the
small intestine exceeds four liters per day. It falls to the large intestine to recover
most of that fluid. This inevitably slows down the transport of the gut contents,
which in turn will cause them to be overgrown with bacteria.9 The bacterial flora
is mostly harmless, though, and it even helps with breaking down undigested
remnants in the gut content and thereby freeing up the water bound osmotically
by them. They produce some vitamins, too, for example folic acid, but also some
potentially toxic substances such as amines and ammonia. The latter are taken up
and dealt with by the liver.
1.7 Answers to practice questions
1.1: Anabolic pathways create new biomolecules, usually complex ones, from simpleprecursors. Catabolic pathways break down biomolecules in order to produce ATP, NADPH,or building blocks for anabolic reactions. Amphibolic pathways can function in bothcatabolic and anabolic processes.
1.2: Organic carbon is derived from photosynthesis in plants, whereas reduced nitrogenis derived from nitrogen fixation in soil bacteria.
1.3: The major products of digestion are glucose, amino acids, and fatty acids, whichare released from carbohydrates, proteins, and triacylglycerol, respectively. Utilization ofthese products proceeds via pyruvate an acetyl-CoA.
1.4: See table in slide 1.6.1.
1.5: The portal circulation drains venous blood from the stomach, intestines, pancreas,and spleen into the portal vein. The blood then enters the liver, where it is distributed andprocessed before being drained again into the systemic circulation.
1.6: The functional unit of the liver is the lobule. It receives blood from branches of boththe liver artery and the portal vein, which flows through the lobule’s sinusoids toward itscentral vein. The epithelial cells that line the sinusoids extract and process solutes fromthe blood, some of which they secrete into bile duct tributaries.
1.7: Gastric acid denatures proteins, which initiates the digestion of food proteins andalso helps to inactivate ingested microbes.
9The party trick that prevents bacterial colonization of our other hollow organs is to dischargeand replace the fluids more rapidly than the bacteria can grow. Accumulation and stasis of fluidinvariably leads to bacterial overgrowth and often infection; examples are recurrent urinary tractinfections when bladder function is impaired, and the respiratory infections facilitated by viscous,slowly flowing bronchial secretions in patients with cystic fibrosis.

16 1 Introduction
1.8: Pancreatic juice supplies the depolymerizing enzymes for all foodstuffs, whereas bilesupplies no enzymes but contains bile acids, which solubilize fat but are not importantin the processing of other foodstuffs. Both pancreatic juice and bile contain bicarbonate,which serves to neutralize gastric acid.
1.9: Starch is broken down by pancreatic amylase to maltose and isomaltose, both ofwhich are cleaved to glucose by cognate disaccharidases located at the surface of intestinalepithelial cells. The epithelia take up glucose by sodium cotransport and release it at thebasolateral side through facilitated diffusion.
1.10: SGLT mediates the uptake of glucose into cells by sodium co-transport. The trans-port is driven by three forces: (1) The concentration gradient of glucose itself—glucose canbe higher or lower outside the cell than inside, favouring or disfavouring uptake (2) Theconcentration gradient for sodium; [Na+] is always higher outside the cell, which favorsco-transport (3) The membrane potential, which is always negative inside in non-excitablecells such as those containing SGLT transporters; this also favors uptake.

Chapter 2
Refresher
2.1 Preliminary note
This chapter reviews some key concepts from second year biochemistry. Feel free
to skip it if you remember a thing or two from that distant past.
2.2 How enzymes work: active sites and catalytic mechanisms
As with all proteins, the activity of enzymes depends on the precise arrangement
and interaction of their amino acid residues and side chains. A straightforward
example of this is chymotrypsin. Chymotrypsin is one of the major proteases in
the human digestive tract, where its job is to knock down large protein molecules
into small peptides that are then further processed by peptidases.
2.2.1 The “catalytic triad” in the active site of chymotrypsin
OH
N
N
H ⊖O O
Asp102
His57
Ser195
Notes: The active site of chymotrypsin contains aspartate 102, histidine 57, and
serine 195. The aspartate and the histidine cooperate to deprotonate the hydroxyl
17

18 2 Refresher
group of the serine, which then attacks the substrate peptide bond (see next slide).
Molecular structure rendered from 1afq.pdb.
The Asp-His-Ser motif is very common among proteases and esterases, so
much so that it is often simply referred to as the catalytic triad. For example, the
protease trypsin and several lipases that occur in human metabolism also have this
motif and share the same mechanism of catalysis. Other enzymes, for example
the proteasome, may contain glutamic acid instead of aspartic acid, or threonine
instead of serine. These variants still contain the same functional groups and work
the same way.
2.2.2 The catalytic mechanism of chymotrypsin
N′
R1
C
O
HN
R2
C′
O⊖
Ser195
N′
R1
C
O⊖O
Ser195
HN
R2
C′
N
Asp102
OH
O
His57
NH
HN
Asp102
O⊖
O
His57
N
N′
R1
CO H2N
R2
C′
OSer195
Notes: After it has been deprotonated by aspartate and histidine, the serine per-
forms a nucleophilic attack on the carbonyl group of the substrate peptide bond.
This produces a short-lived tetrahedral intermediate that gives way when the C-
terminal peptide fragment leaves; the N-terminal fragment remains covalently
attached to the serine. This state of affairs, which is shown as the final stage in
this slide, is reached after the first half of the reaction.
In the second half reaction, which is not shown, the aspartate and histidine
residues deprotonate a water molecule, and the hydroxide ion thus formed then
bounces the N-terminal peptide fragment off the serine, again by nucleophilic
attack on the carbonyl group. The bond undergoing cleavage at this stage is an
ester, which yields more readily than the amide bond in the first stage.
2.1 What is the catalytic triad, and how does it work?

2.2 How enzymes work: active sites and catalytic mechanisms 19
2.2.3 Many enzymes require coenzymes
With chymotrypsin, the enzyme molecule and its amino acid side chains supply
all the necessary tools for catalysis. In contrast, many other enzyme molecules
require coenzymes for their activity. For example, alanine aminotransferase, which
transfers the α-amino group from alanine to α-ketoglutarate, contains the coen-
zyme pyridoxal phosphate within its active site. In the reaction, the coenzyme
cooperates with a lysine reside that is part of the enzyme itself (see slide 12.2.1).
Most enzyme molecules have just one active site, or, in case they are mul-
timeric, one active site per subunit. However, there are exceptions: Fatty acid
synthase has as many as six different active sites on each subunit (see slide 10.5.2).
Pyruvate dehydrogenase is a multienzyme complex that contains one active site
on each subunit, but it combines three different types of subunits, each with a
different coenzyme and catalytic function, into one functional assembly (see slide
5.2.2).
2.2.4 IUBMB classification of enzymes
Enzyme class Catalyzed reactions
oxidoreductases catalyze redox reactions, frequently involvingone of the coenzymes NAD+, NADP+, or FAD
transferases transfer functional groups between metabolites,e.g. a phosphate from ATP to a sugar hydroxyl
hydrolases catalyze hydrolysis reactions, such as thoseinvolved in the digestion of foodstuffs
lyases perform elimination reactions that result in theformation of double bonds
isomerases facilitate the interconversion of isomers
ligases form new covalent bonds at the expense of ATPhydrolysis
Notes: The IUBMB nomenclature divides all enzymes into six classes according to
the reactions they catalyze. Within each of these main classes, there are subclasses
and sub-sub classes, which reflect differences in substrate usage and mechanism
of catalysis. The categories at all three hierarchical levels are assigned unique
numbers, and each individual enzyme receives a number as well that is unique
within its sub-sub class. An enzyme can therefore be unequivocally identified
by a dot-separated identifier containing four numbers overall. This identifier is
prefixed with the letters “EC” (for “Enzyme Commission”). Fittingly, the identifier
EC 1.1.1.1 goes to the single most important enzyme in student lifestyle—namely,
alcohol dehydrogenase, or, as IUBMB puts it, alcohol:NAD oxidoreductase.1 A list
1This commendable enzyme, residing in the liver, degrades ethanol, and without it, some of usmight be drunk all the time!

20 2 Refresher
of all the enzyme activities recorded by the IUBMB classification is available at
chem.qmul.ac.uk/iubmb.
The IUBMB scheme also assigns explicit names, which are often rather formidable,
such as this one for the enzyme otherwise known as transketolase (see chapter
9): sedoheptulose-7-phosphate: d-glyceraldehyde-3-phosphate glycolaldehydetrans-
ferase. Reciting this name three times in quick succession will cure any stammer;
however, we will forgo this benefit and use the traditional shorter names in this
text.
2.2 Why does alcohol dehydrogenase have the IUBMB identifier EC 1.1.1.1?
2.3 Energetics of enzyme-catalyzed reactions
With each enzymatic reaction, as with any other chemical reaction, energy comes in
with these two questions: 1) will the reaction proceed at all in the desired direction,
and 2) if it does, will it proceed at a sufficient rate?
The first question is decided by the free energy of the reaction, ∆G; a reaction
will go forward if, and only if, the associated ∆G is negative. The second question
depends on the activation energy, ∆G∗, which forms a barrier between the initial
state and the final state of the reactants. The very short-lived, energy-rich state
at the top of this barrier is called the transition state. Enzymes can substantially
lower the activation energy ∆G∗ and thus accelerate reactions, but they cannot
change the overall free energy ∆G—and therefore, the direction or equilibrium—of
the reaction.
2.3.1 A simile: the Walchensee–Kochelsee hydroelectric power system
Notes: The different roles of ∆G and ∆G∗ in biochemical reactions can be illus-
trated with a simile. The slide shows two natural lakes in the German Alps. The
Walchensee is situated 200 m above the Kochelsee. A conduit was dug across the
barrier between these two lakes to make the water flow downhill and drive a hy-
droelectric turbine. Additional tunnels drain other lakes and rivers to enhance the
supply of water to the Walchensee.

2.3 Energetics of enzyme-catalyzed reactions 21
2.3.2 Analogies in the simile
Hydroelectric system Metabolic pathway
altitude energy
difference in altitude betweenlakes
energy difference betweenmetabolites (∆G)
height of ridge between lakes ∆G∗ of uncatalyzed reaction
tunnels enzymes
tunnel barrages regulatory switches ofenzymes
Notes: An enzyme facilitates the interconversion of metabolites by creating an
energetic “tunnel” across the energy barrier between them. Like a water conduit,
an enzyme can facilitate the flow. However, it cannot change its direction, which
will depend solely on the difference in altitude (∆G).
In the hydro-electric system, tunnels can be opened or shuttered by barrages to
accommodate variations in the amount of rainfall or in energy demand. Similarly,
enzymes have regulatory switches that allow for adjustments in the flow rate
through metabolic pathways in keeping with changing physiological needs.
2.3.3 Discrepancies in the simile
Hydroelectric system Metabolic pathway
all tunnels work the sameway
enzymes have different catalyticmechanisms
potential energy determinedby one parameter: altitude
free energy of metabolitesdepends on two parameters:∆H and ∆S
water always collects at thebottom
molecules partition between lowerand higher energy levels
Notes: Our simile illustrates some, but not all aspects of enzyme reactions. For
example, all tunnels are alike; in contrast, each enzyme needs a specific “trick” or
catalytic mechanism in order to accomplish the specific task at hand. Investigating
the catalytic mechanisms of individual enzymes is an important and fascinating
aspect of biochemistry.
Another difference concerns the energetic states. The energy difference be-
tween the two lakes is completely determined by their difference in altitude. How-
ever, the difference in free energy (∆G) between two metabolites also depends
on entropy, which is determined by their concentrations. Reactions are therefore
subject to equilibrium; states with higher ∆H are less populated, but never totally
unoccupied. The equilibrium is given by this relationship:

22 2 Refresher
n1
n2= e−
∆GRT (2.1)
where n1 and n2 represent the numbers of molecules in the high and low energy
states, respectively. (R is the gas constant, whereas T is the absolute temperature.)
Equation 2.1 applies to the occupancy of the initial and the final states of a
reaction. It also applies to the distribution of molecules between the initial state
and the transition state of a reaction. The tendency of molecules to spontaneously
populate states of higher energy explains that chemical reactions will occur at all,
even though the energy level of the transition state is always higher than those
of the initial and final states. However, the higher the activation energy, the more
rarefied the transition state will become. The number of molecules that can first
climb the barrier and then hop down on the other side thus becomes smaller, and
the reaction slower with increasing activation energy. Enzymes—and catalysts
in general—create transition states that are lower in energy and therefore more
populated than the uncatalyzed ones.
2.3 Explain the different meanings and implications of ∆G and ∆G∗ for the equilibriumand rate of a chemical reaction, and the effect of an enzyme on each.
2.4 The role of ATP in enzyme-catalyzed reactions
As we have seen, enzymes alone cannot drive endergonic reactions forward; how-
ever, an enzyme may couple an intrinsically endergonic reaction to an exergonic
one, so as to make the overall reaction exergonic also. Most commonly, the auxil-
iary exergonic reaction consists in the hydrolysis of ATP to ADP or AMP. While this
use of ATP pervades all of enzymology, it is important to understand that there
is no equally general chemical mechanism of ATP utilization: each enzyme needs
to find its own way of actually, chemically linking ATP hydrolysis to the reaction
which it needs to drive.
2.4.1 The catalytic mechanism of glutamine synthetase
Notes: As an example, this slide shows how glutamine synthetase uses ATP to
produce glutamine from glutamate and ammonia.
While the net turnover of ATP is hydrolysis, the ATP molecule isn’t hydrolyzed
directly. Instead, the phosphate group is first transferred to the substrate to create
an intermediate product, glutamyl-5-phosphate. In this mixed anhydride, the
phosphate group makes a very good leaving group, which facilitates its subsequent
substitution by ammonia. Therefore, the utilization of ATP is a central part of this
enzyme’s catalytic mechanism. We will see some more examples of ATP usage in
enzyme catalysis in the remainder of this notes.
2.4 How does ATP utilization facilitate the glutamine synthetase reaction?

2.5 Regulation of enzyme activity 23
O
C
−O
CH
NH2
CH2
CH2
C
O
O⊖
AdenosineOP
O
O−
OP
O
O−
OP
O
O−
−O
ADP
O
C
−O
CH
NH2
CH2
CH2
C
O
O P
O
O−
O− O
C
−O
CH
NH2
CH2
CH2
C
O
NH2
NH3
Pi
Glutamate
Glutamyl-5-phosphate Glutamine
2.5 Regulation of enzyme activity
Just as a hydroelectric power station has to adjust to variations in water supply and
demand for electricity, metabolic pathways and enzymes must adapt to changes in
substrate availability and in demand for their products. The activities of enzymes
are regulated at different levels. Activating gene expression will increase the
abundance of an enzyme, whereas activation of protein breakdown will decrease it.
In addition, there are mechanisms for reversibly activating or inactivating existing
enzyme molecules, which enable swifter and potentially less wasteful adaptation.
These reversible mechanisms are discussed in the following slides.
2.5.1 The phosphofructokinase reaction
O
PO O−
O−
O
OH
OH
OH
CH2OH O
PO O−
O−
O
OH
OH
OH
O
PO O−
O−
ATP
ADP
Fructose-6-phosphate Fructose-1,6-bisphosphate
Notes: The enzyme phosphofructokinase transfers a phosphate group from ATP
to fructose-6-phosphate, producing fructose-1,6-bisphosphate. This reaction oc-
curs as an early step in the degradation of glucose. Since this pathway ultimately
serves to regenerate ATP from ADP and phosphate, one might expect phosphofruc-
tokinase to be activated by ADP. However, it turns out that activation is mediated
by AMP instead. The rationale for this preference is discussed in the next slide.

24 2 Refresher
2.5.2 The adenylate kinase reaction equilibrates AMP, ADP and ATP
2ADP ATP+AMP
K =[ATP] [AMP]
[ADP]2⇐⇒ [AMP] = [ADP]2
K
[ATP]
[AMP]
[ADP]
Notes: When ATP is consumed and ADP levels rise, some ATP can be regenerated
by adenylate kinase, which turns two ADP molecules into one ATP and one AMP.
According to the law of mass action, this also means that AMP levels rise quadrat-
ically with the level of ADP (assuming that changes to the level of ATP are small,
which is usually the case). Its steeper rise makes AMP a better sensor of cellular
energy demand than ADP itself, and it therefore makes sense that AMP, not ADP
regulates the activity of phosphofructokinase.
2.5 Explain how the cellular levels of AMP, ADP and ATP are related to each other.
2.5.3 Allosteric regulation of phosphofructokinase by AMP
Notes: To accomplish the stimulation of phosphofructokinase, AMP interacts with
the enzyme at an allosteric binding site, that is, a site that is distant and function-
ally distinct from the active site. In this structure of the dimeric enzyme (rendered
from 1pfk.pdb), two molecules of ADP are bound for each enzyme subunit. The
left panel shows an ADP molecule (red) bound in one of the active sites, which also
contains the the other product of the reaction (fructose-1,6-bisphosphate, green).
The side view in the right panel shows two more ADP molecules bound at the
interface of the two enzyme subunits, within the allosteric binding sites that in
the cell would bind AMP rather than ADP. The fourth ADP molecule in the second
active site is hidden from view.
The adenine nucleotides bound at the two different sites assume entirely dif-
ferent roles. The ADP in the active site participates in the reaction. The AMP in
the allosteric site does not; instead, its job is to change the conformation of the
entire enzyme molecule. This conformational change will be transmitted through

2.5 Regulation of enzyme activity 25
the body of the protein to the active site and increase the efficiency of catalysis
there.
Allosteric regulation of enzymes is exceedingly common; it is not limited to
nucleotides or any other particular class of metabolites. Allosteric effectors can
be either stimulatory, as is AMP in this example, or inhibitory. As an example
of the latter, ATP is not only a cosubstrate but also an allosteric inhibitor of
phosphofructokinase.
Considering that the main purpose of the degradative pathway downstream
of phosphofructokinase is regeneration of ATP, it makes sense to reduce the
substrate flow through this pathway when ATP levels are high. The allosteric effect
of ATP on phosphofructokinase is an example of feedback inhibition, that is, the
inhibition of an early step in a pathway by that pathway’s main product. This is a
very common principle in metabolic regulation.
2.5.4 How allosteric regulation works
Notes: An allosterically regulated enzyme has two possible conformations that are
in equilibrium with each other. Both the active site and the allosteric binding site
change shape along with the molecule. An allosteric activator will bind selectively
to the regulatory site in the shape that it assumes in the enzyme’s active confor-
mation; the binding energy will shift the equilibrium towards this conformation.
Conversely, an inhibitor will selectively bind and stabilize the enzyme’s inactive
conformation.
As you can see from these considerations, activators and inhibitors may share
the same regulatory site; with phosphofructokinase, this applies to ATP and AMP.
Note, however, that human phosphofructokinase has an additional allosteric site
that permits regulation by another effector (see slide 7.5.3).

26 2 Refresher
2.5.5 Enzyme regulation by protein phosphorylation
Notes: Another important means of regulating enzyme activity is through phos-
phorylation of the enzyme molecules. This is mediated by protein kinases, which
transfer a phosphate group from ATP to specific amino acid side chains on the
regulated enzymes.
When considering how protein phosphorylation works, it is best to think of the
transferred phosphate group as an allosteric effector that happens to be covalently
attached to the enzyme. Like proper allosteric regulators, the phosphate group
imposes a conformational change that is transmitted to the active site through
the body of the protein; and in both cases, it depends entirely on the enzyme
in question whether it responds to the effector with an increase or a decrease
in activity. For example, ATP allosterically inhibits phosphofructokinase, but it
activates the functionally opposite enzyme fructose-1,6-bisphosphatase (see slide
7.5.3). Similarly, phosphorylation inhibits glycogen synthase but activates glycogen
phosphorylase, which degrades glycogen (slide 8.4.1).
The major difference between allosteric regulation on the one hand and pro-
tein phosphorylation on the other is in the duration; an allosteric effector will
dissociate as soon as its concentration drops, whereas phosphorylation will re-
main in effect until it is reversed by a specific protein phosphatase. Another,
less obvious difference is that phosphorylation can apply to multiple sites in one
protein. For example, in endothelial nitric oxide synthase (see slide 9.3.5), phos-
phorylation of alternate sites causes either activation or inhibition, respectively;
this is managed by separate, site-specific protein kinases. In contrast, multiple
and strictly alternate sites are not feasible with non-covalently binding allosteric
effectors.
2.6 Enzymes may be regulated by allosteric effectors and through phosphorylation. Dis-cuss the similarities and differences between both regulatory mechanisms.
2.5.6 Oligomeric enzymes behave cooperatively
Notes: While allosteric control is in principle feasible with both monomeric and
oligomeric enzyme molecules, almost all allosteric enzymes are indeed oligomeric
proteins. Phosphofructokinase is a dimer; this is not uncommon, but often the

2.5 Regulation of enzyme activity 27
number of subunits is considerably larger. Oligomeric enzymes usually respond
cooperatively to effector binding, which means that all subunits change conforma-
tion simultaneously. This enables the enzymes to react more sensitively to small
changes in effector concentration. Cooperative responses may be observed not
only with allosteric effectors but also with substrates.
0
25
50
75
100
0 25 50 75 100
React
ion
velo
city
Ligand concentration
This slide illustrates theoretical dose-response curves for monomeric, dimeric
and tetrameric enzymes. Each subunit is assumed to bind the ligand with the
same affinity; the differences in curve shape arise from cooperativity alone. Note,
however, that cooperativity may be partial, which means that oligomer subunits
retain a degree of independence. Partial cooperativity results in experimental
dose-response curves that are not as steep as theoretically possible.
2.5.7 Substrate cycles can amplify molecular regulation mechanisms
A
B
C
A
B
C
A
B
C
E
A
B
C
E
(a) (b)
Notes: Cooperativity is one device for increasing the sensitivity of metabolic flux
to regulation; substrate cycles are another. This is illustrated here for activation,
but it applies similarly to inhibitory effectors as well. Let’s consider a simple,
hypothetical pathway A B C (panel a). The rate is limited by the first reaction
(A B), so that the basal throughput of both reactions is the same; we may assume
that this flow rate equals 1. If we apply an effector E that doubles the rate of the
forward reaction A B, the subsequent reaction B C will be accelerated by the
same factor, since we assumed the first reaction to be rate-limiting.

28 2 Refresher
We can achieve the same basal throughput for B C as in (a) using a substrate
cycle between A and B, in which one enzyme converts A to B with a flow rate of 2,
and a second enzyme converts B back to A with a rate of 1 (panel b). If we now add
the same effector as in (a) and accordingly double the flow rate A B, we obtain a
flow rate of 4 for A B. Diminished by the unchanged flow B A, the resulting net
flow rate for B C becomes 3. The substrate cycle therefore amplifies the increase
in metabolic flux in response to the same regulatory effect of E. This regulatory
mechanism could be made even more effective by subjecting the step B C to
inhibition by E; such a pattern is observed for example with the substrate cycle
formed by phosphofructokinase and fructose-1,6-bisphosphatase (slide 7.5.3).
Substrate cycles occur in several places in metabolism; we will see some exam-
ples in sections 6.10 and 7.5. In order to crank such a cycle, some energy must
be expended—for example, the forward reaction may hydrolyze ATP, while the
reverse reaction does not regenerate it. This energy expenditure becomes the net
effect of the cycle, and for this reason substrate cycles are also referred to as futile
cycles. The energy is simply dissipated as heat, which to a degree may be useful,
particularly in warm-blooded animals; however, the throughput of such cycles
must always be kept in check in order to avoid excessive energy wastage.
2.5.8 Regulation of enzyme molecule abundance
• transcriptional induction
• accelerated mRNA degradation
• ubiquitin ligation, followed by proteolytic degradation
Notes: While all of the mechanisms discussed above reversibly modulate the ac-
tivity of existing enzyme molecules, an enzyme’s activity may also be varied by
changing its abundance in the cell. Firstly, the transcription of the gene encod-
ing the enzyme can be turned on or off. This mechanism is employed by many
hormones, for example thyroid hormones or cortisol and other steroid hormones.
Similarly, the stability of the messenger RNA encoding the enzyme can be up-
or downregulated by RNA-binding proteins and other mechanisms [1], with the
corresponding effects on the abundance of the enzyme molecules.
Enzyme molecules can also be tagged with a small protein named ubiquitin,
which marks the protein for proteolytic degradation within the proteasomes.
Hormones may affect the activity of an enzyme through more than one of these
mechanisms. For example, insulin increases the activity of glycogen synthase
by way of transcriptional induction, increasing mRNA stability, and inhibition of
protein phosphorylation.
In the following chapters, we will discuss the details of regulation only with
some selected enzymes. Nevertheless, please keep in mind that virtually all en-
zyme molecules are subject to one or more regulatory mechanisms. The impor-
tance of these molecular control mechanisms in the regulation of metabolism as a
whole cannot be overstated.

2.6 Answers to practice questions 29
2.6 Answers to practice questions
2.1: The catalytic triad is found in the active sites of esterases and peptidases. It comprisesthe side chains of three amino acid residues, namely, aspartate, histidine, and serine. Inthe catalytic mechanism, aspartate and histidine cooperate to deprotonate the hydroxylgroup of serine, which thus becomes the nucleophile that cleaves the substrate’s ester oramide bond through attack on its carbonyl group.
2.2: Most likely because someone on the Enzyme Commission had a sense of humor.
2.3: ∆G measures the difference in free energy between the substrate and the product of areaction and thus determines its equilibrium. ∆G∗ measures the difference in free energybetween the substrate and the transition state of the reaction and determines its rate. Anenzyme that catalyzes the reaction will lower ∆G∗ but not affect ∆G; it will increase therate, but not change the equilibrium of the reaction.
2.4: The terminal phosphate of ATP is transferred to the side chain carboxyl group ofglutamate. This produces a mixed anhydride, from which ionic phosphate is released aftersubstitution by free ammonia.
2.5: The three metabolites are at equilibrium, which is mediated by adenylate kinase.This enzyme reversibly converts two molecules of ADP to ATP plus AMP. AMP rises moresharply than ADP when ATP levels decline.
2.6: Allosteric effectors bind non-covalently, whereas phosphorylation is a covalent mod-ification. Like allosteric effectors, regulatory phosphate groups are typically bound at alocation other than the active site, and both affect enzyme activity through conformationalchanges that are transmitted to the active site. In both cases, it depends on the enzymemolecule itself whether the regulatory effect consists in activation or inhibition.


Chapter 3
Glycolysis
3.1 Overview of glucose metabolism
Pathway Function
glycolysis, citric acidcycle, respiratory chain
complete degradation of glucose forATP production
hexose monophosphateshunt
degradation of glucose for regenerationof NADPH
glycogen synthesis anddegradation
short-term glucose storage
gluconeogenesis synthesis of glucose from amino acids,lactate, or acetone
Notes: Glucose is a key metabolite in human metabolism, and we will spend a
good bit of time on the various pathways that are concerned with the utilization,
storage, and regeneration of glucose. The first step in the degradation of glucose is
glycolysis, which breaks down glucose to pyruvate. The main purpose of glycolysis
is the generation of energy (ATP). A modest amount of ATP is produced in glycoly-
sis directly, but much more ATP is formed downstream of glycolysis through the
complete oxidation of pyruvate.
An alternative pathway for complete glucose breakdown is the hexose mono-
phosphate shunt, which produces NADPH rather than ATP. Both ATP and NADPH
are needed in every cell, and accordingly both glycolysis and the hexose mono-
phosphate shunt are ubiquitous.
Glycogen is a polymeric storage form of glucose, not unlike starch, which is
found in plants. Glycogen is most abundant in the liver and in striated muscle,1
1Striated muscle comprises skeletal muscle and heart muscle. The second major type of muscletissue is smooth muscle, which occurs in blood vessels and internal organs and is under control bythe autonomic nervous system.
31

32 3 Glycolysis
although some is found in other tissues also. Glycogen is synthesized when glu-
cose supply is high, and its degradation helps to maintain the blood glucose level
when we are fasting. When glycogen is depleted, more glucose is synthesized from
scratch in gluconeogenesis. This pathway’s most important substrates are amino
acids, which are obtained either from a protein-rich diet—for example, when we
feast on meat exclusively—or, during starvation, from breakdown of cellular pro-
tein, mainly in skeletal muscle. Gluconeogenesis occurs in the liver and in the
kidneys.
3.1.1 The place of glycolysis in glucose degradation
glucose pyruvate
acetyl-CoA fatty acids
triacylglycerol
“H2”
H2Omitochondrion
glycolysis
CO2
pyruvatedehydrogenase CO2
citric acid cycle
O2 ADP+Pi
ATP
respiratory chain
Notes: As noted above, glycolysis is only the first stage of glucose degradation.
Under aerobic conditions, most of the pyruvate formed in glycolysis undergoes
complete oxidative degradation to CO2 and H2O.
Pyruvate destined for complete degradation is transported to the mitochon-
dria, where it is decarboxylated to acetyl-CoA by pyruvate dehydrogenase. Acetyl-
CoA is completely degraded in the citric acid cycle (or tricarboxylic acid cycle;
TCA cycle for short). The “H2” that is produced here is not gaseous but bound to
cosubstrates, as NADH + H+ and FADH2, respectively. It is subsequently oxidized
in the respiratory chain; it is in this final stage of glucose breakdown that most of
the ATP is actually produced.
If glucose is available in excess of immediate needs and glycogen is already
stocked up to capacity, it will still be broken down by glycolysis and pyruvate
dehydrogenase to acetyl-CoA. However, acetyl-CoA will then not be oxidized, but
it will instead be used for fatty acid synthesis; the fatty acids are converted to
triacylglycerol. Fatty acid synthesis occurs in the cytosol of cells in the liver and
fat tissue.
We will now consider all these pathways in their turn, starting in this chapter
with glycolysis.

3.2 Reactions in glycolysis 33
3.1 Name the pathways involved in glucose utilization and summarize their functions.
3.1.2 Alternate structures of d-glucose
OH
OH
OH
CH2OH
O
OH
O
OH
OH
CH2OH
OH
OH
OH
OH
OH
CH2OH
O
OH
α-d-Glucose Aldehyde form β-d-Glucose
Notes: Glucose occurs in α and β ring forms that are anomeric at the C1 carbon
(highlighted). In the presence of water, one form can reversibly change into the
other via an open-chain aldehyde form. Polymers of glucose contain either the
α or the β ring form. Within most of these polymers, the C1 hydroxyl groups
participate in glycosidic bonds, which prevents ring opening, and therefore the
spontaneous transitions between the anomeric forms cannot occur. Starch and
glycogen consist of α-d-glucose and yield it during degradation, and this form is
also the first substrate in glycolysis.
3.2 Reactions in glycolysis
OH
OH
OH
CH2OH
O
OH OH
OH
OH
O
PO O−
O−
O
OH
O
PO O−
O−
O
OH
OH
OH
CH2OH O
PO O−
O−
O
OH
OH
OH
O
PO O−
O−
1
ATP ADP
2
ATP ADP
3
4
Glucose Glucose-6- P Fructose-6- P Fructose-1,6-bis- P
OH
O
O P
O
O−
O−
O
OH
O P
O
O−
O−
5
O
PO O−
O−
O
OH
O P
O
O−
O−6
Pi
NAD+NADH+H+
COO−
OH
O P
O
O−
O−
ADPATP
7
3-Phosphoglycerate
1,3-Bisphosphoglycerate Glyceraldehyde-3- P Dihydroxyacetone- P
8
COO−
O P
O
O−
O−
OH
H2O
9
COO−
O P
O
O−
O−
CH2
ADP ATP
10
COO−
O
CH3
NADH+H+ NAD+
11
COO−
OH
CH3
2-Phosphoglycerate Phosphoenolpyruvate Pyruvate Lactate
Notes: Glycolysis involves 10 enzymatic reactions, as follows:

34 3 Glycolysis
1. The phosphorylation of glucose at position 6 by hexokinase,
2. the conversion of glucose-6-phosphate to fructose-6-phosphate by phospho-
hexose isomerase,
3. the phosphorylation of fructose-6-phosphate to the 1,6-bisphosphate by phos-
phofructokinase,
4. the cleavage of fructose-1,6-bisphosphate by aldolase. This yields two differ-
ent products, dihydroxyacetone phosphate and glyceraldehyde-3-phosphate,2
5. the isomerization of dihydroxyacetone phosphate to a second molecule of
glyceraldehyde-3-phosphate by triose phosphate isomerase,
6. the dehydrogenation and concomitant phosphorylation of glyceraldehyde-3-
phosphate to 1,3-bis-phosphoglycerate by glyceraldehyde-3-phosphate dehy-
drogenase,
7. the transfer of the 1-phosphate group from 1,3-bis-phosphoglycerate to ADP
by phosphoglycerate kinase, which yields ATP and 3-phosphoglycerate,
8. the isomerization of 3-phosphoglycerate to 2-phosphoglycerate by phospho-
glycerate mutase,
9. the dehydration of 2-phosphoglycerate to phosphoenolpyruvate by enolase,
and finally
10. the transfer of the phosphate group from phosphoenolpyruvate to ADP by
pyruvate kinase, to yield a second molecule of ATP.
Most of the pyruvate produced in step 10 undergoes oxidative degradation in
the mitochondria. The 11th reaction, catalyzed by lactate dehydrogenase, mostly
occurs under anaerobic conditions (see section 3.4), or in those cells that have
no mitochondria and therefore lack the ability to oxidatively degrade pyruvate
altogether. The latter applies to red blood cells and thrombocytes. Lymphocytes,
which do have mitochondria, apparently rely largely on anaerobic glycolysis as
well.
Most, but not all reactions in glycolysis are reversible; this is indicated in
the slide by double and single arrows, respectively. Because it contains several
irreversible reactions, the pathway as a whole is also irreversible. However, as
discussed in chapter 7, alternate routes exist that bypass the irreversible reactions
and allow glucose to be synthesized from pyruvate.
3.2 Name the metabolites and enzymes in glycolysis.
3.3 Mechanisms of enzyme catalysis in glycolysis
Metabolic reactions are catalyzed by enzymes. Enzymes are not magicians but
sophisticated catalysts, and their chemical mechanisms are often understood quite
well, at least in principle. We will now look at the catalytic mechanisms of several
enzymes from glycolysis. Some of these mechanisms will recur in similar form in
enzymes from other pathways.
2Aldolase is sometimes referred to as aldolase A, in order to distinguish it from aldolase B, whichoccurs in fructose degradation (see slide 4.2.1)

3.3 Mechanisms of enzyme catalysis in glycolysis 35
Our first example is hexokinase, which carries out the first reaction in the
glycolytic pathway. The kind of reaction that it carries out—the transfer of the
terminal phosphate group from ATP onto a hydroxyl group on the substrate—is
very common in biochemistry, and we will see more examples in these notes. The
mechanism of phosphorylation is always the same, so it suffices to discuss it once.
3.3.1 The phosphate groups in ATP are shielded from nucleophilic attack
O
OH
N N
N
NH2
N
OH
P
O
⊖O
OP
O
⊖O
O⊕P
O
⊖O
⊖
O
X⊖R
Notes: Most reactions that involve the transfer of a phosphate group from ATP to
something else are exergonic, that is, they are energetically favorable. For example,
the hydrolysis of ATP—that is, the transfer of the phosphate group to water—has
a free energy of -35 J/K mol. It is interesting to note then that ATP is nevertheless
quite stable in solution, which means that there must be a high activation energy
barrier that resists hydrolysis of the phosphate anhydride bond.
This energy barrier is due to the negative charges at the perimeter of the
triphosphate group that shield the phosphorus atoms in the center from nucle-
ophiles which are also negatively charged. Accordingly, to lower this barrier,
kinases provide compensating positive charges within their active sites that en-
gage the negative charges on the ATP molecule and thereby clear the way for
nucleophilic attack on the phosphorus.
3.3.2 The catalytic mechanism of hexokinase
Notes: In hexokinase, the negative charges of the phosphate groups are shielded
by magnesium ions and by positively charged amino acid side chains in the active
site. This facilitates nucleophilic attack by and phosphate group transfer to the
substrate.
The charge shielding mechanism solves one problem, but another one remains,
namely, how to limit the reaction to the right nucleophile. After all, the most
abundant nucleophile in the cell is water, which should make hydrolysis the most
likely outcome of ATP activation. This problem is addressed in the next slide.

36 3 Glycolysis
O AdenosineP
O
O⊖
⊕NH2
HNHN
Arg
OP
O
O⊖
Mg2+
OP
OX⊖R
O⊖
O⊖
⊕H3N
Lys
R X P
O
O−
O− −O P
O
O−
O P
O
O−
Adenosine
3.3.3 Hexokinase envelopes its substrates to prevent ATP hydrolysis
Notes: After binding of its substrate glucose (yellow and red) and its cosubstrate
ATP (not shown), hexokinase adopts a closed conformation, in which substrate
and cosubstrate are buried within the enzyme, and water is excluded from the
active site and from the reaction (left). The magnified view on the right shows the
C6 oxygen of glucose peeking out of the enzyme’s active site; ATP would occupy
the cavity above. Rendered from 3b8a.pdb.
OH
OH
OH
H2C OH
O
OH
Glucose
OH
OH
OH
H OH
O
OH
Xylose
If the enzyme is given xylose instead of glucose, one water molecule can squeeze
into the active site along with the sugar. This water assumes the place of the C6
hydroxymethyl group of glucose, and it will be activated by hexokinase to react
with ATP, which will result in ATP hydrolysis.
3.3 Explain the catalytic mechanism of hexokinase.

3.3 Mechanisms of enzyme catalysis in glycolysis 37
3.3.4 Phosphohexose isomerase performs acid-base catalysis
O
P
OH
OH H
OHO H ⊖OH
⊕NH3
LysH
⊕
N
His
OH
P
OH
OH H
OH
O H OH
⊕NH3
LysN
His
OH
P
OH
OH
OHH ⊖O O
Glu
O
H⊕
OH
P
OH
OH
O
H
H O O
Glu
OH
OH
P
OH
OH
O
HC
H
OH
O
P
OH
OH
OH
CH2OH
Notes: Phosphohexose isomerase provides an excellent example of acid-base cata-
lysis, which involves the reversible protonation and deprotonation of the substrate.
The substrate’s hemiacetal bond is opened by the concerted action of a protonated
histidine and of a hydroxide ion, which at the outset is bound to a lysine residue.
Then, a glutamate residue abstracts a proton from C2 and donates it back to C1,
which causes the C−−O double bond to migrate from C1 to C2.
Not shown in the picture are several auxiliary charged residues in the active
site, which form ion pairs with charges that develop transiently on the substrate,
and thereby stabilize the transition state. Closure of the hemiacetal bond in
fructose-6-phosphate, which concludes the reaction, is analogous to the initial ring
opening and involves the same catalytic amino acid residues [2].
3.3.5 Glyceraldehyde-3-phosphate dehydrogenase carries out covalent cataly-
sis
Cys
S
H
N
His
Cys
S⊖ O H⊕
H
R
Cys
S
H
⊕NAD
R
O H B
Cys
S⊕H O
⊖O P
O
O−
O−R
Cys
S
H
O
R
O P
O
O−
O−
NADH
Notes: Glyceraldehyde-3-phosphate dehydrogenase provides a straightforward ex-
ample of covalent catalysis. This reaction mechanism is very common in dehydro-

38 3 Glycolysis
genation reactions, for example in the citric acid cycle and in the β-oxidation of
fatty acids. The reaction goes through the following steps:
1. A cysteine in the enzyme’s active site is deprotonated by an auxiliary histidine
to a thiolate anion (−S–).
2. Glyceraldehyde-3-phosphate (shown as R−(−−O)−H) binds to the active site,
and the thiolate performs a nucleophilic attack on its aldehyde carbon. This
yields a tetrahedral intermediate state, in which the substrate becomes bound
covalently to the enzyme—hence the term “covalent catalysis”.
3. The covalent intermediate gives up two electrons and two protons to NAD+
and the enzyme, which yields NADH and converts the substrate to a thioester.
NADH leaves.
4. The thioester is cleaved by a phosphate ion, again through nucleophilic attack.
The product (1,3-bisphosphoglycerate) leaves, and the enzyme is restored to
its original state.
The redox cosubstrate used by glyceraldehyde-3-phosphate dehydrogenase,
nicotinamide adenine dinucleotide (NAD+), also accepts most of the hydrogen that
accrues in the degradative pathways downstream of glycolysis. Its structure and
the details of its reduction by hydrogen are shown in slide 3.3.6.
3.4 Summarize the catalytic mechanisms of phosphohexose isomerase and of glyceralde-hyde-3-phosphate dehydrogenase.
3.3.6 Structure and redox chemistry of NAD+ and NADP+
O O
OH
⊕
N
NH2
O
OHP O−O
O
P O−O
O O
O X
N N
N
NH2
N
OH
P
O
O−
O−NAD: X = H NADP: X =
R
⊕
N
NH2
O
R
H
O
H
SCys
R
N
NH2
OHH
R
O
H⊕
SCys
Notes: The panel on the left shows the structure of NAD+ and NADP+; the re-
dox-active nicotinamide moiety is highlighted. The panel on the right shows the
reduction of this moiety by glyceraldehyde-3-dehydrogenase. The electrons and
the hydrogen are transferred from the substrate to the C4 of the nicotinamide. The
electrons then redistribute within the ring.

3.3 Mechanisms of enzyme catalysis in glycolysis 39
As you can see, NAD+ and NADP+ differ solely by the absence or presence of
a phosphate group at the lower ribose ring, which has absolutely nothing to do
with the actual redox chemistry. Why, then, is it there at all? It simply serves as
a tag that allows NAD+ and NADP+ to interact with separate sets of enzymes. The
significance of this duality is discussed in a later chapter (see slide 9.3.1).
3.3.7 Pyruvate Kinase
O
OH
N N
N
NH2
N
OH
OP
O
O−
OP
O
O−
O⊖O−P
O
−O
O⊕H
O
O−
CH2
HO
O
O−
CH2
⊕H
O
O
O−
CH3
Notes: The mechanism of pyruvate kinase is similar to that of hexokinase—except
that the reaction proceeds the other way, producing ATP rather than consuming it.
Yet, both reactions are irreversible. How can this be?
In the hexokinase reaction, the terminal phosphate of ATP is converted from
an anhydride to a phosphoester, which is inherently lower in energy; this makes the
reaction exergonic and irreversible. The same also applies to phosphofructokinase
and to most other phosphorylation reactions. However, the pyruvate kinase is a
special case. Its intermediate product, which occurs immediately after transfer of
the phosphate group from phosphoenolpyruvate to ADP, is enolpyruvate. Removal
of the phosphate group allows the enol group to rearrange itself into a keto group.
This second step of the reaction is sufficiently exergonic to offset the energetic cost
of converting the phosphoester to the anhydride, and it thus pushes the overall
equilibrium of the reaction towards ATP formation.
3.5 Explain why the reactions catalyzed by hexokinase and pyruvate kinase are bothirreversible, but proceed in opposite directions.
3.3.8 Energy-rich functional groups in substrates of glycolysis
• the enolphosphate in PEP
• the carboxyphosphate in 1,3-bisphosphoglycerate
• the thioester in the active site of glyceraldehyde-3-dehydrogenase

40 3 Glycolysis
Notes: As you know, the most abundant and important energy-rich metabolite
in the cell is ATP. Within this molecule, the energy is stored in the energy-rich
phosphate anhydride bonds. Cleavage of these bonds is exergonic, and the energy
released by cleavage drives the various reactions and processes powered by ATP.
Conversely, in creating ATP from ADP, we require energy to form a new phosphate
anhydride bond. We just saw how this energy is derived from phosphoenolpyru-
vate, and we thus may say that the enolphosphate group is another energy-rich
group.
The first ATP in glycolysis is formed by cleavage of the carboxyphosphate
mixed anhydride in 1,3-bisphosphoglycerate, and we may thus infer that such
mixed anhydrides are energy-rich groups, too. The same functional group also
occurs in acetylphosphate and in succinylphosphate, and both of these are
capable as well to drive the formation of phosphate anhydride bonds in ATP or
GTP.
In slide 3.3.5, we saw that the carboxyphosphate was formed from ionic phos-
phate and a thioester bond. Since the free phosphate ion is low in energy, it follows
that the energy that went into the mixed anhydride came from the thioester. This
means that thioesters are energy-rich groups, too.
3.4 Glycolysis under aerobic and anaerobic conditions
As we will see in subsequent chapters, the complete oxidative (aerobic) degradation
of each glucose molecule yields approximately 30 molecules of ATP. How much of
this accrues in glycolysis?
The initial phosphorylation reactions (steps 1 and 3 in slide 3.2) expend two
molecules of ATP. One molecule of ATP each is obtained in steps 7 and 10. Since
all of the steps from 6 to 11 occur twice per molecule of glucose, the net balance
is a gain of two moles of ATP per mole of glucose—a very modest contribution to
the final tally. Still, glycolysis is a viable source of ATP, and it is the major one
that operates in our tissues under anaerobic conditions, that is, while oxygen is in
short supply. This concerns mostly skeletal muscle during maximal exercise, such
as a 100 meter dash. As noted above, erythrocytes and some other cell types rely
on anaerobic glycolysis even under aerobic conditions.
3.4.1 Regeneration of cytosolic NAD+ under aerobic conditions
Notes: The glyceraldehyde-3-phosphate dehydrogenase reaction (step 6 in slide
3.2) reduces one equivalent of NAD+ to NADH. The concentration of NAD+ in the
cytosol is not high, and it must therefore be regenerated from NADH in order
for glycolysis to continue. Under aerobic conditions, the hydrogen is transferred
from NADH to one of several carriers that deliver it to the respiratory chain in the
mitochondria, and ultimately to oxygen. These shuttle mechanisms are discussed
in detail in section 6.9. Under anaerobic conditions, this is impossible; therefore,
other means for hydrogen disposal are required.

3.4 Glycolysis under aerobic and anaerobic conditions 41
Glyceraldehyde-3- P 1,3-Bis- P -glycerate
NAD+ NADH+H+
CarrierCarrier-H2
1/2 O2 H2O Mitochondrion
3.4.2 Under anaerobic conditions, NAD+ is regenerated by lactate dehydroge-
nase
Notes: In human metabolism, pyruvate serves as a makeshift hydrogen acceptor
under anaerobic conditions; it is reduced to lactate by lactate dehydrogenase (step
11 in slide 3.2). The lactate is released into the bloodstream, where it accumulates;
it is removed and recycled after restoration of oxygen supply. The muscle pain
caused by lactate accumulation forces us to discontinue anaerobic exercise after a
short while.3
Glyceraldehyde-3- P 1,3-Bis- P -glycerate
NAD+ NADH+H+
COO−
H OH
CH3
COO−
O
CH3
Lactate Pyruvate
3.4.3 Ethanolic fermentation in yeast serves a dual purpose
Notes: Anaerobic glycolysis also occurs in many microbes, which also face the
need to reoxidize NADH. Without the option of reverting to oxidative metabolism
within a short time span, they must also deal with the continued accumulation of
acid. The yeast Saccharomyces cerevisiae solves this problem through ethanolic
fermentation: The acid is converted to a neutral and considerably less toxic com-
pound (ethanol) via decarboxylation. The CO2 developed in this reaction makes
3Measurement of the blood lactate concentration is performed in sports medicine to gauge thecapacity of a trained athlete to sustain aerobic rather than anaerobic metabolism during prolongedexertion. The anatomical correlate of endurance is not so much the quantity of muscle tissue butthe extent of its vascularization, that is, the abundance of capillaries in the tissue. A high density ofcapillaries ensures good oxygen supply.

42 3 Glycolysis
bread dough rise up, whereas the ethanol does the same to government tax rev-
enue.4
Glyceraldehyde-3- P 1,3-Bis- P -glycerate
NAD+ NADH+H+
H2C OH
C
CH3
HC O
C
CH3
COO−
O
CH3
Ethanol PyruvateCO2Acetaldehyde
3.6 Explain how the NADH that accumulates in the glyceraldehyde-3-dehydrogenase reac-tion is oxidized under anaerobic conditions in humans and in baker’s yeast.
3.5 Transport and utilization of glucose in the liver and in other organs
As was noted in slide 1.6.13, uptake of glucose from the blood occurs by facilitated
diffusion and is mediated by GLUT transporters. These occur in several sub-types
whose properties are tuned to the physiological roles of different organs.
3.5.1 Kinetics of glucose transport by facilitated diffusion
Notes: A typical carrier for passive substrate transport alternates between two
conformations that are open to either side of the membrane. On both sides of
the membrane, the substrate reversibly binds to the carrier protein; binding and
dissociation are governed by mass action kinetics. Transport occurs when the
protein changes from the outward-facing to the inward-facing conformation, or
vice versa, while a substrate molecule is bound to it.
The sequence of events in passive transport resembles the pattern of Michaelis-
Menten enzyme kinetics—in both cases, a solute binds reversibly to a protein,
which then performs some state-altering action on it. Accordingly, the velocity of
4The English name of this organism is baker’s yeast, but the literal translation would be “sugarfungus of the beer”.

3.5 Transport and utilization of glucose in the liver and in other organs 43
transport by facilitated diffusion follows the familiar Michaelis-Menten law:
Vtransport = Vmax[S]
KM + [S](3.1)
where KM is the Michaelis constant, [S] is the substrate concentration, Vtransport
is the rate of transport, and Vmax is the maximum rate of transport. This rate is
reached at high substrate concentrations, that is, when [S]≫ KM.
Vmax is proportional to the number of carrier molecules. In many tissues, the
number of glucose transporters varies depending on insulin levels. In this way,
insulin controls the rate of glucose uptake into cells in these tissues (see slide
13.2.16).
3.5.2 GLUT transporters in different tissues vary in their affinity for glucose
0
25
50
75
100
0 2 4 6 8 10
Tra
nsp
ort
rate
(%
of
max)
Glucose (mM)
GLUT2 (liver)
GLUT4 (muscle, fat)
GLUT3 (brain)
Notes: At lower substrate concentrations, the rate of transport becomes depen-
dent on KM, which is inversely related to the affinity of the transporter for the
substrate. From equation 3.1, it can be seen that Vtransport will be equal to 1/2Vmax
when the glucose concentration equals KM; therefore, the smaller KM, the more
effective the uptake of glucose will be at low concentrations.
The smallest KM—or in other words, the highest glucose affinity—occurs with
the GLUT3 transporter subtype, which is found in the brain. Given that normal
plasma glucose levels are between 4 and 7 mM, the brain will extract glucose
efficiently at both high and low glucose levels. In organs with GLUT subtypes
of lower affinity, the rate of uptake drops more significantly as glucose becomes
depleted. The decrease in transport efficiency is most pronounced with the GLUT2
transporter, which occurs in the liver.
3.5.3 Reaction velocities of hexokinase and glucokinase
Notes: Organ-specific variation of glucose affinity is also observed at the stage of
glucose phosphorylation. The liver has a special enzyme called glucokinase, which

44 3 Glycolysis
performs the same reaction as does hexokinase but differs from the latter by a
higher KM value.5
0
25
50
75
100
0 2 4 6 8 10R
eact
ion
velo
city
(%
)Glucose (mM)
Glucokinase (liver)
Hexokinase (other tissues)
Accordingly, in the liver, phosphorylation will proceed more slowly when the
level of blood glucose is low, and most of the glucose will be allowed to pass
through the liver and make its way into the general circulation. In contrast, at
high concentration, the liver will extract a greater share of the available glucose
and convert it to glycogen or fatty acids. The kinetic properties of both glucose
transport and phosphorylation therefore support the regulatory function of the
liver in blood glucose metabolism.
At this point, we must note that the intrinsic kinetic properties of transporter
and enzyme molecules are but one piece in the puzzle of glucose regulation. In-
sulin and several other hormones control the expression, distribution and activity
of transporters and enzymes. Hormonal regulation is essential for proper coordi-
nation of glucose utilization, as is evident from its severe disturbances in diabetes
mellitus and other endocrine diseases (see chapters 13 and 14).
The graphs in this slide and the previous one were plotted using parameters
tabulated in references [4, 5, 6].
3.7 Explain how glucose uptake and utilization is prioritized between different tissues.
3.6 Answers to practice questions
3.1: See table in slide 3.1.
3.2: See the list in section 3.2.
3.3: Within the active site of hexokinase, the negative charges on the ATP molecule areshielded by magnesium and cationic amino acid residues, which facilitates nucleophilicattack by the hydroxyl group of glucose on the terminal phosphate of ATP. Hydrolysis ofthe activated ATP is prevented by exclusion of water from the active site.
3.4: Phosphohexose isomerase uses acid-base catalysis to open the pyranose ring of glu-cose-6-phosphate, then shift the carbonyl group from the first to the second carbon toproduce fructose-6-phosphate, and finally close the furanose ring of the product. Glyceral-
5Glucokinase also binds glucose cooperatively, as is evident from the slightly sigmoidal shape ofthe graph. Interestingly, glucokinase is a monomer; apart from the active site, it also has a regulatory,allosteric glucose binding site [3].
More detailed analysis shows that there are more than two variants of glucose-6-kinase activity,and that organs may express more than one variant.

3.6 Answers to practice questions 45
dehyde-3-phosphate dehydrogenase uses covalent catalysis to transfer hydrogen from itssubstrate to NAD+ and then phosphorylate the remainder of the substrate to 1,3-bis-phos-phoglycerate.
3.5: Like most other kinases, hexokinase catalyzes an exergonic phosphate transfer fromATP to its substrate. Pyruvate kinase, in contrast, is able to transfer phosphate in theopposite direction because this enables the product to undergo a strongly exergonic tau-tomerization from its enol to the keto form.
3.6: Humans reoxidize NADH by reducing pyruvate to lactate. Baker’s yeast first decar-boxylates pyruvate to acetaldehyde, which it then reduces to ethanol. NADH is reoxidizedin the second reaction.
3.7: Organs with high priority, in particular the brain, have GLUT transporters and hexo-kinase isozymes with high affinity, which will work near maximum speed at both low andhigh concentrations. In contrast, organs with low priority, particularly the liver, expresstransporters and hexokinase isozymes (glucokinase) that have relatively high KM valuesand therefore lose activity at low glucose concentrations. Glucose utilization is also af-fected by insulin, which is necessary for glucose uptake in many tissues (this applies inparticular to muscle and fat tissue, see slide 13.2.15).


Chapter 4
Catabolism of sugars other than glucose
4.1 Dietary sugars other than glucose
Trivial name Composition Source
lactose (milk sugar) disaccharide ofglucose and galactose
milk
sucrose disaccharide ofglucose and fructose
sugar cane, sugarbeet, other fruits
fructose monosaccharide various fruits
sorbitol sugar alcohol fruits;semisynthetic
ribose, deoxyribose monosaccharides nucleic acids
Notes: Starch is the most abundant carbohydrate in our diet, which makes glucose
the most important dietary monosaccharide. However, our diet contains several
other sugars in significant amounts. The guiding motif in the metabolism of these
sugars is economy: instead of completely separate degradative pathways, there
are short adapter pathways which merge into the main pathway of carbohydrate
degradation, that is, glycolysis.
Lactose and sucrose are disaccharides. Degradation of both sugars begins with
hydrolytic cleavage, which releases glucose and galactose or glucose and fructose,
respectively. Fructose is also found in the diet as a monosaccharide. We already
know how glucose is degraded, so we here only need to concern ourselves with
the remaining monosaccharides. The degradation of sorbitol will be discussed as
well, whereas ribose and deoxyribose will be covered in later chapters.
47
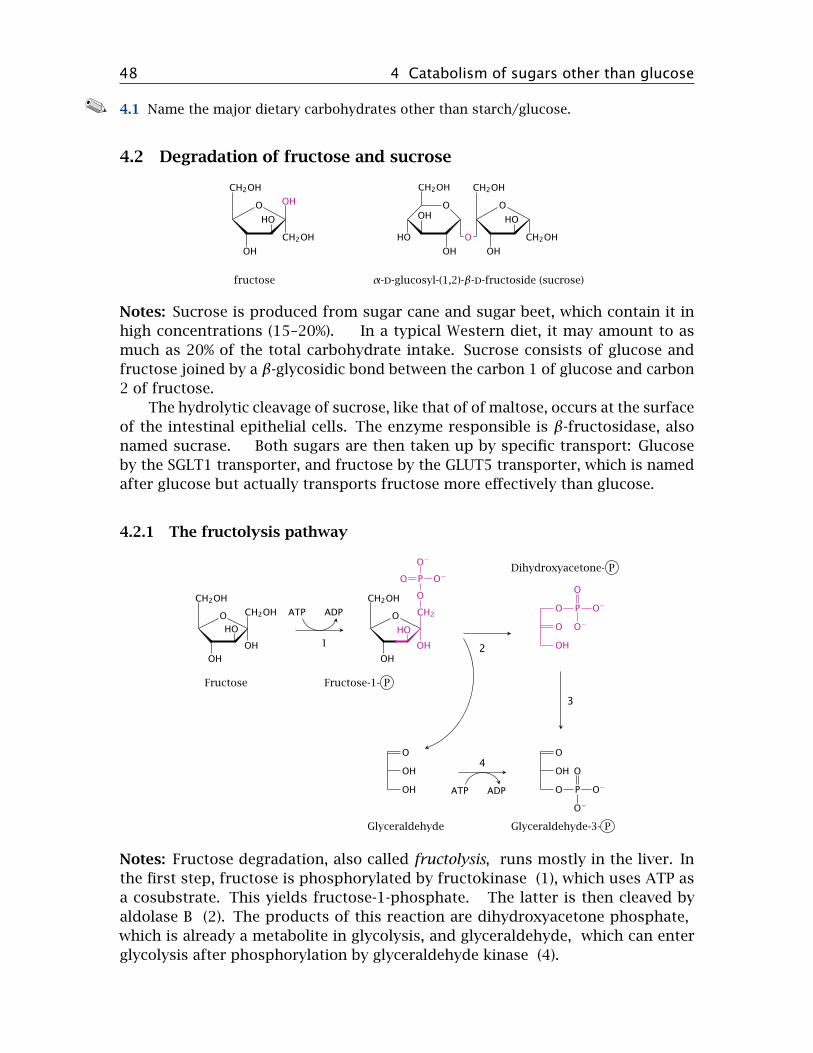
48 4 Catabolism of sugars other than glucose
4.1 Name the major dietary carbohydrates other than starch/glucose.
4.2 Degradation of fructose and sucrose
CH2OH
O
OH
OH
OH
CH2OH O
OH
OH
CH2OH
O
OH
CH2OH
O
OH
OH
CH2OH
fructose α-d-glucosyl-(1,2)-β-d-fructoside (sucrose)
Notes: Sucrose is produced from sugar cane and sugar beet, which contain it in
high concentrations (15–20%). In a typical Western diet, it may amount to as
much as 20% of the total carbohydrate intake. Sucrose consists of glucose and
fructose joined by a β-glycosidic bond between the carbon 1 of glucose and carbon
2 of fructose.
The hydrolytic cleavage of sucrose, like that of of maltose, occurs at the surface
of the intestinal epithelial cells. The enzyme responsible is β-fructosidase, also
named sucrase. Both sugars are then taken up by specific transport: Glucose
by the SGLT1 transporter, and fructose by the GLUT5 transporter, which is named
after glucose but actually transports fructose more effectively than glucose.
4.2.1 The fructolysis pathway
CH2OH
O
OH
OH
OH
CH2OH
CH2OH
O
OH
OH
OH
CH2
O
PO O−
O−
O P
O
O−
O−
O
OH
O
OH
OH
O
OH
O P
O
O−
O−
ATP ADP
ATP ADP
Fructose Fructose-1- P
Dihydroxyacetone- P
Glyceraldehyde Glyceraldehyde-3- P
12
3
4
Notes: Fructose degradation, also called fructolysis, runs mostly in the liver. In
the first step, fructose is phosphorylated by fructokinase (1), which uses ATP as
a cosubstrate. This yields fructose-1-phosphate. The latter is then cleaved by
aldolase B (2). The products of this reaction are dihydroxyacetone phosphate,
which is already a metabolite in glycolysis, and glyceraldehyde, which can enter
glycolysis after phosphorylation by glyceraldehyde kinase (4).

4.2 Degradation of fructose and sucrose 49
Glyceraldehyde can alternately be utilized by conversion to glycerol and then
to glycerol-1-phosphate. The latter is a substrate in the synthesis of triacylglyc-
erol, that is, fat. Fructose and sucrose appear to promote obesity more strongly
than equivalent amounts of starch or glucose, and it has been suggested that
its utilization via glycerol-1-phosphate, with subsequent triacylglycerol synthesis,
may be among the reasons.
4.2.2 Fructose intolerance
Fructose Fructose-1- P Glyceraldehyde
ATP ADP
Dihydroxyacetone- P
Glyceraldehyde-3- P
3- P -glycerate 1,3-Bis- P -glycerate Pi
Fructokinase Aldolase B
PG-kinase
NADH+H+ NAD+
Notes: Fructose intolerance is a hereditary disease caused by a homozygous defect
in the aldolase B gene. In this condition, fructose is still phosphorylated by
fructokinase. The resulting fructose-1-phosphate, however, cannot be processed
further, and therefore the phosphate tied up in it cannot be reclaimed. Since
phosphate is required for the regeneration of ATP from ADP, this means that ATP
will be lacking, too, which will sooner or later damage or even destroy the cell.
Accordingly, the disease is characterized by potentially severe liver failure.
Fructose, alone or in combination with glucose, has been used in the past in
the intravenous nutrition of intensive care patients; the perceived advantage of
this treatment was the insulin-independent utilization of fructose. However, large
intravenous dosages of fructose can significantly deplete liver ATP [7]; apparently,
under heavy load, aldolase B may be unable to keep up with fructose kinase.
Fructose is no longer a major component of intravenous nutrition schemes.
A defect in the gene encoding fructokinase leads to a condition named fruc-
tosemia or fructosuria. As these names suggest, fructose levels are increased both
in the blood1 and the urine. Since fructose is not phosphorylated, no phosphate
depletion occurs, and the liver cells do not incur any damage. The disease is
therefore quite benign.
4.2 Explain how fructose is degraded, and the causation of fructose intolerance and offructosemia.
1Haima is the Greek word for blood; hematology is the medical discipline that deals with diseasesof the blood.

50 4 Catabolism of sugars other than glucose
4.3 Lactose and galactose
OH
OH
OH
CH2OH
OHO OH
OH
OH
CH2OH
O
O
OH
OH
CH2OH
OHO
β-d-galactose β-d-galactosyl-(1 4)-d-glucoside (lactose)
Notes: Lactose, a disaccharide of glucose and galactose, is the major carbohydrate
contained in milk. Like maltose and sucrose, it is cleaved at the brush border of
the small intestine, and the monosaccharide fragments are absorbed and passed
along to the liver. The enzyme that accomplishes the cleavage is lactase or, more
precisely, β-galactosidase.
4.3.1 The Leloir pathway for galactose utilization
Lactose Galactose
Glucose Galactose-1- P UDP-Glucose
Glucose-6- P Glucose-1- P UDP-Galactose
Gal-1- P uridyltransferase
. . .
Lactase
Galactokinase
UDP-Gal epimerase
Phosphogluco-
mutase
Glycolysis
Notes: Galactose is utilized by conversion to glucose; this happens to a large ex-
tent in the liver, but the pathway is active in other tissues as well. The sugar is first
phosphorylated by galactokinase. The resulting galactose-1-phosphate undergoes
an exchange reaction with UDP-glucose, which is catalyzed by galactose-1-phos-
phate uridyltransferase and releases glucose-1-phosphate and UDP-galactose.
Glucose-1-phosphate can be converted by phosphoglucomutase to glucose-6-phos-
phate, which is the first intermediate in glycolysis. UDP-galactose is converted to
UDP-glucose by UDP-galactose epimerase.
In this pathway, UDP-glucose and UDP-galactose fulfill catalytic roles but are
not subject to any net turnover, much like the intermediates in the citric acid
cycle. It might therefore be said that they form a tiny metabolic cycle between the
two of them. Also note that, save for the final epimerase reaction, the pathway is
really just smoke and mirrors—performing the epimerization on galactose directly

4.3 Lactose and galactose 51
would accomplish the same net effect, without being chemically more difficult in
any way.2
4.3 Summarize the Leloir pathway of galactose degradation.
4.3.2 Mechanism of UDP-galactose epimerase
O
OH
OH
CH2OH
OHO
P
O
O−
O P
O
O−
OO
OH
N O
NH
O
O
OH
OH
CH2OH
O
O
P
O
O−
O P
O
O−
OO
OH
N O
NH
O
O
OH
OH
CH2OH
O
HO P
O
O−
O P
O
O−
OO
OH
N O
NH
O
UDP-Galactose
UDP-Glucose
Notes: One unusual feature of UDP-galactose epimerase is its use of NAD+ as a
coenzyme, rather than as a cosubstrate—that is, NAD+ undergoes no net reduction
or oxidation in this case. Nevertheless, it functions here much in the same way as it
does in other enzyme reactions. The 4′-hydroxyl group of the sugar is transiently
dehydrogenated to a keto group, and in this step NAD+ accepts the abstracted
hydrogen. The substrate is then rotated within the active site before the H2 is
transferred back to it, which causes the 4′-OH group to now point the other way.
4.3.3 Lactose intolerance
Notes: A deficiency of the lactase enzyme in the small intestine gives rise to
lactose intolerance, which is found frequently in people of East Asian descent who
are past their infant age.
If lactose is not cleaved, it cannot be absorbed, so it travels down the drain
from the small to the large intestine. Many of the bacteria found there have the
capacity to metabolize lactose, which they will happily convert to acids and gas.
For example, Escherichia coli has a pathway called mixed acid fermentation. One
2Galactose is contained in the glycosyl moieties of many glycoproteins and glycolipids. Theenzymes and activated intermediates for the synthesis of galactose from glucose and for its incor-poration into glycosyl moieties are widespread among life forms. They predate the emergence oflactose secretion by mammals, and evolution chose to reuse them for lactose utilization.

52 4 Catabolism of sugars other than glucose
of the products of this fermentation is formic acid (HCOOH), which is then cleaved
by formic acid lyase to H2 and CO2. The decarboxylation of formic acid serves the
same purpose as that of pyruvate in ethanolic fermentation, namely, the removal
of excess acidity resulting from the fermentation (see slide 3.4.3).
The aberrant fermentation and gas formation leads to abdominal discomfort and
diarrhea. Since the environment in the large intestine lacks oxygen, H2 generated
in the bacterial fermentation is not oxidized but instead enters the system as such
and is mostly exhaled. An increase in exhaled hydrogen gas provoked by ingesting
a test dose of lactose can be used to diagnose the condition.
Treatment consists in omission of lactose in the diet. Milk can be pre-treated
with purified bacterial β-galactosidase, rendering it suitable for consumption by
lactose-intolerant individuals. Fermented milk products such as yogurt and cheese
are depleted of lactose by microbial fermentation and therefore do not pose a
problem for lactose-intolerant individuals.
4.4 Explain the pathogenesis of lactose intolerance.
4.3.4 Galactosemia
Notes: Three different enzyme deficiencies in the pathway are subsumed under
the name galactosemia, which means “galactose in the blood.” All of these are
rare; type I is the most common and most severe form. Here, the deficient enzyme
is galactose-1-phosphate uridyltransferase. This leads to a buildup of galactose-
phosphate, but also of several other metabolites. The disease becomes manifest
in newborns with acute liver failure and is deadly if not promptly diagnosed and
treated. In many countries, this enzyme defect is part of neonatal screening
programs.

4.4 Sorbitol is an intermediate of the polyol pathway 53
Type Enzyme deficiency Accumulating metabolites
I galactose-1-phosphate-uridyltransferase
galactose,galactose-1-phosphate,galactitol, galactonate
II galactokinase galactose, galactitol
III UDP-galactoseepimerase
galactose-1 phosphate,UDP-galactose
Therapy consists in the removal of galactose from the diet, but even so organ
damage develops, most commonly affecting the CNS and, in girls, the ovaries. The
residual pathology that develops in spite of the diet is ascribed to the endogenous
synthesis of galactose, which proceeds via UDP-glucose and UDP-galactose; the
UDP-galactose epimerase reaction is reversible.
For a long time, it was assumed that accumulation of galactose-1-phosphate
and phosphate depletion are responsible for cell and organ damage, which is
analogous to the pathogenic mechanism in fructose intolerance (see slide 4.2.2).
However, this assumption has been thrown into question by the results of animal
experiments. When galactose-1-uridyltransferase is genetically knocked out in
mice, these develop a profile of metabolite accumulation that closely resembles
human patients, but they do not display any of the pathology observed in humans
[8]. What is more, some rare human cases have been reported that show the usual
biochemical manifestations, but no clinical signs [9]. The quest for the true cause
of the pathology affecting most human patients continues [10, 11].
In the order of the pathway, type II galactosemia comes first, as it involves a
defect of galactokinase. In this case, galactose simply does not enter the Leloir
pathway at all; it builds up in the blood and is mostly eliminated in the urine.
The liver will not be adversely affected. However, there is a common complication
elsewhere: the eyes will develop cataract, that is, obfuscation of the lenses. This
is due to the reduction of galactose to galactitol in the cells of these organs by
aldose reductase (see slide 4.4).
The rarest form of galactosemia is due to the defect of UDP-galactose epimerase.
The biochemical pattern is similar to type I, except that UDP-galactose also ac-
cumulates, and as in type I, developmental delay seems to occur [12]. In this
condition, both the utilization and the synthesis of galactose are inhibited, and
it appears necessary to maintain a low level of dietary galactose to supply the
synthesis of galactose-containing glycolipids and glycoproteins.
4.5 Describe and discuss type I galactosemia.
4.4 Sorbitol is an intermediate of the polyol pathway
Notes: Sorbitol is not strictly a sugar, since it has no keto or aldehyde group. It
is normally a minor component of dietary carbohydrates, but it is also prepared
semisynthetically and used as a sweetener. In addition, it is formed in our own

54 4 Catabolism of sugars other than glucose
metabolism from glucose in the polyol pathway, which then converts it further
to fructose. Note the use of NADPH as a cosubstrate in the first step, and of
NAD+ in the second. NADP exists mostly in the reduced state, while NAD is mostly
oxidized (see slide 9.3.1), which means that both drive the pathway in the indicated
direction.
aldosereductase
sorbitoldehydrogenase
O
OH
OH
OH
OH
OH
OH
OH
OH
OH
OH
OH
OH
O
OH
OH
OH
OH
NADPH+H+
NADP+
NAD+
NADH+H+
glucose sorbitol fructose
The first enzyme, aldose reductase, is not specific for glucose but can also reduce
galactose, which gives rise to galactitol. As stated above, the elevated blood level
of galactose in galactosemia type II causes galactitol to accumulate in the lenses;
the same occurs with glucose and sorbitol in insufficiently treated diabetes mellitus
(see slide 14.5.7). Accumulation of either sorbitol or galactitol causes cataract; this
is ascribed to their osmotic activity, which causes cell damage through swelling.
Like the cells in the lens, nerve cells are able to take up glucose in an insulin-in-
dependent fashion, and like cataract, nerve cell damage (diabetic polyneuropathy)
is a common long-term complication in diabetes. It appears plausible that sorbitol
accumulation might also be responsible for this nerve cell damage. Inhibitors of
aldose reductase have been developed and have shown promise in animal models
of both diabetes and galactosemia, but evidence of clinical effectiveness in humans
is scarce.
Conversion of glucose to fructose via the polyol pathway occurs in the seminal
vesicles, which are part of the male sexual organs, and fructose is found in the
sperm fluid. It supplies the sperm cells with fuel in their frantic quest for an
oocyte; the advantage of this somewhat unusual source of energy may be that
fructose will not be pilfered by the other tissues the sperm fluid will get into
contact with.
Now, if sperm cells require fructose to sustain their motility, one might expect
that prevention of fructose synthesis with aldose reductase inhibitors would dis-
rupt male fertility and thus provide the long-sought pill for males. However, I have
not seen any experimental studies on this subject.
4.5 Answers to practice questions
4.1: See table in section 4.1.
4.2: Fructose is degraded by fructokinase, which produces fructose-1-phosphate, aldolaseB, which produces dihydroxyacetone phosphate and glyceraldehyde, and glyceraldehydekinase. Fructose intolerance is due to a homozygous enzyme defect in aldolase B, whichcauses fructose-1-phosphate to accumulate and free phosphate to be depleted. Fruc-

4.5 Answers to practice questions 55
tosemia results from a defect of fructokinase and causes a buildup of free fructose inblood and urine.
4.3: Galactose undergoes phosphorylation to the 1-phosphate by galactokinase. Galactose-1-phosphate is exchanged for glucose-1-phosphate by galactose-1-phosphate uridyltrans-ferase, which uses UDP-glucose as its other substrate. Glucose-1-phosphate is converted tothe 6-phosphate by phosphoglucomutase, whereas UDP-galactose epimerase regeneratesUDP-glucose.
4.4: Lactose intolerance results from a deficiency of intestinal lactase. Ingested lactosecannot be cleaved and taken up in the small intestine and therefore reaches the largeintestine, where it is metabolized by bacteria. Changes in bacterial metabolism, includingincreased gas formation, gives rise to abdominal discomfort and diarrhea.
4.5: Type I galactosemia is caused by a defect of galactose-1-phosphate uridyltransferase.Metabolites upstream of the deficient enzyme accumulate, as do the aberrant conversionproducts galactitol and galactonate. The disease causes potentially severe pathology in theliver and other organs, but the biochemical mechanism of organ damage is not preciselyunderstood.

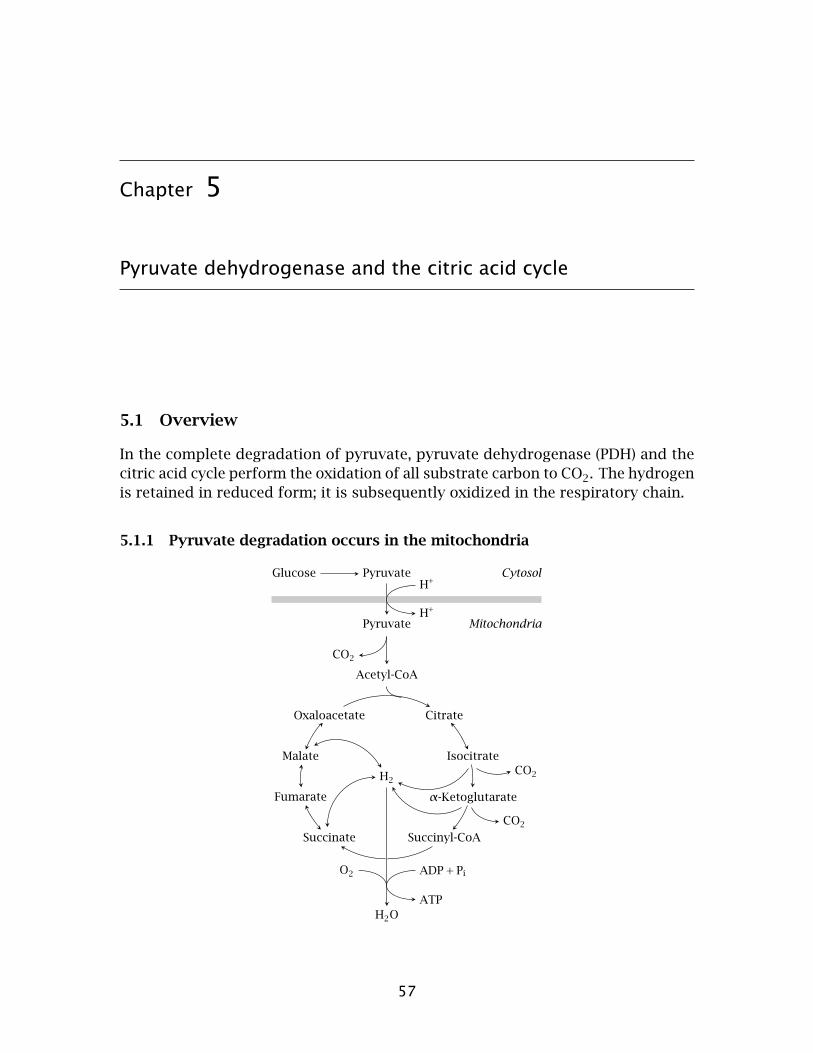
Chapter 5
Pyruvate dehydrogenase and the citric acid cycle
5.1 Overview
In the complete degradation of pyruvate, pyruvate dehydrogenase (PDH) and the
citric acid cycle perform the oxidation of all substrate carbon to CO2. The hydrogen
is retained in reduced form; it is subsequently oxidized in the respiratory chain.
5.1.1 Pyruvate degradation occurs in the mitochondria
Glucose Pyruvate
Pyruvate
Cytosol
Mitochondria
Acetyl-CoA
CO2
Oxaloacetate
Malate
Fumarate
Succinate
Citrate
Isocitrate
α-Ketoglutarate
Succinyl-CoA
H2CO2
CO2
H2O
O2 ADP+Pi
ATP
H+
H+
57

58 5 Pyruvate dehydrogenase and the citric acid cycle
Notes: Pyruvate is produced by glycolysis in the cytosol, while PDH and all sub-
sequent degradative steps are located in the mitochondria. Therefore, pyruvate
needs to be transported from the cytosol to the mitochondrial matrix.
The outer mitochondrial membrane contains porins, which are membrane
proteins that form non-specific pores and allow free permeation of most small
metabolites, including pyruvate. In contrast, the inner mitochondrial membrane
is much more restrictive, and it is permeable to only those metabolites for which
it contains specific carrier systems. The pyruvate carrier is an active transporter
that co-transports pyruvate and a proton.1
Red blood cells and blood platelets lack mitochondria and accordingly cannot
degrade pyruvate. These cells reduce pyruvate to lactate, which they then release
into the bloodstream (see slide 3.4.2).
5.1 Summarize the metabolite transport properties of the inner and outer mitochondrialmembranes.
5.2 Structure and function of pyruvate dehydrogenase
Pyruvate dehydrogenase is a large and complex molecule with interesting struc-
tural, catalytic and regulatory properties.
5.2.1 The PDH reaction occurs in three successive steps that are catalyzed by
three different subunits
O OH
OCH3
CoAS
OCH3
CO2
E1
CoA–SH
E2
NAD+
NADH+H+
E3
Notes: The overall reaction catalyzed by PDH is as follows:
Pyruvate + CoA-SH + NAD+ CO2 + acetyl-CoA + NADH + H+
This reaction does not occur all at once; instead, it is carried out as a sequence
of group transfers and redox steps by three different catalytic subunits. These
subunits are named according to the specific partial reactions they catalyze:
1. pyruvate dehydrogenase2 removes CO2,
1Alternatively, we might say that pyruvate is exchanged for an OH– ion; the net effect is virtuallythe same.
2You will notice that the name “pyruvate dehydrogenase” is ambiguous, denoting both the entirecomplex and the first subunit.

5.2 Structure and function of pyruvate dehydrogenase 59
2. dihydrolipoyl transacetylase transfers the remainder of the substrate to coen-
zyme A, and
3. dihydrolipoyl dehydrogenase transfers the H2 that was retained in the preced-
ing steps to NAD+.
Instead of using these explicit names, we will here adopt a commonly used
shorthand notation and refer to them as E1, E2, and E3, respectively.
5.2.2 The structural organization of the PDH complex
E1 E1 + E2 E1 + E2 + E3
Notes: Each pyruvate dehydrogenase complex contains multiple copies of each of
the three enzyme subunits. E1 and E2 are present in 24 copies each. The E. coli
enzyme contains 12 copies of E3, as shown in this illustration, whereas 24 copies
are found in the mammalian enzyme. In addition, the complex also contains
regulatory kinase and phosphatase subunits (see slide 5.3.2).
Within this large assembly, each E1 subunit is still located close to one or
more subunits of the E2 and E3 types. The reaction intermediates thus need to
travel only a short distance from one active site to the next, which increases the
overall catalytic efficiency. Generally speaking, high substrate throughput is the
key advantage of multi-enzyme complexes over a series of individual enzymes.3
5.2.3 A lipoamide tether guides the substrate from one active site to the next
Notes: The catalytic efficiency of PDH is further increased by another neat trick:
The intermediate substrates become covalently attached to lipoamide. This coen-
zyme is covalently attached to E2, but due to its long, flexible linker can reach into
the active sites of adjacent E1 and E3 subunits as well. The lipoamide tether thus
guides the substrate from one active site to the next, preventing it from leaving
until it has completed the course.
5.2 Describe the structural organization of pyruvate dehydrogenase, and explain the roleof the covalently bound dihydrolipoyl moiety.
3The pyruvate dehydrogenase complex remains intact when purified from cell extracts. Withsome other enzymes, there is evidence that they form functional complexes in vivo, even though theyemerge from purification procedures as individual and functional molecules. For example, malatedehydrogenase and citrate synthase may associate in vivo, so that oxaloacetate may pass directlyfrom one to the other [13]. Another intriguing example is the association of glycolytic enzymes withthe outer surface of the mitochondria [14].

60 5 Pyruvate dehydrogenase and the citric acid cycle
NHO
S
O
SH
E2
E1 E3
5.2.4 The pyruvate dehydrogenase reaction involves multiple coenzymes
Notes: Each of the subunits E1–E3 requires a coenzyme to work its particular magic.
In addition, two cosubstrates are also used, namely, NAD+ and coenzyme A.4
Coenzyme Subunit Role in catalysis
thiaminepyrophosphate
E1 provides a carbanion fornucleophilic attack on the substrate
lipoamide E2 transfers substrate to coenzyme A,retains hydrogen
flavin adeninedinucleotide (FAD)
E3 transfers H2 from lipoamide toNAD+
5.2.5 Thiamine pyrophosphate forms a carbanion
Notes: The coenzyme thiamine pyrophosphate (TPP), which is derived from thi-
amine (vitamin B1), is associated with the E1 subunit of PDH. In cooperation with
an aspartate residue in the active site, TPP forms a carbanion, that is, a negative
charge on a carbon atom. The TPP carbanion is resonance-stabilized; an electron
can move back and forth between the carbanion and the neighboring cationic
nitrogen.
Carbanions are very powerful nucleophiles, and the TPP carbanion functions
as such in the decarboxylation of pyruvate.
4Yes, strictly speaking, coenzyme A is a cosubstrate, since it is transformed from one state toanother in the reaction; a true coenzyme should emerge from the reaction unchanged, just likethe enzyme. As you can see, the distinction between coenzymes and cosubstrates is not strictlymaintained in the traditional nomenclature.

5.2 Structure and function of pyruvate dehydrogenase 61
Asp
O
OH
NHN
H
⊕
N
HS P
P
N
Asp
O
O⊖
N NH
⊕
N
HS P
P
NH
N NH2
⊕
N
⊖ S P
P
N
N NH2
⊕
N
HS
N
5.2.6 Decarboxylation of pyruvate by E1
Notes: The TPP5 carbanion attacks the keto group of pyruvate, which leads to a
covalent intermediate from which CO2 is cleaved. This yields another carbanion,
now located within the hydroxyethyl group that is the remainder of the substrate.
This new carbanion, which is again resonance-stabilized by TPP, sets the stage for
the next step in the reaction.
R1
⊕
N
⊖
C
OH⊕
CH3C
⊖O
O
S
R2
R1
⊕
N
C
O
H
CH3C
O⊖
O
S
R2
R1
⊕
N
⊖C
O
H
CH3
C
O
O
S
R2
5.2.7 Release of acetyl-CoA and disposal of hydrogen
Notes: The plot continues from the previous slide at the top right. The carbanion
on the hydroxyethyl group attacks the disulfide bond of lipoamide. The entire
substrate is then cleaved from TPP and carried by lipoamide to E2, where it is
transferred to coenzyme A and released as acetyl-CoA. Lipoamide is reduced
to dihydrolipoamide in the process; it is reoxidized by E3, which transfers the
hydrogen to NAD+, using FAD as an intermediate carrier. This concludes the
pyruvate dehydrogenase reaction.
5.3 Give an overview of the three steps involved in the PDH reaction.
5Note that only the thiazole ring of TPP is shown in this slide; its second ring is represented byR1.

62 5 Pyruvate dehydrogenase and the citric acid cycle
R1
⊕
N
C⊖
O
H
CH3S
S
⊕
H
S
R2
S
CH3
OHS
S
CH3 O
S⊖ACoH⊕
SH
HS
HS
S
O
CH3
CoA
FAD
FADH2
NADH+H+
NAD+
E1
E2
E3
5.3 Regulation of pyruvate dehydrogenase
We had seen earlier that enzymes may be regulated by allosteric control or through
phosphorylation (section 2.5). Pyruvate dehydrogenase exemplifies both mecha-
nisms.
5.3.1 Alternate metabolic destinations of pyruvate
1. conversion to acetyl-CoA by PDH for complete degradation or for synthesis of
fatty acids and cholesterol
2. carboxylation to oxaloacetate, for use in gluconeogenesis or in the citric acid
cycle
3. synthesis of amino acids, e.g., transamination to alanine
4. reduction to lactate
Notes: Pyruvate is used in several different pathways. All these pathways, includ-
ing PDH, must be coordinated and regulated in order to achieve the proper flow
rates along each of them. In the case of pyruvate dehydrogenase, the flow rate is
controlled by several feedback and feed-forward mechanisms.
5.3.2 Regulation of PDH by allosteric effectors and by phosphorylation
Notes: Pyruvate dehydrogenase is allosterically activated by fructose-1,6-bisphos-
phate and inhibited by NADH and acetyl-CoA.
Phosphorylation of PDH is mediated by a special regulatory enzyme, pyruvate
dehydrogenase kinase. This enzyme is part of the PDH multienzyme complex.
Phosphorylation inactivates pyruvate dehydrogenase. The kinase is, in turn, sub-

5.4 The citric acid cycle 63
ject to allosteric activation by NADH and acetyl-CoA, while it is inhibited by ADP,
NAD+ and by free coenzyme A.
Fructose-1,6-bis- P CoA-SH, NAD+, pyruvate Acetyl-CoA, NADH
PDH
PDH- P
kinase phosphatase
Ca++Catalysis
Activation
Inhibition
Phosphorylation is reversed, and the activity of pyruvate dehydrogenase restored
by a protein phosphatase, which is also associated with the pyruvate dehydroge-
nase complex.
All of the above regulatory effects make good physiological sense. NADH and
acetyl-CoA inhibit PDH, which means that the enzyme will slow down when its
products accumulate. Such feedback inhibition is a straightforward way to link the
activity of a pathway to the metabolic requirements it serves. On the other hand,
pyruvate, NAD+ and fructose-1,6-bisphosphate apply feed-forward activation—as
more substrate arrives, the enzyme should gather speed.
One more interesting detail is that the PDH phosphatase is activated by calcium
ions. Calcium ions also trigger the contraction of muscle cells. Concomitant
activation of PDH anticipates the need to replace the ATP that will be consumed
in the contraction.
5.4 Summarize the regulation of pyruvate dehydrogenase.
5.4 The citric acid cycle
Almost all carbon that accrues in carbohydrate degradation is converted by PDH
to acetyl-CoA. The latter metabolite is also formed, by different enzymes, in the
degradation of fatty acids and of ketogenic amino acids, and it therefore is a
central hub in energy metabolism. The next step toward complete oxidation is the
citric acid cycle, also referred to as the Krebs cycle or the tricarboxylic acid cycle
(TCA cycle for short).
The basic idea of the TCA cycle consists in releasing the substrate carbon as
CO2, while retaining the substrate hydrogen for “cold combustion” in the respi-
ratory chain. However, a closer look reveals that something is missing from this
description.

64 5 Pyruvate dehydrogenase and the citric acid cycle
5.4.1 The overall reaction of the TCA cycle: does it add up?
CH3COOH 2 CO2 + 4 H2
2 H2O+ CH3COOH 2 CO2 + 4 H2
Notes: While the substrate carbon enters the TCA cycle as acetyl-CoA, the coen-
zyme A moiety is simply hydrolyzed off in the very first reaction; therefore, with
only a little sleight of hand, we can neglect coenzyme A and substitute acetate for
acetyl-CoA as the substrate.
If we look back at figure slide 5.1.1, we see that the TCA cycle produces four
molecules of H2 and two molecules of CO2. Now, if we attempt to balance our
single acetate substrate with these amounts of CO2 and H2, we see that we are
short 4 hydrogen and 2 oxygen atoms on the left side. However, we can balance
the equation by adding two molecules of water.6
What this means is that half of the H2 produced in the TCA cycle is gained
by the reduction of hydrogen from water. The water-derived oxygen that accrues
in the process is used to complete the oxidation of the acetate carbon. Hydrogen
derived from both water and acetate is then re-oxidized in the respiratory chain to
generate ATP.
The energy yield of the TCA cycle itself, in terms of directly generated energy-
rich phosphoanhydride bonds, is very modest—just one molecule of GTP, equiva-
lent to one ATP, is generated for each molecule of acetyl-CoA degraded, compared
to approximately 15 in the respiratory chain. This comparison shows that the TCA
cycle’s main contribution to ATP generation is to provide H2 for the respiratory
chain.
5.4.2 The citrate synthase reaction
Notes: The first reaction in the TCA cycle is catalyzed by citrate synthase. It is
mediated by acid-base catalysis; abstraction of a proton from the methyl group
of acetyl-CoA by an aspartate residue in the active site converts acetyl-CoA to an
enol form, which then attacks the carbonyl group of oxaloacetate. The reaction is
assisted by two histidine residues and pulled forward by the subsequent hydrolysis
of citryl-CoA. Figure drawn after a scheme given in [15].
6Where exactly do the two water molecules enter the TCA cycle? For one of them, it is obvious(see step 7 in slide 5.4.3). However, the second one is a bit harder to spot. Hint: it is not the H2Othat hydrolyzes off the acetyl-CoA in the citrate synthase reaction, since that is already accountedfor by substituting acetate for acetyl-CoA in our simplified reaction scheme.

5.4 The citric acid cycle 65
Citrate Citryl-CoA
Oxaloacetate
Acetyl-CoA
CoA
S O H⊕
NN
His274
H
H
H⊖OO
Asp375
CoA
S O H NN
His274
CH2
O
H
N⊕
N
His320
COO−H2C
−OOC
CoA
S O
CH2
COO−
OH
CH2
−OOC
HO O
CH2
COO−
OH
CH2
−OOC
H2OCoA-SH
5.4.3 Reactions in the TCA cycle: from citrate to oxaloacetate
Notes: The paragraph numbers below correspond to those of the reactions in the
figure. The first reaction in the figure is the second in the cycle overall, which is
why it gets the number 2.
2. The hydroxyl group in the newly formed citrate is shifted to an adjacent
carbon to yield isocitrate. This reaction is catalyzed by citrate isomerase and
involves the transient elimination of water across the two carbons involved; the
water is then added back in the reverse orientation.
3. Isocitrate is decarboxylated and dehydrogenated by isocitrate dehydroge-
nase, which yields α-ketoglutarate. In contrast to the pyruvate dehydrogenase
reaction, dehydrogenation precedes decarboxylation. The dehydrogenated inter-
mediate is known as oxalosuccinate.
4. α-Ketoglutarate is converted to succinyl-CoA by α-ketoglutarate dehydro-
genase. This catalytic mechanism of this enzyme is completely analogous to that
of pyruvate dehydrogenase.
5. Succinyl-CoA is converted to succinate by succinate thiokinase, and GDP is
concomitantly phosphorylated to GTP. From the mechanism of the glyceraldehyde-
3-phosphate dehydrogenase reaction (Figure 3.3.5), we already know that thioester
bonds are energy-rich and can drive the phosphorylation of carboxylic acids. A
carboxylic acid phosphate, succinylphosphate, also occurs as an intermediate in
the succinate thiokinase reaction. As is the case with 1,3-bisphosphoglycerate, the
phosphate group is subsequently transferred to a nucleotide diphosphate. While
succinate thiokinase uses GDP rather than ADP, the amounts of energy involved
are virtually the same.
6. Succinate is dehydrogenated across the CH2−CH2 bond by succinate dehy-
drogenase, which yields fumarate. The coenzyme used in this reaction is flavin
adenine dinucleotide (FAD). As a rule of thumb, you can assume that FAD is used

66 5 Pyruvate dehydrogenase and the citric acid cycle
in the dehydrogenation of CH−CH bonds, whereas either NAD+ or NADP+ are used
in the dehydrogenation of CH−OH bonds. While all other enzymes in the TCA
are in aqueous solution in the mitochondrial matrix, succinate dehydrogenase is
bound to the inner surface of the inner mitochondrial membrane; it is identical
with complex II of the respiratory chain (see slide 6.4).
Citrate
H2C COO−
OH COO−
H2C COOH
H2O
2
H2C COO−
C COO−
HC COOH
H2O
2
Isocitrate
H2C COO−
HC COO−
CH
OH COOH
NAD+
NADH+H+
3
H2C COO−
HC COO−
O COOH
H+
CO2
3
α-Ketoglutarate
H2C COO−
CH2
O COOHCoA-SH
NAD+
CO2
NADH+H+
4Succinyl-CoA
H2C COO−
CH2
O S
CoAPi
CoA-SH
5
H2C COO−
CH2
O O
P O−O
O−
GDP GTP
5
Succinate
H2C COO−
CH2
O O−
FAD FADH2
6
Fumarate
H COO−
H−OOC
H2O
7
OH COO−
H−OOC
Malate
NAD+
NADH+H+
O COO−
H−OOC
Oxaloacetate
8
7. Fumarate is hydrated to l-malate by fumarase.
8. Malate is dehydrogenated by malate dehydrogenase to oxaloacetate. This
step regenerates oxaloacetate, which can again enter the citrate synthase reaction,
and thus completes the cycle.
5.5 Do we really have to know the structures?
5.4.4 α-Ketoglutarate dehydrogenase resembles PDH
Notes: As pointed out above, α-ketoglutarate dehydrogenase uses the same cat-
alytic mechanism as pyruvate dehydrogenase. The similarity is reflected in a high
degree of homology between the subunits of the two enzymes. If you look closely

5.5 Regulation of the citric acid cycle 67
at the PDH mechanism (Figure 5.2.1), you will see that the reactions carried out by
the final subunit (E3) will be identical in both cases, since E3 comes into play when
only hydrogen is left but the rest of the substrate has already been disposed of.
Indeed, the two multienzyme complexes share the very same E3 protein; only E1
and E2 are specific for the respective substrates. The same E3 subunit occurs yet
again in an analogous multienzyme complex that participates in the degradation
of the branched chain amino acids (slide 12.4.4), as well as in the glycine cleavage
system (slide 15.2.6).
E1
E2
E3
Pyruvate
CO2
CoA-SH
Acetyl-CoA
NAD+
NADH+H+
E1
E2
E3
α-Ketoglutarate
CO2
CoA-SH
Succinyl-CoA
NAD+
NADH+H+
5.5 Regulation of the citric acid cycle
• ATP and NADH inhibit isocitrate dehydrogenase
• NADH inhibits α-ketoglutarate dehydrogenase
• High levels of NADH will lower the oxaloacetate concentration, which limits
citrate synthase activity
Notes: Acetyl-CoA is not only utilized for complete oxidation but also for the
biosynthesis of fatty acids, cholesterol, and ketone bodies. Therefore, the activity
of the citric acid cycle must be balanced with those of the various synthetic path-
ways. This regulation is mainly exercised by NADH, the major direct product of
the TCA, and by ATP, the ultimate product of complete substrate oxidation via the
TCA and the respiratory chain.
It is noteworthy that the equilibrium of the malate dehydrogenase reaction
favors malate. The concentration of oxaloacetate is thus quite low, and it will be
lowered further if NADH accumulates. This limits the rate of the initial reaction of
the TCA, that is, the synthesis of citrate, and it also detracts from the free energy
of that reaction. To make citrate synthesis go forward, it is necessary to sacrifice
the energy-rich thioester bond in the citryl-CoA intermediate, which in contrast to
succinyl-CoA is simply hydrolyzed and not used toward the synthesis of GTP or
ATP.

68 5 Pyruvate dehydrogenase and the citric acid cycle
The mitochondrion contains two isozymes of isocitrate dehydrogenase; one
uses NAD+ and the other NADP+ as the cosubstrate. Intriguingly, the feedback
inhibition by NADH and ATP applies only to the NAD+-dependent isozyme, but not
to the NADP+-dependent one.
In cells with high TCA activity, such as heart and skeletal muscle, the NADP-
dependent variant is actually present at higher activity than the NAD-dependent
one. How, then, is the NADP-dependent enzyme regulated? This regulation appears
to occur in coordination with the flow through the respiratory chain and the proton-
motive at the inner mitochondrial membrane. The mechanism is quite fascinating
and is discussed at the end of the following chapter.
5.6 Summarize the regulation of the TCA cycle.
5.6 Reactions that divert and replenish TCA cycle intermediates
Several metabolites in the citric acid cycle are also substrates in biosynthetic
pathways, for example those for heme or various amino acids, and through these
pathways are drained from the cycle. When this occurs, they will need to be
replenished. Similarly, when the workload of a cell and its ATP demand increase,
the TCA cycle must then process acetyl-CoA at an accelerated rate, which requires
an increase in the pool of TCA cycle intermediates.
The first thing to note is that just feeding more acetyl-CoA into the TCA
cycle does not address this problem, since acetyl-CoA simply offsets the two CO2
molecules that are lost in subsequent reactions in the cycle. Instead, we need a net
supply of any of the intermediates with four or more carbon atoms that function
catalytically rather than as substrates.
One important and abundant source of TCA cycle intermediates is the pyruvate
carboxylase reaction, which makes oxaloacetate from pyruvate (slide 7.2.4). Often,
however, the oxaloacetate thus obtained is immediately diverted again toward
glucose synthesis (gluconeogenesis). In this situation, amino acids become the
major net source of TCA cycle intermediates (see chapter 12).
5.7 Answers to practice questions
5.1: Mitochondria have two membranes. The outer membrane contains porins, whichnon-selectively allow permeation of small metabolites. The inner membrane only containsspecific carrier proteins, which restrict transport to their cognate substrates.
5.2: Pyruvate dehydrogenase is a multienzyme complex that contains multiple copies ofthree different catalytic subunits (E1–E3), as well as two regulatory subunits. The dihy-drolipoyl moiety is bound to the E2 subunit; it accepts the substrate in the active site of E1
and guides it along to the active sites of E2 and E3.
5.3: In the active site of E1, thiamine pyrophosphate (TPP) cooperates with an aspartateresidue to form a carbanion, which performs nucleophilic attack on the carbonyl groupof pyruvate and thereby initiates its decarboxylation. The remainder of the substrateinitially remains bound to TPP, but is then transferred to lipoamide as an acetyl group.

5.7 Answers to practice questions 69
In the active site of E2, the acetyl group is transferred from lipoamide to coenzyme A.Lipoamide becomes reduced to dihydrolipoamide in the process; it is reoxidized by E3,which transfers the H2 to NAD+.
5.4: PDH is subject to allosteric activation by fructose-1,6-bisphosphate and to inhibitionby acetyl-CoA and NADH. It is also subject to inhibition by phosphorylation, which in turnis activated by the products and inhibited by the substrates of PDH.
5.5: Yes. Metabolism without structures is as useful as memorizing phone books (orprobably even less so).
5.6: NAD-dependent isocitrate dehydrogenase is inhibited by ATP and NADH. The latteralso inhibits α-ketoglutarate dehydrogenase and shifts the malate dehydrogenase equilib-rium away from oxaloacetate, which slows down the citrate synthase reaction.


Chapter 6
The respiratory chain
6.1 Introduction
In the respiratory chain, the NADH and FADH2 that was accumulated in the pre-
ceding degradative pathways is finally disposed of by reacting it with molecular
oxygen. The free energy of this “cold combustion” is used to generate ATP. The
amount of ATP generated in the respiratory chain far exceeds the modest quan-
tities produced in the upstream pathways; this is the reason why only aerobic
metabolism enables us to sustain physical exertion for extended periods of time.
The workings of the respiratory chain are quite different from all other path-
ways in human metabolism. Each of those other pathways consists of a succession
of discrete enzymatic reactions. Inasmuch as these pathways contribute to the
production ATP, the energy is always passed from one energy-rich bond to the
next, with a newly created phosphoanhydride bond in ATP as the final recipient. In
contrast, the respiratory chain combines chemical reactions with physical forces
that are not pinned down to individual molecules, and the energy is stored and
converted in novel ways.
71

72 6 The respiratory chain
6.2 Overview
Notes: The respiratory chain involves four large protein complexes (I–IV) as well as
ATP synthase (AS). All of these are embedded in the inner mitochondrial membrane.
Coenzyme Q (Q) and cytochrome C (C) are diffusible electron carriers.
I
II
Q
III
C
IV
ADP+ Pi
ATP
H⊕
H⊕
H⊕
H⊕
⊖
⊖ ⊖
⊖
NADH
NAD⊕
+H⊕
FADH2
FAD+2H⊕
2H⊕
+1
2O2
H2O
AS
In this scheme, the mitochondrial matrix is below the membrane, whereas the
cytosol is above it. The reactions carried out in the chain are explained below.
Note that the reactants in this scheme are not stoichiometrically balanced.
6.2.1 Functional stages in the respiratory chain
1. H2 is abstracted from NADH+H+ and from FADH2
2. The electrons obtained with the hydrogen are passed down a cascade of carrier
molecules located in complexes I–IV, then transferred to O2
3. Powered by electron transport, complexes I, III, and IV expel protons across
the inner mitochondrial membrane
4. The expelled protons reenter the mitochondrion through ATP synthase, driv-
ing ATP synthesis
Notes: The electron transport chain (ETC) comprises complexes I–IV. Hydrogen is
acquired by complexes I and II from NADH and FADH2, respectively. The electrons
are then passed down the chain to complex IV, which transfers them to molecular
oxygen; the reduced oxygen then reacts with protons to yield water.
Complexes I, III and IV extract energy from the electron flow and use it to
expel protons across the membrane. For each electron migrating down the chain,
multiple protons are pumped out of the mitochondrion. The protons accumulated
outside the mitochondrion are allowed back in through ATP synthase. This protein
is a molecular motor, driven to rotate by the flow of protons through it into
the mitochondrial matrix. The rotary motion of ATP synthase in turn drives the
synthesis of ATP from ADP and phosphate.1
1As mentioned before, the porins in the outer mitochondrial membrane are permeable for mostsmall molecules and ions, and thus the proton concentration in the space between the two mito-

6.3 ATP synthesis can be separated from electron transport 73
If you think that all this sounds somewhat strange and vague, you are quite
right—but don’t let that trouble you. The purpose of this overview is only to divide
and conquer, to break up the overall process into manageable parts that we can
then tackle in detail in their turn.
6.3 ATP synthesis can be separated from electron transport
The first thing to note about electron transport and ATP synthesis is that they can
be experimentally separated from one another. So-called uncoupling agents allow
the observation of electron transport without ATP synthesis. On the other hand,
ATP synthesis works without electron transport if a proton gradient is created in
some other way.
6.3.1 Uncoupling proteins dissipate the proton gradient
Q
C
H⊕
H⊕
H⊕
H⊕
⊖
⊖ ⊖
⊖
Notes: Uncoupling proteins are membrane proteins, also embedded in the inner
mitochondrial membrane, that passively transport protons, allowing them to by-
pass ATP synthase. Electron transport and hydrogen oxidation—and, upstream
of it, degradation of energy-rich substrates—will continue, but ATP synthesis will
cease; the energy that would have gone into ATP synthesis is simply dissipated as
heat.
Uncoupling proteins are found in particularly high concentration in the mi-
tochondria of brown fat tissue, which differs from the more abundant white fat
tissue by its high density of mitochondria.2 Brown fat tissue serves the purpose
of producing heat, by way of simply oxidizing fat without ATP production. The
physiological significance is discussed in slide 10.3.8.
chondrial membranes equilibrates readily with the cytosol. The proton concentration gradient thatpowers ATP synthesis therefore exists across the inner mitochondrial membrane only.
2The cytochromes of the abundant mitochondria give this tissue its brown color; the white colorof regular fat tissue tells us that its density of mitochondria must be low.

74 6 The respiratory chain
6.3.2 The uncoupling action of dinitrophenol
O⊖
NO2
NO2
H⊕
OH
NO2
NO2
O⊖
NO2
NO2
H⊕
OH
NO2
NO2
Cytosol Mitochondrial matrix
Notes: The synthetic compound dinitrophenol can diffuse across the inner mi-
tochondrial membrane in both its protonated and unprotonated form. It can
therefore carry protons into the mitochondrion, thereby dissipating the driving
force for ATP synthase.3 Just like uncoupling proteins do in brown fat tissue, dini-
trophenol will induce the burning of fat or other substrates and the production
of heat—but in the mitochondria everywhere, not just in brown fat tissue. In the
1930s, dinitrophenol was used as a drug for losing excess body weight. It worked,
too, but cases of fatal hyperthermia and other side effects caused the speedy dis-
continuation of this use. Wikipedia reports that the drug remains popular among
bodybuilders, however, which seems of a piece with other reckless self-medication
practices among the followers of this cult.
6.3.3 The Racker experiment: bacteriorhodopsin can drive ATP synthase
Notes: The effects of uncouplers show that electron transport can occur in the
absence of ATP synthesis. On the other hand, ATP synthesis will occur in the
absence of electron transport if a proton gradient is sustained in some other
way. This was elegantly demonstrated by Ephraim Racker, who incorporated ATP
synthase into liposomes along with bacteriorhodopsin, a membrane protein from
the halophilic (that is, salt-loving) bacterium Halobacterium halobium.
Bacteriorhodopsin is a very unusual protein that functions as a light-driven
proton pump: just shining light on it makes it pump protons across the membrane.
In our experiment, illuminating the sample will make bacteriorhodopsin pump
3Dinitrophenol is a hydrophobic molecule, and it therefore is not surprising that it can crossmembranes in protonated form. However, the high membrane permeability of its deprotonated,negatively charged form is unusual. This is related to the two electron-withdrawing nitro groups,which cause the negative charge to be highly delocalized; this prevents the molecule from attract-ing a tightly bound hydration shell that otherwise would interfere with its permeation across themembrane.

6.4 Molecules in the electron transport chain 75
protons into the liposome. This will crank the ATP synthase and make it synthesize
ATP from ADP and ionic phosphate.
H⊕
H⊕
H⊕
H⊕
ADP+Pi
ATP
H⊕
H⊕
H⊕
H⊕
H⊕
Note that the orientation of both proteins shown here is inside-out relative to that
found in their natural host membranes. Therefore, protons will here accumulate
on the inside, and ATP synthesis proceed on the outside; this is the reverse of the
situation in vivo.
The theoretical significance of these experimental findings is that, although
the electron transport chain and ATP synthase reside in the same membrane and
in close proximity, the proton gradient is the only required functional link between
them. The electron transport chain generates the proton gradient, whereas ATP
synthase puts it to work and thereby dissipates it. Because of this clear distinction,
we can safely examine these two functions separately from each other.
6.1 Explain the theoretical implications of dinitrophenol uncoupling of the respiratorychain, and of the Racker experiment.
6.4 Molecules in the electron transport chain
Notes: This slide shows the structures of the four respiratory chain complexes that
form the respiratory chain.4 The gray rectangle represents the inner mitochondrial
membrane. Among the redox cofactors, yellow and red blobs represent iron sulfur
clusters. Organic rings (black) with red balls (iron atoms) in the center are hemes;
other organic rings are flavins or ubiquinone (Q). The blue ball next to one of the
hemes in complex IV is the copper ion in its active site. Each of the four complexes
has a specific role in the electron transport process:
1. Complex I accepts hydrogen from NADH+H+and is therefore also called
NADH dehydrogenase. The NADH is oxidized back to NAD+ and thereby readied
for the next round of reduction in the TCA cycle or by pyruvate dehydrogenase.
The hydrogen is split into electrons and protons. The electrons travel along a
string of redox cofactors that traverses the entire protein complex and are then
transferred to the small, membrane-resident carrier molecule known as ubiquinone
4Drawn from 3m9s.pdb, 2fbw.pdb, 3cx5.pdb, 2zxw.pdb, and 3cyt.pdb, after a figure in [16].

76 6 The respiratory chain
or coenzyme Q, which passes them on to complex III. Powered by this electron
migration, complex I ejects four protons across the membrane.
Complex I Complex II Complex III Complex IV
cytochrome C
Q
Cytoplasmic side
Mitochondrial matrix
2. Complex II accepts hydrogen from FADH2, which was reduced by succi-
nate. It was mentioned in slide 5.4.3 that complex is identical with succinate
dehydrogenase, which illustrates that the two pathways are really functionally one.
The electrons are again transferred to coenzyme Q; however, no proton extrusion
occurs at complex II.5
3. Complex III reoxidizes coenzyme Q and expels more protons. According to
the coenzyme Q cycle model presented below, four protons are being expelled at
this stage for each pair of electrons transported, but in some sources the number of
protons expelled is given as two; this illustrates that there still is some uncertainty
about the mechanistic details. Having performed their work at complex III, the
electrons are delivered to the small electron carrier protein cytochrome C.
4. Complex IV accepts the electrons from cytochrome C and is accordingly
also called cytochrome C oxidase. The electrons are transferred to oxygen, and
the considerable free energy associated with this electron transfer step is used to
expel up to four protons from the mitochondrial matrix.
Electrons do not occur in free form but are always part of molecules or ions.6
Therefore, to make electrons flow along the prescribed path along complexes I–
IV, these proteins must provide functional groups that are able to accept and
donate electrons. These groups must be closely spaced, within a few Angstroms
of each other, to allow for efficient electron transfer. Furthermore, to persuade
5In contrast to complexes I, III and IV, complex II does not span the entire membrane; this readilysuggests that proton translocation will not occur here.
6Electrons do occur free as β particles in ionizing β radiation. However, to escape captureby molecules, β particles must possess an amount of energy much higher than those available inbiochemical or other chemical reactions. When β particles impinge on a solid body, they dissipatetheir energy by breaking up any molecules in their path into radicals or ions, until they are finallycaptured again.

6.4 Molecules in the electron transport chain 77
the electrons to flow in the right direction, the successive transitions must be
exergonic, that is, their free energy (∆G) must be negative.
In the figure above, you can see a multitude of redox cofactors, neatly spaced
along the protein molecules, that function as “stepping stones” for the migrating
electrons. These prosthetic groups fall into various structural classes.
6.4.1 Iron-containing redox cofactors
Fe2⊕
NN⊖
O
OH
N
O
OH
⊖
N
Heme Iron-sulfur cluster
Notes: Most of the redox cofactors in the respiratory chain are hemes and iron-
sulfur clusters, both of which contain iron ions. Hemes are tetrapyrrol rings that
hold a single central iron ion. This iron ion can adopt different oxidation states,
mostly Fe2+ and Fe3+, although Fe4+ occurs with one of the hemes in complex IV.7
In iron-sulfur clusters, it is again the iron that accepts and donates electrons
by alternating between different oxidation states. Each iron ion is held in place by
four sulfur atoms, which either belong to cysteine side chains (orange) or are free
sulfides (S2–; yellow). The two types of sulfurs may occur in various proportions,
which results in iron-sulfur clusters of different size.
The pyrrole rings or sulfur atoms do not only keep the iron ions in place but
also modulate their redox potentials. These potentials are further tweaked by the
specific molecular environment of each cofactor, in such a way as to enable the
electrons to flow from one cofactor to the next.
6.2 Describe the iron-containing redox cofactors that occur in the respiratory chain.
6.4.2 Flavin-containing redox cofactors
Notes: The flavin nucleotides flavin adenine dinucleotide (FAD) and flavin mononu-
cleotide (FMN) can occur in three different states of reduction, which differ by
single electrons. Unlike NAD, which can accept or donate electrons only in pairs,
flavins can accept or yield electrons one at a time. Therefore, flavins can buffer
the electron flow between NAD and iron-containing redox cofactors, and this is
7Some of the hemes in the respiratory chain are referred to as “cytochromes.” Somewhat con-fusingly, the same term is, with other molecules, applied to the entire complex of a heme and theprotein it is bound to.

78 6 The respiratory chain
why the very first cofactor that accepts the electrons from NADH in complex I is
indeed an FMN molecule.8
H3C NNH
ONN
OH
OH
OH
OH
O P
O
O−
O X
CH3
H3C NH
NH
OHNN
R
CH3
H3C NNH
OHNN
R
CH3
X = H : FMN
X = AMP : FAD FMNH/FADH
FMNH2/FADH2
In addition to the stationary redox cofactors that occur within complexes I–IV,
there are two electron carriers that are not tightly associated with one individual
complex but function as shuttles between them:
1. Ubiquinone or coenzyme Q. This coenzyme contains a quinone group. It
carries electrons, as hydrogen, from complexes I and II to complex III. It also con-
tains a long hydrophobic polyisoprene tail, which confines it to the hydrophobic
interior of the membrane. Like flavins, ubiquinone can transfer electrons singly or
in pairs; this is important in the coenzyme Q cycle (see slide 6.6.3).
2. Cytochrome C. This is a small protein that again contains a heme. It is
located at the outer surface of the inner mitochondrial membrane and shuttles
electrons between complex III and complex IV.9
6.3 Explain the role of flavin cofactors in electron transfer processes.
6.4.3 The respiratory chain produces reactive oxygen species as byproducts
Notes: Several redox cofactors in the respiratory chain are prone to side reactions
with molecular oxygen, which produce superoxide (O–2 ) and other reactive oxygen
species, that is, partially reduced forms or oxygen. These have the potential to
damage cellular membranes and macromolecules and must be scavenged. This
topic is discussed further in slide 9.3.8.
8Electron buffering between NADPH and heme by flavins occurs in cytochrome P450 reductase(see slide 18.2) and in nitric oxide synthase (slide 9.3.5).
9In addition to its role in the respiratory chain, cytochrome C is also an important intracellularsignaling molecule; its release from damaged mitochondria triggers apoptosis (programmed celldeath; see reference [17] and slide 18.5.1). Another molecule with surprising connections toapoptosis is glyceraldehyde-3-phosphate dehydrogenase [18]; this enzyme is reportedly associatedwith the outer mitochondrial membrane.

6.5 The energetics of electron transport 79
NNH
OHNN
R
NNH
ONN
RO2 O
–•2
H+
O
O
. . .
O−
O
O
O
. . .
O
OO2 O
–•2
FAD/FMN
coenzyme Q
6.5 The energetics of electron transport
In discussing the driving forces of electron transport above, we have referred to
both the free energy and the redox potential. Before considering the energetics of
the respiratory chain in more detail, we will briefly review how exactly these two
physical terms relate to one another.
6.5.1 Redox reactions can be compartmentalized to produce a measurable
voltage
V
1
2H2 H⊕
e⊖
Q Q⊖
e⊖
V
H2 2H⊕
2e⊖
H⊕+NAD⊕ NADH
2e⊖
∆E > 0 ∆E < 0
Notes: This slide illustrates the experimental setup for measuring the redox po-
tential of an electron carrier. Left panel: coenzyme Q withdraws electrons from
the standard hydrogen electrode, which by definition gives it a positive redox po-
tential (∆E). Right: NADH pushes electrons toward the standard electrode, making
its ∆E negative.
In the experimental setup, the molecule of interest and a reference solute
are contained in two adjacent buffer-filled chambers. Platinum electrodes are im-
mersed in both solutions and connected through a voltmeter (V). As electrons are
withdrawn from the solute in one chamber and delivered to the other, the volt-
meter indicates the direction and magnitude of the potential difference. Protons
and other ions can flow across a salt bridge between the chambers so as to pre-
serve electroneutrality. In order to allow the flow of ions but prevent mixing of the

80 6 The respiratory chain
chamber contents by convection, this hole is covered with a porous membrane or
plugged with agar.
The reference solute commonly used in chemistry is H2, equilibrated with
hydrogen gas at 1 atm above the solution. The corresponding oxidized form, H+,
is adjusted to 1 mol/l or pH 0. The immersed platinum electrode not only conducts
electrons but also serves as a catalyst for the interconversion between H2 and H+.
The potential of a redox carrier measured against this electrode is defined
as its standard redox potential or ∆E0. For biochemical purposes, the standard
electrode solution is buffered at pH 7 rather than pH 0, and the redox potentials
measured against this electrode are referred to as ∆E′
0. A pH of 7 is just as arbitrary
a reference point as pH 0, but we will stick with it because the textbooks do so,
too.
6.5.2 The redox potential (∆E) is proportional to the free energy (∆G)
∆G ≡energy
moles (number of molecules)
∆E ≡energy
charge transferred
∆G =energy
charge transferred×
charge transferred
moles
∆G = ∆E ×charge transferred
moles
therefore
∆G = −∆E ×n× F (6.1)
Notes: From the previous slide, it is clear that electrons will flow spontaneously
from one redox cofactor to another if the corresponding ∆E is positive. We also
know that reactions proceed spontaneously if their ∆G is negative. The two param-
eters are directly related to one another according to equation 6.1. Either one is
therefore sufficient to describe the energetics of the reaction; the reason why redox
potentials are more commonly used in this context is that they can be measured
more directly than ∆G.
In the equation, ∆E is the difference in the redox potentials between two co-
factors. The parameter n is the number of electrons transferred in the reaction;
for example, NADH feeds two electrons at a time into the chain, which means that
n equals two for this reaction. In contrast, heme typically accepts and donates
single electrons, which means that n = 1. The F in the equation is Faraday’s
constant, which tells us how many units of charge are carried by one mole elec-

6.5 The energetics of electron transport 81
trons (96,500 coulombs/mol).10 One can think of a cofactor’s redox potential as its
affinity for electrons—the higher it is, the more strongly the cofactor will attract
electrons.11
6.5.3 Redox potentials and free energies in the respiratory chain
I
III
IV
NADH FMN
(Fe-S)N-2
CoQ
Heme c1 CytC
Heme a3
O2
FADH2
−0.4
0
0.4
0.8
75
0.0
−75
−150
∆E′ 0
(V)
∆G
(KJ /
2m
ol
ele
ctro
ns)
Notes: This slide shows the redox potentials, and the corresponding free energy
levels, of some selected electron carriers in the respiratory chain. The lowest
potential is found with NAD+, in keeping with its position at the start of the
transport chain. The next carrier in sequence, FMN, is part of complex I. It has a
slightly higher potential than NADH and is therefore able to accept its electrons.
The redox potential increases continuously along the respiratory chain to reach its
highest value at oxygen, which therefore has the highest affinity for the electrons
and gets to keep them. Reduced oxygen, which recombines with protons to yield
water, thus is the end product of respiration.
The iron-sulfur cluster N2, which occupies the lowermost position within com-
plex I as shown in slide 6.4, has a significantly higher potential than the FMN. This
step in potential corresponds to a significant amount of free energy that is released
at some point within complex I as the electrons travel through it from FMN toward
N2. Complex I uses this energy to expel protons from the mitochondrion, against
10Remember that the volt, which is the unit of ∆E, is defined as joule/coulomb, since voltage =energy/charge, hence the need for Faraday’s constant.
Like Avogadro’s number, Faraday’s constant is a relic of history, required only because the physicalunits of mass and electrical charge had already been arbitrarily chosen before the inherent massesand charges of atoms and electrons were discovered. One could in principle define a system of unitswithout either of these crummy numbers. Indeed, chemists often use Daltons, and physicists useelectron volts (eV), in order to avoid them.
The minus sign in equation 6.1 results from the fact that the electron-donating electrode, thecathode, is considered negative. This is entirely arbitrary and meaningless, but it is also very handyas a trap in exam questions.
11You have encountered the same concept with chemical elements as their electronegativity: Anelement with a high electronegativity holds on to electrons particularly tightly, i.e. it has a highaffinity for electrons.

82 6 The respiratory chain
their concentration gradient. Major steps in potential that drive proton expulsion
also occur within complex III and complex IV.
Only minor steps of potential occur in the delivery of electrons from complex I
to complex III via coenzyme Q, and between complexes III and IV via cytochrome C.
Likewise, with complex II, the potentials of both entry and exit points must fall into
the narrow interval between FADH2 and coenzyme Q, which means that very little
energy is released as electrons traverse this complex. Such minor steps in redox
potential suffice to jog the electrons along, but they are too small to contribute to
proton pumping.
6.4 What is the relationship between free energy and redox potential?
6.5 At which of the four complexes in the electron transport chain does the greatest stepin redox potential occur? Which one has the smallest step?
6.6 Interfacing different types of electron carriers
In addition to their specific redox potentials, which establish the general direction
of electron flow, the redox cofactors in the respiratory chain also differ in two
other important aspects:
1. NADH, FADH2, FMNH2 and coenzyme Q carry both electrons and protons—
that is, hydrogen. In contrast, the hemes and the iron-sulfur clusters carry
only electrons.
2. NAD+ can only accept and donate pairs of electrons, whereas the hemes and
iron-sulfur clusters can only accept and donate single electrons.
The switch from the two-electron carrier NADH to the one-electron carrying Fe−S
clusters within complex I is negotiated by FMN, which, as discussed above, can
accept or donate electrons both pairwise and singly.
6.6.1 The first two redox steps in complex I
NADH+H+ + FMN NAD+ + FMNH2 (6.2)
FMNH2 + FeIII−S FMNH• +H+ + FeII
−S (6.3)
FMNH• + FeIII−S FMN+H+ + FeII
−S (6.4)
Notes: After accepting H2 from NADH + H+ (equation 6.2), FMNH2 donates the
electrons one by one to the first Fe−S cluster (equations 6.3 and 6.4), adopting a
sufficiently stable radical form between these two transfers. The electron transfer
between FMNH2 and Fe−S also illustrates what happens if an electron-only carrier
is reduced by a hydrogen carrier: The protons are simply shed into the solution.
6.6 Explain how electrons are transferred from NADH to the iron-sulfur clusters in com-plex I.

6.6 Interfacing different types of electron carriers 83
6.6.2 The reduction of coenzyme Q involves protons and electrons
O
O
O
O
e⊖
O
O
. . .
O⊖
O2H⊕
e⊖ O
OH
. . .
OH
O
2H⊕ 2e
⊖
Q
Q⊖ QH2
Notes: Hydrogen carriers may also be reduced by electron carriers. This happens
with coenzyme Q, which is reduced by the iron sulfur cluster N2 in complex I. In
this case, protons are taken up from the solution, but only in the second reduction
step:
FeII−S+Q Q− + FeIII
−S (6.5)
FeII−S+ 2 H+ +Q− QH2 + FeIII
−S (6.6)
Hydrogen carriers alternate with electron-only carriers at several points in the
chain. This means that electrons are stripped of their protons and rejoined by
protons again repeatedly during transport. Where protons are stripped off, they
may be preferentially released at the cytosolic side, whereas uptake of protons
may preferentially occur on the mitochondrial side. This would account for some,
but not all of the proton translocation occurring in the respiratory chain.
As an example of of the foregoing, we will have a look at the (in)famous
ubiquinone cycle. Ubiquinone (or coenzyme Q) is a hydrogen carrier; like FAD and
FMN, it can carry two electrons but can accept and donate them one at a time.
6.6.3 The Q cycle (criminally simplified)
Notes: The Q cycle or ubiquinone cycle runs within complex III, which accepts
reduced ubiquinone from the surrounding membrane. Complex III has two binding
sites for ubiquinone, and both of them are occupied while the cycle runs; we will
here call them A and B. The ubiquinone cycle goes through the following stages,
starting at the top left:
1. At the outset, a reduced ubiquinone (QH2) is bound to site A, and an oxidized
one (Q) is bound to site B. The protons of QH2 are stripped off and expelled to
the cytosolic side. The electrons part company and migrate to two different

84 6 The respiratory chain
electron carrier groups within complex III; one of these is an iron-sulfur cluster,
whereas the other is a heme.
QH2
Q e⊖
–Q
Q
QH2
cytochrome C
to complex IV
2H⊕
QH2
Q⊖
2H⊕
–Q
QH2
to complex IV
2H⊕
B
A
B
A
B
A
B
A
2. The iron sulfur cluster donates its electron to cytochrome C, while the heme
transfers its electron to the second molecule of ubiquinone in site B. The
ubiquinone molecule in site A, now oxidized, trades places with another one
in the surrounding membrane that was reduced in the preceding steps of the
respiratory chain.
3. The protons and electrons of the new QH2 in site A are abstracted and split
as in the first step. The heme passes on its electron to coenzyme Q in site
B. Now completely reduced, the coenzyme Q picks up two protons from the
mitochondrial matrix to form QH2.
4. The electron that had been transferred to the Fe–S cluster is donated to cyto-
chrome C. The Q in site A trades places with QH2 in site B, which completes
the cycle.
According to this scheme, with each molecule of ubiquinone reduced in the
respiratory chain, the two protons it carries are expelled into the cytosol, and two
additional protons are taken up from the mitochondrial matrix and expelled into
the cytosol as well. Therefore, complex III uses ubiquinone as a prosthetic group
to facilitate the movement of protons across the membrane.
If you compare the outline of the ubiquinone cycle given here to the description
in your textbook, you might find the similarity somewhat remote. In reality, as you
can see in slide 6.4, complex III contains several more redox co-factors that act as
intermediate stepping stones in the electron transfer steps outlined above. They
have been skipped here for simplicity.
6.7 How can electrons be transferred from electron-only carriers such as iron-sulfur clus-ters to hydrogen carriers such as ubiquinone?

6.7 How is electron transport linked to proton pumping? 85
6.6.4 Reduction of oxygen by cytochrome C oxidase (complex IV)
O
2+
O
1+
O−
3+
O−
2+
e⊖
H⊕
O2−
4+
OH−
2+
H⊕e⊖
OH−
3+
OH−
2+
2H⊕
H2O
3+
2+
2e⊖2+
1+
O2
Notes: Cytochrome C is a small hemoprotein that shuttles electrons from complex
III to complex IV. The latter complex, which is also known as cytochrome C oxidase,
completes the transfer of electrons by delivering them to oxygen. In the process,
it pumps some more protons out of the mitochondrial matrix. The reduction
of oxygen is the trickiest step in the entire respiratory chain, as it takes a full
four electrons to reduce molecular oxygen (O2) all the way to two molecules of
water. Since cytochrome C delivers the electrons to complex IV one at a time, the
reduction will involve partially reduced oxygen species. As noted above, partially
reduced oxygen species are reactive and toxic when let loose upon the cell, so their
premature release from cytochrome C oxidase must be minimized.
Cytochrome C oxidase does its best to control this problem by binding oxygen
tightly and reducing it swiftly. The oxygen molecule is clamped in the active
site between the iron of a heme and a copper ion, which is coordinated by three
histidine residues (left). Both metal ions also function as redox cofactors in the
reduction. Each of them advances one electron to the oxygen, which is thereby
reduced to peroxide, using one electron from each metal ion. Uptake of an electron
delivered by cytochrome C and abstraction of a further one from the iron fully
reduces both oxygen atoms. Uptake of protons generates first hydroxide and
then water, which is released. Iron and copper are subsequently restored to their
original oxidation levels further electrons obtained from cytochrome C.
6.8 Explain how cytochrome C oxidase (complex IV) minimizes the formation of reactiveoxygen species in the stepwise reduction of oxygen.
6.7 How is electron transport linked to proton pumping?
• Some redox steps in the ETC are coupled to proton binding and dissociation,
which may occur at opposite sides of the membrane. Example: Coenzyme Q
cycle at complex III

86 6 The respiratory chain
• Redox steps that do not involve hydrogen directly need a different mechanism
in order to contribute to proton pumping. Example: Sequence of iron-sulfur
clusters and hemes in complex IV
Notes: As pointed out above, some of the protons that undergo expulsion from
the mitochondrion are accepted from the hydrogen carriers NADH and ubiquinone
and travel together with electrons for a part of the journey. However, at some point
they must part company, and the protons must be expelled, whereas the electrons
are retained. Also, more protons are being expelled than can be accounted for by
the hydrogen carriers. This is obvious with complex IV, which does not interact
with any hydrogen carriers at all yet expels up to four protons for each pair of
electrons accepted. So, there must be mechanisms that extract energy from the
transfer of proton-less electrons and apply it towards the expulsion of electron-less
protons. How does this work?
6.7.1 Linking electron movement to proton pumping: A conceptual model
Notes: The experimental evidence on this point is still fragmentary, and inasmuch
as they are understood, the emerging mechanisms are quite complex. Therefore,
instead of trying to describe them faithfully, this slide presents a simplified con-
ceptual model to provide an idea of how things might work.
The basic idea is that capture and release of electrons cause conformational
changes to a protein. This is entirely analogous to conformational changes caused
by allosteric effectors binding to enzymes, or by phosphate groups bound to
cytoskeletal proteins such as the myosin light chain. An electron carries a charge,
a charge causes a field, and a field creates forces that act on charged residues on
the protein; thus, in principle, it is not hard to imagine how migrating electrons
can cause conformational changes.

6.8 ATP synthesis 87
In our conceptual model, a spring-loaded valve controls the proton conduit.
The lever of the valve carries an electron-transporting cofactor (a heme or FeS-
cluster). This cofactor receives an electron from another cofactor upstream (A),
which then becomes occupied by the next electron (B). Electrostatic repulsion
moves the valve (C), such that the proton is translocated and the electron can jump
to the next cofactor downstream (D). The extended spring—which is a metaphor
for conformational strain—then returns the valve to its original position (E).
6.7.2 Stoichiometry of proton ejection
It is commonly stated that approximately ten protons are ejected for each pair of
electrons abstracted from NADH, such that four protons are ejected at each of
complexes I and IV, and 2 at complex III.12 Complex II does not eject any protons
but just abstracts them from FADH2 and passes them on to ubiquinone. If you
look at slide 6.5.3, you will notice that the difference in the redox potentials of
FAD and ubiquinone is rather small. Consequently, the amount of free energy
associated with the transfer of electrons from FAD to ubiquinone is too small to
permit the performance of work against the proton gradient.
6.8 ATP synthesis
Most of the ATP that results from complete oxidative degradation of glucose is syn-
thesized only after the substrate has already vanished in the form of CO2 and H2O.
At this stage, the entire available energy is stored in the so-called proton-motive
force across the inner mitochondrial membrane. ATP synthesis is powered by the
protons that yield to this force and are pulled back by it into the mitochondrion.
6.8.1 Proton pumping creates both a concentration gradient and a membrane
potential
Notes: The proton concentration in the cytosol is approximately ten times higher
than that in the mitochondrial matrix. While this creates a significant significant
driving force, the larger contribution to the overall proton-motive force comes
from the electrostatic membrane potential across the inner mitochondrial mem-
brane. Like the proton concentration gradient, this electrical potential is a direct
consequence of the proton pumping: Each proton ejected leaves one negative
charge behind inside the mitochondrion.
In a fully energized mitochondrion, the membrane potential amounts to ap-
proximately ~150 mV.13 According to equation 6.8, this potential confers a free
energy of approximately 15 kJ/mol to each proton, whereas equation 6.7 indicates a
12Note that this number is at variance with the mechanism of the coenzyme Q cycle given above,which ejects four protons for each equivalent of ubiquinone. Different sources offer varying num-bers.
13Above a potential of 150 mV, the inner membrane becomes increasingly leaky for protons (seesection 6.10), so that such higher potentials will not be sustained.
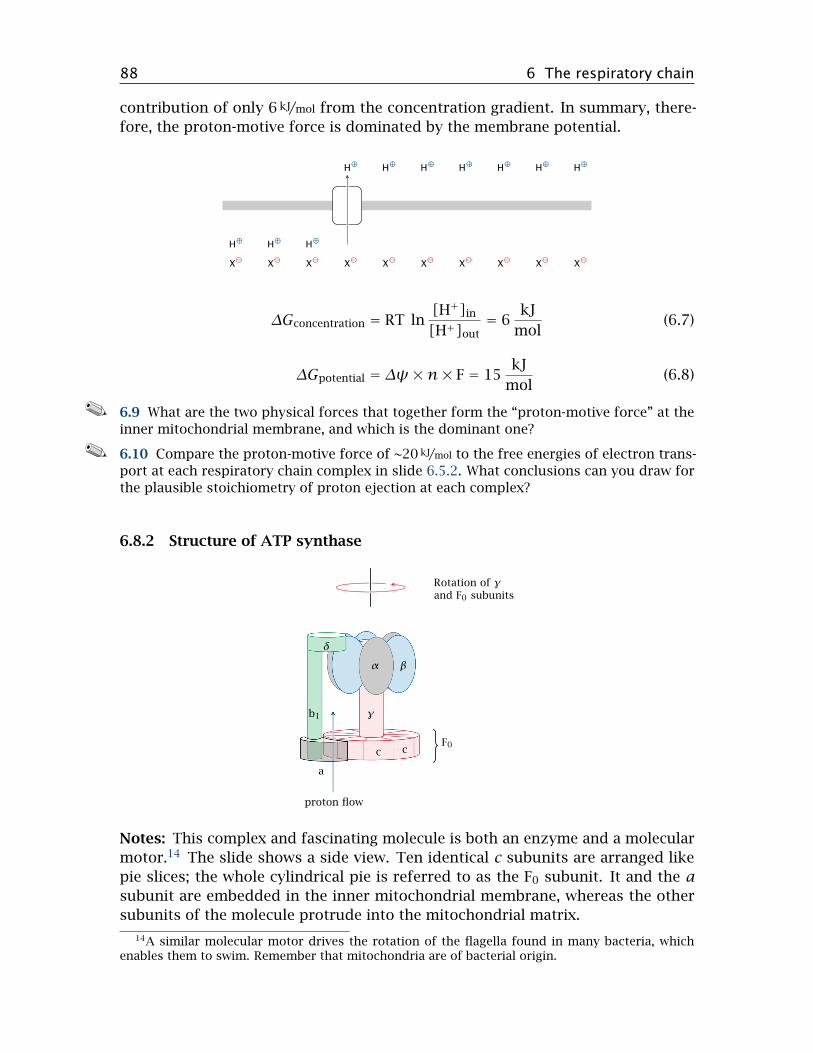
88 6 The respiratory chain
contribution of only 6 kJ/mol from the concentration gradient. In summary, there-
fore, the proton-motive force is dominated by the membrane potential.
H⊕
H⊕
H⊕
X⊖
X⊖
X⊖
X⊖
X⊖
X⊖
X⊖
X⊖
X⊖
X⊖
H⊕
H⊕
H⊕
H⊕
H⊕
H⊕
H⊕
∆Gconcentration = RT ln[H+]in[H+]out
= 6kJ
mol(6.7)
∆Gpotential = ∆ψ×n× F = 15kJ
mol(6.8)
6.9 What are the two physical forces that together form the “proton-motive force” at theinner mitochondrial membrane, and which is the dominant one?
6.10 Compare the proton-motive force of ~20 kJ/mol to the free energies of electron trans-port at each respiratory chain complex in slide 6.5.2. What conclusions can you draw forthe plausible stoichiometry of proton ejection at each complex?
6.8.2 Structure of ATP synthase
α β
γ
c c
a
b1
δ
F0
proton flow
Rotation of γand F0 subunits
Notes: This complex and fascinating molecule is both an enzyme and a molecular
motor.14 The slide shows a side view. Ten identical c subunits are arranged like
pie slices; the whole cylindrical pie is referred to as the F0 subunit. It and the a
subunit are embedded in the inner mitochondrial membrane, whereas the other
subunits of the molecule protrude into the mitochondrial matrix.
14A similar molecular motor drives the rotation of the flagella found in many bacteria, whichenables them to swim. Remember that mitochondria are of bacterial origin.

6.8 ATP synthesis 89
The F0 and the γ subunit (both shaded in red) rotate relative to all other
subunits. The γ stalk therefore rotates within and rubs against the bushing formed
by the six α and β subunits. The rotation is driven by the flow of protons that
occurs at the interface of the a and F0 subunits.
6.8.3 The binding-change model of ATP synthase catalysis
ADP Pi
ATP
ATP
α
βγ
Notes: The interaction of the rotating γ subunit with the static β subunits is
crucial to ATP synthesis. Because of the asymmetric shape of the γ subunit, its
rotation imposes cyclic conformational changes upon the α and β subunits that
surround it. The β subunit, which contains the active site of the enzyme, extracts
mechanical work from these conformational changes and ultimately converts it
into the chemical energy contained in ATP.
How does the β subunit convert mechanical into chemical energy? Strictly
speaking, it doesn’t—it turns out that the isolated β-subunit can create ATP from
ADP and ionic phosphate all by itself. In doing so, the β subunit adopts two distinct
conformational states. In the first state, it binds ADP and phosphate. Once both
are bound, β transitions to the second state, which binds ATP with exceptionally
high affinity but no longer binds ADP and phosphate. Formation of several avid
but non-covalent bonds between β and ATP provides the energy that is needed to
create the new, energy-rich phosphate anhydride bond in ATP.
With the isolated β subunit, we have at this point reached a dead end—ATP is
bound so avidly as to never be released, which means that no further turnover can
occur. It is at this stage that, in the intact enzyme, the γ subunit comes into play.
Rotation of γ forces another change of conformation upon β that in turn kicks the
ATP out of the active site. The force imposed by γ on β must be so strong as to
overcome and offset the large binding energy that ties the ATP to β. In summary,
therefore, the synthesis of ATP proceeds spontaneously inside β, and the energy

90 6 The respiratory chain
of rotation is applied to force out the avidly bound ATP and prime β for the next
round of catalysis.
6.11 Explain the binding-change model of ATP synthesis inside ATP synthase.
6.8.4 How does proton flux drive ATP synthase?
Notes: The last remaining puzzle is how the proton flux actually causes the mov-
ing parts of the enzyme to rotate. As shown in slide 6.8.2, the proton flux passes
between the a subunit and the F0 subunit, which contains 10 identical c chains
arranged in a pie-slice fashion; for simplicity, only one c chain is highlighted in
the current slide.
The two gray cylinders in this cartoon are proton conduits contained within
the a subunit; the remainder of the a subunit is not shown. The proton conduits
span the outer and the inner membrane leaflet, respectively, but they do not meet;
it is the rotating F0 disk that mediates the flow of protons between them. To this
end, each c chain has a strategic aspartate residue that faces the surrounding lipid
membrane and can reversibly accept a proton.
In the top left of the figure, the aspartate (shown as a little groove) of the
highlighted c subunit is about to accept a proton from the periplasmic space15
via the corresponding conduit. In the next frame, the disk has moved a bit and
accepted the proton; it then goes around by almost a full turn, until it reaches the
other conduit (bottom right). In the final frame, the proton has left the disk and
is on its way to the mitochondrial matrix, while the c subunit is about to move on
and pick up then next proton.
There is indeed evidence that agrees with this model; for example, the strategic
aspartate on the F0 disk is alternatingly accessible from the two opposite sides
of the membrane. However, while it seems simple and elegant, this model has
15The periplasmic space is the the narrow space between the inner and the outer mitochondrialmembrane.

6.8 ATP synthesis 91
one fundamental shortcoming: While it tells us how rotation of ATP synthase can
dissipate the proton gradient, it does not explain how ATP synthase manages to
derive any torque from this process, so that it can perform work against resistance.
More specifically, what makes the rotor keep going in the same direction instead
of just oscillating back and forth between the two conduits? This would save it
the trouble of performing work, while still permitting proton flux.16
6.8.5 Proton flux causes c chains to rotate within the F0 disk
Notes: The absence of a flywheel effect that would help F0 move past dead spots
means that proton flux and F0 rotation must be tightly coupled. This assumption
is supported by the observation that the c chain undergoes a significant confor-
mational change upon protonation or deprotonation [19]. The authors of the cited
study proposed a functional model that is shown here in a simplified cartoon
depiction.
One of the 10 c subunits is highlighted in blue, as is the proton carried by it.
In the top left, this subunit is about to accept a proton from the cytosolic conduit.
In the second frame, the proton has been accepted, and the c subunit has rotated
about its own axis. The entire F0 disk then rotates by nearly a full turn, which
brings our highlighted c subunit to the inward-connecting conduit. The aspartate
now delivers its proton, whereupon the subunit swivels back about its own axis.
During this transition, the aspartate holds on to the end of the conduit—that is,
the stationary a subunit—and thus causes the entire F0 disk to rotate forward.
This second rotation of the c subunit constitutes the “power stroke” of the engine.
The model implies that the number of protons transported per rotation is
identical to that of the c subunits in F0. Intriguingly, ATP synthases in different
16A steam engine gets around a similar problem by employing inertia, which is provided by a nice,heavy, cast-iron flywheel. That is not possible here because of the minuscule dimensions. A studentwho took my class in 2005, Kelvin Cheung, took on the challenge to calculate the kinetic energy ofrotating ATP synthase; it works out to about one billionth of the energy required for making 1 ATP.

92 6 The respiratory chain
organisms vary in their number of c subunits, which will directly affect the sto-
ichiometric ratio of ATP synthesis to proton transport. It would be interesting
to know whether there are complementary variations in the number of protons
driven out per electron during electron transport. Otherwise, the different subunit
stoichiometry of F0 should directly translate into a different ATP yield in the entire
respiratory chain.
6.9 Auxiliary shuttles for the mitochondrial reoxidation of cytosolicNADH
In slide 3.4.1, it was mentioned that, under aerobic conditions, the NAD+ con-
verted to NADH in the cytosol by glyceraldehyde-3-phosphate dehydrogenase is
re-oxidized in the respiratory chain. NADH itself, however, cannot pass the in-
ner mitochondrial membrane, and in fact not even the more permissive outer
membrane. How, then, is its oxidation accomplished?
It turns out that NADH is not translocated at all but is reoxidized, or dehy-
drogenated, in the cytosol. The hydrogen is then taken to the mitochondrion by
other carriers. These shuttle system work in a somewhat roundabout manner,
tying together several enzyme activities with specific transporters in the inner
mitochondrial membrane.
6.9.1 A hypothetical malate-oxaloacetate shuttle
cytosol mitochondrial matrix
malate malate
oxaloacetate oxaloacetate
NAD+
NADH+H+
NAD+
NADH+H+
Notes: A simple but somewhat dubious shuttle is shown in this picture. Among
the various mitochondrial exchange transporters that engage malate, there is one
that can directly swap it for oxaloacetate [20]. This transporter has been found in
the mitochondria of multiple mammalian organs, and under suitable conditions
in vitro, it can sustain reoxidation of external NADH by isolated mitochondria [21].
The problem with this hypothetical shuttle is the ratio of NADH to NAD+,
which in vivo is usually higher in the mitochondria than in the cytosol. This should
crank the malate-oxaloacetate shuttle the wrong way, exporting NADH from the
mitochondria rather than importing it. Therefore, until evidence of its operation
within intact cells becomes available, this cycle cannot be assumed to be of major
significance.

6.9 Auxiliary shuttles for the mitochondrial reoxidation of cytosolic NADH 93
6.9.2 The malate-aspartate shuttle
cytosol
H+glutamate
aspartate
α-ketoglutarate
malateoxaloacetate
NAD+NADH+H+
mitochondrial matrix
H+ glutamate
aspartate
α-ketoglutarate
malate oxaloacetate
NADH+H+NAD+
1 1
2 2
Notes: The malate-aspartate shuttle combines four substrates and two trans-
porters with two enzymes, both of which are required on both sides of the mem-
brane. In the cytosol, malate dehydrogenase (1) regenerates NAD+ by reducing ox-
aloacetate to malate, which is then exchanged for mitochondrial α-ketoglutarate.
Inside the mitochondrion, malate is converted back to oxaloacetate, which is then
transaminated by aspartate aminotransferase (2). This yields aspartate, which is
exchanged for cytosolic glutamate, as well as α-ketoglutarate, which is exchanged
for malate. Transamination is then reversed in the cytosol, which restores oxaloac-
etate and glutamate and closes the cycle.
While the malate-aspartate shuttle is more complex than the malate-oxaloac-
etate shuttle, it does have the advantage with respect to driving force: the gluta-
mate-aspartate exchanger cotransports one proton with each molecule of gluta-
mate, which means that the proton-motive force drives the cycle in the required
direction [22].
The significance of this shuttle in vivo is supported by both experimental and
clinical observations. Genetic defects of enzymes or carriers in the cycle cause
lactic acidosis, that is, a pathological accumulation of lactic acid in the body,
which indicates that the normal disposal of cytosolic NADH is disrupted. Similarly,
pharmacological inhibition of aspartate aminotransferase with aminooxyacetate
inhibits glucose oxidation and increases lactate levels [22, 23].
6.12 Draw the malate-aspartate shuttle, and explain why it is more plausible to occurin vivo than the simpler, hypothetical direct exchange of malate and oxaloacetate.
6.9.3 The glycerophosphate shuttle
Notes: In the glycerophosphate shuttle, the hydrogen is never actually transported
to the mitochondrion. Dihydroxyacetone phosphate serves as the intermediate

94 6 The respiratory chain
hydrogen acceptor and is reduced in the cytosol to glycerophosphate by glycero-
phosphate dehydrogenase. Glycerophosphate traverses the outer mitochondrial
membrane and is then reoxidized to dihydroxyacetone phosphate by a second
glycerophosphate dehydrogenase (GPD). This enzyme is associated with the outer
surface of the inner membrane, and it feeds the abstracted electrons directly into
the respiratory chain at the level of coenzyme Q. Like succinate dehydrogenase,
which also supplies electrons to the respiratory chain at the level of coenzyme Q,
glycerophosphate dehydrogenase employs FAD is the coenzyme.
outer membrane inner membrane
Glycerophosphate Glycerophosphate
DHAP DHAP
NAD+
NADH+H+ FADH2
FAD QH2
Q
GPD
The glycerophosphate shuttle bypasses complex I in the respiratory chain and
therefore induces ejection of four fewer protons from the cytosol. However, this
shortfall is partially compensated for by the two protons that stay behind in the cy-
tosol (or more accurately, the periplasmic space) when the electrons get abstracted
from glycerophosphate. While slightly less energy-efficient than the malate-as-
partate shuttle, this shuttle is certainly more straightforward, since it avoids all
substrate transport across the inner mitochondrial membrane. In particular, it
cuts out oxaloacetate, whose low concentration inside the mitochondrion probably
forms the kinetic bottleneck of the malate-aspartate shuttle. It is interesting to
note that the glycerophosphate shuttle is highly active in insect muscle, which has
an extremely high ATP turnover during flight.
6.13 Explain the glycerophosphate shuttle and compare it to the malate-asparte shuttle.
6.10 Regulation of the respiratory chain
Most of the time and in most cells, the respiratory chain runs at rates that are
substantially below the maximum. How is the flow rate of the respiratory chain
controlled? In a healthy and not maximally exerted cell, there is much more ATP
than ADP or phosphate, so that these become limiting for the flow. If ATP synthase
is short of substrates, dissipation of the proton-motive force will slow down. The
proton pumps will find it difficult to extrude more protons, and since electron
transport and proton pumping are tied to one another, the dehydrogenation of
NADH and FADH2 will slow down as well.
The flow rate of the respiratory chain also affects those of glycolysis and the
TCA cycle. Both ATP and NADH participate in this regulation:

6.10 Regulation of the respiratory chain 95
1. A low consumption of ATP will result in its accumulation to higher levels.
Many enzymes, including phosphofructokinase, are inhibited by ATP.
2. Low activity of the respiratory chain causes NADH to accumulate, which slows
down glyceraldehyde-3-phosphate dehydrogenase, pyruvate dehydrogenase,
α-ketoglutarate dehydrogenase, and the NAD+-dependent isocitrate dehydro-
genase.
It should be noted that mitochondrial respiration does not completely stall, even
when no ADP is available as a substrate for ATP synthase. In this situation, the
membrane potential across the inner mitochondrial membrane rises higher, which
in turn makes the inner mitochondrial membrane more permeable to protons. This
so-called proton leak is responsible for about 20% of the metabolic rate at rest.
While several different transport proteins have been proposed to account for the
proton leak [24], the most plausible mechanism is the futile cycle discussed in
slide 6.10.3 below.
6.10.1 The two mitochondrial isocitrate dehydrogenases
Isocitrate
α-Ketoglutarate
NADP+
NADPH+H+
CO2
NAD+
NADH+H+
CO2
Notes: The above regulatory mechanisms are quite straightforward. There is, how-
ever, one remaining mystery. We have already noted that there are two forms
of isocitrate dehydrogenase, one using NAD+ and the other NADP+ as the cosub-
strate. While the NAD+-dependent form is inhibited by NADH and ATP, the NADP+-
dependent form is not, and one might thus expect that it would go at full blast
even when the demand for ATP is low and NADH is high. What is more, the NADP+-
dependent enzyme is actually more highly expressed than the NAD+-dependent
form. How, then, is the NADP+-dependent enzyme prevented from uncontrolled
consumption of isocitrate, and why does it exist at all?
The answer to the first question is that, at least when demand for ATP is low,
the NADP+-dependent isocitrate dehydrogenase reaction is close to equilibrium.
This equilibrium is sustained by a high mitochondrial level of NADPH, which in
turn is maintained by nicotinamide nucleotide transhydrogenase.
6.10.2 Nicotinamide nucleotide transhydrogenase couples hydrogen transfer
with proton transport
Notes: This remarkable protein, which is located in the inner mitochondrial mem-
brane, is both an enzyme and a transporter. It reduces NADP+ to NADPH at the

96 6 The respiratory chain
expense of NADH. As with ATP synthase, the enzyme reaction is coupled to the
translocation of protons:
NADH+NADP+ +H+out NAD+ +NADPH+H+in
H+
NADP+
NADPH+H+
NAD+
NADH+H+
Note that the transhydrogenase involves only mitochondrial NAD and NADP; the
pools existing in the cytosol are unaffected.
6.10.3 At rest, transhydrogenase and the isocitrate dehydrogenases form a
futile cycle
transhydrogenase
H+
NAD-dependentdehydrogenase
α-ketoglutarate + CO2
NAD+
NADH
NADP-dependentdehydrogenase
isocitrate
NADP+
NADPH
Notes: This slide and the following one show how the transhydrogenase may be
integrated with the function and regulation of the TCA cycle and the respiratory
chain [25].
When the demand for ATP is low, mitochondrial NADH and the proton-motive
force will both be at high levels, which will cause the transhydrogenase to reduce
NADP+ at the expense of NADH. Accordingly, the NADPH concentration will be
high, which results in near-equilibrium conditions for the NADP+-dependent isoci-
trate dehydrogenase also. If the NADPH concentration is high enough, there would
be a low net flux within an interesting futile cycle that involves both isocitrate de-

6.11 ATP yield of complete glucose oxidation 97
hydrogenases and the transhydrogenase, and the net effect of which is the influx
of one proton in each round.17
6.10.4 When ATP demand is high, transhydrogenase turns into an auxiliary
proton pump
transhydrogenase
H+
NAD-dependentdehydrogenase
α-ketoglutarate + CO2
NAD+
NADH
NADP-dependentdehydrogenase
isocitrate
NADP+
NADPH
respiratorychain
Notes: On the other hand, when the demand for ATP is high, the proton-motive
force and the level of NADH will be lower. Under these conditions, the transhydro-
genase should switch direction, now consuming NADPH to produce more NADH,
which in turn will be consumed at a fast clip in the respiratory chain. This also
means that transhydrogenase will work as an auxiliary proton pump, thus aug-
menting the proton-motive force and ATP synthesis.
What is more, the consumption of NADPH by transhydrogenase will topple
the equilibrium of NADP+-dependent isocitrate dehydrogenase. Like the NAD+-
dependent enzyme, it will now consume isocitrate. Due to the NADP+-dependent
enzyme’s higher abundance, NADPH will be preferentially generated, with the
benefit of an extra proton expelled by transhydrogenase.
Now this is a truly marvelous piece of engineering by Mother Nature, isn’t it?
I’d say this is as close as it gets to intelligent design.
6.14 Is nicotinamide transhydrogenase proof of Life’s creation by intelligent design?
6.11 ATP yield of complete glucose oxidation
The amount of ATP gained in the respiratory chain for each molecule of glucose
degraded is large, but it cannot be calculated with complete precision and varies
between different physiological states.
17This futile cycle might also contribute significantly to the proton leak that occurs at high levelsof the proton-motive force (see section 6.10 above).

98 6 The respiratory chain
6.11.1 Theoretical ATP per molecule of glucose completely oxidized
Quantity Intrinsic value Per glucose
Accrued hydrogen 10 NADH, 2FADH2
Protons ejected 10 per NADH, 6per FADH2
112
Proton-powered ATPsynthase revolutions
10 protons perrevolution
11.2
ATP from ATP synthase 3 per revolution 33.6
ATP from glycolysis 2
GTP from TCA cycle 2
Total 37.6
Notes: The number of NADH molecules given here includes all molecules accruing
in glycolysis, pyruvate dehydrogenase, and the TCA cycle. The numbers of protons
pumped per molecule of NADH or FADH2 are based on the assumption that com-
plexes I, III, and IV pump 4, 2, and 4 protons, respectively. GTP, which is formed
in the succinate thiokinase reaction in the TCA cycle, is energetically equivalent to
ATP.
6.11.2 Processes other than ATP synthesis that are powered by the proton
gradient
• Nicotinamide nucleotide transhydrogenase
• Uncoupling proteins; proton leak
• Secondary active transport:
– ATP4–/ADP3– antiport
– phosphate/H+ symport
– amino acid/H+ symport
– pyruvate/H+ symport
Notes: The amount of ATP given in the preceding slide is a theoretical maximum.
In reality, the ATP yield will be significantly lower, because some protons are
used for purposes other than driving ATP synthase. Most importantly, some
protons are needed for ATP transport. ATP synthesized in the mitochondrion
must be exported to the cytosol, and ADP produced there has to get back in.
This is accomplished by a special transporter protein in the inner mitochondrial
membrane that exchanges ATP and ADP for each other. Since ATP carries one
more negative charge than ADP (ATP4– vs. ADP3–), this exchange amounts to a net
export of one negative charge, or to the net import of one positive charge per ATP.
Moreover, ionic phosphate produced by cytosolic ATP cleavage also must return

6.12 Answers to practice questions 99
to the mitochondrion, which consumes another proton. These processes detract
considerably from the theoretical efficiency of ATP synthesis.
The expenditure of extra protons on the transport of ATP, ADP and phosphate
provides a clear benefit to the cell. It allows the transport of ATP and ADP against
their concentration gradients. This enables the cell to maintain a high ATP/ADP
ratio in the cytosol, which helps drive the ATP-consuming reactions there forward,
whereas a higher ADP/ATP ratio in the mitochondria allows the ATP synthase to
go at speed.
6.12 Answers to practice questions
6.1: The two experiments show that electron transport and proton pumping on the onehand, and ATP synthesis on the other, are functionally linked only by the proton gradient;there is no direct functional link between the proteins that carry out the two processes.
6.2: The iron-containing cofactors comprise hemes, which contain one iron ion coordi-nated in the center of a tetrapyrrol ring, and iron-sulfur clusters, which contain multipleiron ions bound by cysteine side chain thiol groups and free sulfide ions.
6.3: Flavin cofactors (FAD and FMN) are able to accept and donate electrons both singlyand pairwise. They therefore mediate electron transfer between the nicotinamide cofactors(NADH and NADPH) and iron cofactors, which can only accept electrons one at a time.
6.4: ∆G = −∆E × n × F. Therefore, reactions that are associated with a positive redoxpotential are exergonic and proceed spontaneously.
6.5: Largest: Complex IV; smallest: complex II.
6.6: NADH yields H2 to FMN, which then yields the electrons in two discrete steps to theneighboring Fe–S cluster. Concomitantly, the protons are shed into solution.
6.7: Simultaneously with accepting electrons, the hydrogen carrier must pick up protonsfrom solution.
6.8: The enzyme clamps O2 between an iron and a copper ion, which between themadvance three electrons to the oxygen molecule. Thus, a single electron arriving fromupstream (cytochrome C) will suffice to complete the reduction, and the partially reducedstate is of short duration.
6.9: The membrane potential is the dominant force, and the proton gradient is the minorone.
6.10: Complexes I, III and IV extract approximately 60, 40, and 80 kJ/mol, respectively, fromelectron transport. This would suggest that they expel no more than 3, 2, and 4 protons,respectively, from the mitochondrial matrix.
6.11: The catalytic β subunit has built-in ATP synthase activity; it can form ATP from freeADP and ionic phosphate, driven by its exceptionally high affinity for ATP. The ATP isejected when the rotating γ subunit imposes a conformational change on the β subunit.
6.12: For the sketch, see slide 6.9.2. It is more plausible than direct malate-oxaloacetateexchange because it ties in the glutamate-aspartate exchanger, which is propelled in thedesired direction by proton cotransport.
6.13: In the glycerophosphate shuttle, dihydroxyacetonephosphate in the cytosol acceptsH2 from NADH, enters the inter-membrane space, and is reoxidized by a cognate dehy-drogenase that feeds the electrons into the respiratory chain at the level of coenzyme Q.

100 6 The respiratory chain
The electrons bypass complex I, which means that fewer protons are extruded from themitochondrion compared to electrons that enter the mitochondria via the malate-aspar-tate shuttle. However, the glycerophosphate shuttle is simpler and probably has highercapacity than the malate-aspartate shuttle.
6.14: Almost.
Chapter 7
Gluconeogenesis
7.1 Introduction
Glucose is a key metabolite in human metabolism, but it is not always available
at sufficient levels in the diet. Therefore, a pathway exists that converts other
foodstuffs into glucose. This pathway is called gluconeogenesis.
7.1.1 Glucose is an indispensable metabolite
• The brain requires at least ~50% of its calories in the form of glucose
• Red blood cells exclusively subsist on glucose
• Glucose is a precursor of other sugars needed in the biosynthesis of nucleoti-
des, glycoproteins, and glycolipids
• Glucose is needed to replenish NADPH, which supplies reducing power for
biosynthesis and detoxification
Notes: These considerations make the need for gluconeogenesis quite clear—we
can’t just leave the blood glucose level up to the vagaries of dietary supply.
7.1.2 Overview of gluconeogenesis
Notes: Gluconeogenesis is the reversal of glycolysis, with several workarounds
for the irreversible reactions in that pathway. In this scheme, the reactions that
are shared between glycolysis and gluconeogenesis are shown in blue, whereas
reactions that are specific for gluconeogenesis are shown in red. As you can see,
both pyruvate and oxaloacetate are starting points for red arrows; therefore, any
pathway that yields either of these, or indeed any other intermediate of glycolysis,
can supply substrate carbon for gluconeogenesis. These pathways are indicated
here by green arrows.
101

102 7 Gluconeogenesis
Glucose
Glucose-6- P
Fructose-6- P
Fructose-1,6-bis- P
Glyceraldehyde-3- P
P -enolpyruvate
Pyruvate
Acetyl-CoA
α-Ketoglutarate
Succinyl-CoAFumarate
Oxaloacetate
Lactate
Acetone
Glycerol
Amino acids
The major substrate supply for gluconeogenesis is protein, both dietary and en-
dogenous. Protein is first broken down into its constituent amino acids. Those
amino acids that can be converted to pyruvate or any of the TCA cycle inter-
mediates can serve as substrates for gluconeogenesis, and are therefore called
glucogenic.
Leucine, lysine and the aromatic amino acids are degraded to acetyl-CoA or
acetoacetate. Since acetoacetate is a ketone body, and acetyl-CoA can be converted
to ketone bodies, these amino acids are called ketogenic. While it was believed
for a long time that ketogenic amino acids cannot be converted to glucose in
human metabolism, this is not strictly true, since the ketone body acetone can
be converted to pyruvate (see slide 10.4.3). Nevertheless, the contribution of
ketogenic amino acids to glucose regeneration is likely minor.
Gluconeogenesis proceeds only in the liver and the kidneys, and since the liver
is five times larger than the two kidneys combined, it synthesizes most of the
glucose. The pathway does not occur in the brain, fat tissue, or skeletal muscle.
Together with glycogen degradation (see slide 8.3.5), gluconeogenesis ensures
stable blood glucose levels between meals. Gluconeogenesis also enables us to
maintain the necessary glucose levels when on a diet that is rich in protein but low
in carbohydrates.
7.1 Briefly describe the biochemical process of gluconeogenesis.
7.2 Reactions in gluconeogenesis
Most reactions are shared with glycolysis, which we already know, and we here
only need to consider the small number of reactions that are specific to gluconeo-
genesis.

7.2 Reactions in gluconeogenesis 103
The final reaction in glycolysis is the transfer of the phosphate group from
phosphoenolpyruvate (PEP) to ATP. This reaction is irreversible because of the
strongly exergonic nature of the accompanying rearrangement of pyruvate from
the enol to the keto form (see slide 3.3.7). In gluconeogenesis, it takes two en-
zymatic steps to turn pyruvate back into PEP, namely (1) the carboxylation of
pyruvate to oxaloacetate by pyruvate carboxylase, and (2) conversion of oxaloac-
etate to PEP by phosphoenolpyruvate carboxykinase.
7.2.1 The pyruvate carboxylase reaction
H3C C
O
C
O
OH
C
O
OH
CH2 C
O
C
O
OH
CO2
ATP ADP + Pi
Notes: With the pyruvate carboxylase reaction, we are able to metabolically fix
CO2—just like plants! Before we try to claim Kyoto treaty credits for this ability,
however, it is necessary to consider that the very same molecule of CO2 gets
released again in the next step. The whole purpose of transient CO2 fixation is to
enable this subsequent reaction, which is shown in slide 7.2.4.
7.2.2 The active site of E. coli biotin carboxylase
Biotin
Arg338 Glu296
HCO–3 Mg2+
Arg292
ADP
Notes: The pyruvate carboxylase reaction occurs in two separate steps, which in
human metabolism are carried out in two distinct active sites of a single enzyme
molecule. In E. coli, the two activities are found on separate enzyme molecules. The
first enzyme activity is biotin carboxylase, which attaches CO2 to the coenzyme
biotin.
The figure (rendered from 3G8C.pdb) shows the location of the reactants, as
well as several strategic amino acid residues, within the active site of the E. coli
enzyme. The reaction involves bicarbonate and ATP; the terminal phosphate group
of ATP would fit into the space between ADP, arginine 292, and bicarbonate. The
roles of arginine 338 and glutamate 296 are illustrated in the next slide.

104 7 Gluconeogenesis
7.2.3 Activation of bicarbonate and carboxylation of biotin
O
H2N⊕
NH
Arg
NH2
NH
R S
N H O POOH
⊖O O
ADP
⊖O
OH
⊖O O
Glu
O
H2N⊕
NH
Arg
NH2
NH
R S
N H O P O
OH
O⊖
⊖O
O
HO O
Glu
O⊖
H2N⊕
NH
Arg
NH2
NH
R S
N O P O
OH
O⊖
OH
O
HO O
Glu
O
NH2⊕
NH
Arg
NH2
NH
R S
N ⊖O
OOH
Glu
P
OH
O
O⊖
O
OH
Notes: Glutamate 296 in the active site initiates the proceedings by deprotonating
bicarbonate, which in turn attacks the terminal phosphate of ATP. This yields
carboxyphosphate, which in turn deprotonates biotin; arginine 338 stabilizes the
anionic biotin intermediate that forms transiently at this stage. The biotin anion
finally attacks the carboxyphosphate, producing phosphate and carboxybiotin.
Figure simplified after a scheme given in [26].
Beyond its role in biotin-dependent carboxylation reactions, carboxyphosphate
(or carbonic-phosphoric anhydride) also occurs as an intermediate in the carbamo-
ylphosphate synthetase reaction, which is the first step in the urea cycle (see slide
12.3.1).
7.2.4 The carboxylation of pyruvate
O O
⊖O
OH
O
N
O
NH
O
⊖O O
O
OHR
S
O
H
CH2
⊖O O H⊕
CH2
H
Notes: The second active site—or, in the E. coli pathway, the second enzyme—
transfers the carboxyl group from biotin to pyruvate. The reaction begins with
pyruvate adopting the enoyl configuration. The electrons of the C−−C double bond
then perform a nucleophilic attack on the carboxyl group, to which biotin readily
yields. The product is oxaloacetate.
7.2 Describe the mechanism of the pyruvate carboxylase reaction.

7.3 Energy balance of gluconeogenesis 105
7.2.5 The phosphoenolpyruvate carboxykinase reaction
O
O⊖
O
O
OH
CO2
H2C
⊖O
O
POH
O⊖
O GDP
O
OH
GDP
H2C
OP⊖O
OH
O
O
OH
Notes: In the phosphoenolpyruvate carboxykinase reaction, the CO2 that just had
been attached to the substrate leaves again. This gives rise to an enolpyruvate
anion intermediate that attacks and acquires the terminal phosphate group of
GTP. The product is phosphoenolpyruvate, which is an intermediate of glycolysis.
All reactions between phosphoenolpyruvate and fructose-1,6-bisphosphate are
reversible; we can therefore skip ahead to the latter metabolite.
7.2.6 Fructose-1,6-bisphosphatase and glucose-6-phosphatase
Fructose-1,6-bisphosphate+H2O Fructose-6-phosphate+ Pi
Glucose-6-phosphate+H2O Glucose+ Pi
Notes: These reactions revert the substrate phosphorylations that occur in the
first and the third step of glycolysis, which are catalyzed by hexokinase and phos-
phofructokinase, respectively. In gluconeogenesis, the phosphate groups are sim-
ply hydrolyzed off, which is not a very difficult sort of reaction.
7.3 Which enzymes in glycolysis catalyze irreversible reactions, and how are these reac-tions bypassed in gluconeogenesis?
7.3 Energy balance of gluconeogenesis
Reaction ATP/GTP input
2 pyruvate 2 oxaloacetate 2
2 oxaloacetate 2 PEP 2
2 3- P -glycerate 2 1,3-bis- P -glycerate 2
Total 6
Notes: Gluconeogenesis requires an input of six equivalents of ATP or GTP for
each molecule of glucose. In glycolysis, there was a net gain of only two molecules
of ATP per molecule of glucose. The expenditure of an extra four equivalents
of ATP in gluconeogenesis reverts the energy balance of the pathway, so that it
actually proceeds in the opposite direction. Formation of no more than two ATP

106 7 Gluconeogenesis
molecules makes it exergonic to turn glucose into pyruvate, whereas expenditure
of six ATP equivalents makes it exergonic to turn pyruvate back into glucose.
7.4 Interactions of gluconeogenesis with other pathways
As pointed out above (section 7.1), substrate carbon for gluconeogenesis accrues
mostly from amino acid degradation and is harvested at the level of pyruvate or
of TCA cycle intermediates. Pyruvate carboxylase, which turns pyruvate into a
TCA cycle intermediate, is important not only in gluconeogenesis, but also in the
replenishment of TCA cycle intermediates, which may become depleted through
diversion to the biosynthesis of amino acids or of heme. Therefore, this enzyme is
expressed not only in the organs that perform gluconeogenesis (liver and kidneys)
but ubiquitously.
Gluconeogenesis is also part of two interorgan cycles, namely, the Cori cycle
and the glucose-alanine cycle. These will be discussed after several other partici-
pating pathways have been introduced (see slides 8.5.3 and 12.3.5).
7.4.1 Mitochondrial substrate transport in gluconeogenesis
ATP
ADP
Pi
malate
oxaloacetate
pyruvate
ATP
ADP
Pi
malate
oxaloacetate
pyruvate
CO2 ATP
ADP+Pi
NADH+H+
NAD+
NADH+H+
NAD+
H+ H+Cytosol Mitochondria
pyruvatecarboxylase
malatedehydrogenase
dicarboxylatetransporter
ATP synthase
Notes: In keeping with its role in replenishing TCA cycle intermediates, pyruvate
carboxylase resides inside the mitochondria. The next step in gluconeogenesis,
catalyzed by phosphoenolpyruvate carboxykinase, occurs in the cytosol; therefore,
oxaloacetate must in some way be exported from the mitochondria again.
We had already seen that the mitochondrial concentration of oxaloacetate is
low, and that the malate dehydrogenase equilibrium favors malate (section 5.5).
It turns out that substrate export occurs indeed at the level of malate, which
is exchanged for phosphate by a mitochondrial transport protein known as the
dicarboxylate carrier. The malate dehydrogenase reaction is then reversed in the

7.4 Interactions of gluconeogenesis with other pathways 107
cytosol; the NADH produced can be used in the reversal of the glyceraldehyde-3-
dehydrogenase reaction (see slide 3.3.5), which occurs later on in gluconeogenesis.
The phosphate that entered the mitochondrion in exchange for malate can
be used by ATP synthase, and the ATP be exchanged for cytosolic ADP, which
balances the entire transport cycle and supplies one ATP to the cytosol, where it
may for example be used by phosphoglycerate kinase in gluconeogenesis.
The mitochondrial export of malate is susceptible to inhibition by methyl-
malonate. The coenzyme A thioester of methylmalonate occurs in the metabolic
utilization of fatty acids with uneven numbers of carbon atoms (see slide 10.3.6).
This pathway requires vitamin B12. A lack of the vitamin will cause free methyl-
malonate to accumulate. This may inhibit gluconeogenesis and thus account for
the clinical hypoglycemia that sometimes accompanies vitamin B12 deficiency [27].
7.4 Explain how oxaloacetate is transported from the mitochondrion to the cytosol tosupply gluconeogenesis.
7.4.2 Ethanol degradation inhibits gluconeogenesis
ethanol
acetaldehyde
acetate
acetyl-CoA
malate
lactate
oxaloacetate
pyruvate
glucose
NADH+H+
NAD+
Notes: Like gluconeogenesis, ethanol degradation occurs in the liver. The utiliza-
tion of one molecule of ethanol by alcohol dehydrogenase and then aldehyde
dehydrogenase yields acetate, which is converted to acetyl-CoA by acetate thioki-
nase.
For each molecule of ethanol degraded, two equivalents of NAD+ are reduced
to NADH. This raises the cytosolic [NADH]/[NAD+] ratio, which in turn reduces both
pyruvate and oxaloacetate and thus deprives gluconeogenesis of its substrates. In
alcoholic patients, this problem is often compounded by a low intake of carbohyd-
rates. Clinically manifest hypoglycemia with unconsciousness is a well-known and
potentially dangerous complication in alcohol addiction.
7.5 Explain how alcohol degradation interferes with gluconeogenesis.

108 7 Gluconeogenesis
7.5 Regulation of gluconeogenesis
The activity of enzymes in gluconeogenesis is regulated by several mechanisms
according to the metabolic needs of the cell and those of the entire body.
7.5.1 Simultaneous activity of glycolysis and gluconeogenesis creates futile
cycles
glucose
glucose-6- P
ATP
ADP
Pi
H2O
fructose-6- P
fructose-1,6-bis- P
ATP
ADP
Pi
H2O
ADP
ATP
ADP+Pi
ATP+CO2
GDP + CO2GTP
oxaloacetate PEP
pyruvate
Notes: Each of these short cycles combines one enzyme from glycolysis (blue
arrows) with one or two enzymes from gluconeogenesis (red arrows). In each case,
the net result of the cycle is simply the consumption of ATP or GTP and the release
of heat.
These cycles have been shown to run in living cells at appreciable levels, possi-
bly for the sake of heat production; and as pointed out in chapter 2, such substrate
cycles also sharpen up regulatory responses (see slide 2.5.7). Nevertheless, their
activity must be kept in check in order to avoid excessive wastage of ATP. Some,
but not all of the regulatory mechanisms that exercise this control are understood.
7.5.2 Glucose phosphorylation cycling involves two separate compartments
Glucose Glucose
Glucose-6- P Glucose-6- P
HexokinaseGlucose-6-phosphatase
CytosolEndoplasmic reticulum
ATP
ADP+PiH2O
Pi
Notes: In this cycle, hexokinase or glucokinase operates in the cytosol, whereas
glucose-6-phosphatase is located in the endoplasmic reticulum. It seems likely that
flow through the cycle is limited by the capacity of glucose-6-phosphate transport

7.5 Regulation of gluconeogenesis 109
to the ER. Interestingly, the transporter and the phosphatase are expressed in
many tissues, not just those that perform gluconeogenesis [28]; it is not clear at
present what, if any, function other than futile cycling this might serve.
7.5.3 Allosteric regulation limits fructose-6-phosphate phosphorylation
cycling
Fructose-6- P
ATP
AMP
Fructose-2,6-bis- P
Fructose-1,6-bis- P
Pi
H2O
ATP
ADP
PhosphofructokinaseFructose-1,6-bisphosphatase
Notes: Phosphofructokinase is inhibited by ATP. This makes sense, since ATP
formation is the main purpose of glycolysis, in conjunction with the TCA cycle
and the respiratory chain. On the other hand, depletion of ATP will result in a
buildup of ADP and AMP; it thus also makes sense that ADP and AMP stimulate
phosphofructokinase (section 2.5).
Fructose-1,6-bisphosphatase is stimulated by ATP and inhibited by AMP. This
behavior is opposite to that of phosphofructokinase, and it ensures that only one
of the two enzymes will be fully active at any given time, which helps to limit the
rate of futile cycling.
7.5.4 Hormonal control of phosphofructokinase and
fructose-1,6-bisphosphatase
Epinephrin, glucagon Insulin
Adenylate cyclase Phosphodiesterase
ATP cAMP AMP
Protein kinase A
PFK 2/F-2,6-bis-P’ase PFK 2/F-2,6-bis-P’ase
Fructose-2,6-bis- P
Fructose-6- P

110 7 Gluconeogenesis
Notes: Phosphofructokinase and fructose-1,6-bisphosphatase also show opposite
responses to a third allosteric effector, namely, fructose-2,6-bisphosphate. This
molecule is not a regular metabolite of glucose metabolism but is synthesized
solely for the sake of its regulation, and it occurs at much lower levels than fruc-
tose-1,6-bisphosphate. Its concentration is under the control of hormones via the
secondary messenger 3’,5’-cyclo-AMP (cAMP). The entire cascade consists of the
following stages:
1. The hormones bind to their respective receptors on the cell surface, which
then promote the formation of cAMP by adenylate cyclase (glucagon and
epinephrine) or its degradation by phosphodiesterase (insulin).
2. cAMP binds to and activates protein kinase A, which phosphorylates the
enzyme phosphofructokinase 2 (PFK 2). This phosphorylation can be reversed
by a protein phosphatase.
3. PFK 2 has two opposite activities: In the dephosphorylated state, it acts as
the kinase and therefore raises the level of fructose-2,6-bisphosphate. In the
phosphorylated state, it acts as the corresponding phosphatase and therefore
decreases the level of fructose-2,6-bisphosphate.
Since fructose-2,6-bisphosphate activates phosphofructokinase and inhibits
fructose-1,6-bisphosphatase, the upshot of glucagon and epinephrine action is to
promote gluconeogenesis and inhibit glycolysis. Insulin has the opposite effect.
The actions of all these hormones will be considered in more detail in chapter 13.
7.6 Explain the role of fructose-2,6-bisphosphate in the regulation of glycolysis and glu-coneogenesis.
7.5.5 The secondary messengers cAMP and fructose-2,6-bisphosphate
OO
OH
N N
N
NH2
N
PO
O−
O
O
PO O−
O−
O
OH
OH
O P
O
O−
O−
CH2OH
cyclic 3′,5′-AMP (cAMP) fructose-2,6-bisphosphate
Notes: This slide just shows the structures of the secondary messengers intro-
duced in the previous one. In the structure of fructose-2,6-bisphosphate, the
phosphate group attached to the 2′-position is highlighted.
It should be noted that, among the three allosteric effectors of phosphofructok-
inase and fructose-1,6-bisphosphatase, ATP and AMP reflect the energetic situation
of the cell itself, whereas the level of fructose-2,6-bisphosphate is regulated by
hormonal stimulation and thus controls the same enzymes on behalf of the needs

7.6 Answers to practice questions 111
of the body as a whole. This is a nice example of how regulatory signals of different
origin and meaning are integrated at the molecular level.
7.5.6 Regulation of pyruvate kinase
• allosteric inhibition by ATP
• allosteric activation by alanine and fructose-1,6-bisphosphate
• inhibition by PKA-mediated phosphorylation
Notes: In the third cycle shown in slide 7.5.1, throughput is limited between PEP
and pyruvate. The liver form of pyruvate kinase is allosterically activated by
fructose-1,6-bisphosphate. It is allosterically inhibited by alanine and by ATP, and
it is also inhibited through phosphorylation downstream of cAMP.
The effects of ATP and fructose-1,6-bisphosphate provide some more exam-
ples of feedback and feed-forward regulation. Alanine is a key substrate for hepatic
gluconeogenesis, since it carries substrate carbon and surplus nitrogen from mus-
cle to the liver in catabolic conditions (see slide 12.3.5); it thus makes sense that
alanine should inhibit glycolysis.
Also note that this cycle involves both mitochondrial and cytosolic enzymes,
and some of the mitochondrial transporters involved (see slide 7.4.1) might also
constrain the flow through this cycle.
7.6 Answers to practice questions
7.1: Gluconeogenesis is the synthesis of glucose from pyruvate or oxaloacetate and theirprecursors, which include the glucogenic amino acids and lactate. The reactions in thispathway are mostly shared with glycolysis, with workarounds for the irreversible kinasereactions of that pathway. Gluconeogenesis occurs only in the liver and kidneys, not inother organs.
7.2: The reaction occurs in two distinct steps, catalyzed by separate active sites. In thefirst step, ATP is used to activate bicarbonate to carboxyphosphate, which then transfersCO2 to biotin. In the second step, biotin yields CO2 to pyruvate, which transiently adoptsenoyl configuration.
7.3: The enzymes in glycolysis are hexokinase, which is bypassed by glucose-6-phos-phatase, phosphofructokinase, which is bypassed by fructose-1,6-phosphatase, and pyru-vate kinase, which is bypassed by the combined action of pyruvate carboxylase and phos-phoenolpyruvate carboxykinase.
7.4: Oxaloacetate is first reduced to malate, which is exchanged for cytosolic phosphate.In the cytosol, malate is converted back to oxaloacetate.
7.5: The oxidation of ethanol in the liver to acetaldehyde and then acetate reduces twoequivalents NAD+ to NADH. The raised level of NADH promotes the reduction of ox-aloacetate to malate and of pyruvate to lactate by malate dehydrogenase and lactatedehydrogenase, respectively. This diverts key substrates from gluconeogenesis.
7.6: Fructose-2,6-bisphosphate allosterically activates phosphofructokinase 1 and inhibitsfructose-1,6-bisphosphatase, that is, it promotes glycolysis and inhibits gluconeogenesis.

112 7 Gluconeogenesis
The formation of fructose-2,6-bisphosphate is under hormonal control; its formation isincreased by insulin and decreased by epinephrine and glucagon. These hormonal effectsare mediated via cAMP and protein kinase A.

Chapter 8
Glycogen metabolism
8.1 Overview
In addition to gluconeogenesis, the reversible storage of glucose in the form of
glycogen provides a second major mechanism of glucose homeostasis.
Glycogen is a branched glucose polymer that is found in many organs, but the
largest quantities occur in the liver and in skeletal muscle. The liver can store up
to 150–200 grams, which amounts to 10% of the organ’s wet weight. It draws
from this reservoir to maintain the blood glucose concentration; glycogen plays a
major role in day-to-day glucose homeostasis.
While skeletal muscle contains glycogen at much lower concentration than
the liver, its much larger overall mass means that the absolute amount of glycogen
stored there is approximately twice higher than in the liver. The contribution of
muscle glycogen to glucose homeostasis is less well understood.
8.2 Glycogen structure
8.2.1 Why store glucose in polymeric form?
• The osmotic pressure is governed by the gas equation:
pV = nRT ⇐⇒ p =n
VRT
• Glycogen amounts to 10% of the liver’s wet weight, equivalent to 600 mM
glucose
• When free, 600 mM glucose would triple the osmotic activity of the cytosol—
liver cells would swell and burst
113

114 8 Glycogen metabolism
• Linking 2 (3, . . . ) molecules of glucose divides the osmotic effect by 2 (3, . . . ),
permitting storage of large amounts of glucose at physiological osmolarity
Notes: The proportionality of concentration and osmotic activity does not strictly
apply to large molecules, but the approximation is good enough for the present
purpose.
8.1 Why is glucose stored as glycogen?
8.2.2 Covalent structure of glycogen
O Glycogenin
OH
OH
CH2OH
O
O
OH
OH
CH2OH
O
O
OH
OH
CH2O
OH
OH
CH2OH
O
O
OH
OH
CH2OH
O
O
OH
OH
CH2OH
O
O. . .
O
O
OH
OH
CH2OH
O
O
OH
OH
CH2OH
O
O. . .
Notes: Glycogen consists of linear stretches of glucose residues connected by α-
1 4-glycosidic bonds, with branches that are attached through α-1 6-glycosidic
bonds. The entire tree-shaped polymer, or dendrimer, is rooted in a single molecule
of the protein glycogenin. Each linear stretch contains approximately 13 glucose
residues and, except of course for the outermost layer of the molecule, carries two
branches of the same length that are attached 3–4 residues apart.
The structure of glycogen is similar to that of amylopectin (see slide 1.6.11).
However, in glycogen, the density of branches is greater, which means that a
glycogen molecule has a greater number of free ends than an amylopectin molecule
of the same molecular weight. The number of free ends determines the possible
rates of synthesis and breakdown, and the greater number of free ends in glycogen
than in amylopectin reflects a difference in metabolic rates, which are higher in
animals, particularly warm-blooded ones, than in plants.
8.2.3 The size of glycogen particles is limited by crowding in the outer layers
Notes: According to the rules detailed in the preceding slide, the number of
branches will double with each successive generational layer of the glycogen mo-
lecule. However, the amount of space available to those branches will only grow
in proportion to the square of the particle radius or, approximately, the square
of the number of generations. Taking into account the actual dimensions and
architecture of the polymer, it has been calculated that in the 13th generation the
required space would exceed the available space. Therefore, a glycogen molecule
can contain no more than 12 generational layers. This implies that a single glyco-

8.2 Glycogen structure 115
gen molecule can contain up to approximately 54,000 glucose residues; it will have
a molecular weight of almost 107 Da and a diameter of approximately 25 nm [29].
0 5 10 15
Layer
volu
me
Layer generation
available
required
Electron microscopy shows glycogen particles whose dimensions agree well with
this theoretical maximum size of single molecules; these are referred to as βparticles. In many tissues, variable numbers of β particles are found clustered
into so-called α particles. Interestingly, α particles can be broken up with thiol-
reducing agents, which implies that they are held together by disulfide bonds.
Disulfides usually form between protein molecules. In addition to such scaffolding
proteins, glycogen particles also contain a considerable number of enzymes and
regulatory proteins [30], some of which will be discussed below.
8.2.4 Glycogen is more loosely packed and more soluble than amylose
Glycogen Amylose
Notes: The above structural model of glycogen assumes a relatively loose packing
of the glucose residues within the α-1 4-linked linear stretches. However, per-
fectly linear polyglucose—that is, amylose—adopts a much more densely packed
helical structure. In this structure, more hydroxyl groups are engaged in hydrogen
116 8 Glycogen metabolism
bonds with other glucose residues rather than with water; amylose therefore has
low aqueous solubility.1
Unlike amylose, which mostly serves for long-term storage in plant bulbs and
seeds, glycogen typically is degraded within hours of synthesis; this rapid turnover
is facilitated by its loose structure. However, if branch formation breaks down,
aberrant, condensed glycogen particles may arise that are no longer amenable to
regular turnover. Various enzyme defects that interfere with branch formation
cause the accumulation of such particles inside the cells; an example is the defect
of the enzyme laforin in Lafora disease (see slide 8.6.4).
Aberrant glycogen particles also arise spontaneously in normal metabolism.
The high density of polyglucose chains in the outermost layers of the glycogen
molecule may interfere with the activity of branching enzyme and may promote
tighter packing. Lysosomal glycogen degradation (see section 8.3.7) may have
evolved as a pathway to dispose of such dysfunctional particles.2
8.3 Glycogen synthesis and degradation
The regular, periodic structure of glycogen corresponds to similarly regular and
periodic methods of synthesis and breakdown that require only a modest number
of enzymes. The following enzyme reactions occur in glycogen synthesis:
Synthesis:
1. synthesis of an activated precursor, UDP-glucose, by UTP:glucose-1-phosphate
uridylyltransferase
2. initiation of glycogen synthesis by glycogenin
3. introduction of branches by branching enzyme
4. chain elongation by glycogen synthase
5. repeat steps 3 and 4
Degradation:
1. depolymerization of linear strands by phosphorylase
2. removal of branches by debranching enzyme
3. repeat steps 1 and 2
8.3.1 Activation of glucose for glycogen synthesis
Notes: Both glycogenin and glycogen synthase use an activated form of glucose,
UDP-glucose, which is formed from glucose-6-phosphate in two steps. Phospho-
glucomutase first transforms glucose-6-phosphate to glucose-1-phosphate (1),
1Cooking starch has the effect of breaking up hydrogen bonds within amylose and increase itsdegree of hydration. Amylose thereby becomes digestible by amylase. Cooking food ranks amongmankind’s greatest inventions, almost comparable to Twitter and the iPad.
2Undegraded insoluble glycogen particles may be seen inside the cells of aged individuals. Suchparticles are described as corpora amylacea in the brain and as cardiac colloid in heart muscle.
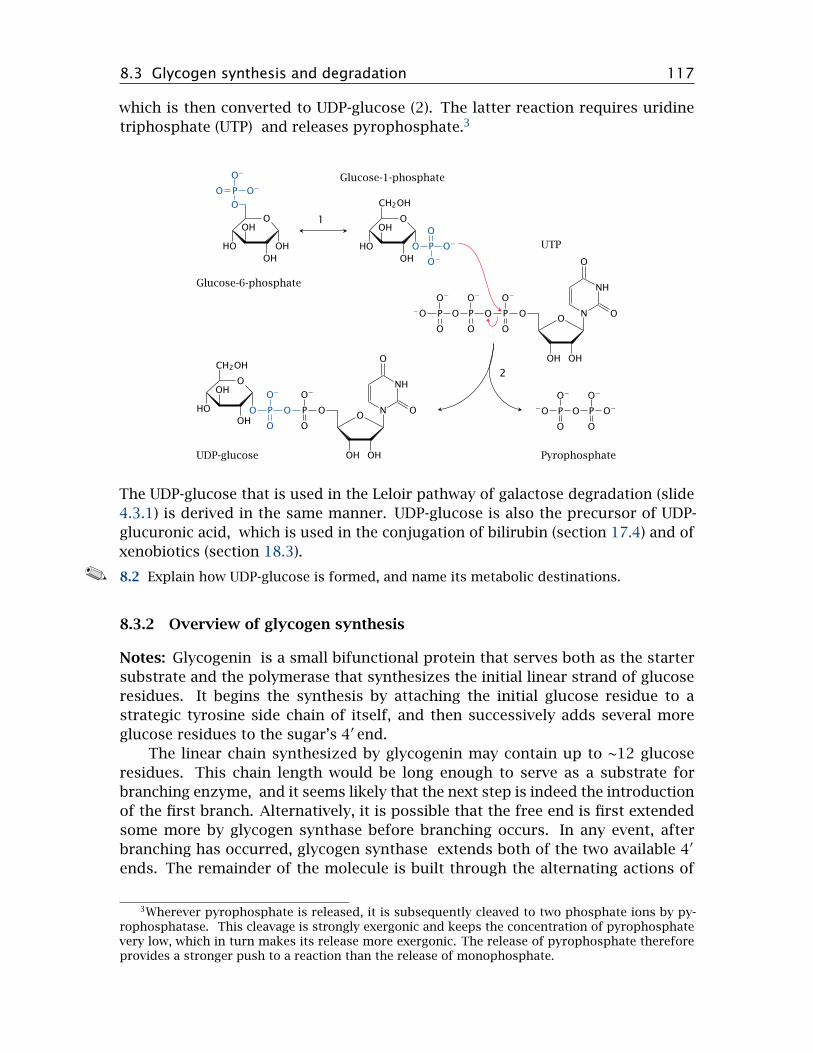
8.3 Glycogen synthesis and degradation 117
which is then converted to UDP-glucose (2). The latter reaction requires uridine
triphosphate (UTP) and releases pyrophosphate.3
OH
OH
OH
O
PO O−
O−
O
OH O P
O
O−
O−
OH
OH
CH2OH
O
OH
OP
O
O−
OP
O
O−
OP
O
O−
−OO
OH
N O
NH
O
OH
OP
O
O−
OP
O
O−
O
OH
OH
CH2OH
O
OHO
OH
N O
NH
O
OH
O−P
O
O−
OP
O
O−
−O
Glucose-6-phosphate
Glucose-1-phosphate
UTP
PyrophosphateUDP-glucose
1
2
The UDP-glucose that is used in the Leloir pathway of galactose degradation (slide
4.3.1) is derived in the same manner. UDP-glucose is also the precursor of UDP-
glucuronic acid, which is used in the conjugation of bilirubin (section 17.4) and of
xenobiotics (section 18.3).
8.2 Explain how UDP-glucose is formed, and name its metabolic destinations.
8.3.2 Overview of glycogen synthesis
Notes: Glycogenin is a small bifunctional protein that serves both as the starter
substrate and the polymerase that synthesizes the initial linear strand of glucose
residues. It begins the synthesis by attaching the initial glucose residue to a
strategic tyrosine side chain of itself, and then successively adds several more
glucose residues to the sugar’s 4′ end.
The linear chain synthesized by glycogenin may contain up to ~12 glucose
residues. This chain length would be long enough to serve as a substrate for
branching enzyme, and it seems likely that the next step is indeed the introduction
of the first branch. Alternatively, it is possible that the free end is first extended
some more by glycogen synthase before branching occurs. In any event, after
branching has occurred, glycogen synthase extends both of the two available 4′
ends. The remainder of the molecule is built through the alternating actions of
3Wherever pyrophosphate is released, it is subsequently cleaved to two phosphate ions by py-rophosphatase. This cleavage is strongly exergonic and keeps the concentration of pyrophosphatevery low, which in turn makes its release more exergonic. The release of pyrophosphate thereforeprovides a stronger push to a reaction than the release of monophosphate.

118 8 Glycogen metabolism
branching enzyme and glycogen synthase; the cycle repeats until the glycogen
reaches its inherent size limit at approximately 10 MDa (see slide 8.2.3).
Glycogenin
Branching enzyme
Glycogen synthase
HO Gg
UDP-Glc
UDP
UDP-Glc
UDP
UDP-Glc
UDP
. . .
O GgGlcGlcGlcGlcGlcGlcGlcGlcGlcGlcGlcGlc
O GgGlcGlcGlcGlc
GlcGlcGlcGlcGlcGlc
GlcGlc
UDP-Glc
UDP
. . .
UDP-Glc
UDP
. . .
The reactions performed by glycogenin itself and by glycogen synthase are equiv-
alent. It is interesting to note that the carbon 1 of each glucose subunit is in the
α-configuration both in UDP-glucose and in glycogen. What does this tell us about
the mechanism of the reaction?
8.3.3 A hypothetical reaction mechanism of glycogen synthase
O
PO O−
O
PO O−
O
O⊖ O
Glu
OH
OH
CH2OH
O
OH
O
OH
N O
NH
O
OH
O O
Glu
OH
OH
CH2OH
O
OH
. . .
OH
OH
CH2OH
O
O
OH
OH
CH2OH
O
O⊖UDP
. . .
OH
OH
CH2OH
O
O
OH
OH
CH2OH
O
O
OH
OH
CH2OH
O
OH
Notes: Nucleophilic substitutions can occur either synchronously or asynchro-
nously. In the first case, which is called the SN2 mechanism, one substituent leaves
as the other arrives; each of them holds on to the same carbon atom with “half a
bond” in the transition state. Most commonly, the incoming substituent attacks
from the direction opposite to the position of the leaving substituent. With asym-
metric carbons such as the C1 of α-D-glucose, this should result in a reversal

8.3 Glycogen synthesis and degradation 119
to the β configuration. The α configuration may then be restored in a second
substitution.
The hypothetical scheme in this slide illustrates such a double SN2 mechanism.
The first substitution leads to a covalent intermediate with an active site gluta-
mate, in which the C1 of glucose has been inverted to the β configuration. The
subsequent nucleophilic attack by the activated C4′hydroxyl group restores the αform.
8.3.4 An alternative glycogen synthase mechanism
O
PO O−
O
PO O−
O
OH
OH
CH2OH
O
OH
O
OH
N O
NH
O
OH
X
PO O−
O
PO O−
O⊖
δ+
OH
OH
CH2OH
Oδ+
OH
O
OH
N O
NH
O
OH
. . .
OH
OH
CH2OH
O
O
OH
OH
CH2OH
O
OH
. . .
OH
OH
CH2OH
O
O
OH
OH
CH2OH
O
O
OH
OH
CH2OH
O
OHUDP
Notes: Double-substitution mechanisms similar to the one shown in the preceding
slide are indeed employed by several glycosyltransferases, including glycogen
phosphorylase and branching enzyme. However, with glycogen synthase itself, the
evidence appears to favor a different mechanism that does not involve covalent
catalysis by the enzyme, but instead a direct activation of both the C1 of the
incoming glucose and the C4′ hydroxyl group of the preceding chain [31], as is
depicted in simplified form in this slide. Note how the UDP that is released in the
first step of the reaction assumes a catalytic role in the second step.
8.3.5 Overview of glycogen degradation
Notes: Glycogen degradation is brought about by phosphorylase and debranch-
ing enzyme. All glucose residues that are joined by α-1 4-glycosidic bonds—that
is, those in the straight segments—are released by glycogen phosphorylase. Most
enzymes that cleave glycosidic bonds simply hydrolyze them; examples are intesti-
nal amylase and β-galactosidase. In contrast, glycogen phosphorylase employs
phosphate ions instead of water, and so produces glucose-1-phosphate rather

120 8 Glycogen metabolism
than free glucose.4 Glucose-1-phosphate is then converted to the mainstream
metabolite glucose-6-phosphate by phosphoglucomutase.
O GgGlcGlcGlcGlc
GlcGlcGlcGlcGlcGlcGlcGlc
GlcGlcGlcGlcGlc
Pi
Glc-1- P Pi
Glc-1- P
O GgGlcGlcGlcGlc
GlcGlcGlcGlc
GlcGlcGlc
O GgGlcGlcGlcGlc
Glc
GlcGlcGlcGlcGlcGlc
H2O
Glc
phosphorylase
debranching enzyme
In the liver, which stores glycogen for the benefit of the entire body, the lion’s share
of glucose-6-phosphate will be dephosphorylated by glucose-6-phosphatase and
then released into the circulation; overall, this is equivalent to outright hydrolysis.
However, muscle uses glycogen largely toward its own energy needs, and therefore
glucose-6-phosphate will usually be funneled straight into glycolysis. In this case,
the use of phosphorolysis instead of hydrolysis bypasses the hexokinase reaction,
thereby saving one equivalent of ATP.5
Glycogen phosphorylase only degrades the chain ends to within four residues
of a branching point. Then, debranching enzyme takes over and transplants
the stub to another free end, where it becomes again a substrate for phosphory-
lase. However, this reaction leaves behind a single residue attached by a α-1 6-
glycosidic bond. This residue is subsequently released by the same enzyme as free
glucose through hydrolysis.
8.3 Give a summary of glycogen synthesis and degradation.
8.3.6 The reaction mechanism of phosphorylase
Notes: Glycogen phosphorylase uses pyridoxal phosphate (PLP) as a coenzyme. If
you are familiar with the usual catalytic role of PLP, you may find this surprising;
and indeed, phosphorylase employs it PLP a unique manner that bears no resem-
blance to its typical role in amino acid metabolism (see for example section 12.2).
In those reactions, the organic ring of PLP, which is grayed out in this figure, func-
4Phosphorolysis also occurs in the release of ribose and deoxyribose from nucleosides (seesection 16.4).
5Glycogen arose early in evolution, and the glycogen usage pattern of early organisms likelyresembled muscle rather than liver tissue. Therefore, the energy efficiency of phosphorolysis wasadvantageous to those early organisms, too.

8.4 Regulation of glycogen metabolism 121
tions as a reversible “electron sink.” In contrast, glycogen phosphorylase mainly
uses the phosphate group of PLP, which it deploys to prime a free phosphate ion
for attack on the terminal glycosidic bond of the glycogen substrate.
HO
OH
OH
OGlycogen
H
O
P
−O
O−O
H
O
P
O
O
N
OH
N
−O
O
OH
HO
OH
OH
δ+
H
OGlycogen
O
P O−−O
OH
O−
P O
O
N
OH
N
−O
Oδ+
OH
HO
OH
OH
OP
O−
O−O
HO
P O
O
N
OH
N
−O
O
OH
8.3.7 Lysosomal glycogen disposal
• concerns a minor fraction of glycogen
• key enzyme: acid maltase; enzyme defect causes slow but inexorable glycogen
accumulation
• possible role: disposal of structurally aberrant glycogen particles that have
become “tangled up” during repeated cycles of glucose accretion and depletion
Notes: In liver cells, approximately 10% of all glycogen particles are found inside
lysosomes [30], where they undergo slow degradation by acid maltase. This
enzyme catalyzes the same reactions as intestinal amylase and maltase (see slide
1.6.12) but has an acidic pH optimum, in keeping with the acidic environment
inside lysosomes (pH ~4.5). The lysosomal degradation pathway is important for
the disposal of structurally aberrant glycogen particles; additional metabolic roles
may exist but are currently not well understood. An enzyme defect for lysosomal
maltase causes Pompe’s disease (slide 8.6.2).
8.4 Regulation of glycogen metabolism
We have seen in slide 7.5.4 that phosphofructokinase and the complementary
enzyme fructose-1,6-bisphosphatase are regulated by both intracellular and extra-
cellular signals. The same applies to the key enzymes in glycogen metabolism.

122 8 Glycogen metabolism
8.4.1 Allosteric regulation of glycogen synthase and phosphorylase
Glycogen
ATP
AMP
Glucose-6- P
Glucose-1- P
UDP-glucose
PhosphorylaseGlycogen synthase
Notes: The allosteric regulatory effects exercised by glucose-6-phosphate, ATP and
AMP on glycogen phosphorylase and glycogen synthase make good physiological
sense. Depletion of ATP is an excellent reason to release glucose from the store
in order to make some more. On the other hand, glucose-6-phosphate will be
plentiful when glucose itself is abundant, and therefore signals an opportunity for
replenishing the glycogen stores.
8.4 Explain the allosteric regulation of glycogen synthase and phosphorylase.
8.4.2 Hormonal control of glycogen metabolism
Epinephrin, glucagon Insulin
Adenylate cyclase Phosphodiesterase
ATP cAMP AMP
Protein kinase A
Glycogensynthase
Glycogen
synthase- P
Phosphorylasekinase
Phosphorylase
kinase- P
Phosphorylase Phosphorylase- P
Notes: Hormonal control of glycogen metabolism is similar to that of gluconeo-
genesis; the cascade shown here is identical to that shown in slide 7.5.4 all the
way from the hormones to the activation of protein kinase A. The activated kinase
directly phosphorylates glycogen synthase, which inactivates that enzyme. Pro-
tein kinase A indirectly stimulates glycogen breakdown by phosphorylation of a

8.5 Interorgan relationships in glycogen metabolism 123
dedicated regulatory enzyme, phosphorylase kinase, which in turn phosphorylates
glycogen phosphorylase.
Note that glycogen synthase and phosphorylase respond in opposite ways
to phosphorylation: The synthase is inactivated, whereas the phosphorylase is
activated.
8.5 Explain the hormonal control of glycogen synthase and phosphorylase.
8.4.3 Regulatory differences between liver and muscle phosphorylase
Liver enzyme Muscle enzyme
Inhibition by glucose + −
Activation by Ca2+− +
Activation by AMP even whenunphosphorylated
− +
Notes: There are regulatory differences between glycogen phosphorylase in mus-
cle and liver. Glucose inhibits the liver enzyme but not the muscle enzyme, and
Ca2+ stimulates the muscle enzyme but not the liver enzyme. Recall that Ca2+ is
also the trigger for muscle contraction; the simultaneous stimulation of glycogen
breakdown therefore anticipates an increased demand for ATP.
As one would expect from their regulatory differences, the phosphorylases in
liver and muscle are different molecules. Enzymes that catalyze the same reaction
yet are separate molecules are referred to as isozymes. Although we usually don’t
mention it, many other enzymes covered in this text occur as multiple isozymes,
too.
8.6 Explain the physiological function of glycogen.
8.5 Interorgan relationships in glycogen metabolism
As stated above, the two tissues that have the most significant pools of glycogen
are the liver and skeletal muscle. Liver glycogen is turned over rapidly; it serves
as the major reserve of blood glucose during short-term fasts. Once liver glycogen
is depleted, muscle glycogen can be drawn down; this, however, requires some
roundabout metabolic trickery.
8.5.1 Liver glycogen utilization
Notes: The liver mobilizes glucose from its glycogen store via glycogen phospho-
rylase and phosphoglucomutase, which yields glucose-6-phosphate. The latter is
transported to the endoplasmic reticulum, where it is dephosphorylated. Glucose
is taken back to the cytosol and released into the bloodstream.

124 8 Glycogen metabolism
Glycogen
Glucose-1- P
Glucose-6- PGlucose-6- P
Glucose Glucose
Glucose
glucose-6-phosphatase glucokinase
endoplasmic reticulum
extracellular space
cytosol
Some of the glucose will be rephosphorylated before making it out of the cell,
creating the futile cycle discussed in slide 7.5.2. However, the dominant glucose
phosphorylating enzyme in the liver is glucokinase, which has fairly low affinity for
glucose (see slide 3.5.3); therefore, enough glucose will escape rephosphorylation
and be released into the bloodstream.
8.5.2 Muscle glycogen utilization
Glycogen
Glucose-1- P
Glucose-6- PGlucose-6- P Pyruvate
Glucose Glucose
Glucose
Lactate
Lactate
glucose-6-phosphatase hexokinase LDH
endoplasmic reticulum
Notes: Muscle glycogen primarily serves the energy needs of muscle tissue itself;
during prolonged physical exercise, most of it is broken down to glucose-6-phos-
phate and then consumed via the usual pathways right within the cells that stored
it. As discussed above, this usage is facilitated by calcium-mediated activation of
glycogen phosphorylase.
Under suitable conditions, namely, prolonged fast without physical exercise,
muscle glycogen can also contribute to the replenishment of blood glucose. How-
ever, even though muscle cells have been shown to express glucose-6-phosphatase

8.5 Interorgan relationships in glycogen metabolism 125
[32] and thus are, in principle, able to produce free glucose, they should find it dif-
ficult to release it. This is because muscle contains hexokinase, which has a much
greater substrate affinity than glucokinase and therefore will keep the intracellular
level of free glucose well below the extracellular concentration. The net transport
of glucose should therefore be directed inward at all times; this agrees with all the
physiological evidence that I could find.
The way around this obstacle is to convert glucose-6-phosphate to pyruvate
and then lactate. At a low rate, lactate formation occurs even in resting muscle
and under aerobic conditions. This lactate is derived in various proportions from
blood glucose and glycogen, respectively. In animal experiments, epinephrine
promotes glycogen utilization and lactate release [33], but overall the hormonal
control of this process and the magnitude of its contribution to systemic glucose
control are not well characterized.
8.7 Explain how substrate carbon derived from muscle glycogen may be made availableto bolster blood glucose levels.
8.5.3 The Cori cycle
Glucose
Pyruvate Lactate
2 ATP
2 ADP
NADH+H+
NAD+
Pyruvate
Glucose
NAD+
NADH+H+ 6 ATP
6 ADP
Notes: While skeletal muscle relies on oxidative metabolism most of the time,
some other tissues, notably red blood cells and lymphocytes, which collectively
account for some 4 kg of cell mass, depend mostly or even exclusively on anaerobic
glycolysis even under aerobic conditions. The lactate released in peripheral tissues
is scooped up by the liver, which converts it back to glucose through gluconeogen-
esis. This process is known as the Cori cycle, named after its discoverers Carl and
Gerti Cori, who worked it out as early as 1929 [34].
Skeletal produces lactate at a very much higher rate during short bouts of
maximal exercise when the ATP demand exceeds the capacity for aerobic metabo-
lism. Some textbooks state that the Cori cycle resupplies the muscle with glucose
in this situation also. This is, however, quite impossible. During intense exercise,
the cardiac blood output is diverted from the visceral organs to skeletal muscle.
Therefore, when ATP demand exceeds the oxygen supply of skeletal muscle, the
oxygen shortfall would be even greater in the liver, should it indeed attempt to
make enough ATP for sustaining the muscle through gluconeogenesis; and even

126 8 Glycogen metabolism
with sufficient oxygen, its capacity for making glucose would fall far short of the
muscles’ voracious appetite.
Anaerobic exercise can be sustained for only short periods of time anyway.
During this period, the lactate turned out by skeletal muscle will simply accumu-
late; it will then slowly be scooped up by the liver and turned back into glucose
after we have collapsed at the side of the track to catch our breath.
8.8 Describe the Cori cycle.
8.6 Glycogen storage diseases
Genetic defects have been described for several enzymes of glycogen metabolism.
The clinical syndromes associated with these defects are referred to as glycogen
storage diseases. While these conditions are not particularly common, they do
shed some light on the physiological significance of glycogen metabolism. Some
conditions are clinically severe and are the focus of ongoing therapeutic research.
A few examples are briefly discussed below.
8.6.1 Glucose-6-phosphatase deficiency (von Gierke disease)
• glucose formed in gluconeogenesis or released from glycogen cannot be ex-
ported from liver and kidney cells
• glycogen builds up in liver and kidneys
• severe hypoglycemia
• lactic acidosis
• hyperlipidemia
• hyperuricemia
Notes: Gluconeogenesis and glycogen degradation in liver and kidneys produce
glucose-6-phosphate, which must then be dephosphorylated to glucose in order to
be exported into the bloodstream (see slide 8.5.1). An enzyme defect for glucose-6-
phosphatase prevents glucose release, which causes abnormally low blood glucose
levels (hypoglycemia). Some of the surplus glucose accumulates as glycogen,
whereas the remainder is converted to pyruvate in glycolysis and either emerges
as lactate or, downstream of pyruvate dehydrogenase, is turned into triacylglyc-
erol and cholesterol; the excess lactate and lipids account for the observed lactic
acidosis and hyperlipidemia.
The causation of hyperuricemia—excess blood levels of uric acid, see section
16.5—is less obvious. During episodes of hypoglycemia, the liver will be intensely
stimulated by glucagon and epinephrine and make a forceful but futile attempt to
mobilize its stored glycogen. The large amount of glucose-6-phosphate produced
in this attempt, which cannot be converted to glucose, ties up and depletes cellular

8.6 Glycogen storage diseases 127
phosphate. This impedes the regeneration of ATP and raises the level of AMP,
some of which then enters degradation to uric acid [35].6
The clinical severity of this disease may vary, presumably due to different
levels of residual enzyme activity. Some cases may be managed with a diet of
frequent, starch-rich meals, which helps to avoid hypoglycemia. In more severe
cases, liver transplantation may become necessary.
8.9 Name the enzyme defect that underlies von Gierke disease, and explain why it givesrise to hypoglycemia.
8.6.2 Acid maltase deficiency (Pompe disease)
Infant chest X-ray,normal heart
Infant with Pompedisease, distended heart
Normal skeletal muscle(transverse section)
Glycogen aggregatesin Pompe disease
Notes: A homozygous deficiency of acid maltase7 disrupts lysosomal glycogen
degradation and results in glycogen accumulation. Skeletal and heart muscle are
more strongly affected than the liver. The tissue section of diseased muscle tissue
shows “white holes,” which represent unstained aggregates of glycogen particles.
Glycogen accumulation interferes with muscle cell function and contraction, and
heart failure—a heavily impacted, severely distended heart is shown here in an
X-ray image—leads to death.
The condition, which is known as Pompe’s disease, can vary in severity; com-
plete lack of enzyme activity becomes manifest in infants, whereas mutations
that reduce but do not completely inactivate the enzyme will cause milder disease
with onset deferred to later childhood or adolescence. The disease can be treated
with enzyme replacement therapy. The recombinant enzyme preparation is FDA-
approved; its price is astronomical. This therapeutic approach is more thoroughly
discussed in section 19.3.
8.6.3 Muscle phosphorylase deficiency (McArdle’s disease)
• Deficient glycogen breakdown inhibits rapid ATP replenishment
• Patients experience rapid exhaustion and muscle pain during exertion
• Liver phosphorylase and blood glucose homeostasis remain intact
6This mechanism bears some resemblance to the hyperuricemia that can be triggered in healthypatients through fructose overload (see slide 16.6.4).
7Maltose is a suitable model substrate, but the real role of this “maltase” enzyme is to cleave theα 4-glycosidic bonds in glycogen.

128 8 Glycogen metabolism
Notes: Since liver and muscle phosphorylase are distinct isozymes, defects usually
affect one and spare the other.8 In McArdle’s disease, the muscle isoform is
selectively affected. An unexplained symptom in this disease is the so-called
“second wind” phenomenon: during physical activity, patients initially fatigue
rapidly, but then recover to a degree under continued exercise.
The lack of muscle phosphorylase should also inhibit the utilization of muscle
glycogen toward blood glucose stabilization by way of the Cori cycle (see slide
8.5.3); one might therefore expect that McArdle’s disease might involve episodes
of hypoglycemia. Interestingly, however, the literature does not contain reports of
hypoglycemia in these patients.
8.6.4 Lafora disease
• deficiency for laforin, a glycogen phosphatase
• accumulation of hyper-phosphorylated glycogen (Lafora bodies)
• patients develop epilepsy, dementia
Notes: Laforin is a phosphatase that is associated with glycogen particles and
removes phosphate groups from glycogen itself [37]. The functional significance
of glycogen phosphorylation and dephosphorylation is not clear; and you will no-
tice that it was not even mentioned above. However, genetic deficiencies of the
phosphatase lead to the accumulation of Lafora bodies, which consist of phos-
phorylated, poorly branched glycogen molecules. The disease becomes manifest
through a specific form of epilepsy (myoclonic seizures) and dementia and is fatal.
The CNS symptoms—like the involvement of the kidneys in v. Gierke disease, see
above—illustrate that tissues other than liver and muscle contain glycogen as well
and may be damaged by its accumulation.
8.7 Answers to practice questions
8.1: Conversion of glucose to a polymeric form greatly reduces the osmotic activity ofglucose and thus allows it to be stored at much higher density than would otherwise becompatible with physiological osmotic conditions.
8.2: UDP-glucose is formed from glucose via glucose-6-phosphate and glucose-1-phos-phate by hexokinase, phosphoglucomutase, and glucose-1-phosphate uridyltransferase.The latter enzyme also requires UTP and releases pyrophosphate. UDP-glucose serves a cat-alytic role in galactose utilization and is the precursor of glycogen and of UDP-glucuronicacid, which in turn serves as a cosubstrate in bilirubin and drug conjugation reactions.
8.3: See the enumeration of reaction steps at the beginning of section 8.3.
8.4: Phosphorylase is activated by AMP and inhibited by ATP and glucose-6-phosphate.Glycogen synthase is activated by glucose-6-phosphate.
8.5: Glucagon or epinephrine activate adenylate cyclase, which produces cAMP, whileinsulin activates phosphodiesterase, which reduces cAMP. When it is high enough, cAMP
8The two enzymes do share a common subunit, which may occasionally may be deficient also[36].

8.7 Answers to practice questions 129
activates protein kinase A, which directly phosphorylates and thereby inactivates glycogensynthase. The kinase also phosphorylates a secondary kinase that phosphorylates, andthereby activates, glycogen phosphorylase.
8.6: Glycogen is a polymeric form of glucose that allows storage of the latter in largeamounts. The highest concentrations are found in the liver. Liver, and possible musclecells, store glucose as glycogen under the influence of insulin, and they degrade glycogento glucose and release it into the circulation under the influence of glucagon and epineph-rine. The synthesis and degradation of glycogen helps to maintain a stable blood glucoseconcentration through phases of varying supply and demand.
8.7: Skeletal muscle contains all enzymes for converting glycogen to glucose, but dueto its content of hexokinase is likely unable to accumulate enough free glucose to effectits release into the circulation. However, glycogen-derived glucose may be converted topyruvate and then lactate, which may be released and enter gluconeogenesis in the liver.
8.8: The Cori cycle is an interorgan cycle, combining gluconeogenesis in the liver withanaerobic glycolysis in peripheral tissues. It enables the disposal and utilization of lactateformed in anaerobic glycolysis.
8.9: The deficient enzyme is glucose-6-phosphatase. Without it, the liver and kidney areunable to release free glucose formed through glycogen degradation and gluconeogen-esis, which are the key pathways for blood glucose stabilization—that is, prevention ofhypoglycemia—in fasting periods.


Chapter 9
The hexose monophosphate shunt
9.1 Outline of the pathway
Glucose-6- P
Ribulose-5- P
Ribose-5- P
RNA, ribonucleotides
Ribo-, deoxyribonucleotides
2 NADP+
CO22 NADPH+H+
Notes: The previous chapters have shown that glucose-6-phosphate has a central
place in carbohydrate metabolism. This chapter describes yet another pathway
that starts with this key metabolite, namely, the hexose monophosphate shunt,
or HMS for short. Since this pathway comprises both pentoses and hexoses, it
is sometimes also referred to as the pentose phosphate pathway. It serves two
major functions that are important for biosynthesis, namely (1) the regeneration
of NADPH from NADP+, and (2) the provision or utilization of ribose. Within the
pathway, we can distinguish two phases:
1. the oxidative phase, in which glucose-6-phosphate is oxidized and decarboxy-
lated to ribulose-5-phosphate, and which yields two equivalents of NADPH,
and
131

132 9 The hexose monophosphate shunt
2. the regenerative “sugar shuffle” phase, which converts ribulose-5-phosphate
back to 5/6 equivalents of glucose-6-phosphate.
If all the glucose-6-phosphate formed in the regenerative phase reenters the
oxidative phase in each turn of the cycle, all of it will eventually be completely
oxidized to CO2, with the production of 12 equivalents of NADPH. Therefore,
the hexose monophosphate shunt provides an alternate pathway for the complete
degradation of glucose to CO2. While the sequence of glycolysis, PDH and TCA
cycle involves both the cytosol and the mitochondria, the HMS runs entirely in
the cytosol. This ties in with the fact that most of the biosynthetic reactions
that require NADPH also occur in the cytoplasm or in the ER, rather than in the
mitochondria. It also means that the HMS is present in red blood cells, which lack
mitochondria.
The oxidative and the regenerative phases of the HMS can occur at the same
time, but they can also function independently from one another. This allows
net flux through the pathway to follow alternative patterns in different metabolic
situations:
1. NADPH regeneration. Complete oxidation of glucose-6-phosphate, with
maximum yield of NADPH and without any net formation or utilization of other
sugars, occurs when the oxidative phase and the regenerative phase occur in
lockstep.
2. Nucleotide biosynthesis. One of the sugar phosphate intermediates of the
regenerative phase is ribose-5-phosphate, which also serves as a precursor of
nucleotides and nucleic acids. If required, ribose-5-phosphate can be diverted
toward nucleotide biosynthesis, with a corresponding reduction in the yield of
regenerated glucose-6-phosphate. Since all reactions in the regenerative phase
are reversible, glucose-6-phosphate can in principle also be converted to ribose-5-
phosphate without any concomitant net oxidation.
3. Ribose utilization. With a typical diet that is reasonably rich in starch, the
net flow through the sugar shuffle will be from hexoses to pentoses. However,
when eating meat only, our intake of ribose in the form of RNA will be a very
significant fraction of the total dietary carbohydrates, and the net flow in the
hexose monophosphate shunt will likely go the opposite way (see section 16.4).
9.1 Name the three metabolic functions served by the hexose monophosphate shunt.
9.2 Reactions in the hexose monophosphate shunt
9.2.1 Reactions in the oxidative stage
Notes: Three enzymes are required in the oxidative phase:
1. Glucose-6-phosphate dehydrogenase oxidizes glucose-6-phosphate to 6-phos-
phogluconolactone and reduces one molecule of NADP+ to NADPH.

9.2 Reactions in the hexose monophosphate shunt 133
OH
OH
OH
O
PO O−
O−
O
OH
O
OH
OH
O
PO O−
O−
O
OH
NADP+
NADPH+H+
1H2O
2
OH
O
OH
OH
OH
OH
O P
O
O−
O−
OH
O
OH
O
OH
OH
O P
O
O−
O−
OH
O
OH
OH
O P
O
O−
O−
NADP+
NADPH+H+
CO2
3 3
Glucose-6- P
6- P -Gluconolactone
6- P -GluconateRibulose-5- P
2. Gluconolactonase cleaves the internal ester bond, which gives 6-phosphoglu-
conate.
3. 6-Phosphogluconate dehydrogenase reduces another molecule of NADP+ and
decarboxylates 6-phosphogluconate to the pentose ribulose-5-phosphate.
After completion of these three initial reactions, NADPH generation is over,
and all that remains is to juggle sugars in order to regenerate hexoses from pen-
toses.
9.2.2 Reactions in the sugar shuffle stage
Notes: The sugar shuffle stage involves the enzymes ribulose-5-phosphate epimer-
ase (RE), ribulose-5-phosphate isomerase (RI), transketolase (TK), and transaldolase
(TA). They bring about the following reactions:
1. Two molecules of ribulose-5-phosphate are converted to xylulose-5-phosphate
by ribulose-5-phosphate epimerase, and a third one is converted to ribose-
5-phosphate by ribulose-5-phosphate isomerase.
2. Transketolase transfers a C2 unit from one xylulose-5-phosphate to the ribose-
5-phosphate, yielding glyceraldehyde-3-phosphate and the C7 sugar sedohep-
tulose-7-phosphate.
3. Transaldolase transfers a C3 unit from sedoheptulose-7-phosphate back to
glyceraldehyde-3-phosphate, which yields fructose-6-phosphate and the C4
sugar erythrose-4-phosphate.
4. Transketolase transfers a C2 unit from the second molecule of xylulose-5-phos-
phate to erythrose-4-phosphate. This yields a second molecule of fructose-6-
phosphate and again glyceraldehyde-3-phosphate.
At the conclusion of the reactions depicted in this slide, three molecules of
ribulose-5-phosphate have been converted to two molecules of fructose-6-phos-
phate and one molecule of glyceraldehyde-3-phosphate. Fructose-6-phosphate can
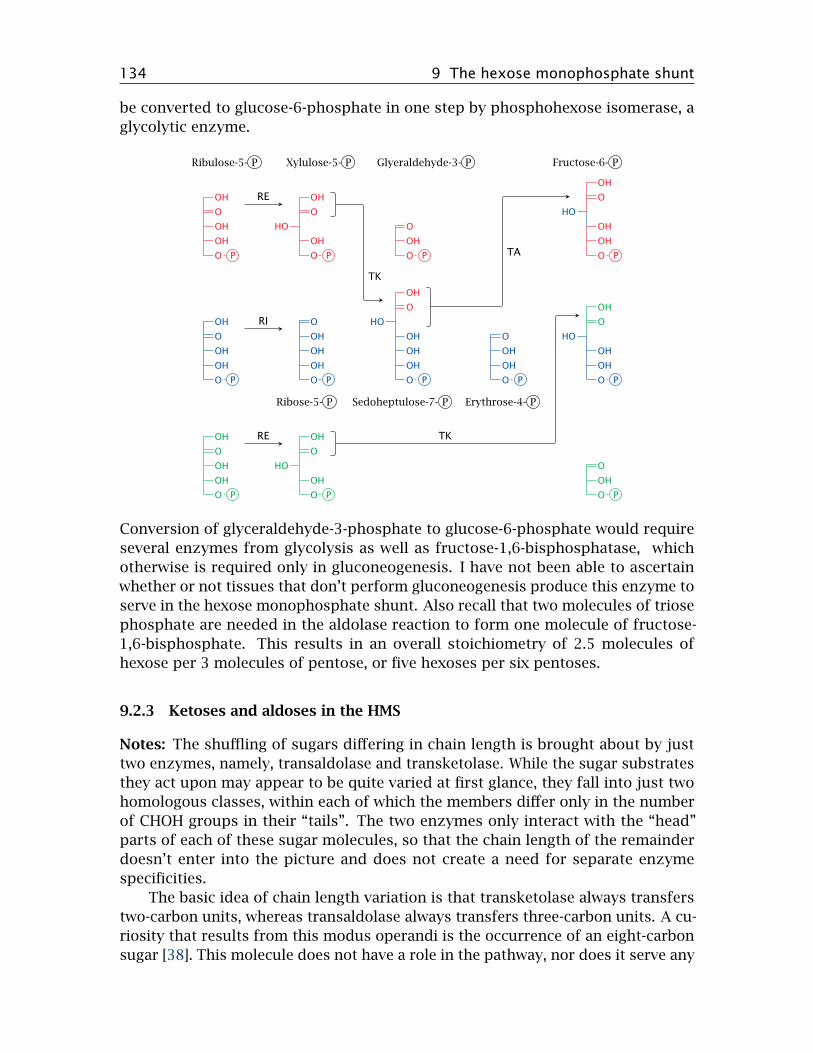
134 9 The hexose monophosphate shunt
be converted to glucose-6-phosphate in one step by phosphohexose isomerase, a
glycolytic enzyme.
OH
O
OH
OH
O P
OH
O
OH
OH
O P
OH
O
OH
OH
O P
OH
O
OH
OH
O P
O
OH
OH
OH
O P
OH
O
OH
OH
O P
O
OH
O P
OH
O
OH
OH
OH
OH
O P
O
OH
OH
O P
OH
O
OH
OH
OH
O P
O
OH
O P
OH
O
OH
OH
OH
O P
RE
RI
RE
TK
TA
TK
Ribulose-5- P Xylulose-5- P Glyeraldehyde-3- P Fructose-6- P
Ribose-5- P Sedoheptulose-7- P Erythrose-4- P
Conversion of glyceraldehyde-3-phosphate to glucose-6-phosphate would require
several enzymes from glycolysis as well as fructose-1,6-bisphosphatase, which
otherwise is required only in gluconeogenesis. I have not been able to ascertain
whether or not tissues that don’t perform gluconeogenesis produce this enzyme to
serve in the hexose monophosphate shunt. Also recall that two molecules of triose
phosphate are needed in the aldolase reaction to form one molecule of fructose-
1,6-bisphosphate. This results in an overall stoichiometry of 2.5 molecules of
hexose per 3 molecules of pentose, or five hexoses per six pentoses.
9.2.3 Ketoses and aldoses in the HMS
Notes: The shuffling of sugars differing in chain length is brought about by just
two enzymes, namely, transaldolase and transketolase. While the sugar substrates
they act upon may appear to be quite varied at first glance, they fall into just two
homologous classes, within each of which the members differ only in the number
of CHOH groups in their “tails”. The two enzymes only interact with the “head”
parts of each of these sugar molecules, so that the chain length of the remainder
doesn’t enter into the picture and does not create a need for separate enzyme
specificities.
The basic idea of chain length variation is that transketolase always transfers
two-carbon units, whereas transaldolase always transfers three-carbon units. A cu-
riosity that results from this modus operandi is the occurrence of an eight-carbon
sugar [38]. This molecule does not have a role in the pathway, nor does it serve any

9.2 Reactions in the hexose monophosphate shunt 135
other known physiological function, and probably constitutes a byproduct that
simply exists at equilibrium.
OH
O
OH
OH
O P
OH
O
OH
OH
O P
OH
O
OH
OH
OH
O P
OH
O
OH
OH
OH
OH
O P
O
OH
OH
OH
O P
O
OH
OH
O P
O
OH
O P
TK TK TKTA TA
RE
RI
Ribulose-5- P
Ribose-5- P Erythrose-4- P Glyceraldehyde-3- P
Xylulose-5- P Fructose-6- P Sedoheptulose-7- P
9.2 Imagine three players who hold five chips each, who have been asked to trade chipsin amounts of no less than two and no more than three, so that they will end up with six,six and three chips, respectively. How can they do this with the smallest possible numberof trades?
9.2.4 The mechanism of transketolase
⊕
N
R
⊖
O H⊕
OH
OH
OH
O P
S
R
⊕
N
R
OH
OH
O
H OH
O P
S
R
⊕
N
R
OH
OH
⊖
O
OH
O P
S
R
O
H⊕
OH
OH
OH
O P
⊕
N
R
O H
OH
OH
OH
OH
OH
O P
S
R
OH
O
OH
OH
OH
OH
O P
Notes: Transketolase employs the coenzyme thiamine pyrophosphate (TPP), which
we encountered before in the pyruvate dehydrogenase E1 enzyme (slide 5.2.5). As
in the pyruvate dehydrogenase reaction, the key function of TPP is to provide a
carbanion, and as before, the carbanion reacts covalently with a carbonyl group
and cleaves the adjacent C−C bond of the substrate.

136 9 The hexose monophosphate shunt
It is here, however, that the similarity between transketolase and pyruvate
dehydrogenase ends. In the second part of the reaction, another aldose substrate
enters and carries the transiently coenzyme-bound C2 subunit away, regenerating
the TPP carbanion.
9.2.5 The mechanism of transaldolase
NH2Lys O
OH
OH
OH
OH
OH
O P
NH
⊕Lys
OH
OH
O H
OH
OH
O P
NH
Lys
OH
OH
O
OH
OH
O P
O
H⊕
OH
O P
NH
⊕Lys
OH
OH
OH
OH
O P
NH2Lys O
OH
OH
OH
OH
O P
OH–
OH–
Notes: Transaldolase also forms a covalent intermediate with the fragment of the
sugar molecule it transfers, and once more the carbonyl bond serves as the point
of attack for cleavage. However, transaldolase cleaves the bond after the second
carbon atom, resulting in the transfer of a C3 unit. The two stages of the reaction
are again reversals of each other, with the exception that the two sugar substrates
differ in chain length.
Considering their mechanisms, it is clear that both the transketolase and
the transaldolase reactions are readily reversible. So are the isomerase reactions
that interconvert the various pentose phosphates. The entire pathway therefore
can proceed in either direction and bring about the interconversion of pentoses,
hexoses, and sugars of other lengths, in any amounts and proportions as needed.
9.3 Discuss similarities and differences between the reaction mechanisms of transaldolaseand transketolase.
9.3 The physiological role of NADPH
Our discussion of the HMS pathway is now complete, and we will now have a look
at the various metabolic functions of NADPH.

9.3 The physiological role of NADPH 137
9.3.1 Why do we need both NADH and NADPH?
O O
OH
N
NH2
OHH
OHP O−O
O
P O−O
O O
OH
N N
N
NH2
N
OH
O O
OH
N
NH2
OHH
OHP O−O
O
P O−O
O O
O
P O−O
O−
N N
N
NH2
N
OH
Notes: Why is NADPH needed in addition to NADH? The two coenzymes only differ
by one phosphate group, and that group is far away from where the action is: The
redox-active group is the pyridine ring in the nicotinamide moiety (highlighted),
whereas the extra phosphate in NADP is located on the adenosine moiety at the
other end of the molecule.
While the phosphate group does not make any difference to the redox chem-
istry performed by the two coenzymes,1 it enables them to interact with separate
sets of enzymes. Consider that all enzymes which consume or regenerate NAD+
will share the same pool of the cosubstrate, and the reaction equilibria of all of
them will be affected by the same ratio of oxidized to reduced form, [NAD+]/[NADH].
The extra phosphate group on NADP allows it to interact with another, differ-
ent set of enzymes. Therefore, because the coenzymes participate in separate sets
of equilibria, they can themselves be maintained in different redox states. To use a
simile: the two coenzymes are like two different currencies—both are money, but
it is possible to tune the cost of borrowing of each separately to different economic
objectives. Inside the cell, NAD is mostly oxidized. The ready availability of NAD+
will help to speed up the oxidative reactions in the TCA cycle and glycolysis. In
contrast, NADP is mainly found in the reduced state, which will promote reductive
reactions in biosynthesis.
The choice of of either NAD or NADP as the cosubstrate will not only affect
the turnover rate of a redox reaction but also its free energy (∆G). According to
[39], the [NADH]/[NAD+] ratio in the cytosol is 0.001, while the [NADPH]/[NADP+] ratio is
100. Neglecting the very slight difference in ∆G0, the 105 times higher relative
abundance of NADPH works out to a difference of ~30 kJ/mol in actual ∆G. This
amount of energy is similar to that released by the hydrolysis of ATP to ADP, which
is not a coincidence (see next slide).
1If we use the same concentrations of reduced and oxidized forms in vitro, the difference in theirredox potentials is very small; that is, both have virtually the same standard redox potentials.

138 9 The hexose monophosphate shunt
9.3.2 NADPH generation by malic enzyme
Pi
malate
pyruvate
Pi
malate
oxaloacetate
pyruvate
CO2 ATP
ADP+Pi
NADH+H+
NAD+
NADPH+H+
NADP+
CO2
H+ H+Cytosol Mitochondria
pyruvatecarboxylase
malatedehydrogenase
dicarboxylatetransporter
malicenzyme
Notes: While the HMS is the major source of NADPH in most tissues, some other
pathways contribute to the supply, particularly in tissues that synthesize fatty
acids or sterols.
The shuttle shown here reuses most elements of the one that moves oxaloac-
etate from the mitochondria to the cytosol for gluconeogenesis (see slide 7.4.1,
which also shows how to balance the transport of phosphate). However, in the final
step of the shuttle considered here, cytosolic malate is not converted to oxaloac-
etate but is instead decarboxylated by malic enzyme, which generates NADPH; the
pyruvate that is left over can reenter the mitochondria.
On the mitochondrial side, the shuttle consumes one equivalent of NADH and
ATP each. The ATP drives the carboxylation of pyruvate, which is reverted by malic
enzyme. Assuming that malic enzyme can recover the full free energy acquired
from ATP during carboxylation and apply it toward the reduction of NADP+, the
enzyme should indeed be able to raise the ratio of cytosolic NADPH to NADP+
to beyond that of NAD by the factor of 105 explicated in slide 9.3.1. While this
assumption may be a bit optimistic, it is also not strictly necessary, since the[NADH]/[NAD+] ratio is significantly higher in the mitochondria than in the cytosol,
which helps push the cycle in the indicated direction. Overall, the participation
of ATP in this cycle accounts for the difference in concentration and free energy
between NADPH and NADH discussed in the preceding slide.
9.3.3 NADPH generation by transhydrogenase and NADP-linked isocitrate de-
hydrogenase
Notes: We have already encountered nicotinamide nucleotide transaminase as a
source of mitochondrial NADPH before (see slide 6.10.2). From the mitochondria,
NADPH can be transported to the cytosol by the concerted action of NADP-de-
pendent isocitrate dehydrogenases on both sides of the membrane and of two
mitochondrial carriers, which together manage to exchange isocitrate for α-ketog-
lutarate across the membrane.

9.3 The physiological role of NADPH 139
nicotinamide nucleotidetranshydrogenase
isocitratedehydrogenase
citrate/isocitratecarrier
oxoglutaratecarrier
Mitochondria
NADH+H+ NAD+
NADPH+H+NADP+
H+
α-ketoglutarateisocitrate
CO2
malate
Cytosol
malate
α-ketoglutarate isocitrate
NADPH+H+ NADP+
CO2
Note that this cycle does not involve the hydrolysis of ATP. The single proton
imported by the transhydrogenase does not provide quite the same amount of free
energy as ATP, and the question therefore arises how sufficient driving force for
the overall process is derived. As far as I can see, the only other contributing factor
is the more reduced state of NAD inside the mitochondrion as compared to the
cytosol.2 It may thus be that this shuttle works only when both the proton-motive
force and the mitochondrial NADH are at high levels, while cytosolic NADPH is
lowered due to high rates of consumption, such as for example during fatty acid
synthesis in fat tissue [40].
9.4 Explain how cytosolic NADPH can be regenerated.
9.3.4 Uses of NADPH
1. synthesis of fatty acids and cholesterol
2. fixation of ammonia by glutamate dehydrogenase
3. oxidative metabolism of drugs and poisons by cytochrome P450 enzymes
4. generation of nitric oxide and of reactive oxygen species by phagocytes
5. scavenging of reactive oxygen species that form as byproducts of oxygen
transport and of the respiratory chain
Notes: The first three topics on this list will be covered in the later chapters on the
metabolism of triacylglycerol, cholesterol, amino acids, and drugs, respectively.
Here, we will briefly look at the roles of NADPH in the formation of nitric oxide
and in the formation and the scavenging of reactive oxygen species.
9.5 Summarize the metabolic uses of NADPH.
2The exchange of isocitrate for α-ketoglutarate is electroneutral, and thus does not derive addi-tional drive from the proton-motive force.

140 9 The hexose monophosphate shunt
9.3.5 Nitric oxide synthase requires NADPH
O
OHNH2
N
NH2 NH2
NADPH+H+
O2
NADP+
H2O
O
OHNH2
N
NH2 NH
OH
1/2(NADPH+H+)
O2
1/2NADP+
H2O
O
OHNH2
NH
NH2 O
+
N−−O
Arginine N-Hydroxyarginine Citrulline
Notes: Nitric oxide is synthesized intracellularly by nitric oxide synthase (NOS).
This reaction is rather complex and involves two successive monooxygenase steps.
In the first step, arginine is converted to N-hydroxyarginine (NOHA), which is
cleaved in the second step to NO and citrulline.
NOS occurs in several variations. Endothelial NOS (eNOS) and neuronal NOS
(nNOS) are found in the cell types indicated by their names. Inducible NOS (iNOS)
is found mainly in inflammatory cells. All these enzymes are homologous and
perform the same reaction, but they differ in their regulatory properties.
9.3.6 Signaling effects of nitric oxide
Notes: Nitric oxide produced by NOS diffuses out of the cell of origin, for example
a vascular endothelial cell, and then into another one, such as a vascular smooth
muscle cell. Within its target cell, NO binds and activates soluble guanylate cyclase
(sGC), which then begins to make cyclic GMP (cGMP). Like cAMP, cGMP acts as a
second messenger inside the cell.
Also like cAMP, cGMP targets multiple effector molecules. Activation of cGMP-
dependent protein kinase (cGK) results in the phosphorylation of various proteins.
In vascular smooth muscle, this induces relaxation, which in turn lowers the blood
pressure; this is exploited by NO-releasing drugs in the treatment of hypertension.
Phosphodiesterase 5 (PDE) is activated by cGMP, too, and begins to degrade both

9.3 The physiological role of NADPH 141
cAMP and cGMP. Actuation of cyclic nucleotide-gated cation channels affects the
membrane potential and the cellular calcium level.
9.3.7 Phagocytes use NADPH to generate reactive oxygen species
2O2 + NADPH 2O–2 + NADP+ + H+
2O–2 + 2H+ H2O2 + O2
H2O2 + Cl–
OCl–
+ H2O
NADPH oxidase
Superoxide dismutase
Myeloperoxidase
Notes: Neutrophil granulocytes (depicted) and macrophages ingest bacteria and
then fuse the endocytotic vacuole with granules that contain various kinds of
antimicrobial molecules. Among these, there are several enzymes that produce
reactive oxygen species. The first such enzyme is NADPH oxidase, which con-
verts molecular oxygen to superoxide. Subsequently, superoxide dismutase and
myeloperoxidase produce H2O2 and HOCl. All of these reactive oxygen species
(ROS) have powerful antimicrobial activity, and patients with defects in NADPH
oxidase or myeloperoxidase are prone to severe bacterial infections.
Superoxide can also combine with nitric oxide to form peroxynitrite, another
molecule with strong antimicrobial activity. This is one function of the NO gener-
ated in macrophages by inducible nitric oxide synthase (iNOS).
9.6 Explain the role of NADPH in the formation of antimicrobial effector molecules inphagocytes.
9.3.8 Scavenging of reactive oxygen species requires NADPH, too
Notes: Where not needed for immune defense, reactive oxygen species are harm-
ful rather than useful; for example, they can react with non-saturated fatty acyl
residues in lipid membranes (see below). Nevertheless, some ROS continually form
as byproducts of respiration and also of oxygen transport in erythrocytes, since
binding to hemoglobin offers O2 an opportunity to steal an electron from the heme
and turn itself into superoxide.
ROS toxicity is controlled by glutathione (G-SH), which is present in the cells
at low millimolar concentrations. An important step in the detoxification of ROS
is the reduction of hydrogen peroxide (H2O2) to water by glutathione peroxidase

142 9 The hexose monophosphate shunt
(1). In the process, glutathione is oxidized to its disulfide form (G-SS-G). Reduced
glutathione is then regenerated at the expense of NADPH by glutathione reductase
(2).
HS
O
NH
O
HO
NH
O
H2N
O
HO
H S
O
NH
O
OH
NH
O
NH2
O
OH
S
O
NH
O
HO
NH
O
H2N
O
HO
S
O
NH
O
OH
NH
O
NH2
O
OH
H2O2 2H2O
NADPH+H+
NADP+
1
2
G−SS−G2 G−SH
9.4 Glucose-6-phosphate dehydrogenase deficiency
• X-chromosomally encoded—males more severely affected
• most patients are healthy most of the time—hemolytic crises occur upon
exposure to drugs or diet components that cause enhanced formation of ROS
• manifest in red blood cells because these cells lack protein synthesis—no
replacement of deficient protein molecules
• affords partial protection against malaria—similar to sickle cell anemia and
other hemoglobinopathias
Notes: Red blood cells lack mitochondria and thus depend entirely on the hexose
monophosphate shunt for NADPH regeneration. Mutations in glucose-6-phosphate
dehydrogenase—the first enzyme in the pathway, see section 9.2—that reduce its
activity limit the supply of NADPH and, therefore, the capacity of the cell to detox-
ify reactive oxygen species. ROS that go unscavenged will cause the peroxidation
of membrane lipids (see slide 11.6.10 for the mechanism) and destroy the cell.
This condition—namely, the occurrence of episodes of hemolytic anemia upon
ingestion of ROS-inducing foods or drugs—is called favism.
Glucose-6-phosphate dehydrogenase is encoded on the X chromosome, and
accordingly males (who have only one X chromosome) are affected the most. How-
ever, heterozygous females are not exempt, since, in keeping with the “Mary Lyon
hypothesis,” one of the two X chromosomes in females is inactivated randomly
early during embryonic development [41]; therefore, in heterozygous females, the
bone marrow precursors of the red blood cells will represent a mosaic of intact
and deficient genes. Indeed, the observation of such a mosaic in glucose-6-phos-
phate dehydrogenase deficiency was the first proof of random X chromosome
inactivation in humans [42].

9.4 Glucose-6-phosphate dehydrogenase deficiency 143
9.4.1 Vicia faba and favism
H2N NH
O
NH
O
H2N NH
O
NH
O
HO
Divicine Isouramil
Notes: The word “favism” derives from the Latin name of the broad bean, Vicia
faba. Broad beans contain several pyrimidine derivatives such as isouramil and
divicine that can catalyze the formation of ROS through redox cycling, which is
explained in the next slide.
9.4.2 Redox cycling of isouramil
HN NH
O
NH
O
O
H2N NH
O
NH
O
HONADPH
NADP+
4
GSSG
2 GSH
1
O2
H2O2
2
2 H2O
2 GSH
GSSG
3
NADP+
NADPH
4
Notes: This scheme outlines the redox cycle induced by isouramil. Reactions (1)
and (2) occur spontaneously, without any need for enzymatic catalysis. The H2O2
formed in reaction (2) is reduced by glutathione peroxidase (3). The glutathione
disulfide formed in reactions (1) and (3) is reduced at the expense of NADPH in
reaction (4) by glutathione reductase. Therefore, this redox cycle consumes four
equivalents of reduced glutathione (GSH) in every full turn. Divicine and some
other substances contained in broad beans cause analogous cycles.
9.4.3 Malaria parasites detoxify heme by crystallization
Notes: Malaria parasites multiply inside erythrocytes, where they feed on hemo-
globin. They digest the protein (globin) but leave behind the heme, which is toxic to
them because it catalyzes the formation of reactive oxygen species. To reduce the
toxicity of heme, the parasites induce its crystallization; the crystalline deposits
are visible inside the infected cells as brownish so-called malaria pigment. The
parasites also produce several heme-binding proteins to aid in the detoxification.

144 9 The hexose monophosphate shunt
Another factor that may contribute to the protection of the parasites from heme
toxicity is the red cells’ own glutathione-dependent ROS scavenging pathway. This
provides a plausible explanation for the observation that glucose-6-phosphate
dehydrogenase deficiency affords partial protection from malaria, which has led to
the enrichment of this enzyme defect in the human gene pool in endemic malaria
areas.
9.4.4 Primaquine and glucose-6-phosphate dehydrogenase deficiency
N
NHNH2
O
N
NHNH2
O
OH
N
NNH2
O
O
Primaquine
CYP450
H2O2O2
GSSG 2 GSH
Notes: The higher prevalence of glucose-6-phosphate dehydrogenase deficiency
in people from traditionally malaria-infested areas is something to keep in mind
when treating malaria patients with primaquine. The drug is hydroxylated to
5-hydroxyprimaquine by cytochrome P450 enzymes, and the metabolite will set
up a redox cycle that is analogous to the isouramil-based one shown in slide 9.4.2
(but is only shown partially in this slide). Primaquine thus may induce hemolytic
crises in these patients. Several other drugs can do the same.
9.7 Explain the causation and significance of favism.
9.5 Answers to practice questions
9.1: NADPH regeneration, as well as synthesis and utilization of ribose-5-phosphate.
9.2: They can do this by adopting the trading scheme of the hexose monophosphate shunt.Transketolase corresponds to a two chip trade, transaldolase to a three chip trade.
9.3: Both enzymes employ covalent catalysis and initiate the reaction by nucleophilicattack on their substrates’ carbonyl groups, and both reactions are reversible. The enzymesdiffer in the nature of their nucleophiles (thiamine pyrophosphate with transketolase, a

9.5 Answers to practice questions 145
lysyl residue with transaldolase) and in the position of bond cleavage/formation relativeto the carbonyl groups.
9.4: Aside from the hexose monophosphate shunt, cytosolic NADPH can be regeneratedusing mitochondrial reducing power. In one such pathway, mitochondrial malate is translo-cated to the cytosol and converted to pyruvate by malic enzyme, which yields NADPH; thepyruvate can be converted back to malate by pyruvate carboxylase and malate dehydroge-nase in the mitochondria.
Another pathway involves isocitrate, for which there is an NADP-dependent dehy-drogenase both in the cytosol and the mitochondria. A cycle propelled by nicotinamidenucleotide transhydrogenase effects the formation of isocitrate in the mitochondria andits dehydrogenation in the cytosol.
9.5: See list in slide 9.3.4.
9.6: NADPH is used by NADPH oxidase to reduce O2 to superoxide, which can then giverise to H2O2 and HOCl through the actions of superoxide dismutase and myeloperoxidase.Superoxide can react with NO, whose formation by nitric oxide synthase also requiresNADPH, to peroxynitrite. All these molecules have antimicrobial activity.
9.7: Favism is caused by a genetic defect of glucose-6-phosphate dehydrogenase. Thisdefect limits the capacity of erythrocytes to regenerate reduced glutathione.
Broad beans contain isouramil and several similar compounds that cause redox cycles.In such a redox cycle, molecular oxygen is reduced to hydrogen peroxide, which in turnis reduced to water, at a total expense of four equivalents of reduced glutathione. Ifglucose-6-phosphate dehydrogenase deficiency patients ingest broad beans, the limitedsupply of reduced glutathione causes hydrogen peroxide to accumulate. This results inlipid peroxidation within the cell membrane and then hemolysis.
Similar redox cycles can also arise from certain drugs and drug metabolites, and theapplication of such drugs must be avoided in patients with favism.


Chapter 10
Triacylglycerol metabolism
10.1 Overview
Various types of lipids occur in the human body, namely 1) triacylglycerol, 2) chol-
esterol, and 3) polar lipids, which include phospholipids, glycolipids and sphin-
golipids. This chapter will focus on triacylglycerol; cholesterol will be covered in
a separate chapter. The metabolism of polar lipids will not be covered systemati-
cally.
In contrast to polar lipids and cholesterol, which are found in the membranes
of every cell, triacylglycerol is concentrated mostly in adipose (fat) tissue; minor
amounts of triacylglycerol occur in other cell types, such as liver epithelia and
skeletal muscle fibers. Yet, overall, triacylglycerol is the most abundant lipid
species, and the only one with an important role in energy metabolism.
Triacylglycerol occurs in human metabolism in two roles, namely 1) as a food-
stuff, which accounts for a significant fraction of our caloric intake, and 2) as a
store of metabolic energy. This store can be replenished using dietary triacylglyc-
erol or through endogenous synthesis from carbohydrates or proteins.
10.1.1 Foodstuffs and their energy contents
Notes: The amount of energy stored per gram of tissue is far higher in fat than in
any other tissue, for two reasons:
1. One gram of triacylglycerol itself contains more than twice as many calories
as one gram of carbohydrates or protein. This is simply because triacylglycerol
contains much less oxygen than carbohydrates, in which oxygen contributes half
the mass but essentially no metabolic energy. Similarly, the oxygen, nitrogen and
sulfur contained in protein detract from its energy density.
147

148 10 Triacylglycerol metabolism
Foodstuff Energy (kcal/g)
protein 4
carbohydrates 4
triacylglycerol 9
alcohol 7
2. Triacylglycerol in fat cells coalesces to droplets that are entirely free of
water. In contrast, protein and carbohydrates, including glycogen, always remain
hydrated, which further diminishes the density of energy storage.
10.1.2 Carbon pools in carbohydrate and fat metabolism
Triacyl—glycerolFatty acids Glycerol- P
Glucose
Glycogen
Ketone bodies
Acetyl-CoA
Glyceraldehyde- P
Pyruvate
Notes: Because of its high energy density, it makes sense that most of the excess
glucose or protein is converted to fat, while only a limited fraction is stored as
glycogen. There is, however, one limitation to the usefulness of triacylglycerol: the
conversion of carbohydrate or protein to fatty acids via acetyl-CoA is more or less
a one-way street. Carbon stored as triacylglycerol is, for the most part, confined
to the limited scope of pathways on the left of the red line in this slide. Within
this pool, the carbon may be turned into free fatty acids, which can serve as fuel
for heart and skeletal muscle, or into ketone bodies, which can supply energy to
several more organs, including the brain. However, it can no longer be turned back
into glucose; or at least not efficiently so, since the dotted “bootlegger’s pathway”
that leads from ketone bodies to pyruvate (and from there again to glucose) has
limited capacity (see slide 10.4.3).
Because of the restricted metabolic scope of triacylglycerol, we cannot rely
exclusively on fat degradation in a catabolic situation. Once glycogen is used up,
continued fasting will deplete not only stored fat but also protein, most notably in
skeletal muscle, which is necessary to maintain a sufficient supply of glucose via
gluconeogenesis.
10.1 Explain the advantages and disadvantages of triacylglycerol and glycogen as storesof metabolic energy.

10.2 Digestion and uptake of dietary triacylglycerol 149
10.2 Digestion and uptake of dietary triacylglycerol
As discussed in the first chapter (slide 1.6.8), dietary triacylglycerol undergoes
hydrolysis in the digestive tract. The main products of hydrolysis are monoacyl-
glycerol and free fatty acids.
10.2.1 Triacylglycerol and its cleavage products
O
O
O
O
O
O
OH O
O
OH
HO
O
HO
O
HO
O
HO
O
Triacylglycerol Monoacylglycerol Fatty acids
C16:0 C18:0 C18:1 C18:2
Notes: The fatty acids found in natural fats vary both in chain length and in
the number of double bonds. The slide shows the four most abundant species;
from the left to the right, their trivial names are palmitate, stearate, oleate,
and linoleate. Other chain lengths and degrees of unsaturation occur.1 A minor
fraction of dietary fatty acids, mostly from plants, contain less than 12 carbon
atoms; these so-called medium-chain fatty acids have some peculiar metabolic
properties that make them therapeutically useful in certain diseases (slide 10.3.9).
10.2.2 Solubilization of fat by detergents
Notes: Detergents are amphiphilic molecules that are freely soluble in water at low
concentrations but reversibly aggregate into micelles at higher ones. When mixed
with fat, monomeric detergent molecules penetrate the fat particles and break
them up into mixed micelles; in this form, the fat becomes amenable to cleavage
by lipases. The fatty acids released by enzymatic hydrolysis act as detergents
themselves and will aid in the solubilization of remaining fat during digestion.2
1Linolenic acid looks like linoleic acid but has an additional double bond between the third andthe fourth carbon from the far end. Such ω3-fatty acids are required but cannot be synthesized inhuman metabolism; they are therefore essential.
2Curd soap is prepared simply by alkaline hydrolysis of fat; it consists of the sodium salts of thefatty acids released.
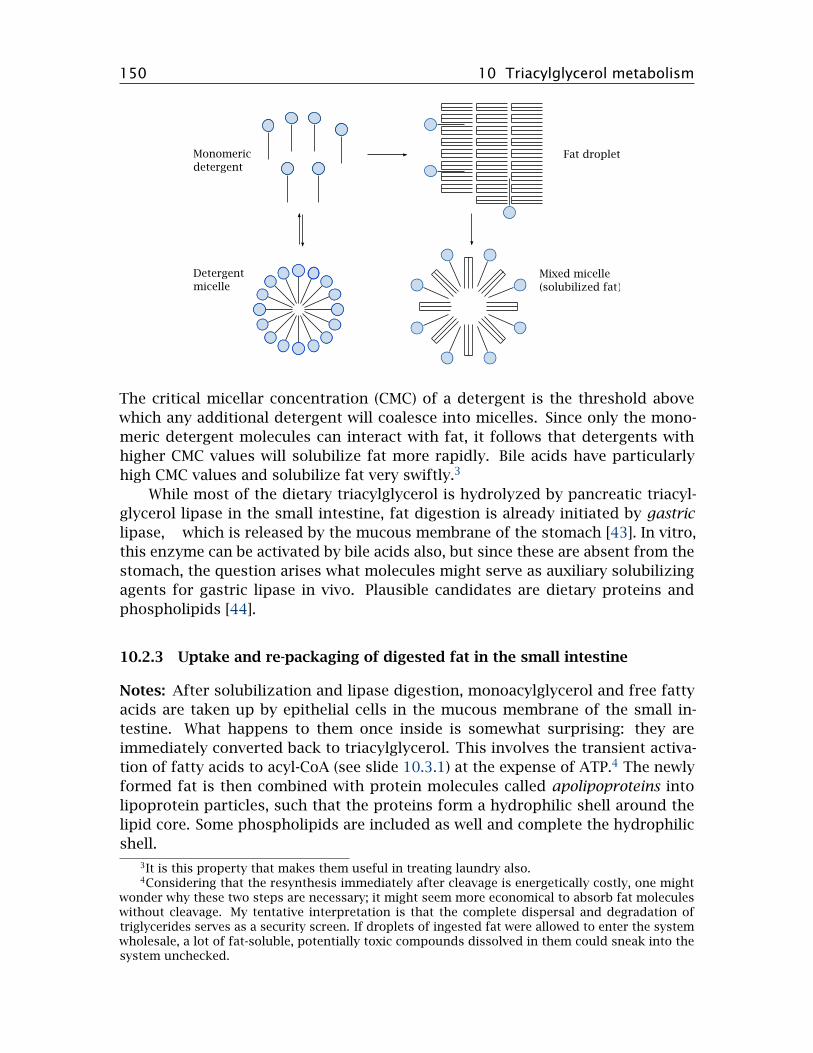
150 10 Triacylglycerol metabolism
The critical micellar concentration (CMC) of a detergent is the threshold above
which any additional detergent will coalesce into micelles. Since only the mono-
meric detergent molecules can interact with fat, it follows that detergents with
higher CMC values will solubilize fat more rapidly. Bile acids have particularly
high CMC values and solubilize fat very swiftly.3
While most of the dietary triacylglycerol is hydrolyzed by pancreatic triacyl-
glycerol lipase in the small intestine, fat digestion is already initiated by gastric
lipase, which is released by the mucous membrane of the stomach [43]. In vitro,
this enzyme can be activated by bile acids also, but since these are absent from the
stomach, the question arises what molecules might serve as auxiliary solubilizing
agents for gastric lipase in vivo. Plausible candidates are dietary proteins and
phospholipids [44].
10.2.3 Uptake and re-packaging of digested fat in the small intestine
Notes: After solubilization and lipase digestion, monoacylglycerol and free fatty
acids are taken up by epithelial cells in the mucous membrane of the small in-
testine. What happens to them once inside is somewhat surprising: they are
immediately converted back to triacylglycerol. This involves the transient activa-
tion of fatty acids to acyl-CoA (see slide 10.3.1) at the expense of ATP.4 The newly
formed fat is then combined with protein molecules called apolipoproteins into
lipoprotein particles, such that the proteins form a hydrophilic shell around the
lipid core. Some phospholipids are included as well and complete the hydrophilic
shell.
3It is this property that makes them useful in treating laundry also.4Considering that the resynthesis immediately after cleavage is energetically costly, one might
wonder why these two steps are necessary; it might seem more economical to absorb fat moleculeswithout cleavage. My tentative interpretation is that the complete dispersal and degradation oftriglycerides serves as a security screen. If droplets of ingested fat were allowed to enter the systemwholesale, a lot of fat-soluble, potentially toxic compounds dissolved in them could sneak into thesystem unchecked.

10.2 Digestion and uptake of dietary triacylglycerol 151
Lipoproteins occur in various subtypes (see slide 11.4.2). The specific type formed
at this stage, the chylomicrons, are the largest of all lipoproteins, with a molecular
mass of up to 1010 Dalton, a diameter up to 1 µm, and approximately 107 molecu-
les of triacylglycerol. The chylomicrons also transport dietary cholesterol; this is
discussed in slide 11.4.3.
Like glucose and other solutes taken up from the gut, the chylomicrons are re-
leased into the extracellular space at the basolateral side of the intestinal epithelia.
However, unlike those solutes, the chylomicrons are not drained toward the liver
via the portal vein, but instead are drained via the lymphatics. This is explained in
the next two slides.
10.2.4 The lymphatics drain excess fluid from the interstitial space
artery
vein
interstitialspace
blood fluid filtration
osmotic reuptake
lymph drainage
capillary
lymphvessel
Notes: This slide and the next one introduce a bit of background to explain how
chylomicrons are transported from the intestine to the systemic circulation.
The capillaries of the blood circulation are porous, and the hydrostatic pres-
sure within them drives the filtration of plasma fluid into the interstitial space.
Since the pores in the capillary walls are small, filtration is limited to water and

152 10 Triacylglycerol metabolism
small solutes. Albumin and other plasma proteins are not filtrated and therefore
maintain an osmotic pressure gradient that opposes and mostly compensates for
hydrostatic filtration. The fraction of the filtrate that is not recovered through
osmosis is drained by lymphatic vessels and then back to the venous side of the
systemic circulation.5
10.2.5 Chylomicrons are drained from the intestine through the lymphatics,
bypassing the liver
Notes: Just as plasma proteins are excluded from diffusing out of capillaries, the
chylomicrons are excluded from diffusing into them. Chylomicrons thus cannot
enter the circulation directly and must instead be drained through the lymphatic
system. The thoracic duct, which is the major effluent of the entire lymphatic
system, joins one of the major veins just a short distance upstream of the heart,
but downstream of the liver. Therefore, unlike glucose and other small molecules
that are taken up in the intestines, chylomicrons bypass the portal circulation and
the liver. They will, however, reach the liver via the systemic circulation at a later
stage (see next slide).
10.2.6 Lipoprotein lipase extracts triacylglycerol from chylomicrons
Notes: Once the chylomicrons have entered the circulation, the capillary wall bar-
rier must again be overcome in the delivery of triacylglycerol to extravascular cells.
This is accomplished with the help of lipoprotein lipase, which is located on the en-
dothelial surface. It binds the chylomicrons and extracts triacylglycerol from them,
which it then cleaves again to fatty acids and glycerol. These small molecules can
cross the endothelial barrier by diffusion and reach the cells in the surrounding
tissue.
5This slow but steady flow of fluid through all tissues is also important for immune surveillance:when a lymph vessel traverses a lymph node, the resident macrophages and lymphocytes samplethe lymph fluid for unusual antigens that would signal an infection upstream, and will promptlymount an immune response to such antigens.

10.3 Utilization of fatty acids: β-oxidation 153
In adipose cells, the fatty acids are combined with glycerol yet again for storage. In
other cell types, most notably muscle cells, they may either be stored or degraded
directly to acetyl-CoA, which is then consumed in the TCA cycle and the respiratory
chain. The remnants of chylomicrons, depleted of most of their triacylglycerol, are
captured by the liver, endocytosed, and degraded. The cholesterol and remaining
fat released in the process is either utilized in the liver or repackaged into other
lipoprotein particles.6
10.2 Describe the processes involved in triacylglycerol digestion, absorption and storage.
10.3 Utilization of fatty acids: β-oxidation
As briefly mentioned before, the utilization of fatty acids occurs by way of conver-
sion to acetyl-CoA, which is accomplished in β-oxidation. This pathway runs in
the mitochondria, so the first task after cellular uptake of the fatty acid molecule
is to get it into the mitochondrion.
10.3.1 Two activated forms of fatty acids
Notes: Fatty acids are initially activated to fatty acyl-CoA in the cytosol. This
is also the form in which they enter degradation by β-oxidation. However, dur-
ing transport, the CoA-moiety is transiently replaced by carnitine. This slide
shows the structures of both the CoA- and the carnitine-activated forms; the entire
transport process is outlined in the next one.
6At this point, we might again wonder why the transport of fat from the intestines to other tissuesis so complicated—it might seem easier to do just pour the free fatty acids into the bloodstream. Onereason is that free fatty acids are toxic. As mentioned before, they are detergents—and detergentsdissolve cell membranes. (Interestingly, the membranes of the intestinal cells withstand very highconcentrations of bile and fatty acids! They manage this due to their high content of ceramide,which is also found in the keratin of the skin.) However, as we will see later, fatty acids with shorteracyl chains are indeed transported in free form.

154 10 Triacylglycerol metabolism
O
SNH
O
NH
O
OH
O
P O−O
O
P O−O
O O
OH
N N
N
NH2
N
OH
O
O
N+
O
−O
Acyl-CoA
Acyl-carnitine
10.3.2 Activation of fatty acids and transport to the mitochondrion
Notes: Fatty acids are activated in the cytosol to acyl-CoA by acyl thiokinase, also
known as acyl-CoA synthetase. After transport across the outer mitochondrial
membrane, the acyl group is transferred to carnitine by carnitine acyltransferase.
Exchange for free carnitine transports the acylcarnitine molecule into the mito-
chondrial matrix, where carnitine is replaced again with coenzyme A by a second
acyl transferase.
Outer membrane Inner membrane
CoA-SH
Acyl-CoA Acyl-CoA
CoA-SH
Acyl-carnitine Acyl-carnitine
Acyl-CoA
CarnitineCarnitineATP
AMP + PPi
Fatty acid
CoA-SH
One unusual aspect of this transport process is that the energy of the thioester
bond in acyl-CoA seems to be sufficiently well preserved in the ester bond of acyl-
carnitine to allow the exchange reaction to be reversed inside the mitochondrion.
Carboxyl esters bonds don’t usually have a sufficiently high energy content for
that. I once stumbled upon a theoretical paper explaining why carnitine is special
in this regard, but it went straight over my head, and I therefore cannot give you
an explanation.

10.3 Utilization of fatty acids: β-oxidation 155
10.3.3 Reactions in β-oxidation
β
β′
CoAS
O
CoAS
O
CoAS
O OH
CoAS
O O
CoAS
O
CoAS
O
FAD
FADH2
1
H2O
2
NAD+
NADH+H+
3
4
CoA−SH
Notes: The term β-oxidation refers to the Greek lettering of the carbons in organic
molecules: the α carbon is right beside a functional group, and the β carbon is the
next one. It is at the second carbon from the thioester, then, where the action is in
β-oxidation. The reactions are as follows:
1. The fatty acyl-CoA molecule is first dehydrogenated between the α and the
β carbon atoms by acyl-CoA dehydrogenase. FAD accepts the hydrogen
abstracted and is reduced to FADH2. This yields 2-trans-enoyl-CoA.
2. The trans double bond just created is hydrated—that is, water is added to
it—by enoyl-CoA hydratase, which yields hydroxyacyl-CoA. The α carbon is
now once more fully reduced.
3. The β-hydroxyl group is converted to a keto group by hydroxyacyl-CoA dehy-
drogenase. NAD+ accepts the hydrogen. The product is β-ketoacyl-CoA.
4. Thiolase introduces a new molecule of coenzyme A to cleave the β-ketoacyl-
CoA, which releases acetyl-CoA and a new, shortened acyl-CoA that enters the
next cycle of β-oxidation.
The process is repeated until the fatty acid is completely broken down. In the
case of acyl chains with even numbers of carbons, this will yield acetyl-CoA only,
whereas those with odd numbers of carbons will yield one molecule of propionyl-
CoA in the final thiolase step. There is a special pathway to take care of the
propionyl-CoA, which is surprisingly complicated (see slide 10.3.6).
10.3 Draw the reactions in β-oxidation.

156 10 Triacylglycerol metabolism
10.3.4 Shared reaction patterns in β-oxidation and TCA cycle
Enzyme Reaction Cosubstrate TCA cyclependant
acyl-CoAdehydrogenase
dehydrogenationof CH2−CH2
bond
FAD succinatedehydrogenase
enoyl-CoAhydratase
hydration ofCH2−−CH2 bond
H2O fumarase
hydroxyacyl-CoAdehydrogenase
dehydrogenationof CH−OH bond
NAD+ malatedehydrogenase
Notes: You may have noticed the similarities of the enzyme reactions discussed
above to some others we have seen before. In the first three steps, the similarities
to reactions from the citric acid cycle are quite straightforward. Also notice the
consistent use of redox coenzymes (NAD+ and FAD) in both pathways: Wherever
a CH−OH bond is dehydrogenated, NAD+ is employed as the cosubstrate,7 while
FAD is used where dehydrogenation occurs across a CH−CH bond.
10.3.5 The reaction mechanism of thiolase
CoAS
O O
Enzyme
BH+
S−
CoAS
O
Enzyme
B
H+
S
O
−S CoA
CoAS
O
Notes: The thiolase mechanism does not have a closely analogous precedent
among the reactions we have seen so far. However, if we look at the individual
steps of the thiolase reaction, we can still recognize some familiar features:
7This also holds in other pathways and for CH−NH bonds. The only exception I’m aware of isthe dehydrogenation of glycerophosphate in the glycerophosphate shuttle.

10.3 Utilization of fatty acids: β-oxidation 157
1. The nucleophilic attack of a cysteine thiolate in the active site on a carbonyl
group in the substrate yields a covalent intermediate. This also happens with
glyceraldehyde-3-phosphate dehydrogenase (see slide 3.3.5).
2. Acid-base catalysis breaks a C−C bond adjacent to the carbonyl bond. Note
that the thiolase reaction is reversible. Making of a C−C bond adjacent to the
carbonyl group by acid-base catalysis then occurs in the reverse reaction, which
we have seen before with citrate synthase (slide 5.4.2).
3. The creation of one thioester at the expense of another occurs in the second
step of the pyruvate dehydrogenase reaction (see slide 5.2.7).
10.3.6 Utilization of propionate
CoAS
O
CoAS
O O
OH
CoAS
O O
OHCoA
S
O
O
OH
ATP
CO2
ADP
1
2
3
Propionyl-CoA S-methylmalonyl-CoA
R-methylmalonyl-CoASuccinyl-CoA
Notes: Fatty acids with odd numbers of carbon atoms yield one molecule of propi-
onyl-CoA as the final degradation product. This metabolite has a rather elaborate
degradative pathway:
1. Initially, propionyl-CoA is converted to S-methylmalonyl-CoA by propionyl-
CoA carboxylase. This reaction uses CO2 and ATP, with biotin serving as a
coenzyme; the mechanism resembles that of pyruvate carboxylase (slide 7.2.4).
2. S-methylmalonyl-CoA is converted to its enantiomer R-methylmalonyl-CoA
by methylmalonyl-CoA racemase.
3. Finally, one carboxyl group is transplanted within the molecule by methyl-
malonyl-CoA mutase to yield succinyl-CoA. This is a frighteningly complex re-
action; we will skip the gory details and just note that it requires vitamin B12,
in the form of adenosylcobalamin, as a coenzyme. When this vitamin is lacking,
methylmalonyl-CoA backs up and is hydrolyzed to free methylmalonate, which
may inhibit gluconeogenesis (see slide 7.4.1).
Note that succinyl-CoA is a citric acid cycle intermediate. It can therefore enter
gluconeogenesis (see slide 7.1), so that propionyl-CoA is an exception to the rule
that carbon from fatty acids cannot be used for gluconeogenesis. However, since
fatty acids with odd numbers of carbons amount to a small fraction of all fatty
acids, this exception is not quantitatively very important.

158 10 Triacylglycerol metabolism
10.4 If we assume that oxidation of NADH yields 3 equivalents of ATP and oxidationof FADH2 yields 2, how many equivalents of ATP does the complete oxidation of onemolecule of palmitoyl-CoA provide?
10.3.7 Organ relationships in triacylglycerol utilization
triacylglycerol
glycerol fatty acids
acetyl-CoA
ketone bodies
gluconeogenesis glucose
acetyl-CoA
acetyl-CoA
glycolysis
Notes: When triacylglycerol is mobilized from the fat tissue, its hydrolysis to free
fatty acids and glycerol is initiated by an enzyme named hormone-sensitive lipase.
This lipase is stimulated downstream of glucagon and epinephrine, the antagonist
hormones of insulin. As see before in carbohydrate metabolism (slides 7.5.4 and
8.4.2), the two hormones activate adenylate cyclase and protein kinase A. The
fatty acids produced by the lipase are released into the bloodstream, where they
bind to albumin for transport. The fatty acids can be utilized in two different
ways:
1. Directly, that is, they are taken up by the energy-requiring target tissue
and degraded by β-oxidation. We noted above that β-oxidation is preceded by
the translocation to the mitochondrion, which requires carnitine. About 95% of
all carnitine is found in skeletal muscle,8 which implies that muscle tissue is the
major client for direct utilization. The heart muscle cells also consume fatty acids
through β-oxidation.
2. Indirectly, after initial conversion to ketone bodies in the liver. This term
comprises two small organic acids, acetoacetate and β-hydroxybutyrate, as well
as acetone. The brain, which in the well-fed state only utilizes glucose for ATP
regeneration, is able to replace up to 50% of its usual glucose consumption with
ketone bodies during starvation. The brain is responsible for approximately 20%
of our total energy consumption at rest, and therefore is a major consumer of
ketone bodies. Other major clients are the heart and skeletal muscle.
8The word carnis is Latin for meat—as in chili con carne.

10.3 Utilization of fatty acids: β-oxidation 159
The second cleavage product of fat, glycerol, is released into the bloodstream
and picked up by the liver as well. It is phosphorylated by glycerol kinase to
glycerophosphate. As we have seen before (slide 6.9.3), this metabolite can be
dehydrogenated to dihydroxyacetone phosphate, which may enter gluconeogene-
sis. Glycerol released from fat constitutes a minor source of glucose in times of
starvation.
The pattern of fat usage sketched out here holds for the bulk of all adipose
tissue, which is white. An exception from this pattern is brown fat tissue, which is
covered in the next slide.
10.3.8 Brown fat tissue
Notes: Cells in white fat tissue owe their color to the fact that they contain little
else than large, single triacylglycerol droplets. Intensely colored tissues, other than
the pigment cells of the skin, are rich in heme or cytochromes. This is also the case
with brown fat tissue. In addition to multiple small lipid droplets (Ld), they contain
an abundance of mitochondria (M), which in turn are rich in cytochromes. The
mitochondria in this particular tissue also contain a high amount of an uncoupling
protein (slide 6.3.1) called thermogenin.
In contrast to white fat cells, brown fat cells do not release fatty acids into
the circulation but instead carry out β-oxidation themselves. The accumulated
hydrogen is oxidized in the respiratory chain. The resulting proton-motive force is
not used for ATP synthesis, but is instead simply dissipated as heat—the purpose
of brown fat is heat production.
There is little brown fat in adult humans or most other adult mammals. How-
ever, there is a substantial amount in newborns, who because of their higher
surface-to-volume ratio, and their helplessness, are at greater risk of hypother-
mia. Brown fat is also found in hibernating animal species such as groundhog,
which need it to reheat themselves to operating temperature during arousal from
hibernation.

160 10 Triacylglycerol metabolism
10.3.9 Medium-chain fatty acids
• contain less than 12 carbon atoms
• low content in most foods, but relatively high (10–15%) in palm seed and
coconut oil, from which they are industrially prepared
• triglycerides with medium chains are more soluble and more rapidly hy-
drolyzed by gastric and pancreatic lipase
• not efficiently re-esterified inside intestinal cells; systemic uptake mostly as
free fatty acids
• reach mitochondria by diffusion, without prior activation to acyl-CoA and
acyl-carnitine
Notes: Medium-chain fatty acids (MCFA) are not a major constituent of our regular
diet, nor are they required; however, they can be useful in patients whose ability to
digest or absorb regular fats is compromised. They are more readily hydrolyzed
by enzymes, in particular by gastric lipase, which usually plays a minor role only
in the digestion of triacylglycerol with regular, longer acyl chains.
Gastric lipase continues to be secreted, even at increased levels [45], when pan-
creatic lipase is lacking due to exocrine pancreas insufficiency. Therefore, MCFA
triglycerides can still be processed in this situation. They are used in the dietary
treatment of such patients and also of those with other types of fat maldigestion
and malabsorption.
10.5 Explain how fatty acids are transported to the mitochondria for β-oxidation.
10.4 Ketone body metabolism
fatty acids acetyl-CoA
acetoacetateβ-hydroxy-butyrate
β-hydroxy-butyrate
acetoacetate
acetoacetyl-CoA
acetyl-CoA
FADH2FAD
NADH+H+NAD+
succinyl-CoA
succinate
citrate
Notes: The key idea of ketone body metabolism is to convert free fatty acids into
more water-soluble substrates that are easier to transport and to metabolize. This
scheme gives an overview of organ relationships and pathways; note that the
reactions are not stoichiometrically balanced.

10.4 Ketone body metabolism 161
Ketone bodies are formed mostly in the liver. As stated earlier, the first
stage of ketogenesis consists in β-oxidation. The resulting acetyl-CoA is turned
into acetoacetate along the pathway detailed in the next slide. The subsequent
reduction of acetoacetate to β-hydroxybutyrate allows the liver to dispose of some
of the surplus hydrogen that accumulates during β-oxidation. Both acetoacetate
and β-hydroxybutyrate are released into the circulation.
Utilization of ketone bodies in the brain, muscle and other tissues is quite
straightforward. β-Hydroxybutyrate is dehydrogenated again to acetoacetate,
which steals coenzyme A from succinyl-CoA to become acetoacetyl-CoA. Thio-
lase then cleaves acetoacetyl-CoA to two molecules of acetyl-CoA, which enter the
TCA cycle.
10.4.1 Synthesis of acetoacetate and β-hydroxybutyrate
CoAS
O
CoAS
O
CoAS
O O
CoA-SH
1
2 acetyl-CoA acetoacetyl-CoA
CoAS
O OH
O
OH
O
O
OH
OH
O
OH
2 O
SCoA
CoA-SH
H2O
3
CoAS
O
NADH+H+
NAD+
4
HMG-CoAacetoacetateβ-hydroxybutyrate
Notes: This slide details the mitochondrial pathway that converts acetyl-CoA to
ketone bodies. It involves the following steps:
1. formation of acetoacetyl-CoA from two molecules of acetyl-CoA by thiolase.
This step is the reversal of the final step in β-oxidation;
2. formation of hydroxymethylglutaryl-CoA (HMG-CoA) by HMG-CoA synthase;
3. release of acetoacetate by HMG-CoA lyase; and
4. reduction of acetoacetate to β-hydroxybutyrate by β-hydroxybutyrate dehy-
drogenase.
10.4.2 Decarboxylation of acetoacetate
Notes: Acetone can form from acetoacetate through spontaneous, non-enzymatic
decarboxylation. As shown in this plot (redrawn from [46]), the rate of decar-
boxylation is enhanced by unfractionated serum proteins. The catalytic activity of

162 10 Triacylglycerol metabolism
serum is greater when ketogenesis has been induced, suggesting the existence of a
specific enzyme activity. A bacterial acetoacetate decarboxylase is known and has
been studied in molecular detail; however, the hypothetical mammalian enzyme
remains incompletely characterized [47].
0
20
40
60
80
0 20 40 60 80 100 120
Ace
ton
e p
rod
uce
d (
A.U
.)
Incubation time (min)
serum ultrafiltrate
washed serum proteins
O O
OH
O
CO2
Acetoacetate
Acetone
10.4.3 Acetone can serve as a precursor for gluconeogenesis
Notes: While many textbooks, even ones of recent vintage, continue to spread the
myth of acetone being a useless metabolic dead end, it has been known for some
time that acetone can be converted to pyruvate, which can then enter gluconeoge-
nesis [48]. Thus, acetone provides a back door for fatty acyl carbon to be turned
back into glucose. The capacity of this pathway appears to be limited; it has been
estimated that up to 11% of endogenously produced glucose may be derived from
acetone in fasting humans [49].
CH3
C O
CH3
H2C OH
C O
CH3
H2C OH
CHHO
CH3
NADPH+H+
O2
NADP+
H2O
NADH+H+
NAD+
NAD+
NADH
HC O
CHHO
CH3
OH
C O
CHHO
CH3
OH
C O
C O
CH3 H2O
NAD+
NADH+H+
NAD+
NADH+H+
acetone acetol 1,2-propanediol
pyruvate l-lactate l-lactaldehyde
The first step of the pathway shown here is catalyzed by the enzyme cytochrome
P450 type 2E1. This enzyme can also metabolize ethanol and is transcriptionally
induced by both acetone and ethanol. The enzyme that converts acetol to propane-
diol has not been characterized; the subsequent steps are catalyzed by alcohol

10.4 Ketone body metabolism 163
dehydrogenase and aldehyde dehydrogenase, respectively, which also function
in the major pathway of ethanol degradation (see slide 7.4.2).9
10.6 Give an outline of ketone body metabolism.
10.4.4 Anticonvulsant effects of acetone and acetol
40
80
120
1 10 100
PT
Z t
hre
shold
(m
g/k
g)
Metabolite injected (mmol/kg)
acetone
acetol
noneH2N
O
OH
N
N
NN
γ-Aminobutyric acid (GABA)
Pentylenetetrazole (PTZ)
Notes: At higher than physiological plasma concentrations, acetone acts like a
general anesthetic, as do many organic solvents (e.g. chloroform and diethylether).
This is also the case for some antiepileptic drugs. An important common target
for anesthetics and antiepileptic drugs is the GABAA receptor, which is one of the
two major inhibitory neurotransmitter receptors in the central nervous system.10
Accordingly, acetone has been proposed to be responsible for the effectiveness
of the ketogenic diet in epilepsy. This diet was the first effective treatment of this
disease [51], and it remains in use in a significant number of patients, particularly
children, who don’t respond to antiepileptic drugs.
The ketogenic diet restricts carbohydrates and protein, and it supplies most
calories as triacylglycerol, much of which is then converted to ketone bodies.
In animal experiments, acetone has greater antiepileptic potency than the two
other ketone bodies and, as illustrated here, also than the metabolites formed
in its own breakdown. In the experiment shown here [52], the GABAA receptor
antagonist pentylenetetrazole was used to induce epileptic seizures. Injection of
acetone raises the dosage of pentylenetetrazole necessary to trigger seizures. It
does this at lower concentrations than its metabolite acetol, indicating greater
anticonvulsant potency.
The ketogenic diet does not work in all patients, and it seems desirable to
increase its effectiveness. A possible strategy to achieve this might be to combine
the diet with inhibitors of metabolic breakdown of acetone [53]. This approach is
currently undergoing experimental evaluation.
9A second pathway from acetol to pyruvate involves the oxidation of acetol by cytochromeP450 2E1 to methylglyoxal, which is then converted to d-lactate through addition and subsequenthydrolysis of glutathione [48].
10Considering the very high concentrations of ketone bodies in diabetic coma, one might assumethat acetone contributes to the causation of unconsciousness in this condition. However, a clinicalstudy on this question has concluded that acetone is likely not a dominant factor [50].

164 10 Triacylglycerol metabolism
10.5 Fatty acid synthesis
Fatty acids can be synthesized from acetyl-CoA. This is the major pathway for
utilizing excess dietary carbohydrates and protein. Fatty acid synthesis occurs
mainly in the fat tissue and the liver. It runs in the cytosol, which keeps it apart
from mitochondrial β-oxidation. In broad outline, fatty acid synthesis is a reversal
of β-oxidation: two carbon atoms at a time are added to a growing fatty acid
molecule, and the new β carbon is then reduced to the alkane level. However, the
mechanistic details are somewhat different.
The bulk of the work in fatty acid synthesis is accomplished by a single en-
zyme, fatty acid synthase, which is quite an amazing molecule: it combines six
active sites with eight distinct catalytic activities on a single polypeptide chain. Its
product is palmitic acid (hexadecanoic acid). As stated before, fatty acids vary in
their chain lengths and degree of bond saturation. These variants are derived from
palmitate through chain elongation and desaturation, which are accomplished by
separate enzymes called elongases and desaturases.
10.5.1 The acetyl-CoA carboxylase reaction
CoAS
O ATP
CO2
ADP+Pi
CoAS
O O
OH
Acetyl-CoA Malonyl-CoA
Notes: The only reaction in palmitate synthesis that is not carried out by fatty acid
synthase itself is catalyzed by acetyl-CoA carboxylase. I hope that by now you rec-
ognize the pattern: CO2 is fixed, and ATP is expended—another biotin-dependent
reaction, working in the same way as pyruvate carboxylase and propionyl-CoA
carboxylase.
The acetyl-CoA carboxylase reaction is performed for each C2 subunit that
is added to the growing fatty acid, except the very first one. As with pyruvate
carboxylase in gluconeogenesis, the attachment of CO2 is transient, and one can
think of it simply as an activation step that facilitates subsequent C−C bond
formation.
10.5.2 The structure of fatty acid synthase
Notes: All further reactions are catalyzed by fatty acid synthase. In animals, this
is a large molecule with multiple active sites located on a single polypeptide chain.
Two of these polypeptides form an active dimer. The active sites are highlighted
in the structure (rendered from 2vz8.pdb), and their locations along the sequence
of the fatty acid synthase molecule are given as acronyms, as follows: KS, ketoacyl
synthase; MAT, malonyl-acetyltransferase; KR, ketoacyl reductase; DH, hydroxyacyl
dehydratase; ER, enoylreductase. The numbers indicate the place of each active
site in the sequence of reactions. ACP is acyl carrier protein, and TE thioesterase;
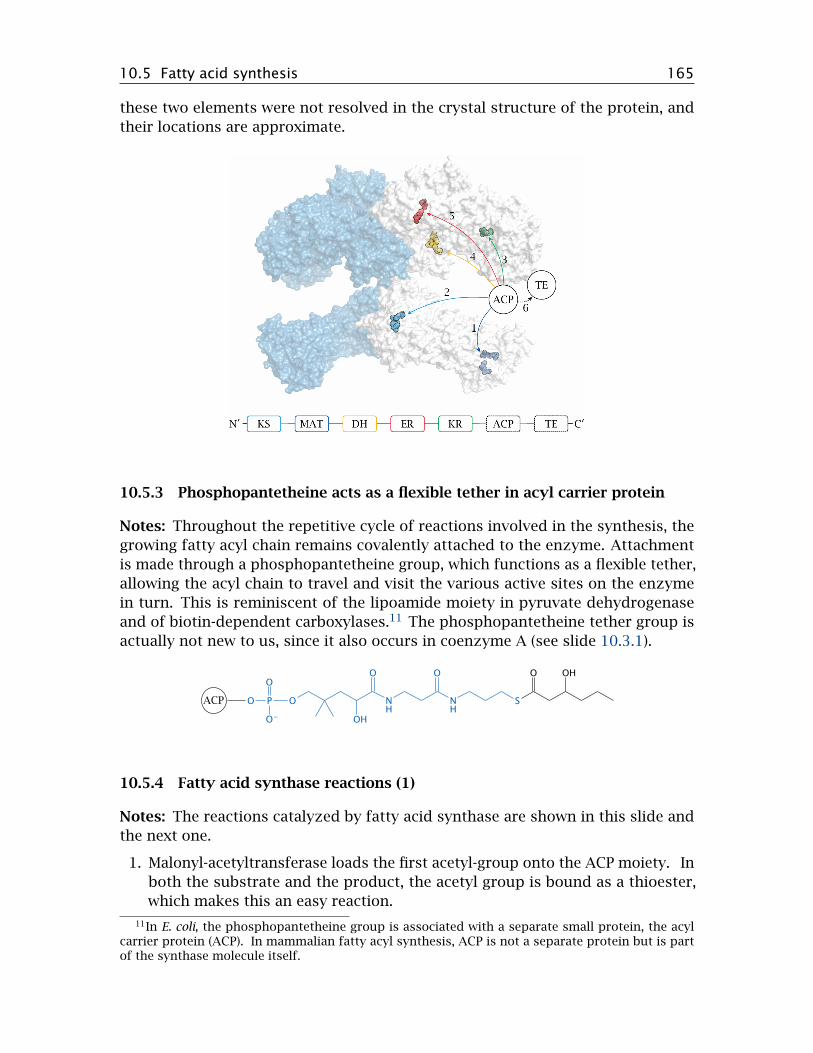
10.5 Fatty acid synthesis 165
these two elements were not resolved in the crystal structure of the protein, and
their locations are approximate.
10.5.3 Phosphopantetheine acts as a flexible tether in acyl carrier protein
Notes: Throughout the repetitive cycle of reactions involved in the synthesis, the
growing fatty acyl chain remains covalently attached to the enzyme. Attachment
is made through a phosphopantetheine group, which functions as a flexible tether,
allowing the acyl chain to travel and visit the various active sites on the enzyme
in turn. This is reminiscent of the lipoamide moiety in pyruvate dehydrogenase
and of biotin-dependent carboxylases.11 The phosphopantetheine tether group is
actually not new to us, since it also occurs in coenzyme A (see slide 10.3.1).
OHO
SNH
O
NH
O
OH
OP
O
O−
OACP
10.5.4 Fatty acid synthase reactions (1)
Notes: The reactions catalyzed by fatty acid synthase are shown in this slide and
the next one.
1. Malonyl-acetyltransferase loads the first acetyl-group onto the ACP moiety. In
both the substrate and the product, the acetyl group is bound as a thioester,
which makes this an easy reaction.
11In E. coli, the phosphopantetheine group is associated with a separate small protein, the acylcarrier protein (ACP). In mammalian fatty acyl synthesis, ACP is not a separate protein but is partof the synthase molecule itself.

166 10 Triacylglycerol metabolism
2. In another thioester transfer, ketoacyl synthase acquires the acetyl group
from ACP and retains it on its active site cysteine.
3. Malonyl-acetyltransferase transfers a malonyl residue from malonyl-CoA (sup-
plied by acetyl-CoA carboxylase) to ACP.
4. Inside the ketoacyl synthase active site, the malonyl group is decarboxylated,
and the carbanion that forms in the process attacks the acetyl group that had
been acquired earlier. This yields the thioester of acetoacetate.
5. Ketoacyl reductase converts acetoacetate to β-hydroxybutyrate.
10.5.5 Fatty acid synthase reactions (2)
Notes: The synthesis continues from the last slide, with the following reactions:
6. hydroxyacyl dehydratase eliminates water, and

10.5 Fatty acid synthesis 167
7. enoylreductase reduces the ensuing double bond. These two steps yield
butyrate.
8. Ketoacyl synthase acquires the butyrate, freeing up ACP.
9. Malonyl-acetyltransferase acquires the next malonyl residue from malonyl-
CoA, which is again supplied by acetyl-CoA carboxylase.
From this point on, the the cycle repeats—ketoacyl synthase decarboxylates
malonate and forms the next β-keto acid, ketoacyl reductase reduces it, and so on.
The cycle executes seven times overall, which results in the formation of palmitate;
the palmitoyl residue is then released as free palmitate by the thioesterase activity
of fatty acid synthase.
10.7 Give an outline of fatty acid synthesis.
10.5.6 Mitochondrial export of acetyl-CoA via citrate
mitochondria
citrate
oxaloacetate
malate
cytosol
citrate
oxaloacetate
malate
NADH+H+
NAD+ NAD+
NADH+H+
acetyl-CoA
CoA-SH ATP
ADP+Pi
CoA-SH
acetyl-CoA
Notes: We have noted above that fatty acid synthesis occurs in the cytosol. Since
acetyl-CoA is formed in the mitochondrion by pyruvate dehydrogenase, it needs
to get out of the mitochondrion and into the cytosol.
We saw before that there is a similar problem in β-oxidation. In that case,
the transport of acyl-CoA to the mitochondria is accomplished by the carnitine
carrier system (slide 10.3.2). Since all reactions in the latter system are reversible,
and acetyl-CoA is also an acyl-CoA, we might expect that the carnitine carrier
system could help us out here as well. On the other hand, if transport of acyl-CoA
molecules went both ways, this might facilitate a futile cycle of fatty acid synthesis
and degradation.
It turns out that acetyl-CoA is indeed transported by other means. One of them
is illustrated in this slide. Here, citrate is exported by the tricarboxylate carrier sys-
tem. Cleavage by ATP-citrate lyase reverts the citrate synthase reaction, producing
acetyl-CoA and oxaloacetate. The latter is reduced by malate dehydrogenase, and
malate is exchanged for citrate. As you can see, this process will also transport one
NADH equivalent to the mitochondria, which is usually accomplished by dedicated
shuttle systems (section 6.9).

168 10 Triacylglycerol metabolism
10.5.7 Mitochondrial export of acetyl-CoA via acetoacetate
mitochondria
2 acetyl-CoA acetoacetyl-CoA
HMG-CoA
acetoacetate
cytosol
2 acetyl-CoA
acetoacetyl-CoA
acetoacetate
CoA-SHacetyl-CoA
CoA-SH
acetyl-CoA ATP CoA-SH
AMP+PPi
CoA-SH
Notes: A fairly straightforward transport mechanism consists in the export of
acetoacetate, which is generated in the mitochondria by the ketogenesis pathway
(see slide 10.4.1). Acetoacetate can be converted back to acetyl-CoA by cytosolic
acetoacetyl-CoA synthetase, which uses ATP, and then cleaved to two molecules of
acetyl-CoA by thiolase. The pathway has been demonstrated in rat livers [54, 55]
and is also found in high activity in adipose tissue [56].
Fatty acid synthesis also requires a large amount of NADPH in the cytosol.
This can be supplied by the hexose monophosphate shunt, but shuttles that export
NADPH from the mitochondria also contribute (see slide 9.3.2f).
10.8 Explain how the acetyl-CoA needed for fatty acid synthesis is exported from themitochondria to the cytosol.
10.5.8 Elongation and desaturation of fatty acids
• elongases reside in mitochondria and endoplasmic reticulum
• chemistry of elongation similar to β-oxidation in mitochondria, similar to fatty
acid synthase in the ER
• desaturases occur in the ER, introduce double bonds at various positions
• double bonds are created at least 9 carbons away from the ω end—ω-3 fatty
acids cannot be formed and are therefore essential
Notes: Palmitate is the end product released by fatty acid synthase; fatty acids
with longer chains are formed from palmitate by separate elongase enzymes.
Inside the mitochondria, the pathway of elongation is mostly a reversal of β-
oxidation, except that NADPH is used instead of FADH2 in the final reduction of
enoyl-CoA. In the ER, the chemistry resembles that of fatty acid synthase, except
that the substrate is bound to coenzyme A rather than to the enzyme itself.
Desaturases contain iron and cooperate with several other redox-active pro-
teins in the ER membrane; the hydrogen abstracted from the fatty acid is trans-
ferred to molecular oxygen. None of the human or animal desaturases can intro-

10.5 Fatty acid synthesis 169
duce double bonds closer than 9 carbons away from the ω end—that is, non-car-
boxyl end—of the substrate. Since we requireω-3 andω-6 fatty acids as synthetic
precursors of membrane lipids and of prostaglandins, such fatty acids are es-
sential, that is, they must be obtained from the diet. All ω-3 and ω-6 fatty
acids ultimately originate in plant metabolism, even if we may ingest them with
animal-derived food.
10.5.9 Cerulenin, an antibiotic that irreversibly inhibits fatty acid synthase
O O
OH
O
O
H⊕
O
NH2
S⊖ Cys FAS
O
OH
O
NH2
S
Cys FAS
β-keto acid
cerulenin
covalent adduct
Notes: Cerulenin is a fungal antibiotic that binds and irreversibly inactivates fatty
acid synthase. Its structure resembles the β-ketoacyl intermediates of fatty acid
synthesis, and indeed cerulenin binds to the ketoacyl synthetase site of the enzyme.
The cysteine residue in this site then reacts with the epoxide ring in cerulenin and
is alkylated.
While epoxide derivatives are not terribly popular as drugs because they tend
to be quite reactive and often toxic, there is presently some interest in the develop-
ment of fatty acid synthase inhibitors, modeled on the structure of cerulenin, for
the treatment of obesity. While this does not strike me as a particularly promis-
ing idea,12 a more interesting application is in the treatment of cancer. This is
discussed in the next slide.
10.5.10 Fatty acid synthase inhibition slows tumor growth in mouse experi-
ments
Notes: Most non-cancerous cells do not express fatty acid synthase, relying instead
on fatty acids supplied by the liver and fat tissue. However, fatty acid synthase
expression has been observed in cancer cells. The cells probably use these fatty
12I look forward to the discoveries of metabolic derailments these drugs will cause in the face ofcontinued excess caloric intake. What is going to become of the surplus acetyl-CoA when fatty acidsynthesis is inhibited: Ketone bodies? Cholesterol? Will glycolysis be backed up and diabetes beinduced? All of the above?

170 10 Triacylglycerol metabolism
acids to supply their synthesis of membrane glyco- and phospholipids, which they
require for proliferation. In any event, inhibition of fatty acid synthase in tumor
cells can drive them into apoptosis (programmed cell death).
O
OH
OH
OH
O
O O
OH
OH
OH
0
0.1
0.2
0.3
0.4
0.5
0 10 20 30 40
avg. tu
mor
volu
me (
cm3)
days of treatment
untreated
compound 7
compound 7
This slide shows an experimental synthetic drug (with the provisional name “com-
pound 7”) that is somewhat similar to polyphenols occurring in green tea and
other natural sources. In mice experiments, it substantially reduces the growth
rate of transplanted cancer. While such experimental cancers are notorious for
being easier to treat than actual clinical cancer in humans, the results suggest that
this line of research is worth pursuing. Figure prepared from original data in [57].
10.6 The glyoxylate cycle
Citrate
Isocitrate
α-Ketoglutarate
Succinyl-CoASuccinate
Fumarate
Malate
Oxaloacetate
Acetyl-CoA
Glyoxylate
Acetyl-CoA
Glucose
Notes: It was discussed before that carbon contained in fatty acids cannot be uti-
lized efficiently for gluconeogenesis, since there is no efficient pathway to convert
the acetyl-CoA that results from their breakdown into TCA cycle intermediates
(see section 5.6 and slide 10.1.2). Interestingly, however, plants do have a straight-
forward pathway to do just this, namely, the glyoxylate cycle, which is an ancillary
road to the TCA cycle.
In the glyoxylate cycle, the two decarboxylation steps of the TCA cycle are
skipped, and an entry point for a second molecule of acetyl-CoA is created. In this

10.7 Answers to practice questions 171
manner, plants are able to use two molecules of acetyl-CoA for the net synthesis
of one C4 TCA cycle intermediate.
10.6.1 Reactions in the glyoxylate cycle
Glyoxylate
SuccinateH2C COO−
HC COO−
CH
OH COOH
H2C COO−
H2C COO−
CH
O COOH
Isocitrate lyase
H2C
O
OH
CH
COO−HO
H3C
O
S CoA
CH
COO−O
H2O
CoA-SH
Malate synthaseAcetyl-CoA
Notes: The cycle involves two reactions, both of which are mechanistically similar
to citrate synthase:
1. Isocitrate is split into succinate and glyoxylate by isocitrate lyase. Since the
isocitrate dehydrogenase and the α-ketoglutarate dehydrogenase reactions
are bypassed, the loss of two carbons as CO2 is avoided; these carbons are
retained in the form of glyoxylate.
2. Glyoxylate combines with the second acetyl-CoA molecule to form malate.
This reaction is catalyzed by malate synthase, and like the citrate synthase
reaction it is pushed forward by the concomitant hydrolysis of coenzyme A.
You know that many plant seeds are very rich in oil—that is, fat. The glyoxylate
cycle enables plant seeds to store metabolic energy and carbon at high density
as fat, and to use it for the synthesis of glucose and other carbohydrates during
germination.
10.7 Answers to practice questions
10.1: Glycogen consists of glucose and can be readily converted back to it; triacylglycerolcan not be efficiently converted to glucose but instead yields only free fatty acids andketone bodies, which cannot be utilized by some tissues. However, the energy density ofhydrated glycogen is much lower than that of triacylglycerol.
10.2: Ingested triacylglycerol is solubilized by bile acids and cleaved by pancreatic lipase.The cleavage products—free fatty acids, glycerol and monoacylglycerol—are taken up intothe epithelia of the small intestine, joined into triacylglycerol again and packaged intochylomicron particles. The latter enter the circulation via the lymphatics. In the capillariesof the circulation, lipoprotein lipase extracts triacylglycerol and cleaves it. The free fattyacids produced are mostly either consumed by muscle cells or stored as triacylglycerol infat cells.

172 10 Triacylglycerol metabolism
10.3: See scheme in slide 10.3.3
10.4: β-Oxidation provides 7 equivalents of NADH and FADH2 each, as well as 8 equiva-lents of acetyl-CoA. Oxidation of the latter in the TCA cycle provides 24 more equivalentsof NADH and 8 more of FADH2. Assuming a yield of 3 ATP per NADH and 2 per FADH2,this works out to (24+ 7)× 3+ (8+ 7)× 2 = 123 equivalents of ATP.
10.5: Fatty acids with regular chain lengths are first activated to acyl-CoA in the cytosol,then transported across the outer mitochondrial membrane and converted to acylcarnitine,exchanged for carnitine across the inner mitochondrial membrane, and finally convertedto acyl-CoA again in the mitochondrial matrix.
Medium chain fatty acids skip all these preliminaries and simply reach the mitochon-drial matrix by diffusion.
10.6: Ketone bodies are acetoacetate, β-hydroxybutyrate and acetone. Acetoacetate andβ-hydroxybutyrate are synthesized in the liver and can, to a degree, replace glucose as anenergy substrate for the brain and other tissues when glucose supply is low.
The major substrate for ketone body synthesis are free fatty acids mobilized from fattissue by hormone-sensitive lipase. β-Oxidation in the liver produces acetyl-CoA, which inturn is converted to acetoacetate and its reduction product β-hydroxybutyrate. Utilizationof ketone bodies proceeds through conversion back to acetyl-CoA.
Acetone arises from spontaneous as well as enzymatic decarboxylation of acetoac-etate. It can be converted to pyruvate through an oxidative pathway that starts with itsconversion to acetol; since pyruvate can feed into gluconeogenesis, this provides a “backdoor” for the conversion of some carbon from fatty acids to glucose.
10.7: Fatty acid synthesis occurs in the cytosol and is mostly carried out a single enzyme,namely, fatty acid synthase. The process is somewhat similar to β-oxidation, but it employsNADPH in both reduction steps, and it also involves transient activation of acetyl-CoA tomalonyl-CoA by acetyl-CoA carboxylase. The product is palmitate, which may undergodesaturation elongation by additional enzymes.
10.8: It can be exported either as citrate, which is then cleaved by ATP citrate lyase tooxaloacetate and acetyl-CoA, or as acetoacetate, which is then activated by a thiokinaseand cleaved to two molecules of acetyl-CoA by thiolase.

Chapter 11
Cholesterol metabolism
11.1 Biological significance of cholesterol
• Cholesterol is an essential lipid constituent of cell membranes
• Cholesterol is a precursor of steroid hormones and of bile acids
• Intermediates of cholesterol biosynthesis are required to make vitamin D and
for posttranslational modification of membrane proteins
• High plasma cholesterol promotes atherosclerosis
Notes: Contrary to popular belief, the biological role of cholesterol is not limited
to being the bad guy. Instead, it has a number of essential physiological functions:
1. In humans and animals, cholesterol is a major constituent of the cell mem-
branes. Cholesterol modulates physical properties of these membranes that
in turn affect the function of membrane proteins such as receptors and trans-
porters. Experimental depletion of membrane cholesterol cripples many cellu-
lar functions.
2. Cholesterol is the biosynthetic precursor of bile acids, which are essential for
fat digestion.
3. Cholesterol is the precursor of all steroid hormones, namely, androgens, estro-
gens, progestins, glucocorticoids, mineralocorticoids, and calciferol (vitamin
D).
Nevertheless, it certainly is true that cholesterol also plays a major role in the
pathogenesis of atherosclerosis. In this chapter, we will first cover the metabolic
pathways that involve cholesterol, and then take a look at the role of cholesterol
in this important cardiovascular disease.
173

174 11 Cholesterol metabolism
11.1.1 Processes that determine the cholesterol balance
• intestinal uptake of dietary cholesterol
• de novo cholesterol synthesis
• synthesis of steroid hormones from cholesterol
• synthesis of bile acids from cholesterol, and their biliary secretion
• biliary secretion of surplus cholesterol in unmodified form
Notes: Cholesterol can both be synthesized endogenously and obtained from the
diet. Note that significant amounts of cholesterol only occur in meat, eggs, and
milk products; plants and mushrooms contain other sterols but very little chol-
esterol. The fact that vegetarians survive tells us that our capacity to synthesize
cholesterol suffices to cover our need for cholesterol entirely.
11.1 What are dietary sources of cholesterol? Do we require cholesterol in the diet?
11.2 Cholesterol synthesis
The pathway of cholesterol synthesis is quite elaborate. We will start with a general
outline and then go through most, but not all of the reactions in detail.
11.2.1 Overview of cholesterol synthesis
acetyl-CoA HMG-CoA mevalonate
activated C5activated C10activated C15
squalene (linear C30) lanosterol cholesterol
HMG-CoA
reductase
Notes: Cholesterol synthesis starts with acetyl-CoA, which is used to synthesize
hydroxymethylglutaryl-CoA (HMG-CoA). The reactions in this initial stage are the
same as in ketogenesis (see slide 10.4.1). However, while ketogenesis occurs in
the mitochondria, HMG-CoA destined for sterol synthesis is formed in the cytosol.
Therefore, like the synthesis of fatty acids, cholesterol biosynthesis depends on
the export of acetyl-CoA from the mitochondria. Also as with fatty acids, multiple
steps in the cholesterol synthesis require NADPH. How these two requirements are
met has been discussed earlier (see slide 10.5.6f).
All steps downstream of HMG-CoA occur in the smooth endoplasmic reticulum.
HMG-CoA reductase reduces HMG-CoA to mevalonate; this enzyme is the major
target of regulation in the entire pathway. Mevalonate is converted to various
isoprene intermediates. Several rounds of “polymerization”—I’m using the term

11.2 Cholesterol synthesis 175
loosely—produce the linear hydrocarbon molecule squalene, which is cyclized
to the first sterol intermediate. This molecule, lanosterol, is then converted to
cholesterol by several successive modifications.
11.2 Which reaction is the major regulatory step in cholesterol synthesis?
11.2.2 Initial activation steps in cholesterol synthesis
CoAS
O
CoAS
O
CoAS
O O
CoA-SH
1
CoAS
O
H2O CoA-SH
2CoA
S
O OH
O
OH
O⊖
O OH
OH
3ATP
3ADP
4
2NADPH + 2H+
2NADP+
H2O + CoA-SH
3
O⊖
O OP
O P PO P P
CO2
P ⊖
5
HMG-CoA
mevalonateisopentenyl-pyrophosphate
Notes: The reactions shown in this slide are catalyzed by thiolase (1), HMG-CoA
synthase (2), HMG-CoA reductase (3), mevalonate kinase and phosphomevalonate
kinase (4), and diphosphomevalonate decarboxylase (5). In the subsequent
steps of the pathway, six molecules of isopentenyl-pyrophosphate are used for the
synthesis of one cholesterol molecule.
11.2.3 Formation of a C10 intermediate
Notes: The next stage begins with the conversion of one molecule of isopentenyl-
pyrophosphate to dimethylallyl-pyrophosphate, catalyzed by the isopentenyl-pyro-
phosphate isomerase. The product is condensed with another molecule of isopen-
tenyl-pyrophosphate to yield geranyl-pyrophosphate. In this reaction, catalyzed by
geranyl-pyrophosphate synthase, the pyrophosphate of the first substrate serves
as a leaving group. The resulting carbocation reacts with the double bond of the
second substrate.

176 11 Cholesterol metabolism
O P P
O P P ⊕ O P P
⊕O P P
O P P
PPi
H⊕
geranyl-pyrophosphate
dimethylallyl-pyrophosphate
isopentenyl-pyrophosphate
11.2.4 Formation of C15 and C30 intermediates
Notes: The synthesis of the C15 intermediate, farnesyl-pyrophosphate, is catalyzed
by the eponymous synthase and mechanistically resembles that of geranyl-pyro-
phosphate. Farnesyl-pyrophosphate is used not only in sterol synthesis but also in
the posttranslational modification of some membrane-associated proteins. While
the amount of farnesyl-pyrophosphate used for this purpose is not very large, in-
hibition of protein farnesylation may contribute to the clinical effect of inhibitory
drugs that act upstream in this pathway; this includes the statins, which inhibit
HMG-CoA reductase (see slide 11.7.2).
O P P O P P
H⊕PPi
O P P
P P ONADPH + H
+
2 PPiNADP+
farnesyl-pyrophosphate
squalene
isopentenyl-pyrophosphategeranyl-pyrophosphate

11.2 Cholesterol synthesis 177
Two molecules of farnesyl-pyrophosphate are joined head to head in the synthe-
sis of the final linear sterol precursor, namely, squalene; the enzyme is named
squalene synthase.
11.2.5 Squalene cyclization yields the first sterol intermediate
O
⊕H
HO
⊕
HO
NADPH+H+
O2
NADP+
H2O
H+
lanosterol
squalene
squalene epoxide
Notes: The reactions shown here are catalyzed by squalene epoxidase and lanos-
terol synthase. The rearrangement indicated by the dashed arrow is not a real
reaction—we just rotate a couple of single bonds to show how the pieces fall into
place for the subsequent cyclization.
The oxygen is introduced by squalene epoxidase, a cytochrome P450 enzyme.
Such enzymes use NADPH to reduce one of the two atoms of molecular oxygen,
while retaining the other one in a highly reactive state, which they then use toward
their specific purposes (see slide 18.2). Squalene synthase inserts its active oxygen
into a C−−C double bond of the substrate to form an epoxide. The subsequent
cleavage of the epoxide by lanosterol synthase starts a cascade of reactions that
goes from one end of the molecule to the other, closing all four rings of the sterol
skeleton in the process. Note that a methyl group also changes its place on the
sterol ring; the reaction mechanism is quite intricate.
11.2.6 Demethylation, desaturation and saturation steps convert lanosterol to
cholesterol
Notes: Several successive modifications convert lanosterol to 7-dehydrocholes-
terol and then cholesterol. Like squalene epoxidase, several of the enzymes that
catalyze these reactions also belong to the cytochrome P450 family. We will not
consider them in detail; however, several of these enzymes are inhibited by the

178 11 Cholesterol metabolism
drug triparanol, which was once used to treat hypercholesterolemia before being
withdrawn due to toxicity.
HO HO HO
lanosterol 7-dehydrocholesterol cholesterol
11.3 What is the role of cytochrome P450 enzymes in the synthesis of cholesterol?
11.2.7 UV-dependent synthesis of cholecalciferol
HO
HO
OH
OH OH
7-Dehydrocholesterol Cholecalciferol 1,25-Dihydroxycholecalciferol
hν 25-OH 1-OH
Notes: The last biosynthetic precursor of cholesterol, 7-dehydrocholesterol, is also
the precursor of vitamin D3 (cholecalciferol). The conversion of 7-dehydrocholes-
terol to cholecalciferol, which involves the breakage of the bond indicated by the
red arrow, is a photochemical reaction; it requires the absorption of a UV photon
and can therefore only occur in the skin. Two successive enzymatic hydroxylations
(which do not require any more UV light) yield 1,25-dihydroxy-cholecalciferol. This
molecule is is a transcriptional regulator that activates the uptake of calcium and
phosphate from the gut.
A lack of 1,25-dihydroxy-cholecalciferol causes rickets, a formerly quite com-
mon disease that is characterized by lack of bone mineral and bone deformities.
Cholecalciferol is also the vitamin du jour, and if we are to believe the news, the
deficiency also causes depression, cancer, earthquakes, and at least 105 % of all
other evils befalling mankind.
The essential function of 1,25-dihydroxycalciferol is responsible for the varia-
tion of human skin colors. While dark pigment protects the skin from damage by
UV irradiation, the UV photons swallowed up by the pigment are no longer avail-
able for the synthesis of cholecalciferol. When Homo sapiens left Africa’s sun for
cloudier climates, the shortage of sunshine created a selective pressure for lighter
skin, which increases the availability of photons for cholecalciferol synthesis. The

11.3 Regulation of cholesterol synthesis 179
remarkably pale skin of people of British or Irish descent tells you all you need to
know about the weather in those places. Avoid.
11.4 What are the metabolic roles of 7-dehydrocholesterol?
11.2.8 Sterol metabolism occurs in the smooth endoplasmic reticulum
Notes: Many intermediates in the synthesis of cholesterol and of its derivatives
are very hydrophobic and very poorly soluble in water; they therefore have to
reside in an apolar environment. On the other hand, the enzymes, like almost all
proteins, are at least partially polar and cannot immerse completely in the same
apolar environment.
The solution to this problem is to perform the reactions at the interface of
polar and apolar environments, that is, at membrane surfaces. This means that the
membrane of the smooth ER is not just there to delimit a separate compartment—
it is a reaction compartment all by itself. Accordingly, liver cells and other cells
that engage in sterol chemistry have a well developed smooth ER with a very large
cumulative membrane surface area.
The ER also hosts many enzymes that function in drug metabolism, including
cytochrome P450 and UDP-glucuronosyltransferases (see chapter 18). The func-
tional context is the same—many drug molecules that must undergo metabolism
before being eliminated are quite hydrophobic and thus also require interfacial
chemistry.
11.3 Regulation of cholesterol synthesis
HMG-CoA reductase subject to feedback inhibition by cholesterol. Additionally,
its activity is subject to transcriptional regulation, which occurs through a rather
unique mechanism.

180 11 Cholesterol metabolism
11.3.1 Transcriptional regulation of cholesterol synthesis starts in the ER
Notes: The sterol response element (SRE) is a DNA consensus sequence that con-
trols the transcription of HMG-CoA reductase. The corresponding SRE-binding
protein (SREBP) is initially embedded in the ER membrane, and thus evidently
unable to get in touch with its DNA target. SREBP is bound to a second protein,
namely, SREBP cleavage activating protein (SCAP). This protein is the actual chol-
esterol sensor; it can adopt two different conformations, depending on the content
of cholesterol in the surrounding membrane. The conformation that predominates
at high cholesterol content lets SCAP bind to a third protein, INSIG.1 When this
ternary complex forms, it is rapidly targeted toward proteolytic degradation, and
that is the end of it.
At low cholesterol concentrations, however, SCAP does not bind to INSIG, and
this is when things get interesting, as shown in the next slide.
11.3.2 When cholesterol is low, SREBP is sorted to the Golgi apparatus
Notes: At low cholesterol concentrations, SCAP binds to some other membrane
proteins (shown in green) that recruit it into nascent vesicles, and it takes SREBP
along for the ride. When these vesicles bud off from the ER membrane, they
travel to the Golgi apparatus and fuse with its membrane. The Golgi is a cellular
organelle that performs many types of posttranslational protein modifications,
such as glycosylation, lipid modification, and proteolytic processing.
1INSIG stands for “insulin-induced gene.”
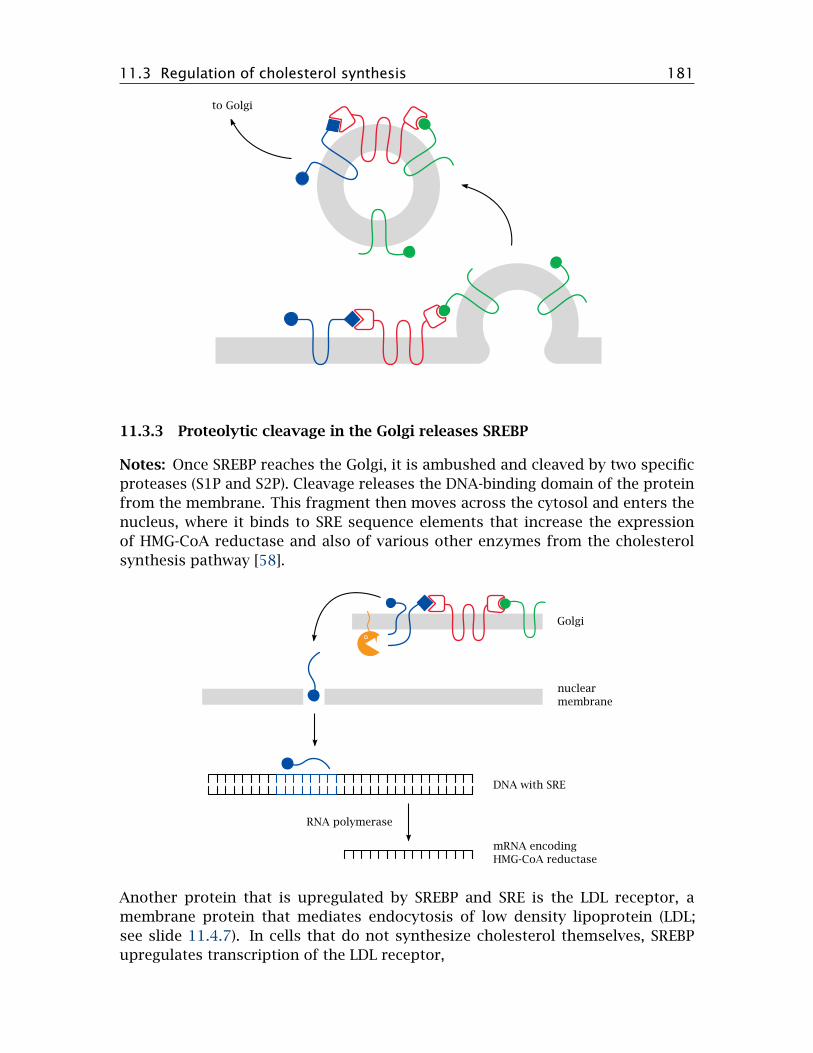
11.3 Regulation of cholesterol synthesis 181
11.3.3 Proteolytic cleavage in the Golgi releases SREBP
Notes: Once SREBP reaches the Golgi, it is ambushed and cleaved by two specific
proteases (S1P and S2P). Cleavage releases the DNA-binding domain of the protein
from the membrane. This fragment then moves across the cytosol and enters the
nucleus, where it binds to SRE sequence elements that increase the expression
of HMG-CoA reductase and also of various other enzymes from the cholesterol
synthesis pathway [58].
Another protein that is upregulated by SREBP and SRE is the LDL receptor, a
membrane protein that mediates endocytosis of low density lipoprotein (LDL;
see slide 11.4.7). In cells that do not synthesize cholesterol themselves, SREBP
upregulates transcription of the LDL receptor,

182 11 Cholesterol metabolism
Like SREBP and SCAP, HMG-CoA reductase is anchored in the ER membrane.
This does not seem necessary for the chemistry it performs. Instead, this location
facilitates the negative feedback regulation imposed on it by cholesterol. Indeed,
the enzyme contains a sterol-sensing domain that is homologous to the one found
in SCAP [59].
11.5 How does the transcriptional regulation of cholesterol biosynthesis work?
11.4 Cholesterol transport
Like other lipids, cholesterol has low water solubility and therefore requires special
mechanisms and vehicles for transport. In the bloodstream, both cholesterol and
triacylglycerol are transported within lipoproteins.
11.4.1 Lipoprotein structure
apolipoproteins
phospholipids,free cholesterol
triacylglycerol,cholesterol esters
Notes: We had already encountered one type of lipoprotein, namely, the chylomi-
crons, which are formed in the intestinal mucosa (see slide 10.2.3). Different
lipoprotein types vary in composition and particle size, but the overall structure is
similar for all of them. The surface consists mainly of phospholipids, which form
a monolayer.
Apolipoproteins are embedded into the surface of the particle. These protein
molecules mainly serve as “address tags” that mediate the interaction with target
molecules and cells, such as lipoprotein lipase on endothelial cells (slide 10.2.6) or
the LDL receptor (see later). Some apolipoproteins are stably associated with their
lipoprotein particles; for example, a given molecule of apolipoprotein B remains
associated with the same chylomicron or VLDL (very low density lipoprotein, see
below) particle throughout its lifetime. Exchangeable apolipoproteins have regula-
tory roles; for example, apolipoprotein CII reversibly associates with VLDL particles
and activates their interaction with lipoprotein lipase.

11.4 Cholesterol transport 183
11.4.2 Classification of plasma lipoproteins
Chylomicrons VLDL LDL HDL
Density(g/ml)
0.95 0.95–1.0 1.02–1.06 1.06–1.12
Origin small intestine liver liver liver
Function distributedietary TAGandcholesterol
distributeTAG fromliver
distributecholesterolfrom liver
return excesscholesterol toliver
Predominantlipid species
TAG TAG cholesterol phospholipids,cholesterol
Notes: As you will notice, the variation in density between the various lipoprote-
ins is modest, but it is large enough to allow their separation by density gradient
centrifugation, and they are classified according to their behavior in this fraction-
ation procedure. As noted before, ‘LDL’ stands for low density lipoprotein; ‘HDL’
means high density lipoprotein, and ‘VLDL’ is very low density lipoprotein. The
differences in density arise from two circumstances:
1. Lipids are lighter than protein. Within the particles, proteins are found only
at the surface, whereas the interior contains only lipids; therefore, the frac-
tional content of protein is lower with larger particles than with smaller ones.
Chylomicrons are the largest and least dense lipoprotein species.
2. Triacylglycerol is lighter, but cholesterol is heavier than water. Accordingly, a
high content of cholesterol in the lipid fraction will also increase the overall
density.
Note the central role of the liver, which orchestrates most of the lipid transport,
with the exception of intestinal lipid uptake and packaging into chylomicrons. We
will now first look at the uptake of cholesterol in the intestine and then at its
transport to other organs.
11.4.3 Two membrane proteins control the uptake of sterols from the intes-
tine
Notes: The uptake of cholesterol by intestinal epithelial cells begins with endo-
cytosis. This process is controlled by NPC1L1, a membrane protein which is
deficient in a lipid storage disorder known as Niemann-Pick disease. NPC1L1 is a
sterol sensor and promotes cholesterol uptake through endocytosis.
From the endocytotic vesicles, cholesterol is transferred to the endoplasmic
reticulum by the microsomal triglyceride transfer protein (MTTP). Acylation by acyl-
CoA cholesterol acyltransferase (ACAT) yields a cholesterol ester, which is loaded
into a nascent chylomicron together with triacylglycerol. After the chylomicrons

184 11 Cholesterol metabolism
have been released from the intestinal cells and reached the circulation via the
lymphatics, most of their triacylglycerol is depleted by capillary lipoprotein lipase.
The cholesterol stays behind in the chylomicron remnants, which are taken up and
utilized in the liver (see slide 10.2.6).
In contrast to what its name suggests, MTTP transports not only triacylglycerol
but also sterols. Mutational inactivation of this protein results in abetalipopro-
teinemia.2 Such patients have reduced levels of chylomicrons and are affected by
malabsorption of lipids and of lipid-soluble vitamins.
The NPC1L1-mediated uptake of cholesterol by endocytosis does not discrimi-
nate between cholesterol and other, structurally similar sterols derived from plants.
After uptake, the latter are diverted toward a transport protein in the apical mem-
brane, ABCA5/8, which expels them right back into the gut lumen through active
transport.
11.6 How is cholesterol taken up in the small intestine?
11.4.4 Plant sterol structures
Notes: Plants contain little cholesterol but instead contain a variety of structurally
similar sterols. The sterol ring is the same as with cholesterol in all sterols shown,
but the tails are somewhat different.
Plant sterols compete with cholesterol for “space” inside the cytoplasmic mem-
brane of intestinal cells, and therefore reduce the rate of cholesterol absorption by
endocytosis. Dietary application of sitosterol or other plant sterols is a moderately
effective strategy to reduce cholesterol absorption.
11.7 How do plant sterols influence intestinal cholesterol uptake?
2The name of “abetalipoproteinemia” denotes the lack of apolipoprotein B, which is the majorprotein constituent of both chylomicrons and VLDL.

11.4 Cholesterol transport 185
HO
tail
ring
ring
ring
ring
ring
cholesterol
avenasterol
brassicasterol
campesterol
stigmasterol
11.4.5 Structures of ABC transporters in the inward-open and outward-open
conformations
Notes: Both ABCA5/8 (previous slide) and ABCA1 (slide 11.4.7) are members of
the ATP-binding cassette or ABC family of transporters. These have a common
structural organization. Several ABC transporters have been crystallized in the
inward- and outward open conformations, and the structures provide a glimpse of
how they work.
ATP
ABC transporters often have rather broad substrate specificity and mediate the
membrane translocation of many metabolites and xenobiotics. In addition to
cholesterol and other membrane lipids, important examples are bile acids (slide
11.5.3), conjugated bilirubin (slide 17.4), drugs, and drug metabolites (18.1.3).

186 11 Cholesterol metabolism
Cancer cells often overexpress ABC transporters, which renders them resistant to
multiple anticancer drugs.
11.4.6 ABC transporters induce substrate “flip-flop” across the membrane
Notes: One feature that is shared by many ABC transporter substrates is their
amphiphilic nature. Most ABC transporters expel their substrates from the cytosol
to the extracellular space. In this case, the substrate initially resides within the
inner leaflet of the cytoplasmic membrane. Once it enters the inward-open confor-
mation of the transporter, the latter undergoes a transition to the outward-open
conformation, which is powered by the hydrolysis of ATP. The substrate then
leaves the transporter and diffuses into the outer membrane leaflet, from where it
may distribute to other extracellular reservoirs.
11.4.7 Transport of cholesterol between the liver and peripheral tissues
chylomicrons
chylomicron remnants
cholesterol
Liver
VLDL
HDL
nascent HDL
LDL
cholesterol
Other tissues
LPL
LPL
LDL receptor
ABCA1LCAT
Notes: The liver synthesizes cholesterol from acetyl-CoA (section 11.2). The chol-
esterol pool in liver cells also receives the dietary cholesterol, which is contained in

11.4 Cholesterol transport 187
the chylomicron remnants that are formed through the extraction of triacylglycerol
from chylomicrons by lipoprotein lipase (LPL; slide 10.2.6).
Liver cells package esterified cholesterol, together with triacylglycerol, into
particles of very low density lipoprotein (VLDL). Like chylomicrons, VLDL interacts
with lipoprotein lipase and thereby turns into intermediate (IDL) and then low
density lipoprotein (LDL).
LDL is taken up by cells in the periphery through endocytosis, which is me-
diated by the LDL receptor.3 Excess cholesterol is exported from the cell by an
active transporter (ABCA1) and delivered to high density lipoprotein (HDL), which
then carries it back to the liver. Cholesterol transport by HDL is facilitated by
lecithin-cholesterol acyltransferase (see next slide).
11.4.8 The lecithin-cholesterol acyltransferase (LCAT) reaction
N⊕
OP
O
O⊖O
O
O
O
O
OH
lecithin
cholesterol
N⊕
OP
O
O⊖O
OH
O
O
O
O
lysolecithin
cholesterol ester
LCAT
Notes: The HDL particle contains the enzyme lecithin cholesterol acyltransferase,
or LCAT for short, which converts cholesterol to cholesterol esters.
The LCAT reaction occurs at the surface of HDL particles. The transfer of one
acyl chain from a lecithin (phosphatidylcholine) molecule to cholesterol produces
a cholesterol ester and lysolecithin. The significance for cholesterol transport is
illustrated in the next slide.
Cholesterol also undergoes esterification as it is packaged into chylomicrons
and VLDL inside intestinal and liver cells, respectively. In these cases, acyl-CoA
serves as the donor of the acyl residue (see slide 11.4.3).
3LDL manages to leave the circulation by transcytosis, that is, endocytosis by the vascular en-dothelial cells on the luminal side, followed by exocytosis on the opposite side.

188 11 Cholesterol metabolism
11.4.9 Cholesterol esters can be stored inside lipoprotein particles
Notes: Cholesterol is amphiphilic and tends to accumulate at lipid/water inter-
faces, with the OH group exposed to the aqueous phase. Free cholesterol can
therefore be transported only within the outermost layer of lipid molecules of
a lipoprotein particle. In contrast, cholesterol esters are entirely hydrophobic
and readily partition into the interior of lipoprotein particles. The LCAT reaction
therefore greatly increases the transport capacity of HDL particles for cholesterol.
11.8 Explain the LCAT reaction and its role for cholesterol transport.
11.5 Bile acid metabolism and transport
Bile acids are the quantitatively most important derivatives of cholesterol. Aside
from their essential role in fat digestion, they are also required to keep hydropho-
bic constituents of the bile in solution, such as unconjugated bilirubin (see section
17.4) and cholesterol itself.
11.5.1 Bile acids are derived from cholesterol
OHO
O−
OHOH
OH
OH OH
O
HN
S O−O
O
cholate taurocholate
Notes: Cholic acid and some other bile acids are synthesized from cholesterol in
the liver. Taurocholate is produced through conjugation of cholate with taurine;
similarly, glycocholate is produced through conjugation with glycine.

11.5 Bile acid metabolism and transport 189
11.9 What kinds of molecules are derived from cholesterol in human metabolism? Whichderivatives are quantitatively the most important ones?
11.5.2 Bile acids undergo enterohepatic cycling
Notes: In an enterohepatic cycle, a substance is secreted by the liver into the bile,
passes into the intestine and is taken up again into the blood, either by passive
diffusion across cell membranes or by active transport. Since blood drained from
the intestines feeds into the portal vein, the substance will return to the liver,
where it may be captured by liver cells and once again secreted into the bile.
Bile acids are taken up by active transport in the terminal ileum, that is, in the
lowermost section of the small intestine. The efficiency of reuptake is normally
> 90 %. Only the fraction that is not recovered needs to be replaced by de novo
synthesis from cholesterol.
During their repeated passages through the intestine, some bile acids undergo
modification by microbial enzymes; an example is the formation of deoxycholate
from cholate. Such modified molecules become part of the circulating bile acid
pool.
11.5.3 Bile acid cycling involves multiple transport proteins
Notes: A variety of transport proteins enable the bile acid enterohepatic cycle. Se-
cretion from the liver cell into the bile is driven by ABCC2, another ABC type trans-
porter (compare slide 11.4.5). Reuptake from the lumen of the gut is mediated by
the apical sodium-coupled bile acid transporter (ASBT). A similar transporter, the
Na+-dependent taurocholate cotransporting polypeptide (NTCP), mediates uptake
from the blood back into the liver cell. At the basolateral membranes of both
intestinal and liver cells, organic anion transport proteins (OATPs), which have a
fairly low degree of substrate specificity, participate in bile acid transport.

190 11 Cholesterol metabolism
11.10 Explain the enterohepatic cycle of bile acids.
11.5.4 A deficient ABCC2 transporter causes Dubin-Johnson syndrome
• impaired excretion of bile acids cholesterol precipitates in the bile bile
stones
• impaired excretion of bilirubin jaundice
• impaired excretion of many drugs potential drug toxicity
Notes: Compared to other hereditary gene defects, this one is relatively frequent.
As noted above, the liver can secrete some surplus cholesterol into the bile, where it
is kept in solution by bile acids. A shortage of bile acids promotes its precipitation,
which ultimately leads to gallstones. However, cholesterol precipitates also tend
to form without the transporter defect, and the sterol is indeed the most common
gallstone ingredient.
Apart from bile acids, ABCC2 also secretes conjugated bilirubin (bilirubin
diglucuronide, see slide 17.4) as well as the conjugated forms of several drugs
(section 18.3). In Dubin-Johnson patients, the retention of bilirubin leads to jaun-
dice, whereas the reduced rate of drug elimination increases their concentration
in the system and can lead to toxicity. Such drug toxicity may be prevented by
reducing the dosage, or by using drugs that are mostly eliminated through the
kidneys. Overall, with proper management, Dubin-Johnson syndrome is not very
severe.
11.6 Cholesterol and atherosclerosis
11.6.1 Is atherosclerosis a metabolic disease?
. . . when considering pathogenesis, it is important to remember that the
best documented initiating factor in atherogenesis is still hypercholes-

11.6 Cholesterol and atherosclerosis 191
terolemia and that additional factors, of which there are many, should
whenever possible be considered in the context of how they relate to the
processes initiated by hypercholesterolemia [60].
Notes: This quote sums it up rather well—cholesterol metabolism is a key element
in the pathogenesis of atherosclerosis. Another key factor is blood pressure,
whose role is illustrated by the simple observation that atherosclerosis afflicts the
arteries but not the veins. The accumulation of lymphocytes and macrophages in
atherosclerotic lesions highlights the role of inflammation.
In keeping with the scope of these notes, we will here focus on the metabolic
causes of atherosclerosis and consider any other factors only in broad outline.
11.6.2 Macroscopic appearance of atherosclerotic lesions
Notes: The earliest readily visible atherosclerotic lesion is the fatty streak. It forms
within the wall of an artery, in the thin layer of connective tissue that is located
underneath the endothelium (the innermost cell layer of any blood vessel) and
atop the thick layer of smooth muscle that maintains the wall tension and blood
pressure.
Fatty streaks are very common—they will be found in the arteries of virtually
any middle-aged to elderly person. As such, a fatty streak does not constitute a
problem. However, it tends to progress to more serious stages with time. These
advanced lesions wreak havoc in various ways:
1. Once they become large, they will constrict the lumen of the artery and hence
reduce the blood flow.
2. The endothelium atop an advanced lesion may erode. An intact endothelium
inhibits blood clot formation; endothelial lesions bring the blood into contact
with tissues and molecules that promote blood coagulation. A blood clot, or
thrombus, that forms atop such an eroded lesion will cause acute occlusion
of the artery. This is what happens in myocardial infarction and in most cases
of stroke.
3. An advanced lesion may damage not only the endothelium but also the mus-
cular layer of the arterial wall, which may then rupture. Approximately 20% of
all cases of stroke arise in this manner.
Atherosclerosis is a systemic disease. While most commonly manifest in the
heart and the brain, vascular occlusion and infarction can strike anywhere and

192 11 Cholesterol metabolism
everywhere; for example, constriction of arteries in the legs causes leg muscle pain
even under light exercise (walking), which is known as intermittent claudication.4
11.6.3 Microscopic appearance of atherosclerotic lesions
Normal artery Foam cells in early lesion
Detritus, fibrosis in advanced lesion High-grade stenosis, thrombus
A B
C D
Notes: This slide shows cross sections of a normal artery (A) and of atherosclerotic
lesions in different stages of advancement (B–D). The normal artery displays inner
and outer layers of connective tissue, stained in dark purple, as well as a strong
intermediate muscular layer that shows up in a lighter shade. The endothelium is
too thin to be discerned at this low power of magnification. The blood clot in the
lumen is a post-mortem artifact.
Panel B shows a higher power view of an early lesion. The bubbly appearance is
due to foam cells, which are macrophages stuffed chock-full with lipids.5 Panel C
shows an advanced lesion with connective tissue proliferation and accumulation of
detritus within the vessel wall; the lumen of the artery is considerably constricted.
Panel D shows an artery that was already almost completely obliterated by a
proliferating lesion that had encompassed the entire circumference; the narrow
residual lumen is blocked by an acutely formed thrombus (stained yellow-brown).
4The German vernacular name for this condition translates as “window shopping disease”—notuncommonly, afflicted patients stop before every window display, feigning interest, in order todisguise their predicament.
5The appearance of empty “bubbles” inside the foam cells is an effect of the tissue fixation andstaining technique: Organic solvents used in fixation wash out lipids, and most histological dyesbind to proteins or nucleic acids but not lipids.

11.6 Cholesterol and atherosclerosis 193
11.6.4 Development of an atherosclerotic lesion
A B C D
Thrombocyte
Foam cell
Macrophage
Endothelial cell
Cholesterol crystals
Modified LDL
Native LDL
Notes: This slide summarizes the developmental stages of an atherosclerotic le-
sion. A key role is played by low density lipoprotein (LDL), a specific type of plasma
lipoprotein particles that is rich in cholesterol (see slide 11.4.2).
(A) High blood pressure promotes the formation of small defects in the endothe-
lium. These initial lesions allow blood plasma carrying LDL to seep into the
subendothelial tissue; this is followed by transmigration of macrophages. Re-
active oxygen species and enzymes released by macrophages modify the LDL.
(B) Modified LDL is taken up by macrophages. Lipid overload turns macrophages
into foam cells.
(C) Foam cells perish, disintegrate and release the accumulated cholesterol, which
forms crystalline deposits. These crystals activate new macrophages and cause
them to release inflammatory cytokines that further incite and amplify the
inflammation [61].
(D) In an advanced lesion, cells in the muscular layer proliferate, progressively
constricting the artery. When the endothelium that covers the lesion becomes
eroded, thrombocytes and plasmatic coagulation factors are activated and
initiate blood clotting, causing acute thrombus formation and obstruction.
As an alternative to thrombus formation, acute failure of a damaged artery can
also occur through rupture. As stated above, approximately 20% of all cerebral in-
farctions are caused by rupture and hemorrhage rather than thrombotic occlusion.
Hemorrhage is less common in other organs.
The proinflammatory activity of cholesterol crystals echoes that of other crys-
talline deposits with different chemical composition, such as urate crystals in gout
[62] and silica crystals in silicosis (miner’s lung). Intracellular signaling complexes
called inflammasomes are involved in the reaction in each case.
11.11 Explain the origin and significance of foam cells in atherosclerotic lesions.

194 11 Cholesterol metabolism
11.6.5 Metabolic aspects of atherosclerosis
• cholesterol uptake, synthesis and degradation
• cholesterol transport in the circulation: LDL (low density lipoprotein) and HDL
(high density lipoprotein)
• biochemical changes that turn physiological, benign LDL into an atherogenic
agent
11.6.6 Two modes of uptake of cholesterol into macrophages
Notes: With macrophages as with other cell types, uptake of native LDL via the LDL
receptor is regulated by negative feedback, which lets the cells avoid cholesterol
overload. The downregulation of the LDL receptor is achieved by transcriptional
regulation via the SREBP/SCAP pathway (section 11.3).
In contrast to other cells, however, macrophages also have so-called scavenger
receptors, through which they bind and ingest various kinds of debris. Scavenger
receptors do not take up native LDL and are not subject to cholesterol-dependent
regulation. Oxidized or otherwise modified LDL, however, does enter via the scav-
enger receptors, which induces cholesterol overload and transforms the macro-
phages to foam cells. This is a crucial step in the pathogenesis of atherosclerosis.
11.6.7 Experimental modifications that turn LDL into a ligand for the scav-
enger receptor
Notes: In order to better understand what processes might turn LDL into a scav-
enger receptor ligand, various types of chemical modifications have been applied
in vitro. All of the experimental modifications shown here affect the amino groups
of the protein component of LDL (apolipoprotein B). They do not mimic oxidation;
therefore, these findings show that LDL oxidation is not the only mechanism that
may cause pathologically increased uptake of cholesterol into macrophages. Some,
but not all of these modifications are likely to occur in vivo.

11.6 Cholesterol and atherosclerosis 195
proteinNH2
protein
HN
O
protein
HN
O
NH2
proteinN
OH
OH
OH
OH
OH
unmodified amine (native LDL)
acetylated amine
carbamylated amine
glucosylated amine
11.6.8 Which modifications of LDL are significant in vivo?
Notes: Oxidized LDL has been demonstrated inside atherosclerotic lesions. Ox-
idation is widely considered to be the most important single mechanism of LDL
modification. It is, however, not very well characterized in molecular terms, and
the relative importance of protein and lipid oxidation is not clear.
Modification Possible causes
acetylation easily achieved in vitro, but not plausiblein vivo
carbamylation promoted by urea, which is enhanced inkidney disease; also promoted bysmoking
glucosylation promoted by high blood glucose(diabetes)
partial proteolysis proteases released from macrophages
oxidation of lipidsand apolipoproteins
reactive oxygen species released frommacrophages
Carbamylation is due to the reaction of amino groups with isocyanate (HN−−C−−O),
which arises through isomerization from urea. Isocyanate apparently also forms
from isothiocyanate (HN−−C−−S) through oxidation, and it has been proposed that
this mechanism promotes atherosclerosis in smokers [63].
Glucosylation is likely increased in diabetes and may contribute to the ob-
served acceleration of atherosclerosis in diabetic patients, although it will be diffi-
cult to separate this effect from that of other metabolic consequences of diabetes
such as hyperlipidemia. The mechanism of glucosylation is the same as with that
of hemoglobin (see section 14.5.8).
Proteases are released by inflammatory cells, which occur in atherosclerotic
lesions; therefore, partial proteolytic degradation is another mechanism that is
plausible in vivo [64].

196 11 Cholesterol metabolism
11.12 What is the significance of LDL modifications in the development of atherosclerosis?Which types of pathogenic modifications of LDL have been characterized?
11.6.9 How does LDL become oxidized?
• Transition metals (Fe, Cu) convert O2 to reactive oxygen species: hydrogen
peroxide (H2O2), superoxide (•O−O–)
• Macrophages produce reactive oxygen species
• Lipoxygenases produce lipid hydroperoxy-radicals that can bind to LDL and
induce lipid peroxidation
• Myeloperoxidase produces hypochlorite (HOCl)
Notes: The formation of reactive oxygen species (ROS) catalyzed by transition
metals is common; it is not restricted to atherosclerotic lesions but also occurs
for example in mitochondrial respiration. However, activated macrophages likely
cause more ROS formation than vagrant transition metals.
Lipoxygenases attach molecular oxygen to arachidonic acid and similar polyun-
saturated fatty acids. The peroxy radicals thus generated can then associate with
LDL and set off a self-sustaining cycle of lipid peroxidation (see below).
The reaction of H2O2 with chloride ions generates bleach (HOCl), which can
react with tyrosine residues. This reaction is catalyzed by myeloperoxidase and is
important in antimicrobial defense. However, its contribution to the development
of atherosclerotic lesions seems questionable.
11.6.10 Self-sustained lipid peroxidation induced by peroxy radicals
R1
R2
H
R1
R2
•
R1
R2
O O•
R1
R2
O OH
R1
R2
H
HOO•
HOOH
O2
Notes: Lipid peroxidation is initiated by a radical. This can be a hydroperoxy
radical, as shown here, or an even more reactive hydroxy radical, which can form
from superoxide (O–2 ) in the presence of transition metals. The radical steals a
hydrogen from a methylene group of an unsaturated fatty acyl residue, which
is thereby turned into a radical itself and sets off a self-sustaining cycle of lipid

11.6 Cholesterol and atherosclerosis 197
peroxidation that requires nothing more than further unsaturated fatty acids and
molecular oxygen.
The peroxidation can also begin with lipid peroxy radicals that are formed
by lipoxygenases, which produce such molecules as precursors of leukotrienes
and other mediators of inflammation. Lipoxygenase inhibitors have shown some
potential to slow down atherosclerosis in animal models; however, it is difficult
to determine how much of that benefit is due to reduced oxidation of LDL, as
opposed to the inhibited signaling by proinflammatory mediators.
The same process of lipid peroxidation also occurs in cell membranes. This
is important in various diseases. An example is favism, a condition in which the
failure to neutralize reactive oxygen species causes the destruction of red blood
cells (see slide 9.4.2).
11.13 How does autocatalytic lipid peroxidation occur, and where does it matter in thepathogenesis of atherosclerosis?
11.6.11 α-Tocopherol intercepts lipid peroxidation
R1
R2
O O• HO
O
R1
R2
O OH
O
O
R1
R2
•
R1
R2
O
O
Notes: Various antioxidants can intercept the autocatalytic process of lipid per-
oxidation. Particularly effective are α-tocopherol and related compounds, which
collectively are referred to as vitamin E, and which due to their fat-soluble nature
are enriched in cell membranes.
You may have noticed that generous amounts of vitamin E are routinely added
to vegetable oil and lard. This is not done out of concern for your health; rather,
the rationale is to protect these foods from turning rancid through peroxidation
of their unsaturated fatty acids.

198 11 Cholesterol metabolism
11.6.12 Experimental evidence implicating LDL oxidation in the pathogenesis
of atherosclerosis
• Vitamin E reduces the severity of atherosclerosis in animal models—but not
in clinical studies on humans
• Antibodies against oxidized LDL are found in blood; among these, IgG pro-
motes atherosclerosis, whereas IgM inhibits it
• Haptoglobin alleles differ in the efficiency of hemoglobin clearance, which
correlates inversely with susceptibility to atherosclerosis
• Production of HOCl by myeloperoxidase: Chlorotyrosine residues detectable
in oxLDL ex vivo—but myeloperoxidase k.o. mice have increased susceptibility
to atherosclerosis
Notes: Regarding vitamin E: It never ceases to amaze me how many therapies that
work wonders in mice fall flat when applied to humans. Too bad we aren’t mice . . .
maybe after all Douglas Adams [65] was right about who was running the show
between man and mice?6
The effect of antibodies to oxidized LDL may be due to opsonization: antibody-
decorated particles are taken up more efficiently by phagocytes, which have recep-
tors for antibodies on their surface. Since there are receptors for both IgG and
IgM, I’m not sure what to make of the observed difference between the two types
of antibodies on atherosclerosis progression. In any case, the observation that
antibodies have any effect at all suggests that their antigen matters.
Haptoglobin is a serum protein that captures hemoglobin released from de-
cayed erythrocytes. In adults, the regular turnover of red blood cells releases sev-
eral grams of hemoglobin every day. If free hemoglobin is not promptly cleared,
it may shed heme, which then may bind to LDL and promote its oxidation [66].
Haptoglobin genotypes are associated with the risk to suffer from complications
of atherosclerosis [67].
Myeloperoxidase produces HOCl from H2O2. While oxidation of LDL by HOCl
may promote LDL phagocytosis, the effect of genetic myeloperoxidase knockout
suggests that HOCl is less effective in this regard than the H2O2 consumed in its
formation would have been.
11.7 Cholesterol metabolism and the treatment of atherosclerosis
11.7.1 Lowering LDL cholesterol: therapeutic principles
• inhibition of cholesterol synthesis
• inhibition of cholesterol uptake
• inhibition of cholesterol ester transfer protein
6Of note, Adams died at 49, only a few years after finishing his book “The Hitchhiker’s Guide tothe Galaxy,” in which he exposed the far-ranging conspiracy of mice. It would seem that the miceexacted their revenge!

11.7 Cholesterol metabolism and the treatment of atherosclerosis 199
• inhibition of bile acid reuptake
• LDL apheresis
Notes: Lowering cholesterol is a key objective in the clinical management of athe-
rosclerosis. Based on the foregoing, we can appreciate the strategies listed here.
Two or more of these strategies are often used in combination.
11.7.2 “Statins” inhibit HMG-CoA reductase
F
N
OH
OH
O
OH
ONH
AtorvastatinMevastatin
Mevalonate
HO
O
O
OO
HO
OH
OHO
Notes: Inhibition of HMG-CoA reductase is currently the single most effective
and widely used strategy to lower plasma cholesterol. The first inhibitor was
mevastatin, a natural compound isolated from the fungus Penicillium citrinum. Its
function in nature is probably to inhibit the growth of competing fungal species
by blocking their synthesis of ergosterol, which also requires HMG-CoA reductase.
Some early therapeutically useful statins, such as lovastatin, were derived
from mevastatin. Modern statins such as atorvastatin depart from the mevastatin
structure. However, both mevastatin and atorvastatin contain a moiety resembling
the product of the enzyme reaction (mevalonate).
HMG-CoA reductase has four subunits, with four active sites located at subunit
interfaces. The picture shows one active site confined between two subunits, which
are rendered in white and blue, respectively. An atorvastatin molecule occupies
the active site. Rendered from 1hwk.pdb.
11.7.3 Inhibitors of intestinal cholesterol uptake
Notes: Inhibitors of intestinal cholesterol absorption represent another plausible
strategy to lower plasma cholesterol, but their effect on blood cholesterol levels is
less powerful than that of the statins.
Ezetimibe binds to the NPC1L1 protein in the luminal cell membrane (slide
11.4.3) and inactivates it. The drug is used mostly in conjunction with statin drugs.

200 11 Cholesterol metabolism
The β-lactam ring in the center of the structure is likely reactive, which suggests
that ezetimibe may bind its target covalently, but I have not found experimental
evidence supporting this assumption.
F N
OH
O
OH
F
HO FFF
O
NH
N
NH
FF
F
O
S
S
NNH
O
S
ezetimibe sitosterol
lomitapide
CP-113,818
Lomitapide inhibits the transfer of cholesterol from endocytotic vesicles to the
ER by mitochondrial triglyceride transfer protein (MTTP). At the ER, cholesterol is
normally converted to cholesterol esters by ACAT. CP-113,818 is an experimental
inhibitor of ACAT. These two strategies are currently still experimental.
Sitosterol and other plant sterols compete with cholesterol for intestinal
uptake. This “low tech” strategy is clinically proven yet has modest benefits.
11.7.4 Cholesterol ester transfer protein (CETP) short-circuits cholesterol
transport by lipoproteins
LDL
HDL
CETP
cholesterol
cholesterolesters
triacylglycerol
O
NH
S
O
dalcetrapib
Notes: CETP, a serum protein, facilitates the exchange of triacylglycerol and chol-
esterol esters between HDL and LDL. The net effect seems to be an increase of LDL
cholesterol, and accordingly inhibition of CETP looks like a promising strategy.
Dalcetrapib is one of several CETP inhibitors that have been or currently are
under study by various pharmaceutical companies. While dalcetrapib indeed
raises the ratio of HDL cholesterol to LDL cholesterol, large scale clinical trials
have been put on hold due to lack of improvement in clinical outcomes [68].

11.7 Cholesterol metabolism and the treatment of atherosclerosis 201
11.7.5 Cholestyramine particles absorb bile acids
OHO
⊖O
OH OH
N⊕
N⊕
cholestyramine cholic acid
Notes: Cholestyramine and similar polymers adsorb bile acids due to a combina-
tion of electrostatic and hydrophobic forces. This prevents the bile acids from
being taken up at the end of the small intestine. They are replaced by de novo
synthesis from cholesterol, which therefore depletes the pool of cholesterol in the
liver.
The strategy is effective but has some side effects. The concentration of bile
acids in the bile is reduced; this promotes precipitation of cholesterol and other
poorly soluble bile constituents, which may then form gallstones. The polymer
particles may also bind some drugs or fat-soluble vitamins and prevent their
absorption.
11.7.6 LDL apheresis
• Blood is diverted through an extra-corporeal filtration device
• cells are separated from plasma
• LDL is removed from plasma by affinity methods or size-based filtration
• The remaining plasma and cells are returned to the circulation
• The procedure is repeated in weekly or biweekly intervals
Notes: While conceptually simple, LDL apheresis is involved and time-consuming
in practice. It is therefore used only in severe cases, such as homozygous familial
hypercholesterolemia.
11.7.7 More . . .
• triparanol—an old drug, inhibits some CYP450 enzymes in the conversion
from lanosterol to cholesterol; withdrawn due to toxicity
• bezafibrate—a PPARγ agonist
• nicotinic acid—activates hormone-sensitive lipase through a G protein coupled
receptor named HM74A; 5 likely additional mechanisms
• probucol and succinobucol—supposedly antioxidants that prevent LDL oxida-
tion, but also cause unrelated changes in other laboratory parameters

202 11 Cholesterol metabolism
• guar gum and other carbohydrate fibers —absorb and prevent intestinal up-
take of cholesterol and bile acids with variable efficiency
• thyroid hormone analogs—promote LDL utilization
Notes: We will not cover these drugs in detail, but you may find it interesting to
look them up in the literature yourself.
11.14 Explain the major therapeutic strategies for lowering LDL cholesterol.
11.8 Gene defects in cholesterol transport and metabolism
11.8.1 Familial hypercholesterolemia is due to a gene defect in the LDL recep-
tor
chylomicrons
chylomicron remnants
cholesterol
Liver
VLDL
HDL
nascent HDL
LDL
cholesterol
Other tissues
LPL
LPL
LDL receptor
ABCA1LCAT
Notes: In Caucasians, this gene defect occurs with a heterozygote frequency of 1
in 500. While most other hereditary defects of metabolism are clinically manifest
only in homozygous form, familial hypercholesterolemia is symptomatic in both
heterozygous and homozygous individuals, and therefore much more commonly
encountered in clinical practice.
The defect is more severe in homozygous patients, whose levels of LDL in the
blood are several times higher than normal. Before effective treatment options
became available, these patients used to develop severe atherosclerosis at young
age, leading to death due to myocardial infarction or stroke by the age of 40 years
or earlier. This situation has improved through therapy with statin drugs and LDL
apheresis.
11.15 What is the underlying defect in familial hypercholesterolemia? What are the con-sequences?

11.8 Gene defects in cholesterol transport and metabolism 203
11.8.2 Tangier disease: Disruption of cholesterol transfer to HDL
chylomicrons
chylomicron remnants
cholesterol
Liver
VLDL
HDL
nascent HDL
LDL
cholesterol
Other tissues
LPL
LPL
LDL receptor
ABCA1LCAT
Notes: Tangier disease, which is very rare, is interesting from a mechanistic point
of view. The defect concerns the ABC transporter that exports surplus choleste-
rol from the cell for delivery to HDL. As a consequence, HDL is greatly reduced.
Interestingly, LDL cholesterol is also reduced; this may be due to the transfer of
cholesterol between LDL and HDL mediated by CETP (see slide 11.7.4).
Fatty deposits are found in the liver, spleen and cornea. Patients develop
atherosclerosis, type 2 diabetes, and neuropathy.
11.8.3 A defective plant sterol exporter causes sitosterolemia
Notes: Genetic deficiency of the ABCA5/8 transporter results in sitosterolemia.
Plant sterols that are taken up from the gut lumen can no longer be extruded,
accumulate inside the mucosal cells, and ultimately find their way into the chy-
lomicrons and the system. Patients have very high levels of plant sterols in the
plasma; they develop lipid deposits in the skin and atherosclerosis.

204 11 Cholesterol metabolism
In these patients, therapeutic application of plant sterols in order to inhibit
cholesterol uptake would obviously be a bad idea. The treatment of choice is
ezetimibe [69, 70], which inhibits the NPC1L1 protein (see slide 11.7.3).
11.9 Answers to practice questions
11.1: Dietary sources are meat and animal products only. We do not require dietarycholesterol, since our own biosynthetic capacity can cover our metabolic needs.
11.2: The conversion of hydroxymethylglutaryl-CoA to mevalonate by HMG-CoA reduc-tase.
11.3: Cytochrome P450 enzymes catalyze the formation of lanosterol from the last linearprecursor, squalene, and several subsequent demethylation and desaturation steps.
11.4: 1. Immediate biosynthetic precursor of cholesterol 2. Precursor of cholecalciferol,which is formed from 7-dehydrocholesterol through a photochemical reaction in the skin
11.5: A regulatory DNA motif, the sterol response element (SRE), is found upstream of theHMG-CoA synthase gene and related genes. It is activated by SREBP, a protein that startslife as a membrane protein in the ER. If cholesterol in the ER membrane is low, SREBPis bound by SCAP, which is sorted to the Golgi apparatus, where SREBP is proteolyticallycleaved and released from the membrane. SREBP then translocates to the nucleus, whereit binds SRE and activates transcription.
11.6: Cholesterol is taken up on the apical side of the epithelial cells by endocytosis, whichis under the control of the NPC1L1 protein. Cholesterol is transferred by a sterol carrierprotein from the endocytotic vesicles to the ER, where it is converted to a cholesterol esterby ACAT and then packaged into nascent chylomicrons.
11.7: They compete with it at the initial stage (NPC1L1-mediated endocytosis). Afterendocytosis, they are expelled back into the intestine by a dedicated ABC transporter.
11.8: The LCAT reaction transfers one of the two acyl chains from lecithin to cholesterol,producing lysolecithin and a cholesterol ester. Unlike free cholesterol, cholesterol esterscan partition into the interior of lipoprotein particles. They can therefore be transportedin greater amounts than free cholesterol, which is restricted to the surface of the particles.
11.9: Steroid hormones and bile acids. The latter ones are made in greater amounts.
11.10: Bile acids are secreted into the bile by liver epithelial cells. After traveling down theintestinal lumen, they are taken up by specific active transport in the lowermost sectionof the small intestine. The extent of reuptake is above 90%. They reach the liver via theportal vein and are again extracted from the blood and secreted by the liver epithelia.
11.11: Foam cells are macrophages that have ingested modified LDL. The “bubbles” insidea foam cell contain cholesterol and cholesterol esters that were contained in the LDL.When a foam cell dies, these lipids are released into the extracellular space, where theyprecipitate or crystallize. This sustains and perpetuates the inflammatory process.
11.12: Different chemical modifications of LDL result in the uptake of the modified LDLparticles into macrophages via the scavenger receptor. Since this uptake is not subject tofeedback inhibition, the macrophages become overloaded with cholesterol and transforminto foam cells.
Modifications that have been found to have this effect include oxidation, which affectsmostly lipids, as well as enzymatic degradation and chemical reactions such as glucosyla-tion and carbamylation, which affect mostly the apolipoproteins.

11.9 Answers to practice questions 205
11.13: The reaction is initiated by superoxide, which abstracts an electron from a doublebond in an unsaturated fatty acid. The fatty acyl radical produced reacts with molecu-lar oxygen, which produces a peroxy radical that can engage in the same reaction assuperoxide and thus perpetuate the cycle.
Lipid peroxidation can affect LDL and contribute to its oxidation. Oxidized LDL istaken up by macrophages in atherosclerotic lesions and induces their transformation foamcells.
11.14: 1. Inhibition of HMG-CoA reductase, the rate-limiting step of cholesterol synthesis2. Depletion of bile acids with polymer particles (e.g. cholestyramine) 3. Inhibition ofintestinal cholesterol uptake, with either plant sterols (sitosterol) or ezetimibe (inhibitorof NPC1L1)
11.15: This condition is due to a genetic defect in the LDL receptor. The excessively highLDL promotes atherosclerosis, which becomes manifest early and severely.


Chapter 12
Amino acid metabolism
12.1 Metabolic uses of amino acids
• building blocks for protein synthesis
• precursors of nucleotides and heme
• source of energy
• neurotransmitters
• precursors of neurotransmitters and hormones
Notes: We have seen before that, during digestion in the gut, proteins are bro-
ken down to their constituent amino acids. Proteins contain twenty standard
amino acids, which are incorporated into them during translation. Proteins may
also contain several non-standard amino acids; these are mostly formed by post-
translational modification, and they are much less abundant than the standard
amino acids. In this chapter, we will focus on the standard amino acids, although
some non-standard ones will appear in the urea cycle.
Animals and humans obtain many important metabolites from their food
and have a fairly lazy synthetic metabolism. While many other organisms, even
simple ones such as E. coli, can make all their amino acids from scratch, we
possess synthetic pathways for only 11 out of the 20 standard amino acids. The
remaining ones must be obtained from the diet and accordingly are referred to as
the essential amino acids.1 A certain amount of dietary protein is therefore strictly
necessary, and the lack of food protein is a very common form of malnutrition in
impoverished countries. Nevertheless, during day-to-day protein turnover, most
of the amino acids used in protein synthesis are obtained not from food but rather
through endogenous protein breakdown; food protein only replaces the fraction
of amino acids diverted toward other destinations.
1These essential amino acids are histidine, isoleucine, leucine, lysine, methionine, phenylala-nine, threonine, tryptophan, and valine. Arginine can be synthesized but apparently not always insufficient amounts, and thus is often listed as the tenth essential amino acid.
207

208 12 Amino acid metabolism
In this chapter, we will mostly focus on degradative pathways of amino acids;
their synthesis will be touched upon only briefly. The roles of specific amino acids
in the synthesis of nucleotides are covered in chapter 16. The use of glycine in the
synthesis of heme is discussed in chapter 17.
12.1.1 Outline of amino acid degradation
• The liver is the major site of degradation for most amino acids, but muscle
and kidney dominate the degradation of specific ones
• Nitrogen is removed from the carbon skeleton and transferred to α-ketoglu-
tarate, which yields glutamate
• The carbon skeletons are converted to intermediates of the mainstream carbon
oxidation pathways via specific adapter pathways
• Surplus nitrogen is removed from glutamate, incorporated into urea, and
excreted
Notes: All amino acids contain at least one nitrogen atom, which forms their α-
amino group; several amino acids contain additional nitrogen atoms in their side
chains. Some nitrogen is used in biosynthesis, for example of nucleotides, but
most of it is surplus and must be eliminated. To this end, the liver incorporates it
into urea, which is released into the bloodstream and excreted by the kidneys.
Removal of nitrogen is typically an early step in the degradation and leaves
behind the carbon skeleton. The structure of the latter is different for each amino
acid, and accordingly each amino acid has its own specific pathway of degradation.
12.1.2 Amino acid breakdown pathways join mainstream carbon utilization at
different points of entry
Arg, Gln, Glu, His, Pro
Ile, Met, Thr, Val
Phe, Tyr
Asn, Asp
Ala, Cys, Gly, Ser
Leu, Lys, Phe, Trp, Tyr
propionyl-CoA
acetoacetate
α-ketoglutarate
succinyl-CoA
fumarate
oxaloacetate
pyruvate
acetyl-CoA
glucose
glucogenic
ketogenic
Notes: The degradative pathways can be divided into two major classes. As shown
here, most amino acids are converted to intermediates of the citric acid cycle or
to pyruvate, which in turn can serve as precursors for gluconeogenesis; these are

12.2 Transamination of amino acids 209
the glucogenic amino acids. Those amino acids that yield acetoacetate are called
ketogenic, since acetoacetate is one of the ketone bodies (see slide 10.4).
If you look carefully, you will see that phenylalanine and tyrosine are found on
both sides of the divide, since they yield both fumarate and acetoacetate. I suppose
that makes them both glucogenic and ketogenic, although some might insist that
either category should take precedence; this is merely a matter of definition.
Depending on the composition of our diet, amino acids may be very important
as a source of energy. While plant-derived foodstuffs are typically rich in starch,
meat is high in protein but low in carbohydrates. Therefore, when on a diet that
contains mostly meat, amino acids become our major source of glucose.
What happens if protein is supplied in excess of the amount needed to cover
our requirement for glucose? While the liver in principle contains all enzyme
activities required to oxidize the surplus carbon, measurements of the liver’s
overall oxygen consumption indicate that most of the oxidation must happen
elsewhere [71]. Presumably, much of the carbon still ends up as glucose, which
is then either stored as glycogen or released into the circulation. In the latter
case, the surplus will mostly be converted to fat in adipose tissue. A surplus of
ketogenic amino acids will mostly be converted to fat in the liver, which is then
packaged and released as VLDL (see slide 11.4.2).
12.1 Explain why we need a minimum amount of protein in the diet. Also explain thedifference between glucogenic and ketogenic amino acids.
12.2 Transamination of amino acids
COOH
CHH2N
CH3
COOH
C O
CH2
CH2
COOH
COOH
C O
CH3
COOH
CHH2N
CH2
CH2
COOH
l-alanine α-ketoglutarate pyruvate l-glutamate
Notes: Most standard amino acids lose their α-amino group early on in degrada-
tion through transamination, that is, transfer to an α-keto acid. This is illustrated
here for alanine, which transfers its amino group to α-ketoglutarate to become
pyruvate.2 Transamination is mediated by several different aminotransferase
enzymes. These may be specific for individual amino acids, or they may be able to
process a group of chemically similar ones. The latter applies to the group of the
branched-chain amino acids, which comprises leucine, isoleucine, and valine.
In the case of alanine, the α-keto acid that accepts the amino group is α-
ketoglutarate; this also applies to most other amino acids. Transamination is
freely reversible; therefore, both glutamate and α-ketoglutarate are substrates of
2Since we already know how to degrade pyruvate, transamination is all that is required to accountfor the degradation of alanine. Similarly, as we had seen in slide 6.9.2, aspartate is transaminated tooxaloacetate, which again suffices to account for its utilization.

210 12 Amino acid metabolism
multiple transaminases. If amino groups are to be transferred between two amino
acids other than glutamate, this will usually involve the formation of glutamate as
an intermediate. The role of glutamate in transamination is only one aspect of its
central place in amino acid metabolism (see slide 12.3.7).
12.2.1 The reaction mechanism of transamination
H3C C
H
COOH
NH2
OCH
⊖O
⊕
NH
P
H2O
H3C C
H B
Enzyme
COOH
N⊕ CH
⊖O
H
⊕
NH
P
H3C
H⊕
C
O⊖HBH⊕
Enzyme
COOH
N⊕ CH
⊖O
H
NH
P
H3C
H⊕
C
OH
COOH
N⊕
H CH
⊖O
H
NH
P
H3C C
O
COOH
H3N⊕
CH
⊖O
NH
P
Notes: In this scheme, we again show alanine as the example substrate, but the
mechanism is very general. All transaminases employ the coenzyme pyridoxal
phosphate (PLP), which is the centerpiece of the reaction mechanism. The aldehyde
group of PLP can form an aldimine, or Schiff base, with the α amino group of the
substrate, which releases water.3
After binding of the substrate to PLP, a catalytic base in the active side ab-
stracts its α hydrogen as a proton, and the surplus electron left behind travels all
the way down to the nitrogen at the bottom of the PLP ring, inverting the entire
sequence of single and double bonds along the way. This has the effect of turning
the bond between the α carbon and the α nitrogen into a Schiff base, which then
undergoes hydrolysis to release pyruvate.
At this point, the reaction is only half complete—the nitrogen is still attached
to PLP and needs to be transferred to α-ketoglutarate. The sequence of steps
involved in this transfer is the exact reversal of the ones shown here, so we won’t
show them in detail. However, you might still find it a useful exercise to draw
these reaction steps yourself.
It is interesting to compare the transaminase mechanism with that of serine
hydroxymethyltransferase (slide 15.2.4). While that enzyme breaks the bond be-
tween the α carbon and the side chain rather than the amino group, it uses PLP in
3At the outset, PLP actually forms a Schiff base with a lysine side chain of the enzyme, which isthen displaced by the incoming substrate; these steps have been skipped here for simplicity. Theliberated lysine then assumes the role of the catalytic base, which is represented here by B.

12.3 Nitrogen disposal and excretion 211
much the same manner to destabilize the substrate by withdrawing an electron.
This also occurs in other PLP-mediated reactions; and in those reactions, PLP is
often said to act as an electron sink. PLP also serves as a coenzyme in the glycogen
phosphorylase reaction; however, its catalytic role there is entirely different (see
slide 8.3.6).
12.2 Compare the role of pyridoxal phosphate in amino acid transamination to that inthe glycogen phosphorylase reaction.
12.2.2 The ping pong bi bi mechanism of transamination
R1 C
H
COOH
NH2
R1 C COOH
O
R2 C COOH
O
R2 C
H
COOH
NH2
OCH
⊖O
⊕
NH
P
H2NCH
⊖O
NH
P
OCH
⊖O
⊕
NH
P
Notes: The interaction of the transaminase with its substrates involves four dis-
crete steps: 1) the first substrate enters, 2) the first product leaves, 3) the second
substrate enters, and 4) the second product leaves. Such a strictly sequential order
is referred to as a ping pong mechanism. A ping pong bi bi mechanism is one
that, on top of being strictly sequential, involves exactly two substrates and two
products.4
While two different substrates must be used for the reaction to have some
useful effect, it is of course possible for R1 and R2 to be identical—the reaction
will work just fine, but simply achieve no net turnover.
12.3 Nitrogen disposal and excretion
• Nitrogen accruing outside the liver is transported to the liver as glutamine or
alanine
• In the liver, nitrogen is released as free ammonia
• Ammonia is incorporated into urea
• Urea is released from the liver into the bloodstream and excreted through the
kidneys
4While this bit of nomenclature may be surprising in its nonchalance, we should probably begrateful that it did not fall to some Old World biochemists with classical inclinations to dream up aname for the behavior. The mind boggles at the possibilities—perhaps: Antidromo-binary vacillatoryallochronic?

212 12 Amino acid metabolism
Notes: While transamination solves the problem of removing the α-nitrogen for
the amino acids other than glutamate, there also must be mechanisms for regen-
erating the α-ketoglutarate that is converted to glutamate in each transamination
reaction, and for the ultimate disposal of nitrogen. A reaction that directly regen-
erates α-ketoglutarate is catalyzed by glutamate dehydrogenase, as follows:
glutamate+H2O+NAD+ α-ketoglutarate+NH3 +NADH+H+
While this reaction is straightforward, it produces free ammonia, which is quite
toxic and must be kept at low (micromolar) concentrations in the systemic circula-
tion at all times. Therefore, free ammonia is not a suitable medium for ultimate
disposal of nitrogen; instead, elimination occurs mostly in the form of urea. The
sequence of reactions that incorporates nitrogen into urea is the urea cycle.5
The glutamate dehydrogenase reaction is reversible in principle, but the affin-
ity of the enzyme for ammonia is low. Interestingly, this enzyme can utilize both
NAD+ and NADP+ as cosubstrates. As we have seen (slide 9.3.1), the former is
present in the cell mostly in the oxidized form, which would favor the release of
ammonia, whereas the latter is mostly found as NADPH, which would favor am-
monia fixation. It is not entirely clear what regulatory mechanism, if any, prevents
the enzyme from performing both reactions in a cycle, which would simply cause
the reduction of NAD+ at the expense of NADPH.
12.3.1 The urea cycle, part 1: carbamoylphosphate synthetase
HO
O
O− HO
O
H3N
O P
O
O−
O−
O
−O NH2
O
OP
O
O−
−O NH2
ATP ADP Pi ATP ADP
Notes: The urea cycle runs only in the liver. It begins with the incorporation of am-
monia into carbamoylphosphate by the corresponding synthetase. This reaction
occurs in three successive steps. The first step uses ATP to activate bicarbonate
to carbonylphosphate, which then captures free ammonia to form carbamate. An-
other ATP-dependent step activates that intermediate to carbamoylphosphate. The
carbamoyl group will find its way into the urea that is produced by the urea cycle.
5In liver cirrhosis, one of the main problems is the lacking capability of the liver to detoxify am-monia derived from bacterial metabolism in the large intestine. Oral antibiotics (e.g. paromomycin)are used in this condition to reduce bacterial growth and ammonia formation.
Some ammonia is excreted with the urine as well, where it serves to buffer surplus protons alsodestined for excretion. However, this ammonia is not extracted from the circulation but is formedfrom glutamine directly in the kidneys.

12.3 Nitrogen disposal and excretion 213
12.3.2 The urea cycle, part 2: subsequent reactions
2 3
3
4
5
NH2
O
NH2
O P
NH2
COOH
Pi
NH2
O NH
NH2
COOH
ATP
PPi
NH
OPMA
NH2
COOH
COOH
NH
NH2
COOH
AMP
NH
NH
COOH
COOH
NH
NH2
COOH
COOH
COOH
NH
NH2
O
NH2
NH2
NH
NH2
COOH
H2O
carbamoyl- P
citrulline
aspartate
arginino-succinate
fumaratearginine
urea
ornithine
Notes: The subsequent reactions in the urea cycle are as follows:
2. The carbamoyl group is transferred from carbamoylphosphate to the δ-amino
group of ornithine, a non-standard amino acid homologous to lysine, by or-
nithine transcarbamylase. This reaction yields citrulline.
3. Citrulline and aspartate form argininosuccinate, catalyzed by argininosucci-
nate synthetase. This reaction again requires ATP, which is converted to AMP
in the process.
4. Argininosuccinate is cleaved to fumarate and arginine by argininosuccinase.
5. Urea is released from arginine by arginase, which regenerates ornithine and
closes the cycle.
You will have noticed that only one of the nitrogens in urea is accounted for
by carbamoylphosphate and, therefore, ammonia. The overall reaction of the urea
cycle is
NH3 +HCO−3 + aspartate (NH2)2CO+ fumarate
with the additional expenditure of several equivalents of ATP in order to make
things happen. Therefore, half of the nitrogen in urea is actually derived from
aspartate, not ammonia. Where does this aspartate come from?
12.3 Draw the urea cycle.
12.3.3 The urea cycle in context
Notes: To answer this question, we just need to pull together our previous knowl-
edge about transamination as well as the citric acid cycle. Fumarate is turned into
malate and then oxaloacetate in the citric acid cycle, so we can just borrow those
reactions. Oxaloacetate can be transaminated by aspartate aminotransferase us-

214 12 Amino acid metabolism
ing glutamate (slide 6.9.2), which in turn acquired its nitrogen by transamination
of some other amino acid destined for degradation. In other words, the aspartate
simply serves as an intermediate carrier of nitrogen en route from amino acid
degradation to urea synthesis.
amino acid α-keto acid
α-KG Glu
NH3
carbamoyl- P
HCO–3, ATP
AS
Cit
Orn
Arg
urea
Aspoxaloacetate
malate
fumarate
amino acid α-keto acid
α-KG Glu
transaminases
glutamate dehydrogenase
urea cycle
TCA cycle
The network of reactions shown in this slide accounts for the disposal of nitrogen
that accrues in amino acid degradation in the liver. As stated at the outset, other
tissues also break down amino acids; for example, skeletal muscle metabolizes the
lion’s share of the branched-chain amino acids. Therefore, a mechanism is needed
to ferry the nitrogen produced in the peripheral organs to the liver. Ammonia
cannot be used as a carrier, since it is too toxic; amino acids are a better alternative.
The two most important nitrogen carriers are alanine and glutamine (see below).
12.3.4 The urea cycle spans mitochondria and cytosol
mitochondria cytosol
citrulline
ornithine
H+ H+
citrulline
ornithine
argininosuccinate
arginine
carbamoyl-phosphate
NH3 + HCO–3
2 ADP
2 ATP
aspartate
ATP AMP
fumarate
urea
Notes: The carbamoylphosphate synthetase reaction and the ornithine transcarba-
mylase reaction occur inside the mitochondria, while the remaining reactions take
place in the cytosol. This requires the transport of ornithine and citrulline, which

12.3 Nitrogen disposal and excretion 215
are exchanged for each other by a specific transporter in the inner mitochondrial
membrane.
Ornithine has two free amino groups, while citrulline has one. The exchange
transport is rendered electrically neutral by the cotransport of a proton out of the
mitochondria, that is, against its concentration gradient. The energetic cost of this
uphill transport is offset by the expenditure of ATP in other steps of the urea cycle.
Nevertheless, the coupling of this substrate exchange to proton export will keep
the cytosolic concentration of citrulline low at equilibrium.
Also note that the reactions that involve fumarate and aspartate occur in the
cytosol. We had just noted that the conversion of fumarate back to aspartate
involves some reactions borrowed from the TCA cycle. That cycle runs in the
mitochondria; however, fumarate does not need to enter the mitochondria at this
stage, since all required enzyme activities are also present in the cytosol.
12.3.5 The glucose-alanine cycle
amino acid
α-keto acid
α-KG
Glu
1
Ala
pyruvate
glucose
1
Ala
pyruvate
glucose
α-KG
Glu
1
NH3
H2O
2
urea
Notes: The glucose-alanine cycle is an interorgan cycle that piggybacks on the
Cori cycle and accomplishes a net transport of nitrogen from muscle and other
peripheral tissues to the liver. Here, pyruvate that is produced from glucose in
the periphery is not reduced to lactate—as is the case in the Cori cycle, see slide
8.5.3—but instead transaminated to alanine, which is then transported to the liver.
There, transamination is reversed, and pyruvate is converted again to glucose by
gluconeogenesis. Release of glucose into the bloodstream and renewed glycolysis
in the periphery close the cycle.
Apart from the reactions of glycolysis and gluconeogenesis, the cycle involves
various transaminases (1) and glutamate dehydrogenase (2).
12.3.6 Nitrogen transport by glutamine
Notes: Glutamine is the most abundant amino acid in the blood; it is significant
both as a nitrogen and a carbon carrier.6 It can bring about a net transfer of nitro-
gen from peripheral tissues to the liver in exchange for glutamate. The enzymes
6Some cell types, including leukocytes and the intestinal epithelia, use glutamine rather thanglucose as their major energy-providing substrate.

216 12 Amino acid metabolism
involved in the overall scheme are transaminases (1), glutamate dehydrogenase (2),
glutamine synthetase (3), and glutaminase (4). The latter two reactions are shown
in detail in slide 12.3.7.
amino acid
α-keto acid
α-KG
Glu
1
NH3
H2O
2
Glu
Gln
3
Glu
Gln
NH3
H2O
4
urea
One might reason that, in the liver, glutamate could be further deaminated by
glutamate dehydrogenase, and α-ketoglutarate be returned to the periphery, which
would allow the transfer of two nitrogen atoms in each turn of the cycle. This
should work in principle, but the plasma concentration of α-ketoglutarate is too
low for it to be quantitatively important.
12.4 Explain how nitrogen that accrues in the degradation of amino acids in muscle tissueis transported to the liver.
12.3.7 The central role of glutamate in nitrogen disposal
HOO
H2N
ONH2
HOO
H2N
OOH
HOO
O
OOH
H2O
NH3
glutaminase
NH3 + ATP
ADP + Pi
glutaminesynthetase
NAD+ + H2O
glutamatedehydrogenase
NADH + H+ + NH3
urea
amino acid
α-keto acid
oxaloacetate aspartate
transaminases
Notes: If we summarize the network of reactions in nitrogen elimination, we find
that glutamate has a central place in it. Glutamate collects nitrogen from other
amino acids through transamination and either releases it as ammonia or transfers

12.3 Nitrogen disposal and excretion 217
it to aspartate in order to feed the urea cycle. Together with glutamine, it also
controls the level of free ammonia and accomplishes the transport of nitrogen
between organs.
As shown in this scheme, glutamate is formed from glutamine by glutaminase,
and it can be turned back into glutamine by glutamine synthetase.7 Evidently, both
enzymes together would create a futile cycle that would accomplish nothing except
ATP hydrolysis. In most organs, only one or the other enzyme has significant
activity; for example, glutamine synthetase predominates in skeletal muscle (see
slide 12.3.6), whereas glutaminase is abundant in the kidneys, which use it to
secrete ammonium chloride into the urine when eliminating excess acid.
The liver contains both glutaminase and glutamine synthetase, which would
suggest that futile cycling should occur. However, as it turns out, the enzymes are
present inside the same tissue but not the same cells. Instead, they are distributed
strategically within the liver lobule so as to create a confined compartment to host
the urea cycle (see next slide).
12.3.8 Control of ammonia levels in the liver lobule
blood from portal vein
blood from liver artery
blood to systemic circulation
glutamate dehydrogenase,
glutaminase: NH3urea cycle runs at speed
glutamine synthetase: NH3before blood leaves liver
Notes: The toxicity of ammonia mandates that its concentration be kept very
low in the systemic circulation. On the other hand, for the urea cycle to run
at speed, the concentration must be high enough to saturate the initial enzyme,
carbamoylphosphate synthetase, to a useful degree. Therefore, ammonia must be
released when the blood enters the liver tissue, and scooped up again before the
blood is drained away into the general circulation.
To make this work, the enzymes that release or fix ammonia, respectively,
are strategically distributed in the liver tissue. We had seen before that the liver
consists of functional units called lobules, with the blood filtering through each
lobule from the periphery towards the center, from where it is drained toward
the systemic circulation (slide 1.6.3). Glutaminase and glutamate dehydrogenase,
which release ammonia, are found predominantly in the periphery of the lobule,
7The reaction mechanism of glutamine synthetase is shown in slide 2.4.1.

218 12 Amino acid metabolism
the so-called periportal zone. Here, they increase the concentration of free ammo-
nia, allowing the urea cycle to run at speed. As the blood seeps into the pericentral
zone toward the lobule’s central vein, ammonia is scavenged again by glutamine
synthetase before the blood is drained from the liver into the general circulation.
A similar spatial separation applies to the enzymes of arginine degradation.
The first step in this pathway is catalyzed by arginase, which also functions in the
urea cycle and produces ornithine. In the periportal zone, it would be deleterious
to continue the degradation beyond ornithine, since this would drain the urea
cycle of its intermediates. Therefore, the next enzyme in the pathway, ornithine
aminotransferase, is only found in the periportal zone, in which the urea cycle
must shut down anyway.
The purposeful distribution of different enzyme activities illustrates nicely
how biochemical and anatomical levels of organization are interrelated, and how
our body is not just a bag of cells, not even at the level of individual organs and
tissues.
12.3.9 Regulation of the urea cycle
glutamine
glutamate
N-acetyl-glutamate
NH3
carbamoyl- P
urea
ornithineaspartate
oxaloacetate
α-ketoglutarate
Notes: At the heart of the mechanisms that control flow through the urea cycle,
we once again find glutamine and glutamate. Glutaminase gets the ball rolling by
releasing ammonia from glutamine. Quite unusually, ammonia exercises positive
feedback on glutaminase, which causes a rapid accumulation of both glutamate
and ammonia. High levels of glutamate then promote the incorporation of ammo-
nia into urea in several ways.
1. Some glutamate is converted to N-acetylglutamate. This is a regulatory
molecule that allosterically activates carbamoylphosphate synthetase.
2. Glutamate is also the biosynthetic precursor of ornithine. A high level of
glutamate will also raise the level of ornithine, which will increase the flow
through the urea cycle.

12.4 Degradative pathways of individual amino acids 219
3. As we have seen, glutamate itself feeds nitrogen into urea synthesis via gluta-
mate dehydrogenase or via aspartate.
Note that all these regulatory events amplify the flow through the urea cycle;
they are the ones that run in the periportal zone of the liver lobule. As stated
above, the urea cycle is shut down in the pericentral zone through the capture of
remaining ammonia by glutamine synthetase as well as by ornithine degradation.
12.5 Explain how flow through the urea cycle is controlled within the liver lobule.
12.3.10 Hereditary enzyme defects in the urea cycle
• may affect any of the enzymes in the cycle
• urea cannot be synthesized, nitrogen disposal is disrupted
• ammonia accumulates, as do other metabolites depending on the deficient
enzyme
• treatment
– protein-limited diet
– arginine substitution
– alternate pathway therapy
Notes: Urea cycle defects primarily become symptomatic due to the accumulation
of ammonia, which impairs brain function. Another aspect is the deficiency of argi-
nine. In healthy individuals, arginine can be diverted from the urea cycle toward
protein synthesis as required, but this supply is lacking if the cycle is disrupted.
This may induce protein catabolism, thereby exacerbating the symptoms. The
problem is addressed by the addition of arginine to the diet. If the enzyme defect
is not between citrulline and arginine, it is possible to supply citrulline instead;
this has the advantage of picking up one nitrogen equivalent en route to arginine.
The rationale for treating these enzyme defects with a protein-restricted diet is
fairly obvious. Another, more intriguing approach is known as alternate pathway
therapy. Here, the patients are given several innocuous organic acids that are
substrates for conjugation with amino acids. These conjugates then serve as an
alternative vehicle for the renal elimination of surplus nitrogen. This ingenious
form of treatment is further discussed in slide 18.3.7.
12.6 Explain the pathogenesis and treatment of urea cycle enzyme defects.
12.4 Degradative pathways of individual amino acids
The degradation pathways for the individual amino acids vary considerably in
complexity. As we had seen, some amino acids only require a single transamination
step; on the other hand, others have lengthy degradation pathways with intriguing
catalytic mechanisms. We will here consider some selected examples; several
others are discussed in a later chapter (slides 15.2.4–15.2.7).

220 12 Amino acid metabolism
12.4.1 Asparagine degradation
HO
O
H2N
O
NH2
HO
O
H2N
O
OH
HO
O
O
O
OH
H2O
NH2
1
α-KG
Glu
2
asparagine aspartate oxaloacetate
Notes: Asparagine is homologous to glutamine, and its degradation is analogous,
too—just like glutaminase produces glutamate, asparaginase (1) produces aspar-
tate, which can then be transaminated by aspartate aminotransferase (2) to ox-
aloacetate. Asparaginase is mentioned here not for any notable chemistry, but
rather because of some interesting medical context.
Asparagine is a non-essential amino acid, which means that it can be synthe-
sized by human cells; the enzyme responsible for this, asparagine synthetase, uses
glutamine as the amide group donor. Nevertheless, in some forms of leukemia,
the leukemic cells lack the synthetic capacity for asparagine. This can be exploited
for therapy—the leukemia patients are treated with intravenous application of
asparaginase.8 This lowers the serum level of asparagine and therefore starves the
leukemic cells.
12.7 Explain the use of asparaginase in leukemia.
12.4.2 Serine dehydratase
HO
O
H2N
HO
HO
O
H2N
HO
O
O
H2O
H2O
NH3
serine aminoacrylate pyruvate
Notes: Serine, another non-essential amino acid, can be degraded along several dif-
ferent pathways; this slide shows one of them. Only the first step is enzymatically
catalyzed; the aminoacrylate produced is unstable and spontaneously hydrolyzes
to pyruvate. The second step releases ammonia, which must be disposed of. It
seems that in humans the reaction occurs only in the liver, where the ammonia
can directly enter the urea cycle.
Like the transaminases, the enzyme uses pyridoxal phosphate, and the role
of the coenzyme is often presented along the lines of the usual electron sink
8The enzyme used for this treatment is purified from E. coli. In healthy patients, repeated injec-tions of a bacterial protein would soon induce antibodies, which would quickly render the enzymeinactive. However, in leukemia patients, the disease itself, and the cytotoxic drugs simultaneouslyapplied—such as, for example, cytosine arabinoside (slide 16.9.7)—conspire to suppress antibodyformation. If it occurs anyway, enzyme prepared from another bacterium, Erwinia chrysanthemi,can be used. Immunogenicity of the enzyme can be reduced by derivatization of the protein withpolyethyleneglycol (PEG).

12.4 Degradative pathways of individual amino acids 221
mechanism (see slide 12.2.1). However, based on the crystal structure of the
enzyme, a different mechanism has been proposed, in which no electron sink
appears and instead the phosphate group of PLP plays a prominent role [72]. I am
not enough of a chemist to judge how plausible this mechanism may be.
12.4.3 Serine-pyruvate transaminase
HO
O
H2N
OH
HO
O
O
OH
HO
O
OH
OH
HO
O
OH
OP
pyruvate
alanine
1
xxNADH+H+
NAD+xxx
2
ATP
ADP
3
serine hydroxypyruvate glycerate 3- P -glycerate
Notes: An alternative pathway starts with the transamination of serine rather
than with deamination. In a departure from the usual routine, the transaminase
employs pyruvate rather than α-ketoglutarate as its other substrate, which yields
alanine (1); subsequently, of course, the nitrogen may yet be transferred from
alanine to α-ketoglutarate. Serine itself is converted to hydroxypyruvate, which is
then reduced to glycerate by hydroxypyruvate reductase (2). Glycerate kinase (3)
produces 3-phosphoglycerate.
While both pyruvate, which is produced by serine dehydratase, and the 3-
phosphoglycerate produced here can serve as substrates for gluconeogenesis, the
transamination pathway shown in this slide avoids the release of free ammonia. It
would therefore be preferable in tissues other than the liver.
A third alternative for serine degradation is provided by serine hydroxyme-
thyltransferase, which produces N,N ′-methylenetetrahydrofolate and glycine. This
pathway is covered in slide 15.2.4.
12.8 Summarize the three pathways for serine degradation.
12.4.4 Degradation of leucine
Notes: Leucine, isoleucine and valine are collectively referred to as the branched-
chain amino acids. Unlike the other amino acids, these ones undergo degradation
mostly in skeletal muscle. This is reminiscent of fatty acids, which are also de-
graded prominently in muscle, and indeed several steps in leucine degradation
have similarity with the reactions we have seen in fatty acid metabolism. Leucine
degradation involves the following steps:
1. Transamination by branched chain amino acid (BCAA) transaminase yields
α-ketoisocaproate.
2. α-Ketoisocaproate is decarboxylated and dehydrogenated by branched chain
α-keto acid dehydrogenase. Like the transaminase in step 1, this dehydroge-
nase participates in the degradation of all branched chain amino acids (valine,
leucine, isoleucine). The reaction mechanisms and the structural organization

222 12 Amino acid metabolism
of this enzyme are completely analogous to pyruvate dehydrogenase and α-
ketoglutarate dehydrogenase, and all use the very same E3 subunit (see slide
5.4.4).
1 2 3
456
HO
O
H2N
α-KG
Glu
HO
O
O
CoA-SH
NAD+
CO2
NADH+H+
CoAS
O
CoAS
O
CoAS
O
O
HO
H2O
CoAS
O
OHO
HO
CoAS
O
O
O
HO
ATPADP+Pi
CO2
FAD FADH2
3. The resulting metabolite, isovaleryl-CoA, is similar in structure to a fatty acyl-
CoA. It likewise undergoes a FAD-dependent dehydrogenation reaction (by
isovaleryl-CoA dehydrogenase), which yields isopentenyl-CoA.
4. Biotin-dependent carboxylation yields methylglutaconyl-CoA. In all of the
previous carboxylation reactions we have seen, carboxylation was facilitated
by a vicinal carbonyl group, which tend to withdraw electrons from the car-
bon being carboxylated. This electron-withdrawing effect can be relayed by a
conjugated C−−C double bond, which is the case here.9
5. Addition of water by methylglutaconyl-CoA hydratase yields HMG-CoA.
6. HMG-CoA is split by HMG-CoA lyase to acetyl-CoA and acetoacetate.
The final reaction occurs in the very same way in ketone body synthesis (see
slide 10.4.1). Evidently, therefore, leucine is a purely ketogenic amino acid.
12.9 Describe the degradation pathway of leucine.
12.4.5 Degradation of phenylalanine and tyrosine
Notes: While the degradation of leucine shows a comforting similarity to previ-
ously encountered pathways, the situation is profoundly different with phenylala-
nine. This is due to the aromatic nature of the side chain. Aromatic rings are quite
stable, and therefore some brute force is needed to crack them open. The best tool
for this task is molecular oxygen, and a liberal dose of it is used in the breakdown
of phenylalanine. The pathway involves the following reactions:
1. Phenylalanine is converted to tyrosine by phenylalanine hydroxylase. In this
reaction, the second oxygen atom is released as water, reduced at the expense
of the redox cosubstrate tetrahydrobiopterin (BH4).
9The mediation of electron-withdrawing effects by conjugated C−−C double bonds is referred toas the vinylogous effect.

12.5 Hereditary enzyme defects in amino acid metabolism 223
HO O
NH2
O2 + BH4
H2O + BH2
HO O
NH2
OH
α-Ketoglutarate
Glutamate
HO O
O
OH
O2
CO2
HO O
OH
OH
Phenylalanine Tyrosine Hydroxyphenylpyruvate Homogentisate
1 2 3
4
5
6
O2
HO O
O
OO
OH
HO
O O O
O
OH
Maleylacetoacetate
Fumarylacetoacetate
H2O
HO
O O
HO
O
O
OHAcetoacetate Fumarate
F
F F
N
O
O
O
O
O
NTBC
2. Tyrosine transaminase yields p-hydroxyphenylpyruvate.
3. p-Hydroxyphenylpyruvate dioxygenase uses another oxygen molecule to turn
hydroxyphenylpyruvate into homogentisate. I have traced the bits and pieces
in this reaction using colors, but an actual explanation of the advanced magic
performed by the enzyme is beyond my feeble powers of narration.
4. Ring cleavage by homogentisate dioxygenase uses a third molecule of oxygen.
The product is maleylacetoacetate.
5. Maleylacetoacetate isomerase produces fumarylacetoacetate.
6. Fumarylacetoacetate hydrolase releases fumarate and acetoacetate.
Since the first transformation of phenylalanine yields tyrosine, it follows that
the pathway accounts for the degradation of both amino acids, and moreover that
tyrosine is not an essential amino acid. Of the two final products, fumarate can
enter gluconeogenesis, while acetoacetate cannot.
2-[2-Nitro-4-(trifluoromethyl)benzoyl]cyclohexane-1,3-dione10 (NTBC), also
shown in this slide, is an inhibitor of p-hydroxypyruvate dioxygenase. The use of
this inhibitor in tyrosinemia will be explained below.
12.5 Hereditary enzyme defects in amino acid metabolism
Since there are so many different pathways for the degradation of the various
amino acids, it is understandable that many of the known inborn errors of metabo-
lism are related to amino acid metabolism. We will consider a few examples that
affect the pathways discussed here.
10As you may have guessed, that full name was a straight copy-and-paste job.

224 12 Amino acid metabolism
12.5.1 Phenylketonuria (PKU)
• homozygous defect of phenylalanine hydroxylase
• affects one in 10,000 newborns among Caucasians; frequency differs with race
• excess of phenylalanine causes symptoms only after birth; intrauterine devel-
opment normal
• cognitive and neurological deficits, probably due to cerebral serotonin deficit
• treatment with phenylalanine-restricted diet
• some cases are due to reduced affinity of enzyme for cofactor THB, can be
treated with high dosages of THB
Notes: As with most genetic enzyme defects, the clinical disease is manifest only
in homozygous individuals. Dietary phenylalanine that is not used for protein syn-
thesis accumulates and causes toxicity. It appears that the excess phenylalanine
crowds out tryptophan at the l-aromatic amino acid transporter in brain capillar-
ies. This transporter keeps the brain supplied with all aromatic amino acids. Since
tryptophan is the precursor of the neurotransmitter serotonin, the competitive
inhibition of its transport to the brain results in a lack of cerebral serotonin [73],
which is believed to cause the observed deficits in brain function and development.
In addition to phenylalanine itself, some aberrant metabolites derived from it
also occur at increased levels, and the appearance of ketone derivatives such as
phenylpyruvic acid in the urine has given the disease its name. These metabolites
have no proven connection to the pathogenesis of the disease.
12.5.2 The Guthrie test for diagnosing phenylketonuria
Grow E. coli Phe– onrich medium
Spread on minimalmedium
Cells persist, but donot grow
Place patients’ blood sampleson inoculated agar—bacteriawill grow around samplescontaining excess phenylala-nine
Notes: The treatment of phenylketonuria is pretty straightforward: Limitation of
dietary phenylalanine. Tyrosine is sufficiently available in a reasonably protein-
rich diet, so that the lack of its endogenous formation won’t be a problem. The

12.5 Hereditary enzyme defects in amino acid metabolism 225
challenge, then, is to diagnose the disease in newborn kids, before any damage
is done. Happily, the enzyme defect does not cause a problem during fetal de-
velopment, since the placenta constantly equilibrates both useful and potentially
harmful metabolites between the maternal and the fetal circulation. Buildup of a
metabolite in the fetus will therefore not occur as long as the mother’s metabolism
is able to degrade it.
The modern test for phenylketonuria is effective but boring—a sample of
blood is drawn, and the phenylalanine concentration in the serum is determined by
HPLC. The original test—the Guthrie test—was a bit more roundabout in principle,
yet ingenious and exceedingly simple and cheap in practice. Moreover, it well
illustrates the power of bacterial genetics in biochemistry, and it therefore merits
discussion here.
In contrast to mammalian cells, the bacterium Escherichia coli can synthesize
all 20 standard amino acids, as long as it has ammonia, some inorganic salts, and
an organic carbon source such as glucose. Such a substrate mixture constitutes
a minimal medium. The Guthrie test makes use of a mutant E. coli strain that is
Phe–, which means that it is unable to synthesize phenylalanine on its own. This
strain can be grown on a rich medium that supplies phenylalanine; however, when
spread onto minimal medium, it will not grow.
Now, if we take a little snippet of filter paper soaked with a drop of baby
blood and place it on top of the inoculated minimal medium, any phenylalanine
contained in it will diffuse into the surrounding agar. If there is enough of it in the
sample, this will allow the bacteria in the vicinity to resume growth. Therefore, a
zone of bacterial growth surrounding a blood sample will identify a patient with
phenylketonuria. Brilliant!
Note that, for this test to work, we cannot collect the blood sample right away
after birth. As noted above, the fetal blood equilibrates with the mother’s, and so
the phenylalanine concentration is only slightly increased at birth. We therefore
must allow 1–2 weeks after delivery for phenylalanine to accumulate in the child’s
blood for the Guthrie test to respond. This is a drawback of the test relative to
the HPLC method—the latter is more quantitatively accurate and readily detects
the smaller increase in phenylalanine concentration that is present at the time of
delivery.
12.5.3 Ochratoxin A inhibits phenylalanyl-tRNA synthetase
Notes: The variation of the gene frequency for PKU between races and geograph-
ical areas suggests that some regional environmental conditions may confer a
selective advantage to the heterozygous state, as is the case with sickle cell ane-
mia and glucose-6-phosphate dehydrogenase deficiency in regions with endemic
malaria. It has been proposed that the heterozygote advantage in PKU consists
in protection from the fungal toxin ochratoxin A, which is produced by some
Aspergillus molds that cause food to rot [74].
Ochratoxin A competitively inhibits the coupling of phenylalanine to its cog-
nate tRNA by the corresponding aminoacyl transferase and thereby disrupts pro-

226 12 Amino acid metabolism
tein synthesis. It is more toxic to fetuses than to adults, most likely because
fetuses are short of the enzymes that inactivate xenobiotics and toxins such as
ochratoxin. Mothers who are heterozygous for PKU will have a somewhat higher
level of phenylalanine, which will be shared with the fetus via the placenta. This
will counter the inhibition of tRNA aminoacylation in the fetus and thereby afford
it some measure of protection.
OH
ONH2
OH
O
HN
OH
O
Cl
O
OOH
ATP AMP + PPi
Phe-tRNA synthetase
OH
ONH2
One of the places with the highest abundance of PKU is Ireland. This country is
also known for its repeated historic episodes of severe famine. Starving people will
tend to eat rotten food rather than discard it. Indeed, reference [74] reports that
lowered rates of abortion were found in Irish women who were heterozygous for
PKU. I have not ascertained whether the time periods covered by those statistics
coincided with periods of actual famine.
12.10 Explain the cause, pathogenesis, diagnosis and treatment of phenylketonuria.

12.6 Answers to practice questions 227
12.5.4 Tyrosinemia
• homozygous defect of fumarylacetoacetate hydrolase
• fumarylacetoacetate and preceding metabolites back up
• fumaryl- and maleylacetoacetate react with glutathione and other nucleophiles,
causing liver toxicity
• the drug NTCB inhibits p-hydroxyphenylpyruvate dioxygenase, intercepting
the degradative pathway upstream of the toxic metabolites
• dietary restriction of tyrosine required to prevent neurological deficit
Notes: Tyrosinemia is comparatively common in Quebec. In this case, there seems
to be no heterozygote advantage; instead, the high incidence is due to the so-called
founder effect, that is, the common descent of the afflicted population from a small
group of founding settlers that happened to contain one or several carriers of the
gene. (Refer to slide 12.4.5 for the relevant pathway and enzyme reactions.)
12.11 Explain the cause, pathogenesis, diagnosis and treatment of tyrosinemia.
12.6 Answers to practice questions
12.1: We need dietary protein because we lack the biosynthetic pathways for about halfof all amino acids, which we nevertheless require for our own protein synthesis.
Glucogenic amino acids are those that can be converted to substrates of gluconeoge-nesis. Ketogenic amino acids are those that yield acetoacetate and/or acetyl-CoA. Lysineand tryptophan are strictly ketogenic, phenylalanine and tyrosine match both categories,and all others are glucogenic.
12.2: In amino acid transamination, the substrate becomes covalently bound to PLP via analdimine bond, through which the coenzyme reversibly abstracts electrons from the sub-strate. In contrast, glycogen phosphorylase uses the phosphate group of PLP to transientlydeprotonate a substrate phosphate ion.
12.3: See schemes in slides 12.3.1 and 12.3.2.
12.4: The nitrogen is transported to the liver in the form of alanine and glutamine. Alanineis formed through transamination of pyruvate, whereas glutamine is formed from gluta-mate by glutamine synthetase. The liver retrieves the nitrogen again via transamination(alanine) and through glutaminase.
12.5: The urea cycle is activated in the periportal zone of the lobule by glutaminase andglutamate dehydrogenase, which release free ammonia from their substrates. Glutamatealso gives rise to ornithine, which increase the pool of urea cycle intermediates, and toN-acetylglutamate, which allosterically activates carbamoylphosphate synthetase. In thepericentral zone of the lobule, the cycle is shut down by ornithine degradation and byglutamine synthetase, which captures remaining free ammonia.
12.6: Enzyme defects in the urea cycle disrupt the disposal of nitrogen and lead to theaccumulation of ammonia, which is neurotoxic. Since the urea cycle also serves to supplyarginine, that amino acid is often lacking and must be substituted. Additionally, theseconditions are treated with a protein-restricted diet. Finally, alternate pathway therapyuses organic acids that undergo amino acid conjugation; the conjugates are excreted andthus cause the removal of surplus nitrogen from the body.
228 12 Amino acid metabolism
12.7: Some types of leukemic cells lack the capacity to synthesize asparagine and aretherefore susceptible to its depletion in the blood by asparaginase. Normal cells are notaffected by this treatment.
12.8: 1) Serine dehydratase induces deamination of serine to pyruvate, 2) serine-pyru-vate transaminase produces glycerate, and 3) serine hydroxymethyltransferase producesglycine and N,N ′-methylenetetrahydrofolate.
12.9: The degradation pathway begins with transamination and a subsequent step thatresembles pyruvate dehydrogenase. The resulting acyl-CoA undergoes FAD-dependentβ-dehydrogenation, carboxylation and hydration; this produces HMG-CoA, which in turnyields acetoacetate and acetyl-CoA.
12.10: PKU is due to a homozygous enzyme defect for phenylalanine hydroxylase. Phe-nylalanine builds up and dislodges tryptophan from the shared transporter that mediatesuptake of both amino acids into the brain, which causes a lack of tryptophan and henceserotonin in the brain. The disease can be diagnosed by direct measurement of phe-nylalanine plasma levels or through the Guthrie test, which a phenylalanine-auxotrophicbacterial strain. Treatment consists in a phenylalanine-restricted diet.
12.11: Tyrosinemia is due to a homozygous defect of fumarylacetoacetate hydrolase.This causes the build-up of fumarylacetoacetate and maleylacetoacetate, which are chemi-cally reactive and cytotoxic. Treatment uses dietary restriction and NTCB, which inhibitsp-hydroxyphenylpyruvate dioxygenase and thereby forestalls the build-up of the toxicmetabolites downstream.

Chapter 13
Hormonal regulation of metabolism
13.1 Hormones that affect energy metabolism
Hormone Message
insulin glucose and amino acids available, moresubstrates on the way
glucagon glucose and amino acids in short supply,need to mobilize internal reserves
epinephrine prepare for imminent sharp rise insubstrate demand
glucocorticoids prepare for extended period of highdemand
thyroid hormones increase basal metabolic rate
Notes: We have already touched briefly on the effects of insulin, glucagon and
epinephrine on gluconeogenesis and glycogen metabolism. In this chapter, we
will take a more thorough look at these hormones’ properties and activities. This
will provide the foundation for the next chapter, in which we will consider the
disruptions of metabolic regulation that occur in diabetes mellitus.
Of the hormones listed in the table, only insulin has the effect of lowering
blood glucose. The other hormones are all antagonistic to insulin, and a pathologi-
cal increase in their secretion may result in symptomatic diabetes. In the case of
glucocorticoids, symptomatic diabetes may also arise from their use as drugs.
Both glucocorticoids and thyroid hormones cause their effects mostly through
up- and down-regulating gene transcription. The two types of hormones control
different sets of target genes, but both upregulate the expression of β-adrenergic
receptors, that is, receptors for epinephrine, and so amplify the metabolic effects
of this hormone.
13.1 Which hormones are antagonistic to insulin with respect to the blood glucose level?
229

230 13 Hormonal regulation of metabolism
13.2 Insulin
13.2.1 Langerhans’ islets in the pancreas produce insulin and glucagon
Notes: Insulin is produced in the islets of Langerhans, which are small clusters
of cells that occur interspersed within the exocrine pancreas. In this picture, one
islet is shown in the center, and a tangential section across another is seen in the
bottom right. The two islets are embedded in a “red sea” of exocrine pancreas
tissue.
The function of the exocrine pancreas—secretion of digestive enzymes and
of bicarbonate into the small intestine—has been discussed in slide 1.6.7. The
products of islet cells are secreted into the bloodstream; therefore, the islets
collectively function as an endocrine gland. Among the several cell types found in
the islets, the β-cells produce insulin, whereas the α-cells produce glucagon.
13.2.2 A little bit of history: The purification of insulin—the problem
Notes: When purifying a protein of interest from some organ, standard practice is
to first grind up the tissue with a homogenizer, and then to subject the homogenate
to various fractionation procedures so as to incrementally enrich the protein,

13.2 Insulin 231
until it is sufficiently clean. With pancreatic tissue, homogenization releases large
amounts of proteases from the exocrine gland cells; these enzymes will then chop
up any other protein contained in the homogenate before it can be purified. Once it
had been recognized that pancreatic islets must contain an anti-diabetic hormone,
the proteases present in the pancreas homogenates foiled initial attempts to purify
it.1
13.2.3 The purification of insulin—Banting’s solution
apply ligature,reseal abdomen
pancreatic juice backsup, exocrine tissueself-destroys
obtain protease-freehomogenized extract
Notes: The bright idea that overcame this problem occurred, in one of his sleepless
nights, to a young physician named Frederick Banting. He immediately resolved
to pursue this idea at the University of Toronto, where he was joined in this effort
by a junior colleague, Charles Best.
It had previously been observed in human patients that occlusion of the pan-
creatic duct induced a protracted self-destruction of the exocrine pancreas, while
sparing the pancreatic islets. Banting surgically obstructed the pancreatic ducts of
experimental animals to induce destruction of the exocrine pancreas. The source
of the contaminating proteases was thus removed, and Banting and his colleagues
were able to extract and purify insulin from the islets that remained intact within
the biochemically inert scar tissue that had replaced the exocrine pancreas.
It is worth noting that Banting and his colleagues did not proceed to claim a
patent, but instead shared their discovery freely, encouraging everyone else to use
it. Their generosity ensured that the diabetics of the world were soon supplied
with insulin.
13.2 How did Banting solve the problem of proteolytic degradation of insulin in pancreasextract?
1In modern practice, one could likely prevent this using protease inhibitor cocktails; however,such inhibitors were not available at the time.
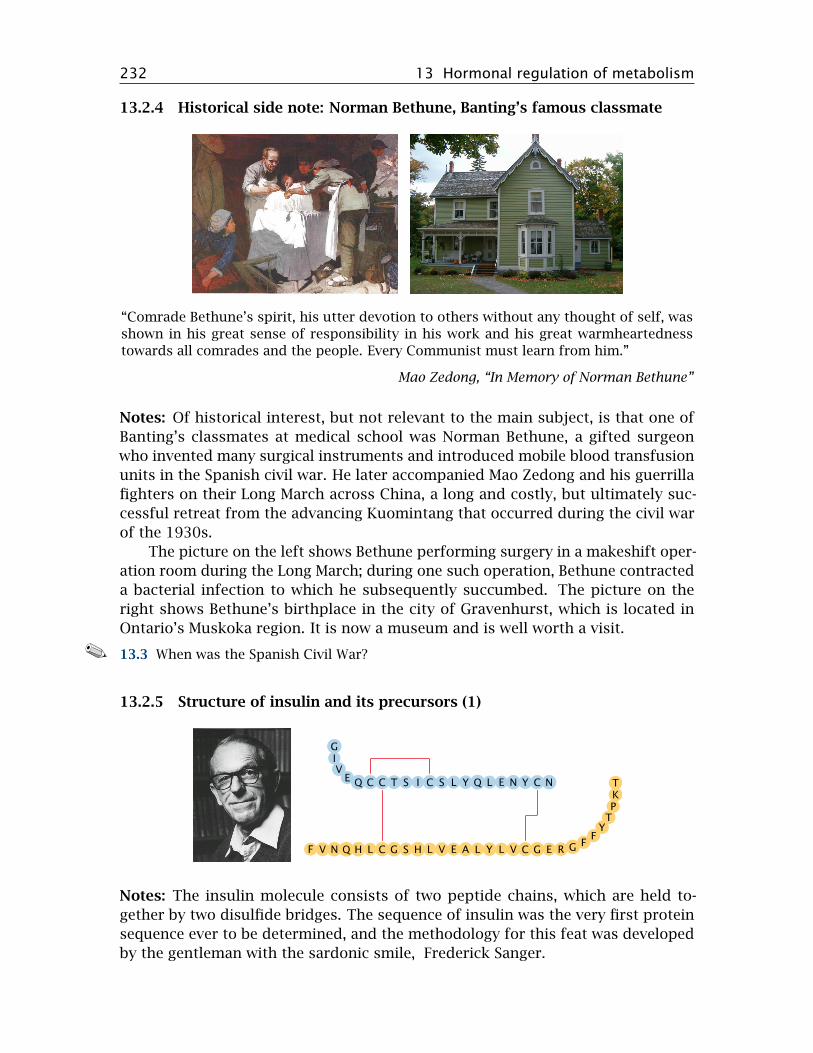
232 13 Hormonal regulation of metabolism
13.2.4 Historical side note: Norman Bethune, Banting’s famous classmate
“Comrade Bethune’s spirit, his utter devotion to others without any thought of self, wasshown in his great sense of responsibility in his work and his great warmheartednesstowards all comrades and the people. Every Communist must learn from him.”
Mao Zedong, “In Memory of Norman Bethune”
Notes: Of historical interest, but not relevant to the main subject, is that one of
Banting’s classmates at medical school was Norman Bethune, a gifted surgeon
who invented many surgical instruments and introduced mobile blood transfusion
units in the Spanish civil war. He later accompanied Mao Zedong and his guerrilla
fighters on their Long March across China, a long and costly, but ultimately suc-
cessful retreat from the advancing Kuomintang that occurred during the civil war
of the 1930s.
The picture on the left shows Bethune performing surgery in a makeshift oper-
ation room during the Long March; during one such operation, Bethune contracted
a bacterial infection to which he subsequently succumbed. The picture on the
right shows Bethune’s birthplace in the city of Gravenhurst, which is located in
Ontario’s Muskoka region. It is now a museum and is well worth a visit.
13.3 When was the Spanish Civil War?
13.2.5 Structure of insulin and its precursors (1)
GIV
E Q C C T S I C S L Y Q L E N Y C N
F V N Q H L C G S H L V E A L Y L V C G E R G FF
YTPKT
Notes: The insulin molecule consists of two peptide chains, which are held to-
gether by two disulfide bridges. The sequence of insulin was the very first protein
sequence ever to be determined, and the methodology for this feat was developed
by the gentleman with the sardonic smile, Frederick Sanger.

13.2 Insulin 233
Sanger went on to develop similarly ingenious methods for sequencing RNA
and DNA. His own account of these discoveries [75], appropriately entitled “Se-
quences, sequences and sequences,” is quite humorous and well worth reading.
13.2.6 Structure of insulin and its precursors (2)
preproinsulin proinsulin C peptide insulin
Notes: Pre-proinsulin is the primary translation product, as it runs off the ribo-
some at the membrane of the rough endoplasmic reticulum. It still contains the
N-terminal signal peptide and lacks the disulfide bridges. The signal peptide is
cleaved off, and the disulfide bonds are formed en route from the ER via the Golgi
apparatus to the secretory vesicles. The C-peptide is cleaved off as well, but it
remains inside the vesicles and is secreted together with insulin.
C-peptide has for a long time been considered physiologically irrelevant; it
was used only as a diagnostic parameter to assess the residual secretory function
of β-cells in type 2 diabetics. However, several recent experimental studies support
the idea that C-peptide itself is active as a growth factor, and that its lack in type
1 diabetes contributes to the development of diabetic long-term complications.
On cell surfaces, saturable binding sites have been characterized, suggesting the
existence of a specific receptor; however, no receptor has yet been purified. In
small-scale pilot studies on type 1 diabetics, beneficial effects have been observed
when insulin was supplemented with C-peptide. However, these studies have not
yet translated into routine therapy of diabetes [76].
13.4 What is the C-peptide, and what is its significance?
13.2.7 Sequences of human, swine, and bovine insulins
Notes: Until the late 1980s, swine and cow insulins were the mainstay of insulin
substitution therapy. They are fully active in humans but differ from human insulin
in one or three amino acid positions, respectively. This difference may promote
the formation of antibodies, which bind and inactivate insulin. Recombinantly

234 13 Hormonal regulation of metabolism
expressed human insulin has replaced the animal insulins in therapy, which has
largely done away with this problem.2
GIVEQCC
CLHQNVF GSHLVEALYLVCGERGFFYTPKT
TSICSLYQLENYCN
GIVEQCC
CLHQNVF GSHLVEALYLVCGERGFFYTPKA
TSICSLYQLENYCN
GIVEQCC
CLHQNVF GSHLVEALYLVCGERGFFYTPKA
ASVCSLYQLENYCN
13.2.8 Insulin secretion in the β-cell is controlled by glucose and triggered by
membrane depolarization
Notes: While insulin controls the rate of glucose uptake in many tissues, the β-
cells, which control the release of insulin, themselves take up glucose in an insulin-
independent manner; the rate of uptake cells thus simply depends on the plasma
glucose level. Inside the β-cells, glucose undergoes degradation, which increases
the cellular level of ATP. The ATP then binds to the sulfonylurea receptor, which
in turn closes a potassium channel associated with it. This leads to an increase
in the membrane potential, which activates a voltage-gated Ca++ channel. Ca++
entering the cell triggers the exocytosis of insulin and C-peptide.
Glucose is not the only substrate that can be degraded to yield ATP, and it
is not surprising that some amino acids and fatty acids will also promote insulin
secretion. In addition, several types of cell surface receptors contribute to the
activation of insulin secretion in a manner that is not dependent on substrate
degradation.
2More recently, recombinant insulins with point mutations have been introduced into clinicaltreatment. Interestingly, these insulins seem to be less prone to antibody induction than porcineand bovine insulins were. This may be due to their reduced tendency to form aggregates (see slide14.5.11).

13.2 Insulin 235
H2O, CO2
ADP + Pi
ATP
Ca2+
K+ K+
Ca2+
ATP
ATP
Insulin
InsulinGlucose
Glucose
Membranepotential
Sulfonylurea receptor
13.2.9 The sulfonylurea receptor controls an associated potassium channel
Notes: This figure illustrates how the polypeptide chains of the sulfonylurea re-
ceptor and of the associated “inward rectifier” Kir channel crisscross the cell mem-
brane. The N-terminus of the sulfonylurea receptor is extracellularly located. NBF1
and NBF2 are nucleotide-binding folds, that is, conserved protein sequence motifs
that are involved in the binding of ATP.
The scheme shows a single Kir molecule; however, a functional K+ channel consists
of four Kir subunits. The entire ensemble of Kir and sulfonylurea receptor subunits
is referred to as a KATP channel.
13.2.10 KATP channels also regulate the tone of smooth muscle cells
Notes: KATP channels serve in more than one physiological role. In vascular
smooth muscle cells, KATP channels regulate the strength of contraction. Sus-
tained contraction of a muscle cell will reduce its ATP level, which will promote
dissociation of ATP from the sulfonylurea receptor and open the connected Kir
channel. The increase in K+ permeability will lower the membrane potential and
inhibit the activation of voltage-gated calcium channels; this, in turn, will inhibit
cell contraction. This mechanism protects the cell from excessive exertion: when
ATP is depleted, the opening of the KATP channels will cause the cell to ignore any

236 13 Hormonal regulation of metabolism
further calcium signals and suspend contraction until it has caught its breath and
replenished ATP.
Drugs that counteract the effect of ATP on the sulfonylurea receptor will keep
the Kir open and promote relaxation of vascular smooth muscle cells. This is an
effective means to lower blood pressure.
13.2.11 Tolbutamide promotes closing of the KATP channel
HN
OHN
S OO
Cl
SO
O
N
NHHN
O−S
O
OO
+
N NH2
N
NH2
N
Tolbutamide Diazoxide IptakalimMinoxidil sulfate
Notes: The sulfonylurea receptor is so named because it responds to sulfonylurea
derivatives such as tolbutamide. The effect of tolbutamide augments that of
ATP, so that a given level of glucose/ATP results in the secretion of more insulin.
This is a useful therapeutic principle in type 2 diabetes, as long as the patients’
β-cells remain functional. It is ineffective in type 1 diabetes, since the β-cells are
destroyed in this condition (see chapter 14).
The drugs diazoxide and minoxidil contain structurally similar moieties but
inhibit the sulfonylurea receptor. They are used to induce vascular relaxation, but
diazoxide in particular also reduces insulin secretion as a side effect. The drug
iptakalim reportedly activates the vascular KATP channel but inhibits the one on
β-cells; this would combine the two beneficial effects. Iptakalim likely interacts
directly with the Kir channel rather than with the sulfonylurea receptor.
13.5 What is the mode of action and the therapeutic use of sulfonylurea drugs (e.g. tolbu-tamide)?

13.2 Insulin 237
13.2.12 The insulin receptor is a receptor tyrosine kinase
Notes: The insulin receptor is found on the surface of all body cells that respond
to the hormone. The highest receptor density is found on liver cells; in fact, more
than half of the insulin that is released by the pancreas is captured by receptors
in the liver (recall that venous blood from the pancreas is drained into the portal
vein; see slide 1.6.2).
The insulin receptor is located in the cytoplasmic membrane; it is a receptor
tyrosine kinase. Aside from insulin, human growth hormone and many other
growth factors have receptors of this type. Receptor tyrosine kinases are one of
the major functional classes of hormone receptors.
A receptor tyrosine kinase has two functional domains. The extracellular
domain binds to the hormone. This causes a conformational change to the entire
receptor, which activates the intracellular protein tyrosine kinase domain. The
activated receptor binds one or several cognate protein substrates, which it then
phosphorylates at specific tyrosine residues. The phosphorylated substrates leave
the receptor and interact with downstream adapter proteins, which then set off
various intracellular signaling cascades.
13.2.13 Insulin receptor first phosphorylates itself and then a number of in-
sulin receptor substrate proteins
Notes: In the case of insulin receptor, the first target for phosphorylation is an-
other insulin receptor molecule; mutual phosphorylation of the two receptors
locks both into the active conformation. Subsequently, the receptor molecules
phosphorylate a series of regulatory proteins, which are referred to as insulin
receptor substrates (IRS).
13.6 What is the signaling mechanism of the insulin receptor?

238 13 Hormonal regulation of metabolism
13.2.14 Insulin effects on glycogen synthesis
Notes: The effect of insulin on glycogen synthesis is mediated through a cascade
that involves phosphorylated insulin receptor substrate 1 (IRS-1), phosphatidyli-
nositol-3-kinase (PI-3K), and protein kinase B, which phosphorylates and thereby
inactivates glycogen synthase kinase 3. This results in less phosphorylation of
glycogen synthase; glycogen synthase itself will therefore be left in the dephos-
phorylated, active state.
Insulin also activates phosphodiesterase, which lowers cAMP and thereby also
affects the phosphorylation of glycogen synthase and of phosphorylase kinase
(see slide 8.4.2). This effect is mediated via protein kinase B, too, but the exact
molecular cascade from PKB to phosphodiesterase is not clear.
13.7 How does insulin affect glycogen metabolism?

13.2 Insulin 239
13.2.15 The role of insulin in glucose transport
Active transport Facilitated transport
insulin-independent
small intestine,kidney tubules
brain, β-cells, red bloodcells, cornea and lens of theeye
insulin-dependent
never muscle, fat, most othertissues
Notes: The brain must keep working at all times; it depends on glucose and can
take it up from the blood with or without insulin. In contrast, most other tissues
can more readily replace glucose with other energy-rich substrates. The uptake of
glucose into the cells of those tissues depends on insulin. When glucose supply is
low, insulin secretion drops as well. Glucose uptake by insulin-dependent tissues
ceases, which preserves glucose for the brain.
If blood glucose drops to excessively low values—this state is called hypo-
glycemia—the brain will no longer manage to obtain enough glucose, which will
lead to unconsciousness and can result in brain damage and death.
13.2.16 Insulin promotes glucose uptake by increasing the surface exposure
of GLUT 4 transporters
Glc
Glc
high insulin low insulin
Notes: The distinction between insulin-dependent and -independent uptake cor-
relates with different subtypes of the GLUT transporters. The major insulin-
dependent type is GLUT 4, whereas GLUT 1 and 2 are insulin-independent. GLUT4
transporters undergo reversible translocation between the cytoplasmic membrane
and intracellular storage vesicles. Obviously, only transporters currently resid-
ing in the cell membrane can transport glucose. The transporter migration is
controlled through insulin-dependent phosphorylation of cytoskeletal proteins
downstream of protein kinase B.
Insulin-independent transporters remain in the cell membrane throughout.
In diabetes mellitus, cells with insulin-dependent glucose uptake will experience

240 13 Hormonal regulation of metabolism
glucose starvation, whereas those with insulin-independent uptake will be exposed
to glucose overload.
13.8 How does insulin affect glucose transport?
13.2.17 Transcriptional regulation by insulin
Notes: In addition to regulating the activity of pre-formed enzymes and trans-
porters through phosphorylation, insulin also regulates the de novo expression of
proteins at the level of transcription.
The participating proteins are numerous and all have suitably intriguing and
cryptic names—for example, “Sos” is shorthand for “son of sevenless”—but we
won’t go into details about them here.
13.3 Other hormones
Epinephrine Cortisol Triiodothyronine
HO
OH
OH
NH
O
O
OH
OHOH
I
OOH
NH2
I
O I
OH
Glucagon
N′ C′H S Q G T F T S D Y S K Y L D S R R A Q D F V Q W L M N T

13.3 Other hormones 241
Notes: Glucagon is a peptide hormone that is produced in the α-cells of the pan-
creatic islets. Epinephrine is produced in the medulla, and cortisol in the cortex of
the adrenal glands. All these hormones are antagonists of insulin.
13.3.1 Glucagon and epinephrine act via G-protein-coupled receptors
Notes: Glucagon and epinephrine act through cognate G protein-coupled recep-
tors (GPCRs). Like receptor tyrosine kinases (RTKs), GPCRs are located in the
cytoplasmic membrane. In contrast to RTKs, however, GPCRs do not have any
enzymatic activity themselves. A GPCR functions solely by changing conformation
in response to the binding of its cognate agonist, which occurs on the extracellular
side (1). This conformational change is recognized on the intracellular side by a
heterotrimeric G protein (2), which becomes bound to the receptor and is thereby
activated. The active state of the G protein is stabilized by the non-covalent bind-
ing of GTP, which replaces a GDP molecule that was left behind in a previous round
of activation (3). Upon GTP binding, the G protein dissociate into the α-subunit
and the βγ-dimer, each of which then seeks out its cognate effector protein (4).
The α-subunit has a built-in, slow GTPase activity. When this activity kicks in
and cleaves the bound GTP molecule (5), the activated state is terminated,3 and the
α-subunit rejoins a βγ-dimer (6). The inactive trimer then awaits the next round
of activation by the same or another GPCR molecule.
3The rate of GTP cleavage is modulated by special regulatory proteins, which we will not go intohere. There just seems to be no end to the layers, convolutions and intricacies of signal transductionin cells; compared to it, metabolism is positively sane, simple and elegant.

242 13 Hormonal regulation of metabolism
13.3.2 The glucagon and epinephrine receptors activate adenylate cyclase and
protein kinase A
Notes: One type of G protein can couple to several types of GPCR; this is the
case with the the so-called stimulatory G protein (GS), which couples to both the
glucagon receptor and the β-adrenergic receptor, which binds epinephrine. The
α-subunit of this G protein (αS) activates adenylate cyclase, which converts ATP to
cyclic AMP (cAMP). This second messenger then binds and activates protein kinase
A (PKA), which phosphorylates a number of target enzymes.
Adenylate cyclase is also targeted by the α-subunit an inhibitory G protein, Gi,
which is activated downstream of other GPCRs, such as for example α2-adrenergic
receptors or several serotonin receptor subtypes. Another major signaling cas-
cade that is controlled by GPCRs is the phospholipase C/protein kinase C pathway,
which is activated for example by vasopressin and oxytocin receptors. In these
notes, however, we will confine the discussion to epinephrine, glucagon, and pro-
tein kinase A.
13.3.3 Metabolic effects of protein kinase A
Notes: This slide summarizes downstream effects of PKA activation that were
already discussed in detail earlier. The roles of PKA in gluconeogenesis and
in glycogen synthesis are shown in slides 7.5.4 and 8.4.2, respectively. PKA also
activates hormone-sensitive lipase in fat tissue, which induces the release of free
fatty acids and glycerol (slide 10.3.7).

13.3 Other hormones 243
Target Effect Metabolic consequence
glycogensynthase
glucose is not locked up in glycogen,remains available
phosphorylasekinase
phosphorylase is activated, glucoseis released from glycogen storage
PFK-2 /Fructose-2,6-bisphosphatase
/ Fructose-2,6-bisphosphate drops;glycolysis is inhibited,gluconeogenesis is activated
hormone-sensitivelipase
fatty acids will be mobilized forβ-oxidation and ketogenesis
13.3.4 Glucocorticoids and thyroid hormones act on nuclear hormone recep-
tors to activate transcription
Notes: While they are inactive, nuclear hormone receptors are located in the cy-
tosol. When activated by ligand binding, they translocate to the nucleus and bind
to cognate DNA sequences, recruit a number of other regulatory proteins (not
shown) and ultimately induce the transcription of genes in the vicinity of their
target DNA sequences.
enzymes,receptors,transporters
nuclear hormonereceptor
13.3.5 DNA binding by thyroid hormone receptors
Notes: Nuclear hormone receptors function as dimeric molecules. This picture
illustrates the binding of a thyroid hormone receptor homodimer (TRβ; left) and
of a heterodimer of TRβ with retinoid X receptor (RXR; yellow) to specific tar-
get sequences in the DNA. The structures of the receptor molecules (rendered
from 3m9e.pdb and 2nll.pdb) are not complete; the hormone-binding domains are
missing, and only the DNA-binding domains are shown.

244 13 Hormonal regulation of metabolism
A G G T C A
5′ 3′
AGGTCA
3′ 5′
A G G T C A A G G T C A
5′ 3′ 5′ 3′
Note that TRβ and RXR bind to the same hexanucleotide motif. Nevertheless,
the two receptor dimers recognize different DNA target sequences, since the two
instances of the hexanucleotide differ in orientation and spacing. Therefore, the
two dimers bind to different sites on the DNA and control different sets of genes.
One key mechanism through which thyroid hormones affect energy metabo-
lism is the transcriptional induction of mitochondrial uncoupling proteins. As
discussed earlier (slide 6.3.1), uncoupling proteins mediate the conversion of me-
tabolic energy to heat and therefore increase the burn rate of glucose and other
energy-rich substrates. Nevertheless, thyroid hormones do not reduce blood glu-
cose, since they also induce the expression of β-adrenergic receptors, and they
therefore amplify the glucose-enhancing effect of epinephrine.
13.3.6 Metabolic effects of glucocorticoid hormones
• induction of enzymes for glycogen synthesis, glycogen breakdown, and gluco-
neogenesis
• induction of enzymes for protein breakdown, supplying substrates for gluco-
neogenesis
• induction of adrenergic receptors
. . . overall, glucocorticoids increase blood glucose
Notes: In addition to their role in metabolic regulation, glucocorticoids also inhibit
inflammation and immune responses. They are used as drugs in the treatment
of various inflammatory and autoimmune diseases; their metabolic effects then
become unwanted side effects of such therapy.

13.3 Other hormones 245
13.3.7 Glucocorticoid receptor agonists and antagonists
0
25
50
75
100
Eff
ect
(%
dexam
eth
aso
ne)
Prednisolone
RU 24858
Mifepris
tone
IL-1β↓
TAT ↑
O
F
O
OH
OHOH
O
O
OH
OHOH
Dexamethasone Prednisolone
O
F
OH
O
O
OHN
Mifepristone RU 24858
Notes: Dexamethasone and prednisolone are synthetic glucocorticoid receptor ag-
onists that exert both antiinflammatory and metabolic effects. Mifepristone is
a glucocorticoid receptor antagonist. In the experiment shown on the right, the
activities of these conventional drugs were compared to those of the experimental
drug RU 24858. Downregulation of interleukin-1β (IL-1β) measures antiinflam-
matory activity, whereas the activity of tyrosine transaminase (TAT), an enzyme
that participates in amino acid degradation (see slide 12.4.5), represents metabolic
regulation. Figure prepared from original data in [77].
With dexamethasone, prednisolone and mifepristone, the antiinflammatory
and metabolic effects are similarly weak or strong. In contrast, with RU 24858, they
are clearly distinct, suggesting that this drug selectively triggers the antiinflam-
matory glucocorticoid effect but avoids the side effects on metabolic regulation.
Such selective glucocorticoid receptor agonists are promising but not yet in clinical
use. The biochemical mechanism that underlies the dissociation of metabolic and
antiinflammatory glucocorticoid effects is quite interesting [78].
Note that mifepristone is an antagonist not only at the glucocorticoid receptor
but also at the progestin receptor; its typical medical applications relate to the
latter activity.
13.9 How do thyroid hormones affect metabolic turnover?
13.3.8 Control of food intake by leptin

246 13 Hormonal regulation of metabolism
Notes: Leptin is a peptide hormone produced by fat tissue, in proportion to its
abundance and current triacylglycerol content. It acts upon receptors in the hy-
pothalamus and reduces appetite. This slide illustrates the effect of genetic knock-
out of leptin in mice (no points for correctly identifying the knockout and the
wild-type mouse).
While leptin is important in long-term regulation of metabolism and body
weight, initial expectations that leptin substitution or leptin receptor agonists
might be useful in the treatment of obesity in humans have not been fulfilled.
It appears that in adipose patients there is no leptin deficiency, but rather an
insensitivity to it, similar to the insensitivity to insulin in type 2 diabetes (see next
chapter).
13.4 Answers to practice questions
13.1: Glucagon, epinephrine, glucocorticoids (cortisol), thyroid hormones
13.2: By surgically occluding the pancreatic duct, thereby inducing degeneration of theexocrine pancreas tissue, several weeks before recovering the pancreas.
13.3: Just kidding. (It lasted from 1936 to 1939—but I can promise it won’t be on theexam.)
13.4: The C-peptide is produced by proteolytic processing of proinsulin. It is secretedalong with insulin and has incompletely characterized hormone activity itself.
13.5: Sulfonylurea drugs bind to the sulfonylurea receptor in pancreatic β-cells and pro-mote the closed stated of the Kir potassium channel associated with that receptor. Thispromotes membrane depolarization, calcium influx and insulin secretion. These drugs canbe used in diabetes type 2.
13.6: It is a receptor tyrosine kinase. Binding of insulin causes association of two receptormolecules with mutual phosphorylation, and subsequently the phosphorylation of insulinreceptor substrate (IRS) proteins.
13.7: Insulin activates phosphodiesterase, which lowers the level of cAMP. This resultsin a decreased phosphorylation of glycogen synthase, which is thereby activated, and ofphosporylase kinase and subsequently also phosphorylase, which is inactivated.
The phosphorylation of glycogen synthase is further reduced by way of phosphoryla-tion and thereby inhibition of glycogen synthase kinase 3.
13.8: Insulin controls the surface expression of some, but not all GLUT transporters. Wheninsulin levels are low, GLUT transporters in many tissues are removed from the surfaceand stored in intracellular vesicles, which reduces the rate of cellular glucose uptake. Thisaffects fat tissue and skeletal muscle, but not the liver and the brain.
13.9: They induce mitochondrial uncoupling proteins, which uncouple the electron trans-port chain from ATP synthesis. This means that substrate oxidation is no longer restrictedby the rate of ATP synthesis and therefore is increased.

Chapter 14
Diabetes mellitus
14.1 Introduction
Apart from atherosclerosis, diabetes mellitus is the most common metabolic dis-
ease. It is caused by an absolute or relative lack of insulin activity, which disrupts
the regulation and balance of many metabolic pathways. Examining the pathogen-
esis of diabetes is instructive and a good opportunity for us to recapitulate what
we have learned so far.
14.1.1 What’s in a name?
1. diabetes: “marching through”—urine is produced incessantly
2. mellitus: honey-sweet—as opposed to diabetes insipidus (insipid—without fla-
vor)
What does the adjective tell us about a traditional method of diagnosis?
Notes: The traditional method of diagnosis was exactly as suggested by this
nomenclature. It was effective, though not quantitative. For those of you who
aspire to a career in medicine, it may be comforting to know that it is no longer in
use.1
1Diabetes insipidus is due to the lack of anti-diuretic hormone (ADH), a peptide secreted fromthe posterior hypophyseal gland. This hormone promotes the retention of water by reuptake in thecollecting duct section of the nephron (see below). Loss of ADH production, typically due to a lesionof the hypophyseal gland, results in a dilute urine, but without loss of glucose or other metabolites.
247

248 14 Diabetes mellitus
14.1.2 Forms and causes of diabetes mellitus
Notes: Type 1 diabetes is the form typically observed in the young, whereas the
type 2 is more frequent overall and is typically observed in the elderly. MODY—
maturity type onset diabetes of the young—is type 2 diabetes in young people.
Form Cause
type 1 lack of insulin due to destruction ofβ-cells in pancreas islets
type 2 lack of functional response to insulin
secondary excess activity of hormones antagonisticto insulin
The causation of diabetes type 1 is well understood: it arises from an immuno-
logical cross-reaction that destroys the insulin-producing β-cells of the pancreatic
islets, which causes a lack of insulin. In contrast, type 2 diabetics may secrete
normal, sometimes even increased amounts of insulin. The hormone also binds to
its receptors on the cells in the body, which however fail to respond adequately to
this stimulus. In spite of substantial research efforts over several decades, we still
don’t clearly understand the reasons for this lacking functional response.
Secondary, or symptomatic, diabetes is diverse. A straightforward example is
the excessive secretion of glucagon by a glucagonoma, that is, a benign tumor de-
rived from glucagon-secreting α-cells in pancreatic islets. More commonly, though,
secondary diabetes is caused by treatment with high dosages of glucocorticoid
hormones in the treatment of auto-immune diseases.
14.2 Mechanism of renal glucose loss
The loss of glucose with the urine is a consequence of too high glucose blood
levels, which result from the failure of uptake and utilization by insulin-dependent
tissues, as well as from various kinds of metabolic dysregulation (see below).
Renal glucose loss is not the most severe symptom of diabetes, but it is never-
theless a prominent one. In order to understand how it comes about, we will first
take a look kidney function. This will also provide useful background for some
topics in later chapters.
14.2.1 Overview of kidney function
Urine is “distilled” from blood plasma in several stages:
1. ultrafiltration: 10-20% of the blood plasma volume that passes through the
kidneys is squeezed across a molecular sieve; small solutes are filtrated, macro-
molecules are retained

14.2 Mechanism of renal glucose loss 249
2. solute reuptake: glucose, amino acids, salts etc. are recovered from the ultra-
filtrate through active transport
3. water reuptake: driven by osmotic gradient
4. solute secretion: some substrates are actively secreted into the nascent urine
Notes: Blood flows through the kidneys at a rate of ~1.2 l/min, or ~1700 l/day. A bit
more than half of that volume is blood plasma, and if we assume a plasma filtration
rate of 15%, we obtain a filtrate volume of approximately 150 l/day. Obviously,
therefore, most of the water and of the solutes contained in the filtrate must be
reclaimed, and only the leftovers appear in the final urine. On the other hand,
some solutes are secreted into the nascent urine only after filtration.
14.2.2 The nephron
Macula densa
Glomerulus
Proximaltubule
Distaltubule
Loop of Henle
Collecting duct
Notes: Just as the liver consists of many lobules that each comprise the whole
organ function in a small microcosm, the kidney also consists of many instances
of a repeating functional unit, the nephron, that comprises all stages of urine
production. Each of the two kidneys contains ~1.3 million nephrons that all work
in parallel.
A nephron consists of a glomerulus and a tubular part that can be divided
into the proximal tubule, the loop of Henle, and the distal tubule; the latter joins a
collecting duct that drains several nephrons towards the exit.
The primary filtrate is formed in the glomerulus. It flows into the proximal
tubule, where glucose, amino acids, and most of the salt ions are reclaimed by
specific active transporters; water follows by osmosis. More water is reclaimed
in Henle’s loop. Along this stretch, a very high salt concentration prevails in the
interstitial space of the surrounding tissue, which allows the nascent urine to
become significantly more concentrated than blood plasma. Fine tuning of urine
concentration, pH and salt content occurs in the distal tubule.
Reuptake of glucose in the nephron occurs through sodium-coupled active
transport. The number and capacity of the transporter molecules in the proximal
tubules is limited.
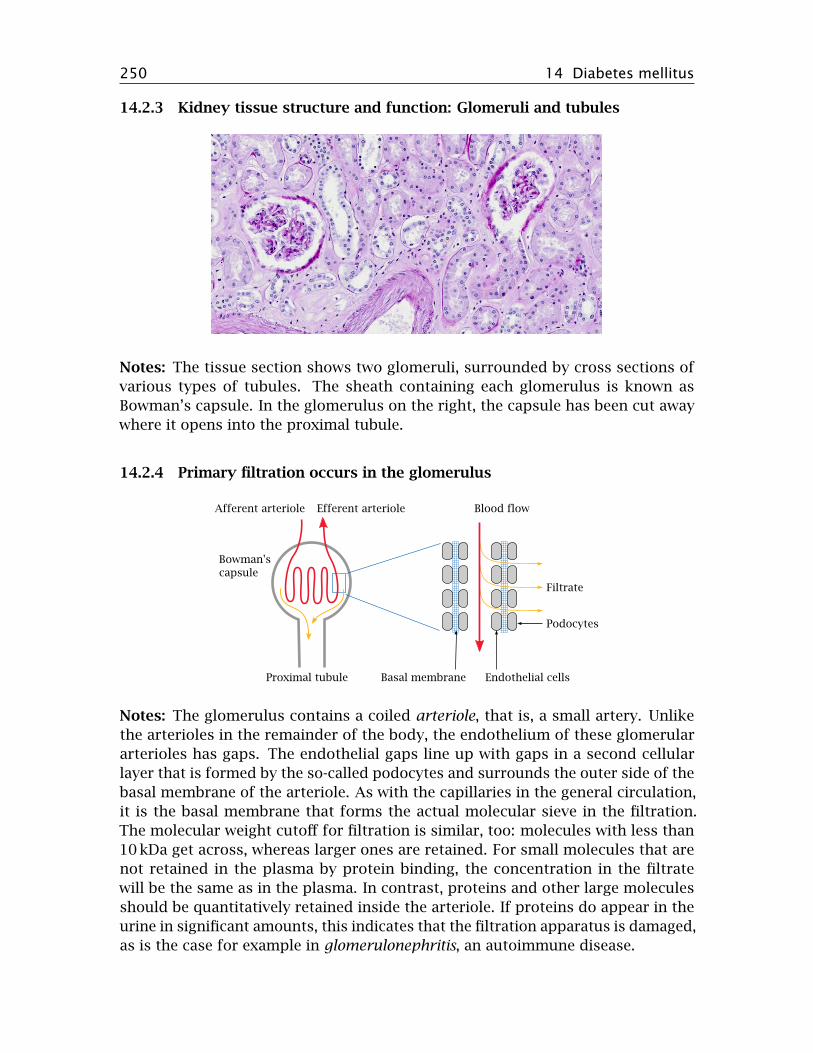
250 14 Diabetes mellitus
14.2.3 Kidney tissue structure and function: Glomeruli and tubules
Notes: The tissue section shows two glomeruli, surrounded by cross sections of
various types of tubules. The sheath containing each glomerulus is known as
Bowman’s capsule. In the glomerulus on the right, the capsule has been cut away
where it opens into the proximal tubule.
14.2.4 Primary filtration occurs in the glomerulus
Notes: The glomerulus contains a coiled arteriole, that is, a small artery. Unlike
the arterioles in the remainder of the body, the endothelium of these glomerular
arterioles has gaps. The endothelial gaps line up with gaps in a second cellular
layer that is formed by the so-called podocytes and surrounds the outer side of the
basal membrane of the arteriole. As with the capillaries in the general circulation,
it is the basal membrane that forms the actual molecular sieve in the filtration.
The molecular weight cutoff for filtration is similar, too: molecules with less than
10 kDa get across, whereas larger ones are retained. For small molecules that are
not retained in the plasma by protein binding, the concentration in the filtrate
will be the same as in the plasma. In contrast, proteins and other large molecules
should be quantitatively retained inside the arteriole. If proteins do appear in the
urine in significant amounts, this indicates that the filtration apparatus is damaged,
as is the case for example in glomerulonephritis, an autoimmune disease.

14.2 Mechanism of renal glucose loss 251
Glomerular filtration is driven by the hydrostatic pressure gradient across the
wall of the arteriole. In regular capillaries, the hydrostatic pressure is fairly low,
and since it is almost entirely balanced by the osmotic activity of the plasma pro-
teins, very little net filtration occurs (see slide 10.2.4). In contrast, the hydrostatic
pressure within the glomerular arterioles is much higher, and therefore filtration
proceeds apace.
14.2.5 Reuptake and secretion occur in the tubular segments
Notes: The bulk of the metabolites, including glucose, and most of the water are
taken up again in the proximal tubule of the nephron. Other metabolites, such
as uric acid (slide 16.5.4), are secreted into the urine in the proximal tubule by
active transport. The distal segments of the tubule are concerned with fine-tuning
the urine volume, and with the secretion or retention of salt ions and protons
according to the currently prevailing metabolic situation.
14.2.6 The capacity for glucose reuptake is saturated slightly above the phys-
iological plasma concentration range
Reabsorptionmaximum
normalrange
Glu
cose
filt
rate
dor
excr
ete
d
Plasma glucose level
Glucosefiltrated
Glucoseexcreted
Notes: The normal range of glucose in the blood is approximately 4–7 mM. Glu-
cose starts to appear in the urine when the plasma glucose level exceeds the
reabsorption maximum of ~10 mM. This level is easily exceeded in untreated or
inadequately treated diabetics, who are therefore prone to glucosuria. If glucose
is detected in the urine, this means that at some time during the last couple of
hours the blood glucose must have exceeded the reabsorption threshold. Testing

252 14 Diabetes mellitus
for glucose in the urine can thus be useful in assessing the stringency of glucose
control in a patient.
Due to its osmotic activity, glucose excreted in the urine will also cause an
increase in the urine volume; this effect is referred to as osmotic diuresis.2
14.3 Metabolic dysregulation in diabetes mellitus
14.3.1 Lack of insulin drives up cAMP
glucacon
glucagon receptor
epinephrine
β-adrenergic receptor
adenylate cyclase
ATP cAMP
phosphodiesterase
AMP
insulin
insulin receptor
protein kinase B
Notes: Many metabolic pathways are regulated by the balance between glucagon
and epinephrine on the one hand and insulin on the other. The level of the intra-
cellular second messenger cyclic AMP (cAMP) is a key parameter that represents
this balance. Glucagon and epinephrine activate adenylate cyclase, which forms
cAMP, whereas insulin activates phosphodiesterase, which cleaves cAMP. If insulin
is lacking or insulin sensitivity is diminished, the level of cAMP will go up, and
protein kinase A (PKA) will be activated.
As we have seen, one of the target proteins controlled by cAMP and PKA
is the bifunctional enzyme phosphofructokinase-2/fructose-2,6-bisphosphatase.
Phosphorylation of this enzyme activates the bisphosphatase, which lowers the
level of fructose-2,6-bisphosphate (see slide 7.5.4). This inhibits glycolysis and
activates gluconeogenesis (see slide 7.5.3).
Excessive cAMP levels also affect glycogen metabolism, such that glycogen
synthesis is inhibited and breakdown is increased (see slide 8.4.2). Therefore,
even though blood glucose is already high to due to lack of cellular uptake in
peripheral tissues, both gluconeogenesis and glycogen breakdown in the liver are
activated, producing more glucose and further compounding the excessive glucose
accumulation.
14.1 How does diabetes affect the rate of gluconeogenesis?
2Osmotic diuresis can also be induced with other solutes. The sugar alcohol mannitol has beenused in this manner to speed up the elimination of drugs and poisons, but this treatment appearsto be no longer in common use.

14.3 Metabolic dysregulation in diabetes mellitus 253
14.3.2 Lack of insulin induces triacylglycerol breakdown in fat tissue
epinephrine, glucagon insulin
adenylate cyclase phosphodiesterase
ATP cAMP AMP
protein kinase A
hormone-sensitive lipase
triacylglycerolfatty acids,glycerol
Notes: The cAMP/PKA cascade also activates the hormone-sensitive lipase in fat
tissue. This enzyme initiates the breakdown of triacylglycerol to free fatty acids
and glycerol, which are then released into the blood stream. Glycerol will feed into
gluconeogenesis in the liver. Fatty acids may be directly consumed or feed into
ketogenesis in the liver.
14.3.3 Lack of insulin induces protein breakdown in muscle tissue
protein
amino acids keto acids
α-ketoglutarate
glutamate
malate
pyruvate
alanine alanine
pyruvate glucose
TCAcycle
glutamate
α-ketoglutarate
Notes: In skeletal muscle, the lack of insulin prevents uptake of glucose, which
creates a need for alternative sources of energy. In part, this need is filled by fatty
acids and ketone bodies, but additionally protein degradation is activated.3
The amino acid released by protein breakdown also enter degradation. As we
have seen, many amino acids are converted to pyruvate or to TCA cycle interme-
diates (slide 12.1.2); the latter can also be converted to pyruvate by malic enzyme
3Indeed, protein degradation is activated beyond the muscle’s own metabolic need by signalingpathways that also cause muscle wasting in chronic inflammation and cancer [79].

254 14 Diabetes mellitus
(see slide 9.3.2). Pyruvate is transaminated to alanine, which travels to the liver
and enters gluconeogenesis. Alanine formation and transport to the liver also
occur as part of the glucose-alanine cycle (slide 12.3.5). The difference between
the regular function of that cycle and the catabolic situation in untreated diabetes
is that glucose cannot reenter the muscle cells; this greatly accelerates the loss of
substrate carbon from muscle.
14.2 What happens to protein metabolism in muscle in diabetes?
14.3.4 Substrate overload in the liver leads to ketogenesis and lipoprotein
synthesis
glucose fatty acidsamino acids
amino acidsglucose pyruvate
acetyl-CoA
cholesterol
fatty acids
triacylglycerol
lipoproteins
lipoproteins
ketone bodies
ketone bodies
Notes: The various causes of glucose accumulation, as well as the accelerated
degradation of fat and protein in peripheral tissues, cause a general substrate
overload in the liver. At some point, the level of glucose will be so high that
glycolysis resumes and pyruvate dehydrogenase starts turning out acetyl-CoA.
Some of the free fatty acids mobilized in the fat tissue undergo β-oxidation and
produce more acetyl-CoA, whereas others are converted again to triacylglycerol.
A large share of the excess acetyl-CoA is converted to ketone bodies, which
will reach plasma levels far beyond those that occur physiologically during star-
vation. Some acetyl-CoA is converted instead to cholesterol, which together with
triacylglycerol is packaged into lipoproteins. The lipoproteins are released into
the bloodstream. Elevated blood lipids are a typical finding and contribute to the
accelerated development of atherosclerosis in insufficiently treated diabetics.
14.3.5 Laboratory findings in untreated or under-treated diabetes
Notes: Ketone bodies are fairly strong acids. The kidneys normally compensate for
the accumulation of ketone bodies in the blood through the secretion of protons
in the form of ammonium chloride. However, the excessive rate of ketogenesis

14.3 Metabolic dysregulation in diabetes mellitus 255
in acute diabetes tends to overwhelm the capacity of the kidneys to balance the
blood pH. The condition is referred to as ketoacidosis. 4
Observation Cause
increased blood glucose excessive gluconeogenesis, lack ofutilization
glucose excreted inurine
capacity for renal reuptake exceeded
acidosis (low blood pH) high plasma levels of ketone bodies
increased urea levels accelerated muscle protein breakdown
increased bloodlipoproteins
increased synthesis and packaging ofcholesterol and triacylglycerol in theliver
14.3 What is acidosis, and what causes acidosis in untreated diabetes?
14.3.6 Typical symptoms and history in a new case of type 1 diabetes
Symptom Cause
dehydration osmotic diuresis due to glucose excretion
acetone smell acetone forms from acetoacetate, isexhaled
coma both acidosis and blood hyperosmolarityimpair brain function
loss of body weight dehydration, breakdown of proteins andfat
recent flu-like disease,possibly myocarditis
coxsackievirus infection
Notes: In addition to dehydration and pH deviation, one might consider high ace-
tone levels as an additional cause of diabetic coma, since acetone has documented
narcotic activity [80, 81]. This possibility has been considered in a study on sev-
eral patients that had experienced diabetic coma [50]; the authors concluded that
plasma acetone levels in these patients fell short of narcotic concentrations.
14.4 How is acetone formed in diabetic metabolism, and what is its significance?
4Other possible forms of acidosis are accumulation of lactate (lactic acidosis) and respiratoryacidosis, which is due to insufficient removal of CO2 through the lungs. Lactic acidosis can beinduced by oral metformin and related oral antidiabetic drugs (see slide 14.5.14).

256 14 Diabetes mellitus
14.4 The role of coxsackieviruses in the pathogenesis of type 1 dia-betes
Notes: Coxsackieviruses belong to the enterovirus group, like hepatitis A virus and
poliovirus. These viruses contain a single-stranded RNA genome and are “naked”,
that is, they do not possess a lipid envelope.
Coxsackieviruses can cause non-specific febrile disease but occasionally give
rise to pleurodynia, which is characterized by chest pain during breathing that
results from the infection of muscles in the rib cage. These viruses may also cause
myocarditis, that is, an infection of the heart muscle. You will not be surprised to
hear that, of the two, myocarditis is the much more serious condition.
The involvement of coxsackieviruses in the pathogenesis of type 1 diabetes is
not due to direct damage to the pancreatic β-cells by the virus; instead, it arises
from an immunological cross-reaction between viral antigens with cellular antigens
found in the β-cells.
14.4.1 Outline of T lymphocyte function in antiviral immune responses
Notes: The eradication of viral infections involves cellular immunity, which is
mediated mostly by T-lymphocytes. These cells occur in several variants, namely

14.4 The role of coxsackieviruses in the pathogenesis of type 1 diabetes 257
• T-helper cells,
• T-suppressor cells, and
• T-killer cells (cytotoxic T cells).
The interaction between lymphocytes and other nucleated cells that enables
the lymphocytes to recognize and eliminate virus-infected cells is controlled by
two protein molecules. These two proteins are the HLA molecules, which we find
on all nucleated cells, and the T cell receptors, which occur only on T lymphocytes.
HLA molecules present potentially antigenic peptides to the T cell recep-
tors. These peptides are samples drawn randomly from the entire set of cellular
proteins: As proteins undergo turnover and degradation within the cell, some
of the ensuing peptide fragments will become bound to HLA molecules and be
transported to the cell surface.5 If the cell is not infected by a virus, these surface-
exposed peptides will all be fragments of human-encoded proteins; on the other
hand, if the cell is virus-infected, a lot of these peptides will be of viral origin.
The HLA-associated peptides are recognized by T cell receptors. These recep-
tors occur in very many variants that differ in antigen specificity. The variants are
produced through combinatorial rearrangement of DNA fragments in the corre-
sponding genes of the T cells, which means that all receptor molecules found on a
given T cell, as well as on all of its daughter cells, will be identical.6
Since a T cell receptor arises through a randomized DNA recombination pro-
cess, its antigen specificity is also random; it may have affinity for a self antigen,
that is, a macromolecule that occurs normally in the body and has every right
to be there, or for a non-self antigen such as viral protein. Any T lymphocytes
that recognize self antigens are normally weeded out by the immune system it-
self; this is the role of the T suppressor cells.7 In contrast, T helper cells and
T killer cells that have no auto-reactive specificity are allowed to persist, since they
may have useful affinity for non-self antigens such as viral proteins. Once such
a T cell comes across another nucleated cell that happens to present its cognate
antigenic peptide, it will bind to this cell and attack it. The T cell-mediated killing
of virus-infected cells is a key process in antiviral immune defense.
The random generation of T cell clones with novel antigen specificities may
also produce cross-reactive clones that recognize both self antigens and viral
antigens. Such clones will usually be suppressed, but occasionally an acute virus
infection may intercede and cause them to proliferate before the suppression takes
hold. This may then result in damage to cells that express the cross-reacting self
antigen. Such a cross-reaction may occur between coxsackieviruses and some self
5The abbreviation HLA stands for human leukocyte antigen, but HLA molecules are found on allnucleated cells, not just leukocytes. They are, however, not found on red blood cells, which haveno protein synthesis and thus no use for HLA molecules. HLA molecules are very diverse betweenindividuals; this is what makes them antigens. Their absence on red blood cells explains why bloodtransfusions are far less fraught with immunological incompatibilities than are organ transplants.
6A similar mechanism also produces the clonal variation of antibody specificities in B lympho-cytes.
7Failure of the T suppressor cells to eradicate autoreactive T helper or T killer cells will result inautoimmune diseases.

258 14 Diabetes mellitus
antigens of pancreatic β-cells, causing the destruction of β-cells and giving rise to
type 1 diabetes.
14.4.2 Structure of a T cell receptor bound to its cognate peptide presented
by an HLA molecule
presented peptide
T cell receptor
HLA molecule
HLA residues thatinteract with theT cell receptor
Notes: When a T cell receptor binds to an antigenic peptide, it really recognizes
the complex of the HLA molecule and the peptide, not just the presented peptide
alone. This means that the HLA antigen may augment or reduce the affinity of
T cells for the peptide, and thereby modulate the strength of the immune reaction.
This holds both for regular immune reactions against viruses or other microbes8
and for autoimmune reactions such as that affecting pancreatic β-cells. Therefore,
the risk of developing type 1 diabetes varies substantially between different HLA
genotypes. Structures rendered from 1ao7.pdb.
14.5 Which infectious agent induces the immunological cross-reaction that leads to thedestruction of pancreatic β-cells in diabetes type 1?
14.4.3 HLA alleles influence the risk of developing type 1 diabetes
HLA-DQ Haplotype Relative risk Absolute risk
A1: 0301-0302 / B1: 0501-0201 21 6%
B1: 0602 0.03 0.01%
Notes: The alleles and associated risks listed here are just one illustrative example
of the influence of HLA genotypes on the risk of contracting type 1 diabetes. The
relative risks are calculated to the average risk of the population; the absolute risks
represent the probabilities of contracting type 1 diabetes for persons carrying the
allele in question. Note that 94% of the individuals with the high-risk allele will not
contract diabetes.8The diversity of HLA antigens among humans is believed to have arisen through the exposure
to different infective agents that selected for different HLA antigens. Association of specific HLAalleles with protection from infection is documented for various pathogens, including HIV [82].

14.5 Therapy of diabetes 259
14.5 Therapy of diabetes
14.5.1 How to treat a fresh case of acute diabetes
1. Severely sick, possibly comatose patient
• infusion therapy for fluid replacement, pH and electrolyte adjustment
• parenteral nutrition with proportional insulin substitution
• frequent monitoring of lab parameters (glucose, salts, pH) to adjust ther-
apy
2. Upon stabilization
• reversal to oral nutrition
• train patient to adhere to a stable, regular diet and inject themselves with
insulin
• teach patient to monitor blood glucose and to recognize symptoms of
hyper- and hypoglycemia
Notes: New, untreated cases of diabetes present themselves with different degrees
of clinical urgency. The acute illness and coma scenario is more likely to occur in
diabetes type 1 than type 2, since in the former insulin secretion subsides acutely,
whereas in the latter things tend to go downhill more slowly. Acutely ill patients
will require both phases of treatment outlined in this slide, whereas others will
seek treatment at less advanced stages and can enter the second stage of treatment
right away.
Acutely sick diabetes patients typically have lost a lot of fluid and salts. They
are likely in acidosis, that is, their blood pH is too low due to the accumulation of
ketone bodies. All these deviations must be corrected by infusion therapy. Insulin
is initially administered with the infusion. All components of the infusion, and the
flow rate of the infusion itself, are adjusted according to frequent laboratory tests.
When the acute situation has been brought under control, the infusion therapy
is terminated and the patient is returned to oral nutrition. The next task is to
find out how much insulin this individual patient needs to match their appropri-
ate caloric intake. This usually takes a few weeks of experimentation. Once an
appropriate schedule for diet and insulin injections has been worked out and the
patient has been properly trained, they can be discharged, which is followed by
initially frequent ambulant supervision.
14.6 Which problems need to be addressed in the treatment of an acute case of type 1diabetes?
14.5.2 Kinetics of physiological insulin secretion
Notes: The blood level of insulin rises up rapidly immediately after a meal and
then slowly declines over a time course of several hours. The slow pace of the
decline is due to sustained secretion of insulin at slowly decreasing rates; individ-

260 14 Diabetes mellitus
ual insulin molecules that have been secreted into the plasma decay much faster,
with a half-life of only ~15 minutes. This rapid inactivation is brought about by
peptidases in the blood plasma. If we simply inject insulin intravenously, it will
be just as rapidly degraded as the endogenously secreted hormone; in fact, this is
what happens to insulin that is applied with the infusion treatment in the acute
stage.
time
pla
sma
insu
lin
level
meal big meal
sustainedsecretion
postprandialpeak
Continuous infusion is, of course, not practical for long-term treatment; instead,
we need a way to mimic the slow, protracted changes of the physiological insulin
profile with a limited number of injections per day. The following slides illustrate
how this is accomplished.
14.5.3 The reversible aggregation of insulin delays its diffusion from tissue
into the circulation
Capillary wall
Hexamer Dimer Monomer
Notes: When we inject the insulin into the tissue (typically into the subcutaneous
fat tissue—not into the cells, but rather into the fluid-filled interstitial space in
between) instead of intravenously, insulin has to diffuse across the walls of the
capillaries to reach the circulation, which will occur in a protracted fashion. At high
concentration, the extravascular insulin will form hexameric complexes, which are
too large to freely diffuse across capillary walls; the required dissociation into
dimers and then monomers will further delay the uptake.
The extent of insulin aggregation varies with the ion composition and pH in the
preparation. For example, zinc ions stabilize the hexamer, and a low pH induces

14.5 Therapy of diabetes 261
aggregation of hexamers into larger complexes, from which the insulin will take
even longer to fully dissociate. These effects can be used to tweak the intended
rate of uptake in clinically used insulin preparations.
14.5.4 Delayed release of insulin from protamine complexes
protamine MARYRCCRSQSRSRYYRQRQRSRRRRRRSCQTRRRAMRCCRPRYRPRCRRH
Notes: Another effective trick for tweaking the rate of release of insulin is to
complex it with protamine, a small, basic DNA-binding protein that occurs in
sperm cells. Insulin itself is negatively charged at neutral pH; the two proteins
simply cluster together due to ionic interaction.
While protamine complexes and other measures to promote insulin aggrega-
tion cause delayed and protracted uptake of insulin into the circulation, another
useful technique is to derivatize insulin so as to increase its stability in the circu-
lation. A derivative that has been christened “insulin detemir” carries a fatty acyl
residue, which causes it to reversibly bind to albumin; in the albumin-bound state,
it is protected from degradation by circulating peptidases.
14.7 How does insulin aggregation affect the rate of systemic uptake of subcutaneouslyinjected insulin?
14.5.5 Biphasic insulin preparations
pla
sma i
nsu
lin
time
short-acting
long-acting
combination
Notes: As pointed out above, insulin preparations can be tweaked and tuned
for a faster or slower time course of action. In order to mimic both the steep
increase and the slow decline of the physiological insulin secretion profile (see
slide 14.5.2), fast-release and slow-release preparations are mixed into so-called
biphasic insulins.
For many decades, biphasic and slow-release insulin preparations, applied two
to three times per day, were most widely used in insulin substitution therapy.

262 14 Diabetes mellitus
However, the accuracy of glucose control that can be achieved with such regimens
is limited, and the current trend favors more frequent insulin injections for tighter
glucose control. While this is less convenient for the patient, it does help to avoid
or postpone long-term complications of diabetes (see below).
14.5.6 Short-term complications of insulin-requiring diabetes
Deviation Symptoms
insulin too low hyperglycemia, acidosis, . . . , coma
insulin too high hypoglycemia, coma
Notes: Insulin substitution treatment can go off the rails when the endocrine and
metabolic situation of the patient changes, while the insulin dosage does not. For
example, acute infections may drive up cortisol secretion, which in turn will raise
blood glucose; on the other hand, loss of appetite, vomiting or diarrhea will reduce
glucose uptake and blood levels.
In extreme cases, both low glucose levels (hypoglycemia) and excessively high
ones (hyperglycemia) can induce coma. Among the two forms, hypoglycemic
coma is more common and more immediately life-threatening. Therefore, in case
we should find a comatose patient with known diabetes, and we are unable to
determine whether he is hyper- or hypoglycemic—a largely hypothetical case now
that glucose meters have become ubiquitous—we would inject glucose first. If the
patient wakes up, the patient was indeed hypoglycemic; if not, we would assume
the opposite and would then try insulin.
14.5.7 Long-term complications of insulin-requiring diabetes
Biochemical deviation Clinical manifestation
accumulation of sorbitol in thelens of the eye
cataract
increased conversion ofglucose to lipids
increased blood fats,atherosclerosis
glucosylation of proteins?sorbitol accumulation?
damage to nerve fibres,kidneys, other organs
Notes: Long-term complications of diabetes typically develop several decades af-
ter the onset of diabetes itself. They affect a multitude of organs, most notably
the vasculature, the peripheral nervous system, and the kidneys. Among these
complications, the causation of cataract by sorbitol accumulation is quite well
understood (see slide 4.4). Sorbitol accumulation has been suggested as a mech-
anism in nerve cell damage also, but the evidence is less clear; aldose reductase
inhibitors like tolrestat so far have not demonstrated unequivocal clinical benefits

14.5 Therapy of diabetes 263
[83]. Elevated blood lipids (slide 14.3.4), protein glycosylation (slide 11.6.7), and
lack of C-peptide [76] are other potential mechanisms of long-term tissue damage.
Even though the biochemical mechanisms that underly the pathogenesis of
diabetic long term complications are not fully understood, it has been observed
that the severity of the clinical picture correlates with the cumulative extent and
duration of upward deviations in the blood glucose level.
In the early days of insulin substitution therapy, the blood glucose used to
be adjusted to levels somewhat above the normal range; this was done in order
to prevent hypoglycemia, which could be acutely life-threatening. However, while
sufficient to prevent acute symptoms, this approach favors the occurrence of long-
term complications. Intensive insulin therapy (slide 14.5.9) addresses this problem.
14.5.8 HbA1C as a parameter of long-term glucose control
NH2OHCGlc COOHHbA1
NHCGlc COOHHbA1C
H2O
Notes: Glucose exists in an equilibrium between the ring-shaped hemiacetal form
and the open chain aldehyde form (see slide 3.1.2). The aldehyde form can react
with free amino groups of proteins. Among the latter, the N-terminal α-amino
group has a lower pKa and therefore is more reactive than the ϵ-groups of lysine
side chains.
Protein glucosylation has been considered as a mechanism leading to the devel-
opment of diabetic long-term complications, but the evidence is scarce. Whether
or not it has a direct role in pathogenesis, it can be used as a diagnostic marker for
assessing the metabolic adjustment in diabetic patients. Glucosylation is a slow
reaction and occurs over weeks. Therefore, the extent of glucosylation of a long-
lived protein such as hemoglobin will indicate how well-adjusted the glucose level
has been, on average, for the last 4–6 weeks. This is useful to gauge the quality of
metabolic control in patients during intervals between visits to the doctor.
14.8 What are common short term complications of diabetes? What are common longterm complications? What are the underlying biochemical mechanisms?
14.5.9 Intensive insulin therapy
• rationale: prevent long term complications through tight control of blood
glucose
• means: frequent glucose sampling and injections, or continuous insulin appli-
cation with pump, such that the rate of insulin infusion is controlled by the
current glucose level

264 14 Diabetes mellitus
• challenge: avoid hypoglycemia through insulin overdose—we need to mini-
mize the delay between insulin application and effect
Notes: Intensive insulin therapy is increasingly accepted as the best form of treat-
ment, particularly in young patients, who have the most to gain from the post-
ponement of long term complications.
An obvious risk in this therapy is the accidental overdosing of insulin. To
control this risk, we need to ensure that any amount of insulin that is applied is
also promptly absorbed, so that it does not carry over beyond the time point of
the next injection. Mutant insulins have been developed that have an increased
rate of uptake. Note that this purpose is the exact opposite to that of preparations
such as protamine insulin (see slide 14.5.4).
14.5.10 Nerdy intermission: delayed feedback causes signal oscillation
Sig
nal
Time
delayed reaction
immediate reaction
Notes: In regular physiology, the blood levels of glucose are connected by a neg-
ative feedback loop: As glucose rises, insulin rises and causes glucose to drop;
conversely, a dropping glucose level will reduce the output of insulin, which then
causes the glucose level to rise again.
Negative feedback loops operate in many places in metabolic regulation and
ensure the homeostasis of metabolite levels. To be effective, the response of a
negative feedback loop to changed input must be swift, since delayed feedback
will cause overshooting corrections and induce oscillations.
In intensive insulin therapy, the ideal goal is to replace the function of the
physiological glucose-insulin feedback loop. Apart from timely injections of in-
sulin, this also requires that the injected insulin quickly reaches the bloodstream
and becomes active. If the insulin effect takes hold too slowly after injection, this
will cause delayed feedback and potentially dangerous oscillations of the glucose
level.
14.5.11 Structural basis for proline B28 mutations
Notes: Several insulin mutants optimized for rapid uptake contain substitutions
of the proline residue in the 28th position of the B chain. The effects of these
mutations can be understood from the structure of insulin aggregates.

14.5 Therapy of diabetes 265
Dimer 1
Dimer 2 Dimer 3
Gly B23
Glu B21
Pro B28
The structure on the left is that of an insulin hexamer, consisting of three dimers.
In each dimer, one monomer is shown in yellow and the other in blue; the green
balls in the center are zinc ions. On the right, it is shown how the hydrophobic pro-
line residue in position B28 of one monomer interacts favorably with the adjacent
side chains of the second monomer; this interaction stabilizes the dimer.
Substitution of proline with a charged residue breaks this favorable interaction.
In insulin aspart, the proline is replaced with aspartate, which creates electrostatic
repulsion with glutamate B21 on the other subunit. In insulin lispro, proline
B28 and lysine B29 are swapped, which also reduces the mutual affinity of the
adjoining monomers. Mutants like these are currently widely used in intensive
insulin therapy.
14.9 What is the purpose of intensive insulin therapy? What are the tools?
14.5.12 Oral antidiabetic drugs
NNO
O
NH
O
SO
S
OHN
O
HN
NH
NNNH2
NH2
Acarbose Metformin
Rosiglitazone Tolbutamide
OH
OH
OH
CH2OH
O
O
OH
OH
CH2OH
O
O
OH
OH
CH2OH
O
O
OH
OH
CH3
O
NHOH
OH
CH2OH
OH
Notes: Oral antidiabetic drugs are used only in type 2 diabetes. These structures
are just for illustration—no points for memorizing them.

266 14 Diabetes mellitus
14.5.13 Action modes of oral antidiabetics
Drug Action mechanism
tolbutamide sulfonylurea receptor agonist
rosiglitazone peroxisome proliferator-activated receptor γagonist
acarbose inhibition of the brush border enzymes sucraseand maltase—reduced or delayed glucoseuptake
tolrestat aldose reductase inhibitor (withdrawn)
metformin NADH dehydrogenase inhibition ?
Notes: The action mode of tolbutamide was covered earlier (slide 13.2.8). Since
its role is to stimulate insulin secretion from pancreatic β-cells, it is clear that it is
useless in type 1 diabetes, since most or all β-cells are destroyed in this case.
Rosiglitazone is an agonist of the PPARγ, a nuclear hormone receptor that
regulates the transcription of numerous enzymes and transporters involved in
glucose and fat metabolism. It reduces insulin resistance in type 2 diabetes, but
it has numerous side effects including the promotion of heart failure that have
led to its withdrawal from the market in Europe. Efforts to find similar drugs with
fewer side effects are ongoing.
Aldose reductase inhibitors have been considered briefly above (slide 14.5.7),
and metformin will be considered below.
14.5.14 Hypothetical mode of action of metformin
NAD+
NADH
NAD+
Lactate
Pyruvate
2 H+
2 e– 12 O2
H2OH+ H+
ADP
ATP
Pi
ADP
ATPAMP
AMP-activatedprotein kinase
1
4
3
2
Metformin
Notes: Metformin and related biguanide drugs are probably the most widely used
oral antidiabetics. In vitro, metformin has been shown to inhibit NADH dehydroge-
nase (1), that is, complex I of the respiratory chain. As a consequence, the activity
of ATP synthase (2) should drop, too. This would increase the level of ADP, and
adenylate kinase (3) should cause AMP to rise as well.

14.6 Answers to practice questions 267
The regulatory effects of AMP resemble some of those brought about by in-
sulin (slides 7.5.3f). In addition, there is an AMP-activated protein kinase that
participates in metabolic regulation. Among other effects, this regulatory enzyme
activates insulin-independent glucose uptake by cells that normally do require
insulin. Another potentially relevant effect of AMP is the inhibition of adenylate
cyclase [84], which would counteract the effect of glucagon and epinephrine, and
so help to restore the balance between insulin and its antagonists.
If this proposed mechanism is correct, metformin should also cause accumu-
lation of NADH. This would drive lactate dehydrogenase (4) into reverse mode,
producing lactate. Lactate acidosis is indeed a known complication of metformin
therapy.
14.5.15 Inhibition of complex I of the respiratory chain by metformin
50
75
100
125
resp
irati
on
rate
(%
of
con
trol)
50µM 100µM 50µM 100µM metformin
glutamate + malate succinate
24 hours
60 hours
Notes: This slide (data from [85]) shows some experiments supporting the mech-
anism depicted in the preceding slide. Metformin inhibits the respiratory activity
of mitochondria when fed with malate but not when fed with succinate. Malate
dehydrogenase produces NADH, which delivers electrons to complex I. In contrast,
succinate dehydrogenase produces FADH2, which feeds its electrons to complex II
and so bypasses the blockade of complex I.
Various aspects of the action mode presented here have been called into ques-
tion by several experimental studies. One such study attempted but failed to ob-
serve the expected concomitant change in the [ADP]/[ATP] ratio [86]. Furthermore,
genetic knockout of AMP-activated kinase does not abolish the glucose-lower-
ing action of metformin [87]. Therefore, despite the long-standing clinical use
of biguanide drugs, their mode of action is not yet fully understood.
14.10 What is the mode of action metformin?
14.6 Answers to practice questions
14.1: In diabetes, insulin is missing (type 1) or ineffective (type 2). Insulin-antagonistichormones prevail and increase the level of cAMP, which results in decreased fructose-

268 14 Diabetes mellitus
2,6-bisphosphate due to phosphorylation of the bifunctional enzyme phosphofructoki-nase 2/fructose-2,6-bisphosphatase. This, in turn, increases the activity of fructose-1,6-bisphosphatase and decreases the activity of phosphofructokinase.
The lack of insulin also induces fat and muscle protein breakdown, which producesglycerol and free amino acids, respectively. Glycerol and most amino acids are substrateprecursors for gluconeogenesis.
14.2: In response to the lack of glucose inside the muscle cell, protein degradation isactivated. Amino acids are in part completely degraded within the muscle cell, and inpart are passed to the liver via the blood stream. Nitrogen that results from amino aciddegradation inside the muscle cells is exported from the cell as glutamine or as alanine.To the extent that alanine and other glucogenic amino acids feed into gluconeogenesisin the liver, the carbon cannot re-enter the muscle cell, which accelerates the net loss ofcarbon from the muscle.
14.3: Acidosis is the acidic deviation of blood pH (<7.35). Acidosis in untreated diabeticsis caused by the accumulation of ketone bodies (acetoacetate and β-hydroxybutyrate) inthe blood. Acidosis due to ketone bodies is also referred to as ketoacidosis.
14.4: Acetone is formed through decarboxylation from acetoacetate, and it might con-tribute to diabetic coma through its general anesthetic effect.
14.5: Coxsackievirus.
14.6: 1. Dehydration (=loss of water), 2. acidosis, 3. electrolyte imbalances, 4. lack ofinsulin.
14.7: Hexamers or larger aggregates of insulin are too large to diffuse across from theinterstitial fluid into the capillaries. Therefore, the systemic uptake of insulin from aggre-gated forms is limited by the rate of their dissociation.
14.8: Short term complications: 1. Relapse of hyperglycemia due to inadequate insulinsupply or activity, with glucose accumulation and excretion, dehydration and ketoacidosis2. Hypoglycemia due to excessive application of insulin, which can result in coma
Long term complications: 1. Cataract, through accumulation of sorbitol in the lens2. Accelerated atherosclerosis and diffuse tissue damage, possibly due in part to glucosy-lation of proteins.
14.9: Diabetic long term complications are more severe and develop more rapidly inpatients whose glucose levels exceed the physiological range. The purpose of intensiveinsulin therapy is to prevent long term complications by keeping the glucose concentrationstrictly within the physiological range at all times.
The therapy is based on the frequent measurement of blood glucose, and on the useof highly soluble insulins that upon injection are rapidly taken up into the circulation. Analternative is the use of insulin pumps, which provide an automatic feedback betweenblood glucose and the insulin infusion rate.
14.10: Metformin is believed to inhibit complex I of the respiratory chain. This wouldincrease the level of AMP in the cell and therefore promote glycolysis and inhibit gluco-neogenesis. It would also increase NADH, which in turn would promote the accumulationof lactic acid, which is a known complication of metformin treatment.

Chapter 15
Biosynthetic pathways using tetrahydrofolate and vitamin B12
15.1 Overview
The transfer of single carbon units, in various redox states, is important in several
biosynthetic pathways. The two coenzymes tetrahydrofolate and methylcobalamin
play central roles in these reactions. Both coenzymes are derived from vitamins,
and deficiencies of these vitamins are not uncommonly encountered in clinical
medicine, usually as a consequence of another underlying medical condition.
We will first look at the biochemical reaction cycles and then consider the
pathological consequences that result from their disruption through vitamin defi-
ciencies.
15.2 Tetrahydrofolate-mediated carbon transfer reactions
15.2.1 The role of tetrahydrofolate in biosynthetic reactions
amino acids2 urea, H2O, CO2
THF THF−C1
Cn+1 products Cn precursors
carbon sources
C1–tetrahydrofolate pool
biosynthetic pathways
Notes: The degradation pathways for several amino acids produce single carbon
units that are transferred to tetrahydrofolate (THF) as an intermediate carrier.
269

270 15 Biosynthetic pathways using tetrahydrofolate and vitamin B12
Tetrahydrofolate, in turn, donates the single carbons to various biosynthetic inter-
mediates.
15.2.2 Folic acid is reduced by dihydrofolate reductase (DHFR)
H2N N N
HN
O
NH
O OH
O
OH
N
OH
N
npteridine moiety
p-aminobenzoate polyglutamate
H2N N N
NRH
N
OH
N
H2N N NH
NRH
N
OH
N
H2N N NH
NRHHN
OH
N
NADPH+H+
NADP+
NADPH+H+
NADP+
folate dihydrofolate tetrahydrofolate
Notes: Folic acid is the vitamin as it is found in the diet. It consists of three
distinct moieties: a pteridine moiety, a p-aminobenzoate moiety, and one or several
glutamate residues.
The metabolically active form is tetrahydrofolate, which is formed from fo-
late in two successive NADPH-dependent reductions, both catalyzed by the same
enzyme, namely, dihydrofolate reductase.
The number of glutamate residues contained in folic acid or tetrahydrofolate
(THF) changes at various stages of transport and utilization. Intestinal uptake
and transport through the blood occur with only one glutamate attached. After
uptake into liver cells, several more glutamate residues are added. The number
of glutamate residues present is involved in the regulation of folate-dependent
metabolism.
15.2.3 Sources and destinations of C1 units transferred by tetrahydrofolic acid
Sources:
1. serine, glycine
2. histidine, tryptophan
Biosynthetic destinations:
1. purine bases
2. thymine
3. S-adenosylmethionine choline phospholipids, creatine, epinephrine, DNA
methylation

15.2 Tetrahydrofolate-mediated carbon transfer reactions 271
Notes: Degradation of the amino acids glycine, serine, histidine and tryptophan
provides C1 units to tetrahydrofolate. Serine and glycine are more abundant than
the two others and therefore are the main sources.
15.1 Summarize the role of tetrahydrofolic acid in metabolism.
15.2.4 The serine hydroxymethyltransferase reaction: release of CH2O
HO CH2 C
H
COOH
NH2
OCH
⊖O
⊕
NH
P
H2O
H
B
Enzyme
O CH2 C
H
COOH
N⊕ CH
⊖O
H
⊕
NH
P
O CH2
⊕B H
Enzyme
C
H
COOH
N⊕ CH
⊖O
H
NH
P
O CH2
B
Enzyme
H C
H
COOH
N⊕ CH
⊖O
H
⊕
NH
P
Notes: One of the major reactions that supply C1 units to THF is the cleavage
of serine by serine hydroxymethyltransferase. The active site of this enzyme
contains the coenzyme pyridoxal phosphate (PLP) and a catalytic base (here
represented by B). As in amino acid transamination (section 12.2), the α-amino
group of the substrate serine forms a Schiff base with PLP. Through this bond,
PLP can reversibly withdraw and donate electrons, which in cooperation with the
catalytic base facilitates cleavage of the bond between the α- and the β-carbon. The
β-carbon is released as formaldehyde, and the aldimine is subsequently hydrolysed
to release glycine (not shown).
Note that the reaction is reversible and therefore can bring about the synthesis
of serine from glycine and N,N ′-methylene-THF.
15.2.5 The serine hydroxymethyltransferase reaction (2): capture of formalde-
hyde by THF yields N,N ′-methylene-THF
Notes: The formaldehyde released by serine cleavage is captured immediately by
THF while still within the active site. This yields N,N ′-methylene-THF.
It should be noted that, while the mechanism presented here is found in the
textbooks, an alternate mechanism has been proposed in which THF plays a more
immediate role in the cleavage of serine, and free formaldehyde does not occur as
an intermediate [88].

272 15 Biosynthetic pathways using tetrahydrofolate and vitamin B12
HO CH2 CH
NH3
COOH O CH2 H2C
NH3
COOH
H2N N NH
NHR
HN
OH
N
H2N N NH
NR
H2C
N
OH
N
H2O
serine glycine
tetrahydrofolate N,N -methylene-tetrahydrofolate
15.2 Write the equation for the serine hydroxymethyltransferase reaction.
15.2.6 N,N ′-methylene-THF production by the glycine cleavage system
NH
O
S
S
NH
O
SH
S
NH2
HN
OHS
HS
H2NO
OH
CO2
THFNH3 + N,N’-CH2-THF
NAD+
NADH + H+
Notes: Another major reaction to supply C1 units to THF is the degradation of
glycine by the glycine cleavage system. This is a multi-enzyme complex with
three separate catalytic subunits and one substrate carrier protein. The latter
possesses a lipoamide moiety to which the substrate becomes transiently attached,
a feature that is also found in pyruvate dehydrogenase (see slide 5.2.7). The initial
decarboxylation reaction uses pyridoxal phosphate as a coenzyme, and the second
reaction again appears to involve the capture of a formaldehyde intermediate by
THF.
In the third reaction, the dihydrolipoamide formed in the second step is dehy-
drogenated, which restores the initial disulfide form of lipoamide. This reaction
is identical to the final steps in the pyruvate dehydrogenase, α-ketoglutarate de-
hydrogenase, and branched chain α-keto acid dehydrogenase reactions. Indeed,
all four multienzyme complexes employ the same dihydrolipoate dehydrogenase
subunit for this purpose.
15.3 What is the glycine cleavage system? What reaction does it catalyze?

15.2 Tetrahydrofolate-mediated carbon transfer reactions 273
15.2.7 Histidine degradation produces N,N ′-methenyl-THF
N,N′-methenyl-THF
histidine urocanateimidazolone-propionate
formimino-glutamate
HO
O
NH2
N NH
HO
O
N NH
HO
O
O
N NH
HO
O
O
OH NH
NH
glutamate
THF
H2N N NH
NHR
N
NHOH
NH2N N N
H
NR⊕N
OH
N
NH3
H2O H2O
H+
NH3
Notes: Degradation of histidine proceeds via the intermediates urocanate, imida-
zolone-propionate and formimino-glutamate. The formimine (or methenimine)
group of the latter is transferred to tetrahydrofolate. Subsequent cleavage of am-
monia yields N,N ′-methenyl-THF, which can either be oxidized to formyl-THF or
reduced to N,N ′-methylenetetrahydrofolate (see slide 15.2.8).
15.2.8 Redox transitions between various forms of C1-THF
RNH
HN
NH
RN
CH
O
HN
NH
RN
⊕N
CH
NH
HCOOH
ATP ADP+Pi
NADP+
CO2
NADPHH2O
H+
NADPH
NADP+
RN
N
CH2
NH
RN
N
CH3
NH
NADH
NAD+
THF N10-formyl-THF N,N ′-methenyl-THF
N,N ′-methylene-THFN5-methyl-THF
Notes: C1 derivatives of THF exist in different redox states that can be converted
into one another. The final reduction, which leads from N,N ′-methylenetetrahy-
drofolate to N5-methyl-THF, is apparently irreversible; this is relevant for the
methyl trap hypothesis that accounts for the pathogenesis of anemia in vitamin
B12 deficiency (see slide 15.5.6).

274 15 Biosynthetic pathways using tetrahydrofolate and vitamin B12
N10-Formyl-THF can be formed from THF through capture of formic acid,
which in turn arises from tryptophan degradation. It can also be converted back
to THF by NADP+-dependent dehydrogenation of the formyl group to CO2. The
latter reaction is used to dispose of excess C1-intermediates when supply exceeds
demand.
15.2.9 Overview of flux through the C1-THF pool
tryptophan
formic acid
N10-formyl-THF
purine bases
histidine
formimino-THF
N,N ′-methenyl-THF
serine
glycine
N,N ′-methylene-THF
thymine
N5-methyl-THF
methionine
B12
HCN N
CH
HN
NCH3
O
HN
O NH
CH3S
NH2
O
OH
Notes: Formyl-THF and N,N ′-methylene-THF donate carbons in nucleotide syn-
thesis. Methyl-THF donates methyl groups to the synthesis of methionine. Me-
thionine synthesis constitutes the link between folate-dependent and vitamin B12-
dependent C1 metabolism. An activated form of methionine functions as a methyl
donor in several important biosynthetic pathways (see slide 15.4.2).
In the depicted structures of adenine, thymine and methionine, the carbons
that are acquired via THF are highlighted.
15.4 What are the possible redox states of C1 carbon associated with tetrahydrofolate?Which ones supply the synthesis of purine bases, of thymine, and of methionine, respec-tively?
15.3 Folate antimetabolites as antimicrobials
Notes: Folic acid metabolism in microbes contains drug targets for antimicrobial
therapy. An important example are the sulfonamides, which became available
in the 1930s and were the first broad-spectrum antibacterial drugs. The first
such drug, sulfamidochrysoidine (trade name Prontosil), was developed as a red
dyestuff. Its antibacterial activity was discovered in a test program that systemati-
cally evaluated the effects of all the company’s new compounds in animal experi-
ments.
The compound as such, when tested in vitro, has no antibacterial activity.
The active component is sulfanilamide, which is released in animals or humans

15.4 Cobalamin-dependent methylation reactions 275
by reductive metabolism. Its antibacterial action is due to its competition with
p-aminobenzoic acid, which is a precursor that becomes incorporated into folic
acid in its bacterial biosynthesis (see slide 15.2.2). Since humans do not synthesize
folate, they are not affected by sulfanilamide.
H2N
NH2
N
N S
O
NH2
O
H2N S
O
NH2
O
H2N
OH
O
Sulfamidochrysoidine (Prontosil)
Sulfanilamide
p-Aminobenzoic acid
NH2NNH2
N
O
O
O
Trimethoprim
Pyrimethamine
H2N N NH2
Cl
N
The antibacterial effect of sulfonamides can be substantially increased by combi-
nation with inhibitors of dihydrofolate reductase such as trimethoprim. In this
case, the selective toxicity of the inhibitor for bacteria is due not to the absence
of the enzyme in humans—dihydrofolate reductase is needed in both bacterial
and human metabolism—but instead to the molecular differences between the
bacterial and the human enzyme.
Combinations of a sulfonamide and a dihydrofolate reductase inhibitor can
also be used in the treatment of some protozoal infections. One such combination,
sulfadoxine plus pyrimethamine, was widely used against malaria at one time,
but the development of resistance among the malaria parasites has since made
it obsolete in this application. It is still used in toxoplasmosis and Pneumocystis
carinii infections.
Inhibitors of human dihydrofolate reductase, such as methotrexate, are used
in the treatment of tumors and autoimmune diseases (see slide 16.9.5).
15.5 Explain the therapeutic applications of inhibitors of folic acid synthesis and of dihy-drofolate reductase.
15.4 Cobalamin-dependent methylation reactions
15.4.1 Structure of methylcobalamin
Notes: Cobalamin is a coenzyme with a complex structure. Its corrin ring coordi-
nates a single cobalt ion, which is central to the ability of cobalamin to facilitate
the cleavage and formation of carbon bonds by way of radical intermediates.

276 15 Biosynthetic pathways using tetrahydrofolate and vitamin B12
O
NH2
N
NH2O
N
NH2
O
NH2O
N
NH2 O
N⊖
Co2+
NH2
O
O
NH
PMA
The two major forms of cobalamin are adenosylcobalamin and methylcobalamin.
Shown here is methylcobalamin, which is formed as an intermediate in the synthe-
sis of methionine from homocysteine (see below). The methyl group is obtained
from N5-methyl-THF. In this chapter, we only deal with methylcobalamin-depen-
dent reactions. Adenosylcobalamin is needed in the utilization of propionyl-CoA
(see slide 10.3.6); it is not considered in detail in these notes.
15.4.2 The S-adenosylmethionine (SAM) cycle requires vitamin B12
THF−CH3
THF
B12
B12−CH3
homocysteine
ymethionine S-adenosylmethionine (SAM)
S-adenosylhomocysteine (SAH)
ATPi 3 Pi
H2Oadenosine
precursor
methylated product
Notes: In the SAM cycle, methionine is first activated to S-adenosylmethionine
(SAM), which then serves as a methyl group donor in various biosynthetic reac-
tions. Methyl group donation leaves behind S-adenosylhomocysteine, which is
then cleaved to adenosine and homocysteine. The regeneration of methionine
from homocysteine requires vitamin B12 in the form of methylcobalamin.

15.4 Cobalamin-dependent methylation reactions 277
15.4.3 Structures of S-adenosylmethionine and S-adenosylhomocysteine
O
OHNH3
S⊕
CH3 O
OH
N N
N
NH2
N
OH
O
OHNH3
S
O
OH
N N
N
NH2
N
OH
SAM SAH
Notes: The key feature of SAM is the methyl group attached to a sulfonium ion
(S+). The inherent instability of the sulfonium group makes this compound a good
methyl group donor.
S-adenosylhomocysteine (SAH) is not only the byproduct of SAM-dependent
methylation reactions but also a competitive inhibitor. It must therefore be re-
cycled promptly in order to avoid disruption of the SAM cycle. In vitamin B12
deficiency, the regeneration of SAM from SAH is impeded, and the accumulating
SAH interferes with subsequent methylation reactions [89].
15.4.4 SAM-dependent methylation reactions
1. methylation of phosphatidylethanolamine (PE) to phosphatidylcholine (PC)
2. guanidinoacetate creatine
3. norepinephrine epinephrine
4. acetylserotonin melatonin
5. DNA methylation
6. methylation of drugs (e.g. mercaptopurine)
Notes: Among these pathways, the biosynthesis of PC and of creatine are quanti-
tatively the most important ones.
15.6 What biosynthetic reactions require vitamin B12?
15.4.5 Phosphatidylethanolamine methylation
Notes: Phosphatidylcholine (PC) is a major constituent of mammalian cell mem-
branes. It is formed in three successive SAM-dependent methylation steps from
phosphatidylethanolamine (PE).
PC can also be synthesized using dietary choline, and conceivably this pathway
might supply enough PC for myelin synthesis. However, in animal experiments,
depletion of vitamin B12 has been shown to decrease PC and to increase PE in the
brain [90], suggesting that PE methylation is important for sufficient PC synthesis.

278 15 Biosynthetic pathways using tetrahydrofolate and vitamin B12
O−P
O
O
O
O
O
OO
NH2
O−P
O
O
O
O
O
OO
NH
O−P
O
O
O
O
O
OO
N
O−P
O
O
O
O
O
OO
N⊕
SAM SAH SAM SAH SAM SAH
PE methyl-PE dimethyl-PE PC
15.4.6 Sphingomyelin acquires its phosphocholine headgroup from PC
Notes: Sphingomyelin, another important membrane phospholipid, is synthe-
sized from its precursor ceramide through phosphocholine transfer from PC;
therefore, its synthesis indirectly also depends on the SAM cycle and vitamin
B12.
O
PO
N+
O
O−
O
O
O
O
HO
OH
HN
O
HO
O
O
O
O OH
HN
O
O
PO
N+
O
O−
PC ceramide diacylglycerol sphingomyelin
15.7 What is the SAM cycle? At what point in the cycle is vitamin B12 required?
15.4.7 Major nerve fibers are myelinated
Notes: Myelin sheaths consist of multiple layers of cell membranes, which contain
more phospholipids and less protein than most other cell membranes. These
elaborate structures enable the saltatory conduction of action potentials, which
is much faster than the pedestrian non-saltatory conduction that occurs along
non-myelinated fibers. The picture shows a cross section through a single nerve

15.4 Cobalamin-dependent methylation reactions 279
fiber; the thick, dark zone surrounding the axon is the myelin, which consists of
multiple stacked membrane bilayers.1
Cobalamin deficiency causes demyelination or nerve fibers in the central and pe-
ripheral nervous system. The neurological, and in advanced stages neuropsy-
chiatric, consequences can be severe. In addition to the disruption of PC and
sphingomyelin biosynthesis, deficient methylation of myelin-associated proteins
has been considered as another pathogenic mechanism [89].
15.4.8 Creatine metabolism
NH2
CH2
COO−
NH+2
C NH2
NH
CH2
COO−
arginine ornithine
NH+2
C NH2
N CH3
CH2
COO−
SAM SAH
NH+2
C NH P
N CH3
CH2
COO−
H3CN
O
NH
HN
ADP
ATP
P
glycine guanidinoacetate creatine
creatine phosphatecreatinine
creatine kinase
Notes: The first two steps in creatine synthesis occur in the kidney and the liver,
respectively; the second step involves S-adenosylmethionine. Most of the creatine
1The number of stacked bilayers surrounding the axon in this picture is approximately 20, but itcan be substantially higher in the fastest-conducting axons.

280 15 Biosynthetic pathways using tetrahydrofolate and vitamin B12
is then accumulated in skeletal muscle. There, it is reversibly phosphorylated
to creatine phosphate. This reaction is readily reversible, and the physiological
function of creatine phosphate is to form a rapidly available reserve of energy-rich
phosphate groups.
Heart and skeletal muscle contain different isoforms of creatine kinase (CK).
As with other enzymes, an increased activity of CK in the plasma is a diagnostic
indicator of organ damage. High levels of the cardiac isoform of CK are a typical
sign of a recent myocardial infarction or of viral myocarditis.
As indicated in the slide, creatine phosphate can undergo spontaneous ring
closure to creatine; this reaction affects approximately 1.5% of the total creatinine
pool every day. Creatine is eliminated through the kidneys, predominantly through
glomerular filtration. Its concentration in the plasma is used as a diagnostic
indicator of kidney function—the lower the glomerular filtration rate, the higher
the steady-state concentration of creatinine. In elderly patients, the creatinine level
is often used to adjust the dosages of drugs that also undergo renal elimination.
15.5 Folate and vitamin B12 deficiency syndromes
Since both folate and B12 are vitamins, deficiency arises from disruptions of intesti-
nal uptake. We therefore need to understand how this intestinal uptake occurs.
15.5.1 Uptake, transport and storage of folic acid
• contained in vegetables (Latin folium = leaf)
• synthesized by bacterial flora in the large intestine
• active transport mediates intestinal uptake and renal reuptake, as well as
accumulation in the liver
• 50% of all folate is stored in the liver
Notes: The high folate content of the liver is consistent with its prominent role in
amino acid metabolism.
Since nutrients and vitamins are typically taken up from the small intestine,
one might wonder whether or not folate that is synthesized by bacteria in the
colon can be taken up by the host. Experiments with instillation of isotopically
labeled folate during colonoscopy indicate that uptake from the large intestine is
indeed possible [91]. However, the depletion of folate observed in malnutrition
or in diseases of the small intestine indicates that colon bacteria do not provide
folate in sufficient amounts.
15.5.2 Causes of folate deficiency
• inflammatory bowel diseases
• surgical bowel resection (short intestine syndrome)

15.5 Folate and vitamin B12 deficiency syndromes 281
• cytochrome P450-inducing drugs
• excessive alcohol consumption—contentious
Notes: The first two causes in this list compromise the resorption of folic acid
from the small intestine; they apply similarly to many other nutrient deficiency
syndromes as well. Alcohol is often cited as a cause of folate deficiency, but no
single biochemical mechanism has emerged as the major connection: “Ethanol-
associated folate deficiency can develop because of dietary inadequacy, intestinal
malabsorption, altered hepatobiliary metabolism, enhanced colonic [that is, bacte-
rial] metabolism, and increased renal excretion” [92].
In studies on the effects of alcohol on folate metabolism with experimental
animals, the poor—or lucky, some might say—fellers were usually exposed to
excessive dosages, as for example in [93]. In several studies on humans, the corre-
lation between alcohol intake and folate deficiency has been altogether questioned;
see for example [94].
Several members of the cytochrome P450 family of enzymes are important
in the degradation and inactivation of drugs, which, like folate-dependent meta-
bolism, occurs to a large extent in the liver (see chapter 18). Due to their broad
substrate specificities, they cause some modification and inactivation of innocent
bystander metabolites also; one of these is folic acid. Various drugs, including
ethanol, increase cytochrome P450 activity through transcriptional induction, and
long-standing application of such drugs may cause depletion of folic acid through
increased metabolism.
15.5.3 Folate deficiency causes macrocytic anemia
normal red cells macrocytic red cells
Notes: In macrocytic anemia, the number of blood cells is reduced, but the size of
the individual cells is increased. With red blood cells, the content of hemoglobin
per cell is also increased. On the whole, however, the hemoglobin content of the
blood is decreased, which makes this condition a form of anemia.
C1 units derived from THF are required at several points in nucleotide biosyn-
thesis (see slide 15.2.9). The inhibition of nucleotide biosynthesis that results from
the lack of THF will interfere with DNA synthesis and cell division more strongly
than with protein synthesis. Protein synthesis “outruns” DNA synthesis, leading
to the accumulation of more protein per cell between successive cell divisions. In
the precursor cells of erythrocytes, this causes a greater than normal hemoglobin
content per cell.

282 15 Biosynthetic pathways using tetrahydrofolate and vitamin B12
Macrocytosis—enlargement of red blood cells—is also often observed in al-
coholism, but it may not always be caused by folate deficiency, and the overall
content of hemoglobin in the blood may not be reduced.
15.5.4 The intestinal uptake of vitamin B12 involves multiple carrier proteins
Notes: The intestinal uptake of vitamin B12 is a rather intricate affair. The vitamin
contained in the food is bound to enzymes or other proteins. In the stomach, these
are denatured by gastric acid and cleaved by pepsin. The vitamin thus released is
immediately bound by the carrier protein haptocorrin, which is secreted by the
gastric mucous membrane.
When the stomach contents reach the small intestine, haptocorrin itself is
degraded by trypsin or other pancreatic proteases, and vitamin B12 is released
again. The free vitamin is then recaptured by intrinsic factor, a second carrier
protein that is also produced by the gastric mucosa (and which up to this point
simply came along for the ride). The B12-intrinsic factor complex then travels all
the way down to the terminal ileum, the lowermost section of the small intestine,
where it is taken up by receptor-mediated endocytosis. Inside the cells of the gut
epithelium, vitamin B12 changes carriers for a third time; bound to its final carrier,
transcobalamin, the vitamin then reaches the liver and all other tissues beyond.
The daily uptake of vitamin B12 is on the order of only 1-5µg. The liver stores
about 2-5 mg. When uptake is disrupted, this store will last a long while before
vitamin deficiency becomes clinically manifest.

15.5 Folate and vitamin B12 deficiency syndromes 283
15.5.5 Various causes of B12 deficiency
Disease Pathogenetic mechanism
autoimmunegastritis
destruction of the gastric parietal cells thatproduce gastric acid, haptocorrin, and intrinsicfactor
pancreaticinsufficiency
failure to digest haptocorrin
inflammatorybowel disease
disrupted uptake of B12 bound to intrinsic factor
receptordeficiencies
disrupted binding and cellular uptake of intrinsicfactor or transcobalamin
Notes: Uptake can be disrupted in various circumstances. Crohn’s disease, a
major form of inflammatory bowel disease, often most severely affects the terminal
ileum, which is where cobalamin, bound to intrinsic factor, must be taken up. In
many Crohn’s patients, the terminal ileum is damaged to a point where it needs to
be surgically removed.
The classical form of vitamin B12 deficiency, known as pernicious anemia, is
caused by an autoimmune disease that destroys the parietal cells, the specific
cell type in the gastric mucosa that secretes both haptocorrin and intrinsic factor.
The parietal cells also produce gastric acid, the lack of which will compromise the
release of B12 from food proteins.
The earliest clinical treatment of pernicious anemia due to vitamin B12 defi-
ciency consisted in the ingestion of copious amounts of homogenized raw liver.
Apparently, this was not everybody’s cup of tea, and some patients refused this
treatment, in spite of the serious consequences. The situation improved when liver
extracts enriched for the vitamin became available. Nowadays, the pure compound
is applied orally or intravenously.
As stated above, the amount of cobalamin stored in the liver is many times
larger than the daily requirement; the vitamin deficiency therefore tends to become
clinically manifest with considerable delay after the disruption of vitamin uptake.
This is something to watch out for in patients who have apparently recovered
from some intestinal disease or surgery but who have been left with compromised
digestive or absorptive function.
Cobalamin has a very high affinity for cyanide, and cyanocobalamin is a com-
mon synthetic derivative used as a supplement. Hydroxycobalamin can shed a
hydroxide and bind a cyanide ion. In gram amounts, hydroxycobalamin can be
used to scavenge free cyanide in acute cyanide poisonings; reportedly, this
treatment is superior to the use of oxidative agents that induce the formation of
methemoglobin as a cyanide scavenger [95].
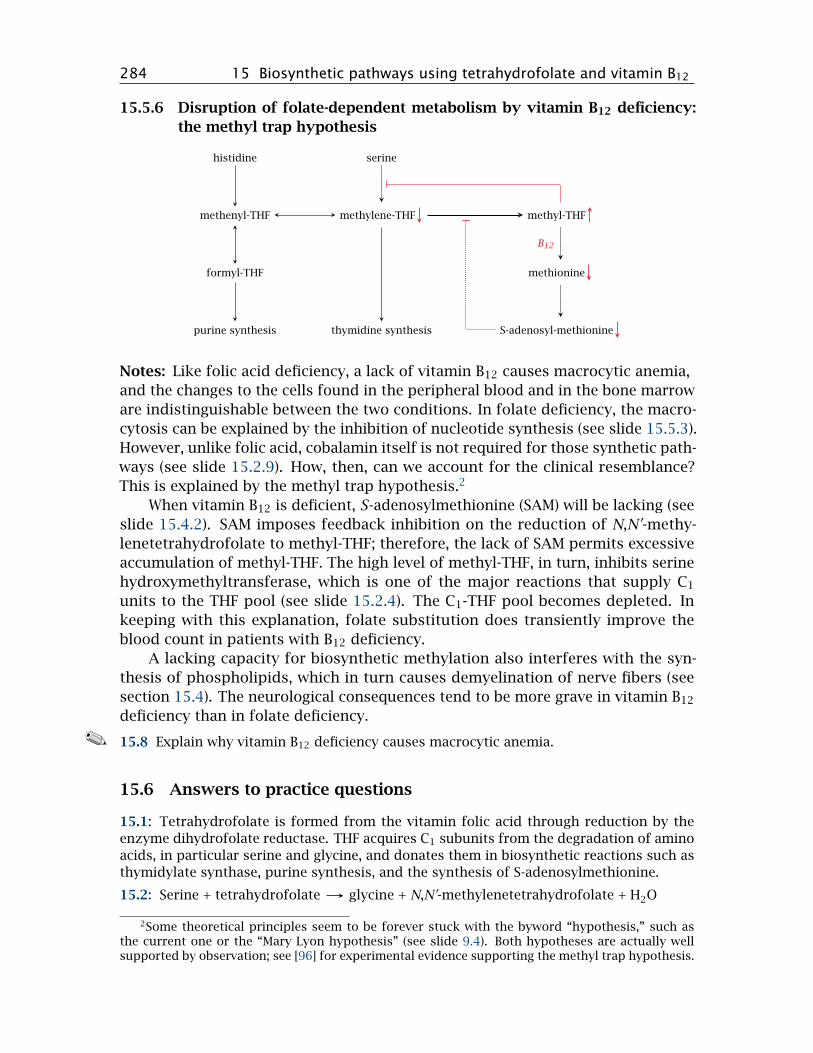
284 15 Biosynthetic pathways using tetrahydrofolate and vitamin B12
15.5.6 Disruption of folate-dependent metabolism by vitamin B12 deficiency:
the methyl trap hypothesis
formyl-THF
methenyl-THF methylene-THF methyl-THF
methionine
S-adenosyl-methioninepurine synthesis thymidine synthesis
histidine serine
B12
Notes: Like folic acid deficiency, a lack of vitamin B12 causes macrocytic anemia,
and the changes to the cells found in the peripheral blood and in the bone marrow
are indistinguishable between the two conditions. In folate deficiency, the macro-
cytosis can be explained by the inhibition of nucleotide synthesis (see slide 15.5.3).
However, unlike folic acid, cobalamin itself is not required for those synthetic path-
ways (see slide 15.2.9). How, then, can we account for the clinical resemblance?
This is explained by the methyl trap hypothesis.2
When vitamin B12 is deficient, S-adenosylmethionine (SAM) will be lacking (see
slide 15.4.2). SAM imposes feedback inhibition on the reduction of N,N ′-methy-
lenetetrahydrofolate to methyl-THF; therefore, the lack of SAM permits excessive
accumulation of methyl-THF. The high level of methyl-THF, in turn, inhibits serine
hydroxymethyltransferase, which is one of the major reactions that supply C1
units to the THF pool (see slide 15.2.4). The C1-THF pool becomes depleted. In
keeping with this explanation, folate substitution does transiently improve the
blood count in patients with B12 deficiency.
A lacking capacity for biosynthetic methylation also interferes with the syn-
thesis of phospholipids, which in turn causes demyelination of nerve fibers (see
section 15.4). The neurological consequences tend to be more grave in vitamin B12
deficiency than in folate deficiency.
15.8 Explain why vitamin B12 deficiency causes macrocytic anemia.
15.6 Answers to practice questions
15.1: Tetrahydrofolate is formed from the vitamin folic acid through reduction by theenzyme dihydrofolate reductase. THF acquires C1 subunits from the degradation of aminoacids, in particular serine and glycine, and donates them in biosynthetic reactions such asthymidylate synthase, purine synthesis, and the synthesis of S-adenosylmethionine.
15.2: Serine + tetrahydrofolate glycine + N,N ′-methylenetetrahydrofolate + H2O
2Some theoretical principles seem to be forever stuck with the byword “hypothesis,” such asthe current one or the “Mary Lyon hypothesis” (see slide 9.4). Both hypotheses are actually wellsupported by observation; see [96] for experimental evidence supporting the methyl trap hypothesis.

15.6 Answers to practice questions 285
15.3: The glycine cleavage system is a multi-enzyme complex that consists of three dif-ferent enzymes and a substrate carrier protein with a lipoamide moiety. I cleaves glycineaccording to the following equation:
Glycine + NAD+ + THF NH3 + CO2 + NADH+H+ + N,N′-methylene-THF
15.4: The C1 carbon can be carried by THF as a formyl, methenyl, methylene, or methylgroup. Purine synthesis uses formyl-THF, thymidylate synthase uses methylene-THF, andmethionine synthesis uses methyl-THF.
15.5: Folic acid is synthesized by microbes but not by human cells. Therefore, inhibitorsof folate synthesis are selectively toxic for microbes and can be used for antimicrobialtherapy. Sulfonamides are the predominant class of folate synthesis inhibitors.
Dihydrofolate reductase occurs in both microbial and human cells. Inhibitors that se-lectively target the microbial enzymes are available and are used for antimicrobial therapy,preferably in conjunction with sulfonamides. Inhibitors of the human enzyme are used incancer therapy and for immunosuppression.
15.6: See slide 15.4.4.
15.7: The S-adenosylmethionine or SAM cycle is a pathway that mediates the transferof methyl groups from N,N ′-methyl-THF to phosphatidylethanolamine (PE) and variousother substrates. The first reaction, which is vitamin B12-dependent, is the transfer of themethyl group from methyl-THF to homocysteine, which yields methionine. Using ATP,methionine is then activated to S-adenosylmethionine, which donates the methyl group tovarious acceptors, including PE, epinephrine, and (cytosine bases in) DNA. The cleavage ofS-adenosylhomocysteine to adenosine and homocysteine completes the cycle.
15.8: In vitamin B12 deficiency, macrocytic anemia arises through the formation of exces-sive amounts of methyl-tetrahydrofolate, at the expense of formyl- and methylene-THF,which are required in the synthesis of nucleotides.
Vitamin B12 is required in the conversion of homocysteine to methionine, which isthen converted to S-adenosylmethionine. The latter exerts feedback inhibition on thereduction of methylene-THF to methyl-THF. Lack of vitamin B12 disrupts this negativefeedback.


Chapter 16
Nucleotide metabolism
16.1 Introduction
16.1.1 Functions of nucleotides in biochemistry
• Building blocks of nucleic acids
• Cosubstrates and coenzymes
• Signaling
Notes: I’ll be wildly optimistic and assume that you remember a thing or two about
nucleic acids, so we will mostly skip this topic.
Nucleotides are very important as cosubstrates in metabolism. As you know,
ATP occurs everywhere, but GTP, CTP, and UTP drive some biochemical reactions
as well.
Adenosine and adenine nucleotides also function as signaling molecules; for
example, ADP is important in thrombocyte activation. Caffeine is an antagonist
at adenosine receptors, which tells us that adenosine is important in the regula-
tion of vigilance. Cyclic AMP (slide 7.5.4)and cyclic GMP (slide 9.3.6) function as
intracellular second messengers.
16.1.2 Structures of NAD, acetyl-CoA, and PAPS
Notes: Nucleotides also occur as parts of more complex cosubstrates and coen-
zymes, three of which are shown here. These three molecules have very different
“business ends.” In coenzyme A, the business end is the thiol group that becomes
bound to the substrate, and in NAD+ it is the nicotinamide moiety that under-
goes reversible reduction and oxidation. In 3′-phosphoadenosine-5′-phosphosul-
fate (PAPS), the key feature is the mixed phosphosulfate anhydride that activates
the sulfate toward transfer, in much the same way as the terminal phosphate is
287

288 16 Nucleotide metabolism
activated in ATP. In methylcobalamin, the chemically active center is the cobalt ion
that facilitates carbon bond cleavage and formation (see section 15.4).
NAD+
O O
OH
⊕
N
NH2
O
OHP O−O
O
P O−O
O O
OH
N N
N
NH2
N
OH
PAPS
O S
O−
OH
O P
O−
O
O O
OH
N N
N
NH2
N
O
P O−O
O−
coenzyme A
HS NH
O
NH
O
OH
O
P O−O
O
P O−O
O O
OH
N N
N
NH2
N
OH
The adenosine moiety found in each of these molecules, shown in blue, does not
directly participate in any of the catalytic functions; instead, it just serves as a tag
to facilitate recognition of the cosubstrates by the corresponding enzymes. Why,
then, do cosubstrates so often possess nucleotides as their binding tags, rather
than for example amino acids or peptides? A plausible answer is provided by the
RNA world hypothesis.
16.1.3 The RNA world hypothesis
Notes: The RNA world is a hypothetical early stage of evolution. In this early world,
RNA was the predominant macromolecule. RNA not only stored and propagated
genetic information, a role that is almost universally filled by DNA in current life
forms, but it also realized and expressed this information, which in current life
forms is mostly accomplished by proteins.
The empirical basis of the RNA world hypothesis is that RNA can indeed
assume the role of DNA, as it still does in RNA viruses and viroids, and that it can
also have catalytic activity, as is the case in ribosomes and smaller ribozymes.

16.1 Introduction 289
The structure of the ribosome also suggests an evolutionary path along which
RNA enzymes may have been replaced by protein enzymes in evolution. The
catalytic centers of a ribosome (left) consist entirely of RNA (blue). The tiny red
dot in the center represents the antibiotic chloramphenicol, lodged in one of the
active sites of a bacterial ribosome; we are peeping at it through the ribosome’s
peptide exit tunnel. Ribosomal proteins (green) serve in structural and auxiliary
roles.
Like ribosomes, other RNA enzymes may at first have coopted peptides as
structural components, and possibly as coenzymes. The peptides may then have
grown into ever more important roles within the hybrid molecules, until they took
over entirely and made the RNA component obsolete.
16.1.4 Why have cosubstrates become fossilized, whereas enzymes have not?
Me substrate 1
cosubstrate
substrate 2
Me enzyme 4
enzyme 3
enzyme 2enzyme 1
. . .
. . .
. . .
. . .
. . .. . .
. . .
. . .
An enzyme’s world . . .
. . . and a cosubstrate’s world
Notes: In a world dominated by RNA, one would expect cosubstrates and carrier
molecules to contain some nucleotide moieties also. However, if the above scenario
for the evolutionary replacement of RNA enzymes by protein enzymes is correct,
why did a similar replacement not occur with cosubstrates?
Let us consider the world from the perspective of an enzyme and of a cosub-
strate, respectively. An enzyme’s world is simple, containing one or a few sub-
strates and maybe a cosubstrate or coenzyme. If we make some random change
to the structure of the enzyme, there is a reasonable chance that the interactions
with all of these ligands will remain intact.
In contrast, a cosubstrate such as ATP or NADH inhabits a much more complex
world, containing a very large number of interacting enzymes. Chances are that a
change to its molecular structure would disrupt its interaction with some enzyme
molecule or other that is essential to the survival of the cell. Structural changes
to cosubstrates are therefore “forbidden,” and they may well look now exactly as
they did shortly after life first arose billions of years ago.1
1The acyl carrier protein (ACP) domain that is found in fatty acid synthase is basically coenzymeA with adenosine replaced by a peptide moiety (see slide 10.5.3). This is possible since ACP is privateproperty of fatty acid synthase and does not need to function with other enzymes.
The constraining effect of a large number of interactions can also be seen with peptides likeglutathione or proteins like calmodulin, which are also very strongly conserved throughout evolution.

290 16 Nucleotide metabolism
16.1 Explain the RNA world hypothesis, and the concept that nucleotide-based coenzymesmay be molecular fossils from the RNA world.
16.2 Overview of metabolic pathways for nucleotides
16.2.1 Metabolic routes and pathways of nucleotides
• De novo synthesis
• Intestinal uptake of nucleosides
• Endogenous turnover (partial degradation/salvage)
• Degradation and excretion
Notes: Synthesis of nucleotides from scratch occurs in all tissues, and its capacity
is sufficient to fully cover the needs of the organism; we do not require any nucle-
otides or bases in the diet. Nevertheless, nucleic acids contained in the diet are
broken down to nucleosides, which are taken up with high efficiency and degraded
(see section 16.4).
The pathways for the degradation of endogenous nucleotides have some over-
lap with those for dietary ones. Intermediates of nucleotide degradation can also
enter salvage pathways and then be reverted to complete nucleotides. We will now
look at all these pathways in turn.
There are two major synthetic pathways, for purine and pyrimidine bases,
respectively, both of which diverge towards their ends to produce the different
variants. We will begin with the pathway for purine synthesis.
16.3 Purine synthesis
16.3.1 Overview of purine synthesis
OP
O
O−
−OO
OH OH
O P
O
O−
O P
O
O−
O−
OP
O
O−
−OO
OH
N N
NH
O
N
OH
PRPP
IMP
ring synthesis
ring modificationGMP
ring modificationAMP
Notes: Adenine and guanine nucleotides are derived from a common precursor,
inosine monophosphate (IMP), which consists of ribose phosphate and a purine

16.3 Purine synthesis 291
derivative known as hypoxanthine. IMP is synthesized from 5′-phosphoribosyl-1′
-pyrophosphate (PRPP) in a sequence of no less than 10 steps. In two of these
steps, single carbon units are acquired from N10-formyltetrahydrofolate.
The conversions of IMP to AMP and to GMP, respectively, are reversible. There-
fore, AMP and GMP can be converted into one another via IMP as required.
16.3.2 IMP synthesis (1)
ribose-5-phosphate PRPP
OP
O
O−
−OO
OH OHOH
OP
O
O−
−OO
OH OHO P
O
O−
O P
O
O−
O−
ATP
AMP
glutamine
glutamate + PPi
OP
O
O−
−OO
OH OH
NH2OP
O
O−
−OO
OH OH
HN O
NH2
glycine + ATP
ADP + Pi
phosphoribosylamineglycinamide ribotide (GAR)
Notes: The substrate of the first reaction, ribose-5-phosphate, is supplied by the
hexose monophosphate shunt. The enzymes for the reactions shown in this slide
are, in order, ribose phosphate diphosphokinase, glutamine-PRPP-amidotrans-
ferase, and glycinamide ribotide synthetase.
16.3.3 IMP synthesis (2)
Notes: Construction of the hypoxanthine ring continues in a piecemeal fashion;
atoms highlighted in different colors are derived from different precursors. Prod-
ucts (enzymes): FGAR, formylglycinamide ribotide (GAR transformylase); FGAM,
formylglycinamidine ribotide (FGAM synthetase); AIR, 5′-aminoimidazole ribotide
(AIR synthetase); CAIR, 4′-carboxy-5′-aminoimidazole ribotide (AIR carboxylase);
SAICAR, succinyl-aminoimidazole-carboxamido-ribotide (SAICAR synthetase);
AICAR, aminoimidazole-carboxamido-ribotide (adenylosuccinate lyase).

292 16 Nucleotide metabolism
R
HN O
NH2
R
HN O
HN
O
R
HN NH
HN
O
R
N NH2
N
R
N NH2
O
OHN
R
N NH2
O
NH
O OH
O OH
N
R
N NH2
O
NH2N
CAIRSAICARAICAR
asp + ATP
ADP + Pifumarate
GAR FGAR FGAM AIR
N10-formyl-THF
THF
gln + ATP
glu + ADP + Pi
ATP
ADP + Pi
CO2
16.3.4 IMP synthesis (3)
Notes: AICAR transformylase and IMP cyclohydrolase conclude the synthesis of
the ribose-attached hypoxanthine ring.
R
N NH2
O
NH2N
R
N NH
O
O
NH2N
R
N N
O
NHN
N10-formyl-THF
THF H2O
AICAR FAICAR IMP
Most of the chemistry in this pathway seems quite straightforward. Where ATP or
GTP come into play, they are used to phosphorylate hydroxyl groups, which are
thus activated for substitution by ammonia (released from glutamine) or by the
amino group of aspartate.
The most remarkable reaction appears to be the direct carboxylation of 5-
aminoimidazole ribotide (AIR) by AIR carboxylase, which unlike e.g. pyruvate car-
boxylase requires neither ATP nor biotin. Indeed, AIR carboxylase uses CO2 di-
rectly instead of ATP-activated bicarbonate, which is used by the biotin-dependent
enzymes. This is made possible by its energetic coupling with the subsequent
reaction (see next slide).
16.3.5 A bifunctional enzyme combines AIR carboxylase and SAICAR syn-
thetase activities
Notes: AIR carboxylase is actually part of a bifunctional enzyme that also contains
the next enzyme activity in the pathway (SAICAR synthetase), and the carboxylated
product (CAIR) is directly channeled to the SAICAR synthetase active site. The

16.3 Purine synthesis 293
two active sites are located close to the entrance and the exit, respectively, of a
connecting tunnel [97].
substrate substrate
product
The equilibrium of the AIR carboxylase reaction probably does not favor the prod-
uct (CAIR). In contrast, the SAICAR synthetase is driven forward by ATP hydrolysis.
Thus, the tunnel that connects the two active sites would seem to function like a
“vacuum cleaner” that removes all the product from the AIR carboxylate site and
thereby pushes that reaction forward also. Structure rendered from 2h31.pdb.
16.3.6 Synthesis of AMP from IMP
OP
O
O−
−O O
OH
N N
N
NH2
N
OH
OP
O
O−
−O O
OH
N N
NH
O
N
OH
OP
O
O−
−O O
OH OH
N N
N
NH
O
OH
OH
O
N
GDP + Pi
GTP + aspartate
fumarate
adenylosuccinate
adenylosuccinate lyase
adenylosuccinatesynthetase
AMP
IMP
H2O
NH3
AMP deaminase
Notes: The synthesis of AMP from IMP occurs in two steps. In the first step, an
aspartate is acquired to form adenylosuccinate. The subsequent elimination of
fumarate—or, strictly speaking, the elimination of AMP from fumarate—is similar
to the conversion of SAICAR to AICAR (slide 16.3.3). Indeed, both reactions are
carried out by the same enzyme, which is named adenylosuccinate lyase after the
reaction depicted here.

294 16 Nucleotide metabolism
If the supply of AMP exceeds demand, it can be converted back to IMP by
AMP deaminase, either for degradation or for conversion to GMP (see slide 16.3.7).
Taken together, the three reactions in this slide create a cycle that does not accom-
plish any net turnover of AMP but simply splits aspartate to fumarate, with the
hydrolysis of GTP. This so-called purine nucleotide cycle may indeed be activated
in muscle tissue, where it serves to swiftly increase the pool of TCA cycle inter-
mediates in times of increased energy demand. However, it seems that a genetic
deficiency for adenine deaminase is quite common and usually asymptomatic [98],
suggesting that the function of this cycle is not crucial for muscle function.
16.3.7 Synthesis of GMP from IMP
OP
O
O−
−OO
OH
N N NH2
NH
O
N
OH
OP
O
O−
−OO
OH
N N
NH
O
N
OH
OP
O
O−
−OO
OH OH
N NH
O
NH
O
N
NAD+ + H2O
NADH + H+
glutamine + ATP + H2O
glutamate + AMP + PPi
XMP
GMP synthetase
IMP dehydrogenase
GMP
IMP
NADPH
NADP+ + NH3
GMP reductase
Notes: After the initial dehydrogenation of IMP to xanthosine monophosphate
(XMP), glutamine serves once more as the nitrogen donor in the conversion of this
intermediate to GMP. Excess GMP can be turned back into IMP for degradation or
conversion to AMP.
Note the crosswise utilization of cosubstrates in the syntheses of AMP and
GMP: AMP synthesis requires GTP, whereas GMP synthesis is driven by ATP. There-
fore, an oversupply of either purine nucleotide will accelerate the synthesis of the
other one. This arrangement helps to adjust the abundance of the two purine bases
according to metabolic demands. Additional mechanisms that help to ensure this
balance are discussed in the next slide.
16.3.8 Feedback regulation in purine synthesis
Notes: Purine synthesis is subject to feedback inhibition at several levels. All
guanine and adenine nucleotides allosterically inhibit the synthesis of phosphori-
bosylamine (PRA) from PRPP. The common precursor IMP inhibits the formation

16.4 Utilization of dietary nucleic acids 295
of PRPP itself, as do ADP and GDP (not shown). These effects adjust the flow
through the common pathway up to IMP in keeping with the total need for purine
nucleotide synthesis.
Ribose-5-phosphate
PRPP
PRA
IMP
XMP
GMP
GDP
GTP
Adenylosuccinate
AMP
ADP
ATP
The balance between AMP and GMP synthesis is maintained by the crosswise
cosubstrate requirement that was discussed above (green lines). In addition, GMP
and AMP both inhibit the formation of their immediate precursors from IMP; this
inhibition is competitive.
16.2 Give an overview of the biosynthesis of purine nucleotides and its regulation.
16.4 Utilization of dietary nucleic acids
16.4.1 Overview of digestion and utilization of nucleic acids
Notes: Nucleic acids are of nutritive value mainly because of the sugars they con-
tain, namely, ribose and deoxyribose. In the small intestine, pancreatic nucleases
(DNAse and RNAse) break down nucleic acids to nucleotides, which are dephos-
phorylated by alkaline phosphatase to nucleosides; the latter are taken up by
sodium-coupled active transport. There are two intestinal transporters that prefer
purine and pyrimidine nucleosides, respectively, but have fairly broad and over-
lapping specificity. This loose specificity permits piggyback uptake of nucleoside
analogue drugs such as idoxuridine and 6-mercaptopurine riboside (see section
16.9).
After uptake, nucleosides mostly undergo degradation in the liver. Cleavage
by purine and pyrimidine nucleoside phosphorylases gives free bases and ribose-
or deoxyribose-1-phosphate. The sugar phosphates are converted to mainstream
degradative intermediates via short adapter pathways (see next slide).

296 16 Nucleotide metabolism
nucleic acids
nucleotides
nucleosides
nucleosides nucleotides
sugar phosphates bases
CO2 and H2O uric acid, β-amino acids
nucleotides
degradation
salvagephosphorylase
intestinal uptake
phosphatase
DNAse, RNAse
Na+
Pi
H2O
H2O
Pi
Both free bases and uncleaved nucleosides can in principle be reused toward
the synthesis of nucleotides. However, the salvage pathways that accomplish this
appear to mostly process endogenously synthesized bases, whereas those obtained
from the diet mostly undergo degradation and excretion [99, 100].
16.4.2 Utilization of ribose and deoxyribose
OHO
OH OH
O P
O
O−
O−
OP
O
O−
−OO
OH OH
OH
phosphopentomutase
hexose monophosphateshunt
5/6 glucose-6-phosphate
OHO
OH
O P
O
O−
O−
OP
O
O−
−OO
OH
OH
glyceraldehyde-3-phosphate +acetaldehyde
deoxyribose phosphatealdolase
Notes: The ribose-1-phosphate and deoxyribose-1-phosphate that are released
from dietary nucleosides are first converted to the respective 5-phosphates by
phosphopentomutase. This reaction is analogous to the interconversion of
glucose-6-phosphate and glucose-1-phosphate by phosphoglucomutase (see slide
8.3.1).
The subsequent utilization pathways diverge. Ribose-5-phosphate is an inter-
mediate of the hexose monophosphate shunt and can be converted to glucose-6-

16.5 Purine degradation and salvage pathways 297
phosphate in this pathway (see slide 9.2.2). Deoxyribose-5-phosphate is cleaved—
across the red squiggly line in the figure—by a specific aldolase, which produces
glyceraldehyde-3-phosphate, an intermediate of glycolysis, and acetaldehyde. The
latter is also an intermediate in ethanol degradation (see slide 7.4.2) and is utilized
along this pathway.
16.3 Can ribose and deoxyribose be utilized for the synthesis of glucose? If so, do theyboth provide the same yield of glucose per mole of starting material?
16.5 Purine degradation and salvage pathways
The following pathways account for the degradation of endogenous purine nucle-
otides, as well as of the free bases that result from the phosphorolysis of dietary
ones.
16.5.1 Degradation of endogenous purine nucleotides (overview)
GMPXMPIMPAMP
guanosinexanthosineinosineadenosine
guaninexanthinehypoxanthineadenine
uric acid
5
21
3
45
deamination
oxidation
dephosphorylation
phosphorolysis
Notes: Enzymes: 1, AMP deaminase; 2, IMP dehydrogenase; 3, adenosine deami-
nase; 4, guanase; 5, xanthine dehydrogenase or oxidase.
The AMP deaminase reaction is shown in the next slide; the adenosine deam-
inase reaction is analogous. The guanase and xanthine dehydrogenase/oxidase
reactions are depicted in slide 16.5.3. The dephosphorylation of the monophos-
phate nucleotides to the nucleosides and the subsequent phosphorolysis to free
bases occurs in the same way as outlined above for dietary nucleotides and nucle-
osides (slide 16.4.1).
16.5.2 Adenine nucleotide degradation
Notes: As shown in slide 16.5.1, the degradation of AMP can follow several alter-
native routes that perform dephosphorylation, phosphorolysis, deamination, and
oxidation reactions in different sequences. This figure depicts one of these alter-
native routes in detail. The depicted reactions are catalyzed by AMP deaminase

298 16 Nucleotide metabolism
(1), IMP dehydrogenase (2), 5′-nucleotidase (3), purine nucleoside phosphorylase
(4), and xanthine dehydrogenase/oxidase (5).
N N
Ribose-P
N
NH2
N
NH
N
Ribose-P
N
O
N
O NH
N
Ribose-P
N
O
HN
O NH
N
Ribose
N
O
HN
O NH
NH
N
O
HN
O NH
NH
O
HN
O
HN
H2O
NH3
NAD++H2O
NADH
H2O
phosphate
phosphate
Ribose-1-P
NAD+
NADH+H+
AMP IMP XMP
xanthosinexanthineuric acid
1 2
3
45
16.5.3 The guanase and xanthine dehydrogenase/oxidase reactions
Notes: Guanase deaminates guanine to xanthine, which is again converted to
uric acid by xanthine dehydrogenase. The latter enzyme also occurs in a second
variation, which arises through protein modification. Intracellularly, most enzyme
molecules function as a dehydrogenase and reduce NAD+, as shown in the previous
slide. Partial proteolysis, or the introduction of a strategic disulfide bond, prevent
the interaction of the enzyme with NAD+, and the molecule then switches to O2
reduction, as shown in this slide. The oxidase activity is found in extracellular
enzyme molecules, which lack a supply of NAD+ anyway.
NH
NH
N
O
N
O NH
NH
N
O
HN
NH2 NH
NH
N
O
HN
O NH
NH
O
HN
O
HN
O2 + H2O
H2O2
O2 + H2O
H2O2
H2O
NH3
xanthineoxidase
uric acid
guanaseguaninexanthinehypoxanthine

16.5 Purine degradation and salvage pathways 299
As we had seen before, adenosine degradation may produce free hypoxanthine.
Xanthine dehydrogenase or oxidase both can convert hypoxanthine to xanthine
and the latter to uric acid.
16.4 Explain the metabolic utilization of dietary nucleic acids.
16.5.4 Renal urate elimination: tubular reuptake and secretion
urate
organic acidURAT1
urateMRP4
urate
organic acid?
urateATP?
Interstitial fluid /blood plasma
Tubule epithelial cell Tubule lumen(nascent urine)
Notes: Most of the uric acid formed by purine degradation is eliminated via the
kidneys. Urate is subject primarily to glomerular filtration and tubular reuptake
(see slide 14.2.5), while tubular secretion (by an ABC transporter named MRP4) is
less important.
Reuptake of urate from the primary filtrate is mediated by the URAT1 exchange
transporter. Several drugs and metabolites that affect renal urate elimination
interact with this transporter [101]. Typically, when present in the lumen of the
tubule, such compounds will compete with urate for reuptake; this is the mode of
action of uricosuric drugs like benzbromarone or probenecid. On the other hand,
when present inside the epithelial cells, they may act as substrates for exchange
and therefore increase the rate of reuptake, as is the case with pyrazinoic acid (see
slide 16.6.5).
16.5.5 Non-primates break down uric acid to allantoin
Notes: While uric acid is the terminal product of purine degradation in humans
and other apes, many other organisms, ranging from fungi to mammals, perform
several subsequent reactions that degrade uric acid further to allantoin, which is
then excreted. Allantoin is more water-soluble than uric acid and therefore avoids
the problems that can arise from the low solubility of uric acid in humans (see
slide 16.6.2).
The first step in urate degradation is carried out by urate oxidase (uricase).
Interestingly, humans actually possess an inactive copy of the urate oxidase gene,
which indicates that at some point during evolution this enzyme activity was
lost. Since the genetic enzyme defect spread throughout the entire population,
there likely was some selective advantage to it. Several hypotheses have been
proposed as to the nature of this advantage, ranging from antioxidant effects of
uric acid over protection from UV irradiation to a rise in blood pressure. While

300 16 Nucleotide metabolism
the correlation between uric acid blood levels and hypertension is worth noting
from a clinical point of view [102], the biological advantage of an increase in blood
pressure is not obvious to me; and even if it existed, it would seem implausible for
evolution to cripple a perfectly fine pathway when a plethora of other physiological
mechanisms for adjusting the blood pressure was already available.
O NH
NH
O
HN
O
HN
O2+H2O H2O2
O N NH
O
HN
OHO
HN
H2O
HO
OOH
NH
ONH2
N
O
HN
CO2
O
NH
ONH2
NH
O
HN
urate oxidase (uricase)
hydroxyisouratehydrolase
OHCU decarboxylase
spontaneous
spontaneous
uric acid
allantoin
2-oxo-4-hydroxy-4-carboxy-5-ureido-imidazoline (OHCU)
While the role of urate oxidase has been known for a long time, the subsequent
two enzyme reactions shown in this slide have only recently been discovered [103].
The reason for their delayed discovery is that urate oxidase alone is sufficient for
the conversion of urate to allantoin, since the subsequent reactions also occur
spontaneously. The major difference is that the spontaneous decay produces
allantoin as a racemic mixture, whereas enzymatic formation gives rise to one
enantiomer only.
16.5.6 Overview of purine salvage reactions
Notes: Nucleosides and free bases that arise during the degradation of nucleic
acids and nucleotides can be salvaged and reused. This scheme shows the reac-
tions involved in purine salvage, which produce AMP, GMP and IMP. The conversion
of the latter to AMP or GMP (blue arrows) involves the same reactions as in de novo
synthesis (see slides 16.3.6 and 16.3.7).
Enzymes: 1, adenosine kinase; 2, inosine kinase; 3, guanosine kinase; 4,
adenine phosphoribosyltransferase (APRT); 5, hypoxanthine-guanine phosphori-
bosyltransferase (HGPRT). The APRT and HGPRT reactions are analogous to the
orotate phosphoribosyltransferase reaction (see slide 16.7.1).

16.6 Diseases related to purine degradation 301
GMPXMPIMPAMP
adenylo-succinate
GuanosineXanthosineInosineAdenosine
GuanineXanthineHypoxanthineAdenine
Uric acid
321
4 55
nucleoside kinases
phosphoribosyltransferases
shared with biosynthesis
degradation
16.6 Diseases related to purine degradation
16.6.1 Enzyme defects in purine degradation and salvage
Notes: Adenosine deaminase deficiency induces apoptosis in T cells, which results
in severe combined immunodeficiency (SCID; see section 19.2).
Enzyme Biochemical effects Clinical symptoms
adenosinedeaminase
accumulation of dAand dATP
severe combinedimmunodeficiency(SCID)
HGPRT defective purinesalvage, increased denovo synthesis anddegradation
gout; impeded cerebraldevelopment andself-mutilation(Lesch-Nyhansyndrome)
HGPRT is encoded on the X chromosome; therefore, the enzyme defect, which is
known as Lesch-Nyhan syndrome, is observed mostly in boys. Excessive urate
production and gout are expected, but the causation of the neurological symptoms
is not well understood. Excessive activation of adenosine receptors in the brain
during fetal development has been proposed. Disruption of dopamine activity in
the brain has been repeatedly observed [104]; an interesting animal model of this
effect has been described [105]. However, a clear picture of how HGPRT deficiency
causes cerebral dopamine deficiency during development has not yet emerged.

302 16 Nucleotide metabolism
16.6.2 Gout
• Genetic or dietary factors cause chronically increased urate production or
retention
• Urate has limited solubility and may form crystalline deposits, preferentially
in joints and soft tissue
• Urate crystals activate inflammation and lead to arthritis that is painful and,
in the long run, destructive
Notes: The mechanism that links urate crystals to inflammation has been eluci-
dated [62] and is similar to the one that applies to cholesterol crystals [61].
16.6.3 Diets and drugs that may promote gout
• too much food, too rich in purines
• excessive fructose or sucrose
• alcoholic beverages—but not all kinds: beer yes, wine no
• anorexia nervosa (!)
• drugs that interfere with uric acid secretion: pyrazinamide, salicylic acid
• drugs that contain purines: dideoxyadenosine
Notes: It seems that the uptake of purines and the subsequent production of uric
acid are linearly related to purine ingestion [100]. Therefore, a purine-rich diet is a
straightforward way to contract gout.
There are several plausible connections between alcohol and gout, of which
no single one has unequivocally been shown to be the dominant one. Degradation
of alcohol via alcohol dehydrogenase and then aldehyde dehydrogenase produces
NADH, which shifts the equilibrium of the lactate dehydrogenase reaction from
pyruvate to lactate (see slide 7.4.2). Lactate may increase the retention of uric acid
in the kidneys by serving as an exchange substrate in tubular transport (see slide
16.5.4).
A statistical study found an association of beer, but not wine, consumption
with gout [106]. The amounts of alcohol ingested by both groups were similar,
suggesting that moderate consumption of alcohol as such does not promote gout.
Beer is higher in calories and in purines than wine, which may account for the
difference observed in this study.
Considering the association of a rich diet with gout, it seems surprising that
anorexia nervosa, an eating disorder in which patients eat only the bare minimum
required to ward off death, and sometimes less, may also lead to gout [107]. This
has been ascribed to the formation of ketone bodies, which as organic acids may
also serve as exchange substrates in the tubular reuptake of uric acid and thereby
increase urate retention.
The drug 2,3-dideoxyadenosine inhibits retroviral reverse transcriptase and is
used in the treatment of HIV infections (see slide 16.9.11). It undergoes degrada-

16.6 Diseases related to purine degradation 303
tion like other purine nucleotides and as such will contribute to uric acid produc-
tion, which may occasionally trigger gout [108].
16.6.4 Gout: the fructose connection
fructose fructose-1- P glyceraldehyde
ATP ADP
dihydroxyacetone- P
glyceraldehyde-3- P
3- P -glycerate1,3-bis- P -glycerate
Pi
fructokinase aldolase B
PG-kinase
NADH+H+ NAD+adenylatekinase
1/2 ATP1/2 AMP
purinedegradation
1/2 urate
Notes: Fructose has been linked to increased uric acid production both experi-
mentally [109] and statistically [110]. The mechanism is as follows: Fructokinase
produces fructose-1-phosphate more rapidly than it can be turned over by aldolase
B. This ties up phosphate, which is then no longer available for the regeneration of
ATP. This raises the level of ADP, which is disproportionated by adenylate kinase
to ATP and AMP, and the latter enters degradation via AMP deaminase (to IMP) or
5′-nucleotidase (to adenosine; see slide 16.5.1).
In keeping with the assumption that uric acid formation is promoted by limit-
ing aldolase B activity, heterozygous carriers of a deficient gene for this enzyme
experience a greater increase of urate synthesis in response to a fructose challenge
than individuals with two intact gene copies [111]. As noted before, a homozygous
defect of aldolase B causes hereditary fructose intolerance. In this condition, phos-
phate sequestration and ATP depletion reach a much greater extent, with much
more immediate and disastrous consequences for the liver cells (see slide 4.2.2).
16.6.5 Drugs that affect purine degradation and elimination
Notes: Allopurinol is an inhibitor of xanthine dehydrogenase/oxidase. When it
is used, hypoxanthine and xanthine will accumulate instead of uric acid. These
intermediates are more soluble than uric acid and are readily excreted. Allopurinol
is very effective and a mainstay in the treatment of gout.
Probenecid and benzbromarone are uricosuric drugs, that is, they increase
the excretion of uric acid with the urine through inhibition of its tubular reuptake
by the URAT1 transporter (see slide 16.5.4). The increased efficiency of urate
excretion lowers the urate levels in blood and tissues, which in turn reduces the
risk of precipitation in the joints. Uricosuric drugs also are widely used in gout
therapy.

304 16 Nucleotide metabolism
O
N
N NH
NH
O
S
O
N
O
OH
Br
OH
Br
O
O
HO
O OH O NH2
N
N
O OH
N
N
O OH
N
O
N
allopurinol probenecid benzbromarone
salicylic acid pyrazinamide pyrazinoate 5-hydroxy-pyrazinoate
Some drugs or drug metabolites promote the tubular reuptake of uric acid, presum-
ably by functioning as exchange substrates at the URAT1 transporter. This effect
can occur with salicylic acid, and it is very pronounced with pyrazinoic acid and
its 5-hydroxy derivative, the metabolites of the tuberculostatic drug pyrazinamide.
Treatment with pyrazinamide, which is carried out over several months and at
dosages of gram amounts per day, may therefore trigger gout.
16.5 Explain the mode of action of uricosuric drugs.
16.6.6 Acute urate nephropathy in tumor lysis syndrome
• Occurs during chemotherapy of malignancies, particularly with lymphomas
and leukemias
• Chemotherapy causes acute decay of large numbers of tumor cells
• Degradation of nucleic acids from decaying cells produces large amounts of
uric acid
• Uric acid in nascent urine exceeds solubility and precipitates, clogging up and
damaging the kidney tubules
• Clinically manifest as acute kidney failure with high fatality rate
Notes: The underlying problem in acute urate nephropathy is again an excess of
uric acid, but in this case it occurs very suddenly and on an altogether different
scale than in simple gout. As a consequence, the capacity for reuptake in the prox-
imal tubules is overwhelmed, and the excess uric acid appears in large quantities
in the distal tubules. As water is reclaimed from the nascent urine, the uric acid
becomes more concentrated. Moreover, the pH value in the distal tubule is often
acidic, which will cause uric acid (pKa=5.75) to become protonated and precipitate.
The condition is particularly common with lymphomas and leukemias. Unlike
most other cancers, in which most tumor cells are contained in a single solid mass
that is surgically removed prior to chemotherapy, leukemias and most lymphomas
grow diffusely and are not amenable to surgical removal; therefore, chemotherapy

16.7 Synthesis and degradation of pyrimidines 305
is used right from the start and impinges on a far greater number of malignant
cells in the body. As a preventive measure, leukemia or lymphoma patients that
undergo chemotherapy receive allopurinol concomitantly. This treatment has
greatly reduced the incidence of acute urate nephropathy.
16.6 Explain the role of xanthine oxidase in purine degradation, and the therapeutic useof xanthine oxidase inhibitors in gout and in tumor lysis syndrome.
16.7 Would uricosuric drugs be useful in the treatment of tumor lysis syndrome? Why, orwhy not?
16.6.7 Rasburicase, a better preventive treatment for urate nephropathy
Adenine Hypoxanthine
Guanine Xanthine
Uric acid
Allantoin
Urine
Allopurinol
Rasburicase
Notes: This slide shows the action modes of allopurinol and of rasburicase, which
is an uricase enzyme from an Aspergillus mold that is recombinantly produced
in baker’s yeast (Saccharomyces cerevisiae). The enzyme will convert uric acid
to allantoin (see slide 16.5.5). This mode of action complements the decreased
formation of uric acid attained with allopurinol. Like the latter drug, rasburicase
is used—by way of intravenous infusion—to prevent acute urate nephropathy in
leukemia patients undergoing chemotherapy. Individually, rasburicase is superior
to allopurinol, but it should also be possible to use both drugs in combination.
Since rasburicase is a non-self protein, it is immunogenic, and it thus may
induce the formation of antibodies that inactivate it and additionally may cause
allergic complications. This problem is mitigated by the immunosuppressive effect
of chemotherapy and, in leukemia, of the disease itself. However, it will likely make
rasburicase unsuitable for long-term use in gout patients [112].
16.7 Synthesis and degradation of pyrimidines
16.7.1 Synthesis of pyrimidines (1)
Notes: In contrast to the purine rings of AMP and GMP, which are assembled atop
the phosphoribose moiety, the skeleton of the pyrimidine bases is synthesized
before attachment to ribose phosphate.

306 16 Nucleotide metabolism
HCO–3 O
NH2
O P
O
O−
O− O
NH2
NH
O
OH
OOH
O NH
O
OH
O
HN
O NH
O
OH
O
HN
P O
OH OH
NO
OH
O
HN
O
gln + 2ATP
glu + 2ADP + Pi
1
aspartate
Pi
2
H2O
3
NAD+
NADH+H+
4
PRPP
PPi
5
bicarbonate carbamoylphosphate carbamoylaspartate
dihydroorotateorotate
orotidine mono-phosphate
The first intermediate is carbamoylphosphate. The corresponding enzyme, carba-
moylphosphate synthetase 2, uses glutamine as the nitrogen donor; in contrast,
carbamoylphosphate synthetase 1, which occurs in the urea cycle, uses free am-
monia directly (see slide 12.3.1).
In the second reaction, aspartate transcarbamylase transfers the carbamoyl
group of carbamoylphosphate to the α-amino group of aspartate, which yields
carbamoylaspartate. Ring closure through intramolecular Schiff base formation
(3) yields dihydroorotate, and subsequent dehydrogenation (4) produces orotate.
Orotate phosphoribosyltransferase (5) forms orotidine-5′-monophosphate (OMP),
in a reaction that resembles purine salvage (compare slide 16.5.6). Indeed, this
enzyme has relatively broad specificity and also functions in the salvage of uracil
and in the activation of its analogue 5-fluorouracil (see slide 16.9.1).
16.7.2 Synthesis of pyrimidines (2)
P O
OH OH
NO
OH
O
HN
O
P O
OH OH
N
O
HN
O
P O
OH OH
N
NH2
N
O
CO2
gln + ATP
glu + ADP + Pi
OMP UMP CMP
Notes: From OMP, it is only a short way to the final pyrimidine nucleotides. Decar-
boxylation of OMP yields UMP directly; glutamine donates another nitrogen in the
synthesis of CMP from UMP.

16.7 Synthesis and degradation of pyrimidines 307
16.7.3 Degradation of pyrimidines
UMP uridine
CMP cytidine
uracil
acetyl-CoA
O NH
O
HN
Pi
Pi
Pi ribose-1 P
H2O
NH3NADPH+H+
NADP+
H2O
O NH
OOH
H2N
H2O
NH3 + CO2
HO
O
NH2
α-KG
glutamate
HO
O
ONAD+
CoA-SH
NADH+H+
CO2
dihydrouracil
ureido-propionate
β-alaninemalonatesemialdehyde
Notes: Like their synthesis, degradation of pyrimidine bases is also fairly straight-
forward. Cytidine is deaminated to uridine. Pyrimidine nucleoside phosphorylase
cleaves uridine to free uracil and ribose-1-phosphate. One of the amide bonds in
the uracil ring is opened through hydrolysis, and ammonia and CO2 are cleaved
off to produce β-alanine. This compound may be excreted with the urine, or it
may be transaminated and converted to acetyl-CoA.2
Thymine is degraded in the same manner as uracil, producing methylated
analogues each step along the way. In the final step, methylmalonyl-semialdehyde
gives rise to propionyl-CoA, which is utilized as outlined in slide 10.3.6.
16.8 Explain the degradation of pyrimidine nucleosides.
16.7.4 β-Alanine may be used to synthesize carnosine
Notes: Carnosine is a dipeptide of β-alanine and histidine. It is found in high
concentrations (~5 mM) in muscle; lower concentrations are found in nerve cells.
One intriguing property is illustrated here, namely, its reaction with hydroxyl
radicals, which results in the formation of a more stable carnosine radical [113].
Hydroxyl radicals are produced by ionizing radiation and mediate most of the
cellular damage caused by radiation. The animal experiment depicted in the plot
[114] suggests that carnosine may scavenge those radicals and reduce the inflicted
damage. Note though that the number of mice used in this experiment was rather
small.
While numerous biological activities have been proposed for carnosine, the
most important one is likely to buffer the lactic acid that accumulates in skeletal
muscle during anaerobic exercise. The pKa value of carnosine is very close to the
2Unlike regular alanine, β-alanine carries the amino group on the second carbon from the car-boxyl group. This position is also referred to as the β carbon, whereas the first one is the α carbon.

308 16 Nucleotide metabolism
physiological intracellular pH, which maximizes buffer capacity. Carnosine and
its methylated analogue ophidine are highly abundant (40–50 mM) in the muscle
tissue of whales. Most likely, this large buffer capacity helps the whales to sustain
extended periods of anaerobic muscle metabolism during their dives to the deep
[115].
NH2
O NH
O
HO
N
HN
β-alanine
histidine
0
2
4
6
8
10
0 5 10 15 20 25 30
Su
rviv
ing m
ice
Days after irradiation
irradiation,no carnosine
irradiation,carnosine
no treatment
NH2
O NH
O
HO
N
OH
HN
·
NH2
O NH
O
HO
N
N
·
·OH
HOH
16.8 Synthesis of deoxyribonucleotides
Notes: The synthetic pathways covered so far all produce ribonucleotides. In
addition, we also need deoxyribonucleotides as precursors for DNA synthesis.
These are made from ribonucleotides.
RR dNTP kinase DNA polymerases
TS
ADP
GDP
CDP
UDP
dADP
dGDP
dCDP
dUDP
dUMP dTMP
dTDP
dATP
dGTP
dCTP
dTTP
DNA
The conversion of ribonucleotides to deoxyribonucleotides occurs at the level of
the nucleoside diphosphates. All four ribonucleotides—ADP, CDP, GDP and UDP—
are reduced by the same enzyme, ribonucleotide reductase (RR). This reaction
requires NADPH.
With dA, dC and dG, the deoxytriphosphates are then obtained simply through
ATP-dependent phosphorylation by nucleoside diphosphate kinase. In contrast,

16.9 Nucleotide antimetabolites as anticancer and antiviral drugs 309
uracil still has to be converted to thymine for the purpose of DNA synthesis. In
order to prevent incorporation of uracil into DNA, dUDP is first dephosphorylated
to dUMP by a cognate phosphatase. dUMP then enters the thymidylate synthase
reaction (TS); the product, dTMP, is phosphorylated twice to produce dTTP.
16.9 Explain the role and synthetic pathway of deoxyribonucleotides.
16.8.1 The thymidylate synthase reaction
RN
H+
N
HNNNH2
HN
O
CH2
O
HN
O N
dR
⊖SEnzyme
NH2
⊕
N
NH
R
HNNNH2
HN
O
CH2
H
O
HN
O N
dR
S Enzyme
NH2
N
H+
HN R
HNNNH2
HN
O H
CH2
O
HN
O N
dR
S Enzyme
NH+3
N
HNR
H
HNNNH2
HN
O
CH3
O
HN
O N
dR
⊖SEnzyme
NH2
N
NH
R
HNNNH2
HN
O
dUMP covalent intermediate
N,N′-methylene-tetrahydrofolate dTMP dihydrofolate
Notes: Thymidylate synthase acquires a single carbon from the cosubstrate N,N ′
-methylenetetrahydrofolate (methylene-THF) and transfers it to dUMP. The reduc-
tion of the methylene carbon to the methyl group as found in the product (dTMP)
occurs at the expense of THF, which is thereby converted to dihydrofolate and has
to be reduced again to THF by dihydrofolate reductase (see slide 15.2.2).
Note that, halfway through the reaction, the enzyme, the substrate, and the co-
substrate are all joined together in a covalent intermediate, which is then resolved
through the abstraction of a proton from position 5 of the uracil by a catalytic
base in the enzyme’s active site (red arrow). This mechanism forms the basis of
the inhibition of thymidylate synthase by the antitumor drug 5-fluorouracil (see
slide 16.9.1).
16.9 Nucleotide antimetabolites as anticancer and antiviral drugs
Notes: Nucleotide analogues are of major importance in the chemotherapy of
both cancers and virus infections. With antiviral drugs, selective toxicity for virus-
infected cells is possible, because viral enzymes often differ from the analogous
human ones with respect to their susceptibility to specific inhibitors. In contrast,
the same kind of selectivity is not possible with cancer cells, which have the

310 16 Nucleotide metabolism
same enzymes as noncancerous cells do; antimetabolites that kill cancer cells are
invariably toxic to noncancerous cells also. However, cancer cells are often more
susceptible to these cytotoxic drugs because they are more readily driven by them
into apoptosis, that is, programmed cell death (see slide 18.5.1), which is triggered
by a various forms of DNA damage.
Therapeutic principle Examples
direct inhibition of DNA/RNApolymerization
dideoxyadenosine, cytosinearabinoside, acyclovir
inhibition of nucleotidesynthesis
mercaptopurine,fluorouracil, methotrexate
Incorporation of mutagenicanalogues into DNA
idoxuridine
As will become clear from the discussion of individual examples below, some drugs
can cause interference by more than one mechanism.
16.9.1 Dual action mode of 5-fluorouracil
Thymidylatesynthase
Mutagenesis
O N
O
N
O N
F
O
N
O N
CH3
O
N
Uridine
dUMP
dTMP
5-F-Uridine
5-F-dUMP
5-F-d-Uridine
5-F-dUTP
5-F-dUDP
d-Thymidine
dTTP
DNA
Notes: 5-fluorouracil (5-FU) is a base analogue that mimics both uracil and thymine.
The dual resemblance endows it with a twofold mode of metabolic activation and
of action. One of several initial activation products, 5′-fluorodeoxyuridine, is also
used as a drug itself.
The metabolic activation of 5-FU occurs along the so-called salvage pathways
that recycle bases and nucleosides released by nucleic acid degradation. 5-FU is
activated by the same enzymes that salvage uracil. A key activation product is
5-FdUMP, which is a suicide substrate for thymidylate synthase (see next slide).
This is its major mode of action and the one that makes it an antimetabolite.

16.9 Nucleotide antimetabolites as anticancer and antiviral drugs 311
5-FU is also activated by enzymes that salvage thymine and thus may wind up
as 5′-fluoro-dUTP, which is incorporated into DNA; this will cause point mutations
(see slide 16.9.3).
16.9.2 Inhibition of thymidylate synthase by 5-fluorouracil
NH
F
O
HN
O
P O
OH
N
F
O
HN
O
CH2
F
O
HN
O N
OH
OP
S Enzyme
NH2
NNHR
HNNNH2
HN
ON,N′-methylene-THF
thymidylate
synthase
5-FU 5-FdUMP covalent adduct
Notes: 5′-Fluorouridine monophosphate (5-FdUMP) is accepted by thymidylate syn-
thase as a substrate and reacts with methylene-THF and the enzyme right up to
the point where all three are joined in a covalent intermediate (slide 16.8.1). At
this stage, however, the fluorine in position 5 of the uracil resists abstraction by
the catalytic base of the enzyme. The covalent intermediate therefore cannot be
resolved, and the enzyme molecule remains irreversibly locked up.
Inhibition of thymidylate synthase will starve the cell of thymine required for
DNA synthesis. Fluorouracil has shown particularly good activity in colon cancer,
but there seems to be no known biochemical reason to account for this empirical
rule.
16.9.3 Mutagenesis through mispairing of the 5-FU iminol tautomer
HN
O N
dR
F
ON
N
H
H
N
NRd
N
Adenine
5-FU, amide form
H
N
O N
dR
F
OH
N
O
N
NRd
N
NH H
5-FU, iminol form
Guanine
Notes: 5-F-dUTP can be incorporated into DNA and promote point mutations. This
is due to the fluorine, which withdraws electrons from the ring; this, in turn, pulls
electrons into the ring from other substituents and encourages the molecule to

312 16 Nucleotide metabolism
assume the iminol configuration. In this configuration, the base no longer pairs
with adenine but with guanine.
If the iminol configuration is present during DNA replication, guanine will be
chosen for incorporation into the opposite strand. This mutagenic effect of 5-FU
augments its anticancer effect.
16.9.4 Thymine and various halogen analogues
thymine fluorouracil bromouracil iodouracil
Notes: The bromo- and iodo-analogs of deoxythymidine, 5-bromouracil-deoxyribo-
side (5-BUdR) and 5-iodouracil-deoxyriboside (idoxuridine), are also incorporated
into DNA. Bromine and iodine are larger than fluorine and similar to a methyl
group in size. Therefore, the activated triphosphates more closely resemble dTTP
and are more effectively incorporated than the fluoro-derivative.
Like fluorouracil, idoxuridine is used in tumor therapy. 5-BUdR is not used clin-
ically but has in the past been widely used for shotgun mutagenesis experiments
in genetic research.
16.9.5 Indirect inhibition of thymidine synthesis by methotrexate
RNH2C
N
HNNNH2
HN
O
N
HN R
HNNNH2
HN
O
NH
HN R
HNNNH2
HN
O
NADP+NADPH+H+
serine
glycine
dTMP
dUMP
SHMTTS
DHFR
Notes: Methotrexate is an inhibitor of dihydrofolate reductase (see slide 15.2.2).
This enzyme is required to reduce the dihydrofolate produced by the thymidylate
synthase reaction to THF again, so that it can accept another carbon from serine
hydroxymethyltransferase or another enzyme.
Methotrexate can be used in tumor therapy. Because it is not a nucleotide
analogue and does not react with DNA, it is not mutagenic, which makes it more

16.9 Nucleotide antimetabolites as anticancer and antiviral drugs 313
suitable than most base analogues in antiproliferative therapy not related to tu-
mors. In particular, methotrexate is used to suppress lymphocyte proliferation in
severe autoimmune diseases such as rheumatoid arthritis or Crohn’s disease.
16.10 Explain the synthetic pathway for deoxythymidine triphosphate (dTTP), startingwith UDP. Explain how 5-fluorouracil and methotrexate interfere with this pathway.
16.9.6 Mercaptopurine inhibits purine synthesis
HN N
NH
S
N
OP
O
O−
−OO
OH OH
N N
NH
S
N
PRPP
HGPRT
Ribose-5-phosphate
PRPP
PRA
IMP
XMP
GTP
Adenylosuccinate
ATP
mercaptopurine
thio-IMP
Notes: Mercaptopurine is activated to a nucleotide analogue by HGPRT, which also
salvages the endogenous bases hypoxanthine and guanine (see slide 16.5.6). The
analogue is not steered efficiently toward DNA incorporation. Instead, its main
effect consists in the inhibition of de novo purine synthesis, by way of its similarity
to inosine monophosphate, which inhibits the first enzyme in the pathway (ribose
phosphate diphosphokinase). The related drug thioguanine acts in a similar
manner. Lack of DNA incorporation means low mutagenicity; like methotrexate,
the two drugs are used not only in cancer but also in immunosuppressive therapy.
Mercaptopurine and thioguanine are metabolized through methylation by thio-
purine methyltransferase, which uses S-adenosylmethionine as a cosubstrate. A
defect of that enzyme, as such, has no manifest symptoms, but when treated with
either drug these individuals may suffer severe myelosuppression, that is, disrupted
cell proliferation in the bone marrow. It is therefore advisable, and in some cases
mandatory, to test patients’ enzyme activities before using these drugs.
Mercaptopurine is also metabolized by xanthine dehydrogenase/oxidase.
Combination of mercaptopurine with xanthine oxidase inhibitors such as allopuri-
nol can again result in bone marrow toxicity, but is sometimes used deliberately
to increase the immunosuppressive effect.
16.9.7 Structure of cytosine arabinoside (araC)
Notes: Cytosine arabinoside (cytarabine, araC) deviates from the normal cytosine
nucleotides not in the base but in its sugar moiety, arabinose, which is epimeric to

314 16 Nucleotide metabolism
ribose at the second carbon atom. Like ribonucleosides, cytosine arabinoside can
pass across the intestinal mucosa with the help of nucleoside transporters, which
facilitates its uptake.
HOO
OH
N O
N
NH2
OH
HOO
N O
N
NH2
OH
HOO
HO
N O
N
NH2
OH
Cytidine Deoxycytidine Cytosine arabinoside (araC)
16.9.8 Metabolic activation and inactivation of araC
Notes: AraC enters the target cell by facilitated diffusion through the equilibrative
nucleoside transporter (ENT). In order to become a substrate for DNA polymerase,
araC must be phosphorylated to the triphosphate (araCTP); this is accomplished
by nucleoside and nucleotide kinases.
araCaraU
araUMP araCMP araCTP
ENTMDR
dC deaminase
dCMP deaminase dNMP, dNDP kinases
dC kinase5 ′-nucleotidase
The activation of araC to araCTP can be intercepted at several stages. The extrusion
of araC itself is mediated by multi-drug resistance transporters (MDR) such as P-
glycoprotein, which belong to the family of ABC transporters (see slide 11.4.5).
Like cytidine and deoxycytidine, araC can undergo deamination either as a free
nucleoside or as a monophosphate, and the initial phosphorylation can be undone
by the enzyme 5′-nucleotidase. Increased expression of MDR or of enzymes that
counteract the activation of araC to araCTP cause tumor cell resistance (see slide
16.9.9).

16.9 Nucleotide antimetabolites as anticancer and antiviral drugs 315
16.9.9 Overexpression of 5′-nucleotidase in leukemic cells reduces survival
rates
0
25
50
75
100
0 12 24 36 48 60
no 5-NT overexpression
5-NT overexpression
Time (months)
Pati
en
tssu
rviv
ing
(%)
Notes: AraC is an important drug in the treatment of acute myeloic leukemia
(AML). This plot shows that reduced susceptibility to araC due to increased ex-
pression of 5′-nucleotidase correlates with a significantly reduced duration of
relapse-free survival in AML patients. Figure prepared from original data in [116].
16.9.10 Action mode of araCTP
Notes: AraCTP is accepted as a substrate by DNA polymerase and becomes incor-
porated into a growing DNA strand. The polymerase may or may not manage to
continue past an incorporated araC molecule. If it does not, DNA repair will be
activated, and the base will be excised and replaced; this amounts to a delay of
DNA synthesis and constitutes a proapoptotic signal.
If DNA polymerase does manage to continue past an incorporated araC mole-
cule, the latter becomes part of a continuous DNA double strand. Such interposed
araC residues then become preferred substrate sites for DNA topoisomerase II,

316 16 Nucleotide metabolism
which cleaves the DNA double strand [117]. Resealing of the double strand may
fail and lead to chromosome breaks.
16.9.11 Dideoxyadenosine inhibits retroviral DNA polymerase
2,3-dideoxy-adenosine (ddA)DNA
P
O
−O OO
N O
N
NH2
O
P
O
−O OO
N N
N
NH2
N
O
P
O
−O OO
N O
NH
O
CH3
OH
OHO
!
N N
N
NH2
N
Notes: Base and nucleoside analogues are also useful in the treatment of viral
diseases. An example is dideoxyadenosine (didanosine, ddA), which lacks the 3-
OH group of the deoxyribose moiety. Since the 3- and the 5-OH groups form the
bonds within the DNA strand, incorporation of ddA into a growing DNA strand
causes termination of synthesis.3
The cellular DNA polymerases do not efficiently incorporate ddA, so it has
limited cytotoxicity. However, the reverse transcriptase enzymes in retroviruses
such as HIV use ddA efficiently, which leads to disruption of viral DNA synthesis.
Inhibitors of reverse transcriptase such as ddA are a standard component of HIV
therapy.
As stated above (slide 16.6.3), long-term application of didanosine may pro-
mote the manifestation of gout.
16.9.12 Aciclovir and ganciclovir
HOO
N N NH2
NH
O
N
HO
OH
O
N N NH2
NH
O
N
aciclovir ganciclovir
Notes: Aciclovir (or acyclovir) and ganciclovir are even more severely crippled
than dideoxyadenosine, and it is quite remarkable that some enzymes even accept
3You may recall that base-specific chain termination by dideoxy-nucleotides is the basis of theSanger method of DNA sequencing. If you don’t, consider yourself reprehended.

16.9 Nucleotide antimetabolites as anticancer and antiviral drugs 317
them as substrates. This is the case with enzymes of viruses from the Herpes
group, which includes herpes simplex virus, cytomegalovirus, varicella zoster virus
and a bunch of others. These are relatively large and complex viruses, which
contain not only the bare minimum of enzymes such as nucleic acid polymerases
but also their own nucleotide kinases.
16.9.13 Aciclovir: mode of action on herpes virus
HO O N N NH2
NH
O
N
OH
P O O N N NH2
NH
O
N
OH
P P P O O N N NH2
NH
O
N
OH
HO O N N NH2
NH
O
N
P O O N N NH2
NH
O
N
P P P O O N N NH2
NH
O
N
cellular DNApolymerases
cellular kinases
cellular kinases
viral DNApolymerase
viral kinase
viral DNA cellular DNAcellular DNA
Aciclovir Deoxyguanosine
Notes: The selective toxicity of aciclovir for Herpes virus-infected cells, as opposed
to normal cells, arises at two stages. Firstly, aciclovir is phosphorylated to the
monophosphate only by viral nucleoside kinase, but not by the cellular enzyme.
Secondly, the triphosphate, which is formed from the monophosphate by cellular
kinases, is accepted as a substrate only by the viral DNA polymerase. This dual
mechanism of selective toxicity causes aciclovir to be well tolerated yet effective.
16.11 Explain the modes of action of the antiviral drugs dideoxyadenosine and aciclovir.
16.9.14 Some more inhibitors of viral nucleic acid synthesis
Notes: Foscarnet is an unusual drug. It is an analogue of pyrophosphate, which
is released in each successive addition of a nucleotide to a growing DNA or RNA
strand, and subsequently cleaved to phosphate:
DNAn + dNTP DNAn+1 + PPi
PPi + H2O 2 Pi

318 16 Nucleotide metabolism
−O P
O−
O O−
OOH
O
P OHO
OH
N
NH2
N
O O
P
O O
O
O
O O
O
OO
NN
N
NH2
N
Foscarnet Cidofovir Tenofovir disoproxil
Nucleic acid polymerases contain binding sites for the pyrophosphate (PPi) that
is formed in the first step. Foscarnet lodges into the pyrophosphate binding
sites on several viral polymerases. Unlike pyrophosphate, foscarnet is resistant
to hydrolysis; it therefore remains bound to the polymerase enzymes and inhibits
their activity.
Cidofovir is similar to aciclovir in having a mutilated ribose moiety. In ad-
dition, it also carries a phosphonate group; it therefore functionally resembles a
nucleoside monophosphate and does not require the initial phosphorylation step,
which gives it a broader spectrum than aciclovir. After addition of two more phos-
phates to this phosphonate group by cellular kinases, the drug inhibits several
viral DNA polymerases.
Tenofovir disoproxil follows the same principle as cidofovir. However, it
additionally carries two ester groups on the phosphonate. These groups make the
drug more hydrophobic, which facilitates its diffusion across cell membranes. This
improves the efficiency of intestinal uptake and distribution within the body. After
cellular uptake, the ester groups are cleaved by esterases, which traps the molecule
inside the cell and allows it to interact with nucleotide kinases and polymerases.
16.10 Answers to practice questions
16.1: The RNA world is a hypothetical stage in the molecular evolution of life that predatesthe current biochemical world. In the RNA world, RNA assumed the roles of DNA and ofprotein enzymes in addition to the ones it still owns today.
In the current biochemical world, enzymes are almost completely consist of proteins.However, many coenzymes still contain nucleotides rather than peptides. A possibleexplanation is that coenzymes had become involved in interactions with many differentenzymes early on, which restrained their evolutionary freedom.
16.2: The synthesis of the purine nucleotides AMP and GMP follows a common route from5′-phosphoribosyl-1′-pyrophosphate (PRPP) to inosine monophosphate (IMP). In the initialand committed step, the pyrophosphate group of PRPP is replaced by an amino groupderived from glutamine, which yields phosphoribosylamine (PRA). In nine successive steps,the purine ring is built atop this amino group, which becomes the N1 member atom ofthe ring. The carbons are supplied variously by glycine, CO2 and formyl-THF, whereas thenitrogens are acquired from glycine, aspartate, and glutamine.
AMP and GMP are synthesized from IMP in two steps each. They can be convertedback to IMP in a single step, and therefore balanced with one another according to currentmetabolic needs. AMP and GMP exert feedback inhibition on their own synthesis from IMP.

16.10 Answers to practice questions 319
Adenine and guanine nucleotides also inhibit the committed step (PRA synthesis), and IMPinhibits the formation of PRPP from ribose phosphate.
16.3: Ribose can be converted to glucose in the HMS; therefore, 1 mole of ribose willbe converted to 5/6 moles of glucose. Deoxyribose, as its 5-phosphate, is cleaved by acognate aldolase to glyceraldehyde-3-phosphate and acetaldehyde. The former can enterglycolysis or gluconeogenesis, whereas the latter is converted to acetyl-CoA, which inhuman metabolism cannot be converted to glucose.
Two molecules of glyceraldehyde-3-phosphate are required to make one molecule ofglucose; therefore, the maximal yield of glucose would be 1 molecule of glucose for 2 mole-cules of deoxyribose. Therefore, ribose provides 5/3 times more glucose than deoxyribose.
16.4: Dietary DNA and RNA are broken down by pancreatic DNAse and RNAse, respec-tively. After dephosphorylation, the nucleosides are taken up by specific transport anddegraded in the liver. The sugars are cleaved by phosphorylases, which yields deoxyribose-and ribose-1-phosphates. Purines are broken down to uric acid and excreted; pyrimidinesare broken down mostly to β-alanine and either excreted as such or completely degraded toacetyl-CoA. The sugar 1-phosphates are first converted to 5-phosphates by pentose phos-phate mutase and utilized by the hexose monophosphate shunt (ribose-5-phosphate) orby cleavage to glyceraldehyde-3-phosphate and acetaldehyde (deoxyribose-5-phosphate).
16.5: Uricosuric drugs competitively inhibit the tubular reuptake of uric acid by the URAT1transporter. This accelerates the renal excretion of uric acid.
16.6: In purine degradation, adenine and guanine are converted by deamination to hypox-anthine and xanthine, respectively. Xanthine oxidase converts hypoxanthine to xanthine,as well as xanthine to uric acid. Uric acid is the final product of purine degradation and isexcreted.
Uric acid has limited solubility, and increased levels of uric acid lead to its precipi-tation or crystallization in joints (gout) or in the kidneys. The latter occurs most acutelyand dramatically in tumor lysis syndrome during chemotherapy; this is most common inleukemia. In both conditions, inhibition of xanthine oxidase prevents the final oxidationsteps, leading to the excretion of hypoxanthine and xanthine of uric acid. These are moresoluble than uric acid and therefore less prone to precipitate prior to excretion.
16.7: In tumor lysis syndrome, uricosuric drugs would only further accelerate the buildupof uric acid inside the kidney tubules and would make matters worse.
16.8: Cytidine is deaminated to uridine by cytidine deaminase. Uridine is cleaved by aphosphorylase to uracil and ribose-1-phosphate. The uracil ring is then opened throughhydrolysis, and cleavage of ammonia and CO2 gives β-alanine. The latter can be furtherdegraded by transamination and dehydrogenation to acetyl-CoA, or alternatively it can beused for the synthesis of carnosine.
The degradation of thymidine is analogous and produces methylated analogs, withpropionyl-CoA as the final product.
16.9: Deoxyribonucleotides function exclusively as precursors of DNA. Deoxyribonucle-oside diphosphates—dADP, dCDP, dGDP and dUDP—are formed from the correspondingribonucleoside diphosphates by the same enzyme, ribonucleotide reductase. All exceptdUDP are then phosphorylated to the triphosphates.
In contrast, dUDP first undergoes dephosphorylation to dUMP and is then convertedby thymidylate synthase to dTMP. The latter is then phosphorylated to dTDP and finallyto dTTP.
16.10: UDP is converted to dUDP by ribonucleotide reductase and then dephosphorylatedto dUMP. Thymidylate synthase transfers the C1 from N,N ′-methylenetetrahydrofolate to

320 16 Nucleotide metabolism
position 5 of the uracil base in dUMP, producing dTMP. This reaction proceeds throughan intermediate state in which methylene-THF, uracil and the enzyme are all covalentlylinked. Subsequently, dTMP is phosphorylated twice to dTDP and then dTTP.
5-Fluorouracil is activated to 5-dUMP via salvage reactions. It functions as a substrateanalogue for thymidylate synthase. The reaction stalls at the stage of the covalent reactionintermediate; since the enzyme is unable to abstract fluorine from the uracil ring, itremains trapped in the covalent intermediate.
In the thymidylate synthase reaction, N,N ′-methylenetetrahydrofolate is convertedto dihydrofolate, which needs to be reduced by dihydrofolate reductase before it canacquire another C1 subunit and supply it to thymidylate synthase. Methotrexate inhibitsdihydrofolate reductase and therefore indirectly inhibits dTMP synthesis.
16.11: Dideoxyadenosine lacks the 3-OH group in the ribose moiety to which the nextnucleotide would be attached in DNA synthesis. Therefore, its incorporation into a grow-ing DNA strand will cause synthesis to terminate. It is not an efficient substrate forhuman DNA polymerase but is readily accepted by retroviral reverse transcriptase, and isaccordingly used in the treatment of HIV infections.
Aciclovir is used to treat herpes virus infections. It has a rudimentary sugar moiety inwhich the carbons 2 and 3 of ribose are altogether lacking. It is not an efficient substrateof human nucleoside kinases, yet it is phosphorylated by herpes virus nucleoside kinase.Moreover, the triphosphate inhibits herpes virus DNA polymerase but not the humanenzyme.

Chapter 17
Iron and heme metabolism
17.1 Structure and function of heme
Fe2⊕
NN⊖
O
OH
N
O
OH
⊖
N
Notes: Heme consists of a porphyrin ring that holds a central iron ion. “Porphyr”
is the name of purple-colored gemstone. Heme is colored, too, but its color varies
with the protein it is bound to and with the oxidation state of the iron. In addition
to hemoglobin, heme is also found in many cytochromes, a term that literally
translates as “cell color” and comprises various classes of enzymes and electron
carriers. The red-brown colors of tissues like liver, kidney, and brown fat are due
to their abundance of heme-containing enzymes or of mitochondria, which contain
many heme cofactors within the proteins of the electron transport chain.
In this chapter, we will focus on the biosynthesis and degradation of heme
itself. The roles of heme in the respiratory chain and in cytochrome P450 enzymes
are covered in chapters 6 and 18, respectively.
321
322 17 Iron and heme metabolism
17.1.1 Functions of heme
Redox chemistry
• electron transport: cytochromes in the respiratory chain
• enzyme catalysis: cytochrome P450, cyclooxygenase, others
Reversible binding of gases
• O2: hemoglobin and myoglobin (80–90% of all heme)
• NO: guanylate cyclase
Notes: In hemoglobin and myoglobin, the heme iron remains in the ferrous or
Fe2+ state throughout the cycle of oxygen binding and release. In redox-active
enzymes and in the respiratory chain, heme regularly goes back and forth between
the ferrous and the ferric or Fe3+ states, and sometimes also the ferryl or Fe4+
state.
In cytochrome P450 enzymes, the function of heme is to facilitate the forma-
tion of reactive oxygen (see slide 18.2). Similarly, formation of reactive oxygen
species (ROS) may also occur as a side reaction wherever heme functions in trans-
port of oxygen or of electrons, and protective mechanisms are required to contain
damage by ROS. In hemoglobin, molecular oxygen (O2) may abscond with an extra
electron and thereby turn itself into superoxide (O–2 ), while the heme iron is left
one electron short. Hemoglobin that has lost one electron is called methemoglobin;
it is unable to carry oxygen. Its iron is reduced to the ferrous form again by an
NADH-dependent enzyme, methemoglobin reductase.1
Protective mechanisms that scavenge reactive oxygen species include the en-
zymes superoxide dismutase and catalase, as well as antioxidants such as to-
copherol (vitamin E; see slide 11.6.11) and ascorbic acid (vitamin C). Organisms
that lack such protective mechanisms are anaerobic, that is, they survive only in
the absence of oxygen. Anaerobic organisms occur among both prokaryotes and
eukaryotes.
17.1 Summarize the biochemical and physiological functions of heme.
17.2 Heme biosynthesis
17.2.1 Overview
Notes: Heme contained in the food is taken up from the intestines, but this is
only relevant because of the iron it contains. The organic porphyrin ring is mostly
synthesized from scratch. The synthetic pathway is split across two compartments;
1Methemoglobin reductase also participates in reductive metabolism of drugs and xenobiotics(see section 18.4). In that context, it is often referred to as diaphorase.
Interestingly, methemoglobin binds cyanide ions more avidly than reduced hemoglobin does. Thisis used in the treatment cyanide poisoning: Controlled application of oxidizing agents—such asdimethylaminophenol or sodium nitrite, [118]—turns some hemoglobin into methemoglobin, whichthen captures cyanide and prevents its binding to hemes in the respiratory chain. It seems, however,that treatment with hydroxycobalamin is superior (see slide 15.5.5)

17.2 Heme biosynthesis 323
the initial and final steps occur in the mitochondria, while the intervening ones
occur in the cytosol. Heme exerts feedback inhibition on the first step in the
pathway.
mitochondria cytosol
8 succinyl-CoA + 8 glycine
8 δ-aminolevulinic acid 4 porphobilinogen
hydroxymethylbilane
uroporphyrinogen
coproporphyrinogen
protoporphyrinogen
protoporphyrin
heme
synthesis ofbuilding blocks
formation oflinear precursor
ring closure
ring modifications
iron emplacement
17.2.2 The δ-aminolevulinate synthase reaction
Notes: The first reaction in the porphyrin synthesis pathway occurs in the mi-
tochondria. Glycine forms a Schiff base with pyridoxal phosphate (PLP) in the
aminolevulinate synthase enzyme. Pyridoxal phosphate acts as a transient “elec-
tron sink”, as it usually does and as is illustrated for serine hydroxymethyltrans-
ferase in slide 15.2.4. Decarboxylation of the enzyme-bound glycine produces a
carbanion intermediate, which reacts with the carbonyl carbon in succinyl-CoA.
H2N
O
O⊖
PLP
N
CH2⊖
O
S
CoA
O
OH
PLP
N
O
O
OH
NH2
O
O
OH
PLP H2O
CO2 CoA-S–
H2O
PLP
glycine succinyl-CoA δ-ALA
The aminolevulinate synthase reaction is the committed step of heme synthesis
and is subject to feedback inhibition by heme, the final product of the pathway.
The reaction product, δ-aminolevulinic acid (δ-ALA), is transported to the cytosol,
where the next four reactions occur.
17.2 What is the committed step of heme biosynthesis, and how is it regulated?

324 17 Iron and heme metabolism
17.2.3 The porphobilinogen synthase reaction
2
porphobilinogen
H2N
O
O
OH
H2N
NH
Lys
O
OH O
OH
NH⊕
Lys
NH2
H2N
NH⊕
Lys
O
OH
NH
Lys
NH2
O
OH
NH2
NH
Lys
O
OH
NH
NH
Lys
O
OH
NH2
O
OH
NH
O
OH
Enzyme
Lys NH2
Lys NH2
H+
2 H2OH+
Notes: In the second reaction of heme synthesis, porphobilinogen synthase con-
denses two molecules of δ-ALA into one molecule of porphobilinogen, with the
elimination of two molecules of water. At the outset, both substrate molecules
form Schiff bases with two separate lysine residues in the active site. The water is
already lost at this stage; however, the more interesting reaction steps that lead
to the formation of the pyrrole ring still lie ahead. It should be noted that the
reaction mechanism depicted here is still somewhat tentative [119].
17.2.4 A substrate analogue inside the active site of porphobilinogen synthase
HO
O
NH2
NH2
OOH
Notes: This pretty picture (rendered from 1pv8.pdb) shows a model compound
(structure on the right) inside the active site of porphobilinogen synthase, next
to a zinc ion. It sheds little light on the reaction mechanism, or on the specific
role of zinc. The only point I want to make here is that zinc is important for this
enzyme. In lead intoxication, the zinc in porphobilinogen synthase is dislodged

17.2 Heme biosynthesis 325
by lead, which inhibits the enzyme and therefore the biosynthesis of heme and
hemoglobin.
17.3 What is the effect of lead intoxication on heme biosynthesis, and what laboratoryfindings would you expect in patients suffering from it?
17.2.5 Porphobilinogen deaminase synthesizes hydroxymethylbilane
hydroxymethylbilane
H2N
Ac P
NH
Enzyme-SH
NH3
Enzyme S
Ac P
NH
NH3
H2N
Ac P
NH
Enzyme S
Ac P
NH
Ac P
NH
4 NH3
H2N4
Ac P
NH
Enzyme S
Ac P
NH
Ac P
NH
Ac P
NH
Ac P
NH
Ac P
NH
Ac P
NH
H2O
HO
Ac P
NH
Ac P
NH
Ac P
NH
Ac P
NH
Notes: Porphobilinogen deaminase (or hydroxymethylbilane synthase) turns four
molecules of porphobilinogen into one linear tetramer. The process involves the
priming of the enzyme with two porphobilinogen subunits (shown in blue and
green) which remain with the enzyme molecule throughout and serve as a pros-
thetic group. Another unusual feature of this enzyme is that it uses ammonia as a
leaving group. (In this scheme, Ac and P denote the acetate and propionate groups
that are part of the porphobilinogen molecule; compare slide 17.2.3.)
17.2.6 Synthesis of uro- and coproporphyrinogen III
Notes: Hydroxymethylbilane, when left alone, cyclizes spontaneously, giving rise
to a ring with fourfold rotational symmetry, with acetyl groups and propionyl
groups alternating regularly around the perimeter of the molecule. The product of
this spontaneous reaction is named uroporphyrinogen I.
Nature, however, prefers another isomer, namely, uroporphyrinogen III. To
forestall its spontaneous cyclization into uroporphyrinogen I, hydroxymethylbi-
lane is captured and processed directly by uroporphyrinogen III cosynthase, which
forms a complex with porphyrinogen deaminase. The cosynthase creates the im-
probable-looking spiro intermediate shown here within brackets, which leads to
the inverted orientation of the acetate and propionate side chains on the fourth
ring in uroporphyrinogen III.
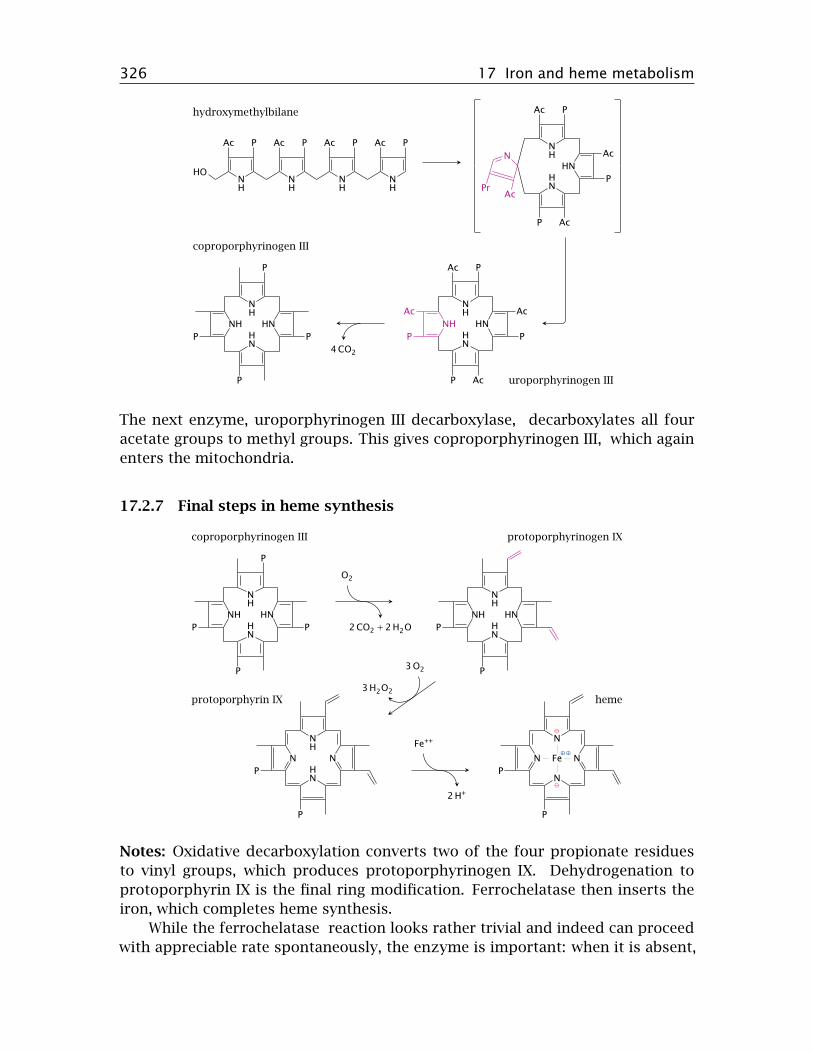
326 17 Iron and heme metabolism
HO
Ac P
NH
Ac P
NH
Ac P
NH
Ac P
NH
Ac
NH
P
Ac
HN
P
Ac
HN
P
N
PrAc
P
NH
Ac
Ac
NH
P
Ac
HN
P
Ac
HN
P
P
NH
NH
P
HN
PHN
P
4 CO2
uroporphyrinogen III
coproporphyrinogen III
hydroxymethylbilane
The next enzyme, uroporphyrinogen III decarboxylase, decarboxylates all four
acetate groups to methyl groups. This gives coproporphyrinogen III, which again
enters the mitochondria.
17.2.7 Final steps in heme synthesis
P
NH
NH
P
HN
PHN
P
P
NH
NH
HN
HN
P
P
N
NH
N
HN
P
P
N Fe⊕⊕
⊖
N
N
N⊖
P
O2
2 CO2 +2 H2O
3 O2
3 H2O2
Fe++
2 H+
coproporphyrinogen III protoporphyrinogen IX
protoporphyrin IX heme
Notes: Oxidative decarboxylation converts two of the four propionate residues
to vinyl groups, which produces protoporphyrinogen IX. Dehydrogenation to
protoporphyrin IX is the final ring modification. Ferrochelatase then inserts the
iron, which completes heme synthesis.
While the ferrochelatase reaction looks rather trivial and indeed can proceed
with appreciable rate spontaneously, the enzyme is important: when it is absent,

17.3 Disruptions of heme synthesis 327
protoporphyrin IX accumulates, which gives rise to a clinically manifest form of
porphyria [120].
Heme retains the vinyl groups that were introduced at the stage of protopor-
phyrinogen IX. Addition of the sulfhydryl groups of cysteine side chains across
these vinyl groups can produce covalent bonds between heme and some of its
apoproteins. Such covalent attachment occurs for example in cytochrome C oxi-
dase, but it does not happen in hemoglobin.
17.4 Explain the function of ferrochelatase.
17.3 Disruptions of heme synthesis
• hereditary enzyme defects (porphyrias)
• iron depletion
• vitamin B6 deficiency—inhibition of aminolevulinate synthase
• lead poisoning—inhibition of porphobilinogen synthase
Notes: Hereditary deficiencies are known for each of the enzymes in the synthetic
pathway. Clinical symptoms are due to both lack of heme and to the accumu-
lation of biosynthetic intermediates. Heme exercises feedback inhibition on the
first enzyme in the synthetic pathway, that is, δ-ALA synthase. A lack of heme
therefore disinhibits this enzyme and amplifies the accumulation of intermediates
upstream of the enzyme defect in question. Backed-up synthetic intermediates
often undergo spontaneous conversion to aberrant products.
Inhibition of heme synthesis can also result from causes other than enzyme
defects. The most common cause is iron depletion; another one is deficiency
of vitamin B6, which can result from malnutrition or, in inflammatory intestinal
diseases, from malabsorption. Vitamin B6 (pyridoxin) is the precursor of pyridoxal
phosphate, the coenzyme in aminolevulinate synthase. Lead intoxication causes
inhibition of porphobilinogen synthase (see slide 17.2.3); it is now less common
than it used to be.
17.3.1 Disruption of heme synthesis microcytic, hypochromic anemia
Notes: Regardless of the underlying cause, the inhibition of heme synthesis will
result in red blood cells that are smaller and contain less hemoglobin than normal
ones. This condition is named microcytic, hypochromic anemia. The term “micro-
cytic” refers to the reduced cell size, whereas “hypochromic” denotes the reduced
intracellular hemoglobin concentration.
17.5 Explain the connection between vitamin B6 deficiency and microcytic anemia.

328 17 Iron and heme metabolism
Normal red blood cells Microcytic anemia
17.3.2 Porphyria cutanea tarda (PCT) is caused by uroporphyrinogen decar-
boxylase deficiency
Notes: The accumulation of porphyrin precursors in various enzyme defects in
porphyrin synthesis can cause photosensitization of the skin. The clinical picture
can vary a bit, depending on the specific intermediate. As an example, we will
consider the disease porphyria cutanea tarda (translated: chronic porphyria of the
skin), which is the most common form of porphyria. Here, the deficient enzyme is
uroporphyrinogen III decarboxylase (see slide 17.2.6).
P
NH
Ac
Ac
NH
P
Ac
HN
P
Ac
HN
P
P
NH
NH
P
HN
PHN
P
4 CO2
P
N
Ac
Ac
NH
P
Ac
N
P
Ac
HN
P
spontaneousoxidation
coproporphyrinogen IIIuroporphyrinogen III
uroporphyrin III
17.3.3 Laboratory and clinical findings in PCT
Notes: The accumulating uroporphyrinogen distributes throughout the body and
becomes oxidized non-enzymatically to the non-physiological product uropor-
phyrin III. In the skin, uroporphyrin III can absorb photons and then react with
molecular oxygen to produce reactive oxygen species; the latter inflict the skin

17.3 Disruptions of heme synthesis 329
tissue damage that is illustrated in the slide. An important aspect of treatment is
the protection of skin from direct sunlight.
0
1
350 400 450
Ab
sorb
an
ce
Wavelength (nm)
The absorbed wavelength range (or absorption spectrum) differs between the var-
ious porphyrins. Uroporphyrin III has an absorption peak at 405 nm, which is at
the blue end of the visible spectrum; this peak is readily detectable in blood serum
samples (left). The sun light is more intense in the visible range than in the UV
range. Sun screen lotion, which is designed to absorb UV light but not visible light,
will not prevent photosensitization by uroporphyrin III.
17.3.4 Causation of porphyria cutanea tarda
• hereditary—rare, autosomal dominant; enzyme defect is manifest in all tissues
• sporadic—exogenous, or related to genetic defect in iron uptake regulation
– caused by alcohol, halogenated hydrocarbons, other toxic substances
– enzyme activity lacking in the liver but not erythrocytes and other tissues—
enzyme is functional but inhibited by interfering metabolites
• iron overload seems important in both hereditary and sporadic forms
Notes: Sporadic PCT is often associated with disturbances of iron homeostasis.
Approximately two thirds of sporadic PCT patients carry a deficient allele for the
iron regulator HFE. In homozygous form, this gene defect causes hemochromatosis,
a disease that is characterized by severe iron overload. HFE knockout mice show
increased intestinal expression and activity of iron uptake transporters.
Iron overload of the liver can also occur in chronic infections and in other
chronic inflammatory diseases (see section 17.5). Blood letting—which depletes
iron—is reportedly beneficial in PCT, regardless of the cause of the iron overload.
17.6 Explain the pathogenesis of the hereditary form of porphyria cutanea tarda.
17.3.5 Acute intermittent porphyria (AIP)
• deficiency of porphobilinogen deaminase, autosomal dominant
• excessive synthesis of δ-ALA in liver

330 17 Iron and heme metabolism
• surplus porphobilinogen in urine—urine is colored red
• δ-ALA induces psychiatric symptoms—too often misdiagnosed and mistreated
• abdominal pain (neuropathic)
• episodes can be induced by drugs
Notes: The genetic defect in acute intermittent porphyria concerns the enzyme
porphobilinogen deaminase. Both porphobilinogen and δ-ALA accumulate. Por-
phobilinogen is excreted with the urine and, through spontaneous oxidation, forms
a characteristic red pigment. The more severe clinical symptoms, however, are due
to accumulation of δ-aminolevulinate. This metabolite competitively inhibits the
binding of γ-aminobutyrate (GABA), an inhibitory neurotransmitter, to its recep-
tors [121], which likely causes both the psychiatric symptoms (agitation, confusion)
and the neurological ones (nausea, abdominal pain) in AIP.
The dysregulation mainly affects heme synthesis in the liver. As the name of
the disease suggests, it is not always manifest but only intermittently. Heme is
the prosthetic group of cytochrome P450 enzymes, which are important in drug
metabolism and are induced in the liver by various drugs (see slide 18.2.2). It
appears that ALA synthase is induced along with the cytochrome P450 enzymes,
and AIP attacks are often triggered or aggravated by the application of such drugs.
Specific drugs that induce cytochrome P450 and ALA synthase include barbi-
turic acid derivatives and carbamazepine, which were, and occasionally still are,
used in the treatment of psychiatric symptoms. Fatal outcomes have occurred
when AIP patients were misdiagnosed and treated with barbituric acid derivati-
ves.2 One element of the correct therapy consists in the application of heme,
which inhibits ALA synthase.
17.7 Explain the disease acute intermittent porphyria (AIP).
17.4 Heme degradation
Notes: Red blood cells have a regular lifespan of 120 days (although it can be
considerably shorter in some diseases). At the end of this lifespan, they are cap-
tured and ingested by phagocytes in the spleen and the liver. When the globin
protein is proteolytically degraded, heme is released. Heme itself undergoes degra-
dation mostly in the liver. Ring cleavage by heme oxygenase produces biliverdin,
which is in turn reduced to bilirubin. Some bilirubin is excreted into the bile
as such; however, the greater share is first conjugated with glucuronic acid by
UDP-glucuronosyltransferase, form 1A1, and excreted thereafter. The major trans-
port protein responsible for excretion of the diglucuronide is an ABC transporter
(ABCC2), the same one that also secretes bile acids (see slide 11.5.3).
In the large intestine, part of the conjugated bilirubin undergoes deconjuga-
tion by bacterial β-glucuronidases. In the anaerobic environment that prevails
2Generally speaking, any kind of psychiatric disturbance can potentially be due to organic causes,and therefore a thorough medical history and examination is necessary in each psychiatric patient. Ifyou decide to become a psychiatrist, make it a point not to forget about your neurology and internalmedicine.

17.4 Heme degradation 331
inside the colon, the released bilirubin subsequently undergoes reduction, again
by bacterial enzymes, to variously colored pigments that produce the stool color.
Another reduction product, urobilinogen, is taken up and excreted with the urine,
causing the yellow color of the latter.
HO
ON Fe
NCH
N
N
O
OH
HO
ON
NH
OO
HNHN
O
OH
3NADPH + 3O2
CO + Fe3+ + 3NADP+ + 3H2O
NADPH
NADP+
O
NH
O OH
NH
NH
OOH
NH
O
2 UDP-glucuronide
2 UDP
O
O O
OH
OHOHOH
O
NH
NH
O
NH
NH
O
O O
O O
OH
OHOHOH
heme
bilirubindiglucuronide
biliverdin
bilirubin
17.8 Explain how heme is degraded, and how the degradation product is disposed of.
17.4.1 Jaundice
Accumulation of bilirubin in the body. Causes:
• mechanically blocked excretion: bile duct blocked by bile stone or tumor
• increased production: hemolytic anemia (premature decay of red blood cells)
• decreased conjugation: enzyme defect, liver disease
• decreased excretion of conjugated heme: deficiency of ABCC2 transporter
(Dubin-Johnson syndrome)
Notes: Some fairly simple clues can narrow down the cause of jaundice in a given
patient. If excretion of bilirubin is blocked, the pigments derived from it will be
absent, and the stool will have a grayish color.
Hemolysis consists in the accelerated decay of red blood cells; it may result
from biochemical causes such as glucose-6-phosphate dehydrogenase deficiency
(see section 9.4), or from immunological ones such as Rhesus incompatibility.
In hemolysis, the serum level of unconjugated bilirubin will be more strongly
increased than that of the diglucuronide. On the other hand, when the flow of the
bile is backed up, the conjugated bilirubin will spill back into the serum and will
be increased.

332 17 Iron and heme metabolism
Liver diseases can affect synthesis, conjugation and biliary secretion of biliru-
bin in various degrees, and either form of bilirubin can be more strongly increased
than the other.
17.4.2 Enzyme defects in bilirubin conjugation by
UDP-glucuronosyltransferase
• transient, usually mild: neonatal jaundice
• genetic, mild: Gilbert syndrome—asymptomatic jaundice
• genetic, severe, rare: Crigler-Najjar syndrome
Notes: Neonatal jaundice is a normal event that is caused by a transiently low
level of UDP-glucuronosyltransferase 1A1.3 In most cases, it does not cause any
problems and simply goes away within two weeks after birth, as the level of
enzyme activity increases. If the serum level of bilirubin gets too high, however, it
may accumulate in the brain and cause neurological problems (see next slide). To
prevent this, newborns can be treated with phototherapy (see slide 17.4.4).
Crigler-Najjar syndrome is due to the genetic deficiency of UDP-glucurono-
syltransferase 1A1. It initially becomes manifest as neonatal jaundice; however,
since the gene defect is permanent, the situation doesn’t improve with time. As
in many other gene defects, there are variants with total or partial disruption of
enzyme activity. Milder cases are classified as Gilbert’s syndrome; the boundary
between Gilbert’s and Crigler-Najjar syndrome will be somewhat arbitrary. When
residual enzyme activity is present, it is possible to increase it with drugs such as
phenobarbital that transcriptionally induce it.
As in neonatal jaundice, phototherapy is also used in Crigler-Najjar syndrome,
but its efficiency decreases with time, since the growth of the body reduces its
surface to volume ratio, and therefore a diminishing fraction of the bilirubin in
the body can be reached by illumination. The disease is best treated with liver
transplants, as the transplanted liver will not be affected by the underlying gene
defect and be able to conjugate and excrete bilirubin.
17.4.3 Bilirubin encephalopathy (“kernicterus”)
Notes: This slide shows a brain section from a patient with severe bilirubin en-
cephalopathy. The yellow color in the deeper structures of the forebrain—the
so-called basal ganglia—is due to bilirubin accumulation. Through an unknown
biochemical mechanism, bilirubin causes damage to the basal ganglia, which re-
sults in motor dysfunction and other neurological symptoms.
3Prior to birth, the bilirubin formed by the fetus is eliminated via the placenta and therefore doesnot accumulate. The same applies to the toxic metabolites that accumulate in phenylketonuria (seeslide 12.5.1) and several other hereditary metabolic diseases, which therefore become manifest onlyafter birth.

17.4 Heme degradation 333
17.4.4 Photoisomerization products of bilirubin
Notes: In phototherapy, bilirubin absorbs photons and subsequently undergoes
cis-trans isomerization across the two remaining double bonds between the pyr-
role rings of the bilirubin molecule, as well as ring formation [122]. This slide
shows some of the photochemical reaction products. The 4Z,15Z isomer of biliru-
bin (top left) is the one that is produced directly by biliverdin reductase, and which
is eliminated very slowly in the unconjugated form. The other isomers are elim-
inated more rapidly; the fastest rate of elimination is observed with lumirubin
(cyclobilirubin).
O
NH
OOH
NH
NH
O OH
NH
O
NH
O NH
OOH
NH
O OH
NH
O
O
NH
OOH
NH
NH
O OH
NH
O
OOH
NH
O
NNH
O OH
NH
O
4Z,15Z
4Z,15E
4E,15Z
15Z-lumirubin
While the absorption maximum of bilirubin is in the blue wavelength band, green
light reportedly produces lumirubin more efficiently, and it also induces less cyto-
toxic byproducts in cell culture models [123]. It seems, however, that blue lamps
are still more widely used in practice, and the literature does not make mention
of significant side effects of blue light, even in the long-term treatment of Crigler-
Najjar patients [124].
17.9 Explain the rationale and application of phototherapy in newborns.

334 17 Iron and heme metabolism
17.4.5 Sn-mesoporphyrin, an inhibitor of heme oxygenase
NN⊖
O
OH
N
O
OH
⊖
N
0
5
10
15
20
25
30
0 5 10 15 20 25
Perc
en
t
Peak plasma bilirubin (mg/dL)
Sn-mesoporphyrin
Phototherapy
Sn++
Notes: The inhibition of heme oxygenase with Sn-mesoporphyrin has been used
successfully in clinical studies to treat neonatal jaundice. The study summarized
in this slide examined the effectiveness of Sn-mesoporphyrin in the treatment of
newborns with glucose-6-phosphate dehydrogenase deficiency (see slide 9.4). In
this condition, the lifespan of red blood cells is diminished, which increases the
rate of heme degradation; newborns therefore are at an increased risk of severe
jaundice.
Remarkably, a single injection of the drug was sufficient to reduce the peak
levels of bilirubin to a greater extent than the reference treatment (phototherapy).
It should be noted that both forms of treatment sufficed to keep the peak bilirubin
levels below 25 mg/dL, which is considered sufficient to avoid damage to the brain.
Phototherapy currently remains the standard treatment in clinical practice. Figure
prepared from original data in [125].
17.4.6 Is CO a signaling molecule, like NO?
Notes: Nitric oxide is an important signaling molecule. As a small molecule, it
can easily diffuse out of one cell and into another. Inside the target cell, it binds
to soluble guanylate cyclase (sGC). Interestingly, the NO-binding site on sGC is a

17.5 Iron uptake, transport and storage 335
heme molecule. Binding of NO to one face of the heme releases a histidine side
chain on the other, which causes a conformational change and activation of the
sGC molecule.
In vitro experiments show that CO can also bind and activate sGC. It has there-
fore been proposed that heme oxygenase, which produces CO, has a regulatory
role in addition to its metabolic one. However, while this idea has been around for
awhile, I have not come across solid evidence that supports a significant signaling
role of CO in vivo.
17.5 Iron uptake, transport and storage
• uptake in the small intestine: Fe2+—free or bound to heme
• transient storage as ferritin inside the intestinal epithelia
• transport in the blood: Fe3+—bound to transferrin with very high affinity
• cellular uptake: endocytosis of transferrin, release of iron in acidic endosome
• storage: intracellular ferritin particles
• depletion: scaled-off cells, blood loss, breast milk
Notes: Only ferrous iron (Fe2+) can be taken up from the small intestine, so that
is what we give to patients. Still, during passage through the intestine, much of
the ferrous iron is oxidized to the ferric form (Fe3+), which means that intestinal
uptake is not very efficient.
The very high affinity of transferrin to iron means that there is practically no
free iron in the blood serum. Bacteria, like human cells, require iron for growth;
therefore, keeping free iron very low is an important non-specific immune mech-
anism. Many pathogenic bacteria produce their own high-affinity iron-binding
molecules (siderophores) to acquire iron within this iron-depleted environment.
In chronic infections, free iron in the serum is reduced even below the normal
low value, presumably in an attempt by the immune system to starve microbial
pathogens of iron. The same also happens in tumor patients and non-infectious
inflammatory diseases such as rheumatism, since the immune system is not smart
enough to tell the difference between these and infections. As a result, an anemia
develops in which the blood cells look just like the ones in true iron depletion.
However, in contrast to the latter, the level of cellular storage iron will be increased
in this case—iron is not lacking, it is just being kept out of circulation. If iron
sequestration is observed in a patient, one must search for the underlying disease
that causes it.
Loss of iron occurs with cells being scaled off from the skin and intestinal ep-
ithelia, with blood loss (menstruation, blood donations), with diaplacental transfer
to a growing fetus, and with breast milk. Mothers who have many children within
a relatively short period of time have a good chance to incur iron depletion, so this
is something to watch out for as a physician.

336 17 Iron and heme metabolism
17.5.1 Structure of ferritin
Notes: Ferritin is hollow protein particle that consists of 24 identical subunits. Up
to ~4,500 iron ions can be stored inside the particle, in the form of FeOOH.
On the left, two neighboring subunits have been removed from the front of
the sphere, and we are peeking into the interior of the shell, which in vivo would
be packed with iron. On the right, some more subunits have been removed, and
the iron ions actually contained in the crystal structure—just one per subunit—are
shown as spheres. Can you figure out why the crystallographers did not try to
obtain a structure of the fully loaded particle? Rendered from 1fha.pdb.
17.5.2 Ferritin in the small intestine regulates iron uptake

17.6 Answers to practice questions 337
17.5.3 Hemosiderin in liver tissue
Notes: In diseases that cause iron overload, the storage capacity of ferritin will be
exceeded. Excess iron will then precipitate around the ferritin particles and cause
them to aggregate. These iron-rich aggregates are called hemosiderin.
Iron overload can occur as a result of multiple blood transfusions, or of genetic
defects that interfere with iron transport. An example is a defect of ceruloplasmin,
a copper-containing serum protein that oxidizes Fe2+ to Fe3+.
In the figure, the brown stipples represent the hemosiderin. The dark blue
blotches are out of focus and are just precipitated dye particles, that is, artifacts;
this tends to happen if dye solutions stand around on the shelf for too long.
17.10 Describe the structure and function of ferritin.
17.6 Answers to practice questions
17.1: 1. Transport (hemoglobin) and intermediate storage (myoglobin) of oxygen, 2. En-zyme catalysis (cytochrome P450 enzymes, cyclooxygenases), 3. Electron transport (respi-ratory chain), 4. Allosteric regulation (binding of NO to guanylate cyclase).
17.2: The synthesis of δ-aminolevulinate from succinyl-CoA and glycine by δ-aminolevuli-nate synthase. It is inhibited by heme.
17.3: Lead inhibits porphobilinogen synthase and therefore heme biosynthesis. Thisresults in hypochromic anemia, that is, less hemoglobin per erythrocyte, and increasedblood levels of δ-aminolevulinate, the substrate of porphobilinogen synthase.
17.4: Ferrochelatase catalyzes the last step in heme synthesis. It inserts an iron ion intothe protoporphyrin IX ring.
17.5: Microcytic anemia results from the inhibition of heme synthesis. Vitamin B6 is theprecursor of pyridoxal phosphate, which is the coenzyme of ALA synthase. A reducedactivity of ALA synthase will reduce the rate of heme synthesis.
17.6: The enzyme defect concerns uroporphyrinogen III decarboxylase. UroporphyrinogenIII accumulates and is non-enzymatically converted to uroporphyrin III, which distributesthroughout the body. In the skin, it mediates the photochemical formation of reactiveoxygen species, which cause skin damage.
17.7: AIP is due to the excessive production of δ-aminolevulinic acid (ALA) and the fol-lowing metabolite, porphobilinogen. The disease is due to mutations in porphobilinogen

338 17 Iron and heme metabolism
deaminase. Its episodes can be triggered by drugs that induce ALA synthase. Excretion ofporphobilinogen causes the urine to turn red. Accumulation of ALA itself causes neuro-logical and psychiatric symptoms due to competitive inhibition of GABA receptors in thecentral nervous system.
17.8: Heme oxygenase breaks he porphyrin ring and releases CO. The product, biliverdin,is then reduced to bilirubin. The two carboxylic acid moieties of bilirubin are conjugatedwith glucuronic acid by UDP-glucuronosyltransferase, and bilirubin-diglucuronide is se-creted with the bile.
17.9: In newborns, the enzyme activity of UDP-glucuronosyltransferase 1A1 is low, so thatunconjugated bilirubin accumulates. This poses a risk of neurological damage.
The unconjugated bilirubin distributes throughout the body, including the skin, andin the latter location is accessible to light. Absorption of blue or green light promotes theformation of bilirubin isomers that are more readily excreted even without conjugation.Phototherapy therefore lowers the level of bilirubin.
17.10: Ferritin is the major intracellular storage medium for iron. Each ferritin particle isa large protein complex with 24 identical subunits. It forms a hollow shell that can storeup to 4,500 iron ions.

Chapter 18
Metabolism of drugs and xenobiotics
18.1 Functional significance
• inactivation and facilitated elimination of drugs and xenobiotics
• activation of prodrugs
• formation of active metabolites with similar or novel activity
• detoxification of toxic xenobiotics
• toxification of non-toxic xenobiotics
Notes: Drugs can be considered a subset of xenobiotics, that is, natural compounds
of exogenous origin that may find their way into the human body. Other important
classes of xenobiotics are potentially toxic plant alkaloids or fungal toxins. The
metabolic pathways that have evolved to deal with these natural xenobiotics are
active on many synthetic drugs also.
In most cases, metabolic transformation of a drug results in its inactivation
and accelerated elimination from the body. However, other outcomes are possible,
as will be discussed below.
18.1.1 Enzyme specificity in drug metabolism
• key problem: a limited number of enzymes must cope with an unlimited
number of substrates
• many drug-metabolizing enzymes have fairly broad specificities
• enzyme specificities overlap—many drugs give rise to multiple metabolites
Notes: The human body contains several dozen enzymes that are primarily dedi-
cated to the metabolism of xenobiotics. Many of these enzymes can modify a large
number of structurally diverse drugs and xenobiotics.
339

340 18 Metabolism of drugs and xenobiotics
18.1.2 Example: metabolism of phenobarbital
O
NH
O
OHN
NADPH+H+
O2
NADP+
H2O
O
NH
O
OHOHN
O
NH
O
O S
O
O
O−O
HN
O
NH
O
O
O
O−O
OH
OH
OH
OHN
UDP-glucuronide
UDP
PAPS
3′-P-AMP
Notes: Phenobarbital, a barbituric acid derivative with both sleep-inducing and
anti-epileptic activity, illustrates both the significance and the workings of drug
metabolism. The drug molecule itself is quite hydrophobic. This causes the drug
to distribute into fat tissue. The amount that remains in the plasma is partially
bound to plasma proteins. Therefore, only a small fraction of the drug is, at any
time, found freely dissolved in the blood plasma and thus amenable to filtration
and excretion in the kidneys, or to biliary secretion in the liver. Elimination of the
unmodified drug is thus very slow, and the lion’s share of the drug is excreted
after enzymatic conjugation.
Phenobarbital as such is not amenable to conjugation reactions. This problem
is overcome by a cytochrome P450 enzyme, which introduces a hydroxyl group
into the molecule. This hydroxyl group is then conjugated with either glucuronic
acid or sulfate. Both of these metabolites are sufficiently polar and are effectively
excreted through the kidneys.
18.1.3 Drug metabolism facilitates drug elimination
Notes: Drug metabolism works hand in hand with excretion. The key organs in
drug metabolism and excretion are the small intestine, the liver, and the kidneys.
Drug-modifying enzymes are highly expressed in the small intestine and the
liver. The reactions catalyzed by these enzymes are classified into phase I and
phase II reactions. Broadly speaking, a phase I reaction introduces a functional
group into a substrate that enables its subsequent conjugation in a phase II reac-
tion. Conjugation, in most cases, increases the polarity of the substrate, rendering
it more amenable to secretion into the bile or to excretion in the urine. The two
stages of phenobarbital metabolism depicted in the preceding slide exemplify
phase I and phase II transformations, respectively.

18.2 Cytochrome P450 enzymes 341
Drug molecule
Reactive metabolite Conjugate
Urine
phase 1
phase 2
Deconjugation,reuptake
Biliary secretion of drugs or drug conjugates requires active transport, as does
tubular secretion into the nascent urine. Some of the transport proteins involved
recognize the groups that were conjugated to the drug molecules, for example,
glucuronic acid or glutathione. Excretion by active transport is sometimes referred
to as phase III of elimination.
Note also that drugs that are taken orally will encounter drug-metabolizing
enzymes in the small intestine and the liver before they even enter the systemic
circulation. In many cases, a large fraction of the drug molecules is already mod-
ified and inactivated at this early stage; this fraction is referred to as the drug’s
first pass effect.
18.1 Explain the physiological significance of drug metabolism, and the distinction be-tween phase I and phase II metabolism.
18.2 Cytochrome P450 enzymes
ER membrane
Reductase Cytochrome P450NADPH+H
+
NADP+
FAD
FADH2
FMNH2
FMN
Heme
Heme-O!
O2
H2O
R–OH
R–H
Notes: Cytochrome P450 is a large family of enzymes that are found in both
prokaryotic and eukaryotic organisms. In mammalian cells, they are found in both
the ER and the mitochondria, and they function in various biosynthetic pathways,
such as cholesterol and steroid hormone synthesis. Several dozen CYP450 (CYP)
isoforms are involved in drug metabolism; they are the most important group of
enzymes in phase I metabolism. These isoforms are found mostly in the ER.
The reactions catalyzed by CYP enzymes start with the abstraction of hydrogen
from NADPH by cytochrome P450 reductase, an auxiliary enzyme. The hydrogen
is used by CYP to reduce one of the two atoms of molecular oxygen to water. The

342 18 Metabolism of drugs and xenobiotics
other oxygen atom is retained in a highly reactive form, which is then used to force
one or the other kind of reaction on a substrate.
18.2.1 Reactions catalyzed by cytochrome P450
R−H[O]
R−OH Carbon oxidation
RCH2−OH[O]
RCH−−O+H2O
RCH−−O[O]
RCOOH
R2N−H[O]
R2N−OH Heteroatom oxidation
R3N[O]
R3N−−O
R2S[O]
R2S−−O
RO−CH2R[O]
ROH+O−−CHR Dealkylation
R2N−CH2R[O]
R2NH+O−−CHR
R−HC−−CH−R[O]
R−HCO
CH−R Epoxide formation
Notes: Apart from aromatic or aliphatic hydroxylation, CYP enzymes can also
bring about several other types of reactions. Oxidation can occur once or repeat-
edly; for example, hydroxyl groups can be further oxidized to aldehydes and car-
boxylic acids. Oxidation is not confined to carbons but can also affect heteroatoms.
Dealkylation is a powerful way to break up and inactivate drug molecules.
Amine oxidation, aldehyde formation, and epoxide formation yield reactive
groups that may subsequently cause toxic effects. Therefore, while drug metabo-
lism often abolishes toxicity, sometimes is can actually create it.
18.2 Explain the mode of action of cytochrome P450 enzymes, and name some typicalreactions that they perform on drug molecules.
18.2.2 Transcriptional induction of CYP450 3A4
Notes: Considering that there are several dozen different CYP enzymes in human
cells, it is remarkable that a single isoform, CYP3A4, is involved in the metabolism
of some 50% of all clinically prescribed drugs. Like several other isoforms, CYP3A4
is inducible, that is, its rate of gene transcription is increased by certain drugs.
With CYP3A4, the nuclear hormone receptor that mediates induction is the
pregnane X receptor (PXR). When a suitable drug binds to this receptor, it translo-
cates from the cytosol to the nucleus and binds to its cognate regulatory DNA
sequences, referred to as xenobiotic response elements (XRE); this results in in-
creased transcription of genes in the vicinity. The PXR responds to a particularly
wide variety of drugs, which in part accounts for the prominent role of CYP3A4 in
drug metabolism.

18.2 Cytochrome P450 enzymes 343
Cytochrome P450,phase II enzymes,ABC transporters
PXR
Enzyme induction often leads to accelerated metabolism of multiple drugs, not
just the inducing drug itself. Examples are rifampicin, an antibiotic used in tuber-
culosis, as well as phenytoin and phenobarbital, which are used as anti-epileptic
agents. These drugs all induce accelerated inactivation of each other. Furthermore,
they also accelerate the metabolism of contraceptives and render these drugs
ineffective.
Together with cytochrome P450 enzymes, conjugating enzymes and active
transporters that function in drug excretion are also induced. CYP enzymes con-
tain heme; the first and rate-limiting step of heme synthesis is catalyzed by δ-
aminolevulinate synthase (see slide 17.2.2). This enzyme is also induced, and
through this mechanism certain drugs, including the examples listed above, can
exacerbate acute intermittent porphyria (see slide 17.3.5).
18.3 Explain the role of enzyme induction in drug metabolism.
18.2.3 Structure of erythromycin bound to cytochrome P450 3A4
OH
O
O
OH
N
O
O
O
OH
O
O
OH
OHO
Notes: Another reason of CYP3A4’s prominent role in drug metabolism is its own
ability to accommodate a wide variety of substrates within its active site. This
slide and the next one illustrate two examples. The drugs, erythromycin in this
slide and ketoconazole in the next one, are shown in blue or green. The heme of
CYP3A4 is shown in red, and several amino acid side chains that interact with the
drug molecules are shown in yellow. Note the differences in protein conformation
and the interacting residues between both slides.

344 18 Metabolism of drugs and xenobiotics
18.2.4 Ketoconazole bound to cytochrome P450 3A4
Cl
Cl
N
N
O
O
O
NN
O
Notes: This slide shows two molecules of ketoconazole bound within the active
site of CYP3A4. The binding of the second molecule is likely an artifact of the high
drug concentration used in the crystallography experiment.
Note that the imidazole group of one drug molecule is bound to the heme iron.
Ketoconazole is an antifungal agent that inhibits 14α-demethylase, a cytochrome
P450 enzyme that is essential for the synthesis of ergosterol, the major sterol
found in fungal cell membranes. One side effect of ketoconazole is the inhibition
of drug metabolism in humans.
Structures rendered from 2j0d.pdb and 2v0m.pdb, [126].
18.2.5 Superposition of the erythromycin- and the ketoconazole-bound struc-
tures
Notes: The erythromycin-bound structure is shown in orange, and the ketocona-
zole-bound one in blue. The polypeptide backbones track each other closely for
the most part, but they diverge noticeably in several places, particularly atop the
active site. These local deviations illustrate the remarkable conformational flex-

18.2 Cytochrome P450 enzymes 345
ibility of the enzyme molecule that allows it to accommodate, and therefore to
metabolize, a large number different substrates.1
18.4 Some cytochrome P450 enzymes, for example CYP3A4, act upon an unusually widerange of different substrates. How can this be explained?
18.2.6 Formation of active metabolites by CYP450 enzymes
N
O
N
Cl
N
OH
O
NH
Cl
Diazepam Oxazepam
CYP450
H2N O
N
H2N O
N
O
CYP450
Carbamazepine Carbamazepine-10,11-epoxide
HO
N
OH
HO
N
OH
OOH
Terfenadine
Fexofenadine
CYP450
Notes: While drug metabolism often results in inactivation, metabolites may retain
pharmacological activity, or sometimes even acquire novel ones. For example,
two CYP-mediated reactions convert diazepam to oxazepam, which retains the
pharmacological activity of the parent compound.
Some active metabolites, including oxazepam and fexofenadine, have become
drugs in their own right. Since these molecules are already prepared for conju-
gation, they are usually more rapidly eliminated than the parent compounds. In
the case of oxazepam, this is an advantage when the intention is to induce sleep,
since most of the drug will have been excreted the next day. In contrast, diazepam
works better in the treatment of epilepsy, where a more stable and steady level of
drug activity is desired.
With all examples shown in this slide, both the parent molecules and the me-
tabolites have pharmacological activity. For various applications, drugs have been
designed that actually require metabolic conversion to become active; such mole-
cules are referred to as prodrugs. Some organic nitrates, for example nitroglycerin,
are metabolized by cytochrome P450 enzymes to release nitric oxide as the active
principle. Other examples of prodrugs are sulfonamides (see slide 15.3) as well as
tenofovir and cidofovir (slide 16.9.14).
18.5 Explain the concept of active drug metabolites.
1In the molecular structures, there also are some discontinuities. These represent conforma-tionally flexible segments of the polypeptide chain that did not give rise to distinct diffractionsignals.

346 18 Metabolism of drugs and xenobiotics
18.2.7 Benzopyrene as an example of harmful metabolism of xenobiotics
Benzopyrene
OH
O
OH
Benzopyrene–DNA adduct
CYP1A1
DNA
Notes: Benzopyrene and related compounds activate the aromatic hydrocarbon
receptor (AHR), a nuclear hormone receptor that is functionally similar to PXR but
instead of CYP3A4 induces CYP1A1. The reaction of this enzyme with aromatic
hydrocarbons tends to produce epoxides, which react easily with nucleophiles.
Epoxides of polycyclic aromatic molecules are particularly harmful, since they can
intercalate into DNA. The epoxide can then react covalently with the DNA and
cause mutagenic damage.
Polycyclic aromatic hydrocarbons such as benzopyrene arise from incomplete
combustion of organic matter, such as in car exhaust fumes or cigarette smoke.
Their metabolic conversion to epoxides and subsequent reaction with DNA is the
major mechanism of carcinogenesis in smokers.
18.6 Explain the role of metabolism in the carcinogenic effect of polycyclic aromatichydrocarbons such as benzopyrene.
18.7 If a molecule of benzopyrene has been metabolically activated to an epoxide, whatwill be the mechanism of reaction with nucleic acids?
18.3 Phase II reactions
18.3.1 Summary of phase II reactions
Notes: This list is sorted roughly according to decreasing importance. Glucuron-
idation is the most common reaction, followed by sulfation; both were illustrated
in slide 18.1.2. Some more reactions will be illustrated below.
None of the cosubstrates and reaction mechanisms employed in conjugation
are used exclusively in drug metabolism. UDP-glucuronide and PAPS are also used
in the synthesis of proteoglycans, glutathione occurs in many redox reactions and
in the synthesis of leukotriene mediators, and amino acid conjugation is used
with bile acids. Some enzymes may act upon both endogenous metabolites and
xenobiotics; examples are catechol-O-methyltransferase, which apart from drugs
also conjugates epinephrine and norepinephrine, and glycine-N -acyltransferase,
which attaches glycine to both drugs and to cholic acid.

18.3 Phase II reactions 347
Enzymes Cosubstrates Functionalgroups
UDP-glucuronosyl-transferases
UDP-glucuronide −OH, −NH2
sulfotransferases PAPS −OH, −NH2
glutathione-S-transferases
glutathione epoxy groups,double bonds
acetyltransferases acetyl-CoA −OH, −NH2
methyltransferases SAM −OH, −NH2, −SH
epoxide hydrolase H2O epoxide groups
aminoacyltransferases amino acids −COOH
18.3.2 Detoxification of benzopyrene epoxide derivatives by epoxide hydro-
lase or glutathione-S-transferase
Notes: Fortunately for smokers, not all aromatic epoxide molecules will end up
reacting with DNA. One major detoxification pathway is the reaction with glu-
tathione, which is facilitated by glutathione-S-transferase (left). Epoxide hydrolase
(right) also contributes to the detoxification.
OH
O
OH
OH
OH
OH
OH
S
OH
OH
OH
O
NH
OHO
NHO
OH
ONH2
H2OG−SH
The epoxide hydrolase reaction occurs after a phase I reaction, so therefore could
be considered part of phase II. On the other hand, it does not result in conjugation,
and it thus might be considered not to be part of phase II. So, which phase does it
belong to?
This question is purely one of definition and therefore irrelevant. It is only
mentioned to illustrate that the distinction between phase I and II reactions, while
useful, has its limitations.

348 18 Metabolism of drugs and xenobiotics
18.3.3 Metabolism of acetaminophen
NH O
OH
N O
O
SG
NH O
OH
ProteinS
NH O
OH
G–SH
Protein–SH
CYP450
Acetaminophen NAPQI
Notes: Acetaminophen also undergoes successive phase I and phase II reactions.
The initial CYP-catalyzed reaction yields N-acetyl-p-benzoquinone imine (NAPQI).
This molecule is also quite reactive towards nucleophiles, particularly sulfhydryl
groups. Glutathione is the most abundant intracellular thiol, with a free concen-
tration of ~5 mM, and while supplies last will neutralize most NAPQI. However,
once glutathione has been depleted, NAPQI will start reacting with cellular macro-
molecules and cause cytotoxicity. This mostly affects the liver, since it has the
highest activity of cytochrome P450 enzymes and therefore will produce the most
NAPQI.
Acetaminophen is well tolerated when applied at dosages that will not deplete
glutathione. However, it turns toxic rapidly once the safe dosage limit is exceeded.
18.8 Explain the role of metabolism in the toxicity of acetaminophen.
18.3.4 Morphine skips phase I and is conjugated directly
HO O OH
N
O O OH
N
OH
OH
O−O
O
OH
UDP-glucuronide
UDP
Morphine Morphine-3-glucuronide
Notes: Phase I reactions are not necessary if a drug molecule already contains
functional groups suitable for conjugation. An example is morphine, which has
two hydroxyl groups. The conjugation of either, or both, with glucuronic acid is
sufficient for excretion. Interestingly, one of the two single glucuronides—the one
not shown here—retains pharmacological activity.

18.3 Phase II reactions 349
N-demethylation of morphine by cytochrome P450 can occur but does not
significantly affect excretion.
18.3.5 Acetylation of INH by N-acetyltransferase 2 (NAT 2)
NH2
NHO
N
O
NH
NHO
N
O
NH
NH2
OHO
N
acetyl-CoA
CoA-SH
H2O
Isoniazid Isonicotinic acid
Acetylhydrazine
Notes: The metabolism of isoniazid (isonicotinic acid hydrazide, INH; a tubercu-
lostatic agent) also starts with a phase II reaction. N-acetyltransferase 2 (NAT2)
acetylates the hydrazide group. The product can decay, and the acetyl-hydrazide
can transfer its acetyl group to other nucleophiles in the cell.
18.3.6 Bimodal distribution of INH acetylation speed
0
5
10
15
20
25
0 1 2 3 4 5 6 7 8 9
Fre
qu
en
cy (
ind
ivid
uals
)
INH in plasma (µg/mL) after 6h
Fast, slow acetylators
Notes: The depicted experiment measured the speed of acetylation. A fixed test
dosage was applied at t=0, and the remaining plasma concentration was deter-
mined 6 hours later. There clearly are two separate peaks, which represent the
fast and slow acetylators, respectively. Among Caucasians, about 50% express an
inactive NAT2 allele, which causes the slow-acetylator phenotype. The percentage
of slow acetylators is lower among Asians (but was higher in a small study on
Kenyans [127]; I don’t know how representative that study is).
Apart from isoniazid, the NAT2 enzyme and its polymorphism also affects
the inactivation rates of some other drugs, such as procainamide and hydralazine,
which in slow acetylators are more likely to cause toxicity. A role of this polymor-
phism has also been reported in the susceptibility to bladder cancer caused by
aromatic amines, which in Europeans was found to correlate with slow acetylator

350 18 Metabolism of drugs and xenobiotics
status. Surprisingly, this correlation was not observed in Chinese [128]. The reason
for this discrepancy is unknown.
18.9 What are fast and slow acetylators?
18.3.7 Amino acid conjugation: Glutamine conjugation of phenylacetate
OH
O
CoAS
O
NH
O
O
OH
ONH2
H2NO
OH
ONH2
CoA–SH
ATP AMP+PPi CoA–SH
Phenylaceticacid
Glutamine
Conjugate
Notes: Amino acid conjugation is limited to xenobiotics that are carboxylic acids,
which are first activated to coenzyme A-thioesters and then linked to an amino
acid by an amide bond. The amino acid may be glutamine (as shown), glycine, or
taurine. The latter two amino acids are also used in the synthesis of the conjugated
bile acids taurocholate and glycocholate (see slide 11.5.1).
The pathway can be put to use in the alternate pathway therapy of urea cycle
enzyme defects (see slide 12.3.10). In this application, the usual physiological
role of amino acid conjugation is turned on its head. Normally, amino acids are
expended in order to eliminate unwanted organic acids; in contrast, here we supply
innocuous organic acids, the amino acid conjugates of which then become vehicles
for the elimination of surplus nitrogen. Brilliant!
An organic acid commonly used in alternate pathway therapy is phenylbu-
tanoic acid, which first undergoes β-oxidation to phenylacetic acid (the substrate
shown here) before conjugation to glutamine and excretion. It may be combined
with benzoate, which undergoes conjugation with glycine and therefore recruits
another enzyme and another pool of nitrogen.
18.10 Name the major types of reactions, enzymes and cosubstrates in phase II drugmetabolism.
18.4 Reductive drug metabolism
Multiple enzymes:
• methemoglobin reductase (diaphorase)
• cytochrome P450 reductase
• thioredoxin
• bacterial metabolism
• . . .

18.5 Anti-tumor drugs that are preferentially activated in tumor cells 351
Notes: While cytochrome P450 enzymes play the most important role in phase I
metabolism, some drugs are actually reduced rather than oxidized at this stage.
The enzymes involved are a somewhat heterogeneous bunch and primarily serve
in roles other than the metabolism of xenobiotics.
18.5 Anti-tumor drugs that are preferentially activated in tumor cells
This section, after some introduction, examines two antitumor prodrugs that at-
tempt to exploit metabolic activation to selectively target tumor cells.
18.5.1 DNA damage triggers programmed cell death
Growth factors, adhesion molecules Fas-ligand, TNF
Receptor tyrosine kinases, GPCRs Death receptors Cell membrane
PIP3-kinases Adapter proteins
Proliferation AKT Caspases Apoptosis
Microtubuledisruption
Bcl family Cytochrome C Mitochondria
MDM2 p53 ATM, ATR, ARF
Cell cycle arrest, DNA repair DNA damage Nucleus
Notes: Programmed cell death, or apoptosis, is a protective mechanism that in-
hibits the proliferation of genetically damaged cells. DNA damage is detected by
so-called checkpoint proteins during various stages of the cell cycle. Extracellular
signals can promote or inhibit apoptosis. Cancer cells are often more suscepti-
ble to apoptotic stimuli than normal cells are. This is exploited by the use of
DNA-damaging, cytotoxic drugs in cancer chemotherapy.
18.5.2 Mechlorethamine, a DNA-alkylating drug
Notes: Many anticancer drugs are DNA-alkylating agents; mechlorethamine is a
straightforward example. Bifunctional DNA-alkylating agents such as this one have
much higher antitumor activity than monofunctional ones, since they can crosslink
the two DNA strands; this makes semi-conservative DNA repair impossible.

352 18 Metabolism of drugs and xenobiotics
ClN
Cl ClN⊕
N
dR
N NH2
NH
O
N
ClN
N⊕
N
dR
N NH2
N
OHN
N⊕
N
dR
N NH2
N
OH
N⊕
OH
N
NH2 N N
dR
Cl–
18.5.3 CB 1954, an experimental antitumor drug that is activated by nitro
group reduction and acetylation
Notes: The experimental drug CB 1954 is, in its original form, a monovalent alky-
lating agent; the alkylating group is the aziridine group (the three-membered ring
at the top). It is activated to a bifunctional agent in two steps. Diaphorase (methe-
moglobin reductase) reduces the nitro group to a hydroxylamine, which is then
acetylated by an acetyltransferase to form a reactive acetoxy group [129].
NO2
N
O
NH2 NO2
OH
HN
N
O
NH2 NO2
NH2
N
O
NH2 NO2
O
O
HN
N
O
NH2 NO2
HN
N
O
NH
NH2NNN
N⊕
O
NH
NH2N
O
NH2 NO2
2 NADH 2 NAD+
H2O
NADH NAD+
H2O
acetyl-CoA
CoA–SH
DNA
acetate
For reasons that are not well understood, the environment inside tumor cells is
often more reducing than in nontumorous cells, which will result in preferential
activation of this drug inside tumor cells. CB 1954 is somewhat of a perennial
“experimental” drug, which probably means that it is not very compelling in clin-
ical use. However, several established anticancer drugs such as doxorubicin and
bleomycin also require reductive activation [130], which may enhance their selec-
tivity for cancer cells.

18.6 Answers to practice questions 353
18.5.4 Canfosfamide, an antitumor drug that targets alkylant-resistant tumor
cells
OH
ONH2
O NH
O
NH
OH
O
S
O
O
H
O⊖
GST
H
OP
ON
Cl
Cl
N
Cl
Cl OH
GST
⊖OP
ON
Cl
Cl
N
Cl
Cl
S
O
O
R
Canfosfamide Byproduct
Alkylating drug
Notes: Glutathione conjugation can inactivate alkylating agents, for example ones
with epoxide groups (slide 18.3.2) or anticancer drugs such as mechlorethamine
(slide 18.5.2). Accordingly, tumor cells may develop resistance to alkylating antitu-
mor drugs by increasing their expression of glutathione-S-transferase.
The antitumor agent canfosfamide targets such cells, since it has been de-
signed to require activation by glutathione-S-transferase (GST; the catalytic residue
is a tyrosine). This drug is currently in clinical trials.
18.6 Answers to practice questions
18.1: Drug metabolism usually inactivates drugs and facilitates their elimination. Thehighest activities of drug-metabolizing enzymes are found in the small intestine and theliver; therefore, orally applied drug molecules often are inactivated even before they reachthe systemic circulation.
Drug molecules often undergo several successive reactions. Phase I reactions intro-duce reactive groups into drug molecules that are often inert otherwise; such reactionsare most often carried out by cytochrome P450 enzymes.
Phase II reactions are conjugations. They often operate on functional groups on thatwere introduced into the drug molecule in a phase I reaction. The groups that are attachedto the drug molecules are usually polar. Increased polarity promotes excretion of the drug.
18.2: Cytochrome P450 enzymes use two electrons from NADPH to asymmetrically reduceO2, such that one oxygen atom is disposed of as water and the other one is retained atthe heme, which forms the prosthetic group of the enzyme. This reactive oxygen atom isthen used to force a reaction on the substrate. Reactions include oxidation of aromaticor aliphatic carbon atoms, nitrogen or sulfur atoms, dealkylation of heteroatoms, andepoxidation of double bonds.
18.3: Drug molecules can bind and activate nuclear hormone receptors, which then bindto specific sequence motifs in the genome. This results in the increased expression ofcytochrome P450 enzymes, as well as phase II enzymes and transporters. This results inthe accelerated inactivation and elimination of the inducing drug molecules, and possiblyof others that may be applied simultaneously.

354 18 Metabolism of drugs and xenobiotics
The pregnane X receptor, or PXR, has particularly broad ligand specificity. PXR medi-ates transcriptional activation of CYP3A4, which in turn participates in the metabolism of∼50% of all drugs.
18.4: 1. CYP3A4 and several other enzymes have flexible active sites that can accommo-date a large variety of substrates. 2. Cytochrome P450 enzymes transfer oxygen in a highlyactivated form that can react with a wide range of different functional groups. Therefore,it is not necessary for the substrate to interact or cooperate with the enzyme in a highlyspecific manner.
18.5: Metabolic transformation of drug molecules does not always lead to inactivation,and where it does not, the products are referred to as active metabolites. Some drugs evenrequire metabolic transformation for activity; these are referred to as prodrugs.
18.6: Polycyclic aromatic hydrocarbons are hydrophobic and planar molecules and, assuch, tend to intercalate into DNA. Since the unmodified aromatic compounds are chem-ically inert, intercalation as such does little damage. However, introduction of epoxidebonds by cytochrome P450 (in particular type 1A1) makes the aromatic hydrocarbonsreactive and enables them to covalently react with DNA. During DNA replication, suchcovalent adducts cause mutations and potentially cancer.
Epoxides can be detoxified by phase II enzymes, in particular glutathione-S-transferaseand epoxide hydrolase.
18.7: After intercalation, a nucleophile in the DNA, typically a nitrogen, will performnucleophilic attack on one of the carbons in the epoxide. The reaction is analogous to theone shown in slide 18.3.2, in which the sulfur of glutathione acts as the nucleophile.
18.8: Acetaminophen is converted by cytochrome P450 to a reactive intermediate (N-acetyl-p-benzoquinone imine, NAPQI) that reacts with glutathione. Toxicity ensues whenglutathione is depleted, leaving the cell unprotected from excess NAPQI and reactiveoxygen species.
18.9: Fast and slow acetylators are individuals that carry different alleles for the enzymeN -acetyltransferase 2 (NAT2). In slow acetylators, the enzyme is inactive. This causes aslower rate of acetylation and inactivation of INH and several other drugs, particularlyaromatic amines.
18.10:1. Glucuronic acid conjugation (UDP-glucuronosyltransferases, UDP-glucuronide)2. Sulfate conjugation (Sulfotransferases, Phosphoadenosine-phosphosulfate)3. Acetylation (N - and O-acetyltransferases, acetyl-CoA)4. Methylation (Methyltransferases, S-adenosylmethionine)5. Amino acid conjugation (glutamine, glycine, taurine)

Chapter 19
Enzyme and gene therapy of enzyme defects
19.1 General considerations
• How many organs are affected by the enzyme defect: One organ, a few, or all
organs?
• How severe is the defect?
• Can the defect be adequately controlled by conventional treatment?
Notes: While some enzymes, such as pyruvate dehydrogenase, are expressed and
required in almost all cells, others are expressed exclusively or preferentially in
selected organs. For example, UDP-glucuronosyltransferases are expressed mostly
in the liver, and enzyme defects accordingly affect this organ the most.
The clinical severity of enzyme defects ranges from benign to fatal. A fairly
benign defect is the Gilbert syndrome, in which the rate of bilirubin glucuronida-
tion is reduced. This condition requires nothing more than caution in the selection
and dosage of drugs when treating other diseases. On the other hand, untreated
adenosine deaminase deficiency is fatal (see sections 16.5 above and 19.2 below).
Obviously, aggressive therapeutic strategies such as organ transplants or gene
therapy are warranted only with severe defects.
19.1.1 Conventional therapeutic strategies
• diets
• drugs
• organ transplants
Notes: Diets can be used in many enzyme defects, and if effective, they are cer-
tainly preferable. An example is the fructose- and sucrose-free diet in fructose
intolerance, which effectively prevents the deleterious depletion of free phosphate
and of ATP in this disease (see slide 4.2.2).
355

356 19 Enzyme and gene therapy of enzyme defects
Drugs are useful in several hereditary enzyme defects, but usually in a limited
way. We have already discussed the use of NTCB in tyrosinemia (slide 12.5.4) and
of organic acids in urea cycle defects (slide 12.3.10); a few more examples are
discussed below. Organ transplants are useful in those diseases that primarily
affect a single organ, typically the bone marrow or the liver.
19.1 Explain how organ transplants can be used to treat genetic enzyme defects.
19.1.2 Therapeutic strategies based on molecular biology
Correction of . . .
• DNA: gene therapy
• mRNA: suppression of mutant stop codons with drugs
• protein: enzyme substitution
Notes: Enzyme defects are in principle the most logical and suitable targets for
gene therapy. A key advantage of gene therapy is its long-lasting effect—at least
in principle, the treatment maybe be effective for life. However, in most enzyme
defects, gene therapy is still at the experimental stage, and it has not yet become
the standard therapy in any specific disease.
Enzyme substitution therapy is more widely used. Since the enzyme molecules
have a limited half-life, the enzyme has to be applied regularly, often in weekly
or bi-weekly intervals. While this is costly and somewhat inconvenient, it has
the advantage that the therapy can simply be discontinued in case of untoward
reactions, which would obviously not be feasible with gene therapy.
Correction at the mRNA level through suppression of stop codons—also re-
ferred to as translational antitermination—is confined to a few specific examples;
obviously, not all gene defects that inactivate an enzyme involve mutant stop
codons.
19.1.3 Translational antitermination with PTC124 (ataluren)
Notes: Many genetic diseases are caused by point mutations that inactivate some
important enzyme or other protein. Very often, such inactivating mutations are
heterogeneous; deletions, insertions, frameshift mutations, and point mutations
may all give rise to the same clinical picture. The only group of patients that may
benefit from translational antitermination are those who carry a point mutation
that creates a premature stop codon in an otherwise intact open reading frame. In
this situation, it may be possible to restore expression of a functional protein by
promoting translational miscoding, that is, incorporation of some amino acid or
other vis-a-vis the mutant stop codon, which then enables the ribosome to keep
translating right through to the regular stop codon.1
1If you are wondering now how this can be done without suppressing the orderly termination oftranslation at the regular stop codon, I have no answer for you, but nevertheless commend you for

19.1 General considerations 357
Ribosomes
Nascent proteins
Regular stop codon
Functional protein
Mutant stop codon
Incomplete protein
PTC124
Functional protein
An experimental drug that promotes translational suppression of mutant prema-
ture stop codons is PTC124 [131], also named ataluren. Its biochemical mode of
action is not known exactly; however, it is noteworthy that several aminoglycoside
antibiotics have similar effects, and some are also being investigated for similar
therapeutic uses [132]. Aminoglycosides bind to ribosomes and, at sub-inhibitory
concentrations, reduce translational fidelity; it may be that ataluren does the same.
19.1.4 Ataluren in cystic fibrosis
normalrange
pathologicalrange
Time (days)
Nasa
lp
ote
nti
al
diff
ere
nce
(mV
)
Phase 1 Phase 2
0 14 28 42
-20
-15
-10
-5
0
5
10
paying attention. In case you were not wondering about this, you were probably not really studyingbut just cramming for the exam.
Translational miscoding will not usually restore the original amino acid that was present beforethe stop mutation occurred. Therefore, a further requirement is that the amino acid residue inquestion is not critical for protein activity.

358 19 Enzyme and gene therapy of enzyme defects
Notes: The effectiveness of ataluren in various genetic diseases has been tested in
clinical pilot studies. This slide illustrates one such study, which was performed on
cystic fibrosis patients. This disease is caused by a deficiency in an ABC transporter
that exports chloride ions from cells, which impedes the secretion of fluid in all
kinds of exocrine glands. Multiple organs are functionally impaired, but the most
serious consequences arise from the buildup of viscous mucus in the lungs, which
facilitates chronic bacterial infections and ultimately leads to organ destruction.
In a sizable minority of all cystic fibrosis patients, the gene defect consists
in a premature stop codon, and in this group translational antitermination is
a plausible therapeutic strategy. The data illustrate the response to the drug
among such patients, during two successive phases of treatment. The effect of
the drug was measured as the electric potential difference that exists across the
nasal mucous membrane; this potential is increased when the chloride export by
the epithelial cells is reduced. Lines connect measurements on individual patients
before and after each course of treatment. Evidently, most patients experienced
a reduction in potential, that is, an increase in chloride export. Figure prepared
from original data in [133].
19.1.5 Technical considerations for gene therapy
1. gene transfer in vivo versus in vitro
2. transfer method: viral vectors vs naked DNA
3. location of transferred gene: chromosomal versus episomal
4. expression of transferred genes: transient versus permanent
5. immune reactions to vector (particularly where repeated application is re-
quired)
Notes: The basic idea of gene therapy is to introduce a functional copy of the
defective gene into the affected body cells, so that they can start making their
own functional protein. In many cases, we would like to deliver the gene to only
those tissues or organs that actually require the deficient gene, and to do so
with high efficiency. This has in practice been difficult. However, in the example
discussed below, namely, adenosine deaminase deficiency, this can be achieved by
first isolating the target cells—in this case, the bone marrow stem cells—and then
introducing the gene into them in vitro.
Transfer of naked DNA into cells can be achieved by electroporation or using
cationic lipids. These methods are only applicable in vitro. Viral vectors, which
are packaged into the viral capsids and coats proteins of some pathogenic viruses
and, like regular viruses, enter body cells and deliver their nucleic acids with high
efficiency, can be used both in vitro and in vivo.
One way to achieve persistence and permanent expression of the transferred
gene is to stably integrate it into the genome of the recipient cell. This is most
efficiently achieved with retrovirus-derived vectors, since chromosomal integration
is part of the life retroviral cycle. However, a caveat is that the location of insertion

19.2 Adenosine deaminase deficiency 359
within the genome cannot be reliably controlled. Integration may occur in the vicin-
ity of some cancer-related gene, causing its transcriptional up- or downregulation.
Cases of leukemia have been induced in experiments both in humans and animals.
Adenoviruses are double-stranded DNA viruses that replicate without inte-
gration into the host cell genome. Accordingly, adenovirus-derived vectors will
not insert into the genome, which is safer. However, such episomal replication
will typically not be as long-lasting and stable as that of the retroviral vectors. If
repeated application of the vector is required, this will likely work only a limited
number of times, since, like the wild-type viruses, the coated vector particles are
immunogenic, and antibodies will interfere with their entry into cells.
Viruses of the Herpes family remain episomal yet are persistent, which is in
principle a very favorable combination. While their very large genome—Herpes
viruses are second only to Pox viruses in this regard—makes their use as vectors
technically challenging, they might well emerge as the vectors of choice in the long
run. An overview of the state of the art concerning viral vectors can be found in
[134].
19.2 Explain the advantages and disadvantages of retroviral vectors for gene therapy.
19.2 Adenosine deaminase deficiency
Adenosine deaminase (ADA) catalyzes the first step in the degradation of adeno-
sine and deoxyadenosine (see section 16.5). Deoxyadenosine accumulates and is
phosphorylated by salvage kinases, which yields dATP. Accumulating dATP exer-
cises feedback inhibition on ribonucleotide reductase [135], which is required in
the de novo synthesis of all deoxynucleotides (see slide 16.8).
ADP
GDP
CDP
UDP
dADP
dGDP
dCDP
dUDP
dATP
dGTP
dCTP
dTTP
DNA
dAMP
dGMP
dCMP
dTMP
dA
dI
Adenosine
deaminase
Ribonucleotide reductase
The resulting imbalance in the supply of deoxyribonucleotides—dATP is up, whe-
reas all others are down—constrains the rate of DNA replication.
Interference with DNA replication promotes apoptosis (see slide 18.5.1).
While the enzyme defect is manifest in all cells, apoptosis actually occurs only in
T-lymphocytes, which quite generally are much more prone to it than other cells.
The decisive role of apoptosis in this condition is evident from the dependence of
T-cell degeneration on p53 [136], a nuclear protein that is a key switch of apoptosis.

360 19 Enzyme and gene therapy of enzyme defects
The apoptotic demise of the T-cells becomes manifest in early infancy in the
form of a severe combined immunodeficiency (SCID). The deficiency is referred to
as combined because it affects both humoral immunity, that is, antibody formation,
and cellular immunity, which is mediated by killer T-cells. Without treatment, the
children die after a few years; aggressive treatment is therefore justified.
19.2.1 Conventional therapy of ADA deficiency: Allogenic bone marrow trans-
plant
• currently the standard treatment
• side effects and complications can be severe
• requires compatible donor
Notes: Lymphocytes are the only cells adversely affected by ADA deficiency. These
cells originate in the bone marrow; therefore, replacement of the patient’s bone
marrow with that of a healthy donor is an effective and curative treatment.
Allogenic bone marrow transplantation is a risky procedure and truly an ordeal.
It requires an immunologically compatible donor. The best odds for finding one
is within the family; the chance of a match between siblings is one in four. Failing
that, a donor may be found anywhere in the world. As ever more people are getting
typed for histocompatibility antigen profile for the sake of some transplant or
other, the odds of finding a random match are improving.
However, except for identical twins,2 no donor will ever be 100% compatible,
and there remains a risk of immunological complications. In addition, during
the first few weeks after transplantation, the patient has essentially no immune
system, and the risk of severe, even fatal infections is high. In short, less risky and
less torturous alternatives are desirable.
19.2.2 Experimental drug treatment of ADA deficiency
HOO
N N
N
NH2
N
OH
! O
OH
N N
N
NH2
N
OH
HOO
OH
NN
NH
OH H
N
2-deoxy-adenosine 5-deoxy-adenosine pentostatin
Notes: The experimental drug 5-deoxyadenosine—2′-deoxyadenosine is shown
just for comparison—inhibits deoxyadenosine kinase, which catalyzes the phos-
phorylation of deoxyadenosine to dAMP. Considering that the phosphorylation
2An identical twin would not be helpful with ADA deficiency, because he or she would suffer fromthe same enzyme defect. However, identical twins come in handy with bone marrow transplants inleukemia; the same goes for other organ transplants. Therefore, I urge you to get yourself a twin atthe earliest opportunity.

19.2 Adenosine deaminase deficiency 361
affects the 5-hydroxy group of the sugar, it is pretty obvious why this molecule is
not a substrate of the kinase.
This inhibitor is effective in principle but not sufficient. There is a second
enzyme, which is named deoxycytidine kinase but actually has a broader specificity
than suggested by this name, and which also phosphorylates deoxyadenosine. In
studies on cell cultures, this enzyme had to be inhibited also in order to permit
lymphocytes to survive [137]. This inhibitory approach has so far only been tried
in vitro; I have not yet seen any follow-up studies on its suitability in vivo.
Pentostatin is an inhibitor of adenosine deaminase. This obviously isn’t useful
in treating ADA deficiency, but it can be used to create experimental animal models
of the condition. It is clinically used to kill lymphocytes in graft-versus-host
reactions, as well as in certain forms of lymphocyte-derived malignancies.
19.3 Could 5-deoxyadenosine cause cytotoxicity by being incorporated into DNA? Whynot?
19.2.3 Researching ADA enzyme therapy: first attempt
Searching PubMed for the terms in the title led me to this gem: Adenosine Deami-
nase Enzyme Therapy Prevents and Reverses the Heightened Cavernosal Relaxation
in Priapism [138]
Notes: Priapism is a state of sustained erection without sexual arousal and is
reportedly quite painful. It seems that an increased level of extracellular adenosine,
which activates adenosine receptors, can induce priapism. One possible source of
extracellular adenosine is the decay of red blood cells, for example in sickle cell
anemia3
According to the study cited, application of adenosine deaminase enzyme is
an effective treatment for priapism. Interesting, for sure, but it has of course
nothing to do with adenosine deaminase deficiency, other than that the enzyme
was readily available for this therapeutic experiment because of its common use
in the treatment of ADA deficiency.
19.2.4 Researching ADA enzyme therapy: second attempt
Another interesting find was this early study: Enzyme replacement therapy for
adenosine deaminase deficiency and severe combined immunodeficiency
• strategy: application of frozen irradiated red blood cells (!)
• therapy improved immune status and helped patient survive for 17 months
(while waiting for blood marrow transplant)
Notes: This study [140] was performed before the advent of recombinant methods
for enzyme expression and purification. The use of red cells as carriers of the
enzyme is really quite ingenious! Adenosine and deoxyadenosine can leave and
3One might expect priapism to occur in hemolytic crises in glucose-6-phosphate dehydrogenasedeficiency also; anecdotal evidence seems to support this assumption [139]).

362 19 Enzyme and gene therapy of enzyme defects
enter cells through nucleoside transporters (which have been discussed before,
see slides 16.4.1 and 16.9.8), and can therefore undergo degradation inside the
transfused red cells.
Notwithstanding the ingenuity of this treatment, it is bound to result in iron
overload in the long term (see slide 17.5.3). A better form of treatment is to use
the purified adenosine deaminase enzyme instead of blood transfusions. With
modern means, the recombinantly expressed human enzyme would seem to be
the obvious choice. At least in those patients that still express a nonfunctional
version of the enzyme—as opposed to no enzyme at all; both variants occur—
this enzyme should have the lowest likelihood of inducing inactivating antibodies.
However, it seems that currently a bovine enzyme preparation is still in use [141].
Presumably, ADA deficiency patients are more tolerant toward the application of a
non-self protein because of their immune defect. Furthermore, the bovine enzyme
is modified with PEG, both to reduce its immunogenicity and to increase its dwell
time in the system.4
While the inherent immunosuppression of ADA patients will facilitate the
use of purified enzyme, it will also make the patients more susceptible to graft-
versus-host reactions, that is, the proliferation of and immunological aggression by
transferred lymphocytes. In the study cited [140], the blood cells were irradiated
before transfusion, presumably in order to destroy any remaining lymphocytes
and thus prevent this complication.
19.4 Why can transfusion of red blood cells be used for enzyme therapy of adenosinedeaminase deficiency?
19.2.5 Gene therapy of ADA deficiency
Still at the stage of clinical studies, not mainstream. A recent study [143] was
performed as follows:
• Non-myeloablative conditioning
• CD34+ bone marrow cells (stem cells) were isolated from the blood, trans-
duced in vitro with a retroviral vector carrying a functional ADA gene, and
reintroduced into the body
• ADA expression achieved in lymphocytes: ~5% in bone marrow, ~75% in pe-
riphery
• All patients survived at time point of compilation of study (2–8 years after
treatment), but some required additional enzyme treatment
Notes: The non-myeloablative conditioning used in this study means that the pa-
tients’ bone marrow was not entirely destroyed after harvesting of stem cells.
Therefore, after treatment, the genetically modified cells co-existed with non-
modified ones.5 It is noteworthy that a full 75% of T-lymphocytes in the peripheral
4A good review on the use of PEG to modify enzymes and other therapeutic proteins is [142].5Myeloablative conditioning is the norm in allogenic bone marrow transplants, which is most
commonly performed as the treatment of last resort in leukemia or lymphoma patients.

19.3 Enzyme therapy of lysosomal enzyme defects 363
blood expressed ADA, while only 5% of the cells in the bone marrow did. This
discrepancy is most likely due to the survival advantage of the ADA-expressing
T-cells.
My interpretation of this cautious approach is that the investigators wanted to
keep the option of an allogenic bone marrow transplant, in case the gene therapy
failed. Myeloablative conditioning is very aggressive, and it can be used only
once on each patient. Considering the fairly favorable outcome of this cautious
initial experiment, it seems to me that a somewhat more aggressive approach,
with a larger number of stem cells being transformed, and with a more intense
decimation of the remaining bone marrow in the conditioning phase, is justified.
19.5 Explain the various form of therapy that can be used to treat adenosine deaminasedeficiency.
19.3 Enzyme therapy of lysosomal enzyme defects
Adenosine deaminase is active in the cytoplasm, and since the substrates can
enter and leave the cells by facilitated diffusion, there is no major problem with
arranging for the enzyme to meet its substrate. However, this is different in
lysosomal enzyme defects.
Lysosomes contain a diverse range of hydrolytic enzymes (hydrolases), which
are important in the breakdown of both extracellular and intracellular molecules.
These enzymes have an acidic pH optimum, which matches the acidic environment
inside phagolysosomes, that is, the vesicles that form by fusion of substrate-
containing vesicles with lysosomes.
There are quite a few hereditary enzyme defects that concern one or the other
lysosomal hydrolase, and depending on the type of compound that now can no
longer be degraded and therefore accumulates, these diseases are referred to as
lipidoses, mucopolysaccharidoses, or glycogenoses.
When a lysosomal enzyme is deficient, the substrate nevertheless continues
to be targeted to phagolysosomes. Therefore, in order to treat this condition with
enzyme therapy, we need to get the enzyme into the lysosomes as well. We will
look at some examples to understand how this can be achieved.
19.3.1 Pompe disease
• defect of acid maltase, a lysosomal enzyme
• glycogen accumulates
• various forms: complete absence of enzyme (manifestation in infants) vs.
residual activity (manifestation in older children or adolescents)
• affects mainly the skeletal muscle; glycogen accumulation leads to muscle
tissue degeneration
• muscle strength progressively degrades, to the point that patients are no
longer able to breathe

364 19 Enzyme and gene therapy of enzyme defects
Notes: In Pompe disease, the deficient enzyme is acid maltase (see slide 8.6.2).
Without this enzyme, lysosomal glycogen degradation stalls (see slide 8.3.7), and
undegraded glycogen particles slowly accumulate. The accumulation of glycogen
concerns mostly skeletal and heart muscle and leads to the degeneration of these
tissues.
19.3.2 Enzyme therapy of Pompe disease
• recombinant enzyme expressed in rabbit mammary glands, isolated from rab-
bit milk
• target group: juvenile patients (not infants)
• dosage: 20 mg/kg every two weeks
• clinical outcome: improvement of muscle strength, but not to normal level
• no severe immune reactions
Notes: The dosage of enzyme applied in this clinical study [144] is quite large; it
is remarkable that enough of it can be obtained from rabbits. Even with this large
amount of enzyme, the success of the treatment is only partial; this is most likely
related to the limited efficiency of targeting the enzyme to the lysosomes.
19.3.3 Clinical outcome of enzyme therapy: Muscle strength
Notes: The two continuous curves at the top are the references for boys and girls.
The shorter graphs at the bottom show the data from individual patients over the
time course of the study. It is evident that muscle strength improves but remains
below normal.
Figure adapted from [144]. Also note the very clever color coding used in the
figure.

19.3 Enzyme therapy of lysosomal enzyme defects 365
19.3.4 The mannose-6-phosphate receptor targets proteins to the lysosome
Notes: This cartoon—loosely based on one from [145]—illustrates the role of the
mannose-6-phosphate receptor in targeting proteins to the lysosomes and endo-
somes. Proteins that contain the sugar mannose-6-phosphate in their glycosyl
moieties can bind to the mannose-6-phosphate receptor, a membrane protein that
occurs in several types of intracellular vesicles and compartments. The receptor
picks up lysosomal enzymes within the trans-Golgi network and ensures that they
indeed make their way to the lysosomes. Acid maltase is one of the proteins that
are transported to the lysosomes by this mechanism.
Some mannose-6-phosphate receptor molecules also make their way to the
cell surface. These receptor molecules can bind to acid maltase that was applied
therapeutically and is present in the extracellular space. The receptor-enzyme
complexes will undergo endocytosis and find themselves in endosomes that re-
versibly fuse with lysosomes. Hitching a ride inside a vagrant lysosome, an enzyme
molecule may eventually alight upon the undegraded substrate within another en-
dosome. Considering how roundabout and haphazard this transport process is, it
is perhaps not surprising that the targeting of therapeutically applied lysosomal
enzymes is not very efficient.
19.3.5 Optimization of acid maltase glycosylation
Notes: Protein glycosylation occurs within the Golgi apparatus and the trans-Golgi
network. It is a stepwise process, in which several different glycosyltransferases
attach sugar moieties to the ends of growing oligosaccharide chains. The composi-
tion of the oligosaccharide moieties attached to a given protein can vary with the
host cell that expresses it. In the case of lysosomal enzymes, such differences may
affect the rate of uptake into cells.
The experimental study summarized in this slide illustrates the importance
of the carbohydrate moiety for cellular uptake. Acid maltase was expressed in

366 19 Enzyme and gene therapy of enzyme defects
control CHO cells (blue lines) and in a derived cell line engineered for increased
incorporation of mannose-6-phosphate into the oligosaccharides (green lines, CHO
M6P ). The enzyme expressed in these cells contains greater amounts of mannose-
6-phosphate than a control sample obtained from CHO cells (left), and it is indeed
taken up more efficiently into cells lacking the enzyme (right). Figure prepared
from original data in [146].
0
6
12
18
10 20 30 40 50
Up
take (
mU
/mg c
ell
pro
tein
)Enzyme in medium (nM)Man-6- P 2 Man-6- P
Enzyme man-6- P content (chromatography) Enzyme uptake into target cells
CHO wt
CHO M6P
In the following slides, we will, as a final example, take a look at Gaucher dis-
ease. This is another lysosomal enzyme defect that displays some interesting and
instructive differences to Pompe disease.
19.3.6 The biochemical defect in Gaucher disease
glucosylceramide ceramide
glucoseHO
OH OH
O
OH O
OH
HN
O
HO
OH OH
O
OH OH OH
OH
HN
O
H2O
Notes: Glucocerebrosidase hydrolyzes glucosylceramide, a glycosphingolipid
that occurs in cell membranes. The enzyme defect affects mostly macrophages,
since these cells take up expired cells and degrade their constituents. Via an un-
known mechanism, the accumulation of glucosylceramide inside the macrophages

19.3 Enzyme therapy of lysosomal enzyme defects 367
causes inflammatory, proliferative and degenerative changes in those organs that
host a lot of macrophages, that is, liver, spleen, and bone marrow.
Enzyme therapy again requires the uptake of the enzyme molecules into the
cells and the lysosomes. However, this is easier to achieve with macrophages than
with most other cell types. Macrophages have multiple cell surface receptors that
promote uptake, such as for example immunoglobulin receptors.6 Another recep-
tor class are lectins, that is, sugar-binding proteins. Their normal function is to
bind to the cell surface oligosaccharides of microbes and mediate their phagocyto-
sis. One of these lectins, the mannose receptor, can be targeted to facilitate the
uptake of therapeutically applied glucocerebrosidase.
19.3.7 Partial deglycosylation of glucocerebrosidase accelerates uptake into
macrophages
NeuNAc
Gal Gal
GlcNAc GlcNAc
Man Man
Man
GlcNAc
GlcNAc Fuc
Enzyme protein
10
100
0 5 10 15 20 25 30
En
zym
e i
n p
lasm
a (
%)
Time after injection (min)
Notes: Glucocerebrosidase contains a posttranslationally attached oligosaccha-
ride moiety that has a characteristic sequence of specific sugars. The terminal
sugars—N-acetylneuraminic acid, galactose, and N-acetylglucosamine—can be re-
moved using specific glycosidases; this will expose the mannose residues con-
tained within and thus enable the binding of the enzyme to mannose receptors.
The experiment depicted here shows that this partial deglycosylation greatly ac-
celerates the clearance of the enzyme from plasma, such that the plasma half-life
drops from 21 minutes to 2.3 minutes. Much of the rapidly cleared enzyme winds
up inside the macrophages, where it can digest accumulated glucocerebroside.
Figure prepared from original data in [147].
Enzyme therapy of Gaucher disease is remarkably effective and is the current
standard of treatment.
6Another aspect that likely facilitates the uptake of enzyme by macrophages is the absenceof an endothelial barrier. While muscle cells are separated from the blood flow by a continuousendothelium, the macrophages in the spleen and liver reside directly within the blood-percolatedsinusoids.

368 19 Enzyme and gene therapy of enzyme defects
19.3.8 Drug treatment of Gaucher disease
OH
OH
N
OH
OH
O
NHN
OH
O O
miglustat eliglustat
Notes: These two drugs are inhibitors of glucocerebroside synthesis. Total inhi-
bition of glucocerebroside synthesis is not compatible with life, so this strategy
does not obviate the need for enzyme therapy and is not free of side effects.
Serendipitously, miglustat was also found to inhibit spermatogenesis in mice,
suggesting a new approach for male contraception. This effect, however, could not
be substantiated in men [148].
19.6 Explain the fundamental problem with enzyme therapy of lysosomal enzyme defects,and how it can be overcome. Explain how enzyme therapy works in Pompe disease and inGaucher disease.
19.4 Answers to practice questions
19.1: Cells in transplanted organs retain the intact genes of the organ donor, and thereforewill express an intact version of the enzyme that is deficient in the recipient’s body.Transplantation can be used in those enzyme defects that affect mostly one organ, suchas the liver or the bone marrow.
19.2: Advantage: Integration of vector into host cell DNA enables permanent, stableexpression of transferred gene. Disadvantage: The virus inserts into the DNA at randomlychosen locations. This can occasionally lead to the activation of dormant tumor-promotinggenes and thereby to cancer or leukemia.
19.3: Consider the reactions that precede the incorporation of a nucleotide into DNA. (No,this is not a sufficient answer, but rather a hint at how to arrive at one.)
19.4: Red blood cells, as well as other cells, contain nucleoside transporters that allowdeoxyadenosine and other nucleosides to freely pass into and out the cells. Therefore, dAcan enter the transfused red cells and be converted do deoxyinosine, which can then leavethe cells and be completely degraded elsewhere.
19.5:1. Enzyme therapy: Parenteral substitution of the enzyme. This needs to be repeated
indefinitely.2. Allogenic bone marrow transplant: The patient’s bone marrow is replaced using
bone marrow stem cells from a healthy relative. Curative but potentially severe side effectsand complications due to immunological incompatibility.

19.4 Answers to practice questions 369
3. Gene therapy: Intact copies of the adenosine deaminase gene are transferred intothe patient’s own bone marrow stem cells. Potentially curative if genes are stably ex-pressed. Avoids immunological complications of bone marrow transplant but, at leastwith retroviral vectors, has risks such as leukemia.
4. Drug therapy: Inhibition of salvage pathway kinases that convert deoxyadenosineto dATP. Experimental and unproven.
19.6: The fundamental problem is that lysosomal enzymes are active only inside lyso-somes, but intravenously applied enzymes are not usually transported into lysosomes.The problem can be overcome by endowing the enzymes with oligosaccharide moietieswhich are recognized by cellular receptors that trigger endocytosis.
On nucleated cells in general, endocytosis and transport to the lysosomes is facilitatedby the mannose-6-phosphate receptor. This is exploited in Pompe disease, which is causedby a lack of the lysosomal enzyme acid maltase. Recombinantly expressed acid maltasecarrying mannose-6-phosphate is taken up by muscle cells via the mannose-6-phosphatereceptor.
Gaucher disease affects macrophages; the missing enzyme is glucocerebrosidase.These cells have a mannose receptor, which normally serves to mediate phagocytosis ofmicrobes. Glucocerebrosidase is purified and partially deglycosylated in order to exposemannose residues contained within its natural oligosaccharide moiety. This modifiedenzyme is rapidly and efficiently taken up by macrophages.


Chapter 20
Credits and copyright
20.1 Preliminary note
Most of the illustrations in these notes were created by me; this is the case for all
plots, reaction schemes, molecular structures, and cartoons, except where stated
otherwise. These images—like the text, which was entirely written by me—are
subject to the terms of the copyright notice below.
Photographs were obtained from various sources. Most of the histological
images were obtained from pathorama.ch and are reproduced here with the kind
permission of that website’s owner, Katharina Glatz. All micrographs for which
another source is not specified below were obtained from this source.
For all other photographs, the sources are listed below, as far as I have been
able to ascertain them. These images have been used either with explicit permis-
sion of the originating websites’ owners, or under the following rationales:
• Images from wikipedia: These are usually released under the Creative Com-
mons 3.0 license, which permits their incorporation, in unchanged form, into
a collection, without affecting the copyright of the resulting collection as a
whole. I believe that these lecture notes and slides constitute a collection
conforming to this clause.
• Images from individual sources, for which no copyright holder could be iden-
tified, or for which requests for permission to reuse went unanswered: the
use of these images is deemed appropriate (1) because of general fair use
considerations, and/or (2) because the images in question constitute faithful
reproductions of physical phenomena, without artistic originality, and there-
fore, according to a decision by the US Court of Appeals, are not subject to
copyright protection.
If you have the rights to an image used without explicit permission and credit,
and you do not agree with its use in these notes, please let me know, and I will
371

372 20 Credits and copyright
remove that image. If you have the rights and you do agree with its use, I would
appreciate a brief note to this effect, so that I can give you the proper credit.
20.2 Individual image credits
All images not listed here are my own work.

20.2 Individual image credits 373
Slide Source
1.6.10 Right: with kind permission by Roger Wagner, University of Delaware.
Left: From pathorama.ch.
2.3.1 Left: from bayregio.de; right: author’s own work.
8.6.2 Panel 1: from pathorama.ch, panel 2: from wikipedia, panels 3 and 4:
Origin and copyright ownership unknown.
9.3.7 Photograph by Tommaso Leonardi, via wikipedia.
9.4.1 Photograph downloaded from morguefile.com. Image was stated to be
available without attribution; it seems to have been removed since from
the website.
9.4.3 Photograph by Ernst Hempelmann, via wikipedia. β-Hematin structure
rendered from coordinates kindly provided by Katherine de Villiers.
10.3.8 From reference [149].
11.2.8 From Histology@Yale with kind permission by Peter Takizawa.
13.2.3 Photograph from the University of Toronto Image Bank. Image is in the
public domain.
13.2.4 Left: poster by Song Ren. Image obtained via the International Institute
of Social History. Right: photograph by Claudette Bue, via wikipedia.
13.2.5 Portrait from Michigan State University. On the website, Dr. Sanger
himself is listed as the source of the photograph.
13.2.7 Cartoons downloaded from childcoloringpages.net and
pagestocolor.net. Subsequently converted to vector graphics format.
Both websites stated the images to be free and did not identify the
creators.
13.3.8 This image is found in multiple locations on the web. According to this
reference, the image originated with Jackson Laboratories.
14.4 EM image from the Public Health Image Library of the CDC (id 5630).
Image is in the public domain.
15.4.7 From Histology@Yale with permission by Peter Takizawa.
15.5.3 Origin and copyright ownership unknown
17.3.1 Origin and copyright ownership unknown
17.3.3 From the Cleveland Clinic Center for Continuing Education with
permission

20 Credits and copyright
20.3 Copyright notice
No part of this document may be reproduced without written consent from the
author, except as follows:
• You may download an electronic copy for your personal use.
• You may print a copy for your personal use.
• If you are an instructor and use these notes in teaching your class, you may
distribute electronic copies free of charge to your students. You may also
distribute printed copies to them for free; or you may charge a fee, but only
to cover the costs of printing, without any surcharge.
• You may adapt the accompanying set of PowerPoint presentations by rearrang-
ing, adding, deleting, or modifying individual slides. The modified presenta-
tions may be shared with your class or with other instructors, but you may
not charge a fee for such modified files.
• You may use individual images or short excerpts in keeping with general fair
use considerations. In any such use, proper attribution must be made.
It is not permissible to post any of these files on a publicly accessible web
server. Exempt from this restriction are websites access to which is restricted to
the students of a class that uses these notes and slides as teaching materials.
All the above clauses apply to all file formats of this document—currently
HTML, ePub and PDF—as well as to the accompanying sets of PDF and PowerPoint
slides.
Exempt from all above restrictions are several images that have been obtained
from third parties, and which are identified in section 20.2 above. Refer to the orig-
inators of those works for copyright restrictions that may apply to your intended
reuse.
374

Bibliography
[1] X. Wu and G. Brewer. “The regulation of mRNA stability in mammalian cells: 2.0”.Gene 500 (2012), 10–21. PMID: 22452843 (cited on p. 28).
[2] J. H. Lee et al. “Crystal structure of rabbit phosphoglucose isomerase complexedwith its substrate D-fructose 6-phosphate”. Biochemistry 40 (2001), 7799–7805.PMID: 11425306 (cited on p. 37).
[3] M. Larion and B. G. Miller. “Homotropic allosteric regulation in monomeric mam-malian glucokinase”. Arch Biochem Biophys 519 (2012), 103–111. PMID: 22107947(cited on p. 44).
[4] M. D. Meglasson and F. M. Matschinsky. “Discrimination of glucose anomersby glucokinase from liver and transplantable insulinoma”. J Biol Chem 258(1983), 6705–6708. PMID: 6304052 (cited on p. 44).
[5] F. Raggi and D. S. Kronfeld. “Higher glucose affinity of hexokinase in sheep brainthan in rat brain” (1966) (cited on p. 44).
[6] F.-Q. Zhao and A. F. Keating. “Functional properties and genomics of glucose trans-porters”. Curr Genomics 8 (2007), 113–128. PMID: 18660845 (cited on p. 44).
[7] J. C. Bode et al. “Depletion of liver adenosine phosphates and metabolic effects ofintravenous infusion of fructose or sorbitol in man and in the rat”. Eur J Clin Invest3 (1973), 436–441. PMID: 4772339 (cited on p. 49).
[8] C. Ning et al. “Galactose metabolism by the mouse with galactose-1-phosphateuridyltransferase deficiency”. Pediatr Res 48 (2000), 211–217. PMID: 10926297(cited on p. 53).
[9] B. Panis et al. “Untreated classical galactosemia patient with mild phenotype”. MolGenet Metab 89 (2006), 277–279. PMID: 16621642 (cited on p. 53).
[10] N. D. Leslie. “Insights into the pathogenesis of galactosemia”. Annu Rev Nutr 23(2003), 59–80. PMID: 12704219 (cited on p. 53).
[11] G. T. Berry. “Is prenatal myo-inositol deficiency a mechanism of CNS injury ingalactosemia?” J Inherit Metab Dis 34 (2011), 345–355. PMID: 21246399 (cited onp. 53).
[12] J. B. Holton et al. “Galactosaemia: a new severe variant due to uridine diphos-phate galactose-4-epimerase deficiency”. Arch Dis Child 56 (1981), 885–887. PMID:7305435 (cited on p. 53).
[13] I. Morgunov and P. A. Srere. “Interaction between citrate synthase and malate dehy-drogenase. Substrate channeling of oxaloacetate”. J Biol Chem 273 (1998), 29540–29544. PMID: 9792662 (cited on p. 59).
375

Bibliography
[14] J. W. A. Graham et al. “Glycolytic enzymes associate dynamically with mitochondriain response to respiratory demand and support substrate channeling”. Plant Cell19 (2007), 3723–3738. PMID: 17981998 (cited on p. 59).
[15] M. Karpusas, B. Branchaud, and S. J. Remington. “Proposed mechanism for thecondensation reaction of citrate synthase: 1.9-A structure of the ternary complexwith oxaloacetate and carboxymethyl coenzyme A”. Biochemistry 29 (1990), 2213–2219. PMID: 2337600 (cited on p. 64).
[16] T. Yagi and A. Matsuno-Yagi. “The proton-translocating NADH-quinone oxidoreduc-tase in the respiratory chain: the secret unlocked”. Biochemistry 42 (2003), 2266–2274. PMID: 12600193 (cited on p. 75).
[17] X. Liu et al. “Induction of apoptotic program in cell-free extracts: requirement fordATP and cytochrome c”. Cell 86 (1996), 147–157. PMID: 8689682 (cited on p. 78).
[18] A. Colell, D. R. Green, and J. . E. Ricci. “Novel roles for GAPDH in cell death andcarcinogenesis”. Cell Death Differ 16 (2009), 1573–1581. PMID: 19779498 (cited onp. 78).
[19] V. K. Rastogi and M. E. Girvin. “Structural changes linked to proton translocationby subunit c of the ATP synthase”. Nature 402 (1999), 263–268. PMID: 10580496(cited on p. 91).
[20] S. Passarella et al. “Oxaloacetate uptake into rat brain mitochondria and recon-struction of the malate/oxaloacetate shuttle”. Biochem Biophys Res Commun 119(1984), 1039–1046. PMID: 6712663 (cited on p. 92).
[21] A. Atlante et al. “Mitochondria from the left heart ventricles of both normotensiveand spontaneously hypertensive rats oxidize externally added NADH mostly viaa novel malate/oxaloacetate shuttle as reconstructed in vitro”. Int J Mol Med 18(2006), 177–186. PMID: 16786170 (cited on p. 92).
[22] B. Safer. “The Metabolic Significance of the Malate-Aspartate Cycle in Heart”. CircRes 37 (1975), 527–533. PMID: 172258 (cited on p. 93).
[23] J. T. Barron, L. Gu, and J. E. Parrillo. “Malate-aspartate shuttle, cytoplasmic NADHredox potential, and energetics in vascular smooth muscle”. J Mol Cell Cardiol 30(1998), 1571–1579. PMID: 9737943 (cited on p. 93).
[24] A. S. Divakaruni and M. D. Brand. “The regulation and physiology of mitochondrialproton leak”. Physiology (Bethesda) 26 (2011), 192–205. PMID: 21670165 (cited onp. 95).
[25] L. A. Sazanov and J. B. Jackson. “Proton-translocating transhydrogenase and NAD-and NADP-linked isocitrate dehydrogenases operate in a substrate cycle which con-tributes to fine regulation of the tricarboxylic acid cycle activity in mitochondria”.FEBS Lett 344 (1994), 109–116. PMID: 8187868 (cited on p. 96).
[26] C.-Y. Chou, L. P. C. Yu, and L. Tong. “Crystal structure of biotin carboxylase incomplex with substrates and implications for its catalytic mechanism”. J Biol Chem284 (2009), 11690–11697. PMID: 19213731 (cited on p. 104).
[27] M. L. Halperin, C. M. Schiller, and I. B. Fritz. “The inhibition by methylmalonicacid of malate transport by the dicarboxylate carrier in rat liver mitochondria. Apossible explanation for hypoglycemia in methylmalonic aciduria”. J Clin Invest 50(1971), 2276–2282. PMID: 4398537 (cited on p. 107).
[28] A. Burchell. “Endoplasmic reticulum phosphate transport”. Kidney Int 49(1996), 953–958. PMID: 8691743 (cited on p. 109).
376

Bibliography
[29] E. Goldsmith, S. Sprang, and R. Fletterick. “Structure of maltoheptaose by differenceFourier methods and a model for glycogen”. J Mol Biol 156 (1982), 411–427. PMID:7086906 (cited on p. 115).
[30] P. J. Roach et al. “Glycogen and its metabolism: some new developments and oldthemes”. Biochem J 441 (2012), 763–787. PMID: 22248338 (cited on pp. 115, 121).
[31] F. Sheng et al. “The crystal structures of the open and catalytically competent closedconformation of Escherichia coli glycogen synthase”. J Biol Chem 284 (2009), 17796–17807. PMID: 19244233 (cited on p. 119).
[32] J.-J. Shieh et al. “A glucose-6-phosphate hydrolase, widely expressed outside theliver, can explain age-dependent resolution of hypoglycemia in glycogen storagedisease type Ia”. J Biol Chem 278 (2003), 47098–47103. PMID: 13129915 (cited onp. 125).
[33] L. A. Nolte, E. A. Gulve, and J. O. Holloszy. “Epinephrine-induced in vivo muscleglycogen depletion enhances insulin sensitivity of glucose transport”. J Appl Physiol(1985) 76 (1994), 2054–2058. PMID: 7914887 (cited on p. 125).
[34] C. F. Cori and G. T. Cori. “Glycogen formation in the liver from D- and L-lactic acid”.J Biol Chem 81 (1929), 389–403 (cited on p. 125).
[35] H. L. Greene et al. “ATP depletion, a possible role in the pathogenesis of hyper-uricemia in glycogen storage disease type I”. J Clin Invest 62 (1978), 321–328. PMID:276529 (cited on p. 127).
[36] B. Burwinkel et al. “Autosomal glycogenosis of liver and muscle due to phosphory-lase kinase deficiency is caused by mutations in the phosphorylase kinase subunit(PHKB)”. Hum Mol Genet 6 (1997), 1109–1115. PMID: 9215682 (cited on p. 128).
[37] C. A. Worby, M. S. Gentry, and J. E. Dixon. “Laforin, a dual specificity phosphatasethat dephosphorylates complex carbohydrates”. J Biol Chem 281 (2006), 30412–30418. PMID: 16901901 (cited on p. 128).
[38] E. Racker and E. Schroeder. “Formation and utilization of octulose-8-phosphate bytransaldolase and transketolase”. Arch Biochem Biophys 66 (1957), 241–243. PMID:13395544 (cited on p. 134).
[39] R. L. Veech, L. V. Eggleston, and H. A. Krebs. “The redox state of free nicotinamide-adenine dinucleotide phosphate in the cytoplasm of rat liver”. Biochem J 115(1969), 609–619. PMID: 4391039 (cited on p. 137).
[40] J. K. Suagee et al. “De novo fatty acid synthesis and NADPH generation in equineadipose and liver tissue”. Comp Biochem Physiol B Biochem Mol Biol 155 (2010), 322–326. PMID: 19962447 (cited on p. 139).
[41] M. F. Lyon. “Gene action in the X-chromosome of the mouse (Mus musculus L.)”Nature 190 (1961), 372–373. PMID: 13764598 (cited on p. 142).
[42] E. Beutler, M. Yeh, and V. F. Fairbanks. “The normal human female as a mosaic ofX-chromosome activity: studies using the gene for G-6-PD-deficiency as a marker”.Proc Natl Acad Sci U S A 48 (1962), 9–16. PMID: 13868717 (cited on p. 142).
[43] F. Carriere et al. “Secretion and contribution to lipolysis of gastric and pancreaticlipases during a test meal in humans”. Gastroenterology 105 (1993), 876–888. PMID:8359655 (cited on p. 150).
[44] Y. Gargouri, H. Moreau, and R. Verger. “Gastric lipases: biochemical and physiologi-cal studies”. Biochim Biophys Acta 1006 (1989), 255–271. PMID: 2688745 (cited onp. 150).
377

Bibliography
[45] M. Roulet et al. “Gastric emptying and lingual lipase activity in cystic fibrosis”.Pediatr Res 14 (1980), 1360–1362. PMID: 7208153 (cited on p. 160).
[46] G. J. van Stekelenburg and G. Koorevaar. “Evidence for the existence of mammalianacetoacetate decarboxylase: with special reference to human blood serum”. ClinChim Acta 39 (1972), 191–199. PMID: 4624981 (cited on p. 161).
[47] G. Koorevaar and G. J. van Stekelenburg. “Mammalian acetoacetate decarboxylaseactivity. Its distribution in subfractions of human albumin and occurrence in vari-ous tissues of the rat”. Clin Chim Acta 71 (1976), 173–183. PMID: 963888 (cited onp. 162).
[48] J. P. Casazza, M. E. Felver, and R. L. Veech. “The metabolism of acetone in rat”. JBiol Chem 259 (1984), 231–236. PMID: 6706932 (cited on pp. 162, 163).
[49] G. A. J. Reichard et al. “Plasma acetone metabolism in the fasting human”. J ClinInvest 63 (1979), 619–626. PMID: 438326 (cited on p. 162).
[50] M. J. Sulway and J. M. Malins. “Acetone in diabetic ketoacidosis”. Lancet 2(1970), 736–740. PMID: 4195976 (cited on pp. 163, 255).
[51] E. P. G. Vining. “The ketogenic diet”. Adv Exp Med Biol 497 (2002), 225–231. PMID:11993735 (cited on p. 163).
[52] M. Gasior et al. “The anticonvulsant activity of acetone, the major ketone bodyin the ketogenic diet, is not dependent on its metabolites acetol, 1,2-propanediol,methylglyoxal, or pyruvic acid”. Epilepsia 48 (2007), 793–800. PMID: 17386058(cited on p. 163).
[53] M. Palmer. “Combination treatment of epilepsy with ketogenic diet and concur-rent pharmacological inhibition of cytochrome P450 2E1”. Med Hypotheses 80(2013), 481–485. PMID: 23363738 (cited on p. 163).
[54] J. R. Stern. “A role of acetoacetyl-CoA synthetase in acetoacetate utilization by ratliver cell fractions”. Biochem Biophys Res Commun 44 (1971), 1001–1007. PMID:5125223 (cited on p. 168).
[55] G. Endemann et al. “Lipogenesis from ketone bodies in the isolated perfusedrat liver. Evidence for the cytosolic activation of acetoacetate”. J Biol Chem 257(1982), 3434–3440. PMID: 7061490 (cited on p. 168).
[56] B. M. Buckley and D. H. Williamson. “Acetoacetyl-CoA synthetase; a lipogenic en-zyme in rat tissues”. FEBS Lett 60 (1975), 7–10. PMID: 1227960 (cited on p. 168).
[57] T. Puig et al. “Novel Inhibitors of Fatty Acid Synthase with Anticancer Activity”. ClinCancer Res 15 (2009), 7608–7615. PMID: 20008854 (cited on p. 170).
[58] Y. Sakakura et al. “Sterol regulatory element-binding proteins induce an entirepathway of cholesterol synthesis”. Biochem Biophys Res Commun 286 (2001), 176–183. PMID: 11485325 (cited on p. 181).
[59] J. L. Goldstein, R. A. DeBose-Boyd, and M. S. Brown. “Protein sensors for membranesterols”. Cell 124 (2006), 35–46. PMID: 16413480 (cited on p. 182).
[60] D. Steinberg. “Atherogenesis in perspective: hypercholesterolemia and inflamma-tion as partners in crime”. Nat Med 8 (2002), 1211–1217. PMID: 12411947 (cited onp. 191).
[61] K. Rajamäki et al. “Cholesterol crystals activate the NLRP3 inflammasome in humanmacrophages: a novel link between cholesterol metabolism and inflammation”.PLoS One 5 (2010), e11765. PMID: 20668705 (cited on pp. 193, 302).
378

Bibliography
[62] F. Martinon et al. “Gout-associated uric acid crystals activate the NALP3 inflamma-some”. Nature 440 (2006), 237–241. PMID: 16407889 (cited on pp. 193, 302).
[63] Z. Wang et al. “Protein carbamylation links inflammation, smoking, uremia andatherogenesis”. Nat Med 13 (2007), 1176–1184. PMID: 17828273 (cited on p. 195).
[64] S. Bhakdi et al. “Beyond cholesterol: the enigma of atherosclerosis revisited”.Thromb Haemost 91 (2004), 639–645. PMID: 15045123 (cited on p. 195).
[65] D. Adams. The Hitchhiker’s Guide to the Galaxy. Pan Macmillan, 2005. isbn:9780330438957. url: http://books.google.ca/books?id=jo8wHAAACAAJ(cited on p. 198).
[66] V. V. Bamm et al. “Haptoglobin phenotypes differ in their ability to inhibit hemetransfer from hemoglobin to LDL”. Biochemistry 43 (2004), 3899–3906. PMID:15049697 (cited on p. 198).
[67] J. Delanghe et al. “Haptoglobin polymorphism and peripheral arterial occlusivedisease”. Atherosclerosis 145 (1999), 287–292. PMID: 10488955 (cited on p. 198).
[68] A. S. Goldberg and R. A. Hegele. “Cholesteryl ester transfer protein inhibitors fordyslipidemia: focus on dalcetrapib”. Drug Des Devel Ther 6 (2012), 251–259. PMID:23055695 (cited on p. 200).
[69] D. Lütjohann et al. “Long-term efficacy and safety of ezetimibe 10 mg in patientswith homozygous sitosterolemia: a 2-year, open-label extension study”. Int J ClinPract 62 (2008), 1499–1510. PMID: 18822021 (cited on p. 204).
[70] K. Tsubakio-Yamamoto et al. “Current therapy for patients with sitosterolemia–effect of ezetimibe on plant sterol metabolism”. J Atheroscler Thromb 17(2010), 891–900. PMID: 20543520 (cited on p. 204).
[71] J. T. Brosnan. “Glutamate, at the interface between amino acid and carbohydratemetabolism”. J Nutr 130 (2000), 988S–990S. PMID: 10736367 (cited on p. 209).
[72] T. Yamada et al. “Crystal structure of serine dehydratase from rat liver”. Biochem-istry 42 (2003), 12854–12865. PMID: 14596599 (cited on p. 221).
[73] Y. H. Loo. “Serotonin deficiency in experimental hyperphenylalaninemia”. J Neu-rochem 23 (1974), 139–147. PMID: 4546911 (cited on p. 224).
[74] L. I. Woolf. “The heterozygote advantage in phenylketonuria”. Am J Hum Genet 38(1986), 773–775. PMID: 3717163 (cited on pp. 225, 226).
[75] F. Sanger. “Sequences, sequences, and sequences”. Annu Rev Biochem 57 (1988), 1–28. PMID: 2460023 (cited on p. 233).
[76] J. Wahren, A. Kallas, and A. A. F. Sima. “The clinical potential of C-peptide replace-ment in type 1 diabetes”. Diabetes 61 (2012), 761–772. PMID: 22442295 (cited onpp. 233, 263).
[77] B. M. Vayssière et al. “Synthetic glucocorticoids that dissociate transactivation andAP-1 transrepression exhibit antiinflammatory activity in vivo”. Mol Endocrinol 11(1997), 1245–1255. PMID: 9259316 (cited on p. 245).
[78] E. M. King et al. “Glucocorticoid repression of inflammatory gene expression showsdifferential responsiveness by transactivation- and transrepression-dependentmechanisms”. PLoS One 8 (2013), e53936. PMID: 23349769 (cited on p. 245).
[79] S. T. Russell et al. “Mechanism of induction of muscle protein loss by hypergly-caemia”. Exp Cell Res 315 (2009), 16–25. PMID: 18973755 (cited on p. 253).
379

Bibliography
[80] K. Nylen, S. Likhodii, and W. M. Burnham. “The ketogenic diet: proposed mecha-nisms of action”. Neurotherapeutics 6 (2009), 402–405. PMID: 19332336 (cited onp. 255).
[81] V. Postolache et al. “[Effect of acetone upon barbiturate anesthesia]”. Arch Toxikol25 (1969), 333–337. PMID: 5384572 (cited on p. 255).
[82] K. S. MacDonald et al. “Influence of HLA supertypes on susceptibility and resistanceto human immunodeficiency virus type 1 infection”. J Infect Dis 181 (2000), 1581–1589. PMID: 10823757 (cited on p. 258).
[83] K. E. Schemmel, R. S. Padiyara, and J. J. D’Souza. “Aldose reductase inhibitors in thetreatment of diabetic peripheral neuropathy: a review”. J Diabetes Complications24 (2010), 354–360. PMID: 19748287 (cited on p. 263).
[84] R. A. Miller et al. “Biguanides suppress hepatic glucagon signalling by decreasingproduction of cyclic AMP”. Nature 494 (2013), 256–260. PMID: 23292513 (cited onp. 267).
[85] M. R. Owen, E. Doran, and A. P. Halestrap. “Evidence that metformin exerts its anti-diabetic effects through inhibition of complex 1 of the mitochondrial respiratorychain”. Biochem J 348 Pt 3 (2000), 607–614. PMID: 10839993 (cited on p. 267).
[86] S. A. Hawley et al. “The antidiabetic drug metformin activates the AMP-activatedprotein kinase cascade via an adenine nucleotide-independent mechanism”. Dia-betes 51 (2002), 2420–2425. PMID: 12145153 (cited on p. 267).
[87] M. Foretz et al. “Metformin inhibits hepatic gluconeogenesis in mice independentlyof the LKB1/AMPK pathway via a decrease in hepatic energy state”. J Clin Invest120 (2010), 2355–2369. PMID: 20577053 (cited on p. 267).
[88] V. Schirch and D. M. Szebenyi. “Serine hydroxymethyltransferase revisited”. CurrOpin Chem Biol 9 (2005), 482–487. PMID: 16125438 (cited on p. 271).
[89] D. G. Weir and J. M. Scott. “The biochemical basis of the neuropathy in cobalamindeficiency”. Baillieres Clin Haematol 8 (1995), 479–497. PMID: 8534958 (cited onpp. 277, 279).
[90] J. van der Westhuyzen et al. “Effect of a vitamin B-12-deficient diet on lipid and fattyacid composition of spinal cord myelin in the fruit bat”. J Nutr 113 (1983), 531–537.PMID: 6131113 (cited on p. 277).
[91] S. Aufreiter et al. “Folate is absorbed across the colon of adults: evidence fromcecal infusion of (13)C-labeled [6S]-5-formyltetrahydrofolic acid”. Am J Clin Nutr90 (2009), 116–123. PMID: 19439459 (cited on p. 280).
[92] A. Hamid, N. A. Wani, and J. Kaur. “New perspectives on folate transport in relationto alcoholism-induced folate malabsorption–association with epigenome stabilityand cancer development”. FEBS J 276 (2009), 2175–2191. PMID: 19292860 (citedon p. 281).
[93] K. E. McMartin and T. D. Collins. “Relationship of alcohol metabolism to folatedeficiency produced by ethanol in the rat”. Pharmacol Biochem Behav 18 Suppl 1(1983), 257–262. PMID: 6634838 (cited on p. 281).
[94] O. V. Fernando and E. W. Grimsley. “Prevalence of folate deficiency and macrocyto-sis in patients with and without alcohol-related illness”. South Med J 91 (1998), 721–725. PMID: 9715215 (cited on p. 281).
[95] A. Chan et al. “Cobinamide is superior to other treatments in a mouse model ofcyanide poisoning”. Clin Toxicol (Phila) 48 (2010), 709–717. PMID: 20704457 (citedon p. 283).
380

Bibliography
[96] K. Fujii, T. Nagasaki, and F. M. Huennekens. “Accumulation of 5-methyltetrahydrofolate in cobalamin-deficient L1210 mouse leukemia cells”.J Biol Chem 257 (1982), 2144–2146. PMID: 7061412 (cited on p. 284).
[97] S.-X. Li et al. “Octameric structure of the human bifunctional enzyme PAICS inpurine biosynthesis”. J Mol Biol 366 (2007), 1603–1614. PMID: 17224163 (cited onp. 293).
[98] G. Van den Berghe et al. “The purine nucleotide cycle and its molecular defects”.Prog Neurobiol 39 (1992), 547–561. PMID: 1529104 (cited on p. 294).
[99] N. Zöllner and W. Gröbner. “Dietary feedback regulation of purine and pyrimidinebiosynthesis in man”. Ciba Found Symp (1977), 165–178. PMID: 245992 (cited onp. 296).
[100] W. Löffler et al. “Influence of dietary purines on pool size, turnover, and excretionof uric acid during balance conditions. Isotope studies using 15N-uric acid”. Res ExpMed (Berl) 181 (1982), 113–123. PMID: 6294765 (cited on pp. 296, 302).
[101] A. Enomoto et al. “Molecular identification of a renal urate anion exchanger thatregulates blood urate levels”. Nature 417 (2002), 447–452. PMID: 12024214 (citedon p. 299).
[102] D. I. Feig et al. “Hypothesis: Uric acid, nephron number, and the pathogenesis ofessential hypertension”. Kidney Int 66 (2004), 281–287. PMID: 15200435 (cited onp. 300).
[103] I. Ramazzina et al. “Completing the uric acid degradation pathway through phylo-genetic comparison of whole genomes”. Nat Chem Biol 2 (2006), 144–148. PMID:16462750 (cited on p. 300).
[104] W. L. Nyhan. “Dopamine function in Lesch-Nyhan disease”. Environ Health Perspect108 Suppl 3 (2000), 409–411. PMID: 10852837 (cited on p. 301).
[105] G. R. Breese et al. “A dopamine deficiency model of Lesch-Nyhan disease–theneonatal-6-OHDA-lesioned rat”. Brain Res Bull 25 (1990), 477–484. PMID: 2127238(cited on p. 301).
[106] H. K. Choi et al. “Alcohol intake and risk of incident gout in men: a prospectivestudy”. Lancet 363 (2004), 1277–1281. PMID: 15094272 (cited on p. 302).
[107] M. Kishibe, H. Sakai, and H. Iizuka. “Chronic tophaceous gout secondary to self-induced vomiting in anorexia nervosa”. J Dermatol 37 (2010), 578–580. PMID:20536680 (cited on p. 302).
[108] D. L. Mehlhaff and D. S. Stein. “Gout secondary to ritonavir and didanosine”. AIDS10 (1996), p. 1744. PMID: 8970701 (cited on p. 303).
[109] P. U. Heuckenkamp and N. Zöllner. “Fructose-induced hyperuricaemia”. Lancet 1(1971), 808–809. PMID: 4101315 (cited on p. 303).
[110] H. K. Choi and G. Curhan. “Soft drinks, fructose consumption, and the risk ofgout in men: prospective cohort study”. BMJ 336 (2008), 309–312. PMID: 18244959(cited on p. 303).
[111] R. D. Oberhaensli et al. “Study of hereditary fructose intolerance by use of 31Pmagnetic resonance spectroscopy”. Lancet 2 (1987), 931–934. PMID: 2889861 (citedon p. 303).
[112] P. Richette et al. “Rasburicase for tophaceous gout not treatable with allopurinol:an exploratory study”. J Rheumatol 34 (2007), 2093–2098. PMID: 17896799 (citedon p. 305).
381

Bibliography
[113] M. Tamba and A. Torreggiani. “A pulse radiolysis study of carnosine in aqueoussolution”. Int J Radiat Biol 74 (1998), 333–340. PMID: 9737536 (cited on p. 307).
[114] A. A. Boldyrev. “Carnosine: new concept for the function of an old molecule”.Biochemistry (Mosc) 77 (2012), 313–326. PMID: 22809149 (cited on p. 307).
[115] A. A. Boldyrev, G. Aldini, and W. Derave. “Physiology and pathophysiology of carno-sine”. Physiol Rev 93 (2013), 1803–1845. PMID: 24137022 (cited on p. 308).
[116] C. M. Galmarini et al. “In vivo mechanisms of resistance to cytarabine in acutemyeloid leukaemia”. Br J Haematol 117 (2002), 860–868. PMID: 12060121 (cited onp. 315).
[117] S. D. Cline and N. Osheroff. “Cytosine arabinoside lesions are position-specifictopoisomerase II poisons and stimulate DNA cleavage mediated by the humantype II enzymes”. J Biol Chem 274 (1999), 29740–29743. PMID: 10514448 (cited onp. 316).
[118] T. F. Cummings. “The treatment of cyanide poisoning”. Occup Med (Lond) 54(2004), 82–85. PMID: 15020725 (cited on p. 322).
[119] E. K. Jaffe. “The porphobilinogen synthase catalyzed reaction mechanism”. BioorgChem 32 (2004), 316–325. PMID: 15381398 (cited on p. 324).
[120] A. L. Herrick and K. E. L. McColl. “Acute intermittent porphyria”. Best Pract Res ClinGastroenterol 19 (2005), 235–249. PMID: 15833690 (cited on p. 327).
[121] W. E. Müller and S. H. Snyder. “Delta-aminolevulinic acid: influences on synapticGABA receptor binding may explain CNS symptoms of porphyria”. Ann Neurol 2(1977), 340–342. PMID: 214024 (cited on p. 330).
[122] S. Onishi et al. “Metabolism of bilirubin and its photoisomers in newborn infantsduring phototherapy”. J Biochem 100 (1986), 789–795. PMID: 3782069 (cited onp. 333).
[123] T. Christensen et al. “Cells, bilirubin and light: formation of bilirubin photoproductsand cellular damage at defined wavelengths”. Acta Paediatr 83 (1994), 7–12. PMID:8193477 (cited on p. 333).
[124] H. Job, G. Hart, and G. Lealman. “Improvements in long term phototherapy forpatients with Crigler-Najjar syndrome type I”. Phys Med Biol 41 (1996), 2549–2556.PMID: 8938045 (cited on p. 333).
[125] A. Kappas, G. S. Drummond, and T. Valaes. “A single dose of Sn-mesoporphyrinprevents development of severe hyperbilirubinemia in glucose-6-phosphatedehydrogenase-deficient newborns”. Pediatrics 108 (2001), 25–30. PMID: 11433050(cited on p. 334).
[126] M. Ekroos and T. Sjögren. “Structural basis for ligand promiscuity in cytochromeP450 3A4”. Proc Natl Acad Sci U S A 103 (2006), 13682–13687. PMID: 16954191(cited on p. 344).
[127] J. R. Rashid, Kofi-Tsepko, and F. D. Juma. “Acetylation status using hydralazine inAfrican hypertensives at Kenyatta National Hospital”. East Afr Med J 69 (1992), 406–408. PMID: 1396201 (cited on p. 349).
[128] K. Golka et al. “The enhanced bladder cancer susceptibility of NAT2 slow acetyla-tors towards aromatic amines: a review considering ethnic differences”. Toxicol Lett128 (2002), 229–241. PMID: 11869833 (cited on p. 350).
382

Bibliography
[129] R. J. Knox et al. “Bioactivation of CB 1954: reaction of the active 4-hydroxylaminoderivative with thioesters to form the ultimate DNA-DNA interstrand crosslink-ing species”. Biochem Pharmacol 42 (1991), 1691–1697. PMID: 1930294 (cited onp. 352).
[130] V. Favaudon. “On the mechanism of reductive activation in the mode of action ofsome anticancer drugs”. Biochimie 64 (1982), 457–475. PMID: 6181817 (cited onp. 352).
[131] E. M. Welch et al. “PTC124 targets genetic disorders caused by nonsense mutations”.Nature 447 (2007), 87–91. PMID: 17450125 (cited on p. 357).
[132] T. Goldmann et al. “A comparative evaluation of NB30, NB54 and PTC124 in transla-tional read-through efficacy for treatment of an USH1C nonsense mutation”. EMBOMol Med 4 (2012), 1186–1199. PMID: 23027640 (cited on p. 357).
[133] E. Kerem et al. “Effectiveness of PTC124 treatment of cystic fibrosis caused bynonsense mutations: a prospective phase II trial”. Lancet 372 (2008), 719–727.PMID: 18722008 (cited on p. 358).
[134] N. Brunetti-Pierri. “Gene therapy for inborn errors of liver metabolism: progresstowards clinical applications”. Ital J Pediatr 34 (2008), p. 2. PMID: 19490653 (citedon p. 359).
[135] H. L. Elford and A. L. Lin. “Adenosine deaminase impairment and ribonucleotidereductase in human cells”. Ann N Y Acad Sci 451 (1985), 98–112. PMID: 3907454(cited on p. 359).
[136] P. Benveniste and A. Cohen. “p53 expression is required for thymocyte apopto-sis induced by adenosine deaminase deficiency”. Proc Natl Acad Sci U S A 92(1995), 8373–8377. PMID: 7667298 (cited on p. 359).
[137] M. L. Joachims et al. “Inhibition of deoxynucleoside kinases in human thymocytesprevents dATP accumulation and induction of apoptosis”. Nucleosides NucleotidesNucleic Acids 27 (2008), 816–820. PMID: 18600545 (cited on p. 361).
[138] J. Wen et al. “Adenosine deaminase enzyme therapy prevents and reverses theheightened cavernosal relaxation in priapism”. J Sex Med 7 (2010), 3011–3022.PMID: 19845544 (cited on p. 361).
[139] A. L. Burnett and T. J. Bivalacqua. “Glucose-6-phosphate dehydrogenase deficiency:an etiology for idiopathic priapism?” J Sex Med 5 (2008), 237–240. PMID: 17971109(cited on p. 361).
[140] S. H. Polmar et al. “Enzyme replacement therapy for adenosine deaminase defi-ciency and severe combined immunodeficiency”. N Engl J Med 295 (1976), 1337–1343. PMID: 980079 (cited on pp. 361, 362).
[141] H. B. Gaspar. “Bone marrow transplantation and alternatives for adenosine deam-inase deficiency”. Immunol Allergy Clin North Am 30 (2010), 221–236. PMID:20493398 (cited on p. 362).
[142] S. Jevsevar, M. Kunstelj, and V. G. Porekar. “PEGylation of therapeutic proteins”.Biotechnol J 5 (2010), 113–128. PMID: 20069580 (cited on p. 362).
[143] A. Aiuti et al. “Gene therapy for immunodeficiency due to adenosine deaminasedeficiency”. N Engl J Med 360 (2009), 447–458. PMID: 19179314 (cited on p. 362).
[144] C. I. van Capelle et al. “Effect of enzyme therapy in juvenile patients with Pompedisease: a three-year open-label study”. Neuromuscul Disord 20 (2010), 775–782.PMID: 20817528 (cited on p. 364).
383

Bibliography
[145] P. Ghosh, N. M. Dahms, and S. Kornfeld. “Mannose 6-phosphate receptors: newtwists in the tale”. Nat Rev Mol Cell Biol 4 (2003), 202–212. PMID: 12612639 (citedon p. 365).
[146] A. J. McVie-Wylie et al. “Biochemical and pharmacological characterization of dif-ferent recombinant acid α-glucosidase preparations evaluated for the treatment ofPompe disease”. Mol Genet Metab 94 (2008), 448–455. PMID: 18538603 (cited onp. 366).
[147] J. A. Barranger and E. O’Rourke. “Lessons learned from the development of enzymetherapy for Gaucher disease”. J Inherit Metab Dis 24 Suppl 2 (2001), 89–96. PMID:11758684 (cited on p. 367).
[148] J. K. Amory et al. “Miglustat has no apparent effect on spermatogenesis in normalmen”. Hum Reprod 22 (2007), 702–707. PMID: 17067996 (cited on p. 368).
[149] L. de Meis et al. “Fusion of the endoplasmic reticulum and mitochondrial outermembrane in rats brown adipose tissue: activation of thermogenesis by Ca2+”. PLoSOne 5 (2010), e9439. PMID: 20209153 (cited on p. 373).
384

Index
ABC transporters
bile acid transport, 189
deficiencies
Dubin-Johnson syndrome, 190
sitosterolemia, 203–204
Tangier disease, 203
sterol transport, 184, 187
structure and function, 185–186
ACAT, see acyl-CoA cholesterolacyltransferase
acetaminophen, metabolism, 348
acetoacetate
decarboxylation, 161–162
leucine degradation, 222
mitochondrial acetyl-CoA export,168
synthesis, 161
acetone
anticonvulsant activity, 163
metabolism, 161–163
substrate for gluconeogenesis,162–163
acetyl-CoA
formation by pyruvatedehydrogenase, 58, 61
glyoxylate cycle, 170–171
mitochondrial export, 167–168
oxidation, see citric acid cycle
acetyl-CoA carboxylase, 164
acetylphosphate, 40
aciclovir, 316–317
acid maltase, 121
deficiency, 127
enzyme therapy, 364
acid-base catalysis, 36–37
activation energy (∆G∗), 20
active transport
glucose, 14
acute intermittent porphyria, 329–330
acute myeloic leukemia (AML), 315
acute urate nephropathy, 304–305
acyl carrier protein, 165n
acyl thiokinase, 154
acyl-CoA cholesterol acyltransferase, 183
acyl-CoA dehydrogenase, 155
acyl-CoA synthetase, see acyl thiokinase
adenine phosphoribosyltransferase(APRT), 300
adenosine deaminase, 297
adenosine deaminase deficiency, 301
bone marrow transplant, 360
enzyme therapy, 361–362
experimental drug treatment,360–361
gene therapy, 362–363
pathogenesis, 359–360
adenosine kinase, 300
385

Index
adenosine monophosphate (AMP)deaminase, 297, 298
adenosine monophosphate (AMP)synthesis, 293–294
adenylate cyclase, 110, 158inhibtion by metformin, 267
adenylate kinase, 23–24, 303adenylosuccinate lyase, 291, 293AICAR, see purine nucleotide synthesisalbumin
osmotic activity, 152transport of free fatty acids, 158
alcohol dehydrogenase, 19, 107acetone breakdown, 163
aldehyde dehydrogenase, 107acetone breakdown, 163
aldolase, 34aldolase B, 48, 303
deficiency (fructose intolerance), 49aldose reductase, 54
inhibitors, in diabetes, 263allantoin, 299allopurinol, 303, 313amino acids
conjugation, 350degradation
asparagine, 220glycine, 272histidine, 273leucine, 221–222overview, 208–209phenylalanine, tyrosine, 222–223serine, 220–221, 271
metabolic uses, 207transamination
mechanism, 210–211overview, 209–210
aminoacrylate, 2205′-aminoimidazole ribotide synthetase,
291aminoimidazole-carboxamido-ribotide
(AICAR) transformylase, 292aminooxyacetate, 93aminotransferases, see amino acids,
transaminationammonia
carbamoylphosphate synthesis, 212nitrogen fixation, 4release and scavenging in the liver
lobule, 217–218urinary excretion, 212n
AMP-activated kinase, 267amphibolic
definition, 3amylase, 13–14amylopectin, 13amylose, 13anabolic
definition, 2anaerobic glycolysis, see glycolysis,
anaerobicanemia
hemolytic, in glucose-6-phosphatedehydrogenase deficiency, 142
microcytic hypochromic, 327anorexia nervosa, 302apolipoproteins, 182apoptosis, 78n, 351, 359araC, see cytosine arabinosidearchaebacteria, 4arginase, 213arginine deficiency, in ure cycle enzyme
defects, 219argininosuccinase, 213argininosuccinate synthetase, 213asparaginase, 220asparagine synthetase, 220aspartate aminotransferase, 93, 213aspartate transcarbamylase, 306ataluren, 356–358atherosclerosis
and hypercholesterolemia, 190–191blood clot formation, 191metabolic aspects, 194role of oxidized LDL, 198vascular lesions
morphology, 191–192pathogenesis, 193
atorvastatin, 199ATP
hydrolysis, 35role in enzyme reactions, 22
ATP synthasebinding-change model, 89–90driven by proton flux, 90–92structure, 88–89
ATP-citrate lyase, 167ATP/ADP transporter, mitochondrial, 98autotrophic
definition, 3
bacteriorhodopsin, 74
386

Index
baker’s yeast, 41Banting, Frederick, 231benzbromarone, 303Best, Charles, 231β-alanine, 307β-oxidation
reaction mechanisms, 156–157reactions, 155
β-hydroxybutyratesynthesis, 161
Bethune, Norman, 232bezafibrate, 201bile acids, 11–12
absorbers, for lowering cholesterol,201
enterohepatic cycle, 189structure, 188
bilirubinconjugation and deconjugation, 330photoisomerization, 333
bilirubin encephalopathy, 332biliverdin, 330biotin
leucine degradation, 222malonyl-CoA carboxylase, 164pyruvate carboxylase, 104
1,3-bis-phosphoglycerate, 34, 40branched chain α-keto acid
dehydrogenase, 221branched chain amino acid transaminase,
221branching enyzme, 1175-bromouracil-deoxyriboside (5-BUdR),
312brown fat tissue, 73, 159
C-peptide, 233canfosfamide, 353carbamoylphosphate synthetase
pyrimidine nucleotide synthesis, 306urea cycle, 212
carbon monoxide, putative signalingfunction, 334
4′-carboxy-5′-aminoimidazole ribotidecarboxylase, 291, 292
carboxyphosphate, 104carnitine, 153carnosine, 307–308catabolism
definition, 2overview, 5–6
catalytic triad, see chymotrypsin,catalytic mechanism
cataractin diabetes, 54in type II galactosemia, 53
CB 1954, 352cerulenine, 169cholecalciferol, 178cholesterol
biological functions, 173intestinal uptake, 183–184
therapeutic inhibition, 199–200metabolism, as a therapeutic target,
198–199synthesis
overview, 174–175reactions, 175–178regulation, 179–182
transport by lipoproteins, 186–188turnover, processes involved in, 174
cholesterol ester transfer protein, 200cholestyramine, 201chylomicrons
disposal, 153synthesis and transport, 150–152vs. other lipoproteins, 183
chymotrypsincatalytic mechanism, 17–18
cidofovir, 318citrate isomerase, 65citrate synthase, 64
mitochondrial acetyl-CoA export,167
citric acid cycle, 63–68overall reaction, 64reactions, 64–66regulation, 67–68replenishment of intermediates, 68
citrullinenitric oxide synthase, 140urea cycle, 213
cobalamindeficiency
causes, 283treatment, 283
in cyanide poisoning, 283intestinal uptake, 282methionine synthesis, 276structure, 275–276
coenzyme Q, 76, see also Q cyclecoenzymes
387

Index
role in catalysis, 19coproporphyrinogen III, 326Cori cycle, 125–126covalent catalysis, 37–38coxsackievirus, and type 1 diabetes, 256Crigler-Najjar syndrome, 332Crohn’s disease, 283cyanide poisoning, 322n
cobalamin treatment, 283cyclic AMP (cAMP)
dysregulation in diabetes mellitus,252
regulation of gluconeogenesis,109–111
regulation of glycogen metabolism,122–123
cyclic GMP (cGMP), 140cystic fibrosis, 357–358cytarabine, see cytosine arabinosidecytochrome C, 76, 78, 84cytochrome C oxidase, 76
reaction mechanism, 84–85cytochrome P450
acetone metabolism, 162in drug metabolism, 341–345
prominent role of CYP3A4, 342structure, 343toxification of benzopyrene, 346transcriptional induction, 342–343
cytochrome P450 reductase, 350cytosine arabinoside, 313–316
dalcetrapib, 200debranching enzyme, 119, 1207-dehydrocholesterol, 178∆G and ∆G∗, in enzyme reactions, 20δ-aminolevulinate synthase, 3235-deoxyadenosine, 360deoxycytidine kinase, 361deoxyribonucleotide synthesis, 308–309deoxyribose phosphate aldolase, 297desaturases, 168–169dexamethasone, 245diabetes
type 2sulfonylurea drugs, 236
diabetes insipidus, 247ndiabetes mellitus
aldose reductase inhibitors, 263cataract, 262clinical symptoms, 255
complicationslong term, 262–263short term, 262
dysregulation of glucose metabolism,252
dysregulation of lipid and proteinmetabolism, 253–254
etymology, 247forms, 248hyperglycemia, 262hypoglycemia, 262insulin therapy, intensive, 263–265laboratory findings, 254–255oral antidiabetics, 265–266renal glucose loss, 251–252therapy
acute case, 259type 1, pathogenesis, 256–258
diaphorase, 350, 352dideoxyadenosine, 316digestion
bile, role of, 11–12enzymes, 11overview, 5–6
digestive system, 6–15dihydrofolate reductase, 312
inhibitorsantimicrobials, 275
reactions, 270dihydroorotate, 306dihydroxyacetone phosphate, 34, 48
glycerophosphate shuttle, 931,25-dihydroxycholecalciferol, 178dimethylallyl-pyrophosphate, 175dinitrophenol, 73–74diphosphomevalonate decarboxylase,
175DNA polymerase, inhibitors, 315–318DNA topoisomerase, 315drug metabolism
active metabolites, 345conjugation reactions, 346–350overview, 339phase I, II, and III, 340–341reductive, 350–351
Dubin-Johnson syndrome, 190
earthquakes, 178eliglustat, 368elongases, 168–169endoplasmic reticulum
388

Index
smoothsterol metabolism, 179
energy-rich bonds and functional groups,39–40
enolase, 34enoyl-CoA hydratase, 155enoylreductase, see fatty acid synthase,
reactionsenzyme activity
allosteric regulation, 25and cooperativity, 26–27control by phosphorylation, 26transcriptional control, 28
enzyme defects, see also specificenzymes
enzyme therapyadenosine deaminase deficiency,
361–362, 366–367Pompe disease, 364
gene therapyadenosine deaminase deficiency,
362–363technical considerations, 358–359
lysosomal, enzyme therapy, 363–367therapeutic options, 355–356
enzymes, IUBMB classification, 19–20epinephrine
gluconeogenesis, 109–110glycogen metabolism, 122–123hormone-sensitive lipase, 158signaling mechanism, 241–242
epoxide hydrolase, 347equilibrative nucleoside transporter
(ENT), 314erythromycin, 343erythrose-4-phosphate, 133essential fatty acids, 169ethanol
degradation, 107folate deficiency, 281
ethanolic fermentation, 41–42ezetimibe, 199
Faraday’s constant, 80farnesyl-pyrophosphate
cholesterol synthesis, 176fast acetylators, 349–350fat tissue
white and brown, 159fatty acid synthase
pharmacological inhibition, 169–170
reactions, 165–167structure and catalytic activities,
164–165fatty acids
common variants, 149elongation and desaturation,
168–169essential, 149n, 169mitochondrial transport, 153–154synthesis
overview, 164reactions, 164–167
utilization, 153–155odd-numbered chain lengths, 157
favism, 142–144ferritin, 336–337ferrochelatase, 326flavin adenine dinucleotide (FAD), 65, 77flavin mononucleotide (FMN), 77flavine adenine nucleotide (FAD), 1555-fluorouracil, 310–312foam cells, 192folic acid
antimetabolitesantimicrobials, 274–275
deficiency, 280–282uptake and storage, 280
foodstuffsenergy contents, 147types, 4–5
formic acid, 51formylglycinamidine ribotide synthetase,
291foscarnet, 317free energy (∆G), 20fructokinase, 48, 303fructolysis, see fructose degradationfructose
and obesity, 49degradation, 48–49hyperuricemia, 303in sperm fluid, 54intolerance, 49
fructose-1-phosphate, 48fructose-1,6-bisphosphatase, 105
putative role in hexosemonophosphate shunt, 134
regulation, 109fructose-1,6-bisphosphate, 34fructose-2,6-bisphosphate
389

Index
regulation of gluconeogenesis,109–111
fructose-6-phosphate, 34hexose monophosphate shunt, 133
β-fructosidase, 48fumarase, 66fumarate
citric acid cycle, 65futile cycles, see substrate cycles
G protein coupled receptors, 241–242galactitol, 54galactokinase, 50, 53galactose
degradation, 50–51enzyme defects, see galactosemia
galactose epimerasereaction mechanism, 51
galactose-1-phosphate, 50, 52galactose-1-phosphate uridyltransferase,
50, 52galactosemia, 52–53β-galactosidase, 50, 52γ-aminobutyrate (GABA), 330ganciclovir, 316gastric acid, 9gastric lipase, 150, 160Gaucher disease, 366–368
drug treatment, 368geranyl-pyrophosphate synthase, 175Gilbert’s syndrome, 332glucacon
signaling mechanism, 241–242glucagon, 230
gluconeogenesis, 109–110glycogen metabolism, 122–123hormone-sensitive lipase, 158
glucocerebrosidase, 366–367partial deglycosylation for enzyme
therapy, 367glucocorticoids
metabolic effects, 244receptor agonists and antagonists,
245signaling mechanism, 243–244
glucokinase, 43–44gluconeogenesis
energy balance, 105–106inhibition by ethanol, 107metabolic connections, 106mitochondrial transport in, 106–107
overview, 101–102reactions, 102–105regulation, 108–111
hormones, 109–110gluconolactonase, 133glucose
active transport, 14anomers, 33degradation
ATP yield, 97–99overview, 31–32
GLUT transporters, 14regulation by insulin, 239–240subtypes and kinetics, 42–43
intestinal uptake, 14organ-specific utilization, 42–44
glucose alanine cycle, 215glucose-1-phosphate, 50, 119glucose-6-phosphatase, 105
deficiency, 126–127expression in muscle, 125glycogen degradation, 120regulation, 109
glucose-6-phosphate, 34glycogen degradation, 120hexose monophosphate shunt, 132in galactose degradation, 50
glucose-6-phosphate dehydrogenasedeficiency, 142–144
neonatal jaundice, 334reaction, 132
glucosylceramide, 366GLUT transporters, see under glucoseglutamate
in nitrogen disposal, 216–217in transamination, 209malate-aspartate shuttle, 93
glutamate dehydrogenase, 212, 216glutaminase, 217–218
regulation, 218glutamine
as a nitrogen carrier, 215–216glutamine synthetase, 22, 217–218glutamine-PRPP-amidotransferase, 291glutathione
peroxidase, 143scavenging of reactive oxygen
species, 141–142glutathione-S-transferase, 347glyceraldehyde, 48
kinase, 48
390

Index
glyceraldehyde-3-phosphate, 34hexose monophosphate shunt, 133
glyceraldehyde-3-phosphatedehydrogenase, 34
in apoptosis, 78nreaction mechanism, 37–38
glycerol, 49glycerol-1-phosphate, 49glycerophosphate shuttle, 93–94glycinamide ribotide synthetase, 291glycinamide ribotide transformylase, 291glycine cleavage system, 272glycogen
α and β particles, 115degradation, 119–121
lysosomal, 121metabolism
liver vs. muscle, 123–125overview, 113–114regulation, 121–123
structure, 113–116synthesis, 116–119
glycogen phosphorylase, 119allosteric regulation, 122liver and muscle isoforms, 123muscle
deficiency, 127–128reaction mechanism, 120–121
glycogen storage diseases, 126–128glycogen synthase, 117–119
regulation, 122, 238glycogen synthase kinase 3, 238glycogenin, 117glycolysis, 31–44
anaerobicATP yield, 40cell types, 34
reactions, 33–34reversible and irreversible reactions,
34glyoxylate cycle, 170–171gout, 302–304
dietary factors, 302guanase, 297, 298guano, 4nguanosine kinase, 300guanosine monophsphate (GMP)
synthesis, 294guar gum, 202Guthrie test, 224–225
Haber-Bosch process, 4nhaptocorrin, 282haptoglobin, 198HbA1C, 263HDL, see high density lipoproteinHelicobacter pylori, 10heme
biosynthesis, 322–327crystallization in malaria parasites,
143functions, 322respiratory chain cofactors, 77
heme biosynthesisdisruptions (overview), 327
heme degradation, 330–335heme oxygenase, 330hemochromatosis, 329hemosiderin, 337heterotrophic
definition, 3hexokinase, 34
and glucokinase, 43–44reaction mechanism, 35–36
hexose monophosphate shunthomologous sugar series, 134–135overview, 131–132reactions, 132–134
hibernating animals, 159high density lipoprotein, 183, 187Hitchhiker’s Guide to the Galaxy, 198HLA molecules, 257–258homogentisate dioxygenase, 223hormonal regulation
overview, 229hormone-sensitive lipase, 158Howard Hughes, 1human immunodeficiency virus (HIV),
316human leukocyte antigens, see HLA
moleculeshydroxyacyl dehydratase, see fatty acid
synthase, reactionshydroxyacyl-CoA dehydrogenase, 155hydroxybutyrate dehydrogenase, 161hydroxymethylbilane synthase, 325hydroxymethylglutaryl-CoA lyase, 161,
222hydroxymethylglutaryl-CoA reductase
reaction, 175regulation, 179therapeutic inibition, 199
391

Index
hydroxymethylglutaryl-CoA synthasecholesterol synthesis, 175ketone body synthesis, 161
p-hydroxyphenylpyruvate dioxygenase,223
therapeutic inhibition in tyrosinemia,227
hydroxypyruvate, 221hypercholesterolemia
familial, 202induction of atherosclerosis,
190–191hyperlipidemia
glucose-6-phosphatase deficiency,126
hyperuricemia, see also gout, 302drug-induced, 304glucose-6-phosphatase deficiency,
126Lesch-Nyhan syndrome, 301
hypoglycemiaethanol-induced, 107glucose-6-phosphatase deficiency,
126in vitamin B12 deficiency, 107
hypoxanthine, 292, 299hypoxanthine-guanine
phosphoribosyltransferase(HGPRT), 300
deficiency, 301
idoxuridine, 312inflammasomes, 193inosine kinase, 300inosine monophosphate (IMP), 290, 294inosine monophosphate (IMP)
dehydrogenase, 297, 298inosine monophosphate cyclohydrolase,
292INSIG, 180insulin
aggregation, 260–261biphasic preparations, 261–262discovery, 230–231gluconeogenesis, 109–110glucose transport, 239–240glycogen metabolism, 122–123, 238mutants, for intensive therapy,
264–265primary structure, 232–234protamine complex, 261
secretionregulation, 234–235
secretion, kinetics, 259–260transcriptional regulation, 240
insulin receptorsignaling mechanism, 237
intellligent design, 97intestinal organs, see also stomach, liver,
etc., 6–7intestine, large, 15intestine, small
structure, 12intrinsic factor, 282iron depletion, 327, 335iron overload, 337iron uptake and storage, 335–337iron-sulfur clusters, 77isocitrate, 65isocitrate dehydrogenase, 65
NAD- and NADP-dependent isoforms,67–68, 95–97
isocitrate lyase, 171isomaltose, 13isoniazid, metabolism, 349–350isopentenyl-CoA, 222isopentenyl-pyrophosphate isomerase,
175isouramil, 143isovaleryl-CoA, 222isozymes, 123IUBMB classification of enzymes, 19–20
jaundicecauses, 331–332neonatal, 332–334phototherapy, 333
kernicterus, 332ketoacidosis, 255ketoacyl reductase, see fatty acid
synthase, reactionsketoacyl synthase, see fatty acid
synthase, reactionsketoconazole, 344ketogenic diet, 163α-ketoglutarate
citric acid cycle, 65in transamination, 209
α-ketoglutarate dehydrogenase, 65reaction mechanism, 66–67
α-ketoisocaproate, 221
392

Index
ketone body metabolismdysregulation in diabetes, 254overview, 160–161reactions, 161–163
kidneysfunction, overview, 248–249glomerular filtration, 250–251loss of glucose in diabetes, 251–252tissue structure, 249–250tubular reuptake and secretion, 251
lactase, see β-galactosidaselactate, 34
anaerobic exercise, 126blood level, 41nmuscle glycogen utilization, 125
lactate dehydrogenase, 34, 40–41lactic acidosis, 93, 255nlactose
degradation, 50–51intolerance, 51–52structure, 50
lactose intolerance, 51Lafora disease, 128Langerhans islets, 230lanosterol, 177LDL, see low density lipoproteinLDL apheresis, 201lead intoxication, 324, 327lecithin-cholesterol acetyltransferase,
187–188Leloir pathway, see galactose degradationleptin, 245–246Lesch-Nyhan syndrome, 301leucine degradation, 221–222linoleate, 149lipids
types, 147lipoamide
in pyruvate dehydrogenase, 59lipoprotein lipase, 152–153lipoproteins
classification, 183general structure, 182
liverglycogen content, 113glycogen utilization, 123–124lobules, 8–9
localized enzyme expression,217–218
substrate overload in diabetes, 254
liver cirrhosis, 212nlomitapide, 200lovastatin, 199low density lipoprotein, 183
chemical modifications, 194–195in atherosclerosis, 193
lymphocytesanaerobic glycolysis, 34
macrocytic anemiafolate deficiency, 281–282in cobalamin deficiency, 284
macrophagescholesterol accumulation, 194conversion to foam cells, 192production of ROS, 141
malaria, 143–144l-malate, 66malate dehydrogenase, 66
regulation of the TCA cycle, 67malate synthase, 171malate-aspartate shuttle, 92–93malate-oxaloacetate shuttle, 92maleylacetoacetate isomerase, 223malonyl-acetyltransferase, see fatty acid
synthase, reactionsmaltose, 13mannose receptor, 367mannose-6-phosphate receptor, 365–366Mary Lyon hypothesis, 142McArdle’s disease, 127–128mechlorethamine, 351medium-chain fatty acids, 160mercaptopurine, 313metabolism
autotrophic and heterotrophic, 3carbon pools, 148catabolic and anabolic, 2–3drug targets in, 2hormonal regulation, overview, 229in plants and bacteria, 3–4medical significance, 1
metformin, 266–267methemoglobin reductase, 322, 350, 352methotrexate, 312–313methyl trap hypothesis, 284methylcobalamin, see cobalaminmethylglutaconyl-CoA, 222methylmalonyl-CoA racemase, 157mevalonate kinase, 175mevastatin, 199
393

Index
mifepristone, 245miglustat, 368minimal medium, 225mitochondria
hydrogen shuttles, 92–94inner and outer membrane, 58proton leak, 87n, 95proton-motive force, 87–88
transport driven by, 98–99mitochondrial triglyceride transfer
protein, 183, 200mixed acid fermentation, 51morphine
metabolism, 348–349muscle, see also skeletal muscle
smooth vs. striated, 31muscle tissue
fatty acid utilization, 158myelin, 278–279myeloperoxidase, 141, 198
N,N ′-methylenetetrahydrofolate, see alsofolic acid
regeneration, 271–273N-acetylglutamate, 218N-acetyltransferase 2, 349–350NAD
and NADP, 39comparison, 137transhydrogenase, 95–97
in β-oxidation, 155mitochondrial dehydrogenation of
NADH, 82, 266redox mechanism, 38–39reoxidation of NADH under
anaerobic conditions, 40–42NADPH
metabolic uses, overview, 139oxidase, 141regeneration
hexose monophosphate shunt,132–133
malic enzyme, 138transhydrogenase, 138–139
neonatal jaundice, 332–334nicotinamide adenine dinucleotide, see
NAD, NADHnicotinamide adenine dinucleotide
phosphate, see NADP, NADPHnicotinamide nucleotide
transhydrogenase, 95–97
nicotinic acid, 201nitric oxide
signaling effects, 140–141, 335synthase, 140
2-[2-nitro-4-(trifluoromethyl)benzoyl]-cyclohexane-1,3-dione, 223,227
nitrogen disposaloverview, 211–212transport between organs, 215–216
nitrogen fixation, 3–4NPC1L1, 183, 199NTBC, 223, 227nuclear hormone receptors, 243–244nucleic acids
dietary, utilization, 295–2975′-nucleotidase, 314–315nucleotide antimetabolites, 309–310nucleotide synthesis, see purine
synthesis, pyrimidine synthesisnucleotides
as part of coenzymes, 287–288biochemical roles, 287dietary, utilization, 295–297pathways
overview, 290
ochratoxin A, 225–226oleate, 149organic anion transport proteins, 189ornithine aminotransferase, 218ornithine transcarbamylase, 213orotate phosphoribosyltransferase, 306orotidine monophosphate (OMP), 306osmotic diuresis, 252oxaloacetate, 66
malate-aspartate shuttle, 93oxalosuccinate, 65oxidized LDL, 195–196
role in atherosclerosis, 198
P-glycoprotein, 314palmitate, 149
fatty acid synthesis, 164pancreas
endocrine, 230exocrine, 11
insufficiency, 160pancreatic DNAse and RNAse, 295pancreatic lipase, 150parietal cells, 283
394

Index
pentose posphate shunt, see hexosemonophosphate shunt
pentostatin, 361PEP, see phosphoenolpyruvatepernicious anemia, 283phagocytes
production of ROS, 141phenobarbital, metabolism, 340phenylacetic acid, 350phenylalanine degradation, 222–223phenylalanine hydroxylase, 222
deficiency, 224phenylbutanoic acid, 350phenylketonuria, 224–226phosphatidylcholine
biosynthesis, 277LCAT reaction, 187sphingomyelin biosynthesis, 278
phosphatidylethanolamine, 277phosphatidylinositol-3-kinase, 238phosphodiesterase, 110, 238phosphoenolpyruvate, 34, 39, 40phosphoenolpyruvate carboxykinase,
105phosphofructokinase, 34
allosteric regulation, 23–25, 109phosphofructokinase 2, 110phosphoglucomutase
galactose degradation, 50glycogen degradation, 120glycogen synthesis, 116
6-phosphogluconate, 1336-phosphogluconolactone, 132phosphoglycerate kinase, 34phosphoglycerate mutase, 342-phosphoglycerate, 343-phosphoglycerate, 34phosphohexose isomerase, 34phosphohexoseisomerase
reaction mechanism, 36–37phosphomevalonate kinase, 175phosphopantetheine, 165phosphopentomutase, 2965′-phosphoribosyl-1′-pyrophosphate, 291,
306phosphoribosylamine, 291, 2945′-posphoribosyl-1′-pyrophosphate, 291phosphorylase, see glycogen
phosphorylasephotosynthesis, 3
ping pong bi bi enzyme reactionmechanism, 211
plant sterols, 184, 200polyol pathway, 53–54
in diabetic polyneuropathy, 54Pompe disease, 127
enzyme therapy, 364porphobilinogen deaminase, 325
deficiency, 330porphobilinogen synthase, 324–325porphyria cutanea tarda, 328–329prednisolone, 245pregnane X receptor, 342priapism, 361primaquine, 144probenecid, 303probucol, 201propionate
in β-oxidation, 157propionyl-CoA carboxylase, 157proteasome, 18proteasomes, 28protein kinase A, 110, 122, 158, 242protein kinase B, 238protoporphyrinogen IX, 326PRPP, see 5′-phosphoribosyl-1′
-pyrophosphatepurine nucleoside phosphorylase, 295,
298purine nucleotide cycle, 294purine nucleotide degradation, 297–300purine nucleotide salvage, 300purine nucleotide synthesis
overview, 290–291reactions, 291–294regulation, 294–295
pyrazinamide, metabolites, 304pyridoxal phosphate
amino acid transamination, 210–211pyridoxal phosphateδ-aminolevulinate synthase, 323
glycogen phosphorylase, 120serine dehydratase, 220serine hydroxymethyltransferase,
271pyrimidine nucleoside phosphorylase,
295, 307pyrimidine nucleotide degradation, 307pyrimidine nucleotide synthesis,
305–306pyrophosphatase, 117n
395

Index
pyruvatemitochondrial transport, 58
pyruvate carboxylaseand citric acid cycle, 106mechanism, 103–105role in citric acid cycle, 68
pyruvate dehydrogenase, 58–63coenyzmes, 59–60kinase, 62phosphatase, 63reaction, 58–59reaction mechanisms, 59–61regulation, 62–63subunit structure, 59
pyruvate kinase, 34reaction mechanism, 39regulation, 111
Q cycle, 82–84
Racker experiment, 74–75rasburicase, 305reactive oxygen species
formation by hemoglobin, 322formation in phagocytes, 141formation in the respiratory chain,
78lipid peroxidation, 196–197NADPH and glutathione in
scavenging, 141–142receptor tyrosine kinases, 237red blood cells
anaerobic glycolysis, 34redox potential
and free energy, 80–81measurement, 79–80
respiratory acidosis, 255nrespiratory chain
overview, 71–73protein complexes, 75–77proton pumping
mechanism, 85–87stoichiometry, 87
redox cofactors, 77–78hydrogen and electron carriers, 82single- and two-electron carriers,
82redox potentials and free energies,
81–82regulation, 94–97uncoupling proteins, 73
retinoid X receptor, 243ribonucleotide reductase, 308ribose phosphate diphosphokinase, 291ribose-5-phosphate
hexose monophosphate shunt, 133ribosephosphate diphosphokinase, 313ribulose-5-phosphate, 133
epimerase, 133isomerase, 133
rickets, 178RNA world, 288–289Rolls Royce, 1
S-adenosylhomocysteine, 277S-adenosylmethionine
cycle, 276role in biosynthesis, 277structure, 277
Saccharomyces cerevisiae, 41SAICAR, see purine nucleotide synthesissalicylic acid, 304Sanger, Frederick, 232SCAP, 180–182scavenger receptor, 194sedoheptulose-7-phosphate, 133serine dehydratase, 220–221serine hydroxymethyltransferase, 271serine-pyruvate transaminase, 221serotonin, deficit in phenylketonuria, 224severe combined immunodeficiency, 360Sherlock Holmes, 1Sinorhizobium meliloti, 4sitosterol, 200
structure, 184sitosterolemia, 203–204skeletal muscle
Cori cycle, 125–126glycogen content, 113glycogen utilization, 124–125
skin pigmentation, 178slow acetylators, 349–350smooth muscle, 31nSn-mesoporphyrin, 334sodium glucose transporter (SGLT1), 14sorbitol, 53sphingomyelin, 278squalene
cyclization, 177synthesis, 177
SREBP, 180–182
396

Index
SREBP cleavage activating protein (SCAP),180–182
standard hydrogen electrode, 79standard redox potential, 80statins, 199stearate, 149sterol response element-binding protein
(SREBP), 180–182stomach, 9–10
parietal cells, 283striated muscle, 31nsubstrate cycles
in gluconeogenesis, 108–109metabolic regulation, 27–28
succinate, 65succinate dehydrogenase, 65succinate thiokinase, 65succinobucol, 201succinyl-aminoimidazole-carboxamido-
ribotide synthetase,291
succinyl-CoApropionate utilization, 157TCA cycle, 65
succinyl-CoA mutase, 157succinylphosphate, 40sucrase, 48sucrose
degradation, 48–49sugar beet, 48sugar cane, 48sulfonamides, 274–275sulfonylurea receptor, 234–236superoxide, see reactive oxygen speciessuperoxide dismutase, 141
T cell receptors, 257T lymphocytes, subtypes and functions,
256–258Tangier disease, 203TCA cycle, see citric acid cycletenofovir disoproxil, 318terminal ileum
bile acid reuptake, 189cobalamin uptake, 282
tetrahydrofolaterole in biosynthesis, 269–271, 274
thermogenin, 159thiamine pyrophosphate
pyruvate dehydrogenase, 60–61transketolase, 135–136
thioesteras an energy-rich group, 40in the glyceraldehyde-3-phosphate
dehydrogenase reaction, 38thioguanine, 313thiolase
cholesterol synthesis, 175reaction mechanism, 156–157
thiopurine methyltransferase, 313thioredoxin, 350thrombocytes
anaerobic glycolysis, 34thymidylate synthase, 309, 311thyroid hormones
signaling mechanims, 243–244tocopherol, 197tolbutamide, 236transaldolase, 133
reaction mechanism, 136transamination, see amino acids,
transaminationbranched chain amino acids, 221
transcobalamin, 282transition state, 20, 22transketolase, 133
IUBMB nomenclature, 20reaction mechanism, 135–136
translational antitermination, 356–358triacylglycerol
digestion and uptake, 149–151efficiency of energy storage, 147–148solubilization by bile acids, 149–150structure, 149utilization, organ relationships,
158–159triacylglycerol lipase, 150trimethoprim, 275triose phosphate isomerase, 34triparanol, 201tumor lysis syndrome, 304–305tyrosine degradation, 222–223tyrosine transaminase, 223tyrosinemia, 227
ubiquinone, see coenzyme Q, 78ubiquitin, 28UDP-galactose, 50UDP-glucose
in galactose degradation, 50UDP-galactose epimerase, 50, 53UDP-glucose
397

Index
glycogen synthesis, 116UDP-glucuronic acid
biosynthesis, 117ulcers, gastric and duodenal, 10uncoupling proteins, 73, 244URAT1 transporter, 299urate oxidase, see uricaseurea cycle
distribution of enzyme activity(, 217distribution of enzyme activity), 218enzyme defects, 219
alternate pathway therapy, 350integration with other pathways,
213–216reactions, 212–213regulation, 218–219
uric aciddegradation in non-primates,
299–300formation, 299renal elimination, 299
uricase, 299therapeutic use, 305
uricosuric drugs, 299, 303
uridine triphosphate (UTP)glycogen synthesis, 117
uroporphyrinogen decarboxylase, 326uroporphyrinogen III cosynthase, 325uroporphyrinogen III decarboxylase
deficiency, 328
very low density lipoprotein, 183vitamin B12
propionate utilization, 157vitamin B12, see cobalaminvitamin B6 deficiency, 327vitamin D, 178vitamin E, 197VLDL, see very low density lipoproteinvon Gierke disease, 126–127
xanthine, 299xanthine dehydrogenase/oxidase, 297,
298, 303, 313xanthosine monophosphate (XMP), 294xenobiotic response elements, 342xylose, 36xylulose-5-phosphate, 133
398