Not Invented Here? Innovation in company towns
38
Not Invented Here? Innovation in Company Towns Ajay Agrawal * Iain Cockburn † Carlos Rosell ‡§ September 11, 2009 Abstract We examine variation in the concentration of inventive activity across 72 of North America’s most highly innovative locations. In 12 of these areas, innovation is particu- larly concentrated in a single, large firm; we refer to such locations as “company towns.” We find that inventors employed by large firms in these locations tend to draw dispro- portionately from their firm’s own prior inventions (as measured by citations to their own prior patents) relative to what would be expected given the underlying distribution of innovative activity across all inventing firms in a particular technology field. Further- more, we find such inventors are more likely to build upon the same prior inventions year after year. However, smaller firms in company towns do not exhibit this myopic behavior; they draw upon prior inventions as broadly as their small-firm counterparts in more diverse locations. In addition, we find no evidence that inventions from company town firms, large or small, have any less impact. However, inventions by large firms in company towns do seem to have a narrower impact in terms of geographic scope. Furthermore these firms appropriate a disproportionately large fraction of their impact themselves. JEL classification: O18, O33, R11 Keywords: Knowledge flows, agglomeration, recombination, innovation, entrepreneurship * University of Toronto and NBER † Boston University and NBER ‡ Department of Finance, Government of Canada § We thank David Audretsch, Ron Jarmin, Ed Glaeser, Stuart Rosenthal, Will Strange, Peter Thompson, and participants at the NBER Cities and Entrepreneurship Conference for helpful comments. This research was partially funded by the Social Sciences and Humanities Research Council of Canada (Grant No.410-2009- 2020) and the Martin Prosperity Institute. Their support is gratefully acknowledged.
-
Upload
independent -
Category
Documents
-
view
0 -
download
0
Transcript of Not Invented Here? Innovation in company towns

Not Invented Here?
Innovation in Company Towns
Ajay Agrawal∗ Iain Cockburn† Carlos Rosell‡§
September 11, 2009
AbstractWe examine variation in the concentration of inventive activity across 72 of North
America’s most highly innovative locations. In 12 of these areas, innovation is particu-larly concentrated in a single, large firm; we refer to such locations as “company towns.”We find that inventors employed by large firms in these locations tend to draw dispro-portionately from their firm’s own prior inventions (as measured by citations to theirown prior patents) relative to what would be expected given the underlying distributionof innovative activity across all inventing firms in a particular technology field. Further-more, we find such inventors are more likely to build upon the same prior inventionsyear after year. However, smaller firms in company towns do not exhibit this myopicbehavior; they draw upon prior inventions as broadly as their small-firm counterparts inmore diverse locations. In addition, we find no evidence that inventions from companytown firms, large or small, have any less impact. However, inventions by large firmsin company towns do seem to have a narrower impact in terms of geographic scope.Furthermore these firms appropriate a disproportionately large fraction of their impactthemselves.
JEL classification: O18, O33, R11
Keywords: Knowledge flows, agglomeration, recombination, innovation, entrepreneurship
∗University of Toronto and NBER†Boston University and NBER‡Department of Finance, Government of Canada§We thank David Audretsch, Ron Jarmin, Ed Glaeser, Stuart Rosenthal, Will Strange, Peter Thompson,
and participants at the NBER Cities and Entrepreneurship Conference for helpful comments. This researchwas partially funded by the Social Sciences and Humanities Research Council of Canada (Grant No.410-2009-2020) and the Martin Prosperity Institute. Their support is gratefully acknowledged.

1 Introduction
The mechanisms that underlie the agglomeration benefits that offset congestion costs and
result in the observed geographic concentration of economic activity are of central interest in
urban economics. For example, Glaeser et al. (1992) contrast three theories (Marshall-Arrow-
Romer, Porter, Jacobs), all of which emphasize agglomeration benefits due specifically to
knowledge spillovers while advancing differing views on the ways in which their importance to
city growth is mediated by industrial diversity and market structure. The evidence presented
in that paper indicates that knowledge spillovers across, rather than within, industries is
most important, supporting the idea that diverse regional “hubs” of economic activity enjoy
a productivity advantage relative to other locations. These hubs also appear to be unusually
fertile locations for entrepreneurial ventures (Acs (2002)).
These ideas are exemplified by the well known success of Silicon Valley – a quintessential
hub characterized by technological diversity and many small, entrepreneurial firms (in ad-
dition to high-performing large firms) that make up a highly competitive market structure.
However, other locations are also innovative but are, relatively, neither technologically diverse
nor particularly dispersed in terms of the local market structure. Route 128 in Massachusetts
and Research Triangle Park in North Carolina are locations often contrasted with Northern
California since they are dominated by fewer and larger firms. Of course there are much more
extreme examples, such as Rochester, New York; Boise, Idaho; and Peoria, Illinois, that,
while being innovative locations, are even more concentrated and dominated by a single firm
(Kodak, Micron, and Caterpillar, respectively).
How might such variety in city types coexist if the advantages conferred upon firms located
in diverse hubs are indeed real and significant? Duranton and Puga (2001) provide a theory
of “nursery cities” that integrates the entrepreneurship literature with urban economics by
emphasizing the difference in benefits to diversity of location across the life cycle of products.
Entrepreneurial firms developing new products benefit from being located in diverse cities
because they can more easily borrow from different activities but once they have settled on
2

their “ideal process” they benefit from being in specialized cities where production costs are
lower.
These seminal theories are predicated on the assertion that inventors have easier access to
ideas that are local. This belief is based on the notion that not all knowledge associated with
inventions is codified, but rather much is tacit and thus more easily transferred by way of
face-to-face interactions, which are more likely to occur between co-located individuals (Arrow
(1962), Polanyi (1966), Nelson and Winter (1982), Kogut and Zander (1992), Agrawal (2006)).
This assumption is consistent with the empirical findings of Jaffe et al. (1993) that knowledge
flows are localized.
However, the propensity to transfer information between inventors may vary across firm
and location types even controlling for distance. In fact, in her comparison of Silicon Valley to
Route 128, Saxenian (1994) highlights regional variation in the culture of sharing knowledge
across organizations as one of the central explanations for the difference in the performance
of firms between those two locations. On a related theme Almeida and Kogut (1999) exploit
the variation in intra-regional labor mobility to explain regional variation in the localization
of knowledge spillovers, arguing that the circulation of people within a city drives knowledge
flow. To the extent that access to knowledge is central to productivity and growth, such
regional variation in the sourcing of knowledge is of considerable importance.
In this paper we further explore differences across types of regions in the sourcing of
knowledge. In doing so we focus on innovation, rather than production, an activity where
anecdotal evidence points to a substantial performance penalty associated with insularity and
lack of diversity: the Not Invented Here (NIH) Syndrome. Specifically, we examine innovation
in “company towns” – cities within which innovative activity is highly concentrated in a few
firms, and which also tend to be relatively small in terms of absolute size. In contrast to the
positive productivity and growth effects associated with large, diverse, and competitive hubs,
in these cities we expect to see a distinct effect of location on innovation. We conjecture that
if in fact company town inventors suffer from reduced access to knowledge, then that would be
3

reflected in the prior inventions upon which they choose to build. In other words, creativity in
these locations would tend to be more myopic, drawing less upon “outside” knowledge than
would be expected given the underlying distribution of knowledge across the economy. This
myopia may in turn have a negative impact on the productivity of innovative activity.
We begin our empirical exploration of this issue by examining how myopia in the creative
process of invention is related to the concentration of inventive activity across locations.
We find that creativity in company towns is indeed more myopic on certain dimensions.
In particular, inventors in these locations are more likely than others to build upon prior
inventions developed in their own firm, even after controlling for the underlying distribution
of relevant innovative activity across all firms. Furthermore, firms in these locations are more
likely to draw upon the same set of prior inventions year after year, whether or not it is
their own, compared to firms in more diverse locations that more quickly refresh the pool of
knowledge upon which they build.
However, perhaps more surprisingly, we find no evidence of this myopic behavior among
small firms in company towns. These firms draw just as broadly from external sources in
terms of the prior inventions they build upon as their small-firm counterparts in more diverse
locations. The NIH Syndrome thus seems to be a feature only of large firms based in company
town locations characterized by a lack of industrial diversity and a concentrated local market
structure of invention.
We then turn to examining whether the observed myopia in company towns matters.
Specifically, we examine the relation between creative myopia and the impact on subsequent
innovation. We find no evidence that company town inventions have less impact on future
innovation. However, we do find that the impact of inventions by large firms in company
towns is narrower in terms of geographic scope. Moreover, a larger fraction of the impact is
appropriated by the inventing firm itself.
Yet, without data to distinguish between impact that is priced (e.g., through licensing)
versus non-priced (i.e., a genuine externality of the type specified in Romer (1990)), the
4

implications of our findings for growth are ambiguous. In other words, despite an apparent
reduced access to localized knowledge spillovers from other firms, our results offer no basis
to conclude that company town innovation is inferior in terms of its contribution to welfare
or firm-level productivity relative to that of other locations, even though it appears to be
somewhat more myopic at large firms.
2 Background
Knowledge externalities – or “spillovers” – play a critical role in most theories of innovation
and growth, reflecting the widespread recognition that inventions usually incorporate or build
upon ideas or information generated by others and that in many instances access to these
inputs to the knowledge production function is not explicitly priced. In Alfred Marshall’s
memorable phrase, ideas are “as it were, in the air.”
But are these ideas equally accessible to all potential users? Research on the microfounda-
tions of spillovers suggests not. On the one hand, knowledge externalities appear to be quite
strongly localized, likely due to their tacitness (Jaffe et al. (1993), Rosenthal and Strange
(2001), Rosenthal and Strange (2008), Agrawal et al. (2008)). Even in an era of relatively
low communication costs and increasingly systematized, codified, and searchable knowledge,
inventors appear to be significantly less likely to use knowledge generated in physically distant
locations.
On the other hand, analysis of the organization and management of corporate R&D has
shown that firms invest significant resources in order to develop “absorptive capacity” to
enhance their ability to exploit externally generated knowledge (Cohen and Levinthal (1989),
Cockburn and Henderson (1998)). In other words, even if not explicitly priced, accessing
ideas generated by others is not costless and may be strongly conditioned by institutions,
geography, and the optimizing responses of firms and inventors.
One interesting and important factor driving the cost of accessing knowledge spillovers is
the structure of local innovation markets. The foundational work of Glaeser et al. (1992),
5

Audretsch and Feldman (1996), and Rosenthal and Strange (2003), among others, has linked
knowledge spillovers to the location and composition of production activity. The finding of
Feldman and Audretsch (1999) – that diversity of economic activity at a given location pro-
motes innovation – is particularly provocative in that it links the nature of “local knowledge”
to theories of “recombinant” growth (Weitzman (1998)). Other research has linked spillovers
to industry structure in the industrial organization sense; for example, Feldman (2003) and
Agrawal and Cockburn (2003) link the efficiency of local knowledge spillovers to the presence
of large “anchor tenant” firms.1
Here, we investigate another potential source of heterogeneity in the cost of accessing
spillovers: the (alleged) propensity of R&D workers to discount or ignore sources of knowledge
that are external to their team or organization. Katz and Allen (1982) popularized the so-
called NIH Syndrome in their study of the propensity of research teams with little turnover
to become progressively less productive.2 The NIH Syndrome has since been widely evoked
by practicing managers and in managerially oriented scholarship (Kanter (1983), Leonard-
Barton (1995), Chesbrough (2006)), and journalists have identified colorful instances such
as Apple Computer in the early 1990s where managers inhabited a “reality distortion field”
that led them to reject good ideas because they were not generated in-house.3 However,
there is surprisingly little quantitative evidence as to the prevalence and impact of the NIH
Syndrome. A handful of managerial surveys (e.g., de Pay (1989), Mehrwald (1999)) have
identified systematic biases against external knowledge, though Menon and Pfeffer (2003)
find the opposite effect – a systematic preference for outsider knowledge.
Why might such a bias exist? One reason simply may be that the cost of accessing exter-
nal knowledge is higher than for accessing internal knowledge. This is likely to be the case
when knowledge is transmitted by person-to-person contact or when an organization raises
1Klepper and Simons (2000a) and Klepper and Simons (2000b) also identify the role of industry structure inthe sense of incumbents versus entrants driving localized innovation but emphasize knowledge that is internalrather than external to the firm.
2Clagett (1967) is an earlier reference.3Burrows, P. “Apple; Yes Steve, You fixed it. Congrats, now what’s next?” Business Week, July 31, 2002,
p.102.
6
barriers to external sources of knowledge (for example, by restricting participation in peer
communities or travel to conferences) in the name of limiting disclosure of trade secrets (Cock-
burn and Henderson (1998)). Social psychologists also suggest powerful effects of “in-group
favoritism” and “out-group derogation” as mechanisms supporting social identity (Brewer
and Brown (1998)). Group affiliation and social identity may be an important contributor
to self-esteem, satisfaction, or intrinsic motivation (Hogg and Abrams (1988)), and private
rewards from affiliating with groups or strengthening groups may therefore play a significant
role in shaping individual behavior. Economists also have interpreted group affiliation and
actions that reinforce group membership as efficient mechanisms for supporting coordination
or developing trust among group members that facilitate within-group transactions (Glaeser
et al. (2000), Efferson et al. (2008)). In addition, it may be the case that these factors that
influence the propensity to source knowledge externally are mediated by firm size. Indeed,
we will see that large firms seem more susceptible to myopic behavior.
In this paper, we test for evidence of a systematic bias against use of knowledge that is
external to the firm as shown by the propensity to “self-cite” patents. Our analysis focuses
on the role of geography to the extent that location characteristics (i.e., diversity and lo-
cal market structure) mediate firm-level tendencies towards myopic behavior. We recognize
that self-citation may occur for many reasons. Individuals or organizations working in highly
specialized fields or on very specific topics are more likely than average to self-cite simply
because they constitute a large fraction of the relevant prior work. Self-citation within an
organization may also be more likely to occur because of the lower cost of accessing knowl-
edge that is familiar or transmitted by person-to-person contact. We hypothesize that the
cultural/behavioral forces driving the NIH Syndrome may be particularly strong in the social
or institutional environment of company towns where the activity of a single firm dominates
the local innovation market. Thus, although the NIH Syndrome may cause elevated levels of
self-citation within an organization, laboratory, or work group, it is likely to be difficult to
distinguish it from other factors driving self-citation. Here, however, we believe that geogra-
7

phy may provide a useful source of identification. If this is the case, then the NIH Syndrome
may be visible in the propensity of organizations in such locations to self-cite at a rate that
is “above baseline.”
3 Data
We construct our sample using data from the United States Patent and Trademark Office
(USPTO).4 We collect all utility patents issued between the years 1985 and 1995, inclusive.
This represents 984,888 patents. We limit our focus to the US and Canada and thus drop
all patents that do not have at least one inventor residing in either country. This reduces
our sample to 540,999 patents. Furthermore, we drop all patents that are not assigned to
non-government organizations, including unassigned patents. In other words, we only keep
patents assigned to organizations such as firms, universities, and hospitals. This results in a
sample of 392,830 patents.
We further refine our sample by focusing only on geographic locations that are reasonably
active in innovation. To achieve this, we use city, state/province, and country data associated
with inventor addresses to assign each inventor to an MSA. We then count the number of
patent-inventors per MSA where all inventors are located in the same MSA. For example, if
a patent has two inventors, one in Boston and one in New York, we ignore this patent when
counting the number of patents in these two cities. However, if both inventors are in Boston,
then that patent increases Boston’s patent count by one. We then drop the MSAs that have
fewer than 500 of these patent-inventors. As such, we focus our attention on the 72 most
highly innovative MSAs (down from a total of 408 MSAs). This reduces the total number of
focal patents to 264,078. We use this set of patents as our base sample.
4Specifically, we use USPTO data that Bronwyn Hall and her collaborators cleaned and coded (Hall et al.(2002)).
8

4 Methodology
In this section, we describe the empirical techniques employed to address the following two
questions: 1) Do inventors based in locations characterized by more concentrated inventive
activity exhibit higher levels of creative myopia? 2) Do inventions developed in locations that
are more myopic have less impact on future innovation? We use US patent data to construct
our key measures of innovative activity and in particular utilize citation data to construct
measures of myopia (citations made) and impact (citations received). We begin by defining
our two key measures of MSA-level concentration of inventive activity.
4.1 Concentration of Inventive Activity
We measure the concentration of inventive activity across MSAs on two dimensions: 1) across
firms and 2) across technology fields. In both cases, we use a Herfindahl-type index to
characterize the degree of concentration. We characterize particularly concentrated locations
as company towns. We describe the construction of each measure below.
4.1.1 Concentration Across Firms
We base our measure of the concentration of inventive activity on a Herfindahl-type metric
that characterizes how patents by inventors in a particular MSA are distributed across firms
(i.e., assignees). In other words, if Nmsa represents the total number of patents by inventors
located in a given MSA and Nmsa,i represents the number of patents issued to assignee i, then
we define our measure FirmConcentrationmsa as:
FirmConcentrationmsa =[1 −
∑i∈I
(Nmsa,i
Nmsa
)2] Nmsa
Nmsa − 1
where I is the set of all assignees within the MSA that have been issued a patent.
This measure is similar to the well-known measures of basicness and generality that Hall
et al. (2002) introduced. However, rather than measuring the concentration of citations made
9

and received by a patent in a particular technology field, we instead use it to measure the
concentration of firm inventive activity within an MSA. This measure takes values between
zero and one, where MSAs with inventive activity more highly concentrated among assignees
score values closer to zero and those with greater dispersion obtain values closer to one.5
4.1.2 Concentration Across Technology Fields
We construct our technology field concentration measure in a similar fashion. However, rather
than measuring the dispersion of patents across assignees, we measure dispersion across two-
digit technology fields.6 Specifically, if Nmsa,t represents the number of patents developed by
inventors located in a particular MSA and categorized as belonging to technology field t, we
define our technology field concentration measure TechnologyConcentrationmsa as:
TechnologyConcentrationmsa =[1 −
∑t∈T
(Nmsa,t
Nmsa
)2] Nmsa
Nmsa − 1
where T is the set of all technology fields to which patents can be assigned. This measure
takes values between zero and one, where MSAs that are more diverse in their technological
landscape obtain values closer to one and those that are more narrowly focused take values
closer to zero.7
4.1.3 Company Towns
We classify locations that are particularly concentrated along these two dimensions as com-
pany towns. Specifically, 12 (16.7%) of our 72 MSAs with the highest levels of innovative activ-
ity are measurably more concentrated than the others. We characterize the MSAs with innova-
tion market structure product values (TechnologyConcentrationmsa∗FirmConcentrationmsa)
5We drop patents that are not assigned when we calculate this measure. However, we test the robustnessof our results by treating unassigned patents in an MSA: 1) as if they are all assigned to a single assignee inthat location and 2) as if they are each assigned to a different assignee in that location. Our results persist.
6Hall et al. (2002) describe the two-digit classification scheme, which has 36 distinct technology categoriesthat can be aggregated into six broad one-digit categories.
7Again, we drop patents that have no specified assignee when we calculate this measure.
10

of less than 0.7 as company towns. The value of this product index for each of our company
towns is at least 3.5 standard deviations below the mean of the non-company town sample
(or 0.84 standard deviations below the mean of the full sample). Perhaps more intuitively,
they appear as outliers upon visual inspection of the scatter plot presented in Figure 1.
In descending order according to the overall level of inventive activity as measured by
patents, the MSAs we characterize as company towns include: 1) Rochester, NY (Kodak), 2)
Albany, NY (General Electric), 3) Saginaw, MI (Dow), 4) Baton Rouge, LA (Ethyl Corp.),
5) Harrisburg, PA (AMP), 6) Ottawa, ON (Nortel), 7)Rockford, IL (Sundstrand Corp.),
8) Boise, ID (Micron Technology Inc.), 9) Binghamton, NY (IBM), 10) Johnson City, TN
(Kodak), 11) Melbourne, FL (Harris), and 12) Peoria, IL (Caterpillar).8
We list these locations and describe their innovative activity in Table 1. We note several
interesting observations about this set of locations. First, they vary considerably in their
levels of innovative activity. The largest MSA, Rochester, has just over 10 times the amount
of patents (10,950) as the smallest, Peoria (976). Second, in every case the role of the
dominant firm is significant. Even in Ottawa, where the dominant firm, Nortel, plays the
least significant role relative to the overall inventive activity in its location, it still accounts
for more than 30% of all patents invented in that MSA during the sample period. At the
other extreme, General Electric accounts for almost 72% of all patents invented in Albany.
Third, company towns vary significantly in terms of their importance to the overall inven-
tive activity of their dominant firms. For example, Binghamton and Johnson City account for
just under 10% of all inventive activity by IBM and Kodak, respectively. On the other hand,
Baton Rouge and Boise account for, respectively, 86% of Ethyl Corp.’s and 97% of Micron
Technology Inc.’s overall inventive activities.
Fourth, small firms, which we define simply by their level of inventive activity (less than
400 patents issued over the 11-year study period), account for approximately 20% of inventive
activity in Rochester, Albany, and Saginaw, but over 60% in Baton Rouge and Ottawa. It is
8We list the dominant firm associated with each company town in brackets.
11

also interesting to note that while Rochester, Albany, and Saginaw have other large firms in
addition to their dominant firm, the other MSAs do not.9
Finally, we illustrate the geographic distribution of our company towns in Figure 2. Al-
though we base our data on a sample of patents issued reasonably recently (1985-1995), our
company towns are predominantly located in older industrial locations. Specifically, four
are in the Northeast (Rochester, Albany, Binghamton, Harrisburg), three are in the Midwest
(Peoria, Rockford, Saginaw), three are in the South (Johnson City, Melbourne, Baton Rouge),
and only one is in the West (Boise), while one is in Canada (Ottawa).
4.2 Creative Myopia
Creative myopia is a measure of the degree to which inventors are “nearsighted” in drawing
disproportionately from prior inventions that are in some way close to them. We employ
several myopia metrics to capture different dimensions of distance. These include: 1) Or-
ganizational Myopia: self-cite (building disproportionately on the inventing firm’s own prior
inventions), 2) Organizational Myopia: new knowledge (building disproportionately on prior
inventions the focal firm has built on before), 3) Technological Myopia (building dispropor-
tionately on prior inventions from the same field as the focal invention), 4) Locational Myopia
(building disproportionately on prior inventions from the same MSA as the focal invention),
and 5) Temporal Myopia (building disproportionately on older prior inventions). We describe
the construction of each of these measures in turn.
4.2.1 Organizational Myopia: Self-citation to Own Prior Inventions
We measure this type of myopia by the extent to which a firm’s patents draw upon its own
prior inventions. We do this by assessing the extent to which citations on a patent refer to
prior patents by the same firm as the patent making the citation. Specifically, for each MSA
we count the total number of citations, Cmsa, made by patents produced in the MSA. Of these
9In other words, for most MSAs, the percentage of patents assigned to the dominant firm plus small firmsadd up to almost 100%.
12

citations we then count those where the assignee of the citing and cited patents is the same.
This is an assignee self-citation and the total number of these is given by Csmsa. Consequently,
the average rate at which firms within an MSA make self-citations is given by,
SelfCiteMyopiamsa =Cs
msa
Cmsa
4.2.2 Organizational Myopia: Use of New Knowledge
Considering all patents issued to a firm in a particular year and a particular two-digit technol-
ogy field, we measure “New Knowledge” as the fraction of the prior art aggregated over this
set of patents that is cited by the firm for the first time.10 Thus, to construct this measure,
we determine the number of unique patents, Ca,s,t, that are cited by assignee a’s set of patents
issued in year s in technology field t. We further determine the number of these citations
made for the first time by a, Cfa,s,t. Consequently, we define our new knowledge measure as:
NewKnowledgeMyopiaa,s,t =Cf
a,s,t
Ca,s,t
Thus, this measure can take values between zero and one. The closer this measure is to zero,
the more myopic the firm’s inventive process. That is to say, lower values of this measure
indicate that the firm tends to build on the same prior art as it did in the past, even if that
prior art was not invented by the firm itself.
At the MSA level, new knowledge myopia is given as the average value of NewKnowledgeMyopiaa,s,t
across all assignees and technology fields in the MSA during our sample period.
10We are limited to patent data for each assignee back to 1976. Therefore, we drop citations to patentsissued before 1976 from both the numerator and denominator of this fractional count measure. Thus, “firsttime” actually means cited for the first time since 1976. We do not consider this data limitation problematicsince our sample includes patents issued between 1985 and 1995.
13

4.2.3 Technological Myopia
We construct technological myopia in a similar fashion and with the same citation data as
organizational myopia. Here, we measure the degree to which firms within an MSA make
citations that refer back to patents categorized in the same two-digit technology field as the
patents that make the citations. The greater the share of citations that refer to patents in
the same technology field, the greater the level of technological myopia. Specifically, if Cmsa
denotes the number of citations made by all patents in a given MSA and Cgmsa refers to the
number of these citations where the citing and cited patent share the same technology field,
then technological myopia is defined as:
TechnologyMyopiamsa =Cg
msa
Cmsa
4.2.4 Locational Myopia
Locational myopia describes the degree to which patents produced within a given MSA cite
patents produced in the same MSA. However, patents may have multiple inventors based in
different locations. Therefore, to construct this measure we focus on the number of patent-
MSA pairs that are cited and how many of these pairings involve the same MSA in which
the citing patents are produced. Generally, if patents within an MSA cite a total of Cmsa
patent-MSA pairs and C lmsa of these citations refer to patent-MSA pairs originating in the
same MSA as the citing patents then, the locational myopia measure is given by:
LocationMyopiamsa =C l
msa
Cmsa
4.2.5 Temporal Myopia
Our temporal myopia measures include the average and minimum citation lags measured in
years. Specifically, we define a lag as the difference between the grant year of the citing patent
i, (gyeari), and the grant year of a cited patent x, (gyearx). Thus, the average citation lag is
14
the average difference in grant years between the citing patent and each cited patent. That
is, if the citing patent makes C citations, then the average citation lag is:
AverageCitationLagi =1
C
C∑x=1
(gyeari − gyearx)
In contrast, the minimum citation lag is:
LagtoMostRecentPatenti = min{gyeari − gyearx}|Cx=1
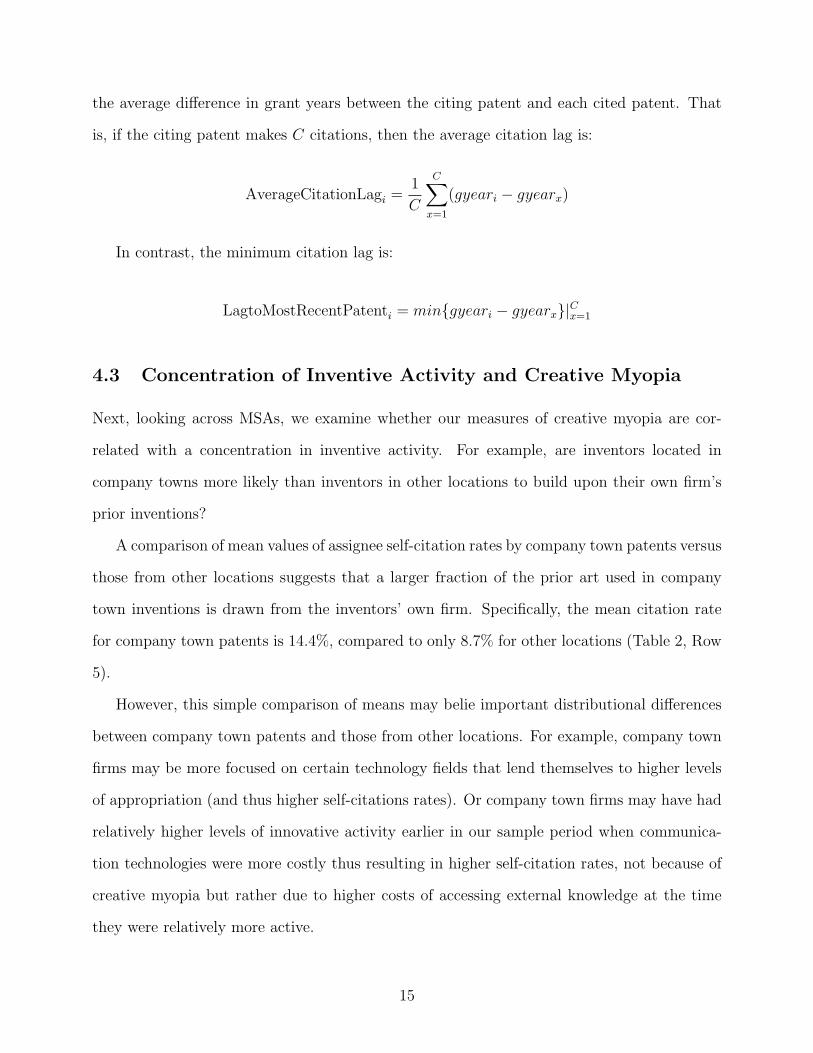
4.3 Concentration of Inventive Activity and Creative Myopia
Next, looking across MSAs, we examine whether our measures of creative myopia are cor-
related with a concentration in inventive activity. For example, are inventors located in
company towns more likely than inventors in other locations to build upon their own firm’s
prior inventions?
A comparison of mean values of assignee self-citation rates by company town patents versus
those from other locations suggests that a larger fraction of the prior art used in company
town inventions is drawn from the inventors’ own firm. Specifically, the mean citation rate
for company town patents is 14.4%, compared to only 8.7% for other locations (Table 2, Row
5).
However, this simple comparison of means may belie important distributional differences
between company town patents and those from other locations. For example, company town
firms may be more focused on certain technology fields that lend themselves to higher levels
of appropriation (and thus higher self-citations rates). Or company town firms may have had
relatively higher levels of innovative activity earlier in our sample period when communica-
tion technologies were more costly thus resulting in higher self-citation rates, not because of
creative myopia but rather due to higher costs of accessing external knowledge at the time
they were relatively more active.
15

We employ a matched sample method similar to that pioneered by Jaffe et al. (1993)
in order to control for the underlying distribution of innovative activity across technology
fields and time.11 We begin with the set of company town patents where all inventors on
each patent, in cases of multiple-inventor patents, are based in the same location. There
are 23,007 such patents. We then select a “control patent” for each company town patent
using the following algorithm: 1) Construct the control sample from patents originating in
the 60 MSAs that are not identified as company towns and that do not have any inventors
residing in any of the 12 company town MSAs; 2) Of these, identify patents having the same
application year as the focal patent; 3) Of these, identify the patent(s) having the most USPC
classifications in common with the focal patent. At minimum, eligible control patents will
have in common the three-digit technology field. Otherwise, control patents have the same
primary classification or the same primary and secondary classification and so on, and we
choose the patent that exhibits the greatest degree of similarity with the focal patent. If we
are unable to find a control patent with at least the same 3-digit technology field as the focal
patent, then we drop the focal patent from the sample; 4) If more than one control patent
remains as the “best” possible control, then we select the patent closest to the focal patent
in terms of issue date as the control (in the event of a tie, we select randomly).12
4.4 Conditional Logit Model
To confirm the results of the matched pair analysis and to control for other determinants
of self-citation, we estimate a conditional logit model for the probability of each citing-cited
pair of patents in the sample falling into one of the following mutually exclusive categories:
(a) a self-citation within the same “laboratory,” (b) a citation made by the focal laboratory
11We fully appreciate the critiques of this method presented in Thompson and Fox-Kean (2005) and Thomp-son (2006). We address this by matching on both more detailed and multiple technology categories; still, werecognize that the matching process is imperfect. We further address this issue in our conditional logitanalysis.
12Given the construction of our matched sample, the potential exists that a given control patent is matchedmultiple times to different focal patents. In addition, at a broad conceptual level, we note that this method-ology implicitly assumes that the spatial distribution of patents, technology, and firms are all exogenous andindependent.
16

to another entity within the same MSA, or (c) a citation to prior inventions developed out-
side the inventors’ own MSA.13 In the spirit of the classic citation function (Caballero and
Jaffe (2002)), we control for differences in the number of potentially citable patents in each
category by estimating the McFadden choice model (McFadden (1974)) with the size of the
relevant pool of possible citations as an attribute of each of these alternatives.14 In these
regressions, the main variables of interest are the company town dummy and the large labo-
ratory dummy.15 We also control for MSA size (total number of patents and population), the
number of university patents in the MSA, the technology class of the citing patent, and the
citation lag (difference between the grant years of the citing and cited patents).
4.5 Creative Myopia and the Impact on Future Innovation
We employ the count of citations received by a patent as a proxy for the impact it has had
on subsequent innovation. Several studies have shown the number of citations received to be
correlated with various measures of patent value, including patent renewals (Harhoff et al.
(1999)), consumer surplus (Trajtenberg (1990)), expert opinion (Albert et al. (1991)), and
market value of the assignee firm (Hall et al. (2005)).16
We compare the relative impact of inventions across location types using the matched
sample method. To this end we employ the same sample of matched patents as that described
above to determine whether patents originating in company towns receive fewer citations than
similar patents originating in more industrially diverse locations.
13We use the term “laboratory” to denote the research presence of a firm in a single location. In otherwords, we would refer to a firm that patents in three locations as having three labs. Where it is obvious thatwe are referring to a firm in a single location context we use the term “firm” and “lab” interchangeably.
14Citation functions of the type proposed by Caballero and Jaffe (2002) that are estimated from cell countsprove very difficult to estimate for these data since cells are so sparsely populated.
15We use the term “large” laboratories to denote those labs that are assigned 400 or more patents over theperiod under study: 1985-1995.
16In addition, the interpretation of citations received as a proxy for impact is consistent with that held bythe USPTO: “If a single document is cited in numerous patents, the technology revealed in that documentis apparently involved in many developmental efforts. Thus, the number of times a patent document is citedmay be a measure of its technological significance.” (Office of Technology Assessment and Forecast, SixthReport, 1976, p. 167).
17
5 Results
In this section, we report results on our two relationships of interest: 1) concentration of
inventive activity and myopic behavior and 2) creative myopia and impact on subsequent
innovation. Overall, we find a positive correlation between concentration and lab-level myopia
(though not other types) but uncover no evidence of a correlation between myopia and impact.
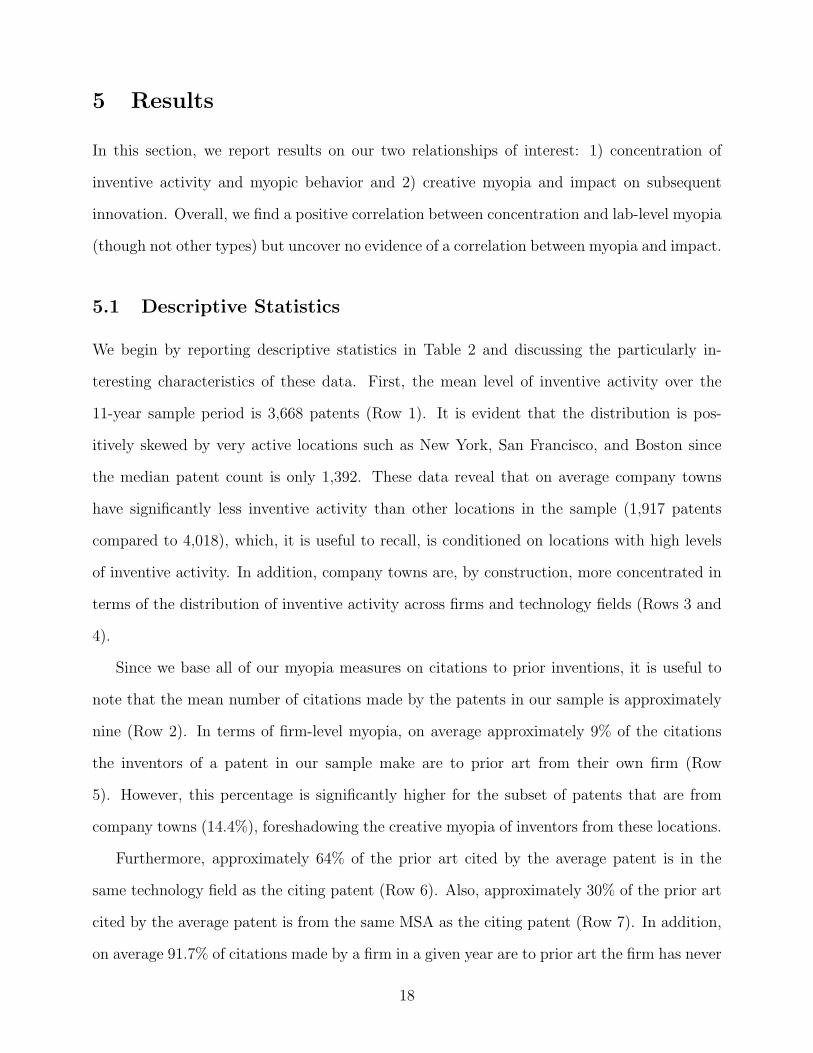
5.1 Descriptive Statistics
We begin by reporting descriptive statistics in Table 2 and discussing the particularly in-
teresting characteristics of these data. First, the mean level of inventive activity over the
11-year sample period is 3,668 patents (Row 1). It is evident that the distribution is pos-
itively skewed by very active locations such as New York, San Francisco, and Boston since
the median patent count is only 1,392. These data reveal that on average company towns
have significantly less inventive activity than other locations in the sample (1,917 patents
compared to 4,018), which, it is useful to recall, is conditioned on locations with high levels
of inventive activity. In addition, company towns are, by construction, more concentrated in
terms of the distribution of inventive activity across firms and technology fields (Rows 3 and
4).
Since we base all of our myopia measures on citations to prior inventions, it is useful to
note that the mean number of citations made by the patents in our sample is approximately
nine (Row 2). In terms of firm-level myopia, on average approximately 9% of the citations
the inventors of a patent in our sample make are to prior art from their own firm (Row
5). However, this percentage is significantly higher for the subset of patents that are from
company towns (14.4%), foreshadowing the creative myopia of inventors from these locations.
Furthermore, approximately 64% of the prior art cited by the average patent is in the
same technology field as the citing patent (Row 6). Also, approximately 30% of the prior art
cited by the average patent is from the same MSA as the citing patent (Row 7). In addition,
on average 91.7% of citations made by a firm in a given year are to prior art the firm has never
18

cited before (Row 8). Finally, in terms of impact, the mean patent in our sample receives a
citation from approximately 14 subsequent inventions (Row 10).
We provide insight into the differences in citing behavior between inventors from company
towns and those from other locations in Table 3. Although inventors of the average company
town patent self-cite with almost twice the propensity of the average patent from other loca-
tions (19.5% compared to 10.6%; Column 2, Rows 5 and 6), company town inventors make
less than half the proportion of citations to prior art from the local MSA that was not devel-
oped by their own firm (2.8% compared to 7.0%; Column 3). The inventors of the average
company town patent also base a smaller fraction of their overall prior art on inventions by
other firms that are outside their local MSA (73% compared to 79%; Column 5).
5.2 Are Company Towns More Myopic?
We report the average values of our set of myopia measures for inventions from company
towns versus those from other locations in Table 4. We divide our sample into two, such
that patents by large laboratories (with over 400 patents assigned over the 11-year sample
period) are in one subsample and patents assigned to smaller labs are in the other. We base
the results presented in the top panel (A) on the large-lab subsample.
The results in the first row indicate that the assignee self-citation rate for company town
inventions is 1.75 times higher than for similar patents from more diverse locations; on average
28% of all citations made by company town inventors are to prior inventions from their own
firm compared to only 16% in other locations. We interpret this result as suggestive that
company town inventors are more myopic in the innovation process than those from other
locations.
However, although they may be more myopic, we find no evidence that company town
inventors draw any less widely from other technology fields. The results reported in Row 2
indicate that approximately one-third of the prior art cited is from technology fields outside
of that of the focal patent, regardless of whether the inventor is based in a company town
19

or not. This result remains remarkably consistent even when we drop self-citations from the
analysis (Row 8). However, it is important to recall that we conduct our analysis at the
two-digit NBER classification level of technological similarity. This is a broad-level taxonomy
with category distinctions such as “organic compounds,” “drugs,” and “biotechnology.” So,
to the extent that company town inventions draw upon a technologically more narrow set of
prior ideas within this level of classification, we miss that since we do not detect that level of
bias.
The results reported in Row 3 indicate that company town inventions from large labs draw
66% more of their prior art from their local area. However, this is primarily the result of their
tendency to build upon their own lab’s prior art (i.e., same firm, same MSA). When we drop
assignee self-citations from the sample (Row 9), we see that these inventors draw only half the
fraction of their prior art from other local inventors as compared to inventors in industrially
dispersed locations. In other words, company town inventors are not geographically myopic
beyond their tendency to build disproportionately on prior art from their own lab. This is
underscored when we focus only on lab-level self-citations (Row 4). The large lab self-citation
rate of company town inventions is more than double that of inventions from outside company
towns.
The results reported in Row 5 indicate that 79% of the citations made by company town
inventors are to prior art that their lab has not cited before. This is less than the 86% of
prior art cited by firms in more industrially dispersed locations that is new to the citing firm;
moreover, this difference is statistically significant. Furthermore, this result persists when we
drop self-citations from the sample (Row 6). In addition, the 7% difference in the fraction of
prior art utilized that is new to the inventing firm is more important than it may first appear
since this measure is the yearly average. This difference is compounded year after year as
firms in more diverse locations refresh the pool of knowledge upon which they build more
quickly.
The results reported in Row 7 suggest that large-lab company town inventors do not build
20
upon older prior art. In fact, company town citations are on average slightly more recent.
However, this difference is driven by self-citations (Row 11). We find similar results when we
examine the citation lag to the most recent citation on a patent, rather than the average lag
across all citations (Rows 8 and 12).
In the lower panel (B) of Table 4 we examine the same set of myopia measures, this
time applied to the subsample of small labs. Overall, these results indicate that small labs
in company towns do not exhibit myopic behavior as their large-lab counterparts do. The
difference in myopia measures between these inventions and those from other locations is
much smaller and in most cases goes in the opposite direction. That is, small-lab inventors
are slightly less likely to self-cite than their non-company town matches.
To summarize, company town inventors at large labs are myopic in the sense that they
are more likely to build upon prior art from their own lab and they are also more likely to
build upon prior art their lab has built upon in the past, whether it is their own or invented
by others. However, company town inventors at small labs do not exhibit this type of myopic
behavior.
Despite company town inventors at large labs being more myopic in terms of building upon
their own prior inventions, they are not particularly myopic on other key dimensions. They
are not more likely than others to build upon prior art from the same technology field in which
they are working. Nor are they more likely to build upon prior art from their local area above
and beyond their propensity to draw from their lab’s own prior art. Moreover, they build
upon prior art that is equally current as that used by their counterparts in more industrially
dispersed locations. Thus, we find no evidence of company town inventors building upon
relatively outdated ideas.
5.2.1 Conditional Logit Results
The results from our conditional logit regression, presented in Tables 5 and 6, suggest a
significant degree of myopia in company towns. These tables report the marginal effects at
21

sample means of each explanatory variable on the probability of citations made by a patent
falling into each category. All of the estimated marginal effects are significant at the 1% level
or better, even with robust standard errors.
In Table 5, the positive and strongly significant effect of the company town dummy on the
self-citation and citation-within-MSA outcomes indicates a significant degree of myopia. The
magnitude of this effect is substantial. In terms of odds ratios, all else equal, compared to a
patent from a less concentrated MSA, a patent generated in a company town is more than
three times more likely likely to self-cite its own lab, relative to the probability of citing a
patent originating outside its own location. Citation to the same lab or same MSA is slightly
more likely (odds-ratio of 1.04) in larger MSAs (i.e., locations with more overall patents) and
less likely in MSAs with more university patents.
The negative coefficient on the citation lag indicates that citations made to older patents
are less likely to be a self-citation or a within-MSA citation. There are also significant differ-
ences across technology classes and a very large negative effect of the diversity of technology
on the probability of self- or within-MSA citation. We obtain very similar results when we add
additional controls for the year the citation is made or the year the cited patent is granted.
Table 6 allows for a different effect of being in a company town for small versus large
firms. We interact a large-lab dummy (the lab has over 400 patents assigned during the
period 1985-1995) with a dummy for company town. The large and positive main effect and
interaction effect indicate that myopia is much more significant for larger compared to smaller
firms. Estimated coefficients on the other variables are very similar to those in Table 5.
After controlling for a variety of other MSA characteristics, we thus find evidence of
significantly higher rates of within-firm and within-MSA citation in company towns. As we
find in the matched-pairs analysis, large labs drive this phenomenon. Even after controlling
for differences in the size of the pool of self-citable patents, smaller companies are significantly
less likely to cite their own patents or patents originating in the same MSA.
22

5.3 Does Myopia Hinder Innovation Impact?
The findings we report above suggest that innovation in company towns is more myopic
than in other locations. It is tempting to assume that myopia in innovation is undesirable.
However, we have no basis upon which to make such an assumption. In this section, we bring
this question to the data.
5.3.1 Myopia and Impact: Matching Method Analysis
In Table 7, we report the average number of citations received by inventions from company
towns versus those from other locations. Using the same matched sample as described above,
we present in the top panel results based on patents by large labs and in the lower panel by
small labs.
We report the main result in the first row of the table. Although they may be more myopic,
patents by inventors at large firms in company towns have no less impact on subsequent
innovation than other patents in the same technology field. This result holds equally for
small firms in company towns (Row 10). In both cases, patents from company towns receive
just as many citations as those from more diverse locations.
Consistent with our prior results based on citations made, patents by inventors at large
company town firms receive 2.3 times the number of self-citations. In other words, although
there is no difference in the overall level of impact from inventions developed inside versus
outside company towns, a much larger fraction of the impact is realized by the (large) inventing
firm itself in company towns (Row 2). This is not the case with small firms (Row 11).
We find no evidence of a difference in the technological breadth of impact resulting from
company town inventions. Approximately 40% of the citations received come from outside
the focal patent’s own technology field. This applies to both large and small firms (Rows 3
and 12).
The results reported in the fourth row indicate that although inventions from company
towns are likely to receive more self-citations, they are not likely to receive more citations
23

from their own location overall. Consistent with other findings in prior studies concerning
the localization of knowledge flows, such as Jaffe et al. (1993), Thompson and Fox-Kean
(2005), Agrawal et al. (2006), and Rosenthal and Strange (2008), we find that even firms in
industrially dispersed locations receive a significant fraction of their citations from their own
MSA. Thus, although firms in industrially dispersed locations “lose” in terms of local self-
citations relative to those in company towns, they seem to “gain” in terms of citations from
other firms in their home location. The results reported in Row 8, where we drop assignee
self-citations, confirm this intuition; comparing the number of citations received from local
inventors, patents in industrially dispersed locations receive 3.2 times the number of citations
as those received by company town inventions.
Although company town inventions do not appear to have less overall impact on subse-
quent innovation in terms of the absolute number of citations received, the results reported
in the sixth row indicate that the geographic scope of their impact is diminished. Large
lab inventions developed in company towns are cited in only 4.55 unique MSAs on average
compared to inventions developed in other locations that are cited in 5.08 unique MSAs on
average. In other words, inventions from company towns impact subsequent innovation in 10
percent fewer locations, on average. Upon excluding self-citations the difference becomes even
more dramatic. Company town inventions impact subsequent innovation in approximately
20 percent fewer locations (Row 9). The company town effect on smaller labs is present, but
less pronounced. The company town discount is only 4 percent and decreases to 3 percent
when self-citations are excluded (Rows 15 and 18).
6 Conclusion
Company towns are an interesting feature of the geography of innovation: Inventive activity
in some locations is dominated by a single organization, which may have important implica-
tions for the economics of localized knowledge spillovers. We find that in these locations, large
firms tend to be more myopic than those in locations where the inventive activity is less con-
24
centrated. However, smaller firms located in company towns do not exhibit myopic behavior,
suggesting that geography need not dictate access to knowledge produced elsewhere. Instead,
geographic isolation may facilitate the development of certain attitudes towards innovation
to which inventors in large-firm environments might be particularly susceptible.
The causes of this myopia are unclear. One hypothesis is that it reflects the Not Invented
Here Syndrome, the alleged tendency of R&D workers to discount or ignore knowledge from
sources external to their organization or work team. In large firms located in company towns,
this propensity may be particularly strong.
The NIH Syndrome is generally thought to have a negative impact on the productivity of
R&D; if this is true, then the myopia we observe should have a negative effect on the impact
of these inventions. Interestingly, however, we see no evidence of this, at least as captured by
the number of citations received by the patents belonging to the firms in our sample. Myopic
inventors tend to produce patents that are less likely to be cited externally, but this is made
up for by higher levels of internal citations. Of course, it may be that the economic value of
patents that are disproportionately self-cited is lower, such that myopia does in fact have a
negative impact. But this finding also points to potential benefits associated with “in group
favoritism” as a mechanism supporting efficient internal exchange and coordination.
The forward citation patterns we observe, both higher rates of self-citation and a narrower
scope of geographic impact, are also consistent with firms in company towns having a higher
ability to appropriate returns from R&D. Choosing to be geographically isolated may be an
effective way to limit spillovers to competitors. In other words, geographic isolation may
lower the cost of appropriating knowledge developed in-house while at the same time increase
the cost of accessing externally generated knowledge. The fact that some firms choose to
locate in company towns while others do not reveals differences in the relative costs and
benefits associated with knowledge appropriation and access across firms. As noted above, our
empirical analysis implicitly assumes that the spatial distribution of firms and technology is
exogenous and independent. If instead we allow for endogenous optimizing choices of location
25

the interpretation of these results may be rather different. Identifying firm characteristics that
underlie differences in the relative costs and benefits associated with knowledge appropriation
and access is the next logical step in this line of inquiry.
26
References
Acs, Z., 2002. Innovation and the Growth of Cities. Edward Elgar Publishing.
Agrawal, A., January 2006. Engaging the Inventor: Exploring Licensing Strategies for Univer-
sity Inventions and the Role of Latent Knowledge. Strategic Management Journal 27 (1),
63–79.
Agrawal, A. K., Cockburn, I., McHale, J., 2006. Gone But Not Forgotten: Labor Flows,
Knowledge Spillovers, and Enduring Social Capital. Journal of Economic Geography 6 (5),
571–591.
Agrawal, A. K., Cockburn, I. M., 2003. The Anchor Tenant Hypothesis: Examining the Role
of Large, Local, R&D-Intensive Firms in University Knowledge Transfer. International
Journal of Industrial Organization 21, 1227–1253.
Agrawal, A. K., Kapur, D., McHale, J., 2008. How Do Spatial and Social Proximity Influence
Knowledge Flows? Evidence from Patent Data. Journal of Urban Economics 64, 258–269.
Albert, M., Avery, D., Narin, F., McAllister, P., 1991. Direct Validation of Citation Counts
as Indicators of Industrially Important Patents. Research Policy 20, 251–259.
Almeida, P., Kogut, B., July 1999. Localization of Knowledge and the Mobility of Engineers
in Regional Networks. Management Science 45 (7), 905–917.
Arrow, K. J., 1962. Economic welfare and the allocation of resources for invention. In: Nelson,
R. R. (Ed.), The Rate and Direction of Inventive Activity: Economic and Social Factors.
Princeton University Press, pp. 609–625.
Audretsch, D., Feldman, M., June 1996. R&D Spillovers and the Geography of Innovation
and Production. American Economic Review 86 (3), 630–40.
Brewer, M., Brown, R., 1998. Intergroup Relations. In: Gilbert, D., Fiske, S., Lindzey, G.
(Eds.), The Handbook of Social Psychology 2. McGraw-Hill, New York, pp. 554–594.
27
Caballero, R. J., Jaffe, A., 2002. How High are the Giants’ Shoulders: An Empirical Assess-
ment of Knowledge Spillovers and Creative Destruction in a Model of Economic Growth.
In: Jaffe, A., Trajtenberg, M. (Eds.), Patents, Citations, & Innovations: A Window on the
Knowledge Economy. The MIT Press, pp. 89–151.
Chesbrough, H., 2006. Open Business Models: How to Thrive in the New Innovation Land-
scape. Harvard Business School Press.
Clagett, R. P., 1967. Receptivity to Innovation - Overcoming N.I.H., m.S. Thesis, Alfred P.
Sloan School of Management, MIT.
Cockburn, I. M., Henderson, R. M., June 1998. Absorptive Capacity, Coauthoring Behavior,
and the Organization of Research in Drug Discovery. The Journal of Industrial Economics
XLVI (2), 157–182.
Cohen, W. M., Levinthal, D. A., September 1989. Innovation and Learning: The Two Faces
of R&D. The Economic Journal 99 (397), 569–596.
de Pay, D., 1989. Kulturspezifische determinanten der organisation von innovationsprozessen.
Zeitschrift fur Betriebswirtschaft, Erganzungsheft 1, 131–167.
Duranton, G., Puga, D., December 2001. Nursery Cities: Urban Diversity, Process Innovation,
and the Life Cycle of Products. American Economic Review 91 (5), 1454–1477.
Efferson, C., Lalive, R., Fehr, E., September 2008. The Coevolution of Cultural Groups and
Ingroup Favoritism. Science 321 (5897), 1844–1849.
Feldman, M., Audretsch, D. B., 1999. Innovation in Cities: Science-Based Diversity, Special-
ization, and Localized Competition. European Economic Review 43, 409–429.
Feldman, M. P., 2003. The Locational Dynamics of the US Biotech Industry: Knowledge
Externalities and the Anchor Hypothesis. Industry and Innovation 10, 311–328.
28

Glaeser, E. L., Kallal, H. D., Scheinkman, J. A., Shleifer, A., 1992. Growth in Cities. Journal
of Political Economy 100 (6), 1126–1152.
Glaeser, E. L., Laibson, D., Scheinkman, J., Soutter, C., 2000. Measuring Trust. Quarterly
Journal of Economics 115, 811–846.
Hall, B., Jaffe, A., Trajtenberg, M., 2002. The NBER Patent Citations Data File: Lessons,
Insights and Methodological Tools. In: Jaffe, A., Trajtenberg, M. (Eds.), Patents, Citations,
& Innovations: A Window on the Knowledge Economy. The MIT Press, pp. 403–59.
Hall, B., Jaffe, A., Trajtenberg, M., Spring 2005. Market Value and Patent Citations. The
Rand Journal of Economics 36 (1), 16–38.
Harhoff, D., Narin, F., Scherer, F., Vopel, K., August 1999. Citation Frequency and the Value
of Patented Inventions. The Review of Economics and Statistics 81 (3), 511515.
Hogg, M., Abrams, D., 1988. Social Identifications: A Social Psychology Of Intergroup Rela-
tions and Group Processes. London: Routledge.
Jaffe, A., Henderson, R., Trajtenberg, M., August 1993. Geographic Localization of Knowl-
edge Spillovers as Evidenced by Patent Citations. Quarterly Journal of Economics 108 (3),
577–98.
Kanter, R., 1983. The Change Masters. Simon and Schuster: New York.
Katz, R., Allen, T. J., 1982. Investigating the Not Invented Here (NIH) Syndrome: A Look at
the Performance, Tenure, and Communication Patterns of 50 R&D Project Groups. R&D
Management 12 (1), 7–19.
Klepper, S., Simons, K. L., 2000a. Dominance by Birthright: Entry of Prior Radio Pro-
ducers and Competitive Ramifications in the U.S. Television Receiver Industry. Strategic
Management Journal 21 (10-11), 997–1016.
29

Klepper, S., Simons, K. L., August 2000b. The Making of an Oligopoly: Firm Survival
and Technological Change in the Evolution of the U.S. Tire Industry. Journal of Political
Economy 108 (4), 728–760.
Kogut, B., Zander, U., 1992. Knowledge of the Firm, Combinative Capabilities, and the
Replication of Technology. Organizational Science 3 (3), 383397.
Leonard-Barton, D., 1995. Wellsprings of Knowledge. Boston, MA: Harvard Business School
Press.
McFadden, D., 1974. Conditional logit analysis of qualitiative choice analysis. In: Zarembka,
P. (Ed.), Frontiers in Econometrics. Academic Press, pp. 105–42.
Mehrwald, H., 1999. Das ’Not Invented Here’-Syndrom. In: Forschung und Entwicklung.
Wiesbaden: Dt. Univ.- Verl.
Menon, T., Pfeffer, J., 2003. Valuing Internal versus External Knowledge. Management Sci-
ence 49 (4), 497–513.
Nelson, R., Winter, S., 1982. An Evolutionary Theory of Economic Change. Harvard Univer-
sity Press Cambridge MA.
Polanyi, M., 1966. The Tacit Dimension. Routledge and Kegan Paul London UK.
Romer, P., October 1990. Endogenous Technological Change. Journal of Political Economy
98 (5).
Rosenthal, S. S., Strange, W. C., 2001. The Determinants of Agglomeration. Journal of Urban
Economics 50, 191–229.
Rosenthal, S. S., Strange, W. C., 2003. Geography, Industrial Organization, and Agglomera-
tion. The Review of Economics and Statistics 85 (2), 377–393.
30

Rosenthal, S. S., Strange, W. C., 2008. The Attenuation of Human Capital Spillovers. Journal
of Urban Economics 64, 373389.
Saxenian, A., 1994. Regional Advantage: Culture and Competition in Silicon Valley and
Route 128. Harvard University Press, Cambridge.
Thompson, P., May 2006. Patent Citations and the Geography of Knowledge Spillovers:
Evidence From Inventor and Examiner Added Citations. The Review of Economics and
Statistics 88 (2), 383–8.
Thompson, P., Fox-Kean, M., March 2005. Patent Citations and the Geography of Knowledge
Spillovers: A Reassessment. American Economic Review 95 (1), 450–460.
Trajtenberg, M., Spring 1990. A Penny for Your Quotes: Patent Citations and the Value of
Innovations. The RAND Journal of Economics 21 (1), 172–187.
Weitzman, M., May 1998. Recombinant Growth. The Quarterly Journal of Economics
CXIII (2), 331–360.
31

Tab
le1:
Com
pan
yTow
ns
MSA
Dom
inant
Dom
inant
Tota
lN
o.
of
%ofM
SA
’sN
um
ber
of
%of
%ofM
SA
’sFir
mTec
hnolo
gy
Pate
nts
Pate
nts
Pate
nts
Pate
nts
Dom
inant
Pate
nts
inM
SA
Ass
igned
toA
ssig
ned
toA
ssig
ned
toFir
m’s
Tota
lA
ssig
ned
toD
om
inant
Dom
inant
Dom
inant
Fir
mPate
nts
Sm
all
Fir
min
MSA
Fir
mW
orl
dw
ide
inth
isM
SA
Fir
ms
Roch
este
r(N
Y)
Kodak
chem
icals
10,9
50
5,3
04
48.4
6,7
93
78.1
20.2
Alb
any
(NY
)G
Eel
ectr
onic
s5,2
55
3,7
73
71.8
9,0
73
41.6
20.6
Sagin
aw
(MI)
Dow
chem
icals
3,4
41
1,7
40
50.6
3,9
16
44.4
22.5
Bato
nR
ouge
(LA
)E
thylC
orp
.ch
emic
als
2,0
10
718
35.7
836
85.9
64.3
Harr
isburg
(PA
)A
MP
elec
tronic
s1,8
35
1,0
96
59.7
1,7
84
61.4
40.3
Ott
aw
a(O
N)
Nort
elco
mpute
rs1,6
37
498
30.4
966
51.6
69.6
Rock
ford
(IL)
Sundst
rand
elec
tronic
s1,5
99
756
47.3
1,0
63
71.1
52.7
Bois
e(I
D)
Mic
ron
elec
tronic
s1,3
44
558
41.5
576
96.9
58.5
Bin
gham
ton
(NY
)IB
Mco
mpute
rs1,2
66
814
66.4
8,8
50
9.2
33.6
Johnso
nC
ity
(TN
)K
odak
chem
icals
1,1
18
627
56.1
6,7
93
9.2
43.9
Mel
bourn
e(F
L)
Harr
isel
ectr
onic
s1,0
80
467
43.2
706
66.1
56.8
Peo
ria
(IL)
Cate
rpilla
rm
echanic
al
976
639
65.5
820
77.9
34.5
We
base
the
sam
ple
on
US
pate
nts
issu
edto
non-g
over
nm
ent
org
aniz
ati
ons
bet
wee
n1985-1
995,in
clusi
ve,
wher
eat
least
one
inven
tor
islo
cate
din
the
US
or
Canada.
32

Table 2: Descriptive Statistics
All MSAs Company Towns Other LocationsMean Median Mean Mean
1. No. patents by MSA 3,668 1,392 1,917 4,018(5,470) (2,421) (5,845)
2. No. Citations Made 9.665 9.638 8.568 9.885(1.583) (1.499) (1.517)
Diversity3. Assignee 0.871 0.935 0.550 0.935
(0.163) (0.149) (0.053)4. Technological 0.916 0.931 0.841 0.931
(0.050) (0.086) (0.014)
Self-Citation5. Assignee 0.097 0.091 0.144 0.087
(0.047) (0.073) (0.034)6. Technological 0.641 0.639 0.652 0.638
(0.034) (0.057) (0.028)7. MSA 0.301 0.290 0.377 0.286
(0.117) (0.182) (0.094)
Percentage of New Citations8. All Citations 0.917 0.912 0.915 0.917
(0.020) (0.032) (0.017)9. Excluding Self-Citations 0.919 0.914 0.923 0.918
(0.019) (0.029) (0.016)
10. No. Cites Rcvd by Patent 14.422 13.586 14.843 14.337(4.591) (8.098) (3.619)
11. No. of Patents 264,078 23,007 241,071
Standard deviations in parenthesis.
33

Tab
le3:
Dec
ompos
itio
nof
Pri
orA
rt
Cit
atio
ns
MSA
Sel
f-C
ites
MSA
Sel
f-C
ites
MSA
Non
-Sel
f-C
ites
MSA
Non
-Sel
f-C
ites
Mad
eA
ssig
nee
Sel
f-C
ites
Ass
ignee
Non
-Sel
f-C
ites
Ass
ignee
Sel
f-C
ites
Ass
ignee
Non
-Sel
f-C
ites
Abso
lute
Num
ber
All
Pat
ents
6.89
10.
684
0.44
10.
267
5.49
8C
ompan
yTow
ns
6.81
51.
246
0.20
40.
351
5.01
4O
ther
Loca
tion
s6.
899
0.63
10.
464
0.25
95.
545
Shar
eof
Cit
atio
ns
All
Pat
ents
7.32
30.
114
0.06
60.
036
0.78
5C
ompan
yTow
ns
7.13
80.
195
0.02
80.
046
0.73
1O
ther
Loca
tion
s7.
340
0.10
60.
070
0.03
50.
790
34
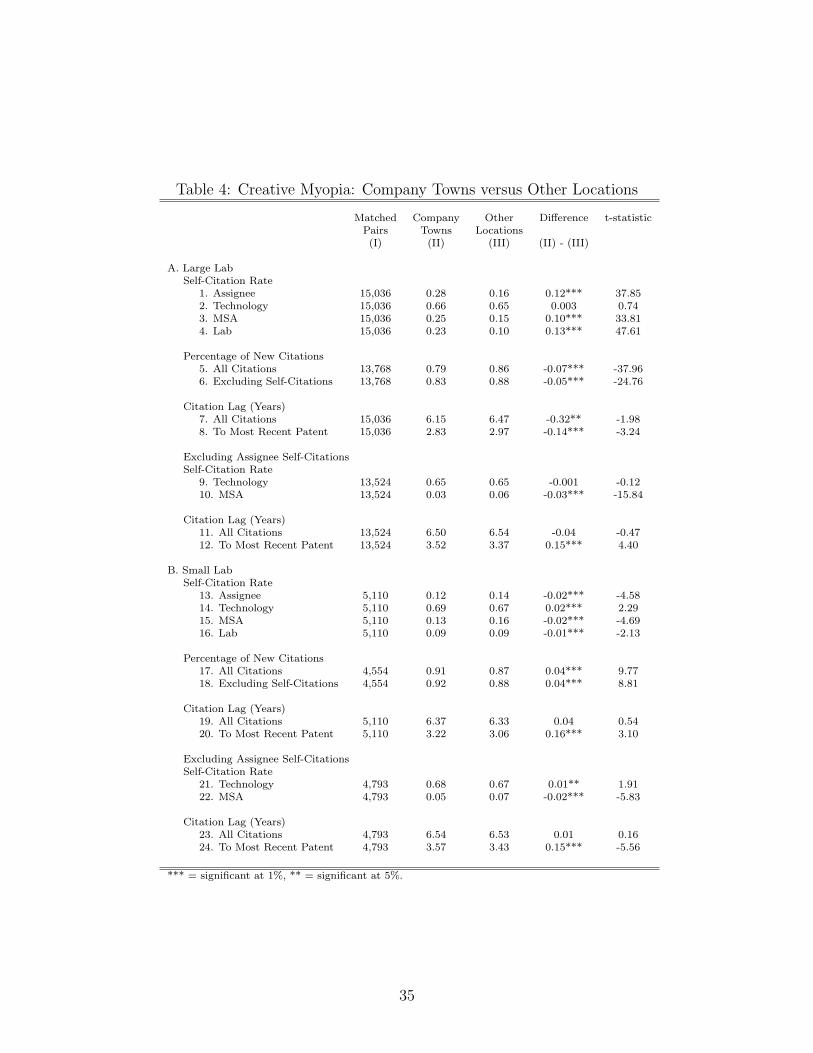
Table 4: Creative Myopia: Company Towns versus Other Locations
Matched Company Other Difference t-statisticPairs Towns Locations(I) (II) (III) (II) - (III)
A. Large LabSelf-Citation Rate
1. Assignee 15,036 0.28 0.16 0.12*** 37.852. Technology 15,036 0.66 0.65 0.003 0.743. MSA 15,036 0.25 0.15 0.10*** 33.814. Lab 15,036 0.23 0.10 0.13*** 47.61
Percentage of New Citations5. All Citations 13,768 0.79 0.86 -0.07*** -37.966. Excluding Self-Citations 13,768 0.83 0.88 -0.05*** -24.76
Citation Lag (Years)7. All Citations 15,036 6.15 6.47 -0.32** -1.988. To Most Recent Patent 15,036 2.83 2.97 -0.14*** -3.24
Excluding Assignee Self-CitationsSelf-Citation Rate
9. Technology 13,524 0.65 0.65 -0.001 -0.1210. MSA 13,524 0.03 0.06 -0.03*** -15.84
Citation Lag (Years)11. All Citations 13,524 6.50 6.54 -0.04 -0.4712. To Most Recent Patent 13,524 3.52 3.37 0.15*** 4.40
B. Small LabSelf-Citation Rate
13. Assignee 5,110 0.12 0.14 -0.02*** -4.5814. Technology 5,110 0.69 0.67 0.02*** 2.2915. MSA 5,110 0.13 0.16 -0.02*** -4.6916. Lab 5,110 0.09 0.09 -0.01*** -2.13
Percentage of New Citations17. All Citations 4,554 0.91 0.87 0.04*** 9.7718. Excluding Self-Citations 4,554 0.92 0.88 0.04*** 8.81
Citation Lag (Years)19. All Citations 5,110 6.37 6.33 0.04 0.5420. To Most Recent Patent 5,110 3.22 3.06 0.16*** 3.10
Excluding Assignee Self-CitationsSelf-Citation Rate
21. Technology 4,793 0.68 0.67 0.01** 1.9122. MSA 4,793 0.05 0.07 -0.02*** -5.83
Citation Lag (Years)23. All Citations 4,793 6.54 6.53 0.01 0.1624. To Most Recent Patent 4,793 3.57 3.43 0.15*** -5.56
*** = significant at 1%, ** = significant at 5%.
35

Table 5: Conditional Logit Regression: Marginal Effects
Lab Level Citation CitationSelf-Citation within MSA Outside MSA
(non-self-cite)
Citing-cited pair specific variables
Company town dummy 0.028* 0.042* -0.070*33.41 30.17 -45.59
Number of patents 0.0004* 0.005* -0.006*21.26 70.83 -74.67
Number of university patents (1000s) -0.002* -0.033* 0.035*-4.55 -28.50 28.87
MSA population (millions) -0.0002* -0.005* 0.005*-6.48 -37.61 38.41
MSA technology dispersion -0.033* -0.044* 0.077*-9.89 -4.10 6.91
Citing-cited patent citation lag -0.001* -0.009* 0.010*-52.05 -116.06 128.12
Technology class effects x x x
Choice specific variables
Number of citable patents in MSA 1.4E-10* -9.00E-09* 8.90E-09*8.92 -8.92 8.92
Number of citable patents outside MSA 8.3E-10* 8.90E-09* -9.70E-09*8.92 8.92 -8.92
Number of potential self-cites -9.70E-10* 1.40E-10* 8.30E-10*-8.92 8.92 8.92
Robust standard errors. * = significant at 1%. N = 4,923,693.
36

Table 6: Conditional Logit Regression: Marginal Effects, Disaggregated by Lab Size
Lab Level Citation CitationSelf-Citation within MSA Outside MSA
(non-self-cite)
Citing-cited pair specific variables
Company town dummy -0.003* -0.013* 0.015*-4.25 -5.74 6.77
Large lab size dummy 0.003* 0.050* -0.053*12.79 66.50 -68.04
Company town dummy 0.038* 0.034* -0.072*X Large lab size dummy 14.87 11.95 -20.82
Number of patents 0.0003* 0.005* -0.005*17.13 62.95 -65.89
Number of university patents (1000s) -0.001* -0.025* 0.025*-1.69 -21.71 21.41
MSA population (millions) -0.0001* -0.004* 0.004*-3.33 -31.79 31.91
MSA technology dispersion -0.049* -0.093* 0.141*-15.02 -8.49 12.34
Citing-cited patent citation lag -0.001* -0.009* 0.010*-51.40 -114.29 126.13
Technology class effects x x x
Choice specific variables
Number of citable patents in MSA 1.70E-10* -1.10E-08* 1.10E-08*10.62 -10.62 10.62
Number of citable patents outside MSA 9.80E-10* 1.10E-08* -1.20E-08*10.62 10.62 -10.62
Number of potential self-cites -1.10E-09* 1.70E-10* 9.80E-10*-10.62 10.62 10.62
Robust standard errors. * = significant at 1%. N = 4,923,693.
“Large” refers to labs with 400 or more patents.
37

Table 7: Impact Measured by Citations Received
Matched Company Other Difference t-statisticPairs Towns Towns(I) (II) (III) (II) - (III)
A. Large Lab Patents Matched
Includes Assignee Self-Citations
1. Total Citations Received 16,382 13.19 13.33 -0.14 -0.692. Self-Citations Received (same Assignee) 16,382 3.72 1.62 2.11*** 26.683. Citations Received from same Technology 16,382 7.63 7.48 0.15 1.19
4. Citations Received from Focal MSA 16,382 3.85 4.77 -0.93*** -5.995. Citations Received from Same Lab 16,382 3.29 2.96 0.32*** 2.476. Number of Unique Citing MSAs 16,382 4.55 5.08 -0.53*** -12.48
Excludes Assignee Self-Citations
7. Citations Received from same Technology 16,382 5.36 6.48 -1.12*** -10.758. Citations Received from Focal MSA 16,382 0.56 1.81 -1.25*** -19.609. Number of Unique Citing MSAs 16,382 3.81 4.66 -0.85*** -20.69
B. Small Lab Patents Matched
Includes Assignee Self-Citations
10. Total Citations Received 5,750 12.97 13.37 -0.40 -1.1811. Self-Citations Received (same Assignee) 5,750 0.95 1.37 -0.41*** -5.3612. Citations Received from same Technology 5,750 8.04 8.04 0.001 0.01
13. Citations Received from Focal MSA 5,750 2.02 2.82 -0.80*** -5.4014. Citations Received from Same Lab 5,750 0.69 1.26 -0.58*** -7.7815. Number of Unique Citing MSAs 5,750 5.33 5.54 -0.21*** -2.69
Excludes Assignee Self-Citations
16. Citations Received from same Technology 5,750 7.38 7.15 0.23 1.0617. Citations Received from Focal MSA 5,750 1.33 1.56 -0.23** -1.9518. Number of Unique Citing MSAs 5,750 5.02 5.20 -0.19*** -2.43
*** = significant at 1%, ** = significant at 5 %.
38