
here - Academy Publishing Center
194
-
Upload
khangminh22 -
Category
Documents
-
view
1 -
download
0
Transcript of here - Academy Publishing Center


i
Academy Publishing CenterJournal of Renewable Energy and Sustainable Development (RESD)First edition 2015© All rights reserved Copyright 2015
Permissions may be sought directly Academy Publishing Center,Arab Academy for Science, Technology, and Maritime Transport,Abu Kir Campus, Alexandria, EGYPTP.O. Box: Miami 1029Tel:(+203) 5622366/88 – EXT 1069 and (+203) 561 1818Fax: (+203) 561 1818Web Site: http://apc.aast.edu
No responsibility is assumed by the publisher for any injury and/or damage to persons or property as amatter of products liability, negligence or otherwise, or from any use or operation of any methods,products, instructions or ideas contained in the material herein.
Every effort has been made to trace the permission holders of figures and in obtaining permissionswhere necessary.
ISSN: 2356-8518 Print Version
ISSN: 2356-8569 Online Version
Journal of Renewable Energy and Sustainable Development (RESD) Volume 3, Issue 1, Special issue, March 2017 - ISSN 2356-8569
Volume 3, Issue 1, Special Issue, March 2017
RESD © 2017http://apc.aast.edu

ii
Journal of Renewable Energy andSustainable Development
RESD
Renewable Energy and Sustainable Development (RESD) is a biannual international peer-reviewed
journal which presents a global forum for dissemination of research articles, case studies and reviews
focusing on all aspects of renewable energy and its role in sustainable development. The topics of focal
interest to RESD include, but are not limited to, all aspects of wind energy, wave/tidal energy, solar
energy, as well as energy from biomass and biofuel. The integration of renewable energy technologies
in electrical power networks and smart grids is another topic of interest to RESD. Experimental,
computational and theoretical studies are all welcomed to RESD.
Sustainable development is a multidisciplinary advancing to the center of energy research with the
declaration of UN millennium development goals for the first time in 2000, and continued to constitute a
challenge in energy technologies in the past decade. RESD is mainly interested in case studies of
sustainable development and its relation to transition economies in the Middle East, Africa, Asia and
Oceania.
RESD has an outstanding editorial board of eminent scientists, researchers and engineers who
contribute and enrich the journal with their vast experience in different fields of interest to the journal.
The journal is open-access with a liberal Creative Commons Attribution-Non Commercial-
4.0 International License. Which preserves the copyrights of published materials to the authors and
protects it from unauthorized commercial use or derivation. The journal is financially supported by Arab
Academy for Science, Technology and Maritime Transporting in order to maintain quality open-access
source of research papers on renewable energy and sustainable development.
Journal of Renewable Energy and Sustainable Development (RESD) Volume 3, Issue 1, Special Issue March 2017 - ISSN 2356-8569
RESD © 2017http://apc.aast.edu

iii
Editorial Committee
Editor-in-Chief
Yasser Gaber Dessouky, Ph.DProfessor of Electrical Engineering and Renewable Energy TechnologiesArab Academy for Science and Technology and Maritime Transport(AASTMT) Abu Kir Campus, POBox: 1029 Miami,Alexandria, EGYPTE-mail: [email protected]
Associate Editors
Rania El Sayed Abdel Galil, Ph.D.Associate Professor, Architectural Engineering and Environmental DesignArab Academy for Science and Technology and Maritime Transport(AASTMT) Abu Kir Campus, POBox: 1029 Miami,Alexandria, EGYPTEmail: [email protected]
Jingzheng Ren, Ph.D.Associate Professor, Chemical EngineeringUniversity of Southern Denmark,DENMARKEmail: [email protected]
Aly Ismail Shehata , Ph.D.Assistant Professor, Mechanical EngineeringArab Academy for Science and Technology and Maritime Transport(AASTMT) Abu Kir Campus, POBox: 1029 Miami,Alexandria, EGYPTEmail: [email protected]
Ahmed Aboushady, Ph.D.Assistant Professor, Electrical EngineeringRobert Gordon University,Aberdeen, United [email protected]
Editorial Board
Abdel Salam Hamdy Makhlouf, PhDProfessor, University of Texas – Pan American, USA
Adam Fenech, PhDAssociate Professor, University of Prince Albert Island, CANADA
Adel Al Taweel, PhDProfessor, Dalhousie University, CANADA
Ahmed Zobaa, PhDSenior Lecturer, Brunel University London, U.K
Aziz Naamane, PhDSenior Researcher, Laboratoire des Sciences de l’information et des Systèmes, FRANCE
Journal of Renewable Energy and Sustainable Development (RESD) Volume 3, Issue 1, Special Issue, March 2017 - ISSN 2356-8569
RESD © 2017http://apc.aast.edu

iv
Barry Wayne Williams, Ph.DProfessor, Strathclyde University, U.K
Chin-Hsiang Cheng, Ph.DProfessor, National Cheng Kung University, TAIWAN
Dieter Schramm, PhDProfessor, University of Duisburg-Essen, GERMANY
Ehab Fahmy El-Saadany, Ph.DProfessor, University of Waterloo, CANADA
Fei GAO, PhDAssociate Professor, University of Technology of Belfort-Montbéliard, FRANCE
Francesco Martinico, PhDProfessor, Università di Catania, ITALY
Frede Blaabjerg, PhDProfessor, Allborg University, DENMARK
Fouad H. Fouad, PhDProfessor, University of Alabama at Birmingham, U.S.A
Han-Seung Lee, PhDProfessor, Hanyang University, SOUTH KOREA
Hassan M.K. Abdel-Salam, PhDProfessor, Alexandria University, EGYPT
Hebatalla F. Abouelfadl, PhDAssociate Professor, Faculty of Fine Arts, Alexandria University, EGYPT
Jawad Faiz, Ph.DProfessor, University of Tehran, IRAN
Kouzou Abdellah, PhDAssociate Professor, Djelfa University, ALGERIA
Mohamed Youssef, PhDAssistant Professor, University of Ontario, Institute of Technology, CANADA
Mohamed Ismail, PhDProfessor, Hanyang University, SOUTH KOREA
Moustafa Abdel-Maksoud, Dr.-IngProfessor, Hamburg University of Technology, GERMANY
Nacer Msridi, PhDSenior Researcher, Laboratoire des Sciences de l’information et des Systèmes, FRANCE
Perter Breuhaus, PhDChief Scientist, International Research Institute Stavanger, NORWAY
Ping Zheng, PhDProfessor, Harbin Institute of Technology, CHINA
Robert F. Boehm, PhDProfessor, University of Nevada, Las Vegas, U.S.A
Robert W. Peters, Ph.DProfessor, University of Alabama, U.S.A
Journal of Renewable Energy and Sustainable Development (RESD) Volume 3, Issue 1, Special Issue, March 2017 - ISSN 2356-8569
RESD © 2017http://apc.aast.edu

v
Sheldon Williamson, PhDAssociate Professor, University of Ontario, Institute of Technology, CANADA
Stephen Connelly, PhDSenior Lecturer, the University of Sheffield, U.K
Suk Won Cha, PhDProfessor, Seoul National University, SOUTH KOREA
Susan Roaf, PhDProfessor, Heriot Watt University, U.K
Waleed F. Faris, PhDProfessor, International Islamic University of Malaysia, MALAYSIA
Yi-Tung Chen, Ph.DProfessor, University of Nevada Las Vegas, U.S.A
Youcef Soufi, PhDProfessor, University of Tébessa, ALGERIA
Advisory Board
Abbas Abdel Halim Yehia, PhDProfessor, Architectural Engineering & Environmental Design, Arab Academy for Science & Technologyand Maritime Transport, Egypt
Abdel-Wahab Shalaby Kassem, PhDProfessor, Agricultural Engineering Department, Faculty of Agriculture, Alexandria University, Egypt
Adel Khalil, PhDProfessor, Mechanical Power Engineering Department Faculty of Engineering, Cairo University, Egypt
Ahmed Abu Saud, M.ScChief Executive Officer (CEO) Of Egyptian Environmental Affairs Agency (EEAA)
Ahmed Hossam El-Din, PhDProfessor, Electrical Engineering Department, Alexandria University, Egypt
Almoataz Y. Abdelaziz, PhDProfessor, Faculty of Engineering, Ain Shams University, EGYPT
Amr A. Amin, PhDProfessor, Electric Power And Machines Department, Faculty of Engineering, Helwan University,Egypt
Anhar Ibrahim Hegazi, PhDDirector, Energy Efficiency Unit, IDSC, Egyptian Cabinet of Ministers, Egypt
Fatma Ahmed Moustafa Ali, PhDChairman for The Executive Committee for The Regional Center for Renewable Energy and EnergyEfficiency (RCREEE), Egypt
Fatma El Zahraa Hanafi Ashour, PhDChairman, Chemical Engineering Department, Faculty of Engineering, Cairo University, Egypt
Journal of Renewable Energy and Sustainable Development (RESD) Volume 3, Issue 1, Specail Issue, March 2017 - ISSN 2356-8569
RESD © 2017http://apc.aast.edu

vi
Fuad Ahmed Abulfotuh, PhDProfessor Emeritus, Alexandria University, Egypt
Galal Osman, PhDVice President, World Wind Energy Association (WWEA), Bonn, Germany
Hend Farouh, PhDExecutive Director of Central Unit For Sustainable Cities & Renewable Energy, New UrbanCommunities Authority, NUCA
Khaled El Zahaby, PhDChairman, Housing And Building National Research Center, HBRC, Cairo, Egypt
Mohamed Mostafa El-Khayat, PhDManaging Director of Technical Affairs Sector, New And Renewable Energy Authority, Egypt
Mohamed Orabi, PhDDirector, Aswan Power Electronics Applications Research Center (APEARC), Aswan University, Egypt
Radwan H. Abdel Hamid, PhDProfessor, Helwan University, Egypt
Mohamed El SobkiExecutive Director, New And Renewable Energy Authority, Egypt
Tareq Emtairah, PhDExecutive Director, Regional Center for Renewable Energy and Energy Efficiency (RCREEE), Egypt
Journal of Renewable Energy and Sustainable Development (RESD) Volume 3, Issue 1, Special Issue, March 2017 - ISSN 2356-8569
RESD © 2017http://apc.aast.edu

Journal of Renewable Energy and Sustainable Development (RESD) Volume 3, Issue 1, Special Issue, March 2017 - ISSN 2356-8569
International Conference on New Trends for Sustainable Energy
The (First International Conference on New Trends for Sustainable Energy) was held in October 1-3, 2016 at
Pharos University, Alexandria, Egypt. with the cooperation of the KTH (Royal Institute of Technology) of
Sweden under the auspices of the Minister of Electricity and Renewable Energy and the auspices of the
Minister of Higher Education and Scientific Research.
The Conference discussed the general new Trends in Sustainable Energy development through
distinguished keynotes speakers from Sweden and Egypt. The steering committee managed the peer
reviewing process to the submitted papers and selected accepted papers is published in this special issue of
the RESD in Volume 3, No.1.
The conference was specifically designed to focus on the issues related to energy and energy conservation.
Industry leaders, engineers and academics will discuss in this conference the latest developments in the use
and production of renewable energy and ways of energy conservation focusing on six main topics:
1. Power Engineering
2. Energy Conservation
3. Solar Energy
4. Saving Energy In Building
5. Architectural Energy Saving
6. Other Energy Topics
Executive Committee
Prof. Mahmoud El-Gammal Conference Chairman
Prof. Mohamed Fahim Conference Secretary General
Prof. Ahmed Abdallah Conference Communications Manager
Prof. Adel Abo Ella Scientific Committee Chairman
Prof. Ahmed Abde El Mutal Organizing Committee Chairman
Prof. Abdel Moneim Moussa
Prof. Hisham Galal El Shimy
Prof.Mohamed Abdel Rahman
Prof.Ahmed Hegazy
Dr. Yasser Hassan El kamshoushy
Dr. Alaa Khalil
Eng. Karim Soliman
Scientific Committee
Prof. Abdelmonem Mousa Pharos University
Prof. Ossama El Masry Pharos University
Prof. Mahmoud El-Gammal Pharos University
Prof. Mohamed Fahim Pharos University
Prof. Alaa Shebl Pharos University
Prof. Ramadan Abdelmaksoud Pharos University
Prof. Mohamed Gamal Wasel Pharos University
Prof.Hassan ElGhazoly Pharos University
Prof. Kadry Montaser Pharos University
Dr.Mohamed Abdel Rahman Pharos University
Prof. Hassan Farag Alexandria University
Prof. Nabil Abbaasy Alexandria University
RESD © 2017 http://apc.aast.edu
vii

Journal of Renewable Energy and Sustainable Development (RESD) Volume 3, Issue 1, Special Issue, March 2017 - ISSN 2356-8569
Prof. Fahmy Bendary Alexandria University
Prof. Wael Amoghlany Alexandria University
Prof. Adel Abou El Ella * Menoufia University
Prof. Ahmed Abdallah Menoufia University
Prof. Ahmed Hegazy Menoufia University
Prof. Ahmed Refaat Tanta University
Prof. Mamoun Muhamed Royal institute of Technology
Prof. Bjorn Palm Royal institute of Technology
Prof. Göran Engdahl * Royal institute of Technology
Prof. Lennar Soder Royal institute of Technology
Prof. Thomas Ackermann Royal institute of Technology
Prof. Mark Howells Royal institute of Technology
Prof. Semida Silveira Royal institute of Technology
Prof. Andrew Martin Royal institute of Technology
Prof. Per Lundqvist Royal institute of Technology
Prof. Olga Kordas Royal institute of Technology
Prof. Yohannes Kiros Royal institute of Technology
RESD © 2017 http://apc.aast.edu
viii

Journal of Renewable Energy and Sustainable Development (RESD) Volume 3, Issue 1, Special Issue, March 2017 - ISSN 2356-8569
Table of Contents
Editorial Articles
1. POWER ENGINEERING
Simulation of Distance Relay for Load Encroachment Alleviation with Agent Based Supervision of Zone-3
Mohamed Badr, Nabil Abassy, Emtethal Abdallah 1-11
Optimal PMUs Placement Due to Several Stages for Achieving Full System Observability 12-18
Mohamed Badr, Ahmed Hossam-Eldin, Nabil Abassy
Development of Reliability Indices for Electric Distribution Network in Egypt 19-23
Eman Ahmed, Sherein Abdualla, Kamelia Youssef, Hatem Waheed
Reliability Improvement of Power Distribution Systems using Advanced Distribution Automation
M. R. Elkadeem, M. A. Alaam, Azmy Azmy 24-32
DG Allocation Based on Reliability, Losses and Voltage Sag Considerations: an expert system approach
Sahar Abdel Moneim Moussa, Ayman Abdelwahed 33-38
Harmonics Monitoring Survey on LED Lamps 39-45
Abdelrahman Ahmed Akila, Kamelia Youssef, Ibrahim Yassin
Harmonic Analysis of Radial Distribution Systems Embedded Shunt Capacitors 46-54
Abdallah Elsherif, Tamer Fetouh, Hasan Shaaban
Application of DSTATCOM coupled with FESS for Power Quality Enhancement and Fault Mitigation
Nada Mamdouh, R.A. Swief, M.A.L. Badr 55-63
2. ENERGY CONSERVATION
Assessment of Energy Conservation in Egypt's Electric System 64-70
Azhar El Saeed Awad Abou Ghoniem
ICT for Community Energy 71-73
Caroline Van der Weerdt, Richard Carmichael, Björn Palm
3. SOLAR ENERGY
Performance Improvement of Roof Transparent Solar Still Coupled With Agriculture Greenhouse
Alaa H. Salah, Gasser E Hassan, Mohamed Elhelw, Hassan Fath, Samy E. Elsherbiny 74-78
Role of Dyestuff in Improving Dye-Sensitized Solar Cell Performance 79-82
Yehia Selim, Ahmed Mohamed
Factors Affect Dye Sensitized Solar Cells performance 83-86
Ahmed Mohamed, Yehia Selim
Highlight of Grid-connected PV systems in administrative buildings in Egypt 87-94
Dina Said, Marwa Mostafa, Kamelia Youssef, Hatem Waheed
RESD © 2017
http://apc.aast.edu
ix

Journal of Renewable Energy and Sustainable Development (RESD) Volume 3, Issue 1, Special Issue, March 2017 - ISSN 2356-8569
4. SAVING ENERGY IN BUILDING
Opportunities of energy saving in lighting systems for public buildings 95-98
Ayman Abd El-khalek, Kamelia Youssef, Ibrahim Yassin
Energy efficiency opportunities in Hotels 99-103
Dina Said, Kamelia Youssef, Hatem Waheed
5. ARCHITECTURAL ENERGY SAVING
Sustainability and Conserved Energy Value of Heritage Buildings 104-117
Dalia Elsorady
Dynamic Facades: Environmental Control Systems for Sustainable Design 118-127
Riham Nady
Low-Carbon Communities between Vision and Implementation the Case of Borg Al Arab 128-140
Riham Nady
Exploring the Importance of Employing Bio and Nano-Materials for Energy Efficient Buildings
Construction 141-149
Mona Naguib, Mohamed El Fakharany
Towards a zero carbon Alexandria 150-154
Mona Salem, Mary Zekry
Green Building between Tradition and Modernity Study Comparative Analysis between
Conventional Methods and Updated Styles of Design and Architecture Processors 155-163
H Elshimy, N Samir
6. OTHER ENERGY TOPICS
Hydrogen through Water Electrolysis and Biomass Gasification for Application in Fuel Cells
Y. Kirosa, S. Marinib, M. Villab, P. Nellib 164-165
Application of the Fuzzy Computational Intelligence in Power Quality Data Management 166-174
Hoda Farag
A Modified Open Loop Control of a Matrix Converter Connected to Wind Energy System 175-182
Kotb Tawfiq, A.F. Abdou, E. E. EL-Kholy, S. S. Shokralla
x
RESD © 2017 http://apc.aast.edu

Renewable Energy and Sustainable Development (RESD) Volume 3 Issue 1, Special Issue, March 2017 - ISSN 2356-8569 http://dx.doi.org/10.21622/RESD.2017.03.1.001
This Paper has been Accepted and Presented in the (First International Conference on New Trends for Sustainable Energy) 1-3 October, 2016 at Pharos University, Alexandria, Egypt.
1
RESD © 2017 http://apc.aast.edu
Simulation of Distance Relay for Load Encroachment
Alleviation with Agent Based Supervision of Zone-3 Mohamed A. Badr, Nabil H. Abassy Emtethal and N. Abdallah
Electrical Engineering Department, Alexandria University, Alexandria, Egypt.
[email protected], [email protected],
Abstract - Cascaded tripping of power lines due to
mal-operation of zone-3 distance relays has been
one of the main causes of many previous blackouts
worldwide. Encroachment of load into zone-3
characteristics during stressed system operation
conditions is a basic factor for such mal-operation of
the relays. By improving the operation of zone-3, it is
possible to prevent mal-operations so that cascaded
line tripping can be avoided.For proper study of the
behavior of distance relay during faults and load
encroachment phenomenon, we must build a model
of distance relay, soin this paper a modeling study of
distance relay is implemented using
MATLAB/Simulink program.However, this model is
distinguished from previous modelsthat, examines in
detail the third zone of distance relay. Many cases
are simulated with changing line loading and fault
location to ensure the capability of the relay to detect
the fault and thus the maximum loadability limit of
distance relay is obtained.In order to prevent
cascading events caused by hidden failures in zone-3
relays, agent based relay architectures have been
suggested in the recent past. In such architectures
each zone-3 relay contains agents that require
communication with other agents at various relevant
relays in order to distinguish a real zone-3 event from
a temporary overload. In this paper, a local master
agent is consulted by all zone-3 agents before a
tripping decision is made. The master agent
maintains a rule base which is updated based on the
local topology of the network and real time monitoring
of the status of other relays and circuit breakers.
Cisco Packet Tracer program is used for running
communication network simulations. The result of the
simulation indicate that the time estimated to send
and receive a packet data unit (PDU) message
between one relay to anther can satisfy the
communication requirement for the proposed scheme
with fiber media.
Keywords - Distance Relay, Load Encroachment,
Hidden Failure, Cascading Blackouts, Agents,
Communication, TCP/IP.
I. INTRODUCTION
Transmission lines are usually protected by distance
relays. The main objective of the distance relaying
protection scheme is to isolate a faulted line out of
service as soon as possible to minimize the negative
effect of the fault on the power grid. The secondary
objective of the fault isolation is to minimize the
amount of load shedding as a result of the
disconnection of lines by distance relay. Distance
relays are classified as local primary (zone-1) relays,
secondary (zone-2) relays and remote back up (zone-
3) relays [1]. By comparing primary relays with remote
backup relays, remote backup relays require longer
fault clearing time and also its operation to remove a
fault may lead to larger area of load shedding.
Therefore the distance relaying protection schemes
are designed in such a way that the remote back up
relays do not operate unless it is certainly necessary
i.e. when both the zone-1 and zone-2 relays fail to
clear the fault.Worldwide analysis of recent wide area
cascading failures has shown that very often these
failures were mainly caused by the mis-operation of
the third zone of a distance protection relay [2]. The
hidden failure, load encroachment and power swing
phenomena are the most common problems to solve
when dealing with the third zone of distance
protection [2]. It is well reported that the majority of
blackouts along with their consequences could have
been eliminated if the mal operation of distance relays
could have been avoided. Zone-3 is especially
exposed to load encroachment and power swing,
where all these situations can lead to the measured
impedance encroachment into the zone-3 area. This
results in relay mal-operation and can be a leading
factor to a large scale blackout occurrence. Despite
Renewable Energy and Sustainable Development (RESD) Volume 3 Issue 1, Special Issue, March 2017 - ISSN 2356-85 96 http://dx.doi.org/10.21622/RESD.2017.03.1.001
2 RESD © 2017 http://apc.aast.edu
the fact of zone-3 setting encroachment, the system
operational conditions may not be dangerous and in
case of load encroachment the load may be
permissible due to the transmission lines temporary
load ability. In case of stable power swing, after some
time the system recovers to its normal operation
conditions. The important issue is to distinguish
whether the third zone area encroachment is a result
of fault and the relay should operate, or it is one from
abovementioned situations and the relay decision
about tripping should be restrained [3].
Modern study discussed and modeled the
characteristics of the Mho relay. In this paper we
established a model of distance relaying protection
using MATLAB program. In [4] PSCAD/EMTDC
Software is used to study the performance of the
relay characteristics with different type of faults (L-G,
L-L, L-L-G etc.) at different locations. That work
presented only the simulation of distance relay during
faults. But in our model, we take into account the
problems that faced the distance relays during faults
and normal operations like the effect of ground
resistance during ground faults and the problem of
load encroachment respectively. We study the effect
of ground resistance by changing the value of ground
resistance and studying the effect of it on the
impedance of distance relay. Also, we study the
problem of load encroachment in our model by
increasing the value of load gradually till reach to the
maximum loadability limit of distance relay.
A hidden failure is a defect (incorrect relay setting or
software or hardware error) in a relay which may go
unidentified for a long time and gets excited by
another event leading to erroneous removal of circuit
elements [5]. Because of hidden failures, zone-3
relays may be extra sensitive to temporary line
overloading due to transients, results in unreal fault
as a fault in a line and mis-trip even though it is not
recognized as a faulty condition by zone-1 or zone-2
relay. At this instance, if power system is operating
under stressed conditions, the hidden failure induced
zone-3 relay mis-trip may initiate other line trips
leading to catastrophic failures like blackouts.
According to the analysis of historical blackouts such
as the 1965 Great North-east blackout, the 1977 New
York blackout and the 1996 western blackout, North
American Electric Reliability Council (NERC)
concluded that the mis-operation of zone-3 relays is
one of the major causes of cascading outages leading
to blackout events [2], [10]. Therefore, Horowitz and
Phadke[6] reviewed the distance relaying protection
scheme to judge the necessity of the remote back up
relays but concluded that the zone-3 relays cannot be
omitted as its elimination will put the power system at
risk . Also, according to a report from the latest 2003
blackout in the US [7], many of zone-3 distance relays
operated under the overload situation, which further
stressed the system thereby causing the cascading
blackout in the end. This kind of relay mal-operation
may further weaken the system. Zone-3 relays can
incorrectly trip a line due to hidden failures [8], [9].
One of the main objectives of smart grid is to prevent
these types of mis-operations of power system
protection components, by establishing
communication between its components. This paper
concerns on zone-3 relay mis-operation. In [11] a
distributed agent based supervisory scheme is
proposed to make zone-3 relays able to withstand
hidden failure induced tripping, facilitated by
communication network. In their approach the entire
power grid is populated with software components
called agents at every relay. Communication
architecture is established between hierarchically
distinguished master and slave relay agents to help
making critical decisions. In order to aid the zone-3
relays to distinguish between a real fault and an
unreal fault (due to unexpected loading conditions), in
this paper we establish a simple model of
communications between relays using TCP/IP
protocol to help the distance relaying scheme
reducing the zone-3 mis-operation further reducing
the cascading outages.
The rest of this paper is organized as follows: section
II presents the implementation of distance relays
model using MATLAB software. The load
encroachment phenomena and loadabilitly limits of
distance relays are explained briefly in section III.
Section IV describes the agents rules of zone-3 to
avoid mis-operation of distance relay, also presents
the established model in Cisco Packet Tracer
program. Section V concludes the paper.
II. MODELING AND SIMULATION OF
DISTANCE RELAY
Fig. 1 shows the basic distance protection scheme of
a transmission line. The impedance measurement
inputs are the values of three phase current and
voltage signals taken from the current transformer

Renewable Energy and Sustainable Development (RESD) Volume 3 Issue 1, Special Issue, March 2017 - ISSN 2356-85 96 http://dx.doi.org/10.21622/RESD.2017.03.1.001
3 RESD © 2017 http://apc.aast.edu
(CT) and potential transformer (PT) respectively.
Three phase current and voltage waveforms must be
filtered first to eliminate the harmonic contents which
may present due to arcing of the fault. The filtered
waveforms are then sampled at a selected sampling
frequency before being used digitally inside distance
relay. The relays compare the setting impedance with
the measured impedance to determine if the fault is
inside or outside the protected zone.
Fig .1. One-line diagram of simulation system
Distance relays are also named impedance relays
[12]. They are used to calculate line impedance by
measurement of voltages and currents at one single
end. For example, as shown in Fig. 2 Mho type
distance relays, by comparing the setting value and
the measured value the relay can determine if there
is a fault or not .Distance relays immediately release
a trip signal when the impedance value is inside the
zone-1 impedance circle of distance relay. For
security protection consideration, the confirmation of
a fault occurrence will not be made until successive
trip signals are released in one season (faulted
section).
Fig .2. Distance relay of mho characteristic type
Different formulas should be adopted when
calculating the fault impedance due to different fault
types. Table 1 indicates calculation formula for all of
the fault types. [13].
Fig .3. Snapshot of the transmission line and load model
Table 1. Fault impedance formula for different faults
Fault Type Formula
Phase A to G VA/( IA+ 3 K0I0)
Phase B to G VB/( IB+ 3 K0I0)
Phase C to G VC/( IC+ 3 K0I0)
Phase A to Phase B VAB/( IA- IB)
Phase B to Phase C VBC/( IB- IC)
Phase C to Phase A VCA/( IC- IA)
where,
A, B and C indicate faulty phases, G indicates ground
line, VA, VB and VC indicate voltage phasors, IA, IB
and IC indicate current phasors, I0 is zero-sequence
current, K0= residual compensation factor where K0
= (Z0-Z1)/3Z, where Z0 = line zero-sequence
impedance, Z1 = line positive-sequence impedance.
In this paper in order to get exact simulation results,
we must establish accurate network model.
Simulink/PSB (power system blockset) is used to
create power system model for simulation. Fig. 3
shows the developed model of transmission line and
load in MATLAB/Simulink. From this figure, it can be
seen that the transmission line is separated into two
equal lines. The reason is to simulate a fault at a
point along the transmission line where the first line
simulates the fault distance from the substation
terminal until fault point while the second line
simulates the remaining distance from fault point until
the end of the transmission line.
When power systems faults occur, the signals may
contain high frequency components. As shown in
Fig.4, these higher frequency components must be
eliminated, so we adopt analogue low pass filters in
the simulated systems. After filtration, the only
remained fundamental voltage and current
waveforms will be passed to FFT blockset. The
Renewable Energy and Sustainable Development (RESD) Volume 3 Issue 1, Special Issue, March 2017 - ISSN 2356-85 96 http://dx.doi.org/10.21622/RESD.2017.03.1.001
4 RESD © 2017 http://apc.aast.edu
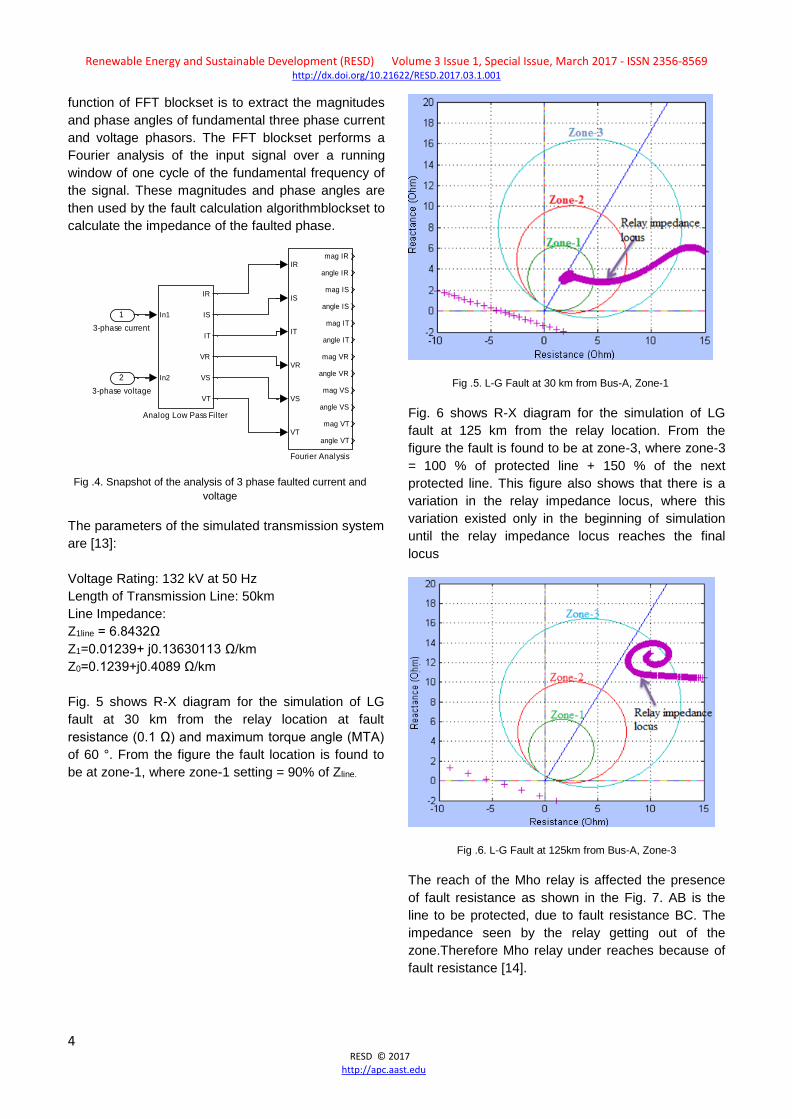
function of FFT blockset is to extract the magnitudes
and phase angles of fundamental three phase current
and voltage phasors. The FFT blockset performs a
Fourier analysis of the input signal over a running
window of one cycle of the fundamental frequency of
the signal. These magnitudes and phase angles are
then used by the fault calculation algorithmblockset to
calculate the impedance of the faulted phase.
Fig .4. Snapshot of the analysis of 3 phase faulted current and
voltage
The parameters of the simulated transmission system
are [13]:
Voltage Rating: 132 kV at 50 Hz
Length of Transmission Line: 50km
Line Impedance:
Z1line = 6.8432Ω
Z1=0.01239+ j0.13630113 Ω/km
Z0=0.1239+j0.4089 Ω/km
Fig. 5 shows R-X diagram for the simulation of LG
fault at 30 km from the relay location at fault
resistance (0.1 Ω) and maximum torque angle (MTA)
of 60 °. From the figure the fault location is found to
be at zone-1, where zone-1 setting = 90% of Zline.
Fig .5. L-G Fault at 30 km from Bus-A, Zone-1
Fig. 6 shows R-X diagram for the simulation of LG
fault at 125 km from the relay location. From the
figure the fault is found to be at zone-3, where zone-3
= 100 % of protected line + 150 % of the next
protected line. This figure also shows that there is a
variation in the relay impedance locus, where this
variation existed only in the beginning of simulation
until the relay impedance locus reaches the final
locus
Fig .6. L-G Fault at 125km from Bus-A, Zone-3
The reach of the Mho relay is affected the presence
of fault resistance as shown in the Fig. 7. AB is the
line to be protected, due to fault resistance BC. The
impedance seen by the relay getting out of the
zone.Therefore Mho relay under reaches because of
fault resistance [14].
IR
IS
IT
VR
VS
VT
mag IR
angle IR
mag IS
angle IS
mag IT
angle IT
mag VR
angle VR
mag VS
angle VS
mag VT
angle VT
Fourier Analysis
In1
In2
IR
IS
IT
VR
VS
VT
Analog Low Pass Filter
2
3-phase voltage
1
3-phase current

Renewable Energy and Sustainable Development (RESD) Volume 3 Issue 1, Special Issue, March 2017 - ISSN 2356-85 96 http://dx.doi.org/10.21622/RESD.2017.03.1.001
5 RESD © 2017 http://apc.aast.edu
Fig .7. Effect of fault resistance on reach of the relay
Fig. 8 shows R-X diagram for the simulation of LG
fault at 30 km from the relay location. By comparing
fig. 5 and fig. 8 it can be noted that the fault
resistance has deviated the final point of fault
impedance locus far away from zone-1 reach.
Fig .8. L-G Fault at 30km from Bus-A with Rf = 10 Ω
III. LOAD ENCROACHMENT AND
LOADABILITY LIMITS OF DISTANCE
RELAYS
The relay impedances zones of protection must be
selected carefully in order to avoid load
encroachment problems. The zone of protection with
greater risk is zone-3, since it is the Mho circle with
the greatest area and closest proximity to the load
impedance. Zone-3 settings are certainly vulnerable
to load encroachment conditions during high load and
power swings conditions, which can cause the load
impedance to travel towards the boundaries of the
zone-3 mho circle and cause an undesired trip. Fig. 9
shows the apparent impedance of the load with
respect to a distance relay with a forward reaching
mho characteristic.
Fig .9. The apparent load impedance w.r.t mho relay
For Mho relay impedance settings, minimum trip MVA
is often calculated in accordance with the following
formula [15]:
𝑀𝑉𝐴𝑇 =(0.85×𝑉𝐿𝐿 )
2
𝑍𝑟×𝑐𝑜𝑠(𝑀𝑇𝐴−𝝋) (1)
where,
MVAT = minimum MVA required to trip
VLL = nominal line voltage in kV depressed to 85% of
normal
MTA = maximum torque angle of relay (characteristic
impedance angle)
Zr = relay reach in primary Ohms at MTA
φ = maximum anticipated phase angle of load.
When using the above calculated loadability limits for
planning or operating purposes, it is important that the
user be advised whether the limits include any
margins [16]. By MVA_TEqu. (1), the minimum MVA
required to trip in the proposed model is 618 MVA.
Fig. 10 shows the R-X diagram where the load
impedance increased to 618 MVA under the normal
operating condition. It may be noted that the relay
impedance located in the circle of zone-3 so, the relay
will see the increasing of load as a fault and the relay
will trip the circuit breaker. By comparing with the
value of the calculated minimum MVA required to trip,
we will conclude that 618 MVA is approximately the
minimum value for the occurrence of the load
encroachment phenomenon for this relay.

Renewable Energy and Sustainable Development (RESD) Volume 3 Issue 1, Special Issue, March 2017 - ISSN 2356-85 96 http://dx.doi.org/10.21622/RESD.2017.03.1.001
6 RESD © 2017 http://apc.aast.edu
Fig .10. Normal operation at 618 MVA
For distance elements, such as "Mho" characteristic,
the susceptibility of the zone to pickup on load
generally increases as the reach (impedance setting)
is increased. The mho characteristic is most likely to
respond to system transient load changes, but may
also detect steady-state load - especially when it is
heavy and inductive in nature. Alterations in zone
characteristics can be made which will reduce the
susceptibility of distance zone responding undesirably
to a load condition; some of them are outlined as
following [16]:
1. Increase of the torque angle.
2. Adoption of a lens characteristic.
3. Use of blinders.
4. Use of load encroachment characteristic.
Options 1, 2, and 3 above, reduce the susceptibility of
the relay response to heavy load conditions but
reduce the coverage of resistive faults. Option 4
presents the most effective and reliable method of
discriminating system faults from heavy load
conditions. The load encroachment is a protection
feature available in modern line relay packages (for
example: [17], [18]) that enables the protection
engineer to define custom load regions in forward and
reverse direction. Modern study like [19] improves the
operation of the distance protection relay by
introducing a new blocking algorithm using Dynamic
Thermal Line Rating (DTLR) to restrain relay from
tripping when conditions in electrical power system
allow for it. This reference focused on the possibility of
Dynamic Thermal Line Rating usage to prevent
distance protection relay from tripping in situations of
extreme load conditions and power swing by
introducing an additional blocking signal into the
distance relay. The blocking signal is based on the
DTLR technique monitoring weather conditions and
calculating the overhead conductor temperature and
actual for ambient weather conditions conductor
current limit and the author [19] analyzed this
technique by using MATAB/Simulink.
In the implemented model, different values of
maximum torque angle for example (60°, 75°, and
90°) are applied. As shown in Fig. 11, the simulation
results show that,to increase line loading (greater than
minimum MVA required to trip), the MTA angle can be
adjusted on some relays up to 90 degrees. As
indicated, such adjustments can increase line
loadability as measured along the load apparent
impedance line. If the applied relay has the capability
of increasing MTA, this method maintains trip
dependability while increasing loadability security with
minimum cost implications.
Fig .11. Mho circle torque angle adjustment
IV. AGENT RULES OF ZONE 3 DISTANCE
RELAYS TO PREVENT HIDDEN
FAILURES AND BLACKOUTS
A. Model
Further studies suggested that incorrect operation
performed by zone-3 back up protection relays is due
to the presence of hidden failures that may trip a
healthy line instead of a faulty line. Such false trips
may lead to a sequence of trips resulting in a
catastrophic failure like blackout [8].

Renewable Energy and Sustainable Development (RESD) Volume 3 Issue 1, Special Issue, March 2017 - ISSN 2356-85 96 http://dx.doi.org/10.21622/RESD.2017.03.1.001
7 RESD © 2017 http://apc.aast.edu
In this paper, a distributed agent based supervisory
model is suggested to make zone-3 relays able to
distinguish between real faults and false faults
specially hidden failures induced tripping, facilitated by
the communication network to become an integral
parts of the smart grid. Zone-3 relays are often overly
sensitive to remote line overloading, and are known to
cause mis-trips during cascading failure scenarios.
Therefore, providing robustness to zone-3 relays to
minimize the risk of erroneous trips, especially when
hidden failuresare existed [8], is an important problem.
In the proposed schemes, a grid is populated with
agents at each relay, and an agent hierarchy is
maintained in master/slave relationship. The
communication established between relay agents
decreases the probability of erroneous zone-3 trips
thereby preventing them from annoying cascading
failure scenarios, and reducing the probability of
cascading blackouts. Many studies [20], [21]
discussed this issue and presented different
approaches and schemes for communications
between agents.
It is possible that a fault in a single transmission line
can be sensed at least by six relays i.e. zone-1, zone-
2 and zone-3 from both ends of the transmission line.
Therefore in order to classify a sensed fault as a real
fault or an unreal fault, agent of the faulted zone (relay
that sense fault) has to communicate with at least five
other agents. This can result in huge communication
overhead and longer response times. If the total
response time is greater than the relay fault clearing
times, agent based relay supervision scheme does
not serve the intended purpose. Therefore, in order to
reduce the response times, agents are hierarchically
distinguished as slave agents and master agents. A
slave agent associated with a relay is called as "slave
agent" and a master agent associated with a relay is
called as "master agent".
A slave agent relay records the fault status of its
associated relay and reports it to the master agent.
Master agent is endowed with high privileges and
responsibilities. At any given time, a master agent has
the fault status information of all the slave agents
reporting to it. Therefore whenever a relay senses a
fault, its associated slave relay agent records it and
queries the master agent, master agent compares the
queried slave relay agent’s fault status with the fault
statuses of other slave agent relays protecting the
same transmission line to classify the fault as a real
fault or an unreal fault and respectively acknowledges
the queried slave relay agent to trip or not to trip the
line out of service [21].
In proposed scheme as shown in Fig. 12, each relay
is associated with an agent that has the ability to
communicate with other agents in the network.
Whenever a relay senses a fault in the transmission
line protected by it, its associated agent records it and
communicates with other agents protecting the same
transmission line in the network to find out if the
perceived fault is real fault or unreal fault. If the
majority of other relays protecting the same
transmission line also sense a fault, classifying it as a
faulty condition, master agent can advise its
associated relay to trip. On the other hand if the
majority of the other relays protecting the same
transmission line do not sense a fault, categorizing it
as a fault-free condition,master agent advises the
relay not to trip. This is because the relay might have
sensed a fault due to temporary loading conditions
and it is not required for the relay to trip.
In this paper we focus only on the communication
between relay agents and estimate the sending and
receiving time, and we do not take into account the
setting of agents. In this work, to gain better
evaluation of communication for the zone-3
supervision scheme we use Cisco Packet Tracer
program as a communication tools.
Fig .12. Flow chart of the proposed scheme of agent rules
The master agent has the topology of transmission
system within its domain, including the relays and

Renewable Energy and Sustainable Development (RESD) Volume 3 Issue 1, Special Issue, March 2017 - ISSN 2356-85 96 http://dx.doi.org/10.21622/RESD.2017.03.1.001
8 RESD © 2017 http://apc.aast.edu
breakers. All other agents in the domain are
considered as slave agents. In the proposed scheme,
as shown in Fig. 13, whenever a zone-3 relay senses
a fault in its zone as a reduction in impedance, it
queries the domain master agent if any other slave
agents associated with the associated set of zone-1
and zone-2 relays reported any abnormality. The
master agent then requests the status of the
remaining slave relay agents. Based on the response
of the other relays, the master agent can decide if
zone-1 or 2 could not clear a fault that zone-3 must
act upon. If not, the zone-3 will periodically query
master agent until the faulty condition is either cleared
or the master agent instructs the zone-3 relay to
continue with its trip timer. This will reduce the
probability of false trips by zone-3 relays. The request,
response delays of communication must be within the
time allowed for zone-3 relays to wait before tripping.
The choice of the networking topology, the
communication protocol, and the physical media of
the network will affect these delays. Also, whether to
use the Internet or any other type of networks will also
have to be decided.
Fig .13. Communications in the proposed scheme
As an illustration, consider a part of the IEEE 14 bus
system, as shown in Fig. 14. Consider a fault on the
transmission line between buses 10 and 11 in the
vicinity of bus 11, the relays that will sense this fault
are, zone-3 of relays R(9,15), R(12,12) and R(13,20)
sense this fault. Ideally the zone-1 of relays R(10,17)
and R(11,17), zone-2 of relay R(6,11) and zone-3 of
relays R(9,15), R(12,12), R(13,20) should see the
fault. Based on the response of the relays, the master
agent would locate the fault and would allow the zone-
3 timers of relays R(9,15), R(12,12), R(13,20) to
continue, whereas it would block the zone 3 timer of
all other relays ((14,16) in this case). If there is any
zone-1 or zone-2 relay operation and subsequent
circuit breaker operation, resulting in a successful
clearing of the fault, the master agent would silence all
the zone-3 timers. Thus the operation of zone-3 is
under the supervision of the master agent. One other
expected benefit of this scheme is the identification of
hidden failures in these relays. For example, in the
above scenario if any of the listed relay pick-ups is not
observed or other relays (like (14,16)) respond, it is an
indication of a hidden failure in the relay that has not
responded or responded wrongly, in sensing the fault.
Fig .14. Part of IEEE-14 bus system
Many studies [11], [20] presented different types of
communications and response time. In [11] the study
was experimented with various communication
topologies, protocols, and media to figure out which
topology, media, and protocol would make the
presented scheme feasible. It is clear that with fiber
media, all possible protocols, and topologies will allow
enough slack in latency for the studied scheme to
work. In [20]three different network topologies and
physical media of communication were evaluated to
find out the most suitable network topology and
physical media that meets the time constraints of
zone-3 relay supervision scheme. The networking and
optimization simulation results indicate that the
proposed scheme can reduce the undesirable zone-3
tripping and thus reduce the probability of occurrence
of blackouts. In this paper a model is implemented as
follows in the next section to study the time of
response between mater agent and slave agents. The
results of this model give better response, where the
time of response is less that the time gained before in
the previous studies.
B. Simulated example:
We assume each protection relay to be an agent
which can communicate with master agent directly. In
this way, relays near a bus/substation compose a
local area network (LAN) which uses Ethernet as link
layer protocol. Then relays can send message from
this LAN to other LANs or master agent through
Renewable Energy and Sustainable Development (RESD) Volume 3 Issue 1, Special Issue, March 2017 - ISSN 2356-85 96 http://dx.doi.org/10.21622/RESD.2017.03.1.001
9 RESD © 2017 http://apc.aast.edu
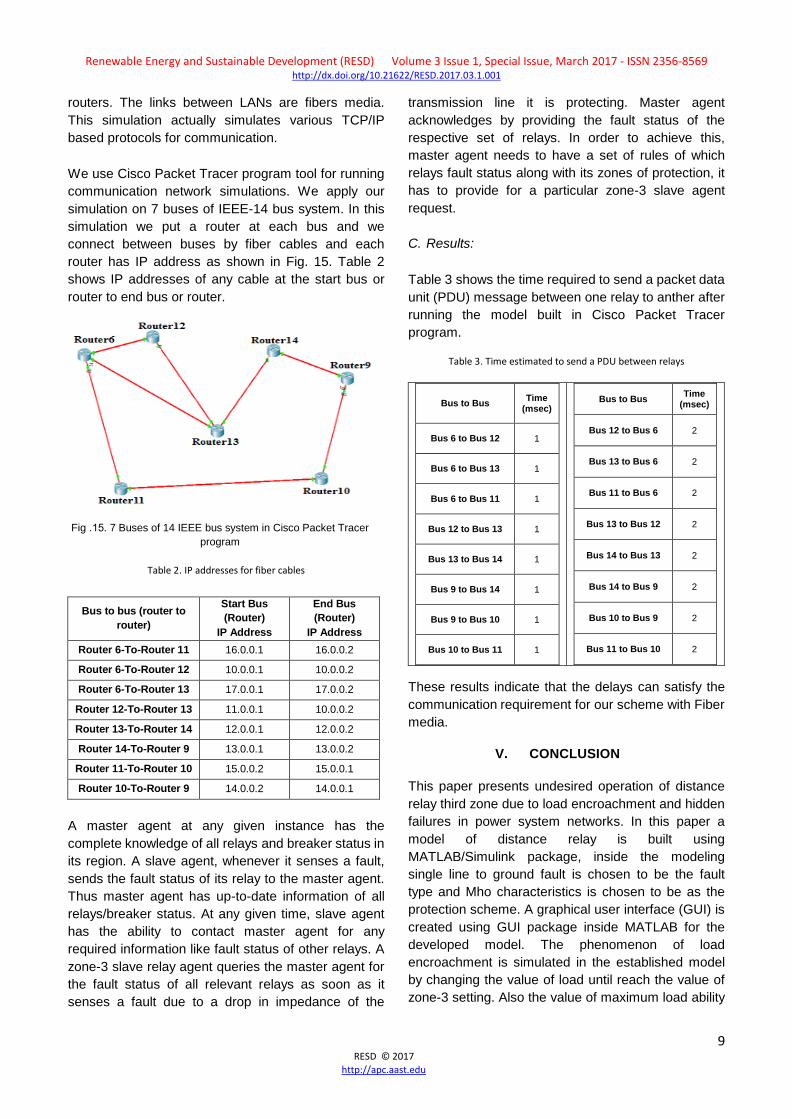
routers. The links between LANs are fibers media.
This simulation actually simulates various TCP/IP
based protocols for communication.
We use Cisco Packet Tracer program tool for running
communication network simulations. We apply our
simulation on 7 buses of IEEE-14 bus system. In this
simulation we put a router at each bus and we
connect between buses by fiber cables and each
router has IP address as shown in Fig. 15. Table 2
shows IP addresses of any cable at the start bus or
router to end bus or router.
Fig . 51 . 7 Buses of 14 IEEE bus system in Cisco Packet Tracer
program
Table 2. IP addresses for fiber cables
Bus to bus (router to
router)
Start Bus
(Router)
IP Address
End Bus
(Router)
IP Address
Router 6-To-Router 11 16.0.0.1 16.0.0.2
Router 6-To-Router 12 10.0.0.1 10.0.0.2
Router 6-To-Router 13 17.0.0.1 17.0.0.2
Router 12-To-Router 13 11.0.0.1 10.0.0.2
Router 13-To-Router 14 12.0.0.1 12.0.0.2
Router 14-To-Router 9 13.0.0.1 13.0.0.2
Router 11-To-Router 10 15.0.0.2 15.0.0.1
Router 10-To-Router 9 14.0.0.2 14.0.0.1
A master agent at any given instance has the
complete knowledge of all relays and breaker status in
its region. A slave agent, whenever it senses a fault,
sends the fault status of its relay to the master agent.
Thus master agent has up-to-date information of all
relays/breaker status. At any given time, slave agent
has the ability to contact master agent for any
required information like fault status of other relays. A
zone-3 slave relay agent queries the master agent for
the fault status of all relevant relays as soon as it
senses a fault due to a drop in impedance of the
transmission line it is protecting. Master agent
acknowledges by providing the fault status of the
respective set of relays. In order to achieve this,
master agent needs to have a set of rules of which
relays fault status along with its zones of protection, it
has to provide for a particular zone-3 slave agent
request.
C. Results:
Table 3 shows the time required to send a packet data
unit (PDU) message between one relay to anther after
running the model built in Cisco Packet Tracer
program.
Table 3. Time estimated to send a PDU between relays
Bus to Bus Time
(msec)
Bus 6 to Bus 12 1
Bus 6 to Bus 13 1
Bus 6 to Bus 11 1
Bus 12 to Bus 13 1
Bus 13 to Bus 14 1
Bus 9 to Bus 14 1
Bus 9 to Bus 10 1
Bus 10 to Bus 11 1
Bus to Bus Time
(msec)
Bus 12 to Bus 6 2
Bus 13 to Bus 6 2
Bus 11 to Bus 6 2
Bus 13 to Bus 12 2
Bus 14 to Bus 13 2
Bus 14 to Bus 9 2
Bus 10 to Bus 9 2
Bus 11 to Bus 10 2
These results indicate that the delays can satisfy the
communication requirement for our scheme with Fiber
media.
V. CONCLUSION
This paper presents undesired operation of distance
relay third zone due to load encroachment and hidden
failures in power system networks. In this paper a
model of distance relay is built using
MATLAB/Simulink package, inside the modeling
single line to ground fault is chosen to be the fault
type and Mho characteristics is chosen to be as the
protection scheme. A graphical user interface (GUI) is
created using GUI package inside MATLAB for the
developed model. The phenomenon of load
encroachment is simulated in the established model
by changing the value of load until reach the value of
zone-3 setting. Also the value of maximum load ability

Renewable Energy and Sustainable Development (RESD) Volume 3 Issue 1, Special Issue, March 2017 - ISSN 2356-85 96 http://dx.doi.org/10.21622/RESD.2017.03.1.001
10 RESD © 2017 http://apc.aast.edu
limit of distance relay is calculated and simulated
using the established model in MATLAB. The problem
of cascading events caused by hidden failures in
zone-3 is also presented in this paper.We proposed a
hierarchically distributed agent based distance
relaying protection scheme and use communications
between each relay by using IP protocols for
communication to reduce the cascading outages like
blackouts due to zone-3 relay undesirable trips. This
technique is very helpful to distinguish between real
faults and unreal faults.
REFERENCES
[1] G. Phadke and J. S. Thorp, "Computer relaying
for power systems", In second edition, Research
Studies Press Ltd and John Wiley & Sons, 2009.
[2] DamirNovosel, Miroslav M. Begovic, and
VahidMadani, "Shedding light on blackout" ,IEEE
Power and Energy Magazine, January/February
2004 pp. 32-43.
[3] Thomas L. Baldwin, Magdy S. Tawfik and Miles
McQueen, “Contingency Analysis of Cascading
Line Outage Events", Power Systems
Conference, March 2011.
[4] Swapnil Sharma, JagdishBichve, and
YuvrajsinhBharthania, " Performance analysis of
Mho relay characteristics using the PSCAD",
International Journal of Advance Engineering and
Research Development, Volume 2, Issue 1,
January -2015,pp. 103-110.
[5] SurachetTamronglak, "Analysis of power system
disturbances due to relay hidden failures", Ph.D.
Dissertation, Virginia Polytechnic and State
University, Blacksburg, Virginia, March 1994.
[6] HOROWITZ S., PHADKE A, "Third zone
revisited", IEEE Transaction Power Delivery,
2006, 21, (1), pp. 23–29.
[7] "Final Report on the August 14, 2003 Blackout in
the United States and Canada: Causes and
Recommendations"[Online]. U.S.-Canada Power
System Outage Task Force, 2004
Available:https://reports.energy.gov/BlackoutFina
l-Web.pdf.
[8] H. Wang and J. Thorp, " Optimal locations for
protection system enhancement: a simulation of
cascading outages", Power Delivery, IEEE
Transactions on, October 2001,pp. 528-533.
[9] A. G. Phadke, "Hidden failures in electric power
systems", International Journal of Critical
Infrastructures, January 2004, pp.64-75.
[10] J. Thorp and A. Phadke, "Protecting power
systems in the post-restructuring era", Computer
Applications in Power, IEEE, 12(1), PP. 33-37,
January 1999.
[11] S. Garlapati, H. Lin, S. Sambamoorthy, S.
Shukla, and J. Thorp. ,"Agent based supervision
of zone 3 relays to prevent hidden failure based
tripping", in Smart Grid Communications (Smart
Grid Comm), 2010 First IEEE International
Conference on, October, 2010, pp.256 -261.
[12] L. C. Wu, C.W. Liu and C. S Chen, "Modeling
and testing of a digital distance relay using
Matlab/Simulink", IEEE 2005.
[13] MuhdHafiziIdris, Surya Hardi, MohdZamriHasan,
"Teaching distance relay using matlab/simulink
graphical user interface", Malaysian Technical
Universities Conference on Engineering &
Technology, 2012.
[14] Yashasvi, Vidushi, Ramesh, "Simulation of mho
characteristics for transmission line protection
using PSCAD" ,IJREAS, Volume 2, Issue 2
,February 2012.
[15] Power System Relay Commitee Working Group,
"Application of overreaching distance relays",
2009.
[16] System Protection and Control Task Force of the
North American Electric Reliability Council,
“Methods to Increase Line Relay Laod ability,”
June 7, 2006. [Online] Available:
http://www.nerc.com/docs/pc/spctf/Methods_to_I
ncrease_Line_Relay_Loadability_6-7-
06_%282%29.pdf
[17] G. E. Digital Energy, "D90Plus line distance
protection", GE Digital Energy, 1.8 edition, 2012.
[18] Alstom, "MICOM Mho P446 Fast Multifunction
Distance Protection Relay", Alstom, 2011.

Renewable Energy and Sustainable Development (RESD) Volume 3 Issue 1, Special Issue, March 2017 - ISSN 2356-85 96 http://dx.doi.org/10.21622/RESD.2017.03.1.001
11 RESD © 2017 http://apc.aast.edu
[19] VishvadeepJ.Dhawale, Vishal Dake and Prafulla
A.Desale, "Blocking the Distance Relay 3rd Zone
Operation during Power Swings by DTLR
Enhancement in MATLAB/Simulink",
International Journal of Electronic and Electrical
Engineering. ISSN 0974-2174 Volume 7,
Number 7, 2014, pp. 757-765.
[20] ShravanGarlapati, Hua Lin , Andrew Heier,
Sandeep K. Shukla, and James Thorp, "A
hierarchically distributed non-intrusive agent
aided distance relaying protection scheme to
supervise Zone 3", Electrical Power and Energy
Systems,2013 , pp 42–49.
[21] Hua Lin, SanthoshkumarSambamoorthy,
SandeepShukla, James Thorp, LamineMili "AD-
HOC vs. supervisory wide area backup relay
protection validated on power/network co-
simulation platform", proceedings of the 17th
power systems computation conference,
Stockholm, Sweden, August 22-26,2011.

Renewable Energy and Sustainable Development (RESD) Volume 3 Issue 1, Special Issue, March 2017 - ISSN 2356-8569 http://dx.doi.org/10.21622/RESD.2017.03.1.012
This Paper has been Accepted and Presented in the (First International Conference on New Trends for Sustainable Energy)
1-3 October, 2016 at Pharos University, Alexandria, Egypt
12 RESD © 2017 http://apc.aast.edu
Optimal PMUs Placement Due to Several Stages for
Achieving Full System Observability Mohamed A. Badr, Ahmed. A. Hossam-Eldin and Nabil. H. Abbasy
Electrical Engineering Department, Alexandria University, Alexandria, Egypt
Abstract - The new measurement devices such as
phasor measurement units (PMUs), is considered to
be an essential component in implementing future
power network systems. The problem of optimal
placement of PMUs (OPP) requires finding a
minimum numbers of PMUs that must be installed to
provide full system observability. Due to the large
number of the PMUs required and their relatively high
cost, it is important to partition the installation of
PMUs placement into several stages to overcome this
problem. A new proposal depends on limiting the
number of installed PMUs at each stage and
maximizing system observability will be illustrated in
this paper. The proposed method will be implemented
on IEEE-14 bus system and IEEE-30 bus system.
I. INTRODUCTION
Operation of the power system is becoming very
complicated and facing many challenges every time
due to the expanding of the power generation and
transmission utilities. The power systems have also
become so interdependent that the events in one
area can cascade and have significant impact on
other remote areas. This change in the industry is
putting pressure for the development of new tools to
monitor system stability and reliability.
Until recently, available measurement sets did not
contain phase angle measurements due to the
technical difficulties associated with the
synchronization of measurements at remote
locations. Global positioning satellite (GPS)
technology alleviated these difficulties and lead to the
development of phasor measurement units (PMUs).
Synchronized Phase Measurement Unit (PMU) is a
monitoring device, which was first introduced in mid-
1980s. Phasor measurement units (PMU) are
devices, which use synchronization signals from the
global positioning system (GPS) satellites and
provide the phasors of voltage and currents
measured at a given substation. As the PMUs
become more and more affordable, their utilization
will increase not only for substation applications but
also at the control centers for the EMS applications
[1].
All Synchrophasor measurements are time tagged
with the Coordinated Universal Time, via GPS. All
GPS receivers generate a very accurate pulse, which
is used by PMUs to generate very precise sampling
pulses. PMUs provide a more exact view of the
system because samples are taken and time
stamped in a microsecond sampling window and
although data from multiple units can only be
available and time aligned in the order of milliseconds
the time stamp included with the measurements
eliminates the errors introduced in the state estimator
by the size of the scanning window.
Different methods which are used to compute the
minimum required numbers of PMUs for full system
observability will be described in part II.
Importance of PMU in wide area monitoring system,
and PMUs placement based on system
decomposition will be illustrated in part III.
Different methods which are used for multi-stage of
PMUs placement in power system will be described
in part IV. Implementation of optimal multi-stage
PMUs placement will be carried out on IEEE-14 bus
and IEEE-30 bus systems, part V.
II. OPTIMAL PMUS PLACEMENT FOR FULL
POWER SYSTEM OBSERVABILITY
The main objective from this section is to explain
different methods which are used for optimal PMUs
placement to make the system fully observable. An
integer linear programming (ILP) approach is used to
determine the optimal number and locations of
PMUs. PMUs placement guarantees the system
observability during normal operating conditions as
well as single branch outages or single PMU outages.
The proposed scheme is applied to the IEEE-14 bus
and IEEE-30 bus systems.

Renewable Energy and Sustainable Development (RESD) Volume 3 Issue 1, Special Issue, March 2017 - ISSN 2356-8569 http://dx.doi.org/10.21622/RESD.2017.03.1.012
13 RESD © 2017 http://apc.aast.edu
A. OBSERVABILITY RULES FOR PMUS
PLACEMENT
A PMU is able to measure the voltage phasor of the
installed bus and the current phasors of some or all
the lines connected to that bus. The following rules
can be used for PMUs placement:
Rule 1; assign one voltage measurement to a bus
where a PMU is placed, including one current
measurement to each branch connected to the bus
itself.
Rule 2; assign one voltage pseudo-measurement to
each node Reached by another equipped with a
PMU.
Rule 3; assign one current pseudo-measurement to
each branch connecting two buses where voltages
are known. This allows interconnecting observed
zones.
Rule 4; assign one current pseudo-measurement to
each Branch where current can be indirectly
calculated by the Kirchhoff current law (KCL). This
rule applies when the current balance at a node is
known [2].
B. INTEGER LINEAR PROGRAMMING(ILP) FOR
PMUS
A PMU placed at bus i will measure the voltage
phasor of bus i and a predetermined number of
phasor currents of outgoing branches of that bus.
The number of the measured current phasors
depends on the number of PMU channels made
available.
It is assumed that a PMU placed at bus i will
measure all current phasors of the branches
connected to that bus, in addition to the voltage
phasor of bus i. Therefore, with the absence of any
conventional measurements in the system, bus i will
be observable if at least one PMU is placed within
the set formed by bus i and all buses incident to it.
The zero injection bus, single PMU outage and
transmission line failure will be considered.
Therefore, the objective of optimal PMU placement
problem is to determine the minimum number of
PMUs so as to preserve the system Observability
[3]. This objective can be formulated as:
(1)
(2)
(3)
Where:
Xi is a binary decision variable associated with
bus i
I is the set of buses;
fi is the observability function related to bus i;
aij is a binary decision variable associated with
bus
i and j
Table 1. Results of OPP for IEEE-14 bus system
Scenario Min No of
PMUs Optimal locations
Normal topology 4 2, 6, 7, 9
Modeling of ZI 3 2, 6, 9
Single PMU outage
with modeling of ZI 7 2, 6, 9, 4, 5, 10, 13
III. PMUS PLACEMENT BASED ON SYSTEM
DECOMPOSITION [4]
Due to the large required number from PMUs to fulfill
power system observability it is considered
economically infeasible to install all these PMUs in
one shot. The optimal PMUs placement (OPP) is
divided into muti-stage installation. This means
solving the OPP in incremental placement strategy.
Area system decomposition by using the spanning
tree method will be illustrated. The optimal number of
PMUs for each area will be determined taking into
consideration the effect of the internal and boundary
buses, using these properties to minimize the total
number of PMUs for full power system observability.
In this section an approach used for finding the initial
partitioning between the buses of the power system
will be overviewed. This approach was firstly
proposed by Branes [5]. The approach partition the
network into many blocks (m) or sub-networks then, it
creates a formulation for that partitioning by using

Renewable Energy and Sustainable Development (RESD) Volume 3 Issue 1, Special Issue, March 2017 - ISSN 2356-8569 http://dx.doi.org/10.21622/RESD.2017.03.1.012
14 RESD © 2017 http://apc.aast.edu
ILP. The main principle for this approach is to find the
minimum spanning tree for the network after that, the
system is partitioned using equi-partitioning, multi-
partitioning algorithm [6] and Kruskal algorithm [7].
Consider a power system with n buses and partitions.
Partitions are separated by tie-lines whose terminal
buses are assigned to both the connecting blocks.
Thus, after decomposition, each bus will belong to
anyone of these two categories:
Internal bus (XI), if its neighbors belong to block-i.
(The bus inside area and is not connected to
buses of any other areas.)
Boundary bus (Xb), if its neighbors are internal
buses of block-i and at least one boundary bus
from another block. (The bus inside area but
connected to buses of external area)
Based on these two categories, six bus vectors are
defined as follow:
XiI - set of internal buses of block-i.
Xib - set of boundary buses of block-i.
XiTb - set of total boundary buses (including buses
of blocks adjacent to block-i ) associated with
block-i.
X= XiI; Xib - set of total buses in block-i.
XT= XiI; XiTb - set of buses of block-i including
neighboring boundary buses also.
XB - set of boundary buses to be excluded from
block-i its constraint function.
The optimal PMU placement has been formulated as
an Integer Linear Programming problem in order to
minimize the total cost of PMU installation and the
constraints are formulated using phasor
measurements from PMUs along with the pseudo-
measurements. Pseudo-measurements are obtained
using Ohm’s and Kirchhoff’s laws. [8].
The following steps have been used to optimally
place the PMUs in the sub-networks.
1. Sort the blocks in descending order of their size
2. Start block counter, i = 1.
3. Identify all set of buses for the block-i i.e. XiI, Xib,
XiTb, X= XiI; Xib, XT= XiI; XiTb.
4. Formulate ILP problem for block-i as,
Subject to
where
Cj is the cost of PMU installation at bus. Assume
that, cost of installation of each PMU has assumed
to be equal and considered as 1 p.u. Thus, in (1)
Cj = 1.
f is constraint set; constraint at any bus-j is
formulated in such a way that it becomes
observable either through direct phasor
measurement or phasor pseudo-measurement.
This is achieved either by directly placing the PMU
at the bus-j or at any one of the buses directly
connected to the bus-j.
XB is the set of boundary buses to be excluded
while formulating constraint set of block. This is an
essential step; otherwise, each boundary bus
would be considered twice for the constraint
formulation and would lead to increased optimal
PMU solution. Thus, when a boundary bus is once
considered for the constraint formulation, it should
be added in the XB set so that it cannot be
considered again. Clearly, for i = 1 the first block,
XB would be a null vector and after each iteration it
has to be updated.
5. Update XB = XB; Xib.
6. If i = k, then Stop, else i = i+1 and go to step 3.
The results of the portioning of IEEE-14 bus system
are shown in figure (1)
Fig .1. OPP result for IEEE14 bus system after system
decomposition [4]
Renewable Energy and Sustainable Development (RESD) Volume 3 Issue 1, Special Issue, March 2017 - ISSN 2356-8569 http://dx.doi.org/10.21622/RESD.2017.03.1.012
15 RESD © 2017 http://apc.aast.edu
Table 2. optimal PMU placement results for IEEE-14 bus system
System
Number
of
partitions
Number
of buses
Number of
zero
injection
Optimal
PMUs
IEEE 14 3 5,5,4 0 4
IV. PROPOSED METHOD FOR OPTIMAL
MULTI-STAGE OF PMUS PLACEMENT
FOR FULL SYSTEM OBSERVABILITY
In this section the main principle of the proposed
algorithm will be explained. The simulation results will
be illustrated. The proposed utilizing model depends
on maximizing the system observability taking into
consideration installing limited number of PMUs at
each stage as constraints. The model will be
implemented on IEEE-14 bus and IEEE-30 bus
systems.
The main principle of the present algorithm is
maximizing the observability of the power system
subject to a limited number of PMUs at each stage.
By this way a direct relationship between the PMUs
placement at each stage and the cost or the available
budget during that stage will be considered. The main
objective function is to maximize the observability.
Max O (4)
Subject to
No PMU ≤ M (5)
Where M is the number of PMUs at each stage
determined based on allocated budget for the
particular stage.
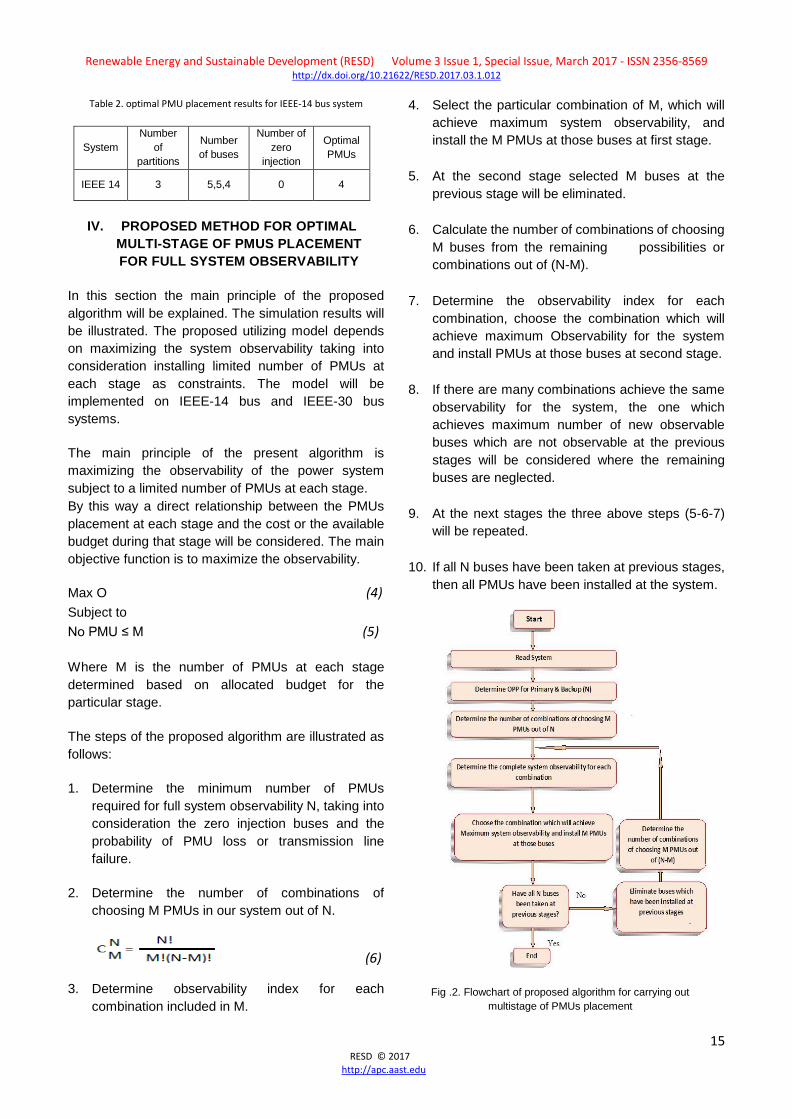
The steps of the proposed algorithm are illustrated as
follows:
1. Determine the minimum number of PMUs
required for full system observability N, taking into
consideration the zero injection buses and the
probability of PMU loss or transmission line
failure.
2. Determine the number of combinations of
choosing M PMUs in our system out of N.
(6)
3. Determine observability index for each
combination included in M.
4. Select the particular combination of M, which will
achieve maximum system observability, and
install the M PMUs at those buses at first stage.
5. At the second stage selected M buses at the
previous stage will be eliminated.
6. Calculate the number of combinations of choosing
M buses from the remaining possibilities or
combinations out of (N-M).
7. Determine the observability index for each
combination, choose the combination which will
achieve maximum Observability for the system
and install PMUs at those buses at second stage.
8. If there are many combinations achieve the same
observability for the system, the one which
achieves maximum number of new observable
buses which are not observable at the previous
stages will be considered where the remaining
buses are neglected.
9. At the next stages the three above steps (5-6-7)
will be repeated.
10. If all N buses have been taken at previous stages,
then all PMUs have been installed at the system.
Fig .2. Flowchart of proposed algorithm for carrying out
multistage of PMUs placement

Renewable Energy and Sustainable Development (RESD) Volume 3 Issue 1, Special Issue, March 2017 - ISSN 2356-8569 http://dx.doi.org/10.21622/RESD.2017.03.1.012
16 RESD © 2017 http://apc.aast.edu
V. CASE STUDY
In this study the above steps will be implemented. For
simplifying it can be assumed that the number of
PMUs which will be installed at each stage M = 2. The
implementation will be carried out for the IEEE-14 bus
system and IEEE-30 bus system.
A. IEEE-14 bus system
From section II, the minimum number of PMUs
placement for full power system observability (OPP) of
IEEE-14 bus system is seven PMUs as follow:
The OPP = [2 6 9 4 5 10 13]
By implementing the above steps in section IV on
IEEE-14 bus system, the results are shown in table
(3). The combination numbers of choosing 2 PMUs
from 7 are 21 as shown in the below equation.
(7)
From the simulation results, it is found that, there are
three combinations that will achieve same system
observability, ten buses will be observable at each
one. These combinations are (6, 9), (6, 4), (4, 13). To
define which one must be installed at the first stage
from the above three Combinations, the maximum
number of new observable buses at the second stage
which are not observable at first stage for each
combination must be defined. After that start with the
combination number which achieve maximum number
of new observable buses at second stage. from the
simulation results it can be concluded that, all three
combinations will achieve three new observable
buses at second stage. the combination of (6,9) will
achieve these three buses four times while the other
two combinations will achieve these three buses two
times only.
So at first stage it is recommended to install two
PMUs at buses (6, 9). After the first stage the
following buses are observable [4 5 11 12 13
7 10 14 6 9]. After completing that stage the
system observability will be 0.7143, as shown in table
(3).
At second stage, to define the location of the PMUs
which will be installed at the second stage, we should
carry out the followings:
Table 3. OMPP for IEEE-14 bus system results
4 3 2 1 Stages
10 4, 5 2, 13 6,9 Location of PMUs
13 13 13 10
Number of
observable buses
at system
Non Non 1 2 3 Non New observable
buses
1 2
3 4
5 11
12 13
7 10
14 6
9
1 2 3
4 5
11 12
13 7
10 14
6 9
1 2 3
4 5
11 12
13 7
10 14
6 9
4 5
11
12
13 7
10
14 6
9
Observable buses
status
0.9285 0.9285 0.9285 0.7143 Observability
Function
Fig .3. Observability function toward multi-stages of PMUs.
B. IEEE-30 bus system
The minimum numbers of PMUs placement for full
power system observability are 16 PMUs. The optimal
PMUs placement is (OPP)
OPP = [1 3 5 7 9 10 12 13 15 17
19 20 22 24 27 29].
The combinations or possibilities of choosing 2 buses
from 16 are 120 as follow:
(8)
From the results found that, there are one
combination (10, 12), will achieve maximum system
observability, ten buses buses. So at the first stage
two PMUs will be installed at buses (10,12). After that
stage the observable buses are [4 6 9 17 20
21 22 13 14 15 16 10 12].
To define the location of the PMUs which will be
installed at the second stage, the following steps must
be carried out:
0
0.5
1
Stage1
stage2
stage3
stage4
Observability
Observability

Renewable Energy and Sustainable Development (RESD) Volume 3 Issue 1, Special Issue, March 2017 - ISSN 2356-8569 http://dx.doi.org/10.21622/RESD.2017.03.1.012
17 RESD © 2017 http://apc.aast.edu
1. Eliminate any combination which contains bus 10
or bus 12.
2. Determine the remaining possibilities or
combinations of choosing 2 from 14 as follow:
(9)
For each combination, we should determine the new
observable buses which are not observable in the first
stage. From the results it can be concluded that, there
are two combinations will achieve the maximum
number of new observable buses (8 buses), which are
not observable at first stage these combination are (1,
27) & (5, 27). To define which one must be installed at
the second stage, the number of buses which are not
observable at the second stage for each one must be
calculated. The combination which will achieve the
maximum number of new observable buses will be
taken. From the results it can be concluded that, it is
no difference between the two combination (1, 27) &
(5, 27), as if two PMUs are installed at buses (1,27) or
at (5,27), four new buses will be observable at the
third stage which are not observable at the second
stage. So at the second stage two PMUs can be
installed at buses (1, 27) or (5, 27). It can be assumed
that, at the second stage two PMUs will be installed at
buses (1, 27).
At the next stages same concept will be implemented.
The final results are shown in table (4).
Table 4. Conclusion results of proposed method for OMPP for IEEE-30
bus system
From the above simulation results on the two systems
it can be concluded that, the complete system
observability is achieved much before the last stage of
installation of PMUs. Also all the tie lines become
observed well before the last stage of PMUs
placement. Since the PMUs placement is robust
against a PMU failure or single line outage.
Fig .4. Observability function belongs to number of stages for
IEEE-30 bus system.
VI. CONCLUSION
Improvements in power system control and protection
is achieved by utilizing real time synchronized phasor
measurements PMUs. The trend in recent years is the
steady increase of Phasor Measurement Units
(PMUs) installations worldwide for various
applications. Placement of phasor measurement units
(PMUs) in power systems has often been formulated
for achieving total network observability. In practice,
however, the installation process is not implemented
at once, but at several stages, because the number of
available PMUs at each time period is restricted due
to financial problems.
Full system observability will be achieved by installing
PMU at each bus, but the PMUs are expensive
devices. So it very important to minimize the numbers
of PMUs in power system. So different methods are
used to compute the minimum required numbers from
PMUs in order to fulfill the system observability even
PMUs failure or transmission line loss.
An Integer linear programming method had been
implemented. The optimal PMUs placement (OPP)
will be extended to multi-stages installation. This
means that instead of solving OPP in one shot, it will
be divided into many stages. New method will be
overviewed. That method depends on the
decomposition of the power system into sub-networks
and computes the optimal PMUs placement (OPP) for
each sub-network.

Renewable Energy and Sustainable Development (RESD) Volume 3 Issue 1, Special Issue, March 2017 - ISSN 2356-8569 http://dx.doi.org/10.21622/RESD.2017.03.1.012
18 RESD © 2017 http://apc.aast.edu
Because of the power system with considerable size
will require a huge numbers of phasor measurement
units (PMUs) for full system observability and also due
to high cost of PMUs it is very important to find
methods for multi-stages of PMUs placement
installation.
A new proposed method had been explained. This
method is depending on installing a definite number of
PMU at each stage. The study case and simulation
had been implemented on the IEEE-14 bus system
and IEEE-30 bus system.
REFERENCES
[1] Bei Xu, Ali Abur “Optimal Placement of Phasor
Measurement Units for State Estimation” Texas A
& M University. Power Systems Engineering
Research Center Publication, Pp.1-14. October
2005.
[2] Bei Gou “Generalized integer linear programming
formulation for optimal PMU placement” IEEE
Transactions on Power Systems, Volume 23,
Issue3, Pp.1099 – 1104, Aug. 2008.
[3] Gomathi Venugopal, Ramachandran. Veilumuth,
and Chellammal. Arumugam “Optimal Location of
PMUs for complete observability of Power system
sub-network” ACEEE International Journal on
Control System and Instrumentation, Vol. 1, No.
1, July 2010.
[4] Ranjana Sodhi, and S.C.Srivastava “Optimal
PMUs Placement to Ensure Observability of
Power System”. Fifteenth National Power
Systems Conference (NPSC), IIT Bombay,
December 2008.
[5] B.W Kernighan and L. Lin Bell Syst “An Efficient
Heuristic Procedure for Partitioning
Graphs”. Bell System Technical Journal, Volume
49, Issue 2, Pp.291–307, February 1970.
[6] I.O. Habiballah, V.H. Quintana, “Integer-Linear
Programming Eigenvector-Based Approach for
Multi Partitioning Power System State Estimation
Networks” IEEE Proc. on Generation,
Transmission & Distribution. Vol. 141, issue No. 1,
Pp. 11-18, January 1994.
[7] Aaron M. Tenenbaum, “Data Structures Using C”.
Pearson Education, Prentice Hall, Facsimile
edition, Pp.11-18, Dec.1991.
[8] S.B. Yusof, G.J. Rogers, R.T.H. Alden “Slow
Coherency Based Network Partitioning Including
Load Buses”. IEEE Transactions On Power
Systems, Vol. 8, Issue No. 3, Pp.1375-1382,
August 1993.

Renewable Energy and Sustainable Development (RESD) Volume 3 Issue 1, Special Issue, March 2017 - ISSN 2356-8569 http://dx.doi.org/10.21622/RESD.2017.03.1.019
This Paper has been Accepted and Presented in the (First International Conference on New Trends for Sustainable Energy) 1-3 October, 2016 at Pharos University, Alexandria, Egypt
19 RESD © 2017
http://apc.aast.edu
Development of Reliability Indices for Electric Distribution
Network in Egypt Eman Ahmed, Sherein Abdualla, Kamelia Youssef and Hatem Waheed
Egyptian Electric Utility and Consumer Protection Regulatory Agency
[email protected], [email protected]
Abstract - Reliability indices (RIs) are the elemental
benchmark used by Egyptian Electricity Holding
Company (EEHC), and the Electric Utility and
Consumer Protection Regulatory Agency (Egypt ERA)
to evaluate the continuity and compliance of supply,
which surpasses the customer's requirements and
satisfaction.
The power system is very complex, mixing huge
different types of generating resources and clusters to
supply electric power through transmission and
distribution system to a number of customers with
varying requirements.
The main function of electric system is to supply
customers with electric energy that has an acceptable
degree of reliability and quality. The power system
continuity of supply level is controlled through system
indices. The most widely used reliability indices are
SAIFI, SAIDI and CAIDI (IEEE std. 1366-2000).
Historical electrical indices, reliability indices threshold
and satisfaction index are used as guide for electric
network performance, which measure the adequate
and secure power supply.
The paper presents the reliability indices, relation
between indices and satisfaction area to highlight the
appropriate guideline values for electric systems, also
presents the development of indices since 2011 to
now for distribution network in Egypt.
Keywords - Reliability; Power System; Benchmark;
Continuity; Indicators.
I. INTRODUCTION
The Egyptian Electricity Holding Company (EEHC)
mission towards the society is to supply electricity to
all types of consumers according to international
performance standards taking into consideration all
environmental, social and economic determinates
and also the terms and conditions set by The
Egyptian Electric Utility and Consumer Protection
Regulatory Agency (EGYPTERA).
EEHC has sixteen affiliated companies as shown in
“Fig. 1” (six generations (EPC), nine distributions and
the Egyptian Electricity Transmission Company
(ETC)).
Fig. 1. the relation between EEHC and Egypt ERA
The main objectives of electricity Distribution
Company
(EDC) are:
Distributing and selling to consumers on medium
and low voltages.
Managing, operating and maintaining medium
and low voltages grids in the company.
Ensuring high level of quality, availability and
continuity of supply to distribution customers.

Renewable Energy and Sustainable Development (RESD) Volume 3 Issue 1, Special Issue, March 2017 - ISSN 2356-8569 http://dx.doi.org/10.21622/RESD.2017.03.1.019
20 RESD © 2017
http://apc.aast.edu
The following procedures have been taken to
improve
Continuity of supply indices:
Analysis of the causes in case of increased
unplanned interruptions and relate it to network
renovation and Rehabilitation plans.
Follow up the implementation of maintenance
programs to insure optimizations of interruption
of supply time and at the same time
implementation of the maintenance procedures
with high quality.
Intensive field inspections and data collection for
interruptions.
Each EDC consists of number of geographical
sectors, Have number of districts. The district network
consists of MV distributors, distribution transformers
(MV/LV), and MV, LV lines, as shown in “Fig.2”.
EEHC and EGYPTERA use RIs to trace the
Performance of EDCs. EGYPTERA most commonly
uses KPIs: SAIFI, SAIDI, CAIDI, ENS and CENS.
II. PERFORMANCE INDICES (PIS)
Recommended interruption indices or key
performance indices (PIs) are those defined in both
IEEE 1366[1] and the CIGRE study committee C2 [2]:
SAIFI (System Average Interruption Frequency
Index): the average number of sustained
interruptions per customer during the year.
SAIDI (System Average Interruption Duration
Index): the average time for which customers
power supply is interrupted in a year.
CAIDI (Customer Average Interruption Duration
Index): the average time required to restore
service to the average customer per sustained
interruption.
ENS (Energy Not Supplied): the summation of
energy not supplied due to supply interruptions
over a year Period. Its cost is CENS (cost of
energy not supplied).
Fig. 2. Part of geographical area of an EDC
III. SYSTEM RELIABILITY INDICES (RIS)
A. System Average Interruption Frequency Index
(SAIFI)
It measures the average number of interruptions
experienced by each customer. All planned and
unplanned interruptions are used in calculating the
index. SAIFI can be calculated as follows:
SAIFI = (No. of interruptions during one year)/ (No. of
customers).
B. System Average Interruption Duration Index
(SAIDI)
It measures the yearly average interruptions duration
per customer. It can be calculated as follows:
SAIDI = (Σduration of interruption in min)/ (No. of
customers).
C. Customer Average Interruption Duration Index
(CAIDI)
It measures the average time required to restore
service to the average customer per interruption. The
following formula is employed for calculating CAIDI:
CAIDI = (SAIDI)/ (SAIFI). [4], [5]
IV. CONTINUITY OF POWER SUPPLY
The main aspects of quality for electric network
operation are continuity of supply, safety, technical
quality of the commodity, end user service and
environmental impact. Continuity of supply measures
the electric networks ability to supply the end users
with electricity. It is generally characterized as the
frequency and duration of interruptions in supply.

Renewable Energy and Sustainable Development (RESD) Volume 3 Issue 1, Special Issue, March 2017 - ISSN 2356-8569 http://dx.doi.org/10.21622/RESD.2017.03.1.019
21 RESD © 2017
http://apc.aast.edu
Continuity of power supply or sustained outage –
an outage that lasts longer than a specified
amount of time .SAIDI, SAIFI and CAIDI are all
based on sustained outage .The duration of a
sustained outage varies from state to state.
IEEE -1366 defines the duration of sustained
outage to be 5 minutes.
Power quality – measure of the purity of the
electric waveform on power lines. A power
quality event, which is not the same as an
outage, occurs when one of the waveforms
differs from a pure sinusoidal waveform or one
or two phases of power are lost. [10]
Measurements that can quantify power quality are
harmonic distortion and peak to peak voltage. Power
quality events can last from few cycles to a few
seconds and can be caused by lightning strikes,
falling trees, utility operations and operations from
other customers such as disturbances from starting a
large motor.
A. International example
A review of some countries revealed the SAIDI and
SAIFI performance shown in “Table I”. These
countries also put greater emphasis on power quality
[3], [11]
B. Variables affecting reliability indices
1. Longer circuits lead to more interruptions. It is
easier to provide higher reliability in urban areas;
line lengths are shorter.
2. The distribution supply configuration greatly
impacts reliability. Long radial lines provide the
poorest service; grid networks are exceptionally
reliable.
3. Higher primary voltages tend to be more
unreliable, mainly because of longer lines.
Table 1. EUROPEAN RELIABILITY PERFORMANCE, WITH MAJOR EVENTS
Country SAIDI SAIFI
Austria 72 0.9
Denmark 24 0.5
France 62 1.0
Germany 23 0.5
Italy 58 2.2
Nerthlands 33 0.3
Spain 104 2.2
UK 90 0.8
*Source: council of European energy regulator ASBL (2008) 4th
benchmarking report on the quality of electricity supply .Brussel
CEER.
Faults and interruptions have significant year-to-year
variation because weather conditions vary
significantly, age of electrical equipment, or
performance of protective systems. These factor
variations are translated into variations in the number
of faults and in reliability indices.
C. Relation between SAIFI & CAIDI
The envelope of “acceptable supply” for relation
between frequency of interruptions and longest
duration per interruption is shown in “Fig.3”.
Find optimum and customer satisfied: “A” area,
represents the area of biggest reliability, move
towards the origin, the performance will be better.
Customer dissatisfied: Balanced area represents
the lower reliability, divided to:
Region “B” indicates for the excess number of
interruptions but for short time durations.
Region “C” indicates for little number of
interruptions but for long time durations.
Vertical axis “X” and horizontal axis “Y” give the
reliability indices threshold.
D. Performance indicators for EDC
“Table 2” and “Table 3” represent the development of
SAIFI and CAIDI during 2011:2014 for EDCs. If
indicators through the three years are abnormal, (as
CAIDI for EDC3 & EDC5), the stray number must be
dropped out.
Fig.3. Relation between SAIFI and CAIDI

Renewable Energy and Sustainable Development (RESD) Volume 3 Issue 1, Special Issue, March 2017 - ISSN 2356-8569 http://dx.doi.org/10.21622/RESD.2017.03.1.019
22 RESD © 2017
http://apc.aast.edu
Table 2. DEVELOPMENT OF CAIDI FOR EDCS
CAIDI
Company 2011 2012 2013 2014 average
EDC1 102.4 117.761 107.852 97.062 106.269
EDC2 31.768 27.12 24.118 21.758 26.191
EDC3 54.851 18.483 18.906 9.509 25.437
EDC4 143.577 2.094 7.576 67.048 55.074
EDC5 40.071 40.416 41.76 36.177 39.606
EDC6 67.841 48.567 27.377 28.104 42.972
EDC7 23.879 24.474 88.877 106.13 60.84
EDC8 152.413 106.931 103.703 108.7 117.937
EDC9 77.801 83.167 130.727 171.301 115.749
Table 3. DEVELOPMENT OF SAIFI FOR EDCS
SAIFI
Company 2011 2012 2013 2014 average
EDC1 0.435 0.495 0.423 0.341 0.4235
EDC2 0.192 0.169 0.134 0.131 0.1565
EDC3 0.149 0.934 0.958 0.764 0.70125
EDC4 0.452 0.405 0.442 0.445 0.436
EDC5 0.66 0.533 1.01 1.009 0.803
EDC6 3.01 2.145 0.095 0.081 1.3328
EDC7 0.121 0.117 1.388 0.559 0.5463
EDC8 0.289 0.169 0.464 0.225 0.287
EDC9 1.59 2.237 0.221 0.179 1.0568
The relation between SAIFI and CAIDI for 9 EDCs
during 2011:2014 is presented in “fig. 4”.
Fig.4. relation between SAIFI&CAIDI for EDCs (data 2011-2012-
2013-2014)
Fig.5 Relation between SAIFI and CAIDI fir EDCs in 2014
“Fig.5” represents the envelope of “acceptable supply
“for relation between SAIFI and CAIDI for EDCs in
2014.
According to IEEE1366, 2001 the target of SAIFI and
CAIDI are 1.0 and 90 minute respectively, they are
close to the calculated threshold values
Notes:
1. SAIFI and CAIDI are improved in 2014 for most
EDCs.
2. EDC2 and EDC3 are in optimum area
V. CONCLUSION
There is increasing demand from consumers for more
reliable and economical electric power. Many factors
share to evaluate the reliability of a power network:
design, planning, operation and maintenance and
faults; which have their contributed input to all power
network reliability.
The main measures to improve reliability: adequate
maintenance, adoption of preventive maintenance
rather than break down maintenance, improving
power quality and ensuring coordination protection
settings.
The reliability indicators for electric network in Egypt
are used by EEHC and Egypt Era to benchmark
performance and scenariotize investments in
generation, transmission and distribution network, to
improve performance. Also, these indicators are used
by system planners and operators as a channel to
improve the level of customer service.
Reliability level for its delivery facilities and, where
appropriate to improve performance.
The results are the reliability performance objectives
for EDCs, ETC, and EPCs shall have threshold
objective designed to help maintain the acceptable
envelop.
REFERENCES
[1] L.Goel, “based reliability studies of a distribution
test system,” Monte Carlo simulation
[Online]. Available:
http://www.sciencedirect.com

Renewable Energy and Sustainable Development (RESD) Volume 3 Issue 1, Special Issue, March 2017 - ISSN 2356-8569 http://dx.doi.org/10.21622/RESD.2017.03.1.019
23 RESD © 2017
http://apc.aast.edu
[2] H.Haroonabadi, and M.R.Haghifam, ”Generation
Reliability Assessment in Power Markets Using
Monte Carlo simulation and intelligent system,”
World Applied Sciences Journal 5(3):302-310,
2008.
[3] Dennis Hesseling en Mahir Sari, ” The
introduction of quality regulation of electricity
distribution in the Netherlands,” European Energy
Law report ш, 2006.
[4] Kamelia Youssef and Hafez El-Salmawy,”Indices
of supply: Benchmarking EDCs in Egypt,”
MEPCON 2009, Assuit University,Egypt.
[5] Kamelia Youssef and Hafez El-Salmawy,”Power
Quality: reliability indices for transmission system
in Egypt, “The conference of the power quality
and harmonics (JCNC),” Amman, Jordan.
[6] Mahmud Fatuhi , Firuzabad, and Saeed Afshar,
”Reliability analysis in Electrical
Distribution system considering preventive
maintenance applications on circuit breakers,”
World Academy of Science, Engineering and
Technology 49 2009.
[7] Math BOLLEN, and Anders HOLM, ”A customer –
oriented approach towards reliability indices,”
CIRED, 19th International Conference on
Electricity Distribution, Vienna, 2007.
[8] Lina BERTLING, and Roland ERIKSSON, ”Impact
of maintenance strategy on cost and reliability of
distribution systems,”CIRED 17th International
Conference on Electricity Distribution , Barcelona,
2003.
[9] Michael HOLZENTHAL, Andre OSTERHOLT,
”Reliability Based Planned: Reducing the Re-
investment needs of an Urban Utility,” CIRED
17th International Conference on Electricity
Distribution , Barcelona , 2003.
[10] Konstantin Petrov, and Daniel Grote, ”Quality of
supply,” Presentation for ERRA Tariff Committee,
April 2010
[11] “Electricity Distribution Quality of Service
Report2002/2003,” 14 Distribution Network
Operators, Great Britain, July 2004.
[12] A. Sumper, A. Sudria, and F.Ferrer, ”International
Reliability Analysis in Distribution Networks,”
CITCEA, Universidad Politecnica de Catalunya,
Spain.
Renewable Energy and Sustainable Development (RESD) Volume 3 Issue 1, Special Issue, March 2017 - ISSN 2356-8569 http://dx.doi.org/10.21622/RESD.2017.03.1.024
This Paper has been Accepted and Presented in the (First International Conference on New Trends for Sustainable Energy) 1-3 October, 2016 at Pharos University, Alexandria, Egypt.
24 RESD © 2017 http://apc.aast.edu
Reliability Improvement of Power Distribution Systems
using Advanced Distribution Automation M. R. Elkadeem, M. A. Alaam and Ahmed M. Azmy
Elec. Power and Machines Eng. Depart., Faculty of Eng., Tanta University, Tanta, Egypt
[email protected], mhmd.aboelazem@f-
eng.tanta.edu.eg, [email protected]
Abstract - Towards the complete vision of smarter
distribution grid, advanced distribution automation
system (ADAS) is one of the major players in this area.
In this scope, this paper introduces a generic strategy
for cost-effective implementation and evaluation of
ADAS. Along with the same line, fault location, isolation
and service restoration (FLISR) is one of the most
beneficial and desirable applications of ADAS for self-
healing and reliability improvement. Therefore, a local-
centralized-based FLISR (LC-FLISR) architecture is
implemented on a real, urban, underground medium
voltage distribution network. For the investigated
network, the complete procedure and structure of the
LC-FLISR are presented. Finally, the level of reliability
improvement and customers’ satisfaction
enhancement are evaluated. The results are presented
in the form of a comparative study between the
proposed automated and non-automated distribution
networks. The results show that the automated network
with proposed ADAS has a considerable benefit
through a significant reduction in reliability indices. In
addition, it has remarkable benefits observed from
increasing customers’ satisfaction and reducing
penalties from industry regulators.
Keywords - Advanced distribution automation system,
Fault location, isolation and service restoration, Self-
healing grid, Relaibilty assessment study.
I. INTRODUCTION
In the contemporary world, the electrical distribution
system is the backbone of the smart grid environment.
However, most of customer outages are a result of the
distribution networks, where 80% of customer
interruptions attribute to faults and component failure at
the feeder level [1]. Conventional distribution systems
do not involve much automation i.e. rely mainly on
manual operations, and do not have any
communication or information exchange i.e. blind
system. During system events, the absence of
monitoring and lack of information with increasing
failure rate would dramatically increase the duration
and number of customers affected by specific outage.
The technical impact will appear in decreasing the
reliability level of the network and the quality of supply.
The significant economic impact of this would be
observed in increasing the outages cost of utility and
their customers. For these reasons, improving system
reliability and power quality becomes an important
issue.
Keeping the above problems in mind, distribution
automation (DA) is the key answer to many challenges
facing electrical distribution networks. Referring to
electrical power research institute (EPRI), advanced
distribution automation system (ADAS) has been
defined as “a fully controllable and flexible distribution
system that will facilities the exchange of electrical
energy and information between participants and
system components” [2], [3]. The expected results of
applying DA on medium voltage (MV) distribution
networks include, for example, reliable, resilience, self-
healing, fully controllable and efficient distribution
system for energy delivery to end users in customers’
domain. Much of efforts that depend upon modernizing
the distribution network are accomplished and many
utilities around the world started distribution automation
projects [4]-[9]. ADAS combines different applications
that have been discussed in [10] and summarized as
follows:
Fault location, isolation, and service restoration
Volt/Var control and optimization
Distributed generation resources management
Adaptive distribution feeder protection
coordination
Optimal feeder reconfiguration
Automatic meter reading
Demand side management

Renewable Energy and Sustainable Development (RESD) Volume 3 Issue 1, Special Issue, March 2017 - ISSN 2356-8569 http://dx.doi.org/10.21622/RESD.2017.03.1.024
25 RESD © 2017 http://apc.aast.edu
Fault location, isolation and service restoration
(FLISR) is defined as the most beneficial, attractive
application among all applications of ADAS in order to
getting self-healing grid, enhancing the reliability level
of distribution networks, reducing operation and
maintenance cost and increasing customers
satisfaction. This is achieved by means of reducing the
outage time from several hours to few minutes [11].
There are different architectures for FLISR
implementation based on where the decision is made:
fully-centralized (FC-FLISR) [6],[7], fully-decentralized
(FD-FLISR) [8],[9] and local-centralized (LC-FLISR)
architectures. In fully centralized architecture, the
FLISR algorithms are implemented in DMS/SCADA
system located at the control centre (CC) in so far
area. In the decentralized architecture, the FLISR uses
an intelligent local controller, integrated with the
multiple switches distributed along feeder nodes.
The scope of this paper is to evaluate the effective
utilization of ADAS within power distribution systems.
In the context of ADAS implementation, to avoid the
huge investment and maximize the benefits towards a
complete vision for the smart distribution grid, a
generic strategy for ADAS is developed in this paper.
Also, a local-centralized architecture is presented as
the most appropriate architecture for FLISR
implementation within the investigated distribution
network. The reasons and encouragements for this
choice are discussed in the next sections. In addition,
the structure and procedure of FLISR system are
presented. Finally. The reliability assessment study is
performed using analytical technique. The results are
presented in the form of a comparative study between
the proposed automated and non-automated
distribution networks. The results show that the
automated network with proposed ADAS is able to
achieve a significant and considerable improvement in
reliability level of the distribution network.
II. DESCRIPTION AND OPERATION OF THE
DISTRIBUTION NETWORK UNDER STUDY
A. Description of the investigated distribution
network
To prove the validity of the proposed study, it will be
performed on a real distribution network as a case
study. This distribution network is an actual, urban,
underground, 11 kV rated distribution network with
open-ring configuration. As demonstrated in Fig. 1, the
investigated network consists of an 11 kV distribution
substation fed from a 22 kV distribution system, which
has a 750 MVA short circuit capacity. This distribution
substation supplies four outgoing feeders. Each is
protected by and intelligent electronic devices (IED) at
the beginning of the feeder. The lengths of these
feeders are 5.485 km, 1.750 km, 3.725 km, and 6.725
km, respectively. The distribution network contains
thirty-five 11 kV compact secondary substations
(CSSs), which are installed over the four feeders. Each
CSS is a fully equipped package substation divided
into three main compartments: incoming MV
compartment, transformer (XFMR) compartment and
low voltage feeder panel (LVFP) compartment as
illustrated in
Fig. 2.
CB 3CB 1 CB 4CB 2
5 MVA
XFMR
750 MVA SC
Grid Supply
System
11 kV
22 kV
S/S with NC SW
S/S with NO SW
S/S 5-1
S/S 6-2
S/S 4-2 S/S 4-3
S/S 7-3
S/S 7-4
S/S 11-4 S/S 11-1
Fig .1. 11 kV Underground distribution network
SF6
CB
Incoming
cable
Outgoing
cable
0.4 kV
LVFP11/0.4 kV
`
XFMR
MCCB
Loads
Facilities
11 kV RMU
LBS
LBSMCCB
Fig .2. Compact secondary substation compartments

Renewable Energy and Sustainable Development (RESD) Volume 3 Issue 1, Special Issue, March 2017 - ISSN 2356-8569 http://dx.doi.org/10.21622/RESD.2017.03.1.024
26 RESD © 2017 http://apc.aast.edu
B. Operation mode of the investigated distribution
network
The existing MV distribution network is a conventional
network and have not involved much automation i.e.
rely mainly on manual operations. Traditional FLISR
still exhibits long time and stressful efforts as follows:
The fault is detected via the outage reports
received from the outage customers.
Afterwards, investigation process for fault
localization to determine the faulty section is
started. This process necessitates the patrolling of
the entire network.
For successful isolation of the faulty section,
manual-switching actions are completely
accomplished by human intervention.
Finally, other manual switching actions are
executed to restore the service to healthy
customers.
Briefly, FLISR is performed manually via human
intervention and hence, the network operator is facing
some of technical and financial issues that are defined
and represented by increasing the outages time and
outages costs, especially with the presence of the
underground cables spread over long distances.
Consequently, it is suffered from low level of service
reliability and low customers’ satisfaction.
III. THE PROPSED ADVANCED DISTRIBUTION
AUTOMATION SYSTEM
Motivated by the earlier mentioned issues in the
previous section, ADAS is an imperative solution in
order to strengthen the operation of MV distribution
networks. This following section attempt to discuss
some issues related to ADAS implementation from
different points of view, e.g. ADAS strategy of
implementation, selection of the most appropriate
architecture. Finally, the structure and requirements of
the proposed automation system is introduced.
A. Implemented strategy of ADAS
Although it may be not possible to describe a
successful ADAS strategy, rapid deployments
worldwide have thought some lessons [11], [12] that
help to construct the proposed implemented strategy
for the existing distribution network, as illustrated in
Fig. 3. The target of the proposed ADAS strategy is to
determine the main requirements of ADAS including
selection of the most appropriate architecture or
approach for ADAS, defining of automation degree
and complete structure of ADAS. The detailed
explanation of the proposed ADAS strategy will be
presented as follows:
Define the most
appropriate ADAS
scheme
Specify the
automation
degree
Determine the structure and
requirements of ADAS
Technical and
Financials issues
Determine the optimal
automation level $
Monitoring Control
Partially ADAS Fully ADAS
FLISROperation
Fig .3. General Strategy for distribution automation
implementation
The proposed strategy starts with selection of the most
significant and beneficial application that is currently
needed for the system. This application will be the first
phase of the smart distribution network and will be
defined according to the existing technical and
financial issues facing the distribution network e.g. for
the existing distribution network, which is presented as
a case study, FLISR is defined. The second step is to
define the most appropriate architecture for ADAS.
The ADAS scheme is refer to where the decision is
made. Three different scheme are introduced in
section I. The selection criteria are based on the
requirements of the defined application, the nature of
the existing control strategy of the network, network
size and configuration, as well as economic resources.
The next step is the specification of the automation
degree. The automation degree is categorized into
three categories; monitoring, control, and operation or
any combination of them. This is based on the network
operator target and requirements. After that, utility
have to determine the copmlete structure and
requirements of the ADAS. In general, the main
structure and requirements of ADAS include: flexible
electrical hardware facilities, modern communication
technologies and intelligent software applications [11].
Finally, for for reasonable degree of improvement in
system performance and economic justification and
profitability, cost/benefit analysis is performed to
determine the optimal automation level of the
distribution network. The automation level of MV
distribution network is considered to be percentage of

Renewable Energy and Sustainable Development (RESD) Volume 3 Issue 1, Special Issue, March 2017 - ISSN 2356-8569 http://dx.doi.org/10.21622/RESD.2017.03.1.024
27 RESD © 2017 http://apc.aast.edu
automated points in the network. For underground
networks, the automated points are the number of
secondary substations (S/Ss) retrofitted with smart
devices such as feeder remote terminal units and fault
indicators.
B. Proposed Local-centralized FLISR
Nowadays, the great evolution of smart sensors,
advanced communication technologies and utilization
growing of SCADA/DMS, accelerates the
transformation of the traditional distribution networks
into automated systems. Following the proposed
strategy for ADAS, FLISR application is defined as the
most appropriate solution among all applications of
ADAS to achieve self-healing grid and to improve the
reliability level of distribution network. FLISR is
implemented on the existing MV distribution network
based on local-centralized architecture, called (LC-
FLISR). The information is acquired and analysed in
primary substation. Then, the control decision is
executed automatically on real network or after
confirmed by the operator using the SCADA interface.
The idea behind FLISR is to achieve the self-healing
grid, where the service for all customers is restored
automatically after few minutes (< 5 minutes) from fault
from fault occurrence [11]. The main objectives of the
LC-FLISR are illustrated in Fig. 4. So, As shown in Fig.
5, the proposed structure of ADAS consists of:
Therefore, this paper aims to present a simple and
more efficient CBPWM technique to control three to
five-phase matrix converters, which can be used to
supply a five-phase induction motor drive system that
delivers some advantageous features for industrial
applications. The basic concept of the proposed
technique is already published in [27]. Thanks to its
simplicity, the proposed technique will be based on the
indirect modulation of the 3×5 MC which control the
converter as a double stage converter. Therefore, the
carrier based PWM methods are applied for each
stage independently. The proposed modulation will
maximize the converter VTR by operating the
converter in the overmodulation mode as well as in the
linear modulation mode. It also controls the input
power factor by controlling the input current
displacement angle. The proposed modulation
technique is verified using simulation and
experimental results based on a laboratory prototype
and the dSPACE-DS1104 controller platform and the
results are compared by the existing SVM technique.
Master unit controller (called MU) as the “decision
support system” of the ADAS. The information is
acquired and analysed by MU. Then, the control
decision is executed automatically on real network
or after confirmed by the operator using the
SCADA interface
Intelligent software applications (FLISR
algorithms); as this paper focus on FLISR
application. Thereby, there are two main intelligent
algorithms are needed to be integrated with
ADAS: “fault location” and “service restoration”
algorithms.
Modern communication technologies as the heart
of ADAS. The core mission of the network
communications is to provide information
exchange facilities between field devices
dispersed geographically along the distribution
grid and master unit located at primary substation.
Flexible electrical hardware facilities (field
devices).
Detect the
fault
quickly
Locate the
fault
accurately
Isolate only
the faulty
section
Restore the
service
within < 5 min
Fig .4. FLISR Objectives
Wire/
Wireless
Two-away
Communication
network
NO
IED-1
SCADAFLISR Algorithms
IED-2
FRTU
Smart S/S
FRTU
FRTU
FRTU
FRTU
FRTU
FRTU
Master UnitCommunication
getaway
Fig .5. Over view of local-centralized ADAS structure

Renewable Energy and Sustainable Development (RESD) Volume 3 Issue 1, Special Issue, March 2017 - ISSN 2356-8569 http://dx.doi.org/10.21622/RESD.2017.03.1.024
28 RESD © 2017 http://apc.aast.edu
Regardin to field devices, the secondary substations
play a vital role in the evolution toward the self-healing
grid. Therefore, the retrofitting of the existing
traditional S/Ss with smart equipment suitable for
ADAS. A typical configuratuon of smart S/S is
presented in Fig. 6, where the figure is taken from [13].
However, the smart devices that are suitable for the
propsed ADAS are only highlighed. So, the smart S/S
is consists of: smart RMU equipped with motorized
LBSs, motorized CB, fault indicators (FIs), voltage
indicators (VIs), and uninterruptible power supply
(UPS). Also, the smart S/S is supported with feeder
remote terminal unit (FRTU) acts as a local controller
for field devices. In addition, FRTU acts as a gateway
between field devices and MU. From the literature [14],
the communication between MU and FRTUs in this
paper will take place through public GPRS
communication based on IEC 60870-5-101 protocols
as a cost-effective solution [5]. On the other hand,
connection with field devices will be wired (serial RS-
232/RS-458) using conventional IEC 60870-1-104 or
Modbus RTU protocols supported by field devices. On
the way to realise a high level of reliability, reducing
outage time and outage cost, increasing customer
satisfaction, a fully automated system is implemented.
So, all S/Ss would be retrofitted with smart equipment
that are suitable for DAS.
FI
FI
M
LBS
LBSSF6 CB
Cable
Loads
11/0.4 KV
MCCB
0.4 kV
LVFP
VI
VI
FRTU
GPRSIEC 60870-5-101
UPS
11 kV smart
RMU
XFMR Kiosk
RS 232/458
IEC 60870-5-104
M
M
Fig.6. Typical configuration of smart S/S with ADAS equipment
C. Proposed ADAS architecture:
In this paper LC-FLISR architecture is selected as the
most appropriate solution due to the following
reasons:
The choice of a LC-FLISR architecture to be
implemented in this paper is judged by the following
reasons:
Compared to fully centralized architecture, there is
no need for huge investment that is required for FC-
FLISR scheme including SCADA/DMS hardware
and software. The decision is taken from MU
located at the primary substation within the same
graphical area of the entire network. The results, the
communication is over relatively short distances.
Hence, high-speed data transfer is achieved and the
service restoration time is lower. The significant
economic impact of would be observed in
decreasing the customer outages cost of utility and
their customers.
Compared to distributed architecture that has
limited functionality, in LC-FLISR, the structure of
constructed algorithm located in primary substation
is easy to be modified and expanded to
accommodate the upcoming extensions in the
network. Also, because of the communication
network between MU and RFTUs are already used
in the system e.g. GPRS network, a few costs are
required with adding more ADAS application such
as volt/var control and Distributed generation
resources management
D. LC-FLISR procedur
In this subsection, the steps of LC-FLISR procedure
are discussed as follows:
Firstly, with permanent fault occurrence the IEDs
at the beginning of each feeder will detect and
initiate the corrective action as quickly as possible
for the corresponding feeder CB.
With the help of the FPIs installed in each smart
S/Ss, the faulty section well-known between the
last flashed FI and first unflashed FI.
The next is to isolate only the faulty section. So, a
control commands are automatically issued by MU
in order to open the proper LBSs surrounding the
fault.
After the faulty section is isolated successfully, the
LC- FLISR algorithms are triggered swiftly through
SCADA inputs such as LBSs and FPIs statuses.
With fault location capability integrated with the
proposed ADAS system. The probable location of
the faulty point will be estimated, [15] rather than
determining the faulty section. Consequently, the
fault damage inspection and repairing time and
money can be saved.
Renewable Energy and Sustainable Development (RESD) Volume 3 Issue 1, Special Issue, March 2017 - ISSN 2356-8569 http://dx.doi.org/10.21622/RESD.2017.03.1.024
29 RESD © 2017 http://apc.aast.edu
Finally, the service can be restored again for the
customers of remaining healthy sections by the
help of the service restoration algorithm
implemented in MU. the service restoration
algorithm is responsible for generating a suitable
restoration-switching plane to the proper LBSs in
the system to achieve the goal [16]. As a result, it
will improve the service reliability and increases the
operational efficiency of the network.
IV. RELIABILITY ASSESSMENT STUDY
A. Reliability indices and technique
In order to quantify and evaluate the benefit of ADAS
implementation, reliability assessment study is
performed. System reliability refers to the capability
of the system to perform its specified task correctly
for certain duration of time. The system reliability is
represented using two terms “system adequacy” and
system security”. There are two categories of indices
that used to define the reliability level of the
distribution system; load point reliability indices and
system reliability indices. The load point indices
include; average failure rate, λi (f/yr), expected
outage duration, ri (hr), and unavailability, Ui (hr/yr)
for load point “i” [17]. Also, the expected energy not
supplied index at each load point, EENSi (MWhr/yr)
can be used to assess the performance of the system.
From theses load point indices, the system reliability
indices such as SAIDI, SAIFI, CAIDI and EENS can be
then calculated for the whole system [17]. Theses
indices can be calculated according to references,
[18], [19] as follows:
λi = λ1 + λ2 + ⋯ λM = (f/yr) (1)
Ui = λ1r1 + λ2r2 + ⋯ λMrM =
∑ λxMx=1 rx (hr/yr)
(2)
ri = Ui
λi =
∑ λxMx=1 rx
∑ λxMx=1
(hr) (3)
𝐸𝐸𝑁𝑆𝑖 = 𝑃𝑖 𝑈𝑖 (MWhr/yr) (4)
SAIDI =∑ 𝑼𝒊𝑵𝒊
𝑵𝑻𝒊=𝟏
𝑵𝑻 (hr/yr)
(5)
SAIFI ==∑ λiNi
NTi=1
NT (int/yr)
(6)
CAIDI = SAIDI
SAIFI (hr/int) (7)
EENS = ∑ PiUiNTi=1 (MWhr/yr) (8)
where: λj is failure rate of component j (f/yr), M is the
number of components that affect the load point “i”, rj
"is" the restoration time of load point “i” after failure of
component “x” (hr), Pi is the total demand at load
point “i” and NT is the total number of customers
served (MW).
The reliability level of the distribution system depends
mainly on the overall time of the FLISR procedure after
fault event. This time is estimated according to the
operating strategy non-automated and automated
distribution network. In this paper, the reliability study
is performed using analytical technique based on
failure mode effect analysis (FMEA) [20]. The basic
procedure used in the analytical technique is shown in
Fig. 7.
Obtain network and customer data
Consider the failure for component x
Identify the affected area and load points
Start
NO
Calculate λix , rix and Uix for an affected load point i
Is all
components are
considered
Yes
Accumulate load point indices to calculate
the total load point indices λi , ri and Ui
Calculate system indices SAIDI, SAIFI, ...
Report the results
End
x = x+1
x = 1
Fig. 7. Procedure of the analytical technique for reliability
assessment

Renewable Energy and Sustainable Development (RESD) Volume 3 Issue 1, Special Issue, March 2017 - ISSN 2356-8569 http://dx.doi.org/10.21622/RESD.2017.03.1.024
30 RESD © 2017 http://apc.aast.edu
B. Simulation results
The structure and configuration of the investigated 11
kV distribution network is presented in section II-A.
The reliability indices of the distribution network are
evaluated with two operating philosophy: non-
automated distribution network strategy e and
automated distribution network. Then, the results are
compared in order to ensure the achievement of
improving the reliability indices using ADAS. The
network reliability data are taken from IEEE Standard
493-2007 (Golden book) [19], and given in Table. 1.
Table 1. NETWORK RELIABILITY DATA
Equipment category
Failure rate (failure/year)
Repair time (h/failure)
Unavailability (h/year)
Comments
LV CB 0.0027 4 0.0108
MV CB 0.0036 2.1 0.0076
LV Cable 0.00141 10.5 0.0148 1000 circuit ft.
MV Cable 0.00613 26.5 0.1642 1000 circuit ft.
Disc. Switch 0.0061 3.6 0.022
MV Transf. 0.003 130 1.026 Replace by
spare
LV SWGR 0.0024 24 0.0576
MV SWGR 0.0102 26.8 0.2733
The reliability study is performed under the following
assumption: normally, the distribution network
operates in open-ring configuration, but some of the
network feeders can be connected to each other
through the normally open tie switch and the average
restoration time for the healthy customers defined to
be under 5 minutes with automated network and two
hours with non-automated one. Also all the CBs and
LBSs are assumed to be 100% reliable and all failures
are statistically independent.
The load point reliability indices such as λ, r, U and
EENSI are calculated using FMEA method with the
help ETAP®12.60 software package and the results
are presented in Table 2 for comparative study
purpose between non-automated and automated
network. In addition, the system reliability indices such
as SAIDI, SAIFI, and EENS are also calculated for
each of four feeders and whole system and given in
Table 3. The results indicate clearly that the load point
indices are improved significantly for all load points in
the investigated distribution network by implementing
the proposed ADAS. In addition, there are a clear
reduction in system indices, i.e. SAIDI and EENS, for
all system feeders and whole system. For the whole
system, there is a reduction in both SAIDI and EENS
by 34 % and 32 % respectively by using ADAS as
shown in Fig. 8. This is observed through the reduction
in reliability indices. So, this will directly lead to the
improvement of the reliability level of the investigated
distribution network, increase customer satisfaction,
reducing system interruption cost for various load
categories (residential, commercial, industrial and so
on) by quick restoration of service and reducing
penalties and achieve incentives offered by regulators.
Table 2. Results summary of load point indices for non-automated and
automated distribution network
LP Feeder
Non-automated Automated
r
(hr)
U
(hr/yr)
EENSI
(MWhr/yr)
r
(hr)
U
(hr/yr)
EENSI
(MWhr/yr)
1 #1 4.744 1.108 0.148 3.029 0.707 0.094
2 #1 4.916 1.157 0.284 3.214 0.757 0.186
3 #1 4.826 1.131 0.303 3.117 0.731 0.196
4 #1 5.023 1.188 0.172 3.330 0.788 0.114
5 #1 4.934 1.162 0.081 3.234 0.762 0.053
6 #1 6.035 1.500 0.045 4.424 1.100 0.033
7 #1 4.726 1.131 0.056 3.009 0.702 0.035
8 #1 4.826 1.188 0.101 3.117 0.731 0.065
9 #1 5.023 1.167 0.083 3.330 0.788 0.055
10 #1 4.735 1.105 0.077 3.019 0.705 0.049
11 #1 5.049 1.196 0.153 3.359 0.796 0.102
12 #1 5.995 1.487 0.156 4.381 1.087 0.114
13 #1 4.853 1.139 0.186 3.146 0.738 0.121
14 #2 7.934 0.860 0.292 6.491 0.704 0.239
15 #2 8.213 0.904 0.360 6.792 0.748 0.298
16 #2 8.196 0.902 0.252 6.775 0.745 0.208
17 #2 8.309 0.920 0.047 6.896 0.763 0.039
18 #2 8.530 0.956 0.227 7.135 0.800 0.190
19 #2 8.180 0.899 0.355 6.757 0.743 0.293
20 #2 8.066 0.881 0.095 6.634 0.724 0.078
21 #2 8.196 0.902 0.230 6.775 0.745 0.190
22 #3 5.875 0.961 0.211 4.257 0.696 0.153
23 #3 5.998 0.987 0.073 4.389 0.722 0.053
24 #3 6.309 1.054 0.135 4.725 0.790 0.101
25 #3 6.438 1.083 0.048 4.864 0.818 0.036
26 #3 7.013 1.215 0.389 5.486 0.951 0.304
27 #3 7.013 1.215 0.112 5.486 0.951 0.087
28 #3 6.610 1.122 0.103 5.051 0.857 0.079
29 #3 5.924 0.971 0.618 4.310 0.706 0.449
30 #3 6.747 1.153 0.101 5.198 0.888 0.078
31 #3 6.022 0.992 0.045 4.415 0.727 0.033
32 #3 8.204 1.517 0.194 6.773 1.252 0.160
33 #3 10.35 2.177 0.279 9.09 1.913 0.245
34 #4 5.403 1.444 0.252 2.914 0.779 0.136
35 #4 5.169 1.366 0.190 2.652 0.701 0.098
36 #4 5.326 1.418 0.238 2.828 0.753 0.127
37 #4 5.224 1.384 0.145 2.714 0.719 0.075
38 #4 5.232 1.387 0.371 2.723 0.722 0.193
39 #4 5.380 1.436 0.460 2.888 0.771 0.247
40 #4 5.224 1.384 0.169 2.714 0.719 0.088
41 #4 5.411 1.447 0.296 2.923 0.782 0.160
42 #4 5.240 1.390 0.193 2.732 0.724 0.101
43 #4 4.405 1.165 0.149 2.661 0.704 0.090
44 #4 5.326 1.418 0.149 2.828 0.753 0.079
45 #4 5.341 1.423 0.198 2.845 0.758 0.106
46 #4 5.318 1.416 0.085 2.819 0.750 0.045
47 #4 5.310 1.413 0.091 2.810 0.748 0.048
48 #4 5.310 1.413 0.197 2.810 0.748 0.104

Renewable Energy and Sustainable Development (RESD) Volume 3 Issue 1, Special Issue, March 2017 - ISSN 2356-8569 http://dx.doi.org/10.21622/RESD.2017.03.1.024
31 RESD © 2017 http://apc.aast.edu
Table 3. Comparison between system reliability indices for non-
automated and automated distribution network
Operating philosophy
Feeder SAIDI (hr/yr)
SAIFI (int/yr)
CAIDI (hr/int)
EENS (MWhr/yr)
Non-automated
Feeder 1 1.20 0.24 5.08 1.85
Feeder 2 0.91 0.11 8.23 1.86
Feeder 3 1.22 0.17 7.04 2.31
Feeder 4 1.40 0.26 5.37 3.18
System 1.20 0.21 5.86 9.19
Automated
Feeder 1 0.80 0.24 3.37 1.22
Feeder 2 0.75 0.11 6.81 1.53
Feeder 3 0.96 0.17 5.52 1.78
Feeder 4 0.75 0.26 2.86 1.7
System 0.79 0.21 3.87 6.23
(a) Effect of distribution automation on SAIDI
(b) Effect of distribution automation on EENS
Fig. 8. Reduction in SAIDI and EENS with ADAS
V. CONCLUSIONS
The growing importance of ADAS and its expected
benefits on the operation of distribution systems
encourage the investigation of this subject. The results
show that the determination of the generic strategy for
ADAS will avoid the huge investment toward a
complete vision of smarter distribution systems.
Following the proposed implemented ADAS strategy,
FLISR application has been implemented on real,
urban, underground 11 kV distribution network based
on local-centralized architecture. From the
investigation, the presented architecture is defined as
a cost-effective solution with the existing network. The
results of reliability analysis for both automated and
non-automated distribution network are evaluated and
compared. It is concluded that the automated network
with the proposed ADAS has a tangible benefit through
considerable reduction in load point indices. Along with
the same line, the system indices such as SAIDI and
EENS exhibit a significant reduction by 34 % and 32
%, respectively. In addition, the proposed ADAS
provides an intangible benefits observed by grater
customer satisfaction and reduced penalties by
industry regulators through the reduction of the outage
time and outage cost.
REFERENCES
[1] Shang-Wen Luan; Jen-Hao Teng; Shun-Yu
Chan; Lain-Chyr Hwang, “Development of an
automatic reliability calculation system for
advanced metering infrastructure,” in Industrial
Informatics (INDIN), 2010 8th IEEE International
Conference on, pp. 342-347, 13-16 July 2010.
[2] M. McGranaghan and F. Goodman, "Technical
and system requirements for Advanced
Distribution Automation," Electricity Distribution,
2005. CIRED 2005. 18th International
Conference and Exhibition on, Turin, Italy, 2005,
pp. 1-5.
[3] R. W. Uluski, "The role of Advanced Distribution
Automation in the Smart Grid," Power and Energy
Society General Meeting, 2010 IEEE,
Minneapolis, 2010, pp. 1-5.
[4] Shahin, M.A., “Smart Grid self-healing
implementation for underground distribution
networks,” in Innovative Smart Grid Technologies
- Asia (ISGT Asia), 2013 IEEE, pp.1-5, 10-13
Nov. 2013.
[5] Siirto, O., Kuru, J., and Lehtonen, M., “Fault
location, isolation and restoration in a city
distribution network,” in Electric Power Quality
and Supply Reliability Conference (PQ), 2014,
pp. 367-370, 11-13 June 2014.
[6] Gomes, D.; Colunga, R.; Gupta, P.;
Balasubramanian, A., “Distribution automation
case study: Rapid fault detection, isolation, and
power restoration for a reliable underground
distribution system,” in Protective Relay
Engineers, 2015 68th Annual Conference on,
00.1
0.2
0.3
0.4
0.5
Feeder
1Feeder
2Feeder
3Feeder
4System
pu
0
0.1
0.2
0.3
0.4
0.5
Feeder
1Feeder
2Feeder
3Feeder
4System
pu
Renewable Energy and Sustainable Development (RESD) Volume 3 Issue 1, Special Issue, March 2017 - ISSN 2356-8569 http://dx.doi.org/10.21622/RESD.2017.03.1.024
32 RESD © 2017 http://apc.aast.edu
pp.325-334, March 30 2015-April 2 2015.
[7] Kuru, J.; Ihonen, T.; Haikonen, J., “Control-
center-based automatic fault isolation and
restoration system for rural medium voltage
networks,” in Electricity Distribution (CIRED
2013), 22nd International Conference and
Exhibition on , pp.1-4, 10-13 June 213.
[8] Chollot, Y.; Wild, J.; Berry, T.; Jourdan, A.;
Raison, B.; Marguet, R.; Houssin, J.; Joubert, R.,
“Decentralized self healing solution tested in the
framework of GreenLys smart grid project,” in
PowerTech 2013 IEEE, Grenoble, pp. 1-7, 16-20
June 2013.
[9] Coster, Edward; Kerstens, Wim; Berry, Tom,
“Self healing distribution networks using smart
controllers,” in Electricity Distribution (CIRED
2013), 22nd International Conference and
Exhibition on. Stockholm, pp.1-4, 10-13 June
2013.
[10] IEEE Distribution Automation Workig Group,
“Smart Grid for Distribution Systems: The
Benefits and Challenges of Distribution
Automation(DA),” IEEE White Pap., 2007.
[11] Madani, V.; Das, R.; Aminifar, F.; McDonald, J.;
Venkata, S.S.; Novosel, D.; Bose, A.;
Shahidehpour, M., “Distribution Automation
Strategies Challenges and Opportunities in a
Changing Landscape,” in Smart Grid, IEEE
Transactions on , vol.6, no.4, pp.2157-2165, July
2015.
[12] R. Das, V. Madani, F. Aminifar, J. McDonald, S.S
Venkata. D., Novosel, A.Bose and M.
Shahidehpour, "Distribution Automation
Strategies: Evolution of Technologies and the
Business Case," inIEEE Transactions on Smart
Grid, vol. 6, no. 4, pp. 2166-2175, July 2015.
[13] Späck H., Schüpferling B., Riemenschneider J.
and Schelte M., "Intelligent transformer
substations in modern medium voltage networks
as part of “smart grid”," Power Generation
Transmission, Distribution and Energy
Conversion (MedPower 2010), 7th
Mediterranean Conference and Exhibition on,
Agia Napa, 2010, pp. 1-7.
[14] V. Gungor, D. Sahin, and T. Kocak, "Smart Grid
Technologies: Communication Technologies and
Standards," in IEEE Transactions on Industrial
Informatics, vol. 7, no. 4, pp. 529-539, Nov. 2011.
[15] Yanfeng Gong; Guzman, A., “Integrated Fault
Location System for Power Distribution Feeders,”
in Industry Applications, IEEE Transactions on ,
vol.49, no.3, pp.1071-1078, May-June 2013.
[16] Sudhakar, T. D., & Srinivas, K. N. "Restoration of
power network–a bibliographic survey,"
European Transactions on Electrical Power, vol.
21, no. 1, pp. 635-655, 2011.
[17] Subban, P.P., Awodele, K.O., “Reliability impact
of different smart grid techniques on a power
distribution system,” in Innovative Smart Grid
Technologies Latin America (ISGT LA), 2013
IEEE PES Conference On, pp.1-8, 15-17 April
2013.
[18] IEEE Guide for Electric Power Distribution
Reliability Indices," in IEEE Std 1366-2003
(Revision of IEEE Std 1366-1998), pp.1-50, May
14 2004.
[19] IEEE Recommended Practice for the Design of
Reliable Industrial and Commercial Power
Systems," in IEEE Std 493-2007 (Revision of
IEEE Std 493-1997), pp.1-689, June 25 2007.
[20] Ahmed R. Abul'Wafa, “Reliability Improvement of
Radial Distribution System with Different
Configurations of Disconnecting Switches,” The
16th International Middle East Power Systems
Conference (MEPCON'14). Cairo, Egypt, 3-25
December 2014.

Renewable Energy and Sustainable Development (RESD) Volume 3 Issue 1, Special Issue, March 2017 - ISSN 2356-85 96 http://dx.doi.org/10.21622/RESD.2017.03.1.033
This Paper has been Accepted and Presented in the (First International Conference on New Trends for Sustainable Energy) 1-3 October, 2016 at Pharos University, Alexandria, Egypt.
33 RESD © 2017 http://apc.aast.edu
DG- Allocation Based on Reliability, Losses, and Voltage
Sag Considerations – An Expert System Approach Sahar Abdel Moneim1 Moussa and Ayman Abdelwahed2
1 Department of Electrical Engineering, University of Pharos, Alexandria, Egypt 2 Mathematics & Physics Department Faculty of Engineering, Alexandria University, Alexandria, Egypt
Abstract - Expert System (ES) as a branch of
Artificial Intelligence (AI) methodology can potentially
help in solving complicated power system problems.
This may be more appropriate methodology than
conventional optimization techniques when
contradiction between objectives appears in reaching
the optimum solution. When this contradiction is the
hindrance in reaching the required system operation
through the application of traditional methods ES can
give a hand in such case.
In this paper, the knowledge- based ES technique is
proposed to reach near-optimum solution which is
further directed to the optimum solution through
particle swarm optimization (PSO) technique. This
idea is known as Hybrid-Expert-System (HES). The
proposed idea is used in getting the optimum
allocation of a number of distributed generation (DG)
units on Distribution System (DS) busbars taking into
consideration three issues; reliability, voltage sag, and
line losses. Optimality is assessed on the economic
basis by calculating money benefits (or losses)
resulting from DG addition considering the three
aforementioned issues. The effectiveness of the
proposed technique is ascertained through example.
Keywords – Expert system; Artificial Intelligence;
particle swarm optimizatiom; Hybrid Expert System;
Disteributed generation; reliability; voltage sag.
I. INTRODUCTION
The problem of optimum allocation of DG units is one
of the most challenging problems emerged since the
advent of DG technology in DS. This is due to the
inherent characteristics of the electric power systems
with their contradicting behavior. As an example,
raising the generating capacity of the grid may lead to
improving voltage sag phenomenon at some busbars
and -at the same time- impairing this phenomenon at
other busbars. Another example is the case when
seeking at getting the optimum placing of a number of
DG units which minimizes the overall transmission
losses. This placing may not achieve the required
reliability level, or, at least does not verify the best
possible reliability indices. Many other contradictions
are found among grid operation, control, and
protection. Although most of literature about the
problem of DG allocation deal with radial systems
which are relatively simple [1-5]. The problem is still
complex and needs some assumptions to simplify the
solution. In many cases these assumptions limit the
usability of the suggested methods and the benefit
gained from them. On the other hand few authors
consider ring and interconnected systems which add
more complexity to the problem [6].
It becomes an agreement among all authors that the
Artificial Intelligence (AI) techniques are the only
suitable methods for solving the problem of optimum
DG allocation. Conventional optimization techniques
cannot be applied because of the non-convexity of
the objective function and the different nature of the
problem variables which contain electrical, statistical,
and economical variables. However the common
drawback in most of the AI optimization methods is
that these methods do not have a robust algorithm
which assures that the solution is the absolute
minimum (the least value) in case of minimization
problem. This is similar to the case of nonconvex
objective function in conventional optimization.
This paper suggests utilizing Hybrid Expert System
(HES) for improving and accelerating the solution of
optimum DG allocation either by conventional
optimization methods or by AI techniques. ES is not
an optimization technique rather than it helps in
getting adequate and quick pragmatic answers for
problems that defy effective solution. In the present
work a rule chain containing heuristic rules is adopted
to help in getting a “near optimum” DG allocation.

Renewable Energy and Sustainable Development (RESD) Volume 3 Issue 1, Special Issue, March 2017 - ISSN 2356-8569 http://dx.doi.org/10.21622/RESD.2017.03.1.033
34 RESD © 2017
http://apc.aast.edu
This solution can be used as a starting population in
the PSO methods which helps in reducing number of
iterations and gives better results.
II. NOMENCLATURE
NS: Total number of busbars in the grid.
ND: Number of DG units.
TLL: Total power losses in grid lines, in p.u. kW.
CK: Cost of p.u. kWh loss in grid lines.
8760: Average number of hours per year.
CL: Total annual line loss cost of the grid, $.
CVS(j-k): Voltage of busbar #j when S.C. occurs on busbar #k.
NV(k): Estimated number of S.C. on bus #k, per year.
F(j): Loss cost from load isolation resulting from voltage sag or
from forced outage at bus #j in p.u. kW.
R(k): Availability of busbar k.
VC(j): Critical trip voltage at busbar #j due to voltage sag.
VS(j): Voltage at busbar #j during S.C..
CS: Total annual loss cost due to voltage sags, $.
CT: Total annual cost in the grid due to line losses and voltage
sags, $.
Vi, Vj: Voltages of busbars #i, j resulting from load flow solution.
Vi*, Vj* Conjugates of , respectively.
yi: Series admittance of line between busbars i and j.
yij: Shunt admittance of line between busbars i and j.
R, X: Series resistance and reactance of line respectively, in p.u..
Pi, Qi: Active and reactive net injected power at busbar #i, in p.u.
Pij : Real power transmitted by line i-j.
III. PROBLEM FORMULATION
The problem can be stated as follows: “It is required
to get the best possible allocation of a number of DG
units at busbars of a DS taking into consideration
three factors; line power losses, voltage sag and
reliability”.
As a common practice, the objective function of the
problem is derived on the form of cost function of loss
costs of the followings:
1. Loss cost due to transmission power loss (CL).
This cost reduces by reducing transmission line
power loss.
2. Loss cost due to load isolation by undervoltage
protection resulting from S.C. occurring
somewhere at any busbar in the DS (CV). This
cost may be reduced by minimizing the effect of
S.C. occurring at one busbar on the transient
voltage drops at other DS busbars.
3. Loss cost due to load interruption (CR). This can
be minimized by maximizing the reliability indices
at the grid loads.
Mathematically, the problem can be written as:
(1)
Subject to
NSiwhereVVV iii ;maxmin (2)
NSjiwherePP ijij ,;max (3)
Conceptually, the calculation of CT is based on the
following functions:
4. Load flow: this function uses any traditional method
such as Newton-Raphson and Gauss-Seidel
methods from which TLL is calculated. DG are
modelled as PQ busses. Hence, the first part of
equation (1) is calculated as follows;
(4)
5. Voltage sag: this function determines the grid
buses which will be tripped by undervoltage relays
when a three-phase S.C. occurs on one bus in the
grid. This is calculated for S.C. on all buses, one at
a time. Expected loss cost due to voltage sags is
calculated as:
NS
k
NS
j
kjCVSCS1 1
)( (5)
)()()( jAkNSkjCVS (6)
Where;
)()(0)(
)()()()()(
jVCjVSifjA
jVCjVSifjPLjFjA
(7)
6. Reliability; Reliability assessment in radial DS is
relavively simple as load connected to any bus
requires that all components from the supply point
be avaliable. However, this concept cannot be
applied to the case when both main substation and
DG feed the grid at the same time as the grid
becomes no longer radial. For this reason, most of
researchers assume one DG only for reliability
assement and allows the DG operate
independently (island) where the main power is not
present [7,8].

Renewable Energy and Sustainable Development (RESD) Volume 3 Issue 1, Special Issue, March 2017 - ISSN 2356-8569 http://dx.doi.org/10.21622/RESD.2017.03.1.033
35 RESD © 2017 http://apc.aast.edu
However, two issues have to be considered in order to
simulate practical requirements. These are:
1. Some distribution grids are fed from more than one
point. This makes the grid as ring or even
interconnected configuration.
2. It is essential to evaluate the reliability indices at
load points considering both DG units and main
supply feeding the grid at the same time. This
represents most of practical applications.
The two aforementioned issues violate the condition
of series reliability and draw attention to the
importance of reliability evaluation of ring and
interconnected systems. In the present work, reliability
of ring and interconnected network is calculated
following the method suggested in [9]. Cost of load
interruptions resulting from forced outage of any
component in the DS is calculated as
Nk
k
kFkPLkRCR1
)()())(1( (8)
IV. HYBRID EXPERT SYSTEM
Rule-Based Expert System is a branch of Artificial
Intelligent system created to solve problems in a
particular domain. It has been developed to assist in
finding pragmatic answers for problems that defy
effective solution [10]. All knowledge in an ES is
provided by people who are experts in that domain.
ES may contain heuristic rules which differ from other
rules in that, they are not formulated as a result of
ordinary accepted knowledge but are rules that only
an expert would know. In general, to create an ES a
team consisting of expert and knowledge engineer
gathers the facts, rules and heuristic rules for a
domain and organizes them into an AI program. The
same problem may find different solutions
according to the ES used in this program [11].
As a matter of fact, not all problems can be or should
be solved by mean of an ES. Further, even among
those solution by ES is appropriate, the results found
may be marginally accepted. In this paper we suggest
HES to improve results and reduce the calculation
effort. The proposed methodology utilizes ES first to
get- near optimum- solution to the problem under
study, then this solution is considered as the initial
population for the PSO method. In this work, a rule
chain containing three heuristic rules is adopted to
help in getting near-optimum solution for the DG units
allocation which can be taken as starting populations
in the PSO technique. These are:
Rule #1
IF Node has high load and it is connected with
high resistance lines.
THEN Begin with this node for DG installation for loss
minimization.
Rule #2
IF The cost of load tripping at the node is high
and the load is critical.
THEN Installation of DG at this node has the second
preference.
Rule #3
IF The grid is highly interconnected.
THEN The issue of reliability has less importance in DG allocation.
V. PARTICLE SWARM OPTIMIZATION
PSO is a branch of AI systems emerged in the last
three decades as an efficient method of optimization
[12]. It is characterized as a population of random
space. A particle’s location in the multidimensional
problem space represents one solution for the
problem. When a particle moves to a new location, a
different problem solution is generated. This solution
is evaluated by fitness function that provides a
quantitative value for the solution’s utility.
The velocity and direction of each particle moving
along each dimension of the problem space will be
altered with each generation of movement. In
combination, the particle’s personal experience and its
neighbors’ experience influence the movement of
each particle through a problem [13].
VI. CASE STUDY
The proposed problem structure was tested on the
IEEE 14-bus system given in [14]. Table I contains the
system lines and loads raw data
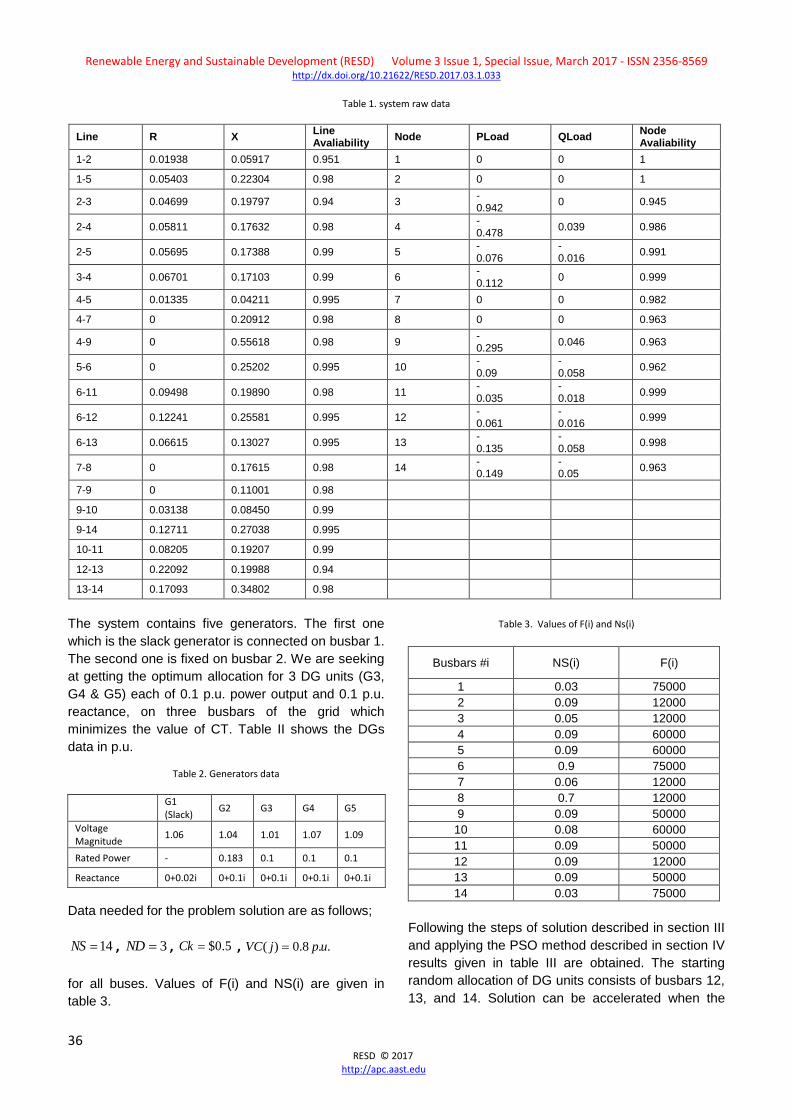
Renewable Energy and Sustainable Development (RESD) Volume 3 Issue 1, Special Issue, March 2017 - ISSN 2356-8569 http://dx.doi.org/10.21622/RESD.2017.03.1.033
36 RESD © 2017
http://apc.aast.edu
Table 1. system raw data
The system contains five generators. The first one
which is the slack generator is connected on busbar 1.
The second one is fixed on busbar 2. We are seeking
at getting the optimum allocation for 3 DG units (G3,
G4 & G5) each of 0.1 p.u. power output and 0.1 p.u.
reactance, on three busbars of the grid which
minimizes the value of CT. Table II shows the DGs
data in p.u.
Table 2. Generators data
G1 (Slack)
G2 G3 G4 G5
Voltage Magnitude
1.06 1.04 1.01 1.07 1.09
Rated Power - 0.183 0.1 0.1 0.1
Reactance 0+0.02i 0+0.1i 0+0.1i 0+0.1i 0+0.1i
Data needed for the problem solution are as follows;
14NS , 3ND , 5.0$Ck , ..8.0)( upjVC
for all buses. Values of F(i) and NS(i) are given in
table 3.
Table 3. Values of F(i) and Ns(i)
Busbars #i NS(i) F(i)
1 0.03 75000
2 0.09 12000
3 0.05 12000
4 0.09 60000
5 0.09 60000
6 0.9 75000
7 0.06 12000
8 0.7 12000
9 0.09 50000
10 0.08 60000
11 0.09 50000
12 0.09 12000
13 0.09 50000
14 0.03 75000
Following the steps of solution described in section III
and applying the PSO method described in section IV
results given in table III are obtained. The starting
random allocation of DG units consists of busbars 12,
13, and 14. Solution can be accelerated when the
Line R X Line Avaliability
Node PLoad QLoad Node Avaliability
1-2 0.01938 0.05917 0.951 1 0 0 1
1-5 0.05403 0.22304 0.98 2 0 0 1
2-3 0.04699 0.19797 0.94 3 - 0.942
0 0.945
2-4 0.05811 0.17632 0.98 4 - 0.478
0.039 0.986
2-5 0.05695 0.17388 0.99 5 - 0.076
- 0.016
0.991
3-4 0.06701 0.17103 0.99 6 - 0.112
0 0.999
4-5 0.01335 0.04211 0.995 7 0 0 0.982
4-7 0 0.20912 0.98 8 0 0 0.963
4-9 0 0.55618 0.98 9 - 0.295
0.046 0.963
5-6 0 0.25202 0.995 10 - 0.09
- 0.058
0.962
6-11 0.09498 0.19890 0.98 11 - 0.035
- 0.018
0.999
6-12 0.12241 0.25581 0.995 12 - 0.061
- 0.016
0.999
6-13 0.06615 0.13027 0.995 13 - 0.135
- 0.058
0.998
7-8 0 0.17615 0.98 14 - 0.149
- 0.05
0.963
7-9 0 0.11001 0.98
9-10 0.03138 0.08450 0.99
9-14 0.12711 0.27038 0.995
10-11 0.08205 0.19207 0.99
12-13 0.22092 0.19988 0.94
13-14 0.17093 0.34802 0.98

Renewable Energy and Sustainable Development (RESD) Volume 3 Issue 1, Special Issue, March 2017 - ISSN 2356-8569 http://dx.doi.org/10.21622/RESD.2017.03.1.033
37 RESD © 2017 http://apc.aast.edu
three heuristic rules of the ES is applied. Rule #1
recommends starting with node #8, rule #2
recommends node #8 hence node #12 followed by
node 14. Rule #3 recommends node #9. Combining
the three ES rules suggests starting population
consisting of nodes 8, 9, and 12 which reduces the
number of PSO iterations from 34 to 9 iterations only.
Table 4. Results of the case study
Iteration Number
Generators Distribution Line
Losses G1 G2 G3 G4 G5
1 1 2 12 13 14 0.13451+0.44637i
2 1 2 11 12 13 0.12426+0.43931i
3 1 2 9 10 14 0.13739+0.48425i
4 1 2 10 12 13 0.11837+0.42714i
5 1 2 11 12 14 0.11911+0.42988i
6 1 2 8 12 13 0.11427+0.42553i
7 1 2 9 10 12 0.12897+0.46042i
8 1 2 10 11 12 0.11876+0.42963i
9 1 2 9 10 11 0.12804+0.46105i
10 1 2 8 11 12 0.11099+0.41879i
11 1 2 10 11 13 0.11797+0.43456i
12 1 2 11 13 14 0.11838+0.42846i
13 1 2 9 10 13 0.12768+0.46575i
14 1 2 9 12 14 0.12116+0.43572i
15 1 2 9 12 13 0.11859+0.42843i
16 1 2 10 11 14 0.12326+0.44395i
17 1 2 8 11 13 0.10912+0.42089i
18 1 2 10 12 14 0.11741+0.42666i
19 1 2 9 13 14 0.11975+0.43336i
20 1 2 8 10 12 0.10918+0.42021i
21 1 2 9 11 12 0.11654+0.42447i
22 1 2 8 12 14 0.11002+0.4198i
23 1 2 10 13 14 0.11619+0.42454i
24 1 2 9 11 14 0.12445+0.44704i
25 1 2 8 10 11 0.11035+0.42422i
26 1 2 8 9 12 0.10749+0.4245i
27 1 2 8 10 13 0.10697+0.42107i
28 1 2 9 11 13 0.11595+0.43049i
29 1 2 8 11 14 0.1092+0.4212i
30 1 2 8 9 10 0.10954+0.43193i
31 1 2 8 9 11 0.10805+0.42773i
32 1 2 8 10 14 0.10774+0.42167i
33 1 2 8 9 13 0.10574+0.42463i
34 1 2 8 9 14 0.10686+0.42443i
Table 5. Costs of the case study
Iteration Number
Line Losses
Cost
Voltage
Sag Cost
Unavailabi
lity Cost
Total Cost
1 589.1321 116.522 3.005 708.6591
2 544.2604 126.2712 2.734 673.2656
3 601.7814 49.872 4.166 655.8194
4 518.477 116.0267 3.005 637.5087
5 521.6899 112.7459 3.101 637.5368
6 500.4813 132.9739 2.266 635.6142
7 564.8807 61.4675 4.088 630.4362
8 520.1535 105.9278 3.334 629.4153
9 560.8087 64.6447 4.954 630.4074
10 486.1372 134.815 2.232 623.1842
11 516.729 99.2065 3.678 619.6135
12 518.513 96.9881 3.606 619.1072
13 559.2217 55.1854 4.133 618.5401
14 530.7001 82.372 4.000 617.0727
15 519.4398 91.4309 3.824 614.6947
16 539.8922 66.5135 5.000 611.4057
17 477.9535 128.2474 2.629 608.8299
18 514.2624 91.4699 3.023 608.7553
19 524.4897 78.9075 3.998 607.3952
20 478.1931 121.2071 2.999 602.3992
21 510.4279 88.8656 3.862 603.1555
22 481.8692 116.8675 3.988 602.7247
23 508.9287 87.0806 3.988 599.9972
24 545.1025 49.8114 4.135 599.0489
25 483.3392 108.0512 3.001 594.3914
26 470.8275 96.8246 3.023 570.6751
27 468.5132 98.0881 3.201 569.8024
28 507.882 56.3075 4.097 568.2866
29 478.29 74.1125 4.001 556.4035
30 479.7864 65.5598 4.999 550.3451
31 473.2767 67.4876 4.001 544.7653
32 471.8799 68.2468 4.000 544.1267
33 463.1405 64.987 4.923 533.0505
34 468.0572 59.3839 4.096 531.5371
VII. DISSCUSSION
This paper is based mainly on economical
consideration when dealing with DG allocation on DS
busbars. The main conclusions which can be
extracted from the present work are:

Renewable Energy and Sustainable Development (RESD) Volume 3 Issue 1, Special Issue, March 2017 - ISSN 2356-8569 http://dx.doi.org/10.21622/RESD.2017.03.1.033
38 RESD © 2017
http://apc.aast.edu
Cost of line losses has the maximum value
among the three costs (line losses- voltage sag-
unavailability).
Cost of load isolation due to voltage sag has
tangible value and should not be ignored in
economic studies.
Cost of loss of supply to loads due to forced
outage of network component has minor effect in
case of ring and interconnected distribution
networks. However this cost cannot be ignored in
case of radial systems.
HES can greatly reduce the number of iterations
and calculation effort in PSO application.
Generally, there is an inverse trend between line
loss and voltage sag costs.
REFERENCES
[1] Task Force on Distributed Generation Planning
and Optimization, “State-of-the-art-techniques and
challenges ahead for distribution generation
planning and optimization,” IEEE Trans. Power
Systems, vol. 28, no. 2, May 2013.
[2] R. A. Walling, R. Saint, R. C. Dugan, J. Burke,
and L.A. Kojovic, “Summary of distributed
resources impact on power delivery systems,”
IEEE Trans. Power Del., vol. 23, no. 3, pp.1636-
1644, Jul. 2008.
[3] IEEE Standard for Intrconnecting Distributed
Resources With Electric Power Systems., IEEE
Std. 1547-2003, 2003.
[4] R. Macdonald and G.W. Ault, “An optimisation
model to integrate active network management
into the distribution network investment planning
task,” in Proc. 2011 Int. Conf. Electricity
Distribution (CIRD).
[5] V. Ravikumar Pandi, H.H. Zeineldein, and
Weidong Xiao, “Determining optimal location and
size od distributed generator resources
considering harmonic and protection coordination
limits,” IEEE Trans. Power Systems, vol. 28, no.
2, May 2013.
[6] M. H. Bollen and F. Hassan, Integration of
Distributed Generatian in Power System. New
York: Wiley-IEEE Press, 2011.
[7] K. Abookazemi, M.Y. Hassan, and M. S. Majid, “A
review on optimal placement methods of
distribution generation sources,”2010 IEEE
International Conference on Power and Energy
(PECon2010).
[8] Cesar Augusto Penuela Meneses and Jose
Roberto Sanches Mantovani, “Improving the grid
operation and reliability cost of distributed
systems with dispersed generation,” IEEE Trans.
Power systems, vol. 28, no. 3, August 2013.
[9] Sahar A. Moussa, “Expert system aided power
reinforcement with reliability and voltage sag
consideration,”IEEE International Conference on
Systems, Computing Sciences and Software
Engineeering (SCSS10), Bridgeport, CT 06604,
USA, Dec 3-6, 2010.
[10] Shang Gao and Zaiyue Zhang, “Multiplicate
particle swarm optimization Algorithm,” Journal of
Computers, vol. 5, no. 1, pp 150-157, Jan. 2010.
[11] Sahar A. Moussa, “Distributed generation unit
allocation utilizing expert system with reliability
and voltage sag consideration,” 2015 IEEE LISAT
Conference, May 1st , 2015.
[12] J. Kennedy and R Eberhart, “Particle swarm
optimization,” Proceedings of IEEE International
Conference on Netral Networks (ICNN’95) , vol
IV, pp 1942-1948, Perth, Australia, 1995.
[13] Shawkat M. Hamdan, “ Modified particle swarm
optimization techniques in electrical power system
analysis,”Ph.D. Deseration, BUA,2014.

Renewable Energy and Sustainable Development (RESD) Volume 3 Issue 1, Special Issue, March 2017 - ISSN 2356-8569 http://dx.doi.org/10.21622/RESD.2017.03.1.039
This Paper has been Accepted and Presented in the (First International Conference on New Trends for Sustainable Energy) 1-3 October, 2016 at Pharos University, Alexandria, Egypt.
39 RESD © 2017 http://apc.aast.edu
Harmonics Monitoring Survey on LED Lamps Abdelrahman Ahmed Akila1 Kamelia Youssef2 ,Ibrahim Yassin3
1Energy Rationalization Department South Delta for Electricity Distribution Company, Tanta, Egypt
(2,3)Improving Energy Efficiency of Lighting& Building Appliances Project, Nasr City, Egypt
(2,3)[email protected]
Abstract - Light Emitting Diode (LED) lamps are being
increasingly used in many applications. These LED
lamps operate using a driver, which is a switching
device. Hence, LED lamps will be a source of
harmonics in the power system. These harmonics if not
well treated, may cause severe performance and
operational problems. In this paper, harmonics
(amplitude and phase angles) generated by both LED
lamps and conventional fluorescent lamps will be
studied practically. Then they will be analyzed and
evaluated. Compared to each other harmonics
generated by both LED and conventional florescent
lamps, self mitigation may occur based on the phase
angle of these harmonics. All data will be measured
using power analyzer and will be done on a sample of
actual lamps.
Keywords — LED lighting; harmonics; power quality;
conventional lighting;
I. INTRODUCTION
Recently, the LED technology is being applied in
modern light sources which are now widely used in the
lighting industry. They replace traditional bulbs,
halogens, and fluorescent light sources for indoor
lighting [1]. They are also used for outdoor lighting,
building decoration, and vehicles applications. The
main purpose of using LED lamps is energy saving
because of their low energy consumption and overall
efficiency augmentation [2].
Energy saving lamps due to their non-linear
characteristics, inject harmonic currents into the
network [3]. This may be a problem because, for a very
high penetration level of these types of lamps, the
overall voltage harmonic distortion may increase
considerably [4]. LED lamps are modern technology
hence; they may replace conventional light lamps for
reasons of power quality improving [5]. In [6], a power
quality (PQ) study on various number of LED lamps
showed that they could damp the overall harmonics
injected in the distribution network. Compared to other
light sources a better improved THD could be achieved
by mixing various light sources. Since LED lamps
could mitigate each other harmonics, various types of
light sources could also do the same.
In this paper, different types of lamps will be studied
and their power quality will be analyzed. In section two,
a LED lamps advantages and disadvantages will be
illustrated. While, in section three, power quality was
defined. Practical PQ results for different types of
lamps were presented in section four. Finally, the
conclusions and future work.
II. LED LAMPS
LED lamps have the potential to play a major role in
developing commercial, residential, and public
buildings just as compact fluorescent lamps (CFLs) did
three decades ago. That’s because LED lamps
obviously offer great energy saving potential. For
some LED lamps, their efficacies already exceed 100
lumens per watt.
LED lamps are much more complex than
incandescent lamps. The main difference between
both lamps is that LEDs requires direct current (DC) in
order to operate which is supplied through power
electronics driver, rather than the resistive
incandescent filament which is a different type of load
that operates on alternating current (AC). The LEDs’
driver must convert AC to DC and decrease the
voltage to more adequate level. There is also a
phenomenon called “latency” which represents
another difference between both LED and
incandescent lamps. For the incandescent lamps, light
is maintained for some period of time after the feed-in
current is being cut. That’s because the incandescent

Renewable Energy and Sustainable Development (RESD) Volume 3 Issue 1, Special Issue, March 2017 - ISSN 2356-8569 http://dx.doi.org/10.21622/RESD.2017.03.1.039
40 RESD © 2017
http://apc.aast.edu
filaments do not cool down instantly. On the other
hand, LEDs react very quickly to even small variations
in current, also phosphor-converted or remote
phosphor LEDs tend to have very small latency.
A. Advantages of LED Lighting
• LED lamps can be finely tuned to produce a wide
range of color temperatures by mixing different
colored LED chips in the same array. Incandescent
and halogen lamps typically provide light with a
color temperature in the range from 2600k to 3000k
(2700k is the most common) while, LEDs generally
have color temperature ranging from 2700k up to
6000k or higher.
• LEDs efficacy is being improved quickly.
• Dimmers are being used in the majority of LED
bulbs.
• While, incandescent lamps have an average lifetime
between 1000 and 2000 hours, most of LED Lamps
have an average lifetime of over 35000 hours and a
warranty of 5 years.
• LEDs do not tend to fail suddenly (as an
incandescent lamp does), but instead their light
output slowly decrease.
• Many LED lamps have almost no warm-up delay,
while most of them turn on instantly at full brightness.
This advantage is in corresponding to particular
lamps such as fluorescent high intensity discharge,
and high pressure sodium, which in order to reach
full brightness consume time from a few seconds to
several minutes.
• LED illumination has small amount of infrared and
almost no ultraviolet emissions.
• LED lights can be dimmed which offers a flexible
control, color, and distribution.
• LED lights can be switched on and off frequently
without negatively affecting their lifetime of light
emission.
• LED lights are still more expensive than CFL lights,
but they are far less expensive than they were year
ago.
• LEDs operate silently with no annoying flickering
noises.
• LEDs provide a range of various colors for different
applications and purposes.
The major and mandatory advantage of LEDs is the
huge reduction in energy consumption they offer when
replacing traditional lighting.
B. Disadvantages of LED Lighting
• LEDs do not concentrate a “point source” of light,
hence they cannot be used in applications that
requires highly collimated beam.
• On an initial capital cost basis, LEDs are currently
more expensive than conventional lighting
technologies.
• LEDs must be supplied with certain current value
which requires applying series resistors or current-
regulated power supplies.
III. POWER QUALITY ANALYSIS
A power quality (PQ) analysis has been performed by
comparing the different luminaries’ performance.
According to [7] and [8]:
Current harmonic distortion is a phenomenon arising
from the operation of non-linear loads, which is caused
by non-sinusoidal waveforms accompanied to
sinusoidal wave with frequencies of integral multiples
of the source frequency
The total harmonic distortion (THD) is a measurement
of the harmonic distortion value and it is defined as the
ratio of the sum of all harmonic components’ powers
to the fundamental’s power. and it is defined for current
and voltage respectively as follow [9]:
(1)
(2)
Where:
Ih = individual harmonic current
Uh = individual harmonic voltage

Renewable Energy and Sustainable Development (RESD) Volume 3 Issue 1, Special Issue, March 2017 - ISSN 2356-8569 http://dx.doi.org/10.21622/RESD.2017.03.1.039
41 RESD © 2017
http://apc.aast.edu
I1 = Fundamental current
U1 = Fundamental voltage
h = order of harmonics
Power factor (PF) represents the ratio of the average
power converted by the device -real power- and the
maximum average power that may be converted -
apparent power- considering the same rms values of
current and voltage. PF could be considered an
indicator for the quality of the energy conversion.
A. Harmonics Emission Standard
Harmonic emission of individual lamps is restricted by
the standard IEC 61000-3-2 [7]. Limitation are
classified into two categories:
• Lamps with an active input ≤ 25 w
• Lamps with an active input > 25 w
Lamps with an active power ≤ 25 w have a higher
margin for harmonic current in percentage. It is
assumed that a large number of smaller lamps will
emit less harmonic currents than a small number of
bigger lamps. Table (1) shows the limited harmonic
current of lighting equipments according to the
mentioned standard (for P > 25 w).
B. Recommended values for displacement factor
The recommended values for displacement PF is
presented by the standard IEC 62612-2013 [8]. Table
(2) summarizes these values.
Table 1. LIMITS OF HARMONIC CURRENT OF LIGHTING EQUIPMENT
ACCORDING TO IEC61000-3-2
Harmonic order (h)
Maximum harmonic current
permitted (calculated in %
compared to fundamental
magnitude)
2 2
3 30*(power factor)
5 10
7 7
9 5
11< h≤ 39 (odd only) 3
Table 2. LED LAMP POWER FACTOR FOR LAMPS WITH INTEGRATED
CONTROL GEAR
Power Power Factor (PF)
P ≤ 2 w No requirement
2 w < P ≤ 5 w ≥ 0.4
5 w < P ≤ 25 w ≥ 0.7
P > 25 w ≥ 0.9
IV. EXPERIMENTAL TESTS ON LED LIGHTS
Luminaries are generally nonlinear loads connected to
the low voltage AC distribution network. Some kind of
light sources, like fluorescent lamps and LEDs, require
a power supply system (ballast or driver) to interface
them with the electric network. Generally, the current
waveform contains some amount of distortion,
depending on the luminaries’ technology.
A. Case Study (A)
The experimental tests, carried by the energy analyzer,
have been performed on different kinds of indoor
luminaries:
• LED bulbs
• LED Tubes
• LED Panels
The results of the power quality (PQ) analysis for the
previous three types of lamps are presented in tables
(3), (4), (5), and (6) respectively. Tables (3) and (4)
shows the results of studying 12 samples of light bulbs.
Table 3. PQ ANALYSIS FOR LED BULBS (1)
Sample No. 1 2 3 4 5 6
Rated Power (w)
12 10 9 9 9 9
Measured Power (w)
11.5 9.1 10 7.9 8.9 9.2
PF 0.567 0.927 0.937 0.954 0.979 0.932
Vrms (V) 219.9 219.8 220 220.1 220 220
THDV (%) 2 2.4 1.1 1.4 2.1 2.1
Irms (A) 0.093 0.045 0.048 0.038 0.041 0.045
THDI (%) 122.5 22.6 21.9 18.0 15.1 22.7
I3 % 81.6 17.1 16.4 15.6 6.5 15.4
I5 % 55.9 11.1 8.8 3.1 10.7 11.6
I7 % 39 6.4 8.5 4.2 6.1 7.8
I9 % 34.5 2.9 5.2 3.1 3.7 4.8
I11 % 30.5 4.0 3.1 4.0 1.7 1.9

Renewable Energy and Sustainable Development (RESD) Volume 3 Issue 1, Special Issue, March 2017 - ISSN 2356-8569 http://dx.doi.org/10.21622/RESD.2017.03.1.039
42 RESD © 2017
http://apc.aast.edu
Table 4. PQ ANALYSIS FOR LED BULBS (2)
Sample No. 7 8 9 10 11 12
Rated
Power (w) 9 6 6 5 4 3
Measured
Power (w) 8.9 6.3 5.9 5.1 4.0 1.6
PF 0.955 0.917 0.663 0.437 0.541 0.109
Vrms (V) 220.1 220.9 218.9 220 220.2 220.2
THDV (%) 2.2 1.3 1.4 1.2 0.7 1.3
Irms (A) 0.042 0.031 0.041 0.053 0.033 0.067
THDI (%) 20.5 24.5 60.8 63.0 137.7 19.3
I3 % 18.2 18.3 50.1 44.2 87.3 10.3
I5 % 5 10.8 25.1 27.6 73.3 7.8
I7 % 2 9.3 15.2 20.2 54.9 8.5
I9 % 2.5 3.9 10.7 13.2 38.4 1.8
I11 % 2.8 3.2 10.1 3.5 25.1 4.1
Table 5. PQ ANALYSIS FOR LED TUBES
Sample No. 1 (120
cm)
2 (120
cm)
3 (60
cm)
4 (60
cm)
Rated
Power (w) 18 18 10 9
Measured
Power (w) 18 16.8 9.9 8.8
PF 0.947 0.906 0.927 0.966
Vrms (V) 220.1 220 220.2 220.2
THDV (%) 2.1 1.2 2.3 1.2
Irms (A) 0.086 0.084 0.048 0.041
THDI (%) 20.2 43.6 22.1 16.1
I3 % 14.6 19.8 14.0 8.8
I5 % 9.6 11.3 11.1 7.5
I7 % 8.2 31.7 10.6 6.4
I9 % 4.1 10.5 3.6 5.6
I11 % 2.6 7.0 2.1 3.4
Table 6. PQ ANALYSIS FOR LED PANELS (60×60)
Sample No. 1 2 3 4
Rated
Power (w) 42 42 32 32
Measured
Power (w) 43.3 41.3 31.4 31.6
PF 0.953 0.973 0.927 0.929
Vrms (V) 220.3 220.9 220.2 220.6
THDV (%) 1.3 1.2 3.1 1.1
Irms (A) 0.208 0.192 0.154 0.153
THDI (%) 15.9 11.8 12 10.5
I3 % 14.5 10.8 8.5 8.1
I5 % 3.6 3.4 5.8 3.9
I7 % 1.1 1.4 1.1 1.3
I9 % 2.2 1.8 3.6 3.5
I11 % 2.1 1.1 2.4 1.9
From Tables (3), (4), (5), and (6) the PQ analysis has
led to these considerations:
1. The THDV is only related to the harmonic
background already existing into the grid. All values
are in complying with IEC standard limits (< 5%).
2. Most of PF values are almost close to the unit value,
which means that fundamental voltage and current
have a small phase shift. Hence, current harmonics
do not have a strong impact on the quality of the
energy conversion [2].
3. PF in samples 1 & 12 -in Tables (3), (4) - are not
accepted according to IEC standard limits. Shown
in Figs. (1), (2)
4. In samples 1 & 11 -in Tables (3), (4) - the current
waveforms are affected by distortion, while voltage
is almost sinusoidal, as indicated by THD indices
and waveforms in Figs. (1), (3).
5. Fig. (4), (5) for waveforms of sample 4 & 2 in Table
(5) & Fig. (6) for sample 3 in Table (6), they all
contain current harmonics.
6. Individual current harmonics I3, I5, I7, I9, I11 are
dominated.
Fig .1. LED bulb 12 w
Fig .2. LED candle 3 w
Fig .3. LED candle 4 w
Fig .4. LED tube 9 w
V I
V
I
V I
V
I

Renewable Energy and Sustainable Development (RESD) Volume 3 Issue 1, Special Issue, March 2017 - ISSN 2356-8569 http://dx.doi.org/10.21622/RESD.2017.03.1.039
43 RESD © 2017
http://apc.aast.edu
Fig .5. LED tube 18 w
Fig .6. LED panel (60×60) 32 w
B. Case Study(B)
Power quality analyzer model HIOKI 3196 has been
used in this step of testing in order to measure both
magnitude and angle for each harmonic order. It is
anticipated that if the same harmonic order generated
by various electric equipments has different phase
angle, it may be self mitigated. Hence, various types of
lamps were tested in order to prove this hypothesis.
The lamps’ samples that have been tested were as
follow:
• LED 18w Tube 120 cm
• 40w fluorescent lamp with electronic ballast
• 40w fluorescent lamp with magnetic ballast
• LED bulb 9w
• CFL 26w
In Table (7) PQ test results for these 5 samples are
shown.
The following figures show the magnitude and angle for
each harmonic order tabulated in complex form for all
the samples. In Fig. (7) the 3rd harmonic for 4 samples
is shown and because CFL 26w lamp has the largest
level of harmonics it was excluded from the charts in
order to give adequate space for the other samples to
be shown clearly. In Fig. (8) the 5th harmonic for 4
samples are shown. For Figs. (9), (10), and (11) there
are not homogenous distribution for the five samples
although in Fig. (11), the 11th harmonic of both
magnetic and electronic ballast will mitigate each other.
Fig .7. 3rd Harmonic of Current
Table 7. PQ ANALYSIS FOR VARIOUS LAMPS
Sample
No. 1 2 3 4 5
Rated
Power
(w)
18 40 40 9 26
Measure
d Power
(w)
18 36.00 49.5 8.10 11
PF -0.95 - - -0.76 -0.59
Vrms (V) 225.23
0 224.48 225.72 211.28 211.15
THDV
(%) 2.720 2.78 2.02 2.73 2.73
Irms (A) 0.082 0.16 0.22 0.05 0.09
THDI (%) 13.640 14.66 11.18 16.88 116.08
I3 % 4.42 9.68 11.03 13.00 73.64
Phase I3 -
132.23 141.76 -85.3 -45.74
-
152.58
I5 % 8.23 5.88 0.94 6.52 42.63
Phase I5 56.82 66.55 69.71 120.44 -52.41
I7 % 7.28 6.68 0.7 2.18 37.01
Phase I7 120.85 125.73 43.37 125.90 -9.84
I9 % 4.78 4.47 0.33 3.78 40.22
Phase I9 13.03 -32.96 131.86 52.30 67.83
I11 % 1.30 2.88 0.29 2.02 33.05
Phase
I11 -95.06 79.39 -52.61
-
104.38 166.57
Fig .8. 5th Harmonic of Current
V I
V I

Renewable Energy and Sustainable Development (RESD) Volume 3 Issue 1, Special Issue, March 2017 - ISSN 2356-8569 http://dx.doi.org/10.21622/RESD.2017.03.1.039
44 RESD © 2017
http://apc.aast.edu
Fig .9. 7th Harmonic of Current
Fig .10. 9th Harmonic of Current
Fig .11. 11th Harmonic of Current
From previous figures, I3 for fluorescent lamp with
electronic ballast and for LED 9W are in opposite
directions. For the other harmonic orders which could
not be mitigated completely, various devices could
reduce THD in current waveform generated by each
other, if they are not pure opposite to each other.
V. CONCLUSION
Harmonics generated by various loads could be a
serious problem if not well treated. In this paper an
analysis study for different kinds of lamps such as LED,
CFL, and fluorescent showed the power quality
performance for each type. If the harmonic order of
certain types of lamps could be controlled in order to
stand up to the one generated from its alternatives, this
will certainly reduce the size of the problem. As a future
work, these studies could be repeated for a group of
lamps in order to investigate the effectiveness of the
results of this research.
REFERENCES
[1] M. S. Islam, N. A. Chowdhury, A. K. Sakil, A.
Khandakar, A. Iqbal and H. Abu-Rub, "Power
quality effect of using incandescent, fluorescent,
CFL and LED lamps on utility grid," Smart Grid
and Renewable Energy (SGRE), 2015 First
Workshop on, Doha, 2015, pp. 1-5.
[2] H. Shabbir, M. Ur Rehman, S. A. Rehman, S. K.
Sheikh and N. Zaffar, "Assessment of harmonic
pollution by LED lamps in power systems," Power
Systems Conference (PSC), 2014 Clemson
University, Clemson, SC, 2014, pp. 1-7.
[3] S. Uddin, H. Shareef, A. Mohamed and M. A.
Hannan, "An analysis of harmonics from LED
lamps," 2012 Asia-Pacific Symposium on and
power quality) and maximum possible loading in a
power system,"Utility Exhibition on Power and
Energy Systems: Issues & Prospects for Asia
(ICUE), 2011 International Conference and,
Pattaya City, 2011, pp. 1-5 Electromagnetic
Compatibility, Singapore, 2012, pp. 837-840.
[4] S. K. Rönnberg, M. Wahlberg and M. H. J. Bollen,
"Harmonic emission before and after changing to
LED lamps — Field measurements for an urban
area," Harmonics and Quality of Power (ICHQP),
2012 IEEE 15th International Conference on,
Hong Kong, 2012, pp. 552-557.
[5] V.George, A. Bagaria, P. Singh, S. R.
Pampattiwar and S. Periwal, "Comparison of CFL
and LED lamp - harmonic disturbances,
economics (costand power quality) and maximum
possible loading in a power system,"Utility
Exhibition on Power and Energy Systems: Issues
& Prospects for Asia (ICUE), 2011 International
Conference and, Pattaya City, 2011, pp. 1-5
[6] S. Uddin, H. Shareef, A. Mohamed and M. A.
Hannan, "An analysis of harmonic diversity factors
applied to LED lamps," Power System
Technology (POWERCON), 2012 IEEE
International Conference on, Auckland, 2012, pp.
1-5.

Renewable Energy and Sustainable Development (RESD) Volume 3 Issue 1, Special Issue, March 2017 - ISSN 2356-8569 http://dx.doi.org/10.21622/RESD.2017.03.1.039
45 RESD © 2017
http://apc.aast.edu
[7] IEC 61000-3-2 "Electromagnetic compatibility
(EMC) - Part 3-2: Limits - Limits for harmonic
current emissions.
[8] IEC 62612 – 2013 “Self- Ballasted LED lamps for
general lighting services with supply voltages
>50v”.
[9] K. Sajjad, G. Kalsoom and A. Mughal, "Simplified
THD measurement and analysis for electronic
power inverters," 2015 12th International Bhurban
Conference on Applied Sciences and Technology
(IBCAST), Islamabad, 2015, pp. 186-191.

Renewable Energy and Sustainable Development (RESD) Volume 3 Issue 1, Special Issue, March 2017 - ISSN 2356-8569 http://dx.doi.org/10.21622/RESD.2017.03.1.046
This Paper has been Accepted and Presented in the (First International Conference on New Trends for Sustainable Energy) 1-3 October, 2016 at Pharos University, Alexandria, Egypt.
46 RESD © 2017 http://apc.aast.edu
Harmonic Analysis of Radial Distribution Systems
Embedded Shunt Capacitors Abdallah Elsherif,Tamer Fetouh and Hasan Shaaban
Department of Electrical Engineering, Faculty of Engineering, Menoufia University, Shebin El-Kom, Egypt
[email protected], tamer.attia@sh-
eng.menofia.edu.eg, [email protected]
Abstract - Harmonic analysis is an important
application for analysis and design of distribution
systems. It is used to quantify the distortion in voltage
and current waveforms at various buses for a
distribution system. However such analysis has
become more and more important since the presence
of harmonic-producing equipment is increasing. As
harmonics propagate through a system, they result in
increased power losses and possible equipment loss-
of-life. Further equipments might be damaged by
overloads resulting from resonant amplifications.
There are a large number of harmonic analysis
methods that are in widespread use. The most
popular of these are frequency scans, harmonic
penetration and harmonic power flow. Current source
(or current injection) methods are the most popular
forms of such harmonic analyses. These methods
make use of the admittance matrix inverse which
computationally demand and may be a singular in
some cases of radial distributors. Therefore, in this
paper, a new fast harmonic load flow method is
introduced. The introduced method is designed to
save computational time required for the admittance
matrix formation used in current injection methods.
Also, the introduced method can overcome the
singularity problems that appear in the conventional
methods. Applying the introduced harmonic load flow
method to harmonic polluted distribution systems
embedded shunt capacitors which commonly used for
losses minimization and voltage enhancement, it is
found that the shunt capacitor can maximize or
minimize system total harmonic distortion (THD)
according to its size and connection point. Therefore,
in this paper, a new proposed multi-objective particle
swarm optimization "MOPSO" for optimal capacitors
placement on harmonic polluted distribution systems
has been introduced. The obtained results verify the
effectiveness of the introduced MOPSO algorithm for
voltage THD minimization, power losses minimization
and voltage enhancement of radial distribution
systems.
Keywords - Total harmonic distortion, Power losses,
Radial distribution systems, Particle swarm
optimization, Harmonic load flow and Frequency
scan.
I. INTRODUCTION
Harmonic analysis is an important application for
distribution systems analysis and design. It is used to
quantify the distortion in voltage and current
waveforms, which are caused by nonlinear loads,
electronically switched loads and converters etc., at
various buses for a distribution system, and to
determine whether dangerous resonant problem
exists and how they might be mitigated. However
such analysis has become more and more important
since the presence of harmonic-producing equipment
is increasing. As harmonics propagate through a
system, they result in increased power losses and
possible equipment loss-of-life. Further equipments
might be damaged by overloads resulting from
resonant amplifications [1]-[3].
Distortion in AC voltage and current waveforms can
be studied by expressing the harmonic sources of the
waveforms as a Fourier series with the fundamental
frequency equal to the power frequency. Then,
utilizing the harmonic analysis it can investigate the
generation and propagation of these components
throughout a given distribution systems. Research in
this area has led to the availability of fairly general
techniques and softwares for the formulations and
solutions of harmonic propagation problem. The
techniques vary in terms of data requirements,
modeling complexity, problem formulation and
solution algorithm. In [4]-[6] the frequency-domain
was presented to calculate the frequency response of
a system. In [7], it was presented a time-domain
based transient-state analysis that utilize the EMPT

Renewable Energy and Sustainable Development (RESD) Volume 3 Issue 1, Special Issue, March 2017 - ISSN 2356-8569 http://dx.doi.org/10.21622/RESD.2017.03.1.046
47 RESD © 2017 http://apc.aast.edu
program for harmonic analysis. However, one of the
main disadvantages of the time-domain-based
method is that the lack of the load flow constraints
(such as, constant power specification at load buses)
at the fundamental frequency. Recently, the idea of
Wavelet Transform is integrated into the harmonic
analysis [8], [9], for which system components and
power devices need to be derived first and then the
harmonic analysis is applied, and hence more
computational time is needed.
The conventional harmonic load flow methods use
load flow programs, and employing the frequency-
based component model, for updating admittance
matrix and then rerun the load flow program for each
harmonic order. However, the decomposition of the
admittance matrix is a time-consuming procedure and
it makes the conventional methods difficult for real-
time analysis. Furthermore, determination of the
buses voltage values needs admittance matrix
inverse computation, which in some cases of radial
distribution systems is singular. In this paper, fast
harmonic load flow method for radial distribution
systems, which can overcome the singularity
problems without excessive computation time need,
is presented. Applying the introduced harmonic load
flow method to harmonic polluted distribution systems
embedded shunt capacitors which commonly used
for losses minimization and voltage enhancement, it
is found that the shunt capacitor can maximize or
minimize system total harmonic distortion (THD)
according to its size and connection point. Therefore,
in this paper, a new proposed multi-objective particle
swarm optimization "MOPSO" for optimal capacitor
placement on harmonic polluted distribution systems,
based on a modified Non-Dominated Sorting
algorithm, has been introduced. The obtained results
verify the effectiveness of the introduced MOPSO
algorithm for voltage THD minimization, power losses
minimization and voltage enhancement of radial
distribution systems.
II. HARMONIC LOAD FLOW OF RADIAL
DISTRIBUTION SYSTEMS
The Harmonic Load Flow (HLF) is one of the most
important tools for distribution system analysis and
design. It can be used to quantify the harmonic
distortion in voltage and current waveforms at various
buses for a given power system, and also to
determine whether the dangerous resonant problems
may exist and how they might be mitigated. Such
analysis has become more important since the
presence of harmonic-producing equipment is
increasing. In this section a new introduced harmonic
load flow technique for radial distribution systems is
introduced. The introduced technique can overcome
the difficulties faced by the conventional harmonic
load flow methods, such as the needed computation
time, the admittance matrix reformation for each
considered harmonic order, and the admittance
matrix singularity problem.
The introduced technique employs the equivalent
current injection transformation and the BIBC and
BCBV matrices, which can be constructed as
mentioned in Ref. [10]. The computation steps of the
introduced HLF technique can be summarized as
follows.
1. Fundamental load flow
The fundamental load flow is carried out by the
iterative solution of the following three equations,
from which the buses voltage and load current can be
obtained [10].
*
m i ii m
i
m+1 m
m+1 0 m+1
s
P +jQI =
(V )
ΔV = BCBV BIBC . I
V = V - ΔV
(1)
where Pi and Qi are the specified active and
reactive powers at the ith bus, and Vi is the voltage
at that bus.
2. Branches and harmonic sources injected currents
relationship
In order to clear the branches and the harmonic
sources currents relationship, let us consider the
simple distribution system shown in Fig. 1, in which
the harmonic injected currents are expressed as I2h,
I4h, and I5h, while the distributor branch currents are
expressed as Ib1h, Ib2h, ..... and Ib6h. Firstly, the
harmonic sources injected current, for each harmonic
order, are calculated as a percentage of the obtained
load fundamental current. Then the branch currents,
for each harmonic order, can be obtained as,
h h
n x (nb-1)n x 1 (nb-1) x 1Ib = BIBC . I (2)
For the assumed simple distribution system shown in
Fig. 1, the branches current can be simplified and

Renewable Energy and Sustainable Development (RESD) Volume 3 Issue 1, Special Issue, March 2017 - ISSN 2356-8569 http://dx.doi.org/10.21622/RESD.2017.03.1.046
48 RESD © 2017 http://apc.aast.edu
obtained as follow,
h
1
h
h2
2h
h3
4h
h4
5h
5
h
6
1 1 1Ib
0 1 0Ib-I
0 1 0Ib= -I
0 0 1Ib-I
0 0 0Ib
0 0 0Ib
(3)
3. Distributor buses voltage computation
Referring to Fig. 1, the buses voltage for hth harmonic
order can be computed as follow,
h h h h
S/SV = V - BCBV . Ib (4)
where [Vh] is the vector of buses voltage except the
substation, VhS/S is the substation harmonic order
voltage vector, and BCBVh is the Branch-Current to
Bus-Voltage matrix and it is given for the considered
system in the form,
h
12
h h
12 23
h h h
h 12 23 34
h h
12 25
h h h
12 25 56
h h h
12 23 37
Z 0 0 0 0 0
Z Z 0 0 0 0
Z Z Z 0 0 0BCBV =
Z 0 0 Z 0 0
Z 0 0 Z Z 0
Z Z 0 0 0 Z
(5)
It is to be noted that when a shunt capacitors are
connected at a buses of a given distribution system to
which a number of nonlinear loads are connected, it
cannot determine the connected capacitor current for
any considered harmonic order. This is because the
harmonic voltage across its terminal is not known.
Hence Eq. 2 cannot be applied to obtain the branches
currents and the introduced harmonic load flow
algorithm fails to be completed. However, using the
repetitive load flow algorithm, the required capacitor
harmonic current can be determined at each harmonic
order but larger computation time values are needed.
Assuming shunt capacitors to be connected to the
distribution system then the distributor branches
currents can be obtained from the general form,
h h
n x 2 nb-1n x1 2 nb-1 1Ib = DBIBC . Ihs
x (6)
where the DBIBC matrix is formed by placing two
BIBC matrix side by side. Ihsh is the current vector of
the harmonic source injected currents and shunt
capacitors currents.
Considering capacitors connection at buses 3 and 6 of
the simple assumed system as shown in Fig. 2, the
branches currents are obtained in simplified form as
follow,
h h
1 2
h h
2 4
h h
3 5
h
4
h h
5 3
h h
6 6
1 1 1 1 1Ib -Ih
0 1 0 1 0Ib -Ih
0 1 0 0 0Ib -Ih=
0 0 1 0 1Ib
0 0 0 0 1Ib +Is
0 0 0 0 0Ib +Is
(7)
Applying Eq. (4), considering the substation harmonic
voltage equals zero, the distributor buses voltage can
be calculated from the equation,
h h h h h
12 12 12 12 12h
2h h
12 12h h h
12 12 12h hh 23 233
h h h
12 23 12h h h
12 12 12hhh23344
h
12h h
12 12h
5
h
6
h
7
Z Z Z Z ZV
Z ZZ Z Z
Z ZV
Z Z ZZ Z Z
Z ZV
= - ZZ Z
V Z
V
V
h
2
h
4
hh512h
12h h
25 25
hh hh
312 2512h h h
12 12 12h h
25 56
h h
12 12h h h
12 12 12h h
23 23
-Ih
-Ih
-IhZZ
Z
+IsZ Z ZZ Z Z
Z Z
Z ZZ Z Z
Z Z
h
6+Is
(8)
From Eq. (8), for the assumed distribution system,
the voltage at the capacitor connected buses can be
written as,
h
2h h h12 12h h h 4h
12 12 12h h3 h23 23 5
h hhh 12 2512h h h6 h12 12 12h h
325 56h
6
-Ih
Z Z -IhZ Z ZVb
Z Z -Ih
Z Z ZVb Z Z Z
+IsZ Z
+Is
(9)
Also, the voltage at the shunt capacitor can be given
as a function of it impedance at hth harmonic and the
capacitor current as,
h h h
3 3 3
h h h
6 6 6
Vb ZC x Is
Vb ZC x Is
(10)
Substituting from Eq. (10) into Eq. (9),

Renewable Energy and Sustainable Development (RESD) Volume 3 Issue 1, Special Issue, March 2017 - ISSN 2356-8569 http://dx.doi.org/10.21622/RESD.2017.03.1.046
49 RESD © 2017 http://apc.aast.edu
h
12h hh hh12 12h3 23
23 h
4hhhh 12h h566 12 12 h
25
h
12 h
12h
23
h h
12 25h
12
ZZ ZZC 0 -Ih Is
Z-Ih
Z-Ih Is0 ZC Z Z
Z
ZZ
Z
Z ZZ
h
3
h
6
h
56
+Is
+Is
Z
(11)
Solving Eq. (11), the shunt capacitor current can be
obtained depending on the value of the known
harmonic sources injected currents and given shunt
capacitors and branches impedance. Note that Eqs.
(8, 9 and 11) are written for the special case shown in
Fig. 2.
Ib1
S/S1 2
Ib2
3
Ib3
4
Ib4
I5h
5
Ib5
6
Ib6
7
I2h I4
h
Fig. 1. Harmonic polluted simple distribution system
Ib1
S/S1 2
Ib2
3
Ib3
4
Ib4
Ih5h
5
Ib5
6
Ib6
7
Ih2h
Ih4h
Is6h
Is3h
Fig. 2. Harmonic polluted distribution system with embedded
shunt capacitors
h>hmax
Yes
No
Output results
Input system data
h=hmin : hmax
Form the BIBC matrix
Form the BCBV at the fundamental frequency
Carry out fundamental load flow
considering shunt capacitors
Update the system matrices ( ZCh and BCBVh)
Calculate the shunt capacitor currents using Eq. (11)
and Eq. (14)
Calculate the buses voltage using Eq. (11)
Fig. 3. Flowchart of harmonic load flow procedure
From the previous derivation, the harmonic load
flow considering the connection of shunt capacitors
can be obtained following the flowchart shown in
Fig. 3,
A. Harmonic Load Flow Computation Results
Considering the Shunt Capacitors Connection to
the 11-Bus Test System
In this section the introduced harmonic load flow
technique has been tested on the 11-bus test system,
shown in Fig. 4, which introduced in Ref. [11]. Table 1
lists the 11-bus impedances of distribution feeders.
The load demand at each bus has been recorded in
Table-2.
2 3 4
69/11.4KV
Sub
station
51 6 7 8 9 10 11
10 MVA
Fig. 4. Single line diagram of the 11-bus test system
Table 1. SYSTEM IMPEDANCE OF THE 11-BUS DISTRIBUTION FEEDERS
Bus Impedance (p.u.)
From To R X
2 3 0.0932 0.2121
3 4 0.0106 0.1575
4 5 0.0643 0.4112
5 6 0.0523 0.4612
6 7 0.0531 0.2063
7 8 0.0845 0.4963
8 9 0.0554 0.3832
9 10 0.0491 0.4612
10 11 0.0554 0.4353
Table 2. LOADS DEMAND OF THE 11-BUS DISTRIBUTION SYSTEM
Bus P (KW) Q(Kvar)
2 0 0
3 427 140
4 684 224.8
5 534 400.5
6 534 544.8
7 1048 786
8 406 196.6
9 972 857.2
10 408 416.2
11 1487 921.6
Total 6610 5340

Renewable Energy and Sustainable Development (RESD) Volume 3 Issue 1, Special Issue, March 2017 - ISSN 2356-8569 http://dx.doi.org/10.21622/RESD.2017.03.1.046
50 RESD © 2017 http://apc.aast.edu
Table 3. HARMONIC CURRENT GENERATED AT EACH BUS [11]
Harmonic
order
Harmonic current (%)
Bus
3
Bus
4
Bus
5
Bus
6
Bus
7
Bus
8
Bus
9
Bus
10
Bus
11
2 1.80 2.14 1.61 1.33 1.46 2.18 1.25 1.88 1.87
4 1.50 1.39 1.02 0.82 0.94 1.42 0.80 1.22 1.17
5 3.11 3.16 3.50 3.40 1.44 2.96 4.36 3.61 4.01
7 2.19 2.23 2.46 2.38 2.90 2.08 3.08 2.55 2.84
8 0.64 0.61 0.52 0.48 0.48 0.63 0.43 0.56 0.53
10 0.62 0.53 0.34 0.21 0.32 0.56 0.25 0.47 0.46
11 1.15 1.15 1.28 1.19 1.60 1.05 1.72 1.37 1.59
13 1.04 1.04 1.09 0.98 1.36 0.95 1.44 1.20 1.38
14 0.39 0.34 0.17 0.06 0.16 0.34 0.11 0.28 0.27
16 0.26 0.24 0.18 0.15 0.16 0.24 0.14 0.21 0.20
17 0.82 0.82 0.87 0.80 1.08 0.75 1.14 0.95 1.09
19 0.81 0.79 0.80 0.71 0.98 0.72 1.03 0.89 1.01
20 0.41 0.36 0.20 0.10 0.19 0.36 0.13 0.30 0.29
22 0.43 0.39 0.26 0.18 0.24 0.39 0.19 0.33 0.32
23 0.35 0.39 0.55 0.57 0.70 0.34 0.78 0.53 0.62
25 0.48 0.50 0.60 0.60 0.72 0.46 0.77 0.60 0.68
Fig. 5 Voltage THD of each bus of the 11-bus test system [11]
Fig. 6 Voltage THD of each bus of the 11-bus test system using
the introduced method
Fig. 7 Single line diagram of the 33-bus distribution test system
Fig. 8 Voltage THD of each bus of the 33-bus system with and
without connection of optimal capacitors
The injected harmonic current values to the
considered distribution system are given in Table III.
Also, it is assumed that a capacitor banks with total
capacity of 1500 kvar is connected to the distribution
system at Bus 10 to provide the reactive power
compensation for the feeder [11]. Fig. 5 shows the
THD at each bus given in Ref. [11] while the THD
value obtained from the introduced harmonic load
flow method is given in Fig. 6. The obtained results
verify the effectiveness of the introduced HLF
method.
fh > fhmax
Yes
No
Output results
Input system data
fh=fhmin : f
hmax
Update the system parameter at a frequency “fh”
Calculate the buses voltage using Eqs. (10 and 11) for the
introduced method
Inject a current of “1A” to the kth bus at
which the frequency scan is required
Calculate the impedance at bus “k”
ZfBus-k=Vbus-k/Ik
Fig. 9 Flowchart of the impedance scan algorithm
1 2 3 4 5 6 7 8 9 10 110
2
4
6
8
10
12
Bus
TH
D (
%)
0 2 4 6 8 10 12 14 16 18 20 22 24 26 28 30 32 340
5
10
15
20
25
Bus No.
TH
D (
%)
After optimal capacitor connection
Without capacitor connection

Renewable Energy and Sustainable Development (RESD) Volume 3 Issue 1, Special Issue, March 2017 - ISSN 2356-8569 http://dx.doi.org/10.21622/RESD.2017.03.1.046
51 RESD © 2017 http://apc.aast.edu
Fig. 10 Impedance scan at some buses of the 33-bus
distribution system
B. Harmonic Load Flow Computation Results
Considering the Shunt Capacitors Connection to
the 33-Bus Test System
In this section, the harmonic load flow computations
for the 33-bus distribution system, shown in Fig. 7
with the branches and loads data given in Ref. [12],
are carried out considering the connection of shunt
capacitors given in Ref [13]. The obtained capacitors
sizes and connection point in Ref [13] represent the
optimum values for loss minimization and voltage
enhancement. Ref [13] obtains the optimal
capacitors sizes at the fundamental frequency, not
considering harmonic effect. The capacitors size are
600, 150, 300, 350, 600 and 450 Kvar and
connected at buses 7, 9, 14, 25, 30 and 31,
respectively. After carrying out the harmonic load
flow computations considering the harmonic current
injection of orders 5, 7, 11, 13, 15, 17, 23 and 25
with a ratio of 1/n from the fundamental load current
value, where "n" is the harmonic order. The
nonlinear loads are considered to be at buses 4, 8,
14, 18, 24, 29 and 32. Fig. 8 shows the computed
THD at each bus with and without optimal capacitor
connection, from which it is clear that the THD value
at bus 25 after capacitor connection reaches a value
about 25%, which unacceptable value according to
[14]. The impedance scan at this bus, See Section
III, shows that this bus is subjected to parallel
resonance at the 13th harmonic order with the
connection of previous optimal capacitors. Also,
although, the connection of a capacitor at bus 9, the
THD at buses 9, 10, 11 and 12 is less than that
before optimal capacitor connection. Therefore, from
the obtained results it can be said that the capacitor
optimal size and location at fundamental frequency
may lead to unacceptable THD at distribution system
buses. On the other hand shunt capacitor
connection to distribution systems can be used for
THD minimization besides voltage enhancement
and losses minimization if they properly sized and
located.
III. FREQUENCY (IMPEDANCE) SCAN
A frequency or impedance scan refers to a plot
showing the magnitude and phase angle of the
driving point impedance (of the linear network) at an
interested bus versus the frequency, and it can
provide some useful, and sometimes qualitative,
insight into the system performance under harmonic
pollution. The term “scan” arises from the systematic
variation of frequency from an initial value fmin to a
final value fmax. The impedance scan computation
steps can be summarized by the following flowchart
shown in Fig. 9.
Now, considering the connection of the capacitors
listed in Section II-B, and carrying out the
impedance scan of the 33-bus system, the
impedance scan at some buses are shown in Fig.
10, from which it is clear that bus 25 is subjected to
parallel resonance at 15th harmonic order which
prove the larger obtained THD value given in Fig. 8.
Although a parallel resonance occurrence at bus 9
near 31th harmonic order, the THD at this bus with
capacitor connection is smaller than its value without
capacitor connection, see Fig. 8. The reason is the
absence of injected harmonic current at this higher
harmonic order. Also, although a parallel resonance
occurrence at bus 18 as shown in Fig. 10, the THD
at this bus, shown in Fig. 8 is the same for the cases
with or without capacitor connection. The reason is
the occurrences of parallel resonance at 9th
harmonic order which not existing.
IV. CAPACITOR OPTIMAL PLACEMENT ON
HARMONIC POLLUTED DISTRIBUTION
SYSTEMS
It is found in Sections. II-B and III that considering
only the fundamental frequency the optimal sizes and
connection points for the connected capacitors with a
given harmonic polluted distribution system may lead
to an occurrence of a parallel resonance and larger
THD values for the buses voltage. Therefore, in this
section, it is introduced a Multi-Objective Particle
Swarm Optimization (MOPSO) algorithm for the
1 3 5 7 9 11 13 15 17 19 21 23 25 27 29 31 330
100
200
300
400
500
600
Harmonic order
Imp
ed
an
ce
(o
hm
)
at bus 7
at bus 9
at bus 18
at bus 25
at bus 31

Renewable Energy and Sustainable Development (RESD) Volume 3 Issue 1, Special Issue, March 2017 - ISSN 2356-8569 http://dx.doi.org/10.21622/RESD.2017.03.1.046
52 RESD © 2017 http://apc.aast.edu
optimal capacitor sizes and locations on a harmonic
polluted distribution system. The buses voltage THD
minimization, total power losses minimization and
voltage enhancement are the considered objective
functions. A modified Non-Dominated Sorting
algorithm [15] has been used with PSO technique for
achieving the optimum solution. The computation
steps for the introduced MOPSO algorithm are given
in the flowchart, shown in Fig. 11.
Applying the introduced MOPSO algorithm, the
capacitor optimal placement on the 33-bus
distribution system is carried out. Assuming that the
loads connected to buses 5, 7, 8, 10, 11, 14, 15, 17,
24, 2, 27, 29, 30, 31 and 32 to be nonlinear loads,
and each of them inject the harmonic orders 5, 7, 11,
13, 15, 17, 23 and 25 with the amplitude 1/n from the
load fundamental current value, where "n" is the
harmonic order. The assumed number of the
connected capacitor, in this case, is five capacitors.
The optimal capacitors sizes and connection point for
the introduced MOPSO and individual objective
functions are listed in Table 4. Fig. 12, and Fig. 13
show the buses voltage THD and the buses voltage
values of the 33-bus system after optimal capacitor
connection mentioned in Table 4.
Fig. 14 shows the impedance scan at bus 18 of the
33-bus distribution system with the connection of the
obtained optimal capacitor given in Table IV. Case a,
b, c and d, shown in Fig. 14, represent the frequency
scan after the connection of the optimal capacitor
obtained applying the MOPSO, f1 only, f2 only and f3
only, respectively.
Fig. 15 shows the convergence of the global best
solution for the case of the multi-objective.
V. CONCLUSIONS
Harmonic analysis is an important application for
distribution systems analysis and design. In this
paper, a new fast harmonic load flow method has
been introduced to overcome the shortage of the
conventional HLF methods. The introduced method
can overcome the singularity problems that appear in
the conventional methods without excessive
computational time required for the admittance matrix
formation used in conventional harmonic load flow
methods. The obtained results verify the
effectiveness of the introduced HLF method.
Applying the introduced harmonic load flow method to
harmonic polluted distribution systems embedded
shunt capacitors which commonly used for losses
minimization and voltage enhancement, it is found
that the shunt capacitor can maximize or minimize
buses voltage THD of distribution systems according
to its size and connection point. Therefore, in this
paper, a new proposed MOPSO algorithm for optimal
capacitors placement on harmonic polluted
distribution systems has been introduced based on a
modified Non-Dominated Sorting algorithm. The
obtained results verify the effectiveness of the
introduced MOPSO algorithm for voltage THD
minimization, power losses minimization and voltage
enhancement of radial distribution systems.
Input system data including the nonlinear load injected
current values and their harmonic orders and location
Iteration
end
Get the optimal solution
Yes
No
Initialize the particles position and the MOPSO
algorithm constants
For each particle position
1- Run the harmonic load flow program
2- Compute f1(Power losses)
3- Compute f2 (THD)
4- Compute f3 (VII)
Run the Non-Dominated sort algorithm
Compute the pbest and gbest Updating the particles
velocity and position
Fig. 11 Flowchart of the introduced multi-objective PSO
algorithm

Renewable Energy and Sustainable Development (RESD) Volume 3 Issue 1, Special Issue, March 2017 - ISSN 2356-8569 http://dx.doi.org/10.21622/RESD.2017.03.1.046
53 RESD © 2017 http://apc.aast.edu
Table 4. Optimal capacitor placement on the 33-bus distribution system
Fig. 12 Buses voltage THD of the 33-bus system Fig. 15 Convergence of the objective function
Fig. 13 Buses voltage of the 33-bus system
Fig. 14 Impedance scan at bus 18 of the 33-bus system
REFERENCES
[1] F. D. Martzloff and T. M. Gruz, “Power Quality
Site Survey: Facts, Fiction and Fallacies”, IEEE
Trans. On IA, Vol. 24, pp. 1005-1018,1988.
[2] Xia and G. T. Heydt, ‘‘Harmonic Power Study
Part II - Implementation and Practical
Application,” IEEE Trans. on PAS, Vol. PAS
101, No. 6, June 1982, pp.
[3] ”Modeling and Simulation of the Propagation of
Harmonics in Electric Power Network Part I:
Concepts, Models and Simulation Techniques,”
Task Force on Harmonics Modeling and
Simulation, IEEE Trans. on Power Delivery, Vol.
11, No. 1, Jan. 1996, pp. 452- 465.
[4] ”Modeling and Simulation of the Propagation of
Harmonics in Electric Power Network Part 11:
Sample Systems and Examples,” Task Force on
Harmonics Modeling and Simulation, IEEE
Trans on Power Delivery, Vol. 11, No. 1, pp.
466-474, Jan. 1996.
S/S 4 7 10 13 16 19 22 25 28 31 330
5
10
15
20
25
Bus No.
TH
D (
%)
Multi-objective
Objective f1 only
Objective f2 only
Objective f3 only
10 20 30 40 50 60 70 80 90 100
5
10
15
20
25
30
Iteration
Obje
ctive
S/S 4 7 10 13 16 19 22 25 28 31 330.9
0.92
0.94
0.96
0.98
1
Bus No.
Vo
lta
ge
(p
.u.)
Multi-objective
Objective f1 only
Objective f2 only
Objective f3 only
Without capacitors
1 3 5 7 9 11 13 15 17 19 21 23 250
50
100
150
200
Harmonic order
Imp
ed
an
ce
(o
hm
)
Case a
Case b
Case c
Case d
Objective function Optimal size and connection point Losses
(KW)
Multi-objective Bus 16 14 32 33 33
200.74 Size (Kvar) 582.8 510.4 513.4 648.4 665.7
Ploss minimization only (f1) Bus 7 17 29 30 3
185.86 Size (Kvar) 624.2 348.1 356.2 220.1 680.8
THD minimization only (f2) Bus 18 31 9 14 20
228.45 Size (Kvar) 540.3 635.0 470.2 566.6 363.9
Voltage enhancement only (f3) Bus 18 31 9 14 20 208.87
Size (Kvar) 468.2 550.3 407.5 491.1 315.4 208.87
Without capacitors 228.5

Renewable Energy and Sustainable Development (RESD) Volume 3 Issue 1, Special Issue, March 2017 - ISSN 2356-8569 http://dx.doi.org/10.21622/RESD.2017.03.1.046
54 RESD © 2017 http://apc.aast.edu
[5] Xia and G. T. Heydt, “Harmonic Power Study
Part I - Formulation and Solution,” IEEE Trans.
on PAS, Vol. PAS 101, No. 6, June 1982, pp.
1257-1265.
[6] Y. H. Yan, C. S. Chen, C. S. Moo and C. T. Hsu,
"Harmonic Analysis for Industrial Customers",
IEEE Transactions on Industrial Applications,
Vol. 30, No. 2, 1994.
[7] R. H. Kitchin, “Converter Harmonics in Power
System Using State-Variable Analysis,” IEE
Proc. G. T. Heydt and A. W. Galli, “Transient
Power.
[8] "Quality Problem Analyzed Using Wavelet” IEEE
Trans. on PWRD, Vol. 12, No. 2, Apr. 1997, pp.
908- 915.
[9] T. Zheng, E. B. Makram and A. A. Girgis,
“Power System Transient and Harmonic Studies
Using Wavelet Transform,” IEEE Trans. on
Power Delivery, Vol. 14, NO. 4, Oct. 1999, pp.
1461-1468.
[10] J.-H. Teng, "A Direct Approach for Distribution
System Load Flow Solutions", IEEE Trans. on
Power Delivery, vol. 18, no. 3, pp. 882–887,
July. 2003.
[11] Y. D. Lee, C. S. Chen, C. T. Hsu, and H. S.
Cheng,"Harmonic Analysis for the Distribution
System with Dispersed Generation Systems", in
Proc. 2006 International Conference on Power
System Technology.
[12] M. A. Kashem, V. Ganapathy, G. B. Jasmon,
and M. I. Buhari, “A novel method for loss
minimization in distribution networks,” in Proc.
IEEE Int. Conf. Elect. Utility Deregulation
Restruct. Power Technol., 2000, pp. 251–256.
[13] Abbas Baghipour and Saeed Fallahian, "Multi-
objective Placement of Capacitor Banks in
Distribution System using Bee Colony
Optimization Algorithm", Journal of Advances in
Computer Research, Vol. 6, No. 2, May 2015.
[14] IEEE Recommended Practice for Monitoring
Electric Power Quality, IEEE Std 115, 2009.
[15] Kalyanmoy Deb, Amrit Pratap, Sameer Agarwal,
and T. Meyarivan, "A Fast Elitist Multi-objective
Genetic Algorithm: NSGA-II. IEEE Transactions
on Evolutionary Computation, 6(2):182-197,
April 2002.

Renewable Energy and Sustainable Development (RESD) Volume 3 Issue 1, Special Issue, March 2017 - ISSN 2356-8569 http://dx.doi.org/10.21622/RESD.2017.03.1.055
This Paper has been Accepted and Presented in the (First International Conference on New Trends for Sustainable Energy) 1-3 October, 2016 at Pharos University, Alexandria, Egypt.
55 RESD © 2017 http://apc.aast.edu
Application of DSTATCOM coupled with FESS for Power
Quality Enhancement and Fault Mitigation Nada Mamdouh, R.A.Swief and M.A.L. Badr
Department of Electrical Power and Machines Engineering, Ain Shames University, Cairo, Egypt
Abstract - In power systems, the use of renewable
energy, especially Wind power generation is steadily
increasing around the world. However, this
incorporation and the lack of controllability over the
wind, and the type of generation used cause problems
in the power quality and in the dynamics of the
system. In this work, the use of a Distribution Static
Synchronous Compensator (DSTATCOM) coupled
with a Flywheel Energy Storage System (FESS) is
proposed to mitigate problems introduced by the
intermittency of wind power generation. A dynamic
model of the DSTATCOM/FESS device is briefly
presented and a multi-level control technique is
proposed. The proposed control technique has one
control mode for active power, and two control modes
to choose between, for reactive power and voltage
control. The above technique has been used here to
enhance not only the steady state operation but also
to mitigate sudden load changes. The control system
under consideration, with the DSTATCOM/FESS, and
its controls are analyzed also, under the conditions of
different faults which may happen in the system.
Simulation tests of the device are analyzed when it is
combined with wind generation in the electric system.
The results demonstrate satisfactory performance of
the proposed control techniques, as well as a high
effectiveness of the control system to mitigate
problems introduced by wind power generation.
Keywords - Distribution Static Synchronous
Compensator (DSTATCOM), Flywheel Energy
Storage System (FESS), power quality, Wind Power,
fault.
I. INTRODUCTION
Due to the increase in population and
industrialization, demand of electricity is increased
too. So, integration of renewable energy in power
networks becomes very important in the generation of
power now a day [1].
The generated power from the wind energy is
considered to be the most economical alternative
within the renewable energy resources; due to its
main advantages such as the large number of
potential sites for planting installation and a rapidly
evolving technology, with many suppliers offering
from individual turbine sets to turnkey projects.
However, due to the lack of controllability over the
wind and the type of generation system used,
problems arise in the electrical systems. One of the
major problems of wind conversion systems is the
variations of the output power produced by short-term
wind fluctuations, which affect the power quality and
may lead to system instability [2]. In order to mitigate
the variation in power quality, and enhance the
during-fault performance of the system, which may
occur due to wind variations, load step changes,
which can last for seconds or minutes or even longer,
a scheme of Distributed Static Synchronous
Compensator (DSTATCOM) connected at a point of
common coupling with flywheel (FESS) is suggested
[3].
A DSTATCOM is one of the main shunt controllers to
be used in distribution systems. It is suitable for its
fast-response. Its solid-state power controller
provides flexible voltage control at the point of
common coupling with the utility grid, a matter which
leads to power quality improvements. This device can
exchange active and reactive powers with the wind
energy resource, if an energy storage system, in this
case a flywheel system, is included with it into the DC
bus [4].
A FESS stores kinetic energy in its rotating mass. In
this paper, the flywheel system has been used as a
short-term energy storage device. Flywheel systems
can be classified as low-speed flywheel (LS-FESS)
and high-speed flywheel (HS-FESS) devices.
However, HS-FESS represents a newer technology
than LS-FESS. In fact, HS-FESS provides better
speeds of response, cycling characteristics and
electric efficiencies. As the HS-FESS will be the only
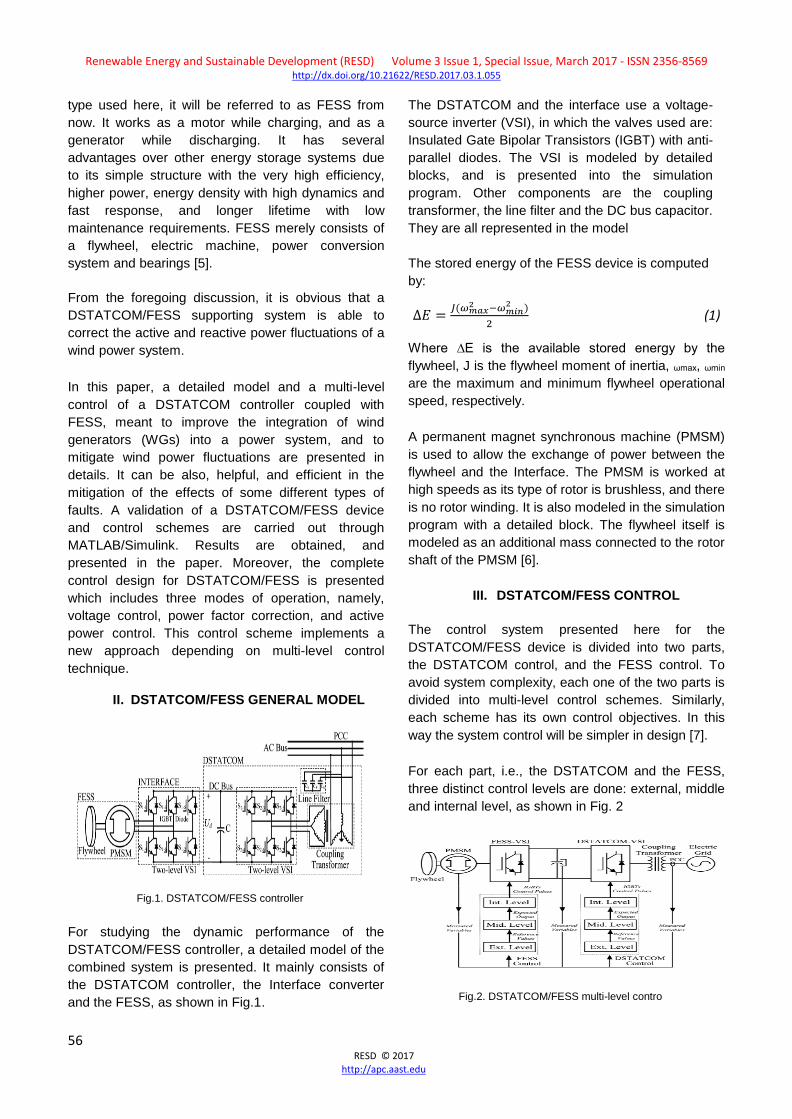
Renewable Energy and Sustainable Development (RESD) Volume 3 Issue 1, Special Issue, March 2017 - ISSN 2356-8569 http://dx.doi.org/10.21622/RESD.2017.03.1.055
56 RESD © 2017 http://apc.aast.edu
type used here, it will be referred to as FESS from
now. It works as a motor while charging, and as a
generator while discharging. It has several
advantages over other energy storage systems due
to its simple structure with the very high efficiency,
higher power, energy density with high dynamics and
fast response, and longer lifetime with low
maintenance requirements. FESS merely consists of
a flywheel, electric machine, power conversion
system and bearings [5].
From the foregoing discussion, it is obvious that a
DSTATCOM/FESS supporting system is able to
correct the active and reactive power fluctuations of a
wind power system.
In this paper, a detailed model and a multi-level
control of a DSTATCOM controller coupled with
FESS, meant to improve the integration of wind
generators (WGs) into a power system, and to
mitigate wind power fluctuations are presented in
details. It can be also, helpful, and efficient in the
mitigation of the effects of some different types of
faults. A validation of a DSTATCOM/FESS device
and control schemes are carried out through
MATLAB/Simulink. Results are obtained, and
presented in the paper. Moreover, the complete
control design for DSTATCOM/FESS is presented
which includes three modes of operation, namely,
voltage control, power factor correction, and active
power control. This control scheme implements a
new approach depending on multi-level control
technique.
II. DSTATCOM/FESS GENERAL MODEL
Fig.1. DSTATCOM/FESS controller
For studying the dynamic performance of the
DSTATCOM/FESS controller, a detailed model of the
combined system is presented. It mainly consists of
the DSTATCOM controller, the Interface converter
and the FESS, as shown in Fig.1.
The DSTATCOM and the interface use a voltage-
source inverter (VSI), in which the valves used are:
Insulated Gate Bipolar Transistors (IGBT) with anti-
parallel diodes. The VSI is modeled by detailed
blocks, and is presented into the simulation
program. Other components are the coupling
transformer, the line filter and the DC bus capacitor.
They are all represented in the model
The stored energy of the FESS device is computed
by:
∆𝐸 =𝐽(𝜔𝑚𝑎𝑥
2 −𝜔𝑚𝑖𝑛2 )
2 (1)
Where ∆E is the available stored energy by the
flywheel, J is the flywheel moment of inertia, ωmax, ωmin
are the maximum and minimum flywheel operational
speed, respectively.
A permanent magnet synchronous machine (PMSM)
is used to allow the exchange of power between the
flywheel and the Interface. The PMSM is worked at
high speeds as its type of rotor is brushless, and there
is no rotor winding. It is also modeled in the simulation
program with a detailed block. The flywheel itself is
modeled as an additional mass connected to the rotor
shaft of the PMSM [6].
III. DSTATCOM/FESS CONTROL
The control system presented here for the
DSTATCOM/FESS device is divided into two parts,
the DSTATCOM control, and the FESS control. To
avoid system complexity, each one of the two parts is
divided into multi-level control schemes. Similarly,
each scheme has its own control objectives. In this
way the system control will be simpler in design [7].
For each part, i.e., the DSTATCOM and the FESS,
three distinct control levels are done: external, middle
and internal level, as shown in Fig. 2
Fig.2. DSTATCOM/FESS multi-level contro

Renewable Energy and Sustainable Development (RESD) Volume 3 Issue 1, Special Issue, March 2017 - ISSN 2356-8569 http://dx.doi.org/10.21622/RESD.2017.03.1.055
57 RESD © 2017 http://apc.aast.edu
A. DSTATCOM CONTROL
Each control level of the DSTATCOM has functions
to be fulfilled. By the external level, active and
reactive power exchange between the DSTATCOM
and the utility system can be
Fig.3. three-level control of DSTATCOM
determined. The external control level is designed for
performing active power control mode (APCM), power
factor control mode (PFCM) and voltage control mode
(VCM). By the middle level, the expected output is
dynamically tracked to the reference values set by the
external level. This block has two main parts, the
current regulator and the DC voltage regulator. By the
internal level, firing signals are generated for the
switching valves of the VSI of the DSTATCOM. The
internal level is mainly composed of a line
synchronization module and a three-phase pulse-
width modulation firing pulses generator [8]. The three
control levels of the DSTATCOM with all parts given in
details are shown in Fig. 3.
B. FESS CONTROL
The control of the FESS is done through the control of
the Interface -VSI. For a three-phase voltage of
controllable amplitude and phase with the VSI, the
PMSM can work as a motor storing energy or as
generator delivering energy. Like the DSTATCOM
control, by the external level, power exchange
between the DC bus of the DSTATCOM and the
FESS can be determined so as to fulfill the required
power imposed by the DSTATCOM as shown in Fig.
4. The maximum efficiency of the PMSM is obtained
by computing the reference current iqmr from the
torque of the PMSM by using Eq. (2), and the
reference current idmr is set to zero [9].
Te_r= 3
2 p ψmiqmr (2)
Where, Te_r is the electromagnetic reference torque of
the machine, p is the number of pairs of poles, and ψm
is the magnetic flux.
The reference torque is calculated through a speed
regulator which adjusts the actual speed of the
machine (ωm) to the reference speed of the machine
(ωmr) .The reference speed is computed from the
reference power of the
machine, Pmac r, which is the power, to be stored or
delivered by the flywheel, which can be expressed
using Eq. (3).
Pmac_r = d/dt ( 1
2 J ω2
mr ) (3)
The reference power of the machine is calculated by
summing up the reference power of the
DSTATCOM/FESS (Pr) and the power losses of the
machine (Ploss), which denotes the sum of the copper
losses (PCu), the iron losses (PFe), and the mechanical
losses (Pmec) [10].
Fig.4. the external -level control of FESS
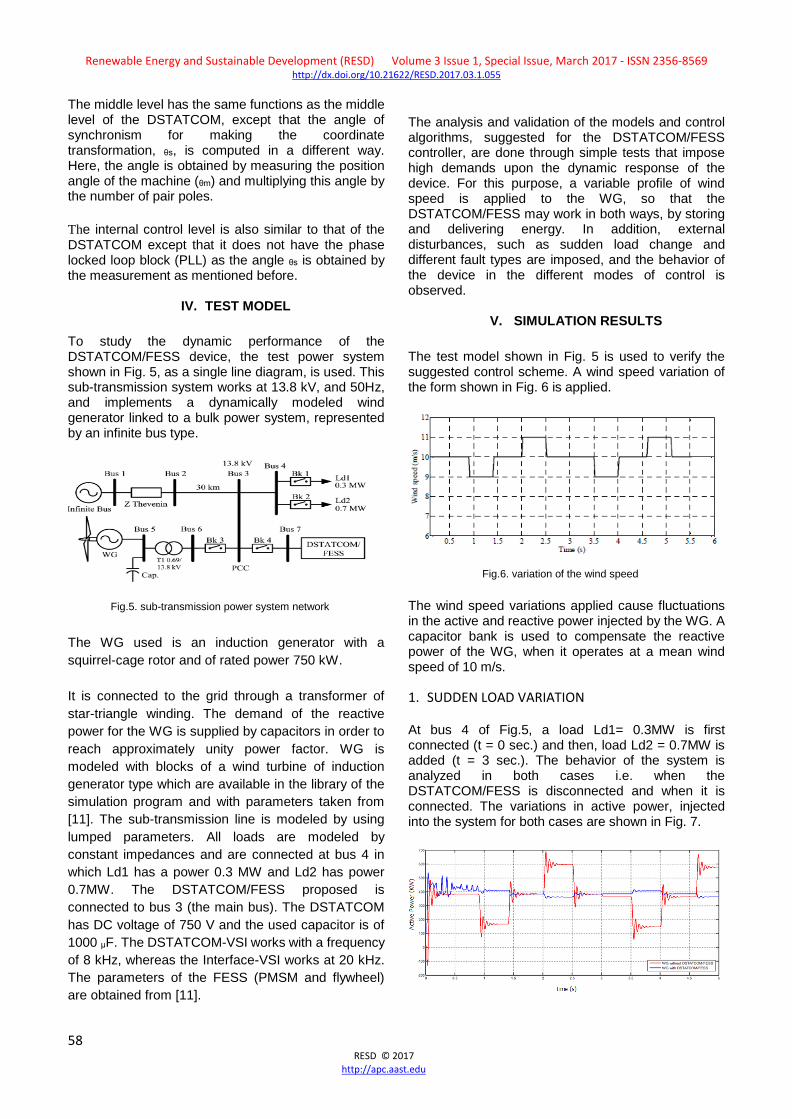
Renewable Energy and Sustainable Development (RESD) Volume 3 Issue 1, Special Issue, March 2017 - ISSN 2356-8569 http://dx.doi.org/10.21622/RESD.2017.03.1.055
58 RESD © 2017 http://apc.aast.edu
The middle level has the same functions as the middle level of the DSTATCOM, except that the angle of synchronism for making the coordinate transformation, θs, is computed in a different way. Here, the angle is obtained by measuring the position angle of the machine (θm) and multiplying this angle by the number of pair poles.
The internal control level is also similar to that of the DSTATCOM except that it does not have the phase locked loop block (PLL) as the angle θs is obtained by the measurement as mentioned before.
IV. TEST MODEL
To study the dynamic performance of the DSTATCOM/FESS device, the test power system shown in Fig. 5, as a single line diagram, is used. This sub-transmission system works at 13.8 kV, and 50Hz, and implements a dynamically modeled wind generator linked to a bulk power system, represented by an infinite bus type.
Fig.5. sub-transmission power system network
The WG used is an induction generator with a
squirrel-cage rotor and of rated power 750 kW.
It is connected to the grid through a transformer of
star-triangle winding. The demand of the reactive
power for the WG is supplied by capacitors in order to
reach approximately unity power factor. WG is
modeled with blocks of a wind turbine of induction
generator type which are available in the library of the
simulation program and with parameters taken from
[11]. The sub-transmission line is modeled by using
lumped parameters. All loads are modeled by
constant impedances and are connected at bus 4 in
which Ld1 has a power 0.3 MW and Ld2 has power
0.7MW. The DSTATCOM/FESS proposed is
connected to bus 3 (the main bus). The DSTATCOM
has DC voltage of 750 V and the used capacitor is of
1000 μF. The DSTATCOM-VSI works with a frequency
of 8 kHz, whereas the Interface-VSI works at 20 kHz.
The parameters of the FESS (PMSM and flywheel)
are obtained from [11].
The analysis and validation of the models and control algorithms, suggested for the DSTATCOM/FESS controller, are done through simple tests that impose high demands upon the dynamic response of the device. For this purpose, a variable profile of wind speed is applied to the WG, so that the DSTATCOM/FESS may work in both ways, by storing and delivering energy. In addition, external disturbances, such as sudden load change and different fault types are imposed, and the behavior of the device in the different modes of control is observed.
V. SIMULATION RESULTS
The test model shown in Fig. 5 is used to verify the suggested control scheme. A wind speed variation of the form shown in Fig. 6 is applied.
Fig.6. variation of the wind speed
The wind speed variations applied cause fluctuations in the active and reactive power injected by the WG. A capacitor bank is used to compensate the reactive power of the WG, when it operates at a mean wind speed of 10 m/s.
1. SUDDEN LOAD VARIATION
At bus 4 of Fig.5, a load Ld1= 0.3MW is first connected (t = 0 sec.) and then, load Ld2 = 0.7MW is added (t = 3 sec.). The behavior of the system is analyzed in both cases i.e. when the DSTATCOM/FESS is disconnected and when it is connected. The variations in active power, injected into the system for both cases are shown in Fig. 7.

Renewable Energy and Sustainable Development (RESD) Volume 3 Issue 1, Special Issue, March 2017 - ISSN 2356-8569 http://dx.doi.org/10.21622/RESD.2017.03.1.055
59 RESD © 2017 http://apc.aast.edu
Fig.7. the active power of the WG-DSTATCOM/FESS.
It is obvious that when the DSTATCOM/FESS device is connected, the variations of power injected from the WG into the system, are reduced, indicating that the active power is approximately constant.
For the reactive power control, three different cases are observed: DSTATCOM/FESS disconnected, DSTATCOM/FESS connected working in Power Factor Control Mode (PFCM) and DSTATCOM/FESS connected working in Voltage Control Mode (VCM) as shown in Fig.8.
Fig.8. the reactive power of the WG-DSTATCOM/FESS.
When the DSTATCOM/FESS-connected working in
PFCM, it is observed that the reactive power injected
is zero. So, the device proposed has satisfactorily
compensated the reactive power variations of the WG.
When the DSTATCOM/FESS-connected working in
VCM, the reactive power variations from the WG are
also compensated in order to make the voltage at bus
4 equal to 1 pu.
The voltage at bus 4 can also be observed as shown in
Figs. 9, 10, 11, 12, 13 and 14. When the
DSTATCOM/FESS is disconnected, significant
variations in voltage happen. This is due to both the
variations of power from the WG and those of the
load. When the DSTATCOM/FESS device is
connected in PFCM, there are no voltage variations
due to the variations in the wind power. However, in
this mode, the voltage has a value different from 1 pu
due to the load variation. When the
DSTATCOM/FESS device is connected in VCM, the
voltage is approximately maintained at 1 PU and does
not change due to the variations in wind power or the
variations of the load. So this control mode solves, in
quite an effective way, the problem caused by the
PFCM. Thus, the VCM is the most convenient mode
when the connection point of the WG has no other
device that controls the voltage.
Fig.9. voltage at bus 4 without DSTATCOM/FESS connected.
Fig.10. Expanded scale of voltage at bus 4 without
DSTATCOM/FESS connected at time = 3 sec
Fig.11. voltage at bus 4 with DSTATCOM/FESS connected in
VCM.
Fig.12. Expanded scale of voltage at bus 4 with
DSTATCOM/FESS connected in VCM at time = 3 sec
Fig.13. voltage at bus 4 with DSTATCOM/FESS connected in

Renewable Energy and Sustainable Development (RESD) Volume 3 Issue 1, Special Issue, March 2017 - ISSN 2356-8569 http://dx.doi.org/10.21622/RESD.2017.03.1.055
60 RESD © 2017 http://apc.aast.edu
PFCM
Fig.14. Expanded scale of voltage at bus 4 with
DSTATCOM/FESS connected in PFCM at time = 3 sec.
2. OPERATION UNDER DIFFERENT TYPES OF FAULTS
For the system of Fig. 5, different types of faults are
applied at bus 4; such as line to ground fault, line to
line fault, line to line to ground fault, three lines to
ground fault, and the system is studied under each
case of them in details. In the following the simulation
results of the foregoing types of faults are given
A. LINE TO GROUND FAULT
For line to ground fault, assumed to happen at t = 3
sec., and then be removed after 0.5 sec., three cases
are observed: in the case when the
DSTATCOM/FESS is disconnected, significant
variations in voltage happen. These are shown in Fig.
15.When the DSTATCOM/FESS is connected, and
working in VCM, the variation in voltage is mitigated
as shown in Fig. 16. When the DSTATCOM/FESS is
connected; working in PFCM, as shown in Fig. 17,
voltage variation is mitigated, as well. In all cases
when the DSTATCOM/FESS operates in VCM mode
the dynamic performance of the system is best.
Fig.15. voltage at bus 4 without DSTATCOM/FESS connected
of line to ground fault.
Fig.16. voltage at bus 4 with DSTATCOM/FESS connected.in
VCM of line to ground fault.
Fig.17. voltage at bus 4 with DSTATCOM/FESS connected.in
PFCM of line to ground fault.
B. LINE TO LINE FAULT
For line to line fault, assumed to happen at t = 3 sec.,
and then be removed after 0.5 sec., three cases are
observed: in the case when the DSTATCOM/FESS is
disconnected, significant variations in voltage happen.
These are shown in Fig. 18.When the
DSTATCOM/FESS is connected, and working in
VCM, the variation in voltage is mitigated. In addition,
the time taken by the system to return to stability
decreased as shown in Fig. 19. When the
DSTATCOM/FESS is connected; working in PFCM,
as shown in Fig. 20, voltage variation is mitigated and
the time taken to regain stability decreased as well. In
all cases when the DSTATCOM/FESS operates in
VCM mode the dynamic performance of the system is
best.
Fig.18. voltage at bus 4 without DSTATCOM/FESS connected
of line to line fault.

Renewable Energy and Sustainable Development (RESD) Volume 3 Issue 1, Special Issue, March 2017 - ISSN 2356-8569 http://dx.doi.org/10.21622/RESD.2017.03.1.055
61 RESD © 2017 http://apc.aast.edu
Fig.19. voltage at bus 4 with DSTATCOM/FESS connected.in
VCM of line to line fault.
Fig.20. voltage at bus 4 with DSTATCOM/FESS connected.in
PFCM of line to ground fault
C. LINE TO LINE TO GROUND FAULT
For line to line to ground fault, assumed to happen at t
= 3 sec., and then be removed after 0.5 sec., three
cases are observed: in the case when the
DSTATCOM/FESS is disconnected, significant
variations in voltage happen. These are shown in Fig.
21.When the DSTATCOM/FESS is connected, and
working in VCM, the amplitude of faulty voltage
increased as shown in Fig. 22. When the
DSTATCOM/FESS is connected; working in PFCM,
as shown in Fig.23, the amplitude of faulty voltage
increased, as well. In all cases when line to line fault
happen it is better to disconnect the
DSTATCOM/FESS.
Fig.21. voltage at bus 4 without DSTATCOM/FESS connected
of line to line to ground fault.
Fig.22. voltage at bus 4 with DSTATCOM/FESS connected.in
VCM of line to line to ground fault.
Fig.23. voltage at bus 4 with DSTATCOM/FESS connected.in
PFCM of line to line to ground fault.
D. THREE LINES TO GROUND FAULT
For three lines to ground fault, assumed to happen at t
= 3 sec., and then be removed after 0.5 sec., three
cases are observed: in the case when the
DSTATCOM/FESS is disconnected, significant
variations in voltage happen and at the time of fault
the voltage reach zero, as shown in Fig. 24.When the
DSTATCOM/FESS is connected, and working in
VCM, the variation in voltage is increased as shown in
Fig. 25. When the DSTATCOM/FESS is connected;
working in PFCM, as shown in Fig. 26, voltage
variation is increased, as well. In all cases when three
lines to ground fault happen, it is better to disconnect
the DSTATCOM/FESS
.
Fig.24. voltage at bus 4 without DSTATCOM/FESS connected
of three lines to ground fault.

Renewable Energy and Sustainable Development (RESD) Volume 3 Issue 1, Special Issue, March 2017 - ISSN 2356-8569 http://dx.doi.org/10.21622/RESD.2017.03.1.055
62 RESD © 2017 http://apc.aast.edu
Fig.25. voltage at bus 4 with DSTATCOM/FESS connected.in
VCM of three lines to ground fault
Fig.26. voltage at bus 4 with DSTATCOM/FESS connected.in
PFCM of three lines to ground fault.
VI. CONCLUSIONS
This paper presents the control algorithms of a
DSTATCOM controller coupled with a FESS System.
A proposal is made of a fully detailed model with
multilevel control algorithm based on the synchronous
rotating d-q reference frame. The incorporation of the
DSTATCOM/FESS with wind generation in the electric
system was studied, and its behavior is analyzed in
different control modes.
From the results obtained, it is concluded that with the
proposed device, the power fluctuations coming from
a WG are effectively mitigated. It was shown that the
WG-DSTATCOM/FESS system can deliver an
approximately constant active power in a time range
of seconds or more. For the reactive power control, it
was shown that the system is able to provide an
approximately unity power factor or to maintain the
voltage in the connection point. The voltage control
operates satisfactorily in case of power disturbances
in the WG and also for fluctuations in the system. The
WG-DSTATCOM/FESS system is also studied under
different types of faults, the results show that
DSTATCOM/FESS is better to be connected during
line to ground and line to line fault, while during line to
line to ground and three lines to ground fault,
disconnection of it is better. Therefore, the
incorporation of DSTATCOM/FESS has shown that it
can improve the power quality in wind systems, as
well as, during some types of faults
REFERENCES
[1] Boopathi.R, Vijayakumar.G,'' A Statcom-Control
Scheme for Grid Connected Hybrid Wind-Solar
Energy System to Improve Power Quality'',
international journal of engineering sciences and
research technology, january 2014.
[2] Mohod, S.W., Aware, M.V.: ‘Power quality issues
& it’s mitigation technique in wind energy
generation’, IEEE Harmonics Qual. Power, 2008,
pp. 1–6
[3] Suvire, G.O., Mercado, P.E.: ‘Combined control of
a distribution static synchronous
compensator/flywheel energy storage system for
wind energy applications’ IET Gener. Transm.
Distrib. , 2012, Vol. 6, Iss. 6, pp. 483–492.
[4] Song, Y.H., Johns, A.T.: ‘Flexible AC transmission
systems (FACTS)’ (IEE Press, London, UK,
1999).
[5] Mohamed I. Daoud, Ayman S. Abdel-Khalik, A.
Elserougi, A. Massoud1, S. Ahmed3, Nabil H.
Abbasy ''An Artificial Neural Network Based
Power Control strategy of Low-Speed Induction
Machine Flywheel Energy Storage System'',
Journal of in information technology, Vol. 4, No. 2,
May 2013.
[6] Suvire, G.O., Mercado, P.E.: ‘Imporvement of
power quality in wind energy applications using a
DSTATCOM coupled with a Flywheel energy
storage’, IEEE Harmonics and Quality of Power
(2008).
[7] M.G. Molina, P.E. Mercado, Multilevel control of a
Static Synchronous Compensator combined with
a SMEScoil for applications on Primary Frequency
Control, in: Proc. CBA 2004, Gramado, Brazil,
September 2004.
[8] Nada Mamdouh, R. A. Swief, M. A. Badr, '' Power
Quality Enhancement for Wind Farms using a
DSTATCOM coupled with a Flywheel Energy
Storage System'', 17th International Middle-East
Power System Conference (MEPCON'15)
Mansoura University, Egypt, December 15-17,
2015.

Renewable Energy and Sustainable Development (RESD) Volume 3 Issue 1, Special Issue, March 2017 - ISSN 2356-8569 http://dx.doi.org/10.21622/RESD.2017.03.1.055
63 RESD © 2017 http://apc.aast.edu
[9] H. Toliyat, S. Talebi, P. McMullen, C. Huynh, A.
Filatov, Advanced high-speed flywheel energy
storage systems for pulsed power applications,
IEEE Electric Ship Technologies Symposium
(2005) 379–386.
[10] Mi, G.R. Slemon, R. Bonert, ''Modeling of iron
losses of surface-mounted permanent magnet
synchronous motors'', IEEE (2001) 2585–2591.
[11] Suvire, G.O., Mercado, P.E.: ‘DSTATCOM with
flywheel energy storage system for wind energy
applications: control design and simulation’,
Elsevier –Electr. Power Syst. Res., 2010, 80, (3),
pp. 345–353.

Renewable Energy and Sustainable Development (RESD) Volume 3 Issue 1, Special Issue, March 2017 - ISSN 2356-8569 http://dx.doi.org/10.21622/RESD.2017.03.1.064
This Paper has been Accepted and Presented in the (First International Conference on New Trends for Sustainable Energy) 1-3 October, 2016 at Pharos University, Alexandria, Egypt.
64 RESD © 2017 http://apc.aast.edu
Assessment of Energy Conservation in Egypt's Electric
System Eng.Azhar El Saeed Awad Abou Ghoniem
Engineer at Alexandria Electricity Distribution Company
Address 9 Sidi El Metwally Street, Attareen, Alexandria, Egypt
Abstract - This paper proposes a simple carrier-
based PWM (CBPWM) technique to control the three-
to five-phase Direct Matrix Converter (3×5 DMC). The
proposed technique uses the indirect modulation
approach to control the 3×5 DMC such as a three-
phase bidirectional rectifier followed by five-phase
voltage source inverter (VSI). Based on this approach,
it is possible to synthesize the desired five-phase
output voltages with sinusoidal three-phase input
currents and unity input power factor. A CBPWM
method is suggested for each stage independently
including both linear and overmodulation operating
modes. By the proposed technique, in both operating
modes, the maximum possible overall Voltage
Transfer Ratio (VTR) is achieved. Moreover, this
technique allows the input power factor to be
controlled by controlling the input current
displacement angle. The feasibility of the proposed
technique has been verified by a series of simulation
and experimental results based on Matlab/Simulink
and dSPACE-DS1104 platform. The results show that
a sinusoidal output and input waveforms can be
achieved with a maximum possible VTR in the linear
region. However, in the overmodulation region, a
maximum possible VTR is achieved at the cost of
some distortion of output and input waveforms.
Therefore, this technique can be used for the
application where a higher VTR is essential.
I. INTRODUCTION
In the last few years Egyptian electrical system has
been encountered by many challenges for instance
shortage of primary source of energy which needed
for generating electricity from power plants, continues
increase in load demand, high value of peak load,
great sum of energy subsides and high cost of
investments for production, transmission and
distribution of power.
Egypt`s electrical system is characterized by fuel fired
electric generating power plants. Thermal electrical
power plants combined of thermal, gas and combined
cycle power stations have the major share of
production which represents approximately 89% of
electric power generation. Hydroelectric power is 9%,
in addition to 2% for renewable and zero nuclear
power plant is included. The major contribution of fuel
fired power plants is distinguished highly. Fossil fuel
is the corner stone of the electric production system,
green renewable energies solar and wind is very
limited with no other renewable. Diversity of primary
sources isn't wide. This splitting up situation confirms
that thermal electric power generation represents the
dominant part of the nation electric system. Although
there are many considerations against consequences
of burning fossil fuel upon the environment due to
emission of harmful gasses, fuel fired power plants
have several advantages of relatively rational cost of
installations, reasonable cost of generating energy
per KWH, simple operation & maintenance conditions
and long life time. Fig (1) illustrates share of electrical
power plants in Egypt`s electric system EES-2014.
Fig .1. Egypt`s electric generation by type
Egypt`s electric system has ratios of primary electric
generation by type very close to that of worldwide
electric system. It means thermal power plants are
the dominants (global generation: 88% thermal, 1-3
green renewable). Fig (2) shows prime electric
generation by type in universal electric system (2010).
9%11%
43%
35%
2%
Share of total primary energy supply-Egypt (2014)
Hydro
Gas
Steam
Combined cycle
Renewables

Renewable Energy and Sustainable Development (RESD) Volume 3 Issue 1, Special Issue, March 2017 - ISSN 2356-8569 http://dx.doi.org/10.21622/RESD.2017.03.1.064
65 RESD © 2017 http://apc.aast.edu
Fig .2. illustrates share of electric generation in worldwide electric
power system
II. BACK GROUND
Primary sources of energy for Electricity generation in
Egypt are basically oil and natural gas. Their
production and consumption pass through three
phases; first, from mid 70`S till mid 90s` increase in
production was greater than consumption. Second,
Oil production declined simultaneously with increase
in consumption in local market till year 2005. Natural
gas was substituted for oil in electricity generation. At
fine, oil and natural gas productions were reduced
dramatically with high increase in local consumption.
A big gap between (oil & natural gas) production and
consumption is created and it has been continued till
now. Therefore, electricity generation is certainly
affected by deficiency of fuel [1] Fig (3) shows oil
productions and consumptions during last four
decades in Egypt.
Source: \\ peak oil production
Fig .3. oil productions and consumptions in last four decades in
Egypt
Assured remaining reserves for oil & natural gas in
Egypt are very limited and they decrease annually
in regular bases as shown in fig (4). I n year 2030
Oil and N.G will decay almost to one third of their
reserves; at then no consumption of Oil & N.G will
be admitted [5].
Source: http:// www.iea.org/statist/index.htm
Fig .4. Remaining reserves for oil & natural gas in Egypt
III. EGYPT`S ELECTRIC SYSTEM
CHALLENGES
Declining of oil & gas productions simultaneously
with raise in consumptions.
increase in electric load demand by about 4.5%
annually
High daily peak power demand (worsen the
system overall efficiency and increases energy
price.
Significant technical and un technical losses.
Limited contribution and utilization of renewable
energies.
Lack of finance resources in energy sectors and
huge budget of subsides for fuel and electricity.
Maintenances along the network are somehow
lower than recommended.
Weakness of energy saving policies and programs
in different activities.
IV. MAJOR PILLARS FOR SOLUTION
A new energy policy for solution of Egypt`s` electric
system difficulties has been put into actions by the
system planners and decision makers; it mainly
depends upon three pillars given as:
1. Improve overall efficiency of existing electric
system.
2. Maximize contributions (production & use) of
available types of renewable energies (RE).
3. Initiate\ promote an impressive energy saving
program and apply strategic plan for improve
energy efficiency.
34%
24%30%
5%6% 1%
OIL
NATURAL GAS
COAL
NUCTEAR
HYDRO
RENEWABLES
World wide prime electric generation by type (2010)
0
0.05
0.1
0.15
0.2
0.25
0.3
0.35
0.4
19
60
19
62
19
64
19
66
19
68
19
70
19
72
19
74
19
76
19
78
19
80
19
82
19
84
19
86
19
88
19
90
19
92
19
94
19
96
19
98
20
00
20
02
20
04
20
06
20
08
20
10
BIL
LIO
N B
AR
REl
(b
bl)
Oil Prduction & Consumption
PROCUCTION CONSUMPTION
Renewable Energy and Sustainable Development (RESD) Volume 3 Issue 1, Special Issue, March 2017 - ISSN 2356-8569 http://dx.doi.org/10.21622/RESD.2016.02.2.064
66 RESD © 2017 http://apc.aast.edu
Suggested points of solution are the main areas of
implementation; they are already put in the pathway.
Extra factors have also been included.
Actions have been taken for solution points 1 & 2 in
power supply side have led to increase System
overall efficiency to higher than 0.44, increase
availability of generating units up to 87%, reduction in
fuel consumption to (0.209) gm oil equivalent/KWH
and reduction in System losses almost to 11%[6] .
Point 3 of solution can be verified by bilateral
cooperation between power provider and end users to
achieve the goal of energy saving.
V. ENERGY CONSERVATION AND IMPROVE
ENERGY EFFICIENCY.
Energy saving is defined as two terms energy
conservation EC and energy efficiency improvement
EEI, first, energy conservation means less input
power for lower output; for example air conditions and
lighting with lower operating hours, switch off lights of
unoccupied areas and stop unloaded motors ..Etc.
Second, energy efficiency improvement means less
input power for the same output; for example use high
efficient electrical and electronic appliances and
devices.
Factors influence applications of energy saving
procedures are given in Fig (6).
Fig .5. factors affect applications of energy saving techniques
Better use of electric energy is achieved by energy
conservation, modifying efficiencies of equipment and
customer behavior against use and consumption of
energy as well.
VI. ENERGY SAVING FROM ECONOMIC
AND ENVIRONMENTAL PERSPECTIVE
Meeting the ever increasing in electric load demand
coincides with high reliability and availability and in
presence of a gap between oil and gas production;
energy saving is a must.
Multiple advantages of energy savings are achieved
for both power providers (electric utilities) and end
users since energy saving is regarded as an
additional source of power with low cost price for the
reason that cost of saving energy is lower than cost of
generating it.
A. Benefits of Energy Saving for Electric System
Improve electric system overall efficiency.
Reduce system losses and boost up voltage levels
Perform better load profile & lower peak demand
Decrease fuel needed for electricity Production.
Downsizing capacities of electrical generating units
& lengthen their expected life times.
Declining energy costs especially at periods of
peak demands.
Reduce air pollutions and guarantee environmental
safety.
B. Benefits of Energy Saving for customer
Reduce customer electric energy bills.
Increase customer system capacity for the same
ratings of components.
Possible extend in loads for the same contracted
power.
Lower losses and improved voltage drop.
Higher customer system power quality.
VII. PROGRAMS OF ENERGY CONSERVATION
IN EGYPT
Several programs of energy Conservation have been
conducted since mid1990`s up to date, Alexandria
electricity distribution company (AEDC) has
participated in several programs such as:
Energy conservation and urban environment in
Mediterranean countries (95-96), the program was
sponsored by European commission, it has been
planned to customer awareness of compact
fluorescent lamps (CFL) and Primary studies in
cogeneration techniques.
USAID energy conservation and environmental
project (DSM). The objectives were designed to,
first develop and launch demand side
management unit at AEDC. Second, test potential
impacts of industrial DSM (96-97).

Renewable Energy and Sustainable Development (RESD) Volume 3 Issue 1, Special Issue, March 2017 - ISSN 2356-8569 http://dx.doi.org/10.21622/RESD.2017.03.1.064
67 RESD © 2017 http://apc.aast.edu
Energy and environmental auditing in small &
medium enterprises (SME`S) in Alexandria
network, it intended to identify and evaluate
opportunities for energy conservation and
environmental protection for SME`S. Energy
efficiency improvement & green house gas
reduction (EEIGGR) was sponsored by developing
program of United Nations and in cooperation with
(EEHC) Egypt`s electricity holding company (99-
2002).
Energy conservation in governmental buildings in
collaboration with (EEHC) and Alexandria
governorate (2006-2007).
Energy efficiency improvement for small industrial
enterprises in cooperation with (IMC) industrial
modernization center (2007-2010).
Energy efficiency improvement in public lighting in
collaboration with (EEHC) and ministries of
industry & trade, finance and social developments
(2009).
Energy conservation in worship houses mosques,
cathedrals and churches in collaboration with
(EEHC) (2010-2011).
Energy efficiency improvement for small industrial
enterprises in cooperation with (IMC) industrial
modernization center (2015-2016).
VIII. CASE STUDY
In a program of energy conservation, a variety of
medium scale end user utilities are selected to
implement energy audit / survey to identify potentials
of no cost/ low cost energy saving opportunities in
administrative, commercial, industrial, worship houses
and governmental facilities. Numbers of 50 utilities
were included in the survey. Energy saving
opportunities for electricity fuel and water were
identified; reduction in emitted co2 was evaluated.
ost of investments and pay back periods for options
were estimated.
High cost opportunities for energy savings are
avoided and utility doesn't have the suitable
demonstration project is excluded from the program.
IX. SEQUENCE OF PROGRAM EXECUTION
Steps of completing the survey and reported the
results are conducted according to the sequence
given in Fig (6).
Fig .6. flow chart of energy saving reported program
X. MEASURING PARAMETERS AND DEVICES
Electrical measurements are executed by energy
analyzer device at low voltage side of .a Customer
plant. It is a robust device with ability to store an
enormous amount of data in a memory box. Recorded
data are transmitted to computers by interface unit
and converted to graphs. Measuring parameters are
volt (V), current (I), active & reactive power (P&Q),
power factor (PF), harmonic total and individuals
(THDV%, V n% THDI%, I n %). Measuring Period is a
daylong or more to record variables during complete
load cycle. Luxmeter is a device for measuring lighting
intensity.
Thermal parameters are measured by gas analyzer
device to measure exhaust (flue) gases as o2, co2, &
co. Ultrasonic microphone to measure leakage in
steam/ compressed air. Temperature sensor and
barometer are also used.
XI. ENERGY SAVING PROGRAM DATA
The program included 50 utilities represent groups of
activities such as commercial buildings, hotels,
cinema, conference centers, hospitals, worship
houses, educational and governmental buildings,
sports club,..Etc. Table (1) gives group No., activity
types and % weight of each.
data collection
sit visite
measuring phase
data analysis
pre feasibility study
feasibility study & tech. specif..

Renewable Energy and Sustainable Development (RESD) Volume 3 Issue 1, Special Issue, March 2017 - ISSN 2356-8569 http://dx.doi.org/10.21622/RESD.2016.02.2.064
68 RESD © 2017 http://apc.aast.edu
Table 1. activities types and numbers of categories
Group
No. Activity type Utilities no. % weight
1 Commercial building 5 10
2 hotel 6 12
3 Conference center 2 4
4 Sport club 1 2
5 hospital 4 8
6 Resort & tourist village 3 6
7 Worship house 2 4
8 Educational building 1 2
9 Governmental building 1 2
10 industrial facility 25 50
TOTAL 50 100
Several energy saving opportunities were achieved for
facilities included in the survey. They are summarized
as follows:
Power factor improvement.
Lighting system upgrade.
Air condition & heat ventilation system
improvement.
Boiler fuel consumption improvement.
Steam distribution system efficiency
improvement.
Automatic control of steam feeding.
Cogenerations & waste heat recovery.
Load management (demand control).
Boiler blow down rate.
Steam traps replacement and maintenances.
Steam condensate system install & maintenance.
PV solar power and /or solar heating systems.
Steam & compressed air leakage minimize.
Results of survey show that most utilities use more
than one type of energy source like electricity, fuel,
steam and compressed air. Any utility almost has at
least one opportunity for energy saving and improve
lighting system is a common option for all individuals.
Many electrical, thermal and environmental options
were achieved; they are classified as Reduction in
power peak demand in megawatt (MW), saving in
electrical energy consumptions in mega watt hour
(MWH), fuel use reduction in tones and water use in
cubic meter (m3) are evaluated. Corresponding
reduction in energy cost in Pounds (LE) are
estimated. Environmental impact due to saving in co2
in tones was computed. Cost of equipments in LE and
pay back periods in years were calculated. Results
are shown in tables (2) and (3).
Table 2. energy audits for 50 AEDC end user`s sites & energy savings
Activity type
Saving
options
saving Water
(1000
m3)
Fuel
oil#6
(1000
tone)
Penalti
es
(1000L
) MW MWH
Commercial
building
2 , 3
&12 0 397.55 0 0 0
Hotels 1, 2, 3
8 & 9 0.312 1457.81 2.64 0.11 85.50
Conference
center 1 & 2 0 380.53 0 0 28.83
Sport club 1 & 2
0 19.98 0 0 4.82
hospitals 1, 2, 5
11&13 0.342 1404.79 1 0.039 133.99
Resort & tourist
village 1 & 2 0 688.96 0 0 9
Worship houses
2 & 3 0 11.79 0 0 0
Educational
building 2 0 20.41 0 0 0
Governmental
building 2 & 3 0 63.11 0 0 0
industrial
company
1, 2, 3,
4
5, 6, 7,
8 9, 10,
11
12 & 13
2.48 7527.88 249.02 235.37 708.38
Total saving
3.14 11972.8 252.67 235.52 970.52
Table 3. results of energy saving s and environment impact
Activity type Saving co2
(1000 tone)
Total
saving
(1000L.E)
Invested
Cost
(1000 L.E)
Payback
period
(year)
Commercial
building 0.34 95.97 132.08 1.38
Hotels
1.43 364.73 448. 25 1.23
Conference
center 0.29 98.65 144.95 2.8
Sport club
0.15
13.81 70.24
5.1
Hospitals 0.66 412.32 454.48 1.1
Resorts & tourist
villages 0.52 128.70 74.54 0.58
Worship houses
0.01
1.80
5.19 6.6
Educational
building 0.014 3.67 4.15 1.1
Governmental
building 0.048 11.68 6.70 0.57
Industrial
companies 71.47 6008.33 6129.50 1.02
TOTAL
74.94 7139.67 7469.92 1.05

Renewable Energy and Sustainable Development (RESD) Volume 3 Issue 1, Special Issue, March 2017 - ISSN 2356-8569 http://dx.doi.org/10.21622/RESD.2017.03.1.064
69 RESD © 2017 http://apc.aast.edu
Calculations are based upon prices of all types of
energies and costs of materials. Irrespective electricity
tariff, prices of fuels and cost of materials are often
unfixed; that don’t change the ending results anyway.
Calculations are performed based upon fuel
consumption is 0.209 grams of oil equivalent per KWH
and emission of warming gas co2 is 3.082/kg fuel.
Results obtained from a medium scale energy saving
program implemented to 50 utilities represent different
load categories such as commercial, educational,
governmental buildings, hotels, sports clubs,
conference centers, worship houses and industrial
utilities evaluate and assess the benefits gained from
energy conservation program applied to a random
sample of loads.
Tables (1) & (2) and (3) illustrate the results, it show
that:
Most savings are achieved in group (10) presented
in table (1). It`s weight% is 50% but it provides
savings between 0.63 to 0.99 of total savings, i.e.
potentials of energy savings are considerable in
industrial sector.
Savings are remarkable in electrical energy
consumption in groups (4, 7) despite cost of
investments for each need relative long payback
period.
Total reduction is 3.14 M.W in peak load demand
.Yearly Savings are 11972.8 MWH in electric
energy, 252.67 *1000 (m3) in water and 235.52
*103 (tone) in fuel.
Total cost saving is 7139.67*103 L.E, estimated
cost of investments is 7469.92*103 L.E; overall
payback period is 1.05 year.
Good environment impact; reduction equals
74.94*103 tone of emitted gas co2 is accomplished
Investigation of results show that in any organization
energy is often consumed somehow in an inefficient
manner, excess consumptions in electricity, fuel and
water are observed, therefore, energy conservation
programs could be implemented upon any class of
business. Results are significant. Procedures of
improvements are almost simple and easily Applied,
Invested cost isn`t highly sound, payback periods are
very limited and positive effect upon environment is
extremely attained.
XII. CONCLUSIONS
Since Egypt`s electric system encounters several
challenges that seriously affect its performance from
view points of continuity, adequacy and quality that
may reflect negatively upon satisfaction of consumers
and detrimentally have an effect on economic
situation; this has push decision makers and system
planners to establish a strategic plan for solution
depends on three supports including; efficiency
improvement of present electric system, scale up
contributions and use of all available types of
renewable energies and promote/encourage energy
saving programs, adding to installation of coal fired
electric power plants and nuclear power stations.
Shortage in natural resources of prime energies oil &
natural gas , volatile in petroleum prices in world
markets and guarantee safety of environment as a
result of fossil fuel fired power plants make the
challenges are great. Although increase contribution
of renewable energies in Egypt`s electric system is
suitable solution in long run, it also controlled by
extremely large invested cost needed by local or
foreign financiers. As will as setting up power plants
certainly require few years till electricity begins to
generate.
Energy saving seems to be the key factor for
assurance of adequacy, continuity and quality of
power supply. Electric utilities especially distribution
companies are in the heart of events, they have a big
role in involving the end users participation in energy
saving programs, the customer `s awareness,
guidance and support will lead to wonderful results.
Media and social organizations have also a great
responsibility in drive the individuals towards energy
savings.
REFRANCES
[1] “Future Options for Energy Production and
Consumption in Egypt„ International Policy
Published El Ahram Magazine – Egypt, 2014.
[2] “Oil Peak Production„ Research by Dr. Mahmud
Refaee, Published Oil Peak in Arabic.Org, www.
The gulf biz.com/vb/forum.php 2009,
[3] “Renewable Energy And Energy Efficiency
Open The Pathway To Affordable Sustainable
Energy„ Dr. Paul H. Suding, International Green
Renewable Energy Conference (IGREC), Cairo
2009.

Renewable Energy and Sustainable Development (RESD) Volume 3 Issue 1, Special Issue, March 2017 - ISSN 2356-8569 http://dx.doi.org/10.21622/RESD.2016.02.2.064
70 RESD © 2017 http://apc.aast.edu
[4] “Renewable Energy Strategy for 2020 and
Regulatory Frame Work„ Dr. Hafez Salmawii,
Electric Regulatory and Customer Protection
Agency magazine - Egypt, 2009.
[5] “Fossil Fuel Energy Consumption and depletion„
Dr. Mohamed Zohiary, published in petroleum &
energy conference, Mansura University 2008.
[6] Egypt regulatory Electricity Agency and customer
protection (Egypt era) periodic magazine 2015
[7] “75 Potentials of Energy Savings in industrial and
commercial installations„ Hand Book, Dr.
Camellia Yusuf, Egypt, 2003.
[8] “Energy Conservation Opportunities in Electric
Distribution System„ Hand Book, Dr. Camellia
Yusuf, Egypt, 2002.
[9] “Demand Side Management„ manual published
by energy conservation & environment project,
sponsored by USAID, 1995.
[10] http:// www.iea.org/statist/index.htm.
[11] https://www.openoil.net/wiki/ar/index.php.

Renewable Energy and Sustainable Development (RESD) Volume 3 Issue 1, Special Issue, March 2017 - ISSN 2356-8569 http://dx.doi.org/10.21622/RESD.2017.03.1.071
This Paper has been Accepted and Presented in the (First International Conference on New Trends for Sustainable Energy) 1-3 October, 2016 at Pharos University, Alexandria, Egypt.
71 RESD © 2017
http://apc.aast.edu
ICT for Community Energy
Caroline van der Weerdt, Richard Carmichael and Björn Palm
TNO, Imperial College London, KTH
[email protected], [email protected],
Abstract - Community energy initiatives are becoming
more and more widespread. For them to be successful
and flourish, engagement from people in the
community is a prerequisite. ICT can provide the
means to support engagement, by helping people to
assess the impact and benefits of a CE project and by
capturing and disseminating the benefits. Also, ICT can
support with the design and management of a CE
project; and lastly ICT can support research on the
topic.
Keywords - Community energy, ICT, engagement,
participation, CIVIS.
I. INTRODUCTION
Due to changing dynamics in social structures,
technology, economics and politics, the traditional role
division between citizens and government has started
to shift. This shift is often referred to as a transition: “a
gradual, continuous process of societal change where
the structural character of society (or a complex sub-
system of society) transforms” [1]. A result of this
transition is the fact that community-led initiatives arise
more and more, of which specifically the number of
communities that generate their own energy is notably
growing [2]. Also known as ‘community energy’ (CE),
this refers to initiatives where communities exhibit a
high degree of ownership and control of an energy
project, as well as benefitting collectively from the
outcomes [3]. Although often characterised by a high
degree of motivation from the people involved, we
propose that for these initiatives to flourish in practice,
information- and communication technologies (ICT)
can support community engagement; a crucial
prerequisite for a successful initiative. This topic is part
of the FP7 CIVIS project, that explores the potential of
social networks and communities to significantly
reduce energy use and carbon emission.
II. ICT FOR COMMUNITY ENERGY
For a CE initiative to become more than a daydream
of a few, engagement is needed from the broader
population. CE projects can address both the supply
and demand of energy, for example realising a
communal windmill or collective buying of energy.
Engagement in turn means that people have to
understand the goal of the initiative, feel connected to
it, and are willing to take action to reach this communal
goal. Engagement is therefore the result of the
weighing of impacts and benefits, and is thus very
much coloured by people’s values [4]. Values are what
people find important; they can range from individual
and collective accomplishments, competence or
autonomy, to community spirit and environmental
protection. For people to make a well-informed
assessment of a CE initiative, thereby addressing the
values people hold, we propose that ICT can service
as a supporting tool in CE initiatives.
Fig .1. Possible intervention points for ICT to support
engagement.
The range of potential roles for ICT in relation to
maximizing engagement for CE may be grouped into
three categories: ICT to support engagement (as
depicted in Figure 1 above); ICT to support project
design/management; and ICT to support research.
The three categories, and how ICT can specifically
support, are briefly explained here:

Renewable Energy and Sustainable Development (RESD) Volume 3 Issue 1, Special Issue, March 2017 - ISSN 2356-8569 http://dx.doi.org/10.21622/RESD.2017.03.1.071
72 RESD © 2017 http://apc.aast.edu
III. ICT TO SUPPORT ENGAGEMENT
Remove specific barriers (e.g. crowdfunding for
financing project or sourcing volunteers);
Facilitate action and participation (e.g. providing
practical information, awareness-raising);
Support sharing info/ advice/experiences
(knowledge-sharing) (e.g. online forum facility
including video, audio and interactive media for
user-generated content);
Create opportunities for interaction between
citizens and enhancing experiences of social
gratification from collective activities (e.g.
gamification and social gaming element to
maximize social presence, trust, reciprocity,
fairness etc.);
Give feedback to participants/citizens others’
participation and activity including the enjoyable
aspects of participation in collective action (e.g.
Content posted on the platform by participants);
Give feedback to participants/citizens about the
positive impacts, accomplishments and benefits
(broadly defined) of the CE initiative (e.g. Content
posted on the platform by project , e.g. to promote
pro-social values by broadening the usual discourse
about benefits beyond financial ones);
Improve the measurement and assessment of
impacts and benefits of all kinds and collating an
evidence base and disseminating this (e.g. using
digital media of various kinds. This could also spur
other communities/actors to follow suit);
Disseminate benefits, accomplishments and activity
more widely beyond the community and to other
stakeholders (e.g. this could include supporting and
disseminating user-generated content (UGC), i.e.
first-hand accounts about project benefits/impacts
or experiences of participation.
IV. ICT TO SUPPORT DESIGN
ICT can support design and management of
projects/initiatives (e.g. feedback from users/citizens to
project designers/leaders/coordinators to support
consensus-building, decision-making and data
collection). Applying the feedback in turn can lead to
more engagement if people see that their input is used.
V. ICT TO SUPPORT RESEARCH
ICT can support research and data collection/sharing
(e.g. platform functionality to allow/facilitate research
activity and data collection on engagement, attitudes
and user experience such as discussions, polls and
making data available to other projects/researchers).
This would also help in the accumulation of an
evidence base. Applying the data in turn can lead to
more engagement by making the value of the initiative
more explicit.
VI. CONCLUSION
We argue that perceived benefits and impacts from a
CE initiative can play an important role in supporting
engagement and that ICT can play an important role in
both addressing the evidence for assessment of
impacts and in capturing and representing these to
increase participants’ awareness of these
impacts/benefits. Furthermore, ICT can be used as a
supporting tool for the design and management of an
CE project itself, and for broadening the evidence base
for research purposes.
VII. ACKNOWLEDGEMENTS
This research is supported by the EU FP7 CIVIS
project.
REFERENCES
[1] P. Martens and J. Rotmans, “Transitions in a
globalising world”, Futures 37, 2005, pp. 1133–
1144
[2] N. de Koning et al, “Participatie en zelforganisatie in
het energiedomein: 9 methodes (TRANSLATED:
Participation and self-organisation in the energy
domain: 9 methods)”. Delft: TNO R11862, 2014.
[3] G. Walker and P. Devine-Write, “Community
Renewable Energy, What should it mean?” Energy
Policy 36, 2010, pp. 497-500
[4] D5.2 Current Public Engagement. [Online].
Available : http://www.civisproject.eu/

Renewable Energy and Sustainable Development (RESD) Volume 3 Issue 1, Special Issue, March 2017 - ISSN 2356-8569 http://dx.doi.org/10.21622/RESD.2017.03.1.071
73 RESD © 2017
http://apc.aast.edu
VIII. ABOUT THE AUTHORS
Caroline van der Weerdt specialises in sustainable
consumer behaviour at TNO.
Richard Carmichael’s research at Imperial College
London focusses on household consumer engagement
with smart tariffs and renewable energy.
Björn Palm’s research is related to energy conservation
in the built environment, particularly HVAC systems,
but also use of ICT for reduction of environmental
impac

Renewable Energy and Sustainable Development (RESD) Volume 3 Issue 1, Special Issue, March 2017 - ISSN 2356-8569 http://dx.doi.org/10.21622/RESD.2017.03.1.074
This Paper has been Accepted and Presented in the (First International Conference on New Trends for Sustainable Energy) 1-3 October, 2016 at Pharos University, Alexandria, Egypt.
74 RESD © 2017 http://apc.aast.edu
Performance Improvement of Roof Transparent Solar Still
Coupled With Agriculture Greenhouse Alaa H. Salah1 Gasser E. Hassan2 Mohamed Elhelw3 Hassan Fath4, Samy M. Elsherbiny5
(1,2)Department of Computer-Based Engineering Applications, City for Scientific Research and Technological
Applications, Alexandria, Egypt
(3,4,5)Mechanical Engineering Department ,Faculty of Engineering, Alexandria University, Alexandria, Egypt
Abstract - In Egyptian desert, growing plants is
difficult due to harsh climate (hot at the daytime and
cold at the night), infertile soil, low average rainfall
and lack of fresh water for irrigation purposes. A
set of simple transparent solar stills are integrated
with a new solar driven agriculture greenhouse (GH).
The stills are placed at the GH roof to use the extra
solar radiation (above that required for plant
photosynthesis process) for water desalination. In
addition to water desalination concept the solar still
units even reduce the cooling load during the daytime.
A net of aluminum metal coated with black colour is
placed on the base of the solar still units to raise the
water temperature (enhance desalination process)
and provide partially shading for the GH. Using
aluminum net decreases also the number of solar still
units required to produce the required amount of GH
fresh water leading to a significant cost reduction..
Therefore, this technique can be used for the
application where a higher VTR is essential.
The main objectives of this work are sizing of the
aluminum net, spacing between solar still units to
obtain the threshold of plant requirements. Also fresh
water production and greenhouse climatic conditions
that plant needs (temperature, relative humidity, air
velocity and amount of oxygen) are simulated.
Numerical simulation was carried out for the hottest
day of Borg Elarab, Alexandria (Egypt).
Keywords - renewable energy; solar energy; water
desalination; agriculture greenhouse; solar stills
I. INTRODUCTION
Water, suitable soil, solar radiation and suitable
climate are the major parameters for high quality and
quantity plants production. Most of Egypt deserts are
not used because of water shortage and harsh
climatic conditions.
The threshold of solar radiation plant needs for
photosynthesis process is 8.46 MJ/m2.day (2.35
kW.hr/m2.day) [1]. Plants often need a temperature in
the range of 10 – 30 oC and a relative humidity in the
range of 60 – 90 % [2]. Where the temperature should
not be high to avoid water stress resulting from water
losses through the plant leaves. Also, low humidity
increases the water loss as a result of transpiration.
On the other hand high humidity severely limits
evaporation rates, so water is not being transported
from the root zone and neither are any nutrients [3].
Therefore, solar radiation, temperature and relative
humidity should be controlled to produce a proper
environment for plant growth. GH can present an
agriculture solution as the main environmental factors
can be controlled as temperature, relative humidity,
and photosynthetic photon flux.

Renewable Energy and Sustainable Development (RESD) Volume 3 Issue 1, Special Issue, March 2017 - ISSN 2356-8569 http://dx.doi.org/10.21622/RESD.2017.03.1.074
75 RESD © 2017 http://apc.aast.edu
Parameter Nomenclature
𝐴𝑔𝑟 Area of the greenhouse floor
𝐵𝑐 Breadth of the channel
𝐶𝑝,𝑔 Specific heat of glass
𝐶𝑝,𝑝 Specific heat of the plants
𝐶𝑝,𝑎𝑙 Specific heat of aluminum
𝐻𝑏 Heat transfer coefficient to soil
ℎ𝑤 Height of water in the solar still
L Length of the GH
LAI Leaf area index
𝐿𝑏 Base length of solar still
lp Characteristic length of a leaf
𝑀𝑝 Mass of the plants
𝑚𝑎𝑖𝑟. Mass flow rate of mixed air
𝑁𝑆𝑆,𝑟 No. of solar still units in vertical riser
𝑁𝑆𝑆,ℎ No. of solar still units in horizontal riser
ra Plant aerodynamic resistance
rs Plant stomatal resistance
Tco Cooling water temperature
𝑇𝑜 Temperature of soil at larger depth
𝑡𝑛𝑒𝑡 The thickness of the metal net
𝑊 Width of the GH into paper
𝛼𝑎𝑙 Absorptivity of aluminum
𝛼𝑝 Absorptivity of the plants
𝛼𝑔 Absorptivity of glass
𝛼𝑔𝑟 Absorptivity of the GH floor
𝛼𝑤 Absorptivity of water
Angle of the solar still cover
𝜀𝑔 Emissivity of glass
𝜀𝑔𝑟 Emissivity of the GH floor
𝜀𝑝 Emissivity of the plants
𝜀𝑤 Emissivity of water
𝐴𝑙
Density of aluminum
𝑔 Density of glass
𝑤
Density of water
𝑔 Transmissivity of glass
𝑤 Transmissivity of water
Tapp Approach temperature
A new GH design of inside controlled climate, solar
driven and self-sufficient of water production
agriculture greenhouse system is developed to
overcome these problems [2-4] where a roof solar
stills are placed on the GH roof.
In this paper, a net of aluminum coated by black color
is placed over the base of solar still units to enhance
the desalination process. A mathematical model
based on mass and heat transfer for each
greenhouse component has been modified to predict
the inside climate conditions and calculate the water
production of the system. The simulation is carried
out for the hottest day of Borg Elarab, Egypt.
II. SYSTEM DESCRIPTION
Figure 1 clarifies the Conceptual Configuration of the
on-roof transparent solar still coupled with agriculture
greenhouse system. The system consists of a
greenhouse cavity covered with transparent cover, a
condenser at exit of greenhouse cavity, vertical and
inclined risers, down comer channel, short chimney, a
set of simple transparent solar still units placed in
vertical and inclined risers.
Fig .1. Conceptual Configuration of the GH Integrated With Roof
Solar Stills
Figure 2 clarifies the Solar Still Configuration. A net of
aluminum metal coated with black colour is placed on
the base of the solar still units.
Fig .2. Conceptual Configuration of the Solar Still Unit
Part of the solar radiation is transmitted for plant
photosynthesis process and the main part is
absorbed by the solar still units for saline water
desalination. The rest of solar energy is absorbed by
transparent covers of the greenhouse and solar still
units and get heated to enhance the air natural
circulation.

Renewable Energy and Sustainable Development (RESD) Volume 3 Issue 1, Special Issue, March 2017 - ISSN 2356-8569 http://dx.doi.org/10.21622/RESD.2017.03.1.074
76 RESD © 2017 http://apc.aast.edu
The circulating air (coming from the GH down comer
channel) is mixed with fresh ambient air to adjust its
temperature and relative humidity to be suitable with
plant requirements, Figure (1). The mixed air passes
through GH cavity and entrain the water vapor
produced by plant inspiration. Then, part of this
humid air passes through a chilled water condenser
to condense as fresh water while the other part is
bypassed. After that air is mixed and passes through
vertical and inclined risers to cool the solar still units
and get heated causing natural draft.
III. MATHEMATICAL MODEL
Mathematical model is developed to calculate the
hourly transmitted and absorbed solar radiation for
each GH surface based on clear sky day model [5]
and quantify the GH performance based on mass and
energy balance for each GH component where the
following assumptions were taken in the
consideration: a) uniform distribution for circulating air
temperature and relative humidity; b) The
temperature at deep ground is constant and
evaporation from the greenhouse floor is negligible;
c) lumped system is considered for each GH
component; d) Thermal properties of the plants are
same as those of water; f) One dimensional model.
IV. RESULTS AND DISCUSSIONS
The thermal performance of the system is illustrated
based on developed model calculations for
environmental conditions of the hottest day (the 11th
of July) which represents summer season of Borg
Elarab, Egypt. Design and operational parameters
that have been used as input parameters for the
developed mathematical model are given in Table 1.
Table 1. Input parameters
Geometrical parameters Operational parameters
𝐴𝑔𝑟 160 m2 𝑚𝑎𝑖𝑟. 0.5 kg/s
𝐵𝑐 1.5 m 𝑀𝑝 1600 kg 𝑁𝑆𝑆,𝑟 60 Tapp 5 oC 𝑁𝑆𝑆,ℎ 120 Tco 10 oC 𝑊 20 m Plant parameters L 8 m lp 0.03 [6] 𝑊𝑏 1 m LAI 3 [6] 𝐿𝑏 0.75 m
ra 50 (day) to 5000 (night) S/m [7] ℎ𝑤 0.01 m
30o rs 250 S/m [7] 𝑡𝑛𝑒𝑡 0.005 m
Thermal and optical parameters
𝛼𝑝 0.4 [8] 𝑤
1000 kg/m3
𝛼𝑔 0.06 [9] 𝐴𝑙
2712 kg/m3 𝛼𝑔𝑟 0.4 [10] 𝑔 0.9 [12] 𝛼𝑎𝑙 0.92 𝑤 0.7 𝛼𝑤 0.89 𝐶𝑝,𝑔 4190 J/kg k [11] 𝜀𝑔 0.92 𝐶𝑝,𝑝 4190 J/kg k [13] 𝜀𝑔𝑟 0.93 𝐶𝑝,𝑎𝑙 921.096 𝜀𝑝 0.92 𝐻𝑏 1 w/m2 oC [14] 𝜀𝑤 0.4733 𝑇𝑜 17 oC [14] 𝑔
2500 kg/m3 [11]
The ambient temperature and relative humidity is
shown in Figure 3. The ambient temperature varies
from 23.5 to 31 oC and the ambient relative humidity
varies from 55 to 91%.
Figures 4 and 5 show the effect of using AL-metal
with area ratio between the metal net and the base of
20% on the performance of climate inside the
greenhouse. It is seen that changing the area ratio
did not cause any change in the inside microclimate
conditions.
Figure 6 and 7 show the effect of using AL-metal on
the GH fresh water production and the transmitted
solar radiation respectively.
Fig .3. Ambient conditions (temperature and relative humidity)

Renewable Energy and Sustainable Development (RESD) Volume 3 Issue 1, Special Issue, March 2017 - ISSN 2356-8569 http://dx.doi.org/10.21622/RESD.2017.03.1.074
77 RESD © 2017 http://apc.aast.edu
Fig .4. Effect of using AL-metal net on GH temperature.
Fig .5. Effect of using AL-metal net on GH RH.
Fig .6. Effect of using AL-metal net on water production.
Fig .7. Effect of using AL-metal net on solar radiation
transmittance.
V. CONCLUSIONS
It is concluded that the developed GH-Still integrated
system can produce its needs of water for irrigation
purposes. Using AL-metal net with area of 20% of the
solar still base area increases the water production
by 50%. The transmitted solar radiation slightly
affected by the metal net, but the internal
performance of the greenhouse was not affected.
VI. ACKNOWLEDGMENT
This research paper is supported through research
project with title of "Solar-Greenhouse-Desalination
System Self productive of Energy and Irrigating
Water Demand". The project is funded by STDF
(Science & Technology Development Fund) with
Project no. 10495, (2015-2016).
REFERENCES
[1] FAO2013,"Good Agricultural Practices for
greenhouse vegetable crops: Principles for
Mediterranean climate areas", ISBN 978-92-5-
107649-1, 2013.
[2] Gasser Hassan, Alaa Salah, Mohamed Elhelw,
Amany Hassan and Hassan Fath,"Development
of a Novel Solar Driven Agriculture Greenhouse:
Self Sufficient of Energy and Irrigating Water",
International Desalination Association (IDA)
World Congress on Desalination and Water
Reuse 2015/San Diego, CA, USA, REF:
IDAWC15- Hassan, August (2015)
[3] Tesfaldet Yohannes and Hassan Fath, “Thermal
Analysis of a Novel Agriculture Greenhouse: Self
Sufficient of Energy and Irrigating Water”, 24th
Canadian Congress of Applied Mechanics, June
2-6 (2013).
[4] Radwan A. and Hassan Fath, “Thermal
Performance of Greenhouse with Built-in Solar
Distillation System: Experimental Study”,
Desalination, Vol. 181, 1-3, 5, 193-206 (2005).
[5] American Society of Heating Refrigeration and
Air conditioning Engineers, "ASHRAE Handbook
of Fundamentals," Atlanta, (1993).
[6] F. Berroug, E. Lakhal, M. El Omari, M. Faraji,
and H. El Qarnia, "Thermal performance of a

Renewable Energy and Sustainable Development (RESD) Volume 3 Issue 1, Special Issue, March 2017 - ISSN 2356-8569 http://dx.doi.org/10.21622/RESD.2017.03.1.074
78 RESD © 2017 http://apc.aast.edu
greenhouse with a phase change material north
wall," Energy and Buildings, vol. 43, pp. 3027-
3035, 2011.
[7] M. Chaibi and T. Jilar, "System design, operation
and performance of roofintegrated desalination in
greenhouses," Solar energy, vol. 76, pp. 545-
561, 2004.
[8] V. Sethi, "On the selection of shape and
orientation of a greenhouse: Thermal modeling
and experimental validation," Solar Energy, vol.
83, pp. 21-38, 2009.
[9] P. Sharma, G. Tiwari, and V. Sorayan,
"Temperature distribution in different zones of the
micro-climate of a greenhouse: a dynamic
model," Energy conversion and management,
vol. 40, pp. 335-348, 1999.
[10] M. Ghosal and G. Tiwari, "Modeling and
parametric studies for thermal performance of an
earth to air heat exchanger integrated with a
greenhouse," Energy conversion and
management, vol. 47, pp. 1779-1798, 2006.
[11] F. P. Incropera, D. P. Dewitt, T. L. Bergman,
and A. S. Lavine, Fundamentals of Heat and
Mass Transfer, Sixth ed.: John Wiley & Sons,
Inc., 2007.
[12] M. Chaibi, "Analysis by simulation of a solar still
integrated in a greenhouse roof," Desalination,
vol. 128, pp. 123-138, 2000.
[13] R. Singh and G. Tiwari, "Thermal heating of
controlled environment greenhouse: a transient
analysis," Energy conversion and management,
vol. 41, pp. 505-522, 2000.
[14] V. Sethi, "On the selection of shape and
orientation of a greenhouse: Thermal modeling
and experimental validation," Solar Energy, vol.
83, pp. 21-38, 2009.
Renewable Energy and Sustainable Development (RESD) Volume 3 Issue 1, Special Issue, March 2017 - ISSN 2356-8569 http://dx.doi.org/10.21622/RESD.2017.03.1.079
This Paper has been Accepted and Presented in the (First International Conference on New Trends for Sustainable Energy) 1-3 October, 2016 at Pharos University, Alexandria, Egypt.
79 RESD © 2017
http://apc.aast.edu
Role of Dyestuff in Improving Dye-Sensitized Solar Cell
Performance Yehia Selim1, Ahmed A. Mohamed2
1Faculty of Engineering, Pharos University, Alexandria, Egypt
2Faculty of Engineering, Menoufia University, Shebin El-Kom, Egypt [email protected], [email protected]
Abstract - Dye-sensitized solar cells DSSCs have
attracted great attention for their simple fabrication
process, low production costs, relatively high
conversion efficiency, and being environmental
friendly.
DSSC are a combination of materials, consisting of a
transparent electrode coated with a dye-sensitized
mesoporous film of nanocrystalline particles of TiO2,
an electrolyte containing a suitable redox-couple and
a electrode.
DSSCs use organic dye assist to produce electricity in
a wide range of light conditions, indoors and outdoors.
The dye in the solar cell is the key element since it is
responsible for light harvesting ability, photoelectron
generation (the creation of free charges after injection
of electrons into the nanostructured semi-conducting
oxide) and electron transfer.
For this reason, this paper gives a background of
dyestuff, types and limitations. The motivation of this
work is to design a simple, easy and prepare an
efficient organic dye sensitizer.
Also, this paper investigates the important criteria
which are considered for selecting dye to enhance
DSSC efficiency.
Keywords - dye-sensitized solar cells, DSSC
performance, dye, poto sensitizers, organic dye
sensitizer.
I. INTRODUCTION
Solar energy provides a clean, renewable and
cheaper energy source for human race, while serving
as a primary energy source for another type of energy
sources, namely; wind energy, water, bio-energy and
fossil fuel. The solar cells used in harvesting the solar
power are commonly categorized into different types
in respect to the composition of their material e.g.
organic dye solar cells, non-crystal, multiple crystal,
and single crystal silicon solar cells. A solar cell
usually signifies the cell that is made from silicon
crystal material. Nevertheless, the production cost of
the solar cells based on silicon crystal material
compared to the Dye-Sensitized Solar Cells (DSSCs)
is high. DSSCs are devices that convert solar to
electric energy by light sensitization established on
wide energy band semiconductor [1]. DSSC shows a
very promising future in the field of photovoltaic cells.
DSSC also known as Grätzel cell is a new type of
solar cell [2], and have attracted a great interest due
to their minimal production cost, and environmental
friendliness
DSSC considered as third generation solar cells of
high efficiency with low production costs. Although
present-day DSSCs provide light-to-electricity
conversion of less than 12%, further condensed
investigations daily done for improvement this ratio by
modifying not only each single component's function
of the cell but also optimizing their compilation for
easier and efficient communication between them to
produce maximum benefits.
In addition, DSSC devices can be manufactured to be
semi-transparent to harvest light from any direction in
order to be used as photovoltaic windows in buildings
or small devices.
The dyestuffs which are the backbone of the DSSC
or photo-electro-chemical-voltaic cells are common
issue in many research centers interested in
developing photovoltaic cells.
This review article presents what we know and what
we need to know about role of dye in DSSC in order
to formulate basic guidelines and strategies for
improving of dye-sensitized solar cells.

Renewable Energy and Sustainable Development (RESD) Volume 3 Issue 1, Special Issue, March 2017 - ISSN 2356-8569 http://dx.doi.org/10.21622/RESD.2017.03.1.079
80 RESD © 2017
http://apc.aast.edu
Also, in this perspective article, some important
points will be recommended for further increase of
DSSC efficiency.
In order to be familiar with the function or dyestuff in
the DSSC a concise overview will be summarized
about different types of dyestuff, its role in DSSC,
relation with colors and light, classification according
to application and structure , synthesis and what
factors affecting its quality.
II. DYE SOLAR SENSITIZED CELLS (DSSC)
CONSTRUCTION
DSSC comprises of a nano-crystalline porous
semiconductor electrode-absorbed dye as a power
electrode and counter electrode, an electrolyte
containing iodide and triiodide ions, and shown in
Figure (1).
Fig .1. Construction of DSSC
III. SIMILARITIES OF DSSCS AND
PHOTOSYNTHESIS
Both DSSCs and plants both harvest energy from
sunlight. Photovoltaic solar cells collect sunlight and
change it to electricity. Plant leaves gather sunlight
and convert it into stored chemical energy. Both
DSSCs and plants are utilizing dye to convert light
energy into another sorts of energy, but they do it in
different ways.
Photosynthesis, the effectiveness of the light
conversion in plant's leaves in which chlorophyll acts
as the dye corresponds to the sensitizer dye in DSSC
as shown in Figure (2).
Fig .2.
Light energy transfers (in plant) into chemical reaction
forming formal dehyde( from CO2+H2O+hv = HCHO
+O2) which polymerized to glucose (6HCHO =
C6H12O6 )then starch ( C6H10O5)n or cellulose
polymers, while Light energy converted to electric
current in DSSC.
So, the DSSC is designed based on photosynthesis
phenomena.
IV. DYE AS PHOTO SENSITIZER
In spite of several elements combining the DSSC (2
electrodes, dye, electrolyte, sealing),
The dye which acts as sensitizers in DSSCs plays an
essential task in absorption and conversion of
incident light ray into electricity.
Dye is considered as a promising element for getting
more performance to DSSC.
V. WHAT IS DYE
By definition Dyes can be said to be colored, ionising
and aromatic organic compounds which shows an
affinity towards the substrate to which it is being
applied. It is generally applied in a solution that is
aqueous. Dyes may also require a mordant for better
fastness on the material on which it is applied.
Dyes are applied to numerous substrates for example
to textiles, leather, plastic, paper etc. in liquid form.
One characteristic of dye is that the dyes must get
completely or at least partially soluble in which it is
being put to. The rule that we apply to other
chemicals is similarly applicable to dyes also.
Precautions should be taken upon handling of dyes
For example certain kind of dyes can be toxic,
carcinogenic and can pose as a hazard to health.
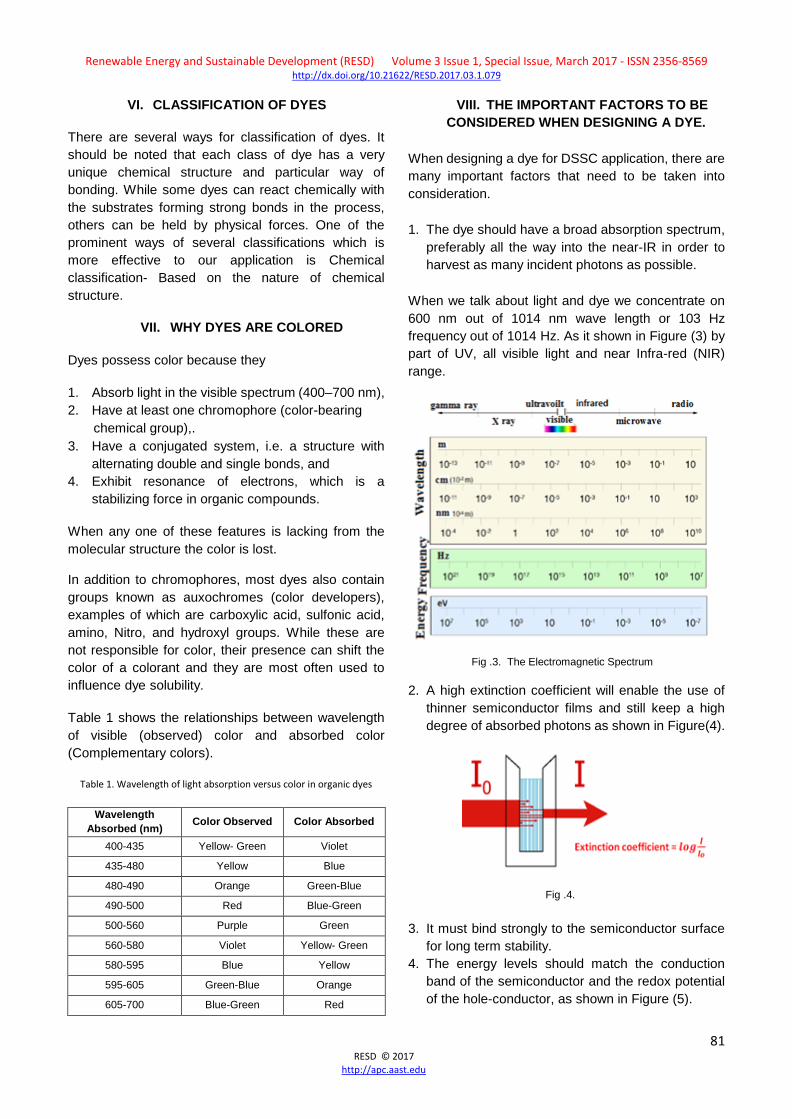
Renewable Energy and Sustainable Development (RESD) Volume 3 Issue 1, Special Issue, March 2017 - ISSN 2356-8569 http://dx.doi.org/10.21622/RESD.2017.03.1.079
81 RESD © 2017
http://apc.aast.edu
VI. CLASSIFICATION OF DYES
There are several ways for classification of dyes. It
should be noted that each class of dye has a very
unique chemical structure and particular way of
bonding. While some dyes can react chemically with
the substrates forming strong bonds in the process,
others can be held by physical forces. One of the
prominent ways of several classifications which is
more effective to our application is Chemical
classification- Based on the nature of chemical
structure.
VII. WHY DYES ARE COLORED
Dyes possess color because they
1. Absorb light in the visible spectrum (400–700 nm),
2. Have at least one chromophore (color-bearing
chemical group),.
3. Have a conjugated system, i.e. a structure with
alternating double and single bonds, and
4. Exhibit resonance of electrons, which is a
stabilizing force in organic compounds.
When any one of these features is lacking from the
molecular structure the color is lost.
In addition to chromophores, most dyes also contain
groups known as auxochromes (color developers),
examples of which are carboxylic acid, sulfonic acid,
amino, Nitro, and hydroxyl groups. While these are
not responsible for color, their presence can shift the
color of a colorant and they are most often used to
influence dye solubility.
Table 1 shows the relationships between wavelength
of visible (observed) color and absorbed color
(Complementary colors).
Table 1. Wavelength of light absorption versus color in organic dyes
Wavelength
Absorbed (nm) Color Observed Color Absorbed
400-435 Yellow- Green Violet
435-480 Yellow Blue
480-490 Orange Green-Blue
490-500 Red Blue-Green
500-560 Purple Green
560-580 Violet Yellow- Green
580-595 Blue Yellow
595-605 Green-Blue Orange
605-700 Blue-Green Red
VIII. THE IMPORTANT FACTORS TO BE
CONSIDERED WHEN DESIGNING A DYE.
When designing a dye for DSSC application, there are
many important factors that need to be taken into
consideration.
1. The dye should have a broad absorption spectrum,
preferably all the way into the near-IR in order to
harvest as many incident photons as possible.
When we talk about light and dye we concentrate on
600 nm out of 1014 nm wave length or 103 Hz
frequency out of 1014 Hz. As it shown in Figure (3) by
part of UV, all visible light and near Infra-red (NIR)
range.
Fig .3. The Electromagnetic Spectrum
2. A high extinction coefficient will enable the use of
thinner semiconductor films and still keep a high
degree of absorbed photons as shown in Figure(4).
Fig .4.
3. It must bind strongly to the semiconductor surface
for long term stability.
4. The energy levels should match the conduction
band of the semiconductor and the redox potential
of the hole-conductor, as shown in Figure (5).

Renewable Energy and Sustainable Development (RESD) Volume 3 Issue 1, Special Issue, March 2017 - ISSN 2356-8569 http://dx.doi.org/10.21622/RESD.2017.03.1.079
82 RESD © 2017
http://apc.aast.edu
5. Easy and straightforward synthesis for future large
scale production.
6. Low toxicity and possibility to recycle.
7. High photo-stability to sustain at least 20 years of
use.
8. Achieve a long lifetime of the injected electrons by
blocking the recombination pathways.
Fig .5.
The properties of the organic sensitizers can be
modified by incorporating different groups into the
molecule.
By choosing the right design, the sensitizer can be
tuned in order to increase the long wavelength
absorption, achieve a high extinction coefficient, and
shift the energy levels to improve the performance of
the solar cell.
The positions of the energy levels in the sensitizer are
of great importance.
A small gap between the levels gives the possibility to
harvest more low energy photons.
If the energy exceeds the band gap of the
semiconductor, the photon can be absorbed and an
electron will be excited from the valence band to the
conduction band. Electrons in the conduction band
can move, which allows for electric current, as shown
in Figure (6). The difference between the photon
energy and the band gap will end up as heat.
Fig .6.
A common way of designing organic dyes is the D-π-
A strategy [4], where the molecule is built up of an
electron donor, a conjugated linker, and an electron
acceptor, as illustrated in Figure (7). This structure will
yield an intramolecular charge separation upon
excitation which is desired for DSSCs.
Fig .7.
IX. CONCLUSION
This review article presents what we know and what
we need to know about role of dye in DSSC in order
to formulate basic guidelines and strategies for
improving of dye-sensitized solar cells.
Also, this paper investigates the important criteria
which are considered for selecting dye to enhance
DSSC efficiency, and it has been shown that, there
are a great number of factors that need to be kept in
mind.
REFERENCES
[1] Oluwaseun Adedokun et al., Review on Natural
Dye-Sensitized Solar Cells, International Journal
of Engineering Technology Vol. 2, No.2, 2016.
[2] B. O’Regan, M. Gratzel, (1991) A Low-cost high
efficiency solar cell based on dye-sensitized
colloidal TiO2 films, Nature, 353: 737-740.
[3] http://www.globalspec.com/reference/41766/2032
79/classification-of-dyes.
[4] Enediyne as p linker in D–p–A dyes for
dyesensitized solar cells† Youfu Wang,a Luhua
Dong,a Zhiwei Zheng,b Xing Li,b Rulin Xiong,a
Jianli Hua*b and Aiguo Hu*a, RSC Advances
Issue 15, 2016 (An international journal to further
the chemical sciences).

Renewable Energy and Sustainable Development (RESD) Volume 3 Issue 1, Special Issue, March 2017 - ISSN 2356-8569 http://dx.doi.org/10.21622/RESD.2017.03.1.083
This Paper has been Accepted and Presented in the (First International Conference on New Trends for Sustainable Energy) 1-3 October, 2016 at Pharos University, Alexandria, Egypt.
83 RESD © 2017 http://apc.aast.edu
Factors Affect Dye Sensitized Solar Cells performance Ahmed A. Mohamed1, Yehia Selim2
1Faculty of Engineering, Pharos University, Alexandria, Egypt
2Faculty of Engineering, Menoufia University, Shebin El-Kom, Egypt
[email protected], [email protected]
Abstract - Recently, dye-sensitized solar cells
(DSSCs) have received great attention for their simple
fabrication process, low production costs and,
relatively high conversion efficiency.
DSSC are a combination of materials, consisting of a
transparent electrode coated with a dye-sensitized
mesoporous film of nanocrystalline particles of TiO2,
an electrolyte containing a suitable redox couple and
an electrode. In order to optimize DSSC performance,
it is important to fully understand the factors which
affect the key features of DSSC characteristics.
This paper presents an overview of the construction of
a dye-sensitized solar cell, operating principle of
DSSC, DSSC performance and, investigates the most
important parameters which affect Dye-Sensitized
Solar Cells performance.
Keywords - dye-sensitized solar cells, DSSC
performance, dye, Factors improve DSSC efficiency
I. INTRODUCTION
Traditional energy sources (fossil full) face a number
of challenges such as:
Increasing energy demand;
Fuel depletion.
Climate change; and
Pollution and public-health hazards.
From an environmental perspective, renewable
energy source is an alternative source to the
conventional energy sources.
Solar energy sources are considered one of the most
promising renewable sources [1-6], since solar
energy sources are clean, inexhaustible, environment
friendly, plentiful and easy to utilize. Also, solar
energy sources can provide electricity in remote
areas where electricity is not available.
Solar cells give us the easier way to utilize the
enormous source of renewable energy. Solar cells
are considered a best choice of solar energy since it
cuts-down electricity bill, needs low maintenance,
produces no pollution, no emission and no noise.
Solar cells are usually divided into three main
categories called generations [7]. As shown in Figure
(1), first generation solar cells are mainly based on
silicon wafers and its efficiency is about 15-25
%.These types of solar cells dominate the market.
The benefits of this solar cell technology lie in their
good performance, as well as their high stability.
However, they are rigid, relatively expensive to
produce, have a low efficiency, and are more at risk
to lose some of their efficiency at higher
temperatures.
Second generation solar cells is used to produce a
cheaper solar cell by applying thin-film technology.
These solar cells use less material and lower cost
manufacturing processes compared to the first
generation solar cells. However the 2nd generation
solar cells have significant limitations, including lower
overall efficiency compared to 1st generation and the
toxicity of the component materials used.
The goal of third generation technologies is to
enhance poor electrical performance of second
generation (thin-film technologies) while maintaining
very low production costs.
3rd generation solar cells, are based on
nanostructured materials and they are made of purely
organic or a mixture of organic and inorganic
components, thus allowing for a vast and
inexhaustible choice of materials.
Fig. 1. Solar cells technologies

Renewable Energy and Sustainable Development (RESD) Volume 3 Issue 1, Special Issue, March 2017 - ISSN 2356-8569 http://dx.doi.org/10.21622/RESD.2017.03.1.083
84 RESD © 2017 http://apc.aast.edu
There are four types of third-generation PV
technologies:
Nanocrystal solar cells
Polymer solar cells
Dye sensitized solar cells
Concentrated solar cells
Fig. 2. Third-generation PV technologies
Among the different possibilities of 3rd generation
solar cells, Dye sensitized solar cells (DSSCs) have
the most promising prospect.
Manufacturing of DSSC is simple, mostly low cost,
and incorporate environmentally friendly materials.
DSSC uses an organic dye to produce electricity in a
wide range of light conditions, indoors and outdoors.
However, a major drawback is the temperature
sensitivity of the liquid electrolyte. Hence a lot of
research is going on to improve the electrolyte’s
performance and cell stability.
This paper presents an overview of
Construction of a dye-sensitized solar cell ,
Operating principle of DSSC,
DSSC performance
The factors affect performance of Dye Solar Cells.
II. CONSTRUCTION OF A DYE-SENSITIZED
SOLAR CELL
DSSC has 3 primary parts, anode, counter electrode
and iodide electrolyte. With a few simple materials,
you can create a working solar cell that mimics the
process of photosynthesis. Indium Transparent
conductive oxide ITO
Fig. 3. Construction of a dye-sensitized solar cell
Figure (3) shows the four parts of DSSC which are:
The electrode film layer (TiO2), covered by a dye
molecules, that absorbs solar energy;
Indium tin oxide (ITO) layer is used to facilitate
charge transfer from the electrode layer;
The counter electrode layer made of C;
Iodide electrolyte it used to supply electrons to dye
to replace the ones being extracted by TiO2.
III. OPERATING PRINCIPLE OF A DYE-
SENSITIZED SOLAR CELL (DSSC)
With aid of Figure (4), the operating principle of a
dye-sensitized solar cell (DSSC) is explained as
follows:
Light strikes the dye molecules.
If the photon has enough energy, it will excite an
electron from the dye, which is transmitted into
the conduction band of the TiO2.
The electrons will be collected by front electrode
and supplied to external circuit to the counter
electrode.
The counter electrode returns electrons from the
external circuit back to the cycling current in the
cell.
The original state of the dye is subsequently
restored by electron transferred from the redox
electrolyte.
The electrolyte itself is restored to its original
state by an electron coming from counter
electrode.
Fig. 4. Working principle of DSSC

Renewable Energy and Sustainable Development (RESD) Volume 3 Issue 1, Special Issue, March 2017 - ISSN 2356-8569 http://dx.doi.org/10.21622/RESD.2017.03.1.083
85 RESD © 2017 http://apc.aast.edu
Generation of electrical power under illumination is
achieved by the capability of DSSC to produce
voltage over an external load and current through the
load at the same time. DSSC is characterized by
current-voltage (J-V) curve and (P-V) curve of the cell
as shown in figure (5) [8]:
Fig. 5. Current-voltage (J-V) curve and (P-V) curve of the cell
In this Figure, When the cell is short circuited under
illumination, the maximum current (short circuit ISC)
or short circuit current density ( JSC) is generated,
while under open circuit conditions no current can
flow and the voltage (open circuit voltage, VOC) is at
its maximum .
Also in this figure, DSSC output power increases with
increase in value of voltage /current density, reaches
a maximum value at optimum value of voltage
/current density and then starts decreasing, reaches
zero value at open circuit voltage/short circuit current.
The maximum power point can be obtained by
determining the maxima of output power (Pmax)
where Pmax is equal to
Pmax = Vmp Imp= Vmp Jmp Acell
Where:
Imp = the current at the maximum power output
Jmp= the current density at the maximum power
output
Vmp = the voltage at the maximum power output
Acell = the illuminated cell area
The value of conversion efficiency of prepared dye
sensitized solar cells was measured from Eq. (1),
were η is overall conversion efficiency and VOC, ISC,
FF, Pin are the open-circuit voltage, short-circuit
current density, fill factor and the intensity of incident
light, respectively.
Fig. 6. Performance of DSSC
Figure (6) illustrates the performance of DSSCs, and
the solar power (P) can be calculated by the
equation: P=IV
The energy conversion efficiency of DSSCs is
described by the ratio of the maximum electrical
power output Pmax to the solar energy input Pin. The
maximum electrical power output Pmax is calculated
by the maximum current Jmp and the maximum
voltage Vmp:
Pmax=Jmp x Vmp
The solar power input is taken as the product of the
irradiance of the incident light that is measured in
W/m2:
(1)
The fill factor FF is index of loss electric generation
or a measure of the quality of the solar cell, and it
can be calculated by comparing the maximum short-
circuit current Jsc and maximum open-circuit voltage
Voc to the maximum current Jmp and maximum
voltage Vmp:
(2)
By subsuming Eq. (2) into Eq. (1),
(3)
The ideal power density of DSSCs is the product of
Jsc and Voc . The maximum power density is the
product of Jmp and Vmp , and the difference
between the two comes from the resistances of the
cell, electrolyte, electrode, and other components.
The energy conversion efficiency of DSSCs is related

Renewable Energy and Sustainable Development (RESD) Volume 3 Issue 1, Special Issue, March 2017 - ISSN 2356-8569 http://dx.doi.org/10.21622/RESD.2017.03.1.083
86 RESD © 2017 http://apc.aast.edu
to the ideal power density and maximum power
density as shown in Figure (6). When the fill factor is
equal to 1, Jsc and Voc are the same as Jmp and
Vmp . The series resistance Rs includes the cell,
electrolyte, electrode, and interface resistance.
IV. FACTORS IMPROVE DSSC EFFICIENCY
The DSSC contains several different components: A
conducting glass substrate, a mesoporous
semiconductor film, a sensitizer, an electrolyte with a
redox couple and a counter electrode. The
optimization of each of them is of great importance in
order to improve the overall efficiency.
Figure (7) presents best properties of each of the
materials which constitute the DSSC of the overall
process for energy conversion.
Fig. 7. The property of each DSSC components
A lot of researchers do all affords to satisfy the
requirement properties of each DSSC's components
[9]. Unfortunately, the researchers affords don't give a
significant increase. But from my view if a
cooroperation between Electrical, Chemical and
Mechanical departments is done a good result is
expected.
V. CONCLUSIONS
The potential for improvement in the power
conversion efficiency of DSSC is regarded as a highly
promising method for efficient and economical
conversion of light in to electrical energy.
The DSSC contains several different components;
the optimization of each of these components is of
great importance to improve the overall efficiency.
The key requirements for efficient sensitization needs
examination of numerous dyes of different chemical
structure and functional groups.
Determination of the absorption spectrum of the dye
and its stability are most important components
influencing solar cell performance.
Investigations of Influence of physical factors affected
DSSC performance require co working between
scientific branches (Electrical, Chemical and
Mechanical).
REFERENCES
[1] Solar Electricity Handbook, Michael Boxwell,
Greenstream Publishing, 2016 Edition
[2] Solar Energy in Developing Countries:
Perspectives and Prospects :
[3] a Report ...By National Academy of Sciences
(U.S.). Board on Science and Technology for
International.
[4] Solar Engineering of Thermal Processes. John
A. Duffie, William A. Beckman. Wiley, 1991.
[5] Karim Hegazy, Egypt's Energy Sector - Energy
Charter, Energy Charter Secretariat Knowledge
Centre 2015, ISSN: 2406-6087
[6] Egypt Crisis in the energy sector, economic-
research.bnpparibas.com/October 2013
[7] Solar Energy in Egypt Advantages and
Obstacles www.numov.org/de/...al/.../616-5-dr-
samir-ayad-egyptian-solar-energy-systems-co
[8] 3 Generations of Solar Cells: Solar Facts and
Advice,
[9] www.solar-facts-and-advice.com/solar-cells.
[10] P.M. Sommeling, H.C. Rieffe, Spectral response
and IV-characterization of dye-sensitized
nanocrystalline TiO2 solar cells, Solar Energy
Materials & Solar Cells 62 (2000).
[11] Claudia Longo; Marco-A. De Paoli, Dye-
sensitized solar cells: a successful combination
of materials , J. Braz. Chem. Soc. vol.14 no.6
São Paulo Nov./Dec. 2003.

Renewable Energy and Sustainable Development (RESD) Volume 3 Issue 1, Special Issue, March 2017 - ISSN 2356-8569 http://dx.doi.org/10.21622/RESD.2017.03.1.087
This Paper has been Accepted and Presented in the (First International Conference on New Trends for Sustainable Energy) 1-3 October, 2016 at Pharos University, Alexandria, Egypt.
87 RESD © 2017 http://apc.aast.edu
Highlight of Grid-connected PV systems in administrative
buildings in Egypt Dina M.Said, Marwa Mostafa, Kamelia Youssef and Hatem Waheed
EgyptERA, Cairo, Egypt
[email protected], [email protected],
[email protected], [email protected]
Abstract - Solar energy applications are becoming
increasingly common in Egypt. The abundant
sunshine in Egypt, as well as the increasing
competitiveness of solar energy systems including-
but not limited to photovoltaic (PV), – predicts that
these technologies could be weighed to be raised in
Egypt.
PV systems are installed on roof tiles or other parts of
building structures to supplement grid utility, reduce
electric bills, and provide emergency back–up energy.
Moreover, they simultaneously reduce significant
amounts of CO2 emissions. It is foreseen, a number
of residential and public buildings in Egypt are using
solar power to cut electric utility bills significantly. The
approximately payback period to recover the
investment costs for PV systems is up to about 5
years. In addition, it is more economical to use PV
system than grid utility systems. The two components
that determine the total initial price of a grid-
connected PV system are the modules and the
balance of systems (BOS). The BOS includes
different components such as mounting frames,
inverters and site- specific installation hardware.
The Government of Egypt (GOE) has endorsed the
deployment of PV systems through three approaches.
It started with a prime minister decree to install PV
projects on one-thousand of the governmental
buildings. This was followed by as an initiative called
"Shamsk ya Masr", and finally the Feed-in Tariff (FiT)
projects.
Following the prime minster decree the Egyptian
Electricity Holding Company (EEHC) and its affiliated
companies took the lead to install PV systems at the
top roof of their administrative buildings and
interconnect these systems to the electricity network
where the suitable locations have been selected for
mounting them. About 90 PV systems have been
already mounted with about a capacity of 9 MW. On
the other hand, "Shamsk ya Masr" has considered
energy efficiency (EE) so as to complement the PV
systems, which will be installed on administrative
buildings. Cost- effective EE measures should be
implemented prior to or at the same time as
implemented PV program. The amount of electricity
that a PV system produces depends on the system
type, orientation and the available solar resource. In
2014, the GOE issued the Feed-in Tariff program to
further promote RE technologies in general and PV in
particular. Egyptian Electric Utility and Consumer
Protection Regulatory Authority (Egypt ERA) has set
the regulations, promotion and awareness for PVs.
This approach has been applied for administrative
buildings as well.
The paper highlights the impact of the previously
mentioned mechanisms in deploying PV technologies
through small scale projects. It also represents a cost-
benefit analysis for the installed systems taking into
account the measured value for PV parameters
(kWh/kWp, PSH) and daily load profiles of the
selected administrative buildings.
Keywords - photovoltaic (PV), emissions, Feed-in
Tariff (FiT), cost- benefit, peak sun hours,grid- tied.
I. INTRODUCTION
The Egyptian Electricity Holding Company (EEHC)
has sixteen affiliated companies six generation
companies (EPCs), nine distribution companies
(EDCs) and the Egyptian Electricity Transmission
Company (EETC).
Both the Solar Radiation Atlas and the German
Aerospace Center estimate Egypt's economically
viable solar potential in the range of 74 billion
MWh/year, or many times Egypt's current electricity

Renewable Energy and Sustainable Development (RESD) Volume 3 Issue 1, Special Issue, March 2017 - ISSN 2356-8569 http://dx.doi.org/10.21622/RESD.2017.03.1.087
88 RESD © 2017 http://apc.aast.edu
production. The Energy Research Center at Cairo
University's Faculty of Engineering estimate that 6
MW of solar PV are currently installed in Egypt. In
addition, a 150 MW integrated-solar combined-cycle
power plant is in Kureimat, with a solar component of
20 MW is already under operation.
II. PV SYSTEMS
Solar panels generate free power from the sun by
converting sunlight to electric power with no moving
parts, no emissions, and no maintenance. The PV
system structure is very flexible. PV modules are the
main building blocks, these can be arranged into
array to increase electric energy production. Normally
additional equipment is necessary in order to
transform energy into a useful form or store energy
for future use. The resulting system will therefore be
determined by the energy needs, or loads, in a
particular application.
Solar PV is one of the world's fastest growing
renewable energy technologies. This is due to its
flexibility in both size and location, ease of installation
to both new and retrofit buildings and low operation
and maintenance costs. For the PV system to be
located on the roof of a building, roof structure must
be deigned to accommodate the additional dead
loads (static load) of the PV system. The solar panels
and racking will add approximately 3 pounds for each
square foot of collector area [1].
A. Advantages of solar PV :
• PV panels provide clean-green energy. During
electric production with PV, there is no harmful
greenhouse gas emissions, thus PV is
environmentally friendly.
• PV panels via photoelectric phenomenon,
generate electricity in a direct electricity generation
way.
• PV panels have no moving parts, except in case of
sun-tracking mechanical bases.
• PV panels are totally silent, producing no noise at
all.
• PV panels are easy to install on rooftops.
• Solar energy is energy supplied by nature –it is
free and abundant.
• Solar energy can be made available anywhere
there is sunlight.
• Solar panels cost is currently on a fast reducing
track and expected to continue reducing for the
next years.
• Operation and maintenance cost for PV panels
are considered to be low, almost negligible.
B. Disadvatnges of solar PV :
• Solar panels efficiency levels are relatively low.
• PV panels require relatively large areas.
• Solar energy panels require additional equipment
(inverters) to convert DC to AC in order to be used
on the power network.
• Solar energy has intermittency issues, not shining
at night but also during daytime there may be
cloudy or rainy weather.
• Consequently, intermittency and unpredictability of
solar energy makes solar energy panels less
reliable a solution.
III. PV PLANTS PROBLEMS IN EGYPT [2]
Egypt lies in dusty and very dry weather with limited
rainfall (<10mm), the results on the PV test park in
Cairo:
• Two months dusty module has an energy
reduction of 25%.
• One year dusty module has an energy reduction
of 35%.
IV. GRID- TIED
These systems are directly coupled to the electric
distribution network and do not require battery
storage. Electric energy is either sold or bought from
the local electric utility depending on the local energy
load patterns and the solar resource variation during
the day, this operation mode requires an inverter to
convert DC to AC currents. There are many benefits
that could be obtained from using grid-tied PV system
instead of the traditional stand-alone schemes. These
benefits are:

Renewable Energy and Sustainable Development (RESD) Volume 3 Issue 1, Special Issue, March 2017 - ISSN 2356-8569 http://dx.doi.org/10.21622/RESD.2017.03.1.087
89 RESD © 2017 http://apc.aast.edu
1. Smaller PV arrays can supply the same load
reliably.
2. Takes advantage of the existing electrical
infrastructure.
3. Less balance of system (BoS) component are
needed
4. Eliminates the need for energy storage
5. Lower capital cost.
• Solar Atlas of Egypt
Egypt is one of the world's most attractive sites for
solar energy thanks to both ample sunlight and
proximity to existing and potential energy grids. Solar
power uses direct sunlight and must be located in
regions with high direct solar radiation. Among the
most promising areas of the world are: the South-
Western United States, Central and South America,
Northern and Southern Africa, the Mediterranean
countries of Europe, the Middle east and Iran [3].
High intensity of direct solar radiation ranging between
2000 – 3200 kWh/m2/year from North to South. The
sun shine duration ranges between 9-11 h/day from
North to South, with very few cloudy days.
Fig .1. represents the map of Egypt's annual average
of direct solar radiation.
Fig .1. map of Egypt's annual average of direct solar radiation.
Table 1. shows the comparison between direct,
diffuse radiation (kWh/m2.a) in Berlin and Cairo.
Horizontal plane radiation in Berlin and Cairo are 1000
and 2000 kWh/m2.a respectively.
Table 1. Comparison between direct, diffuse radiation
(kWh/m2.a) in Berlin and Cairo
Month Berlin Cairo
Direct Diffuse Direct Diffuse
Jan 6 13 67 33
Feb 12 22 75 40
Mar 30 41 103 61
Apr 42 65 120 72
May 60 90 143 80
Jun 64 94 161 71
Jul 67 89 163 70
Aug 64 70 147 68
Sep 40 49 124 57
Oct 21 30 99 50
Nov 9 13 64 43
Dec 3 10 55 36
% 42 % 58% 66 % 34%
Table 2. represents the total monthly solar irradiation
[kWh/m²], for this table:
• Horizz.Global solar radiation on horizontal surface
in kWh/m2/day
• Best incline: Solar energy density on south facing
flat plate tilted by the latitude angle of the site in
kWh/m2/day
• South: Solar energy density on N-S polar axis and
E-W tracking in kWh/m2/day
• East / west: Solar energy density on E-W polar
axis and N-S tracking in kWh/m2/day

Renewable Energy and Sustainable Development (RESD) Volume 3 Issue 1, Special Issue, March 2017 - ISSN 2356-8569 http://dx.doi.org/10.21622/RESD.2017.03.1.087
90 RESD © 2017 http://apc.aast.edu
Table 2. Total monthly solar irradiation [kWh/m²]
"in Marsa - Matroh (Egypt-North)"
V. MONTIROING SYSTEM
A monitoring system is a common component in PV
systems. Monitoring allows tracking of solar system
performance over the life of the system and makes it
easy to identify systems that perform below
expectation and may be in need maintenance.
Monitoring systems requires an internet connection in
the room that contains the inverter.
The monitoring system was designed to meet
guideline of standard IEC 61724 and within the
framework of the International Energy Agency
Photovoltaic Power System (IEA PVPS) Program. For
the general data acquisition, a multi- function
increasing device measures the different parameters,
such as: KWP /month, kWh/day, kWh/month , …etc.
Egypt's geographic location provides a generous solar
resource that should be exploited to its maximum
potential. The use of PV technology could allow the
local community to take advantage of this resource
without sacrificing land resources by using the
building rooftops as energy collection fields. Using
roof areas is more economical.
VI. PERFORMANCE INDICES OF PV
SYSTEMS
There are many indices for assessing PV systems
performance
1. Peak Sun Hours ( PSH)
This is the equivalent number of hours per day when
solar irradiance average 1000 W/m2, or it refers to the
solar irradiance which a particular location would
receive if the sun was shining at its maximum value
for a certain number of hours. Fig .2. represents this
definition.
Fig .2. Definition of PHS
PHS is calculated based on the following equation:
PHS (ℎ𝑟𝑠
𝑑𝑎𝑦) =
𝐴𝑣𝑔.𝐷𝑎𝑖𝑙𝑦 𝐼𝑟𝑟𝑎𝑑𝑖𝑎𝑡𝑖𝑜𝑛 (𝑘𝑊ℎ/𝑚2.𝑑𝑎𝑦)
𝑃𝑒𝑎𝑘 𝑆𝑢𝑛 (1𝑘𝑊
𝑚2) (1)
By using the monitoring data for 90 PV systems
related to EDCs according to geographical location for
each EDC. The calculation of PHS were carried out
and presented in Table (3).
The result is: av. PHS for 90 PV located in different
locations in Egypt, are between 4 and 7.7 hr/d.
Table 3. The PSH for EDCs
Company Range of PSH
(hr/d)
Av. PSH
(hr/d)
EDC 1 3.9 – 7.2 5.3
EDC 2 4 4
EDC 3 2.7 – 12.4 5.1
EDC 4 5.5 – 6.4 4.1
EDC 5 3.6 – 7.1 5.1
EDC 6 2.9 – 7.1 4.4
EDC 7 3.9 – 6.2 4.7
EDC 8 3.7 – 6.8 7.7
EDC 9 3.9 – 6.5 5.2
Orientation JAN FEB MAR APR MAY JUN JUL AUG SEP OCT NOV DEC
Horizz. 3.1 3.97 5.33 6.61 7.37 8.01 7.98 7.37 6.3 4.73 3.51 2.92
South 5.27 6.32 7.17 8.41 8.89 9.27 9.33 9.08 8.16 6.69 5.34 4.7
East/West 4.9 5.49 5.89 6.81 7.35 7.81 7.73 7.13 6.34 5.56 4.84 4.46
Best incline 4.54 5.3 5.83 6.54 6.54 6.52 6.6 6.63 6.29 5.45 4.54 4.08

Renewable Energy and Sustainable Development (RESD) Volume 3 Issue 1, Special Issue, March 2017 - ISSN 2356-8569 http://dx.doi.org/10.21622/RESD.2017.03.1.087
91 RESD © 2017 http://apc.aast.edu
2. Performance ratio (PR)
The PR is the ratio of PV energy actually used to the
energy theoretically available. PR is calculated based
on the following equation
PR = Yf / Yr
Where:
Yf is final system yield = Epv / Po
in ( kWh/KWp.d) or (hr/d)
Yr is reference yield = Hi/GSTC
in (kWh/KWp.d) or (hr/d)
Table 4. The PR values for PV systems in Egypt
Company
Yr
Range of global
solar radiation
( kWh/m2.d) (Hi)
Yf
(av.)
kWh/k
Wp.d
PR
EDC 1 < 5.4 5.3 0.98
EDC 2 5.4 – 5.8 4 0.72 – 0.74
EDC 3 5.6 – 5.8 5.1 0.88 – 0.91
EDC 4 5.4 – 5.6 4.1 0.73 – 0.76
EDC 5 5.8 – 6.0 5.1 0.85 – 0.9
EDC 6 5.8 – 6.0 4.4 0.73 – 0.76
EDC 7 5.8 – 6.0 4.7 0.81 – 0.84
EDC 8 6.4 – 6.6 4.7 0.71 – 0.73
EDC 9 6.8 – 7.1 5.2 0.73 – 0.77
Table 4. shows the PR values for some PV system
according to their locations indicated by each DC.
Previously, companies used to guarantee the specific
yield of a PV plant
• Typically required by uninformed clients.
• Not possible due to fluctuations in weather
conditions.
• Ends in very conservative calculations to minimize
risk.
Nowadays, PV clients are more informed
• Request PR guarantees
Typical PR ranges 70 - 85 %
Independent testing body typically conducts audits.
• Factors affecting PR:
• Irradiance losses.
Modules are rated at STC.
• Temperature losses.
Modules 25 degrees Celsius.
• Module mismatch.
Due to + or – tolerance range in module rating.
• Cabling losses.
• Transformer losses.
• Inverter losses.
• Soiling losses.
• Shading losses.
VII. BENEFIT- COST ANALYSIS
1. Benefit-cost analysis:
When the benefits of a project can be valued, they are
discounted and aggregated, and compared with the
associated aggregate costs over the lifetime of a
project. Comparison between project costs and
benefits can be conducted in the following ways:
• Benefit-cost ratio: compares the total discounted
benefits of electrification with total discounted costs,
as a ratio, and provides an indication of the scale of
return on the investment. This is done by examining
the ratio of the present value of benefits to the
present value of costs. If the ratio of benefits to
costs is greater than one, the project can be viewed
as desirable from an economic point of view.
2. Economic Benefits and Costs:
Investment evaluations of energy systems generally
include an assessment of the projected benefits
compared to the estimated costs of the system. The
direct financial benefit of a BIPV system is primarily
the value of energy generated.
These benefits and the direct economic costs of a
BIPV may be viewed as:
• Projected Benefits = Value of Electricity Generated
• Estimated Costs =
Capital Costs + Periodic Costs + Replacement Costs
Quantitative analysis is a tool that facilitates ranking
and choosing among investment alternatives. As
such, quantitative procedures appear to be
straightforward. However, numerous factors influence
comparative evaluations. A building owner's economic
expectations about future interest rates, inflation, and
fuel costs directly affect investment decisions, as can
utility interface requirements, environmental
regulations, and tax incentives.

Renewable Energy and Sustainable Development (RESD) Volume 3 Issue 1, Special Issue, March 2017 - ISSN 2356-8569 http://dx.doi.org/10.21622/RESD.2017.03.1.087
92 RESD © 2017 http://apc.aast.edu
The Egyptian government started installing PV
projects on one-thousand of the governmental
buildings, which was followed by as an initiative called
"Shamsk ya Masr", then the Feed-in Tariff (FiT)
projects were launched.
VIII. FIT
Egypt faces a major challenge in generating electricity
from its primary energy resources, especially oil and
natural gas that contribute to 97% of the total energy
resources. Studies show that even though Egypt has
reasonable reserve of gas and oil, it is likely that it will
face severe shortage in satisfying its electricity
demand due to rapid growth in demand and the
increase of oil and gas extraction costs [4]. Noticing
this problem, Egypt has consequently pursued several
mechanisms for deploying Renewable Energy (RE)
technologies and integrating them to the Egyptian
electricity systems.
Unfortunately, lots of barriers have impeded Egypt
from achieving any of its electricity generation targets;
particularly financial and regulatory barriers. Feed-in
tariff (FiT) is one of the mechanisms that has been
adequately studied but was never recognized as a
possible solution to the deployment of RE due to
existing electricity tariff subsidies. Moreover, the huge
political transition that started in 2011 has led to
deteriorating the economic and financial position of
the country. The global economic slowdown, started in
2008, caused a decline in Foreign Direct Investment,
the international reserves also fell sharply by that
time, and its creditworthiness has been undermined
as reflected by lowering of the international ratings
assigned to Egypt. Certainly, this is considered a
typical unhealthy environment to attract investments
or even to maintain the existing ones. Recently, the
government of Egypt (GoE) has launched several
national programs in order to regain its economic
health.
On September 2014, Egypt has announced its
ambitious FiT program for deploying 4300 MW of wind
and solar energy in a 2-years’ time. It is believed that
the program as designed in this way would overcome
most of the barriers that have hindered the RE market
in Egypt.
FiT planning program for Egypt includes the early
provision for setting the RE target for Egypt at larger
and the capacity cap for the FiT program in particular.
1. RE-FiT Policy Making
Several studies were conducted to assess the energy
situation in Egypt. These studies have indicated that
retaining balance between oil and natural gas
production and their usage within three (3) years can
be achieved after overcoming the economic
challenges facing the oil and natural gas sector.
However, it is expected that Egypt will be a net
importer of oil and natural gas within ten (10) years
from the start of the third decade of this century. This
situation represents an additional challenge for the
Egyptian economy which will become more vulnerable
to the price fluctuations in the international energy
markets, which can’t be predicted or controlled.
Therefore, there has to be diversity in the energy
resources so as to maximize the benefits of using
local RE resources which are characterized by
sustainability and stable prices. [5]
A. Setting the Target
The starting point for RE policy making is usually the
definition of targets in terms of installed capacity or
minimum shares in the country’s electricity production.
In Feb. 2008, the Supreme Council of Energy has set
a target to have a 20% of the total generated
electricity to be from RE resources by the 2020. Wind
energy was been given the priority such that it would
represent 12% of the total target (equivalent to 7200
MW). Hydro power will provide 6% and the remaining
2% will come from other RE resources including solar
and biomass energies. In July 2012, the Cabinet
approved the Egyptian Solar Energy target with a total
installed capacity of 3500 MW by the year 2027. It
includes 2800 MW from Concentrated Solar Power
(CSP); in addition to 700 MW from Photovoltaic (PV).
The private sector should participate with 67% of the
mentioned capacities, while the governmental projects
share, represented by New and Renewable Energy
Authority (NREA), will be 33%.[6]
B. Defining the Mechanisms
Once targets have been defined the choice of
appropriate policy instruments/mechanisms should
realize their achievement. They considerably vary in
their design and conception. Some of them stimulate
the supply of renewable electricity, while others
directly affect the demand. Furthermore, support
schemes can be distinguished according to the
chosen instrument.

Renewable Energy and Sustainable Development (RESD) Volume 3 Issue 1, Special Issue, March 2017 - ISSN 2356-8569 http://dx.doi.org/10.21622/RESD.2017.03.1.087
93 RESD © 2017 http://apc.aast.edu
All of the above mentioned mechanisms are currently
in place in Egypt. State owned projects which are
carried out by NREA, the BOO projects which are
carried out by the Egyptian Electric Transmission
Company (EETC) through tendering process, and the
bilateral market of RE where Power Producers (PPs)
that get into bilateral contracts with their own
customers, are all mechanisms that Egypt has
undertaken for quite long time. However, the
achievements that were expected from these
mechanisms have never been satisfied. A deep
insight into the reasons behind such shortcomings is
due to (but not limited to); the GoE could hardly
manage the sovereign risks causing prolonged delay
in the first 250 MW BOO wind projects, the heavily
subsided tariffs and absence of quota system hurdles
the bilateral market of RE so that PPs to could hardly
get into contracts with direct customers, and last but
not least, failure to realize the RE Fund. Accordingly,
a concrete design for a FiT system taking into
consideration the current economic, financial,
regulatory and legal barriers became essential. [7]
C. Design of Feed-in tariff program
In October 2014, the FiT program for (PV - Wind)
projects has been announced according to a prime
minister decree. A total capacity cap of 4300 MW is to
be achieved over the first regulatory period of applying
the FiT. This target includes 300 MW for small PV
projects below 500 kW, 2000 MW for medium size PV
projects which range from 500 kW up to 50 MW and
the remaining 2000 MW is from wind projects with
capacities ranging from 20 MW up to 50 MW. The first
regulatory period starts from the day of announcing
the FiT (i.e. October 2014) and ends if either the
capacity cap is reached or a two years period is
passed, whichever happens first. The EETC or the
electricity distribution companies are committed to
purchase the produced electricity from RE power
plants at the prices announced by the Cabinet over
the duration of the PPAs which is 20 years for wind
and 25 years for PV.
Four basic pillars should be in place to support the
design of the FiT program. These are the legal,
regulatory, contractual frameworks and the tariff
structure. Each of these four pillars will be discussed
in this section. [8]
IX. CONCLUSION
Within Egypt power Strategic plan, the power sector
strategy is depending on the diversification and
expansion of energy resources, and rational use of
conventional energy resources.
Moreover the solar Atlas indicates that Egypt is one of
the sun belt countries endowed with high intensity of
direct solar radiation ranging between 2000-3200
kWh/m2/year and sunshine duration from 9-11 hours
per day which offers opportunities of investing in Solar
energy projects.
The Egyptian Electricity Holding Company is
cooperating with the New and Renewable Energy
authority through the following:
• Generation planning taking into consideration the
contribution of the renewable energy.
• Network planning to ensure safe evacuation of the
generated energy from the renewable energy
projects.
• The Egyptian Electricity Transmission Company is
tendering competitive biddings for the construction
of renewable energy power plants through BOO
(Build, Own and operate) model at predetermined
sites.
The endowment of Egypt with these renewable
resources is offering a great opportunity to exchange
"Clean Energy" through the electrical interconnection
with neighboring countries.
The Egyptian Electricity Holding Company and its
affiliated companies have taken the initiative to install
solar Photo Voltaic (PV) systems at the top roof of
their administrative buildings and interconnect these
systems to the Unified Power System where the
suitable locations have been selected for mounting
them 90% solar PV systems have been contracted
with a total capacity of 9 MW.
The Monitoring systems are good tools to evaluate the
performance for the PV plants.
The results are:
• av. PSH in range 4: 7.7 hr/d
• PR in range 0.71: 0.98 which is in the
recommended range.

Renewable Energy and Sustainable Development (RESD) Volume 3 Issue 1, Special Issue, March 2017 - ISSN 2356-8569 http://dx.doi.org/10.21622/RESD.2017.03.1.087
94 RESD © 2017 http://apc.aast.edu
FiT is considered a solution to major challenges
hindering the development of RE market in Egypt,
although being a challenge in itself. The learning
process that preceded the design of the FiT program,
started at a time when this approach was not foreseen
at any level of decision making in the GoE.
However it was essential to gain the adequate
knowledge of FiT design at large, and for the Egyptian
case in specific. For solar energy, the tariff was
categorized between different sizes of projects in
order to match with the different categories of
customers (individuals, commercial and large
investors). Also, the GoE has provided soft loans for
individuals and small customers. When it came to
implementation, the design was accurately fine-tuned;
first to the economic updates, second to overcome
various barriers which have been ingrained in the
existing corporate’s culture. Moreover, the GoE has
mandated the electricity companies to carry out the
required procedures on behalf of the small customers
in order to facilitate the process of acquiring the loans.
Also, a one-stop-shop entity to facilitate the
overwhelming official procedures was established.
Finally, it is worth mentioning that lack of interest in a
FiT program from the GOE has stopped it for years,
nevertheless the commitments which GoE has
recently declared were the backbone for supporting
the FiT today. These include; issuance of the RE law
that among its articles has approved the quota system
that reduces the financial burden on the electricity
sector due to the feed-in tariff, availing state lands for
investors, providing sovereign guarantees for large
projects, offering low interest loans for small projects,
and providing finance for upgrading the transmission
and distribution infrastructure.
REFERENCES
[1] www.solar-rating.org
[2] The First Grid connected PV power plant in Egypt
Arab Organization for Industrialization.
[3] IEC 61724:1998(E): Photovoltaic system
performance monitoring – Guidelines for
measurement, data exchange and analysis.
[4] Draft Egypt Energy Strategy 2035 (2015): “to be
published”
[5] Design of a Feed-In Tariff Structure and a
Contractual Relationship Template for Wind
Power in Egypt (2011): “internal document”
[6] Po Annual Report, (2012/2013): New and
Renewable Energy Authority
http://www.nrea.gov.eg/annual%20report/Annual_
Report_2012_2013_eng.pdf
[7] Combined Renewable Energy Master Plan for
EGYPT (2009 – 2011): “internal document”
[8] Renewable Energy – Feed-in Tariff Projects
Regulations (2014): Egyptian Electric Utility and
Consumer Protection Regulatory Agency
http://egyptera.org/Downloads/taka%20gdida/Dow
nload%20Renewable%20Energy%20Feed-
in%20Tariff%20Regulations.pdf

Renewable Energy and Sustainable Development (RESD) Volume 3 Issue 1, Special Issue, March 2017 - ISSN 2356-8569 http://dx.doi.org/10.21622/RESD.2017.03.1.095
This Paper has been Accepted and Presented in the (First International Conference on New Trends for Sustainable Energy) 1-3 October, 2016 at Pharos University, Alexandria, Egypt.
95 RESD © 2017
http://apc.aast.edu
Opportunities of energy saving in lighting systems for
public buildings Ayman Abd El-khalek, Kamelia Youssef and Ibrahim Yassin
Improving EnergyEfficiency of Lighting & Building Appliances Project
Abstract - The lighting system provides many options
for cost-effective energy saving with low or no
inconvenience. Lighting improvements are excellent
investments in most public buildings, it is usually cost-
effective to address because lighting improvements
are often easier to make than many process
upgrades.
For public buildings, the easy no and low cost options
to help save money and improve the energy
performance are:
Understand energy use.
Identify options
Prioritize actions
Make the changes and measure the savings.
Continue managing energy efficiency.
The challenge is to retrofit traditional lamps with LED
lamps of good quality. The benefits of LED light bulbs
are long-lasting, durable, cool, mercury free, more
efficient, and cost effective.
The light Emitting Diode (LED) bulb uses a
semiconductor as its light source, and is currently one
of the most energy efficient and quickly developing
types of bulbs for lighting. LEDs increasingly are
being purchased to replace traditional bulbs. LEDs
are relatively more expensive than other types of
bulbs, but are very cost-effective because they use
only a fraction of electricity of traditional lighting
methods nd can last for longer.
Benchmarking guides decision makers to policies
aimed at the energy sector through better
understanding of energy consumption trends
nationwide, e.g.: energy price, moderating, peak
demand, and encouraging sectors, low energy
expansions.
The “Improving Energy Efficiency Project of Lighting
and Appliances” carried out energy audits and
implemented opportunities of energy saving in lighting
for different type of public buildings.
To rationalize the use of energy by giving guidelines
to consumers, the IEEL&A project prepared some
brochures.
This paper leads with the results of case studies as
energy audits, opportunities in lighting systems,
energy saving and CO2 reduction.
I. INTRODUCTION
Improving Energy Efficiency of Lighting and Building
Appliances (IEEL&A) project was initiated by the
Global Environmental Facility and the United Nations
Developmental Program (GEF-UNDP), in conjunction
with the Ministry of Electricity and Renewable Energy
(MOERE), intends to publish the use of energy
efficient lighting by making energy audits for public
buildings and increase the awareness on the benefits
of using new lighting technologies as LED.
Lighting consumes a considerable share of the total
electricity consumption in Egypt, and it was identified
as one of the main factors of the system peak
consumption. In response, the Egyptian Ministry of
Electricity and Renewable Energy (MOERE) has
encouraged the use of LED on the domestic,
commercial and industrial levels, as energy saving
lamps, to reduce lighting consumption. LEDs are
energy efficient as they consume 85% less electricity
than the incandescent lamps, which are widely used
in Egypt.
Lighting systems provide many options for cost-
effective energy saving with no or low inconvenience.

Renewable Energy and Sustainable Development (RESD) Volume 3 Issue 1, Special Issue, March 2017 - ISSN 2356-8569 http://dx.doi.org/10.21622/RESD.2017.03.1.095
96 RESD © 2017
http://apc.aast.edu
Lighting improvements are excellent investments in
most of public buildings which make very good
savings in electricity consumption.
The challenge is to retrofit traditional lamps with LED
lamps of good quality.
II. LED LIGHTING
The Light-Emitting Diode (LED) is one of today’s most
energy-efficient and rapidly developing lighting
technologies. Quality LED light bulbs last longer, are
more durable and offer comparable or better light
quality than other types of lighting, also LEDs are
safe on environment as they don’t contain mercury in
its components.
The Light-Emitting Diode (LED) is an electronic
component made from semiconductors and emits
light without lost energy in heat. It is a highly energy
efficient lighting technology, as it uses at least 75%
less energy than traditional lamps, and lasts 25 times
longer than incandescent lighting lamps. It is very
different from other lighting sources such as
incandescent bulbs and Compact Fluorescent Lamps
(CFLs), because of many key differences include the
following:
Long lifetime - LED s’ can last up to 50,000 hours.
Rugged – LED’s are also called (Solid State
Lighting “SSL”) as they are made of solid material
with no filament or tube or bulb to break.
No warm-up period - LED’s light instantly – in
nanoseconds.
Directional – with LED’s you can direct the light
where you want, thus no light is wasted.
Excellent Color Rendering - LED’s do not wash
out colors like other light sources such as
fluorescents, making them perfect for displays and
retail applications.
Environmentally friendly - LED’s contain no
mercury or other hazardous substances.
Controllable - LED’s can be controlled for
brightness and color using dimmers.
Table (1): Summarizes features for LEDs,
incandescent and CFL lamps.
Table (2): Represents wattage comparison between
LEDs, incandescent and CFL lamps.
Table (3): Represents the comparison between
LEDs, incandescent and CFL lamps for efficiency and
Color Rendering Index (CRI).
Table 1. Features for different types of lamps
Feature Light Emitting
Diodes (LEDs)
Incandescent
Light Bulbs
Compact
Fluorescents
(CFLs)
Life Span (Hours) Typically
above 50,000 1,000 – 2,000
8,000 –
10,000
Wattage
(equivalent to 60
W Incandescent
bulb)
6 – 8 W 60 W 13 – 15 W
Temperature
Sensitivity None
Yes,
Somewhat Yes
Sensitive to
humidity No
Yes,
Somewhat Yes
Switching On/Off
Quickly No Effect
Yes,
Somewhat
Yes – lifespan
can reduce
drastically
Turns on instantly Yes Yes
No – takes
time to warm
up
Durability
Durable – can
handle jarring
and bumping
Glass or
filament are
fragile
Glass can
break easily
Toxic Mercury No No Yes
Table 2. Wattage comparison between incandescent, CFL and LED lamps
Incandescent / Halogen CFLs LEDs
40-60 12-15 5-8
60-75 15-18 7-10
75-100 18-23 10-15
100-150 23-35 15-20
150-200 35-45 20-25
200-250 45-60 25-30
Table 3. Comparison between incandescent/Halogen, CFL and LED lamps
in regards to efficacy and CRI
Incandescent /
Halogen CFLs LEDs
Efficacy: 15-25
Lm/W
Efficacy: 40-70
Lm/W
Efficacy: 60-140
Lm/W
CRI: 98-100 CRI: 60-90 70-95
A. DISADVANTAGES OF LED
LED’s are currently more expensive on the initial
capital cost basis than other conventional lighting
technologies.
LED performance largely depends on correctly
engineering the fixture to manage the heat generated

Renewable Energy and Sustainable Development (RESD) Volume 3 Issue 1, Special Issue, March 2017 - ISSN 2356-8569 http://dx.doi.org/10.21622/RESD.2017.03.1.095
97 RESD © 2017
http://apc.aast.edu
by the LED. Over-driving the LED or not engineering
the product to manage heat in high temperatures may
result in overheating of the LED package, eventually
leading to device failure. Heat sinking is required to
maintain long life.
III. ENERGY AUDIT
The energy audit is the first and fundamental step for
any organization, irrespective of type (Public
Administration, Private company), size (SME, large
organization) and sectors (commercial, industrial,
residential), striving to reduce energy consumption
and improve its energy efficiency. The
implementation of the actions identified in the energy
audit will generate values to the Customer (cost
saving) and related environmental benefits. Fig (1)
Describes the steps of an energy audit process.
Fig .1. STEPS OF ENERGY AUDIT PROCESS
1. Final Report of energy audits:
The final report of the energy audit has to include all
the key elements of the energy audit as below:
Executive summary.
Aim, scope and boundaries of the audited object.
Baseline energy flow and adjustment factors.
Criteria for ranking the improving energy
efficiency opportunities.
Assumptions made
Proposed recommendations and action plan.
Expected benefits.
Technical, economic and financial analysis.
The measurement and verification method.
2. BENCHMARKING AS THE BELOW IMPORTANT
FACTORS
Building Energy Index ( BEI ) ( in Kwh/m2/year )
Load factor
Power factor
Lighting Power Density (LPD) ( in W/m2)
Depending on the values of those factors, the energy
conservation potential is determined
IV. CASE STUDY
“Improving Energy Efficiency Project” has intended to
provide technical aid as energy audits by qualified
electrical engineers for more than 60 project and
financial participation of replacing all the lighting
systems for 17 buildings to the LED lighting
technology systems.
Due to the success of those projects and the savings
were recorded and notable, there are more
cooperation with other parties to implement a set of
pilot projects in different sectors and below is a
detailed table of pilot projects that have been already
implemented by the project:
Table 3. RESULTS OF CASE STUDIES
Places have been totally
changed to LED
Number of
LED lamps
Initial
investment
(EGP)
Yearly
energy saving
(kwh)
Lighting
energy
saving
(%)
Yearly
energy
saving
(EGP)
Payba
ck
period
(year)
Public Building (1) 1,740 183,460 158,755 75% 57,946 3.2
Public Building (2) 1,018 91,351 109,433 75% 40,052 2.3
Public Building (3) 2,540 133,215 116,312 75% 42,570 3.1
Hotel (1) 8,312 942,181 1,804,998 81% 828,609 1.2
Hotel (2) 24,304 3,378,948 4,769,556 80% 2,527,865 1.3
Public Building (4) 1,753 346,000 229,520 90% 119,307 3
Public Building (5) 3,600 213,905 231,922 77% 70,672 3.4
Public Building (6) 2,295 134,930 128,824 66% 47,149 3
Public Building (7) 474 31,224 27,358 80% 10,013 2.2
Public Building (8) 9,477 528,011 364,984 65% 195,432 3
Public Building (9) 3,328 252,446 325,339 80% 119,074 2
Bank (1) 5,280 231,792 73,333 82% 627,216 0.4
Bank (2) 1,601 235,251 312,136 77% 206,010 1.1
Commercial Store 3,940 289,322 396,617 72% 187,698 1.5
Public Building (10) 100 275,220 48,904 76% 26,897 3
Public Building (11) 2,991 328,669 693,636 80% 457,800 0.7
Public Building (1) 3,290 781,631 635,543 75% 400,681 2
Total 76,043 8,377,556 10,427,170 5,964,991

Renewable Energy and Sustainable Development (RESD) Volume 3 Issue 1, Special Issue, March 2017 - ISSN 2356-8569 http://dx.doi.org/10.21622/RESD.2017.03.1.095
98 RESD © 2017
http://apc.aast.edu
V. CONCLUSION
The Egyptian market is shifting toward energy-saving
lighting projects and many pilot projects were
implemented by “Improving Energy Efficiency Project”
and supported by the Ministry of Electricity and
Renewable Energy. The project intended to provide
technical aid as energy audits by qualified electrical
engineers for more than 60 project and financial
participation of replacing all the lighting systems for
17 buildings to the LED lighting technology systems
with a total number of 76,043 changed bulbs of
different types and capabilities to the LED bulbs with
a total investment 8.3 million Egyptian Pounds worth
of energy savings of 10 million Kilowatt hours per
year with a value of saving about 5 million pounds per
year.
REFERENCES
[1] “Efficient Lighting Market Baselines and
Assessment” by UNEP
[2] “Good practices for Photometric Laboratories” by
UNEP
[3] “Lighting and Energy Savings” by DR. Kamelia
Youssef
[4] “Annual report 2013/2014”, Egyptian Electricity
Holding Company, Ministry of Electricity and
Renewable Energy, Arab Republic of Egypt.
[5] “LED street Light Energy Efficiency case study”,
Asheville, NC, John Cleveland for the USDN
Innovation working Group 9.3.11
[6] www.osram.com
[7] www.continental-lighting.com
[8] www.wikipedia.org

Renewable Energy and Sustainable Development (RESD) Volume 3 Issue 1, Special Issue, March 2017 - ISSN 2356-8569 http://dx.doi.org/10.21622/RESD.2017.03.1.099
This Paper has been Accepted and Presented in the (First International Conference on New Trends for Sustainable Energy) 1-3 October, 2016 at Pharos University, Alexandria, Egypt.
99 RESD © 2017
http://apc.aast.edu
Energy efficiency opportunities in Hotels Dina M.Said, Kamelia Youssef and Hatem Waheed
Egyptera, Cairo, Egypt
[email protected], [email protected],
Abstract - According to the statistics in Egypt (2013),
the number of hotels is 1193, about 407 of them have
contracted power greater than 500 kW.
Air conditioning, lighting, water heating and
refrigeration represent the main activities demanding
electrical energy in hotel business.
The energy consumption per night spend changes a
lot, depending on various factors; facilities provided,
category of hotel, occupancy , geographical situation,
weather conditions, nationality of clients, design and
control of the installations.
Energy benchmarking is an internal management tool
designed to provide ongoing, reliable and verifiable
tracking on the hotels performance. The most useful
performance indicator (or Energy Efficiency
Benchmarking) of hotels are: Lighting Power Density
(LPD) in W (for lighting)/m2, and energy intensity
(kWh/m2/ y).
There are multiple benefits for improving energy in
hotel business; reduces the hotel's operating cost,
reduces climate change risks and promotes green
tourism.
Energy efficiency opportunities are low-cost measures
and cost- effective investments.
There are many energy saving opportunities for
lighting in hotel's guest rooms as well as the more
obvious savings in lobbies and exterior lighting areas.
Behavior campaigns can yield substantial energy
savings, both through the guests and housekeeper
behavior. Encouraging housekeepers to use natural
light during room cleaning is a simple first step to
implement energy saving program.
This paper presents the energy efficiency guidelines
and energy benchmarking for hotels. Also a case
study showing how the energy efficiency program
implemented is presented.
I. OVERVIEW OF ENERGY CONSUMING
ACTIVITIES IN A HOTEL
The main energy consuming activities in a hotel are:
Heating rooms.
Cooling rooms.
Lighting.
Hot water use and other energy consuming
activities by guests.
Preparing meals.
Swimming pools.
Others.
Table (1) represents consumption structure of a
hotel.
Table 1. ENERGY CONSUMPTION STRUCTURE OF A HOTEL [6]
Type of load Energy consumption (%)
Cooling source 14.2 %
Heating source 10.7 %
Fan 15.7 %
Water 2.9 %
Hot water supply 9.9 %
Lighting 14.7 %
Outlet 7.7 %
Others 24.2 %
II. ENERGY EFFICIENCY
uses less energy to perform the same tasks and
functions
saves energy.
lowers operational costs.
reduces carbon emissions/foot print.
increases competitiveness.
Table (2) classified use to EE

Renewable Energy and Sustainable Development (RESD) Volume 3 Issue 1, Special Issue, March 2017 - ISSN 2356-8569 http://dx.doi.org/10.21622/RESD.2017.03.1.099
100 RESD © 2017
http://apc.aast.edu
Table 2. CLASSIFICATION USED TO EE
Item Classification
Energy management
- assess energy profile. - draws up a simple energy policy.
- adopts good housekeeping practices. - ensures periodic serving and maintenance of
equipment and device. - provide information to staff and guests.
Reduction of the Hotels’ heating and
cooling needs
- improves the thermal insulation of the building - avoids uncontrolled air infiltration.
- protects the building from the summer heat.
Equipment efficiency
- improves Lighting efficiency - improves ventilation efficiency.
- improves space cooling efficiency. - improves heating efficiency.
- better operational use of current equipment.
III. ENERGY EFFICIENCY OPPORTUNITIES
EE provides hotel owners and operators cost
savings. Efficiency also improves the service of
capital equipment, enhances guest comfort, and
demonstrates a commitment to climate stewardship.
In a typical hotel, lighting, air conditioning and water
heating represent up to 70 % of total energy
consumption. Laundry is considered as one of the
largest consumption segment of electrical power in
hotels.
The following shows a guide on how to reduce
energy consumption with low cost procedures or no
cost at all sometimes.
A. Laundry EE opportunities
Washing machines shouldn’t be during peak
hours and it is best to operate them only when in
full loads.
Use high efficiency appliances (such as washing
machines, dryers, steam irons etc.) and other
high-efficiency equipment to minimize electricity
consumption.
Reduce the temperature of water used for
laundry from 85°C to 60°C, or use cold water
washing when possible. It will save energy and
cut down on costs.
Make sure that washing machines and dryers are
kept clean and have no scale.
Turn off lights, ventilation and air conditioning
when the area is not being used.
B. Lobby and other hotel areas EE opportunities
Install LEDs in the lobby area and around the
hotel.
Set the temperature in busy areas of the hotel at
24°C.
Switch off or dim lights in areas that receive
natural sunlight during the day.
All light fittings in the hotel should be cleaned on
a regular basis.
Install occupancy sensors for lighting in areas
such as rooms that are not regularly used such
as meeting rooms or storage areas, or
walkways/corridors.
Some elevators can be programmed to stay
stationary on the floor they exit at instead of all
elevators returning to the lobby.
During off-peak periods shut down one or two of
your elevators to help save energy.
Heating of pools can be quite costly. Try to
maintain the temperature of the pool to 25.5°C
Install Light Emitting Diodes (LED) in areas
where the lighting is on continuously or for long
periods, e.g. exit signs, other signs, stairwells,
front desk etc.
Install electricity meters in each department to
monitor consumption.
Operate garden and exterior lights only when
there isn’t enough natural light.
Turn off exterior decorative lights in the middle of
the night when most guests are asleep.
At the end of the workday, make sure that lights,
air conditioning and office equipment is switched
off in the hotel’s back-of-house areas.

Renewable Energy and Sustainable Development (RESD) Volume 3 Issue 1, Special Issue, March 2017 - ISSN 2356-8569 http://dx.doi.org/10.21622/RESD.2017.03.1.099
101 RESD © 2017
http://apc.aast.edu
Make sure equipment is used efficiently in the
hotel’s office areas. E.g. Copiers, fax machines,
computers, printers etc.
C. KITCHENS / RESTAURANTS / COFFEE SHOPS
EE opportunities
Use gas ovens rather than electrical ones if
possible.
Lights in areas such as coffee shops and
restaurants should have flexible or separate
switches so that part of the lighting system can
be switched off if that area is not being used.
Another good idea is to install dimmers.
Keep the walls and ceilings of the restaurants
clean for better light reflection.
Use high efficiency appliances (such as fridges,
freezers, dishwashers, etc.) and other high-
efficiency equipment to minimize electricity
consumption.
Switch off and unplug all appliances after their
use (coffee makers, mixers, blenders, grills,
fryers, plate warmers, stoves etc.). Electricity to
power appliances and electronics are still
consumed while the devices are turned off, so
make sure they are unplugged.
Make sure all kitchen equipment and appliances
are cleaned and checked daily.
Turn off exhaust fans and lights when the kitchen
is not being used.
Keep the refrigerator full if possible.
Do not put items right in front of the refrigerant
coils or fans in a way that would restrict air
circulation.
Try using minimum number of electrical
appliances; avoid using them all simultaneously,
especially during peak hours.
D. Guest rooms EE Opportunities
Install efficient air conditioning units.
Set room temperature to 24°C.
Set unused room temperature to 28°C or switch
them off completely.
Install lighting emitting diodes (LEDs) in all
rooms; LEDs use about 10-15 % of the energy
and last up to 25 times longer than regular
incandescent bulbs.
Install master key-tag switches at the entrance of
each guest room, which is activated by a room
key tag/card. When guests leave the room and
remove the key tag from the holder (master
switch), lighting, heating, ACs, radio and
television are automatically switched off. Energy
management systems such as this can reduce
the electricity consumption of guest rooms by 15
to 30%.
Close the blinds or drapes in unoccupied rooms.
Make sure windows are tightly shut to minimize
air escaping.
Clean lamps and lamp shades regularly.
Set the temperature of water heaters between 49
and 55°C.
Avoid keeping equipment such as televisions,
hair dryers, and lamps close to A/C thermostats.
The heat from these appliances can affect the
thermostat readings and increase energy
consumption.
Provide regular preventive maintenance to all
appliances, boilers, piping and other equipment.
IV. PILOT PROJECT (“Z” HOTEL)
Before energy use can be reduced in the hotel, it is
necessary to understand how energy is being
consumed. It is also helpful to compare the hotel’s
energy consumption to other similar hotels. It’s very
important to know how efficient is the hotel in terms of
energy and where potential energy saving could be
made through energy conservation.
“Z” hotel building mainly consumes its energy on
water heating, space heating, refrigeration, space
cooling, cooking, lighting and other building services.
Renewable Energy and Sustainable Development (RESD) Volume 3 Issue 1, Special Issue, March 2017 - ISSN 2356-8569 http://dx.doi.org/10.21622/RESD.2017.03.1.099
102 RESD © 2017
http://apc.aast.edu
The Z-hotel has166 normal guest rooms, 7 suite
rooms and 4 conference rooms. The annual energy
consumption for the year 2012 is equal to 573,000
KWh
Table (3) Shows electric loads in hotel as result of
energy audit.
Table 3. KW FOR APPLIANCES IN HOTEL
Place Power for appliances (kW)
Guest rooms 1.764/ guest room
Suite rooms 1.963/ suite room
4 Conference rooms 12.97
Bazar 0.125
Laundry 33.476
Kitchen 22.98
Restaurant 2.36
The appliances (electrical loads) are: lamps, TV, mini
bars, hair dryers, washing machines, dryers, irons,
fans, ACs, refrigerators and kitchen machines (coffee
maker, meat blinder, toaster, …).
V. TYPES OF LAMPS AND RATING
Different rating and type of lamps are used. Table (4)
shows the result of audit
Table 4. TYPE AND RATING OF LAMPS
Type of Lamp Rating (W)
CFLs 11 & 22
Fluorescent lamp (T12) 20 & 40
Incandescent lamps 40 & 60 & 100
Halogen lamp 25
LED lamp 3 & 6
Energy performance benchmarking is an internal
management tool designed to provide ongoing,
reliable and verifiable tracking on the hotels
performance. The most useful performance indicator
(or Energy Efficiency Benchmarking) of hotels is:
Lighting Power Density (LPD) in W (for lighting)/m2.
Table (5) shows the calculated LPD for different
places in hotel, and LPD according to ASHRAE/
IENSA standard [1].
From Table (5) it is noticeable that the LPD for
conference rooms, laundry, kitchen and restaurant is
exceeding the standard value. Then a use of high
efficiency fluorescent lamps and electronic ballasts in
such area, which is used for long hours, would greatly
improve both efficacy and LPD.
Table 5. EE BENCHMARKING FOR DIFFERENT PLACE IN HOTEL.
Place Calculated LPD
(w/ m2) ASHRAE/IENSA(1)
LPD (w/ m2)
Guest room 4.125 11
Suite room 4.95 11
Conference room 27.59 13
Bazar 13.44 14
Laundry 22.625 5
Kitchen 24 12
Restaurant 14.15 13
According to [5] the guest room energy benchmark
figures are represented in Table (6).
Table 6. KWH PER OCCUPIED GUEST ROOM PER YEAR
EE rating Good Fair Poor
Electricity kWh/room < 1825 1825-2550 >2550
The guest room energy benchmark for “ Z” hotel is
3312 kWh/room/y.
VI. CONCLUSION
Energy is essential to maintain comfort standards in a
hotel; however it is important that this energy is used
efficiently. Reducing the energy consumption in
hotels helps in environmental protection by reducing
greenhouse gas emissions.
EE in hotel is a valuable resource that creates a win-
win solution on multiple fronts. It saves energy
consumers, money, increases comfort, protects the
environment and enhances the economy. When EE
is mixed with smart energy practices, like turning off
lights, air conditioners, and TVs that are not in use, all
of the benefits above are compounded. Providing
training to all hotel staff on EE is important to
motivate for energy saving.
REFERENCES
[1] ASHRAE/IESNA standard 90.1 Space-by-space
method.
[2] Evaluation of energy Consumption in
Mediterranean island.
Hotels: Case study: The Balearic Islands Hotels
A.Mota-Pol, Michals Karagiorgas Barcelona,
Spain.
[3] Hotels: An overview of energy use and energy
efficiency opportunities energystar.gov.

Renewable Energy and Sustainable Development (RESD) Volume 3 Issue 1, Special Issue, March 2017 - ISSN 2356-8569 http://dx.doi.org/10.21622/RESD.2017.03.1.099
103 RESD © 2017
http://apc.aast.edu
[4] Hotel Design and Energy Consumption Bin Su
World Academy of Science, Engineering and
Technology 72 2012
[5] Energy Efficiency in hospitality Industry
Mr.Pawa Kumar
National Productivity Council, New Delhi.
[6] Energy Conservation for Hotels
Major points, measures, and successful cases
of energy conservation for hotels
The energy conservation center, Japan.

Renewable Energy and Sustainable Development (RESD) Volume 3 Issue 1, Special Issue, March 2017 - ISSN 2356-8569 http://dx.doi.org/10.21622/RESD.2017.03.1.104
This Paper has been Accepted and Presented in the (First International Conference on New Trends for Sustainable Energy)
1-3 October, 2016 at Pharos University, Alexandria, Egypt.
104 RESD © 2017 http://apc.aast.edu
Sustainability and Conserved Energy Value of Heritage
Buildings Associate Prof. Dalia A. Elsorady
Department of Architecture, Pharos University, P.O. Box 37, Sidi Gaber, 21311, Alexandria, Egypt.
Abstract - Conservation and sustainability have long
shared fundamental goals. Heritage buildings are
basically sustainable and will continue to be if their
sound construction and superior materials are
conserved properly. Despite this fact, heritage
buildings have gained a reputation for being
inefficient and therefore unsustainable in the face of
modern, energy-efficient structures. As a result,
models which are measured embodied energy arose
to advocate the retention of heritage structures over
new constructions. The initial need to measure
energy capital in buildings started due to rising needs
to save energy and address global sustainability
goals. Both responses measure overall energy
efficiency of heritage buildings by attempting to
account for the "energy capital." The life cycle
assessment/avoided-impacts model is another model
that acts as a response to the evolving metrics and
currency of sustainability. The Conservation Green
Lab has further developed the capabilities of the life
cycle assessment/ avoided impacts model in 2012 in
its innovative report: “The Greenest Building:
Quantifying the Environmental Value of Building
Reuse”. With this aim, the study applies energy
software models supported by guidelines laid out by
LEED, and are consistent with judicious conservation
practice on a case study heritage building in
Alexandria. The outcome revealed proves that
heritage buildings can be both sustainable and
energy efficient while maintaining their historic
integrity, when dealt with properly.
Keywords - Sustainability, Embodied energy,
Heritage Conservation, LEED, Life Cycle
Assessment, Energy value.
I. INTRODUCTION
Heritage conservation has evolved from the
aspiration to preserve sites linked to specific
identities. The conservation field has also responded
to a raise in energy prices, and deficiency of energy
sources with a number of initiatives. These initiatives
have laid the basis for the embodied energy dispute
of the preservation of existing buildings with their
locked-up energy rather than substitution with new
more energy efficient buildings. Nevertheless,
traditionally, sustainability, when dealing with the built
environment, has relied heavily on “green technology”
and new high performance construction in contrast
with conservation projects. The arguments for
retention of heritage buildings from an energy value
perspective have evolved around the focus of the
energy capital embodied within constructions.
Additionally, the environmental avoided impacts
approach looks at the environmental impacts that are
avoided by rehabilitating an existing heritage
structure compared to demolition and novel
construction.
Continually, the conservation field is faced with the
challenge of bridging the gap between operational
energy and embodied energy when comparing the
efficiency of energy in historic versus new buildings.
Operational energy is defined as the energy used
within a building to heat, cool and illuminate, as it
operates over a typical meteorological year.
Operating energy is a vital component when
measuring the energy used up in a building; the
ability to integrate and mature the operating energy
component into the assessment of the “energy
capital” of a building will develop the argument for the
conservation field. The embodied energy format
measured “energy capital” by what had been
invested, while the life cycle assessment/avoided
impacts scheme measures “energy capital” by what is
required to be spent in the future to improve
operating efficiency of an existing building [1]. In both
cases the “energy capital” of the heritage building is
compared to the “energy capital” of a new building.
The methodology of this research consists of an
outline of the relationship between sustainability and

Renewable Energy and Sustainable Development (RESD) Volume 3 Issue 1, Special Issue, March 2017 - ISSN 2356-8569 http://dx.doi.org/10.21622/RESD.2017.03.1.104
105 RESD © 2017 http://apc.aast.edu
conservation; an in-depth evaluation of the embodied
energy model and the life cycle assessment/avoided
impacts model, followed by the examination of a case
study. Utilization of models is explained and explores
potential options for the conservation field to proceed,
and to continue to be relevant rather than to indicate
these past claims and advances. Embodied energy
for the case study building was assessed using the
survey method. Environmental consequences, or the
avoided impacts, were measured as well as using the
Athena Eco-Calculator provided by the Athena
Sustainable Materials Institute in Canada. The
investigation of a case study was used to draw
conclusions about how to better lever conversation
sustainability, specifically as those conclusions relate
to energy value in heritage structures.
II. LITERATURE REVIEW
A. Conservation, Sustainability and Energy
Sustainable development is defined as “the means to
providing the basic necessities of life... to meet our
needs today while enabling future generations to
meet their needs” [2]. Conservation equals a
commitment to sustainable practices. Certainly there
is a common sense notion that reusing existing
buildings is better than demolishing and replacing
them. The fact is that reducing waste, rather than
accepting and managing it, has become a critical
priority. Reference [3] points out the essential
coincidence between conservation and sustainability
in the ‘3 Rs’ i.e. reduce, reuse and recycle of non-
renewable resources [3]. Reference [4] defines the
embodied energy as “the quantity of energy required
by all activities associated with a production process”
[4].Additionally, reference [5],in his speech at the
National Trust annual conference, explains the term
“embodied energy” as “the total expenditure of
energy involved in the creation of the building and its
constituent materials” [5]. Besides, Ashworth explains
that historic buildings are often viewed as containers
of stored value of embodied energy, and a sort of
frozen employment [6]and [7]. Reference [8]gives an
example: a heritage building with approximately
308,000 exterior bricks, each with an embodied
energy value of 14,300 Thermal Units (BTU),
represents 4.4 million BTUs of energy expended in
the original construction of the building, or 1.3 million
kilowatt hours of electricity [8]. Reference [9]points
out that conservation and adaptive reuse cause much
less destruction to our natural resources than new
construction. Interestingly, about 85 percent of the
total embodied energy in materials is used in their
production and transportation [9]. Unmasking these
costs can provide strong incentives for a transition to
more sustainable energy use, less profligate use of
new materials, and greater use of existing building
stock [10](see figure 1).
Existence of heritage structure is a testament to their
sustainability because they have remained useful
spaces.
A building and its components is a major tenet of
sustainable design. Heritage structures are also
sustainable for the types of architectural elements
they employ. Because most of these buildings were
built before the advent of air-conditioning, they utilize
the earth’s natural energies, such as sunlight and
wind. This consideration is crucial to “greening” a
heritage building because the original materials have
largely performed admirably over decades and even
centuries. Removing the heritage fabric or damaging it
to the point of necessitating its removal would thus
create a less sustainable structure, even if the
replacement was considered more efficient.
Fig .1. Sustainability and Energy Diagram (Source: Author).
Reference [11] identifies the role buildings play from
an energy usage perspective, and it is believed that
the future energy adaptive qualities and design
buildings will have to incorporate with their concepts
[11]. It has been concluded that conservation of
energy within buildings has an integral role in the
effort to cut down on energy consumption.
Furthermore, reference [12] recognizes the benefits
associated with reusing heritage structures versus

Renewable Energy and Sustainable Development (RESD) Volume 3 Issue 1, Special Issue, March 2017 - ISSN 2356-8569 http://dx.doi.org/10.21622/RESD.2017.03.1.104
106 RESD © 2017 http://apc.aast.edu
building new ones. He explains the benefits of
intensifying the discussion to encompass
environmental benefits, including the issue of
embodied energy [12].
Moreover, the Advisory Council on Historic
Preservation commissioned a study regarding energy
conservation and heritage structures. The aim was to
provide a tool for determining the energy value of
heritage structures. The methodology related to
embodied energy used by the Advisory Council for
Historic Preservation (ACHP) measured the embodied
energy of materials and construction for existing,
rehabilitated and new construction. It also measured
the demolition energy for existing buildings; including
the energy to demolish, load and drag away building
materials [13]. Besides, Carter overviews the
importance of the study produced by the ACHP,
Assessing the Energy Conservation Benefits of
Historic Preservation: Methods and Examples, and
affirms that it must extremely influence the
conservation movement and perhaps transform the
way effects on the built environment are evaluated
[14].
B. Resource Conservation and Adaptive Reuse
In 1993, the U.S. Green Building Council was
established with a mission to support sustainability in
the industry of building and construction. Additionally,
the U.S. Green Building Council delivered the green
rating system, LEED. LEED is therefore defined as:
“The most widely recognized and widely used green
building program across the globe. LEED is certifying
1.6 million square feet of building space each day in
more than 130 countries. LEED is a certification
program for buildings, homes and communities that
helps guide the design, construction, operations and
maintenance. Today, nearly 50,000 projects are
currently participating in LEED, comprising more than
8.9 billion square feet of construction space.” [15].
LEED has provided the basis for the building business
to begin designing with sustainable incentives. This
has raised the question: How would heritage
structures be compatible in a world with limited
resources?
Responsiveness of the need to decrease greenhouse
gas emissions has transferred the sustainability
initiative from an energy crisis to a climate of
alleviation. Over the last years, buildings have
continually been noticed as the largest energy use
sector over transportation and industry. As energy use
by buildings continues to be a growing anxiety, the
conservation community can gain traction on the
dispute of heritage buildings adaptive reuse.
Reference [16] has declared that the greenest building
is the one that is already built [16]. Reference [16]
viewpoint has become the framework for a dispute for
many to defend the value of energy embodied in
heritage buildings.
Fig. 13 shows a photograph of the complete
experimental setup. In this figure, the host PC
including the dSPACE controller, which is used to
control and monitor the system variables by using the
connector pins interface, is shown. Also, the power
and interface circuits of the laboratory prototype of the
proposed multi-phase MC are shown.
Reference [17], the former President of the Athena
Sustainable Materials Institute, discusses the
environmental gains in renovation versus new
constructions. This is considered the benchmarking
approach of comparing demolition versus new
construction and estimating the environmental
impacts that are avoided by saving an existing
building [17]. Reference [17] looks at two scenarios,
the first is the minimum avoided impact case, which
entails saving only the structural system of a building,
while the rest is demolished or replaced. The second
scenario is the maximum avoided impact case, which
involves saving the wrapping as well as the structure.
A well known researcher concluded that life cycle
assessment should be used for renovation projects as
a decision support methodology, if the appropriate
data and tools are accessible [17].
The Athena Sustainable Materials Institute has
examined the life cycle analysis, and whole building
energy simulation, in evaluating the material and
operational environmental effects of rehabilitating an
existing building compared to new construction [18].
Furthermore, renewed heritage buildings can function
comparably to new buildings using common
environmental measures such as energy power and
global warming contributions [19]. Finally, in 2012, the
Preservation Green Lab has released its prominent
study results which conclude that building reuse
constantly offers environmental savings over
demolition and new construction. Moreover, it can
take between 10 and 80 years for a new, energy-
efficient building to surmount, through more efficient
operations, the negative climate change impacts that
were formed during the construction process [20].

Renewable Energy and Sustainable Development (RESD) Volume 3 Issue 1, Special Issue, March 2017 - ISSN 2356-8569 http://dx.doi.org/10.21622/RESD.2017.03.1.104
107 RESD © 2017 http://apc.aast.edu
C. Embodied Energy and the ACHP Model
The Advisory Council for Historic Preservation in their
report, defines embodied energy as the energy which
is measured in fossil fuels, and that was consumed to
make any product, bring it to market, put it to use, and
then to dispose of the product at the end of its useful
life [13]. The First and Second Law of
Thermodynamics provide the basis for exploring
embodied energy in resources. Therefore, the quality
of a resource will determine and influence its utility
and value within a system, by raising the quality of a
resource, and it will enforce its own set of
environmental demands. Stein displays this law
through the life cycle of a brick [21]. The brick has the
same amount of material as an equivalent chunk of
clay in the ground. However, the brick in the brick wall
has considerably more value than the unprocessed
soil. In order for the clay in the ground to become a
brick, it has to go through a number of processes
including: extraction of the raw clay, transportation,
crashing and separation of the clay, shaping, firing in
the furnace, transportation to the job site and
assembly in the wall [21]. As a result, the brick has
higher environmental demands. In order to raise the
quality of the clay to that of a brick, energy has been
added. As the brick weathers or declines by natural
processes, or when it is demolished, the resources
and energy that have been added to the material will
be vanished. Decline of materials and assemblies as
a building witness the passage of time is a predictable
consequence of the Second Law of Thermodynamics.
Buildings begin deteriorating at the point of finishing
construction, slowly at first, and then accelerating the
pace of deterioration before slowing once again.
Building owners slow deterioration rate by
preventative maintenance, or compensate
deterioration with repairs and replacements,
incrementally increasing the embodied energy,
ultimately approaching the original values.
In view of that, the Advisory Council on Historic
Preservation has reached a model whichprovides
another tool for determining the total worth of
threatened properties, and, in specific cases, whether
retention and continued use are in the public interest.
The Advisory Council of Historic Preservation has
developed tools for assessing the potential energy
conservation value that preservation provides. The
following are outlined tools [13]. Firstly, the embodied
energy of materials and construction for existing,
rehabilitated, and new construction is the amount of
energy required to process and put materials of
construction in place. Embodied energy increases
with the amount of processing and is not recoverable.
Secondly, demolition energy for existing buildings is
the amount of energy required to raze, load, and haul
away building construction materials. The annual
operational energy for existing, rehabilitated and new
construction is the amount of energy required to
operate the facility where the operational energy
depends upon climate; occupancy characteristics; and
physical design of the building [13].
The methodology of the mentioned report looks at
embodied energy of materials and construction for
existing, rehabilitated and new construction [13]. The
embodied energy calculation includes the amount of
energy to process and put materials of construction
into place. The first model presented is the building
concept model. The report states that “results are
generally correct but not precise,” [21] (Booz, 1979,
p.19). This model states that embodied energy is
measured by assessing the building type and gross
square footage [23]. The concept model as a formula
is expressed as:
Embodied Energy Investment = Gross floor area of
heritage building x invested energy per square foot
specific to the building type from Exhibit 1.
The second model is the building survey model, and it
is considered to be the most useful [13]. Hence,
embodied energy is determined using a rough survey
of primary material quantities, and applying their
relevant energy values.
An evaluation of the data inputs for the above
methods is further investigated to identify the
justification behind the embodied investment dispute.
The variance for heritage structures may be
noticeable because structures were originally built in
varying centuries with varying building technologies
that had utilized varying energy yields. Hence, it is
important to recognize the basis and origins of the
data and numeric quantities. The U.S. Department of
Energy provides a study of patterns of embodied
energy through diverse construction industries [23].
The embodied energy total includes the embodied
energy of the materials plus the direct energy of
construction used at the site. The breakdown of the
forty-nine categories is: seventeen are new building;
five are building maintenance, repair and alteration;
and the remaining twenty-seven are non-building
construction and repair. The Department of Energy
report stresses that 70 percent of embodied energy in

Renewable Energy and Sustainable Development (RESD) Volume 3 Issue 1, Special Issue, March 2017 - ISSN 2356-8569 http://dx.doi.org/10.21622/RESD.2017.03.1.104
108 RESD © 2017 http://apc.aast.edu
new construction is attributed to fabrication of basic
construction and components; the remaining 30
percent is due to delivery and setting up, including
direct fuel purchases, administration, and
transportation of materials, furnishings and
construction equipment [23].
The Advisory Council on Historic Preservation report
has become an embedded dispute within the field as
a link to the sustainability conservation. The ACHP
report has laid the basis for quantifying the energy
value of conserving heritage structures. The ACHP
model was innovative at the time of its release.
However, at what position does the industry respond
to the new wave of energy efficiency and green
building design solutions? The answer to this question
may be evident within the Preservation Green Lab,
National Trust for Historic Preservation’s recent study
[24]. To express what embodied energy is basically
accounting for a formula which can be articulated
starting with the original capital investment, minus the
losses due to decline, plus the added investment
while ownership is maintained, equals the residual
current value of investment (see figure 2).
Consequently, the embodied energy method does not
account for predictable processes that occur to every
building such as deterioration and maintenance,
therefore not accounting for the true current capital
value of the building.
Fig .2. Formula to Express Embodied Energy (Source: Author
based on Booz, 1979).
D. Life Cycle Assessment of Heritage Structures
While conservation is not the sole resolution to
sustainability, it can be an integral part of it. The
Whole Building Design Guide, in its 2012 article
“Sustainable Historic Preservation,” endorses the
notion that “preserving a building is often called the
ultimate recycling project” [25]. It goes on to detail
intrinsic sustainable features within heritage structures
such as sustainable sites, water efficiency, energy
and atmosphere, on-site renewable energy, green
power, materials and resources and indoor
environmental quality [25]. The reality is that these
features emphasize the similarities and common
characteristics in sustainability goals and
conservation.
The Whole Building Design Guide refers to Life Cycle
Assessment (LCA) which is defined by the United
States Environmental Protection Agency as a
technique to assess the environmental aspects, and
potential impacts associated with a product, process,
or service by compiling an inventory of relevant
energy and material inputs and environmental
releases; evaluating the potential environmental
impacts associated with identified inputs and releases,
in addition to interpreting the results to help you make
a more informed decision [26]. LCA is also
appropriate to heritage conservation as it can be
utilized to assess the environmental values and
benefits associated with reusing a building. This
approach to investigating existing structures shifts the
focus from solely embodied energy, which makes up a
fraction of an LCA, to a whole building approach, and
brings to the front position a range of environmental
values [17]. The LCA assessment tool would be used
to compare rehabilitation and new construction, in
addition to comparing various rehabilitation options.
Furthermore, the Greenest Building: Quantifying the
Environmental Value of Building Reuse study has
explored the environmental impact reduction when
rehabilitated buildings are compared to demolition and
new construction. This LCA framework enables the
conservation industry to look at key variables such as
building life span and the efficiency of operation
energy that may affect the decision to reuse buildings
in opposition to building a new one [20]. Three key
findings from the study are: firstly, building reuse
almost always yields fewer environmental impacts
than new construction when comparing buildings of
similar size and functionality; secondly, reuse of
buildings with an average level of energy performance
consistently offers immediate climate change impact
reductions compared to more energy efficient new
construction; and thirdly, materials matter i.e. the
quantity and type of materials used in building
renovation can reduce, or even negate, the benefits of
reuse [20].
E. Athena Sustainable Materials Institute and Life
Cycle Assessment Measures
Several attempts were made to build up spreadsheets
calculating environmental impacts of heritage
buildings retention. Spreadsheets were therefore
developed into software [27]. In 2002, it was released
under the name Environmental Impact Estimator (and
is currently called the Athena Impact Estimator for
Buildings). A second tool, the Athena EcoCalculator

Renewable Energy and Sustainable Development (RESD) Volume 3 Issue 1, Special Issue, March 2017 - ISSN 2356-8569 http://dx.doi.org/10.21622/RESD.2017.03.1.104
109 RESD © 2017 http://apc.aast.edu
for Assemblies, was developed in 2007. The Athena
Institute is still a reliable source providing software,
research and valuable information in the form of life
cycle assessments for the construction industry.
Examining the environmental impacts that are avoided
by recycling a building opposed to demolition
amplifies the dispute for conservation. Accounting for
the energy, in the future, closes the gap that exists
between the energy that was spent at initial
construction, and the energy added for a replacement
building. Therefore, the life cycle assessment/avoided
impacts model is in alignment with the sustainability
goals. The method used was novel and exemplary in
the response to provide the conservation field the
tools.
III. METHODOLOGY
A. Heritage Conservation and Energy Sustainability in
the International Context
Heritage preservation groups around the world have
begun not only informing others about the role of
conservation in sustainability, but also utilizing
sustainable practices in their own preservation
projects. The U.S National Park Service, which
oversees the Secretary of the Interior’s Standards,
has released standards to provide general goals for
preservation projects at the international level, as well
as guidelines for specific aspects of heritage
construction. In fact, within the Secretary of the
Interior’s Standards for Rehabilitation, there are
“special requirements for energy efficiency” that fall
into their guidelines [28].
In addition, the National Trust for Historic Preservation
is a national, private non-profit organization in U.S.
that seeks to “save historic places and revitalize
America’s communities.” [24]. The National Trust has
partnered with LEED, or Leadership in Energy and
Environmental Design, for several of their
preservation projects, showing their dedication to
increasing efficiency and sustainability even further in
historic structures [29]. The Trust utilizes LEED
certifications because their standards focus largely on
the reuse of materials and resources in any
construction project, whether it is a new or existing
building. The National Trust has taken on even more
involvement to partner with several U.S. national
groups to create the Sustainable Preservation
Coalition, which has made the goal of meeting with
the U.S Green Building Council to improve LEED
standards. The coalition’s goal is to improve certain
aspects of the LEED certification system, primarily
because the current versions that “overlook the impact
of projects of cultural value, do not effectively consider
the performance…and embodied energy of historic
materials and assemblies; and are overly focused on
current or future technologies, neglecting the
advantages of many traditional building practices.”
[29]. A heritage construction is inherently sustainable
because it is extremely durable and often utilizes
natural energies, and LEED standards should reflect
this reality. However, even though there are many
ways for the LEED certification process to improve, it
is still possible for heritage buildings to be LEED
certified, or even gain higher recognition in silver, gold
or platinum LEED ratings.
Furthermore, English Heritage, officially known as the
Historic Buildings and Monuments Commission of
England, most recent efforts towards sustainability
have culminated in a document aptly titled “Building
Regulations and Historic Buildings: Balancing the
needs for energy conservation with those of building
conservation.” [30]. The guide is meant to be an
application of the country’s regulation, which deals
with energy conservation in new, existing, and
heritage properties in order to reduce CO2 emissions
and protect the building from negative impacts related
to irreversibility.
B. Energy Sustainability of Heritage Buildings: The
Egyptian Status Quo
The site of the Egyptian Ministry of Electricity and
Renewable Energy was explored to look into Egyptian
efforts towards energy sustainability of heritage
buildings. Unfortunately, no information was available
regarding this issue [31]. Since Egypt has been
lacking a national program for this subject, it therefore
has much to learn from efforts investigated abroad.
This is the reason for investigating international
literature and applying its experiences in this
research. The Egyptian government and Egyptian
governorates should coordinate to better inform the
public about energy sustainability guidelines and their
implementation benefits for heritage structures.
C. Heritage Reuse in Alexandria, Egypt
The practice of rehabilitating old buildings to extend
their use, or recycling them for a new purpose is a
well- established practice in many parts of the world.
Generally speaking, the stock of potential reusable

Renewable Energy and Sustainable Development (RESD) Volume 3 Issue 1, Special Issue, March 2017 - ISSN 2356-8569 http://dx.doi.org/10.21622/RESD.2017.03.1.104
110 RESD © 2017 http://apc.aast.edu
buildings in Alexandria is in Sharq district, in addition
to the central urban area district (see figure 3). One
can point out that Alexandria has maintained its
downtown with architectural continuity to a certain
extent. Likewise, there is a vast number of buildings in
Alexandria that are candidates for continued adaptive
reuse; thus adding up to those in the city centre.
Some are outstanding examples of architecture and
craftsmanship.
D. Case Study Selection
There is a tremendous impact to the environment
when we construct something new, so avoiding new
construction may be the most eco-conscious
approach to our environment.” [27]. Consequently,
several heritage buildings were examined to select the
case study taking into consideration accessibility to
available needed information. The selected case
study is a house which lies at Sharq district in
Alexandria. It is registered as a villa no. 891 within
Alexandria Heritage Report (see figure 4).
It lies at 24KafrAbdou Street in Alexandria [32]
(Alexandria Heritage Report, 2007, Map no. 17).
Fig .3. Alexandria Districts, with Sharq District
It is one of 463 listed buildings in Sharq district. It is
categorized as important at the local level, the
Architectural style is the English style. This style refers
to buildings created under English influence or by
English architects in parts of the world other than
Britain, particularly in the later British colonies and
Empire. The house has utilized the whites of splashes
in the façade and windows of wood. The building roof
is formed of wood and brick veneers. The height of
the ground floor is 4 meters and the height of first and
second floors are 3.5 meters.
Fig .4.KafrAbdou villa (Source: author.)
From Left: Arial Photo for villa in 2016. Middle: Villa before Rehabilitation. Right: Villa after Rehabilitation
Fig .5.KafrAbdou villa (Source: Rehabilitation project consultant)
Up Left: Ground floor plan before rehabilitation
Down left: First floor plan before rehabilitation
Up Right: Ground floor plan after rehabilitation
Down Right: First floor plan after rehabilitation

Renewable Energy and Sustainable Development (RESD) Volume 3 Issue 1, Special Issue, March 2017 - ISSN 2356-8569 http://dx.doi.org/10.21622/RESD.2017.03.1.104
111 RESD © 2017 http://apc.aast.edu
• Case Study Original Form
The house consists initially of a building with an
area of 175 square meters per floor (2 floors = 3767
sq. ft.) within a whole land parcel area of 470
square meters. The house originally composed of
two floors only. The ground floor included the
reception and a kitchen. The upper floor comprised
4 bedrooms and a living room.
• Current Form after Development
During the rehabilitation process, a mass of a 45
square meters area was added to both ground and
first floors. An additional staircase was added
leading to the second floor to meet the needs of the
owner and access the second additional floor. An
elevator was added as well. An additional basement
of 90 square meters was supplemented below the
building to accommodate four car parking spaces.
The ground floor still comprises The second newly
added floor is totally furnished and equipped as a
private flat for the owner’s son. It currently consists
of three bedrooms, a living room and a kitchen.
• Building structure and details
The Structural system is Skeleton (i.e. beams and
columns). Research focus is on material quantities
of the original building to be able to calculate its
contained energy. The original structure of the
building includes 123 cubic meters of reinforced
concrete columns and beams. The house
foundation consists of additional 170 cubic meters.
The foundation also includes 170 square meters of
plain concrete.
• Openings
The house includes 12 windows openings of three
different surface areas which comprise about 32
square meters.
• Brick exterior and interior walls
The total quantity of originally kept internal and
external bricks is about 70 cubic meters of bricks
(70*35=2450 cf).
• Wood Works
Wood flooring of Swedish wood, and wood parquet
totals 245 square meters (using 2inch thickness *
4inch width * 2450 length = 1633 BF) are
successfully kept.
• Asphalt pavement
Asphalt street outside is kept and it comprises 108
square meters of asphalt.
• Iron Works
Several iron works were kept such as iron doors
and fences which have a quantity of 16 square
meters (16*300*2.2=10560 lb).
• Nonferrous Products
These materials may include mortar, sand beneath
wood installations 22 tons approximately
(22*1000*2.2=48400 lb.)
• Infrastructure Works
All electric connections and sanitary works have
been completed to accommodate and comprise
current owner requirements.
E. Research Procedure and Results
The data gathered from the site includes a basic
site visit to assemble building information, building
dimensions, detection of observable materials, and
applicable material quantities. The current function
is residential. Interior access was not permissible.
Architectural Drawings including detailed plans
dimensions before and after restoration, sections
and elevations, were received from the consultant
architect who achieved the rehabilitation process
[33]
The survey level methodology for the embodied
energy analysis (ACHP) was applied for this case
study. The survey method calculator is accessed
through [22] www.thegreenestbuilding.org website.
The survey method examines major material
components of the structure, and calculates the
embodied energy of each individual element for
calculation [22] (thegreenestbuilding.org website)
(Table 1). The data sets comprise extraction of raw
material, manufacturing, transportation and physical
construction (see figure 6).

Renewable Energy and Sustainable Development (RESD) Volume 3 Issue 1, Special Issue, March 2017 - ISSN 2356-8569 http://dx.doi.org/10.21622/RESD.2017.03.1.104
112 RESD © 2017 http://apc.aast.edu
Several assumptions were necessary for structural
materials that were not visible. The green building
association generates British thermal unit (BTUs)
results based on the square footage of materials
used in original construction. For this reason, all
dimensions were changed from available French
Metric units used in Egypt to British Metric units to
be able to apply the Greenest Building calculations
per square footage.
Fig.6. Survey method of energy calculations used in construction.[22] (Application Template :www.thegreenestbuilding.org).
The results from the survey method yield 10726835
MBTU Embodied Energy Investment. The result from
calculations is of 10,726,835 BTUs put into the
Environmental Protection Agency’s Greenhouse Gas
Equivalencies Calculator 10,726,835 BTUs is
equivalent to 770.3 metric tons of CO2 or CO2
equivalent. To humanize these results further: that is
equivalent to the CO2 emissions from the energy use
of 42.6 equivalent area homes for one year. This
number is relevant when comparing it to the results
from the LCA approach.
Limitations related with the embodied energy
approach to quantifying value in heritage structures
are first the handling. While the embodied energy
calculator is accessible for free via the Internet, it is
not a downloadable interactive document. An extra
paper and pencil calculation to get BTUs is necessary.
Time intensity for this approach is low. For the gross
square footage calculation, it took approximately two
hours to perform take offs of existing plans.
Besides, Athena EcoCalculator is a structured excel
spreadsheet workbook, with tabs for various
construction assemblies on each; individual worksheet
with specific assembly information is included. All life
cycle stages are taken into account: resource
extraction and processing; product manufacturing; on-
site construction of assemblies; all related
transportation; maintenance and replacement cycles
over an assumed building service life of 60 years; and
the demolition and transportation of non-metal
materials to landfill [27] (Athena Ecocalculator
website).
Designed to be readily-applied, the EcoCalculator
template can be used without outside consulting or
help of any specialty, and the results are considered
to be reasonable approximations as opposed to
accurate estimates. The use of the Athena
EcoCalculator is to estimate embodied environmental
impacts, and global warming potential measured in
terms of CO2 equivalence. Estimated avoided impacts
associated with demolition of the existing building and
construction of new buildings of essentially the same
size is designed to serve the functions currently being
utilized by the renewed buildings.
Hence, the EcoCalculator provides results for seven
indicators of climate change impacts the classification
of those seven impact categories are fossil fuel
consumption (MJ), global warming potential (GWP) in
tones CO2 e.g., acidification potential, human health
criteria, eutrophication potential, ozone depletion
potential and smog potential. These impact measures
can be assessed to determine which assemblies
provide the lowest negative impact by entering the
square footage of materials into different assemblies.
The summary of the results from the EcoCalculator is
accounted for across the eight climate change
indicators (see figures 7, 8 and 9).
The total avoided impacts for global warming potential
(GWP) were compiled and the inclusion of calculating
the global warming potential for whole building
demolition was added on as an avoided impact in
case of the reuse of an existing building (see figure 7).
The assembly groups are also represented by the
percentage contribution from each assembly to the
seven climate change indicators (see figure 9).

Renewable Energy and Sustainable Development (RESD) Volume 3 Issue 1, Special Issue, March 2017 - ISSN 2356-8569 http://dx.doi.org/10.21622/RESD.2017.03.1.104
113 RESD © 2017 http://apc.aast.edu
Fig .7. Athena EcoCalculator Results on Spreadsheet. (Application Template:www.athenasmi.org).
Fig.8. Athena EcoCalculator Results in the form of Pie charts (Application Template: www.athenasmi.org).

Renewable Energy and Sustainable Development (RESD) Volume 3 Issue 1, Special Issue, March 2017 - ISSN 2356-8569 http://dx.doi.org/10.21622/RESD.2017.03.1.104
114 RESD © 2017 http://apc.aast.edu
Fig.9. .Athena EcoCalculator Percentages on Spreadsheet. (Application Template: www.athenasmi.org).
Out of the eight climate change indicators, global
warming potential is the indicator that can be
translated into a carbon dioxide equivalent. Global
warming potential (GWP), as defined by the
Environmental Protection Agency, was developed to
compare the ability of each greenhouse gas to
catch heat in the atmosphere relative to another
gas. The definition of a GWP for a particular
greenhouse gas is the ratio of heat trapped by one
unit mass to the greenhouse gas to that of one unit
mass CO2 over a specified time period [26] (U.S.
environmental Protection Agency website). The
avoided GWP impact of case study house is
equivalent to emissions from the electricity use of
16equivalent area homes for one year, or CO2
emissions from the energy use of equivalent area of
5.2 homes for one year.
As it is the case with any model, there are particular
limitations in the system. When calculating the
square footage for the Exterior Walls assembly,
there is a built-in 20 percent window to wall ratio.
The model automatically accounts for the 20
percent ratio. Time and user building construction
knowledge is the second limitation. While this
template is accessible, it does require the user to
have some basic architectural building construction
knowledge to choose appropriate building
assemblies.
I. DISCUSSION
Historically, the conservation field has relied on the
embodied energy outputs of BTUs when
discussing the energy capital in existing structures
[13]. However, with the development of the
LCA/avoided impacts approach, outputs in the form
of GWP or carbon dioxide equivalent emissions can
be utilized to still maintain the gallons of gas
comparison [26]. The environmental avoided
impacts model provides a currency that is
interdisciplinary. The environmental avoided impact
incorporates not just emissions from CO2, but also
human health, acidification, water, etc… [27].
This case study identifies and applies two ways to
approach quantifying the energy capital in heritage
structures. Both provide quantitative results, but
with different units of measurements. The
EcoCalculator Life Cycle Assessment measured the
energy capital in terms of eight climate change
indicators, and focused on global warming potential
[27], while the Advisory Council for Historic
Preservation embodied energy ACHP model
measured the energy capital in BTUs. Both
approaches have developed results that represent a
currency that has the potential to be communicable
across the sustainability community. When
measuring embodied energy, capital energy is
viewed retrospectively. We value a building
currently in terms of energy that has been expended
historically, not taking into account that a building
declines over the years. The LCA/avoided
environmental impacts approach looks at what total
replacement with a comparable new building would
require and accounts for the building declining over
the years.
The role that heritage conservation plays within
sustainability and the goal to reduce greenhouse
gas emissions is already on its way to adapting to
modern sustainability goals and policies. Examining
the resulting unit of measurement indicates the
embodied energy model, and produces results that
are measured in BTUs, and they are commonly
translated to gallons of gas. The life cycle

Renewable Energy and Sustainable Development (RESD) Volume 3 Issue 1, Special Issue, March 2017 - ISSN 2356-8569 http://dx.doi.org/10.21622/RESD.2017.03.1.104
115 RESD © 2017 http://apc.aast.edu
assessment/avoided impacts model produces
results in a metric of CO2 and GWP. In terms of the
conservation field utilizing a common currency to
communicate with experts driving sustainability the
life cycle assessment/avoided impacts model
provides these communicable measurements.
II. CONCLUSION
The role of the conservation field within energy
sustainability will continue to expand and adjust
since sustainable strategies and goals are
continually developing. This research has
highlighted the importance of the conservation field
to stay side by side with the saved energy that is
associated with sustainability. It is important for the
conservation field to approach the ability to employ
environmental avoided impact methods when
discussing and assessing heritage structures.
The core aim of sustainability is to safeguard the
eco-system for future generations. Conservation
professionals should adapt to this role, as they have
taken on the role of safeguarding structures,
landscapes and cultures for years. The ability to
reinforce the relationship between conservation,
sustainability and energy should be the
responsibility of the conservation field.
Communicating in a common energy value and
avoiding work in a silo will allow professionals to be
successful at the reuse of heritage structures.
With trained professionals, heritage buildings can
be better protected during retrofits, as well as
becoming more efficient with less impact on the
environment over time. With this understanding of
the broader movement for sustainability and
preservation internationally, we can begin to focus
on and support such initiatives to be performed in
Egypt.
III. ACKNOWLEDGEMENT
The researcher would like to recognize the support
and provision of valuable information and
architectural drawings provided by architect/
Hesham Shaker- Rehabilitation-project consultant.
Thanks are due to Dr. Mohamed S.Soliman-
Department of Computer Engineering- Pharos
University for his technical assistance with the
applied software. The researcher also wishes to
acknowledge the effort undertaken by Dr.
Hebatallah Hassan- Pharos University in editing this
article.
REFERENCES
[1] United States Energy Information
Administration. “Annual Energy Review
2011.” September 2012.
Available at
http://www.eia.gov/totalenergy/data/annual/pd
f/aer.pdf. (Accessed 02 May, 2016).
[2] United Nations, The Rio Declaration on
Environment and Development 1992, United
Nations Conference on environment and
Development, Rio de Janiero, Brazil.
Reprinted in Sustainable Development
Reader edited by Stephen M. Wheeler and
Timothy Beatley. New York: Routledge, 2004.
[3] D. Rodwell, Conservation and Sustainability
in Historic Cities, U.K.: Blackwell publishing
Ltd, 2007.
[4] Treloar, Extracting Embodied Energy Paths
from Input-Output Tables: Towards an Input-
Output-Based Hybrid Energy Analysis
Method. Economic Systems Research,Taylor
and Francis.Vol. 9(4), 1997, pp. 375-91.
[5] D. Rypkema and K. Wiehagen, Dollars and
Sense of Historic Preservation. The Economic
Benefits of Preserving Philadelphia’s Past.
Washington D.C.: National Trust for Historic
Preservation, 2000.
[6] Ashworth, Conservation Designation and the
Revaluation of Property: the risk of heritage
innovation, International Journal of Heritage
Studies, 8(1), 2002, pp. 9- 23.
[7] D. A. Elsorady, The economic value of
heritage properties in Alexandria, Egypt,
International Journal of Heritage Studies,
Volume 20, Issue 2, 2014, pp. 107-122.
[8] M. Wishkoski, Historic Preservation Projects
can be Green, 2006. Available at
http://www.djc.com/news/en/11177209.html
(Accessed 13 March, 2016).
[9] V. Bahl, Ethics of Adaptive Reuse.
Architectural Week.No.240, 2005, B1.1-B1.2.
[10] C. Langston and L. Shen, Application of the
Adaptive Reuse Potential Model in Hong
Kong A Case Study of Lui Seng Shun,

Renewable Energy and Sustainable Development (RESD) Volume 3 Issue 1, Special Issue, March 2017 - ISSN 2356-8569 http://dx.doi.org/10.21622/RESD.2017.03.1.104
116 RESD © 2017 http://apc.aast.edu
International Journal of Strategic Property
Management, 11, 2007, pp. 193-207.
[11] C. Griffin and P. Jr., Energy Conservation in
Buildings: Techniques for Economical Design,
Washington, D.C.: The Construction
Specifications Institute, Inc., 1974.
[12] M. Jackson, “Embodied Energy and Historic
Preservation: A Needed Reassessment”,
Association for Preservation Technology36,
no. 4, 2005, pp. 47-52.
Available at
http://www.jstor.org/stable/4003163.(Accesse
d March 4, 2016).
[13] A. Booz, and H. Booz, Assessing the Energy
Conservation Benefits of Historic
Preservation: Methods and Examples, U.S.:
Advisory Council on Historic Preservation,
1979.
[14] Carter, “Assessing Energy Conservation
Benefits: A Study” in New Energy Old
Buildings,ed. National Trust for Historic
Preservation, Washington, D.C.: Preservation
Press, 1981.
[15] U.S. Green Building Council. “About USGBC.”
Available at
http://new.usgbc.org/about.(Accessed
January 10, 2016).
[16] C. Elefante, “The Greenest Building Is…One
That Is Already Built,” Forum Journal: The
Journal of the National Trust for Historic
Preservation 21, no. 4 (2007), pp. 26-37.
[17] W. Trusty, “Renovating Vs. Building New: The
Environmental Merits.” Canada: The Athena
Institute, 2007.
[18] Athena Sustainable Materials Institute, A Life
Cycle Assessment Study of Embodied Effects
For Existing Historic Buildings, CA: Parks
Canada, 2009.
[19] M. Lucuik, W. Trusty, A. Huffman and A.
Prefasi, The Greenest Building Is the One
That Is Never Built: A Life-Cycle Assessment
Study of Embodied Effects for Historic
Buildings, ASHRAE, Buildings XI, Canada,
2010.
[20] Preservation Green Lab, The Greenest
Building: Quantifying the Environmental Value
of Building Reuse, Washington, D.C.: The
National Trust for Historic Preservation, 2012.
[21] C. Stein, Greening Modernism, New York:
W.W. Norton and Company, 2010.
[22] National Trust for Historic Preservation - The
greenest Building website
Available at
http://www.thegreenestbuilding.org (Accessed
January 10, 2016).
[23] United States Department of Energy, 2010
Buildings Energy Data Book. Prepared for the
Building Technologies Program Energy
Efficiency and Renewable Energy by D&R
International, Ltd. Under contract to Pacific
Northwest National Laboratory, March 2011.
[24] The National Trust for Historic Preservation,
“About Us”.
Available at
http//www.preservationnation.org/about-us
(Accessed February 2, 2016).
[25] Whole Building Design Guide.“Sustainable
Historic Preservation.”WBDG Historic
Preservation Subcommittee. Available at
http://www.wbdg.org/resources/sustainable_h
p.php.(Accessed January 10, 2016).
[26] United States Environmental Protection
Agency. “Life Cycle Assessment
(LCA).”Available at
http://www.epa.gov/nrmrl/std/lca/lca.html.(Acc
essed March 2, 2016).
[27] Athena Sustainable Materials Institute,
Athena EcoCalculator, Available at
http://www.athenasmi.org/our-software-
data/ecocalculator/ (Accessed April 18, 2016).
[28] K. Weeks and A. Grimmer, The Secretary of
the Interior’s Standards for the treatment of
Historic Properties with Guidelines for
Preserving, Rehabilitating, Restoring and
Reconstructing Historic Buildings,
Washington D.C: U.S Department of the
Interior, 1995, pp. 56-57.

Renewable Energy and Sustainable Development (RESD) Volume 3 Issue 1, Special Issue, March 2017 - ISSN 2356-8569 http://dx.doi.org/10.21622/RESD.2017.03.1.104
117 RESD © 2017 http://apc.aast.edu
[29] B. Campagna, “How Changes to LEED Will
Benefit Existing and Historic Buildings,”
Forum News,15, 2008.
[30] English Heritage, “Who We Are”,
Available at http://www.english-
heritage.org.uk/server/show/nav.1665.(Acces
sed March 4, 2016).
[31] Egyptian Ministry of Electricity and
Renewable Energy
Available at
http://www.moee.gov.eg(Accessed March 4,
2016).
[32] ALEX-MED, Alexandria Heritage Catalogue
2007, Alexandria: Bibliotheca Alexandrina,
2007.
[33] Interview with rehabilitation consultant, March
2016).

Renewable Energy and Sustainable Development (RESD) Volume 3 Issue 1, Special Issue, March 2017 - ISSN 2356-8569 http://dx.doi.org/10.21622/RESD.2017.03.1.118
This Paper has been Accepted and Presented in the (First International Conference on New Trends for Sustainable Energy) 1-3 October, 2016 at Pharos University, Alexandria, Egypt.
118 RESD © 2017 http://apc.aast.edu
Dynamic Facades
Environmental Control Systems for Sustainable Design Dr. Riham Nady
Lecturer, Department of Architectural Engineering , Pharos University in Alexandria, Egypt
Abstract - Façades are the most strategic and visible
part of the building which leads to an improvement in
appearance and environmental performances in
buildings. Facades play a significant role in the quality
of a building. It forms the barrier between the internal
space and the outside climate. This means that the
façade is the medium through which the interaction
takes place between the activities, inside and outside.
The image of a building, and therefore for the users, is
reflected through the design of the façade.
In recent practices, architects and engineers are
strategically designing and installing dynamic facades
not only for their aesthetic values, but also for
improving the buildings’ energy performance. The
high integration of these strategies for dynamic
facades increases their durability and suitability, with
current building demands, which targets for energy
efficiency and thermal comfort level.
In the meantime, recent studies show that the majority
of people spend up to 90% of their time indoors
especially in hot climates. This trend has had a high
impact on the requirements of the indoor environment,
consequently turning the buildings into complex
devices that ensure the wellbeing of the people who
use them. Therefore, users are starting to look for
new products for the façade design that comply with
the requirements of energy. This poses an important
question, is there anything to be done to this specific
part of the building in order to positively influence the
overall energy need of the building?
The paper will discuss the concept and the
importance of dynamic facades according to their
design and types, implementations, current
challenges and climate impacts. It will highlight the
history of these facades and the essential parameters
which make the building sustainable through its
facades. Moreover, the paper will analyze two
examples of buildings with dynamic facades with
automated control systems and its effect on the
building environment. At the end, the paper tries to
demonstrate if these facade systems and strategies
could be applicable on the buildings in Egypt.
Finally, the paper aims at integrating the dynamic
facades in buildings as an environmental control
system to achieve a sustainable design to reach good
energy performance in buildings.
Keywords - dynamic facades; sustaianble design;
energy efficiency; environemtal control.
I. INTRODUCTION
In recent years, contemporary architecture has been
deeply influenced by the urgent need for reducing
harmful emissions of carbon dioxide in the
atmosphere. The building sector constitutes in fact
one of the most energy consuming sectors of the
world economy. However, buildings are also
potentials and powerful agents able to carry out with
effectiveness and relatively rapid’s time actions to
minimize emissions, through the drastic reduction of
their energy consumption. With regard to energy
consumption, sustainable building is often directed at
energy-efficient use of fossil fuels and the generation
of renewable energy through technical appliances.
These measures may be considered adjustments to a
furthermore traditional way of building, ignoring the
fact that the building itself can be innovated to an
intelligent, responsive or even proactive device.
From this perception, the building is to be fire-tuned
to its environments and interact intelligently with local
characteristics such as: climate, type of soil and
surroundings. This interaction is most logically
performed by the building skin: the roof, the ground
floor and the façade, where in changeable climates
the use of building mass of the thermally subsoil is an
effective means to smooth big temperature
differences.

Renewable Energy and Sustainable Development (RESD) Volume 3 Issue 1, Special Issue, March 2017 - ISSN 2356-8569 http://dx.doi.org/10.21622/RESD.2017.03.1.118
119 RESD © 2017 http://apc.aast.edu
In this paper, the concept of dynamic facades will be
explored. Also, the importance of active facades
according to their design and types will be discussed.
The paper will present the role of building facades
particularly “dynamic facades” as an innovative
solution that makes buildings sustainable to different
conditions and responsive to different environmental
needs. In addition, the paper analyzes two
applications in different regions with different climates
that deal with technological and environmental
aspects in sustainable building skins and their role in
fulfilling the environmental demands.
Finally, the paper ends up with a comparison
between the two applications to reach different
solutions to be applied on the Egyptian building
facades which could control the surrounding
environment and be sustainable.
II. THE BUILDING SKIN AS A SEPRATING AND A
LINKING ELEMENT BETWEEN INSIDE AND
OUSIDE
Despite changed cultural, economic, building
technological and energetic parameters, the principal
task of architecture is still to create a comfortable
“shelter”. In other words, the fundamental aim of a
building is to protect people from the external climate
conditions, such as intensive solar radiation, extreme
temperatures, precipitation and wind. In construction,
the building skin is the primary subsystem through
which prevailing external conditions can be
influenced and regulated to meet the comfort
requirements of the user inside the building. Like the
skin and clothing of humans, this raiment, too, fulfills
the tasks demand of it by performing a number of
functions made possible by means of the appropriate
design and construction.
The building skin is the dominant system in all
subsystems of a building-the load bearing structure,
mechanical services and spatial framework-not only
in terms of design, but also fulfill a multitude of vital
functions and is a principal factor in the energy
consumption of a building [1].
III. CONCEPT OF DYNAMIC FACADES
The façade is a strategic element because it is the
most visible part of the building. This leads to an
improvement in environmental and appearance
performances of a building. The façade also
exchanges energy with the external environment,
this increases energy performance. The façade
protects structures and interiors of the building and
this contributes to the extension of the life of the
building [2].Thus, the building’s façade should
function as a mediator between the external and
internal environments which can be entrusted with
multiple vital functions that dictate the building’s
energy consumption and which determine the
indoor environmental quality [3]. Dynamic facades
are “facades with the ability to respond to their
environment by either typological change of
material properties that alter the overall form or
local alteration by regulating their energy
consumption to reflect the environmental conditions
that surrounds it”.
Traditionally, the design of a building’s façade is
“static”, where the external environmental boundary
conditions are designed to be constantly changing.
As a result, traditional facades are not capable of
adapting and responding to various changes that
they are exposed to. According to a recently
completed project of the International Agency –
Energy Conservation in Buildings and Community
Systems Programme, the development, application
and the implementation of dynamic facades provide
a necessary step towards creating improvements
for energy efficiency within building environments.
However, through the use of dynamic facades, the
buildings have the ability to react to these
conditions with improved energy efficiency in the
building [2].Facades that respond to the
environment are considered as part of the
building’s envelope in a primarily different way.
Dynamic facades actively adapt to their behavior
over time in response to changing environmental
conditions and performance requirements. The
term “dynamic” in architecture has been described
as the ability of artificial and natural systems to
adapt to varying environmental conditions. Also,
this term is used to describe the interaction
between external environmental conditions and the
façade systems. Thus, environmental conditions
can encompass a range of different elements such
as daylight, wind and heat. However, the term
“environmental conditions” are associated with
solar radiation, daylight and heat [3].
IV. HISTORY OF DYNAMIC FACADES
Within the scope of the technologies of their time,
traditional farmhouses had already made optimum

Renewable Energy and Sustainable Development (RESD) Volume 3 Issue 1, Special Issue, March 2017 - ISSN 2356-8569 http://dx.doi.org/10.21622/RESD.2017.03.1.118
120 RESD © 2017 http://apc.aast.edu
use of energy-saving potentials. The heat generated
by the livestock was used for heating the building, and
straw and hay were not merely bedding and feed but
provided insulation. Energy consumption caused by
burning firewood was kept to a minimum. Windows
had folding shutters that created a thermal buffer
between the glass and the shutter at night, very much
like a double-skin façade today. Double skin
structures make up one of the most widely employed
functional principles used to protect against exterior
environmental influences through the façade
envelope. Prior to the development of insulated glass,
a second window was insulated to utilize the area
between the two windows as a thermal buffer. The
combination of two single glass panes generated
higher insulation values and adapted to the prevailing
weather conditions. During winter both windows
remained closed, whereas during summer, the
exterior windows opened to promote ventilation [4].
In modern times, glass has been used more
frequently, however, this has increased the issue of
excessive cool down in winter and overheating in
summer.
As early as 1929, the integration of the building skin
and the building mechanics was of vital importance in
the goal to successfully translate and realize
innovative façade concepts. Le Corbusier formulated
a concept for a building envelope with positive
impacts on the indoor climate in Precisions: On the
Present State of Architecture and City Planning. He
talked about the “Mur-rneutralisant”: ‘We have seen
that these neutralizing walls are in glass, in stone, or
in both. They are made up of two membranes with a
space of few centimeters between them…A circuit in
that narrow interval between membranes, hot air is
pushed if in Moscow, cold air if at Dakar. The result:
one has regulated in such a way that the inside face,
the inside membrane, stays at a temperature of 18
degrees”.
Le Corbusier’s thoughts were never conveyed into a
satisfactory result. His ideas were far ahead of his
time. Today his “Mur-neutralisant” can be seen as the
predecessor of the exhaust-air façade. This type of
façade allows regulating the environment of the
usable spaces individually independent on the exterior
environment by employing a combination of a double-
skin structure and an air-conditioning unit. Whereas
Le Corbusier aimed to moderate the room adjacent to
the façade with an artificial environment in the building
envelope, modern environmental concepts used the
gap between the façade layers to create a buffer.
Thus, the façade space creates an intermediate
environment between the interior and the exterior [4].
In other words, the regulation and the adaptability of
skin were achieved with control system that is
intelligently planned and easy to operate.
V. THE RELATIONSHIP BETWEEN INDOOR
THERMAL COMFORT AND BUILDING FACADE
In general, facades are designed to respond to many
scenarios and perform functions that can be
contradictory to each other: daylighting versus energy
efficiency, ventilation versus views and energy
generation. Since a wide range of environmental
parameters can affect the quality of indoor spaces and
user’s satisfaction. Numerous studies have been
conducted by researchers and architects in order to
establish design strategies to create acceptable
indoor environments in accordance with the behavior
of users and locality of the buildings. Hence, in view of
the indoor environmental quality, most of the
researchers concentrate on the thermal aspects of
environments and the condition of human thermal
comfort inside the building.
Facades are the main constitute of the building
envelope and a boundary between external and
internal environments, considerably impact the
environmental conditions of indoor spaces, the
thermal performance of buildings and subsequently
the user’s satisfaction. Hence, thermal comfort
conditions depend not only on the external
environmental factors (i.e. air temperature, air
movement, solar radiation) but also mainly on the
architectural parameters and design elements such as
the position and orientation of building, façade
materials, shading devices, type and location of
windows and roof shapes. Thence, design and
selection of facades during the design process of
building should be considered as one of the major
tasks in order to support the quality of visual and
thermal sensations in indoor environments [5].
VI. PARAMETERS FOR DESIGNING DYNAMIC
FAÇADE
The concept of dynamic facades is not new, however,
it is only during the last few years that architects and
engineers have started to trust these systems and use
them in building. Facades focus on feasibility systems
for developing the quality and economy of this
technology to be sustainable in the future [6].There
are several parameters that should be included when
designing building facades. Each has the potential to
define the character and affect the overall perception
of a building.

Renewable Energy and Sustainable Development (RESD) Volume 3 Issue 1, Special Issue, March 2017 - ISSN 2356-8569 http://dx.doi.org/10.21622/RESD.2017.03.1.118
121 RESD © 2017 http://apc.aast.edu
Sun ccontrol
Thermal and visual comforts are dependent on
controlling the light entering a building through its
façade. The amount of light admitted to a building
correlates directly with an increase in interior
temperatures, affecting the comfort level of the users
within. Blinds can provide a simple way to restrict
sunlight subtly without affecting the overall
appearance of the building. Alternatively, shading
elements can be highlighted by integrating the solar
strategy into the façade.
Natural ventilation
The building skin plays an important role in terms of
the natural air exchange in buildings. Ventilation
strategies can also give a strong character to the
elements of a façade. They can be simple, small,
repetitive louvers that allow for localized air
circulation, or involved mechanical systems that direct
fresh air throughout the building.
Daylighting
The use of natural daylight is important, both in terms
of the comfort and contentment of the users and with
regard to reducing the requirements for artificial light.
Daylight systems can be achieved mainly through
passive measures. A simple movable light shelf can
bounce light deep into the space, illuminating the
interior by taking advantage of the reflectivity of the
ceiling. Daylight levels are known to affect the mental
health of the users.
Connection to outdoors
Connection to the outdoors is another sustainability
feature that is physiological in nature, like daylighting.
This could be achieved by applying glass protected by
a vegetated screen that serves as a visual connection
to the outdoors. Sometimes, the walls can open,
connecting the interior of the building directly with the
outdoors. The aim is to blur the boundary between the
interior and exterior space, enhancing the feeling of
building in nature.
Thermal insulation
Thermal insulation systems employ materials and
components capable of reducing heat loss through
transmittance, convection or radiation. The invisible
insulation in walls has a huge potential to impact the
thermal performance of a building. A particular
insulation’s make up and placement within the
layering of the building skin can have large
consequences that are observable in the thermal
performance and aesthetics of the building skin [7].
Moisture control
Bitumen, a natural substance consisting mainly of
hydrocarbons, is frequently used to create moisture
barriers in buildings. It is often thought of the outer
most skin as the water barrier, but more frequently it is
as a rainscreen. There are two kinds of moisture to
contend with when trying to keep the building dry: rain
and condensation. When large temperature
differentials occur between the interior space and the
exterior, condensation forms on the colder surface.
Protection is necessary to prevent this moisture from
seeping into the building. The rainscreen and moisture
barrier work together to prevent the unwanted rain
and condensation from entering the building.
Structural efficiency
It is important to integrate structure into the building
skin. High-rise construction is primarily concerned with
carrying lateral loads, so the diagonal lateral bracing
of the building often called the “Gherkin” is expressed
as part of the skin, helping to define the character of
the building.
Material choices
Materials can give a very distinctive character to a
building. Although they are often overlooked by
professionals early in the design process, materials
are seminal because their texture and appearance
define the experience of the building. Materials also
play a primary technological role and have a
tremendous effect on the comfort of the building.
Possibility of energy generation
There is also the possibility for a building’s skin to
become an energy source. Photovoltaics or flexible
solar thin films can be integrated into facades to
simultaneously generate power and shade a building
[7]. To advance the issue of the building skin with a
view to creating truly sustainable and enduring
architecture, planning must be goal-oriented,
responsible and sensible. Also, a high degree of
technical and creative ability is essential. The
enormous potential of the building skin must be
realized from structural, functional, aesthetic and
ecological perspectives to promote advances in the
development of architecture that is oriented towards
sustainable future [1]
VII. TYPES OF DYNAMIC FACADES
The environment is the key factor that impacts the
design of facades, the amount of layering and the
material choice, all is dependent on these external
forces. So, there are several types of dynamic
δ
z
s

Renewable Energy and Sustainable Development (RESD) Volume 3 Issue 1, Special Issue, March 2017 - ISSN 2356-8569 http://dx.doi.org/10.21622/RESD.2017.03.1.118
122 RESD © 2017 http://apc.aast.edu
facades which could be put in category according to
the previous parameters.
A. User Control Dynamic Façade
The user control system is an automated system that
provides solutions for some time to convey the
actuated and responsive reactions to passive
processes. Applying such a technology to a building’s
façade and integrate it with intelligent features will
develop an adaptive system that will transmit a higher
level of performance while reducing the negative
impact of the environmental conditions and the
consumption of resources. As a consequence,
designing any façade system should take advantage
of all the surrounding conditions and resources to
develop intelligent techniques that observe occupants’
behavior and thus control the façade and achieve a
performative envelope that enhances energy
efficiency, adaptivity and aesthetics.In general,
dynamic and adaptive façade implies that the
intelligent objects and components will be featured
with enhanced abilities to communicate and interact
with environmental conditions and user behavior and
respond to changes in external climatic
circumstances. Therefore, the situational information
can provide the users with complete control through
applications to accomplish its process and adjust its
functions [8].The following example illustrates this
type of dynamic façade. Kiefer Technic Showroom
designed by Ernst Giselbrecht + Partner (2007)
located in Steiermark, Austria. It is an office building
and an exhibition space with a dynamic façade
“Fig.1”. In this building, the façade changes
continuously, each day, each hour which shows a new
“face” that turns into a dynamic sculpture. It changes
according to the outdoor conditions to optimize
internal climate while allowing users to personalize
their own spaces with user controls. The façade
exterior insulation and finishing system (EIFS) in white
plaster operates automatically and can be controlled
by users. The façade shading not only can give the
flexibility in controlling the outdoor conditions, but also
can lend variable forms to the façade design [9].
Fig .1. The dynamic façade of Kiefer Technic Showroom
B. Light Control Dynamic Façade
In this type of façade, automated shading and
daylighting control systems are integrated and operate
appropriately for all environmental conditions. A
notable example is the Arab Institute in Paris
designed by Jean Nouvel in 1988. The façade of the
building showed continuous considerations for the
surface that can actively respond to changes in
environmental conditions “Fig.2 and 3”. The south of
the facades is composed of a 20x10 grid square bays
that consist of a central circular shutter that was set
within a small grid of shutters – the design was
adopted from the geometry of traditional Arab
screens. These screens operate like a series of
camera lenses, shrinking and widening in response to
sensors to control the penetration of sunlight into the
building.
A similar pattern of design was adopted by AEDAS in
Abu Dhabi in Al Bahr Towers (2012). The building
consists of a membrane clad dynamic façade with a
similar hexagonal pattern in the construction of the
active surfaces “Fig.4 and 5”. The design of the
dynamic “mashrabiya” adopted a similar concept by
Nouval to create a responsive façade. The dynamic
mashrabiya includes 1,049 units for the west and east
side of the building, which claims to be the world’s
largest, computerized façade built today for 150
metres high towers. The facades create a folding and
unfolding movement, which adapts to the sun and the
changing environmental conditions [4].This system is
predicted to reduce the solar energy entering the
building by 20%. Also, it is claimed that the design has
resulted in 40% saving in carbon dioxide emissions.
Fig .4. Al Bahr dynamic facades
Fig .2. The façade of Arab
Institute (Paris)
Fig .3. The dynamic
circular shutter adopted
from the traditional
mashrabiya

Renewable Energy and Sustainable Development (RESD) Volume 3 Issue 1, Special Issue, March 2017 - ISSN 2356-8569 http://dx.doi.org/10.21622/RESD.2017.03.1.118
123 RESD © 2017 http://apc.aast.edu
Fig .5. The folding and unfolding movement of the facade
C. Energy Control Dynamic Façade
Another application for dynamic facades is saving energy in buildings and controlling energy performance in buildings. Energy conscious facades is where the envelope has construction functions such as strength and rigidity, stability and durability, control of heat, air and moisture vapor flows, control of liquid water movement cost-effectiveness and fire resistance. The envelope is responsible for the building energy performance [10]. This is illustrated in Henning Larsen’s University Building in Kolding, Denmark that moves in response to changing heat and light “Fig. 6”. The daylight changes and varies during the course of the day and year. Thus, Kolding Campus is fitted with dynamic solar shading, which adjusts to the specific climate conditions and user patterns and provides optimal daylight and a comfortable indoor climate spaces along the façade. The solar shading systems consist of approximately 1,600 triangular shutters of perforated steel. They are mounted on the façade in a way which allows them to adjust to the changing daylight and the desired inflow of light. When the shutters are closed, they lie flat along the façade, while they produce from the façade when half-open of entirely open and provide the building with a very expressive appearance. The solar shading system is fitted with sensors which continuously measure light and heat levels and regulate the shutters mechanically by means of a small motor [11].
Fig .6. The dynamic patterns in the façade of Henning Larsen’s
University Building
D. Wind Responsive Dynamic Façade
Wind as a natural element itself is strong enough to
provide a dynamic pattern of motion without wasting
any energy. Brisbine domestic Terminal Carpark in
Australia (2011) has installed 250,000 aluminum
plates to create this wind-powered façade. The car
park’s entire eastern side appeared to ripple fluidity as
the wind activates 250,000 suspended aluminum
panels. As it responds to the ever-changing patterns
of the wind, the façade created a direct interface
between the built and the natural environments. The
façade itself constantly stays in moving motion as the
wind blows.
E. Façades Designed to Manage Water
A fundamental role for high-performance buildings is
the management of water. It is imperative that roofs
and facades effectively manage rainfall through
material selection and articulated detailing from top to
bottom. Rainscreens are innovative solution to
manage rain and vapor migration. As buildings
embrace a greater set of sustainability challenges,
they also need to collect rainwater. There is a decline
in sources of fresh water and increase of storm runoff
challenges. The importance of designing building to
catch and store water is of growing importance.
VIII. APPLICATIONS ON DYNAMIC FACADES
A. Masdar Institute for Science and Technology
(Abu Dahabi, United Arab Emirates)
Masdar Institute for Science and Technology (2007-
2010) is located in Masdar City under the supervision
of Masdar Initiative. It is designed by Foster +
Partners “Fig. 7”. Abu Dhabi’s climate is considered to
be subtropical climate, with temperatures that very
from warm in winter months to hot in summer with
sunny blue skies prevail throughout the year and
rainfall is infrequent which affect the building
architecture design to fulfill the environmental and
climatic conditions.
Fig .7. Masdar Institute for Science and Technology (Abu Dhabi-
U.A.E)
Sun control
Windows that are not already shaded by adjacent
buildings have louvers vertical to block morning and
afternoon and horizontal to block mid-day sun-set to
prevent direct sunlight from shining into the building.

Renewable Energy and Sustainable Development (RESD) Volume 3 Issue 1, Special Issue, March 2017 - ISSN 2356-8569 http://dx.doi.org/10.21622/RESD.2017.03.1.118
124 RESD © 2017 http://apc.aast.edu
Natural ventilation
There is a contemporary re-interpretation of the
traditional Arabic wind tower which brings cooling
breezes to the courtyard. Rising 45 meters above the
podium, this modern interpretation will be a landmark
for Masdar city. Sensors at the top of the steel
structure operate high level louvers to open in the
direction of the prevailing winds and to close in other
directions to divert wind down the tower. A PTFE
(non-stick brand Teflon) membrane carry the wind
downward while mist generators at the top add
additional cooling to the air. Combinations of
evaporative cooling and air movement techniques
help to moderate perceived air temperatures, thereby
improving users’ comfort.
Moisture control
Behind the foil is a highly insulating and highlysealed
panel. Aside from the rest of the façade, are highly
sealed, insulated and wrapped 90% windows,
recycled aluminum sheeting and rose-red color.
Material
Facades at Masdar city incorporate a variety of
technologies and materials to address sustainable
building. Laboratory buildings are characterized by air-
filled ETFE cushions (30 cm thick) that ensure almost
no solar gain on the structure and limit the heat re-
radiated to the street. A reflective foil-clad inner layer
behind the cushions send light to the pedestrian street
below.
Energy generation
There are over 5,000 square meter roof dynamic
photovoltaic panels which provide power and further
protection from the direct sun. The photovoltaic array
above the building helps to provide 30% of the
electrical load of the city [12].
B. Pearl River Tower (Guangzhou, China)
Pearl River Tower is located in Guangzhou, China. It
was constructed under the supervision of CNTC
Guangzhou Tobacco Company. It was designed and
constructed by Skidmore Owings & Merill with partner
Adrian Smith and Gordon Gill during the period 2006
– 2010 and it had been awarded in 2008 for Green,
Carbon Lowering and Environmental Category: Gold
Award “Fig. 8”.Guangzhou is in south eastern China
which is characterized by its hot humid, heavy rain
climate with predictable prevailing north, south and
south west winds. Summer season is long, wet, hot
and humid, where winter is mild, dry and free of snow
with average mean temperature. These climatic
conditions played an immense role in terms of
different design and sustainability integrated either on
the building scale or façade scale.
Fig .7. The dynamic façade of Pearl River Tower (China)
Sun control
Pearl River Tower integrates various technologies in
building skin design as follows:
Double glazed wall system:
The north and south façade are double layer curtain
wall system which offers insulation that reduces heat
gain and leads to less demand on HVAC systems.
Exterior glazing material:
Exterior glazing is insulated, tempered glass with low-
coating. The inner layer is operable clear glass on the
building south face where low-emittance glass is
coated with microscopically thin, virtually invisible
metal layer that reduces thermal conductivity.
Triple glazed façade:
East and west facades are associated with external
shades and automated blinds within the facades
cavity. A photovoltaic system is integrated into the
building’s external shading system and glass outer
skin.
Ventilation
The most innovative of Pearl River’s element are the
vertical axis integrated wind turbines that are used for
catching the prevailing winds from the south and the
notrth with minimum loss.
Shading
As all the facades of Pearl River Tower are double
glazed facades, then shading blinds are placed within

Renewable Energy and Sustainable Development (RESD) Volume 3 Issue 1, Special Issue, March 2017 - ISSN 2356-8569 http://dx.doi.org/10.21622/RESD.2017.03.1.118
125 RESD © 2017 http://apc.aast.edu
their cavities where motorized venetian blinds is in the
east and west double façade. The blind position is
determined by a photocell that tracks the sun position
to ensure occupancy comfort from both solar gains
and glare.
Energy generation
There are photovoltaic panels which are integrated
into the facades to transform the sun’s energy to
usable AC current where the use of PV cells could be
productive if it is used on certain portions on the
building envelope.
Also, Pearl River Tower is planned to utilize hydrogen
fuel cells in the building façade to store excess
generated energy and convert gas into electricity with
more than 50% energy efficiency which could be used
as power energy for cooling and ventilation [10].
Table 1. Comparison between the parameters of the two applications
Parameter Applications
MIST (Masdar City,
U.A.E.) Pearl River Tower
(Guangzhou, China
1. Sun control Vertical louvers to
prevent direct sunlight
Facades are associated with
external shades and interior automated
blinds
2. Natural ventilation
Re-interpreation of the traditional Arabic
wind tower
Consists of a
double glazed
façade with integral
spandrel panels and
cavity space for air
cooling
3. Daylighting N/A
Integrated glass
façade to provide
visual
transmissions,
enhancing daylight
and reduce artificial
lighting
4. Connection to outdoors
N/A N/A
5. Thermal insulation
N/A N/A
6. Moisture control
High insulated panels N/A
7. Structural efficiency
N/A N/A
8. Material choices
air-filled ETFE cushions with
reflective fiol cladding N/A
9. Energy genration
Energy is 60% less using photvoltaic
panels
Energy is 44% less using photvoltaic cells
and hydrogen fuel cells
IX. TRANSFORMING TRADITIONAL FACADES
INTO DYNAMIC FACADES IN EGYPT
So, the question now, after studying the parameters of
dynamic facades, could these facades be applied in
buildings in the Egyptian context?
The answer is yes, however there are some criteria
concerning the climate of the region, the materials
used and the availability of technologies. Also, design
of facades should take the surrounding environment
of the country, the sun path, wind and humidity and
the use of energy consumed in consideration.
This can be achieved through the delicate traditional
mashrabiya which has offered effective protection
against intense sunlight in Egypt for several centuries.
However, nowadays this traditional Islamic window
element, with its characteristic lattice-work, is used to
cover entire buildings as an oriental ornament
providing local identity and a sun-shading device for
cooling.
In fact, designers have transformed this vernacular
wooden structure into high-tech responsive daylight
system according to the external conditions.
The ancient mashrabiya merges cultural, visual and
technical aspects. Therefore, this window screen is
often found towards the street to enable discretion
and allow cool air to pass through the façade. Several
newer buildings in Egypt have transformed the
oriental window technique into dynamic facades to
reduce the cooling loads for the interior.
Also, the malqaf is another façade element which
could be used in a dynamic way. It is a suitable
source for natural ventilation in buildings especially in
hot arid regions. It is a device or a shaft rising high
above the building where it is cooler and stronger and
the wind channels down into the interior of the
building.
The malqaf could be adapted to move dynamically
according to the direction of the prevailing winds of
the city/country which creates air movement and
consequently natural ventilation . The following table
(Table 2) proposes some ways for improving the
façade systems in Egypt. These recommended ways
could increase comfort and reduce energy
consumption and improve daylighting inside buildings.

Renewable Energy and Sustainable Development (RESD) Volume 3 Issue 1, Special Issue, March 2017 - ISSN 2356-8569 http://dx.doi.org/10.21622/RESD.2017.03.1.118
126 RESD © 2017 http://apc.aast.edu
Table 1. Recommended ways for improving façade systems in Egypt
Design Materials Systems Performance
- Automation
- Daylighting
- Design for adaptability
- Design for intelligence
- Design tools
- Modular coordination
- Natural ventilation
- Advanced materials
- Advanced insulation
- Air/Vapor barriers
- Intelligent materials
- Resource-efficient
materials
- Advanced foundations
- Double enevelope
- Intelligent envelope sysstems
- energy services
- rainscreen
- Modeling
- Monitoring
- Testing
- Rating criteria
X. CONCLUSION
The paper has situated the main objectives for an efficient sustainable building façade taking into account the environmental sustainability aspect, where it has introduced the main parameters for developing building façade concept. Also, it has focused on the different façade techniques in terms of natural ventilation, shading techniques and energy conservation and its role in enhancing the internal environment. According to the applications and examples reported in this paper, building facades play an immense role in building energy efficiency and building energy performance where: Dynamic facades are more widely used to permit
natural light, it is considered also an efficient innovative ventilation system if properly designed.
The most advantageous shading schemes have proved to be external shading device and movable overhangs installed on building façade, considering also other benefits of external shading as it could be suggested as a very effective design solution against overheating.
The most effective shading system is the adjustable exterior shading louvers, where it is considered to be the most effective shading devices as it has a variety of colors and materials.
XI. RECOMMNEDATIONS
In this section, some recommendations about the
appliance of sustainable building façades
technologies in Egypt will be presented taking into
account the environmental, economic and climatic
conditions. Egypt lies within the North African desert,
this geographical location gives the Egyptian climate
some characteristics which affect the design of nay
building especially the facades. The Egyptian climate
is arid and characterized by hot dry summers,
moderate winters and very little rain fall which will
encourage designers to design dynamic facades
which will be able to provide natural ventilation,
shading and reduce energy consumption. There are
some recommendations for architects and
governments in order to enhance the application of
sustainable dynamic facades strategies.
A. Responsibilites for Architects:
Designers should consider important issues for efficient dynamic facades. These issues affect the technologies applied into building façade taking into account its costs and how appropriate it is for building requirements and thus, energy saving. So designers should: Properly select site for the building, as the design
features change with site climatic characteristics.
Properly decide the best façade technology that serves the target of the building.
Choose appropriate ventilation strategies that are suitable for the building usage.
Architects must carefully study the complex issue of material and energy exchange, moreover they must know how to apply the information just thus gained to planning and construction and consult specialized engineers.
Be updated to all computer modeling that can lead the designer to exact performance of the chosen perfect façade strategies.
B. Responsibilites for Governments:
Governments own and maintain a wide range of buildings and facilities where there are a variety of tools that could help the government develop and operate building resources for applying efficient passive cooling strategies in a sustainable manner: It could create community boards and
commissions to study local sustainable issues and provide economic motivation for sustainable design building development.
It should permit training and education programs that focus attention on building sustainable development.
New government buildings should in corporate
and promote energy efficient facades that harmonize with the Egyptian climate.

Renewable Energy and Sustainable Development (RESD) Volume 3 Issue 1, Special Issue, March 2017 - ISSN 2356-8569 http://dx.doi.org/10.21622/RESD.2017.03.1.118
127 RESD © 2017 http://apc.aast.edu
REFERENCES
[1] C.Schittich, “Building Skins:
Concepts.Layers.Materials”, Berlin, Publishers for Architecture, 2001.
[2] Premier, (October 2012). “Dynamic Facades and
Smart Technologies for Building Envelope Requalification”. Research Gate. https://www.researchgate.net/publication/269690115_DYNAMIC_FACADES_AND_SMART_TECHNOLOGIES_FOR_BUILDING_ENVELOPE_REQUALIFICATION
[3] K. Sharadin, “Kinetic Facades: Towards design
for Environemtal Performance”. A Ph.D thesis. School of Architecture and Design. RMIT University, March 2014.
[4] U. Knaack, T. Klein and M. Bilow. “Facades:
Principles of Construction”. German National Library. Germany, 2014.
[5] M. Ahmed, A. Abdel Rahman & A. Hamza,
“Development of Intelligent Façade Based on Outdoor Environemt and Indoor Thermal Comfort”. Proceedia technology, Vol. 19, pp. 742-749, 2015.
[6] http://www.esru.strath.ac.uk/EandE/Web_sites/1415/Dynamic_facades
[7] M. Mclntosh, “Sustainablle Building Skin Design”.
School of Architecture. The University of Texsas.
[8] M. Thobaiti, “Intelligent and Adaptive Façade System: The Impact of Intelligent and Adaptive Façade on the Performance and Energy Efificncy of Building”. Msc. Thesis . University of Maiami. Florida, August 2014.
[9] S. Ismail, Z. Mohammed and S. Morsy, “The
Flexible Facades”. GBER, Vol.1, Issue 3, pp. 54-65.
[10] K. Dewidar, A. Hassan and N. Magdy, “The role
of intelligent facades in energy conservation”. [11] S.Santos. (20 November 2015). “Henning Larsen
Architects Wins Competition to Design a New Forum at Lund University”. http://www.archdaily.com
[12] Masdar City. “Exploring Masdar City”. (2011)

Renewable Energy and Sustainable Development (RESD) Volume 3 Issue 1, Special Issue, March 2017 - ISSN 2356-8569 http://dx.doi.org/10.21622/RESD.2017.03.1.128
This Paper has been Accepted and Presented in the (First International Conference on New Trends for Sustainable Energy) 1-3 October, 2016 at Pharos University, Alexandria, Egypt.
128 RESD © 2017
http://apc.aast.edu
Low-Carbon Communities between
Vision and Implementation
The Case of Borg Al Arab Dr. Riham Nady
Lecturer, Department of Architectural Engineering Pharos University in Alexandria, Egypt
Abstract - Several cities are facing the problem of
running-out of fossil fuels and are contributed to an
estimated 70% of the world’s energy-related
greenhouse gases (GHGs). Consequently, there is a
tremendous need for low-carbon communities which
will lead to more livable, efficient and ultimately
sustainable cities. Furthermore, well-planned and
designed communities can effectively provide the
basic human needs and reduce reliance on fossil
fuels. Some communities have developed strategies
to reach net zero-carbon future by reducing demands
for energy and supplying the remaining demands with
renewable resources.
In the meantime, Egyptian cities face the problem of
greenhouse gases and the lack of energy and water.
Therefore, passive, energy efficient and energy offset
design are needed. This can be achieved through
sustainable transportation systems and the shift to
efficient management of water and waste.
The paper discusses the problem of climate change
and its relation with communities. It investigates
examples of communities that have focused on
reducing their carbon emissions in different parts of
the world. Also, it examines some of the most
important aspects of design strategies that help to
implement low-carbon communities and how could
they be achieved in the Egyptian context (Borg Al
Arab-Alexandria).
The aim of the paper is to highlight certain cities that
demonstrate a deeper understanding of what a low-
carbon community is and how to achieve it through
reducing energy demand and providing the best
options for passive design and renewable energy
supply in the Egyptian communities to become self-
contained in terms of energy.
Keywords - energy-efficient; grenhouse gases; low-
carbon communties; renwable energy sustaianbilty
I. INTRODUCTION
The tremendous increase in energy use in Egypt has
caused many environmental problems and lack of
resources. These problems can be solved through
planning low-carbon communities in the urban
extensions of cities. Presented here is a methodology
for generating appropriate energy design guidelines
for these new communities through analyzing
different examples that have adopted these strategies
in their urban planning to achieve low-carbon goals.
The study starts by discussing the problem of climate
change in cities and the need for low-carbon
communities. Also, it presents the history and
evolution of low-carbon communities and their
different concepts. Then, the study tackles different
low-carbon urban strategies through passive, energy
efficient and offset design. A future model for Borg Al
Arab (Alexandria) is proposed through the main
guidelines for planning of low-carbon communities.
Finally, the paper ends up with a SWOT analysis for
the design of low-carbon communities to compare
points of strengths and weaknesses of low-carbon
concept. The paper proposes different low-carbon
strategies and aspects to be applied in the Egyptian
context and across the developing world.
II. CITIES AND CLIMATE CHANGE
Cities and climate change have a dual relationship.
Cities, as major emitters of greenhouse gases,
contribute to climate change. The changing climate
would cause severe impacts on cities, as they have
the increasing majority of the population and
productive assets. Nevertheless, globally, city
planners are now increasingly paying attention to
climate change for three key reasons. First, the

Renewable Energy and Sustainable Development (RESD) Volume 3 Issue 1, Special Issue, March 2017 - ISSN 2356-8569 http://dx.doi.org/10.21622/RESD.2017.03.1.128
129 RESD © 2017 http://apc.aast.edu
participation of cities is vital in achieving national
environment and development goals. Second, since
cities hold most of the financial, institutional and
intellectual capitals, their attractive participation is
essential in formulating and implementing national
climate change mitigation and adaptation policies.
Finally, cities are sizable co-benefits of climate
change, such as improvements in air quality, traffic
congestion and reduction of heat island effects, which
would accrue by aligning climate change and
development policies [1].
Thus, the activities of urban settlements are key
contributors to climate change factors. Climate
change is characterized by the irreversible build-up of
greenhouse gases (GHGs) and global warming at a
potentially huge cost to the economy and the society
worldwide. Much of the greenhouse gases in the
atmosphere are driven by human activity which is
already affecting the global climate. Emissions of
carbon dioxide (the principle greenhouse gas) have
risen more than ten-fold since the start of the
industrial revolution. Also, the atmospheric
concentrations of carbon dioxide have risen more
than 30% and are projected to reach twice the pre-
industrial level by the middle of this century [2].
World GHG emissions have roughly doubled since
the 1970s and on current policies could rise by over
70% during 2008-2050. Historically, energy-related
GHG emissions were predominantly from richer
developed countries. However, today two-thirds of
the flow of new emissions into the atmosphere is
accounted for the developing countries [3].
At present, growth rates of developing countries’
emissions are expected to surpass those of
developed countries within a matter of decades due
to the rise of populations, low income levels and the
extreme of energy use. In the meantime, it is
estimated that the costs of inaction on climate change
will be large particularly in many developing countries
such as the rise of sea levels, the intense of heat
waves and the decline of agricultural yields in rural
areas. Even more, each degree in global warming
increases irreversible damage worldwide [2].
To address the threat of climate change, GHG
emissions are to be solved, stopped and reversed.
Meeting the challenge will require dramatic advances
in technologies and a shift in how the world economy
generates and uses energy [4].
Thus, all instruments are being mobilized to reduce
net emissions to zero and to adopt the existing
emissions according to a climate change policy. It is
required to change the way in which the buildings are
spatially configured and served and the way in which
communities are planned to reach low-carbon
communities that would contribute to climate change
protection.
III. THE EVOLUTION OF LOW-CARBON
COMMUNITIES
The planning and design of traditional settlements
saves much energy through the pattern and structure
of buildings which aimed to minimize the use of
energy consumed in travelling between essential
activities and also in the operation of buildings. It also
assumes high degrees of self-sufficiency at levels of
settlement structure. There are common structural
and physical features in the layout in most of the
desert cities. The complicated and interrelated factors
that have shaped historic architecture and urban form
in desert regions are mostly affected by climatic
characteristics.
The urban form of traditional Arab cities is highly
centralized or inward looking “Figs.1 and 2”.
Certainly, the orientation and relation to the
environment have been of high importance in the
planning of city. The particular climatic problems
caused the people of the hot arid zone to find
solutions to their settlements’ architecture. The high
radiation and temperature in the summer, diurnal
variations of temperature, seasonal variations from
dry hot summer to cold dry winter, low humidity,
limited water supplies and the dusty winds are the
most important factors in forming the urban structure
of such settlements [5].
Fig .1. The concentrated urban form of old cities

Renewable Energy and Sustainable Development (RESD) Volume 3 Issue 1, Special Issue, March 2017 - ISSN 2356-8569 http://dx.doi.org/10.21622/RESD.2017.03.1.128
130 RESD © 2017
http://apc.aast.edu
Fig .2. Compact buildings in Old Algeria
The arrangement of buildings appears to be compact
in layout. This is ecologically held up as a model for
city planning to minimize the heat flow into the
buildings, thus applying human comfort. It is also
characterized by uniformity in urbanization. These
settlements promote walking and cycling as the main
modes of movement. The main objective of a
traditional city planning is to establish the optimum
orientation of buildings with regard to the sun and the
prevailing winds.
The layout of almost all traditional cities in hot arid
regions is characterized by some features such as
narrow widening streets, large open courtyards and
internal gardens. This design reduces the cooling
load transmitted through the building shell and makes
natural ventilation more desirable and effective.
Based on these examples, Hassan Fathy introduced
the traditional planning of cities “Fig.3”. He employed
narrow streets and introverted houses with inner
courtyards in his design of the village of New Bariz
[6].
Fig. 3. New Bariz village by Hassan Fathy
IV. CONCEPT OF LOW-CARBON COMMUNITIES
Low-carbon communities are more realistic and could
address the emergence of urban scale that would
generate renewable energy systems. A low-carbon
community is “one that has greatly reduced energy
needs through efficiency gains such that the balance
of energy for vehicles, thermal and electrical energy
within the community is met by renewable energy” [7].
This means that, it minimizes the energy demand
within the boundaries through promoting energy
efficiency and balancing the energy consumption and
the facilitation of renewable energy.
The energy performance of a low-carbon community
or a net-zero community can be accounted for in
several ways. The definitions listed below are based
on those by Torcellini (2006):
A. Net-Zero Site Energy
A net zero site energy produces at least as much
renewable energy as it uses over the course of a year
when accounted for at the site. The net zero site
energy concept measures the building’s site, ignoring
whether the utility source is coal or wind.
B. Net-Zero Source Energy
A net source zero energy building (ZEB) produces at
least as much renewable energy as it uses over the
course of a year when accounted for at the source.
Source energy refers to the primary energy used to
generate and deliver the energy to the site.
C. Net-Zero Energy Costs
In a cost ZEB, the amount of money the utility pays
the building owners and the community (for
renewable energy generated on all residential and
community buildings and infrastructure) for the
energy the building exports to the grid is at least
equal to the amount the owner pays the utility for the
energy services and energy used over the year. If
transportation is included, the cost of the fossil-based
fuels is offset by fuel generated from renewable
resources.
D. Net-Zero Energy Emissions
A net-zero emissions community produces and uses
at least as much emissions-free renewable energy as
it uses from emissions-producing energy sources
annually.
A community may be designed to achieve one or
more of the above definitions but may not achieve it in
actual operations every year. If the community
produces at least 75% of its required energy through
the use of on-site renewable energy, it is considered a
near-zero or low-carbon community [7].

Renewable Energy and Sustainable Development (RESD) Volume 3 Issue 1, Special Issue, March 2017 - ISSN 2356-8569 http://dx.doi.org/10.21622/RESD.2017.03.1.128
131 RESD © 2017 http://apc.aast.edu
V. LOW-CARBON COMMUNITIES DESIGN
STRATEGIES
Low-energy design has probably the greatest direct
impact on the nature of cities and communities’ life.
However, urban design and fundamental principles of
how to shape the communities have so far barely
featured in the greenhouse debate. The movement
towards low-energy design in urban planning may
result from the influence of a variety of inter-
connected factors including the design and
technological advancements, ethical considerations,
economic costs and opportunities, risk management
and marketability. The challenge is to design a
community where people live, while also have the
flexibility to evolve and work well environmentally,
socially and economically, both now and for the future
[8].
It is necessary for architects and design professionals
to understand low-energy drivers and to consider
them at the beginning of the design stages and to
continue throughout the construction phase (Table 1).
This section provides an overview of low-carbon deign
strategies and guidelines which discuss various
aspects and scales of interventions for energy efficient
urban planning structured according to the following
categories:
Table 1. Low-carbon communities’ design strategies
Design at Building
Level Design at Urban Level
Passive Design Energy Efficient
Design
Offset
Design
- Building massing
- Building type
- Architural elements
- Sustaianble building
materials
- Green and
pedestrian spaces
- Mobility and
Accessability
(sustainable
transport)
Sustainable food
- Energy
Management
technologies
- Water
management
- Waste
management
A. Passive Design
Building massing
The configuration of building mass is related to
specific climate type and the influence indoor and
outdoor comfort. Certain building typologies increase
shading and ventilation, which can reduce the cooling
load. The recommended elements of the urban form
in hot-dry climates are low-rise, high-density and
narrow streets to achieve optimal energy efficiency
where buildings can provide shade on each other, and
thus lower cooling loads. The shading of streets is
maximized, to create a more comfortable micro-
climate for pedestrians. [9].
This climate-sensitive urban form is seen in Hashtgerd
New Town (Iran) which is based on passive design
“Fig.4”. It bears considerable mitigation and
adaptation potentials by reducing energy consumption
especially for cooling and heating without losing
thermal comfort. The 35 hectares area exploits this
potential by referring to the traditional Iranian city
whose characteristics are translated into a dense and
compact urban form with a clear hierarchy of public,
semi-private and private spaces and access systems
in a low-rise-high density design. The proposed
twenty-nine compact neighborhood clusters are
organized in four rows, stretching from north to south
and are located on the ridges of the hills on the site
allowing the main and hot winds from west and
northwest to channel through the site “Fig.4 and 5”.
Every cluster (approximately 15x30m) and four
building groups are arranged around it.
The clusters are accessible by foot and bike via a
narrow 6m wide path in the north-south direction. All
clusters are connected through these paths which
allow for a compact urban fabric and a reduction for
traffic areas. The organization of each housing group
supports the compact form since it is considered as a
major need for achieving this low-carbon city. This
compactness contributes to the reduction of direct
solar radiation and thermal loss. The orientation of
buildings in Hashtgerd is another major aspect for
energy efficiency. The predominant north-south
orientation of the buildings reduces the cooling
demand by up to 23% and the heating demand by up
to 16%. Also, the low skyline follows the topography of
the site allows for free movement of air above the city
[10].
Fig .4. Hashtgerd New Town (Iran)

Renewable Energy and Sustainable Development (RESD) Volume 3 Issue 1, Special Issue, March 2017 - ISSN 2356-8569 http://dx.doi.org/10.21622/RESD.2017.03.1.128
132 RESD © 2017
http://apc.aast.edu
Fig .5. The dense and compact urban form of the 35ha area
Building type
Building typology, form and design can cater to
various aspects of passive cooling for a comfortable
indoor climate and reduce the cooling loads of
buildings. Passive design strategies (for sun and
wind), guide urban fabric development for low-carbon
communities at the building level and improve the
micro-climate through reduced solar gain. On one
hand, the architectural concept is addressed through
optimal use or protection from the solar radiation, for
both building and outdoor space. Building envelopes
should be oriented along the east-west axis. The
south facing facades are designed to have small
openings and horizontal shading. On the other hand,
buildings are oriented in such a way that the prevailing
winds can be used for most optimal natural ventilation
[9].
Building architectural elements
Building envelope designs are created through the
optimization of window-wall ratios, allowing sufficient
daylight, while minimizing the openings that provide
heat gain. Window shading concepts are used in
order to match the climatic conditions, maximize
natural light and ventilation. Green roofs are to be
promoted, as they improve the shading and thermal
capacity of the building envelope and reduce the solar
heat gain [9].
Sustainable building materials
The design process offers greater opportunities for
reducing environmental impacts through material
selection. One of the primary concerns in selecting
building materials is to avoid negative impacts on
health and provide safety and comfort for building
users. Also, identification of materials and products
that contribute to energy efficiency is one of the
primary selection criteria [11]. Natural building
materials such as stone, brick and wood require
minimal processing and energy inputs. They are
characterized by their durability, adaptability and low
construction impact. Also, the use of local and
regional materials enables energy savings in transport
and compatibility with local building traditions which
support the local economy [12].
B. Energy Efficient Design:
Energy efficient urban design may require the use of
new designs and technologies.
Green and pedestrian spaces
Communities are principally made up of buildings and
infrastructure. However, they contain a significant
proportion of open spaces. On one hand, green open
spaces such as parks, protected green spaces,
gardens, street trees and landscaping provide a high
quality of life and a number of vital ecosystem
services, acting as “green lungs” which absorb and
filter air pollution. They also provide a habitat for
wildlife and offer recreational benefits for the
community residents [13].
Also, to support the short distances and mix of uses,
pedestrian networks need comfortable micro-climatic
conditions in order to access services and amenities
easily without depending on private automobiles. A
comfortable outdoor pedestrian space is created
through the use of porous, light colored-materials for
outdoor public spaces and surfaces. It leads to the
reduction of urban heat island effect and thereby
lowering the outdoor ambient temperature and the
reduction of cooling loads of adjacent buildings.
Native vegetation uses less water and provides dust
protection which enhances natural ventilation for
public outdoors and buildings and reduces the
reflective humidity supporting a more comfortable
outdoor space [9].
This strategy is applied in Xeritown (Dubai-U.A.E.),
where there is a boulevard which ties together the
urban public elements of cafes, restaurants, lobbies
and retail shops. They are all shaded by deep arcades
on one side of the promenade and landscape on the
other. The most public part of the development is
framed by the urban sun shading (an ornamental roof
structure composed of photovoltaic panels providing
low-voltage direct current electricity) which turns the
promenade into a place for strolling, sitting and

Renewable Energy and Sustainable Development (RESD) Volume 3 Issue 1, Special Issue, March 2017 - ISSN 2356-8569 http://dx.doi.org/10.21622/RESD.2017.03.1.128
133 RESD © 2017 http://apc.aast.edu
watching or waiting for the bus “Figs.6 and 7”. The
landscape can be explored by walking or via jogging
or cycling track which runs through it. Xeritown thus,
encourages a public life outdoors at least in winter
months [14].
Fig .6. Sun shading with photovoltaic panels in the streets of
Xeritown
Fig .7. Public outdoor spaces in Xeritown
Mobility and accessibility (sustainable transport)
Current transport patterns are based primarily on
motorized vehicles which generate many social and
environmental problems and economic costs. They
represent a significant source of greenhouse gas
emissions and can affect the community and urban
planning in a direct way. These unsustainable
patterns of transport are expected to worsen under
the conditions of rapid trend of motorization [15]. The
approach of low-carbon transportation reduces
greenhouse gas emissions and can be maintained
through the high shares of low-carbon modes of
transport and at the same time shifting to
environmentally-friendly technologies and enabling a
less car dependent mobility [16].
In order to ensure efficient ways of transporting
people and goods, new communities need to be
planned including easy access to various types of
mobility such as bicycles, bus (light rail), shared taxi
or car pooling within short distances. Within the
community site itself, cycling can be encouraged by
providing accessible, secure and covered bicycle
storage [8].
Also, low-carbon communities need to be designed to
use sustainable transport by offering walkable transit
oriented options, often supplemented by vehicles
powered by renewable energy “Fig.8 and 9”.
Communities with sustainable transport systems are
able to reduce their ecological footprints from their
reduced use of fossil fuels as well as their reduced
dependence upon car-based infrastructure [17].
Fig .8. Electric powered vehicle
Fig .9. The vehicular streets in Xeritown are limited to two lanes
This strategy is achieved in Xeritown (Dubai, U.A.E.)
where it is considered mainly as a pedestrian
neighborhood.
The design of Xeritown reduces pollution, encourages
pedestrian movements and represents a compromise
solution with vehicular streets limited to two lanes.
Consequently, this arrangement discourages driving,
encourages public transportation and reduces private
vehicular transportation to a minimum. The city’s
extensive shaded and well-ventilated pedestrian and
cycling networks, together with the proposed public

Renewable Energy and Sustainable Development (RESD) Volume 3 Issue 1, Special Issue, March 2017 - ISSN 2356-8569 http://dx.doi.org/10.21622/RESD.2017.03.1.128
134 RESD © 2017
http://apc.aast.edu
transport network, all work together to reduce the
carbon emissions emitted by the city’s transportation
systems.
Sustainable local food
Food has significant impacts on the green credentials,
especially if one takes into account the energy use
generated by transporting food from remote locations
to urban places. Reducing the environmental
problems associated with food consumption involves
changing the current food culture. Locally produced
food reduce carbon dioxide emissions from present
approximately one-tenth of the energy consumption of
conventional housing. Energy systems include heat
pumps, a heat recovery system, solar hot water
collectors and photovoltaics. Each house has its own
photovoltaic system to generate electricity “Figs.10
and 11”. Based on the size and needs of the housing
unit, the photovoltiac systems have outputs that vary
from 3.0 to 12.0 KW [19].
Fig .10. Solarsiedlung am Schlierberg complex (Germany)
Fig . 11 . Each house has its own photovoltaic system to generate
electricity
Water management
In many areas of the world, especially in hot arid
urban regions, demand for water exceeds supply and
is seriously straining available water resources.
Excessive water usage can degrade local water
resources, threatening the availability of water for
local future needs [11].
Water management is considered as one of the main
elements to achieve low-carbon communities. This
can be achieved through a number of conservation
measures which can be used in communities. Also,
water reduction measures can conserve and protect
local water resources upon which the local community
depend. In the meantime, preserving the quality of
local water resources can eliminate the need for costly
drinking water treatment processes. Reduction of
water use requires the implementation of strategies at
both the building and site scale. The consumption of
primary water can be reduced to less than half the
current use through applying water efficiency
strategies such as low-flush fixtures, automatic
controls and water-saving devices for kitchens and
bathrooms, as they reduce the flow of water by 50%
without affecting the comfort level of the user.
Also, it is important to use the roofs of buildings to
collect rainwater instead of allowing all water landing
on the building’s roof to run into stormwater drains.
Water is captured, stored and prepared for future
uses. Designing the roofs and angling them properly
can result in a maximum intake of rainwater [12].
Furthermore, water reuse and recycling technologies
can be economical and efficient to reduce a building’s
overall water consumption by directing appropriate
wastewater to other uses such as irrigation [18].
This wastewater concept is introduced in Hammarby
Sojostad (Stockholm) which initiated the first step to
water supply in a sustainable approach. The reduction
of water is achieved by installing low-flush toilets and
fixtures in all housing units. Hammarby Sojostad’s
wastewater (sewage) is treated at Stockholm’s
Henriksdal’s plant. A new experimental treatment
plant is testing innovative alternative system for
stormwater that it would be treated as a landscape
feature. Stormwater from buildings and courtyards is
detained in a stormwater bio-swale canal and in
paved gutters before being released into Lake
Hammarby. The goal for street-water runoff is that it
would be collected on-site in setting tanks and filtered.
In this way, all rainwater and snowmelt from streets is
drained into holding basins and then into settling tanks
[20] “Figs.12”.
Renewable Energy and Sustainable Development (RESD) Volume 3 Issue 1, Special Issue, March 2017 - ISSN 2356-8569 http://dx.doi.org/10.21622/RESD.2017.03.1.128
135 RESD © 2017 http://apc.aast.edu
Fig .12. Storm water retention in Hammarby Sojostad (Stockholm)
Fig .13. Detail of the south-facing photovoltaic array
Waste management
Buildings produce large quantities of waste (solid and
liquid). In many cases, this waste is collected in badly
designed damps, discarded directly in rivers or simply
damped in areas out of site [10]. However, low-carbon
communities have demonstrated considerable
resilience in finding green solutions that reduce the
overall waste, increase recycling and finding new
forms of environmentally friendly treatment of
unavoidable waste [13].
Waste management begins by reviewing the types
and quantities of waste produced and the current
disposal methods and costs [21]. Waste reduction
means minimizing the quantity of waste that is going
to disposal. Also, reuse and recycling are necessary
to prerequisite the provision of easily accessible and
well served areas for separate collection of glass,
paper, plastics and metal with local recycling
possibilities [12].
Also, composting solid waste technology generates a
small amount of energy from a given quantity of waste
and it requires a large amount of waste to become
viable. Advanced thermal treatments turn waste into
energy rich fuels through heating the waste under
controlled conditions. Such approaches to generate
energy from waste require new technologies and
management systems that integrate public health and
environmental engineering with ecological planning
[21].
In Hammarby Sojostad (Stockholm), waste is recycled
into natural gas which is used as an energy source for
the neighborhood. Heat produced through the
purification process is recycled for use at a district
heating unit. Also, Hammarby Sojostad has its own
pilot sewage treatment center where nutrients are
recycled from sewage for use on agricultural land. Any
combustible waste produced is recycled into heat
energy for use in the apartments. Each apartment
block has recycling facilities and biodegradable waste
is composted nearby.
Eliminating the concept of waste is the most
comprehensive approach to waste removal, however,
reducing the initial flow of waste is an important step.
Hammarby Sojostad sets the goal of reducing solid
wastes by 15% and, further, has taken the most the
remaining flows [20].
VI. LOW-CARBON COMMUNITIES IN EGYPT
(A FUTURE MODEL IN BORG AL ARAB
ALEXANDRIA)
The governorate of Alexandria consists of three
individual cities which are Alexandria, Borg Al Arab
city center and New Borg Al Arab. Borg Al Arab is
located about 45 km south-west Alexandria city center
and seven kilometers from the Mediterranean coast.
North of Borg Al Arab city is King Mariout and Mariout
Lake. It is surrounded on all sides by a green belt with
a surface area of 18,000 feddans. The city has an
airport that serves nearly 250,000 passengers every
year and also has the biggest stadium in Egypt. Borg
Al Arab is seen as the natural extension for Alexandria
city yet suffers a continuous environmental abuse
from man-made viloations. It has been subjected to
unplanned urbanization as well as discharge of heavy
industrial pollutants. Thus, the city of Borg Al Arab
faces several problems which can be summarized as
follows:
Urban structure:
Deteriorated conditions of services and the inability
and imbalanced urban growth (industry vs. housing).

Renewable Energy and Sustainable Development (RESD) Volume 3 Issue 1, Special Issue, March 2017 - ISSN 2356-8569 http://dx.doi.org/10.21622/RESD.2017.03.1.128
136 RESD © 2017
http://apc.aast.edu
Residential housing:
Low settlement rate due to the lack of housing for
factory workers and hierarchy of centers.
Industrial factories:
They are causing air and noise pollution due to heavy
traffic of transporting factory material at the entrance
of the city and industrial zones.
Transportation:
Lack of public transport and mass transit modes that
connect Borg Al Arab with Alexandria city center.
Traffic:
High traffic volume at northen and southern city
centers.
Utilities and infrastructure:
High voltage power lines inside the city and low water
pressure in some districts.
Environment:
Common drainage network is used for both industrial
and domestic wastewater, lack of industrial solid
waste collection and disposal systems, lack of building
and agricultural solid waste collection systems.
The governance system:
There is no single authority managing the city and the
residents of the area do not participate in the decision
of uses in the area [22].
VII. GUIDELINE FOR TRANSFORMING
BORGAL ARAB TO A LOW-CARBON
CMMUNITIY
The development plan for Borg El Arab aims at
optimizing the utilization of natural resources without
causing any ecological disequilibrium in this vital and
important zone of the city of Alexandria. Also, it aims
to improve and transform the current city and change
it to a low-carbon community. This will ensure equal
opportunities for generations to come. Within the next
ten years, Borg Al Arab would be an investment
magnet, a job creator, a visitors’ attraction spot within
the city of Alexandria. The broad aim is to create a
socio-economic, environmental, urban and
infrastructure foundation that would initiate a
successful low-carbon development.
Borg Al Arab is found to have great potentials to be
transformed to a low-carbon community and thus
helps in the reduction of carbon emissions and the
negative effects in the area. After analyzing the
previous examples of zero-energy communities and
explaining their strategies and guidelines that can be
applied to reach a low-carbon community, it is found
that Borg Al Arab should undergo some changes in
order to be transformed.
The proposed transformation guidelines are divided
into immediate, medium and long-term action plans.
The sustainable, low-carbon vision of Borg El Arab
can be displayed in a set of objectives as follows:
A. Passive Design:
Building massing
The most cost-effective step towards a reduction in a
building’s energy consumption is the form of buildings.
Thus, it is proposed to create low-rise, high-density
buildings with a proper network of narrow streets in
between to achieve optimal energy efficiency and
solve the problem of urban structure.
Building types, features and materials
It is important that buildings should be oriented north-
south to get the optimal benefit from the prevailing
winds and achieve natural ventilation. Buildings
should be constructed from local building materials
found in the surrounding context. These materials
should be of a high quality, durable and flexible. This
will lead to find a solution for the residential housing
problem [22].
B. Energy-Efficient Design:
Green and pedestrian spaces
It is important to enhance the area of Borg Al Arab with attractive uses, high quality public spaces. Parks and open spaces are necessary to a vital urban extension like Borg Al Arab. Moreover, it is proposed to extend high quality public facilities by linked green areas which provide a central focus for Borg Al Arab.

Renewable Energy and Sustainable Development (RESD) Volume 3 Issue 1, Special Issue, March 2017 - ISSN 2356-8569 http://dx.doi.org/10.21622/RESD.2017.03.1.128
137 RESD © 2017 http://apc.aast.edu
Mobility and accessibility (sustainable transport)
It is encouraged to use clean and economic forms of
transportation such as bicycles and public transit,
……etc. The city should be easily accessed due to its
regional location which enhances its competiveness
and makes it easy to access Borg Al Arab via the
airport and the Alexandria marine port. Also, the area
is connected to the international and coastal roads. It
is recommended to enhance the existing network of
transport by increasing the capacity and quality and
redistribute the nodes geographically in the area as
well as developing new connections to Borg Al Arab.
Sustainable local food
It is proposed to implement and create vast areas
suitable for agriculture to be able to grow local food
which provides the residents with healthy and fresh
resources. Also, it will help to reduce carbon dioxide
emissions from transport and it will help strengthen
the local agriculture economy. Also, it is proposed to
create small gardens or exploit roof tops for growing
food.
C. Energy Offset Design:
Energy Management technologies
It is proposed to use renewable energy solutions
through future plans for establishing solar-operated
electric plants to generate the electricity needed in the
area. This can be achieved through creating a field of
photovoltaic cells (PVs) which can be placed in a land
near Borg Al Arab. Also, it is proposed to create large
wind turbine farms to supply the area with the energy
needed. In this way, the problem of energy will be
solved substantially.
Water management:
People should learn how to use water and this might
need to increase the awareness for water
preservation. It is proposed to reduce the
environmental degradation of water, increase the
capacity and quality of existing sewerage and water
systems and enhance wastewater treatment. Also, it
is proposed to serve all residential areas with potable
water and to incorporate smart water appliances in the
buildings. Furthermore, it is encouraged to use treated
recycled water in irrigation and other non-potable
services.
Waste management:
There is a real need for industrial and agriculture
solid-waste collection and creating disposal systems.
It is proposed to sort and separate wastes at source
into four individual basins, each one is used for a
specific material, for example, one basin for plastics,
metal, glass and paper. Trained workers should
collect the wastes and recycle them to be used again
in the area.
Thus, Alexandria’s environmental and comprehensive
development strategy plan aims at solving the
problems found in Borg Al Arab and at improving the
quality of life and citizens’ comfort. Also, it puts into
act projects that would ensure the city’s sustainable
development based on low-carbon design tools .
VIII. LOW-CARBON COMMUNTIES BWTWEEN
VISION AND IMPLEMENTATION
In order to keep the communities alert to staying
green and sustainable and achieving the low-carbon
applications in Borg Al Arab, it is important to learn
how to be sustainable and have the knowledge
needed for that to maintain the qualities given by that
way of life. In the meantime, it is important to make
SWOT analysis (Table 2) for the points of strengths,
opportunities, points of weakness and threats for the
design and planning of low-carbon communities to
know if it can be implemented and achieved or not.
Table 1. SWOT analysis for low carbon communities
PO
SIT
IVE
FA
CT
OR
S
Strengths Weaknesses
NEG
TIV
E FA
CTO
RS
1. Reducing carbon
footprint and minimizing
emissions of greenhouses
gases (GHGs)
1. Requiring certain
restrictions and
qualifications
2. Minimizing energy
consumption
2. High costs of
technologies
3. Energy conservation
strategies
3. Difficulty in changing
people’s
behavior
4. The use of energy-
efficient technologies 4. Require large site areas
5. Making people aware of
the carbon impact
5. Difficulty of
governmental
regulations
Opportunities Threats
1. Self-sustaining in terms
of
energy needs
1. Funding low-carbon
designs require massive
amounts of energy, water
and land.
2. Encouraging passive,
energy efficient and offset
design and planning
strategies
2. Funding low-carbon
projects comes from
unsustainable means
3. Economic advantages

Renewable Energy and Sustainable Development (RESD) Volume 3 Issue 1, Special Issue, March 2017 - ISSN 2356-8569 http://dx.doi.org/10.21622/RESD.2017.03.1.128
138 RESD © 2017
http://apc.aast.edu
IX. CONCLUSION
The paper shed light on an important community in
the city of Alexandria (Borg Al Arab) which is rich
because of its location and potentials. A land use
strategic vision has been proposed providing a way
forward to a sustainable low-carbon community which
achieves low-energy goals preserving the natural,
socio-cultural and economical dimensions of
sustainability.
This system of criteria and indicators for a low-carbon
community is meant to function as an aspiration for
decision-makers, organizations, planners and
interested citizens. It has to be underlined that a part
of the process towards low-carbon developments and
the use of criteria and strategies are crucial because it
is all about quality of life and concrete impact and
lasting solutions. Low-carbon urban strategies serve
as guidance for all actions, small and big, individual
and collective. Therefore, it is necessary to define
strategies and guidelines for each community
development “Fig.13”.
X. GENERAL FINDINGS AND OUTCOMES
Leading a community towards low carbon strategies is
ambitious and necessary. Fortunately, many cities
have begun this innovative kind of future-oriented
process. Based on the experience of low-carbon
developments in many Arab and European countries,
it is of the utmost importance to improve, innovate and
modernize policy and management activities towards
low-carbon design. Therefore, in case of Egypt (Borg
El Arab-Alexandria), it is important to achieve this type
of communities to reduce energy demands and
provide the best options for passive design, energy-
efficient and offset deign through the use of renewable
energy supply to be self-contained in terms of energy
and decrease the effect of climate change and global
warming. The achievement of a low-carbon
community in Borg Al Arab will be able to substantially
improve energy efficiency, conserve non-renewable
energy, with various economic advantages. Also, the
first and crucial step towards low-carbon is to promote
passive design techniques as much as possible, not
only for community scale, but also for building scale.
Fig. 14: Aspects of low-carbon communities
XI. RECOMMENDATIONS
Based on the conclusions discussed before, the
following recommendations are madeble:
Low-carbon communities should be new and
distinct from the rest of the cities in order to be a
magnet for residents to live and work in it through
applying sustainable low-energy urban strategies
in the planning process of these communities.
Support life-styles that move towards low-carbon
and zero-carbon energy strategies.
Increase public’s environmental awareness for
future challenges to face the environmental issues
in Egypt and understand the concept of low-
carbon communities in order to promote the
development of zero-carbon developments.
Public participation through encouraging people
to participate in building communities with the new
techniques to understand the requirements of
buildings and sites.
Government should lead in reducing carbon
emissions through new ideas and project
developments.
The current situation in Borg Al Arab should be
identified with its major challenges on the local

Renewable Energy and Sustainable Development (RESD) Volume 3 Issue 1, Special Issue, March 2017 - ISSN 2356-8569 http://dx.doi.org/10.21622/RESD.2017.03.1.128
139 RESD © 2017 http://apc.aast.edu
level, and tools should be utilized like SWOT-
analysis and sustainability reporting in order to put
hand on the real problems and find solutions to it.
It is important to eliminate the economic problems
of the area of Borg Al Arab through dealing with
this kind of communities as an important and
significant pole in the country by searching the
properties of the city which distinguish it from
other cities in the same region.
It is important to address the social problems of
Borg Al Arab so as social levels may begin to
move to these new communities and create a kind
of balanced life which is not limited on the poor
and unskilled labor.
REFERENCES
[1] S. Dhar, M. Pathak, and P.R.Shukla, “Promoting
Low Transport in India. Low Carbon City: A
guidebook for City Planners and Practitioners”,
UNEP Centre of Energy, Denmark, August 2013.
[2] W.Chandler, R. Schaeffer, and Z. Dadi, “Climate
Change Mitigation in Developing Countries”,
Prepared for the Pew Center on Global climate
Change, October 2002.
[3] Organization for Economic Co-operation and
Development (OECD), “Climate Change
Mitigation: What do we do?”, Australia, 2008.
[4] United Nations Human Settlements Programme,
“Planning Sustainable Cities: Global Report on
Human Settlements”, London, Earthscan
Publishing, 2009.
[5] M. Arezou, “The desert city as an ancient living
example of ecocity.Case study: Yazd”, Published
in Ecocity World Summit 2008. 7th International
Ecocity Conference. 22-23 April 2008, San
Francisco, United States, 2008.
[6] J.Steel, “An Architecture for People: The
Complete works of Hassan Fathy”, London,
Wihtney Library of Design, 1997.
[7] N. Carlisle, O. Geet, and S. Pless, “Definition of a
“Net Zero Energy” Community”, National
Renewable energy Laboratory (NREL), Colorado,
November 2009.
[8] M. Xameerah, (June 2008), “Eco-towns: Living in
a greener future”, Department for Communities
and Local Government,
http://www.raeng.org.uk/societygov/policy/respons
es/pdf/Eco_Towns_consultation.pdf
[9] Energy Efficiency in the Construction Section in
the Mediterranean (MED-ENEC), (October 2013),
“Energy Efficiency Urban Planning Guidelines for
MENA Region”,
http://www.google.com.eg/url?sa=
t&rct=j&q=&esrc=s&frm=1&source=web&cd=1&v
ed=0CCIQFjAA&url=http%3A%2F%2Fwww.enpii
nfo.eu%2Flibrary%2Fsites%2Fdefault%2Ffiles%2
Fattachments%2FEE%2520Building_MEDENEC
_Nov2013.pdf&ei=h6qUU5raJYTqPJnGgYgI&usg
=AFQjCNHVFJvg4objCgK0QlzAifB4r26qOg&sig2
=TOsFlh8Y99P_JFeXKeUVw&bvm=bv.68445247
,d.ZWU.
[10] S. Seeling, “A master plan for low carbon and
resilient housing: The 35ha area in Hashtgerd
New Town, Iran”, Cities, Volume 28, Issue 16, pp.
545-556, December 2011.
[11] Z. Bromberek, “Ecoresorts: Planning and Design
for Tropics”, New York, Architectural Press, 2009.
[12] P. Gaffron, G. Huismans and F. Skala, “Ecocity
Book I: A better Place to Live”, Vienna, Facultas
Verlags, 2005.
[13] P. Rode and R. Burdett, “Cities: Investing energy
and resource efficiency”, In United Nations
Environment Programme, Towards a Green
Economy: Pathways to Sustainable Development
and Poverty Education, United Nations
Environment Programme, pp.453-492, 2011.
[14] H. Stiftung, “Urban Futures 2030: Urban
Development and Lifestyles of the Future”,
Publication Series on Ecology, Volume 5, January
2011.
[15] K. Sakamoto, H. Dalkmann and D. Palmer, “A
Paradigm Shift towards Sustainable Low- Carbon
Transport”, Institute for Transportation and
Development Policy, New York, August 2010.
[16] P. Sassi, “Strategies for Sustainable Architecture”,
Oxford, Taylor and Francis Group, 2006.

Renewable Energy and Sustainable Development (RESD) Volume 3 Issue 1, Special Issue, March 2017 - ISSN 2356-8569 http://dx.doi.org/10.21622/RESD.2017.03.1.128
140 RESD © 2017
http://apc.aast.edu
[17] Department for Communities and Local
Government, “Eco-towns: Living in a greener
future”, 2008.
[18] A.Kwok and W. Grondzik, “The Green Studio
Handbook: Environmental strategies for
schematic design”, Oxford, Architectural Press,
2007.
[19] M. Guzowski, “Towards Zero-energy Architecture:
New Solar Design”, London, Laurence king
Publisher, 2010.
[20] H. Fraker, “The Hidden Potential of Sustainable
Neighborhoods: Lessons from Low-Carbon
Communities”, Washington, Island Press, 2013.
[21] Z. Grant, (December 2009), “Developing Energy
Efficient and Zero Carbon Strategies for
EcoTowns: Eco-towns Energy Worksheet”,
Town and Country Planning Association, London,
http;//www.tcpa.org.uk/data/files/etws_energy.pdf

Renewable Energy and Sustainable Development (RESD) Volume 3 Issue 1, Special Issue, March 2017 - ISSN 2356-8569 http://dx.doi.org/10.21622/RESD.2017.03.1.141
This Paper has been Accepted and Presented in the (First International Conference on New Trends for Sustainable Energy) 1-3 October, 2016 at Pharos University, Alexandria, Egypt.
141 RESD © 2017
http://apc.aast.edu
Exploring the Importance of Employing Bio and Nano-
Materials for Energy Efficient Buildings Construction
Mona Naguib1, and Mohamed El Fakharany2
1BSC, PHD.,Teacher of Architecture, Pharos University in Alexandria, Alexandria, Egypt
2BSC, M.SC., Teacher assistant of Architecture, Pharos University in Alexandria, Alexandria, Egypt
Abstract - The continued and increasing use of
ordinary building materials to house the ever-growing
world population ensures growing contributions of
carbon (C) to the active carbon cycle through carbon
dioxide (C02) emissions from combustion and
chemical reactions in the raw material to the
atmosphere. To minimize this, materials should be
conserved, reduce their unnecessary use, produce
them more benignly and make them last longer,
recycle and reuse materials. Thus, paper will focus
on exploring alternative building materials and
systems that can be developed in order to balance
atmospheric carbon dioxide. It also presents the Bio-
inspired architecture approach that embraces the
eco-friendly practices of using Biomaterials and
Nano-materials for sustainable dwelling construction
through a number of examples that shows how a
building can be strongly related to its site.
Keywords - Bio-Nano Material, Sustainable
Dwelling Construction, Cradle To Cradle Materials,
Energy Efficient Building Materilas.
I. INTRODUCTION
Building materials are literally part of the air human
breath. Compared to most other materials in the
living world, they are also much longer-lived, with a
much longer use phase. Unfortunately, Current use
of materials for building construction especially for
the housing sector is running down natural systems,
destroying community and biodiversity, debasing
work, and suppressing all kinds of possibilities for
real development. With the exception of wood, sand,
gravel, and natural stone, the manufacture of the
greater part of most conventional building materials
used today is based on the use of hydraulic cement,
lime, fired brick, steel, aluminum, and plastic which
are fossil-fuel intensive in their manufacture.
Following the philosophical principles of Cradle to
Cradle “waste equals food” will also help in creating
a healthy regenerative built environment which will
benefit people and other living creatures as well as
safeguarding the biodiversity.
II. SUSTAINABLE MATERIALS FOR
BUILDING SKINS:
An essential dimension of detoxifying production and
achieving regenerative sustainable design is
increasing the use of renewable and bio-based
materials that can be more safely reabsorbed by
natural systems. As well as using materials that help
preserve the biodiversity of the place. [2] To connect
buildings to place; architects should start by making
the interface of buildings better suited to its
environment. This interface occurs in a building’s
first line of defense to the environment, the building
Skin, which includes the exterior walls, roof, and
exterior openings. However, current envelopes are
seen as barriers from the outside world, instead of
filters like a natural skin. Thus, to make
improvements in the building skin’s efficiency and
construction it is necessary to look on how a
sustainable regenerative building skin should
function.
These are as follows: [1]
1. Protection from the natural elements.
2. Environmentally-friendly manufacturing as well
as adding positive contribution.
3. Not be harmful to the natural environment at
the end of its life
4. Integrate multiple systems within thin
membrane.
5. Regulate transfer of heat, air, water and energy
efficiently.

Renewable Energy and Sustainable Development (RESD) Volume 3 Issue 1, Special Issue, March 2017 - ISSN 2356-8569 http://dx.doi.org/10.21622/RESD.2017.03.1.141
142 RESD © 2017
http://apc.aast.edu
6. Be adaptable to its local environment and
respond accordingly.
7. Be beautiful.
III. EXAMPLES OF NATURAL AND
BIOMATERIALS
A. Hempcrete
Two materials are produced from the hemp plant
stem, fiber from the outer bark and wood chips from
the core. Every part of the hemp plant can be used
for applications like building materials (Hempcrete ,
fibreboard and insulation). Hemp wood chips or
hurds are mixed with lime-based binders and water
to create a bio-composite breathable masonry
material termed hempcrete. The lime is typically
combined with a small amount of cement to reduce
the curing time.
Fig.1. Shows Hemp wood chips are mixed with lime to create
hempcrete Bricks and insulation sheets
Source:http://internationalhempbuilding.org, retrieved 1-5-2013
The common application of hempcrete in buildings is
to be used as infill in timber frame walls. It is also
used to build monolithic walls and floors and to fill
roof cavities. This method has been used in France
since the early 1990’s to construct non-weight
bearing insulating infill walls supported by a timber
frame.
Fig.2. Shows that hempcrete can be cast manually around a
timber frame using a shuttering system,
Source: http://internationalhempbuilding.org, retrieved 1-5-2013
Hempcrete bricks have the capability of being self-
supporting removing the need for a timber frame.
Local style of vernacular buildings can be easily built
with hempcrete bricks.
Hempecrete has many sustainable advantages such
as: [3]
1. Hemp is a rapidly growing, annually renewable
plant.
It takes one hectare of land to grow, in approximately
four months, sufficient hemp to build a three-
bedroom house. This estimated production amounts
to four tones of material per acre per year.
2. Hempcrete is carbon negative.
Buildings built with hempcrete achieve a low carbon
footprint as hemp absorbs nearly twice its dry weight
in CO2 during growth, providing a lower carbon
footprint to all materials it is used to create. The
carbon trapped in the hemp offsets the carbon not
only of the hemp production but also the residual
carbon from the lime binder production after re-
absorption of carbon as the lime cures. A 300mm
hemcrete wall absorbs in its construction 40kg per
m2 CO2. A typical brick and block wall emits 100kg
giving a net benefit of 140kg. [2]
3. Hemp does not require agrochemicals in its
cultivation.
Providing a clean air and clean soil as well as
clean water
4. Hempcrete is also recyclable at the eventual
end of the life of the building.
5. The walls are breathable
This controls moisture and condensation and
improves internal air quality. Hempcrete regulates the
temperature and humidity of a building; in some
cases completely eliminating the need for heating
and cooling systems, resulting in huge energy
savings.
6. Hempcrete does not rot
[when used above ground due to presence of lime]
and is mostly biodegradable. [3]

Renewable Energand Sustainable Development (RESD) Volume 3 Issue 1, Special Issue, March 2017 - ISSN 2356-8569 http://dx.doi.org/10.21622/RESD.2017.03.1.141
143 RESD © 2017
http://apc.aast.edu
B. Rammed Earth Construction and compressed
Earth blocks
Unfired clay bricks and rammed earth are two more
ancient technologies that are finding increasing use
in modern sustainable buildings. Clay and sand are
mixed with water and then placed in formwork to form
bricks, walls or columns. Often soil from the building
site is used, resulting in an extremely low embodied
energy structural element with high thermal mass.
Conventional fired clay bricks require large amounts
of energy for their production and result in the
release of large amounts of carbon dioxide
(MacDougall 2007). Compressed Earth Blocks
(CEB’s) are energy-efficient, comfortable, durable
and cost-effective. In addition, they are insect-proof,
bullet-proof, earthquake-resistant and fire-proof. The
thermal insulation capacity of CEB buildings are up to
10 times more efficient than concrete block building,
meaning cool housing in summer and less heating
required in winter. Unlike modern adobe blocks, the
CEB’s are entirely natural and they don't use asphalt
or other potentially toxic additives. Workers
employing hand presses can make up to 500 blocks
a day, and all the bricks necessary for a modest
house in a week. Hydraulic machines can make all
the blocks for a large house in a day. CEB
construction has been employed around the world,
from Latin America to Africa to India and the Middle
East. CEBs are stronger in compression than regular
adobe blocks. [4] Unfired clay and rammed earth
must be protected from exposure to the elements. To
completely waterproof the unit with the more
expensive option is to wrap the walls in chicken wire
and plaster the whole unit, or else special sealant
coats are available such as Earth Cote elastomeric
polymer coating developed in South Africa which can
be painted on in two coats – primer and finishing
coat. [3]
Soil Selection and quality control:
Fig.3. Shows the two types of soil selection tests to form
compressed earth block,
Source: http://use-it.co.za/, Retrieved 4-5-2013
There are a number of tests used to select the right
soils and ensure that the blocks produced will make
strong blocks. One of them is the squeeze test and
the other one is the jar or bottle test. Soil with a clay
content of between 10 and 50% is the better
selection. The strength of the blocks will vary
depending on the clay content and type. Once the
right soils have been tested and sourced – transport
these to the production site (keep it close to the
source) and prepare soils for production. They should
be dried to ambient moisture conditions (<12%) in the
sun and then blended through the soils blender
(adding stabilizer of lime or cement at 5% to ensure
greater stability and to waterproof the blocks) and
then fed through to the block production system.
Although clay is essential in earth block construction,
blocks that contain too much clay may crack. In some
parts of the world builders use Portland cement to
stabilize the clay – stabilisation is only required for
the lower course of blocks for waterproofing. Lime is
a good stabilizing ingredient for the CEB blocks if it
can be sourced locally as it is cheaper than cement
and also a more natural ingredient. The exact recipe
used to manufacture CEBs will depend on the soil
composition of the region. [8]
Block production:
Blended and sifted soils are loaded into the block
press machine. Several adjustments are required to
set the thickness of the blocks to the desired size,
and then the sensor system takes over for mass
production. Fuel is saved because each hydraulic
ram machine consumes only about 10 gallons or 38
litres of diesel a day. A “set” of CEB equipment, when
fully functioning, will employ in excess of 50
employees. This will include soil selection, soil
preparation, equipment operators, block handlers,
house builders, roofers, electricians, plumbers,
glazers, finishers, security individuals, managers,
truck drivers and inspectors. . [8]
Fig.4. Shows using of earth construction in the three systems
Villa, by Adel Fahmy, Giza, Egypt. Source: Photo taken by
Architect Ahmed abd el Gawad

Renewable Energy and Sustainable Development (RESD) Volume 3 Issue 1, Special Issue, March 2017 - ISSN 2356-8569 http://dx.doi.org/10.21622/RESD.2017.03.1.141
144 RESD © 2017
http://apc.aast.edu
C. Solar-generated Building Material from Seawater
(SBM):
Solar-generated Building Material from Seawater
(SBM) is an alternative building material and system
that has been developed in order to balance
atmospheric carbon dioxide. Using electricity from
renewable sources, limestone-storing carbon can be
precipitated from seawater with simultaneous
production of hydrogen, oxygen, and chlorine gas.
These installations could also produce SBM for use
elsewhere, replacing building materials made with
hydraulic cement like concrete blocks, walls, and
slabs, even foundations. SBM can substitute for
bricks made of fossil-fuel fired lime and clay, not only
reducing CO2 emissions, but subtracting carbon from
the carbon cycle. [11]
Wolf Hilbertz, German architect and inventor is the
father of sea-creation, had mimicked the electrolytic
deposition of sea-shell-like minerals from seawater
and had found a way to use sunlight to turn the
minerals in seawater into limestone for underwater
and dry land constructions. The limestone structures
in the sea will facilitate the growth of corals and
provide habitat for fish and other coral reef species;
Coral reefs are one of the most complex marine
ecosystems, important to sea life and protective of
shorelines from erosion. The method is sustainable,
environmentally safe, and economically and
biologically feasible. [11]
Fig.5. Autopia, ocean settlement with membrance construction.
Photo: W.H. Hilbertz. Source: www.globalcoral.org Retrieved 9-
5-2013
This idea is derived from Coral blocks, which have
been utilized for centuries as a dependable and
lasting building material for structures and roads.
Calcium Carbonate as a Building Material:
Nature uses controlled and uncontrolled bio-
mineralization processes to build a variety of
structures. They produce about 60 different minerals
[9]. CaCO3 is one of the more abundant minerals
involved in the processes which are often on such a
scale that they affect ocean/atmosphere chemistry
and form major parts of sedimentary rocks. When
one molecule CaCO2 is precipitated from seawater,
charge balance requires the formation of one
molecule of carbonic acid and super saturation of
carbonic dioxide. If this escapes to the atmosphere,
carbon is removed from the hydrosphere, but CO2
added to the atmosphere. Therefore, deposition of
CaCO3 is often seen as a source of atmospheric
CO2, SBM is a sink for carbon although its direct
effect on the atmosphere has to be treated as
controversial. To fully assess the role of SBM in the
global atmospheric balance the net effect of all
electrolytic and biogenic reactions needs to be
measured experimentally. At the same time, as a
result, global warming would be mitigated. A note of
caution needs to be taken in equating carbon
removal from the ocean with carbon removal from the
atmosphere. [11]
Fig 6. Examples of the application of bamboo structural
material in the building industry
Source: http://www.inspirationgreen.com/bamboo-
buildings.html, Retrieved 4-6-2013
D. Bambo:
Bamboo is a grass native which has been used as a
building material dating back to 3500 BC (Kennedy,
J.F., 2002:125-131).It is the fastest growing woody
plant on the planet. Most species produce mature
fiber in about three years, much more rapidly than
any tree species. Some species grow by up to one
meter a day, and the majority reaches a height of 30
meters or more. It is adaptable to most climatic
conditions and soil types, acts as an effective carbon
sink and helps counter the greenhouse effect.
According to the Zero Emissions Research Institute
(ZERI), a bamboo forest can sequester 17 times as
much carbon as a typical tree forest. Some species
grow as much as 39 inches in a day. Also, due to
bamboo's high nitrogen consumption, bamboo helps

Renewable Energand Sustainable Development (RESD) Volume 3 Issue 1, Special Issue, March 2017 - ISSN 2356-8569 http://dx.doi.org/10.21622/RESD.2017.03.1.141
145 RESD © 2017
http://apc.aast.edu
mitigate water pollution, as it takes in and transforms
nutrient wastes when planted alongside
manufacturing zones, intensive livestock farming,
and sewage treatment facilities. It can also desalinate
seawater. It is being used increasingly in land
stabilization to check erosion and conserve soil. It
can be grown quickly and easily, even on degraded
land, and harvested sustainably on three- to five-year
rotation. Bamboo is a truly renewable,
environmentally friendly material. [8]
In building construction, Bambo is used as framing,
roofing, flooring, wall matting, ceilings, scaffolding,
boards and panels, plywood, concrete reinforcement,
connecting stakes, and more. Bamboo in buildings
can help reduce the amount of wood, steel and
concrete needed. As a substitute for wood, it can
take great pressure off forests, and contribute to local
self-reliance, since great quantities can be produced
in small areas. It has great compressive and tensile
strength, and has shown great resistance to
earthquakes. [2]
Possibly the major factor contributing to the view of
bamboo as a temporary material is its lack of natural
durability. It is susceptible to attack by insects and
fungi. It deteriorates rapidly in contact with moisture.
Its service life may be as low as one year when in
ground contact. However, the durability of bamboo
can be greatly enhanced by appropriate specification
and design and by careful use of safe and
environmentally friendly preservatives such as boron.
[8]
E. Timber from sustainably managed forests:
Cutting down trees to make buildings does not
immediately sound eco-friendly either, but if sourced
from sustainably managed forests (like those in
Europe and North America), it can be more
environmentally sensitive.
A sustainable forest is a forest that is carefully
managed so that when mature trees are felled they
are replaced with seedlings that eventually grow into
mature trees. In this way the forest is constantly
renewed and will continue to exist providing natural
materials for all generation. The forest is a working
environment, producing wood products such as wood
pulp for the paper / card industry and wood based
materials for furniture manufacture and the
construction industry.
Fig.7. Shows the life cycle of trees in a sustainable forest,
Source:
http://www.technologystudent.com/prddes1/susenv1.html,
Retrieved 12-5-2013
Green says that the modern wood materials have
been used for around 20 years, but until recently they
have been quite niche or used only in low-rise
buildings. What has changed is the way in which
architects and builders are thinking about using
wood. Swapping cement and steel for timber is the
vision of a number of environmentally minded
architects who are planning high-rise buildings
across the world. Wood buildings lock in carbon
dioxide for the life cycle of a structure, while the
manufacture of steel and concrete produces large
amounts of CO2 -- the International Energy Agency
(IEA) estimated that for every 10 kilos of cement
created; six to nine kilos of CO2 are produced. [17]
Example Of High Rise Wooden Building:
The Stadthaus, Murray Grove is one of the highest
modern wooden buildings in London, Completed in
2009. It’s a nine-story residential building with height
of 30 meters. It is the tallest building in Europe
structured entirely of wood. Even the lift shafts and
stairwells are made from wood. It illustrates a
groundbreaking approach of building material
selection that can help achieve carbon-neutral (or
even carbon-negative) buildings with current
technology. It is built of solid slabs of timber, used for
floors and walls, with no other structural framework.
Much like plywood, but on a larger scale, the slabs
are made of layers of solid 1” thick boards, cross-
laminated into large slabs up to 30 ft. long.

Renewable Energy and Sustainable Development (RESD) Volume 3 Issue 1, Special Issue, March 2017 - ISSN 2356-8569 http://dx.doi.org/10.21622/RESD.2017.03.1.141
146 RESD © 2017
http://apc.aast.edu
Fig.8. Shows the wood structure of the 9 stores Stadthaus,
Murray Grove residential building.
Source
http://www.nytimes.com/interactive/2012/06/05/science/0605-
timber.html?_r=0, retrieved 13-7-2016
cross-laminated timber used on the Stadthaus is
classified as air-tight, making it one of London's most
energy efficient buildings. These are quite strong,
resilient, and the solid construction offers excellent
fire-resistance and acoustic separation properties,
compared to more typical hollow “stud” walls. [12]
Wood is a renewable resource and all of the
adhesives and chemicals used in the manufacture of
this system are non-toxic. Compared to conventional
steel and concrete construction, embodied energy
was reduced an equivalent of 340 tons of carbon
emissions. This calculation allows for the fact that
the panels were manufactured in Austria and
transported to the project site in England.
Unfortunately, there is not yet any manufacturing
source in the United Kingdom. Ideally, the building
would be made of lumber from Scotland, reducing
transportation and further reducing the embodied
energy. In addition, approximately 200 tons of
carbon are “locked in” the wood material, which
alone is equivalent to the energy that will be used to
heat, cool and operate the building for twenty years.
Thus, the building will have a negative carbon
footprint until almost 2030. Wood is biodegradable,
the wood slabs will easily disassembled for some re-
use when the day comes for its demolition, following
the concept of “cradle-to-cradle”. The exterior
cladding of the building consists of fiber-cement
panels, made from 70% wood-waste products. [12]
IV. EXAMPLES OF NANO-MATERIALS FOR
GLASS WINDOW AND CURTAIN WALLS
Glass is a sustainable, fully recyclable material and
a resource efficient material which is made of
abundant natural raw material such as sand and
glass waste which provides great environmental
benefits such as contributing to mitigating climate
change and saving precious natural resources. It is
also used to generate renewable energy through
solar-thermal and photovoltaic applications as well
as contributing in safeguarding people’s health and
well-being. Window glass is completely different than
traditional glass bottles, which are the most
recyclable items. By contrast, it is nearly impossible
to recycle window glass. Though the two products
may seem virtually the same, there are actually
some notable differences. Bottle glass has a
different chemical composition and melting
temperature than window glass, meaning the two
products can’t be recycled together. Window glass is
a trickier proposition. Most windows come attached
to metal or wooden frames and have to be
disassembled, which is labor intensive and
expensive. Picking out the different types of window
glass poses a bit more of a challenge. Is the glass
tinted or not? Is it safety glass or tempered glass?
Different glass products have a different melting
point from container glass. All these different
subsets of window glass also cannot be combined to
create a new product. However, there are still
nontraditional ways to properly recycle it. Creative
industry professionals are finding other uses for old
windows. The glass can be melted and
remanufactured into Fiberglas. Ground glass can be
incorporated into glassphalt, a glass and asphalt
blend. Broken glass is combined with concrete to
create terrazzo flooring and countertops. Old
windows can also be reused as is or use them to
construct greenhouses or cold frames for the
garden. However, there are great efforts to create
more innovative bio-regenerative glass materials by
following the Biomimetics approach

Renewable Energand Sustainable Development (RESD) Volume 3 Issue 1, Special Issue, March 2017 - ISSN 2356-8569 http://dx.doi.org/10.21622/RESD.2017.03.1.141
147 RESD © 2017
http://apc.aast.edu
A. Sunclean, Self Cleaning Glass
The advanced architectural glasses, such as
Sunclean, Self cleaning glass, Solarban solar
control, low-e glasses and Oceans of Color
spectrally selective tinted glasses can contribute to
green building projects through their ability to
transmit light and block solar heat, which can
minimize reliance on artificial lighting and air
conditioning.[13]
Fig.9.Hydrophobic surface allows self-cleaning: sacred lotus ,
Source:
http://www.asknature.org/strategy/714e970954253ace485abf1c
ee376ad8, Retrieved 4-5-2013
SunClean glass is inspired by self-cleaning
mechanism of lotus plants, the glass self-cleaning is
formulated with a proprietary coating that becomes
“photocatalytic” and “hydrophilic” after prolonged
exposure to sunlight as it reacts with UV rays to
disintegrate organic deposits and repel dust during
rain.
Fig.10. Diagram shows the difference between conventional
uncoated glass & innovative coated sun-clean, self-cleaning
glass,
Source:
http://www.ppg.com/corporate/ideascapes/glass/products/suncl
ean/Pages/suncleanglass.aspx, Retrieved 18-5-2013
Photocatalysis enables the coating to gradually
break down organic materials that land on its surface
when exposed to UV light.
Hydrophilicity causes water to sheet when it strikes
the coating so that decomposed materials are
naturally rinsed away when it rains. Some types of
the self cleaning glass are also Cradle-to-Cradle
Certified which make them more sustainable and
environmental stewardship. [14]
B. Dye Solar Cell Technology:
Dye solar cell is described as “artificial
Photosynthesis” using an electrolyte, a layer of titania
and ruthenium dye sandwiched between glass. [16]
The main difference from a traditional solar cell is that
Dye solar cell does not require high-energy
consuming silicon, but is instead made of titanium
dioxide, used in white paint and toothpaste.
Fig.11. Dye solar cell inspired from the Photosynthesis of tree
leaves,
Source:
http://www.asknature.org/product/b57e64dd3a2a1a9d36a92a5
a51ef7293, retrieved 4-5-2013
The dye in cells absorbs light just like chlorophyll in
photosynthesis, releasing an electron that is
conducted by the chemical electrolyte in the cell.
Light striking the dye excites electrons which are
absorbed by the titania to become an electric current
many times stronger than found in natural
photosynthesis in plants. [16]
It also can be directly incorporated into buildings by
replacing conventional glass panels rather than
taking up roof or extra land area.
Compared to conventional silicon based photovoltaic
technology, Dye solar cell technology has lower cost
and embodied energy in manufacture, and it
produces electricity more efficiently even in low light
conditions and regardless of the panel's orientation.
[16]
V. CRADLE TO CRADLE CONCEPT
Cradle-to cradle design raises an entirely different
agenda. Rather than seeing materials as a waste
management problem as in the cradle-to grave
system, cradle-to-cradle design is based on the
closed-loop nutrient cycles of nature, in which there
is no waste. By modeling human designs on these

Renewable Energy and Sustainable Development (RESD) Volume 3 Issue 1, Special Issue, March 2017 - ISSN 2356-8569 http://dx.doi.org/10.21622/RESD.2017.03.1.141
148 RESD © 2017
http://apc.aast.edu
regenerative cycles, cradle-to-cradle design seeks,
from the start, to create buildings, communities and
systems that generate wholly positive effects on
human and environmental health. Not less waste and
fewer negative effects, but more positive effects,
buildings that make oxygen, sequester carbon, fix
nitrogen, distill water, provide habitat for thousands of
species, accrue solar energy as fuel, build soil,
create microclimate, change with the seasons,
belong to the place and are beautiful.
The milestone of the cradle to cradle certification is
based on the principle that WASTE=FOOD; that
everything should be designed so that its
components are either biological nutrients, food for
natural systems capable of being composted and
returned to the earth as food for more plants and
animals, or technical nutrients, food for industry
capable of being easily separated and properly
recycled. In the natural world, everything is
conceived of and designed to be food. When
everything (every material, manufacturing process
and emission) is food for one system or the other,
then humanity will be indeed benefitting the
environment. So that building should act like a tree
and cites like a forest. A tree, for example, is not
“zero-emitting.” It emits oxygen and nutrients for soil,
while purifying water and providing habitat for
multiple species. This total quality framework has
been designed to support companies in creating
products that are “good” rather than simply “Less
bad.” [6]
A. The C2C philosophical principles:
McDonough and Braungart had investigated three
key concepts for any environmental design for new
products as well as for buildings design, which are:
All Materials in Continues cycle, Use Renewable
energy only and respect diversity. Despite the
publication of the manifesto “c2c in Architecture” in
2009 as well as the “cradle to cradle criteria for the
built environment” by Douglas Mulhall and Michael
Braungrat in 2010, in which issues such as the C2C
design principles were clarified in building sector,
there is still an insufficiently detailed handbook for the
realization and evaluation of the C2C building project.
The C2C building projects provide their own
interpretation by combining elements from C2C
philosophy with elements from “sustainable building”,
“energy-efficient building”, “Bio-eco logical building”
and others. [7]
Fig.12. Diagram shows the Cradle to Cradle Principles
A. All Materials in Continues Cycle:
“Waste Equal Food” it is the conceptual basis for the
C2C philosophy. All products should be made using
materials that can be recycled with minimal
environmental impact to be reused as biological or
technological nutrients.
B. Use Renewable Energy only:
“Current Solar Income” McDonough and Braungart
use this phrase to argue that manufacturing
processes should use energy from the sun or other
renewable sources instead of fossil fuels which are
earth’s stored solar energy reserve.
C. Respecting Diversity:
It is about evaluating the impact of industrial
processes on all plant and animal life or as
McDonough and Braungart say: “All the children of all
species for all time”. [5]
VI. CONCLUSION
Looking back to learn from nature as well as using
natural materials in building structure will help in
creating more energy efficient buildings. It is highly
recommended to create a community that appreciate
this concept and to be aware about the benefit that
will touch their quality of life by creating an energy
efficient environment.
REFERENCES
[1] Yowell J., Biomimetic Building Skin: A
Phenomenological Approach Using Tree Bark
As Model, 2011, A Thesis Submitted To The
Graduate Faculty In Partial Fulfillment Of The
Requirements For The Degree Of Master Of
Architecture, Norman,University Of Oklahoma
[2] Milani B., Building Materials in a Green
Economy: Community-based Strategies for
Dematerialization. A thesis submitted to the
Department of Adult Education and

Renewable Energand Sustainable Development (RESD) Volume 3 Issue 1, Special Issue, March 2017 - ISSN 2356-8569 http://dx.doi.org/10.21622/RESD.2017.03.1.141
149 RESD © 2017
http://apc.aast.edu
Counsel,2005, ling Psychology and the Institute
for Environmental Studies For The Degree Of
Doctor of Philosophy
[3] Mukherjee A, Structural Benefits Of Hempcrete
Infill In Timber Stud Walls, ., 2012,A thesis
submitted to the Department of Civil
Engineering In conformity with the requirements
for the degree of Master of Applied Science,
Queen’s University Kingston, Ontario, Canada
January,
[4] Kennedy, J.F., M.G. Smith And C. Wanek, The
Art of Natural Building. 2002, Published by New
Society Publishers, Gabriola Island, BC
[5] Mcdonough W., Buildings like trees, cities like
forests, The Catalogue of the Future, 2002.,
Published by Pearson Press.
[6] Braungart M., Mcdonough W. And Bollinger A.,
Cradle to Cradle Design: Creating healthy
emissions- a strategy for eco-effective product &
system Design, in the international Journal of
Cleaner production, 2007, published by
Elsevier, 15, 2007, 1337-348
[7] Debacker W., Greerken T., Stouthuyen P., Vann
Holim M., Vrancken K. And Willems S.,
“Sustainable building, materials and Cradle to
Cradle. A survey of current project practices”,
Published by Danny Wile, OVAM, Mechelen,
June 2011,
[8] Jayanett L. & Follett P., April- september 2003,
bamboo in construction: status and potential,
sustainable building and construction published
by the unep industry and environment, volume
26 no.2-3, page 64-65
[9] Lowenstam, H.A. And Weiner, S., 1989, on
biomineralization, published by oxford university
press
[10] “building an earth block home: the magic
building material” [web page] available at :
http://use-it.co.za/wp-
content/uploads/2011/09/use-it-building-an-
earth-block-home.pdf (accessed (may 4th 2013)
[11] “ocean-grown homes: wolf hilbertz wants to
build low-cost housing from the sea”. turnbul a.,
september 1997, [web page] available at:
http://www.globalcoral.org/ocean-
grown%20homes.htm(accessed (august 24th
2012))
[12] “murray grove apartment building, london,
england” 2013, by the green education
foundation (gef), [web page] available at:
http://www.greeneducationfoundation.org/green-
building-program-sub/case-studies/896-murray-
grove-apartment-building.html((accessed (may
16th 2013))
[13] “product scorecard, architectural glass
(uncoated and coated, ppg industries, inc”,
2011, by cradle to cradle products innovation
institute, [web page] available at:
http://c2ccertified.org/products/scorecard/archite
ctural_glass_uncoated_and_coated, ((accessed
(may 18th 2013))
[14] virginia apartment complex first to showcase
solarban 70xl/sunclean glass” 2009-2012, by
the american ceramic society, [web page]
available at:
http://ceramics.org/ceramictechtoday/tag/suncle
an-glass/, ((accessed (may 18th 2013))
[15] “product scorecard, architectural glass
(uncoated and coated, ppg industries, inc”,
2011, by cradle to cradle products innovation
institute, [web page] available at:
http://c2ccertified.org/products/scorecard/archite
ctural_glass_uncoated_and_coated, ((accessed
(may 18th 2013))
[16] “smit solar ivy” 13 december 2012, by the
biomimicry 3.8 institude, [web page] available
at:
http://www.asknature.org/product/256b9f497821
497773d9f0c442ab367a((accessed (may 19th
2013))
[17] “can wooden skyscrapers transform concrete
jungles?” march 15,2012, by michael green
architect, [web page] available at :
http://edition.cnn.com/2012/03/15/tech/eco-
wood-skyscrapers/index.html?iphoneemail
(accessed (May 15th 2013)).

Renewable Energy and Sustainable Development (RESD) Volume 3 Issue 1, Special Issue, March 2017 - ISSN 2356-8569 http://dx.doi.org/10.21622/RESD.2017.03.1.150
This Paper has been Accepted and Presented in the (First International Conference on New Trends for Sustainable Energy) 1-3 October, 2016 at Pharos University, Alexandria, Egypt.
150 RESD © 2017
http://apc.aast.edu
Towards a zero carbon Alexandria Mona M. Salem and Mary A. Zekry
Assistant Lecturer, Architecture Department, Pharos University in Alexandria, Alexandria, Egypt
[email protected], [email protected]
Abstract - Today, the world faces an unprecedented
environmental crisis. Since the Industrial Revolution,
the accelerated climate change is believed to be a
result of human activities; that increase the
concentration of greenhouse gases (GHG) in the
atmosphere – to which carbon dioxide is the largest
contributor. It made a must beginning to reverse the
damage inflicted on the planet. Egypt is exerting great
efforts to reduce the emissions of Green House Gases
and mitigate the negative impacts of climate change
and deal with the main challenges that affect
sustainable development.
Based on an empirical analytical study, the paper
examines all of the environmental factors and its effect
on carbon dioxide concentration taking into
consideration the characteristic of the urban fabric and
conditions of Alexandria one of the biggest cities in
Egypt as an applied case study of a big willing costal
city. The paper simultaneously aims the management
of the carbon dioxide emissions through several
recommendations based on the stated study, while
creating a vibrant urban environment.
Keywords - Environment; climate change; carbon
dioxide; Sustainable Development; management.
I. INTRODUCTION
Human industrial activities and technological
revolution have led to increased rates and
concentrations of greenhouse gases GHG emissions
in the atmosphere; causing climate change. (1)
Atmosphere has some variable components including
water vapor, dust particles, and ozone. Although these
are found in small amounts, they can have significant
effects on greenhouse gases and climate. (2) These
are not considered sources of air pollution but it has
been influential on the global warming phenomenon.
Carbon dioxide is one of the main gases which has a
large contribution of this phenomenon. (1)Therefore,
the industrial applications of this type of converter are
limited [1].
It is well known that GHG and climate change is a
global phenomenon but its effects would vary from one
place to another on earth. Egypt is expected to be
largely vulnerable to number of risks and threats such
as sea level rise, high temperatures, followed by
shortages in water resources, impacts on agricultural
productivity and difficulty on cultivating some types of
crops; as well as impacts on touristic areas, public
health and infrastructure that would affect energy,
industry, food safety and national economy sectors. (1)
Thus it became a significant matter analyzing the
causes of carbon dioxide emissions and the mainly
environmental factors that affect its concentration in
atmosphere which differ from one place to another at
the different time intervals.
Through studying two main axises of Alexandria city,
different devices had been used to measure the values
of carbon dioxide and several environmental factors in
the atmosphere at different points. The collected data
was analyzed comparing the effect of the
environmental factors on the carbon dioxide
concentration in the atmosphere for the same selected
points. through this analysis a conclusion was made
with some recommendations on how to control the
carbon dioxide emissions, aiming to reduce
greenhouse gases to make Alexandria a zero carbon
city.
II. EGYPT’S STAT E OF CARBON DIOXIDE
EMISSION
The table below shows the GHG emissions in Egypt in
2000 (co2.mt.eq) according to Egypt second national
communication report, also shows the calculated
emissions in 2009.
Table 1. GHG EMISSIONS IN EGYPT
Year
Egypt’s amount of
GHG emissions
(co2eq Mt)
Egypt’s share of the
global GHG
emissions (%)
2000 193,267 0,64
2009 305,1 0,71

Renewable Energy and Sustainable Development (RESD) Volume 3 Issue 1, Special Issue, March 2017 - ISSN 2356-8569 http://dx.doi.org/10.21622/RESD.2017.03.1.150
151 RESD © 2017
http://apc.aast.edu
Egypt's CO2 emissions were fairly stable during the
past decades as shown in the below figure 1. As
compared to industrialized countries, Egypt's CO2
emissions are still considered low, and are marginal on
a global level. Although the CO2 emissions level
increased (from 116.6 Mt CO2 equivalent to reach
226.6Mt CO2 equivalent In 2007, i.e. about 93%
increase), the greenhouse gases in Egypt still
represents a very small percentage of the global yearly
emissions (about 0.96%). (3)
Fig .1. Egypt’s CO2 emissions (metric tons per capita) from
1960 till 2010.
The below figure shows the different activities which
contribute the carbon dioxide emission in Egypt. It is
clearly noticed that fuel combustion in the energy
sector has the major contribution in the carbon dioxide
emission followed by the industrial activities
Fig .2. Sources of Co2 emissions in Egypt.
III. ALEXANDRIA AS A CASE STUDY
Alexandria, with a population approximately 3.9 million
inhabitants, is Egypt’s second largest city situated on
the Mediterranean Sea. Its borders extend along a 70
km coastline north-west of the Nile delta. It is also the
largest city lying directly on the Mediterranean coast.
(4)
Fig .3. A recent map of Alexandria showing the linear form of
the city.
A. Empirical Study
Six environmental factors had been investigated to
observe their effect on the amount of carbon dioxide
concentration in the atmosphere at different selected
points. These environmental factors that had been
investigated are air flow, air velocity, carbon monoxide,
temperature, relative humidity and the urban fabric.
The air velocity and airflow were measured using the
Multifunctional AMI300 device. The carbon dioxide was
measured using 2 devices; Air Quality data logger and
Multifunctional AMI300. The carbon monoxide,
temperature and relative humidity were measured
using Air Quality data logger.
As shown in the below figure the first urban fabric is
the suez canal street which is a main road axis
perpendicular to the sea shore line and the second one
is Abou Queer street which is a main road axis parallel
to the sea shore line.
Fig .4. A map showing the two investigated road axis.
The table below sums up the different environmental
factors measures versus the carbon dioxide emission
in the form of charts in two different urban fabrics.

Renewable Energy and Sustainable Development (RESD) Volume 3 Issue 1, Special Issue, March 2017 - ISSN 2356-8569 http://dx.doi.org/10.21622/RESD.2017.03.1.150
152 RESD © 2017
http://apc.aast.edu
Table. 2. MATRIX OF CARBON DIOXIDE EMISSION VERSUS THE
DIFFERENT ENVIRONMENTAL FACTORS
Po
ints
of
com
pa
riso
n Carbon dioxide emission
Suez Canal Street
The average CO2
emission is 445 ppm
Abou Queer Street
The average CO2 emission is 315 ppm
Air
Flo
w
The average air flow 74
m3/h
The average air flow 60 m3/h
Air
Vel
oci
ty
The average air velocity
is 2.9m/s
The average air velocity is 1.7 m/s
Car
bo
n
mo
nox
ide
The average carbon is 1.6
ppm
The average carbon is 9.7 ppm
Tem
per
atu
re
The average Temperature
is 27 °C
The average Temperature is 26 °C
Rel
ativ
e
Hu
mid
ity
The average relative
humidity is 41%
The average relative humidity is 47%
Urb
an F
abri
c
Figure I. Suez canal street
Urban pattern.
Grid Pattern: While the Suez canal road is perpendicular on the sea shore line; the sub-Streets have been aligned parallel to sea shore which had blocked the cooling breeze of the sea. It causes difficulty in getting out the produced carbon dioxide at once.
Figure II. Abou queer
street Urban pattern.
Grid Pattern: While the Abou Queer road is parallel to the sea shore line; the sub-Streets have been aligned perpendicularly on sea shore line to take advantage of the cooling breeze of the sea. It also helps getting out the produced carbon dioxide at once.
B. Analytical Study
By studying and analyzing the above collected data it
was found that the carbon dioxide emission is higher in
the Suez Canal street with average 445 ppm than Abou
Queer street with average 315 ppm but both are mostly
still below the normal limit which is 450 ppm as shown
in the below chart. This slight difference in CO2
emission showed a slight increase in the average
temperature of in suez canal road with average 27°C
than Abou Queer road with average 26°C.
Fig.7. A chart showing the carbon dioxide readings of both road
axises at 10 selected points.
As for the air velocity factor it was found that with the
increase of the air velocity there is clear decrease in the
CO2 concentration in the atmosphere that could be
noticed in both road axises. The Air flow showed a
steady concentration of CO2 as the air flow increases
at the Suez canal Street, while it showed a slight
decrease in CO2 concentration as the air flow
increases at Abou Queer street.
The average relative humidity of both road axes were
almost close; Abou queer street 47% and Suez Canal
41% were both showed a steady concentration of CO2
with the increase of relative humidity. The carbon
monoxide showed an average higher reading in Abou
Queer street 9.7 ppm than Suez Canal street 1.6 ppm
without a noticeable effect on the CO2 concentration.
Finally the urban fabric which mainly could be noticed
of having an effect on the air velocity and airflow which
showed higher reading is the ax perpendicular to the
sea shore (suez canal road) than in the ax parallel to
the sea shore (Abou Queer road).

Renewable Energy and Sustainable Development (RESD) Volume 3 Issue 1, Special Issue, March 2017 - ISSN 2356-8569 http://dx.doi.org/10.21622/RESD.2017.03.1.150
153 RESD © 2017
http://apc.aast.edu
Table. 3. SWOT ANALYSIS OF STUDY AREA
Strengths Weaknesses
CDM Projects, which had
been approved during 2008,
reduce greenhouse gases
emissions by up to about 0.9
million tons of carbon
dioxide equivalent.
They have also an
investment cost up to $ 66
million USD.
The good urban fabric
around Abou Queer street
allows the immediate
disposal of produced carbon
emissions from automobile
exhausts which decrease the
concentration of carbon
dioxide.
Heritage buildings along
Abou Queer Street feature
strong opportunities for
natural ventilation and
daylight because of strong
thermal mass for heat
absorption.
Many of heritage buildings
in the city haven’t benefited
optimally from changes to
building systems over the
years which prevent these
buildings from receiving the
benefits of full sustainable
upgrades.
limited energy code
requirement for existing
buildings
lack of corporate support
and business community
engagement
Mechanical systems sizes
are driven by the internal
loads on the building (heat
from people, lights and
equipment) as well as the
external envelope loads.
There for, the mechanical
system efficiency is
ultimately dependent on the
architectural design of the
building and its use.
Opportunities Threats
Ratification of the UN
Framework Convention on
Climate Change
(UNFCCC) and Kyoto
protocol and is committed
to any obligation
Institutional formation of a
National Committee of
Climate Changes to manage
all issues related to climate
changes.
Make use of the three
mechanisms of the Kyoto
protocol for the reduction of
GHG emissions: the Clean
Development Mechanism
(CDM), Joint
Implementation and
Emissions Trading.
There are some factories
along Suez canal street that
emit massive amounts of
greenhouse gases such as
carbon dioxide and
methane.
Retrofitting buildings is
critical for the overall
carbon emissions for the
city
IV. CONCLUSION
According to the data collected and analysed it was
found that the carbon dioxide concentration is inversely
proportional with the air velocity, as when the air
velocity increased, the carbon dioxide decreased in
both road axis. This shows that the carbon dioxide
concentration is affected with the air velocity which in
turn is affected by the different urban fabric.
Accordingly it can be concluded that urban fabric with
perpendicular grid to the sea shore line has higher air
velocity and airflow.
V. RECOMMENDATIONS
Promoting Good environmental design solutions
that benefit the community as a whole on both
scales of buildings or urban planning.
Using the open spaces along the Mahmoudya canal
as an entertainment zones with landscape and
green areas to create a strong Green corridor that
can improve livability and reduce the heat island
effect.
Increasing the landscape elements and greenery in
the residential zone and along the Suez Canal
artery to help absorb the vehicle emissions.
Creating a green axis as a spine that links a series
of smaller green plazas to improve transportation,
amenities and livability and also offer a way of
respite for residents, commuters and visitors.
Reducing key sources of carbon dioxide through
policies and investments supporting cleaner
transport, energy-efficient housing, power
generation, industry and better municipal waste
management.
Updating to new, more efficient equipment,
technologies and infrastructure for rail, bus and
taxis, to realize significant carbon savings.
Improving pedestrian and bicycle amenities will also
decrease automobile use.
Adding new transit options such as one-way
car/scooter/bicycle programs will further reduce the
need for private car ownership, reducing carbon
emissions.
Charging vehicles based on their emissions and the
rush-hour congestion of certain roads
Creating an energy code requirement for existing
buildings.
Increasing corporate support and business
community engagement.
Managing the vehicular use carefully adjacent to
buildings and in vocational programs.

Renewable Energy and Sustainable Development (RESD) Volume 3 Issue 1, Special Issue, March 2017 - ISSN 2356-8569 http://dx.doi.org/10.21622/RESD.2017.03.1.150
154 RESD © 2017
http://apc.aast.edu
VI. ACKNOWLEDGMENT
We would like to show our gratitude to our PhD
Professors for sharing their pearls of wisdom with us
during the course of this research and special thanks
to who supported me continuously my beloved
husband Dr. Ramy Moussa.
REFERENCES
[1] Ministry of State for Environmental Affairs,
Egyptian Environmental Affairs Agency, "Egypt
State of Environment 2010", Arab Republic of
Egypt, 2010.
[2] J. Harger, K. Sorensen and M. Khalil, Carbon
cycling. Malaysia: Pergamon Press, 1991.
[3] "Egypt, Arab Rep. | Data", Data.worldbank.org,
2016. [Online]. Available:
http://data.worldbank.org/country/egypt-arab-
rep?view=chart. [Accessed: 30- Jun- 2016].
[4] Alexandria Governorate; and General
Organization of Physical Planning (GOPP),
Ministry of Housing, Utilities and Urban
Development, "Alexandria City Development
Strategy - Moving from Vision to Strategy and
Implementation", The World Bank, Alexandria,
2007.

Renewable Energy and Sustainable Development (RESD) Volume 3 Issue 1, Special Issue, March 2017 - ISSN 2356-8569 http://dx.doi.org/10.21622/RESD.2017.03.1.155
This Paper has been Accepted and Presented in the (First International Conference on New Trends for Sustainable Energy) 1-3 October, 2016 at Pharos University, Alexandria, Egypt.
155 RESD © 2017 http://apc.aast.edu
Green Building between Tradition and Modernity
Study Comparative Analysis between Conventional
Methods and Updated Styles of Design and Architecture
Processors Elshimy .H1 Samir. N2
Associate Professor, Architectural Engineering Department, Pharos University, Alexandria, Egypt
Assistant Lecture, Architectural Engineering Department, Pharos University, Alexandria, Egypt
Abstract - Green house concept appeared from the
ancient to the modern age ages and there is a
tendency to use a traditional architecture with a
pristine ecological environment areas and through
sophisticated systems arrived to modern systems of
the upgraded systems by Treatment architectural
achieve environmental sustainability in recent
years, sustainability concept has become the
common interest of numerous disciplines. The reason
for this popularity is to perform the sustainable
development. The Concept of Green Architecture,
also known as "sustainable architecture” or “green
house,” is the theory, science and style of buildings
designed and constructed in accordance with
environmentally friendly principles. Green house
strives to minimize the number of resources
consumed in the building's construction, use and
operation, as well as curtailing the harm done to
the environment through the emission, pollution and
waste of its components.
To design, construct, operate and maintain buildings
energy, water and new materials are utilized as well
as amounts of waste causing negative effects to
health and environment is generated. In order to limit
these effects and design environmentally sound and
resource efficient buildings; "green building systems"
must be introduced, clarified, understood and
practiced.
This paper aims at highlighting these difficult and
complex issues of sustainability which encompass the
scope of almost every aspect of human life.
Keywords - Greenhouse; sustainable buildings;
natural buildings; living architecture; renewable
resources-eco-design; eco-friendly architecture;
earth-friendly architecture; environmental
architecture; natural architecture.
I. INTRODUCTION
Sustainability is comprehensive therefore a
complex subject. It is of vital importance to all
because it deals with the survival of human species
and almost every living creature on the planet.
Sustainable and eco-friendly architecture is one of
the main aims thans for creating a better life have
made as the ultimate model for all their activities. For
this reason, moving towards a greener architecture is
well-thought-out the main goal of the present
architecture of our time [1]
At the rate the development needs of this world is
using the scarce and limited resources found on the
earth, it is becoming obvious that unless there are
major changes to Man's thinking and behavior, the
future of civilization as known today is dubious.
This complex subject has no straight forward solution,
especially considering that sustainability is a goal for
all to reach as they continually strive to reach towards
it. Green architecture produces environmental, social
and economic benefits. Environmentally, green
architecture helps reduce pollution, conserve natural
resources and prevent environmental degradation.
Economically, it reduces the amount of money that
the building's operators have to spend on water and
energy and improves the productivity of those using
the facility [2]
And, socially, green buildings are meant to be
beautiful and cause only minimal strain on the local
infrastructure.
The buildings in which we live, work, and play protect
us from nature's extremes, yet they also affect our
health and environment in countless ways. As the
environmental impact of buildings becomes more

Renewable Energy and Sustainable Development (RESD) Volume 3 Issue 1, Special Issue, March 2017 - ISSN 2356-8569 http://dx.doi.org/10.21622/RESD.2017.03.1.155
156 RESD © 2017 http://apc.aast.edu
apparent, a new field called "green building" is
gaining momentum. Green, or sustainable, building is
the practice of creating and using healthier and more
resource-efficient models of construction, renovation,
operation, maintenance and demolition [3].
II. PROPLEM STATEMENT
There is no clear approach to design the green
architecture
III. 2. AIM OF STUDY
Access to appropriate methodology for Egypt
correspond to different levels of design in terms of
ecological techniques to advanced one
IV. METHODOLOGY
In order to achieve the stipulated aim, the study
presented in this paper, traces the following steps:
1. General overview on applying “Green
Architecture“ as A concept of sustainability.
2. Analytical Study to ecological project (Adrar
Amlal)
3. Analytical Study to advanced project (Tenth of
Ramadan City) V. GENERAL OVERVIEW ON APPLYING “GREEN
ARCHITECTURE “AS A CONCEPT OF
SUSTAINABILITY
A. Green Architecture
Green architecture, or green design, is an approach
to building that minimizes harmful effects on human
health and the environment. The "green" architect or
designer attempts to safeguard air, water, and earth
by choosing eco-friendly building materials and
construction practices [3].
B. Green Architecture and Green Design
Green architecture defines an understanding of
environment-friendly architecture under all
classifications, and contains some universal consent
[4]; it may have many of these characteristics:
Ventilation systems designed for efficient heating
and cooling
Energy-efficient lighting and appliances
Water-saving plumbing fixtures
Landscapes planned to maximize passive solar
energy
Minimal harm to the natural habitat
Alternate power sources such as solar power or
wind power
Non-synthetic, non-toxic materials
Locally-obtained woods and stone
Responsibly-harvested woods
Adaptive reuse of older buildings
Use of recycled architectural salvage
Efficient use of space
While most green buildings do not have all of these
features, the highest goal of green architecture is to
be fully sustainable.
Also Known As: Sustainable development, eco-
design, eco-friendly architecture, earth-friendly
architecture, environmental architecture, natural
architecture [5].
C. Consideration for Green Building
Green building involves consideration in four main
areas: site development, material selection and
minimization, energy efficiency, and indoor air quality
Consider site development to reduce the impact
of development on the natural environment. For
example, orient the buildings to take advantage
of solar access, shading and wind patterns that
will lessen heating and cooling loads.
Carefully select materials that are durable,
contain recycled content, and are locally
manufactured to reduce negative environmental
impacts. A growing market exists of quality
recycled products at affordable prices.
Incorporate energy-efficient design into buildings
to create an efficient and comfortable
environment. Take advantage of the natural
elements and technologies to conserve
resources and increase occupant
comfort/productivity while lowering long-term
operational costs and pollutants [6].
Design for high indoor air quality to promote
occupant health and productivity.

Renewable Energy and Sustainable Development (RESD) Volume 3 Issue 1, Special Issue, March 2017 - ISSN 2356-8569 http://dx.doi.org/10.21622/RESD.2017.03.1.155
157 RESD © 2017 http://apc.aast.edu
Minimize the waste in construction and
demolition processes by recovering materials and
reusing or recycling those [7].
D. THE PRINCIPLES OF GREEN BUILDING
DESIGN
The green building design process begins with an
intimate understanding of the site in all its beauties
and complexities. An ecological approach to design
aims to integrate the systems being introduced with
the existing on-site ecological functions performed by
Mother Nature.
These ecological functions provide habitat, respond
to the movements of the sun, purify the air as well as
catch, filter and store water. Designers can create
features in their buildings that mimic the functions of
particular eco-systems. Species that thrive in natural
ecosystems may also utilize habitats created in man-
made structures. Creating new habitat on structures
in urbanized areas is especially important to support
bio-diversity and a healthy ecosystem [2].
The following points summarize key principles,
strategies and technologies which are associated
with the five major
Elements of green building design which are:
Sustainable Site Design; Water Conservation and
Quality; Energy and Environment; Indoor
Environmental Quality; and Conservation of Materials
and Resources. This information supports of the use
of the USGBC LEED Green Building Rating System,
but focuses on principles and strategies rather than
specific solutions or technologies, which are often site
specific and will vary from project to project
(USGBC).
Fig. 1. Elements of green building design by author (USGBC).
E. GREEN BUILDING BENEFITS
Green building is not a simple development trend; it is
an approach to building suited to the demands of its
time, whose relevance and importance will only
continue to increase (USGBC)
Comfort. Because a well-designed passive solar
home or building is highly energy efficient, it is
free of drafts. Extra sunlight from the south
windows makes it more cheerful and pleasant in
the winter than a conventional house [8].
Economy. If addressed at the design stage,
passive solar construction doesn’t have to cost
more than conventional construction, and it can
save money on fuel bills [9].
Aesthetics. Passive solar buildings can have a
conventional appearance on the outside, and the
passive solar features make them bright and
pleasant inside.
Environmentally responsible. Passive solar
homes can significantly cut use of heating fuel
and electricity used for lighting. If passive cooling
strategies are used in the design, summer air
conditioning costs can be reduced as well [10].
VI. ANALYTICAL STUDY TO ECOLOGICAL
PROJECT (ADRAR AMLAL)
An applied analytical study on a project of "Adrar
Amlal" hotel in "Gaafar oasis"at Siwa in Egypt.
The mechanism of choosing the construction system
is considered as an important stage in urban projects
due to its relation with a group of limits forming the
building technology, the mechanism of choice is
related to the engineering method of decision support
system used in construction system through building
technical analysis and its application limits which
passThrough a group of consecutive stages related
to the project nature and the surrounding
environment especially in the distinguished sites
environmentally to assure the environmental resource
conservation for humanity secure in his environment
which needs from him to know the Ecological
dimensions (capacity-dependence-recycling).
The research aims to achieve a group of goals, the
most important of them is to reach a mechanism to
choose the suitable construction system matching

Renewable Energy and Sustainable Development (RESD) Volume 3 Issue 1, Special Issue, March 2017 - ISSN 2356-8569 http://dx.doi.org/10.21622/RESD.2017.03.1.155
158 RESD © 2017 http://apc.aast.edu
with sustainable development forming harmony
between the design and the construction system and
the sustainable development to reach the best
economic efficiency of the project encouraging the
environment sustainability as one of affecting
sustains for a balanced environmental urbanism.
Fig. 2. Run harmonic reciprocal approach on the study
A. The research is sequenced as follows
A study and analysis of the decision support
system stages to choose the architectural project
construction system as a primary stage.
A study of factors and limits fuming the
sustainable development and confirming it in
an activated developed way.
A study of the harmony relation between
the construction system and the sustainable
development and the exchangeable effects
between them.
A comparison and ordering the construction
system priorities' and sustainable development
priorities’.
Concluding a mechanism of choosing the best
construction system in harmony with the
sustainable development.
The "Adrar Amlal" hotel in "Gaafar oasis"at Siwa in
Egypt is considered the best example of applying the
mechanism of choosing the construction system in
harmony with sustainable development, the Oasis is
a distinguished site environmentally at Siwa ,it is
centralized around (the White mountain),the project
criteria is there use of the old oasis method of
construction again to build environmental houses of a
new view using building technology by using building
materials which are suitable for Siwa environment
such as (Karsheef (salted masses)-clay-cured palm
cores)
Fig .3. Siwa site for a map of natural
reserves [11].
Fig.4.Natural determinants of the problem of
site [12].
Fig.5.Architectural character of the Siwa
Oasis [13].
B. The research conclusions
First: The choice of the best construction system
suitable for the project environment is the first step to
achieve sustainable development.
Second: The abundance of the environmental
building materials is the most important factor to
choose the environmental construction system.
Third: To make a relation between construction rates
and "replacement and exchange "rates of projects in
site to achieve the environmental sustainable
development.

Renewable Energy and Sustainable Development (RESD) Volume 3 Issue 1, Special Issue, March 2017 - ISSN 2356-8569 http://dx.doi.org/10.21622/RESD.2017.03.1.155
159 RESD © 2017 http://apc.aast.edu
Fourth: Studying and developing the traditional
construction systems of projects in sustainable
sites which helps to make the project more
economic efficient and in harmony with
environmental sustainability
Fifth: The architectural integration together with
knowledge between different stages in study and
construction helps to achieve the environmental
sustainability for the built environment
VII. ANALYTICAL STUDY TO ADVANCED
PROJECT (TENTH OF RAMADAN CITY)
This part has concentrated on the neighborhood
sustainability evaluation and its efficiency in
improving the decision-making for sustainable
development, it plans to provide a better
understanding of the sustainability assessment at the
neighborhood level and provide a critical analysis of
both the theory and practice of neighborhood
sustainability evaluation.
This project aim to introduce a case study for new
application of the microclimate of urban open spaces
is affected by several factors such as the urban form
and geometry, urban density, the vegetation, the
water levels and the properties of surfaces. Both
climatic and physical factors are combined in order to
attain sustainable human thermal comfort conditions.
A. MATERIALS & METHOD
To design the form of a village, town or city, we
should understand the outline design principles of the
urban form.
The concept of sustainability in urban design to
residential communities and housing.
Urban Microclimate
The main purpose of climatic design, on a
macro (Settlement) and micro (building) scale, is to
reduce uncomfortable conditions created by an
excess of heat and dryness. Buildings must be
adapted to extreme summer and Winter, day and
night conditions to achieve a well-balanced indoor
climate. Not only cooling is required; passive heating
may also be required in winter and during cold nights.
Protection is required from the intense radiation from
the sun, ground and surrounding buildings, from dust,
sandstorms and insects (flies). Glare has to be
reduced and dust penetration prevented. Settlements
and buildings, therefore, have to be compact,
providing shade and controllable ventilation.
The urban microclimate plays an important role in
building energy consumption and thermal comfort in
outdoor spaces. Nowadays, cities need to increase
energy efficiency, reduce pollutant emissions and
mitigate the evident lack of sustainability [14]. Human Comfort
Thermal comfort is the most important factor that
Human comfort depends on. Thermal comfort is
affected by six major factors which can be classified
into two categories: personal factors - because they
are characteristics of the occupants and
environmental factors - that are related to the
conditions of the thermal environment. The former
consisting of clothing level and metabolic rate, while
the latter is mean radiant temperature, air
temperature , air speed and humidity. Even if all of
these factors may change with time, standards
usually refer to a steady state to study thermal
comfort, just allowing a change in temperature by
small scale. Air temperature is also governed by solar
radiation.
B. URBAN DESIGN IMPROVEMENT METHODS
FOR THERMAL COMFORT
There are a lot of urban microclimate moderation
approaches Parameters like air temperature, relative
humidity, mean radiant temperature, and wind
velocity can be modified by the effect of urban
interventions, which may improve the outdoor thermal
comfort conditions [15].
Cool Reflective Materials
Water Surfaces
Green Spaces and Vegetation
Building Arrangements with Wind Movement

Renewable Energy and Sustainable Development (RESD) Volume 3 Issue 1, Special Issue, March 2017 - ISSN 2356-8569 http://dx.doi.org/10.21622/RESD.2017.03.1.155
160 RESD © 2017 http://apc.aast.edu
C. SIMULATION TOOLS IN URBAN DESIGN
DECISIONS
There are a Few studies have indicated that a good
neighborhood Sustainability Assessment
Frameworks and Tools should have the following
characteristics Sustainability coverage—
consideration of the major themes of sustainability of
neighborhoods based on which their performance to
be measured in a comprehensive and integrated way
[16].
Several simulation tools related to urban design such
as Ecotect, Urbanism, GIS, Envi-met and others.
Each simulation tool deals with a specific area for
instance. Urbanism is concerned with transportation,
environmental planning, and metropolitan land use;
While Envi-met is concerned with surface-plant-air
interaction inside urban environments. All simulation
tools have an unlimited number of points from the
model that can be analyzed, whereas, in a
measurement study, only the results derived from the
measured spots are reliable.
On the other hand ECOTECT software is designed to
improve the analysis, simulation, and optimization of
high- performance buildings and systems. By using
this software architects and engineers can test,
evaluate and respond to a variety of strategies
because it has a special use in the design and
delivery of sustainable 'green' projects. 3D spatial
models are one of the most advantages of the design
and performance analysis tools because of the
property of cutting edge that helps users to visualize
simulation output, smoothing the translation of
simulation results into the project design. Using
simulation software, design professionals are able to
continuously study and predict how decisions will
impact the performance of the building from the early
phases of design through occupancy without
significant investment in mockups or manual
calculations. Simulation tools such as ECOTECT and
other similar software can improve the building
industry by giving architects and engineers the power
to use performance-based criteria in the design of
projects.
Fig. 6. ECOTECT (Building Performance Simulation Software)
(http://www.zigersnead.com/current/blog/post/ecotect-building-
performance-simulation-software)
D. Tenth of Ramadan City (case study)
El Asher City or Tenth of Ramadan City is located in
the Sharqia governorate of Egypt close to the city of
Cairo and follows the Urban Communities Authority. It
is one of the first generation cities in Egypt, and also
one of the largest new industrial cities. It was
constructed to provide job opportunities for youths as
well as to attract the population increase to the
outside of Cairo and the narrow valley, its climate
classified as hot desert as the rest of Egypt. 1. Design Concept of the project
Design Concept of project (Figure 7) based on
meeting the determinants architectural device “El
Asher City or Tenth of Ramadan City” functional
requirements in line with the Principles sustainable
neighborhood planning to (Figures 8, 9):
Achieve the functional requirements of the project
according to the structural and architectural
determinants.
Reduce waste entrances of apartment buildings in
the movement areas (roads) role habitation and
what reduces the cost of the housing unit.
Designed Muscat approved symmetric to afflict
balance in marketing and reduce differences to
distinguish between the blanks in order to achieve
special layers housing average and exterior
distribution quality takes into account the non-
typical after the concept of housing People's
abhorrent to rush to
The Building was used major traffic battery
different their positions to ensure optimal routing
and compatibility with the gradient vacuum spaces
planning (Figures 10, 11).

Renewable Energy and Sustainable Development (RESD) Volume 3 Issue 1, Special Issue, March 2017 - ISSN 2356-8569 http://dx.doi.org/10.21622/RESD.2017.03.1.155
161 RESD © 2017 http://apc.aast.edu
The idea of assembling buildings to reduce the
blanks rely on among themselves to provide
spaces of the inner shadows.
Fig. 7. Design Concept of the project
Fig. 8. Residential Neighborhood Layout
Fig. 9. Site Perspective
Fig. 10. Hierarchy of Spaces
Fig. 11. Solid and Void Diagram
E . C a s e s t u d y e v a l u a t i o n
The simulation was run on Neighboring residential in
Tenth of Ramadan City In order to investigate the
local microclimate (Solar Radiation, air temperature,
Relative humidity) in the climate of Egypt, Egypt as a
proposed area. Readings of the Microclimatic
parameters were run consecutively currently,
expected and proposed then compared on each
indicator.(Figures 12, 13, 14 and 15).
Fig. 12. The Stereographic Diagrams represent the range of
Maximum Temperature in between (40-45) °c on June and
observed that the highest day temperature is on 7 July.
Fig .13. The Stereographic Diagrams represent the Direct Solar
Radiation (W/m2) & Diffuse Solar Radiation (W/m2).

Renewable Energy and Sustainable Development (RESD) Volume 3 Issue 1, Special Issue, March 2017 - ISSN 2356-8569 http://dx.doi.org/10.21622/RESD.2017.03.1.155
162 RESD © 2017 http://apc.aast.edu
Fig .14. the Stereographic Diagrams represent the Relative
Humidity.
Fig .15. The Stereographic Diagrams represent the Prevailing Winds.
VIII. CONCLUSION
This paper presents a review on urban sustainability
with the aim of Understanding key technical principles
to be considered while planning for new
neighborhoods. Sustainable neighborhoods evolution
and initiatives are described, several design concepts
related to sustainable urban forms are defined and
their sustainability characteristics investigated.
(Focusing on sustainability concepts under the triple
bottom line of environmental, economic, and social
dimensions) and practitioners.
Rapid urbanization has brought environmentally,
socially, and economically great challenges to cities
and societies. To build a sustainable neighborhood,
these challenges need to be faced efficiently and
successfully. In this regard, the first step of action is
to determine the sustainability levels of
neighborhoods. From this perspective, the literature
points to a number of NSA tools. However, as the
critique of these tools suggests they have limitations
in their indicator systems and adaptation in the
developing country context is challenging.
There are many approaches that aim to achieve
sustainable urban forms. Different approaches use
different scales
of concepts, as well as emphasizing some concepts
over others. In practice, many local governments,
planning consultants, landscape architects, and so on
are grappling much more specifically with aspects of
sustainable urban form through a variety of planning
and design approaches and policies.
Different urban forms give differently to sustainability.
Moreover, different planners and scholars may
develop different combinations of design
concepts to achieve sustainable development
goals. They might come with different forms, where
each form emphasizes different concepts. However,
all should be forms that environmentally contribute
beneficially to the planet for the present and future
generations.
The ideal sustainable urban form according to the
design concepts of sustainable urban form is that
which has a high density and adequate diversity,
compact with mixed land uses, and its design is
based on sustainable transportation, greening, and
passive solar energy. Ultimately, sustainable urban
forms aim to achieve different objectives. The most
prominent among them are decreased energy use,
reduced waste and pollution, reduced automobile
use, preservation of open space and sensitive
ecosystems, and livable and community-oriented
human environments.
The Five Principles are highly interrelated and
support each other. High density provides the
population and activity basis for a sustainable
neighborhood; adequate street density is the material
basis; mixed land-use and social mix shape the land
use and social life in the neighborhood, and limited
land use specialization is the first step towards mixed
neighborhoods.
The Five Principles balance population growth,
economic growth, rapid urbanization, sustainable
urban development and other factors, and try to
establish a new urban system. In this system,
population and urban infrastructure accomplish
economies of scale; diversified social networks and
the diversity of land uses to support each other and
develop together and urban space and urban
dwellers live and develop in harmony.

Renewable Energy and Sustainable Development (RESD) Volume 3 Issue 1, Special Issue, March 2017 - ISSN 2356-8569 http://dx.doi.org/10.21622/RESD.2017.03.1.155
163 RESD © 2017 http://apc.aast.edu
Besides good planning and design decisions, the
application of these principles also requires
supporting legal frameworks, an analysis of the local
society and economy, appropriate infrastructure
technology and capacity, and the institutional
capacity to enforce decisions.
REFERENCES
[1] Mohammadjavad, M., Arash, Z., Airya, N.,
Setareh, G., Narjes, E., 2014 “Dilemma of green
and pseudo green architecture based on LEED
norms in case of developing countries”
International Journal of Sustainable Built
Environment (2014) 3, 235–246.
[2] Thomas Rettenwender, 2009, M.A., Mag. Arch.,
LEED AP, Architect and Niklas SpitzMonterey
Peninsula College INTD62 Spring 2009”The
Principles of Green Building Design” Spring
2009.
[3] Roy Madhumita, 2008, Dept. Of architecture,
Jadavpur university, Kolkata, India, “Importance
of green architecture today”.
[4] “Burcu, G., 2015, “Sustainability Education by
Sustainable School Design” Dokuz Eylul
University, Department of Architecture, Turkey
Procedia - Social and Behavioral Sciences 186
(2015) 868 – 873.
[5] USGBC, 2002, U.S. Green Building Council,
Building Momentum: “National Trends and
Prospects for High-Performance Green
Buildings," Prepared for the U.S. Senate
Subcommittee on Environmental and Public
Works by the U.S. Green Building Council,
November 2002.
[6] CBFEE, 1999, "Skylighting and Retail Sales: An
Investigation into the Relationship Between
Daylighting and Human Performance," The
Heschong Mahone Group, on behalf of the
California Board for Energy Efficiency Third Party
Program, 1999.
[7] CGB, 2009, Center for Green Building, “Building
the GREEN Garden State”, New Jersey
Municipalities magazine. Vol. 86, No. 6, June
2009.
[8] Kats, Gregory H.2006, "Greening America's
Schools Costs and Benefits," Capital E.
[9] Kats, Gregory H. 2003, "Green Building Costs
and Financial Benefits." Massachusetts
Technology Collaborative.
[10] Woolley T. 2006. “Natural Building: A Guide to
Materials and Techniques”. Crowood Press.
محميةة 2002 اعالن( "2002)الطبيعية للمحميات المركزية االدارة [11]
مصر, القاهرة" , مطروح بمحافظة الطبيعية سيوة
الحاملة الحوائط وحكاية مصر فى التقليدى البناء( "2008) عماد,فريد [12]
مصر, القاهرة, المصرى المقاول مجلة, .
رقم البيئة لقانون التنفيذية الالئحة(, 2002)البيئة لشئون الدولة وزارة [13]
مصر, القاهرة, 1995 سنة الصادر 338 .
[14] Ragheb G., El-Shimy H. and Ragheb A., 2015;
“LAND FOR POOR: TOWARDS SUSTAINABLE
MASTER PLAN FOR SENSITIVE
REDEVELOPMENT OF SLUMS”, ISSN 1877-
0428, Social and Behavioral Science, Part 1,
212-228.
[15] El-Darwish I.; Ragheb A and Ahmed Sh., 2015
“THE ROLE OF SIMULATION IN URBAN
DESIGN DECISIONS: MICROCLIMATE AND
HUMAN COMFORT CONSIDERATIONS IN
PLANNING”, ISSN 2079-4096, Architecture and
Planning Journal – Faculty of Architecture
Engineering (BAU).
[16] Yigitcanlar, T., Kamruzzaman , Md., and
Teriman, S., (2015), “Neighbourhood
Sustainability Assessment: Evaluating
Residential Development Sustainability in a
Developing Country Context” Sustainability, 7,
2570-2602; doi:10.3390/su7032570.
Renewable Energy and Sustainable Development (RESD) Volume 3 Issue 1, Special Issue, March 2017 - ISSN 2356-8569 http://dx.doi.org/10.21622/RESD.2017.03.1.164
This Paper has been Accepted and Presented in the (First International Conference on New Trends for Sustainable Energy) 1-3 October, 2016 at Pharos University, Alexandria, Egypt.
164 RESD © 2017
http://apc.aast.edu
Hydrogen Through Water Electrolysis and Biomass
Gasification for Application in Fuel Cells Y. Kirosa, S. Marinib, M. Villab and P. Nellib
1Department of Chemical Engineering & Technology, KTH Royal Institute of Technology, SE-100 44 Stockholm,
Sweden
2Dipartmento di Progettazione e Tecnologie, Univeristà di Bergamo, Viale Marconi 5, 22044, Italy
Abstract - Hydrogen is considered to be one of the
most promising green energy carrier in the energy
storage and conversion scenario. Although it is
abundant on Earth in the form of compounds, its
occurrence in free form is extremely low. Thus, it has
to be produced by reforming processes, steam
reforming (SR), partial oxidation (POX) and auto-
thermal reforming (ATR) mainly from fossil fuels for
high throughput with high energy requirements,
pyrolysis of biomass and electrolysis. Electrolysis is
brought about by passing electric current though two
electrodes to evolve water into its constituent parts,
viz. hydrogen and oxygen, respectively. Hydrogen
produced by non-noble metal catalysts for both anode
and cathode is therefore cost-effective and can be
integrated into fuel cells for direct chemical energy
conversion into electrical energy electricity, thus
meeting the sustainable and renewable use with low
carbon footprint.
I. INTRODUCTION
Environmentally benign fuels, which can replace
today’s fossil based fuels, such as gasoline, oil and
coal for combustion either in stationary or mobile
applications is of utmost importance. One such fuel is
hydrogen, which is considered to be the fuel of the
future. Hydrogen is an energy carrier maintaining
potential applications in many industrial processes
such as fertilizers, petroleum refineries, food
processing, bulk and specialty chemicals as well as
power generation. Hydrogen plays an important role
as a potential fuel for aviation, vehicles and domestic
heating requirements either by direct combustion or
in the so-called “cold combustion” as in fuel cells.
Large scale introduction of hydrogen would mean a
paradigm shift as a renewable energy carrier, leading
to a substantial decrease of the greenhouse gases.
Owing to its abundance in the form of compounds
and complexes, it is estimated that over 75% of the
mass of the universe is primarily hydrogen (1). The
combustion product of hydrogen practically being
water makes it to be highly important for clean and
sustainable energy production. Since hydrogen is
energy rich on weight basis ( 120 MJ/kg) compared to
gasoline (44.4 MJ/kg) but poor on volumetric basis,
large volumes of hydrogen has to be stored, handled
and transported for application for example in
vehicles with internal combustion engines or fuel
cells. Therefore one of the daunting challenges for
the introduction of hydrogen as a fuel is to find a safe
method with high storage capacity and facile
generation of the fuel, providing high energy
efficiency, light weight and volume, predictable
performance, fuel purity and economy.
II. HYDROGEN PRODUCTION
Global hydrogen production is estimated to be 50
million tons annually (2,3), where the main feedstock
are fossil fuels, such as natural gas, hydrocarbons
and coal. These processes are highly endothermic,
implying high temperatures (>800 oC) and moderate
pressures (20-30 bar), where a set of reaction steps
such as desulfurization, high and low temperature
shift reactions, methanation and adsorption are
required for high purity hydrogen. Due to the carbon
content contained in the fossil fuels, there is a
stoichiometric emission of carbon and thereby
increasing the concentration of greenhouse gases
(GHG) to the atmosphere. Thus, electrochemical
process of water splitting (electrolysis), where
hydrogen in the cathode and oxygen in the anode are
released is a sustainable solution, if electricity is
generated from renewable energy resources.
The benefit of finding robust, stable and active
electrocatalysts instead of the noble metals, which
are scarce and highly expensive is a challenge for the
production of hydrogen as a “green energy” source

Renewable Energy and Sustainable Development (RESD) Volume 3 Issue 1, Special Issue, March 2017 - ISSN 2356-8569 http://dx.doi.org/10.21622/RESD.2017.03.1.164
165 RESD © 2017
http://apc.aast.edu
for application in industrial processes and fuel cells.
Demand and supply constraints of Ru, Ir and Pt and
platinum group metal alloys for application in large-
scale electrolyzers would mean a decrease of the
loadings by several factors and keeping intact the
catalytic activity. Thus, there is a growing interest in
replacing these electrocatalysts by non-precious and
ample reserves of the transition metals. Herein we
report the sponge-like and highly porous with
significant surface area of the Ni-Al alloys leached out
by KOH for this purpose. Two different
electrochemical reactions for cathodic (hydrogen
evolution) and anodic (oxygen evolution)
configurations were studied by applying alloys of
Raney-Ni catalysts, albeit with different compositions
and doped with other metallic species. The gas
diffusion electrodes (GDE), wet-proofed by PTFE
were prepared by the rolling method in thicknesses of
0.5-07 mm and then tested in 6M KOH at 60-80 oC,
where their polarization curves were assessed in
durability tests. The role of catalyst additives is
significant for lowering the overpotentials and the
intrinsic activities of the respective electrodes to be
able to serve for prolonged performances in alkaline
electrolyzers.
III. FUEL CELLS FOR ELECTRIC GENERATION
The high efficiency, high power density, flexibility in
size and installation area as well as environmentally
friendliness of the fuel cells make them an attractive
and alternative power sources for tractionary,
portable, hybrid and stationary applications. There
are five main types of fuel cells, which have the
common advantages but yet are contending in cost,
access in materials, performance and stability.
Although the pros and cons of each type of fuel cell
are to a large extent specific to the materials,
electrolyte, operation temperature, purity or impurity
of the oxidant, there are however, major
distinguishing marks among them. Common to all fuel
cells is, however the electrochemical oxidation of
hydrogen at the anode and reduction of oxygen at the
cathode resulting in the in the generation of electricity
and heat as well as water.
The low temperature fuel cells, especially polymer
membrane electrolyte fuel cell (PEMFC) and alkaline
fuel cell (AFC) have both a relatively fast start-ups
mainly due to the temperature regime in which they
operate. PEMFC has shown high current densities
and small weight and compact stacks due to the
incorporation of the electrolyte in the polymer matrix.
Not excepting that the noble metal price is high and
less accessible for mass application in fuel cells, the
loss of the activity is ascribed to the agglomeration
and corrosion of the catalyst particles and hence
decrease of the surface areas. The phosphoric acid
(PAFC) as an intermediate temperature fuel cell was
a frontrunner during the 80s and 90s but due to high
loadings of platinum group metals as catalyst, this
fuel cell has been phased out. The molten carbon fuel
cell (MCFC) and solid oxide fuel cell (SOFC) operate
at 500-600 oC and 900-1000 oC, respectively, both
requiring robust materials and thermal stability.
Previous work (4) with wood charcoal and agro-
residues of a producer gas integrated with fuel
processing and gas clean-up laboratory
demonstration unit (LDU) showed a successful
production of hydrogen for operation in a 250 W AFC
system. The integrated system was composed of a
gasifier to generate producer gas, hydrogen
enrichment through high temperature and low
temperature shift reactors, gas cleaning units (sulfur,
carbon dioxide and oxygen) and preferential oxidation
of carbon monoxide. The hydrogen produced after
the gasifier, having 3-6% vol.% after these steps
increased to 20-30 vol.% to be fed to the fuel cell.
Electrical efficiency from material and energy
balances for the system producer gas to the AFC
generator, based on lower heating value of wood to
direct current was found to be 29% . Thus, the study
showed that biomass gasification/pyrolysis can be
integrated for production of electricity both in
decentralized or as stand-alone fuel cell power
generators.
REFERENCES
[1] Contreras, J. Capiro, M. Molero, T. N. Verziroglu,
Int. J. Hydrogen Energy, 24 (1999) 1041.
[2] C. R. Ewan, R. W. K. Allen, Int. J. Hydrogen
Energy, 30 (2005) 809.
[3] Report of the hydrogen production expert panel,
US DOE, Washington DC, 20585, 2013.
[4] Y. Kiros, C. Myrén, S. Schwartz, A.
Sampathrajan, M. Ramanathan, Int. J. Hydrogen
Energy, 24 (1999) 549.

Renewable Energy and Sustainable Development (RESD) Volume 3 Issue 1, Special Issue, March 2017 - ISSN 2356-8569 http://dx.doi.org/10.21622/RESD.2017.03.1.166
This Paper has been Accepted and Presented in the (First International Conference on New Trends for Sustainable Energy)
1-3 October, 2016 at Pharos University, Alexandria, Egypt.
166 RESD © 2017
http://apc.aast.edu
Application of the Fuzzy Computational Intelligence in
Power Quality Data Management Dr. Hoda Farag
Alexandria Electricity Distribution Company, Alexandria, Egypt
Abstract - In Electrical Power Distribution System
the sustained availability and quality of electric
power are the main challenge they need to satisfy
so overcoming the power quality (PQ) degradation
became an asset. This Paper addresses the perfect
load management using the computational
techniques by analyzing the data of the system
taking into account the density of the feeding nodes
and its distribution also the classification of major
Power quality degradations such as power factor
and harmonics in the System and The methodology
will be illustrated, simulated and evaluated using the
fuzzy technique clustering the data and on an
Artificial Neural Network (ANN) to achieve the
optimum utilization of the energy loads and perfect
load management and optimization. Simulation
results demonstrate the effectiveness of the
proposed algorithm in reducing the power and
energy losses, improving the quality of the electric
power system.
Keywords - Power Quality Degradaion; fuzzy
technique; Artificial Neural Network.
I. INTRODUCTION
The power quality is an important issue to maintain
the stability of the Electric Power Distribution
System (EPDS) and its instability due to any kind of
disturbance leads to malfunction of the end user
devices or the complete outage in the Energy
distribution system.
The degradation in quality of power is mainly
caused by disturbances such as voltage swell,
voltage sag, notch, transients, and harmonic
distortions and mainly the non-linear loads that
draw harmonic currents, and as a consequence,
harmonic voltages are generated whenever the
harmonic current flows through the impedance of
the system which are the main cause of power
quality (PQ) degradation leading not only to the
(PQ) degradations or temporary interruption but
also to ultimately complete outage of EPDS[1].
The power quality became more important to
maintain the power system and so the exact and
fast detection of the disturbances created the need
to have a precise system that detect the time and
duration of the occurrence of the disturbance
analyzing the data of the PQ field and classifying
them according to the rate of occurrence and their
effect on the Quality of the network.
Soft computing techniques like the fuzzy logic,
neural networks or combination of them are used to
design an intelligence system. The fuzzy logic used
for reasoning while neural networks provide
algorithms for learning, classification, and
optimization [2], although there are substantial
areas of overlap between neural networks, FL, and
probabilistic reasoning.
Modern spectral and harmonic analysis is based on
Fourier based transforms. However, these
techniques are less efficient in tracking the signal
dynamics for transient disturbances. Consequently,
The wavelet transform has been introduced as an
adaptable technique for non-stationary signal
analysis. Different power quality disturbances are
classified by a unique energy distribution pattern
based on the difference of the discrete wavelet
coefficients of the analyzed signal and a pure sine
wave. [4]. Also the S-transform algorithm and
continuous wavelet transform (CWT) are time
frequency algorithms powerful in detection and
classification of PQ disturbances as in [5]
comparing the effect of each on different categories
of disturbances. As proposed in [6] the power
quality disturbance recognition system contain

Renewable Energy and Sustainable Development (RESD) Volume 3 Issue 1, Special Issue, March 2017 - ISSN 2356-8569 http://dx.doi.org/10.21622/RESD.2017.03.1.166
167 RESD © 2017
http://apc.aast.edu
three main components which are a simulator to
generate the power quality disturbances and the
detector which used the DWT to detect the power
signal disturbances and the neural network
architecture to classify the disturbances with
increases the accuracy of detection.
In this paper we propose a technique that analyzes
the PQ data of the system under consideration
Taking into account the Power factor and peak
hour table in EPDS to predict the undesired PQ
disturbance in the system. This will provides power
system engineers to formulate intelligent strategy
for efficient power system operations. The
proposed algorithm incorporates multi-band
wavelet transformation and the modern
computation intelligent approaches like fuzzy
technique and the artificial neural network.
This paper is organized as follows In the first
section we present a review of related work, In
Section 2 we clarify different sources of major
power degradations like the power factor and the
harmonics and their classification, In Section 3
presents some fundamental Techniques used in
our algorithm like the fuzzy technique . Section
4,we describe the proposed algorithms for the
power quality disturbance detection. Section 5, we
report the effectiveness of our method and
compare results of each algorithm used; At last
conclusion of this paper will be drawn in Section 6.
II. CLASSIFICATION OF MAJOR POWER
QUALITY DEGRADATION
The power quality term PQ can be defined as
voltage quality with reference to slow variation in
voltage magnitude and to indicate the existence of
an adequate and secure power supply.
The patterns of voltage or PQ disturbances need to
be identified for preventive action in order to avoid
the problem in the electrical system and the cause
of any deviation from the ideal waveform. PQ
disturbances/events cover a broad frequency range
with significantly different magnitude variations and
can be non-stationary, thus, accurate techniques
are required to identify and classify these
disturbances [3].
Most of the PQ problems fall into those two
basic categories:-
A. Non steady state variation
which is the abnormality in the voltage or the
current Transient voltages may be detected when
the peak magnitude exceeds a specified threshold.
RMS voltage variations (e.g., sags or interruptions)
may be detected when it exceeds a specified level.
This is classified according to the nature of the
waveform distortion. For non steady state
disturbances, other attributes such as rate of rise,
rate of occurrence and energy potential are useful.
B. Steady-State Variations
Steady state variation is basically a measure of the
magnitude by which the voltage or current may vary
from the nominal value, plus distortion and the
degree of unbalance between the three phases.
These include normal rms voltage variations, and
harmonic and distortion. For steady-state
disturbances, the amplitude, frequency, spectrum,
modulation, source impedance, notch depth and
notch area attributes can be utilized.
Power factor
The power factor is (P.F) is a relation between the
actual power and the apparent power as given by
equation (1)
P.F = cos Φ (1)
The voltage unbalance contributes to poor power
factor in EPDS with the increase of non-linear loads
also as a result of the voltage unbalance between
the three phases.
As most of the distribution companies impose a
penalty to its customers if THEIR loads contributes
towards poor power factor so we need to monitor
the power factor at the industrial customers to force
them to take all adequate steps to maintain their
power factor close to unity.
Harmonics
Harmonic distortion is in the voltage and the current
waveforms in power distribution networks as in
equations 2 and 3 where Vh and Ih are the
amplitude of the voltage and the current at the
harmonic component and Vrms and Irms are the
root mean square values of voltages and currents
for the non-sinusoidal waveforms [9]

Renewable Energy and Sustainable Development (RESD) Volume 3 Issue 1, Special Issue, March 2017 - ISSN 2356-8569 http://dx.doi.org/10.21622/RESD.2017.03.1.166
168 RESD © 2017
http://apc.aast.edu
(2)
(3)
The total harmonic distortion (THD) is a measure of
the harmonic equipment in a distorted wave as in
equation 4.
(4)
Where Mh is the root mean square value of the
harmonic component.
The power Distribution network is ideally designed
to tackle sinusoidal voltage and current waveforms
and the existing power distribution network design is
only capable of absorbing harmonic distortion to a
certain limit. [10] And the extensive use of the non-
linear loads that the conventional power system not
designed to accept it that increases the power
quality disturbances so we need fast and intelligent
methods to detect theses disturbances like the
methods will be mentioned later.
III. FUZZY LOGIC SYSTEM
The Fuzzy logic poses the ability to mimic the
human mind to effectively employ modes of
reasoning that are approximately rather than exact
especially in decisions or action that are based on
precision and certainty [7] .
Zadeh [11] introduced the term fuzzy logic which
described the mathematics of fuzzy set theory
(1965) indicating that there was a third region
beyond True and False by declaring the fuzzy set
that allows partial membership which is an
extension of a crisp set that allows only full
membership or no membership at all.
In designing the fuzzy inference system,
membership function is essentially the curve that
defines how each point in the input space is
mapped to a membership value (or degree of
membership) between 0 and 1. Various types of
membership functions are used, including
triangular, trapezoidal, generalized bell shaped,
Gaussian curves, polynomial curves, and sigmoid
functions and the fuzzy inference systems consist of
if–then rules that specify a relationship between the
input and the output fuzzy sets .
As shown in Figure 1 the fuzzy inference system
(FIS) essentially defines a nonlinear mapping of the
input data vector into a scalar output, using fuzzy
rules. The mapping process involves input/output
membership functions, FL operators, fuzzy if–then
rules, aggregation of output sets and defuzzification.
Fig.1. Block Diagram of the Fuzzy Inference system
IV. THE PROPOSED ALGORITHM
To minimize power quality disturbances and to
devise suitable corrective and preventive measures,
efficient detection and classification techniques are
required in the emerging power systems. As the
recent development in the technologies of the signal
processing and the artificial intelligence we were
able to develop more accurate system based on
these new techniques.
The First step is to develop or pick a suitable
method for the detection of the PQ Degradations
which is the wavelet transforms based on the norm-
entropy based feature extraction which is an ideal
tool for non-stationary signals and the classification
of theses degradations such as the interruption, the
waveform distortions, harmonics, sags, swells, then
clustering these data into our system with the
power factor measurements and the peak hour
table and major power quality degradation like the
harmonics using the fuzzy technique and the
artificial neural network specifying the rules that
enable us to detect the disturbances and hence the
perfect optimization of the energy loads.
A. Feature Extraction and Detection of (PQ)
Disturbances using DWT
The Wavelet domain is a promising domain as it is a
frequency domain technique. DWT is more
preferable for detection of time-frequency variations
as it employs a short window for high frequency
components and long window for low frequency
components which provides the best time frequency
resolution to detect the all Power quality
disturbances.
The Wavelet transform uses wavelet function as the

Renewable Energy and Sustainable Development (RESD) Volume 3 Issue 1, Special Issue, March 2017 - ISSN 2356-8569 http://dx.doi.org/10.21622/RESD.2017.03.1.166
169 RESD © 2017
http://apc.aast.edu
basis function which scales itself according to the
frequency under analysis. As it uses the mother
wavelet function ψ which will generate the high
frequency components (detail) and scaling function
ϕ which will generate the low frequency components
(approximation) to perform simultaneously the multi
resolution analysis decomposition and later the
reconstruction of the signal.
The wavelet function is defined as follows:
(5)
Where ψi,j(x) are the wavelet expansion function
and the two parameter expansion coefficients ci,j
are the discrete wavelet transform coefficients of
f(x) where j is the translation and i is the dilation
parameter
(6)
The mother wavelet is related to the scaling function
as follows:
Ψ(x) = √2∑g(k) ϕ(2x-k)
(7)
And
g(k)= (-1)k h(1-k)
(8)
where g and h are the filter coefficients of half- band
low-pass and high-pass filters.
As the wavelet transform uses a time- window
function that changes in frequency as the mother
wavelet is scaled and translated to provide
information in the frequency and the time domain
not like the STFT where the window function is
fixed.
Using the sub band coding in the WT the signal is
decomposed into different frequency levels and
presented as wavelet coefficients. Depending on
the types of signal, continuous wavelet transforms
(CWT) or discrete wavelet transform (DWT) are
employed.
The waveforms in fig 2 generated using the
MATLAB indicating 6 types of disturbances which
are sag, swell, interruption, harmonics, sag-
harmonics, swell -harmonics.
The statistical parameters used for Power quality
disturbance detection are the sample mean and
variance and wavelet entropy so comparing the
original power signal without disturbance and signal
with disturbance the disturbance type can be
detected.

Renewable Energy and Sustainable Development (RESD) Volume 3 Issue 1, Special Issue, March 2017 - ISSN 2356-8569 http://dx.doi.org/10.21622/RESD.2017.03.1.166
170 RESD © 2017
http://apc.aast.edu
Fig .2. Different Types of PQ Disturbances
Multiresolution analysis leads to a hierarchical and
fast schema and this can be implemented by a set
of successive filter banks until the fourth level of
decomposition and then reconstruction of the signal
as we have done here in this algorithm. One
approximation level which contains the fundamental
frequency component and 4 detail levels that is the
high frequency component which shows the abrupt
change it the discontinuities to show the start and
the end point of the disturbance as shown in fig.3
for a sample of disturbance “voltage sag
disturbance”.
Decomposed voltage sag level 1 using WT
Approximate Signal level 1
Detail Signal level 1
Detail Signal level 2
Detail signal level 3
Approximate signal level 4
Detail signal level 4
Reconstructed approximate signal

Renewable Energy and Sustainable Development (RESD) Volume 3 Issue 1, Special Issue, March 2017 - ISSN 2356-8569 http://dx.doi.org/10.21622/RESD.2017.03.1.166
171 RESD © 2017
http://apc.aast.edu
Reconstructed detail signal
Fig. 3. Feature Detection of a disturbance using the wavelet
transform for the voltage sag
The norm–entropy based feature extraction based
on the measure of the irregularities of states such
as the uncertainty or the irregularity of the signal.
The norm entropy values for detail and
approximation coefficients in each decomposition
level from wavelet transform for different
disturbances calculated as follows:
,
(j=1,2,….,j) (9)
The wavelet Entropy Wsignal is a positive real
number ,j is the number of resolution levels. And the
pure signal is used as a reference to distinguish
disturbances from each other so we subtract the
wavelet entropy of the pure sine of the wavelet
entropy of the disturbance and as declared in fig.
Fig .4. The norm Entropy for some PQ disturbances
ΔW= Wdisturbed signal –Wpure signal (10)
DWT based decomposition is applied in for different
PQ disturbances such as Sag, Swell, Interruption, Sag
with harmonics and Swell with harmonics are
generated using MATLAB and then decomposed
using decomposition algorithm of WT and type of
disturbance is detected.
B. Classification using the fuzzy clustering
technique
The fuzzy clustering technique is based on two main
blocks the first one is the wavelet feature extraction
which work by extracting the different feature through
the wavelet transform as declared in the previous
section then the second block which the fuzzy
inference system that maximize the accuracy of the
detection and classifying the PQ disturbances into
clusters as the decision boundaries of disturbances
may overlap we need to detect and classify the events
overlap by the setting the fuzzy rules. Identifying the
features of the membership function that used to
identify the disturbances using the least number of
features achieving the effective classification of PQ
events.
The rule of the artificial intelligence technique (Fuzzy
Logic) is a measure of the degree of similarity of PQ
disturbances and the total distorted signal energy of
the signal is compared to the corresponding pure
signal. As mentioned above the Fuzzy logic block
consists of the fuzzy inputs which are the feature
extracted with the wavelet transform which are the
norm entropy and the power factor and the Peak hour
table and forming the fuzzy rules as follows :-
Considering the range for Power factor is from 0 to 1
and the values are high, medium and low, Rush hour
values are Peak as P or moderate M or low L.
Rule 1:- if norm entropy is medium and Power factor
is high and Rush hour is L Then the PQ disturbance is
Normal pure signal

Renewable Energy and Sustainable Development (RESD) Volume 3 Issue 1, Special Issue, March 2017 - ISSN 2356-8569 http://dx.doi.org/10.21622/RESD.2017.03.1.166
172 RESD © 2017
http://apc.aast.edu
Rule 2:- if norm entropy is low and Power factor is
high and Rush hour is L Then the PQ disturbance is
sag.
Rule 3:- if norm entropy is high and Power factor is
high and Rush hour is H Then the PQ disturbance is
swell.
Rule 4:- if norm entropy is medium and Power factor
is medium and Rush hour is H Then the PQ
disturbance is harmonic.
Rule 5:- if norm entropy is low and Power factor is
medium and Rush hour is L Then the PQ disturbance
is sag + harmonics.
Rule 6:- if norm entropy is high and Power factor is
medium and Rush hour is H Then the PQ disturbance
is swell + harmonics.
Rule 7:- if norm entropy is low and Power factor is low
and Rush hour is H Then the PQ disturbance is
Interrupt.
Fig. 5. The structure of PQ Disturbance Classification based on
the WT and the fuzzy Logic
Fig .6. The FIS For the membership functions of the PQ
disturbance detection
In the FL algorithm we used 100 signal for detection
and classification and the classification result is shown
in table 1 using the parameters of the power factor
and the peak hour table so the fuzzy logic is able to
detect and classify the power quality disturbance
accurately.
C. Classification through Multilayer Feed forward
Neural Network (MFNN)
Neural networks are simplified model of the biological
nervous system as it’s a highly interconnected
network of a large number of processing elements
(PEs) called neurons that composes the topology of
the Artificial Neural Network (ANN) and the learning
process is done by being trained on some examples
by giving data to acquire knowledge about the
problem, the neural networks adopt various learning
mechanisms of supervised and unsupervised learning
[8].
Artificial Neural Network are characterized by the
number of
interconnections and the node characteristics that are
classified by the kind of learning rules has been
employed and the type of non-linear elements has
been used.
Artificial Neural Networks (ANN) approaches have
been developed to solve problems in power plants
and power systems using the process identification,
sensor validation, monitoring and fault diagnosis, in
power plants, and security assessment, load
identification, load modeling, forecasting and fault
diagnosis, in power systems.
As in our algorithm using the wavelet and neural
network combine the aspects of the wavelet
transformation which works on the frequency domain
for the purpose of feature extraction and selection and
the characteristic decision capabilities of neural
network approaches.
Probabilistic Neural Network for classification of PQ
events based on the features extracted from the detail
coefficients through decompositions.
We used an artificial neural network with 3 layers as
the inputs are the feature extracted using the wavelet
transform (feature extraction block) and the output
specifies the class of disturbance using multiple
instances of the original waveform signal as a test
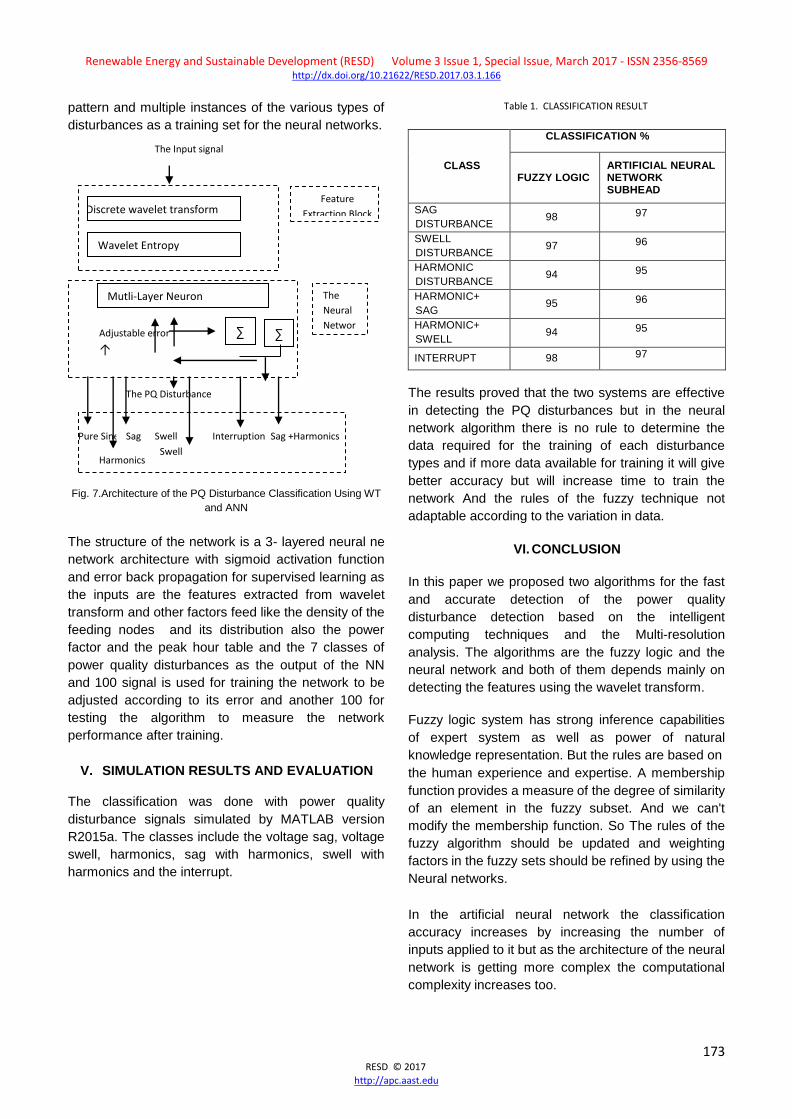
Renewable Energy and Sustainable Development (RESD) Volume 3 Issue 1, Special Issue, March 2017 - ISSN 2356-8569 http://dx.doi.org/10.21622/RESD.2017.03.1.166
173 RESD © 2017
http://apc.aast.edu
pattern and multiple instances of the various types of
disturbances as a training set for the neural networks.
Fig. 7.Architecture of the PQ Disturbance Classification Using WT
and ANN
The structure of the network is a 3- layered neural ne
network architecture with sigmoid activation function
and error back propagation for supervised learning as
the inputs are the features extracted from wavelet
transform and other factors feed like the density of the
feeding nodes and its distribution also the power
factor and the peak hour table and the 7 classes of
power quality disturbances as the output of the NN
and 100 signal is used for training the network to be
adjusted according to its error and another 100 for
testing the algorithm to measure the network
performance after training.
V. SIMULATION RESULTS AND EVALUATION
The classification was done with power quality
disturbance signals simulated by MATLAB version
R2015a. The classes include the voltage sag, voltage
swell, harmonics, sag with harmonics, swell with
harmonics and the interrupt.
Table 1. CLASSIFICATION RESULT
CLASS
CLASSIFICATION %
FUZZY LOGIC ARTIFICIAL NEURAL NETWORK SUBHEAD
SAG
DISTURBANCE 98 97
SWELL
DISTURBANCE 97 96
HARMONIC
DISTURBANCE 94 95
HARMONIC+
SAG 95 96
HARMONIC+
SWELL 94 95
INTERRUPT 98 97
The results proved that the two systems are effective
in detecting the PQ disturbances but in the neural
network algorithm there is no rule to determine the
data required for the training of each disturbance
types and if more data available for training it will give
better accuracy but will increase time to train the
network And the rules of the fuzzy technique not
adaptable according to the variation in data.
VI. CONCLUSION
In this paper we proposed two algorithms for the fast
and accurate detection of the power quality
disturbance detection based on the intelligent
computing techniques and the Multi-resolution
analysis. The algorithms are the fuzzy logic and the
neural network and both of them depends mainly on
detecting the features using the wavelet transform.
Fuzzy logic system has strong inference capabilities
of expert system as well as power of natural
knowledge representation. But the rules are based on
the human experience and expertise. A membership
function provides a measure of the degree of similarity
of an element in the fuzzy subset. And we can't
modify the membership function. So The rules of the
fuzzy algorithm should be updated and weighting
factors in the fuzzy sets should be refined by using the
Neural networks.
In the artificial neural network the classification
accuracy increases by increasing the number of
inputs applied to it but as the architecture of the neural
network is getting more complex the computational
complexity increases too.
∑ ∑
Adjustable error
↑
Mutli-Layer Neuron
The Input signal
Feature
Extraction Block
The
Neural
Networ
k Block
Discrete wavelet transform
Wavelet Entropy
The PQ Disturbance
Type
Pure Sine Sag Swell
Swell
+Harmonics
Sag +Harmonics Interruption
Harmonics

Renewable Energy and Sustainable Development (RESD) Volume 3 Issue 1, Special Issue, March 2017 - ISSN 2356-8569 http://dx.doi.org/10.21622/RESD.2017.03.1.166
174 RESD © 2017
http://apc.aast.edu
We might think of using a hybrid system incorporating
the learning capabilities of ANN and excellent
knowledge representation and inference capabilities
of fuzzy logic that have the ability to self modify their
membership function to achieve the desired
performance.
REFERENCES
[1] Rafael E. Bourguet and Panos J.
Antsaklis,”Artificial Neural Networks In Electric
Power Industry”, Technical Report of the ISIS
Group at the University of Notre Dame, ISIS-94-
007 April, 1994
[2] Min Wang, Piotr ochenkowski , Alexander
Mamishev, “Classification of power quality
disturbances using time-frequency ambiguity
plane and neural networks”, 2001 IEEE .
[3] Saxena, K.S. Verma, and S.N. Singh, “Power
quality event classification: an overview and key
issues”,2010 .
[4] Mahmoud El-Gammal, Amr Abou-Ghazala and
Tarek El-Shennawy,” Detection, localization, and
classification of power quality disturbances using
discrete wavelet transform technique”,Alexandria
Engineering Journal 2003.
[5] Mohamed E.Salem Abozaed,”Detection and
classification of power quality disturbances using
S-Transform and wavelet algorithm”,International
Journa; of Electrical , Computer,Energetic,
Electronic and communication Engineering Vol7,
No:6, 2013.
[6] S.Suja,Jovitha Jerome, “Power signal
disturbance clssification using wavelet based
neural network”,Serbian journal of electric
engineering, Vol. 4, No. 1,June 2007,71-83.
[7] Pearson,“Fuzzy Logic Fundamentals”, Chapter3
, 26 March 2001.
[8] S.Rajasekaran, G.A.vijayalakshami, “Neural
networks, fuzzy logic and genetic algorithm:
synthesis and applications , july 2011.
[9] Zahir Javed paracha ,Design and development
of intelligent computational technique for power
quality data monitoring and management”,
Victoria university Australia, 2011.
[10] Janusz Mindykowski, “Fundamentals of electric
power assessment”, Precedings ,XVII IMEKO
world congress, Uune 22-27 2003, Dubrovnik,
Coroatia.
[11] Zadeh, L.A. (1965): Fuzzy sets, Information and
Control 8(3):338–353.

Renewable Energy and Sustainable Development (RESD) Volume 3 Issue 1, Special Issue, March 2017 - ISSN 2356-8569 http://dx.doi.org/10.21622/RESD.2017.03.1.175
This Paper has been Accepted and Presented in the (First International Conference on New Trends for Sustainable Energy) 1-3 October, 2016 at Pharos University, Alexandria, Egypt.
175 RESD © 2017
http://apc.aast.edu
Modified Open Loop Control of a Matrix Converter
Connected to Wind Energy System Kotb B. Tawfiq, A.F. Abdou, E. E. EL-Kholy and S. S. Shokralla
Department of Electrical Engineering, Menoufia University, Menoufia, Egypt
[email protected], [email protected]
Abstract - wind energy conversion system (WECS) is
bit by bit gaining interest as a suitable source of
renewable energy. In this paper a direct AC-AC matrix
converter is utilized to interface an isolated static load
fed from WECS. A self-excited induction generator is
utilized as it has many advantages in terms of ease of
maintenance, self-protection against short circuits.
This paper proposes a modified open loop control of
matrix converter with indirect space vector modulation.
The modified open loop provides constant output
voltage and constant frequency even if the wind speed
changed. Matrix converter (MC) is used rather than
AC-DC-AC converter as it eliminates the bulky
capacitors. Finally, simulation results for different
operating points are displayed which are consistent
with the expected results.
I. INTRODUCTION
Due to the continuous demand on electrical energy
and environmental concerns, a lot of exertion is being
made to create power from renewable sources of
energy. The advantage of using renewable sources is
absence of harmful emissions. Wind generators have
been generally utilized in autonomous systems for
feeding loads which fall outside the scope of the
electrical network. There are two types of WT
horizontal axis configuration or vertical axis
configuration [1].As a result of the numerous
advantages of using a self-excited induction generator
in converting the captured mechanical energy from
WT made it suitable for use in small and medium size
WECS. Due to the low cost of SCIG compared to
other types of electric machines make it suitable for
isolated load application of WECS. SCIG also have
the ability of self –protection against short circuits and
doesn’t require routine maintenance . AC can be
directly converted to AC with different voltage rms
value and different frequency by using a MC without
using any DC link[2,3]. And this is the bold feature of
MC over rectifier-inverter converter, so MC can be
considered an emerging alternative to the
conventional rectifier- inverter converter [4-7].
Independent control on the output voltage magnitude
and frequency can be provided by utilizing a MC. In
addition to control the phase angle between input
voltage and input current and unity input displacement
factor can be achieved. Due to MC has a faster
dynamic response, MC –based on WECSs has higher
efficiency than conventional one. This paper
introduces a static R-L load controlled by using a MC
fed from WECS as shown in Fig. 1.This paper
proposes a modified open loop control to provide
constant output voltage and constant frequency even
if the wind speed changed. First, a short description
of WT is introduced, in addition to demonstrate how
the wind energy can be ideally caught and changed
over to electric energy. Secondly, a short description
on operation of a SCIG is introduced. Third, indirect
space vector control of matrix converter is presented.
MC is used to control load voltage and frequency.
Fourth modified open loop control of matrix converter
is introduced. Finally, simulation results for different
operating points are displayed.
Fig. 1. matrix converter fed from wind turbine
II. WIND TURBINE
The produced mechanical power from turbine is given by (1).
𝑃𝑚 =1
2𝜌𝑐𝑝𝐴𝑟𝑣𝑤
3 (1)

Renewable Energy and Sustainable Development (RESD) Volume 3 Issue 1, Special Issue, March 2017 - ISSN 2356-8569 http://dx.doi.org/10.21622/RESD.2017.03.1.175
176 RESD © 2017
http://apc.aast.edu
𝑐𝑝(𝜆, 𝜃) = 0.73 (151
𝜆𝑖− 0.58𝜃 − 0.002𝜃2.14 − 13.2) 𝑒
−18.4𝜆𝑖
(2)
𝜆𝑖 =1
1
𝜆−0.02𝜃−
0.003
𝜃3+1
(3)
𝜆 =ωr Rr
vw (4)
Where 𝑃𝑚 represents the generated power, 𝑣𝑤 is the
wind speed in m/s, ρ is the air density in 𝑔/𝑚3, 𝐴𝑟 the
turbine rotor area in 𝑚2, (𝐴𝑟 = 𝜋𝑅𝑟 2 , where 𝑅𝑟 is the
rotor blade radius) and, 𝑐𝑝 a power coefficient. The
power coefficient can be calculated as a function of
tip speed ratio and rotor blade pitch angle θ according
to (2) 𝜔𝑟 is the angular speed of the turbine shaft in
rad/s. In this paper assumes a fixed rotor pitch angle
(θ=0). The previous four equation give, the generated
mechanical power by the wind turbine at a given wind
velocity is a function of the shaft speed. Figure 2
demonstrates the generated mechanical power with
turbine speed at various wind velocity [1].
Fig. 2 mechanical power with turbine spee
III. INDUCTION GENERATOR
Induction machine can be utilized as an induction
generator as well as induction motor without making
any internal modification. Reactive power required for
induction generator can be achieved by connecting a
capacitor bank across the stator terminals. When the
rotor is rotated by a speed greater than synchronous
speed, a little voltage is produced over the stator
terminals because of residual magnetism. A capacitor
current will be produced due to this small generated
voltage, and reactive power which required for
magnetization will increase. Induction generators are
suitable in wind turbines as they produce valuable
power even at different rotor speeds. Neither
commutator nor brush arrangement is required for
Induction generators compared to synchronous
generators. Figure 3 shows the equivalent circuit of
induction generator [1].
Fig. 3 one phase equivalent circuit of induction generator
𝑉𝑠
𝑎𝑏𝑐
0𝑎𝑏𝑐 = [
𝑟𝑠𝑎𝑏𝑐 0
0 𝑟𝑟𝑎𝑏𝑐]
𝑖𝑠𝑎𝑏𝑐
𝑖𝑟𝑎𝑏𝑐 +
𝑑
𝑑𝑡𝜆𝑠
𝑎𝑏𝑐
𝜆𝑟𝑎𝑏𝑐
𝑉𝑠𝑎𝑏𝑐 = [
𝑣𝑠𝑎
𝑣𝑠𝑏
𝑣𝑠𝑐
] , 𝑉𝑟𝑎𝑏𝑐 = [
𝑣𝑟𝑎
𝑣𝑟𝑏
𝑣𝑟𝑐
] , 𝑖𝑠𝑎𝑏𝑐 = [
𝑖𝑠𝑎𝑖𝑠𝑏𝑖𝑠𝑐
] , 𝑖𝑟𝑎𝑏𝑐 =
[
𝑖𝑟𝑎
𝑖𝑟𝑏
𝑖𝑟𝑐
]
𝑟𝑠𝑎𝑏𝑐 = [
𝑟𝑠 0 00 𝑟𝑠 00 0 𝑟𝑠
] , 𝑟𝑟𝑎𝑏𝑐 = [
𝑟𝑟 0 00 𝑟𝑟 00 0 𝑟𝑟
]
𝐿𝑠𝑠𝑎𝑏𝑐 = [
𝐿𝑠𝑠 + 𝐿𝑙𝑠 𝐿𝑠𝑚 𝐿𝑠𝑚
𝐿𝑠𝑚 𝐿𝑠𝑠 + 𝐿𝑙𝑠 𝐿𝑠𝑚
𝐿𝑠𝑚 𝐿𝑠𝑚 𝐿𝑠𝑠 + 𝐿𝑙𝑠
],
𝐿𝑟𝑟𝑎𝑏𝑐 = [
𝐿𝑟𝑟 + 𝐿𝑙𝑟 𝐿𝑟𝑚 𝐿𝑟𝑚
𝐿𝑟𝑚 𝐿𝑟𝑟 + 𝐿𝑙𝑟 𝐿𝑟𝑚
𝐿𝑟𝑚 𝐿𝑟𝑚 𝐿𝑟𝑟 + 𝐿𝑙𝑟
]
𝐿𝑠𝑟𝑎𝑏𝑐 = 𝐿𝑟𝑠
𝑎𝑏𝑐𝑡 =
𝐿𝑠𝑟
[ cos 𝜃𝑟 cos( 𝜃𝑟 +
2𝜋
3) cos( 𝜃𝑟 −
2𝜋
3)
cos( 𝜃𝑟 −2𝜋
3) cos 𝜃𝑟 cos( 𝜃𝑟 +
2𝜋
3)
cos( 𝜃𝑟 +2𝜋
3) cos( 𝜃𝑟 −
2𝜋
3) cos 𝜃𝑟 ]
(5)
Where, 𝑟𝑠: resistance of the stator winding, 𝑟𝑟:
resistance of the rotor winding , 𝐿𝑠𝑠: self-inductance of
the stator winding, 𝐿𝑠𝑚: Mutual inductance between
stator winding, 𝐿𝑟𝑟: self-inductance of the rotor
winding, 𝐿𝑟𝑚: Mutual inductance between rotor
winding, 𝐿𝑠𝑟: Maximum value of Mutual inductance
between stator and rotor winding, 𝐿𝑙𝑠: Leakage
inductance of stator winding, The required
capacitance value for exciting SCIG was calculated
as in [8,9].
0 0.5 1
0
0.5
1
1.2 pu
Max. power at base wind speed (12 m/s) and theta= 0 deg
6 m/s7.2 m/s
8.4 m/s9.6 m/s
10.8 m/s
12 m/s
13.2 m/s
14.4 m/s
Turbine speed (pu of nominal generator speed)
Tur
bine
out
put p
ower
(pu
of n
omin
al m
echa
nica
l pow
er) Turbine Power Characteristics (Pitch angle = 0 deg)

Renewable Energy and Sustainable Development (RESD) Volume 3 Issue 1, Special Issue, March 2017 - ISSN 2356-8569 http://dx.doi.org/10.21622/RESD.2017.03.1.175
177 RESD © 2017
http://apc.aast.edu
IV. MATRIX CONVERTER
MC consists of a nine bidirectional switches which
provide a direct connection between the three phase
input voltage to the load without utilizing any dc link
so MC can be manufactured in a simple and a
compact form as shown on Fig. (4.a). . In 1976 Gigi
and Pelly introduce the first principle of a MC.The first
mathematical form of MC was introduced in 1980 by
Venturini and switches are the primary disadvantage
of this converter [10-15].
(a)
(b)
Fig .4: (a) Direct MC , (b) Indirect virtual DC-link MC
A. MATRIX CONVERTER CONTROL
This paper use indirect space vector control to control
MC. MC consists of nine bidirectional switches which
allow connection all input lines to all output lines.
Indirect space vector control deals with MC as a
rectifier-inverter with virtual DC link as in Fig. (4.b)
which consists of two stages first is rectifier based on
switches S1-S6, second is Inverter which has a three
phases voltage source topology based on six
switches S7–S12 [16].
𝑉𝐷𝐶 = 𝐸 ∗ 𝑉𝑎𝑏𝑐 , 𝑉𝐴𝐵𝐶 = 𝑁 ∗ 𝑉𝐷𝐶
𝑉𝐴𝐵𝐶 = N * E ∗ 𝑉𝑎𝑏𝑐 , K = N ∗ E (6)
𝐸 = [𝑆1 𝑆3 𝑆5
𝑆2 𝑆4 𝑆6], 𝑁 = [
𝑆7 𝑆8
𝑆9 𝑆10
𝑆11 𝑆12
] ,
𝐾 = [
𝑆𝑎𝐴 𝑆𝑏𝐴 𝑆𝑐𝐴
𝑆𝑎𝐵 𝑆𝑏𝐵 𝑆𝑐𝐵
𝑆𝑎𝐶 𝑆𝑏𝐶 𝑆𝑐𝐶
] (7)
[
𝑆𝑎𝐴 𝑆𝑏𝐴 𝑆𝑐𝐴
𝑆𝑎𝐵 𝑆𝑏𝐵 𝑆𝑐𝐵
𝑆𝑎𝐶 𝑆𝑏𝐶 𝑆𝑐𝐶
] = [
𝑆7 𝑆8
𝑆9 𝑆10
𝑆11 𝑆12
] [𝑆1 𝑆3 𝑆5
𝑆2 𝑆4 𝑆6] (8)
Where N, E and K represent inverter, rectifier and MC
transfer function respectively. This strategy deal with
MC as a rectifier-inverter converter so space vector of
the inverter output voltage and space vector of
rectifier input current can be decoupled to control
direct MC[17]. As shown in (4) the output phases can
be compounded by the product and sum of input
phases through rectifier and inverter switches 𝑆1− 𝑆6
and 𝑆7− 𝑆12 respectively. The first row of the matrix
in (10) show how to obtain output phase A from input
phases a, b and c for direct MC using ISVM [18].
[
𝑉𝐴
𝑉𝐵
𝑉𝐶
] = [
𝑆7 𝑆8
𝑆9 𝑆10
𝑆11 𝑆12
] [𝑆1 𝑆3 𝑆5
𝑆2 𝑆4 𝑆6] [
va
vb
vc
] (9)
[
𝑉𝐴
𝑉𝐵
𝑉𝐶
] = [
𝑆7𝑆1 + 𝑆8𝑆2 𝑆7𝑆3 + 𝑆8𝑆4 𝑆7𝑆5 + 𝑆8𝑆6
𝑆9𝑆1 + 𝑆10𝑆2 𝑆9𝑆3 + 𝑆10𝑆4 𝑆9𝑆5 + 𝑆10𝑆6
𝑆11𝑆1 + 𝑆12𝑆2 𝑆11𝑆3 + 𝑆12𝑆4 𝑆11𝑆5 + 𝑆12𝑆6
] ∗
[
𝑣𝑎
𝑣𝑏
𝑣𝑐
]
(10)
The switches of inverter can have only eight allowed
combinations, to avoid short circuit on DC link. These
eight permitted combinations is classified into six
active nonzero output voltage vectors 𝑉1 − 𝑉6 two
zero output voltage vectors 𝑉0 as in Fig. 5(a). For
virtual rectifier there are allowed nine switching
combinations to avoid an open circuit in rectifier.
These nine combinations are divided into six active
nonzero input current vectors 𝐼1 − 𝐼6 and three zero
input current vectors 𝐼0 as shown in (Fig. 5(b)). The
duty cycles 𝑑𝛼 and 𝑑𝛽 of active vectors 𝑉𝛼and 𝑉𝛽
respectively for the reference voltage vector 𝑉𝑂∗ within
a sector of the voltage hexagon can be derived from
Fig. (6.a) [19].
𝑉𝑜∗ = 𝑑𝛼𝑉𝛼 + 𝑑𝛽𝑉𝛽 + 𝑑𝑧Vz (11)
𝑑𝛼 =𝑇𝛼
𝑇𝑠= 𝑚𝑣 . sin (
𝜋
3− 𝜃𝑣) (12)
𝑑𝛽 =𝑇𝛽
𝑇𝑠= 𝑚𝑣 . sin(θv) (13)
𝑑𝑧 =𝑇𝑧
𝑇𝑠= 1 − ( 𝑑𝛼 + 𝑑𝛽) (14)

Renewable Energy and Sustainable Development (RESD) Volume 3 Issue 1, Special Issue, March 2017 - ISSN 2356-8569 http://dx.doi.org/10.21622/RESD.2017.03.1.175
178 RESD © 2017
http://apc.aast.edu
(a) (b)
Fig.5. Hexagon of (a) the inverter, (b) the Rectifier
(a) (b)
Fig. 6. Composition of reference: (a) output voltage vector (b)
input current vector
Where, 𝑇𝛼,𝑇𝛽 𝑎𝑛𝑑 𝑇𝑧are the total duration times of the
vectors𝑉𝛼,𝑉𝛽𝑎𝑛𝑑 𝑉𝑧 . The 𝐼𝐼𝑁∗ can be obtained by
impressing the adjacent active vectors 𝐼𝛾 and 𝐼𝛿 with
the duty cycles 𝑑𝛾 𝑎𝑛𝑑 𝑑𝛿 respectively as shown in
Fig. (6.b). [1,2]
𝐼𝐼𝑁∗ = 𝑑𝛾𝐼𝛾 + 𝑑𝛿𝐼𝛿 + 𝑑𝑜𝑐𝐼0 (15)
𝑑𝛾 = 𝑚𝑐 . sin (π
3− θc) (16)
𝑑𝛿 = 𝑚𝑐 . sin(θc) (17)
𝑑0𝑐 = 1 − ( 𝑑𝛾 + 𝑑𝛿) (18)
B. MODIFIED OPEN LOOP CONTROL OF MATRIX
CONVERTER
MC can control the rms value of the output voltage
and frequency. But the output voltage of matrix
converter in case of open loop control is a percent of
the input voltage. If q is the ratio between output
voltage and input voltage, if q=0.4 in open loop
control, input voltage =100V, the output voltage will
be 40 V but with the required frequency. If the input
voltage changes from 100V to 50 V the output voltage
will be 20 V. If we need to obtain constant output
voltage the q ratio must be changed from 0.4 to 0.8
so the q ratio must be depend on the input voltage
and this can be achieved by modified open loop
control. Modified open loop control takes a signal
from three-phase input voltage and q ratio can be
calculated as in (19).
From table 1 and Eq. (19) the ratio q in case
ofmodified open loop control depend on the input
voltage where if the input voltage decreased the ratio
q increased so that obtain a constant output
voltage.Figure7.a shows the proposed modified open
loop control of indirect space vector modulation.
Figure7.b shows Matlab Simulink modification in the
proposed modified open loop control of indirect space
vector modulation
𝑞 =𝑉𝑜𝑢𝑡
∗
𝑉𝐼𝑁 (19)
Table 1. Modified open loop control and open loop control
𝑽𝑰𝑵 Open Loop Control
Modified open Loop
Control
q 𝑉𝑜𝑢𝑡 q 𝑉𝑜𝑢𝑡
100 0.4 40 0.4 40
50 0.4 20 0.8 40
(a) block diagram of model
(b) Simulink of modification in the Model
Fig. 7. Modified open loop control

Renewable Energy and Sustainable Development (RESD) Volume 3 Issue 1, Special Issue, March 2017 - ISSN 2356-8569 http://dx.doi.org/10.21622/RESD.2017.03.1.175
179 RESD © 2017
http://apc.aast.edu
V. SIMULATION RESULTS
Simulations were done using MATLAB/Simulink
software package. The simulation results for a MC
interfaced wind energy conversion system for an
isolated R-L load(R=2Ω, L=1mH) will be presented.
The bidirectional switch used here is MOSFET and
four ultra-fast diodes. The output filter used is LC filter
with value of L=2.3 mH, C=100 µf [20]. To obtain the
desired output voltage and frequency, the matrix
converter is controlled by using indirect space vector
modulation with modified open loop control. Figure
8shows simulation results at different wind speed with
open loop control. Figure 9 shows simulation results
at different wind speeds with modified open loop
control, In case of a modified open loop control the
output voltage and frequency remain constant to the
desired value 220 V, 50 Hz output even if the wind
speed changed. In case of open loop control the
output voltage is a ratio of input voltage so if the
output voltage changed with speed as shown in fig.8.
Table 2 gives the magnitude of voltages and
frequency with variation of wind speeds. Figure (8.a,
9.a) shows wind velocity with time, where the speed
of wind changed from 7 m/s to 12 m/s at t=0.3 sec,
from 12 m/s to 9 m/s at t= 0.6 sec, from 9 m/s to 6
m/s at t= 1 sec. Figure 8.b shows input voltage to MC
(generated voltage), Fig.8.c shows simulation results
of output voltage of 50 Hz with open loop control. It’s
clear from fig.8.c that the magnitude of the output
voltage isn’t constant; Fig.8.d shows simulation
results of output current of 50 Hz with open loop.
Figure 9.b shows input voltage to MC (generated
voltage), where for t=0:0.3 sec the generated voltage
is 320 V, 25 Hz, where for t=0.3:0.6 sec the
generated voltage is 460 V, 46 Hz, where for t=0.6:1
sec the generated voltage is 380 V, 34Hz, where for
t=1:1.5 sec the generated voltage is 280 V, 21Hz.
Fig.9.c shows simulation results for the desired output
voltage of 220 V, 50 Hz with modified open loop
control. It’s clear from fig.10.c that the magnitude of
the output voltage is constant and equal to the
reference value =220 V; Fig.9.d shows simulation
results of output current of 50 Hz with modified open
loop control.
Table 2. Variation of generated voltage and frequency with wind velocity
Wind velocity m/s Voltage (V) Frequency (Hz)
6 280 21
7 320 25
9 380 34
12 460 46
(a) Dynamic response of wind speed
(b) Input voltage 𝑉𝑎 at different wind speeds
(c) Output voltage 𝑉𝐴 50 Hz
(d) Output current 𝐼𝐴 50 Hz
Fig. 8. Simulation results for open loop control of a matrix
converter
0 0.5 1 1.50
5
10
15
time[sec]
win
d s
pee
d m
/s
0 0.5 1 1.5-500
0
500
time[sec]
inpu
t vo
lta
ge
Va [
V]
0 0.5 1 1.5-300
-200
-100
0
100
200
300
time[sec]
outp
ut
voltage V
A [
V]
0 0.5 1 1.5-100
-50
0
50
100
time [sec]
outp
ut
curr
ent
IA [
A]

Renewable Energy and Sustainable Development (RESD) Volume 3 Issue 1, Special Issue, March 2017 - ISSN 2356-8569 http://dx.doi.org/10.21622/RESD.2017.03.1.175
180 RESD © 2017
http://apc.aast.edu
(a) Dynamic response of wind speed
(b) Input voltage 𝑉𝑎 at different wind speeds
(c) Output voltage 𝑉𝐴 50 Hz
(d) Output current 𝐼𝐴 50 Hz
Fig. 9. Simulation results for modified open loop control
of a matrix converter
Figure 10 show input displacement factor control, Fig.10-a
shows unity input displacement factor, Fig.10-b show input
displacement factor with displacement factor angle equal
to 20 𝑜.
(a) Unity input displacement factor
(b) Displacement factor of angle 20𝑜
Fig.10. control of displacement factor
VI. EXPERIMENTAL RESULTS
Experimental results were performed using DSP1104,
with an isolated static load of (R=20Ω, L=40mH).The
field and armature voltage of DC motor is controlled to
control its speed to simulate wind turbine. Figure 11
show Experimental results for change in speed at a
time 20 sec in case of open loop control with 50 Hz
output frequency, wherefig.11-a shows the change in
speed where speed changes from 1535 rpm to 1675
rpm by increasing the armature voltage. Figure 11-b
shows the input voltage where the rms value and
frequency of the input voltage increase with the
increase in speed. Figure 11-c shows output voltage
in case of open loop control .The rms value of the
output voltage is a precent of the input voltage so the
rms value of the output voltage changes with change
in input voltage.
(a) Speed response
(b) Input voltage 𝑉𝑎
(c) Output voltage 𝑉𝐴
Fig. 11. Experimental results with open loop control &
output frequency 50 Hz
0 0.5 1 1.50
5
10
15
time[sec]
win
d s
pee
d m
/s
0 0.5 1 1.5-500
0
500
time[sec]
input
voltage V
a [
V]
0 0.5 1 1.5-300
-200
-100
0
100
200
300
time[sec]
Outp
ut
Volta
ge
VA
[V
]
0 0.5 1 1.5-100
-50
0
50
100
time[sec]
outp
ut
curr
ent
IA [
A]
0.01 0.02 0.03 0.04 0.05-100
0
100
time[sec]
Va [V
] ,1
00* I
a [A
]
0.02 0.04 0.06-100
0
100
time[sec]
Va
[V] ,
100
*Ia
[A]
0 5 10 15 20 25 30 35 40 451500
1550
1600
1650
1700
time [sec]
N [r
pm]
1535
1675
0 5 10 15 20 25 30 35 40 45-400
-200
0
200
400
time [sec]
Va [V
]
0 5 10 15 20 25 30 35 40 45-400
-200
0
200
400
time [sec]
VA
[V]

Renewable Energy and Sustainable Development (RESD) Volume 3 Issue 1, Special Issue, March 2017 - ISSN 2356-8569 http://dx.doi.org/10.21622/RESD.2017.03.1.175
181 RESD © 2017
http://apc.aast.edu
(a) Speed response
(b) Input voltage 𝑉𝑎
(c) Output voltage 𝑉𝐴
Fig .12. Experimental results with modified open loop
control & output frequency 50 Hz
Figure 12 shows experimental results for change in
speed at a time 18.5 sec in case of modified open
loop control with 50Hz output frequency, where Figure
12-a shows the change in speed where speed
changes from 1528 rpm to 1653 rpm by increasing the
armature voltage. Figure 12-b shows the input voltage
where the rms value and frequency of the input
voltage increase with the increase in speed the input
frequency increases from 30 Hz to 33.5 Hz
approximately. Figure 12-c shows output voltage in
case of modified open loop control .The output
frequency doesn't change even if the input frequency
changes.
VII. CONCLUSIONS
In this paper, a modified open control of the indirect
space vector modulation was introduced which
improve the performance of matrix converter with
variable speed operation of the wind turbine. The
voltage and frequency of a static R-L load can be
controlled by using a MC fed from wind energy
conversion system. The angle between input voltage
and input current of MC can be controlled and unity
input displacement factor can be achieved. The
analysis of indirect space vector modulation was
introduced, in addition to introducing how to transform
from indirect MC to direct one. Model produces a very
good wave form on output side. The simulation and
experimental set up results are consistent with the
expected results, where the direct converters have the
ability to provide sinusoidal wave forms.
REFERENCES
[1] KotbB.Tawfiq,A.F.Abdou,E.E.EL-
Kholy,S.S.Shokralla “Perfo-rmance analysis of a
matrix converter interfaced wind energy
conversion system for static load application “
ICNEEE , Cairo, Egypt 11 – 14 April 2016
[2] KotbB.Tawfiq, A.F.Abdou, E.E.EL-Kholy,
S.S.Shokralla “A Modified Space Vector
Modulation Algorithm for a Matrix Converter with
Lower Total Harmonic Distortion “2016 IEEE
59th Midwest Symposium on Circuits and
Systems,Abu Dhabi,United Arab Emirates.
[3] X. Zhang, W. Wang, D. Liu, H. Wang, X. Cao, S.
He,’’matrix wind turbine generator system ‘’ IEEE
PEDS 2015, Sydney converter control study of
doubly feed induction, Australia9 – 12 June 2015
[4] H. Hojabri, H. Mokhtari and L. Chang, “Reactive
power control of permanent-magnet synchronous
wind generator with matrix converter”, IEEE
Trans. Power Delivery., vol. 28, no. 2, pp.575-
584, April 2013.
[5] N. Holtsmark, S. Sanchez and M. Molinas,
“Speed regulation ofa wind turbine with current
source or matrix converter: tuning procedure”, in
Proc. IEEE 13th Worksop on Control and
Modeling for Power Electronics (COMPEL), June
2012.
[6] R. Teodorescu, and F. Blaabjerg, "Flexible
Control of Small Wind Turbines With Grid Failure
Detection Operating in Stand-Alone and Grid
Connected Mode", IEEE Trans. On Power
Electronics, Vol. 19, NO. 5, SEP. 2004, pp. 1323,
1332.
[7] W. Lu and B. T. Ooi, "Multiterminal LVDC system
for optimal acquisition of power in wind-farm
using induction generators", IEEE Tran. On
Power Electronics Vol. 17, NO. 4, JULY 2002,
pp. 558-563.
0 5 10 15 20 25 30 35 40 451500
1550
1600
1650
1700
time [sec]
N [r
pm]
1528
1653
0 5 10 15 20 25 30 35 40 45-400
-200
0
200
400
time[sec]
Va [V
]
0 5 10 15 20 25 30 35 40 45-400
-200
0
200
400
time [sec]
VA
[V]
Renewable Energy and Sustainable Development (RESD) Volume 3 Issue 1, Special Issue, March 2017 - ISSN 2356-8569 http://dx.doi.org/10.21622/RESD.2017.03.1.175
182 RESD © 2017
http://apc.aast.edu
[8] Rajesh Kumar Thakur,Vivek Agarwal andPaluri
S. V. Nataraj,” A Reliable and Accurate
Calculation of Excitation Capacitance Value for
an Induction Generator Based on Interval
Computation Technique,” International Journal of
Automation and Computing ,November 2011,
,pp.429-436.
[9] ALI M. ELTAMALY, PhD,” New Formula to
Determine the Minimum Capacitance Required
for Self-Excited Induction Generator,” 33rd IEEE
Power Electronics Specialists Conference, 23 -
27 June 2002 Cairns Convention Centre,
Queensland, Australia, 2002.
[10] M. Venturini and A. Alesina, "The generalized
transformer: A new bidirectional sinusoidal
waveform frequency converter with continuously
adjustable input power factor " in Proc. IEEE
PESC’80, 1980, pp. 242– 252.
[11] P. W. Wheeler, IEEE, J. Rodríguez, J. Clare, L.
Empringham, and A. Weinstein, " Matrix
Converters: A Technology Review “, IEEE Trans.
On Industrial elctronicas, Vol. 49, NO. 2, APRIL
2002,pp 276-289.
[12] S.M. Barakati, J.D Aplevich, M. Kazerani,"
controller design for a wind turbine system
including a matrix converter”, IEEE Power
Engineering society General meeting, PP.1-8,
2007.
[13] J. G. Slootweg, S. W. H. de Haan, H. Polinder,
and W. L. Kling, "General Model for
Representing Variable Speed Wind Turbines in
Power System Dynamics Simulations", IEEE
Trans. On Power Systems, Vol. 18, NO. 1,
FEB.2003, pp. 144-151.
[14] Ramasamy BHARANIKUMAR , A.Nirmal
KUMAR,”performance analysis of wind turbine-
driven permanent magnet generator with matrix
converter”,Turk J Elec Eng&Comp Sci, Vol 20
no.3,2012.
[15] R. KumarThakur1 , V. Agarwal, P. S. V. Natara"
A Reliable and Accurate Calculation of Excitation
Capacitance Value for an Induction Generator
Based on Interval Computation Technique ’’
International Journal of Automation and
Computing 8(4), November 2011, 429-436.
[16] Casadei, G. Grandi, G. Serra, A. Tani, “Space
vector control of matrix converters with unity
input power factor and sinusoidal input/output
waveforms,” Proceedings of IEEEPE' 93, Vol. 7,
pp. 170-175, 1993.
[17] L. Gyugyi and B. R. Pelly, Static Power
Frequency Changers: Theory, Performance, and
App1ication, John Wiley & Sons, 1976.E H.
Miller, “A note on reflector arrays IEEE Trans.
Antennas Propagat., to be published.
[18] Wheeler, P., J. Rodriguez, J. Clare, L.
Empringham, and A. Weinstein, “Matrix
converters: A technology review,” IEEE
Transactions on Power Electronics, Vol. 49, No.
2, 2002.
[19] J. Rodriguez, M. Rivera, J. W. Kolar and P. W.
Wheeler, “A review of control and modulation
methods for matrix converters”, IEEE
Trans. Ind. Electron., vol. 59, no. 1, pp. 58- 70,
January 2012
[20] V. Vlatkovic,D. Borojevicand F. C. Lee, “Input
Filter Design for Power Factor Correction
Circuits,”IEEE Transaction on Power
Electronics,pp.199-205,Jan199