Noninvasive characterization of the Trecate (Italy) crude-oil contaminated site: links between...
18
NEWAPPROACHES FOR LOW-INVASIVE CONTAMINATED SITE CHARACTERIZATION, MONITORING AND MODELLING Noninvasive characterization of the Trecate (Italy) crude-oil contaminated site: links between contamination and geophysical signals Giorgio Cassiani & Andrew Binley & Andreas Kemna & Markus Wehrer & Adrian Flores Orozco & Rita Deiana & Jacopo Boaga & Matteo Rossi & Peter Dietrich & Ulrike Werban & Ludwig Zschornack & Alberto Godio & Arash JafarGandomi & Gian Piero Deidda Received: 3 June 2013 /Accepted: 23 December 2013 # Springer-Verlag Berlin Heidelberg 2014 Abstract The characterization of contaminated sites can ben- efit from the supplementation of direct investigations with a set of less invasive and more extensive measurements. A combination of geophysical methods and direct push tech- niques for contaminated land characterization has been pro- posed within the EU FP7 project ModelPROBE and the affiliated project SoilCAM. In this paper, we present results of the investigations conducted at the Trecate field site (NW Italy), which was affected in 1994 by crude oil contamination. The less invasive investigations include ground-penetrating radar (GPR), electrical resistivity tomography (ERT), and electromagnetic induction (EMI) surveys, together with direct push sampling and soil electrical conductivity (EC) logs. Many of the geophysical measurements were conducted in time-lapse mode in order to separate static and dynamic sig- nals, the latter being linked to strong seasonal changes in water table elevations. The main challenge was to extract significant geophysical signals linked to contamination from the mix of geological and hydrological signals present at the site. The most significant aspects of this characterization are: (a) the geometrical link between the distribution of contami- nation and the site’ s heterogeneity, with particular regard to the presence of less permeable layers, as evidenced by the extensive surface geophysical measurements; and (b) the link between contamination and specific geophysical signals, par- ticularly evident from cross-hole measurements. The exten- sive work conducted at the Trecate site shows how a combi- nation of direct (e.g., chemical) and indirect (e.g., geophysi- cal) investigations can lead to a comprehensive and solid understanding of a contaminated site’ s mechanisms. Keywords Hydrogeophysics . GPR . ERT . Electrical methods . Cross-hole . Contamination Responsible editor: Michael Matthies G. Cassiani (*) : J. Boaga : M. Rossi Dipartimento di Geoscienze, Università di Padova, Padova, Italy e-mail: [email protected] A. Binley : A. JafarGandomi Lancaster Environment Centre, Lancaster University, Lancaster, UK A. Kemna : A. F. Orozco Department of Geodynamics and Geophysics, University of Bonn, Bonn, Germany M. Wehrer Institut für Geowissenschaften, Friedrich-Schiller-Universität, Jena, Germany A. F. Orozco Department of Geodesy and Geoinformation, Technical University of Wien, Vienna, Austria R. Deiana Dipartimento dei Beni Culturali: Archeologia, Storia dell’Arte, del Cinema e della Musica, Università di Padova, Padova, Italy P. Dietrich : U. Werban : L. Zschornack UFZ-Helmholtz Centre for Environmental Research, Leipzig, Germany A. Godio Dipartimento di Ingegneria dell’Ambiente, del Territorio e delle Infrastrutture, Politecnico di Torino, Torino, Italy G. P. Deidda Dipartimento di Ingegneria Civile, Ambientale e Architettura, Università di Cagliari, Cagliari, Italy Environ Sci Pollut Res DOI 10.1007/s11356-014-2494-7
Transcript of Noninvasive characterization of the Trecate (Italy) crude-oil contaminated site: links between...
NEWAPPROACHES FOR LOW-INVASIVECONTAMINATED SITE CHARACTERIZATION,MONITORINGANDMODELLING
Noninvasive characterization of the Trecate (Italy)crude-oil contaminated site: links between contaminationand geophysical signals
Giorgio Cassiani & Andrew Binley & Andreas Kemna & Markus Wehrer & Adrian Flores Orozco &
Rita Deiana & Jacopo Boaga & Matteo Rossi & Peter Dietrich & Ulrike Werban & Ludwig Zschornack &
Alberto Godio & Arash JafarGandomi & Gian Piero Deidda
Received: 3 June 2013 /Accepted: 23 December 2013# Springer-Verlag Berlin Heidelberg 2014
Abstract The characterization of contaminated sites can ben-efit from the supplementation of direct investigations with aset of less invasive and more extensive measurements. Acombination of geophysical methods and direct push tech-niques for contaminated land characterization has been pro-posed within the EU FP7 project ModelPROBE and theaffiliated project SoilCAM. In this paper, we present resultsof the investigations conducted at the Trecate field site (NWItaly), which was affected in 1994 by crude oil contamination.The less invasive investigations include ground-penetratingradar (GPR), electrical resistivity tomography (ERT), andelectromagnetic induction (EMI) surveys, together with directpush sampling and soil electrical conductivity (EC) logs.Many of the geophysical measurements were conducted intime-lapse mode in order to separate static and dynamic sig-nals, the latter being linked to strong seasonal changes inwater table elevations. The main challenge was to extract
significant geophysical signals linked to contamination fromthe mix of geological and hydrological signals present at thesite. The most significant aspects of this characterization are:(a) the geometrical link between the distribution of contami-nation and the site’s heterogeneity, with particular regard tothe presence of less permeable layers, as evidenced by theextensive surface geophysical measurements; and (b) the linkbetween contamination and specific geophysical signals, par-ticularly evident from cross-hole measurements. The exten-sive work conducted at the Trecate site shows how a combi-nation of direct (e.g., chemical) and indirect (e.g., geophysi-cal) investigations can lead to a comprehensive and solidunderstanding of a contaminated site’s mechanisms.
Keywords Hydrogeophysics . GPR . ERT . Electricalmethods . Cross-hole . Contamination
Responsible editor: Michael Matthies
G. Cassiani (*) : J. Boaga :M. RossiDipartimento di Geoscienze, Università di Padova, Padova, Italye-mail: [email protected]
A. Binley :A. JafarGandomiLancaster Environment Centre, Lancaster University, Lancaster, UK
A. Kemna :A. F. OrozcoDepartment of Geodynamics and Geophysics, University of Bonn,Bonn, Germany
M. WehrerInstitut für Geowissenschaften, Friedrich-Schiller-Universität, Jena,Germany
A. F. OrozcoDepartment of Geodesy and Geoinformation, Technical Universityof Wien, Vienna, Austria
R. DeianaDipartimento dei Beni Culturali: Archeologia, Storia dell’Arte, delCinema e della Musica, Università di Padova, Padova, Italy
P. Dietrich :U. Werban : L. ZschornackUFZ-Helmholtz Centre for Environmental Research, Leipzig,Germany
A. GodioDipartimento di Ingegneria dell’Ambiente, del Territorio e delleInfrastrutture, Politecnico di Torino, Torino, Italy
G. P. DeiddaDipartimento di Ingegneria Civile, Ambientale e Architettura,Università di Cagliari, Cagliari, Italy
Environ Sci Pollut ResDOI 10.1007/s11356-014-2494-7
Introduction
Conventional techniques for contaminated site characteriza-tion are based on drilling, sampling, and chemical analyses.Even though necessary and informative, these techniques aretime-consuming, cost-intensive, and often do not adequatelysupport decision making as they cannot cover the contaminat-ed site in its full spatial extent. New techniques are thereforenecessary. In particular, these techniques shall allow a step-wise site characterization strategy with possible feedbacks andadjustments. Among such techniques, a prominent role can beplayed by a range of near-surface geophysical techniques.Ground-penetrating radar (GPR, e.g., Annan 2005), electricalresistivity tomography (ERT, e.g., Binley and Kemna 2005),electromagnetic induction (EMI, e.g., Everett and Meju2005), induced polarization and spectral induced polarization(IP/SIP, e.g., Binley and Kemna 2005), and self potential (SP,e.g., Revil et al. 2006) are among the techniques that lendthemselves to these applications. All these techniques canfocus with adequate resolution onto the first meters to tensof meters of subsoil, and possible links exist between therelevant measured physical quantities and the hydrologicaland environmental quantities of interest for contaminated sitecharacterization (consider, e.g., Cassiani et al. 2006; Monegoet al. 2010; Flores Orozco et al. 2011, 2012; Perri et al. 2012).
In general, geophysical techniques in environmental appli-cations are used to characterize different aspects of the prob-lem, namely, site structure, hydrology and hydrogeology,contamination, and bioattenuation.
Site structure
The identification of geological structure is a classical appli-cation of geophysical techniques, and contaminated site char-acterization is no exception. In addition, the mapping ofanthropogenic structures (pipelines and foundations) at aban-doned sites represents a standard application of geophysicalmethods (Everett and Meju 2005).
Hydrology and hydrogeology
The motion of fluids (air and water) can carry contaminantsand put them in contact with potential receptors. One of themost elusive pathways is related to subsurface water migra-tion; thus, the hydrological characterization of the site isextremely important. A vast number of hydrogeophysicalstudies have been devoted to the identification of flow andtransport in the near subsurface, both in the vadose zone (e.g.,Deiana et al. 2008) and in the saturated zone (e.g., Kemnaet al. 2002). The advantage of this type of monitoring is fullyestablished, and a wider application of these techniques tocontaminated site characterization is expected.
Contamination
The localization and characterization of the spatial extent ofcontaminant distribution in the soil and subsoil are potentiallysignificant results that geophysics could provide. However,direct detection of contaminants by means of geophysicalmethods has, so far, proved very problematic. This happensbecause even high contamination levels result in modest vol-ume fractions which, in most cases, translate into weak signalsfor traditional geophysical methods (seismics, DCgeoelectrics, gravity, magnetic, and electromagneticmethods). At a more attentive analysis, it is apparent that theproblem lies not specifically in the low signal intensity that isoften above the instrument sensitivity, but rather in the simul-taneous presence of multiple signal sources, in addition tocontamination, often having larger intensity and independentspatial and temporal distributions. These additional signalsources are mainly the (a) geological structure that is (forour purposes) time-invariant, and (b) the ambient dynamics,which is composed of a number of time-dependent phenom-ena, mostly of a hydrological nature (see above and, e.g.,discussion in Binley et al. 2011). As contaminants oftenproduce a weak signal, this is often overwhelmed by the otherstatic and dynamic signals and often hardly recognizable.Misidentification of the contaminant target with other signalsources is very easy in such a framework and can hinder allefforts to use geophysics in contaminated site characterization.If the focus of characterization is on the identification of thecontaminant location (the hazard, in the risk assessment pro-cedure), then it becomes essential that the other signal sources(structure and hydrological dynamics) be fully understood inorder to extract the residual signal coming from contamina-tion. However, the process of contaminant detection is alsohelped, for certain categories of contaminants, by anotherimportant phenomenon: the associated biological activity.The biological activity often produces large physical signals,such as a marked increase in electrical conductivity (EC), thatcan help identify the areas where contaminant is used as asubstrate by bacteria.
Bioattenuation
While contaminants themselves may be a weak source ofgeophysical signals, the biological activity associated to deg-radation of petroleum hydrocarbons is known to generate by-products that produces large electrical signals (e.g., Atekwanaand Atekwana 2010). In these cases, geophysics can play amajor role. Note that geophysical techniques can also provideestimates of the effectiveness of enhanced bioattenuation orother engineered remediation techniques (such as bioventing,air sparging, steam injection, etc.; e.g., Daily et al. 1995;Flores Orozco et al. 2011; Chen et al. 2012).
Environ Sci Pollut Res
Within the framework of contaminated site characterizationthat essentially revolves around the idea of risk assessment(Petts et al. 1997), the first two aspects (structure and dynam-ics) concur at defining the possible pathways that can putcontamination in contact with possible receptors, while thethird and forth aspects (contamination and bioattenuation) arefunctional to the definition of hazard.
When considering in particular the case of contaminationfrom hydrocarbon (light nonaqueous phase liquids orLNAPLs), biological processes play a fundamental role notonly in the natural degradation of these contaminants but also,as a consequence of the produced by-products, in the possi-bility of detecting them via minimally invasive methods,particularly as a consequence of the increased EC of thesystem (Atekwana and Atekwana 2010). Numerous examplesof the application of geophysical techniques to the detectionand monitoring of hydrocarbon contamination have appearedin the literature over the past two decades (e.g., Benson et al.1997; Bermejo et al. 1997; Sauck et al. 1998; Atekwana et al.2000, 2002, 2004a; Osella et al. 2002; Werkema et al. 2003;Lopes de Castro and Branco 2003; Abdel Aal et al. 2006;Sogade et al. 2006; Bradford 2007; Cassidy 2007; Che-Alotaet al. 2009; Gasperikova et al. 2012) and a comprehensiveview of the state of the art is given by Atekwana andAtekwana (2010). The results of these geophysical studieshave been somehow mixed. The application of the samegeophysical technique at different sites and even at differentlocations on the same site can produce dramatically differentresults. This is largely dependent on the subsurface geologyand hydrogeological conditions, i.e., on the structure of theindividual site, that differ from site to site and produce geo-physical signals larger, in general, than contamination itself. Inaddition, spatial and temporal characteristics of the contami-nation have an important bearing on the geophysical attributesand must be considered for proper interpretation. Note alsothat not all “aged LNAPL plumes” exhibit anomalous geo-physical signatures associated with biodegradation (e.g.,Tezkan et al. 2005). However, a few key facts have beenascertained and can be summarized as follows (seeAtekwana and Atekwana 2010).
First, it has been long established that the presence of lighthydrocarbons enhances the proliferation of microbes that usehydrocarbons as food. These microbes alter hydraulic proper-ties as well as ionic composition of groundwater. Terminalelectron acceptors (TEAs), such as oxygen, nitrate, manga-nese, iron, and sulfate, are necessary for the oxidation ofhydrocarbons to the final by-products (CO2 and water). Theuse of TEAs and production of CO2 alters the redox state andcan produce weathering of the solid matrix. During hydrocar-bon biodegradation, the pore fluid chemistry is changed par-ticularly by a decrease in the TEAs, the production of redoxspecies, and the production of metabolic by-products such asorganic acids, biosurfactants, and biogenic gases. The by-
products of microbial action, such as organic and carbonicacid, can weather the solid matrix. These changes in pore fluidchemistry directly result in changes in electrolytic conductiv-ity that can be measured, e.g., by DC resistivity methods.
Second, the strongest geophysical signals caused by con-tamination and biodegradation occur in the upper portion ofthe saturation zones and in the capillary fringe. In presence ofan oscillating water table, very strong signals come from thesmear zone where the residual hydrocarbon-free phase is incontact with the water moved by the fluctuations of the watertable. The free-phase smearing also makes it more readilyavailable for microbial activity (Lee et al. 2001). As thistransition zone is also very rich in TEAs brought by theintense recharge dynamics, it is not surprising that this zonehouses the most intense biodegradation and the highest pop-ulations of oil degrading microorganisms.
Third, the interpretation of the geophysical signals fromhydrocarbon-contaminated sites must be accompanied by anunderstanding of the fine-scale variations in microbial pro-cesses, in particular, in the vertical direction (consider, e.g.,Atekwana et al. 2005).Microbial processes vary over scales oftens of centimeters as a consequence of the partitioning ofhydrocarbons into different phases and of the influx of TEAs(Atekwana et al. 2000, 2004a, b, c; Werkema et al. 2003).
It must be noted, however, that the subsurface contaminat-ed by hydrocarbons is a dynamic and complexbiophysicochemical environment (consider, e.g., the crudeoil contamination at the Bemidji site; Baedecker et al. 1993;Bennett et al. 1993; Bekins et al. 2001), and its geophysicalresponse will depend on a number of factors including thetype of hydrocarbon and the release history. Therefore, thegeophysical response of this type of contamination and asso-ciated biological processes is highly site-dependent.
In summary, the existing literature confirms that geophys-ical methods can be effectively used to study and monitorhydrocarbon contaminated sites. However, this is not a trivialtask. The interpretation of geophysical data should be accom-panied by a solid understanding of the microbial and geo-chemical context in order to avoid ambiguous conclusions.
In spite of these difficulties, geophysics can provide keyinformation for contaminated sites in view of its capability ofimaging the whole subsurface, potentially in a fully 3D man-ner and in its time evolution (e.g., Daily et al. 1992;LaBrecque et al. 1996). This high potential justifies the needfor intensive basic research in this direction, particularly inview of the economical advantages of using less invasiveinvestigation techniques. In order to address the above needs,the EU Framework Programme 7 (FP7) projectsModelPROBE, led by the Helmholtz Centre forEnvironmental Research (UFZ), Leipzig, Germany, andSoilCAM, led by the Norwegian Institute for Agriculturaland Environmental Research (Bioforsk), Oslo, Norway, werefunded and conducted from 2008 to 2012 (Kästner and
Environ Sci Pollut Res
Cassiani 2009; French et al. 2009). The idea behind bothModelPROBE and SoilCAM was to integrate advanced geo-physical site characterization techniques with new types ofbiological and chemical analyses as screening techniques.Based on these noninvasive surveys, the extent of sources,contamination levels, and soil heterogeneities must be char-acterized first. Hot spots shall then be investigated, e.g., bynew, less invasive, direct push probing systems integratedwith geophysical and hydrogeological methods, combinedwith chemical and isotopic contaminant analysis for sourcelocalization and identification.
The goal of this paper is to present the results of theinvestigations conducted at one of the study sites: theTrecate site (Northern Italy), with the following three specificaims:
(a) To assess the value of geophysical data for the definitionof the site geological and hydrogeological structure.
(b) To define amplitude of dynamic geophysical signals,particularly caused by water table oscillations.
(c) To investigate to what extent, given our understanding ofpoints (a) and (b) above, it is possible for geophysicaltechniques to help in contaminant localization, possiblywith the support of local, direct ground-truthing.
Site description
The general, methodological aims of ModelPROBE andSoilCAM (see above) needed to be tested on well-characterized contaminated sites. One such site is locatedclose to Trecate (Novara, Northwestern Italy). In 1994, thesite was the scene of a crude oil spill following a blowout froman exploration well (named TR24, see Fig. 1). The incidentresulted in approximately 15,000 m3 of middle weight crudeoil being released overland contaminating both soil andgroundwater. The subsequent site remediation and resultingconditions have been reported elsewhere (e.g., Brandt et al.2002). The site is characterized by a thick sequence of poorlysorted silty sands and gravels in extensive lenses, typical ofbraided river sediments. The Ticino river flows northwest tosoutheast a few kilometers east of the site. An artificial layer ofclayey-silty material, about 1 m thick, placed as a liner for ricepaddies about a century ago, overlies most of the site. Themain zone of hydrocarbon contamination at the site coversapproximately 96 hectares (Mage and Porta 2001). An anoxic,electrochemically reductive groundwater plume is present inthe area, with limited extension to southeast from the sitetowards the Ticino River (Christensen et al. 2004). Bothsaturated and unsaturated zones are being monitored for nat-ural attenuation and evolution of contamination conditions(Brandt et al. 2002). Significant levels of hydrocarbon
contamination remain also in the deep vadose zone as shownby the results of contamination measurements on the soilsamples retrieved in recent years through direct push investi-gations to a maximum depth of 10 m (see Fig. 2; Brandt et al.2002). Groundwater levels at the site show seasonal fluctua-tions of 5 to 6 m from about 6 to about 12 m below groundlevel, with higher levels experienced during the summer as aresult of recharge from regional irrigation and flooding of therice paddies (water table elevation is maximum at the end ofSeptember and minimum at the end of March; Cassiani et al.2004).
The hydraulic properties of the local phreatic aquifer weredetermined in the past from pumping tests. The horizontalhydraulic conductivity and porosity have average values of56 m/day and 29 %, respectively. The vertical hydraulicconductivity was estimated to be 3.4 m/day in the saturatedzone using borehole dipole techniques (Burbery et al. 2004)and 0.61 to 1.46 m/day in the unsaturated zone by calibratingvadose models on time-lapse VRP data (Cassiani et al. 2004).
The characteristics of the Trecate site make it, in manyrespects, an excellent test site for the goals of the projects. Inparticular, at this site we do not find the usual abundance ofman-made subterranean structures so common in the majorityof contaminated sites. Such utilities can have a strong geo-physical signal that can mask other, more subtle signals linkedto contamination and biodegradation. However, other com-plexities exist at the Trecate site. For example, the site haslarge water table seasonal oscillations, making the separationof static and dynamic aspects of the geophysical signalschallenging, and requires that repeated time-lapse data beacquired.
Geophysical monitoring at the trecate site
From May 2009 to September 2012, ERT, GPR, IP/SIP, SPand EMI measurements were conducted at the Trecate sitewith the aim of characterizing the structure and contaminationdistribution in the shallow subsurface. Here, we focus on theevidence derived from the combination of ERT, GPR, andEMI data, supported also by direct push EC logs. ERT andGPR measurements were conducted on a number of linesacross the site. However, the most interesting results can bederived from the data collected along two reference profiles(see Fig. 2) that are located in the heavily contaminated region(line A–A!) and the uncontaminated region (line B–B!), re-spectively. Within the SoilCAM project, some monitoringboreholes were also drilled along these two lines, formingtwo pairs of neighboring holes (Fig. 2) indicated in the fol-lowing as 2009 SoilCAM boreholes (in the contaminatedzone) and 2011 SoilCAM boreholes (in the uncontaminatedzone). The borehole pairs reach a depth of about 17 m in thecontaminated zone and 14 m in the uncontaminated zone
Environ Sci Pollut Res

below ground, respectively. Each hole is equipped with 24evenly spaced electrodes, thus allowing a cross-hole ERTacquisition with very good spatial resolution, in the meterrange. The boreholes in each pair are spaced at a fraction oftheir depth, i.e., 6 m for the 2009 SoilCAM boreholes and3.95 m for the 2011 SoilCAM boreholes, respectively.
Surface ERT acquisitions
Measurements were performed using an IRIS Syscal Proresistivity meter, deploying 48 stainless-steel electrodes with
a separation of 2.5 m. We used a “skip-3” (four-electrodedipole separation) dipole–dipole measurement protocol,which means the current and potential dipoles have a lengthof 10 m (skipping three electrodes between positive andnegative poles in current and potential dipoles) and with amaximum separation between current and potential dipoles of37 electrodes. This scheme provides a good signal-to-noiselevel (given the relatively large size of the dipoles) and is still agood spatial resolution. The total line length of B–B! is 120 m,and we consider reliable the inverted results to a depth of atleast 15 m. This is evaluated on the basis on the rule-of-thumb
a
b
c0 1 km 2 km
Fig. 1 a A photo of the crudeTR24 oil well blowout in Trecate,Novara, Italy in 28 February1994. The insets show: b thelocation of the site in Italy and c asatellite image showing the extentof oil spread shortly after theaccident
B
A’
B’
A
Extent of >500 mg/kg TPH
4m
10m
0 50 m 100 m
Fig. 2 Map of the Trecate siteshowing the extent of the areasexceeding 500 mg/kg totalpetroleum hydrocarbon (TPH) insoil at two depths (4 and 10 mbelow ground) as derived fromhistorical (since 1995) direct pushsampling data, together with thetwo main investigation profilesselected for this study (line A–A!and line B–B!). The locations ofthe two pairs of boreholes drilledfor cross-hole geophysicalinvestigations are also shown
Environ Sci Pollut Res
that wants the depth of penetration be a fraction (e.g., 1/5) ofthe total array length, considering also precautionally thatdipole–dipole schemes tend to become less reliable withdepth. Along line A–A!, we performed the measurementsusing 48 electrodes in roll-along (for a total of 81 electrodes)reaching a total length of 200 m, but still the depth of inves-tigation is the same as for line B. All data (1,745 and 722quadrupoles in arrays A and B, respectively) were measuredin normal and reciprocal configurations to allow data errorestimation based on normal-reciprocal discrepancies (e.g.,Binley et al. 1995). Resistance data were collected in the timedomain, using a square-wave current injection with 50 % dutycycle and a pulse length of 2 s. For the inversion of resistancedata, the data error was estimated by a linear model. Outlierswere defined as those associated with a difference betweennormal and reciprocal larger than two times the standarddeviation from the normal/reciprocal misfit from the entiredataset (as described in Flores Orozco et al. 2012), resulting ina removal of approximately 10 to 15 % of the measurements.The error parameterization were implemented in asmoothness-constrained inversion algorithm implemented inR2 (www.es.lancs.ac.uk/people/amb/Freeware/R2/R2.htmand detailed in Binley and Kemna 2005), which was used toperform the inversion of the data here presented.
Surface GPR acquisitions
The surface GPR profiles were acquired using a Sensors &Software PulseEkko Pro system with 100 MHz antennas. Theresults presented here correspond to a minimum-offset acqui-sition, while GPR velocities were estimated from severalcommon midpoint (CMP) surveys along each profile (fortechnical details, see, e.g., Annan 2005).
EMI mapping
Extensive frequency-domain electromagnetic mapping wasconducted over all the accessible areas of the site, using aGF Instruments CMD-4 sonde, having a nominal depth ofpenetration of about 6 m. The goal was to give a large-scalepicture of the shallow subsurface, also in search of possibleman-made artefacts. For a description of the EMI techniques,consider, e.g., Everett and Meju (2005).
Cross-hole acquisitions
The availability of the SoilCAM boreholes made it possible toconduct cross-hole geophysical investigations both in thecontaminated and the uncontaminated areas (see Fig. 2).Cross-hole investigations allow for a much better resolution(in the meter range) at depth and thus allow us to investigate insitu processes such as contaminant distribution and biodegra-dation in their spatial variability at a relatively fine scale.
Cross-hole ERT was run with the same equipment as forsurface measurements. We used the same dipole–dipole skip-3 measuring protocol used in surface acquisitions for a total of722 quadrupoles. Each measurement was also collected alsoas a normal reciprocal pair and outliers were also defined asthose with a large normal reciprocal misfit. Again inversionwas made using the R2 software.
Cross-hole GPR data were collected on the same boreholepairs using the PulseEkko Pro system with 100MHz boreholeantennas. Two acquisition schemes were used, i.e., (1) amultiple offset gather (MOG) with 0.5 m vertical spacingbetween antenna stations and (2) a zero offset profile (ZOP)with 0.25 m spacing between antenna stations. In both cases,the information is mainly contained in the GPR travel timeassociated to each transmitter–receiver pair, as this depends onthe dielectric constant and thus, mainly, on the volumetric soilmoisture content (Annan 2005). In the case of MOG, a tomo-graphic inversion is needed, which can yield a 2-D distribu-tion of electromagnetic velocity and consequently of electricalpermittivity that depends strongly on soil moisture content(e.g., Deiana et al. 2008), while in the case of ZOP, generallyat each depth, it is possible to obtain independently an esti-mate of average permittivity and moisture content (e.g., Rossiet al. 2012).
Direct push EC logs
The joint use of geophysical methods and direct push mea-surements and sampling is becoming state of the art forshallow investigations (e.g., Schütze et al. 2012) and is oneof the approaches endorsed in the ModelPROBE project. Atthe Trecate site, direct push was used to retrieve soil samplesand to provide detailed vertical EC logs at the selected loca-tions. These logs allow for local verifications of the accuracyand resolution of the surface ERT lines.
Geochemical monitoring and contamination at the trecate site
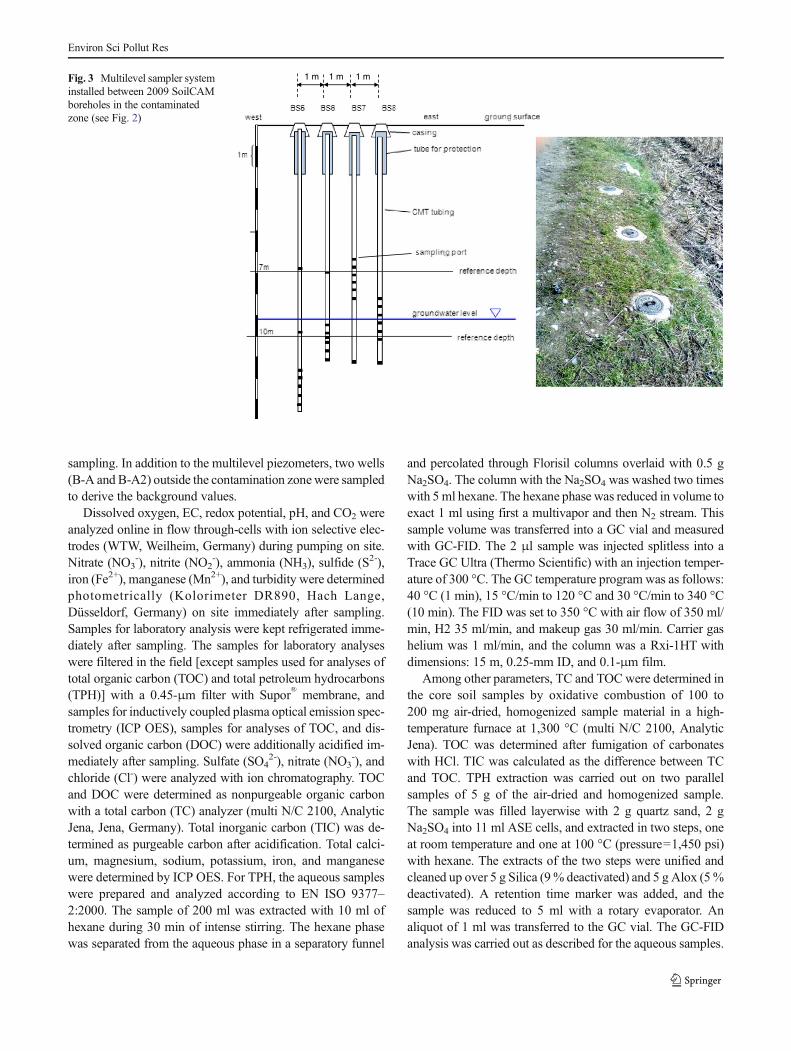
Amultilevel sampling systemwas installed at the Trecate fieldsite in early December 2009. The tubing system is a CMTMultilevel system 503 (Solinst, Canada) with four piezome-ters housing seven sampling ports each (Fig. 3). Close spacingof the sampling ports (as close as 0.4 m) was chosen to supportthe interpretation of geophysical data. The boreholes BS5,BS6, BS7, and BS8 were constructed in distances of 1 m onthe side of the dirt road roughly between the two 2009SoilCAM boreholes, where regular ERT and GPR cross-borehole measurements are made (Fig. 3). Soil core sampleswere taken from the two boreholes BS5 and BS7. Threesampling campaigns were carried out: 30 August !04September 2010; 11 October–15 October 2010, and 10May–12 May 2011. Port purging and stabilization of physi-cochemical online measurements were achieved before each
Environ Sci Pollut Res
sampling. In addition to the multilevel piezometers, two wells(B-A and B-A2) outside the contamination zonewere sampledto derive the background values.
Dissolved oxygen, EC, redox potential, pH, and CO2 wereanalyzed online in flow through-cells with ion selective elec-trodes (WTW, Weilheim, Germany) during pumping on site.Nitrate (NO3
-), nitrite (NO2-), ammonia (NH3), sulfide (S2-),
iron (Fe2+), manganese (Mn2+), and turbidity were determinedphotometrically (Kolorimeter DR890, Hach Lange,Düsseldorf, Germany) on site immediately after sampling.Samples for laboratory analysis were kept refrigerated imme-diately after sampling. The samples for laboratory analyseswere filtered in the field [except samples used for analyses oftotal organic carbon (TOC) and total petroleum hydrocarbons(TPH)] with a 0.45-μm filter with Supor® membrane, andsamples for inductively coupled plasma optical emission spec-trometry (ICP OES), samples for analyses of TOC, and dis-solved organic carbon (DOC) were additionally acidified im-mediately after sampling. Sulfate (SO4
2-), nitrate (NO3-), and
chloride (Cl-) were analyzed with ion chromatography. TOCand DOC were determined as nonpurgeable organic carbonwith a total carbon (TC) analyzer (multi N/C 2100, AnalyticJena, Jena, Germany). Total inorganic carbon (TIC) was de-termined as purgeable carbon after acidification. Total calci-um, magnesium, sodium, potassium, iron, and manganesewere determined by ICP OES. For TPH, the aqueous sampleswere prepared and analyzed according to EN ISO 9377–2:2000. The sample of 200 ml was extracted with 10 ml ofhexane during 30 min of intense stirring. The hexane phasewas separated from the aqueous phase in a separatory funnel
and percolated through Florisil columns overlaid with 0.5 gNa2SO4. The column with the Na2SO4 was washed two timeswith 5 ml hexane. The hexane phase was reduced in volume toexact 1 ml using first a multivapor and then N2 stream. Thissample volume was transferred into a GC vial and measuredwith GC-FID. The 2 μl sample was injected splitless into aTrace GC Ultra (Thermo Scientific) with an injection temper-ature of 300 °C. The GC temperature program was as follows:40 °C (1 min), 15 °C/min to 120 °C and 30 °C/min to 340 °C(10 min). The FID was set to 350 °C with air flow of 350 ml/min, H2 35 ml/min, and makeup gas 30 ml/min. Carrier gashelium was 1 ml/min, and the column was a Rxi-1HT withdimensions: 15 m, 0.25-mm ID, and 0.1-μm film.
Among other parameters, TC and TOCwere determined inthe core soil samples by oxidative combustion of 100 to200 mg air-dried, homogenized sample material in a high-temperature furnace at 1,300 °C (multi N/C 2100, AnalyticJena). TOC was determined after fumigation of carbonateswith HCl. TIC was calculated as the difference between TCand TOC. TPH extraction was carried out on two parallelsamples of 5 g of the air-dried and homogenized sample.The sample was filled layerwise with 2 g quartz sand, 2 gNa2SO4 into 11 ml ASE cells, and extracted in two steps, oneat room temperature and one at 100 °C (pressure=1,450 psi)with hexane. The extracts of the two steps were unified andcleaned up over 5 g Silica (9% deactivated) and 5 g Alox (5%deactivated). A retention time marker was added, and thesample was reduced to 5 ml with a rotary evaporator. Analiquot of 1 ml was transferred to the GC vial. The GC-FIDanalysis was carried out as described for the aqueous samples.
1 m1 m 1 mFig. 3 Multilevel sampler systeminstalled between 2009 SoilCAMboreholes in the contaminatedzone (see Fig. 2)
Environ Sci Pollut Res
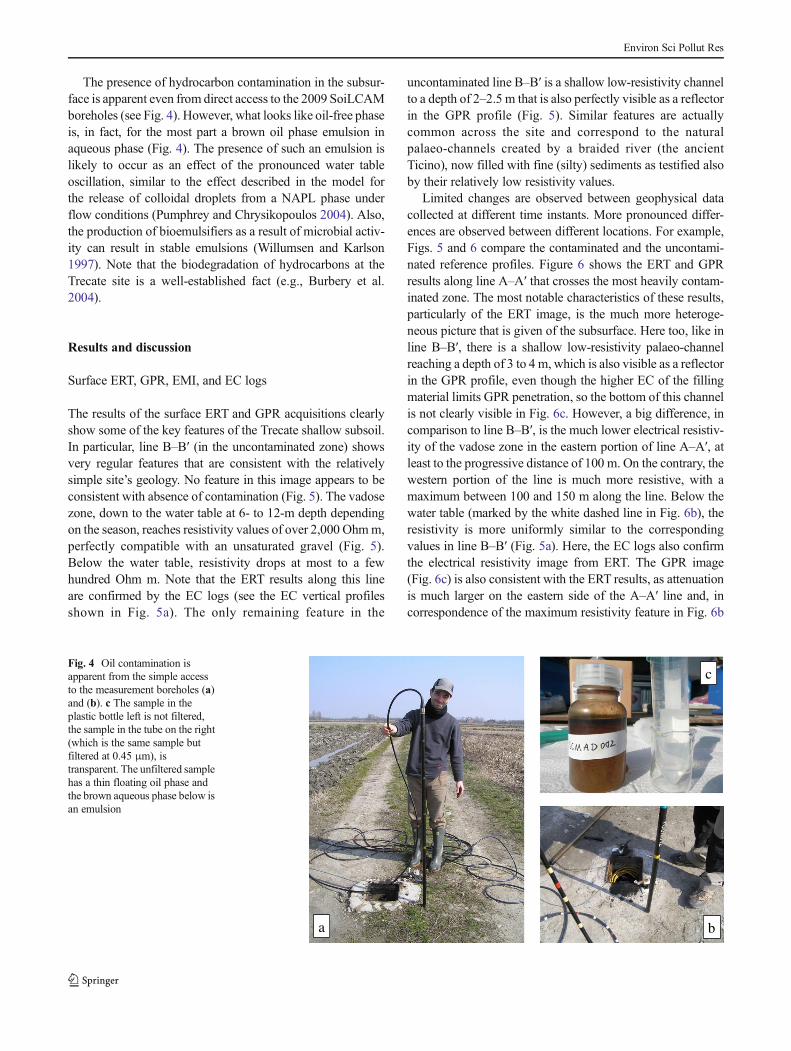
The presence of hydrocarbon contamination in the subsur-face is apparent even from direct access to the 2009 SoiLCAMboreholes (see Fig. 4). However, what looks like oil-free phaseis, in fact, for the most part a brown oil phase emulsion inaqueous phase (Fig. 4). The presence of such an emulsion islikely to occur as an effect of the pronounced water tableoscillation, similar to the effect described in the model forthe release of colloidal droplets from a NAPL phase underflow conditions (Pumphrey and Chrysikopoulos 2004). Also,the production of bioemulsifiers as a result of microbial activ-ity can result in stable emulsions (Willumsen and Karlson1997). Note that the biodegradation of hydrocarbons at theTrecate site is a well-established fact (e.g., Burbery et al.2004).
Results and discussion
Surface ERT, GPR, EMI, and EC logs
The results of the surface ERT and GPR acquisitions clearlyshow some of the key features of the Trecate shallow subsoil.In particular, line B–B! (in the uncontaminated zone) showsvery regular features that are consistent with the relativelysimple site’s geology. No feature in this image appears to beconsistent with absence of contamination (Fig. 5). The vadosezone, down to the water table at 6- to 12-m depth dependingon the season, reaches resistivity values of over 2,000 Ohmm,perfectly compatible with an unsaturated gravel (Fig. 5).Below the water table, resistivity drops at most to a fewhundred Ohm m. Note that the ERT results along this lineare confirmed by the EC logs (see the EC vertical profilesshown in Fig. 5a). The only remaining feature in the
uncontaminated line B–B! is a shallow low-resistivity channelto a depth of 2–2.5 m that is also perfectly visible as a reflectorin the GPR profile (Fig. 5). Similar features are actuallycommon across the site and correspond to the naturalpalaeo-channels created by a braided river (the ancientTicino), now filled with fine (silty) sediments as testified alsoby their relatively low resistivity values.
Limited changes are observed between geophysical datacollected at different time instants. More pronounced differ-ences are observed between different locations. For example,Figs. 5 and 6 compare the contaminated and the uncontami-nated reference profiles. Figure 6 shows the ERT and GPRresults along line A–A! that crosses the most heavily contam-inated zone. The most notable characteristics of these results,particularly of the ERT image, is the much more heteroge-neous picture that is given of the subsurface. Here too, like inline B–B!, there is a shallow low-resistivity palaeo-channelreaching a depth of 3 to 4 m, which is also visible as a reflectorin the GPR profile, even though the higher EC of the fillingmaterial limits GPR penetration, so the bottom of this channelis not clearly visible in Fig. 6c. However, a big difference, incomparison to line B–B!, is the much lower electrical resistiv-ity of the vadose zone in the eastern portion of line A–A!, atleast to the progressive distance of 100 m. On the contrary, thewestern portion of the line is much more resistive, with amaximum between 100 and 150 m along the line. Below thewater table (marked by the white dashed line in Fig. 6b), theresistivity is more uniformly similar to the correspondingvalues in line B–B! (Fig. 5a). Here, the EC logs also confirmthe electrical resistivity image from ERT. The GPR image(Fig. 6c) is also consistent with the ERT results, as attenuationis much larger on the eastern side of the A–A! line and, incorrespondence of the maximum resistivity feature in Fig. 6b
a b
cFig. 4 Oil contamination isapparent from the simple accessto the measurement boreholes (a)and (b). c The sample in theplastic bottle left is not filtered,the sample in the tube on the right(which is the same sample butfiltered at 0.45 μm), istransparent. The unfiltered samplehas a thin floating oil phase andthe brown aqueous phase below isan emulsion
Environ Sci Pollut Res
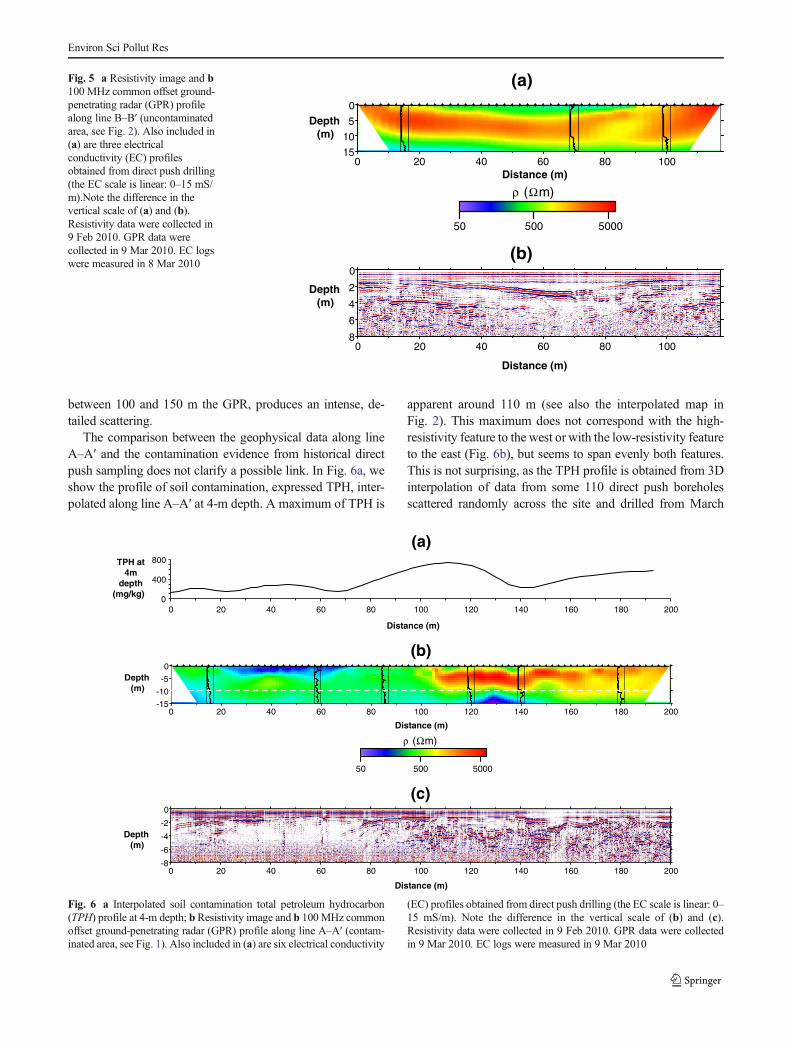
between 100 and 150 m the GPR, produces an intense, de-tailed scattering.
The comparison between the geophysical data along lineA–A! and the contamination evidence from historical directpush sampling does not clarify a possible link. In Fig. 6a, weshow the profile of soil contamination, expressed TPH, inter-polated along line A–A! at 4-m depth. A maximum of TPH is
apparent around 110 m (see also the interpolated map inFig. 2). This maximum does not correspond with the high-resistivity feature to the west or with the low-resistivity featureto the east (Fig. 6b), but seems to span evenly both features.This is not surprising, as the TPH profile is obtained from 3Dinterpolation of data from some 110 direct push boreholesscattered randomly across the site and drilled from March
0 20 40 60 80 100-15-10-50
0 20 40 60 80 100-8
-6
-4
-2
0
1.7 2.7 3.7
Distance (m)
( m)
50 500 5000
Distance (m)
(a)
(b)
Depth (m)
Depth (m)
Fig. 5 a Resistivity image and b100 MHz common offset ground-penetrating radar (GPR) profilealong line B–B! (uncontaminatedarea, see Fig. 2). Also included in(a) are three electricalconductivity (EC) profilesobtained from direct push drilling(the EC scale is linear: 0–15 mS/m).Note the difference in thevertical scale of (a) and (b).Resistivity data were collected in9 Feb 2010. GPR data werecollected in 9 Mar 2010. EC logswere measured in 8 Mar 2010
0 20 40 60 80 100 120 140 160 180 2000
400
800
0 20 40 60 80 100 120 140 160 180 200-15-10-50
Distance (m)
0 20 40 60 80 100 120 140 160 180 200-8
-6
-4
-2
0
Distance (m)
( m)
50 500 5000
Distance (m)
TPH at 4m
depth(mg/kg)
Depth (m)
(a)
(b)
(c)
Depth (m)
Fig. 6 a Interpolated soil contamination total petroleum hydrocarbon(TPH) profile at 4-m depth; b Resistivity image and b 100 MHz commonoffset ground-penetrating radar (GPR) profile along line A–A! (contam-inated area, see Fig. 1). Also included in (a) are six electrical conductivity
(EC) profiles obtained from direct push drilling (the EC scale is linear: 0–15 mS/m). Note the difference in the vertical scale of (b) and (c).Resistivity data were collected in 9 Feb 2010. GPR data were collectedin 9 Mar 2010. EC logs were measured in 9 Mar 2010
Environ Sci Pollut Res

1995 to October 2007 during periodic campaigns spacedabout 6 months. From each borehole, five samples were takenat 2-m spacing from 2- to 10-m depth. We expect that thisdataset can provide a general picture of the subsurface con-tamination, but it is clearly very simplified and undersampledin terms of spatial and possibly temporal resolution.Therefore, from this contamination dataset, we cannot expectto find possible correlations between contamination and geo-physical response that we know is characterized by a verysmall scale spatial variability (e.g., Atekwana and Atekwana2010).
However, the large-scale geophysical data is, in some otherway, informative of the possible mechanisms controlling thecontamination distribution. Figure 7 shows the soil EC (aver-aged over the top 6 m of soil) as measured by EMI. Here,some notable features are immediately apparent, namely: (a) ahighly conductive linear anomaly in correspondence of theroad running north–south across the site, which has beenidentified with an aqueduct pipeline, and (b) some conductive
features running northwest to southeast that correspond to theconductive palaeo-channels noted in the ERT and GPR sec-tions. The EMImap confirms the continuity of these channels,and a comparison between this map and the subsoil contam-ination map (Fig. 2) shows that there is a correlation betweenpresence of these channels and the absence of shallow con-tamination (consider the extent of contamination at 4-m depthin Fig. 2). The contamination in the deeper soil layers is muchmore homogeneously distributed across the site. This distri-bution is compatible with the localized infiltration of oilthrough the most permeable soil zones and the redistributionof hydrocarbon at depth due to the large oscillations of thewater table. Consequently, the presence of the palaeo-channels, filled, as discussed earlier, with electrically conduc-tive fine material having low permeability, is likely to haveprotected the underlying coarser soil from contaminant infil-tration from the ground surface.
Even though surface geophysics proves useful in the iden-tification of these large-scale structural features, it is apparent
0 20 40 60 80 100 120-8
-6
-4
-2
0
H
H’
H
H’
H H’
(a) (b)
(c)
Distance (m)
Depth (m)
High conductivity (low permeability?) channel acting as barrier for vertical migration
Fig. 7 a EM conductivity map obtained using a CMD3 sonde with 5-m penetration. b Soil TPH map at 4- and 10-m depths. c 100 MHz common offsetGPR profile along line H–H! shows very clearly the shallow high conductivity channel
Environ Sci Pollut Res
how a finer resolution is needed to investigate the correlationbetween contamination and geophysical signals. This can beachieved through cross-hole measurements.
Cross-hole ERT and GPR
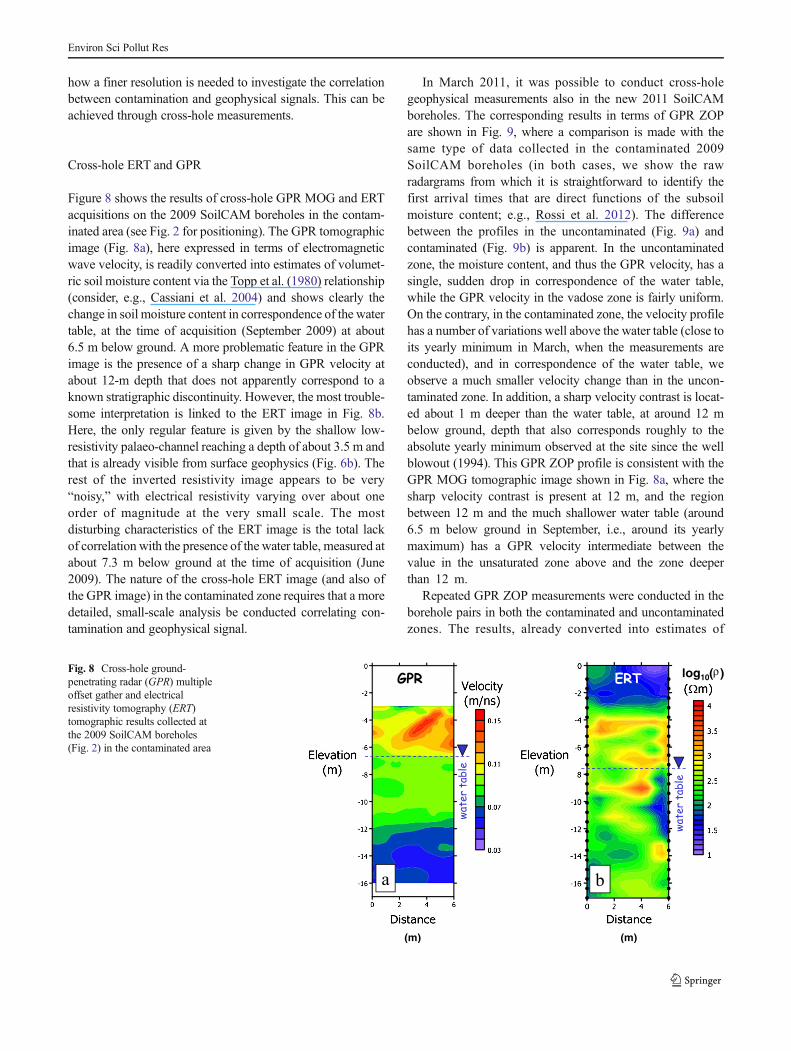
Figure 8 shows the results of cross-hole GPR MOG and ERTacquisitions on the 2009 SoilCAM boreholes in the contam-inated area (see Fig. 2 for positioning). The GPR tomographicimage (Fig. 8a), here expressed in terms of electromagneticwave velocity, is readily converted into estimates of volumet-ric soil moisture content via the Topp et al. (1980) relationship(consider, e.g., Cassiani et al. 2004) and shows clearly thechange in soil moisture content in correspondence of the watertable, at the time of acquisition (September 2009) at about6.5 m below ground. A more problematic feature in the GPRimage is the presence of a sharp change in GPR velocity atabout 12-m depth that does not apparently correspond to aknown stratigraphic discontinuity. However, the most trouble-some interpretation is linked to the ERT image in Fig. 8b.Here, the only regular feature is given by the shallow low-resistivity palaeo-channel reaching a depth of about 3.5 m andthat is already visible from surface geophysics (Fig. 6b). Therest of the inverted resistivity image appears to be very“noisy,” with electrical resistivity varying over about oneorder of magnitude at the very small scale. The mostdisturbing characteristics of the ERT image is the total lackof correlation with the presence of the water table, measured atabout 7.3 m below ground at the time of acquisition (June2009). The nature of the cross-hole ERT image (and also ofthe GPR image) in the contaminated zone requires that a moredetailed, small-scale analysis be conducted correlating con-tamination and geophysical signal.
In March 2011, it was possible to conduct cross-holegeophysical measurements also in the new 2011 SoilCAMboreholes. The corresponding results in terms of GPR ZOPare shown in Fig. 9, where a comparison is made with thesame type of data collected in the contaminated 2009SoilCAM boreholes (in both cases, we show the rawradargrams from which it is straightforward to identify thefirst arrival times that are direct functions of the subsoilmoisture content; e.g., Rossi et al. 2012). The differencebetween the profiles in the uncontaminated (Fig. 9a) andcontaminated (Fig. 9b) is apparent. In the uncontaminatedzone, the moisture content, and thus the GPR velocity, has asingle, sudden drop in correspondence of the water table,while the GPR velocity in the vadose zone is fairly uniform.On the contrary, in the contaminated zone, the velocity profilehas a number of variations well above the water table (close toits yearly minimum in March, when the measurements areconducted), and in correspondence of the water table, weobserve a much smaller velocity change than in the uncon-taminated zone. In addition, a sharp velocity contrast is locat-ed about 1 m deeper than the water table, at around 12 mbelow ground, depth that also corresponds roughly to theabsolute yearly minimum observed at the site since the wellblowout (1994). This GPR ZOP profile is consistent with theGPR MOG tomographic image shown in Fig. 8a, where thesharp velocity contrast is present at 12 m, and the regionbetween 12 m and the much shallower water table (around6.5 m below ground in September, i.e., around its yearlymaximum) has a GPR velocity intermediate between thevalue in the unsaturated zone above and the zone deeperthan 12 m.
Repeated GPR ZOP measurements were conducted in theborehole pairs in both the contaminated and uncontaminatedzones. The results, already converted into estimates of
Fig. 8 Cross-hole ground-penetrating radar (GPR) multipleoffset gather and electricalresistivity tomography (ERT)tomographic results collected atthe 2009 SoilCAM boreholes(Fig. 2) in the contaminated area
Environ Sci Pollut Res
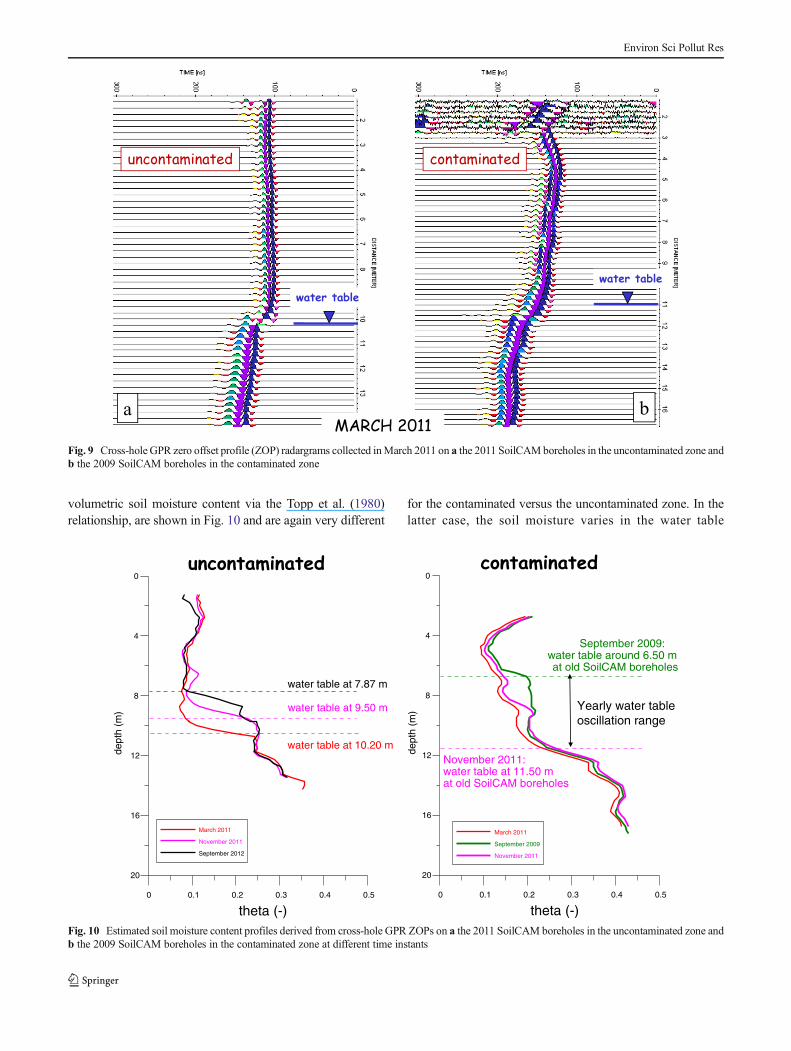
volumetric soil moisture content via the Topp et al. (1980)relationship, are shown in Fig. 10 and are again very different
for the contaminated versus the uncontaminated zone. In thelatter case, the soil moisture varies in the water table
Fig. 9 Cross-hole GPR zero offset profile (ZOP) radargrams collected inMarch 2011 on a the 2011 SoilCAMboreholes in the uncontaminated zone andb the 2009 SoilCAM boreholes in the contaminated zone
Yearly water tableoscillation rangeYearly water tableoscillation range
0 0.1 0.2 0.3 0.4 0.5
theta (-)
20
16
12
8
4
0
dept
h (m
)
March 2011
September 2009
November 2011
November 2011:water table at 11.50 mat old SoilCAM boreholes
September 2009:water table around 6.50 mat old SoilCAM boreholes
0 0.1 0.2 0.3 0.4 0.5
theta (-)
20
16
12
8
4
0
dept
h (m
)
March 2011
November 2011
September 2012
water table at 10.20 m
water table at 7.87 m
water table at 9.50 m
Fig. 10 Estimated soil moisture content profiles derived from cross-hole GPR ZOPs on a the 2011 SoilCAM boreholes in the uncontaminated zone andb the 2009 SoilCAM boreholes in the contaminated zone at different time instants
Environ Sci Pollut Res
oscillation zone from a maximum of about 0.25, compatiblewith the in situ porosity of the sediments, to a minimum ofabout 0.08 that is also a reasonable value for residual moisturecontent after gravity drainage. On the contrary, in the contam-inated zone, the range of oscillation of soil moisture contentgoes from a minimum of 0.14 to a maximum of 0.21, indicat-ing the likely presence of a further phase occupying part of thepore space (at least 4 %, considering the between the highestwater moisture content and the minimum porosity of 25 %observed in the uncontaminated sediments). A second effect
may be clogging of pore throats by biomass, which is likely togrow to a large extent in the presence of abundant substrateand reduce permeability (consider, e.g., Brovelli et al. 2009).In addition, it is likely that this oil phase reduces also perme-ability to water, thus hindering the water drainage when thewater table drops and keeping the residual moisture contentmuch higher than in the clean sediments. Note, however, thatin both zones, the volumetric soil moisture reaches highervalues at depths larger than 12 m, indicating a larger porositybelow that depth. This may point towards the fact that around
-14
-13
-12
-11
-10
-9
-8
-7
-6
1.00 10.00 100.00 1000.00
dept
h [m
]
dept
h [m
]
dissolved organic carbon [mg/l]
BS6BS7BS5BS8BS5BS 6BS 7BS8B-ABS5BS6BS7BS8B-A 2
-14
-13
-12
-11
-10
-9
-8
-7
-6
1.00 10.00 100.00 1000.00
total organic carbon [mg/l]
BS6BS7BS5BS8BS5BS 6BS 7BS8B-ABS5BS6BS7BS8B-A 2
Green 1st campaign: 30.08.-04.09.2010: water table ! - 6.5 m bgl
Blue 2nd campaign: 11.10-15.10.2010: water table ! - 8.5 m bgl
Yellow: 3rd campaign: 10.05.-12.05.2011: water table ! - 8.5 m bgl
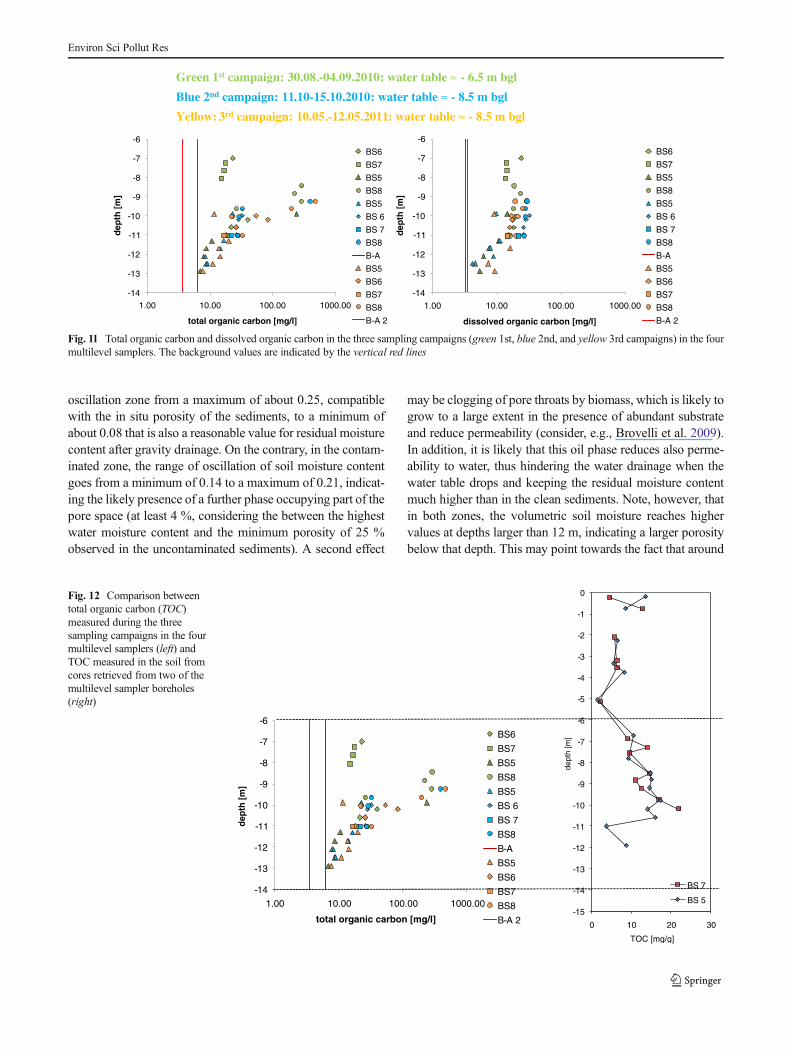
Fig. 11 Total organic carbon and dissolved organic carbon in the three sampling campaigns (green 1st, blue 2nd, and yellow 3rd campaigns) in the fourmultilevel samplers. The background values are indicated by the vertical red lines
-15
-14
-13
-12
-11
-10
-9
-8
-7
-6
-5
-4
-3
-2
-1
0
0 10 20 30
dept
h [m
]
TOC [mg/g]
BS 7
BS 5-14
-13
-12
-11
-10
-9
-8
-7
-6
1.00 10.00 100.00 1000.00
dept
h [m
]
total organic carbon [mg/l]
BS6BS7BS5BS8BS5BS 6BS 7BS8B-ABS5BS6BS7BS8B-A 2
Fig. 12 Comparison betweentotal organic carbon (TOC)measured during the threesampling campaigns in the fourmultilevel samplers (left) andTOC measured in the soil fromcores retrieved from two of themultilevel sampler boreholes(right)
Environ Sci Pollut Res
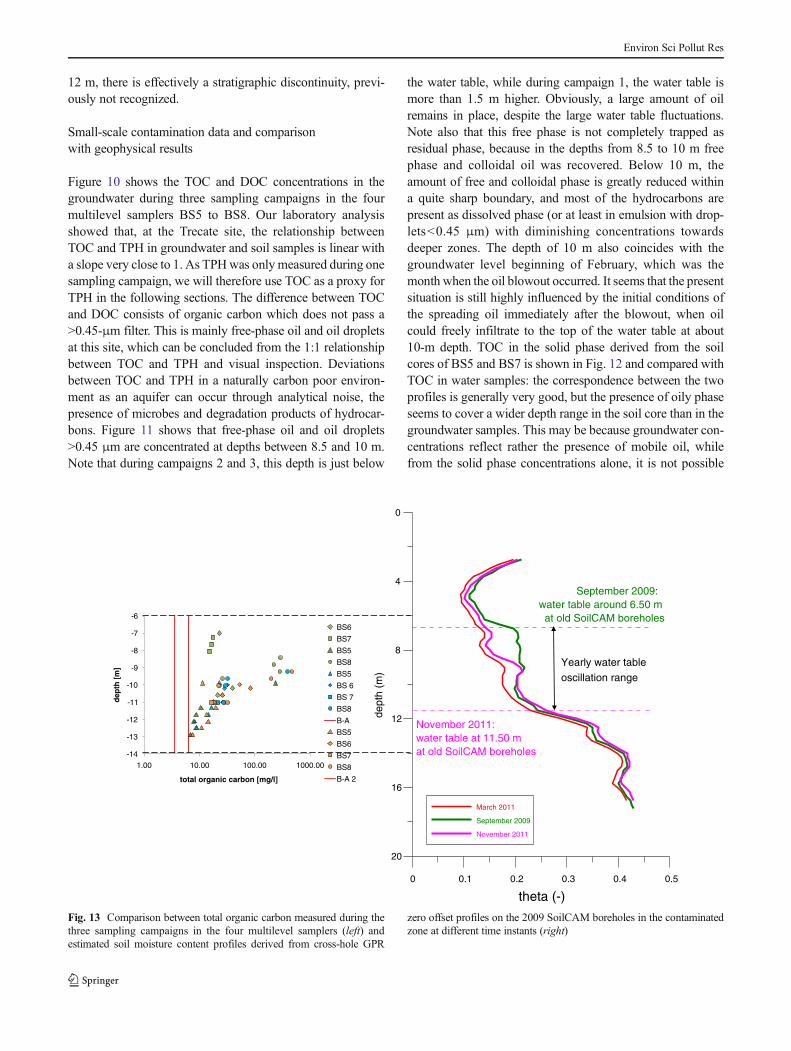
12 m, there is effectively a stratigraphic discontinuity, previ-ously not recognized.
Small-scale contamination data and comparisonwith geophysical results
Figure 10 shows the TOC and DOC concentrations in thegroundwater during three sampling campaigns in the fourmultilevel samplers BS5 to BS8. Our laboratory analysisshowed that, at the Trecate site, the relationship betweenTOC and TPH in groundwater and soil samples is linear witha slope very close to 1. As TPHwas onlymeasured during onesampling campaign, we will therefore use TOC as a proxy forTPH in the following sections. The difference between TOCand DOC consists of organic carbon which does not pass a>0.45-μm filter. This is mainly free-phase oil and oil dropletsat this site, which can be concluded from the 1:1 relationshipbetween TOC and TPH and visual inspection. Deviationsbetween TOC and TPH in a naturally carbon poor environ-ment as an aquifer can occur through analytical noise, thepresence of microbes and degradation products of hydrocar-bons. Figure 11 shows that free-phase oil and oil droplets>0.45 μm are concentrated at depths between 8.5 and 10 m.Note that during campaigns 2 and 3, this depth is just below
the water table, while during campaign 1, the water table ismore than 1.5 m higher. Obviously, a large amount of oilremains in place, despite the large water table fluctuations.Note also that this free phase is not completely trapped asresidual phase, because in the depths from 8.5 to 10 m freephase and colloidal oil was recovered. Below 10 m, theamount of free and colloidal phase is greatly reduced withina quite sharp boundary, and most of the hydrocarbons arepresent as dissolved phase (or at least in emulsion with drop-lets<0.45 μm) with diminishing concentrations towardsdeeper zones. The depth of 10 m also coincides with thegroundwater level beginning of February, which was themonth when the oil blowout occurred. It seems that the presentsituation is still highly influenced by the initial conditions ofthe spreading oil immediately after the blowout, when oilcould freely infiltrate to the top of the water table at about10-m depth. TOC in the solid phase derived from the soilcores of BS5 and BS7 is shown in Fig. 12 and compared withTOC in water samples: the correspondence between the twoprofiles is generally very good, but the presence of oily phaseseems to cover a wider depth range in the soil core than in thegroundwater samples. This may be because groundwater con-centrations reflect rather the presence of mobile oil, whilefrom the solid phase concentrations alone, it is not possible
0 0.1 0.2 0.3 0.4 0.5
theta (-)
20
16
12
8
4
0
dept
h (m
)
March 2011
September 2009
November 2011
November 2011:water table at 11.50 mat old SoilCAM boreholes
September 2009:water table around 6.50 mat old SoilCAM boreholes
Yearly water tableoscillation range
-14
-13
-12
-11
-10
-9
-8
-7
-6
1.00 10.00 100.00 1000.00
dept
h [m
]
total organic carbon [mg/l]
BS6BS7BS5BS8BS5BS 6BS 7BS8B-ABS5BS6BS7BS8B-A 2
Fig. 13 Comparison between total organic carbon measured during thethree sampling campaigns in the four multilevel samplers (left) andestimated soil moisture content profiles derived from cross-hole GPR
zero offset profiles on the 2009 SoilCAM boreholes in the contaminatedzone at different time instants (right)
Environ Sci Pollut Res
to distinguish trapped and mobile NAPL. It is interesting tonote how the zone with trapped and mobile oil phase corre-sponds clearly with the anomalous zone in the GPR ZOPprofiles, as shown in Fig. 13. This comparison corroboratesour hypothesis that the anomalously small soil moisture con-tent oscillation range measured by GPR ZOP is indeed causedby the presence of substantial volumes of oil phase.
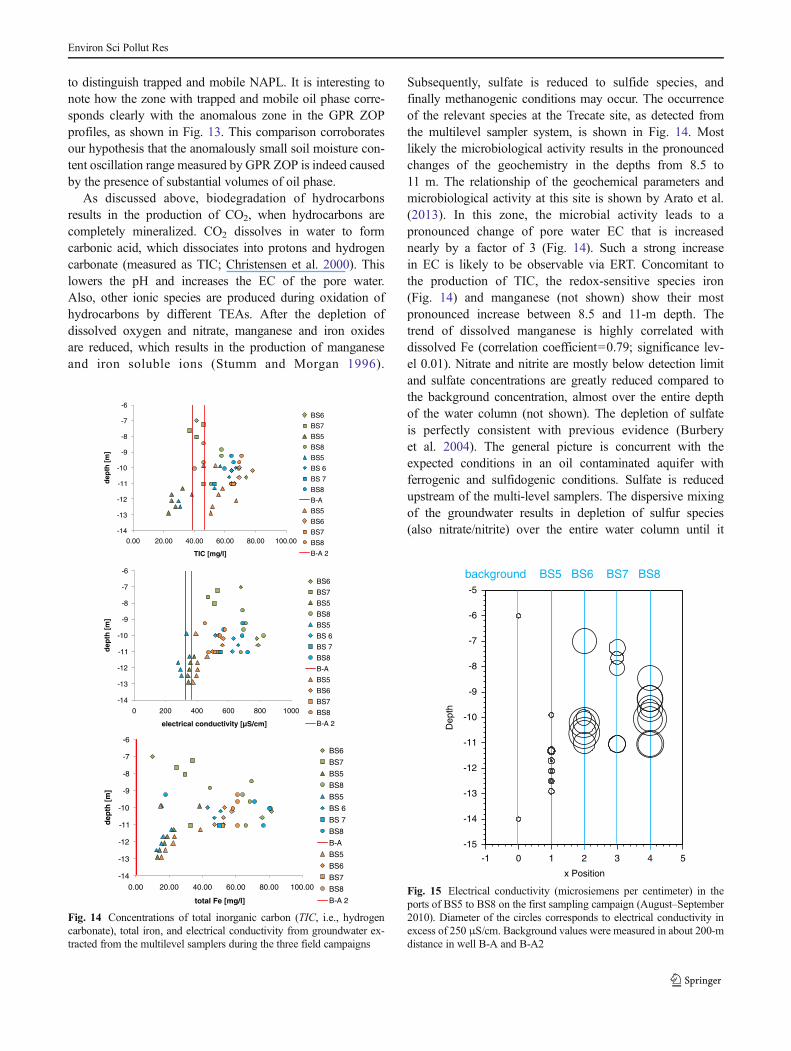
As discussed above, biodegradation of hydrocarbonsresults in the production of CO2, when hydrocarbons arecompletely mineralized. CO2 dissolves in water to formcarbonic acid, which dissociates into protons and hydrogencarbonate (measured as TIC; Christensen et al. 2000). Thislowers the pH and increases the EC of the pore water.Also, other ionic species are produced during oxidation ofhydrocarbons by different TEAs. After the depletion ofdissolved oxygen and nitrate, manganese and iron oxidesare reduced, which results in the production of manganeseand iron soluble ions (Stumm and Morgan 1996).
Subsequently, sulfate is reduced to sulfide species, andfinally methanogenic conditions may occur. The occurrenceof the relevant species at the Trecate site, as detected fromthe multilevel sampler system, is shown in Fig. 14. Mostlikely the microbiological activity results in the pronouncedchanges of the geochemistry in the depths from 8.5 to11 m. The relationship of the geochemical parameters andmicrobiological activity at this site is shown by Arato et al.(2013). In this zone, the microbial activity leads to apronounced change of pore water EC that is increasednearly by a factor of 3 (Fig. 14). Such a strong increasein EC is likely to be observable via ERT. Concomitant tothe production of TIC, the redox-sensitive species iron(Fig. 14) and manganese (not shown) show their mostpronounced increase between 8.5 and 11-m depth. Thetrend of dissolved manganese is highly correlated withdissolved Fe (correlation coefficient=0.79; significance lev-el 0.01). Nitrate and nitrite are mostly below detection limitand sulfate concentrations are greatly reduced compared tothe background concentration, almost over the entire depthof the water column (not shown). The depletion of sulfateis perfectly consistent with previous evidence (Burberyet al. 2004). The general picture is concurrent with theexpected conditions in an oil contaminated aquifer withferrogenic and sulfidogenic conditions. Sulfate is reducedupstream of the multi-level samplers. The dispersive mixingof the groundwater results in depletion of sulfur species(also nitrate/nitrite) over the entire water column until it-14
-13
-12
-11
-10
-9
-8
-7
-6
0.00 20.00 40.00 60.00 80.00 100.00
dept
h [m
]
TIC [mg/l]
BS6BS7BS5BS8BS5BS 6BS 7BS8B-ABS5BS6BS7BS8B-A 2
-14
-13
-12
-11
-10
-9
-8
-7
-6
0 200 400 600 800 1000
dept
h [m
]
electrical conductivity [µS/cm]
BS6BS7BS5BS8BS5BS 6BS 7BS8B-ABS5BS6BS7BS8B-A 2
-14
-13
-12
-11
-10
-9
-8
-7
-6
0.00 20.00 40.00 60.00 80.00 100.00
dept
h [m
]
total Fe [mg/l]
BS6BS7BS5BS8BS5BS 6BS 7BS8B-ABS5BS6BS7BS8B-A 2
Fig. 14 Concentrations of total inorganic carbon (TIC, i.e., hydrogencarbonate), total iron, and electrical conductivity from groundwater ex-tracted from the multilevel samplers during the three field campaigns
background BS5 BS6 BS7 BS8
-15
-14
-13
-12
-11
-10
-9
-8
-7
-6
-5
Dep
th
-1 0 1 2 3 4 5
x Position
Fig. 15 Electrical conductivity (microsiemens per centimeter) in theports of BS5 to BS8 on the first sampling campaign (August–September2010). Diameter of the circles corresponds to electrical conductivity inexcess of 250 μS/cm. Background values were measured in about 200-mdistance in well B-A and B-A2
Environ Sci Pollut Res
reaches the multi-level samplers, which is located in thecentre of the contaminant area. In contrast, reduced ironand manganese species have a shorter transport distancedue to sorption and precipitation reactions at the fringes ofthe iron/manganese reduction zones (Baedecker et al. 1993;Bennett et al. 1993). Therefore, the reduced iron and man-ganese species, which are produced upstream of the multi-level samplers are not transported advective dispersively farenough to result in a homogeneously mixed water columnwith respect to iron and manganese species. This distribu-tion of redox-sensitive species is, to some degree, contra-dicting the common assumption that zones with speciesindicating lower redox potentials should be surrounded byzones with species indicating higher redox potentials(Lyngkilde and Christensen 1992). It is apparent from thehydrogeochemical data that there is a strong correlationbetween the substantial increase of EC and the hydrogeo-chemical parameters, most likely resulting from the micro-biological activity (correlation coefficients of EC with DOC0.72, Fe 0.82, Mn 0.79, HCO3– 0.57; all on a 0.01significance level). The spatial distribution of pore-waterEC in excess of the background value is shown inFig. 15: it is quite apparent that this spatial distribution isquite erratic, with very strong differences (around a factorof 3) over a very short distance (note that the multilevelsampler boreholes are aligned at about 1-m distance from eachother). As thesemultilevel sampler boreholes practically coverthe region between the 2009 SoilCAM boreholes, it comes asno surprise if such a strong variability in EC is mirrored in thecorresponding ERT image to the extent that the variabilityinduced by geochemical processes in the smearing zone is solarge as to hide the expected effect of the water table (Fig. 8b).Most important, it is apparent from the biogeochemical datathat there is a strong correlation between the presence ofhydrocarbon contamination and a substantial increase of EC,most likely caused by microbiological activities.
Conclusions
Our results at the Trecate site confirm that geophysics canhave a key role in the definition of structures and contaminantdistribution at contaminated sites. The knowledge of structureis likely to have a strong influence on contaminant distribu-tion, as it controlled the oil infiltration at the time of accident.Our geophysical characterization shows structural featuresthat are likely to have controlled such infiltration process.But more interesting is the analysis of the correlation betweengeophysical signals and contamination. This analysis wasmade possible by the joint availability of small-scale cross-hole geophysical data (both ERT and GPR) and small-scalegeochemical data (from multilevel samplers). Note that geo-chemical processes and geophysical measurements do notnecessarily have the same spatial scale, but we tried to achievea spatial resolution of the geophysical measurements fineenough to detect the spatial variability observed in the geo-chemical data that appears to be in the meter scale. The resultsfrom multilevel samplers suggest that a strong geochemicalsignal, possibly coming from microbiological activity, is tak-ing place around the smearing zone, between 6- and 11-mdepth, where a large presence of free and trapped hydrocarbonphase is detected. This presence is confirmed by the reducedvariability of soil moisture content in this zone, as well iden-tified by cross-hole GPR measurements. In this zone, weobserve a depletion of oxygen, nitrate, and sulfate and anincrease of iron andmanganese in solution, with a correspond-ing increase also of TIC. These signatures are compatible withmicrobiological activity linked to petroleum biodegradation.The main overall effect is a net increase, as large as a factor ofthree, of pore-water EC, showing a marked spatial variability.This signal is perfectly detectable by cross-hole ERT, alsoshowing the same spatial variability.
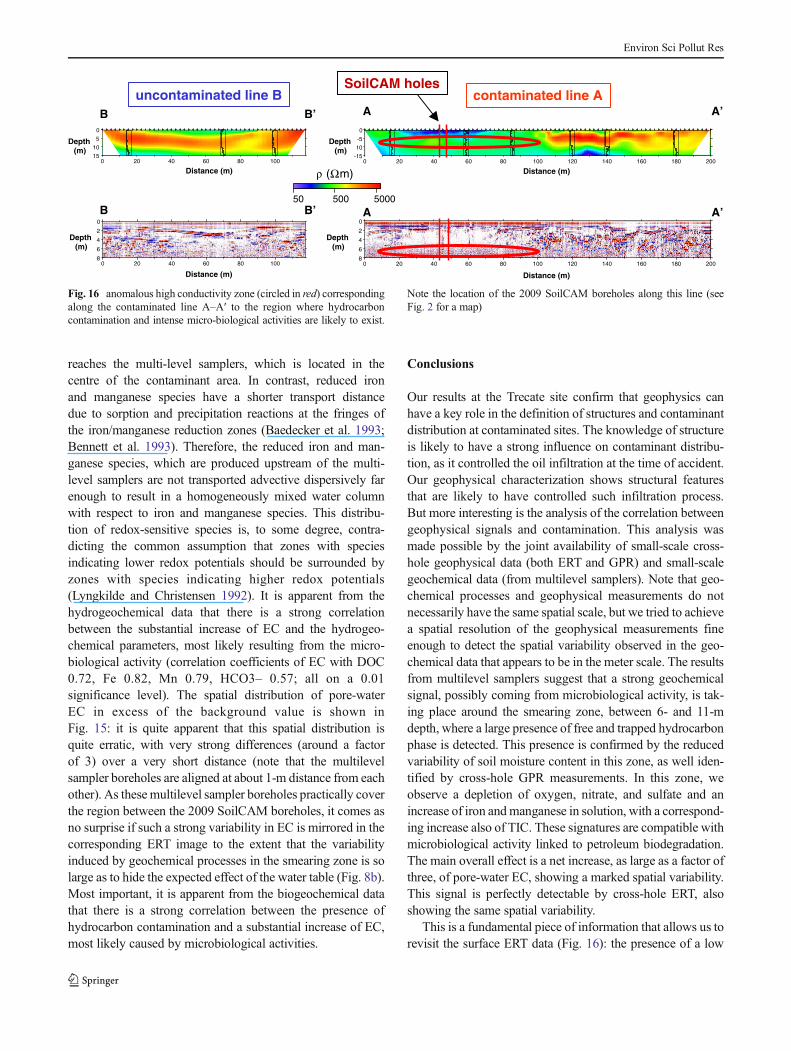
This is a fundamental piece of information that allows us torevisit the surface ERT data (Fig. 16): the presence of a low
0 20 40 60 80 100 120 140 160 180 200-15-10-50
0 20 40 60 80 100 120 140 160 180 200-8
-6
-4
-2
0
Distance (m)
A’A
A’A
0 20 40 60 80 100-15-10-50
0 20 40 60 80 100-8
-6
-4
-2
0
1.7 2.7 3.7
Distance (m) ( m)
50 500 5000
Distance (m)
B’B
B’B
Distance (m)
Depth (m)
Depth (m)
Depth (m)
Depth (m)
contaminated line Auncontaminated line BSoilCAM holes
Fig. 16 anomalous high conductivity zone (circled in red) correspondingalong the contaminated line A–A! to the region where hydrocarboncontamination and intense micro-biological activities are likely to exist.
Note the location of the 2009 SoilCAM boreholes along this line (seeFig. 2 for a map)
Environ Sci Pollut Res

electrical resistivity region along line A–A!, above the watertable and generally around it oscillations, corresponds to theregion where the geochemical signals are detected and islikely to be correlated with biological activity triggered bycontamination. In this manner, we can use geophysical data toextrapolate the detailed, but localized, geochemical informa-tion and potentially draw general conclusions about the larger-scale spatial distribution of hydrocarbon contamination at theTrecate site.
Acknowledgments This research was made possible by funding fromthe EU FP7 collaborative projects ModelPROBE “Model driven soilprobing, site assessment and evaluation” and SoilCAM “Soil contamina-tion: advanced integrated characterization and time-lapse monitoring.”
References
Abdel Aal GZ, Slater LD, Atekwana EA (2006) Induced-polarizationmeasurements on unconsolidated sediments from a site of activehydrocarbon biodegradation. Geophysics 71:H13–H24
Annan AP (2005) GPRmethods for hydrogeological studies. In: Rubin Y,Hubbard SS (eds) Hydrogeophysics, Ser. 50. Springer, Dordrecht,pp 185–214
Arato A, Wehrer M, Biró B, Godio A (2013) Integration of geophysical,geochemical and microbiological data for a comprehensive small-scale characterization of an aged LNAPL-contaminated site.Environ Sci Pollut Res. doi:10.1007/s11356-013-2171-2, this issue
Atekwana EA, Atekwana EA (2010) Geophysical signatures of microbialactivity at hydrocarbon contaminated sites: a review. Surv Geophys31:247–283. doi:10.1007/s10712-009-9089-8
Atekwana EA, Sauck WA, Werkema DD (2000) Investigations ofgeoelectrical signatures at a hydrocarbon contaminated site. JApplGeophys 44(2–3):167–180. doi:10.1016/S0926-9851(98)00033-0
Atekwana EA, Sauck WA, Abdel Aal GZ, Werkema DD (2002)Geophysical investigation of vadose zone conductivity anomaliesat a hydrocarbon contaminated site: implications for the assessmentof intrinsic bioremediation. J Environ Eng Geophys 7:103–110
Atekwana EA, Atekwana EA, Werkema DD, Duris JW, Rossbach S,SauckWA,CassidyDP,Means J, Legall FD (2004a) In situ apparentconductivity measurements and microbial population distribution ata hydrocarbon-contaminated site. Geophysics 69(1):56–63. doi:10.1190/1.1649375
Atekwana EA, Atekwana EA, Rowe RS, Werkema DD, Legall FD(2004b) The relationship of total dissolved solids measurements tobulk electrical conductivity in an aquifer contaminated with hydro-carbon. J Appl Geophys 56:281–294
Atekwana EA, Atekwana E, Legall FD, Krishnamurthy RV (2004c) Fieldevidence for geophysical detection of subsurface zones of enhancedmicrobial activity. Geophys Res Lett 31, L23603
Atekwana EA, Atekwana EA, Legall FD, Krishnamurthy RV (2005)Biodegradation and mineral weathering controls on bulk electricalconductivity in a shallow hydrocarbon contaminated aquifer. JContam Hydrol 80:149–167
Baedecker MJ, Cozzarelli IM, Eganhouse RP, Siegel DI, Bennett PC(1993) Crude-oil in a shallow sand gravel aquifer 3. Biogeochemicalreactions and mass-balance modeling in anoxic groundwater. ApplGeochem 8(6):569–586. doi:10.1016/0883-2927(93)90014-8
Bekins BA, Cozzarelli IM,Godsy EM,Warren E, Essaid HI, TuccilloME(2001) Progression of natural attenuation processes at a crude oilspill site: II. Controls on a spatial distribution of microbial
populations. J Contam Hydrol 53(3–4):387–406. doi:10.1016/S0169-7722(01)00175-9
Bennett PC, Siegel DE, Baedecker MJ, Hult MF (1993) Crude oil in ashallow sand and gravel aquifer: 1. Hydrogeology and inorganicgeochemistry. Appl Geochem 8(6):529–549. doi:10.1016/0883-2927(93)90012-6
Benson AK, Payne KL, Stubben MA (1997) Mapping groundwatercontamination using dc resistivity and VLF geophysicalmethods—a case study. Geophysics 62:80–86
Bermejo JL, Sauck WA, Atekwana EA (1997) Geophysical discovery ofa new LNAPL plume at the former Wurtsmith AFB, Oscoda,Michigan. Ground Water Monit Remediat 17:131–137
Binley AM, Kemna A (2005) DC resistivity and induced polarizationmethods. In: Rubin Y, Hubbard SS (eds) Hydrogeophysics. WaterSci. Technol. Library, Ser. 50. Springer, New York, pp 129–156
Binley, A., Ramirez, A., Daily, W. (1995) Regularised image reconstruc-tion of noisy electrical resistance tomography data. In: Beck MS,Hoyle BS, Morris MA, Waterfall RC, Williams RA (eds), Processtomography — 1995. Proceedings of the 4th Workshop of theEuropean Concerted Action on Process Tomography, Bergen, 6–8April 1995, pp. 401– 410.
Binley AM, Cassiani G, Deiana R (2011) Hydrogeophysics—opportuni-ties and challenges. B GEOFIS TEOR APPL 51(4):267–284
Bradford JH (2007) Frequency-dependent attenuation analysis of ground-penetrating radar data. Geophysics 72:J7–J16. doi:10.1190/1.2710183
Brandt CA, Becker JM, Porta A (2002) Distribution of polycyclic aro-matic hydrocarbons in soils and terrestrial biota after a spill of crudeoil in Trecate, Italy. Environ Toxicol Chem 21:1638–1643
Brovelli A,Malaguerra F, Barry DA (2009) Bioclogging in porousmedia:model development and sensitivity to initial conditions. EnvironModel Softw 24:611–626
Burbery L, Cassiani G, Andreotti G, Ricchiuto T, Semple KT (2004)Welltest and stable isotope analysis for the determination of sulphate-reducing activity in a fast aquifer contaminated by hydrocarbons.Environ Pollut 129(2):321–330
Cassiani G, Strobbia C, Gallotti L (2004) Vertical radar profiles for thecharacterization of deep vadose zones. Vadose Zone J 3:1093–1115
Cassiani G, Bruno V, Villa A, Fusi N, Binley AM (2006) A saline tracertest monitored via time-lapse surface electrical resistivity tomogra-phy. J Appl Geophys 59:244–259. doi:10.1016/j.jappgeo2005.10.007
Cassidy NJ (2007) Evaluating LNAPL contamination using GPR signalattenuation analysis and dielectric property measurements: practicalimplications for hydrological studies. J Contam Hydrol 94:49–75
Che-Alota V, Atekwana EA, Atekwana EA, Sauck WA, Werkema DD(2009) Temporal geophysical signatures due to contaminant massreduction. Geophysics 74(4):B113–B123. doi:10.1190/1.3139769
Chen J, Hubbard SS, Williams KH, Flores Orozco A, Kemna A (2012)Estimating the spatiotemporal distribution of geochemical parame-ters associated with biostimulation using spectral induced polariza-tion data and hierarchical Bayesian models. Water Resour Res 48,W05555. doi:10.1029/2011WR010992
Christensen TH,Bierg PL, Banwart SA, JakobsenR, HeronG, AlbrechtsenHJ (2000) Characterization of redox conditions in groundwater con-taminant plumes. J Contam Hydrol 45(3–4):165–241
Christensen O, Cassiani G, Diggle PJ, Ribeiro P, Andreotti G (2004)Statistical estimation of the relative efficiency of natural attenuationmechanisms in contaminated aquifers. Stoch Env Res Risk A 18:339–350
Daily W, Ramirez A, LaBrecque D, Nitao J (1992) Electrical resistivitytomography of vadose water movement. Water Resour Res 28(5):1429–1442
Daily W, Ramirez A, LaBrecque D, Barber W (1995) Electrical-resistance tomography at the Oregon-Graduate-Institute. J ApplGeophys 33(4):227–237. doi:10.1016/0926-9851(95)00004-L
Environ Sci Pollut Res
Deiana R, Cassiani G, Villa A, Bagliani A, Bruno V (2008) Modelcalibration of a water injection test in the vadose zone of the PoRiver plain using GPR cross-hole data. Vadose Zone J 7:215–226.doi:10.2136/vzj2006.0137
Everett M, Meju M (2005) Near-surface controlled-source electromagneticinduction. In: Rubin Y, Hubbard SS (eds) Hydrogeophysics. WaterSci. Technol. Library, Ser. 50. Springer, New York, pp 157–183
Flores Orozco A, Williams KH, Long PE, Hubbard SS, Kemna A (2011)Using complex resistivity imaging to infer biogeochemical process-es associated with bioremediation of a uranium-contaminated aqui-fer. J Geophys Res 116, G03001
Flores Orozco A, Oberdorster C, Zschornack L, Leven C, Dietrich P,Weiss H (2012) Delineation of subsurface hydrocarbon contamina-tion at a former hydrogenation plant using spectral induced polari-zation imaging. J Contam Hydrol 136:131–144. doi:10.1016/j.jconhyd.2012.06.001
French HK, van der Zee SEATM, Meju M (2009) SoilCAM: soil con-tamination: advanced integrated characterisation and time-lapsemonitoring. Rev Environ Sci Biotechnol 8:125–130. doi:10.1007/s11157-009-9158-y
Gasperikova E, Hubbard SS, Watson DB, Baker GS, Peterson JE,Kowalsky MB, Smith M, Brooks S (2012) Long-term electricalresistivity monitoring of recharge-induced contaminant plume behav-ior. J Contam Hydrol 142:33–49. doi:10.1016/j.jconhyd.2012.09.007
Kästner M, Cassiani G (2009) ModelPROBE: model driven soil probing,site assessment and evaluation. Rev Environ Sci Biotechnol 8:131–136. doi:10.1007/s11157-009-9157-z
Kemna A, Vanderborght J, Kulessa B, Vereecken H (2002) Imaging andcharacterisation of subsurface solute transport using electrical resis-tivity tomography (ERT) and equivalent transport models. J Hydrol267:125–146
LaBrecque DJ, Ramirez AL, Daily WD, Binley AM, Schima SA (1996)ERT monitoring of environmental remediation processes. Meas SciTechnol 7(3):375–383
Lee JY, Cheon JY, Lee KK, Lee SY, LeeMH (2001) Factors affecting thedistribution of hydrocarbon contaminants and hydrogeochemicalparameters in a shallow sand aquifer. J Contam Hydrol 50:139–158
Lopes de Castro D, Branco RMGC (2003) 4-D ground penetrating radarmonitoring of a hydrocarbon leakage site in Fortaleza (Brazil)during its remediation process: a case history. J Appl Geophys 54:127–144
Lyngkilde J, Christensen TH (1992) Redox zones of a landfill leachatepollution plume (Vejen, Denmark). J ContamHydrol 10(4):273–289
Mage R, Porta A (2001) Long-term biodegradation of underground andaquifer contamination at Trecate. In: Leeson A, Johnson PC,Hinchee RE, Semprini L, Magar VS (eds) In situ aeration andaerobic remediation book series: bioremediation series, vol 6, issue10. 6th International In Situ and On-Site BioremediationSymposium, San Diego, CA, 2001 June 4–7, pp 109–114.
Monego M, Cassiani G, Deiana R, Putti M, Passadore G, Altissimo L(2010) Tracer test in a shallow heterogeneous aquifer monitored viatime-lapse surface ERT. Geophysics 75(4):WA61–WA73. doi:10.1190/1.3474601
Osella A, de la Vega M, Lascano E (2002) Characterization of a contam-inant plume due to a hydrocarbon spill using geoelectrical methods.J Environ Eng Geophys 7:78–87
Perri MT, Cassiani G, Gervasio I, Deiana R, Binley AM (2012) A salinetracer test monitored via both surface and cross-borehole electricalresistivity tomography: comparison of time-lapse results. J ApplGeophys 79:6–16. doi:10.1016/j.jappgeo.2011.12.011
Petts J. Cairney T, Smith M (1997) Risk-based contaminated land inves-tigation and assessment. Wiley, ISBN: 978-0-471-96608-1, 352 pp
Pumphrey KM, Chrysikopoulos CV (2004) Non-aqueous phase liquiddrop formation within a water saturated fracture. Colloids Surf APhysicochem Eng Asp 240(1–3):199–209
Revil A, Titov K, Doussan C, Lapenna V (2006) Applications of the self-potential method to hydrological problems. In: Vereecken H, BinleyA, Cassiani G, Kharkhordin I, Revil A, Titov K (eds) Appliedhydrogeophysics. Springer-Verlag, Berlin, pp 255–292
Rossi M, Cassiani G, Binley AM (2012) A stochastic analysis of cross-hole GPR zero-offset profiles for subsurface characterization.Vadose Zone J 11(4):CP9–+. doi:10.2136/vzj2011.0078
Sauck WA, Atekwana EA, Nash MS (1998) High conductivities associ-ated with an LNAPL plume imaged by integrated geophysicaltechniques. J Environ Eng Geophys 2:203–212
Schütze C, Vienken T, Werban U, Dietrich P, Finizola A, Leven C (2012)Joint application of geophysical methods and direct push soil gassurveys for the improved delineation of buried fault zones. J ApplGeophys 82(2012):129–136. doi:10.1016/j.jappgeo.2012.03.002
Sogade JA, Scira-Scappuzzo F, Vichabian Y, Shi WQ, Rodi W, LesmesDP, Morgan FD (2006) Induced-polarization detection and mappingof contaminant plumes. Geophysics 71(3):B75–B84. doi:10.1190/1.2196873
Stumm W, Morgan JJ (1996) Aquatic chemistry, 3rd edn. Wiley, NewYork
Tezkan B, Georgescu P, Fauzi U (2005)A radiomagnetotelluric survey onan oil-contaminated area near the Brazi Refinery, Romania.Geophys Prospect 53:311–323
Topp GC, Davis JL, Annan AP (1980) Electromagnetic determination ofsoil water content: measurements in coaxial transmission lines.Water Resour Res 16:574–582
Werkema DD, Atekwana EA, Endres AL, SauckWA, Cassidy DP (2003)Investigating the geoelectrical response of hydrocarbon contamina-tion undergoing biodegradation. Geophys Res Lett 30:1647. doi:10.1029/2003GL017346
Willumsen PA, Karlson U (1997) Screening of bacteria, isolated fromPAH-contaminated soils, for production of biosurfactants andbioemulsifiers. Biodegradation 7(5):415–423
Environ Sci Pollut Res