
Non-steady-state 210Pb flux and the use of 228 Ra/ 226 Ra as a geochronometer on the Amazon...
22
Marine Geology 125 (1995) 329-350 ELSEVIER Non-steady-state 210Pbflux and the use of 228Ra/226Ra as a geochronometer on the Amazon continental shelf David A. Dukat a~1 , Steven A. Kuehl b~l a Fugro East Inc., 6 Maple Street, Northborough, MA 01532, USA ’ Virginia Institute of Marine Science, College of William and Mary, Gloucester Point, VA 23062, Received 1 August 1993;revision accepted 15 September 1994 USA Abstract The recovery of quasi-cyclic “‘Pb profiles from the foreset region of the Amazon subaqueous delta has raised questions concerning the non-steady-state flux of “l’?b to this region of the shelf. Radioisotopic protiles (210Pb, 23“Th, 22*Ra/226Ra, 13’Cs)from seven kasten cores, along with the analysis of grain size, organic carbon, and clay-sized mineralogy are used to investigate the time scale and the controlling mechanisms of the 21?b cyclicity. A common assumption used in 210Pb geochronology is that the initial specific activity is constant with time; an assumption that is invalid in this region. Variations of particle affinity for ‘l”Pb have been shown to affect the initial specific activity reaching the seabed in various other studies. However, investigations of grain size, organic carbon, and mineralogy have revealed no relationship with the fluctuating 21?Pb activity in this area. A new geochronometer, 228Ra/226Ra, is used to determine sediment accumulation rates over a 30-year time scale, which range from 10 to 60 cm/yr in the study area. Spectral analysis of the 210Pb cyclicity has revealed that the major component of 21’?Pbcyclicity has a frequency of approximately 2-3 years. In addition, components of the “‘Pb cyclicity occur on annual and semi- annual frequencies. The controlling mechanism for the 21(‘Pbcyclicity on these time scales appears to be the seaward transport and accumulation of low-activity fluid muds from the topset region. 1. Introduction The understanding of recent sedimentary pro- cesses in continental margin environments has been greatly enhanced in past decades through the application of short-lived U-Th-series and bomb- produced radioisotopes to sediment geochronol- ogy. For example, ‘lOPb, with a half life of 22.3 years, has proved invaluable in the determination of sediment accumulation rates on about a loo-year time scale (e.g., Krishnaswami et al., 1971; Koide et al., 1972, 1973; Nittrouer et al., ‘Former address: Department of Geological Sciences, University of South Carolina, Columbia, SC 29208, USA. 1979). Shorter-lived natural radioisotopes such as 234Th and ‘Be (half lives of 24 and 53 days, respectively) have proved useful in determining sediment deposition and mixing rates on time scales of a few months (e.g., Aller and Cochran, 1976; DeMaster et al., 1985; Dibb and Rice, 1989). In addition, radioisotopes that have been intro- duced since intensive atmospheric thermonuclear weapons testing began in the mid-1950s (e.g., 137Cs and 23g/240Fu) serve as valuable stratigraphic mark- ers because the input function is well known (e.g., Robbins and Edgington, 1975; Krishnaswami and Lal, 1978). Radiocesium, particularly 13’Cs, has been used extensively to examine the affect of biological mixing on zloPb geochronology, as 0025-3227/95/$9.50 0 1995 Elsevier Science B.V. All rights reserved SSDI 0025-3227(95)00018-6
-
Upload
independent -
Category
Documents
-
view
2 -
download
0
Transcript of Non-steady-state 210Pb flux and the use of 228 Ra/ 226 Ra as a geochronometer on the Amazon...
Marine Geology 125 (1995) 329-350 ELSEVIER
Non-steady-state 210Pb flux and the use of 228Ra/226Ra as a geochronometer on the Amazon continental shelf
David A. Dukat a~1 , Steven A. Kuehl b~l
a Fugro East Inc., 6 Maple Street, Northborough, MA 01532, USA ’ Virginia Institute of Marine Science, College of William and Mary, Gloucester Point, VA 23062,
Received 1 August 1993; revision accepted 15 September 1994
USA
Abstract
The recovery of quasi-cyclic “‘Pb profiles from the foreset region of the Amazon subaqueous delta has raised questions concerning the non-steady-state flux of “l’?b to this region of the shelf. Radioisotopic protiles (210Pb, 23“Th, 22*Ra/226Ra, 13’Cs) from seven kasten cores, along with the analysis of grain size, organic carbon, and clay-sized mineralogy are used to investigate the time scale and the controlling mechanisms of the 21?b cyclicity. A common assumption used in 210Pb geochronology is that the initial specific activity is constant with time; an assumption that is invalid in this region. Variations of particle affinity for ‘l”Pb have been shown to affect the initial specific activity reaching the seabed in various other studies. However, investigations of grain size, organic carbon, and mineralogy have revealed no relationship with the fluctuating 21?Pb activity in this area. A new geochronometer, 228Ra/226Ra, is used to determine sediment accumulation rates over a 30-year time scale, which range from 10 to 60 cm/yr in the study area. Spectral analysis of the 210Pb cyclicity has revealed that the major component of 21’?Pb cyclicity has a frequency of approximately 2-3 years. In addition, components of the “‘Pb cyclicity occur on annual and semi- annual frequencies. The controlling mechanism for the 21(‘Pb cyclicity on these time scales appears to be the seaward transport and accumulation of low-activity fluid muds from the topset region.
1. Introduction
The understanding of recent sedimentary pro- cesses in continental margin environments has been greatly enhanced in past decades through the application of short-lived U-Th-series and bomb- produced radioisotopes to sediment geochronol- ogy. For example, ‘lOPb, with a half life of 22.3 years, has proved invaluable in the determination of sediment accumulation rates on about a loo-year time scale (e.g., Krishnaswami et al., 1971; Koide et al., 1972, 1973; Nittrouer et al.,
‘Former address: Department of Geological Sciences, University of South Carolina, Columbia, SC 29208, USA.
1979). Shorter-lived natural radioisotopes such as 234Th and ‘Be (half lives of 24 and 53 days, respectively) have proved useful in determining sediment deposition and mixing rates on time scales of a few months (e.g., Aller and Cochran, 1976; DeMaster et al., 1985; Dibb and Rice, 1989). In addition, radioisotopes that have been intro- duced since intensive atmospheric thermonuclear weapons testing began in the mid-1950s (e.g., 137Cs and 23g/240Fu) serve as valuable stratigraphic mark- ers because the input function is well known (e.g., Robbins and Edgington, 1975; Krishnaswami and Lal, 1978). Radiocesium, particularly 13’Cs, has been used extensively to examine the affect of biological mixing on zloPb geochronology, as
0025-3227/95/$9.50 0 1995 Elsevier Science B.V. All rights reserved SSDI 0025-3227(95)00018-6
seabed activity profiles often are controlled both by mixing and accumulation (e.g., Benninger et al.. 1979; Nittrouer et al., 1983). In the absence ot mixing, the maximum penetration depth of 137Cs can be used to estimate sediment accumulation since 1954, the time of first significant global fallout (Cambray et al., 1982). These radioisotopes often are used together to unravel the sedimenta- tion history of a particular deposit by examining the relative importance of short-term deposition. net accumulation, and seabed reworking (both physical and biological ).
Seaward of the Amazon River, ‘l”Pb and 13’Cs have been important tools in the determination of sediment accumulation rates and in the under- standing of processes which control sediment deposition and accumulation for much of the subaqueous delta (Kuehl et al.. 1982, 1986a. 1995-this volume). However, cores recovered by Kuehl et al. (1986a) from the foreset region of the Amazon subaqueous delta revealed quasi-cyclic. non-steady-state 210Pb activity profiles that raised new questions concerning the sediment dynamics in this area, as well as commonly used assumptions in ‘lOPb geochronology. Preliminary conclusions were that the 210Pb cycles could be annual; possibly controlled by variations in the Amazon River discharge which could affect particle scavenging of ‘lOPb (Kuehl et al., 1986b; Underkoffler, 1990). A major shortcoming of the previous work was the failure to establish accurate sediment accumulation rates, which would allow for determination of the temporal scale of the ‘rOPb cyclicity. 1-17Cs was found throughout the 3-m gravity cores used in this study and hence only minimum estimates of accumulation rates could be made. The non- steady-state character of particle reactive ‘lOPb in this area apparently renders the traditional tech- nique for accumulation-rate determination invalid, creating a gap in the geochronological tools avail- able for investigations of this, and possibly other environments. Although other potential geochro- nometers with similar time-scales to ‘lOPb (but with different geochemical characteristics) exist in the U-Th decay series, none have been applied widely to shelf sedimentation studies.
One alternative approach would be to utilize the expected ingrowth of 228Ra to secular equilibrium
with its parent r32Th to provide a new geochrono- meter. On interaction with the higher ionic strength of ocean water, radium partially desorbs from river sediment through ion exchange, resulting in an activity deficit between the radium isotopes and their respective parent isotopes in recently depos- ited sediment (Key et al.. 1985; Crook, 1992). With time (and burial) radium isotopes will grow into secular equilibrium as a function of their half- lives. providing a potential means of determining sediment accumulation rates. Ingrowth of “‘Ra (t,,,= 5.8 yr) relative to longer-lived **‘jRa (t,!,= 1600 yr) with depth in the seabed could be a viable geochronometer on about a 30 year time scale.
During this investigation, a variety of geochemi- cal and sedimentological analyses were performed on sediment cores (- 3 m) collected during “A Multidisciplinary Amazon Shelf SEDiment Study” (~Inzn.sSects), from the foreset region of the Amazon subaqueous delta. The genera1 objectives of this study are: to determine the cause and timing of quasi-cyclic 210Pb activity profiles on the Amazon subaqueous delta; and to develop a new geo- chronometer, based on the ingrowth of 228Ra, for which the underlying assumptions are insensitive to variations in particle scavenging, a limitation that apparently prevents the application of 210Pb geochronology in this area.
2. Background
2. I. .huxn river mu’ continentul shelfsetting
The Amazon is the world’s largest river in terms of water discharge, supplying (16’S) of the total riverine input to the oceans (Baumgartner and Reichel, 1975). The discharge of the river varies from a high of 2.25 x 10” m3/s in May/June, to a low of 0.9 x 10’ m3/s in November (Milliman et al., 1975; Nittrouer et al., 1995-this volume). Annual variations in suspended-sediment concen- trations occur that result in maximum sediment discharge preceding maximum water discharge by approximately 2-3 months, although the minimum sediment and water discharges coincide (Meade et al.. 1985; Richey et al., 1986). The river’s average annual sediment discharge is between 1.1
D.A. Dukat, S. A. KuehllMarine Geology I25 (199.5) 329-3.50 331
and 1.3 x 10’ tons, with 85-95% of the sediment ther offshore because of a decrease in the sediment consisting of clays and silts (Gibbs, 1967; Meade supply, and are < 1 cm/yr in the bottomset beds, et al., 1985). Mineralogic examination of the sus- which extend to approximately the 70-m isobath. pended sediment in the river has revealed six major The modern delta is underlain by a basal transgres- components: quartz, kaolinite, illite, montmorillio- sive sand layer (Alexander et al., 1986; Nittrouer nite, chlorite, and feldspar (Gibbs, 1967). et al., 1986b).
A salt-wedge structure is produced on the shelf (Gibbs, 1970; Gibbs, 1982; Geyer et al., 1991) by the extremely large outflow of fresh river water that overrides the denser, saline ocean water and travels seaward and northwestward as a surface plume (Gibbs and Konwar, 1986; Curtin and Legeckis, 1986). This brackish surface plume provides a mechanism for river sediment to be transported directly to the shelf, rather than accu- mulating in the confines of the river mouth (Gibbs and Konwar, 1986). The cross-shelf flow is strongly influenced by tidal fluctuations, which produce a tidal range of up to 6 m in the river mouth (Milliman et al., 1975; Nittrouer et al., 1986a), and tidal velocities of l-2 m/s (Gibbs, 1982; Curtin, 1986). A primary component of the along-shelf flow is the North Brazil Current (NBC), which flows northwestward at l-2 m/s (Flagg et al., 1986), and greatly affects the distribution pattern of the surface plume and the associated sedimentation (Geyer et al., in press). Seasonal variations of the Amazon River dis- charge, the NBC transport and the trade winds produce seasonal changes in the circulation pattern which, in turn, control the transport and fate of particulate and dissolved material (including par- ticle-reactive components such as ‘l”Pb) (Geyer et al., 1991).
2 2 . . ‘l”Pb geochronology and application to the Amazon shelf
Sources for “‘Pb in coastal waters include: offshore ocean waters, riverine supply, in situ decay of 226Ra, and precipitation from the atmosphere (Bruland et al., 1974; DeMaster et al., 1986). DeMaster et al. ( 1986) determined the quantities of 210Pb which were contributed by riverine supply, in situ decay of 226Ra and precipitation from the atmosphere and concluded that the lateral transport from off-shore waters was an important source of 210Pb to the Amazon continental shelf, as evidenced by increasing specific surface activities and isotope inventories seaward across the topset and foreset regions. DeMaster et al. (1986) and Moore et al. (in press) have calculated that up to three-fourths of the 210Pb inventory in the foreset region of the Amazon subaqueous delta is supplied by the advection of off-shore water onto the shelf.
The modem sediment deposit on the Amazon shelf has been described as a subaqueous delta, with topset, foreset, and bottomset stratigraphy (Alexander et al., 1986; Nittrouer et al., 1986b). Kuehl et al. (1986a) examined sediment accumula- tion rates on the Amazon shelf primarily using “‘Pb geochronology. From the shore to approxi- mately the 15-m isobath, the sediment accumula- tion rate is generally low (< 0.1 cm/yr), likely a result of sediment resuspension by waves and tidal currents. Seaward of the 15-m isobath, accumula- tion rates increase to a maximum of about 10 cm/yr in the foreset beds, at approximately the 50-60 m isobath. Accumulation rates decline far-
Particle-reactive radionuclides such as 210Pb are readily removed from the water column through adsorption onto particulate matter and their coat- ings (organic or Fe-Mn oxides) (Jones and Jordan, 1979; Davis, 1984; DeMaster et al., 1986; McKee et al., 1986). The rapid removal of these chemical species from the water column produces activities in excess of supported levels in the seabed. The decay of this excess activity allows for the determi- nation of sediment deposition and accumulation rates. A particle may experience many episodes of emplacement on and removal from the seabed before being preserved in the stratigraphic record (McKee et al., 1983). The temporary emplacement of particles on the seabed is defined as sediment deposition, and the net affect of emplacement and removal events over a longer time scale is sediment accumulation. The characteristic time scale for a radionuclide as a geochronometer is approximately 4-5 times its half-life which provides about a lOO-yr effective time scale for accumulation rates
332 17. A. Duku~. S. A. Kuehl:Murinr Gwlog~ 125 i 1995) 329-350
determined using 210Pb. Shorter-lived radionu- elides such as 234Th and 7Be (T,;, 24d and 53d. respectively) have been successfully employed to determine deposition rates over a 2-4-month time scale (McKee et al., 1983; Olsen et al., 1986).
Geochronology based on 210Pb has been used extensively for studies of various sedimentary envi- ronments (e.g., Krishnaswami et al., 1971; Koide et al., 1972, 1973; Nittrouer et al.. 1979; Smith and Walton, 1980; McKee et al., 1983; Kuehl et al.. 1982, 1986a, 1989). A common assumption for this technique is that there is uniform excess 210Pb activity preserved in the seabed over the effective loo-year time scale. Activity can be affected by variations in grain size (Nittrouer et al., 1979; Kuehl et al., 1989), organic-carbon content (Jones and Jordan, 1979; Davis, 1984; Moore and Dymond, 1988), or small-scale slumping and other mass-wasting processes (Sanford et al., 1990 ). These variations can produce non-steady-state activity profiles, and limit the use of 210Pb as a geochronometer.
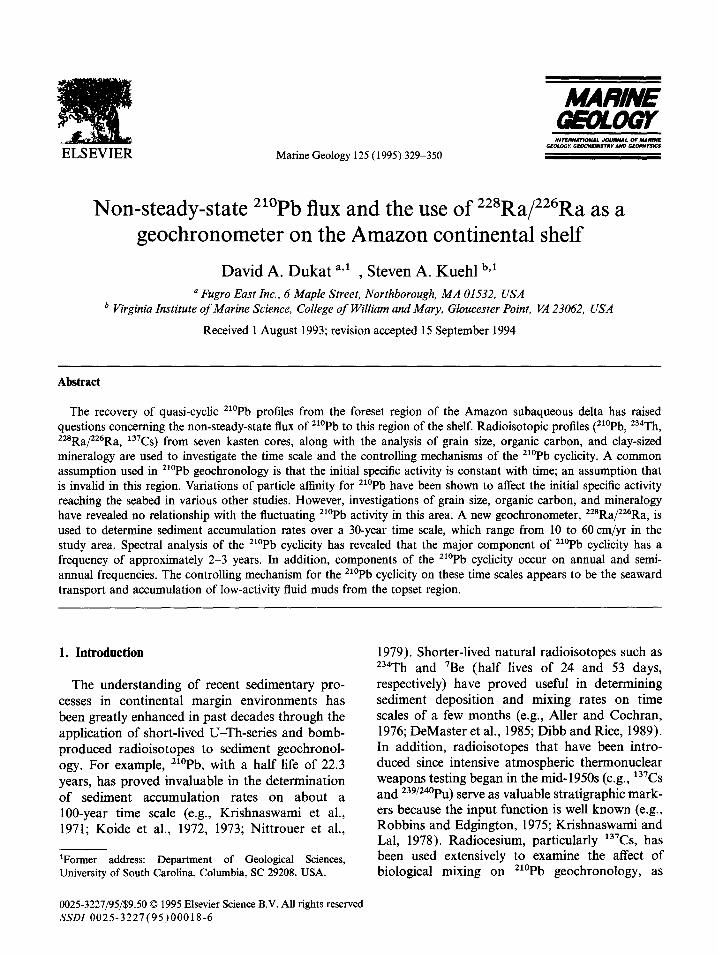
On the Amazon continental shelf. ““Pb has been used for the determination of sediment accu- mulation rates in certain areas (Kuehl et al.. 1982. 1986a). A characteristic 210Pb profile (Fig. IA) from the Amazon shelf is comprised of three regions: a surface layer (SL) of relatively uniform excess ‘lOPb activity, a region of logarithmic decrease in excess activity, and a region of rela- tively uniform 226Ra-supported activity (Kuehl et al., 1986a). The surface region of uniform excess 210Pb activity is a result of physical and/or biologi- cal reworking. Investigations of X-radiographs have demonstrated that the SL, found in water depths less than about 40 m, is characterized by physical sedimentary structures, with little evidence of biological reworking ( Kuehl et al.. 1986b). Mixing of the surface sediments serves to homoge- nize the 210Pb activity. The sediment accumulation rate is simply calculated from the slope of the excess activity profile in the region of logarithmic decrease.
Seaward of the 40-m isobath, Kuehl et al. (1986a) identified a restricted region of quasi-cyclic 210Pb profiles (Fig. lB), which did not allow for the determination of accumulation rates using traditional techniques. Investigations of 210Pb
“%b AdMy (dpn 9.‘) Exc~~~~Ft~Act%y(dpn~-‘)
0.1 1.0 10.0 1.0 10.0 loo.0
300-J
A B
Fig, I. Characteristic seabed profiles of”“Pb from the Amazon
shelf. (A) Profile from the topset region showing three
characteristic zones, including: a near-surface zone of uniform
““Pb activity, a zone of logarithmic decrease in excess *“Pb
activity. and a zone of low uniform *26Ra-supported “‘Pb
activity. PIccumulation rate is calculated from the slope of
excess *r’Pb in the zone of logarithmic decrease. (B) Profile
from the foreset region displaying down-core fluctuations in
excess “‘Pb activity which prevent determination of an
accumulation rate. A coarse sampling interval was used, which
may alias the range and frequency of excess ““Pb cyclicity.
Modified from Kuehl et al. (1986a).
activity profiles and X-radiographs have demon- strated that this region is dominated by rapid deposition and very little physical or biological reworking (Kuehl et al., 1986a,b; Underkoffler, 1990). The mechanism controlling the 210Pb fluc- tuations is not fully understood, but there are several possible explanations (Kuehl et al., 1986a; Underkoffler, 1990). The first assumes constant residence time for particles in the water column, but differing particle affinity for 210Pb as a result of variations in grain size (Nittrouer et al., 1979; Kuehl et al., 1989), organic-carbon content (Moore and Dymond, 1988), or mineralogy. Another explanation assumes particles have the same affinity for 210Pb, but that varying residence time in the “‘Pb-rich open-ocean water could produce fluctuations in the initial activity reaching the seabed. Similarly, assuming constant but limited 210Pb availability in the water column, variations in the suspended-sediment concen- tration could affect the initial specific activity reaching the seabed. Another possibility for vary-
D.A. Dukat, S. A. KuehlJMarine Geology 125 (1995) 329-350 333
ing ‘l”Pb activity is related to the transport history of the particles reaching the study area. For exam- ple, in the case where sediment is supplied by resuspension from the seabed, the particulate transport history and amount of interaction with offshore waters could affect the initial specific activity reaching the seabed.
3. Methods
3.1. Sample collection
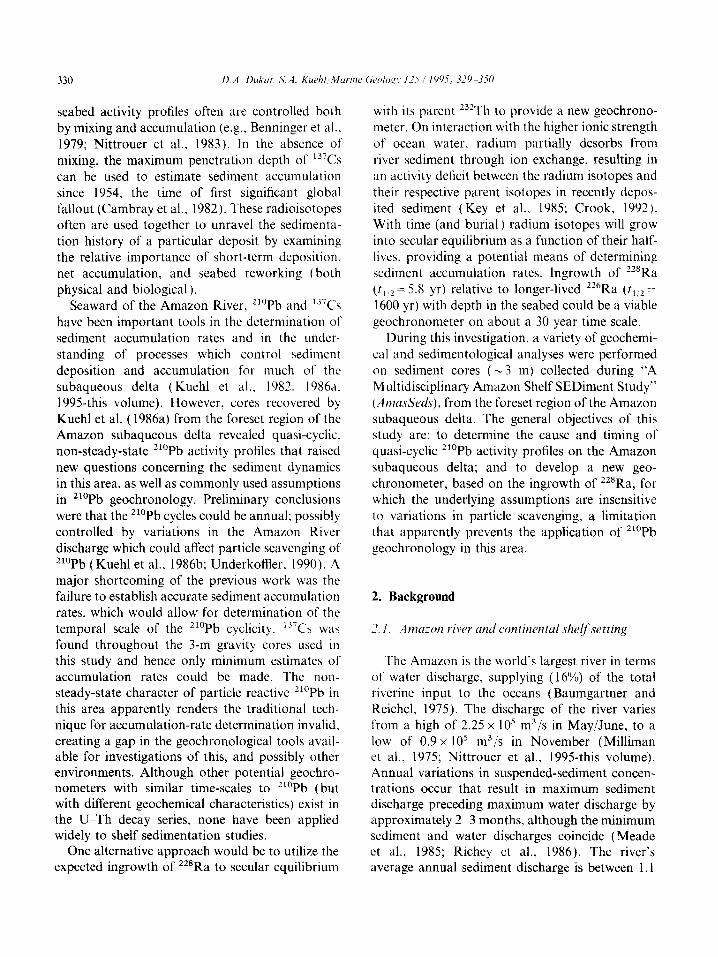
Sediment cores were collected from the Amazon shelf using the R.V. Zselin during February 1990, May 1990, and October 1991, which correspond to the periods of rising, high, and low water discharge, respectively. The cores were collected primarily using a 3-m long, square (12.7 x 12.7 cm) gravity (kasten) corer (Kuehl et al., 1985). Several box cores also were obtained for detailed examination of the seabed near the sediment- water interface. Using a Plexiglas subsampler (30 x 12 x 2.5 cm), vertical slabs were removed from both kasten and box cores for X-radiography aboard ship. The remainder of each kasten core was subdivided as discussed in Results (Radio- isotopic Analysis), homogenized, and placed in water-tight vials (for porosity determination) and in plastic bags. Box cores were sampled on a l-cm interval, with the sediment handled as described for the kasten cores.
3.2. Laboratory analysis
Radioisotopic analyses Radioisotopic measurements were made primar-
ily using a semi-planar intrinsic germanium detec- tor coupled to a multichannel analyzer. Wet, homogenized sediment samples were packed in 70-ml Petri dishes and sealed with electrical tape. In general, radioisotope activity was calculated by multiplying the counts per minute by a factor that incorporates the gamma-ray intensity and detector efficiency. Identical geometry was used for all samples and was considered a constant. For gamma energies below about 295 keV (those of zloPb and 234Th) self-absorption is significant, and
the corrections were made using the approach of Cutshall et al. (1983). In the case of 226Ra measure- ments, the packed samples were set aside for at least 21 days to allow for radon to ingrow and secular equilibrium to be established between 226Ra and its granddaughters 214Pb and 214Bi.
210Pb, 234Th, and 137Cs activities were deter- mined by the direct measurement of their associ- ated gamma decay energies: 46.5 keV, 63.3 keV, and 661.7 keV, respectively. Calculation of “*Ra activities was achieved through the measurement of the 228A~ daughter at 338.4 keV. 226Ra activities were determined by a weighted average from two 214Pb energies, 295.2 keV and 351.9 keV, and a 214Bi gamma peak at 609 keV (Moore, 1984). 232Th activity was estimated by measuring 228Ra activity from two piston cores at a depth below the presence of 137Cs, and assuming secular equilib- rium between “*Ra and 232Th (see Discussion). Excess 234Th activity was determined by first meas- uring a sample shortly after collection, and then measuring the same sample a second time after a period of at least 100 days, which yielded total 234Th and 23sU-supported 234Th activities, respec- tively. The difference between the two measure- ments reflects the excess 234Th activity of the sample, which is then decay corrected to the time of core collection.
Alpha spectroscopy was used in the determina- tion of the 210Pb activities for samples from the X-radiograph slabs, because of the small amount of material. This technique involves the measure- ment of alpha decay for the daughter 210Po, which is separated through spontaneous electrodeposi- tion from an acid leacheate onto a silver planchet, following the general methodology of Nittrouer et al. (1979). This procedure was modified by using a 209Po spike as the yield determinant and by using concentrated HN03 and 6 N HCl to partially digest the sample.
Grain size, organic carbon, clay mineralogy Grain size analyses were performed using a
SediGraph 5000ET. Selected samples were disag- gregated using a 1% sodium hexametaphosphate solution, and then wet sieved through a 63-pm sieve to remove the sand fraction. The weight percent of quarter-phi size fractions was deter-
334 D.A. Dukut, SA. KueidiMurine Geobg_~ 125 i 1995) 329-350
6O
5”
40
3O
20
10
00
lo
2%
52”W 51° 500 49” 4E0 47” 46’
J,
\
\
/ :
L
I 4
t
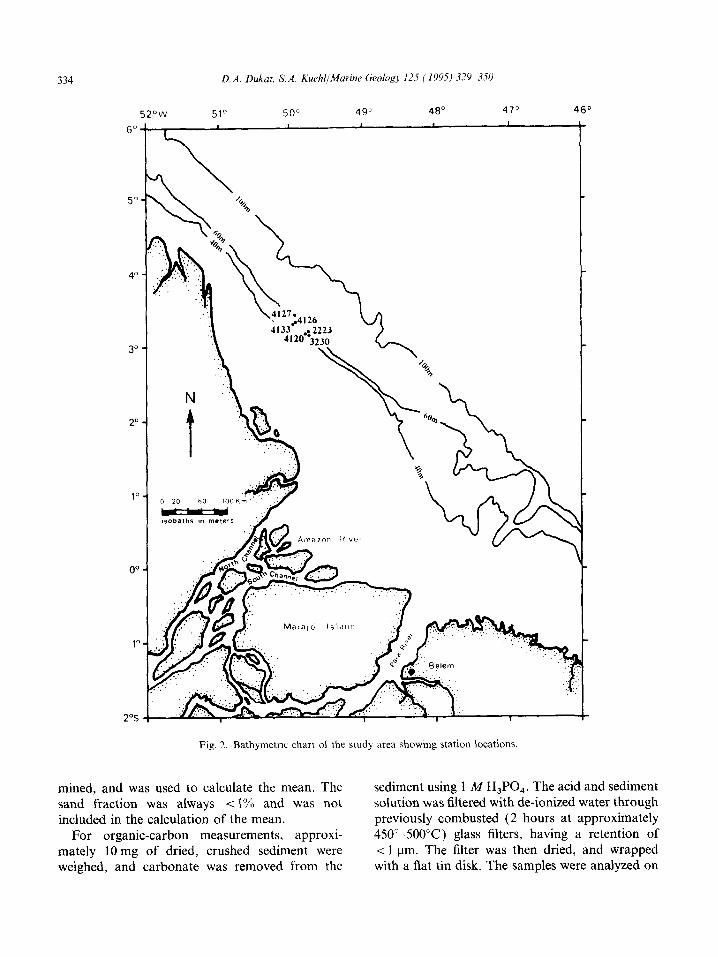
Fig. Bathymetric chart of the study area showing station locations.
mined, and was used to calculate the mean. The sediment using 1 A4 H,PO, . The acid and sediment sand fraction was always < 1% and was not solution was filtered with de-ionized water through
included in the calculation of the mean. previously cornbusted (2 hours at approximately For organic-carbon measurements, approxi- 450”-500°C) glass filters, having a retention of
mately 10 mg of dried, crushed sediment were < 1 urn. The filter was then dried, and wrapped weighed, and carbonate was removed from the with a flat tin disk. The samples were analyzed on
D.A. Dukat, S. A. KuehllMarine Geology 125 (1995) 329-350 335
a Perk&Elmer 2400 CHN Elemental Analyzer to obtain the percent organic carbon by weight.
Mineralogic analysis of clay-sized sediment was
and mounted on glass slides. Samples were scanned using a Scintag X-Ray Diffractometer (XRD).
performed using a technique modified from Segall (1991). Approximately 5-10 ml of wet homoge- nized sediment was added to a 50-ml beaker with a 1% sodium hexametaphosphate solution, and placed in a ultrasonic bath to disperse the sample. MgCl, was added to induce flocculation and cation saturation. Approximately 0.01 grams of this treated sample were vacuum-settled on filters
4. Results
4.1. Radioisotopic analysis
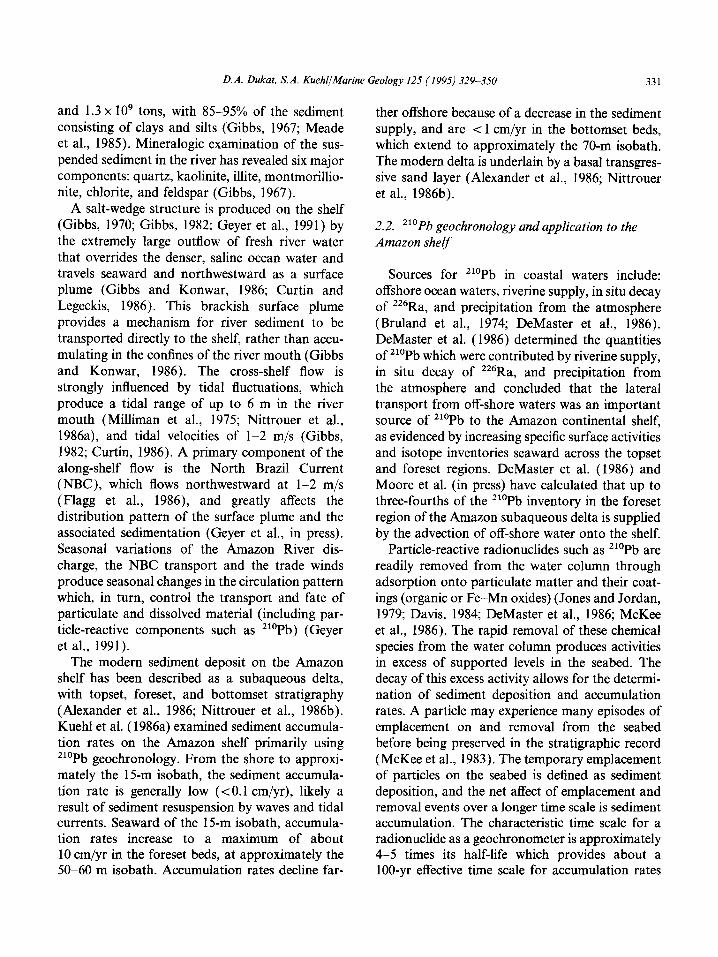
Profiles of 210Pb activity for 7 kasten cores were determined from three stations, over three cruises (Fig. 2), in a region of rapid sediment accumula-
Excess *lo Pb Actiiity (dpm g-l)
0
2223 KC1
0 4 8 12 16
3230 KC1
0 4 8 12 16
4120 KC1
0 4 8 12 16
4126 KC2 4127 KCI 4133 KC1
0 4 8 12 16 0 4 8 12 18 0 4 8 12 16
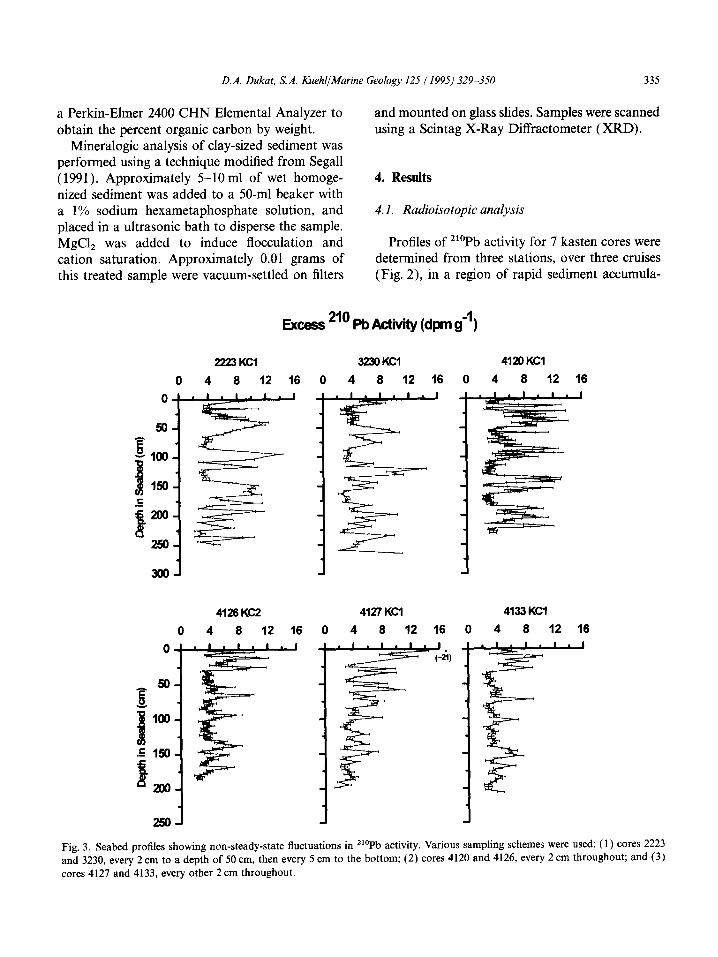
Fig. 3. Seabed profiles showing non-steady-state fluctuations in *l”Pb activity. Various sampling schemes were used: (1) cores 2223
and 3230, every 2 cm to a depth of 50 cm, then every 5 cm to the bottom; (2) cores 4120 and 4126, every 2 cm throughout; and (3) cores 4127 and 4133, every other 2 cm throughout.
336 D.A. Dukat, S.A. Kuehl/Murinr Geology 125 ( 1995) 329 350
tion and quasi-cyclic 210Pb, as previously identified by Kuehl et al. ( 1986a) and Underkoffler ( 1990). The depths in the cores were normalized to a representative porosity of 75’%1, and the “‘Pb activities were corrected for the weight of salt, assuming 35%0 salinity. Excess 210Pb activities for the core profiles were determined by subtracting 226Ra activities from the total measured ‘r”Pb, both as determined by gamma spectroscopy. Where alpha spectroscopy was performed (on X-radiograph slabs), 226Ra-supported 210Pb was assumed to be 1.0 +0.2 dpm/g, as determined previously for this area (Kuehl et al., 1986a; Underkoffler, 1990; Pacioni, 199 1).
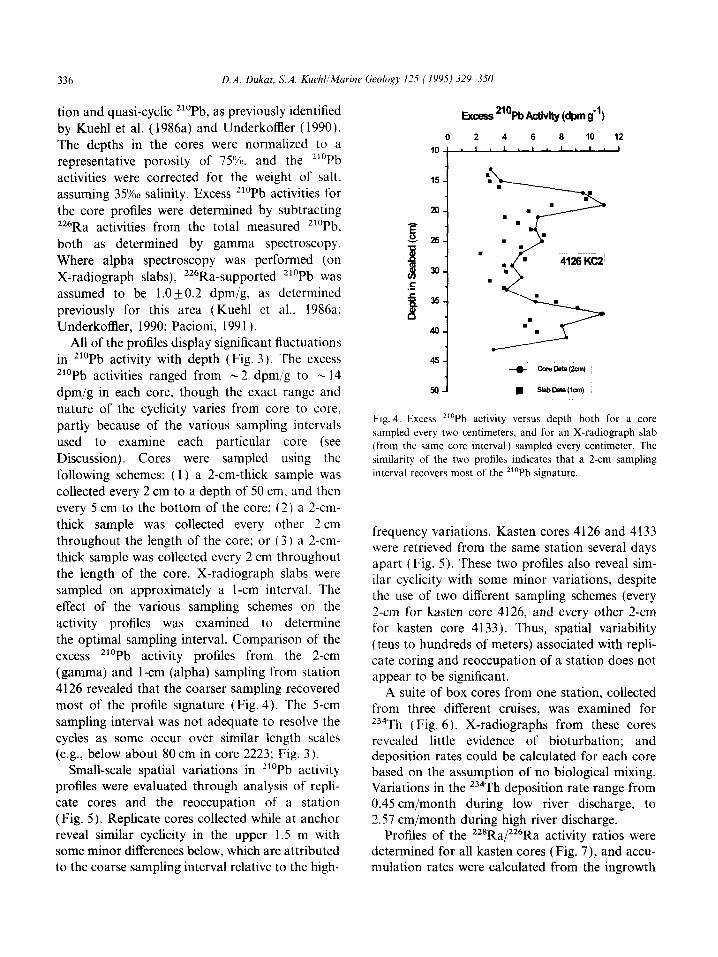
All of the profiles display significant fluctuations in 210Pb activity with depth (Fig. 3). The excess 210Pb activities ranged from .b 2 dpm/g to c 14 dpm/g in each core, though the exact range and nature of the cyclicity varies from core to core. partly because of the various sampling intervals used to examine each particular core (see Discussion). Cores were sampled using the following schemes: ( 1) a 2-cm-thick sample was collected every 2 cm to a depth of 50 cm, and then every 5 cm to the bottom of the core; (2) a 2-cm- thick sample was collected every other 2 cm throughout the length of the core; or (3) a 2-cm- thick sample was collected every 2 cm throughout the length of the core. X-radiograph slabs were sampled on approximately a l-cm interval. The effect of the various sampling schemes on the activity profiles was examined to determine the optimal sampling interval. Comparison of the excess “‘Pb activity profiles from the 2-cm (gamma) and l-cm (alpha) sampling from station 4126 revealed that the coarser sampling recovered most of the profile signature (Fig. 4). The 5-cm sampling interval was not adequate to resolve the cycles as some occur over similar length scales (e.g., below about 80 cm in core 2223; Fig. 3).
Small-scale spatial variations in 210Pb activity profiles were evaluated through analysis of repli- cate cores and the reoccupation of a station (Fig. 5). Replicate cores collected while at anchor reveal similar cyclicity in the upper 1.5 m with some minor differences below, which are attributed to the coarse sampling interval relative to the high-
1 45 1
4126 KC2
Fig. 4. Excess ““Pb activity versus depth both for a core sampled every two centimeters, and for an X-radiograph slab (from the same core interval) sampled every centimeter. The similarity of the two profiles indicates that a 2-cm sampling interval recovers most of the *“Pb signature.
frequency variations. Kasten cores 4126 and 4133 were retrieved from the same station several days apart (Fig. 5). These two profiles also reveal sim- ilar cyclicity with some minor variations, despite the use of two different sampling schemes (every 2-cm for kasten core 4126, and every other 2-cm for kasten core 4133). Thus, spatial variability (tens to hundreds of meters) associated with repli- cate coring and reoccupation of a station does not appear to be significant.
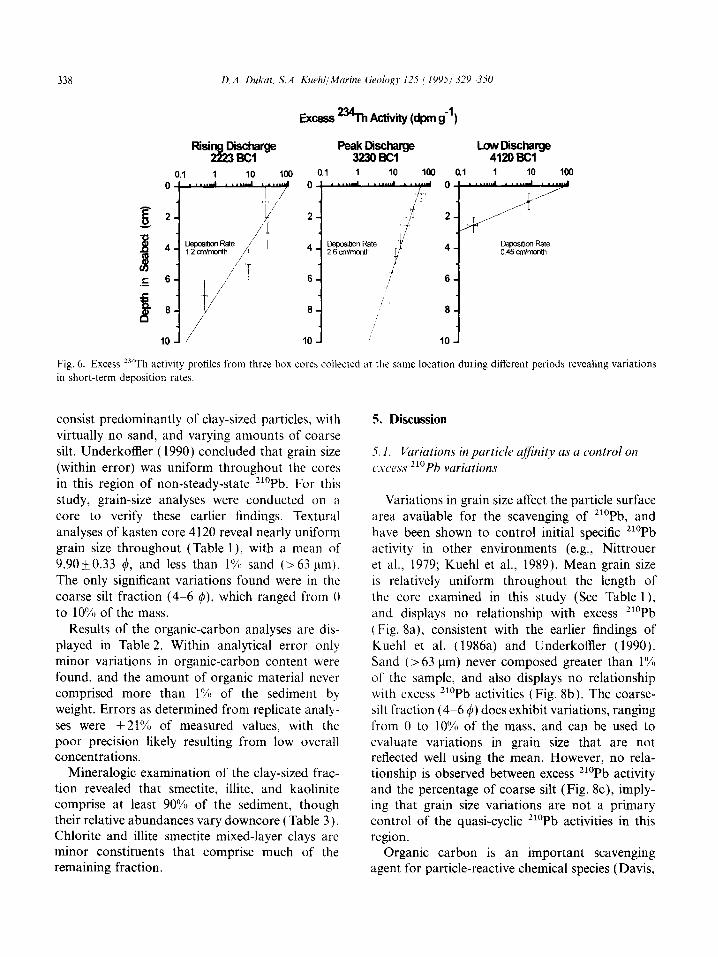
A suite of box cores from one station, collected from three different cruises, was examined for 234Th (Fig. 6). X-radiographs from these cores revealed little evidence of bioturbation; and deposition rates could be calculated for each core based on the assumption of no biological mixing. Variations in the 234Th deposition rate range from 0.45 cm/month during low river discharge, to 2.57 cm/month during high river discharge.
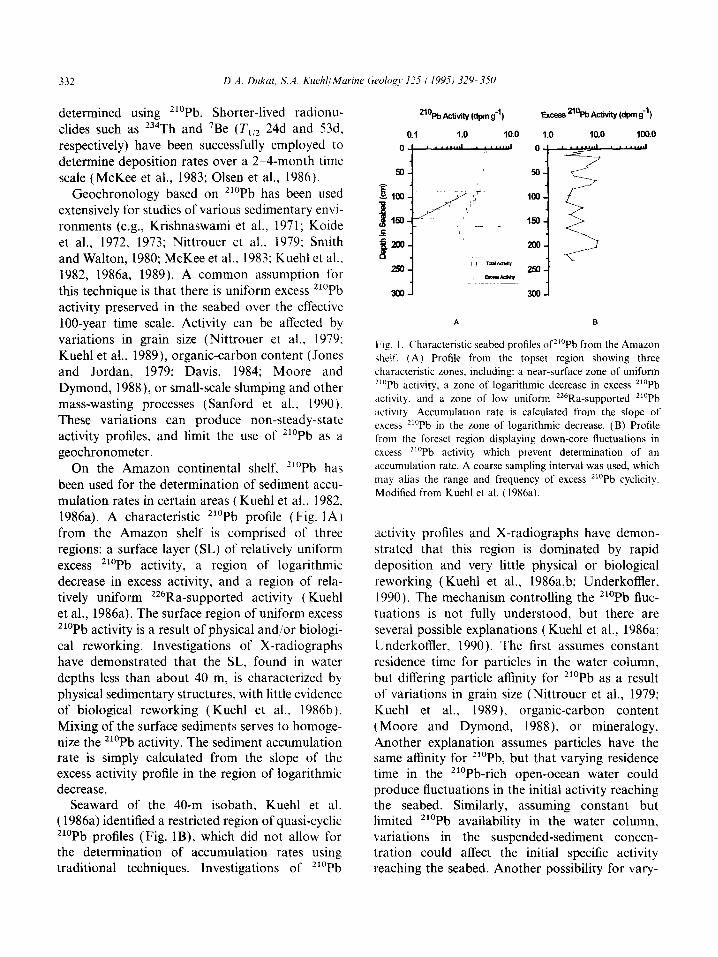
Profiles of the 228Ra/226Ra activity ratios were determined for all kasten cores (Fig. 7), and accu- mulation rates were calculated from the ingrowth
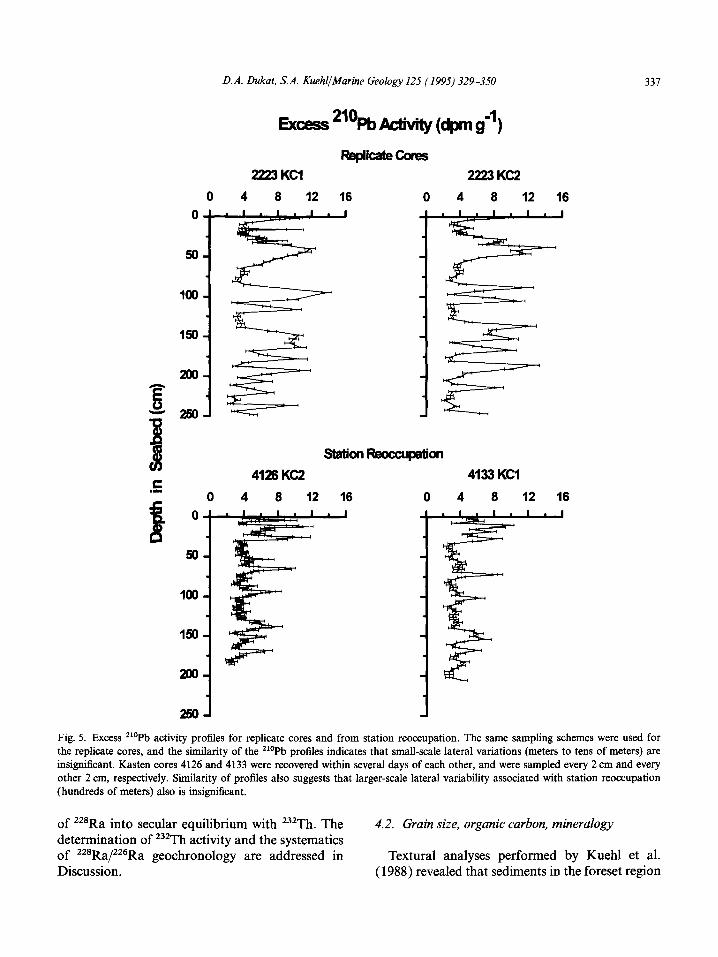
D.A. Dukat, S. A. KuehljMarine Geology 125 (1995) 329-350 337
Excess 21%b Activity (dpm g-l) RepiicateCores
2223 KC1 2223KC2
0 4 8 12 16 0 4 8 12 16
60-
loo-
m-
2fM-
IF - 250-
B 0
60
100
0
stationf3eoaqAon
4126 KC2 4133 KCI
4 8 12 16 0 4 8 12 16
Fig. 5. Excess ‘t”Pb activity profiles for replicate cores and from station reoccupation. The same sampling schemes were used for the replicate cores, and the similarity of the *l”Pb profiles indicates that small-scale lateral variations (meters to tens of meters) are insigniticant. Kasten cores 4126 and 4133 were recovered within several days of each other, and were sampled every 2 cm and every other 2 cm, respectively. Similarity of profiles also suggests that larger-scale lateral variability associated with station reoccupation (hundreds of meters) also is insignificant.
of “*Ra into secular equilibrium with 232Th. The determination of 232Th activity and the systematics of 22sRa/226Ra geochronology are addressed in Discussion.
4.2. Grain size, organic carbon, mineralogy
Textural analyses performed by Kuehl et al. (1988) revealed that sediments in the foreset region
338
Excess 234Th Activity (dpm g-l)
Risin&i$mge -$--=ggCF?
0.1 1 10 loo 0.1 1 10 loo
6
IO-1 / 10 J IO J
Fig. 6. Excess ““Th activity profiles from three box cores collected at the same location during different periods revealing variations
in short-term deposition rates.
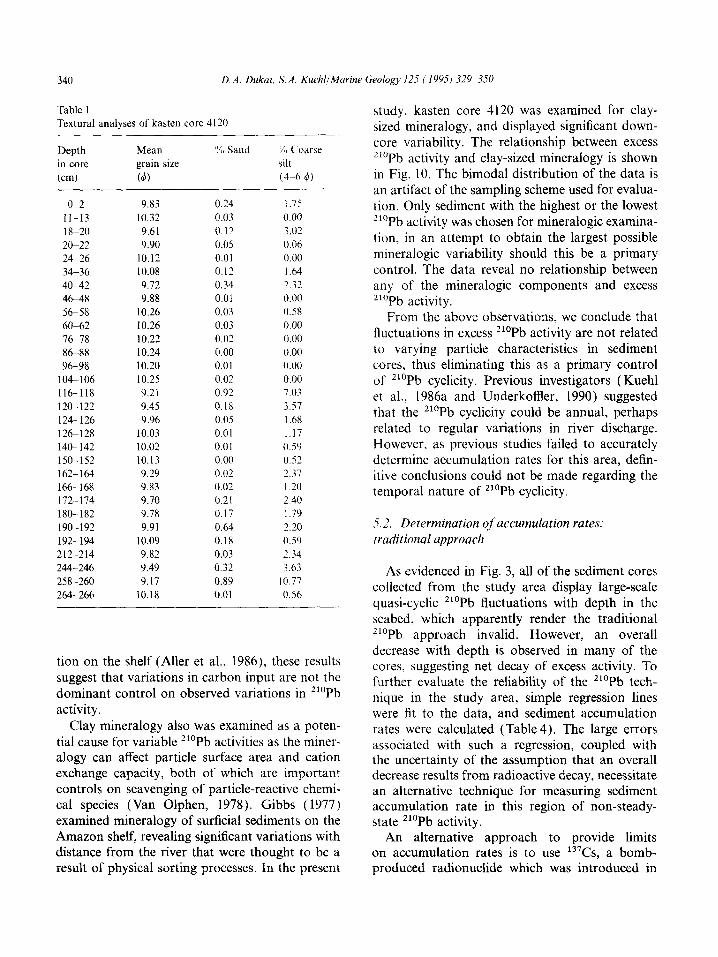
consist predominantly of clay-sized particles, with virtually no sand, and varying amounts of coarse silt. Underkoffler (1990) concluded that grain size (within error) was uniform throughout the cores in this region of non-steady-state ‘lOPb. For this study, grain-size analyses were conducted on a core to verify these earlier findings. Textural analyses of kasten core 4120 reveal nearly uniform grain size throughout (Table l), with a mean of 9.9OkO.33 4, and less than 1% sand (> 63 urn). The only significant variations found were in the coarse silt fraction (4-6 4), which ranged from 0 to 10% of the mass.
Results of the organic-carbon analyses are dis- played in Table 2. Within analytical error only minor variations in organic-carbon content were found, and the amount of organic material never comprised more than 1% of the sediment by weight. Errors as determined from replicate analy- ses were +-21”/0 of measured values, with the poor precision likely resulting from low overall concentrations.
Mineralogic examination of the clay-sized frac- tion revealed that smectite, illite, and kaolinite comprise at least 90% of the sediment, though their relative abundances vary downcore ( Table 3). Chlorite and illite-smectite mixed-layer clays are minor constituents that comprise much of the remaining fraction.
5. Discussion
5. I. Vuriations in purtick ufinity as c1 control on CYMSS ‘l”Pb variutions
Variations in grain size affect the particle surface area available for the scavenging of ‘lOPb, and have been shown to control initial specific 210Pb activity in other environments (e.g., Nittrouer et al., 1979; Kuehl et al., 1989). Mean grain size is relatively uniform throughout the length of the core examined in this study (See Table 1 ), and displays no relationship with excess 210Pb ( Fig. 8a), consistent with the earlier findings of Kuehl et al. (1986a) and Underkoffler (1990). Sand (> 63 urn) never composed greater than 1% of the sample, and also displays no relationship with excess ‘rOPb activities (Fig. 8b). The coarse- silt fraction (4-6 4) does exhibit variations, ranging from 0 to 10% of the mass, and can be used to evaluate variations in grain size that are not reflected well using the mean. However, no rela- tionship is observed between excess ‘l”Pb activity and the percentage of coarse silt (Fig. 8c), imply- ing that grain size variations are not a primary control of the quasi-cyclic 210Pb activities in this region.
Organic carbon is an important scavenging agent for particle-reactive chemical species (Davis,
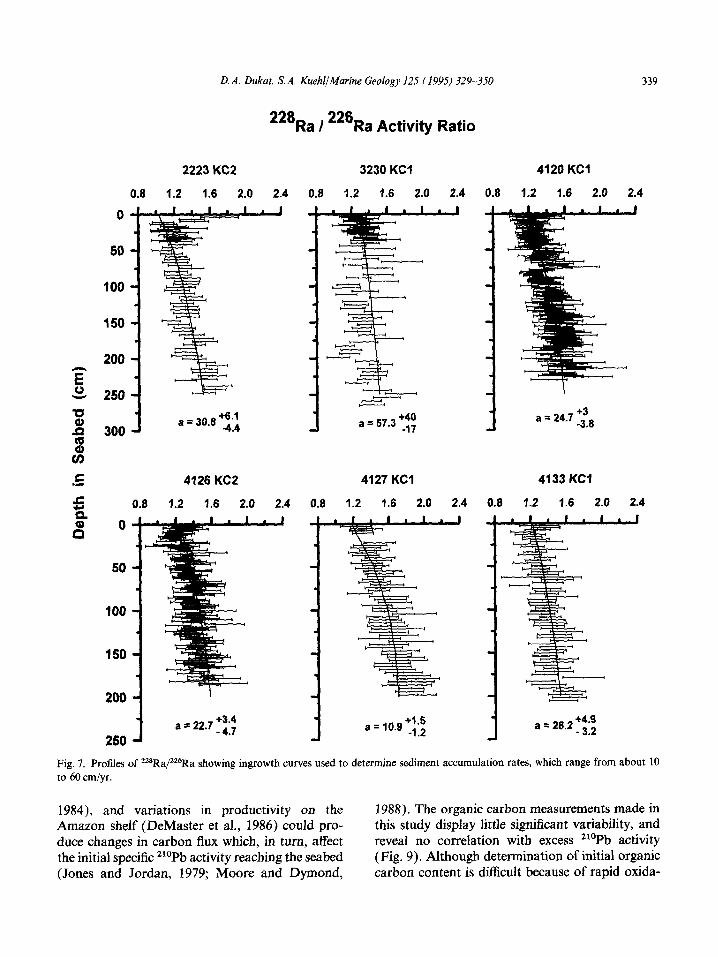
D.A. Dukat, S. A. KuehljiUarine Geology 125 (1995) 329-3SO 339
228Ra / 228 Ra Activity Ratio
0
50
100
2223 KC2 3230 KC1 4120 KC1
0.8 1.2 1.8 2.0 2.4 0.8 1.2 1.8 2.0 2.4 0.8 1.2 1.6 2.0 2.4
150
200
z s 250
v
3 300
tE
C ._
0.8
0
+6.1 a--30.8 4.4
4126 KC2 4127 KC1
1.2 1.6 2.0 2.4 0.8 1.2 1.6 2.0 2.4 0.8
1 a = 10.9 T::i
+3 a = 24.7 _3 8
4133 KC1
1.2 1.6 2.0 2.4
1 a = 28.2 fy2
Fig. 7. Profiles of zzsRa/226Ra showing ingrowth curves used to determine sediment accumulation rates, which range from about 10 to 60 cm/yr.
1984), and variations in productivity on the 1988). The organic carbon measurements made in Amazon shelf (DeMaster et al., 1986) could pro- this study display little significant variability, and duce changes in carbon flux which, in turn, affect reveal no correlation with excess 21ePb activity the initial specific “‘Pb activity reaching the seabed (Fig. 9). Although determination of initial organic (Jones and Jordan, 1979; Moore and Dymond, carbon content is difficult because of rapid oxida-
340 D.A. Dukat, S, A. Kurhl/Marine Geology l-75 ( 1995) 329-350
Table 1
Textural analyses of kasten core 4120
Depth
in core
(cm)
Mean
grain size
NJ)
“i, Sand
O-2 9.83 0.24
II-13 10.32 0.03
18-20 9.61 0.12
20-22 9.90 0.05
24-26 10.12 0.01
34-36 10.08 0.12
40-42 9.72 0.34
46-48 9.88 0.01
56-58 10.26 0.03
60-62 10.26 0.03
76-78 10.22 0.02
86-88 10.24 0.00
96-98 10.20 0.01
104-106 10.25 0.02
116-118 9.21 0.92
120-122 9.45 0.18
124-126 9.96 0.05
126-128 10.03 0.01
140-142 10.02 0.01
150-152 10.13 0.00
162-164 9.29 0.02
166-168 9.83 0.02
172Zl74 9.70 0.21
180-182 9.78 0.17
190-192 9.91 0.64
192-194 10.09 0.18
212-214 9.82 0.03
244246 9.49 0.32
258-260 9.17 0.89
264-266 10.18 0.01
1.75
0.00
3.02
0.06
0.00
1.64
’ 1’ _.. -
0.00
0.58
0.00
0.00
0.00
0.00
0.00
7.03
3.57
I .68
1.17
0.59
0.52
3.37
1.20 2.40
1.79
2.20
0.59
‘7.34
3.63
IO.77
0.56
tion on the shelf (Aller et al., 1986), these results suggest that variations in carbon input are not the dominant control on observed variations in ‘lOPb activity.
Clay mineralogy also was examined as a poten- tial cause for variable 210Pb activities as the miner- alogy can affect particle surface area and cation exchange capacity, both of which are important controls on scavenging of particle-reactive chemi- cal species (Van Olphen, 1978). Gibbs ( 1977) examined mineralogy of surficial sediments on the Amazon shelf, revealing significant variations with distance from the river that were thought to be a result of physical sorting processes. In the present
study, kasten core 4120 was examined for clay- sized mineralogy, and displayed significant down- core variability. The relationship between excess ‘lOPb activity and clay-sized mineralogy is shown in Fig. 10. The bimodal distribution of the data is an artifact of the sampling scheme used for evalua- tion. Only sediment with the highest or the lowest 210Pb activity was chosen for mineralogic examina- tion, in an attempt to obtain the largest possible mineralogic variability should this be a primary control. The data reveal no relationship between any of the mineralogic components and excess “‘Pb activity.
From the above observations, we conclude that fluctuations in excess 210Pb activity are not related to varying particle characteristics in sediment cores, thus eliminating this as a primary control of 210Pb cyclicity. Previous investigators (Kuehl et al., 1986a and Underkoffler, 1990) suggested that the 210Pb cyclicity could be annual, perhaps related to regular variations in river discharge. However, as previous studies failed to accurately determine accumulation rates for this area, defin- itive conclusions could not be made regarding the temporal nature of 210Pb cyclicity.
5.2. Determination of accumulation rates: traditional approach
As evidenced in Fig. 3, all of the sediment cores collected from the study area display large-scale quasi-cyclic 210Pb fluctuations with depth in the seabed, which apparently render the traditional ‘lOPb approach invalid. However, an overall decrease with depth is observed in many of the cores, suggesting net decay of excess activity. To further evaluate the reliability of the “‘Pb tech- nique in the study area, simple regression lines were fit to the data, and sediment accumulation rates were calculated (Table 4). The large errors associated with such a regression, coupled with the uncertainty of the assumption that an overall decrease results from radioactive decay, necessitate an alternative technique for measuring sediment accumulation rate in this region of non-steady- state 210Pb activity.
An alternative approach to provide limits on accumulation rates is to use 13’Cs, a bomb- produced radionuclide which was introduced in
D.A. Dukat, S. A. Kuehl/Marine Geology 125 (1995) 329-350 341
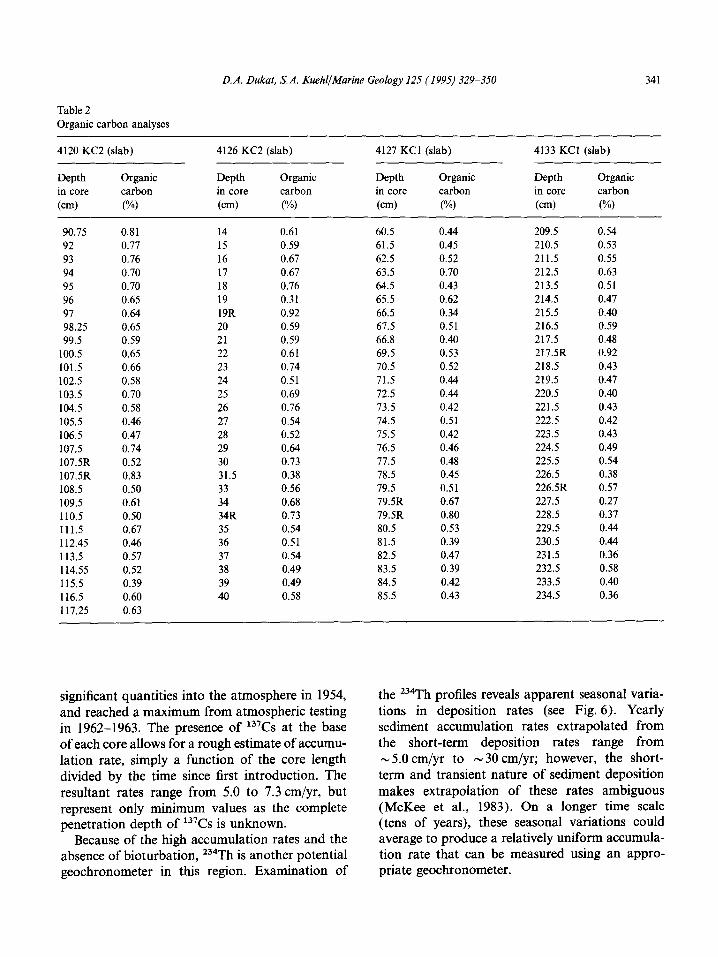
Table 2 Organic carbon analyses
4120 KC2 (slab)
Depth Organic in core carbon
(cd W)
4126 KC2 (slab)
Depth Organic in core carbon
(cm) W)
4127 KC1 (slab)
Depth Organic in core carbon
(cm) W)
4133 KC1 (slab)
Depth Organic in core carbon
(cm) (W
90.15 0.81 92 0.77 93 0.76 94 0.70 95 0.70 96 0.65 97 0.64 98.25 0.65 99.5 0.59
100.5 0.65 101.5 0.66 102.5 0.58 103.5 0.70 104.5 0.58 105.5 0.46 106.5 0.47 107.5 0.74 107.5R 0.52 107.5R 0.83 108.5 0.50 109.5 0.61 110.5 0.50 111.5 0.67 112.45 0.46 113.5 0.51 114.55 0.52 115.5 0.39 116.5 0.60 117.25 0.63
14 0.61 60.5 0.44 209.5 0.54 15 0.59 61.5 0.45 210.5 0.53 16 0.67 62.5 0.52 211.5 0.55 17 0.67 63.5 0.70 212.5 0.63 18 0.76 64.5 0.43 213.5 0.51 19 0.31 65.5 0.62 214.5 0.47 19R 0.92 66.5 0.34 215.5 0.40 20 0.59 67.5 0.51 216.5 0.59 21 0.59 66.8 0.40 217.5 0.48 22 0.61 69.5 0.53 217.5R 0.92 23 0.74 70.5 0.52 218.5 0.43 24 0.51 71.5 0.44 219.5 0.47 25 0.69 72.5 0.44 220.5 0.40 26 0.76 73.5 0.42 221.5 0.43 27 0.54 74.5 0.51 222.5 0.42 28 0.52 75.5 0.42 223.5 0.43 29 0.64 76.5 0.46 224.5 0.49 30 0.73 77.5 0.48 225.5 0.54 31.5 0.38 78.5 0.45 226.5 0.38 33 0.56 79.5 0.51 226.5R 0.57 34 0.68 19.5R 0.67 227.5 0.27 34R 0.73 79SR 0.80 228.5 0.37 35 0.54 80.5 0.53 229.5 0.44 36 0.51 81.5 0.39 230.5 0.44 37 0.54 82.5 0.47 231.5 0.36 38 0.49 83.5 0.39 232.5 0.58 39 0.49 84.5 0.42 233.5 0.40 40 0.58 85.5 0.43 234.5 0.36
significant quantities into the atmosphere in 1954, and reached a maximum from atmospheric testing in 1962-1963. The presence of 13’Cs at the base of each core allows for a rough estimate of accumu- lation rate, simply a function of the core length divided by the time since first introduction. The resultant rates range from 5.0 to 7.3 cm/yr, but represent only minimum values as the complete penetration depth of 13’Cs is unknown.
Because of the high accumulation rates and the absence of bioturbation, 234Th is another potential geochronometer in this region. Examination of
the 234Th profiles reveals apparent seasonal varia- tions in deposition rates (see Fig. 6). Yearly sediment accumulation rates extrapolated from the short-term deposition rates range from N 5.0 cm/yr to -30 cm/yr; however, the short- term and transient nature of sediment deposition makes extrapolation of these rates ambiguous (McKee et al., 1983). On a longer time scale (tens of years), these seasonal variations could average to produce a relatively uniform accumula- tion rate that can be measured using an appro- priate geochronometer.
342
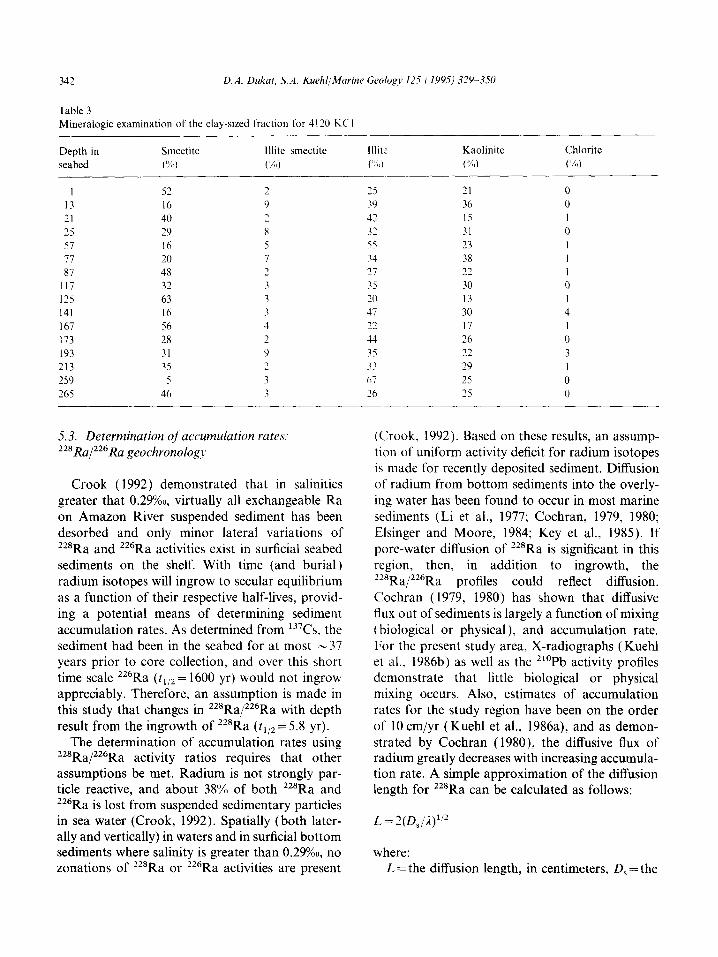
Table 3
D.A. Dukat. S. A. Kuehl! Marine Geology 125 i 1995) 329-350
Mineralogic examination of the clay-sized fraction tar 4120 KC I
Depth in Smectite lllite- smectite
seabed (‘“;I) (‘%I)
I 52 2 13 16 Y
21 40 7
25 29 8
51 16 5
71 20 I
87 48 2
117 32 3
125 63 3
141 16 3
167 56 4
173 28 2
193 31 Y
213 35 2
‘59 5 3
265 46 3
5.3. Determination of‘ accumulation rates. 22aRa/226Ra geochronologq
Crook (1992) demonstrated that in salinities greater that 0.29%~ virtually all exchangeable Ra on Amazon River suspended sediment has been desorbed and only minor lateral variations of 228Ra and 226Ra activities exist in surficial seabed sediments on the shelf. With time (and burial) radium isotopes will ingrow to secular equilibrium as a function of their respective half-lives, provid- ing a potential means of determining sediment accumulation rates. As determined from ls7Cs, the sediment had been in the seabed for at most -37 years prior to core collection, and over this short time scale 226Ra (t1,2 = 1600 yr) would not ingrow appreciably. Therefore, an assumption is made in this study that changes in 228Ra/226Ra with depth result from the ingrowth of “‘Ra (t1,2 = 5.8 yr).
The determination of accumulation rates using 228Ra/226Ra activity ratios requires that other assumptions be met. Radium is not strongly par- ticle reactive, and about 38(/o of both “‘Ra and 226Ra is lost from suspended sedimentary particles in sea water (Crook, 1992). Spatially (both later- ally and vertically) in waters and in suticial bottom sediments where salinity is greater than 0.29%0, no zonations of 228Ra or 226Ra activities are present
-
lllitr Kaolinite Chlorite
(“‘;,I (‘%I) (‘%)
25 21 0
3’) 36 0
32 IS I 32 31 0
.55 23 I 34 38 I 7: 22 1 35 30 0
20 13 I 47 30 4
72 17 I 44 26 0
35 22 3
13 29 1
67 25 0
76 25 0
(Crook. 1992). Based on these results, an assump- tion of uniform activity deficit for radium isotopes is made for recently deposited sediment. Diffusion of radium from bottom sediments into the overly- ing water has been found to occur in most marine sediments (Li et al., 1977: Cochran, 1979, 1980; Elsinger and Moore, 1984; Key et al., 1985). If pore-water diffusion of 228Ra is significant in this region, then, in addition to ingrowth, the 228Ra/226Ra profiles could reflect diffusion. Cochran (1979, 1980) has shown that diffusive flux out of sediments is largely a function of mixing (biological or physical), and accumulation rate. For the present study area, X-radiographs (Kuehl et al., 1986b) as well as the 210Pb activity profiles demonstrate that little biological or physical mixing occurs. Also, estimates of accumulation rates for the study region have been on the order of 10 cm/yr (Kuehl et al., 1986a), and as demon- strated by Cochran (1980) the diffusive flux of radium greatly decreases with increasing accumula- tion rate. A simple approximation of the diffusion length for 228Ra can be calculated as follows:
L = 2(D,/i)1’2
where: L = the diffusion length, in centimeters, D, = the
D.A. D&at, S. A. KuehlJMarine Geology 125 (1995) 329-350 343
15 1. .
(4
10 I 5
. . 1 . . _l- . . 5
. .:.a = .
0
7 a 10 12
7
ban Grain Sii (phi)
ok,,.,.,.,.,., 0 2 4 6 a IO 12
% silt (4-6 phi)
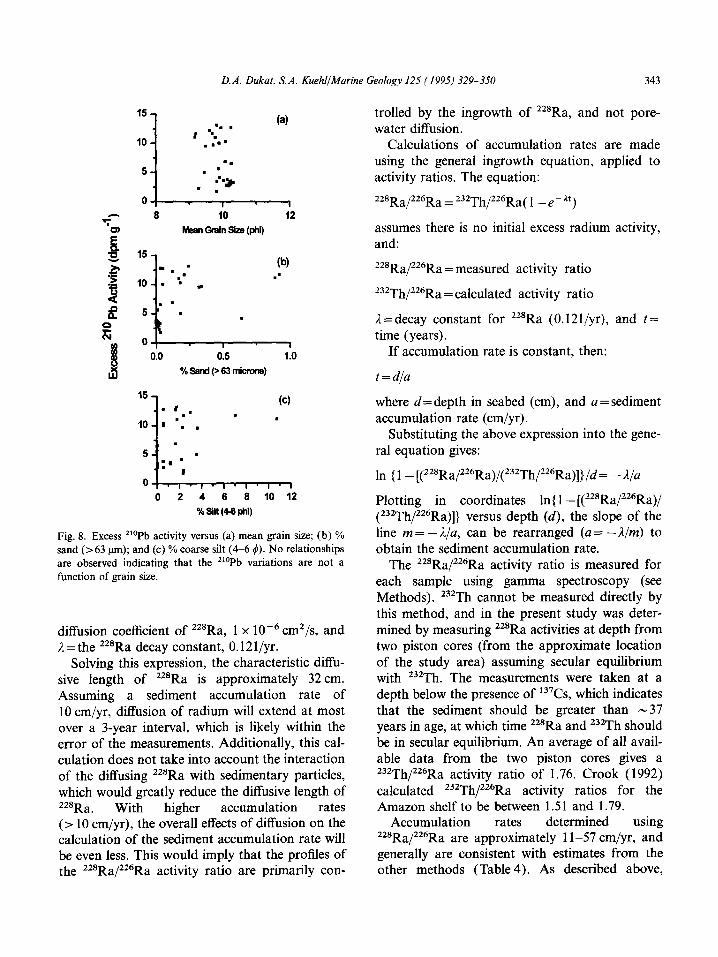
Fig. 8. Excess ‘l@Pb activity versus (a) mean grain size; (b) % sand (>63 pm); and (c) % coarse silt (4-6 4). No relationships are observed indicating that the ‘l”Pb variations are not a function of grain size.
diffusion coefficient of 228Ra, 1 x lop6 c&/s, and L = the 228Ra decay constant, O.l21/yr.
Solving this expression, the characteristic diffu- sive length of zz8Ra is approximately 32 cm. Assuming a sediment accumulation rate of 10 cm/yr, diffusion of radium will extend at most over a 3-year interval, which is likely within the error of the measurements. Additionally, this cal- culation does not take into account the interaction of the diffusing “*Ra with sedimentary particles, which would greatly reduce the diffusive length of “*Ra. With higher accumulation rates (> 10 cm/yr), the overall effects of diffusion on the calculation of the sediment accumulation rate will be even less. This would imply that the profiles of the 228Ra/2z6Ra activity ratio are primarily con-
trolled by the ingrowth of 228Ra, and not pore- water diffusion.
Calculations of accumulation rates are made using the general ingrowth equation, applied to activity ratios. The equation:
22*Ra/226Ra = 232Th/226Ra( 1 _ e-At>
assumes there is no initial excess radium activity, and:
228Ra/226Ra = measured activity ratio
232Th/226Ra = calculated activity ratio
2 = decay constant for “*Ra (O.l21/yr), and t= time (years).
If accumulation rate is constant, then:
t=d/a
where d=depth in seabed (cm), and a= sediment accumulation rate (cm/yr).
Substituting the above expression into the gene- ral equation gives:
In { 1 - [(z28Ra/22”Ra)/(232Th/226Ra)]]/d= -A/a
Plotting in coordinates In{ 1 - [(228Ra/226Ra)/ (232Th/226Ra)]} versus depth (d), the slope of the line m = -A/a, can be rearranged (a = -A/m) to obtain the sediment accumulation rate.
The 228Ra/226Ra activity ratio is measured for each sample using gamma spectroscopy (see Methods). 232Th cannot be measured directly by this method, and in the present study was deter- mined by measuring “*Ra activities at depth from two piston cores (from the approximate location of the study area) assuming secular equilibrium with 232Th. The measurements were taken at a depth below the presence of 137Cs, which indicates that the sediment should be greater than -37 years in age, at which time “*Ra and 232Th should be in secular equilibrium. An average of all avail- able data from the two piston cores gives a 232Th/226Ra activity ratio of 1.76. Crook (1992) calculated 232Th/226Ra activity ratios for the Amazon shelf to be between 1.51 and 1.79.
Accumulation rates determined using 228Ra/226Ra are approximately 11-57 cm/yr, and generally are consistent with estimates from the other methods (Table 4). As described above,
344 D.A. Dukut, S. A. KuehljMurine Geolog) 125 ( 1995) 329-350
4133 KC1 1
I.07 T
4120 KC2
0 4 8 12 16
l3cces!s *‘OPtI Activity
1 4127 KC1
I I ’ I ’ I ’ I
0 4 8 12 16
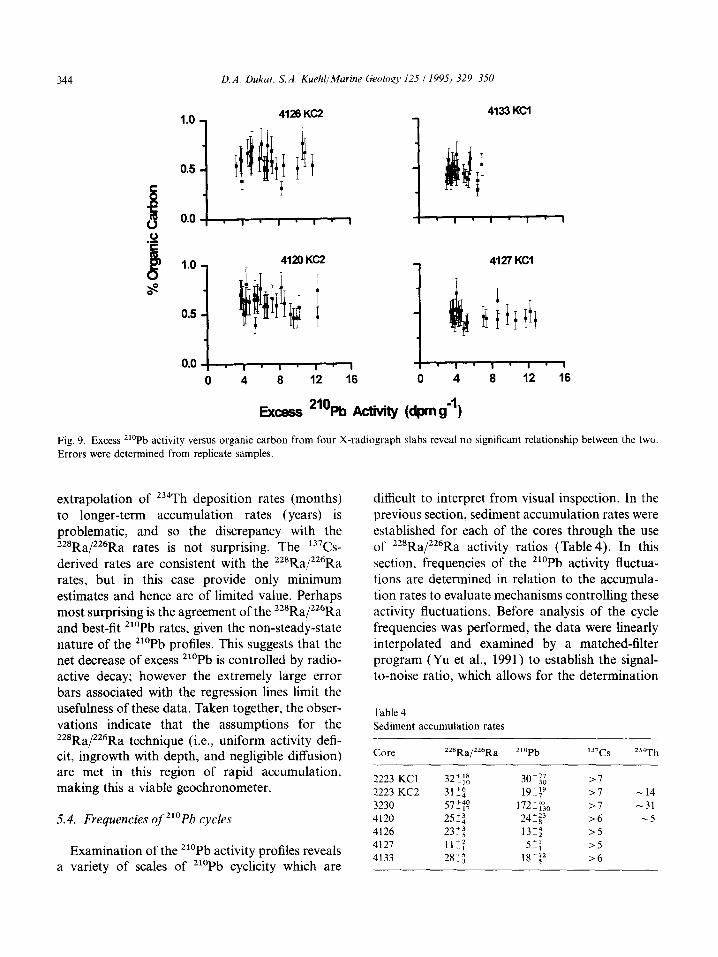
(dpm g-7 Fig. 9. Excess ‘lOPb activity versus organic carbon from four X-radiograph slabs reveal no significant relationship between the two.
Errors were determined from replicate samples.
extrapolation of 234Th deposition rates (months) to longer-term accumulation rates (years) is problematic, and so the discrepancy with the 228Ra/226Ra rates is not surprising. The 137Cs- derived rates are consistent with the 228Ra/226Ra rates, but in this case provide only minimum estimates and hence are of limited value. Perhaps most surprising is the agreement of the 228Ra/226Ra and best-fit 210Pb rates, given the non-steady-state nature of the 210Pb profiles. This suggests that the net decrease of excess 210Pb is controlled by radio- active decay; however the extremely large error bars associated with the regression lines limit the usefulness of these data. Taken together, the obser- vations indicate that the assumptions for the 228Ra/226Ra technique (i.e., uniform activity defi- cit, ingrowth with depth, and negligible diffusion) are met in this region of rapid accumulation, making this a viable geochronometer.
5.4. Frequencies of 210Pb cycles
Examination of the 210Pb activity profiles reveals a variety of scales of 210Pb cyclicity which are
difficult to interpret from visual inspection. in the previous section, sediment accumulation rates were established for each of the cores through the use of 228Ra/226Ra activity ratios (Table 4). In this section, frequencies of the “OPb activity fluctua- tions are determined in relation to the accumula- tion rates to evaluate mechanisms controlling these activity fluctuations. Before analysis of the cycle frequencies was performed, the data were linearly interpolated and examined by a matched-filter program (Yu et al., 1991) to establish the signal- to-noise ratio, which allows for the determination
Table 4
Sediment accumulation rates
Core 228Ra/ZZ6Ra “‘Pb ’ Ws 234Th
2223 KC1 32”s
: 30:” 30 >I
2223 KC2 31?6 19”9 7 >I - 14 3230 57t:lj 172’” 130 >I -31
4120 25T3 4 24’= 8 >6 -5 4126 23Z3 5 13:; >5 4127 11+2
4133 28:: 5” >5
3 18+ >6
D.A. Dukat, S. A. KuehllMarine Geology 125 ( 1995) 329-350 345
lilll (IS) . .
. .
. .
. . . . . . . . .
I ’ I - I ’ 1
40- Winide :
m .' .
20- n n G
n '. . . .
0 1'1'1' I
0 4 a 12 16
4120 KC1
Xl- lllite
.
.
40- ‘. . . n l m . .
‘Z n
0 I ’ I - I - 1
b
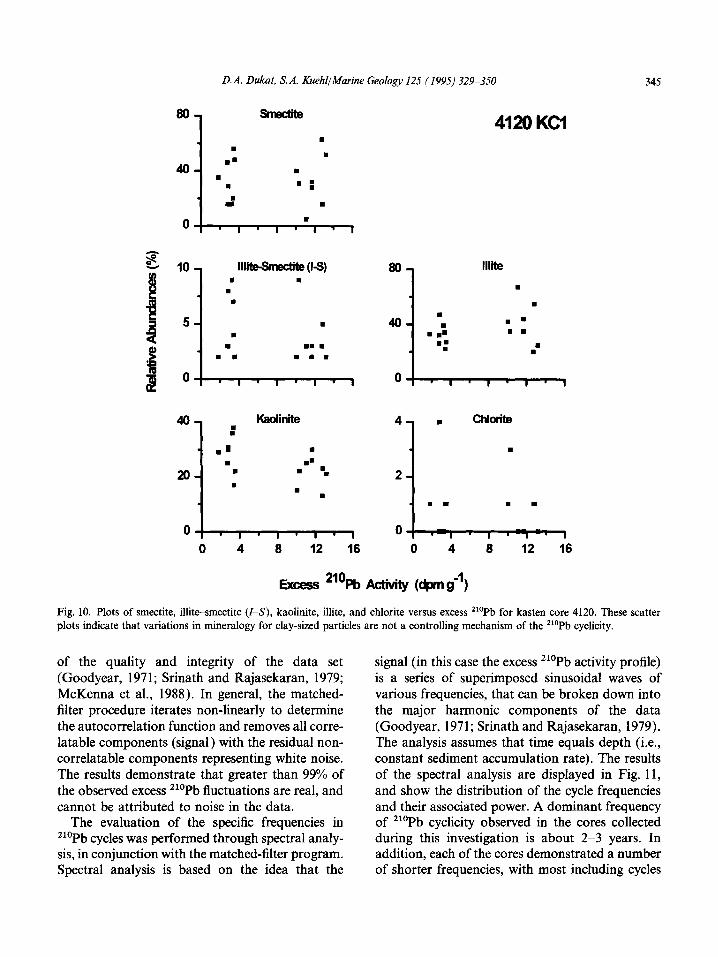
Excess *“Pb Adlvity (dpmg-‘)
Fig. 10. Plots of smectite, illite-smectite (I-S), kaolinite, illite, and chlorite versus excess 21”Pb for kasten core 4120. These scatter plots indicate that variations in mineralogy for clay-sized particles are not a controlling mechanism of the 210Pb cyclicity.
of the quality and integrity of the data set (Goodyear, 197 1; Srinath and Rajasekaran, 1979; McKenna et al., 1988). In general, the matched- filter procedure iterates non-linearly to determine the autocorrelation function and removes all corre- latable components (signal) with the residual non- correlatable components representing white noise. The results demonstrate that greater than 99% of the observed excess “OPb fluctuations are real, and cannot be attributed to noise in the data.
The evaluation of the specific frequencies in 210Pb cycles was performed through spectral analy- sis, in conjunction with the matched-filter program. Spectral analysis is based on the idea that the
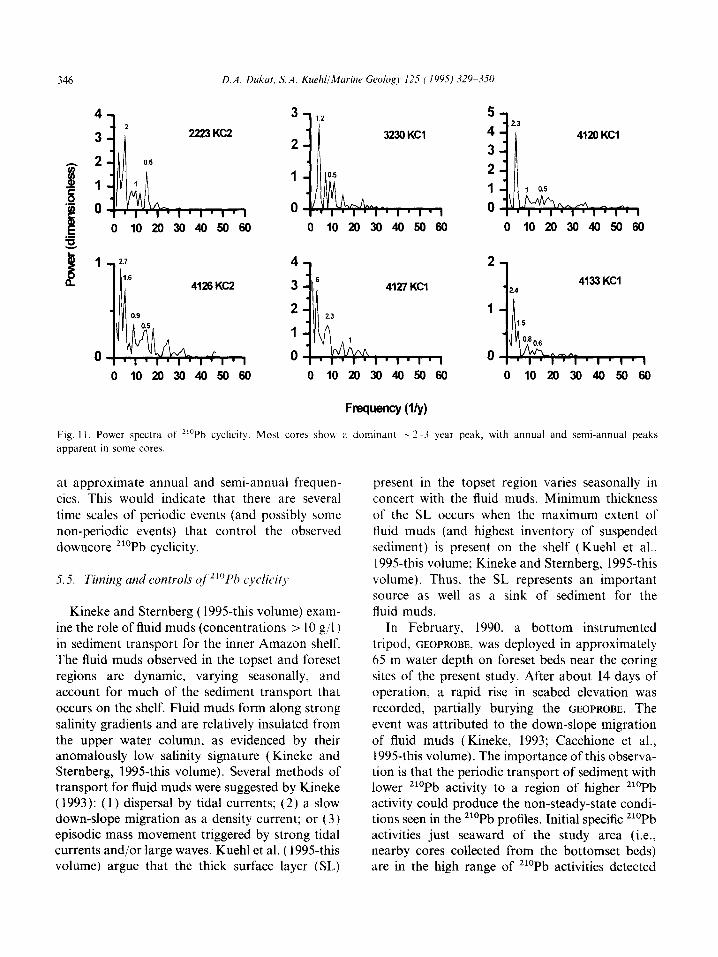
signal (in this case the excess ‘?b activity profile) is a series of superimposed sinusoidal waves of various frequencies, that can be broken down into the major harmonic components of the data (Goodyear, 1971; Srinath and Rajasekaran, 1979). The analysis assumes that time equals depth (i.e., constant sediment accumulation rate). The results of the spectral analysis are displayed in Fig. 11, and show the distribution of the cycle frequencies and their associated power. A dominant frequency of “‘Pb cyclicity observed in the cores collected during this investigation is about 2-3 years. In addition, each of the cores demonstrated a number of shorter frequencies, with most including cycles
346 D.A. Dukat, S.4. KuehliMurine C;a~log~~ 12.5 ( 1995) 329-350
0102030405060 0102030405060 0 lo2030405060
Fres~cyW~)
Fig. 11. Power spectra of ‘l”Pb cyclicity. Most cores shou a dommant -2 ~3 year peak, with annual and semi-annual peaks apparent in some cores.
at approximate annual and semi-annual frequen- cies. This would indicate that there are several time scales of periodic events (and possibly some non-periodic events) that control the observed downcore ‘lOPb cyclicity.
5.5. Timing and controls cf210Ph cyclicity
Kineke and Sternberg (1995-this volume) exam- ine the role of fluid muds (concentrations > 10 g/l ) in sediment transport for the inner Amazon shelf. The fluid muds observed in the topset and foreset regions are dynamic, varying seasonally. and account for much of the sediment transport that occurs on the shelf. Fluid muds form along strong salinity gradients and are relatively insulated from the upper water column, as evidenced by their anomalously low salinity signature (Kineke and Sternberg, 1995this volume). Several methods of transport for fluid muds were suggested by Kineke (1993): (1) dispersal by tidal currents; (2) a slow down-slope migration as a density current; or (3) episodic mass movement triggered by strong tidal currents and/or large waves. Kuehl et al. ( 1995-this volume) argue that the thick surface layer (SL)
present in the topset region varies seasonally in concert with the fluid muds. Minimum thickness of the SL occurs when the maximum extent of fluid muds (and highest inventory of suspended sediment) is present on the shelf (Kuehl et al., 1995this volume; Kineke and Sternberg, 1995-this volume). Thus, the SL represents an important source as well as a sink of sediment for the fluid muds.
In February, 1990, a bottom instrumented tripod, GEOPROBE, was deployed in approximately 65 m water depth on foreset beds near the coring sites of the present study. After about 14 days of operation, a rapid rise in seabed elevation was recorded, partially burying the GEOPROBE. The event was attributed to the down-slope migration of fluid muds (Kineke, 1993; Cacchione et al., 1995-this volume). The importance of this observa- tion is that the periodic transport of sediment with lower 210Pb activity to a region of higher ‘l”Pb activity could produce the non-steady-state condi- tions seen in the 210Pb profiles. Initial specific 210Pb activities just seaward of the study area (i.e., nearby cores collected from the bottomset beds) are in the high range of 210Pb activities detected
D.A. Dukat, S. A. KuehljMarine Geology 125 (199.7) 329-350 347
in the cyclic 210Pb profiles (Kuehl et al., 1982, 1986a; Underkoffler, 1990). Two near-bottom fluid-mud samples collected from 18-m water depth, landward of the quasi-cyclic-2’0Pb area, revealed total activities (measured using partial leaching technique and alpha spectroscopy) of 3.6 and 3.5 dpm/g, consistent with the low-activity portion of the ‘l”Pb cycles (Figs. 3-5). The ‘l”Pb activities measured for the fluid muds also are consistent with the surticial ‘l”Pb activities mea- sured by Kuehl et al. (1982, 1986a, 1995-this volume) in the topset region of the Amazon sub- aqueous delta. There is a general onshore to off- shore trend of increasing 210Pb activities, with up to 75% of the 210Pb in the study area being attributed to offshore sources (DeMaster et al., 1986; Moore et al., in press). This indicates that under ‘typical’ conditions, the sediment being deposited in the foreset region has interacted with the high- 210Pb-activity offshore waters. The low- activity spikes observed in profiles from the foreset region are most likely a function of seaward trans- port of sediment from the topset region to the foreset region of the subaqueous delta that involves no significant interaction with offshore waters (i.e., no additional scavenging of 210Pb).
The time scales of fluid-mud movement are not well understood. Kineke (1993) demonstrated that the fluid muds can be affected by tidal variations, both semi-diurnal and spring/neap, as well as seasonal variations in river discharge. A seasonal buildup of fluid muds on the shelf is observed during rising and high discharge, with the total inventory of suspended sediment being nearly an order of magnitude higher at this time than during falling and low discharge (Kineke and Steinberg, 1995-this volume). The mass-movement event doc- umented by the GEOPROBE demonstrates the dynamic nature of fluid muds and, assuming some seasonality for this process, supports the idea that fluid muds may be important in controlling cyclicity of the “‘Pb profiles. Possible variations in fluid-mud transport to the foreset region are only speculative, based on the relatively short time series of the fluid-mud measurements. In the topset region, investigations reveal that although strong seasonal variations of SL thickness are observed, the entire SL must be resuspended at least every
few years (Kuehl et al., 1995-this volume). These inter-annual resuspension events likely spill over the topset region and are transported as fluid muds to the region of quasi-cyclic 210Pb, resulting in the dominant 2-3-year frequency observed for this area.
From the above discussion, it appears likely that the cross-shelf fluid-mud transport to the foreset region is a dominant control on the non-steady- state input of ‘l”Pb to the foreset region of the Amazon subaqueous delta. Though somewhat cir- cumstantial, the evidence for fluid-mud transport on time scales commensurate with the observed cyclicity is compelling. However, the present data do not rule out the possibility that the quasi-cyclic 210Pb profiles are additionally influenced by other mechanisms.
6. Conclusions
(1) Observed downcore 210Pb cyclicity is affected by the sampling scheme used. Samples collected at 2-cm intervals throughout the length of cores gives the optimal representation of the nature and the frequency of the “OPb cyclicity in this region.
(2) Although the initial specific activity has been shown in other studies to vary with particle characteristics, no relationships were found in this study between 210Pb activity and grain size, organic carbon, or clay-sized mineralogy. Therefore, these relationships are not considered primary controls of the ‘l”Pb cyclicity.
(3) The major shortcoming of previous studies was the inability to establish accurate estimates of the sediment accumulation rates, which allow for the determination of the time scales and controlling mechanisms for the cycles. Traditional assump- tions used for “‘Pb geochronology are invalid in the study region, prompting the need to develop a new geochronological tool. The use of z28Ra/226Ra activity ratios, based on the ingrowth of 228Ra into secular equilibrium with 232Th, permits the determination of sediment accumulation rates on an approximate 30-year time scale. Constant initial activity deficit, insignificant diffusion of 228Ra, and the accurate determination of 232Th are essential for the reliability of this technique, which fills the
348 D.A. Dukat, S.A. Kuehl/Marine Geology 125 ( 1995) 329-350
geochronological gap created by the non-steady- state nature of 210Pb at this site. The range of accumulation rates determined in this study is 11-57 cm/yr.
(4) Using the time scale established by 228Ra/226Ra geochronology, a major component of the 210Pb cyclicity, as determined from spectral analysis, occurs at a frequency of approximately 2-3 years. Additionally, components of the 210Pb cyclicity were noted on an annual and semi-annual time scale. An important mechanism for the cre- ation of the quasi-cyclic 210Pb profiles on these time scales is the input of low-activity fluid muds from the topset region.
(5) Rapid accumulation of fine-grained sedi- ments on the Amazon continental shelf provided ideal conditions for the development of a new geochronological tool. However, the 228Ra/226Ra technique should prove to be a valuable asset in the investigation of rapidly accumulating, fine- grained sediments in other areas. Even where the traditional methods (i.e., 234Th and ‘lOPb) of deter- mining sediment deposition and accumulation rates are valid, this new approach has the potential of providing information on an intermediate ( z 30 yr) time scale, which can enhance our understand- ing of the process of strata formation.
Acknowledgements
This work was supported by the National Science Foundation Grant OCE-8812530 and OCE-9116035. The authors thank all the AmusSeds participants who assisted in the collection of samples (especially the cyclic samplers), and the crew of the R/V Columbus Iselin. Special thanks goes to W.S. Moore for the helpful discussions on various radioisotope techniques, Marylin Segall for her help with clay-mineralogy analysis, Ian Lerche (and associates) for assisting with spectral analysis, and to Gail Kineke and Richard Sternberg for the fluid-mud samples.
Contribution No. 1930 from Virginia Institute of Marine Science, School of Marine Science, College of William and Mary.
References
Alexander, C.R.. Nittrouer, C.A. and DeMaster. D.J., 1986.
High-resolution seismic stratigraphy and its sedimentological
interpretation on the Amazon continental shelf. Cont. Shelf
Res., 6: 331.-351.
Aller. R.C. and Cochran, J.K., 1976. r34Th/238U disequilibrium
in nearshore sediment: particle reworking and diagenetic
time scales. Earth Planet. Sci. Lett., 29: 37-50.
Aller, R.C., Mackin, J.C. and Cox, R.T., 1986. Diagenesis of
Fe and S in Amazon inner shelf muds: apparent dominance
of Fe reduction and implications for the genesis of ironstones.
Cont. Shelf Res.. 6: 2633310.
Baumgartner, A. and Reichel, E., 1975. The World Water
Balance. Elsevier, Amsterdam, 179 pp.
Benninger. L.K., Aller, R.C.. Cochran, J.K. and Turekian.
K.K., 1979. Effects of biological sediment mixing on the
“(‘Pb chronology and trace metal distribution in a Long
Island sound sediment core. Earth Planet. Sci. Lett.,
43: 241--259.
Bruland, K.W., Bertine, K., Koide, M. and Goldberg, E.D.,
1974. History of metal pollution in southern California
coastal zone. Environ. Sci. Tech., 8: 425432.
Cacchione, D.A., Drake, D.E., Kayen, R.W., Stemberg, R.W.,
Kineke, G.C. and Tate, G.B., 1995. Measurements in the
bottom boundary layer on the Amazon Prodelta: Analysis
of a sedimentation event. In: C.A. Nittrouer and S.A. Kuehl
(Editors), Geological Significance of Sediment Transport
and Accumulation on the Amazon Continental Shelf. Mar.
Geol., 125: 2355257.
Cambray, R.S., Playford, K. and Lewis, G.N.J., 1982.
Radioactive fallout in air and rain: results to end of 1981.
UK Atomic Energy Authority Rep., AERE-R 10485.
Harwell, 43 pp.
Cochran, J.K.. 1979. The geochemistry of ***Ra and 226Ra in
marine deposits. Ph.D. Thesis, Yale Univ., New Haven,
CT. 259 pp.
Cochran, J.K., 1980. The flux of *“Ra from the deep-sea
sediments. Earth Planet. Sci. Lett., 49: 381-392.
Crook, C.L., 1992. Solid phase activities of “*Ra, 226Ra, and
*28Th in the Amazon mixing zone. M.S. Thesis, Univ. South
Carolina, 108 pp.
Curtin, T.B. and Legeckis, R.V., 1986. Physical observations
in the plume region of the Amazon River during peak
discharge-I. Surface variability. Cont. Shelf Res., 6: 31-51.
Curtin, T.B., 1986. Physical observations in the plume region
of the Amazon River during peak discharge--III. Currents. Cont. Shelf Res., 6: 73-86.
Cutshall, N.H., Larsen, I.L. and Olsen, CR., 1983. Direct
analysis of ‘iOPb in sediment samples: self-absorption
corrections. Nut. Instrum. Methods, 206: 309-312.
Davis, J.A., 1984. Complexation of trace metals by adsorbed
natural organic matter. Geochim. Cosmochim. Acta, 48: 6199692.
DeMaster, D.J., McKee, B.A., Nittrouer, C.A., Jiangchu, Q,
and Guodong, C., 1985. Rates of sediment accumulation and particle reworking based on radiochemical measurements
D.A. Dukat, S. A. KuehljMarine Geology 125 ( 1995) 329-3.50 349
from continental shelf deposits in the East China Sea. Cont. geochronology with ‘i”Pb. Earth Planet. Sci. L&t., 14: Shelf Res., 4: 143-158. 442-446.
DeMaster, D.J., Kuehl, S.A. and Nittrouer, C.A., 1986. Effects of suspended sediments on geochemical processes near the mouth of the Amazon River: examination of biological silica uptake and the fate of particle reactive elements. Cont. Shelf Res., 6: 107-125.
Dibb, J.E. and Rice, D.L., 1989. The Geochemistry of Beryllium-7 in Chesapeake Bay. Estuarine Coastal Shelf Sci., 28: 379-394.
Koide, M., Bruland, K.W. and Goldberg, E.D., 1973. Th-228/Th-232 and Pb-210 geochronologies in marine and lake sediments. Geochim. Cosmochim. Acta, 37: 1171-l 187.
Krishnaswami, S., Lal, D., Martin, J.M. and Meybeck, M., 1971. Geochronology of lake sediments. Earth Planet. Sci. Lett., 11: 407-414.
Elsinger, R.J. and Moore, W.S., 1984. “*Ra and 226Ra in the mixing zones of the Pee Dee River-Winyah Bay, Yangtze River and Delaware Bay estuaries. Estuarine Coastal Shelf Sci., 18: 601-613.
Flagg, C.N., Gordon, R.L. and McDowell, S., 1986. Hydrographic and current observations on the Continental slope and shelf in the shelf in the Western equatorial Atlantic J. Phys. Oceanogr., 16: 1412-1429.
Geyer, W.R., Beardsley, R.C., Candela, J., Castro, B.M., Legeckis, R.V., Lentz, S.J., Limebumer, R., Miranda, L.B. and Trowbridge, J.H., 1991. The physical oceanography of the Amazon outflow. Oceanography, 4: 8-14.
Geyer, W.R., Beardsley, R.C., Lentz, S.J., Candela, J., Limburner, R., Johns, W.E., Castro, B.M. and Soares, I.D., in press. Physical oceanography of the Amazon shelf. Cont. Shelf Res.
Krishnaswami, S. and Lal, D., 1978. Radionuclide limnochro- nology. In: A. Lerman (Editor), Lakes: Chemistry, Geology, Physics. Springer, New York, pp. 153-177.
Kuehl, S.A., Nittrouer, C.A. and DeMaster, D.J., 1982. Modem sediment accumulation and strata formation on the Amazon Continental Shelf. Mar. Geol., 49: 279-300.
Kuehl, S.A., Nittrouer, C.A., DeMaster, D.J. and Curtin T.B., 1985. A long, square-barrel gravity corer for sedimentological and geochemical investigation of fine-grained sediments. Mar. Geol., 62: 365-370.
Gibbs, R.J., 1967. The geochemistry of the Amazon River system: Part I. The factors that control the salinity and the composition of the suspended solids. Geol. Sot. Am. Bull., 78: 1203-1232.
Kuehl, S.A., DeMaster, D.J. and Nittrouer, C.A., 1986a. Nature of sediment accumulation on the Amazon continental shelf. Cont. Shelf Res., 6: 209-225.
Kuehl, S.A., Nittrouer, C.A. and DeMaster, D.J., 1986b. Distribution of sedimentary structures in the Amazon subaqueous delta. Cont. Shelf Res., 6: 311-336.
Kuehl, S.A., Nittrouer, CA. and DeMaster, D.J., 1988. Microfabric study of fine-grained sediments: Observations from the Amazon subaqueous delta. J. Sediment. Petrol., 58: 12-23.
Gibbs, R.J., 1970. Circulation in the Amazon River estuary and adjacent Atlantic Ocean. J. Mar. Res., 28: 113-123.
Gibbs, R.J., 1977. Clay mineral segregation in the marine environment. J. Sediment. Petrol., 47: 237-243.
Gibbs, R.J., 1982. Currents on the shelf of North-eastern South America. Estuarine Coastal Shelf Sci., 14: 283-299.
Gibbs, R.J. and Konwar, L., 1986. Coagulation and settling of Amazon River suspended sediment. Cont. Shelf Res., 6: 1277149.
Kuehl, S.A., Hairu, T.M. and Moore, W.S., 1989. Shelf sedimentation off the Ganges-Brahrnaputra river system: Evidence for sediment bypassing to the Bengal Fan. Geology, 17: 1132-1135.
Kuehl, S.A., Pacioni, T.D. and Rine, J.M., 1995. Seabed dynamics of the inner Amazon continental shelf: Temporal and spatial variability of surlicial strata. In: CA. Nittrouer and S.A. Kuehl (Editors), Geological Significance of Sediment Transport and Accumulation on the Amazon Continental Shelf. Mar. Geol., 125: 283-302.
Goodyear, C.C., 1971. Signals and Information. Butterworths, London, 310 pp.
Jones, G.B. and Jordan, M.B., 1979. The distribution of organic material and trace metals in sediments from the River Liffey Estuary, Dublin. Estuarine Coastal Mar. Sci., 8: 37-47.
Li, Y.H., Mathieu, D., Biscaye, P. and Simpson, H.J., 1977. The flux of 228Ra from estuarine and continental shelf sediments. Earth Planet. Sci. Lett., 37: 237-241.
McKee, B.A., Nittrouer, C.A. and DeMaster, D.J., 1983. Concepts of sediment deposition and accumulation applied to the continental shelf near the mouth of the Yangtze River. Geology, 11: 631-633.
Key, R.M., Stallard, R.F., Moore, W.S. and Sarmiento, J.L., 1985. Distribution and flux of “‘Ra and 226Ra in the Amazon River estuary. J. Geophys. Res., 90: 6995-7004.
Kineke, G.C., 1993. Fluid muds on the Amazon continental shelf. Ph.D. Thesis, Univ. Washington, Seattle, WA, 259 pp.
Kineke, G.C. and Sternberg, R.W., 1995. Distribution of fluid muds on the Amazon continental shelf. In: C.A. Nittrouer and S.A. Kuehl (Editors), Geological Significance of Sediment Transport and Accumulation on the Amazon Continental Shelf. Mar. Geol., 125: 193-234.
Koide, M., Soutar, A. and Goldberg, E.D., 1972. Marine
McKee, B.A., DeMaster, D.J. and Nittrouer, C.A., 1986. Temporal variability in the partitioning between dissolved and particulate phases on the Amazon shelf: implications for the scavenging of particle-reactive species. Cont. Shelf Res., 6: 87-106.
McKenna, T.E., Lerche, I., Williams, D.F. and Full, W.E., 1988. Quantitative techniques in isotope chronostratigraphy. Palaeogeogr., Palaeoclimatol., Palaeoecol., 64: 241-264.
Meade, R.H.. Dunne, T., Richey, J.E., Santos, U. DeM. and Salati, E., 1985. Storage and remobilization of suspended sediment in the lower Amazon River of Brazil. Science, 228: 4888490.
350 D.A. Dukor, S. A. KurhliMarinr Geology 125 i 1995) 329-350
Milliman, J.D., Summerhayes, C.P. and Barretto, H.T., 1975. Oceanography and suspended matter off the Amazon River: February-March 1973. J. Sediment. Petrol.. 45: 189 206.
Moore, W.S., 1984. Radium isotope measurements using germanium detectors. Nut. Instrum. Methods Phys. Res.. 223: 407-411.
Moore, W.S. and Dymond, J., 1988. Correlation of ““Pb removal with organic carbon fluxes in the Pacific Ocean. Nature, 331: 339-341.
Moore, W.S., DeMaster. D.J., Smoak, J.M., McKee. B.A. and Swarzenski, P.W., in press. Radionuclide tracers of sedi- ment-water interaction on the Amazon shelf. Cont. Shelf. Res.
Nittrouer, CA.. Sternberg, R.W., Carpenter, R. and Bennett. J.T., 1979. The use of ‘r”Pb geochronology as a sedimentolog- ical tool: Application to the Washington continental shelf. Mar. Geol., 61: 297-316.
Nittrouer, C.A., DeMaster, D.J., McKee, B.A.. Cutshall. N.H. and Larsen, LL., 1983/1984. The effect of sediment mixing on Pb-210 accumulation rates for the Washington continental shelf. Mar. Geol., 54: 201-221.
Nittrouer, C.A., Curtin, T.B. and DeMaster, D.J., 1986a. Concentration and flux of suspended sediment on the Amazon continental shelf. Cont. Shelf Res.. 6: 151 174.
Nittrouer, CA., Kuehl, S.A., DeMaster, D.J. and Kowsmann. R.O., 1986b. The deltaic nature of Amazon shelf sedimenta- tion Geol. Sot. Am. Bull., 97: 4444458.
Nittrouer, C.A., Kuehl, S.A.. Sternberg, R.W.. Figueiredo, A.G. and Faria, L.E.C.. 1995. An introduction to the geological significance of sediment transport and accumula- tion on the Amazon continental shelf. In: C.A. Nittrouer and S.A. Kuehl (Editors), Geological Significance 01 Sediment Transport and Accumulation on the Amazon Continental Shelf. Mar. Geol., 125: 177-192.
Olsen, CR., Larsen, LL., Lowry, P.D. and Cutshall. N.G..
1986. Geochemistry and deposition of 7Be in river-estuarine and coastal waters. J. Geophys. Res., 91: 896-908.
Pacioni, T.P., 1991. Temporal and spatial variability of surface mixed layer thickness on the Amazon continental shelf. M.S. Thesis. Univ. South Carolina, 59 pp.
Richey, J.E., Meade, R.H., Saliti, E., Devol, A.H., Nordin. C.F.. Jr. and DOS Santos, U.. 1986. Water discharge and suspended sediment concentrations in the Amazon River: 1982. 1984. Am. Geophys. Union, 22: 756-764.
Robbins. J.A. and Edgington. D.N., 1975. Determination of recent sedimentation rates in Lake Michigan using Pb-210 and Cs-I 37. Geochim. Cosmochim. Acta, 39: 285-304.
Sanford, M.W., Kuehl, S.A. and Nittrouer C.A., 1990. Modern sedimentary processes in the Wilmington Canyon area, U.S. east coast. Mar. Geol., 92: 205-226.
Segall, M.P., 1991. Modern, fine-grained continental margin sedimentation as revealed by clay-sized mineralogy and sedimentary fabric. Ph.D. Thesis, Univ. South Carolina. 227 pp.
Smith, J.N. and Walton. A., 1980. Sediment accumulation rates and geochronologies measured in the Saguenay Fjord using the Pb-210 dating method. Geochim. Cosmochim. Acta. 44: 225-240.
Srinath. M.D. and Rajasekaran, P.K., 1979. An introduction to Statistical Signal Processing with Applications, Wiley, New York, 499 pp.
Underkoffler, E.C.. 1990. Non-steady-state sedimentation on the Amazon continental shelf. M.S. Thesis, Univ. South Carolina, 80 pp.
Van Olphen, H.. 1978. Clay Colloid Chemistry. Interscience. New York, 2nd ed.. 300 pp.
Yu. 2.. Lerche, I., Williams, D.F., Trainor, D. and Healy- Williams, N.. 1991. Application of a matched filter method to enhance signal-to-noise ratios in geologic time series. Nuclear Geophys.. 5: 279-289.