Non-Local Musical Statistics as Guides for Audio-to-Score ...
16
Non-Local Musical Statistics as Guides for Audio-to-Score Piano Transcription ? Kentaro Shibata a , Eita Nakamura a,b,* , Kazuyoshi Yoshii a a Graduate School of Informatics, Kyoto University, Kyoto 606-8501, Japan b The Hakubi Center for Advanced Research, Kyoto University, Kyoto 606-8501, Japan Abstract We present an automatic piano transcription system that converts polyphonic audio recordings into musical scores. This has been a long-standing problem of music information processing, and recent studies have made remarkable progress in the two main component techniques: multipitch detection and rhythm quantization. Given this situation, we study a method integrating deep-neural-network-based multipitch detection and statistical-model-based rhythm quantization. In the first part, we conducted systematic evaluations and found that while the present method achieved high transcription accuracies at the note level, some global characteristics of music, such as tempo scale, metre (time signature), and bar line positions, were often incorrectly estimated. In the second part, we formulated non-local statistics of pitch and rhythmic contents that are derived from musical knowledge and studied their effects in inferring those global characteristics. We found that these statistics are markedly effective for improving the transcription results and that their optimal combination includes statistics obtained from separated hand parts. The integrated method had an overall transcription error rate of 7.1% and a downbeat F-measure of 85.6% on a dataset of popular piano music, and the generated transcriptions can be partially used for music performance and assisting human transcribers, thus demonstrating the potential for practical applications. Keywords: Music transcription; multipitch detection; rhythm quantization; deep neural network; statistical modelling. 1. Introduction Automatic music transcription has been a long-standing fundamental problem in music informatics [2]. The ulti- mate goal is to convert music audio signals into musical scores, which are useful for music performance and music content analysis. For example, a vast number of music au- dio and video files are available on the Web, and for most of them, it is difficult to find the corresponding musical scores, which are necessary for practicing music, making covers, and conducting detailed music analysis. The cen- tral problem of automatic music transcription is to obtain symbolic representation of musical pitches and rhythms from continuous signals. Transcribing polyphonic music, which contains multiple pitches sounding simultaneously, is especially a challenging problem because of the huge search space and the difficulty of separating individual pitches from a sound mixture; it is difficult even for hu- man experts. Here we study the problem of transcribing polyphonic piano music, which is one of the major forms of music. Due to the complexity of the problem, polyphonic mu- sic transcription has been studied as two-split problems, ? This work was in part supported by JSPS KAKENHI Nos. 16H01744 and 19K20340, JST ACCEL No. JPMJAC1602, and the Kyoto University Foundation. * Corresponding author Email address: [email protected] (Eita Nakamura) multipitch detection and rhythm quantization. In multi- pitch detection, an audio signal is converted into a per- formance MIDI sequence, which is a list of musical notes with semitone-level pitches, onset and offset times in sec- onds, and velocities (intensities). Spectrogram factor- ization methods such as nonnegative matrix factoriza- tion (NMF) and probabilistic latent component analysis (PLCA) have been common approaches to this problem [3, 11, 48]. More recently, significant improvements have been achieved by means of deep neural network (DNN) techniques [4, 22, 45, 49]. In rhythm quantization, a performance MIDI sequence is converted into a quantized MIDI sequence where the on- set and offset times are described in units of beats. In this task, utilizing musical knowledge about tempo changes and common rhythmic patterns is essential and methods based on statistical models such as hidden Markov mod- els (HMMs) have been studied for recognizing quantized onset times [9, 21, 39, 43]. For recognizing quantized off- set times, or equivalently note values, a method based on Markov random field has been proposed [38]. Despite the active research in these two fields, studies on the whole audio-to-score transcription problem are still scarce [25]. As a recent attempt, [34] proposed an audio- to-score piano transcription system that integrates a mul- tipitch detection method based on PLCA and a rhythm quantization method based on HMM. That paper con- cluded that the results were often far from the practical Preprint submitted to Information Sciences April 3, 2021 arXiv:2008.12710v3 [cs.SD] 3 Apr 2021
-
Upload
khangminh22 -
Category
Documents
-
view
1 -
download
0
Transcript of Non-Local Musical Statistics as Guides for Audio-to-Score ...
Non-Local Musical Statistics as Guides for Audio-to-Score Piano Transcription?
Kentaro Shibataa, Eita Nakamuraa,b,∗, Kazuyoshi Yoshiia
aGraduate School of Informatics, Kyoto University, Kyoto 606-8501, JapanbThe Hakubi Center for Advanced Research, Kyoto University, Kyoto 606-8501, Japan
Abstract
We present an automatic piano transcription system that converts polyphonic audio recordings into musical scores. Thishas been a long-standing problem of music information processing, and recent studies have made remarkable progressin the two main component techniques: multipitch detection and rhythm quantization. Given this situation, we study amethod integrating deep-neural-network-based multipitch detection and statistical-model-based rhythm quantization. Inthe first part, we conducted systematic evaluations and found that while the present method achieved high transcriptionaccuracies at the note level, some global characteristics of music, such as tempo scale, metre (time signature), andbar line positions, were often incorrectly estimated. In the second part, we formulated non-local statistics of pitchand rhythmic contents that are derived from musical knowledge and studied their effects in inferring those globalcharacteristics. We found that these statistics are markedly effective for improving the transcription results and thattheir optimal combination includes statistics obtained from separated hand parts. The integrated method had anoverall transcription error rate of 7.1% and a downbeat F-measure of 85.6% on a dataset of popular piano music,and the generated transcriptions can be partially used for music performance and assisting human transcribers, thusdemonstrating the potential for practical applications.
Keywords: Music transcription; multipitch detection; rhythm quantization; deep neural network; statistical modelling.
1. Introduction
Automatic music transcription has been a long-standingfundamental problem in music informatics [2]. The ulti-mate goal is to convert music audio signals into musicalscores, which are useful for music performance and musiccontent analysis. For example, a vast number of music au-dio and video files are available on the Web, and for mostof them, it is difficult to find the corresponding musicalscores, which are necessary for practicing music, makingcovers, and conducting detailed music analysis. The cen-tral problem of automatic music transcription is to obtainsymbolic representation of musical pitches and rhythmsfrom continuous signals. Transcribing polyphonic music,which contains multiple pitches sounding simultaneously,is especially a challenging problem because of the hugesearch space and the difficulty of separating individualpitches from a sound mixture; it is difficult even for hu-man experts. Here we study the problem of transcribingpolyphonic piano music, which is one of the major formsof music.
Due to the complexity of the problem, polyphonic mu-sic transcription has been studied as two-split problems,
?This work was in part supported by JSPS KAKENHI Nos.16H01744 and 19K20340, JST ACCEL No. JPMJAC1602, and theKyoto University Foundation.
∗Corresponding authorEmail address: [email protected] (Eita
Nakamura)
multipitch detection and rhythm quantization. In multi-pitch detection, an audio signal is converted into a per-formance MIDI sequence, which is a list of musical noteswith semitone-level pitches, onset and offset times in sec-onds, and velocities (intensities). Spectrogram factor-ization methods such as nonnegative matrix factoriza-tion (NMF) and probabilistic latent component analysis(PLCA) have been common approaches to this problem[3, 11, 48]. More recently, significant improvements havebeen achieved by means of deep neural network (DNN)techniques [4, 22, 45, 49].
In rhythm quantization, a performance MIDI sequenceis converted into a quantized MIDI sequence where the on-set and offset times are described in units of beats. In thistask, utilizing musical knowledge about tempo changesand common rhythmic patterns is essential and methodsbased on statistical models such as hidden Markov mod-els (HMMs) have been studied for recognizing quantizedonset times [9, 21, 39, 43]. For recognizing quantized off-set times, or equivalently note values, a method based onMarkov random field has been proposed [38].
Despite the active research in these two fields, studieson the whole audio-to-score transcription problem are stillscarce [25]. As a recent attempt, [34] proposed an audio-to-score piano transcription system that integrates a mul-tipitch detection method based on PLCA and a rhythmquantization method based on HMM. That paper con-cluded that the results were often far from the practical
Preprint submitted to Information Sciences April 3, 2021
arX
iv:2
008.
1271
0v3
[cs
.SD
] 3
Apr
202
1
level because of the limited performance of the multip-itch detection method. The system proposed in [12] uses amultipitch detection method based on convolutional sparsecoding and a MIDI-to-score conversion method [13] thatuses the Melisma Analyzer [46] for rhythm quantization.No accounts of the full audio-to-score transcription system,however, have been reported in the literature. Another di-rection of research is the end-to-end approach to audio-to-score transcription [8, 41, 44]. At present, however, the re-ported studies cover only constrained conditions (e.g. syn-thetic sound) and are of limited success. Given the signifi-cant progress of DNN-based multipitch detection methods,currently the most promising approach is to integrate oneof these methods with the best-performing rhythm quan-tization method.
Most recent studies on piano transcription rely on theMAPS data [16] for evaluation. This dataset consistsmostly of Western classical music, which is considered tobe a reasonable source of experimental data for its varietyand complexity and for the lack of concerns over copyrightissues. However, musical scores of classical music are eas-ily accessible and there are few demands for new transcrip-tions. From a practical viewpoint, much more commercialand academic demands are expected in the field of popularmusic. Since popular music and classical music have dif-ferent features, it is important to evaluate a transcriptionsystem with popular music data to examine its potentialand limitations in a practical situation.
This study is composed of two parts. The purpose of thefirst study is to examine the potential of the integrationof DNN-based multipitch detection and statistical-model-based rhythm quantization methods. We explicitly con-struct an audio-to-score (wav to MusicXML) piano tran-scription system and conduct systematic evaluations usingclassical music and popular music data. As a result, wefound that although the system achieves high performancein terms of note-level evaluation metrics, it makes a signif-icant amount of errors for global musical characteristics;the most common errors are misidentification of temposcale (halved tempos), metre (confusion of 4/4 time and3/4 time), and positions of bar lines (downbeats). Theresult indicates that these global characteristics cannot beaccurately inferred from local musical statistics consideredin the applied statistical models. As time signature andbar lines are pieces of basic information for understandingthe structure of music, it is crucial for applications thatthey are correctly given in transcribed scores.
Given these results, the purpose of the second study isto understand the principles for correctly estimating theseglobal musical characteristics. In cognitive music theory, ithas been argued that various musical features are involvedin the recognition and representation of metrical structure[29]. Studies on metre detection [18], beat tracking [15],and musical structure analysis [40] have also suggested theimportance of non-local features, such as self-similarityand voice configuration, for determining musical character-istics related to metrical structure. Gathering this knowl-
Performance MIDI
Polyphonic music audio
Quantized MIDI
Multipitch detection
Rhythm quantization
Musical score (MusicXML, PDF, etc.)
Score typesetting
PitchOnset & offset time (in sec)Velocity (intensity)
PitchOnset & offset time (in beat)Time signature
( ,
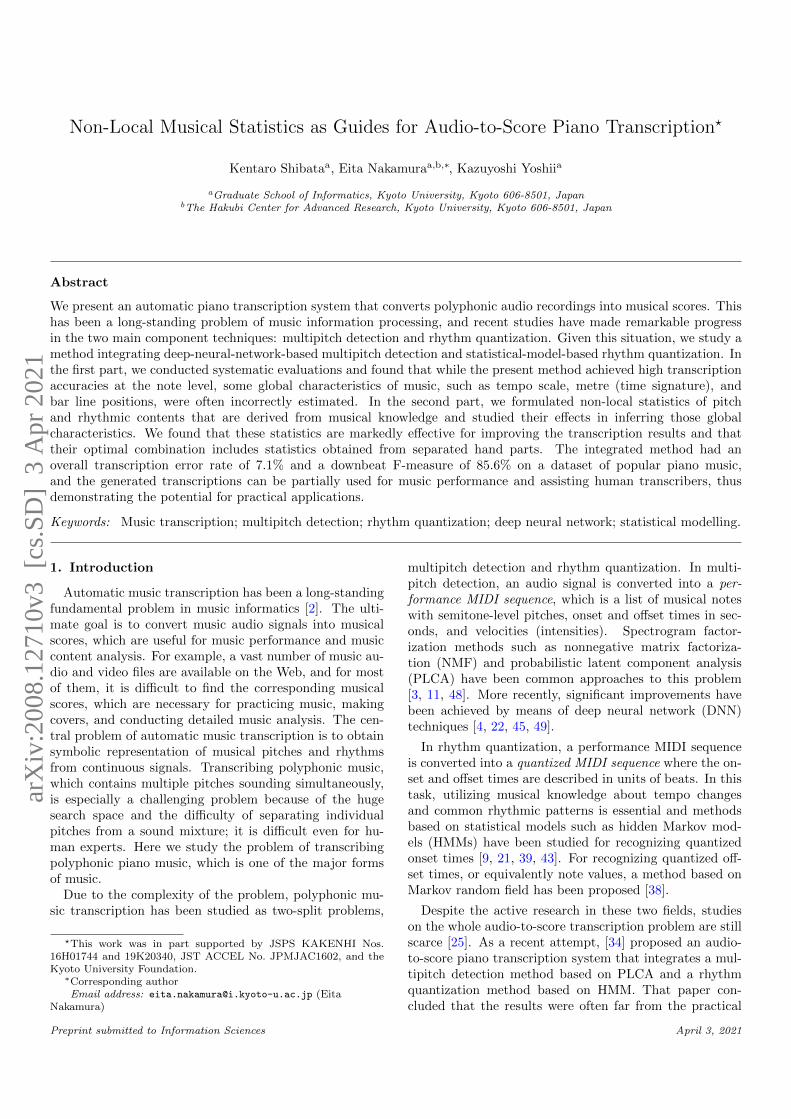
Figure 1: Outline of the piano transcription system.
edge from several research fields, we formulate a set ofmusical statistics and conduct experiments to find out therelevance of each statistic and the optimal combination ofstatistics for improving the transcribed results. The re-sults indicate that non-local statistics are useful guides forinferring the global characteristics and that a specific com-bination of statistics has a significantly better effect thanusing all the statistics or using only local ones.
Compared to the previous systems [34, 44], the presentmethod achieved a considerable improvement and ap-proach towards a practical audio-to-score music transcrip-tion system. As examples in the accompanying webpage1
demonstrate, transcribed scores can partly be used in prac-tice and can assist human transcribers. We also discusscurrent limitations and implications for further studies onautomatic music transcription.
2. Method for Audio-to-Score Piano Transcription
2.1. System Architecture
The outline of the present audio-to-score piano tran-scription system is shown in Fig. 1. In the multipitch de-tection step, a performance MIDI sequence is estimated foran input audio signal. In the rhythm quantization step, theonset and offset times in the performance MIDI sequenceare quantized and represented in beat units. In the scoretypesetting step, the quantized MIDI sequence is convertedto a MusicXML file, which is a common data format forhuman/computer-readable score representation. We ex-plain these three steps in the following sections.
2.2. Multipitch Detection
We use a convolutional neural network (CNN) calledDeepLabv3+, which was first used for image segmentation[10] and later applied for multipitch detection [49]. The
1https://audio2score.github.io/
2
Performance MIDI
Masked onsetsand velocities
Pitch activationswith onsets
Onsets and velocities
Audiospectrogram
PitchNet
OnVelNet
Velocities
Onsets
Velocities
Onsets
Pitch activations
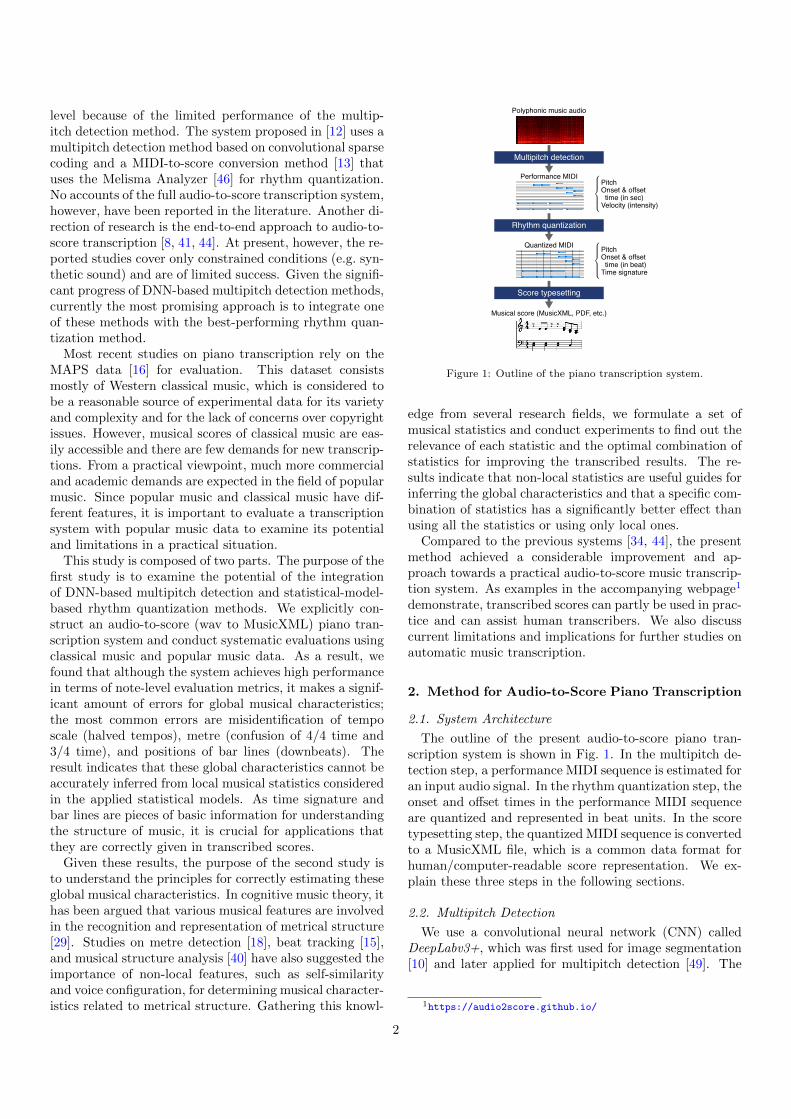
Figure 2: Architecture of the multipitch detection method(POVNet).
original network [49] estimates only pitch activation andwe modify it to estimate onset and velocity as well. Themultipitch detection method (POVNet) consists of twoDNNs, one for pitch analysis (PitchNet) and the otherfor onset and velocity estimation (OnVelNet) (Fig. 2).These networks are trained separately, and a performanceMIDI sequence is obtained by combining their outputs.The inputs to these networks are harmonic combined fre-quency and periodicity (HCFP) features [49] denoted byZ ∈ R2H×F×T
+ , where H is the number of harmonic par-tials, F the number of frequency bins, and T the numberof time frames.
Given HCFP features Z as input, PitchNet outputs anF × T probability matrix Pp, whose element Pp(f, t) ∈[0, 1] represents the salience of frequency f at frame t. Thenetwork architecture is the same as in [49] (F = 352 =88 × 4 and H = 6). In the last layer, Pp is obtained bya sigmoid function. PitchNet is trained by a binary cross-entropy loss function
Lp = − 1
FT
F,T∑
f,t=1
[{1− Pp(f, t)
}ln{
1− Pp(f, t)}
+ Pp(f, t) lnPp(f, t)
], (1)
where Pp ∈ {0, 1}F×T denotes a binary pitch activationmatrix obtained from the ground-truth MIDI data (sustainpedal events are taken into account). Finally, an M × Tpitch activation matrix Dp, whose element Dp(m, t) ∈{0, 1} represents the presence of semitone-level pitch m atframe t, is obtained by binarizing and down-sampling Pp
along the frequency axis (M = 88 is the number of pitcheson a piano keyboard).
Given HCFP features Z as input, OnVelNet outputsan onset probability matrix Po ∈ [0, 1]F×T and an inten-sity matrix Pv ∈ [0, 1]F×T , whose elements Po(f, t) andPv(f, t) represent the onset salience and the intensity, re-spectively, at frequency f and frame t. The intensity heretakes a real value between 0 and 1 corresponding to anintegral value between 0 and 127 defined as velocity inthe MIDI format. OnVelNet has the same architecture asPitchNet except for the last layer, where Po is obtained by
a sigmoid function and Pv is obtained by a clip functionwith an interval of [0, 1]. This network is trained by mini-mizing the weighted sum Lov = woLo + wvLv of a binarycross-entropy loss Lo and a mean squared error loss Lv
given by
Lo = − 1
FT
F,T∑
f,t=1
[{1− Po(f, t)
}ln{
1− Po(f, t)}
+ Po(f, t) lnPo(f, t)
], (2)
Lv =1
FT
F,T∑
f,t=1
Po(f, t){Pv(f, t)− Pv(f, t)
}2
. (3)
Here, Po ∈ {0, 1}F×T is a binary matrix representing the
presence of note onsets and Pv ∈ [0, 1]F×T is a real-valuedmatrix representing the intensities of note onsets. Thesetwo matrices are obtained from the ground-truth MIDIdata. To allow small fluctuations of onset times, Po(f, t±1) are set to 1 if Po(f, t) = 1 originally. Finally, an onsetmatrix Do ∈ {0, 1}M×T is obtained by binarizing Po anddown-sampling the result along the frequency axis. If Do
has successive 1 s along the time axis, these elements areset to 0 except the 1 at the centre. A velocity matrixDv ∈ {0, . . . , 127}M×T is obtained by applying scaling,rounding-down, and down-sampling to Pv.
A performance MIDI sequence (tn, tn, pn, vn)Nn=1 repre-senting the onset times tn, offset times tn, pitches pn, andvelocities vn of notes is obtained from pitch activations Dp,onset matrix Do, and velocity matrix Dv (N is the num-ber of notes in the MIDI sequence). To ensure the consis-tency between the pitch activations and onsets, Do(m, t)is set to 0 if Dp(m, t) = 0. Onset times are obtained bypicking time-frequency bins that satisfy Dp(m, t) = 1 andDp(m, t−1) = 0, and Do is used for detecting successivenotes. The following rules are applied as well:
• If an onset from Dp and one from Do are within 100ms, they are merged by retaining only the earlier one.
• Notes with durations of < 30 ms are removed.
• Notes with velocities of < 40 are removed.
The threshold on the durations is set to eliminate unphysi-cal notes (30 ms approximately corresponds to a 64th notein a tempo of 120 beats per minutes (BPM)). The thresh-old on the velocities has the effect of reducing false posi-tives with some risk of missing soft notes. The value is nottuned and was determined after some trials.
2.3. Rhythm Quantization
Given a performance MIDI sequence (tn, tn, pn, vn)Nn=1,the rhythm quantization method estimates a quantizedMIDI sequence (τn, τn, pn)Nn=1. The onset score times τnare estimated first (onset rhythm quantization step) andthe offset score times τn are estimated subsequently (notevalue recognition step). For onset rhythm quantization,
3

we use the metrical HMM [21, 43] extended for polyphonicmusic [34]. For note value recognition, we use the methodin [38]. As preparation for later discussions, we here sum-marize the onset rhythm quantization method.
The metrical HMM describes the generative process ofonset score times, local tempos, and onset times. On-set score times τn are generated by a Markov modelwith initial probability P (τ1) and transition probabilitiesP (τn|τn−1). These probabilities are represented in termsof metrical positions bn, which indicate the positions of τnrelative to bar lines. Onset score times and metrical posi-tions are described in units of tatums (minimal resolutionof beats). The tatum unit is assumed to be 1/3 of a 16thnote in this study. The length B of a bar is determined bythe underlying metre (for example, B = 48 for 4/4 timeand B = 36 for 3/4 time) and metrical position bn hasa value in {0, 1, . . . , B − 1} where bn = 0 indicates thedownbeat (beginning of a bar). In addition, we introducea chord variable gn that indicates whether the (n − 1)thand n th notes have the same onset score time (gn = CH)or not (gn = NC). Based on this data representation,the initial probability is given as P (τ1) = P (b1) and thetransition probabilities are given as
P (τn|τn−1) = χbn−1,gn(δgn,CHδbn,bn−1+ δgn,NCπbn−1,bn),
(4)
where δ is Kronecker’s symbol, χbn−1,gn = P (gn|bn−1) arethe probabilities of chordal notes at each metrical posi-tion, and πbn−1,bn = P (bn|bn−1) are the metrical transitionprobabilities. The difference τn−τn−1 between consecutiveonset score times is determined as
τn − τn−1 =
0, gn = CH;
bn − bn−1, gn = NC, bn > bn−1;
bn − bn−1 +B, gn = NC, bn ≤ bn−1.
(5)
The chord probabilities χbn−1,gn and metrical transitionprobabilities πbn−1,bn describe the frequencies of rhythmicpatterns used in music and are learned from musical scoredata.
The local tempos un describe the ratio of the onset timescale described in seconds and the score time scale de-scribed in tatum units. To allow tempo variations, theyare assumed to obey a Gaussian-Markov model:
u1 = Gauss(uini, σ2iniu), un = Gauss(un−1, σ
2u). (6)
Here, Gauss(µ, σ2) denotes a Gaussian distribution withmean µ and standard deviation σ, uini represents the aver-age initial tempo, σiniu the amount of global tempo varia-tion, and σu the amount of local tempo changes. Given thesequence of onset score times τn and local tempos un, theonset times tn are generated by the Gaussian/Exponentialmodel in [36] as
P (tn) =
{Gauss(tn−1 + un−1(τn − τn−1), σ2
t ), gn = NC;
Exp(tn−1, λt), gn = CH,
(7)
where Exp(x, λ) denotes an exponential distribution withscale parameter λ and support [x,∞). The parametersσt and λt represent the fluctuation of onset times; theformer is for time intervals between chords and the latterfor asynchrony of chordal notes.
Putting together the probabilistic models in Eqs. (4),(6), and (7), we can calculate the joint probabilityP (t1:N , τ1:N , u1:N ) (t1:N denotes (tn)Nn=1 etc.). Given theonset times t1:N , we can estimate the onset score timesτ1:N and local tempos u1:N by maximizing the probabil-ity P (τ1:N , u1:N |t1:N ) ∝ P (t1:N , τ1:N , u1:N ). This can bedone by the Viterbi algorithm with discretization of thetempo variables [34].
So far, we have assumed that the underlying metre andthe corresponding bar length B are given. To estimate themetre of the input performance, we can apply the maxi-mum likelihood method [39]. The procedure is as follows:we construct multiple metrical HMMs corresponding tocandidate metres (4/4, 3/4, 2/4, etc.), calculate the max-imum probability P (t1:N , τ1:N , u1:N ) for each model, andfinally obtain the most probable metre according to theprobability.
2.4. Score Typesetting
To convert a quantized MIDI sequence to graphical mu-sical score representation, it is necessary to properly assignthe musical notes to either the right-hand part or the left-hand part. To do this, we use the hand part separationmethod of [35]. There are often more than one melody(or “voice” in musical terminology) in each hand part,and in that case, it is necessary to separate the voicesas well. Although several voice separation methods ex-ist [7, 14, 31], some assume strictly monophonic voices,which is inappropriate for general piano music, and theothers have not been made available for public use. There-fore, we implemented a cost-function-based voice separa-tion method that can handle homophonic voices. Sincewe need some space to describe the method in detail andit is not the main scope of this study, the voice separa-tion method is presented in Appendix A. The result ofhand part and voice separation is preserved as a quantizedMIDI sequence with separated tracks, each correspondingto voices. In the last step of score typesetting, we usethe public software MuseScore 32 to obtain score nota-tion in the MusicXML format. To properly preserve thevoice structure, the quantized MIDI sequence is importedto MuseScore and a MusicXML file with multiple voicetracks is exported. The final transcription result in theMusicXML format is obtained by merging the voice tracksin each hand part into a single staff.
2MuseScore 3, https://musescore.org/.
4

3. Systematic Evaluation
3.1. Data and Experimental Setups
We use two kinds of music data, classical music andpopular music, for evaluating the transcription system.To simplify the experimental setup, we train and test themethods separately for these two sets of data. The pur-pose of using classical music data is to enable compar-ison with existing methods and we use the convention-ally used MAPS dataset [16]. This dataset contains pi-ano pieces by various composers and the audio recordingsof MIDI sequences with manually added musical expres-sions. Specifically, for testing, we use the 60 pieces labelled“ENSTDkCl” and “ENSTDkAm,” which are recordingsof MIDI piano playbacks of the MIDI data. For trainingthe chord probabilities and metrical transition probabili-ties of the metrical HMM, the dataset of classical musicin [38] is used, as is done in [34]. We use the same pa-rameterization for the performance model as in [34]: thetempo variables are discretized into 50 values logarith-mically equally spaced in the range between umin = 0.3s/QN (sec per quarter note) and umax = 1.5 s/QN (cor-responding to BPM 40 and BPM 200), σu = 3.32 × 10⁻²
s/QN, uini =√umaxumin, σiniu = 3σu, σt = 0.02 s, and
λt = 0.0101 s. We also use the default parameter valuesfor the note value recognition method as in [34].
The purpose of using popular music data is to examinethe system’s performance in a practical situation, as dis-cussed in the Introduction. For testing, we collected 81piano covers of popular music whose audio recordings areavailable on YouTube and corresponding musical scoresare available from a public website3. These pieces wereselected from the most popular pieces and were intendedto cover a variety of artists and different levels of perfor-mance difficulty. The pieces were played by various pi-anists; some were played with a real piano and the otherswere played with a digital piano. The quality of the audiorecordings was generally high. Since most pieces are J-pop songs, we hereafter call this dataset the J-pop dataset.For training the chord probabilities and metrical transitionprobabilities of the metrical HMM for popular music, weused a collection of 811 pieces, which were obtained froma public website4. We downloaded all musical scores thatappeared by searching ‘piano cover’ in the website and re-moved noisy ones with obviously irregular typesetting. Wecall this dataset the MuseScore dataset. For the parame-ters of the performance model, we use a parameterizationslightly different from the one for classical music becausethe amount of tempo changes is usually smaller in popularmusic performances. We set σu = 3.32 × 10⁻³ s/QN andσt = 0.03 s. We use the default parameter values for thenote value recognition method as in the case of classicalmusic.
3Yamaha Music Entertainment Holdings, Print gakufu, https:
//www.print-gakufu.com/.4MuseScore 3, https://musescore.org/.
Method Pf Rf Ff Pn Rn Fn
PLCA [34] — — — 77.9 68.9 72.8OaF [23] 92.9 78.5 84.9 87.5 85.6 86.4DeepLabv3+ [49] 87.5 86.3 86.7 — — —PitchNet only 89.3 84.4 86.6 91.1 68.4 77.5POVNet 89.3 85.7 87.3 89.7 84.1 86.7
Table 1: Accuracies (%) of multipitch detection on the MAPS-ENSTDkCl and MAPS-ENSTDkAm datasets. The best values(within a range of 1 percentage point (PP)) are indicated in boldfont.
The POVNet was trained with the MAPS dataset ex-cluding the “ENSTDkCl” and “ENSTDkAm” subsets byusing the RAdam optimizer [30] with a standard initiallearning rate of 0.001. We set the loss weights wo = 0.9and wv = 0.1, taking into account the importance of on-set detection and the difficulty of velocity estimation. Theframe shift for the HCFP features was 20 ms and inputsto the CNNs had 512 frames (10.24 s) and were shifted by128 frames (2.56 s).
3.2. Accuracy of Multipitch Detection
We first evaluated the performance of the multipitchdetection method, since it is an important component tocompare with the previous method [34]. For this purpose,we use the MAPS dataset, which includes the ground-truthMIDI data, and the frame-level metrics and note-level met-rics defined in [1]; the dataset and metrics are convention-ally used in the research field. In the frame-level metrics,the precision Pf , recall Rf , and F-measure Ff are calcu-lated with a time resolution of 10 ms. In the note-levelmetrics, the precision Pn, recall Rn, and F-measure Fn
are calculated by judging detected onsets that are within±50 ms from ground-truth onsets as correct. For consis-tency with previous studies, we used the first 30 s of eachrecording.
The results are summarized in Table 1. In addition toPOVNet, the PLCA method used in [34], a representativeDNN-based method [23] (OaF; Onsets and Frames trainedwith the MAESTRO dataset), the original DeepLabv3+in [49], and the results using only PitchNet are comparedin the table. POVNet outperformed the others in boththe frame-level and note-level F-measures. POVNet andOaF had equivalent Fn, which were significantly higherthan Fn for the PLCA method. The difference in Rn
between POVNet and the method using only PitchNetclearly demonstrates the efficacy of OnVelNet, which en-abled detection of repeated tones.
3.3. Accuracy of Audio-to-Score Transcription
To evaluate the performance of audio-to-score transcrip-tion systems, we use the edit-distance-based metrics de-fined in [34] and the MV2H metrics defined in [33]. In theformer metrics, the following error rates (ERs) are calcu-lated: pitch ER Ep, missing note rate Em, extra note rate
5
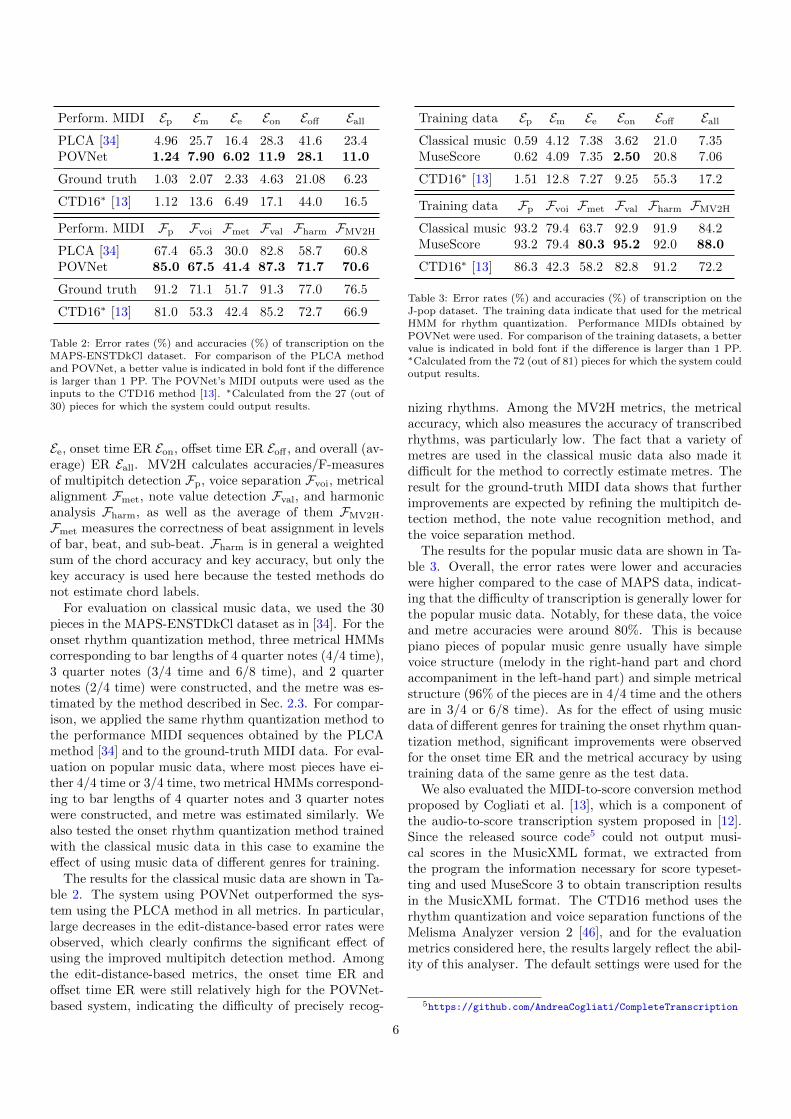
Perform. MIDI Ep Em Ee Eon Eoff Eall
PLCA [34] 4.96 25.7 16.4 28.3 41.6 23.4POVNet 1.24 7.90 6.02 11.9 28.1 11.0
Ground truth 1.03 2.07 2.33 4.63 21.08 6.23
CTD16∗ [13] 1.12 13.6 6.49 17.1 44.0 16.5
Perform. MIDI Fp Fvoi Fmet Fval Fharm FMV2H
PLCA [34] 67.4 65.3 30.0 82.8 58.7 60.8POVNet 85.0 67.5 41.4 87.3 71.7 70.6
Ground truth 91.2 71.1 51.7 91.3 77.0 76.5
CTD16∗ [13] 81.0 53.3 42.4 85.2 72.7 66.9
Table 2: Error rates (%) and accuracies (%) of transcription on theMAPS-ENSTDkCl dataset. For comparison of the PLCA methodand POVNet, a better value is indicated in bold font if the differenceis larger than 1 PP. The POVNet’s MIDI outputs were used as theinputs to the CTD16 method [13]. ∗Calculated from the 27 (out of30) pieces for which the system could output results.
Ee, onset time ER Eon, offset time ER Eoff , and overall (av-erage) ER Eall. MV2H calculates accuracies/F-measuresof multipitch detection Fp, voice separation Fvoi, metricalalignment Fmet, note value detection Fval, and harmonicanalysis Fharm, as well as the average of them FMV2H.Fmet measures the correctness of beat assignment in levelsof bar, beat, and sub-beat. Fharm is in general a weightedsum of the chord accuracy and key accuracy, but only thekey accuracy is used here because the tested methods donot estimate chord labels.
For evaluation on classical music data, we used the 30pieces in the MAPS-ENSTDkCl dataset as in [34]. For theonset rhythm quantization method, three metrical HMMscorresponding to bar lengths of 4 quarter notes (4/4 time),3 quarter notes (3/4 time and 6/8 time), and 2 quarternotes (2/4 time) were constructed, and the metre was es-timated by the method described in Sec. 2.3. For compar-ison, we applied the same rhythm quantization method tothe performance MIDI sequences obtained by the PLCAmethod [34] and to the ground-truth MIDI data. For eval-uation on popular music data, where most pieces have ei-ther 4/4 time or 3/4 time, two metrical HMMs correspond-ing to bar lengths of 4 quarter notes and 3 quarter noteswere constructed, and metre was estimated similarly. Wealso tested the onset rhythm quantization method trainedwith the classical music data in this case to examine theeffect of using music data of different genres for training.
The results for the classical music data are shown in Ta-ble 2. The system using POVNet outperformed the sys-tem using the PLCA method in all metrics. In particular,large decreases in the edit-distance-based error rates wereobserved, which clearly confirms the significant effect ofusing the improved multipitch detection method. Amongthe edit-distance-based metrics, the onset time ER andoffset time ER were still relatively high for the POVNet-based system, indicating the difficulty of precisely recog-
Training data Ep Em Ee Eon Eoff Eall
Classical music 0.59 4.12 7.38 3.62 21.0 7.35MuseScore 0.62 4.09 7.35 2.50 20.8 7.06
CTD16∗ [13] 1.51 12.8 7.27 9.25 55.3 17.2
Training data Fp Fvoi Fmet Fval Fharm FMV2H
Classical music 93.2 79.4 63.7 92.9 91.9 84.2MuseScore 93.2 79.4 80.3 95.2 92.0 88.0
CTD16∗ [13] 86.3 42.3 58.2 82.8 91.2 72.2
Table 3: Error rates (%) and accuracies (%) of transcription on theJ-pop dataset. The training data indicate that used for the metricalHMM for rhythm quantization. Performance MIDIs obtained byPOVNet were used. For comparison of the training datasets, a bettervalue is indicated in bold font if the difference is larger than 1 PP.∗Calculated from the 72 (out of 81) pieces for which the system couldoutput results.
nizing rhythms. Among the MV2H metrics, the metricalaccuracy, which also measures the accuracy of transcribedrhythms, was particularly low. The fact that a variety ofmetres are used in the classical music data also made itdifficult for the method to correctly estimate metres. Theresult for the ground-truth MIDI data shows that furtherimprovements are expected by refining the multipitch de-tection method, the note value recognition method, andthe voice separation method.
The results for the popular music data are shown in Ta-ble 3. Overall, the error rates were lower and accuracieswere higher compared to the case of MAPS data, indicat-ing that the difficulty of transcription is generally lower forthe popular music data. Notably, for these data, the voiceand metre accuracies were around 80%. This is becausepiano pieces of popular music genre usually have simplevoice structure (melody in the right-hand part and chordaccompaniment in the left-hand part) and simple metricalstructure (96% of the pieces are in 4/4 time and the othersare in 3/4 or 6/8 time). As for the effect of using musicdata of different genres for training the onset rhythm quan-tization method, significant improvements were observedfor the onset time ER and the metrical accuracy by usingtraining data of the same genre as the test data.
We also evaluated the MIDI-to-score conversion methodproposed by Cogliati et al. [13], which is a component ofthe audio-to-score transcription system proposed in [12].Since the released source code5 could not output musi-cal scores in the MusicXML format, we extracted fromthe program the information necessary for score typeset-ting and used MuseScore 3 to obtain transcription resultsin the MusicXML format. The CTD16 method uses therhythm quantization and voice separation functions of theMelisma Analyzer version 2 [46], and for the evaluationmetrics considered here, the results largely reflect the abil-ity of this analyser. The default settings were used for the
5https://github.com/AndreaCogliati/CompleteTranscription
6
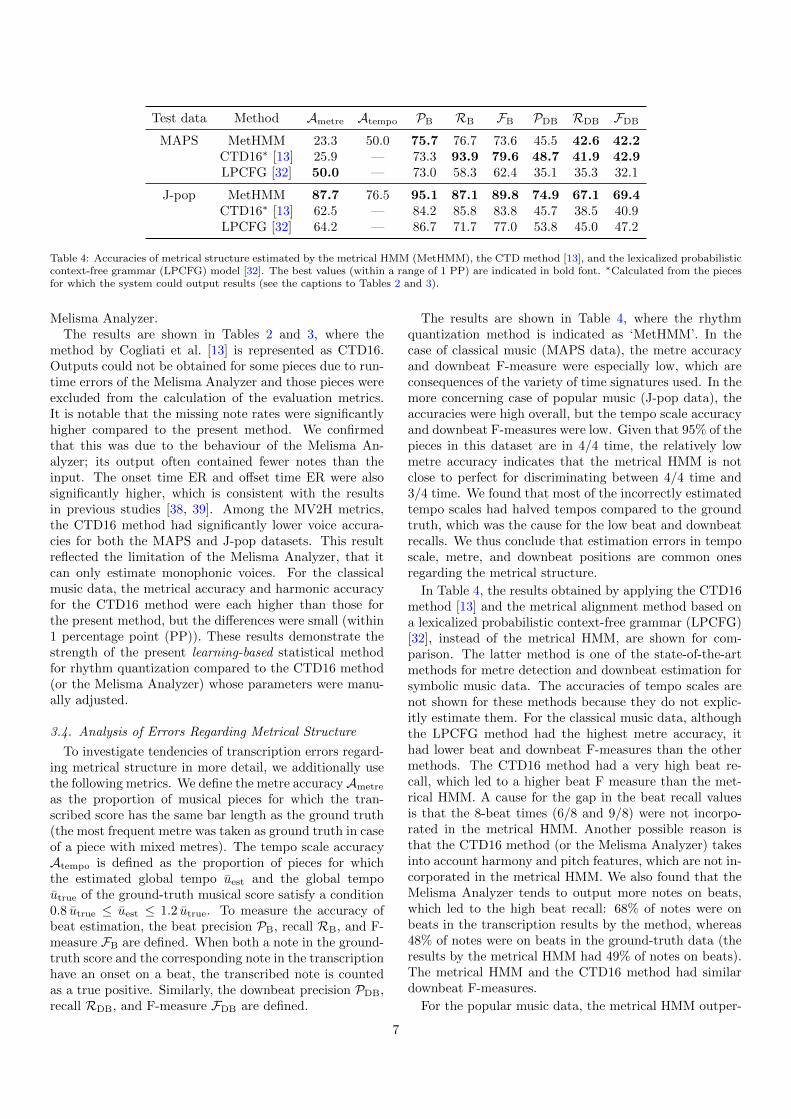
Test data Method Ametre Atempo PB RB FB PDB RDB FDB
MAPS MetHMM 23.3 50.0 75.7 76.7 73.6 45.5 42.6 42.2CTD16∗ [13] 25.9 — 73.3 93.9 79.6 48.7 41.9 42.9LPCFG [32] 50.0 — 73.0 58.3 62.4 35.1 35.3 32.1
J-pop MetHMM 87.7 76.5 95.1 87.1 89.8 74.9 67.1 69.4CTD16∗ [13] 62.5 — 84.2 85.8 83.8 45.7 38.5 40.9LPCFG [32] 64.2 — 86.7 71.7 77.0 53.8 45.0 47.2
Table 4: Accuracies of metrical structure estimated by the metrical HMM (MetHMM), the CTD method [13], and the lexicalized probabilisticcontext-free grammar (LPCFG) model [32]. The best values (within a range of 1 PP) are indicated in bold font. ∗Calculated from the piecesfor which the system could output results (see the captions to Tables 2 and 3).
Melisma Analyzer.The results are shown in Tables 2 and 3, where the
method by Cogliati et al. [13] is represented as CTD16.Outputs could not be obtained for some pieces due to run-time errors of the Melisma Analyzer and those pieces wereexcluded from the calculation of the evaluation metrics.It is notable that the missing note rates were significantlyhigher compared to the present method. We confirmedthat this was due to the behaviour of the Melisma An-alyzer; its output often contained fewer notes than theinput. The onset time ER and offset time ER were alsosignificantly higher, which is consistent with the resultsin previous studies [38, 39]. Among the MV2H metrics,the CTD16 method had significantly lower voice accura-cies for both the MAPS and J-pop datasets. This resultreflected the limitation of the Melisma Analyzer, that itcan only estimate monophonic voices. For the classicalmusic data, the metrical accuracy and harmonic accuracyfor the CTD16 method were each higher than those forthe present method, but the differences were small (within1 percentage point (PP)). These results demonstrate thestrength of the present learning-based statistical methodfor rhythm quantization compared to the CTD16 method(or the Melisma Analyzer) whose parameters were manu-ally adjusted.
3.4. Analysis of Errors Regarding Metrical Structure
To investigate tendencies of transcription errors regard-ing metrical structure in more detail, we additionally usethe following metrics. We define the metre accuracyAmetre
as the proportion of musical pieces for which the tran-scribed score has the same bar length as the ground truth(the most frequent metre was taken as ground truth in caseof a piece with mixed metres). The tempo scale accuracyAtempo is defined as the proportion of pieces for whichthe estimated global tempo uest and the global tempoutrue of the ground-truth musical score satisfy a condition0.8 utrue ≤ uest ≤ 1.2 utrue. To measure the accuracy ofbeat estimation, the beat precision PB, recall RB, and F-measure FB are defined. When both a note in the ground-truth score and the corresponding note in the transcriptionhave an onset on a beat, the transcribed note is countedas a true positive. Similarly, the downbeat precision PDB,recall RDB, and F-measure FDB are defined.
The results are shown in Table 4, where the rhythmquantization method is indicated as ‘MetHMM’. In thecase of classical music (MAPS data), the metre accuracyand downbeat F-measure were especially low, which areconsequences of the variety of time signatures used. In themore concerning case of popular music (J-pop data), theaccuracies were high overall, but the tempo scale accuracyand downbeat F-measures were low. Given that 95% of thepieces in this dataset are in 4/4 time, the relatively lowmetre accuracy indicates that the metrical HMM is notclose to perfect for discriminating between 4/4 time and3/4 time. We found that most of the incorrectly estimatedtempo scales had halved tempos compared to the groundtruth, which was the cause for the low beat and downbeatrecalls. We thus conclude that estimation errors in temposcale, metre, and downbeat positions are common onesregarding the metrical structure.
In Table 4, the results obtained by applying the CTD16method [13] and the metrical alignment method based ona lexicalized probabilistic context-free grammar (LPCFG)[32], instead of the metrical HMM, are shown for com-parison. The latter method is one of the state-of-the-artmethods for metre detection and downbeat estimation forsymbolic music data. The accuracies of tempo scales arenot shown for these methods because they do not explic-itly estimate them. For the classical music data, althoughthe LPCFG method had the highest metre accuracy, ithad lower beat and downbeat F-measures than the othermethods. The CTD16 method had a very high beat re-call, which led to a higher beat F measure than the met-rical HMM. A cause for the gap in the beat recall valuesis that the 8-beat times (6/8 and 9/8) were not incorpo-rated in the metrical HMM. Another possible reason isthat the CTD16 method (or the Melisma Analyzer) takesinto account harmony and pitch features, which are not in-corporated in the metrical HMM. We also found that theMelisma Analyzer tends to output more notes on beats,which led to the high beat recall: 68% of notes were onbeats in the transcription results by the method, whereas48% of notes were on beats in the ground-truth data (theresults by the metrical HMM had 49% of notes on beats).The metrical HMM and the CTD16 method had similardownbeat F-measures.
For the popular music data, the metrical HMM outper-
7
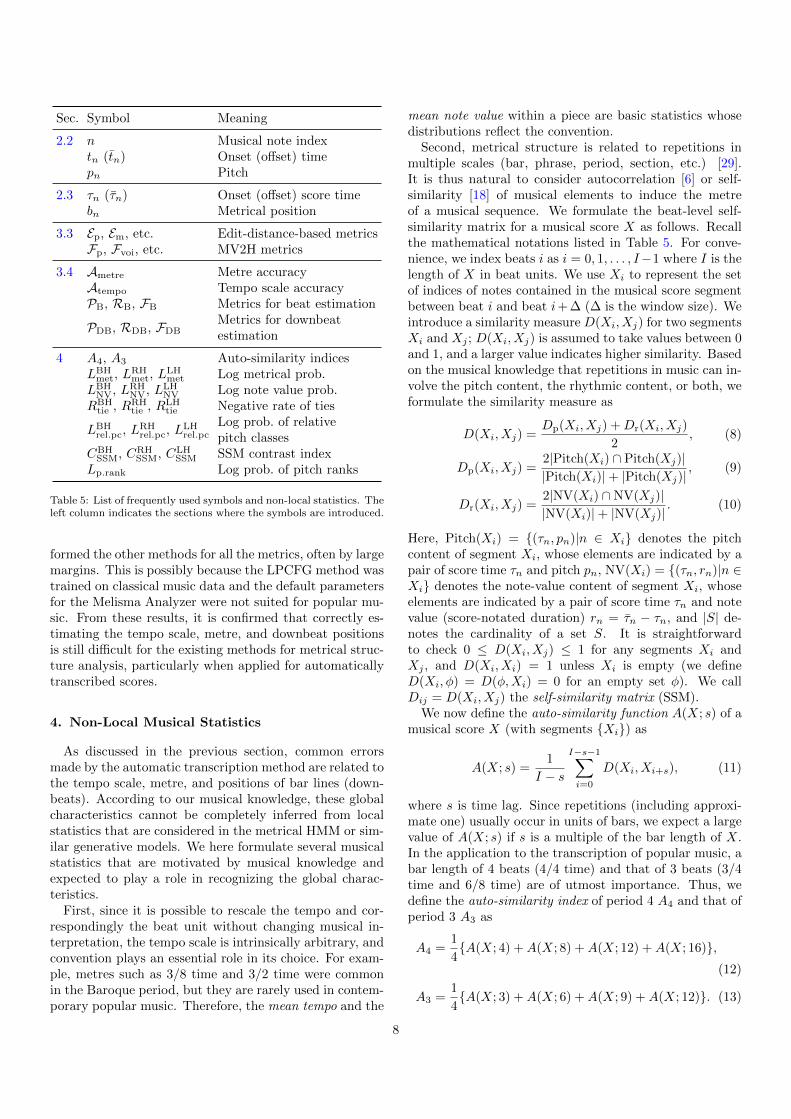
Sec. Symbol Meaning
2.2 n Musical note indextn (tn) Onset (offset) timepn Pitch
2.3 τn (τn) Onset (offset) score timebn Metrical position
3.3 Ep, Em, etc. Edit-distance-based metricsFp, Fvoi, etc. MV2H metrics
3.4 Ametre Metre accuracyAtempo Tempo scale accuracyPB, RB, FB Metrics for beat estimation
PDB, RDB, FDBMetrics for downbeatestimation
4 A4, A3 Auto-similarity indicesLBH
met, LRHmet, L
LHmet Log metrical prob.
LBHNV, LRH
NV, LLHNV Log note value prob.
RBHtie , RRH
tie , RLHtie Negative rate of ties
LBHrel.pc, LRH
rel.pc, LLHrel.pc
Log prob. of relativepitch classes
CBHSSM, CRH
SSM, CLHSSM SSM contrast index
Lp.rank Log prob. of pitch ranks
Table 5: List of frequently used symbols and non-local statistics. Theleft column indicates the sections where the symbols are introduced.
formed the other methods for all the metrics, often by largemargins. This is possibly because the LPCFG method wastrained on classical music data and the default parametersfor the Melisma Analyzer were not suited for popular mu-sic. From these results, it is confirmed that correctly es-timating the tempo scale, metre, and downbeat positionsis still difficult for the existing methods for metrical struc-ture analysis, particularly when applied for automaticallytranscribed scores.
4. Non-Local Musical Statistics
As discussed in the previous section, common errorsmade by the automatic transcription method are related tothe tempo scale, metre, and positions of bar lines (down-beats). According to our musical knowledge, these globalcharacteristics cannot be completely inferred from localstatistics that are considered in the metrical HMM or sim-ilar generative models. We here formulate several musicalstatistics that are motivated by musical knowledge andexpected to play a role in recognizing the global charac-teristics.
First, since it is possible to rescale the tempo and cor-respondingly the beat unit without changing musical in-terpretation, the tempo scale is intrinsically arbitrary, andconvention plays an essential role in its choice. For exam-ple, metres such as 3/8 time and 3/2 time were commonin the Baroque period, but they are rarely used in contem-porary popular music. Therefore, the mean tempo and the
mean note value within a piece are basic statistics whosedistributions reflect the convention.
Second, metrical structure is related to repetitions inmultiple scales (bar, phrase, period, section, etc.) [29].It is thus natural to consider autocorrelation [6] or self-similarity [18] of musical elements to induce the metreof a musical sequence. We formulate the beat-level self-similarity matrix for a musical score X as follows. Recallthe mathematical notations listed in Table 5. For conve-nience, we index beats i as i = 0, 1, . . . , I−1 where I is thelength of X in beat units. We use Xi to represent the setof indices of notes contained in the musical score segmentbetween beat i and beat i+ ∆ (∆ is the window size). Weintroduce a similarity measure D(Xi, Xj) for two segmentsXi and Xj ; D(Xi, Xj) is assumed to take values between 0and 1, and a larger value indicates higher similarity. Basedon the musical knowledge that repetitions in music can in-volve the pitch content, the rhythmic content, or both, weformulate the similarity measure as
D(Xi, Xj) =Dp(Xi, Xj) +Dr(Xi, Xj)
2, (8)
Dp(Xi, Xj) =2|Pitch(Xi) ∩ Pitch(Xj)||Pitch(Xi)|+ |Pitch(Xj)|
, (9)
Dr(Xi, Xj) =2|NV(Xi) ∩NV(Xj)||NV(Xi)|+ |NV(Xj)|
. (10)
Here, Pitch(Xi) = {(τn, pn)|n ∈ Xi} denotes the pitchcontent of segment Xi, whose elements are indicated by apair of score time τn and pitch pn, NV(Xi) = {(τn, rn)|n ∈Xi} denotes the note-value content of segment Xi, whoseelements are indicated by a pair of score time τn and notevalue (score-notated duration) rn = τn − τn, and |S| de-notes the cardinality of a set S. It is straightforwardto check 0 ≤ D(Xi, Xj) ≤ 1 for any segments Xi andXj , and D(Xi, Xi) = 1 unless Xi is empty (we defineD(Xi, φ) = D(φ,Xi) = 0 for an empty set φ). We callDij = D(Xi, Xj) the self-similarity matrix (SSM).
We now define the auto-similarity function A(X; s) of amusical score X (with segments {Xi}) as
A(X; s) =1
I − sI−s−1∑
i=0
D(Xi, Xi+s), (11)
where s is time lag. Since repetitions (including approxi-mate one) usually occur in units of bars, we expect a largevalue of A(X; s) if s is a multiple of the bar length of X.In the application to the transcription of popular music, abar length of 4 beats (4/4 time) and that of 3 beats (3/4time and 6/8 time) are of utmost importance. Thus, wedefine the auto-similarity index of period 4 A4 and that ofperiod 3 A3 as
A4 =1
4{A(X; 4) +A(X; 8) +A(X; 12) +A(X; 16)},
(12)
A3 =1
4{A(X; 3) +A(X; 6) +A(X; 9) +A(X; 12)}. (13)
8
Time in beat units Time in bar units Time in bar units
SS
M c
onst
ruct
ion
Dow
n-sa
mpl
e
Tim
e sh
ift b
y on
e be
at
Beat-level SSM Bar-level SSM Time-shifted bar-level SSM
&?cc
˜œ œ œ œ ‰ Jœœœœ œœœ œœœ œœœ
œ œ œ œ œ ˙œœœ œœœ œœœ œœœ
˜œ œ œ ˜œ Jœœœœ œœœ œœœ œœœ
œ œ œ œ ˜œ Jœœœœ œœœ œœœ œœœ
œ œ œ œ œ œ œœœœ œœœ œœœ œœœ
˙ œ œ œ œ
œ œ œ œ œ œ œ œ# œœ œ œ œ ˙ œ œ
œ œ œ œ œ œ œ œ œ
&?
˜œ Jœ œ# œ œ œ
œ œ œ œ œ œ œ œ œ
œ œ œ ˙ œ œ
œ œ œ œ œ œ œ œ œ
œ œ œ œ œ œ œ œ œ
œ œ œ œ œ œ œ œ
œ œ œ œ œ œ œ œ œ œ
œ œ œ œ œ œ œ œ
œ œ œ œ Œ œ ˜œ
œ œ œ œ œœœœ Œ
˜˙ Œœœ œ œ œ œ œœœ œœœ œ œ œ œ œ˙ ˙
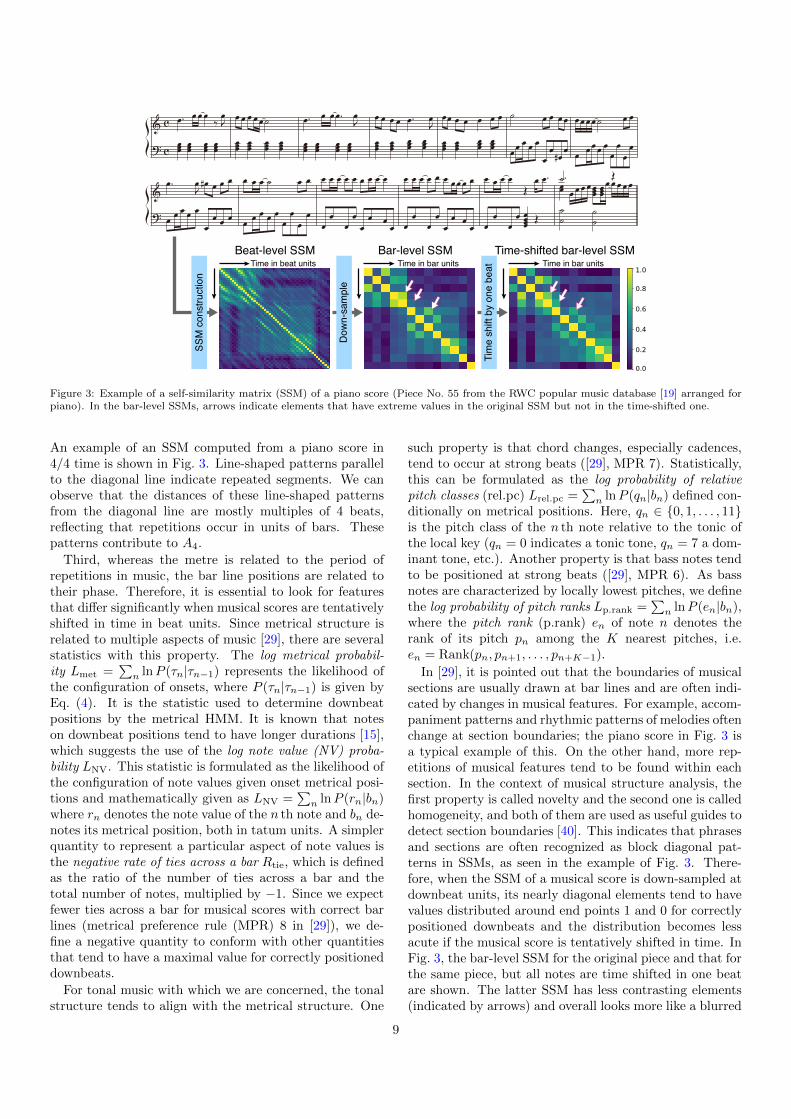
Figure 3: Example of a self-similarity matrix (SSM) of a piano score (Piece No. 55 from the RWC popular music database [19] arranged forpiano). In the bar-level SSMs, arrows indicate elements that have extreme values in the original SSM but not in the time-shifted one.
An example of an SSM computed from a piano score in4/4 time is shown in Fig. 3. Line-shaped patterns parallelto the diagonal line indicate repeated segments. We canobserve that the distances of these line-shaped patternsfrom the diagonal line are mostly multiples of 4 beats,reflecting that repetitions occur in units of bars. Thesepatterns contribute to A4.
Third, whereas the metre is related to the period ofrepetitions in music, the bar line positions are related totheir phase. Therefore, it is essential to look for featuresthat differ significantly when musical scores are tentativelyshifted in time in beat units. Since metrical structure isrelated to multiple aspects of music [29], there are severalstatistics with this property. The log metrical probabil-ity Lmet =
∑n lnP (τn|τn−1) represents the likelihood of
the configuration of onsets, where P (τn|τn−1) is given byEq. (4). It is the statistic used to determine downbeatpositions by the metrical HMM. It is known that noteson downbeat positions tend to have longer durations [15],which suggests the use of the log note value (NV) proba-bility LNV. This statistic is formulated as the likelihood ofthe configuration of note values given onset metrical posi-tions and mathematically given as LNV =
∑n lnP (rn|bn)
where rn denotes the note value of the n th note and bn de-notes its metrical position, both in tatum units. A simplerquantity to represent a particular aspect of note values isthe negative rate of ties across a bar Rtie, which is definedas the ratio of the number of ties across a bar and thetotal number of notes, multiplied by −1. Since we expectfewer ties across a bar for musical scores with correct barlines (metrical preference rule (MPR) 8 in [29]), we de-fine a negative quantity to conform with other quantitiesthat tend to have a maximal value for correctly positioneddownbeats.
For tonal music with which we are concerned, the tonalstructure tends to align with the metrical structure. One
such property is that chord changes, especially cadences,tend to occur at strong beats ([29], MPR 7). Statistically,this can be formulated as the log probability of relativepitch classes (rel.pc) Lrel.pc =
∑n lnP (qn|bn) defined con-
ditionally on metrical positions. Here, qn ∈ {0, 1, . . . , 11}is the pitch class of the n th note relative to the tonic ofthe local key (qn = 0 indicates a tonic tone, qn = 7 a dom-inant tone, etc.). Another property is that bass notes tendto be positioned at strong beats ([29], MPR 6). As bassnotes are characterized by locally lowest pitches, we definethe log probability of pitch ranks Lp.rank =
∑n lnP (en|bn),
where the pitch rank (p.rank) en of note n denotes therank of its pitch pn among the K nearest pitches, i.e.en = Rank(pn, pn+1, . . . , pn+K−1).
In [29], it is pointed out that the boundaries of musicalsections are usually drawn at bar lines and are often indi-cated by changes in musical features. For example, accom-paniment patterns and rhythmic patterns of melodies oftenchange at section boundaries; the piano score in Fig. 3 isa typical example of this. On the other hand, more rep-etitions of musical features tend to be found within eachsection. In the context of musical structure analysis, thefirst property is called novelty and the second one is calledhomogeneity, and both of them are used as useful guides todetect section boundaries [40]. This indicates that phrasesand sections are often recognized as block diagonal pat-terns in SSMs, as seen in the example of Fig. 3. There-fore, when the SSM of a musical score is down-sampled atdownbeat units, its nearly diagonal elements tend to havevalues distributed around end points 1 and 0 for correctlypositioned downbeats and the distribution becomes lessacute if the musical score is tentatively shifted in time. InFig. 3, the bar-level SSM for the original piece and that forthe same piece, but all notes are time shifted in one beatare shown. The latter SSM has less contrasting elements(indicated by arrows) and overall looks more like a blurred
9
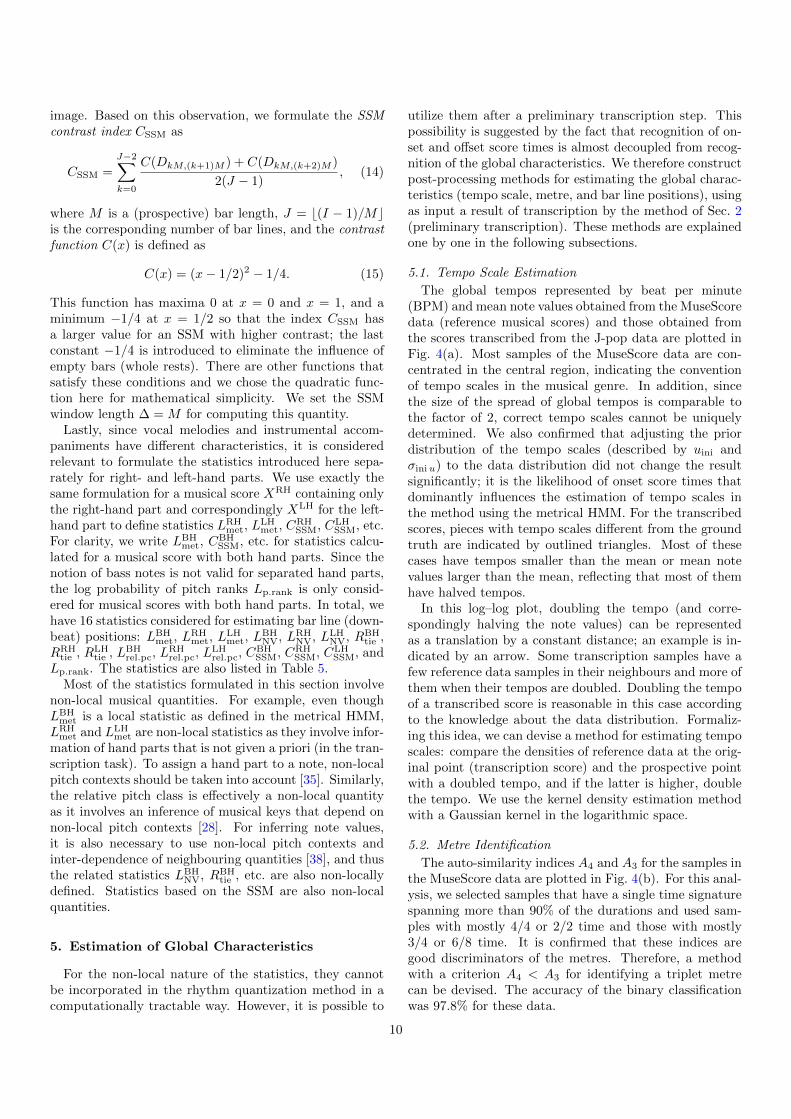
image. Based on this observation, we formulate the SSMcontrast index CSSM as
CSSM =
J−2∑
k=0
C(DkM,(k+1)M ) + C(DkM,(k+2)M )
2(J − 1), (14)
where M is a (prospective) bar length, J = b(I − 1)/Mcis the corresponding number of bar lines, and the contrastfunction C(x) is defined as
C(x) = (x− 1/2)2 − 1/4. (15)
This function has maxima 0 at x = 0 and x = 1, and aminimum −1/4 at x = 1/2 so that the index CSSM hasa larger value for an SSM with higher contrast; the lastconstant −1/4 is introduced to eliminate the influence ofempty bars (whole rests). There are other functions thatsatisfy these conditions and we chose the quadratic func-tion here for mathematical simplicity. We set the SSMwindow length ∆ = M for computing this quantity.
Lastly, since vocal melodies and instrumental accom-paniments have different characteristics, it is consideredrelevant to formulate the statistics introduced here sepa-rately for right- and left-hand parts. We use exactly thesame formulation for a musical score XRH containing onlythe right-hand part and correspondingly XLH for the left-hand part to define statistics LRH
met, LLHmet, C
RHSSM, CLH
SSM, etc.For clarity, we write LBH
met, CBHSSM, etc. for statistics calcu-
lated for a musical score with both hand parts. Since thenotion of bass notes is not valid for separated hand parts,the log probability of pitch ranks Lp.rank is only consid-ered for musical scores with both hand parts. In total, wehave 16 statistics considered for estimating bar line (down-beat) positions: LBH
met, LRHmet, L
LHmet, L
BHNV, LRH
NV, LLHNV, RBH
tie ,RRH
tie , RLHtie , LBH
rel.pc, LRHrel.pc, LLH
rel.pc, CBHSSM, CRH
SSM, CLHSSM, and
Lp.rank. The statistics are also listed in Table 5.Most of the statistics formulated in this section involve
non-local musical quantities. For example, even thoughLBH
met is a local statistic as defined in the metrical HMM,LRH
met and LLHmet are non-local statistics as they involve infor-
mation of hand parts that is not given a priori (in the tran-scription task). To assign a hand part to a note, non-localpitch contexts should be taken into account [35]. Similarly,the relative pitch class is effectively a non-local quantityas it involves an inference of musical keys that depend onnon-local pitch contexts [28]. For inferring note values,it is also necessary to use non-local pitch contexts andinter-dependence of neighbouring quantities [38], and thusthe related statistics LBH
NV, RBHtie , etc. are also non-locally
defined. Statistics based on the SSM are also non-localquantities.
5. Estimation of Global Characteristics
For the non-local nature of the statistics, they cannotbe incorporated in the rhythm quantization method in acomputationally tractable way. However, it is possible to
utilize them after a preliminary transcription step. Thispossibility is suggested by the fact that recognition of on-set and offset score times is almost decoupled from recog-nition of the global characteristics. We therefore constructpost-processing methods for estimating the global charac-teristics (tempo scale, metre, and bar line positions), usingas input a result of transcription by the method of Sec. 2(preliminary transcription). These methods are explainedone by one in the following subsections.
5.1. Tempo Scale Estimation
The global tempos represented by beat per minute(BPM) and mean note values obtained from the MuseScoredata (reference musical scores) and those obtained fromthe scores transcribed from the J-pop data are plotted inFig. 4(a). Most samples of the MuseScore data are con-centrated in the central region, indicating the conventionof tempo scales in the musical genre. In addition, sincethe size of the spread of global tempos is comparable tothe factor of 2, correct tempo scales cannot be uniquelydetermined. We also confirmed that adjusting the priordistribution of the tempo scales (described by uini andσiniu) to the data distribution did not change the resultsignificantly; it is the likelihood of onset score times thatdominantly influences the estimation of tempo scales inthe method using the metrical HMM. For the transcribedscores, pieces with tempo scales different from the groundtruth are indicated by outlined triangles. Most of thesecases have tempos smaller than the mean or mean notevalues larger than the mean, reflecting that most of themhave halved tempos.
In this log–log plot, doubling the tempo (and corre-spondingly halving the note values) can be representedas a translation by a constant distance; an example is in-dicated by an arrow. Some transcription samples have afew reference data samples in their neighbours and more ofthem when their tempos are doubled. Doubling the tempoof a transcribed score is reasonable in this case accordingto the knowledge about the data distribution. Formaliz-ing this idea, we can devise a method for estimating temposcales: compare the densities of reference data at the orig-inal point (transcription score) and the prospective pointwith a doubled tempo, and if the latter is higher, doublethe tempo. We use the kernel density estimation methodwith a Gaussian kernel in the logarithmic space.
5.2. Metre Identification
The auto-similarity indices A4 and A3 for the samples inthe MuseScore data are plotted in Fig. 4(b). For this anal-ysis, we selected samples that have a single time signaturespanning more than 90% of the durations and used sam-ples with mostly 4/4 or 2/2 time and those with mostly3/4 or 6/8 time. It is confirmed that these indices aregood discriminators of the metres. Therefore, a methodwith a criterion A4 < A3 for identifying a triplet metrecan be devised. The accuracy of the binary classificationwas 97.8% for these data.
10
10
100
Mea
n no
te v
alue
(4
= q
uart
er n
ote)
BPM
MuseScore data (reference)J-pop data (transcription)J-pop data (incorrect tempo scale)
200908070605040
987654
3
2
0
0.1
0.2
0.3
0.4
0.5
0.6
0.7
0.8
0 0.1 0.2 0.3 0.4 0.5 0.6 0.7 0.8
Mostly 3/4 or 6/8 timeMostly 4/4 or 2/2 time
A4
A3
Accuracy 1 0.9 0.8 0.7 0.6 0.5 0.4
Difference significance 1.6 1.4 1.21 0.8 0.6 0.4 0.2
All
0.3
(a) (b) (c)
LBHmet
LRHmet
LLHmet
LBHNV
LRHNV
LLHNV
RBHtie
RRHtie
RLHtie
LBHrel.pc
LRHrel.pc
LLHrel.pc
CBHSSM
CRHSSM
CLHSSM
Lp.rank
Figure 4: Non-local musical statistics and global musical characteristics. (a) Distribution of global tempos represented by beat per minute(BPM) and mean note values. Circles indicate samples in the reference MuseScore data and triangles indicate samples in the scores transcribedfrom the J-pop data. Transcribed scores with incorrect tempo scales are indicated by outlined triangles. For one such sample, the neighbouris marked by an oval, and similarly for the point obtained by doubling the tempo (indicated by an arrow). (b) Auto-similarity indicesfor samples in the MuseScore data. (c) Accuracies and difference significances of downbeat estimation on the MuseScore data using eachstatistic and all the statistics (only pieces in 4/4 time were used). The difference significances are obtained by calculating the differences ofthe statistics between the original and time-shifted scores and dividing the mean by the standard deviation (averaged for the cases of one,two, and three beat shifts), representing how significant the statistics differ between scores with correct downbeat positions and those withincorrect downbeat positions.
5.3. Positions of Bar Lines
The 16 statistics considered for estimating bar line(downbeat) positions were constructed so that they havelarger values for musical scores with correctly positioneddownbeats than those with misaligned downbeats. We candevise a method for estimating downbeat positions basedon this property, similarly to the method of maximum like-lihood estimation. To estimate the downbeat positions fora given transcribed score, we calculate the statistics forthis score and for those scores obtained by applying timeshifts of one, two, and three beats. The values of thestatistics are compared among these four versions of thescore and the one with the maximal values is estimated asthe correct score. For a score in 3/4 time, a time shift ofthree beats does not change downbeat positions and it isnecessary to compare only three versions in practice.
For calculating the statistics, we apply the method of[35] for separating hand parts in the preliminary transcrip-tion. We also use an HMM for local key detection to cal-culate the relative pitch classes, which is a probabilisticvariant of the Krumhansl-Schmuckler method [28]. Forthe calculation of an SSM, we set ∆ to the bar length Mof the preliminary transcription result. For the calculationof pitch rank, we set K = 10 because there are usually 10to 20 notes in a bar and a span of each bass note is usuallyone bar or a half. Prior to the analysis, the parametersof the log probabilities LBH
met, LBHNV, etc. were learned from
the MuseScore dataset.To investigate the effect of each of the 16 statistics, we
first analysed the accuracy of downbeat estimation usingeach statistic alone on the MuseScore data. We used pieces
in 4/4 time (a dominant part of the data) and testedwhether the method can correctly reproduce the correctdownbeat positions. Results are shown in Fig. 4(c), wherethe significances of the differences of the statistics betweenthe original and time-shifted scores are also shown. First,since the chance rate of this estimation problem is 25%,every statistic had some positive effect in estimating down-beat positions. On the other hand, as a single statistic,only LLH
met, LBHNV, LRH
NV, and RLHtie had a higher accuracy
than LBHmet, which is equivalent to the metrical HMM and
considered as a baseline. As expected, a statistic with alarge difference significance generally had a high accuracy.A notable exception is RLH
tie , whose relatively low signifi-cance is caused by a large variance of this quantity.
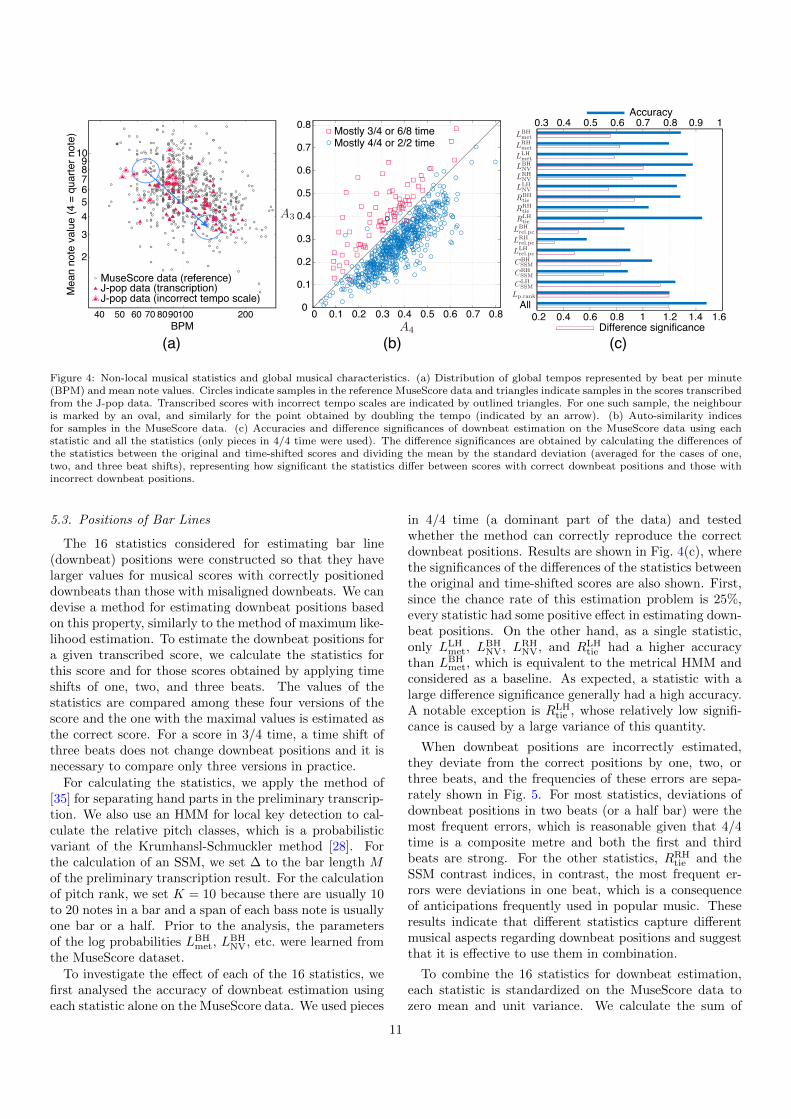
When downbeat positions are incorrectly estimated,they deviate from the correct positions by one, two, orthree beats, and the frequencies of these errors are sepa-rately shown in Fig. 5. For most statistics, deviations ofdownbeat positions in two beats (or a half bar) were themost frequent errors, which is reasonable given that 4/4time is a composite metre and both the first and thirdbeats are strong. For the other statistics, RRH
tie and theSSM contrast indices, in contrast, the most frequent er-rors were deviations in one beat, which is a consequenceof anticipations frequently used in popular music. Theseresults indicate that different statistics capture differentmusical aspects regarding downbeat positions and suggestthat it is effective to use them in combination.
To combine the 16 statistics for downbeat estimation,each statistic is standardized on the MuseScore data tozero mean and unit variance. We calculate the sum of
11
-1
0
1
2
1 2 3
Diff
eren
ce
Err
or r
ate
-1
0
1
2
1 2 3
Diff
eren
ce
Err
or r
ate
-1
0
1
2
3
1 2 3
Diff
eren
ce
Err
or r
ate
-2
0
2
4
1 2 3
Diff
eren
ce
Err
or r
ate
-2
0
2
4
1 2 3
Diff
eren
ce
Err
or r
ate
-2
0
2
4
1 2 3
Diff
eren
ce
Err
or r
ate
-2
0
2
4
6
1 2 3
Diff
eren
ce
Err
or r
ate
-2
0
2
4
6
1 2 3
Diff
eren
ce
Err
or r
ate
-3
0
3
6
9
1 2 3
Diff
eren
ce
Err
or r
ate
-0.2
0
0.2
0.4
1 2 3
Diff
eren
ce
Err
or r
ate
-0.2
0
0.2
0.4
1 2 3D
iffer
ence
Err
or r
ate
-0.3
0
0.3
0.6
1 2 3
Diff
eren
ce
Err
or r
ate
-0.5
0
0.5
1
1 2 3
Diff
eren
ce
Err
or r
ate
-0.5
0
0.5
1
1 2 3
Diff
eren
ce
Err
or r
ate
-0.5
0
0.5
1
1 2 3
Diff
eren
ce
Err
or r
ate
-2
0
2
4
1 2 3
Diff
eren
ce
Err
or r
ate
0
0.25
0.5
0
0.25
0.5
0
0.25
0.5
0
0.25
0.5
0
0.25
0.5
0
0.25
0.5
0
0.25
0.5
0
0.25
0.5
0
0.25
0.5
0
0.25
0.5
0
0.25
0.5
0
0.25
0.5
0
0.25
0.5
0
0.25
0.5
0
0.25
0.5
0
0.25
0.5
LBHmet LRH
met LLHmet
LBHNV LRH
NV LLHNV
RBHtie RRH
tie RLHtie
LBHrel.pc LRH
rel.pc LLHrel.pc
CBHSSM CRH
SSM CLHSSM
Lp.rank
Figure 5: Error rates of downbeat estimation on the MuseScore data using each statistic (only pieces in 4/4 time were used). In each panel,the blue boxes under the labels 1, 2, and 3 indicate the frequencies of errors where the estimated downbeats were deviated by one, two,and three beats from the correct positions. The mean and standard deviation of the differences of each statistic between the original andtime-shifted scores are shown as red circles and bars.
the standardized statistics for an input score and its time-shifted versions and obtain the one that maximizes thevalue to estimate downbeat positions. For the MuseScoredata, the accuracy when all the statistics are used is shownin Fig. 4(c), which was higher than the best value obtainedby any single statistic. In general, we can optimize thecombination of used statistics. There are 216 = 65536 pos-sible combinations and we notate a particular combinationas a binary vector called a criterion vector. For example,100-001-010-000-000-1 means that LBH
met, LLHNV, RRH
tie , andLp.rank are used (the order of the statistics is shown inFig. 6(b)).
For optimization, we use the J-pop data and the tran-scribed scores obtained by the method in Sec. 2. Similarlyas for 4/4 time, we calculated the statistics for triplet me-tre using the MuseScore data and used them to obtain thestandardized statistics. We used the separate datasets foroptimization and training to avoid overfitting. We appliedthe aforementioned methods for tempo scale estimationand metre estimation before the application of the down-beat estimation method using the statistics.
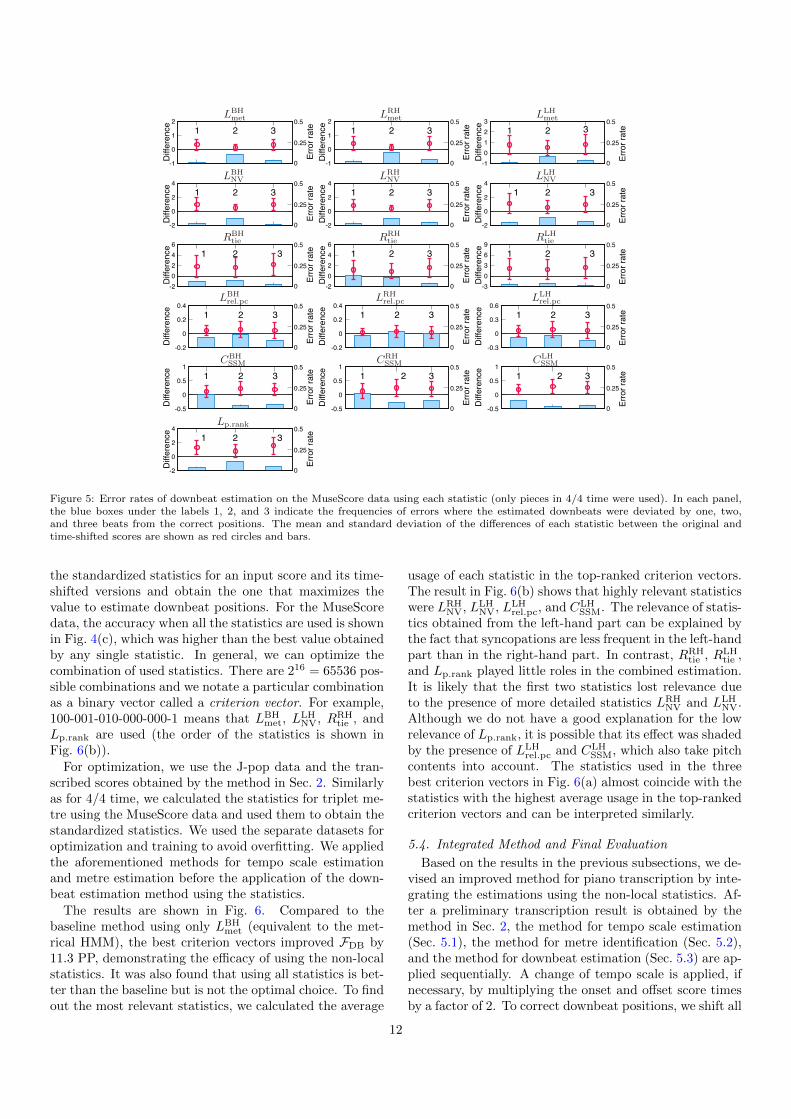
The results are shown in Fig. 6. Compared to thebaseline method using only LBH
met (equivalent to the met-rical HMM), the best criterion vectors improved FDB by11.3 PP, demonstrating the efficacy of using the non-localstatistics. It was also found that using all statistics is bet-ter than the baseline but is not the optimal choice. To findout the most relevant statistics, we calculated the average
usage of each statistic in the top-ranked criterion vectors.The result in Fig. 6(b) shows that highly relevant statisticswere LRH
NV, LLHNV, LLH
rel.pc, and CLHSSM. The relevance of statis-
tics obtained from the left-hand part can be explained bythe fact that syncopations are less frequent in the left-handpart than in the right-hand part. In contrast, RRH
tie , RLHtie ,
and Lp.rank played little roles in the combined estimation.It is likely that the first two statistics lost relevance dueto the presence of more detailed statistics LRH
NV and LLHNV.
Although we do not have a good explanation for the lowrelevance of Lp.rank, it is possible that its effect was shadedby the presence of LLH
rel.pc and CLHSSM, which also take pitch
contents into account. The statistics used in the threebest criterion vectors in Fig. 6(a) almost coincide with thestatistics with the highest average usage in the top-rankedcriterion vectors and can be interpreted similarly.
5.4. Integrated Method and Final Evaluation
Based on the results in the previous subsections, we de-vised an improved method for piano transcription by inte-grating the estimations using the non-local statistics. Af-ter a preliminary transcription result is obtained by themethod in Sec. 2, the method for tempo scale estimation(Sec. 5.1), the method for metre identification (Sec. 5.2),and the method for downbeat estimation (Sec. 5.3) are ap-plied sequentially. A change of tempo scale is applied, ifnecessary, by multiplying the onset and offset score timesby a factor of 2. To correct downbeat positions, we shift all
12
20
30
40
50
60
70
80
90
1 10 100 1000 10000Rank of criterion vector
F DB(%
)
0 0.2 0.4 0.6 0.8 1Average usage
(a)
(b)
Top 0.14% Top 1.02%LBHmet
LRHmet
LLHmet
LBHNV
LRHNV
LLHNV
RBHtie
RRHtie
RLHtie
LBHrel.pc
LRHrel.pc
LLHrel.pc
CBHSSM
CRHSSM
CLHSSM
Lp.rank
Best criterion vectors (85.6%) 011-011-000-011-001-0 111-011-000-011-001-0 111-011-000-111-001-0
Baseline (100-000-000-000-000-0)
111-111-111-111-111-1
Figure 6: Optimization of the criterion vector for downbeat esti-mation on the J-pop data. (a) Downbeat F-measures for all possiblecombinations of statistics used for estimation (sorted in F-measures).(b) Average usage of statistics in the top-ranked criterion vectors.
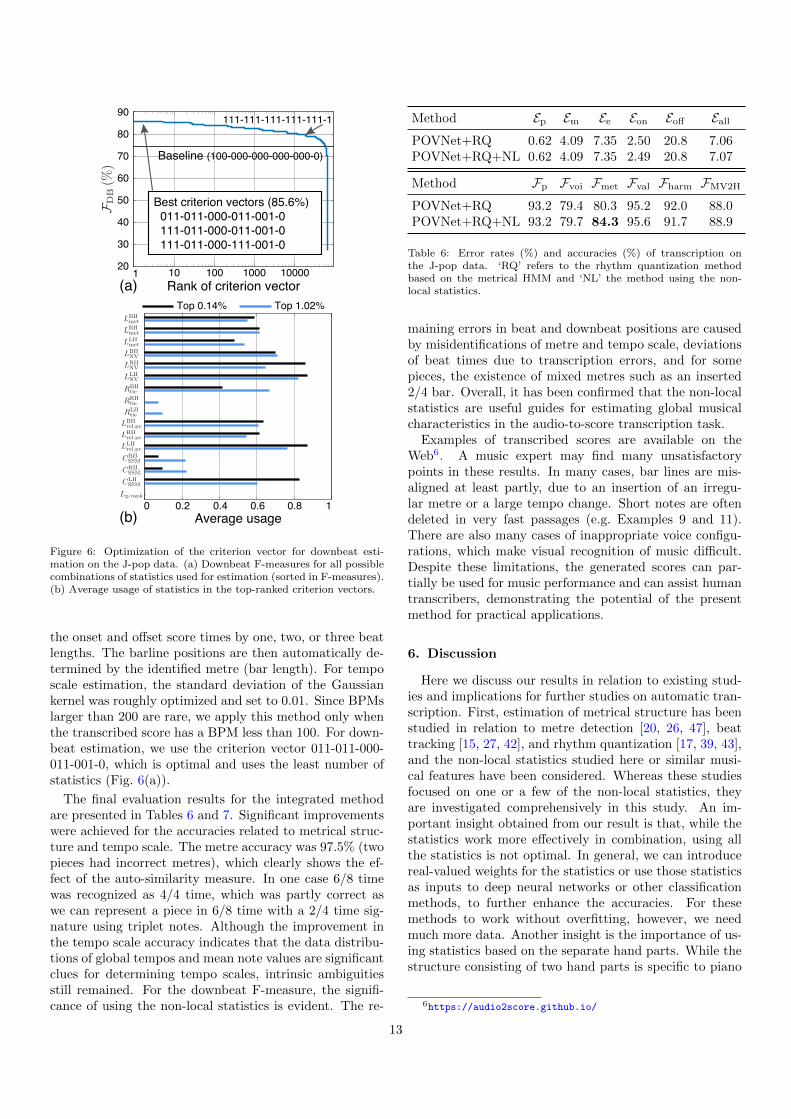
the onset and offset score times by one, two, or three beatlengths. The barline positions are then automatically de-termined by the identified metre (bar length). For temposcale estimation, the standard deviation of the Gaussiankernel was roughly optimized and set to 0.01. Since BPMslarger than 200 are rare, we apply this method only whenthe transcribed score has a BPM less than 100. For down-beat estimation, we use the criterion vector 011-011-000-011-001-0, which is optimal and uses the least number ofstatistics (Fig. 6(a)).
The final evaluation results for the integrated methodare presented in Tables 6 and 7. Significant improvementswere achieved for the accuracies related to metrical struc-ture and tempo scale. The metre accuracy was 97.5% (twopieces had incorrect metres), which clearly shows the ef-fect of the auto-similarity measure. In one case 6/8 timewas recognized as 4/4 time, which was partly correct aswe can represent a piece in 6/8 time with a 2/4 time sig-nature using triplet notes. Although the improvement inthe tempo scale accuracy indicates that the data distribu-tions of global tempos and mean note values are significantclues for determining tempo scales, intrinsic ambiguitiesstill remained. For the downbeat F-measure, the signifi-cance of using the non-local statistics is evident. The re-
Method Ep Em Ee Eon Eoff Eall
POVNet+RQ 0.62 4.09 7.35 2.50 20.8 7.06POVNet+RQ+NL 0.62 4.09 7.35 2.49 20.8 7.07
Method Fp Fvoi Fmet Fval Fharm FMV2H
POVNet+RQ 93.2 79.4 80.3 95.2 92.0 88.0POVNet+RQ+NL 93.2 79.7 84.3 95.6 91.7 88.9
Table 6: Error rates (%) and accuracies (%) of transcription onthe J-pop data. ‘RQ’ refers to the rhythm quantization methodbased on the metrical HMM and ‘NL’ the method using the non-local statistics.
maining errors in beat and downbeat positions are causedby misidentifications of metre and tempo scale, deviationsof beat times due to transcription errors, and for somepieces, the existence of mixed metres such as an inserted2/4 bar. Overall, it has been confirmed that the non-localstatistics are useful guides for estimating global musicalcharacteristics in the audio-to-score transcription task.
Examples of transcribed scores are available on theWeb6. A music expert may find many unsatisfactorypoints in these results. In many cases, bar lines are mis-aligned at least partly, due to an insertion of an irregu-lar metre or a large tempo change. Short notes are oftendeleted in very fast passages (e.g. Examples 9 and 11).There are also many cases of inappropriate voice configu-rations, which make visual recognition of music difficult.Despite these limitations, the generated scores can par-tially be used for music performance and can assist humantranscribers, demonstrating the potential of the presentmethod for practical applications.
6. Discussion
Here we discuss our results in relation to existing stud-ies and implications for further studies on automatic tran-scription. First, estimation of metrical structure has beenstudied in relation to metre detection [20, 26, 47], beattracking [15, 27, 42], and rhythm quantization [17, 39, 43],and the non-local statistics studied here or similar musi-cal features have been considered. Whereas these studiesfocused on one or a few of the non-local statistics, theyare investigated comprehensively in this study. An im-portant insight obtained from our result is that, while thestatistics work more effectively in combination, using allthe statistics is not optimal. In general, we can introducereal-valued weights for the statistics or use those statisticsas inputs to deep neural networks or other classificationmethods, to further enhance the accuracies. For thesemethods to work without overfitting, however, we needmuch more data. Another insight is the importance of us-ing statistics based on the separate hand parts. While thestructure consisting of two hand parts is specific to piano
6https://audio2score.github.io/
13
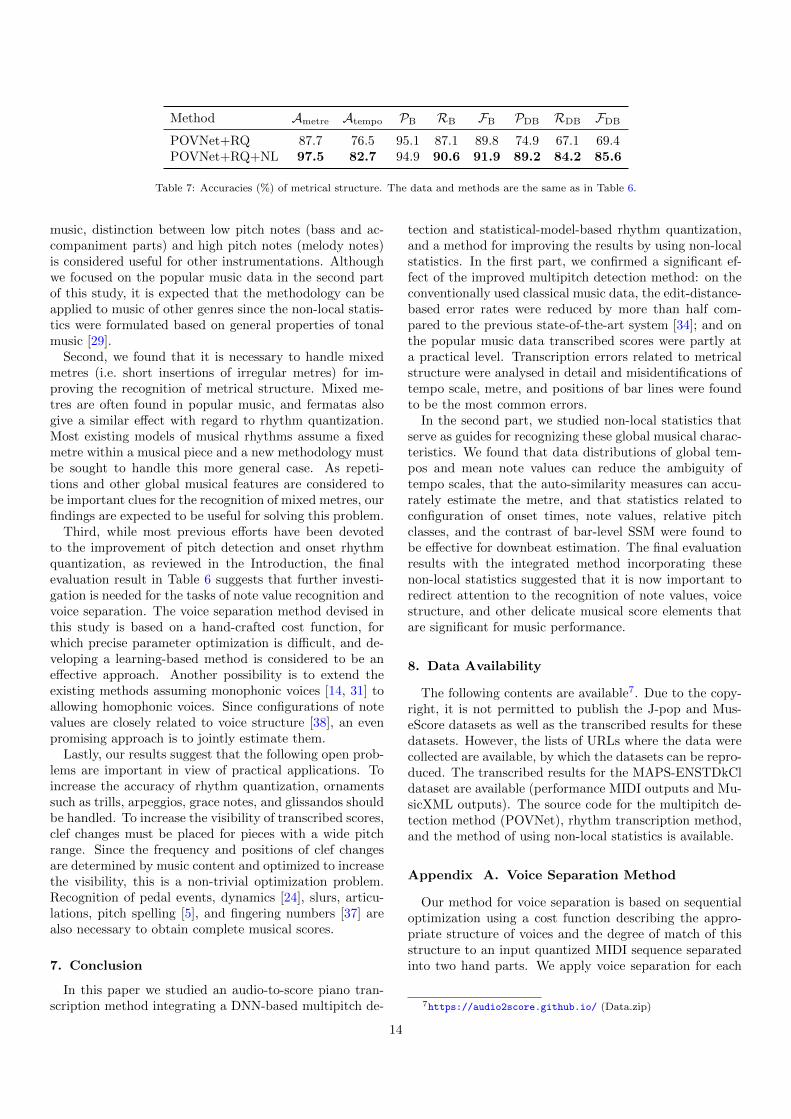
Method Ametre Atempo PB RB FB PDB RDB FDB
POVNet+RQ 87.7 76.5 95.1 87.1 89.8 74.9 67.1 69.4POVNet+RQ+NL 97.5 82.7 94.9 90.6 91.9 89.2 84.2 85.6
Table 7: Accuracies (%) of metrical structure. The data and methods are the same as in Table 6.
music, distinction between low pitch notes (bass and ac-companiment parts) and high pitch notes (melody notes)is considered useful for other instrumentations. Althoughwe focused on the popular music data in the second partof this study, it is expected that the methodology can beapplied to music of other genres since the non-local statis-tics were formulated based on general properties of tonalmusic [29].
Second, we found that it is necessary to handle mixedmetres (i.e. short insertions of irregular metres) for im-proving the recognition of metrical structure. Mixed me-tres are often found in popular music, and fermatas alsogive a similar effect with regard to rhythm quantization.Most existing models of musical rhythms assume a fixedmetre within a musical piece and a new methodology mustbe sought to handle this more general case. As repeti-tions and other global musical features are considered tobe important clues for the recognition of mixed metres, ourfindings are expected to be useful for solving this problem.
Third, while most previous efforts have been devotedto the improvement of pitch detection and onset rhythmquantization, as reviewed in the Introduction, the finalevaluation result in Table 6 suggests that further investi-gation is needed for the tasks of note value recognition andvoice separation. The voice separation method devised inthis study is based on a hand-crafted cost function, forwhich precise parameter optimization is difficult, and de-veloping a learning-based method is considered to be aneffective approach. Another possibility is to extend theexisting methods assuming monophonic voices [14, 31] toallowing homophonic voices. Since configurations of notevalues are closely related to voice structure [38], an evenpromising approach is to jointly estimate them.
Lastly, our results suggest that the following open prob-lems are important in view of practical applications. Toincrease the accuracy of rhythm quantization, ornamentssuch as trills, arpeggios, grace notes, and glissandos shouldbe handled. To increase the visibility of transcribed scores,clef changes must be placed for pieces with a wide pitchrange. Since the frequency and positions of clef changesare determined by music content and optimized to increasethe visibility, this is a non-trivial optimization problem.Recognition of pedal events, dynamics [24], slurs, articu-lations, pitch spelling [5], and fingering numbers [37] arealso necessary to obtain complete musical scores.
7. Conclusion
In this paper we studied an audio-to-score piano tran-scription method integrating a DNN-based multipitch de-
tection and statistical-model-based rhythm quantization,and a method for improving the results by using non-localstatistics. In the first part, we confirmed a significant ef-fect of the improved multipitch detection method: on theconventionally used classical music data, the edit-distance-based error rates were reduced by more than half com-pared to the previous state-of-the-art system [34]; and onthe popular music data transcribed scores were partly ata practical level. Transcription errors related to metricalstructure were analysed in detail and misidentifications oftempo scale, metre, and positions of bar lines were foundto be the most common errors.
In the second part, we studied non-local statistics thatserve as guides for recognizing these global musical charac-teristics. We found that data distributions of global tem-pos and mean note values can reduce the ambiguity oftempo scales, that the auto-similarity measures can accu-rately estimate the metre, and that statistics related toconfiguration of onset times, note values, relative pitchclasses, and the contrast of bar-level SSM were found tobe effective for downbeat estimation. The final evaluationresults with the integrated method incorporating thesenon-local statistics suggested that it is now important toredirect attention to the recognition of note values, voicestructure, and other delicate musical score elements thatare significant for music performance.
8. Data Availability
The following contents are available7. Due to the copy-right, it is not permitted to publish the J-pop and Mus-eScore datasets as well as the transcribed results for thesedatasets. However, the lists of URLs where the data werecollected are available, by which the datasets can be repro-duced. The transcribed results for the MAPS-ENSTDkCldataset are available (performance MIDI outputs and Mu-sicXML outputs). The source code for the multipitch de-tection method (POVNet), rhythm transcription method,and the method of using non-local statistics is available.
Appendix A. Voice Separation Method
Our method for voice separation is based on sequentialoptimization using a cost function describing the appro-priate structure of voices and the degree of match of thisstructure to an input quantized MIDI sequence separatedinto two hand parts. We apply voice separation for each
7https://audio2score.github.io/ (Data.zip)
14
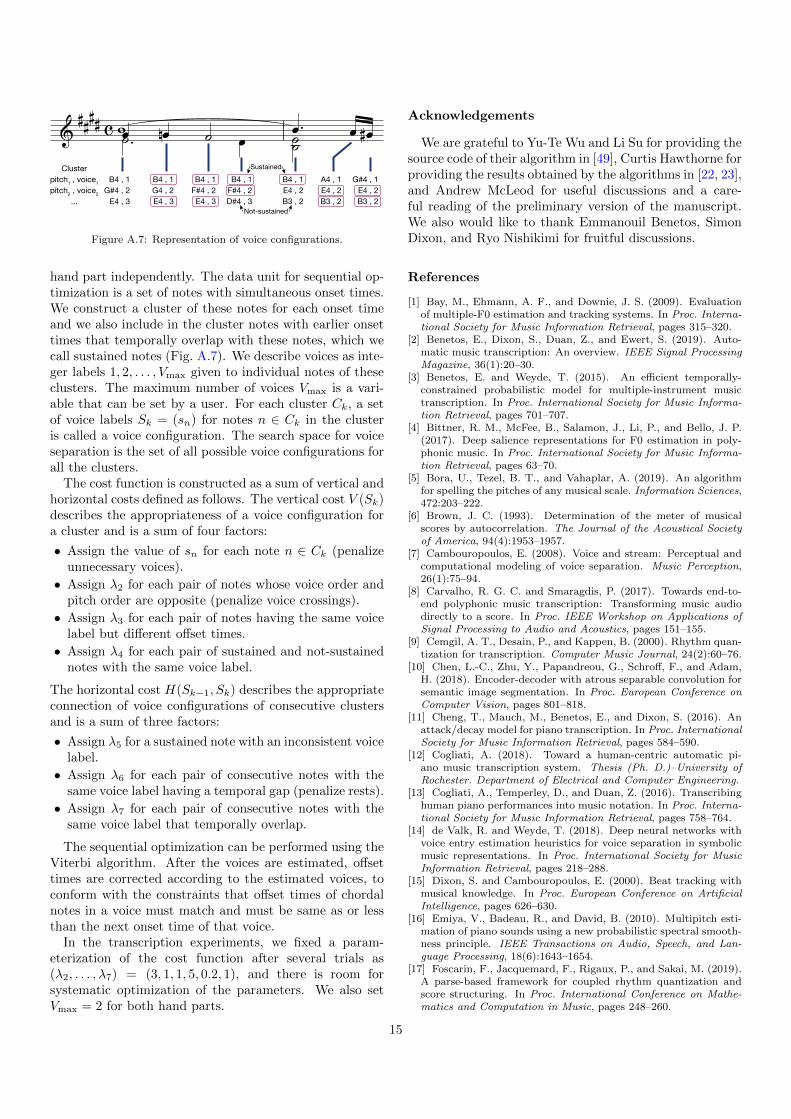
& #### c wœ œn ˙.˙ œ .œ œ œ#˙B4 , 1
G#4 , 2E4 , 3
B4 , 1G4 , 2E4 , 3
B4 , 1F#4 , 2E4 , 3
B4 , 1F#4 , 2D#4 , 3
B4 , 1E4 , 2B3 , 2
A4 , 1E4 , 2B3 , 2
G#4 , 1E4 , 2B3 , 2
Clusterpitch1 , voice1pitch2 , voice2
...
Sustained
Not-sustained
Figure A.7: Representation of voice configurations.
hand part independently. The data unit for sequential op-timization is a set of notes with simultaneous onset times.We construct a cluster of these notes for each onset timeand we also include in the cluster notes with earlier onsettimes that temporally overlap with these notes, which wecall sustained notes (Fig. A.7). We describe voices as inte-ger labels 1, 2, . . . , Vmax given to individual notes of theseclusters. The maximum number of voices Vmax is a vari-able that can be set by a user. For each cluster Ck, a setof voice labels Sk = (sn) for notes n ∈ Ck in the clusteris called a voice configuration. The search space for voiceseparation is the set of all possible voice configurations forall the clusters.
The cost function is constructed as a sum of vertical andhorizontal costs defined as follows. The vertical cost V (Sk)describes the appropriateness of a voice configuration fora cluster and is a sum of four factors:
• Assign the value of sn for each note n ∈ Ck (penalizeunnecessary voices).
• Assign λ2 for each pair of notes whose voice order andpitch order are opposite (penalize voice crossings).
• Assign λ3 for each pair of notes having the same voicelabel but different offset times.
• Assign λ4 for each pair of sustained and not-sustainednotes with the same voice label.
The horizontal cost H(Sk−1, Sk) describes the appropriateconnection of voice configurations of consecutive clustersand is a sum of three factors:
• Assign λ5 for a sustained note with an inconsistent voicelabel.
• Assign λ6 for each pair of consecutive notes with thesame voice label having a temporal gap (penalize rests).
• Assign λ7 for each pair of consecutive notes with thesame voice label that temporally overlap.
The sequential optimization can be performed using theViterbi algorithm. After the voices are estimated, offsettimes are corrected according to the estimated voices, toconform with the constraints that offset times of chordalnotes in a voice must match and must be same as or lessthan the next onset time of that voice.
In the transcription experiments, we fixed a param-eterization of the cost function after several trials as(λ2, . . . , λ7) = (3, 1, 1, 5, 0.2, 1), and there is room forsystematic optimization of the parameters. We also setVmax = 2 for both hand parts.
Acknowledgements
We are grateful to Yu-Te Wu and Li Su for providing thesource code of their algorithm in [49], Curtis Hawthorne forproviding the results obtained by the algorithms in [22, 23],and Andrew McLeod for useful discussions and a care-ful reading of the preliminary version of the manuscript.We also would like to thank Emmanouil Benetos, SimonDixon, and Ryo Nishikimi for fruitful discussions.
References
[1] Bay, M., Ehmann, A. F., and Downie, J. S. (2009). Evaluationof multiple-F0 estimation and tracking systems. In Proc. Interna-tional Society for Music Information Retrieval, pages 315–320.
[2] Benetos, E., Dixon, S., Duan, Z., and Ewert, S. (2019). Auto-matic music transcription: An overview. IEEE Signal ProcessingMagazine, 36(1):20–30.
[3] Benetos, E. and Weyde, T. (2015). An efficient temporally-constrained probabilistic model for multiple-instrument musictranscription. In Proc. International Society for Music Informa-tion Retrieval, pages 701–707.
[4] Bittner, R. M., McFee, B., Salamon, J., Li, P., and Bello, J. P.(2017). Deep salience representations for F0 estimation in poly-phonic music. In Proc. International Society for Music Informa-tion Retrieval, pages 63–70.
[5] Bora, U., Tezel, B. T., and Vahaplar, A. (2019). An algorithmfor spelling the pitches of any musical scale. Information Sciences,472:203–222.
[6] Brown, J. C. (1993). Determination of the meter of musicalscores by autocorrelation. The Journal of the Acoustical Societyof America, 94(4):1953–1957.
[7] Cambouropoulos, E. (2008). Voice and stream: Perceptual andcomputational modeling of voice separation. Music Perception,26(1):75–94.
[8] Carvalho, R. G. C. and Smaragdis, P. (2017). Towards end-to-end polyphonic music transcription: Transforming music audiodirectly to a score. In Proc. IEEE Workshop on Applications ofSignal Processing to Audio and Acoustics, pages 151–155.
[9] Cemgil, A. T., Desain, P., and Kappen, B. (2000). Rhythm quan-tization for transcription. Computer Music Journal, 24(2):60–76.
[10] Chen, L.-C., Zhu, Y., Papandreou, G., Schroff, F., and Adam,H. (2018). Encoder-decoder with atrous separable convolution forsemantic image segmentation. In Proc. European Conference onComputer Vision, pages 801–818.
[11] Cheng, T., Mauch, M., Benetos, E., and Dixon, S. (2016). Anattack/decay model for piano transcription. In Proc. InternationalSociety for Music Information Retrieval, pages 584–590.
[12] Cogliati, A. (2018). Toward a human-centric automatic pi-ano music transcription system. Thesis (Ph. D.)–University ofRochester. Department of Electrical and Computer Engineering.
[13] Cogliati, A., Temperley, D., and Duan, Z. (2016). Transcribinghuman piano performances into music notation. In Proc. Interna-tional Society for Music Information Retrieval, pages 758–764.
[14] de Valk, R. and Weyde, T. (2018). Deep neural networks withvoice entry estimation heuristics for voice separation in symbolicmusic representations. In Proc. International Society for MusicInformation Retrieval, pages 218–288.
[15] Dixon, S. and Cambouropoulos, E. (2000). Beat tracking withmusical knowledge. In Proc. European Conference on ArtificialIntelligence, pages 626–630.
[16] Emiya, V., Badeau, R., and David, B. (2010). Multipitch esti-mation of piano sounds using a new probabilistic spectral smooth-ness principle. IEEE Transactions on Audio, Speech, and Lan-guage Processing, 18(6):1643–1654.
[17] Foscarin, F., Jacquemard, F., Rigaux, P., and Sakai, M. (2019).A parse-based framework for coupled rhythm quantization andscore structuring. In Proc. International Conference on Mathe-matics and Computation in Music, pages 248–260.
15
[18] Gainza, M. (2009). Automatic musical meter detection. InProc. International Conference on Acoustics, Speech, & SignalProcessing, pages 329–332.
[19] Goto, M., Hashiguchi, H., Nishimura, T., and Oka, R. (2002).RWC music database: Popular, classical and jazz music databases.In Proc. International Society for Music Information Retrieval,pages 287–288.
[20] Haas, W. B. D. and Volk, A. (2016). Meter detection in symbolicmusic using inner metric analysis. In Proc. International Societyfor Music Information Retrieval, pages 441–447.
[21] Hamanaka, M., Goto, M., Asoh, H., and Otsu, N. (2003).A learning-based quantization: Unsupervised estimation of themodel parameters. In Proc. International Computer Music Con-ference, pages 369–372.
[22] Hawthorne, C., Elsen, E., Song, J., Roberts, A., Simon, I., Raf-fel, C., Engel, J., Oore, S., and Eck, D. (2018). Onsets and frames:Dual-objective piano transcription. In Proc. International Societyfor Music Information Retrieval, pages 50–57.
[23] Hawthorne, C., Stasyuk, A., Roberts, A., Simon, I., Huang,C.-Z. A., Dieleman, S., Elsen, E., Engel, J., and Eck, D. (2019).Enabling factorized piano music modeling and generation withthe MAESTRO dataset. In Proc. International Conference onLearning Representations. arXiv preprint arXiv:1908.03265.
[24] Jeong, D., Kwon, T., and Nam, J. (2020). Note-intensity es-timation of piano recordings using coarsely aligned MIDI score.Journal of the Audio Engineering Society, 68(1/2):34–47.
[25] Kapanci, E. and Pfeffer, A. (2005). Signal-to-score music tran-scription using graphical models. In Proc. International JointConferences on Artificial Intelligence, pages 758–765.
[26] Klapuri, A. (2003). Musical meter estimation and music tran-scription. In Cambridge Music Processing Colloquium, pages 40–45.
[27] Krebs, F., Bock, S., and Widmer, G. (2015). An efficient state-space model for joint tempo and meter tracking. In Proc. Inter-national Society for Music Information Retrieval, pages 72–78.
[28] Krumhansl, C. L. (2001). Cognitive foundations of musicalpitch. Oxford University Press.
[29] Lerdahl, F. and Jackendoff, R. (1983). A Generative Theory ofTonal Music. MIT Press.
[30] Liu, L., Jiang, H., He, P., Chen, W., Liu, X., Gao, J., andHan, J. (2019). On the variance of the adaptive learning rate andbeyond. arXiv preprint arXiv:1908.03265.
[31] McLeod, A. and Steedman, M. (2016). HMM-based voice sep-aration of MIDI performance. Journal of New Music Research,45(1):17–26.
[32] McLeod, A. and Steedman, M. (2017). Meter detection in sym-bolic music using a lexicalized PCFG. In Proc. Sound and MusicComputing Conference, pages 373–379.
[33] McLeod, A. and Steedman, M. (2018). Evaluating automaticpolyphonic music transcription. In Proc. International Society forMusic Information Retrieval, pages 42–49.
[34] Nakamura, E., Benetos, E., Yoshii, K., and Dixon, S. (2018).Towards complete polyphonic music transcription: Integratingmulti-pitch detection and rhythm quantization. In Proc. Inter-national Conference on Acoustics, Speech, & Signal Processing,pages 101–105.
[35] Nakamura, E., Ono, N., and Sagayama, S. (2014). Merged-output HMM for piano fingering of both hands. In Proc. Interna-tional Society for Music Information Retrieval, pages 531–536.
[36] Nakamura, E., Ono, N., Sagayama, S., and Watanabe, K.(2015). A stochastic temporal model of polyphonic MIDI per-formance with ornaments. Journal of New Music Research,44(4):287–304.
[37] Nakamura, E., Saito, Y., and Yoshii, K. (2020). Statisticallearning and estimation of piano fingering. Information Sciences,517:68–85.
[38] Nakamura, E., Yoshii, K., and Dixon, S. (2017a). Note valuerecognition for piano transcription using Markov random fields.IEEE/ACM Transactions on Audio, Speech, and Language Pro-cessing, 25(9):1542–1554.
[39] Nakamura, E., Yoshii, K., and Sagayama, S. (2017b). Rhythm
transcription of polyphonic piano music based on merged-outputHMM for multiple voices. IEEE/ACM Transactions on Audio,Speech, and Language Processing, 25(4):794–806.
[40] Nieto, O., Mysore, G. J., Wang, C.-i., Smith, J. B., Schluter,J., Grill, T., and McFee, B. (2020). Audio-based music struc-ture analysis: Current trends, open challenges, and applications.Transactions of the International Society for Music InformationRetrieval, 3(1):246–263.
[41] Nishikimi, R., Nakamura, E., Fukayama, S., Goto, M.,and Yoshii, K. (2019). Automatic singing transcription basedon encoder-decoder recurrent neural networks with a weakly-supervised attention mechanism. In Proc. International Confer-ence on Acoustics, Speech, & Signal Processing, pages 161–165.
[42] Peeters, G. and Papadopoulos, H. (2010). Simultaneous beatand downbeat-tracking using a probabilistic framework: Theoryand large-scale evaluation. IEEE Transactions on Audio, Speech,and Language Processing, 19(6):1754–1769.
[43] Raphael, C. (2002). A hybrid graphical model for rhythmicparsing. Artificial Intelligence, 137:217–238.
[44] Roman, M. A., Pertusa, A., and Calvo-Zaragoza, J. (2019). Aholistic approach to polyphonic music transcription with neuralnetworks. In Proc. International Society for Music InformationRetrieval, pages 731–737.
[45] Sigtia, S., Benetos, E., and Dixon, S. (2016). An end-to-end neural network for polyphonic piano music transcription.IEEE/ACM Transactions on Audio, Speech, and Language Pro-cessing, 24(5):927–939.
[46] Temperley, D. (2009). A unified probabilistic model for poly-phonic music analysis. Journal of New Music Research, 38(1):3–18.
[47] Temperley, D. and Sleator, D. (1999). Modeling meter andharmony: A preference-rule approach. Computer Music Journal,23(1):10–27.
[48] Vincent, E., Bertin, N., and Badeau, R. (2010). Adaptiveharmonic spectral decomposition for multiple pitch estimation.IEEE Transactions on Audio, Speech, and Language Processing,18(3):528–537.
[49] Wu, Y.-T., Chen, B., and Su, L. (2019). Polyphonic musictranscription with semantic segmentation. In Proc. InternationalConference on Acoustics, Speech, & Signal Processing, pages 166–170.
16


![Una Limosna [orch] SCORE](https://static.fdokumen.com/doc/165x107/631e9c1925add517740b2033/una-limosna-orch-score.jpg)