No Slide Title - Soil Plant Atmosphere Research | Mississippi State ...
74
Crop Growth - High-temperature Injury to Reproductive Parts K. Raja Reddy Mississippi State University Mississippi State, MS
-
Upload
khangminh22 -
Category
Documents
-
view
5 -
download
0
Transcript of No Slide Title - Soil Plant Atmosphere Research | Mississippi State ...

Crop Growth-
High-temperatureInjury to Reproductive Parts
K. Raja ReddyMississippi State University
Mississippi State, MS

Plant Responses to Extreme Temperatures

It’s too cold I need some
waterIt’s very
hot

Plant Responses to Extreme Temperatures
• Few plant species survive a steady high temperatures above 45 °C
Actively growing tissues can rarely survive over 45°C
However, non-growing cells or organs (Pollen and seed) can survive much higher temperatures.
- some pollen up to 70 °C
- some seed up to 120 °C.• Heat stress is also a major problem in greenhouses,
where low air speed and high humidity decreases leaf cooling and thus affecting leaf/canopy temperatures.

Plant Responses to Extreme Temperatures • Plants do adapt to high temperature:
Reflective leaf hairs and waxes
Leaf rolling, and vertical leaf orientation
Small leaves and dissected (okra) leaf morphology
Synthesis of heat-shock proteins (HSPs)
Help cells withstand heat stress
However, the functions of all HSPs are not yet fully known, but many act as molecular chaperons, help stabilize and fold proteins, assist in polypeptide transport across membranes, protect enzymes, etc.

Plant Critical Processes at Extreme Temperatures • Photosynthesis and respiration, and conductivity will be
affected by high temperatures.
• However, photosynthesis declines faster than respiration and conductivity at high temperatures.
• The point when the amount of CO2 fixed equals to the amount of CO2 released by respiration is called temperature compensation point. At this point and beyond, the carbon is not replaced, and carbohydrate reserves will be used for cellular functions.
• Therefore, the imbalance between photosynthesis and respiration causes deleterious effects at high temperatures.

Plant Critical Processes at Extreme Temperatures
• The question is how do plant groups respond to high temperatures?
• Enhanced temperatures are more detrimental in C3plants than in C4 or CAM plants because of rates of both dark and photorespiration are increased more in C3plants.
• What happens to C3 plants under elevated CO2conditions?

Climatic Zones and Temperature Conditions

Day of the Year0 50 100 150 200 250 300 350
Tem
pera
ture
, °C
0
5
10
15
20
25
30
35
40
Phoenix, AZ
Stoneville, MS
Maros, Indonesia
Long-Term Average Temperatures

for Four US Cotton Producing AreasTe
mpe
ratu
re, °
C
Day of the Year0 50 100 150 200 250 300 350
-10
0
10
20
30
40-10
0
10
20
30
40
Days above Optimum = 0
Days above Optimum = 85
Stoneville, Mississippi
Corpus Christ i, Texas
Long-term Average Temperatures
0 50 100 150 200 250 300 350
Days above Optimum = 36
Bakersfield, California
Days above Optimum = 111
Phoenix, Arizona

Days0 51015202530
Temperature, °C
15
20
25
30
35
40
Hourly Temperatures for July 1995Mississippi State, MS

Temperature Conditions - Diurnal TrendsMississippi State, MS - 1995
Hours (CST)0 2 4 6 8 10 12 14 16 18 20 22 24
Tem
pera
ture
, °C
0
5
10
15
20
25
30
35
40
19 Aug. 1995
2 May, 199523 Sep. 1995

Diurnal temperature data recorded in June 1989 at Fatehpur, Rajasthan, India, (Latitude 27°C 37'N).
5 cm depth of soil (▲)0.5 cm depth of soil (●)150 cm above the soil surface (■)
Howarth, 1991

Climate Change and Crop Production
• Past changes in greenhouse gases has resulted about 0.6 °C increase in global average temperature during the last century.
• If current and future rates of changes in greenhouse gases and other land-use changes continue, then, these changes will exacerbate the natural climate changes and may result in:
- 2 to 6 °C warmer temperatures
- More frequent episodes of extreme events (heat, cold, drought, excessive rainfall resulting in floods, severe hurricanes, etc.).

Second green revolution to overcome
environmental stresses

Cotton
5 bolls per plant with 6 g per boll will yield 1.98 bales per acre
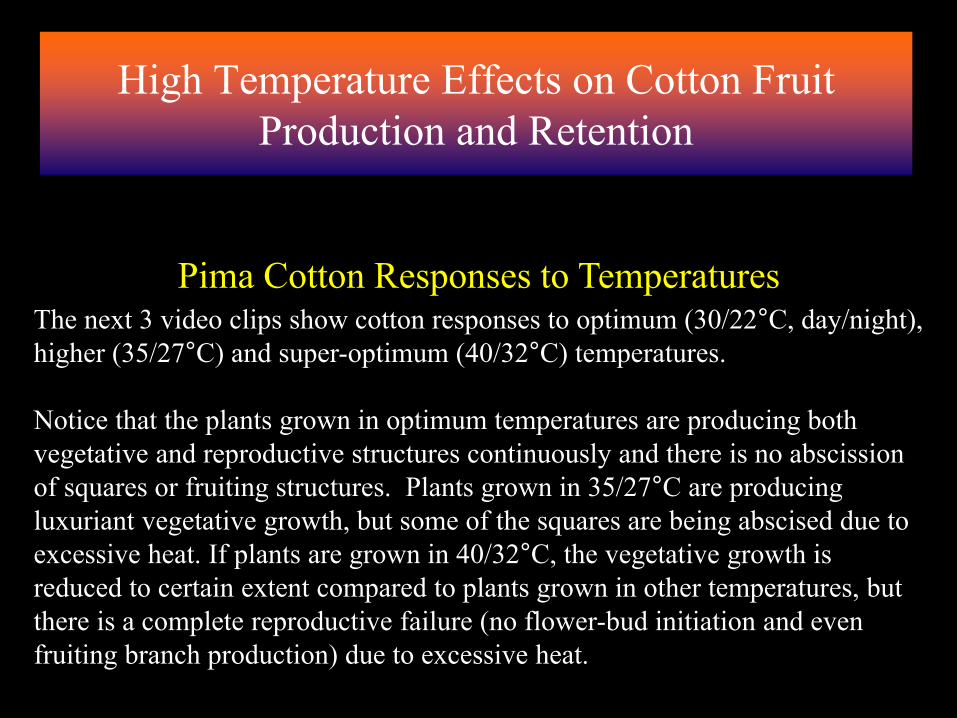
High Temperature Effects on Cotton Fruit Production and Retention
Pima Cotton Responses to TemperaturesThe next 3 video clips show cotton responses to optimum (30/22°C, day/night), higher (35/27°C) and super-optimum (40/32°C) temperatures.
Notice that the plants grown in optimum temperatures are producing both vegetative and reproductive structures continuously and there is no abscission of squares or fruiting structures. Plants grown in 35/27°C are producing luxuriant vegetative growth, but some of the squares are being abscised due to excessive heat. If plants are grown in 40/32°C, the vegetative growth is reduced to certain extent compared to plants grown in other temperatures, but there is a complete reproductive failure (no flower-bud initiation and even fruiting branch production) due to excessive heat.

Optimum TemperatureNo Injury to Reproductive Parts

Higher Temperature InjuryPartial Injury to Reproductive Parts

Super High Temperature InjuryTotal Reproductive Failure, Including
Fruiting Branch Production

High Temperature Effects on Cotton – Upland Cotton
Temperature, °C15 20 25 30 35
Bol
ls a
nd S
quar
es, n
o. p
lant
-1
0
10
20
30
40
50
60
70
80
Retained
Produced

High Temperature Effects on Cotton – Pima Cotton
Temperature, °C15 20 25 30 35
Bol
ls a
nd S
quar
es, n
o. p
lant
-1
0
25
50
75
100
700 350
CO2 µl l-1

20/12 25/15 30/20 35/25 40/30
242 320 330 293 225
17 63 143 17 0.8
12 44 100 12 0.6
73 97 100 88 68
Day/Night Temperature, °C
Bolls
Total Wt.
% of Optimum
% of Optimum
Grams per Plant
Table 1. Effect of temperature on cotton growth, cv. Stoneville 825, harvested 49 days after initiation of temperature treatments. tretments are imposed at first flower. Standard error of the mean values are shown.
Environment - Crop Growth – High Temperature Injury to Reproductive Parts

Environment - Crop Growth – High TemperaturesInjury to Reproductive Parts
Temperature, °C25 26 27 28 29 30 31 32 33 34 35
Bol
ls, n
o. m
-2
0
50
100
150
200
250
300
350
Bolls Retained
Bolls Produced
CO2, µl l-1
350 700

Projected Temperatures and Cotton Development
Days to the EventTreatment
Square Flower Open Boll
1995 plus 2°C 24 48 941995 plus 0°C 26 51 101
1995 minus 2°C 33 65 144
1995 plus 5°C 21 42 77
1995 plus 7°C 19 39 No Fruit
No significant differences were observed between CO2 levels

High Temperature InjuryTemperature and CO2 Interactions
Temperature Deviation from 1995, °C1995-2 1995 1995+2 1995+5 1995+7
Vege
tativ
e W
eigh
t, g
plan
t-1
050
100150200250300350400450500
360 CO2 µL L-1
720 CO2 µL L-1
Vegetative Biomass

High Temperature InjuryTemperature and CO2 Interactions – Cotton
Temperature Deviation from 1995, °C1995-2 1995 1995+2 1995+5 1995+7
Bolls
and
Squ
ares
, no
plan
t-1
0
50
100
150
200
250
300
360 CO2 µl l-1
720 CO2 µl l-1
Fruiting Sites

High Temperature InjuryTemperature and CO2 Interactions – Cotton
Temperature Deviation from 1995, °C1995-2 1995 1995+2 1995+5 1995+7
Ret
aine
d Bo
lls, n
o pl
ant-1
0
10
20
30
40
50
60
70
80
360 CO2 µl l-1
720 CO2 µl l-1
Retained Bolls

High Temperature InjuryTemperature and CO2 Interactions – Cotton
Temperature Deviation from 1995, °C1995-2 1995 1995+2 1995+5 1995+7
Bol
l Wei
ght,
g pl
ant-1
0
50
100
150
200
250
300
350
400
360 CO2 µL L-1
720 CO2 µL L-1
Boll weight

High Temperature InjuryTemperature and CO2 Interactions – Cotton
Temperature, °C24 26 28 30 32 34
(g k
g-1 D
ry W
eigh
t)
0
100
200
300
400
350 µL L-1
700 µL L-1
Frui
t Pro
duct
ion
Effic
ienc
y
Fruit Production Efficiency

Climate Change Scenario
Lint Y
ield
(kg
ha-1)
800
1000
1200
1400
1600
1800
2000
2200Current + Ambient CO2Current + Elevated CO2Future + Elevated CO2
Hot Dry Cold Dry Cold Wet NormalHot Wet
1993
1980
1992
1984
1989
Reddy et al. 2002
High Temperature InjuryUsing Simulation Models – Cotton Lint Yield
Cotton Lint Yield and Climate Scenarios
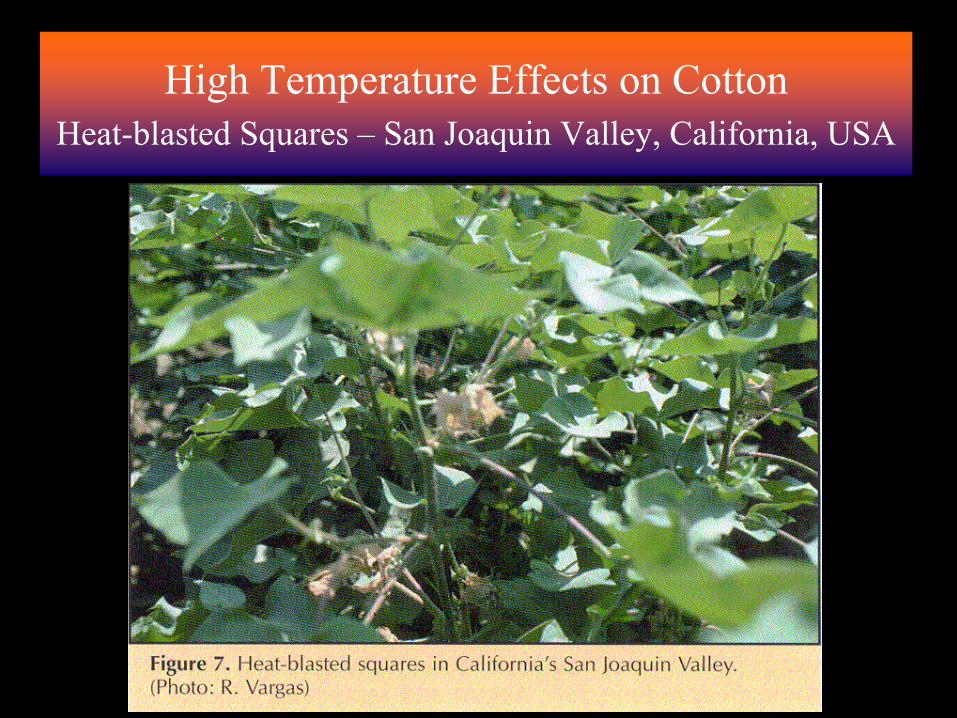
High Temperature Effects on CottonHeat-blasted Squares – San Joaquin Valley, California, USA

High Temperature Effects on CottonHeat-blasted Flowers – San Joaquin Valley, California, USA

High Temperature Effects on Cotton
The high temperature injury in cotton to reproductive growth and development is not fully understood so for.
High temperature causes some heat-sensitive cultivars/species (Pima cotton) to be vegetative (total reproductive failure and the reproductive induction process is sensitive). Not much is known why plants stay vegetative at those high temperature conditions.
Once the flower-buds (squares) are formed, exposure to extremely high temperatures (35/27oC) will result in abscission of squares.

High Temperature Effects on CottonNutrient starvation is not the factor that causes that square abortion because plants grown in elevated or twice ambient CO2 and under optimum nutrient conditions also drop those squares, and the nutrient demand for squares is minimal.
The evidence suggest that the 2 weeks prior to and 1 week post flower is the most sensitive stage in cotton.
Systematic evaluation is needed to quantify the effects of high temperature on both the male (anther, pollen growth and development) and female (ovule growth and development).

High Temperature Effects on Cotton
Breeders need simple and quantitative methods to screen genotypic variability and to find or breed a genotype to a niche environment for optimum crop production.
Biotechnology may play a role in developing cultivars that are more heat-tolerant.
Heat-tolerance will be beneficial even in today’s environment, and will be needed more in a warmer future climatic conditions.

High Temperature Target Sites in Plants
Kaushal et al., Cogent Food & Agriculture (2016), 2: 1134380http://dx.doi.org/10.1080/23311932.2015.1134380
Morphological, physiological, metabolic, and reproductive changes in plants under heat stress.(1) Direct injury: includes aggregation and denaturation of proteins as well as increased fluidity of membranes.(2) Indirect injury: includes inactivation of enzymes in chloroplasts and mitochondria, inhibition of protein synthesis, enhanced protein degradation and loss of membrane integrity.All these alterations result in cell injury or even death within a few minutes, which ultimately leads to catastrophic collapse of cellular organization

High Temperature Target Sites in Plants
Kaushal et al., Cogent Food & Agriculture (2016), 2: 1134380http://dx.doi.org/10.1080/23311932.2015.1134380
Both microgametophyte and megagametophyte are the main target sites of heat stress, with the former more heat sensitive.

Kaushal et al., Cogent Food & Agriculture (2016), 2: 1134380http://dx.doi.org/10.1080/23311932.2015.1134380
High Temperature Effects on Reproductive and Grain-filling Stages

High Temperature Effects on Reproductive and Grain-filling Stages
•The four differentiated layers of anther wall cells (epidermal, endothecium, middle layer, and tapetum cells) are sequentially degraded during pollen maturation.
•This degradation process appears to be controlled by programmed cell death (PCD) and results dehiscence of anther walls.
Higashitani, A. 2013. High-temperature injury and auxin biosynthesis in microsporogenesis. Front. Plant Sci. 4:47, 1-4.
Summary of HT injury to anther early development and effect of exogenous application of auxin.

Kaushal et al., Cogent Food & Agriculture (2016), 2: 1134380http://dx.doi.org/10.1080/23311932.2015.1134380

High Temperature InjuryTemperature and CO2 – Rice Growth
Temperature, °C20 22 24 26 28 30 32 34 36
Biom
ass,
g p
lant
-1
0
2
4
6
8
10
12330 ppm660 ppm
20% more at 660 than at 330
Baker and Allen, 1993

High Temperature InjuryTemperature and CO2 – Rice
Temperature, °C20 22 24 26 28 30 32 34 36 38
Ric
e yi
eld,
t ha
-1
0
2
4
6
8
10
12330 ppm660 ppm
Baker and Allen, 1993

High Temperature Effects on Rice Fertility
Rice
Cooling degree days are calculated based air temperatures and with a base temperature of 22 °C: 22 – mean temperature

High Temperature Effects on Rice Fertility

High Temperature Effects on Rice Yields
Temperature, °C20 22 24 26 28 30 32 34 36 38
Gra
in Y
ield
, Mg
ha-1
0
2
4
6
8
10
12
14
CO2, µl l-1
700
300
Baker et al.,1993

Rice Growing Areas – Weather Stations (67 locations) -

Growing season temperatures from those locations listed inthe previous slide and with an additional 5°C added to thosetemperatures relative to optimum and marginal conditions
Sites
Tem
pera
ture
, °C
15
20
25
30
35
40From the data presented in Slide 16, we can estimate Ambient temperature: 25.36°C = 8.26 Mg/haAmbient plus 5°C: 30.36°C = 5.51 Mg/ha, 33%

High Temperature InjuryTemperature and CO2 Interactions – Sorghum
32/22 36/26 40/30 44/340
6
12
18
24
30
Air temperature (°C)(daytime maximum/nighttime minimum)
350 mol CO2 mol-1 700 mol CO2 mol-1
Seed
yie
ld (g
pla
nt-1
)
32/22 36/26 40/30 44/340
25
50
75
100
Air temperature (°C)(daytime maximum/nighttime minimum)
350 mol CO2 mol-1 700 mol CO2 mol-1
See
d-se
t (%
)
Seed
wei
ght,
g pl
ant-1
Seed
-set
, %
Seed Weight and Seed-set

High Temperature InjuryTemperature and CO2 Interactions – Sorghum
0700
0800
0900
1000
1100
1200
1300
1400
0
25
50
75
100
Time of the day (h)
350 mol CO2 mol-1 700 mol CO2 mol-1
In-v
itro
pol
len
germ
inat
ion
(%)
(a) 32/22°C
0700
0800
0900
1000
1100
1200
1300
1400
0
25
50
75
100
Time of the day (h)
350 mol CO2 mol-1 700 mol CO2 mol-1
In-v
itro
pol
len
germ
inat
ion
(%)
(b) 36/26°C
• Elevated temperature decreased pollen longevity.• Elevated CO2 had no effect.
Prasad et al. 2005
Pollen Germination

High Temperature InjuryTemperature and CO2 Interactions – Dry Beans
0
1 0
2 0
3 0
4 0
2 8 / 1 83 1 / 2 13 4 / 2 43 7 / 2 74 0 / 3 00
5
1 0
1 5
2 0
A i r t e m p e r a t u r e ( d a y / n i g h t , ° C )
To
ta
l
dr
y
we
ig
ht
(
pl
an
t-
1)
7 0 0 m o l C O2 m o l- 1 3 5 0 m o l C O2 m o l- 1( a )
( b )
Se
ed
y
ie
ld
(
g
pl
an
t-
1)
• Elevated temperatures decreased total dry weights and seed yields.
• Elevated CO2 increased seed yields but to a lesser extent at high temperatures.
Prasad et al. 2005
Total Weight and Seed Weight

High Temperature InjuryTemperature and CO2 – Groundnut
32/22 36/26 40/30 44/340
200
400
600
800
Air temperature (°C)(daytime maximum/nighttime minimum)
350 mol CO2 mol-1 700 mol CO2 mol-1
Vege
tativ
e dr
y w
eigh
t (g
m-2
)
y = -3600 +209x -2.62x2; r2 = 0.96
y = -3995 +224x -2.62x2; r2 = 0.96
32/22 36/26 40/30 44/340
100
200
300
400
500
Air temperature (°C)(daytime maximum/nighttime minimum)
350 mol CO2 mol-1 700 mol CO2 mol-1Se
ed y
ield
(g m
-2)
y = -774 +78.9x -1.38x2; r2 = 0.98
y = -591 +75.6x -1.38x2; r2 = 0.99
Harvest, index, seed size, shelling percentage, seed-set, pollen viability and seed number did not change between CO2 levels, but drastically reduced with increase in temperatures.
Prasad et al. 2005
Total Weight and Seed Weight

High Temperature InjuryTemperature and CO2 – Rangeland C4 Grass – Big Bluestem
Temperature, °C
15 20 25 30 35 40
Vega
etat
ive
biom
ass,
g p
lant
-1
0
10
20
30
40
50
Seed
wei
ght,
g pl
ant-1
0
1
2
3
4
5
360 ppm720 ppm Vegaetative
Reproductive
1.5% °C-1
8.4% °C-1
Vegetative Weight and Seed Weight
Kakani and Reddy, 2006

Temperature Effects on Crop YieldSeveral Major Crops
Crop Topt, °C
Tmax, °C
Yield at Topt, t/ha
Yield at 28
°C, t/ha
Yield at 32°Ct/ha
% decrease (28 to 32 °C)
Rice 25 36 7.55 6.31 2.93 54
Soybean 28 39 3.41 3.41 3.06 10
Dry bean 22 32 2.87 1.39 0.00 100
Peanut 25 40 3.38 3.22 2.58 20
Grain sorghum
26 35 12.24 11.75 6.95 41
Allen et al., 2000

4-week old cotton seedlings
High Temperature Effects on Growth Stages of Major Crops

• There are no beneficial effects of elevated CO2 on reproductive processes.
• There are no beneficial interaction of CO2 on temperature effects on reproductive processes and yield.
• Negative effects of elevated temperature on seed set, seed yield and harvest index were greater at elevated CO2 (grain sorghum, dry bean and big blue stem).
High Temperature InjuryConclusions – Temperature and CO2 Interactions

High Temperature and Crop Productivity
Effects of Multiple Abiotic Factors

UV-B Radiation, kJ m-2 d-10 7 14
Phot
osyn
thes
is, µ
mol
m-2
s-1
0
10
20
30
40
50
60
24/16 °C30/22 °C36/28 °C
UV-B Radiation and Temperature Cotton Reproductive Growth and Development
30/22
36/28

UV-B Radiation, kJ m-2 d-10 7 14
Bolls
and
squ
ares
, no.
pla
nt-1
0
20
40
60
80
100
12024/16 °C30/22 °C36/28 °C
30/22
36/28
Bolls and Squares
UV-B Radiation and Temperature Cotton Reproductive Growth and Development

30/22
36/28
UV-B Radiation, kJ m-2 d-10 7 14
Bolls
pro
duce
d, n
o. p
lant
-1
0
10
20
30
4024/16 °C30/22 °C36/28 °C
Bolls Produced
UV-B Radiation and Temperature Cotton Reproductive Growth and Development

30/22
36/28
UV-B Radiation, kJ m-2 d-10 7 14
Ret
aine
d bo
lls, n
o. p
lant
-1
0
10
20
30
4024/16 °C30/22 °C36/28 °C
Retained Bolls
UV-B Radiation and Temperature Cotton Reproductive Growth and Development

30/22
36/28
Pollen Pollen germination
no. anther-1 %
192 70
70 1
UV-B Radiation and Temperature Cotton Reproductive Growth and Development
180-210
50-80

Growing Conditions and Treatments:Temperature (°C) CO2 (ppm) UV-B (kJ m-2 d-1)
30/22 360 0
5
38/30 720 10
15
Treatments
UV-B Radiation and Soybean Genotypes Reproductive Growth and Development

Control +T
+UV-B +T+UV-B
UV-B and Temperature Soybean Reproductive Development – Sensitive Cultivar

• There are no beneficial effects of elevated CO2on reproductive processes in the crops investigated (cotton, soybean, rice, sorghum and beans).
• There are no beneficial interaction of temperature on UV-B effects on reproductive processes.
• High temperatures and higher UV-B aggravated the damaging effect on many reproductive processes.
• Elevated CO2 did not ameliorate the damaging effects of either higher temperatures or elevated UV-B levels.
Climate Change and Crop ProductivityConclusions – Temperature and CO2 Interactions

High Temperature and Crop Productivity
Genotypic Variability

Climate Change and Crop ProductivityCotton – Pollen Germination - Genotypic Variability
Temperature, °C10 15 20 25 30 35 40 45 50
Polle
n ge
rmin
atio
n, %
0
10
20
30
40
50
60
70DP 458 B/RRNuCOTN 35B
Cotton
Kakani et al., 2005

Temperature, °C10 20 30 40 50
Ger
min
atio
n, %
0
20
40
60
80
100STALWARTPI471938DG 5630RR
Soybean
Climate Change and Crop ProductivitySoybean – Pollen Germination - Genotypic Variability
Salem et al., 2006

0
10
20
30
40
50
60
70
80
10 15 20 25 30 35 40 45 50
ICGV 92116
ICGV 92118
55-437
Susceptible Moderate
Tolerant
Temperature (C)
Polle
n ge
rmin
atio
n (%
)
Effect of temperature on percentage pollen germination of susceptible(Topt < mean-LSD), moderately tolerant (Topt = mean±LSD) and tolerant(Topt > mean+LSD) genotypes. Symbols are observed values and linesare fitted values.
Temperature – Pollen Germination
% Tb Topt Tmax
40 13.8 26.5 38.551.5 11.7 30.6 40.770.3 11.9 31.9 45.2
Kakani et al., 2002

0
2
4
6
8
10
12
14
16
10 15 20 25 30 35 40 45 50
ICGV 92116ICGV 9211655-437
Temperature (C)
Temperature – Pollen Tube Growth
Length Tb Topt Tmax
1280 16.0 36.4 45.51080 15.3 30.5 37.71410 14.5 37.6 45.1
Kakani et al., 2002

Climate Change and Crop ProductivityCotton – Pollen Germination – Cardinal Temperatures
Genotypic Variability
Genotypes0 5 10 15
Car
dina
l tem
pera
tues
, °C
510152025303540455055
Cotton
Tmax
Topt
Tmin
43.3 °C
30.4 °C
15.1 °C
Kakani et al., 2005

Climate Change and Crop ProductivitySoybean – Pollen Germination – Cardinal Temperatures
Genotypic Variability
Genotypes0 5 10 15 20 25 30 35 40 45 50
Car
dina
l tem
pera
tues
, °C
510152025303540455055
SoybeanTmax
Topt
Tmin
47.2 °C
30.2 °C
13.3 °C
Salem et al., 2006
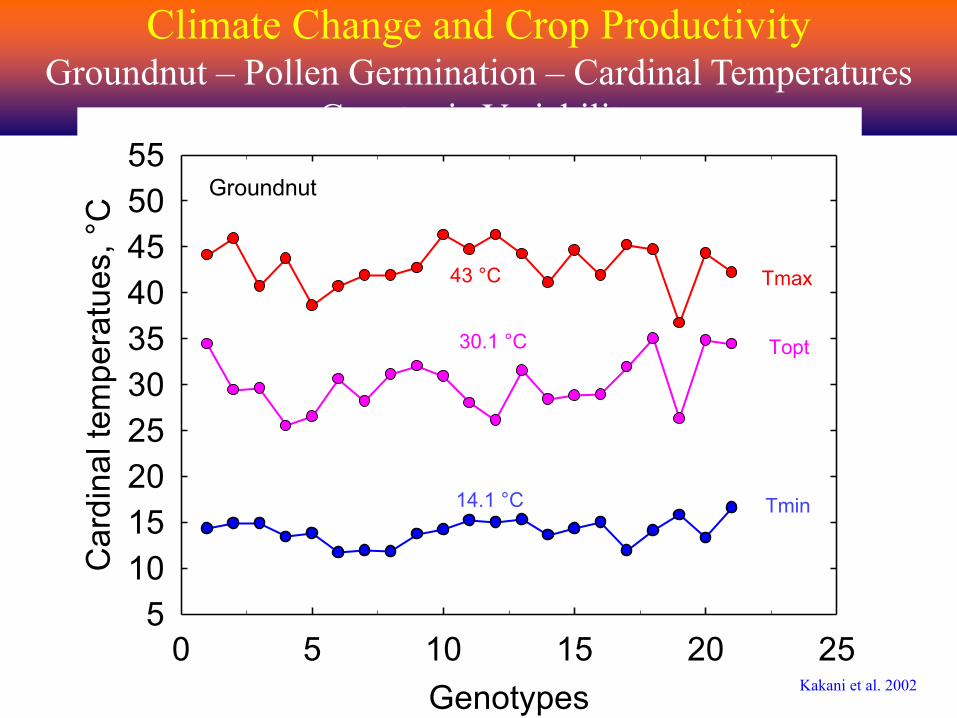
Climate Change and Crop ProductivityGroundnut – Pollen Germination – Cardinal Temperatures
Genotypic Variability
Genotypes0 5 10 15 20 25
Car
dina
l tem
pera
tues
, °C
510152025303540455055
Groundnut
Tmax
Topt
Tmin
43 °C
30.1 °C
14.1 °C
Kakani et al. 2002

• The influence of stress factors on reproductive biology of crops/plants has not been well studied.
• Better screening tools/methods are needed to assess the genotypic variability among crop species.
• The current rate of climate change and climate variability and projected changes in climate are unprecedented, and plants may not cope with these rapid changes.
• There is an urgent need to develop crop cultivars to a variety of stresses (high and low temperatures, water/drought stress, salt stress, UV-B radiation stress etc. either alone or in combination).
High Temperature Injury – Crop ReproductionConcluding Remarks