NMR structure of the protein NP_247299.1: comparison with the crystal structure
14
structural communications Acta Cryst. (2010). F66, 1367–1380 doi:10.1107/S1744309110005890 1367 Acta Crystallographica Section F Structural Biology and Crystallization Communications ISSN 1744-3091 NMR structure of the protein NP_247299.1: comparison with the crystal structure Kristaps Jaudzems, a,b Michael Geralt, a,b Pedro Serrano, a,b Biswaranjan Mohanty, a,b Reto Horst, a,b Bill Pedrini, c Marc-Andre ´ Elsliger, a,b Ian A. Wilson a,b,d and Kurt Wu ¨thrich a,b,c,d * a Department of Molecular Biology, The Scripps Research Institute, La Jolla, CA 92037, USA, b Joint Center for Structural Genomics, http://www.jcsg.org, USA, c Institute of Molecular Biology and Biophysics, ETH Zurich, CH-8093 Zurich, Switzerland, and d Skaggs Institute of Chemical Biology, The Scripps Research Institute, La Jolla, CA 92037, USA Correspondence e-mail: [email protected] Received 10 December 2009 Accepted 13 February 2010 PDB Reference: NP_247299.1, 2kla. The NMR structure of the protein NP_247299.1 in solution at 313 K has been determined and is compared with the X-ray crystal structure, which was also solved in the Joint Center for Structural Genomics (JCSG) at 100 K and at 1.7 A ˚ resolution. Both structures were obtained using the current largely automated crystallographic and solution NMR methods used by the JCSG. This paper assesses the accuracy and precision of the results from these recently established automated approaches, aiming for quantitative statements about the location of structure variations that may arise from either one of the methods used or from the different environments in solution and in the crystal. To evaluate the possible impact of the different software used for the crystallographic and the NMR structure determinations and analysis, the concept is introduced of reference structures, which are computed using the NMR software with input of upper-limit distance constraints derived from the molecular models representing the results of the two structure determinations. The use of this new approach is explored to quantify global differences that arise from the different methods of structure determination and analysis versus those that represent interesting local variations or dynamics. The near-identity of the protein core in the NMR and crystal structures thus provided a basis for the identification of complementary information from the two different methods. It was thus observed that locally increased crystallographic B values correlate with dynamic structural poly- morphisms in solution, including that the solution state of the protein involves a slow dynamic equilibrium on a time scale of milliseconds or slower between two ensembles of rapidly interchanging conformers that contain, respectively, the cis or trans form of the C-terminal proline and represent about 25 and 75% of the total protein. 1. Introduction The hypothetical protein NP_247299.1 is the gene product of locus MJ0327 in the genomic sequence of the Methanococcus jannaschii genome (Bult et al., 1996). Its function is unknown, but on the basis of sequence similarity the NP_247299.1 protein has been assigned to the dinitrogenase iron–molybdenum cofactor family (PF02579). This family includes NifB, NifX and NifY, all of which are involved in bio- synthesis of the nitrogenase iron–molybdenum cofactor (FeMo-co) in nitrogen-fixing bacteria (Rubio et al. , 2002). The crystal structure of NP_247299.1 (PDB code 2qtd) has pre- viously been solved by the Joint Center for Structural Genomics (JCSG). The NMR solution structure of NP_247299.1 has now been determined independently as part of a methods-development project in the JCSG. In this paper, we describe the NMR solution structure of NP_247299.1 obtained using a new protocol that was implemented by the JCSG NMR Core (see below) and present a systematic comparison of the results obtained by largely automated solution structure determination with the crystal structure. In pursuing this comparison, we explore the use of reference crystal and NMR structures to investigate the influence of the different structure- determination software used by the two methods. The reference structures are computed from distance restraints derived from the crystal and solution molecular models, respectively, using the same simulated-annealing protocol as used for the computation and refinement of the experimental NMR structure. This study leads to a
Transcript of NMR structure of the protein NP_247299.1: comparison with the crystal structure

structural communications
Acta Cryst. (2010). F66, 1367–1380 doi:10.1107/S1744309110005890 1367
Acta Crystallographica Section F
Structural Biologyand CrystallizationCommunications
ISSN 1744-3091
NMR structure of the protein NP_247299.1:comparison with the crystal structure
Kristaps Jaudzems,a,b Michael
Geralt,a,b Pedro Serrano,a,b
Biswaranjan Mohanty,a,b Reto
Horst,a,b Bill Pedrini,c
Marc-Andre Elsliger,a,b
Ian A. Wilsona,b,d and
Kurt Wuthricha,b,c,d*
aDepartment of Molecular Biology, The Scripps
Research Institute, La Jolla, CA 92037, USA,bJoint Center for Structural Genomics,
http://www.jcsg.org, USA, cInstitute of
Molecular Biology and Biophysics, ETH Zurich,
CH-8093 Zurich, Switzerland, and dSkaggs
Institute of Chemical Biology, The Scripps
Research Institute, La Jolla, CA 92037, USA
Correspondence e-mail: [email protected]
Received 10 December 2009
Accepted 13 February 2010
PDB Reference: NP_247299.1, 2kla.
The NMR structure of the protein NP_247299.1 in solution at 313 K has been
determined and is compared with the X-ray crystal structure, which was also
solved in the Joint Center for Structural Genomics (JCSG) at 100 K and at 1.7 A
resolution. Both structures were obtained using the current largely automated
crystallographic and solution NMR methods used by the JCSG. This paper
assesses the accuracy and precision of the results from these recently established
automated approaches, aiming for quantitative statements about the location
of structure variations that may arise from either one of the methods used or
from the different environments in solution and in the crystal. To evaluate
the possible impact of the different software used for the crystallographic and
the NMR structure determinations and analysis, the concept is introduced of
reference structures, which are computed using the NMR software with input of
upper-limit distance constraints derived from the molecular models representing
the results of the two structure determinations. The use of this new approach is
explored to quantify global differences that arise from the different methods of
structure determination and analysis versus those that represent interesting local
variations or dynamics. The near-identity of the protein core in the NMR and
crystal structures thus provided a basis for the identification of complementary
information from the two different methods. It was thus observed that locally
increased crystallographic B values correlate with dynamic structural poly-
morphisms in solution, including that the solution state of the protein involves a
slow dynamic equilibrium on a time scale of milliseconds or slower between two
ensembles of rapidly interchanging conformers that contain, respectively, the cis
or trans form of the C-terminal proline and represent about 25 and 75% of the
total protein.
1. Introduction
The hypothetical protein NP_247299.1 is the gene product of locus
MJ0327 in the genomic sequence of the Methanococcus jannaschii
genome (Bult et al., 1996). Its function is unknown, but on the basis
of sequence similarity the NP_247299.1 protein has been assigned to
the dinitrogenase iron–molybdenum cofactor family (PF02579). This
family includes NifB, NifX and NifY, all of which are involved in bio-
synthesis of the nitrogenase iron–molybdenum cofactor (FeMo-co) in
nitrogen-fixing bacteria (Rubio et al., 2002).
The crystal structure of NP_247299.1 (PDB code 2qtd) has pre-
viously been solved by the Joint Center for Structural Genomics
(JCSG). The NMR solution structure of NP_247299.1 has now been
determined independently as part of a methods-development project
in the JCSG. In this paper, we describe the NMR solution structure of
NP_247299.1 obtained using a new protocol that was implemented
by the JCSG NMR Core (see below) and present a systematic
comparison of the results obtained by largely automated solution
structure determination with the crystal structure. In pursuing this
comparison, we explore the use of reference crystal and NMR
structures to investigate the influence of the different structure-
determination software used by the two methods. The reference
structures are computed from distance restraints derived from the
crystal and solution molecular models, respectively, using the same
simulated-annealing protocol as used for the computation and
refinement of the experimental NMR structure. This study leads to a

quantitative evaluation of the close global similarity of the protein
core in the NMR and crystal structures and to detailed information
on localized polymorphisms in the solution structure and their
manifestation in the crystallographic data.
2. Materials and methods
2.1. Protein preparation
The plasmid vector pSpeedET containing the NP_247299.1 gene
was obtained from the JCSG Crystallomics Core, where it had been
generated using the polymerase incomplete primer extension (PIPE)
cloning method (Klock et al., 2008) to produce the protein for the
crystal structure determination. For the NMR sample preparation,
pSpeedET-NP_247299.1 was used as the template for PCR amplifi-
cation with the primers 50-CGGCATATGGAAAACCTGTATTTT-
CAGGGAATAAATATGAAAGTAGCCATTTCAATG-30 and 50-
CGGAAGCTTTTATGGATTACTTATTTTACTTAATTCCCCCT-
CAATAAATAAAGAG-30, where the NdeI and HindIII restriction
sites are underlined and the initiation and stop codons are italicized.
The forward primer contains an ENLYFQG TEV protease cleavage
site (shown in bold). The PCR product was digested with NdeI and
HindIII and inserted into the vector pET-28b between the same
restriction sites after treatment with calf intestinal alkaline phos-
phatase (CIP). The resulting plasmid pET-28b-TEV-NP_247299.1
was used to transform Escherichia coli strain BL21 (DE3) (Novagen)
and the protein was expressed in M9 minimal media containing either
1 g l�1 15NH4Cl and 4 g l�1 unlabeled d-glucose or 1 g l�1 15NH4Cl
and 4 g l�1 [13C6]-d-glucose (Cambridge Isotope Laboratories) as the
sole sources of nitrogen and carbon. After the addition of 100 mg l�1
kanamycin, the cells were grown at 310 K to an OD600 of 0.70,
induced with 1 mM isopropyl �-d-1-thiogalactopyranoside (IPTG)
and kept at 291 K for a further 20 h (final OD600 = 0.91). The cells
were harvested at 5000g and 277 K for 10 min and freeze–thawed at
193 K for 15 min. The cell pellet was resuspended in 46 ml buffer A
(20 mM sodium phosphate pH 7.5, 300 mM NaCl, 15 mM imidazole,
1 mM DTT) containing one Complete EDTA-free protease-inhibitor
cocktail tablet (Roche) and lysed by ultrasonication. The soluble
fraction of the cell lysate was isolated by centrifugation for 30 min
at 20 000g and 277 K and passed through a 0.22 mm pore-size filter.
The solution was then applied onto a 5 ml HisTrap HP column (GE
Healthcare) pre-equilibrated in buffer A. The bound protein was
eluted using a linear imidazole gradient from 15 to 500 mM over a
200 ml volume. Fractions containing the protein were pooled and
treated with 25 mg ml�1 TEV protease for 17 h at 307 K in order to
remove the 25-residue N-terminal expression and purification
tag. The product was applied onto a HiPrep 26/10 desalting column
pre-equilibrated in buffer A. The NP_247299.1 recovered from the
flowthrough was reapplied onto a HisTrap HP 5 ml column pre-
equilibrated in buffer A. Fractions containing the protein were
concentrated to 10 ml by ultrafiltration using an Amicon
ultracentrifugal filter device with 3 kDa molecular-weight cutoff
(Millipore) and then applied onto a HiLoad 26/60 Sephacryl S-100
gel-filtration column (GE Healthcare) pre-equilibrated in NMR
buffer (20 mM sodium phosphate pH 6.5, 1 mM DTT). The fractions
containing NP_247299.1 were pooled and concentrated from 45 ml to
500 ml by ultrafiltration. All purification steps were monitored by
SDS–PAGE. The yield of purified NP_247299.1 was 5.7 mg per litre
of culture.
NMR samples were prepared by adding 5%(v/v) D2O and
0.03%(w/v) NaN3 to 500 ml of a 0.9 mM solution of 15N,13C-labeled
NP_247299.1 in NMR buffer.
2.2. NMR spectroscopy
NMR experiments were conducted at 313 K on Bruker Avance 600
and 800 MHz spectrometers equipped with a TXI HCN z-gradient
cryoprobe and an xyz-gradient room-temperature probe, respec-
tively. 4D APSY-HACANH, 5D APSY-HACACONH and 5D APSY-
CBCACONH data sets were recorded with 29, 32 and 24 projections,
respectively (Hiller et al., 2005, 2008). Three NOESY spectra were
recorded with a mixing time of 60 ms: 3D [1H,1H]-NOESY-15N-
HSQC, 3D [1H,1H]-NOESY-13C(ali)-HSQC and 3D [1H,1H]-
NOESY-13C(aro)-HSQC. The 13C carrier frequencies were at 26 and
125 p.p.m. for the recording of the 13C(ali) and 13C(aro) data sets,
respectively. A 3D HNHA experiment (Vuister & Bax, 1993) was
recorded for the determination of 3JHN� coupling constants. Chemical
shifts were referenced internally to the residual water signal. The
chemical shift of the solvent water resonance relative to DSS was
4.61 p.p.m.
2.3. NMR structure determination
The polypeptide backbone resonance assignments were obtained
from the aforementioned APSY-NMR experiments. The APSY-
generated four- and five-dimensional peak lists were used as input for
automated backbone assignment with the software UNIO-MATCH
v.1.0.2 (Volk et al., 2008). The backbone assignments were then
interactively checked and completed. Side-chain resonance assign-
ments were obtained with the program UNIO-ATNOS/ASCAN
v.1.0.2 (Herrmann et al., 2002b; Fiorito et al., 2008), using as input the
aforementioned 3D 15N-resolved and 13C-resolved [1H,1H]-NOESY
spectra. The assignments obtained from this automatic procedure
were interactively checked and extended using the software CARA
(Keller, 2004). NOE distance restraints were automatically collected
using the same three NOESY data sets as for the side-chain assign-
ment as input for the program UNIO-ATNOS/CANDID v.1.0.2
(Herrmann et al., 2002a,b), which was used in combination with the
NMR structure-calculation program CYANA v.3.0 (Guntert et al.,
1997). No explicit torsion-angle restraints were used in the input. A
standard seven-cycle UNIO-ATNOS/CANDID protocol (Herrmann
et al., 2002a) was employed, with 80 random starting conformers
being subjected to a simulated-annealing schedule consisting of 8000
steps of torsion-angle molecular dynamics. The 40 conformers with
the lowest residual CYANA target-function values after UNIO-
ATNOS/CANDID cycle 7 were energy-minimized in a water shell
with the program OPALp (Luginbuhl et al., 1996) using the AMBER
force field (Cornell et al., 1995). The 20 conformers with the lowest
target-function values that satisfied the validation criteria (see below)
were selected and analyzed using the program MOLMOL (Koradi et
al., 1996).
2.4. Structure validation and data deposition
Analysis of the stereochemical quality of the molecular models was
accomplished using the PDB validation tools (http://www.pdb.org/),
the JCSG Validation Central Suite (http://www.jcsg.org) and the
Verify3D structure-validation server (http://nihserver.mbi.ucla.edu/
Verify_3D/) in an in-house validation protocol used by the JCSG
NMR Core (unpublished work). The chemical shifts have been
deposited in BioMagResBank (accession No. 16389; http://
www.bmrb.wisc.edu) and the atomic coordinates of the 20 conformers
representing the NMR structure were deposited in the Protein Data
Bank (accession code 2kla).
structural communications
1368 Jaudzems et al. � NP_247299.1 Acta Cryst. (2010). F66, 1367–1380

2.5. Calculation of reference crystal and reference NMR structures
from proton–proton distance constraints derived from the crystal
and NMR structures, respectively, using the same simulated-
annealing protocol as used for the experimental NMR structure
determination
In order to derive proton–proton distances from the X-ray crystal
structure of NP_247299.1 (PDB code 2qtd), the positions of the H
atoms were calculated using the standard residue geometry from the
AMBER94 library in the software MOLMOL (Koradi et al., 1996).
All intra- and inter-residual distances shorter than 5.0 A between
pairs of H atoms were then extracted and those involving labile
protons with fast chemical exchange (Wuthrich, 1986) were elimi-
nated from the resulting list. The input of upper-limit distance bounds
for the structure calculation was generated by increasing these
proton–proton distances by 15%. This ‘loosening’ of the distance
constraints is in line with the basic strategy of interpreting 1H–1H
NOEs in terms of upper-limit distance bounds (Wuthrich, 1986); this
procedure ensured good convergence of the simulated annealing and
yielded identical structures as were obtained when using the actual
distances as input. A bundle of 20 energy-minimized conformers
representing the reference crystal structure was computed using the
torsion-angle molecular-dynamics algorithm of the program CYANA,
following the same selection protocol as for the experimental NMR
structure determination.
To obtain the reference NMR structure, we followed a three-step
protocol. (i) A list was prepared of all the 1H—1H distances shorter
than 5.0 A in the 20 conformers that represent the NMR structure.
(ii) A new list was obtained that included the longest distance among
the 20 conformers for each pair of H atoms in the list resulting from
(i). (iii) The input of upper-limit distance bounds contained all the
entries in list (ii) that were shorter than 5.75 A [this value was
empirically selected as the shortest cutoff that gave virtually identical
results of the structure calculation to an input consisting of the
complete list (ii)]. A bundle of 20 energy-minimized conformers was
generated using the same selection criteria as for the reference crystal
structure and the experimental NMR structure.
2.6. Comparison of the global displacements in the NMR structure,
the reference NMR structure and the reference crystal structure
with displacements calculated from the B values of the X-ray
structure
Global displacements (Billeter et al., 1989) of the backbone heavy
atoms N, C� and C0 in the bundles of 20 energy-refined conformers
that were used to represent the NMR structure, the reference NMR
structure and the reference crystal structure, D, were calculated using
MOLMOL (Koradi et al., 1996). For further interpretation, we used
the average displacement per residue, D, which is the arithmetic
average of the D values for these three atoms per residue,
D ¼1
3
P
i¼N;C�;C0Di: ð1Þ
Similarly, we define the average crystallographic B value per residue,
B, as
B ¼1
3
P
i¼N;C�;C0Bi: ð2Þ
To formally express the precision of the crystal structure determi-
nation by D values, as used for the NMR structure and the two
reference structures, we determined an empirical correlation coeffi-
cient, c, from a linear least-squares fit of the B values in the experi-
mental crystal structure to the corresponding D values in the
reference crystal structure, so that the relation
h�xi ¼ c � B ð3Þ
defines displacements per residue that correspond to the B values. We
thus do not address the question of comparing absolute values of D
and B in the NMR structure and the crystal structure. In some ways
(3) corresponds to the ‘inverse’ of previous approaches to derive
‘pseudo-B values’ from NMR displacements in attempts to obtain
improved models for molecular replacement in crystal structure
determinations (Weiss et al., 1995; Wilmanns & Nilges, 1996).
2.7. Computation of global r.m.s.d. values, solvent accessibility and
occluded surface packing (OSP)
Global r.m.s.d. values for the bundles of 20 conformers repre-
senting the NMR structure, the reference NMR structure and the
reference crystal structure were computed with MOLMOL (Koradi
et al., 1996) using the mean coordinates as the reference. For each
bundle of 20 conformers, r.m.s.d. values were computed for three
atom selections, i.e. the backbone heavy atoms (bb), the core atoms
with less than 15% solvent accessibility (co) and all heavy atoms (ha).
For the crystal structure, the r.m.s.d. values for the three different
atom selections were calculated according to
h�xi ¼1
N
PN
j¼1
h�xij; ð4Þ
where N is the number of atoms selected for the superposition and
h�xij was derived with (5) for each individual atom j from its crys-
tallographic B value,
h�xij ¼ c � Bj; ð5Þ
where c is the correlation coefficient determined for the backbone
heavy atoms with (3) (see also Fig. 3a).
For comparison of different structures, each bundle was repre-
sented by the conformer with the smallest bb r.m.s.d. relative to the
mean coordinates. R.m.s.d. values comparing different structures
were then calculated for the atom selections bb, co and ha.
Solvent accessibility was only computed for the NMR structure,
where mean values for the 20 conformers were obtained either for
individual heavy atoms or for individual amino-acid residues. The
rolling-sphere model implemented in the software MOLMOL was
used, with a radius of 1.4 A for the sphere representing the solvent
molecule and a computation precision value of 3 (Koradi et al., 1996).
The occluded surface packing (OSP) was computed with the OS
software package (Pattabiraman et al., 1995; http://www.csb.yale.edu/
userguides/datamanip/os/), considering all heavy atoms in the poly-
peptide chain. Two different approaches were used. On the one hand,
OSPs were evaluated for the crystal structure and for the conformers
closest to the mean of the bundles representing the NMR structure
and the two reference structures. In addition, OSPs were calculated
for all 20 NMR conformers and the mean value and standard
deviation were then evaluated.
3. Results
3.1. NMR structure of NP_247299.1
The automation of the determination of the NMR structure of
NP_247299.1, as described in x2.3, provided the following results: the
automated UNIO-MATCH routine yielded assignments for the 1HN,15N, 13C� and 1H� atoms of 97 residues (94%) and for the 13C� atoms
of 91 residues. Interactive validation showed that the automated
structural communications
Acta Cryst. (2010). F66, 1367–1380 Jaudzems et al. � NP_247299.1 1369

procedure had not generated any incorrect assignments and the
backbone and 13C� assignments were extended interactively to all 104
residues. On the basis of the complete backbone assignments, auto-
mated side-chain assignment with the program UNIO-ATNOS/
ASCAN resulted in complete or partial assignments of the nonlabile
H atoms of all 104 residues. Interactive inspection showed that about
95% of these assignments were correct and, for most of the side
chains with partial assignment, the chemical shift lists could be
expanded interactively. The time used for the interactive steps was
about 70 h.
The NMR structure of NP_247299.1 comprises three �-helices
consisting of residues 45–54, 66–72 and 86–95, five �-strands formed
by residues 4–10, 24–30, 35–42, 58–61 and 77–80 and a short 310-helix
for residues 19–21 in the sequential order �1–310–�2–�3–�1–�4–�2–
�5–�3 (Fig. 1a). The longest polypeptide segment with nonregular
secondary structure contains residues 11–18, but is well defined. The
�-strands form a twisted sheet with topology 3–2–1–4–5, in which
strands 3, 1, 4 and 5 are parallel to each other and strand 2 is anti-
parallel (Fig. 1a). Helices �1 and �2 are arranged in parallel at a small
angle, with the 310-helix positioned between them at their N-terminal
ends. This combination of three helices is docked against one side of
the twisted �-sheet, whereas helix �3 is located on the opposite side.
Statistics of the NMR structure determination are given in Table 1.
The fold topology of NP_247299.1 resembles a ribonuclease H-like
motif, with a three-layer �/�/� architecture. A DALI search (Holm
et al., 2008) revealed eight structures with a Z score of �10, which
indicates strong fold similarity. Seven of these proteins belong to the
COG1433 protein family, which contains 28 functionally unchar-
acterized conserved proteins from 13 different genomes, including
NP_247299.1. Superposition of the previously reported structures of
structural communications
1370 Jaudzems et al. � NP_247299.1 Acta Cryst. (2010). F66, 1367–1380
Figure 1Amino-acid sequence and NMR structure of protein NP_247299.1 and comparison of the NMR structure with the crystal structure. (a) Stereo ribbon diagram of the NMRconformer closest to the mean coordinates of the bundle of conformers in (b). Color code: �-strands, cyan; helices, red/yellow; nonregular secondary structure, gray. Theindividual regular secondary structures are identified and the two chain ends are marked N and C. (b) Stereoview of a superposition of the polypeptide backbone heavyatoms of residues 1–102 of the crystal structure (black line) with the 20 conformers representing the NMR structure (brown). The crystal structure was superimposed for bestfit with the mean atomic coordinates of the 20 NMR conformers. (c) Amino-acid sequence. Residues �2 and �1 originate from the expression and purification tag at theTEV cleavage site and are not part of NP_247299.1. The locations of regular secondary structures are indicated above the sequence.
six COG1433-family proteins [PDB codes 2re2 (Joint Center for
Structural Genomics, unpublished work), 1rdu (Etezady-Esfarjani et
al., 2004), 1o13 (Joint Center for Structural Genomics, unpublished
work), 1t3v (Columbus et al., 2005), 2yx6 (T. Hosaka, K. Murayama,
T. Terada, M. Shirouzu & S. Yokoyama, unpublished work) and 1eo1
(Cort et al., 2000)] with NP_247299.1 confirmed high conservation of
the relative spatial arrangement of the regular secondary structures,
with any structure variations being limited to the connecting nonre-
gular polypeptide segments, where they appear to correlate with
amino-acid insertions and deletions.
3.2. Strategy for structure comparisons
During the last decade, the JCSG has developed novel largely
automated protocols for NMR structure determination (unpublished
work) and crystal structure determination, the latter of which has
been found by others to yield the highest quality crystal structures
presently deposited in the PDB (Brown & Ramaswamy, 2007). Here,
we compare the accuracy and precision of NMR and X-ray structures
of the protein NP_247299.1 that were independently determined with
these new approaches. Since the two structures were found to have
a virtually identical protein core, this study can furnish a detailed
evaluation of local structure variations that may be associated with
the different environments in solution and in single crystals. We
established a frame of reference for this comparison that would
monitor the possible impact of the different software used for the
structure calculation and refinement by the two techniques. To this
end, we used the NMR software to compute a reference crystal
structure and a reference NMR structure based on an input of upper
distance constraints derived from the corresponding experimental
structures, as described in x2. This approach was validated by
checking that all of the experimentally observed NOE cross-peaks
coincide with peak positions contained in the structure-derived input.
We then explore the use of these two reference structures to support
the evaluation of the significance of the few apparent differences
between the experimental NMR and crystal structures. While
systematic comparisons of crystal structures and NMR structures
have been carried out for many years (see, for example, Billeter et al.,
1989; Braun et al., 1989, 1992; Hyberts et al., 1992; Yang et al., 2007),
owing to the advancement of the two methodologies and the auto-
mated methods that can reduce human error or bias, we can now
focus on more subtle differences between the NMR and crystal
structures that might in some instances also relate to the biological
function. The identification of such locally variable sites is guided by a
search for sequence locations with high B values in the crystal
structure or/and high variation within the bundle of 20 NMR
conformers. Characterization of these local ‘hot spots’ is then
supported by additional NMR measurements.
3.3. Global fold comparisons
The NMR structure of NP_247299.1 was solved at 313 K using
0.9 mM protein solution in 20 mM sodium phosphate buffer pH 6.5
containing 1 mM DTT and 0.03%(w/v) NaN3. The crystal structure
was determined to 1.7 A resolution at 100 K using a crystal obtained
at 277 K from 100 mM Tris–HCl solution pH 7.0 containing 50%(w/v)
PEG 200. Here and in x3.4 we identify differences between the results
of these two structure determinations.
The reference structures were calculated from a significantly larger
number of upper-limit distance constraints than the experimental
NMR structure. The main factors causing the numbers of constraints
to differ (Table 1) are that, owing to the limited resolution and
sensitivity of the NMR experiments, only a fraction of the short
1H—1H distances are collected in the solution structure determina-
tion, whereas in the aforementioned molecular models all the short
contacts are evaluated. Furthermore, in the present reference struc-
ture calculations only the methyl groups were represented by pseudo-
atoms (Wuthrich et al., 1983), whereas in the experimentally collected
input the methylene groups and the pairs of symmetry-related ring
protons of Phe and Tyr were also represented by pseudo-atoms.
The high global structure similarity between the NMR and X-ray
structures of NP_247299.1 is visualized by superposition of the crystal
structure and the bundle of NMR conformers (Fig. 1b). A quanti-
tative comparison yielded backbone (bb) and all-heavy-atom (ha)
r.m.s.d. values of 0.93 and 1.82 A, respectively, between the NMR
conformer closest to the mean coordinates of the bundle of 20
conformers and the crystal structure (Fig. 2). To assess the signifi-
cance of these r.m.s.d. values between the experimental data, we use
the aforementioned reference structures as a frame of reference. We
conclude from the following observations that the two reference
structures provide a valid basis for this work: comparison of the two
reference structures yields similar r.m.s.d. values to those between the
experimental structures and the closest similarities prevail on the one
hand between the crystal structure and the reference crystal structure
and on the other hand between the NMR structure and the reference
NMR structure. The crystal structure and the reference crystal
structural communications
Acta Cryst. (2010). F66, 1367–1380 Jaudzems et al. � NP_247299.1 1371
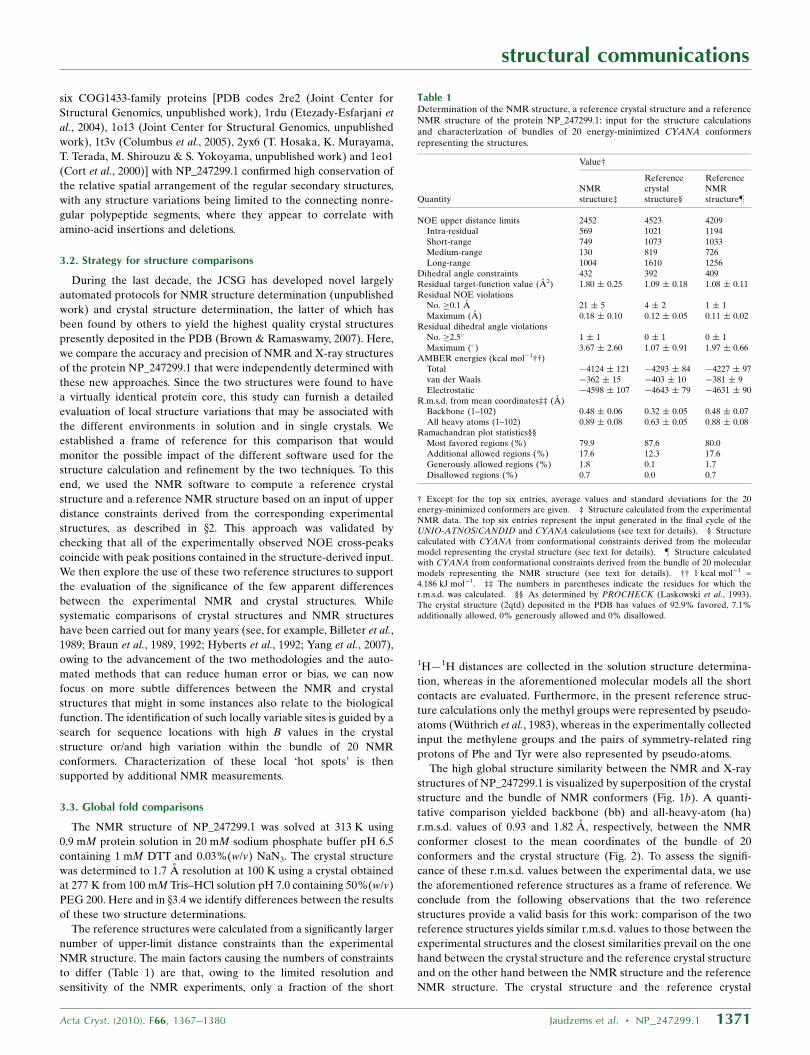
Table 1Determination of the NMR structure, a reference crystal structure and a referenceNMR structure of the protein NP_247299.1: input for the structure calculationsand characterization of bundles of 20 energy-minimized CYANA conformersrepresenting the structures.
Value†
QuantityNMRstructure‡
Referencecrystalstructure§
ReferenceNMRstructure}
NOE upper distance limits 2452 4523 4209Intra-residual 569 1021 1194Short-range 749 1073 1033Medium-range 130 819 726Long-range 1004 1610 1256
Dihedral angle constraints 432 392 409Residual target-function value (A2) 1.80 � 0.25 1.09 � 0.18 1.08 � 0.11Residual NOE violations
No. �0.1 A 21 � 5 4 � 2 1 � 1Maximum (A) 0.18 � 0.10 0.12 � 0.05 0.11 � 0.02
Residual dihedral angle violationsNo. �2.5� 1 � 1 0 � 1 0 � 1Maximum (�) 3.67 � 2.60 1.07 � 0.91 1.97 � 0.66
AMBER energies (kcal mol�1††)Total �4124 � 121 �4293 � 84 �4227 � 97van der Waals �362 � 15 �403 � 10 �381 � 9Electrostatic �4598 � 107 �4643 � 79 �4631 � 90
R.m.s.d. from mean coordinates‡‡ (A)Backbone (1–102) 0.48 � 0.06 0.32 � 0.05 0.48 � 0.07All heavy atoms (1–102) 0.89 � 0.08 0.63 � 0.05 0.88 � 0.08
Ramachandran plot statistics§§Most favored regions (%) 79.9 87.6 80.0Additional allowed regions (%) 17.6 12.3 17.6Generously allowed regions (%) 1.8 0.1 1.7Disallowed regions (%) 0.7 0.0 0.7
† Except for the top six entries, average values and standard deviations for the 20energy-minimized conformers are given. ‡ Structure calculated from the experimentalNMR data. The top six entries represent the input generated in the final cycle of theUNIO-ATNOS/CANDID and CYANA calculations (see text for details). § Structurecalculated with CYANA from conformational constraints derived from the molecularmodel representing the crystal structure (see text for details). } Structure calculatedwith CYANA from conformational constraints derived from the bundle of 20 molecularmodels representing the NMR structure (see text for details). †† 1 kcal mol�1 =4.186 kJ mol�1. ‡‡ The numbers in parentheses indicate the residues for which ther.m.s.d. was calculated. §§ As determined by PROCHECK (Laskowski et al., 1993).The crystal structure (2qtd) deposited in the PDB has values of 92.9% favored, 7.1%additionally allowed, 0% generously allowed and 0% disallowed.

structure exhibit nearly identical r.m.s.d.s relative to the experimental
NMR structure.
Fig. 2 also includes information on the precision with which the
experimental structures and the reference structures are defined. Not
surprisingly, although our approach does not warrant a quantitative
comparison of the r.m.s.d. values for the two experimental structures,
it appears that overall the crystal structure determined at 100 K is
more precisely defined than the 313 K NMR solution structure. The
following observation on the treatment of the crystal structure with
the NMR software is of special interest: although the average
displacement calculated with (4) for all heavy atoms in the crystal
structure, h�xi = 0.32 A, is essentially identical to the value obtained
for the backbone heavy atoms, h�xi = 0.30 A, the r.m.s.d. values for
the corresponding selections of atoms in the reference crystal struc-
ture differ by nearly twofold, which is similar to the corresponding
relations in the NMR structure and the reference NMR structure.
Overall, the preliminary conclusions from the data collected in
Fig. 2 are that the global structural properties of the polypeptide
backbone and the core atoms with solvent accessibility below 15%
are nearly identical in the crystal and solution structures and that the
larger r.m.s.d. values calculated for the all-heavy-atom comparisons
can be almost entirely attributed to the solvent-accessible segments
of the polypeptide chain. The data of Fig. 2 will be further analyzed in
x4 based on comparison of the structural details in the four molecular
species represented in the figure.
3.4. Comparison of structural details
In this section, we extend the global structure comparisons of Fig. 2
by evaluation of selected per-residue parameters, which we then
consider along the amino-acid sequence. All of these comparative
studies use the crystal structure atomic coordinates and/or the
bundles of 20 conformers that represent the NMR structure and the
two reference structures (Fig. 2). In instances where the bundles of 20
conformers are represented by a single conformer, the conformer
structural communications
1372 Jaudzems et al. � NP_247299.1 Acta Cryst. (2010). F66, 1367–1380
Figure 2Analysis of the crystal, NMR and reference crystal and NMR structures. (a) R.m.s.d. values describing the precision of structure determinations of NP_247299.1 by NMR insolution at 313 K or by X-ray diffraction in crystals at 100 K and pairwise comparisons of the two experimentally determined structures. The atoms used for the comparisonsare bb, backbone atoms N, C� and C0 ; co, core heavy atoms defined as having less than 15% solvent accessibility; ha, all heavy atoms. These three atom-type selections weresuperimposed for best fit of residues 1–102 to compute the r.m.s.d. values. (b) Corresponding data as in (a) for the reference NMR structure and the reference crystalstructure and for pairwise comparisons with the experimental structures. In (a) and (b), numbers framed by thick lines represent the precision of the experimental NMR andcrystal structures and their comparison. For the crystal structure, ‘global deviations’ corresponding to the r.m.s.d.s were computed from the experimental B values using (2)–(5). For the structure comparisons, r.m.s.d. values were computed between the crystal structure coordinates and those of the conformer closest to the mean atomiccoordinates of each of the three ensembles of 20 conformers that represent the NMR structure and the two reference structures. Numbers framed by medium lines representthe precision of the reference NMR and reference crystal structures and their comparison and thin frames contain the comparisons between experimental and referencestructures.

with the smallest global backbone r.m.s.d. value relative to the mean
coordinates of the bundle is used.
3.4.1. Precision along the amino-acid sequence. To represent the
precision of the NMR structure and the two reference structures, we
use the per-residue displacement, D, as defined by (1). For the crystal
structure, the per-residue displacement h�xi is used as calculated
from the B values with (2) and (3). Fig. 3(a) illustrates the empirical
determination of the coefficient c in (3) by a linear fit of the crys-
tallographic B values to the D values of the reference crystal struc-
ture. Fig. 3(b) shows plots of the displacements versus amino-acid
sequence for the NMR structure, the crystal structure and the two
reference structures analyzed in Fig. 2. For the NMR structure, the
profile of the plot of displacements versus the sequence is very closely
mimicked by the reference NMR structure. Somewhat larger varia-
tions are observed between the crystal structure and the reference
crystal structure, which probably reflects the use of different software
for the refinement of these two molecular species. For a large part
of the sequence, there is also a close coincidence of the qualitative
features of these profiles between the experimental NMR and crystal
structures. For example, there is a good correlation of small
displacements with the positions of the �-strands. For the �-helical
regions, the displacements vary between lower and higher values,
with an indication of three- to four-residue repeats. Since the helices
are flanked by the �-sheet on one side and exposed to the solvent on
the other (Fig. 1a), these periodic variations of the displacements
appear to correlate with the side-chain solvent accessibility. The close
similarity of the displacement profiles for the experimental structures
and the reference structures is remarkable, confirming that the NMR
software reproduces the experimental structures in the reference
crystal structure and the reference NMR structure (see also x2.5).
Relatively high displacements are observed for residues 10–15, 30–34,
44–48 and 66–75 in the crystal structure and for residues 35–39, 42–46,
52–56 and 73–75 in the NMR structure.
Overall, the data in Fig. 3(b) show that the small global r.m.s.d.
values for the pairwise comparisons of the two experimental struc-
tures and the two reference structures in Fig. 2 are paralleled by close
coincidence of the per-residue displacements along nearly the entire
sequence. The aforementioned short polypeptide segments with
above-average displacement values either in the NMR or the crystal
structure will be used as a lead for investigating possible local
differences between the protein structures in solution and in the
crystal (see x4).
3.4.2. Backbone dihedral angles. Overall, most of the dihedral
angles in the NMR structure are defined with high precision and
coincide closely with the X-ray structure, as shown in Figs. 4(a), 4(b)
and 4(c). In this figure, we use a presentation of the protein dihedral
angles that was adapted from Hyberts et al. (1992). The ranges of ’and about the mean values in the ensembles of 20 conformers are
represented by blue bars. Red dots represent deviations of the
dihedral angle values in the crystal structure from the corresponding
mean values of the bundles of 20 conformers. Fig. 4(a) presents the ’and data for the experimental NMR structure. Excluding the two
chain-terminal pentapeptide segments, only nine residues have a
spread exceeding �60� of the ’-angle values among the 20 NMR
conformers. All of these, except for Thr38 and Lys39, which will be
discussed in x4.4, are located in loops or turns and Gly83 is the only
one with solvent accessibility below 15%. The sizeable spread of its ’angle occurs in concert with a large spread for Glu82. Comparison
with the crystal structure shows that nearly all ’ and dihedral
angles in the crystal fall within the range covered by the 20 NMR
conformers. The only large differences are seen for the ’ values of
Asn3 and Val12 and the value of Asp11. In addition, deviations of
more than 15� from the range covered by the NMR conformers are
found for ’ of Lys5, Lys23, Lys75 and Glu97 and for of Gly47. Four
other residues have ’ and values in the crystal structure that are
within 15� of the ranges covered by the 20 NMR conformers but for
which at least one of the dihedral angles deviates by more than 60�
from the mean of the NMR conformers, i.e. Asp31, Asp32, Glu82 and
Gly83.
Comparison of the reference NMR structure with the crystal
structure (Fig. 4b) reproduces the data seen in the comparison of the
NMR and crystal structures in Fig. 4(a). In contrast, the reference
structural communications
Acta Cryst. (2010). F66, 1367–1380 Jaudzems et al. � NP_247299.1 1373
Figure 3Comparison of crystallographic B values and NMR displacements (D). (a) Linearleast-squares fit of the crystallographic B values (2) versus the correspondingdisplacements D (1) in the reference crystal structure, yielding the c value in (3) forNP_247299.1, with c = 1/87. (b) Plots of the per-residue polypeptide backbonedisplacements versus the NP_247299.1 sequence. Upper panel, crystal structure andreference crystal structure. Lower panel, NMR structure and reference NMRstructure. For the crystal structure, per-residue displacements were calculated fromthe B values with (2) and (3). For the NMR structure and the two referencestructures, the data correspond to the per-residue displacements calculated with(1). The locations of regular secondary structures are indicated at the bottom of theupper panel.

crystal structure shows a large spread of the backbone dihedral angles
only for Glu82 and Gly83 (see above; Fig. 4c). For all other residues,
the dihedral angles are precisely defined by the crystallographic data
when re-evaluated with the use of the NMR software. In conclusion,
we observe that the high accuracy of the backbone conformation in
the crystal structure is matched by about 90% of the polypeptide
chain in the solution structure. In x4, the few outliers will be used as a
lead for analyzing possible local differences between the NMR and
crystal structures.
3.4.3. Side-chain torsion angles. Data on the side-chain torsion
angles (Figs. 4d, 4e and 4f) are presented in a format corresponding to
the presentation of the backbone dihedral angles. A remarkably high
coincidence is again found between the NMR and crystal structures,
with 34 of 40 hydrophobic core side chains (asterisks in Figs. 4d, 4e
and 4f) having the same �1 values in the crystal and NMR structures.
However, for about 20% of the residues, there are significant
differences in the side-chain torsion angles between the crystal
structure and the mean values of the bundle of NMR conformers. For
the solvent-accessible residues, the side-chain torsion angles in the
bundles of 20 conformers representing the NMR structure and the
two reference structures show quite large spreads. It is also apparent
that comparisons of the NMR structure and the reference NMR with
the crystal structure yield similar results. As will be explained in x4,
it is of interest for interpretation of the data in Fig. 4(d) that the
reference crystal structure shows large spreads for the �1 angles of
Ser, Asp and Cys residues and large �2 values for Glu.
3.4.4. Occluded surface packing. Plots of the occluded surface
packing (OSP; Pattabiraman et al., 1995) per residue versus the
sequence are displayed in Fig. 5(a), where the NMR structure and the
two reference structures are represented by the conformer closest to
the mean coordinates of the structure bundles. In addition, Fig. 5(b)
reports the mean per-residue OSP values and the standard deviations
for the bundle of 20 conformers, which shows that the spread of the
OSP values for the individual residues is small when compared with
the variations along the sequence. Notwithstanding small quantitative
variations, the NMR and crystal structures, as well as the two refer-
ence structures (Fig. 2), all display the same OSP profiles, including
low packing of the central polypeptide segment of residues 32–41,
reduced packing near the two chain ends and near-identical extreme
values for individual residues. On a general note, it is apparent that
high OSP values correlate with low solvent accessibility and, within
limits, also with the assignment of regular secondary structures.
4. Discussion
The key message is that the two structures of NP_247299.1 deter-
mined with current JCSG methodology either in solution at 313 K for
NMR data collection or in a single crystal at 100 K show very close
coincidence both globally (Fig. 2) and in residue-by-residue com-
parisons (Figs. 3, 4 and 5). The extensive overall similarity of the two
structures now provides a basis for investigations of subtle local
structural communications
1374 Jaudzems et al. � NP_247299.1 Acta Cryst. (2010). F66, 1367–1380
Figure 4Variation in backbone dihedral and side-chain torsion angles and comparisons with the crystal structure. (a–c) Spread of the values for the backbone dihedral angles ’ and in the bundles of 20 conformers representing the NMR structure (a), the reference NMR structure (b) and the reference crystal structure (c) of NP_247299.1 (Fig. 2) andcomparisons with the crystal structure. In this presentation, the mean value in the bundles of 20 conformers is at 0� , the blue vertical bars represent the spread of the valueswithin the bundles and the red dots indicate the deviation of the crystal structure values from the corresponding mean values for the bundle of 20 conformers. (d–f) Spread ofthe values for the amino-acid side-chain torsion angles �1 and �2 in the NMR structure (d), the reference NMR structure (e) and the reference crystal structure (f) ofNP_247299.1 (Fig. 2) and comparison with the crystal structure. At the top, the locations of the regular secondary structures are indicated and asterisks identify the residueswith solvent accessibility below 15% in the NMR structure. Filled circles at the bottom of (f) indicate four residues for which the side chains were truncated in the crystalstructure because they were not observed in the electron-density maps.

structure variability. This approach is supported by the reference
NMR structure, the reference crystal structure (Fig. 2) and supple-
mentary NMR measurements, in addition to those of our standard
structure-determination protocol (see Figs. 6, 7 and 8 below).
4.1. Global comparisons
We introduced the concept of reference structures and explored its
use in support of the evaluation and comparison of the experimental
NMR and crystal structures. The precision of the reference NMR
structure is essentially identical to that of the experimental NMR
structure (Fig. 2), confirming that the limited data set that can be
collected in a structure-quality protein solution contains sufficient
information to achieve nearly identical precision of the structure
determination as would be obtained from the complete set of distance
constraints. As we have pointed out previously, the precision of the
reference crystal structure differs by about twofold when considering
either the backbone heavy atoms or all heavy atoms, whereas the
experimental crystal structure shows nearly identical global r.m.s.d.
values for these two selections of atoms (Fig. 2). We rationalize this
apparent difference by the facts that on the one hand the experi-
mental crystal structure is subject to intermolecular contacts in the
crystal lattice and side-chain atoms that were poorly defined in the
electron-density maps were not included and their side chains were
truncated (identified in Figs. 4d, 4e and 4f). On the other hand,
calculation of the reference crystal structure using the NMR software
CYANA v.3.0 (Guntert et al., 1997) and OPALp (Luginbuhl et al.,
1996) is performed with a single molecule embedded in a water bath.
We further rationalize the approximately 30% higher precision of the
reference crystal structure when compared with the reference NMR
structure by the fact that the X-ray data were collected at a much
lower temperature than the NMR data.
Overall, we conclude from these considerations that the combi-
nation of crystal structure and reference crystal structure provides
a robust platform for comparative studies with the solution NMR
structure. In particular, the availability of the reference crystal
structure helps to distinguish between effects from the different
protein environments in the crystal and in solution and from possible
bias arising from the use of different software for the refinement
of the two experimental structures. A general conclusion from the
global comparisons in Fig. 2 and the data on individual amino-acid
residues in Figs. 3, 4 and 5 is that the polypeptide segments of
NP_247299.1 with solvent accessibility below 15% can be near-
identically superimposed in the NMR and crystal structures, while
larger structure variations are indicated for some of the more highly
solvent-exposed polypeptide segments.
4.2. Implications of high crystallographic B values in discrete
polypeptide segments
Along the polypeptide chain, high B-value-derived displacements
(3) are noted for four segments (residues 10–15, 30–34, 44–48 and 66–
74). Segments 10–15 and 30–34 in the NMR structure are further
explored here. The high B values in the other two segments relate to
independently observed dynamic features of the NMR structure, as
described in x4.4 and x4.6.
In the NOE-based NMR structure, residues 10–15 form a tight
turn, with the peptide bond Asp11–Val12 flipped by 180� when
compared with the crystal structure (Fig. 6a). This local feature in the
NOE-based NMR structure is sterically unfavorable. We, therefore,
collected additional NMR data that would be differently averaged in
a dynamic conformational ensemble than the 1H–1H NOEs, i.e. scalar
amide proton–�-proton spin–spin couplings, 3JHN� (Table 2). For
Val12, a 3JHN� value of 7.1 Hz was measured. Using the Karplus
relation for this coupling constant (Wuthrich, 1986), we estimate
that the corresponding values in the crystal and NMR structures of
Fig. 6(a) would be 8.9 and 4.5 Hz, respectively. We conclude that
the experimental value of 7.1 Hz corresponds to a weighted average
owing to conformational exchange between two or multiple locally
different conformers present in solution. The r�6-weighted average of
the NOE distance constraints corresponding to these rapidly inter-
structural communications
Acta Cryst. (2010). F66, 1367–1380 Jaudzems et al. � NP_247299.1 1375
Table 2Backbone ’ dihedral angle values for residues 10–15 and 30–35 of NP_247299.1.
See text for the residue selection.
’ (�)/3JHN� (Hz)
Residue NMR structure† Crystal structure‡ 3JHN� measured§ (Hz)
Met10 �116/10.0 �118/10.1 8.9Asp11 �101/9.3 �96/8.8 9.0Val12 �143/8.9 �63/4.5 7.1Asp13 �127/10.0 �108/9.7 n.d.}Lys14 �152/7.9 �175/4.8 n.d.}Ile15 �58/3.9 �60/4.2 4.8
Ile30 �110/9.8 �113/10.0 10.7Asp31 �137/9.4 �145/8.7 7.8Asp32 �165/6.1 40/6.6 7.8Asn33 59/7.3 56/7.3 6.5Glu34 �124/10.0 �130/9.8 8.0Val35 �70/5.4 �66/4.9 4.7
† ’-angle values in the NMR structure expressed as the average from the 20 conformersand corresponding values for 3JHN� predicted by the Karplus relation. ‡ ’-angle valuesin the crystal structure and corresponding values for 3JHN� predicted by the Karplusrelation. § Experimentally measured 3JHN� coupling constants. } Precise valuescould not be determined owing to spectral overlap.
Figure 5Surface packing along the polypeptide chain. (a) Plots versus the amino-acidsequence of the per-residue occluded surface packing (OSP, a dimensionlessquantity covering the range 0.0–1.0; Pattabiraman et al., 1995) for the NMRstructure, the crystal structure and the two reference structures of NP_247299.1(Fig. 2). For the NMR structure and the two reference structures, the OSP value forthe conformer closest to the mean atomic coordinates are shown. Color code: NMRstructure, red; crystal structure, blue; reference NMR structure, green; referencecrystal structure, black. At the top, the locations of the regular secondary structuresare indicated and asterisks identify the residues with solvent accessibility below15% in the NMR structure. (b) Plot versus the amino-acid sequence of the meanper-residue OSP values in the NMR structure and the standard deviations amongthe 20 conformers (red).

changing conformers thus resulted in a spurious sterically unfavor-
able local structure which is not compatible with the additional 3JHN�
data. In this instance, the high B values of this region in the crystal
structure led us to discover a local dynamic feature in the NMR
structure obtained using our standard protocol, in which conforma-
tional averaging was taking place on the sub-millisecond time scale.
Residues 30–34 again form a tight turn in the crystal structure
which is also seen in two of the 20 NMR conformers. A second form,
which is present in 18 of the 20 NMR conformers, has the Asp31–
Asp32 peptide bond rotated by 180� (Fig. 6b). Similar to the situation
represented in Fig. 6(a), this leads to a sterically unfavorable local
conformation. Although, in this case, the 3JHN� values do not provide
equally clear evidence, we conclude that the high B values in the
crystal structure again correlate with a spurious local structural detail
that results from dynamic averaging of 1H–1H NOE distance con-
straints.
4.3. Implications of high displacements in a polypeptide segment of
the NMR structure
The segment corresponding to residues 52–56 has the highest
displacements in the NMR structure, with particularly low precision
structural communications
1376 Jaudzems et al. � NP_247299.1 Acta Cryst. (2010). F66, 1367–1380
Figure 6Stick representations of polypeptide segments in the NMR structure and in the crystal structure that show local variation as discussed in the text. C, N, O and H atoms arecolored black, blue, red and gray, respectively. (a) Residues 10–15. (b) Residues 30–35. (c) Residues 27–39, which undergo a dynamic process involving residues 36–39, asevidenced by the NMR data in Fig. 7.

for Glu54 and Asn55. We attribute this locally low precision to
limited experimental NOE data for three adjacent hydrophilic resi-
dues on the solvent-exposed face of helix �1. Segment 53–55 has on
average only 14 NOE constraints per residue, compared with the
mean value for the entire polypeptide chain of 24 constraints per
residue.
4.4. Implications of variable backbone dihedral angles
The segment consisting of residues 36–39 attracted attention since
it shows the only large variations of backbone dihedral angle values
within regular � or � secondary structure. We noticed that the posi-
tion of a �-bulge in strand �3 varies among the 20 NMR conformers
(Fig. 6c) and involves rearrangement of the hydrogen-bonding
network. In the crystal structure and in 17 of the 20 conformers, a
classic �-bulge is observed spanning residues 36–37. Two NMR con-
formers show a conformation with residue 38 bulged out. One NMR
conformer shows a conformation with the peptide bond between
Thr38 and Lys39 flipped by 180� and Lys39 and Val40 bulged out. It is
quite intriguing that the reduced occluded surface-packing values
observed in this region for both the NMR and the crystal structures
(Fig. 5a) would appear to allow local rearrangements. A qualitative
line-shape analysis of the HN resonances of residues Ser36–Lys39
confirms conformational fluctuations on the millisecond timescale,
which is evidenced in severe line broadening of peaks in the 2D
[15N,1H]-HSQC spectrum (Fig. 7). Additional NMR measurements at
298 K showed more pronounced line broadening for the resonances
in Figs. 7(b) and 7(c), confirming that we observe exchange broad-
ening of the averaged signals of the exchanging conformers
(Wuthrich, 1986).
4.5. Side-chain dihedral angles and packing density
The comparison of side-chain dihedral angles (Figs. 4d, 4e and 4f)
showed that large spreads of �1 and �2 values in the NMR structure
occur more frequently than for the backbone angles, which could be
attributed in the first instance to the higher degree of freedom of
peripheral side chains in solution. An initial clue to the interpretation
of the lower precision of side-chain torsion angles also comes from
the fact that the reference crystal structure shows large spreads for
the �1 angles of several Ser, Asp and Cys residues and for the �2
angles of Glu residues, which do not include non-labile H atoms
beyond the �- or �-methylene positions, respectively, and are there-
fore not constrained during the NMR structure-calculation protocol.
As the conformations of the side chains determine how the protein is
packed, we looked for a correlation between the spread of � angles
and the variation in packing density. However, as shown in Fig. 5(b),
the standard deviations for the occluded surface-packing values in the
NMR structure have similar small values for all residues, indicating
that the lower precision of � angles in the NMR structure has no
substantial impact on packing density. As large changes in side-chain
conformations would particularly affect the packing of core residues,
we analyzed the definition of the �1 and �2 angles of Ile, Leu and Val
residues, which are usually located in the protein core. For 22 of 26
Ile, Leu and Val residues, the �1-angle spread is less than 60�, where
all of the outliers are Val. For 12 of 18 Ile and Leu residues, the �2-
angle spread is less than 60�. This indicates a certain level of plasticity
in the core of the protein that allows local rearrangements of internal
side chains, such as the flipping of particular isopropyl groups,
without affecting the packing density. For solvent-exposed peripheral
side chains, the packing is low in general and is not further affected by
large spreads of �1 and �2 angles.
4.6. C-terminal Asn–Pro cis–trans isomerization in the NMR
structure
Cis–trans isomerization of the C-terminal Asn–Pro peptide bond
was first identified from analysis of the 2D [15N,1H]-HSQC spectrum
(Fig. 7a). Each isoform showed distinct peaks for Ile101, Ser102 and
Asn103 and also for the spatially proximal Ile64, Ser65 and Glu66
(Figs. 8a and 8b). Interestingly, the residues Ile64–Glu66 also show
higher B-value-derived displacements in the crystal structure, which
would appear to be a consequence of the influence of the Pro104 cis–
trans equilibrium. The identity of the cis and trans isoforms was
established from the characteristic 13C� and 13C� chemical shifts
(Grathwohl & Wuthrich, 1976a) and from having either d��NP or d��
NP
NOE connectivities, as illustrated in Figs. 8(c) and 8(d). In Fig. 8(c)
strong NOE cross-peaks between H�2/3 of Pro104 and H� of Asn103
structural communications
Acta Cryst. (2010). F66, 1367–1380 Jaudzems et al. � NP_247299.1 1377
Figure 7NMR evidence for slow conformational exchange between several locally differentconformations formed by the polypeptide segment 36–39 (see also Fig. 6c) and forthe coexistence of two conformational species with distinct NMR signals for thepolypeptide segments 64–66 and 101–104 (see also Fig. 8). (a) 2D [15N,1H]-HSQCspectrum of a 0.9 mM solution of NP_247299.1 recorded at 800 MHz and 313 K.The cross-peaks of the residues involved in the aforementioned conformationalpolymorphisms are identified with the following color code: blue, residues 36–39and, for reference, Glu77, Ala81 and Val86 [see (b) and (c) below]; red, residues64–66 and 101–103, which all show two signals (see Fig. 8). (b, c) NMR line-shapeanalysis reveals slow conformational exchange between the different conforma-tions of the polypeptide segment 36–39 shown in Fig. 6(c). (b) and (c) show cross-sections along !2(1H) and !1(15N), respectively, illustrating pronounced linebroadening of the cross-peaks belonging to Lys36 (red), Ser37 (blue), Thr38(green) and Lys39 (magenta) when compared with the reference peaks of Glu77(black), Ala81 (black dashed line) and Val86 (black dashed/dotted line).

structural communications
1378 Jaudzems et al. � NP_247299.1 Acta Cryst. (2010). F66, 1367–1380
Figure 8Cis–trans isomerization of Pro104. (a) Stick representation of all heavy atoms of the polypeptide segments 64–66 and 101–104 for which peak doubling was observed in the2D [15N,1H]-HSQC spectrum of Fig. 7(a). The structure containing trans Pro104 is shown. C atoms are colored yellow (residues 64–66) or green (residues 101–104), N atomsare colored blue and O atoms are colored red. Stretches of polypeptide backbone outside of these segments are colored gray. (b) Surface view of the two segments in (a)colored in yellow and blue, respectively. (c, d) Identification of the cis and trans conformations in NP_247299.1 based on 13C chemical shifts and 1H–1H NOEs. (c) and (d)show strips from a 3D 13C(ali)-resolved [1H,1H]-NOESY spectrum representing the signals of the trans and cis forms of the Asn103–Pro104 peptide bond, respectively. (c)The trans form of Pro104 is manifested by d��
NP NOE connectivities (red arrows) and by the typical 13C� and 13C� chemical shift pattern (blue arrows). (d) The cis form ofPro104 is manifested by d��
NP NOE peaks (red arrows) and the large difference of about 9 p.p.m. between the 13C� and 13C� chemical shifts (blue arrows).

indicate that these are in close contact, as expected for a trans proline,
while Fig. 8(d) shows the typical NOE pattern for a cis proline with
strong peaks between H� of Pro104 and H� of Asn103 (Wuthrich,
1986). The amount of cis proline was estimated from the relative
peak-intensity ratios of resonances belonging to the two isoforms
to be about 25% (segments 101–104 and 66–68 both give equivalent
values), which is in agreement with previous observations on
C-terminal proline cis–trans equilibria (Grathwohl & Wuthrich,
1976b).
4.7. Further evaluation of the crystal structure in light of the NMR
structure
In all of the aforementioned polypeptide segments for which the
NMR data indicate local polymorphisms, there is no indication
of multiple conformations based on the coordinates and structure
factors deposited in the PDB. In order to more precisely define the
range of ‘thermal motion/positional uncertainty’ in each of these
regions that had higher B values than the rest of the structure, the
X-ray structure was subjected to multiple cycles of simulated-
annealing refinement using phenix.refine. Except for residues in the
30–34 loop region (see below) and SeMet1, no significant differences
relative to the original REFMAC5-refined coordinates were identi-
fied. In particular, for residues 10–15, the electron density is unam-
biguous and does not show any evidence of the Asp11–Val12 peptide
flip indicated by the NMR data. Residues 30–34 did show some minor
differences between the initial REFMAC5 model and the rebuilt
phenix.refine model, but again there was no indication that the
backbone adopts multiple conformations. For residues 36–39, where
the NMR data are interpreted as a ‘sliding �-bulge’, the maps are
once again unambiguous, without any indication of multiple confor-
mations of the backbone. Multiple attempts were made at building
the C-terminal tripeptide and the spatially adjoining segment of
residues 64–66 into two conformations, representing the trans and cis
isomers of Pro104 at varying occupancies, in order to investigate
whether a small proportion of the cis isomer could be accommodated
into the X-ray model. While there is clear-cut NMR evidence for the
presence of two local conformations formed by these six residues
(Figs. 7 and 8), we found no evidence for multiple conformations; the
conformer with cis-Pro104 did not refine well and was pushed out of
the density in each case. It should be noted that this region packs
against a symmetry-related molecule in the crystal structure. More-
over, the carboxy-terminus hydrogen bonds to Lys36 in the symmetry-
related molecule and to two waters, which together appear to
stabilize the trans conformation.
Overall, there is no evidence for local multiple conformations in the
X-ray electron-density maps recorded at 1.7 A resolution and 100 K
that would correspond to the NMR observations in solution at 313 K.
This leads to the conclusion that one predominant conformation
is present at 100 K and in the crystal lattice, but that the locally
increased B values in these few specific regions are indicative of some
static or dynamic polymorphism that can be observed in more detail
in the solution NMR measurements at a much higher temperature.
A recent related assessment of dynamics in the crystal at low temp-
erature and correlations with solution NMR data concluded that
additional ambient-temperature X-ray data collection combined with
mutagenesis could aid in uncovering relations to function of subtle
correlations between multiple data sets recorded with different
methods (Fraser et al., 2009).
This work was supported by NIH Protein Structure Initiative grant
U54 GM074898 from the National Institute of General Medical
Sciences (http://www.nigms.nih.gov). PS was supported by a fellow-
ship from the Spanish Ministry of Science and Education and by
the Skaggs Institute of Chemical Biology. KJ was supported by a
fellowship from the Latvian Institute of Organic Synthesis and by the
Skaggs Institute of Chemical Biology. KW is the Cecil H. and Ida
M. Green Professor of Structural Biology and IW is the Hansen
Professor of Structural Biology at TSRI. We thank the other
members of the JCSG for their valuable contributions to the crystal
structure of NP_247299.1 (PDB code 2qtd). Portions of this research
were carried out at the Stanford Synchrotron Radiation Lightsource
(SSRL) and the Advanced Light Source (ALS). The SSRL is a
national user facility operated by Stanford University on behalf of the
US Department of Energy, Office of Basic Energy Sciences. The
SSRL Structural Molecular Biology Program is supported by the
Department of Energy, Office of Biological and Environmental
Research and by the National Institutes of Health (National Center
for Research Resources, Biomedical Technology Program and the
National Institute of General Medical Sciences). Genomic DNA
from M. jannaschii was obtained from the American Type Culture
Collection (ATCC 43067).The content is solely the responsibility of
the authors and does not necessarily represent the official views of
the National Institute of General Medical Sciences or the National
Institutes of Health.
References
Billeter, M., Kline, A. D., Braun, W., Huber, R. & Wuthrich, K. (1989). J. Mol.Biol. 206, 677–687.
Braun, W., Epp, O., Wuthrich, K. & Huber, R. (1989). J. Mol. Biol. 206,669–676.
Braun, W., Vasak, M., Robbins, A. H., Stout, C. D., Wagner, G., Kagi, J. H. &Wuthrich, K. (1992). Proc. Natl Acad. Sci. USA, 89, 10124–10128.
Brown, E. N. & Ramaswamy, S. (2007). Acta Cryst. D63, 941–950.Bult, C. J. et al. (1996). Science, 273, 1058–1073.Columbus, L., Peti, W., Etezady-Esfarjani, T., Herrmann, T. & Wuthrich, K.
(2005). Proteins, 60, 552–557.Cornell, W. D., Cieplak, P., Bayly, C. I., Gould, I. R., Merz, K. M., Ferguson,
D. M., Spellmeyer, D. C., Fox, T., Caldwell, J. W. & Kollman, P. A. (1995). J.Am. Chem. Soc. 117, 5179–5197.
Cort, J. R., Yee, A., Edwards, A. M., Arrowsmith, C. H. & Kennedy, M. A.(2000). J. Struct. Funct. Genomics, 1, 15–25.
Etezady-Esfarjani, T., Herrmann, T., Peti, W., Klock, H. E., Lesley, S. A. &Wuthrich, K. (2004). J. Biomol. NMR, 29, 403–406.
Fiorito, F., Herrmann, T., Damberger, F. F. & Wuthrich, K. (2008). J. Biomol.NMR, 42, 23–33.
Fraser, J. S., Clarkson, M. W., Degnan, S. C., Erion, R., Kern, D. & Alber, T.(2009). Nature (London), 462, 669–673.
Grathwohl, C. & Wuthrich, K. (1976a). Biopolymers, 15, 2025–2041.Grathwohl, C. & Wuthrich, K. (1976b). Biopolymers, 15, 2043–2057.Guntert, P., Mumenthaler, C. & Wuthrich, K. (1997). J. Mol. Biol. 273,
283–298.Herrmann, T., Guntert, P. & Wuthrich, K. (2002a). J. Biomol. NMR, 24,
171–189.Herrmann, T., Guntert, P. & Wuthrich, K. (2002b). J. Mol. Biol. 319, 209–227.Hiller, S., Fiorito, F., Wuthrich, K. & Wider, G. (2005). Proc. Natl Acad. Sci.
USA, 102, 10876–10881.Hiller, S., Wider, G. & Wuthrich, K. (2008). J. Biomol. NMR, 42, 179–195.Holm, L., Kaariainen, S., Rosenstrom, P. & Schenkel, A. (2008). Bioinfor-
matics, 24, 2780–2781.Hyberts, S. G., Goldberg, M. S., Havel, T. F. & Wagner, G. (1992). Protein Sci. 1,
736–751.Keller, R. (2004). Computer Aided Resonance Assignment. http://cara.nmr.ch/.Klock, H. E., Koesema, E. J., Knuth, M. W. & Lesley, S. A. (2008). Proteins, 71,
982–994.Koradi, R., Billeter, M. & Wuthrich, K. (1996). J. Mol. Graph. 14, 51–55.Laskowski, R. A., MacArthur, M. W., Moss, D. S. & Thornton, J. M. (1993). J.
Appl. Cryst. 26, 283–291.Luginbuhl, P., Guntert, P., Billeter, M. & Wuthrich, K. (1996). J. Biomol. NMR,
8, 136–146.
structural communications
Acta Cryst. (2010). F66, 1367–1380 Jaudzems et al. � NP_247299.1 1379

Pattabiraman, N., Ward, K. B. & Fleming, P. J. (1995). J. Mol. Recognit. 8,334–344.
Rubio, L. M., Rangaraj, P., Homer, M. J., Roberts, G. P. & Ludden, P. W. (2002).J. Biol. Chem. 277, 14299–14305.
Volk, J., Herrmann, T. & Wuthrich, K. (2008). J. Biomol. NMR, 41, 127–138.Vuister, G. W. & Bax, A. (1993). J. Am. Chem. Soc. 115, 7772–7777.Weiss, M. S., Anderson, D. H., Raffioni, S., Bradshaw, R. A., Ortenzi, C.,
Luporini, P. & Eisenberg, D. (1995). Proc. Natl Acad. Sci. USA, 92, 10172–
10176.Wilmanns, M. & Nilges, M. (1996). Acta Cryst. D52, 973–982.Wuthrich, K. (1986). NMR of Proteins and Nucleic Acids. New York: Wiley-
Interscience.Wuthrich, K., Billeter, M. & Braun, W. (1983). J. Mol. Biol. 169, 949–
961.Yang, L. W., Eyal, E., Chennubhotla, C., Jee, J., Gronenborn, A. M. & Bahar, I.
(2007). Structure, 15, 741–749.
structural communications
1380 Jaudzems et al. � NP_247299.1 Acta Cryst. (2010). F66, 1367–1380