NMR studies of the structure, kinetics and interactions of the ...
285
NMR studies of the structure, kinetics and interactions of the conserved RNA motifs in the FMDV IRES A thesis submitted to the University of Manchester for the degree of PhD in the Faculty of Engineering and Physical Sciences 2012 Usman Rasul School of Chemistry
-
Upload
khangminh22 -
Category
Documents
-
view
1 -
download
0
Transcript of NMR studies of the structure, kinetics and interactions of the ...
1
NMR studies of the structure, kinetics and
interactions of the conserved RNA motifs
in the FMDV IRES
A thesis submitted to the University of Manchester
for the degree of PhD in the Faculty of Engineering
and Physical Sciences
2012
Usman Rasul
School of Chemistry
2
Table of Contents
Title Page 1
Table of Contents 2
List of Figures 7
List of Tables 25
Symbols and Abbreviations 28
Abstract 32
Declaration 33
Copyright Statement 33
Acknowledgements 34
Chapter 1: Introduction 35
1.1 Significance of the project 35
1.1.1 The role of IRES in picornavirus translation 35
1.1.2 The IRES and antiviral therapy 37
1.1.3 The IRES in biotechnology 39
1.1.4 RNA structural biology 41
1.2 Picornaviruses and translation 43
1.2.1 Picornavirus classification and genome 43
1.2.2 mRNA and cap-dependent translation 44
1.2.3 FMDV and cap-independent translation 45
1.2.4 Internal Ribosome Entry Site (IRES) 46
1.2.5 FMDV IRES 47
1.3 Nucleic acid chemistry 50
1.3.1 Nucleic acids 50
1.3.2 RNA synthesis 52
1.3.2.1 Chemical synthesis 52
1.3.2.2 Enzymatic synthesis 54
1.3.3 RNA nucleotide structure 56
1.3.4 RNA base pairing and stacking 58
1.3.5 RNA structure 60
3
1.4 RNA interactions 63
1.4.1 Intramolecular interactions 63
1.4.2 RNA and Mg2+
63
1.4.3 RNA-RNA interactions 65
1.5 Principles of NMR spectroscopy 67
1.5.1 Basic theory of NMR 67
1.5.2 Chemical shift, coupling constant and linewidth 68
1.5.3 Nuclear relaxation 69
1.5.3.1 Spin-lattice relaxation 70
1.5.3.2 Spin-spin relaxation 70
1.5.4 Nuclear Overhauser Effect (NOE) 72
1.5.5 NMR of rate processes 74
1.5.5.1 Base pair kinetics 74
1.5.5.2 Chemical exchange 75
1.5.6 1D 19
F-NMR and 31
P-NMR 77
1.5.7 Two-dimensional (2D) NMR spectroscopy 78
1.5.8 Three-dimensional (3D) NMR spectroscopy 79
1.6 Principles of molecular modelling 80
1.6.1 Molecular mechanics (MM) 80
1.6.2 Energy minimisation 81
1.6.3 Simulated annealing and molecular dynamics (MD) 82
1.7 Previous work 83
1.8 Aim of the project 84
Chapter 2: Materials and methods 86
2.1 RNA sample preparation for NMR studies 86
2.2 NMR spectroscopy 88
2.2.1 NMR spectrometers 88
2.2.2 NMR experimental parameters 88
2.2.3 Data processing and analysis 89
2.3 NMR techniques 91
2.3.1 Solvent suppression 91
2.3.2 1D NMR experiments with decoupling 93
2.3.3 Variable temperature (VT) experiments 94
2.3.4 T1 measurements 94
2.3.5 Water magnetisation transfer experiments 95
2.3.6 2D Double-Quantum Filtered Correlation Spectroscopy
(DQF-COSY) 96
4
2.3.7 2D Total Correlation Spectroscopy (TOCSY) 97
2.3.8 2D Heteronuclear Single Quantum Coherence (HSQC) 98
2.3.9 2D Nuclear Overhauser Effect Spectroscopy (NOESY) 99
2.3.10 2D Heteronuclear Overhauser Effect Spectroscopy
(HOESY) 100
2.3.11 2D CPMG-HSQC-NOESY 101
2.3.12 3D NOESY/2Q-COSY 102
2.4 NMR assignment of RNA 103
2.4.1 Assignment strategy 103
2.4.2 Identification of base protons 106
2.4.2.1 Identification of exchangeable protons 106
2.4.2.2 Identification of non-exchangeable protons 107
2.4.3 Identification of sugar protons 108
2.4.4 Sequence-specific resonance assignment 109
2.5 Structure determination protocol of RNA 111
2.5.1 Restraints 111
2.5.1.1 Distance restraints 111
2.5.1.2 Dihedral angle restraints 112
2.5.1.3 Hydrogen bonds and planarity restraints 113
2.5.2 Structure calculation 114
2.5.3 Conformational analysis 117
2.5.4 Structure validation 120
2.6 Quantitative measurement of exchange rate constants 121
Chapter 3: NMR studies of the FMDV 16mer RNA and the effect
of Mg2+
123
3.1 Structure determination of the 16mer apo-RNA 123
3.1.1 NMR assignment 123
3.1.1.1 Exchangeable proton assignment 123
3.1.1.2 Non-exchangeable proton assignment 128
3.1.2 Structure calculation 142
3.1.3 NMR solution structure 144
3.1.3.1 Ensemble and final structure 144
3.1.3.2 GNRA tetraloop 145
3.1.3.3 Intramolecular interactions 146
3.1.4 Conformational analysis 148
3.2 Effect of Mg2+
on 16mer RNA chemical shifts 152
3.2.1 Changes in proton chemical shift 152
3.2.2 Changes in phosphorus chemical shift 155
5
3.3 Effect of Mg2+
on 16mer RNA stability 157
3.3.1 1H-NMR variable temperature (VT) series 157
3.3.2 31P-NMR variable temperature (VT) series 161
3.4 Imino proton exchange in the 16mer RNA 162
3.4.1 NOE exchange 162
3.4.2 T1 of imino protons 164
3.4.3 Exchange rate of imino protons 165
3.4.4 Effect of Mg2+
on imino proton exchange rates 168
3.5 Structure determination of the 16mer Mg2+
RNA complex 170
3.5.1 NMR assignment 170
3.5.1.1 Exchangeable proton assignment 170
3.5.1.2 Non-exchangeable proton assignment 173
3.5.2 Structure calculation 185
3.5.3 NMR solution structure 187
3.5.3.1 Ensemble and final structure 187
3.5.3.2 GNRA tetraloop 188
3.5.3.3 Intramolecular interactions 189
3.5.4 Conformational analysis 191
3.5.5 Comparison of the 16mer apo/Mg2+
RNA NMR structures 195
3.6 Mg2+
-induced structural changes to the 16mer apo-RNA 196
Chapter 4: : NMR studies of the FMDV 15mer RNA and its
complex with the 16mer RNA 201
4.1 Structure determination of the 15mer apo-RNA 201
4.1.1 NMR assignment 201
4.1.1.1 Exchangeable proton assignment 201
4.1.1.2 Non-exchangeable proton assignment 205
4.1.2 Structure calculation 213
4.1.3 NMR solution structure 215
4.1.3.1 Ensemble and final structure 215
4.1.3.2 Heptaloop 216
4.1.3.3 Intramolecular interactions 217
4.1.4 Conformational analysis 218
4.1.5 Comparison of the 15mer and 16mer apo-RNA NMR
structures 222
4.2 Effect of Mg2+
on the 15mer RNA 223
4.3 1GHz NMR studies of the 16mer apo-RNA 227
4.3.1 Effect of magnetic field strength on the 16mer apo-RNA 227
4.3.2 Sensitivity enhancement with 1GHz 229
6
4.4 RNA-RNA interaction 230
4.4.1 Analysis of the RNA-RNA complex in 1H2O 230
4.4.2 Analysis of the RNA-RNA complex in 2H2O 234
4.4.3 Model of the RNA-RNA interaction 238
Chapter 5: 19
F-NMR studies of selectively fluorinated RNAs 240
5.1 19F-NMR studies of the 5-FU 16mer and 15mer RNAs 240
5.1.1 Identification of fluorination 240
5.1.2 Effect of the 19
F nucleus on the 5-FU 16mer RNA 244
5.1.2.1 Exchangeable proton assignment 244
5.1.2.2 Non-exchangeable proton assignment 246
5.1.2.3 The 2D 1H-
19F HOESY experiment 247
5.1.2.4 Effect of the 19
F nucleus on 31
P chemical shifts 248
5.1.3 Effect of magnetic field strength on the 5-FU 16mer RNA 250
5.1.4 Effect of the 19
F nucleus on the 5-FU 15mer RNA 251
5.1.5 Effect of Mg2+
on the 19
F signal 253
5.2 19F-NMR studies of the 5-FU 16mer/15mer complex 255
Chapter 6: Conclusion and Future work 257
6.1 Conclusion 257
6.1.1 Structure of the conserved RNA motifs 257
6.1.2 The role of Mg2+
259
6.1.3 RNA-RNA interaction 260
6.1.4 Errors and their implications 261
6.2 Future work 262
6.2.1 Binding of Mg2+
ions to RNA 262
6.2.2 Isotopically labelled RNA 263
6.2.3 RNA tertiary contacts 264
References 266
Appendices 277
Appendix I: NMRPipe script 277
Appendix II: XPLOR scripts 278
Word count: 63,403
7
List of Figures
Figure 1.1.1 An IRES bicistronic expression vector. CAT and LUC are the first and
second reporter genes, respectively, surrounding the FMDV IRES. The arrow depicts the
direction of translation...………………….........................................................................40
Figure 1.2.1 The genomic structure of the FMDV viral RNA. The coding region or ORF
is divided into the L-region and three distinctive regions of P1, P2 and P3, coding for the
capsid and non-structural proteins. The 5’-UTR precedes the coding region and the 3’-
UTR is situated after the coding region…………………………………………………..43
Figure 1.2.2 The normal cap-dependent translation. The mRNA requires the 5’-end cap
(7-methylguanosine) structure along with complex interaction between the 40S ribosome
and several eukaryotic initiation factors (eIFs) to allow for translation initiation………..44
Figure 1.2.3 The IRES mediated cap-independent translation. Translation initiation does
not require the 5’-end cap structure and eIF4E in picornaviruses. Instead, the IRES
provides an entry/binding site for the 40S ribosome, so the ribosomal scanning can
start…………......................................................................................................................45
Figure 1.2.4 The FMDV IRES structure separated into five domains (1-5), from residues
1 (5’-C) to 462 (U-3’). Domain 3 is the central domain, from residues 86 (5’-G) to 299 (C-
3’). The apical region of domain 3 is found within the orange circle…………………….47
Figure 1.2.5 Illustration of the hammerhead region, a 79mer RNA (G150-U228) found in
domain 3 of the FMDV IRES. The 16mer RNA (U172-A187) shown in the red box and
36mer RNA (C159-G194) in the blue box, are displayed………………………………..48
Figure 1.2.6 Illustration of the apical region of domain 3 in the FMDV IRES, located
below the hammerhead region. The 15mer RNA (G229-C243) is indicated by the area
inside the red box…………………………………………………………………………49
Figure 1.3.1 Structures of purine and pyrimidine bases, and sugars, in DNA and RNA.
Atoms are numbered according to the IUPAC convention.35
……………………………50
Figure 1.3.2 A phosphodiester bond linking two nucleosides, adenosine and guanosine,
from the 5’ to 3’-end……………………………………………………………………...51
Figure 1.3.3 A phosphoramidite building block with four different sites required for
protection…………………………………………………………………………………53
8
Figure 1.3.4 Seven dihedral angles, α, β, γ, δ, ε, ζ, χ, revealing the conformation of a
nucleotide and five dihedral angles, ν0, ν1, ν2, ν3, ν4, defining the conformation of the five-
membered sugar ring………………………………………………………………...........56
Figure 1.3.5 The two main sugar conformations (a) C3’-endo in RNA and (b) C2’-endo in
DNA………………………………………………………………………………………57
Figure 1.3.6 (a) the relationship between the syn/anti notations and the corresponding
dihedral angle values. (b) The pseudorotation phase cycle of the pentose sugar showing
the relationship between the pseudorotation phase angle (P), and the endo and exo
notations.35
………………………………………………………………………………...57
Figure 1.3.7 Illustration of canonical (a) G.C (b) A.U, and non-canonical (c) G.U, base
pairing…………………………………………………………………………………......58
Figure 1.3.8 Illustration of the base stacking interactions between adjacent bases in a base
paired helical stem. The rectangles represent the G, C, A, U bases, the unfilled circles
correspond to the pentose sugar, red circles represent the phosphorus atoms and green
triangles symbolise the base stacking interactions………………………………………..59
Figure 1.3.9 Illustration of the secondary structure of tRNA. The four-way junction
consists of the acceptor arm and the three hairpin loops, the D-loop, the T-loop and the
anticodon loop…………………………………………………………………………….61
Figure 1.3.10 G.A sheared base pairing found in GNRA tetraloop motifs, between the
first and fourth base. Two hydrogen bonds are formed between (guanine 2-amino and
adenine N7) and between (guanine N3 and adenine 6-amino); shown as blue dashed
lines……………………………………………………………………………………….62
Figure 1.4.1 Potential Mg2+
-ion interaction with the RNA phosphate backbone. The
diagram illustrates the Mg2+
ions (green circles), water molecules (red circles with
attached blue circles) and phosphate oxygens (lone red circles). Ion interactions can
involve specific interactions with RNA whereby the Mg2+
ions act as (a) chelated ions, (b)
water-positioned ions and (c) diffuse ions………………………………………………..64
Figure 1.4.2 Two main types of A-minor motifs (left) Type I and (right) Type II. The blue
broken lines represent hydrogen bonding within C.G base pairing and red broken lines
represent hydrogen bonding in A-minor interactions…………………………………….66
9
Figure 1.5.1 Scheme illustrating (a) Spin-lattice (T1) relaxation where magnetisation
relaxes back to longitudinal axis; (b) Spin-spin (T2) relaxation where the spins precess in
the x,y plane and fan out as they lose coherence………………………………………….69
Figure 1.5.2 A plot of T1 (blue curve) and T2 (red curve) as a function of correlation time
(τc). Small molecules have a correlation time in the 10-12
to 10-10
second range while large
molecules are above 10-9
seconds………………………………………………………...71
Figure 1.5.3 Energy level diagram of a two spin system illustrating four energy levels
(N1>N2>N3>N4) with their corresponding α/β spin states. WA and WX represent single
quantum transition in HA and HX, respectively. W0 and W2 represent zero and double
quantum transitions, respectively…………………………………………………………72
Figure 1.5.4 Scheme illustrating the NOE effect in a two spin system; (a) spin populations
before saturation of nucleus HA, (b) spin populations after saturation of nucleus HA……73
Figure 1.5.5 Example of chemical exchange between two conformations of the same
nucleus. The nucleus can change magnetic environments between the two conformations
in fast, intermediate and slow exchange regimes, on the NMR timescale………………..76
Figure 1.5.6 The basic pulse sequence of a 2D NMR experiment. The evolution time (t1)
is the period between the two 90° pulses whereby T1 and T2 relaxation occurs. The
acquisition time (t2) begins immediately after the last 90° pulse…………………………78
Figure 1.5.7 The pulse sequence for a 3D NOESY-TOCSY experiment, constructed from
a combination of the NOESY and TOCSY pulse sequences……………………………..79
Figure 2.3.1 The presaturation pulse sequence. A selective, low power presaturation pulse
saturates the water frequency, which is followed by a non-selective, high power pulse to
excite the desired protons…………………………………………………………………91
Figure 2.3.2 The WATERGATE pulse sequence. The 90° (non-selective) and the 180°
(selective) pulses are shown in the top line. The τ delays inserted for gradient recovery.
The bottom line displays the pulsed magnetic gradients. Most protons experience gradient-
180°-gradient and are refocused, while the water protons experience gradient-0-gradient
and are dephased. Therefore, during signal acquisition (t2) the water signal is
suppressed………………………………………………………………………………...92
10
Figure 2.3.3 1D X-{H} decoupled NMR experiment, where X represents an NMR active
nucleus apart from 1H. The decoupling pulse is activated at the same time as the FID is
acquired for nucleus X……………………………………………………………………93
Figure 2.3.4 The inversion recovery pulse sequence. A 180° pulse is followed by a
variable delay (τ) and then a 90° detection pulse…………………………………………94
Figure 2.3.5 The pulse sequence of the water magnetisation transfer experiment. The
DANTE sequence is followed by a variable delay (τm) and three 90° pulses. Gradient
pulses are represented by G1, G2 and G3.71
……………………………………………...95
Figure 2.3.6 The pulse sequence of a DQF-COSY experiment. The first 90° pulse is the
same as in a standard COSY experiment. The second 90° pulse is immediately followed
by a third 90° pulse; the third pulse acts in combination with second pulse as a double-
quantum filter to convert the double-quantum coherence created by the second pulse back
into single-quantum coherence.91
…………………………………………………………96
Figure 2.3.7 The pulse sequence of a TOCSY experiment. The first 90° pulse flips the
spin magnetisation onto the x,y plane. The evolution period is followed by the isotropic
mixing, which transfers magnetisation between spins connected via an unbroken network
of couplings.93
…………………………………………………………………………….97
Figure 2.3.8 1H-
13C HSQC sequence adapted from the INEPT pulse sequence. The first
pulses are derived from INEPT pulse sequence which transfers magnetisation from 1H to
13C nuclei. A 180° pulse on
1H nuclei forms a spin echo, so the evolution of coupling is
refocused. At mid-evolution the 13
C spin magnetisation then evolves during t1, at which
time it acquires a frequency label according to the offset of 13
C. The inverse INEPT step
transfers magnetisation back to 1H from
13C nuclei, yielding enhanced sensitivity of
13C
comparable to that of 1H.
95………………………………………………………………..98
Figure 2.3.9 The pulse sequence of a NOESY experiment. The first 90° pulse flips the
spins onto the x,y plane. The spins precess in the evolution period before a second 90°
pulse flips the spins onto longitudinal axis and a predetermined mixing period allows for
the exchange of magnetisation between dipolar spins. Finally the spins are flipped back
onto the x,y plane for detection.96
………….......................................................................99
Figure 2.3.10 The pulse sequence of the HOESY experiment, whereby X is the observed
nucleus. The X signal is recorded during t2 and the 1H signal is recorded as a function of
t1.98
……………………………………………………………………………………….100
11
Figure 2.3.11 The pulse sequence of the 1H-
31P CPMG-HSQC-NOESY experiment. τ
represents the delays times around the 180° refocusing pulses, τm is the mixing time for
the NOESY component. The symbol G corresponds to the gradient pulses shown as black
filled shaped pulses.100
…………………………………………………………………..101
Figure 2.3.12 The 3D NOESY/2Q-COSY pulse sequence. The DANTE (Delays
Alternating with Nutation for Tailored Excitation) presaturation sequence is used to
suppress the residual water signal. The evolution period (t1) is followed by the NOE
mixing time (τm) and then the multiple quantum excitation step (τMQ). The t1 and t2 are the
first and second indirect dimensions, and t3 is the third (direct) dimension…………….102
Figure 2.4.1 Protocol for NMR assignment of RNA. The green boxes indicate the solvent
used. The red boxes contain information on the specific NMR experiments employed and
the cyan boxes represent the assignments that can be obtained from the corresponding
experiment(s)………………………………………………………………………….....103
Figure 2.4.2 Scheme representing intranucleotide H6/H8-H1’ connectivities (blue) and
internucleotide H6/H8-H1’ connectivities (red). These connectivities follow well
established NOE sequential assignment pathways………………………………………110
Figure 2.4.3 Scheme representing intranucleotide H1’-H2’ connectivities (blue) and
internucleotide H2’-H6/H8 connectivities (red)………………………………………...110
Figure 2.5.1 Scheme summarising the procedure for structure determination of RNA. The
restraints are added to the starting structure, which is followed by the simulated annealing
step. The lowest RMSD structure generated from the simulated annealing process is used
for the refinement step. The lowest RMSD structure from the refinement process is then
assessed for acceptance as the final NMR solution structure……………………………116
Figure 2.5.2 Definitions of the different parameters used in the 3DNA program.
Complementary base pair parameters (red), base pair step parameters (blue) and local
helical parameters (green) are clearly outlined. All images illustrate the positive values of
the corresponding parameters. Helical twist (Ω) is the same as twist (ω) and helical rise (h)
is the same as rise (Dz).107
…………………………………………………………..118-119
Figure 3.1.1 700 MHz 1H-NMR spectrum of the FMDV 16mer apo-RNA, at 2°C in
1H2O,
displaying the imino region. Six peaks were identified corresponding to the imino protons
of U175, U176, G185, G186, G177 and G178. The G178 loop imino proton peak can be
clearly observed highfield of the stem imino proton peaks……………………………..124
12
Figure 3.1.2 700 MHz NOESY (250ms) spectrum of the FMDV 16mer apo-RNA, at 2°C
in 1H2O, illustrating the imino region of the spectrum. The cross-diagonal peaks
correspond to imino-imino connectivities. The sequential assignment starts from G178,
labelled in red, and finishes at G186, labelled in blue. Inset: Secondary structure of the
16mer RNA highlighting the imino-imino connectivities observed, represented by light
blue oval shapes…………………………………………………………………………126
Figure 3.1.3 700 MHz NOESY (150ms) spectrum of the FMDV 16mer apo-RNA, at 2°C
in 1H2O, illustrating the imino-amino region of the spectrum. Connectivities from imino
protons to NH2*/NH2/H2/H5/H1’ protons can be observed (NH2* corresponds to the
proton involved in base pair hydrogen bonding); connectivities are marked by a black
circle……………………………………………………………………………………..127
Figure 3.1.4 Illustration of the identification of C5-H5 and C6-H6 peaks in the 1H-
13C
HSQC spectrum and the subsequent assignment of H5-H6 cross peaks in the NOESY
spectrum, of the FMDV 16mer apo-RNA. Bottom left panel: 600 MHz NOESY (400ms)
spectrum, at 25°C in 2H2O; blue circles indicate H5-H6 cross peaks. Top left panel: 600
MHz 1H-
13C HSQC spectrum at 25°C in
2H2O, displaying C6-H6 peaks. Bottom right
panel: 600 MHz 1H-
13C HSQC spectrum at 25°C in
2H2O, displaying C5-H5 peaks…..129
Figure 3.1.5 Top/Bottom panels: 600 MHz NOESY (400ms) spectrum of the FMDV
16mer apo-RNA, at 25°C in 2H2O. The blue line represents C173 H6–H1’ to U175 H6–H1’
intra- and internucleotide connectivities, and the green line represents A180 H8-H1’ to
A183 H8-H1’ intra- and internucleotide connectivities; same colouring as in secondary
structure shown. The (i) corresponds to an intranucleotide connectivity. The red circles
correspond to H5-H6 connectivities……………………………………………………..131
Figure 3.1.6 Illustration of the identification of C6-H6, C8-H8 and C1’-H1’ peaks in the 1H-
13C HSQC spectrum and the subsequent assignment of H6/H8-H1’ cross peaks in the
NOESY spectrum, of the FMDV 16mer apo-RNA. (a) 600 MHz 1H-
13C HSQC spectrum
at 25°C in 2H2O, displaying the C6-H6 and C8-H8 peaks. (b,c) 600 MHz NOESY (400ms)
spectrum at 25°C in 2H2O. (d,e) 600 MHz
1H-
13C HSQC spectrum at 25°C in
2H2O,
displaying the C1’-H1’ peaks……………………………………………………………132
Figure 3.1.7 Illustration of the assignment of intranucleotide H1’-H2’ and internucleotide
H2’-H6/H8 connectivities in the NOESY spectrum, with the aid of the 1H-
13C HSQC
spectrum, of the FMDV 16mer apo-RNA. Bottom panels: 600 MHz 1H-
13C HSQC spectra
at 25°C in 2H2O. Top panels: 600 MHz NOESY (400ms) spectra at 25°C in
2H2O…….133
13
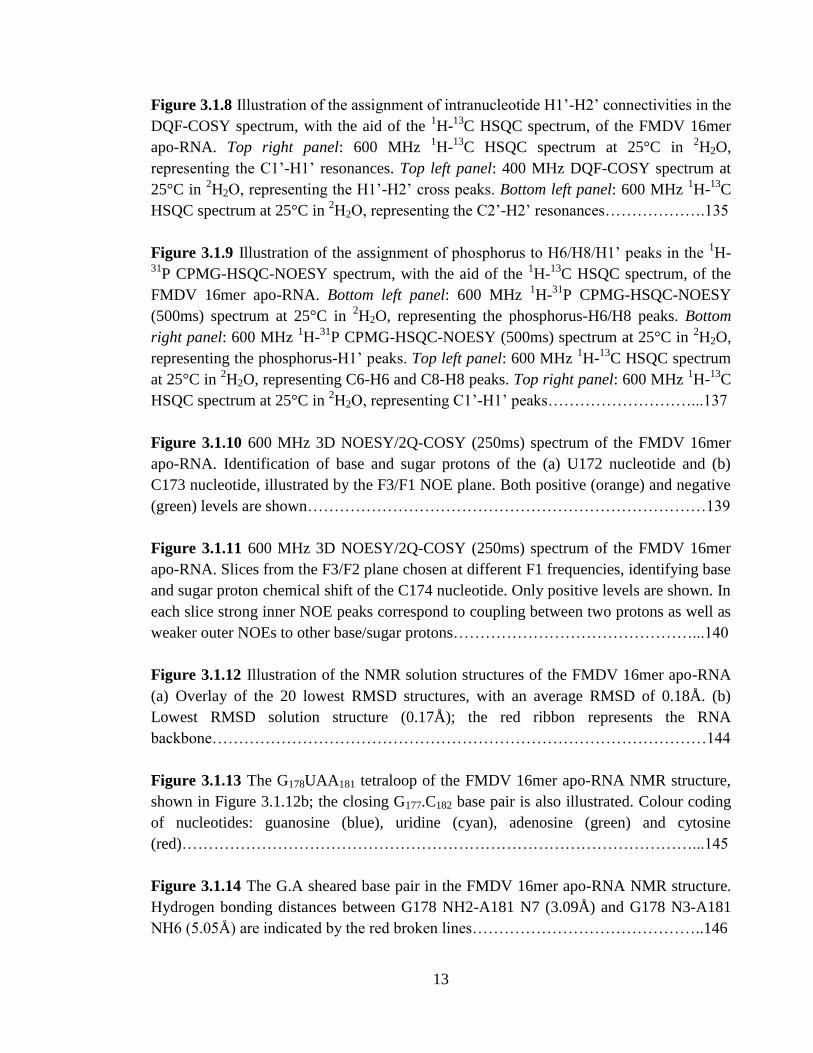
Figure 3.1.8 Illustration of the assignment of intranucleotide H1’-H2’ connectivities in the
DQF-COSY spectrum, with the aid of the 1H-
13C HSQC spectrum, of the FMDV 16mer
apo-RNA. Top right panel: 600 MHz 1H-
13C HSQC spectrum at 25°C in
2H2O,
representing the C1’-H1’ resonances. Top left panel: 400 MHz DQF-COSY spectrum at
25°C in 2H2O, representing the H1’-H2’ cross peaks. Bottom left panel: 600 MHz
1H-
13C
HSQC spectrum at 25°C in 2H2O, representing the C2’-H2’ resonances……………….135
Figure 3.1.9 Illustration of the assignment of phosphorus to H6/H8/H1’ peaks in the 1H-
31P CPMG-HSQC-NOESY spectrum, with the aid of the
1H-
13C HSQC spectrum, of the
FMDV 16mer apo-RNA. Bottom left panel: 600 MHz 1H-
31P CPMG-HSQC-NOESY
(500ms) spectrum at 25°C in 2H2O, representing the phosphorus-H6/H8 peaks. Bottom
right panel: 600 MHz 1H-
31P CPMG-HSQC-NOESY (500ms) spectrum at 25°C in
2H2O,
representing the phosphorus-H1’ peaks. Top left panel: 600 MHz 1H-
13C HSQC spectrum
at 25°C in 2H2O, representing C6-H6 and C8-H8 peaks. Top right panel: 600 MHz
1H-
13C
HSQC spectrum at 25°C in 2H2O, representing C1’-H1’ peaks………………………...137
Figure 3.1.10 600 MHz 3D NOESY/2Q-COSY (250ms) spectrum of the FMDV 16mer
apo-RNA. Identification of base and sugar protons of the (a) U172 nucleotide and (b)
C173 nucleotide, illustrated by the F3/F1 NOE plane. Both positive (orange) and negative
(green) levels are shown…………………………………………………………………139
Figure 3.1.11 600 MHz 3D NOESY/2Q-COSY (250ms) spectrum of the FMDV 16mer
apo-RNA. Slices from the F3/F2 plane chosen at different F1 frequencies, identifying base
and sugar proton chemical shift of the C174 nucleotide. Only positive levels are shown. In
each slice strong inner NOE peaks correspond to coupling between two protons as well as
weaker outer NOEs to other base/sugar protons………………………………………...140
Figure 3.1.12 Illustration of the NMR solution structures of the FMDV 16mer apo-RNA
(a) Overlay of the 20 lowest RMSD structures, with an average RMSD of 0.18Å. (b)
Lowest RMSD solution structure (0.17Å); the red ribbon represents the RNA
backbone…………………………………………………………………………………144
Figure 3.1.13 The G178UAA181 tetraloop of the FMDV 16mer apo-RNA NMR structure,
shown in Figure 3.1.12b; the closing G177.C182 base pair is also illustrated. Colour coding
of nucleotides: guanosine (blue), uridine (cyan), adenosine (green) and cytosine
(red)……………………………………………………………………………………...145
Figure 3.1.14 The G.A sheared base pair in the FMDV 16mer apo-RNA NMR structure.
Hydrogen bonding distances between G178 NH2-A181 N7 (3.09Å) and G178 N3-A181
NH6 (5.05Å) are indicated by the red broken lines……………………………………..146
14
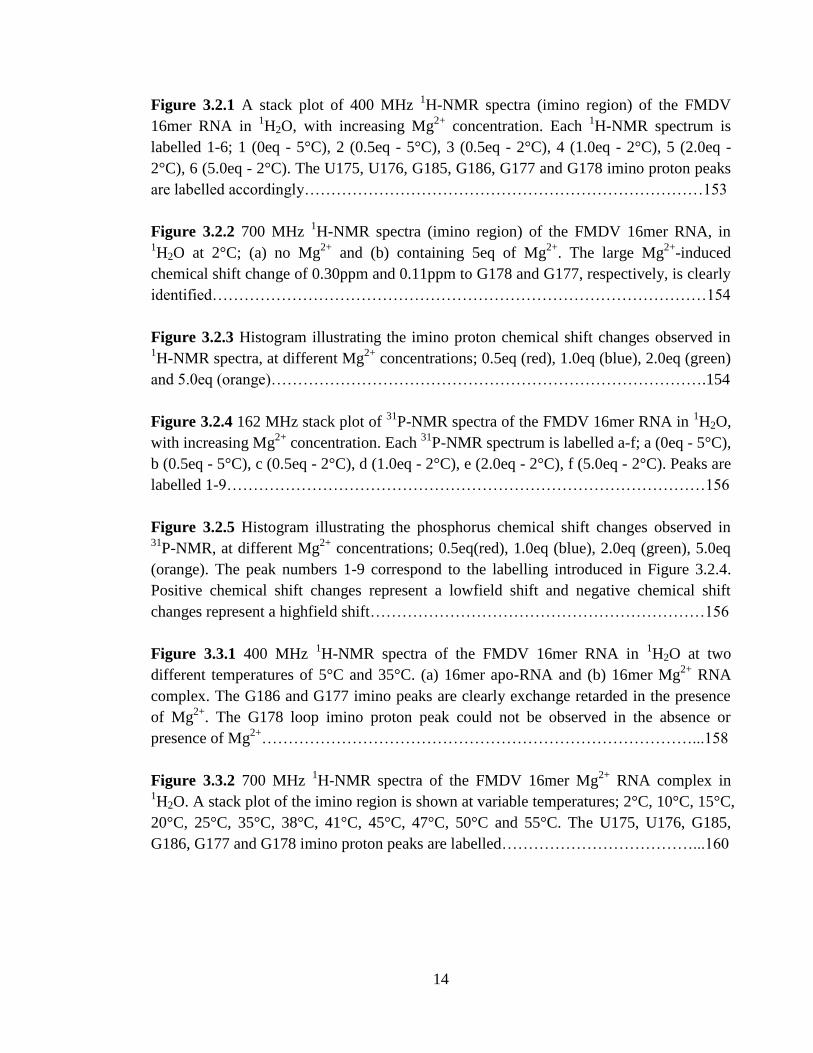
Figure 3.2.1 A stack plot of 400 MHz 1H-NMR spectra (imino region) of the FMDV
16mer RNA in 1H2O, with increasing Mg
2+ concentration. Each
1H-NMR spectrum is
labelled 1-6; 1 (0eq - 5°C), 2 (0.5eq - 5°C), 3 (0.5eq - 2°C), 4 (1.0eq - 2°C), 5 (2.0eq -
2°C), 6 (5.0eq - 2°C). The U175, U176, G185, G186, G177 and G178 imino proton peaks
are labelled accordingly…………………………………………………………………153
Figure 3.2.2 700 MHz 1H-NMR spectra (imino region) of the FMDV 16mer RNA, in
1H2O at 2°C; (a) no Mg
2+ and (b) containing 5eq of Mg
2+. The large Mg
2+-induced
chemical shift change of 0.30ppm and 0.11ppm to G178 and G177, respectively, is clearly
identified…………………………………………………………………………………154
Figure 3.2.3 Histogram illustrating the imino proton chemical shift changes observed in 1H-NMR spectra, at different Mg
2+ concentrations; 0.5eq (red), 1.0eq (blue), 2.0eq (green)
and 5.0eq (orange)……………………………………………………………………….154
Figure 3.2.4 162 MHz stack plot of 31
P-NMR spectra of the FMDV 16mer RNA in 1H2O,
with increasing Mg2+
concentration. Each 31
P-NMR spectrum is labelled a-f; a (0eq - 5°C),
b (0.5eq - 5°C), c (0.5eq - 2°C), d (1.0eq - 2°C), e (2.0eq - 2°C), f (5.0eq - 2°C). Peaks are
labelled 1-9………………………………………………………………………………156
Figure 3.2.5 Histogram illustrating the phosphorus chemical shift changes observed in 31
P-NMR, at different Mg2+
concentrations; 0.5eq(red), 1.0eq (blue), 2.0eq (green), 5.0eq
(orange). The peak numbers 1-9 correspond to the labelling introduced in Figure 3.2.4.
Positive chemical shift changes represent a lowfield shift and negative chemical shift
changes represent a highfield shift………………………………………………………156
Figure 3.3.1 400 MHz 1H-NMR spectra of the FMDV 16mer RNA in
1H2O at two
different temperatures of 5°C and 35°C. (a) 16mer apo-RNA and (b) 16mer Mg2+
RNA
complex. The G186 and G177 imino peaks are clearly exchange retarded in the presence
of Mg2+
. The G178 loop imino proton peak could not be observed in the absence or
presence of Mg2+
………………………………………………………………………...158
Figure 3.3.2 700 MHz 1H-NMR spectra of the FMDV 16mer Mg
2+ RNA complex in
1H2O. A stack plot of the imino region is shown at variable temperatures; 2°C, 10°C, 15°C,
20°C, 25°C, 35°C, 38°C, 41°C, 45°C, 47°C, 50°C and 55°C. The U175, U176, G185,
G186, G177 and G178 imino proton peaks are labelled………………………………...160
15
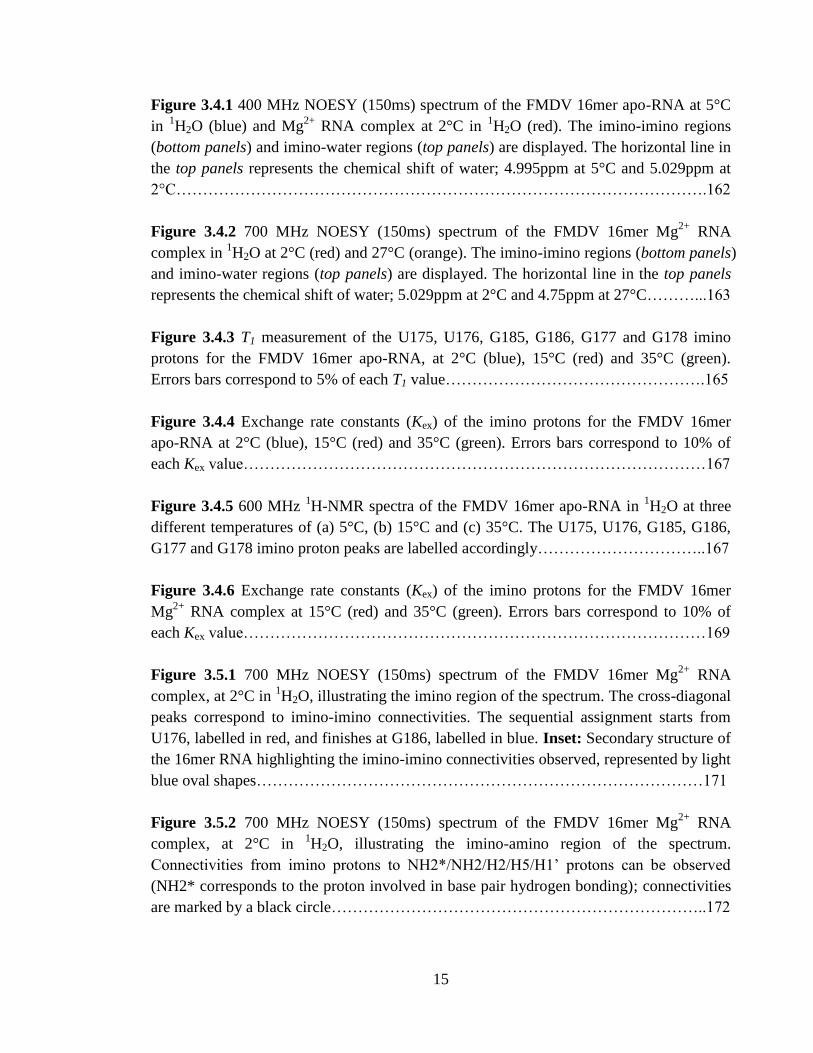
Figure 3.4.1 400 MHz NOESY (150ms) spectrum of the FMDV 16mer apo-RNA at 5°C
in 1H2O (blue) and Mg
2+ RNA complex at 2°C in
1H2O (red). The imino-imino regions
(bottom panels) and imino-water regions (top panels) are displayed. The horizontal line in
the top panels represents the chemical shift of water; 4.995ppm at 5°C and 5.029ppm at
2°C……………………………………………………………………………………….162
Figure 3.4.2 700 MHz NOESY (150ms) spectrum of the FMDV 16mer Mg2+
RNA
complex in 1H2O at 2°C (red) and 27°C (orange). The imino-imino regions (bottom panels)
and imino-water regions (top panels) are displayed. The horizontal line in the top panels
represents the chemical shift of water; 5.029ppm at 2°C and 4.75ppm at 27°C………...163
Figure 3.4.3 T1 measurement of the U175, U176, G185, G186, G177 and G178 imino
protons for the FMDV 16mer apo-RNA, at 2°C (blue), 15°C (red) and 35°C (green).
Errors bars correspond to 5% of each T1 value………………………………………….165
Figure 3.4.4 Exchange rate constants (Kex) of the imino protons for the FMDV 16mer
apo-RNA at 2°C (blue), 15°C (red) and 35°C (green). Errors bars correspond to 10% of
each Kex value……………………………………………………………………………167
Figure 3.4.5 600 MHz 1H-NMR spectra of the FMDV 16mer apo-RNA in
1H2O at three
different temperatures of (a) 5°C, (b) 15°C and (c) 35°C. The U175, U176, G185, G186,
G177 and G178 imino proton peaks are labelled accordingly…………………………..167
Figure 3.4.6 Exchange rate constants (Kex) of the imino protons for the FMDV 16mer
Mg2+
RNA complex at 15°C (red) and 35°C (green). Errors bars correspond to 10% of
each Kex value……………………………………………………………………………169
Figure 3.5.1 700 MHz NOESY (150ms) spectrum of the FMDV 16mer Mg2+
RNA
complex, at 2°C in 1H2O, illustrating the imino region of the spectrum. The cross-diagonal
peaks correspond to imino-imino connectivities. The sequential assignment starts from
U176, labelled in red, and finishes at G186, labelled in blue. Inset: Secondary structure of
the 16mer RNA highlighting the imino-imino connectivities observed, represented by light
blue oval shapes…………………………………………………………………………171
Figure 3.5.2 700 MHz NOESY (150ms) spectrum of the FMDV 16mer Mg2+
RNA
complex, at 2°C in 1H2O, illustrating the imino-amino region of the spectrum.
Connectivities from imino protons to NH2*/NH2/H2/H5/H1’ protons can be observed
(NH2* corresponds to the proton involved in base pair hydrogen bonding); connectivities
are marked by a black circle……………………………………………………………..172

16
Figure 3.5.3 Top and bottom panels: 600 MHz NOESY (400ms) spectrum of the FMDV
16mer Mg2+
RNA complex, at 25°C in 2H2O. The blue line represents U172 H6-H1’ to
G178 H1’-U179 H6 intra- and internucleotide connectivities, and the green line represents
A180 H8-H1’ to A187 H8-H1’ intra- and internucleotide connectivities; same colouring as
in secondary structure shown. The (i) corresponds to an intranucleotide connectivity and (s)
corresponds to a sequential connectivity. The red circles correspond to H5-H6
connectivities…………………………………………………………………………….174
Figure 3.5.4 Illustration of the identification of C6-H6, C8-H8 and C1’-H1’ peaks in the 1H-
13C HSQC spectrum and the subsequent assignment of H6/H8-H1’ cross peaks in the
NOESY spectrum, of the FMDV 16mer Mg2+
RNA complex. (a) and (d) 600 MHz 1H-
13C
HSQC spectrum at 25°C in 2H2O, displaying C6-H6 and C8-H8 peaks. (b), (c) and (e) 600
MHz NOESY (250ms) spectrum, at 25°C in 2H2O. (f) and (g) 600 MHz
1H-
13C HSQC
spectrum at 25°C in 2H2O, displaying C1’-H1’ peaks…………………………………..175
Figure 3.5.5 Illustration of the assignment of intranucleotide H1’-H2’ and internucleotide
H2’-H6/H8 connectivities in the NOESY spectrum, with the aid of the 1H-
13C HSQC
spectrum, of the FMDV 16mer Mg2+
RNA complex. Bottom panels: 600 MHz 1H-
13C
HSQC spectra at 25°C in 2H2O. Top panels: 600 MHz NOESY (250ms) spectra at 25°C in
2H2O……………………………………………………………………………………..176
Figure 3.5.6 Illustration of the assignment of intranucleotide H1’-H2’ connectivities in the
DQF-COSY spectrum, with the aid of the 1H-
13C HSQC spectrum, of the FMDV 16mer
Mg2+
RNA complex. Top right panel: 600 MHz 1H-
13C HSQC spectrum at 25°C in
2H2O,
representing the C1’-H1’ peaks. Top left panel: 600 MHz DQF-COSY spectrum at 25°C
in 2H2O, representing the H1’-H2’ cross peaks. Bottom left panel: 600 MHz
1H-
13C HSQC
spectrum at 25°C in 2H2O, representing the C2’-H2’ peaks…………………………….178
Figure 3.5.7 Illustration of the assignment of intranucleotide H3’-H4’ connectivities in the
DQF-COSY spectrum, with the aid of the 1H-
13C HSQC spectrum, of the FMDV 16mer
Mg2+
RNA complex. Top panel: 600 MHz DQF-COSY spectrum at 25°C in 2H2O,
representing the H3’-H4’ cross peaks. Middle panel: 600 MHz 1H-
13C HSQC spectrum at
25°C in 2H2O, representing the C3’-H3’ peaks. Bottom panel: 600 MHz
1H-
13C HSQC
spectrum at 25°C in 2H2O, representing the C4’-H4’ peaks…………………………….179
Figure 3.5.8 Illustration of the assignment of intranucleotide H5’-H5’’ connectivities in
the DQF-COSY spectrum, with the aid of the 1H-
13C HSQC spectrum, of the FMDV
16mer Mg2+
RNA complex. Top panel: 600 MHz DQF-COSY spectrum at 25°C in 2H2O,
representing the H5’-H5’’ cross peaks. Bottom panel: 600 MHz 1H-
13C HSQC spectrum at
25°C in 2H2O, representing the C5’-H5’ and C5’-H5’’ peaks…………………………..180
17
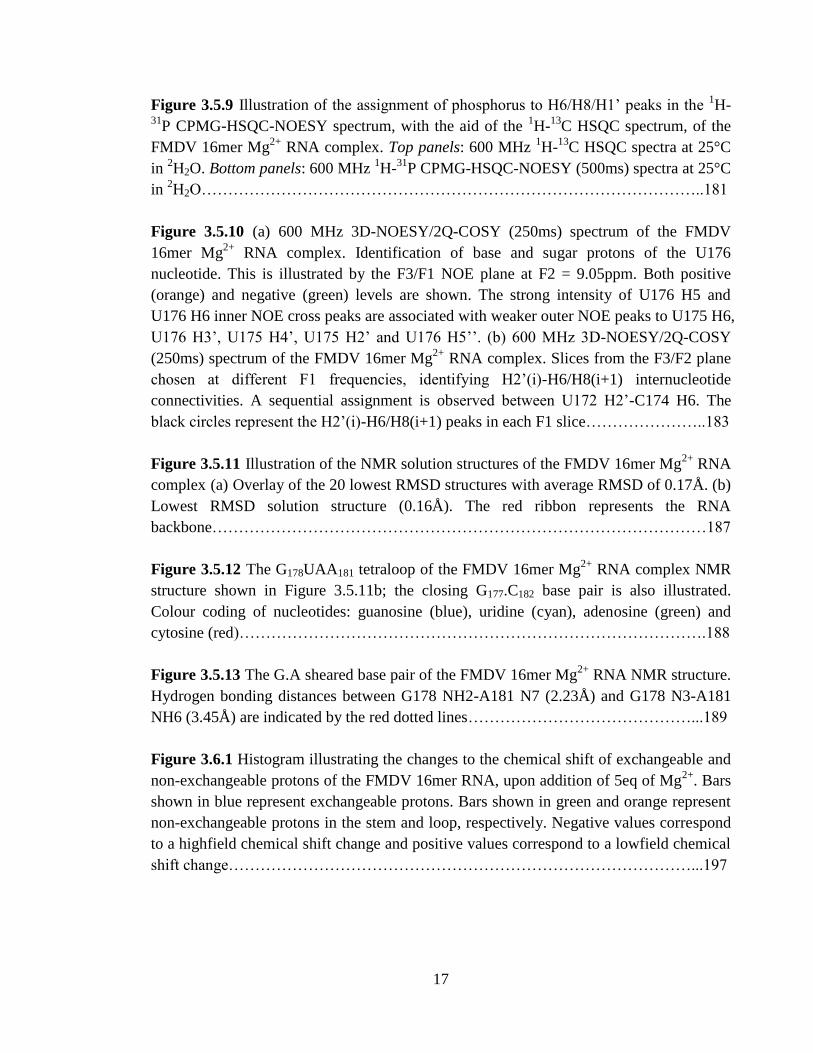
Figure 3.5.9 Illustration of the assignment of phosphorus to H6/H8/H1’ peaks in the 1H-
31P CPMG-HSQC-NOESY spectrum, with the aid of the
1H-
13C HSQC spectrum, of the
FMDV 16mer Mg2+
RNA complex. Top panels: 600 MHz 1H-
13C HSQC spectra at 25°C
in 2H2O. Bottom panels: 600 MHz
1H-
31P CPMG-HSQC-NOESY (500ms) spectra at 25°C
in 2H2O…………………………………………………………………………………..181
Figure 3.5.10 (a) 600 MHz 3D-NOESY/2Q-COSY (250ms) spectrum of the FMDV
16mer Mg2+
RNA complex. Identification of base and sugar protons of the U176
nucleotide. This is illustrated by the F3/F1 NOE plane at F2 = 9.05ppm. Both positive
(orange) and negative (green) levels are shown. The strong intensity of U176 H5 and
U176 H6 inner NOE cross peaks are associated with weaker outer NOE peaks to U175 H6,
U176 H3’, U175 H4’, U175 H2’ and U176 H5’’. (b) 600 MHz 3D-NOESY/2Q-COSY
(250ms) spectrum of the FMDV 16mer Mg2+
RNA complex. Slices from the F3/F2 plane
chosen at different F1 frequencies, identifying H2’(i)-H6/H8(i+1) internucleotide
connectivities. A sequential assignment is observed between U172 H2’-C174 H6. The
black circles represent the H2’(i)-H6/H8(i+1) peaks in each F1 slice…………………..183
Figure 3.5.11 Illustration of the NMR solution structures of the FMDV 16mer Mg2+
RNA
complex (a) Overlay of the 20 lowest RMSD structures with average RMSD of 0.17Å. (b)
Lowest RMSD solution structure (0.16Å). The red ribbon represents the RNA
backbone…………………………………………………………………………………187
Figure 3.5.12 The G178UAA181 tetraloop of the FMDV 16mer Mg2+
RNA complex NMR
structure shown in Figure 3.5.11b; the closing G177.C182 base pair is also illustrated.
Colour coding of nucleotides: guanosine (blue), uridine (cyan), adenosine (green) and
cytosine (red)…………………………………………………………………………….188
Figure 3.5.13 The G.A sheared base pair of the FMDV 16mer Mg2+
RNA NMR structure.
Hydrogen bonding distances between G178 NH2-A181 N7 (2.23Å) and G178 N3-A181
NH6 (3.45Å) are indicated by the red dotted lines……………………………………...189
Figure 3.6.1 Histogram illustrating the changes to the chemical shift of exchangeable and
non-exchangeable protons of the FMDV 16mer RNA, upon addition of 5eq of Mg2+
. Bars
shown in blue represent exchangeable protons. Bars shown in green and orange represent
non-exchangeable protons in the stem and loop, respectively. Negative values correspond
to a highfield chemical shift change and positive values correspond to a lowfield chemical
shift change……………………………………………………………………………...197
18
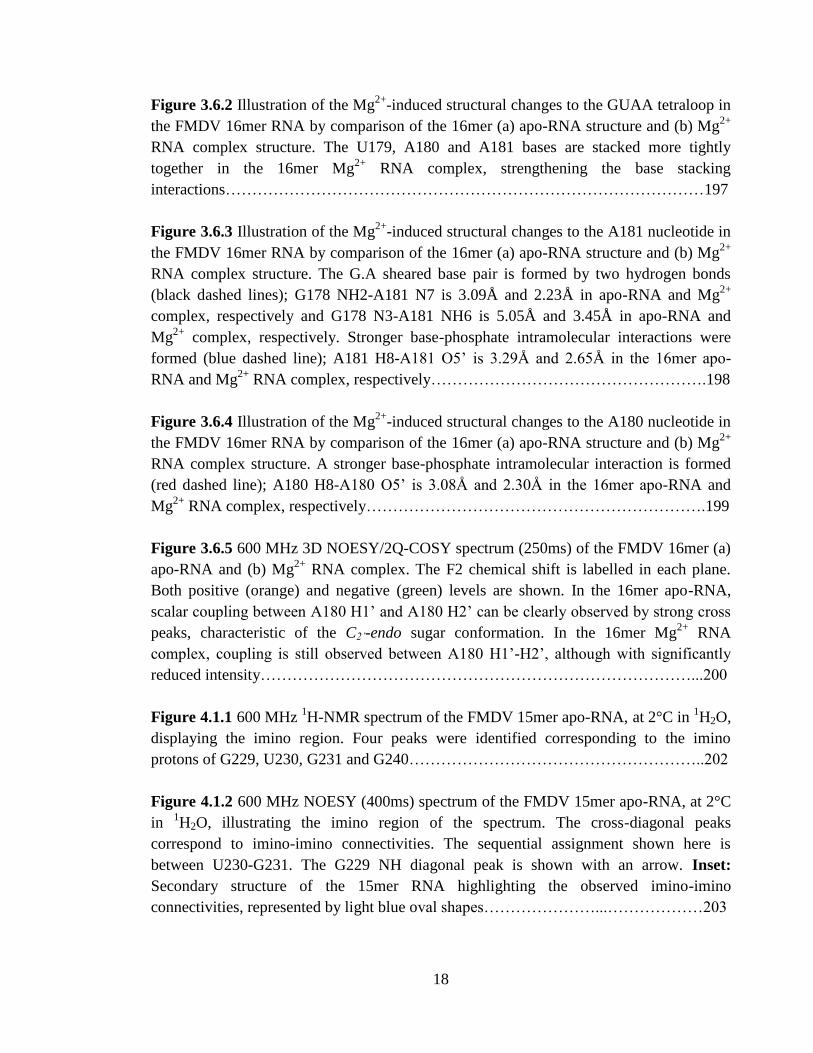
Figure 3.6.2 Illustration of the Mg2+
-induced structural changes to the GUAA tetraloop in
the FMDV 16mer RNA by comparison of the 16mer (a) apo-RNA structure and (b) Mg2+
RNA complex structure. The U179, A180 and A181 bases are stacked more tightly
together in the 16mer Mg2+
RNA complex, strengthening the base stacking
interactions………………………………………………………………………………197
Figure 3.6.3 Illustration of the Mg2+
-induced structural changes to the A181 nucleotide in
the FMDV 16mer RNA by comparison of the 16mer (a) apo-RNA structure and (b) Mg2+
RNA complex structure. The G.A sheared base pair is formed by two hydrogen bonds
(black dashed lines); G178 NH2-A181 N7 is 3.09Å and 2.23Å in apo-RNA and Mg2+
complex, respectively and G178 N3-A181 NH6 is 5.05Å and 3.45Å in apo-RNA and
Mg2+
complex, respectively. Stronger base-phosphate intramolecular interactions were
formed (blue dashed line); A181 H8-A181 O5’ is 3.29Å and 2.65Å in the 16mer apo-
RNA and Mg2+
RNA complex, respectively…………………………………………….198
Figure 3.6.4 Illustration of the Mg2+
-induced structural changes to the A180 nucleotide in
the FMDV 16mer RNA by comparison of the 16mer (a) apo-RNA structure and (b) Mg2+
RNA complex structure. A stronger base-phosphate intramolecular interaction is formed
(red dashed line); A180 H8-A180 O5’ is 3.08Å and 2.30Å in the 16mer apo-RNA and
Mg2+
RNA complex, respectively……………………………………………………….199
Figure 3.6.5 600 MHz 3D NOESY/2Q-COSY spectrum (250ms) of the FMDV 16mer (a)
apo-RNA and (b) Mg2+
RNA complex. The F2 chemical shift is labelled in each plane.
Both positive (orange) and negative (green) levels are shown. In the 16mer apo-RNA,
scalar coupling between A180 H1’ and A180 H2’ can be clearly observed by strong cross
peaks, characteristic of the C2’-endo sugar conformation. In the 16mer Mg2+
RNA
complex, coupling is still observed between A180 H1’-H2’, although with significantly
reduced intensity………………………………………………………………………...200
Figure 4.1.1 600 MHz 1H-NMR spectrum of the FMDV 15mer apo-RNA, at 2°C in
1H2O,
displaying the imino region. Four peaks were identified corresponding to the imino
protons of G229, U230, G231 and G240………………………………………………..202
Figure 4.1.2 600 MHz NOESY (400ms) spectrum of the FMDV 15mer apo-RNA, at 2°C
in 1H2O, illustrating the imino region of the spectrum. The cross-diagonal peaks
correspond to imino-imino connectivities. The sequential assignment shown here is
between U230-G231. The G229 NH diagonal peak is shown with an arrow. Inset:
Secondary structure of the 15mer RNA highlighting the observed imino-imino
connectivities, represented by light blue oval shapes…………………...………………203
19
Figure 4.1.3 600 MHz NOESY (400ms) spectrum of the FMDV 15mer apo-RNA, at 2°C
in 1H2O, illustrating the imino-amino region of the spectrum. Connectivities from imino
protons to NH2*/NH2/H2/H5 protons can be observed (NH2* corresponds to the proton
involved in base pair hydrogen bonding); connectivities are marked with a black
circle……………………………………………………………………………………..204
Figure 4.1.4 Illustration of the identification of C5-H5 and C6-H6 peaks in the 1H-
13C
HSQC spectrum and the subsequent assignment of H5-H6 cross peaks in the NOESY
spectrum, of the FMDV 15mer apo-RNA. Bottom left panel: 700 MHz NOESY (250ms)
spectrum, at 25°C in 2H2O; blue circles indicate H5-H6 cross peaks. Top left panel: 400
MHz 1H-
13C HSQC spectrum, at 25°C in
2H2O, displaying the C6-H6 peaks. Bottom right
panel: 400 MHz 1H-
13C HSQC spectrum, at 25°C in
2H2O, displaying the C5-H5
peaks…………………………………………………………………………………….206
Figure 4.1.5 700 MHz NOESY (250ms) spectrum of the FMDV 15mer apo-RNA, at
25°C in 2H2O. The blue line represents G229 H8-H1’ to A234 H1’-C235 H6 intra- and
internucleotide connectivities. The green line represents C238 H6-H1’ to C243 H6-H1’
intra- and internucleotide connectivities (same colouring in secondary structure shown).
H6/H8 and H2 chemical shifts are labelled in black and blue, respectively. The (i)
corresponds to an intranucleotide connectivity and (s) corresponds to a sequential
connectivity. The red circles correspond to H5-H6 connectivities……………………...207
Figure 4.1.6 Illustration of the assignment of intranucleotide H1’-H2’ and internucleotide
H2’-H6/H8 connectivities in the NOESY spectrum, with the aid of the 1H-
13C HSQC
spectrum, of the FMDV 15mer apo-RNA. Bottom panels: 400 MHz 1H-
13C HSQC spectra
at 25°C in 2H2O. Top panels: 700 MHz NOESY (250ms) spectra at 25°C in
2H2O…….208
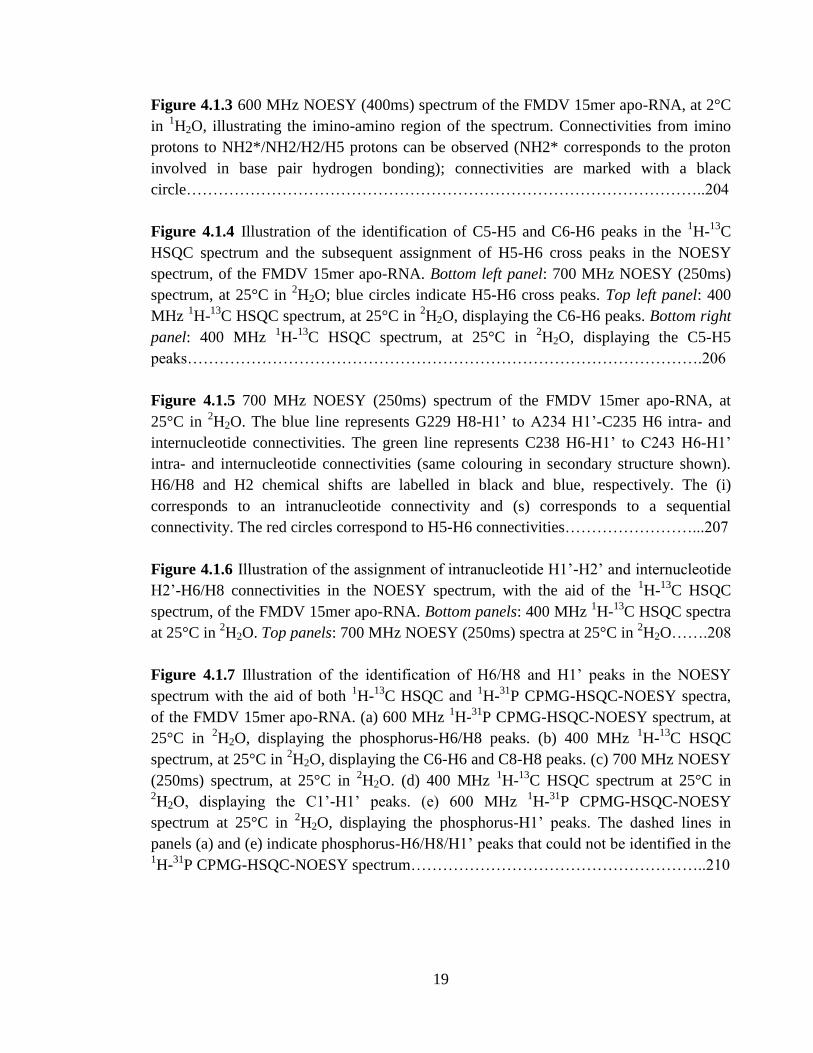
Figure 4.1.7 Illustration of the identification of H6/H8 and H1’ peaks in the NOESY
spectrum with the aid of both 1H-
13C HSQC and
1H-
31P CPMG-HSQC-NOESY spectra,
of the FMDV 15mer apo-RNA. (a) 600 MHz 1H-
31P CPMG-HSQC-NOESY spectrum, at
25°C in 2H2O, displaying the phosphorus-H6/H8 peaks. (b) 400 MHz
1H-
13C HSQC
spectrum, at 25°C in 2H2O, displaying the C6-H6 and C8-H8 peaks. (c) 700 MHz NOESY
(250ms) spectrum, at 25°C in 2H2O. (d) 400 MHz
1H-
13C HSQC spectrum at 25°C in
2H2O, displaying the C1’-H1’ peaks. (e) 600 MHz
1H-
31P CPMG-HSQC-NOESY
spectrum at 25°C in 2H2O, displaying the phosphorus-H1’ peaks. The dashed lines in
panels (a) and (e) indicate phosphorus-H6/H8/H1’ peaks that could not be identified in the 1H-
31P CPMG-HSQC-NOESY spectrum………………………………………………..210
20
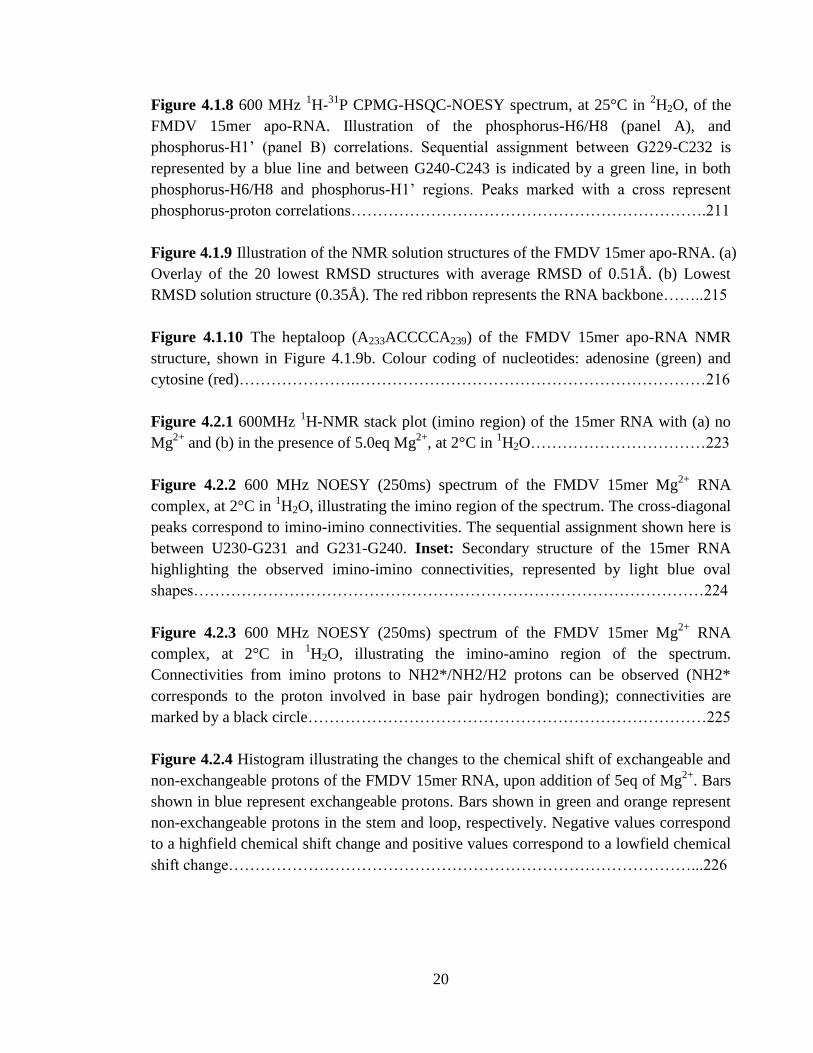
Figure 4.1.8 600 MHz 1H-
31P CPMG-HSQC-NOESY spectrum, at 25°C in
2H2O, of the
FMDV 15mer apo-RNA. Illustration of the phosphorus-H6/H8 (panel A), and
phosphorus-H1’ (panel B) correlations. Sequential assignment between G229-C232 is
represented by a blue line and between G240-C243 is indicated by a green line, in both
phosphorus-H6/H8 and phosphorus-H1’ regions. Peaks marked with a cross represent
phosphorus-proton correlations………………………………………………………….211
Figure 4.1.9 Illustration of the NMR solution structures of the FMDV 15mer apo-RNA. (a)
Overlay of the 20 lowest RMSD structures with average RMSD of 0.51Å. (b) Lowest
RMSD solution structure (0.35Å). The red ribbon represents the RNA backbone……..215
Figure 4.1.10 The heptaloop (A233ACCCCA239) of the FMDV 15mer apo-RNA NMR
structure, shown in Figure 4.1.9b. Colour coding of nucleotides: adenosine (green) and
cytosine (red)………………….…………………………………………………………216
Figure 4.2.1 600MHz 1H-NMR stack plot (imino region) of the 15mer RNA with (a) no
Mg2+
and (b) in the presence of 5.0eq Mg2+
, at 2°C in 1H2O……………………………223
Figure 4.2.2 600 MHz NOESY (250ms) spectrum of the FMDV 15mer Mg2+
RNA
complex, at 2°C in 1H2O, illustrating the imino region of the spectrum. The cross-diagonal
peaks correspond to imino-imino connectivities. The sequential assignment shown here is
between U230-G231 and G231-G240. Inset: Secondary structure of the 15mer RNA
highlighting the observed imino-imino connectivities, represented by light blue oval
shapes……………………………………………………………………………………224
Figure 4.2.3 600 MHz NOESY (250ms) spectrum of the FMDV 15mer Mg2+
RNA
complex, at 2°C in 1H2O, illustrating the imino-amino region of the spectrum.
Connectivities from imino protons to NH2*/NH2/H2 protons can be observed (NH2*
corresponds to the proton involved in base pair hydrogen bonding); connectivities are
marked by a black circle…………………………………………………………………225
Figure 4.2.4 Histogram illustrating the changes to the chemical shift of exchangeable and
non-exchangeable protons of the FMDV 15mer RNA, upon addition of 5eq of Mg2+
. Bars
shown in blue represent exchangeable protons. Bars shown in green and orange represent
non-exchangeable protons in the stem and loop, respectively. Negative values correspond
to a highfield chemical shift change and positive values correspond to a lowfield chemical
shift change……………………………………………………………………………...226
21
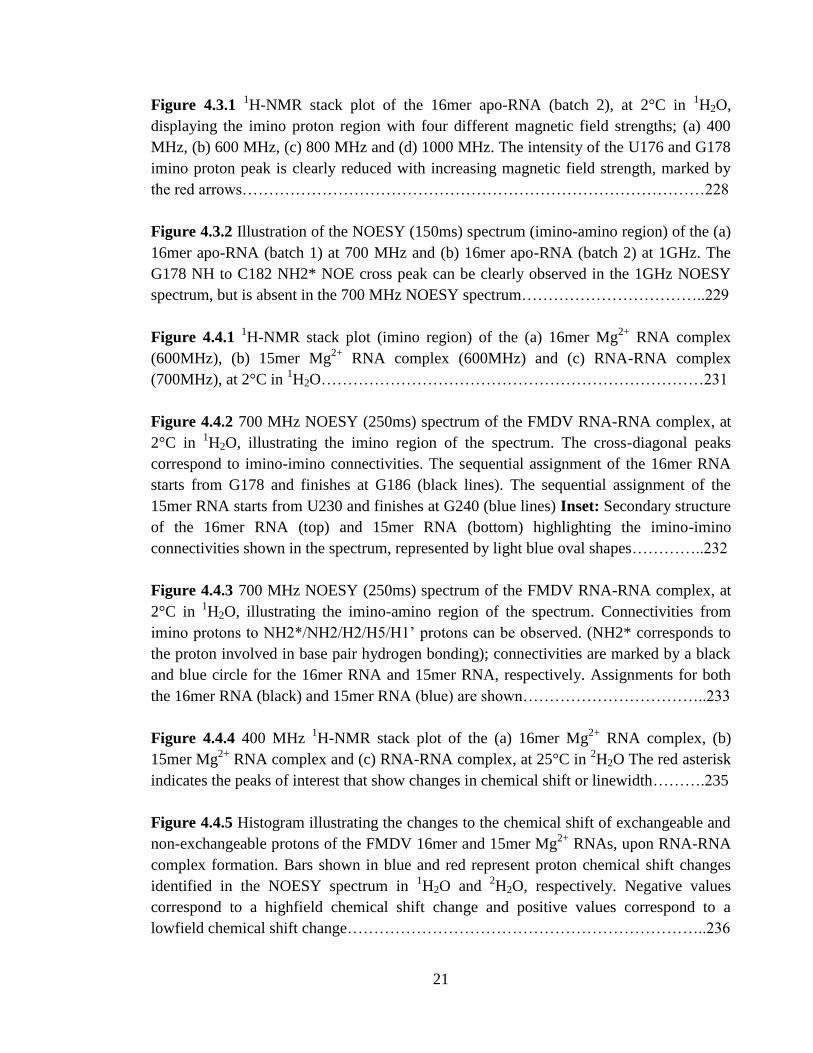
Figure 4.3.1 1H-NMR stack plot of the 16mer apo-RNA (batch 2), at 2°C in
1H2O,
displaying the imino proton region with four different magnetic field strengths; (a) 400
MHz, (b) 600 MHz, (c) 800 MHz and (d) 1000 MHz. The intensity of the U176 and G178
imino proton peak is clearly reduced with increasing magnetic field strength, marked by
the red arrows……………………………………………………………………………228
Figure 4.3.2 Illustration of the NOESY (150ms) spectrum (imino-amino region) of the (a)
16mer apo-RNA (batch 1) at 700 MHz and (b) 16mer apo-RNA (batch 2) at 1GHz. The
G178 NH to C182 NH2* NOE cross peak can be clearly observed in the 1GHz NOESY
spectrum, but is absent in the 700 MHz NOESY spectrum……………………………..229
Figure 4.4.1 1H-NMR stack plot (imino region) of the (a) 16mer Mg
2+ RNA complex
(600MHz), (b) 15mer Mg2+
RNA complex (600MHz) and (c) RNA-RNA complex
(700MHz), at 2°C in 1H2O………………………………………………………………231
Figure 4.4.2 700 MHz NOESY (250ms) spectrum of the FMDV RNA-RNA complex, at
2°C in 1H2O, illustrating the imino region of the spectrum. The cross-diagonal peaks
correspond to imino-imino connectivities. The sequential assignment of the 16mer RNA
starts from G178 and finishes at G186 (black lines). The sequential assignment of the
15mer RNA starts from U230 and finishes at G240 (blue lines) Inset: Secondary structure
of the 16mer RNA (top) and 15mer RNA (bottom) highlighting the imino-imino
connectivities shown in the spectrum, represented by light blue oval shapes…………..232
Figure 4.4.3 700 MHz NOESY (250ms) spectrum of the FMDV RNA-RNA complex, at
2°C in 1H2O, illustrating the imino-amino region of the spectrum. Connectivities from
imino protons to NH2*/NH2/H2/H5/H1’ protons can be observed. (NH2* corresponds to
the proton involved in base pair hydrogen bonding); connectivities are marked by a black
and blue circle for the 16mer RNA and 15mer RNA, respectively. Assignments for both
the 16mer RNA (black) and 15mer RNA (blue) are shown……………………………..233
Figure 4.4.4 400 MHz 1H-NMR stack plot of the (a) 16mer Mg
2+ RNA complex, (b)
15mer Mg2+
RNA complex and (c) RNA-RNA complex, at 25°C in 2H2O The red asterisk
indicates the peaks of interest that show changes in chemical shift or linewidth……….235
Figure 4.4.5 Histogram illustrating the changes to the chemical shift of exchangeable and
non-exchangeable protons of the FMDV 16mer and 15mer Mg2+
RNAs, upon RNA-RNA
complex formation. Bars shown in blue and red represent proton chemical shift changes
identified in the NOESY spectrum in 1H2O and
2H2O, respectively. Negative values
correspond to a highfield chemical shift change and positive values correspond to a
lowfield chemical shift change…………………………………………………………..236
22
Figure 4.4.6 Top and bottom panels: 600 MHz NOESY (250ms) spectrum of the FMDV
RNA-RNA complex, at 25°C in 2H2O. The black and blue lines represent the sequential
H6/H8-H1’ intra- and internucleotide connectivities, for the 16mer and 15mer Mg2+
RNAs,
respectively. The (i) corresponds to an intranucleotide connectivity and (s) corresponds to
a sequential connectivity. The red circles and light blue squares correspond to H5-H6
connectivities for the 16mer and 15mer Mg2+
RNAs, respectively. Assignments for both
the 16mer Mg2+
RNA (black) and 15mer Mg2+
RNA (blue) are shown………………...237
Figure 4.4.7 Scheme illustrating the possible RNA-RNA interaction between the FMDV
16mer RNA (left) and the 15mer RNA (right). The rectangles represent the bases, which
have been numbered. Base pairing is represented by three black lines for G.C base pairs
and two black lines for A.U base pairs. The unfilled circles correspond to the sugar ribose,
red circles represent the phosphorus atom and green triangles symbolise the base stacking
interactions. Chemical shift and linewidth changes to protons in nucleotides are
represented by the blue filled rectangles and circles. The broken black line between the
orange brackets indicates the possible area of RNA-RNA interaction………………….239
Figure 5.1.1 376 MHz 19
F-NMR stack plot of the 5-FU 16mer RNA, in 1H2O at (a) 2°C,
(b) 10°C and (c) 25°C. 19
F chemical shifts were referenced to CFCl3…………………..241
Figure 5.1.2 376 MHz 19
F-NMR stack plot of the 5-FU 15mer RNA, in 1H2O at (a) 2°C,
(b) 10°C and (c) 25°C. 19
F chemical shifts were referenced to CFCl3…………………..242
Figure 5.1.3 1GHz NOESY (150ms) spectrum of the 5-FU 16mer RNA at 2°C in 1H2O
(orange) overlaid on the 1GHz NOESY (250ms) spectrum of the unlabelled 16mer RNA
(batch 2) at 2°C in 1H2O (green). The overlay displays the U172, C173, C174, U175,
U176, U179 and C182 H5-H6 cross peaks found in the aromatic region of the spectra.
Cross peaks of the unlabelled 16mer RNA have been labelled by a cross……………...243
Figure 5.1.4 600 MHz NOESY (400ms) spectrum of the 5-FU 15mer RNA at 2°C in 1H2O (orange) overlaid on the 600 MHz NOESY (400ms) spectrum of the unlabelled
15mer RNA at 2°C in 1H2O (green). The overlay displays the U230, C232, C235, C236,
C237, C238, C241 and C243 H5-H6 cross peaks found in the aromatic region of the
spectra. Cross peaks of the unlabelled 15mer RNA have been labelled by a cross……..243
Figure 5.1.5 1GHz 1H-NMR stack plot (imino region) of the (a) 16mer apo-RNA (batch 2)
and (b) 5-FU 16mer RNA, at 2°C in 1H2O. The U175, U176, G185, G186, G177 and
G178 imino proton peaks are labelled…………………………………………………...244
23
Figure 5.1.6 1GHz NOESY (250ms) spectra of the FMDV 16mer apo-RNA (batch 2), left,
and 5-FU 16mer apo-RNA, right, at 2°C in 1H2O, illustrating the imino region of the
spectrum. The cross-diagonal peaks correspond to imino-imino connectivities. The
sequential assignment shown in both spectra is between G178-G186, although the G177-
U176 imino-imino connectivity is not observed for the 5-FU 16mer RNA. Insets:
Secondary structure of the 16mer RNA highlighting the observed imino-imino
connectivities, represented by light blue oval shapes…………………………………...245
Figure 5.1.7 1GHz NOESY (250ms) spectra of the FMDV 16mer apo-RNA (batch 2), left,
and 5-FU 16mer apo-RNA, right, at 2°C in 1H2O, illustrating the imino-amino region of
the spectrum. Connectivities from imino protons to NH2*/NH2/H2/H5/H1’ protons can be
observed (NH2* corresponds to the proton involved in base pair hydrogen bonding);
connectivities are marked by a black circle……………………………………………...246
Figure 5.1.8 Top and bottom panels: 600 MHz NOESY (400ms) spectrum of the FMDV
5-FU 16mer RNA, at 25°C in 2H2O. The blue line represents intra- and internucleotide
connectivities from U172 H1’ to G177 H8 and the green line from U179 H1’ to A187 H8
connectivities. The (i) corresponds to an intranucleotide connectivity and (s) corresponds
to a sequential connectivity. The red circles correspond to H5-H6 connectivities……...247
Figure 5.1.9 600 MHz 1H-
19F HOESY (250ms) spectrum of the FMDV 5-FU 16mer RNA,
at 25°C in 2H2O.
19F chemical shifts were referenced to CF3COOH……………………248
Figure 5.1.10 162 MHz 31
P-NMR stack plot of the (a) 16mer apo-RNA (batch 1) and (b)
5-FU 16mer RNA, at 2°C in 1H2O. Peaks in the
31P-NMR spectrum of the 16mer apo-
RNA are labelled 1-9. Peaks 1, 2 and 9 correspond to U179, A180/C182 and A181
phosphorus (labelled in red), respectively……………………………………………….249
Figure 5.1.11 1H-NMR stack plot of the 5-FU 16mer RNA, at 2°C in
1H2O, displaying the
imino proton region with four different magnetic field strengths; (a) 400 MHz, (b) 600
MHz, (c) 800 MHz and (d) 1000 MHz. The intensity of the U176 and G178 imino proton
peak is clearly reduced with increasing magnetic field strength, marked by the red
arrows……………………………………………………………………………………250
Figure 5.1.12 A 1H-NMR stack plot (imino region) of the (a) 15mer apo-RNA (600 MHz)
and (b) 5-FU 15mer RNA (800 MHz), at 2°C in 1H2O. A lowfield shift of 0.78ppm is
observed for the U230 imino proton in the 5-FU 15mer RNA………………………….251
24
Figure 5.1.13 162 MHz 31
P-NMR stack lot of the (a) 15mer apo-RNA and (b) 5-FU
15mer RNA, at 25°C in 1H2O. A highfield shift of 0.52ppm is observed for the U230
phosphorus in the 5-FU 15mer RNA……………………………………………………252
Figure 5.1.14 376MHz 19
F-NMR stack plot of the 5FU 16mer RNA, with (a) no Mg2+
and
(b) with 5.0eq Mg2+
, at 25°C in 2H2O. A highfield shift of 0.27ppm was observed for the
U179 F5 peak in the 5-FU 16mer RNA. 19
F chemical shifts were referenced to
CFCl3…………………………………………………………………………………….253
Figure 5.1.15 600 MHz 1H-
19F HOESY (250ms) spectrum of the (a) FMDV 5-FU 16mer
apo-RNA and (b) FMDV 5-FU 16mer Mg2+
RNA complex, at 25°C in 2H2O.
19F chemical
shifts were referenced to CF3COOH…………………………………………………….254
Figure 5.1.16 376MHz 19
F-NMR stack plot of the 5FU 15mer RNA, with (a) no Mg2+
and
(b) with 5.0eq Mg2+
, at 25°C in 2H2O. A highfield shift of 0.05ppm was observed for the
U230 F5 peak in the 5-FU 15mer RNA. 19
F chemical shifts were referenced to
CFCl3…………………………………………………………………………………….254
Figure 5.2.1 376 MHz 19
F-NMR stack plot of the (a) 5-FU 16mer Mg2+
RNA complex, (b)
5-FU 15mer Mg2+
RNA complex, (c) 5-FU RNA-RNA complex, at 25°C in 2H2O. The red
asterisks represent the additional smaller peaks observed in the 5-FU RNA-RNA complex. 19
F chemical shifts were referenced to CFCl3.………………………………………………256
Figure 5.2.2 600 MHz 1H-
19F HOESY (250ms) spectrum of the (a) FMDV 5-FU 16mer
Mg2+
RNA complex and (b) FMDV 5-FU 15mer Mg2+
RNA complex, at 25°C in 2H2O.
19F chemical shift referenced to CF3COOH. Assignments for both the 5-FU 16mer RNA
(black) and 5-FU 15mer RNA (blue) are shown………………………………………...256
25
List of Tables
Table 2.4.1 Summary of 1H and
13C chemical shifts observed in NOESY and
1H-
13C
HSQC spectra of RNA. H-bonded refers to ‘hydrogen’ bonded………………………..105
Table 2.5.1 Dihedral angle restraints used for defining nucleotide structure (α, β, γ, δ, ε, ζ,
χ) and the ribose sugar (ν1 and ν2) in the structure calculations.35
………………………113
Table 3.1.1 1H,
13C and
31P NMR chemical shifts of the FMDV 16mer apo-RNA, in
1H2O
and 2H2O…………………………………………………………………………………141
Table 3.1.2 A summary of the total number of restraints used for the structure
determination of the FMDV 16mer apo-RNA…………………………………………..143
Table 3.1.3 Ten intramolecular interactions in total were identified in the GUAA tetraloop
of the FMDV 16mer apo-RNA NMR structure. The interactions formed between donor
and acceptor atoms are given, the type of interaction, the specificity of the interaction and
the distances between the proton donor and acceptor atoms…………………………….147
Table 3.1.4 Local helical parameter values for the FMDV 16mer apo-RNA structure,
calculated by the 3DNA analysis program………………………………………………149
Table 3.1.5 Base pair step parameter values for the FMDV 16mer apo-RNA structure,
calculated by the 3DNA analysis program………………………………………………149
Table 3.1.6 Complementary base pair parameter values for the FMDV 16mer apo-RNA
structure, calculated by the 3DNA analysis program……………………………………149
Table 3.1.7 Dihedral angle values of nucleotides in the FMDV 16mer apo-RNA structure,
calculated by the 3DNA (black) and CURVES (red) analysis programs. Angles are all
measured in degrees……………………………………………………………………..150
Table 3.1.8 Dihedral angle values (ν1 and ν2), pseudorotation phase angle (Phase) and
amplitude (Amp) values that define the sugar ribose conformation for each nucleotide in
the FMDV 16mer apo-RNA structure. Values were calculated by the 3DNA (black) and
CURVES (red) analysis programs………………………………………………………151
Table 3.5.1 1H,
13C and
31P NMR chemical shifts of the FMDV 16mer Mg
2+ RNA
complex, in 1H2O and
2H2O……………………………………………………………..184
26
Table 3.5.2 A summary of the total number of restraints used for the structure
determination of the FMDV 16mer Mg2+
RNA complex……………………………….186
Table 3.5.3 Seven intramolecular interactions in total were identified in the GUAA
tetraloop of the FMDV 16mer Mg2+
RNA complex NMR structure. The interactions
formed between donor and acceptor atoms are given, the type of interaction, the
specificity of the interaction and the distances between the proton donor and acceptor
atoms…………………………………………………………………………………….190
Table 3.5.4 Local helical parameter values for the FMDV 16mer Mg2+
RNA complex
structure, calculated by the 3DNA analysis program……………………………………191
Table 3.5.5 Base pair step parameter values for the FMDV 16mer Mg2+
RNA complex
structure, calculated by the 3DNA analysis program……………………………………192
Table 3.5.6 Complementary base pair parameter values for the FMDV 16mer Mg2+
RNA
complex structure, calculated by the 3DNA analysis program………………………….192
Table 3.5.7 Dihedral angle values of nucleotides in the FMDV 16mer Mg2+
RNA
complex structure, calculated by the 3DNA (black) and CURVES (red) analysis programs.
Angles are all measured in degrees……………………………………………………...193
Table 3.5.8 Dihedral angle values (ν1 and ν2), pseudorotation phase angle (Phase) and
amplitude (Amp) values that define the sugar ribose conformation for each nucleotide in
the FMDV 16mer Mg2+
RNA complex structure. Values were calculated by the 3DNA
(black) and CURVES (red) analysis programs………………………………………….194
Table 3.6.1 A comparison of dihedral angle and distance values obtained from the FMDV
16mer apo-RNA and Mg2+
RNA complex structures, highlighting the changes induced by
Mg2+
……………………………………………………………………………………..199
Table 4.1.1 1H,
13C and
31P NMR chemical shifts of the FMDV 15mer apo-RNA, in
1H2O
and 2H2O…………………………………………………………………………………212
Table 4.1.2 A summary of the total number of restraints used for the structure
determination of the FMDV 15mer apo-RNA…………………………………………..214
27
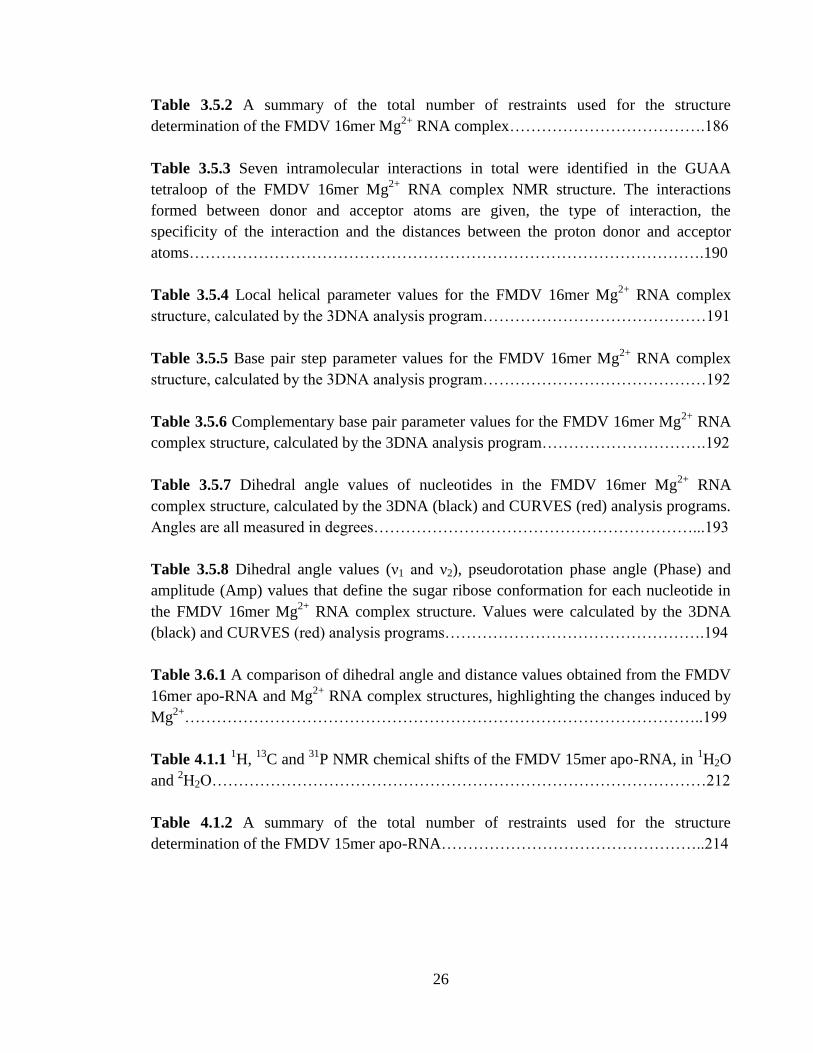
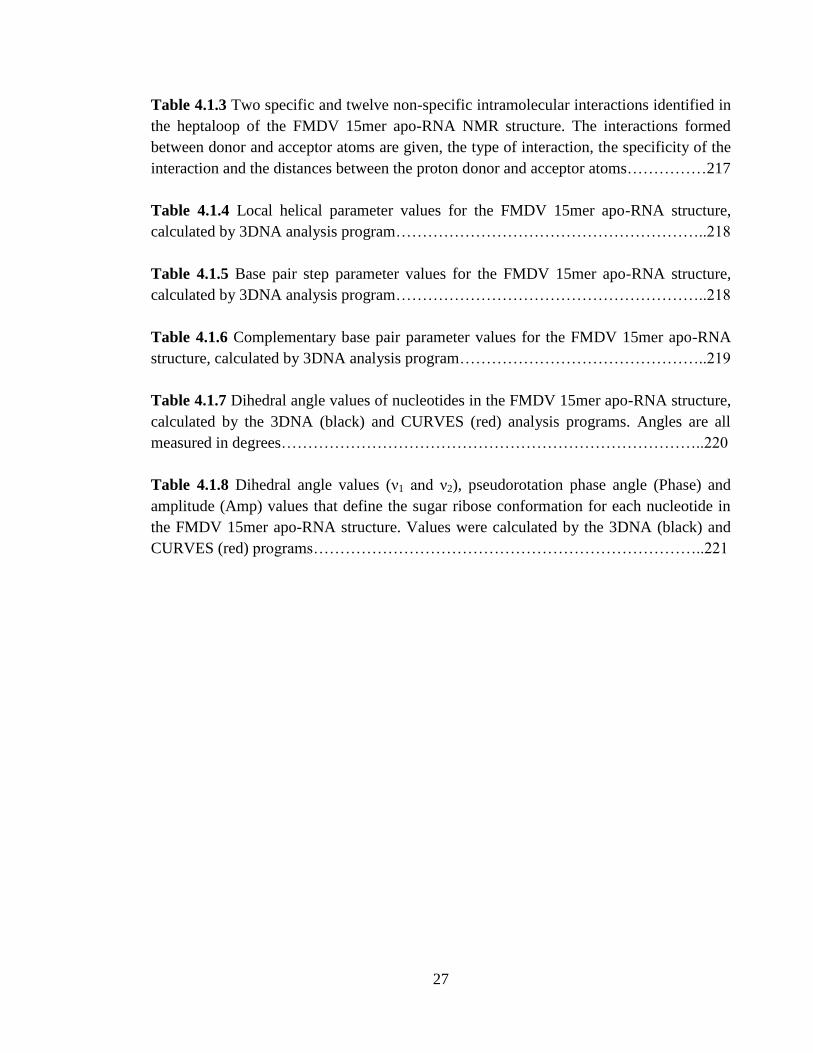
Table 4.1.3 Two specific and twelve non-specific intramolecular interactions identified in
the heptaloop of the FMDV 15mer apo-RNA NMR structure. The interactions formed
between donor and acceptor atoms are given, the type of interaction, the specificity of the
interaction and the distances between the proton donor and acceptor atoms……………217
Table 4.1.4 Local helical parameter values for the FMDV 15mer apo-RNA structure,
calculated by 3DNA analysis program…………………………………………………..218
Table 4.1.5 Base pair step parameter values for the FMDV 15mer apo-RNA structure,
calculated by 3DNA analysis program…………………………………………………..218
Table 4.1.6 Complementary base pair parameter values for the FMDV 15mer apo-RNA
structure, calculated by 3DNA analysis program………………………………………..219
Table 4.1.7 Dihedral angle values of nucleotides in the FMDV 15mer apo-RNA structure,
calculated by the 3DNA (black) and CURVES (red) analysis programs. Angles are all
measured in degrees……………………………………………………………………..220
Table 4.1.8 Dihedral angle values (ν1 and ν2), pseudorotation phase angle (Phase) and
amplitude (Amp) values that define the sugar ribose conformation for each nucleotide in
the FMDV 15mer apo-RNA structure. Values were calculated by the 3DNA (black) and
CURVES (red) programs………………………………………………………………..221
28
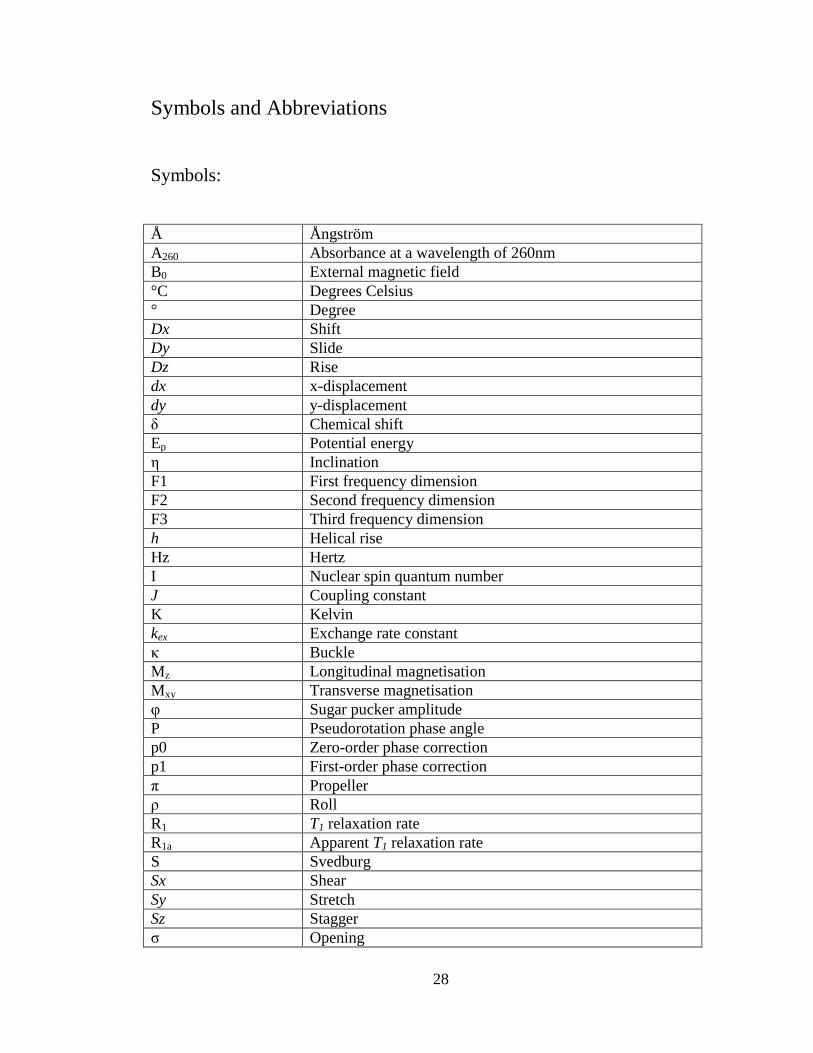
Symbols and Abbreviations
Symbols:
Å Ångström
A260 Absorbance at a wavelength of 260nm
B0 External magnetic field
°C Degrees Celsius
° Degree
Dx Shift
Dy Slide
Dz Rise
dx x-displacement
dy y-displacement
δ Chemical shift
Ep Potential energy
η Inclination
F1 First frequency dimension
F2 Second frequency dimension
F3 Third frequency dimension
h Helical rise
Hz Hertz
I Nuclear spin quantum number
J Coupling constant
K Kelvin
kex Exchange rate constant
κ Buckle
Mz Longitudinal magnetisation
Mxy Transverse magnetisation
φ Sugar pucker amplitude
P Pseudorotation phase angle
p0 Zero-order phase correction
p1 First-order phase correction
π Propeller
ρ Roll
R1 T1 relaxation rate
R1a Apparent T1 relaxation rate
S Svedburg
Sx Shear
Sy Stretch
Sz Stagger
σ Opening
29
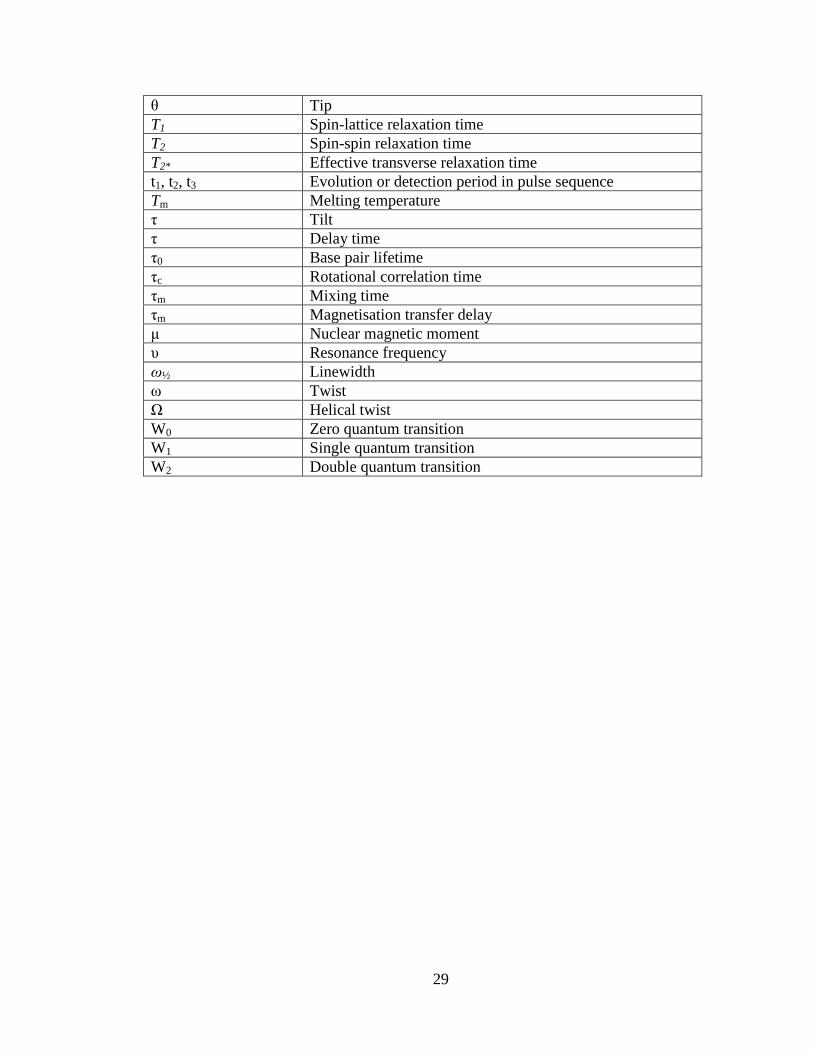
θ Tip
T1 Spin-lattice relaxation time
T2 Spin-spin relaxation time
T2* Effective transverse relaxation time
t1, t2, t3 Evolution or detection period in pulse sequence
Tm Melting temperature
τ Tilt
τ Delay time
τ0 Base pair lifetime
τc Rotational correlation time
τm Mixing time
τm Magnetisation transfer delay
μ Nuclear magnetic moment
υ Resonance frequency
ω½ Linewidth
ω Twist
Ω Helical twist
W0 Zero quantum transition
W1 Single quantum transition
W2 Double quantum transition
30
Abbreviations:
1D One-dimensional
2D Two-dimensional
3D Three-dimensional
5-FU 5-fluorouridine
A Adenine
C Cytosine
CAT Chloramphenicol acetyltransferase
CHARMM Chemistry at Harvard macromolecular mechanics
COSY Correlated spectroscopy
CPG Controlled pore glass
CPMG Carr-Purcell-Meiboom-Gill
CrPV Cricket paralysis virus
DANTE Delays alternating with nutation for tailored excitation
DQF-COSY Double quantum filtered COSY
DMT 4,4-dimethoxytrityl
DNA Deoxyribonucleic acid
E.coli Escherichia coli
EFF Empirical force fields
eIF Eukaryotic initiation factor
eq Equivalents
EMCV Encephalomyocarditis virus
FID Free induction decay
G Guanine
GFP Green fluorescent protein
GHz Gigahertz
FMDV Foot-and-Mouth Disease virus
HCV Hepatitis C virus
HOESY Heteronuclear overhauser effect spectroscopy
HPLC High-performance liquid chromatography
HSQC Heteronuclear single quantum coherence
INEPT Insensitive nuclei enhancement by polarisation transfer
IRES Internal ribosome entry site
ITAF IRES trans-acting factor
IUPAC International union of pure and applied chemistry
LUC Luciferase
MD Molecular dynamics
Met Methionine
MHz Megahertz
miRNA microRNA
ml millilitre
MM Molecular mechanics
mM millimolar
31
mm millimetre
MQ Multiple quantum
mRNA Messenger RNA
ms milliseconds
NMR Nuclear magnetic resonance
NTPs Nucleotide triphosphates
nm nanometre
ns nanoseconds
NOE Nuclear overhauser effect
NOESY Nuclear overhauser effect spectroscopy
OD Optical density
ORF Open reading frame
PAGE Polyacrylamide gel electrophoresis
PES Potential energy surface
ppm parts per million
ps picoseconds
PTB Polypyrimidine tract binding protein
RDC Residual dipolar coupling
RF Radio-frequency
rMD Restrained molecular dynamics
RMSD Root Mean Square Deviation
RNA Ribonucleic acid
RNAi RNA interference
RNase Ribonuclease
siRNA Small interfering RNA
ssRNA Single-stranded RNA
TBDMS t-butyldimethylsilyl
TOCSY Total correlation spectroscopy
tRNA Transfer RNA
μg microgram
μl microlitre
μs microseconds
UTR Untranslated region
U Uracil
vdW van der Waals
VT Variable temperature
WATERGATE Water suppression by gradient-tailored excitation
32
Abstract
The structure, kinetics, and interactions of the conserved 16mer and 15mer RNA motifs of
the internal ribosome entry site (IRES) of the Foot-and-Mouth Disease virus (FMDV),
have been investigated by homonuclear and heteronuclear NMR techniques. The 16mer
RNA is endowed with a classic GNRA tetraloop motif, which is essential for IRES
activity and the 15mer RNA motif is a potential tetraloop receptor. We have determined
three high resolution NMR solution structures of the 16mer apo-RNA, the 16mer Mg2+
RNA complex and the 15mer apo-RNA with RMSDs of 0.17Å, 0.16Å and 0.35Å,
respectively. The high precision of these NMR structures was achieved by including a
large number of NMR experimental restraints, derived from NOEs and coupling constants,
and validating them using the MolProbity program. The 16mer RNA structure comprised
of six base pairs with a GUAA tetraloop and the 15mer RNA structure comprised of four
base pairs and a large heptaloop; this is the first heptaloop to be studied by NMR.
Addition of Mg2+
to the 16mer apo-RNA caused selective chemical shift changes to the
stem G177 and loop G178 imino proton resonances, suggesting Mg2+
-induced
conformational change to the GUAA tetraloop. This was supported by a significant
chemical shift change to the selectively 19
F-labelled loop U179 in the 5-FU 16mer RNA.
Furthermore, variable temperature experiments revealed retarded imino proton exchange
for the stem and loop imino protons, demonstrating the enhanced thermodynamic stability
conferred by Mg2+
. This enhancement in stability was confirmed by measuring the imino
proton exchange rates for the 16mer apo-RNA and the 16mer Mg2+
RNA complex.
Analysis of the 16mer apo-RNA and its Mg2+
RNA complex NMR solution structures
revealed that Mg2+
-induced structural changes to the GUAA tetraloop act to stabilise the
loop via stronger base stacking and intramolecular interactions. Fascinatingly, we
discovered that Mg2+
ions provide increased stability required for the formation of a G.A
sheared base pair in the GUAA tetraloop. RNA-RNA interactions between the 16mer and
15mer RNAs and their fluorinated analogues were studied by NMR spectroscopy. Small
changes to chemical shift and linewidth of proton peaks in the non-fluorinated RNA-RNA
complex provided evidence for a weak interaction between the loop of the 16mer RNA
and the stem of the 15mer RNA. 19
F-NMR experiments revealed additional peaks for the 19
F-labelled U179 of the fluorinated 16mer/15mer RNA complex providing further good
evidence of RNA-RNA interaction.
The NMR structures of the conserved RNA motifs and their interactions have yielded
important information in understanding the properties and behaviour of RNA. This will
provide the first stepping stone in understanding the IRES mechanism and its use in
antiviral therapy and biotechnology.
33
Declaration
No portion of the work referred to in this thesis has been submitted in support of an
application for another degree or qualification of this or any other university or other
institute of learning.
Copyright Statement
The author of this thesis (including any appendices and/or schedules to this thesis) owns
certain copyright or related rights in it (the “Copyright”) and s/he has given The
University of Manchester certain rights to use such Copyright, including for
administrative purposes.
Copies of this thesis, either in full or in extracts and whether in hard or electronic copy,
may be made only in accordance with the Copyright, Designs and Patents Act 1988 (as
amended) and regulations issued under it or, where appropriate, in accordance with
licensing agreements which the University has from time to time. This page must form
part of any such copies made.
The ownership of certain Copyright, patents, designs, trademarks and other intellectual
property (the “Intellectual Property”) and any reproductions of copyright works in the
thesis, for example graphs and tables (“Reproductions”), which may be described in this
thesis, may not be owned by the author and may be owned by third parties. Such
Intellectual Property and Reproductions cannot and must not be made available for use
without the prior written permission of the owner(s) of the relevant Intellectual Property
and/or Reproductions.
Further information on the conditions under which disclosure, publication and
commercialisation of this thesis, the Copyright and any Intellectual Property and/or
Reproductions described in it may take place is available in the University IP Policy (see
http://www.campus.manchester.ac.uk/medialibrary/policies/intellectual-property.pdf), in
any relevant Thesis restriction declarations deposited in the University Library, The
University Library’s regulations (see
http://www.manchester.ac.uk/library/aboutus/regulations) and in The University’s policy
on presentation of Theses.
34
Acknowledgements
I would like to thank Allah the Almighty for giving me the opportunity to make a
contribution to scientific research and being able to finish this research project
successfully.
I would like to thank my supervisor Dr. Vasudevan Ramesh for his guidance and support
throughout my project and my colleagues (Dr Tony Cheung, Dr John King, Dr Misbah
Nareen, Misbah Ghafoor, Sadia Mohammed and Nick Chan) for helpful discussions.
For their assistance in use of NMR facilities, I would like to thank Tom Frankiel, Geoff
Kelly and Alain Oregioni of the National Institute of Medical Research (NIMR) in Mill
Hill, UK, Moreno Lelli of the Centre de RMN à Très Hauts Champs (CRMN) in Lyon,
France and Roger Speak at the School of Chemistry, University of Manchester.
Finally, I would like to express gratitude to my family for their continued support,
especially from my mother, Rehana Rasul, and my wife, Usma Rasul.
35
Chapter 1: Introduction
The introduction chapter consists of eight different sections. The first section highlights
the importance of the project and establishes the area of research. Sections 1.2 through to
1.6 provide relevant background, and finally the previous work and the aims of the project
are summarised in sections 1.7 and 1.8, respectively.
1.1 Significance of the project
1.1.1 The role of IRES in picornavirus translation
Protein synthesis involves the process of translation, in which eukaryotic messenger RNA
(mRNA) is decoded to produce proteins. Initiation of translation in mRNAs commences
with the 5ʹ-end cap-dependent recruitment of a 40S ribosomal unit, with the aid of specific
eukaryotic initiation factors (eIFs).1 In contrast, picornaviruses adopt a different method of
recruiting the ribosomal unit.
The picornaviruses are a family of animal viruses that contain positive-sense, single-
stranded, RNA genomes. They are able to take control of the host cell translation
machinery in a way that allows efficient translation of the viral coding region and
inhibition of host cell protein synthesis. An important feature of the picornaviral RNA
genome is the unusually long 5ʹ-untranslated region (5ʹ-UTR), preceding the viral coding
region. The 5ʹ-UTR exhibits a high degree of secondary structure elements, one of which
is a specialised regulatory element known as the internal ribosome entry site (IRES).2 The
IRES has attracted much attention as it is involved in a novel mechanism for the initiation
of protein synthesis, whereby translation is cap-independent.3 The IRES element is a
distinctive feature of the picornavirus genome, whose secondary structures are
phylogenetically conserved. However, different classes of the IRES element show no
similarity in primary sequence or secondary structure.4
This raises the question of how the
IRES elements can direct initiation of translation with dissimilar sequence and structure.
The most probable answer is that the tertiary structure of the IRES RNA plays a critical
36
role in the initiation of translation in picornaviruses. Both structural and functional studies
have shown a close relationship between IRES RNA structure and biological activity.5-6
In
addition, a second factor, which is also essential for IRES activity, is the RNA-binding
proteins such as eukaryotic initiation factors (eIFs) and IRES trans-acting factors
(ITAFs).7 Understanding the relationship between these two factors and IRES function
would improve our knowledge of cap-independent translation in viral RNAs.
The Picornaviridae family encompass many different species including the Foot-and-
Mouth disease virus (FMDV) and the Encephalomyocarditis virus (EMCV). The FMDV
IRES consists of multiple domains (domains 1-5); shown in Figure 1.2.4.8 Domain 3
contains a highly conserved hammerhead structure that includes a 4-way junction and 3
short stem-loop structures (Figure 1.2.5). At the apex of one of the short stem-loops is a
GNRA motif that has been found to be essential for IRES activity. The GNRA motif (N
represents any base and R represents a purine) is a tetraloop spanning residues
G178UAA181 in the FMDV IRES. Fascinatingly, mutation at any of the four bases in the
GUAA tetraloop, especially at the 4th
position, results in a considerable reduction in IRES
activity.9 It has been suggested that the GNRA motif plays a critical role in structural
organisation in the apical region of domain 3, possibly involving RNA-RNA interactions
to GNRA binding sites in domain 3.10
However, the exact role played by the GNRA motif
is still not well understood. Therefore, knowledge of the structure-function relationship of
the conserved GNRA motif is extremely important in determining the molecular basis of
its critical role in IRES function.
Understanding IRES biology is essential for providing insight into translational initiation
in viral RNAs. However, the basic mechanisms through which the IRES recruits the
ribosome have only recently come to light. The IRES mechanism in the FMDV is still
relatively unexplored and not well understood. A systematic study of the structure,
kinetics and interactions of conserved RNA motifs in the FMDV IRES will help to
decipher the mechanism of its function. Elucidating this mechanism should enable
scientists to develop new antiviral approaches and strategies for gene therapy, which has
been highlighted in the next two sub-sections.
37
1.1.2 The IRES and antiviral therapy
The IRES is essential in the FMDV life cycle and remains highly conserved within species.
Therefore, inhibition of the process of FMDV translation represents an attractive target in
the development of novel antiviral drugs. This sub-section will highlight the therapeutic
approaches being developed to target FMDV translation for the development of novel
antiviral therapy.
A number of different approaches have been investigated to target viral translation.
Strategies under investigation include targeting the cis-acting IRES and the trans-acting
host cell factors, which are essential for viral translation. The most common techniques for
targeting the IRES are oligonucleotide-based therapeutics such as antisense
oligonucleotides, RNA interference (RNAi), nucleic acid aptamers and ribozymes.
Additionally, small molecule inhibitors that target specific sites in the IRES are also
becoming a popular choice for therapy. These approaches intend to block translation
initiation in viral RNAs and can ultimately provide a cure for diseases such as Foot-And-
Mouth disease.
Antisense oligonucleotides are short nucleic acid molecules whose sequence is
complementary to the target RNA molecule. They can bind to the target RNA sequence, in
this case the IRES, and inhibit translation either through steric interference of the
translation machinery, changing the conformation of the RNA structure or cleavage of
RNA by RNase H. Antisense oligonucleotides have been directed against the FMDV
IRES resulting in significant reduction of FMDV translation initiation.11
RNAi controls
the post-transcriptional regulation of gene expression using microRNA (miRNA) and
small interfering RNA (siRNA). These RNA molecules can bind to complementary
sequences of the target RNA, which leads to the silencing of target gene expression. For
example, binding to mRNA can alter the level of protein expression. RNAi has been
investigated as a potential treatment against a variety of diseases including Hepatitis C.
Studies have used RNAi to target a conserved region of the Hepatitis C Virus (HCV)
IRES to inhibit translation, significantly reducing HCV infection in cell culture.12
Nucleic
38
acid aptamers are single stranded DNA or RNA molecules that can adopt complex three-
dimensional structures, which bind to a specific target molecule. An advantage of using
aptamers is that they can bind to highly structured targets such as the IRES RNA structure.
For example, RNA aptamers have been targeted against the HCV IRES, whereby two
aptamers were isolated that bound successfully to the HCV IRES, leading to inhibition of
IRES-dependent translation.13
Ribozymes, ribonucleic acid enzymes, are catalytic RNA
molecules, which are able to cleave their own phosphodiester bonds (self-cleaving) or of
other RNA molecules. There are many different types of ribozymes, including the
hammerhead ribozymes, group I/II introns and RNase P. The use of ribozymes to target
against the IRES in picornaviruses has been investigated as a therapeutic option. The
RNase P ribozyme has been shown to recognise the FMDV IRES element, leading to
strong inhibition of translation in cell culture.14
In addition to oligonucleotide-based strategies, small molecule inhibitors have also been
used to target the IRES in picornaviruses. Quinacrine is a well known compound with a
variety of different medical applications. It is a nucleic acid intercalator capable of
inhibiting replication, transcription and translation. Interestingly, it has also been shown to
inhibit cell-free IRES-mediated translation in EMCV, HCV and poliovirus.15
A new class
of benzimidazole inhibitors has also been found to show high affinity for domain IIa of the
HCV IRES, inhibiting HCV translation.16
Furthermore, NMR investigation revealed the
mechanism of action; it was determined that inhibitor binding induced a major
conformational change in domain IIa of HCV IRES.17
The results from these studies are very promising and provide an opportunity to develop
antiviral tools in the treatment of viral infections such as the Foot-And-Mouth disease.
However, these approaches will require a better understanding of the mechanism of
translation initiation in the FMDV and the role of cellular and viral trans-acting factors in
modulating IRES activity. This justifies the investigation of the FMDV IRES, which may
eventually have far-reaching implications for medicinal virology.
39
1.1.3 The IRES in biotechnology
Bicistronic vectors allow the efficient expression of two distinct coding sequences and are
important tools for molecular biology and gene therapy. One of the most promising
strategies to co-express multiple genes is to incorporate an IRES element into a gene
vector design.18
In IRES bicistronic expression vectors, two cistrons are linked together by
an IRES allowing co-translational expression of both genes. The advantage is that only
one promoter is needed for the expression of two genes. In biotechnology applications, the
expression of two proteins is often required, one being a marker or reporter gene such as
the green fluorescent protein (GFP), and the other being the gene of interest. This allows
the tracking and/or selection of transduced cells based on the detection of the selectable
marker protein. Recently, novel types of IRES-based retroviral vectors are being used for
expression and functional studies.19
The bicistronic vector design has been exploited to measure IRES activity by using
bicistronic reporter assays. Two reporter genes are placed either side of the IRES, which
code for two different proteins such as chloramphenicol acetyltransferase (CAT) and
luciferase (LUC). The first gene coding for CAT is translated by a cap-dependent manner
while translation initiation for the second gene coding for LUC is directed by the IRES,
which is cap-independent (Figure 1.1.1). The advantage of this setup is that the IRES can
independently drive translation of the downstream cistron. Subsequently, IRES activity is
measured by quantifying the expression of LUC, relative to the expression of CAT.
Bicistronic reporter assays have been invaluable to explore the link between IRES
structure and translation initiation in the FMDV. Several mutational studies have
investigated the sensitivity of the IRES to nucleotide substitutions. The most revealing
study showed that two highly conserved RNA motifs (GUAA and RAAA) in domain 3 of
the FMDV IRES, are essential for IRES function.9 This has prompted the recent escalation
of interest in the IRES element, and for the first time, includes the NMR investigation of
conserved RNA motifs in the FMDV IRES.
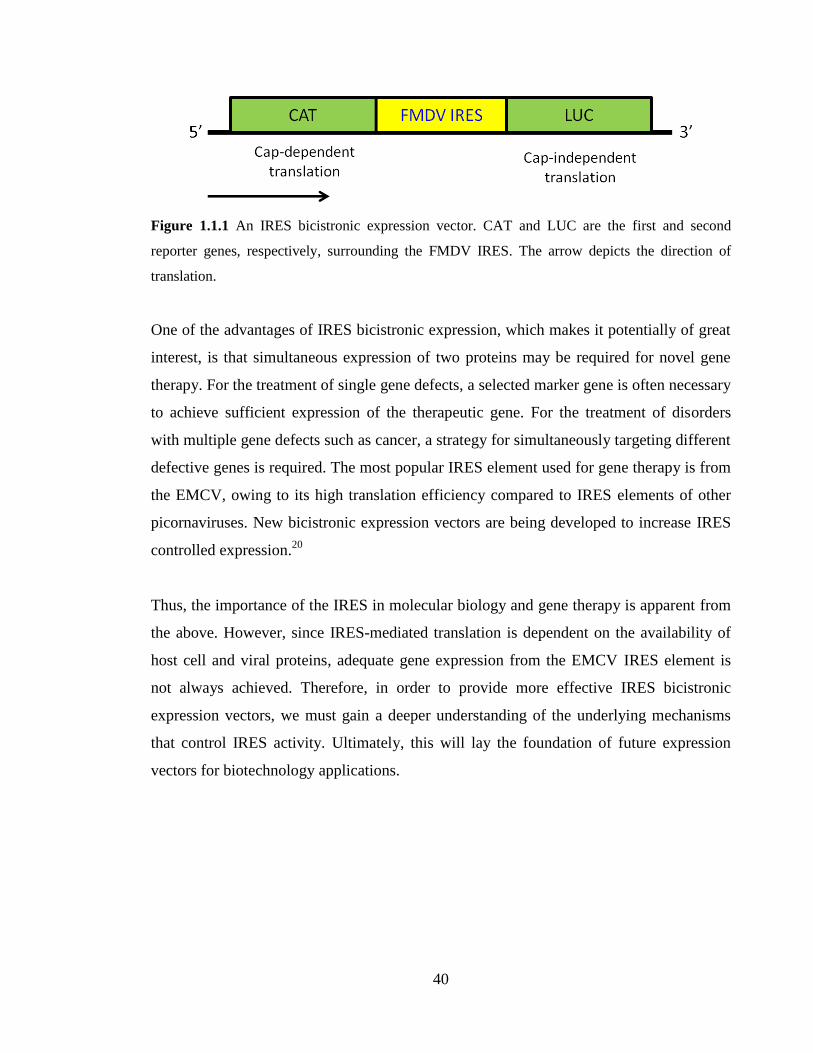
40
Figure 1.1.1 An IRES bicistronic expression vector. CAT and LUC are the first and second
reporter genes, respectively, surrounding the FMDV IRES. The arrow depicts the direction of
translation.
One of the advantages of IRES bicistronic expression, which makes it potentially of great
interest, is that simultaneous expression of two proteins may be required for novel gene
therapy. For the treatment of single gene defects, a selected marker gene is often necessary
to achieve sufficient expression of the therapeutic gene. For the treatment of disorders
with multiple gene defects such as cancer, a strategy for simultaneously targeting different
defective genes is required. The most popular IRES element used for gene therapy is from
the EMCV, owing to its high translation efficiency compared to IRES elements of other
picornaviruses. New bicistronic expression vectors are being developed to increase IRES
controlled expression.20
Thus, the importance of the IRES in molecular biology and gene therapy is apparent from
the above. However, since IRES-mediated translation is dependent on the availability of
host cell and viral proteins, adequate gene expression from the EMCV IRES element is
not always achieved. Therefore, in order to provide more effective IRES bicistronic
expression vectors, we must gain a deeper understanding of the underlying mechanisms
that control IRES activity. Ultimately, this will lay the foundation of future expression
vectors for biotechnology applications.
41
1.1.4 RNA structural biology
Currently, there has been great emphasis on studying the IRES. This is on a par with the
recent explosion in RNA research as RNA molecules have been shown to be involved in
wide variety of biological processes. Not only will scientists have a better comprehension
of the complexities of RNA structure, kinetics and interactions, but will also be able to
apply this knowledge into key technologies, eg. antiviral therapeutics and construction of
new expression vectors, as previously described.
However, how does one approach the large task of studying RNA in the form of the IRES.
Since the structure of biological macromolecules such as proteins and nucleic acids is
important for their function, structural biologists have endeavoured to unravel the three
dimensional structures of RNA in the hope that it will provide new information about their
function. X-ray crystallography and nuclear magnetic resonance (NMR) spectroscopy are
two techniques that have been extensively used for the structure determination of proteins
and nucleic acid molecules.
The main advantage of using X-ray methods was that large RNA molecules could be
studied, eg. transfer RNA (tRNA). Recently, the 2009 Nobel Prize in Chemistry was given
for studies of the structure and function of the ribosome, in which the structure of a whole
ribosome was determined. Clearly, high-resolution X-ray structures of RNA have helped
structural biologists advance in the area of RNA biology. In contrast, NMR spectroscopy
methods are still limited to smaller RNA structures. However, it does provide several,
unique, advantages over X-ray methods, which have had a profound effect on our
understanding of RNA. Firstly, non-crystalline samples are used, which means that they
are studied in solution; commonly known as solution-state NMR. The advantage is that it
allows biomolecules to be studied under physiological conditions found in the cell.
Additionally, solution conditions can be varied such as temperature, pH and ionic strength,
which provide the possibility of studying biomolecules in more depth. Secondly, NMR
spectroscopy can be applied for molecules where single crystals cannot be produced. It
has generally been more difficult to obtain well-ordered RNA crystals for high-resolution
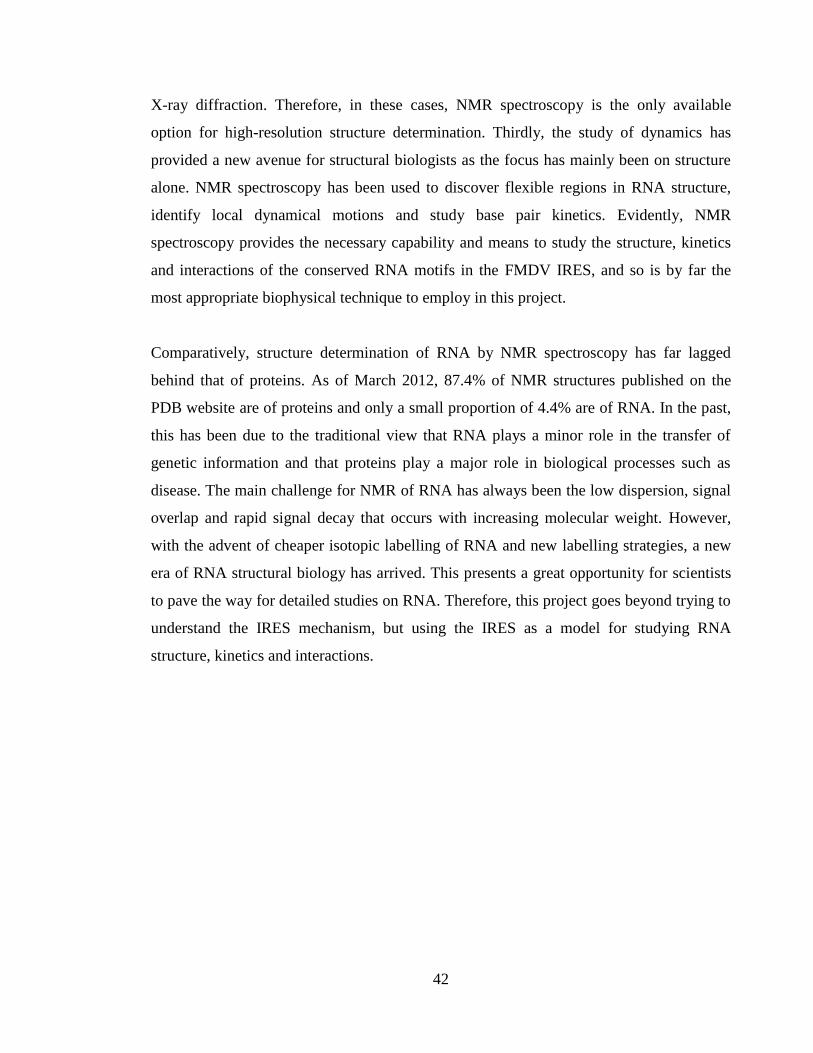
42
X-ray diffraction. Therefore, in these cases, NMR spectroscopy is the only available
option for high-resolution structure determination. Thirdly, the study of dynamics has
provided a new avenue for structural biologists as the focus has mainly been on structure
alone. NMR spectroscopy has been used to discover flexible regions in RNA structure,
identify local dynamical motions and study base pair kinetics. Evidently, NMR
spectroscopy provides the necessary capability and means to study the structure, kinetics
and interactions of the conserved RNA motifs in the FMDV IRES, and so is by far the
most appropriate biophysical technique to employ in this project.
Comparatively, structure determination of RNA by NMR spectroscopy has far lagged
behind that of proteins. As of March 2012, 87.4% of NMR structures published on the
PDB website are of proteins and only a small proportion of 4.4% are of RNA. In the past,
this has been due to the traditional view that RNA plays a minor role in the transfer of
genetic information and that proteins play a major role in biological processes such as
disease. The main challenge for NMR of RNA has always been the low dispersion, signal
overlap and rapid signal decay that occurs with increasing molecular weight. However,
with the advent of cheaper isotopic labelling of RNA and new labelling strategies, a new
era of RNA structural biology has arrived. This presents a great opportunity for scientists
to pave the way for detailed studies on RNA. Therefore, this project goes beyond trying to
understand the IRES mechanism, but using the IRES as a model for studying RNA
structure, kinetics and interactions.
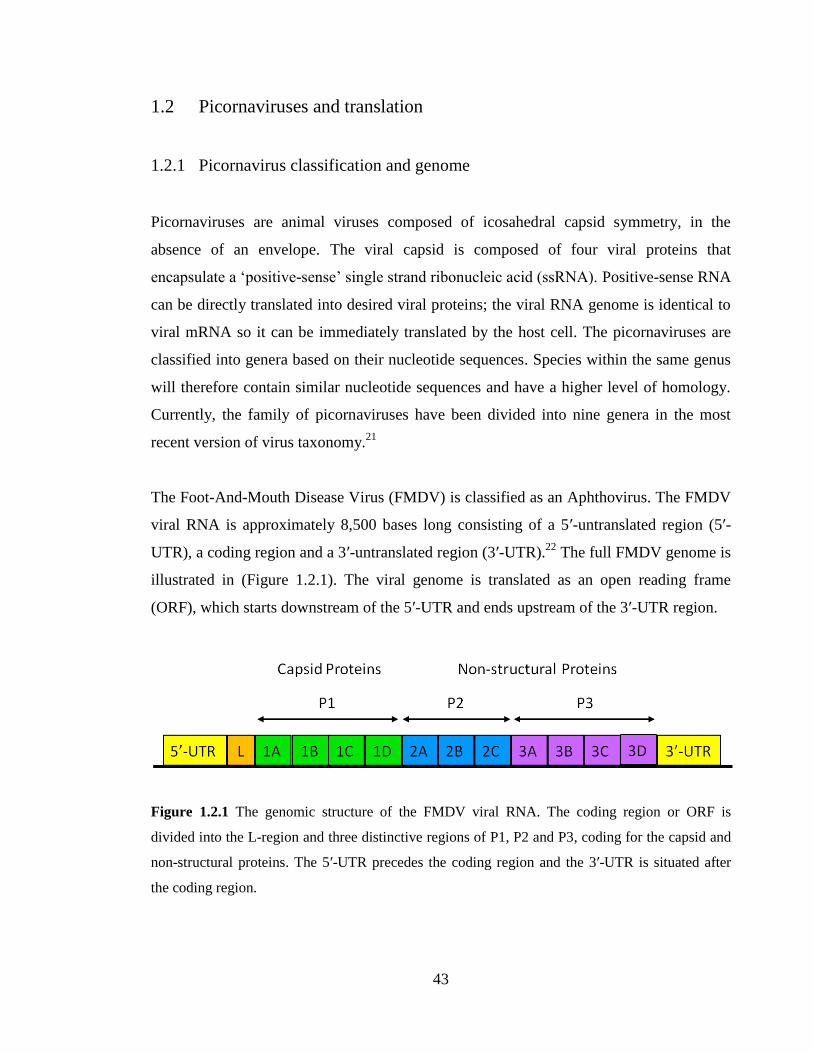
43
1.2 Picornaviruses and translation
1.2.1 Picornavirus classification and genome
Picornaviruses are animal viruses composed of icosahedral capsid symmetry, in the
absence of an envelope. The viral capsid is composed of four viral proteins that
encapsulate a ‘positive-sense’ single strand ribonucleic acid (ssRNA). Positive-sense RNA
can be directly translated into desired viral proteins; the viral RNA genome is identical to
viral mRNA so it can be immediately translated by the host cell. The picornaviruses are
classified into genera based on their nucleotide sequences. Species within the same genus
will therefore contain similar nucleotide sequences and have a higher level of homology.
Currently, the family of picornaviruses have been divided into nine genera in the most
recent version of virus taxonomy.21
The Foot-And-Mouth Disease Virus (FMDV) is classified as an Aphthovirus. The FMDV
viral RNA is approximately 8,500 bases long consisting of a 5ʹ-untranslated region (5ʹ-
UTR), a coding region and a 3ʹ-untranslated region (3ʹ-UTR).22
The full FMDV genome is
illustrated in (Figure 1.2.1). The viral genome is translated as an open reading frame
(ORF), which starts downstream of the 5ʹ-UTR and ends upstream of the 3ʹ-UTR region.
Figure 1.2.1 The genomic structure of the FMDV viral RNA. The coding region or ORF is
divided into the L-region and three distinctive regions of P1, P2 and P3, coding for the capsid and
non-structural proteins. The 5ʹ-UTR precedes the coding region and the 3ʹ-UTR is situated after
the coding region.
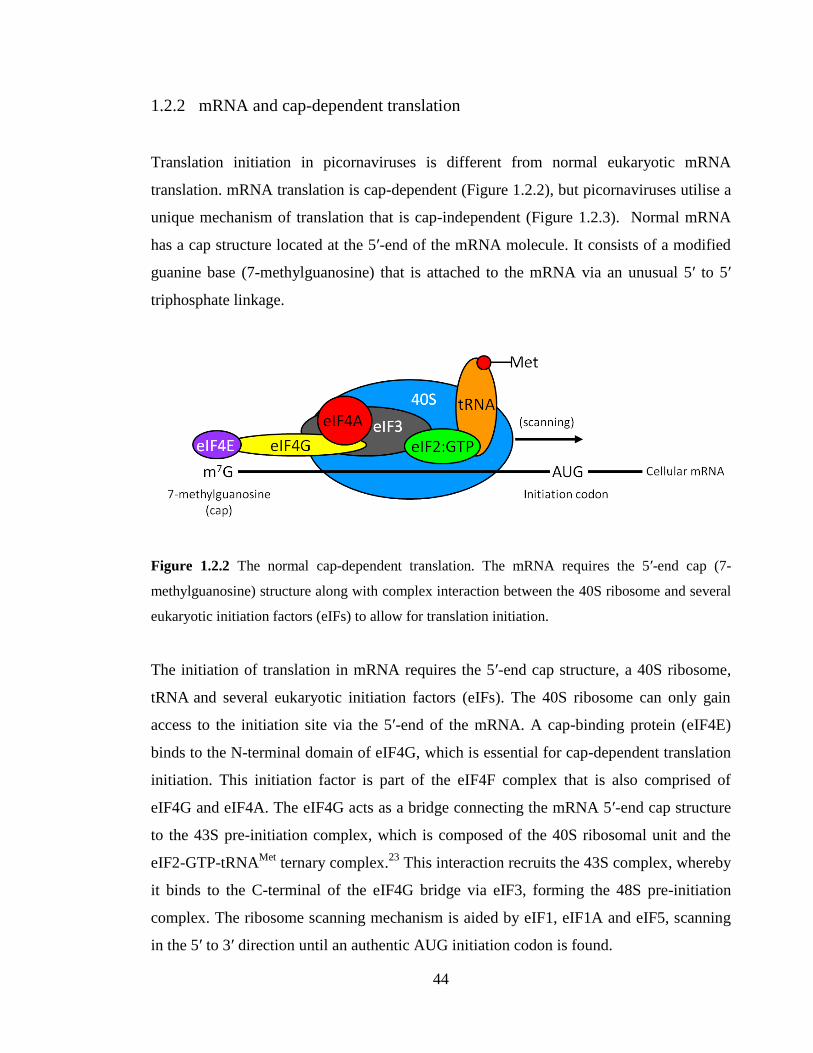
44
1.2.2 mRNA and cap-dependent translation
Translation initiation in picornaviruses is different from normal eukaryotic mRNA
translation. mRNA translation is cap-dependent (Figure 1.2.2), but picornaviruses utilise a
unique mechanism of translation that is cap-independent (Figure 1.2.3). Normal mRNA
has a cap structure located at the 5ʹ-end of the mRNA molecule. It consists of a modified
guanine base (7-methylguanosine) that is attached to the mRNA via an unusual 5ʹ to 5ʹ
triphosphate linkage.
Figure 1.2.2 The normal cap-dependent translation. The mRNA requires the 5ʹ-end cap (7-
methylguanosine) structure along with complex interaction between the 40S ribosome and several
eukaryotic initiation factors (eIFs) to allow for translation initiation.
The initiation of translation in mRNA requires the 5ʹ-end cap structure, a 40S ribosome,
tRNA and several eukaryotic initiation factors (eIFs). The 40S ribosome can only gain
access to the initiation site via the 5ʹ-end of the mRNA. A cap-binding protein (eIF4E)
binds to the N-terminal domain of eIF4G, which is essential for cap-dependent translation
initiation. This initiation factor is part of the eIF4F complex that is also comprised of
eIF4G and eIF4A. The eIF4G acts as a bridge connecting the mRNA 5ʹ-end cap structure
to the 43S pre-initiation complex, which is composed of the 40S ribosomal unit and the
eIF2-GTP-tRNAMet
ternary complex.23
This interaction recruits the 43S complex, whereby
it binds to the C-terminal of the eIF4G bridge via eIF3, forming the 48S pre-initiation
complex. The ribosome scanning mechanism is aided by eIF1, eIF1A and eIF5, scanning
in the 5ʹ to 3ʹ direction until an authentic AUG initiation codon is found.
45
1.2.3 FMDV and cap-independent translation
Picornaviruses have two main characteristics, which prohibit their use of the conventional
cap-dependent mechanism for translation initiation. Firstly, picornaviral RNA does not
have a cap structure at its 5ʹ-end, unlike most mRNAs, which would prevent the cap-
binding complex from assembling. Secondly, the 5ʹ-UTR is very long and has several non-
authentic start codons, making canonical translation initiation very unlikely. Generally,
cap-independent translation of mRNA can be very inefficient, however, this is not the case
in picornaviral RNA translation. In picornaviral translation, initiation occurs by a cap-
independent mechanism that does not require the 5ʹ-end cap structure and whereby the
40S ribosome can recognise the authentic initiation codon.
Figure 1.2.3 The IRES mediated cap-independent translation. Translation initiation does not
require the 5ʹ-end cap structure and eIF4E in picornaviruses. Instead, the IRES provides an
entry/binding site for the 40S ribosome, so the ribosomal scanning can start.
Cap-dependent mRNA is inhibited in infected cells due to cleavage of the N-terminal of
eIF4G by viral L-proteases. This results in the separation of the cap-binding function
associated with N-terminus of eIF4G. Cleavage leaves one-third of the N-terminal
fragment and two-thirds of the C-terminal fragment.24
Initiation of translation in
picornaviruses only requires the C-terminal of eIF4G, which binds to the highly structured
picornaviral IRES and interacts with 40S ribosomal subunit bound eIF4A and eIF3.25
In
addition, the FMDV IRES also requires two IRES trans-acting factors known as
polypyrimidine tract binding protein (PTB) and ITAF45, for ribosomal binding.26
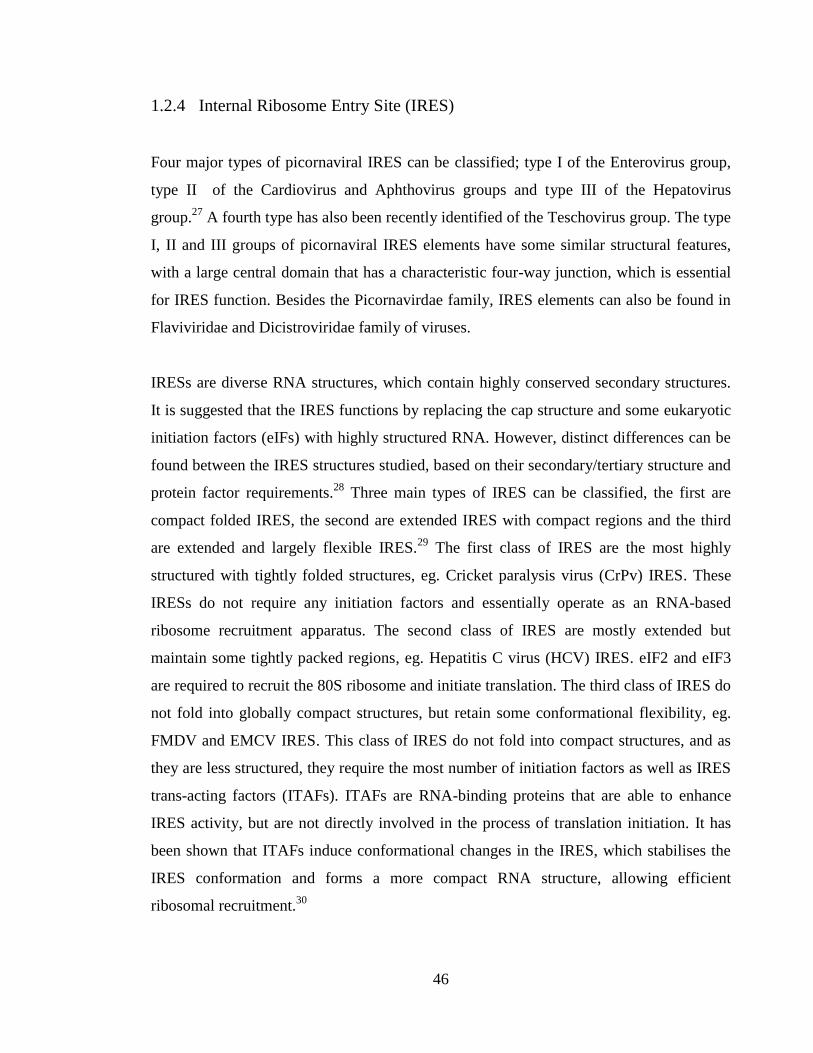
46
1.2.4 Internal Ribosome Entry Site (IRES)
Four major types of picornaviral IRES can be classified; type I of the Enterovirus group,
type II of the Cardiovirus and Aphthovirus groups and type III of the Hepatovirus
group.27
A fourth type has also been recently identified of the Teschovirus group. The type
I, II and III groups of picornaviral IRES elements have some similar structural features,
with a large central domain that has a characteristic four-way junction, which is essential
for IRES function. Besides the Picornavirdae family, IRES elements can also be found in
Flaviviridae and Dicistroviridae family of viruses.
IRESs are diverse RNA structures, which contain highly conserved secondary structures.
It is suggested that the IRES functions by replacing the cap structure and some eukaryotic
initiation factors (eIFs) with highly structured RNA. However, distinct differences can be
found between the IRES structures studied, based on their secondary/tertiary structure and
protein factor requirements.28
Three main types of IRES can be classified, the first are
compact folded IRES, the second are extended IRES with compact regions and the third
are extended and largely flexible IRES.29
The first class of IRES are the most highly
structured with tightly folded structures, eg. Cricket paralysis virus (CrPv) IRES. These
IRESs do not require any initiation factors and essentially operate as an RNA-based
ribosome recruitment apparatus. The second class of IRES are mostly extended but
maintain some tightly packed regions, eg. Hepatitis C virus (HCV) IRES. eIF2 and eIF3
are required to recruit the 80S ribosome and initiate translation. The third class of IRES do
not fold into globally compact structures, but retain some conformational flexibility, eg.
FMDV and EMCV IRES. This class of IRES do not fold into compact structures, and as
they are less structured, they require the most number of initiation factors as well as IRES
trans-acting factors (ITAFs). ITAFs are RNA-binding proteins that are able to enhance
IRES activity, but are not directly involved in the process of translation initiation. It has
been shown that ITAFs induce conformational changes in the IRES, which stabilises the
IRES conformation and forms a more compact RNA structure, allowing efficient
ribosomal recruitment.30
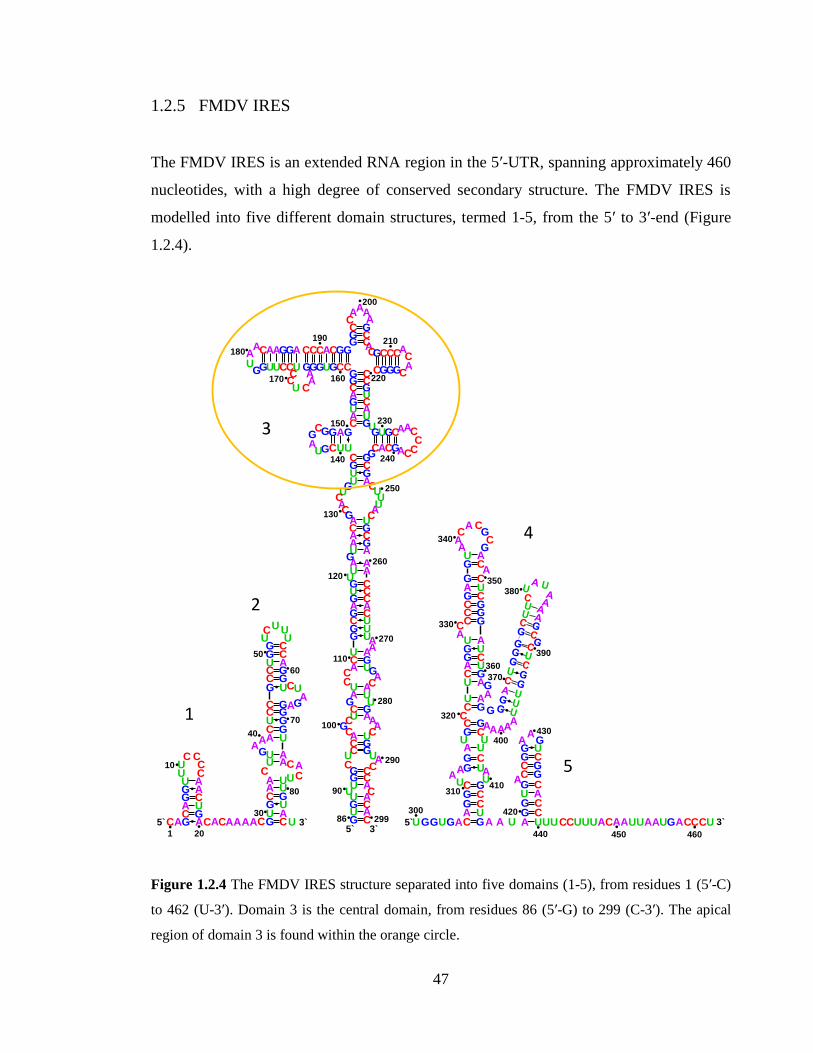
47
1.2.5 FMDV IRES
The FMDV IRES is an extended RNA region in the 5ʹ-UTR, spanning approximately 460
nucleotides, with a high degree of conserved secondary structure. The FMDV IRES is
modelled into five different domain structures, termed 1-5, from the 5ʹ to 3ʹ-end (Figure
1.2.4).
Figure 1.2.4 The FMDV IRES structure separated into five domains (1-5), from residues 1 (5ʹ-C)
to 462 (U-3ʹ). Domain 3 is the central domain, from residues 86 (5ʹ-G) to 299 (C-3ʹ). The apical
region of domain 3 is found within the orange circle.
440 450 460
U
C
AU
G
A
G
CA
U
A
U
G
C
G
C
A
U
U
U
U
C
CC
CC
C
C
CGG G
GG
GG
GAA
A
A
AA AA
A
CC
C
C
C
CC
C
C
C
G
GG
G
G
G
C
G
CA
G
C
C160
180
170
190
AUUAGC
C
GCA
200
210
220
C
C
G
A
U
G
CA
C
G
C
A
GC GCGGUAU CG
AC
CU
A
U
G
C
GG
G
C
UAG
230
240
150
140
GU
CA
UCACG
UUU
AC
GC
AA
AU
AAG
AU
CC
UG
CGAA
U
UC
CG
UGUG
AUGCUA
AA
AUUA
CC
GA
C
G U
AUGC
G
AG
C
UC
CGCGAU
CC
GAA
C
UC
UAC
A
UC
U
AG
CG
U C
5` 3`
130
120
110
100
90
250
260
270
280
290
86 299
CA
G
AC
C
AC
UG
G
C
UC
C
G
GA
GC
350
A
GC
G
A
C
UU
G
AG
UAGC
CA
G
U
AC
A
U
GA
360
340
330
GAGC
CAAAA
CG
UAUU
CGUG
GC
AA A
UUCGCGUAGCAGUGGU A A U UA UU
CGCG
U ACGGC
A
GCCGUG
AA
G
CCUUUA AC AUUAAUGACCCU
320
310
300
370
380
390
400
410
420
430A
C
U
CC
GG
U UUU
U AGCGCUG
GC
CU
AA
GGCGUGC
U AU A
AA
G
A UA U
CCAUC
GCUG
U ACG UCAAAACCAAG
GCA U
CGAG
U AUUC C
CC
A1
10
20
30
40
50
60
70
80
5` 3` 5` 3`
1
2
3
4
5
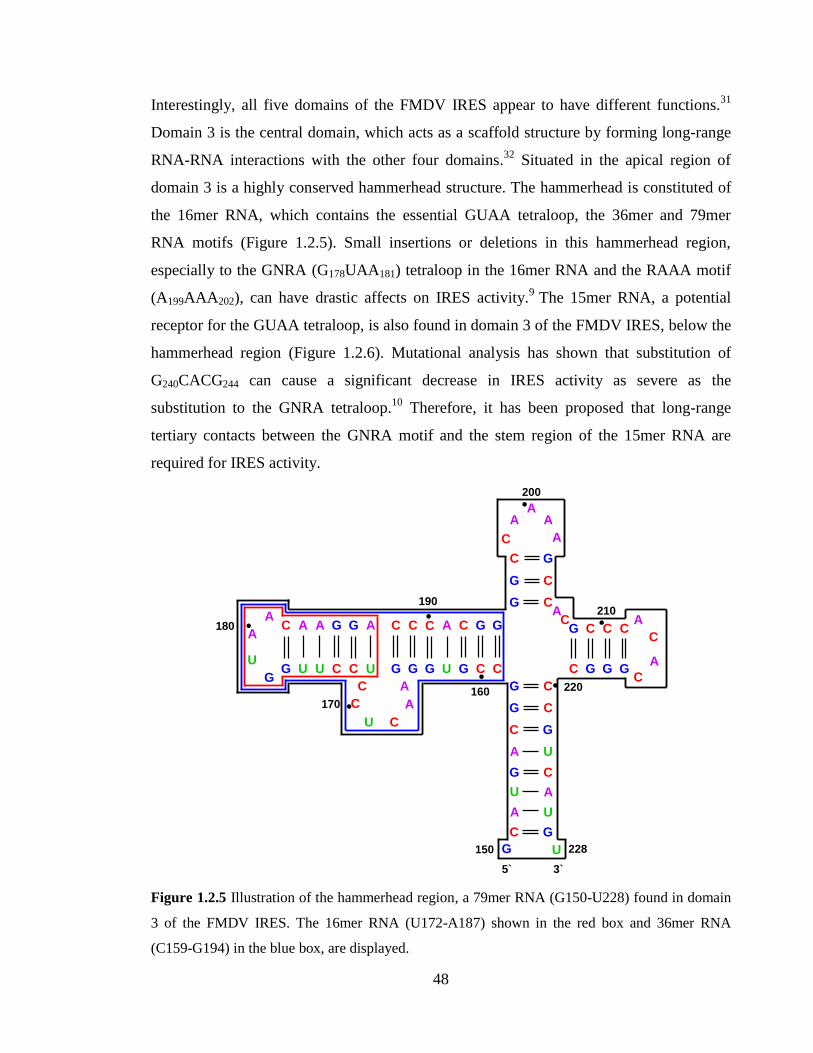
48
Interestingly, all five domains of the FMDV IRES appear to have different functions.31
Domain 3 is the central domain, which acts as a scaffold structure by forming long-range
RNA-RNA interactions with the other four domains.32
Situated in the apical region of
domain 3 is a highly conserved hammerhead structure. The hammerhead is constituted of
the 16mer RNA, which contains the essential GUAA tetraloop, the 36mer and 79mer
RNA motifs (Figure 1.2.5). Small insertions or deletions in this hammerhead region,
especially to the GNRA (G178UAA181) tetraloop in the 16mer RNA and the RAAA motif
(A199AAA202), can have drastic affects on IRES activity.9
The 15mer RNA, a potential
receptor for the GUAA tetraloop, is also found in domain 3 of the FMDV IRES, below the
hammerhead region (Figure 1.2.6). Mutational analysis has shown that substitution of
G240CACG244 can cause a significant decrease in IRES activity as severe as the
substitution to the GNRA tetraloop.10
Therefore, it has been proposed that long-range
tertiary contacts between the GNRA motif and the stem region of the 15mer RNA are
required for IRES activity.
Figure 1.2.5 Illustration of the hammerhead region, a 79mer RNA (G150-U228) found in domain
3 of the FMDV IRES. The 16mer RNA (U172-A187) shown in the red box and 36mer RNA
(C159-G194) in the blue box, are displayed.
A
U
G
A
G
C A
U
A
U
G
C
G
C
A
U
U
U
U
C
C
C
C C
C
C
CG G G
G G
G
G
G
A
A
A
A
A
A AA
A
C
C
C
C
C
C
C
C
C
C
G
G
G
G
G
G
C
G
C
A
G
C
C
5` 3`
150
160
180
170
190
AU
UA
GC
UG
C
GC
A
200
210
220
228
49
Figure 1.2.6 Illustration of the apical region of domain 3 in the FMDV IRES, located below the
hammerhead region. The 15mer RNA (G229-C243) is indicated by the area inside the red box.
Domains 2, 4 and 5 are involved in the interaction with RNA binding proteins, which
include the eukaryotic initiation factors (eIFs) and IRES trans-acting factors (ITAFs).
Domain 2 is a stem-loop structure, which consists of four helical sections separated by
three bulges. The loop contains five nucleotides, which forms a binding site for the ITAF
called polypyrimidine tract-binding protein (PTB). Two stem-loop structures are found in
domain 4, which are essential for the interaction between the FMDV IRES and eIF4G.33
Particularly, mutational analysis has shown that specific nucleotides are vital for this
RNA-protein interaction; nucleotides A312A313 in the distal part of domain 4 and two
highly conserved dinucleotides, A329C330 and G360A361. This RNA-protein interaction is
another important area for studying cap-independent translation.
Domain 5 is a stem-loop structure, which consists of two helices separated by one
conserved nucleotide (A424) and a tri-loop. The nucleotides in the loop and the bulged
A424 nucleotide are both critical for binding of eIF4B to the FMDV IRES.33
Domain 5 is
linked to a single stranded region approximately 25 nucleotides in length, known as the
polypyrimidine tract, which leads to the authentic AUG codon. There are two AUG
codons found in the ORF, of which both can function as authentic codons depending on
the genera of virus. In FMDV, initiation of translation can occur at either the first AUG
(termed Lab) or at the downstream AUG codon (termed Lb).11
AU
UA
GC
C
C
G
A
U
G
CA
C
G
C
AU
GC G
CG
GU
AU
AC
C
U
A
U
G
C
GG
G
C
U
A
G
230
240
150
140
5` 3`
248135
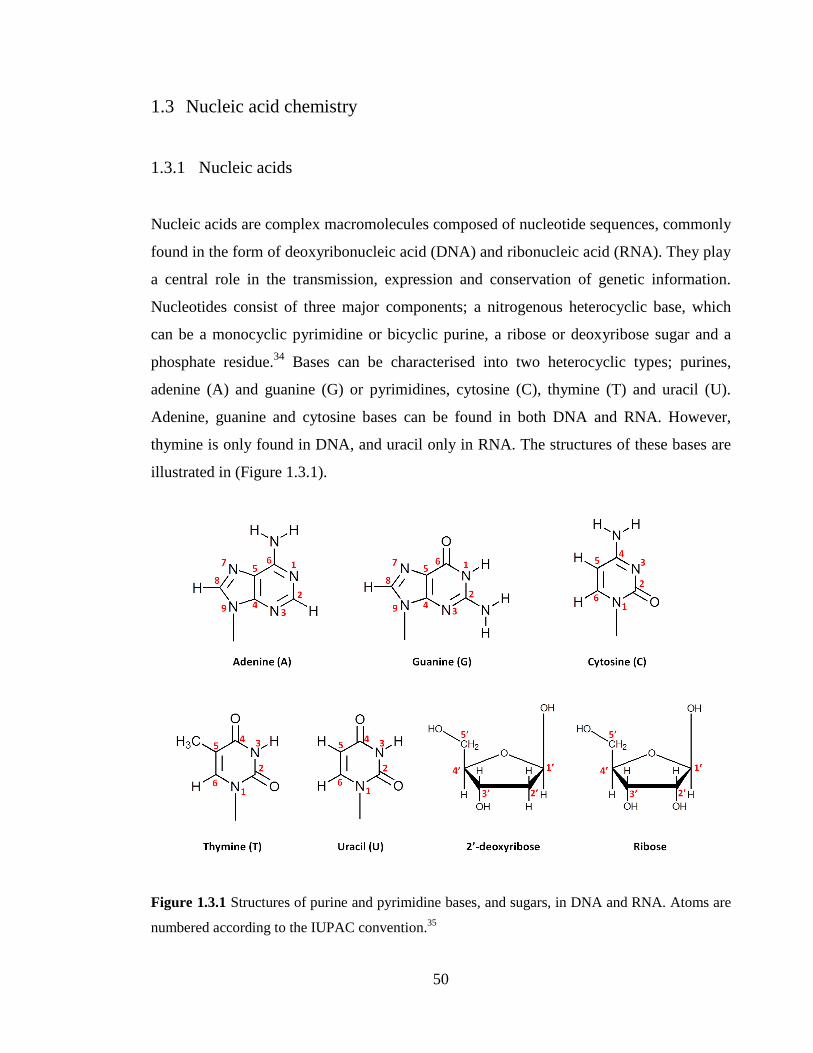
50
1.3 Nucleic acid chemistry
1.3.1 Nucleic acids
Nucleic acids are complex macromolecules composed of nucleotide sequences, commonly
found in the form of deoxyribonucleic acid (DNA) and ribonucleic acid (RNA). They play
a central role in the transmission, expression and conservation of genetic information.
Nucleotides consist of three major components; a nitrogenous heterocyclic base, which
can be a monocyclic pyrimidine or bicyclic purine, a ribose or deoxyribose sugar and a
phosphate residue.34
Bases can be characterised into two heterocyclic types; purines,
adenine (A) and guanine (G) or pyrimidines, cytosine (C), thymine (T) and uracil (U).
Adenine, guanine and cytosine bases can be found in both DNA and RNA. However,
thymine is only found in DNA, and uracil only in RNA. The structures of these bases are
illustrated in (Figure 1.3.1).
Figure 1.3.1 Structures of purine and pyrimidine bases, and sugars, in DNA and RNA. Atoms are
numbered according to the IUPAC convention.35
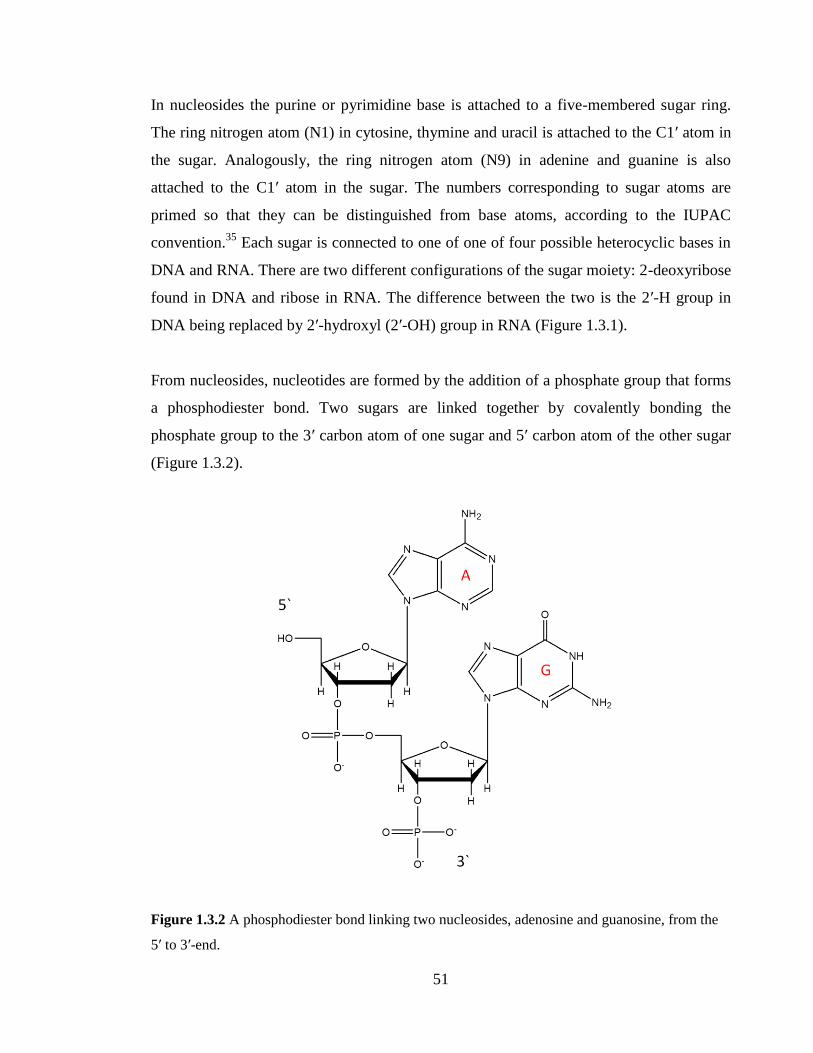
51
In nucleosides the purine or pyrimidine base is attached to a five-membered sugar ring.
The ring nitrogen atom (N1) in cytosine, thymine and uracil is attached to the C1ʹ atom in
the sugar. Analogously, the ring nitrogen atom (N9) in adenine and guanine is also
attached to the C1ʹ atom in the sugar. The numbers corresponding to sugar atoms are
primed so that they can be distinguished from base atoms, according to the IUPAC
convention.35
Each sugar is connected to one of one of four possible heterocyclic bases in
DNA and RNA. There are two different configurations of the sugar moiety: 2-deoxyribose
found in DNA and ribose in RNA. The difference between the two is the 2ʹ-H group in
DNA being replaced by 2ʹ-hydroxyl (2ʹ-OH) group in RNA (Figure 1.3.1).
From nucleosides, nucleotides are formed by the addition of a phosphate group that forms
a phosphodiester bond. Two sugars are linked together by covalently bonding the
phosphate group to the 3ʹ carbon atom of one sugar and 5ʹ carbon atom of the other sugar
(Figure 1.3.2).
Figure 1.3.2 A phosphodiester bond linking two nucleosides, adenosine and guanosine, from the
5ʹ to 3ʹ-end.
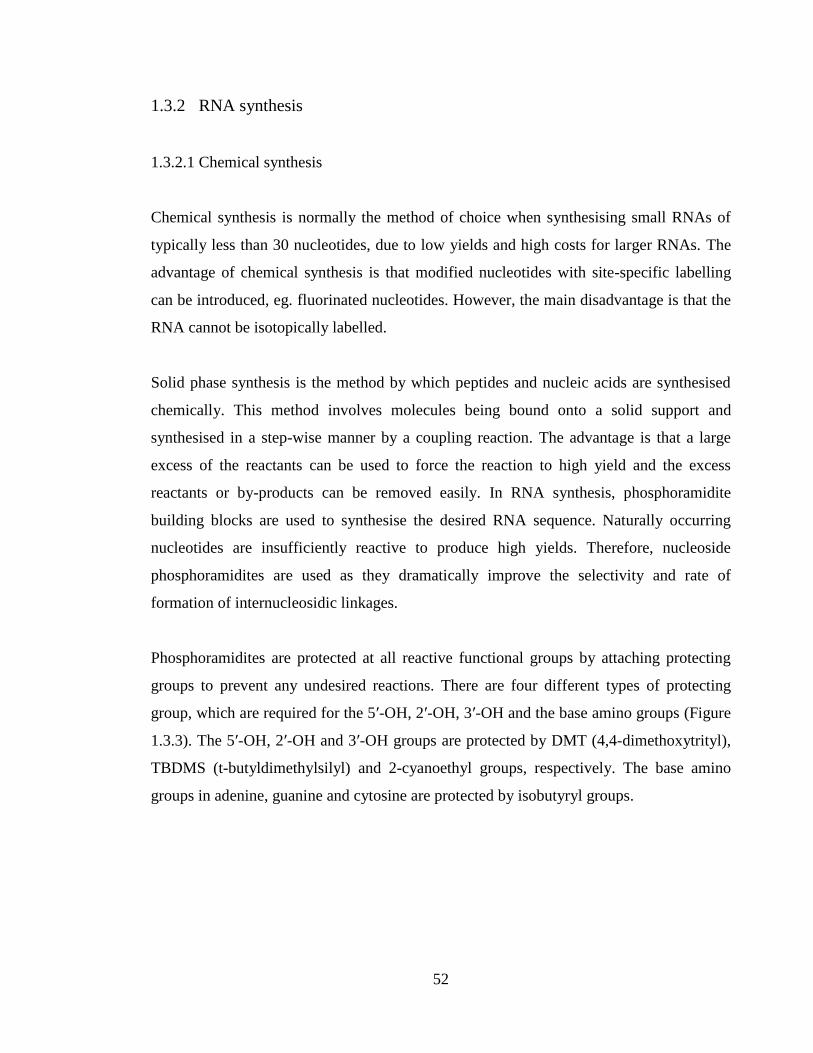
52
1.3.2 RNA synthesis
1.3.2.1 Chemical synthesis
Chemical synthesis is normally the method of choice when synthesising small RNAs of
typically less than 30 nucleotides, due to low yields and high costs for larger RNAs. The
advantage of chemical synthesis is that modified nucleotides with site-specific labelling
can be introduced, eg. fluorinated nucleotides. However, the main disadvantage is that the
RNA cannot be isotopically labelled.
Solid phase synthesis is the method by which peptides and nucleic acids are synthesised
chemically. This method involves molecules being bound onto a solid support and
synthesised in a step-wise manner by a coupling reaction. The advantage is that a large
excess of the reactants can be used to force the reaction to high yield and the excess
reactants or by-products can be removed easily. In RNA synthesis, phosphoramidite
building blocks are used to synthesise the desired RNA sequence. Naturally occurring
nucleotides are insufficiently reactive to produce high yields. Therefore, nucleoside
phosphoramidites are used as they dramatically improve the selectivity and rate of
formation of internucleosidic linkages.
Phosphoramidites are protected at all reactive functional groups by attaching protecting
groups to prevent any undesired reactions. There are four different types of protecting
group, which are required for the 5ʹ-OH, 2ʹ-OH, 3ʹ-OH and the base amino groups (Figure
1.3.3). The 5ʹ-OH, 2ʹ-OH and 3ʹ-OH groups are protected by DMT (4,4-dimethoxytrityl),
TBDMS (t-butyldimethylsilyl) and 2-cyanoethyl groups, respectively. The base amino
groups in adenine, guanine and cytosine are protected by isobutyryl groups.
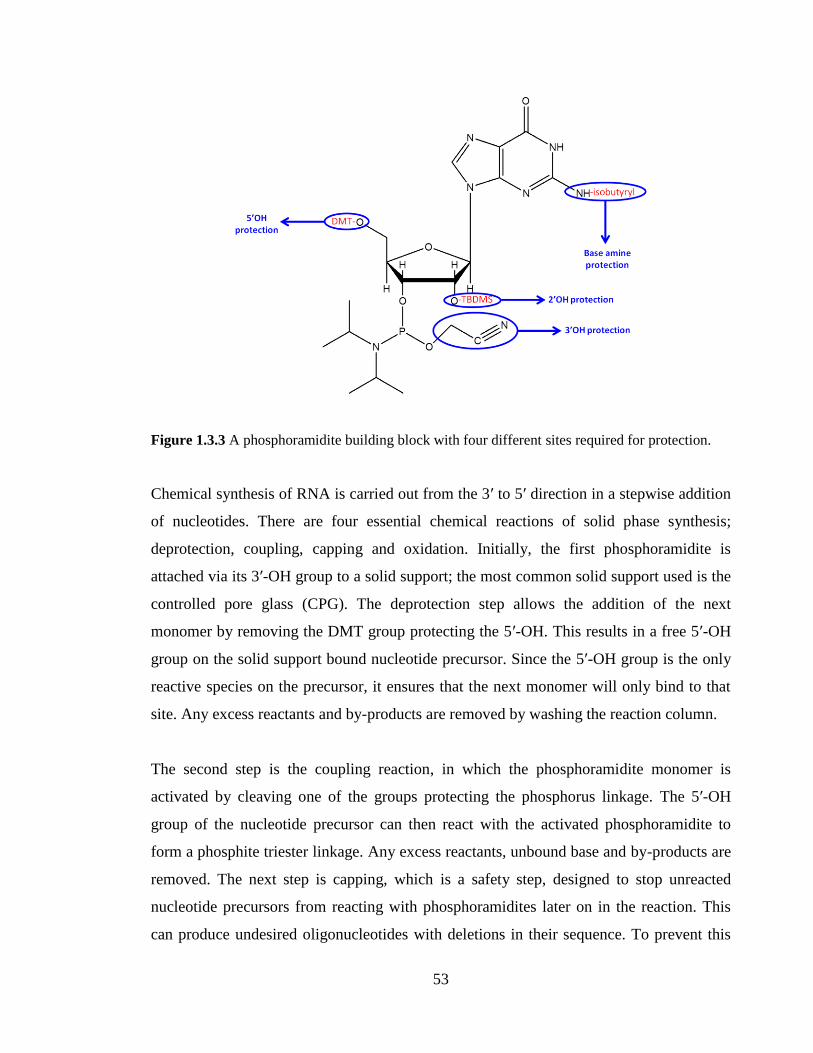
53
Figure 1.3.3 A phosphoramidite building block with four different sites required for protection.
Chemical synthesis of RNA is carried out from the 3ʹ to 5ʹ direction in a stepwise addition
of nucleotides. There are four essential chemical reactions of solid phase synthesis;
deprotection, coupling, capping and oxidation. Initially, the first phosphoramidite is
attached via its 3ʹ-OH group to a solid support; the most common solid support used is the
controlled pore glass (CPG). The deprotection step allows the addition of the next
monomer by removing the DMT group protecting the 5ʹ-OH. This results in a free 5ʹ-OH
group on the solid support bound nucleotide precursor. Since the 5ʹ-OH group is the only
reactive species on the precursor, it ensures that the next monomer will only bind to that
site. Any excess reactants and by-products are removed by washing the reaction column.
The second step is the coupling reaction, in which the phosphoramidite monomer is
activated by cleaving one of the groups protecting the phosphorus linkage. The 5ʹ-OH
group of the nucleotide precursor can then react with the activated phosphoramidite to
form a phosphite triester linkage. Any excess reactants, unbound base and by-products are
removed. The next step is capping, which is a safety step, designed to stop unreacted
nucleotide precursors from reacting with phosphoramidites later on in the reaction. This
can produce undesired oligonucleotides with deletions in their sequence. To prevent this
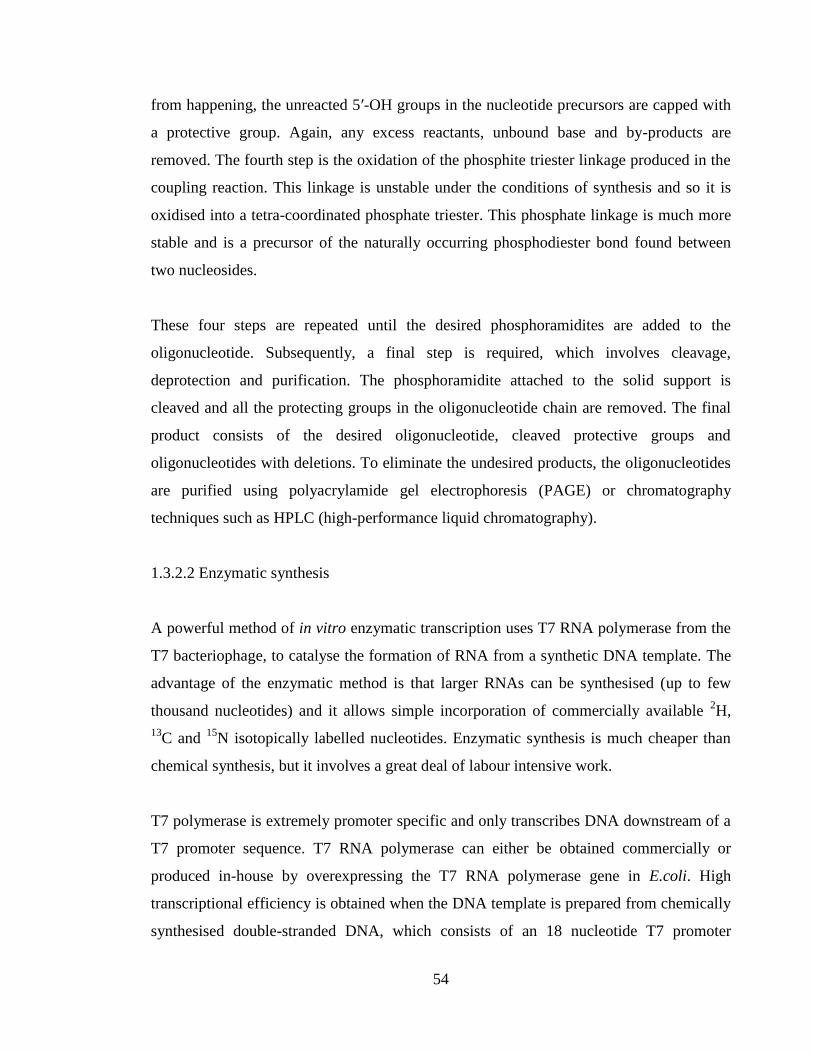
54
from happening, the unreacted 5ʹ-OH groups in the nucleotide precursors are capped with
a protective group. Again, any excess reactants, unbound base and by-products are
removed. The fourth step is the oxidation of the phosphite triester linkage produced in the
coupling reaction. This linkage is unstable under the conditions of synthesis and so it is
oxidised into a tetra-coordinated phosphate triester. This phosphate linkage is much more
stable and is a precursor of the naturally occurring phosphodiester bond found between
two nucleosides.
These four steps are repeated until the desired phosphoramidites are added to the
oligonucleotide. Subsequently, a final step is required, which involves cleavage,
deprotection and purification. The phosphoramidite attached to the solid support is
cleaved and all the protecting groups in the oligonucleotide chain are removed. The final
product consists of the desired oligonucleotide, cleaved protective groups and
oligonucleotides with deletions. To eliminate the undesired products, the oligonucleotides
are purified using polyacrylamide gel electrophoresis (PAGE) or chromatography
techniques such as HPLC (high-performance liquid chromatography).
1.3.2.2 Enzymatic synthesis
A powerful method of in vitro enzymatic transcription uses T7 RNA polymerase from the
T7 bacteriophage, to catalyse the formation of RNA from a synthetic DNA template. The
advantage of the enzymatic method is that larger RNAs can be synthesised (up to few
thousand nucleotides) and it allows simple incorporation of commercially available 2H,
13C and
15N isotopically labelled nucleotides. Enzymatic synthesis is much cheaper than
chemical synthesis, but it involves a great deal of labour intensive work.
T7 polymerase is extremely promoter specific and only transcribes DNA downstream of a
T7 promoter sequence. T7 RNA polymerase can either be obtained commercially or
produced in-house by overexpressing the T7 RNA polymerase gene in E.coli. High
transcriptional efficiency is obtained when the DNA template is prepared from chemically
synthesised double-stranded DNA, which consists of an 18 nucleotide T7 promoter
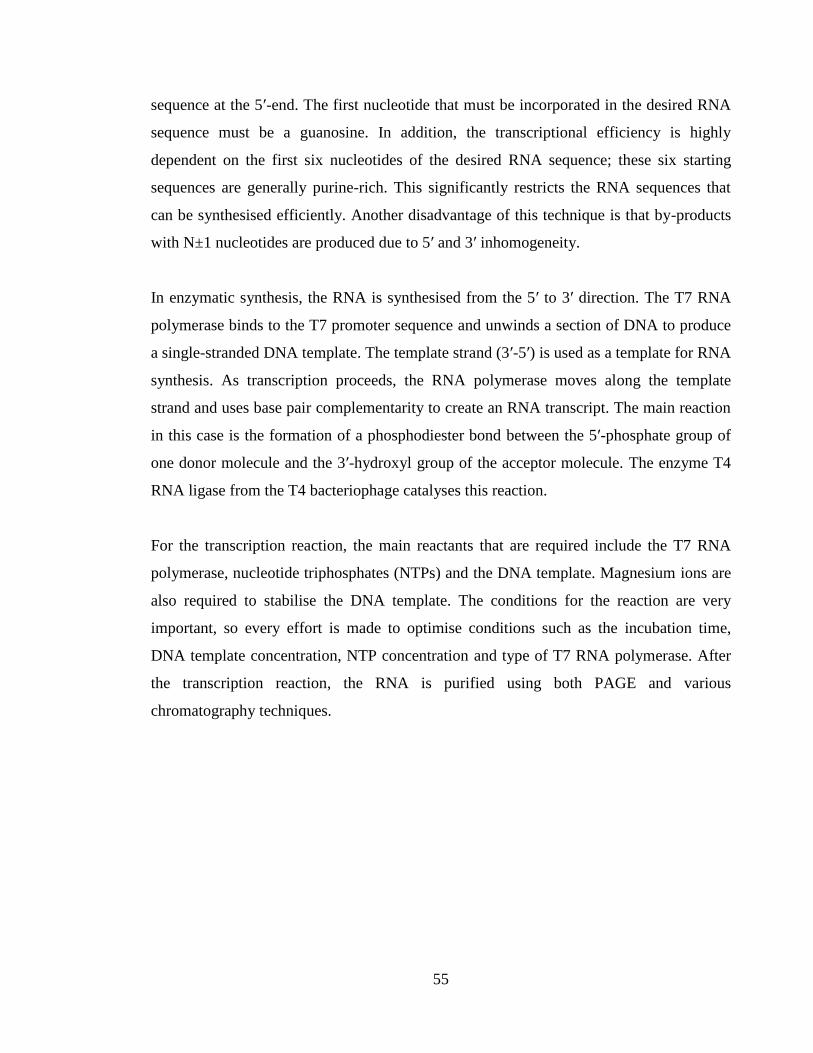
55
sequence at the 5ʹ-end. The first nucleotide that must be incorporated in the desired RNA
sequence must be a guanosine. In addition, the transcriptional efficiency is highly
dependent on the first six nucleotides of the desired RNA sequence; these six starting
sequences are generally purine-rich. This significantly restricts the RNA sequences that
can be synthesised efficiently. Another disadvantage of this technique is that by-products
with N±1 nucleotides are produced due to 5ʹ and 3ʹ inhomogeneity.
In enzymatic synthesis, the RNA is synthesised from the 5ʹ to 3ʹ direction. The T7 RNA
polymerase binds to the T7 promoter sequence and unwinds a section of DNA to produce
a single-stranded DNA template. The template strand (3ʹ-5ʹ) is used as a template for RNA
synthesis. As transcription proceeds, the RNA polymerase moves along the template
strand and uses base pair complementarity to create an RNA transcript. The main reaction
in this case is the formation of a phosphodiester bond between the 5ʹ-phosphate group of
one donor molecule and the 3ʹ-hydroxyl group of the acceptor molecule. The enzyme T4
RNA ligase from the T4 bacteriophage catalyses this reaction.
For the transcription reaction, the main reactants that are required include the T7 RNA
polymerase, nucleotide triphosphates (NTPs) and the DNA template. Magnesium ions are
also required to stabilise the DNA template. The conditions for the reaction are very
important, so every effort is made to optimise conditions such as the incubation time,
DNA template concentration, NTP concentration and type of T7 RNA polymerase. After
the transcription reaction, the RNA is purified using both PAGE and various
chromatography techniques.
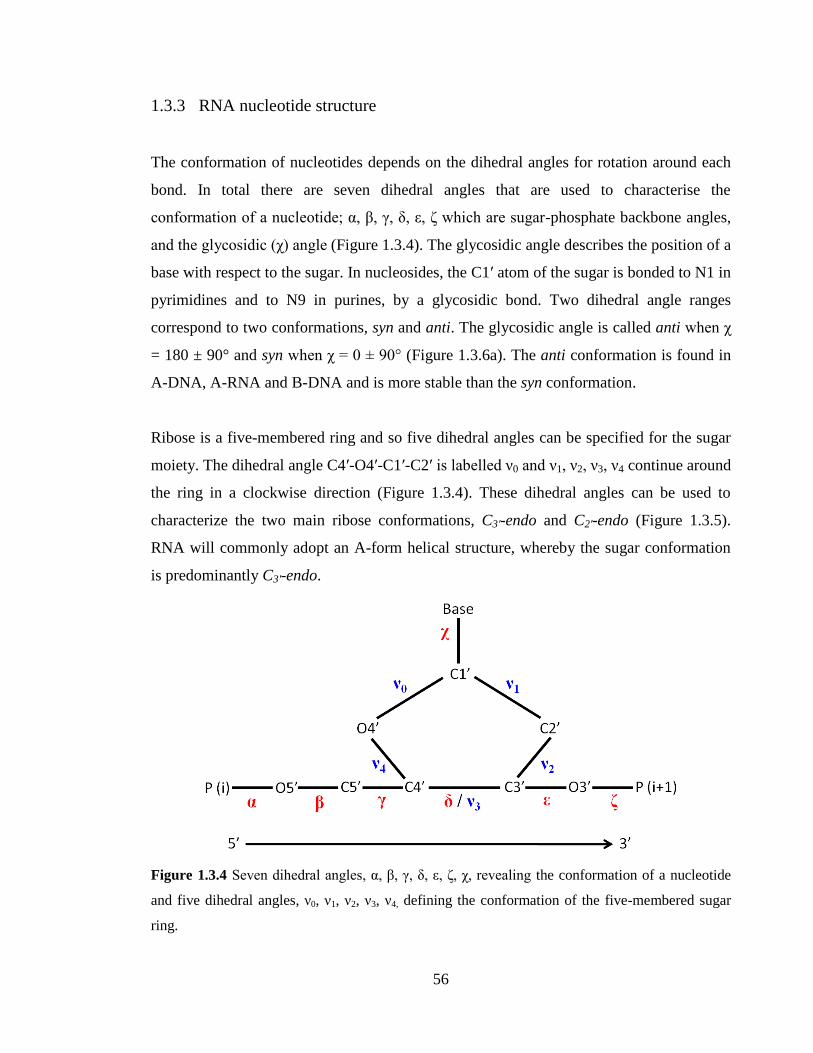
56
1.3.3 RNA nucleotide structure
The conformation of nucleotides depends on the dihedral angles for rotation around each
bond. In total there are seven dihedral angles that are used to characterise the
conformation of a nucleotide; α, β, γ, δ, ε, ζ which are sugar-phosphate backbone angles,
and the glycosidic (χ) angle (Figure 1.3.4). The glycosidic angle describes the position of a
base with respect to the sugar. In nucleosides, the C1ʹ atom of the sugar is bonded to N1 in
pyrimidines and to N9 in purines, by a glycosidic bond. Two dihedral angle ranges
correspond to two conformations, syn and anti. The glycosidic angle is called anti when χ
= 180 ± 90° and syn when χ = 0 ± 90° (Figure 1.3.6a). The anti conformation is found in
A-DNA, A-RNA and B-DNA and is more stable than the syn conformation.
Ribose is a five-membered ring and so five dihedral angles can be specified for the sugar
moiety. The dihedral angle C4ʹ-O4ʹ-C1ʹ-C2ʹ is labelled ν0 and ν1, ν2, ν3, ν4 continue around
the ring in a clockwise direction (Figure 1.3.4). These dihedral angles can be used to
characterize the two main ribose conformations, C3ʹ-endo and C2ʹ-endo (Figure 1.3.5).
RNA will commonly adopt an A-form helical structure, whereby the sugar conformation
is predominantly C3ʹ-endo.
Figure 1.3.4 Seven dihedral angles, α, β, γ, δ, ε, ζ, χ, revealing the conformation of a nucleotide
and five dihedral angles, ν0, ν1, ν2, ν3, ν4, defining the conformation of the five-membered sugar
ring.
57
Figure 1.3.5 The two main sugar conformations (a) C3ʹ-endo in RNA and (b) C2ʹ-endo in DNA.
The pentose sugar conformation can also be specified in terms of the pseudorotation phase
angle (P).36
The pseudorotation phase angle defines the sugar pucker conformation and
identifies which two atoms of the other three are out of the plane. The relationship
between the phase angle and the endo/exo notations is illustrated in Figure 1.3.6b.
Figure 1.3.6 (a) the relationship between the syn/anti notations and the corresponding dihedral
angle values. (b) The pseudorotation phase cycle of the pentose sugar showing the relationship
between the pseudorotation phase angle (P), and the endo and exo notations.35
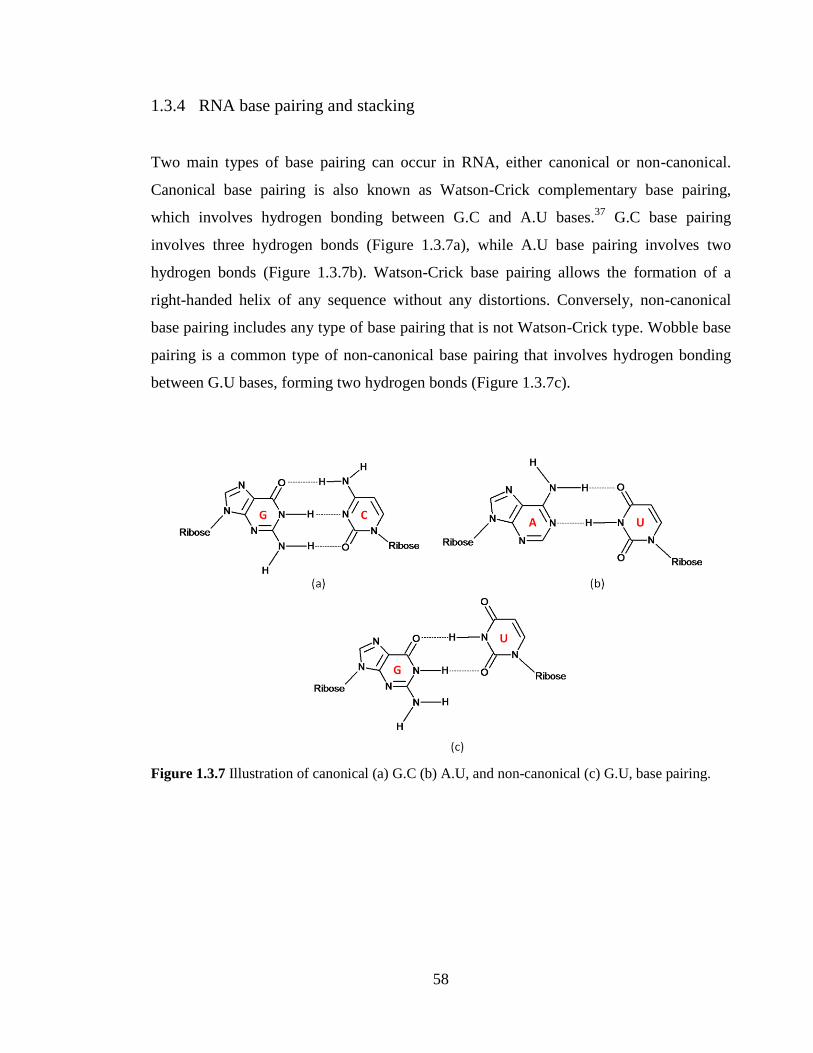
58
1.3.4 RNA base pairing and stacking
Two main types of base pairing can occur in RNA, either canonical or non-canonical.
Canonical base pairing is also known as Watson-Crick complementary base pairing,
which involves hydrogen bonding between G.C and A.U bases.37
G.C base pairing
involves three hydrogen bonds (Figure 1.3.7a), while A.U base pairing involves two
hydrogen bonds (Figure 1.3.7b). Watson-Crick base pairing allows the formation of a
right-handed helix of any sequence without any distortions. Conversely, non-canonical
base pairing includes any type of base pairing that is not Watson-Crick type. Wobble base
pairing is a common type of non-canonical base pairing that involves hydrogen bonding
between G.U bases, forming two hydrogen bonds (Figure 1.3.7c).
Figure 1.3.7 Illustration of canonical (a) G.C (b) A.U, and non-canonical (c) G.U, base pairing.
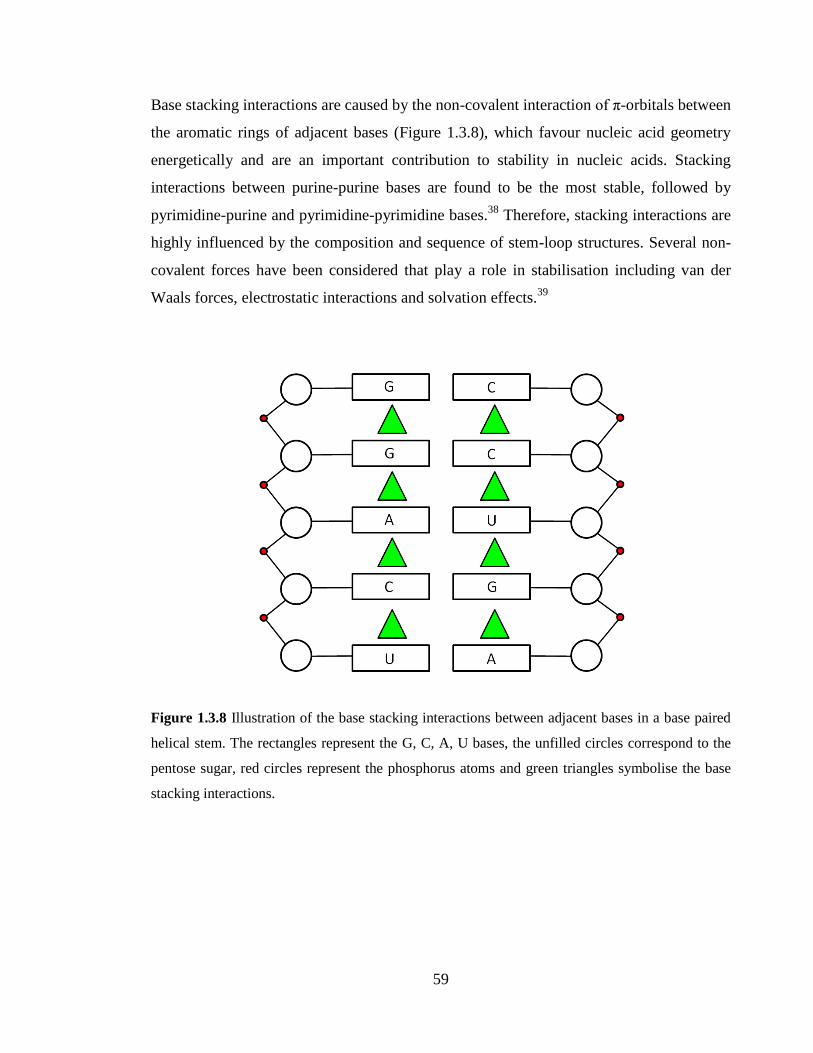
59
Base stacking interactions are caused by the non-covalent interaction of π-orbitals between
the aromatic rings of adjacent bases (Figure 1.3.8), which favour nucleic acid geometry
energetically and are an important contribution to stability in nucleic acids. Stacking
interactions between purine-purine bases are found to be the most stable, followed by
pyrimidine-purine and pyrimidine-pyrimidine bases.38
Therefore, stacking interactions are
highly influenced by the composition and sequence of stem-loop structures. Several non-
covalent forces have been considered that play a role in stabilisation including van der
Waals forces, electrostatic interactions and solvation effects.39
Figure 1.3.8 Illustration of the base stacking interactions between adjacent bases in a base paired
helical stem. The rectangles represent the G, C, A, U bases, the unfilled circles correspond to the
pentose sugar, red circles represent the phosphorus atoms and green triangles symbolise the base
stacking interactions.
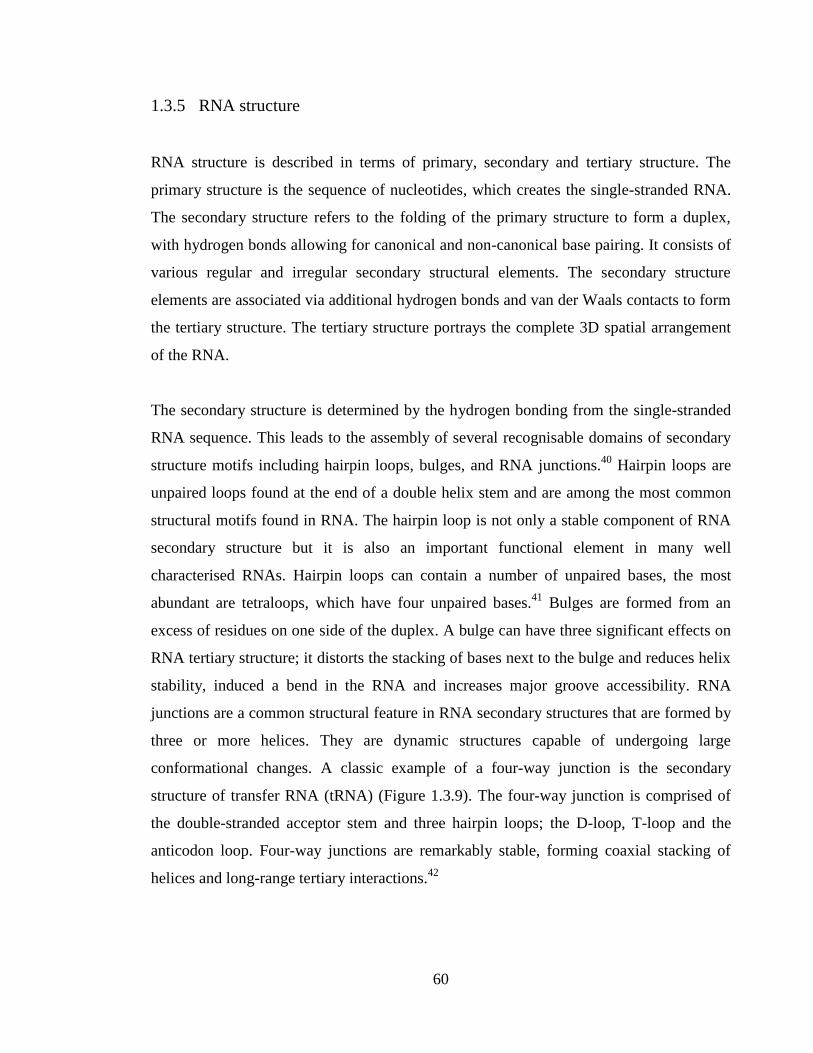
60
1.3.5 RNA structure
RNA structure is described in terms of primary, secondary and tertiary structure. The
primary structure is the sequence of nucleotides, which creates the single-stranded RNA.
The secondary structure refers to the folding of the primary structure to form a duplex,
with hydrogen bonds allowing for canonical and non-canonical base pairing. It consists of
various regular and irregular secondary structural elements. The secondary structure
elements are associated via additional hydrogen bonds and van der Waals contacts to form
the tertiary structure. The tertiary structure portrays the complete 3D spatial arrangement
of the RNA.
The secondary structure is determined by the hydrogen bonding from the single-stranded
RNA sequence. This leads to the assembly of several recognisable domains of secondary
structure motifs including hairpin loops, bulges, and RNA junctions.40
Hairpin loops are
unpaired loops found at the end of a double helix stem and are among the most common
structural motifs found in RNA. The hairpin loop is not only a stable component of RNA
secondary structure but it is also an important functional element in many well
characterised RNAs. Hairpin loops can contain a number of unpaired bases, the most
abundant are tetraloops, which have four unpaired bases.41
Bulges are formed from an
excess of residues on one side of the duplex. A bulge can have three significant effects on
RNA tertiary structure; it distorts the stacking of bases next to the bulge and reduces helix
stability, induced a bend in the RNA and increases major groove accessibility. RNA
junctions are a common structural feature in RNA secondary structures that are formed by
three or more helices. They are dynamic structures capable of undergoing large
conformational changes. A classic example of a four-way junction is the secondary
structure of transfer RNA (tRNA) (Figure 1.3.9). The four-way junction is comprised of
the double-stranded acceptor stem and three hairpin loops; the D-loop, T-loop and the
anticodon loop. Four-way junctions are remarkably stable, forming coaxial stacking of
helices and long-range tertiary interactions.42
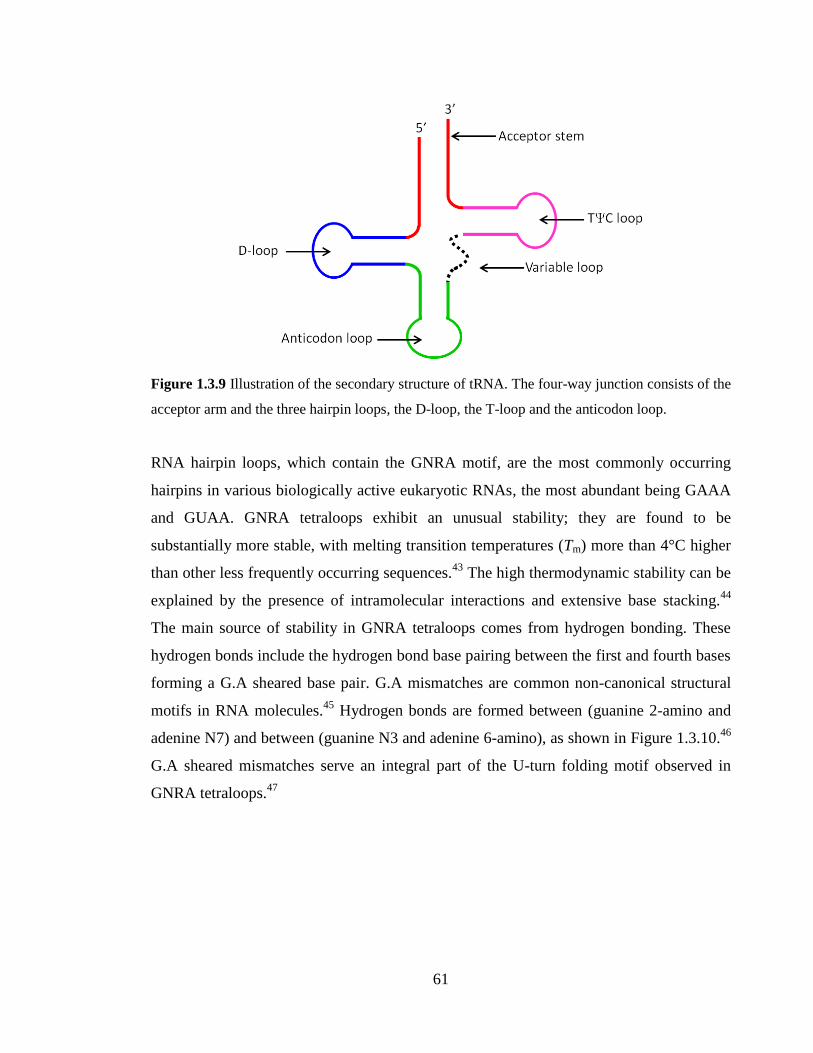
61
Figure 1.3.9 Illustration of the secondary structure of tRNA. The four-way junction consists of the
acceptor arm and the three hairpin loops, the D-loop, the T-loop and the anticodon loop.
RNA hairpin loops, which contain the GNRA motif, are the most commonly occurring
hairpins in various biologically active eukaryotic RNAs, the most abundant being GAAA
and GUAA. GNRA tetraloops exhibit an unusual stability; they are found to be
substantially more stable, with melting transition temperatures (Tm) more than 4°C higher
than other less frequently occurring sequences.43
The high thermodynamic stability can be
explained by the presence of intramolecular interactions and extensive base stacking.44
The main source of stability in GNRA tetraloops comes from hydrogen bonding. These
hydrogen bonds include the hydrogen bond base pairing between the first and fourth bases
forming a G.A sheared base pair. G.A mismatches are common non-canonical structural
motifs in RNA molecules.45
Hydrogen bonds are formed between (guanine 2-amino and
adenine N7) and between (guanine N3 and adenine 6-amino), as shown in Figure 1.3.10.46
G.A sheared mismatches serve an integral part of the U-turn folding motif observed in
GNRA tetraloops.47
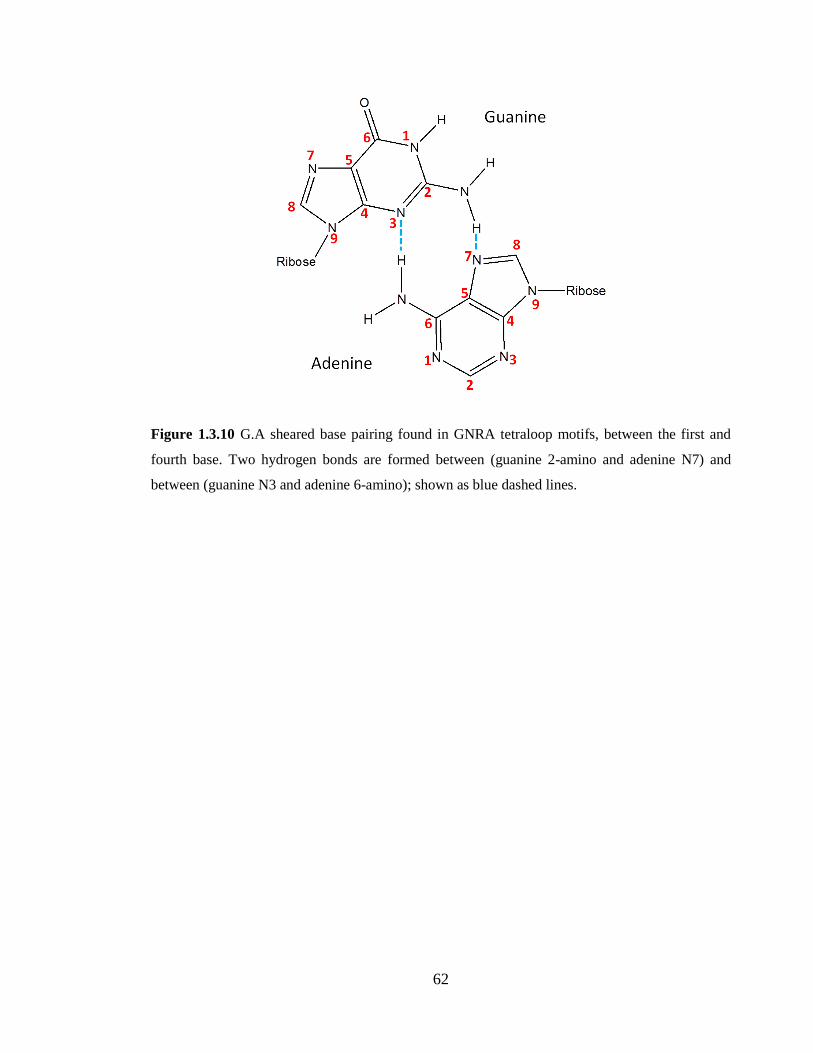
62
Figure 1.3.10 G.A sheared base pairing found in GNRA tetraloop motifs, between the first and
fourth base. Two hydrogen bonds are formed between (guanine 2-amino and adenine N7) and
between (guanine N3 and adenine 6-amino); shown as blue dashed lines.
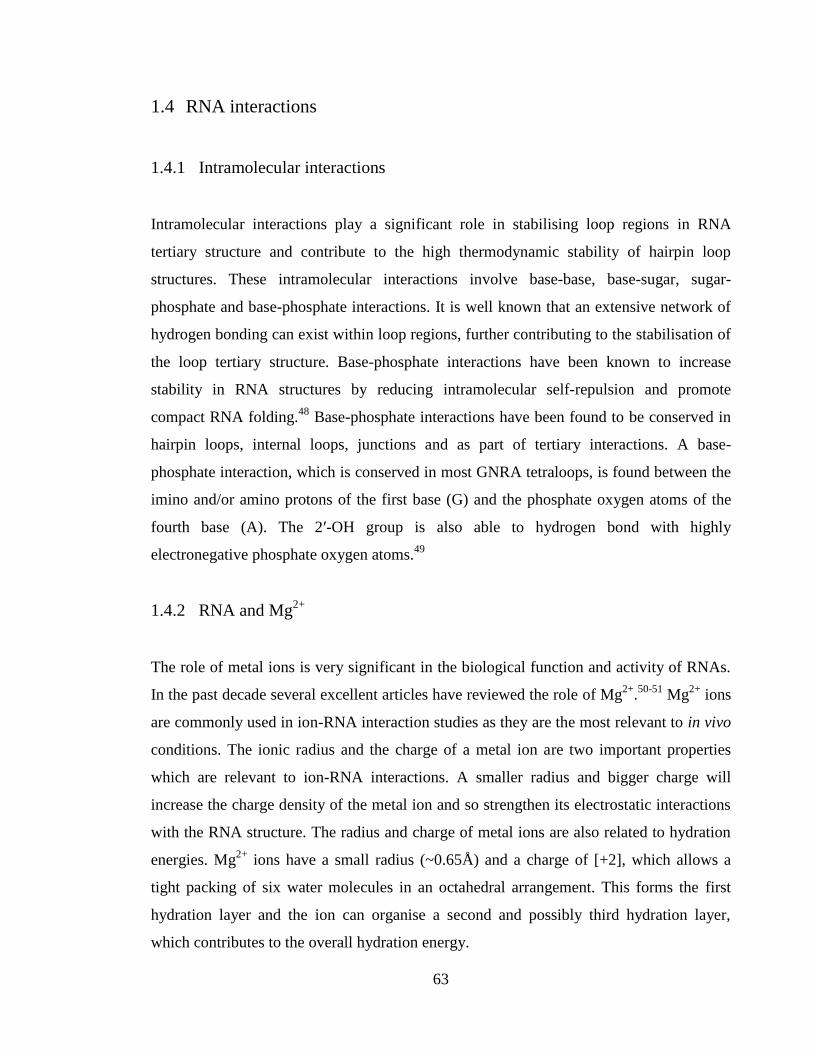
63
1.4 RNA interactions
1.4.1 Intramolecular interactions
Intramolecular interactions play a significant role in stabilising loop regions in RNA
tertiary structure and contribute to the high thermodynamic stability of hairpin loop
structures. These intramolecular interactions involve base-base, base-sugar, sugar-
phosphate and base-phosphate interactions. It is well known that an extensive network of
hydrogen bonding can exist within loop regions, further contributing to the stabilisation of
the loop tertiary structure. Base-phosphate interactions have been known to increase
stability in RNA structures by reducing intramolecular self-repulsion and promote
compact RNA folding.48
Base-phosphate interactions have been found to be conserved in
hairpin loops, internal loops, junctions and as part of tertiary interactions. A base-
phosphate interaction, which is conserved in most GNRA tetraloops, is found between the
imino and/or amino protons of the first base (G) and the phosphate oxygen atoms of the
fourth base (A). The 2ʹ-OH group is also able to hydrogen bond with highly
electronegative phosphate oxygen atoms.49
1.4.2 RNA and Mg2+
The role of metal ions is very significant in the biological function and activity of RNAs.
In the past decade several excellent articles have reviewed the role of Mg2+
.50-51
Mg2+
ions
are commonly used in ion-RNA interaction studies as they are the most relevant to in vivo
conditions. The ionic radius and the charge of a metal ion are two important properties
which are relevant to ion-RNA interactions. A smaller radius and bigger charge will
increase the charge density of the metal ion and so strengthen its electrostatic interactions
with the RNA structure. The radius and charge of metal ions are also related to hydration
energies. Mg2+
ions have a small radius (~0.65Å) and a charge of [+2], which allows a
tight packing of six water molecules in an octahedral arrangement. This forms the first
hydration layer and the ion can organise a second and possibly third hydration layer,
which contributes to the overall hydration energy.
64
Divalent ions such as Mg2+
in particular have been studied extensively. Mg2+
plays a
substantial role in RNA tertiary structure stabilisation; positive Mg2+
ions reduce the
repulsion of the negatively charged phosphates in RNA causing stabilisation.52
The
addition of Mg2+
can significantly enhance the thermodynamic stability of RNA motifs,
possibly by non-specific interactions with the phosphate backbone.53
As well as stabilising
the secondary structure they also promote RNA folding and alter RNA dynamics.54
The
folding of RNA tertiary structure increases the charge density and negative electrostatic
potential, which causes a dramatic increase in the number of cations pulled to the RNA
surface.55
This involves ion-RNA interaction whereby Mg2+
ions act as ‘diffuse ions’,
‘water-positioned ions’ or ‘chelated ions’ (Figure 1.4.1).56
Figure 1.4.1 Potential Mg2+
-ion interaction with the RNA phosphate backbone. The diagram
illustrates the Mg2+
ions (green circles), water molecules (red circles with attached blue circles)
and phosphate oxygens (lone red circles). Ion interactions can involve specific interactions with
RNA whereby the Mg2+
ions act as (a) chelated ions, (b) water-positioned ions and (c) diffuse ions.
Diffuse ions are largely hydrated forming a hexahydrate Mg(H2O)62+
complex, with first
and partial second hydration layers. Although there is no contact between the ion and the
RNA surface, ion-RNA interactions are mediated by electrostatic interactions between the
ionic charge of Mg2+
and the RNA electrostatic field. Water-positioned ions hold a single
hydration layer between themselves and the RNA surface. Consequently, the close
proximity of the ion to the RNA surface directly influences the positioning of the hydrated
65
ion. Electrostatic interactions between the ion and RNA surface and also the perturbation
of ion hydration layers have to be considered here in terms of energetic factors. Chelated
ions directly interact with specific sites on the RNA surface, held together by electrostatic
forces. However, the free energy required to partially dehydrate a fully hydrated ion
becomes a major energetic factor especially for metal ions such as Mg2+
with high
hydration energies.57
An essential ingredient for IRES function is the dependence on Mg2+
, which has been
proposed to enhance thermodynamic stability and promote RNA folding.53
Mg2+
ions are
suggested to play a significant role in the stabilisation and folding of RNA structures,
possibly by enhancing the electrostatic interactions with the phosphate backbone. UV
absorbance experiments confirmed the improved stability arising from Mg2+
binding with
a dramatic increase in melting temperature of the FMDV 16mer RNA (ΔTm 70°C –
75.5°C).58
It has also been established that Mg2+
ions play an important role in mediating
RNA-RNA interactions.59
1.4.3 RNA-RNA interactions
RNAs follow a hierarchical folding pathway whereby the secondary structure elements
such as helices, hairpin loops and bulges form first, followed by the final tertiary structure
of the RNA molecule. Long-range tertiary interactions in biologically active RNAs are
known to mediate RNA tertiary folding by the binding of GNRA tetraloops to specific
receptor sites.60
These RNA-RNA interactions include A-minor motifs, ribose zippers, and
A-platforms.61
A-minor motifs provide the majority of tertiary interactions used for
interhelical packing in complex RNAs studied to date.62
The tertiary contacts formed by
GNRA tetraloops, consist of A-minor interactions involving tandem adenosine docking
into the minor groove of an RNA helix.63
These A-minor interactions can involve adenosines, which are unpaired or part of non-
canonical G.A sheared base pairing; both can be found in GNRA tetraloops. The high
frequency and conservation of GNRA tetraloops emphasises the importance of long-range
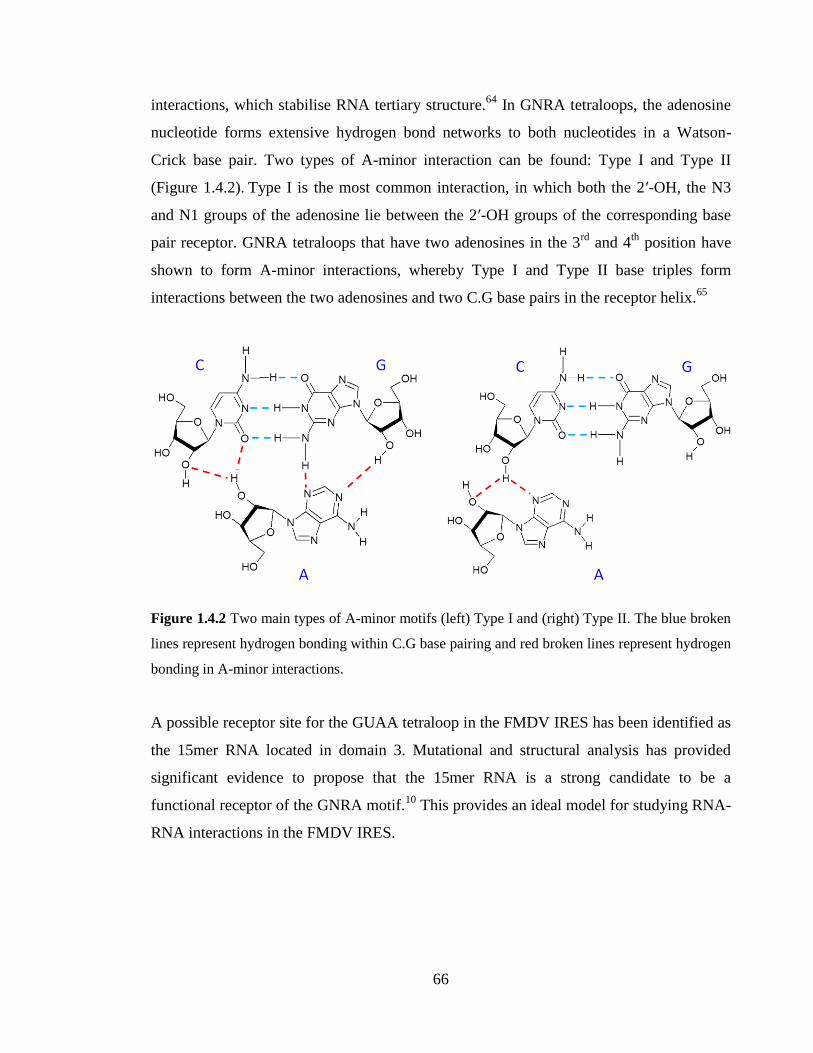
66
interactions, which stabilise RNA tertiary structure.64
In GNRA tetraloops, the adenosine
nucleotide forms extensive hydrogen bond networks to both nucleotides in a Watson-
Crick base pair. Two types of A-minor interaction can be found: Type I and Type II
(Figure 1.4.2). Type I is the most common interaction, in which both the 2ʹ-OH, the N3
and N1 groups of the adenosine lie between the 2ʹ-OH groups of the corresponding base
pair receptor. GNRA tetraloops that have two adenosines in the 3rd
and 4th
position have
shown to form A-minor interactions, whereby Type I and Type II base triples form
interactions between the two adenosines and two C.G base pairs in the receptor helix.65
Figure 1.4.2 Two main types of A-minor motifs (left) Type I and (right) Type II. The blue broken
lines represent hydrogen bonding within C.G base pairing and red broken lines represent hydrogen
bonding in A-minor interactions.
A possible receptor site for the GUAA tetraloop in the FMDV IRES has been identified as
the 15mer RNA located in domain 3. Mutational and structural analysis has provided
significant evidence to propose that the 15mer RNA is a strong candidate to be a
functional receptor of the GNRA motif.10
This provides an ideal model for studying RNA-
RNA interactions in the FMDV IRES.
67
1.5 Principles of NMR spectroscopy66
1.5.1 Basic theory of NMR
Nuclear magnetic resonance (NMR) spectroscopy is a powerful analytical technique that
is used to solve complex structural problems in biological chemistry. NMR involves
perturbing magnetic nuclei and detecting perturbations in the spins of the nuclei in the
sample. This section will focus on the main principles of NMR spectroscopy.
The nuclear magnetic resonance phenomenon lies in the magnetic properties of the atomic
nucleus and forms the basis of NMR spectroscopy. The spin of a nucleus is a quantum
mechanical property, which gives rise to its magnetic properties. The spin of a nucleus is
characterised by the spin quantum number (I). The interaction of the nuclear magnetic
moment (µ) with the external magnetic field (B0), leads to a split in the energy of the spin
states. The total number of possible energy levels can be given by the 2I+1 rule.
Consequently, if we consider nuclei such as 1H,
13C or
31P with spin of ½, according to the
2I+1 rule there are two possible spin states.
Due to Boltzmann distribution, there is a slight excess of spin populations in the lower
energy state than the higher energy state. The population excess in the lower energy state
determines the probability of a transition of spins in the lower energy state to the higher
energy state. To stimulate the transition of spins from the lower energy state to the higher
energy state, a radiation of frequency which exactly matches the energy gap is required.
This is called the resonance condition. A radiofrequency (RF) pulse can be used to
stimulate the transition of spin populations between the two energy levels.
The absorption of energy can be detected as an emission signal, which is usually referred
to as the resonance signal. Since the energy gap between spin states of every nucleus will
be different, each nucleus will acquire a specific resonance frequency, which can be
observed as resonance peaks in an NMR spectrum.
68
1.5.2 Chemical shift, coupling constant and linewidth
The chemical shift describes the dependence of nuclear magnetic energy levels on the
electronic environment. Therefore, resonance signals observed in NMR spectra arise due
to nuclei in different chemical environments. Electrons within a molecule oppose the
external magnetic field (B0) and thereby shield the nuclei. Shielding of a nucleus increases
with the number of electrons. Consequently, nuclei with different electron densities will
be shielded to different strengths, therefore nuclei will precess at different frequencies and
give separate resonance signals in the NMR spectrum. The variations in resonance
frequencies of the same type of nucleus can be seen as chemical shifts in NMR spectra.
Chemical shift (δ) is given with respect to a reference frequency, measured in parts per
million (ppm).67
Scalar coupling (J) arises due to the interaction between spins of two non-equivalent
neighbouring nuclei. Coupling of two spins is influenced by bonded molecular electrons
on the localised magnetic field produced by the two nuclei. Scalar couplings are observed
through a small number of chemical bonds and so its value, measured in Hz, is highly
characteristic of these chemical bonds. The size of the scalar couplings is the coupling
constant, which can give information on the nature of the bond. Three bond couplings are
very useful in providing dihedral angle information of the bonds, using the Karplus
equation.68
The linewidth (ω½) of resonance signals is of paramount importance in NMR
spectroscopy as peaks have to be clearly resolved in order to assign them more accurately.
The separation between two peaks relative to their linewidth will determine the degree to
which they are resolved. The linewidth is the width of the peak measured at half the peak
height. In high-resolution NMR spectroscopy, the linewidth must be minimised to produce
well resolved peaks.
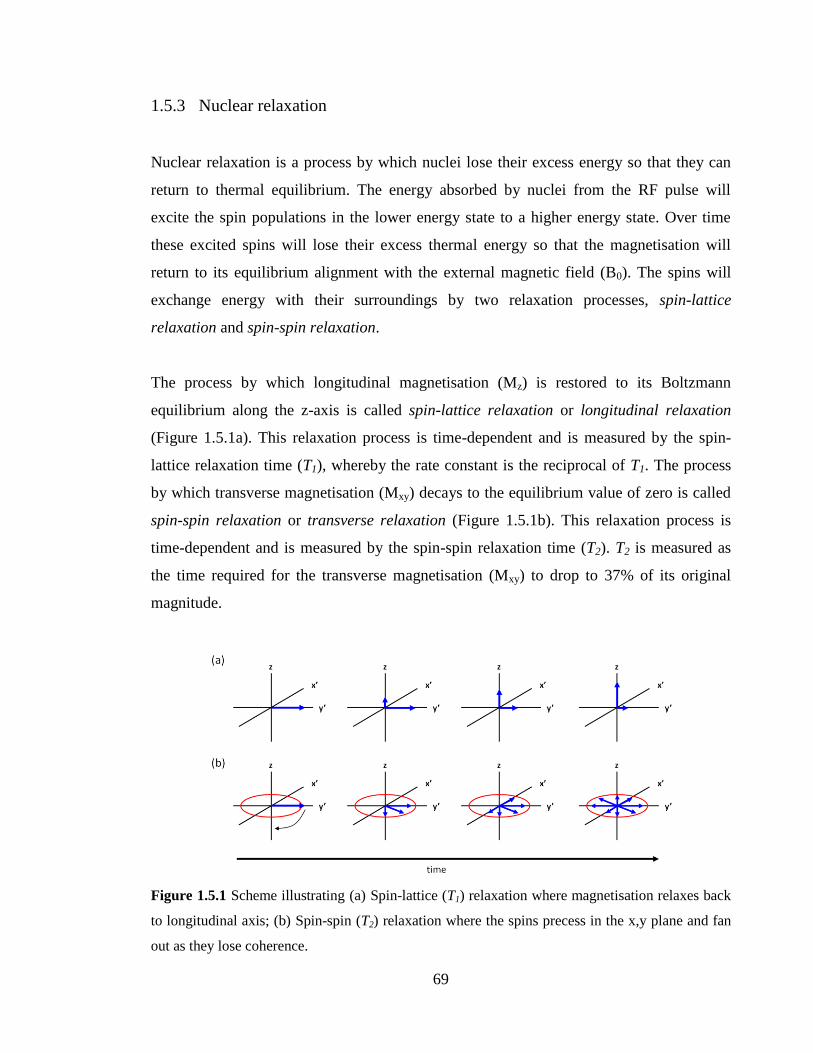
69
1.5.3 Nuclear relaxation
Nuclear relaxation is a process by which nuclei lose their excess energy so that they can
return to thermal equilibrium. The energy absorbed by nuclei from the RF pulse will
excite the spin populations in the lower energy state to a higher energy state. Over time
these excited spins will lose their excess thermal energy so that the magnetisation will
return to its equilibrium alignment with the external magnetic field (B0). The spins will
exchange energy with their surroundings by two relaxation processes, spin-lattice
relaxation and spin-spin relaxation.
The process by which longitudinal magnetisation (Mz) is restored to its Boltzmann
equilibrium along the z-axis is called spin-lattice relaxation or longitudinal relaxation
(Figure 1.5.1a). This relaxation process is time-dependent and is measured by the spin-
lattice relaxation time (T1), whereby the rate constant is the reciprocal of T1. The process
by which transverse magnetisation (Mxy) decays to the equilibrium value of zero is called
spin-spin relaxation or transverse relaxation (Figure 1.5.1b). This relaxation process is
time-dependent and is measured by the spin-spin relaxation time (T2). T2 is measured as
the time required for the transverse magnetisation (Mxy) to drop to 37% of its original
magnitude.
Figure 1.5.1 Scheme illustrating (a) Spin-lattice (T1) relaxation where magnetisation relaxes back
to longitudinal axis; (b) Spin-spin (T2) relaxation where the spins precess in the x,y plane and fan
out as they lose coherence.
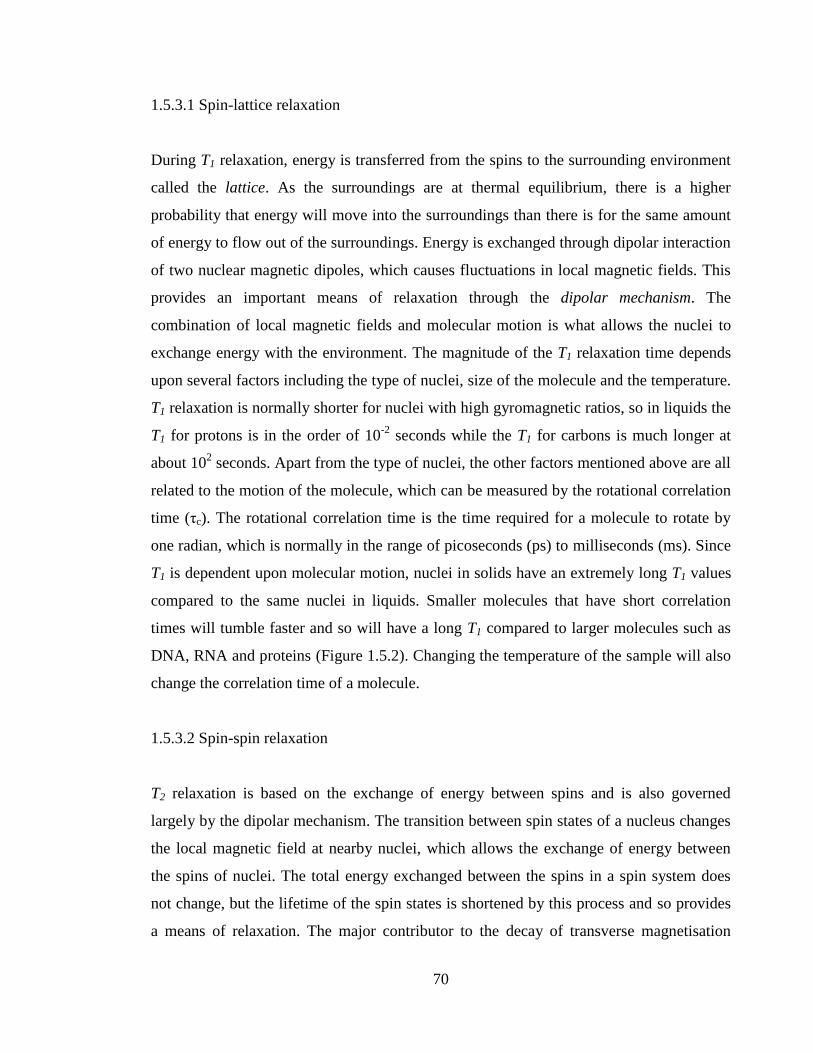
70
1.5.3.1 Spin-lattice relaxation
During T1 relaxation, energy is transferred from the spins to the surrounding environment
called the lattice. As the surroundings are at thermal equilibrium, there is a higher
probability that energy will move into the surroundings than there is for the same amount
of energy to flow out of the surroundings. Energy is exchanged through dipolar interaction
of two nuclear magnetic dipoles, which causes fluctuations in local magnetic fields. This
provides an important means of relaxation through the dipolar mechanism. The
combination of local magnetic fields and molecular motion is what allows the nuclei to
exchange energy with the environment. The magnitude of the T1 relaxation time depends
upon several factors including the type of nuclei, size of the molecule and the temperature.
T1 relaxation is normally shorter for nuclei with high gyromagnetic ratios, so in liquids the
T1 for protons is in the order of 10-2
seconds while the T1 for carbons is much longer at
about 102 seconds. Apart from the type of nuclei, the other factors mentioned above are all
related to the motion of the molecule, which can be measured by the rotational correlation
time (τc). The rotational correlation time is the time required for a molecule to rotate by
one radian, which is normally in the range of picoseconds (ps) to milliseconds (ms). Since
T1 is dependent upon molecular motion, nuclei in solids have an extremely long T1 values
compared to the same nuclei in liquids. Smaller molecules that have short correlation
times will tumble faster and so will have a long T1 compared to larger molecules such as
DNA, RNA and proteins (Figure 1.5.2). Changing the temperature of the sample will also
change the correlation time of a molecule.
1.5.3.2 Spin-spin relaxation
T2 relaxation is based on the exchange of energy between spins and is also governed
largely by the dipolar mechanism. The transition between spin states of a nucleus changes
the local magnetic field at nearby nuclei, which allows the exchange of energy between
the spins of nuclei. The total energy exchanged between the spins in a spin system does
not change, but the lifetime of the spin states is shortened by this process and so provides
a means of relaxation. The major contributor to the decay of transverse magnetisation
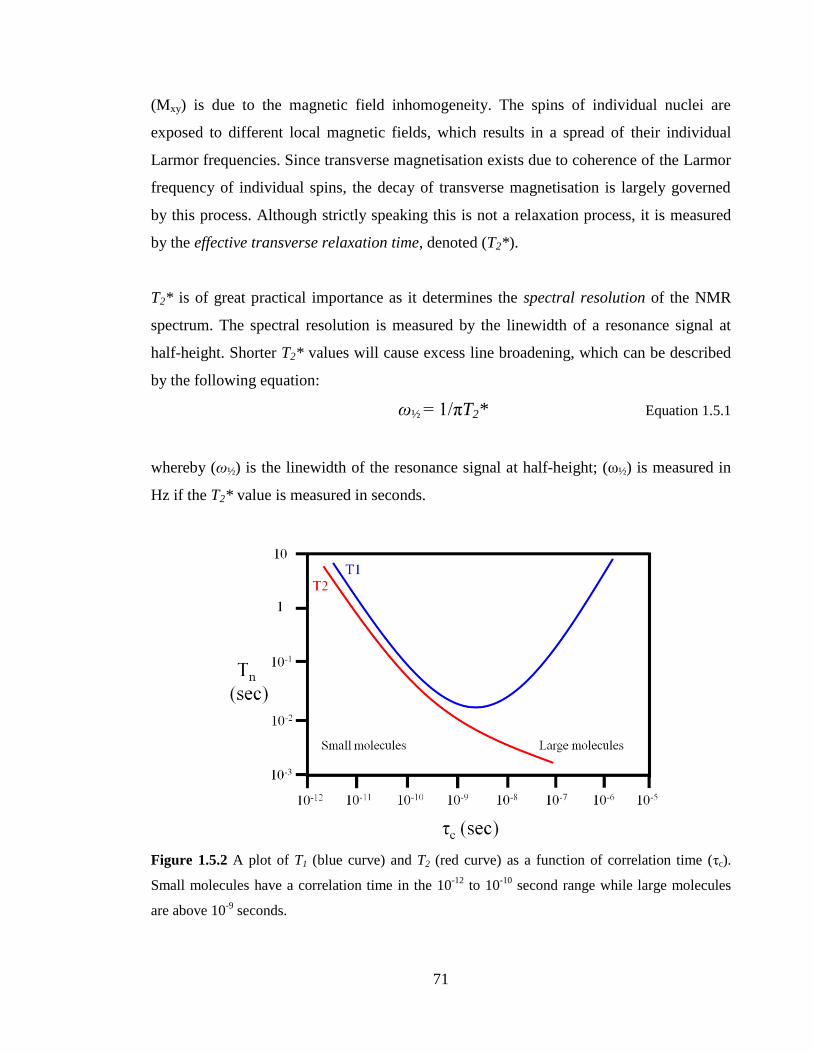
71
(Mxy) is due to the magnetic field inhomogeneity. The spins of individual nuclei are
exposed to different local magnetic fields, which results in a spread of their individual
Larmor frequencies. Since transverse magnetisation exists due to coherence of the Larmor
frequency of individual spins, the decay of transverse magnetisation is largely governed
by this process. Although strictly speaking this is not a relaxation process, it is measured
by the effective transverse relaxation time, denoted (T2*).
T2* is of great practical importance as it determines the spectral resolution of the NMR
spectrum. The spectral resolution is measured by the linewidth of a resonance signal at
half-height. Shorter T2* values will cause excess line broadening, which can be described
by the following equation:
ω½ = 1/πT2* Equation 1.5.1
whereby (ω½) is the linewidth of the resonance signal at half-height; (ω½) is measured in
Hz if the T2* value is measured in seconds.
Figure 1.5.2 A plot of T1 (blue curve) and T2 (red curve) as a function of correlation time (τc).
Small molecules have a correlation time in the 10-12
to 10-10
second range while large molecules
are above 10-9
seconds.
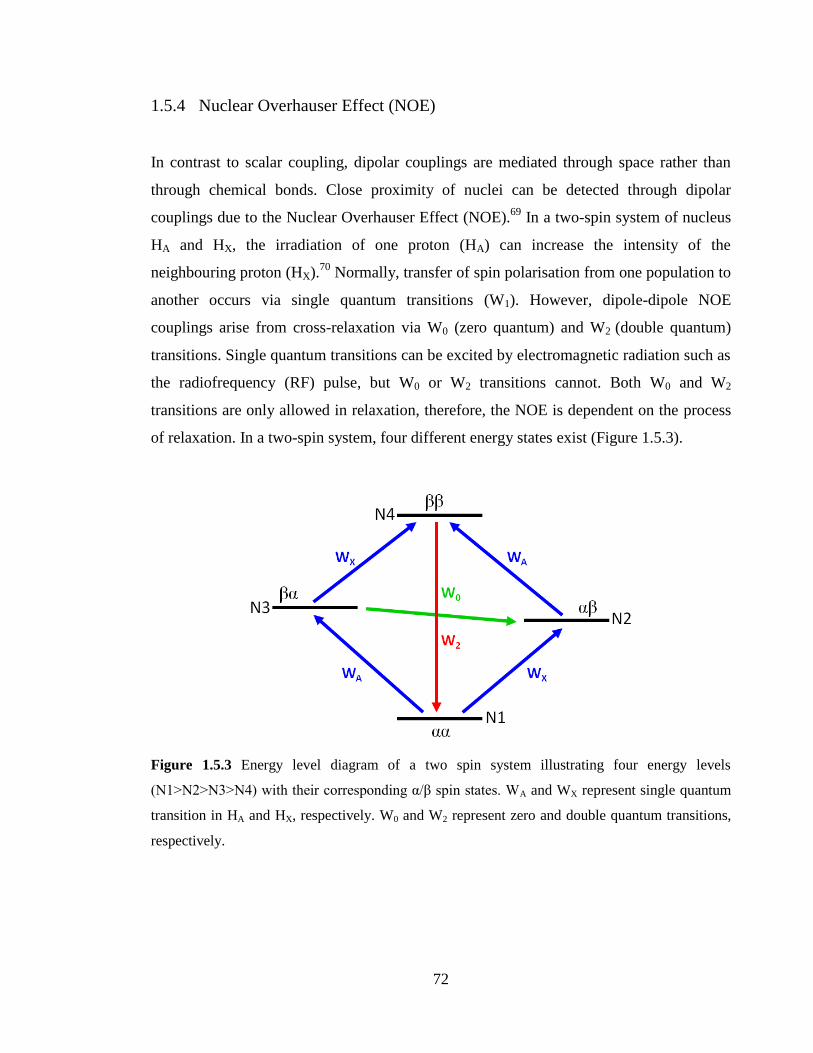
72
1.5.4 Nuclear Overhauser Effect (NOE)
In contrast to scalar coupling, dipolar couplings are mediated through space rather than
through chemical bonds. Close proximity of nuclei can be detected through dipolar
couplings due to the Nuclear Overhauser Effect (NOE).69
In a two-spin system of nucleus
HA and HX, the irradiation of one proton (HA) can increase the intensity of the
neighbouring proton (HX).70
Normally, transfer of spin polarisation from one population to
another occurs via single quantum transitions (W1). However, dipole-dipole NOE
couplings arise from cross-relaxation via W0 (zero quantum) and W2 (double quantum)
transitions. Single quantum transitions can be excited by electromagnetic radiation such as
the radiofrequency (RF) pulse, but W0 or W2 transitions cannot. Both W0 and W2
transitions are only allowed in relaxation, therefore, the NOE is dependent on the process
of relaxation. In a two-spin system, four different energy states exist (Figure 1.5.3).
Figure 1.5.3 Energy level diagram of a two spin system illustrating four energy levels
(N1>N2>N3>N4) with their corresponding α/β spin states. WA and WX represent single quantum
transition in HA and HX, respectively. W0 and W2 represent zero and double quantum transitions,
respectively.
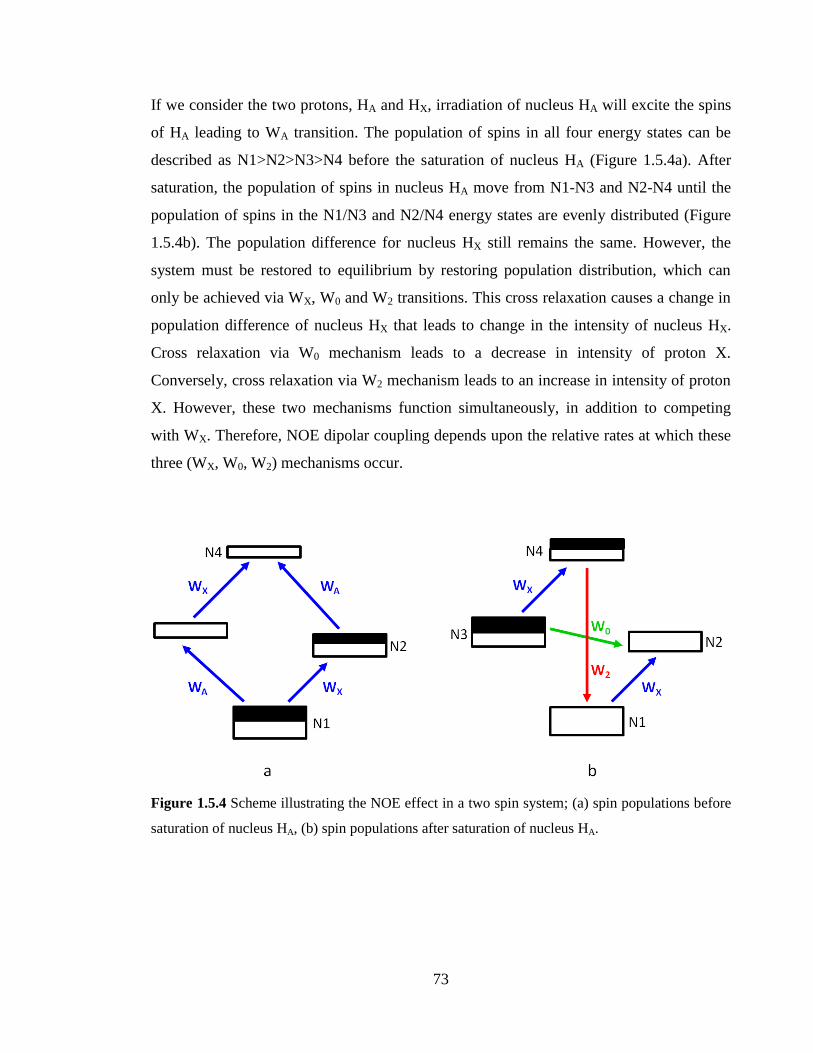
73
If we consider the two protons, HA and HX, irradiation of nucleus HA will excite the spins
of HA leading to WA transition. The population of spins in all four energy states can be
described as N1>N2>N3>N4 before the saturation of nucleus HA (Figure 1.5.4a). After
saturation, the population of spins in nucleus HA move from N1-N3 and N2-N4 until the
population of spins in the N1/N3 and N2/N4 energy states are evenly distributed (Figure
1.5.4b). The population difference for nucleus HX still remains the same. However, the
system must be restored to equilibrium by restoring population distribution, which can
only be achieved via WX, W0 and W2 transitions. This cross relaxation causes a change in
population difference of nucleus HX that leads to change in the intensity of nucleus HX.
Cross relaxation via W0 mechanism leads to a decrease in intensity of proton X.
Conversely, cross relaxation via W2 mechanism leads to an increase in intensity of proton
X. However, these two mechanisms function simultaneously, in addition to competing
with WX. Therefore, NOE dipolar coupling depends upon the relative rates at which these
three (WX, W0, W2) mechanisms occur.
Figure 1.5.4 Scheme illustrating the NOE effect in a two spin system; (a) spin populations before
saturation of nucleus HA, (b) spin populations after saturation of nucleus HA.
74
1.5.5 NMR of rate processes
1.5.5.1 Base pair kinetics
The kinetics of base pair opening and imino proton exchange represents a probe for the
dynamic motions of base pairs in nucleic acids. NMR spectroscopy can be used to
measure base pair kinetics and imino proton exchange rates, which can provide additional
information to complement the structural studies of nucleic acids and aid in the
investigation of RNA-Mg2+
and RNA-RNA interactions.
Base pair kinetics is interpreted by a two-state model (open/closed) whereby the base pair
opens and closes, but imino proton exchange only occurs in the open state; in the closed
state the imino protons are protected in Watson-Crick base pairing.71
Once it is in the open
state, the imino proton can exchange via an acid-base catalysed reaction with proton
acceptors. The imino proton exchange rate induced by a proton acceptor is:
Equation 1.5.2
where kcoll is the collision rate, [acc] is the proton acceptor concentration, and the ΔpK is
the pKa difference between the imino proton (pKG = 9.3, pKU = 9.2) and acceptor.72
The
collision rate is typically in the range of 108 to 10
9 s
-1. A successful collision is needed for
proton exchange. When the pK of the acceptor is larger than that of the donor, the rate of
exchange is efficient, although this is dependent on the proton acceptor concentration as
shown in the above equation. When the pK of the acceptor is much less than that of the
donor, as in imino proton exchange with water (pK of H3O+ is -1.7), the rate of exchange
is less efficient.
However, imino proton exchange in base pairs is a two-step process requiring base pair
opening, followed by a transfer to a proton acceptor such as water or a catalyst, eg. NH3.
The imino proton exchange time induced by a proton acceptor is:
75
Equation 1.5.3
where τ0 is the base pair lifetime, Kdiss is the base pair dissociation constant and kex,acc is
the imino proton exchange rate in the open state. The base pair lifetime is a measure of the
minimum time required for the base pair to open. If the imino proton exchange occurs at
every opening event, then the exchange time (τex) is equal to the base pair lifetime (τ0). In
RNA duplexes, base pair lifetimes can range from 2ms to 50ms and 0.1 to 2ms at 15°C for
d(G.C) and d(A.T) base pairs, respectively.72
Base pair lifetimes can vary for G.C and A.T
base pairs within an RNA sequence, depending on base pair stability and exposure to
solvent. Imino proton exchange rates can vary from 1.0s-1
to 40.0s-1
for guanine and uracil
imino protons at 35°C.73
1.5.5.2 Chemical exchange
Chemical exchange processes are significant in NMR spectroscopy as they can provide
information on dynamic processes. The linewidth and line intensity of NMR resonance
signals are sensitive to chemical exchange processes, so allow the means to study
dynamics in NMR. Here, the concept of exchange regimes will be introduced for
intramolecular exchange.
If a molecule is in equilibrium between two conformations, A and B, then the individual
nuclei concerned will experience two different chemical environments. Since the chemical
shift of nuclei depends upon their chemical environment, the effect on peak positions
depends on the rates of interconversion, kA and kB, and the magnitude of the difference in
chemical shifts. The rates of interconversion and the equilibrium are concentration
independent as the conformational changes occur within the same molecule.
If the interconversion rate is slow on the NMR timescale, whereby kA and kB << Δυ (Δυ is
the difference in chemical shift measured in Hz), then two separate peaks are observed.
This type of exchange regime is called slow exchange. The two peaks correspond to the
two different conformations of A and B and the relative intensities of the two peaks
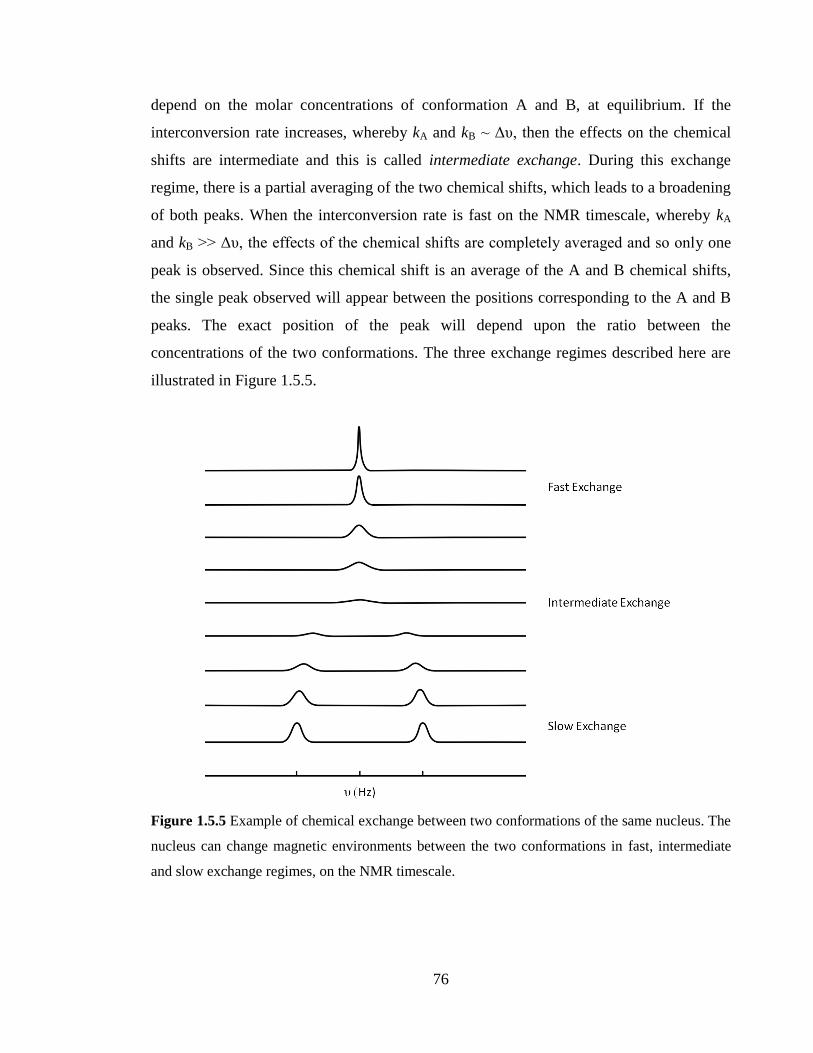
76
depend on the molar concentrations of conformation A and B, at equilibrium. If the
interconversion rate increases, whereby kA and kB ~ Δυ, then the effects on the chemical
shifts are intermediate and this is called intermediate exchange. During this exchange
regime, there is a partial averaging of the two chemical shifts, which leads to a broadening
of both peaks. When the interconversion rate is fast on the NMR timescale, whereby kA
and kB >> Δυ, the effects of the chemical shifts are completely averaged and so only one
peak is observed. Since this chemical shift is an average of the A and B chemical shifts,
the single peak observed will appear between the positions corresponding to the A and B
peaks. The exact position of the peak will depend upon the ratio between the
concentrations of the two conformations. The three exchange regimes described here are
illustrated in Figure 1.5.5.
Figure 1.5.5 Example of chemical exchange between two conformations of the same nucleus. The
nucleus can change magnetic environments between the two conformations in fast, intermediate
and slow exchange regimes, on the NMR timescale.
77
1.5.6 1D 19
F-NMR and 31
P-NMR
The most commonly used 1D heteronuclear NMR experiments, apart from 13
C-NMR,
include 19
F-NMR and 31
P-NMR. The 19
F nucleus has a spin of ½, a similar gyromagnetic
ratio to 1H and a natural abundance of 100%, which gives it a relative sensitivity of 0.83
(when 1H is 1.00). One particular advantage of
19F-NMR spectroscopy is the large
chemical shift range (>1200ppm), which is much greater than for protons (~15ppm).74
This large range is attributed to the dominance of paramagnetic shielding, as opposed to
diamagnetic shielding in 1H-NMR, which is responsible for the wide variation of
19F
chemical shifts. The 19
F nucleus is easily accessible by NMR spectroscopy, but its
application has been less important because fluorine compounds are rarely found in nature.
However, 19
F-NMR has become increasingly more important in studying biological
systems, whereby 19
F analogues of biologically important molecules can be obtained.
Recently, 19
F-NMR has been exploited for structure analysis, binding studies and
metabolic studies.75 76
In nucleic acids, 5-fluorouridine (5-FU) substitutions are largely
used to incorporate 19
F labels in DNA or RNA sequences. Therefore, 19
F-NMR of
fluorinated DNA/RNA samples provides a valuable tool for probing nucleic acid
secondary structure, dynamics and interactions. 19
F chemical shifts of 5-FU pyrimidines
range between -90.0 to -85.0ppm and -169ppm to -164ppm when referenced to
Trifluoroacetic acid (CF3COOH) and Trichlorofluoromethane (CFCl3), respectively.
The 31
P nucleus also has a spin of ½ and a natural abundance of 100%. However, due to
its low gyromagnetic ratio, the relative sensitivity is only 6.6% when compared to 1H,
which can seriously limit the use of 31
P-NMR. The range of chemical shifts for
phosphorus is also very large (~4000ppm). However, in contrast to fluorine, phosphorus
has been studied more thoroughly by NMR spectroscopy as it is found in the phosphate
backbone of nucleic acids. 31
P chemical shifts are very sensitive to changes in the local
environment due to the large anisotropic distribution of electrons.77
Therefore, 31
P-NMR
spectroscopy is an excellent method to probe the backbone conformation of nucleic acid
structures. 31
P chemical shifts of nucleotides range between 4.0ppm and -6.0ppm, when
referenced to phosphoric acid.
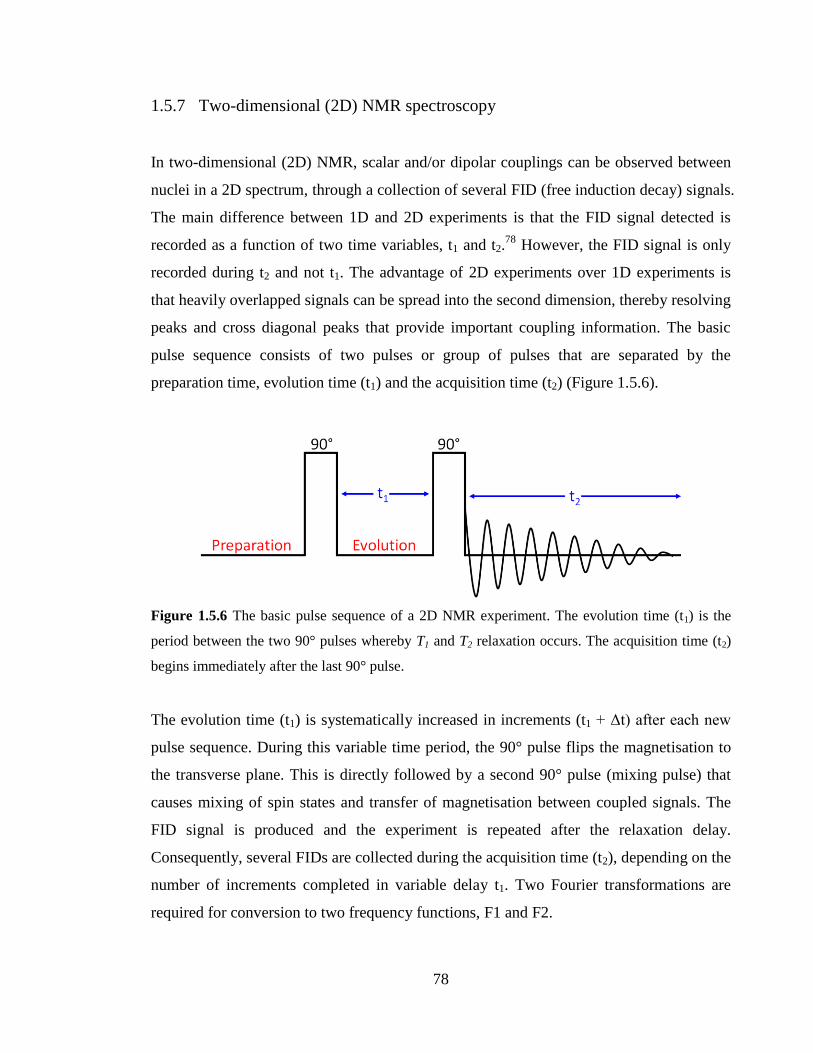
78
1.5.7 Two-dimensional (2D) NMR spectroscopy
In two-dimensional (2D) NMR, scalar and/or dipolar couplings can be observed between
nuclei in a 2D spectrum, through a collection of several FID (free induction decay) signals.
The main difference between 1D and 2D experiments is that the FID signal detected is
recorded as a function of two time variables, t1 and t2.78
However, the FID signal is only
recorded during t2 and not t1. The advantage of 2D experiments over 1D experiments is
that heavily overlapped signals can be spread into the second dimension, thereby resolving
peaks and cross diagonal peaks that provide important coupling information. The basic
pulse sequence consists of two pulses or group of pulses that are separated by the
preparation time, evolution time (t1) and the acquisition time (t2) (Figure 1.5.6).
Figure 1.5.6 The basic pulse sequence of a 2D NMR experiment. The evolution time (t1) is the
period between the two 90° pulses whereby T1 and T2 relaxation occurs. The acquisition time (t2)
begins immediately after the last 90° pulse.
The evolution time (t1) is systematically increased in increments (t1 + Δt) after each new
pulse sequence. During this variable time period, the 90° pulse flips the magnetisation to
the transverse plane. This is directly followed by a second 90° pulse (mixing pulse) that
causes mixing of spin states and transfer of magnetisation between coupled signals. The
FID signal is produced and the experiment is repeated after the relaxation delay.
Consequently, several FIDs are collected during the acquisition time (t2), depending on the
number of increments completed in variable delay t1. Two Fourier transformations are
required for conversion to two frequency functions, F1 and F2.
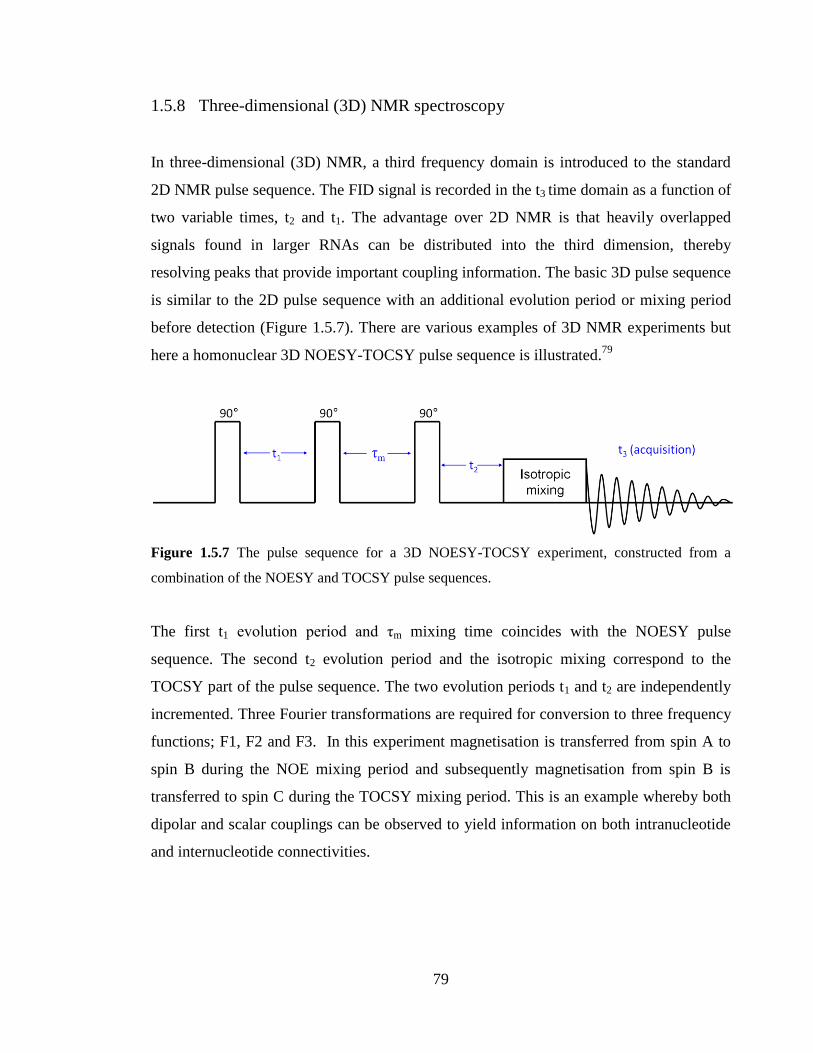
79
1.5.8 Three-dimensional (3D) NMR spectroscopy
In three-dimensional (3D) NMR, a third frequency domain is introduced to the standard
2D NMR pulse sequence. The FID signal is recorded in the t3 time domain as a function of
two variable times, t2 and t1. The advantage over 2D NMR is that heavily overlapped
signals found in larger RNAs can be distributed into the third dimension, thereby
resolving peaks that provide important coupling information. The basic 3D pulse sequence
is similar to the 2D pulse sequence with an additional evolution period or mixing period
before detection (Figure 1.5.7). There are various examples of 3D NMR experiments but
here a homonuclear 3D NOESY-TOCSY pulse sequence is illustrated.79
Figure 1.5.7 The pulse sequence for a 3D NOESY-TOCSY experiment, constructed from a
combination of the NOESY and TOCSY pulse sequences.
The first t1 evolution period and τm mixing time coincides with the NOESY pulse
sequence. The second t2 evolution period and the isotropic mixing correspond to the
TOCSY part of the pulse sequence. The two evolution periods t1 and t2 are independently
incremented. Three Fourier transformations are required for conversion to three frequency
functions; F1, F2 and F3. In this experiment magnetisation is transferred from spin A to
spin B during the NOE mixing period and subsequently magnetisation from spin B is
transferred to spin C during the TOCSY mixing period. This is an example whereby both
dipolar and scalar couplings can be observed to yield information on both intranucleotide
and internucleotide connectivities.
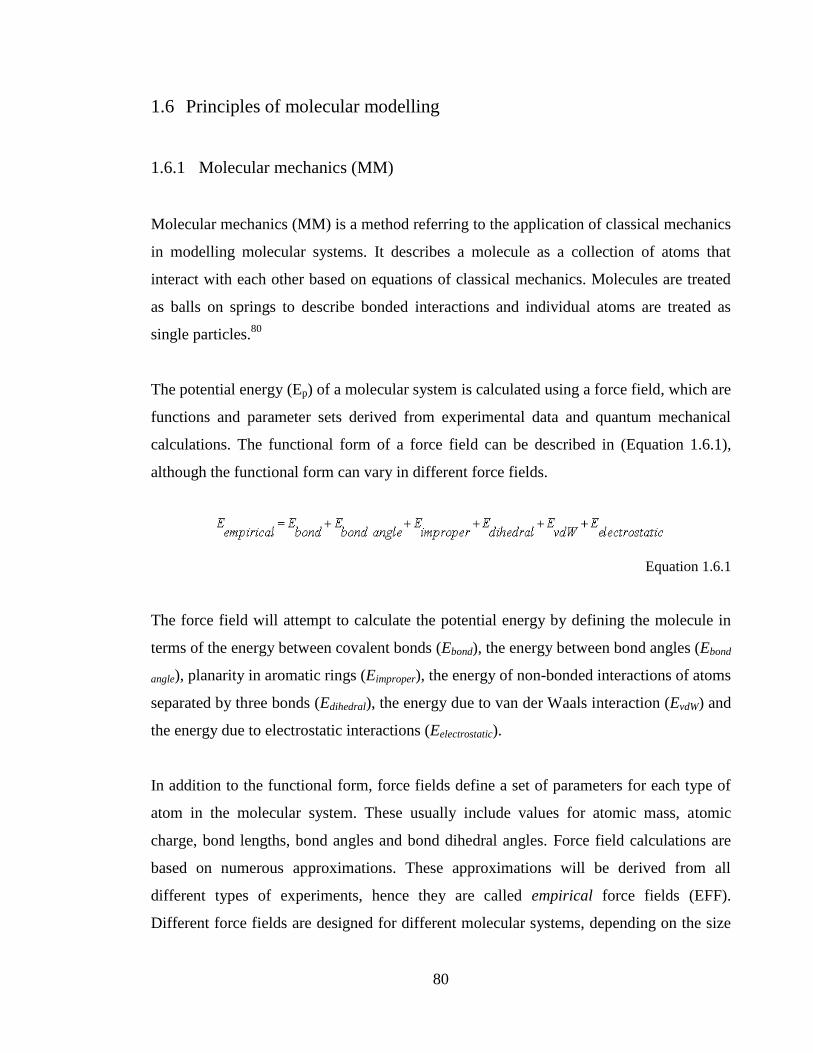
80
1.6 Principles of molecular modelling
1.6.1 Molecular mechanics (MM)
Molecular mechanics (MM) is a method referring to the application of classical mechanics
in modelling molecular systems. It describes a molecule as a collection of atoms that
interact with each other based on equations of classical mechanics. Molecules are treated
as balls on springs to describe bonded interactions and individual atoms are treated as
single particles.80
The potential energy (Ep) of a molecular system is calculated using a force field, which are
functions and parameter sets derived from experimental data and quantum mechanical
calculations. The functional form of a force field can be described in (Equation 1.6.1),
although the functional form can vary in different force fields.
Equation 1.6.1
The force field will attempt to calculate the potential energy by defining the molecule in
terms of the energy between covalent bonds (Ebond), the energy between bond angles (Ebond
angle), planarity in aromatic rings (Eimproper), the energy of non-bonded interactions of atoms
separated by three bonds (Edihedral), the energy due to van der Waals interaction (EvdW) and
the energy due to electrostatic interactions (Eelectrostatic).
In addition to the functional form, force fields define a set of parameters for each type of
atom in the molecular system. These usually include values for atomic mass, atomic
charge, bond lengths, bond angles and bond dihedral angles. Force field calculations are
based on numerous approximations. These approximations will be derived from all
different types of experiments, hence they are called empirical force fields (EFF).
Different force fields are designed for different molecular systems, depending on the size
81
and the type of molecules involved. The most popular force fields include CHARMM81
(Chemistry at HARvard Macromolecular Mechanics) and AMBER82
(Assisted Model
Building and Energy Refinement), both developed for nucleic acids and proteins.
1.6.2 Energy minimisation
The geometry of a molecule determines many of its chemical and physical properties,
therefore calculating accurate geometries of a molecular system is very important. Stable
structures best define the accurate geometry of a molecule, therefore computational
methods are employed to explore and find the most stable structures.
Energy minimisation is a method which is used to find the best atomic arrangement of a
structure that leads to a more stable structure. The stability of a structure is measured by
its energy; the lower the energy the more stable the molecule. Therefore, energy
minimisation involves exploring various possibilities to find a structure with the lowest
energy value. This is achieved by creating a potential energy surface (PES). A PES
mathematically describes the relationship between the different molecular geometries and
their corresponding single point energies. Energy minimisation is used to find minima on
the potential energy surface, which involves adjusting the structural geometry of a
molecule in order to reduce the energy of the conformation.
Various algorithms have been designed to find the lowest energy conformation of a
molecular system. These include calculus based minimisation methods, genetic algorithms,
Monte Carlo methods, quantum mechanical and molecular mechanical optimisation
methods, molecular dynamics and simulated annealing methods. Several factors need to
be taken into account in order to identify the most appropriate algorithm(s) for the given
problem. In the case of modelling nucleic acids and proteins with respect to energy
minimisation, molecular mechanical methods are most commonly employed.
82
1.6.3 Simulated annealing and molecular dynamics (MD)
Simulated annealing heats the initial structure to a very high temperature. This provides
energy to atoms, which allows them to become unstuck from their original positions and
move randomly through conformational space. Subsequently, the temperature is reduced
slowly in order to increase the chance of finding the lowest energy conformations.
Molecular dynamics (MD) simulations can provide information about the time-dependent
motion of molecular systems. A molecular dynamics simulation allows molecules to
explore conformational space in the region defined by atomic positions and velocities.
Unlike energy minimisation calculations, the MD calculation accounts for thermal motion,
providing thermal energy to molecules so they can cross potential energy barriers.
Molecular dynamics is a very important tool used to study the thermodynamic properties
and dynamics of molecules. MD simulations require a force field, which calculates the
potential energy of the system and describes the terms by which the particles in the
simulation will interact. MD involves providing kinetic energy to the PES and the
subsequent motion of the molecular system over the PES. These motions follow the laws
of classical mechanics, but for more detailed simulations, quantum mechanics can also be
employed. MD simulations calculate the future positions and velocities of atoms based on
their current positions and velocities.
A variation of molecular dynamics is restrained molecular dynamics (rMD), which
incorporates experimental data to the molecular dynamics simulation. This type of
molecular dynamics has been used to generate the NMR solution structures reported in
this thesis. The experimental data in this case consists of distance restraints derived from
NOESY data.
One disadvantage of molecular dynamics simulations is that the timescale of simulations
are much shorter than chemical processes and most physical processes, which occur in
nanoseconds or longer. Therefore, long-term processes cannot be studied as they would
take too much computational time.
83
1.7 Previous work
As part of my MSc project (University of Manchester, 2007), I carried out a research
project. The structure and Mg2+
binding properties of the conserved 16mer RNA, located
in domain 3 of the FMDV IRES, were investigated by NMR spectroscopy and molecular
modelling. Various 1D and 2D NMR experiments were performed on the 16mer apo-RNA
in 1H2O. However, the full assignment and structure determination of the 16mer apo-RNA
are now fully reported in chapter 3 of this thesis.
Molecular dynamics simulations were used to investigate the effect of Mg2+
on the FMDV
16mer RNA structure, using HyperChem software. The presence of Mg2+
alone created a
compact structure, which did not conform to the standard helical structure of A-form RNA.
Interestingly, in the presence of both water and Mg2+
, a good quality structure was
produced. The addition of Mg2+
to the 16mer RNA in water resulted in the stabilisation of
the entire 16mer RNA structure. Furthermore, the addition of excess Mg2+
around the
GNRA tetraloop revealed shorter hydrogen bond distances between the G.A sheared base
pair. These results provided preliminary evidence for the effect of Mg2+
on the 16mer
RNA structure.
Molecular modelling methods were also applied to investigate the possible RNA-RNA
interaction between the FMDV 16mer RNA and the 15mer RNA. It was hypothesised that
the two adenosine nucleotides in the GUAA tetraloop of the 16mer RNA, form A-minor
interactions with the two target G.C base pairs (G231.C241 and C232.G240) found in the
15mer RNA. It was found that the A181 nucleotide in the tetraloop could form four
possible hydrogen bonds with its target G.C base pair (G231.C241), while the A180
nucleotide could only form two possible hydrogen bonds with its target G.C base pair
(G232.C240).
84
1.8 Aim of the project
The principal aim of the project is to elucidate the three dimensional structure of the
conserved RNA motifs in the FMDV IRES and study their kinetics and interactions. For
NMR investigation, two highly conserved RNA motifs have been chosen for NMR
structure determination: the 16mer RNA and the 15mer RNA, located in the apical region
of domain 3 of the FMDV IRES. The results obtained will help us to gain a better
comprehension on the three-dimensional nature of RNA structures, which are complex
and not understood at this stage.
Mg2+
plays a vital role in the stabilisation of RNA structures and the 16mer RNA was
selected to investigate the effect of Mg2+
on RNA structure and kinetics, using NMR
spectroscopy. The aim is to solve the three-dimensional structure of the 16mer RNA in the
absence of Mg2+
and then to titrate Mg2+
to study effect on 16mer RNA tertiary structure
conformation. Subsequently, the three-dimensional structure of the 16mer RNA in the
presence of Mg2+
will be solved. Additionally, the imino proton exchange rates of the
16mer apo-RNA and Mg2+
RNA complex will be measured to quantify the effect of Mg2+
.
To allow the folding of RNA structures into complex three-dimensional structures, long-
range RNA-RNA interactions are essential for folding and function of biologically active
RNAs. However, the molecular details of these interactions are largely unknown. We
believe that the GNRA tetraloop of the 16mer RNA is involved in long-range tertiary
contacts with a conserved 15mer RNA. The objective here is to firstly solve the three-
dimensional structure of the 15mer RNA. Subsequently, the main goal is to merge the
16mer and 15mer RNAs and study the RNA-RNA complex using NMR methods. This
will provide us with any evidence of an interaction involving these two RNAs and in the
larger context it will enhance our knowledge of interactions between RNAs.
Fluorine substituted RNAs can be effectively used to study the effect of Mg2+
on RNA
structure as well as the interaction between two RNAs. The 5-FU 16mer RNA was used to
investigate the effect of Mg2+
. Subsequently, the 5-FU 15mer RNA was used to make an
85
RNA-RNA complex of two fluorinated RNA samples. The purpose was to provide any
additional evidence that could support the results found in chapters 3 and 4. Additionally,
this was a great opportunity to study fluorine substituted RNAs by NMR spectroscopy and
develop the scope for 19
F-NMR studies.
86
Chapter 2: Materials and Methods
Chapter 2 highlights all the relevant materials required to repeat the study as well as
methods used to prepare NMR samples, implement NMR experiments, process and
analyse NMR data, and finally employ structure determination protocols. Additionally, a
section has been devoted to the quantification of imino proton exchange rates.
Assistance in setting up the NMR experiments was provided by the scientific staff at
NIMR (London, U.K.) and CRMN (Lyon, France) and technical staff at the University of
Manchester. However, all the data processing, analysis, interpretation and structure
calculations were carried out by myself.
2.1 RNA sample preparation for NMR studies
Five main samples were prepared for NMR investigation. This included the FMDV
16mer-gGUAAc-tetraloop RNA sample (batches 1 and 2) and the 15mer-cAACCCCAg-
heptaloop RNA sample, with sequence 5ʹ-UCCUUG(GUAA)CAAGGA-3ʹ and 5ʹ-
GUGC(AACCCCA)GCAC-3ʹ, respectively. In addition, two fluorinated samples were
also prepared; 5-fluorouracil (5-FU) 16mer and 15mer RNAs with fluorination at the H5
position of U179 and U230 bases, respectively. These five samples were purchased from
Metabion international AG (Martinsried, Germany), synthesised chemically with HPLC
purification and used without further purification.
RNA samples from Metabion were prepared for NMR by dissolving the RNA sample in
filtered Q-water. After lyophilisation of the sample, 400μl of 20mM NaCl and 10mM
H3PO4 was added. The sample was annealed by gently heating to 80C followed by slow
cooling. NMR samples were prepared by addition of 90% filtered Q-water (1H2O) and
10% deuterated water (2H2O) or ~100% deuterated water, to a 5mm NMR tube, with a
total volume of 600μl. Samples that were reconstituted from 1H2O to
2H2O were
lyophilised extensively to remove any trace of water from the sample. The final
concentrations of the 16mer (batch 1), 16mer (batch 2), 15mer, 5-FU 16mer and 5-FU
87
15mer RNA samples were 1.21mM, 0.45mM, 0.75mM, 0.2mM and 0.16mM, respectively,
in 600μl solution.
Calculation of RNA concentrations was based on UV absorbance measurements at 260nm
(A260). For UV absorbance measurements, the diluted RNA samples were placed in a
clean sterile cuvette with another cuvette containing 1000μl filtered Q-water prepared as a
‘blank’. The baseline was zeroed using another blank in the sample chamber before the
A260 measurement was made. RNA absorbs at 260nm producing a sharp peak observable
in the spectrum. The absorbance at this wavelength was measured and used to calculate
the concentration of the sample using the molecular weight of the RNA and also the
calculated (µg/OD260) value. These values were obtained using an oligonucleotide
calculator found online at www.ribotask.com.
A 64mM Mg2+
stock solution (1.0ml) was made in 1H2O, based on the concentration of the
16mer RNA (batch 1). The 16mer RNA sample (batch 1) was titrated with Mg2+
.
Titrations were performed by four separate additions of Mg2+
, with concentrations of
0.605mM (0.5eq), 1.21mM (1.0eq), 2.42mM (2.0eq) and 6.05mM (5.0eq). A total of
100μl of Mg2+
was added to the sample, which was subsequently lyophilised and
constituted to 600μl of 1H2O. The 16mer apo-RNA and Mg
2+ RNA complex (batch 1) was
used for structure determination and monitoring the effect of Mg2+
. For the 16mer RNA
sample (batch 2), a 35μl addition of Mg2+
was made corresponding to 5.0eq. This sample
was used for measuring the imino proton exchange rates and also for producing the
16mer/15mer RNA-RNA complex. An addition of 59μl of Mg2+
was made to the 15mer
RNA sample, corresponding to 5.0eq. Subsequently, the 16mer/15mer RNA-RNA
complex was formed by addition of 437μl of the 15mer RNA to the 16mer RNA (batch 2),
producing a 0.45mM RNA-RNA complex. The remaining 15mer Mg2+
RNA sample was
made up to 600μl producing a concentration of 0.23mM.
A second 76.7mM Mg2+
stock solution (1.0ml) was made in 2H2O. A volume of 13μl and
10.5μl of this stock solution was added to the 5-FU 16mer and 5-FU 15mer RNA samples,
respectively, corresponding to 5.0eq of Mg2+
. The fluorinated 16mer/15mer RNA-RNA
88
complex was formed by addition of 225μl of the 5-FU 15mer to a 0.06mM 5-FU 16mer
RNA sample. The sample was lyophilised and constituted into 600μl of 2H2O, producing a
0.06mM RNA-RNA complex of the two fluorinated RNAs.
2.2 NMR spectroscopy
2.2.1 NMR spectrometers
NMR experiments were acquired using Bruker Avance 600/700 MHz spectrometers and
Varian Inova 600/800 MHz spectrometers at NIMR (National Institute for Medical
Research) in Mill Hill, London. Access was also given to the latest Bruker Avance 1GHz
spectrometer at the Centre de RMN à Très Hauts Champs (CRMN) in Lyon, France. Our
research group was one of the first groups in the world to gain access to the 1GHz
spectrometer. Furthermore, a Bruker 400 MHz spectrometer was also used at the
University of Manchester, School of Chemistry.
Only the Bruker 600 MHz, 700 MHz and 1GHz spectrometers were equipped with
cryogenically cooled probes. All the spectrometers, except for the Bruker 400 MHz, were
equipped with triple resonance (1H,
13C,
15N) probes. The Varian 600 MHz spectrometer
was equipped with probes capable of detecting 19
F and 31
P nuclei. The Bruker 400 MHz
spectrometer was equipped with a broadband probe capable of detecting 19
F and 31
P nuclei.
All spectrometers were equipped with variable temperature units.
2.2.2 NMR experimental parameters
Several NMR experimental parameters were taken into consideration when performing
multidimensional NMR experiments. The most important parameters required to set up
NMR experiments included the 90º pulse width, number of scans, spectral width, carrier
frequency, total number of data points, number of experiments (for 2D and 3D only) and
water suppression techniques.
89
NMR spectra were acquired using the software supplied by Bruker and Varian
spectrometers. The 90º pulses were calibrated separately for each sample on the
spectrometers used in the NIMR facility and EU-NMR. Generally, for small RNAs the
pulse width is between 6-10μs. However, the spectrometers used in the University of
Manchester had default settings and so the pulse width was set to 10.00μs. The number of
scans used for NMR experiments varies greatly and depends on the spectrometer
frequency, the concentration of the RNA sample and the type of experiment. For 1H-NMR
experiments, the number of scans generally ranged between 128-1024 scans. A larger
number of scans were used for 31
P-NMR and 19
F-NMR experiments for better sensitivity.
For 2D experiments, the number of scans normally ranged between 16-64 scans. The
spectral width used in 1H-NMR experiments was dependent on the type of solvent in the
sample. Samples in 1H2O had a larger spectral width range between 20-26ppm, which
allowed the observation of the lowfield imino proton region. Samples in 2H2O had smaller
spectral width of typically 10ppm. The carrier frequency was always set to the water
signal frequency for the 1H dimension to minimise any artefacts. The total number of data
points acquired for 1D NMR experiments usually ranged between 8192 and 65536. In 2D
experiments the number of data points in the first dimension was normally 4096, but the
number of data points in the second dimension was the same as the number of experiments.
The number of experiments refers to the number of increments in the evolution period(s),
which is only applicable for 2D and 3D NMR experiments. This typically ranged between
400-1200 in 2D NMR experiments. The WATERGATE water suppression technique was
used to reduce the sharp water signal of samples in 1H2O.
83 Conversely, the presaturation
technique was used to suppress any residual water peak of samples in 2H2O.
84 Details for
these two water suppression techniques are given in sub-section 2.3.1.
2.2.3 Data processing and analysis
All 1D NMR data were processed using the Spinworks program. The NMRPipe program
was used to process both 2D and 3D raw NMR data.85
NMRPipe is a program designed
for multidimensional spectral processing and analysis. The NMRPipe script that was used
consisted of three parts (Appendix I). The first part converts the .fid file from
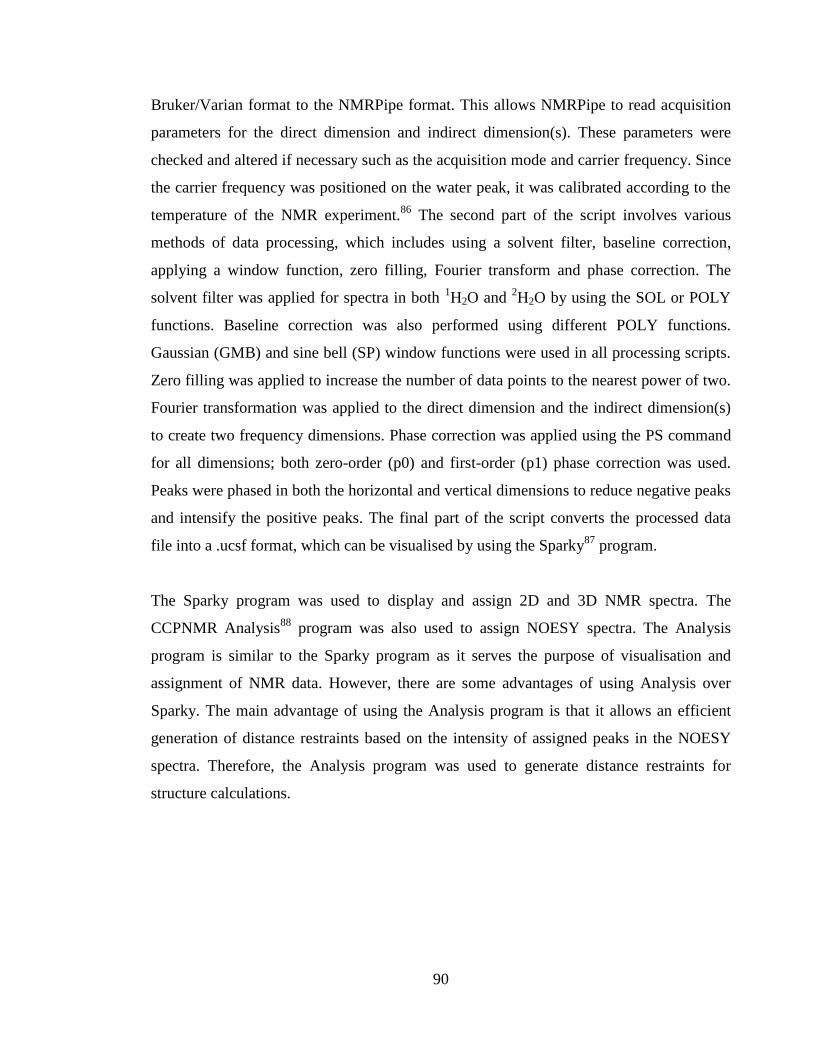
90
Bruker/Varian format to the NMRPipe format. This allows NMRPipe to read acquisition
parameters for the direct dimension and indirect dimension(s). These parameters were
checked and altered if necessary such as the acquisition mode and carrier frequency. Since
the carrier frequency was positioned on the water peak, it was calibrated according to the
temperature of the NMR experiment.86
The second part of the script involves various
methods of data processing, which includes using a solvent filter, baseline correction,
applying a window function, zero filling, Fourier transform and phase correction. The
solvent filter was applied for spectra in both 1H2O and
2H2O by using the SOL or POLY
functions. Baseline correction was also performed using different POLY functions.
Gaussian (GMB) and sine bell (SP) window functions were used in all processing scripts.
Zero filling was applied to increase the number of data points to the nearest power of two.
Fourier transformation was applied to the direct dimension and the indirect dimension(s)
to create two frequency dimensions. Phase correction was applied using the PS command
for all dimensions; both zero-order (p0) and first-order (p1) phase correction was used.
Peaks were phased in both the horizontal and vertical dimensions to reduce negative peaks
and intensify the positive peaks. The final part of the script converts the processed data
file into a .ucsf format, which can be visualised by using the Sparky87
program.
The Sparky program was used to display and assign 2D and 3D NMR spectra. The
CCPNMR Analysis88
program was also used to assign NOESY spectra. The Analysis
program is similar to the Sparky program as it serves the purpose of visualisation and
assignment of NMR data. However, there are some advantages of using Analysis over
Sparky. The main advantage of using the Analysis program is that it allows an efficient
generation of distance restraints based on the intensity of assigned peaks in the NOESY
spectra. Therefore, the Analysis program was used to generate distance restraints for
structure calculations.
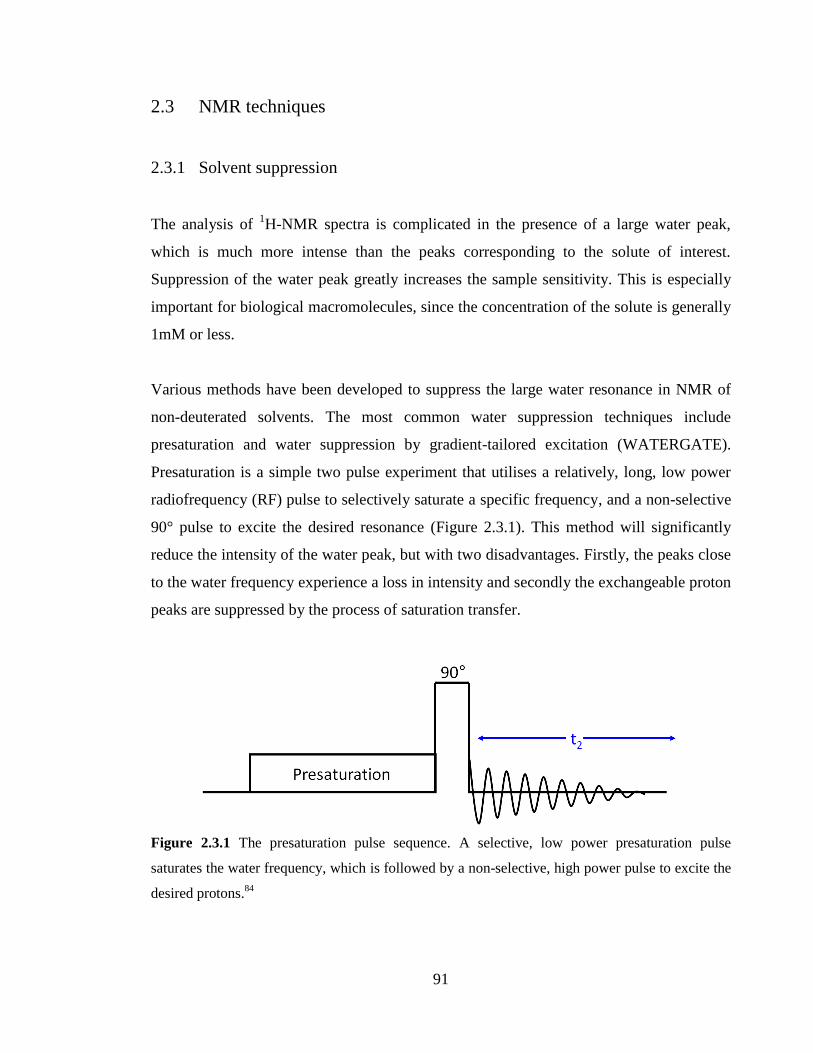
91
2.3 NMR techniques
2.3.1 Solvent suppression
The analysis of 1H-NMR spectra is complicated in the presence of a large water peak,
which is much more intense than the peaks corresponding to the solute of interest.
Suppression of the water peak greatly increases the sample sensitivity. This is especially
important for biological macromolecules, since the concentration of the solute is generally
1mM or less.
Various methods have been developed to suppress the large water resonance in NMR of
non-deuterated solvents. The most common water suppression techniques include
presaturation and water suppression by gradient-tailored excitation (WATERGATE).
Presaturation is a simple two pulse experiment that utilises a relatively, long, low power
radiofrequency (RF) pulse to selectively saturate a specific frequency, and a non-selective
90° pulse to excite the desired resonance (Figure 2.3.1). This method will significantly
reduce the intensity of the water peak, but with two disadvantages. Firstly, the peaks close
to the water frequency experience a loss in intensity and secondly the exchangeable proton
peaks are suppressed by the process of saturation transfer.
Figure 2.3.1 The presaturation pulse sequence. A selective, low power presaturation pulse
saturates the water frequency, which is followed by a non-selective, high power pulse to excite the
desired protons.84
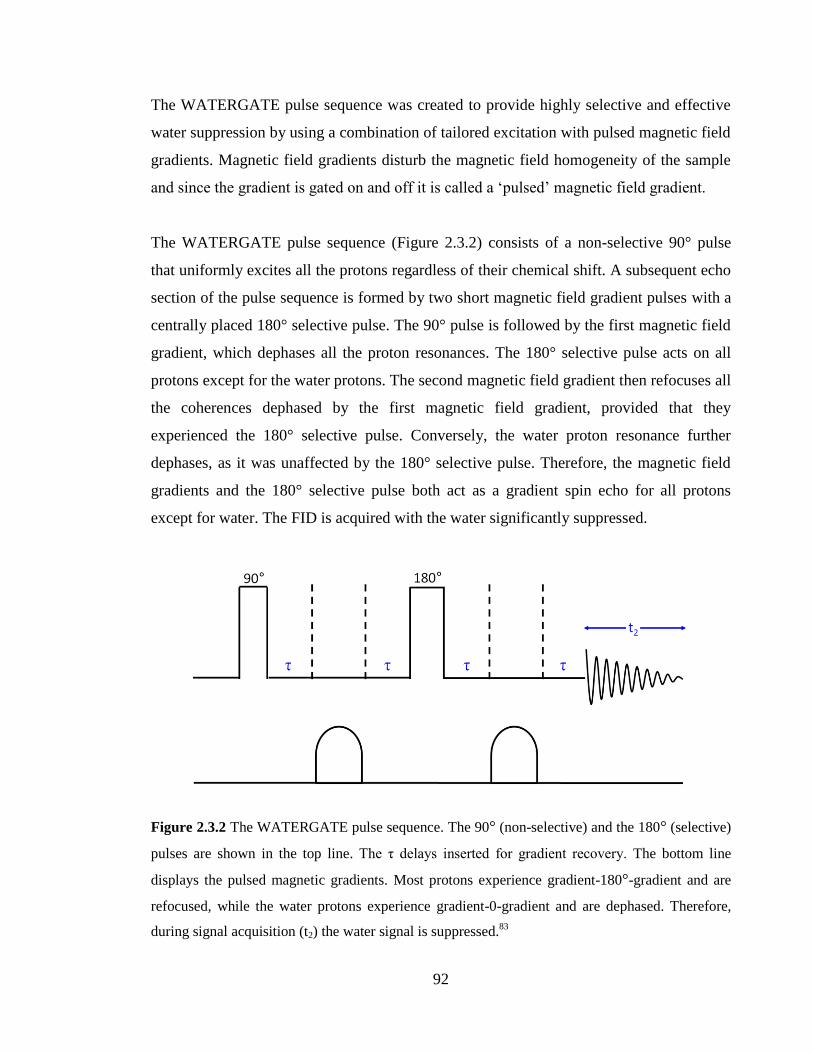
92
The WATERGATE pulse sequence was created to provide highly selective and effective
water suppression by using a combination of tailored excitation with pulsed magnetic field
gradients. Magnetic field gradients disturb the magnetic field homogeneity of the sample
and since the gradient is gated on and off it is called a ‘pulsed’ magnetic field gradient.
The WATERGATE pulse sequence (Figure 2.3.2) consists of a non-selective 90° pulse
that uniformly excites all the protons regardless of their chemical shift. A subsequent echo
section of the pulse sequence is formed by two short magnetic field gradient pulses with a
centrally placed 180° selective pulse. The 90° pulse is followed by the first magnetic field
gradient, which dephases all the proton resonances. The 180° selective pulse acts on all
protons except for the water protons. The second magnetic field gradient then refocuses all
the coherences dephased by the first magnetic field gradient, provided that they
experienced the 180° selective pulse. Conversely, the water proton resonance further
dephases, as it was unaffected by the 180° selective pulse. Therefore, the magnetic field
gradients and the 180° selective pulse both act as a gradient spin echo for all protons
except for water. The FID is acquired with the water significantly suppressed.
Figure 2.3.2 The WATERGATE pulse sequence. The 90° (non-selective) and the 180° (selective)
pulses are shown in the top line. The τ delays inserted for gradient recovery. The bottom line
displays the pulsed magnetic gradients. Most protons experience gradient-180°-gradient and are
refocused, while the water protons experience gradient-0-gradient and are dephased. Therefore,
during signal acquisition (t2) the water signal is suppressed.83

93
2.3.2 1D NMR experiments with decoupling
19F-NMR and
31P-NMR experiments are performed with
1H decoupling in order to
simplify NMR spectra, by eliminating unwanted couplings. These experiments are
heteronuclear decoupling experiments because the observed and decoupled nuclei are
different. In 1D 19
F-NMR and 31
P-NMR decoupling experiments, the 19
F or 31
P nucleus is
observed with normal RF field, while at the same time irradiating the 1H nucleus with a
second, stronger RF field. Broadband decoupling techniques are used to irradiate all
protons within the proton spectral range, resulting in effective decoupling of all protons. It
is normally applied using a set of multiple pulses.
Figure 2.3.3 displays the pulse sequence of an ‘inverse gated decoupling’ technique. Here
the observed X nucleus is perturbed by a 90° pulse and the FID signal recorded. The
decoupling is applied only during the acquisition time to decouple all the protons.
Figure 2.3.3 1D X-{H} decoupled NMR experiment, where X represents an NMR active nucleus
apart from 1H. The decoupling pulse is activated at the same time as the FID is acquired for
nucleus X.
94
2.3.3 Variable temperature (VT) experiments
Variable temperature (VT) experiments involve performing 1D NMR experiments at
several different temperatures. VT experiments can allow the observation temperature-
dependent effects in NMR spectra, which can provide valuable information on RNA
structure and kinetics. A stack plot of the 1D NMR spectra, at different temperature points,
can be used to monitor changes in chemical shift or linewidth. Typically, 1H-NMR VT
experiments are used to monitor the extent of imino proton exchange for RNA samples in
1H2O. This can give useful information on the relative stability of base pairs.
2.3.4 T1 measurements
The inversion recovery experiment is used for the measurement of T1 values. A 180° pulse
is applied to invert the magnetisation to the -z-axis, and after a variable delay of τ seconds,
a second 90° pulse is applied which flips the magnetisation to the -y-axis where it can be
detected. The experiment is repeated with several different values of τ. Typically, a
relaxation delay of 5T1 must be given to allow the magnetisation to reach equilibrium,
although this is usually not practical. Once the experiments are complete, the spectra can
be plotted as a function of τ. Figure 2.3.4 represents the pulse sequence used for inversion
recovery experiments.
Figure 2.3.4 The inversion recovery pulse sequence. A 180° pulse is followed by a variable delay
(τ) and then a 90° detection pulse.
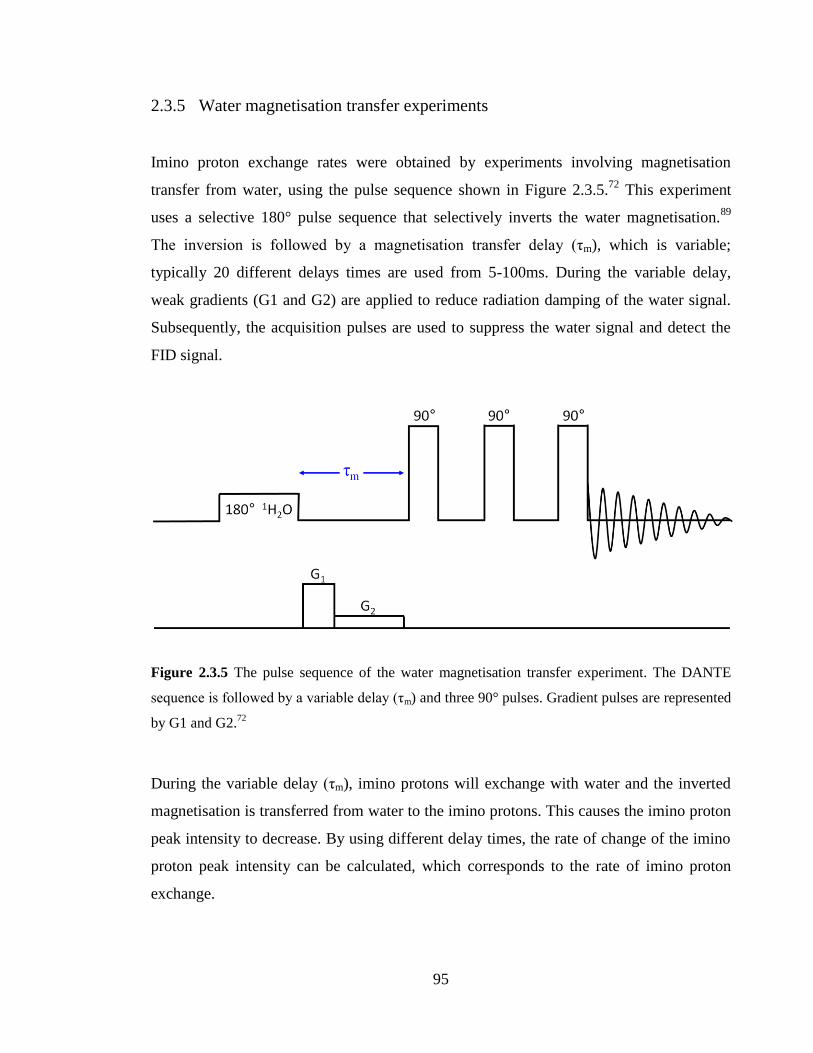
95
2.3.5 Water magnetisation transfer experiments
Imino proton exchange rates were obtained by experiments involving magnetisation
transfer from water, using the pulse sequence shown in Figure 2.3.5.72
This experiment
uses a selective 180° pulse sequence that selectively inverts the water magnetisation.89
The inversion is followed by a magnetisation transfer delay (τm), which is variable;
typically 20 different delays times are used from 5-100ms. During the variable delay,
weak gradients (G1 and G2) are applied to reduce radiation damping of the water signal.
Subsequently, the acquisition pulses are used to suppress the water signal and detect the
FID signal.
Figure 2.3.5 The pulse sequence of the water magnetisation transfer experiment. The DANTE
sequence is followed by a variable delay (τm) and three 90° pulses. Gradient pulses are represented
by G1 and G2.72
During the variable delay (τm), imino protons will exchange with water and the inverted
magnetisation is transferred from water to the imino protons. This causes the imino proton
peak intensity to decrease. By using different delay times, the rate of change of the imino
proton peak intensity can be calculated, which corresponds to the rate of imino proton
exchange.
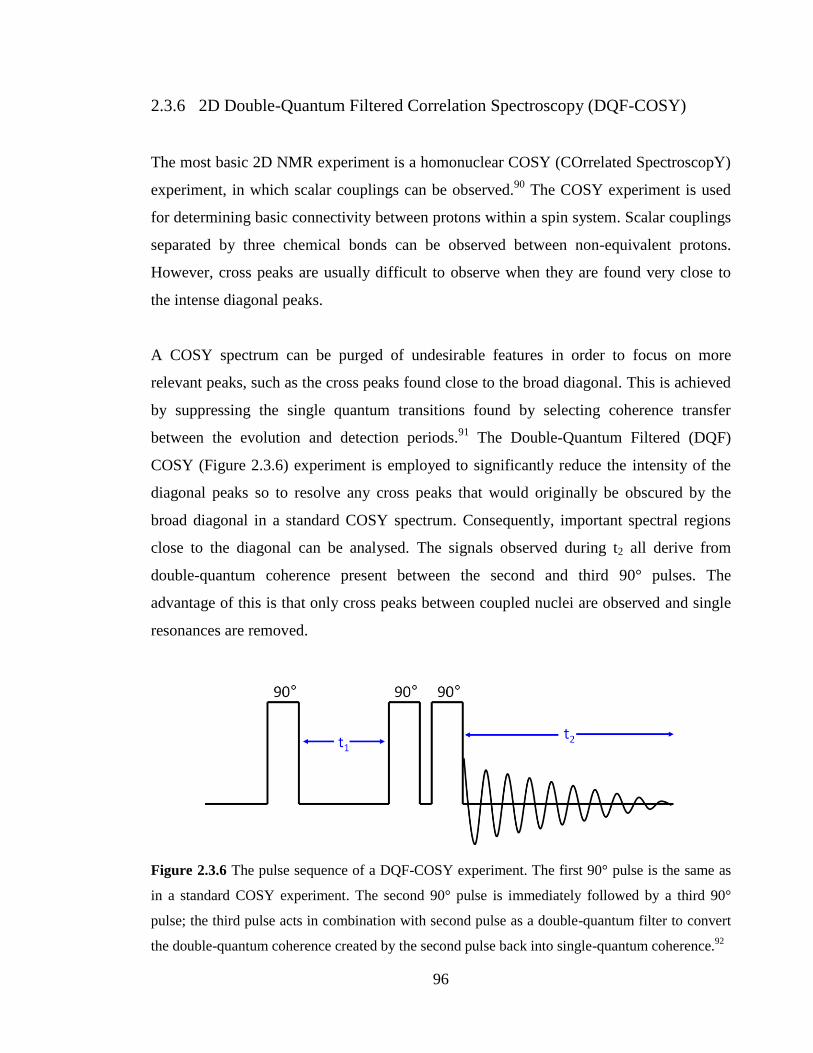
96
2.3.6 2D Double-Quantum Filtered Correlation Spectroscopy (DQF-COSY)
The most basic 2D NMR experiment is a homonuclear COSY (COrrelated SpectroscopY)
experiment, in which scalar couplings can be observed.90
The COSY experiment is used
for determining basic connectivity between protons within a spin system. Scalar couplings
separated by three chemical bonds can be observed between non-equivalent protons.
However, cross peaks are usually difficult to observe when they are found very close to
the intense diagonal peaks.
A COSY spectrum can be purged of undesirable features in order to focus on more
relevant peaks, such as the cross peaks found close to the broad diagonal. This is achieved
by suppressing the single quantum transitions found by selecting coherence transfer
between the evolution and detection periods.91
The Double-Quantum Filtered (DQF)
COSY (Figure 2.3.6) experiment is employed to significantly reduce the intensity of the
diagonal peaks so to resolve any cross peaks that would originally be obscured by the
broad diagonal in a standard COSY spectrum. Consequently, important spectral regions
close to the diagonal can be analysed. The signals observed during t2 all derive from
double-quantum coherence present between the second and third 90° pulses. The
advantage of this is that only cross peaks between coupled nuclei are observed and single
resonances are removed.
Figure 2.3.6 The pulse sequence of a DQF-COSY experiment. The first 90° pulse is the same as
in a standard COSY experiment. The second 90° pulse is immediately followed by a third 90°
pulse; the third pulse acts in combination with second pulse as a double-quantum filter to convert
the double-quantum coherence created by the second pulse back into single-quantum coherence.92
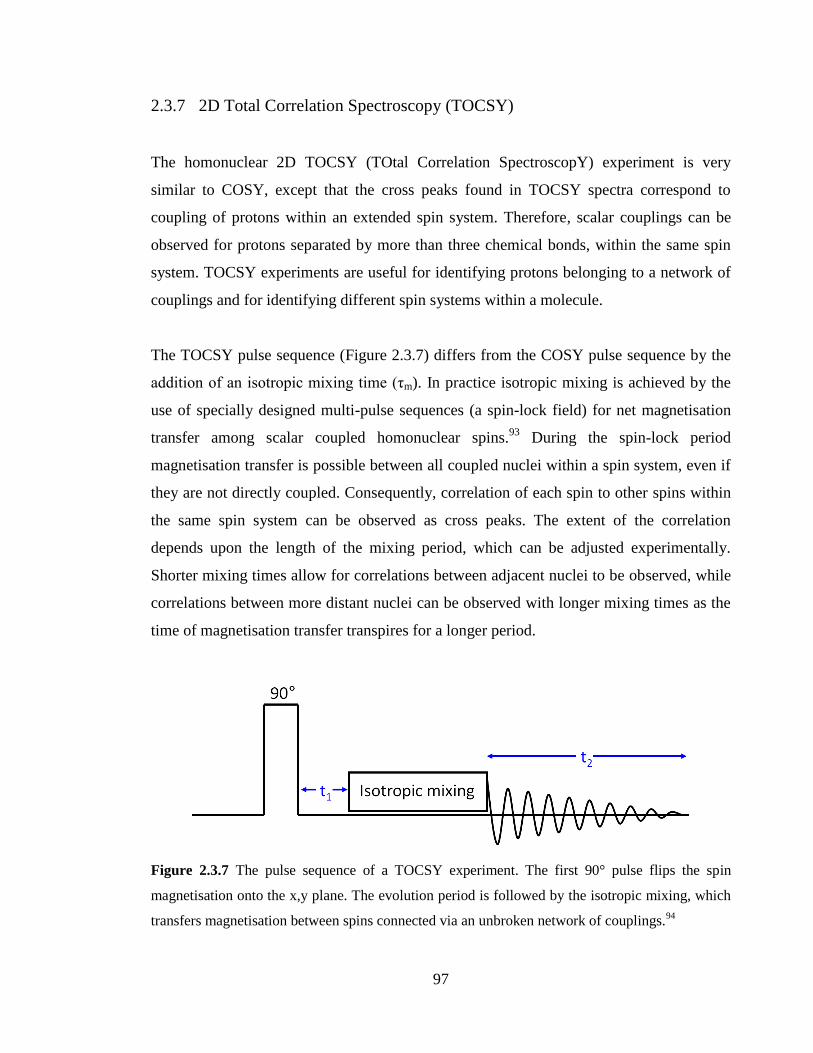
97
2.3.7 2D Total Correlation Spectroscopy (TOCSY)
The homonuclear 2D TOCSY (TOtal Correlation SpectroscopY) experiment is very
similar to COSY, except that the cross peaks found in TOCSY spectra correspond to
coupling of protons within an extended spin system. Therefore, scalar couplings can be
observed for protons separated by more than three chemical bonds, within the same spin
system. TOCSY experiments are useful for identifying protons belonging to a network of
couplings and for identifying different spin systems within a molecule.
The TOCSY pulse sequence (Figure 2.3.7) differs from the COSY pulse sequence by the
addition of an isotropic mixing time (τm). In practice isotropic mixing is achieved by the
use of specially designed multi-pulse sequences (a spin-lock field) for net magnetisation
transfer among scalar coupled homonuclear spins.93
During the spin-lock period
magnetisation transfer is possible between all coupled nuclei within a spin system, even if
they are not directly coupled. Consequently, correlation of each spin to other spins within
the same spin system can be observed as cross peaks. The extent of the correlation
depends upon the length of the mixing period, which can be adjusted experimentally.
Shorter mixing times allow for correlations between adjacent nuclei to be observed, while
correlations between more distant nuclei can be observed with longer mixing times as the
time of magnetisation transfer transpires for a longer period.
Figure 2.3.7 The pulse sequence of a TOCSY experiment. The first 90° pulse flips the spin
magnetisation onto the x,y plane. The evolution period is followed by the isotropic mixing, which
transfers magnetisation between spins connected via an unbroken network of couplings.94
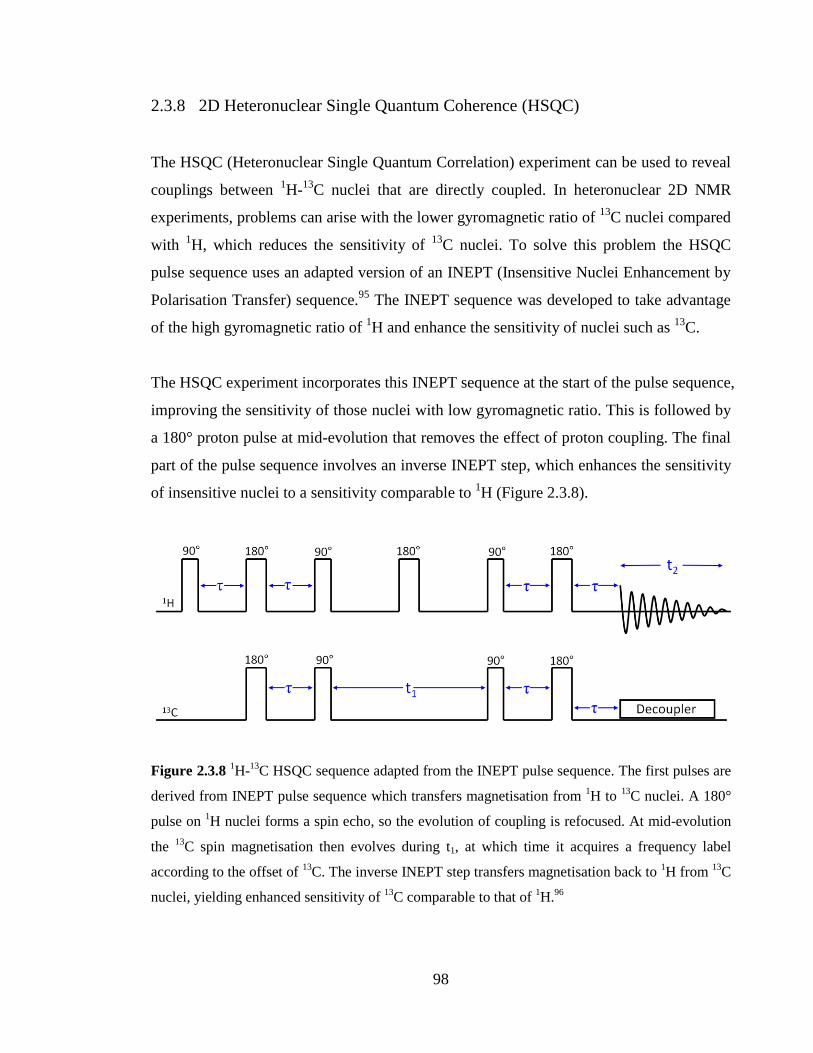
98
2.3.8 2D Heteronuclear Single Quantum Coherence (HSQC)
The HSQC (Heteronuclear Single Quantum Correlation) experiment can be used to reveal
couplings between 1H-
13C nuclei that are directly coupled. In heteronuclear 2D NMR
experiments, problems can arise with the lower gyromagnetic ratio of 13
C nuclei compared
with 1H, which reduces the sensitivity of
13C nuclei. To solve this problem the HSQC
pulse sequence uses an adapted version of an INEPT (Insensitive Nuclei Enhancement by
Polarisation Transfer) sequence.95
The INEPT sequence was developed to take advantage
of the high gyromagnetic ratio of 1H and enhance the sensitivity of nuclei such as
13C.
The HSQC experiment incorporates this INEPT sequence at the start of the pulse sequence,
improving the sensitivity of those nuclei with low gyromagnetic ratio. This is followed by
a 180° proton pulse at mid-evolution that removes the effect of proton coupling. The final
part of the pulse sequence involves an inverse INEPT step, which enhances the sensitivity
of insensitive nuclei to a sensitivity comparable to 1H (Figure 2.3.8).
Figure 2.3.8 1H-
13C HSQC sequence adapted from the INEPT pulse sequence. The first pulses are
derived from INEPT pulse sequence which transfers magnetisation from 1H to
13C nuclei. A 180°
pulse on 1H nuclei forms a spin echo, so the evolution of coupling is refocused. At mid-evolution
the 13
C spin magnetisation then evolves during t1, at which time it acquires a frequency label
according to the offset of 13
C. The inverse INEPT step transfers magnetisation back to 1H from
13C
nuclei, yielding enhanced sensitivity of 13
C comparable to that of 1H.
96
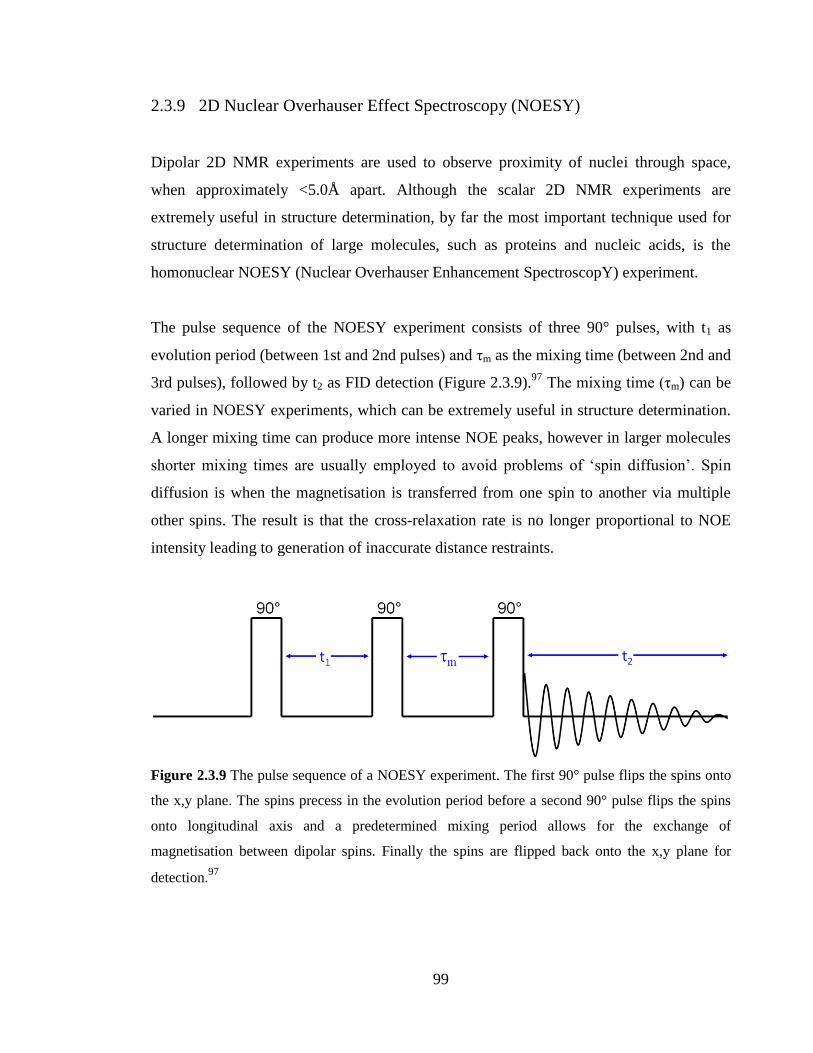
99
2.3.9 2D Nuclear Overhauser Effect Spectroscopy (NOESY)
Dipolar 2D NMR experiments are used to observe proximity of nuclei through space,
when approximately <5.0Å apart. Although the scalar 2D NMR experiments are
extremely useful in structure determination, by far the most important technique used for
structure determination of large molecules, such as proteins and nucleic acids, is the
homonuclear NOESY (Nuclear Overhauser Enhancement SpectroscopY) experiment.
The pulse sequence of the NOESY experiment consists of three 90° pulses, with t1 as
evolution period (between 1st and 2nd pulses) and τm as the mixing time (between 2nd and
3rd pulses), followed by t2 as FID detection (Figure 2.3.9).97
The mixing time (τm) can be
varied in NOESY experiments, which can be extremely useful in structure determination.
A longer mixing time can produce more intense NOE peaks, however in larger molecules
shorter mixing times are usually employed to avoid problems of ‘spin diffusion’. Spin
diffusion is when the magnetisation is transferred from one spin to another via multiple
other spins. The result is that the cross-relaxation rate is no longer proportional to NOE
intensity leading to generation of inaccurate distance restraints.
Figure 2.3.9 The pulse sequence of a NOESY experiment. The first 90° pulse flips the spins onto
the x,y plane. The spins precess in the evolution period before a second 90° pulse flips the spins
onto longitudinal axis and a predetermined mixing period allows for the exchange of
magnetisation between dipolar spins. Finally the spins are flipped back onto the x,y plane for
detection.97
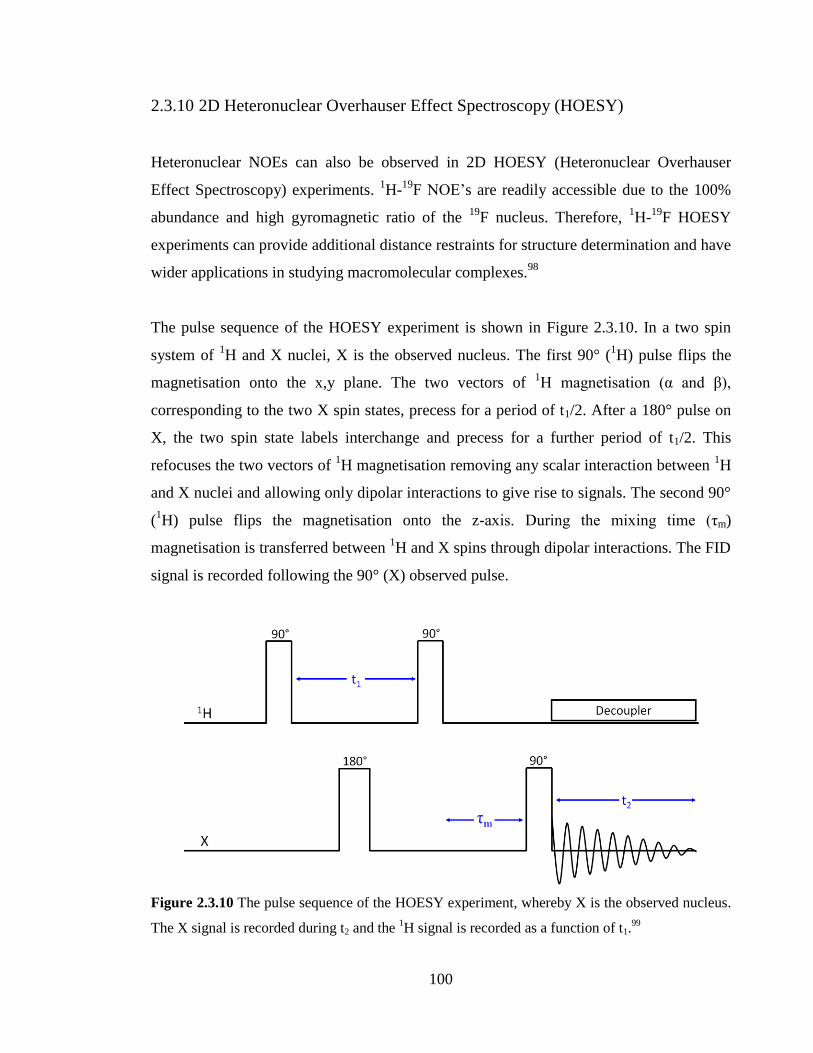
100
2.3.10 2D Heteronuclear Overhauser Effect Spectroscopy (HOESY)
Heteronuclear NOEs can also be observed in 2D HOESY (Heteronuclear Overhauser
Effect Spectroscopy) experiments. 1H-
19F NOE’s are readily accessible due to the 100%
abundance and high gyromagnetic ratio of the 19
F nucleus. Therefore, 1H-
19F HOESY
experiments can provide additional distance restraints for structure determination and have
wider applications in studying macromolecular complexes.98
The pulse sequence of the HOESY experiment is shown in Figure 2.3.10. In a two spin
system of 1H and X nuclei, X is the observed nucleus. The first 90° (
1H) pulse flips the
magnetisation onto the x,y plane. The two vectors of 1H magnetisation (α and β),
corresponding to the two X spin states, precess for a period of t1/2. After a 180° pulse on
X, the two spin state labels interchange and precess for a further period of t1/2. This
refocuses the two vectors of 1H magnetisation removing any scalar interaction between
1H
and X nuclei and allowing only dipolar interactions to give rise to signals. The second 90°
(1H) pulse flips the magnetisation onto the z-axis. During the mixing time (τm)
magnetisation is transferred between 1H and X spins through dipolar interactions. The FID
signal is recorded following the 90° (X) observed pulse.
Figure 2.3.10 The pulse sequence of the HOESY experiment, whereby X is the observed nucleus.
The X signal is recorded during t2 and the 1H signal is recorded as a function of t1.
99
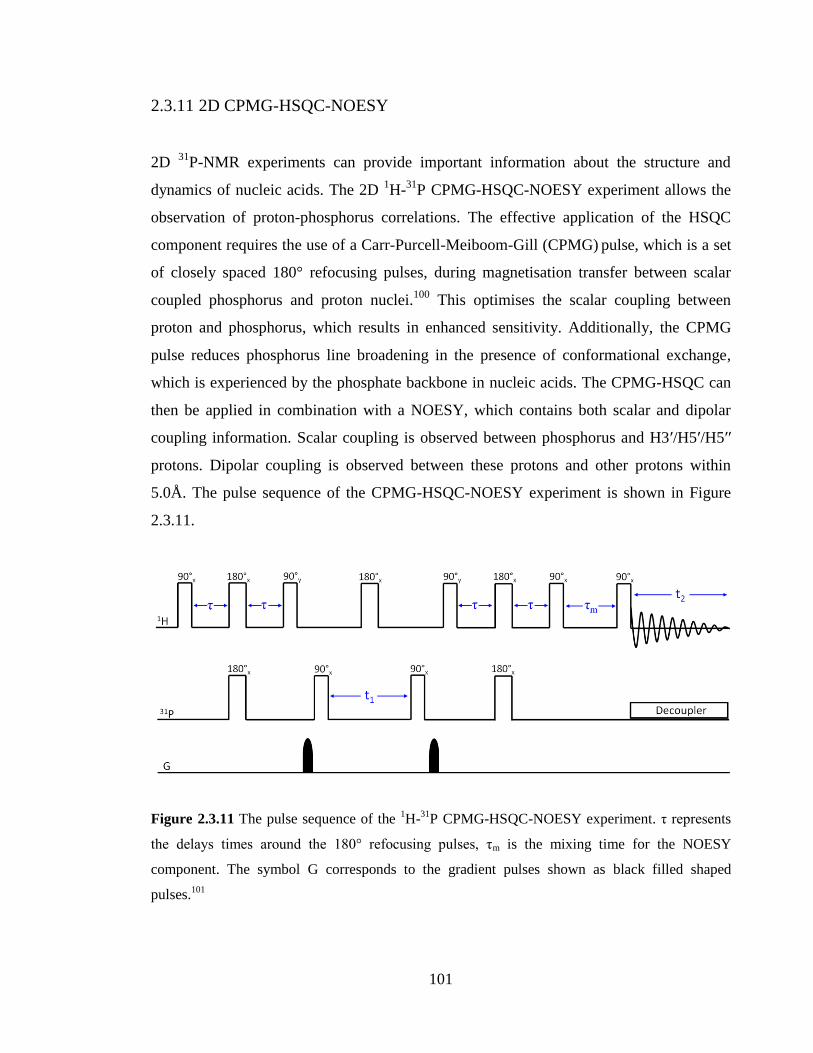
101
2.3.11 2D CPMG-HSQC-NOESY
2D 31
P-NMR experiments can provide important information about the structure and
dynamics of nucleic acids. The 2D 1H-
31P CPMG-HSQC-NOESY experiment allows the
observation of proton-phosphorus correlations. The effective application of the HSQC
component requires the use of a Carr-Purcell-Meiboom-Gill (CPMG) pulse, which is a set
of closely spaced 180° refocusing pulses, during magnetisation transfer between scalar
coupled phosphorus and proton nuclei.100
This optimises the scalar coupling between
proton and phosphorus, which results in enhanced sensitivity. Additionally, the CPMG
pulse reduces phosphorus line broadening in the presence of conformational exchange,
which is experienced by the phosphate backbone in nucleic acids. The CPMG-HSQC can
then be applied in combination with a NOESY, which contains both scalar and dipolar
coupling information. Scalar coupling is observed between phosphorus and H3ʹ/H5ʹ/H5ʹʹ
protons. Dipolar coupling is observed between these protons and other protons within
5.0Å. The pulse sequence of the CPMG-HSQC-NOESY experiment is shown in Figure
2.3.11.
Figure 2.3.11 The pulse sequence of the 1H-
31P CPMG-HSQC-NOESY experiment. τ represents
the delays times around the 180° refocusing pulses, τm is the mixing time for the NOESY
component. The symbol G corresponds to the gradient pulses shown as black filled shaped
pulses.101
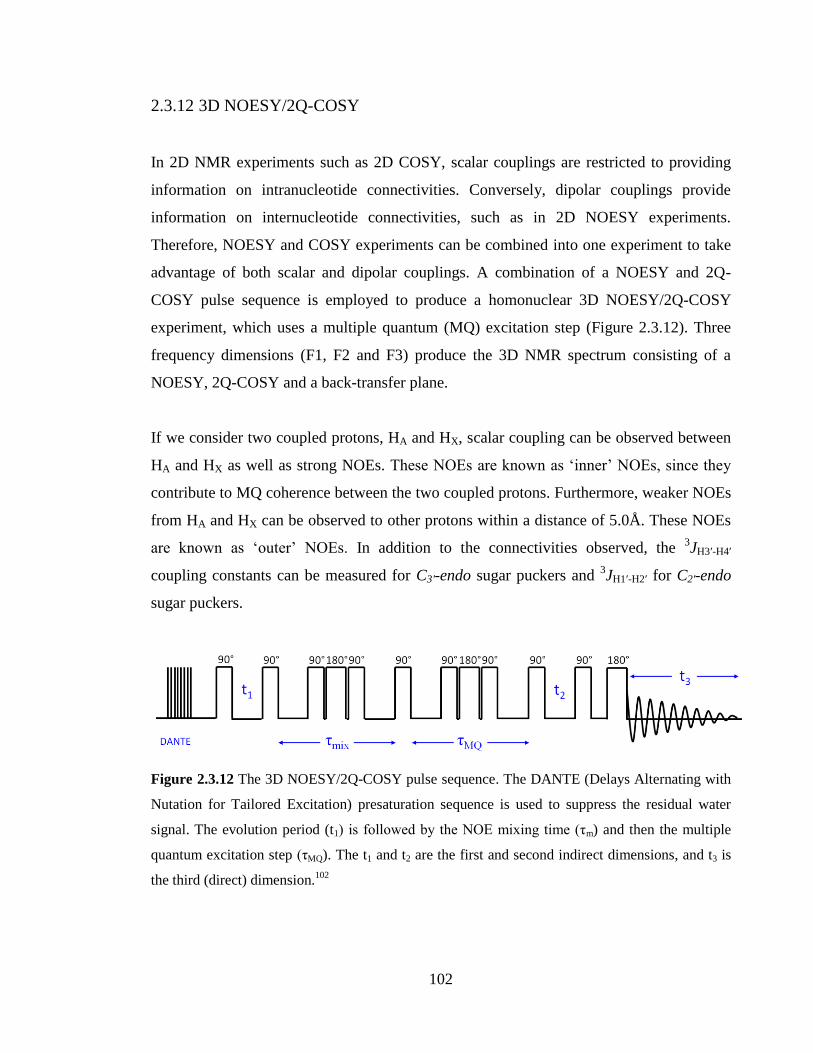
102
2.3.12 3D NOESY/2Q-COSY
In 2D NMR experiments such as 2D COSY, scalar couplings are restricted to providing
information on intranucleotide connectivities. Conversely, dipolar couplings provide
information on internucleotide connectivities, such as in 2D NOESY experiments.
Therefore, NOESY and COSY experiments can be combined into one experiment to take
advantage of both scalar and dipolar couplings. A combination of a NOESY and 2Q-
COSY pulse sequence is employed to produce a homonuclear 3D NOESY/2Q-COSY
experiment, which uses a multiple quantum (MQ) excitation step (Figure 2.3.12). Three
frequency dimensions (F1, F2 and F3) produce the 3D NMR spectrum consisting of a
NOESY, 2Q-COSY and a back-transfer plane.
If we consider two coupled protons, HA and HX, scalar coupling can be observed between
HA and HX as well as strong NOEs. These NOEs are known as ‘inner’ NOEs, since they
contribute to MQ coherence between the two coupled protons. Furthermore, weaker NOEs
from HA and HX can be observed to other protons within a distance of 5.0Å. These NOEs
are known as ‘outer’ NOEs. In addition to the connectivities observed, the 3JH3ʹ-H4ʹ
coupling constants can be measured for C3ʹ-endo sugar puckers and 3JH1ʹ-H2ʹ for C2ʹ-endo
sugar puckers.
Figure 2.3.12 The 3D NOESY/2Q-COSY pulse sequence. The DANTE (Delays Alternating with
Nutation for Tailored Excitation) presaturation sequence is used to suppress the residual water
signal. The evolution period (t1) is followed by the NOE mixing time (τm) and then the multiple
quantum excitation step (τMQ). The t1 and t2 are the first and second indirect dimensions, and t3 is
the third (direct) dimension.102

103
2.4 NMR assignment of RNA
2.4.1 Assignment strategy
NMR spectroscopy is a powerful technique that is used to solve complex structural
problems. It has been used for many years to study the structure and dynamics of RNA.
However, within the current limitations of NMR spectroscopy, approximately 50
nucleotides can be analysed at high resolution with complete assignments. To assign the
structure of RNA, various NMR experiments are employed, which provide information on
base pairing, local conformation, secondary and tertiary structure of RNA. The NMR
assignment strategy of RNA is well established and usually follows a standard
methodology.103
In the past decade, advances in NMR spectroscopy have promoted
experiments for both unlabelled and labelled RNA.104-105
This assignment strategy was
applied when performing 2D and 3D NMR experiments (Figure 2.4.1).
Figure 2.4.1 Protocol for NMR assignment of RNA. The green boxes indicate the solvent used.
The red boxes contain information on the specific NMR experiments employed and the cyan boxes
represent the assignments that can be obtained from the corresponding experiment(s).
104
The NOESY experiment (2°C/1H2O) was mainly used for the assignment of imino-imino
connectivities for local secondary structure and imino-amino connectivities to establish
base pairing involved in the RNA helix. Cross peaks corresponding to imino to
H2/H5/H6/H8 connectivities were also assigned. The NOESY experiment (25°C/ 2H2O)
was used for H5-H6 assignment and sequential assignment of H6/H8-H1ʹ intra- and
internucleotide connectivities. The 1H-
13C HSQC experiment allows the observation of
1H-
13C one bond couplings, which means that proton chemical shifts can be clearly
identified due to the large dispersion of 13
C chemical shifts. Consequently, 1H-
13C HSQC
experiments were extremely useful for the assignment of cross peaks in NOESY spectra.
The DQF-COSY experiment (25°C/2H2O) was used for identification of sugar proton spin
systems. The main use of the DQF-COSY was to identify H1ʹ-H2ʹ and H3ʹ-H4ʹ cross
peaks, which provided information on the sugar pucker conformation of nucleotides. The
1H-
31P CPMG-HSQC-NOESY experiment (25°C/
2H2O) was used for phosphate backbone
assignment and confirmation of H3ʹ, H4ʹ, H5ʹ, H5ʹʹ chemical shifts, provided by 1H-
31P
couplings. The homonuclear 3D NOESY/2Q-COSY experiment allowed the identification
of sugar proton chemical shifts.
To aid in the assignment of NOESY and 1H-
13C HSQC spectra, the standard observable
chemical shifts of various 1H and
13C nuclei present in RNA were utilised. Chemical shifts
are characterised by specific ranges, which correspond to particular atoms within the RNA
structure. Table 2.4.1 presents the 1H and
13C chemical shifts of peaks observed in
NOESY and 1H-
13C HSQC spectra.
The assignment of cross peaks in NOESY spectra is the most important aspect of the
assignment procedure. There are three main steps to be taken which would allow for
complete assignment of RNA. The first step is the identification of base protons (NH, NH2,
H2, H5, H6 and H8). The second step is to identify the sugar proton spin system (H1ʹ, H2ʹ,
H3ʹ, H4ʹ, H5ʹ and H5ʹʹ). The third step is to correlate the base protons to sugar protons,
with intra- and internucleotide connectivities. These three steps are discussed in the
following sub-sections.
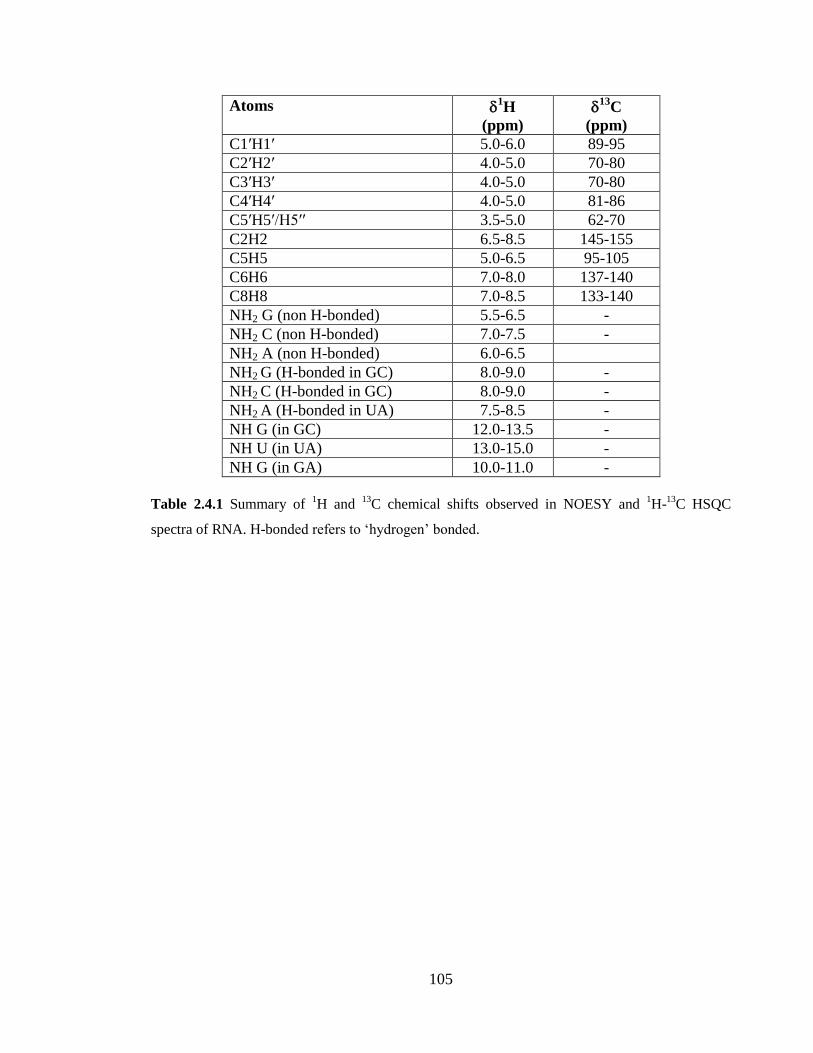
105
Atoms 1H
(ppm)
13
C
(ppm)
C1ʹH1ʹ 5.0-6.0 89-95
C2ʹH2ʹ 4.0-5.0 70-80
C3ʹH3ʹ 4.0-5.0 70-80
C4ʹH4ʹ 4.0-5.0 81-86
C5ʹH5ʹ/H5ʹʹ 3.5-5.0 62-70
C2H2 6.5-8.5 145-155
C5H5 5.0-6.5 95-105
C6H6 7.0-8.0 137-140
C8H8 7.0-8.5 133-140
NH2 G (non H-bonded) 5.5-6.5 -
NH2 C (non H-bonded) 7.0-7.5 -
NH2 A (non H-bonded) 6.0-6.5
NH2 G (H-bonded in GC) 8.0-9.0 -
NH2 C (H-bonded in GC) 8.0-9.0 -
NH2 A (H-bonded in UA) 7.5-8.5 -
NH G (in GC) 12.0-13.5 -
NH U (in UA) 13.0-15.0 -
NH G (in GA) 10.0-11.0 -
Table 2.4.1 Summary of 1H and
13C chemical shifts observed in NOESY and
1H-
13C HSQC
spectra of RNA. H-bonded refers to ‘hydrogen’ bonded.
106
2.4.2 Identification of base protons
2.4.2.1 Identification of exchangeable protons
Exchangeable proton correlations provide information on base stacking and base pairing.
Therefore, the assignment of exchangeable protons is crucial in determining the secondary
and tertiary structure of RNA. There are two different protons that fall in the exchangeable
category, imino and amino protons. Imino protons correspond to an –NH group on uracil
and guanine bases. Amino protons correspond to an –NH2 group on adenine, guanine and
cytosine bases.
Imino protons can be unambiguously assigned by observing NOE cross peaks between
imino-imino protons of guanine and uracil. Imino-imino connectivities between
neighbouring base pairs are generally at least 3.5-4.0Å apart, while cross-strand imino-
imino connectivities can be up to 5.0Å apart, in A-form RNA. Uracil and guanine imino
proton chemical shifts can be distinguished in Watson-Crick base pairing. Uracil and
guanine imino protons resonate between 13.0-15.0ppm and 12.0-14.0ppm, respectively,
which means that uracil imino protons are generally found to be lowfield of guanine imino
protons. The weaker hydrogen bonding of A.U base pairs compared to G.C base pairs
results in uracil imino protons being more exposed to the external magnetic field than
guanine imino protons. Therefore, uracil imino protons are more deshielded than guanine
imino protons, causing uracil imino protons to be shifted lowfield of guanine imino
protons. However, it can be difficult to distinguish between guanine and uracil imino
protons as they can be affected by ring current shifts and hydrogen bonding.
Imino protons from unpaired bases or non-canonical base pairing have distinct highfield
chemical shifts in the range of 10-12ppm. This is because guanine and uracil bases, which
are base paired and located in the helix, are involved in base stacking interactions. Base
stacking interactions are caused by the non-covalent interaction of π-orbitals between the
aromatic rings of adjacent bases. When an external magnetic field is directed
perpendicular to the plane of the base aromatic rings, a magnetic field is induced called
107
the ring current effect. Imino protons experience a deshielding effect because the induced
magnetic field is in the same direction as the external magnetic field, which results in a
lowfield shift. Therefore, if we apply the same principle to bases that are partially base
stacked or are not involved in base stacking, the imino proton chemical shifts would
appear more highfield.
Amino protons are found highfield of imino protons due to the increased diamagnetic
shielding provided by the second electron from hydrogen. However, the two protons in
NH2 have distinct chemical shifts as one is involved in hydrogen bonding in Watson-Crick
base pairing. The hydrogen bonded proton is found lowfield of its non-hydrogen bonded
analogue, due to deshielding from the electronegative oxygen hydrogen bond acceptor.
Cytosine NH2 resonances can be observed easily, in comparison with adenine and guanine
NH2 resonances, due to slow exchange. In Watson-Crick base pairing, two strong NOE
cross peaks can be observed from guanine NH to cytosine NH2. Adenine and guanine
amino protons are difficult to observe unless under low temperature or pH. However,
adenine amino protons can be identified from intense NOE cross peaks from uracil NH to
adenine NH2, in A.U base pairs.
2.4.2.2 Identification of non-exchangeable protons
Pyrimidine H5 and H6 resonances can be readily identified through strong NOE cross
peaks in NOESY (1H2O and
2H2O) spectra, which are observable due to the covalently
fixed 2.4Å distance between the two protons. Generally, H5 chemical shifts are identified
by examining NOE cross peaks between guanine NH to cytosine H5 and uracil NH to its
own H5. Subsequently, the identified H5 chemical shifts can be used to identify strong
H5-H6 NOE cross peaks, in NOESY (1H2O/
2H2O) spectra. Uracil and cytosine H5
resonances can be distinguished from C5 chemical shifts in 1H-
13C HSQC spectra. Uracil
C5 chemical shifts are typically found lowfield (100-105ppm) of cytosine C5 chemical
shifts (95-100ppm). From the assignment of H5-H6 cross peaks in the NOESY (2H2O)
spectrum, the H6 chemical shifts are identified, which allows the subsequent assignment
of C6-H6 correlations in 1H-
13C HSQC spectra. C6-H6 and C8-H8 peaks are found in the
108
same region in 1H-
13C HSQC spectra, due to similar
1H and
13C chemical shifts. Therefore,
the assignment of C6-H6 correlations allows for easier assignment of C8-H8 correlations
through process of elimination and the identification of H8 chemical shifts.
In Watson-Crick A.U base pairing, the adenine H2 proton gives rise to a strong NOE cross
peak to the base paired uracil imino proton, which is observed in the NOESY (1H2O)
spectrum. H2 proton chemical shifts are in a similar range to that of H6 and H8, but they
can be easily identified from 1H-
13C HSQC spectra, since C2 chemical shifts are found
lowfield of C6 and C8. Both intra- and internucleotide connectivities between H2-H1ʹ can
be observed in the NOESY (2H2O) spectrum, corresponding to a distance of 4.5 Å or
longer.
2.4.3 Identification of sugar protons
Anomeric H1ʹ chemical shifts are generally found in the 5.0-6.0ppm range; unusually
shifted H1ʹ resonances can be observed further highfield at 3.5-4.5ppm. In 1H-
13C HSQC
spectra, C1ʹ resonances are observed at 90-95ppm and provide the best way to assign H1ʹ
resonances. NOESY and TOCSY spectra can also be used to distinguish between H1ʹ and
H5 resonances within the same spectral region, through correlations between H5 and H6
protons.
In the DQF-COSY spectrum, the H1ʹ-H2ʹ coupling constant is small (<2Hz),
corresponding to the C3ʹ-endo conformation found in A-form RNA, so cross peaks
between H1ʹ and H2ʹ are not always evident. The C3ʹ-endo conformation is predominant in
regular RNA secondary structure so only a small number of cross peaks are expected in
the anomeric-sugar region. Conversely, the coupling constant between H3ʹ-H4ʹ is
approximately 7Hz for C3ʹ-endo sugars, so cross peaks between H3ʹ-H4ʹ can be more
easily observed and used to indicate a C3ʹ-endo conformation.
Sugar proton chemical shifts from H2ʹ, H3ʹ, H4ʹ, H5ʹ and H5ʹʹ can be quite difficult to
identify. These resonances all appear within the 3.0-5.0ppm range and most of them lie in
109
a narrower range of 4.0-5.0ppm. There are two different methods used to identify sugar
proton chemical shifts. The first method involves the observation of NOE cross peaks to
H1ʹ protons, in the NOESY (2H2O) spectrum. Strong NOE cross peaks are observed for
H1ʹ-H2ʹ connectivities due to the covalently fixed distance of 2.8-3.0Å, so they can be
easily assigned. Similarly, H1ʹ-H3ʹ, H1ʹ-H4ʹ, H1ʹ-H5ʹ and H1ʹ-H5ʹʹ cross peaks can also be
observed and assigned. The second method used for observation of sugar proton
resonances is by involving correlation to 31
P nuclei in the phosphodiester backbone, using
1H-
31P CPMG-HSQC-NOESY experiments. Correlations between phosphorus and H3ʹ,
H5ʹ, H5ʹʹ can be observed through scalar coupling.
2.4.4 Sequence-specific resonance assignment
In clearly defined A-form duplex regions of RNA, sequence-specific sequential
assignment is possible, which allows the identification of each nucleotide in the RNA
sequence. H6/H8-H1ʹ NOE cross peaks can be easily identified; each aromatic H6/H8
proton shows two NOE cross peaks to H1ʹ. The first corresponds to an intranucleotide
connectivity between the H6/H8 and H1ʹ protons. The second corresponds to an
internucleotide connectivity between the H1ʹ proton and its 3ʹ-neighbouring H6/H8 proton.
These connectivities are shown in Figure 2.4.2. The sequential distance between H6/H8-
H1ʹ is greater than 4.0Å in A-form RNA helices. The combination of both intranucleotide
and internucleotide connectivities can lead to full sequential assignment.
Sequence-specific sequential assignment can also be achieved by identifying
intranucleotide H1ʹ-H2ʹ connectivities and then internucleotide H2ʹ-H6/H8 connectivities
(Figure 2.4.3). The internucleotide connectivity corresponds to a correlation between the
H2ʹ proton and its 3ʹ-neighbouring H6/H8 proton. In the C3ʹ-endo conformation, the
sequential H2ʹ to H6/H8 protons are in close proximity (~3.0Å) and so can be observed as
strong NOE cross peaks.
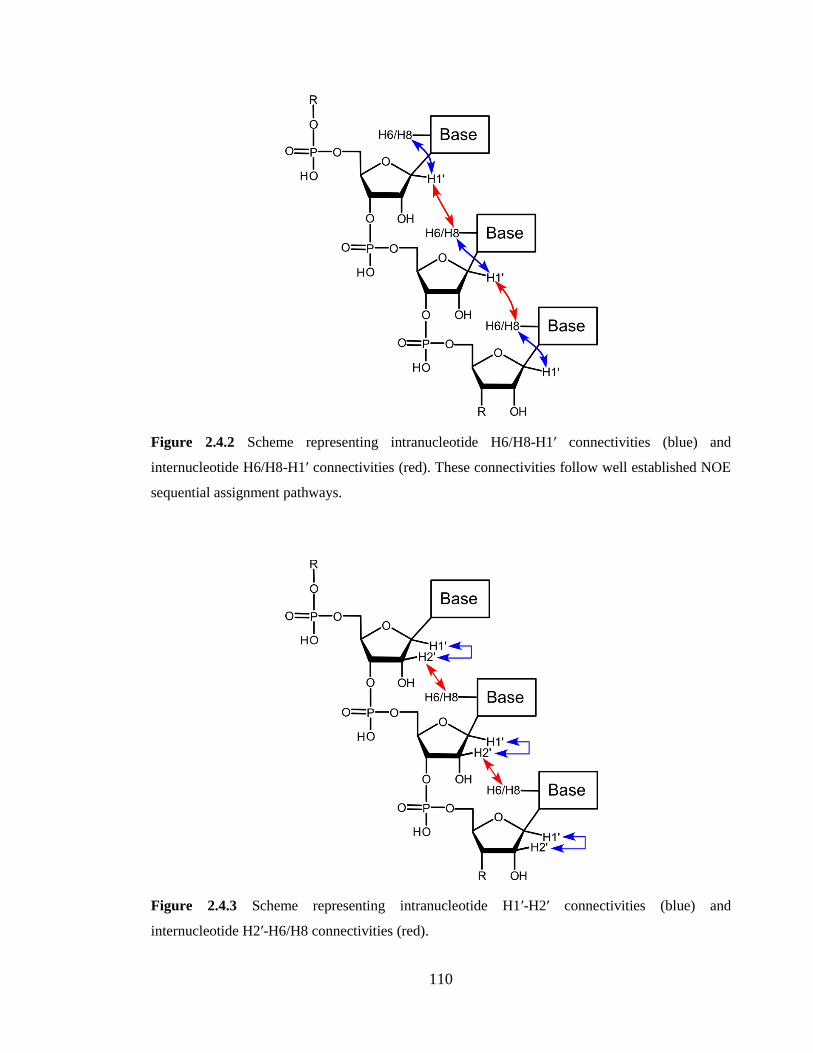
110
Figure 2.4.2 Scheme representing intranucleotide H6/H8-H1ʹ connectivities (blue) and
internucleotide H6/H8-H1ʹ connectivities (red). These connectivities follow well established NOE
sequential assignment pathways.
Figure 2.4.3 Scheme representing intranucleotide H1ʹ-H2ʹ connectivities (blue) and
internucleotide H2ʹ-H6/H8 connectivities (red).
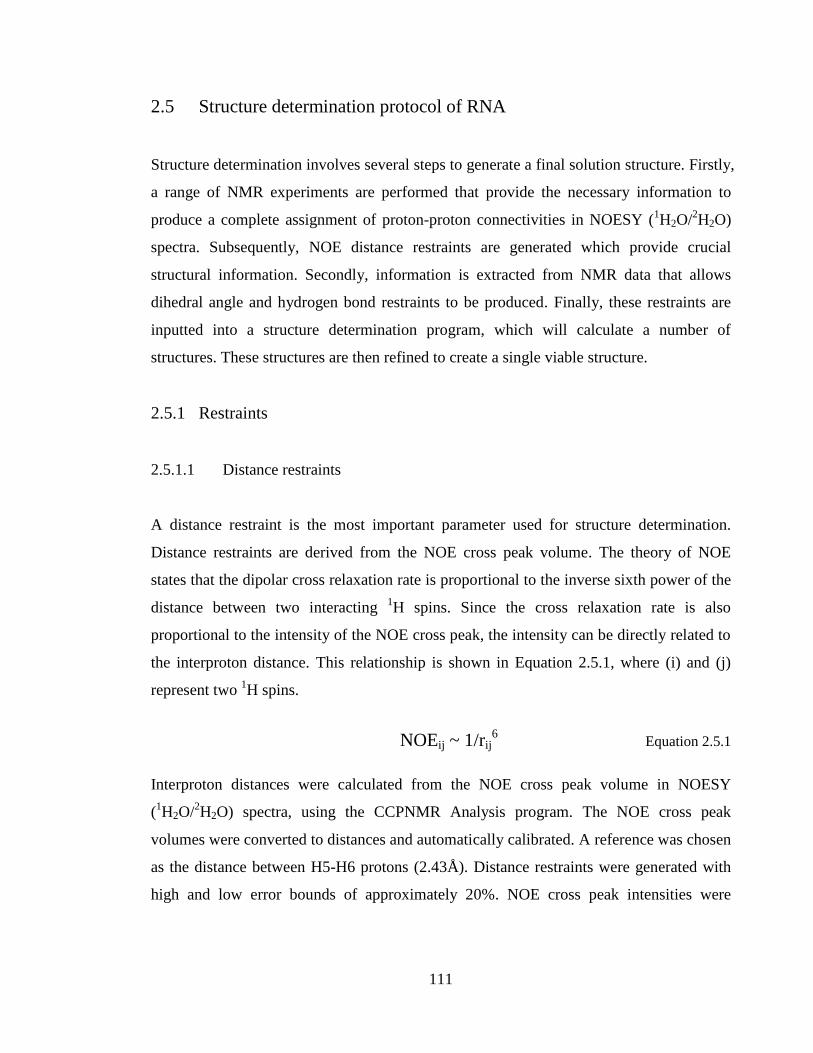
111
2.5 Structure determination protocol of RNA
Structure determination involves several steps to generate a final solution structure. Firstly,
a range of NMR experiments are performed that provide the necessary information to
produce a complete assignment of proton-proton connectivities in NOESY (1H2O/
2H2O)
spectra. Subsequently, NOE distance restraints are generated which provide crucial
structural information. Secondly, information is extracted from NMR data that allows
dihedral angle and hydrogen bond restraints to be produced. Finally, these restraints are
inputted into a structure determination program, which will calculate a number of
structures. These structures are then refined to create a single viable structure.
2.5.1 Restraints
2.5.1.1 Distance restraints
A distance restraint is the most important parameter used for structure determination.
Distance restraints are derived from the NOE cross peak volume. The theory of NOE
states that the dipolar cross relaxation rate is proportional to the inverse sixth power of the
distance between two interacting 1H spins. Since the cross relaxation rate is also
proportional to the intensity of the NOE cross peak, the intensity can be directly related to
the interproton distance. This relationship is shown in Equation 2.5.1, where (i) and (j)
represent two 1H spins.
NOEij ~ 1/rij6 Equation 2.5.1
Interproton distances were calculated from the NOE cross peak volume in NOESY
(1H2O/
2H2O) spectra, using the CCPNMR Analysis program. The NOE cross peak
volumes were converted to distances and automatically calibrated. A reference was chosen
as the distance between H5-H6 protons (2.43Å). Distance restraints were generated with
high and low error bounds of approximately 20%. NOE cross peak intensities were
112
categorised into strong (1.8–2.5 Å), medium (2.6–3.3 Å), weak (3.4–5.0 Å) and very weak
(5.1–7.0 Å) ranges. These ranges were based on the intensities of known H5-H6 distances.
2.5.1.2 Dihedral angle restraints
Dihedral angle restraints are used with distance restraints to improve the tertiary RNA
structure, specifically the RNA backbone conformation. They can be experimentally
generated from 3J coupling constants using the Karplus relationship. There are six
backbone dihedral angles and a seventh glycosidic angle that were incorporated into
structure calculations. Additionally, the ν1 and ν2 dihedral angles were used to restrain the
sugar pucker conformation.
The NOE cross peak distances of H8-H1ʹ (purine) and H6-H1ʹ (pyrimidine) were used to
define the glycosidic angle (χ). Strong intranucleotide H6/H8-H1ʹ cross peaks (2.0-2.5Å)
indicate syn conformation of glycosidic angle. Conversely, weak intranucleotide H6/H8-
H1ʹ cross peaks (3.5-4.5Å) indicate anti conformation of the glycosidic angle.
The sugar ribose conformation was also restrained for each nucleotide by defining the δ
angle. The DQF-COSY experiment was used to observe H1ʹ-H2ʹ cross peaks. 3JH1ʹ-H2ʹ
couplings less than 2Hz are characteristic of the C3ʹ-endo conformation. Couplings less
than 2Hz are usually not observed in a DQF-COSY experiment as the negative and
positive lines will cancel out. Therefore, the absence of H1ʹ-H2ʹ cross peaks are generally
assumed to indicate C3ʹ-endo conformation, while the observation of clear cross peaks
indicates C2ʹ-endo conformation.
Coupling constant information was unavailable to obtain the (α), (β), (γ), (ε) and (ζ)
dihedral angle restraints used to define nucleotide structure. Therefore, dihedral angles
were loosely restrained to the range within A-form parameters.35
All dihedral angles used
in the structure determination of the 16mer apo-RNA, 16mer Mg2+
RNA complex and
15mer apo-RNA are summarised in Table 2.5.1.
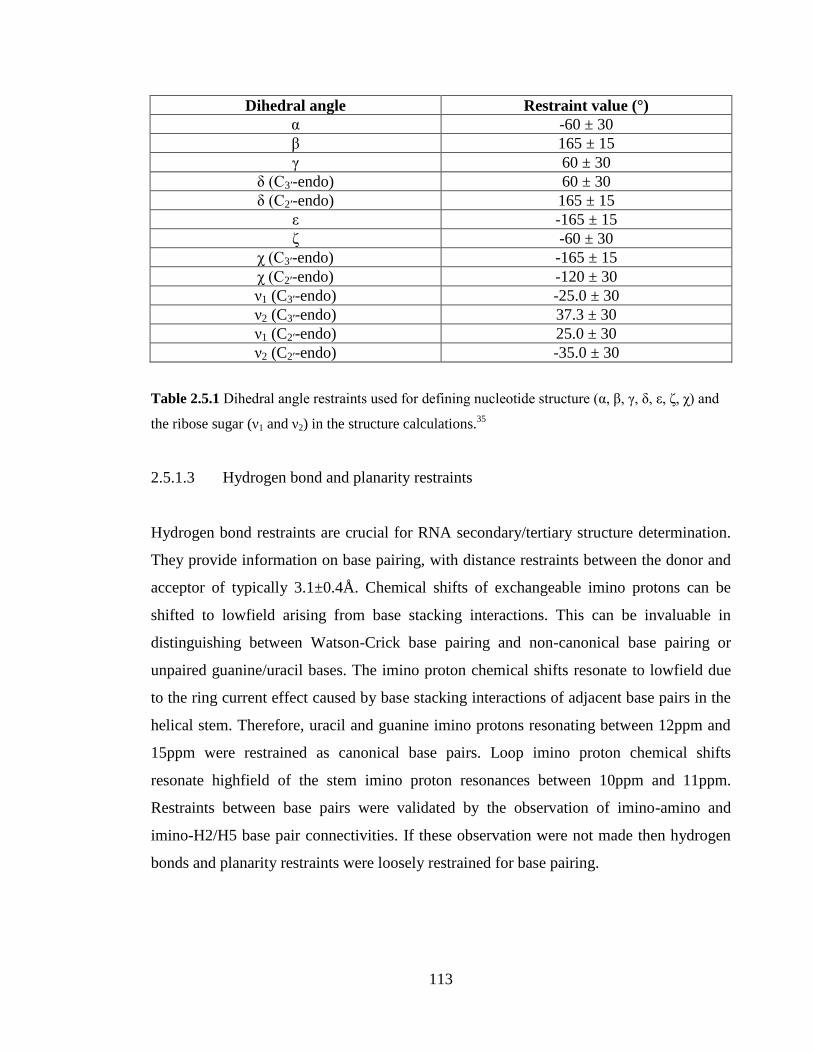
113
Dihedral angle Restraint value (°)
α -60 ± 30
β 165 ± 15
γ 60 ± 30
δ (C3ʹ-endo) 60 ± 30
δ (C2ʹ-endo) 165 ± 15
ε -165 ± 15
ζ -60 ± 30
χ (C3ʹ-endo) -165 ± 15
χ (C2ʹ-endo) -120 ± 30
ν1 (C3ʹ-endo) -25.0 ± 30
ν2 (C3ʹ-endo) 37.3 ± 30
ν1 (C2ʹ-endo) 25.0 ± 30
ν2 (C2ʹ-endo) -35.0 ± 30
Table 2.5.1 Dihedral angle restraints used for defining nucleotide structure (α, β, γ, δ, ε, ζ, χ) and
the ribose sugar (ν1 and ν2) in the structure calculations.35
2.5.1.3 Hydrogen bond and planarity restraints
Hydrogen bond restraints are crucial for RNA secondary/tertiary structure determination.
They provide information on base pairing, with distance restraints between the donor and
acceptor of typically 3.1±0.4Å. Chemical shifts of exchangeable imino protons can be
shifted to lowfield arising from base stacking interactions. This can be invaluable in
distinguishing between Watson-Crick base pairing and non-canonical base pairing or
unpaired guanine/uracil bases. The imino proton chemical shifts resonate to lowfield due
to the ring current effect caused by base stacking interactions of adjacent base pairs in the
helical stem. Therefore, uracil and guanine imino protons resonating between 12ppm and
15ppm were restrained as canonical base pairs. Loop imino proton chemical shifts
resonate highfield of the stem imino proton resonances between 10ppm and 11ppm.
Restraints between base pairs were validated by the observation of imino-amino and
imino-H2/H5 base pair connectivities. If these observation were not made then hydrogen
bonds and planarity restraints were loosely restrained for base pairing.
114
2.5.2 Structure calculation
Structure determination is the process by which experimental data are utilised to generate
three-dimensional structures with the aid of computational structure determination
programs. The most popular biomolecular structure determination program used for
macromolecules such as DNA, RNA and proteins is XPLOR-NIH.106
Structure determination calculations require a starting structure, to which experimental
restraints can be added. The starting structure is created by using two separate files, a
structure file and a topology file. The structure file contains all the atomic coordinates of
the atoms found in the molecule. The topology file adds additional information such as
atom types, charges and bond lengths etc., to complete the construction of the molecule.
The structure determination program can extract information from both files to define the
starting structure.
Once the starting structure is generated, experimental restraints can be input into the
structure determination calculation. NOE distance restraints, dihedral angle restraints,
hydrogen bond restraints and also planarity restraints can be included. However, the
inclusion of experimental restraints is not always possible depending on the quality of
NMR data. Subsequently, restraints can be added to the structure calculation that will
avoid the production of very random structures, improving the viability of structures
generated. Distance restraints are derived directly from NOE data. Dihedral angle
restraints and hydrogen bond restraints can be approximated with certain assumptions and
refined, accordingly. When the selected restraints are included with the starting structure,
the structure calculation can proceed.
The next step in the structure determination process is to take the randomised starting
structure and run the structure determination calculations, which is outlined in Figure 2.5.1.
Firstly, the process of ‘simulated annealing’ is carried out. The initial temperature was set
to 3500K and reduced by 12.5K every time step, until the final temperature of 25K was
reached. High temperature dihedral angle dynamics were run for 800ps. This was
115
followed by torsion angle minimisation and Cartesian-space energy minimisation. The
simulated annealing process generated 200 structures, of which the 20 lowest RMSD (root
mean square deviation) structures were accepted.
The lowest RMSD structure generated by the simulated annealing step was then placed
into the refinement step. The refinement step takes the violations produced in the
simulated annealing step into consideration. Violations are defined as parameters that have
a value which has fallen outside the error bounds. The refinement step aims to reduce the
number of violations in order to generate improved structures. The 200 structures that are
produced from the refinement step are analysed and checked to see whether there are large
violations to the distance restraints and dihedral angle restraints. In the refinement step, an
initial energy minimisation step was followed by a high temperature step (10ps). The
temperature for the dihedral angle simulated annealing calculation was set to 2000K and
reduced by 25K every time step, until the final temperature of 25K was reached. A torsion
angle energy minimisation and a Cartesian-space energy minimisation were run to
produce the refined structures. Structures were rejected based on the number of violations
they produced. If this was consistent throughout most of the refined structures generated
then restraints would have to be examined and modified accordingly. Modifications would
be placed into the starting structure and the processes discussed above would be repeated.
When the top 20 average structures have been collected, a final structure can be acquired
on the basis of lowest energy values, low root mean square deviation (RMSD) and least
violations. The VMD-XPLOR program was used to visualise the ensemble of structures
and calculate the RMSD values.107
The final structure can also be represented as an
ensemble of aligned structures, to show the extent of convergence of lowest energy
structures.
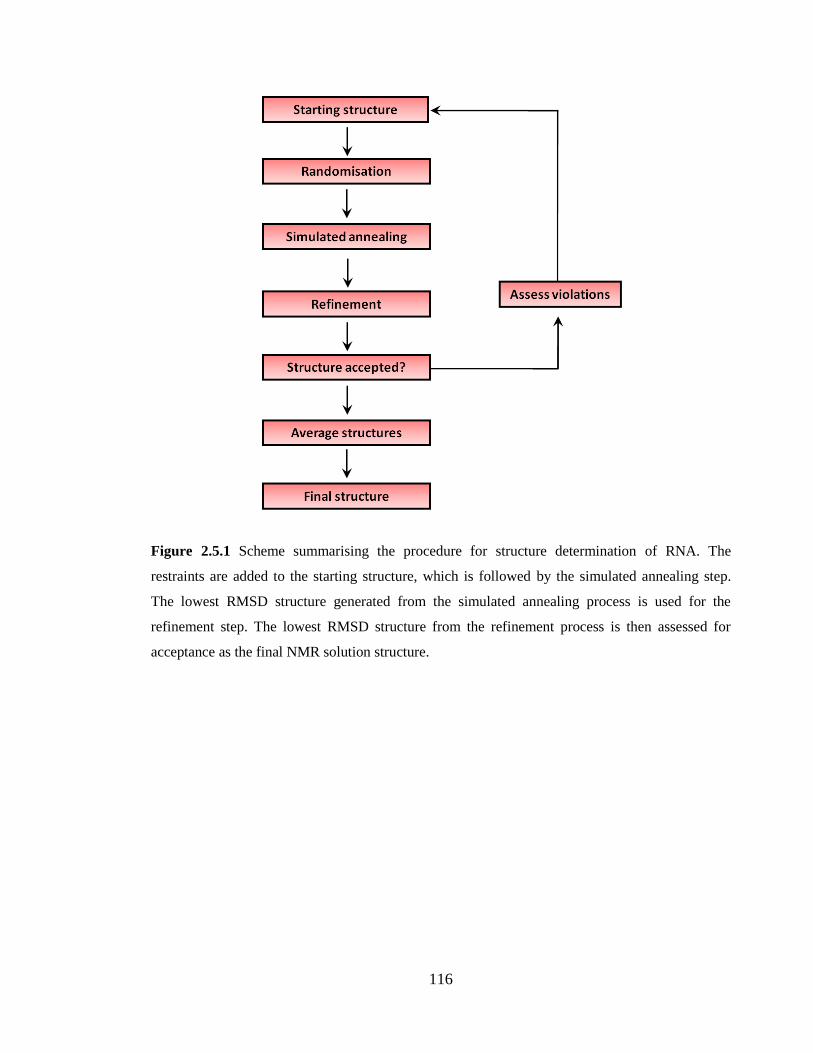
116
Figure 2.5.1 Scheme summarising the procedure for structure determination of RNA. The
restraints are added to the starting structure, which is followed by the simulated annealing step.
The lowest RMSD structure generated from the simulated annealing process is used for the
refinement step. The lowest RMSD structure from the refinement process is then assessed for
acceptance as the final NMR solution structure.
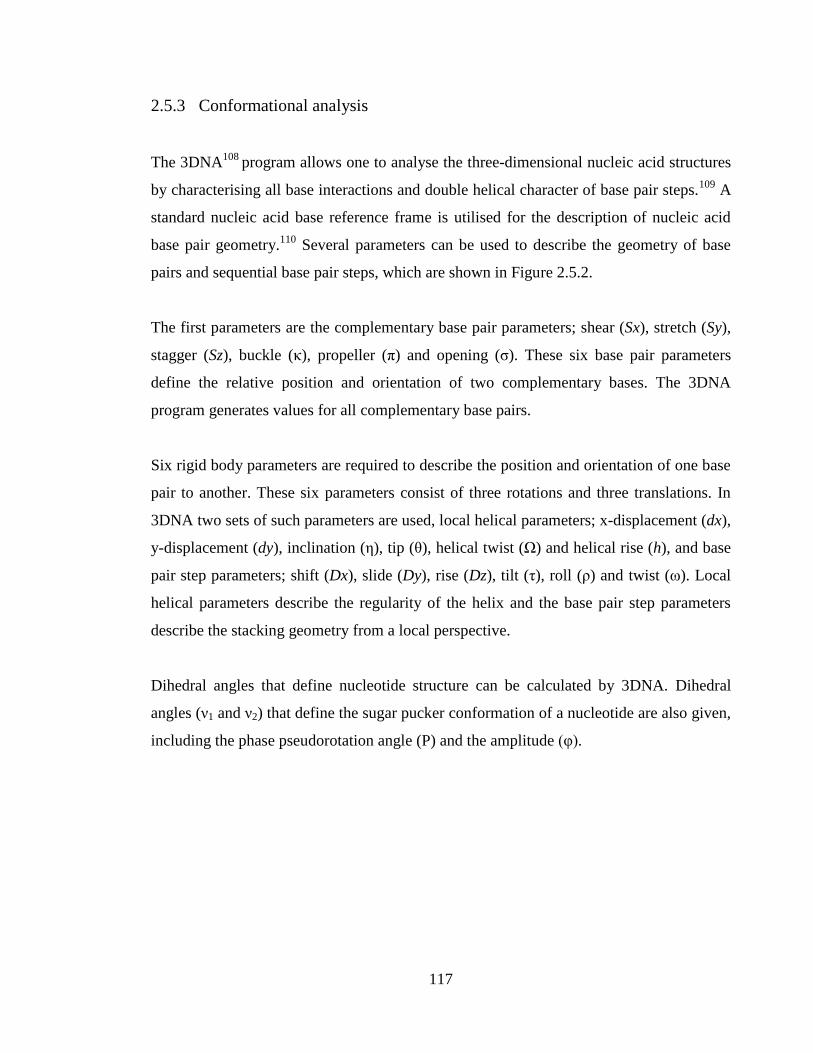
117
2.5.3 Conformational analysis
The 3DNA108
program allows one to analyse the three-dimensional nucleic acid structures
by characterising all base interactions and double helical character of base pair steps.109
A
standard nucleic acid base reference frame is utilised for the description of nucleic acid
base pair geometry.110
Several parameters can be used to describe the geometry of base
pairs and sequential base pair steps, which are shown in Figure 2.5.2.
The first parameters are the complementary base pair parameters; shear (Sx), stretch (Sy),
stagger (Sz), buckle (κ), propeller (π) and opening (σ). These six base pair parameters
define the relative position and orientation of two complementary bases. The 3DNA
program generates values for all complementary base pairs.
Six rigid body parameters are required to describe the position and orientation of one base
pair to another. These six parameters consist of three rotations and three translations. In
3DNA two sets of such parameters are used, local helical parameters; x-displacement (dx),
y-displacement (dy), inclination (η), tip (θ), helical twist (Ω) and helical rise (h), and base
pair step parameters; shift (Dx), slide (Dy), rise (Dz), tilt (τ), roll (ρ) and twist (ω). Local
helical parameters describe the regularity of the helix and the base pair step parameters
describe the stacking geometry from a local perspective.
Dihedral angles that define nucleotide structure can be calculated by 3DNA. Dihedral
angles (ν1 and ν2) that define the sugar pucker conformation of a nucleotide are also given,
including the phase pseudorotation angle (P) and the amplitude (φ).
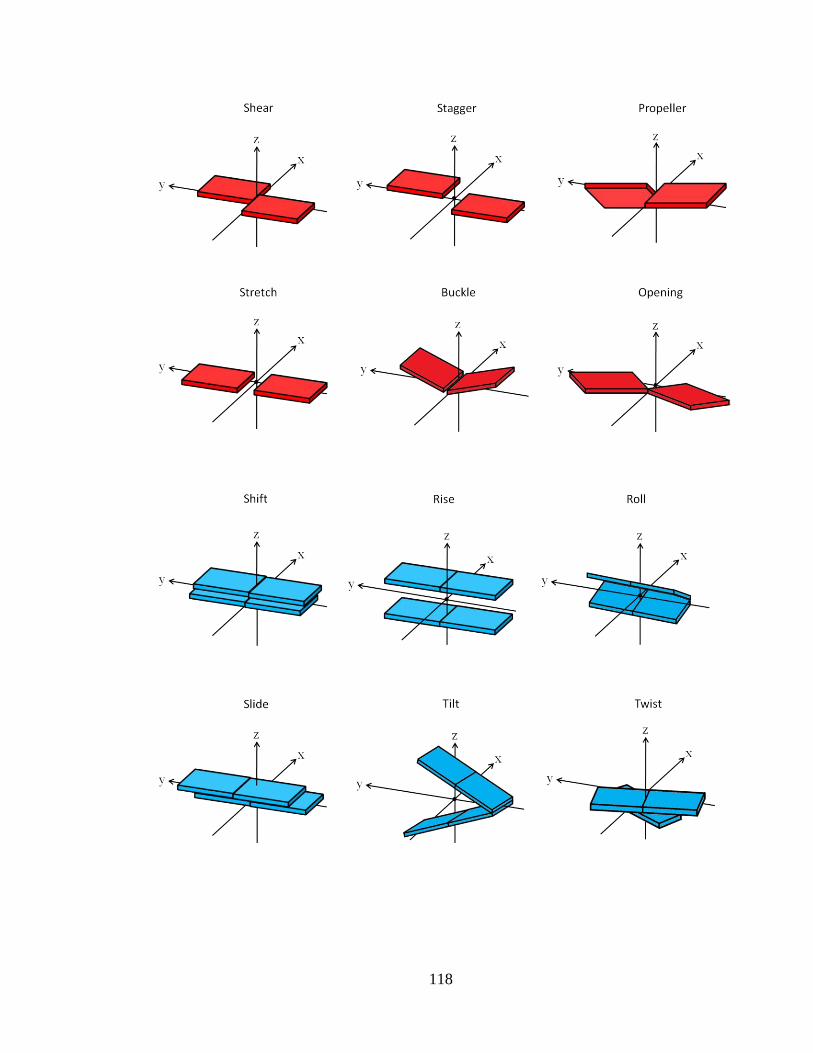
118
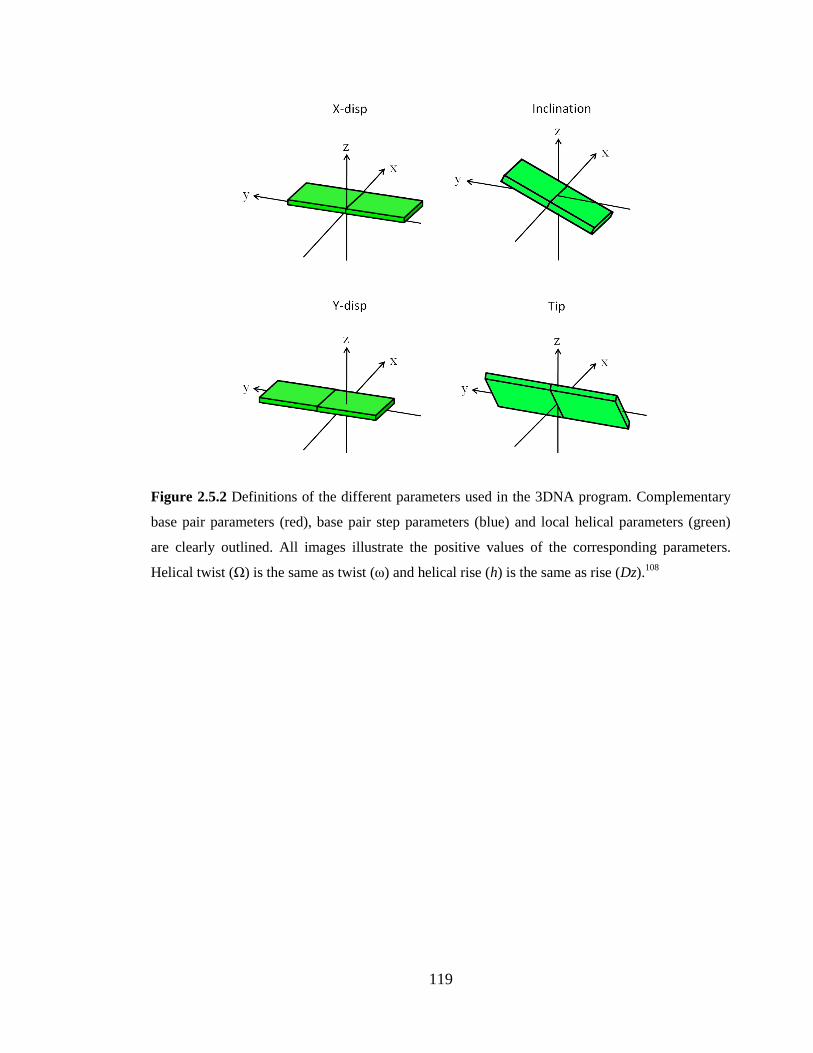
119
Figure 2.5.2 Definitions of the different parameters used in the 3DNA program. Complementary
base pair parameters (red), base pair step parameters (blue) and local helical parameters (green)
are clearly outlined. All images illustrate the positive values of the corresponding parameters.
Helical twist (Ω) is the same as twist (ω) and helical rise (h) is the same as rise (Dz).108
120
2.5.4 Structure validation
MolProbity is a structure validation program that evaluates the quality of protein and
nucleic acid structures.111
It uses the all-atom analysis method to assess the quality of
structures by combining information from atom positions, optimisation of explicit
hydrogen atoms and the van der Waals radii of atoms. This all-atom analysis method
operates by rolling a virtual 0.5Å diameter ball around the van der Waal surface of atoms.
It then calculates the number of non-bonded atom pairs that overlap by more than 0.4Å.
This is reported as a ‘clash score’, which is the number of serious clashes per 1000 atoms.
The clashes do not represent strained conformations but indicate the inconsistencies in the
structure.
MolProbity also runs a geometrical analysis of the structure, which includes an evaluation
of bond lengths, bond angles, sugar pucker conformation and backbone conformation. The
bond length and angles are assessed by comparing them with nucleic acid parameter sets
that contain information on equilibrium bond lengths and angles. The value given
corresponds to the percentage of nucleotides that contain deviated bond length(s) or
angle(s). The ribose sugar pucker is assessed by measuring the perpendicular distance
between the C1ʹ-N1/N9 glycosidic bond vector and the subsequent 3ʹ-end phosphate group;
>2.9Å for C3ʹ-endo and <2.9Å for C2ʹ-endo. Recently a consensus classification and
nomenclature have been defined for the RNA backbone, using all of the backbone
dihedral angles.112
Fifty-four conformers have been identified, which are used to identify
the conformers present in an RNA structure.
The final structures of the 16mer apo-RNA, 16mer Mg2+
RNA complex and 15mer RNA,
were all validated using the MolProbity program. Values for the five different parameters
mentioned were obtained.
121
2.6 Quantitative measurement of exchange rate constants
Imino proton exchange rates were measured using a 600 MHz Varian INOVA
spectrometer. Imino proton exchange theory has been previously described in sub-section
1.5.5.
The T1 rate constants of the imino protons of the 16mer apo-RNA and 16mer Mg2+
RNA
complex (batch 2) were determined by semi-selective inversion recovery experiments,
whereby the inversion pulse was applied to the imino proton region. In total, 13 delays
were used in the inversion recovery experiments; 0ms, 50ms, 100ms, 150ms, 200ms,
250ms, 300ms, 350ms, 400ms, 450ms, 500ms, 750ms and 1000ms. A relaxation delay of
8.0s was used between each pulse sequence to allow magnetisation to reach equilibrium.
The apparent relaxation rates of the imino protons (R1a) were determined by measuring
the integral of each imino proton peak in the stack plot and fitting the data to a three
parameter exponential function using the MestReNova program. The R1a value for each
imino proton was calculated ten times in order to acquire an average value. T1 values were
subsequently calculated by using the T1=1/R1a relationship. T1 measurements for water
were not made, so a value of 0.3s-1
was used for the apparent relaxation rate of water
(R1w).71
Imino proton exchange rates were measured by water magnetisation transfer experiments
at three different temperatures of 2°C, 15°C, 35°C for the 16mer apo-RNA and two
temperatures of 15°C and 35°C for the 16mer Mg2+
RNA complex. Since the imino proton
exchange rates are temperature dependent, a temperature of 15°C was chosen to measure
the exchange rate of the rapidly exchanging G178 loop imino proton and 35°C to measure
exchange rate of the exchange retarded stem imino protons. In total, 20 different delay
times were used ranging from 5ms to 100ms. A relaxation delay of 17.5s was allowed for
complete relaxation of the water longitudinal magnetisation. The exchange rates were
calculated by fitting relative peak intensities to the equation:
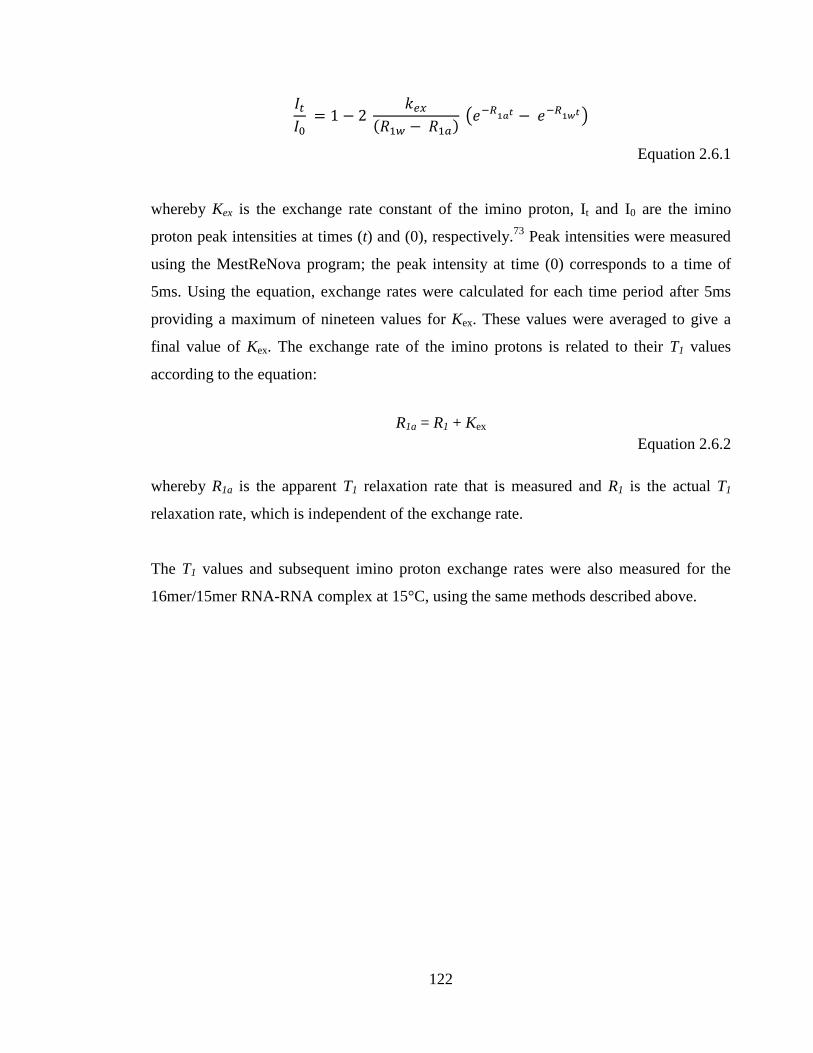
122
Equation 2.6.1
whereby Kex is the exchange rate constant of the imino proton, It and I0 are the imino
proton peak intensities at times (t) and (0), respectively.73
Peak intensities were measured
using the MestReNova program; the peak intensity at time (0) corresponds to a time of
5ms. Using the equation, exchange rates were calculated for each time period after 5ms
providing a maximum of nineteen values for Kex. These values were averaged to give a
final value of Kex. The exchange rate of the imino protons is related to their T1 values
according to the equation:
R1a = R1 + Kex
Equation 2.6.2
whereby R1a is the apparent T1 relaxation rate that is measured and R1 is the actual T1
relaxation rate, which is independent of the exchange rate.
The T1 values and subsequent imino proton exchange rates were also measured for the
16mer/15mer RNA-RNA complex at 15°C, using the same methods described above.

123
Chapter 3: NMR studies of the FMDV 16mer RNA and the effect
of Mg2+
Chapter 3 will firstly describe the NMR assignment and structure determination of the
16mer apo-RNA, and also include a conformational analysis of the NMR solution
structure. Subsequently, the focus of this chapter shifts to the effect of Mg2+
on the 16mer
RNA, which includes the effect on RNA chemical shifts, RNA stability and imino proton
exchange rates. Finally, the structure determination of the 16mer Mg2+
RNA complex is
detailed in a similar manner to the 16mer apo-RNA.
3.1 Structure determination of the 16mer apo-RNA
3.1.1 NMR assignment
The chemical shift table for the FMDV 16mer apo-RNA is displayed at the end of this
sub-section in Table 3.1.1. Chemical shifts were provided for all 1H,
13C and
31P nuclei
that were identified.
3.1.1.1 Exchangeable proton assignment
Imino proton identification and assignment
Six peaks were observed in the imino region of the 1H-NMR spectrum in
1H2O at 2°C,
between 10-15ppm (Figure 3.1.1). The initial assignment of the imino proton peaks was
based on knowledge of chemical shifts. Chemical shifts can be used to ambiguously
assign uracil and guanine imino proton peaks and most importantly distinguish between
stem and loop imino proton peaks. The imino proton peak at 10.54ppm was clearly shifted
to highfield of the stem imino proton peaks, meaning that it could only correspond to the
loop G178 or U179 loop imino protons. The presence of stem imino proton peaks found
between 12.0-15.0ppm, clearly showed that these bases were stacked in a double-helical
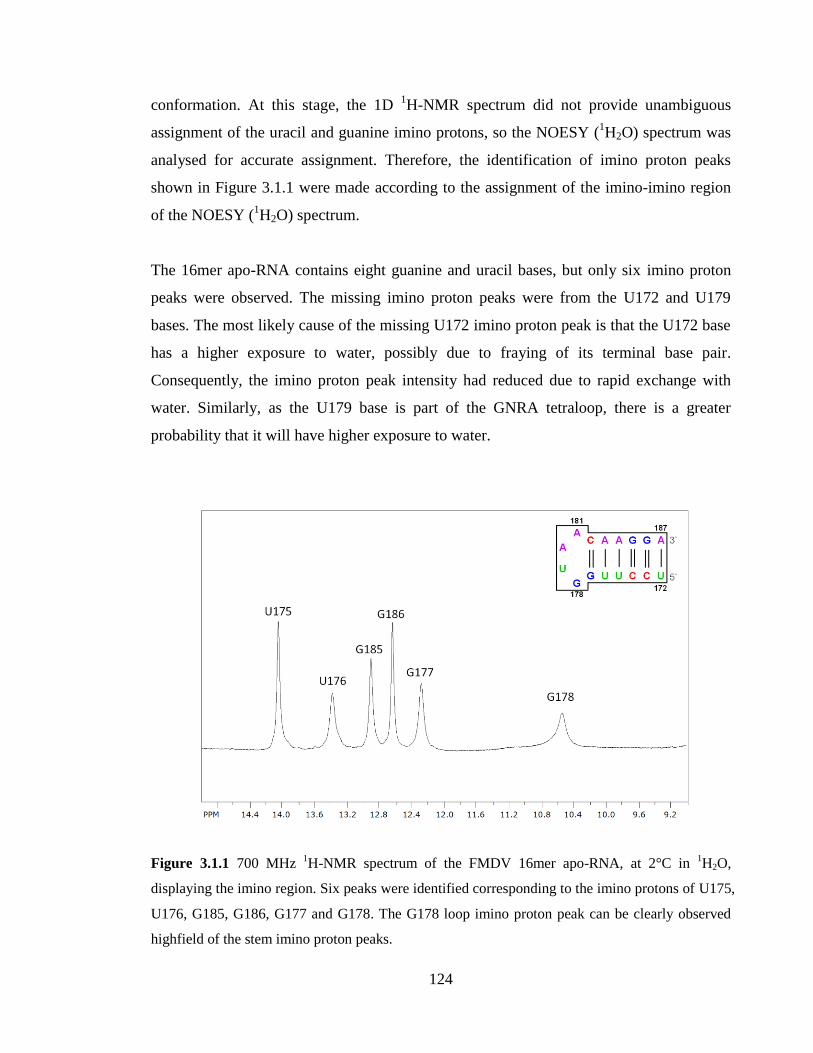
124
conformation. At this stage, the 1D 1H-NMR spectrum did not provide unambiguous
assignment of the uracil and guanine imino protons, so the NOESY (1H2O) spectrum was
analysed for accurate assignment. Therefore, the identification of imino proton peaks
shown in Figure 3.1.1 were made according to the assignment of the imino-imino region
of the NOESY (1H2O) spectrum.
The 16mer apo-RNA contains eight guanine and uracil bases, but only six imino proton
peaks were observed. The missing imino proton peaks were from the U172 and U179
bases. The most likely cause of the missing U172 imino proton peak is that the U172 base
has a higher exposure to water, possibly due to fraying of its terminal base pair.
Consequently, the imino proton peak intensity had reduced due to rapid exchange with
water. Similarly, as the U179 base is part of the GNRA tetraloop, there is a greater
probability that it will have higher exposure to water.
Figure 3.1.1 700 MHz 1H-NMR spectrum of the FMDV 16mer apo-RNA, at 2°C in
1H2O,
displaying the imino region. Six peaks were identified corresponding to the imino protons of U175,
U176, G185, G186, G177 and G178. The G178 loop imino proton peak can be clearly observed
highfield of the stem imino proton peaks.
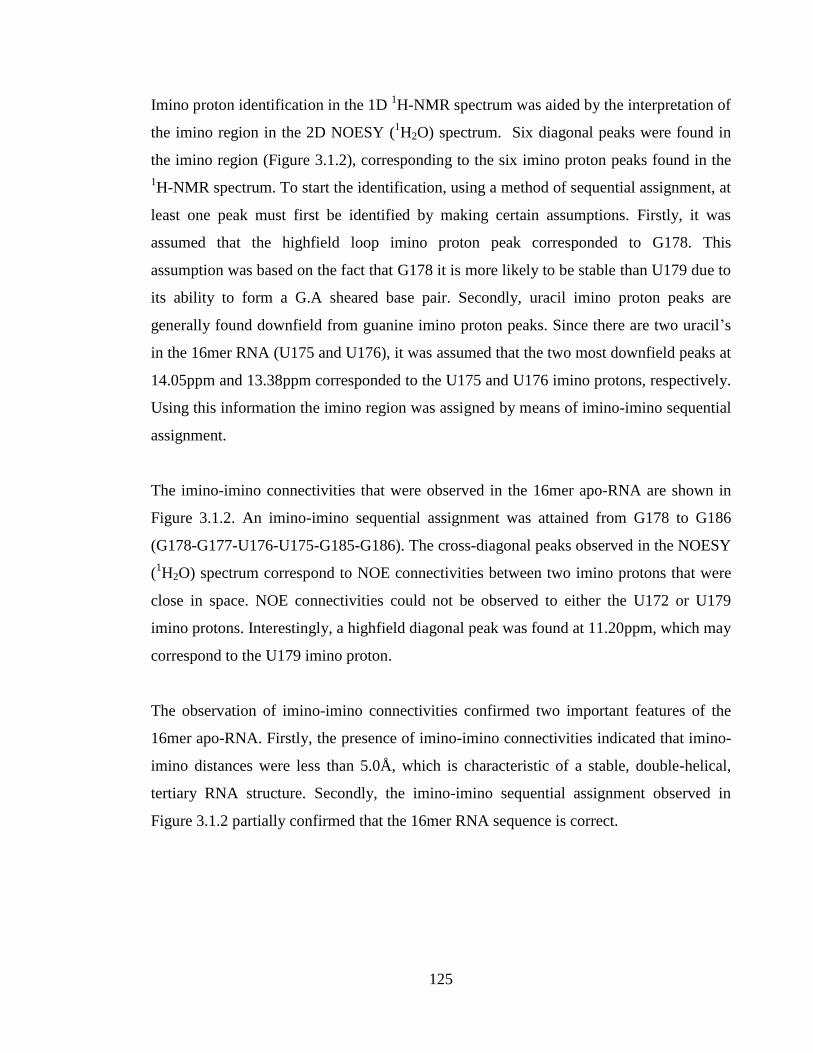
125
Imino proton identification in the 1D 1H-NMR spectrum was aided by the interpretation of
the imino region in the 2D NOESY (1H2O) spectrum. Six diagonal peaks were found in
the imino region (Figure 3.1.2), corresponding to the six imino proton peaks found in the
1H-NMR spectrum. To start the identification, using a method of sequential assignment, at
least one peak must first be identified by making certain assumptions. Firstly, it was
assumed that the highfield loop imino proton peak corresponded to G178. This
assumption was based on the fact that G178 it is more likely to be stable than U179 due to
its ability to form a G.A sheared base pair. Secondly, uracil imino proton peaks are
generally found downfield from guanine imino proton peaks. Since there are two uracil’s
in the 16mer RNA (U175 and U176), it was assumed that the two most downfield peaks at
14.05ppm and 13.38ppm corresponded to the U175 and U176 imino protons, respectively.
Using this information the imino region was assigned by means of imino-imino sequential
assignment.
The imino-imino connectivities that were observed in the 16mer apo-RNA are shown in
Figure 3.1.2. An imino-imino sequential assignment was attained from G178 to G186
(G178-G177-U176-U175-G185-G186). The cross-diagonal peaks observed in the NOESY
(1H2O) spectrum correspond to NOE connectivities between two imino protons that were
close in space. NOE connectivities could not be observed to either the U172 or U179
imino protons. Interestingly, a highfield diagonal peak was found at 11.20ppm, which may
correspond to the U179 imino proton.
The observation of imino-imino connectivities confirmed two important features of the
16mer apo-RNA. Firstly, the presence of imino-imino connectivities indicated that imino-
imino distances were less than 5.0Å, which is characteristic of a stable, double-helical,
tertiary RNA structure. Secondly, the imino-imino sequential assignment observed in
Figure 3.1.2 partially confirmed that the 16mer RNA sequence is correct.
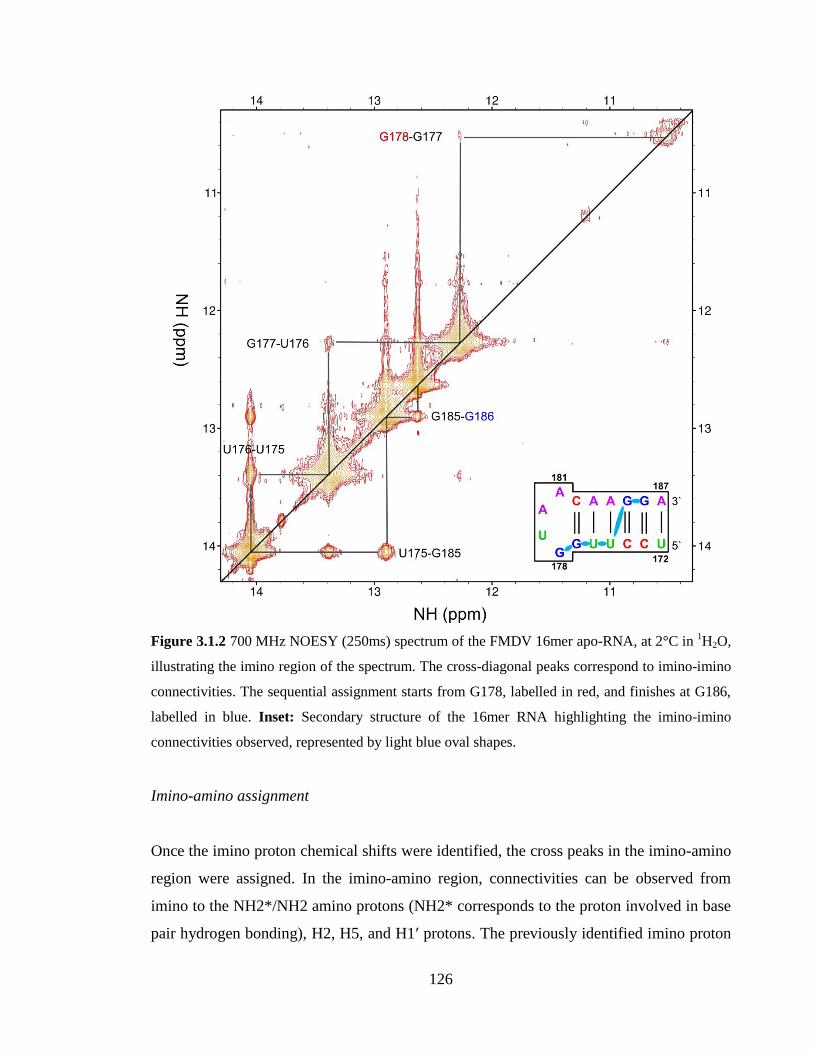
126
Figure 3.1.2 700 MHz NOESY (250ms) spectrum of the FMDV 16mer apo-RNA, at 2°C in 1H2O,
illustrating the imino region of the spectrum. The cross-diagonal peaks correspond to imino-imino
connectivities. The sequential assignment starts from G178, labelled in red, and finishes at G186,
labelled in blue. Inset: Secondary structure of the 16mer RNA highlighting the imino-imino
connectivities observed, represented by light blue oval shapes.
Imino-amino assignment
Once the imino proton chemical shifts were identified, the cross peaks in the imino-amino
region were assigned. In the imino-amino region, connectivities can be observed from
imino to the NH2*/NH2 amino protons (NH2* corresponds to the proton involved in base
pair hydrogen bonding), H2, H5, and H1ʹ protons. The previously identified imino proton
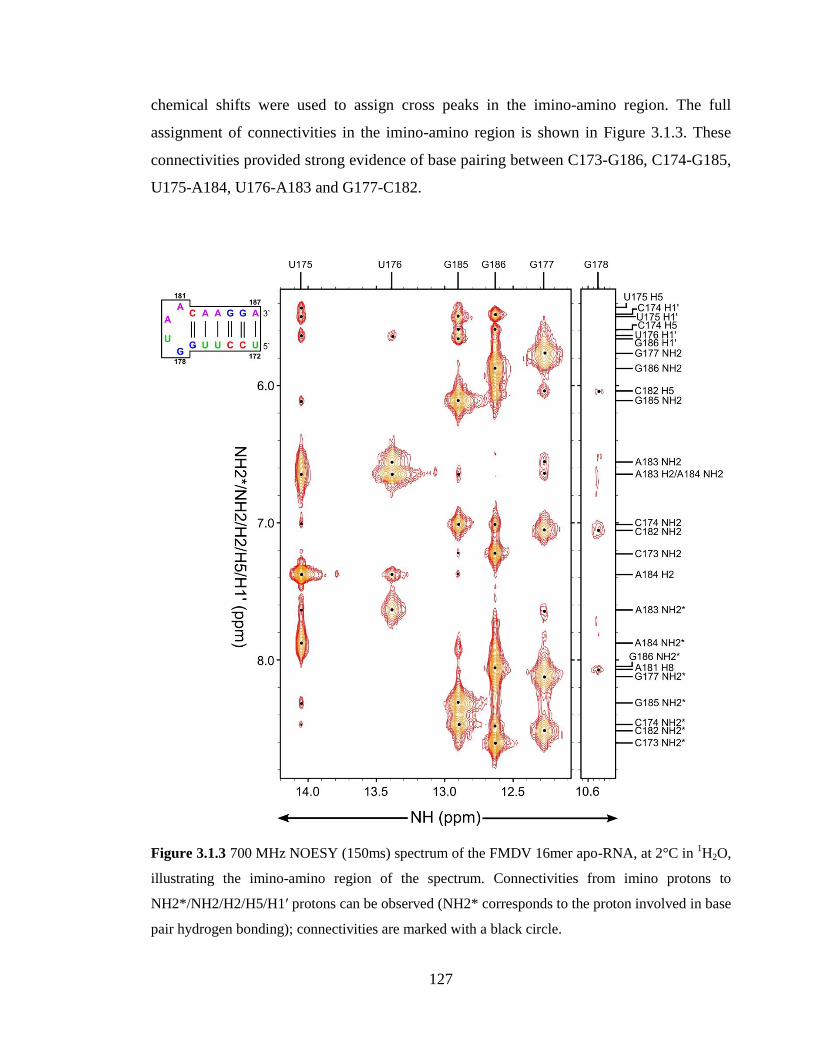
127
chemical shifts were used to assign cross peaks in the imino-amino region. The full
assignment of connectivities in the imino-amino region is shown in Figure 3.1.3. These
connectivities provided strong evidence of base pairing between C173-G186, C174-G185,
U175-A184, U176-A183 and G177-C182.
Figure 3.1.3 700 MHz NOESY (150ms) spectrum of the FMDV 16mer apo-RNA, at 2°C in 1H2O,
illustrating the imino-amino region of the spectrum. Connectivities from imino protons to
NH2*/NH2/H2/H5/H1ʹ protons can be observed (NH2* corresponds to the proton involved in base
pair hydrogen bonding); connectivities are marked with a black circle.
128
3.1.1.2 Non-exchangeable proton assignment
H5-H6 assignment
In the FMDV 16mer RNA, there are four uracil nucleotides and three cytosine nucleotides,
so seven H5-H6 cross peaks were expected to be observed in total. H5-H6 cross peaks are
usually very strong as the distance between H5-H6 protons is approximately 2.4Å.
The H5 and H6 proton chemical shifts of the 16mer apo-RNA, were identified from three
different spectra: NOESY in 1H2O, NOESY in
2H2O and
1H-
13C HSQC in
2H2O. Figure
3.1.4 illustrates the assignment of H5-H6 cross peaks observed in the NOESY (2H2O)
spectrum, with the aid of the 1H-
13C HSQC spectrum. The
1H-
13C HSQC spectrum allows
the identification of H5 and H6 proton chemical shifts due to the C5 and C6 chemical
shifts being distinctly different. Six H5 and H6 proton chemical shifts were identified in
the 1H-
13C HSQC spectrum, corresponding to U172, C173, C174, U175, U179 and C182.
Subsequently, six H5-H6 cross peaks were assigned in the NOESY (2H2O) spectrum
(Figure 3.1.4).
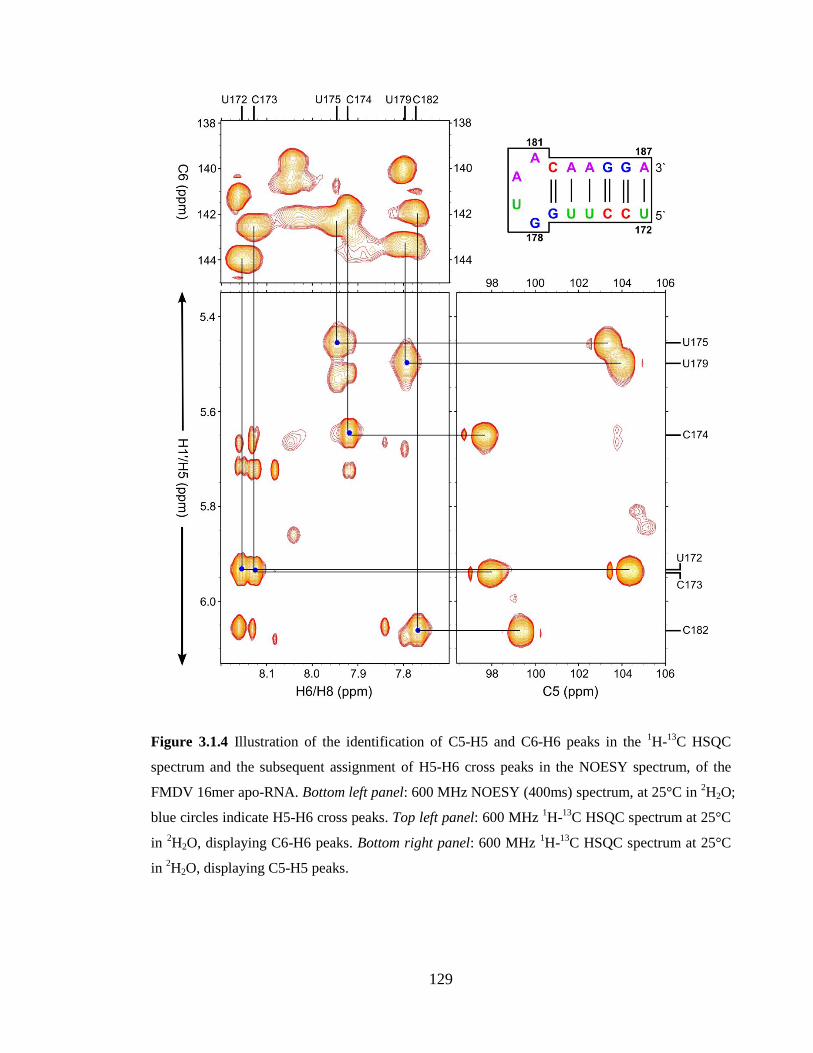
129
Figure 3.1.4 Illustration of the identification of C5-H5 and C6-H6 peaks in the 1H-
13C HSQC
spectrum and the subsequent assignment of H5-H6 cross peaks in the NOESY spectrum, of the
FMDV 16mer apo-RNA. Bottom left panel: 600 MHz NOESY (400ms) spectrum, at 25°C in 2H2O;
blue circles indicate H5-H6 cross peaks. Top left panel: 600 MHz 1H-
13C HSQC spectrum at 25°C
in 2H2O, displaying C6-H6 peaks. Bottom right panel: 600 MHz
1H-
13C HSQC spectrum at 25°C
in 2H2O, displaying C5-H5 peaks.
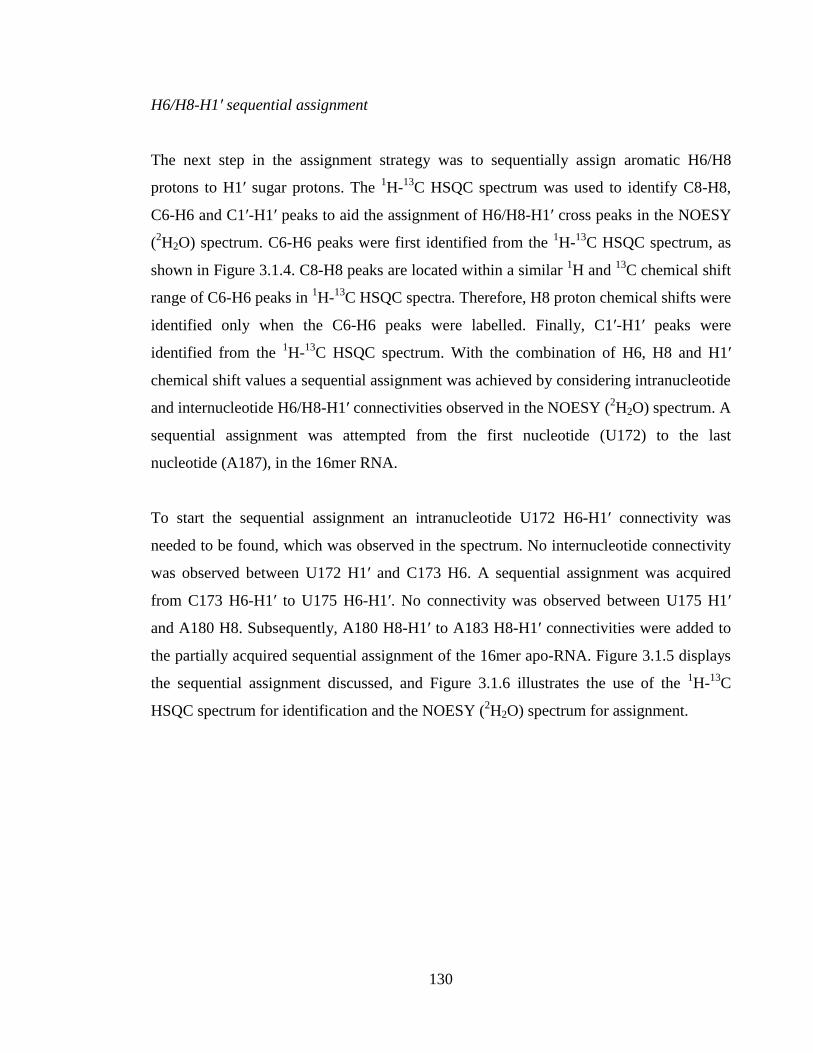
130
H6/H8-H1ʹ sequential assignment
The next step in the assignment strategy was to sequentially assign aromatic H6/H8
protons to H1ʹ sugar protons. The 1H-
13C HSQC spectrum was used to identify C8-H8,
C6-H6 and C1ʹ-H1ʹ peaks to aid the assignment of H6/H8-H1ʹ cross peaks in the NOESY
(2H2O) spectrum. C6-H6 peaks were first identified from the
1H-
13C HSQC spectrum, as
shown in Figure 3.1.4. C8-H8 peaks are located within a similar 1H and
13C chemical shift
range of C6-H6 peaks in 1H-
13C HSQC spectra. Therefore, H8 proton chemical shifts were
identified only when the C6-H6 peaks were labelled. Finally, C1ʹ-H1ʹ peaks were
identified from the 1H-
13C HSQC spectrum. With the combination of H6, H8 and H1ʹ
chemical shift values a sequential assignment was achieved by considering intranucleotide
and internucleotide H6/H8-H1ʹ connectivities observed in the NOESY (2H2O) spectrum. A
sequential assignment was attempted from the first nucleotide (U172) to the last
nucleotide (A187), in the 16mer RNA.
To start the sequential assignment an intranucleotide U172 H6-H1ʹ connectivity was
needed to be found, which was observed in the spectrum. No internucleotide connectivity
was observed between U172 H1ʹ and C173 H6. A sequential assignment was acquired
from C173 H6-H1ʹ to U175 H6-H1ʹ. No connectivity was observed between U175 H1ʹ
and A180 H8. Subsequently, A180 H8-H1ʹ to A183 H8-H1ʹ connectivities were added to
the partially acquired sequential assignment of the 16mer apo-RNA. Figure 3.1.5 displays
the sequential assignment discussed, and Figure 3.1.6 illustrates the use of the 1H-
13C
HSQC spectrum for identification and the NOESY (2H2O) spectrum for assignment.
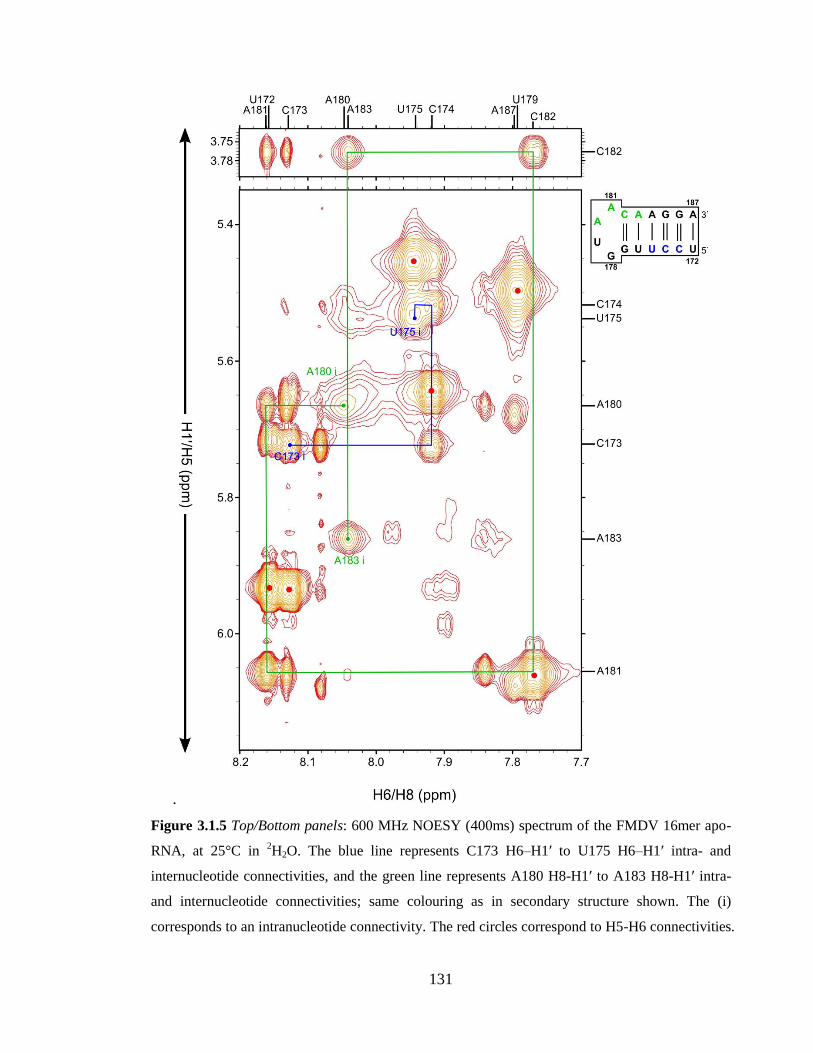
131
.
Figure 3.1.5 Top/Bottom panels: 600 MHz NOESY (400ms) spectrum of the FMDV 16mer apo-
RNA, at 25°C in 2H2O. The blue line represents C173 H6–H1ʹ to U175 H6–H1ʹ intra- and
internucleotide connectivities, and the green line represents A180 H8-H1ʹ to A183 H8-H1ʹ intra-
and internucleotide connectivities; same colouring as in secondary structure shown. The (i)
corresponds to an intranucleotide connectivity. The red circles correspond to H5-H6 connectivities.
132
Figure 3.1.6 Illustration of the identification of C6-H6, C8-H8 and C1ʹ-H1ʹ peaks in the 1H-
13C
HSQC spectrum and the subsequent assignment of H6/H8-H1ʹ cross peaks in the NOESY
spectrum, of the FMDV 16mer apo-RNA. (a) 600 MHz 1H-
13C HSQC spectrum at 25°C in
2H2O,
displaying the C6-H6 and C8-H8 peaks. (b,c) 600 MHz NOESY (400ms) spectrum at 25°C in
2H2O. (d,e) 600 MHz
1H-
13C HSQC spectrum at 25°C in
2H2O, displaying the C1ʹ-H1ʹ peaks.
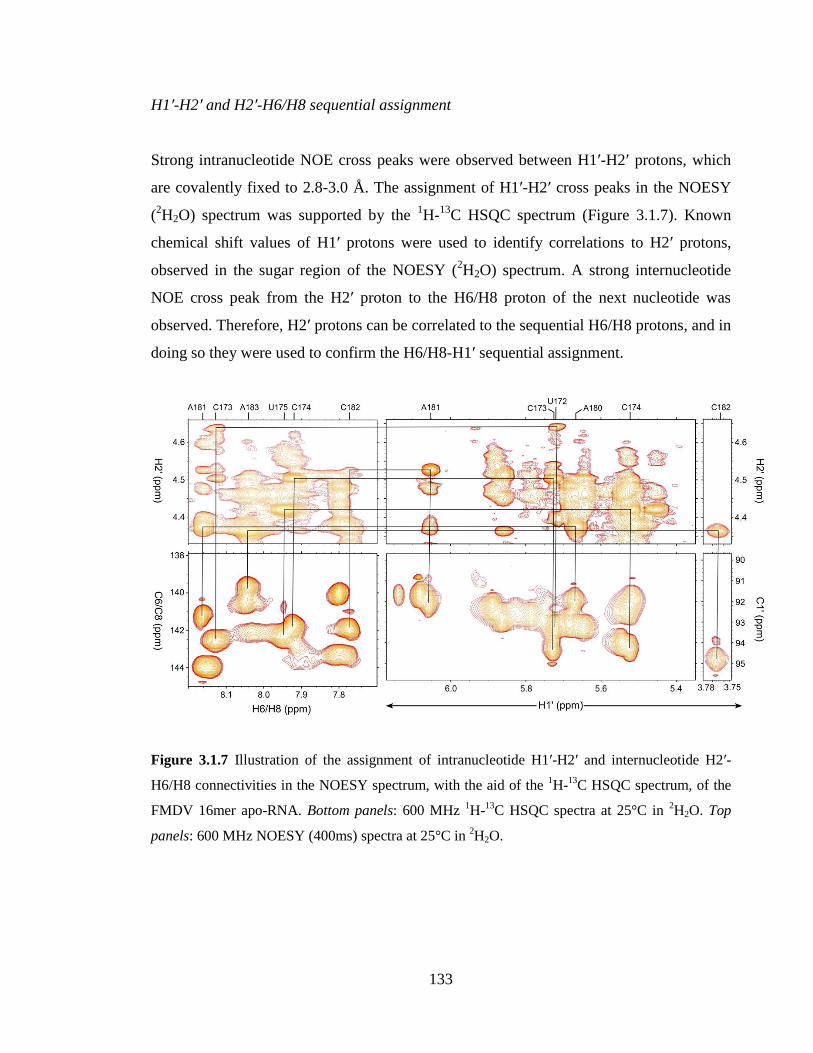
133
H1ʹ-H2ʹ and H2ʹ-H6/H8 sequential assignment
Strong intranucleotide NOE cross peaks were observed between H1ʹ-H2ʹ protons, which
are covalently fixed to 2.8-3.0 Å. The assignment of H1ʹ-H2ʹ cross peaks in the NOESY
(2H2O) spectrum was supported by the
1H-
13C HSQC spectrum (Figure 3.1.7). Known
chemical shift values of H1ʹ protons were used to identify correlations to H2ʹ protons,
observed in the sugar region of the NOESY (2H2O) spectrum. A strong internucleotide
NOE cross peak from the H2ʹ proton to the H6/H8 proton of the next nucleotide was
observed. Therefore, H2ʹ protons can be correlated to the sequential H6/H8 protons, and in
doing so they were used to confirm the H6/H8-H1ʹ sequential assignment.
Figure 3.1.7 Illustration of the assignment of intranucleotide H1ʹ-H2ʹ and internucleotide H2ʹ-
H6/H8 connectivities in the NOESY spectrum, with the aid of the 1H-
13C HSQC spectrum, of the
FMDV 16mer apo-RNA. Bottom panels: 600 MHz 1H-
13C HSQC spectra at 25°C in
2H2O. Top
panels: 600 MHz NOESY (400ms) spectra at 25°C in 2H2O.
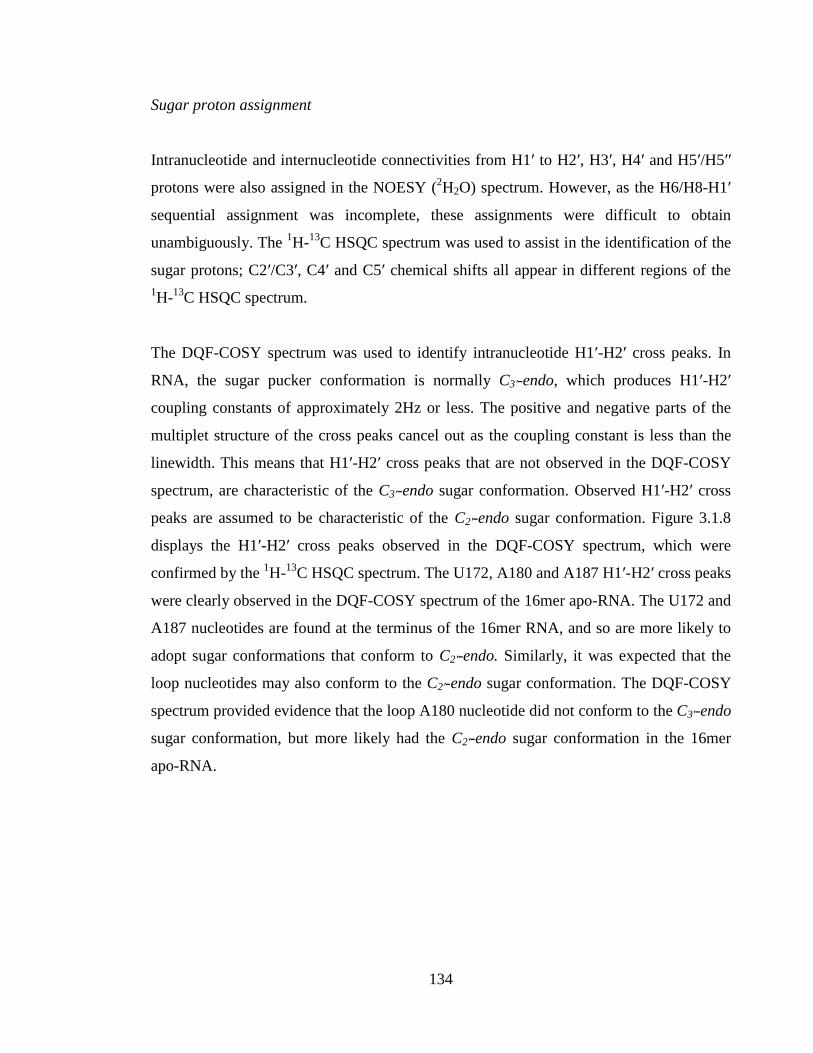
134
Sugar proton assignment
Intranucleotide and internucleotide connectivities from H1ʹ to H2ʹ, H3ʹ, H4ʹ and H5ʹ/H5ʹʹ
protons were also assigned in the NOESY (2H2O) spectrum. However, as the H6/H8-H1ʹ
sequential assignment was incomplete, these assignments were difficult to obtain
unambiguously. The 1H-
13C HSQC spectrum was used to assist in the identification of the
sugar protons; C2ʹ/C3ʹ, C4ʹ and C5ʹ chemical shifts all appear in different regions of the
1H-
13C HSQC spectrum.
The DQF-COSY spectrum was used to identify intranucleotide H1ʹ-H2ʹ cross peaks. In
RNA, the sugar pucker conformation is normally C3ʹ-endo, which produces H1ʹ-H2ʹ
coupling constants of approximately 2Hz or less. The positive and negative parts of the
multiplet structure of the cross peaks cancel out as the coupling constant is less than the
linewidth. This means that H1ʹ-H2ʹ cross peaks that are not observed in the DQF-COSY
spectrum, are characteristic of the C3ʹ-endo sugar conformation. Observed H1ʹ-H2ʹ cross
peaks are assumed to be characteristic of the C2ʹ-endo sugar conformation. Figure 3.1.8
displays the H1ʹ-H2ʹ cross peaks observed in the DQF-COSY spectrum, which were
confirmed by the 1H-
13C HSQC spectrum. The U172, A180 and A187 H1ʹ-H2ʹ cross peaks
were clearly observed in the DQF-COSY spectrum of the 16mer apo-RNA. The U172 and
A187 nucleotides are found at the terminus of the 16mer RNA, and so are more likely to
adopt sugar conformations that conform to C2ʹ-endo. Similarly, it was expected that the
loop nucleotides may also conform to the C2ʹ-endo sugar conformation. The DQF-COSY
spectrum provided evidence that the loop A180 nucleotide did not conform to the C3ʹ-endo
sugar conformation, but more likely had the C2ʹ-endo sugar conformation in the 16mer
apo-RNA.
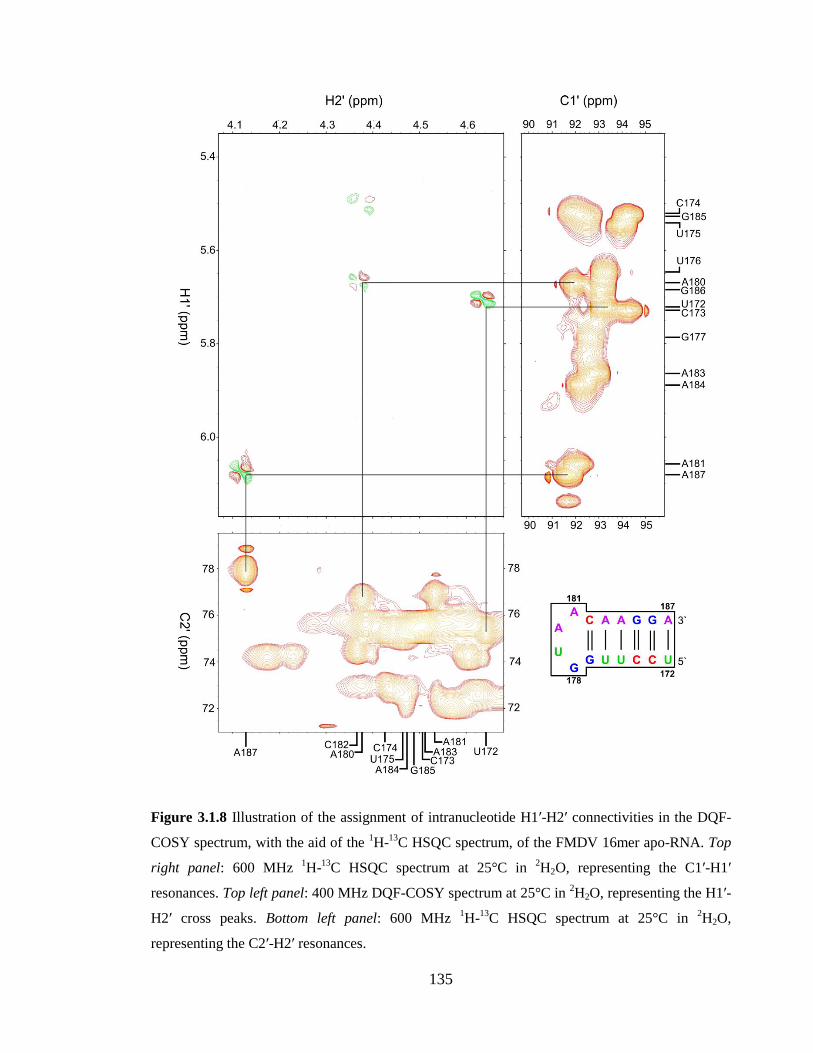
135
Figure 3.1.8 Illustration of the assignment of intranucleotide H1ʹ-H2ʹ connectivities in the DQF-
COSY spectrum, with the aid of the 1H-
13C HSQC spectrum, of the FMDV 16mer apo-RNA. Top
right panel: 600 MHz 1H-
13C HSQC spectrum at 25°C in
2H2O, representing the C1ʹ-H1ʹ
resonances. Top left panel: 400 MHz DQF-COSY spectrum at 25°C in 2H2O, representing the H1ʹ-
H2ʹ cross peaks. Bottom left panel: 600 MHz 1H-
13C HSQC spectrum at 25°C in
2H2O,
representing the C2ʹ-H2ʹ resonances.
136
Phosphorus identification and assignment
The 1H-
31P CPMG-HSQC-NOESY experiment was used to observe connectivities
between phosphorus and proton nuclei. This experiment involved both scalar and dipolar
coupling; scalar coupling between the phosphorus nuclei to H3ʹ/H5ʹ/H5ʹʹ protons, and
dipolar coupling between the H3ʹ/H5ʹ/H5ʹʹ protons to other sugar and base protons. The
H6/H8 protons and the H1ʹ protons were identified relative to the phosphorus chemical
shift, which aided in confirming the H6/H8-H1ʹ sequential assignment as well as
identifying proton chemical shifts that had not been previously identified. The most
intense peaks corresponded to the scalar correlation between phosphorus nuclei and the
H3ʹ, H5ʹ, H5ʹʹ protons. These protons gave strong intranucleotide NOEs to nearby sugar
protons in the same nucleotide. Both intra- and internucleotide NOEs were observed to
H6/H8 and H1ʹprotons, but these NOEs were much weaker in intensity.
Since most of the H6/H8 and H1ʹ chemical shifts had been identified in the 16mer apo-
RNA, this information was used to identify the corresponding correlations to phosphorus
chemical shifts. In the 1H-
31P CPMG-HSQC-NOESY spectrum, four H6/H8 and two H1ʹ
correlations to phosphorus were assigned, using the 1H-
13C HSQC spectrum (Figure 3.1.9).
Subsequently, three phosphorus chemical shifts were identified for the C173, C174 and
C182 nucleotides. Due to the lack of clearly observed peaks in the spectrum, it was not
possible to obtain a sequential assignment between phosphorus and H6/H8/H1ʹprotons.
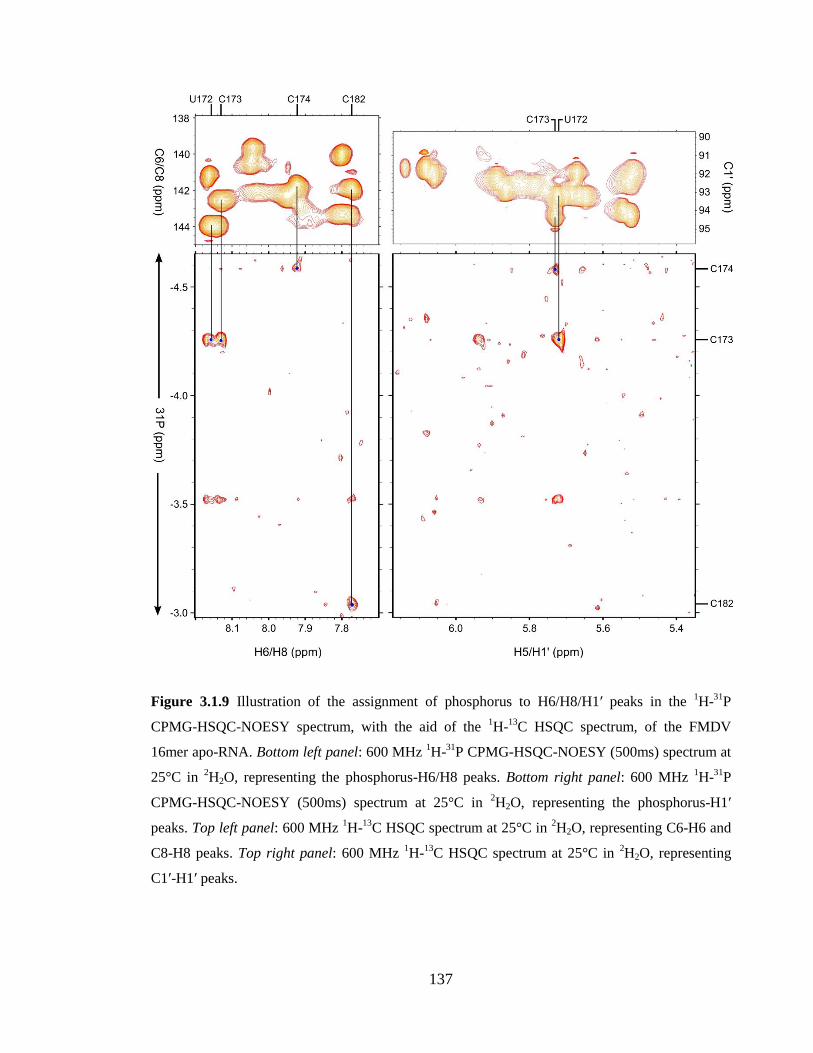
137
Figure 3.1.9 Illustration of the assignment of phosphorus to H6/H8/H1ʹ peaks in the 1H-
31P
CPMG-HSQC-NOESY spectrum, with the aid of the 1H-
13C HSQC spectrum, of the FMDV
16mer apo-RNA. Bottom left panel: 600 MHz 1H-
31P CPMG-HSQC-NOESY (500ms) spectrum at
25°C in 2H2O, representing the phosphorus-H6/H8 peaks. Bottom right panel: 600 MHz
1H-
31P
CPMG-HSQC-NOESY (500ms) spectrum at 25°C in 2H2O, representing the phosphorus-H1ʹ
peaks. Top left panel: 600 MHz 1H-
13C HSQC spectrum at 25°C in
2H2O, representing C6-H6 and
C8-H8 peaks. Top right panel: 600 MHz 1H-
13C HSQC spectrum at 25°C in
2H2O, representing
C1ʹ-H1ʹ peaks.
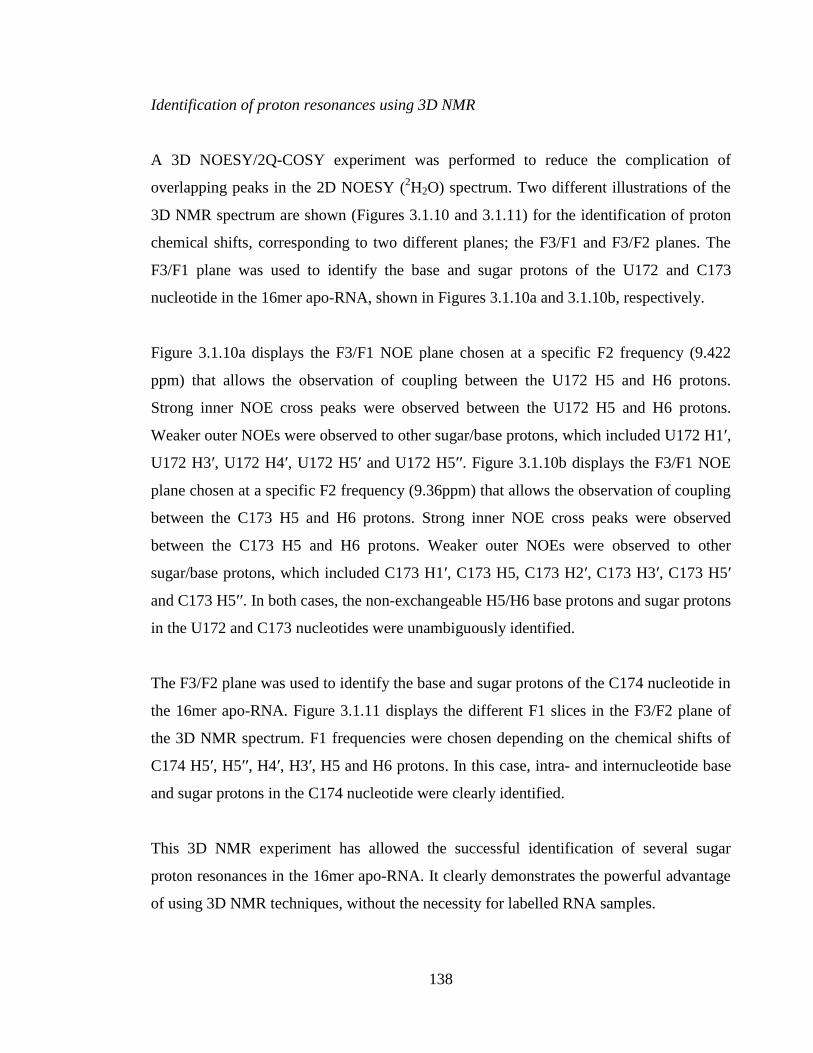
138
Identification of proton resonances using 3D NMR
A 3D NOESY/2Q-COSY experiment was performed to reduce the complication of
overlapping peaks in the 2D NOESY (2H2O) spectrum. Two different illustrations of the
3D NMR spectrum are shown (Figures 3.1.10 and 3.1.11) for the identification of proton
chemical shifts, corresponding to two different planes; the F3/F1 and F3/F2 planes. The
F3/F1 plane was used to identify the base and sugar protons of the U172 and C173
nucleotide in the 16mer apo-RNA, shown in Figures 3.1.10a and 3.1.10b, respectively.
Figure 3.1.10a displays the F3/F1 NOE plane chosen at a specific F2 frequency (9.422
ppm) that allows the observation of coupling between the U172 H5 and H6 protons.
Strong inner NOE cross peaks were observed between the U172 H5 and H6 protons.
Weaker outer NOEs were observed to other sugar/base protons, which included U172 H1ʹ,
U172 H3ʹ, U172 H4ʹ, U172 H5ʹ and U172 H5ʹʹ. Figure 3.1.10b displays the F3/F1 NOE
plane chosen at a specific F2 frequency (9.36ppm) that allows the observation of coupling
between the C173 H5 and H6 protons. Strong inner NOE cross peaks were observed
between the C173 H5 and H6 protons. Weaker outer NOEs were observed to other
sugar/base protons, which included C173 H1ʹ, C173 H5, C173 H2ʹ, C173 H3ʹ, C173 H5ʹ
and C173 H5ʹʹ. In both cases, the non-exchangeable H5/H6 base protons and sugar protons
in the U172 and C173 nucleotides were unambiguously identified.
The F3/F2 plane was used to identify the base and sugar protons of the C174 nucleotide in
the 16mer apo-RNA. Figure 3.1.11 displays the different F1 slices in the F3/F2 plane of
the 3D NMR spectrum. F1 frequencies were chosen depending on the chemical shifts of
C174 H5ʹ, H5ʹʹ, H4ʹ, H3ʹ, H5 and H6 protons. In this case, intra- and internucleotide base
and sugar protons in the C174 nucleotide were clearly identified.
This 3D NMR experiment has allowed the successful identification of several sugar
proton resonances in the 16mer apo-RNA. It clearly demonstrates the powerful advantage
of using 3D NMR techniques, without the necessity for labelled RNA samples.
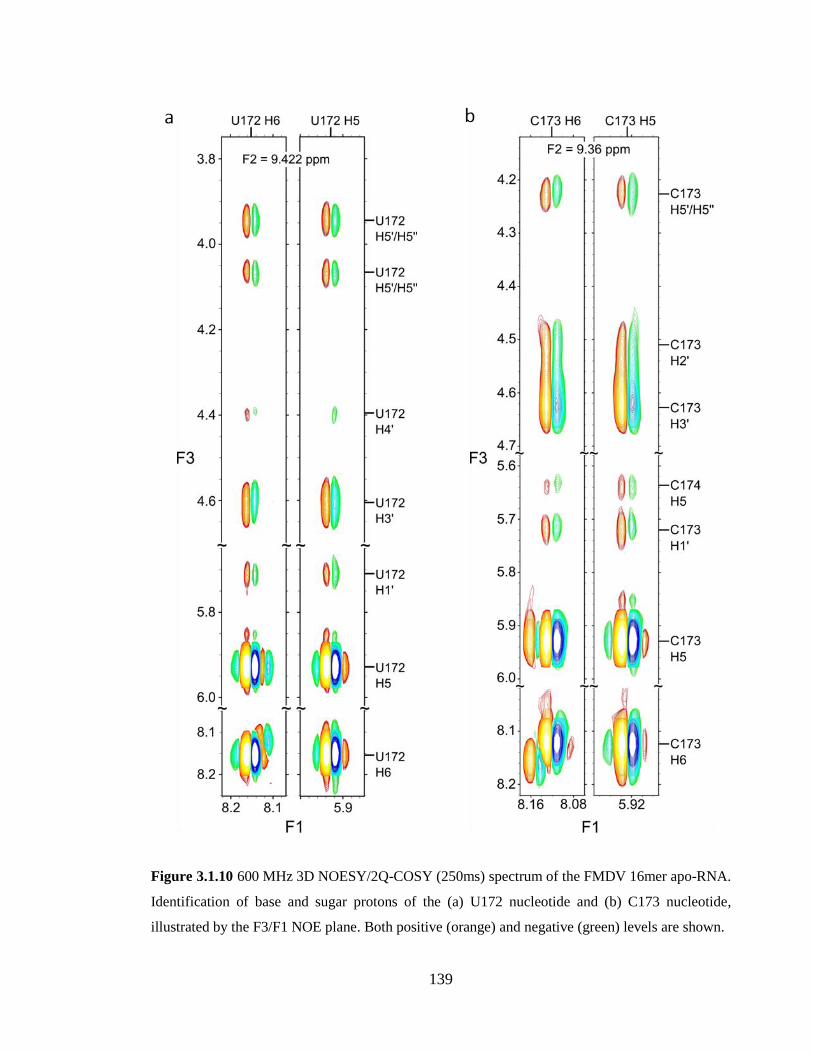
139
Figure 3.1.10 600 MHz 3D NOESY/2Q-COSY (250ms) spectrum of the FMDV 16mer apo-RNA.
Identification of base and sugar protons of the (a) U172 nucleotide and (b) C173 nucleotide,
illustrated by the F3/F1 NOE plane. Both positive (orange) and negative (green) levels are shown.
140
Figure 3.1.11 600 MHz 3D NOESY/2Q-COSY (250ms) spectrum of the FMDV 16mer apo-RNA.
Slices from the F3/F2 plane chosen at different F1 frequencies, identifying base and sugar proton
chemical shift of the C174 nucleotide. Only positive levels are shown. In each slice strong inner
NOE peaks correspond to coupling between two protons as well as weaker outer NOEs to other
base/sugar protons.
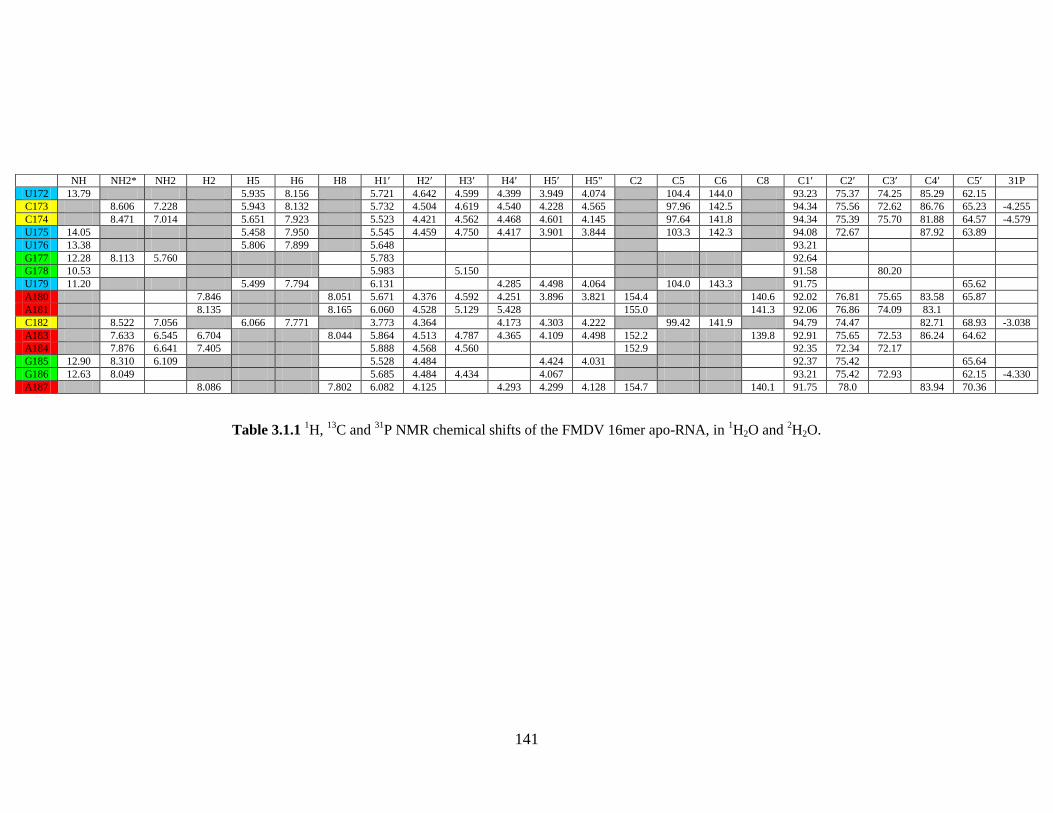
141
Table 3.1.1 1H,
13C and
31P NMR chemical shifts of the FMDV 16mer apo-RNA, in
1H2O and
2H2O.
NH NH2* NH2 H2 H5 H6 H8 H1ʹ H2ʹ H3ʹ H4ʹ H5ʹ H5" C2 C5 C6 C8 C1ʹ C2ʹ C3ʹ C4ʹ C5ʹ 31P
U172 13.79 5.935 8.156 5.721 4.642 4.599 4.399 3.949 4.074 104.4 144.0 93.23 75.37 74.25 85.29 62.15 C173 8.606 7.228 5.943 8.132 5.732 4.504 4.619 4.540 4.228 4.565 97.96 142.5 94.34 75.56 72.62 86.76 65.23 -4.255
C174 8.471 7.014 5.651 7.923 5.523 4.421 4.562 4.468 4.601 4.145 97.64 141.8 94.34 75.39 75.70 81.88 64.57 -4.579
U175 14.05 5.458 7.950 5.545 4.459 4.750 4.417 3.901 3.844 103.3 142.3 94.08 72.67 87.92 63.89
U176 13.38 5.806 7.899 5.648 93.21
G177 12.28 8.113 5.760 5.783 92.64
G178 10.53 5.983 5.150 91.58 80.20
U179 11.20 5.499 7.794 6.131 4.285 4.498 4.064 104.0 143.3 91.75 65.62
A180 7.846 8.051 5.671 4.376 4.592 4.251 3.896 3.821 154.4 140.6 92.02 76.81 75.65 83.58 65.87
A181 8.135 8.165 6.060 4.528 5.129 5.428 155.0 141.3 92.06 76.86 74.09 83.1
C182 8.522 7.056 6.066 7.771 3.773 4.364 4.173 4.303 4.222 99.42 141.9 94.79 74.47 82.71 68.93 -3.038
A183 7.633 6.545 6.704 8.044 5.864 4.513 4.787 4.365 4.109 4.498 152.2 139.8 92.91 75.65 72.53 86.24 64.62
A184 7.876 6.641 7.405 5.888 4.568 4.560 152.9 92.35 72.34 72.17
G185 12.90 8.310 6.109 5.528 4.484 4.424 4.031 92.37 75.42 65.64
G186 12.63 8.049 5.685 4.484 4.434 4.067 93.21 75.42 72.93 62.15 -4.330
A187 8.086 7.802 6.082 4.125 4.293 4.299 4.128 154.7 140.1 91.75 78.0 83.94 70.36
142
3.1.2 Structure calculation
Distance restraints were generated from NOESY spectra of the 16mer apo-RNA.
Exchangeable NOE restraints were obtained from the NOESY spectrum of the 16mer apo-
RNA in 1H2O, with 150ms mixing time. The exchangeable NOE restraints consisted of
imino-imino connectivities, imino-amino connectivities and imino-H2/H5 connectivities.
Non-exchangeable NOE restraints were obtained from the NOESY spectrum of the 16mer
apo-RNA in 2H2O, with 250ms mixing time. The non-exchangeable NOE restraints
consisted of H5-H6 connectivities, H6/H8-H1ʹ intra- and internucleotide connectivities,
H1ʹ-H5 connectivities, aromatic to aromatic connectivities, H1ʹ to sugar and sugar to
H6/H8 connectivities.
The absence of strong intranucleotide H6/H8-H1ʹ cross peaks for stem nucleotides,
allowed the glycosidic angle of all stem nucleotides to be restrained to the anti
conformation. No intranucleotide connectivities were observed for G178 and U179, so
their glycosidic angles were not defined. A180 and A181 were also not defined to allow
some conformational flexibility in the loop region. In the DQF-COSY experiment, the
U172 and A187 H1ʹ-H2ʹ cross peaks were clearly observed. Therefore, the δ angle was
restrained to the C2ʹ-endo conformation for U172 and A187 and the other stem nucleotides
were restrained to the C3ʹ-endo conformation. The δ angle for the loop nucleotides was not
restrained due to sugar pucker dynamics found in GNRA tetraloops.44
The α, β, γ, ε and ζ
dihedral angles were solely defined for the stem nucleotides, except for U172 and A187.
The imino proton chemical shifts resonate lowfield due to the ring current effect caused by
base stacking interactions of adjacent base pairs in the helical stem. The only exception
was the G178 loop imino proton. Therefore, the bases corresponding to the stem uracil
and guanine imino proton peaks were restrained as canonical base pairs. Hydrogen bond
restraints were added for all six base pairs. However, since the U172 imino proton peak
was not observed and no connectivities from it were found in the NOESY (1H2O)
spectrum, the hydrogen bond restraints between U172-A187 were loosely restrained. For
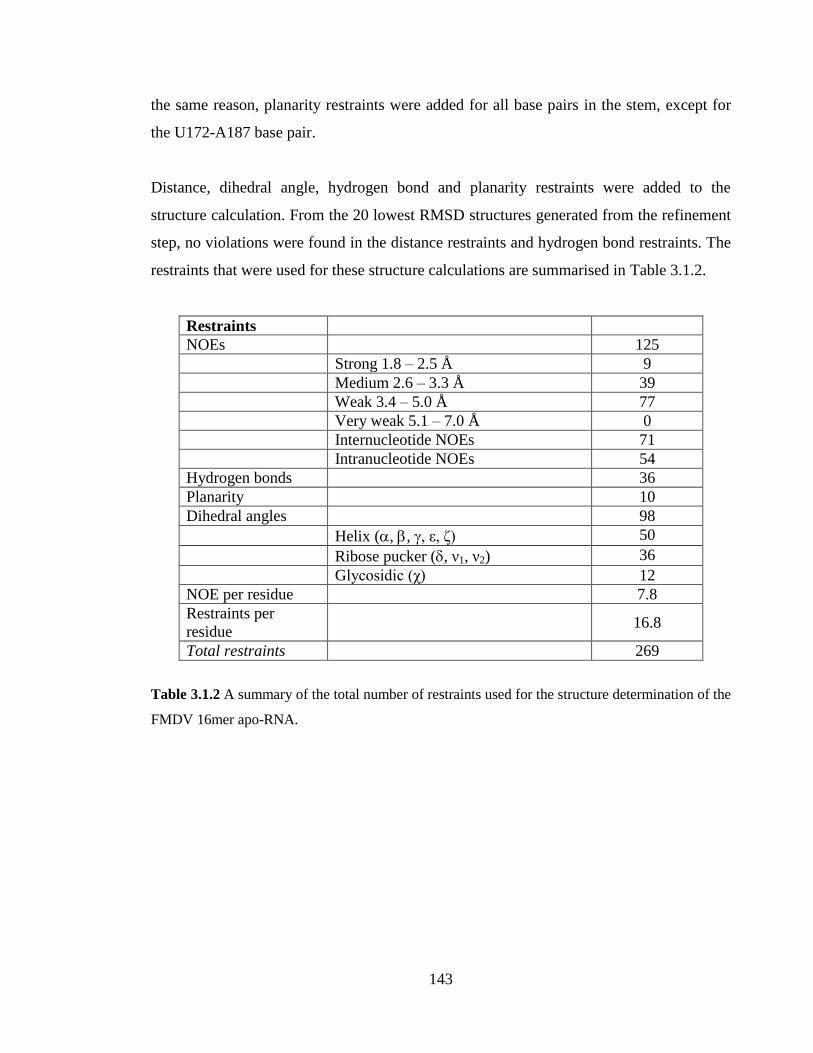
143
the same reason, planarity restraints were added for all base pairs in the stem, except for
the U172-A187 base pair.
Distance, dihedral angle, hydrogen bond and planarity restraints were added to the
structure calculation. From the 20 lowest RMSD structures generated from the refinement
step, no violations were found in the distance restraints and hydrogen bond restraints. The
restraints that were used for these structure calculations are summarised in Table 3.1.2.
Restraints
NOEs 125
Strong 1.8 – 2.5 Å 9
Medium 2.6 – 3.3 Å 39
Weak 3.4 – 5.0 Å 77
Very weak 5.1 – 7.0 Å 0
Internucleotide NOEs 71
Intranucleotide NOEs 54
Hydrogen bonds 36
Planarity 10
Dihedral angles 98
Helix (, , , ε, ζ) 50
Ribose pucker (, ν1, ν2) 36
Glycosidic (χ) 12
NOE per residue 7.8
Restraints per
residue
16.8
Total restraints 269
Table 3.1.2 A summary of the total number of restraints used for the structure determination of the
FMDV 16mer apo-RNA.
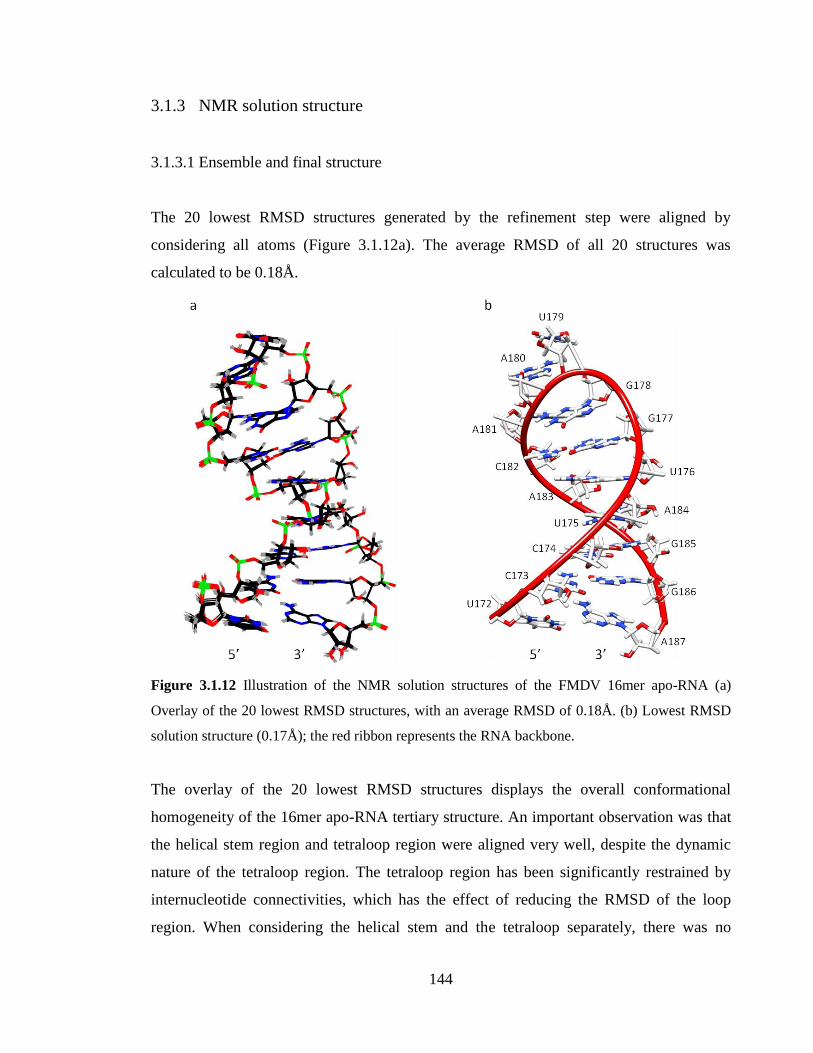
144
3.1.3 NMR solution structure
3.1.3.1 Ensemble and final structure
The 20 lowest RMSD structures generated by the refinement step were aligned by
considering all atoms (Figure 3.1.12a). The average RMSD of all 20 structures was
calculated to be 0.18Å.
Figure 3.1.12 Illustration of the NMR solution structures of the FMDV 16mer apo-RNA (a)
Overlay of the 20 lowest RMSD structures, with an average RMSD of 0.18Å. (b) Lowest RMSD
solution structure (0.17Å); the red ribbon represents the RNA backbone.
The overlay of the 20 lowest RMSD structures displays the overall conformational
homogeneity of the 16mer apo-RNA tertiary structure. An important observation was that
the helical stem region and tetraloop region were aligned very well, despite the dynamic
nature of the tetraloop region. The tetraloop region has been significantly restrained by
internucleotide connectivities, which has the effect of reducing the RMSD of the loop
region. When considering the helical stem and the tetraloop separately, there was no
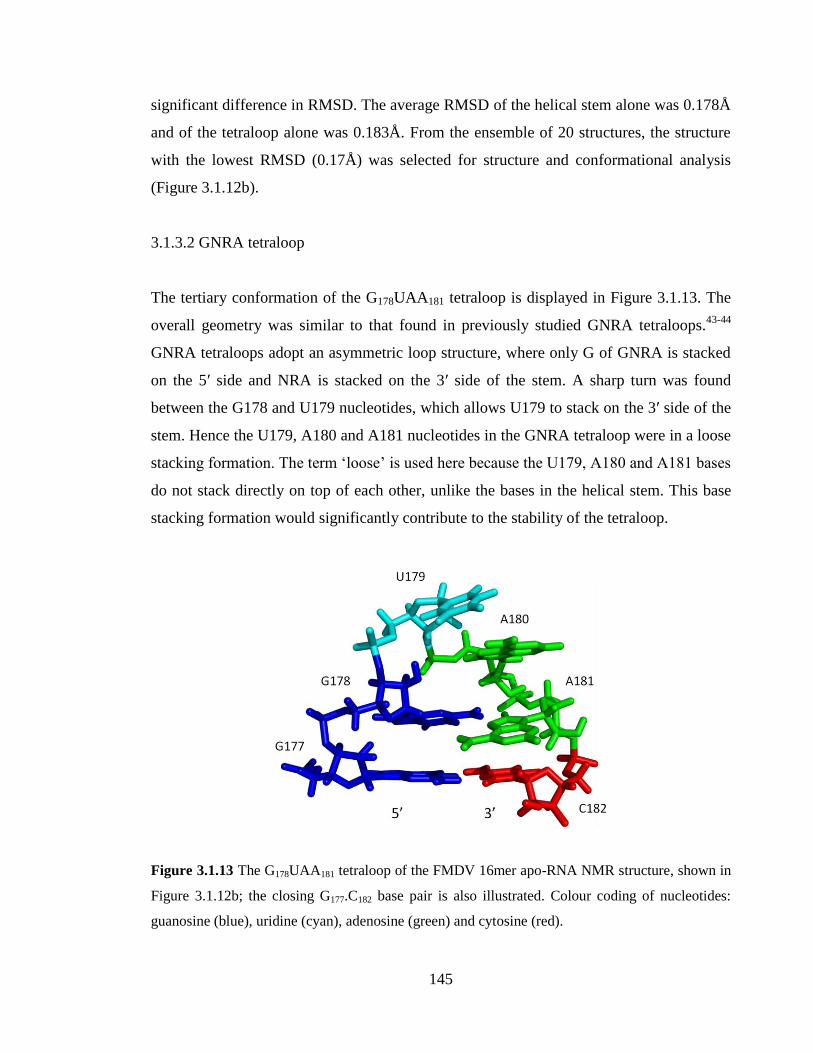
145
significant difference in RMSD. The average RMSD of the helical stem alone was 0.178Å
and of the tetraloop alone was 0.183Å. From the ensemble of 20 structures, the structure
with the lowest RMSD (0.17Å) was selected for structure and conformational analysis
(Figure 3.1.12b).
3.1.3.2 GNRA tetraloop
The tertiary conformation of the G178UAA181 tetraloop is displayed in Figure 3.1.13. The
overall geometry was similar to that found in previously studied GNRA tetraloops.43-44
GNRA tetraloops adopt an asymmetric loop structure, where only G of GNRA is stacked
on the 5ʹ side and NRA is stacked on the 3ʹ side of the stem. A sharp turn was found
between the G178 and U179 nucleotides, which allows U179 to stack on the 3ʹ side of the
stem. Hence the U179, A180 and A181 nucleotides in the GNRA tetraloop were in a loose
stacking formation. The term ‘loose’ is used here because the U179, A180 and A181 bases
do not stack directly on top of each other, unlike the bases in the helical stem. This base
stacking formation would significantly contribute to the stability of the tetraloop.
Figure 3.1.13 The G178UAA181 tetraloop of the FMDV 16mer apo-RNA NMR structure, shown in
Figure 3.1.12b; the closing G177.C182 base pair is also illustrated. Colour coding of nucleotides:
guanosine (blue), uridine (cyan), adenosine (green) and cytosine (red).
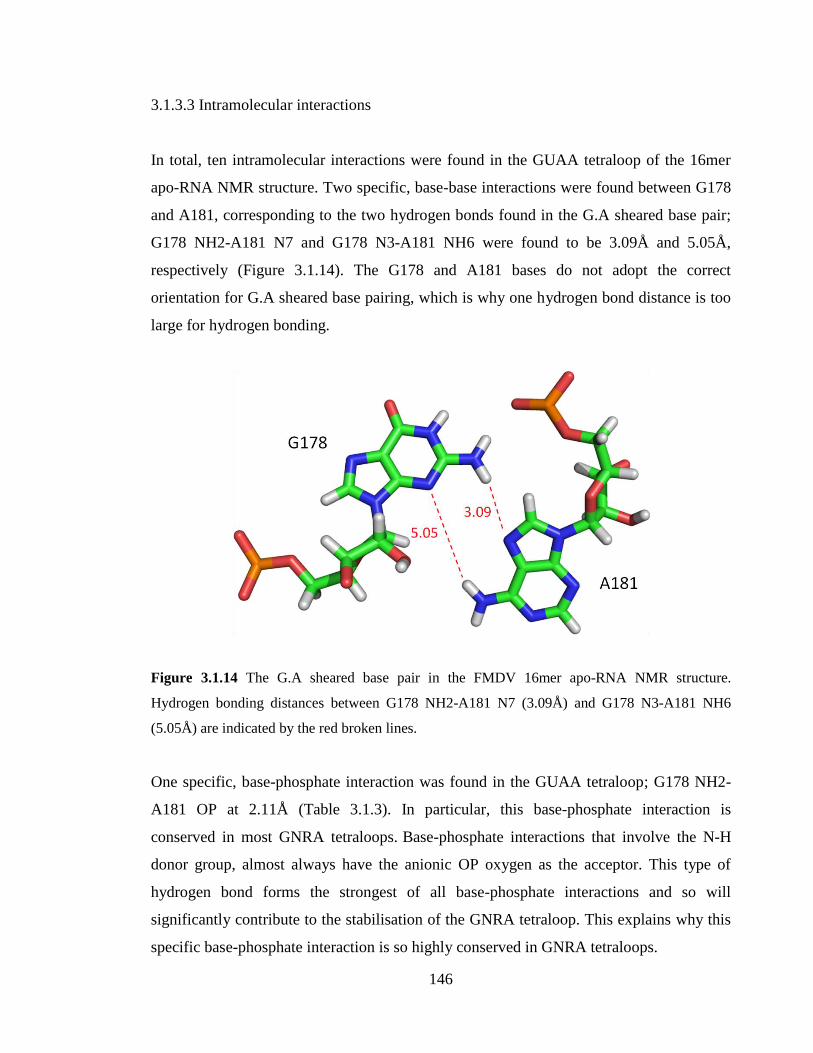
146
3.1.3.3 Intramolecular interactions
In total, ten intramolecular interactions were found in the GUAA tetraloop of the 16mer
apo-RNA NMR structure. Two specific, base-base interactions were found between G178
and A181, corresponding to the two hydrogen bonds found in the G.A sheared base pair;
G178 NH2-A181 N7 and G178 N3-A181 NH6 were found to be 3.09Å and 5.05Å,
respectively (Figure 3.1.14). The G178 and A181 bases do not adopt the correct
orientation for G.A sheared base pairing, which is why one hydrogen bond distance is too
large for hydrogen bonding.
Figure 3.1.14 The G.A sheared base pair in the FMDV 16mer apo-RNA NMR structure.
Hydrogen bonding distances between G178 NH2-A181 N7 (3.09Å) and G178 N3-A181 NH6
(5.05Å) are indicated by the red broken lines.
One specific, base-phosphate interaction was found in the GUAA tetraloop; G178 NH2-
A181 OP at 2.11Å (Table 3.1.3). In particular, this base-phosphate interaction is
conserved in most GNRA tetraloops. Base-phosphate interactions that involve the N-H
donor group, almost always have the anionic OP oxygen as the acceptor. This type of
hydrogen bond forms the strongest of all base-phosphate interactions and so will
significantly contribute to the stabilisation of the GNRA tetraloop. This explains why this
specific base-phosphate interaction is so highly conserved in GNRA tetraloops.
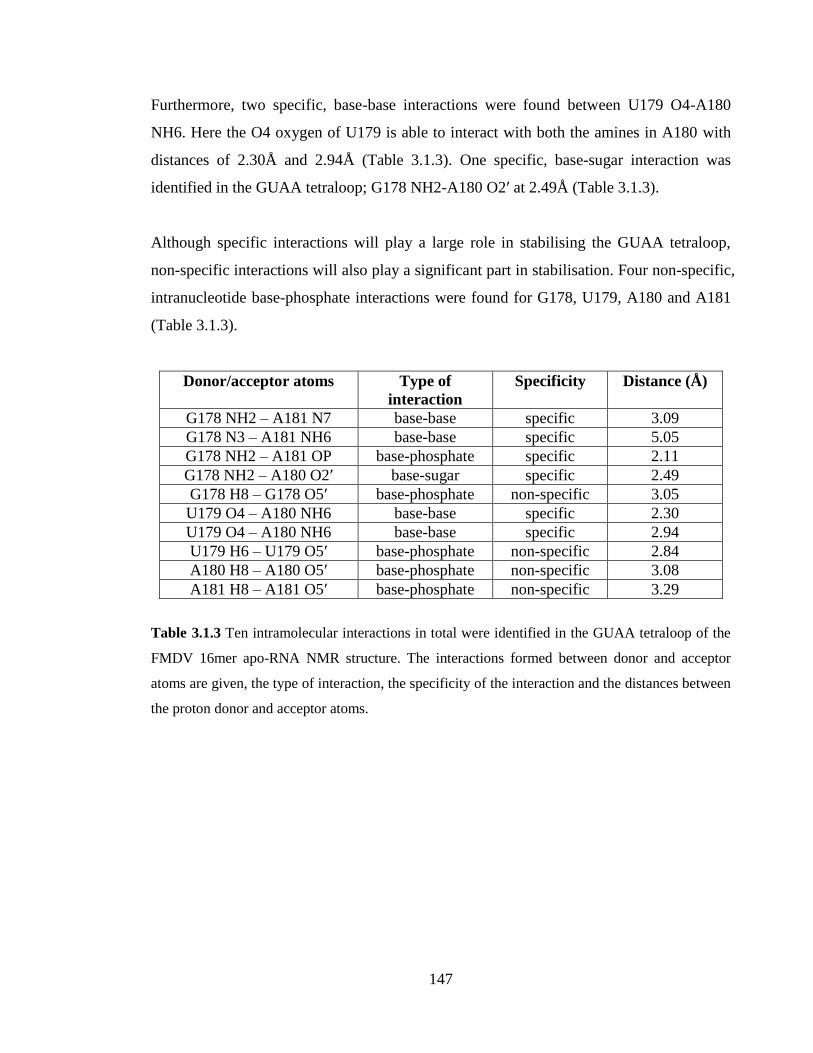
147
Furthermore, two specific, base-base interactions were found between U179 O4-A180
NH6. Here the O4 oxygen of U179 is able to interact with both the amines in A180 with
distances of 2.30Å and 2.94Å (Table 3.1.3). One specific, base-sugar interaction was
identified in the GUAA tetraloop; G178 NH2-A180 O2ʹ at 2.49Å (Table 3.1.3).
Although specific interactions will play a large role in stabilising the GUAA tetraloop,
non-specific interactions will also play a significant part in stabilisation. Four non-specific,
intranucleotide base-phosphate interactions were found for G178, U179, A180 and A181
(Table 3.1.3).
Donor/acceptor atoms Type of
interaction
Specificity Distance (Å)
G178 NH2 – A181 N7 base-base specific 3.09
G178 N3 – A181 NH6 base-base specific 5.05
G178 NH2 – A181 OP base-phosphate specific 2.11
G178 NH2 – A180 O2ʹ base-sugar specific 2.49
G178 H8 – G178 O5ʹ base-phosphate non-specific 3.05
U179 O4 – A180 NH6 base-base specific 2.30
U179 O4 – A180 NH6 base-base specific 2.94
U179 H6 – U179 O5ʹ base-phosphate non-specific 2.84
A180 H8 – A180 O5ʹ base-phosphate non-specific 3.08
A181 H8 – A181 O5ʹ base-phosphate non-specific 3.29
Table 3.1.3 Ten intramolecular interactions in total were identified in the GUAA tetraloop of the
FMDV 16mer apo-RNA NMR structure. The interactions formed between donor and acceptor
atoms are given, the type of interaction, the specificity of the interaction and the distances between
the proton donor and acceptor atoms.
148
3.1.4 Conformational analysis
The 3DNA program was used to perform a conformational analysis on the final 16mer
apo-RNA NMR structure. The local helical parameters, base pair step parameters and
complementary base pair parameters were calculated and are displayed in Tables 3.1.4,
3.1.5 and 3.1.6, respectively.
When analysing the 16mer apo-RNA structure, it was first determined whether the RNA
helical structure did indeed exhibit an A-form conformation. The two best parameters that
can be used to distinguish between A-form and B-form conformations are the ‘x-
displacement’ (local helical parameter) and ‘slide’ (base pair step parameter). Values
obtained for the 16mer apo-RNA were compared with average values obtained for A-
DNA and B-DNA crystal structures.110
Both the ‘x-displacement’ value of -3.19Å (Table
3.1.4) and ‘slide’ value of -1.40Å (Table 3.1.5), suggested that the 16mer apo-RNA
structure is characteristic of an A-form helical conformation.
One other parameter that may be useful for analysing the conformation of the tetraloop in
the 16mer apo-RNA structure is the complementary base pair parameter, ‘shear’. Since the
G.A base pair in the tetraloop is a sheared base pair, the ‘shear’ parameter value of the
G.A base pair can be compared with the other canonical base pairs. The ‘shear’ parameter
value of the G.A base pair was found to be 7.67Å (Table 3.1.6). In contrast to the average
canonical base pair values (-0.05Å), the value of 7.67Å confirms the sheared conformation
of the G.A base pair.
The base pairing between U172-A187 could not be confirmed by NMR and the final
NMR solution structure clearly displayed a frayed base pair. This is shown by the
deviation from average values, consistent with standard base pairing, of the
complementary base pair parameters ‘propeller’ and ‘opening’ (Table 3.1.6).
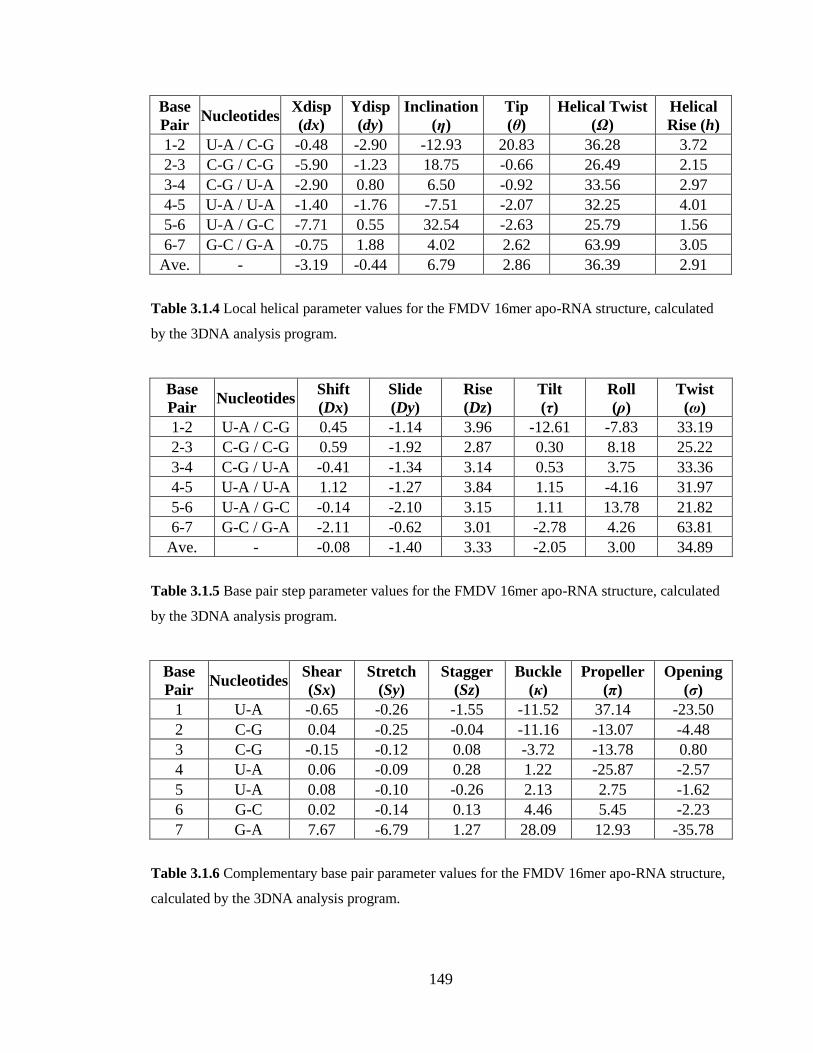
149
Base
Pair Nucleotides
Xdisp
(dx)
Ydisp
(dy)
Inclination
(η)
Tip
(θ)
Helical Twist
(Ω)
Helical
Rise (h)
1-2 U-A / C-G -0.48 -2.90 -12.93 20.83 36.28 3.72
2-3 C-G / C-G -5.90 -1.23 18.75 -0.66 26.49 2.15
3-4 C-G / U-A -2.90 0.80 6.50 -0.92 33.56 2.97
4-5 U-A / U-A -1.40 -1.76 -7.51 -2.07 32.25 4.01
5-6 U-A / G-C -7.71 0.55 32.54 -2.63 25.79 1.56
6-7 G-C / G-A -0.75 1.88 4.02 2.62 63.99 3.05
Ave. - -3.19 -0.44 6.79 2.86 36.39 2.91
Table 3.1.4 Local helical parameter values for the FMDV 16mer apo-RNA structure, calculated
by the 3DNA analysis program.
Base
Pair Nucleotides
Shift
(Dx)
Slide
(Dy)
Rise
(Dz)
Tilt
(τ)
Roll
(ρ)
Twist
(ω)
1-2 U-A / C-G 0.45 -1.14 3.96 -12.61 -7.83 33.19
2-3 C-G / C-G 0.59 -1.92 2.87 0.30 8.18 25.22
3-4 C-G / U-A -0.41 -1.34 3.14 0.53 3.75 33.36
4-5 U-A / U-A 1.12 -1.27 3.84 1.15 -4.16 31.97
5-6 U-A / G-C -0.14 -2.10 3.15 1.11 13.78 21.82
6-7 G-C / G-A -2.11 -0.62 3.01 -2.78 4.26 63.81
Ave. - -0.08 -1.40 3.33 -2.05 3.00 34.89
Table 3.1.5 Base pair step parameter values for the FMDV 16mer apo-RNA structure, calculated
by the 3DNA analysis program.
Base
Pair Nucleotides
Shear
(Sx)
Stretch
(Sy)
Stagger
(Sz)
Buckle
(κ)
Propeller
(π)
Opening
(σ)
1 U-A -0.65 -0.26 -1.55 -11.52 37.14 -23.50
2 C-G 0.04 -0.25 -0.04 -11.16 -13.07 -4.48
3 C-G -0.15 -0.12 0.08 -3.72 -13.78 0.80
4 U-A 0.06 -0.09 0.28 1.22 -25.87 -2.57
5 U-A 0.08 -0.10 -0.26 2.13 2.75 -1.62
6 G-C 0.02 -0.14 0.13 4.46 5.45 -2.23
7 G-A 7.67 -6.79 1.27 28.09 12.93 -35.78
Table 3.1.6 Complementary base pair parameter values for the FMDV 16mer apo-RNA structure,
calculated by the 3DNA analysis program.
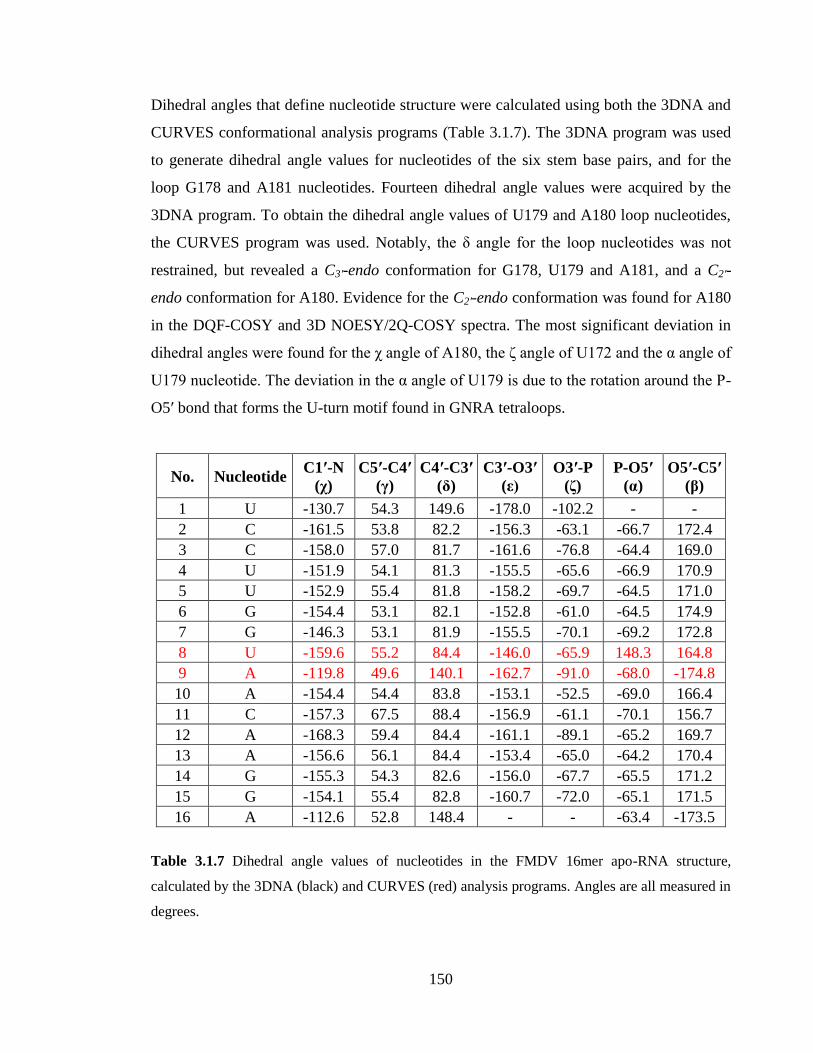
150
Dihedral angles that define nucleotide structure were calculated using both the 3DNA and
CURVES conformational analysis programs (Table 3.1.7). The 3DNA program was used
to generate dihedral angle values for nucleotides of the six stem base pairs, and for the
loop G178 and A181 nucleotides. Fourteen dihedral angle values were acquired by the
3DNA program. To obtain the dihedral angle values of U179 and A180 loop nucleotides,
the CURVES program was used. Notably, the δ angle for the loop nucleotides was not
restrained, but revealed a C3ʹ-endo conformation for G178, U179 and A181, and a C2ʹ-
endo conformation for A180. Evidence for the C2ʹ-endo conformation was found for A180
in the DQF-COSY and 3D NOESY/2Q-COSY spectra. The most significant deviation in
dihedral angles were found for the χ angle of A180, the ζ angle of U172 and the α angle of
U179 nucleotide. The deviation in the α angle of U179 is due to the rotation around the P-
O5ʹ bond that forms the U-turn motif found in GNRA tetraloops.
No. Nucleotide C1ʹ-N
(χ)
C5ʹ-C4ʹ
(γ)
C4ʹ-C3ʹ
(δ)
C3ʹ-O3ʹ
(ε)
O3ʹ-P
(ζ)
P-O5ʹ
(α)
O5ʹ-C5ʹ
(β)
1 U -130.7 54.3 149.6 -178.0 -102.2 - -
2 C -161.5 53.8 82.2 -156.3 -63.1 -66.7 172.4
3 C -158.0 57.0 81.7 -161.6 -76.8 -64.4 169.0
4 U -151.9 54.1 81.3 -155.5 -65.6 -66.9 170.9
5 U -152.9 55.4 81.8 -158.2 -69.7 -64.5 171.0
6 G -154.4 53.1 82.1 -152.8 -61.0 -64.5 174.9
7 G -146.3 53.1 81.9 -155.5 -70.1 -69.2 172.8
8 U -159.6 55.2 84.4 -146.0 -65.9 148.3 164.8
9 A -119.8 49.6 140.1 -162.7 -91.0 -68.0 -174.8
10 A -154.4 54.4 83.8 -153.1 -52.5 -69.0 166.4
11 C -157.3 67.5 88.4 -156.9 -61.1 -70.1 156.7
12 A -168.3 59.4 84.4 -161.1 -89.1 -65.2 169.7
13 A -156.6 56.1 84.4 -153.4 -65.0 -64.2 170.4
14 G -155.3 54.3 82.6 -156.0 -67.7 -65.5 171.2
15 G -154.1 55.4 82.8 -160.7 -72.0 -65.1 171.5
16 A -112.6 52.8 148.4 - - -63.4 -173.5
Table 3.1.7 Dihedral angle values of nucleotides in the FMDV 16mer apo-RNA structure,
calculated by the 3DNA (black) and CURVES (red) analysis programs. Angles are all measured in
degrees.
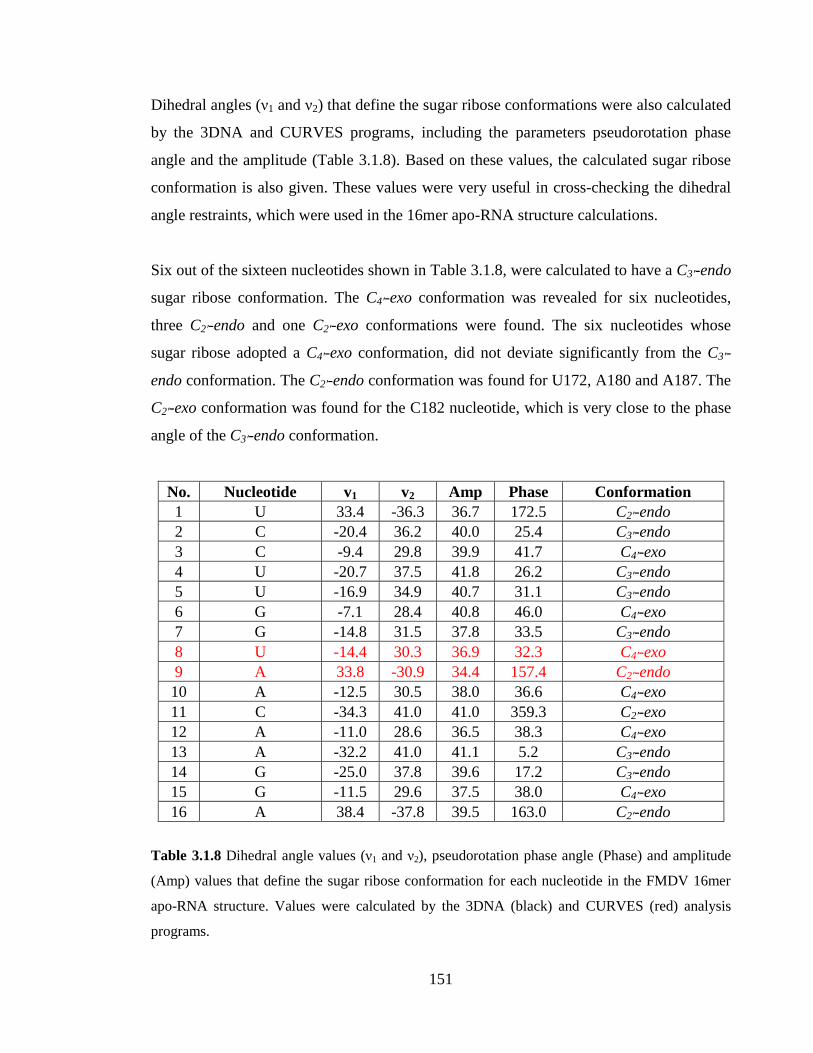
151
Dihedral angles (ν1 and ν2) that define the sugar ribose conformations were also calculated
by the 3DNA and CURVES programs, including the parameters pseudorotation phase
angle and the amplitude (Table 3.1.8). Based on these values, the calculated sugar ribose
conformation is also given. These values were very useful in cross-checking the dihedral
angle restraints, which were used in the 16mer apo-RNA structure calculations.
Six out of the sixteen nucleotides shown in Table 3.1.8, were calculated to have a C3ʹ-endo
sugar ribose conformation. The C4ʹ-exo conformation was revealed for six nucleotides,
three C2ʹ-endo and one C2ʹ-exo conformations were found. The six nucleotides whose
sugar ribose adopted a C4ʹ-exo conformation, did not deviate significantly from the C3ʹ-
endo conformation. The C2ʹ-endo conformation was found for U172, A180 and A187. The
C2ʹ-exo conformation was found for the C182 nucleotide, which is very close to the phase
angle of the C3ʹ-endo conformation.
No. Nucleotide v1 v2 Amp Phase Conformation
1 U 33.4 -36.3 36.7 172.5 C2ʹ-endo
2 C -20.4 36.2 40.0 25.4 C3ʹ-endo
3 C -9.4 29.8 39.9 41.7 C4ʹ-exo
4 U -20.7 37.5 41.8 26.2 C3ʹ-endo
5 U -16.9 34.9 40.7 31.1 C3ʹ-endo
6 G -7.1 28.4 40.8 46.0 C4ʹ-exo
7 G -14.8 31.5 37.8 33.5 C3ʹ-endo
8 U -14.4 30.3 36.9 32.3 C4ʹ-exo
9 A 33.8 -30.9 34.4 157.4 C2ʹ-endo
10 A -12.5 30.5 38.0 36.6 C4ʹ-exo
11 C -34.3 41.0 41.0 359.3 C2ʹ-exo
12 A -11.0 28.6 36.5 38.3 C4ʹ-exo
13 A -32.2 41.0 41.1 5.2 C3ʹ-endo
14 G -25.0 37.8 39.6 17.2 C3ʹ-endo
15 G -11.5 29.6 37.5 38.0 C4ʹ-exo
16 A 38.4 -37.8 39.5 163.0 C2ʹ-endo
Table 3.1.8 Dihedral angle values (ν1 and ν2), pseudorotation phase angle (Phase) and amplitude
(Amp) values that define the sugar ribose conformation for each nucleotide in the FMDV 16mer
apo-RNA structure. Values were calculated by the 3DNA (black) and CURVES (red) analysis
programs.
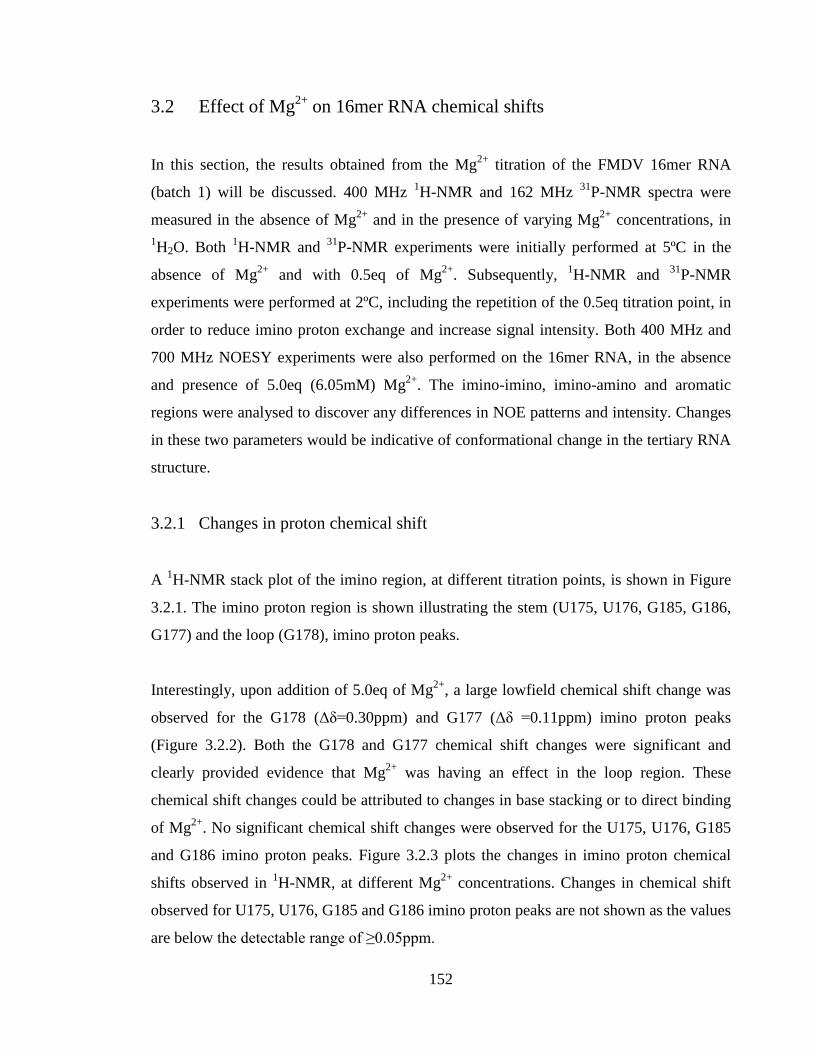
152
3.2 Effect of Mg2+
on 16mer RNA chemical shifts
In this section, the results obtained from the Mg2+
titration of the FMDV 16mer RNA
(batch 1) will be discussed. 400 MHz 1H-NMR and 162 MHz
31P-NMR spectra were
measured in the absence of Mg2+
and in the presence of varying Mg2+
concentrations, in
1H2O. Both
1H-NMR and
31P-NMR experiments were initially performed at 5ºC in the
absence of Mg2+
and with 0.5eq of Mg2+
. Subsequently, 1H-NMR and
31P-NMR
experiments were performed at 2ºC, including the repetition of the 0.5eq titration point, in
order to reduce imino proton exchange and increase signal intensity. Both 400 MHz and
700 MHz NOESY experiments were also performed on the 16mer RNA, in the absence
and presence of 5.0eq (6.05mM) Mg2+
. The imino-imino, imino-amino and aromatic
regions were analysed to discover any differences in NOE patterns and intensity. Changes
in these two parameters would be indicative of conformational change in the tertiary RNA
structure.
3.2.1 Changes in proton chemical shift
A 1H-NMR stack plot of the imino region, at different titration points, is shown in Figure
3.2.1. The imino proton region is shown illustrating the stem (U175, U176, G185, G186,
G177) and the loop (G178), imino proton peaks.
Interestingly, upon addition of 5.0eq of Mg2+
, a large lowfield chemical shift change was
observed for the G178 (Δδ=0.30ppm) and G177 (Δδ =0.11ppm) imino proton peaks
(Figure 3.2.2). Both the G178 and G177 chemical shift changes were significant and
clearly provided evidence that Mg2+
was having an effect in the loop region. These
chemical shift changes could be attributed to changes in base stacking or to direct binding
of Mg2+
. No significant chemical shift changes were observed for the U175, U176, G185
and G186 imino proton peaks. Figure 3.2.3 plots the changes in imino proton chemical
shifts observed in 1H-NMR, at different Mg
2+ concentrations. Changes in chemical shift
observed for U175, U176, G185 and G186 imino proton peaks are not shown as the values
are below the detectable range of ≥0.05ppm.
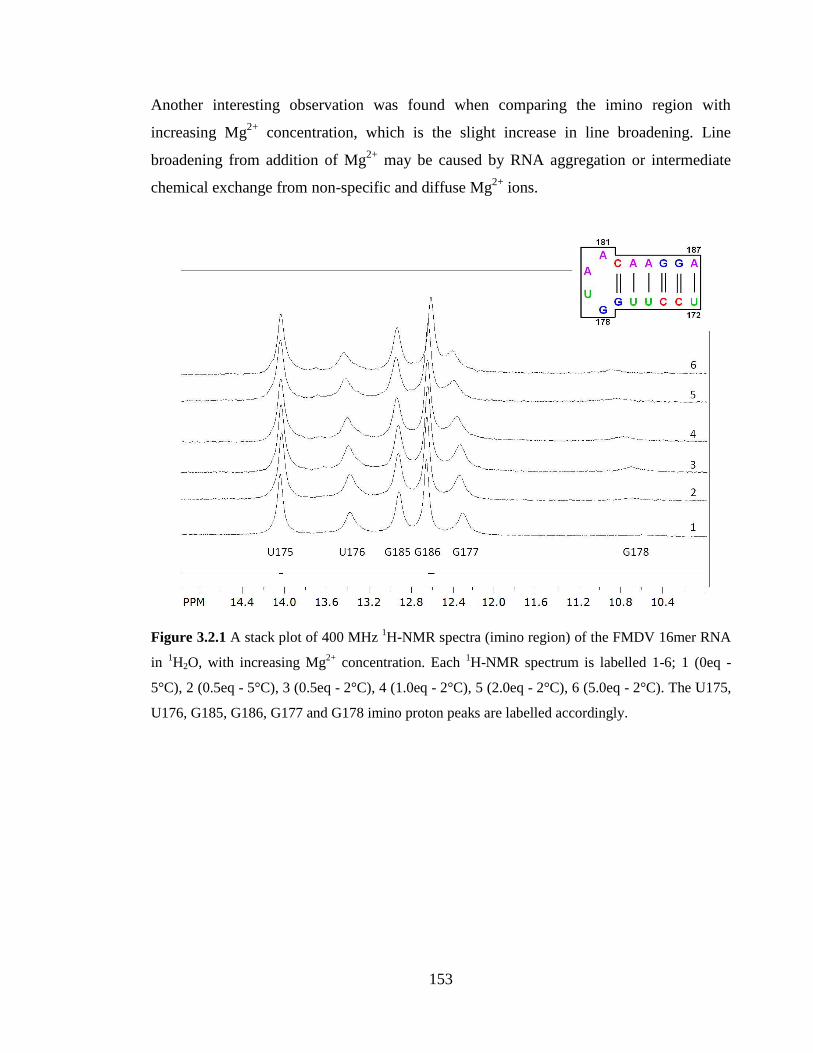
153
Another interesting observation was found when comparing the imino region with
increasing Mg2+
concentration, which is the slight increase in line broadening. Line
broadening from addition of Mg2+
may be caused by RNA aggregation or intermediate
chemical exchange from non-specific and diffuse Mg2+
ions.
Figure 3.2.1 A stack plot of 400 MHz 1H-NMR spectra (imino region) of the FMDV 16mer RNA
in 1H2O, with increasing Mg
2+ concentration. Each
1H-NMR spectrum is labelled 1-6; 1 (0eq -
5°C), 2 (0.5eq - 5°C), 3 (0.5eq - 2°C), 4 (1.0eq - 2°C), 5 (2.0eq - 2°C), 6 (5.0eq - 2°C). The U175,
U176, G185, G186, G177 and G178 imino proton peaks are labelled accordingly.
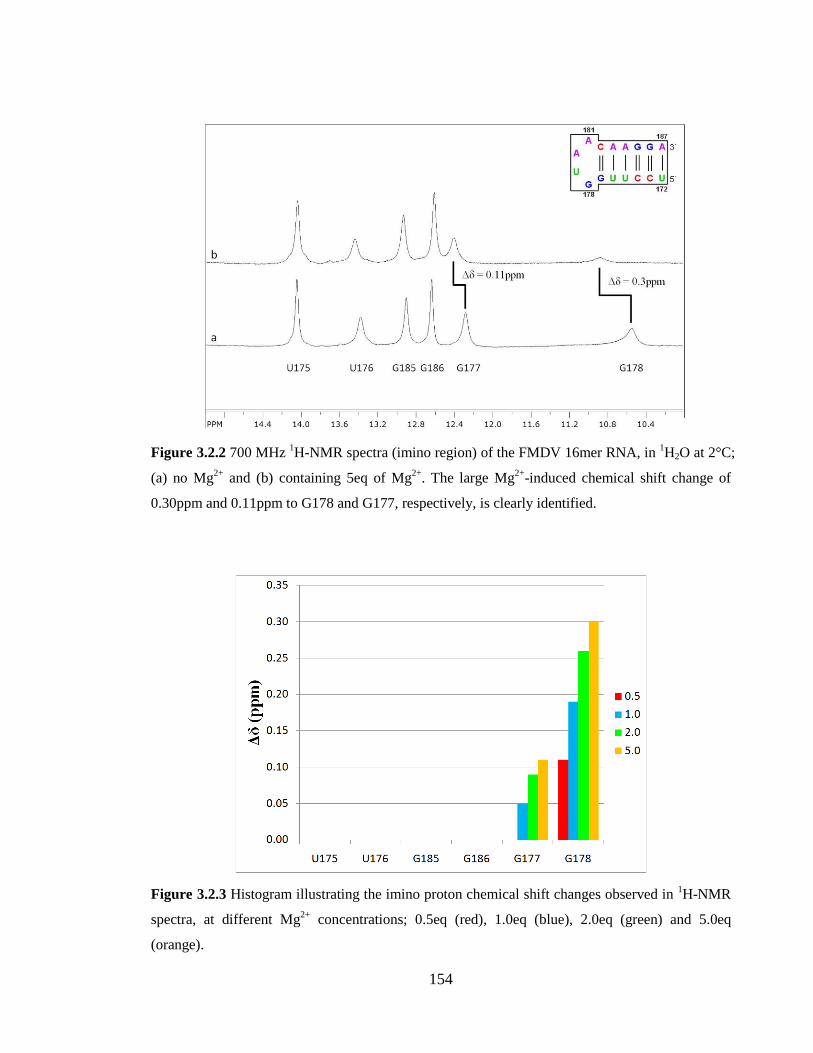
154
Figure 3.2.2 700 MHz 1H-NMR spectra (imino region) of the FMDV 16mer RNA, in
1H2O at 2°C;
(a) no Mg2+
and (b) containing 5eq of Mg2+
. The large Mg2+
-induced chemical shift change of
0.30ppm and 0.11ppm to G178 and G177, respectively, is clearly identified.
Figure 3.2.3 Histogram illustrating the imino proton chemical shift changes observed in 1H-NMR
spectra, at different Mg2+
concentrations; 0.5eq (red), 1.0eq (blue), 2.0eq (green) and 5.0eq
(orange).
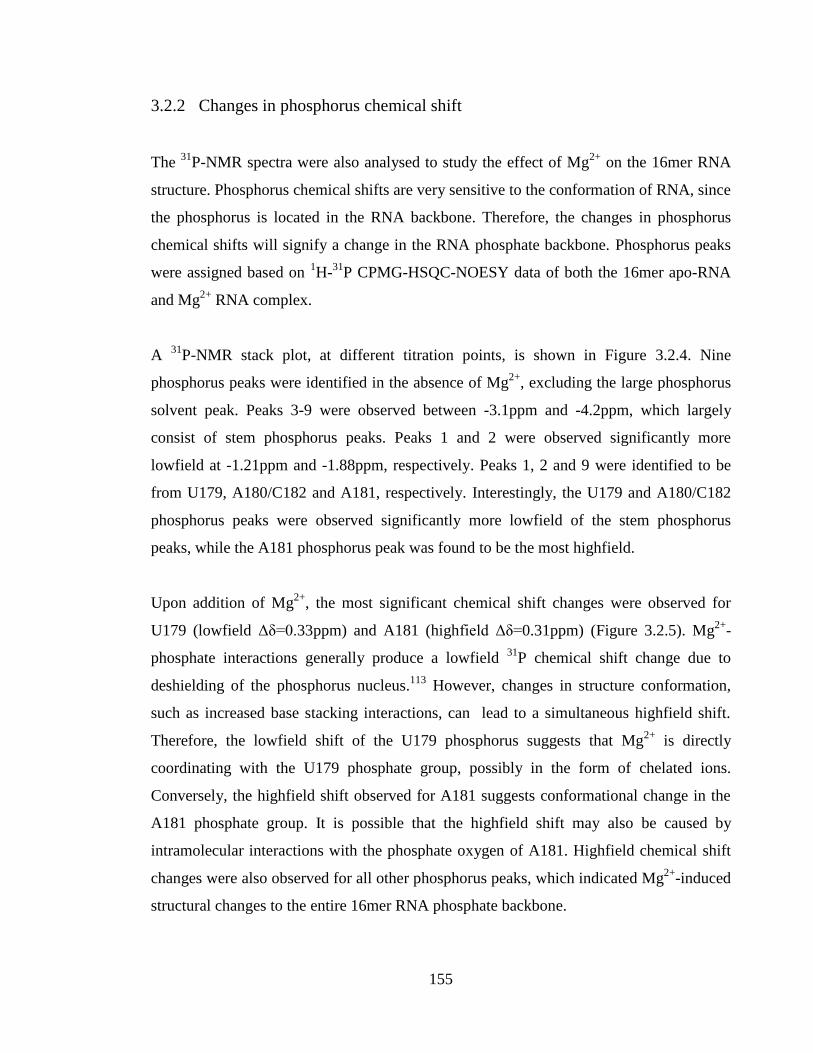
155
3.2.2 Changes in phosphorus chemical shift
The 31
P-NMR spectra were also analysed to study the effect of Mg2+
on the 16mer RNA
structure. Phosphorus chemical shifts are very sensitive to the conformation of RNA, since
the phosphorus is located in the RNA backbone. Therefore, the changes in phosphorus
chemical shifts will signify a change in the RNA phosphate backbone. Phosphorus peaks
were assigned based on 1H-
31P CPMG-HSQC-NOESY data of both the 16mer apo-RNA
and Mg2+
RNA complex.
A 31
P-NMR stack plot, at different titration points, is shown in Figure 3.2.4. Nine
phosphorus peaks were identified in the absence of Mg2+
, excluding the large phosphorus
solvent peak. Peaks 3-9 were observed between -3.1ppm and -4.2ppm, which largely
consist of stem phosphorus peaks. Peaks 1 and 2 were observed significantly more
lowfield at -1.21ppm and -1.88ppm, respectively. Peaks 1, 2 and 9 were identified to be
from U179, A180/C182 and A181, respectively. Interestingly, the U179 and A180/C182
phosphorus peaks were observed significantly more lowfield of the stem phosphorus
peaks, while the A181 phosphorus peak was found to be the most highfield.
Upon addition of Mg2+
, the most significant chemical shift changes were observed for
U179 (lowfield Δδ=0.33ppm) and A181 (highfield Δδ=0.31ppm) (Figure 3.2.5). Mg2+
-
phosphate interactions generally produce a lowfield 31
P chemical shift change due to
deshielding of the phosphorus nucleus.113
However, changes in structure conformation,
such as increased base stacking interactions, can lead to a simultaneous highfield shift.
Therefore, the lowfield shift of the U179 phosphorus suggests that Mg2+
is directly
coordinating with the U179 phosphate group, possibly in the form of chelated ions.
Conversely, the highfield shift observed for A181 suggests conformational change in the
A181 phosphate group. It is possible that the highfield shift may also be caused by
intramolecular interactions with the phosphate oxygen of A181. Highfield chemical shift
changes were also observed for all other phosphorus peaks, which indicated Mg2+
-induced
structural changes to the entire 16mer RNA phosphate backbone.
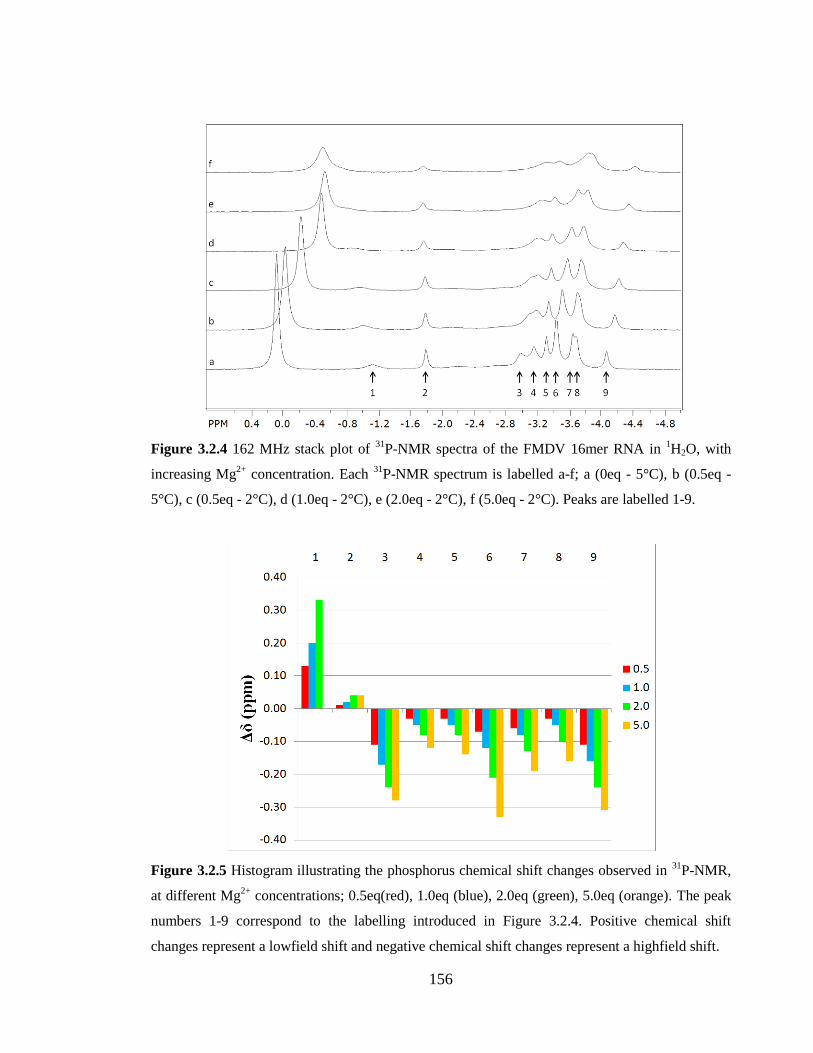
156
Figure 3.2.4 162 MHz stack plot of 31
P-NMR spectra of the FMDV 16mer RNA in 1H2O, with
increasing Mg2+
concentration. Each 31
P-NMR spectrum is labelled a-f; a (0eq - 5°C), b (0.5eq -
5°C), c (0.5eq - 2°C), d (1.0eq - 2°C), e (2.0eq - 2°C), f (5.0eq - 2°C). Peaks are labelled 1-9.
Figure 3.2.5 Histogram illustrating the phosphorus chemical shift changes observed in 31
P-NMR,
at different Mg2+
concentrations; 0.5eq(red), 1.0eq (blue), 2.0eq (green), 5.0eq (orange). The peak
numbers 1-9 correspond to the labelling introduced in Figure 3.2.4. Positive chemical shift
changes represent a lowfield shift and negative chemical shift changes represent a highfield shift.
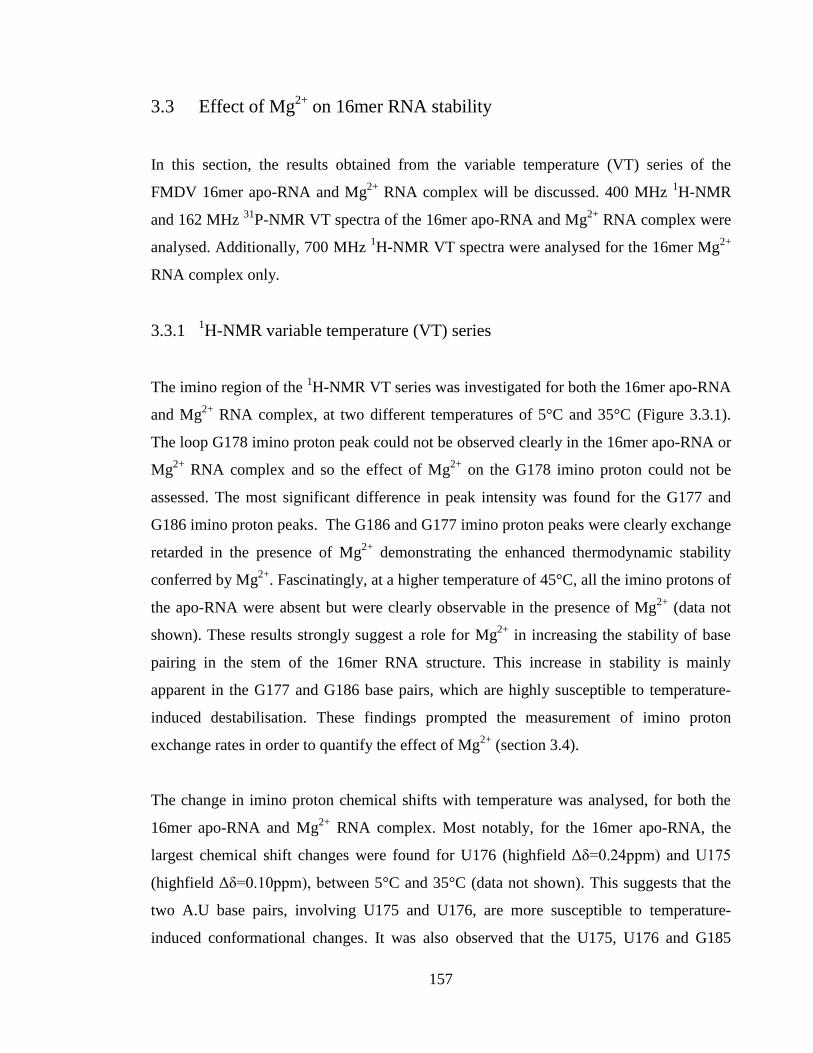
157
3.3 Effect of Mg2+
on 16mer RNA stability
In this section, the results obtained from the variable temperature (VT) series of the
FMDV 16mer apo-RNA and Mg2+
RNA complex will be discussed. 400 MHz 1H-NMR
and 162 MHz 31
P-NMR VT spectra of the 16mer apo-RNA and Mg2+
RNA complex were
analysed. Additionally, 700 MHz 1H-NMR VT spectra were analysed for the 16mer Mg
2+
RNA complex only.
3.3.1 1H-NMR variable temperature (VT) series
The imino region of the 1H-NMR VT series was investigated for both the 16mer apo-RNA
and Mg2+
RNA complex, at two different temperatures of 5°C and 35°C (Figure 3.3.1).
The loop G178 imino proton peak could not be observed clearly in the 16mer apo-RNA or
Mg2+
RNA complex and so the effect of Mg2+
on the G178 imino proton could not be
assessed. The most significant difference in peak intensity was found for the G177 and
G186 imino proton peaks. The G186 and G177 imino proton peaks were clearly exchange
retarded in the presence of Mg2+
demonstrating the enhanced thermodynamic stability
conferred by Mg2+
. Fascinatingly, at a higher temperature of 45°C, all the imino protons of
the apo-RNA were absent but were clearly observable in the presence of Mg2+
(data not
shown). These results strongly suggest a role for Mg2+
in increasing the stability of base
pairing in the stem of the 16mer RNA structure. This increase in stability is mainly
apparent in the G177 and G186 base pairs, which are highly susceptible to temperature-
induced destabilisation. These findings prompted the measurement of imino proton
exchange rates in order to quantify the effect of Mg2+
(section 3.4).
The change in imino proton chemical shifts with temperature was analysed, for both the
16mer apo-RNA and Mg2+
RNA complex. Most notably, for the 16mer apo-RNA, the
largest chemical shift changes were found for U176 (highfield Δδ=0.24ppm) and U175
(highfield Δδ=0.10ppm), between 5°C and 35°C (data not shown). This suggests that the
two A.U base pairs, involving U175 and U176, are more susceptible to temperature-
induced conformational changes. It was also observed that the U175, U176 and G185
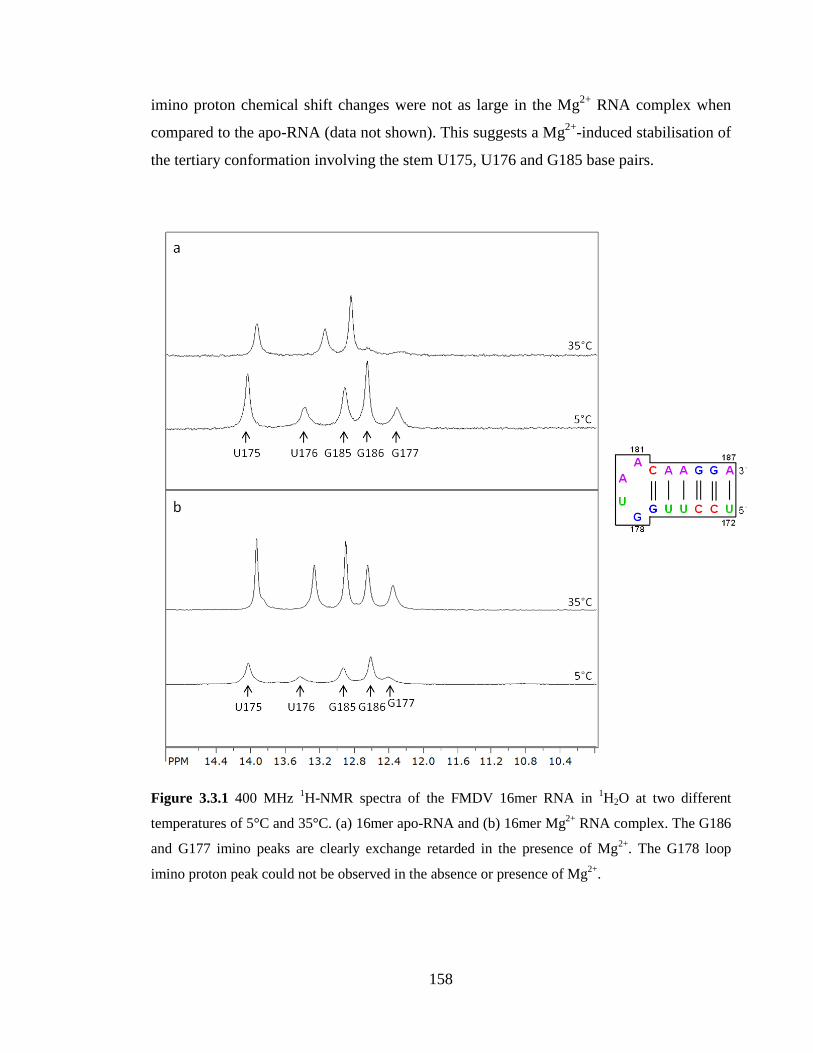
158
imino proton chemical shift changes were not as large in the Mg2+
RNA complex when
compared to the apo-RNA (data not shown). This suggests a Mg2+
-induced stabilisation of
the tertiary conformation involving the stem U175, U176 and G185 base pairs.
Figure 3.3.1 400 MHz 1H-NMR spectra of the FMDV 16mer RNA in
1H2O at two different
temperatures of 5°C and 35°C. (a) 16mer apo-RNA and (b) 16mer Mg2+
RNA complex. The G186
and G177 imino peaks are clearly exchange retarded in the presence of Mg2+
. The G178 loop
imino proton peak could not be observed in the absence or presence of Mg2+
.
159
A second 700 MHz 1H-NMR VT series was performed on the 16mer Mg
2+ RNA complex
in order to observe the G178 loop imino proton more clearly and monitor changes in its
intensity and chemical shift. Additional temperature points between 35°C-45°C allowed
more accurate monitoring of the decrease in intensity of G177 and G186 imino proton
peaks. Figure 3.3.2 displays a stack plot of the imino region between 2°C-55°C.
Interestingly, the G178 imino proton peak could be observed between 2°C-15°C but
disappeared completely at 20°C. The U175, U176 and G185 imino proton peaks could be
observed up to the highest temperature point of 55°C. The G177 and G186 imino proton
peaks could still be observed at 50°C, but were rendered absent at 55°C. Again, this
clearly illustrates the enhanced stability produced by Mg2+
.
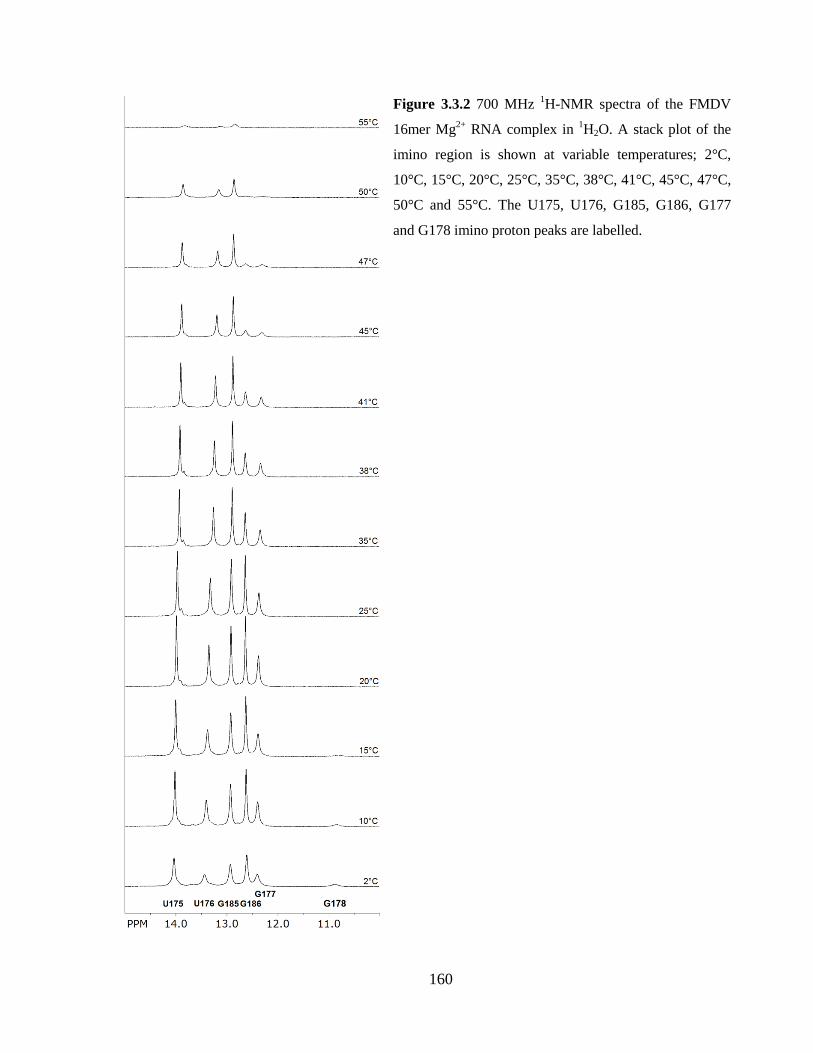
160
Figure 3.3.2 700 MHz 1H-NMR spectra of the FMDV
16mer Mg2+
RNA complex in 1H2O. A stack plot of the
imino region is shown at variable temperatures; 2°C,
10°C, 15°C, 20°C, 25°C, 35°C, 38°C, 41°C, 45°C, 47°C,
50°C and 55°C. The U175, U176, G185, G186, G177
and G178 imino proton peaks are labelled.
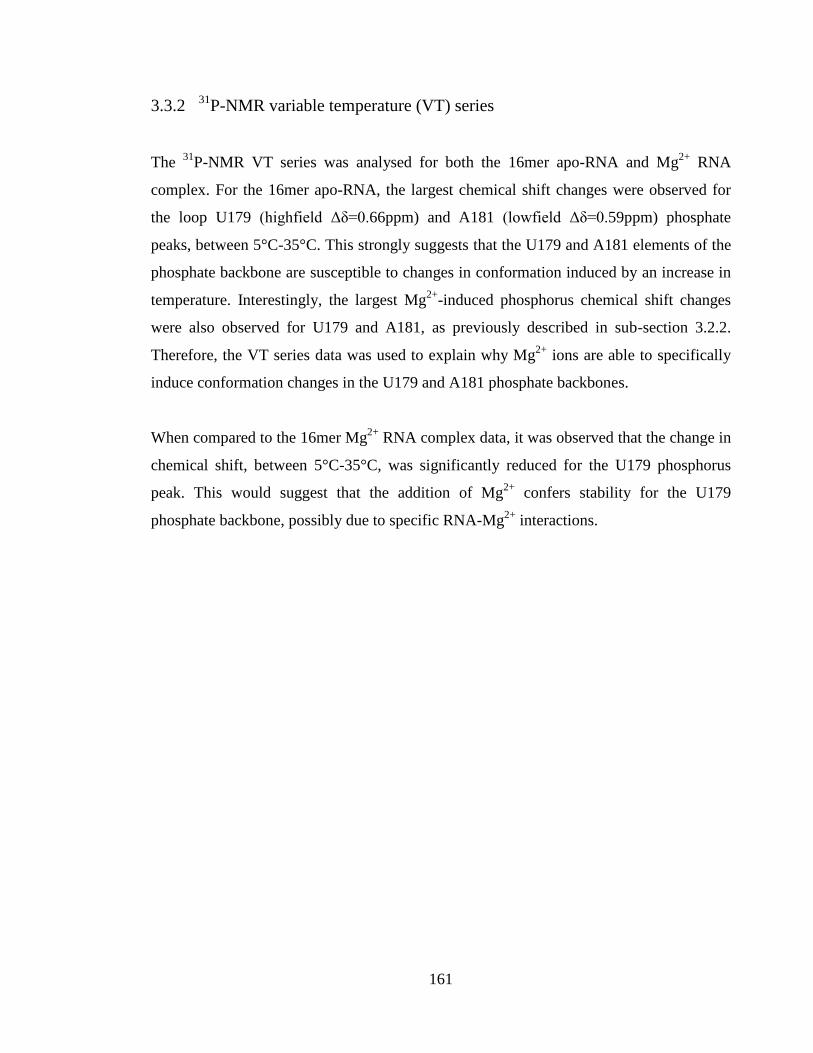
161
3.3.2 31P-NMR variable temperature (VT) series
The 31
P-NMR VT series was analysed for both the 16mer apo-RNA and Mg2+
RNA
complex. For the 16mer apo-RNA, the largest chemical shift changes were observed for
the loop U179 (highfield Δδ=0.66ppm) and A181 (lowfield Δδ=0.59ppm) phosphate
peaks, between 5°C-35°C. This strongly suggests that the U179 and A181 elements of the
phosphate backbone are susceptible to changes in conformation induced by an increase in
temperature. Interestingly, the largest Mg2+
-induced phosphorus chemical shift changes
were also observed for U179 and A181, as previously described in sub-section 3.2.2.
Therefore, the VT series data was used to explain why Mg2+
ions are able to specifically
induce conformation changes in the U179 and A181 phosphate backbones.
When compared to the 16mer Mg2+
RNA complex data, it was observed that the change in
chemical shift, between 5°C-35°C, was significantly reduced for the U179 phosphorus
peak. This would suggest that the addition of Mg2+
confers stability for the U179
phosphate backbone, possibly due to specific RNA-Mg2+
interactions.
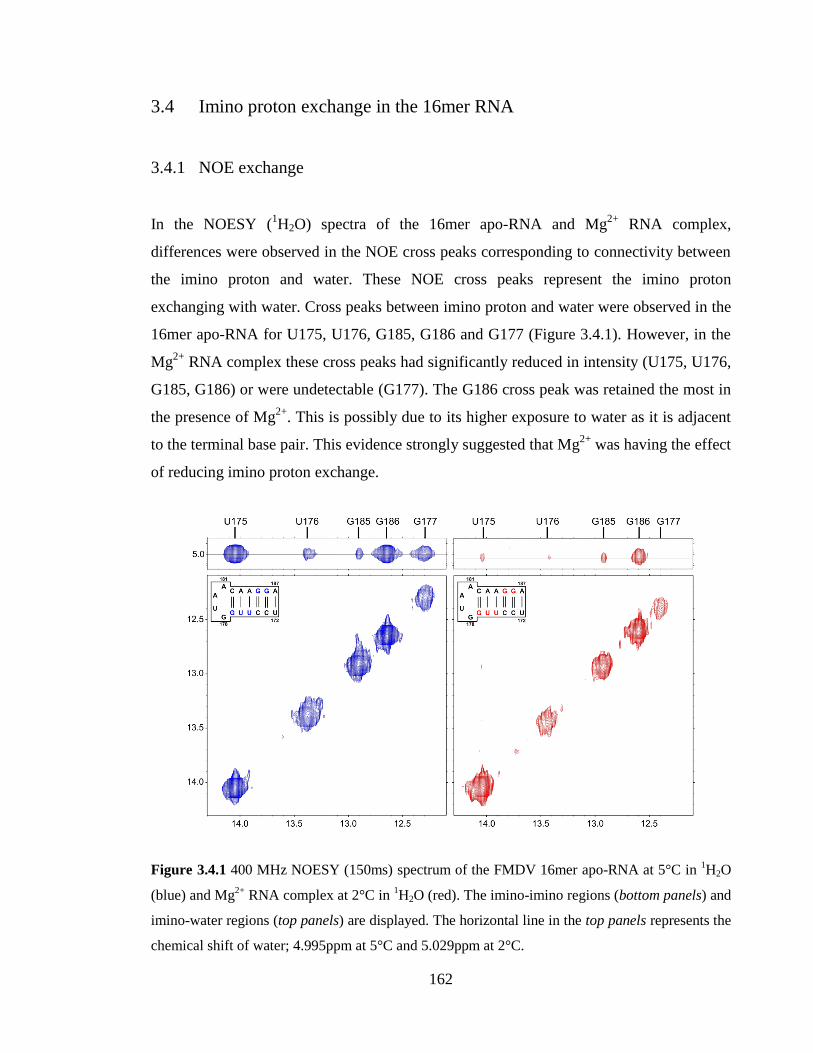
162
3.4 Imino proton exchange in the 16mer RNA
3.4.1 NOE exchange
In the NOESY (1H2O) spectra of the 16mer apo-RNA and Mg
2+ RNA complex,
differences were observed in the NOE cross peaks corresponding to connectivity between
the imino proton and water. These NOE cross peaks represent the imino proton
exchanging with water. Cross peaks between imino proton and water were observed in the
16mer apo-RNA for U175, U176, G185, G186 and G177 (Figure 3.4.1). However, in the
Mg2+
RNA complex these cross peaks had significantly reduced in intensity (U175, U176,
G185, G186) or were undetectable (G177). The G186 cross peak was retained the most in
the presence of Mg2+
. This is possibly due to its higher exposure to water as it is adjacent
to the terminal base pair. This evidence strongly suggested that Mg2+
was having the effect
of reducing imino proton exchange.
Figure 3.4.1 400 MHz NOESY (150ms) spectrum of the FMDV 16mer apo-RNA at 5°C in 1H2O
(blue) and Mg2+
RNA complex at 2°C in 1H2O (red). The imino-imino regions (bottom panels) and
imino-water regions (top panels) are displayed. The horizontal line in the top panels represents the
chemical shift of water; 4.995ppm at 5°C and 5.029ppm at 2°C.
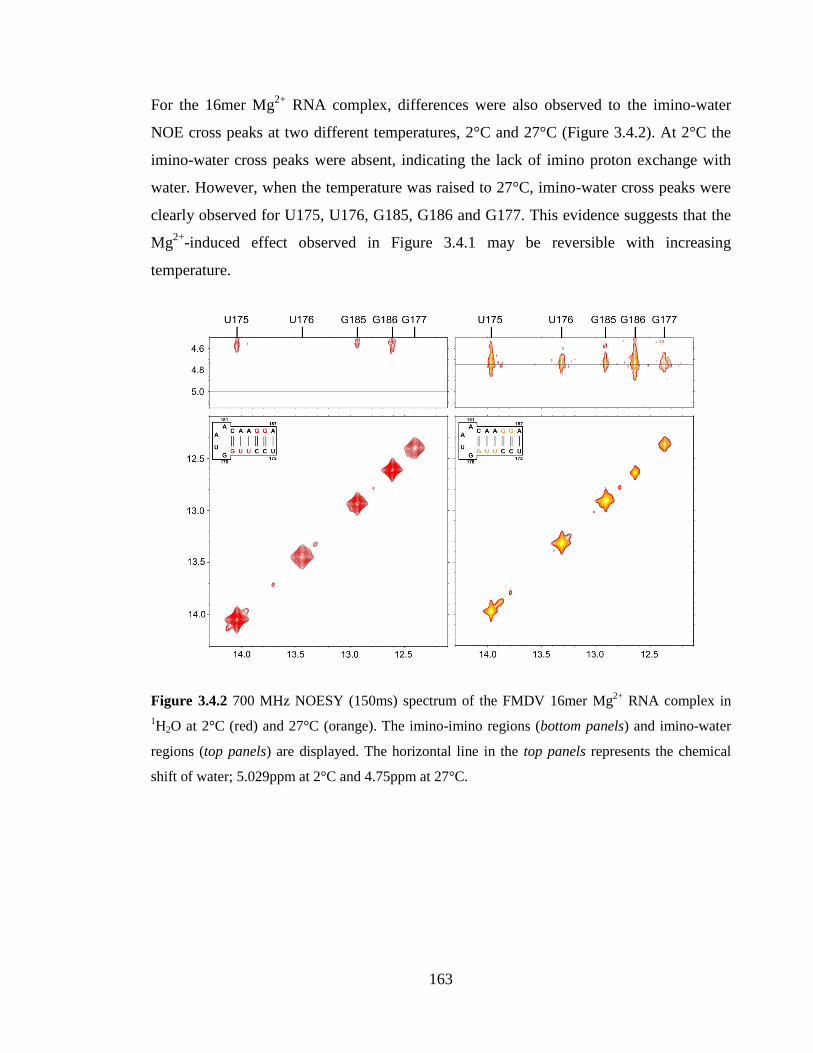
163
For the 16mer Mg2+
RNA complex, differences were also observed to the imino-water
NOE cross peaks at two different temperatures, 2°C and 27°C (Figure 3.4.2). At 2°C the
imino-water cross peaks were absent, indicating the lack of imino proton exchange with
water. However, when the temperature was raised to 27°C, imino-water cross peaks were
clearly observed for U175, U176, G185, G186 and G177. This evidence suggests that the
Mg2+
-induced effect observed in Figure 3.4.1 may be reversible with increasing
temperature.
Figure 3.4.2 700 MHz NOESY (150ms) spectrum of the FMDV 16mer Mg2+
RNA complex in
1H2O at 2°C (red) and 27°C (orange). The imino-imino regions (bottom panels) and imino-water
regions (top panels) are displayed. The horizontal line in the top panels represents the chemical
shift of water; 5.029ppm at 2°C and 4.75ppm at 27°C.
164
3.4.2 T1 of imino protons
The imino proton exchange rates of the 16mer apo-RNA (batch 2) were measured by
using a water magnetisation transfer experiment. However, to calculate the exchange rates
of the imino protons, T1 measurement of the individual imino protons was also necessary.
For the 16mer apo-RNA, T1 experiments were performed at three different temperatures;
2°C, 15°C and 35°C. In these experiments the apparent T1 (T1a) value was measured, so
henceforth the T1 values stated will refer to T1a.
The T1 measurement of the imino protons at these three different temperatures revealed
some interesting results (Figure 3.4.3). At 2°C, the T1 value of the G178 loop imino proton
was significantly smaller compared to the T1 value of the stem imino protons. This is due
to the faster exchange rate of the G178 loop imino proton; the rate of T1 relaxation
increases as the value of Kex increases according to Equation 2.6.2 (Methods: section 2.6).
We also observed that the T1 values of the stem guanine imino protons were very similar
and that they were smaller than the uracil imino proton T1 values. At 15°C, the T1 values
of G178 and U175 decrease owing to the faster exchange rate of these imino protons.
Conversely, an increase in the T1 values of the stem U176, G185, G186, G177 imino
protons is observed, since the T1 of selectively inverted protons is inversely proportional
to the correlation time. However, as the temperature increases to 35°C, the T1 relaxation
rate increases for all the imino protons, again due to faster exchange of the imino protons.
Since the T1 values measured for the imino protons are dependent on the exchange rate,
they can give an indication of how imino proton exchange rates change with temperature.
For example, when comparing the T1 values of imino protons at 2°C and 35°C, it is clear
that the G185 imino proton exchange rate has been affected the least by the increase in
temperature. Nevertheless, the exchange rate constants themselves give a much more
accurate measurement of imino proton exchange.
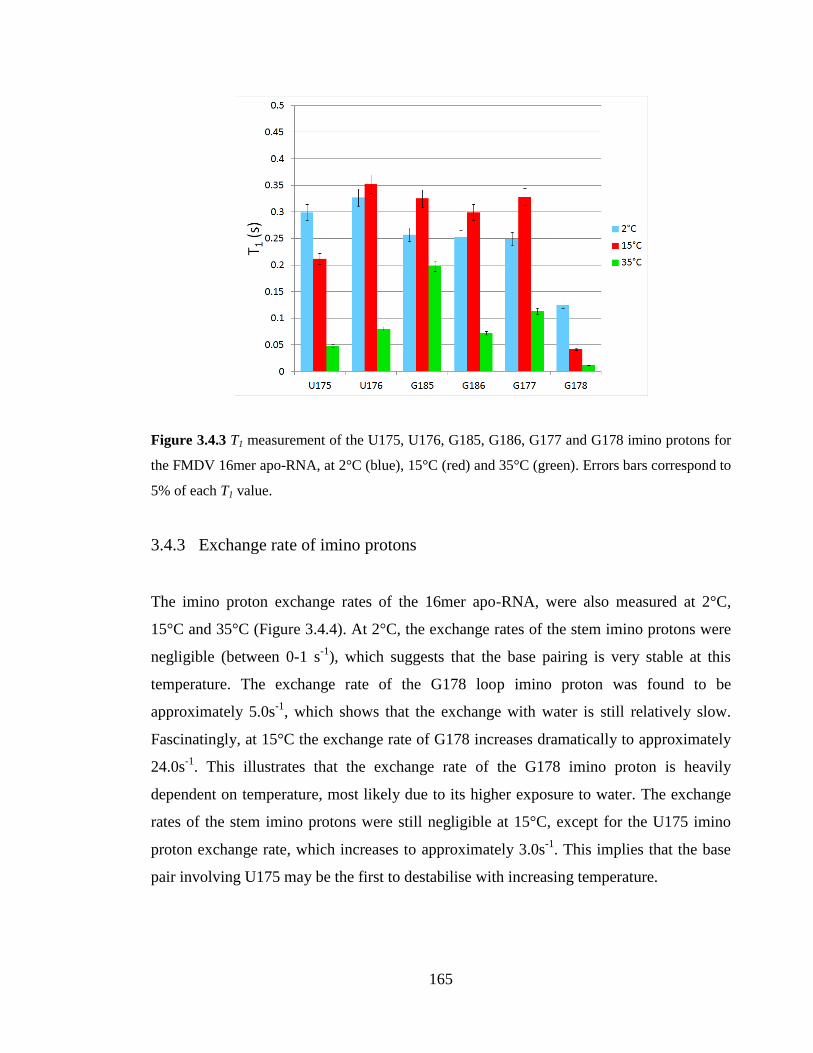
165
Figure 3.4.3 T1 measurement of the U175, U176, G185, G186, G177 and G178 imino protons for
the FMDV 16mer apo-RNA, at 2°C (blue), 15°C (red) and 35°C (green). Errors bars correspond to
5% of each T1 value.
3.4.3 Exchange rate of imino protons
The imino proton exchange rates of the 16mer apo-RNA, were also measured at 2°C,
15°C and 35°C (Figure 3.4.4). At 2°C, the exchange rates of the stem imino protons were
negligible (between 0-1 s-1
), which suggests that the base pairing is very stable at this
temperature. The exchange rate of the G178 loop imino proton was found to be
approximately 5.0s-1
, which shows that the exchange with water is still relatively slow.
Fascinatingly, at 15°C the exchange rate of G178 increases dramatically to approximately
24.0s-1
. This illustrates that the exchange rate of the G178 imino proton is heavily
dependent on temperature, most likely due to its higher exposure to water. The exchange
rates of the stem imino protons were still negligible at 15°C, except for the U175 imino
proton exchange rate, which increases to approximately 3.0s-1
. This implies that the base
pair involving U175 may be the first to destabilise with increasing temperature.
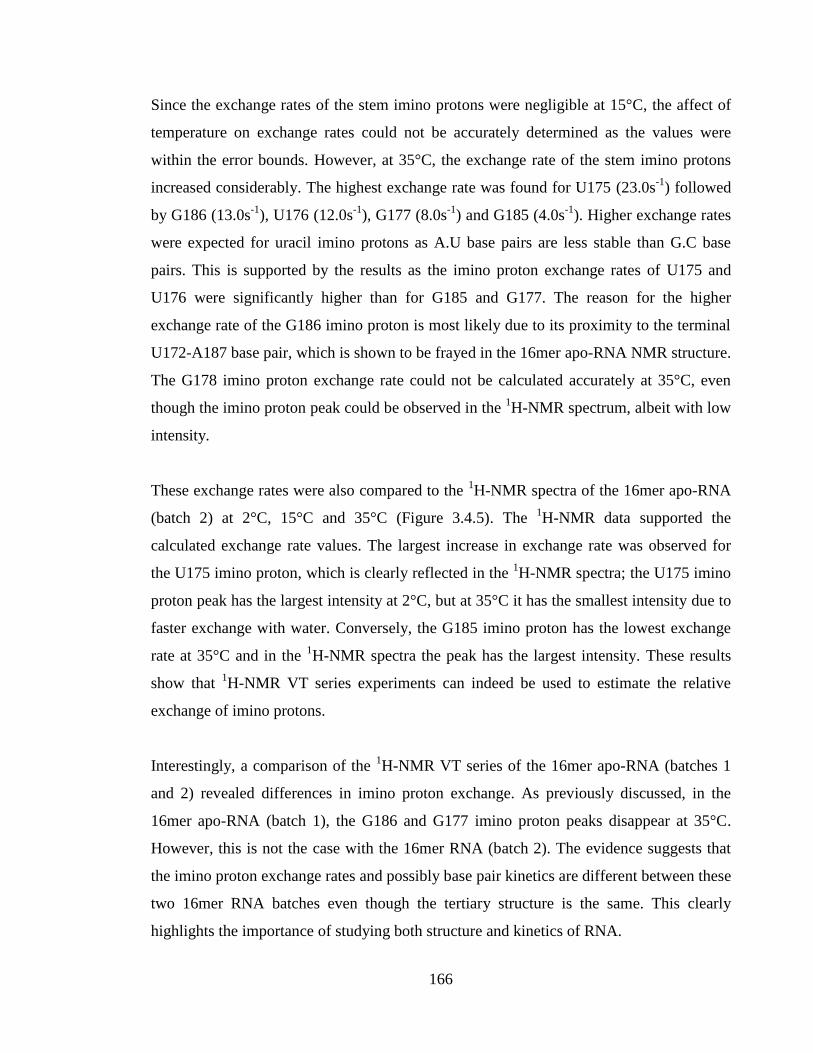
166
Since the exchange rates of the stem imino protons were negligible at 15°C, the affect of
temperature on exchange rates could not be accurately determined as the values were
within the error bounds. However, at 35°C, the exchange rate of the stem imino protons
increased considerably. The highest exchange rate was found for U175 (23.0s-1
) followed
by G186 (13.0s-1
), U176 (12.0s-1
), G177 (8.0s-1
) and G185 (4.0s-1
). Higher exchange rates
were expected for uracil imino protons as A.U base pairs are less stable than G.C base
pairs. This is supported by the results as the imino proton exchange rates of U175 and
U176 were significantly higher than for G185 and G177. The reason for the higher
exchange rate of the G186 imino proton is most likely due to its proximity to the terminal
U172-A187 base pair, which is shown to be frayed in the 16mer apo-RNA NMR structure.
The G178 imino proton exchange rate could not be calculated accurately at 35°C, even
though the imino proton peak could be observed in the 1H-NMR spectrum, albeit with low
intensity.
These exchange rates were also compared to the 1H-NMR spectra of the 16mer apo-RNA
(batch 2) at 2°C, 15°C and 35°C (Figure 3.4.5). The 1H-NMR data supported the
calculated exchange rate values. The largest increase in exchange rate was observed for
the U175 imino proton, which is clearly reflected in the 1H-NMR spectra; the U175 imino
proton peak has the largest intensity at 2°C, but at 35°C it has the smallest intensity due to
faster exchange with water. Conversely, the G185 imino proton has the lowest exchange
rate at 35°C and in the 1H-NMR spectra the peak has the largest intensity. These results
show that 1H-NMR VT series experiments can indeed be used to estimate the relative
exchange of imino protons.
Interestingly, a comparison of the 1H-NMR VT series of the 16mer apo-RNA (batches 1
and 2) revealed differences in imino proton exchange. As previously discussed, in the
16mer apo-RNA (batch 1), the G186 and G177 imino proton peaks disappear at 35°C.
However, this is not the case with the 16mer RNA (batch 2). The evidence suggests that
the imino proton exchange rates and possibly base pair kinetics are different between these
two 16mer RNA batches even though the tertiary structure is the same. This clearly
highlights the importance of studying both structure and kinetics of RNA.
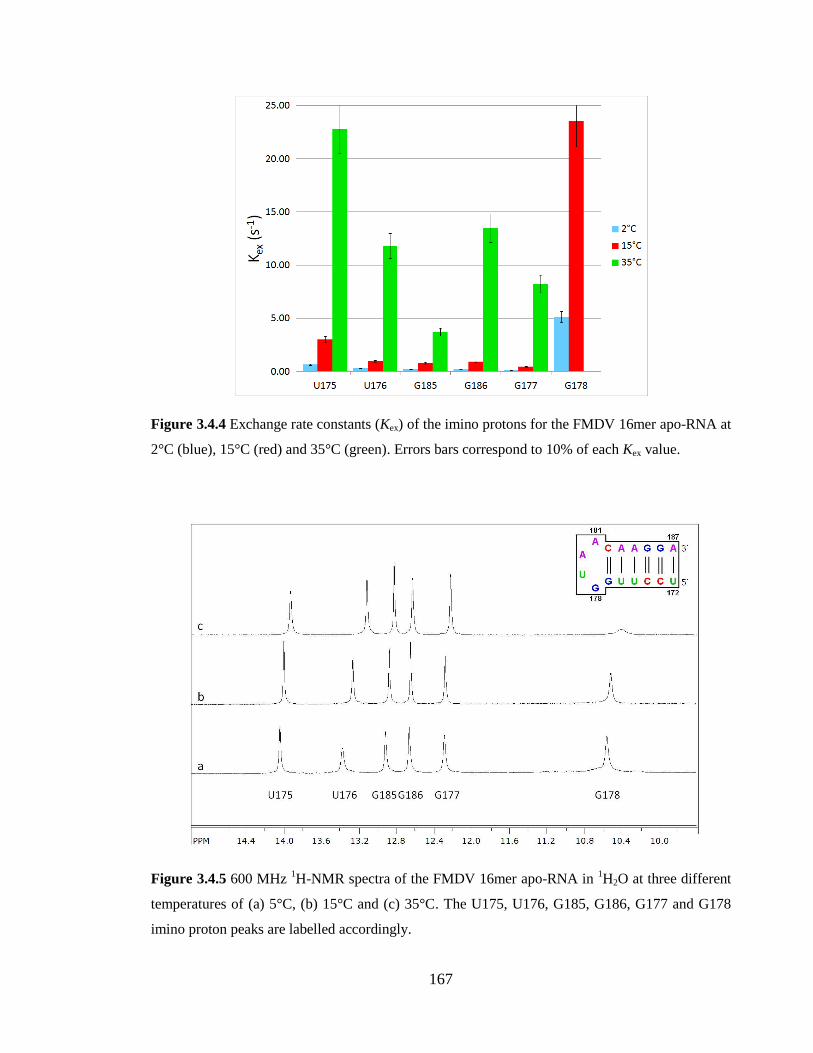
167
Figure 3.4.4 Exchange rate constants (Kex) of the imino protons for the FMDV 16mer apo-RNA at
2°C (blue), 15°C (red) and 35°C (green). Errors bars correspond to 10% of each Kex value.
Figure 3.4.5 600 MHz 1H-NMR spectra of the FMDV 16mer apo-RNA in
1H2O at three different
temperatures of (a) 5°C, (b) 15°C and (c) 35°C. The U175, U176, G185, G186, G177 and G178
imino proton peaks are labelled accordingly.
168
3.4.4 Effect of Mg2+
on imino proton exchange rates
The imino proton exchange rates were measured for the 16mer Mg2+
RNA complex at two
temperatures of 15°C and 35°C (Figure 3.4.6). Subsequently, a comparison was made
between the imino proton exchange rates of the 16mer apo-RNA and Mg2+
RNA complex.
At 15°C, the exchange rate of the G178 imino proton increased from 24.0s-1
to 37.0s-1
,
which is an increase of approximately 55%. A possible explanation for this is that the
Mg2+
ions are positioned close to the imino proton of the G178 base, which is easily
accessible due to the large major groove of the GUAA tetraloop. Since these Mg2+
ions
are fully or partially hydrated, it is likely that it would be the equivalent of exposing the
G178 imino proton to more water.
The changes in exchange rates of the stem imino protons were observed at 35°C. In
particular, the exchange rate of the U175 and U176 imino protons reduced significantly by
approximately 75% and 55% respectively, upon addition of Mg2+
. This suggests that Mg2+
is able to increase the stability of the A.U base pairs involving the U175 and U176 bases.
Consequently, this may have the effect of further stabilising the stem region of the 16mer
RNA and possibly the global tertiary structure. A small, but detectable, decrease in
exchange rate was found for the G177 imino proton, possibly caused by enhanced stability
conferred in the GUAA tetraloop. No significant change in exchange rate was found for
the G185 and G186 imino protons.
These imino proton exchange results give further evidence of Mg2+
-induced stabilisation
and support the 1H-NMR data. Importantly, the exchange rate constants of the imino
protons have been calculated, which provided a more accurate picture of imino proton
exchange. Therefore, together with the results revealed in the VT series experiments, the
measurement of imino proton exchange rates was justified in order to quantify the imino
proton exchange phenomenon and understand the influence of temperature and Mg2+
on
RNA base pair kinetics.
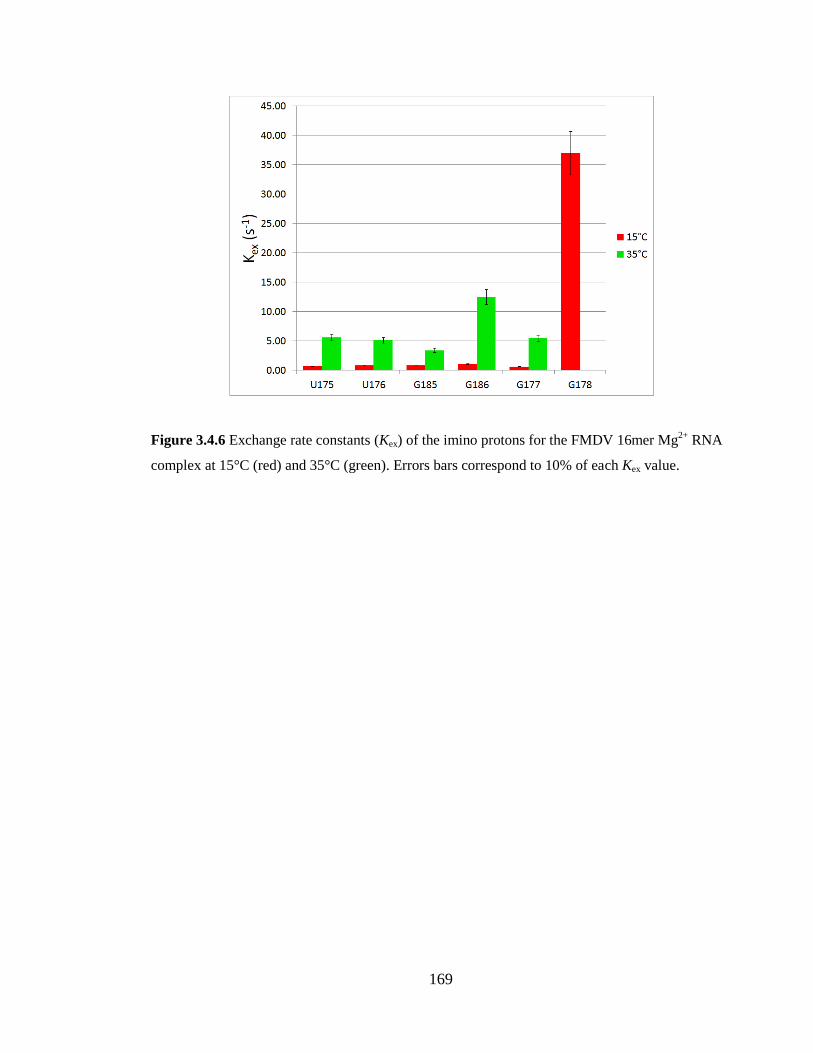
169
Figure 3.4.6 Exchange rate constants (Kex) of the imino protons for the FMDV 16mer Mg2+
RNA
complex at 15°C (red) and 35°C (green). Errors bars correspond to 10% of each Kex value.
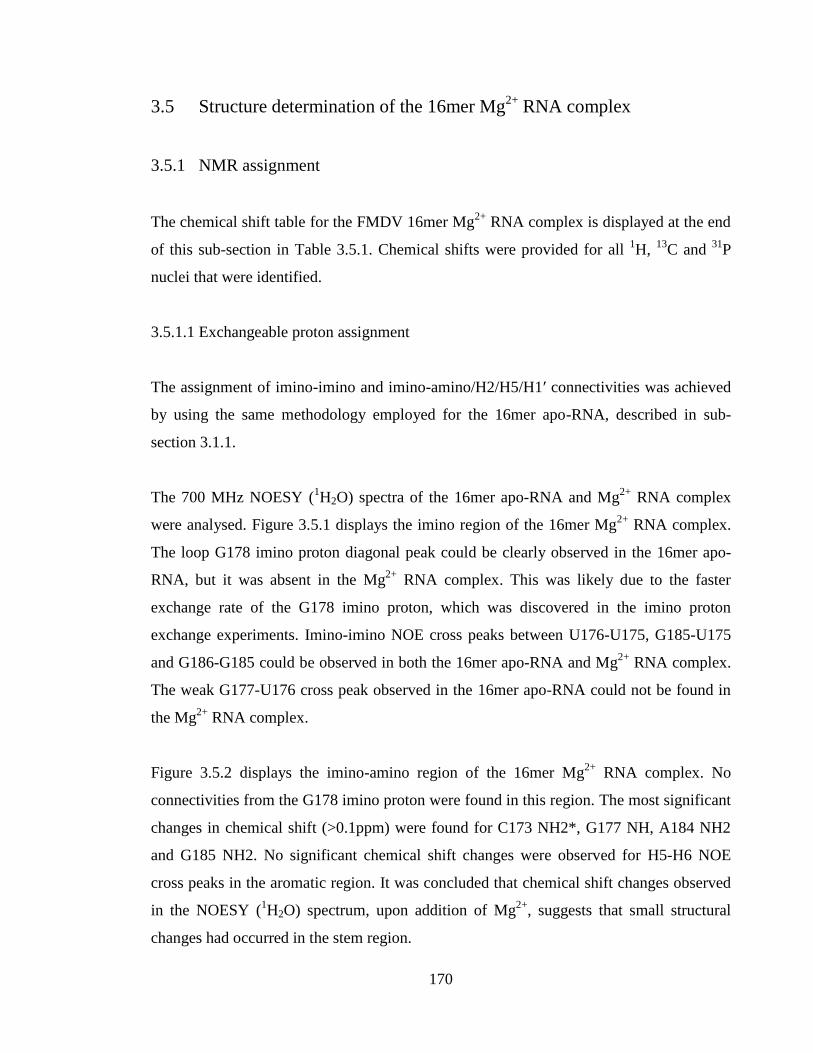
170
3.5 Structure determination of the 16mer Mg2+
RNA complex
3.5.1 NMR assignment
The chemical shift table for the FMDV 16mer Mg2+
RNA complex is displayed at the end
of this sub-section in Table 3.5.1. Chemical shifts were provided for all 1H,
13C and
31P
nuclei that were identified.
3.5.1.1 Exchangeable proton assignment
The assignment of imino-imino and imino-amino/H2/H5/H1ʹ connectivities was achieved
by using the same methodology employed for the 16mer apo-RNA, described in sub-
section 3.1.1.
The 700 MHz NOESY (1H2O) spectra of the 16mer apo-RNA and Mg
2+ RNA complex
were analysed. Figure 3.5.1 displays the imino region of the 16mer Mg2+
RNA complex.
The loop G178 imino proton diagonal peak could be clearly observed in the 16mer apo-
RNA, but it was absent in the Mg2+
RNA complex. This was likely due to the faster
exchange rate of the G178 imino proton, which was discovered in the imino proton
exchange experiments. Imino-imino NOE cross peaks between U176-U175, G185-U175
and G186-G185 could be observed in both the 16mer apo-RNA and Mg2+
RNA complex.
The weak G177-U176 cross peak observed in the 16mer apo-RNA could not be found in
the Mg2+
RNA complex.
Figure 3.5.2 displays the imino-amino region of the 16mer Mg2+
RNA complex. No
connectivities from the G178 imino proton were found in this region. The most significant
changes in chemical shift (>0.1ppm) were found for C173 NH2*, G177 NH, A184 NH2
and G185 NH2. No significant chemical shift changes were observed for H5-H6 NOE
cross peaks in the aromatic region. It was concluded that chemical shift changes observed
in the NOESY (1H2O) spectrum, upon addition of Mg
2+, suggests that small structural
changes had occurred in the stem region.
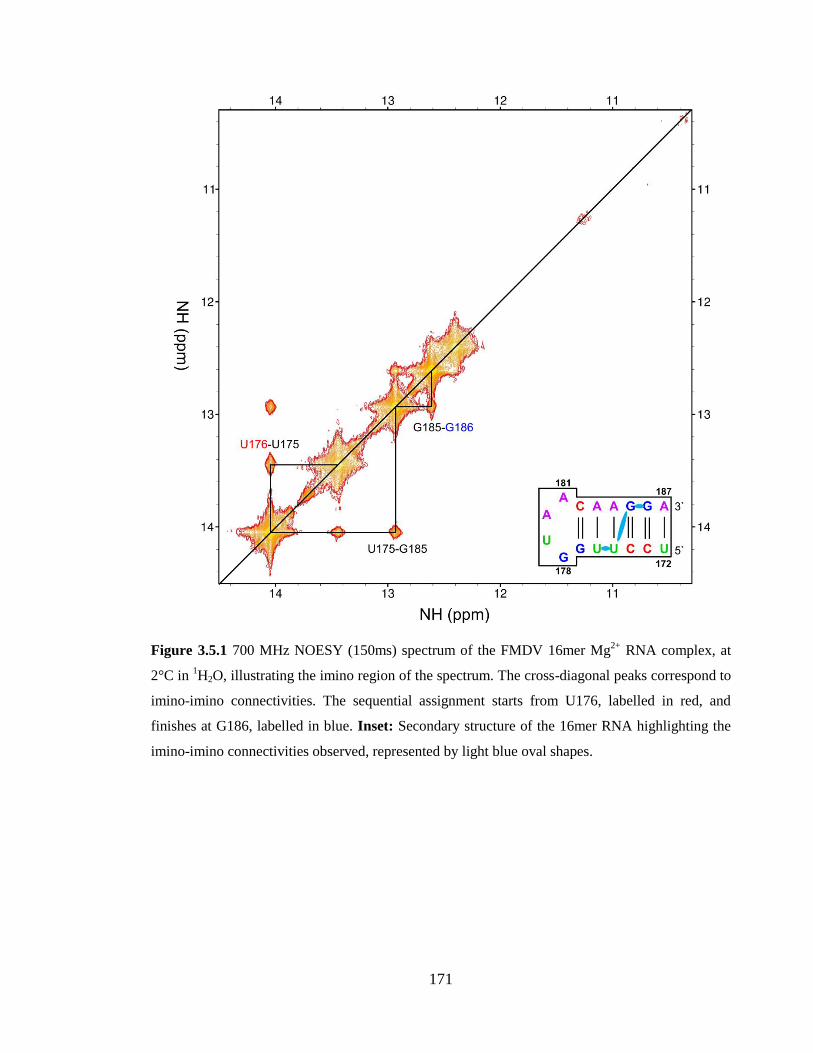
171
Figure 3.5.1 700 MHz NOESY (150ms) spectrum of the FMDV 16mer Mg2+
RNA complex, at
2°C in 1H2O, illustrating the imino region of the spectrum. The cross-diagonal peaks correspond to
imino-imino connectivities. The sequential assignment starts from U176, labelled in red, and
finishes at G186, labelled in blue. Inset: Secondary structure of the 16mer RNA highlighting the
imino-imino connectivities observed, represented by light blue oval shapes.
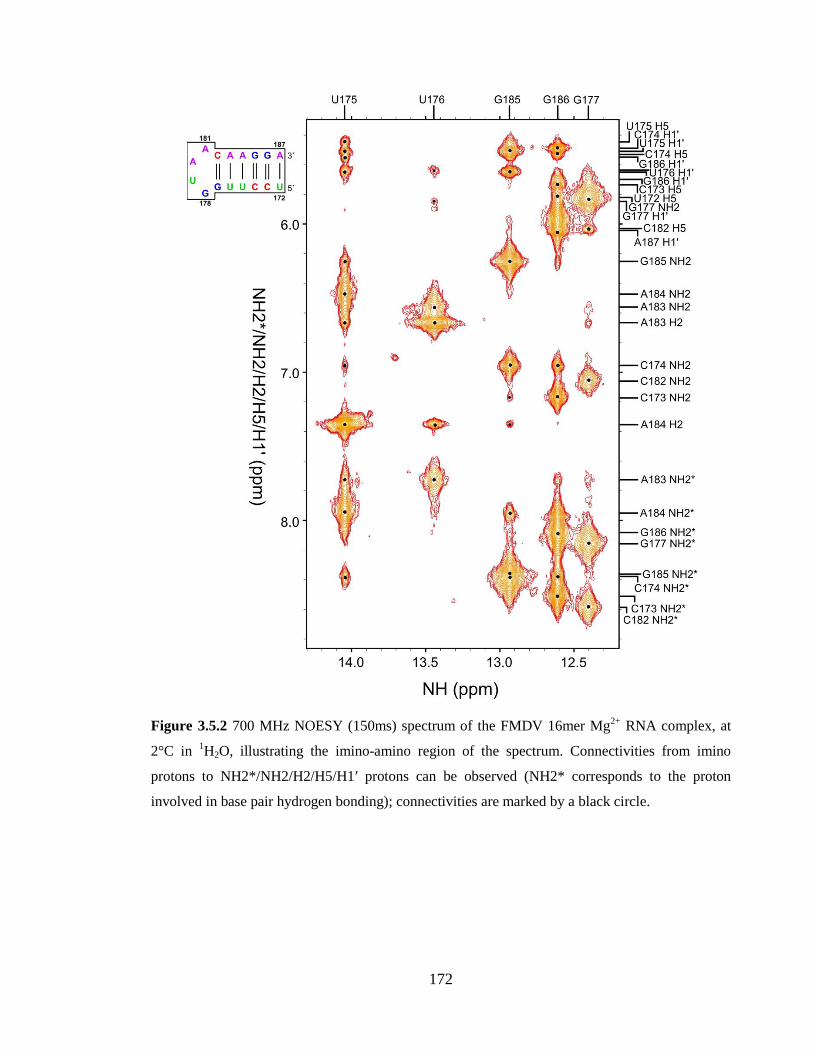
172
Figure 3.5.2 700 MHz NOESY (150ms) spectrum of the FMDV 16mer Mg2+
RNA complex, at
2°C in 1H2O, illustrating the imino-amino region of the spectrum. Connectivities from imino
protons to NH2*/NH2/H2/H5/H1ʹ protons can be observed (NH2* corresponds to the proton
involved in base pair hydrogen bonding); connectivities are marked by a black circle.
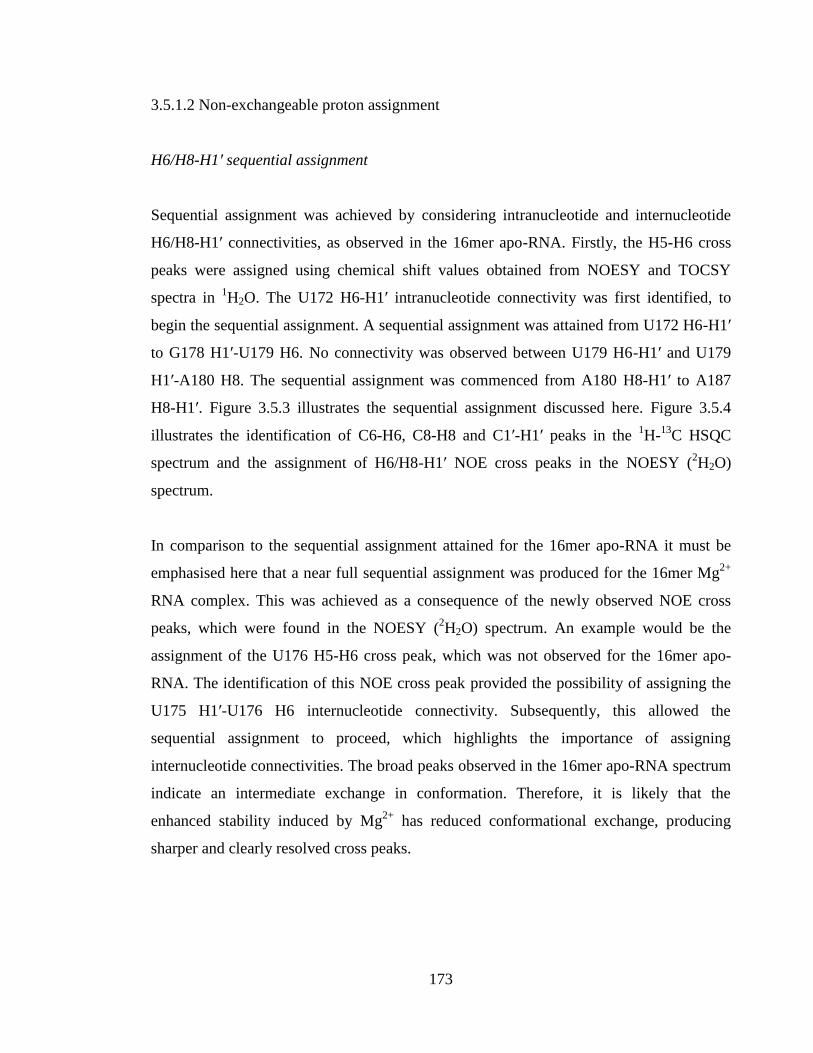
173
3.5.1.2 Non-exchangeable proton assignment
H6/H8-H1ʹ sequential assignment
Sequential assignment was achieved by considering intranucleotide and internucleotide
H6/H8-H1ʹ connectivities, as observed in the 16mer apo-RNA. Firstly, the H5-H6 cross
peaks were assigned using chemical shift values obtained from NOESY and TOCSY
spectra in 1H2O. The U172 H6-H1ʹ intranucleotide connectivity was first identified, to
begin the sequential assignment. A sequential assignment was attained from U172 H6-H1ʹ
to G178 H1ʹ-U179 H6. No connectivity was observed between U179 H6-H1ʹ and U179
H1ʹ-A180 H8. The sequential assignment was commenced from A180 H8-H1ʹ to A187
H8-H1ʹ. Figure 3.5.3 illustrates the sequential assignment discussed here. Figure 3.5.4
illustrates the identification of C6-H6, C8-H8 and C1ʹ-H1ʹ peaks in the 1H-
13C HSQC
spectrum and the assignment of H6/H8-H1ʹ NOE cross peaks in the NOESY (2H2O)
spectrum.
In comparison to the sequential assignment attained for the 16mer apo-RNA it must be
emphasised here that a near full sequential assignment was produced for the 16mer Mg2+
RNA complex. This was achieved as a consequence of the newly observed NOE cross
peaks, which were found in the NOESY (2H2O) spectrum. An example would be the
assignment of the U176 H5-H6 cross peak, which was not observed for the 16mer apo-
RNA. The identification of this NOE cross peak provided the possibility of assigning the
U175 H1ʹ-U176 H6 internucleotide connectivity. Subsequently, this allowed the
sequential assignment to proceed, which highlights the importance of assigning
internucleotide connectivities. The broad peaks observed in the 16mer apo-RNA spectrum
indicate an intermediate exchange in conformation. Therefore, it is likely that the
enhanced stability induced by Mg2+
has reduced conformational exchange, producing
sharper and clearly resolved cross peaks.
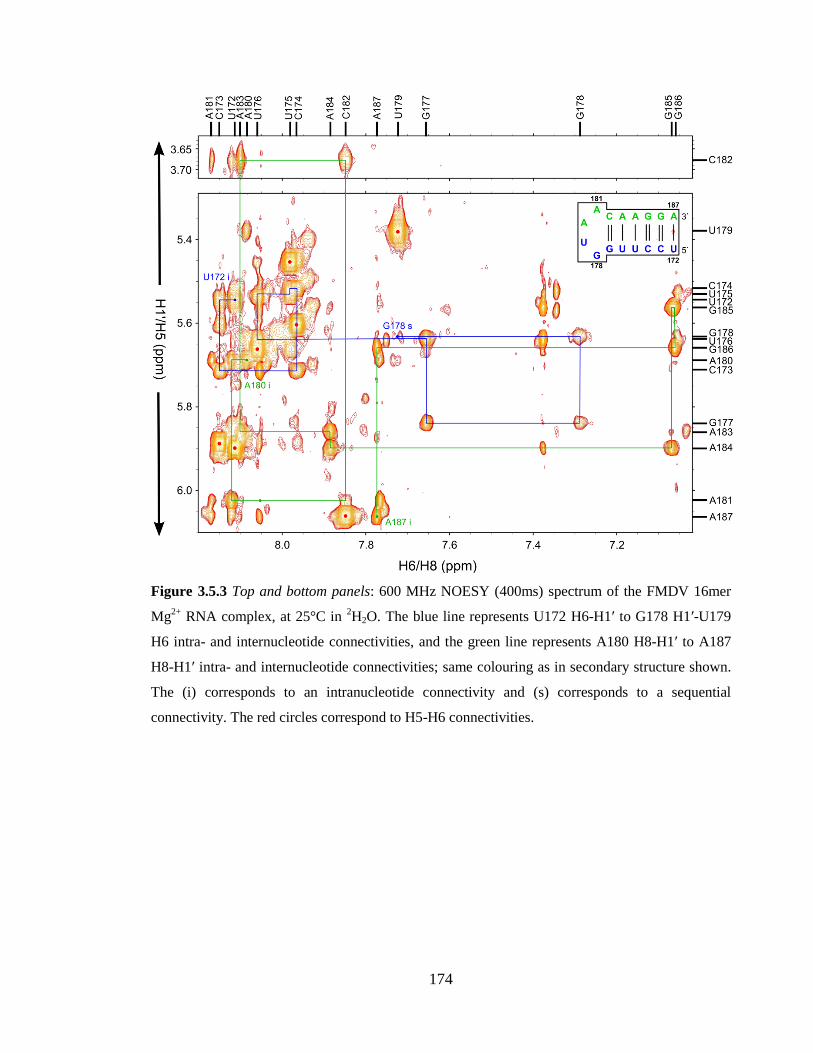
174
Figure 3.5.3 Top and bottom panels: 600 MHz NOESY (400ms) spectrum of the FMDV 16mer
Mg2+
RNA complex, at 25°C in 2H2O. The blue line represents U172 H6-H1ʹ to G178 H1ʹ-U179
H6 intra- and internucleotide connectivities, and the green line represents A180 H8-H1ʹ to A187
H8-H1ʹ intra- and internucleotide connectivities; same colouring as in secondary structure shown.
The (i) corresponds to an intranucleotide connectivity and (s) corresponds to a sequential
connectivity. The red circles correspond to H5-H6 connectivities.
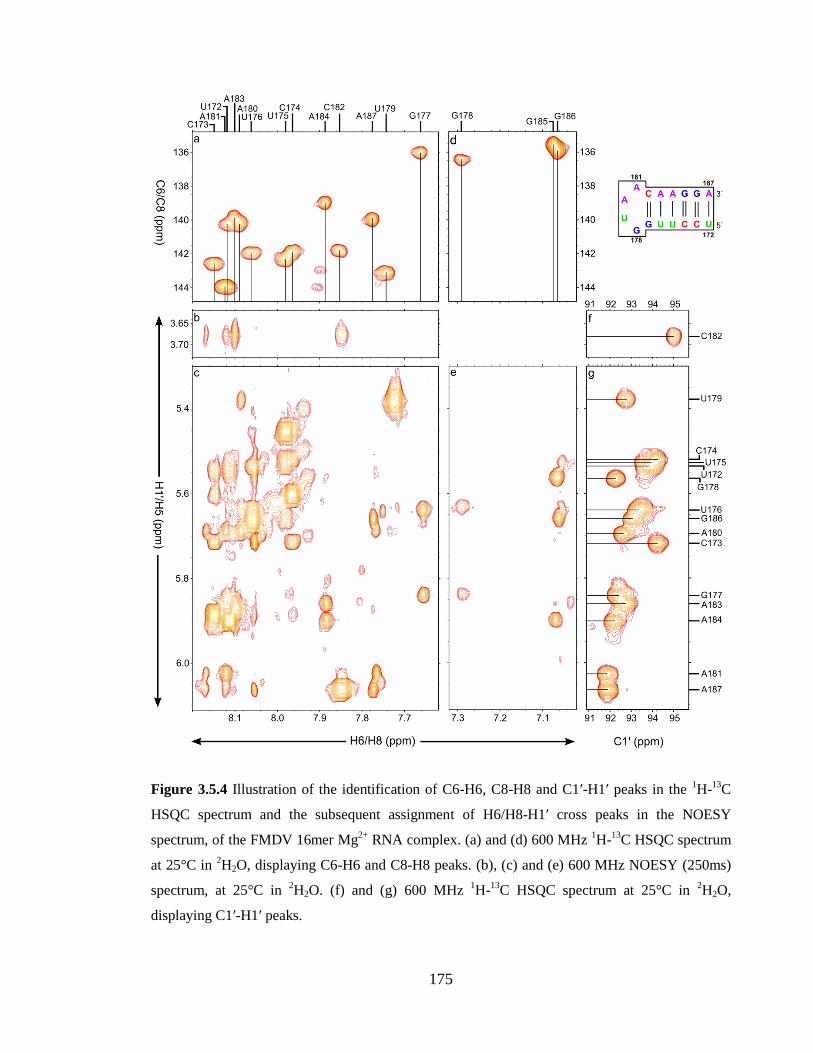
175
Figure 3.5.4 Illustration of the identification of C6-H6, C8-H8 and C1ʹ-H1ʹ peaks in the 1H-
13C
HSQC spectrum and the subsequent assignment of H6/H8-H1ʹ cross peaks in the NOESY
spectrum, of the FMDV 16mer Mg2+
RNA complex. (a) and (d) 600 MHz 1H-
13C HSQC spectrum
at 25°C in 2H2O, displaying C6-H6 and C8-H8 peaks. (b), (c) and (e) 600 MHz NOESY (250ms)
spectrum, at 25°C in 2H2O. (f) and (g) 600 MHz
1H-
13C HSQC spectrum at 25°C in
2H2O,
displaying C1ʹ-H1ʹ peaks.
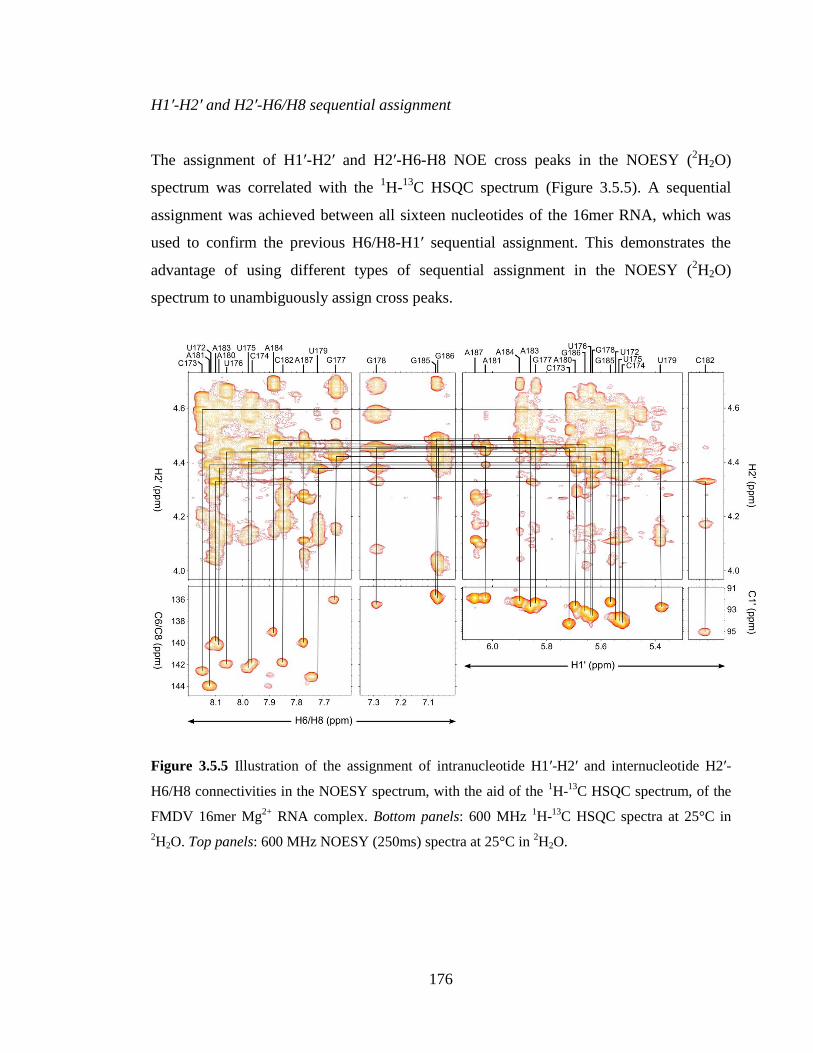
176
H1ʹ-H2ʹ and H2ʹ-H6/H8 sequential assignment
The assignment of H1ʹ-H2ʹ and H2ʹ-H6-H8 NOE cross peaks in the NOESY (2H2O)
spectrum was correlated with the 1H-
13C HSQC spectrum (Figure 3.5.5). A sequential
assignment was achieved between all sixteen nucleotides of the 16mer RNA, which was
used to confirm the previous H6/H8-H1ʹ sequential assignment. This demonstrates the
advantage of using different types of sequential assignment in the NOESY (2H2O)
spectrum to unambiguously assign cross peaks.
Figure 3.5.5 Illustration of the assignment of intranucleotide H1ʹ-H2ʹ and internucleotide H2ʹ-
H6/H8 connectivities in the NOESY spectrum, with the aid of the 1H-
13C HSQC spectrum, of the
FMDV 16mer Mg2+
RNA complex. Bottom panels: 600 MHz 1H-
13C HSQC spectra at 25°C in
2H2O. Top panels: 600 MHz NOESY (250ms) spectra at 25°C in
2H2O.
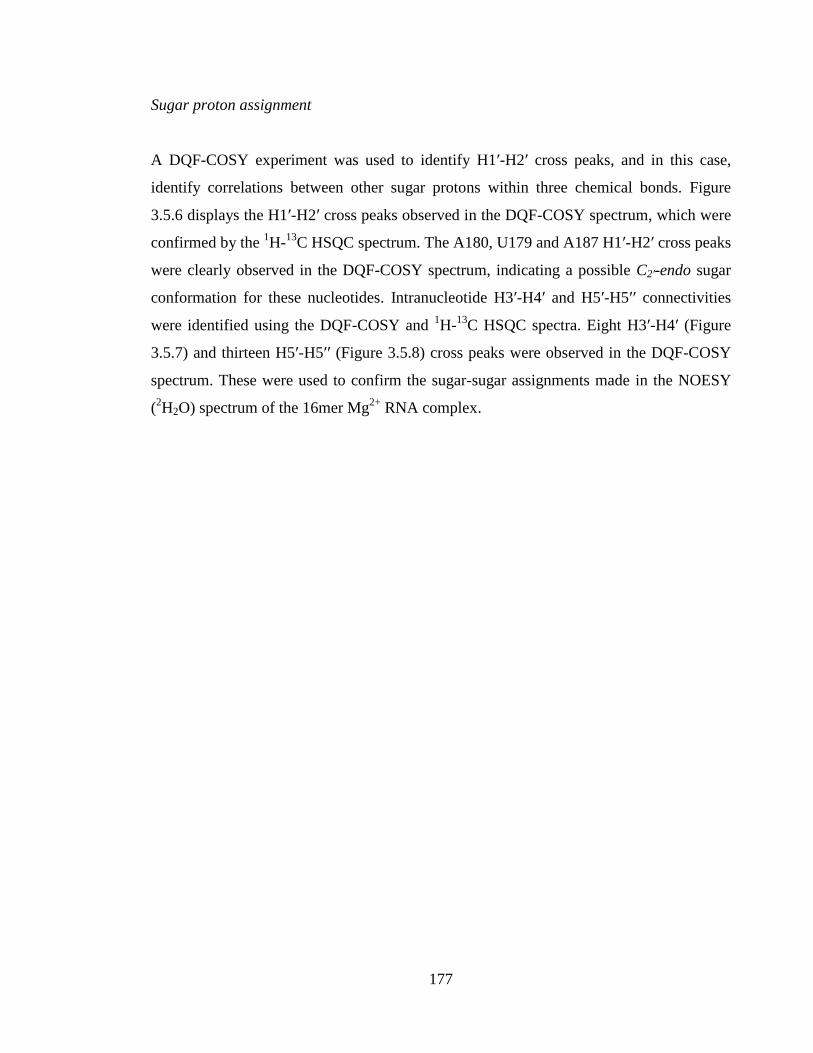
177
Sugar proton assignment
A DQF-COSY experiment was used to identify H1ʹ-H2ʹ cross peaks, and in this case,
identify correlations between other sugar protons within three chemical bonds. Figure
3.5.6 displays the H1ʹ-H2ʹ cross peaks observed in the DQF-COSY spectrum, which were
confirmed by the 1H-
13C HSQC spectrum. The A180, U179 and A187 H1ʹ-H2ʹ cross peaks
were clearly observed in the DQF-COSY spectrum, indicating a possible C2ʹ-endo sugar
conformation for these nucleotides. Intranucleotide H3ʹ-H4ʹ and H5ʹ-H5ʹʹ connectivities
were identified using the DQF-COSY and 1H-
13C HSQC spectra. Eight H3ʹ-H4ʹ (Figure
3.5.7) and thirteen H5ʹ-H5ʹʹ (Figure 3.5.8) cross peaks were observed in the DQF-COSY
spectrum. These were used to confirm the sugar-sugar assignments made in the NOESY
(2H2O) spectrum of the 16mer Mg
2+ RNA complex.
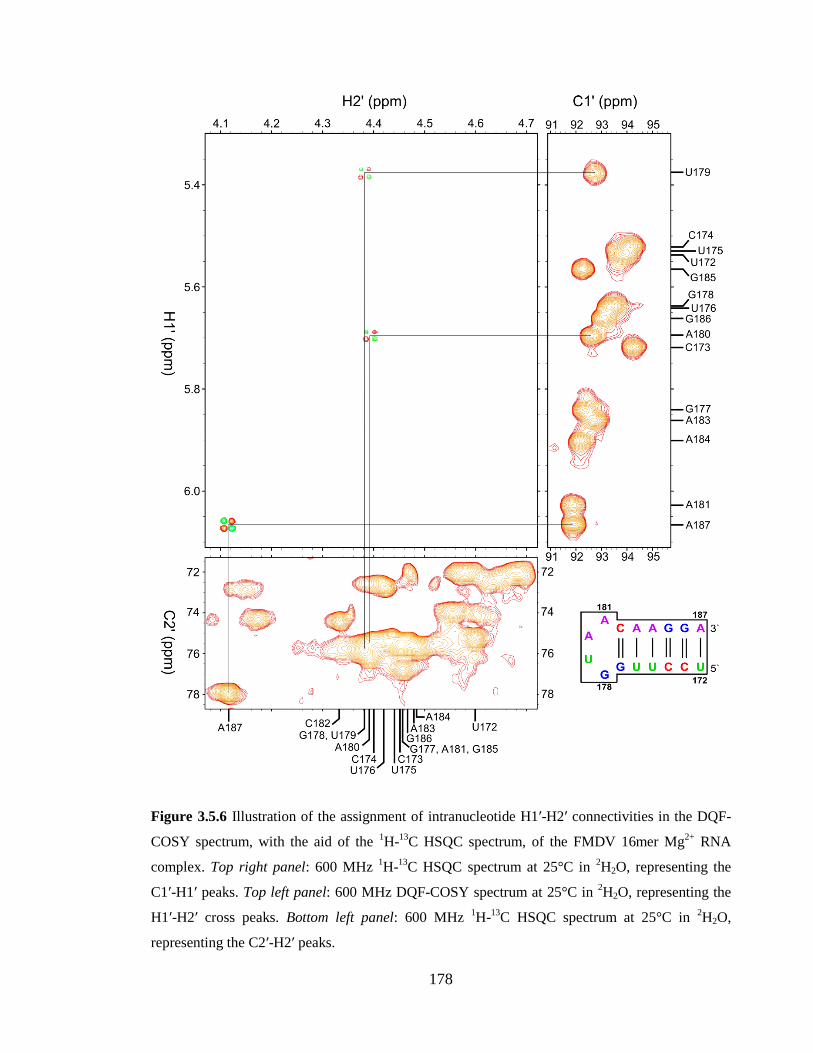
178
Figure 3.5.6 Illustration of the assignment of intranucleotide H1ʹ-H2ʹ connectivities in the DQF-
COSY spectrum, with the aid of the 1H-
13C HSQC spectrum, of the FMDV 16mer Mg
2+ RNA
complex. Top right panel: 600 MHz 1H-
13C HSQC spectrum at 25°C in
2H2O, representing the
C1ʹ-H1ʹ peaks. Top left panel: 600 MHz DQF-COSY spectrum at 25°C in 2H2O, representing the
H1ʹ-H2ʹ cross peaks. Bottom left panel: 600 MHz 1H-
13C HSQC spectrum at 25°C in
2H2O,
representing the C2ʹ-H2ʹ peaks.
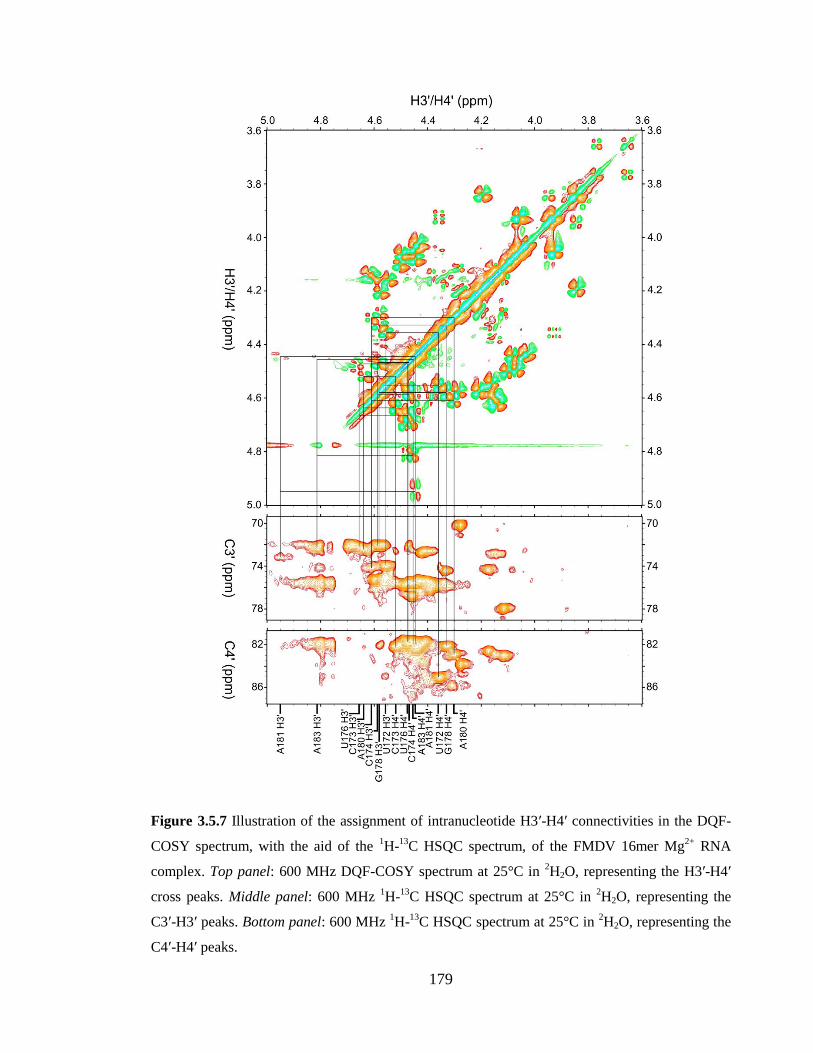
179
Figure 3.5.7 Illustration of the assignment of intranucleotide H3ʹ-H4ʹ connectivities in the DQF-
COSY spectrum, with the aid of the 1H-
13C HSQC spectrum, of the FMDV 16mer Mg
2+ RNA
complex. Top panel: 600 MHz DQF-COSY spectrum at 25°C in 2H2O, representing the H3ʹ-H4ʹ
cross peaks. Middle panel: 600 MHz 1H-
13C HSQC spectrum at 25°C in
2H2O, representing the
C3ʹ-H3ʹ peaks. Bottom panel: 600 MHz 1H-
13C HSQC spectrum at 25°C in
2H2O, representing the
C4ʹ-H4ʹ peaks.
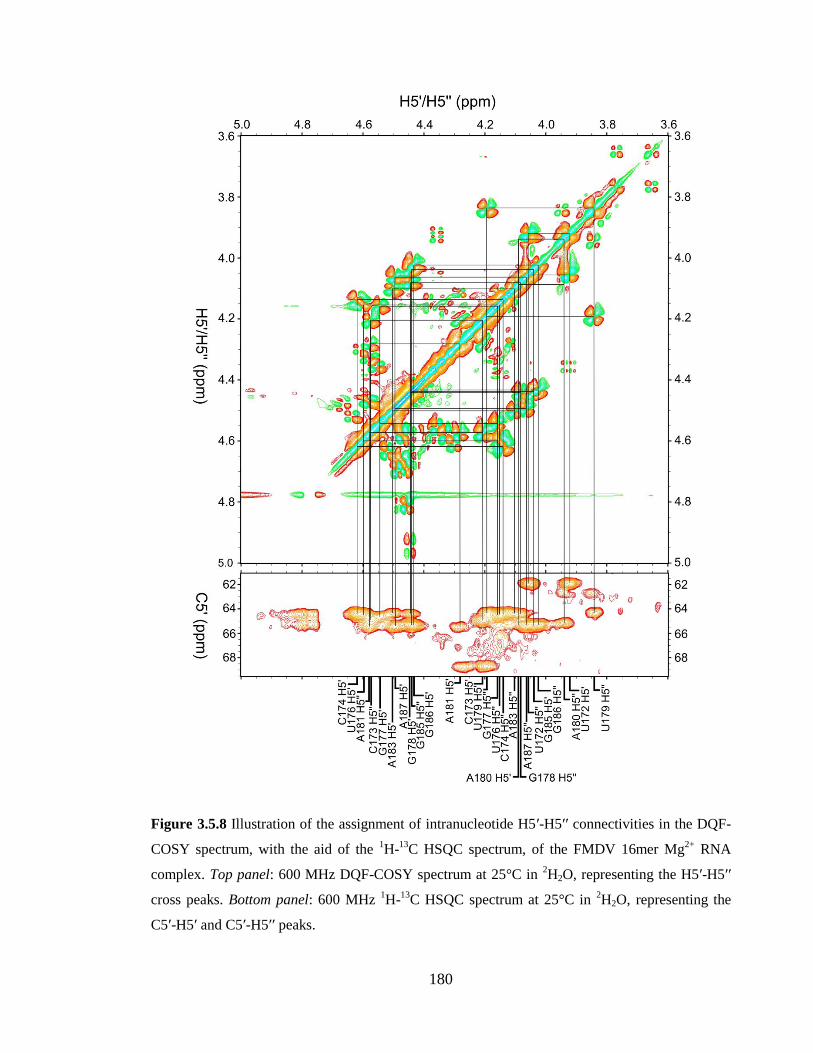
180
Figure 3.5.8 Illustration of the assignment of intranucleotide H5ʹ-H5ʹʹ connectivities in the DQF-
COSY spectrum, with the aid of the 1H-
13C HSQC spectrum, of the FMDV 16mer Mg
2+ RNA
complex. Top panel: 600 MHz DQF-COSY spectrum at 25°C in 2H2O, representing the H5ʹ-H5ʹʹ
cross peaks. Bottom panel: 600 MHz 1H-
13C HSQC spectrum at 25°C in
2H2O, representing the
C5ʹ-H5ʹ and C5ʹ-H5ʹʹ peaks.
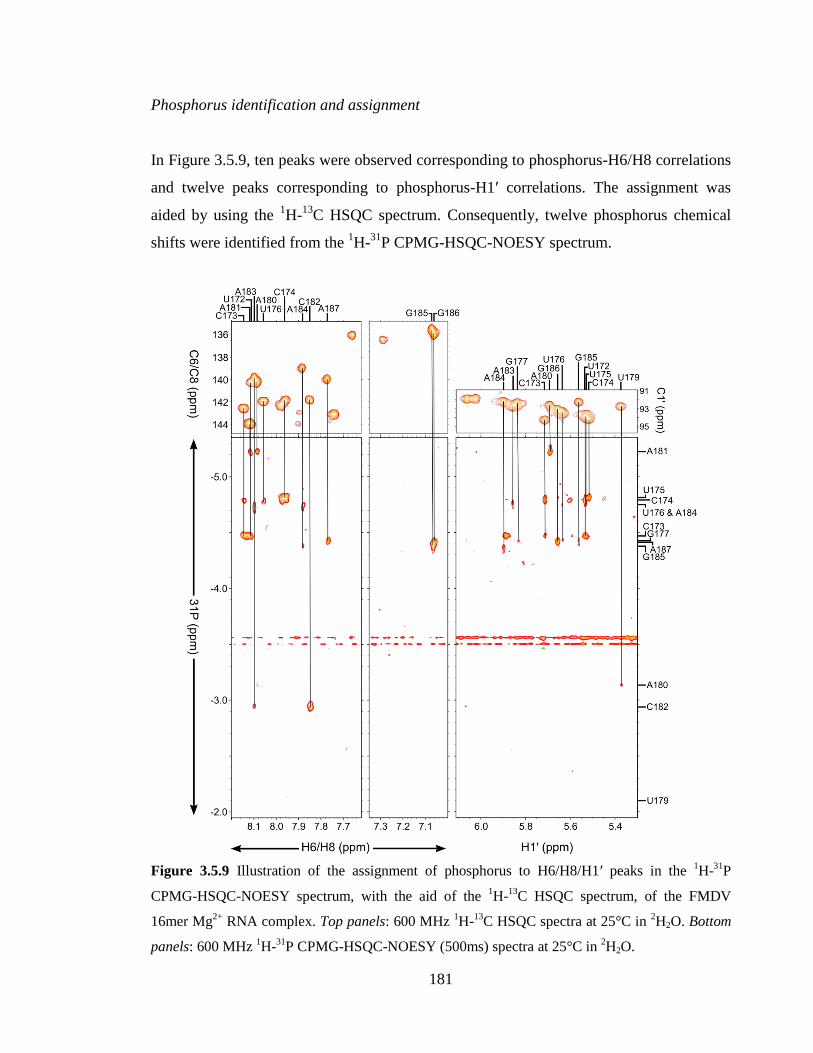
181
Phosphorus identification and assignment
In Figure 3.5.9, ten peaks were observed corresponding to phosphorus-H6/H8 correlations
and twelve peaks corresponding to phosphorus-H1ʹ correlations. The assignment was
aided by using the 1H-
13C HSQC spectrum. Consequently, twelve phosphorus chemical
shifts were identified from the 1H-
31P CPMG-HSQC-NOESY spectrum.
Figure 3.5.9 Illustration of the assignment of phosphorus to H6/H8/H1ʹ peaks in the 1H-
31P
CPMG-HSQC-NOESY spectrum, with the aid of the 1H-
13C HSQC spectrum, of the FMDV
16mer Mg2+
RNA complex. Top panels: 600 MHz 1H-
13C HSQC spectra at 25°C in
2H2O. Bottom
panels: 600 MHz 1H-
31P CPMG-HSQC-NOESY (500ms) spectra at 25°C in
2H2O.
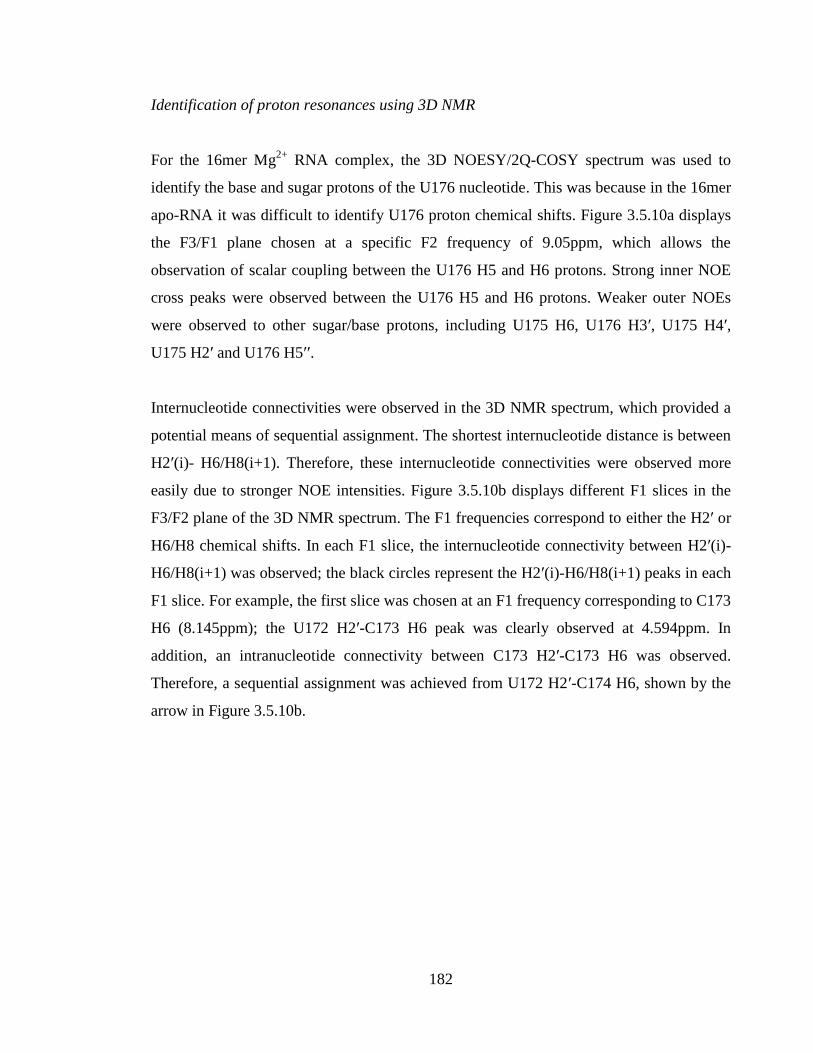
182
Identification of proton resonances using 3D NMR
For the 16mer Mg2+
RNA complex, the 3D NOESY/2Q-COSY spectrum was used to
identify the base and sugar protons of the U176 nucleotide. This was because in the 16mer
apo-RNA it was difficult to identify U176 proton chemical shifts. Figure 3.5.10a displays
the F3/F1 plane chosen at a specific F2 frequency of 9.05ppm, which allows the
observation of scalar coupling between the U176 H5 and H6 protons. Strong inner NOE
cross peaks were observed between the U176 H5 and H6 protons. Weaker outer NOEs
were observed to other sugar/base protons, including U175 H6, U176 H3ʹ, U175 H4ʹ,
U175 H2ʹ and U176 H5ʹʹ.
Internucleotide connectivities were observed in the 3D NMR spectrum, which provided a
potential means of sequential assignment. The shortest internucleotide distance is between
H2ʹ(i)- H6/H8(i+1). Therefore, these internucleotide connectivities were observed more
easily due to stronger NOE intensities. Figure 3.5.10b displays different F1 slices in the
F3/F2 plane of the 3D NMR spectrum. The F1 frequencies correspond to either the H2ʹ or
H6/H8 chemical shifts. In each F1 slice, the internucleotide connectivity between H2ʹ(i)-
H6/H8(i+1) was observed; the black circles represent the H2ʹ(i)-H6/H8(i+1) peaks in each
F1 slice. For example, the first slice was chosen at an F1 frequency corresponding to C173
H6 (8.145ppm); the U172 H2ʹ-C173 H6 peak was clearly observed at 4.594ppm. In
addition, an intranucleotide connectivity between C173 H2ʹ-C173 H6 was observed.
Therefore, a sequential assignment was achieved from U172 H2ʹ-C174 H6, shown by the
arrow in Figure 3.5.10b.
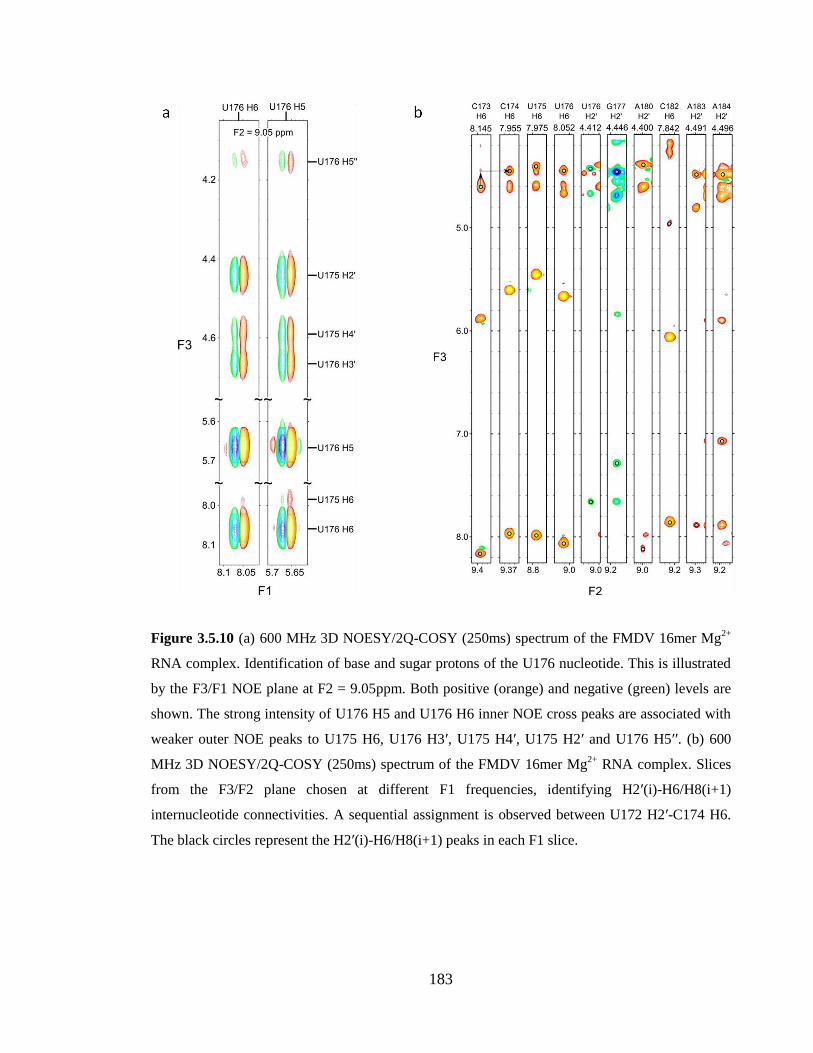
183
Figure 3.5.10 (a) 600 MHz 3D NOESY/2Q-COSY (250ms) spectrum of the FMDV 16mer Mg2+
RNA complex. Identification of base and sugar protons of the U176 nucleotide. This is illustrated
by the F3/F1 NOE plane at F2 = 9.05ppm. Both positive (orange) and negative (green) levels are
shown. The strong intensity of U176 H5 and U176 H6 inner NOE cross peaks are associated with
weaker outer NOE peaks to U175 H6, U176 H3ʹ, U175 H4ʹ, U175 H2ʹ and U176 H5ʹʹ. (b) 600
MHz 3D NOESY/2Q-COSY (250ms) spectrum of the FMDV 16mer Mg2+
RNA complex. Slices
from the F3/F2 plane chosen at different F1 frequencies, identifying H2ʹ(i)-H6/H8(i+1)
internucleotide connectivities. A sequential assignment is observed between U172 H2ʹ-C174 H6.
The black circles represent the H2ʹ(i)-H6/H8(i+1) peaks in each F1 slice.
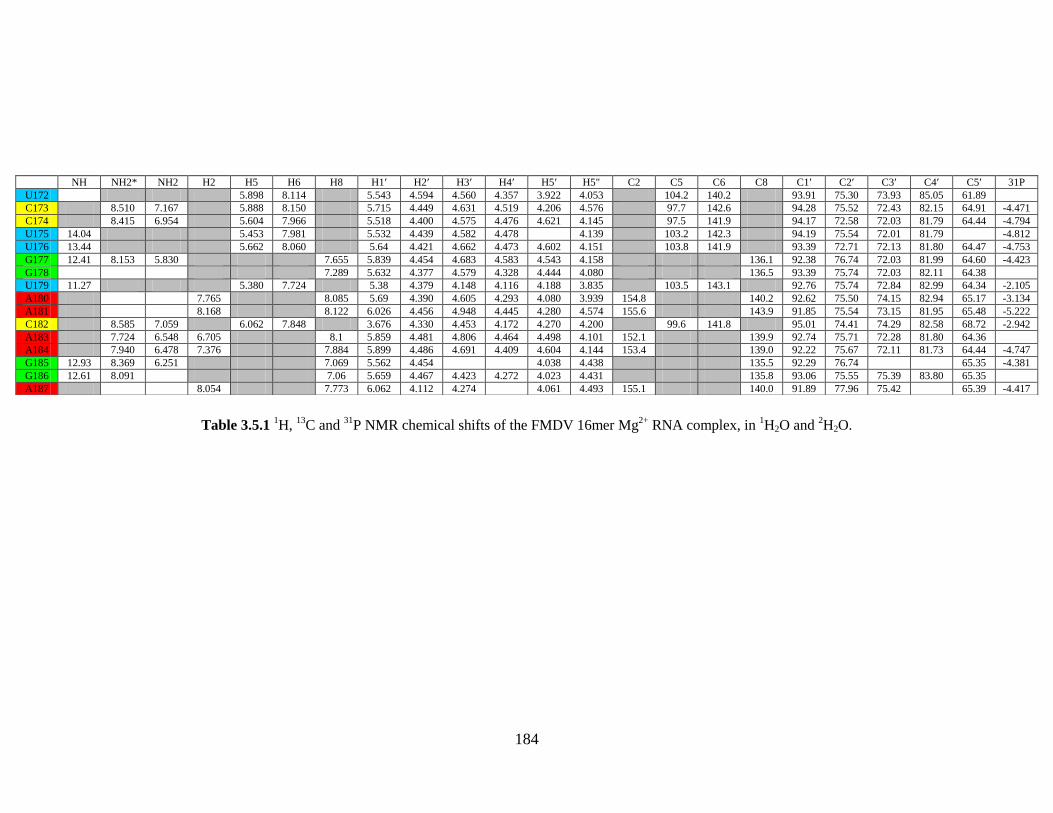
184
Table 3.5.1 1H,
13C and
31P NMR chemical shifts of the FMDV 16mer Mg
2+ RNA complex, in
1H2O and
2H2O.
NH NH2* NH2 H2 H5 H6 H8 H1ʹ H2ʹ H3ʹ H4ʹ H5ʹ H5" C2 C5 C6 C8 C1ʹ C2ʹ C3ʹ C4ʹ C5ʹ 31P
U172 5.898 8.114 5.543 4.594 4.560 4.357 3.922 4.053 104.2 140.2 93.91 75.30 73.93 85.05 61.89 C173 8.510 7.167 5.888 8.150 5.715 4.449 4.631 4.519 4.206 4.576 97.7 142.6 94.28 75.52 72.43 82.15 64.91 -4.471
C174 8.415 6.954 5.604 7.966 5.518 4.400 4.575 4.476 4.621 4.145 97.5 141.9 94.17 72.58 72.03 81.79 64.44 -4.794
U175 14.04 5.453 7.981 5.532 4.439 4.582 4.478 4.139 103.2 142.3 94.19 75.54 72.01 81.79 -4.812
U176 13.44 5.662 8.060 5.64 4.421 4.662 4.473 4.602 4.151 103.8 141.9 93.39 72.71 72.13 81.80 64.47 -4.753
G177 12.41 8.153 5.830 7.655 5.839 4.454 4.683 4.583 4.543 4.158 136.1 92.38 76.74 72.03 81.99 64.60 -4.423
G178 7.289 5.632 4.377 4.579 4.328 4.444 4.080 136.5 93.39 75.74 72.03 82.11 64.38
U179 11.27 5.380 7.724 5.38 4.379 4.148 4.116 4.188 3.835 103.5 143.1 92.76 75.74 72.84 82.99 64.34 -2.105
A180 7.765 8.085 5.69 4.390 4.605 4.293 4.080 3.939 154.8 140.2 92.62 75.50 74.15 82.94 65.17 -3.134
A181 8.168 8.122 6.026 4.456 4.948 4.445 4.280 4.574 155.6 143.9 91.85 75.54 73.15 81.95 65.48 -5.222
C182 8.585 7.059 6.062 7.848 3.676 4.330 4.453 4.172 4.270 4.200 99.6 141.8 95.01 74.41 74.29 82.58 68.72 -2.942
A183 7.724 6.548 6.705 8.1 5.859 4.481 4.806 4.464 4.498 4.101 152.1 139.9 92.74 75.71 72.28 81.80 64.36
A184 7.940 6.478 7.376 7.884 5.899 4.486 4.691 4.409 4.604 4.144 153.4 139.0 92.22 75.67 72.11 81.73 64.44 -4.747
G185 12.93 8.369 6.251 7.069 5.562 4.454 4.038 4.438 135.5 92.29 76.74 65.35 -4.381
G186 12.61 8.091 7.06 5.659 4.467 4.423 4.272 4.023 4.431 135.8 93.06 75.55 75.39 83.80 65.35
A187 8.054 7.773 6.062 4.112 4.274 4.061 4.493 155.1 140.0 91.89 77.96 75.42 65.39 -4.417
185
3.5.2 Structure calculation
Distance restraints were generated from the NOESY spectra of the 16mer Mg2+
RNA
complex. Exchangeable NOE restraints were obtained from the NOESY spectrum in 1H2O,
with 150ms mixing time. Non-exchangeable NOE restraints were obtained from the
NOESY spectrum in 2H2O, with 250ms mixing time. The non-exchangeable NOE distance
restraints consisted of base and sugar ribose connectivities.
The absence of strong intranucleotide H6/H8-H1ʹ cross peaks for stem nucleotides,
allowed the glycosidic angle of all stem nucleotides to be restrained to the anti
conformation. The glycosidic angles were not defined for loop nucleotides to allow some
conformational flexibility in the loop region. All stem nucleotides were restrained to the
C3ʹ-endo conformation, except for A187. The δ angle for the loop nucleotides was not
restrained, even though 3JH3-ʹH4ʹ couplings larger than 2Hz for the A180 and A181 loop
nucleotides were clearly observed in the DQF-COSY spectrum.
Hydrogen bond restraints were added for all six base pairs. However, since the U172
imino proton peak was not observed and no connectivities were found in the NOESY
(1H2O) spectrum, the hydrogen bond restraints between U172-A187 were loosely
restrained. For the same reason, planarity restraints were added for all base pairs except
for U172-A187.
Distance, dihedral angle, hydrogen bond and planarity restraints were added to the
structure calculation. From the 20 lowest RMSD structures generated from the refinement
step, one violation was found in the distance restraints. The restraints that were used for
these structure calculations are summarised in Table 3.5.2.
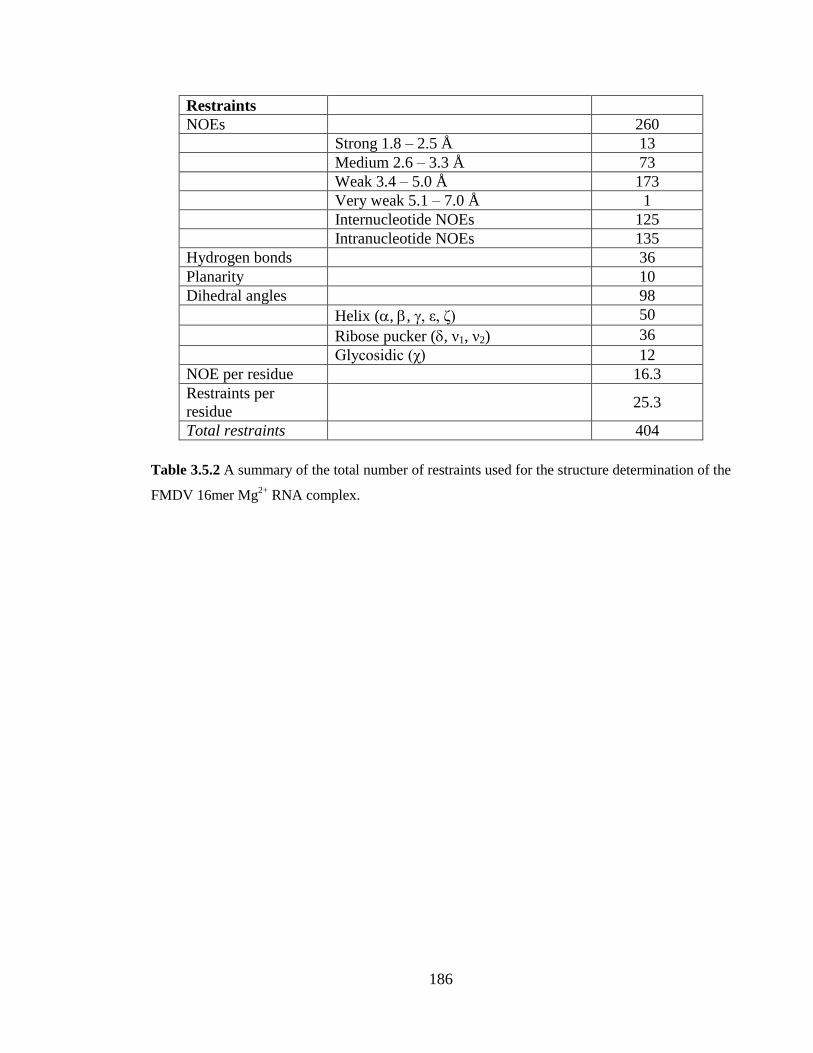
186
Restraints
NOEs 260
Strong 1.8 – 2.5 Å 13
Medium 2.6 – 3.3 Å 73
Weak 3.4 – 5.0 Å 173
Very weak 5.1 – 7.0 Å 1
Internucleotide NOEs 125
Intranucleotide NOEs 135
Hydrogen bonds 36
Planarity 10
Dihedral angles 98
Helix (, , , ε, ζ) 50
Ribose pucker (, ν1, ν2) 36
Glycosidic (χ) 12
NOE per residue 16.3
Restraints per
residue
25.3
Total restraints 404
Table 3.5.2 A summary of the total number of restraints used for the structure determination of the
FMDV 16mer Mg2+
RNA complex.
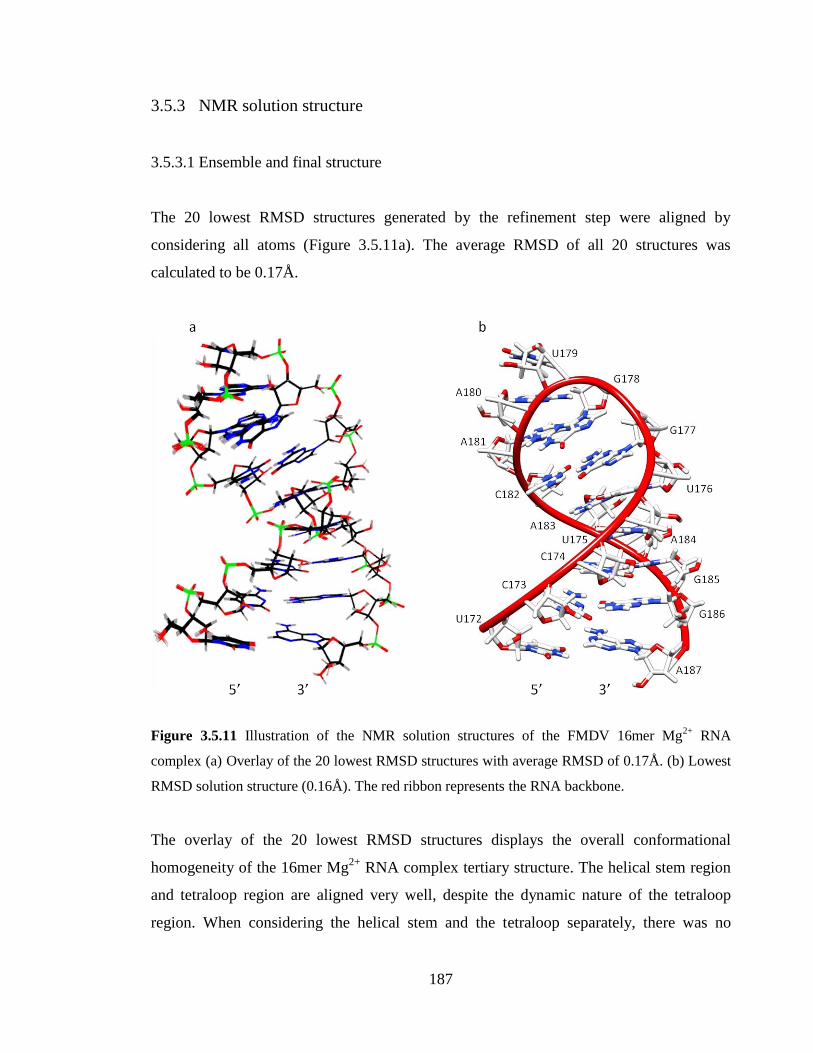
187
3.5.3 NMR solution structure
3.5.3.1 Ensemble and final structure
The 20 lowest RMSD structures generated by the refinement step were aligned by
considering all atoms (Figure 3.5.11a). The average RMSD of all 20 structures was
calculated to be 0.17Å.
Figure 3.5.11 Illustration of the NMR solution structures of the FMDV 16mer Mg2+
RNA
complex (a) Overlay of the 20 lowest RMSD structures with average RMSD of 0.17Å. (b) Lowest
RMSD solution structure (0.16Å). The red ribbon represents the RNA backbone.
The overlay of the 20 lowest RMSD structures displays the overall conformational
homogeneity of the 16mer Mg2+
RNA complex tertiary structure. The helical stem region
and tetraloop region are aligned very well, despite the dynamic nature of the tetraloop
region. When considering the helical stem and the tetraloop separately, there was no
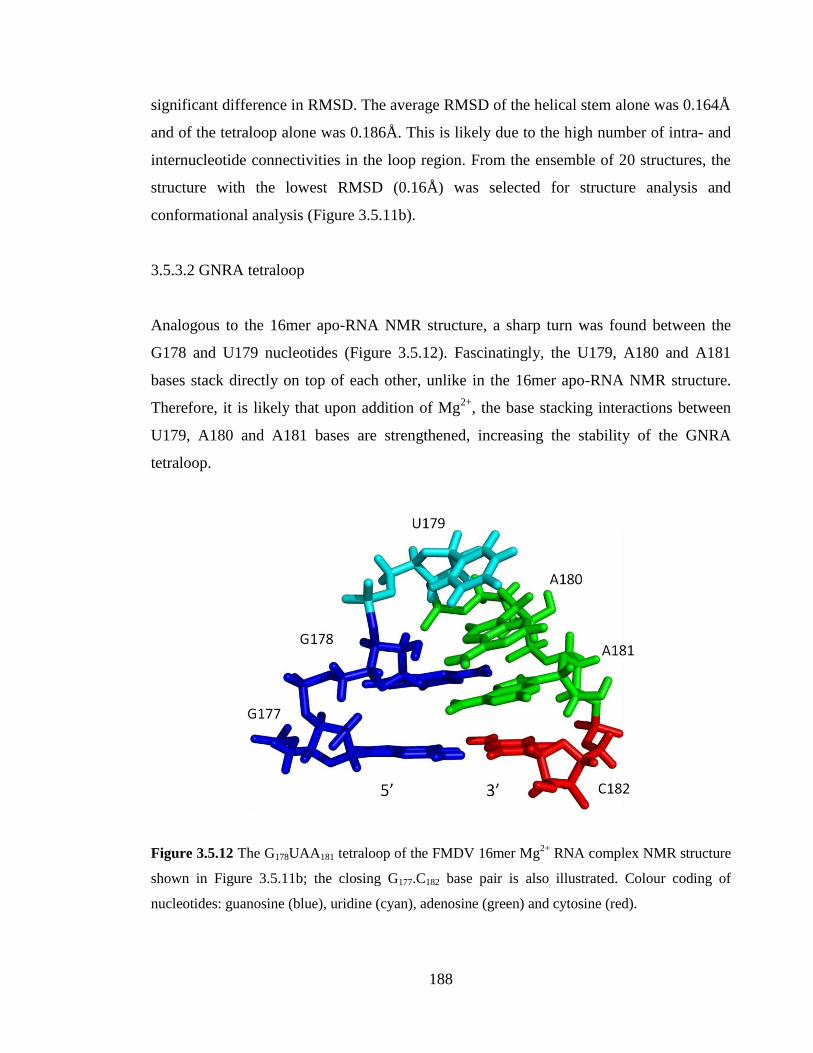
188
significant difference in RMSD. The average RMSD of the helical stem alone was 0.164Å
and of the tetraloop alone was 0.186Å. This is likely due to the high number of intra- and
internucleotide connectivities in the loop region. From the ensemble of 20 structures, the
structure with the lowest RMSD (0.16Å) was selected for structure analysis and
conformational analysis (Figure 3.5.11b).
3.5.3.2 GNRA tetraloop
Analogous to the 16mer apo-RNA NMR structure, a sharp turn was found between the
G178 and U179 nucleotides (Figure 3.5.12). Fascinatingly, the U179, A180 and A181
bases stack directly on top of each other, unlike in the 16mer apo-RNA NMR structure.
Therefore, it is likely that upon addition of Mg2+
, the base stacking interactions between
U179, A180 and A181 bases are strengthened, increasing the stability of the GNRA
tetraloop.
Figure 3.5.12 The G178UAA181 tetraloop of the FMDV 16mer Mg2+
RNA complex NMR structure
shown in Figure 3.5.11b; the closing G177.C182 base pair is also illustrated. Colour coding of
nucleotides: guanosine (blue), uridine (cyan), adenosine (green) and cytosine (red).
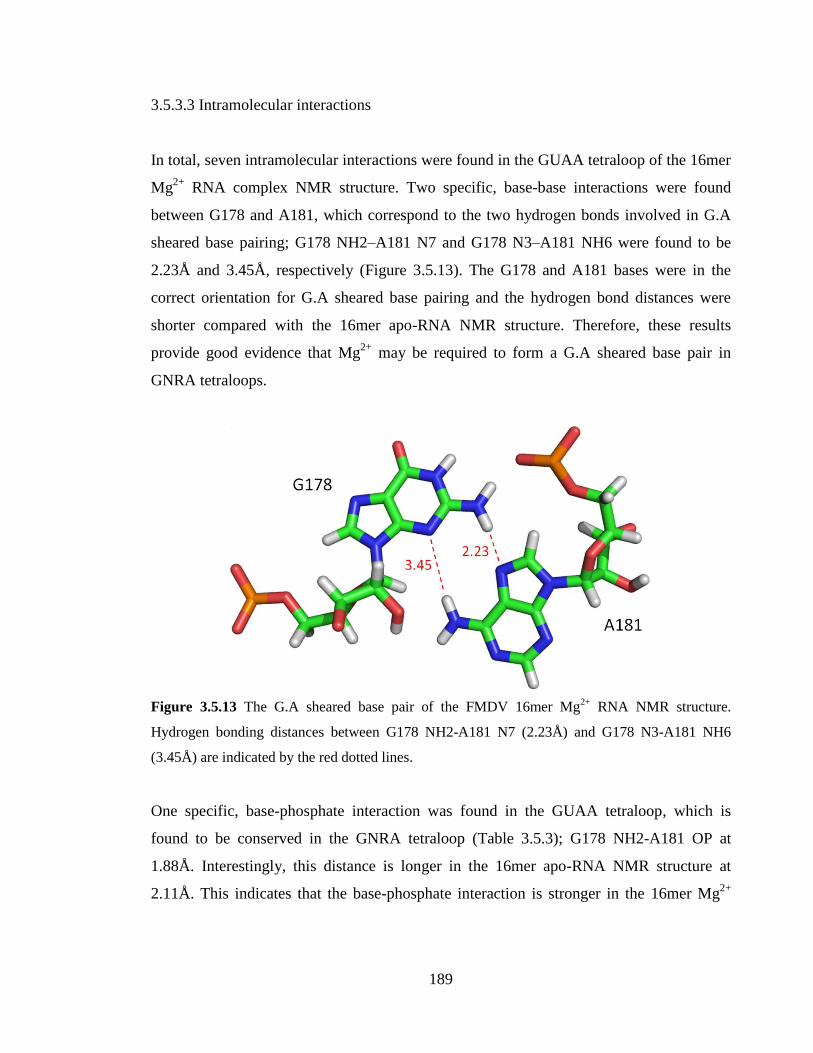
189
3.5.3.3 Intramolecular interactions
In total, seven intramolecular interactions were found in the GUAA tetraloop of the 16mer
Mg2+
RNA complex NMR structure. Two specific, base-base interactions were found
between G178 and A181, which correspond to the two hydrogen bonds involved in G.A
sheared base pairing; G178 NH2–A181 N7 and G178 N3–A181 NH6 were found to be
2.23Å and 3.45Å, respectively (Figure 3.5.13). The G178 and A181 bases were in the
correct orientation for G.A sheared base pairing and the hydrogen bond distances were
shorter compared with the 16mer apo-RNA NMR structure. Therefore, these results
provide good evidence that Mg2+
may be required to form a G.A sheared base pair in
GNRA tetraloops.
Figure 3.5.13 The G.A sheared base pair of the FMDV 16mer Mg2+
RNA NMR structure.
Hydrogen bonding distances between G178 NH2-A181 N7 (2.23Å) and G178 N3-A181 NH6
(3.45Å) are indicated by the red dotted lines.
One specific, base-phosphate interaction was found in the GUAA tetraloop, which is
found to be conserved in the GNRA tetraloop (Table 3.5.3); G178 NH2-A181 OP at
1.88Å. Interestingly, this distance is longer in the 16mer apo-RNA NMR structure at
2.11Å. This indicates that the base-phosphate interaction is stronger in the 16mer Mg2+
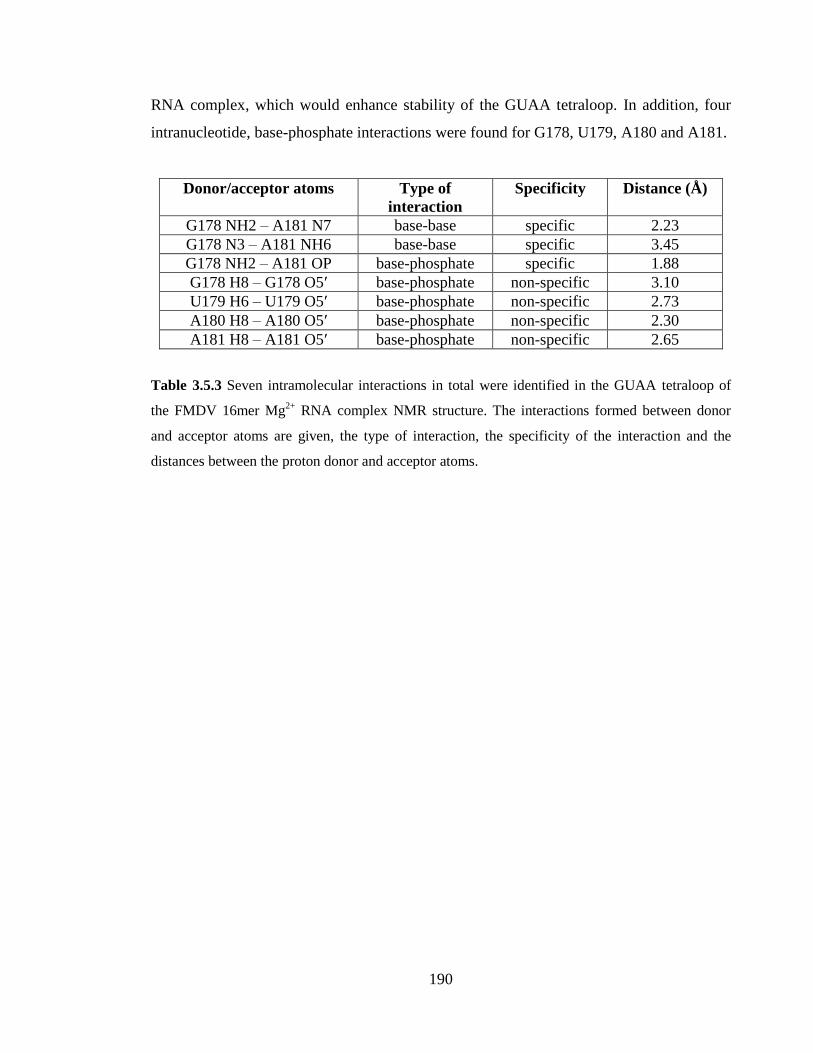
190
RNA complex, which would enhance stability of the GUAA tetraloop. In addition, four
intranucleotide, base-phosphate interactions were found for G178, U179, A180 and A181.
Donor/acceptor atoms Type of
interaction
Specificity Distance (Å)
G178 NH2 – A181 N7 base-base specific 2.23
G178 N3 – A181 NH6 base-base specific 3.45
G178 NH2 – A181 OP base-phosphate specific 1.88
G178 H8 – G178 O5ʹ base-phosphate non-specific 3.10
U179 H6 – U179 O5ʹ base-phosphate non-specific 2.73
A180 H8 – A180 O5ʹ base-phosphate non-specific 2.30
A181 H8 – A181 O5ʹ base-phosphate non-specific 2.65
Table 3.5.3 Seven intramolecular interactions in total were identified in the GUAA tetraloop of
the FMDV 16mer Mg2+
RNA complex NMR structure. The interactions formed between donor
and acceptor atoms are given, the type of interaction, the specificity of the interaction and the
distances between the proton donor and acceptor atoms.
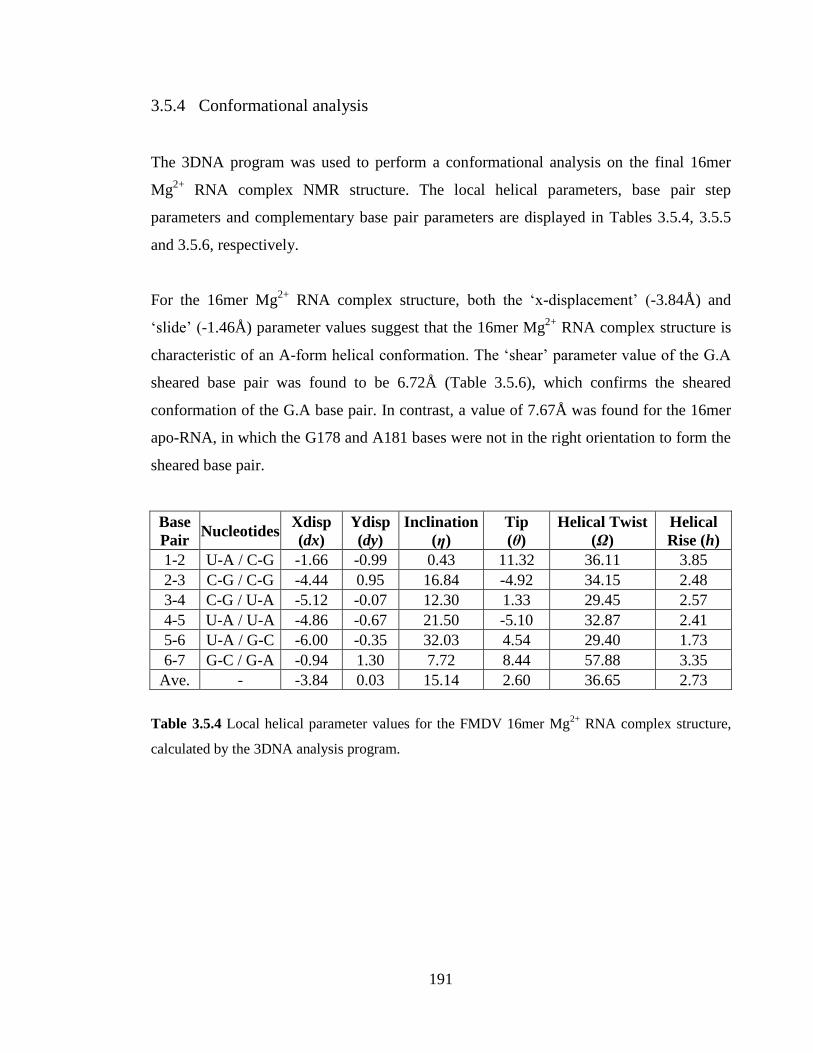
191
3.5.4 Conformational analysis
The 3DNA program was used to perform a conformational analysis on the final 16mer
Mg2+
RNA complex NMR structure. The local helical parameters, base pair step
parameters and complementary base pair parameters are displayed in Tables 3.5.4, 3.5.5
and 3.5.6, respectively.
For the 16mer Mg2+
RNA complex structure, both the ‘x-displacement’ (-3.84Å) and
‘slide’ (-1.46Å) parameter values suggest that the 16mer Mg2+
RNA complex structure is
characteristic of an A-form helical conformation. The ‘shear’ parameter value of the G.A
sheared base pair was found to be 6.72Å (Table 3.5.6), which confirms the sheared
conformation of the G.A base pair. In contrast, a value of 7.67Å was found for the 16mer
apo-RNA, in which the G178 and A181 bases were not in the right orientation to form the
sheared base pair.
Base
Pair Nucleotides
Xdisp
(dx)
Ydisp
(dy)
Inclination
(η)
Tip
(θ)
Helical Twist
(Ω)
Helical
Rise (h)
1-2 U-A / C-G -1.66 -0.99 0.43 11.32 36.11 3.85
2-3 C-G / C-G -4.44 0.95 16.84 -4.92 34.15 2.48
3-4 C-G / U-A -5.12 -0.07 12.30 1.33 29.45 2.57
4-5 U-A / U-A -4.86 -0.67 21.50 -5.10 32.87 2.41
5-6 U-A / G-C -6.00 -0.35 32.03 4.54 29.40 1.73
6-7 G-C / G-A -0.94 1.30 7.72 8.44 57.88 3.35
Ave. - -3.84 0.03 15.14 2.60 36.65 2.73
Table 3.5.4 Local helical parameter values for the FMDV 16mer Mg2+
RNA complex structure,
calculated by the 3DNA analysis program.
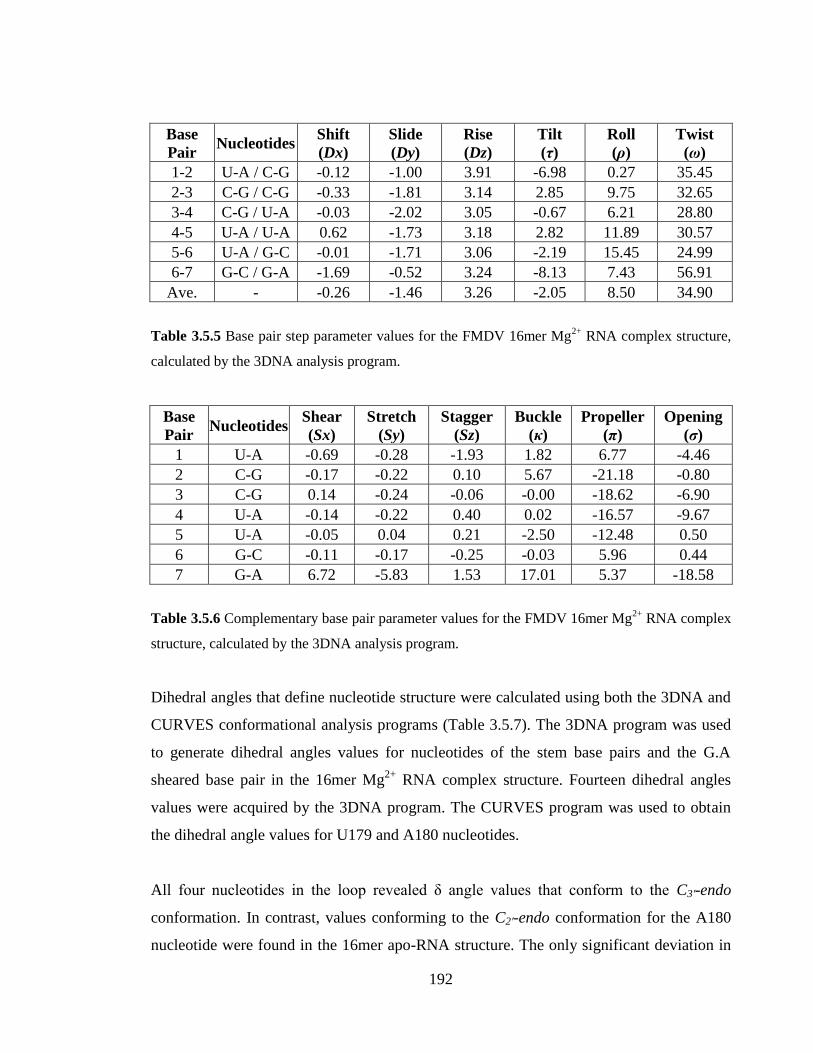
192
Base
Pair Nucleotides
Shift
(Dx)
Slide
(Dy)
Rise
(Dz)
Tilt
(τ)
Roll
(ρ)
Twist
(ω)
1-2 U-A / C-G -0.12 -1.00 3.91 -6.98 0.27 35.45
2-3 C-G / C-G -0.33 -1.81 3.14 2.85 9.75 32.65
3-4 C-G / U-A -0.03 -2.02 3.05 -0.67 6.21 28.80
4-5 U-A / U-A 0.62 -1.73 3.18 2.82 11.89 30.57
5-6 U-A / G-C -0.01 -1.71 3.06 -2.19 15.45 24.99
6-7 G-C / G-A -1.69 -0.52 3.24 -8.13 7.43 56.91
Ave. - -0.26 -1.46 3.26 -2.05 8.50 34.90
Table 3.5.5 Base pair step parameter values for the FMDV 16mer Mg2+
RNA complex structure,
calculated by the 3DNA analysis program.
Base
Pair Nucleotides
Shear
(Sx)
Stretch
(Sy)
Stagger
(Sz)
Buckle
(κ)
Propeller
(π)
Opening
(σ)
1 U-A -0.69 -0.28 -1.93 1.82 6.77 -4.46
2 C-G -0.17 -0.22 0.10 5.67 -21.18 -0.80
3 C-G 0.14 -0.24 -0.06 -0.00 -18.62 -6.90
4 U-A -0.14 -0.22 0.40 0.02 -16.57 -9.67
5 U-A -0.05 0.04 0.21 -2.50 -12.48 0.50
6 G-C -0.11 -0.17 -0.25 -0.03 5.96 0.44
7 G-A 6.72 -5.83 1.53 17.01 5.37 -18.58
Table 3.5.6 Complementary base pair parameter values for the FMDV 16mer Mg2+
RNA complex
structure, calculated by the 3DNA analysis program.
Dihedral angles that define nucleotide structure were calculated using both the 3DNA and
CURVES conformational analysis programs (Table 3.5.7). The 3DNA program was used
to generate dihedral angles values for nucleotides of the stem base pairs and the G.A
sheared base pair in the 16mer Mg2+
RNA complex structure. Fourteen dihedral angles
values were acquired by the 3DNA program. The CURVES program was used to obtain
the dihedral angle values for U179 and A180 nucleotides.
All four nucleotides in the loop revealed δ angle values that conform to the C3ʹ-endo
conformation. In contrast, values conforming to the C2ʹ-endo conformation for the A180
nucleotide were found in the 16mer apo-RNA structure. The only significant deviation in
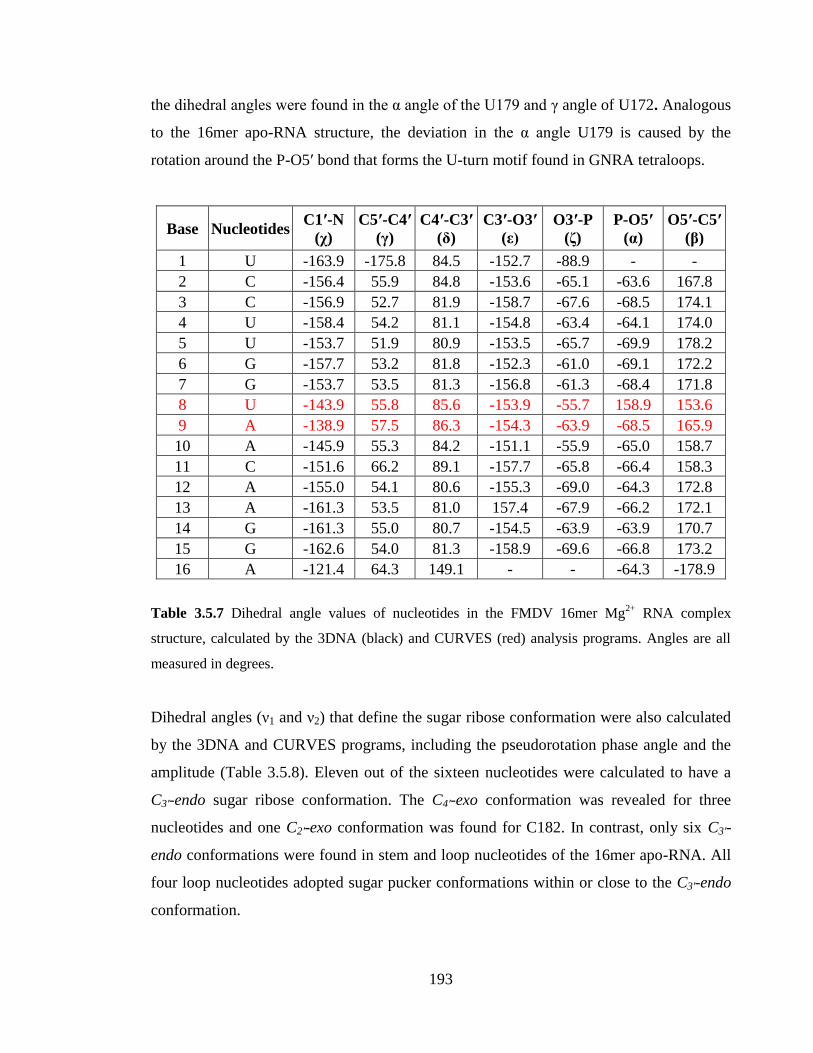
193
the dihedral angles were found in the α angle of the U179 and γ angle of U172. Analogous
to the 16mer apo-RNA structure, the deviation in the α angle U179 is caused by the
rotation around the P-O5ʹ bond that forms the U-turn motif found in GNRA tetraloops.
Base Nucleotides C1ʹ-N
(χ)
C5ʹ-C4ʹ
(γ)
C4ʹ-C3ʹ
(δ)
C3ʹ-O3ʹ
(ε)
O3ʹ-P
(ζ)
P-O5ʹ
(α)
O5ʹ-C5ʹ
(β)
1 U -163.9 -175.8 84.5 -152.7 -88.9 - -
2 C -156.4 55.9 84.8 -153.6 -65.1 -63.6 167.8
3 C -156.9 52.7 81.9 -158.7 -67.6 -68.5 174.1
4 U -158.4 54.2 81.1 -154.8 -63.4 -64.1 174.0
5 U -153.7 51.9 80.9 -153.5 -65.7 -69.9 178.2
6 G -157.7 53.2 81.8 -152.3 -61.0 -69.1 172.2
7 G -153.7 53.5 81.3 -156.8 -61.3 -68.4 171.8
8 U -143.9 55.8 85.6 -153.9 -55.7 158.9 153.6
9 A -138.9 57.5 86.3 -154.3 -63.9 -68.5 165.9
10 A -145.9 55.3 84.2 -151.1 -55.9 -65.0 158.7
11 C -151.6 66.2 89.1 -157.7 -65.8 -66.4 158.3
12 A -155.0 54.1 80.6 -155.3 -69.0 -64.3 172.8
13 A -161.3 53.5 81.0 157.4 -67.9 -66.2 172.1
14 G -161.3 55.0 80.7 -154.5 -63.9 -63.9 170.7
15 G -162.6 54.0 81.3 -158.9 -69.6 -66.8 173.2
16 A -121.4 64.3 149.1 - - -64.3 -178.9
Table 3.5.7 Dihedral angle values of nucleotides in the FMDV 16mer Mg2+
RNA complex
structure, calculated by the 3DNA (black) and CURVES (red) analysis programs. Angles are all
measured in degrees.
Dihedral angles (ν1 and ν2) that define the sugar ribose conformation were also calculated
by the 3DNA and CURVES programs, including the pseudorotation phase angle and the
amplitude (Table 3.5.8). Eleven out of the sixteen nucleotides were calculated to have a
C3ʹ-endo sugar ribose conformation. The C4ʹ-exo conformation was revealed for three
nucleotides and one C2ʹ-exo conformation was found for C182. In contrast, only six C3ʹ-
endo conformations were found in stem and loop nucleotides of the 16mer apo-RNA. All
four loop nucleotides adopted sugar pucker conformations within or close to the C3ʹ-endo
conformation.
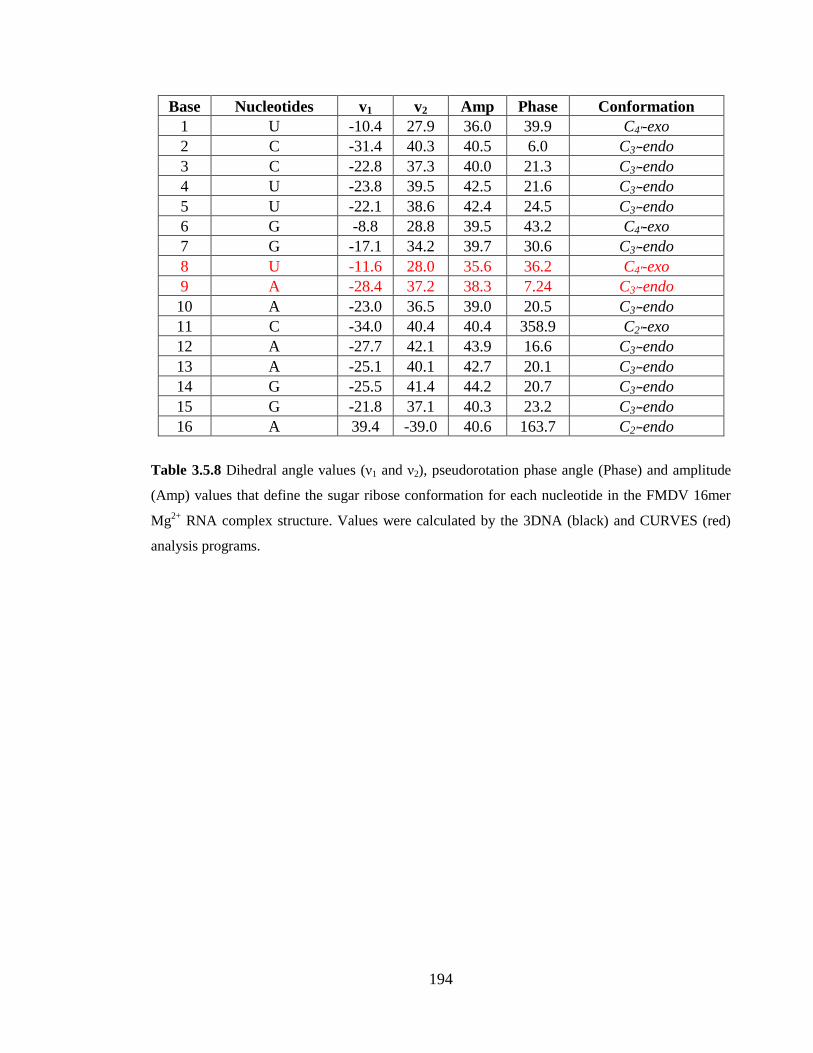
194
Base Nucleotides v1 v2 Amp Phase Conformation
1 U -10.4 27.9 36.0 39.9 C4ʹ-exo
2 C -31.4 40.3 40.5 6.0 C3ʹ-endo
3 C -22.8 37.3 40.0 21.3 C3ʹ-endo
4 U -23.8 39.5 42.5 21.6 C3ʹ-endo
5 U -22.1 38.6 42.4 24.5 C3ʹ-endo
6 G -8.8 28.8 39.5 43.2 C4ʹ-exo
7 G -17.1 34.2 39.7 30.6 C3ʹ-endo
8 U -11.6 28.0 35.6 36.2 C4ʹ-exo
9 A -28.4 37.2 38.3 7.24 C3ʹ-endo
10 A -23.0 36.5 39.0 20.5 C3ʹ-endo
11 C -34.0 40.4 40.4 358.9 C2ʹ-exo
12 A -27.7 42.1 43.9 16.6 C3ʹ-endo
13 A -25.1 40.1 42.7 20.1 C3ʹ-endo
14 G -25.5 41.4 44.2 20.7 C3ʹ-endo
15 G -21.8 37.1 40.3 23.2 C3ʹ-endo
16 A 39.4 -39.0 40.6 163.7 C2ʹ-endo
Table 3.5.8 Dihedral angle values (ν1 and ν2), pseudorotation phase angle (Phase) and amplitude
(Amp) values that define the sugar ribose conformation for each nucleotide in the FMDV 16mer
Mg2+
RNA complex structure. Values were calculated by the 3DNA (black) and CURVES (red)
analysis programs.
195
3.5.5 Comparison of the 16mer apo/Mg2+
RNA NMR structures
The successful determination of the 16mer apo and Mg2+
complex RNA structures
allowed a comparison to be made between the two RNAs. In this sub-section the
similarities and differences will be highlighted.
The assignment of the 16mer apo and Mg2+
complex RNAs proceeded using the NMR
assignment strategy. The assignments produced from the NOESY spectra in both 1H2O
and 2H2O were extremely important as they provided the distance restraints required for
structure determination. The number of NOE restraints per residue generated for the
16mer apo and Mg2+
complex RNA structures was 7.8 and 16.3, respectively. Relatively,
52% fewer NOEs per residue were used in the 16mer apo-RNA structure. The reason for
this is because the NOESY (2H2O) spectrum of the 16mer apo-RNA, possessed broad
lines and reduced sensitivity when compared to the 16mer Mg2+
RNA complex. This
hindered efforts to produce a H6/H8-H1ʹ sequence-specific sequential assignment, which
made further assignment difficult. Regardless of the limitations faced with the 16mer apo-
RNA, the 16mer apo-RNA structures generated were of very good quality with low
RMSDs. This may be due to the larger number of internucleotide connectivities obtained
compared to intranucleotide connectivities; 71 and 54, respectively.
In contrast, the H6/H8-H1ʹ assignment of the 16mer Mg2+
RNA complex was more
straightforward. A greater number of intra- and internucleotide NOE cross peaks could be
observed and assigned, most likely due to the stabilisation effect produced by the presence
of Mg2+
. Consequently, the final twenty 16mer Mg2+
RNA complex structures generated
had low RMSDs, with no significant difference in RMSD found between the stem and
loop region. The final solution structures of both the 16mer apo and Mg2+
complex RNAs
were of a high standard. Structure validation using the Molprobity program, revealed no
bad bonds, angles, sugar pucker and backbone conformations for the NMR structures of
both the 16mer apo-RNA and Mg2+
RNA complex. Clash scores were found to be low;
31.2 and 21.4 for the 16mer apo-RNA and Mg2+
RNA complex, respectively.
196
3.6 Mg2+
-induced structural changes to the 16mer apo-RNA
The only major structural difference in the stem region of the 16mer apo-RNA structure
was found for the U172 nucleotide, upon addition of Mg2+
. The DQF-COSY experiment
provided clear evidence of the change from C2ʹ-endo to C3ʹ-endo sugar conformation for
the U172 nucleotide, which was also observed in the NMR structures. Consequently, the
U172 base changes its orientation to stack with C173, which was not the case in the 16mer
apo-RNA structure. Therefore, this would have the effect of increasing stability of the
terminal stem region. This is another example of the stabilising effect of Mg2+
on RNA.
Significant chemical shift changes to exchangeable and non-exchangeable protons were
also observed in the stem region of the 16mer RNA, upon addition of Mg2+
(Figure 3.6.1).
It was observed that the conformation of the GUAA tetraloop was significantly different
between the 16mer apo and Mg2+
RNA structures. Mg2+
is known to interact with the
negatively charged phosphate backbone, so was likely that Mg2+
has caused the
conformational change in the phosphate backbone of the GUAA tetraloop. The
consequence of these structural changes in the loop was that the U179, A180 and A181
bases were tightly stacked together on the 3ʹ-end, creating a more compact GUAA
tetraloop (Figure 3.6.2) allowing for stronger base stacking interactions. These structural
changes allowed the formation of stronger intramolecular interactions due to shorter
hydrogen bond distances. Crucially, the two hydrogen bonds involved in forming a G.A
sheared base pair were shorter (Figure 3.6.3). This suggests that Mg2+
is required to form a
stable G.A sheared base pair, which was not possible in the 16mer apo-RNA structure.
Base-phosphate interactions between A180 H8-A180 O5ʹ and A181 H8-A181 O5ʹ were
also stronger in the Mg2+
RNA complex structure, adding to the stability of the loop
(Figures 3.6.3 and 3.6.4). Both the intramolecular and base stacking interactions are
improved following the Mg2+
-induced structural changes to the GUAA tetraloop, which
significantly contribute towards its stability. These findings demonstrate the ability of
Mg2+
to enhance stability in the GNRA tetraloop and the mechanism by which Mg2+
is
able to do that. Table 3.6.1 summaries the changes highlighted here.
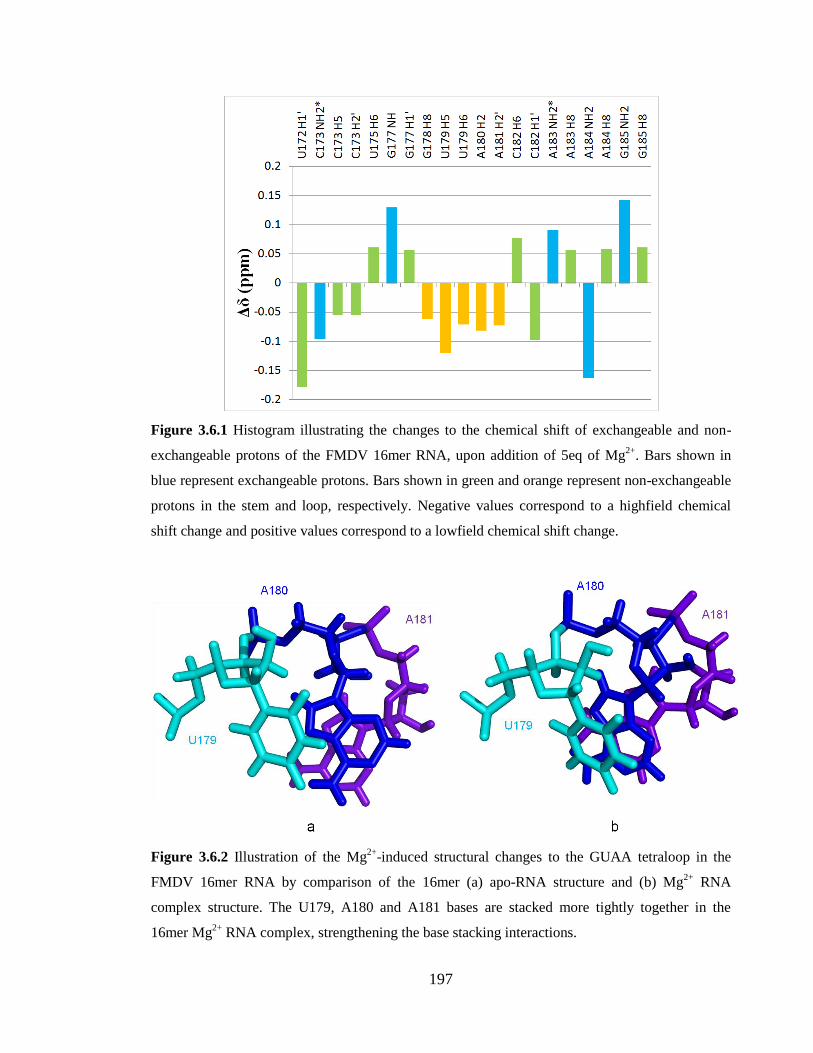
197
Figure 3.6.1 Histogram illustrating the changes to the chemical shift of exchangeable and non-
exchangeable protons of the FMDV 16mer RNA, upon addition of 5eq of Mg2+
. Bars shown in
blue represent exchangeable protons. Bars shown in green and orange represent non-exchangeable
protons in the stem and loop, respectively. Negative values correspond to a highfield chemical
shift change and positive values correspond to a lowfield chemical shift change.
Figure 3.6.2 Illustration of the Mg2+
-induced structural changes to the GUAA tetraloop in the
FMDV 16mer RNA by comparison of the 16mer (a) apo-RNA structure and (b) Mg2+
RNA
complex structure. The U179, A180 and A181 bases are stacked more tightly together in the
16mer Mg2+
RNA complex, strengthening the base stacking interactions.
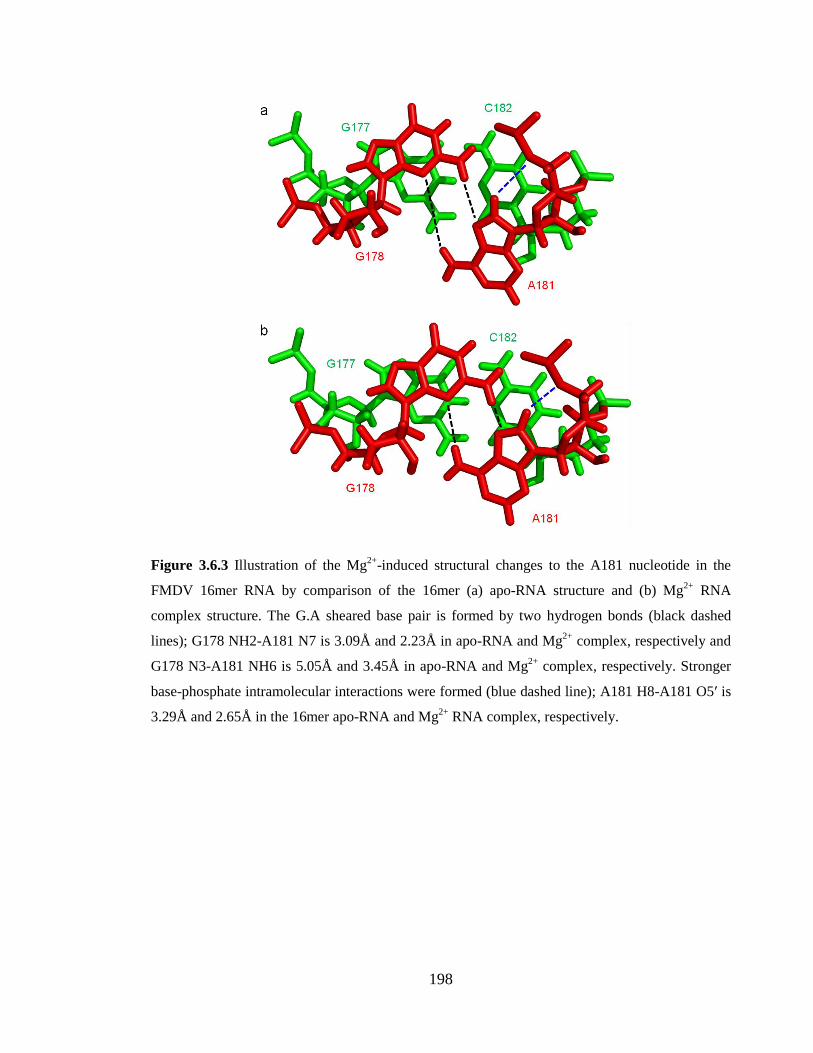
198
Figure 3.6.3 Illustration of the Mg2+
-induced structural changes to the A181 nucleotide in the
FMDV 16mer RNA by comparison of the 16mer (a) apo-RNA structure and (b) Mg2+
RNA
complex structure. The G.A sheared base pair is formed by two hydrogen bonds (black dashed
lines); G178 NH2-A181 N7 is 3.09Å and 2.23Å in apo-RNA and Mg2+
complex, respectively and
G178 N3-A181 NH6 is 5.05Å and 3.45Å in apo-RNA and Mg2+
complex, respectively. Stronger
base-phosphate intramolecular interactions were formed (blue dashed line); A181 H8-A181 O5ʹ is
3.29Å and 2.65Å in the 16mer apo-RNA and Mg2+
RNA complex, respectively.
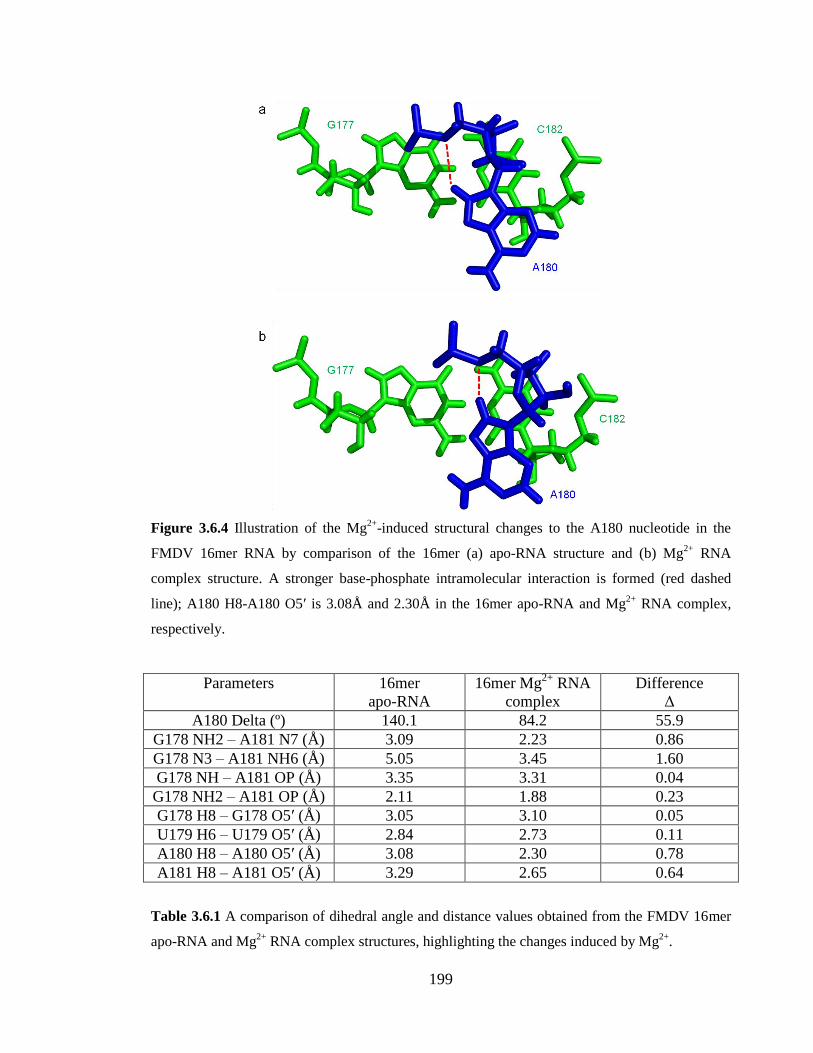
199
Figure 3.6.4 Illustration of the Mg2+
-induced structural changes to the A180 nucleotide in the
FMDV 16mer RNA by comparison of the 16mer (a) apo-RNA structure and (b) Mg2+
RNA
complex structure. A stronger base-phosphate intramolecular interaction is formed (red dashed
line); A180 H8-A180 O5ʹ is 3.08Å and 2.30Å in the 16mer apo-RNA and Mg2+
RNA complex,
respectively.
Parameters 16mer
apo-RNA
16mer Mg2+
RNA
complex
Difference
Δ
A180 Delta (º) 140.1 84.2 55.9
G178 NH2 – A181 N7 (Å) 3.09 2.23 0.86
G178 N3 – A181 NH6 (Å) 5.05 3.45 1.60
G178 NH – A181 OP (Å) 3.35 3.31 0.04
G178 NH2 – A181 OP (Å) 2.11 1.88 0.23
G178 H8 – G178 O5ʹ (Å) 3.05 3.10 0.05
U179 H6 – U179 O5ʹ (Å) 2.84 2.73 0.11
A180 H8 – A180 O5ʹ (Å) 3.08 2.30 0.78
A181 H8 – A181 O5ʹ (Å) 3.29 2.65 0.64
Table 3.6.1 A comparison of dihedral angle and distance values obtained from the FMDV 16mer
apo-RNA and Mg2+
RNA complex structures, highlighting the changes induced by Mg2+
.
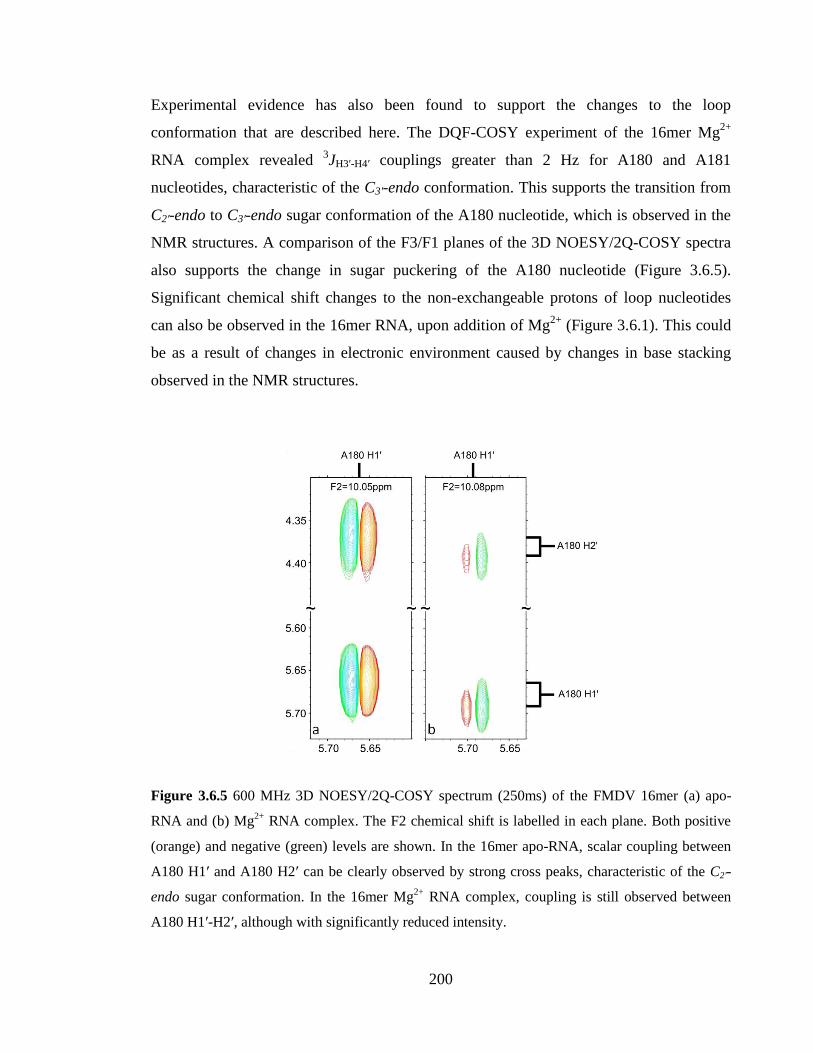
200
Experimental evidence has also been found to support the changes to the loop
conformation that are described here. The DQF-COSY experiment of the 16mer Mg2+
RNA complex revealed 3JH3ʹ-H4ʹ couplings greater than 2 Hz for A180 and A181
nucleotides, characteristic of the C3ʹ-endo conformation. This supports the transition from
C2ʹ-endo to C3ʹ-endo sugar conformation of the A180 nucleotide, which is observed in the
NMR structures. A comparison of the F3/F1 planes of the 3D NOESY/2Q-COSY spectra
also supports the change in sugar puckering of the A180 nucleotide (Figure 3.6.5).
Significant chemical shift changes to the non-exchangeable protons of loop nucleotides
can also be observed in the 16mer RNA, upon addition of Mg2+
(Figure 3.6.1). This could
be as a result of changes in electronic environment caused by changes in base stacking
observed in the NMR structures.
Figure 3.6.5 600 MHz 3D NOESY/2Q-COSY spectrum (250ms) of the FMDV 16mer (a) apo-
RNA and (b) Mg2+
RNA complex. The F2 chemical shift is labelled in each plane. Both positive
(orange) and negative (green) levels are shown. In the 16mer apo-RNA, scalar coupling between
A180 H1ʹ and A180 H2ʹ can be clearly observed by strong cross peaks, characteristic of the C2ʹ-
endo sugar conformation. In the 16mer Mg2+
RNA complex, coupling is still observed between
A180 H1ʹ-H2ʹ, although with significantly reduced intensity.
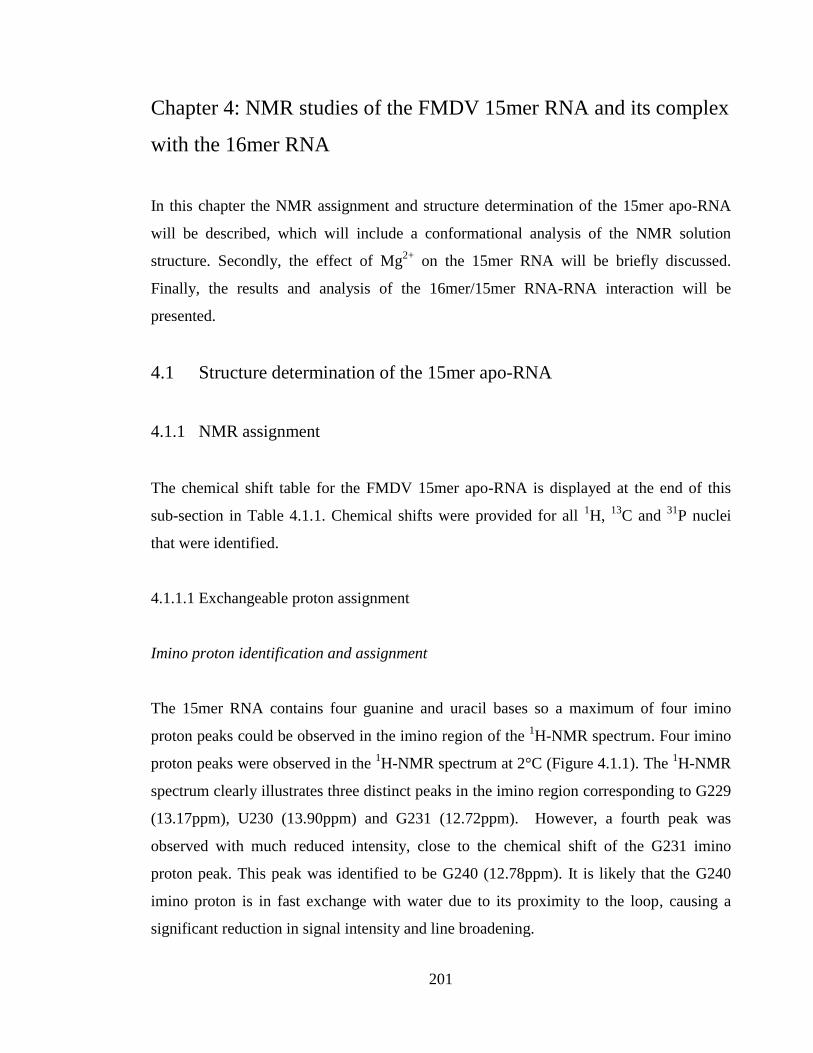
201
Chapter 4: NMR studies of the FMDV 15mer RNA and its complex
with the 16mer RNA
In this chapter the NMR assignment and structure determination of the 15mer apo-RNA
will be described, which will include a conformational analysis of the NMR solution
structure. Secondly, the effect of Mg2+
on the 15mer RNA will be briefly discussed.
Finally, the results and analysis of the 16mer/15mer RNA-RNA interaction will be
presented.
4.1 Structure determination of the 15mer apo-RNA
4.1.1 NMR assignment
The chemical shift table for the FMDV 15mer apo-RNA is displayed at the end of this
sub-section in Table 4.1.1. Chemical shifts were provided for all 1H,
13C and
31P nuclei
that were identified.
4.1.1.1 Exchangeable proton assignment
Imino proton identification and assignment
The 15mer RNA contains four guanine and uracil bases so a maximum of four imino
proton peaks could be observed in the imino region of the 1H-NMR spectrum. Four imino
proton peaks were observed in the 1H-NMR spectrum at 2°C (Figure 4.1.1). The
1H-NMR
spectrum clearly illustrates three distinct peaks in the imino region corresponding to G229
(13.17ppm), U230 (13.90ppm) and G231 (12.72ppm). However, a fourth peak was
observed with much reduced intensity, close to the chemical shift of the G231 imino
proton peak. This peak was identified to be G240 (12.78ppm). It is likely that the G240
imino proton is in fast exchange with water due to its proximity to the loop, causing a
significant reduction in signal intensity and line broadening.
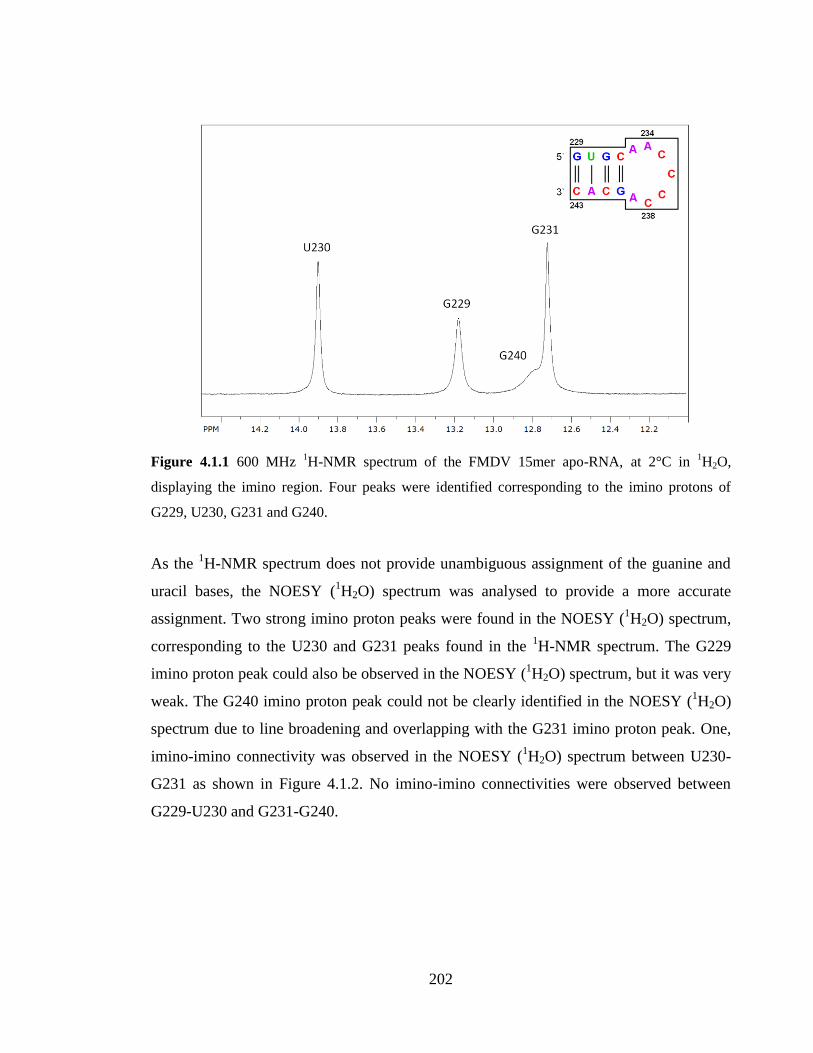
202
Figure 4.1.1 600 MHz 1H-NMR spectrum of the FMDV 15mer apo-RNA, at 2°C in
1H2O,
displaying the imino region. Four peaks were identified corresponding to the imino protons of
G229, U230, G231 and G240.
As the 1H-NMR spectrum does not provide unambiguous assignment of the guanine and
uracil bases, the NOESY (1H2O) spectrum was analysed to provide a more accurate
assignment. Two strong imino proton peaks were found in the NOESY (1H2O) spectrum,
corresponding to the U230 and G231 peaks found in the 1H-NMR spectrum. The G229
imino proton peak could also be observed in the NOESY (1H2O) spectrum, but it was very
weak. The G240 imino proton peak could not be clearly identified in the NOESY (1H2O)
spectrum due to line broadening and overlapping with the G231 imino proton peak. One,
imino-imino connectivity was observed in the NOESY (1H2O) spectrum between U230-
G231 as shown in Figure 4.1.2. No imino-imino connectivities were observed between
G229-U230 and G231-G240.
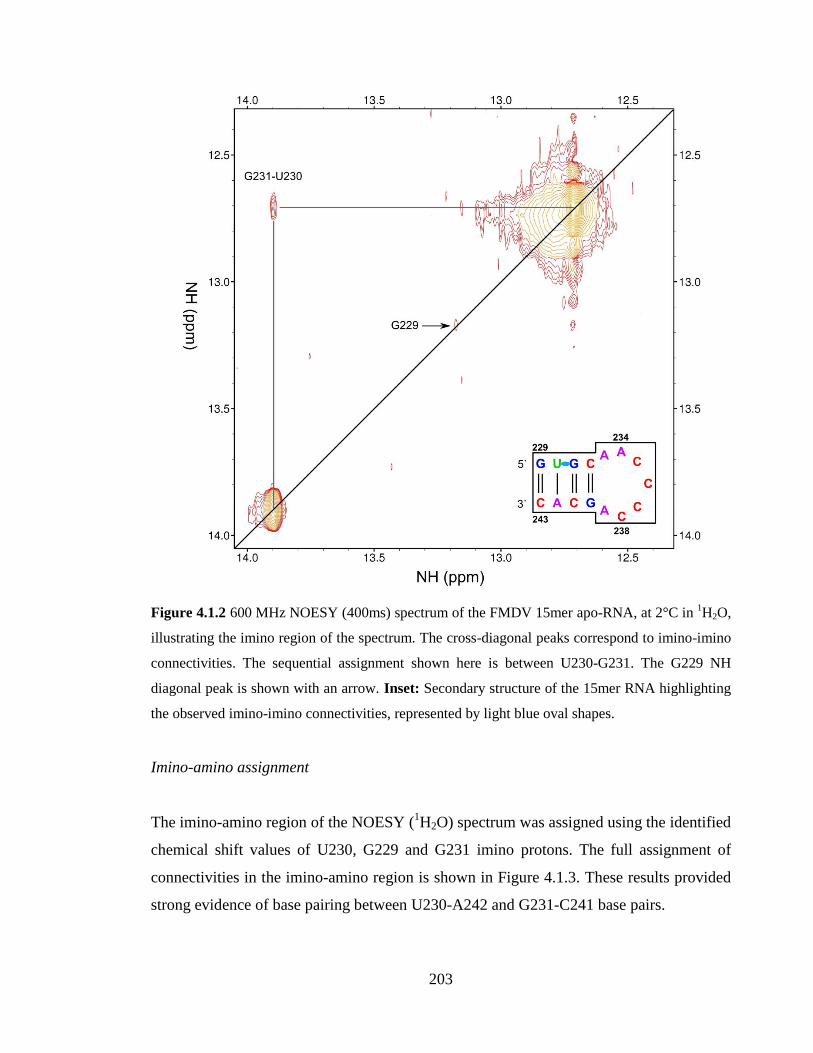
203
Figure 4.1.2 600 MHz NOESY (400ms) spectrum of the FMDV 15mer apo-RNA, at 2°C in 1H2O,
illustrating the imino region of the spectrum. The cross-diagonal peaks correspond to imino-imino
connectivities. The sequential assignment shown here is between U230-G231. The G229 NH
diagonal peak is shown with an arrow. Inset: Secondary structure of the 15mer RNA highlighting
the observed imino-imino connectivities, represented by light blue oval shapes.
Imino-amino assignment
The imino-amino region of the NOESY (1H2O) spectrum was assigned using the identified
chemical shift values of U230, G229 and G231 imino protons. The full assignment of
connectivities in the imino-amino region is shown in Figure 4.1.3. These results provided
strong evidence of base pairing between U230-A242 and G231-C241 base pairs.
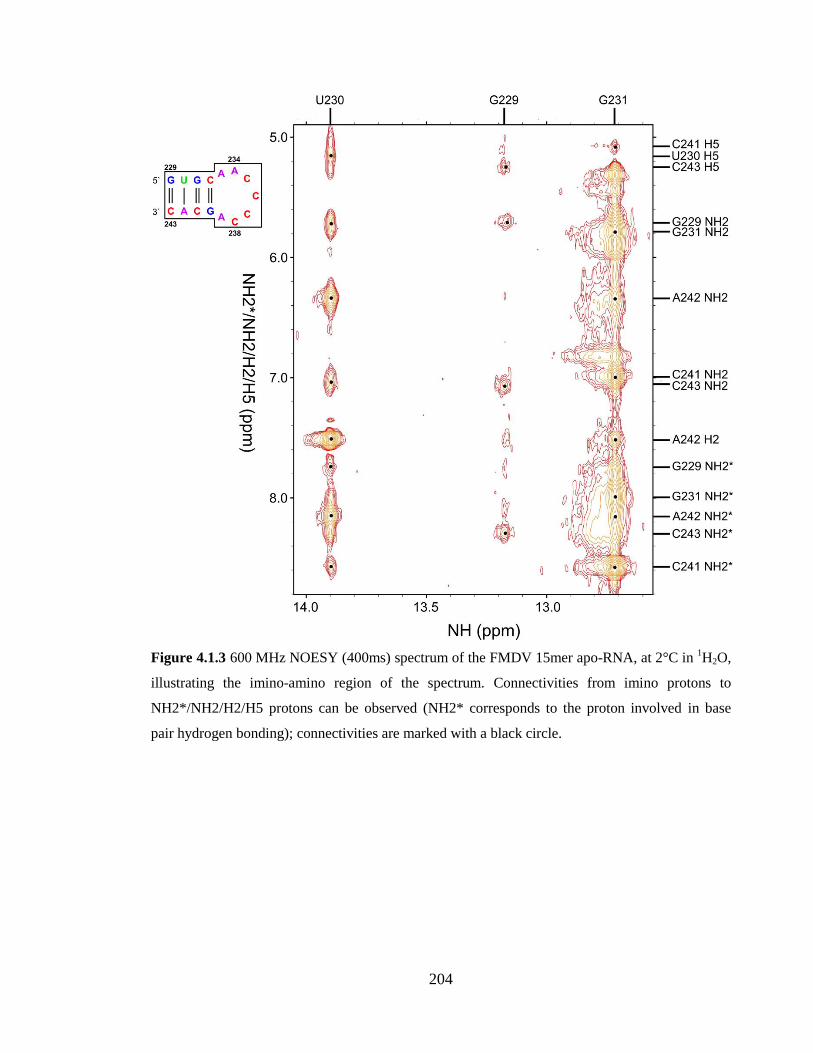
204
Figure 4.1.3 600 MHz NOESY (400ms) spectrum of the FMDV 15mer apo-RNA, at 2°C in 1H2O,
illustrating the imino-amino region of the spectrum. Connectivities from imino protons to
NH2*/NH2/H2/H5 protons can be observed (NH2* corresponds to the proton involved in base
pair hydrogen bonding); connectivities are marked with a black circle.
205
4.1.1.2 Non-exchangeable proton assignment
H5-H6 assignment
In the FMDV 15mer RNA, there is one uracil and three cytosine nucleotides in the stem
and four cytosine nucleotides in the loop. Accordingly, eight H5-H6 cross peaks are
expected to be observed in the NOESY (2H2O) spectrum. The U230, C232, C235, C236,
C237, C238, C241 and C243 H5-H6 cross peaks were assigned successfully. Figure 4.1.4
illustrates the assignment of H5-H6 cross peaks in the NOESY (2H2O) spectrum, with the
aid of the 1H-
13C HSQC spectrum. Interestingly, the H5 chemical shifts of the loop C236,
C237 and C238 nucleotides were found to be lowfield to those of the stem cytosine
nucleotides, except for the C235 nucleotide.
H6/H8-H1ʹ sequential assignment
A sequential assignment was carried out from G229 H8-H1ʹ to C243 H6-H1ʹ. The
intranucleotide G229 H8-H1ʹ connectivity was found to start the sequential assignment. A
sequential assignment was attained from G229 H8-H1ʹ to A234 H1ʹ-C235 H6. In this part
of the sequential assignment, connectivities to A234 H2 were used instead of A234 H8.
No intranucleotide connectivity was observed between C235 H6-H1ʹ and C237 H1ʹ-C238
H8. Subsequently, the sequential assignment commenced from C238 H6-H1ʹ to C243 H6-
H1ʹ; connectivities to A239 H2 were used instead of A239 H8. The reason for using
connectivities to A234 H2 and A239 H2 is because the cross peaks corresponding to these
connectivities could be clearly observed. This is because the A234 and A239 nucleotides
are found in the 15mer RNA loop and so distances from intra- and internucleotide H2-H1ʹ
were shorter than H8-H1ʹ. The use of H2-H1ʹ connectivities highlighted the importance of
using alternative methods for sequential assignment depending on the RNA tertiary
structure. Figure 4.1.5 illustrates the sequential assignment discussed.
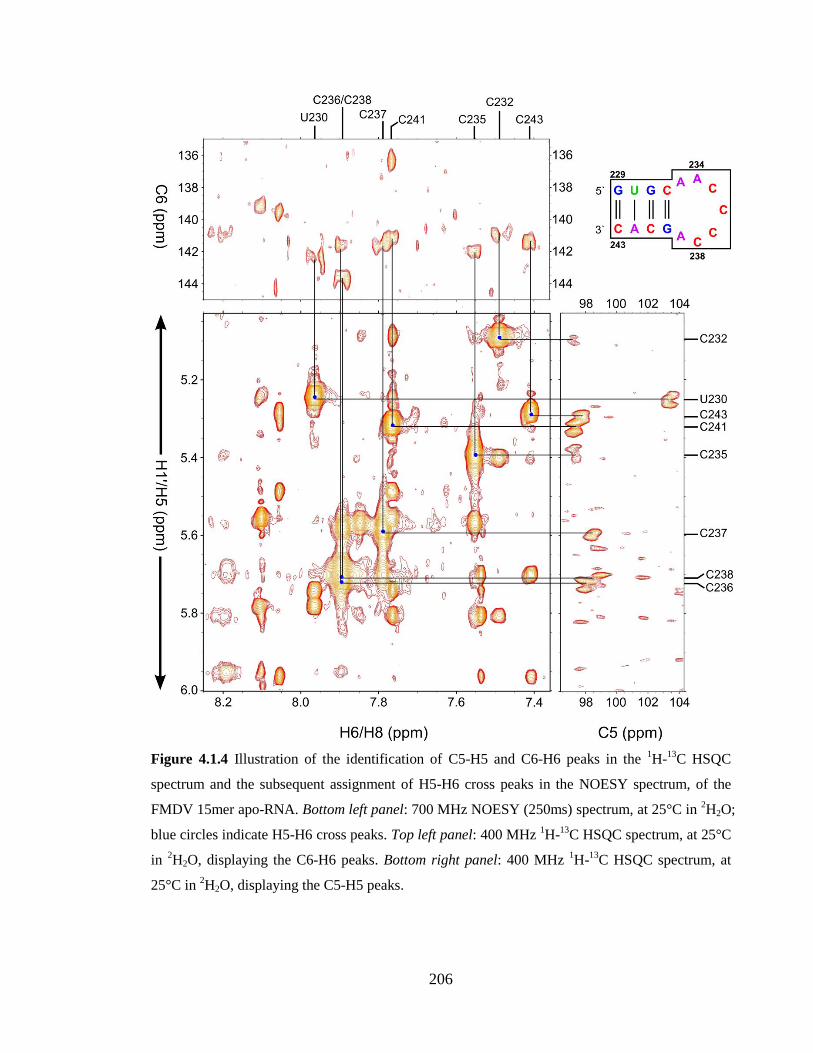
206
Figure 4.1.4 Illustration of the identification of C5-H5 and C6-H6 peaks in the 1H-
13C HSQC
spectrum and the subsequent assignment of H5-H6 cross peaks in the NOESY spectrum, of the
FMDV 15mer apo-RNA. Bottom left panel: 700 MHz NOESY (250ms) spectrum, at 25°C in 2H2O;
blue circles indicate H5-H6 cross peaks. Top left panel: 400 MHz 1H-
13C HSQC spectrum, at 25°C
in 2H2O, displaying the C6-H6 peaks. Bottom right panel: 400 MHz
1H-
13C HSQC spectrum, at
25°C in 2H2O, displaying the C5-H5 peaks.
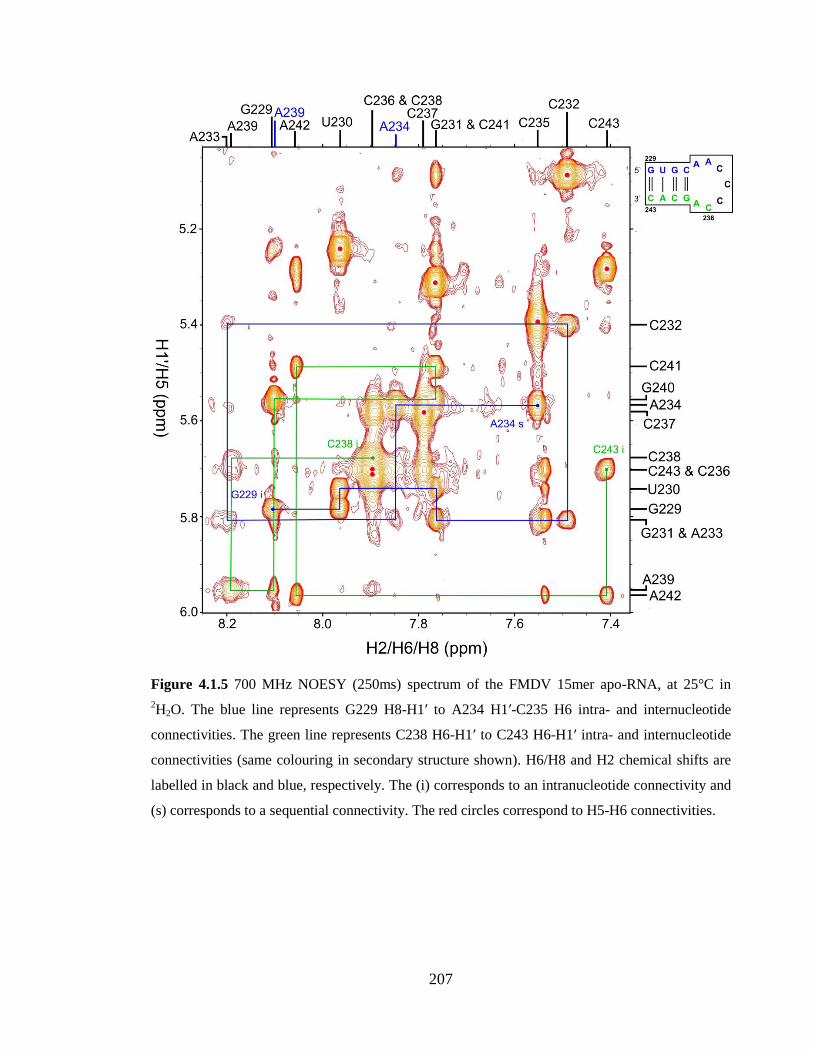
207
Figure 4.1.5 700 MHz NOESY (250ms) spectrum of the FMDV 15mer apo-RNA, at 25°C in
2H2O. The blue line represents G229 H8-H1ʹ to A234 H1ʹ-C235 H6 intra- and internucleotide
connectivities. The green line represents C238 H6-H1ʹ to C243 H6-H1ʹ intra- and internucleotide
connectivities (same colouring in secondary structure shown). H6/H8 and H2 chemical shifts are
labelled in black and blue, respectively. The (i) corresponds to an intranucleotide connectivity and
(s) corresponds to a sequential connectivity. The red circles correspond to H5-H6 connectivities.
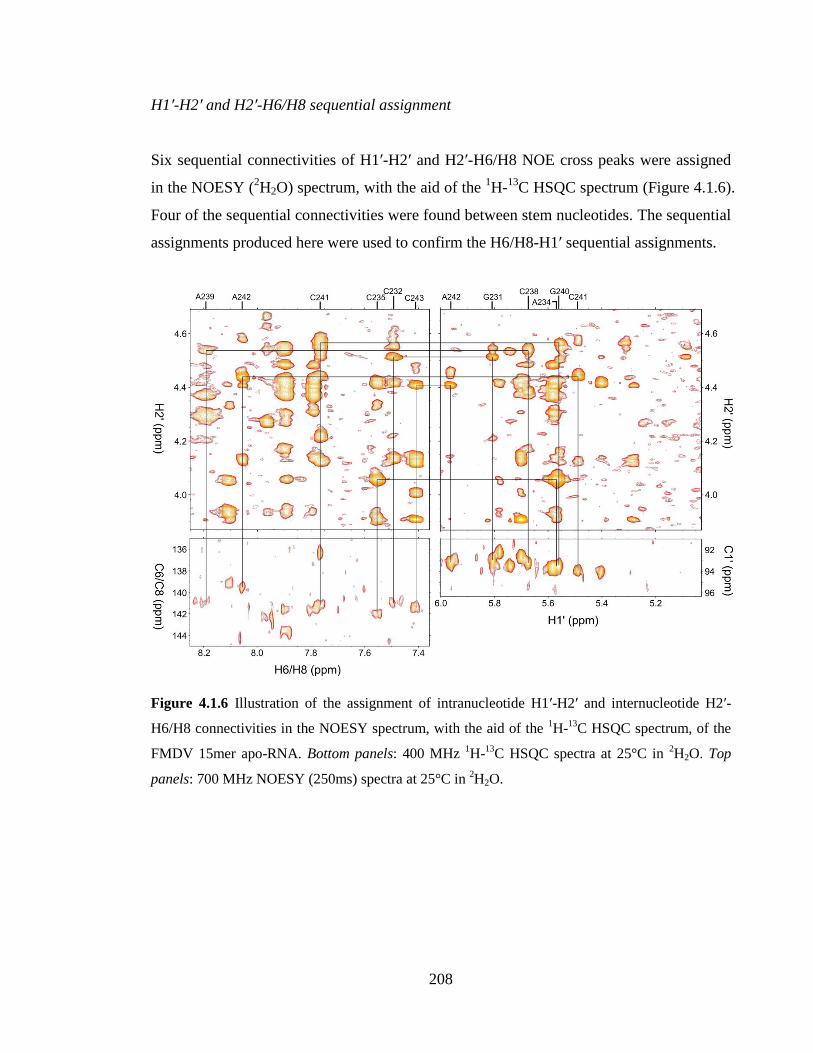
208
H1ʹ-H2ʹ and H2ʹ-H6/H8 sequential assignment
Six sequential connectivities of H1ʹ-H2ʹ and H2ʹ-H6/H8 NOE cross peaks were assigned
in the NOESY (2H2O) spectrum, with the aid of the
1H-
13C HSQC spectrum (Figure 4.1.6).
Four of the sequential connectivities were found between stem nucleotides. The sequential
assignments produced here were used to confirm the H6/H8-H1ʹ sequential assignments.
Figure 4.1.6 Illustration of the assignment of intranucleotide H1ʹ-H2ʹ and internucleotide H2ʹ-
H6/H8 connectivities in the NOESY spectrum, with the aid of the 1H-
13C HSQC spectrum, of the
FMDV 15mer apo-RNA. Bottom panels: 400 MHz 1H-
13C HSQC spectra at 25°C in
2H2O. Top
panels: 700 MHz NOESY (250ms) spectra at 25°C in 2H2O.
209
Sugar proton assignment
Intranucleotide and internucleotide cross peaks from H1ʹ to H2ʹ, H3ʹ, H4ʹ, H5ʹ and H5ʹʹ
protons were assigned. Analogously, intranucleotide and internucleotide cross peaks from
H2ʹ, H3ʹ, H4ʹ, H5ʹ and H5ʹʹ protons to H2/H6/H8 protons were also assigned.
The DQF-COSY spectrum was analysed to find H1ʹ-H2ʹ cross peaks. The C243 H1ʹ-H2ʹ
cross peak was clearly observed in the DQF-COSY spectrum; no other H1ʹ-H2ʹ cross
peaks were found. The C243 nucleotide is the last nucleotide located at the 3ʹ-end of the
FMDV 15mer RNA, which means that it is more susceptible to changes in sugar pucker
conformation.
Phosphorus identification and assignment
The chemical shifts of H6/H8 and H1ʹ protons were identified relative to the 31
P chemical
shifts in the 1H-
31P CPMG-HSQC-NOESY spectrum, which assisted in confirming the
H6/H8-H1ʹ sequential assignment. Figure 4.1.7 illustrates the identification of H6/H8 and
H1ʹ chemical shifts in the NOESY (2H2O) spectrum, using both the
1H-
13C HSQC
spectrum and the 1H-
31P CPMG-HSQC-NOESY spectrum.
Using the 1H-
31P CPMG-HSQC-NOESY spectrum, phosphorus correlations to H6/H8 and
H1ʹ protons in both the 5ʹ and 3ʹ directions can be observed, resulting in a phosphorus
driven pathway for sequential assignment of the 15mer apo-RNA. Therefore, a sequential
assignment was attempted from phosphorus to H6/H8 (Figure 4.1.8: panel A) and
phosphorus to H1ʹ (Figure 4.1.8: panel B). Panel A in Figure 4.1.8 illustrates a sequential
assignment from U230 phosphorus to C232 H6 and C241 phosphorus to C243 H6. Panel
B in Figure 4.1.8 illustrates a sequential assignment from G229 H1ʹ to G231 H1ʹ and C241
H1ʹ to C243 H1ʹ. A sequential assignment from phosphorus to H6/H8/H1ʹ could not be
found for either the loop nucleotides or the G240 nucleotide.
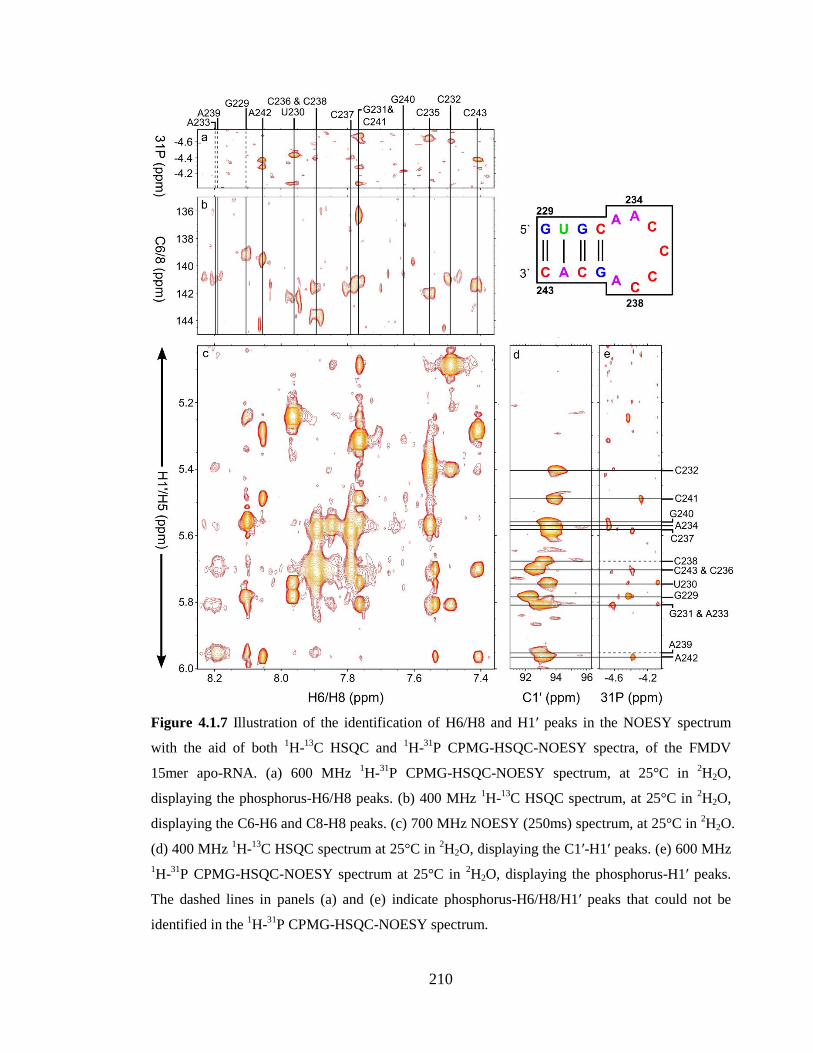
210
Figure 4.1.7 Illustration of the identification of H6/H8 and H1ʹ peaks in the NOESY spectrum
with the aid of both 1H-
13C HSQC and
1H-
31P CPMG-HSQC-NOESY spectra, of the FMDV
15mer apo-RNA. (a) 600 MHz 1H-
31P CPMG-HSQC-NOESY spectrum, at 25°C in
2H2O,
displaying the phosphorus-H6/H8 peaks. (b) 400 MHz 1H-
13C HSQC spectrum, at 25°C in
2H2O,
displaying the C6-H6 and C8-H8 peaks. (c) 700 MHz NOESY (250ms) spectrum, at 25°C in 2H2O.
(d) 400 MHz 1H-
13C HSQC spectrum at 25°C in
2H2O, displaying the C1ʹ-H1ʹ peaks. (e) 600 MHz
1H-
31P CPMG-HSQC-NOESY spectrum at 25°C in
2H2O, displaying the phosphorus-H1ʹ peaks.
The dashed lines in panels (a) and (e) indicate phosphorus-H6/H8/H1ʹ peaks that could not be
identified in the 1H-
31P CPMG-HSQC-NOESY spectrum.
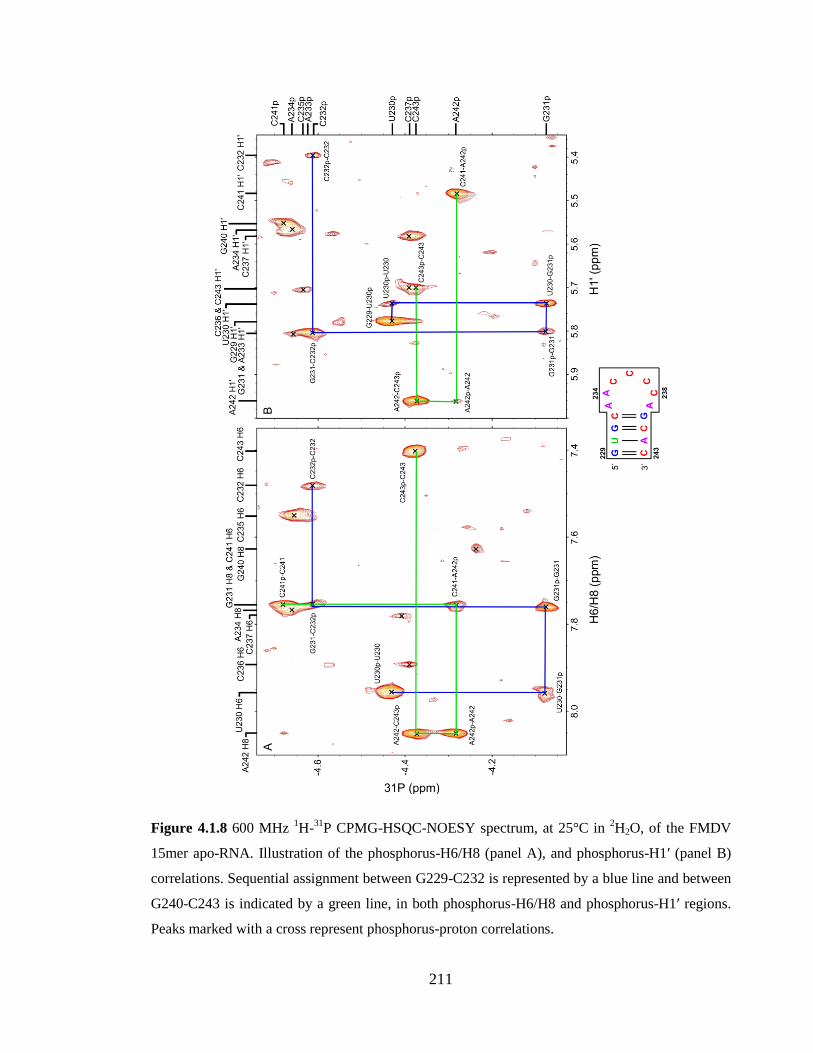
211
Figure 4.1.8 600 MHz 1H-
31P CPMG-HSQC-NOESY spectrum, at 25°C in
2H2O, of the FMDV
15mer apo-RNA. Illustration of the phosphorus-H6/H8 (panel A), and phosphorus-H1ʹ (panel B)
correlations. Sequential assignment between G229-C232 is represented by a blue line and between
G240-C243 is indicated by a green line, in both phosphorus-H6/H8 and phosphorus-H1ʹ regions.
Peaks marked with a cross represent phosphorus-proton correlations.

212
Table 4.1.1 1H,
13C and
31P NMR chemical shifts of the FMDV 15mer apo-RNA, in
1H2O and
2H2O.
NH NH2* NH2 H2 H5 H6 H8 H1ʹ H2ʹ H3ʹ H4ʹ H5ʹ H5" C2 C5 C6 C8 C1ʹ C2ʹ C3ʹ C4ʹ C5ʹ 31P
G229 13.18 7.743 5.722 8.106 5.781 4.822 4.629 4.415 4.054 3.936 139.1 92.16 75.03 74.91 82.28 62.86
G229
U230 13.90 5.244 7.963 5.745 4.772 4.666 4.537 4.274 103.4 142.2 93.45 72.88 73.03 82.40 65.36 -4.431 U230
G231 12.72 7.984 5.779 7.764 5.807 4.512 4.550 4.216 141.0 92.94 75.56 82.48 -4.075 G231
C232 5.087 7.491 5.397 4.416 4.134 97.27 136.3 94.15 73.79 64.82 -4.606 C232
A233 8.195 5.809 4.684 4.803 141.0 93.25 72.72 74.89 -4.627 A233
A234 7.849 7.763 5.569 4.057 4.335 154.2 141.0 93.55 76.08 64.84 -4.658 A234
C235 5.392 7.551 3.913 4.310 97.27 142.1 64.98 -4.640 C235
C236 5.716 7.892 5.702 98.91 141.7 92.71 C236
C237 5.581 7.790 5.579 4.486 4.406 98.44 141.7 93.72 76.10 82.14 -4.392 C237
C238 5.706 7.895 5.679 4.537 4.383 4.171 98.05 141.7 93.21 76.08 82.74 65.13 -4.179 C238
A239 8.101 8.193 5.955 4.896 4.618 4.295 154.2 141.0 93.02 75.48 83.62 65.44 -3.754 A239
G240 12.78 7.627 5.557 4.567 4.452 4.507 4.136 140.5 93.41 76.10 64.83 G240
C241 8.571 6.994 5.313 7.765 5.491 4.442 97.23 141.0 93.98 75.32 -4.680 C241
A242 8.157 6.342 7.535 8.054 5.967 4.408 4.711 4.456 4.132 4.584 153.6 139.6 93.25 75.91 72.67 82.33 -4.280 A242
C243 8.298 7.072 5.283 7.408 5.701 3.908 4.144 4.010 97.70 141.4 92.57 77.61 83.48 -4.373 C243
213
4.1.2 Structure calculation
Distance restraints were generated from the NOESY spectra of the 15mer apo-RNA.
Exchangeable NOE restraints were obtained from the NOESY spectrum of the 15mer apo-
RNA in 1H2O, with 400ms mixing time. Non-exchangeable NOE restraints were obtained
from the NOESY spectrum of the 15mer apo-RNA in 2H2O, with both 150ms and 250ms
mixing times.
All nucleotides except for A234, C235, C236 and C237 were restrained to the anti
conformation. No H6/H8-H1ʹ intranucleotide connectivities were observed for the four
loop nucleotides mentioned, so their glycosidic angles were not defined. All stem
nucleotides were restrained to the C3ʹ-endo conformation except for the C243 nucleotide,
which was restrained to the C2ʹ-endo conformation. The δ angle was not restrained for the
loop nucleotides.
Hydrogen bond restraints were added for all four base pairs. However, no connectivities
could be observed from the G240 imino proton in the NOESY (1H2O) spectrum so the
hydrogen bond restraints between C232-G240 were loosely restrained. The G229-C243
base pair was also loosely restrained as the terminal base pairs are subject to motion due to
the proximity to solution. Planarity restraints were added for three base pairs with the
exception of the C232-G240 base pair.
Distance, dihedral angle, hydrogen bond and planarity restraints were added to the
structure calculation. From the 20 lowest RMSD structures generated from the refinement
step, one violation was found in the distance restraints and hydrogen bond restraints. The
restraints that were used for these structure calculations are summarised in Table 4.1.2.
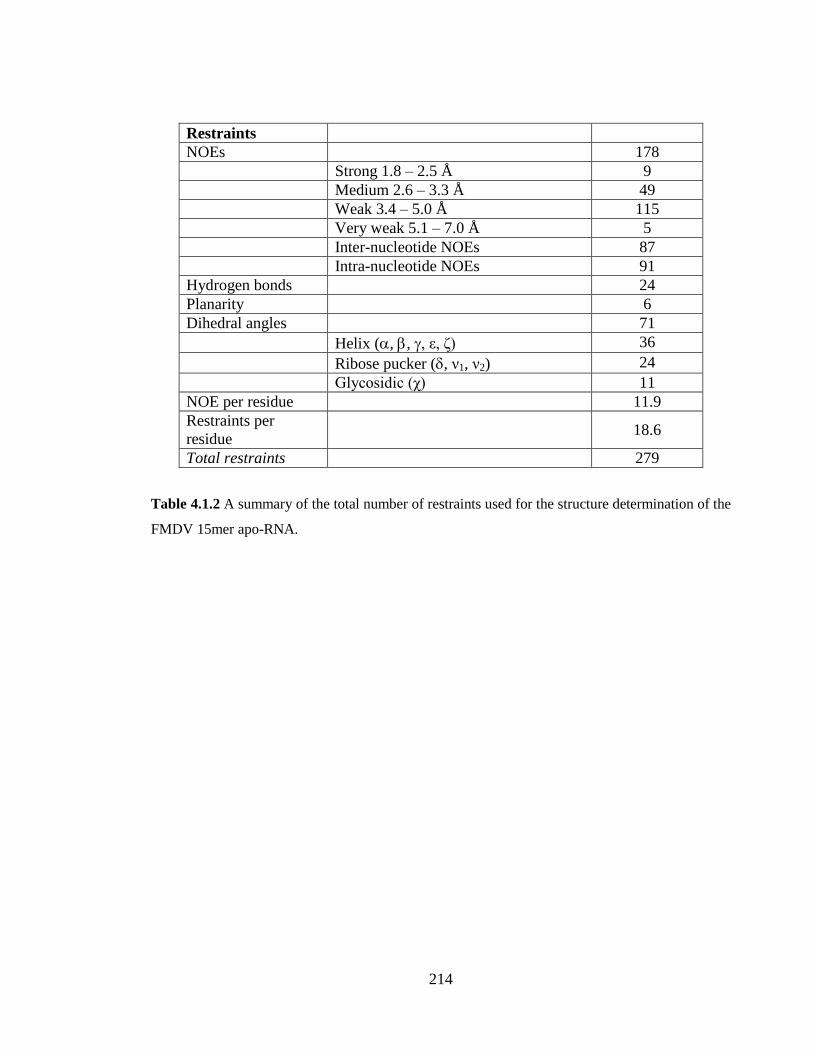
214
Restraints
NOEs 178
Strong 1.8 – 2.5 Å 9
Medium 2.6 – 3.3 Å 49
Weak 3.4 – 5.0 Å 115
Very weak 5.1 – 7.0 Å 5
Inter-nucleotide NOEs 87
Intra-nucleotide NOEs 91
Hydrogen bonds 24
Planarity 6
Dihedral angles 71
Helix (, , , ε, ζ) 36
Ribose pucker (, ν1, ν2) 24
Glycosidic (χ) 11
NOE per residue 11.9
Restraints per
residue
18.6
Total restraints 279
Table 4.1.2 A summary of the total number of restraints used for the structure determination of the
FMDV 15mer apo-RNA.
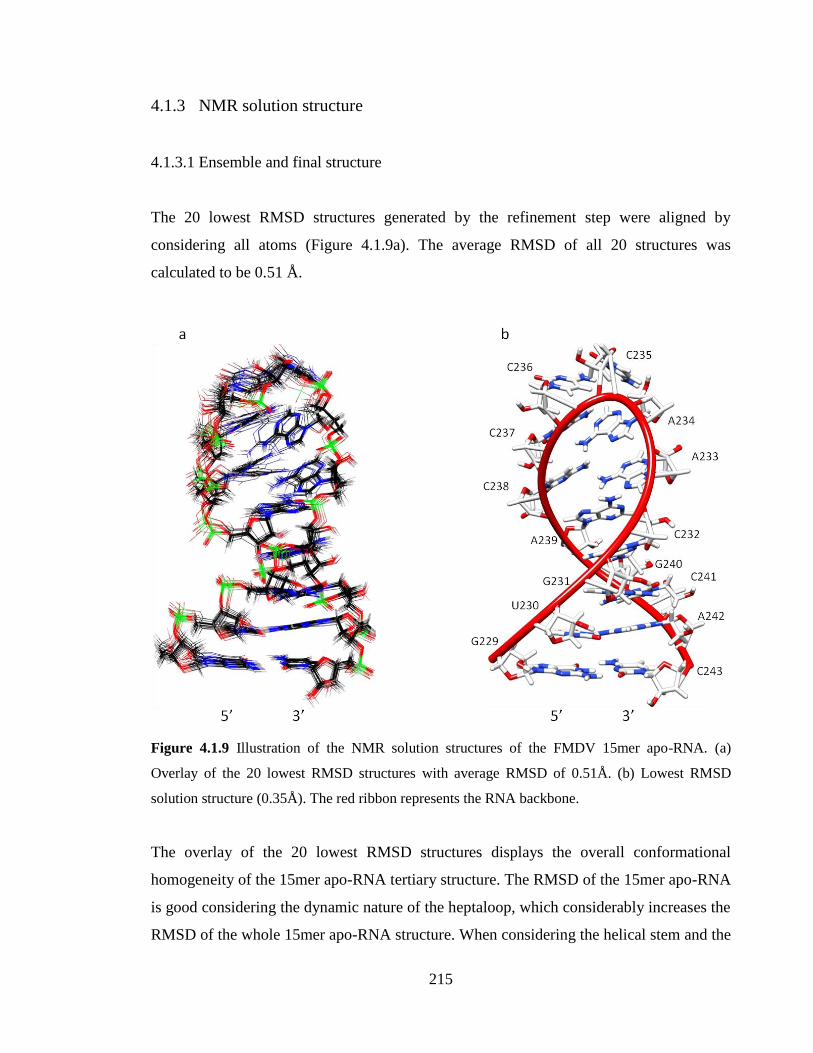
215
4.1.3 NMR solution structure
4.1.3.1 Ensemble and final structure
The 20 lowest RMSD structures generated by the refinement step were aligned by
considering all atoms (Figure 4.1.9a). The average RMSD of all 20 structures was
calculated to be 0.51 Å.
Figure 4.1.9 Illustration of the NMR solution structures of the FMDV 15mer apo-RNA. (a)
Overlay of the 20 lowest RMSD structures with average RMSD of 0.51Å. (b) Lowest RMSD
solution structure (0.35Å). The red ribbon represents the RNA backbone.
The overlay of the 20 lowest RMSD structures displays the overall conformational
homogeneity of the 15mer apo-RNA tertiary structure. The RMSD of the 15mer apo-RNA
is good considering the dynamic nature of the heptaloop, which considerably increases the
RMSD of the whole 15mer apo-RNA structure. When considering the helical stem and the
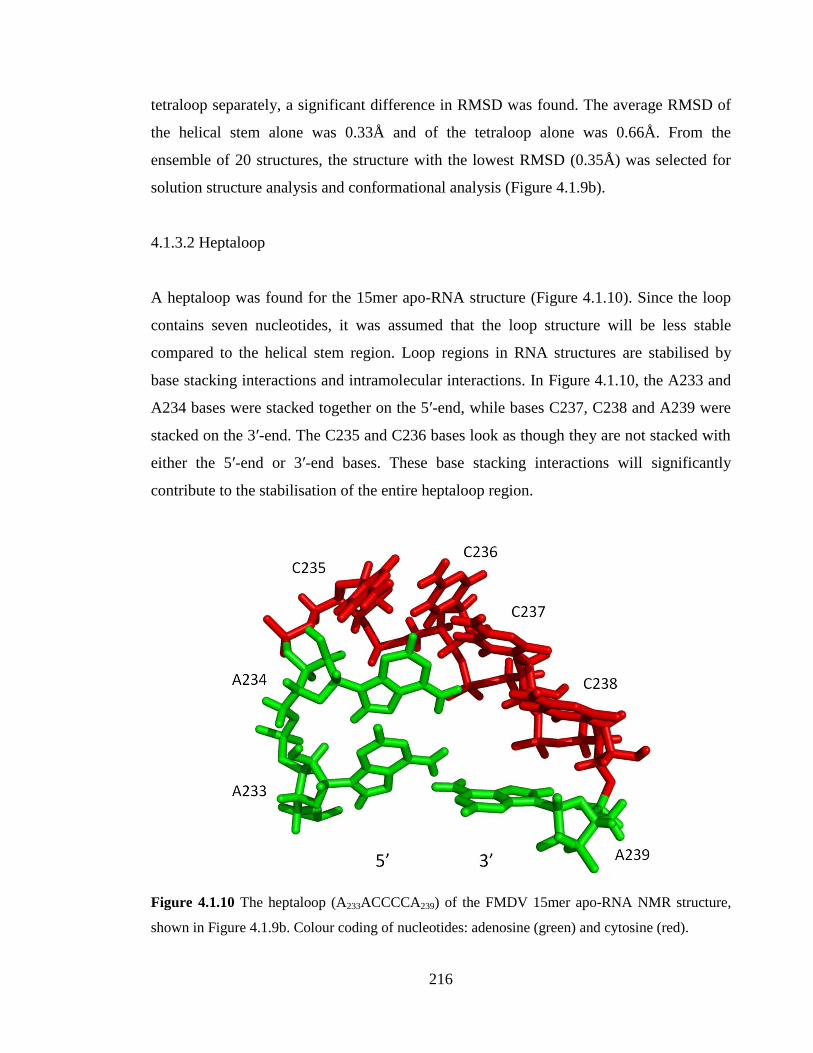
216
tetraloop separately, a significant difference in RMSD was found. The average RMSD of
the helical stem alone was 0.33Å and of the tetraloop alone was 0.66Å. From the
ensemble of 20 structures, the structure with the lowest RMSD (0.35Å) was selected for
solution structure analysis and conformational analysis (Figure 4.1.9b).
4.1.3.2 Heptaloop
A heptaloop was found for the 15mer apo-RNA structure (Figure 4.1.10). Since the loop
contains seven nucleotides, it was assumed that the loop structure will be less stable
compared to the helical stem region. Loop regions in RNA structures are stabilised by
base stacking interactions and intramolecular interactions. In Figure 4.1.10, the A233 and
A234 bases were stacked together on the 5ʹ-end, while bases C237, C238 and A239 were
stacked on the 3ʹ-end. The C235 and C236 bases look as though they are not stacked with
either the 5ʹ-end or 3ʹ-end bases. These base stacking interactions will significantly
contribute to the stabilisation of the entire heptaloop region.
Figure 4.1.10 The heptaloop (A233ACCCCA239) of the FMDV 15mer apo-RNA NMR structure,
shown in Figure 4.1.9b. Colour coding of nucleotides: adenosine (green) and cytosine (red).

217
4.1.3.3 Intramolecular interactions
Fourteen intramolecular interactions were identified in total of which twelve were found
to be non-specific (Table 4.1.3). Six base-phosphate interactions were identified, all
involving the O5ʹ phosphate oxygen and the aromatic H6/H8 protons. Three sugar-
phosphate interactions were identified, which involved the O3ʹ phosphate oxygen and the
2ʹ-hydroxyl group of the sugar ribose. One base-sugar interaction was identified between
the 2ʹ-OH group of the sugar ribose and the O5ʹ phosphate oxygen atom. Two sugar-sugar
interactions were found between the 2ʹ-OH and O4ʹ atoms, in the sugar ribose. Only two
specific interactions were identified in the heptaloop, both involving base-base
interactions. Despite the dynamic nature of such a large heptaloop, these intramolecular
interactions will increase the stability of the loop and therefore the entire 15mer RNA
structure.
Donor/acceptor atoms Type of
interaction
Specificity Distance (Å)
A233 N1 – A239 NH6 base-base specific 3.01
C236 NH4 – C235 N3 base-base specific 2.01
A233 H8 – A233 O5ʹ base-phosphate non-specific 3.05
A233 (2ʹ-OH) – A234 O4ʹ sugar-sugar non-specific 3.07
A234 H8 – A234 O5ʹ base-phosphate non-specific 3.53
A234 (2ʹ-OH) – C235 O5ʹ base-sugar non-specific 2.57
C235 (2ʹ-OH) – C236 O3ʹ sugar-phosphate non-specific 2.73
C236 H6 – C236 O5ʹ base-phosphate non-specific 2.86
C236 (2ʹ-OH) – C237 O3ʹ sugar-phosphate non-specific 2.57
C237 H6– C237 O5ʹ base-phosphate non-specific 3.49
C237 (2ʹ-OH) – C238 O3ʹ sugar-phosphate non-specific 2.55
C238 H6 – C238 O5ʹ base-phosphate non-specific 2.91
A239 H8 – A239 O5ʹ base-phosphate non-specific 2.67
A239 (2ʹ-OH) – G240 O4ʹ sugar-sugar non-specific 3.27
Table 4.1.3 Two specific and twelve non-specific intramolecular interactions were identified in
the heptaloop of the FMDV 15mer apo-RNA NMR structure. The interactions formed between
donor and acceptor atoms are given, the type of interaction, the specificity of the interaction and
the distances between the proton donor and acceptor atoms.
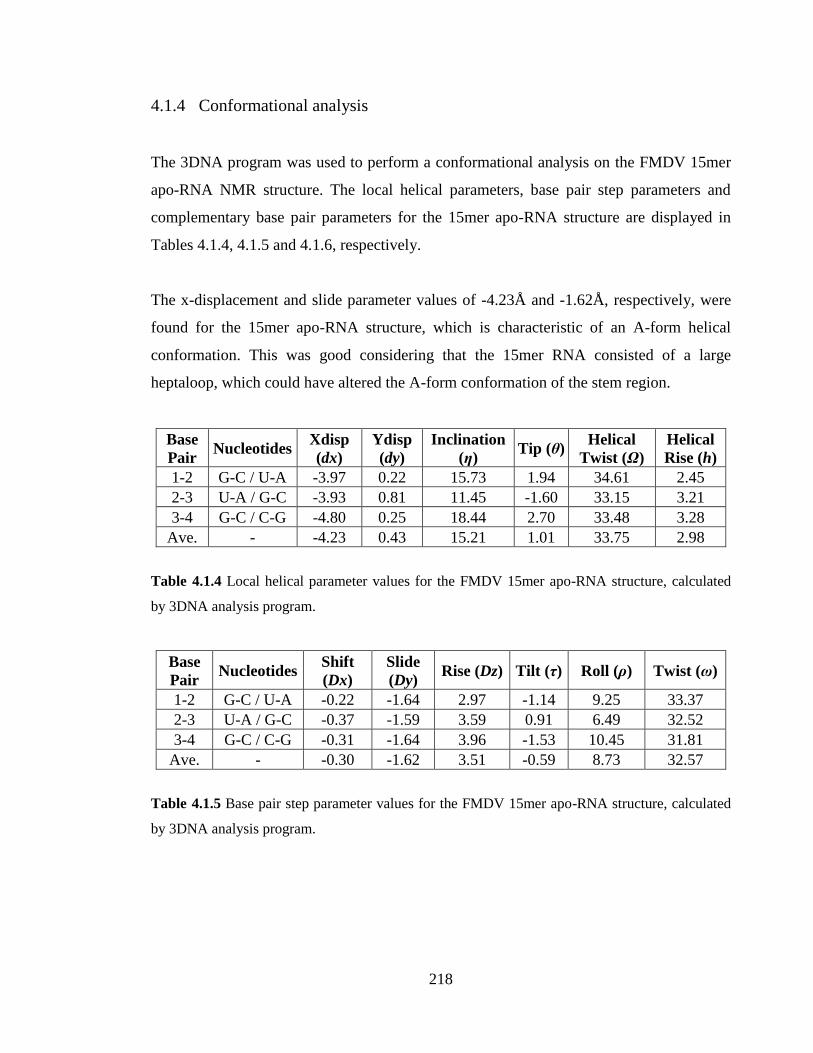
218
4.1.4 Conformational analysis
The 3DNA program was used to perform a conformational analysis on the FMDV 15mer
apo-RNA NMR structure. The local helical parameters, base pair step parameters and
complementary base pair parameters for the 15mer apo-RNA structure are displayed in
Tables 4.1.4, 4.1.5 and 4.1.6, respectively.
The x-displacement and slide parameter values of -4.23Å and -1.62Å, respectively, were
found for the 15mer apo-RNA structure, which is characteristic of an A-form helical
conformation. This was good considering that the 15mer RNA consisted of a large
heptaloop, which could have altered the A-form conformation of the stem region.
Base
Pair Nucleotides
Xdisp
(dx)
Ydisp
(dy)
Inclination
(η) Tip (θ)
Helical
Twist (Ω)
Helical
Rise (h)
1-2 G-C / U-A -3.97 0.22 15.73 1.94 34.61 2.45
2-3 U-A / G-C -3.93 0.81 11.45 -1.60 33.15 3.21
3-4 G-C / C-G -4.80 0.25 18.44 2.70 33.48 3.28
Ave. - -4.23 0.43 15.21 1.01 33.75 2.98
Table 4.1.4 Local helical parameter values for the FMDV 15mer apo-RNA structure, calculated
by 3DNA analysis program.
Base
Pair Nucleotides
Shift
(Dx)
Slide
(Dy) Rise (Dz) Tilt (τ) Roll (ρ) Twist (ω)
1-2 G-C / U-A -0.22 -1.64 2.97 -1.14 9.25 33.37
2-3 U-A / G-C -0.37 -1.59 3.59 0.91 6.49 32.52
3-4 G-C / C-G -0.31 -1.64 3.96 -1.53 10.45 31.81
Ave. - -0.30 -1.62 3.51 -0.59 8.73 32.57
Table 4.1.5 Base pair step parameter values for the FMDV 15mer apo-RNA structure, calculated
by 3DNA analysis program.
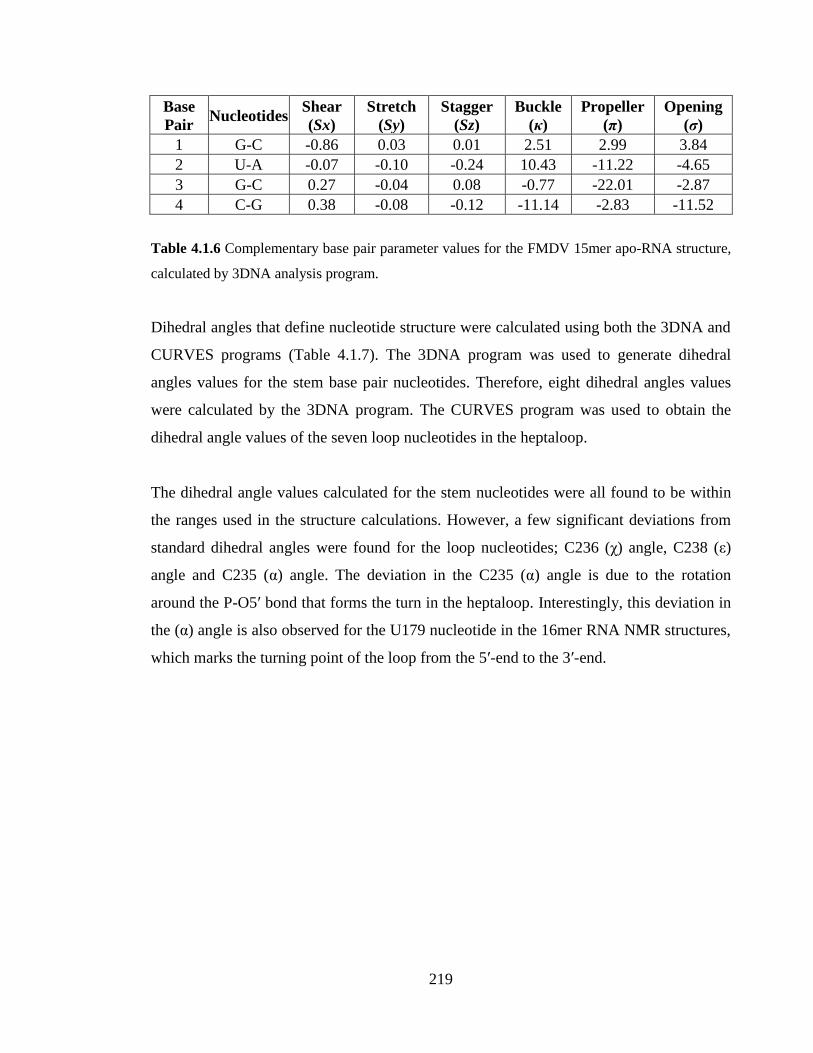
219
Base
Pair Nucleotides
Shear
(Sx)
Stretch
(Sy)
Stagger
(Sz)
Buckle
(κ)
Propeller
(π)
Opening
(σ)
1 G-C -0.86 0.03 0.01 2.51 2.99 3.84
2 U-A -0.07 -0.10 -0.24 10.43 -11.22 -4.65
3 G-C 0.27 -0.04 0.08 -0.77 -22.01 -2.87
4 C-G 0.38 -0.08 -0.12 -11.14 -2.83 -11.52
Table 4.1.6 Complementary base pair parameter values for the FMDV 15mer apo-RNA structure,
calculated by 3DNA analysis program.
Dihedral angles that define nucleotide structure were calculated using both the 3DNA and
CURVES programs (Table 4.1.7). The 3DNA program was used to generate dihedral
angles values for the stem base pair nucleotides. Therefore, eight dihedral angles values
were calculated by the 3DNA program. The CURVES program was used to obtain the
dihedral angle values of the seven loop nucleotides in the heptaloop.
The dihedral angle values calculated for the stem nucleotides were all found to be within
the ranges used in the structure calculations. However, a few significant deviations from
standard dihedral angles were found for the loop nucleotides; C236 (χ) angle, C238 (ε)
angle and C235 (α) angle. The deviation in the C235 (α) angle is due to the rotation
around the P-O5ʹ bond that forms the turn in the heptaloop. Interestingly, this deviation in
the (α) angle is also observed for the U179 nucleotide in the 16mer RNA NMR structures,
which marks the turning point of the loop from the 5ʹ-end to the 3ʹ-end.
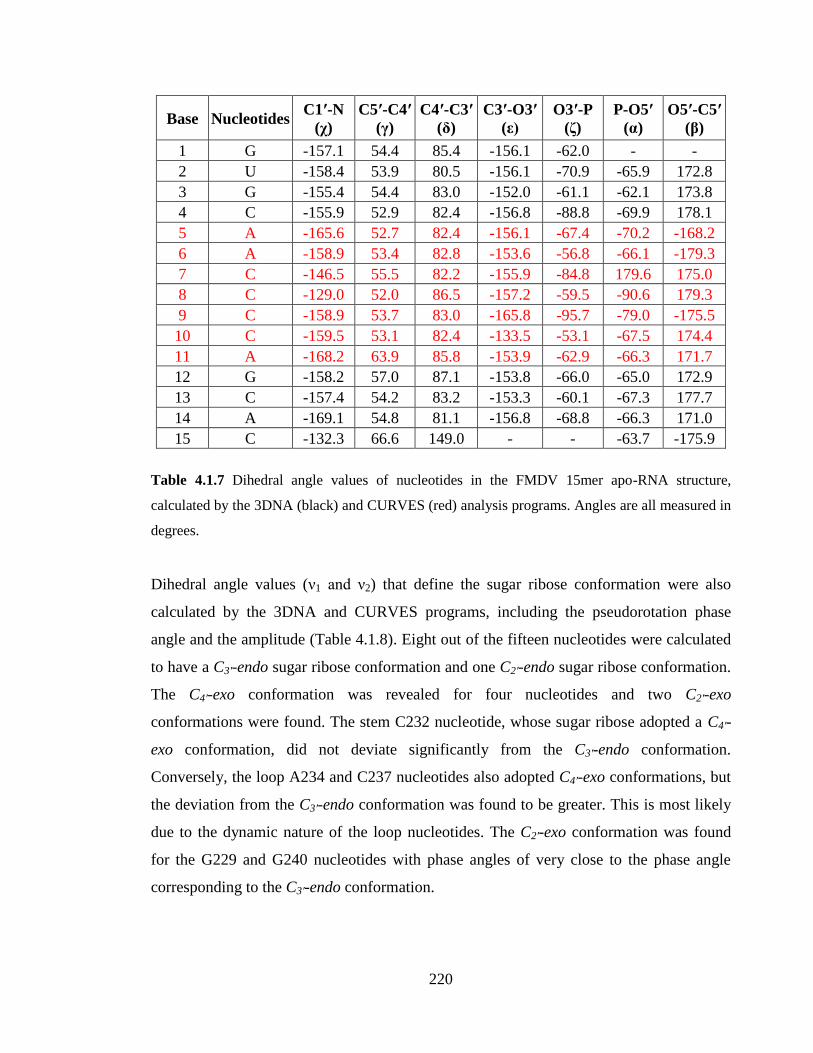
220
Base Nucleotides C1ʹ-N
(χ)
C5ʹ-C4ʹ
(γ)
C4ʹ-C3ʹ
(δ)
C3ʹ-O3ʹ
(ε)
O3ʹ-P
(ζ)
P-O5ʹ
(α)
O5ʹ-C5ʹ
(β)
1 G -157.1 54.4 85.4 -156.1 -62.0 - -
2 U -158.4 53.9 80.5 -156.1 -70.9 -65.9 172.8
3 G -155.4 54.4 83.0 -152.0 -61.1 -62.1 173.8
4 C -155.9 52.9 82.4 -156.8 -88.8 -69.9 178.1
5 A -165.6 52.7 82.4 -156.1 -67.4 -70.2 -168.2
6 A -158.9 53.4 82.8 -153.6 -56.8 -66.1 -179.3
7 C -146.5 55.5 82.2 -155.9 -84.8 179.6 175.0
8 C -129.0 52.0 86.5 -157.2 -59.5 -90.6 179.3
9 C -158.9 53.7 83.0 -165.8 -95.7 -79.0 -175.5
10 C -159.5 53.1 82.4 -133.5 -53.1 -67.5 174.4
11 A -168.2 63.9 85.8 -153.9 -62.9 -66.3 171.7
12 G -158.2 57.0 87.1 -153.8 -66.0 -65.0 172.9
13 C -157.4 54.2 83.2 -153.3 -60.1 -67.3 177.7
14 A -169.1 54.8 81.1 -156.8 -68.8 -66.3 171.0
15 C -132.3 66.6 149.0 - - -63.7 -175.9
Table 4.1.7 Dihedral angle values of nucleotides in the FMDV 15mer apo-RNA structure,
calculated by the 3DNA (black) and CURVES (red) analysis programs. Angles are all measured in
degrees.
Dihedral angle values (ν1 and ν2) that define the sugar ribose conformation were also
calculated by the 3DNA and CURVES programs, including the pseudorotation phase
angle and the amplitude (Table 4.1.8). Eight out of the fifteen nucleotides were calculated
to have a C3ʹ-endo sugar ribose conformation and one C2ʹ-endo sugar ribose conformation.
The C4ʹ-exo conformation was revealed for four nucleotides and two C2ʹ-exo
conformations were found. The stem C232 nucleotide, whose sugar ribose adopted a C4ʹ-
exo conformation, did not deviate significantly from the C3ʹ-endo conformation.
Conversely, the loop A234 and C237 nucleotides also adopted C4ʹ-exo conformations, but
the deviation from the C3ʹ-endo conformation was found to be greater. This is most likely
due to the dynamic nature of the loop nucleotides. The C2ʹ-exo conformation was found
for the G229 and G240 nucleotides with phase angles of very close to the phase angle
corresponding to the C3ʹ-endo conformation.
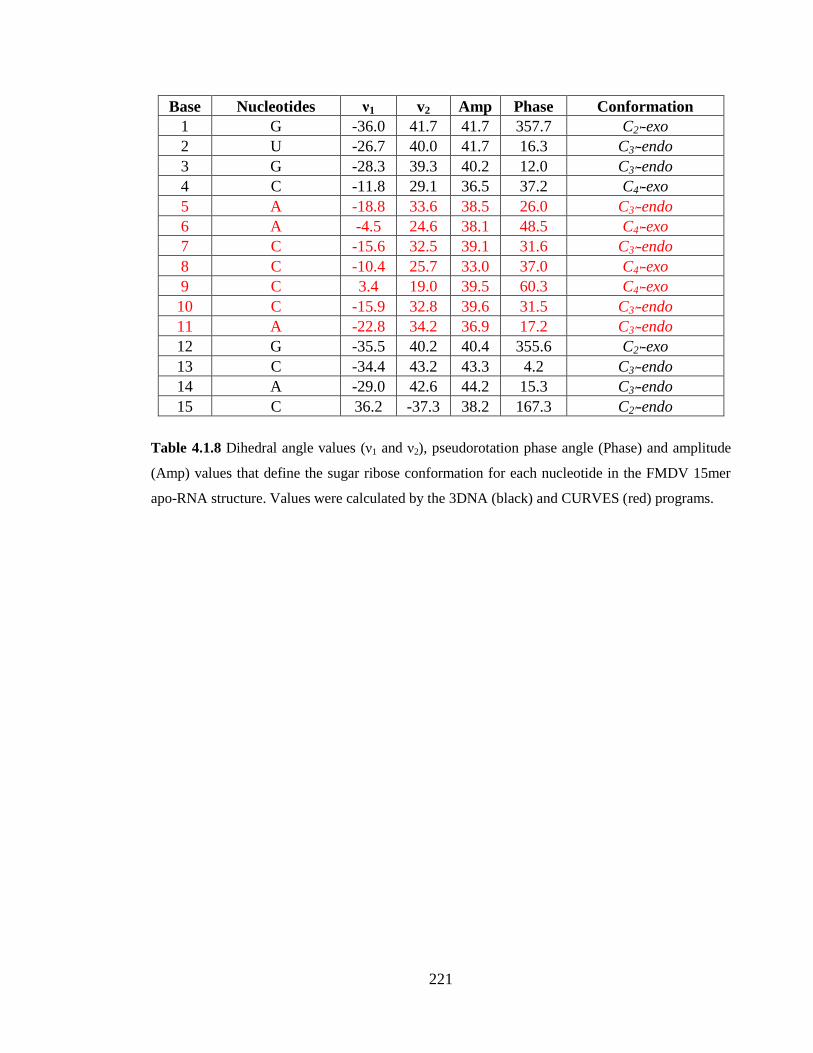
221
Base Nucleotides ν1 v2 Amp Phase Conformation
1 G -36.0 41.7 41.7 357.7 C2ʹ-exo
2 U -26.7 40.0 41.7 16.3 C3ʹ-endo
3 G -28.3 39.3 40.2 12.0 C3ʹ-endo
4 C -11.8 29.1 36.5 37.2 C4ʹ-exo
5 A -18.8 33.6 38.5 26.0 C3ʹ-endo
6 A -4.5 24.6 38.1 48.5 C4ʹ-exo
7 C -15.6 32.5 39.1 31.6 C3ʹ-endo
8 C -10.4 25.7 33.0 37.0 C4ʹ-exo
9 C 3.4 19.0 39.5 60.3 C4ʹ-exo
10 C -15.9 32.8 39.6 31.5 C3ʹ-endo
11 A -22.8 34.2 36.9 17.2 C3ʹ-endo
12 G -35.5 40.2 40.4 355.6 C2ʹ-exo
13 C -34.4 43.2 43.3 4.2 C3ʹ-endo
14 A -29.0 42.6 44.2 15.3 C3ʹ-endo
15 C 36.2 -37.3 38.2 167.3 C2ʹ-endo
Table 4.1.8 Dihedral angle values (ν1 and ν2), pseudorotation phase angle (Phase) and amplitude
(Amp) values that define the sugar ribose conformation for each nucleotide in the FMDV 15mer
apo-RNA structure. Values were calculated by the 3DNA (black) and CURVES (red) programs.
222
4.1.5 Comparison of the 15mer and 16mer apo-RNA NMR structures
Analogous to the 16mer apo-RNA and Mg2+
RNA complex structures, the successful
determination of the 15mer and 16mer apo-RNA structures allowed for a review of their
similarities and differences.
The number of NOE restraints per residue generated for the 15mer and 16mer apo-RNA
structures was 11.9 and 7.8, respectively. Relatively, 35% fewer NOEs per residue were
used for the 16mer apo-RNA structure, which was attributed to the presence of broad lines
in the NOESY (1H2O/
2H2O) spectra of the 16mer apo-RNA. By contrast, the sensitivity
observed in the NOESY (1H2O/
2H2O) spectra of the 15mer apo-RNA was much better,
which allowed easier assignment of NOE cross peaks. However, as the 15mer RNA
contained a heptaloop, the assignment of this region proved much more difficult.
Consequently, the assignment of the 15mer apo-RNA involved a greater amount of effort
in order to assign more internucleotide connectivities, which were required to sufficiently
restrain the heptaloop region. The final twenty 15mer apo-RNA NMR structures generated
had low RMSDs, when considering the large heptaloop.
Structure validation using the Molprobity program revealed no bad bonds, angles, sugar
pucker and backbone conformations for the 15mer and 16mer apo-RNA NMR structures.
Clash scores were found to be low; 31.2 and 12.5 for the 15mer and 16mer apo-RNA
structures, respectively. The final solution structures of both the 16mer and 15mer apo-
RNAs were of a high standard. This justified the investigation of possible RNA-RNA
interactions between the 16mer and 15mer RNAs.
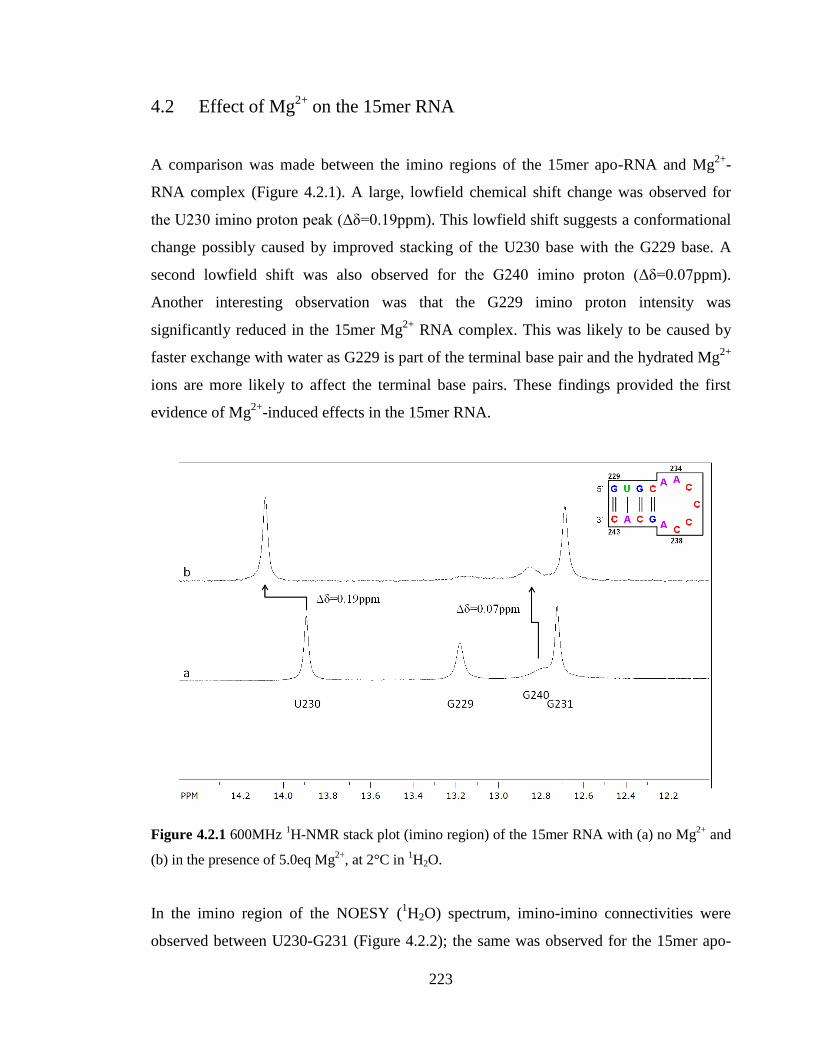
223
4.2 Effect of Mg2+
on the 15mer RNA
A comparison was made between the imino regions of the 15mer apo-RNA and Mg2+
-
RNA complex (Figure 4.2.1). A large, lowfield chemical shift change was observed for
the U230 imino proton peak (Δδ=0.19ppm). This lowfield shift suggests a conformational
change possibly caused by improved stacking of the U230 base with the G229 base. A
second lowfield shift was also observed for the G240 imino proton (Δδ=0.07ppm).
Another interesting observation was that the G229 imino proton intensity was
significantly reduced in the 15mer Mg2+
RNA complex. This was likely to be caused by
faster exchange with water as G229 is part of the terminal base pair and the hydrated Mg2+
ions are more likely to affect the terminal base pairs. These findings provided the first
evidence of Mg2+
-induced effects in the 15mer RNA.
Figure 4.2.1 600MHz 1H-NMR stack plot (imino region) of the 15mer RNA with (a) no Mg
2+ and
(b) in the presence of 5.0eq Mg2+
, at 2°C in 1H2O.
In the imino region of the NOESY (1H2O) spectrum, imino-imino connectivities were
observed between U230-G231 (Figure 4.2.2); the same was observed for the 15mer apo-
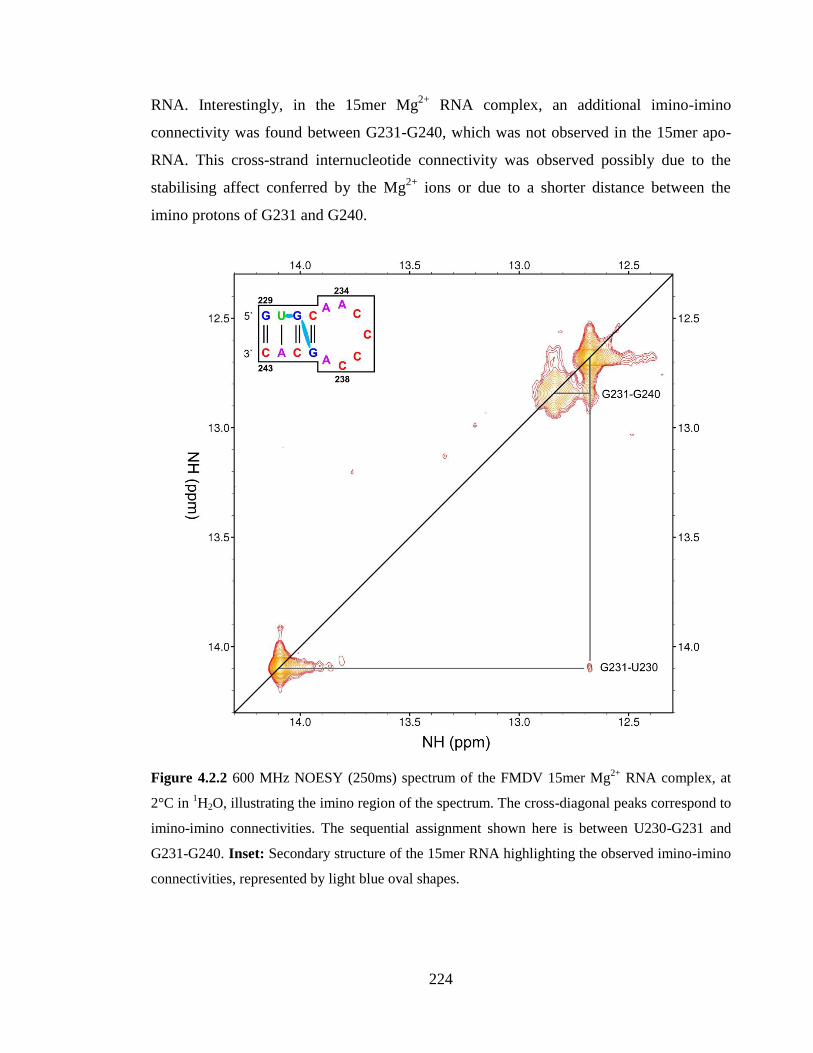
224
RNA. Interestingly, in the 15mer Mg2+
RNA complex, an additional imino-imino
connectivity was found between G231-G240, which was not observed in the 15mer apo-
RNA. This cross-strand internucleotide connectivity was observed possibly due to the
stabilising affect conferred by the Mg2+
ions or due to a shorter distance between the
imino protons of G231 and G240.
Figure 4.2.2 600 MHz NOESY (250ms) spectrum of the FMDV 15mer Mg2+
RNA complex, at
2°C in 1H2O, illustrating the imino region of the spectrum. The cross-diagonal peaks correspond to
imino-imino connectivities. The sequential assignment shown here is between U230-G231 and
G231-G240. Inset: Secondary structure of the 15mer RNA highlighting the observed imino-imino
connectivities, represented by light blue oval shapes.
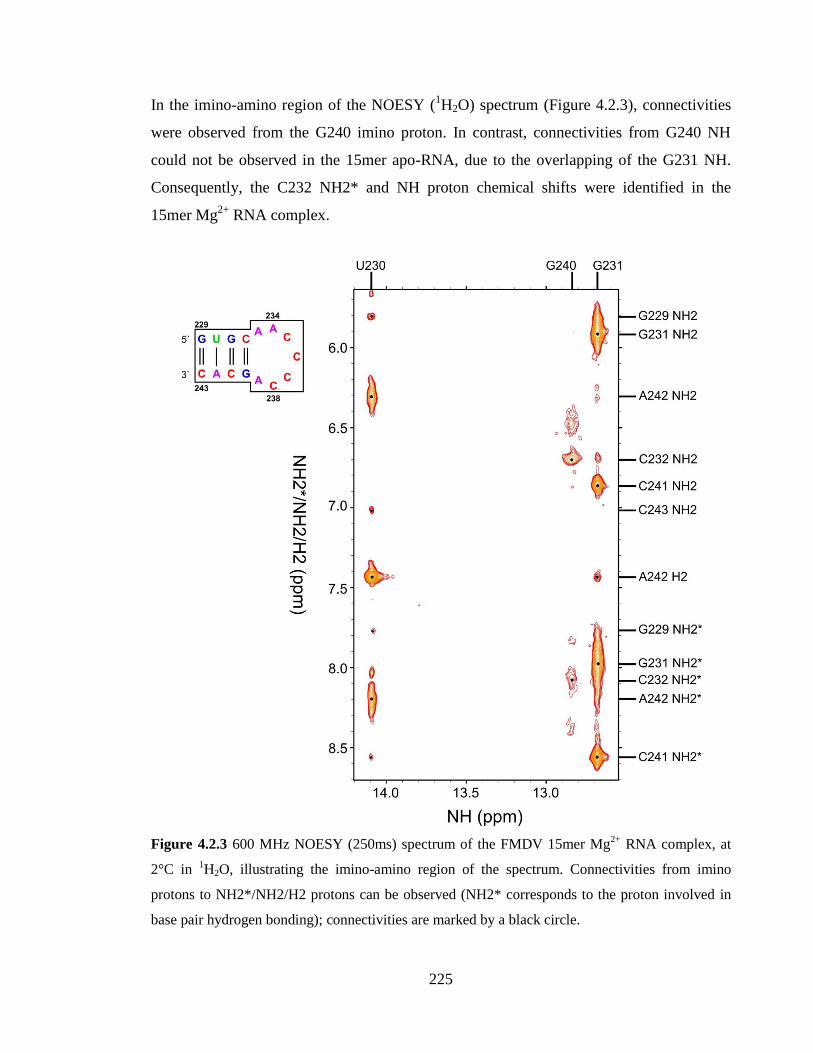
225
In the imino-amino region of the NOESY (1H2O) spectrum (Figure 4.2.3), connectivities
were observed from the G240 imino proton. In contrast, connectivities from G240 NH
could not be observed in the 15mer apo-RNA, due to the overlapping of the G231 NH.
Consequently, the C232 NH2* and NH proton chemical shifts were identified in the
15mer Mg2+
RNA complex.
Figure 4.2.3 600 MHz NOESY (250ms) spectrum of the FMDV 15mer Mg2+
RNA complex, at
2°C in 1H2O, illustrating the imino-amino region of the spectrum. Connectivities from imino
protons to NH2*/NH2/H2 protons can be observed (NH2* corresponds to the proton involved in
base pair hydrogen bonding); connectivities are marked by a black circle.
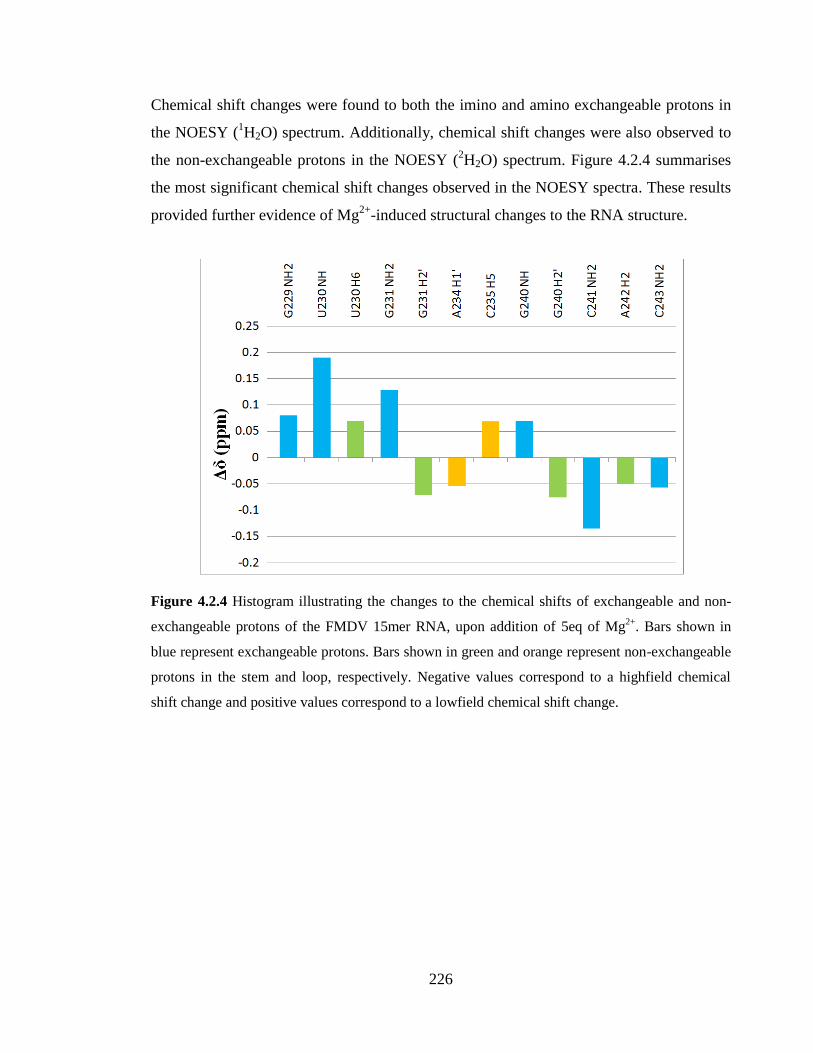
226
Chemical shift changes were found to both the imino and amino exchangeable protons in
the NOESY (1H2O) spectrum. Additionally, chemical shift changes were also observed to
the non-exchangeable protons in the NOESY (2H2O) spectrum. Figure 4.2.4 summarises
the most significant chemical shift changes observed in the NOESY spectra. These results
provided further evidence of Mg2+
-induced structural changes to the RNA structure.
Figure 4.2.4 Histogram illustrating the changes to the chemical shifts of exchangeable and non-
exchangeable protons of the FMDV 15mer RNA, upon addition of 5eq of Mg2+
. Bars shown in
blue represent exchangeable protons. Bars shown in green and orange represent non-exchangeable
protons in the stem and loop, respectively. Negative values correspond to a highfield chemical
shift change and positive values correspond to a lowfield chemical shift change.
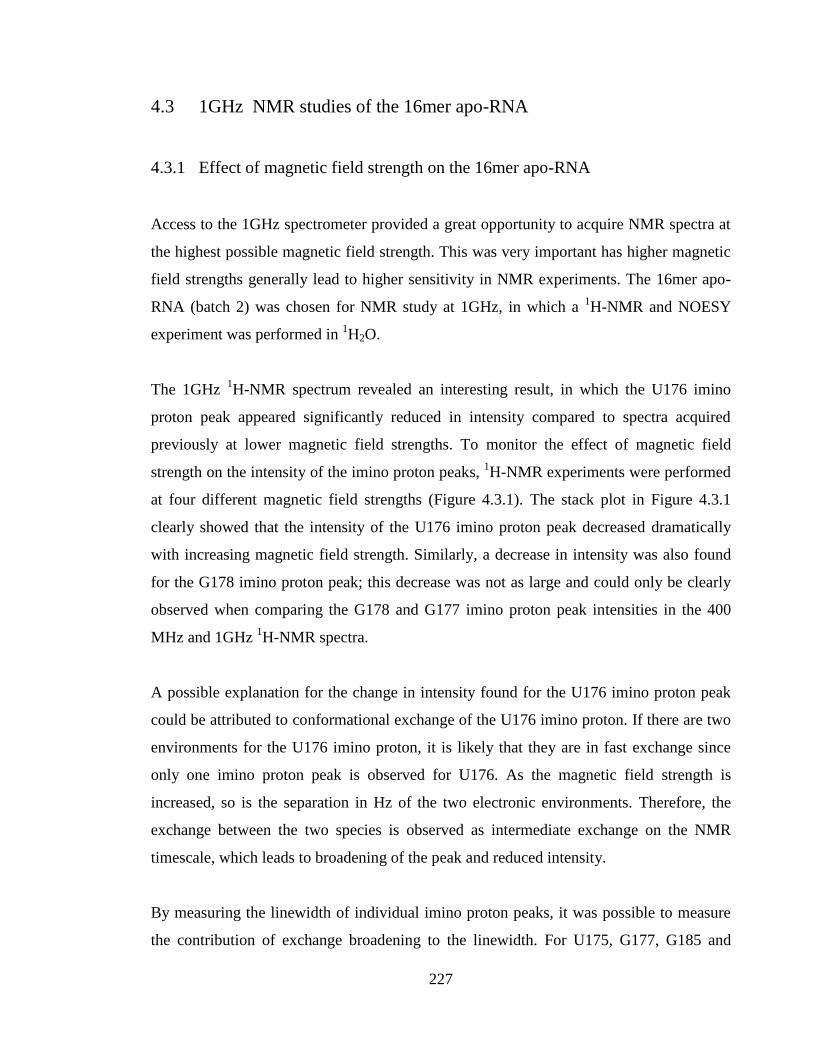
227
4.3 1GHz NMR studies of the 16mer apo-RNA
4.3.1 Effect of magnetic field strength on the 16mer apo-RNA
Access to the 1GHz spectrometer provided a great opportunity to acquire NMR spectra at
the highest possible magnetic field strength. This was very important has higher magnetic
field strengths generally lead to higher sensitivity in NMR experiments. The 16mer apo-
RNA (batch 2) was chosen for NMR study at 1GHz, in which a 1H-NMR and NOESY
experiment was performed in 1H2O.
The 1GHz 1H-NMR spectrum revealed an interesting result, in which the U176 imino
proton peak appeared significantly reduced in intensity compared to spectra acquired
previously at lower magnetic field strengths. To monitor the effect of magnetic field
strength on the intensity of the imino proton peaks, 1H-NMR experiments were performed
at four different magnetic field strengths (Figure 4.3.1). The stack plot in Figure 4.3.1
clearly showed that the intensity of the U176 imino proton peak decreased dramatically
with increasing magnetic field strength. Similarly, a decrease in intensity was also found
for the G178 imino proton peak; this decrease was not as large and could only be clearly
observed when comparing the G178 and G177 imino proton peak intensities in the 400
MHz and 1GHz 1H-NMR spectra.
A possible explanation for the change in intensity found for the U176 imino proton peak
could be attributed to conformational exchange of the U176 imino proton. If there are two
environments for the U176 imino proton, it is likely that they are in fast exchange since
only one imino proton peak is observed for U176. As the magnetic field strength is
increased, so is the separation in Hz of the two electronic environments. Therefore, the
exchange between the two species is observed as intermediate exchange on the NMR
timescale, which leads to broadening of the peak and reduced intensity.
By measuring the linewidth of individual imino proton peaks, it was possible to measure
the contribution of exchange broadening to the linewidth. For U175, G177, G185 and
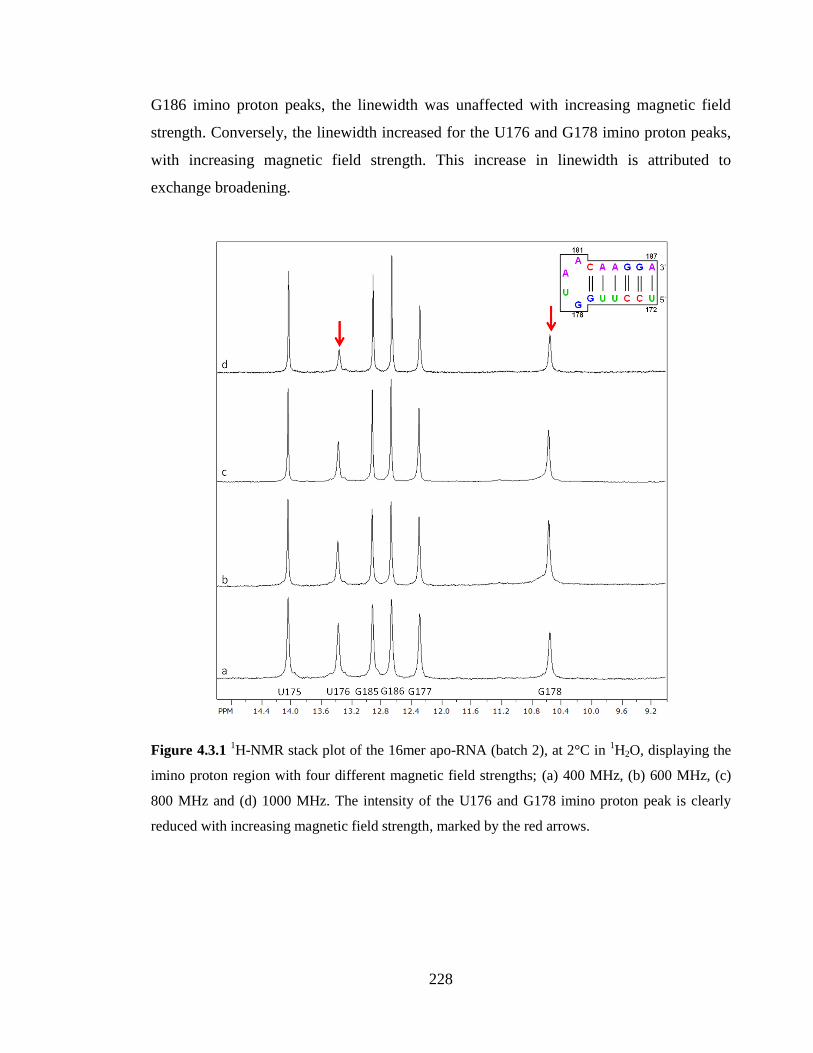
228
G186 imino proton peaks, the linewidth was unaffected with increasing magnetic field
strength. Conversely, the linewidth increased for the U176 and G178 imino proton peaks,
with increasing magnetic field strength. This increase in linewidth is attributed to
exchange broadening.
Figure 4.3.1 1H-NMR stack plot of the 16mer apo-RNA (batch 2), at 2°C in
1H2O, displaying the
imino proton region with four different magnetic field strengths; (a) 400 MHz, (b) 600 MHz, (c)
800 MHz and (d) 1000 MHz. The intensity of the U176 and G178 imino proton peak is clearly
reduced with increasing magnetic field strength, marked by the red arrows.
229
4.3.2 Sensitivity enhancement with 1GHz
The NOESY (1H2O) spectrum of the 16mer apo-RNA (batch 2) was also analysed.
Fascinatingly, an additional cross peak was observed from the G178 imino proton in the
imino-amino region (Figure 4.3.2). NOE cross peaks were difficult to observe from the
G178 imino proton, largely due to the fast exchange with water. These NOE cross peaks
were crucial for generating distance restraints for structure determination, in order to
sufficiently restrain the GNRA tetraloop region. The 1GHz spectrometer offered greater
sensitivity, which allowed the assignment of a new internucleotide connectivity (G178
NH – C182 NH2*). This demonstrates the advantage of using the highest magnetic field
strength possible, especially for RNA structures with dynamic regions.
Figure 4.3.2 Illustration of the NOESY (150ms) spectrum (imino-amino region) of the (a) 16mer
apo-RNA (batch 1) at 700 MHz and (b) 16mer apo-RNA (batch 2) at 1GHz. The G178 NH to
C182 NH2* NOE cross peak can be clearly observed in the 1GHz NOESY spectrum, but is absent
in the 700 MHz NOESY spectrum.
230
4.4 RNA-RNA interaction
4.4.1 Analysis of the RNA-RNA complex in 1H2O
A comparison was made between the imino proton regions of the 16mer Mg2+
RNA
complex (batch 2), the 15mer Mg2+
RNA complex and the RNA-RNA complex (Figure
4.4.1). In the RNA-RNA complex, the G178 loop imino proton peak was clearly observed
highfield at 10.86ppm. Interestingly, a broad peak was also observed highfield of the
G178 imino proton peak in the 16mer Mg2+
RNA complex. This peak may correspond to
the G178 imino proton in a minor conformation, as the chemical shift matches that
observed in the 16mer apo-RNA. The U176, G177 and G185 imino proton peaks were
also observed without any overlapping of the 15mer Mg2+
RNA peaks. However, the
U175 imino proton peak was overlapped with U230 and G186 was overlapped with G231.
Both G229 and G240 imino proton peaks of the 15mer Mg2+
RNA could not be clearly
identified in the RNA-RNA complex.
No significant chemical shift changes were observed for the imino proton peaks of the
16mer and 15mer Mg2+
RNAs. However, changes to the intensity and linewidth were
observed for the G178 imino proton peak. In the RNA-RNA complex, the line intensity of
the G178 imino proton peak was notably reduced and the linewidth had increased. This
may be caused by an increase in the imino proton exchange with water. Therefore, to
provide evidence of this increase in exchange, the imino proton exchange rate was
calculated for the G178 imino proton. Fascinatingly, a dramatic increase in exchange rate
was found for the G178 imino proton, from 37.0s-1
to 145.0s-1
. This significant change in
exchange rate provided the first evidence of a possible interaction between the 16mer and
15mer Mg2+
RNAs. The only explanation was that there may be a change in dynamics of
the 16mer loop region, allowing more solvent exposure to the major groove of the G178
base. Furthermore, the unknown peak found at 10.56ppm was not observed in the RNA-
RNA complex. In light of the increased exchange rate found for G178 imino proton, it is
possible that this peak is no longer visible due to fast exchange.
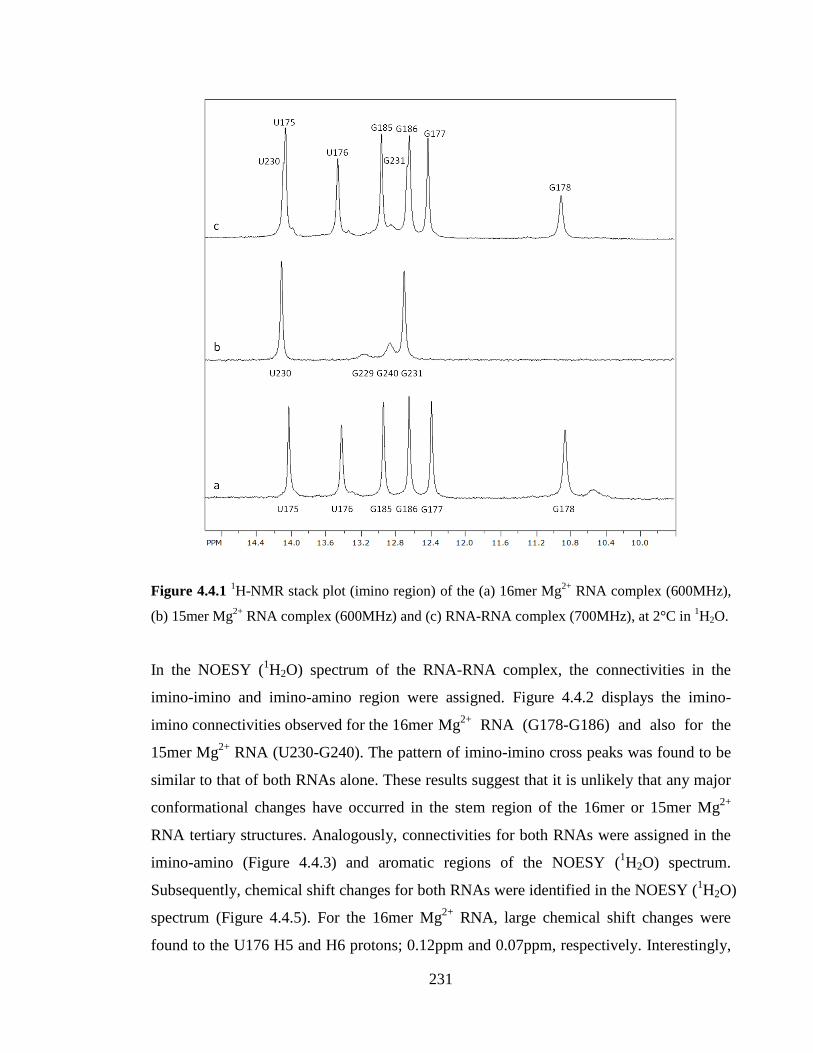
231
Figure 4.4.1 1H-NMR stack plot (imino region) of the (a) 16mer Mg
2+ RNA complex (600MHz),
(b) 15mer Mg2+
RNA complex (600MHz) and (c) RNA-RNA complex (700MHz), at 2°C in 1H2O.
In the NOESY (1H2O) spectrum of the RNA-RNA complex, the connectivities in the
imino-imino and imino-amino region were assigned. Figure 4.4.2 displays the imino-
imino connectivities observed for the 16mer Mg2+
RNA (G178-G186) and also for the
15mer Mg2+
RNA (U230-G240). The pattern of imino-imino cross peaks was found to be
similar to that of both RNAs alone. These results suggest that it is unlikely that any major
conformational changes have occurred in the stem region of the 16mer or 15mer Mg2+
RNA tertiary structures. Analogously, connectivities for both RNAs were assigned in the
imino-amino (Figure 4.4.3) and aromatic regions of the NOESY (1H2O) spectrum.
Subsequently, chemical shift changes for both RNAs were identified in the NOESY (1H2O)
spectrum (Figure 4.4.5). For the 16mer Mg2+
RNA, large chemical shift changes were
found to the U176 H5 and H6 protons; 0.12ppm and 0.07ppm, respectively. Interestingly,
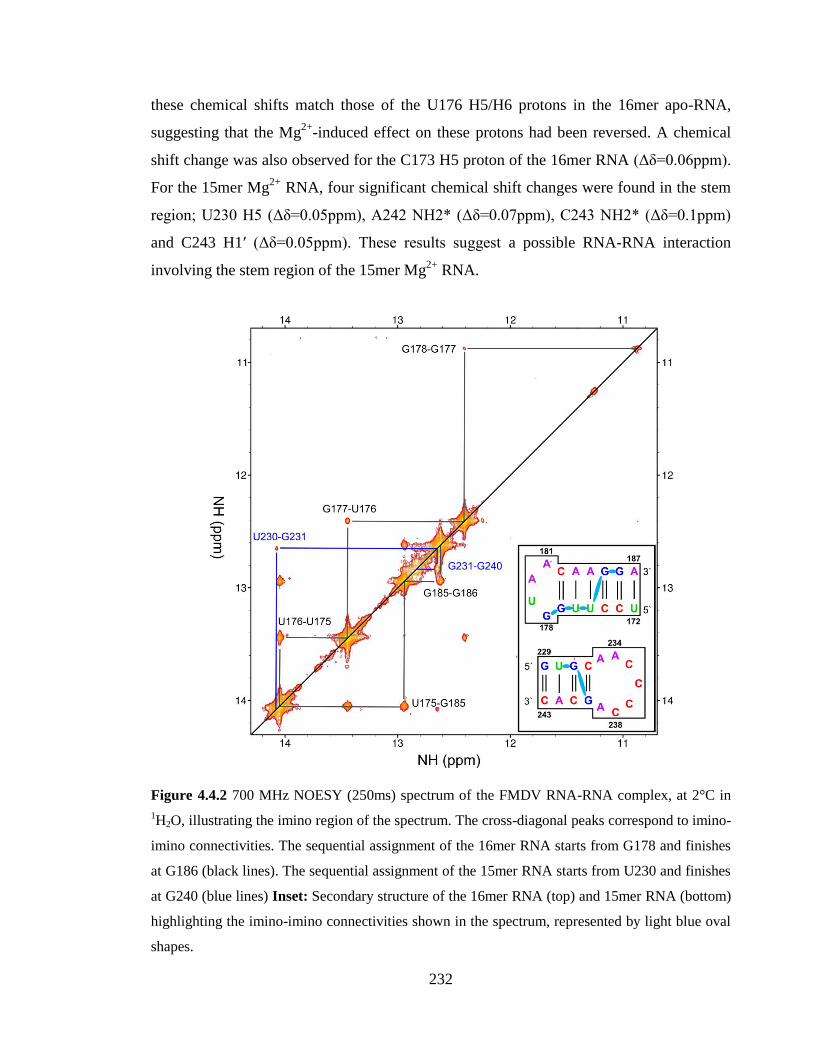
232
these chemical shifts match those of the U176 H5/H6 protons in the 16mer apo-RNA,
suggesting that the Mg2+
-induced effect on these protons had been reversed. A chemical
shift change was also observed for the C173 H5 proton of the 16mer RNA (Δδ=0.06ppm).
For the 15mer Mg2+
RNA, four significant chemical shift changes were found in the stem
region; U230 H5 (Δδ=0.05ppm), A242 NH2* (Δδ=0.07ppm), C243 NH2* (Δδ=0.1ppm)
and C243 H1ʹ (Δδ=0.05ppm). These results suggest a possible RNA-RNA interaction
involving the stem region of the 15mer Mg2+
RNA.
Figure 4.4.2 700 MHz NOESY (250ms) spectrum of the FMDV RNA-RNA complex, at 2°C in
1H2O, illustrating the imino region of the spectrum. The cross-diagonal peaks correspond to imino-
imino connectivities. The sequential assignment of the 16mer RNA starts from G178 and finishes
at G186 (black lines). The sequential assignment of the 15mer RNA starts from U230 and finishes
at G240 (blue lines) Inset: Secondary structure of the 16mer RNA (top) and 15mer RNA (bottom)
highlighting the imino-imino connectivities shown in the spectrum, represented by light blue oval
shapes.
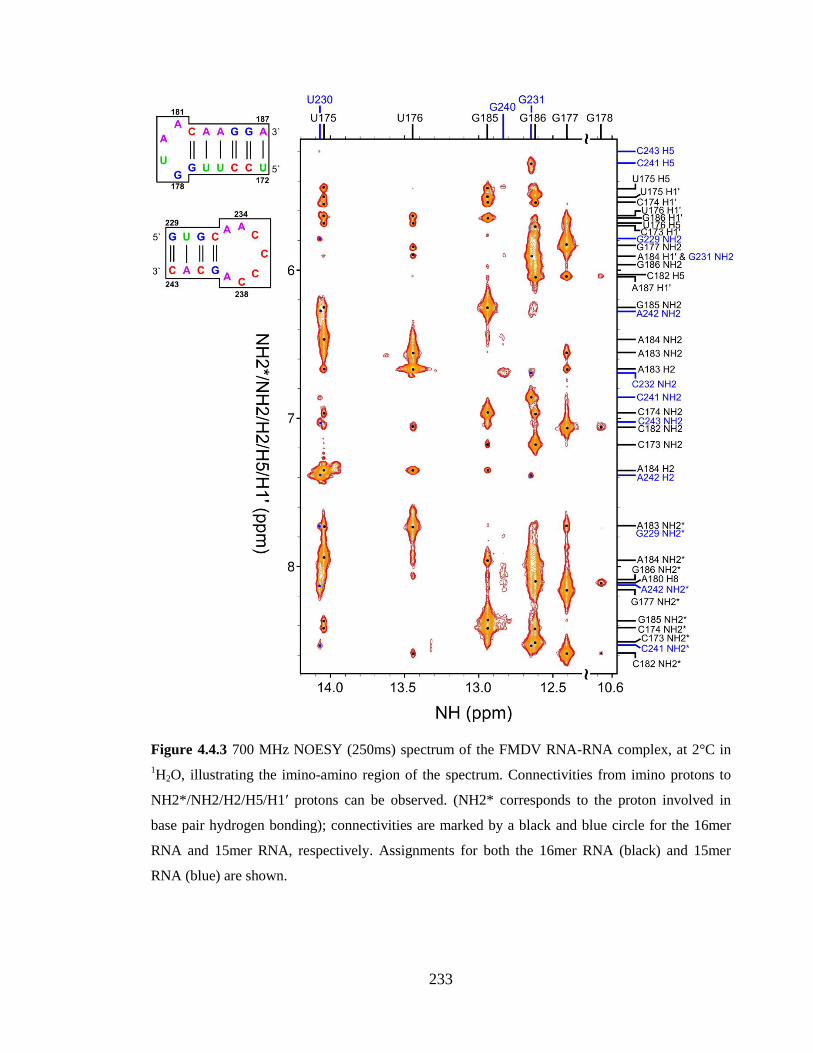
233
Figure 4.4.3 700 MHz NOESY (250ms) spectrum of the FMDV RNA-RNA complex, at 2°C in
1H2O, illustrating the imino-amino region of the spectrum. Connectivities from imino protons to
NH2*/NH2/H2/H5/H1ʹ protons can be observed. (NH2* corresponds to the proton involved in
base pair hydrogen bonding); connectivities are marked by a black and blue circle for the 16mer
RNA and 15mer RNA, respectively. Assignments for both the 16mer RNA (black) and 15mer
RNA (blue) are shown.
234
4.4.2 Analysis of the RNA-RNA complex in 2H2O
Subsequently, the RNA-RNA complex was constituted in 2H2O. The
1H-NMR spectrum
of the RNA-RNA complex was compared with the 1H-NMR spectra of the 16mer and
15mer Mg2+
RNAs (Figure 4.4.4). The H6/H8 aromatic protons were observed between
6.6-8.5ppm and H5/H1ʹ protons were observed between 5.1-6.2ppm, in all three spectra.
In order to detect any changes to the chemical shift or linewidth of peaks in the RNA-
RNA complex, specific peaks were selected within the 1H-NMR spectra of the 16mer and
15mer Mg2+
RNAs. These peaks were selected on the basis that they could be clearly
observed in the RNA-RNA complex and that the peaks did not overlap between the 16mer
and 15mer Mg2+
RNAs.
For the 16mer Mg2+
RNA, six peaks were identified corresponding to A183 H2,
G185/G186 H8, A181 H8, A187 H2, A181 H1ʹ and C182 H5. The A183 H2 and
G185/G186 H8 proton peaks can be found in a very distinct region of the spectrum and
can be easily identified in the RNA-RNA complex. Interestingly, these two peaks are
broader in the RNA-RNA complex. The line broadening could be caused by shorter T2
relaxation due to a longer correlation time, which would indicate RNA-RNA complex
formation. Conversely, the A181 H8 peak was found to be more intense in the RNA-RNA
complex. For the 15mer Mg2+
RNA, three peaks were identified corresponding to
A233/A239 H8, A242 H1ʹ and A239 H1ʹ. Interestingly, small chemical shift changes were
observed for the A242 H1ʹ and A239 H1ʹ peaks.
On the whole, small changes in chemical shift, line intensity and linewidth, indicated a
possible weak RNA-RNA interaction. These results did not conclusively point towards a
specific binding site, but there was enough evidence to suggest changes, structural and/or
dynamic, to the 16mer and 15mer Mg2+
RNAs within the RNA-RNA complex.
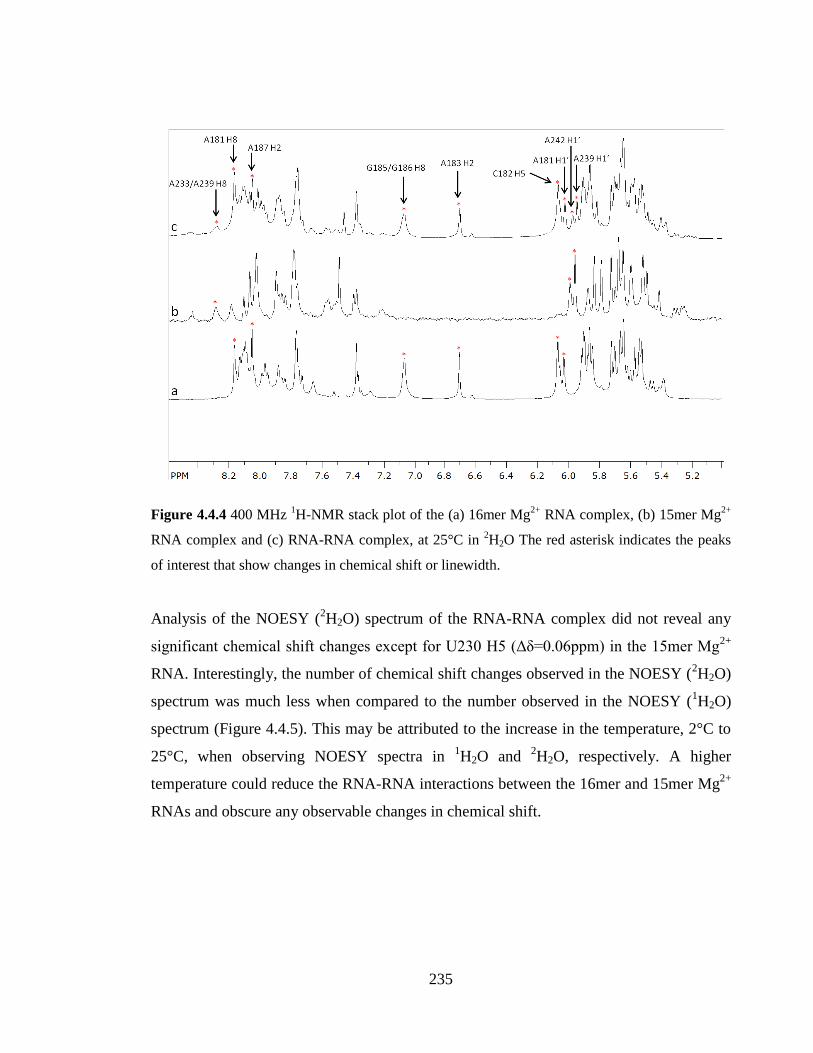
235
Figure 4.4.4 400 MHz 1H-NMR stack plot of the (a) 16mer Mg
2+ RNA complex, (b) 15mer Mg
2+
RNA complex and (c) RNA-RNA complex, at 25°C in 2H2O The red asterisk indicates the peaks
of interest that show changes in chemical shift or linewidth.
Analysis of the NOESY (2H2O) spectrum of the RNA-RNA complex did not reveal any
significant chemical shift changes except for U230 H5 (Δδ=0.06ppm) in the 15mer Mg2+
RNA. Interestingly, the number of chemical shift changes observed in the NOESY (2H2O)
spectrum was much less when compared to the number observed in the NOESY (1H2O)
spectrum (Figure 4.4.5). This may be attributed to the increase in the temperature, 2°C to
25°C, when observing NOESY spectra in 1H2O and
2H2O, respectively. A higher
temperature could reduce the RNA-RNA interactions between the 16mer and 15mer Mg2+
RNAs and obscure any observable changes in chemical shift.
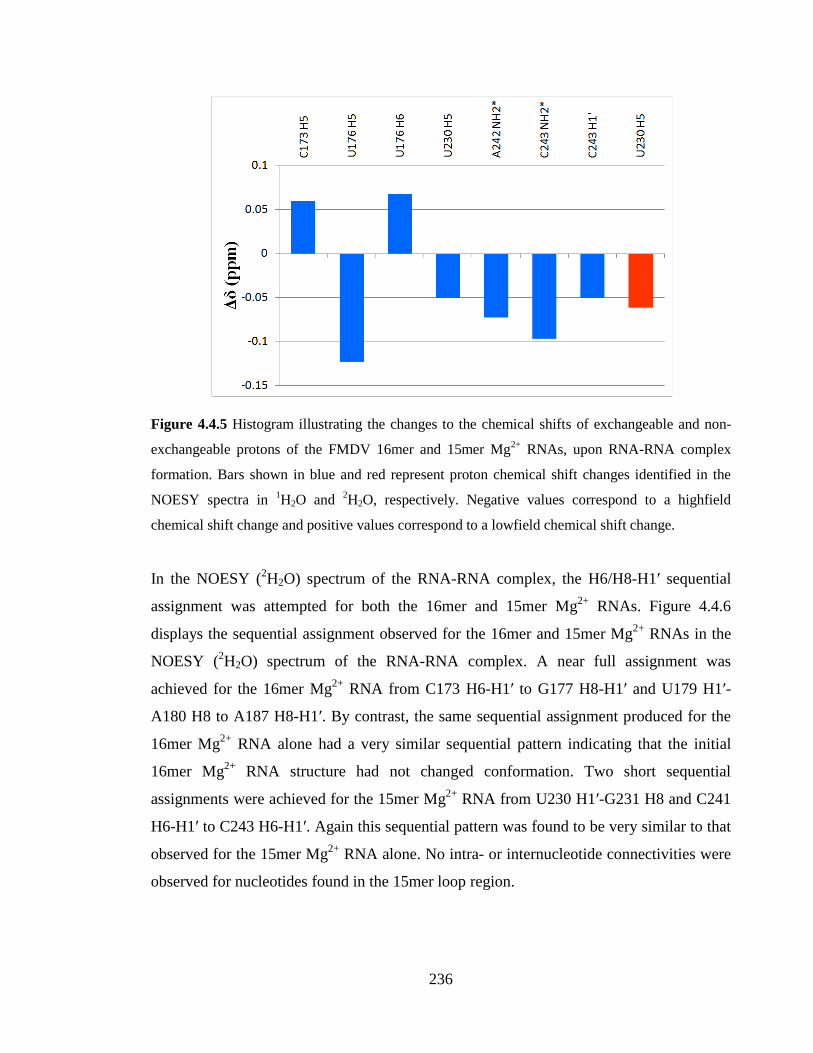
236
Figure 4.4.5 Histogram illustrating the changes to the chemical shifts of exchangeable and non-
exchangeable protons of the FMDV 16mer and 15mer Mg2+
RNAs, upon RNA-RNA complex
formation. Bars shown in blue and red represent proton chemical shift changes identified in the
NOESY spectra in 1H2O and
2H2O, respectively. Negative values correspond to a highfield
chemical shift change and positive values correspond to a lowfield chemical shift change.
In the NOESY (2H2O) spectrum of the RNA-RNA complex, the H6/H8-H1ʹ sequential
assignment was attempted for both the 16mer and 15mer Mg2+
RNAs. Figure 4.4.6
displays the sequential assignment observed for the 16mer and 15mer Mg2+
RNAs in the
NOESY (2H2O) spectrum of the RNA-RNA complex. A near full assignment was
achieved for the 16mer Mg2+
RNA from C173 H6-H1ʹ to G177 H8-H1ʹ and U179 H1ʹ-
A180 H8 to A187 H8-H1ʹ. By contrast, the same sequential assignment produced for the
16mer Mg2+
RNA alone had a very similar sequential pattern indicating that the initial
16mer Mg2+
RNA structure had not changed conformation. Two short sequential
assignments were achieved for the 15mer Mg2+
RNA from U230 H1ʹ-G231 H8 and C241
H6-H1ʹ to C243 H6-H1ʹ. Again this sequential pattern was found to be very similar to that
observed for the 15mer Mg2+
RNA alone. No intra- or internucleotide connectivities were
observed for nucleotides found in the 15mer loop region.
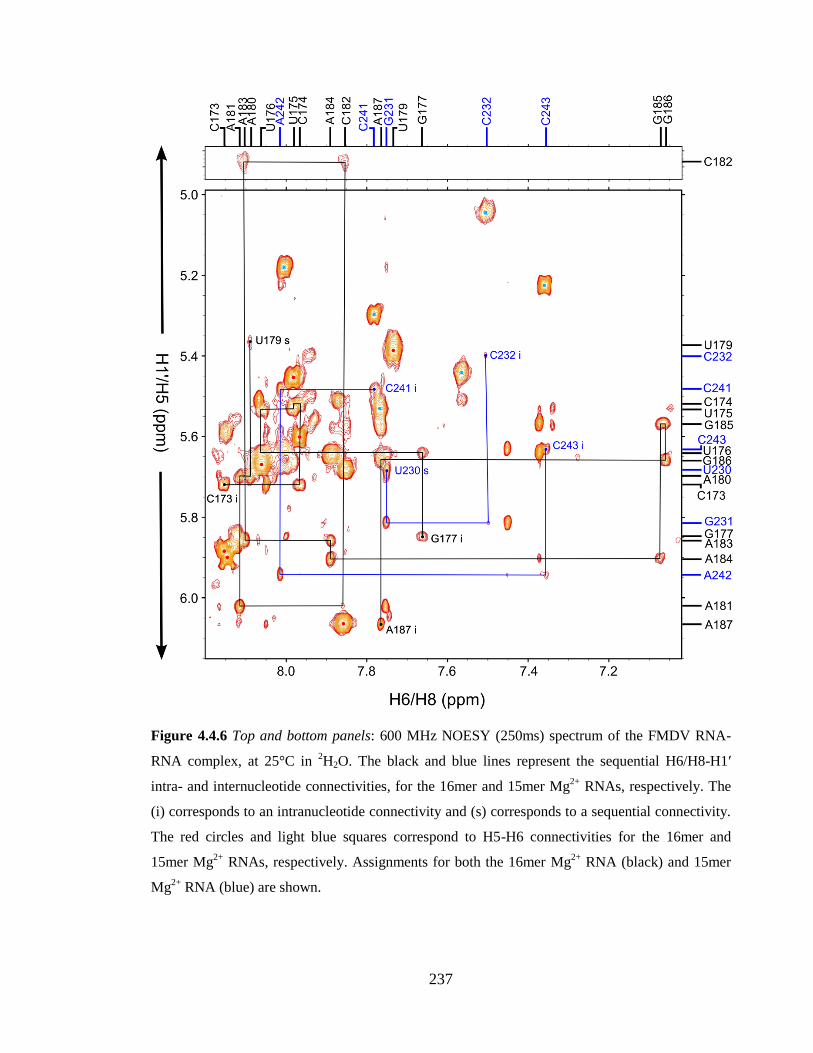
237
Figure 4.4.6 Top and bottom panels: 600 MHz NOESY (250ms) spectrum of the FMDV RNA-
RNA complex, at 25°C in 2H2O. The black and blue lines represent the sequential H6/H8-H1ʹ
intra- and internucleotide connectivities, for the 16mer and 15mer Mg2+
RNAs, respectively. The
(i) corresponds to an intranucleotide connectivity and (s) corresponds to a sequential connectivity.
The red circles and light blue squares correspond to H5-H6 connectivities for the 16mer and
15mer Mg2+
RNAs, respectively. Assignments for both the 16mer Mg2+
RNA (black) and 15mer
Mg2+
RNA (blue) are shown.
238
4.4.3 Model of the RNA-RNA interaction
With the information gathered from the analysis of the RNA-RNA complex, a model of
the possible RNA-RNA interaction was proposed between the 16mer and the 15mer
RNAs. Firstly, the potential regions involved in the RNA-RNA interaction were identified
for the 16mer RNA and the 15mer RNA.
In the 16mer RNA, the G178 imino proton was found to have an increased exchange rate.
As previously stated, this may have been caused by a change in dynamics of the GNRA
tetraloop, prompted by the close proximity of the 15mer RNA. Changes were also
observed to the line intensity of the A181 H8 peak. Additionally, chemical shift changes
were found to the U176 H5 and H6 protons, and linewidth changes to A183 H2. Therefore,
the G178-A181 base pair in the 16mer loop and the U176-A183 base pair in the 16mer
stem were found to be possible sites of interaction. In the 15mer RNA, chemical shift
changes to protons in the U230 and A242 nucleotides pointed to towards a possible site of
interaction around the U230-A242 base pair.
Figure 4.4.7 is a scheme that illustrates the possible RNA-RNA interaction between the
16mer and 15mer RNAs. The possible sites of interaction have been highlighted along
with the specific nucleotides in which chemical shift and linewidth changes were observed.
From this model it was hypothesised that the 16mer RNA and 15mer RNA may have
formed a heterodimer complex, whereby the 16mer RNA loop interacts with the stem
region of the 15mer RNA and the 15mer RNA loop interacts with stem region of the
16mer RNA. However, this may be one of many interactions occurring between the two
RNAs since the interaction was found to be weak.
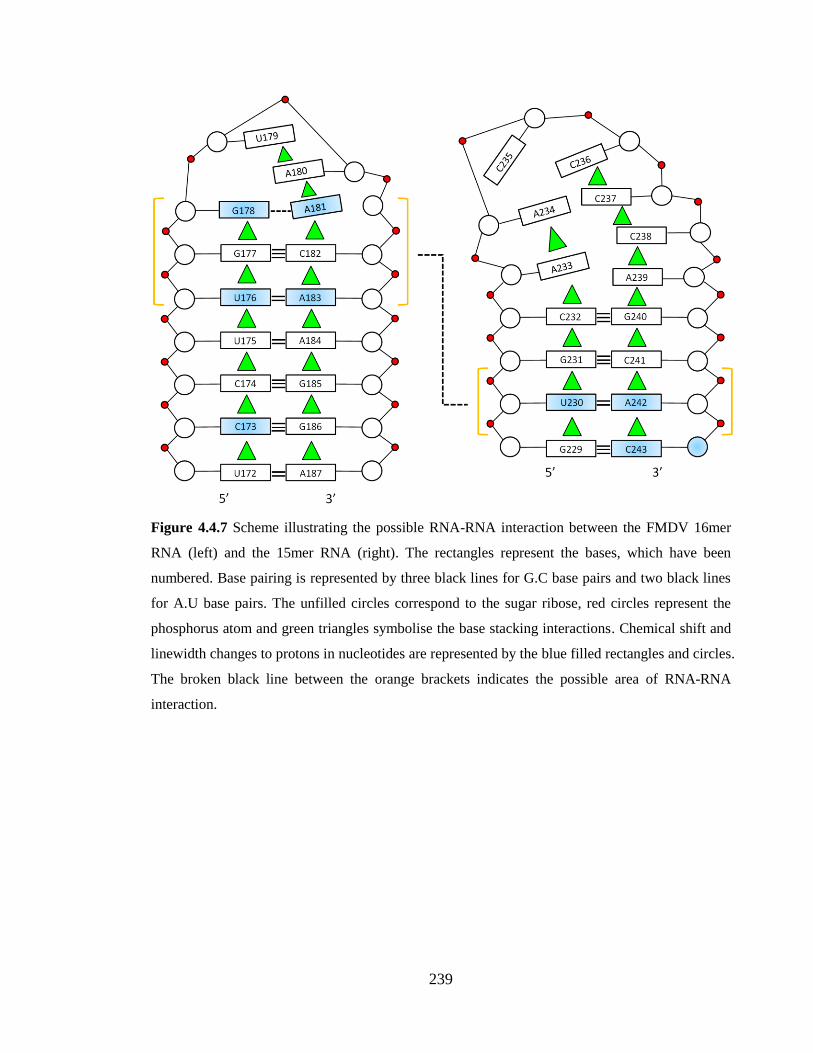
239
Figure 4.4.7 Scheme illustrating the possible RNA-RNA interaction between the FMDV 16mer
RNA (left) and the 15mer RNA (right). The rectangles represent the bases, which have been
numbered. Base pairing is represented by three black lines for G.C base pairs and two black lines
for A.U base pairs. The unfilled circles correspond to the sugar ribose, red circles represent the
phosphorus atom and green triangles symbolise the base stacking interactions. Chemical shift and
linewidth changes to protons in nucleotides are represented by the blue filled rectangles and circles.
The broken black line between the orange brackets indicates the possible area of RNA-RNA
interaction.
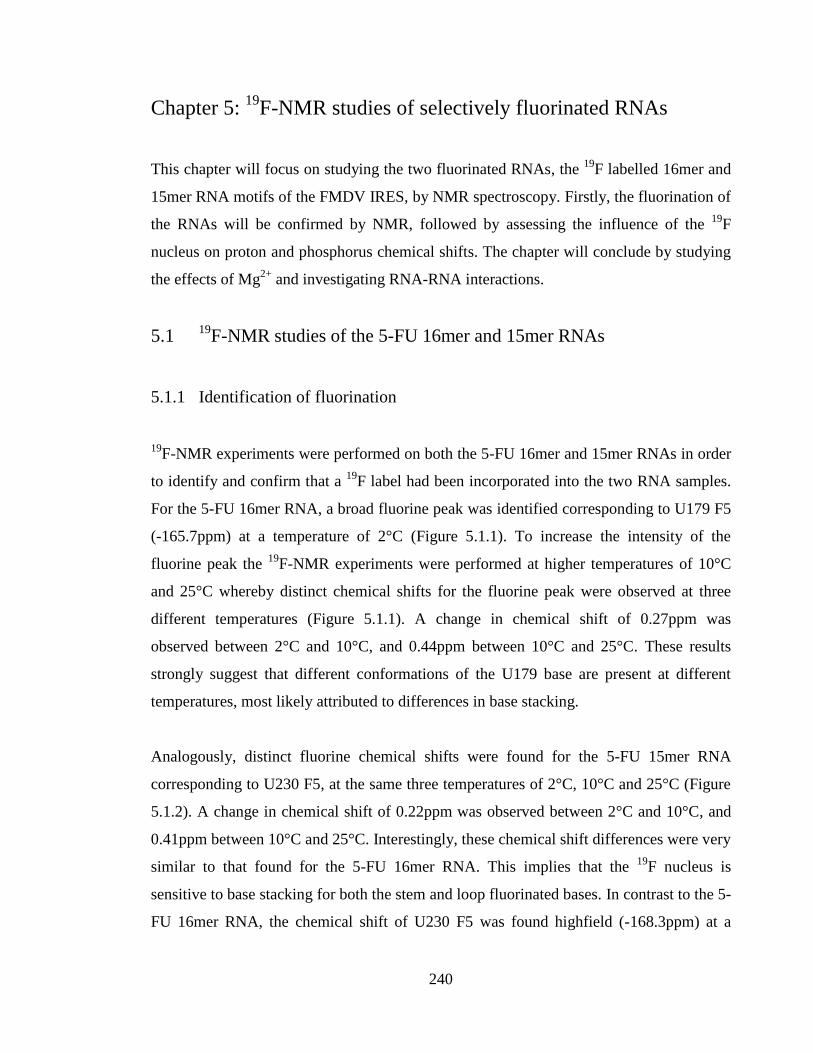
240
Chapter 5: 19
F-NMR studies of selectively fluorinated RNAs
This chapter will focus on studying the two fluorinated RNAs, the 19
F labelled 16mer and
15mer RNA motifs of the FMDV IRES, by NMR spectroscopy. Firstly, the fluorination of
the RNAs will be confirmed by NMR, followed by assessing the influence of the 19
F
nucleus on proton and phosphorus chemical shifts. The chapter will conclude by studying
the effects of Mg2+
and investigating RNA-RNA interactions.
5.1 19F-NMR studies of the 5-FU 16mer and 15mer RNAs
5.1.1 Identification of fluorination
19F-NMR experiments were performed on both the 5-FU 16mer and 15mer RNAs in order
to identify and confirm that a 19
F label had been incorporated into the two RNA samples.
For the 5-FU 16mer RNA, a broad fluorine peak was identified corresponding to U179 F5
(-165.7ppm) at a temperature of 2°C (Figure 5.1.1). To increase the intensity of the
fluorine peak the 19
F-NMR experiments were performed at higher temperatures of 10°C
and 25°C whereby distinct chemical shifts for the fluorine peak were observed at three
different temperatures (Figure 5.1.1). A change in chemical shift of 0.27ppm was
observed between 2°C and 10°C, and 0.44ppm between 10°C and 25°C. These results
strongly suggest that different conformations of the U179 base are present at different
temperatures, most likely attributed to differences in base stacking.
Analogously, distinct fluorine chemical shifts were found for the 5-FU 15mer RNA
corresponding to U230 F5, at the same three temperatures of 2°C, 10°C and 25°C (Figure
5.1.2). A change in chemical shift of 0.22ppm was observed between 2°C and 10°C, and
0.41ppm between 10°C and 25°C. Interestingly, these chemical shift differences were very
similar to that found for the 5-FU 16mer RNA. This implies that the 19
F nucleus is
sensitive to base stacking for both the stem and loop fluorinated bases. In contrast to the 5-
FU 16mer RNA, the chemical shift of U230 F5 was found highfield (-168.3ppm) at a
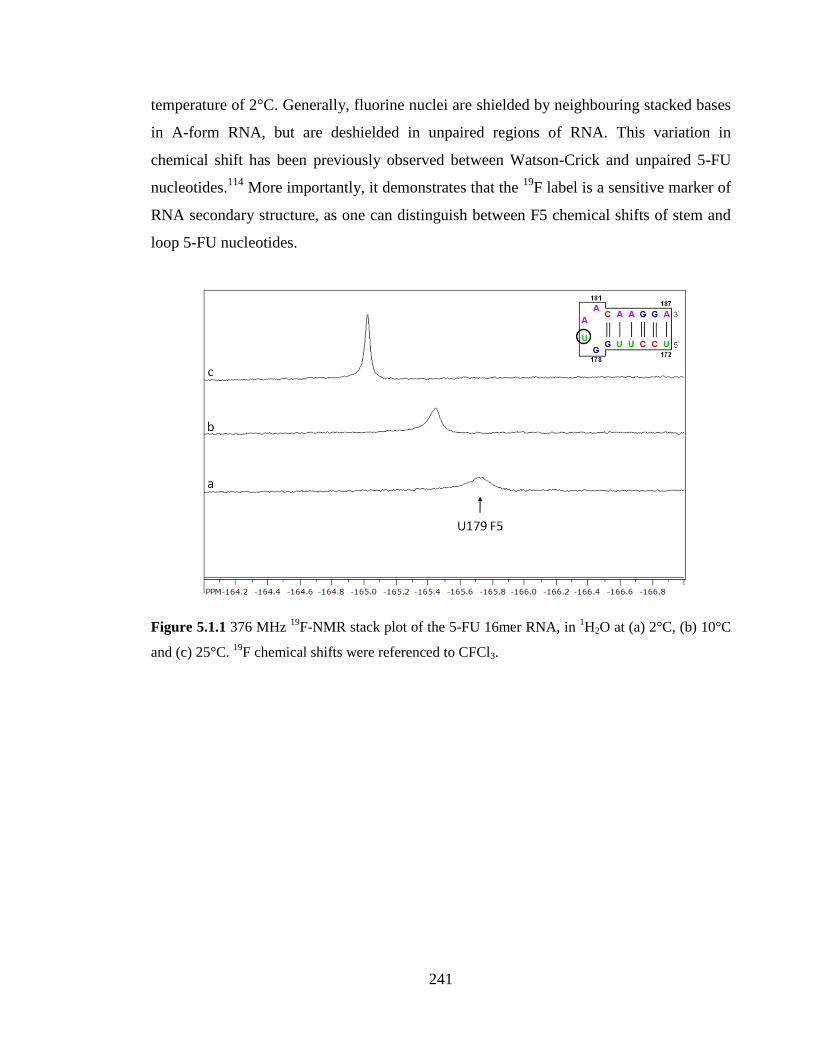
241
temperature of 2°C. Generally, fluorine nuclei are shielded by neighbouring stacked bases
in A-form RNA, but are deshielded in unpaired regions of RNA. This variation in
chemical shift has been previously observed between Watson-Crick and unpaired 5-FU
nucleotides.114
More importantly, it demonstrates that the 19
F label is a sensitive marker of
RNA secondary structure, as one can distinguish between F5 chemical shifts of stem and
loop 5-FU nucleotides.
Figure 5.1.1 376 MHz 19
F-NMR stack plot of the 5-FU 16mer RNA, in 1H2O at (a) 2°C, (b) 10°C
and (c) 25°C. 19
F chemical shifts were referenced to CFCl3.
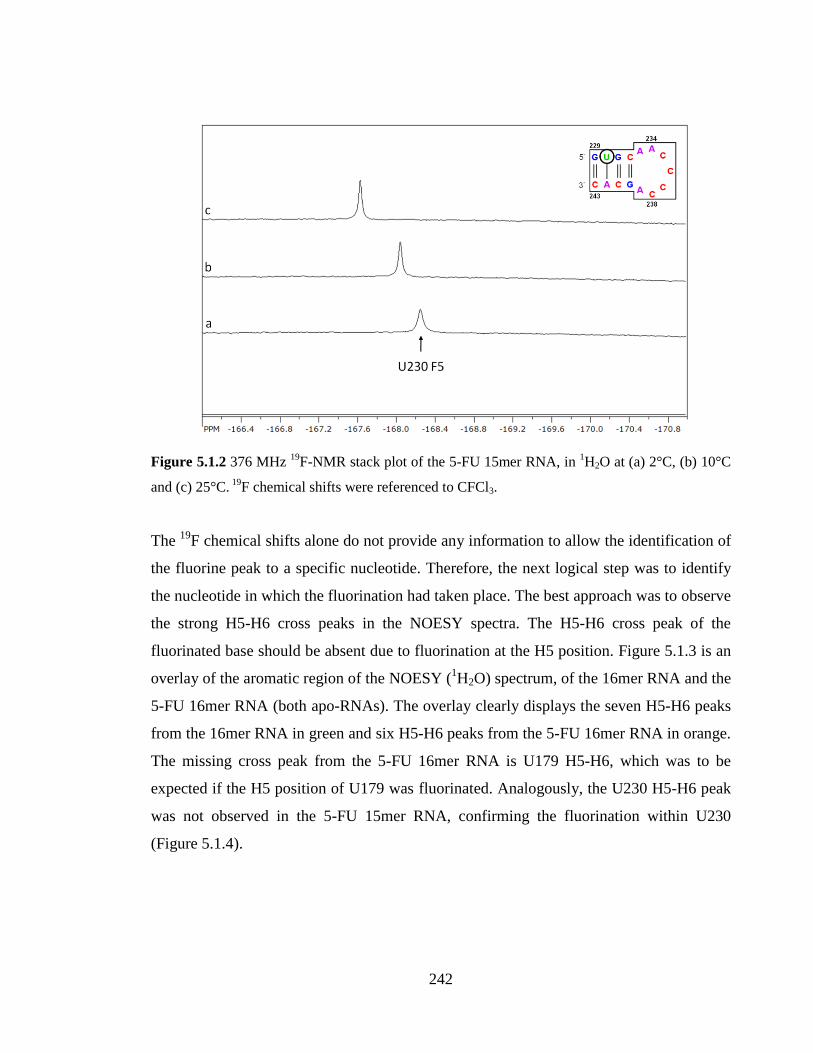
242
Figure 5.1.2 376 MHz 19
F-NMR stack plot of the 5-FU 15mer RNA, in 1H2O at (a) 2°C, (b) 10°C
and (c) 25°C. 19
F chemical shifts were referenced to CFCl3.
The 19
F chemical shifts alone do not provide any information to allow the identification of
the fluorine peak to a specific nucleotide. Therefore, the next logical step was to identify
the nucleotide in which the fluorination had taken place. The best approach was to observe
the strong H5-H6 cross peaks in the NOESY spectra. The H5-H6 cross peak of the
fluorinated base should be absent due to fluorination at the H5 position. Figure 5.1.3 is an
overlay of the aromatic region of the NOESY (1H2O) spectrum, of the 16mer RNA and the
5-FU 16mer RNA (both apo-RNAs). The overlay clearly displays the seven H5-H6 peaks
from the 16mer RNA in green and six H5-H6 peaks from the 5-FU 16mer RNA in orange.
The missing cross peak from the 5-FU 16mer RNA is U179 H5-H6, which was to be
expected if the H5 position of U179 was fluorinated. Analogously, the U230 H5-H6 peak
was not observed in the 5-FU 15mer RNA, confirming the fluorination within U230
(Figure 5.1.4).
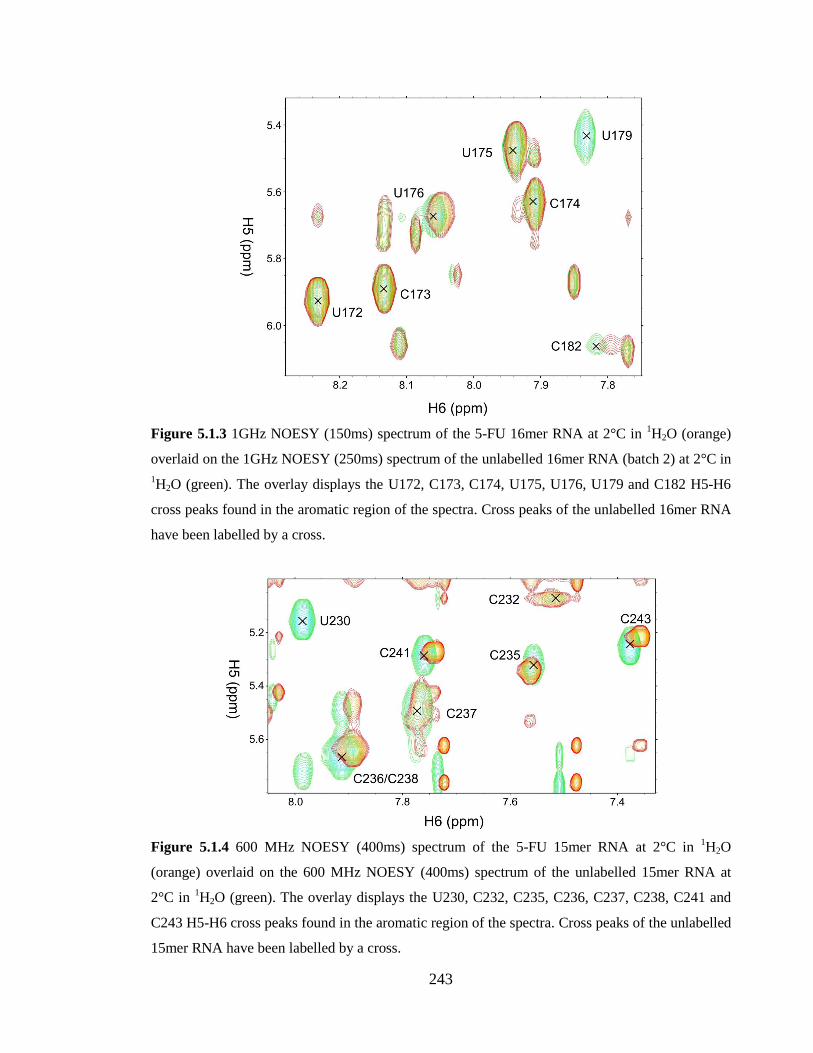
243
Figure 5.1.3 1GHz NOESY (150ms) spectrum of the 5-FU 16mer RNA at 2°C in 1H2O (orange)
overlaid on the 1GHz NOESY (250ms) spectrum of the unlabelled 16mer RNA (batch 2) at 2°C in
1H2O (green). The overlay displays the U172, C173, C174, U175, U176, U179 and C182 H5-H6
cross peaks found in the aromatic region of the spectra. Cross peaks of the unlabelled 16mer RNA
have been labelled by a cross.
Figure 5.1.4 600 MHz NOESY (400ms) spectrum of the 5-FU 15mer RNA at 2°C in 1H2O
(orange) overlaid on the 600 MHz NOESY (400ms) spectrum of the unlabelled 15mer RNA at
2°C in 1H2O (green). The overlay displays the U230, C232, C235, C236, C237, C238, C241 and
C243 H5-H6 cross peaks found in the aromatic region of the spectra. Cross peaks of the unlabelled
15mer RNA have been labelled by a cross.
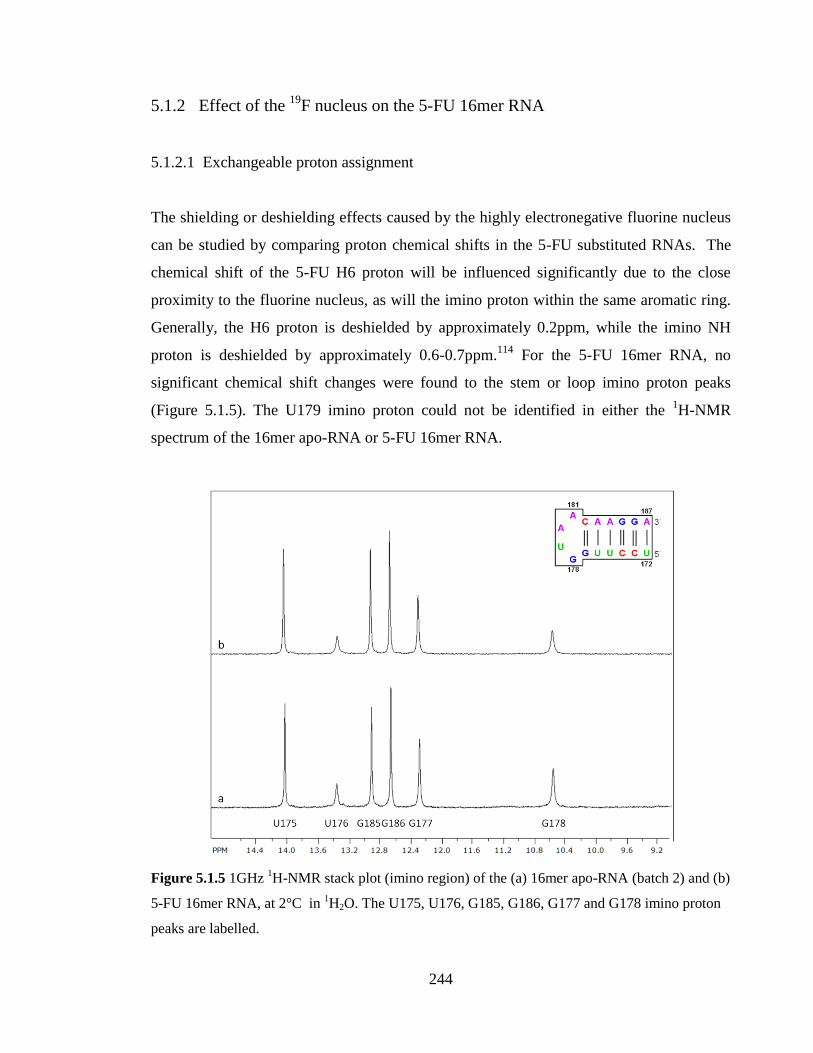
244
5.1.2 Effect of the 19
F nucleus on the 5-FU 16mer RNA
5.1.2.1 Exchangeable proton assignment
The shielding or deshielding effects caused by the highly electronegative fluorine nucleus
can be studied by comparing proton chemical shifts in the 5-FU substituted RNAs. The
chemical shift of the 5-FU H6 proton will be influenced significantly due to the close
proximity to the fluorine nucleus, as will the imino proton within the same aromatic ring.
Generally, the H6 proton is deshielded by approximately 0.2ppm, while the imino NH
proton is deshielded by approximately 0.6-0.7ppm.114
For the 5-FU 16mer RNA, no
significant chemical shift changes were found to the stem or loop imino proton peaks
(Figure 5.1.5). The U179 imino proton could not be identified in either the 1H-NMR
spectrum of the 16mer apo-RNA or 5-FU 16mer RNA.
Figure 5.1.5 1GHz 1H-NMR stack plot (imino region) of the (a) 16mer apo-RNA (batch 2) and (b)
5-FU 16mer RNA, at 2°C in 1H2O. The U175, U176, G185, G186, G177 and G178 imino proton
peaks are labelled.
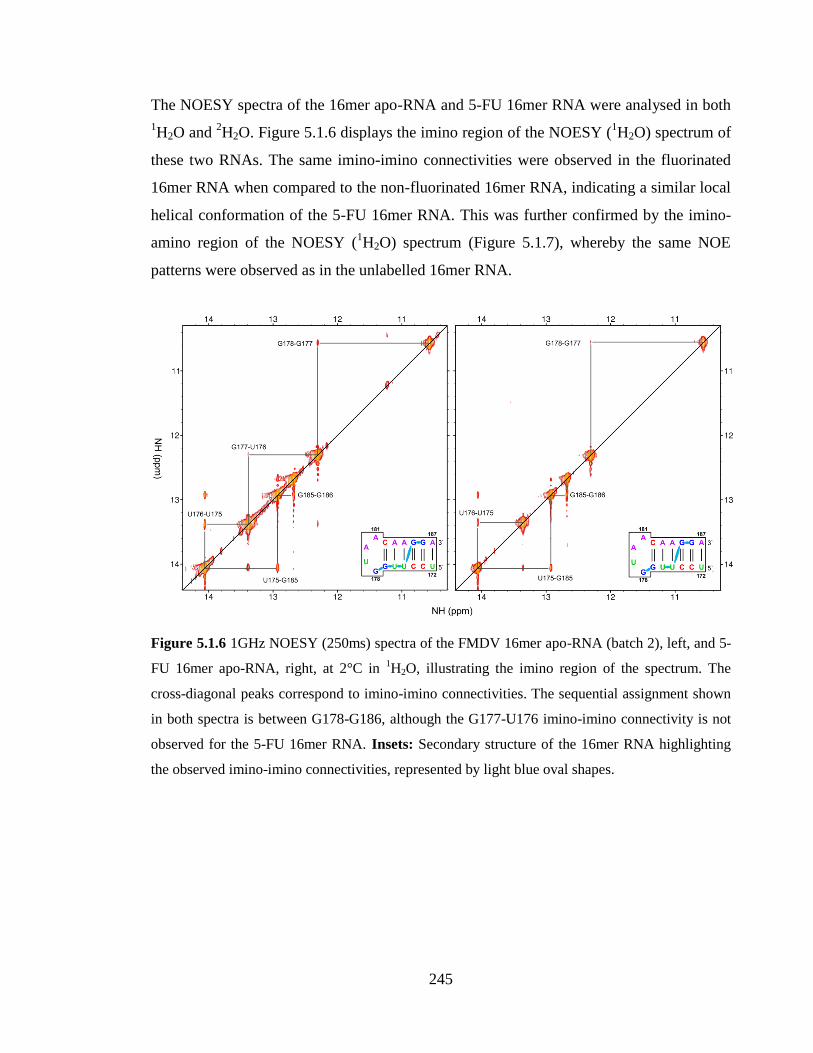
245
The NOESY spectra of the 16mer apo-RNA and 5-FU 16mer RNA were analysed in both
1H2O and
2H2O. Figure 5.1.6 displays the imino region of the NOESY (
1H2O) spectrum of
these two RNAs. The same imino-imino connectivities were observed in the fluorinated
16mer RNA when compared to the non-fluorinated 16mer RNA, indicating a similar local
helical conformation of the 5-FU 16mer RNA. This was further confirmed by the imino-
amino region of the NOESY (1H2O) spectrum (Figure 5.1.7), whereby the same NOE
patterns were observed as in the unlabelled 16mer RNA.
Figure 5.1.6 1GHz NOESY (250ms) spectra of the FMDV 16mer apo-RNA (batch 2), left, and 5-
FU 16mer apo-RNA, right, at 2°C in 1H2O, illustrating the imino region of the spectrum. The
cross-diagonal peaks correspond to imino-imino connectivities. The sequential assignment shown
in both spectra is between G178-G186, although the G177-U176 imino-imino connectivity is not
observed for the 5-FU 16mer RNA. Insets: Secondary structure of the 16mer RNA highlighting
the observed imino-imino connectivities, represented by light blue oval shapes.
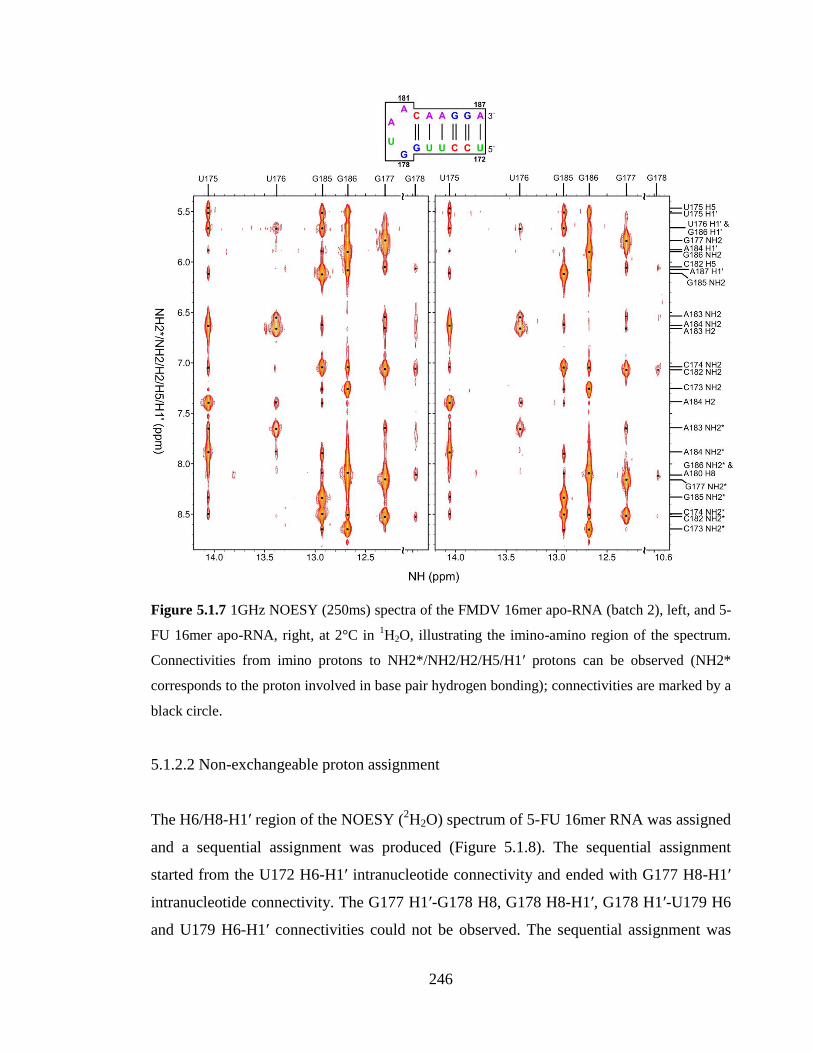
246
Figure 5.1.7 1GHz NOESY (250ms) spectra of the FMDV 16mer apo-RNA (batch 2), left, and 5-
FU 16mer apo-RNA, right, at 2°C in 1H2O, illustrating the imino-amino region of the spectrum.
Connectivities from imino protons to NH2*/NH2/H2/H5/H1ʹ protons can be observed (NH2*
corresponds to the proton involved in base pair hydrogen bonding); connectivities are marked by a
black circle.
5.1.2.2 Non-exchangeable proton assignment
The H6/H8-H1ʹ region of the NOESY (2H2O) spectrum of 5-FU 16mer RNA was assigned
and a sequential assignment was produced (Figure 5.1.8). The sequential assignment
started from the U172 H6-H1ʹ intranucleotide connectivity and ended with G177 H8-H1ʹ
intranucleotide connectivity. The G177 H1ʹ-G178 H8, G178 H8-H1ʹ, G178 H1ʹ-U179 H6
and U179 H6-H1ʹ connectivities could not be observed. The sequential assignment was
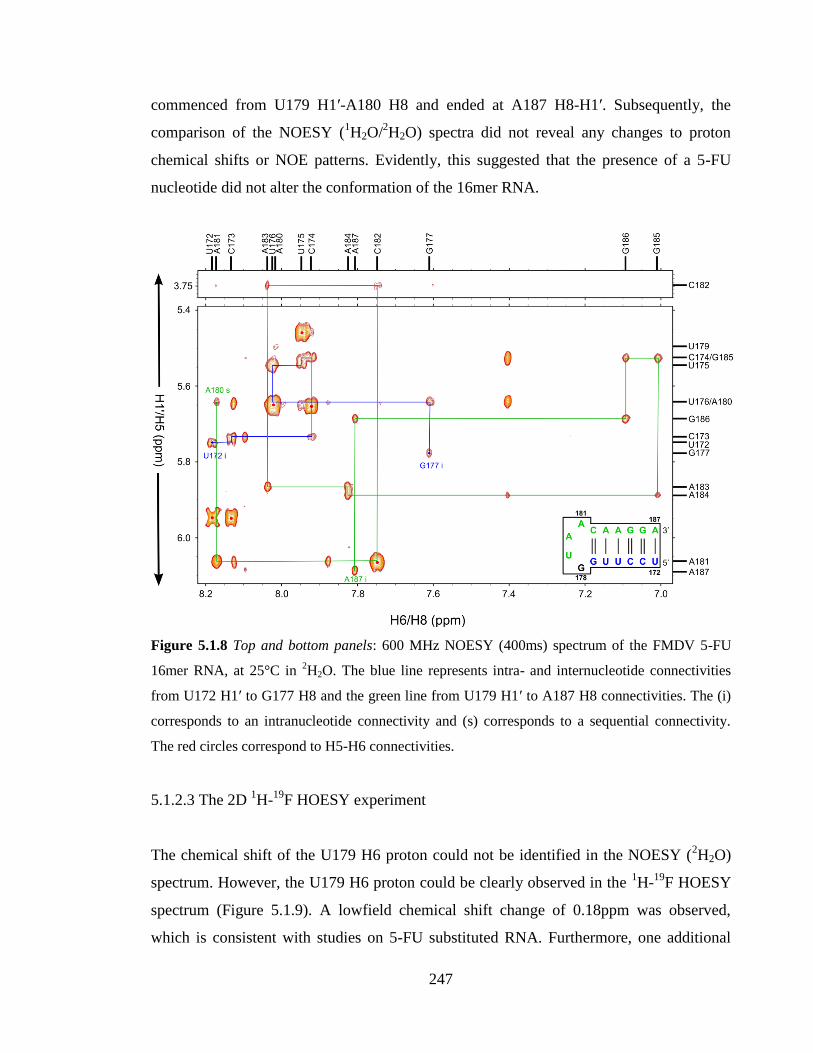
247
commenced from U179 H1ʹ-A180 H8 and ended at A187 H8-H1ʹ. Subsequently, the
comparison of the NOESY (1H2O/
2H2O) spectra did not reveal any changes to proton
chemical shifts or NOE patterns. Evidently, this suggested that the presence of a 5-FU
nucleotide did not alter the conformation of the 16mer RNA.
Figure 5.1.8 Top and bottom panels: 600 MHz NOESY (400ms) spectrum of the FMDV 5-FU
16mer RNA, at 25°C in 2H2O. The blue line represents intra- and internucleotide connectivities
from U172 H1ʹ to G177 H8 and the green line from U179 H1ʹ to A187 H8 connectivities. The (i)
corresponds to an intranucleotide connectivity and (s) corresponds to a sequential connectivity.
The red circles correspond to H5-H6 connectivities.
5.1.2.3 The 2D 1H-
19F HOESY experiment
The chemical shift of the U179 H6 proton could not be identified in the NOESY (2H2O)
spectrum. However, the U179 H6 proton could be clearly observed in the 1H-
19F HOESY
spectrum (Figure 5.1.9). A lowfield chemical shift change of 0.18ppm was observed,
which is consistent with studies on 5-FU substituted RNA. Furthermore, one additional
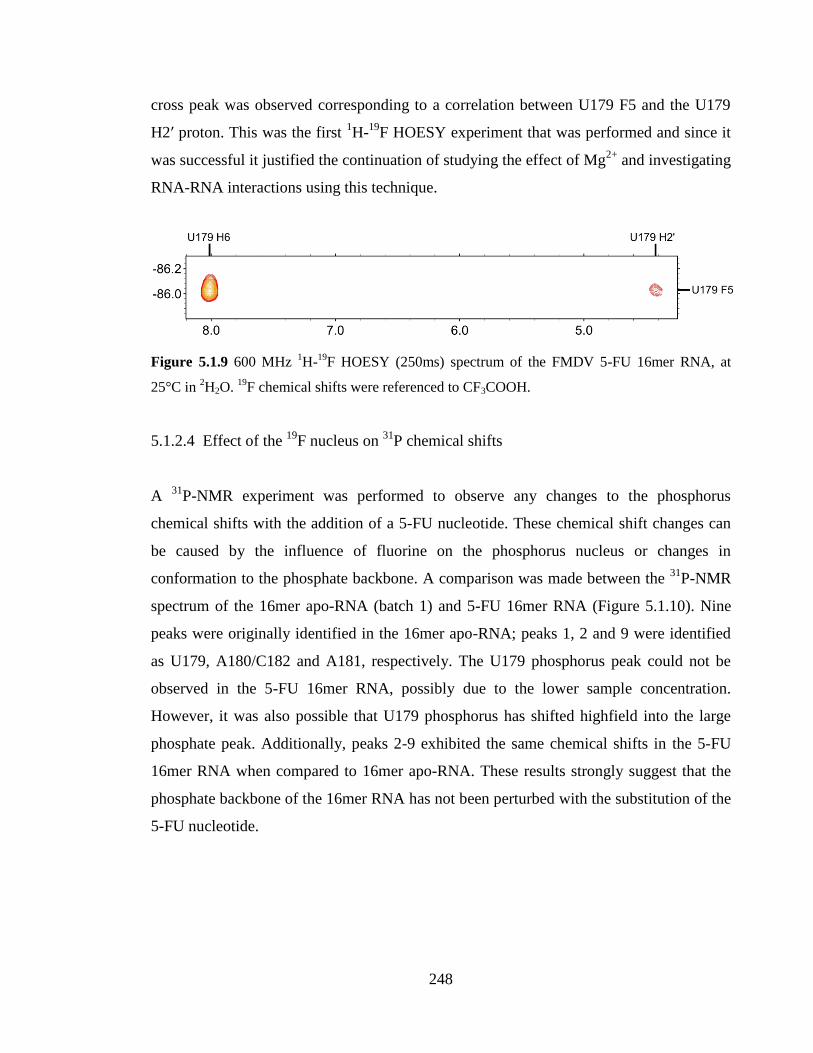
248
cross peak was observed corresponding to a correlation between U179 F5 and the U179
H2ʹ proton. This was the first 1H-
19F HOESY experiment that was performed and since it
was successful it justified the continuation of studying the effect of Mg2+
and investigating
RNA-RNA interactions using this technique.
Figure 5.1.9 600 MHz 1H-
19F HOESY (250ms) spectrum of the FMDV 5-FU 16mer RNA, at
25°C in 2H2O.
19F chemical shifts were referenced to CF3COOH.
5.1.2.4 Effect of the 19
F nucleus on 31
P chemical shifts
A 31
P-NMR experiment was performed to observe any changes to the phosphorus
chemical shifts with the addition of a 5-FU nucleotide. These chemical shift changes can
be caused by the influence of fluorine on the phosphorus nucleus or changes in
conformation to the phosphate backbone. A comparison was made between the 31
P-NMR
spectrum of the 16mer apo-RNA (batch 1) and 5-FU 16mer RNA (Figure 5.1.10). Nine
peaks were originally identified in the 16mer apo-RNA; peaks 1, 2 and 9 were identified
as U179, A180/C182 and A181, respectively. The U179 phosphorus peak could not be
observed in the 5-FU 16mer RNA, possibly due to the lower sample concentration.
However, it was also possible that U179 phosphorus has shifted highfield into the large
phosphate peak. Additionally, peaks 2-9 exhibited the same chemical shifts in the 5-FU
16mer RNA when compared to 16mer apo-RNA. These results strongly suggest that the
phosphate backbone of the 16mer RNA has not been perturbed with the substitution of the
5-FU nucleotide.
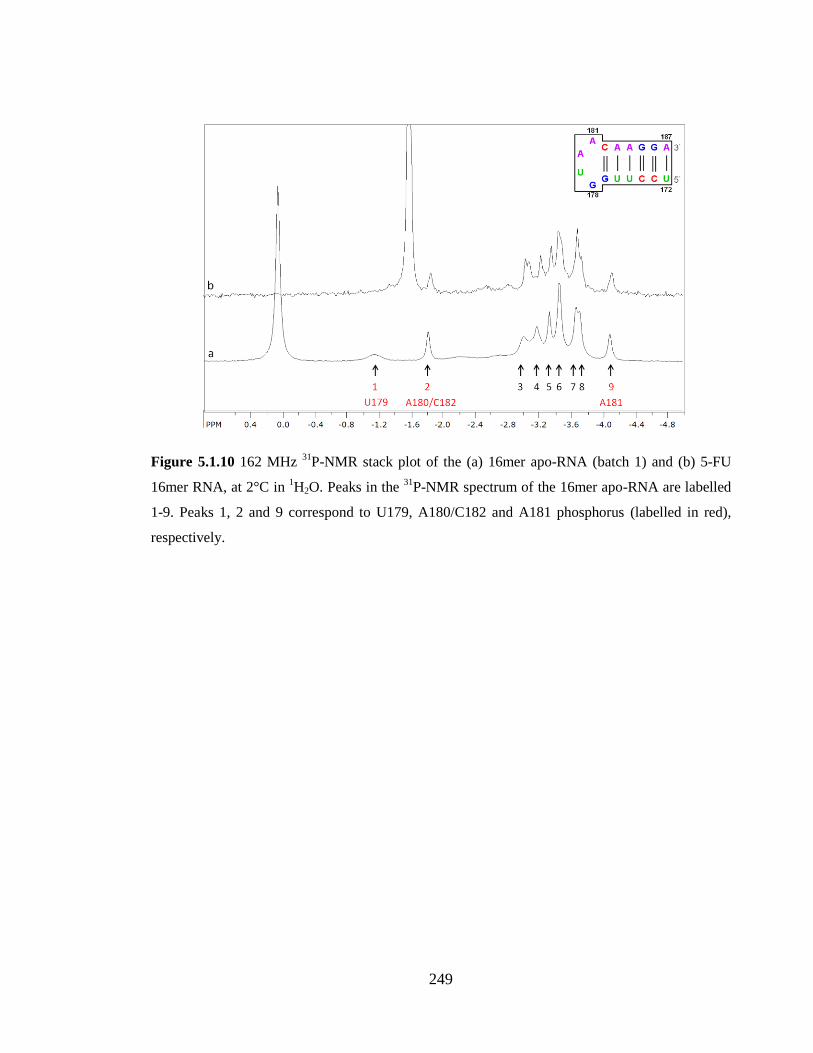
249
Figure 5.1.10 162 MHz 31
P-NMR stack plot of the (a) 16mer apo-RNA (batch 1) and (b) 5-FU
16mer RNA, at 2°C in 1H2O. Peaks in the
31P-NMR spectrum of the 16mer apo-RNA are labelled
1-9. Peaks 1, 2 and 9 correspond to U179, A180/C182 and A181 phosphorus (labelled in red),
respectively.
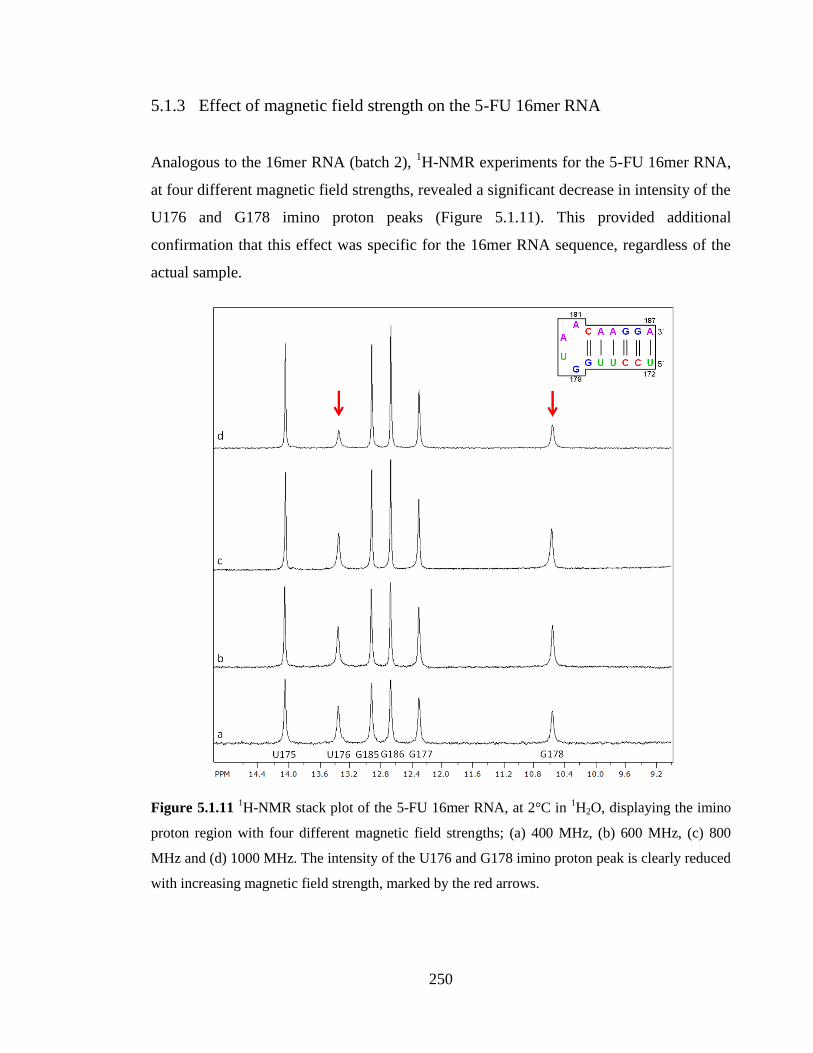
250
5.1.3 Effect of magnetic field strength on the 5-FU 16mer RNA
Analogous to the 16mer RNA (batch 2), 1H-NMR experiments for the 5-FU 16mer RNA,
at four different magnetic field strengths, revealed a significant decrease in intensity of the
U176 and G178 imino proton peaks (Figure 5.1.11). This provided additional
confirmation that this effect was specific for the 16mer RNA sequence, regardless of the
actual sample.
Figure 5.1.11 1H-NMR stack plot of the 5-FU 16mer RNA, at 2°C in
1H2O, displaying the imino
proton region with four different magnetic field strengths; (a) 400 MHz, (b) 600 MHz, (c) 800
MHz and (d) 1000 MHz. The intensity of the U176 and G178 imino proton peak is clearly reduced
with increasing magnetic field strength, marked by the red arrows.
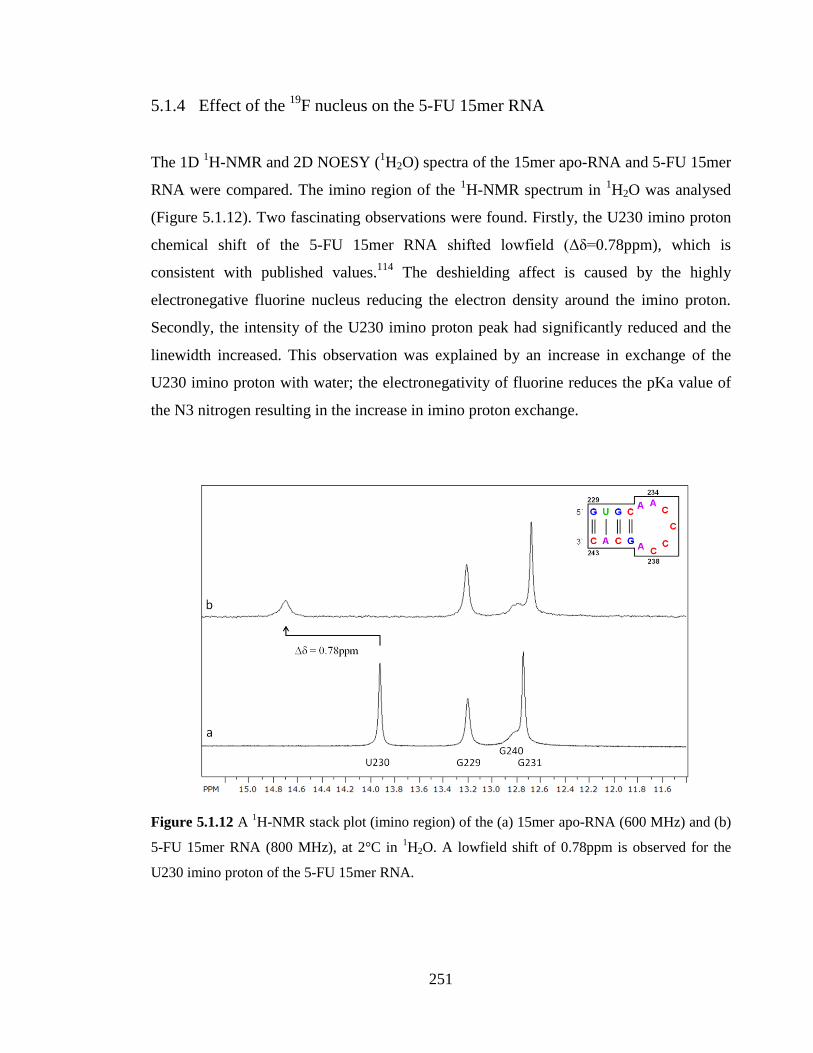
251
5.1.4 Effect of the 19
F nucleus on the 5-FU 15mer RNA
The 1D 1H-NMR and 2D NOESY (
1H2O) spectra of the 15mer apo-RNA and 5-FU 15mer
RNA were compared. The imino region of the 1H-NMR spectrum in
1H2O was analysed
(Figure 5.1.12). Two fascinating observations were found. Firstly, the U230 imino proton
chemical shift of the 5-FU 15mer RNA shifted lowfield (Δδ=0.78ppm), which is
consistent with published values.114
The deshielding affect is caused by the highly
electronegative fluorine nucleus reducing the electron density around the imino proton.
Secondly, the intensity of the U230 imino proton peak had significantly reduced and the
linewidth increased. This observation was explained by an increase in exchange of the
U230 imino proton with water; the electronegativity of fluorine reduces the pKa value of
the N3 nitrogen resulting in the increase in imino proton exchange.
Figure 5.1.12 A 1H-NMR stack plot (imino region) of the (a) 15mer apo-RNA (600 MHz) and (b)
5-FU 15mer RNA (800 MHz), at 2°C in 1H2O. A lowfield shift of 0.78ppm is observed for the
U230 imino proton of the 5-FU 15mer RNA.
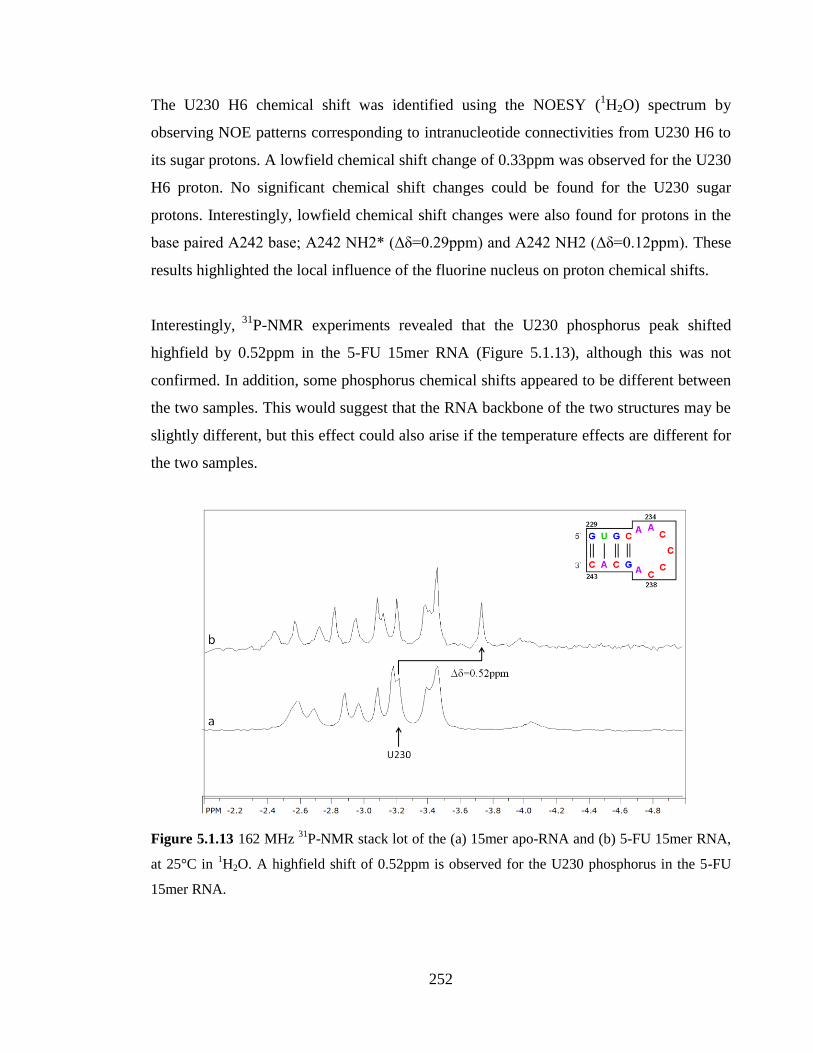
252
The U230 H6 chemical shift was identified using the NOESY (1H2O) spectrum by
observing NOE patterns corresponding to intranucleotide connectivities from U230 H6 to
its sugar protons. A lowfield chemical shift change of 0.33ppm was observed for the U230
H6 proton. No significant chemical shift changes could be found for the U230 sugar
protons. Interestingly, lowfield chemical shift changes were also found for protons in the
base paired A242 base; A242 NH2* (Δδ=0.29ppm) and A242 NH2 (Δδ=0.12ppm). These
results highlighted the local influence of the fluorine nucleus on proton chemical shifts.
Interestingly, 31
P-NMR experiments revealed that the U230 phosphorus peak shifted
highfield by 0.52ppm in the 5-FU 15mer RNA (Figure 5.1.13), although this was not
confirmed. In addition, some phosphorus chemical shifts appeared to be different between
the two samples. This would suggest that the RNA backbone of the two structures may be
slightly different, but this effect could also arise if the temperature effects are different for
the two samples.
Figure 5.1.13 162 MHz 31
P-NMR stack lot of the (a) 15mer apo-RNA and (b) 5-FU 15mer RNA,
at 25°C in 1H2O. A highfield shift of 0.52ppm is observed for the U230 phosphorus in the 5-FU
15mer RNA.
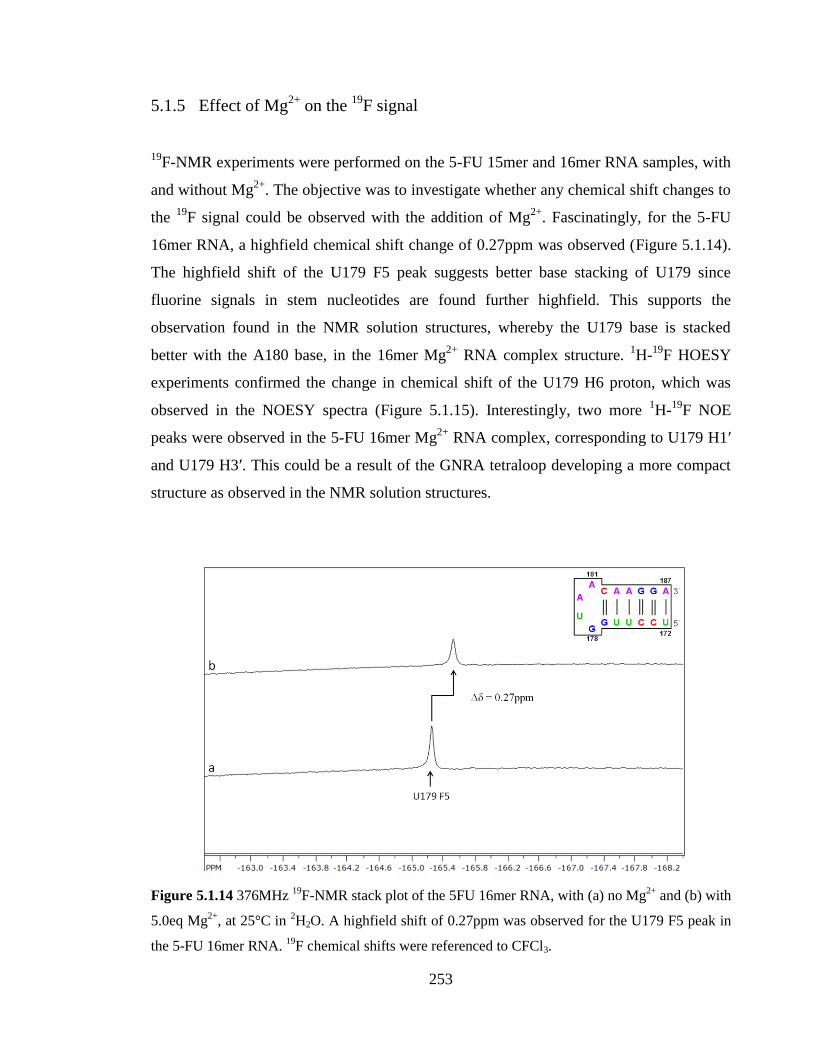
253
5.1.5 Effect of Mg2+
on the 19
F signal
19F-NMR experiments were performed on the 5-FU 15mer and 16mer RNA samples, with
and without Mg2+
. The objective was to investigate whether any chemical shift changes to
the 19
F signal could be observed with the addition of Mg2+
. Fascinatingly, for the 5-FU
16mer RNA, a highfield chemical shift change of 0.27ppm was observed (Figure 5.1.14).
The highfield shift of the U179 F5 peak suggests better base stacking of U179 since
fluorine signals in stem nucleotides are found further highfield. This supports the
observation found in the NMR solution structures, whereby the U179 base is stacked
better with the A180 base, in the 16mer Mg2+
RNA complex structure. 1H-
19F HOESY
experiments confirmed the change in chemical shift of the U179 H6 proton, which was
observed in the NOESY spectra (Figure 5.1.15). Interestingly, two more 1H-
19F NOE
peaks were observed in the 5-FU 16mer Mg2+
RNA complex, corresponding to U179 H1ʹ
and U179 H3ʹ. This could be a result of the GNRA tetraloop developing a more compact
structure as observed in the NMR solution structures.
Figure 5.1.14 376MHz 19
F-NMR stack plot of the 5FU 16mer RNA, with (a) no Mg2+
and (b) with
5.0eq Mg2+
, at 25°C in 2H2O. A highfield shift of 0.27ppm was observed for the U179 F5 peak in
the 5-FU 16mer RNA. 19
F chemical shifts were referenced to CFCl3.
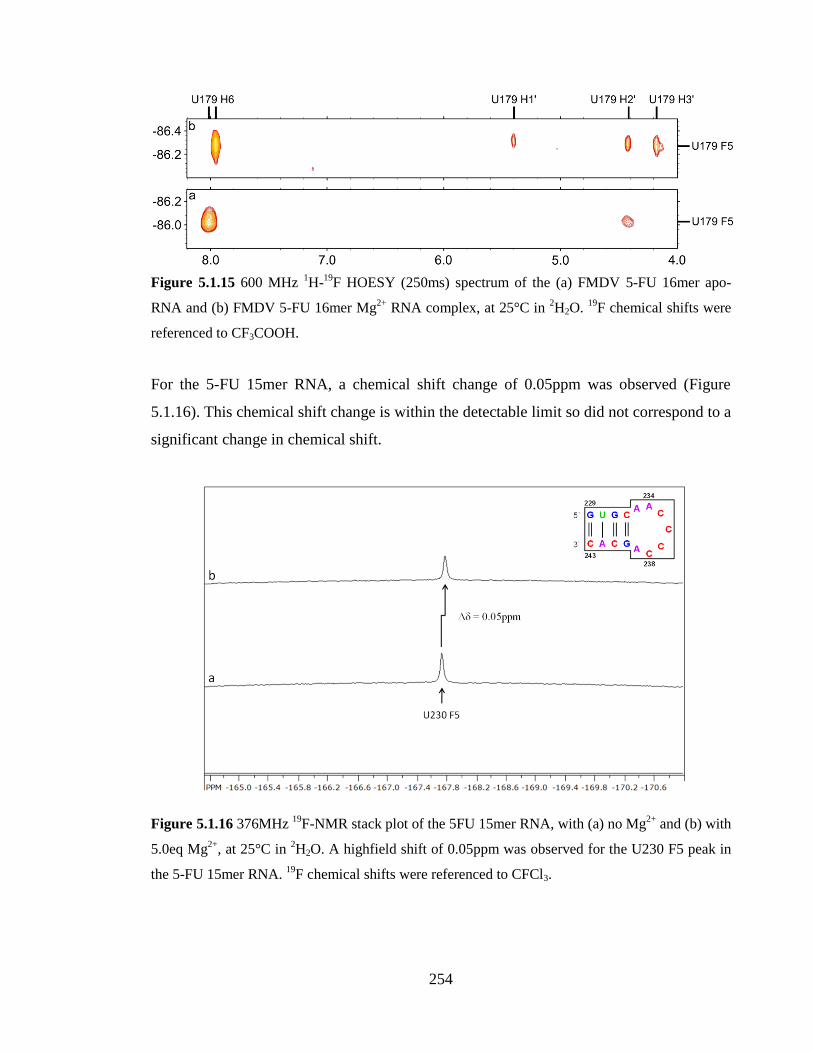
254
Figure 5.1.15 600 MHz 1H-
19F HOESY (250ms) spectrum of the (a) FMDV 5-FU 16mer apo-
RNA and (b) FMDV 5-FU 16mer Mg2+
RNA complex, at 25°C in 2H2O.
19F chemical shifts were
referenced to CF3COOH.
For the 5-FU 15mer RNA, a chemical shift change of 0.05ppm was observed (Figure
5.1.16). This chemical shift change is within the detectable limit so did not correspond to a
significant change in chemical shift.
Figure 5.1.16 376MHz 19
F-NMR stack plot of the 5FU 15mer RNA, with (a) no Mg2+
and (b) with
5.0eq Mg2+
, at 25°C in 2H2O. A highfield shift of 0.05ppm was observed for the U230 F5 peak in
the 5-FU 15mer RNA. 19
F chemical shifts were referenced to CFCl3.
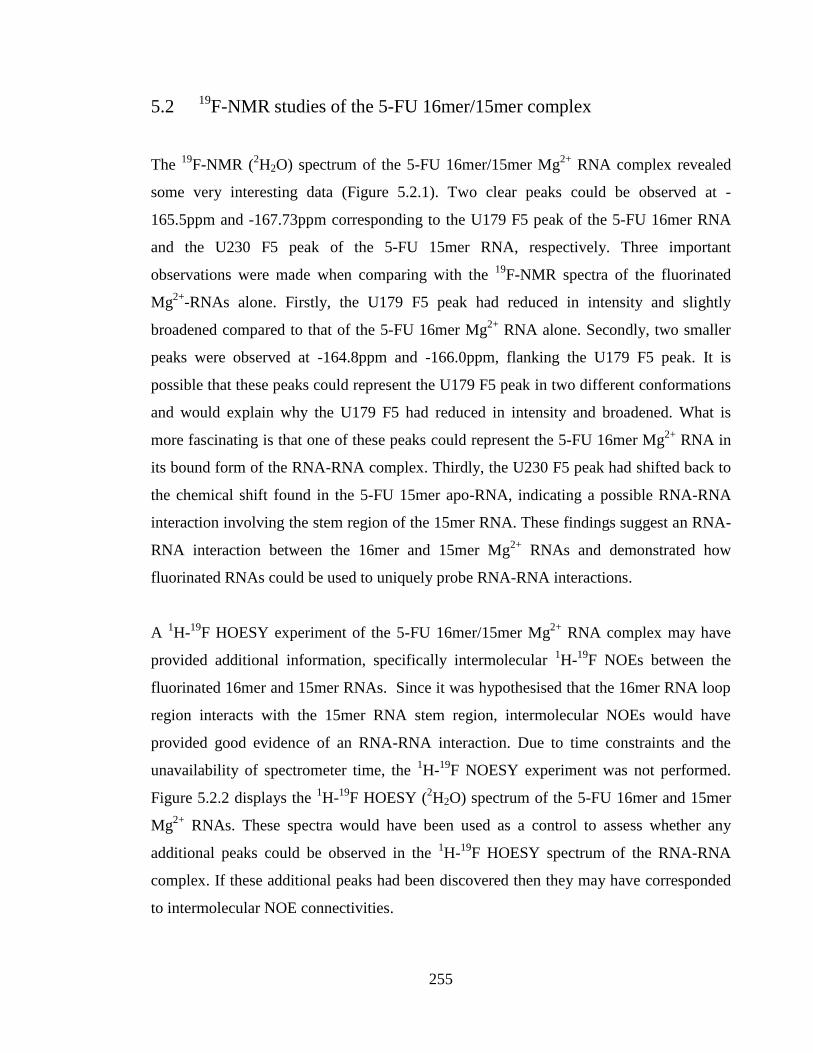
255
5.2 19F-NMR studies of the 5-FU 16mer/15mer complex
The 19
F-NMR (2H2O) spectrum of the 5-FU 16mer/15mer Mg
2+ RNA complex revealed
some very interesting data (Figure 5.2.1). Two clear peaks could be observed at -
165.5ppm and -167.73ppm corresponding to the U179 F5 peak of the 5-FU 16mer RNA
and the U230 F5 peak of the 5-FU 15mer RNA, respectively. Three important
observations were made when comparing with the 19
F-NMR spectra of the fluorinated
Mg2+
-RNAs alone. Firstly, the U179 F5 peak had reduced in intensity and slightly
broadened compared to that of the 5-FU 16mer Mg2+
RNA alone. Secondly, two smaller
peaks were observed at -164.8ppm and -166.0ppm, flanking the U179 F5 peak. It is
possible that these peaks could represent the U179 F5 peak in two different conformations
and would explain why the U179 F5 had reduced in intensity and broadened. What is
more fascinating is that one of these peaks could represent the 5-FU 16mer Mg2+
RNA in
its bound form of the RNA-RNA complex. Thirdly, the U230 F5 peak had shifted back to
the chemical shift found in the 5-FU 15mer apo-RNA, indicating a possible RNA-RNA
interaction involving the stem region of the 15mer RNA. These findings suggest an RNA-
RNA interaction between the 16mer and 15mer Mg2+
RNAs and demonstrated how
fluorinated RNAs could be used to uniquely probe RNA-RNA interactions.
A 1H-
19F HOESY experiment of the 5-FU 16mer/15mer Mg
2+ RNA complex may have
provided additional information, specifically intermolecular 1H-
19F NOEs between the
fluorinated 16mer and 15mer RNAs. Since it was hypothesised that the 16mer RNA loop
region interacts with the 15mer RNA stem region, intermolecular NOEs would have
provided good evidence of an RNA-RNA interaction. Due to time constraints and the
unavailability of spectrometer time, the 1H-
19F NOESY experiment was not performed.
Figure 5.2.2 displays the 1H-
19F HOESY (
2H2O) spectrum of the 5-FU 16mer and 15mer
Mg2+
RNAs. These spectra would have been used as a control to assess whether any
additional peaks could be observed in the 1H-
19F HOESY spectrum of the RNA-RNA
complex. If these additional peaks had been discovered then they may have corresponded
to intermolecular NOE connectivities.
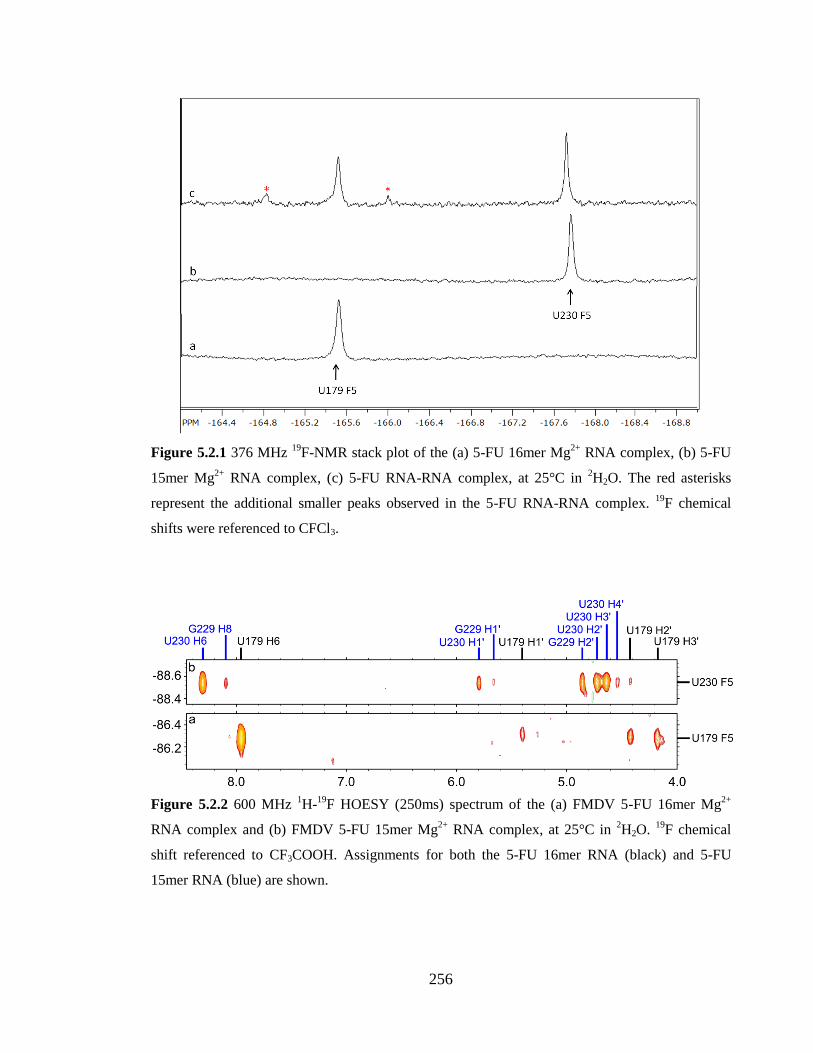
256
Figure 5.2.1 376 MHz 19
F-NMR stack plot of the (a) 5-FU 16mer Mg2+
RNA complex, (b) 5-FU
15mer Mg2+
RNA complex, (c) 5-FU RNA-RNA complex, at 25°C in 2H2O. The red asterisks
represent the additional smaller peaks observed in the 5-FU RNA-RNA complex. 19
F chemical
shifts were referenced to CFCl3.
Figure 5.2.2 600 MHz 1H-
19F HOESY (250ms) spectrum of the (a) FMDV 5-FU 16mer Mg
2+
RNA complex and (b) FMDV 5-FU 15mer Mg2+
RNA complex, at 25°C in 2H2O.
19F chemical
shift referenced to CF3COOH. Assignments for both the 5-FU 16mer RNA (black) and 5-FU
15mer RNA (blue) are shown.
257
Chapter 6: Conclusion and Future work
6.1 Conclusion
The main aim of the project was to investigate the three dimensional structure, kinetics
and interactions of the conserved RNA motifs in the FMDV IRES. Specifically, there
were three main areas in this thesis that were of prime interest: the NMR structures of the
16mer and 15mer apo-RNAs, the effect of Mg2+
on these conserved RNAs and the RNA-
RNA interaction. In this chapter, the findings of these three main areas will be
summarised. Finally, suggestions for future work are indicated.
6.1.1 Structure of the conserved RNA motifs
The NMR structure of the 16mer and 15mer apo-RNAs provided deep insight into the
tertiary structure of these RNA motifs. Firstly, the NMR structures confirmed the
predicted secondary structure of the 16mer and 15mer RNAs. The 16mer apo-RNA NMR
structure was found to have six base pairs and four unpaired nucleotides in the tetraloop.
The 15mer apo-RNA NMR structure was found to have four base pairs with a large
heptaloop. This demonstrates that NMR structures can be used to ascertain and verify the
secondary structure of RNA motifs, which have been previously determined by other
experimental methods.
Secondly, detailed analysis of the NMR structures provided interesting features of the
tertiary structures. For the 16mer apo-RNA NMR structure, the six base pairs were found
to conform to the canonical A-form helical conformation. However, the terminal base pair
(U172-A187) was found to be frayed, caused by more exposure to the solvent. This
suggested that terminal A.U base pairing may be susceptible to destabilisation and fraying.
Additionally, the NMR data clearly showed a C2ʹ-endo sugar conformation for the U172
and A187 nucleotides. Four unpaired nucleotides were found in the GNRA tetraloop
(G178UAA181), with the G178 base stacked on the 5ʹ-end and the three succeeding bases
stacked on the 3ʹ-end. The GUAA tetraloop structure also showed that the two main
258
factors involved in stabilising the GUAA tetraloop are base stacking and intramolecular
interactions. Base stacking would have the largest contribution to the stabilisation of the
GUAA tetraloop. However, both specific and non-specific base-phosphate interactions
were observed in the GUAA tetraloop, which would play a significant role in stabilising
the GUAA tetraloop. Furthermore, the NMR data confirmed that the A180 nucleotide, in
the GUA180A tetraloop, possessed a C2ʹ-endo sugar conformation. Interestingly, the NMR
data also confirmed the existence of conformational exchange of the sugar pucker for the
loop nucleotides of the 16mer apo-RNA.
For the 15mer apo-RNA NMR structure, the four base pairs were found to conform to the
typical A-form helical conformation, despite the presence of a large heptaloop. The
terminal base pair (G229-C243) formed a standard base pairing conformation and was not
frayed like the terminal A.U base pair in the 16mer apo-RNA NMR structure. This
suggests that terminal G.C base pairs are much more stable than terminal A.U base pairs
in hairpin loops. Seven unpaired nucleotides formed the heptaloop in the 15mer apo-RNA
NMR structure. Since this was the first heptaloop RNA structure to be studied by any
structure determination method to the best of our knowledge, it was an exciting prospect
to observe the tertiary structure of the heptaloop (A233ACCCCA239). The base stacking
formation was not as simple as observed for the GUAA tetraloop in the 16mer apo-RNA
NMR structure. The first two bases (A233 and A234) stacked at an angle on the 5ʹ-end,
while the last three bases (C237, C238 and A239) were found to be stacked. Similar to the
GUAA tetraloop of the 16mer apo-RNA NMR structure, the largest contribution to
stabilisation would come from the base stacking interactions. However, a large number of
non-specific base-phosphate and sugar-phosphate interactions were also observed in the
heptaloop structure, playing a significant part in loop stability.
Overall, the 16mer and 15mer apo-RNA NMR structures have provided detailed
information about the tertiary conformation of RNA hairpin loops, which will impart a
greater understanding of RNA structure. This also presented a good opportunity to study
the role of Mg2+
and investigate the RNA-RNA interaction between the 16mer and 15mer
RNAs.
259
6.1.2 The role of Mg2+
Mg2+
plays an essential role in RNA stability, RNA folding and RNA-RNA interactions.
The 16mer RNA was used as a model to study the effect of Mg2+
on RNA structure and
stability using NMR methods. The results obtained provided new knowledge about the
role of Mg2+
. There are two main effects of Mg2+
that will be discussed. The first describes
the effect of Mg2+
on RNA structure and the second will describe the effect of Mg2+
on
RNA stability.
It was hypothesised that Mg2+
can interact with 16mer RNA, thereby changing the tertiary
conformation in order to increase the stability of the entire 16mer RNA. 1H-NMR
experiments immediately confirmed that Mg2+
was having an effect on the 16mer
tetraloop, as large chemical shift changes were observed for the loop G178 and G177
imino protons. Significant chemical shift changes to the exchangeable and non-
exchangeable protons in the 16mer stem and loop regions, strongly suggested a Mg2+
-
induced change in tertiary conformation. This was supported by analogous chemical shift
changes observed in the 15mer RNA. 31
P-NMR experiments were able to establish that
Mg2+
induced changes to the phosphate backbone of the entire length of the 16mer RNA,
specifically to the tetraloop region. A lowfield chemical shift change found for the U179
phosphorus indicated possible specific interaction of chelated Mg2+
ions in proximity to
the G178 and U179 nucleotides. 19
F-NMR experiments revealed a significant 19
F chemical
shift change to U179 F5, which further supported the effect of Mg2+
on the tetraloop.
For the first time, the NMR structure of a hairpin loop was generated, with and without
Mg2+
. This provided a novel understanding into the Mg2+
-induced structural changes and
its link to RNA stability. The NMR structures revealed enhanced stability for the terminal
base pair (U172-A187), since the base pair was not frayed in the 16mer Mg2+
RNA
complex and the U172 base was able to stack with the adjacent C173 base. This structural
change was accompanied by a change in sugar conformation for U172 from C2ʹ-endo to
C3ʹ-endo. The most significant structural changes were found for the 16mer GUAA
tetraloop. The tetraloop was altered by the presence of Mg2+
to become more compact,
260
allowing for better base stacking and stronger intramolecular interactions. These changes
would directly lead to a significant enhancement in loop stability, contributing to the
stability of the whole 16mer RNA structure.
Evidence of Mg2+
increasing thermodynamic stability of the 16mer RNA was clearly
apparent in the VT series and imino proton exchange experiments. The G186 and G177
imino proton peaks were clearly exchange retarded in the presence of Mg2+
at 35°C. In
addition, Mg2+
was able to significantly stabilise the base pairing at a higher temperature
of 45°C. Imino proton exchange rates revealed that the stem base pairing was very stable
up to 15°C, due to low exchange rates of the stem imino protons. Conversely, the loop
G178 imino exchange rate was higher compared to the stem imino protons due to
increased exposure to the solvent. From the imino proton exchange experiments, it was
discovered that Mg2+
was able to significantly increase the base pair stability of A.U base
pairs, which would have the consequence of stabilising the stem region even further.
Mg2+
has long been known to increase stability of RNA structure, but the mechanism by
which Mg2+
is able to induce structural and dynamical changes to RNA structure has still
eluded researchers. This investigation has provided a greater understanding for the role of
Mg2+
with the conclusion that Mg2+
is able to alter the RNA structure to improve stability
through maximising base stacking and intramolecular interactions.
6.1.3 RNA-RNA interaction
It was hypothesised, by E. Martínez-Salas and co-workers10
that the FMDV 16mer and
15mer RNA motifs interact with each other, forming long-range tertiary contacts.
Although it was not possible to study the interaction between these two RNAs as part of
the whole native hammerhead region, it presented an important opportunity to investigate
the interaction between two small hairpin loop structures.
The most significant observation that was made in the RNA-RNA complex is that the loop
G178 imino proton peak of the 16mer RNA was considerably reduced in intensity caused
261
by faster exchange with water; confirmed by the calculated imino proton exchange rates.
This suggested the possibility that the 16mer tetraloop was involved in forming RNA-
RNA interactions. Changes in linewidth and intensity of peaks in the 1H-NMR spectra and
chemical shift changes in the NOESY spectra provided further evidence of RNA-RNA
interactions. In addition, a lower number of chemical shift changes were observed at a
higher temperature, indicating a temperature-dependent interaction between the two RNAs.
19F-NMR experiments revealed two extra fluorine peaks for U179 F5 of the 5-FU 16mer
RNA indicating a possible equilibrium between two different RNA-RNA interactions.
These results indicated that there is a weak interaction between the two RNAs. However,
it is entirely possible that this interaction is much stronger when the two RNAs are part of
the whole apical region of domain 3 in the FMDV IRES. Therefore, further work must be
performed to understand the critical role of the 16mer GNRA tetraloop in IRES function.
6.1.4 Errors and their implications
The results described in the thesis were all subject to experimental, systematic and random
errors. Experimental errors were mainly related to errors in the measurement of chemical
shifts and the assignment of resonances in NMR spectra. These were very few and
minimised further by carefully checking the chemical shift data and assignments to make
sure that they were all correct. Examples of systematic errors can include instrumental
error, changes in environment during the running of long NMR experiments such as
variation in temperature and imperfect calibration of NMR data. Since these errors are
inherent to any data acquisition they were difficult to minimise by any later action.
Random errors can be related to the measurement of chemical shifts, coupling constants,
linewidth, NOE intensities, T1 and Kex from NMR data. These errors were minimised by
either setting a detectable limit for changes in values or by making repeated measurements.
The errors mentioned above were not significant enough to affect either the results or their
interpretation. Therefore, the conclusions drawn from the results are reliable and valid.
262
6.2 Future work
The purpose of studying the FMDV IRES was to use it as a model to gain better
understanding in the area of RNA structural biology and also to unravel the mechanism of
translation initiation. The studies conducted in this thesis have provided valuable insight
into the structure, kinetics and interactions of RNA and are the first steps to advancing our
knowledge on IRES translation initiation. The relationship between the IRES structure and
its function is still unknown at this time. To provide a greater understanding of the
complex nature of the conserved RNA motifs in the FMDV IRES further experiments
must be performed in order to achieve this outcome.
6.2.1 Binding of Mg2+
ions to RNA
NMR spectroscopy has been used to investigate the effect of Mg2+
binding with RNA,
whereby chemical shift mapping and imino proton exchange experiments were utilised.
However, other experimental methods must be imposed to provide direct evidence for the
interaction between Mg2+
and RNA structure. Two important techniques used in NMR for
the investigation of Mg2+
interaction are paramagnetic line broadening and the use of
cobalt hexamine (Co(NH3)63+
).115
116
Line broadening experiments use paramagnetic ions
such as Mn2+
to substitute Mg2+
. The proximity of Mn2+
ions to RNA structure induces
line broadening due to faster relaxation of specific proton peaks, which represent nuclei
within 5Å from Mn2+
. These peaks can be identified and indicate the possible site of Mg2+
binding. Cobalt hexamine (Co(NH3)63+
) is an analogue of Mg2+
that is used in NMR
spectroscopy to mimic Mg2+
ions. The advantage of using cobalt hexamine is that it
provides direct NOE contacts between the NH3 protons of (Co(NH3)63+
) and RNA protons.
2J-[
1H,
15N]-HSQC NMR experiments can also be used to probe the direct coordination of
Mg2+
to N7 of purines.117
Changes in chemical shift to N7 and H8 nuclei can both be
monitored upon addition of Mg2+
, which may give an indication of the binding mode of
Mg2+
.
263
6.2.2 Isotopically labelled RNA
Uniformly, 13
C- and 15
N-isotopically labelled RNA samples would provide a great
opportunity to perform a wide variety of NMR experiments. Not only will this
substantially aid in more reliable assignments for structure determination, but will also
provide new prospects of studying RNA dynamics and interactions. A new strategy can
then be employed to study the larger conserved RNA motifs in domain 3 of the FMDV
IRES. The most promising would be the 36mer RNA found in the apical region of domain
3, which constitutes the 16mer RNA. The knowledge gained could bring us closer to
understanding the relationship between RNA structure/dynamics and function.
Various 2D NMR experiments can be performed for the identification and assignment of
protons in 13
C/15
N-labelled RNAs. These experiments include the 2D 1H-
15N HSQC
118,
the 2D HCNCH119
and the HNN-COSY120
. The combination of uniformly labelled RNA
and 3D NMR experiments can provide a means of unambiguous assignment and
significantly reduce the problem of overlapping peaks. These experiments include the 3D
1H-
13C HSQC-NOESY
121, the 3D HCCH-TOCSY
122 and the 3D HCP
123.
In order to study larger RNAs by NMR spectroscopy, such as the 79mer RNA in domain 3
of the FMDV IRES, different labelling strategies will have to be employed. This is
because there are two major problems that come with larger RNAs, spectral overlap and
increased linewidth.124
Signal overlapping problems become increasingly substantial with
larger RNAs as there are a greater number of protons in the same given spectra width.
Furthermore, the slower tumbling of larger RNAs results in more efficient T2 relaxation
and increasing linewidths. Therefore, to overcome these limitations, alternate labelling
strategies must be sought, mainly involving selective and segmental labelling of RNA.125
An example of selective labelling involves the use of deuterium (2H) isotopes, which can
produce >90% enriched RNA samples. The great advantage of this labelling strategy is
that it solves the problem of spectral overlap and increases sensitivity due to reduced
linewidths. Segmental labelling involves ligating an isotopically labelled RNA to a larger
unlabelled RNA. This method may be applied to the 79mer RNA, whereby the labelled
264
36mer RNA is ligated with unlabelled RNA. It is believed that the 79mer RNA produces a
stable four-way junction, which has yet to be studied by NMR, and will be crucial to
understanding its role in the IRES mechanism. Subsequently, 2D and 3D filtered/edited
experiments can then be employed to remove the signals from protons attached to labelled
nuclei while retaining signals from protons attached to unlabelled nuclei, and vice
versa.126
This would facilitate the NMR assignment and structure determination of the
labelled and unlabelled regions of the 79mer RNA.
6.2.3 RNA tertiary contacts
IRES activity depends upon the formation of tertiary RNA contacts within domain 3 of the
FMDV IRES. With the advances in labelling strategies and NMR techniques, it is possible
to study RNA-RNA interactions within large RNAs instead of studying two separate RNA
molecules. Therefore, in order to investigate the possible RNA-RNA interaction between
the GUAA tetraloop of the 16mer RNA with the 15mer RNA, one would need an RNA
that would encompass both the 16mer and 15mer RNA motifs. This would have to involve
segmental labelling, whereby the 16mer and 15mer RNAs are isotopically labelled as part
of the larger RNA. Filtered-edited NMR experiments are extremely useful in this case as
long-range tertiary interactions can be identified.
265
Papers to be published
The results of the project described in chapters 3 to 5 will be published in peer reviewed
journals and they are listed below.
1. Usman Rasul, Vasudevan Ramesh (2012) NMR studies of the structure, kinetics
and interactions of the conserved RNA motifs in the FMDV IRES. RNA, (To be
submitted).
2. Usman Rasul, Vasudevan Ramesh (2012) Elucidation of RNA-RNA interactions
in the FMDV IRES using NMR spectroscopy. Nucleic Acids Res., (To be
submitted).
266
References 1 Bedard K. M., Semler B. L. (2004) Regulation of picornavirus gene expression.
Microbes and Infection, 6, 702-713.
2 Kühn R., Luz N., Beck E. (1990) Functional analysis of the internal translation initiation
site of foot-and-mouth disease virus. J. Virol., 64(10), 4625-4631.
3 Jackson R. J., Howell M. T., Kaminski A. (1990) The novel mechanism of initiation of
picornavirus RNA translation. Trends Biochem. Sci., 15, 477-483.
4 Baird S. D., Turcotte M., Korneluk R. G., Holcik M. (2006) Searching for IRES. RNA,
12, 1-31.
5 Fernández-Miragall O., Martínez-Salas E. (2003) Structural organization of a viral IRES
depends on the integrity of the GNRA motif. RNA, 9, 1333-1344.
6 Martínez-Salas E., Fernández-Miragall O. (2004) Picornavirus IRES: structure function
relationship. Curr Pharm Des., 10(30), 3757-3767.
7 Lin J. Y., Chen T. C., Weng K. F., Chang S. C., Chen L. L., Shih S. R. (2009) Viral and
host proteins involved in picornavirus life cycle. J. Biomed. Sci., 16(1): 103.
8 Pilipenko E. V., Blinov V. M., Chernov B. K., Dmitrieva T. M., Agol V. I. (1989)
Conservation of the secondary structure elements of the 5ʹ-untranslated region of cardio-
and aphthovirus RNAs. Nucleic Acids Res., 17(14), 5701-5711.
9 López De Quinto S., Martínez-Salas E. (1997) Conserved Structural Motifs Located in
Distal Loops of Aphthovirus Internal Ribosome Entry Site Domain 3 Are Required for
Internal Initiation of Translation. J. Virol., 71, 4171-4175.
10
Fernández-Miragall O., Ramos R., Ramajo J., Martínez-Salas E. (2006) Evidence of
reciprocal tertiary interactions between conserved motifs involved in organizing RNA
structure essential for internal initiation of translation. RNA, 12, 223-234.
11
Pöyry T. A., Jackson R. J. (2011) Mechanisms governing the selection of translation
initiation sites on foot-and-mouth disease virus RNA. J. Virol., 85(19), 10178-10188.
267
12 Chevalier C., Saulnier A., Benureau Y., Fléchet D., Delgrange D., Colbére-Garapin F.,
Wychowski C., Martin A. (2007) Inhibition of hepatitis C virus infection in cell culture by
small interfering RNAs. Mol. Ther., 15(8), 1452-1462.
13
Kikuchi K., Umehara T., Nishikawa F., Fukuda K., Haseqawa T., Nishikawa S. (2009)
Increased inhibitory ability of conjugated RNA aptamers against the HCV IRES. Biochem.
Biophys. Res. Commun., 386(1), 118-123.
14
Fernández N., Martínez-Salas E. (2010) Tailoring the switch from IRES-dependent to
5ʹ-end dependent translation with the RNase P ribozyme. RNA, 16(4), 852-862.
15
Gasparian A. V., Neznanov N., Jha S., Galkin O., Moran J. J., Gudkov A. V., Gurova K.
V., Komar A. A. (2010) Inhibition of EMCV and poliovirus replication by quinacrine:
implications for the design and discovery of novel anti-viral drugs. J. Virol., 84(18), 9390-
9397.
16
Seth P. P., Miyaji A., Jefferson E. A., Sannes-Lowery K. A., Osgood S. A., Propp S. S.,
Ranken R., Massire C., Sampath R., Ecker D. J., Swayze E. E., Griffey R. H. (2005) SAR
by MS: discovery of a new class of RNA-binding small molecules for the hepatitis C virus:
internal ribosome entry site subdomain IIa. J Med Chem., 48(23), 7099-7102.
17
Paulsen R. B., Seth P. P., Swayze E. E., Griffey R. H., Skalicky J. J., Cheatham T. E. III,
Davis D. R. (2010) Inhibitor-induced structural change in the HCV IRES domain IIa RNA.
Proc. Natl. Acad. Sci. USA, 107(16), 7263-7268.
18
Ngoi S. M., Chien A. C., Lee C. G. (2004) Exploiting internal ribosome entry sites in
gene therapy vector design. Curr Gene Ther., 4(1), 15-31.
19
Albagli-Curiel O., Lécluse Y., Pognonec P., Boulukos K. E., Martin P. (2007) A new
generation of pPRIG-based retroviral vectors. BMC Biotechnol., 7:85.
20
Martin P., Albaqli O., Poggi M. C., Boulukos K. E., Pognonec P. (2006) Development
of a new bicistronic retroviral vector with strong IRES activity. BMC Biotechnol., 6:4.
21
Stanway G., Brown F., Christian P., Hovi T., Hyypiä T., King A. M. Q., Knowles N. J.,
Lemon S. M., Minor P. D., Pallansch M. A., Palmenberg A. C. and Skern T. (2005).
Family Picornaviridae. In: "Virus Taxonomy. Eighth Report of the International
Committee on Taxonomy of Viruses". Eds. Fauquet C. M., Mayo M. A., Maniloff J.,
Desselberger U. and Ball L.A. Elsevier/Academic Press, London. p. 757-778.

268
22 Grubman M. J., Baxt B. (2004) Foot-and-Mouth Disease. Clin. Microbiol. Rev., 17,
465-493.
23
Hentze M. W. (1997) eIF4G: a multipurpose ribosome adapter? Science, 275, 500-501.
24
Lamphear B. J., Kirchweger R., Skern T., Rhoads R. E. (1995) Mapping of functional
domains in eukaryotic protein synthesis initiation factor 4G (eIF4G) with picornaviral
proteases. J. Biol. Chem., 270(37), 21975-21983.
25
Saleh L., Rust R. C., Füllkrug R., Beck E., Bassili G., Ochs K., Niepmann M. (2001)
Functional interaction of translation initiation factor eIF4G with the foot-and-mouth
disease virus internal ribosome entry site. J. Gen. Virol., 82, 757-763.
26
Pilipenko E. V., Pestova T. V., Kolupaeva V. G., Khitrina E. V., Poperechnaya A. N.,
Agol V. I., Hellen C. U. (2000) A cell cycle-dependent protein serves as a template-
specific translation initiation factor. Genes Dev., 14(16), 2028-2045.
27
Niepmann M. (2009) Internal Translation Initiation of Picornaviruses and Hepatitis C
virus. Biochim. Biophys. Acta., 1789(9-10), 529-541.
28
Balvay L., Rifo R. S., Ricci E. P., Decimo D., Ohlmann T. (2009) Structural and
functional diversity of viral IRESes. Biochim. Biophys. Acta., 1789(9-10), 542-557.
29
Filbin M. E., Kieft J. S. (2009) Toward a structural understanding of IRES RNA
function. Curr. Opin. Struct. Biol., 19(3), 267-276.
30
Yu Y., Abaeva I. S., Marintchev A., Pestova T. V., Hellen C. U. (2011) Common
conformational changes induced in type 2 picornavirus IRESs by cognate trans-acting
factors. Nucleic Acids Research, 39(11), 4851-4865.
31
Serrano P., Ramajo J., Martinez-Salas E. (2009) Rescue of internal initiation of
translation by RNA complementation provides evidence for a distribution of functions
between individual IRES domains. Virology, 388(1), 221-229.
32
Ramos R., Martínez-Salas E. (1999) Long-range RNA interactions between structural
domains of the Aphthovirus internal ribosome entry site (IRES). RNA, 5, 1374-1383.
33
Lopez de Quinto S., Lafuente E., Martinez –Salas E. (2001) IRES interaction with
translation initiation factors: functional characterization of novel RNA contacts with eIF3,
eIF4B, and eIF4GII. RNA, 7(9), 1213-1226.
269
34 Bloomfield V. A., Crothers D. M., Tinoco I. Jr. (2000) Nucleic acids: Structures,
properties, and functions. University science books, USA.
35
Markley J. L., Bax A., Arata Y., Hilbers C. W., Kaptein R., Sykes B. D., Wright P. E.,
Wuthrich K. (1998) Recommendations for the presentation of NMR structures of proteins
and nucleic acids. J. Mol. Biol., 280(5), 933-952.
36
Altona C., Sundaralingam M. (1972) Conformational analysis of the sugar ring in
nucleosides and nucleotides. New description using the concept of pseudorotation. JACS,
94(23), 8205-8212.
37
Watson J.D., Crick F.H.C. (1953) Molecular Structure of Nucleic Acids – A structure
for deoxyribose nucleic acid. Nature, 171, 737-738.
38
Gratzer W. B. (1969) Association of nucleic-acid bases in aqueous solution: a solvent
partition study. Eur. J. Biochem., 10, 184-187.
39
Guckian K. M., Schweitzer B. A., Ren R. X.-F., Sheils C. J., Tahmassebi D. C., Kool E.
T. (2000) Factors contributing to aromatic stacking in water: Evaluation in the context of
DNA. J. Am. Chem. Soc., 122, 2213-2222.
40
Chen Y., Varani G. (2010) RNA Structure. Encyclopedia of Life Sciences, John Wiley
& Sons Ltd.
41
Cheong C., Cheong Hae-Kap. (2010) RNA Structure: Tetraloops. Encyclopedia of Life
Sciences, John Wiley & Sons Ltd.
42
Laing C., Schlick T. (2009) Analysis of four-way junctions in RNA structures. J. Mol.
Biol., 390(3), 547-559.
43
Heus H., Pardi A. (1991) Structural Features That Give Rise to the Unusual Stability of
RNA Hairpins Containing GNRA Loops. Science, 253, 191-194.
44
Jucker F., Heus H., Yip P., Moors E., Pardi A. (1996) A Network of Heterogeneous H
Bonds in GNRA Tetraloops. J. Mol. Biol., 264, 968-980.
45
Nagaswamy U., Larios-sanz M., Hury J., Collins S., Zhang Z., Zhao Q., Fox G. (2002)
NCIR: a database of non-canonical interactions in known RNA structures. Nucleic Acids
Res., 30, 395-397.
270
46 Heus H.A., Wijmenga S.S., Hoppe H., Hilbers C.W. (1997) The detailed structure of
tandem GA mismatched base pair in RNA duplexes is context dependent. J. Mol. Biol.,
271, 147-158.
47
Jucker F. M., Pardi A. (1995) GNRA tetraloops make a U-turn. RNA, 1, 219-222.
48
Zirbel C. L., Sponer J. E., Sponer J., Stombaugh J., Leontis N. B. (2009) Classification
and energetics of the base-phosphate interactions in RNA. Nucleic Acids Res., 37(15),
4898-4918.
49
Ulyanov N. B., James T. L. (2010) RNA structural motifs that entail hydrogen bonds
involving sugar-backbone atoms of RNA. New J. Chem., 34(5), 910-917.
50
Carter R. J., Holbrook S. R. (2003) RNA structure: Roles of divalent metal ions.
Encyclopedia of Life Sciences, John Wiley & Sons Ltd.
51
Pyle A. (2002) Metal ions in the structure and function of RNA. J. Biol. Inorg. Chem.,
7-8, 679-690.
52
Draper D. E. (2004) A guide to ions and RNA structure. RNA, 10, 335-343.
53
Phelan M., Banks R. J., Conn G., Ramesh V. (2004) NMR studies of the structure and
Mg2+
binding properties of a conserved RNA motif of EMCV picornavirus IRES element.
Nucleic Acids Res., 32, 4715-4724.
54
Woodson S. A. (2005) Metal ions and RNA folding: a highly charged topic with a
dynamic future. Curr. Opin. Chem. Biol., 9(2), 104-109.
55
Draper D.E (2008) RNA Folding: Thermodynamic and Molecular Descriptions of the
Roles of Ions. Biophys. J., 95(12), 5489-5495.
56
Draper D. E., Grilley D., Soto A. M. (2005) Ions and RNA folding. Annu. Rev. Biophys.
Biomol. Struct., 34, 221-243.
57
Draper D. E., Visra V. K. (1998) RNA shows its metal. Nat. Struct. Biol., 5(11), 927-
930.
58
Rasul U. (2007) NMR, molecular modeling and biophysical studies of conserved stem-
loop RNA motifs of EMCV and FMDV IRES. MSc (Cheminformatics) thesis, University
of Manchester.
271
59 Geary C., Baudrey S., Jaeger L. (2008) Comprehensive features of natural and in vitro
selected GNRA tetraloop-binding receptors. Nucleic Acids Res., 36(4), 1138-1152.
60
Ohuchi S. P., Ikawa Y., Nakamura Y. (2008) Selection of a novel class of RNA-RNA
interaction motifs based on the ligase ribozyme with defined modular architecture. Nucleic
Acids Res., 36(11), 3600-3607.
61
Noller H. F. (2005) RNA structure: reading the ribosome. Science, 309(5740), 1508-
1514.
62
Battle D. J., Doudna J. A. (2002) Specificity of RNA-RNA helix recognition. Proc. Natl.
Acad. Sci. U S A, 99(18), 11676-11681.
63
Correll C. C., Swinger K. (2003) Common and distinctive features of GNRA tetraloops
based on a GUAA tetraloop structure at 1.4 Å resolution. RNA, 9, 355-363.
64
Prathiba J., Malathi R. (2008) Group I introns and GNRA tetraloops: remnants of ‘The
RNA World’. Mol. Biol. Rep., 35(2), 239-249.
65
Nissen P., Ippolito J. A., Ban N., Moore P. B., Steitz T. A. (2001) RNA tertiary
interactions in the large ribosomal subunit: the A-minor motif. Proc. Natl. Acad. Sci. USA,
98(9), 4899-4903.
66
Abraham R. J., Fisher J., Loftus P. (1988) Introduction to NMR spectroscopy. John
Wiley & Sons Ltd., England; Reprint Edition.
67
Harris R. K., Becker E. D., Cabral de Menezes S. M., Goodfellow R., Granger P. (2002)
NMR Nomenclature: Nuclear spin properties and conventions for chemical shifts. IUPAC
recommendations 2001. Solid State Nucl. Magn. Reson., 22(4), 458-483.
68
Karplus M. (1963) Vicinal proton coupling in nuclear magnetic resonance. J. Am. Chem.
Soc., 85, 2870-2871.
69
Overhauser A. W. (1953) Polarization of Nuclei in Metals. Phys. Rev., 92, 411-415.
70
Anet F. A. L., Bourn A. J. R. (1965) Nuclear Magnetic Spectral Assignments from
Nuclear Overhauser Effects. J. Am. Chem. Soc., 87(22), 5250-5251.
71
Gueron M., Leroy J. L. (1995) Studies of base pair kinetics by NMR measurement of
proton exchange. Methods Enzymol., 261, 383-413.
272
72 Snoussi K., Leroy J. L. (2001) Imino proton exchange and base-pair kinetics in RNA
duplexes. Biochemistry, 40(30), 8898-8904.
73
Lee J. H., Pardi A. (2007) Thermodynamics and kinetics for base-pair opening in the P1
duplex of the Tetrahymena group I ribozyme. Nucleic Acids Res., 35(9), 2965-2974.
74
Berger S., Braun S., Kalinowski H. (1997) NMR spectroscopy of the non-metallic
elements. John Wiley & Sons Ltd., England.
75
Cobb S. L., Murphy C. D. (2009) 19
F NMR applications in chemical biology. J.
Fluorine Chem., 130(2), 132-143.
76
Puffer B., Kreutz C., Rieder U., Ebert M. O., Konrat R., Micura R. (2009) 5-Fluoro
pyrimidines: labels to probe DNA and RNA secondary structures by 1D 19
F NMR
spectroscopy. Nucleic Acids Res., 37(22), 7728-7740.
77
Gorenstein D. G., Goldfield E. M. (1982) High resolution phosphorus NMR
spectroscopy of transfer ribonucleic acids. Mol. Cell Biochem., 46(2), 97-120.
78
Aue W. P., Bartholdi W., Ernst R. R. (1975) Two-dimensional spectroscopy -
application to nuclear magnetic resonance. J Chem Phys., 64(5), 2229-2246.
79
Vuister G. W., Boelens R., Kaptein R. (1988) Nonselective three-dimensional NMR
spectroscopy. The 3D NOE-HOHAHA experiment. J. Magn Reson., 80, 176-185.
80
Hinchliffe A. (2003) Molecular modeling for beginners. John Wiley & Sons Ltd.,
England.
81
Brooks B. R., Bruccoleri R. E., Olafson B. D., States D. J., Swaminathan S., Karplus M.
(1983) CHARMM: A program for macromolecular energy, minimization, and dynamics
calculations. J. Comp. Chem., 4, 187-217.
82
Weiner S. J., Kollman P. A., Case D. A., Singh U. C., Ghio C., Alagona G., Profeta S.
Jr., Weiner P. (1984) A new force field for molecular mechanical simulation of nucleic
acids and proteins. J. Am. Chem. Soc., 106, 765-784.
83
Piotto M., Saudek V., Sklenar V. (1992) Gradient-tailored excitation for single-quantum
NMR spectroscopy of aqueous solutions. J. Biomol. NMR, 2(6), 661-665.
273
84 Hoult D. I. (1976) Solvent peak saturation with single phase and quadrature Fourier
transformation. J. Magn. Reson., 21(2), 337.
85
Delaglio F., Grzesiek S., Vuister G. W., Zhu G., Pfeifer J., Bax A. (1995) NMRPipe: a
multidimensional spectral processing system based on UNIX pipes. J Biomol NMR, 6,
277-293.
86
Gottlieb H., Kotlyar V., Nudelman A. (1997) NMR Chemical Shifts of Common
Laboratory Solvents as Trace Impurities. J Org Chem, 62, 7512-7515.
87
Goddard T. D., Kneller D. G., SPARKY 3, University of California, San Francisco.
88
Vranken W. F., Boucher W., Stevens T. J., Fogh R. H., Pajon A., Llinas M., Ulrich E.
L., Markley J. L., Ionides J., Laue E. D. (2005) The CCPN data model for NMR
spectroscopy: development of a software pipeline. Proteins, 59(4), 687-696.
89
Morris G. A., Freeman R. (1978) Selective excitation in Fourier transform nuclear
magnetic resonance. J. Magn. Reson., 29(3), 433-462.
90
Bodenhausen G., Kogler H., Ernst R. R. (1984) Selection of coherence transfer
pathways in NMR pulse experiments. J. Magn. Reson., 58, 370-388.
91
Piantini U., Sorensen O. W., Ernst R. R. (1982) Multiple quantum filters for elucidating
NMR coupling networks. JACS, 104, 6800-6801.
92
Rance M., Sorensen O. W., Bodenhausen G., Wagner G. (1983) Improved spectral
resolution in COSY 1H NMR spectra of proteins via double quantum filtering. Biochem.
Biophys. Res. Commun., 117(2), 479-485.
93
Braunschweiler L., Ernst R. R. (1983) Coherence transfer by isotropic mixing:
Application to proton correlation spectroscopy. J. Magn. Reson., 53(3), 521-528.
94
Bax A., Davis D. G. (1985) MLEV-17 based 2D homonuclear magnetisation transfer
spectroscopy. J. Magn. Reson., 65(2), 355-360.
95
Morris G. A., Freeman R. (1979) Enhancement of nuclear magnetic resonance signals
by polarization transfer. JACS, 101(3) 780-762.
96
Bodenhausen G., Ruben D. J. (1980) Natural abundance Nitrogen-15 NMR by
enhanced heteronuclear spectroscopy. Chem. Phys. Letters., 69(1), 185-189.
274
97 Jeener J., Meier B. H., Bachmann P., Ernst R. R. (1979) Investigation of exchange
processes by two-dimensional NMR spectroscopy. J. Chem. Phys., 71(11), 4546-4553.
98
Metzler W. J., Leighton P., Ponzy L. (1988) Two-dimensional heteronuclear NOE
spectroscopy; Application to 19F-labeled oligodeoxyribonucleotides. J. Magn. Reson.,
76(3), 534-539.
99
Rinaldi P. L. (1983) Heteronuclear 2D-NOE spectroscopy. J. Am. Chem. Soc., 105(15),
5167-5168.
100
Meiboom S., Gill D. (1958) Modified spin-echo method for measuring nuclear
relaxation times. Rev. Sci. Instrum., 29(8), 688-691.
101
Luy B., Marino J. P. (2001) 1H-
31P CPMG-correlated experiments for the assignment
of nucleic acids. J. Am. Chem. Soc., 123(45), 11306-11307.
102
Nooren I. M., Wang K. Y., Borer P. N., Pelczer I. (1998) Full 1H NMR assignment of 2
24-nucleotide RNA hairpin: Application of the 1H 3D-NOE/2QC experiment. J. Biomol.
NMR, 11(3), 319-328.
103
Varani G., Aboul-ela F., Allain F. H. T. (1996) NMR investigation of RNA structure.
Prog. In NMR Spec., 29, 51-127.
104
Fürtig B., Richter C., Wöhnert J., Schwalbe H. (2003) NMR Spectroscopy of RNA.
Chembiochem, 4, 936-962.
105
Flinders J., Dieckmann T. (2006) NMR spectroscopy of ribonucleic acids. Prog. in
NMR Spec., 48, 137-159.
106
Schwieters C. D., Kuszewski J. J., Clore G. M. (2006) Using Xplor–NIH for NMR
molecular structure determination. Prog. in NMR Spec., 48, 47-62.
107
Schwieters C. D., Clore G. M. (2001) The VMD-XPLOR visualisation package for
NMR structure refinement. J. Magn. Res., 149, 239-244.
108
Lu X-J, Olson W. K. (2003) 3DNA: a software package for the analysis, rebuilding and
visualization of three-dimensional nucleic acid structures. Nucleic Acids Res., 31(17),
5108-5121.
275
109 Lavery R., Sklenar H. (1988) The definition of generalised helicoidal parameters and
of axis curvature for irregular nucleic acids. J. Biomol. Struct. Dyn., 6(1), 63-91.
110
Olson W. K., Bansal M., Burley S. K., Dickerson R. E., Gerstein M., Harvey S. C.,
Heinemann U., Lu X. J., Neidle S., Shakked Z., Sklenar H., Suzuki H., Tung C. S.,
Westhof E., Wolberger C., Berman H. M. (2001) A standard reference frame for the
description of nucleic acid base-pair geometry. J. Mol. Biol., 313, 229-237.
111
Chen V. B., Arendall W. B. 3rd
, Headd J. J., Keedy D. A., Immormino R. M., Kapral G.
J., Murray L. W., Richardson J. S., Richardson D. C. (2010) MolProbity: all-atom
structure validation for macromolecular crystallography. Acta Crystallogr. D. Biol.
Crystallogr., 66(Pt.1), 12-21.
112
Richardson J. S., Schneider B., Murray L. W., Kapral G. J., Immormino R. M., Headd
J. J., Richardson D. C., Ham D., Hershkovits E., Williams L. D., Keating K. S., Pyle A.
M., Micallef D., Westbrook J., Berman H. M.; RNA Ontology Consortium. (2008) RNA
backbone: consensus all-angle conformers and modular string nomenclature (an RNA
Ontology Consortium contribution). RNA, 14(3), 465-481.
113
Maderia M., Horton T. E., DeRose V. J. (2000) Metal Interactions with a GAAA RNA
Tetraloop Characterized by 31P NMR and Phosphorothioate Substitutions. Biochemistry,
39, 8193-8200.
114
Hennig M., Scott L. G., Sperling E., Bermel W., Williamson J. R. (2007) Synthesis of
5-fluoropyrimidine nucleotides as sensitive NMR probes of RNA structure. J. Am. Chem.
Soc., 129(48), 14911-14921.
115
Davis J. H., Foster T. R., Tonelli M., Butcher S. E. (2007) Role of metal ions in the
tetraloop-receptor complex as analysed by NMR. RNA, 13, 76-86.
116
Noeske J., Schwalbe H., Wöhnert J. (2007) Metal-ion binding ad metal-ion induced
folding of the adenine sensing riboswitch aptamer domain. Nucleic Acids Res., 35(15),
5262-73.
117
Erat M. C., Kovacs H., Sigel R. K. (2010) Metal ion-N7 coordination in a ribozyme
branch domain by NMR. J. Inorg. Biochem., 104(5), 611-613.
118
Fürtig B., Richter C., Bermel W., Schwalbe H. (2004) New NMR experiments for
RNA nucleobase resonance assignment and chemical analysis of an RNA UUCG tetraloop.
J. Biomol. NMR, 28(1), 69-79.
276
119 Sklenar V., Rejante M. R., Peterson R. D., Wang E., Feigon J. (1993) Two-
dimensional triple-resonance HCNCH experiment for direct correlation of ribose H1ʹ and
base H8, H6 protons in 13
C, 15
N-labeled RNA oligonucleotides. J. Am. Chem. Soc,
115(25), 12181-12182.
120
Dingley A. J., Grzesiek S. (1998) Direct observation of hydrogen bonds in nucleic acid
base pairs by internucleotide 2JNN couplings. J. Am. Chem. Soc., 120(33), 8293-8297.
121
Fesik S. W., Zuiderweg E. R. P. (1988) Heteronuclear three-dimensional NMR
spectroscopy. A strategy for the simplification of homonuclear two-dimensional NMR
spectra. J. Magn Reson., 78, 588-593.
122
Bax A., Clore G. M., Gronenborn A. M. (1990) 1H-
1H correlation via isotropic mixing
of 13
C magnetisation, a new three-dimensional approach for assigning 1H and
13C spectra
of 13-enriched proteins. J. Magn. Reson., 88(2), 425-431.
123
Heus H. A., Wijmenga S. S., van de Ven F. J. M., Hilbers C. W. (1994) Sequential
backbone assignment in 13C-labeled RNA via through-bond coherence transfer using
three-dimensional triple resonance spectroscopy (1H,
13C,
31P) and two-dimensional
Hetero-TOCSY. J. Am. Chem. Soc., 116, 4983-4984.
124
Dayie K. T. (2008) Key labelling technologies to tackle sizeable problems in RNA
structural biology. Int. J. Mol. Sci., 9(7), 1214-1240.
125
Lu K., Miyazaki Y., Summers M. F. (2010) Isotope labelling strategies for NMR
studies of RNA. J. Biomol. NMR, 46(1), 113-125.
126
Peterson R. D., Theimer C. A., Wu H., Feigon J. (2004) New applications of 2D
filtered/edited NOESY for assignment and structure elucidation of RNA and RNA-protein
complexes. J. Biomol. NMR., 28(1), 59-67.
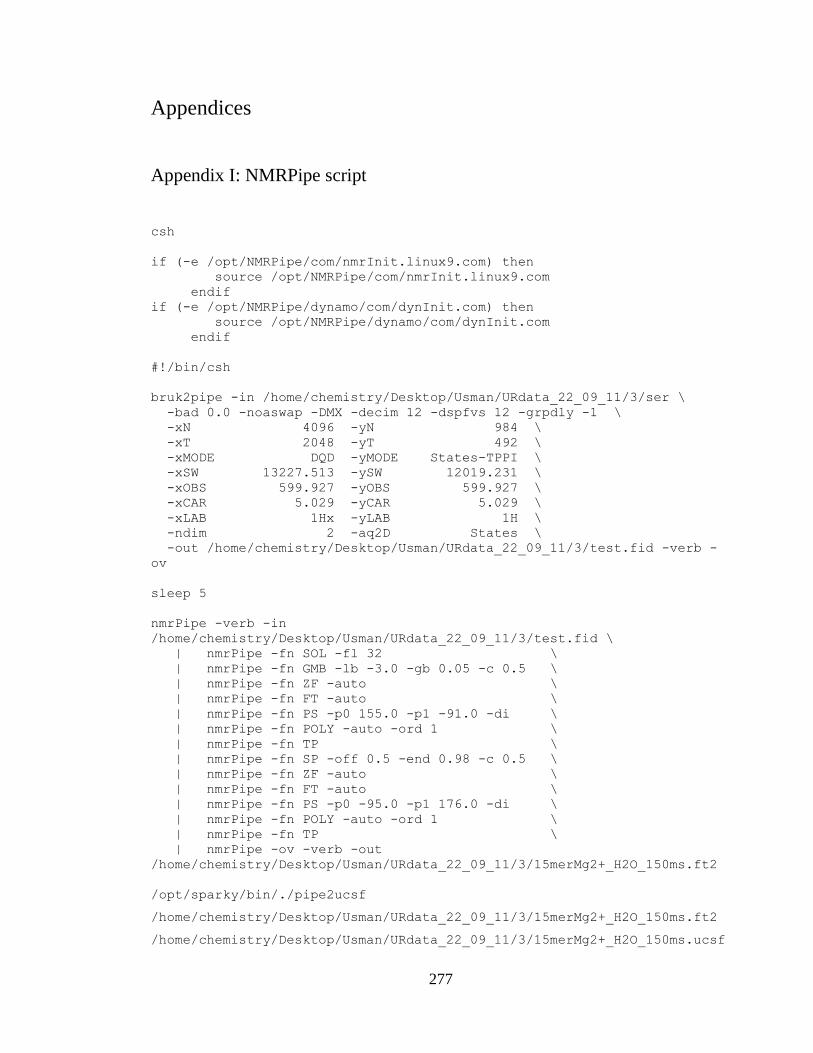
277
Appendices
Appendix I: NMRPipe script
csh
if (-e /opt/NMRPipe/com/nmrInit.linux9.com) then
source /opt/NMRPipe/com/nmrInit.linux9.com
endif
if (-e /opt/NMRPipe/dynamo/com/dynInit.com) then
source /opt/NMRPipe/dynamo/com/dynInit.com
endif
#!/bin/csh
bruk2pipe -in /home/chemistry/Desktop/Usman/URdata_22_09_11/3/ser \
-bad 0.0 -noaswap -DMX -decim 12 -dspfvs 12 -grpdly -1 \
-xN 4096 -yN 984 \
-xT 2048 -yT 492 \
-xMODE DQD -yMODE States-TPPI \
-xSW 13227.513 -ySW 12019.231 \
-xOBS 599.927 -yOBS 599.927 \
-xCAR 5.029 -yCAR 5.029 \
-xLAB 1Hx -yLAB 1H \
-ndim 2 -aq2D States \
-out /home/chemistry/Desktop/Usman/URdata_22_09_11/3/test.fid -verb -
ov
sleep 5
nmrPipe -verb -in
/home/chemistry/Desktop/Usman/URdata_22_09_11/3/test.fid \
| nmrPipe -fn SOL -fl 32 \
| nmrPipe -fn GMB -lb -3.0 -gb 0.05 -c 0.5 \
| nmrPipe -fn ZF -auto \
| nmrPipe -fn FT -auto \
| nmrPipe -fn PS -p0 155.0 -p1 -91.0 -di \
| nmrPipe -fn POLY -auto -ord 1 \
| nmrPipe -fn TP \
| nmrPipe -fn SP -off 0.5 -end 0.98 -c 0.5 \
| nmrPipe -fn ZF -auto \
| nmrPipe -fn FT -auto \
| nmrPipe -fn PS -p0 -95.0 -p1 176.0 -di \
| nmrPipe -fn POLY -auto -ord 1 \
| nmrPipe -fn TP \
| nmrPipe -ov -verb -out
/home/chemistry/Desktop/Usman/URdata_22_09_11/3/15merMg2+_H2O_150ms.ft2
/opt/sparky/bin/./pipe2ucsf
/home/chemistry/Desktop/Usman/URdata_22_09_11/3/15merMg2+_H2O_150ms.ft2
/home/chemistry/Desktop/Usman/URdata_22_09_11/3/15merMg2+_H2O_150ms.ucsf
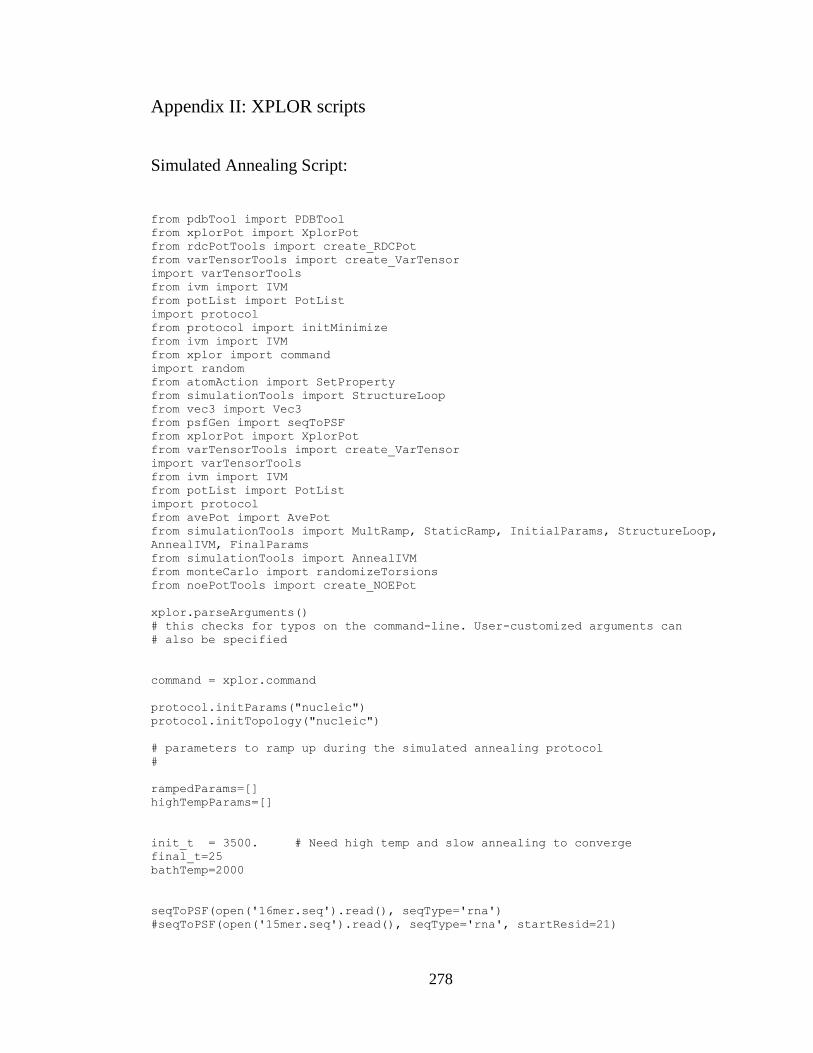
278
Appendix II: XPLOR scripts
Simulated Annealing Script:
from pdbTool import PDBTool
from xplorPot import XplorPot
from rdcPotTools import create_RDCPot
from varTensorTools import create_VarTensor
import varTensorTools
from ivm import IVM
from potList import PotList
import protocol
from protocol import initMinimize
from ivm import IVM
from xplor import command
import random
from atomAction import SetProperty
from simulationTools import StructureLoop
from vec3 import Vec3
from psfGen import seqToPSF
from xplorPot import XplorPot
from varTensorTools import create_VarTensor
import varTensorTools
from ivm import IVM
from potList import PotList
import protocol
from avePot import AvePot
from simulationTools import MultRamp, StaticRamp, InitialParams, StructureLoop,
AnnealIVM, FinalParams
from simulationTools import AnnealIVM
from monteCarlo import randomizeTorsions
from noePotTools import create_NOEPot
xplor.parseArguments()
# this checks for typos on the command-line. User-customized arguments can
# also be specified
command = xplor.command
protocol.initParams("nucleic")
protocol.initTopology("nucleic")
# parameters to ramp up during the simulated annealing protocol
#
rampedParams=[]
highTempParams=[]
init_t = 3500. # Need high temp and slow annealing to converge
final_t=25
bathTemp=2000
seqToPSF(open('16mer.seq').read(), seqType='rna')
#seqToPSF(open('15mer.seq').read(), seqType='rna', startResid=21)
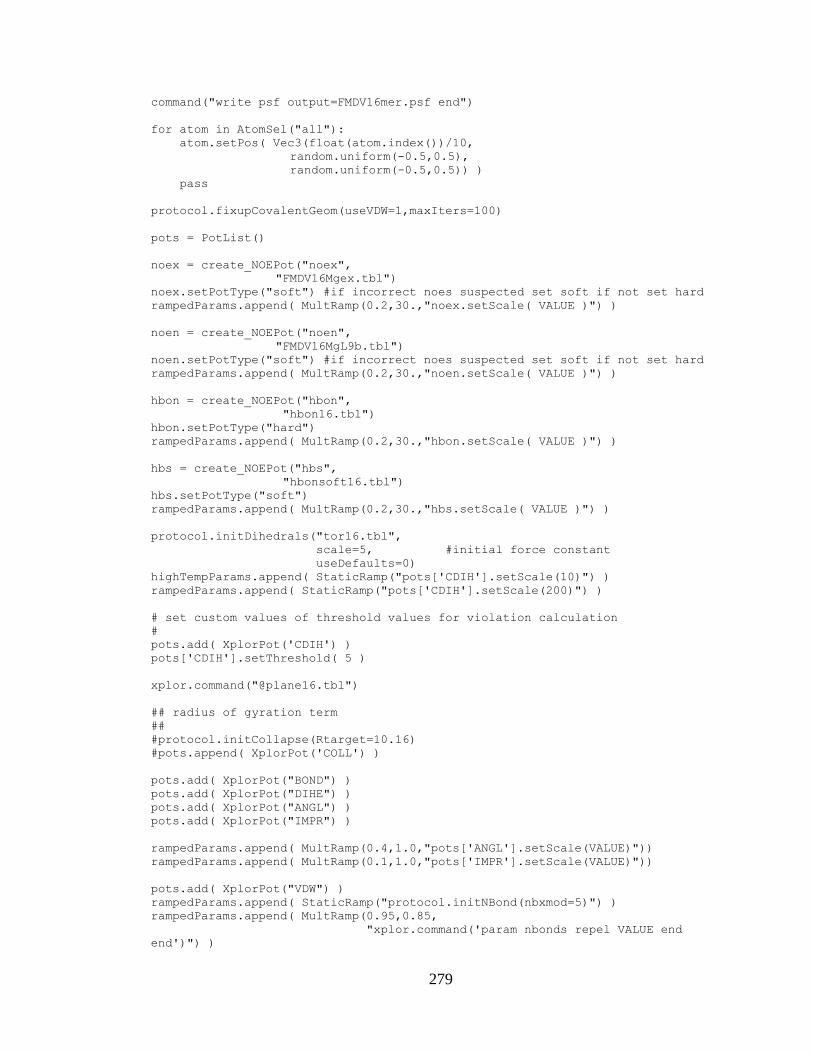
279
command("write psf output=FMDV16mer.psf end")
for atom in AtomSel("all"):
atom.setPos( Vec3(float(atom.index())/10,
random.uniform(-0.5,0.5),
random.uniform(-0.5,0.5)) )
pass
protocol.fixupCovalentGeom(useVDW=1,maxIters=100)
pots = PotList()
noex = create_NOEPot("noex",
"FMDV16Mgex.tbl")
noex.setPotType("soft") #if incorrect noes suspected set soft if not set hard
rampedParams.append( MultRamp(0.2,30.,"noex.setScale( VALUE )") )
noen = create_NOEPot("noen",
"FMDV16MgL9b.tbl")
noen.setPotType("soft") #if incorrect noes suspected set soft if not set hard
rampedParams.append( MultRamp(0.2,30.,"noen.setScale( VALUE )") )
hbon = create_NOEPot("hbon",
"hbon16.tbl")
hbon.setPotType("hard")
rampedParams.append( MultRamp(0.2,30.,"hbon.setScale( VALUE )") )
hbs = create_NOEPot("hbs",
"hbonsoft16.tbl")
hbs.setPotType("soft")
rampedParams.append( MultRamp(0.2,30.,"hbs.setScale( VALUE )") )
protocol.initDihedrals("tor16.tbl",
scale=5, #initial force constant
useDefaults=0)
highTempParams.append( StaticRamp("pots['CDIH'].setScale(10)") )
rampedParams.append( StaticRamp("pots['CDIH'].setScale(200)") )
# set custom values of threshold values for violation calculation
#
pots.add( XplorPot('CDIH') )
pots['CDIH'].setThreshold( 5 )
xplor.command("@plane16.tbl")
## radius of gyration term
##
#protocol.initCollapse(Rtarget=10.16)
#pots.append( XplorPot('COLL') )
pots.add( XplorPot("BOND") )
pots.add( XplorPot("DIHE") )
pots.add( XplorPot("ANGL") )
pots.add( XplorPot("IMPR") )
rampedParams.append( MultRamp(0.4,1.0,"pots['ANGL'].setScale(VALUE)"))
rampedParams.append( MultRamp(0.1,1.0,"pots['IMPR'].setScale(VALUE)"))
pots.add( XplorPot("VDW") )
rampedParams.append( StaticRamp("protocol.initNBond(nbxmod=5)") )
rampedParams.append( MultRamp(0.95,0.85,
"xplor.command('param nbonds repel VALUE end
end')") )
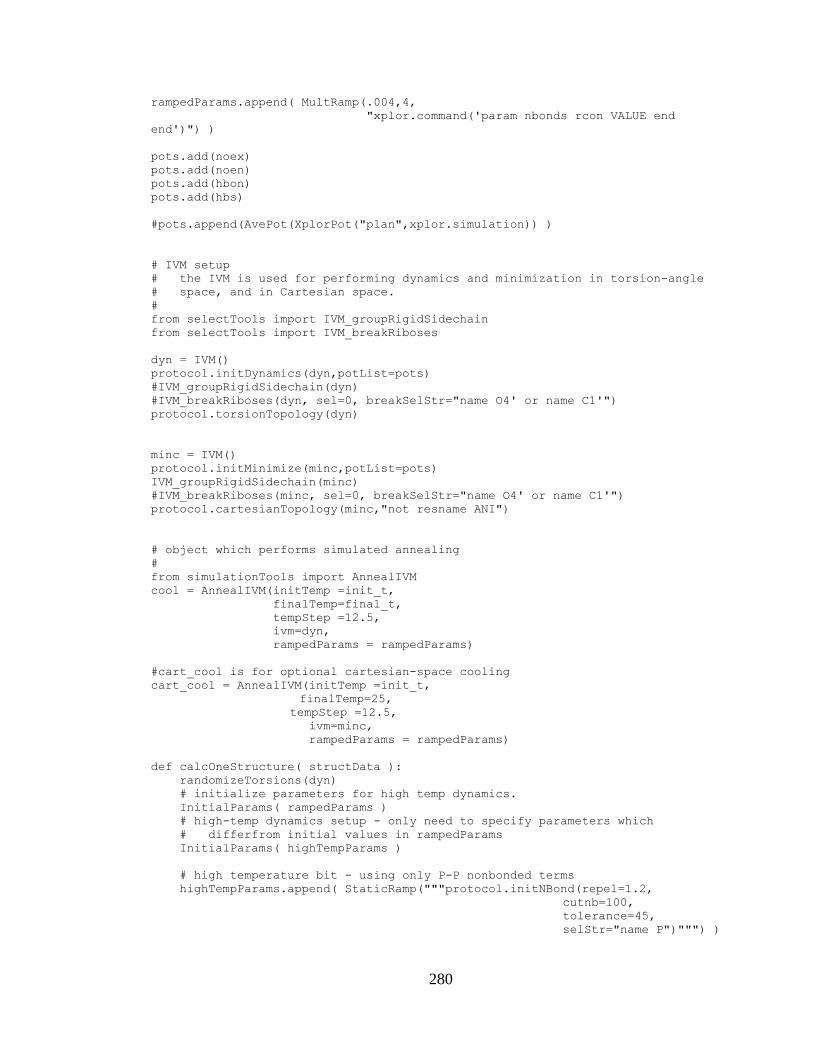
280
rampedParams.append( MultRamp(.004,4,
"xplor.command('param nbonds rcon VALUE end
end')") )
pots.add(noex)
pots.add(noen)
pots.add(hbon)
pots.add(hbs)
#pots.append(AvePot(XplorPot("plan",xplor.simulation)) )
# IVM setup
# the IVM is used for performing dynamics and minimization in torsion-angle
# space, and in Cartesian space.
#
from selectTools import IVM_groupRigidSidechain
from selectTools import IVM_breakRiboses
dyn = IVM()
protocol.initDynamics(dyn,potList=pots)
#IVM_groupRigidSidechain(dyn)
#IVM_breakRiboses(dyn, sel=0, breakSelStr="name O4' or name C1'")
protocol.torsionTopology(dyn)
minc = IVM()
protocol.initMinimize(minc,potList=pots)
IVM_groupRigidSidechain(minc)
#IVM_breakRiboses(minc, sel=0, breakSelStr="name O4' or name C1'")
protocol.cartesianTopology(minc,"not resname ANI")
# object which performs simulated annealing
#
from simulationTools import AnnealIVM
cool = AnnealIVM(initTemp =init_t,
finalTemp=final_t,
tempStep =12.5,
ivm=dyn,
rampedParams = rampedParams)
#cart_cool is for optional cartesian-space cooling
cart_cool = AnnealIVM(initTemp =init_t,
finalTemp=25,
tempStep =12.5,
ivm=minc,
rampedParams = rampedParams)
def calcOneStructure( structData ):
randomizeTorsions(dyn)
# initialize parameters for high temp dynamics.
InitialParams( rampedParams )
# high-temp dynamics setup - only need to specify parameters which
# differfrom initial values in rampedParams
InitialParams( highTempParams )
# high temperature bit - using only P-P nonbonded terms
highTempParams.append( StaticRamp("""protocol.initNBond(repel=1.2,
cutnb=100,
tolerance=45,
selStr="name P")""") )
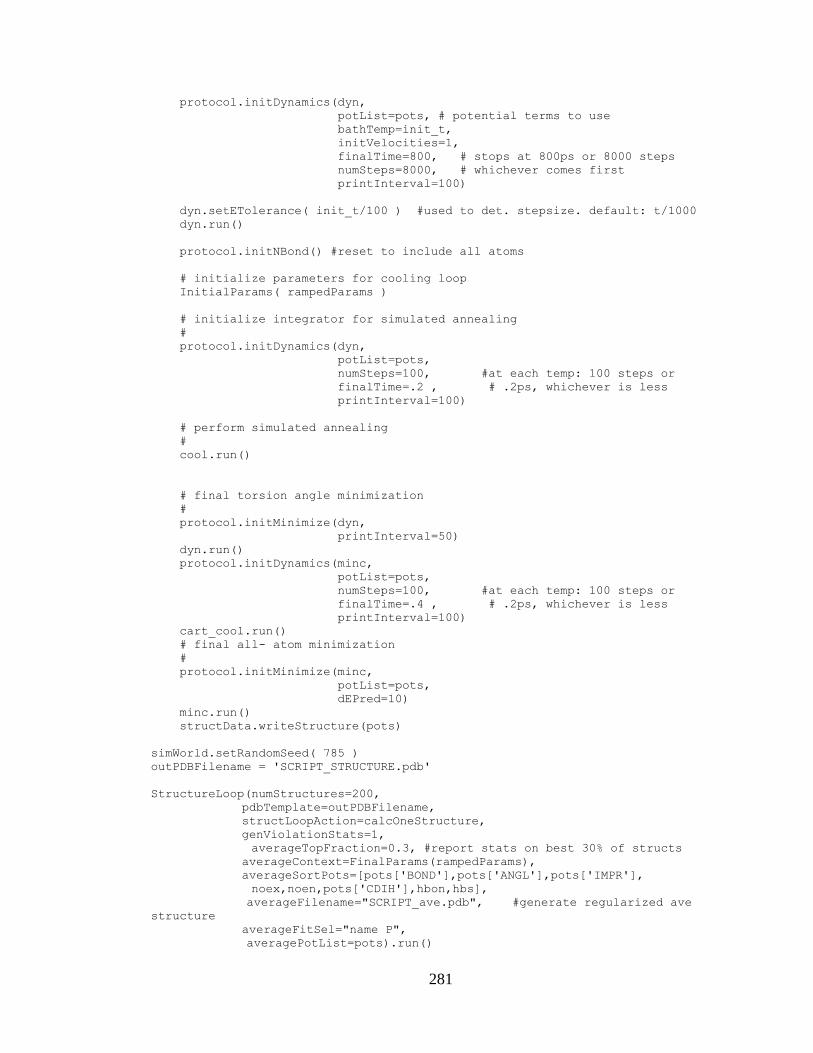
281
protocol.initDynamics(dyn,
potList=pots, # potential terms to use
bathTemp=init_t,
initVelocities=1,
finalTime=800, # stops at 800ps or 8000 steps
numSteps=8000, # whichever comes first
printInterval=100)
dyn.setETolerance( init_t/100 ) #used to det. stepsize. default: t/1000
dyn.run()
protocol.initNBond() #reset to include all atoms
# initialize parameters for cooling loop
InitialParams( rampedParams )
# initialize integrator for simulated annealing
#
protocol.initDynamics(dyn,
potList=pots,
numSteps=100, #at each temp: 100 steps or
finalTime=.2 , # .2ps, whichever is less
printInterval=100)
# perform simulated annealing
#
cool.run()
# final torsion angle minimization
#
protocol.initMinimize(dyn,
printInterval=50)
dyn.run()
protocol.initDynamics(minc,
potList=pots,
numSteps=100, #at each temp: 100 steps or
finalTime=.4 , # .2ps, whichever is less
printInterval=100)
cart_cool.run()
# final all- atom minimization
#
protocol.initMinimize(minc,
potList=pots,
dEPred=10)
minc.run()
structData.writeStructure(pots)
simWorld.setRandomSeed( 785 )
outPDBFilename = 'SCRIPT_STRUCTURE.pdb'
StructureLoop(numStructures=200,
pdbTemplate=outPDBFilename,
structLoopAction=calcOneStructure,
genViolationStats=1,
averageTopFraction=0.3, #report stats on best 30% of structs
averageContext=FinalParams(rampedParams),
averageSortPots=[pots['BOND'],pots['ANGL'],pots['IMPR'],
noex,noen,pots['CDIH'],hbon,hbs],
averageFilename="SCRIPT_ave.pdb", #generate regularized ave
structure
averageFitSel="name P",
averagePotList=pots).run()
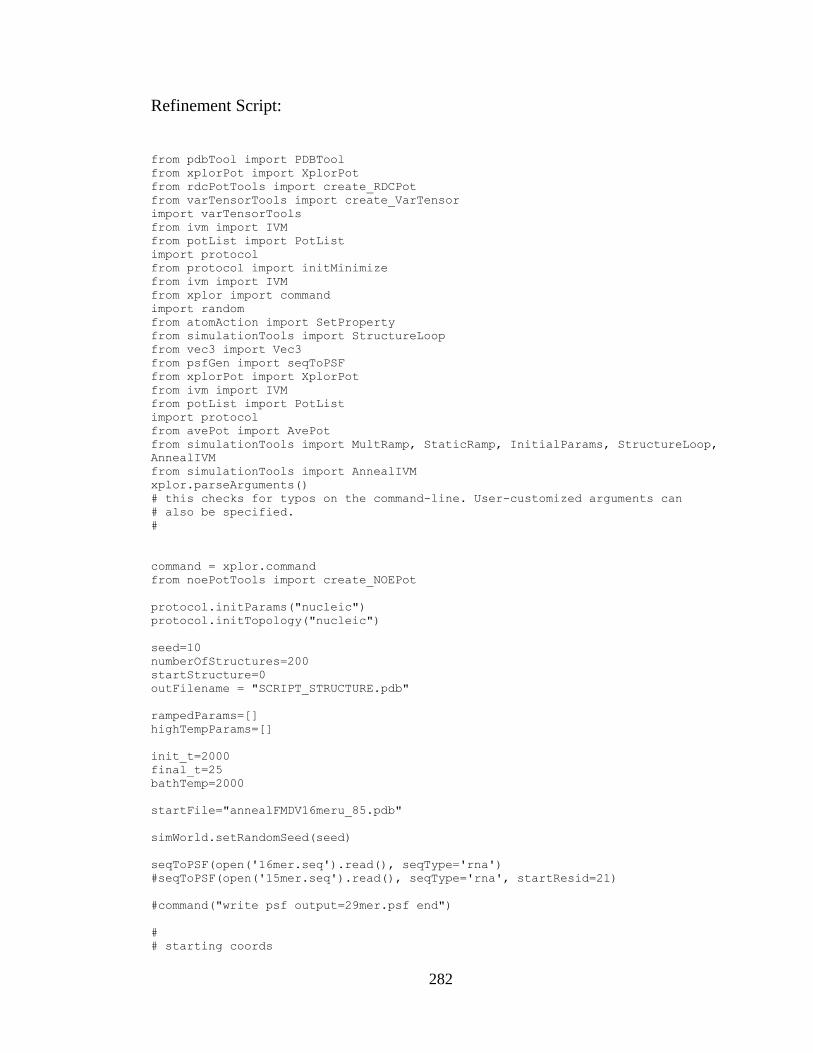
282
Refinement Script:
from pdbTool import PDBTool
from xplorPot import XplorPot
from rdcPotTools import create_RDCPot
from varTensorTools import create_VarTensor
import varTensorTools
from ivm import IVM
from potList import PotList
import protocol
from protocol import initMinimize
from ivm import IVM
from xplor import command
import random
from atomAction import SetProperty
from simulationTools import StructureLoop
from vec3 import Vec3
from psfGen import seqToPSF
from xplorPot import XplorPot
from ivm import IVM
from potList import PotList
import protocol
from avePot import AvePot
from simulationTools import MultRamp, StaticRamp, InitialParams, StructureLoop,
AnnealIVM
from simulationTools import AnnealIVM
xplor.parseArguments()
# this checks for typos on the command-line. User-customized arguments can
# also be specified.
#
command = xplor.command
from noePotTools import create_NOEPot
protocol.initParams("nucleic")
protocol.initTopology("nucleic")
seed=10
numberOfStructures=200
startStructure=0
outFilename = "SCRIPT_STRUCTURE.pdb"
rampedParams=[]
highTempParams=[]
init_t=2000
final_t=25
bathTemp=2000
startFile="annealFMDV16meru_85.pdb"
simWorld.setRandomSeed(seed)
seqToPSF(open('16mer.seq').read(), seqType='rna')
#seqToPSF(open('15mer.seq').read(), seqType='rna', startResid=21)
#command("write psf output=29mer.psf end")
#
# starting coords
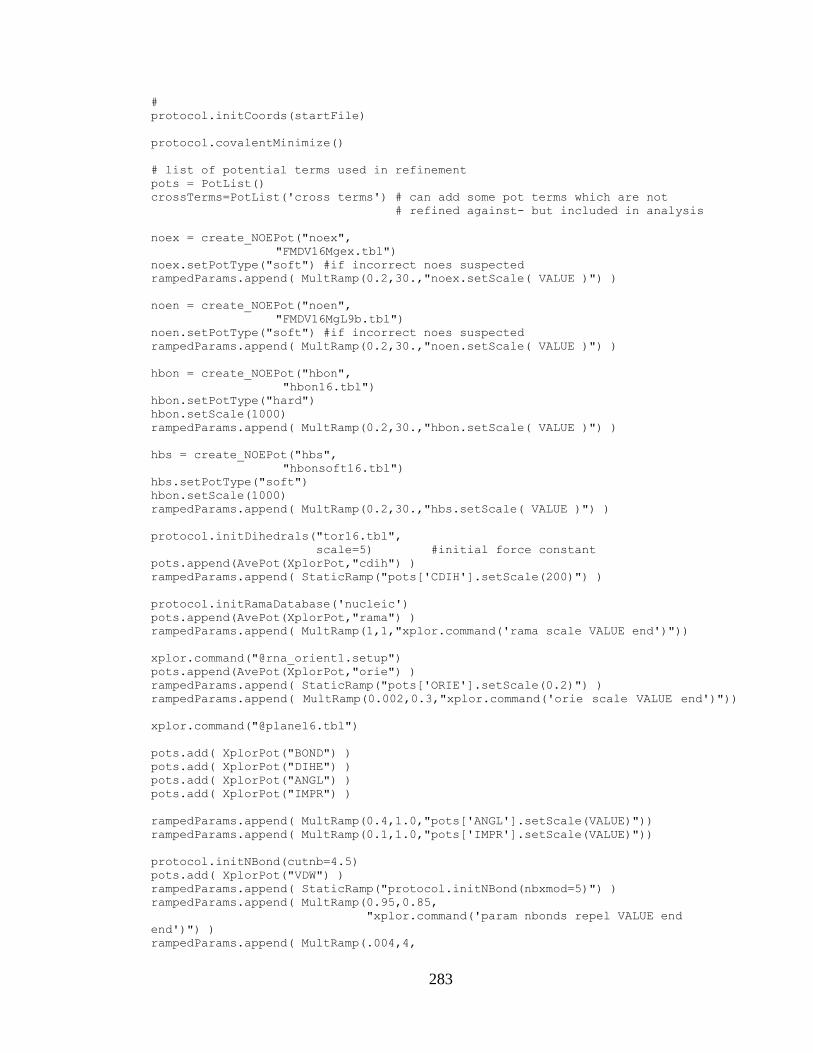
283
#
protocol.initCoords(startFile)
protocol.covalentMinimize()
# list of potential terms used in refinement
pots = PotList()
crossTerms=PotList('cross terms') # can add some pot terms which are not
# refined against- but included in analysis
noex = create_NOEPot("noex",
"FMDV16Mgex.tbl")
noex.setPotType("soft") #if incorrect noes suspected
rampedParams.append( MultRamp(0.2,30.,"noex.setScale( VALUE )") )
noen = create_NOEPot("noen",
"FMDV16MgL9b.tbl")
noen.setPotType("soft") #if incorrect noes suspected
rampedParams.append( MultRamp(0.2,30.,"noen.setScale( VALUE )") )
hbon = create_NOEPot("hbon",
"hbon16.tbl")
hbon.setPotType("hard")
hbon.setScale(1000)
rampedParams.append( MultRamp(0.2,30.,"hbon.setScale( VALUE )") )
hbs = create_NOEPot("hbs",
"hbonsoft16.tbl")
hbs.setPotType("soft")
hbon.setScale(1000)
rampedParams.append( MultRamp(0.2,30.,"hbs.setScale( VALUE )") )
protocol.initDihedrals("tor16.tbl",
scale=5) #initial force constant
pots.append(AvePot(XplorPot,"cdih") )
rampedParams.append( StaticRamp("pots['CDIH'].setScale(200)") )
protocol.initRamaDatabase('nucleic')
pots.append(AvePot(XplorPot,"rama") )
rampedParams.append( MultRamp(1,1,"xplor.command('rama scale VALUE end')"))
xplor.command("@rna_orient1.setup")
pots.append(AvePot(XplorPot,"orie") )
rampedParams.append( StaticRamp("pots['ORIE'].setScale(0.2)") )
rampedParams.append( MultRamp(0.002,0.3,"xplor.command('orie scale VALUE end')"))
xplor.command("@plane16.tbl")
pots.add( XplorPot("BOND") )
pots.add( XplorPot("DIHE") )
pots.add( XplorPot("ANGL") )
pots.add( XplorPot("IMPR") )
rampedParams.append( MultRamp(0.4,1.0,"pots['ANGL'].setScale(VALUE)"))
rampedParams.append( MultRamp(0.1,1.0,"pots['IMPR'].setScale(VALUE)"))
protocol.initNBond(cutnb=4.5)
pots.add( XplorPot("VDW") )
rampedParams.append( StaticRamp("protocol.initNBond(nbxmod=5)") )
rampedParams.append( MultRamp(0.95,0.85,
"xplor.command('param nbonds repel VALUE end
end')") )
rampedParams.append( MultRamp(.004,4,
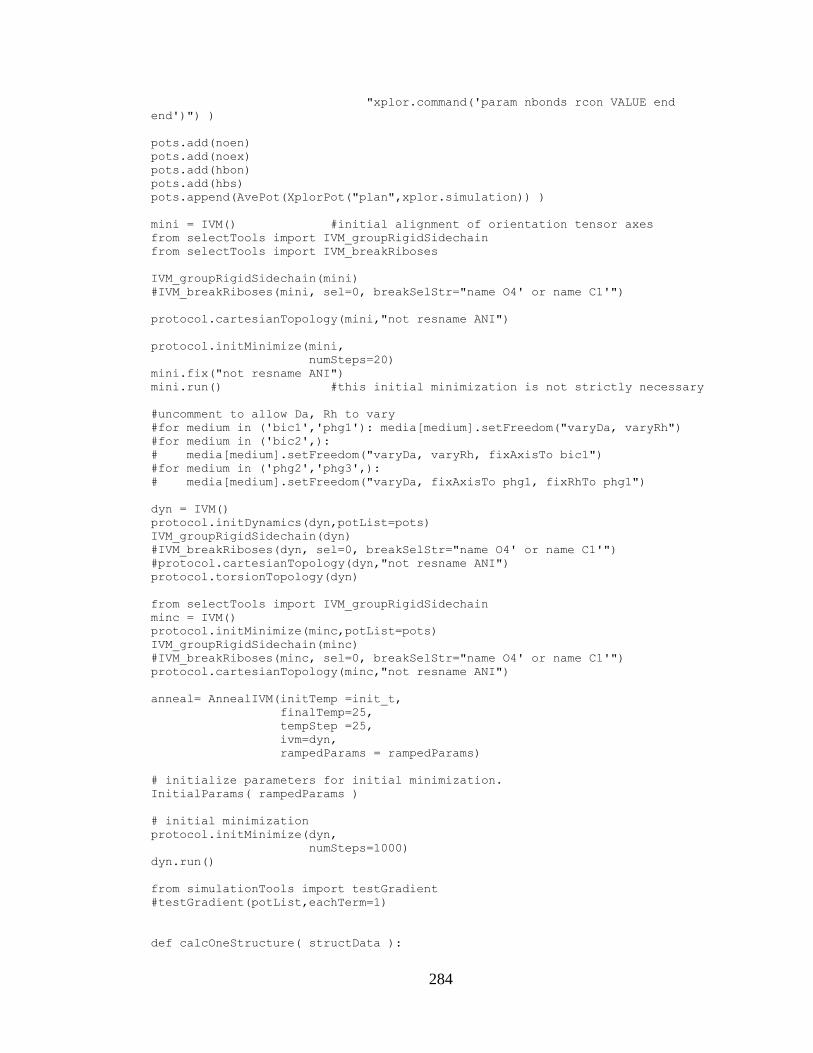
284
"xplor.command('param nbonds rcon VALUE end
end')") )
pots.add(noen)
pots.add(noex)
pots.add(hbon)
pots.add(hbs)
pots.append(AvePot(XplorPot("plan",xplor.simulation)) )
mini = IVM() #initial alignment of orientation tensor axes
from selectTools import IVM_groupRigidSidechain
from selectTools import IVM_breakRiboses
IVM_groupRigidSidechain(mini)
#IVM_breakRiboses(mini, sel=0, breakSelStr="name O4' or name C1'")
protocol.cartesianTopology(mini,"not resname ANI")
protocol.initMinimize(mini,
numSteps=20)
mini.fix("not resname ANI")
mini.run() #this initial minimization is not strictly necessary
#uncomment to allow Da, Rh to vary
#for medium in ('bic1','phg1'): media[medium].setFreedom("varyDa, varyRh")
#for medium in ('bic2',):
# media[medium].setFreedom("varyDa, varyRh, fixAxisTo bic1")
#for medium in ('phg2','phg3',):
# media[medium].setFreedom("varyDa, fixAxisTo phg1, fixRhTo phg1")
dyn = IVM()
protocol.initDynamics(dyn,potList=pots)
IVM_groupRigidSidechain(dyn)
#IVM_breakRiboses(dyn, sel=0, breakSelStr="name O4' or name C1'")
#protocol.cartesianTopology(dyn,"not resname ANI")
protocol.torsionTopology(dyn)
from selectTools import IVM_groupRigidSidechain
minc = IVM()
protocol.initMinimize(minc,potList=pots)
IVM_groupRigidSidechain(minc)
#IVM_breakRiboses(minc, sel=0, breakSelStr="name O4' or name C1'")
protocol.cartesianTopology(minc,"not resname ANI")
anneal= AnnealIVM(initTemp =init_t,
finalTemp=25,
tempStep =25,
ivm=dyn,
rampedParams = rampedParams)
# initialize parameters for initial minimization.
InitialParams( rampedParams )
# initial minimization
protocol.initMinimize(dyn,
numSteps=1000)
dyn.run()
from simulationTools import testGradient
#testGradient(potList,eachTerm=1)
def calcOneStructure( structData ):
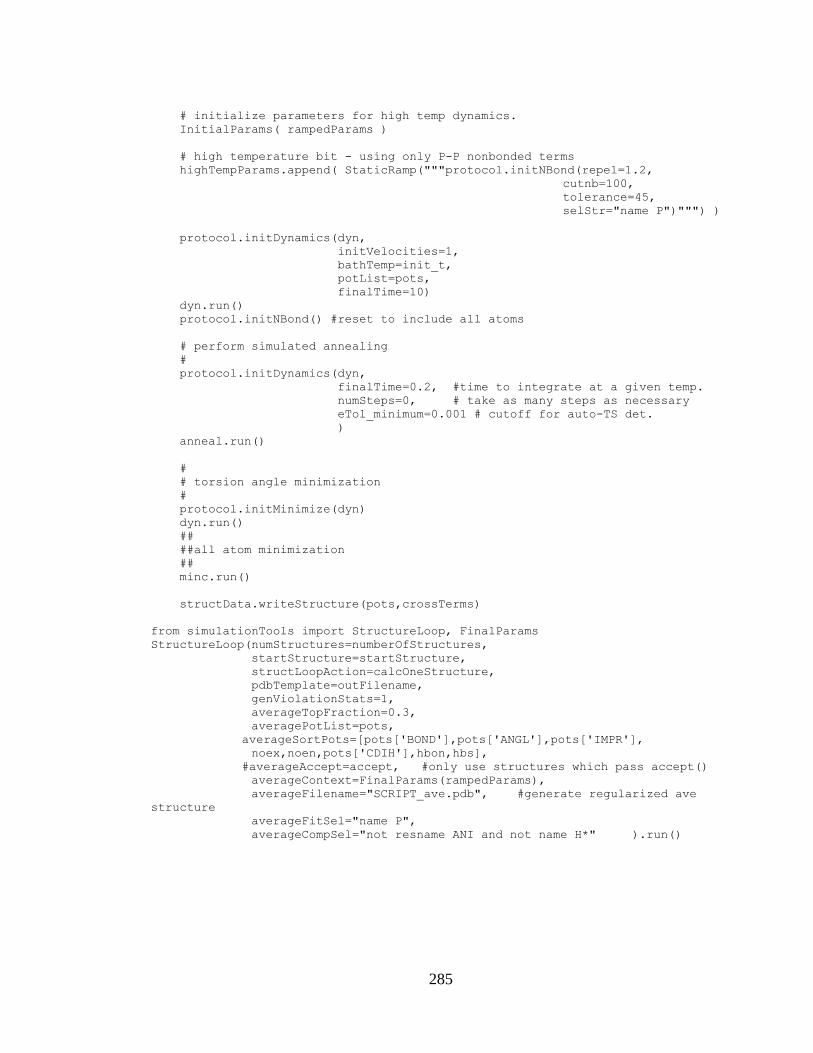
285
# initialize parameters for high temp dynamics.
InitialParams( rampedParams )
# high temperature bit - using only P-P nonbonded terms
highTempParams.append( StaticRamp("""protocol.initNBond(repel=1.2,
cutnb=100,
tolerance=45,
selStr="name P")""") )
protocol.initDynamics(dyn,
initVelocities=1,
bathTemp=init_t,
potList=pots,
finalTime=10)
dyn.run()
protocol.initNBond() #reset to include all atoms
# perform simulated annealing
#
protocol.initDynamics(dyn,
finalTime=0.2, #time to integrate at a given temp.
numSteps=0, # take as many steps as necessary
eTol_minimum=0.001 # cutoff for auto-TS det.
)
anneal.run()
#
# torsion angle minimization
#
protocol.initMinimize(dyn)
dyn.run()
##
##all atom minimization
##
minc.run()
structData.writeStructure(pots,crossTerms)
from simulationTools import StructureLoop, FinalParams
StructureLoop(numStructures=numberOfStructures,
startStructure=startStructure,
structLoopAction=calcOneStructure,
pdbTemplate=outFilename,
genViolationStats=1,
averageTopFraction=0.3,
averagePotList=pots,
averageSortPots=[pots['BOND'],pots['ANGL'],pots['IMPR'],
noex,noen,pots['CDIH'],hbon,hbs],
#averageAccept=accept, #only use structures which pass accept()
averageContext=FinalParams(rampedParams),
averageFilename="SCRIPT_ave.pdb", #generate regularized ave
structure
averageFitSel="name P",
averageCompSel="not resname ANI and not name H*" ).run()