HYPERSPECTRAL BIDIRECTIONAL REFLECTANCE MEASUREMENTS OF FAGUS SYLVATICA LEAVES
Upload
independentCategory
view
3download
0
Europ. J. Agronomy 22 (2005) 391–403
Nitrogen deficiency effects on plant growth, leaf photosynthesis,and hyperspectral reflectance properties of sorghum
Duli Zhaoa, K. Raja Reddya,∗, Vijaya Gopal Kakania, V.R. Reddyb
a Department of Plant and Soil Sciences, Mississippi State University, Box 9555, Mississippi State, MS 39762, USAb USDA-ARS, Alternate Crops and Systems Laboratory, Beltsville, MD 20705-2350, USA
Received 29 February 2004; received in revised form 2 June 2004; accepted 22 June 2004
Abstract
An experiment was conducted under outdoor pot-culture conditions to determine effects of nitrogen (N) deficiency on sorghumgrowth, physiology, and leaf hyperspectral reflectance properties. Sorghum (cv. DK 44C) was seeded in 360 twelve-litre potsfilled with fine sand. All pots were irrigated with half-strength Hoagland’s nutrient solution from emergence to 25 days aftersowing (DAS). Thereafter, pots were separated into three identical groups and the following treatments were initiated: (1) thecontrol (100% N) continued receiving the half-strength nutrient solution; (2) reduced N to 20% of the control (20% N); and(3) withheld N from the solution (0% N). Photosynthetic rate (Pn), chlorophyll (Chl) and N concentrations, and hyperspectralreflectance of the uppermost, fully expanded leaves were determined at 3- to 4-day-interval from 21 to 58 DAS during theN treatments. Plants were harvested 58 DAS to determine effects of N deficiency on leaf area (LA), biomass accumulation,and partitioning. Nitrogen deficiency significantly reduced LA, leaf Chl content and Pn, resulting in lower biomass production.D on capacityo e smallestd da flectanceri ndnP
K nitoring
f -
1
ecreased leaf Pn due to N deficiency was mainly associated with lower stomatal conductance rather than carboxylatif leaf chemistry. Among plant components of dry weights, leaf dry weight had the greatest and root dry weight had thecrease under N deficiency. Nitrogen-deficit stress mainly increased leaf reflectance at 555 (R555) and 715 nm (R715) and causered-edge shift to shorter wavelength. Leaf N and Chl concentrations were linearly correlated with not only the re
atios ofR405/R715 (r2 = 0.68∗∗∗) andR1075/R735 (r2 = 0.64∗∗∗), respectively, but also the first derivatives of the reflectance (dR/dλ)n red edge centered 730 or 740 nm (r2 = 0.73–0.82∗∗∗). These specific reflectance ratios or dR/dλ may be used for rapid aon-destructive estimation of sorghum leaf Chl and plant N status.ublished by Elsevier B.V.
eywords: Sorghum; Nitrogen deficiency; Leaf N and chlorophyll; Photosynthesis; Leaf reflectance; Reflectance ratios; Plant N mo
∗ Corresponding author. Tel.: +1 662 325 9463;ax: +1 662 325 9461.
E-mail address:[email protected] (K.R. Reddy).
1. Introduction
Although sorghum [Sorghum bicolor(L) Moench]is a C4 crop and uses nitrogen (N), CO2, solar radiation and water more efficiently than most C3 crops
161-0301/$ – see front matter Published by Elsevier B.V.
doi:10.1016/j.eja.2004.06.005
392 D. Zhao et al. / Europ. J. Agronomy 22 (2005) 391–403
(Anten et al., 1995; Young and Long, 2000), N nu-trient is still one of major factors limiting crop yield.Depending on soil N fertility, farmers apply anywherebetween 45 and 224 kg N ha−1 in sorghum production.Although adequate supply of N to crops is fundamentalto optimize crop yields, mismanagement of N, such asexcessive N application, can result in contamination ofgroundwater (Jaynes et al., 2001). Therefore, efficientmonitoring of plant N status and appropriate N fertil-izer management are essential to balance the factors ofincreasing cost of N fertilizer, the demand by the crop,and the need to minimize environmental perturbations,especially water quality (Jaynes et al., 2001).
Leaf area (LA) and leaf photosynthetic rates (Pn) aredirectly associated with plant dry matter (DM) produc-tion. Sorghum grain yield is closely related to greenLA (Borrell and Douglas, 1997) and leaf Pn (Lockeand Hons, 1988; Peng et al., 1991). Although C4 cropshave higher photosynthetic N use efficiencies as com-pared with C3 crops (Young and Long, 2000), N sup-ply and plant N status considerably affect sorghumleaf area index (Locke and Hons, 1988), leaf Pn, andcanopy radiation use efficiency (Muchow and Sinclair,1994). Leaf N and chlorophyll (Chl) concentrationsare important physiological parameters of detectingcrop plant N status. Fertilizer N recommendation istraditionally based on soil N status. However, conven-tional laboratory methods for quantifying these vari-ables from destructive sampling of plant tissues andsoil N content measurements are time consuming andc
cropp hasi an-a ex-t .,2i canb tanced t al.,1 02G P,M r theg ancem defi-c or-r ancec tion
was lower than 3.0% of leaf dry weight (Graeff andClaupein, 2003). Nitrogen treatments mainly affectedspectral reflectance in both red and near-infrared (NIR)regions with the increase in reflectance in the red re-gion and a decrease in reflectance in the NIR region forN-deficient corn canopy (Walburg et al., 1982). In con-trast,Blackmer et al. (1996)reported that reflectancesnear 550 and 710 nm were better for detecting cornplant N deficiencies compared with reflectances atother wavelengths. In general, N deficiency usually de-creases leaf Chl concentration resulting in an increasein leaf reflectance in both green (centered 550 nm) andred edge (700–720 nm) ranges (Daughtry et al., 2000;Zhao et al., 2003). However, a variety of causes ofplant stresses may result in increased leaf spectral re-flectance due to reduced amounts of Chl (Carter andKnapp, 2001).
Although many studies have found that non-destructive measurements of leaf or canopy reflectancecan be used for detecting N-deficient stress in corn(Ma et al., 1996; Blackmer et al., 1996), rice (Wang etal., 1998), and wheat (Voullot et al., 1998), relativelyfewer studies described the functional relationships be-tween leaf reflectance values and plant physiologicalvariables, especially leaf N concentration. Leaf spec-tral reflectance properties are closely related to manymorphological, physiological, and biochemical param-eters (Penuelas and Filella, 1998). These parametersare associated with not only growth environments, butalso crop species and growth stages. Although grains andN tud-i e-p t Ns s. Weh ts ofl y beu ringo andt , ane lturec de-t Chlc tiona tita-t e orr fors
ostly.Remote sensing at leaf to landscape scales of
hysiology as affected by environmental stressesmmense potential for timely crop assessment and mgement without destructive sampling of plants or
ensive soil collection procedures (Afanasyev et al001; Daughtry et al., 2000; Filella et al., 1995). Stud-
es have documented that N status of field cropse assessed using leaf or canopy spectral reflecata (Thomas and Gausman, 1977; Chappelle e992; Blackmer et al., 1994; Osborne et al., 20).raeff et al. (2001)investigated the impacts of N,g, and Fe deficiencies on leaf reflectance undereenhouse conditions and concluded that reflecteasurements might be used to detect nutrient
iencies in corn. Under field conditions, significant celations between corn N status and leaf reflecthanges were obtained when leaf N concentra
orghum growth and yield responses to N nutrientfertilizer management have received extensive s
es (Plenet and Cruz, 1997), to date, there are no rorts on identifying the relationships between plantatus and leaf hyperspectral reflectance propertieypothesize that the non-destructive measuremen
eaf reflectances at some specific wavelengths mased to estimate leaf N or Chl contents for monitof sorghum N status. In order to test our hypothesis
o develop the appropriate reflectance algorithmsxperiment was conducted under outdoor pot-cuonditions. The objectives of this study were toermine the effects of N deficiency on leaf N andoncentrations, leaf Pn, and plant DM accumuland partitioning and to develop algorithms or quan
ive relationships between leaf spectral reflectanceflectance ratios and leaf Chl or N concentrationsorghum plant N monitoring.
D. Zhao et al. / Europ. J. Agronomy 22 (2005) 391–403 393
2. Materials and methods
2.1. Plant culture
An outdoor pot-culture experiment was conductedin the 2001 growing season at the Mississippi Agri-cultural and Forestry Experiment Station, Missis-sippi State University, Mississippi State, MS, USA(33◦28′N, 88◦47′W). Seeds of sorghum cultivar, DK44C, were sown on 2 July 2001 in 12-L white polyvinylchloride (PVC) pots filled with fine sand. The pots were0.65 m in height and 0.15 m in diameter with a smallhole at bottom to drain excess water. Three hundred andsixty pots were arranged in nine rows with additionalone border row on each side and oriented east to westwith rows 1-m apart. Seedlings were thinned to one perpot at 7 days after emergence. All pots were irrigatedusing a computer-controlled drip system with half-strength Hoagland’s nutrient solution (Hewitt, 1952) tomaintain favorable conditions of water and nutrients.
2.2. Treatments
Three treatments include: (1) a control irrigated withhalf-strength Hoagland’s nutrient solution throughoutthe experiment (100% N); (2) reduced N in the nutri-ent solution to 20% of the control starting 25 days aftersowing (DAS, 20% N); and (3) withheld N from thenutrient solution starting 25 DAS (0% N) until the fi-nal harvest (58 DAS). Each treatment had three rowsw perm 0%N nd’sn di-v utri-e Then Clf s(
2
ex-p eacht pec-t g ap An-a A)
with spectral range from 350 to 2500 nm (1 nm inter-vals). The optical sensor of the spectroradiometer wasmounted in the frame of a supplemental light source(ML 902, Makita Corporation, Aichi, Japan) with a50-mm distance from target leaf surface. A Spectralonwhite reference panel was used to optimize the instru-ment to 100% reflectance at all wavebands prior toleaf reflectance measurements. When measuring leafreflectance, the individual leaves were placed adaxialside up on top of a black polyurethane background.
After measuring leaf reflectance, five leaf discs(38.5 mm2 each) were immediately punched from eachleaf and placed in a vial with 4 mL of dimethyl sulphox-ide for Chl extraction. Three replicate leaves were sam-pled in each treatment, and the sample vials were in-cubated at room temperature in dark for 24 h to allowfor complete extraction of Chl into the solution. Ab-sorbance of the extract was measured using a Pharma-cia UltraSpec Pro UV/VIS spectrophotometer (Phar-macia, Cambridge, England) at 470, 648, and 664 nm tocalculate concentrations of Chl a and Chl b (Chappelleet al., 1992). The area of individual leaves was deter-mined using a LI-3100 area meter (LI-COR Inc., Lin-coln, NE, USA) after collecting the leaf discs. Leaveswere then immediately dried at 70◦C for 72 h, weighed,and ground to determine total N concentrations accord-ing to standard micro-Kjeldahl procedures (Nelson andSommers, 1972). Specific leaf weight was calculatedas the ratio of leaf dry weight to LA. Concentrations ofleaf Chl (i.e. chlorophyll a + b)were expressed on a LAb eenl LeafN ightb
nce(p acht h us-i ORI S.W lya EDl -th leafcA ec ere
ith 120 pots (40 pots in each row and six potseter row). All plants in both the 20% N and thetreatments received normal half-strength Hoagla
utrient solution prior to the N treatments. Three inidual tanks were used to provide the respective nnt solutions upon imposition of the treatments.utrient solution was modified by substituting Ca2
or Ca(NO3)2 to allow for different N concentrationReddy et al., 1996).
.3. Measurements
During the treatments, three uppermost, fullyanded leaves were sampled from three plants in
reatment every 3 or 4 days at 1100 h. Leaf sral reflectance was measured immediately usinortable ASD FieldSpec FR spectroradiometer (lytical Spectral Devices Inc., Boulder, CO, US
asis in order to determine the relationships betweaf spectral reflectance and Chl concentrations.
concentrations were expressed on both dry weasis (g kg−1) and LA basis (g m−2).
During plant growth, the Pn, stomatal conductags), and intercellular CO2 concentration (Ci ) of the up-ermost, fully expanded leaves from six plants in e
reatment were measured between 1000 and 1200ng a LI-6400 portable photosynthesis system (LI-Cnc., Lincoln, NE, USA) at 31, 43, 49, and 58 DA
hen measuring Pn,gs andCi , the photosyntheticalctive radiation (PAR), provided by a 6400-02 L
ight source, was set to 1500�mol m−2 s−1, temperaure inside the leaf cuvette was set to 30◦C, relativeumidity was adjusted to near ambient level, andhamber CO2 concentration was set to 360�L L−1.dditionally, photosynthetic light- andCi -responsurves of the uppermost, fully expanded leaves w
394 D. Zhao et al. / Europ. J. Agronomy 22 (2005) 391–403
determined from three plants in each treatment be-tween 46 and 50 DAS. When measuring photosyn-thetic light-response curves, the temperature inside theleaf cuvette was set to 30◦C, and CO2 concentrationin the leaf cuvette was set to 360�L L−1. The PARwas gradually increased from 0 to 2000�mol m−2 s−1
in 11 steps. Leaves were adapted in dark for 20 minprior to logging the first measurement. Values ofleaf dark respiration rates (Rd) and light compensa-tion points (LCP) were obtained by linear regressionof the first four light intensities (PAR: 0, 100, 200and 400�mol m−2 s−1) and gas exchange rates. Whenmeasuring photosyntheticCi -response curves, temper-ature in the leaf cuvette was maintained at 30◦C andPAR was set to 1500�mol m−2 s−1. The CO2 concen-tration in the cuvette was changed by 10 steps between0 and 800�L L−1.
Plants were harvested at 58 DAS and separated intoleaves, stems and roots. Leaf area was recorded usingthe LI-3100 leaf area meter. Plant components weredried at 70◦C and weighed to determine the effects ofdifferent N treatments on plant DM accumulation andpartitioning.
2.4. Experimental design and data analysis
The experiment was designed in a randomized com-plete block with three replications. There were 40 pots(plants) in each replication (20 plants for destructivel ea-s wasu -e shipsb
gedo data
TE r accum
T D
L
1 42 30 1
L
P of thre f eacht
for analysis. The reflectance sensitivity to N deficiencywas calculated as the percentage changes in reflectanceat each waveband for the N-deficient treatments (i.e.the 20% N and the 0% N) compared to the control.Statistical analysis procedures of ANOVA and FisherLSD tests atP = 0.05 probability level (SAS Institute,1997) were employed to distinguish among treatmentsfor growth, DM accumulation, leaf Chl and N con-centrations, and leaf reflectance. In order to determinerelationships between leaf Chl or N concentrations andleaf reflectance values at different wavelengths, dataof leaf reflectance, as well as N and Chl concentra-tions, were first averaged over replicate leaves and thenpooled across treatments and sampling dates (n = 21).Coefficients of determination (r2) were calculated andused to evaluate linear relationships of leaf N concen-trations with reflectance values at the averaged 10-nmintervals throughout the range of 400–2500 nm. There-after, the reflectance values at two wavebands with thegreatestr2 values with leaf N or Chl concentrationsused as the numerators and the reflectance values atall other wavebands as denominators to calculate re-flectance ratios and ther2 values of the reflectance ra-tios with leaf N and Chl were further determined.
Additionally, the first derivatives of leaf reflectances(dR/dλ) in red edge (685–745 nm) were calculatedbased on the following equation (Lamb et al., 2002):
dR
dλ= Rλ − R(λ−1)
�λ
w a-s red atλ
s,
w
eaf sampling and the other 20 for photosynthesis murements and final harvest). Linear regressionsed to determine leafRd and LCP. Best-fit nonlinar regression was employed to determine relationetween leaf CO2 exchange rates and PAR orCi .
Leaf spectral reflectance data were first averaver 10-nm intervals to decrease the amount of
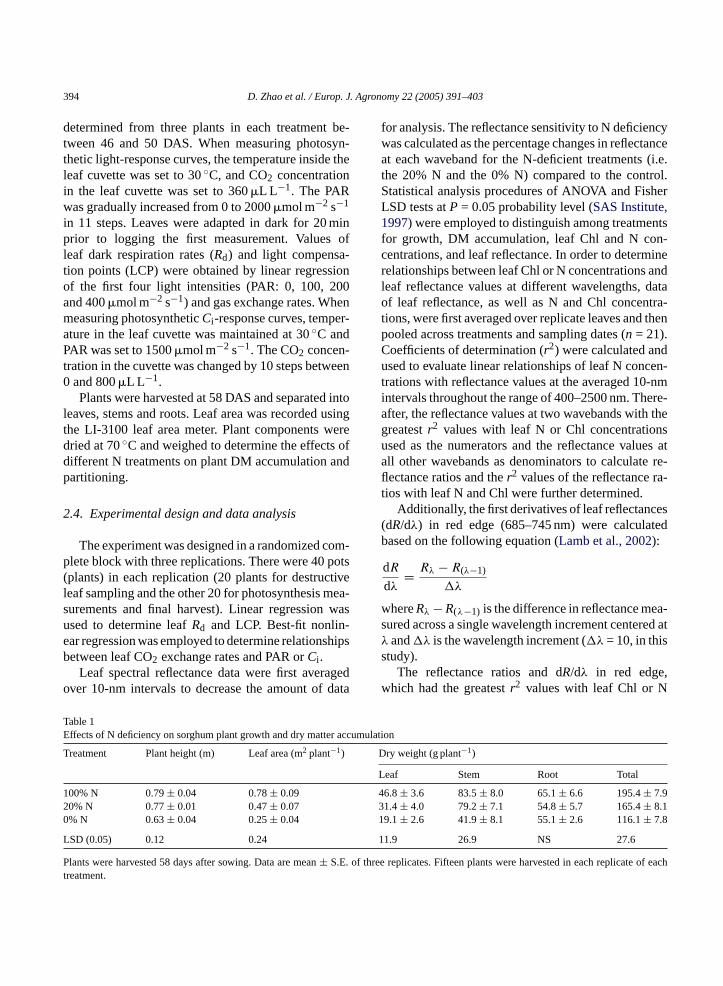
able 1ffects of N deficiency on sorghum plant growth and dry matte
reatment Plant height (m) Leaf area (m2 plant−1)
00% N 0.79± 0.04 0.78± 0.090% N 0.77± 0.01 0.47± 0.07% N 0.63± 0.04 0.25± 0.04
SD (0.05) 0.12 0.24
lants were harvested 58 days after sowing. Data are mean± S.E.reatment.
ulation
ry weight (g plant−1)
eaf Stem Root Total
6.8± 3.6 83.5± 8.0 65.1± 6.6 195.4± 7.91.4± 4.0 79.2± 7.1 54.8± 5.7 165.4± 8.19.1± 2.6 41.9± 8.1 55.1± 2.6 116.1± 7.8
11.9 26.9 NS 27.6
e replicates. Fifteen plants were harvested in each replicate o
hereRλ − R(λ−1) is the difference in reflectance meured across a single wavelength increment centeand�λ is the wavelength increment (�λ = 10, in thistudy).
The reflectance ratios and dR/dλ in red edgehich had the greatestr2 values with leaf Chl or N
D. Zhao et al. / Europ. J. Agronomy 22 (2005) 391–403 395
concentrations, were selected. Data of leaf Chl and leafN were plotted against the corresponding reflectanceratios or the dR/dλ, and linear regression analyses werealso carried out.
3. Results
3.1. Plant growth and dry matter accumulation
At the final harvest (58 DAS), plant height did notdiffer between the control and the 20% N treatments,but plants grown in the 0% N were 20% shorter thanthe control plants (P < 0.05). Both the 20% N and the0% N-treated plants had significantly smaller LA andless DM accumulation than the control plants (Table 1).Leaf area and total DM decreased by 40 and 15%, re-spectively, for the 20% N-treated plants and by 68 and41%, respectively, for the 0% N-treated plants com-pared to the control plants. Of plant components, N de-ficiency had the greatest effect on leaf DM. The 20%N and 0% N treatments resulted in a 33 and 59% lessleaf dry weight, respectively, compared to the control.
3.2. Leaf N and chlorophyll concentrations andphotosynthesis
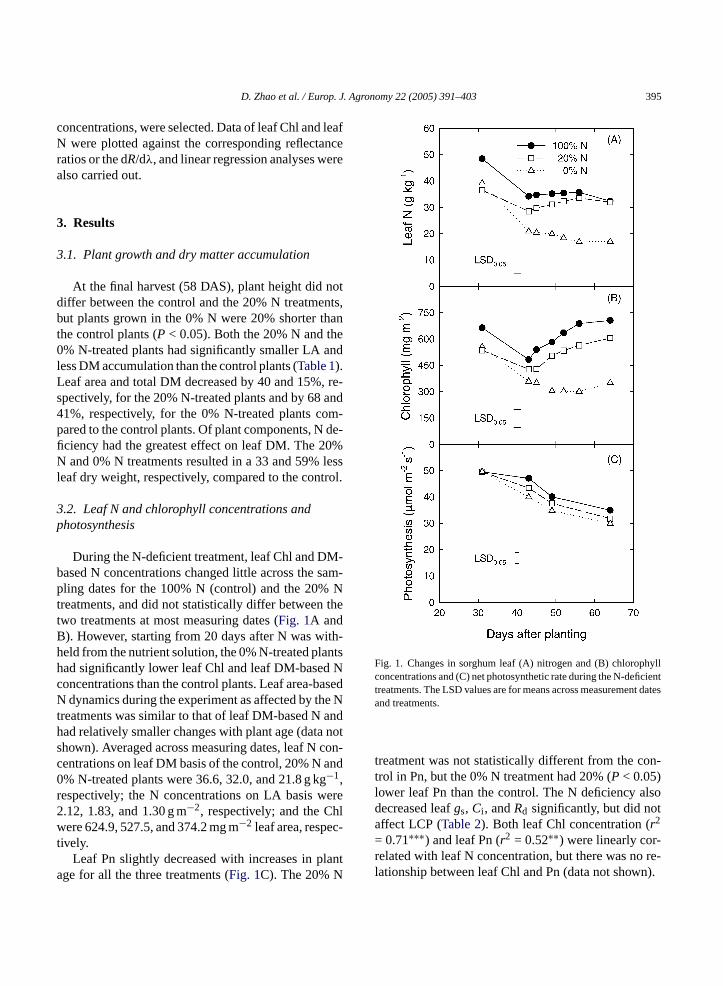
During the N-deficient treatment, leaf Chl and DM-based N concentrations changed little across the sam-pling dates for the 100% N (control) and the 20% Nt thetB ith-h ntsh Nc asedN e Nt andh nots con-c and0 gr ere2 hlw c-t
lanta
Fig. 1. Changes in sorghum leaf (A) nitrogen and (B) chlorophyllconcentrations and (C) net photosynthetic rate during the N-deficienttreatments. The LSD values are for means across measurement datesand treatments.
treatment was not statistically different from the con-trol in Pn, but the 0% N treatment had 20% (P < 0.05)lower leaf Pn than the control. The N deficiency alsodecreased leafgs, Ci , andRd significantly, but did notaffect LCP (Table 2). Both leaf Chl concentration (r2
= 0.71∗∗∗) and leaf Pn (r2 = 0.52∗∗) were linearly cor-related with leaf N concentration, but there was no re-lationship between leaf Chl and Pn (data not shown).
reatments, and did not statistically differ betweenwo treatments at most measuring dates (Fig. 1A and). However, starting from 20 days after N was weld from the nutrient solution, the 0% N-treated plaad significantly lower leaf Chl and leaf DM-basedoncentrations than the control plants. Leaf area-bdynamics during the experiment as affected by th
reatments was similar to that of leaf DM-based Nad relatively smaller changes with plant age (datahown). Averaged across measuring dates, leaf Nentrations on leaf DM basis of the control, 20% N% N-treated plants were 36.6, 32.0, and 21.8 g k−1,espectively; the N concentrations on LA basis w.12, 1.83, and 1.30 g m−2, respectively; and the Cere 624.9, 527.5, and 374.2 mg m−2 leaf area, respe
ively.Leaf Pn slightly decreased with increases in p
ge for all the three treatments (Fig. 1C). The 20% N

396 D. Zhao et al. / Europ. J. Agronomy 22 (2005) 391–403
Table 2Effects of N deficiency on sorghum leaf net photosynthetic rate (Pn), stomatal conductance (gs), intercellular CO2 concentration (Ci ), darkrespiration (Rd), and photosynthetic light compensation point (LCP)
Treatment Pn (�mol m−2 s−1) gs (mol m−2 s−1) Ci (�L L−1) Rd (�mol m−2 s−1) LCP (�mol m−2 s−1)
100% N 42.4 ± 1.9 0.418± 0.053 145.2 ± 9.1 4.19± 0.59 102.2 ± 9.620% N 37.5 ± 2.9 0.310± 0.049 104.0 ± 12.4 1.88± 0.21 74.7 ± 13.10% N 33.9 ± 2.6 0.238± 0.035 80.6 ± 10.6 2.24± 0.45 75.7 ± 4.6
LSD (0.05) 7.1 0.134 31.1 1.56 NS
TheRd and LCP are obtained from the photosynthetic light-response curves as shown inFig. 3. Data are mean± S.E. [n = 12 (four measuringtimes× three replicates) for Pn,gs, andCi ; andn = 3 for Rd and LCP].
3.3. Leaf photosynthetic responses to PAR and Ci
Leaf photosynthetic responses to PAR followed sim-ilar exponential increases with increases in PAR for allthe treatments (Fig. 2A). The differences between thecontrol and the N-deficient plants in leaf Pn increasedas PAR increased. When PAR was between 600 and2000�mol m−2 s−1, the 20% N-treated plants had a16–35% lower leaf Pn and the 0% N-treated plantshad a 31–41% lower leaf Pn compared to the con-trol plants. The N-deficient plants also had significantlylowergsandCi (data not shown). No statistically signif-icant difference was detected in photosynthetic light-response curves between the 0% N and the 20% Ntreatments.
Leaf Pn rapidly increased with increases inCi andalmost reached the maximum values whenCi wasaround 250�L L−1 for all the treatments (Fig. 2B).The differences in photosyntheticCi -response curvesamong the treatments were much smaller compared tothose in the photosynthetic light-response curves. Be-tween 50 and 600�L L−1 of Ci , leaf Pn of the 20% Nand the 0% N treatments were only 7 and 14%, respec-tively, lower than the control.
3.4. Leaf hyperspectral reflectance
Although the leaf reflectance spectra showed simi-lar patterns for all the treatments (Fig. 3A), the N de-fi twor (cen-t ave-bO lu-t r the0 ased
Fig. 2. Leaf photosynthetic responses of sorghum plants to (A) pho-tosynthetically active radiation (PAR) and (B) intercellular CO2 con-centration (Ci ) as affected by the nitrogen deficiencies. Measure-ments were taken 46 and 50 days after sowing. Each data point is themean± S.E. of three measurements.
ciency mainly increased the leaf reflectance atanges of green (centered 555 nm) and red edgeered 715 nm) and the reflectances at these two wands were the most sensitive to N supply (Fig. 3B).ne week after N was withheld from the nutrient so
ion, leaf reflectance values at 555 and 715 nm fo% N treatment increased by 12% and further incre

D. Zhao et al. / Europ. J. Agronomy 22 (2005) 391–403 397
Fig. 3. Effect of nitrogen deficiency on sorghum leaf reflectanceproperties: (A) leaf spectral reflectance and (B) reflectance sensitivityto N deficiency. Data are means of seven sampling dates and threeleaves at each date from 31 to 58 days after sowing. The reflectancesensitivity = [(Rλ of N-deficient treatment− Rλ of the control)/Rλ
of the control× 100%] (λ = 405, 415, 425,. . ., 2495).
by 43% at 4 weeks after the treatment as compared withthe control (data not shown).
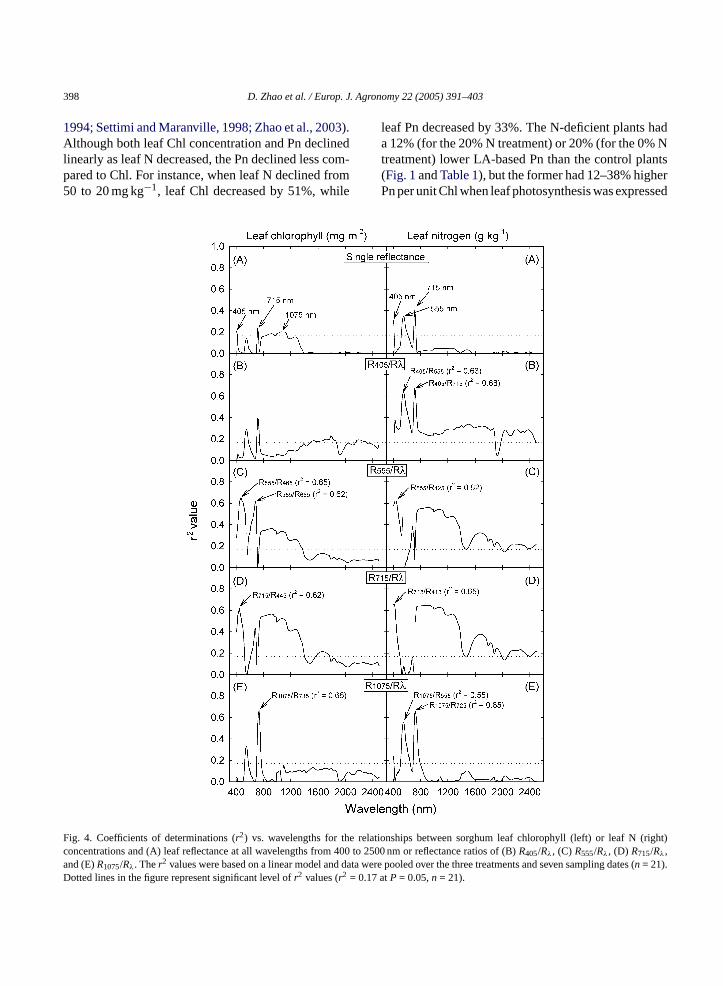
Simple correlation and linear regression analysesindicated that leaf reflectance values at three regionscentered at 405, 715, and 555 or 1075 nm were mostclosely correlated with leaf N and Chl concentrationsamong the reflectance values at all 210 wavebands cal-culated (Fig. 4A). However, reflectances at these sin-gle bands could only explain 13–22% of Chl varia-tion and 31–40% of leaf N variation (i.e.r2 valueswere only 0.13–0.22 for Chl and 0.31–0.40 for leafN concentration). Based on the wavebands where leafreflectances had greatestr2 values with leaf N and Chlconcentrations (Fig. 4A), the reflectance values at thefour specific wavebands (405, 555, 715, and 1075 nm)were selected as numerators to calculate two-band re-flectance ratios with reflectance values at each of allother wavebands (Rλ) from 400 to 2500 nm. Ther2
values of all the simple reflectance ratios with leaf Chlor N were determined (Fig. 4B–E). The reflectance ra-tios with the greatestr2 values with Chl and N concen-trations are shown inFig. 4B–E. Of these reflectanceratios,R1075/R735andR405/R715were most closely andlinearly correlated with leaf Chl (r2 = 0.66) and leafDM-based N (r2 = 0.68), respectively. When leaf Nconcentration was expressed on a LA basis, the bestreflectance ratio (R1075/R735, r2 = 0.73) for estimatingleaf N (g m−2) exactly matched the best reflectance ra-tio for estimating leaf Chl concentration inFig. 4E.
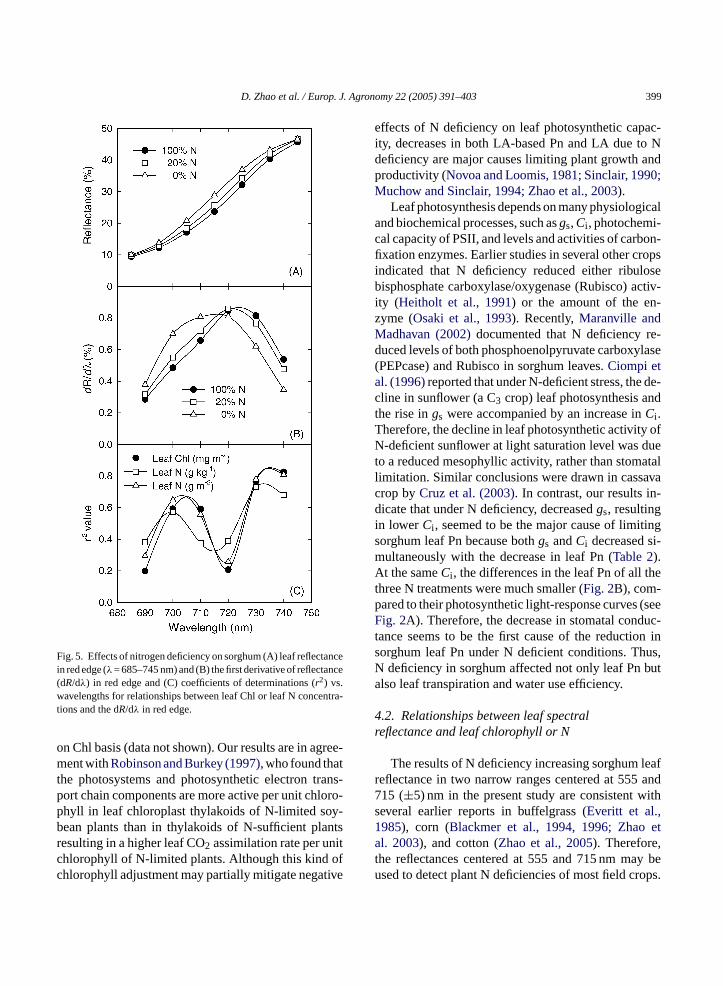
Nitrogen deficiency caused red-edge reflectances(Fig. 5A) and the peak of first derivative of reflectances(dR/dλ) in red edge (Fig. 5B) to shift towards shorterwavelengths (i.e. left side). Ther2 values of the dR/dλ
in red edge with leaf Chl and leaf N concentrationsare presented inFig. 5C. Compared to leaf red-edgereflectances at individual wavelengths (seeFig. 4A)and the reflectance ratios selected (Fig. 4C–E), thedR/dλ centered 730 or 740 nm further improved therelationships between leaf reflectances and leaf Chl (r2
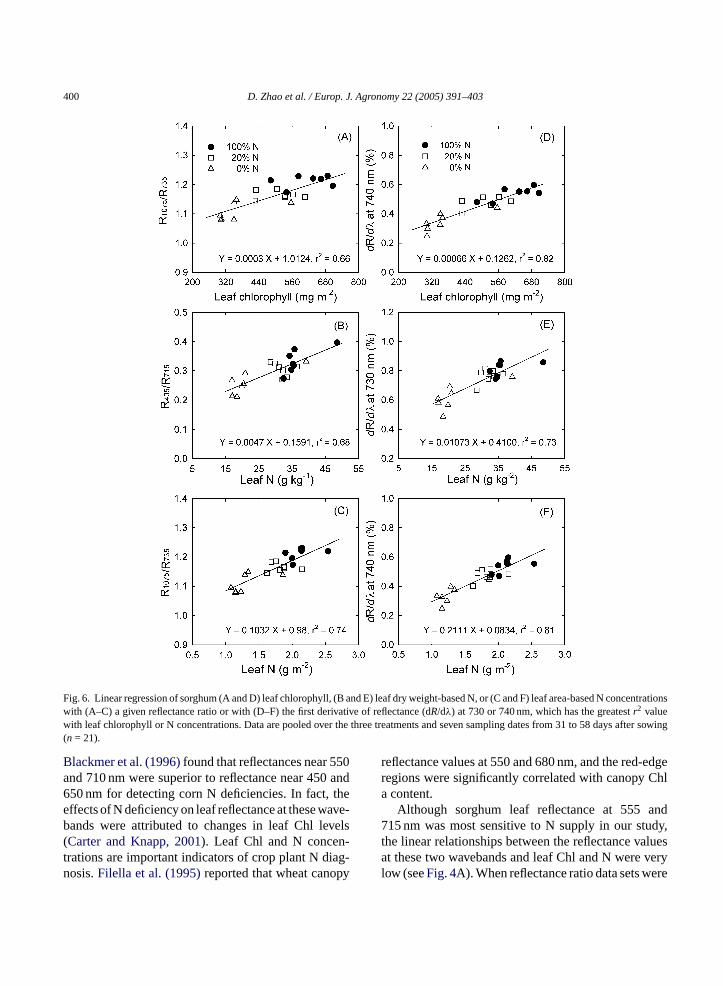
= 0.83) or leaf N (r2 = 0.73 for leaf DW-based N and0.81 for LA-based N). These selected reflectance ratios(R1075/R735 andR405/R715) and dR/dλ in red edge cen-tered 740 or 730 nm increased linearly with increasesin leaf Chl and N concentrations (Fig. 6).
4. Discussion
4n
tlyt tod ed toc edp ion( e toN LAaw int
rre-l af Nc h ear-la ir,
.1. Plant growth and physiological responses toitrogen deficiency
Although sorghum plants use N more efficienhan most C3-type crops and are more tolerantrought and high temperature stresses comparorn (Young and Long, 2000), N deficiency suppresslant growth and DM accumulation and allocatTable 1). Decreased plant biomass production du
shortage was associated with reductions in bothnd leaf photosynthetic capacity (Sinclair, 1990) andas mainly attributed to a smaller LA in sorghum
he present study (seeFig. 1andTable 1).Leaf Chl concentration and Pn were closely co
ated with leaf N levels and decreased linearly as leoncentration decreased. These results agree witier reports in sorghum (Muchow and Sinclair, 1994)nd in corn (Wolfe et al., 1988; Muchow and Sincla
398 D. Zhao et al. / Europ. J. Agronomy 22 (2005) 391–403
1994; Settimi and Maranville, 1998; Zhao et al., 2003).Although both leaf Chl concentration and Pn declinedlinearly as leaf N decreased, the Pn declined less com-pared to Chl. For instance, when leaf N declined from50 to 20 mg kg−1, leaf Chl decreased by 51%, while
FcaD
leaf Pn decreased by 33%. The N-deficient plants hada 12% (for the 20% N treatment) or 20% (for the 0% Ntreatment) lower LA-based Pn than the control plants(Fig. 1andTable 1), but the former had 12–38% higherPn per unit Chl when leaf photosynthesis was expressed
ig. 4. Coefficients of determinations (r2) vs. wavelengths for the relaoncentrations and (A) leaf reflectance at all wavelengths from 400 tond (E)R1075/Rλ. Ther2 values were based on a linear model and dataotted lines in the figure represent significant level ofr2 values (r2 = 0.17
tionships between sorghum leaf chlorophyll (left) or leaf N (right)2500 nm or reflectance ratios of (B)R405/Rλ, (C) R555/Rλ, (D) R715/Rλ,
were pooled over the three treatments and seven sampling dates (n = 21).atP = 0.05,n = 21).
D. Zhao et al. / Europ. J. Agronomy 22 (2005) 391–403 399
Fig. 5. Effects of nitrogen deficiency on sorghum (A) leaf reflectancein red edge (λ= 685–745 nm) and (B) the first derivative of reflectance(dR/dλ) in red edge and (C) coefficients of determinations (r2) vs.wavelengths for relationships between leaf Chl or leaf N concentra-tions and the dR/dλ in red edge.
on Chl basis (data not shown). Our results are in agree-ment withRobinson and Burkey (1997), who found thatthe photosystems and photosynthetic electron trans-port chain components are more active per unit chloro-phyll in leaf chloroplast thylakoids of N-limited soy-bean plants than in thylakoids of N-sufficient plantsresulting in a higher leaf CO2 assimilation rate per unitchlorophyll of N-limited plants. Although this kind ofchlorophyll adjustment may partially mitigate negative
effects of N deficiency on leaf photosynthetic capac-ity, decreases in both LA-based Pn and LA due to Ndeficiency are major causes limiting plant growth andproductivity (Novoa and Loomis, 1981; Sinclair, 1990;Muchow and Sinclair, 1994; Zhao et al., 2003).
Leaf photosynthesis depends on many physiologicaland biochemical processes, such asgs,Ci , photochemi-cal capacity of PSII, and levels and activities of carbon-fixation enzymes. Earlier studies in several other cropsindicated that N deficiency reduced either ribulosebisphosphate carboxylase/oxygenase (Rubisco) activ-ity (Heitholt et al., 1991) or the amount of the en-zyme (Osaki et al., 1993). Recently,Maranville andMadhavan (2002)documented that N deficiency re-duced levels of both phosphoenolpyruvate carboxylase(PEPcase) and Rubisco in sorghum leaves.Ciompi etal. (1996)reported that under N-deficient stress, the de-cline in sunflower (a C3 crop) leaf photosynthesis andthe rise ings were accompanied by an increase inCi .Therefore, the decline in leaf photosynthetic activity ofN-deficient sunflower at light saturation level was dueto a reduced mesophyllic activity, rather than stomatallimitation. Similar conclusions were drawn in cassavacrop byCruz et al. (2003). In contrast, our results in-dicate that under N deficiency, decreasedgs, resultingin lower Ci , seemed to be the major cause of limitingsorghum leaf Pn because bothgs andCi decreased si-multaneously with the decrease in leaf Pn (Table 2).At the sameCi , the differences in the leaf Pn of all thethree N treatments were much smaller (Fig. 2B), com-p (seeF duc-t n ins us,N buta
4r
leafr and7 iths ,1 eta ,t y beu ops.
ared to their photosynthetic light-response curvesig. 2A). Therefore, the decrease in stomatal con
ance seems to be the first cause of the reductioorghum leaf Pn under N deficient conditions. Thdeficiency in sorghum affected not only leaf Pn
lso leaf transpiration and water use efficiency.
.2. Relationships between leaf spectraleflectance and leaf chlorophyll or N
The results of N deficiency increasing sorghumeflectance in two narrow ranges centered at 55515 (±5) nm in the present study are consistent weveral earlier reports in buffelgrass (Everitt et al.985), corn (Blackmer et al., 1994, 1996; Zhaol. 2003), and cotton (Zhao et al., 2005). Therefore
he reflectances centered at 555 and 715 nm mased to detect plant N deficiencies of most field cr
400 D. Zhao et al. / Europ. J. Agronomy 22 (2005) 391–403
Fig. 6. Linear regression of sorghum (A and D) leaf chlorophyll, (B and E) leaf dry weight-based N, or (C and F) leaf area-based N concentrationswith (A–C) a given reflectance ratio or with (D–F) the first derivative of reflectance (dR/dλ) at 730 or 740 nm, which has the greatestr2 valuewith leaf chlorophyll or N concentrations. Data are pooled over the three treatments and seven sampling dates from 31 to 58 days after sowing(n = 21).
Blackmer et al. (1996)found that reflectances near 550and 710 nm were superior to reflectance near 450 and650 nm for detecting corn N deficiencies. In fact, theeffects of N deficiency on leaf reflectance at these wave-bands were attributed to changes in leaf Chl levels(Carter and Knapp, 2001). Leaf Chl and N concen-trations are important indicators of crop plant N diag-nosis.Filella et al. (1995)reported that wheat canopy
reflectance values at 550 and 680 nm, and the red-edgeregions were significantly correlated with canopy Chla content.
Although sorghum leaf reflectance at 555 and715 nm was most sensitive to N supply in our study,the linear relationships between the reflectance valuesat these two wavebands and leaf Chl and N were verylow (seeFig. 4A). When reflectance ratio data sets were
D. Zhao et al. / Europ. J. Agronomy 22 (2005) 391–403 401
created based on reflectance values at the two most N-sensitive bands (555 and 715 nm) and other two wave-bands (405 and 1075 nm) with the greatestr2 valueswith leaf Chl or leaf N, however, leaf Chl and N concen-trations were most highly correlated withR1075/R735andR405/R715, respectively (seeFig. 4). Compared withthe reflectance at single wavebands, the reflectance ra-tios significantly improved precision of estimating leafChl and N concentrations in sorghum. In addition, sev-eral other reflectance ratios may also be used to esti-mate sorghum leaf Chl and N concentrations. Theseratios includeR555/R465, R555/R685 andR715/R445 forChl andR405/R555, R555/R425, R715/R415, R1075/R555,and R1075/R725 for leaf DM-based N. Several otherstudies also reported that leaf reflectance ratios weresuperior to single reflectance values in predicting leafChl or N status in different crops in spite of inconsis-tence in the wavebands used in calculating reflectanceratios (Tarpley et al., 2000; Carter and Spiering, 2002;Read et al., 2002; Zhao et al., 2003). Although the N-sensitive wavebands (i.e. centered 555 and 715 nm) arecommon for most crops, the functional algorithms ofexpressing relationship between leaf N or Chl concen-tration and reflectance or reflectance ratios appears tobe species and experiment dependent.
A red-edge shift to shorter wavelengths with re-duced N supply in the present study is consistent withearlier studies in ryegrass (Lamb et al., 2002) and in cot-ton (Fridgen and Varco, 2004). When regressing leafChl and leaf N concentrations with the first derivativeso arrc0 cer ml selye ep y.
5
andP la-t acityd thed y.
Leaf spectral reflectance, especially in visible andred-edge regions, was very sensitive to sorghum plantN status. Nitrogen deficiency mainly increased leaf re-flectance at 555 and 715 (±5) nm. Changes in leaf re-flectance at these spectral regions were mainly relatedto either N or Chl level of leaves. Leaf Chl and N con-centrations were highly and linearly correlated not onlywith the dR/dλ at 730 or 740 nm, but also with the re-flectance ratios ofR1075/R735 andR405/R715 with thegreatestr2 values. These specific dR/dλ or reflectanceratios could be used for estimating sorghum leaf Chland N concentrations. Therefore, nondestructive mea-surements of leaf spectral reflectance at these narrowwavebands may provide a rapid and inexpensive toolfor in-season estimation of leaf Chl and N contents andfor site-specific N management in sorghum production.
Acknowledgements
This research was funded by the National Aeronau-tical and Space Administration through the RemoteSensing Technology Center at Mississippi State Uni-versity. We thank D. Brand and K. Gourley for techni-cal support and Drs. W.B. Henry, J.E. McMurtrey, andE.R. Hunt Jr. for review of the manuscript and theircomments. Contribution from Department of Plant andSoil Sciences, Mississippi State University, MississippiAgricultural and Forestry Experiment Station, paperno. J10496.
R
A s ofysicaliron.
A huf-
ility.
B anceeaves.
B E.A.,ave
B reathesis
f leaf reflectance (dR/dλ) in red-edge region, the lineelationships between leaf Chl or leaf N and the dR/dλ
entered 740 or 730 nm were further improved (r2 =.73–0.82∗∗∗, Fig. 6D–F) compared to the reflectanatios (r2 = 0.66–0.74,Fig. 6A–C). Therefore, sorghueaf Chl and N concentrations could be more precistimated using either the dR/dλ at the red edge or tharticular reflectance ratios developed in this stud
. Conclusions
Nitrogen deficiency decreased LA, Chl content,n of sorghum plants, resulting in lower DM accumu
ion. Decreased sorghum leaf photosynthetic capue to N deficiency was mainly associated withecreases ings andCi rather than mesophyllic activit
eferences
fanasyev, Y.D., Nezlin, N.P., Kostianoy, A.G., 2001. Patternseasonal dynamics of remotely sensed chlorophyll and phenvironment in the Newfoundland region. Remote Sens. Env76, 268–282.
nten, N.P.R., Schieving, F., Medina, E., Werger, M.J.A., Scfelen, P., 1995. Optimal leaf area indices in C3 and C4 mono-and dicotyledonous species at low and high nitrogen availabPhysiol. Plant. 95, 541–550.
lackmer, T.M., Schepers, J.S., Varvel, G.E., 1994. Light reflectcompared with other nitrogen stress measurements in corn lAgron. J. 86, 934–938.
lackmer, T.M., Schepers, J.S., Varvel, G.E., Walter-Shea,1996. Nitrogen deficiency detection using reflected shortwradiation from irrigated corn canopies. Agron. J. 88, 1–5.
orrell, A.K., Douglas, A.C.L., 1997. Maintaining green leaf ain grain sorghum increases nitrogen uptake under post-androught. Int. Sorghum Millets Newslett. 38, 89–92.
402 D. Zhao et al. / Europ. J. Agronomy 22 (2005) 391–403
Carter, G.A., Knapp, A.K., 2001. Leaf optical properties in higherplants: Linking spectral characteristics to stress and chlorophyllconcentration. Am. J. Bot. 88, 677–684.
Carter, G.A., Spiering, B.A., 2002. Optical properties of intact leavesfor estimating chlorophyll concentration. J. Environ. Qual. 31,1424–1432.
Chappelle, E.W., Kim, M.S., McMurtrey III, J.E., 1992. Ratio anal-ysis of reflectance spectra (RARS): an algorithm for the remoteestimation of the concentrations of chlorophyll a, and chlorophyllb, and carotenoids in soybean leaves. Remote Sens. Environ. 39,239–247.
Ciompi, S., Gentili, E., Guidi, L., Soldatini, G.F., 1996. The ef-fect of nitrogen deficiency on leaf gas exchange and chlorophyllfluorescence parameters in sunflower. Plant Sci. Limerick. 118,177–184.
Cruz, J.L., Mosquim, P.R., Pelacani, C.R., Araujo, W.L., DaMatta,F.M., 2003. Photosynthesis impairment in cassava leavesin response to nitrogen deficiency. Plant Soil 257, 417–423.
Daughtry, C.H.T., Walthall, C.L., Kim, M.S., de Colstoun, E.B., Mc-Murtrey III, J.E., 2000. Estimating corn leaf chlorophyll concen-tration from leaf and canopy reflectance. Remote Sens. Environ.74, 229–239.
Everitt, J.H., Richardson, A.J., Gausman, H.W., 1985. Leafreflectance-nitrogen-chlorophyll relations in buffelgrass. Pho-togramm. Eng. Remote Sens. 51, 463–466.
Filella, I., Serrano, L., Serra, J., Penuelas, J., 1995. Evaluating wheatnitrogen status with canopy reflectance indices and discriminantanalysis. Crop Sci. 35, 1400–1405.
Fridgen, J.L., Varco, J.J., 2004. Dependency of cotton leaf nitrogen,chlorophyll, and reflectance on nitrogen and potassium availabil-ity. Agron. J. 96, 63–69.
Graeff, S., Claupein, W., 2003. Quantifying nitrogen status of corn(Zea maysL.) in the field by reflectance measurements. Eur. J.Agron. 19, 611–618.
G mea-ncies
H tionssed
H n theom-ling,Bu-
J eek,d by
L ster,ationge:. Re-
L ld,Soil
Ma, B.L., Morrison, M.J., Dwyer, L.M., 1996. Canopy light re-flectance and field greenness to assess nitrogen fertilization andyield of maize. Agron. J. 88, 915–920.
Maranville, J.W., Madhavan, S., 2002. Physiological adaptation fornitrogen use efficiency in sorghum. Plant Soil 245, 25–34.
Muchow, R.C., Sinclair, T.R., 1994. Nitrogen response of leaf pho-tosynthesis and canopy radiation use efficiency in field-grownmaize and sorghum. Crop Sci. 34, 721–727.
Nelson, D.W., Sommers, L.E., 1972. A simple digestion procedurefor estimation of total nitrogen in soil and sediments. J. Environ.Qual. 1, 423–425.
Novoa, R., Loomis, R.S., 1981. Nitrogen and plant production. PlantSoil 58, 177–204.
Osaki, M., Shinano, T., Tadano, T., 1993. Effect of nitrogen, phospho-rus, or potassium deficiency on the accumulation of ribulose-1,5-bisphosphate carboxylase/oxygenase and chlorophyll in severalfield crops. Soil Sci. Plant Nutr. 39, 417–425.
Osborne, S.L., Schepers, J.S., Francis, D.D., Schlemmer, M.R., 2002.Detection of phosphorus and nitrogen deficiencies in corn usingspectral radiance measurements. Agron. J. 94, 1215–1221.
Peng, S.B., Krieg, D.R., Girma, F.S., 1991. Leaf photosynthetic rateis correlated with biomass and grain production in grain sorghum.Photosynth. Res. 28, 1–7.
Penuelas, J., Filella, I., 1998. Visible and near-infrared reflectancetechniques for diagnosing plant physiological status. TrendsPlant Sci. 3, 151–156.
Plenet, D., Cruz, P., 1997. The nitrogen requirement of major agricul-tural crops: maize and sorghum. In: Lemaire, G. (Ed.), Diagnosisof the Nitrogen Status in Crops. Berlin Heidelberg, Springer-Verlag, pp. 93–107.
Read, J.J., Tarpley, L., McKinion, J.M., Reddy, K.R., 2002. Narrow-waveband reflectance ratios for remote estimation of nitrogenstatus in cotton. J. Environ. Qual. 31, 1442–1452.
Reddy, A.R., Reddy, K.R., Padjung, R., Hodges, H.F., 1996. Nitrogennutrition and photosynthesis in leaves of Pima cotton. J. Plant
R -gen-Res.
S SAS
S tiontages77–
S ropninguc-
ngen,
T tancef ni-
T hloro-. 69,
raeff, S., Steffens, D., Schubert, S., 2001. Use of reflectancesurements for the early detection of N, P, Mg, and Fe deficiein Zea maysL. J. Plant Nutr. Soil Sci. 164, 445–450.
eitholt, J.J., Johnson, R.C., Ferris, D.M., 1991. Stomatal limitato carbon dioxide assimilation in nitrogen and drought-strewheat. Crop Sci. 31, 135–139.
ewitt, E.J., 1952. Sand and water culture. Methods used istudy of plant nutrition. Technical Communication No. 22, Cmonwealth Bureau of Horticulture and Plantation, East MalMaidstone. Kent Publishers, Commonwealth Agriculturalreaux Farmham Royal, Bucks, England, pp. 187–190.
aynes, D.B., Colvin, T.S., Karlen, D.L., Cambardella, C.A., MD.W., 2001. Nitrate loss in subsurface drainage as affectenitrogen fertilizer rate. J. Environ. Qual. 30, 1305–1314.
amb, D.W., Steyn-Ross, M., Schaare, P., Hanna, M.M., SilveW., Steyn-Ross, A., 2002. Estimating leaf nitrogen concentrin ryegrass (Loliumspp.) pasture using the chlorophyll red-edtheoretical modeling and experimental observations. Int. Jmote Sens. 23, 3619–3648.
ocke, M.A., Hons, F.M., 1988. Effect of N rate and tillage on yieN accumulation and leaf N concentration of grain sorghum.Tillage Res. 12, 223–233.
Nutr. 19, 755–770.obinson, J.M., Burkey, K.O., 1997. Foliar CO2 photoassimila
tion and chloroplast linear electron transport rates in nitrosufficient and nitrogen-limited soybean plants. Photosynth.54, 209–217.
AS Institute, 1997. SAS user’s guide: Statistics, Version 8.Inst. Inc., Cary, North Carolina, USA.
ettimi, J.R., Maranville, J.W., 1998. Carbon dioxide assimilaefficiency of maize leaves under nitrogen stress at different sof plant development. Comm. Soil Sci. Plant Anal. 29, 7792.
inclair, T.R., 1990. Nitrogen influence on the physiology of cyield. In: Rabbinge, R., Goudriaan, J., van Keulen, H., Pende Vries, F.W.T., van Laar, H.H. (Eds.), Theoretical Prodtion Ecology: Reflections and Prospects. Pudoc, Wagenipp. 41–45.
arpley, L., Reddy, K.R., Sassenrath-Cole, G.F., 2000. Reflecindices with precision and accuracy in predicting cotton leatrogen concentration. Crop Sci. 40, 1814–1819.
homas, J.R., Gausman, H.W., 1977. Leaf reflectance vs. leaf cphyll and carotenoid concentrations for eight crops. Agron. J799–802.
D. Zhao et al. / Europ. J. Agronomy 22 (2005) 391–403 403
Voullot, M.O., Huet, P., Boissard, P., 1998. Early detection of Ndeficiency in a wheat crop using physiological and radiometricmethods. Agronomie 18, 117–130.
Walburg, G., Bauer, M.E., Daughtry, C.S.T., Housley, T.L., 1982.Effects of nitrogen nutrition on the growth, yield, and reflectancecharacteristics of corn canopies. Agron. J. 74, 677–683.
Wang, R.C., Wang, K., Shen, Z.Q., 1998. Feasibility of field evalu-ation of rice nitrogen status from reflectance spectra of canopy.Pedosphere 8, 121–126.
Wolfe, D.W., Henderson, D.W., Hsiao, T.C., Alvino, A., 1988. In-teractive water and nitrogen effects on senescence of maize. II.Photosynthetic decline and longevity of individual leaves. Agron.J. 80, 865–870.
Young, K.J., Long, S.P., 2000. Crop ecosystem responses to cli-matic change: maize and sorghum. In: Reddy, K.R., Hodges,H.F. (Eds.), Climate Change and Global Crop Productivity. CABIPublishing, Wallingford, pp. 107–131.
Zhao, D., Reddy, K.R., Kakani, V.G., Read, J.J., Carter, G.A., 2003.Corn (Zea maysL.) growth, leaf pigment concentration, photo-synthesis and leaf hyperspectral reflectance properties as affectedby nitrogen supply. Plant Soil 257, 205–217.
Zhao, D., Reddy, K.R., Kakani, V.G., Read, J.J., Koti, S., 2005. Se-lection of optimum reflectance ratios for estimating leaf nitrogenand chlorophyll concentrations of field-grown cotton. Agron. J.(in press).
Copyright © 2022 FDOKUMEN